QuickLinks -- Click here to rapidly navigate through this document
Exhibit 99.1
SIMON PROPERTY GROUP
Overview
The Company
Simon Property Group, Inc., ("Simon," "we," "us," "our," or the "Company") (NYSE:SPG) is a self-administered and self-managed real estate investment trust ("REIT"). Simon Property Group, L.P. or the Operating Partnership is a majority-owned subsidiary partnership of the Company. Together, the Company and the Operating Partnership, or Simon Group, are engaged primarily in the ownership, development and management of retail real estate properties. Simon Group operates from five retail real estate platforms: regional malls, Premium Outlet Centers®, The Mills®, community/lifestyle centers and international properties. At December 31, 2008, we owned or had an interest in 386 properties comprising 263 million square feet of gross leasable area in North America, Europe and Asia.
This package was prepared to provide (1) ownership information, (2) certain operational information, and (3) balance sheet information as of December 31, 2008, for the Company and the Operating Partnership.
Certain statements made in this Supplemental Package may be deemed "forward-looking statements" within the meaning of the Private Securities Litigation Reform Act of 1995. Although we believe the expectations reflected in any forward-looking statements are based on reasonable assumptions, we can give no assurance that our expectations will be attained, and it is possible that actual results may differ materially from those indicated by these forward-looking statements due to a variety of risks, uncertainties and other factors. Such factors include, but are not limited to: our ability to meet debt service requirements, the availability and terms of financing, changes in our credit rating, changes in market rates of interest and foreign exchange rates for foreign currencies, the ability to hedge interest rate risk, risks associated with the acquisition, development, expansion, leasing and management of properties, general risks related to retail real estate, the liquidity of real estate investments, environmental liabilities, international, national, regional and local economic climates, changes in market rental rates, trends in the retail industry, relationships with anchor tenants, the inability to collect rent due to the bankruptcy or insolvency of tenants or otherwise, risks relating to joint venture properties, costs of common area maintenance, competitive market forces, risks related to international activities, insurance costs and coverage, terrorist activities, changes in economic and market conditions and maintenance of our status as a real estate investment trust. We discuss these and other risks and uncertainties under the heading "Risk Factors" in our annual and quarterly periodic reports filed with the SEC. We may update that discussion in our periodic reports, but otherwise we undertake no duty or obligation to update or revise these forward-looking statements, whether as a result of new information, future developments, or otherwise.
We hope you find this Supplemental Package beneficial. Any questions, comments or suggestions should be directed to: Shelly J. Doran, Vice President of Investor Relations-Simon Property Group, P.O. Box 7033, Indianapolis, IN 46207. Telephone: (317) 685-7330; e-mail:sdoran@simon.com
5
SIMON PROPERTY GROUP
Overview
Reporting Calendar
Results for the next three quarters will be announced according to the following approximate schedule:
| | | | |
First Quarter 2009 | | | April 30, 2009 | |
Second Quarter 2009 | | | July 31, 2009 | |
Third Quarter 2009 | | | November 2, 2009 | |
Stock Information
The Company's common stock and two issues of preferred stock are traded on the New York Stock Exchange under the following symbols:
| | | | |
Common Stock | | | SPG | |
6% Series I Convertible Perpetual Preferred | | | SPGPrI | |
8.375% Series J Cumulative Redeemable Preferred | | | SPGPrJ | |
Credit Ratings
| | | | | | |
Standard & Poor's | | | | | |
| | Corporate | | | A- | | (Stable Outlook) |
| | Senior Unsecured | | | A- | | (Stable Outlook) |
| | Preferred Stock | | | BBB | | (Stable Outlook) |
Moody's | | | | | |
| | Senior Unsecured | | | A3 | | (Stable Outlook) |
| | Preferred Stock | | | Baa1 | | (Stable Outlook) |
6
Simon Property Group Ownership Structure(1)
December 31, 2008
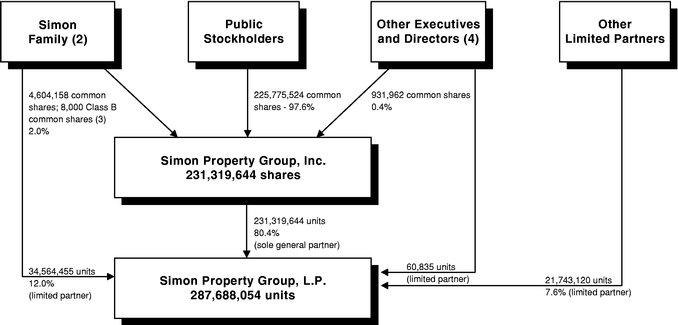
- (1)
- Schedule excludes Company preferred stock (see "Preferred Stock/Units Outstanding") and Operating Partnership units not convertible into common stock.
- (2)
- Consists of Melvin Simon, Herbert Simon, David Simon, and/or trusts established for the benefit of members of the Simon family and Melvin Simon & Associates, Inc.
- (3)
- Holders of Class B common stock are entitled to elect 4 of the members of the Board of Directors and also have voting rights with common stock.
- (4)
- Other executives includes directors and executive officers of the Company, other than Simon family members.
7
SIMON PROPERTY GROUP
Changes in Company Common Share and Operating Partnership Unit Ownership
For the Period from December 31, 2007 through December 31, 2008
| | | | | | | | |
| | Operating
Partnership
Units(1) | | Company
Common
Shares(2) | |
|---|
Number Outstanding at December 31, 2007 | | | 57,913,250 | | | 223,034,282 | |
Activity During the First Nine Months of 2008: | | | | | | | |
Issuance of Common Stock for Stock Option Exercises | | | — | | | 182,106 | |
Conversion of Preferred Stock into Common Stock | | | — | | | 57,175 | |
Conversion of Operating Partnership Units into Common Stock | | | (2,234,987 | ) | | 2,234,987 | |
Conversion of Operating Partnership Units into Cash | | | (144,291 | ) | | — | |
Conversion of Operating Partnership Preferred Units into Units | | | 1,101,765 | | | — | |
Restricted Stock Awards (Stock Incentive Program)(6) | | | — | | | 301,455 | |
Number Outstanding at September 30, 2008 | | |
56,635,737 | | |
225,810,005 | |
Activity During the Fourth Quarter of 2008: | | | | | | | |
Issuance of Common Stock for Stock Option Exercises | | | — | | | 100,000 | |
Conversion of Preferred Stock into Common Stock | | | — | | | 5,094,601 | |
Conversion of Operating Partnership Units into Common Stock | | | (339,621 | ) | | 339,621 | |
Conversion of Operating Partnership Units into Cash | | | (18,160 | ) | | — | |
Conversion of Operating Partnership Preferred Units into Units | | | 90,454 | | | — | |
Restricted Stock Awards (Stock Incentive Program)(6) | | | — | | | (24,583 | ) |
Number Outstanding at December 31, 2008 | | |
56,368,410 | | |
231,319,644 | |
Details for Diluted Common Shares Outstanding(5): | | | | | | | |
Company Common Shares Outstanding at December 31, 2008 | | | | | |
231,319,644 | |
Number of Common Shares Issuable Assuming Conversion of: | | | | | | | |
| | Series I 6% Convertible Perpetual Preferred Stock(3) | | | | | |
6,117,495 | |
| | Series C 7% Cumulative Convertible Preferred Units(3) | | | | | | 71,313 | |
| | Series I 6% Convertible Perpetual Preferred Units(3) | | | | | | 1,223,755 | |
Net Number of Common Shares Issuable Assuming Exercise of Stock Options(4) | | | | | |
397,177 | |
Diluted Common Shares Outstanding at December 31, 2008(5) | | | | | |
239,129,384 | |
- (1)
- Excludes units owned by the Company (shown here as Company Common Shares) and Operating Partnership units not convertible into common shares.
- (2)
- Excludes Operating Partnership preferred units relating to Company preferred stock outstanding (see Schedule of Preferred Stock Outstanding on page 59).
- (3)
- Conversion terms provided on page 59 of this document.
- (4)
- Based upon the weighted average stock price for the quarter ended December 31, 2008.
- (5)
- For FFO purposes.
- (6)
- Net of forfeitures.
8
SIMON PROPERTY GROUP
Selected Financial and Equity Information
As of December 31, 2008
Unaudited
(In thousands, except as noted)
| | | | | | | | | | | | | |
| | As of or for the
Three Months Ended
December 31, | | As of or for the
Twelve Months Ended
December 31, | |
|---|
| | 2008 | | 2007 | | 2008 | | 2007 | |
|---|
| Financial Highlights of the Company | | | | | | | | | | | | | |
| Total Revenue—Consolidated Properties | | $ | 1,029,316 | | $ | 1,035,581 | | $ | 3,783,155 | | $ | 3,650,799 | |
| Net Income Available to Common Stockholders | | $ | 145,203 | | $ | 112,929 | | $ | 422,517 | | $ | 436,164 | |
| Basic Earnings per Common Share (EPS) | | $ | 0.64 | | $ | 0.51 | | $ | 1.88 | | $ | 1.96 | |
| Diluted Earnings per Common Share (EPS) | | $ | 0.64 | | $ | 0.51 | | $ | 1.87 | | $ | 1.95 | |
| FFO of the Operating Partnership | | $ | 540,527 | | $ | 507,742 | | $ | 1,852,331 | | $ | 1,691,887 | |
| Diluted FFO of the Operating Partnership | | $ | 548,040 | | $ | 520,578 | | $ | 1,895,681 | | $ | 1,743,454 | |
| Basic FFO per Share (FFOPS) | | $ | 1.90 | | $ | 1.81 | | $ | 6.56 | | $ | 6.02 | |
| Diluted FFO per Share (FFOPS) | | $ | 1.86 | | $ | 1.76 | | $ | 6.42 | | $ | 5.90 | |
| Distributions per Share | | $ | 0.90 | | $ | 0.84 | | $ | 3.60 | | $ | 3.36 | |
| | | | | | | | |
| | December 31,
2008 | | December 31,
2007 | |
|---|
| Stockholders' Equity Information | | | | | | | |
| Limited Partner Units Outstanding at End of Period | | | 56,368 | | | 57,913 | |
| Common Shares Outstanding at End of Period | | | 231,320 | | | 223,035 | |
| | | | | | |
| Total Common Shares and Units Outstanding at End of Period | | | 287,688 | | | 280,948 | |
| | | | | | |
| Weighted Average Limited Partnership Units Outstanding | | | 57,175 | | | 58,036 | |
| Weighted Average Common Shares Outstanding: | | | | | | | |
| | Basic—for purposes of EPS and FFOPS | | | 225,333 | | | 222,998 | |
| | Diluted—for purposes of EPS | | | 225,884 | | | 223,777 | |
| | Diluted—for purposes of FFOPS | | | 238,263 | | | 237,448 | |
Simon Group's Debt Information |
|
|
|
|
|
|
|
| Share of Consolidated Debt | | $ | 17,766,316 | | $ | 16,933,771 | |
| Share of Joint Venture Debt | | | 6,632,419 | | | 6,568,403 | |
| | | | | | |
| Share of Total Debt | | $ | 24,398,735 | | $ | 23,502,174 | |
| | | | | | |
Simon Group's Market Capitalization |
|
|
|
|
|
|
|
| Common Stock Price at End of Period | | $ | 53.13 | | $ | 86.86 | |
| Common Equity Capitalization, including common operating partnership units | | $ | 15,284,866 | | $ | 24,403,103 | |
| Preferred Equity Capitalization, including preferred operating partnership units | | | 589,532 | | | 1,359,833 | |
| | | | | | |
| Total Equity Market Capitalization | | $ | 15,874,398 | | $ | 25,762,936 | |
| | | | | | |
| Total Capitalization—Including Simon Group's Share of Total Debt | | $ | 40,273,133 | | $ | 49,265,110 | |
| | | | | | |
| | | | | | | | |
| | As of or for the Twelve Months Ended December 31, | |
|---|
| | 2008 | | 2007 | |
|---|
| Miscellaneous Balance Sheet Data | | | | | | | |
| Interest Capitalized during the Period: | | | | | | | |
| | Consolidated Properties | | $ | 27,472 | | $ | 34,591 | |
| | Joint Venture Properties | | $ | 4,127 | | $ | 4,922 | |
| | Simon Group's Share of Joint Venture Properties | | $ | 2,019 | | $ | 2,106 | |
9
On the next three pages, we present balance sheet and income statement data on a pro-rata basis reflecting our proportionate economic ownership of each asset in the Simon Group portfolio.
Basis of Presentation: The consolidated amounts shown are prepared on a consistent basis with our consolidated financial statements. The Company's Share of Joint Ventures column was derived on a property-by-property basis by applying the same percentage interests used to arrive at our share of net income during the period and applying them to all financial statement line items of each property. A similar calculation was performed for minority interests.
10
SIMON PROPERTY GROUP
Unaudited Pro-Rata Statement of Operations
| | | | | | | | | | | | | | | | | | | | | |
| | For the Three Months Ended December 31, 2008 | |
| |
|---|
| | For the
Three Months Ended
December 31, 2007
Our Total Share | |
|---|
| | Consolidated | | Minority
Interest | | Our
Consolidated
Share | | Our
Share of
Joint Ventures | | Our
Total
Share | |
|---|
REVENUE: | | | | | | | | | | | | | | | | | | | |
| | Minimum rent | | $ | 607,100 | | $ | (9,777 | ) | $ | 597,323 | | $ | 209,518 | | $ | 806,841 | | $ | 772,476 | |
| | Overage rent | | | 39,440 | | | (302 | ) | | 39,138 | | | 23,674 | | | 62,812 | | | 67,735 | |
| | Tenant reimbursements | | | 289,290 | | | (5,817 | ) | | 283,473 | | | 109,072 | | | 392,545 | | | 385,452 | |
| | Management fees and other revenues | | | 31,222 | | | — | | | 31,222 | | | — | | | 31,222 | | | 40,371 | |
| | Other income | | | 62,264 | | | (757 | ) | | 61,507 | | | 30,380 | | | 91,887 | | | 95,325 | |
| | | | | | | | | | | | | | |
| | | Total revenue | | | 1,029,316 | | | (16,653 | ) | | 1,012,663 | | | 372,644 | | | 1,385,307 | | | 1,361,359 | |
| | | | | | | | | | | | | | |
EXPENSES: | | | | | | | | | | | | | | | | | | | |
| | Property operating | | | 103,687 | | | (3,327 | ) | | 100,360 | | | 71,691 | | | 172,051 | | | 175,565 | |
| | Depreciation and amortization | | | 268,902 | | | (2,140 | ) | | 266,762 | | | 106,962 | | | 373,724 | | | 343,588 | |
| | Real estate taxes | | | 80,586 | | | (1,351 | ) | | 79,235 | | | 26,797 | | | 106,032 | | | 97,352 | |
| | Repairs and maintenance | | | 32,621 | | | (743 | ) | | 31,878 | | | 14,696 | | | 46,574 | | | 49,672 | |
| | Advertising and promotion | | | 32,729 | | | (467 | ) | | 32,262 | | | 9,363 | | | 41,625 | | | 41,647 | |
| | Provision for credit losses | | | 6,668 | | | (198 | ) | | 6,470 | | | 3,879 | | | 10,349 | | | 8,153 | |
| | Home and regional office costs | | | 36,099 | | | — | | | 36,099 | | | — | | | 36,099 | | | 40,665 | |
| | General and administrative | | | 5,555 | | | — | | | 5,555 | | | — | | | 5,555 | | | 4,682 | |
| | Other | | | 16,651 | | | (511 | ) | | 16,140 | | | 25,347 | | | 41,487 | | | 45,599 | |
| | | | | | | | | | | | | | |
| | | Total operating expenses | | | 583,498 | | | (8,737 | ) | | 574,761 | | | 258,735 | | | 833,496 | | | 806,923 | |
| | | | | | | | | | | | | | |
OPERATING INCOME | | | 445,818 | | | (7,916 | ) | | 437,902 | | | 113,909 | | | 551,811 | | | 554,436 | |
Interest expense | | | (244,933 | ) | | 3,930 | | | (241,003 | ) | | (94,723 | ) | | (335,726 | ) | | (326,593 | ) |
Loss on extinguishment of debt | | | — | | | — | | | — | | | — | | | — | | | — | |
Minority interest in income of consolidated entities | | | (3,986 | ) | | 3,986 | | | — | | | — | | | — | | | — | |
Income tax (expense) benefit of taxable REIT subsidiaries | | | (2,005 | ) | | — | | | (2,005 | ) | | — | | | (2,005 | ) | | 12,727 | |
Income from unconsolidated entities | | | 19,186 | | | — | | | 19,186 | | | (19,186 | ) | | — | | | — | |
Impairment charge | | | (21,172 | ) | | — | | | (21,172 | ) | | — | | | (21,172 | ) | | (55,061 | ) |
Gain on sales of assets and interests in unconsolidated entities, net | | | — | | | — | | | — | | | — | | | — | | | 409 | |
Limited partners' interest in the Operating Partnership | | | (36,345 | ) | | — | | | (36,345 | ) | | — | | | (36,345 | ) | | (34,749 | ) |
Preferred distributions of the Operating Partnership | | | (4,201 | ) | | — | | | (4,201 | ) | | — | | | (4,201 | ) | | (5,362 | ) |
| | | | | | | | | | | | | | |
Income from continuing operations | | | 152,362 | | | — | | | 152,362 | | | — | | | 152,362 | | | 145,807 | |
Discontinued operations, net of limited partners' interest | | | (20 | ) | | — | | | (20 | ) | | — | | | (20 | ) | | 78 | |
Loss on sale of discontinued operations, net of limited partners' interest | | | — | | | — | | | — | | | — | | | — | | | (20,880 | ) |
| | | | | | | | | | | | | | |
NET INCOME | | | 152,342 | | | — | | | 152,342 | | | — | | | 152,342 | | | 125,005 | |
Preferred dividends | | | (7,139 | ) | | — | | | (7,139 | ) | | — | | | (7,139 | ) | | (12,076 | ) |
| | | | | | | | | | | | | | |
NET INCOME AVAILABLE TO COMMON STOCKHOLDERS | | $ | 145,203 | | $ | — | | $ | 145,203 | | $ | — | | $ | 145,203 | | | 112,979 | |
| | | | | | | | | | | | | | |
RECONCILIATION OF NET INCOME TO FFO | | | | | | | | | | | | | | | | | | | |
Net Income | | | | | | | | $ | 152,342 | | $ | — | | $ | 152,342 | | $ | 125,005 | |
Adjustments to Net Income to Arrive at FFO: | | | | | | | | | | | | | | | | | | | |
| | Limited partners' interest in the Operating Partnership and preferred distributions of the Operating Partnership | | | | | | | | | 40,546 | | | — | | | 40,546 | | | 40,111 | |
| | Limited partners' interest in Results of operations from discontinued operations | | | | | | | | | (5 | ) | | — | | | (5 | ) | | 20 | |
| | Depreciation and amortization from consolidated properties and discontinued operations | | | | | | | | | 264,465 | | | — | | | 264,465 | | | 232,162 | |
| | Simon's share of depreciation and amortization from unconsolidated entities | | | | | | | | | — | | | 96,631 | | | 96,631 | | | 109,462 | |
| | Income from unconsolidated entities | | | | | | | | | (19,186 | ) | | 19,186 | | | — | | | — | |
| | Loss on sales of interests in other assets and unconsolidated entities, net of limited partners' interest | | | | | | | | | — | | | — | | | — | | | 20,471 | |
| | Minority interest portion of depreciation and amortization | | | | | | | | | (2,112 | ) | | — | | | (2,112 | ) | | (2,051 | ) |
| | Preferred distributions and dividends | | | | | | | | | (11,340 | ) | | — | | | (11,340 | ) | | (17,438 | ) |
| | | | | | | | | | | | | | | | |
| | FFO of the Operating Partnership | | | | | | | | $ | 424,710 | | $ | 115,817 | | $ | 540,527 | | $ | 507,742 | |
| | | | | | | | | | | | | | | | |
| | | Percentage of FFO of the Operating Partnership | | | | | | | | | 78.57 | % | | 21.43 | % | | 100.00 | % | | 100.00 | % |
11
SIMON PROPERTY GROUP
Unaudited Pro-Rata Statement of Operations
| | | | | | | | | | | | | | | | | | | | | |
| | For the Twelve Months Ended December 31, 2008 | |
| |
|---|
| | For the
Twelve Months Ended
December 31, 2007
Our Total Share | |
|---|
| | Consolidated | | Minority
Interest | | Our
Consolidated
Share | | Our
Share of
Joint Ventures | | Our
Total
Share | |
|---|
REVENUE: | | | | | | | | | | | | | | | | | | | |
| | Minimum rent | | $ | 2,291,919 | | $ | (37,037 | ) | $ | 2,254,882 | | $ | 779,679 | | $ | 3,034,561 | | $ | 2,792,483 | |
| | Overage rent | | | 100,222 | | | (474 | ) | | 99,748 | | | 52,556 | | | 152,304 | | | 156,263 | |
| | Tenant reimbursements | | | 1,065,957 | | | (22,617 | ) | | 1,043,340 | | | 397,547 | | | 1,440,887 | | | 1,324,035 | |
| | Management fees and other revenues | | | 132,471 | | | — | | | 132,471 | | | — | | | 132,471 | | | 113,740 | |
| | Other income | | | 192,586 | | | (2,085 | ) | | 190,501 | | | 110,437 | | | 300,938 | | | 335,321 | |
| | | | | | | | | | | | | | |
| | | Total revenue | | | 3,783,155 | | | (62,213 | ) | | 3,720,942 | | | 1,340,219 | | | 5,061,161 | | | 4,721,842 | |
| | | | | | | | | | | | | | |
EXPENSES: | | | | | | | | | | | | | | | | | | | |
| | Property operating | | | 455,874 | | | (13,297 | ) | | 442,577 | | | 266,242 | | | 708,819 | | | 671,665 | |
| | Depreciation and amortization | | | 969,477 | | | (8,622 | ) | | 960,855 | | | 402,690 | | | 1,363,545 | | | 1,217,101 | |
| | Real estate taxes | | | 334,657 | | | (5,480 | ) | | 329,177 | | | 100,017 | | | 429,194 | | | 390,563 | |
| | Repairs and maintenance | | | 107,879 | | | (2,561 | ) | | 105,318 | | | 51,652 | | | 156,970 | | | 164,405 | |
| | Advertising and promotion | | | 96,783 | | | (1,383 | ) | | 95,400 | | | 26,645 | | | 122,045 | | | 117,441 | |
| | Provision for credit losses | | | 24,035 | | | (691 | ) | | 23,344 | | | 9,609 | | | 32,953 | | | 18,895 | |
| | Home and regional office costs | | | 144,865 | | | — | | | 144,865 | | | — | | | 144,865 | | | 136,610 | |
| | General and administrative | | | 20,987 | | | — | | | 20,987 | | | — | | | 20,987 | | | 19,587 | |
| | Other | | | 67,721 | | | (1,993 | ) | | 65,728 | | | 81,662 | | | 147,390 | | | 134,511 | |
| | | | | | | | | | | | | | |
| | | Total operating expenses | | | 2,222,278 | | | (34,027 | ) | | 2,188,251 | | | 938,517 | | | 3,126,768 | | | 2,870,778 | |
| | | | | | | | | | | | | | |
OPERATING INCOME | | | 1,560,877 | | | (28,186 | ) | | 1,532,691 | | | 401,702 | | | 1,934,393 | | | 1,851,064 | |
Interest expense | | | (947,140 | ) | | 15,755 | | | (931,385 | ) | | (369,456 | ) | | (1,300,841 | ) | | (1,237,667 | ) |
Loss on extinguishment of debt | | | (20,330 | ) | | — | | | (20,330 | ) | | — | | | (20,330 | ) | | — | |
Minority interest in income of consolidated entities | | | (12,431 | ) | | 12,431 | | | — | | | — | | | — | | | — | |
Income tax (expense) benefit of taxable REIT subsidiaries | | | (3,581 | ) | | — | | | (3,581 | ) | | — | | | (3,581 | ) | | 11,322 | |
Income from unconsolidated entities | | | 32,246 | | | — | | | 32,246 | | | (32,246 | ) | | — | | | — | |
Impairment charge | | | (21,172 | ) | | — | | | (21,172 | ) | | — | | | (21,172 | ) | | (55,061 | ) |
Gain on sales of assets and interests in unconsolidated entities, net | | | — | | | — | | | — | | | — | | | — | | | 92,044 | |
Limited partners' interest in the Operating Partnership | | | (107,214 | ) | | — | | | (107,214 | ) | | — | | | (107,214 | ) | | (120,818 | ) |
Preferred distributions of the Operating Partnership | | | (17,599 | ) | | — | | | (17,599 | ) | | — | | | (17,599 | ) | | (21,580 | ) |
| | | | | | | | | | | | | | |
Income from continuing operations | | | 463,656 | | | — | | | 463,656 | | | — | | | 463,656 | | | 519,304 | |
Discontinued operations, net of limited partners' interest | | | (20 | ) | | — | | | (20 | ) | | — | | | (20 | ) | | (93 | ) |
Loss on sale of discontinued operations, net of limited partners' interest | | | — | | | — | | | — | | | — | | | — | | | (27,972 | ) |
| | | | | | | | | | | | | | |
NET INCOME | | | 463,636 | | | — | | | 463,636 | | | — | | | 463,636 | | | 491,239 | |
Preferred dividends | | | (41,119 | ) | | — | | | (41,119 | ) | | — | | | (41,119 | ) | | (55,075 | ) |
| | | | | | | | | | | | | | |
NET INCOME AVAILABLE TO COMMON STOCKHOLDERS | | $ | 422,517 | | $ | — | | $ | 422,517 | | $ | — | | $ | 422,517 | | $ | 436,164 | |
| | | | | | | | | | | | | | |
RECONCILIATION OF NET INCOME TO FFO | | | | | | | | | | | | | | | | | | | |
Net Income | | | | | | | | $ | 463,636 | | $ | — | | $ | 463,636 | | $ | 491,239 | |
Adjustments to Net Income to Arrive at FFO: | | | | | | | | | | | | | | | | | | | |
| | Limited partners' interest in the Operating Partnership and preferred distributions of the Operating Partnership | | | | | | | | | 124,813 | | | — | | | 124,813 | | | 142,398 | |
| | Limited partners' interest in Results of operations from discontinued operations | | | | | | | | | (5 | ) | | — | | | (5 | ) | | (24 | ) |
| | Depreciation and amortization from consolidated properties and discontinued operations | | | | | | | | | 954,494 | | | — | | | 954,494 | | | 892,488 | |
| | Simon's share of depreciation and amortization from unconsolidated entities | | | | | | | | | — | | | 376,670 | | | 376,670 | | | 315,159 | |
| | Income from unconsolidated entities | | | | | | | | | (32,246 | ) | | 32,246 | | | — | | | — | |
| | Gain on sales of interests in other assets and unconsolidated entities, net of limited partners' interest | | | | | | | | | — | | | — | | | — | | | (64,072 | ) |
| | Minority interest portion of depreciation and amortization | | | | | | | | | (8,559 | ) | | — | | | (8,559 | ) | | (8,646 | ) |
| | Preferred distributions and dividends | | | | | | | | | (58,718 | ) | | — | | | (58,718 | ) | | (76,655 | ) |
| | | | | | | | | | | | | | | | |
| | FFO of the Operating Partnership | | | | | | | | $ | 1,443,415 | | $ | 408,916 | | $ | 1,852,331 | | $ | 1,691,887 | |
| | | | | | | | | | | | | | | | |
| | | Percentage of FFO of the Operating Partnership | | | | | | | | | 77.92 | % | | 22.08 | % | | 100.00 | % | | 100.00 | % |
12
SIMON PROPERTY GROUP
Unaudited Pro-Rata Balance Sheet
| | | | | | | | | | | | | | | | | | | | | | |
| | As of December 31, 2008 | |
| |
|---|
| | Consolidated | |
Minority
Interest | | Our
Consolidated
Share | | Our
Share of
Joint Ventures | | Our
Total
Share | | As of
December 31, 2007
Our Total Share | |
|---|
ASSETS: | | | | | | | | | | | | | | | | | | | |
| | Investment properties, at cost | | $ | 25,205,715 | | $ | (204,291 | ) | $ | 25,001,424 | | $ | 9,320,620 | | $ | 34,322,044 | | $ | 33,335,281 | |
| | | Less—accumulated depreciation | | | 6,184,285 | | | (80,395 | ) | | 6,103,890 | | | 1,324,389 | | | 7,428,279 | | | 6,256,587 | |
| | | | | | | | | | | | | | |
| | | 19,021,430 | | | (123,896 | ) | | 18,897,534 | | | 7,996,231 | | | 26,893,765 | | | 27,078,694 | |
| | Cash and cash equivalents | | | 773,544 | | | (5,306 | ) | | 768,238 | | | 306,335 | | | 1,074,573 | | | 782,599 | |
| | Tenant receivables and accrued revenue, net | | | 414,856 | | | (5,205 | ) | | 409,651 | | | 165,220 | | | 574,871 | | | 608,413 | |
| | Investment in unconsolidated entities, at equity | | | 1,663,886 | | | — | | | 1,663,886 | | | (1,663,886 | ) | | — | | | — | |
| | Deferred costs and other assets | | | 1,202,256 | | | (177,488 | ) | | 1,024,768 | | | 243,263 | | | 1,268,031 | | | 1,227,788 | |
| | Notes receivable from related parties | | | 520,700 | | | — | | | 520,700 | | | — | | | 520,700 | | | 548,000 | |
| | | | | | | | | | | | | | |
| | | | Total assets | | $ | 23,596,672 | | $ | (311,895 | ) | $ | 23,284,777 | | $ | 7,047,163 | | $ | 30,331,940 | | $ | 30,245,494 | |
| | | | | | | | | | | | | | |
LIABILITIES: | | | | | | | | | | | | | | | | | | | |
| | Mortgages and other indebtedness | | $ | 18,042,532 | | $ | (276,216 | ) | $ | 17,766,316 | | $ | 6,632,419 | | $ | 24,398,735 | | $ | 23,502,174 | |
| | Accounts payable, accrued expenses, intangibles, and deferred revenues | | | 1,086,248 | | | (9,804 | ) | | 1,076,444 | | | 453,346 | | | 1,529,790 | | | 1,647,163 | |
| | Cash distributions and losses in partnerships and joint ventures, at equity | | | 380,730 | | | — | | | 380,730 | | | (380,730 | ) | | — | | | — | |
| | Other liabilities, minority interest and accrued dividends | | | 179,970 | | | (25,875 | ) | | 154,095 | | | 342,128 | | | 496,223 | | | 493,655 | |
| | | | | | | | | | | | | | |
| | | | Total liabilities | | | 19,689,480 | | | (311,895 | ) | | 19,377,585 | | | 7,047,163 | | | 26,424,748 | | | 25,642,992 | |
| | | | | | | | | | | | | | |
LIMITED PARTNERS' INTEREST IN THE OPERATING PARTNERSHIP | | |
637,140 | | |
— | | |
637,140 | | |
— | | |
637,140 | | |
731,406 | |
LIMITED PARTNERS' PREFERRED INTEREST IN THE OPERATING PARTNERSHIP | | |
229,869 | | |
— | | |
229,869 | | |
— | | |
229,869 | | |
307,713 | |
STOCKHOLDERS' EQUITY: | | | | | | | | | | | | | | | | | | | |
| | CAPITAL STOCK OF SIMON PROPERTY GROUP, INC. (750,000,000 total shares authorized, $.0001 par value, 237,996,000 shares of excess common stock): | | | | | | | | | | | | | | | | | | | |
| | | All series of preferred stock, 100,000,000 shares authorized, 8,387,212 and 14,801,884 issued and outstanding, respectively with a liquidation value of $419,361 and $740,094, respectively | | |
425,545 | | |
— | | |
425,545 | | |
— | | |
425,545 | | |
746,608 | |
| | | Common stock, $.0001 par value, 400,000,000 shares authorized, 235,691,040 and 227,719,614 issued and outstanding | | |
24 | | |
— | | |
24 | | |
— | | |
24 | | |
23 | |
| | | Class B common stock, $.0001 par value, 12,000,000 shares authorized, 8,000 issued and outstanding, respectively | | |
— | | |
— | | |
— | | |
— | | |
— | | |
— | |
| | | Class C common stock, $.0001 par value, 0 and 4,000 shares authorized, issued and outstanding | | |
— | | |
— | | |
— | | |
— | | |
— | | |
— | |
| | Capital in excess of par value | | |
5,410,147 | | |
— | | |
5,410,147 | | |
— | | |
5,410,147 | | |
5,067,718 | |
| | Accumulated deficit | | | (2,444,257 | ) | | — | | | (2,444,257 | ) | | — | | | (2,444,257 | ) | | (2,055,447 | ) |
| | Accumulated other comprehensive income | | | (165,066 | ) | | — | | | (165,066 | ) | | — | | | (165,066 | ) | | 18,087 | |
| | Common stock held in treasury at cost, 4,379,396 shares and 4,697,332, respectively | | | (186,210 | ) | | — | | | (186,210 | ) | | — | | | (186,210 | ) | | (213,606 | ) |
| | | | | | | | | | | | | | |
| | | | Total stockholders' equity | | | 3,040,183 | | | — | | | 3,040,183 | | | — | | | 3,040,183 | | | 3,563,383 | |
| | | | | | | | | | | | | | |
| | $ | 23,596,672 | | $ | (311,895 | ) | $ | 23,284,777 | | $ | 7,047,163 | | $ | 30,331,940 | | $ | 30,245,494 | |
| | | | | | | | | | | | | | |
13
SIMON PROPERTY GROUP
Reconciliation of Net Income to NOI
As of December 31, 2008
(in thousands, except as noted)
Industry practice is to evaluate real estate properties on an unleveraged basis. Net Operating Income ("NOI") is a standard industry performance measure which is defined as operating income plus depreciation and amortization, both calculated in accordance with accounting principles generally accepted in the United States ("GAAP"). We consider NOI to be a key measure of our operating performance that is not specifically defined by GAAP. We believe that NOI is helpful to investors because it is a widely recognized measure of the performance of REITs and provides a relevant basis for comparison among REITs. We also use NOI internally to measure the operating performance of our portfolio.
However, you should understand that NOI:
- •
- does not represent cash flow from operations as defined by GAAP,
- •
- should not be considered as an alternative to net income determined in accordance with GAAP as a measure of operating performance,
- •
- is not an alternative to cash flows as a measure of liquidity, and
- •
- is not indicative of cash flows from operating, investing and financing activities.
The Reconciliation of Net Income to NOI provides net income, which we believe is the most directly comparable GAAP financial measure, and reconciles the amounts to "Total NOI of the Simon Group Portfolio." This schedule also provides the increase in NOI of regional malls and Premium Outlet Centers that are comparable properties for the twelve months ended December 31, 2008.
| | | | | | | | | | | | | |
| | For the Three
Months Ended
December 31, | | For the Twelve
Months Ended
December 31, | |
|---|
| | 2008 | | 2007 | | 2008 | | 2007 | |
|---|
Reconciliation of NOI of consolidated Properties: | | | | | | | | | | | | | |
Net Income | | $ | 152,342 | | $ | 125,005 | | $ | 463,636 | | $ | 491,239 | |
Preferred distributions of the Operating Partnership | | | 4,201 | | | 5,362 | | | 17,599 | | | 21,580 | |
Limited partners' interest in the Operating Partnership | | | 36,345 | | | 34,749 | | | 107,214 | | | 120,818 | |
Discontinued operations—Results of operations and (gain) loss on disposal or sale, net of limited partners' interest | | | 20 | | | 20,802 | | | 20 | | | 28,065 | |
Income tax expense (benefit) of taxable REIT subsidiaries | | | 2,005 | | | (12,727 | ) | | 3,581 | | | (11,322 | ) |
Minority interest in income of consolidated entities | | | 3,986 | | | 4,838 | | | 12,431 | | | 13,936 | |
Interest expense | | | 244,933 | | | 241,565 | | | 947,140 | | | 945,852 | |
Income from unconsolidated entities | | | (19,186 | ) | | (397 | ) | | (32,246 | ) | | (38,120 | ) |
Loss on extinguishment of debt | | | — | | | — | | | 20,330 | | | — | |
Impairment charge | | | 21,172 | | | 55,061 | | | 21,172 | | | 55,061 | |
Gain on sale of interest in unconsolidated entities | | | — | | | (409 | ) | | — | | | (92,044 | ) |
| | | | | | | | | | |
Operating Income | | | 445,818 | | | 473,849 | | | 1,560,877 | | | 1,535,065 | |
Depreciation and amortization | | | 268,902 | | | 235,092 | | | 969,477 | | | 905,636 | |
| | | | | | | | | | |
NOI of consolidated Properties | | $ | 714,720 | | $ | 708,941 | | $ | 2,530,354 | | $ | 2,440,701 | |
| | | | | | | | | | |
Reconciliation of NOI of unconsolidated entities: | | | | | | | | | | | | | |
Net Income | | $ | 92,893 | | $ | 49,482 | | $ | 211,337 | | $ | 407,841 | |
Discontinued operations—Results of operations and gain on disposal or sale, net | | | — | | | (11 | ) | | (47 | ) | | (201,720 | ) |
Interest expense | | | 242,141 | | | 259,214 | | | 969,420 | | | 853,307 | |
Loss (income) from unconsolidated entities | | | 1,340 | | | (207 | ) | | 5,123 | | | (665 | ) |
Gain on sale of asset | | | — | | | 823 | | | — | | | 6,399 | |
| | | | | | | | | | |
Operating Income | | | 336,374 | | | 309,301 | | | 1,185,833 | | | 1,065,162 | |
Depreciation and amortization | | | 203,631 | | | 227,695 | | | 775,887 | | | 627,929 | |
| | | | | | | | | | |
NOI of unconsolidated entities | | $ | 540,005 | | $ | 536,996 | | $ | 1,961,720 | | $ | 1,693,091 | |
| | | | | | | | | | |
Total consolidated and unconsolidated NOI from continuing operations | | $ | 1,254,725 | | $ | 1,245,937 | | $ | 4,492,074 | | $ | 4,133,792 | |
| | | | | | | | | | |
Adjustments to NOI: | | | | | | | | | | | | | |
NOI of discontinued consolidated and unconsolidated Properties | | | (25 | ) | | 124 | | | 22 | | | 8,105 | |
| | | | | | | | | | |
Total NOI of the Simon Group Portfolio | | $ | 1,254,700 | | $ | 1,246,061 | | $ | 4,492,096 | | $ | 4,141,897 | |
| | | | | | | | | | |
Increase in NOI from prior period | | | 0.7 | % | | 32.9 | % | | 8.5 | % | | 24.7 | % |
Less: Joint venture partner's share of NOI | | | 329,190 | | | 347,937 | | | 1,194,183 | | | 1,073,849 | |
| | | | | | | | | | |
Simon Group's Share of NOI | | $ | 925,510 | | $ | 898,124 | | $ | 3,297,913 | | $ | 3,068,048 | |
| | | | | | | | | | |
Increase in Simon Group's Share of NOI from prior period | | | 3.0 | % | | 20.9 | % | | 7.5 | % | | 16.2 | % |
NOI of Regional Malls that are Comparable Properties (1) | | | | | | | | $ | 2,530,515 | | $ | 2,511,121 | |
| | | | | | | | | | | | |
Increase in NOI of Regional Malls that are Comparable Properties (1) | | | | | | | | | 0.8 | % | | | |
| | | | | | | | | | | | | |
NOI of Premium Outlet Centers that are Comparable Properties (1) | | | | | | | | $ | 456,540 | | $ | 424,073 | |
| | | | | | | | | | | | |
Increase in NOI of Premium Outlet Centers that are Comparable Properties (1) | | | | | | | | | 7.7 | % | | | |
| | | | | | | | | | | | | |
- (1)
- Properties that were owned in both of the periods under comparison are referred to as comparable properties.
14
SIMON PROPERTY GROUP
NOI Composition(1)
For the Twelve Months Ended December 31, 2008
| | | | |
| | Percent of Simon Group's
Share of NOI | |
|---|
| U.S. Portfolio NOI by State | | | | |
| Florida | | | 13.2 | % |
| Texas | | | 10.8 | % |
| California | | | 10.3 | % |
| New York | | | 7.4 | % |
| Massachusetts | | | 7.2 | % |
| Georgia | | | 5.0 | % |
| Indiana | | | 4.7 | % |
| Nevada | | | 4.6 | % |
| Pennsylvania | | | 4.4 | % |
| New Jersey | | | 4.1 | % |
| | | | |
| Top 10 Contributors by State | | | 71.7 | % |
| | | | |
NOI by Asset Type |
|
|
|
|
| Regional Malls | | | 66.8 | % |
| Premium Outlet Centers | | | 17.9 | % |
| Mills Portfolio (2) | | | 7.3 | % |
| Community/Lifestyle Centers | | | 3.8 | % |
| International (3) | | | 4.0 | % |
| Other | | | 0.2 | % |
| | | | |
| Total | | | 100.0 | % |
| | | | |
- (1)
- Based on Simon Group's share of total NOI and does not reflect any property, entity or corporate-level debt.
- (2)
- Mills Portfolio includes The Mills®, Mills regional malls and Mills community centers.
- (3)
- International includes seven Premium Outlet Centers in Japan and one Premium Outlet Center in both Mexico and South Korea, plus the shopping centers in France, Italy, Poland, and China.
15
SIMON PROPERTY GROUP
Analysis of Other Income and Other Expense
As of December 31, 2008
(In thousands)
| | | | | | | | | | | | | |
| | For the Three Months
Ended December 31, | | For the Twelve Months
Ended December 31, | |
|---|
| | 2008 | | 2007 | | 2008 | | 2007 | |
|---|
Consolidated Properties | | | | | | | | | | | | | |
Other Income | | | | | | | | | | | | | |
Interest Income | |
$ |
11,239 | |
$ |
14,076 | |
$ |
46,884 | |
$ |
73,647 | |
Lease Settlement Income | | | 1,514 | | | 5,000 | | | 15,438 | | | 34,137 | (1) |
Gains on Land Sales | | | 3,581 | | | 4,982 | | | 11,285 | | | 11,376 | |
Other | | | 45,930 | | | 46,955 | | | 118,979 | | | 130,019 | |
| | | | | | | | | | |
Totals | | $ | 62,264 | | $ | 71,013 | | $ | 192,586 | | $ | 249,179 | |
| | | | | | | | | | |
Other Expense | | | | | | | | | | | | | |
Ground Rent | |
$ |
8,026 | |
$ |
8,773 | |
$ |
30,683 | |
$ |
31,012 | |
Professional Fees | | | 6,315 | | | 8,937 | | | 20,423 | | | 18,054 | |
Other | | | 2,310 | | | 1,526 | | | 16,615 | | | 12,888 | |
| | | | | | | | | | |
Totals | | $ | 16,651 | | $ | 19,236 | | $ | 67,721 | | $ | 61,954 | |
| | | | | | | | | | |
- (1)
- 2007 includes $19 million related to two department store locations that have been redeveloped.
16
SIMON PROPERTY GROUP
U.S. Portfolio GLA
As of December 31, 2008
| | | | | | | | | | | |
Type of Property | | GLA-Sq. Ft. | | Total Owned GLA | | % of Owned GLA | |
|---|
Regional Malls | | | | | | | | | | |
| | Mall Stores | | | 59,146,030 | | | 58,861,653 | | | 38.5 | % |
| | Freestanding | | | 4,321,845 | | | 1,673,748 | | | 1.1 | % |
| | Anchors | | | 96,727,572 | | | 26,361,240 | | | 17.3 | % |
| | | | | | | | |
Regional Mall Total | | | 160,195,447 | | | 86,896,641 | | | 56.9 | % |
Premium Outlet Centers | | |
16,383,378 | | |
16,383,378 | | |
10.7 |
% |
Community/Lifestyle Centers | | |
20,822,340 | | |
14,050,830 | | |
9.2 |
% |
| | The Mills® | | |
22,803,081 | | |
20,284,535 | | |
13.3 |
% |
| | Mills Regional Malls | | | 17,483,816 | | | 8,653,232 | | | 5.7 | % |
| | Mills Community Centers | | | 1,013,832 | | | 962,278 | | | 0.6 | % |
| | | | | | | | |
Mills Portfolio Total | | | 41,300,729 | | | 29,900,045 | | | 19.6 | % |
Office Portion of Retail | | |
2,120,523 | | |
2,120,523 | | |
1.4 |
% |
Other(1) | | |
5,216,742 | | |
3,450,421 | | |
2.2 |
% |
| | | | | | | | |
Total U.S. Properties | | | 246,039,159 | | | 152,801,838 | | | 100.0 | % |
| | | | | | | | |
- (1)
- Consists of: 1) ten other shopping centers and non-Premium outlet centers, and 2) four regional malls (Nanuet Mall, Palm Beach Mall, Raleigh Springs Mall, University Mall (FL)) which are in the process of being redeveloped. These properties contribute 0.2% of Simon Group's share of total NOI.
17
SIMON PROPERTY GROUP
U.S. Regional Mall Operational Information(1)
As of December 31, 2008
| | | | | | | | |
| | As of or for the
Twelve Months
Ended
December 31, | |
|---|
| | 2008 | | 2007 | |
|---|
Total Number of Regional Malls | | | 164 | | | 168 | |
Total Regional Mall GLA (in millions of square feet; includes office portion of retail) | | |
162.2 | | |
164.0 | |
Occupancy(2) | | | | | | | |
| | Consolidated Assets | | | 92.6 | % | | 93.9 | % |
| | Unconsolidated Assets | | | 91.9 | % | | 92.7 | % |
| | Total Portfolio | | | 92.4 | % | | 93.5 | % |
Comparable sales per square foot(3) | | | | | | | |
| | Consolidated Assets | | $ | 445 | | $ | 472 | |
| | Unconsolidated Assets | | $ | 523 | | $ | 530 | |
| | Total Portfolio | | $ | 470 | | $ | 491 | |
Average rent per square foot(2) | | | | | | | |
| | Consolidated Assets | | $ | 38.21 | | $ | 36.24 | |
| | Unconsolidated Assets | | $ | 42.03 | | $ | 38.73 | |
| | Total Portfolio | | $ | 39.49 | | $ | 37.09 | |
| | | | | | | |
Average Base Rent Per Square Foot(2) | | Mall &
Freestanding
Stores | | %
Change | |
|---|
| 12/31/08 | | $ | 39.49 | | | 6.5 | % |
| 12/31/07 | | | 37.09 | | | 4.8 | % |
| 12/31/06 | | | 35.38 | | | 2.6 | % |
| 12/31/05 | | | 34.49 | | | 3.0 | % |
| 12/31/04 | | | 33.50 | | | 3.8 | % |
| 12/31/03 | | | 32.26 | | | 5.1 | % |
Leasing Activity During the Period(2):
| | | | | | | | | | | | | |
| | Average Base Rent(4) | |
| |
| |
|---|
| | Lease
Signings | | Store Closings/
Lease Expirations | | Amount of Change
(Referred to as
"Leasing Spread") | |
|---|
2008 | | $ | 45.74 | | $ | 37.72 | | $ | 8.02 | | | 21.3 | % |
2007 | | | 44.76 | | | 39.12 | | | 5.64 | | | 14.4 | % |
2006 | | | 43.21 | | | 36.73 | | | 6.48 | | | 17.6 | % |
2005 | | | 43.18 | | | 35.78 | | | 7.40 | | | 20.7 | % |
2004 | | | 39.33 | | | 33.59 | | | 5.74 | | | 17.1 | % |
2003 | | | 41.28 | | | 32.99 | | | 8.29 | | | 25.1 | % |
- (1)
- Does not include information for the regional malls in the Mills portfolio.
- (2)
- Includes mall stores.
- (3)
- Based upon the standard definition of sales for regional malls adopted by the International Council of Shopping Centers which includes mall stores less than 10,000 square feet.
- (4)
- Represents the average base rent in effect during the period for those tenants who signed leases as compared to the average base rent in effect during the period for those tenants whose leases terminated or expired.
18
SIMON PROPERTY GROUP
U.S. Regional Mall Lease Expirations(1)(2)
As of December 31, 2008
| | | | | | | | | | |
Year | | Number of
Leases Expiring | | Square
Feet | | Avg. Base Rent
per Square Foot
at 12/31/08 | |
|---|
Mall Stores & Freestanding | | | | | | | | | | |
Month to Month Leases | | |
538 | | |
1,277,545 | |
$ |
38.47 | |
2009 | | | 1,776 | | | 4,802,566 | | $ | 37.70 | |
2010 | | | 2,212 | | | 6,374,978 | | $ | 37.45 | |
2011 | | | 2,218 | | | 5,671,427 | | $ | 35.70 | |
2012 | | | 1,563 | | | 5,274,736 | | $ | 36.19 | |
2013 | | | 1,445 | | | 4,291,127 | | $ | 41.97 | |
2014 | | | 1,297 | | | 3,985,264 | | $ | 42.36 | |
2015 | | | 1,210 | | | 4,088,851 | | $ | 43.46 | |
2016 | | | 1,369 | | | 3,962,654 | | $ | 42.08 | |
2017 | | | 1,363 | | | 4,544,236 | | $ | 43.72 | |
2018 | | | 1,201 | | | 4,646,413 | | $ | 45.76 | |
2019 and Thereafter | | | 587 | | | 3,712,254 | | $ | 36.99 | |
Specialty Leasing Agreements w/ terms in excess of 12 months | | | 1,087 | | | 2,722,383 | | $ | 15.28 | |
Anchor Tenants | | | | | | | | | | |
Month to Month Leases | | |
1 | | |
75,930 | |
$ |
1.90 | |
2009 | | | 14 | | | 1,487,792 | | $ | 3.60 | |
2010 | | | 34 | | | 4,055,343 | | $ | 2.66 | |
2011 | | | 21 | | | 2,261,008 | | $ | 4.22 | |
2012 | | | 28 | | | 3,248,412 | | $ | 4.06 | |
2013 | | | 25 | | | 3,334,115 | | $ | 4.78 | |
2014 | | | 28 | | | 2,655,555 | | $ | 5.31 | |
2015 | | | 9 | | | 752,170 | | $ | 7.11 | |
2016 | | | 10 | | | 1,090,349 | | $ | 7.68 | |
2017 | | | 6 | | | 816,723 | | $ | 2.79 | |
2018 | | | 7 | | | 687,836 | | $ | 7.16 | |
2019 and Thereafter | | | 39 | | | 4,049,524 | | $ | 6.24 | |
- (1)
- Does not include information for the regional malls in the Mills portfolio.
- (2)
- Does not consider the impact of renewal options that may be contained in leases.
19
SIMON PROPERTY GROUP
U.S. Regional Mall Top Tenants(1)
As of December 31, 2008
Top Mall Store Retail Tenants (sorted by percentage of total Simon Group base minimum rent)
| | | | | | | | | | | | | |
Tenant | | Number
of
Stores | | Square
Feet
(000's) | | Percent of
Total
Simon Group
Sq. Ft. | | Percent of
Total Simon
Group Base
Min. Rent | |
|---|
The Gap, Inc. | | | 297 | | | 3,385 | | | 1.4 | % | | 2.0 | % |
Limited Brands, Inc. | | | 321 | | | 1,802 | | | 0.7 | % | | 2.0 | % |
Abercrombie & Fitch Co. | | | 232 | | | 1,666 | | | 0.7 | % | | 1.7 | % |
Foot Locker, Inc. | | | 407 | | | 1,596 | | | 0.6 | % | | 1.5 | % |
Zale Corporation | | | 347 | | | 343 | | | 0.1 | % | | 1.0 | % |
Luxottica Group S.P.A | | | 365 | | | 729 | | | 0.3 | % | | 1.0 | % |
Express LLC | | | 116 | | | 1,045 | | | 0.4 | % | | 0.9 | % |
American Eagle Outfitters, Inc. | | | 160 | | | 908 | | | 0.4 | % | | 0.9 | % |
Sterling Jewelers, Inc. | | | 205 | | | 315 | | | 0.1 | % | | 0.8 | % |
Genesco, Inc. | | | 368 | | | 506 | | | 0.2 | % | | 0.8 | % |
Top Anchors (sorted by percentage of total Simon Group square footage)(2)
| | | | | | | | | | | | | |
Tenant | | Number
of
Stores | | Square
Feet
(000's) | | Percent of
Total
Simon Group
Sq. Ft. | | Percent of
Total Simon
Group Base
Min. Rent | |
|---|
Macy's, Inc. | | | 152 | | | 26,982 | | | 11.0 | % | | 0.4 | % |
Sears Roebuck & Co. | | | 121 | | | 18,411 | | | 7.5 | % | | 0.2 | % |
J.C. Penney Co., Inc. | | | 112 | | | 16,068 | | | 6.5 | % | | 0.7 | % |
Dillard's Dept. Stores | | | 80 | | | 12,065 | | | 4.9 | % | | 0.1 | % |
Nordstrom, Inc. | | | 25 | | | 4,301 | | | 1.7 | % | | 0.1 | % |
Belk, Inc. | | | 22 | | | 2,792 | | | 1.1 | % | | 0.3 | % |
The Bon-Ton Stores, Inc. | | | 22 | | | 2,180 | | | 0.9 | % | | 0.2 | % |
Target Corporation | | | 14 | | | 1,802 | | | 0.7 | % | | 0.0 | % |
The Neiman Marcus Group, Inc. | | | 10 | | | 1,265 | | | 0.5 | % | | 0.1 | % |
Dick's Sporting Goods, Inc. | | | 18 | | | 1,170 | | | 0.5 | % | | 0.3 | % |
Saks Incorporated | | | 9 | | | 1,053 | | | 0.4 | % | | 0.2 | % |
Boscov's Department Stores | | | 3 | | | 594 | | | 0.2 | % | | 0.0 | % |
- (1)
- Does not include information for the regional malls in the Mills portfolio.
- (2)
- Includes space leased and owned by the anchor.
20
SIMON PROPERTY GROUP
U.S. Regional Mall Anchor/Big Box Openings(1)
2008-2010
| | | | | | |
Property Name | | Location | | New Tenant | | Former Tenant |
|---|
Opened in 2008 |
Anderson Mall | | Anderson, SC | | Dillard's | | Belk Mens (relocated) |
Aventura Mall | | Miami Beach, FL | | Nordstrom | | Lord & Taylor |
Burlington Mall | | Burlington (Boston), MA | | Nordstrom | | Filene's |
Crystal Mall | | Waterford, CT | | Bed Bath & Beyond | | Macy's |
| | | | Christmas Tree Shop | | Macy's |
Fashion Mall at Keystone | | Indianapolis, IN | | Nordstrom | | Parisian |
Firewheel Town Center | | Garland, TX | | Dick's Sporting Goods | | N/A |
Laguna Hills Mall | | Laguna Hills, CA | | Nordstrom Rack | | WOW/Good Guys |
Liberty Tree Mall | | Danvers, MA | | Nordstrom Rack | | Stop and Shop |
| | | | Off Broadway Shoes | | Stop and Shop |
Livingston Mall | | Livingston, NJ | | Barnes & Noble | | N/A |
Markland Mall | | Kokomo, IN | | MC Sports | | N/A |
Montgomery Mall | | Montgomeryville, PA | | Dick's Sporting Goods | | N/A |
Northgate Mall | | Seattle, WA | | Bed Bath & Beyond | | Gottschalks |
Northlake Mall | | Atlanta, GA | | Kohl's | | Parisian |
Northshore Mall | | Peabody, MA | | Macy's Furniture | | Lord & Taylor |
| | | | Macy's Mens | | Lord & Taylor |
| | | | P.F. Chang's | | N/A |
Richardson Square | | Richardson, TX | | Lowe's | | N/A |
| | | | Ross Dress for Less (relocated) | | N/A |
Ross Park Mall | | Pittsburgh, PA | | Nordstrom | | Macy's |
| | | | L.L. Bean | | N/A |
Shops at Sunset Place, The | | Miami, FL | | Splitsville | | N/A |
Smith Haven Mall | | Lake Grove, NY | | Barnes & Noble | | Stern's |
Tacoma Mall | | Seattle, WA | | Nordstrom (relocated) | | Mervyn's |
| | | | B.J.'s Brewery & Restaurant | | N/A |
Upper Valley Mall | | Springfield, OH | | MC Sports | | N/A |
21
SIMON PROPERTY GROUP
U.S. Regional Mall Anchor/Big Box Openings(1)
2008-2010
| | | | | | |
Property Name | | Location | | New Tenant | | Former Tenant |
|---|
Openings Projected in 2009 |
Gwinnett Place | | Duluth, GA | | M Mart | | Macy's |
Midland Park Mall | | Midland, TX | | Ulta | | Party City |
Northshore Mall | | Peabody (Boston), MA | | Nordstrom | | Macy's |
Plaza Carolina | | Carolina (San Juan), PR | | Tiendas Capri (relocated) | | N/A |
| | | | Best Buy | | Tiendas Capri |
Springfield Mall | | Springfield, PA | | Target | | Macy's |
University Park Mall | | South Bend, IN | | Barnes & Noble | | Marshall Field's |
Valley Mall | | Harrisonburg, VA | | Books-A-Million | | N/A |
Openings Projected in 2010 |
Coddingtown Mall | | Santa Rosa, CA | | Whole Foods | | Ralph's Grocery |
South Shore Plaza | | Braintree (Boston), MA | | Nordstrom | | Macy's |
- (1)
- Does not include information for the regional malls in the Mills portfolio.
22
SIMON PROPERTY GROUP
U.S. Regional Mall Property Listing(1)
| | | | | | | | | | | | | | | | | | | | |
| |
| |
| |
| |
| | Gross Leasable Area | |
|---|
| | Property Name | | State | | City (CBSA) | | Legal
Ownership | | Anchor | | Mall &
Freestanding | | Total | |
|---|
1. | | McCain Mall | | | AR | | N. Little Rock | | | 100.0 | % | | 554,156 | | | 221,043 | | | 775,199 | |
2. | | Brea Mall | | | CA | | Brea (Los Angeles) | | | 100.0 | % | | 874,802 | | | 444,766 | | | 1,319,568 | |
3. | | Coddingtown Mall | | | CA | | Santa Rosa | | | 50.0 | % | | 547,090 | | | 262,821 | | | 809,911 | |
4. | | Fashion Valley | | | CA | | San Diego | | | 50.0 | % | | 1,053,305 | | | 668,485 | | | 1,721,790 | |
5. | | Laguna Hills Mall | | | CA | | Laguna Hills (Los Angeles) | | | 100.0 | % | | 536,500 | | | 330,061 | | | 866,561 | |
6. | | Santa Rosa Plaza | | | CA | | Santa Rosa | | | 100.0 | % | | 428,258 | | | 270,535 | | | 698,793 | |
7. | | Shops at Mission Viejo, The | | | CA | | Mission Viejo (Los Angeles) | | | 100.0 | % | | 677,215 | | | 473,376 | | | 1,150,591 | |
8. | | Stanford Shopping Center | | | CA | | Palo Alto (San Francisco) | | | 100.0 | % | | 849,153 | | | 528,198 | (7) | | 1,377,351 | |
9. | | Westminster Mall | | | CA | | Westminster (Los Angeles) | | | 100.0 | % | | 716,939 | | | 495,092 | | | 1,212,031 | |
10. | | Mesa Mall(2) | | | CO | | Grand Junction | | | 50.0 | % | | 441,208 | | | 441,129 | | | 882,337 | |
11. | | Town Center at Aurora | | | CO | | Aurora (Denver) | | | 100.0 | % | | 682,169 | | | 402,375 | | | 1,084,544 | |
12. | | Crystal Mall | | | CT | | Waterford | | | 74.6 | % | | 419,405 | | | 350,390 | | | 769,795 | |
13. | | Aventura Mall(2) | | | FL | | Miami Beach (Miami) | | | 33.3 | % | | 1,283,938 | | | 815,416 | | | 2,099,354 | |
14. | | Avenues, The | | | FL | | Jacksonville | | | 25.0% | (3) | | 754,956 | | | 362,861 | | | 1,117,817 | |
15. | | Boynton Beach Mall | | | FL | | Boynton Beach (Miami) | | | 100.0 | % | | 714,210 | | | 387,123 | | | 1,101,333 | |
16. | | Coconut Point | | | FL | | Estero | | | 50.0 | % | | 691,785 | | | 504,554 | | | 1,196,339 | |
17. | | Coral Square | | | FL | | Coral Springs (Miami) | | | 97.2 | % | | 648,144 | | | 296,014 | | | 944,158 | |
18. | | Cordova Mall | | | FL | | Pensacola | | | 100.0 | % | | 395,875 | | | 459,212 | | | 855,087 | |
19. | | Crystal River Mall | | | FL | | Crystal River | | | 100.0 | % | | 302,495 | | | 121,804 | | | 424,299 | |
20. | | Dadeland Mall | | | FL | | Miami | | | 50.0 | % | | 1,132,072 | | | 342,700 | | | 1,474,772 | |
21. | | DeSoto Square | | | FL | | Bradenton | | | 100.0 | % | | 435,467 | | | 253,949 | | | 689,416 | |
22. | | Edison Mall | | | FL | | Fort Myers | | | 100.0 | % | | 742,667 | | | 308,844 | | | 1,051,511 | |
23. | | Florida Mall, The | | | FL | | Orlando | | | 50.0 | % | | 1,092,465 | | | 616,803 | | | 1,709,268 | |
24. | | Gulf View Square | | | FL | | Port Richey (Tampa) | | | 100.0 | % | | 461,852 | | | 291,089 | | | 752,941 | |
25. | | Indian River Mall | | | FL | | Vero Beach | | | 50.0 | % | | 445,552 | | | 302,604 | | | 748,156 | |
26. | | Lake Square Mall | | | FL | | Leesburg (Orlando) | | | 50.0 | % | | 296,037 | | | 262,287 | | | 558,324 | |
27. | | Melbourne Square | | | FL | | Melbourne | | | 100.0 | % | | 416,167 | | | 293,886 | | | 710,053 | |
28. | | Miami International Mall | | | FL | | Miami | | | 47.8 | % | | 778,784 | | | 294,792 | | | 1,073,576 | |
29. | | Orange Park Mall | | | FL | | Orange Park (Jacksonville) | | | 100.0 | % | | 576,051 | | | 379,174 | | | 955,225 | |
30. | | Paddock Mall | | | FL | | Ocala | | | 100.0 | % | | 387,378 | | | 169,501 | | | 556,879 | |
31. | | Port Charlotte Town Center | | | FL | | Port Charlotte | | | 80.0% | (4) | | 458,251 | | | 322,059 | | | 780,310 | |
32. | | Seminole Towne Center | | | FL | | Sanford (Orlando) | | | 45.0% | (3) | | 768,798 | | | 369,499 | | | 1,138,297 | |
33. | | Shops at Sunset Place, The | | | FL | | S. Miami | | | 37.5% | (3) | | 0 | | | 514,559 | | | 514,559 | |
34. | | St. Johns Town Center | | | FL | | Jacksonville | | | 100.0 | % | | 653,291 | | | 568,751 | | | 1,222,042 | |
35. | | Town Center at Boca Raton | | | FL | | Boca Raton (Miami) | | | 100.0 | % | | 1,164,658 | | | 589,410 | | | 1,754,068 | |
36. | | Treasure Coast Square | | | FL | | Jensen Beach | | | 100.0 | % | | 508,176 | | | 372,968 | | | 881,144 | |
37. | | Tyrone Square | | | FL | | St. Petersburg (Tampa) | | | 100.0 | % | | 725,298 | | | 370,270 | | | 1,095,568 | |
38. | | Gwinnett Place | | | GA | | Duluth (Atlanta) | | | 75.0 | % | | 843,609 | | | 436,181 | (7) | | 1,279,790 | |
39. | | Lenox Square | | | GA | | Atlanta | | | 100.0 | % | | 873,580 | | | 671,433 | | | 1,545,013 | |
40. | | Mall of Georgia | | | GA | | Buford (Atlanta) | | | 100.0 | % | | 1,069,590 | | | 727,248 | | | 1,796,838 | |
41. | | Northlake Mall | | | GA | | Atlanta | | | 100.0 | % | | 665,745 | | | 296,235 | | | 961,980 | |
42. | | Phipps Plaza | | | GA | | Atlanta | | | 100.0 | % | | 472,385 | | | 345,490 | | | 817,875 | |
43. | | Town Center at Cobb | | | GA | | Kennesaw (Atlanta) | | | 75.0 | % | | 851,346 | | | 422,808 | | | 1,274,154 | |
44. | | Lindale Mall(2) | | | IA | | Cedar Rapids | | | 50.0 | % | | 305,563 | | | 382,869 | | | 688,432 | |
45. | | NorthPark Mall | | | IA | | Davenport | | | 50.0 | % | | 650,456 | | | 422,332 | | | 1,072,788 | |
46. | | Southern Hills Mall(2) | | | IA | | Sioux City | | | 50.0 | % | | 387,553 | | | 409,172 | | | 796,725 | |
47. | | SouthRidge Mall(2) | | | IA | | Des Moines | | | 50.0 | % | | 388,752 | | | 500,676 | | | 889,428 | |
48. | | Lincolnwood Town Center | | | IL | | Lincolnwood (Chicago) | | | 100.0 | % | | 220,830 | | | 201,911 | | | 422,741 | |
49. | | Northfield Square Mall | | | IL | | Bourbonnais | | | 31.6% | (4) | | 310,994 | | | 246,180 | | | 557,174 | |
50. | | Northwoods Mall | | | IL | | Peoria | | | 100.0 | % | | 472,969 | | | 221,021 | | | 693,990 | |
51. | | Orland Square | | | IL | | Orland Park (Chicago) | | | 100.0 | % | | 773,295 | | | 436,561 | | | 1,209,856 | |
23
SIMON PROPERTY GROUP
U.S. Regional Mall Property Listing(1)
| | | | | | | | | | | | | | | | | | | | |
| |
| |
| |
| |
| | Gross Leasable Area | |
|---|
| | Property Name | | State | | City (CBSA) | | Legal
Ownership | | Anchor | | Mall &
Freestanding | | Total | |
|---|
52. | | River Oaks Center | | | IL | | Calumet City (Chicago) | | | 100.0 | % | | 807,871 | | | 557,412 | (7) | | 1,365,283 | |
53. | | SouthPark Mall | | | IL | | Moline | | | 50.0 | % | | 578,056 | | | 440,798 | | | 1,018,854 | |
54. | | White Oaks Mall | | | IL | | Springfield | | | 80.7 | % | | 556,831 | | | 375,516 | | | 932,347 | |
55. | | Castleton Square | | | IN | | Indianapolis | | | 100.0 | % | | 908,481 | | | 472,986 | | | 1,381,467 | |
56. | | Circle Centre | | | IN | | Indianapolis | | | 14.7% | (3) | | 350,000 | | | 432,196 | | | 782,196 | |
57. | | College Mall | | | IN | | Bloomington | | | 100.0 | % | | 356,887 | | | 278,499 | | | 635,386 | |
58. | | Eastland Mall | | | IN | | Evansville | | | 50.0 | % | | 489,144 | | | 375,323 | | | 864,467 | |
59. | | Fashion Mall at Keystone | | | IN | | Indianapolis | | | 100.0 | % | | 249,721 | | | 433,766 | | | 683,487 | |
60. | | Greenwood Park Mall | | | IN | | Greenwood (Indianapolis) | | | 100.0 | % | | 754,928 | | | 525,162 | | | 1,280,090 | |
61. | | Markland Mall | | | IN | | Kokomo | | | 100.0 | % | | 273,094 | | | 141,811 | | | 414,905 | |
62. | | Muncie Mall | | | IN | | Muncie | | | 100.0 | % | | 435,756 | | | 204,085 | | | 639,841 | |
63. | | Tippecanoe Mall | | | IN | | Lafayette | | | 100.0 | % | | 537,790 | | | 323,632 | | | 861,422 | |
64. | | University Park Mall | | | IN | | Mishawaka | | | 100.0 | % | | 499,876 | | | 361,446 | | | 861,322 | |
65. | | Washington Square | | | IN | | Indianapolis | | | 100.0 | % | | 616,109 | | | 347,167 | | | 963,276 | |
66. | | Towne East Square | | | KS | | Wichita | | | 100.0 | % | | 779,490 | | | 357,310 | | | 1,136,800 | |
67. | | Towne West Square | | | KS | | Wichita | | | 100.0 | % | | 619,269 | | | 333,237 | | | 952,506 | |
68. | | West Ridge Mall | | | KS | | Topeka | | | 100.0 | % | | 716,811 | | | 280,991 | | | 997,802 | |
69. | | Prien Lake Mall | | | LA | | Lake Charles | | | 100.0 | % | | 644,124 | | | 177,244 | | | 821,368 | |
70. | | Arsenal Mall | | | MA | | Watertown (Boston) | | | 100.0 | % | | 191,395 | | | 312,205 | (7) | | 503,600 | |
71. | | Atrium Mall | | | MA | | Chestnut Hill (Boston) | | | 49.1 | % | | 0 | | | 205,058 | | | 205,058 | |
72. | | Auburn Mall | | | MA | | Auburn | | | 49.1 | % | | 417,620 | | | 173,282 | | | 590,902 | |
73. | | Burlington Mall | | | MA | | Burlington (Boston) | | | 100.0 | % | | 780,411 | | | 537,396 | | | 1,317,807 | |
74. | | Cape Cod Mall | | | MA | | Hyannis | | | 49.1 | % | | 420,199 | | | 303,391 | | | 723,590 | |
75. | | Copley Place | | | MA | | Boston | | | 98.1 | % | | 150,847 | | | 1,091,967 | (7) | | 1,242,814 | |
76. | | Emerald Square | | | MA | | North Attleboro (Providence, RI) | | | 49.1 | % | | 647,372 | | | 375,129 | | | 1,022,501 | |
77. | | Greendale Mall | | | MA | | Worcester (Boston) | | | 49.1 | % | | 132,634 | | | 298,247 | (7) | | 430,881 | |
78. | | Liberty Tree Mall | | | MA | | Danvers (Boston) | | | 49.1 | % | | 498,000 | | | 359,835 | | | 857,835 | |
79. | | Mall at Chestnut Hill | | | MA | | Chestnut Hill (Boston) | | | 47.2 | % | | 297,253 | | | 178,093 | | | 475,346 | |
80. | | Northshore Mall | | | MA | | Peabody (Boston) | | | 49.1 | % | | 677,433 | | | 743,622 | | | 1,421,055 | |
81. | | Solomon Pond Mall | | | MA | | Marlborough (Boston) | | | 49.1 | % | | 538,812 | | | 370,420 | | | 909,232 | |
82. | | South Shore Plaza | | | MA | | Braintree (Boston) | | | 100.0 | % | | 547,287 | | | 618,678 | | | 1,165,965 | |
83. | | Square One Mall | | | MA | | Saugus (Boston) | | | 49.1 | % | | 608,601 | | | 321,524 | | | 930,125 | |
84. | | Bowie Town Center | | | MD | | Bowie (Washington, D.C.) | | | 100.0 | % | | 355,557 | | | 328,829 | | | 684,386 | |
85. | | St. Charles Towne Center | | | MD | | Waldorf (Washington, D.C.) | | | 100.0 | % | | 631,602 | | | 348,307 | | | 979,909 | |
86. | | Bangor Mall | | | ME | | Bangor | | | 67.4% | (6) | | 416,582 | | | 236,322 | | | 652,904 | |
87. | | Maplewood Mall | | | MN | | St. Paul (Minneapolis) | | | 100.0 | % | | 588,822 | | | 342,278 | | | 931,100 | |
88. | | Miller Hill Mall | | | MN | | Duluth | | | 100.0 | % | | 429,508 | | | 376,119 | | | 805,627 | |
89. | | Battlefield Mall | | | MO | | Springfield | | | 100.0 | % | | 770,111 | | | 432,352 | | | 1,202,463 | |
90. | | Independence Center | | | MO | | Independence (Kansas City) | | | 100.0 | % | | 499,284 | | | 532,170 | | | 1,031,454 | |
91. | | SouthPark | | | NC | | Charlotte | | | 100.0 | % | | 1,044,742 | | | 580,866 | | | 1,625,608 | |
92. | | Crossroads Mall | | | NE | | Omaha | | | 100.0 | % | | 522,119 | | | 188,403 | | | 710,522 | |
93. | | Mall at Rockingham Park, The | | | NH | | Salem (Boston) | | | 24.6 | % | | 638,111 | | | 382,133 | | | 1,020,244 | |
94. | | Mall of New Hampshire, The | | | NH | | Manchester | | | 49.1 | % | | 447,887 | | | 363,127 | | | 811,014 | |
95. | | Pheasant Lane Mall | | | NH | | Nashua | | | | (5) | | 555,474 | | | 314,194 | | | 869,668 | |
96. | | Brunswick Square | | | NJ | | East Brunswick (New York) | | | 100.0 | % | | 467,626 | | | 297,365 | | | 764,991 | |
97. | | Livingston Mall | | | NJ | | Livingston (New York) | | | 100.0 | % | | 616,128 | | | 368,275 | | | 984,403 | |
98. | | Menlo Park Mall | | | NJ | | Edison (New York) | | | 100.0 | % | | 527,591 | | | 796,382 | (7) | | 1,323,973 | |
99. | | Ocean County Mall | | | NJ | | Toms River (New York) | | | 100.0 | % | | 616,443 | | | 273,778 | | | 890,221 | |
24
SIMON PROPERTY GROUP
U.S. Regional Mall Property Listing(1)
| | | | | | | | | | | | | | | | | | | | |
| |
| |
| |
| |
| | Gross Leasable Area | |
|---|
| | Property Name | | State | | City (CBSA) | | Legal
Ownership | | Anchor | | Mall &
Freestanding | | Total | |
|---|
100. | | Quaker Bridge Mall | | | NJ | | Lawrenceville | | | 38.0% | (6) | | 686,760 | | | 412,070 | | | 1,098,830 | |
101. | | Rockaway Townsquare | | | NJ | | Rockaway (New York) | | | 100.0 | % | | 786,626 | | | 456,927 | | | 1,243,553 | |
102. | | Cottonwood Mall | | | NM | | Albuquerque | | | 100.0 | % | | 631,556 | | | 409,270 | | | 1,040,826 | |
103. | | Forum Shops at Caesars, The | | | NV | | Las Vegas | | | 100.0 | % | | 0 | | | 635,410 | | | 635,410 | |
104. | | Chautauqua Mall | | | NY | | Lakewood | | | 100.0 | % | | 213,320 | | | 218,794 | | | 432,114 | |
105. | | Jefferson Valley Mall | | | NY | | Yorktown Heights (New York) | | | 100.0 | % | | 310,095 | | | 277,309 | | | 587,404 | |
106. | | Mall at The Source, The | | | NY | | Westbury (New York) | | | 25.5% | (3) | | 210,798 | | | 515,580 | | | 726,378 | |
107. | | Roosevelt Field | | | NY | | Garden City (New York) | | | 100.0 | % | | 1,430,425 | | | 778,892 | (7) | | 2,209,317 | |
108. | | Smith Haven Mall | | | NY | | Lake Grove (New York) | | | 25.0 | % | | 794,310 | | | 513,192 | | | 1,307,502 | |
109. | | Walt Whitman Mall | | | NY | | Huntington Station (New York) | | | 100.0 | % | | 742,214 | | | 284,871 | | | 1,027,085 | |
110. | | Westchester, The | | | NY | | White Plains (New York) | | | 40.0 | % | | 349,393 | | | 477,979 | (7) | | 827,372 | |
111. | | Great Lakes Mall | | | OH | | Mentor (Cleveland) | | | 100.0 | % | | 869,454 | | | 378,492 | | | 1,247,946 | |
112. | | Lima Mall | | | OH | | Lima | | | 100.0 | % | | 541,861 | | | 203,650 | | | 745,511 | |
113. | | Richmond Town Square | | | OH | | Richmond Heights (Cleveland) | | | 100.0 | % | | 685,251 | | | 331,498 | | | 1,016,749 | |
114. | | Southern Park Mall | | | OH | | Youngstown | | | 100.0 | % | | 811,858 | | | 382,235 | | | 1,194,093 | |
115. | | Summit Mall | | | OH | | Akron | | | 100.0 | % | | 432,936 | | | 337,198 | | | 770,134 | |
116. | | Upper Valley Mall | | | OH | | Springfield | | | 100.0 | % | | 479,418 | | | 264,686 | | | 744,104 | |
117. | | Penn Square Mall | | | OK | | Oklahoma City | | | 94.5 | % | | 588,137 | | | 462,654 | | | 1,050,791 | |
118. | | Woodland Hills Mall | | | OK | | Tulsa | | | 94.5 | % | | 700,235 | | | 391,539 | | | 1,091,774 | |
119. | | Century III Mall | | | PA | | West Mifflin (Pittsburgh) | | | 100.0 | % | | 831,439 | | | 458,780 | (7) | | 1,290,219 | |
120. | | Granite Run Mall | | | PA | | Media (Philadelphia) | | | 50.0 | % | | 500,809 | | | 535,889 | | | 1,036,698 | |
121. | | King of Prussia Mall | | | PA | | King of Prussia (Philadelphia) | | | 12.4% | (6) | | 1,545,812 | | | 1,067,674 | (7) | | 2,613,486 | |
122. | | Lehigh Valley Mall | | | PA | | Whitehall | | | 37.6% | (6) | | 564,353 | | | 604,338 | (7) | | 1,168,691 | |
123. | | Montgomery Mall | | | PA | | North Wales (Philadelphia) | | | 60.0% | (6) | | 734,855 | | | 413,531 | | | 1,148,386 | |
124. | | Oxford Valley Mall | | | PA | | Langhorne | | | 65.0% | (6) | | 762,558 | | | 556,708 | (7) | | 1,319,266 | |
125. | | Ross Park Mall | | | PA | | Pittsburgh | | | 100.0 | % | | 701,477 | | | 510,243 | | | 1,211,720 | |
126. | | South Hills Village | | | PA | | Pittsburgh | | | 100.0 | % | | 655,987 | | | 481,287 | (7) | | 1,137,274 | |
127. | | Springfield Mall(2) | | | PA | | Springfield (Philadelphia) | | | 38.0% | (6) | | 367,176 | | | 220,803 | | | 587,979 | |
128. | | Plaza Carolina | | | PR | | Carolina (San Juan) | | | 100.0 | % | | 504,796 | | | 588,878 | (7) | | 1,093,674 | |
129. | | Anderson Mall | | | SC | | Anderson | | | 100.0 | % | | 480,209 | | | 190,817 | | | 671,026 | |
130. | | Haywood Mall | | | SC | | Greenville | | | 100.0 | % | | 902,400 | | | 328,561 | | | 1,230,961 | |
131. | | Empire Mall(2) | | | SD | | Sioux Falls | | | 50.0 | % | | 497,341 | | | 576,797 | | | 1,074,138 | |
132. | | Rushmore Mall(2) | | | SD | | Rapid City | | | 50.0 | % | | 470,660 | | | 364,935 | | | 835,595 | |
133. | | Knoxville Center | | | TN | | Knoxville | | | 100.0 | % | | 597,028 | | | 383,212 | | | 980,240 | |
134. | | Oak Court Mall | | | TN | | Memphis | | | 100.0 | % | | 532,817 | | | 317,713 | (7) | | 850,530 | |
135. | | West Town Mall | | | TN | | Knoxville | | | 50.0 | % | | 868,295 | | | 468,455 | | | 1,336,750 | |
136. | | Wolfchase Galleria | | | TN | | Memphis | | | 94.5 | % | | 761,648 | | | 505,572 | | | 1,267,220 | |
137. | | Barton Creek Square | | | TX | | Austin | | | 100.0 | % | | 922,266 | | | 506,721 | | | 1,428,987 | |
138. | | Broadway Square | | | TX | | Tyler | | | 100.0 | % | | 427,730 | | | 200,338 | | | 628,068 | |
139. | | Cielo Vista Mall | | | TX | | El Paso | | | 100.0 | % | | 793,716 | | | 449,571 | | | 1,243,287 | |
140. | | Domain, The | | | TX | | Austin | | | 100.0 | % | | 220,000 | | | 411,101 | (7) | | 631,101 | |
141. | | Firewheel Town Center | | | TX | | Garland (Dallas) | | | 100.0 | % | | 295,532 | | | 705,571 | (7) | | 1,001,103 | |
142. | | Galleria, The | | | TX | | Houston | | | 31.5 | % | | 1,233,802 | | | 1,116,505 | | | 2,350,307 | |
143. | | Highland Mall(2) | | | TX | | Austin | | | 50.0 | % | | 718,741 | | | 355,213 | | | 1,073,954 | |
144. | | Ingram Park Mall | | | TX | | San Antonio | | | 100.0 | % | | 750,888 | | | 374,818 | | | 1,125,706 | |
145. | | Irving Mall | | | TX | | Irving (Dallas) | | | 100.0 | % | | 637,415 | | | 405,299 | | | 1,042,714 | |
146. | | La Plaza Mall | | | TX | | McAllen | | | 100.0 | % | | 776,397 | | | 422,987 | | | 1,199,384 | |
147. | | Lakeline Mall | | | TX | | Cedar Park (Austin) | | | 100.0 | % | | 745,179 | | | 352,627 | | | 1,097,806 | |
148. | | Longview Mall | | | TX | | Longview | | | 100.0 | % | | 440,917 | | | 209,282 | | | 650,199 | |
25
SIMON PROPERTY GROUP
U.S. Regional Mall Property Listing(1)
| | | | | | | | | | | | | | | | | | | | |
| |
| |
| |
| |
| | Gross Leasable Area | |
|---|
| | Property Name | | State | | City (CBSA) | | Legal
Ownership | | Anchor | | Mall &
Freestanding | | Total | |
|---|
149. | | Midland Park Mall | | | TX | | Midland | | | 100.0 | % | | 339,113 | | | 280,088 | | | 619,201 | |
150. | | North East Mall | | | TX | | Hurst (Dallas) | | | 100.0 | % | | 1,191,930 | | | 452,253 | | | 1,644,183 | |
151. | | Rolling Oaks Mall | | | TX | | San Antonio | | | 100.0 | % | | 596,308 | | | 292,169 | (7) | | 888,477 | |
152. | | Sunland Park Mall | | | TX | | El Paso | | | 100.0 | % | | 575,837 | | | 341,829 | | | 917,666 | |
153. | | Valle Vista Mall | | | TX | | Harlingen | | | 100.0 | % | | 389,781 | | | 262,863 | | | 652,644 | |
154. | | Apple Blossom Mall | | | VA | | Winchester | | | 49.1 | % | | 229,011 | | | 211,193 | | | 440,204 | |
155. | | Charlottesville Fashion Square | | | VA | | Charlottesville | | | 100.0 | % | | 381,153 | | | 189,694 | | | 570,847 | |
156. | | Chesapeake Square | | | VA | | Chesapeake (Virginia Beach) | | | 75.0% | (4) | | 534,760 | | | 268,873 | | | 803,633 | |
157. | | Fashion Centre at Pentagon City, The | | | VA | | Arlington (Washington, DC) | | | 42.5 | % | | 472,729 | | | 517,516 | (7) | | 990,245 | |
158. | | Valley Mall | | | VA | | Harrisonburg | | | 50.0 | % | | 315,078 | | | 191,738 | | | 506,816 | |
159. | | Virginia Center Commons | | | VA | | Glen Allen | | | 100.0 | % | | 506,639 | | | 280,964 | | | 787,603 | |
160. | | Columbia Center | | | WA | | Kennewick | | | 100.0 | % | | 408,052 | | | 365,186 | | | 773,238 | |
161. | | Northgate Mall | | | WA | | Seattle | | | 100.0 | % | | 612,073 | | | 446,815 | | | 1,058,888 | |
162. | | Tacoma Mall | | | WA | | Tacoma (Seattle) | | | 100.0 | % | | 804,262 | | | 443,450 | | | 1,247,712 | |
163. | | Bay Park Square | | | WI | | Green Bay | | | 100.0 | % | | 425,773 | | | 274,241 | | | 700,014 | |
164. | | Forest Mall | | | WI | | Fond Du Lac | | | 100.0 | % | | 327,260 | | | 172,914 | | | 500,174 | |
| | | | | | | | | | | | | | | | | | |
| | Total Regional Mall GLA | | | | | | | | | | | 96,727,572 | | | 65,455,103 | | | 162,182,675 | |
| | | | | | | | | | | | | | | | | | |
FOOTNOTES:
- (1)
- Does not include the regional malls in the Mills portfolio or four regional malls (Nanuet Mall, Palm Beach Mall, Raleigh Springs Mall, University Mall (FL)) which are in the process of being redeveloped.
- (2)
- This property is managed by a third party.
- (3)
- The Operating Partnership's direct and indirect interests in some of the properties held as joint venture interests are subject to preferences on distributions in favor of other partners or the Operating Partnership.
- (4)
- The Operating Partnership receives substantially all the economic benefit of the property due to a preference or advance.
- (5)
- The Operating Partnership owns a mortgage note that encumbers Pheasant Lane Mall that entitles it to 100% of the economics of this property.
- (6)
- The Operating Partnership's indirect ownership interest is through an approximately 76% ownership interest in Kravco Simon Investments.
- (7)
- Mall & Freestanding GLA includes office space as follows:
Arsenal Mall—107,188 sq. ft.
Century III Mall—39,119 sq. ft.
Copley Place—867,500 sq. ft.
Fashion Centre at Pentagon City, The—169,089 sq. ft.
Firewheel Town Center—74,999 sq. ft.
Granite Run—4,000 sq. ft.
Greendale Mall—119,860 sq. ft.
Gwinnett Place—32,603 sq. ft.
King of Prussia Mall—13,646 sq. ft.
Lehigh Valley Mall—11,754 sq. ft.
Menlo Park Mall—52,424 sq. ft.
Oak Court Mall—127,411 sq. ft.
Oxford Valley Mall—111,160 sq. ft.
Plaza Carolina—28,436 sq. ft.
River Oaks Center—116,162 sq. ft.
Rolling Oaks Mall—6,383 sq. ft.
Roosevelt Field—1,610 sq. ft.
South Hills Village—4,361 sq. ft.
Stanford Shopping Center—5,748 sq. ft.
The Domain—92,955 sq. ft.
The Westchester—820 sq. ft.
26
SIMON PROPERTY GROUP
U.S. Premium Outlet Centers Operational Information
As of December 31, 2008
| | | | | | | |
| | As of or for the
Twelve Months Ended
December 31, | |
|---|
| | 2008 | | 2007 | |
|---|
Total Number of U.S. Premium Outlet Centers | | | 40 | | | 38 | |
Total U.S. Premium Outlet Centers GLA (in millions of square feet) | | | 16.4 | | | 15.0 | |
Occupancy(1) | | | 98.9 | % | | 99.7 | % |
Comparable sales per square foot(1) | | $ | 513 | | $ | 504 | |
Average base rent per square foot(1) | | $ | 27.65 | | $ | 25.67 | |
Average Base Rent Per Square Foot(1)
|
|
Total
Center |
|
%
Change |
|
|---|
12/31/08 | | $ | 27.65 | | | 7.7 | % |
12/31/07 | | | 25.67 | | | 5.9 | % |
12/31/06 | | | 24.23 | | | 4.6 | % |
12/31/05 | | | 23.16 | | | 6.0 | % |
12/31/04 | | | 21.85 | | | 7.3 | % |
12/31/03 | | | 20.36 | | | n/a | |
Leasing Activity During the Period(1):
| | | | | | | | | | | | | |
| | Average Base Rent(2) | |
| |
| |
|---|
| | Lease
Signings | | Store Closings/
Lease Expirations | | Amount of Change
(Referred to as
"Leasing Spread") | |
|---|
2008 | | $ | 38.07 | | $ | 25.59 | | $ | 12.48 | | | 48.8% | |
2007 | | | 31.43 | | | 23.64 | | | 7.79 | | | 33.0% | |
2006 | | | 29.95 | | | 22.87 | | | 7.08 | | | 31.0% | |
2005 | | | 26.48 | | | 21.91 | | | 4.57 | | | 20.9% | |
2004 | | | 22.78 | | | 20.02 | | | 2.76 | | | 13.8% | |
2003 | | | 25.41 | | | 22.62 | | | 2.79 | | | 12.3% | |
- (1)
- For all owned gross leasable area.
- (2)
- Represents the average base rent for tenants who signed leases as compared to the average base rent in effect for tenants whose leases terminated or expired in the same space.
27
SIMON PROPERTY GROUP
U.S. Premium Outlet Centers Lease Expirations(1)
As of December 31, 2008
| | | | | | | | | | |
Year | | Number of
Leases Expiring | | Square
Feet | | Avg. Base Rent
per Square Foot
at 12/31/08 | |
|---|
2009 | | | 437 | | | 1,555,695 | | $ | 22.21 | |
2010 | | | 483 | | | 2,118,948 | | $ | 25.26 | |
2011 | | | 462 | | | 2,016,767 | | $ | 24.98 | |
2012 | | | 469 | | | 1,967,357 | | $ | 27.34 | |
2013 | | | 461 | | | 2,187,855 | | $ | 28.09 | |
2014 | | | 322 | | | 1,271,798 | | $ | 30.03 | |
2015 | | | 238 | | | 845,429 | | $ | 33.68 | |
2016 | | | 238 | | | 775,587 | | $ | 36.76 | |
2017 | | | 279 | | | 906,732 | | $ | 37.79 | |
2018 | | | 390 | | | 1,411,003 | | $ | 45.03 | |
2019 and Thereafter | | | 281 | | | 1,054,696 | | $ | 46.39 | |
- (1)
- Does not consider the impact of renewal options that may be contained in leases.
28
SIMON PROPERTY GROUP
U.S. Premium Outlet Centers Top Tenants
As of December 31, 2008
(Sorted by percentage of total Simon Group base minimum rent)
| | | | | | | | | | | | | |
Tenant | | Number
of
Stores | | Square
Feet
(000's) | | Percent of
Total
Simon Group
Sq. Ft. | | Percent of
Total Simon
Group Base
Min. Rent | |
|---|
| Phillips—Van Heusen Corporation | | | 194 | | | 926 | | | 0.4 | % | | 0.7 | % |
| The Gap, Inc. | | | 90 | | | 869 | | | 0.4 | % | | 0.6 | % |
| Adidas Promotional Retail Operations, Inc. | | | 66 | | | 545 | | | 0.2 | % | | 0.4 | % |
| Nike Retail Services, Inc. | | | 85 | | | 685 | | | 0.3 | % | | 0.4 | % |
| Jones Retail Corporation | | | 153 | | | 474 | | | 0.2 | % | | 0.4 | % |
| Tommy Hilfiger Retail Operations, Inc. | | | 45 | | | 320 | | | 0.1 | % | | 0.3 | % |
| The William Carter Company, Inc. | | | 73 | | | 348 | | | 0.1 | % | | 0.3 | % |
| Brown Group Retail, Inc. | | | 72 | | | 309 | | | 0.1 | % | | 0.3 | % |
| Coach, Inc. | | | 36 | | | 167 | | | 0.1 | % | | 0.2 | % |
| LCI Holdings, Inc. | | | 63 | | | 400 | | | 0.2 | % | | 0.2 | % |
29
SIMON PROPERTY GROUP
U.S. Premium Outlet Centers Property Listing
| | | | | | | | | | | | | | |
| | Property Name | | State | | City (CBSA) | | Legal
Ownership | | Total Gross
Leasable Area | |
|---|
| 1. | | Camarillo Premium Outlets | | | CA | | Camarillo | | | 100.0% | | | 454,119 | |
| 2. | | Carlsbad Premium Outlets | | | CA | | Carlsbad (San Diego) | | | 100.0% | | | 287,931 | |
| 3. | | Desert Hills Premium Outlets | | | CA | | Cabazon (Riverside) | | | 100.0% | | | 498,848 | |
| 4. | | Folsom Premium Outlets | | | CA | | Folsom (Sacramento) | | | 100.0% | | | 298,848 | |
| 5. | | Gilroy Premium Outlets | | | CA | | Gilroy (San Jose) | | | 100.0% | | | 577,287 | |
| 6. | | Las Americas Premium Outlets | | | CA | | San Diego | | | 100.0% | | | 525,262 | |
| 7. | | Napa Premium Outlets | | | CA | | Napa | | | 100.0% | | | 179,348 | |
| 8. | | Petaluma Village Premium Outlets | | | CA | | Petaluma | | | 100.0% | | | 195,982 | |
| 9. | | Vacaville Premium Outlets | | | CA | | Vacaville | | | 100.0% | | | 442,042 | |
| 10. | | Clinton Crossing Premium Outlets | | | CT | | Clinton | | | 100.0% | | | 276,163 | |
| 11. | | Orlando Premium Outlets | | | FL | | Orlando | | | 100.0% | | | 549,379 | |
| 12. | | St. Augustine Premium Outlets | | | FL | | St. Augustine (Jacksonsville) | | | 100.0% | | | 328,632 | |
| 13. | | North Georgia Premium Outlets | | | GA | | Dawsonville (Atlanta) | | | 100.0% | | | 539,757 | |
| 14. | | Waikele Premium Outlets | | | HI | | Waipahu (Honolulu) | | | 100.0% | | | 209,846 | |
| 15. | | Chicago Premium Outlets | | | IL | | Aurora (Chicago) | | | 100.0% | | | 437,800 | |
| 16. | | Edinburgh Premium Outlets | | | IN | | Edinburgh | | | 100.0% | | | 377,772 | |
| 17. | | Lighthouse Place Premium Outlets | | | IN | | Michigan City | | | 100.0% | | | 454,314 | |
| 18. | | Wrentham Village Premium Outlets | | | MA | | Wrentham (Boston) | | | 100.0% | | | 615,713 | |
| 19. | | Kittery Premium Outlets | | | ME | | Kittery | | | 100.0% | | | 264,425 | |
| 20. | | Albertville Premium Outlets | | | MN | | Albertville (Minneapolis) | | | 100.0% | | | 429,534 | |
| 21. | | Osage Beach Premium Outlets | | | MO | | Osage Beach | | | 100.0% | | | 391,309 | |
| 22. | | Carolina Premium Outlets | | | NC | | Smithfield | | | 100.0% | | | 439,445 | |
| 23. | | Liberty Village Premium Outlets | | | NJ | | Flemington (New York) | | | 100.0% | | | 168,466 | |
| 24. | | Jackson Premium Outlets | | | NJ | | Jackson (New York) | | | 100.0% | | | 285,779 | |
| 25. | | Jersey Shore Premium Outlets | | | NJ | | Tinton Falls | | | 100.0% | | | 434,204 | |
| 26. | | Las Vegas Outlet Center | | | NV | | Las Vegas | | | 100.0% | | | 474,828 | |
| 27. | | Las Vegas Premium Outlets | | | NV | | Las Vegas | | | 100.0% | | | 538,660 | |
| 28. | | Waterloo Premium Outlets | | | NY | | Waterloo | | | 100.0% | | | 417,577 | |
| 29. | | Woodbury Common Premium Outlets | | | NY | | Central Valley | | | 100.0% | | | 844,246 | |
| 30. | | Aurora Farms Premium Outlets | | | OH | | Aurora | | | 100.0% | | | 300,218 | |
| 31. | | Columbia Gorge Premium Outlets | | | OR | | Troutdale (Portland) | | | 100.0% | | | 163,815 | |
| 32. | | Philadelphia Premium Outlets | | | PA | | Limerick (Philadelphia) | | | 100.0% | | | 549,070 | |
| 33. | | The Crossings Premium Outlets | | | PA | | Tannersville | | | 100.0% | | | 411,731 | |
| 34. | | Allen Premium Outlets | | | TX | | Allen (Dallas) | | | 100.0% | | | 441,492 | |
| 35. | | Houston Premium Outlets | | | TX | | Cypress (Houston) | | | 100.0% | | | 425,484 | |
| 36. | | Rio Grande Valley Premium Outlets | | | TX | | Mercedes | | | 100.0% | | | 578,890 | |
| 37. | | Round Rock Premium Outlets | | | TX | | Round Rock (Austin) | | | 100.0% | | | 431,621 | |
| 38. | | Leesburg Corner Premium Outlets | | | VA | | Leesburg (Washington D.C.) | | | 100.0% | | | 463,288 | |
| 39. | | Seattle Premium Outlets | | | WA | | Tulalip (Seattle) | | | 100.0% | | | 402,668 | |
| 40. | | Johnson Creek Premium Outlets | | | WI | | Johnson Creek | | | 100.0% | | | 277,585 | |
| | | | | | | | | | | | | | |
| | | Total U.S. Premium Outlet Centers GLA | | | | | | | | | | | 16,383,378 | |
| | | | | | | | | | | | | | |
30
SIMON PROPERTY GROUP
U.S. Community/Lifestyle Centers Operational Information(1)
As of December 31, 2008
| | | | | | | | |
| | As of or for the Twelve Months Ended December 31, | |
|---|
| | 2008 | | 2007 | |
|---|
| Total Number of Community/Lifestyle Centers | | | 70 | | | 67 | |
| Total Community/Lifestyle Center GLA (in millions of square feet) | | | 20.8 | | | 18.6 | |
| Occupancy(2) | | | | | | | |
| | Consolidated Assets | | | 89.3 | % | | 92.9 | % |
| | Unconsolidated Assets | | | 93.3 | % | | 96.6 | % |
| | Total Portfolio | | | 90.7 | % | | 94.1 | % |
| Average rent per square foot(2) | | | | | | | |
| | Consolidated Assets | | $ | 13.70 | | $ | 12.73 | |
| | Unconsolidated Assets | | $ | 12.41 | | $ | 11.85 | |
| | Total Portfolio | | $ | 13.25 | | $ | 12.43 | |
| | | | | | | |
Average Base Rent Per Square Foot(2) | | Total
Center | | %
Change | |
|---|
| 12/31/08 | | $ | 13.25 | | | 6.6 | % |
| 12/31/07 | | | 12.43 | | | 5.2 | % |
| 12/31/06 | | | 11.82 | | | 3.6 | % |
| 12/31/05 | | | 11.41 | | | 4.6 | % |
| 12/31/04 | | | 10.91 | | | 3.0 | % |
| 12/31/03 | | | 10.59 | | | 4.6 | % |
Leasing Activity During the Period(2):
| | | | | | | | | | | | | |
| | Average Base Rent(3) | |
| |
| |
|---|
| | Lease
Signings | | Store Closings/
Lease Expirations | | Amount of Change
(Referred to as
"Leasing Spread") | |
|---|
| 2008 | | $ | 14.77 | | $ | 13.10 | | $ | 1.67 | | | 12.7 | % |
| 2007 | | | 18.43 | | | 14.56 | | | 3.87 | | | 26.6 | % |
| 2006 | | | 12.47 | | | 10.49 | | | 1.98 | | | 18.9 | % |
| 2005 | | | 15.89 | | | 11.44 | | | 4.45 | | | 38.9 | % |
| 2004 | | | 12.01 | | | 11.16 | | | 0.85 | | | 7.6 | % |
| 2003 | | | 12.38 | | | 10.48 | | | 1.90 | | | 18.1 | % |
- (1)
- Does not include information for the community centers in the Mills portfolio.
- (2)
- For all owned gross leasable area.
- (3)
- Represents the average base rent in effect during the period for those tenants who signed leases as compared to the average base rent in effect during the period for those tenants whose leases terminated or expired.
31
SIMON PROPERTY GROUP
U.S. Community/Lifestyle Centers Lease Expirations(1)(2)
As of December 31, 2008
| | | | | | | | | | |
Year | | Number of
Leases Expiring | | Square
Feet | | Avg. Base Rent
per Square Foot
at 12/31/08 | |
|---|
Mall Stores & Freestanding | | | | | | | | | | |
Month to Month Leases | | |
30 | | |
72,554 | |
$ |
14.77 | |
2009 | | | 131 | | | 426,336 | | $ | 16.10 | |
2010 | | | 234 | | | 753,908 | | $ | 18.93 | |
2011 | | | 236 | | | 747,954 | | $ | 18.92 | |
2012 | | | 161 | | | 538,251 | | $ | 18.22 | |
2013 | | | 196 | | | 691,904 | | $ | 18.96 | |
2014 | | | 60 | | | 246,031 | | $ | 18.94 | |
2015 | | | 57 | | | 250,530 | | $ | 22.36 | |
2016 | | | 45 | | | 188,059 | | $ | 21.44 | |
2017 | | | 41 | | | 192,388 | | $ | 24.10 | |
2018 | | | 79 | | | 381,801 | | $ | 21.61 | |
2019 and Thereafter | | | 59 | | | 373,417 | | $ | 21.73 | |
Specialty Leasing Agreements w/ terms in excess of 12 months | | | 8 | | | 20,018 | | $ | 7.80 | |
Anchor Tenants | | | | | | | | | | |
Month to Month Leases | | |
2 | | |
57,720 | |
$ |
6.03 | |
2009 | | | 9 | | | 310,602 | | $ | 7.75 | |
2010 | | | 29 | | | 882,277 | | $ | 11.43 | |
2011 | | | 17 | | | 715,385 | | $ | 6.59 | |
2012 | | | 18 | | | 638,994 | | $ | 8.20 | |
2013 | | | 25 | | | 756,122 | | $ | 8.99 | |
2014 | | | 27 | | | 993,319 | | $ | 8.35 | |
2015 | | | 18 | | | 615,576 | | $ | 10.88 | |
2016 | | | 21 | | | 678,067 | | $ | 10.53 | |
2017 | | | 21 | | | 864,405 | | $ | 9.45 | |
2018 | | | 20 | | | 754,789 | | $ | 11.35 | |
2019 and Thereafter | | | 25 | | | 1,156,883 | | $ | 11.83 | |
Specialty Leasing Agreements w/ terms in excess of 12 months | | | 1 | | | 25,321 | | $ | 1.04 | |
- (1)
- Does not include information for the community centers in the Mills portfolio.
- (2)
- Does not consider the impact of renewal options that may be contained in leases.
32
SIMON PROPERTY GROUP
U.S. Community/Lifestyle Centers Top Tenants(1)
As of December 31, 2008
(Sorted by percentage of total Simon Group square footage)(2)
| | | | | | | | | | | | | |
Tenant | | Number
of
Stores | | Square
Feet
(000's) | | Percent of
Total
Simon Group
Sq. Ft. | | Percent of
Total Simon
Group Base
Min. Rent | |
|---|
Target Corporation | | | 14 | | | 1,878 | | | 0.8 | % | | 0.0 | % |
Wal-Mart Stores, Inc. | | | 9 | | | 1,052 | | | 0.4 | % | | 0.0 | % |
Kohl's Department Stores, Inc. | | | 10 | | | 913 | | | 0.4 | % | | 0.1 | % |
Best Buy Company, Inc. | | | 20 | | | 866 | | | 0.4 | % | | 0.2 | % |
TJX Companies, Inc. | | | 20 | | | 640 | | | 0.3 | % | | 0.2 | % |
Retail Ventures, Inc. | | | 12 | | | 478 | | | 0.2 | % | | 0.1 | % |
Toys R Us, Inc. | | | 11 | | | 442 | | | 0.2 | % | | 0.1 | % |
Bed Bath & Beyond, Inc. | | | 14 | | | 423 | | | 0.2 | % | | 0.1 | % |
Dick's Sporting Goods, Inc. | | | 8 | | | 389 | | | 0.2 | % | | 0.1 | % |
Burlington Coat Factory | | | 6 | | | 374 | | | 0.2 | % | | 0.1 | % |
- (1)
- Does not include information for the community centers in the Mills portfolio.
- (2)
- Includes space leased and owned by the anchor.
33
SIMON PROPERTY GROUP
U.S. Community/Lifestyle Centers Property Listing(1)
| | | | | | | | | | | | | | |
| | Property Name | | State | | City (CBSA) | | Legal
Ownership | | Total Gross
Leasable Area | |
|---|
| 1. | | Plaza at Buckland Hills, The | | | CT | | Manchester | | | 35.0 | %(3) | | 334,546 | |
2. |
|
Gaitway Plaza |
|
|
FL |
|
Ocala |
|
|
23.3 |
%(3) |
|
208,873 |
|
| 3. | | Highland Lakes Center | | | FL | | Orlando | | | 100.0 | % | | 493,378 | |
| 4. | | Indian River Commons | | | FL | | Vero Beach | | | 50.0 | % | | 255,882 | |
| 5. | | Pier Park | | | FL | | Panama City Beach | | | 100.0 | % | | 815,706 | |
| 6. | | Royal Eagle Plaza | | | FL | | Coral Springs (Miami) | | | 35.0 | %(3) | | 199,059 | |
| 7. | | Terrace at the Florida Mall | | | FL | | Orlando | | | 100.0 | % | | 346,693 | |
| 8. | | Waterford Lakes Town Center | | | FL | | Orlando | | | 100.0 | % | | 949,779 | |
| 9. | | West Town Corners | | | FL | | Altamonte Springs (Orlando) | | | 23.3 | %(3) | | 385,643 | |
| 10. | | Westland Park Plaza | | | FL | | Orange Park (Jacksonville) | | | 23.3 | %(3) | | 163,154 | |
11. |
|
Mall of Georgia Crossing |
|
|
GA |
|
Buford (Atlanta) |
|
|
100.0 |
% |
|
440,612 |
|
12. |
|
Bloomingdale Court |
|
|
IL |
|
Bloomingdale (Chicago) |
|
|
100.0 |
% |
|
630,359 |
|
| 13. | | Countryside Plaza | | | IL | | Countryside (Chicago) | | | 100.0 | % | | 403,756 | |
| 14. | | Crystal Court | | | IL | | Crystal Lake (Chicago) | | | 35.0 | %(3) | | 278,970 | |
| 15. | | Forest Plaza | | | IL | | Rockford | | | 100.0 | % | | 428,039 | |
| 16. | | Lake Plaza | | | IL | | Waukegan (Chicago) | | | 100.0 | % | | 215,462 | |
| 17. | | Lake View Plaza | | | IL | | Orland Park (Chicago) | | | 100.0 | % | | 368,007 | |
| 18. | | Lincoln Crossing | | | IL | | O'Fallon (St. Louis) | | | 100.0 | % | | 243,266 | |
| 19. | | Matteson Plaza | | | IL | | Matteson (Chicago) | | | 100.0 | % | | 270,955 | |
| 20. | | North Ridge Plaza | | | IL | | Joliet (Chicago) | | | 100.0 | % | | 305,070 | |
| 21. | | White Oaks Plaza | | | IL | | Springfield | | | 100.0 | % | | 391,474 | |
| 22. | | Willow Knolls Court | | | IL | | Peoria | | | 35.0 | %(3) | | 382,377 | |
23. |
|
Brightwood Plaza |
|
|
IN |
|
Indianapolis |
|
|
100.0 |
% |
|
38,493 |
|
| 24. | | Clay Terrace | | | IN | | Carmel (Indianapolis) | | | 50.0 | % | | 503,693 | |
| 25. | | Eastland Convenience Center | | | IN | | Evansville | | | 50.0 | % | | 175,639 | |
| 26. | | Greenwood Plus | | | IN | | Greenwood (Indianapolis) | | | 100.0 | % | | 155,319 | |
| 27. | | Hamilton Town Center | | | IN | | Noblesville (Indianapolis) | | | 50.0 | % | | 649,576 | |
| 28. | | Keystone Shoppes | | | IN | | Indianapolis | | | 100.0 | % | | 29,140 | |
| 29. | | Markland Plaza | | | IN | | Kokomo | | | 100.0 | % | | 90,527 | |
| 30. | | Muncie Plaza | | | IN | | Muncie | | | 100.0 | % | | 298,821 | |
| 31. | | New Castle Plaza | | | IN | | New Castle | | | 100.0 | % | | 91,648 | |
| 32. | | Northwood Plaza | | | IN | | Fort Wayne | | | 100.0 | % | | 208,245 | |
| 33. | | Teal Plaza | | | IN | | Lafayette | | | 100.0 | % | | 101,087 | |
| 34. | | Tippecanoe Plaza | | | IN | | Lafayette | | | 100.0 | % | | 90,522 | |
| 35. | | University Center | | | IN | | Mishawaka | | | 100.0 | % | | 150,524 | |
| 36. | | Village Park Plaza | | | IN | | Carmel (Indianapolis) | | | 35.0 | %(3) | | 549,576 | |
| 37. | | Washington Plaza | | | IN | | Indianapolis | | | 100.0 | % | | 50,107 | |
38. |
|
West Ridge Plaza |
|
|
KS |
|
Topeka |
|
|
100.0 |
% |
|
254,519 |
|
39. |
|
Park Plaza |
|
|
KY |
|
Hopkinsville |
|
|
100.0 |
% |
|
114,924 |
|
40. |
|
St. Charles Towne Plaza |
|
|
MD |
|
Waldorf (Washington, D.C.) |
|
|
100.0 |
% |
|
394,873 |
|
41. |
|
Regency Plaza |
|
|
MO |
|
St. Charles (St. Louis) |
|
|
100.0 |
% |
|
287,473 |
|
42. |
|
Ridgewood Court |
|
|
MS |
|
Jackson |
|
|
35.0 |
%(3) |
|
369,501 |
|
43. |
|
Dare Centre |
|
|
NC |
|
Kill Devil Hills |
|
|
100.0 |
% |
|
168,838 |
|
| 44. | | MacGregor Village | | | NC | | Cary | | | 100.0 | % | | 144,859 | |
| 45. | | North Ridge Shopping Center | | | NC | | Raleigh | | | 100.0 | % | | 166,619 | |
46. |
|
Rockaway Convenience Center |
|
|
NJ |
|
Rockaway (New York) |
|
|
100.0 |
% |
|
149,570 |
|
| 47. | | Rockaway Plaza | | | NJ | | Rockaway (New York) | | | 100.0 | % | | 458,828 | |
34
SIMON PROPERTY GROUP
U.S. Community/Lifestyle Centers Property Listing(1)
| | | | | | | | | | | | | | |
| | Property Name | | State | | City (CBSA) | | Legal
Ownership | | Total Gross
Leasable Area | |
|---|
| 48. | | Cobblestone Court | | | NY | | Victor | | | 35.0 | %(3) | | 265,445 | |
49. |
|
Great Lakes Plaza |
|
|
OH |
|
Mentor (Cleveland) |
|
|
100.0 |
% |
|
164,104 |
|
| 50. | | Lima Center | | | OH | | Lima | | | 100.0 | % | | 236,878 | |
51. |
|
Eastland Plaza |
|
|
OK |
|
Tulsa |
|
|
100.0 |
% |
|
190,261 |
|
52. |
|
DeKalb Plaza |
|
|
PA |
|
King of Prussia (Philadelphia) |
|
|
50.3 |
%(4) |
|
101,742 |
|
| 53. | | Henderson Square | | | PA | | King of Prussia (Philadelphia) | | | 76.0 | %(4) | | 107,383 | |
| 54. | | Lincoln Plaza | | | PA | | King of Prussia (Philadelphia) | | | 65.0 | %(4) | | 267,231 | |
| 55. | | Whitehall Mall | | | PA | | Whitehall | | | 38.0 | %(4) | | 588,143 | |
56. |
|
Charles Towne Square |
|
|
SC |
|
Charleston |
|
|
100.0 |
% |
|
71,794 |
|
57. |
|
Empire East(2) |
|
|
SD |
|
Sioux Falls |
|
|
50.0 |
% |
|
297,278 |
|
58. |
|
Knoxville Commons |
|
|
TN |
|
Knoxville |
|
|
100.0 |
% |
|
180,463 |
|
59. |
|
Arboretum at Great Hills |
|
|
TX |
|
Austin |
|
|
100.0 |
% |
|
206,827 |
|
| 60. | | Gateway Shopping Centers | | | TX | | Austin | | | 100.0 | % | | 512,625 | |
| 61. | | Ingram Plaza | | | TX | | San Antonio | | | 100.0 | % | | 111,518 | |
| 62. | | Lakeline Plaza | | | TX | | Cedar Park (Austin) | | | 100.0 | % | | 387,445 | |
| 63. | | Palms Crossing | | | TX | | McAllen | | | 100.0 | % | | 337,249 | |
| 64. | | Richardson Square | | | TX | | Richardson | | | 100.0 | % | | 512,845 | |
| 65. | | Shops at Arbor Walk, The | | | TX | | Austin | | | 100.0 | % | | 442,585 | |
| 66. | | Shops at North East Mall, The | | | TX | | Hurst (Dallas) | | | 100.0 | % | | 364,833 | |
| 67. | | Wolf Ranch Town Center | | | TX | | Georgetown (Austin) | | | 100.0 | % | | 614,012 | |
68. |
|
Chesapeake Center |
|
|
VA |
|
Chesapeake (Virginia Beach) |
|
|
100.0 |
% |
|
305,935 |
|
| 69. | | Fairfax Court | | | VA | | Fairfax (Washington, D.C.) | | | 41.3 | %(3) | | 249,658 | |
| 70. | | Martinsville Plaza | | | VA | | Martinsville | | | 100.0 | % | | 102,105 | |
| | | | | | | | | | | | | | |
| | | Total Community/Lifestyle Center GLA | | | | | | | | | | | 20,822,340 | |
| | | | | | | | | | | | | | |
FOOTNOTES:
- (1)
- Does not include the community centers in Mills portfolio.
- (2)
- This property is managed by a third party.
- (3)
- Outside partner receives substantially all of the economic benefit due to a partner preference.
- (4)
- The Operating Partnership's indirect ownership interest is through an approximate 76% ownership interest in Kravco Simon Investments.
35
SIMON PROPERTY GROUP
U.S. Mills Portfolio Operational Information
As of December 31, 2008
| | | | | | | |
| | As of or for the
Twelve Months Ended
December 31, | |
|---|
| | 2008 | | 2007 | |
|---|
| The Mills® | | | | | | | |
| Total Number of The Mills® | | | 16 | | | 17 | |
| Total GLA (in millions of square feet) | | | 22.8 | | | 24.3 | |
| Occupancy(1) | | | 94.5 | % | | 94.1 | % |
| Comparable sales per square foot(2) | | $ | 372 | | $ | 372 | |
| Average base rent per square foot(1) | | $ | 19.51 | | $ | 19.06 | |
Mills Regional Malls(3) |
|
|
|
|
|
|
|
| Total Number of Regional Malls | | | 16 | | | 16 | |
| Total GLA (in millions of square feet) | | | 17.6 | | | 17.6 | |
| Occupancy(4) | | | 87.4 | % | | 89.5 | % |
| Comparable sales per square foot(2) | | $ | 418 | | $ | 444 | |
| Average rent per square foot(4) | | $ | 36.99 | | $ | 35.63 | |
Mills Community Centers |
|
|
|
|
|
|
|
| Total Number of Community Centers | | | 4 | | | 4 | |
| Total GLA (in millions of square feet) | | | 1.0 | | | 1.0 | |
| Occupancy(1) | | | 96.9 | % | | 97.1 | % |
| Average rent per square foot(1) | | $ | 11.52 | | $ | 10.84 | |
- (1)
- For all owned gross leasable area.
- (2)
- Based upon the standard definition of sales for regional malls adopted by the International Council of Shopping Centers which includes mall stores less than 10,000 square feet.
- (3)
- Does not include two regional malls in Atlanta (Gwinnett Place and Town Center at Cobb) in which The Company held a 50% interest prior to the Mills acquisition.
- (4)
- Includes mall stores.
36
SIMON PROPERTY GROUP
U.S. Mills Portfolio Property Listing
| | | | | | | | | | | | | | |
| | Property Name | | State | | City (CBSA) | | SPG Share
of Legal
Ownership | | Total Gross
Leasable Area | |
|---|
| | | The Mills® | | | | | | | | | | | | |
| 1. | | Arizona Mills | | | AZ | | Tempe (Phoenix) | | | 25.0 | % | | 1,250,934 | |
| 2. | | Arundel Mills | | | MD | | Hanover (Baltimore) | | | 29.6 | % | | 1,291,849 | |
| 3. | | Colorado Mills | | | CO | | Lakewood (Denver) | | | 18.8 | %(1) | | 1,106,368 | |
| 4. | | Concord Mills | | | NC | | Concord (Charlotte) | | | 29.6 | %(1) | | 1,347,377 | |
| 5. | | Discover Mills | | | GA | | Lawrenceville (Atlanta) | | | 25.0 | %(1) | | 1,183,562 | |
| 6. | | Franklin Mills | | | PA | | Philadelphia | | | 50.0 | % | | 1,753,021 | |
| 7. | | Grapevine Mills | | | TX | | Grapevine (Dallas) | | | 29.6 | % | | 1,775,656 | |
| 8. | | Great Mall of the Bay Area | | | CA | | Milpitas (San Jose) | | | 24.5 | %(1) | | 1,380,741 | |
| 9. | | Gurnee Mills | | | IL | | Gurnee (Chicago) | | | 50.0 | % | | 1,821,704 | |
| 10. | | Katy Mills | | | TX | | Katy (Houston) | | | 31.3 | %(1) | | 1,574,216 | |
| 11. | | Ontario Mills | | | CA | | Ontario (Riverside) | | | 25.0 | % | | 1,481,954 | |
| 12. | | Opry Mills | | | TN | | Nashville | | | 24.5 | %(1) | | 1,158,952 | |
| 13. | | Potomac Mills | | | VA | | Prince William (Washington, D.C.) | | | 50.0 | % | | 1,515,731 | |
| 14. | | Sawgrass Mills | | | FL | | Sunrise (Miami) | | | 50.0 | % | | 2,252,117 | |
| 15. | | St. Louis Mills | | | MO | | Hazelwood (St. Louis) | | | 25.0 | %(1) | | 1,191,207 | |
| 16. | | The Block at Orange | | | CA | | Orange (Los Angeles) | | | 25.0 | % | | 717,692 | |
| | | | | | | | | | | | | | |
| | | Subtotal The Mills® | | | | | | | | | | | 22,803,081 | |
|
|
Regional Malls(3) |
|
|
|
|
|
|
|
|
|
|
|
|
| 17. | | Briarwood Mall | | | MI | | Ann Arbor | | | 25.0 | % | | 975,908 | |
| 18. | | Del Amo Fashion Center | | | CA | | Torrance (Los Angeles) | | | 25.0 | %(1) | | 2,403,663 | (2) |
| 19. | | Dover Mall | | | DE | | Dover | | | 34.1 | % | | 887,196 | |
| 20. | | Esplanade, The | | | LA | | Kenner (New Orleans) | | | 50.0 | % | | 899,534 | |
| 21. | | Falls, The | | | FL | | Miami | | | 25.0 | % | | 808,753 | |
| 22. | | Galleria at White Plains, The | | | NY | | White Plains (New York) | | | 50.0 | % | | 878,388 | |
| 23. | | Hilltop Mall | | | CA | | Richmond (San Francisco) | | | 25.0 | % | | 1,069,693 | |
| 24. | | Lakeforest Mall | | | MD | | Gaithersburg (Washington, D.C.) | | | 25.0 | % | | 1,045,525 | |
| 25. | | Mall at Tuttle Crossing, The | | | OH | | Dublin (Columbus) | | | 25.0 | % | | 1,124,752 | |
| 26. | | Marley Station | | | MD | | Glen Burnie (Baltimore) | | | 25.0 | % | | 1,069,865 | |
| 27. | | Meadowood Mall | | | NV | | Reno | | | 25.0 | % | | 884,282 | |
| 28. | | Northpark Mall | | | MS | | Ridgeland | | | 50.0 | % | | 957,998 | |
| 29. | | Shops at Riverside, The | | | NJ | | Hackensack (New York) | | | 50.0 | % | | 745,329 | |
| 30. | | Southdale Center | | | MN | | Edina (Minneapolis) | | | 50.0 | % | | 1,341,627 | (2) |
| 31. | | Southridge Mall | | | WI | | Greendale (Milwaukee) | | | 50.0 | % | | 1,223,106 | |
| 32. | | Stoneridge Mall | | | CA | | Pleasanton (San Francisco) | | | 25.0 | % | | 1,301,492 | |
| | | | | | | | | | | | | | |
| | | Subtotal Regional Malls | | | | | | | | | | | 17,617,111 | |
|
|
Community Centers |
|
|
|
|
|
|
|
|
|
|
|
|
| 33. | | Denver West Village | | | CO | | Lakewood (Denver) | | | 18.8 | % | | 310,090 | |
| 34. | | Arundel Mills Marketplace | | | MD | | Hanover (Baltimore) | | | 29.6 | % | | 101,613 | |
| 35. | | Concord Mills Marketplace | | | NC | | Concord (Charlotte) | | | 50.0 | % | | 230,683 | |
| 36. | | Liberty Plaza | | | PA | | Philadelphia | | | 50.0 | % | | 371,446 | |
| | | | | | | | | | | | | | |
| | | Subtotal Community Centers | | | | | | | | | | | 1,013,832 | |
| | | | | | | | | | | | | | |
| | | Total Mills Properties | | | | | | | | | | | 41,434,024 | |
| | | | | | | | | | | | | | |
- (1)
- The Operating Partnership's direct and indirect interests in some of the properties held as joint venture interests are subject to preferences on distributions in favor of other partners or the Operating Partnership.
- (2)
- Includes office space as follows:
Del Amo Fashion Center—113,000 sq. ft.
Southdale Center—20,295 sq. ft.
- (3)
- Does not include two regional malls in Atlanta (Gwinnett Place and Town Center at Cobb) in which we already held a 50% interest prior to the Mills acquisition.
37
SIMON PROPERTY GROUP
International Operational Information(1)
As of December 31, 2008
| | | | | | | |
| | As of or for the
Twelve Months Ended
December 31, | |
|---|
| | 2008 | | 2007 | |
|---|
European Shopping Centers | | | | | | | |
Total Number of Shopping Centers | | | 52 | | | 51 | |
Total GLA (in millions of square feet) | | | 13.5 | | | 13.3 | |
Occupancy | | | 98.4 | % | | 98.7 | % |
Comparable sales per square foot | | € | 411 | | € | 421 | |
Average rent per square foot | | € | 30.11 | | € | 29.58 | |
International Premium Outlets—Japan | | | | | | | |
Total Number of Premium Outlets | | | 7 | | | 6 | |
Total GLA (in millions of square feet) | | | 2.0 | | | 1.7 | |
Occupancy | | | 99.9 | % | | 100.0 | % |
Comparable sales per square foot | | ¥ | 92,000 | | ¥ | 93,169 | |
Average base rent per square foot | | ¥ | 4,685 | | ¥ | 4,626 | |
- (1)
- Does not include Premium Outlets Punta Norte in Mexico, Yeoju Premium Outlets in South Korea and Changshu In City Plaza in Changshu, China.
38
SIMON PROPERTY GROUP
International Property Listing
| | | | | | | | | | | | | | | | | |
| |
| |
| |
| | Gross Leasable Area(1) | |
|---|
| | Property Name | | City (Metropolitan area) | | SPG
Effective
Ownership(5) | | Hypermarket/
Anchor(4) | | Mall &
Freestanding | | Total | |
|---|
| | | FRANCE | | | | | | | | | | | | | | | |
| 1. | | Bay 2 | | Torcy (Paris) | | | 50.0 | % | | 159,900 | | | 416,900 | | | 576,800 | |
| 2. | | Bay 1 | | Torcy (Paris) | | | 50.0 | % | | — | | | 348,900 | | | 348,900 | |
| 3. | | Bel'Est | | Bagnolet (Paris) | | | 17.5 | % | | 109,800 | | | 63,300 | | | 173,100 | |
| 4. | | Villabé A6 | | Villabé (Paris) | | | 7.5 | % | | 124,900 | | | 159,400 | | | 284,300 | |
| 5. | | Wasquehal | | Wasquehal (Lille) | | | 50.0 | % | | 131,300 | | | 123,400 | | | 254,700 | |
| | | | | | | | | | | | | | | |
| | | Subtotal France | | | | | | | | 525,900 | | | 1,111,900 | | | 1,637,800 | |
|
|
ITALY |
|
|
|
|
|
|
|
|
|
|
|
|
|
|
|
| | | Ancona: | | | | | | | | | | | | | | | |
| 6. | | Ancona | | Ancona | | | 49.0 | %(3) | | 82,900 | | | 82,300 | | | 165,200 | |
| 7. | | Senigallia | | Senigallia (Ancona) | | | 49.0 | % | | 41,200 | | | 41,600 | | | 82,800 | |
|
|
Ascoli Piceno: |
|
|
|
|
|
|
|
|
|
|
|
|
|
|
|
| 8. | | Grottammare | | Grottammare (Ascoli Piceno) | | | 49.0 | % | | 38,900 | | | 55,900 | | | 94,800 | |
| 9. | | Porto Sant'Elpidio | | Porto Sant'Elpidio (Ascoli Piceno) | | | 49.0 | % | | 48,000 | | | 114,300 | | | 162,300 | |
|
|
Bari: |
|
|
|
|
|
|
|
|
|
|
|
|
|
|
|
| 10. | | Casamassima | | Casamassima (Bari) | | | 49.0 | % | | 159,000 | | | 388,800 | | | 547,800 | |
| 11. | | Modugno | | Modugno (Bari) | | | 49.0 | % | | 96,900 | | | 46,600 | | | 143,500 | |
|
|
Bergamo: |
|
|
|
|
|
|
|
|
|
|
|
|
|
|
|
| 12. | | Bergamo | | Bergamo | | | 49.0 | %(3) | | 103,000 | | | 16,900 | | | 119,900 | |
|
|
Brescia: |
|
|
|
|
|
|
|
|
|
|
|
|
|
|
|
| 13. | | Concesio | | Concesio (Brescia) | | | 49.0 | %(3) | | 89,900 | | | 27,600 | | | 117,500 | |
| 14. | | Mazzano | | Mazzano (Brescia) | | | 49.0 | %(2) | | 103,300 | | | 127,400 | | | 230,700 | |
|
|
Brindisi: |
|
|
|
|
|
|
|
|
|
|
|
|
|
|
|
| 15. | | Mesagne | | Mesagne (Brindisi) | | | 49.0 | % | | 88,000 | | | 140,600 | | | 228,600 | |
|
|
Cagliari: |
|
|
|
|
|
|
|
|
|
|
|
|
|
|
|
| 16. | | Marconi | | Marconi (Cagliari) | | | 49.0 | %(3) | | 83,500 | | | 109,900 | | | 193,400 | |
| 17. | | Santa Gilla | | Santa Gilla (Cagliari) | | | 49.0 | %(2) | | 75,900 | | | 114,800 | | | 190,700 | |
|
|
Catania: |
|
|
|
|
|
|
|
|
|
|
|
|
|
|
|
| 18. | | La Rena | | La Rena (Catania) | | | 49.0 | % | | 124,100 | | | 22,100 | | | 146,200 | |
| 19. | | Misterbianco | | Misterbianco (Catania) | | | 49.0 | %(3) | | 83,300 | | | 16,000 | | | 99,300 | |
|
|
Lecco: |
|
|
|
|
|
|
|
|
|
|
|
|
|
|
|
| 20. | | Merate | | Merate (Lecco) | | | 49.0 | %(3) | | 73,500 | | | 88,500 | | | 162,000 | |
|
|
Milan (Milano): |
|
|
|
|
|
|
|
|
|
|
|
|
|
|
|
| 21. | | Cesano Boscone | | Cescano Boscone (Milano) | | | 49.0 | %(3) | | 163,800 | | | 120,100 | | | 283,900 | |
| 22. | | Cinisello | | Cinisello (Milano) | | | 49.0 | % | | 125,000 | | | 250,600 | | | 375,600 | |
| 23. | | Nerviano | | Nerviano (Milano) | | | 49.0 | %(3) | | 83,800 | | | 27,800 | | | 111,600 | |
| 24. | | Rescaldina | | Rescaldina (Milano) | | | 49.0 | % | | 165,100 | | | 212,000 | | | 377,100 | |
| 25. | | Vimodrone | | Vimodrone (Milano) | | | 49.0 | % | | 110,400 | | | 80,200 | | | 190,600 | |
|
|
Monza: |
|
|
|
|
|
|
|
|
|
|
|
|
|
|
|
| 26. | | Monza | | Monza | | | 49.0 | %(3) | | 59,200 | | | 152,500 | | | 211,700 | |
|
|
Naples (Napoli): |
|
|
|
|
|
|
|
|
|
|
|
|
|
|
|
| 27. | | Giugliano | | Giugliano (Napoli) | | | 49.0 | %(6) | | 130,000 | | | 624,500 | | | 754,500 | |
| 28. | | Mugnano di Napoli | | Mugnano (Napoli) | | | 49.0 | %(3) | | 98,000 | | | 94,900 | | | 192,900 | |
| 29. | | Pompei | | Pompei (Napoli) | | | 49.0 | % | | 74,300 | | | 17,100 | | | 91,400 | |
| 30. | | Vulcano Buono | | Nola (Napoli) | | | 22.1 | % | | 142,900 | | | 733,100 | | | 876,000 | |
39
SIMON PROPERTY GROUP
International Property Listing
| | | | | | | | | | | | | | | | | |
| |
| |
| |
| | Gross Leasable Area(1) | |
|---|
| | Property Name | | City (Metropolitan area) | | SPG
Effective
Ownership(5) | | Hypermarket/
Anchor(4) | | Mall &
Freestanding | | Total | |
|---|
| | | Olbia: | | | | | | | | | | | | | | | |
| 31. | | Olbia | | Olbia | | | 49.0 | %(3) | | 74,600 | | | 133,000 | | | 207,600 | |
|
|
Padova: |
|
|
|
|
|
|
|
|
|
|
|
|
|
|
|
| 32. | | Padova | | Padova | | | 49.0 | % | | 73,300 | | | 32,500 | | | 105,800 | |
|
|
Palermo: |
|
|
|
|
|
|
|
|
|
|
|
|
|
|
|
| 33. | | Palermo | | Palermo | | | 49.0 | % | | 73,100 | | | 9,800 | | | 82,900 | |
|
|
Pesaro: |
|
|
|
|
|
|
|
|
|
|
|
|
|
|
|
| 34. | | Fano | | Fano (Pesaro) | | | 49.0 | % | | 56,300 | | | 56,000 | | | 112,300 | |
|
|
Pescara: |
|
|
|
|
|
|
|
|
|
|
|
|
|
|
|
| 35. | | Cepagatti | | Cepagatti (Pescara) | | | 49.0 | % | | 80,200 | | | 189,600 | | | 269,800 | |
| 36. | | Pescara | | Pescara | | | 49.0 | % | | 96,300 | | | 65,200 | | | 161,500 | |
|
|
Piacenza: |
|
|
|
|
|
|
|
|
|
|
|
|
|
|
|
| 37. | | San Rocco al Porto | | San Rocco al Porto (Piacenza) | | | 49.0 | % | | 104,500 | | | 74,700 | | | 179,200 | |
|
|
Rome (Roma): |
|
|
|
|
|
|
|
|
|
|
|
|
|
|
|
| 38. | | Casalbertone | | Roma | | | 49.0 | %(3) | | 62,700 | | | 84,900 | | | 147,600 | |
| 39. | | Collatina | | Collatina (Roma) | | | 49.0 | % | | 59,500 | | | 4,100 | | | 63,600 | |
| 40. | | Porta Di Roma | | Roma | | | 19.6 | % | | 624,800 | | | 630,600 | | | 1,255,400 | |
|
|
Sassari: |
|
|
|
|
|
|
|
|
|
|
|
|
|
|
|
| 41. | | Centro Azuni | | Sassari | | | 49.0 | %(3) | | — | | | 35,600 | | | 35,600 | |
| 42. | | Predda Niedda | | Predda Niedda (Sassari) | | | 49.0 | %(2) | | 79,500 | | | 154,200 | | | 233,700 | |
|
|
Taranto: |
|
|
|
|
|
|
|
|
|
|
|
|
|
|
|
| 43. | | Taranto | | Taranto | | | 49.0 | % | | 75,200 | | | 126,500 | | | 201,700 | |
|
|
Turin (Torino): |
|
|
|
|
|
|
|
|
|
|
|
|
|
|
|
| 44. | | Cuneo | | Cuneo (Torino) | | | 49.0 | % | | 80,700 | | | 201,500 | | | 282,200 | |
| 45. | | Rivoli | | Rivoli (Torino) | | | 49.0 | %(3) | | 61,800 | | | 32,300 | | | 94,100 | |
| 46. | | Torino | | Torino | | | 49.0 | % | | 105,100 | | | 66,700 | | | 171,800 | |
| 47. | | Venaria | | Venaria (Torino) | | | 49.0 | % | | 101,600 | | | 64,000 | | | 165,600 | |
|
|
Venice (Venezia): |
|
|
|
|
|
|
|
|
|
|
|
|
|
|
|
| 48. | | Venezia—Mestre | | Mestre (Venezia) | | | 49.0 | % | | 114,100 | | | 132,600 | | | 246,700 | |
|
|
Verona: |
|
|
|
|
|
|
|
|
|
|
|
|
|
|
|
| 49. | | Bussolengo | | Bussolengo (Verona) | | | 49.0 | %(3) | | 89,300 | | | 75,300 | | | 164,600 | |
|
|
Vicenza: |
|
|
|
|
|
|
|
|
|
|
|
|
|
|
|
| 50. | | Vicenza | | Vicenza | | | 49.0 | % | | 78,400 | | | 20,100 | | | 98,500 | |
| | | | | | | | | | | | | | | |
| | | Subtotal Italy | | | | | | | | 4,534,900 | | | 5,895,300 | | | 10,430,200 | |
|
|
POLAND |
|
|
|
|
|
|
|
|
|
|
|
|
|
|
|
| 51. | | Arkadia Shopping Center | | Warsaw | | | 50.0 | % | | 202,200 | | | 900,800 | | | 1,103,000 | |
| 52. | | Wilenska Station Shopping Center | | Warsaw | | | 50.0 | % | | 92,700 | | | 215,900 | | | 308,600 | |
| | | | | | | | | | | | | | | |
| | | Subtotal Poland | | | | | | | | 294,900 | | | 1,116,700 | | | 1,411,600 | |
|
|
JAPAN |
|
|
|
|
|
|
|
|
|
|
|
|
|
|
|
| 53. | | Gotemba Premium Outlets | | Gotemba City (Tokyo) | | | 40.0 | % | | — | | | 479,000 | | | 479,000 | |
| 54. | | Kobe-Sanda Premium Outlets | | Hyougo-ken (Osaka) | | | 40.0 | % | | — | | | 193,500 | | | 193,500 | |
| 55. | | Rinku Premium Outlets | | Izumisano (Osaka) | | | 40.0 | % | | — | | | 320,600 | | | 320,600 | |
| 56. | | Sano Premium Outlets | | Sano (Tokyo) | | | 40.0 | % | | — | | | 389,900 | | | 389,900 | |
| 57. | | Sendai-Izumi Premium Outlets | | Izumi Park Town (Sendai) | | | 40.0 | % | | — | | | 164,200 | | | 164,200 | |
| 58. | | Toki Premium Outlets | | Toki (Nagoya) | | | 40.0 | % | | — | | | 230,300 | | | 230,300 | |
| 59. | | Tosu Premium Outlets | | Fukuoka (Kyushu) | | | 40.0 | % | | — | | | 239,900 | | | 239,900 | |
| | | | | | | | | | | | | | | |
| | | Subtotal Japan | | | | | | | | — | | | 2,017,400 | | | 2,017,400 | |
40
SIMON PROPERTY GROUP
International Property Listing
| | | | | | | | | | | | | | | | | |
| |
| |
| |
| | Gross Leasable Area(1) | |
|---|
| | Property Name | | City (Metropolitan area) | | SPG
Effective
Ownership(5) | | Hypermarket/
Anchor(4) | | Mall &
Freestanding | | Total | |
|---|
| | | MEXICO | | | | | | | | | | | | | | | |
| 60. | | Premium Outlets Punta Norte | | Mexico City | | | 50.0 | % | | — | | | 231,900 | | | 231,900 | |
| | | | | | | | | | | | | | | |
| | | Subtotal Mexico | | | | | | | | — | | | 231,900 | | | 231,900 | |
|
|
SOUTH KOREA |
|
|
|
|
|
|
|
|
|
|
|
|
|
|
|
| 61. | | Yeoju Premium Outlets | | Seoul | | | 50.0 | % | | — | | | 249,900 | | | 249,900 | |
| | | | | | | | | | | | | | | |
| | | Subtotal South Korea | | | | | | | | — | | | 249,900 | | | 249,900 | |
|
|
CHINA |
|
|
|
|
|
|
|
|
|
|
|
|
|
|
|
| 62. | | Changshu IN CITY Plaza | | Changshu | | | 32.5 | % | | 180,800 | | | 302,800 | | | 483,600 | |
| | | | | | | | | | | | | | | |
| | | Subtotal China | | | | | | | | 180,800 | | | 302,800 | | | 483,600 | |
| | | | | | | | | | | | | | | |
| | | TOTAL INTERNATIONAL ASSETS | | | | | | | | 5,536,500 | | | 10,925,900 | | | 16,462,400 | |
| | | | | | | | | | | | | | | |
FOOTNOTES:
- (1)
- All gross leasable area listed in square feet.
- (2)
- This property is held partially in fee and partially encumbered by a leasehold on the premise which entitles the lessor to the majority of the economics of the portion of the property subject to the leasehold.
- (3)
- This property is encumbered by a leasehold on the entire premises which entitles the lessor the majority of the economics of the property.
- (4)
- Represents the sales area of the anchor and excludes any warehouse/storage areas.
- (5)
- We own our interest in the assets in France and Poland through our shareholdings in Simon Ivanhoe S.a.r.l. Our interest in the Italian assets is owned through Gallerie Commerciali Italia S.p.A., while our interest in the assets in Japan is owned through Chelsea Japan Co., Ltd. We own our interest in Mexico through Fideicomiso Trust No. F/315-5 and our interest in South Korea through Shinsegae Chelsea Co., Ltd. We own our interest in the shopping center in Changshu, Jiangsu Province, China, through our shareholdings in Great Mall Investments Limited.
- (6)
- On April 4, 2007, Gallerie Commerciali Italia acquired the remaining 60% interest in the shopping gallery at this center, which consists of 177,600 sf of leasable area. We own a 19.6% interest in the retail parks at this center, which consist of 446,900 sf of leasable area.
41
SIMON PROPERTY GROUP
Capital Expenditures
For the Twelve Months Ended December 31, 2008
(In thousands)
| | | | | | | | | | | |
| |
| | Unconsolidated
Entities | |
|---|
| | Consolidated
Properties | | Total | | Simon
Group's
Share | |
|---|
| New development projects | | $ | 322,677 | | $ | 503,525 | | $ | 204,704 | |
Redevelopment projects with incremental
GLA and/or anchor replacement | | $ | 247,016 | | $ | 275,638 | | $ | 121,024 | |
| Renovations with no incremental GLA | | $ | 133,669 | | $ | — | | $ | — | |
| Tenant allowances: | | | | | | | | | | |
| | Retail | | $ | 65,864 | | $ | 69,349 | | $ | 25,095 | |
| | Office | | $ | 8,243 | | $ | — | | $ | — | |
| Operational capital expenditures at properties: | | | | | | | | | | |
| | CAM expenditures(1) | | $ | 48,097 | | $ | 33,020 | | $ | 12,611 | |
| | Non-CAM expenditures | | $ | 9,697 | | $ | 54,870 | | $ | 23,592 | |
| | | | | | | | |
| Totals | | $ | 835,263 | | $ | 936,402 | | $ | 387,026 | |
| | | | | | | | |
| Plus (Less): Conversion from accrual to cash basis | | $ | 39,023 | | $ | 30,036 | | | | |
| | | | | | | | | |
| Capital Expenditures for the Twelve Months Ended 12/31/08(2) | | $ | 874,286 | | $ | 966,438 | | | | |
| | | | | | | | | |
| Capital Expenditures for the Twelve Months Ended 12/31/07(2) | | $ | 1,017,472 | | $ | 915,657 | | | | |
| | | | | | | | | |
- (1)
- Expenditures included in the pool of expenses allocated to tenants as common area maintenance or CAM.
- (2)
- Agrees with the line item "Capital expenditures" on the Combined Statements of Cash Flows for the consolidated properties. No statement of cash flows is prepared for the joint venture properties as this is not required by the SEC or GAAP; however, the above reconciliation was completed in the same manner as the reconciliation for the consolidated properties.
42
SIMON PROPERTY GROUP
U.S. Development Activity Report(1)(2)
Project Overview and Construction-in-Progress
As of December 31, 2008
| | | | | | | | | | | | | | | | | | | | | | | | | | | | | |
| |
| |
| |
| |
| |
| |
| |
| | Construction-in-Progress | |
|---|
| |
| |
| |
| |
| |
| |
| |
| |
| | Unconsolidated Entities | |
|---|
| |
| | The
Company's
Ownership
Percentage | |
| |
| |
| | The
Company's
Share of
Net Cost | |
| |
| |
|---|
| Property/Location | | Project Description | | Projected
Opening | | Projected
Gross Cost(3)
(in millions) | | Projected
Net Cost
(in millions) | | Stabilized
Rate of
Return | | Consolidated
Properties | | Total | | The Company's
Share | |
|---|
| New Development Projects | | | | | | | | | | | | | | | | | | | | | | | | | | | | | |
| Cincinnati Premium Outlets | | 400,000 square foot upscale outlet center | | | 100 | % | 8/09 | | $ | 98 | | $ | 92 | | $ | 92 | | | 11 | % | $ | 42.9 | | | — | | | — | |
| Monroe, OH | | | | | | | | | | | | | | | | | | | | | | | | | | | | | |
Significant Redevelopment and Expansion Projects with Incremental GLA |
|
|
|
|
|
|
|
|
|
|
|
|
|
|
|
|
|
|
|
|
|
|
|
|
|
|
|
| Domain, The (Phase II) | | 600,000 square foot expansion of upscale main street center | | | 100 | % | 11/09 | | $ | 164 | | $ | 141 | | $ | 141 | | | 7 | % | $ | 75.5 | | | — | | | — | |
Austin, TX
| | anchored by Dillard's, Dick's Sporting Goods and Village Road Show Theaters | | | | | | | | | | | | | | | | | | | | | | | | | | | |
Camarillo Premium Outlets |
|
220,000 square foot expansion of upscale outlet center anchored |
|
|
100 |
% |
4/09 |
|
$ |
81 |
|
$ |
77 |
|
$ |
77 |
|
|
13 |
% |
$ |
51.1 |
|
|
— |
|
|
— |
|
—The Promenade
Camarillo, CA | | by Saks Fifth Avenue Off 5th and Neiman Marcus Last Call | | | | | | | | | | | | | | | | | | | | | | | | | | | |
South Shore Plaza
Braintree (Boston), MA |
|
Addition of Nordstrom and small shops |
|
|
100 |
% |
3/10 |
|
$ |
129 |
|
$ |
129 |
|
$ |
129 |
|
|
11 |
% |
$ |
40.7 |
|
|
— |
|
|
— |
|
Renovations |
|
|
|
|
|
|
|
|
|
|
|
|
|
|
|
|
|
|
|
|
|
|
|
|
|
|
|
|
|
| Coral Square | | Mall renovation | | | 97 | % | 3/09 | | | | | | | | | | | | | | | | | | | | | | |
| Coral Springs (Miami), FL | | | | | | | | | | | | | | | | | | | | | | | | | | | | | |
Town Center at Cobb |
|
Mall renovation |
|
|
75 |
% |
3/09 |
|
|
|
|
|
|
|
|
|
|
|
|
|
|
|
|
|
|
|
|
|
|
| Kennesaw (Atlanta), GA | | | | | | | | | | | | | | | | | | | | | | | | | | | | | |
Towne East Square |
|
Mall renovation |
|
|
100 |
% |
3/09 |
|
|
|
|
|
|
|
|
|
|
|
|
|
|
|
|
|
|
|
|
|
|
| Wichita, KS | | | | | | | | | | | | | | | | | | | | | | | | | | | | | |
West Ridge Mall |
|
Mall renovation |
|
|
100 |
% |
2/09 |
|
|
|
|
|
|
|
|
|
|
|
|
|
|
|
|
|
|
|
|
|
|
| Topeka, KS | | | | | | | | | | | | | | | | | | | | | | | | | | | | | |
| | | Subtotal Renovations | | | | | | | $ | 49 | | $ | 49 | | $ | 46 | | | 9 | % | $ | 13.6 | | $ | 16.8 | | $ | 14.5 | |
| Anchor/Big Box/Theater Activity | | | | | | | | | | | | | | | | | | | | | | | | | | | | | |
| Plaza Carolina | | Relocation of Tiendas Capri and addition of Best Buy | | | 100 | % | 11/09 | | $ | 13 | | $ | 13 | | $ | 13 | | | 9 | % | $ | 2.5 | | | — | | | — | |
| Carolina (San Juan), PR | | | | | | | | | | | | | | | | | | | | | | | | | | | | | |
Other Projects |
|
|
|
|
|
|
|
|
|
|
|
|
|
|
|
|
|
|
|
|
|
|
|
|
|
|
|
|
|
| Coconut Point | | Addition of Hyatt Place Hotel (108 rooms) | | | 50 | % | 2/09 | | | | | | | | | | | | | | | | | | | | | | |
| Estero, FL | | | | | | | | | | | | | | | | | | | | | | | | | | | | | |
Domain, The (Phase II) |
|
Addition of residential component (411 units) |
|
|
50 |
% |
11/09 |
|
|
|
|
|
|
|
|
|
|
|
|
|
|
|
|
|
|
|
|
|
|
| Austin, TX | | | | | | | | | | | | | | | | | | | | | | | | | | | | | |
Domain, The |
|
Addition of The Westin (340 rooms) |
|
|
50 |
% |
3/10 |
|
|
|
|
|
|
|
|
|
|
|
|
|
|
|
|
|
|
|
|
|
|
| Austin, TX | | | | | | | | | | | | | | | | | | | | | | | | | | | | | |
| | | Subtotal Asset Intensification | | | | | | | $ | 142 | | $ | 141 | | $ | 70 | | | 10 | % | | — | | $ | 40.1 | | $ | 20.0 | |
| Miscellaneous | | | | | | | | | | | | | | | | | | | | | $ | 21.2 | | $ | 35.0 | | $ | 17.4 | |
| | | | | | | | | | | | | | | | | | | | | | | | | | | |
| Total Construction in Progress(4) | | | | | | | | | | | | | | | | | | | | | $ | 247.5 | | $ | 91.9 | | $ | 51.9 | |
| | | | | | | | | | | | | | | | | | | | | | | | | | | |
- (1)
- Does not include the Mills portfolio in which we acquired an interest on March 29, 2007.
- (2)
- Cost and return are based upon current budget assumptions. Actual results may vary.
- (3)
- Projected Gross Cost includes soft costs such as architecture and engineering fees, tenant costs (allowances/leasing commissions), development, legal and other fees, marketing costs, cost of capital, and other related costs.
- (4)
- Does not include our international properties.
43
SIMON PROPERTY GROUP
International Development Activity Report*
Project Overview, Construction-in-Progress
As of December 31, 2008
| | | | | | | | | | | | | |
Shopping center/
Location (Metropolitan area) | | Project Description | | Anchors/Major Tenants | | The Company's
Ownership
Percentage
of Project | | Opening | | Projected
Net Cost*
(in millions) | |
|---|
New Development Projects: | | | | | | | | | | | | | |
Europe: | | | | | | | | | | | | | |
Argine—Napoli, Italy | | 300,000 square foot center anchored by a hypermarket with approximately 75 shops | | Auchan | | | 24.0 | % | December 2009 | | € | 64 | |
Catania—Sicily, Italy | | 642,000 square foot center anchored by a hypermarket with approximately 120 shops | | Auchan | | | 24.0 | % | June 2010 | | € | 157 | |
Asia: | | | | | | | | | | | | | |
Ami Premium Outlets—Ami
(Tokyo), Japan | | 225,000 square foot upscale outlet center | | | | | 40.0 | % | July 2009 | | | JPY 6,193 | |
Hangzhou, China | | 310,000 square foot center anchored by a hypermarket with approximately 85 shops | | Wal-Mart, Forever 21, Sephora, Vero Moda, C&A | | | 32.5 | % | July 2009 | | | CNY 500 | |
Suzhou, China | | 750,000 square foot center anchored by a hypermarket and theater with approximately 200 shops | | Wal-Mart, Best Buy, Golden Harvest Cinemas, Forever 21, C&A, Sephora, Starbucks, Vero Moda, Sport 100, H&M | | | 32.5 | % | September 2009 | | | CNY 1,019 | |
Zhengzhou, China | | 464,000 square foot center anchored by a hypermarket and theater with approximately 90 shops | | Wal-Mart, China Film Cinemas, Forever 21, Sephora, Vero Moda, Sport 100 | | | 32.5 | % | June 2009 | | | CNY 591 | |
- *
- Cost is based upon current budget assumptions. Actual results may vary.
44
SIMON PROPERTY GROUP
Total Debt Amortization and Maturities by Year (Our Share)
As of December 31, 2008
(In thousands)
| | | | | | | | | | | | | |
Year | | Our
Share of
Secured
Consolidated
Debt | | Our
Share of
Unsecured
Consolidated
Debt | | Our
Share of
Unconsolidated
Joint Venture
Debt | | Our
Share of Total
Debt | |
|---|
2009 | | $ | 564,866 | | $ | 900,000 | | $ | 437,040 | | $ | 1,901,906 | |
2010 | | | 1,182,936 | | | 1,100,000 | | | 689,539 | | | 2,972,475 | |
2011 | | | 525,122 | | | 2,496,288 | | | 702,124 | | | 3,723,534 | |
2012 | | | 1,387,919 | | | 1,450,000 | | | 1,146,944 | | | 3,984,863 | |
2013 | | | 907,898 | | | 1,125,000 | | | 532,302 | | | 2,565,200 | |
2014 | | | 593,960 | | | 700,000 | | | 889,717 | | | 2,183,677 | |
2015 | | | 4,032 | | | 1,200,000 | | | 699,379 | | | 1,903,411 | |
2016 | | | 216,279 | | | 1,300,000 | | | 586,256 | | | 2,102,535 | |
2017 | | | 573,283 | | | 500,000 | | | 849,689 | | | 1,922,972 | |
2018 | | | 1,948 | | | 1,000,000 | | | 4,030 | | | 1,005,978 | |
Thereafter | | | 20,096 | | | — | | | 84,276 | | | 104,372 | |
| | | | | | | | | | |
Face Amounts of Indebtedness | | $ | 5,978,339 | | $ | 11,771,288 | | $ | 6,621,296 | | $ | 24,370,923 | |
Premiums (Discounts) on Indebtedness, Net | | | 14,802 | | | 1,887 | | | 11,123 | | | 27,812 | |
| | | | | | | | | | |
Our Share of Total Indebtedness | | $ | 5,993,141 | | $ | 11,773,175 | | $ | 6,632,419 | | $ | 24,398,735 | |
| | | | | | | | | | |
Debt Covenant Compliance Ratios
| | | | | | | | | |
Senior Unsecured Notes Covenant (1) | | Required | | Actual | | Compliance | |
|---|
Total Debt to Total Assets | | | £65% | | 48% | | | Yes | |
Total Secured Debt to Total Assets | | | £50% | | 25% | | | Yes | |
Fixed Charge Coverage Ratio | | | >1.5X | | 2.6X | | | Yes | |
Total Unencumbered Assets to Unsecured Debt | | | ³125% | | 234% | | | Yes | |
- (1)
- Covenants for indentures dated June 7, 2005 and later. Covenants and other provisions of prior supplemental indentures apply to all unsecured debt for as long as any securities issued under prior supplemental indentures remain outstanding or until the covenants in the prior supplemental indentures have been amended. For a complete listing of all debt covenants related to our senior unsecured notes, as well as definitions of the above terms, please refer to Simon Property Group, L.P. filings with the Securities and Exchange Commission.
45
SIMON PROPERTY GROUP
Summary of Indebtedness
As of December 31, 2008
(In thousands)
| | | | | | | | | | | | | | | | |
| | Total
Indebtedness | | Our Share of
Indebtedness | | Weighted
Average
End of Period
Interest Rates | | Weighted
Average Years
to Maturity | |
|---|
Consolidated Indebtedness | | | | | | | | | | | | | |
| | Mortgage Debt | | | | | | | | | | | | | |
| | | Fixed Rate | | $ | 4,382,119 | | $ | 4,110,119 | | | 6.09 | % | | 4.1 | |
| | | Floating Rate Debt (Swapped to Fixed) | | | 300,000 | | | 300,000 | | | 2.81 | % | | 0.1 | |
| | | Floating Rate Debt (Hedged)(1) | | | 281,829 | | | 281,829 | | | 1.98 | % | | 3.9 | |
| | | Floating Rate Debt | | | 1,290,097 | | | 1,286,391 | | | 1.50 | % | | 3.2 | |
| | | | | | | | | | | | |
| | Total Mortgage Debt | | | 6,254,045 | | | 5,978,339 | | | 4.70 | % | | 3.8 | |
| | Unsecured Debt | | | | | | | | | | | | | |
| | | Fixed Rate | | | 10,725,000 | | | 10,725,000 | | | 5.69 | % | | 4.7 | |
| | | Revolving Credit Facility—US Tranche | | | 600,000 | | | 600,000 | | | 0.81 | % | | 2.0 | |
| | | Revolving Credit Facility—Yen Currency | | | 243,990 | | | 243,990 | | | 1.07 | % | | 2.0 | |
| | | Revolving Credit Facility—Euro Currency | | | 202,298 | | | 202,298 | | | 2.96 | % | | 2.0 | |
| | | | | | | | | | | | |
| | | | Total Revolving Credit Facility | | | 1,046,288 | | | 1,046,288 | | | 1.29 | % | | 2.0 | |
| | Total Unsecured Debt | | | 11,771,288 | | | 11,771,288 | | | 5.31 | % | | 4.5 | |
| | Premium | | |
38,737 | | |
38,227 | | | | | | | |
| | Discount | | | (21,538 | ) | | (21,538 | ) | | | | | | |
| | | | | | | | | | | | |
Consolidated Mortgages and Other Indebtedness(2) | | $ | 18,042,532 | | $ | 17,766,316 | | | 5.10 | % | | 4.2 | |
| | | | | | | | | | | | |
Joint Venture Indebtedness | | | | | | | | | | | | | |
| | Mortgage Debt | | | | | | | | | | | | | |
| | | Fixed Rate | | $ | 13,692,667 | | $ | 5,293,575 | | | 5.57 | % | | 5.3 | |
| | | Floating Rate Debt (Swapped to Fixed) | | | 450,000 | | | 225,000 | | | 2.50 | % | | 1.6 | |
| | | Floating Rate Debt (Hedged)(1) | | | 733,898 | | | 318,014 | | | 1.83 | % | | 2.2 | |
| | | Floating Rate Debt | | | 1,686,924 | | | 734,707 | | | 1.86 | % | | 5.0 | |
| | | | | | | | | | | | |
| | Total Mortgage Debt | | | 16,563,489 | | | 6,571,296 | | | 4.87 | % | | 4.9 | |
| | Unsecured Fixed Rate Debt | | |
100,000 | | |
50,000 | | |
7.38 |
% | |
27.2 | |
| | Premium | | |
26,805 | | |
12,914 | | | | | | | |
| | Discount | | | (3,592 | ) | | (1,791 | ) | | | | | | |
| | | | | | | | | | | | |
Joint Venture Mortgages and Other Indebtedness | | $ | 16,686,702 | | $ | 6,632,419 | | | 4.89 | % | | 5.1 | |
| | | | | | | | | | | | | |
Our Share of Total Indebtedness | | | | | $ | 24,398,735 | | | 5.06 | % | | 4.5 | |
Summary of our share of Fixed and Variable Rate Debt | | | | | | | | | | | | | |
| | | Consolidated | | | | | | | | | | | | | |
| | | | Fixed | | | 85.3 | % | $ | 15,151,808 | | | 5.76 | % | | 4.5 | |
| | | | Variable | | | 14.7 | % | | 2,614,508 | | | 1.31 | % | | 2.9 | |
| | | | | | | | | | | | |
| | | 100.0 | % | | 17,766,316 | | | 5.10 | % | | 4.2 | |
| | | Joint Venture | | | | | | | | | | | | | |
| | | | Fixed | | | 84.1 | % | | 5,579,698 | | | 5.58 | % | | 5.5 | |
| | | | Variable | | | 15.9 | % | | 1,052,721 | | | 2.00 | % | | 3.7 | |
| | | | | | | | | | | | |
| | | 100.0 | % | $ | 6,632,419 | | | 4.89 | % | | 5.1 | |
| | | | | | | | | | | | |
Total Debt | | | | | $ | 24,398,735 | | | | | | | |
| | | | | | | | | | | | | |
| | | | Total Fixed Debt | | | 85.0 | % | $ | 20,731,506 | | | 5.74 | % | | 4.8 | |
| | | | | | | | | | | | |
| | | | Total Variable Debt | | | 15.0 | % | $ | 3,667,229 | | | 1.66 | % | | 3.1 | |
| | | | | | | | | | | | |
- (1)
- These debt obligations are hedged by interest rate cap agreements.
- (2)
- Amounts give effect to outstanding derivative instruments as footnoted on the Summary of Indebtedness by Maturity.
46
SIMON PROPERTY GROUP
Summary of Indebtedness by Maturity
As of December 31, 2008
(In thousands)
| | | | | | | | | | | | | | | | | | | | | | |
Property Name | |
| | Maturity
Date | | Interest
Rate(1) | | Interest
Rate
Type | | Secured or
Unsecured | | Total
Indebtedness | | Our
Share of
Indebtedness | |
|---|
| Consolidated Indebtedness: | | | | | | | | | | | | | | | | | | | | | |
| |
Woodland Hills Mall |
|
|
|
|
01/01/09 |
|
|
7.00 |
% |
|
Fixed |
|
|
Secured |
|
$ |
78,612 |
|
$ |
74,263 |
|
| | Simon Property Group, LP (Sr. Notes) | | | | | 01/30/09 | | | 3.75 | % | | Fixed | | | Unsecured | | | 300,000 | | | 300,000 | |
| | Simon Property Group, LP (Sr. Notes) | | | | | 02/09/09 | | | 7.13 | % | | Fixed | | | Unsecured | | | 300,000 | | | 300,000 | |
| | Penn Square Mall | | | | | 03/01/09 | | | 7.03 | % | | Fixed | | | Secured | | | 65,828 | | | 62,205 | |
| |
CPG Partners, LP (Sr. Notes) |
|
|
|
|
03/15/09 |
|
|
3.50 |
% |
|
Fixed |
|
|
Unsecured |
|
|
100,000 |
|
|
100,000 |
|
| | Plaza Carolina—Fixed | | | | | 05/09/09 | | | 5.10 | % | | Fixed | | | Secured | | | 89,975 | | | 89,975 | |
| | Plaza Carolina—Variable Capped | | (2) | | | 05/09/09 | | | 1.34 | % | | Variable | | | Secured | | | 91,829 | | | 91,829 | |
| | Plaza Carolina—Variable Floating | | (2) | | | 05/09/09 | | | 1.34 | % | | Variable | | | Secured | | | 55,097 | | | 55,097 | |
| | Simon Property Group, LP (Sr. Notes) | | | | | 07/15/09 | | | 7.00 | % | | Fixed | | | Unsecured | | | 150,000 | | | 150,000 | |
| | CPG Partners, LP (Sr. Notes) | | | | | 08/17/09 | | | 8.63 | % | | Fixed | | | Unsecured | | | 50,000 | | | 50,000 | |
| | Bloomingdale Court | | (7) | | | 11/01/09 | | | 7.78 | % | | Fixed | | | Secured | | | 26,592 | | | 26,592 | |
| | Forest Plaza | | (7) | | | 11/01/09 | | | 7.78 | % | | Fixed | | | Secured | | | 14,585 | | | 14,585 | |
| | Lake View Plaza | | (7) | | | 11/01/09 | | | 7.78 | % | | Fixed | | | Secured | | | 19,388 | | | 19,388 | |
| | Lakeline Plaza | | (7) | | | 11/01/09 | | | 7.78 | % | | Fixed | | | Secured | | | 21,256 | | | 21,256 | |
| | Lincoln Crossing | | (7) | | | 11/01/09 | | | 7.78 | % | | Fixed | | | Secured | | | 2,935 | | | 2,935 | |
| | Matteson Plaza | | (7) | | | 11/01/09 | | | 7.78 | % | | Fixed | | | Secured | | | 8,537 | | | 8,537 | |
| | Muncie Plaza | | (7) | | | 11/01/09 | | | 7.78 | % | | Fixed | | | Secured | | | 7,381 | | | 7,381 | |
| | Regency Plaza | | (7) | | | 11/01/09 | | | 7.78 | % | | Fixed | | | Secured | | | 4,003 | | | 4,003 | |
| | St. Charles Towne Plaza | | (7) | | | 11/01/09 | | | 7.78 | % | | Fixed | | | Secured | | | 25,613 | | | 25,613 | |
| | West Ridge Plaza | | (7) | | | 11/01/09 | | | 7.78 | % | | Fixed | | | Secured | | | 5,158 | | | 5,158 | |
| | White Oaks Plaza | | (7) | | | 11/01/09 | | | 7.78 | % | | Fixed | | | Secured | | | 15,741 | | | 15,741 | |
| |
Simon Property Group, LP (Sr. Notes) |
|
|
|
|
03/18/10 |
|
|
4.88 |
% |
|
Fixed |
|
|
Unsecured |
|
|
300,000 |
|
|
300,000 |
|
| | Simon Property Group, LP (Sr. Notes) | | | | | 06/15/10 | | | 4.60 | % | | Fixed | | | Unsecured | | | 400,000 | | | 400,000 | |
| | Mall of Georgia | | | | | 07/01/10 | | | 7.09 | % | | Fixed | | | Secured | | | 185,238 | | | 185,238 | |
| | University Park Mall | | (2) | | | 07/09/10 | | | 1.29 | % | | Variable | | | Secured | | | 100,000 | | | 100,000 | |
| | SB Trolley Square Holding | | | | | 08/01/10 | | | 9.03 | % | | Fixed | | | Secured | | | 27,803 | | | 27,803 | |
| | Copley Place | | (2) | | | 08/01/10 | | | 1.09 | % | | Variable | | | Secured | | | 200,000 | | | 196,294 | |
| | Simon Property Group, LP (Sr. Notes) | | | | | 08/15/10 | | | 4.88 | % | | Fixed | | | Unsecured | | | 400,000 | | | 400,000 | |
| | Coral Square | | | | | 10/01/10 | | | 8.00 | % | | Fixed | | | Secured | | | 83,134 | | | 80,823 | |
| | Crystal River | | | | | 11/11/10 | | | 7.63 | % | | Fixed | | | Secured | | | 14,916 | | | 14,916 | |
| | Forum Shops at Caesars, The | | | | | 12/01/10 | | | 4.78 | % | | Fixed | | | Secured | | | 524,657 | | | 524,657 | |
| | Port Charlotte Town Center | | | | | 12/11/10 | | | 7.98 | % | | Fixed | | | Secured | | | 50,998 | | | 40,798 | |
| |
Oxford Valley Mall |
|
|
|
|
01/10/11 |
|
|
6.76 |
% |
|
Fixed |
|
|
Secured |
|
|
74,805 |
|
|
48,616 |
|
| | Revolving Credit Facility—USD | | (2) | | | 01/11/11 | | | 0.81 | % | | Variable | | | Unsecured | | | 600,000 | | | 600,000 | |
| | Revolving Credit Facility—Yen Currency | | (2) | | | 01/11/11 | | | 1.07 | % | | Variable | | | Unsecured | (13) | | 243,990 | | | 243,990 | |
| | Revolving Credit Facility—Euro Currency | | (2) | | | 01/11/11 | | | 2.96 | % | | Variable | | | Unsecured | (14) | | 202,298 | | | 202,298 | |
| | Simon Property Group, LP (Sr. Notes) | | | | | 01/20/11 | | | 7.75 | % | | Fixed | | | Unsecured | | | 200,000 | | | 200,000 | |
| | CPG Partners, LP (Sr. Notes) | | | | | 02/01/11 | | | 8.25 | % | | Fixed | | | Unsecured | | | 150,000 | | | 150,000 | |
| | Simon Property Group, LP (Sr. Notes) | | | | | 06/01/11 | | | 5.38 | % | | Fixed | | | Unsecured | | | 500,000 | | | 500,000 | |
| | Henderson Square | | | | | 07/01/11 | | | 6.94 | % | | Fixed | | | Secured | | | 14,616 | | | 11,104 | |
| | Ingram Park Mall | | (6) | | | 08/11/11 | | | 6.99 | % | | Fixed | | | Secured | | | 77,180 | | | 77,180 | |
47
SIMON PROPERTY GROUP
Summary of Indebtedness by Maturity
As of December 31, 2008
(In thousands)
| | | | | | | | | | | | | | | | | | | | | | |
Property Name | |
| | Maturity
Date | | Interest
Rate(1) | | Interest
Rate
Type | | Secured or
Unsecured | | Total
Indebtedness | | Our
Share of
Indebtedness | |
|---|
| | Knoxville Center | | (6) | | | 08/11/11 | | | 6.99 | % | | Fixed | | | Secured | | | 58,446 | | | 58,446 | |
| | Northlake Mall | | (6) | | | 08/11/11 | | | 6.99 | % | | Fixed | | | Secured | | | 67,423 | | | 67,423 | |
| | Towne West Square | | (6) | | | 08/11/11 | | | 6.99 | % | | Fixed | | | Secured | | | 50,520 | | | 50,520 | |
| | Simon Property Group, LP (Sr. Notes) | | | | | 09/01/11 | | | 5.60 | % | | Fixed | | | Unsecured | | | 600,000 | | | 600,000 | |
| | Gateway Shopping Center | | | | | 10/01/11 | | | 5.89 | % | | Fixed | | | Secured | | | 87,000 | | | 87,000 | |
| | Tacoma Mall | | | | | 10/01/11 | | | 7.00 | % | | Fixed | | | Secured | | | 122,687 | | | 122,687 | |
| |
Simon Property Group, LP (Sr. Notes) |
|
|
|
|
03/01/12 |
|
|
5.00 |
% |
|
Fixed |
|
|
Unsecured |
|
|
600,000 |
|
|
600,000 |
|
| | Secured Term Loan | | (2) | | | 03/05/12 | | | 1.14 | % | | Variable | | | Secured | | | 735,000 | | | 735,000 | |
| | Simon Property Group, LP (Sr. Notes) | | | | | 05/01/12 | | | 5.75 | % | | Fixed | | | Unsecured | | | 400,000 | | | 400,000 | |
| | Gwinnett Place | | | | | 06/08/12 | | | 5.68 | % | | Fixed | | | Secured | | | 115,000 | | | 86,250 | |
| | Town Center at Cobb | | | | | 06/08/12 | | | 5.74 | % | | Fixed | | | Secured | | | 280,000 | | | 210,000 | |
| | CPG Partners, LP (Sr. Notes) | | | | | 06/15/12 | | | 6.88 | % | | Fixed | | | Unsecured | | | 100,000 | | | 100,000 | |
| | Simon Property Group, LP (Sr. Notes) | | | | | 08/28/12 | | | 6.35 | % | | Fixed | | | Unsecured | | | 350,000 | | | 350,000 | |
| | Anderson Mall | | | | | 10/10/12 | | | 6.20 | % | | Fixed | | | Secured | | | 27,755 | | | 27,755 | |
| | Century III Mall | | (4) | | | 10/10/12 | | | 6.20 | % | | Fixed | | | Secured | | | 81,930 | | | 81,930 | |
| | Crossroads Mall | | | | | 10/10/12 | | | 6.20 | % | | Fixed | | | Secured | | | 41,150 | | | 41,150 | |
| | Forest Mall | | (5) | | | 10/10/12 | | | 6.20 | % | | Fixed | | | Secured | | | 16,478 | | | 16,478 | |
| | Highland Lakes Center | | (4) | | | 10/10/12 | | | 6.20 | % | | Fixed | | | Secured | | | 15,189 | | | 15,189 | |
| | Longview Mall | | (4) | | | 10/10/12 | | | 6.20 | % | | Fixed | | | Secured | | | 30,839 | | | 30,839 | |
| | Markland Mall | | (5) | | | 10/10/12 | | | 6.20 | % | | Fixed | | | Secured | | | 21,818 | | | 21,818 | |
| | Midland Park Mall | | (5) | | | 10/10/12 | | | 6.20 | % | | Fixed | | | Secured | | | 31,852 | | | 31,852 | |
| | Palm Beach Mall | | | | | 10/10/12 | | | 6.20 | % | | Fixed | | | Secured | | | 50,953 | | | 50,953 | |
| | Richmond Towne Square | | (5) | | | 10/10/12 | | | 6.20 | % | | Fixed | | | Secured | | | 44,739 | | | 44,739 | |
| | CPG Partners, LP (Sr. Notes) | | | | | 01/15/13 | | | 6.00 | % | | Fixed | | | Unsecured | | | 150,000 | | | 150,000 | |
| | Factory Stores of America—Boaz | | (9) | | | 03/10/13 | | | 9.10 | % | | Fixed | | | Secured | | | 2,678 | | | 2,678 | |
| | The Factory Shoppes at Branson Meadows | | (9) | | | 03/10/13 | | | 9.10 | % | | Fixed | | | Secured | | | 9,160 | | | 9,160 | |
| | MacGregor Village | | (9) | | | 03/10/13 | | | 9.10 | % | | Fixed | | | Secured | | | 6,596 | | | 6,596 | |
| | Factory Stores of America—Georgetown | | (9) | | | 03/10/13 | | | 9.10 | % | | Fixed | | | Secured | | | 6,349 | | | 6,349 | |
| | Factory Stores of America—Graceville | | (9) | | | 03/10/13 | | | 9.10 | % | | Fixed | | | Secured | | | 1,886 | | | 1,886 | |
| | Dare Centre | | (9) | | | 03/10/13 | | | 9.10 | % | | Fixed | | | Secured | | | 1,640 | | | 1,640 | |
| | Factory Stores of America—Lebanon | | (9) | | | 03/10/13 | | | 9.10 | % | | Fixed | | | Secured | | | 1,586 | | | 1,586 | |
| | Factory Stores of America—Nebraska City | | (9) | | | 03/10/13 | | | 9.10 | % | | Fixed | | | Secured | | | 1,488 | | | 1,488 | |
| | North Ridge Shopping Center | | (9) | | | 03/10/13 | | | 9.10 | % | | Fixed | | | Secured | | | 8,056 | | | 8,056 | |
| | Factory Stores of America—Story City | | (9) | | | 03/10/13 | | | 9.10 | % | | Fixed | | | Secured | | | 1,841 | | | 1,841 | |
| | Carolina Premium Outlets—Smithfield | | (9) | | | 03/10/13 | | | 9.10 | % | | Fixed | | | Secured | | | 19,696 | | | 19,696 | |
| | The Crossings Premium Outlets | | | | | 03/13/13 | | | 5.85 | % | | Fixed | | | Secured | | | 53,992 | | | 53,992 | |
| | Simon Property Group, LP (Sr. Notes) | | | | | 03/15/13 | | | 5.45 | % | | Fixed | | | Unsecured | | | 200,000 | | | 200,000 | |
| | Simon Property Group, LP (Sr. Notes) | | | | | 05/30/13 | | | 5.30 | % | | Fixed | | | Unsecured | | | 700,000 | | | 700,000 | |
| | Stanford Shopping Center | | (2) | | | 07/01/13 | | | 2.59 | % | | Variable | | | Secured | | | 240,000 | | | 240,000 | |
| | Battlefield Mall | | | | | 07/01/13 | | | 4.60 | % | | Fixed | | | Secured | | | 94,530 | | | 94,530 | |
| | Kittery Premium Outlets | | (2)(8) | | | 07/10/13 | (16) | | 5.39 | % | | Fixed | | | Secured | | | 43,556 | | | 43,556 | |
| | Lighthouse Place Premium Outlets | | (2)(8) | | | 07/10/13 | (16) | | 5.39 | % | | Fixed | | | Secured | | | 88,623 | | | 88,623 | |
| | Waterloo Premium Outlets | | (2)(8) | | | 07/10/13 | (16) | | 5.39 | % | | Fixed | | | Secured | | | 72,822 | | | 72,822 | |
48
SIMON PROPERTY GROUP
Summary of Indebtedness by Maturity
As of December 31, 2008
(In thousands)
| | | | | | | | | | | | | | | | | | | | | | |
Property Name | |
| | Maturity
Date | | Interest
Rate(1) | | Interest
Rate
Type | | Secured or
Unsecured | | Total
Indebtedness | | Our
Share of
Indebtedness | |
|---|
| | Retail Property Trust (Sr. Notes) | | | | | 09/01/13 | | | 7.18 | % | | Fixed | | | Unsecured | | | 75,000 | | | 75,000 | |
| | Texas Lifestyle Center
Secured Loan | | (2) | | | 09/23/13 | | | 2.39 | % | | Variable | | | Secured | | | 260,000 | | | 260,000 | |
| |
Simon Property Group, LP (Sr. Notes) |
|
|
|
|
01/30/14 |
|
|
4.90 |
% |
|
Fixed |
|
|
Unsecured |
|
|
200,000 |
|
|
200,000 |
|
| | Northfield Square | | | | | 02/11/14 | | | 6.05 | % | | Fixed | | | Secured | | | 29,067 | | | 9,185 | |
| | Montgomery Mall | | | | | 05/11/14 | | | 5.17 | % | | Fixed | | | Secured | | | 89,460 | | | 53,676 | |
| | SB Boardman Plaza Holdings | | | | | 07/01/14 | | | 5.94 | % | | Fixed | | | Secured | | | 23,213 | | | 23,213 | |
| | Desoto Square | | | | | 07/01/14 | | | 5.89 | % | | Fixed | | | Secured | | | 64,153 | | | 64,153 | |
| | Upper Valley Mall | | | | | 07/01/14 | | | 5.89 | % | | Fixed | | | Secured | | | 47,904 | | | 47,904 | |
| | Washington Square | | | | | 07/01/14 | | | 5.94 | % | | Fixed | | | Secured | | | 30,194 | | | 30,194 | |
| | West Ridge Mall | | | | | 07/01/14 | | | 5.89 | % | | Fixed | | | Secured | | | 68,711 | | | 68,711 | |
| | Philadelphia Premium Outlets | | (2) | | | 07/30/14 | | | 2.29 | % | | Variable | | | Secured | | | 190,000 | | | 190,000 | |
| | Chesapeake Square | | | | | 08/01/14 | | | 5.84 | % | | Fixed | | | Secured | | | 70,841 | | | 53,131 | |
| | Brunswick Square | | | | | 08/11/14 | | | 5.65 | % | | Fixed | | | Secured | | | 83,452 | | | 83,452 | |
| | Simon Property Group, LP (Sr. Notes) | | | | | 08/15/14 | | | 5.63 | % | | Fixed | | | Unsecured | | | 500,000 | | | 500,000 | |
| |
DeKalb Plaza |
|
|
|
|
01/01/15 |
|
|
5.28 |
% |
|
Fixed |
|
|
Secured |
|
|
3,071 |
|
|
1,546 |
|
| | Simon Property Group, LP (Sr. Notes) | | | | | 06/15/15 | | | 5.10 | % | | Fixed | | | Unsecured | | | 600,000 | | | 600,000 | |
| | Simon Property Group, LP (Sr. Notes) | | | | | 12/01/15 | | | 5.75 | % | | Fixed | | | Unsecured | | | 600,000 | | | 600,000 | |
| |
Retail Property Trust (Sr. Notes) |
|
|
|
|
03/15/16 |
|
|
7.88 |
% |
|
Fixed |
|
|
Unsecured |
|
|
250,000 |
|
|
250,000 |
|
| | Simon Property Group, LP (Sr. Notes) | | | | | 05/01/16 | | | 6.10 | % | | Fixed | | | Unsecured | | | 400,000 | | | 400,000 | |
| | Arsenal Mall HCHP Office | | | | | 05/05/16 | | | 8.20 | % | | Fixed | | | Secured | | | 1,090 | | | 1,090 | |
| | Las Americas Premium Outlets | | | | | 06/11/16 | | | 5.84 | % | | Fixed | | | Secured | | | 180,000 | | | 180,000 | |
| | White Oaks Mall | | | | | 11/01/16 | | | 5.54 | % | | Fixed | | | Secured | | | 50,000 | | | 40,339 | |
| | Simon Property Group, LP (Sr. Notes) | | | | | 12/01/16 | | | 5.25 | % | | Fixed | | | Unsecured | | | 650,000 | | | 650,000 | |
| |
Simon Property Group, LP (Sr. Notes) |
|
|
|
|
03/01/17 |
|
|
5.88 |
% |
|
Fixed |
|
|
Unsecured |
|
|
500,000 |
|
|
500,000 |
|
| | Wolfchase Galleria | | | | | 04/01/17 | | | 5.64 | % | | Fixed | | | Secured | | | 225,000 | | | 212,616 | |
| | Valle Vista Mall | | | | | 05/10/17 | | | 5.35 | % | | Fixed | | | Secured | | | 40,000 | | | 40,000 | |
| | Summit Mall | | | | | 06/10/17 | | | 5.42 | % | | Fixed | | | Secured | | | 65,000 | | | 65,000 | |
| | Independence Center | | | | | 07/10/17 | | | 5.94 | % | | Fixed | | | Secured | | | 200,000 | | | 200,000 | |
| | Bangor Mall | | | | | 10/01/17 | | | 6.15 | % | | Fixed | | | Secured | | | 80,000 | | | 53,880 | |
| |
Simon Property Group, LP (Sr. Notes) |
|
|
|
|
05/30/18 |
|
|
6.13 |
% |
|
Fixed |
|
|
Unsecured |
|
|
800,000 |
|
|
800,000 |
|
| | Simon Property Group, LP (Sr. Notes) | | | | | 06/15/18 | | | 7.38 | % | | Fixed | | | Unsecured | | | 200,000 | | | 200,000 | |
| |
Sunland Park Mall |
|
|
|
|
01/01/26 |
|
|
8.63 |
% |
|
Fixed |
|
|
Secured |
|
|
33,734 |
|
|
33,734 |
|
| | | | | | | | | | | | | | | | | | | | |
| |
Total Consolidated Indebtedness at Face Value |
|
|
|
|
|
|
|
|
|
|
|
|
|
|
|
$ |
18,025,333 |
|
$ |
17,749,627 |
|
| | | | | | | | | | | | | | | | | | | | |
| | Premium on Fixed-Rate Indebtedness | | | | | | | | | | | | | | | | | 38,737 | | | 38,227 | |
| |
Discount on Fixed-Rate Indebtedness |
|
|
|
|
|
|
|
|
|
|
|
|
|
|
|
|
(21,538 |
) |
|
(21,538 |
) |
| | | | | | | | | | | | | | | | | | | | |
| | Total Consolidated Indebtedness | | | | | | | | | | | | | | | | $ | 18,042,532 | | $ | 17,766,316 | |
| | | | | | | | | | | | | | | | | | | | |
49
SIMON PROPERTY GROUP
Summary of Indebtedness by Maturity
As of December 31, 2008
(In thousands)
| | | | | | | | | | | | | | | | | | | | | | |
Property Name | |
| | Maturity
Date | | Interest
Rate(1) | | Interest
Rate
Type | | Secured or
Unsecured | | Total
Indebtedness | | Our
Share of
Indebtedness | |
|---|
| Joint Venture Indebtedness | | | | | | | | | | | | | | | | | | | | | |
| |
Source, The |
|
|
|
|
03/11/09 |
|
|
6.65 |
% |
|
Fixed |
|
|
Secured |
|
$ |
124,000 |
|
$ |
31,000 |
|
| | Shops at Sunset Place, The | | (2) | | | 05/09/09 | | | 1.19 | % | | Variable | | | Secured | | | 83,897 | | | 31,461 | |
| | Seminole Towne Center | | (2) | | | 07/09/09 | | | 1.09 | % | | Variable | | | Secured | | | 70,000 | | | 31,500 | |
| | Fashion Centre Pentagon Office | | (2) | | | 07/09/09 | | | 1.19 | % | | Variable | | | Secured | | | 40,000 | | | 17,000 | |
| | Briarwood Mall—2 | | | | | 09/01/09 | | | 5.47 | % | | Fixed | | | Secured | | | 530 | | | 133 | |
| | Apple Blossom Mall | | | | | 09/10/09 | | | 7.99 | % | | Fixed | | | Secured | | | 37,123 | | | 18,241 | |
| | Auburn Mall | | | | | 09/10/09 | | | 7.99 | % | | Fixed | | | Secured | | | 43,462 | | | 21,356 | |
| | Toki Premium Outlets—Variable | | | | | 10/30/09 | | | 1.44 | % | | Variable | | | Secured | (12) | | 10,697 | | | 4,279 | |
| | Falls, The | | | | | 11/01/09 | | | 4.34 | % | | Fixed | | | Secured | | | 148,200 | | | 37,050 | |
| | Stoneridge Shopping Center | | (16) | | | 11/01/09 | | | 4.63 | % | | Fixed | | | Secured | | | 293,800 | | | 73,450 | |
| | Briarwood Mall—1 | | | | | 11/01/09 | | | 4.45 | % | | Fixed | | | Secured | | | 192,402 | | | 48,101 | |
| | Meadowood Mall | | (2)(16) | | | 11/09/09 | | | 5.13 | % | | Fixed | | | Secured | | | 182,000 | | | 45,500 | |
| | Colorado Mills | | (2)(16) | | | 11/12/09 | | | 6.12 | % | | Fixed | | | Secured | | | 170,000 | | | 33,057 | |
| |
Mall at Chestnut Hill |
|
|
|
|
02/01/10 |
|
|
8.45 |
% |
|
Fixed |
|
|
Secured |
|
|
13,742 |
|
|
6,489 |
|
| | Southdale Center | | | | | 04/01/10 | | | 5.18 | % | | Fixed | | | Secured | | | 186,550 | | | 93,275 | |
| | Cobblestone Court | | | | | 04/16/10 | | | 1.44 | % | | Variable | | | Secured | | | 2,669 | | | 1,335 | |
| | Westchester, The | | | | | 06/01/10 | | | 4.86 | % | | Fixed | | | Secured | | | 500,000 | | | 200,000 | |
| | Lakeforest Mall | | | | | 07/08/10 | | | 4.90 | % | | Fixed | | | Secured | | | 141,050 | | | 35,263 | |
| | Coddingtown Mall | | | | | 07/14/10 | | | 1.59 | % | | Variable | | | Secured | | | 15,500 | | | 15,500 | |
| | Lehigh Valley Mall | | (2) | | | 08/09/10 | | | 1.00 | % | | Variable | | | Secured | | | 150,000 | | | 56,415 | |
| | Arizona Mills | | | | | 10/05/10 | | | 7.90 | % | | Fixed | | | Secured | | | 134,138 | | | 33,535 | |
| | Net Leases I | | | | | 10/10/10 | | | 7.96 | % | | Fixed | | | Secured | | | 26,501 | | | 13,250 | |
| | Springfield Mall | | (2) | | | 12/01/10 | | | 1.54 | % | | Variable | | | Secured | | | 72,300 | | | 27,467 | |
| | Florida Mall, The | | | | | 12/10/10 | | | 7.55 | % | | Fixed | | | Secured | | | 247,073 | | | 123,537 | |
| | Galleria Commerciali Italia—Catania | | | | | 12/17/10 | | | 3.63 | % | | Variable | | | Secured | (10) | | 37,961 | | | 18,601 | |
| | SouthPark Residential | | (2) | | | 12/31/10 | | | 1.84 | % | | Variable | | | Secured | | | 41,568 | | | 16,627 | |
| |
Atrium at Chestnut Hill |
|
|
|
|
03/11/11 |
|
|
6.89 |
% |
|
Fixed |
|
|
Secured |
|
|
44,610 |
|
|
21,920 |
|
| | Cape Cod Mall | | | | | 03/11/11 | | | 6.80 | % | | Fixed | | | Secured | | | 90,597 | | | 44,517 | |
| | Bay 1 (Torcy) | | | | | 05/31/11 | | | 3.59 | % | | Fixed | | | Secured | (11) | | 19,832 | | | 9,916 | |
| | Firewheel Residential | | (2) | | | 06/20/11 | | | 2.29 | % | | Variable | | | Secured | | | 22,985 | | | 11,493 | |
| | Bay 2 (Torcy) | | | | | 06/30/11 | | | 3.59 | % | | Fixed | | | Secured | (11) | | 73,987 | | | 36,993 | |
| | Highland Mall | | | | | 07/10/11 | | | 6.83 | % | | Fixed | | | Secured | | | 64,821 | | | 32,411 | |
| | Villabe A6—Bel'Est | | | | | 08/31/11 | | | 3.89 | % | | Fixed | | | Secured | (11) | | 12,363 | | | 6,182 | |
| | Wilenska Station Shopping Center | | | | | 08/31/11 | | | 4.29 | % | | Fixed | | | Secured | (11) | | 42,199 | | | 21,100 | |
| | Hyatt Coconut | | (2) | | | 09/09/11 | | | 2.06 | % | | Variable | | | Secured | | | 8,530 | | | 4,265 | |
| | Fashion Centre Pentagon Retail | | | | | 09/11/11 | | | 6.63 | % | | Fixed | | | Secured | | | 152,042 | | | 64,618 | |
| | Denver West Village | | | | | 10/01/11 | | | 8.15 | % | | Fixed | | | Secured | | | 22,184 | | | 4,160 | |
| | Toki Premium Outlets—Fixed | | | | | 10/31/11 | | | 1.80 | % | | Fixed | | | Secured | (12) | | 10,587 | | | 4,235 | |
| | Domain Residential Building P | | (2) | | | 11/07/11 | | | 2.44 | % | | Variable | | | Secured | | | 1,193 | | | 597 | |
| | Shops at Riverside, The | | (2) | | | 11/14/11 | | | 1.24 | % | | Variable | | | Secured | | | 150,000 | | | 75,000 | |
50
SIMON PROPERTY GROUP
Summary of Indebtedness by Maturity
As of December 31, 2008
(In thousands)
| | | | | | | | | | | | | | | | | | | | | | |
Property Name | |
| | Maturity
Date | | Interest
Rate(1) | | Interest
Rate
Type | | Secured or
Unsecured | | Total
Indebtedness | | Our
Share of
Indebtedness | |
|---|
| | Discover Mills—1 | | | | | 12/11/11 | | | 7.32 | % | | Fixed | | | Secured | | | 23,700 | | | 1,684 | |
| | Discover Mills—2 | | | | | 12/11/11 | | | 6.08 | % | | Fixed | | | Secured | | | 135,000 | | | 9,592 | |
| | Galleria Commerciali Italia—Facility A | | (2) | | | 12/22/11 | | | 3.94 | % | | Fixed | | | Secured | (10) | | 335,967 | | | 164,624 | |
| | Galleria Commerciali Italia—Facility B | | | | | 12/22/11 | | | 4.04 | % | | Fixed | | | Secured | (10) | | 332,513 | | | 162,931 | |
| |
St. Louis Mills |
|
|
|
|
01/08/12 |
|
|
6.39 |
% |
|
Fixed |
|
|
Secured |
|
|
90,000 |
|
|
26,829 |
|
| | Kobe Premium Outlets | | | | | 01/31/12 | | | 1.42 | % | | Fixed | | | Secured | (12) | | 20,721 | | | 8,288 | |
| | Tosu Premium Outlets—Variable | | | | | 01/31/12 | | | 1.85 | % | | Variable | | | Secured | (12) | | 11,910 | | | 4,764 | |
| | Dover Mall & Commons | | (2)(3) | | | 02/01/12 | | | 2.39 | % | | Variable | | | Secured | | | 83,756 | | | 28,515 | |
| | Esplanade, The | | (2)(3) | | | 02/01/12 | | | 2.39 | % | | Variable | | | Secured | | | 75,136 | | | 37,568 | |
| | Galleria at White Plains | | (2)(3) | | | 02/01/12 | | | 2.39 | % | | Variable | | | Secured | | | 125,566 | | | 62,783 | |
| | Northpark Mall—Mills | | (2)(3) | | | 02/01/12 | | | 2.39 | % | | Variable | | | Secured | | | 105,543 | | | 52,772 | |
| | Dadeland Mall | | | | | 02/11/12 | | | 6.75 | % | | Fixed | | | Secured | | | 183,700 | | | 91,850 | |
| | Square One | | | | | 03/11/12 | | | 6.73 | % | | Fixed | | | Secured | | | 87,416 | | | 42,954 | |
| | Southridge Mall | | | | | 04/01/12 | | | 5.23 | % | | Fixed | | | Secured | | | 124,000 | | | 62,000 | |
| | Hamilton Town Center | | (2) | | | 05/29/12 | | | 2.04 | % | | Variable | | | Secured | | | 93,314 | | | 46,657 | |
| | Arkadia Shopping Center | | | | | 05/31/12 | | | 3.84 | % | | Fixed | | | Secured | (11) | | 144,208 | | | 72,104 | |
| | Arkadia Shopping Center—2 | | | | | 05/31/12 | | | 4.69 | % | | Fixed | | | Secured | (11) | | 168,741 | | | 84,371 | |
| | Gotemba Premium Outlets—Variable | | | | | 05/31/12 | | | 1.19 | % | | Variable | | | Secured | (12) | | 9,352 | | | 3,741 | |
| | Mills Senior Loan Facility | | (2) | | | 06/07/12 | | | 1.69 | % | | Variable | | | Secured | | | 711,000 | | | 355,500 | |
| | Marley Station | | | | | 07/01/12 | | | 4.89 | % | | Fixed | | | Secured | | | 114,400 | | | 28,600 | |
| | Hilltop Mall | | | | | 07/08/12 | | | 4.99 | % | | Fixed | | | Secured | | | 64,350 | | | 16,088 | |
| | Crystal Mall | | | | | 09/11/12 | | | 5.62 | % | | Fixed | | | Secured | | | 96,461 | | | 71,930 | |
| | Concord Mills Mall | | | | | 12/07/12 | | | 6.13 | % | | Fixed | | | Secured | | | 166,903 | | | 32,963 | |
| |
Katy Mills |
|
|
|
|
01/09/13 |
|
|
6.69 |
% |
|
Fixed |
|
|
Secured |
|
|
145,971 |
|
|
18,246 |
|
| | Del Amo | | (2) | | | 01/23/13 | | | 1.94 | % | | Variable | | | Secured | | | 335,000 | | | 83,750 | |
| | Emerald Square Mall | | | | | 03/01/13 | | | 5.13 | % | | Fixed | | | Secured | | | 132,124 | | | 64,922 | |
| | Avenues, The | | | | | 04/01/13 | | | 5.29 | % | | Fixed | | | Secured | | | 72,796 | | | 18,199 | |
| | Circle Centre Mall | | | | | 04/11/13 | | | 5.02 | % | | Fixed | | | Secured | | | 72,869 | | | 10,690 | |
| | Domain Residential Phase II | | (2) | | | 07/22/13 | | | 2.44 | % | | Variable | | | Secured | | | 4,001 | | | 2,001 | |
| | Solomon Pond | | | | | 08/01/13 | | | 3.97 | % | | Fixed | | | Secured | | | 109,329 | | | 53,722 | |
| | Tosu Premium Outlets—Fixed | | | | | 08/24/13 | | | 1.50 | % | | Fixed | | | Secured | (12) | | 9,802 | | | 3,921 | |
| | Miami International Mall | | | | | 10/01/13 | | | 5.35 | % | | Fixed | | | Secured | | | 94,554 | | | 45,174 | |
| | Fashion Valley Mall | | | | | 10/09/13 | | | 2.44 | % | | Variable | | | Secured | | | 200,000 | | | 100,000 | |
| | Liberty Tree Mall | | | | | 10/11/13 | | | 5.22 | % | | Fixed | | | Secured | | | 35,000 | | | 17,198 | |
| | Galleria Commerciali Italia—Giugliano A | | | | | 10/20/13 | | | 3.69 | % | | Variable | | | Secured | (10) | | 36,968 | | | 18,114 | |
| | Galleria Commerciali Italia—Giugliano B | | | | | 10/20/13 | | | 3.69 | % | | Variable | | | Secured | (10) | | 38,062 | | | 18,650 | |
| | Galleria Commerciali Italia—Giugliano C | | | | | 10/20/13 | | | 4.09 | % | | Variable | | | Secured | (10) | | 16,071 | | | 7,875 | |
| | Mall at Tuttle Crossing | | | | | 11/05/13 | | | 5.05 | % | | Fixed | | | Secured | | | 116,434 | | | 29,109 | |
| | Ontario Mills | | (2)(16) | | | 12/05/13 | | | 5.13 | % | | Fixed | | | Secured | | | 75,000 | | | 18,750 | |
| |
Arundel Marketplace |
|
|
|
|
01/01/14 |
|
|
5.92 |
% |
|
Fixed |
|
|
Secured |
|
|
11,588 |
|
|
2,289 |
|
| | Concord Marketplace | | | | | 02/01/14 | | | 5.76 | % | | Fixed | | | Secured | | | 13,499 | | | 6,750 | |
| | Northshore Mall | | | | | 03/11/14 | | | 5.03 | % | | Fixed | | | Secured | | | 204,832 | | | 100,649 | |
| | Sawgrass Mills | | | | | 07/01/14 | | | 5.82 | % | | Fixed | | | Secured | | | 820,000 | | | 410,000 | |
| | Arundel Mills | | | | | 08/01/14 | | | 6.14 | % | | Fixed | | | Secured | | | 385,000 | | | 114,056 | |
51
SIMON PROPERTY GROUP
Summary of Indebtedness by Maturity
As of December 31, 2008
(In thousands)
| | | | | | | | | | | | | | | | | | | | | | |
Property Name | |
| | Maturity
Date | | Interest
Rate(1) | | Interest
Rate
Type | | Secured or
Unsecured | | Total
Indebtedness | | Our
Share of
Indebtedness | |
|---|
| | Grapevine Mills | | (2)(16) | | | 09/22/14 | | | 6.26 | % | | Fixed | | | Secured | | | 300,000 | | | 88,890 | |
| | Block at Orange | | | | | 10/01/14 | | | 6.25 | % | | Fixed | | | Secured | | | 220,000 | | | 55,000 | |
| | Opry Mills | | | | | 10/10/14 | | | 6.16 | % | | Fixed | | | Secured | | | 280,000 | | | 68,600 | |
| | Gotemba Premium Outlets—Fixed | | | | | 10/25/14 | | | 1.54 | % | | Fixed | | | Secured | (12) | | 81,874 | | | 32,750 | |
| | Indian River Commons | | | | | 11/01/14 | | | 5.21 | % | | Fixed | | | Secured | | | 9,645 | | | 4,823 | |
| | Indian River Mall | | | | | 11/01/14 | | | 5.21 | % | | Fixed | | | Secured | | | 65,355 | | | 32,678 | |
| | Rinku Premium Outlets | | | | | 11/25/14 | | | 1.84 | % | | Fixed | | | Secured | (12) | | 38,752 | | | 15,501 | |
| |
St. Johns Town Center |
|
|
|
|
03/11/15 |
|
|
5.06 |
% |
|
Fixed |
|
|
Secured |
|
|
170,000 |
|
|
85,000 |
|
| | Galleria Commerciali Italia—Cinisello | | | | | 03/31/15 | | | 3.64 | % | | Variable | | | Secured | (10) | | 181,710 | | | 89,038 | |
| | St. John's Town Center Phase II | | (2)(16) | | | 05/10/15 | | | 5.50 | % | | Fixed | | | Secured | | | 77,500 | | | 38,750 | |
| | Gaitway Plaza | | | | | 07/01/15 | | | 4.60 | % | | Fixed | | | Secured | | | 13,900 | | | 3,243 | |
| | Plaza at Buckland Hills, The | | | | | 07/01/15 | | | 4.60 | % | | Fixed | | | Secured | | | 24,800 | | | 8,680 | |
| | Ridgewood Court | | | | | 07/01/15 | | | 4.60 | % | | Fixed | | | Secured | | | 14,650 | | | 5,128 | |
| | Village Park Plaza | | | | | 07/01/15 | | | 4.60 | % | | Fixed | | | Secured | | | 29,850 | | | 10,448 | |
| | West Town Corners | | | | | 07/01/15 | | | 4.60 | % | | Fixed | | | Secured | | | 18,800 | | | 4,388 | |
| | Great Mall of the Bay Area | | (2) | | | 08/28/15 | | | 6.01 | % | | Fixed | | | Secured | | | 270,000 | | | 66,150 | |
| | Clay Terrace | | | | | 10/01/15 | | | 5.08 | % | | Fixed | | | Secured | | | 115,000 | | | 57,500 | |
| | Mall of New Hampshire | | | | | 10/05/15 | | | 6.23 | % | | Fixed | | | Secured | | | 136,439 | | | 67,043 | |
| | Houston Galleria—1 | | | | | 12/01/15 | | | 5.44 | % | | Fixed | | | Secured | | | 643,583 | | | 202,632 | |
| | Houston Galleria—2 | | | | | 12/01/15 | | | 5.44 | % | | Fixed | | | Secured | | | 177,417 | | | 55,860 | |
| |
Smith Haven Mall |
|
|
|
|
03/01/16 |
|
|
5.16 |
% |
|
Fixed |
|
|
Secured |
|
|
180,000 |
|
|
45,000 |
|
| | Quaker Bridge Mall | | | | | 04/01/16 | | | 7.03 | % | | Fixed | | | Secured | | | 19,814 | | | 7,527 | |
| | Eastland Mall | | | | | 06/01/16 | | | 5.79 | % | | Fixed | | | Secured | | | 168,000 | | | 84,000 | |
| | Empire Mall | | | | | 06/01/16 | | | 5.79 | % | | Fixed | | | Secured | | | 176,300 | | | 88,150 | |
| | Granite Run Mall | | | | | 06/01/16 | | | 5.83 | % | | Fixed | | | Secured | | | 118,250 | | | 59,125 | |
| | Mesa Mall | | | | | 06/01/16 | | | 5.79 | % | | Fixed | | | Secured | | | 87,250 | | | 43,625 | |
| | Rushmore Mall | | | | | 06/01/16 | | | 5.79 | % | | Fixed | | | Secured | | | 94,000 | | | 47,000 | |
| | Southern Hills Mall | | | | | 06/01/16 | | | 5.79 | % | | Fixed | | | Secured | | | 101,500 | | | 50,750 | |
| | Valley Mall | | | | | 06/01/16 | | | 5.83 | % | | Fixed | | | Secured | | | 45,994 | | | 22,997 | |
| | Greendale Mall | | | | | 10/01/16 | | | 6.00 | % | | Fixed | | | Secured | | | 45,000 | | | 22,112 | |
| | Coconut Point | | | | | 12/10/16 | | | 5.83 | % | | Fixed | | | Secured | | | 230,000 | | | 115,000 | |
| |
King of Prussia Mall—1 |
|
|
|
|
01/01/17 |
|
|
7.49 |
% |
|
Fixed |
|
|
Secured |
|
|
140,179 |
|
|
17,312 |
|
| | King of Prussia Mall—2 | | | | | 01/01/17 | | | 8.53 | % | | Fixed | | | Secured | | | 9,818 | | | 1,213 | |
| | Mall at Rockingham | | | | | 03/10/17 | | | 5.61 | % | | Fixed | | | Secured | | | 260,000 | | | 63,879 | |
| | Liberty Plaza | | | | | 06/01/17 | | | 5.68 | % | | Fixed | | | Secured | | | 43,000 | | | 21,500 | |
| | Franklin Mills | | | | | 06/01/17 | | | 5.65 | % | | Fixed | | | Secured | | | 290,000 | | | 145,000 | |
| | Gurnee Mills | | | | | 07/01/17 | | | 5.77 | % | | Fixed | | | Secured | | | 321,000 | | | 160,500 | |
| | Potomac Mills | | | | | 07/11/17 | | | 5.83 | % | | Fixed | | | Secured | | | 410,000 | | | 205,000 | |
| | West Town Mall | | | | | 12/01/17 | | | 6.34 | % | | Fixed | | | Secured | | | 210,000 | | | 105,000 | |
| | Changshu SZITIC | | | | | 12/01/17 | | | 6.73 | % | | Fixed | | | Secured | (15) | | 45,477 | | | 14,780 | |
| | Aventura Mall | | | | | 12/11/17 | | | 5.91 | % | | Fixed | | | Secured | | | 430,000 | | | 143,333 | |
52
SIMON PROPERTY GROUP
Summary of Indebtedness by Maturity
As of December 31, 2008
(In thousands)
| | | | | | | | | | | | | | | | | | | | | | |
Property Name | |
| | Maturity
Date | | Interest
Rate(1) | | Interest
Rate
Type | | Secured or
Unsecured | | Total
Indebtedness | | Our
Share of
Indebtedness | |
|---|
| | Sano Premium Outlets | | | | | 05/31/18 | | | 1.08 | % | | Variable | | | Secured | (12) | | 61,144 | | | 24,458 | |
| | Zhengzhou | | | | | 09/01/18 | | | 8.61 | % | | Fixed | | | Secured | (15) | | 42,543 | | | 13,826 | |
| | Hangzhou | | | | | 10/01/18 | | | 8.61 | % | | Fixed | | | Secured | (15) | | 36,675 | | | 11,919 | |
| | Sendai Premium Outlets | | | | | 10/31/18 | | | 1.04 | % | | Variable | | | Secured | (12) | | 41,906 | | | 16,762 | |
| | Whitehall Mall | | | | | 11/01/18 | | | 7.00 | % | | Fixed | | | Secured | | | 12,325 | | | 4,682 | |
| |
Suzhou |
|
|
|
|
01/01/21 |
|
|
8.38 |
% |
|
Fixed |
|
|
Secured |
(15) |
|
73,350 |
|
|
23,839 |
|
| |
Net Leases II |
|
|
|
|
01/10/23 |
|
|
9.35 |
% |
|
Fixed |
|
|
Secured |
|
|
20,873 |
|
|
10,436 |
|
| | AMI Premium Outlets—Fixed | | | | | 09/25/23 | | | 2.22 | % | | Fixed | | | Secured | (12) | | 33,083 | | | 13,234 | |
| | AMI Premium Outlets—Variable | | | | | 09/25/23 | | | 1.04 | % | | Variable | | | Secured | (12) | | 33,083 | | | 13,233 | |
| |
TMLP Trust Preferred Unsecured Securities |
|
|
|
|
03/30/36 |
|
|
7.38 |
% |
|
Fixed |
|
|
Unsecured |
|
|
100,000 |
|
|
50,000 |
|
| | | | | | | | | | | | | | | | | | | | |
| |
Total Joint Venture Indebtedness at Face Value |
|
|
|
|
|
|
|
|
|
|
|
|
|
|
|
$ |
16,663,489 |
|
$ |
6,621,296 |
|
| | | | | | | | | | | | | | | | | | | | |
| | Premium on JV Fixed-Rate Indebtedness | | | | | | | | | | | | | | | | | 26,805 | | | 12,914 | |
| | Discount on JV Fixed-Rate Indebtedness | | | | | | | | | | | | | | | | | (3,592 | ) | | (1,791 | ) |
| | | | | | | | | | | | | | | | | | | | |
| | Total Joint Venture Indebtedness | | | | | | | | | | | | | | | | $ | 16,686,702 | | $ | 6,632,419 | (17) |
| | | | | | | | | | | | | | | | | | | | |
| |
Our Share of Total Indebtedness |
|
|
|
|
|
|
|
|
|
|
|
|
|
|
|
|
|
|
$ |
24,398,735 |
|
| | | | | | | | | | | | | | | | | | | | | |
Footnotes:
- (1)
- Variable rate debt interest rates are based on the following base rates as of December 31, 2008: LIBOR at .44%; EURIBOR at 2.59%; YEN LIBOR at .69%; and PRIME at 3.25%.
- (2)
- Includes applicable extensions available at our option.
- (3)
- These four properties are secured by cross-collateralized and cross-defaulted mortgages.
- (4)
- These three properties are secured by cross-collateralized and cross-defaulted mortgages.
- (5)
- These four properties are secured by cross-collateralized and cross-defaulted mortgages.
- (6)
- These four properties are secured by cross-collateralized and cross-defaulted mortgages.
- (7)
- These eleven properties are secured by cross-collateralized and cross-defaulted mortgages.
- (8)
- These three properties are secured by cross-collateralized and cross-defaulted mortgages.
- (9)
- These eleven properties are secured by cross-collateralized and cross-defaulted mortgages.
- (10)
- Amounts shown in USD Equivalent. Euro equivalent is 694.7 million. Associated with Facility A and B and Giugliano are interest rate swap agreements with a total combined 615.1 million euros notional amount that effectively fixes Facility A and B and Giugliano at 5.21%.
- (11)
- Amounts shown in USD Equivalent. Euro equivalent is 327.3 million. Associated with these loans are interest rate swap agreements with a total combined 319.0 million euros notional amount that effectively fix these loans at a combined 4.77%.
- (12)
- Amounts shown in USD Equivalent. Yen equivalent is 32,908.8 million.
- (13)
- Amounts shown in USD Equivalent. Balance includes borrowings on multi-currency tranche of Yen 22,125.0 million.
- (14)
- Amounts shown in USD Equivalent. Balance includes borrowings on multi-currency tranche of Euro 143.5 million.
- (15)
- Amounts shown in USD Equivalent. Yuan equivalent is 1,350.0 million.
- (16)
- Through an interest rate swap agreement, interest is essentially fixed at the all-in rate presented.
- (17)
- Our share of indebtedness for joint ventures excludes our share of indebtedness of $143.9 million in joint venture entities in which Gallerie Commerciali Italia holds a non-controlling interest.
53
SIMON PROPERTY GROUP
Unencumbered Assets
As of December 31, 2008
| | | | |
Property Name | | City | | State |
|---|
Regional Malls: | | | | |
McCain Mall | | N. Little Rock | | AR |
Brea Mall | | Brea | | CA |
Laguna Hills Mall | | Laguna Hills | | CA |
Santa Rosa Plaza | | Santa Rosa | | CA |
Shops at Mission Viejo, The | | Mission Viejo | | CA |
Westminster Mall | | Westminster | | CA |
Town Center at Aurora | | Aurora | | CO |
Boynton Beach Mall | | Boynton Beach | | FL |
Cordova Mall | | Pensacola | | FL |
Edison Mall | | Fort Meyers | | FL |
Gulf View Square | | Port Richey | | FL |
Lake Square Mall | | Leesburg | | FL |
Melbourne Square | | Melbourne | | FL |
Orange Park Mall | | Orange Park | | FL |
Paddock Mall | | Ocala | | FL |
Town Center at Boca Raton | | Boca Raton | | FL |
Treasure Coast Square | | Jensen Beach | | FL |
Tyrone Square | | St. Petersburg | | FL |
Lenox Square | | Atlanta | | GA |
Phipps Plaza | | Atlanta | | GA |
Lindale Mall | | Cedar Rapids | | IA |
NorthPark Mall | | Davenport | | IA |
SouthRidge Mall | | Des Moines | | IA |
Lincolnwood Town Center | | Lincolnwood | | IL |
Northwoods Shopping Center | | Peoria | | IL |
Orland Square | | Orland Park | | IL |
River Oaks Center | | Calumet City | | IL |
SouthPark Mall | | Moline | | IL |
Castleton Square Mall | | Indianapolis | | IN |
College Mall | | Bloomington | | IN |
Fashion Mall at Keystone, The | | Indianapolis | | IN |
Greenwood Park Mall | | Greenwood | | IN |
Muncie Mall | | Muncie | | IN |
Tippecanoe Mall | | Lafayette | | IN |
Towne East Square | | Wichita | | KS |
Prien Lake Mall | | Lake Charles | | LA |
54
SIMON PROPERTY GROUP
Unencumbered Assets
As of December 31, 2008
| | | | |
Property Name | | City | | State |
|---|
Arsenal Mall | | Watertown | | MA |
Burlington Mall | | Burlington | | MA |
South Shore Plaza | | Braintree | | MA |
Bowie Town Center | | Bowie | | MD |
St. Charles Towne Center | | Waldorf | | MD |
Maplewood Mall | | Minneapolis | | MN |
Miller Hill Mall | | Duluth | | MN |
SouthPark | | Charlotte | | NC |
Pheasant Lane(1) | | Nashua | | NH |
Livingston Mall | | Livingston | | NJ |
Menlo Park Mall | | Edison | | NJ |
Ocean County Mall | | Toms River | | NJ |
Rockaway Townsquare | | Rockaway | | NJ |
Cottonwood Mall | | Albuquerque | | NM |
Chautauqua Mall | | Lakewood | | NY |
Nanuet Mall | | Nanuet | | NY |
Jefferson Valley Mall | | Yorktown Heights | | NY |
Roosevelt Field | | Garden City | | NY |
Walt Whitman Mall | | Huntington Station | | NY |
Great Lakes Mall | | Mentor | | OH |
Lima Mall | | Lima | | OH |
Southern Park Mall | | Boardman | | OH |
Ross Park Mall | | Pittsburgh | | PA |
South Hills Village | | Pittsburgh | | PA |
Haywood Mall | | Greenville | | SC |
Oak Court Mall | | Memphis | | TN |
Barton Creek Square | | Austin | | TX |
Broadway Square | | Tyler | | TX |
Cielo Vista | | El Paso | | TX |
Firewheel Town Center | | Garland | | TX |
Irving Mall | | Irving | | TX |
La Plaza Mall | | McAllen | | TX |
Lakeline Mall | | Cedar Park | | TX |
North East Mall | | Hurst | | TX |
55
SIMON PROPERTY GROUP
Unencumbered Assets
As of December 31, 2008
| | | | |
Property Name | | City | | State |
|---|
Richardson Square Mall | | Richardson | | TX |
Rolling Oaks Mall | | San Antonio | | TX |
Charlottesville Fashion Square | | Charlottesville | | VA |
Virginia Center Commons | | Glen Allen | | VA |
Columbia Center | | Kennewick | | WA |
Northgate Mall | | Seattle | | WA |
Bay Park Square | | Green Bay | | WI |
Premium Outlet Centers: | | | | |
Camarillo Premium Outlets | | Camarillo | | CA |
Carlsbad Premium Outlets | | Carlsbad | | CA |
Desert Hills Premium Outlets | | Cabazon | | CA |
Folsom Premium Outlets | | Folsom | | CA |
Gilroy Premium Outlets | | Gilroy | | CA |
Napa Premium Outlets | | Napa | | CA |
Petaluma Village Premium Outlets | | Petaluma | | CA |
Vacaville Premium Outlets | | Vacaville | | CA |
Clinton Crossing Premium Outlets | | Clinton | | CT |
Orlando Premium Outlets | | Orlando | | FL |
St. Augustine Premium Outlets | | St. Augustine | | FL |
North Georgia Premium Outlets | | Dawsonville | | GA |
Waikele Premium Outlets | | Waipahu | | HI |
Chicago Premium Outlets | | Aurora | | IL |
Edinburgh Premium Outlets | | Edinburgh | | IN |
Wrentham Village Premium Outlets | | Wrentham | | MA |
Albertville Premium Outlets | | Albertville | | MN |
Osage Beach Premium Outlets | | Osage Beach | | MO |
Jackson Premium Outlets | | Jackson | | NJ |
Jersey Shore Premium Outlets | | Tinton Falls | | NJ |
Liberty Village Premium Outlets | | Flemington | | NJ |
Las Vegas Outlet Center | | Las Vegas | | NV |
Las Vegas Premium Outlets | | Las Vegas | | NV |
56
SIMON PROPERTY GROUP
Unencumbered Assets
As of December 31, 2008
| | | | |
Property Name | | City | | State |
|---|
Woodbury Common Premium Outlets | | Central Valley | | NY |
Aurora Farms Premium Outlets | | Aurora | | OH |
Columbia Gorge Premium Outlets | | Troutdale | | OR |
Allen Premium Outlets | | Allen | | TX |
Houston Premium Outlets | | Cypress | | TX |
Rio Grande Valley Premium Outlets | | Mercedes | | TX |
Round Rock Premium Outlets | | Austin | | TX |
Leesburg Corner Premium Outlets | | Leesburg | | VA |
Seattle Premium Outlets | | Seattle | | WA |
Johnson Creek Premium Outlets | | Johnson Creek | | WI |
Community/Lifestyle Centers: | | | | |
Pier Park | | Panama City Beach | | FL |
Royal Eagle Plaza | | Coral Springs | | FL |
Terrace at Florida Mall | | Orlando | | FL |
Waterford Lakes Town Center | | Orlando | | FL |
Westland Park Plaza | | Orange Park | | FL |
Mall of Georgia Crossing | | Atlanta | | GA |
Countryside Plaza | | Countryside | | IL |
Crystal Court | | Crystal Lake | | IL |
Lake Plaza | | Waukegan | | IL |
North Ridge Plaza | | Joliet | | IL |
Willow Knolls Court | | Peoria | | IL |
Brightwood Plaza | | Indianapolis | | IN |
Eastland Convenience Center | | Evansville | | IN |
Greenwood Plus | | Greenwood | | IN |
Keystone Shoppes | | Indianapolis | | IN |
Markland Plaza | | Kokomo | | IN |
New Castle Plaza | | New Castle | | IN |
Northwood Plaza | | Fort Wayne | | IN |
Teal Plaza | | Lafayette | | IN |
Tippecanoe Plaza | | Lafayette | | IN |
University Center | | Mishawaka | | IN |
Washington Plaza | | Indianapolis | | IN |
Park Plaza | | Hopkinsville | | KY |
57
SIMON PROPERTY GROUP
Unencumbered Assets
As of December 31, 2008
| | | | |
Property Name | | City | | State |
|---|
Rockaway Convenience Center | | Rockaway | | NJ |
Rockaway Town Plaza | | Rockaway | | NJ |
Great Lakes Plaza | | Mentor | | OH |
Lima Center | | Lima | | OH |
Eastland Plaza | | Tulsa | | OK |
Lincoln Plaza | | Langhorne | | PA |
Charles Towne Square | | Charleston | | SC |
Empire East | | Sioux Falls | | SD |
Knoxville Commons | | Knoxville | | TN |
The Arboretum | | Austin | | TX |
Ingram Plaza | | San Antonio | | TX |
Shops at North East Mall | | Hurst | | TX |
Wolf Ranch Town Center | | Georgetown | | TX |
Chesapeake Center | | Chesapeake | | VA |
Fairfax Court | | Fairfax | | VA |
Martinsville Plaza | | Martinsville | | VA |
Other: | | | | |
University Mall | | Pensacola | | FL |
Factory Merchants Branson | | Branson | | MO |
Crossville Outlet Center | | Crossville | | TN |
Raleigh Springs Mall | | Memphis | | TN |
Factory Stores at North Bend | | North Bend | | WA |
- (1)
- The Operating Partnership owns a mortgage note that encumbers Pheasant Lane Mall that entitles it to 100% of the economics of this property.
58
SIMON PROPERTY GROUP
Preferred Stock/Units Outstanding
As of December 31, 2008
($ in 000's, except per share amounts)
| | | | | | | | | | | | | | | |
Issuer | | Description | | Number of
Shares/Units | | Per Share
Liquidation
Preference | | Aggregate
Liquidation
Preference | | Ticker
Symbol | |
|---|
Preferred Stock: | | | | | | | | | | | | | | | |
Simon Property Group, Inc. | | Series I 6% Convertible Perpetual Preferred(1) | | | 7,590,264 | | $ | 50 | | $ | 379,513 | | | SPGPrI | |
Simon Property Group, Inc. | | Series J 8.375% Cumulative Redeemable(2) | | | 796,948 | | $ | 50 | | $ | 39,847 | | | SPGPrJ | |
Preferred Units: | | | | | | | | | | | | | | | |
Simon Property Group, L.P. | | Series C 7% Cumulative Convertible(3) | | | 94,235 | | $ | 28 | | $ | 2,639 | | | N/A | |
Simon Property Group, L.P. | | Series D 8% Cumulative Redeemable(4) | | | 1,356,814 | | $ | 30 | | $ | 40,704 | | | N/A | |
Simon Property Group, L.P. | | Series I 6% Convertible Perpetual(5) | | | 1,518,371 | | $ | 50 | | $ | 75,919 | | | N/A | |
Simon Property Group, L.P. | | 7.50% Cumulative Redeemable(6) | | | 255,373 | | $ | 100 | | $ | 25,537 | | | N/A | |
Simon Property Group, L.P. | | 7.75%/8.00% Cumulative Redeemable(7) | | | 850,698 | | $ | 100 | | $ | 85,070 | | | N/A | |
- (1)
- Each share was convertible into common stock through December 31, 2008, as certain conversion conditions were met as of September 30, 2008. Each share was convertible into 0.800295 of a share of common stock during the period beginning on October 1, 2008 and ending on December 31, 2008. As of January 1, 2009, each share would be convertible into 0.805966 of a share of common stock if certain conditions had been met, however, these certain conditions (the conversion triggering price) during the quarter ended December 31, 2008 were not met, and as a result, the Series I Preferred Stock is not convertible for the quarterly period January 1, 2009 through March 31, 2009. The applicable conversion triggering calculation is made on a quarterly basis. The shares are redeemable on or after October 14, 2009, in whole or in part, for cash only at a liquidation preference of $50 per share, if the closing price per share of common stock exceeds 130% of the applicable conversion price for 20 trading days within a period of 30 consecutive trading days ending on the trading day before notice of redemption is issued. The shares are traded on the New York Stock Exchange. The closing price on December 31, 2008 was $42.87 per share.
- (2)
- Each share is redeemable on or after October 15, 2027. The shares are traded on the New York Stock Exchange. The closing price on December 31, 2008 was $43.00 per share.
- (3)
- Each unit is convertible into 0.75676 of a share of common stock. Each unit is redeemable on or after August 27, 2009.
- (4)
- Each unit is redeemable on or after August 27, 2009.
- (5)
- Each unit may be exchanged for a share of Series I 6% Convertible Perpetual Preferred stock or cash, at our option. These units are not currently convertible as the certain conditions described in footnote 1 were not met.
- (6)
- Each unit is redeemable on or after November 10, 2013 or earlier upon the occurrence of certain tax triggering events.
- (7)
- Each unit is redeemable on or after January 1, 2011 or earlier upon the occurrence of certain tax triggering events.
59
QuickLinks
Exhibit 99.1OverviewThe CompanyReporting CalendarStock InformationCredit RatingsOwnership StructureChanges in Common Shares and Unit OwnershipSelected Financial and Equity InformationUnaudited Pro–Rata Statements of OperationsUnaudited Pro–Rata Balance SheetReconciliation of Net Income to NOINOI CompositionAnalysis of Other Income and Other ExpenseU.S. Portfolio GLAU.S. Regional Mall Operational InformationU.S. Regional Mall Lease ExpirationsU.S. Regional Mall Top TenantsU.S. Regional Mall Big Box OpeningsU.S. Regional Mall Property ListingU.S. Premium Outlet Centers Operational InformationU.S. Premium Outlet Centers Lease ExpirationsU.S. Premium Outlet Centers Top TenantsU.S. Premium Outlet Centers Property ListingU.S. Community Centers Operational InformationU.S. Community Centers Lease ExpirationsU.S. Community Centers Top TenantsU.S. Community Centers Property ListingU.S. Mills Portfolio Operational InformationU.S. Mills Portfolio Property ListingInternational Operational InformationInternational Property ListingCapital ExpendituresU.S. Development Activity ReportInternational Development Activity ReportTotal Debt Amortization and Maturities by YearSummary of IndebtednessSummary of Indebtedness by MaturityUnencumbered AssetsPreferred Stock Outstanding