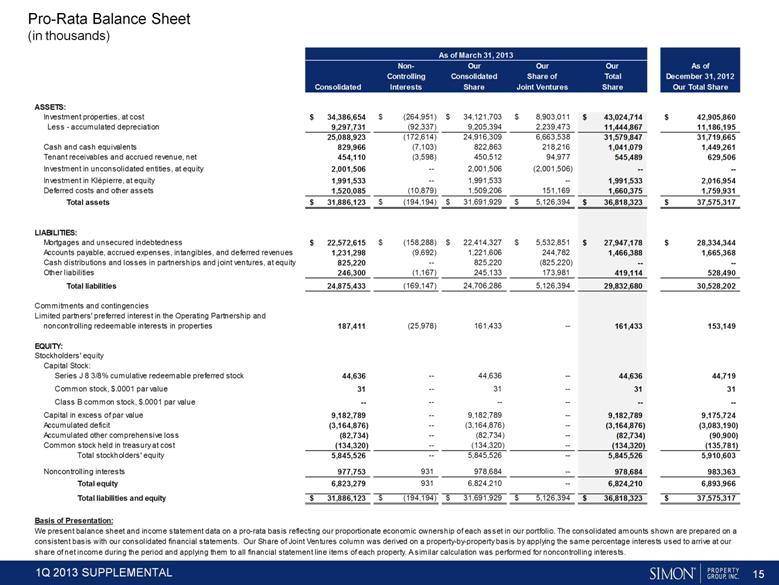
| 15 Pro-Rata Balance Sheet (in thousands) share of net income during the period and applying them to all financial statement line items of each property. A similar calculation was performed for noncontrolling interests. consistent basis with our consolidated financial statements. Our Share of Joint Ventures column was derived on a property-by-property basis by applying the same percentage interests used to arrive at our We present balance sheet and income statement data on a pro-rata basis reflecting our proportionate economic ownership of each asset in our portfolio. The consolidated amounts shown are prepared on a Basis of Presentation: $ 37,575,317 $ 36,818,323 $ 5,126,394 $ 31,691,929 $ (194,194) $ 31,886,123 Total liabilities and equity 6,893,966 6,824,210 -- 6,824,210 931 6,823,279 Total equity 983,363 978,684 -- 978,684 931 977,753 Noncontrolling interests 5,910,603 5,845,526 -- 5,845,526 -- 5,845,526 Total stockholders' equity (135,781) (134,320) -- (134,320) -- (134,320) Common stock held in treasury at cost (90,900) (82,734) -- (82,734) -- (82,734) Accumulated other comprehensive loss (3,083,190) (3,164,876) -- (3,164,876) -- (3,164,876) Accumulated deficit 9,175,724 9,182,789 -- 9,182,789 -- 9,182,789 Capital in excess of par value -- -- -- -- -- -- Class B common stock, $.0001 par value 31 31 -- 31 -- 31 Common stock, $.0001 par value 44,719 44,636 -- 44,636 -- 44,636 Series J 8 3/8% cumulative redeemable preferred stock Capital Stock: Stockholders' equity EQUITY: 153,149 161,433 -- 161,433 (25,978) 187,411 noncontrolling redeemable interests in properties Limited partners' preferred interest in the Operating Partnership and Commitments and contingencies 30,528,202 29,832,680 5,126,394 24,706,286 (169,147) 24,875,433 Total liabilities 528,490 419,114 173,981 245,133 (1,167) 246,300 Other liabilities -- -- (825,220) 825,220 -- 825,220 Cash distributions and losses in partnerships and joint ventures, at equity 1,665,368 1,466,388 244,782 1,221,606 (9,692) 1,231,298 Accounts payable, accrued expenses, intangibles, and deferred revenues $ 28,334,344 $ 27,947,178 $ 5,532,851 $ 22,414,327 $ (158,288) $ 22,572,615 Mortgages and unsecured indebtedness LIABILITIES: $ 37,575,317 $ 36,818,323 $ 5,126,394 $ 31,691,929 $ (194,194) $ 31,886,123 Total assets 1,759,931 1,660,375 151,169 1,509,206 (10,879) 1,520,085 Deferred costs and other assets 2,016,954 1,991,533 -- 1,991,533 -- 1,991,533 Investment in Klépierre, at equity -- -- (2,001,506) 2,001,506 -- 2,001,506 Investment in unconsolidated entities, at equity 629,506 545,489 94,977 450,512 (3,598) 454,110 Tenant receivables and accrued revenue, net 1,449,261 1,041,079 218,216 822,863 (7,103) 829,966 Cash and cash equivalents 31,719,665 31,579,847 6,663,538 24,916,309 (172,614) 25,088,923 11,186,195 11,444,867 2,239,473 9,205,394 (92,337) 9,297,731 Less - accumulated depreciation $ 42,905,860 $ 43,024,714 $ 8,903,011 $ 34,121,703 $ (264,951) $ 34,386,654 Investment properties, at cost ASSETS: Our Total Share Share Joint Ventures Share Interests Consolidated December 31, 2012 Total Share of Consolidated Controlling As of Our Our Our Non- As of March 31, 2013 |