![]()
Filed by Voya Equity Trust (SEC File Nos.: 333-56881; 811-08817) pursuant to Rule 425 under the Securities Act of 1933, as amended, and deemed filed pursuant to Rule 14a-12 under the Securities Exchange Act of 1934, as amended.
February 2, 2015
Voya Investment Management
ClientTalking Points
Voya Core Equity Research Fund
Voya Investment Management (formerly, ING U.S. Investment Management) has announced the following changes to the Fund.
| Planned Change(s) | Effective Date (on or about) | Current | Surviving |
| Reorganization | March 6, 2015 | Voya Core Equity Research Fund | Voya Large Cap Value Fund |
On May 22, 2014, the Board of Trustees (the “Board”) of Voya Core Equity Research Fund (“Core Equity Fund”) approved an Agreement and Plan of Reorganization (“Merger” or “Reorganization”) of the Core Equity Fund into Voya Large Cap Value Fund (“Large Cap Value”). The approval of shareholders of Core Equity Fund is required before the Merger may take place.
| n | What is happening? |
| o | Core Equity Fund is currently sub-advised by Voya Investment Management Co LLC (“Voya IM”). |
| o | A fund prospectus supplement announcing the pending merger was filed on June 6, 2014. |
| o | Shareholders of Core Equity Fund will be sent a combined proxy statement and prospectus regarding the merger on or about December 29, 2014. |
| o | A shareholder meeting will be held on or about February 12, 2015. |
| o | Pending shareholder approval, the Merger will occur as of the close of business on or about March 6, 2015 |
| n | What factors did the Board consider? |
| o | The Board, in approving the Reorganization, considered a number of factors, including, but not limited to, the following: |
| o | an analysis of Voya IM as sub-adviser of each Fund; |

February 2, 2015
Client Talking Points
| o | a presentation from the Adviser regarding proposals, including the Reorganization, intending to, among other things, enhance the efficiency and reduce the complexity of the Voya family of funds; |
| o | the superior performance of Large Cap Value Fund, as compared to the performance of Core Equity Fund in the year to date, three-year and five-year time periods ended March 31, 2014; |
| o | the performance of Core Equity Fund as compared to its Morningstar, Inc. (“Morningstar”) peer group and the performance of Large Cap Value Fund as compared to its Morningstar peer group as of March 31, 2014; |
| o | the lower gross and net expense ratios that current shareholders of both Funds were expected to experience as a result of the Reorganization except that shareholders of Class R6 share of Core Equity Fund were expected to experience the same net expenses; |
| o | the similarities in fee structures of each of the Funds; |
| o | the Adviser’s agreement to further limit the expenses of Large Cap Value Fund contingent upon shareholder approval of the Reorganization; |
| o | at the Board’s request, the Adviser’s agreement to add advisory fee schedule breakpoints to become effective upon execution of the merger; |
| o | the consideration of representations from the Funds’ Chief Investment Risk Officer regarding,e.g., the similarities in the investment objectives and investment strategies of each Fund; |
| o | the similarity in each Fund’s investment process driven mainly by bottom-up research; |
| o | the larger combined asset size of the two Funds, which were expected to result in a reduction in expenses for the benefit of current shareholders of both Funds; and provide superior potential to maintain long-term scale benefits for the shareholders of both Funds; |
| o | the Board’s determination that the Reorganization is in the best interest of Core Equity Fund; |
| o | the fact that direct or indirect costs relating to the Reorganization will not be borne by either Fund or their shareholders; |
| o | the expected tax consequences of the Reorganization to Core Equity Fund and its shareholders, including that the Reorganization is intended to qualify for federal income tax purposes as a tax-free reorganization; |
| o | and the Board’s determination that the Reorganization will not dilute the interests of the shareholders of Core Equity Fund. |
Different Board members may have given different weight to different individual factors and related conclusions.
For financial professional use only. Not for inspection by or distribution to the general public.
February 2, 2015
Client Talking Points
| n | How do the Investment Objectives compare? |
As described in the chart that follows, the Portfolios have substantially identical objectives.
| Core Equity Fund | Large Cap Value | |
| Investment Objective | The Fund seeks long-term growth of capital and income. | The Fund seeks long-term growth of capital and current income. |
| n | What is the experience of the Voya Investment Management Team? |
| o | The Fund will be managed by the Voya IM team of Christopher F. Corapi, Vincent Costa and Robert M. Kloss. |
Christopher F. Corapi, Portfolio Manager and Chief Investment Officer of Equities
Christopher F. Corapi, Portfolio Manager and Chief Investment Officer of equities, joined Voya IM in February 2004. Prior to joining Voya IM, Mr. Corapi served as global head of equity research at Federated Investors since 2002. He served as head of U.S. equities and portfolio manager at Credit Suisse Asset Management beginning in 2000 and head of emerging markets research at JPMorgan Investment Management beginning in 1998.
Vincent Costa, CFA, Portfolio Manager and Head of the Portfolio Engineering Group
Vincent Costa, CFA, Portfolio Manager, also serves as the Head of the Portfolio Engineering Group responsible for managing quantitative research and both engineered and fundamental strategies. Mr. Costa joined Voya IM in April 2006 as head of portfolio management for quantitative equity. Prior to joining Voya IM, Mr. Costa managed quantitative equity investments at both Merrill Lynch Investment Management and a Bankers Trust Company.
Robert M. Kloss, Portfolio Manager
Robert M. Kloss, Portfolio Manager, joined Voya IM in 1992. Mr. Kloss is an analyst on the value team at Voya IM covering the financial services sector and a portfolio manager for the large cap value strategy. Since joining the firm, Bob has served as an equity analyst and a portfolio manager for a variety of value-oriented funds. Previously, he was a principal of Phoenix Strategies, an investment management and consulting firm. He began his career with Wells Fargo Credit Corporation. Bob received both a BA and MS in economics from Arizona State University.
| n | How do the fees and expenses compare? |
These tables describe the fees and expenses that you may pay if you buy and hold shares of the Funds. Pro Forma fees and expenses, which are the estimated fees and expenses of Large Cap Value Fund after giving effect to the Reorganization, assume the Reorganization occurred on May 31, 2014. The Annual Fund Operating Expenses reflect the contractual fees and expenses of the Funds. For the fiscal period ending May 31, 2014, certain reimbursements further reduced the net expenses below the amounts shown here for Class A, Class B, Class C, Class I, Class O, Class R, and Class W shares of Core Equity Fund and Class A, Class B, Class C, Class I, Class O, Class R6, and Class W shares of Large Cap Value Fund. For more information on the net expense ratios for each Fund for the fiscal year ended May 31, 2014, please seeAppendix C for each Fund’s audited financial highlights.
For financial professional use only. Not for inspection by or distribution to the general public.
February 2, 2015
Client Talking Points
Annual Fund Operating Expenses1 Expenses you pay each year as a % of the value of your investment | |||||||
| Core Equity Fund | Large Cap Value Fund | Large Cap Value Fund Pro Forma | |||||
| Class A | |||||||
| Management Fee | % | 0.68 | 0.65 | 0.65 | |||
| Distribution and/or Shareholder Services (12b-1) Fees | % | 0.25 | 0.25 | 0.25 | |||
| Administrative Services Fees | % | 0.08 | 0.10 | 0.10 | |||
| Other Expenses | % | 0.20 | 0.16 | 0.16 | |||
| Acquired Fund Fees and Expenses | % | None | 0.013 | 0.013 | |||
| Total Annual Fund Operating Expenses | % | 1.21 | 1.17 | 1.17 | |||
| Waivers and Reimbursements | % | None2 | None4 | (0.06)4,5 | |||
| Total Annual Fund Operating Expenses after Waivers and Reimbursements | % | 1.21 | 1.17 | 1.11 | |||
| Class B | |||||||
| Management Fee | % | 0.68 | 0.65 | 0.65 | |||
| Distribution and/or Shareholder Services (12b-1) Fees | % | 1.00 | 1.00 | 1.00 | |||
| Administrative Services Fees | % | 0.08 | 0.10 | 0.10 | |||
| Other Expenses | % | 0.20 | 0.16 | 0.16 | |||
| Acquired Fund Fees and Expenses | % | None | 0.013 | 0.013 | |||
| Total Annual Fund Operating Expenses | % | 1.96 | 1.92 | 1.92 | |||
| Waivers and Reimbursements | % | None2 | None4 | (0.06)4,5 | |||
| Total Annual Fund Operating Expenses after Waivers and Reimbursements | % | 1.96 | 1.92 | 1.86 | |||
| Class C | |||||||
| Management Fee | % | 0.68 | 0.65 | 0.65 | |||
| Distribution and/or Shareholder Services (12b-1) Fees | % | 1.00 | 1.00 | 1.00 | |||
| Administrative Services Fees | % | 0.08 | 0.10 | 0.10 | |||
| Other Expenses | % | 0.20 | 0.16 | 0.16 | |||
| Acquired Fund Fees and Expenses | % | None | 0.013 | 0.013 | |||
| Total Annual Fund Operating Expenses | % | 1.96 | 1.92 | 1.92 | |||
| Waivers and Reimbursements | % | None2 | None4 | (0.06)4,5 | |||
| Total Annual Fund Operating Expenses after Waivers and Reimbursements | % | 1.96 | 1.92 | 1.86 | |||
| Class I | |||||||
| Management Fee | % | 0.68 | 0.65 | 0.65 | |||
| Distribution and/or Shareholder Services (12b-1) Fees | % | None | None | None | |||
| Administrative Services Fees | % | 0.08 | 0.10 | 0.10 | |||
| Other Expenses | % | 0.13 | 0.06 | 0.05 | |||
| Acquired Fund Fees and Expenses | % | None | 0.013 | 0.013 | |||
| Total Annual Fund Operating Expenses | % | 0.89 | 0.82 | 0.81 | |||
| Waivers and Reimbursements | % | None2 | (0.01)4 | (0.04)4,5 | |||
| Total Annual Fund Operating Expenses after Waivers and Reimbursements | % | 0.89 | 0.81 | 0.77 | |||
| Class O | |||||||
| Management Fee | % | 0.68 | 0.65 | 0.65 | |||
For financial professional use only. Not for inspection by or distribution to the general public.
February 2, 2015
Client Talking Points
Annual Fund Operating Expenses1 Expenses you pay each year as a % of the value of your investment | |||||||
| Core Equity Fund | Large Cap Value Fund | Large Cap Value Fund Pro Forma | |||||
| Distribution and/or Shareholder Services (12b-1) Fees | % | 0.25 | 0.25 | 0.25 | |||
| Administrative Services Fees | % | 0.08 | 0.10 | 0.10 | |||
| Other Expenses | % | 0.20 | 0.16 | 0.16 | |||
| Acquired Fund Fees and Expenses | % | None | 0.013 | 0.013 | |||
| Total Annual Fund Operating Expenses | % | 1.21 | 1.17 | 1.17 | |||
| Waivers and Reimbursements | % | None2 | None4 | (0.06)4,5 | |||
| Total Annual Fund Operating Expenses after Waivers and Reimbursements | % | 1.21 | 1.17 | 1.11 | |||
| Class R | |||||||
| Management Fee | % | 0.68 | 0.65 | 0.65 | |||
| Distribution and/or Shareholder Services (12b-1) Fees | % | 0.50 | 0.50 | 0.50 | |||
| Administrative Services Fees | % | 0.08 | 0.10 | 0.10 | |||
| Other Expenses | % | 0.20 | 0.16 | 0.16 | |||
| Acquired Fund Fees and Expenses | % | None | 0.013 | 0.013 | |||
| Total Annual Fund Operating Expenses | % | 1.46 | 1.42 | 1.42 | |||
| Waivers and Reimbursements | % | None2 | (0.05)4 | (0.11)4,5 | |||
| Total Annual Fund Operating Expenses after Waivers and Reimbursements | % | 1.46 | 1.37 | 1.31 | |||
| Class R6 | |||||||
| Management Fee | % | 0.68 | 0.65 | 0.65 | |||
| Distribution and/or Shareholder Services (12b-1) Fees | % | None | None | None | |||
| Administrative Services Fees | % | 0.08 | 0.10 | 0.10 | |||
| Other Expenses | % | 0.09 | 0.06 | 0.05 | |||
| Acquired Fund Fees and Expenses | % | None | 0.013 | 0.013 | |||
| Total Annual Fund Operating Expenses | % | 0.85 | 0.82 | 0.81 | |||
| Waivers and Reimbursements | % | (0.11)2 | (0.03)4 | (0.06)4,5 | |||
| Total Annual Fund Operating Expenses after Waivers and Reimbursements | % | 0.74 | 0.79 | 0.75 | |||
| Class W | |||||||
| Management Fee | % | 0.68 | 0.65 | 0.65 | |||
| Distribution and/or Shareholder Services (12b-1) Fees | % | None | None | None | |||
| Administrative Services Fees | % | 0.08 | 0.10 | 0.10 | |||
| Other Expenses | % | 0.20 | 0.16 | 0.16 | |||
| Acquired Fund Fees and Expenses | % | None | 0.013 | 0.013 | |||
| Total Annual Fund Operating Expenses | % | 0.96 | 0.92 | 0.92 | |||
| Waivers and Reimbursements | % | None2 | None4 | (0.06)4,5 | |||
| Total Annual Fund Operating Expenses after Waivers and Reimbursements | % | 0.96 | 0.92 | 0.86 | |||
| 1. | Expense ratios have been adjusted to reflect current expense rates. |
| 2. | The Adviser is contractually obligated to limit expenses to 1.25%, 2.00%, 2.00%, 0.89%, 1.25%, 1.50%, 0.74%, and 1.00% for Class A, Class B, Class C, Class I, Class O, Class R, Class R6, and Class W shares, respectively, through October 1, 2016. The limitation does not extend to interest, taxes, brokerage commissions, extraordinary expenses, and Acquired Fund Fees and Expenses. This limitation is subject to possible recoupment by the Adviser within 36 months of the waiver or reimbursement. Termination or modification of this obligation requires approval by the Board. |
For financial professional use only. Not for inspection by or distribution to the general public.
February 2, 2015
Client Talking Points
| 3. | Total Annual Fund Operating Expenses may be higher than the Fund’s ratio of expenses to average net assets shown in the Fund’s Financial Highlights, which reflect the operating expenses of the Fund and does not include Acquired Fund Fees and Expenses. |
| 4. | The Adviser is contractually obligated to limit expenses to 1.25%, 2.00%, 2.00%, 1.00%, 1.25%, 1.50%, 0.78%, and 1.00% for Class A, Class B, Class C, Class I, Class O, Class R, Class R6, and Class W shares, respectively, through October 1, 2016. In addition, the Adviser is contractually obligated to further limit expenses to 1.20%, 1.95%, 1.95%, 0.80%, 1.20%, 1.45%, 0.78%, and 0.95% for Class A, Class B, Class C, Class I, Class O, Class R, Class R6, and Class W shares, respectively, through October 1, 2016. The limitations do not extend to interest, taxes, brokerage commissions, extraordinary expenses, and Acquired Fund Fees and Expenses. These limitations are subject to possible recoupment by the Adviser within 36 months of the waiver or reimbursement. The Distributor is contractually obligated to waive 0.05% of the distribution fee for Class R shares through October 1, 2016. Termination or modification of these obligations requires approval by the Board. |
| 5. | If shareholders approve the Reorganization, the Adviser has agreed to further limit expenses to 1.10%, 1.85%, 1.85%, 0.76%, 1.10%, 1.35%, 0.74%, and 0.85% for Class A, Class B, Class C, Class I, Class O, Class R, Class R6, and Class W shares, respectively, through October 1, 2016. The limitation does not extend to interest, taxes, brokerage commissions, extraordinary expenses, and Acquired Fund Fees and Expenses. This limitation is subject to possible recoupment by the Adviser within 36 months of the waiver or reimbursement. Termination or modification of these obligations requires approval by the Board. |
| n | How does Core Equity Fund Performance compare to Large Cap Value Fund? |
The following information is intended to help you understand the risks of investing in the Funds. The following bar charts show the changes in each Fund’s Class A shares’ performance from year to year, and the table compares their performance to the performance of broad-based securities market index/indices for the same period. Each Fund’s performance information reflects applicable fee waivers and/or expense limitations in effect during the period presented. Absent such fee waivers/expense limitations, if any, performance would have been lower. Sales charges are not reflected in the bar charts. If they were, returns would be less than those shown. However, the table includes all applicable fees and sales charges. Other class shares’ performance would be higher or lower than Class A shares’ performance because of the higher or lower expenses paid by Class A shares. The Funds’ past performance (before and after taxes) is no guarantee of future results. Class R6 shares of each Fund and Class O shares of Large Cap Value Fund did not have a full calendar year of operations as of December 31, 2013, so no performance is shown.
Voya Core Equity Research Fund - Calendar Year Total Returns
(as of December 31 of each year)
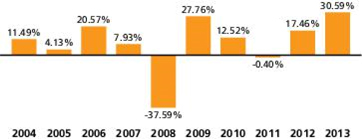
Best quarter: 2nd, 2009, 17.02% and Worst quarter: 4th, 2008, -21.74%
The Fund’s Class A shares’ year-to-date total return as of September 30, 2014: 6.43%
For financial professional use only. Not for inspection by or distribution to the general public.
February 2, 2015
Client Talking Points
Voya Large Cap Value Fund - Calendar Year Total Returns
(as of December 31 of each year)
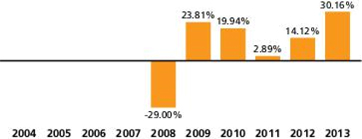
Best quarter: 3rd, 2009, 18.23% and Worst quarter: 4th, 2008, -16.78%
The Fund’s Class A shares’ year-to-date total return as of September 30, 2014: 6.15%
Average Annual Total Returns % (for the periods ended December 31, 2013) | |||||||||||
| 1 Year | 5 Years | 10 Years | Since Inception | Inception Date | |||||||
| Core Equity Fund | |||||||||||
| Class A before taxes | % | 23.12 | 15.66 | 6.91 | N/A | 04/15/1994 | |||||
| After tax on distributions | % | 22.89 | 15.09 | 6.71 | N/A | ||||||
| After tax on distributions with sale | % | 13.24 | 12.31 | 5.56 | N/A | ||||||
| S&P 500® Index1 | % | 32.39 | 17.94 | 7.41 | N/A | ||||||
| Class B before taxes | % | 24.63 | 15.93 | 6.74 | N/A | 03/01/1999 | |||||
| S&P 500® Index1 | % | 32.39 | 17.94 | 7.41 | N/A | ||||||
| Class C before taxes | % | 28.60 | 16.14 | 6.73 | N/A | 06/30/1998 | |||||
| S&P 500® Index1 | % | 32.39 | 17.94 | 7.41 | N/A | ||||||
| Class I before taxes | % | 31.07 | 17.40 | 7.85 | N/A | 01/03/1992 | |||||
| S&P 500® Index1 | % | 32.39 | 17.94 | 7.41 | N/A | ||||||
| Class O before taxes | % | 30.64 | N/A | N/A | 17.97 | 02/06/2009 | |||||
| S&P 500® Index1 | % | 32.39 | N/A | N/A | 19.22 | ||||||
| Class R before taxes | % | 30.24 | N/A | N/A | 22.38 | 08/05/2011 | |||||
| S&P 500® Index1 | % | 32.39 | N/A | N/A | 22.42 | ||||||
| Class W before taxes | % | 30.91 | N/A | N/A | 16.73 | 06/12/2009 | |||||
| S&P 500® Index1 | % | 32.39 | N/A | N/A | 18.33 | ||||||
| Large Cap Value Fund | |||||||||||
| Class A before taxes | % | 22.72 | 16.43 | N/A | 7.19 | 12/18/2007 | |||||
| After tax on distributions | % | 19.04 | 14.34 | N/A | 5.40 | ||||||
| After tax on distributions with sale | % | 14.13 | 12.30 | N/A | 4.88 | ||||||
| Russell 1000® Value Index1 | % | 32.53 | 16.67 | N/A | 5.46 | ||||||
| Class B before taxes | % | 24.10 | 16.81 | N/A | 8.78 | 02/20/2008 | |||||
| Russell 1000® Value Index1 | % | 32.53 | 16.67 | N/A | 6.54 | ||||||
| Class C before taxes | % | 28.24 | 17.05 | N/A | 9.10 | 02/19/2008 | |||||
| Russell 1000® Value Index1 | % | 32.53 | 16.67 | N/A | 6.67 | ||||||
| Class I before taxes | % | 30.58 | N/A | N/A | 15.48 | 03/31/2010 | |||||
| Russell 1000® Value Index1 | % | 32.53 | N/A | N/A | 15.04 | ||||||
| Class R before taxes | % | 29.91 | N/A | N/A | 21.90 | 08/05/2011 | |||||
For financial professional use only. Not for inspection by or distribution to the general public.
February 2, 2015
Client Talking Points
Average Annual Total Returns % (for the periods ended December 31, 2013) | ||||||||||
| 1 Year | 5 Years | 10 Years | Since Inception | Inception Date | ||||||
| Russell 1000® Value Index1 | % | 32.53 | N/A | N/A | 23.34 | |||||
| Class W before taxes | % | 30.55 | N/A | N/A | 18.66 | 06/01/2009 | ||||
| Russell 1000® Value Index1 | % | 32.53 | N/A | N/A | 18.32 | |||||
| 1. | The index returns do not reflect deductions for fees, expenses, or taxes. |
After-tax returns are calculated using the historical highest individual federal marginal income tax rates and do not reflect the impact of state and local taxes. Actual after-tax returns depend on an investor’s tax situation and may differ from those shown, and the after-tax returns shown are not relevant to investors who hold their Fund shares through tax-deferred arrangements such as 401(k) plans or individual retirement accounts. In some cases the after-tax returns may exceed the return before taxes due to an assumed tax benefit from any losses on a sale of Fund shares at the end of the measurement period. After-tax returns are shown for Class A shares only. After-tax returns for other classes will vary.
Appendix C: Financial Highlights
The following financial highlights are intended to help you understand each Fund’s financial performance for the past five years or, if shorter, the period of the operations. Certain information reflects financial results for a single share. The total returns represent the rate that an investor would have earned (or lost) on an investment in a share of each Fund (assuming reinvestment of all dividends and distributions). This information has been derived from each Fund’s financial statements that were audited by KPMG LLP, an independent registered public accounting firm. The reports of KPMG LLP, along with the financial statements included in the annual shareholder reports dated May 31, 2014, are incorporated herein by reference.
Core Equity Research Fund
| Income (loss) from investment operations | Less distributions | Ratios to average net assets | Supplemental data | |||||||||||||||||||||||||||||||||||||||||||||||
| Net asset value, beginning of year or period | Net investment income (loss) | Net realized and unrealized gain (loss) | Total from investment operations | From net investment income | From net realized gains | Total Distributions | Net asset value, end of year or period | Total Return(1) | Expenses before reductions/ additions(2)(3) | Expenses net of fee waivers and/or recoupments, if any(2)(3) | Expenses net of all reductions/ additions(2)(3) | Net | Net assets, end of year or period | Portfolio turnover rate | |||||||||||||||||||||||||||||||||||||
| Year or period ended | ($) | ($) | ($) | ($) | ($) | ($) | ($) | ($) | ($) | (%) | (%) | (%) | (%) | ($000’s) | (%) | ||||||||||||||||||||||||||||||||||||
| Class A | |||||||||||||||||||||||||||||||||||||||||||||||||||
| 05-31-14 | 15.12 | 0.18 | 2.69 | 2.87 | 0.12 | — | 0.12 | 17.87 | 19.10 | 1.21 | 1.10 | 1.10 | 1.05 | 363,999 | 84 | ||||||||||||||||||||||||||||||||||||
| 05-31-13 | 12.18 | 0.13 | • | 2.95 | 3.08 | 0.14 | — | 0.14 | 15.12 | 25.50 | 1.23 | 1.08 | 1.08 | 0.99 | 336,884 | 59 | |||||||||||||||||||||||||||||||||||
For financial professional use only. Not for inspection by or distribution to the general public.
February 2, 2015
Client Talking Points
| Income (loss) from investment operations | Less distributions | Ratios to average net assets | Supplemental data | ||||||||||||||||||||||||||||||||||||||||||||||||||||||
| Net asset value, beginning of year or period | Net investment income (loss) | Net realized and unrealized gain (loss) | Total from investment operations | From net investment income | From net realized gains | Total Distributions | Net asset value, end of year or period | Total Return(1) | Expenses before reductions/ additions(2)(3) | Expenses net of fee waivers and/or recoupments, if any(2)(3) | Expenses net of all reductions/ additions(2)(3) | Net | Net assets, end of year or period | Portfolio turnover rate | ||||||||||||||||||||||||||||||||||||||||||||
| Year or period ended | ($) | ($) | ($) | ($) | ($) | ($) | ($) | ($) | ($) | (%) | (%) | (%) | (%) | ($000’s) | (%) | |||||||||||||||||||||||||||||||||||||||||||
| 05-31-12 | 12.44 | 0.12 | (0.29 | ) | (0.17 | ) | 0.09 | — | 0.09 | 12.18 | (1.29 | ) | 1.26 | 1.08 | 1.08 | 0.98 | 300,026 | 71 | ||||||||||||||||||||||||||||||||||||||||
| 05-31-11 | 10.01 | 0.06 | 2.42 | 2.48 | 0.05 | — | 0.05 | 12.44 | 24.81 | 1.26 | 1.08 | † | 1.08 | † | 0.56 | † | 341,327 | 75 | ||||||||||||||||||||||||||||||||||||||||
| 05-31-10 | 8.77 | 0.05 | 1.26 | 1.31 | 0.07 | — | 0.07 | 10.01 | 15.05 | 1.27 | 1.08 | † | 1.08 | † | 0.50 | † | 294,790 | 124 | ||||||||||||||||||||||||||||||||||||||||
| Class B | ||||||||||||||||||||||||||||||||||||||||||||||||||||||||||
| 05-31-14 | 14.79 | 0.05 | • | 2.65 | 2.70 | 0.01 | — | 0.01 | 17.48 | 18.27 | 1.96 | 1.85 | 1.85 | 0.29 | 2,122 | 84 | ||||||||||||||||||||||||||||||||||||||||||
| 05-31-13 | 11.91 | 0.03 | • | 2.88 | 2.91 | 0.03 | — | 0.03 | 14.79 | 24.50 | 1.98 | 1.83 | 1.83 | 0.22 | 2,412 | 59 | ||||||||||||||||||||||||||||||||||||||||||
| 05-31-12 | 12.18 | 0.03 | • | (0.28 | ) | (0.25 | ) | 0.02 | — | 0.02 | 11.91 | (2.06 | ) | 2.01 | 1.83 | 1.83 | 0.23 | 3,118 | 71 | |||||||||||||||||||||||||||||||||||||||
| 05-31-11 | 9.83 | (0.02 | ) | 2.37 | 2.35 | — | — | — | 12.18 | 23.91 | 2.01 | 1.83 | † | 1.83 | † | (0.19 | )† | 6,206 | 75 | |||||||||||||||||||||||||||||||||||||||
| 05-31-10 | 8.63 | (0.02 | ) | 1.24 | 1.22 | 0.02 | — | 0.02 | 9.83 | 14.11 | 2.02 | 1.83 | † | 1.83 | † | (0.23 | )† | 10,829 | 124 | |||||||||||||||||||||||||||||||||||||||
| Class C | ||||||||||||||||||||||||||||||||||||||||||||||||||||||||||
| 05-31-14 | 14.68 | 0.05 | 2.63 | 2.68 | 0.02 | — | 0.02 | 17.34 | 18.25 | 1.96 | 1.85 | 1.85 | 0.31 | 12,487 | 84 | |||||||||||||||||||||||||||||||||||||||||||
| 05-31-13 | 11.83 | 0.03 | 2.87 | 2.90 | 0.05 | — | 0.05 | 14.68 | 24.57 | 1.98 | 1.83 | 1.83 | 0.24 | 11,009 | 59 | |||||||||||||||||||||||||||||||||||||||||||
| 05-31-12 | 12.11 | 0.03 | (0.29 | ) | (0.26 | ) | 0.02 | — | 0.02 | 11.83 | (2.09 | ) | 2.01 | 1.83 | 1.83 | 0.23 | 9,488 | 71 | ||||||||||||||||||||||||||||||||||||||||
| 05-31-11 | 9.77 | (0.02 | ) | 2.36 | 2.34 | — | — | — | 12.11 | 23.95 | 2.01 | 1.83 | † | 1.83 | † | (0.19 | )† | 11,150 | 75 | |||||||||||||||||||||||||||||||||||||||
| 05-31-10 | 8.58 | (0.02 | ) | 1.23 | 1.21 | 0.02 | — | 0.02 | 9.77 | 14.11 | 2.02 | 1.83 | † | 1.83 | † | (0.24 | )† | 10,500 | 124 | |||||||||||||||||||||||||||||||||||||||
| Class I | ||||||||||||||||||||||||||||||||||||||||||||||||||||||||||
| 05-31-14 | 15.19 | 0.22 | • | 2.72 | 2.94 | 0.18 | — | 0.18 | 17.95 | 19.46 | 0.89 | 0.79 | 0.79 | 1.35 | 33,779 | 84 | ||||||||||||||||||||||||||||||||||||||||||
| 05-31-13 | 12.23 | 0.18 | • | 2.96 | 3.14 | 0.18 | — | 0.18 | 15.19 | 25.95 | 0.92 | 0.75 | 0.75 | 1.33 | 45,163 | 59 | ||||||||||||||||||||||||||||||||||||||||||
| 05-31-12 | 12.49 | 0.15 | (0.28 | ) | (0.13 | ) | 0.13 | — | 0.13 | 12.23 | (0.97 | ) | 0.96 | 0.75 | 0.75 | 1.23 | 31,518 | 71 | ||||||||||||||||||||||||||||||||||||||||
| 05-31-11 | 10.04 | 0.10 | 2.42 | 2.52 | 0.07 | — | 0.07 | 12.49 | 25.25 | 0.95 | 0.77 | † | 0.77 | † | 0.89 | † | 53,006 | 75 | ||||||||||||||||||||||||||||||||||||||||
| 05-31-10 | 8.80 | 0.07 | 1.27 | 1.34 | 0.10 | — | 0.10 | 10.04 | 15.26 | 1.02 | 0.83 | † | 0.83 | † | 0.66 | † | 42,057 | 124 | ||||||||||||||||||||||||||||||||||||||||
| Class O | ||||||||||||||||||||||||||||||||||||||||||||||||||||||||||
| 05-31-14 | 15.10 | 0.17 | 2.70 | 2.87 | 0.12 | — | 0.12 | 17.85 | 19.13 | 1.21 | 1.10 | 1.10 | 1.05 | 26,639 | 84 | |||||||||||||||||||||||||||||||||||||||||||
| 05-31-13 | 12.16 | 0.14 | 2.94 | 3.08 | 0.14 | — | 0.14 | 15.10 | 25.56 | 1.23 | 1.08 | 1.08 | 0.99 | 21,773 | 59 | |||||||||||||||||||||||||||||||||||||||||||
| 05-31-12 | 12.43 | 0.12 | (0.30 | ) | (0.18 | ) | 0.09 | — | 0.09 | 12.16 | (1.36 | ) | 1.26 | 1.08 | 1.08 | 0.98 | 18,409 | 71 | ||||||||||||||||||||||||||||||||||||||||
| 05-31-11 | 10.00 | 0.06 | 2.42 | 2.48 | 0.05 | — | 0.05 | 12.43 | 24.85 | 1.26 | 1.08 | † | 1.08 | † | 0.56 | † | 18,504 | 75 | ||||||||||||||||||||||||||||||||||||||||
| 05-31-10 | 8.77 | 0.05 | 1.26 | 1.31 | 0.08 | — | 0.08 | 10.00 | 14.97 | 1.27 | 1.08 | † | 1.08 | † | 0.49 | † | 13,899 | 124 | ||||||||||||||||||||||||||||||||||||||||
| Class R | ||||||||||||||||||||||||||||||||||||||||||||||||||||||||||
| 05-31-14 | 15.06 | 0.13 | 2.70 | 2.83 | 0.09 | — | 0.09 | 17.80 | 18.87 | 1.46 | 1.35 | 1.35 | 0.81 | 5 | 84 | |||||||||||||||||||||||||||||||||||||||||||
| 05-31-13 | 12.16 | 0.10 | 2.94 | 3.04 | 0.14 | — | 0.14 | 15.06 | 25.17 | 1.48 | 1.33 | 1.33 | 0.74 | 4 | 59 | |||||||||||||||||||||||||||||||||||||||||||
| 08-05-114-05-31-12 | 10.85 | 0.06 | 1.31 | 1.37 | 0.06 | — | 0.06 | 12.16 | 12.70 | 1.51 | 1.33 | 1.33 | 0.83 | 3 | 71 | |||||||||||||||||||||||||||||||||||||||||||
| Class R6 | ||||||||||||||||||||||||||||||||||||||||||||||||||||||||||
| 09-30-134-05-31-14 | 15.97 | 0.09 | • | 2.00 | 2.09 | 0.10 | — | 0.10 | 17.96 | 13.15 | 0.85 | 0.74 | 0.74 | 0.84 | 1,903 | 84 | ||||||||||||||||||||||||||||||||||||||||||
For financial professional use only. Not for inspection by or distribution to the general public.
February 2, 2015
Client Talking Points
| Income (loss) from investment operations | Less distributions | Ratios to average net assets | Supplemental data | ||||||||||||||||||||||||||||||||||||||||||||||||||||||||
| Net asset value, beginning of year or period | Net investment income (loss) | Net realized and unrealized gain (loss) | Total from investment operations | From net investment income | From net realized gains | Total Distributions | Net asset value, end of year or period | Total Return(1) | Expenses before reductions/ additions(2)(3) | Expenses net of fee waivers and/or recoupments, if any(2)(3) | Expenses net of all reductions/ additions(2)(3) | Net | Net assets, end of year or period | Portfolio turnover rate | ||||||||||||||||||||||||||||||||||||||||||||||
| Year or period ended | ($) | ($) | ($) | ($) | ($) | ($) | ($) | ($) | ($) | (%) | (%) | (%) | (%) | ($000’s) | (%) | |||||||||||||||||||||||||||||||||||||||||||||
| Class W | ||||||||||||||||||||||||||||||||||||||||||||||||||||||||||||
| 05-31-14 | 15.16 | 0.22 | • | 2.71 | 2.93 | 0.17 | — | 0.17 | 17.92 | 19.45 | 0.96 | 0.85 | 0.85 | 1.32 | 23,564 | 84 | ||||||||||||||||||||||||||||||||||||||||||||
| 05-31-13 | 12.22 | 0.15 | 2.98 | 3.13 | 0.19 | — | 0.19 | 15.16 | 25.88 | 0.98 | 0.83 | 0.83 | 1.33 | 10,021 | 59 | |||||||||||||||||||||||||||||||||||||||||||||
| 05-31-12 | 12.49 | 0.15 | • | (0.30 | ) | (0.15 | ) | 0.12 | — | 0.12 | 12.22 | (1.10 | ) | 1.01 | 0.83 | 0.83 | 1.18 | 2,488 | 71 | |||||||||||||||||||||||||||||||||||||||||
| 05-31-11 | 10.05 | 0.08 | 2.43 | 2.51 | 0.07 | — | 0.07 | 12.49 | 25.10 | 1.01 | 0.83 | † | 0.83 | † | 0.85 | † | 92 | 75 | ||||||||||||||||||||||||||||||||||||||||||
| 06-12-094-05-31-10 | 9.03 | 0.07 | • | 1.05 | 1.12 | 0.10 | — | 0.10 | 10.05 | 12.44 | 1.02 | 0.83 | † | 0.83 | † | 0.73 | † | 3 | 124 | |||||||||||||||||||||||||||||||||||||||||
| 1. | Total return is calculated assuming reinvestment of all dividends, capital gain distributions and return of capital distributions, if any, at NAV and excluding the deduction of sales charges or contingent deferred sales charges, if applicable. Total return for periods less than one year is not annualized. |
| 2. | Annualized for periods less than a year. |
| 3. | Expense ratios reflect operating expenses of a Fund. Expenses before reductions/additions do not reflect amounts reimbursed by an Investment Adviser and/or Distributor or reductions from brokerage service arrangements or other expense offset arrangements and do not represent the amount paid by a Fund during periods when reimbursements or reductions occur. Expenses net of fee waivers reflect expenses after reimbursement by an Investment Adviser and/or Distributor but prior to February 2, 2015 reductions from brokerage service arrangements or other expense offset arrangements. Expenses net of all reductions/additions represent the net expenses paid by a Fund. Net investment income (loss) is net of all such additions or reductions. |
| 4. | Commencement of operations. |
| · | Calculated using average number of shares outstanding throughout the period. |
| † | Impact of waiving the advisory fee for the ING Institutional Prime Money Market Fund holding has less than 0.005% impact on the expense ratio and net investment income or loss ratio. |
For financial professional use only. Not for inspection by or distribution to the general public.
February 2, 2015
Client Talking Points
Large Cap Value Fund
| Income (loss) from investment operations | Less distributions | Ratios to average net assets | Supplemental data | ||||||||||||||||||||||||||||||||||||||||||||||||||||||||
| Net asset value, beginning of year or period | Net investment income (loss) | Net realized and unrealized gain (loss) | Total from investment operations | From net investment income | From net realized gains | Total Distributions | Net asset value, end of year or period | Total Return(1) | Expenses before reductions/ additions(2)(3) | Expenses net of fee waivers and/or recoupments, if any(2)(3) | Expenses net of all reductions/ additions(2)(3) | Net | Net assets, end of year or period | Portfolio turnover rate | ||||||||||||||||||||||||||||||||||||||||||||||
| Year or period ended | ($) | ($) | ($) | ($) | ($) | ($) | ($) | ($) | ($) | (%) | (%) | (%) | (%) | ($000’s) | (%) | |||||||||||||||||||||||||||||||||||||||||||||
| Class A | ||||||||||||||||||||||||||||||||||||||||||||||||||||||||||||
| 05-31-14 | 12.19 | 0.15 | 1.69 | 1.84 | 0.17 | 1.05 | 1.22 | 12.81 | 16.28 | 1.16 | 1.14 | 1.14 | 1.21 | 206,215 | 149 | |||||||||||||||||||||||||||||||||||||||||||||
| 05-31-13 | 9.88 | 0.17 | 2.62 | 2.79 | 0.18 | 0.30 | 0.48 | 12.19 | 29.02 | 1.15 | 1.14 | 1.14 | 1.55 | 57,211 | 123 | |||||||||||||||||||||||||||||||||||||||||||||
| 05-31-12 | 10.44 | 0.23 | • | (0.41 | ) | (0.18 | ) | 0.21 | 0.17 | 0.38 | 9.88 | (1.53 | ) | 1.21 | 1.15 | 1.15 | 2.30 | 32,435 | 84 | |||||||||||||||||||||||||||||||||||||||||
| 05-31-11 | 8.53 | 0.20 | 1.91 | 2.11 | 0.18 | 0.02 | 0.20 | 10.44 | 25.07 | 1.20 | 1.14 | † | 1.14 | † | 2.18 | † | 11,331 | 46 | ||||||||||||||||||||||||||||||||||||||||||
| 05-31-10 | 7.00 | 0.16 | 1.52 | 1.68 | 0.15 | — | 0.15 | 8.53 | 24.22 | 2.12 | 1.25 | † | 1.25 | † | 1.94 | † | 6,788 | 113 | ||||||||||||||||||||||||||||||||||||||||||
| Class B | ||||||||||||||||||||||||||||||||||||||||||||||||||||||||||||
| 05-31-14 | 12.13 | 0.04 | 1.71 | 1.75 | 0.08 | 1.05 | 1.13 | 12.75 | 15.49 | 1.91 | 1.89 | 1.89 | 0.45 | 6,030 | 149 | |||||||||||||||||||||||||||||||||||||||||||||
| 05-31-13 | 9.83 | 0.09 | • | 2.60 | 2.69 | 0.09 | 0.30 | 0.39 | 12.13 | 28.06 | 1.90 | 1.89 | 1.89 | 0.82 | 589 | 123 | ||||||||||||||||||||||||||||||||||||||||||||
| 05-31-12 | 10.40 | 0.16 | • | (0.41 | ) | (0.25 | ) | 0.15 | 0.17 | 0.32 | 9.83 | (2.27 | ) | 1.96 | 1.90 | 1.90 | 1.58 | 567 | 84 | |||||||||||||||||||||||||||||||||||||||||
| 05-31-11 | 8.51 | 0.13 | 1.90 | 2.03 | 0.12 | 0.02 | 0.14 | 10.40 | 24.01 | 1.95 | 1.89 | † | 1.89 | † | 1.44 | † | 295 | 46 | ||||||||||||||||||||||||||||||||||||||||||
| 05-31-10 | 6.99 | 0.09 | 1.53 | 1.62 | 0.10 | — | 0.10 | 8.51 | 23.31 | 2.87 | 2.00 | † | 2.00 | † | 1.16 | † | 219 | 113 | ||||||||||||||||||||||||||||||||||||||||||
| Class C | ||||||||||||||||||||||||||||||||||||||||||||||||||||||||||||
| 05-31-14 | 12.15 | 0.04 | 1.71 | 1.75 | 0.08 | 1.05 | 1.13 | 12.77 | 15.50 | 1.91 | 1.89 | 1.89 | 0.45 | 95,789 | 149 | |||||||||||||||||||||||||||||||||||||||||||||
| 05-31-13 | 9.85 | 0.08 | 2.62 | 2.70 | 0.10 | 0.30 | 0.40 | 12.15 | 28.11 | 1.90 | 1.89 | 1.89 | 0.80 | 22,862 | 123 | |||||||||||||||||||||||||||||||||||||||||||||
| 05-31-12 | 10.43 | 0.15 | • | (0.40 | ) | (0.25 | ) | 0.16 | 0.17 | 0.33 | 9.85 | (2.31 | ) | 1.96 | 1.90 | 1.90 | 1.55 | 12,095 | 84 | |||||||||||||||||||||||||||||||||||||||||
| 05-31-11 | 8.54 | 0.11 | 1.92 | 2.03 | 0.12 | 0.02 | 0.14 | 10.43 | 23.98 | 1.95 | 1.89 | † | 1.89 | † | 1.40 | † | 3,697 | 46 | ||||||||||||||||||||||||||||||||||||||||||
| 05-31-10 | 7.01 | 0.10 | 1.53 | 1.63 | 0.10 | — | 0.10 | 8.54 | 23.32 | 2.87 | 2.00 | † | 2.00 | † | 1.19 | † | 1,201 | 113 | ||||||||||||||||||||||||||||||||||||||||||
| Class I | ||||||||||||||||||||||||||||||||||||||||||||||||||||||||||||
| 05-31-14 | 12.84 | 0.20 | • | 1.80 | 2.00 | 0.21 | 1.05 | 1.26 | 13.58 | 16.76 | 0.81 | 0.79 | 0.79 | 1.55 | 219,822 | 149 | ||||||||||||||||||||||||||||||||||||||||||||
| 05-31-13 | 10.38 | 0.22 | • | 2.75 | 2.97 | 0.21 | 0.30 | 0.51 | 12.84 | 29.44 | 0.82 | 0.80 | 0.80 | 1.90 | 277,638 | 123 | ||||||||||||||||||||||||||||||||||||||||||||
| 05-31-12 | 10.95 | 0.28 | • | (0.43 | ) | (0.15 | ) | 0.25 | 0.17 | 0.42 | 10.38 | (1.22 | ) | 0.87 | 0.80 | 0.80 | 2.69 | 177,157 | 84 | |||||||||||||||||||||||||||||||||||||||||
| 05-31-11 | 8.95 | 0.23 | 2.00 | 2.23 | 0.21 | 0.02 | 0.23 | 10.95 | 25.22 | 0.88 | 0.82 | † | 0.82 | † | 2.51 | † | 102,577 | 46 | ||||||||||||||||||||||||||||||||||||||||||
| 03-31-104-05-31-10 | 9.46 | 0.04 | (0.51 | ) | (0.47 | ) | 0.04 | — | 0.04 | 8.95 | (4.99 | ) | 1.84 | 0.97 | † | 0.97 | † | 2.18 | † | 44 | 113 | |||||||||||||||||||||||||||||||||||||||
| Class O | ||||||||||||||||||||||||||||||||||||||||||||||||||||||||||||
| 05-31-14 | 12.18 | 0.15 | 1.69 | 1.84 | 0.17 | 1.05 | 1.22 | 12.80 | 16.32 | 1.16 | 1.14 | 1.14 | 1.20 | 6,780 | 149 | |||||||||||||||||||||||||||||||||||||||||||||
| 01-28-134-05-31-13 | 11.15 | 0.06 | • | 1.00 | 1.06 | 0.03 | — | 0.03 | 12.18 | 9.54 | 1.15 | 1.14 | 1.14 | 1.54 | 375 | 123 | ||||||||||||||||||||||||||||||||||||||||||||
| Class R | ||||||||||||||||||||||||||||||||||||||||||||||||||||||||||||
| 05-31-14 | 12.17 | 0.12 | • | 1.70 | 1.82 | 0.15 | 1.05 | 1.20 | 12.79 | 16.12 | 1.41 | 1.34 | 1.34 | 1.01 | 4,263 | 149 | ||||||||||||||||||||||||||||||||||||||||||||
| 05-31-13 | 9.88 | 0.14 | 2.62 | 2.76 | 0.17 | 0.30 | 0.47 | 12.17 | 28.74 | 1.40 | 1.34 | 1.34 | 1.32 | 2,089 | 123 | |||||||||||||||||||||||||||||||||||||||||||||
| 08-05-114-05-31-12 | 9.19 | 0.16 | • | 0.85 | 1.01 | 0.15 | 0.17 | 0.32 | 9.88 | 11.22 | 1.46 | 1.39 | 1.39 | 2.02 | 87 | 84 | ||||||||||||||||||||||||||||||||||||||||||||
| Class R6 | ||||||||||||||||||||||||||||||||||||||||||||||||||||||||||||
| 05-31-14 | 12.84 | 0.20 | • | 1.80 | 2.00 | 0.21 | 1.05 | 1.26 | 13.58 | 16.77 | 0.81 | 0.78 | 0.78 | 1.57 | 265,510 | 149 | ||||||||||||||||||||||||||||||||||||||||||||
| 05-31-134-05-31-13 | 12.84 | 0.00 | * | 0.00 | * | 0.00 | * | — | — | — | 12.84 | 0.00 | 0.79 | 0.78 | 0.78 | 1.92 | 3 | 123 | ||||||||||||||||||||||||||||||||||||||||||
For financial professional use only. Not for inspection by or distribution to the general public.
February 2, 2015
Client Talking Points
| Income (loss) from investment operations | Less distributions | Ratios to average net assets | Supplemental data | |||||||||||||||||||||||||||||||||||||||||||||||||||||||||
| Net asset value, beginning of year or period | Net investment income (loss) | Net realized and unrealized gain (loss) | Total from investment operations | From net investment income | From net realized gains | Total Distributions | Net asset value, end of year or period | Total Return(1) | Expenses before reductions/ additions(2)(3) | Expenses net of fee waivers and/or recoupments, if any(2)(3) | Expenses net of all reductions/ additions(2)(3) | Net | Net assets, end of year or period | Portfolio turnover rate | |||||||||||||||||||||||||||||||||||||||||||||||
| Year or period ended | ($) | ($) | ($) | ($) | ($) | ($) | ($) | ($) | ($) | (%) | (%) | (%) | (%) | ($000’s) | (%) | ||||||||||||||||||||||||||||||||||||||||||||||
| Class W | |||||||||||||||||||||||||||||||||||||||||||||||||||||||||||||
| 05-31-14 | 12.81 | 0.19 | 1.79 | 1.98 | 0.20 | 1.05 | 1.25 | 13.54 | 16.62 | 0.91 | 0.89 | 0.89 | 1.46 | 46,143 | 149 | ||||||||||||||||||||||||||||||||||||||||||||||
| 05-31-13 | 10.36 | 0.19 | 2.76 | 2.95 | 0.20 | 0.30 | 0.50 | 12.81 | 29.32 | 0.90 | 0.89 | 0.89 | 1.79 | 35,301 | 123 | ||||||||||||||||||||||||||||||||||||||||||||||
| 05-31-12 | 10.93 | 0.26 | • | (0.42 | ) | (0.16 | ) | 0.24 | 0.17 | 0.41 | 10.36 | (1.29 | ) | 0.96 | 0.90 | 0.90 | 2.53 | 6,345 | 84 | ||||||||||||||||||||||||||||||||||||||||||
| 05-31-11 | 8.93 | 0.19 | 2.04 | 2.23 | 0.21 | 0.02 | 0.23 | 10.93 | 25.25 | 0.95 | 0.89 | † | 0.89 | † | 2.37 | † | 64 | 46 | |||||||||||||||||||||||||||||||||||||||||||
| 06-01-094-05-31-10 | 7.50 | 0.17 | 1.43 | 1.60 | 0.17 | — | 0.17 | 8.93 | 21.48 | 1.84 | 0.97 | † | 0.97 | † | 2.20 | † | 4 | 113 | |||||||||||||||||||||||||||||||||||||||||||
| 1. | Total return is calculated assuming reinvestment of all dividends, capital gain distributions and return of capital distributions, if any, at NAV and excluding the deduction of sales charges or contingent deferred sales charges, if applicable. Total return for periods less than one year is not annualized. |
| 2. | Annualized for periods less than a year. |
| 3. | Expense ratios reflect operating expenses of a Fund. Expenses before reductions/additions do not reflect amounts reimbursed by an Investment Adviser and/or Distributor or reductions from brokerage service arrangements or other expense offset arrangements and do not represent the amount paid by a Fund during periods when reimbursements or reductions occur. Expenses net of fee waivers reflect expenses after reimbursement by an Investment Adviser and/or Distributor but prior to reductions from brokerage service arrangements or other expense offset arrangements. Expenses net of all reductions/additions represent the net expenses paid by a Fund. Net investment income (loss) is net of all such additions or reductions. |
| 4. | Commencement of operations. |
| · | Calculated using average number of shares outstanding throughout the period. |
| * | Amount is less than $0.005 or 0.005% or more than $(0.005) or (0.005)%. |
| † | Impact of waiving the advisory fee for the ING Institutional Prime Money Market Fund holding has less than 0.005% impact on the expense ratio and net investment income or loss ratio. |
For financial professional use only. Not for inspection by or distribution to the general public.
The foregoing is not an offer to sell, nor a solicitation of an offer to buy, shares of any fund, nor is it a solicitation of any proxy. For information regarding the Portfolio, please call Voya Investment Management toll free at 1-800-992-0180.
For information regarding any of the Funds discussed in this Client Talking Points, please call Voya IM toll free at 1-800-992-0180. To receive a free copy of a Prospectus Supplement and/or Proxy Statement/Prospectus (when available) relating to the proposed merger of Voya Core Equity Research Fund with and into Voya Large Cap Value Fund, please call Voya Investment Management toll free at 1-800-992-0180. This Client Talking Points is qualified in its entirety by reference to the Prospectus Supplement and/or Proxy Statement/Prospectus (when available), and supersedes any prior Client Talking Points. The Prospectus Supplement and/or Proxy Statement/Prospectus contain important information about the pending Portfolio changes, and
For financial professional use only. Not for inspection by or distribution to the general public.
February 2, 2015
Client Talking Points
therefore you are advised to read it. The Prospectus Supplement and/or Proxy Statement/Prospectus and shareholder reports and other information are or will be available for free on the SEC’s website (www.sec.gov). Please read the any Proxy Statement/Prospectus, and the Prospectus Supplement, carefully before making any decision to invest or to approve the merger.
This information is proprietary and cannot be reproduced or distributed. Certain information may be received from sources Voya Investment Management considers reliable; Voya Investment Management does not represent that such information is accurate or complete. Certain statements contained herein may constitute "projections," "forecasts" and other "forward-looking statements" which do not reflect actual results and are based primarily upon applying retroactively a hypothetical set of assumptions to certain historical financial data. Actual results, performance or events may differ materially from those in such statements. Any opinions, projections, forecasts and forward looking statements presented herein are valid only as of the date of this document and are subject to change. Nothing contained herein should be construed as (i) an offer to buy any security or (ii) a recommendation as to the advisability of investing in, purchasing or selling any security. Voya Investment Management assumes no obligation to update any forward-looking information. Past performance is no guarantee of future results.
Your clients should consider the investment objectives, risks, charges and expenses of the Fund carefully before investing. For a free copy of the Portfolio’s prospectus, which contains this and other information, visit us atwww.voyainvestments.com or call Voya Investment Management at 1-800-992-0180. Please instruct your clients to read the prospectus carefully before investing.
CID – 11556
For financial professional use only. Not for inspection by or distribution to the general public.