Strategy, Performance,
and Outlook
February 2005
1

Craig J. Cerny
Chairman and CEO
2

During the course of my remarks today, you will
hear me make certain predictive statements
regarding our plans and strategies and
anticipated financial results to assist you better
in understanding our company.
The forward looking statements about future
results are not absolute.
Refer to our 10K, 10Q’s and 8K’s on file with
the SEC for further detail in this regard.
3
History
Cerny was the managing principal of the bank consulting group of
Smith Breeden and Associates, Inc. (SBA) from 1985 to 1996.
Principals of SBA decided to make bank investments with personal capital
Harrington West was second bank related investment led by Cerny
Harrington West was formed to acquire Los Padres Bank in April
1996, then $140 million in assets with 4 locations on the Central Coast
of California
Initial public offering completed on November 12, 2002 to fund
further expansion
As of December 31, 2004
$1.1 billion in assets
14 banking locations in three states of CA , KS and AZ, when second AZ location
opens in early 2005.
$100.0 million market cap at December 31, 2004
4
Mission Statement
The mission of Harrington West is to be:
growth oriented
high performing on ROE and EPS growth measures
diversified and opportunistic
high product value for retail and commercial customers
relationship-driven/consultative service
emphasize safety and community involvement
use modern financial skills in risk management and
investments
5
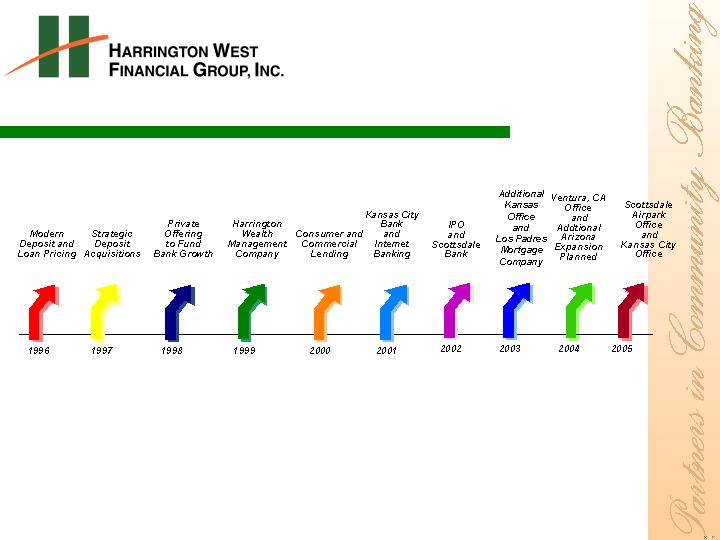
New Product and Project Timeline
6
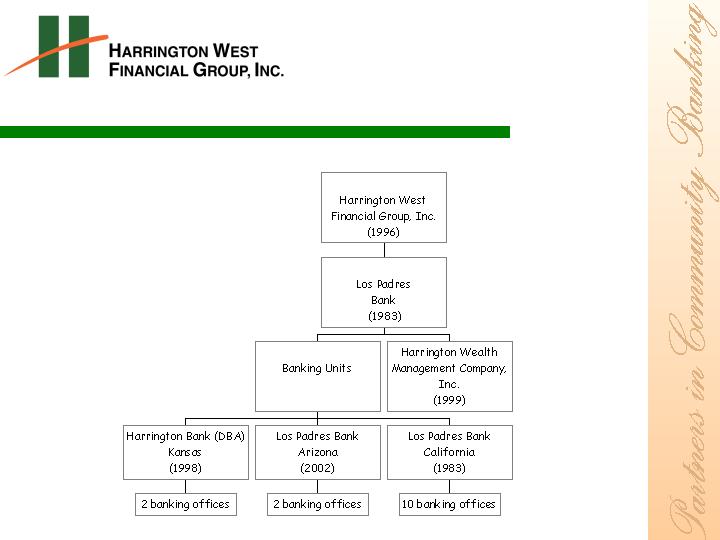
Corporate Structure
7

Why Multiple Markets?
Broad Market
Knowledge
Loan
Diversification
Local Experience
Shareholder
Wealth Creation
Options
Centralized
Administration
8
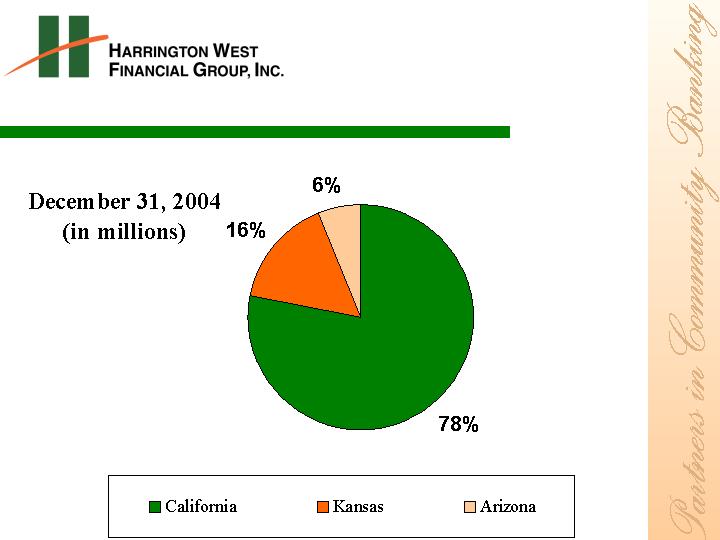
Deposits by Market
Total deposits
$598 million
9
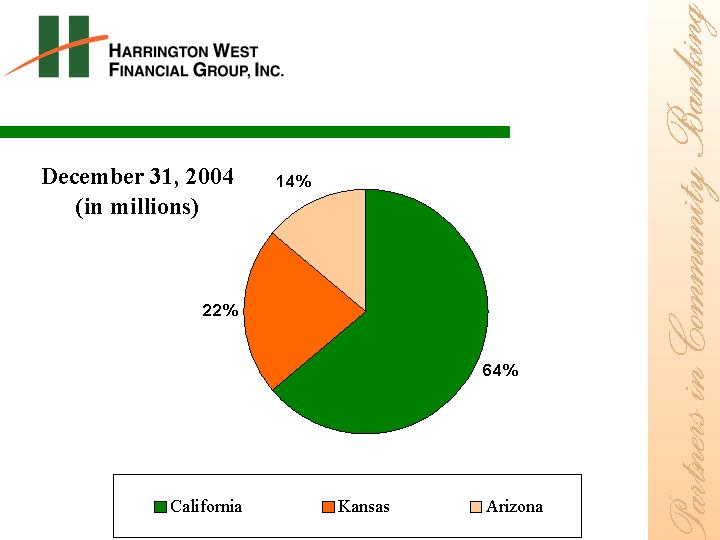
Loans by Market
Total net loans
$598 million
10
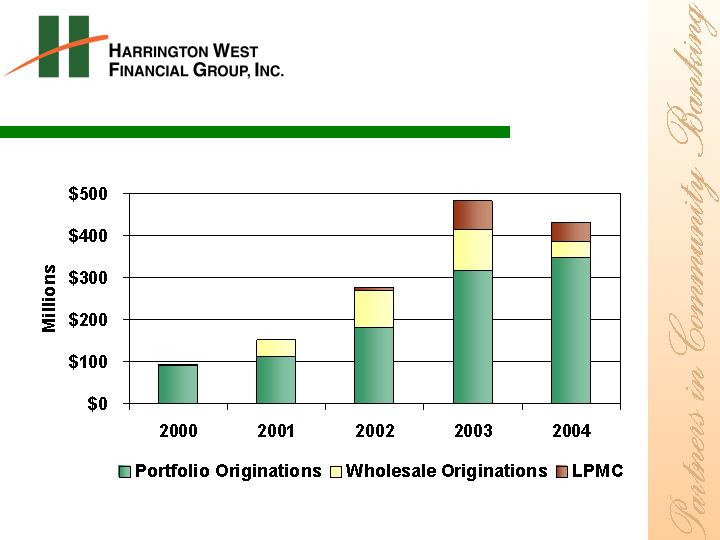
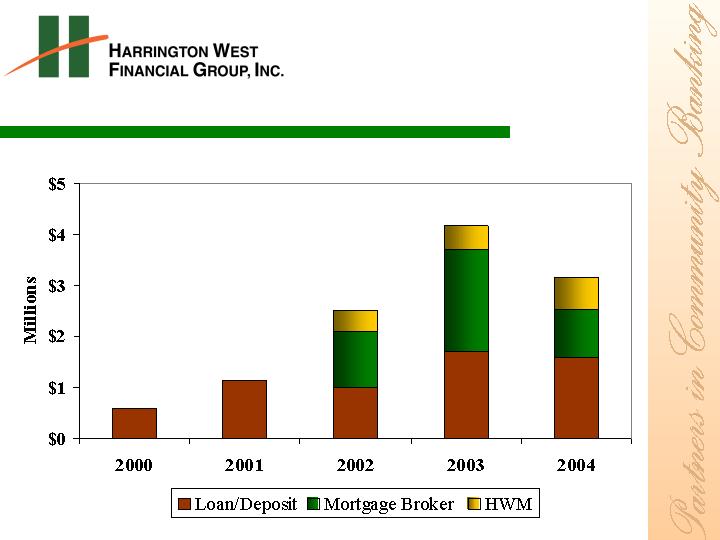
New Loan Originations
11
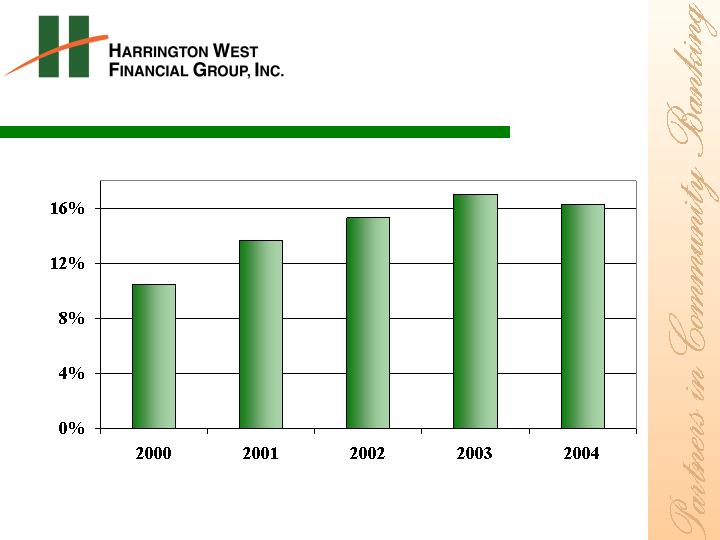
Return on Equity
12
Financial Accomplishments
$2.0
million
$3.1
million
$846
thousand
$6.7
million
$7.6
million
Dec QTD
2003
10.8%
14.7%
(24.4%)
14.2%
11.2%
Change
$2.2
million
$3.4
million
$806
thousand
$7.5
million
$8.4
million
Dec QTD
2004
10.0%
$7.4
million
$8.2
million
Net Income
Core Banking
Income 4
Banking Fee
Income 3
Net Interest
Income 2
Net
Revenue 1
Financial
Measure
$13.3
million
$3.1
million
$28.9
million
$32.7
million
2004
$11.6
million
$4.1
million
$25.3
million
$29.4
million
2003
9.7%
(5.4%)
11.9%
10.5%
Change
1 Net interest income plus banking fee income
2 Net Interest Income after provision for loan losses
3 Loan, deposit, HWM, mortgage brokerage, and other fees
4 Net Revenue minus operating expenses
13
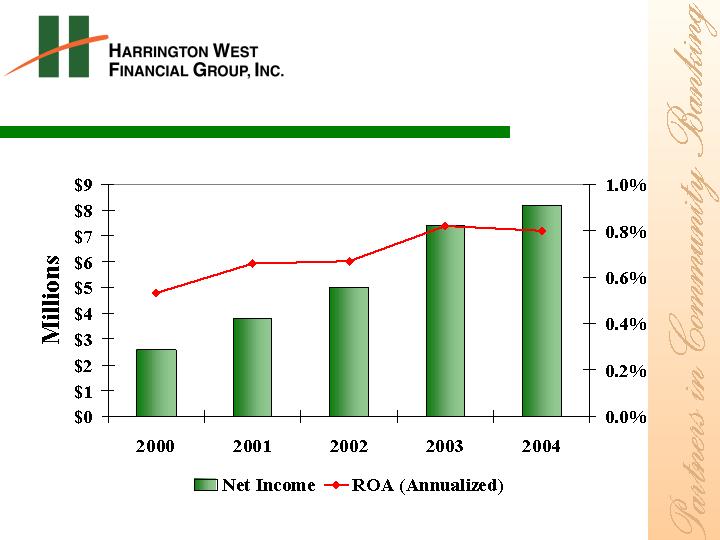
Net Income
14
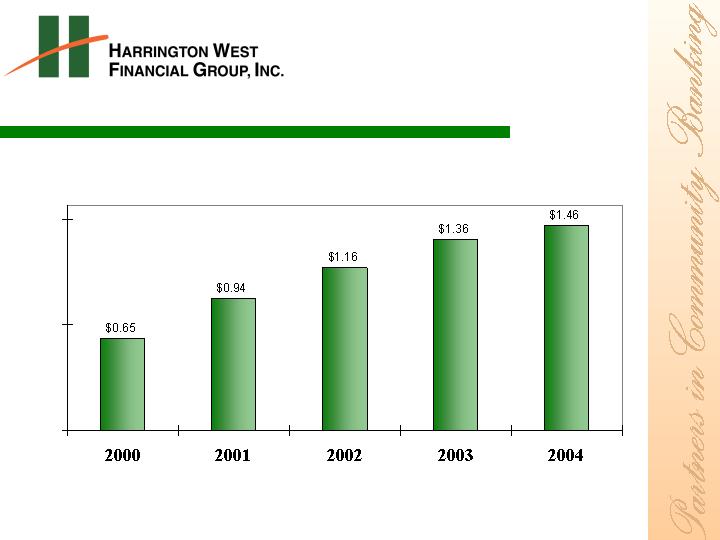
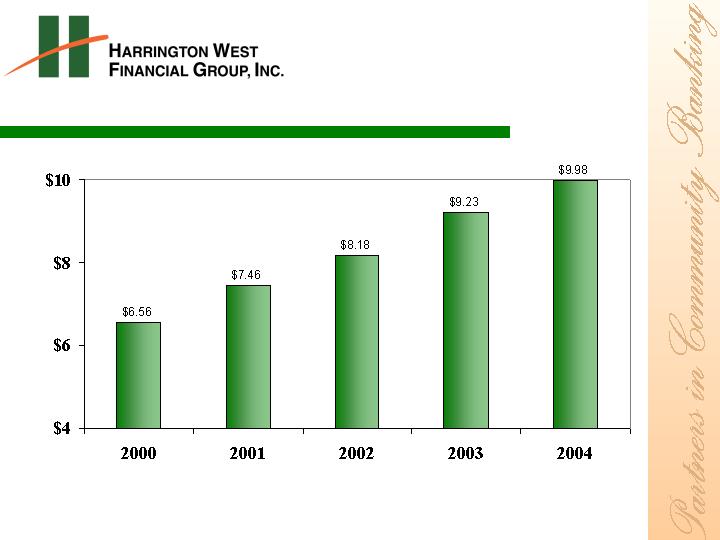
Earnings Per Share
Compounded Annualized Growth Rate from 2000 - 2004 = 22.42%
Note: The per share information above has been adjusted for the 6 for 5 stock
split in the form of a stock dividend to holders of record on February 25, 2004.
15
Book Value Per Share
16
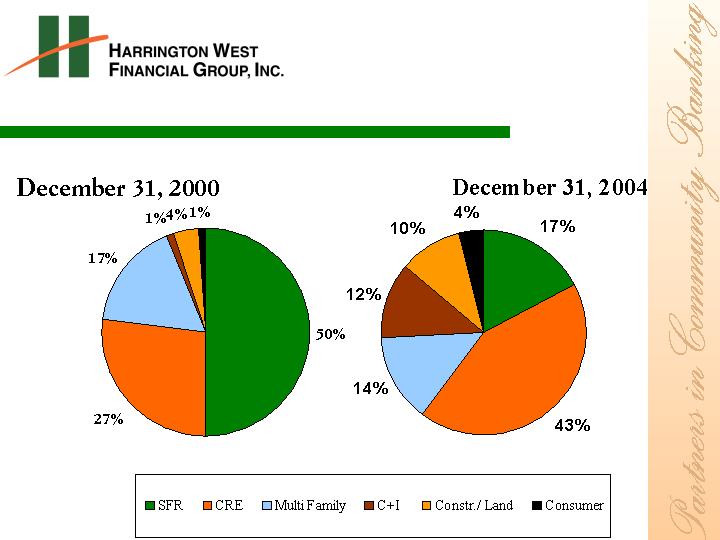
Profit Drivers
Mix Change To Higher Spread Earning Loans
17
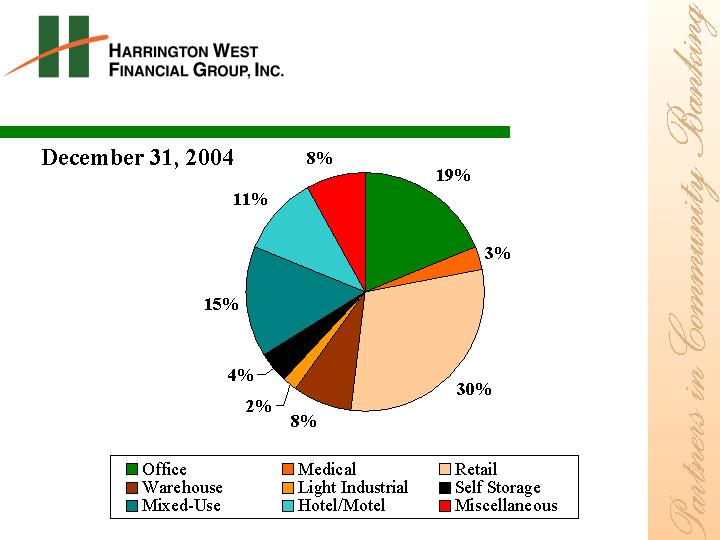
CRE Loan Mix
18
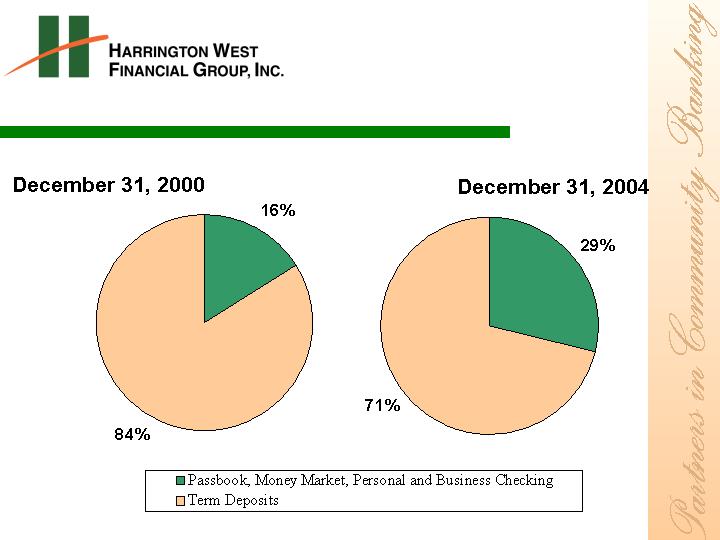
Profit Drivers
Mix Change To Lower Cost Deposits
19

Net Interest Income & Margin
Net interest income is reflected after provision for loan loss.
20
Profit Drivers
Fee Income Growth
21
Profit Drivers
Fee Income
(Dollars in thousands)
Banking Fee Type
Mortgage Brokerage
Fees and Prepayment
Penalties
$298
$260
14.6%
$495
(39.8%)
$1,290
$2,566
(49.7%)
Other Loan Fees
56
55
1.8%
40
40.0%
226
223
1.3%
Deposit, Other Retail
Banking Fee & Other
Income
289
267
8.2%
202
43.1%
1,022
863
18.4 %
Harrington Wealth
Management Fees
163
152
7.2%
109
49.5%
610
456
33.8%
Total
$ 806
$734
9.8%
$ 846
(4.7%)
$ 3,148
$ 4,108
(23.4%)
22
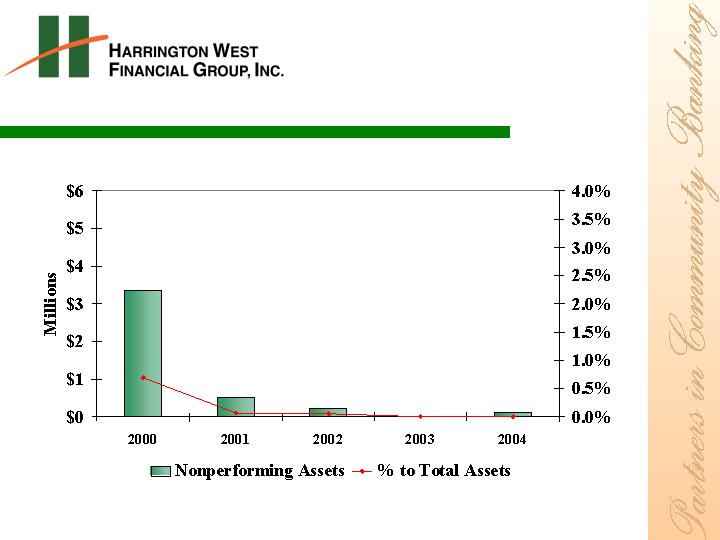
Profit Drivers
Credit Quality Maintained
23
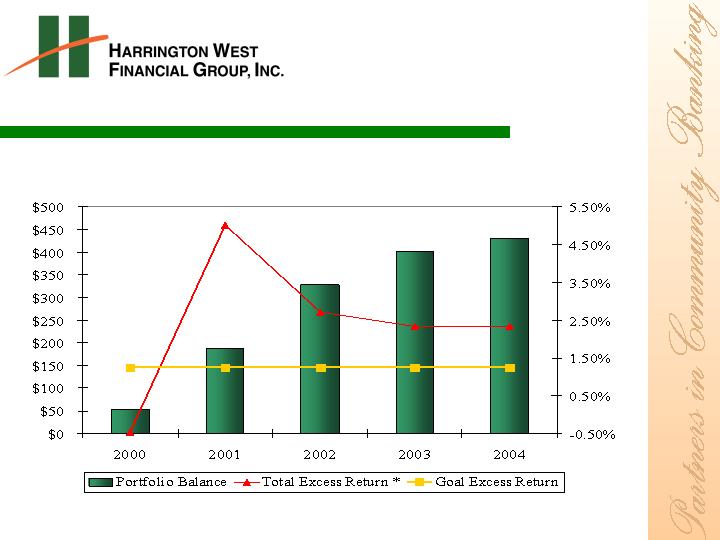
Profit Drivers
Investment Portfolio Performance
* Total Excess Return To One Month LIBOR
24
Strategic Focus for 2004 and Beyond
Maintain excellent financial and investment performance
Continue growth towards a diversified balance sheet.
Focus on expansion of Harrington Wealth Management Company,
Commercial Business Products and new fee producing products to
increase revenue growth.
Overdraft protection
Brokerage services
Focus on mortgage banking income from purchase mortgages and
new builder/realtor programs.
Develop Customer Source applications to track profitable and
opportunity customers and cross selling penetration. Continue
implementation of Sales/Service Program.
Open new banking offices –approximately 2 offices every 15
months.
25

Why Invest in Harrington West?
Track record of improving profitability with a growing franchise
Attractive markets and franchises
Credit quality
Opportunistic strategy
Shareholder focused to maximize value with high inside ownership
Risk Management processes are emphasized
Attractive valuation – January 26, 2005
Peer HWFG
EPS Multiple (LTM) 16.1X *11.81X
Book Multiple 1.91X *1.85X
Dividend Yield 1.89% *2.39%
Payout (LTM) 35% **25%
Rising Cash Dividend to Shareholders
Median of all public banks and thrifts from $500 million to $2 billion in assets per RBC Capital Markets, Inc.
*Based on December 31, 2004 financial information using January 26, 2005 stock price of $18.43 per share.
**Does not include special dividend of 50 cents paid on July 12, 2004.
(NASDAQ Symbol: HWFG)
26
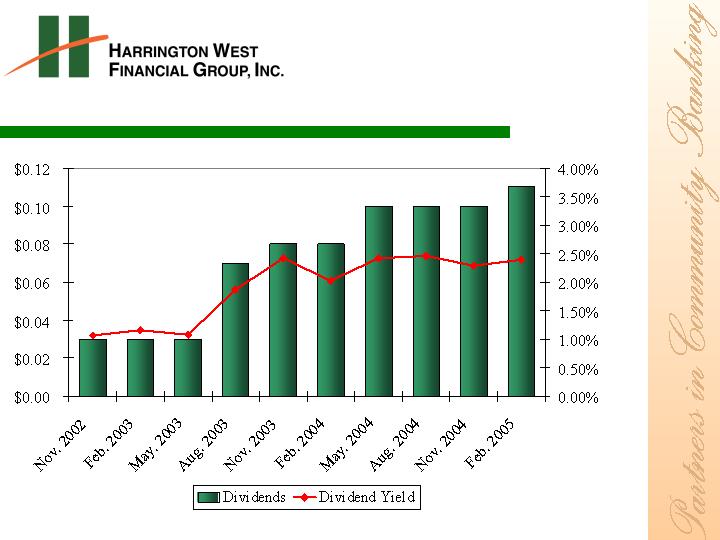
Dividend Payment Per Share
Dividends paid and dividend yield does not include special
dividend of $.50 paid July 12, 2004.
27
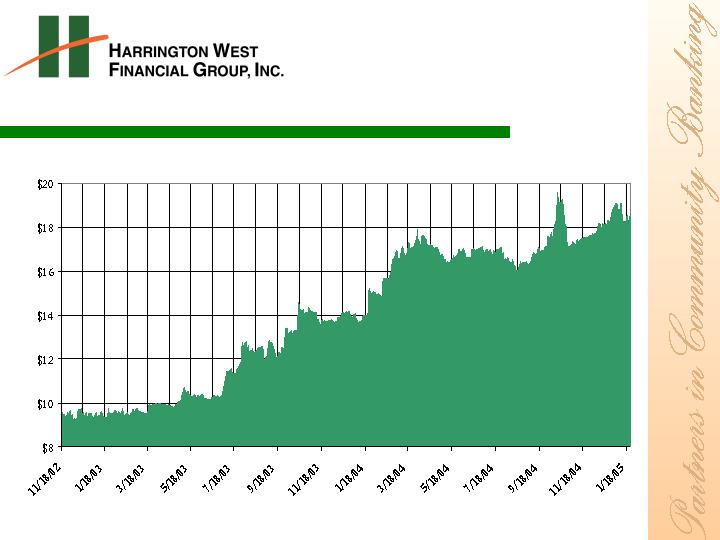
Stock Price
28