Exhibit 99.2
 Harrington West Financial Group, Inc. Shareholder Presentation June 12, 2008 5:00 p.m.
During the course of my remarks today, you will hear me make certain predictive statements regarding our plans and strategies and anticipated financial results to assist you better in understanding our company. The forward looking statements about future results are not absolute. Refer to our 10K, 10Q’s and 8K’s on file with the SEC for further detail in this regard.
3 Shareholder Presentation Mission and Strategies HWFG Market Composition and Contribution The 2007-2008 Environment-The Housing and Credit/Liquidity Crisis HWFG Sought Opportunity Outcome and Response Financial Overview Tactics for 2008 and Beyond
Mission Create shareholder value through developing highly profitable, diversified community banking operations in multiple markets augmented by favorable investment portfolio performance, cost control, and risk management practices. 4
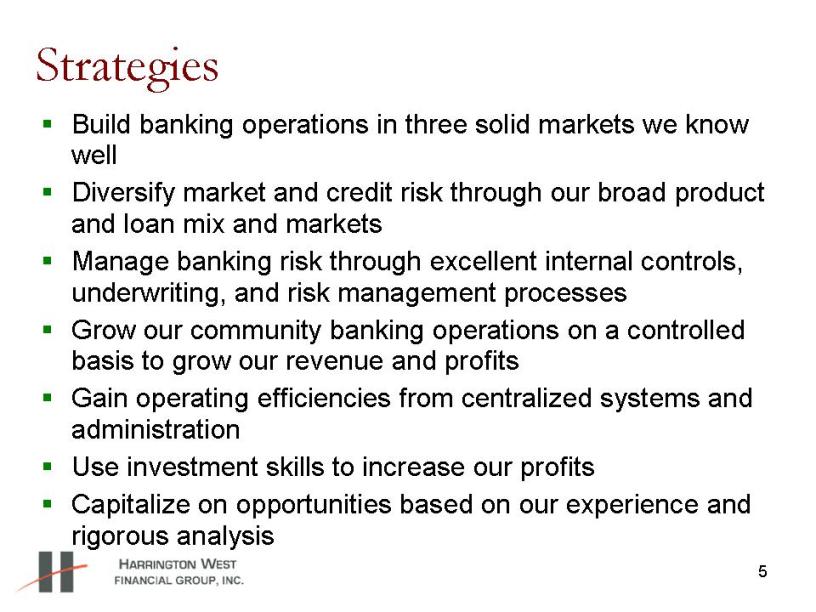
5 Strategies Build banking operations in three solid markets we know well Diversify market and credit risk through our broad product and loan mix and markets Manage banking risk through excellent internal controls, underwriting, and risk management processes Grow our community banking operations on a controlled basis to grow our revenue and profits Gain operating efficiencies from centralized systems and administration Use investment skills to increase our profits Capitalize on opportunities based on our experience and rigorous analysis
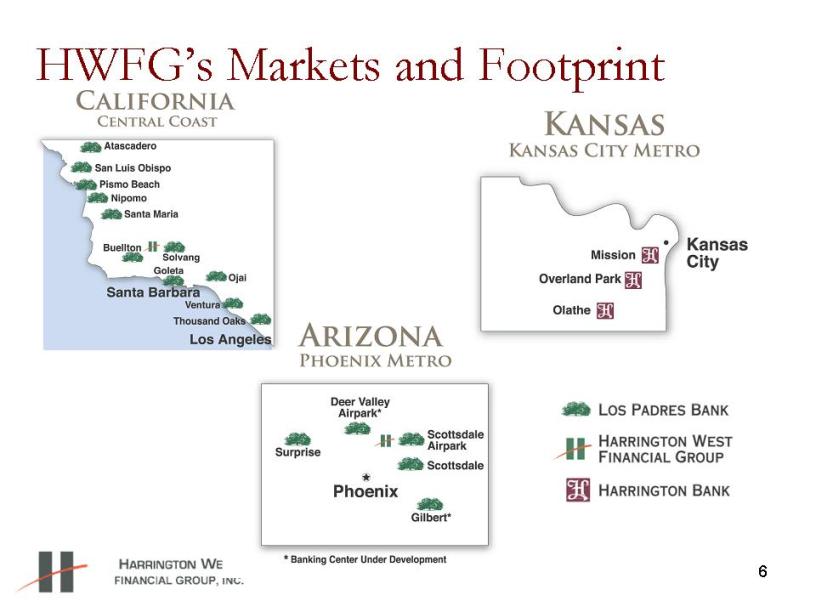
6 HWFG’s Markets and Footprint California Central Coast Kansas Kansas City Metro Atascadero San Luis Obispo Pismo Beach Nipomo Santa Maria Buellton solvang Goleta Ojai Santa Barbara Ventura Thousand Oaks Los Angeles Arizona Phoenix Metro Misión Overland park Olathe Deer Valley Airpark* Surprise Scottsdale Gilbert Phoenix Banking Center Under Development Los Padres Bank Harrington West financial Group Harrington Bank

Loans by Region March 31, 2008 (in millions) Total = $799 Million $489 $167 $143 California Kansas Arizona 7
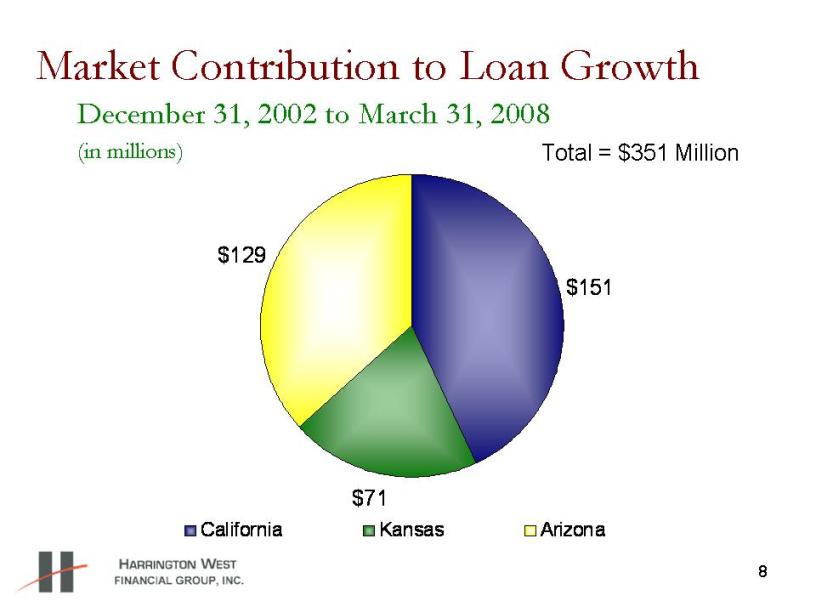
8 Market Contribution to Loan Growth December 31, 2002 to March 31, 2008 (in millions) Total = $351 Million $151 $71 $129 California Kansas Arizona
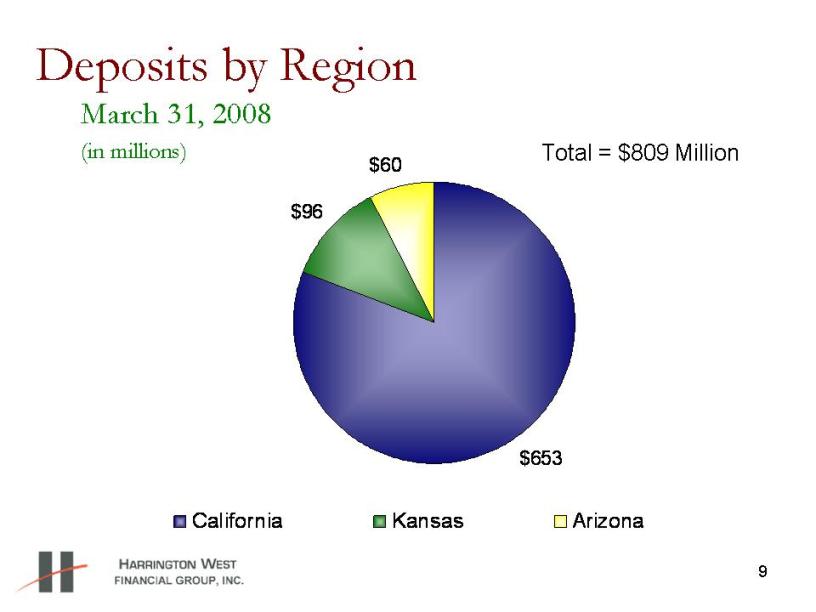
9 Deposits by Region March 31, 2008 (in millions) Total = $809 Million $653 $96 $60 California Kansas Arizona
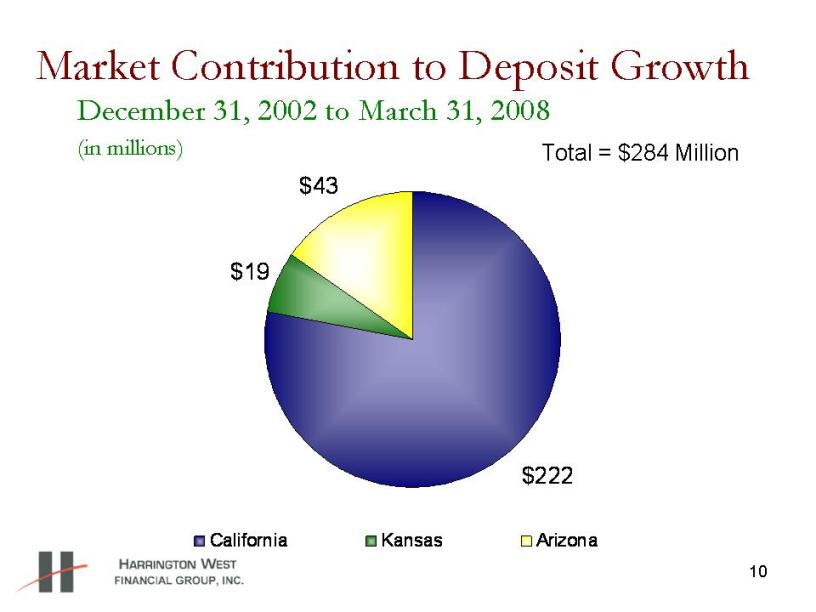
10 Market Contribution to Deposit Growth December 31, 2002 to March 31, 2008 (in millions) Total = $284 Million $222 $19 $43 California Kansas Arizona
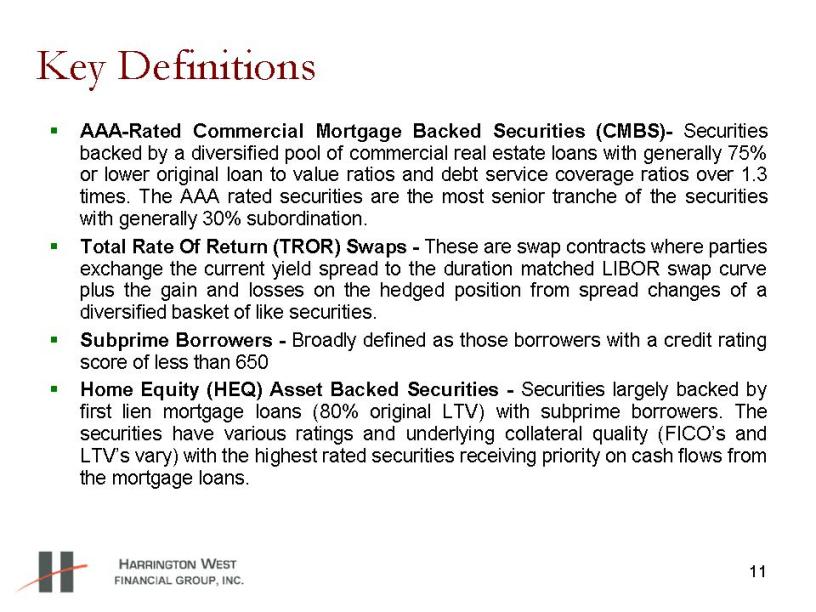
11 Key Definitions AAA-Rated Commercial Mortgage Backed Securities (CMBS)- Securities backed by a diversified pool of commercial real estate loans with generally 75% or lower original loan to value ratios and debt service coverage ratios over 1.3 times. The AAA rated securities are the most senior tranche of the securities with generally 30% subordination. Total Rate Of Return (TROR) Swaps - These are swap contracts where parties exchange the current yield spread to the duration matched LIBOR swap curve plus the gain and losses on the hedged position from spread changes of a diversified basket of like securities. Subprime Borrowers - Broadly defined as those borrowers with a credit rating score of less than 650 Home Equity (HEQ) Asset Backed Securities - Securities largely backed by first lien mortgage loans (80% original LTV) with subprime borrowers. The securities have various ratings and underlying collateral quality (FICO’s and LTV’s vary) with the highest rated securities receiving priority on cash flows from the mortgage loans.
12 The 2007 – 2008 Banking Environment Residential Real Estate Depression What happened? Loose lending standards Sub-prime proliferation
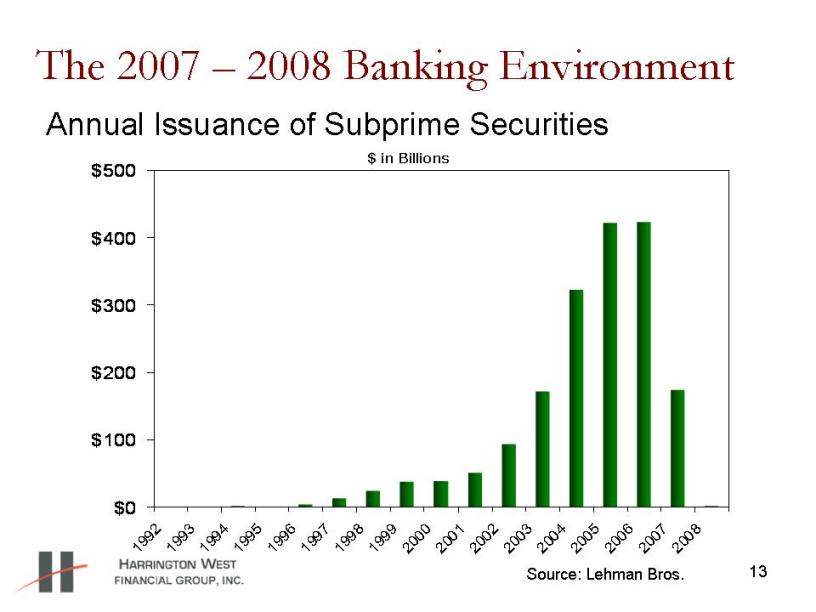
13 The 2007 – 2008 Banking Environment $ in Billions $0 $100 $200 $300 $400 $500 1992 1993 1994 1995 1996 1997 1998 1999 2000 2001 2002 2003 2004 2005 2006 2007 2008 Annual Issuance of Subprime Securities Source: Lehman Bros.
14 The 2007 – 2008 Banking Environment Residential Real Estate Depression What happened? Loose lending standards Sub-prime proliferation Housing price run-up
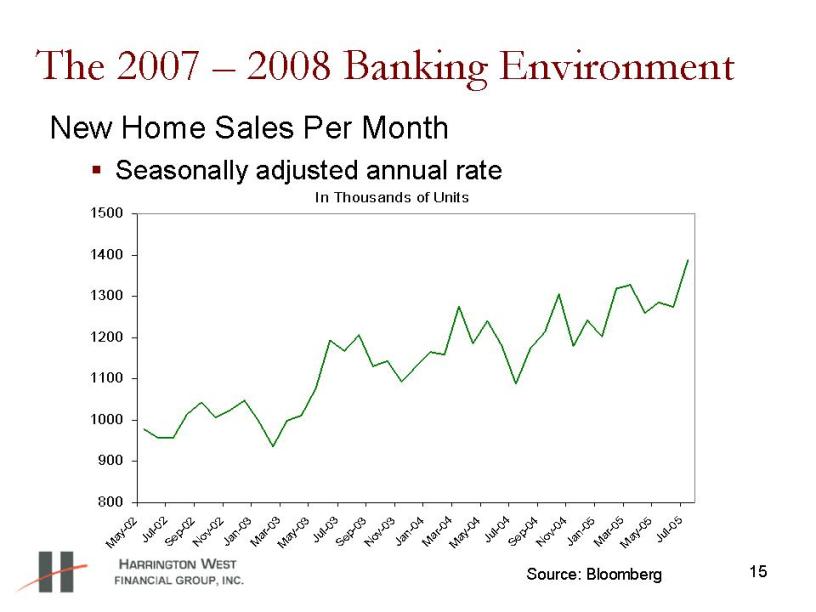
15 The 2007 – 2008 Banking Environment New Home Sales Per Month Seasonally adjusted annual rate In Thousands of Units 800 900 1000 1100 1200 1300 1400 1500 May-02 Jul-02 Sep-02 Nov-02 Jan-03 Mar-03 May-03 Jul -03 Sep-03 Nov-03 Jan-04 Mar-04 May-04 Jul-04 Sep-04 Nov-04 Jan-05 Mar-05 May-05 Jul -05 Source: Bloomberg
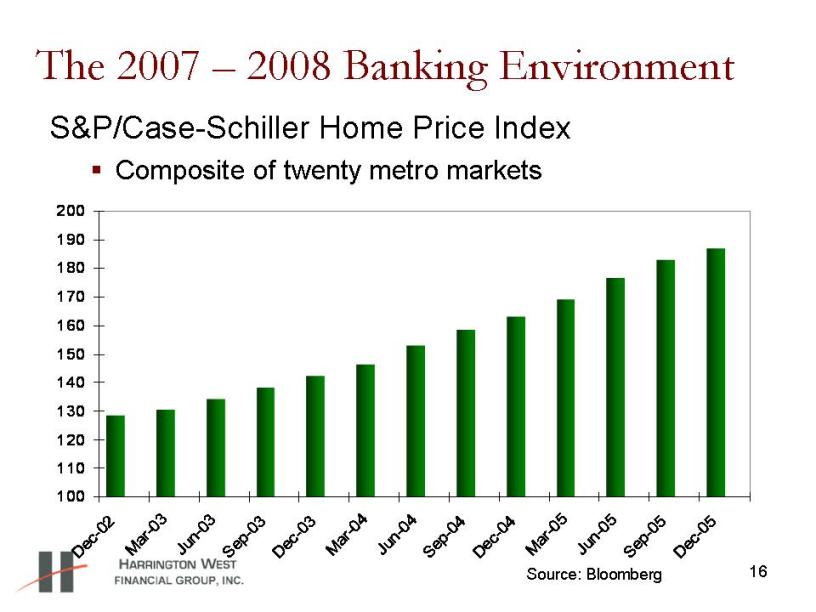
16 The 2007 – 2008 Banking Environment S&P/Case-Schiller Home Price Index �� Composite of twenty metro markets 100 110 120 130 140 150 160 170 180 190 200 Dec -0 2 Mar -0 3 Jun-0 3 Sep -0 3 Dec -0 3 Mar -04 Jun-0 4 Sep -0 4 Dec -0 4 Mar -0 5 Jun-0 5 Sep -0 5 Dec -0 5 Source: Bloomberg
17 The 2007 – 2008 Banking Environment Real estate bubble pops Real estate run-up not sustainable
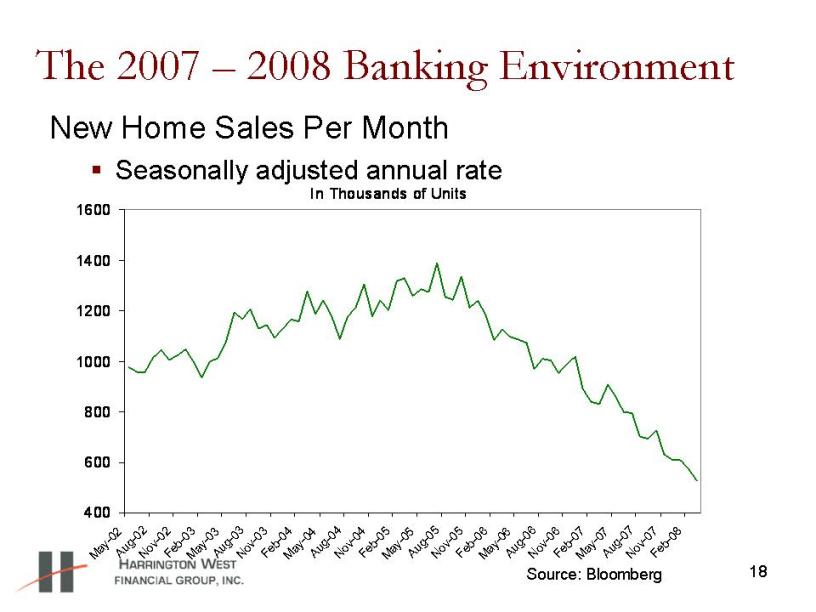
18 The 2007 – 2008 Banking Environment New Home Sales Per Month �� Seasonally adjusted annual rate In Thousands of Units 400 600 800 1000 1200 1400 1600 May-02 Aug-02 Nov-0 2 Feb-03 May-03 Aug-03 Nov-03 Feb-04 May-04 Aug-04 Nov-04 Feb-05 May-05 Aug-05 Nov-05 Feb-06 May-06 Aug-0 6 Nov-0 6 Feb-07 May-07 Aug-07 Nov-0 7 Feb-08 Source: Bloomberg

19 The 2007 – 2008 Banking Environment S&P/Case-Schiller Home Price Index �� Composite of twenty metro markets 100 110 120 130 140 150 160 170 180 190 200 Dec -0 2 Mar-03 Jun-0 3 Sep -0 3 Dec -0 3 Mar-04 Jun-04 Sep-0 4 Dec -0 4 Mar-05 Jun-0 5 Sep -0 5 Dec -0 5 Mar-06 Jun-06 Sep -0 6 Dec -0 6 Mar -0 7 Jun-07 Sep -0 7 Dec -0 7 Source: Bloomberg
20 The 2007 – 2008 Banking Environment Real estate bubble pops Real estate run-up not sustainable Last buyers left holding the bag Delinquencies mount and foreclosures ensue
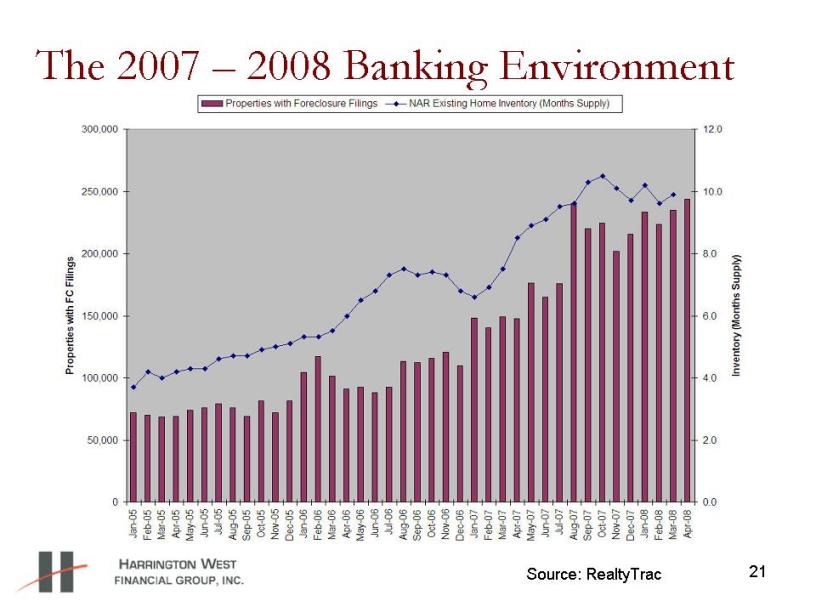
21 The 2007 – 2008 Banking Environment Source: RealtyTrac Jan-05 Feb-05 Mar-05 Apr-05 May-05 Jun-05 Jul-05 Aug-05 Sep-05 Oct-05 Nov-05 Dec-05 Jan-06 Feb-06 Mar-06 Apr-06 May-06 Jun-06 Jul-06 Aug-06 Sep-06 Oct-06 Nov-06 Dec-06 Jan-07 Feb-07 Mar-07 Apr-07 May-07 Jun-07 Jul-07 Aug-07 Sep-07 Oct-07 Nov-07 Dec-07 Jan-08 Feb-08 Mar-08 Apr-08 Properties with FC Filings Inventory (Months Supply) Properties with Foreclosure Filings NAR Existing Home Inventory (Months Supply)
22 The 2007 – 2008 Banking Environment Real estate bubble pops Real estate run-up not sustainable Last buyers left holding the bag Delinquencies mount and foreclosures ensue Write-offs of mortgage loans and securities follow More downward pressure on real estate prices
23 The 2007 – 2008 Banking Environment Credit crisis results Extremely poor sub-prime loan performance causes major risk aversion Spreads widen dramatically on almost all fixed income classes
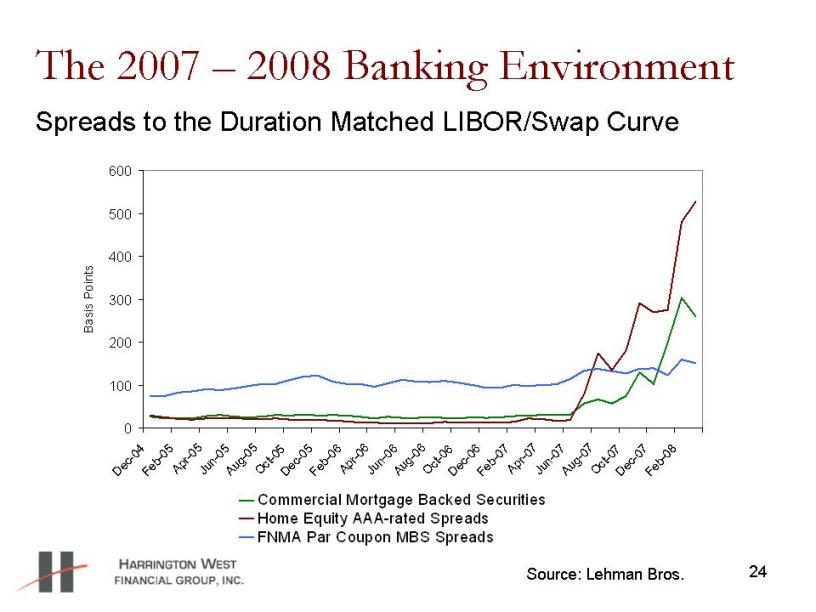
24 The 2007 – 2008 Banking Environment 0 100 200 300 400 500 600 Dec-04 Feb-05 Apr-05 Jun-05 Aug-05 Oct-05 Dec-05 Feb-06 Apr-06 Jun-06 Aug-06 Oct-06 Dec-06 Feb-07 Apr-07 Jun-0 7 Aug-07 Oc t-07 Dec-07 Feb-08 Basis Points Commercial Mortgage Backed Securities Home Equity AAA-rated Spreads FNMA Par Coupon MBS Spreads Spreads to the Duration Matched LIBOR/Swap Curve Source: Lehman Bros.
25 The 2007 – 2008 Banking Environment Credit crisis results Extremely poor sub-prime loan performance causes major risk aversion Spreads widen dramatically on almost all fixed income classes Liquidity becomes non-existent Bank and “Investment Bank” write-offs swell
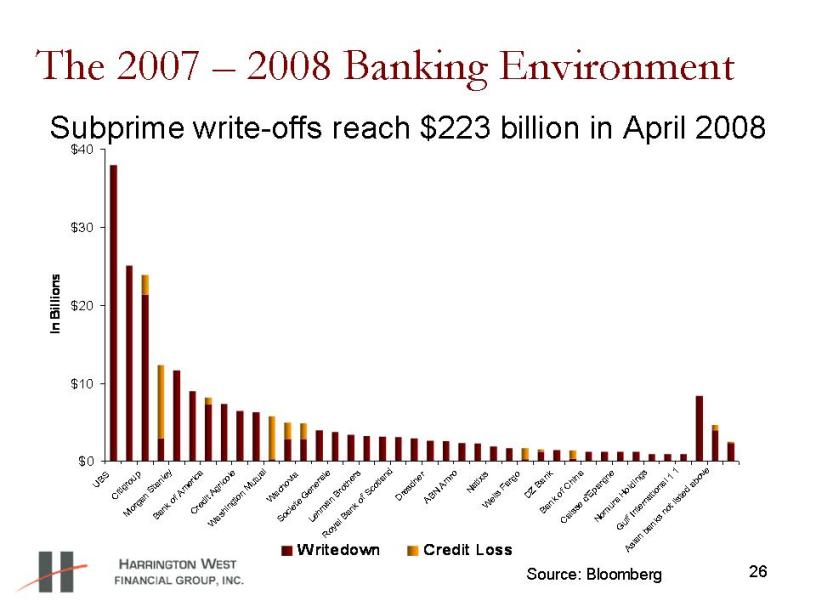
26 The 2007 – 2008 Banking Environment Subprime write-offs reach $223 billion in April 2008 $0 $10 $20 $30 $40 UBS Citigroup Morgan Stanley Bank of America Credit Agricole Washington Mutual Wachovia Societe Generale Lehman Brothers Royal Bank of Scotland Dresdner ABN Amro Natixis Wells Fargo DZ Bank Bank of China Caisse d'Epargne Nomura Holdings Gulf International 1 1 Asian banks not listed above In Billions Writedown Credit Loss Source: Bloomberg
27 The 2007 – 2008 Banking Environment Credit crisis results Extremely poor sub-prime loan performance causes major risk aversion Spreads widen dramatically on almost all fixed income classes Liquidity becomes non-existent Bank and “Investment Bank” write-offs swell Rumors and reality of failure of large mortgage companies, banks, and brokers abound Spreads widen further into mid-March

The 2007 – 2008 Banking Environment Economy weakening with loss of employment 28
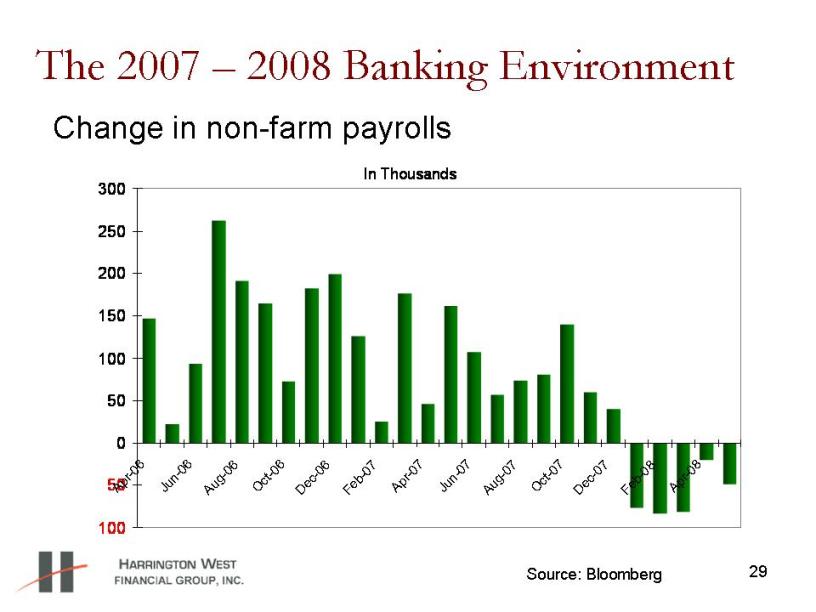
29 The 2007 – 2008 Banking Environment Change in non-farm payrolls In Thousands 100 50 0 50 100 150 200 250 300 Apr-06 Jun-06 Aug-06 Oct-06 Dec-06 Feb-0 7 A pr-07 Jun-07 Aug-07 Oct -07 Dec-07 Feb-08 Apr-0 8 Source: Bloomberg
The 2007 – 2008 Banking Environment Economy weakening with loss of employment Gross Domestic Product slowing 30
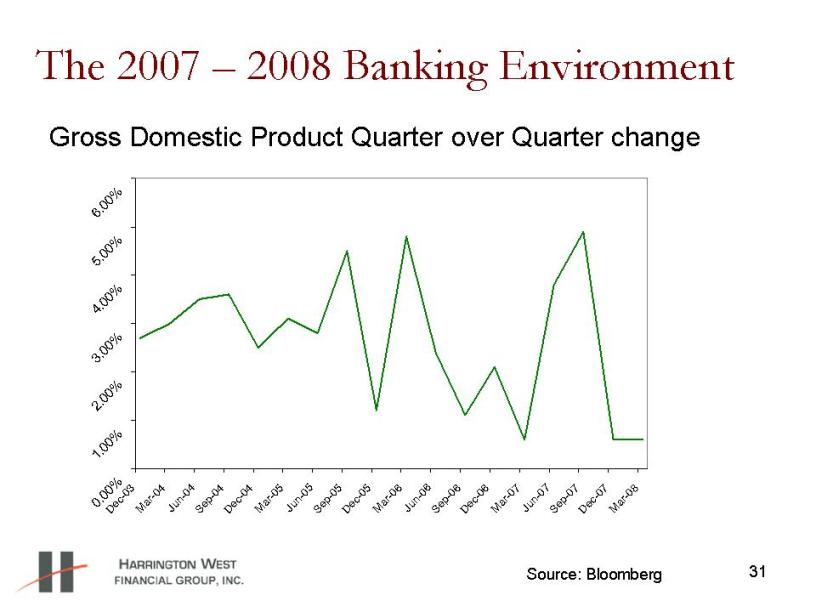
31 The 2007 – 2008 Banking Environment 0.00% 1.00% 2.00% 3.00% 4.00% 5.00 % 6.00% Dec-0 3 Mar-04 Jun-04 Sep-0 4 Dec-04 Mar-05 Jun-05 Sep-05 Dec-05 Mar-06 Jun-06 Sep-06 Dec-06 Mar-07 Jun-07 Sep-07 Dec-07 Mar-08 Gross Domestic Product Quarter over Quarter change Source: Bloomberg

32 The 2007 – 2008 Banking Environment Economy weakening with loss of employment Gross Domestic Product slowing Commodity prices and inflation high
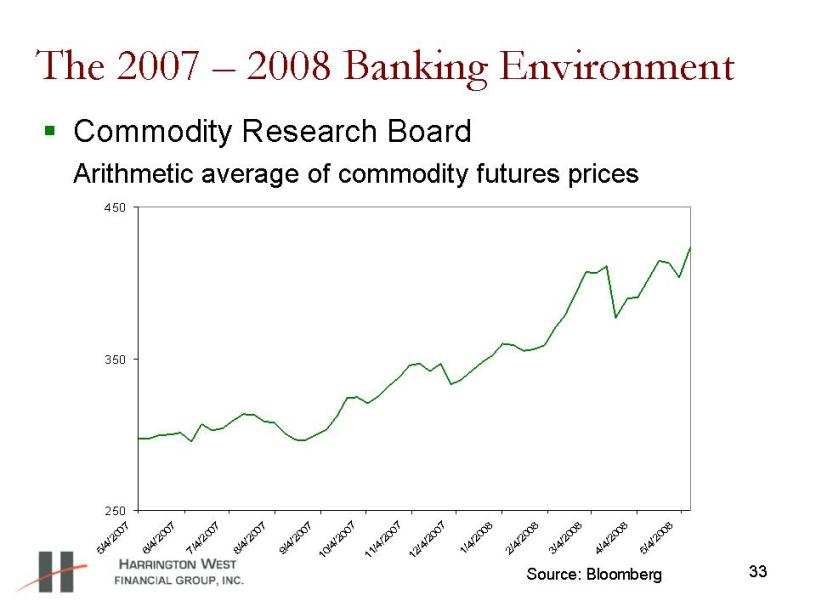
33 The 2007 – 2008 Banking Environment �� Commodity Research Board Arithmetic average of commodity futures prices 250 350 450 5/4/2007 6/4/2007 7/4/2007 8/4/2007 9/4/2007 10/4/2007 11/4/2007 12/4/2007 1/4/2008 2/4/2008 3/4/2008 4/4/2008 5/4/2008 Source: Bloomberg
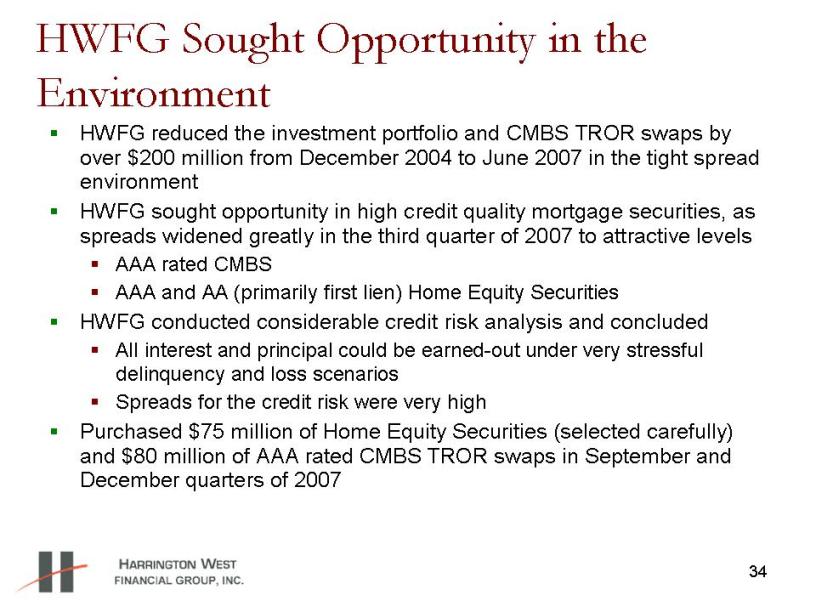
34 HWFG Sought Opportunity in the Environment HWFG reduced the investment portfolio and CMBS TROR swaps by over $200 million from December 2004 to June 2007 in the tight spread environment HWFG sought opportunity in high credit quality mortgage securities, as spreads widened greatly in the third quarter of 2007 to attractive levels AAA rated CMBS AAA and AA (primarily first lien) Home Equity Securities HWFG conducted considerable credit risk analysis and concluded All interest and principal could be earned-out under very stressful delinquency and loss scenarios Spreads for the credit risk were very high Purchased $75 million of Home Equity Securities (selected carefully) and $80 million of AAA rated CMBS TROR swaps in September and December quarters of 2007
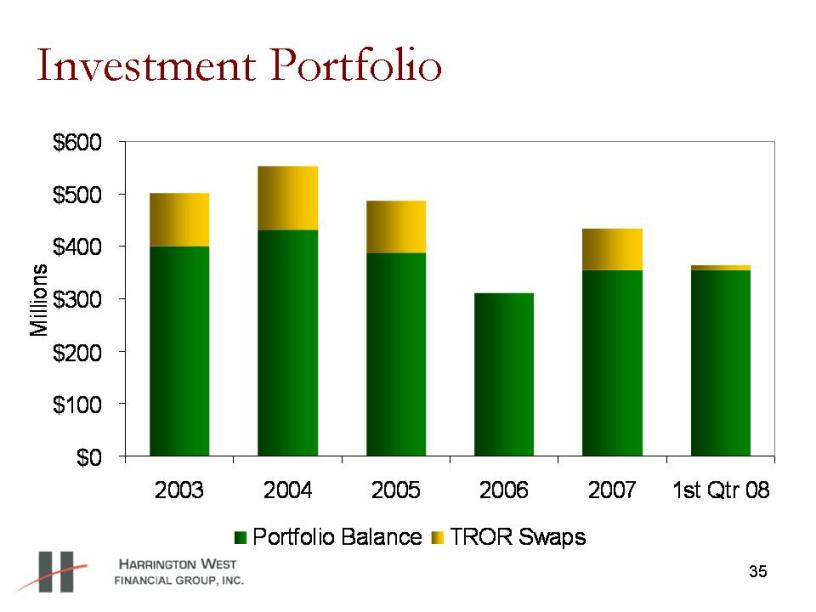
35 Investment Portfolio $0 $100 $200 $300 $400 $500 $600 2003 2004 2005 2006 2007 1st Qtr 08 Millions Portfolio Balance TROR Swaps
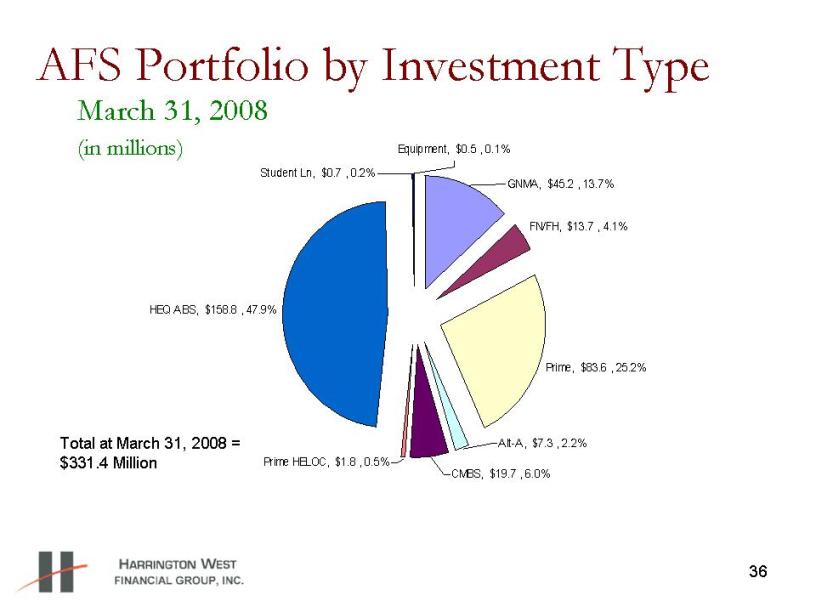
36 AFS Portfolio by Investment Type FN/FH, $13.7 , 4.1% Prime, $83.6 , 25.2% HEQ ABS, $158.8 , 47.9% Student Ln, $0.7 , 0.2% Equipment, $0.5 , 0.1% GNMA, $45.2 , 13.7% Alt-A, $7.3 , 2.2% Prime HELOC, $1.8 , 0.5% CMBS, $19.7 , 6.0% Total at March 31, 2008 = $331.4 Million March 31, 2008 (in millions)

37 AFS Portfolio by Credit Rating AAA, $135.8 , 40% AA, $101.1 , 31% FN/FH MBS, $13.7 , 4% GNMA MBS, $45.2 , 14% A, $26.2 , 8% Below -IG, $4.3 , 1% BBB, $5.0 , 2% Total at March 31, 2008 = $331.4 Million 89% rated AA and higher
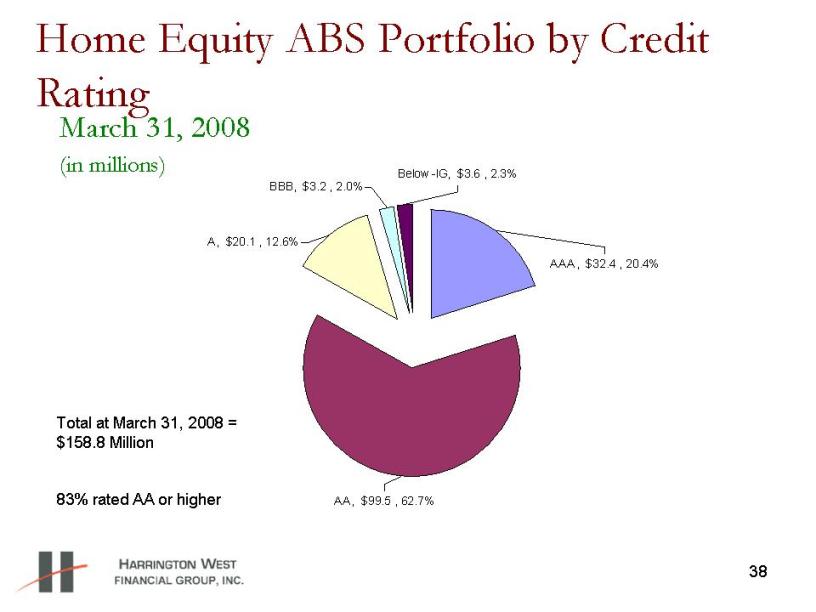
38 Home Equity ABS Portfolio by Credit Rating AAA, $32.4 , 20.4% AA, $99.5 , 62.7% BBB, $3.2 , 2.0% Below -IG, $3.6 , 2.3% A, $20.1 , 12.6% Total at March 31, 2008 = $158.8 Million 83% rated AA or higher March 31, 2008 (in millions)
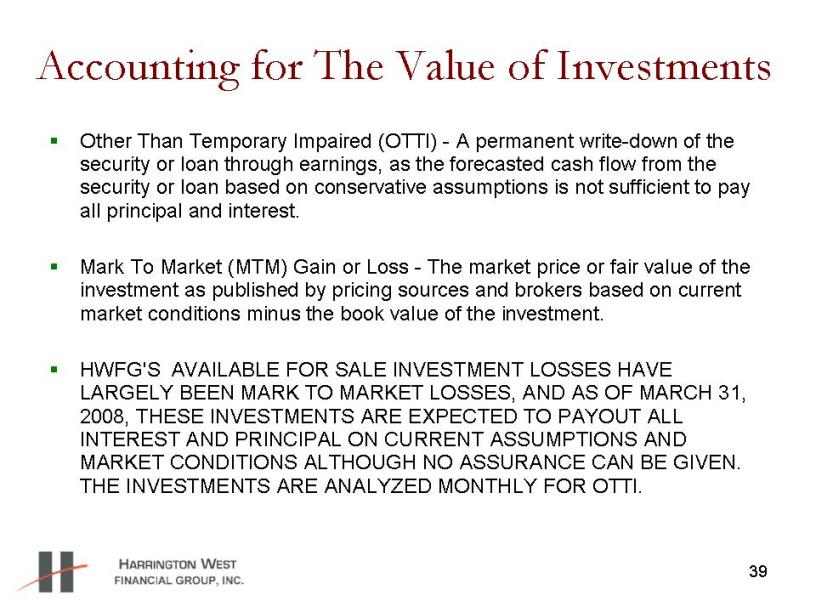
39 Accounting for The Value of Investments Other Than Temporary Impaired (OTTI) - A permanent write-down of the security or loan through earnings, as the forecasted cash flow from the security or loan based on conservative assumptions is not sufficient to pay all principal and interest. Mark To Market (MTM) Gain or Loss - The market price or fair value of the investment as published by pricing sources and brokers based on current market conditions minus the book value of the investment. HWFG'S AVAILABLE FOR SALE INVESTMENT LOSSES HAVE LARGELY BEEN MARK TO MARKET LOSSES, AND AS OF MARCH 31, 2008, THESE INVESTMENTS ARE EXPECTED TO PAYOUT ALL INTEREST AND PRINCIPAL ON CURRENT ASSUMPTIONS AND MARKET CONDITIONS ALTHOUGH NO ASSURANCE CAN BE GIVEN. THE INVESTMENTS ARE ANALYZED MONTHLY FOR OTTI.
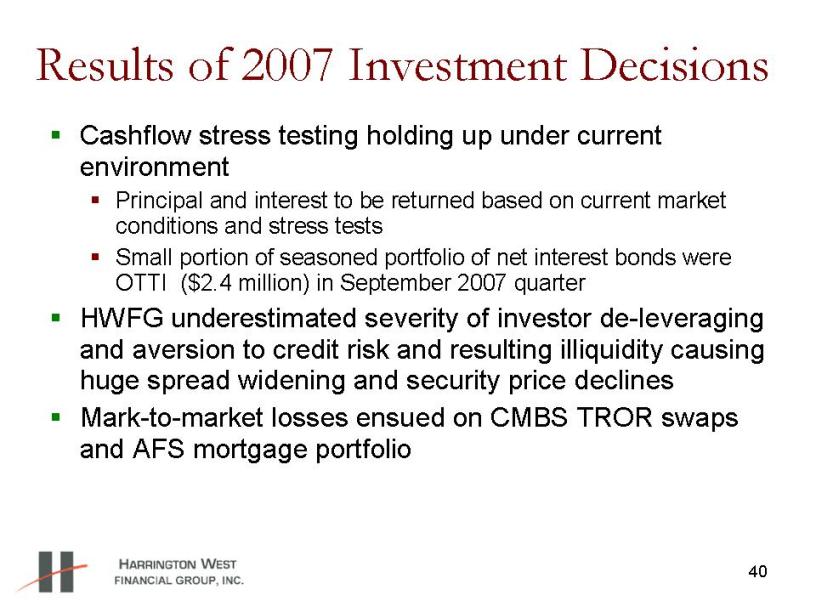
40 Results of 2007 Investment Decisions Cashflow stress testing holding up under current environment Principal and interest to be returned based on current market conditions and stress tests Small portion of seasoned portfolio of net interest bonds were OTTI ($2.4 million) in September 2007 quarter HWFG underestimated severity of investor de-leveraging and aversion to credit risk and resulting illiquidity causing huge spread widening and security price declines Mark-to-market losses ensued on CMBS TROR swaps and AFS mortgage portfolio
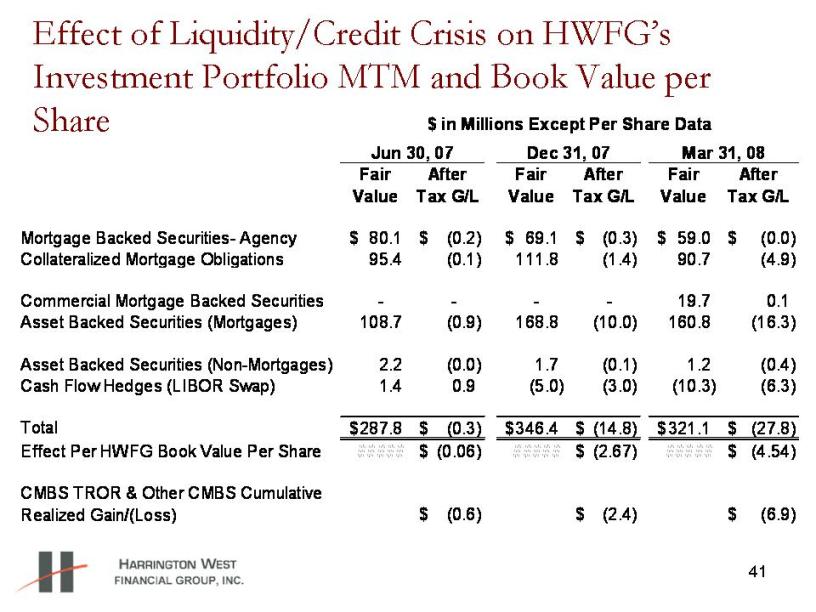
41 Effect of Liquidity/Credit Crisis on HWFG’s Investment Portfolio MTM and Book Value per Share Fair Value After Tax G/L Fair Value After Tax G/L Fair Value After Tax G/L Mortgage Backed Securities- Agency 80.1 $ (0.2) $ 69.1 $ (0.3) $ 59.0 $ (0.0) $ Collateralized Mortgage Obligations 95.4 (0.1) 111.8 (1.4) 90.7 (4.9) Commercial Mortgage Backed Securities - - - - 19.7 0.1 Asset Backed Securities (Mortgages) 108.7 (0.9) 168.8 (10.0) 160.8 (16.3) Asset Backed Securities (Non-Mortgages) 2.2 (0.0) 1.7 (0.1) 1.2 (0.4) Cash Flow Hedges (LIBOR Swap) 1.4 0.9 (5.0) (3.0) (10.3) (6.3) Total 287.8 $ (0.3) $ 346.4 $ (14.8) $ 321.1 $ (27.8) $ Effect Per HWFG Book Value Per Share ##### (0.06) $ ##### (2.67) $ ##### (4.54) $ CMBS TROR & Other CMBS Cumulative Realized Gain/(Loss) (0.6) $ (2.4) $ (6.9) $ in Millions Except Per Share Data Jun 30, 07 Dec 31, 07 Mar 31, 08
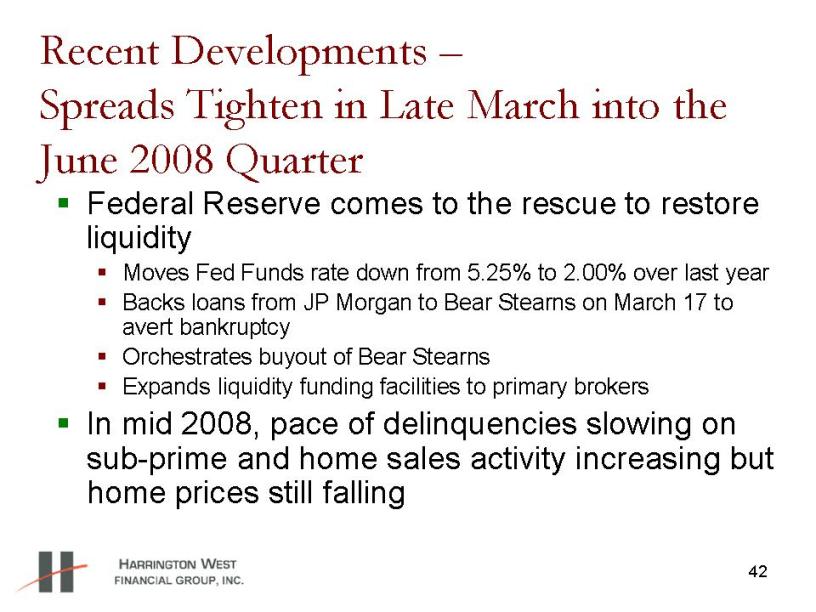
42 Recent Developments – Spreads Tighten in Late March into the June 2008 Quarter Federal Reserve comes to the rescue to restore liquidity Moves Fed Funds rate down from 5.25% to 2.00% over last year Backs loans from JP Morgan to Bear Stearns on March 17 to avert bankruptcy Orchestrates buyout of Bear Stearns Expands liquidity funding facilities to primary brokers In mid 2008, pace of delinquencies slowing on sub-prime and home sales activity increasing but home prices still falling
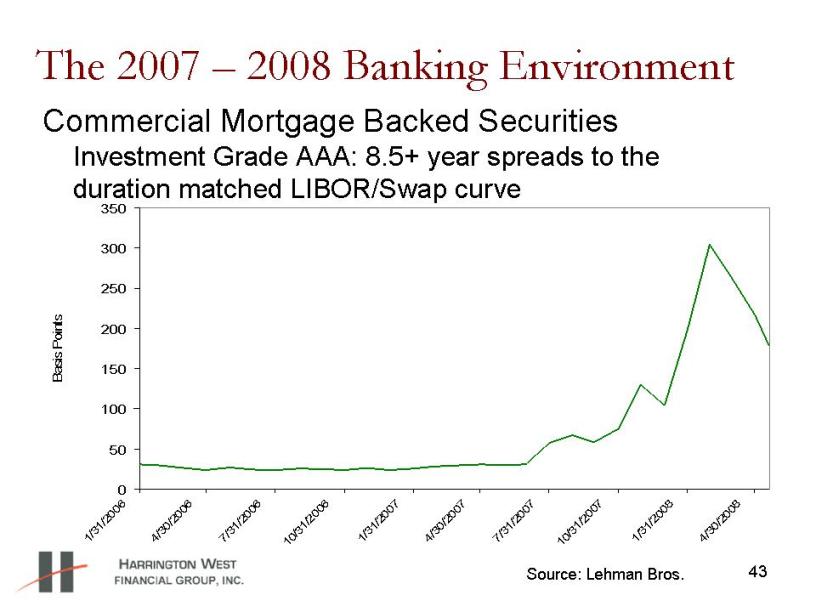
43 The 2007 – 2008 Banking Environment 0 50 100 150 200 250 300 350 1/31/2006 4/30/2006 7/31/2006 10/31/2006 1/31/ 2007 4/30/ 2007 7/31/20 07 10/31/2007 1/31/2008 4/ 30/2008 Basis Points Commercial Mortgage Backed Securities Investment Grade AAA: 8.5+ year spreads to the duration matched LIBOR/Swap curve Source: Lehman Bros.
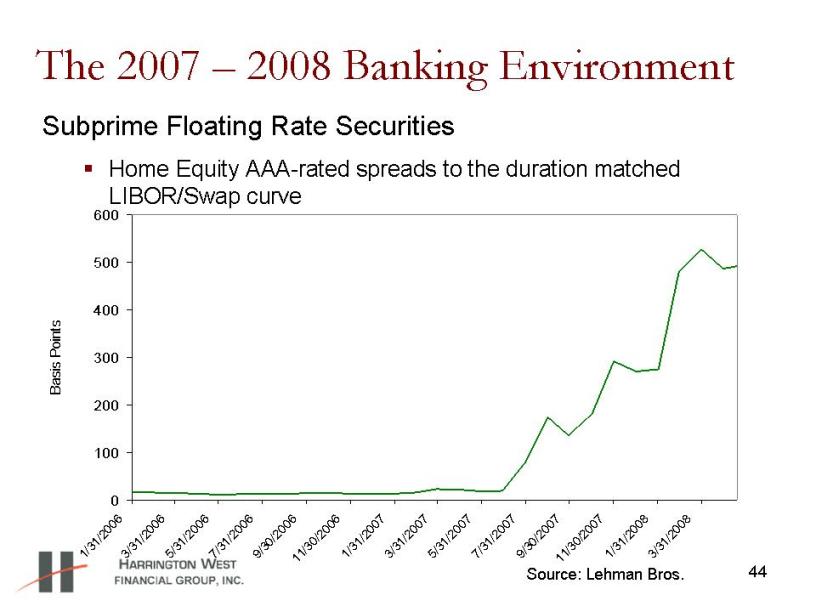
44 The 2007 – 2008 Banking Environment Subprime Floating Rate Securities �� Home Equity AAA-rated spreads to the duration matched LIBOR/Swap curve 0 100 200 300 400 500 600 1/31/2006 3/31/2006 5/31/2006 7/31/2006 9/30/2006 11/30/2006 1/31/2007 3/31/2007 5/31/2007 7/31/2007 9/30/2007 11/30/2007 1/ 31/2008 3/31/2008 Basis Points Source: Lehman Bros.
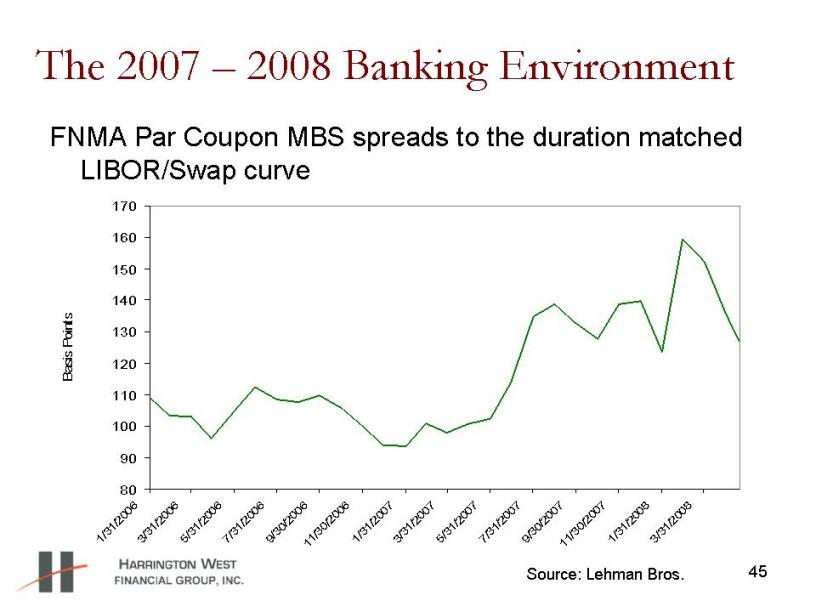
45 The 2007 – 2008 Banking Environment FNMA Par Coupon MBS spreads to the duration matched LIBOR/Swap curve 80 90 100 110 120 130 140 150 160 170 1/31/2006 3/31/2006 5/31/2006 7/31/2006 9/ 30/2006 11/30/2006 1/31/2007 3/31/2007 5/31/2007 7/31/2007 9/30/2007 11/30/2007 1/31/2008 3/31/2008 Basis Points Source: Lehman Bros.
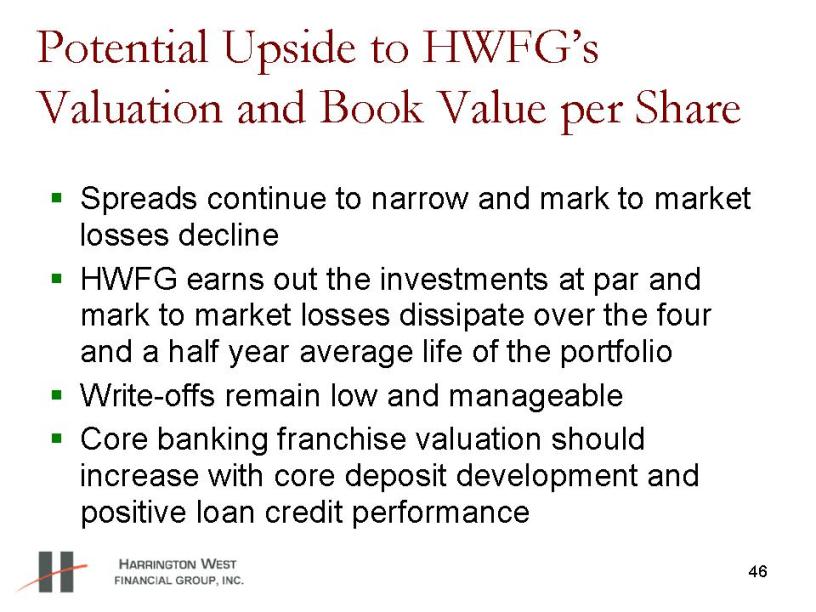
46 Potential Upside to HWFG’s Valuation and Book Value per Share Spreads continue to narrow and mark to market losses decline HWFG earns out the investments at par and mark to market losses dissipate over the four and a half year average life of the portfolio Write-offs remain low and manageable Core banking franchise valuation should increase with core deposit development and positive loan credit performance
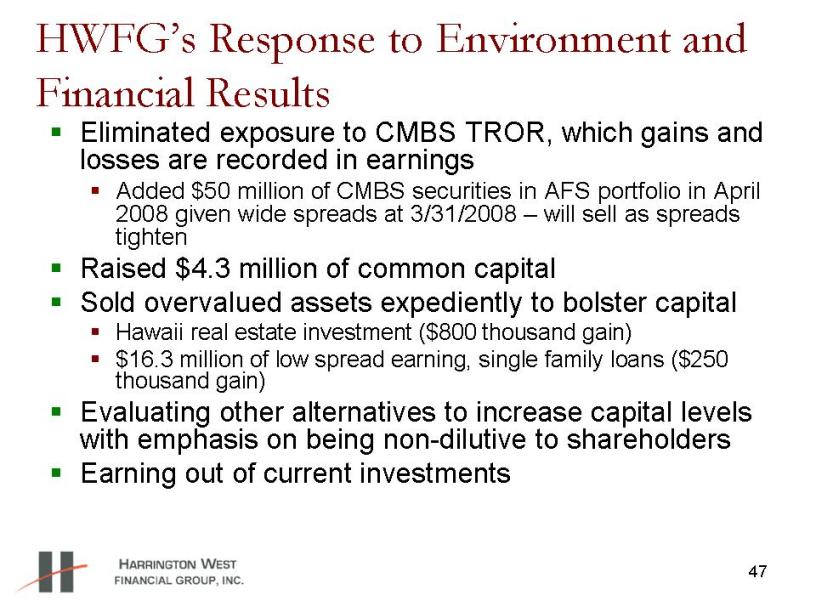
47 HWFG’s Response to Environment and Financial Results Eliminated exposure to CMBS TROR, which gains and losses are recorded in earnings Added $50 million of CMBS securities in AFS portfolio in April 2008 given wide spreads at 3/31/2008 – will sell as spreads tighten Raised $4.3 million of common capital Sold overvalued assets expediently to bolster capital Hawaii real estate investment ($800 thousand gain) $16.3 million of low spread earning, single family loans ($250 thousand gain) Evaluating other alternatives to increase capital levels with emphasis on being non-dilutive to shareholders Earning out of current investments
Financial Overview 2003 - 2007
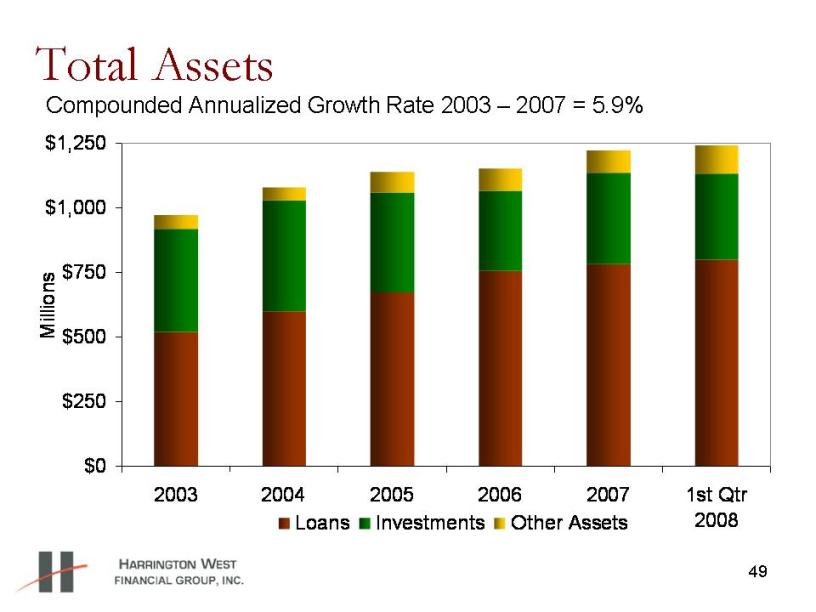
49 Total Assets $0 $250 $500 $750 $1,000 $1,250 2003 2004 2005 2006 2007 1st Qtr 2008 Millions Loans Investments Other Assets Compounded Annualized Growth Rate 2003 – 2007 = 5.9%
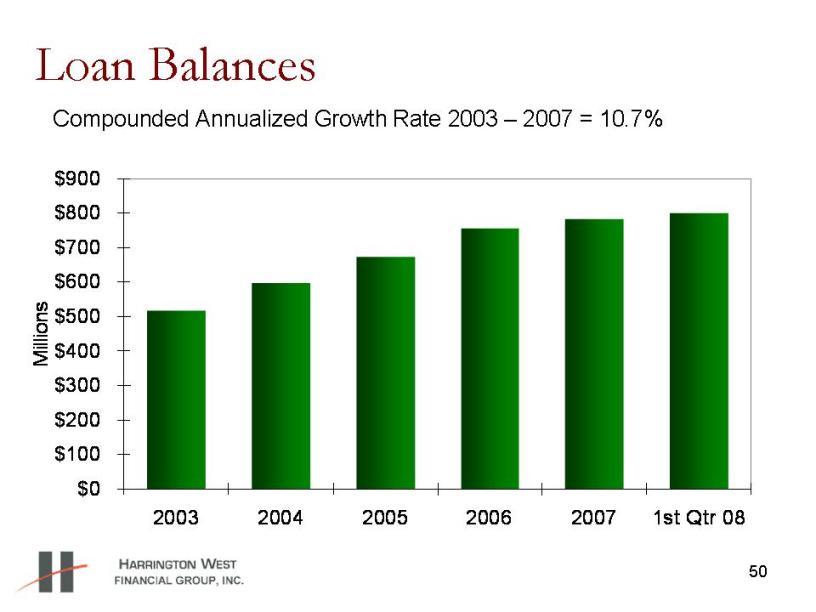
50 50 $0 $100 $200 $300 $400 $500 $600 $700 $800 $900 2003 2004 2005 2006 2007 1st Qtr 08 Millions Loan Balances Compounded Annualized Growth Rate 2003 – 2007 = 10.7%
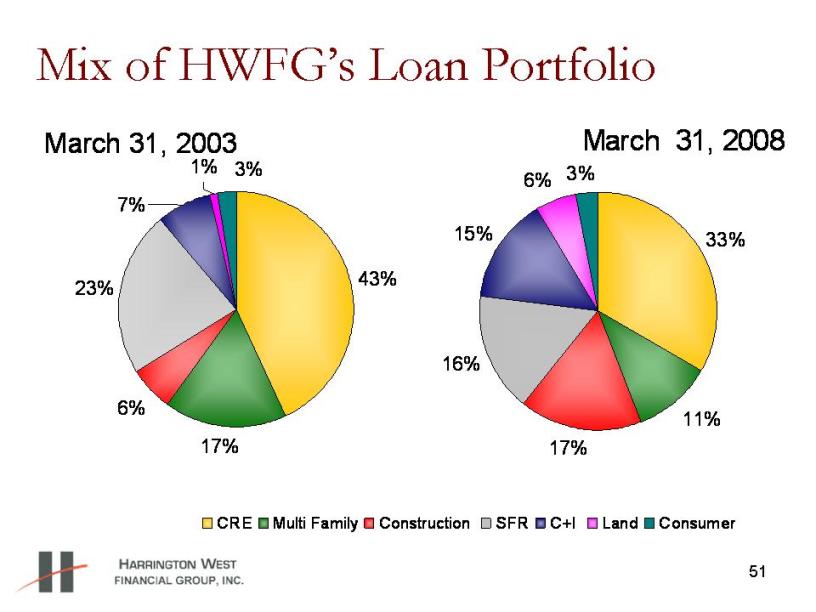
51 Mix of HWFG’s Loan Portfolio March 31, 2008 33% 11% 17% 16% 15% 6% 3% CRE Multi Family Construction SFR C+I Land Consumer March 31, 2003 43% 17% 6% 23% 7% 1% 3%
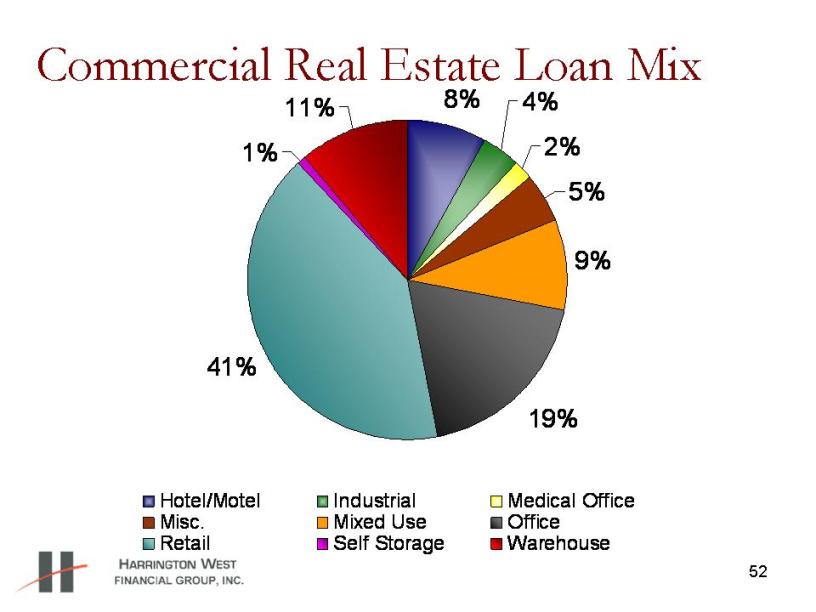
52 Commercial Real Estate Loan Mix 8% 4% 2% 5% 9% 19% 41% 1% 11% Hotel/Motel Industrial Medical Office Misc. Mixed Use Office Retail Self Storage Warehouse
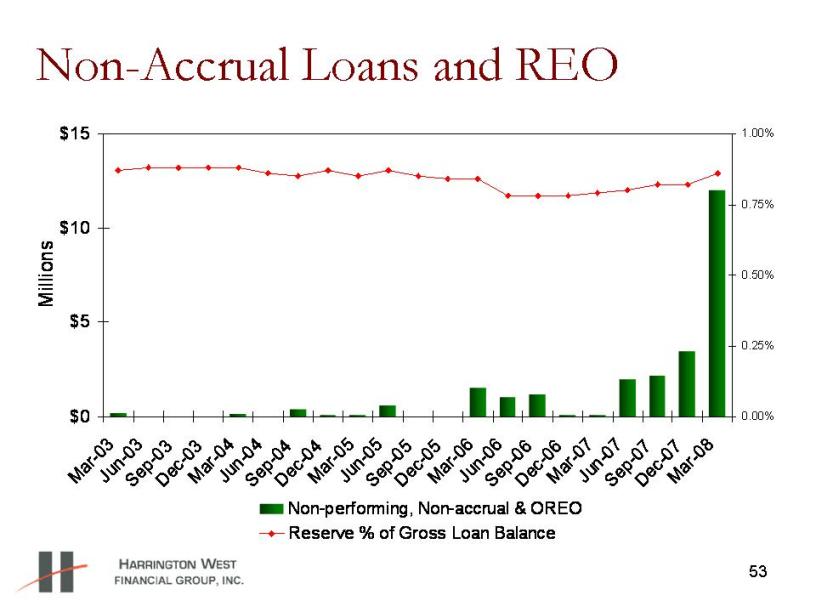
53 Non-Accrual Loans and REO $0 $5 $10 $15 Mar-03 J un -0 3 Sep-03Dec-03Mar-04Jun-04Sep-04 D ec-04Mar-05 Jun -0 5 Sep -05 Dec-05Mar-06 J un-0 6 Sep-06Dec-06Mar-07 Jun-07Sep-0 7 D ec-07Mar-0 8 Millions 0.00% 0.25% 0.50% 0.75% 1.00% Non-performing, Non-accrual & OREO Reserve % of Gross Loan Balance
54 Nature of Non-Accrual Loans – March 31, 2008 No concentration in loan type or geographic region Loans already classified for many months The classified loan pool is relatively stable at $25 to $30 million in loans
55 Nature of Non-Accrual Loans as of March 31, 2008 A total of $3.2 million in income producing, residential mortgage loans to one borrower in the Kansas City metro area A $6.2 million fully-entitled 47 unit residential lot development in California A $1.8 million participation loan on a private residential lot development and golf course in California $238 thousand in small commercial related credits $605 thousand in two related single family mortgage loans
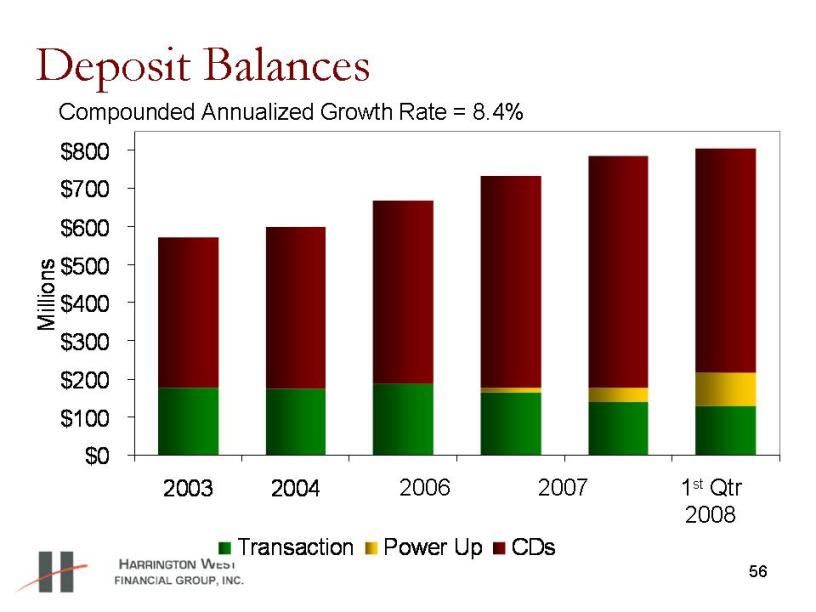
56 Deposit Balances $0 $100 $200 $300 $400 $500 $600 $700 $800 2003 2004 2005 2006 2007 1st Qtr 08 Millions Transaction Power Up CDs Compounded Annualized Growth Rate = 8.4% 2006 2007 1st Qtr 2008
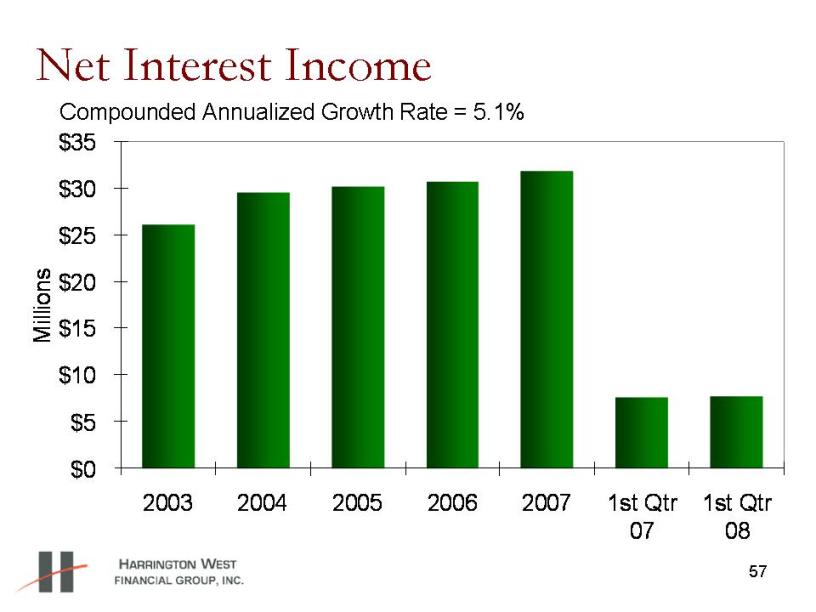
57 Net Interest Income $0 $5 $10 $15 $20 $25 $30 $35 2003 2004 2005 2006 2007 1st Qtr 07 1st Qtr 08 Millions Compounded Annualized Growth Rate = 5.1%
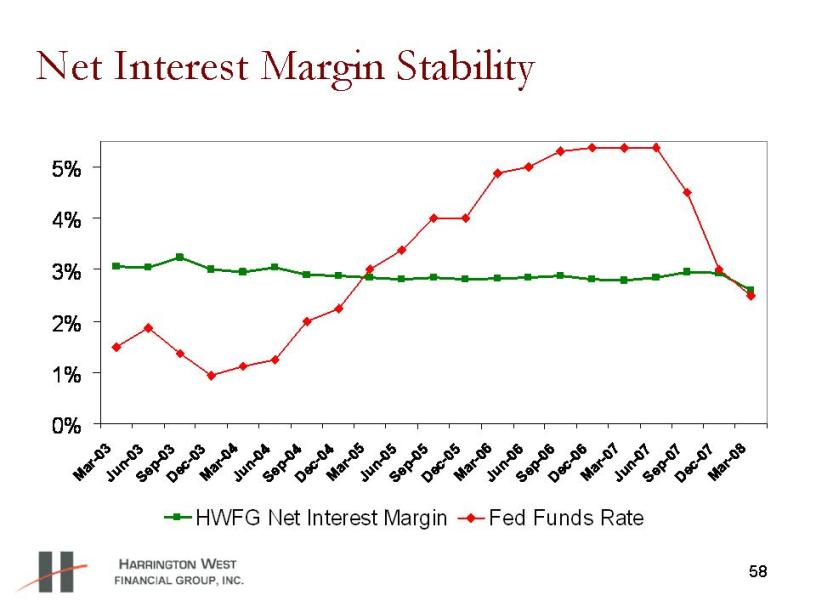
58 Net Interest Margin Stability 0% 1% 2% 3% 4% 5% Mar-03 Jun-03 Sep- 03 D ec- 03 Mar-04 Jun-04 Sep- 04 Dec- 04 Mar-05 Jun-05 S ep-05 Dec- 05 Mar- 06 Jun-06 Sep-06 Dec- 06 Mar- 0 7 Jun-07 Sep-07 Dec - 07 Mar-0 8 HWFG Net Interest Margin Fed Funds Rate
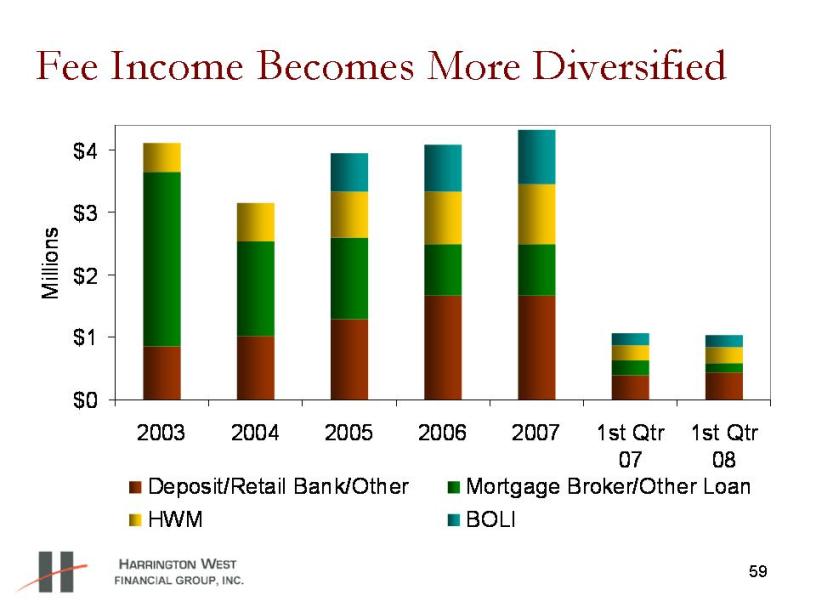
59 Fee Income Becomes More Diversified $0 $1 $2 $3 $4 2003 2004 2005 2006 2007 1st Qtr 07 1st Qtr 08 Millions Deposit/Retail Bank/Other Mortgage Broker/Other Loan HWM BOLI
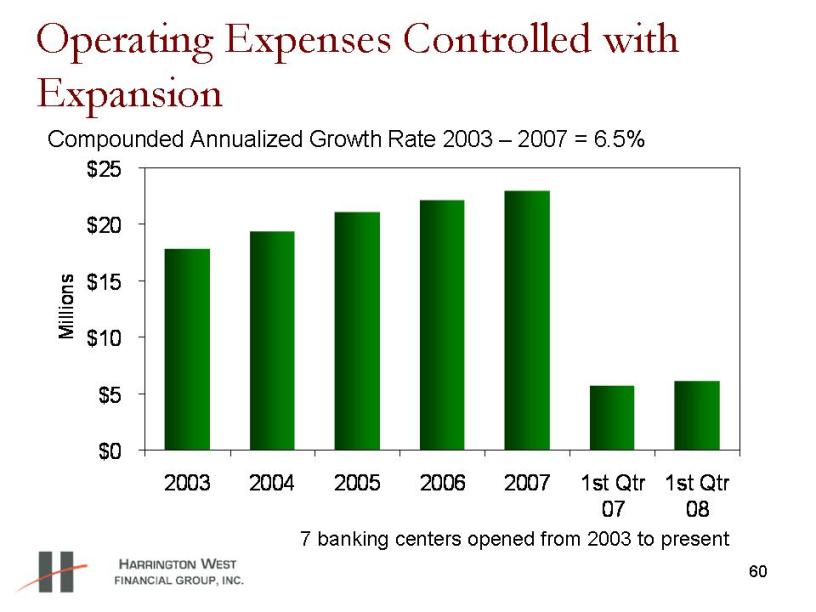
60 Operating Expenses Controlled with Expansion $0 $5 $10 $15 $20 $25 2003 2004 2005 2006 2007 1st Qtr 07 1st Qtr 08 Millions Compounded Annualized Growth Rate 2003 – 2007 = 6.5% 7 banking centers opened from 2003 to present
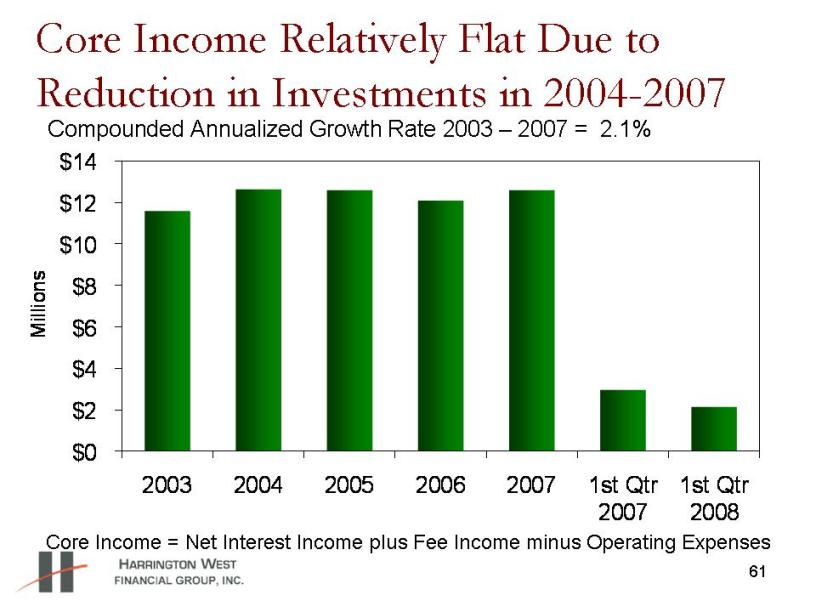
61 Core Income Relatively Flat Due to Reduction in Investments in 2004-2007 $0 $2 $4 $6 $8 $10 $12 $14 2003 2004 2005 2006 2007 1st Qtr 2007 1st Qtr 2008 Millions Core Income = Net Interest Income plus Fee Income minus Operating Expenses Compounded Annualized Growth Rate 2003 – 2007 = 2.1%
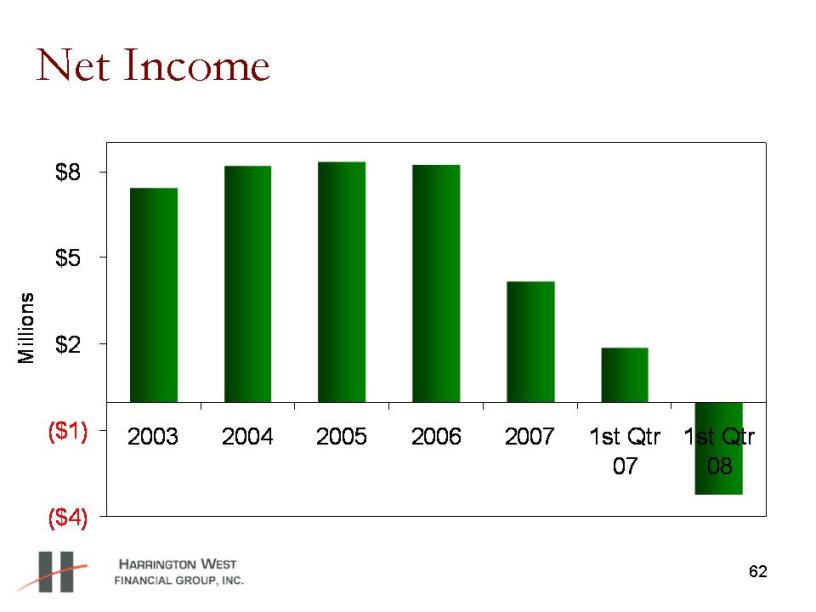
62 Net Income ($4) ($1) $2 $5 $8 2003 2004 2005 2006 2007 1st Qtr 07 1st Qtr 08 Millions
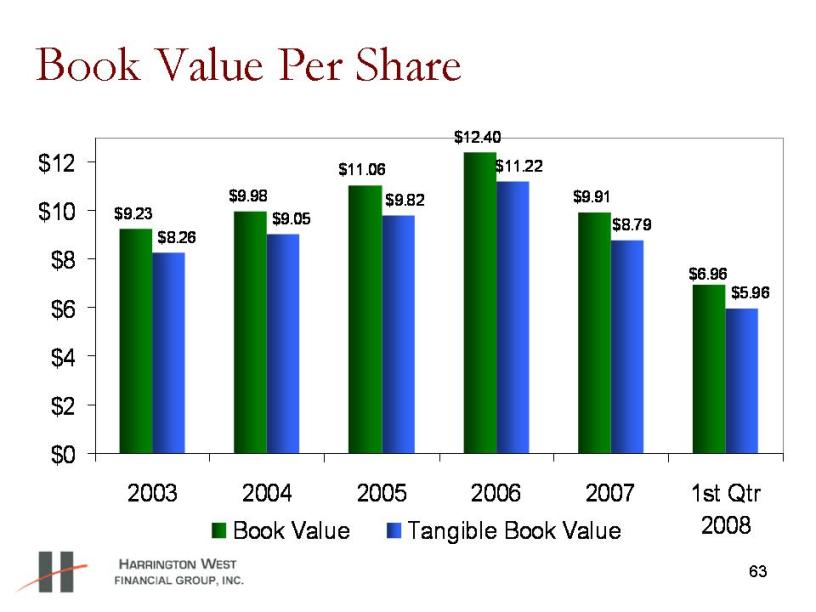
63 Book Value Per Share $9.23 $9.98 $11.06 $12.40 $9.91 $6.96 $8.26 $9.05 $9.82 $11.22 $8.79 $5.96 $0 $2 $4 $6 $8 $10 $12 2003 2004 2005 2006 2007 1st Qtr 2008 Book Value Tangible Book Value
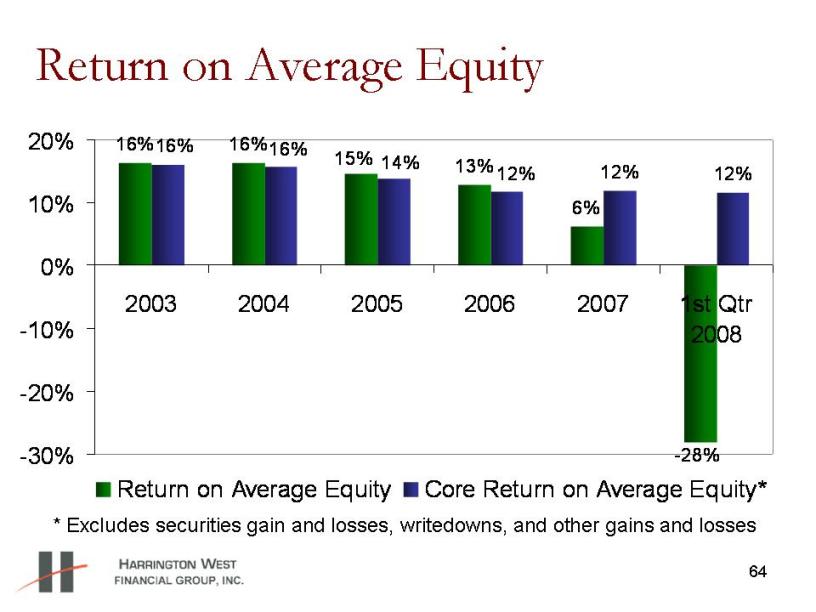
64 Return on Average Equity 16% 16% 13% 6% 12% 12% -28% 15% 16% 16% 14% 12% -30% -20% -10% 0% 10% 20% 2003 2004 2005 2006 2007 1st Qtr 2008 Return on Average Equity Core Return on Average Equity* * Excludes securities gain and losses, writedowns, and other gains and losses
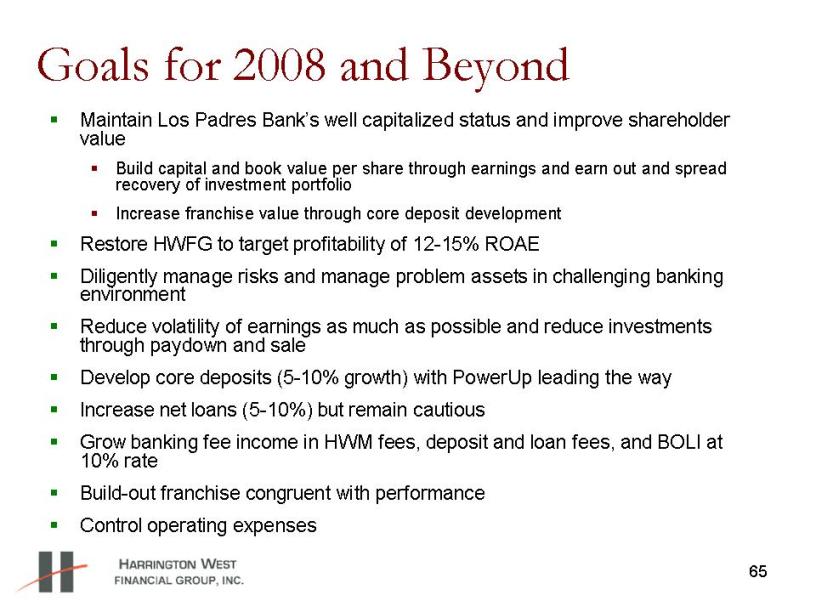
65 Goals for 2008 and Beyond Maintain Los Padres Bank’s well capitalized status and improve shareholder value Build capital and book value per share through earnings and earn out and spread recovery of investment portfolio Increase franchise value through core deposit development Restore HWFG to target profitability of 12-15% ROAE Diligently manage risks and manage problem assets in challenging banking environment Reduce volatility of earnings as much as possible and reduce investments through paydown and sale Develop core deposits (5-10% growth) with PowerUp leading the way Increase net loans (5-10%) but remain cautious Grow banking fee income in HWM fees, deposit and loan fees, and BOLI at 10% rate Build-out franchise congruent with performance Control operating expenses
66 Why Invest in HWFG? Low price to tangible book value of 80% - favorable to peer group Significant upside potential to HWFG’s book value MTM of investments improve from earnout or spread normalization Core earnings accumulate Core earnings produce low to mid teens return on average equity High inside ownership Focus on risk management practices Risks: Further sharp deterioration in real estate values Prolonged weak economy affecting borrowers Adverse change in capital requirements