
DECEMBER 31, 2007
RYDEX VARIABLE TRUST ANNUAL REPORT
BENCHMARK FUNDS
NOVA FUND
RUSSELL 2000® 2x STRATEGY FUND
JAPAN 1.25x STRATEGY FUND
(Formerly, Dynamic Russell 2000® Fund)
(Formerly, Japan Advantage Fund)
INVERSE S&P 500 STRATEGY FUND
(Formerly, Inverse S&P 500 Fund)
RUSSELL 2000® 1.5x STRATEGY FUND
DOW 2x STRATEGY FUND
(Formerly, Russell 2000® Advantage Fund)
(Formerly, Dynamic Dow Fund)
OTC FUND
INVERSE RUSSELL 2000®
INVERSE DOW 2x STRATEGY FUND
INVERSE OTC STRATEGY FUND
STRATEGY FUND
(Formerly, Inverse Dynamic Dow Fund)
(Formerly, Inverse OTC Fund)
(Formerly, Inverse Russell 2000® Fund)
SMALL-CAP VALUE FUND
S&P 500 2x STRATEGY FUND
GOVERNMENT LONG BOND
(Formerly, Dynamic S&P 500 Fund)
1.2x STRATEGY FUND
MID-CAP VALUE FUND
(Formerly, Government Long Bond
OTC 2x STRATEGY FUND
Advantage Fund)
LARGE-CAP VALUE FUND
(Formerly, Dynamic OTC Fund)
INVERSE GOVERNMENT LONG BOND
SMALL-CAP GROWTH FUND
MID-CAP 1.5x STRATEGY FUND
STRATEGY FUND
(Formerly, Mid-Cap Advantage Fund)
(Formerly, Inverse Government
MID-CAP GROWTH FUND
Long Bond Fund)
INVERSE MID-CAP STRATEGY FUND
LARGE-CAP GROWTH FUND
(Formerly, Inverse Mid-Cap Fund)
EUROPE 1.25x STRATEGY FUND
(Formerly, Europe Advantage Fund)
U.S. GOVERNMENT
MONEY MARKET FUND

GO GREEN!
ELIMINATE MAILBOX CLUTTER
Go paperless with Rydex eDelivery—a service giving you full
online access to account documents. Save time, cut down on
mailbox clutter and be a friend to the environment with eDelivery.
With Rydex eDelivery you can:
•
View online confirmations and statements at your
convenience.
•
Receive email notifications when your most recent
account documents are available for review.
•
Access prospectuses, annual reports and semiannual
reports online.
It’s easy to enroll:
1/ Visit www.rydexinvestments.com
e
RYDEX
2/ Click on the Rydex eDelivery logo
DELIVERY
3/ Follow the simple enrollment instructions
If you have questions about Rydex eDelivery services,
contact one of our Shareholder Service Representatives
at 800.820.0888.
This report and the financial statements contained herein are submitted for the general information of our shareholders. The
report is not authorized for distribution to prospective investors unless preceded or accompanied by an effective prospectus.
Distributed by Rydex Distributors, Inc.

TABLE OF CONTENTS
. . . . . . . . . . . . . . . . . . . . . . . . . . . . . . . . . . . . . . . . . . . . . . . . . . . . . . . . . .
2
A BRIEF NOTE ON THE COMPOUNDING OF RETURNS
. . . . . . . . . . . . . . . . . . . . . . . . . . . . . . . . . . . . . . . . .
3
ABOUT SHAREHOLDERS’ FUND EXPENSES
. . . . . . . . . . . . . . . . . . . . . . . . . . . . . . . . . . . . . . . . . . . . . . . . . .
4
PERFORMANCE REPORTS AND FUND PROFILES
. . . . . . . . . . . . . . . . . . . . . . . . . . . . . . . . . . . . . . . . . . . . . .
6
. . . . . . . . . . . . . . . . . . . . . . . . . . . . . . . . . . . . . . . . . . . . . . . . . . . . . . . . . . . .
30
STATEMENTS OF ASSETS AND LIABILITIES
. . . . . . . . . . . . . . . . . . . . . . . . . . . . . . . . . . . . . . . . . . . . . . . . . . .
102
. . . . . . . . . . . . . . . . . . . . . . . . . . . . . . . . . . . . . . . . . . . . . . . . . . . . . . . . . . . .
106
STATEMENTS OF CHANGES IN NET ASSETS
. . . . . . . . . . . . . . . . . . . . . . . . . . . . . . . . . . . . . . . . . . . . . . . . .
110
. . . . . . . . . . . . . . . . . . . . . . . . . . . . . . . . . . . . . . . . . . . . . . . . . . . . . . . . . . . . . . . . .
118
. . . . . . . . . . . . . . . . . . . . . . . . . . . . . . . . . . . . . . . . . . . . . . . . . . . . . . .
122
REPORT OF INDEPENDENT REGISTERED PUBLIC ACCOUNTING FIRM
. . . . . . . . . . . . . . . . . . . . . . . . . . . .
133
. . . . . . . . . . . . . . . . . . . . . . . . . . . . . . . . . . . . . . . . . . . . . . . . . . . . . . . . . . . . . . . . . . .
134
INFORMATION ON BOARD OF TRUSTEES AND OFFICERS
. . . . . . . . . . . . . . . . . . . . . . . . . . . . . . . . . . . . . .
139
THE RYDEX VARIABLE TRUST ANNUAL REPORT
|
1

DEAR SHAREHOLDER,
By the last three months of 2007 the stock market gains of summer and fall seemed like a distant memory.
The intertwined crises in the nation’s housing and credit markets had, by the fourth quarter, led to huge
drops in stock prices and unprecedented volatility. Despite the end of year turmoil, stocks actually turned
in a respectable performance in 2007 with the bellwether Dow Jones Industrial AverageSM (“DJIA”) and
S&P 500® indexes up 8.88% and 5.49% respectively on a total return basis. The tech-heavy Nasdaq 100
Index® , which was up 19.24%, showed that investors had a robust appetite for risk for much of the year.
Despite the fact that calendar year returns were strong, 2007 will in all likelihood be remembered for the
housing debacle that hammered stocks and sent the economy to the brink of recession.
The unfolding housing crisis began to ripple through the world’s financial markets as far back as July, but
it was in the fourth quarter that both the U.S. economy and global financial markets lost momentum—with
the contagion effects of the subprime debt crisis reaching deeper into the global financial system. The
credit crunch that began in the third quarter enveloped the G-7 economies as traditional sources of credit
dried up. As asset values plummeted, financial institutions throughout the developed world found
themselves suddenly undercapitalized. With a full-blown financial crisis unfolding, central banks moved
into crisis prevention mode by pumping capital into their respective financial systems and slashing interest
rates. In perhaps one of the most important developments of the year, the outlines of a coordinated,
global easing campaign began to emerge.
In this uncertain environment fears grew that the Federal Reserve (“Fed”) was “behind the curve,” adding
to the volatility in stock prices. In fact, the Fed’s initial responses to the unfolding crisis were tempered by
inflationary concerns as high energy and commodity prices and a weak U.S. dollar drove inflation
significantly higher towards year end.
Risk appetites that had been running high disappeared, and the avoidance of risk became the dominant
theme as investors fled financial, consumer discretionary, value and small-cap stocks. The small-cap
Russell 2000® Index fell 1.57%, confirming the rotation away from small caps that began to unfold early in
the year. Value stocks also underperformed in 2007 with the S&P 500/Citigroup Pure Value Index
underperforming its growth counterpart by more than 10 points. Both of these trends dovetailed in the
S&P SmallCap 600/Citigroup Pure Value Index which dropped nearly 18.60%, vastly underperforming all
other “style-box” exposures.
Predictably, defensive sectors such as utilities and consumer staples were favored. And, reflecting the
“decoupling” theory—which assumes growth in the developing world can continue in the face of slowing
growth elsewhere—energy, materials and technology stocks rose stratospherically as the respective S&P
500 sector indices rose 34.41%, 22.53% and 16.30%.
Returns for U.S. investors in international stock markets were also boosted by the ongoing decline in the
exchange value of the U.S. dollar, which fell 8.31% against a basket of the world’s major currencies. The
currency effect helped to propel full-year gains for the MSCI EAFE and Emerging Market indices to
11.66% and 38.79%, respectively.
With the flight-to-quality trade fully in motion, interest rates declined and the yield curve steepened.
We think that, as we move into the early months of 2008, stock market volatility will remain a fact of life.
Defensive exposures that performed well should continue to do so, at least on a relative basis until
recession fears abate. Uncorrelated investment strategies, such as absolute return, long/short, commodity,
managed futures and the like, should also provide refuge in a challenging investment climate.
We appreciate the trust you have placed in our firm’s quality and integrity by investing with us.
Sincerely,
David C. Reilly, CFA
Director, Portfolio Strategies
2
|
THE RYDEX VARIABLE TRUST ANNUAL REPORT

A BRIEF NOTE ON THE COMPOUNDING OF RETURNS (Unaudited)
Many of the Rydex Funds described in this report are benchmarked daily to leveraged or inverse
leveraged versions of published indices. To properly evaluate the performance of these funds, it is
essential to understand the effect of mathematical compounding on their respective returns.
Because of the nonlinear effects of leverage applied over time, it is possible for a fund to perform in line
with its benchmark for several individual periods in a row, yet seem to trail the benchmark over the entire
period. It is also possible that a fund that performs in-line with its benchmark on a daily basis may seem to
outperform its benchmark over longer periods.
An Example of Compounding
For example, consider a hypothetical fund that is designed to produce returns that correspond to 150%
of an index. On the first day of a period, the index rises from a level of 100 to a level of 106, producing a
6.0% gain and an expectation that the fund will rise by 9.0%. On the same day, the fund’s net asset value
(“NAV”) increases from $10.00 to $10.90 for a gain of 9.0%–in line with its benchmark.
On day two, assume the index falls from 106 to 99 for a loss of about 6.6%. The fund, as expected, falls
9.9% to a price of $9.82. On each day, the fund performed exactly in line with its benchmark, but for the
two-day period, the fund was down 1.8%, while the index was down only 1.0%. Without taking into
account the daily compounding of returns, one would expect the fund to lose 1.5% and would see the
fund as trailing by 0.3% when in fact it had performed perfectly. This example is summarized in the table
below.
Index
Index
Fund
Fund
Fund
Level
Performance
Expectation
NAV
Performance
Assessment
Start
100
$10.00
Day 1
106
6.0%
9.0%
$10.90
9.0%
In line
Day 2
99
-6.6%
-9.9%
$
9.82
-9.9%
In line
Cumulative
-1.0%
-1.5%
-1.8%
-0.3%
As illustrated by this simple example, the effect of leverage can make it difficult to form expectations or
judgments about fund performance given only the returns of the unleveraged index.
In general, any change in direction in an index will produce compounding that seems to work against an
investor. Were the index to move in the same direction (either up or down) for two or more periods in a
row, the compounding of those returns would work in an investor’s favor, causing the fund to seemingly
beat its benchmark.
As a general rule of thumb, more leverage in a fund will magnify the compounding effect, while less
leverage will generally produce results that are more in line with expectations. In addition, periods of high
volatility in an underlying index will also cause the effects of compounding to be more pronounced, while
lower volatility will produce a more muted effect.
THE RYDEX VARIABLE TRUST ANNUAL REPORT
|
3

ABOUT SHAREHOLDERS’ FUND EXPENSES (Unaudited)
All mutual funds have operating expenses and it is important for our shareholders to understand the
impact of costs on their investments. Shareholders of a Fund incur two types of costs: (i) transaction costs,
including sales charges (loads) on purchase payments, reinvested dividends, or other distributions;
redemption fees; and exchange fees; and (ii) ongoing costs, including management fees, administrative
services, and shareholder reports, among others. These ongoing costs, or operating expenses, are
deducted from a fund’s gross income and reduce the investment return of the fund.
A fund’s expenses are expressed as a percentage of its average net assets, which is known as the expense
ratio. The following examples are intended to help investors understand the ongoing costs (in dollars) of
investing in a Fund and to compare these costs with the ongoing costs of investing in other mutual funds.
The examples are based on an investment of $1,000 made at the beginning of the period and held for
the entire six-month period beginning June 30, 2007 and ending December 31, 2007.
The following tables illustrate a Fund’s costs in two ways:
Table 1. Based on actual Fund return. This section helps investors estimate the actual expenses paid
over the period. The “Ending Account Value” shown is derived from the Fund’s actual return, and the
fourth column shows the dollar amount that would have been paid by an investor who started with
$1,000 in the Fund. Investors may use the information here, together with the amount invested, to
estimate the expenses paid over the period. Simply divide the Fund’s account value by $1,000 (for
example, an $8,600 account value divided by $1,000 = 8.6), then multiply the result by the number
provided under the heading “Expenses Paid During Period.”
Table 2. Based on hypothetical 5% return. This section is intended to help investors compare a Fund’s
cost with those of other mutual funds. The table provides information about hypothetical account
values and hypothetical expenses based on the Fund’s actual expense ratio and an assumed rate of
return of 5% per year before expenses, which is not the Fund’s actual return. The hypothetical account
values and expenses may not be used to estimate the actual ending account balance or expenses paid
during the period. The example is useful in making comparisons because the U.S. Securities and
Exchange Commission (the “SEC”) requires all mutual funds to calculate expenses based on the 5%
return. Investors can assess a Fund’s costs by comparing this hypothetical example with the
hypothetical examples that appear in shareholder reports of other funds.
The calculations above assume no shares were bought or sold during the period. Actual costs may have
been higher or lower, depending on the amount of investment and the timing of any purchases or
redemptions.
Note that the expenses shown in the table are meant to highlight and help compare ongoing costs only
and do not reflect any transactional costs which may be incurred by a Fund.
More information about a Fund’s expenses, including annual expense ratios for the past five years, can be
found in the Financial Highlights section of this report. For additional information on operating expenses
and other shareholder costs, please refer to the appropriate Fund prospectus.
4
|
THE RYDEX VARIABLE TRUST ANNUAL REPORT

ABOUT SHAREHOLDERS’ FUND EXPENSES (Unaudited) (concluded)
Beginning
Ending
Expenses
Expense
Account Value
Account Value
Paid During
Ratio†
June 30, 2007
December 31, 2007
Period*
Table 1. Based on actual Fund return
Nova Fund
1.41%
$1,000.00
$
934.40
$
6.87
Inverse S&P 500 Strategy Fund
1.63%
1,000.00
1,040.50
8.38
OTC Fund
1.51%
1,000.00
1,072.30
7.89
Inverse OTC Strategy Fund
1.72%
1,000.00
941.90
8.42
S&P 500 2x Strategy Fund
1.59%
1,000.00
917.00
7.68
OTC 2x Strategy Fund
1.67%
1,000.00
1,097.70
8.83
Mid-Cap 1.5x Strategy Fund
1.60%
1,000.00
895.00
7.64
Inverse Mid-Cap Strategy Fund
1.67%
1,000.00
1,063.60
8.69
Russell 2000® 2x Strategy Fund
1.60%
1,000.00
801.30
7.26
Russell 2000® 1.5x Strategy Fund
1.61%
1,000.00
863.40
7.56
Inverse Russell 2000® Strategy Fund
1.68%
1,000.00
1,090.90
8.85
Government Long Bond 1.2x Strategy Fund
1.20%
1,000.00
949.10
5.90
Inverse Government Long Bond Strategy Fund
2.94%
1,000.00
891.60
14.02
Europe 1.25x Strategy Fund
1.61%
1,000.00
1,000.80
8.12
Japan 1.25x Strategy Fund
1.60%
1,000.00
884.10
7.60
Dow 2x Strategy Fund
1.60%
1,000.00
952.90
7.88
Inverse Dow 2x Strategy Fund
1.62%
1,000.00
1,019.30
8.25
Small-Cap Value Fund
1.45%
1,000.00
768.50
6.46
Mid-Cap Value Fund
1.45%
1,000.00
882.50
6.88
Large-Cap Value Fund
1.45%
1,000.00
878.30
6.86
Small-Cap Growth Fund
1.46%
1,000.00
920.80
7.07
Mid-Cap Growth Fund
1.46%
1,000.00
970.10
7.25
Large-Cap Growth Fund
1.46%
1,000.00
980.10
7.29
U.S. Government Money Market Fund
1.18%
1,000.00
1,012.30
5.99
Table 2. Based on hypothetical 5% return
Nova Fund
1.41%
1,000.00
1,018.01
7.20
Inverse S&P 500 Strategy Fund
1.63%
1,000.00
1,016.88
8.32
OTC Fund
1.51%
1,000.00
1,017.50
7.71
Inverse OTC Strategy Fund
1.72%
1,000.00
1,016.43
8.78
S&P 500 2x Strategy Fund
1.59%
1,000.00
1,017.09
8.12
OTC 2x Strategy Fund
1.67%
1,000.00
1,016.68
8.52
Mid-Cap 1.5x Strategy Fund
1.60%
1,000.00
1,017.04
8.17
Inverse Mid-Cap Strategy Fund
1.67%
1,000.00
1,016.68
8.52
Russell 2000® 2x Strategy Fund
1.60%
1,000.00
1,017.04
8.17
Russell 2000® 1.5x Strategy Fund
1.61%
1,000.00
1,016.99
8.22
Inverse Russell 2000® Strategy Fund
1.68%
1,000.00
1,016.63
8.58
Government Long Bond 1.2x Strategy Fund
1.20%
1,000.00
1,019.08
6.13
Inverse Government Long Bond Strategy Fund
2.94%
1,000.00
1,010.20
15.01
Europe 1.25x Strategy Fund
1.61%
1,000.00
1,016.99
8.22
Japan 1.25x Strategy Fund
1.60%
1,000.00
1,017.04
8.17
Dow 2x Strategy Fund
1.60%
1,000.00
1,017.04
8.17
Inverse Dow 2x Strategy Fund
1.62%
1,000.00
1,016.94
8.27
Small-Cap Value Fund
1.45%
1,000.00
1,017.80
7.40
Mid-Cap Value Fund
1.45%
1,000.00
1,017.80
7.40
Large-Cap Value Fund
1.45%
1,000.00
1,017.80
7.40
Small-Cap Growth Fund
1.46%
1,000.00
1,017.75
7.45
Mid-Cap Growth Fund
1.46%
1,000.00
1,017.75
7.45
Large-Cap Growth Fund
1.46%
1,000.00
1,017.75
7.45
U.S. Government Money Market Fund
1.18%
1,000.00
1,019.18
6.02
* Expenses are equal to the Fund’s annualized expense ratio, multiplied by the average account value over the period, multiplied by the
number of days in the most recent fiscal half-year, then divided by 365. Expenses shown do not include fees charged by insurance companies.
† This ratio represents annualized Total Expenses, which include interest expense from securities sold short. Excluding short interest expense,
the operating expense ratio of the Inverse Government Long Bond Strategy Fund would be 1.34% lower.
THE RYDEX VARIABLE TRUST ANNUAL REPORT
|
5
PERFORMANCE REPORTS AND FUND PROFILES (Unaudited)
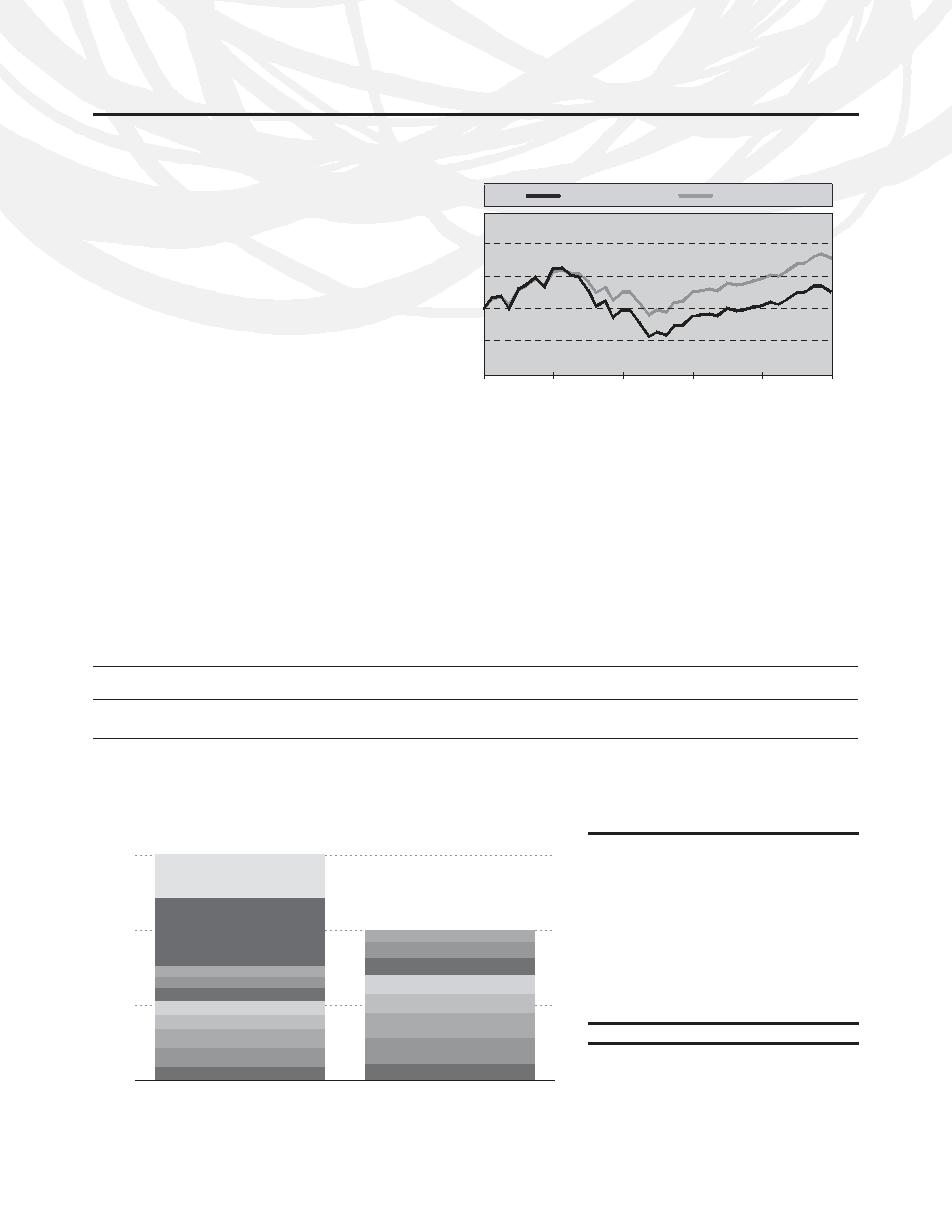
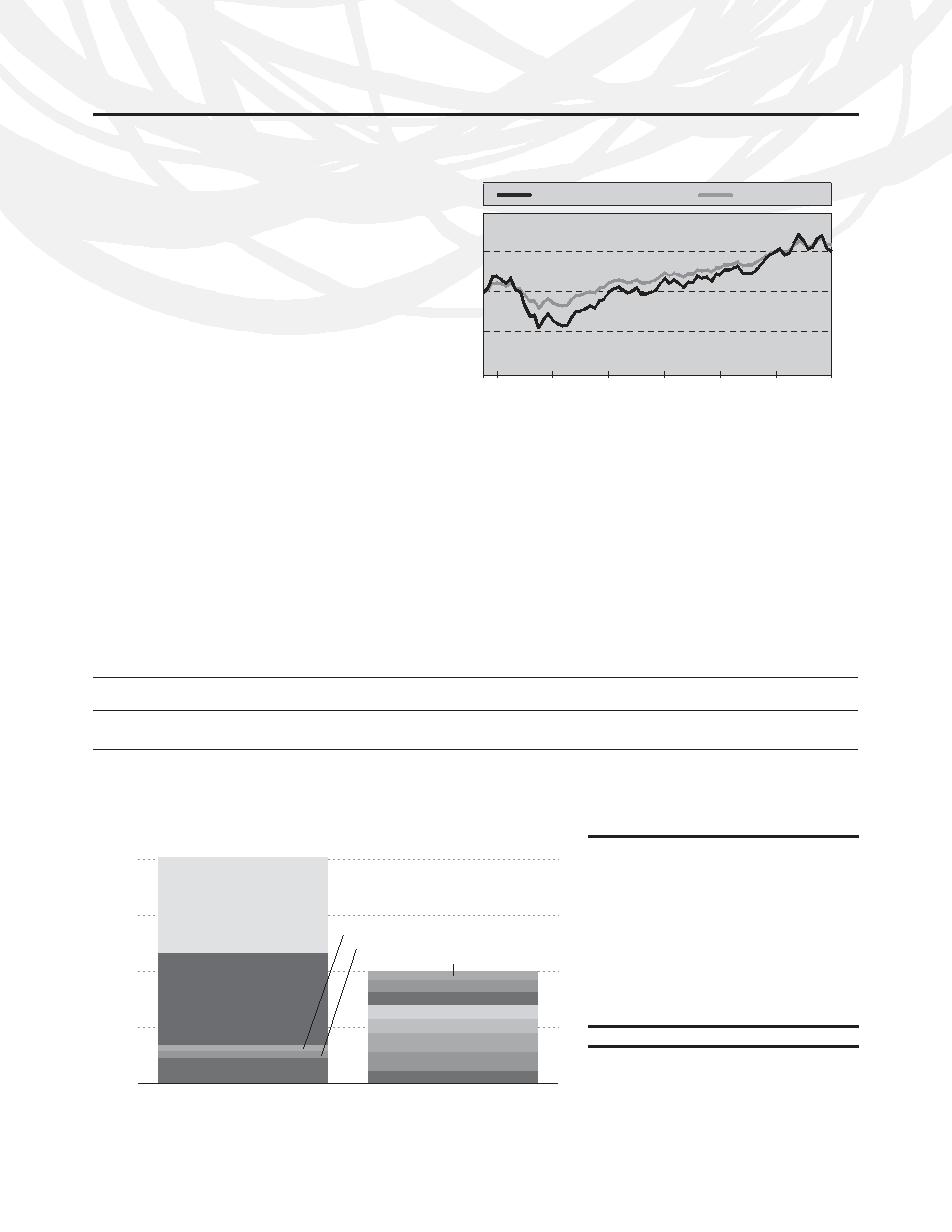
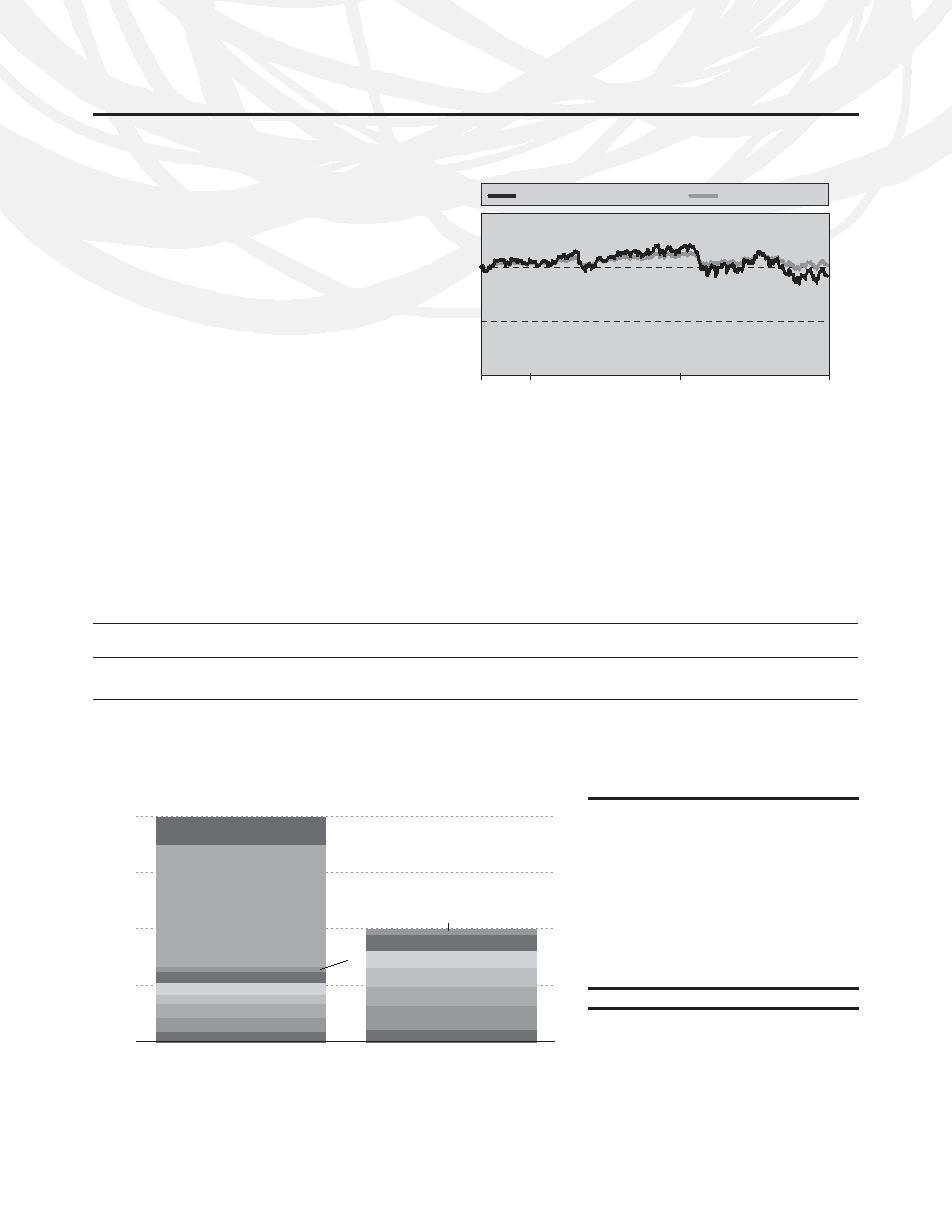
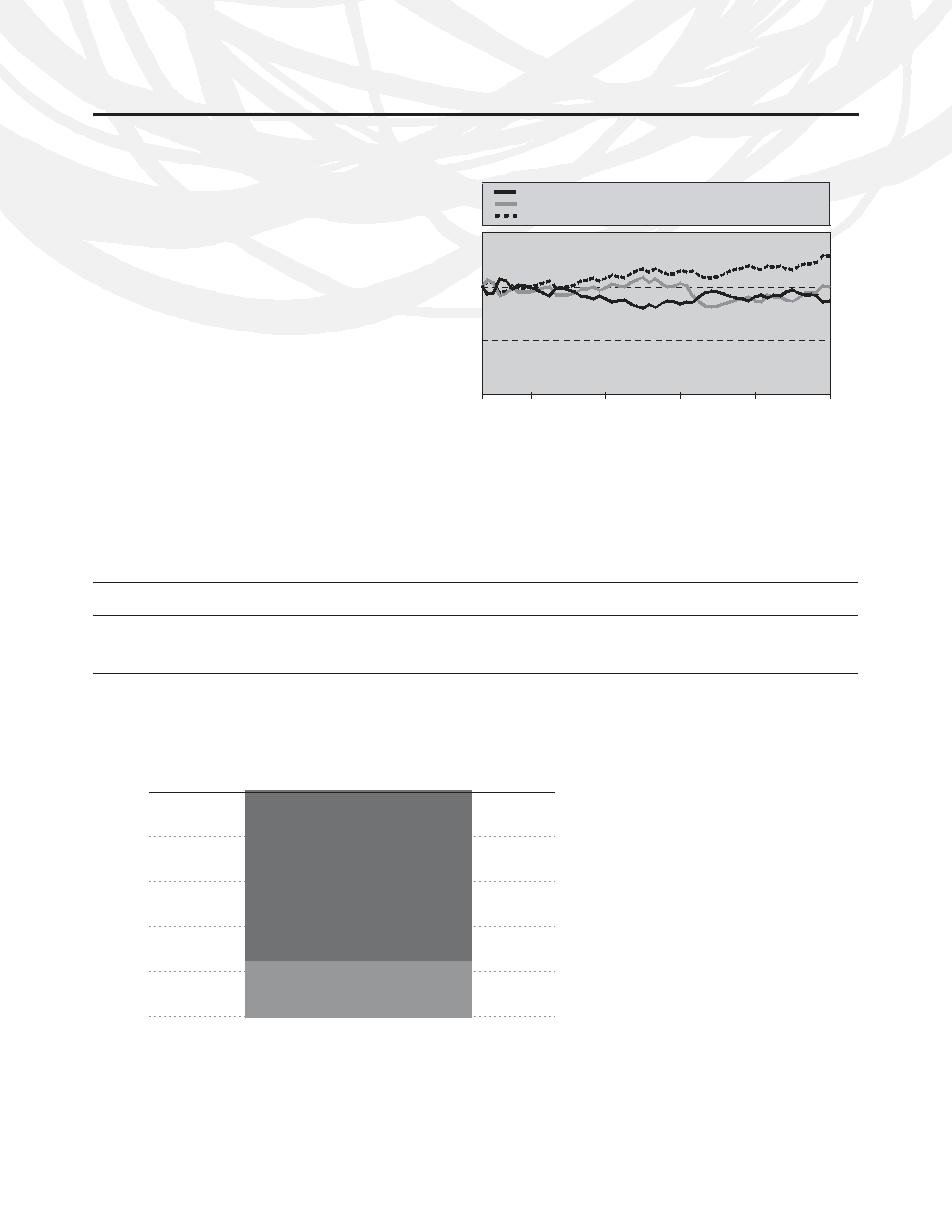
NOVA FUND
Cumulative Fund Performance:
December 31, 1997 – December 31, 2007
OBJECTIVE: To provide investment results that match the
performance of a specific benchmark on a daily basis. The
NOVA FUND
S&P 500 INDEX
Fund’s current benchmark is 150% of the daily performance of
$25,000
the S&P 500 Index.
Inception: May 7, 1997
$20,000
$17,756
The 5.49% total return of the benchmark S&P 500 Index in
$15,000
2007 masked one of the widest divergences in stock market
$12,557
returns seen in years. In the highly chaotic atmosphere that
$10,000
came to characterize the U.S. equity markets over the past 12
months, stock prices were buffeted by strong crosscurrents that
$5,000
showed up most starkly in returns at the sector level. Investors
continued to seek exposure to the rapidly growing global econ-
$0
omy by investing in energy, materials and technology stocks.
12/31/97
12/31/99
12/31/01
12/31/03
12/31/05
12/31/07
Companies involved in these industries are characterized by
strong revenue exposure outside the U.S. with half or more of
the S&P 500 Consumer Discretionary Index. Not surprisingly,
their sales in overseas markets. The S&P 500 sector indices repre-
investors sought the safety associated with traditional defensive
senting these industries rose between 15% and 34% in 2007.
sectors such as utilities and consumer staples which generated
double digit returns in a very difficult environment.
While investors sought growth, they also sought to shield them-
selves from the fallout from the collapse of the nation’s housing
For the year-long period, Rydex Nova Fund produced returns of
market. Financial services stocks were hit the hardest as shown
1.13%. It achieved a daily correlation of 99% to its benchmark of
by the 19% decline in the S&P 500 Financials Index. The outright
150% of the daily price movement of the S&P 500 Index.
implosion in the housing-backed debt markets brought credit
The effects of compounding may cause the longer-term correla-
markets to an abrupt halt and the balance sheets of financial
tion of the Fund to its benchmark to diminish. The apparent dis-
service providers were decimated by write-downs that would ulti-
crepancy between the leveraged and unleveraged indices is the
mately total over $100 billion. Moreover, with consumers reeling
result of compounding, which is described briefly on page 3 of
from falling home values and high energy prices, consumer dis-
this report.
cretionary stocks were avoided as seen from the -13% return of
AVERAGE ANNUAL TOTAL RETURNS FOR THE PERIOD ENDED 12/31/07
One
Five
Ten
Year
Year
Year
NOVA FUND
1.13%
14.88%
2.30%
S&P 500 INDEX
5.49%
12.83%
5.91%
The returns presented above do not reflect the effects of taxes. Past performance is no guarantee of future results. The S&P 500 Index is an
unmanaged stock index and, unlike the Fund, has no management fees or other operating expenses to reduce its reported returns. Returns are
historical and include changes in principal and reinvested dividends and capital gains.
Holdings Diversification (Market Exposure as % of Net Assets)
Ten Largest Holdings (% of Total Net Assets)
Exxon Mobil Corp.
3.2%
150%
Equity Index Swap
General Electric Co.
2.1%
Agreements
Microsoft Corp.
1.8%
AT&T, Inc.
1.6%
Futures
Chevron Corp.
1.3%
100%
Contracts
Consumer Discretionary
Procter & Gamble Co.
1.2%
Consumer Staples
Bank of America Corp.
1.2%
Consumer Discretionary
Industrials
Consumer Staples
Cisco Systems, Inc.
1.1%
Health Care
Industrials
International Business Machines Corp.
1.0%
50%
Health Care
Energy
Energy
JPMorgan Chase & Co.
1.0%
Information Technology
Information Technology
Top Ten Total
15.5%
Financials
Financials
“Ten Largest Holdings” exclude any
Other
Other
temporary cash or derivative investments.
0%
Nova Fund
S&P 500 Index
“Holdings Diversification (Market Exposure as % of Net Assets)” excludes any
temporary cash investments.
6
|
THE RYDEX VARIABLE TRUST ANNUAL REPORT
PERFORMANCE REPORTS AND FUND PROFILES (Unaudited) (continued)
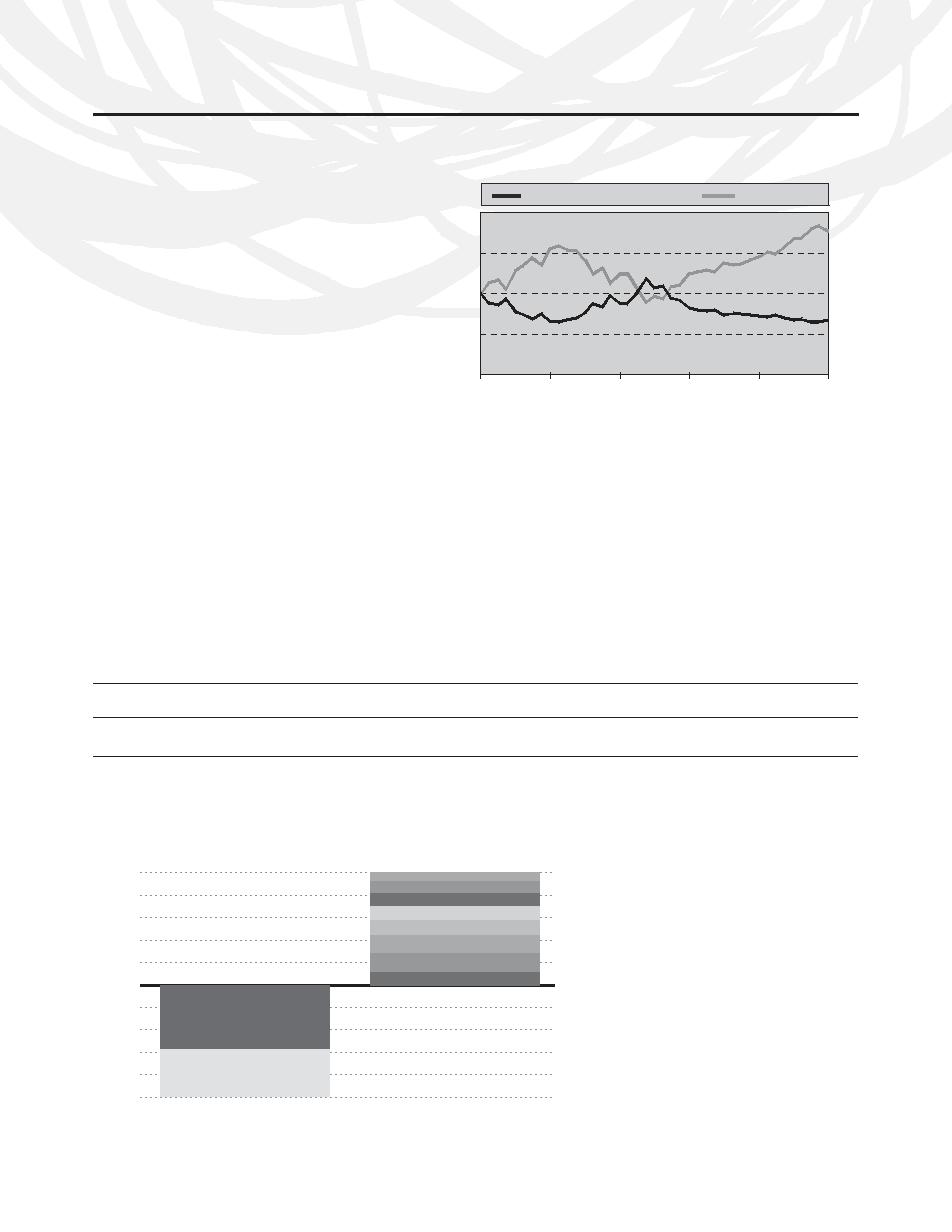
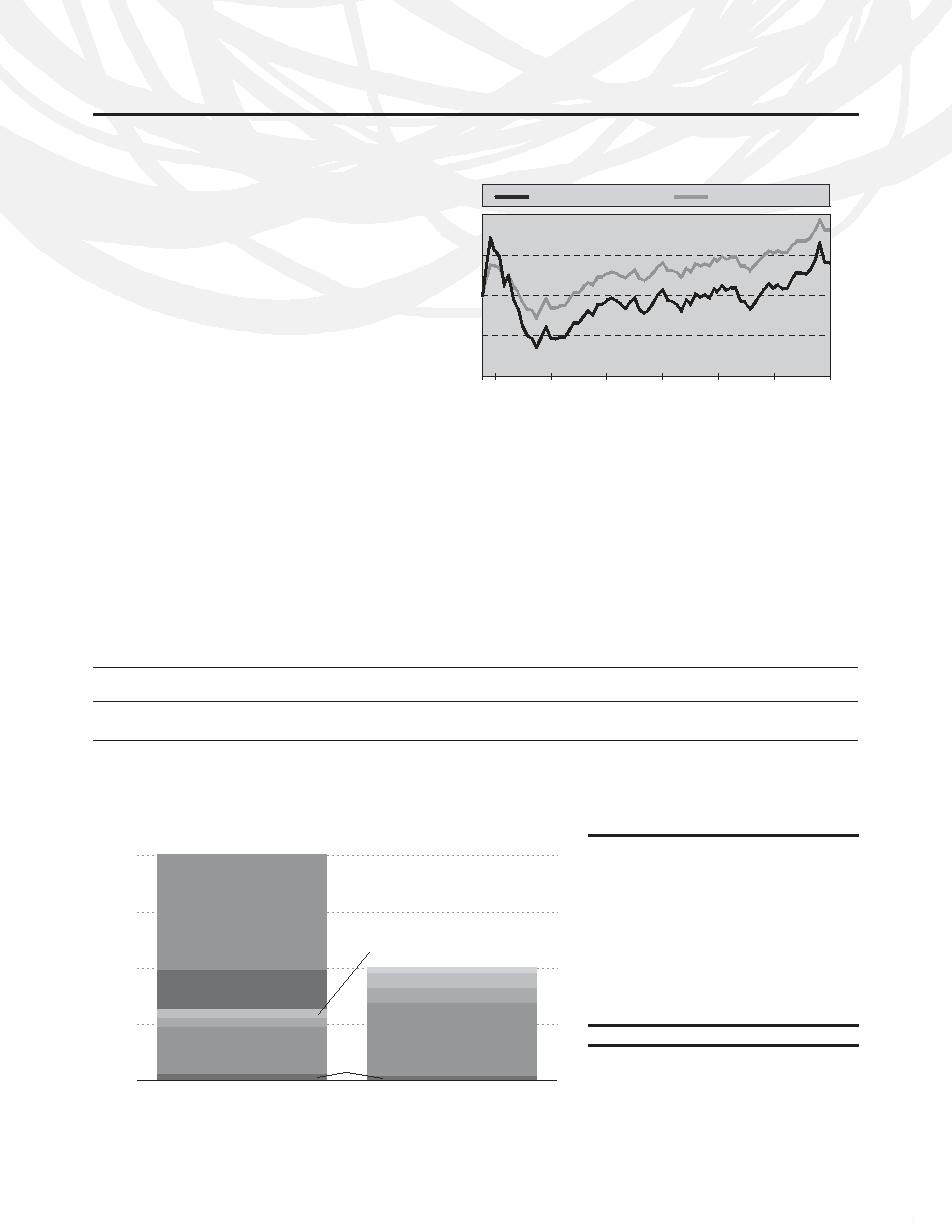
INVERSE S&P 500 STRATEGY FUND
Cumulative Fund Performance:
December 31, 1997 – December 31, 2007
OBJECTIVE: To provide investment results that will inversely
correlate to the performance of the S&P 500 Index.
INVERSE S&P 500 STRATEGY FUND
S&P 500 INDEX
Inception: June 9, 1997
$20,000
The 5.49% total return of the benchmark S&P 500 Index in
$17,756
2007 masked one of the widest divergences in stock market
$15,000
returns seen in years. In the highly chaotic atmosphere that
came to characterize the U.S. equity markets over the past 12
$10,000
months, stock prices were buffeted by strong crosscurrents
that showed up most starkly in returns at the sector level.
$6,830
Investors continued to seek exposure to the rapidly growing
$5,000
global economy by investing in energy, materials and technol-
ogy stocks. Companies involved in these industries are charac-
$0
terized by strong revenue exposure outside the U.S. with half
12/31/97
12/31/99
12/31/01
12/31/03
12/31/05
12/31/07
or more of their sales in overseas markets. The S&P 500 sector
indices representing these industries rose between 15% and
with traditional defensive sectors such as utilities and consumer
34% in 2007.
staples which generated double digit returns in a very difficult
environment.
While investors sought growth, they also sought to shield
themselves from the fallout from the collapse of the nation’s
For the year-long period, Rydex Inverse S&P 500 Strategy Fund
housing market. Financial services stocks were hit the hardest
produced returns of 0.83%. It achieved a daily correlation of
as shown by the 19% decline in the S&P 500 Financials Index.
99% to its benchmark of of -100% of the daily price movement
The outright implosion in the housing-backed debt markets
of the S&P 500 Index.
brought credit markets to an abrupt halt and the balance
The effects of compounding may cause the longer-term corre-
sheets of financial service providers were decimated by write-
lation of the Fund to its benchmark to diminish. The apparent
downs that would ultimately total over $100 billion. Moreover,
discrepancy between the leveraged and unleveraged indices is
with consumers reeling from falling home values and high ener-
the result of compounding, which is described briefly on page
gy prices, consumer discretionary stocks were avoided as seen
3 of this report.
from the -13% return of the S&P 500 Consumer Discretionary
Index. Not surprisingly, investors sought the safety associated
AVERAGE ANNUAL TOTAL RETURNS FOR THE PERIOD ENDED 12/31/07
One
Five
Ten
Year
Year
Year
INVERSE S&P 500 STRATEGY FUND
0.83%
-8.70%
-3.74%
S&P 500 INDEX
5.49%
12.83%
5.91%
The returns presented above do not reflect the effects of taxes. Past performance is no guarantee of future results. The S&P 500 Index is an
unmanaged stock index and, unlike the Fund, has no management fees or other operating expenses to reduce its reported returns. Returns are
historical and include changes in principal and reinvested dividends and capital gains.
Holdings Diversification (Market Exposure as % of Net Assets)
The Fund invests principally in derivative
instruments such as equity index swap
100%
agreements, futures contracts, and options on
Consumer Discretionary
Consumer Staples
index futures.
80%
Industrials
60%
Health Care
Energy
40%
Information Technology
20%
Financials
Other
0%
-20%
Futures Contracts
Short Sales
-40%
-60%
Equity Index
-80%
Swap Agreements
Short Sales
-100%
Inverse S&P 500
S&P 500 Index
Strategy Fund
“Holdings Diversification (Market Exposure as % of Net Assets)” excludes any
temporary cash investments.
THE RYDEX VARIABLE TRUST ANNUAL REPORT
|
7
PERFORMANCE REPORTS AND FUND PROFILES (Unaudited) (continued)
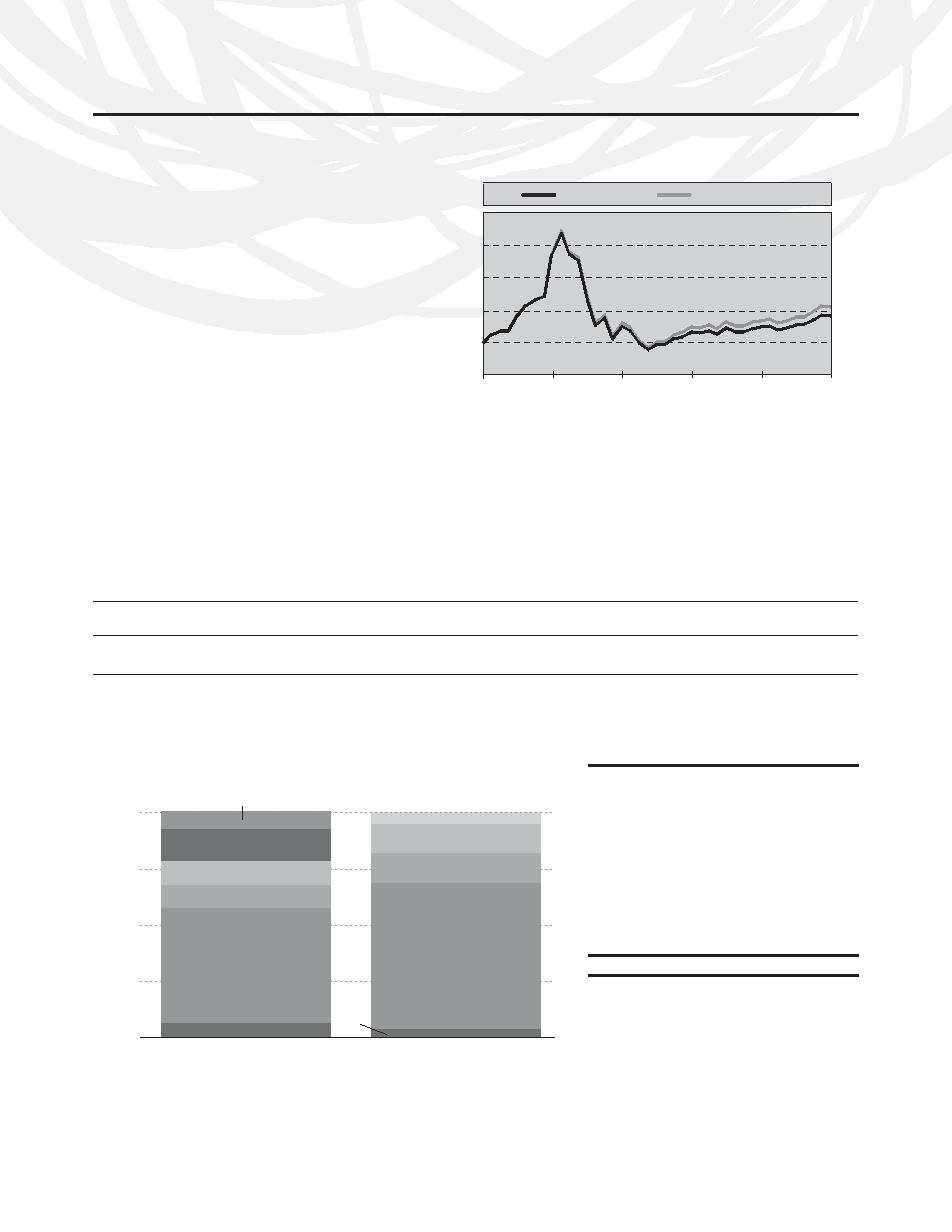
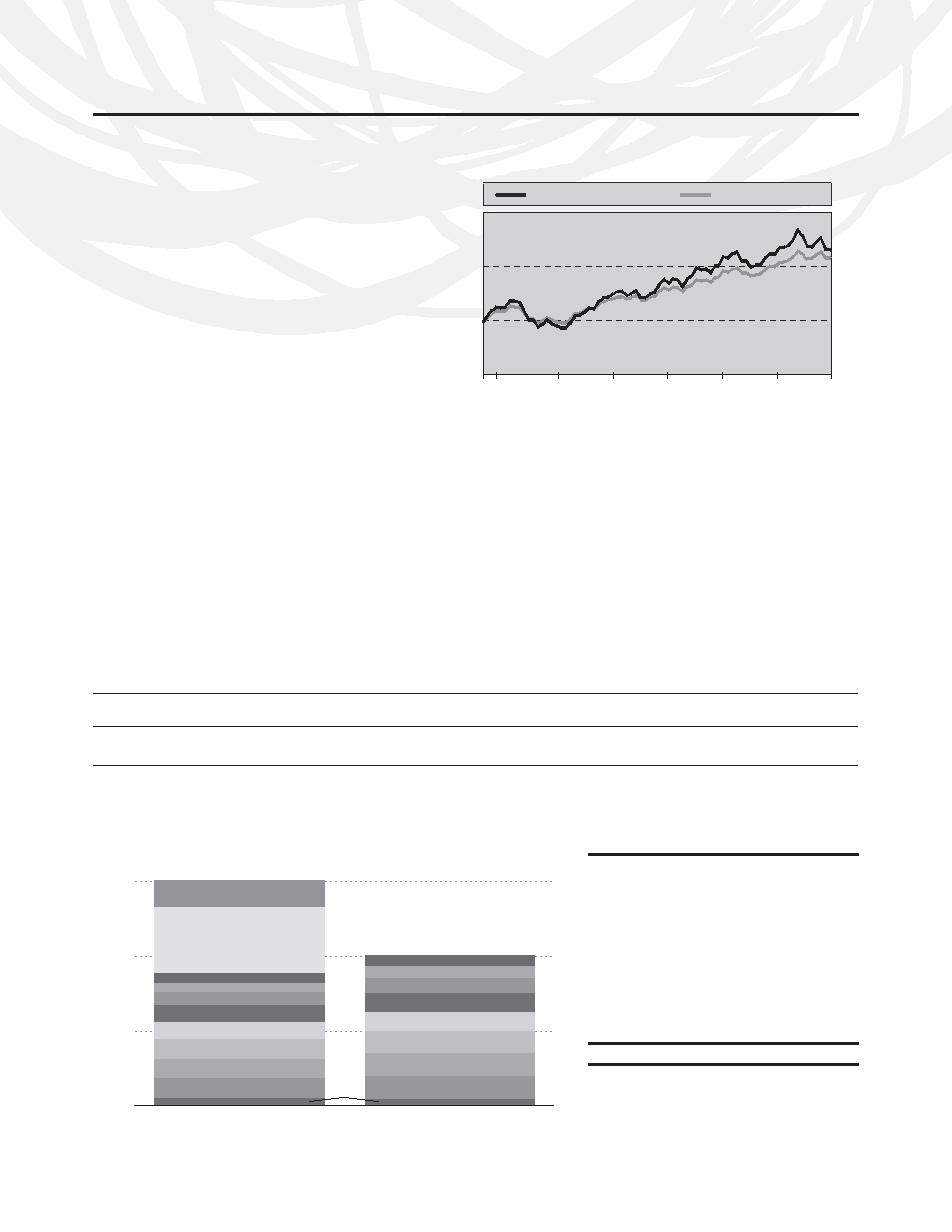
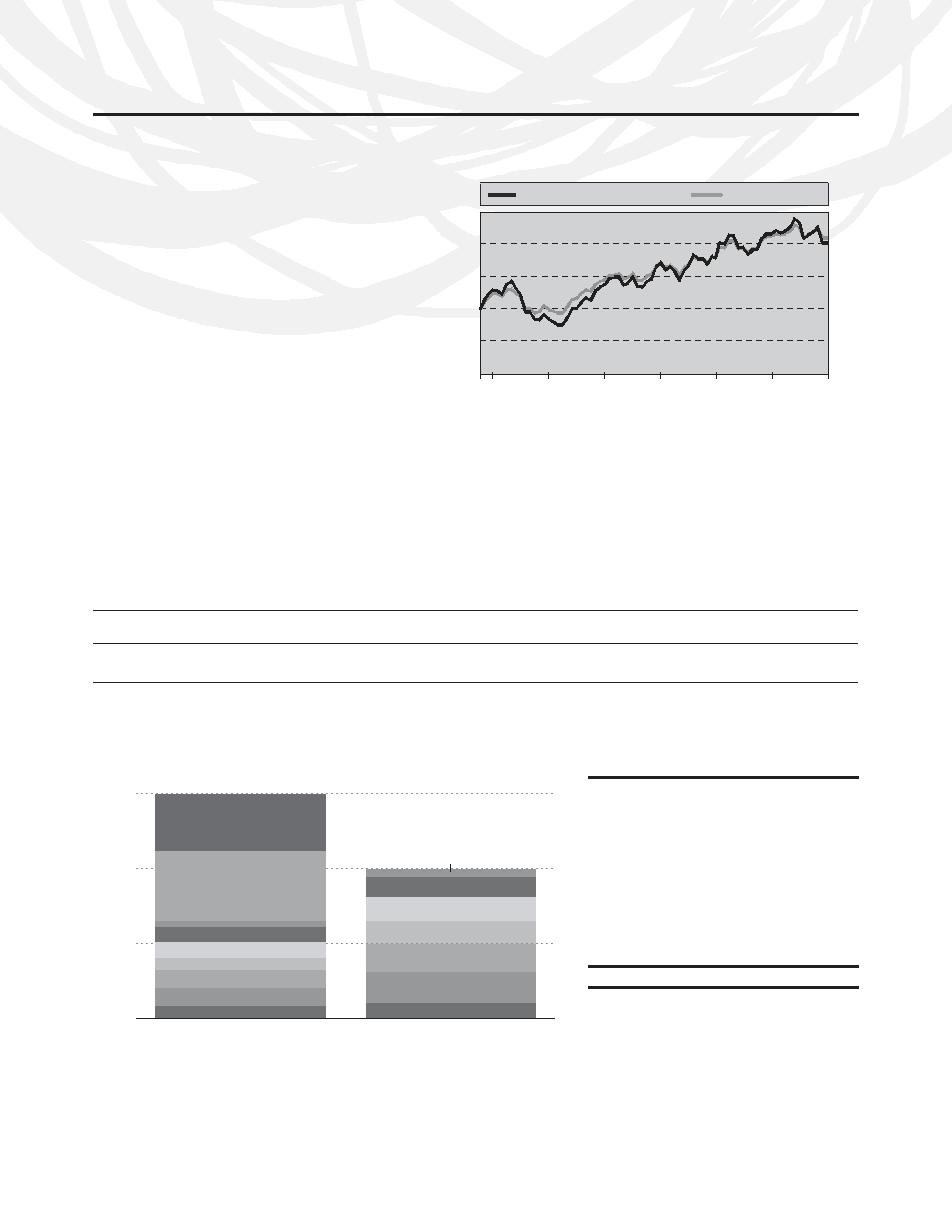
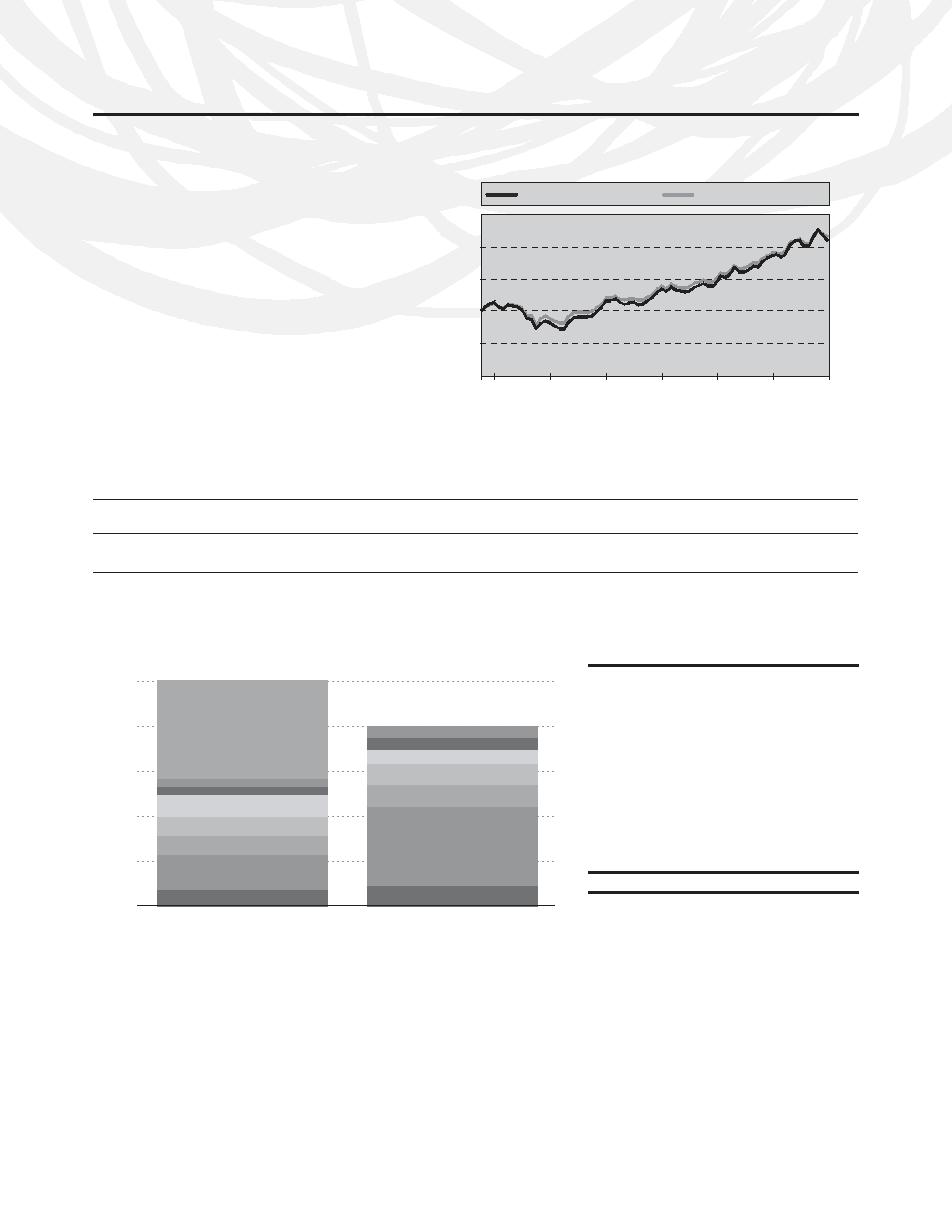
OTC FUND
Cumulative Fund Performance:
December 31, 1997 – December 31, 2007
OBJECTIVE: To provide investment results that correspond
to a benchmark for over-the-counter securities. The Fund’s cur-
OTC FUND
NASDAQ 100 INDEX*
rent benchmark is the Nasdaq 100 Index.
$50,000
Inception: May 7, 1997
$40,000
Tech stocks were one of the big winners in 2007 as shown by
the Nasdaq 100 Index’s 19.24% return for the year. While the
$30,000
broader market averages struggled to generate single digit
returns, prices of technology stocks were buoyed by two pow-
$20,000
$21,042
erful forces. Although the economy began to fade as the year
$18,163
wore on and consumers pulled back from discretionary spend-
$10,000
ing in an attempt to cope with rising energy costs and lower
home values, corporations continued to spend aggressively on
$0
infrastructure by, among other things, upgrading their informa-
12/31/97
12/31/99
12/31/01
12/31/03
12/31/05
12/31/07
tion management systems. With growth opportunities in the
U.S. becoming scarcer as the year unfolded, technology stood
Apple, Cisco, Dell and Intel were major beneficiaries.
out as a bright spot. The other major dynamic that drove tech-
Information technology providers here in the U.S. source nearly
nology stock prices higher during the year was the rapid,
one-half of their revenues outside the U.S. and, as investors
unprecedented and seemingly unstoppable growth in the
sought to expose themselves to the global growth play, tech-
global economy. With emerging powerhouse economies such
nology stocks were ideally positioned to provide that exposure.
as China, Brazil, India and Russia industrializing rapidly and
spending heavily on technology in the process, firms such as
For the year-long period, Rydex OTC Fund produced returns of
17.82%.
* Data points for the line graph do not reflect the reinvestment of dividends on securities in the index.
AVERAGE ANNUAL TOTAL RETURNS FOR THE PERIOD ENDED 12/31/07
One
Five
Ten
Year
Year
Year
OTC FUND
17.82%
14.91%
6.15%
NASDAQ 100 INDEX
19.24%
16.62%
7.96%
The returns presented above do not reflect the effects of taxes. Past performance is no guarantee of future results. The Nasdaq 100 Index is an
unmanaged stock index and, unlike the Fund, has no management fees or other operating expenses to reduce its reported returns. Returns are
historical and include changes in principal and reinvested dividends and capital gains.
Holdings Diversification (Market Exposure as % of Net Assets)
Ten Largest Holdings (% of Total Net Assets)
Apple, Inc.
10.7%
Equity Index Swap
Agreements
Microsoft Corp.
5.4%
100%
Industrials
Google, Inc. — Class A
4.2%
Qualcomm, Inc.
3.8%
Futures Contracts
Consumer Discretionary
Cisco Systems, Inc.
2.9%
75%
Health Care
Consumer Discretionary
Research In Motion Ltd.
2.9%
Oracle Corp.
2.5%
Health Care
Intel Corp.
2.1%
50%
Gilead Sciences, Inc.
1.9%
Comcast Corp. — Class A
1.5%
Information
Information
Top Ten Total
37.9%
Technology
Technology
25%
“Ten Largest Holdings” exclude any temporary
cash or derivative investments.
Other
Other
0%
OTC Fund
Nasdaq 100 Index
“Holdings Diversification (Market Exposure as % of Net Assets)” excludes any
temporary cash investments.
8
|
THE RYDEX VARIABLE TRUST ANNUAL REPORT
PERFORMANCE REPORTS AND FUND PROFILES (Unaudited) (continued)
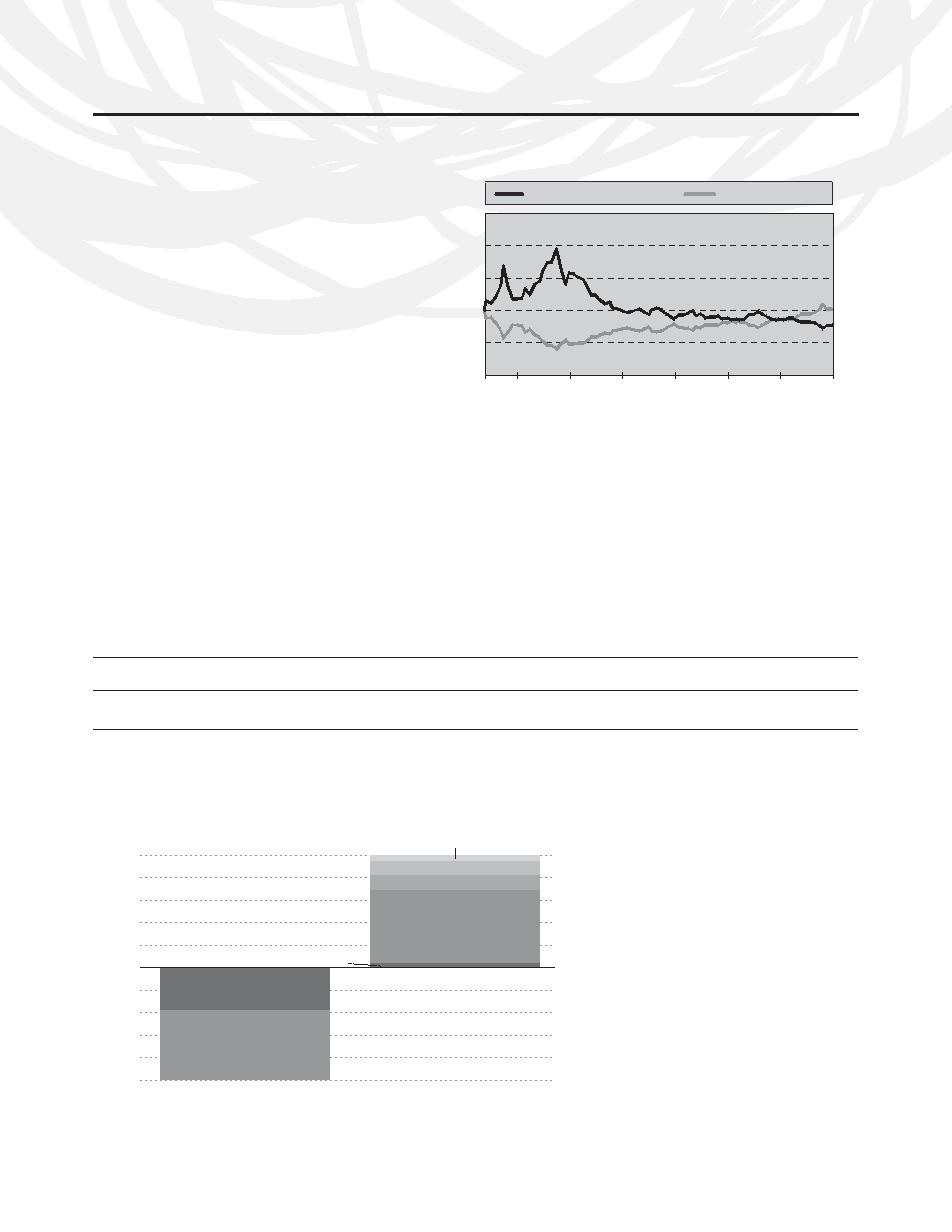
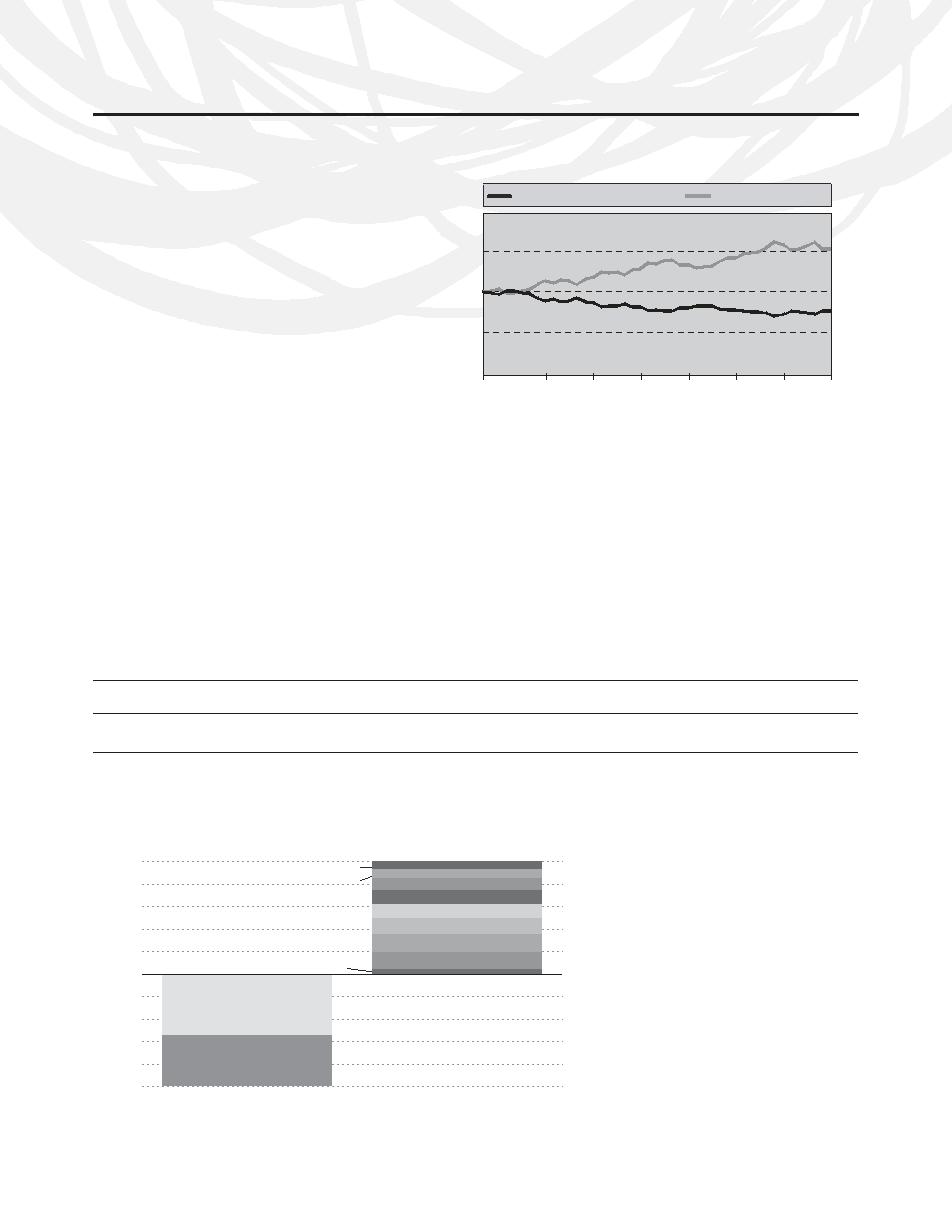
INVERSE OTC STRATEGY FUND
Cumulative Fund Performance:
May 21, 2001 – December 31, 2007
OBJECTIVE: To provide investment results that will match
the performance of a specific benchmark. The Fund’s current
INVERSE OTC STRATEGY FUND
NASDAQ 100 INDEX*
benchmark is the inverse of the performance of the Nasdaq
$25,000
100 Index.
Inception: May 21, 2001
$20,000
Tech stocks were one of the big winners in 2007 as shown by
the Nasdaq 100 Index’s 19.24% return for the year. While the
$15,000
broader market averages struggled to generate single digit
$10,000
$10,158
returns, prices of technology stocks were buoyed by two pow-
$7,721
erful forces. Although the economy began to fade as the year
$5,000
wore on and consumers pulled back from discretionary spend-
ing in an attempt to cope with rising energy costs and lower
$0
home values, corporations continued to spend aggressively on
05/21/01
12/31/01
12/31/02
12/31/03
12/31/04
12/31/05
12/31/06
12/31/07
infrastructure by, among other things, upgrading their informa-
tion management systems. With growth opportunities in the
sought to expose themselves to the global growth play, tech-
U.S. becoming scarcer as the year unfolded, technology stood
nology stocks were ideally positioned to provide that exposure.
out as a bright spot. The other major dynamic that drove tech-
For the year-long period, Rydex Inverse OTC Strategy Fund
nology stock prices higher during the year was the rapid,
produced returns of -11.28%. It achieved a daily correlation of
unprecedented and seemingly unstoppable growth in the
99% to its benchmark of -100% of the daily price movement
global economy. With emerging powerhouse economies such
of the Nasdaq 100 Index.
as China, Brazil, India and Russia industrializing rapidly and
The effects of compounding may cause the longer-term corre-
spending heavily on technology in the process, firms such as
lation of the Fund to its benchmark to diminish. The apparent
Apple, Cisco, Dell and Intel were major beneficiaries.
discrepancy between the leveraged and unleveraged indices is
Information technology providers here in the U.S. source nearly
the result of compounding, which is described briefly on page
one-half of their revenues outside the U.S. and, as investors
3 of this report.
* Data points for the line graph do not reflect the reinvestment of dividends on securities in the index.
AVERAGE ANNUAL TOTAL RETURNS FOR THE PERIOD ENDED 12/31/07
One
Five
Since Inception
Year
Year
(05/21/01)
INVERSE OTC STRATEGY FUND
-11.28%
-13.32%
-3.84%
NASDAQ 100 INDEX
19.24%
16.62%
0.54%
The returns presented above do not reflect the effects of taxes. Past performance is no guarantee of future results. The Nasdaq 100 Index is an
unmanaged stock index and, unlike the Fund, has no management fees or other operating expenses to reduce its reported returns. Returns are
historical and include changes in principal and reinvested dividends and capital gains.
Holdings Diversification (Market Exposure as % of Net Assets)
The Fund invests principally in derivative
instruments such as equity index swap
Industrials
agreements, futures contracts, and options on
100%
index futures.
Consumer Discretionary
80%
Health Care
60%
Information
40%
Technology
20%
Other
0%
Futures Contracts
-20%
Short Sales
-40%
-60%
Equity Index Swap
-80%
Agreements
-100%
Inverse OTC Strategy Fund
Nasdaq 100 Index
“Holdings Diversification (Market Exposure as % of Net Assets)” excludes any
temporary cash investments.
THE RYDEX VARIABLE TRUST ANNUAL REPORT
|
9
PERFORMANCE REPORTS AND FUND PROFILES (Unaudited) (continued)
S&P 500 2x STRATEGY FUND
Cumulative Fund Performance:
October 1, 2001 – December 31, 2007
OBJECTIVE: To provide investment results that will match
the performance of a specific benchmark on a daily basis. The
S&P 500 2x STRATEGY FUND
S&P 500 INDEX
Fund’s current benchmark is 200% of the performance of the
$20,000
S&P 500 Index.
Inception: October 1, 2001
$15,803
$15,000
$15,035
The 5.49% total return of the benchmark S&P 500 Index in
2007 masked one of the widest divergences in stock market
$10,000
returns seen in years. In the highly chaotic atmosphere that
came to characterize the U.S. equity markets over the past 12
months, stock prices were buffeted by strong crosscurrents
$5,000
that showed up most starkly in returns at the sector level.
Investors continued to seek exposure to the rapidly growing
$0
global economy by investing in energy, materials and technol-
10/01/01
12/31/01
12/31/02
12/31/03
12/31/04
12/31/05
12/31/06
12/31/07
ogy stocks. Companies involved in these industries are charac-
terized by strong revenue exposure outside the U.S. with half
from the -13% return of the S&P 500 Consumer Discretionary
or more of their sales in overseas markets. The S&P 500 sector
Index. Not surprisingly, investors sought the safety associated
indices representing these industries rose between 15% and
with traditional defensive sectors such as utilities and consumer
34% in 2007.
staples which generated double digit returns in a very difficult
environment.
While investors sought growth, they also sought to shield
themselves from the fallout from the collapse of the nation’s
For the year-long period, Rydex S&P 500 2x Strategy Fund
housing market. Financial services stocks were hit the hardest
produced returns of 0.61%. It achieved a daily correlation of
as shown by the 19% decline in the S&P 500 Financials Index.
100% to its benchmark of 200% of the daily price movement of
The outright implosion in the housing-backed debt markets
the S&P 500 Index.
brought credit markets to an abrupt halt and the balance
The effects of compounding may cause the longer-term corre-
sheets of financial service providers were decimated by write-
lation of the Fund to its benchmark to diminish. The apparent
downs that would ultimately total over $100 billion. Moreover,
discrepancy between the leveraged and unleveraged indices is
with consumers reeling from falling home values and high ener-
the result of compounding, which is described briefly on page
gy prices, consumer discretionary stocks were avoided as seen
3 of this report.
AVERAGE ANNUAL TOTAL RETURNS FOR THE PERIOD ENDED 12/31/07
One
Five
Since Inception
Year
Year
(10/01/01)
S&P 500 2x STRATEGY FUND
0.61%
18.44%
6.74%
S&P 500 INDEX
5.49%
12.83%
7.60%
The returns presented above do not reflect the effects of taxes. Past performance is no guarantee of future results. The S&P 500 Index is an
unmanaged stock index and, unlike the Fund, has no management fees or other operating expenses to reduce its reported returns. Returns are
historical and include changes in principal and reinvested dividends and capital gains.
Holdings Diversification (Market Exposure as % of Net Assets)
Ten Largest Holdings (% of Total Net Assets)
Exxon Mobil Corp.
1.4%
200%
General Electric Co.
1.0%
Microsoft Corp.
0.8%
Equity Index Swap
AT&T, Inc.
0.7%
150%
Agreements
Information Technology
Procter & Gamble Co.
0.6%
Financials
Chevron Corp.
0.5%
Consumer Discretionary
Johnson & Johnson, Inc.
0.5%
100%
Consumer Staples
Bank of America Corp.
0.5%
Futures Contracts
Industrials
Apple, Inc.
0.5%
Health Care
Cisco Systems, Inc.
0.4%
50%
Energy
Information Technology
Top Ten Total
6.9%
Financials
“Ten Largest Holdings” exclude any temporary cash
Other
Other
or derivative investments.
0%
S&P 500 2x Strategy Fund
S&P 500 Index
“Holdings Diversification (Market Exposure as % of Net Assets)” excludes any
temporary cash investments.
10
|
THE RYDEX VARIABLE TRUST ANNUAL REPORT
PERFORMANCE REPORTS AND FUND PROFILES (Unaudited) (continued)
OTC 2x STRATEGY FUND
Cumulative Fund Performance:
October 1, 2001 – December 31, 2007
OBJECTIVE: To provide investment results that will match
the performance of a specific benchmark on a daily basis. The
OTC 2x STRATEGY FUND
NASDAQ 100 INDEX*
Fund’s current benchmark is 200% of the performance of the
$20,000
Nasdaq 100 Index.
$18,110
Inception: October 1, 2001
$15,000
Tech stocks were one of the big winners in 2007 as shown by
$14,077
the Nasdaq 100 Index’s 19.24% return for the year. While the
$10,000
broader market averages struggled to generate single digit
returns, prices of technology stocks were buoyed by two pow-
erful forces. Although the economy began to fade as the year
$5,000
wore on and consumers pulled back from discretionary spend-
ing in an attempt to cope with rising energy costs and lower
$0
home values, corporations continued to spend aggressively on
10/01/01
12/31/01
12/31/02
12/31/03
12/31/04
12/31/05
12/31/06
12/31/07
infrastructure by, among other things, upgrading their informa-
tion management systems. With growth opportunities in the
sought to expose themselves to the global growth play, tech-
U.S. becoming scarcer as the year unfolded, technology stood
nology stocks were ideally positioned to provide that exposure.
out as a bright spot. The other major dynamic that drove tech-
For the year-long period, Rydex OTC 2x Strategy Fund pro-
nology stock prices higher during the year was the rapid,
duced returns of 28.20%. It achieved a daily correlation of
unprecedented and seemingly unstoppable growth in the
100% to its benchmark of 200% of the daily price movement of
global economy. With emerging powerhouse economies such
the Nasdaq 100 Index.
as China, Brazil, India and Russia industrializing rapidly and
spending heavily on technology in the process, firms such as
The effects of compounding may cause the longer-term corre-
Apple, Cisco, Dell and Intel were major beneficiaries.
lation of the Fund to its benchmark to diminish. The apparent
Information technology providers here in the U.S. source nearly
discrepancy between the leveraged and unleveraged indices is
one-half of their revenues outside the U.S. and, as investors
the result of compounding, which is described briefly on page
3 of this report.
* Data points for the line graph do not reflect the reinvestment of dividends on securities in the index.
AVERAGE ANNUAL TOTAL RETURNS FOR THE PERIOD ENDED 12/31/07
One
Five
Since Inception
Year
Year
(10/01/01)
OTC 2x STRATEGY FUND
28.20%
24.22%
5.62%
NASDAQ 100 INDEX
19.24%
16.62%
10.31%
The returns presented above do not reflect the effects of taxes. Past performance is no guarantee of future results. The Nasdaq 100 Index is an
unmanaged stock index and, unlike the Fund, has no management fees or other operating expenses to reduce its reported returns. Returns are
historical and include changes in principal and reinvested dividends and capital gains.
Holdings Diversification (Market Exposure as % of Net Assets)
Ten Largest Holdings (% of Total Net Assets)
Apple, Inc.
8.7%
200%
Microsoft Corp.
4.1%
Google, Inc. — Class A
3.6%
Qualcomm, Inc.
2.8%
150%
Equity Index Swap
Agreements
Research In Motion Ltd.
2.3%
Consumer
Discretionary
Cisco Systems, Inc.
2.1%
Industrials
Intel Corp.
2.0%
100%
Consumer Discretionary
Oracle Corp.
1.7%
Futures Contracts
Health Care
Gilead Sciences, Inc.
1.5%
eBay, Inc.
1.2%
50%
Health Care
Information
Top Ten Total
30.0%
Information
Technology
Technology
Other
“Ten Largest Holdings” exclude any temporary cash
or derivative investments.
0%
OTC 2x Strategy Fund
Nasdaq 100 Index
“Holdings Diversification (Market Exposure as % of Net Assets)” excludes any
temporary cash investments.
THE RYDEX VARIABLE TRUST ANNUAL REPORT
|
11
PERFORMANCE REPORTS AND FUND PROFILES (Unaudited) (continued)
MID-CAP 1.5x STRATEGY FUND
Cumulative Fund Performance:
October 1, 2001 – December 31, 2007
OBJECTIVE: To provide investment results that correlate to
the performance of a specific benchmark for mid-cap securi-
MID-CAP 1.5x STRATEGY FUND
S&P MIDCAP 400 INDEX
ties. The Fund’s current benchmark is the S&P MidCap 400®
$30,000
Index.
Inception: October 1, 2001
$23,262
$21,755
Mid-cap stocks had a surprisingly good year in 2007, outper-
$20,000
forming the broader market indices in an environment charac-
terized by volatility and risk aversion. The S&P MidCap 400
Index generated a total return of 7.98%, exceeding the
$10,000
returns of the benchmark DJIA and S&P 500 Index. This per-
formance represents something of a departure from historical
relationships as the performance of mid-cap stocks is usually
$0
highly correlated with that of small-cap stocks over time. A
10/01/01
12/31/01
12/31/02
12/31/03
12/31/04
12/31/05
12/31/06
12/31/07
good deal of the favorable performance of mid-cap stocks
was generated in the first six months of the year. Like the rest
large caps—and, at the same time, offer superior liquidity char-
of the equity market, mid-caps struggled in the latter part of
acteristics versus small caps should market sentiment decline as
2007 as markets hunkered down in the face of the housing and
it did in the latter half of the year.
credit market crisis and fears of an economic recession.
With mid-cap stocks delivering solid performance in 2007,
Although stocks rallied in the first half, investors were cognizant
Rydex Mid-Cap 1.5x Strategy Fund handed in a 3.60% total
of the accumulating risks in the economy and financial markets.
return as compared to the S&P MidCap 400 Index, which had a
Investors wanted to remain exposed to stocks but wanted to be
return of 7.98% for the same period. It achieved a daily correla-
ready to head for the exits when stock prices turned down. That
tion of 99% to its benchmark of 150% of the daily price move-
balancing act of trying to generate excess return, or alpha, and
ment of the S&P MidCap 400 Index.
the ability to close out positions in a hurry if conditions deterio-
The effects of compounding may cause the longer-term corre-
rated seemed to find a home in mid-cap stocks. Opportunistic
lation of the Fund to its benchmark to diminish. The apparent
investors, such as long-only mutual fund managers, hedge funds
discrepancy between the leveraged and unleveraged indices is
and private equity managers, were drawn to the potential to
the result of compounding, which is described briefly on page
generate alpha through fundamental research—mid-cap stocks
3 of this report.
tend not to be as excessively covered by Wall Street research as
AVERAGE ANNUAL TOTAL RETURNS FOR THE PERIOD ENDED 12/31/07
One
Five
Since Inception
Year
Year
(10/01/01)
MID-CAP 1.5x STRATEGY FUND
3.60%
19.44%
14.46%
S&P MIDCAP 400 INDEX
7.98%
16.20%
13.24%
The returns presented above do not reflect the effects of taxes. Past performance is no guarantee of future results. The S&P MidCap 400 Index is
an unmanaged stock index and, unlike the Fund, has no management fees or other operating expenses to reduce its reported returns. Returns are
historical and include changes in principal and reinvested dividends and capital gains.
Holdings Diversification (Market Exposure as % of Net Assets)
Ten Largest Holdings (% of Total Net Assets)
Intuitive Surgical, Inc.
1.0%
150%
Equity Index
Cameron International Corp.
0.8%
Swap Agreements
DENTSPLY International, Inc.
0.8%
Telephone & Data Systems, Inc.
0.8%
Futures Contracts
Lam Research Corp.
0.7%
100%
Materials
Henry Schein, Inc.
0.7%
Materials
Utilities
Energy
Western Digital Corp.
0.7%
Utilities
Energy
Consumer Discretionary
MDU Resources Group, Inc.
0.7%
Consumer Discretionary
Health Care
Grant Prideco, Inc.
0.7%
50%
Health Care
AMB Property Corp.
0.7%
Information Technology
Information Technology
Top Ten Total
7.6%
Financials
Financials
“Ten Largest Holdings” exclude any
Industrials
Other
Industrials
temporary cash or derivative investments.
0%
Mid-Cap 1.5x Strategy Fund
S&P MidCap 400 Index
“Holdings Diversification (Market Exposure as % of Net Assets)” excludes any
temporary cash investments.
12
|
THE RYDEX VARIABLE TRUST ANNUAL REPORT
PERFORMANCE REPORTS AND FUND PROFILES (Unaudited) (continued)
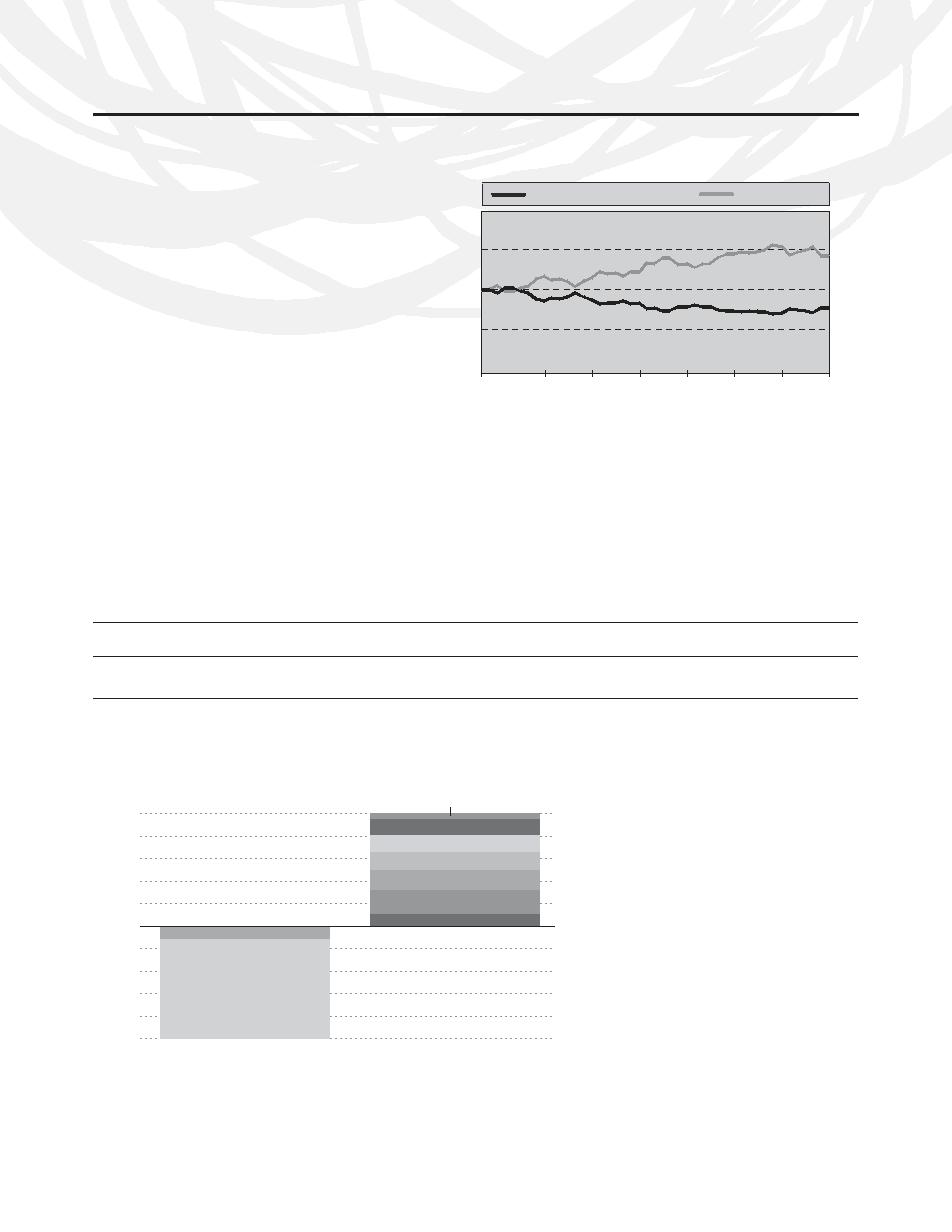
INVERSE MID-CAP STRATEGY FUND
Cumulative Fund Performance:
May 3, 2004 – December 31, 2007
OBJECTIVE: To provide investment results that will match
the performance of a specific benchmark. The Fund’s current
INVERSE MID-CAP STRATEGY FUND
S&P MIDCAP 400 INDEX
benchmark is the inverse of the performance of the S&P
$20,000
MidCap 400 Index.
Inception: May 3, 2004
$15,000
$15,228
Mid-cap stocks had a surprisingly good year in 2007, outper-
forming the broader market indices in an environment charac-
$10,000
terized by volatility and risk aversion. The S&P MidCap 400
$7,624
Index generated a total return of 7.98%, exceeding the returns
of the benchmark DJIA and S&P 500 Index. This performance
$5,000
represents something of a departure from historical relation-
ships as the performance of mid-cap stocks is usually highly
$0
correlated with that of small-cap stocks over time. A good deal
05/03/04
12/31/04
06/30/05
12/31/05
06/30/06
12/31/06
06/30/07
12/31/07
of the favorable performance of mid-cap stocks was generated
in the first six months of the year. Like the rest of the equity
tend not to be as excessively covered by Wall Street research as
market, mid-caps struggled in the latter part of 2007 as mar-
large caps—and, at the same time, offer superior liquidity char-
kets hunkered down in the face of the housing and credit
acteristics versus small caps should market sentiment decline as
market crisis and fears of an economic recession.
it did in the latter half of the year.
Although stocks rallied in the first half, investors were cognizant
With mid-cap stocks delivering positive returns in 2007, Rydex
of the accumulating risks in the economy and financial markets.
Inverse Mid-Cap Strategy Fund performed as expected with a
Investors wanted to remain exposed to stocks but wanted to be
–1.98% return for the period. It achieved a daily correlation of
ready to head for the exits when stock prices turned down. That
99% to its benchmark of 150% of the daily price movement of
balancing act of trying to generate excess return, or alpha, and
the S&P MidCap 400 Index.
the ability to close out positions in a hurry if conditions deterio-
The effects of compounding may cause the longer-term corre-
rated seemed to find a home in mid-cap stocks. Opportunistic
lation of the Fund to its benchmark to diminish. The apparent
investors, such as long-only mutual fund managers, hedge funds
discrepancy between the leveraged and unleveraged indices is
and private equity managers, were drawn to the potential to
the result of compounding, which is described briefly on page
generate alpha through fundamental research—mid-cap stocks
3 of this report.
AVERAGE ANNUAL TOTAL RETURNS FOR THE PERIOD ENDED 12/31/07
One
Since Inception
Year
(05/03/04)
INVERSE MID-CAP STRATEGY FUND
-1.98%
-7.14%
S&P MIDCAP 400 INDEX
7.98%
12.17%
The returns presented above do not reflect the effects of taxes. Past performance is no guarantee of future results. The S&P MidCap 400 Index is
an unmanaged stock index and, unlike the Fund, has no management fees or other operating expenses to reduce its reported returns. Returns are
historical and include changes in principal and reinvested dividends and capital gains.
Holdings Diversification (Market Exposure as % of Net Assets)
The Fund invests principally in derivative
instruments such as equity index swap
100%
Materials
agreements, futures contracts, and options on
Utilities
80%
Energy
index futures.
Consumer Discretionary
60%
Health Care
40%
Information Technology
Financials
20%
Other
Industrials
0%
-20%
Futures Contracts
-40%
Short Sales
-60%
Equity Index
-80%
Swap Agreements
Short Sales
-100%
Inverse Mid-Cap
S&P MidCap 400 Index
Strategy Fund
“Holdings Diversification (Market Exposure as % of Net Assets)” excludes any
temporary cash investments.
THE RYDEX VARIABLE TRUST ANNUAL REPORT
|
13
PERFORMANCE REPORTS AND FUND PROFILES (Unaudited) (continued)
RUSSELL 2000® 2x STRATEGY FUND
Cumulative Fund Performance:
October 27, 2006 – December 31, 2007
OBJECTIVE: To provide investment results that will match
the performance of a specific benchmark on a daily basis. The
RUSSELL 2000
®
2x STRATEGY FUND
RUSSELL 2000 INDEX
Fund’s current benchmark is 200% of the performance of the
$15,000
Russell 2000 Index.
Inception: October 27, 2006
Small-capitalization stocks struggled in 2007 as risk appetites
$10,000
$10,151
$9,096
abated with the unfolding crises in the U.S housing and credit
markets. Small-cap stocks, as shown by the Russell 2000
Index’s -1.57% return, underperformed large-cap stocks by
$5,000
wide margins. Indeed, small-cap stocks had enjoyed a long
and nearly unprecedented run of strong performance for over
six years. In an environment of easy credit and robust risk
$0
appetites, small-cap stocks came to embody the bull market
10/27/06
12/31/06
06/30/07
12/31/07
years of 2003-2007. As is often the case with bull markets how-
ever, valuations began to run away from the fundamentals and
With the Russell 2000 Index delivering negative returns for the
by early 2007 large-cap stocks were looking like a better value.
year, Rydex Russell 2000® 2x Strategy Fund also saw returns in
And to validate Murphy’s Law, the deteriorating valuation pic-
negative territory, with an annual return of -12.59%. It achieved
ture also coincided with a sharp rotation away from risk in the
a daily correlation of 99% to its benchmark of 200% of the
face of slowing economic growth. Historically small-cap stocks
daily price movement of the Russell 2000 Index.
tend to underperform in the late stages of an economic expan-
The effects of compounding may cause the longer-term corre-
sion and, as the year wore on, it was becoming evident that was
lation of the Fund to its benchmark to diminish. The apparent
exactly where we were in the business cycle. Moreover, the
discrepancy between the leveraged and unleveraged indices is
unfolding crisis in the subprime housing market generated a
the result of compounding, which is described briefly on page
massive flight-to-quality in the second half which only served to
3 of this report.
darken the investment climate for small-cap stocks
AVERAGE ANNUAL TOTAL RETURNS FOR THE PERIOD ENDED 12/31/07
One
Since Inception
Year
(10/27/06)
RUSSELL 2000® 2x STRATEGY FUND
-12.59%
-7.73%
RUSSELL 2000 INDEX
-1.57%
1.28%
The returns presented above do not reflect the effects of taxes. Past performance is no guarantee of future results. The Russell 2000 Index is an
unmanaged stock index and, unlike the Fund, has no management fees or other operating expenses to reduce its reported returns. Returns are
historical and include changes in principal and reinvested dividends and capital gains.
Holdings Diversification (Market Exposure as % of Net Assets)
Ten Largest Holdings (% of Total Net Assets)
Hologic, Inc.
0.5%
200%
Equity Index
CF Industries Holdings, Inc.
0.4%
Swap Agreements
Terra Industries, Inc.
0.3%
Priceline.com, Inc.
0.3%
150%
Exterran Holdings, Inc.
0.2%
Futures Contracts
BioMarin Pharmaceutical, Inc.
0.2%
Energy
MGI Pharma, Inc.
0.2%
100%
Industrials
Ansys, Inc.
0.2%
Energy
Health Care
Alexandria Real Estate Equities, Inc.
0.2%
Industrials
Consumer Discretionary
DeVry, Inc.
0.2%
50%
Health Care
Consumer Discretionary
Information Technology
Top Ten Total
2.7%
Information Technology
Financials
Financials
“Ten Largest Holdings” exclude any temporary cash
Other
Other
0%
or derivative investments.
Russell 2000®
Russell 2000 Index
2x Strategy Fund
“Holdings Diversification (Market Exposure as % of Net Assets)” excludes any
temporary cash investments.
14
14
|
|
THE RYDEX VARIABLE TRUST ANNUAL REPORT
THE RYDEX VARIABLE TRUST ANNUAL REPORT
PERFORMANCE REPORTS AND FUND PROFILES (Unaudited) (continued)
PERFORMANCE REPORTS AND FUND PROFILES (Unaudited) (continued)
RUSSELL 2000® 1.5x STRATEGY FUND
Cumulative Fund Performance:
October 1, 2001 – December 31, 2007
OBJECTIVE: To provide investment results that correlate to
the performance of a specific benchmark for small-cap securi-
RUSSELL 2000
®
1.5x STRATEGY FUND
RUSSELL 2000 INDEX
ties. The Fund’s current benchmark is the Russell 2000 Index.
$25,000
Inception: October 1, 2001
$20,811
$20,000
Small-capitalization stocks struggled in 2007 as risk appetites
$20,054
abated with the unfolding crises in the U.S housing and credit
$15,000
markets. Small-cap stocks, as shown by the Russell 2000
Index’s -1.57% return, underperformed large-cap stocks by
$10,000
wide margins. Indeed, small-cap stocks had enjoyed a long
and nearly unprecedented run of strong performance for over
$5,000
six years. In an environment of easy credit and robust risk
appetites, small-cap stocks came to embody the bull market
$0
years of 2003-2007. As is often the case with bull markets how-
10/01/01
12/31/01
12/31/02
12/31/03
12/31/04
12/31/05
12/31/06
12/31/07
ever, valuations began to run away from the fundamentals and
by early 2007 large-cap stocks were looking like a better value.
With the Russell 2000 Index delivering negative returns for the
And to validate Murphy’s Law, the deteriorating valuation pic-
year, Rydex Russell 2000® 1.5x Strategy Fund produced returns
ture also coincided with a sharp rotation away from risk in the
of -6.74%. It achieved a daily correlation of 99% to its bench-
face of slowing economic growth. Historically small-cap stocks
mark of 150% of the daily price movement of the Russell 2000
tend to underperform in the late stages of an economic expan-
Index.
sion and, as the year wore on, it was becoming evident that was
The effects of compounding may cause the longer-term corre-
exactly where we were in the business cycle. Moreover, the
lation of the Fund to its benchmark to diminish. The apparent
unfolding crisis in the subprime housing market generated a
discrepancy between the leveraged and unleveraged indices is
massive flight-to-quality in the second half which only served to
the result of compounding, which is described briefly on page
darken the investment climate for small-cap stocks.
3 of this report.
AVERAGE ANNUAL TOTAL RETURNS FOR THE PERIOD ENDED 12/31/07
One
Five
Since Inception
Year
Year
(10/01/01)
RUSSELL 2000® 1.5X STRATEGY FUND
-6.74%
19.22%
11.78%
RUSSELL 2000 INDEX
-1.57%
16.25%
12.44%
The returns presented above do not reflect the effects of taxes. Past performance is no guarantee of future results. The Russell 2000 Index is an
unmanaged stock index and, unlike the Fund, has no management fees or other operating expenses to reduce its reported returns. Returns are
historical and include changes in principal and reinvested dividends and capital gains.
Holdings Diversification (Market Exposure as % of Net Assets)
Ten Largest Holdings (% of Total Net Assets)
150%
Hologic, Inc.
0.5%
Equity Index
CF Industries Holdings, Inc.
0.3%
Swap Agreements
Terra Industries, Inc.
0.3%
Priceline.com, Inc.
0.3%
Energy
100%
Exterran Holdings, Inc.
0.2%
Futures Contracts
Futures Contracts
Industrials
BioMarin Pharmaceutical, Inc.
0.2%
Ansys, Inc.
0.2%
Health Care
Energy
Energy
MGI Pharma, Inc.
0.2%
Industrials
Consumer Discretionary
50%
Alexandria Real Estate Equities, Inc.
0.2%
Health Care
Health Care
Consumer Discretionary
Information Technology
Onyx Pharmaceuticals, Inc.
0.2%
Information Technology
Top Ten Total
2.6%
Financials
Financials
"Ten Largest Holdings" exclude any temporary cash
0%
Other
Other
or derivative investments.
Russell 2000®
Russell 2000 Index
1.5x Strategy Fund
“Holdings Diversification (Market Exposure as % of Net Assets)” excludes any
temporary cash investments.
THE RYDEX VARIABLE TRUST ANNUAL REPORT
|
15
PERFORMANCE REPORTS AND FUND PROFILES (Unaudited) (continued)
INVERSE RUSSELL 2000® STRATEGY FUND
Cumulative Fund Performance:
May 3, 2004 – December 31, 2007
OBJECTIVE: To provide investment results that will match
the performance of a specific benchmark. The Fund’s current
INVERSE RUSSELL 2000
®
STRATEGY FUND
RUSSELL 2000 INDEX
benchmark is the inverse of the performance of the Russell
$20,000
2000 Index.
Inception: May 3, 2004
$15,000
$14,150
Small-capitalization stocks struggled in 2007 as risk appetites
abated with the unfolding crises in the U.S housing and credit
$10,000
markets. Small-cap stocks, as shown by the Russell 2000 Index’s
$7,702
-1.57% return, underperformed large-cap stocks by wide mar-
gins. Indeed, small-cap stocks had enjoyed a long and nearly
$5,000
unprecedented run of strong performance for over six years. In
an environment of easy credit and robust risk appetites, small-
$0
cap stocks came to embody the bull market years of 2003-
05/03/04
12/31/04
06/30/05
12/31/05
06/30/06
12/31/06
06/30/07
12/31/07
2007. As is often the case with bull markets however, valuations
began to run away from the fundamentals and by early 2007
As expected, in contrast to the negative returns delivered by
large-cap stocks were looking like a better value. And to vali-
its benchmark, Rydex Inverse Russell 2000® Strategy Fund pro-
date Murphy’s Law, the deteriorating valuation picture also coin-
duced returns of 5.37%. It achieved a daily correlation of 99%
cided with a sharp rotation away from risk in the face of slowing
to its benchmark of -100% of the daily price movement of the
economic growth. Historically small-cap stocks tend to under-
Russell 2000 Index.
perform in the late stages of an economic expansion and, as the
year wore on, it was becoming evident that was exactly where
The effects of compounding may cause the longer-term corre-
we were in the business cycle. Moreover, the unfolding crisis in
lation of the Fund to its benchmark to diminish. The apparent
the subprime housing market generated a massive flight-to-
discrepancy between the leveraged and unleveraged indices is
quality in the second half which only served to darken the
the result of compounding, which is described briefly on page
investment climate for small-cap stocks.
3 of this report.
AVERAGE ANNUAL TOTAL RETURNS FOR THE PERIOD ENDED 12/31/07
One
Since Inception
Year
(05/03/04)
INVERSE RUSSELL 2000® STRATEGY FUND
5.37%
-6.88%
RUSSELL 2000 INDEX
-1.57%
9.94%
The returns presented above do not reflect the effects of taxes. Past performance is no guarantee of future results. The Russell 2000 Index is an
unmanaged stock index and, unlike the Fund, has no management fees or other operating expenses to reduce its reported returns. Returns are
historical and include changes in principal and reinvested dividends and capital gains.
Holdings Diversification (Market Exposure as % of Net Assets)
The Fund invests principally in derivative
Energy
instruments such as equity index swap
100%
agreements, futures contracts, and
Industrials
80%
options on index futures.
Health Care
60%
Consumer Discretionary
40%
Information Technology
20%
Financials
0%
Other
Futures Contracts
-20%
-40%
Equity Index Swap
Agreements Short Sales
-60%
-80%
-100%
Inverse Russell
Russell 2000 Index
2000® Strategy Fund
“Holdings Diversification (Market Exposure as % of Net Assets)” excludes any
temporary cash investments.
16
|
THE RYDEX VARIABLE TRUST ANNUAL REPORT
PERFORMANCE REPORTS AND FUND PROFILES (Unaudited) (continued)
PERFORMANCE REPORTS AND FUND PROFILES (Unaudited) (continued)
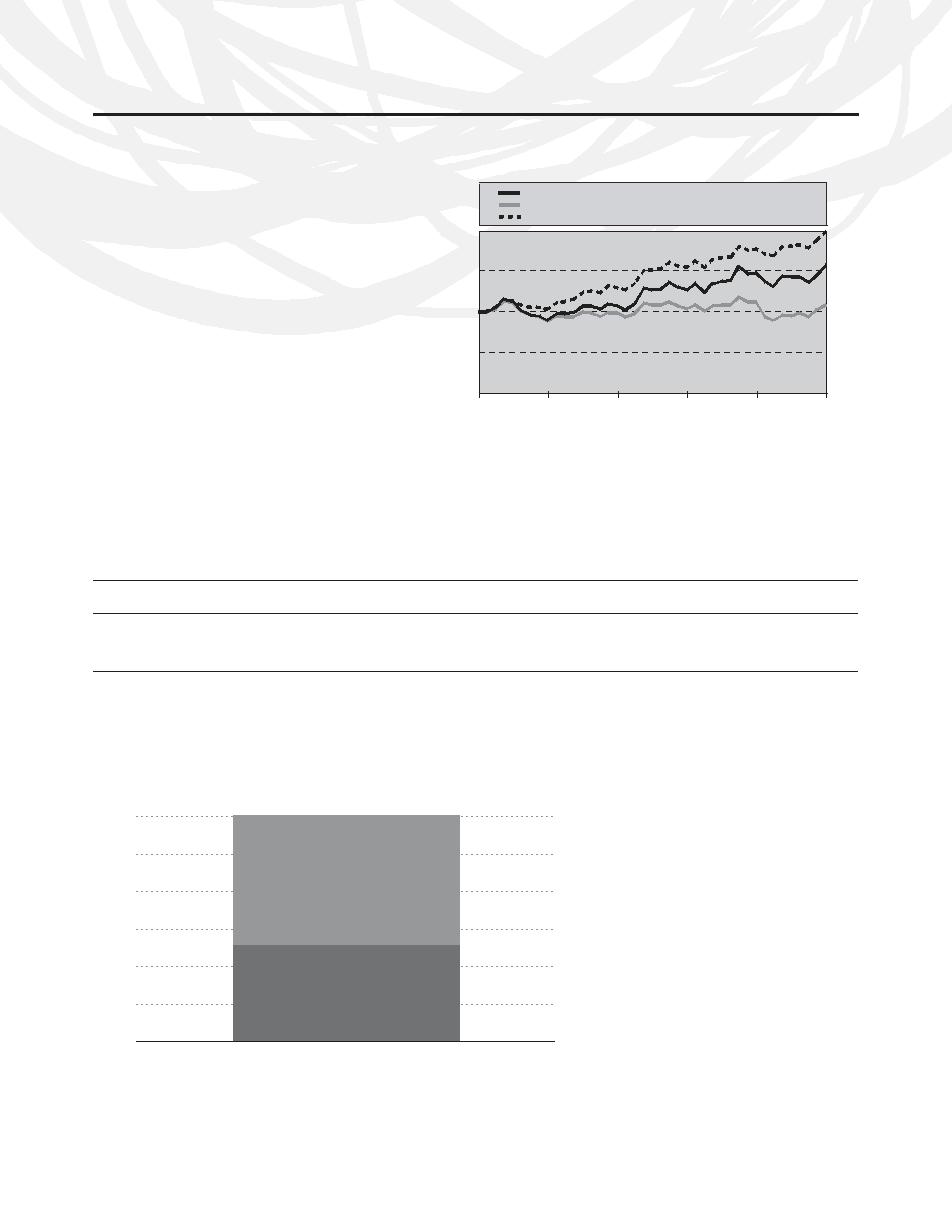
GOVERNMENT LONG BOND 1.2x
Cumulative Fund Performance:
STRATEGY FUND
December 31, 1997 – December 31, 2007
OBJECTIVE: To provide investment results that correspond
GOVERNMENT LONG BOND 1.2x STRATEGY FUND
PRICE MOVEMENT OF LONG TREASURY BOND
LEHMAN LONG TREASURY BOND INDEX
to a benchmark for U.S. Government securities. The Fund's
current benchmark is 120% of the price movement of the Long
$20,000
$19,938
Treasury Bond. The Long Treasury Bond is the U.S. Treasury
bond with the longest maturity, which is currently 30 years.
$15,800
$15,000
Inception: August 18, 1997
A yield of 4.79% was recorded for the 30-year Treasury bond
$10,912
$10,000
at the beginning of 2007. As the Fed worked to interpret eco-
nomic data and decide whether inflation concerns outweighed
the threat of slower growth, the economy remained in a
$5,000
growth mode through July. When the subprime crisis erupted,
the Long Bond yield, which peaked in June at 5.41%, began
$0
its gradual, yet, volatile descent. Increasing subprime mort-
12/31/97
12/31/99
12/31/01
12/31/03
12/31/05
12/31/07
gage write-downs prompted periodic flights to quality.
Investors wondered if the Fed would continue to cut short-
Rydex Government Long Bond 1.2x Strategy Fund benefits
term rates enough to stabilize an economy fighting subprime
from a falling interest rate environment. Since year-to-date
issues, falling home prices, rising oil prices and the threat of
yields were on average lower, the Fund adhered to its objec-
recession. A tone of fear and uncertainty claimed the Treasury
tive and closed up 9.77%.
market for the remainder of the year. The 30-year bond yield
The Fund achieved a daily correlation of more than 99% to its
closed lower at 4.45%.
benchmark of 120% of the daily price performance of the cur-
rent long Treasury bond for the year ended December 31, 2007.
AVERAGE ANNUAL TOTAL RETURNS FOR THE PERIOD ENDED 12/31/07
One
Five
Ten
Year
Year
Year
GOVERNMENT LONG BOND 1.2x STRATEGY FUND
9.77%
4.29%
4.68%
PRICE MOVEMENT OF LONG TREASURY BOND
14.39%
-0.02%
0.88%
LEHMAN LONG TREASURY BOND INDEX
9.81%
5.63%
7.14%
The returns presented above do not reflect the effects of taxes. Past performance is no guarantee of future results. The Lehman Long Treasury
Bond Index is an unmanaged bond index and, unlike the Fund, has no management fees or other operating expenses to reduce its reported
return. The price movement of the Long Treasury Bond represents a cumulative percentage change in its closing price. Returns are historical and
include changes in principal and reinvested dividends and capital gains.
Holdings Diversification (Market Exposure as % of Net Assets)
The Fund invests principally in U.S.
Government securities and in derivative
instruments such as futures and options
120%
contracts.
100%
80%
Futures Contracts
60%
40%
U.S. Treasury
20%
Obligations
0%
Government Long Bond 1.2x Strategy Fund
“Holdings Diversification (Market Exposure as % of Net Assets)” excludes any
temporary cash investments.
THE RYDEX VARIABLE TRUST ANNUAL REPORT
|
17
PERFORMANCE REPORTS AND FUND PROFILES (Unaudited) (continued)
INVERSE GOVERNMENT LONG BOND
Cumulative Fund Performance:
STRATEGY FUND
May 1, 2003 – December 31, 2007
OBJECTIVE: To provide total returns that will inversely cor-
INVERSE GOVERNMENT LONG BOND STRATEGY FUND
PRICE MOVEMENT OF LONG TREASURY BOND
LEHMAN LONG TREASURY BOND INDEX
relate to the price movements of a benchmark for U.S.
Treasury debt instruments or futures contracts on a specified
$15,000
debt instrument. The Fund's current benchmark is the inverse
of the daily price movement of the Long Treasury Bond. The
$12,837
Long Treasury Bond is the U.S. Treasury bond with the longest
maturity, which is currently 30 years.
$10,000
$9,978
$8,676
Inception: May 1, 2003
During the first half of 2007, amid uncertainty regarding eco-
$5,000
nomic growth and inflation, the Fed kept short-term interest
rates on hold. The 30-year bond yield rose slightly higher
through periods of volatility and an inverted yield curve began
$0
to normalize. The benchmark Long Bond moved to a mid-year
05/01/03
12/31/03
12/31/04
12/31/05
12/31/06
12/31/07
high yield of 5.41% from the year’s opening yield of 4.79%. As
oil prices rose, housing prices continued to fall and the sub-
Investors in this Fund benefit from a rising interest rate environ-
prime mortgage crisis unfolded, the benchmark Long Bond
ment. Since Long Bond yields were on average lower than
began its rocky decline. By year-end, the Fed lowered its target
higher, the fund delivered a -4.51% total return for the one-
rate three times from 5.25% to 4.25%. Increasing talk of a
year period.
recession and further easing by the Fed encouraged investors
The Fund achieved a daily correlation of more than 99% to its
to buy Treasuries. On the last day of the year, the Long
benchmark of -100% of the daily price performance of the cur-
Treasury bond yield closed at 4.45%.
rent long Treasury bond for the year ended December 31, 2007.
AVERAGE ANNUAL TOTAL RETURNS FOR THE PERIOD ENDED 12/31/07
One
Since Inception
Year
(05/01/03)
INVERSE GOVERNMENT LONG BOND STRATEGY FUND
-4.51%
-3.00%
PRICE MOVEMENT OF LONG TREASURY BOND
14.39%
-0.05%
LEHMAN LONG TREASURY BOND INDEX
9.81%
5.50%
The returns presented above do not reflect the effects of taxes. Past performance is no guarantee of future results. The Lehman Long Treasury
Bond Index is an unmanaged bond index and, unlike the Fund, has no management fees or other operating expenses to reduce its reported
return. The price movement of the Long Treasury Bond represents a cumulative percentage change in its closing price. Returns are historical and
include changes in principal and reinvested dividends and capital gains.
Holdings Diversification (Market Exposure as % of Net Assets)
The Fund invests principally in short sales
0%
and derivative instruments such as futures
contracts, and options on index futures.
-20%
-40%
U.S. Treasury Obligations
Short Sales
-60%
-80%
Futures Contracts
Short Sales
-100%
Inverse Government
Long Bond Strategy Fund
“Holdings Diversification (Market Exposure as % of Net Assets)” excludes any
temporary cash investments.
18
|
THE RYDEX VARIABLE TRUST ANNUAL REPORT
PERFORMANCE REPORTS AND FUND PROFILES (Unaudited) (continued)
PERFORMANCE REPORTS AND FUND PROFILES (Unaudited) (continued)
EUROPE 1.25x STRATEGY FUND
Cumulative Fund Performance:
October 1, 2001 – December 31, 2007
OBJECTIVE: To provide investment results that correlate to
the performance of a specific benchmark. The Fund's current
EUROPE 1.25x STRATEGY FUND
DOW JONES STOXX 50 INDEX
benchmak is the Dow Jones STOXX 50 Index.
$25,000
Inception: October 1, 2001
$21,345
$20,000
$20,775
European markets tended to outperform U.S. markets in
2007. Perceived value relative to other markets, as well as
$15,000
avoidance of weakening economies elsewhere, drove invest-
ment flows into Europe. As a result, the Dow Jones STOXX 50
$10,000
rose 13.78%, and Rydex Europe 1.25x Strategy Fund rose
13.06% for the year. It achieved a daily correlation of 98% to
its benchmark of 125% of the daily price movement of the
$5,000
Dow Jones STOXX 50 Index.
$0
The effects of compounding may cause the longer-term corre-
10/01/01
12/31/02
12/31/03
12/31/04
12/31/05
12/31/06
12/31/07
12/31/01
lation of the Fund to its benchmark to diminish. The apparent
discrepancy between the leveraged and unleveraged indices is
the result of compounding, which is described briefly on page
3 of this report.
AVERAGE ANNUAL TOTAL RETURNS FOR THE PERIOD ENDED 12/31/07
One
Five
Since Inception
Year
Year
(10/01/01)
EUROPE 1.25X STRATEGY FUND
13.06%
20.95%
12.41%
DOW JONES STOXX 50 INDEX
13.78%
19.73%
12.90%
The returns presented above do not reflect the effects of taxes. Past performance is no guarantee of future results. The Dow Jones Stoxx 50 Index
is an unmanaged stock index and, unlike the Fund, has no management fees or other operating expenses to reduce its reported returns. Returns
are historical and include changes in principal and reinvested dividends and capital gains.
Holdings Diversification (Market Exposure as % of Net Assets)
Ten Largest Holdings (% of Total Net Assets)
125%
HSBC Holdings PLC — SP ADR
3.7%
BP PLC — SP ADR
3.6%
Total SA — SP ADR
3.3%
100%
Equity Index Swap
Materials
Vodafone Group PLC — SP ADR
3.2%
Agreements
Consumer Staples
Energy
Telefonica SA — SP ADR
3.1%
75%
Materials
Telecommunication Services
Telecommunication Services
GlaxoSmithKline PLC — SP ADR
3.0%
Consumer Staples
Health Care
Novartis AG — SP ADR
2.8%
Energy
Energy
Royal Dutch Shell PLC — SP ADR
2.8%
50%
Telecommunication Services
Banco Santander Central Hispano SA —
Health Care
Financials
SP ADR
2.5%
25%
Nokia Oyj — SP ADR
2.3%
Financials
Top Ten Total
30.3%
Other
Other
0%
"Ten Largest Holdings" exclude any
Europe 1.25x Strategy Fund
Dow Jones STOXX 50 Index
temporary cash or derivative investments.
“Holdings Diversification (Market Exposure as % of Net Assets)” excludes any
temporary cash investments.
THE RYDEX VARIABLE TRUST ANNUAL REPORT
|
19
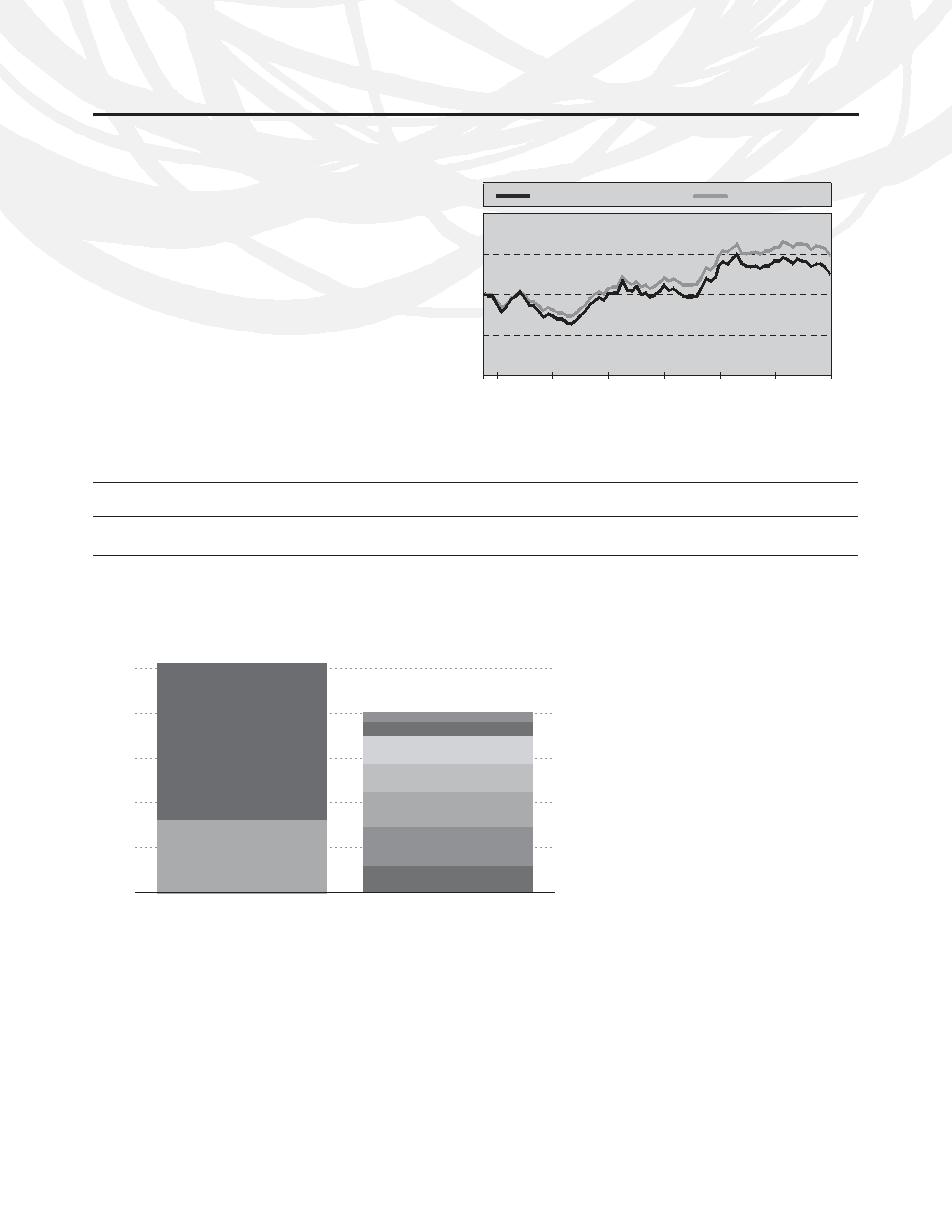
PERFORMANCE REPORTS AND FUND PROFILES (Unaudited) (continued)
JAPAN 1.25x STRATEGY FUND
Cumulative Fund Performance:
October 1, 2001 – December 31, 2007
OBJECTIVE: To provide investment results that correlate to
the performance of a specific benchmark. The Fund’s current
JAPAN 1.25x STRATEGY FUND
TOPIX 100 INDEX
benchmark is the Topix 100 Index.
$20,000
Inception: October 1, 2001
A slowing economy in Japan, characterized by anemic retail
$15,000
$14,884
spending, took a toll on the Japanese equity markets. The
$12,525
Topix Index underperformed U.S. markets, falling 5.56% in
2007. As a result, the Rydex Japan 1.25x Strategy Fund lost
$10,000
11.23% for the period. It achieved a daily correlation of 99%
to its benchmark of 125% of the daily price movement of the
$5,000
Topix Index.
The effects of compounding may cause the longer-term corre-
$0
lation of the Fund to its benchmark to diminish. The apparent
10/01/01
12/31/02
12/31/03
12/31/04
12/31/05
12/31/06
12/31/07
discrepancy between the leveraged and unleveraged indices
12/31/01
is the result of compounding, which is described briefly on
page 3 of this report.
AVERAGE ANNUAL TOTAL RETURNS FOR THE PERIOD ENDED 12/31/07
One
Five
Since Inception
Year
Year
(10/01/01)
JAPAN 1.25x STRATEGY FUND
-11.23%
11.27%
3.67%
TOPIX 100 INDEX
-5.56%
12.91%
6.57%
The returns presented above do not reflect the effects of taxes. Past performance is no guarantee of future results. The Topix 100 Index is an
unmanaged stock index and, unlike the Fund, has no management fees or other operating expenses to reduce its reported returns. Returns are
historical and include changes in principal and reinvested dividends and capital gains.
Holdings Diversification (Market Exposure as % of Net Assets)
The Fund invests principally in derivative
instruments such as equity index swap
125%
agreements, futures contracts, and
options on index futures.
100%
Telecommunication Services
Materials
Equity Index
75%
Swap Agreements
Information Technology
Industrials
50%
Consumer Discretionary
25%
Financials
Futures Contracts
Other
0%
Japan 1.25x Strategy Fund
Topix 100 Index
“Holdings Diversification (Market Exposure as % of Net Assets)” excludes any
temporary cash investments.
20
|
THE RYDEX VARIABLE TRUST ANNUAL REPORT
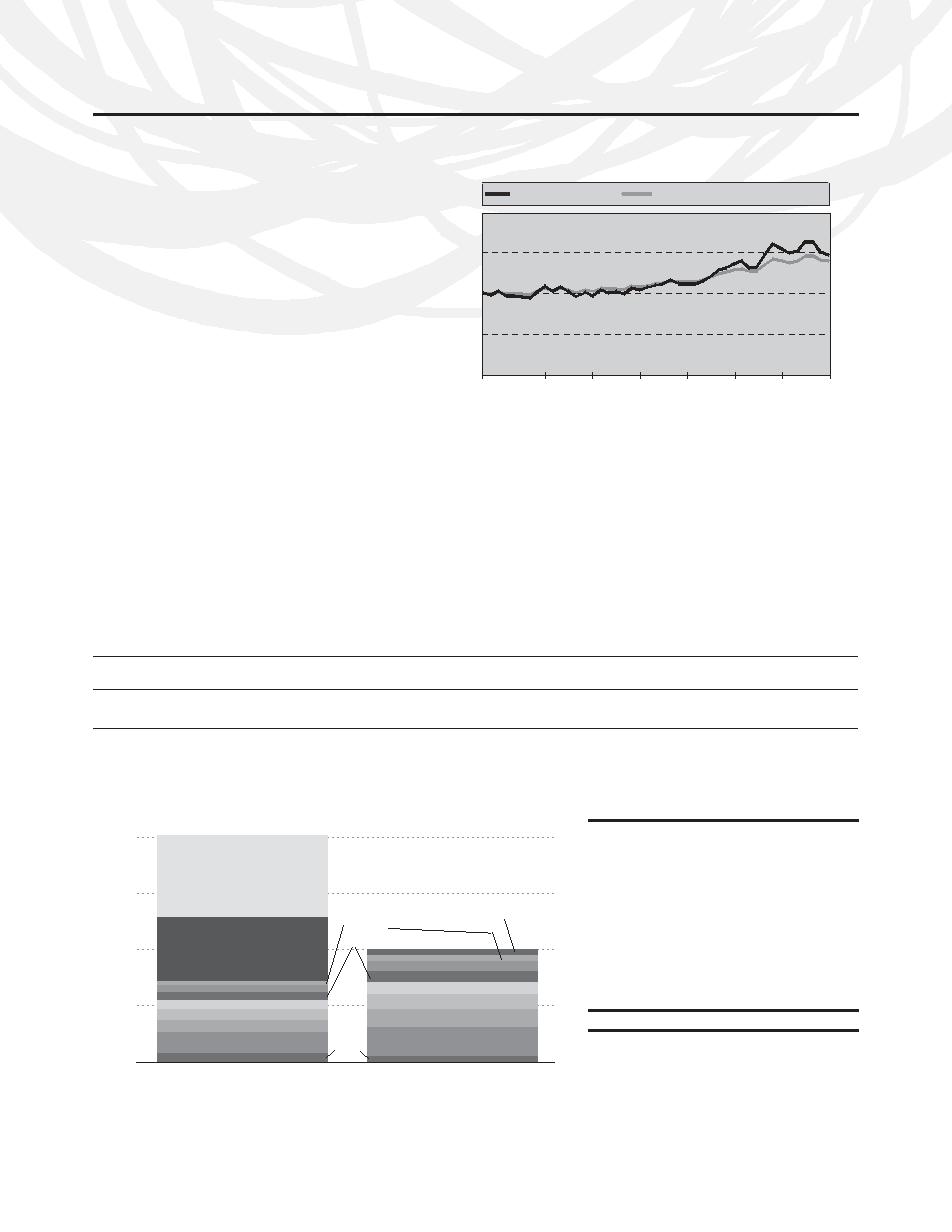
PERFORMANCE REPORTS AND FUND PROFILES (Unaudited) (continued)
PERFORMANCE REPORTS AND FUND PROFILES (Unaudited) (continued)
DOW 2x STRATEGY FUND
Cumulative Fund Performance:
May 3, 2004 – December 31, 2007
OBJECTIVE: To provide investment results that will match
the performance of a specific benchmark on a daily basis. The
DOW 2x STRATEGY FUND
DOW JONES INDUSTRIAL AVERAGE INDEX
Fund’s current benchmark is 200% of the performance of the
$20,000
Dow Jones Industrial Average Index.
Inception: May 3, 2004
$15,000
$14,755
$13,986
Stocks managed to generate positive returns in 2007 despite
a supercharged atmosphere characterized by a recession in
$10,000
the U.S. housing market that approached depression-like con-
ditions, a freezing of global credit markets and fears of eco-
nomic contraction here in the U.S. In this environment, the
$5,000
DJIA rose 8.88% on a total return basis. Representing some of
the most visible companies in the U.S. economy, the Dow
$0
benefited from its focus on many of the largest companies as
05/03/04
12/31/04
06/30/05
12/31/05
06/30/06
12/31/06
06/30/07
12/31/07
measured by stock market capitalization. The near crisis-like
conditions that came to dominate market sentiment in the lat-
Propelled by positive performance from its benchmark index,
ter half of the year played to the perceived safety of larger
Rydex Dow 2x Strategy Fund delivered an annual return of
stocks as did the boom in exports, which was a byproduct of
8.15%. It achieved a daily correlation of 100% to its benchmark
the declining exchange value of the dollar. In the face of lower
of 200% of the daily price movement of the DJIA.
home values, skyrocketing energy prices and static labor mar-
kets, consumers began to pull in their reins in the latter half of
The effects of compounding may cause the longer-term corre-
the year, which drove a general preference for the safety of
lation of the Fund to its benchmark to diminish. The apparent
large stocks. As the year wore on, stock prices were pulled
discrepancy between the leveraged and unleveraged indices is
between fears of slower economic growth and decelerating
the result of compounding, which is described briefly on page
corporate earnings and the panacea of lower interest rates.
3 of this report.
The Fed’s transition to easier monetary policy in September,
with its first interest rate reduction in four years, trumped
concerns over slow growth and a reduced profits outlook.
AVERAGE ANNUAL TOTAL RETURNS FOR THE PERIOD ENDED 12/31/07
One
Since Inception
Year
(05/03/04)
DOW 2x STRATEGY FUND
8.15%
11.20%
DOW JONES INDUSTRIAL AVERAGE INDEX
8.88%
9.59%
The returns presented above do not reflect the effects of taxes. Past performance is no guarantee of future results. The Dow Jones Industrial
Average Index is an unmanaged stock index and, unlike the Fund, has no management fees or other operating expenses to reduce its reported
returns. Returns are historical and include changes in principal and reinvested dividends and capital gains.
Holdings Diversification (Market Exposure as % of Net Assets)
Ten Largest Holdings (% of Total Net Assets)
200%
International Business Machines Corp.
4.8%
Exxon Mobil Corp.
4.1%
Equity Index
Boeing Co.
3.8%
Swap Agreements
150%
3M Co.
3.7%
Telecommunication Services
United Technologies Corp.
3.4%
Energy
Altria Group, Inc.
3.3%
Health Care
100%
Futures Contracts
Procter & Gamble Co.
3.2%
Consumer Discretionary
Caterpillar, Inc.
3.2%
Consumer Discretionary
Financials
Johnson & Johnson, Inc.
2.9%
50%
Financials
Information Technology
Honeywell International, Inc.
2.7%
Information Technology
Consumer Staples
Consumer Staples
Top Ten Total
35.1%
Industrials
Other
Industrials
“Ten Largest Holdings” exclude any
0%
temporary cash or derivative investments.
Dow 2x Strategy Fund
Dow Jones Industrial
Average Index
“Holdings Diversification (Market Exposure as % of Net Assets)” excludes any
temporary cash investments.
THE RYDEX VARIABLE TRUST ANNUAL REPORT
|
21
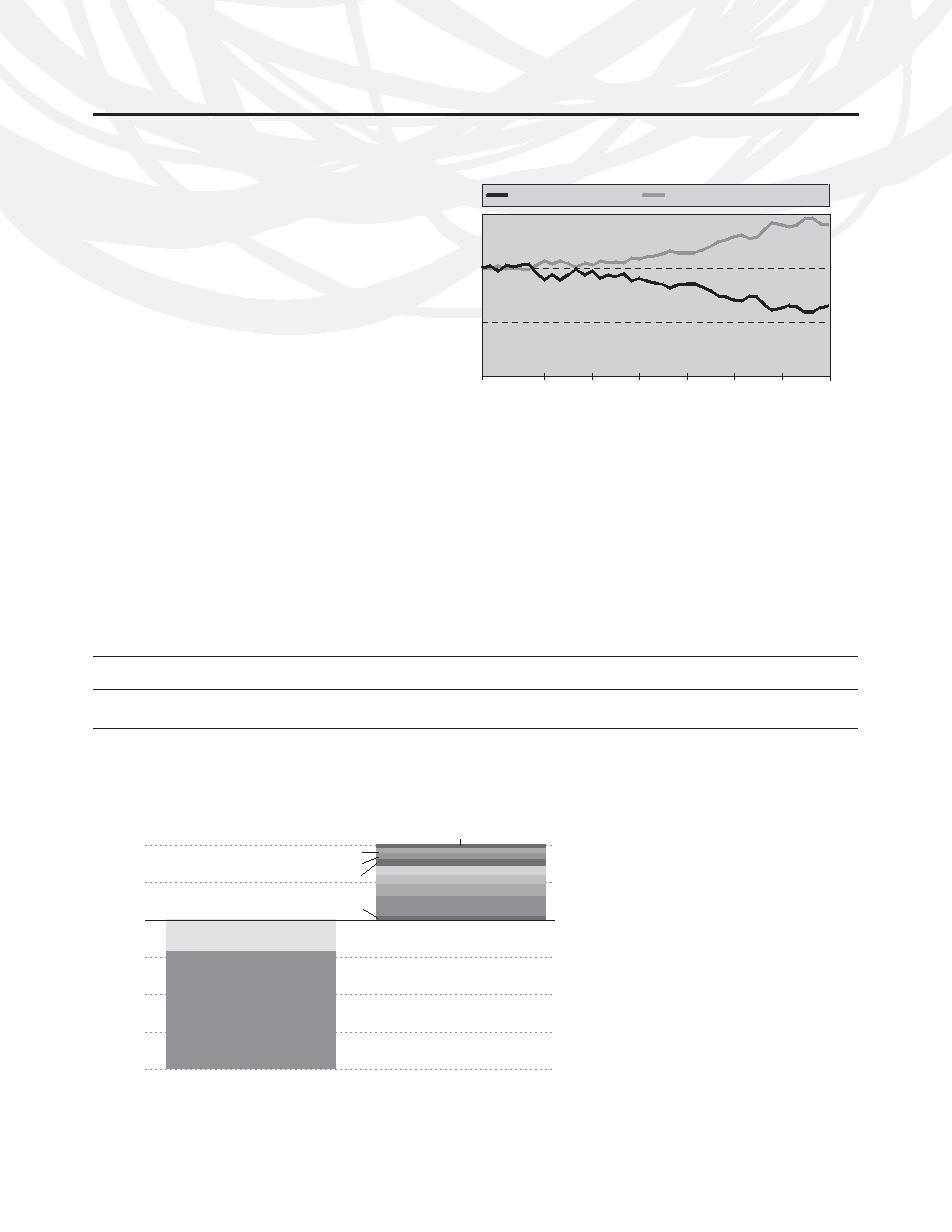
PERFORMANCE REPORTS AND FUND PROFILES (Unaudited) (continued)
INVERSE DOW 2x STRATEGY FUND
Cumulative Fund Performance:
May 3, 2004 – December 31, 2007
OBJECTIVE: To provide investment results that will match
the performance of a specific benchmark on a daily basis. The
INVERSE DOW 2x STRATEGY FUND
DOW JONES INDUSTRIAL AVERAGE INDEX
Fund's current benchmark is 200% of the inverse performance
$15,000
of the Dow Jones Industrial Average Index.
$13,986
Inception: May 3, 2004
Stocks managed to generate positive returns in 2007 despite
$10,000
a supercharged atmosphere characterized by a recession in
the U.S. housing market that approached depression-like con-
$6,406
ditions, a freezing of global credit markets and fears of eco-
$5,000
nomic contraction here in the U.S. In this environment, the
DJIA rose 8.88% on a total return basis. Representing some of
the most visible companies in the U.S. economy, the Dow
benefited from its focus on many of the largest companies as
$0
05/03/04
12/31/04
06/30/05
12/31/05
06/30/06
12/31/06
06/30/07
12/31/07
measured by stock market capitalization. The near crisis-like
conditions that came to dominate market sentiment in the lat-
With the Dow in positive territory for the year, Rydex Inverse
ter half of the year played to the perceived safety of larger
Dow 2x Strategy Fund performed as expected with an annual
stocks as did the boom in exports, which was a byproduct of
return of –8.99%. It achieved a daily correlation of 99% to its
the declining exchange value of the dollar. In the face of lower
benchmark of -200% of the daily price movement of the DJIA.
home values, skyrocketing energy prices and static labor mar-
The effects of compounding may cause the longer-term corre-
kets, consumers began to pull in their reins in the latter half of
lation of the Fund to its benchmark to diminish. The apparent
the year, which drove a general preference for the safety of
discrepancy between the leveraged and unleveraged indices is
large stocks. As the year wore on, stock prices were pulled
the result of compounding, which is described briefly on page
between fears of slower economic growth and decelerating
3 of this report.
corporate earnings and the panacea of lower interest rates.
The Fed’s transition to easier monetary policy in September,
with its first interest rate reduction in four years, trumped con-
cerns over slow growth and a reduced profits outlook.
AVERAGE ANNUAL TOTAL RETURNS FOR THE PERIOD ENDED 12/31/07
One
Since Inception
Year
(05/03/04)
INVERSE DOW 2x STRATEGY FUND
-8.99%
-11.45%
DOW JONES INDUSTRIAL AVERAGE INDEX
8.88%
9.59%
The returns presented above do not reflect the effects of taxes. Past performance is no guarantee of future results. The Dow Jones Industrial
Average Index is an unmanaged stock index and, unlike the Fund, has no management fees or other operating expenses to reduce its reported
returns. Returns are historical and include changes in principal and reinvested dividends and capital gains.
Holdings Diversification (Market Exposure as % of Net Assets)
The Fund invests principally in derivative
Telecommunication Services
instruments such as equity index swap
100%
Energy
agreements, futures contracts, and
Consumer Discretionary
Health Care
Financials
options on index futures.
50%
Information Technology
Consumer Staples
Other
Industrials
0%
Futures Contracts
Short Sales
-50%
Equity Index
-100%
Swap Agreements
Short Sales
-150%
-200%
Inverse Dow 2x
Dow Jones Industrial
Strategy Fund
Average Index
“Holdings Diversification (Market Exposure as % of Net Assets)” excludes any
temporary cash investments.
22
|
THE RYDEX VARIABLE TRUST ANNUAL REPORT
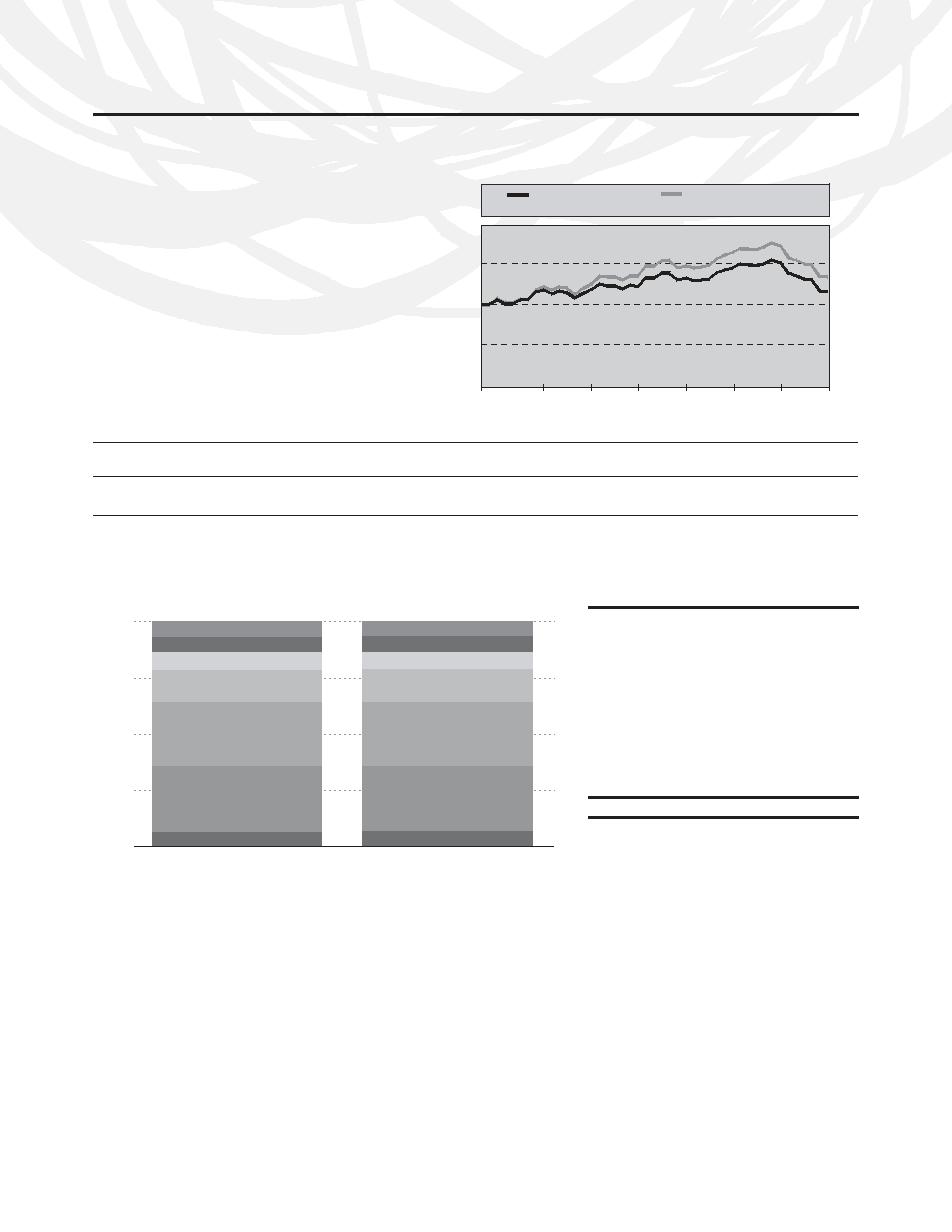
PERFORMANCE REPORTS AND FUND PROFILES (Unaudited) (continued)
PERFORMANCE REPORTS AND FUND PROFILES (Unaudited) (continued)
SMALL-CAP VALUE FUND
Cumulative Fund Performance:
May 3, 2004 – December 31, 2007
OBJECTIVE: To provide investment results that match the
performance of a benchmark for small-cap value securities.
SMALL-CAP VALUE FUND
S&P SMALLCAP 600/
The Fund’s current benchmark is the S&P SmallCap
CITIGROUP PURE VALUE INDEX
600/Citigroup Pure Value Index.
$20,000
Inception: May 3, 2004
With both small-cap and value stocks out of favor in 2007,
$15,000
$13,382
Rydex Small-Cap Value Fund turned in a return of -20.36%
$11,613
versus its benchmark S&P SmallCap 600/Citigroup Pure Value
$10,000
Index’s annual return of -18.60%. The worst performing sec-
tors were the hard-hit consumer discretionary and financials.
The best performing sector was health care, to which the
$5,000
benchmark index has limited exposure.
$0
05/03/04
12/31/04
06/30/05
12/31/05
06/30/06
12/31/06
06/30/07
12/31/07
AVERAGE ANNUAL TOTAL RETURNS FOR THE PERIOD ENDED 12/31/07
One
Since Inception
Year
(05/03/04)
SMALL-CAP VALUE FUND
-20.36%
4.17%
S&P SMALLCAP 600/CITIGROUP PURE VALUE INDEX
-18.60%
8.28%
The returns presented above do not reflect the effects of taxes. Past performance is no guarantee of future results. The S&P SmallCap
600/Citigroup Pure Value Index is an unmanaged stock index and, unlike the Fund, has no management fees or other operating expenses to
reduce its reported returns. Returns are historical and include changes in principal and reinvested dividends and capital gains.
Holdings Diversification (Market Exposure as % of Net Assets)
Ten Largest Holdings (% of Total Net Assets)
100%
LandAmerica Financial Group, Inc.
1.5%
Information Technology
Information Technology
Utilities
Utilities
Stein Mart, Inc.
1.4%
Materials
Materials
Gevity HR, Inc.
1.4%
75%
La-Z-Boy, Inc.
1.4%
Industrials
Industrials
Lithia Motors, Inc. — Class A
1.3%
Stewart Information Services Corp.
1.3%
50%
Financials
Financials
Kellwood Co.
1.3%
Standard Motor Products, Inc.
1.3%
Wabash National Corp.
1.3%
25%
Flagstar Bancorp, Inc.
1.3%
Consumer Discretionary
Consumer Discretionary
Top Ten Total
13.5%
“Ten Largest Holdings” exclude any
Other
Other
0%
temporary cash or derivative investments.
Small-Cap Value Fund
S&P SmallCap 600/
Citigroup Pure Value Index
“Holdings Diversification (Market Exposure as % of Net Assets)” excludes any
temporary cash investments.
THE RYDEX VARIABLE TRUST ANNUAL REPORT
|
23
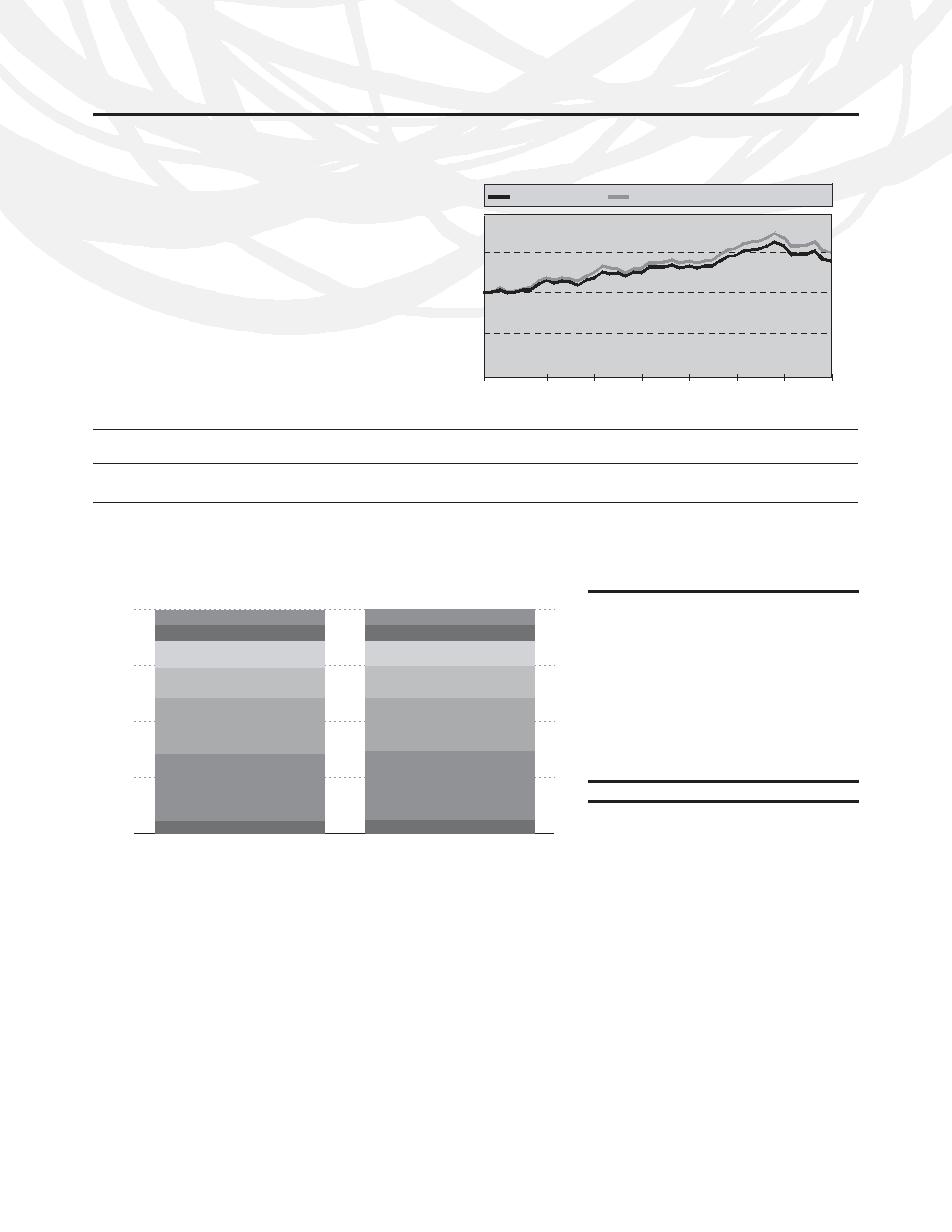
PERFORMANCE REPORTS AND FUND PROFILES (Unaudited) (continued)
MID-CAP VALUE FUND
Cumulative Fund Performance:
May 3, 2004 – December 31, 2007
OBJECTIVE: To provide investment results that match
the performance of the benchmark for mid-cap value securi-
MID-CAP VALUE FUND
S&P MIDCAP 400/CITIGROUP PURE VALUE INDEX
ties. The Fund’s current benchmark is the S&P MidCap
$20,000
400/Citigroup Pure Value Index.
Inception: May 3, 2004
$15,000
$14,990
$13,902
With value stocks out of favor in 2007, Rydex Mid-Cap Value
Fund delivered a -4.85% for the year as compared to its bench-
mark S&P MidCap 400/Citigroup Pure Value Index which deliv-
$10,000
ered a -3.17% return. Energy and telecommunications were the
sectors that reigned supreme in 2007, but the Fund’s bench-
$5,000
mark index has limited exposure to these sectors. With a slow-
ing economy, the worst performing sectors were consumer dis-
$0
cretionary, financials and industrials.
05/03/04
12/31/04
06/30/05
12/31/05
06/30/06
12/31/06
06/30/07
12/31/07
AVERAGE ANNUAL TOTAL RETURNS FOR THE PERIOD ENDED 12/31/07
One
Since Inception
Year
(05/03/04)
MID-CAP VALUE FUND
-4.85%
9.41%
S&P MIDCAP 400/CITIGROUP PURE VALUE INDEX
-3.17%
11.69%
The returns presented above do not reflect the effects of taxes. Past performance is no guarantee of future results. The S&P MidCap 400/Citigroup
Pure Value Index is an unmanaged stock index and, unlike the Fund, has no management fees or other operating expenses to reduce its reported
returns. Returns are historical and include changes in principal and reinvested dividends and capital gains.
Holdings Diversification (Market Exposure as % of Net Assets)
Ten Largest Holdings (% of Total Net Assets)
ArvinMeritor, Inc.
2.5%
100%
Materials
Materials
IndyMac Bancorp, Inc.
2.3%
Information Technology
Information Technology
Furniture Brands International, Inc.
2.2%
Industrials
Industrials
Lee Enterprises, Inc.
2.1%
75%
Utilities
Utilities
YRC Worldwide, Inc.
2.0%
Fidelity National Financial, Inc. — Class A
1.9%
Kelly Services, Inc. — Class A
1.8%
50%
Consumer Discretionary
Consumer Discretionary
Charming Shoppes, Inc.
1.8%
Ryland Group, Inc.
1.8%
Media General, Inc. — Class A
1.7%
25%
Financials
Financials
Top Ten Total
20.1%
“Ten Largest Holdings” exclude any
Other
Other
0%
temporary cash or derivative investments.
Mid-Cap Value Fund
S&P MidCap 400/Citigroup
Pure Value Index
“Holdings Diversification (Market Exposure as % of Net Assets)” excludes any
temporary cash investments.
24
|
THE RYDEX VARIABLE TRUST ANNUAL REPORT
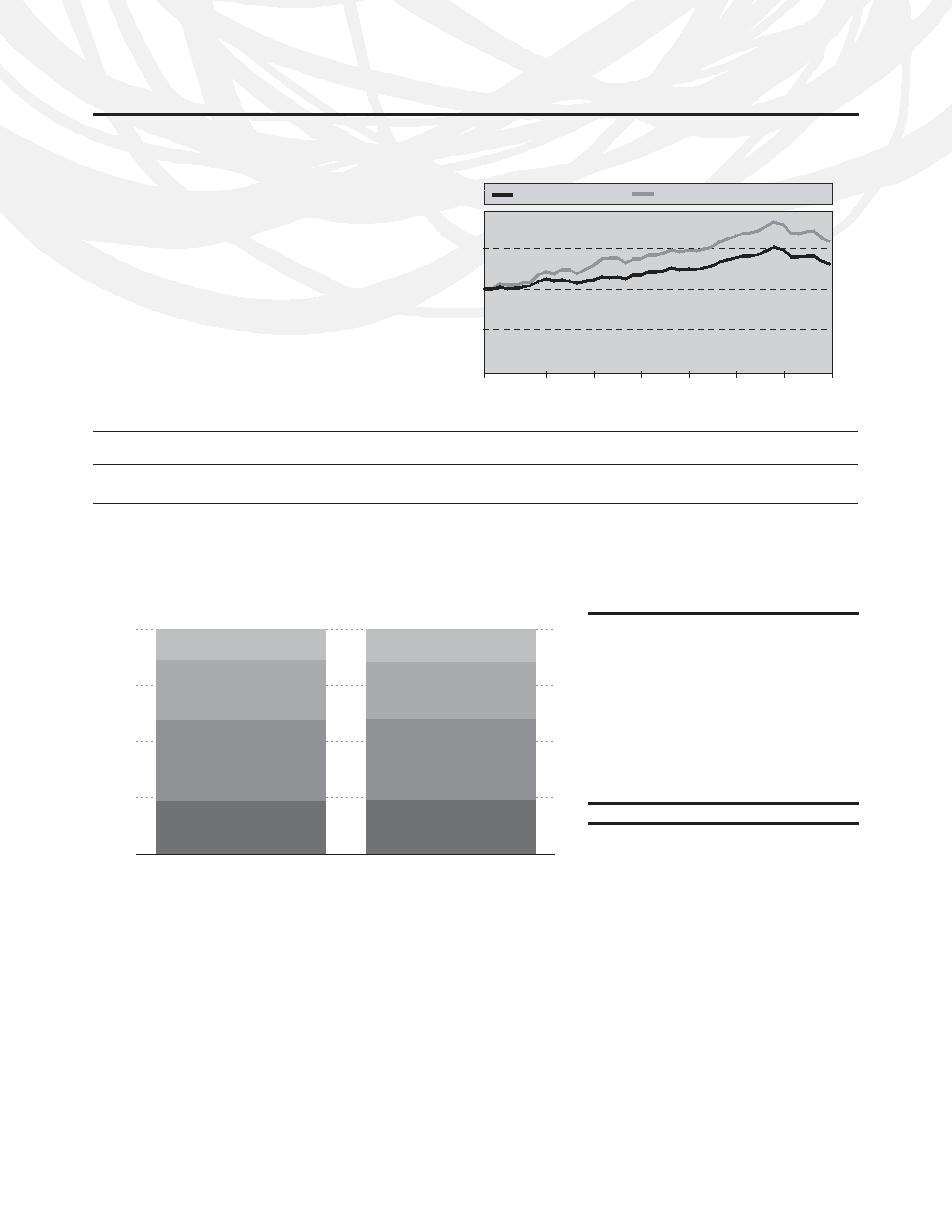
PERFORMANCE REPORTS AND FUND PROFILES (Unaudited) (continued)
PERFORMANCE REPORTS AND FUND PROFILES (Unaudited) (continued)
LARGE-CAP VALUE FUND
Cumulative Fund Performance:
May 3, 2004 – December 31, 2007
OBJECTIVE: To provide investment results that match
the performance of the benchmark for large-cap value securi-
LARGE-CAP VALUE FUND
S&P 500/CITIGROUP PURE VALUE INDEX
ties. The Fund’s current benchmark is the S&P 500/Citigroup
$20,000
Pure Value Index.
Inception: May 3, 2004
$15,881
$15,000
While large-cap stocks did well in 2007, value stocks did not.
$13,050
Rydex Large-Cap Value Fund was in negative territory for the
$10,000
year with a -5.37% return as compared to the S&P
500/Citigroup Pure Value Index, which saw a -3.69% return for
the same period. Financials, consumer discretionary and infor-
$5,000
mation technology were the worst performers in the S&P
500/Citigroup Pure Value index, with energy and industrials
$0
coming out as the best.
05/03/04
12/31/04
06/30/05
12/31/05
06/30/06
12/31/06
06/30/07
12/31/07
AVERAGE ANNUAL TOTAL RETURNS FOR THE PERIOD ENDED 12/31/07
One
Since Inception
Year
(05/03/04)
LARGE-CAP VALUE FUND
-5.37%
7.54%
S&P 500/CITIGROUP PURE VALUE INDEX
-3.69%
13.46%
The returns presented above do not reflect the effects of taxes. Past performance is no guarantee of future results. The S&P 500/Citigroup Pure
Value Index is an unmanaged stock index and, unlike the Fund, has no management fees or other operating expenses to reduce its reported
returns. Returns are historical and include changes in principal and reinvested dividends and capital gains.
Holdings Diversification (Market Exposure as % of Net Assets)
Ten Largest Holdings (% of Total Net Assets)
100%
KB Home
2.2%
Utilities
Utilities
Lennar Corp. — Class A
2.1%
DR Horton, Inc.
2.1%
75%
Dillard’s, Inc. — Class A
1.9%
Consumer Discretionary
Consumer Discretionary
OfficeMax, Inc.
1.8%
Circuit City Stores, Inc.
1.8%
50%
Spectra Energy Corp.
1.8%
Financials
Washington Mutual, Inc.
1.7%
Financials
Freddie Mac
1.6%
25%
CIT Group, Inc.
1.6%
Top Ten Total
18.6%
Other
Other
“Ten Largest Holdings” exclude any
0%
temporary cash or derivative investments.
Large-Cap Value Fund
S&P 500/Citigroup
Pure Value Index
“Holdings Diversification (Market Exposure as % of Net Assets)” excludes any
temporary cash investments.
THE RYDEX VARIABLE TRUST ANNUAL REPORT
|
25
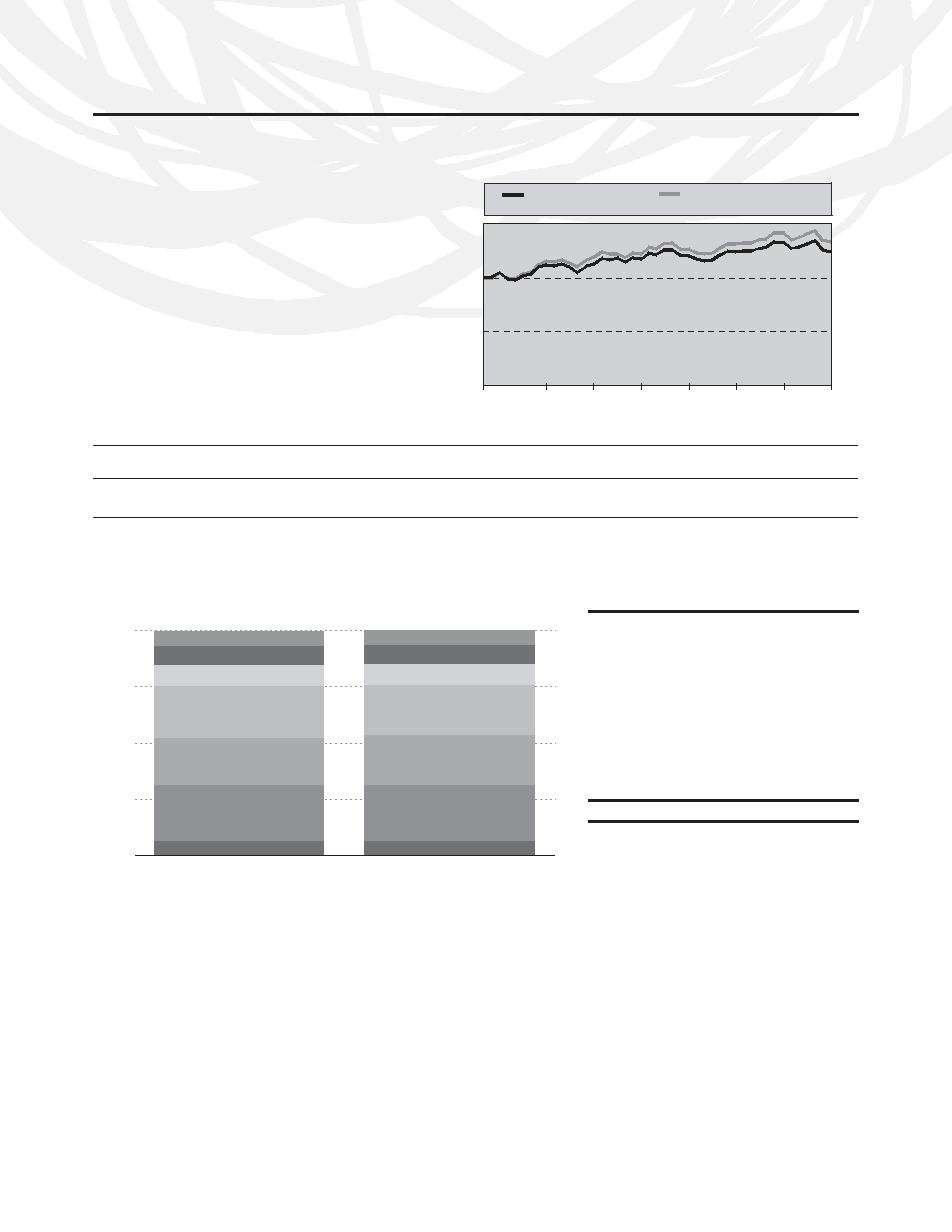
PERFORMANCE REPORTS AND FUND PROFILES (Unaudited) (continued)
SMALL-CAP GROWTH FUND
Cumulative Fund Performance:
May 3, 2004 – December 31, 2007
OBJECTIVE: To provide investment results that match the
performance of a benchmark for small-cap growth securities.
SMALL-CAP GROWTH FUND
S&P SMALLCAP 600/
The Fund’s current benchmark is the S&P SmallCap
CITIGROUP PURE GROWTH INDEX
600/Citigroup Pure Growth Index.
$15,000
Inception: May 3, 2004
$14,403
$13,236
With small-cap stocks underperforming in 2007 and growth
$10,000
back in favor, Rydex Small-Cap Growth Fund was relatively flat
for the year delivering a return of -0.11% compared to the
S&P SmallCap 600/Citigroup Pure Growth Index’s return of
1.51%. Top performing sectors were information technology
$5,000
and energy, while telecommunications and financials were the
worst performing sectors.
$0
05/03/04
12/31/04
06/30/05
12/31/05
06/30/06
12/31/06
06/30/07
12/31/07
AVERAGE ANNUAL TOTAL RETURNS FOR THE PERIOD ENDED 12/31/07
One
Since Inception
Year
(05/03/04)
SMALL-CAP GROWTH FUND
-0.11%
7.95%
S&P SMALLCAP 600/CITIGROUP PURE GROWTH INDEX
1.51%
10.47%
The returns presented above do not reflect the effects of taxes. Past performance is no guarantee of future results. The S&P SmallCap
600/Citigroup Pure Growth Index is an unmanaged stock index and, unlike the Fund, has no management fees or other operating expenses to
reduce its reported returns. Returns are historical and include changes in principal and reinvested dividends and capital gains.
Holdings Diversification (Market Exposure as % of Net Assets)
Ten Largest Holdings (% of Total Net Assets)
Wright Express Corp.
1.2%
100%
Industrials
Industrials
Netgear, Inc.
1.2%
Energy
Energy
LCA-Vision, Inc.
1.2%
Financials
Financials
LHC Group, Inc.
1.2%
75%
Bankrate, Inc.
1.2%
Consumer Discretionary
Consumer Discretionary
TradeStation Group, Inc.
1.2%
HealthExtras, Inc.
1.2%
50%
optionsXpress Holdings, Inc.
1.2%
Health Care
Health Care
Sierra Health Services, Inc.
1.2%
j2 Global Communications, Inc.
1.2%
25%
Information Technology
Information Technology
Top Ten Total
12.0%
“Ten Largest Holdings” exclude any
Other
Other
0%
temporary cash or derivative investments.
Small-Cap Growth Fund
S&P SmallCap 600/Citigroup
Pure Growth Index
“Holdings Diversification (Market Exposure as % of Net Assets)” excludes any
temporary cash investments.
26
|
THE RYDEX VARIABLE TRUST ANNUAL REPORT
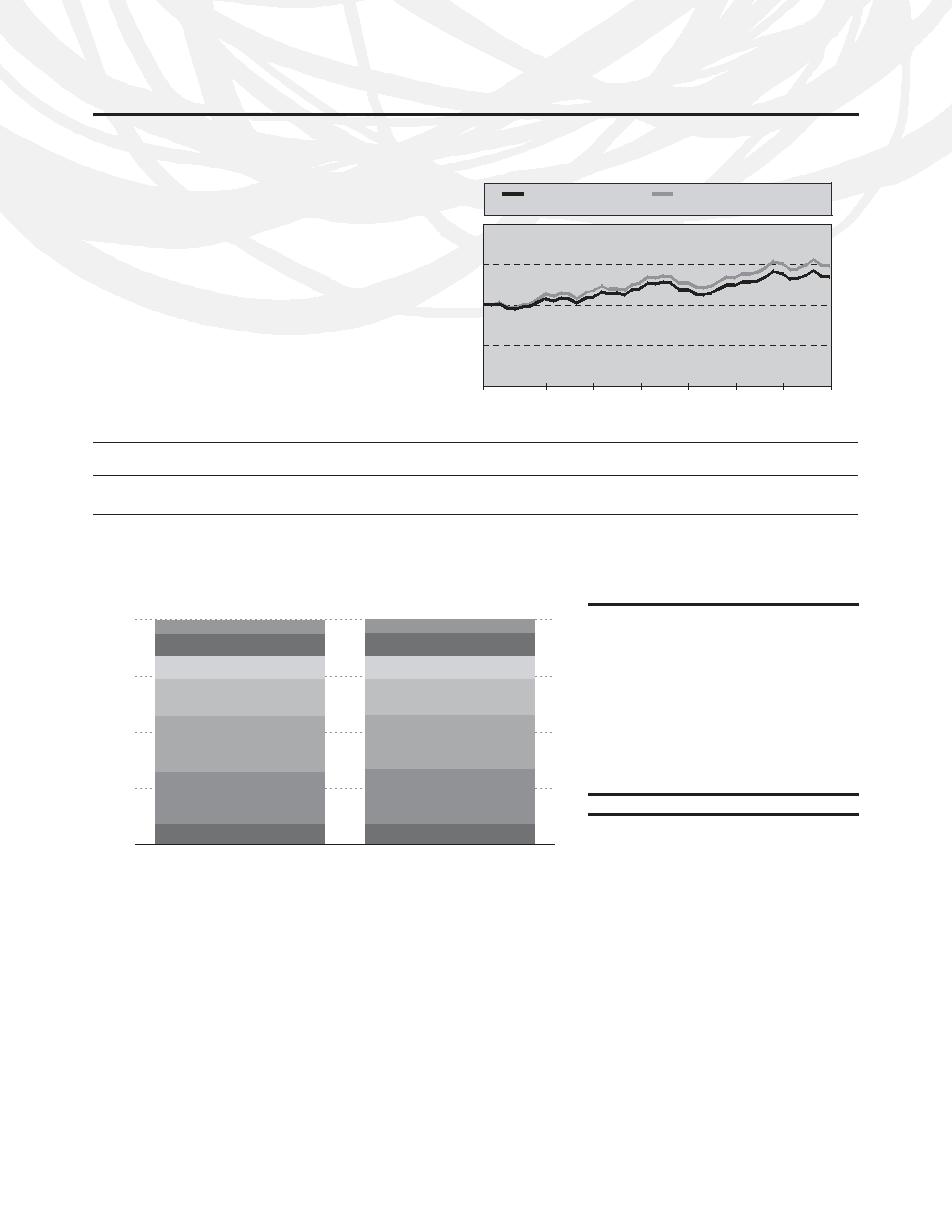
PERFORMANCE REPORTS AND FUND PROFILES (Unaudited) (continued)
PERFORMANCE REPORTS AND FUND PROFILES (Unaudited) (continued)
MID-CAP GROWTH FUND
Cumulative Fund Performance:
May 3, 2004 – December 31, 2007
OBJECTIVE: To provide investment results that match the
performance of a benchmark for mid-cap growth securities.
MID-CAP GROWTH FUND
S&P MIDCAP 400/
The Fund’s current benchmark is the S&P MidCap
CITIGROUP PURE GROWTH INDEX
400/Citigroup Pure Growth Index.
$20,000
Inception: May 3, 2004
Growth was a winner in 2007 and Rydex Mid-Cap Growth
$15,000
$14,845
$13,529
Fund reaped the rewards with a return of 8.42% for the year,
compared to the S&P MidCap 400/Citigroup Pure Growth
$10,000
Index’s return of 10.29% for the same period. Energy and
materials were the winning sectors, while consumer discre-
tionary was the worst performer.
$5,000
$0
05/03/04
12/31/04
06/30/05
12/31/05
06/30/06
12/31/06
06/30/07
12/31/07
AVERAGE ANNUAL TOTAL RETURNS FOR THE PERIOD ENDED 12/31/07
One
Since Inception
Year
(05/03/04)
MID-CAP GROWTH FUND
8.42%
8.60%
S&P MIDCAP 400/CITIGROUP PURE GROWTH INDEX
10.29%
11.38%
The returns presented above do not reflect the effects of taxes. Past performance is no guarantee of future results. The S&P MidCap 400/Citigroup
Pure Growth Index is an unmanaged stock index and, unlike the Fund, has no management fees or other operating expenses to reduce its
reported returns. Returns are historical and include changes in principal and reinvested dividends and capital gains.
Holdings Diversification (Market Exposure as % of Net Assets)
Ten Largest Holdings (% of Total Net Assets)
100%
Encore Acquisition Co.
1.7%
Materials
Materials
Sepracor, Inc.
1.7%
Energy
Energy
Digital River, Inc.
1.7%
Industrials
Industrials
75%
Psychiatric Solutions, Inc.
1.7%
Information Technology
Ventana Medical Systems
1.6%
Information Technology
Hansen Natural Corp.
1.6%
50%
Aeropostale, Inc.
1.5%
Consumer Discretionary
Consumer Discretionary
NVR, Inc.
1.5%
Intuitive Surgical, Inc.
1.5%
25%
F5 Networks, Inc.
1.4%
Health Care
Health Care
Top Ten Total
15.9%
Other
“Ten Largest Holdings” exclude any
Other
0%
temporary cash or derivative investments.
Mid-Cap Growth Fund
S&P MidCap 400/Citigroup
Pure Growth Index
“Holdings Diversification (Market Exposure as % of Net Assets)” excludes any
temporary cash investments.
THE RYDEX VARIABLE TRUST ANNUAL REPORT
|
27

PERFORMANCE REPORTS AND FUND PROFILES (Unaudited) (continued)
LARGE-CAP GROWTH FUND
Cumulative Fund Performance:
May 3, 2004 – December 31, 2007
OBJECTIVE: To provide investment results that match the
performance of a benchmark for large-cap growth securities.
LARGE-CAP GROWTH FUND
S&P 500/CITIGROUP PURE
The Fund’s current benchmark is the S&P 500/Citigroup Pure
GROWTH INDEX
Growth Index.
$15,000
Inception: May 3, 2004
$13,659
$11,734
2007 marked a shift towards strength in growth and large-cap
$10,000
stocks. Rydex Large-Cap Growth Fund delivered a 4.87% total
return for the year as compared to S&P 500/Citigroup Pure
Growth Index’s return of 6.64%. Within the index, all sectors
delivered positive returns with the exception of financials and
$5,000
consumer discretionary. The best performing sectors were
energy, utilities and industrials.
$0
05/03/04
12/31/04
06/30/05
12/31/05
06/30/06
12/31/06
06/30/07
12/31/07
AVERAGE ANNUAL TOTAL RETURNS FOR THE PERIOD ENDED 12/31/07
One
Since Inception
Year
(05/03/04)
LARGE-CAP GROWTH FUND
4.87%
4.46%
S&P 500/CITIGROUP PURE GROWTH INDEX
6.64%
8.88%
The returns presented above do not reflect the effects of taxes. Past performance is no guarantee of future results. The S&P 500/Citigroup Pure
Growth Index is and unmanaged stock index and, unlike the Fund, has no management fees or other operating expenses to reduce its reported
returns. Returns are historical and include changes in principal and reinvested dividends and capital gains.
Holdings Diversification (Market Exposure as % of Net Assets)
Ten Largest Holdings (% of Total Net Assets)
100%
Google, Inc. — Class A
1.4%
Materials
Materials
Sears Holdings Corp.
Consumer Staples
Consumer Staples
1.3%
Industrials
Industrials
IntercontinentalExchange, Inc.
1.2%
75%
Financials
Sunoco, Inc.
1.2%
Financials
CB Richard Ellis Group, Inc. — Class A
1.2%
Energy
Energy
United States Steel Corp.
1.2%
50%
Information Technology
Information Technology
Coach, Inc.
1.2%
Amazon.com, Inc.
1.2%
Expedia, Inc.
1.1%
Consumer Discretionary
Consumer Discretionary
25%
XTO Energy, Inc.
1.0%
Top Ten Total
12.0%
Health Care
Health Care
Other
“Ten Largest Holdings” exclude any
0%
temporary cash or derivative investments.
Large-Cap Growth Fund
S&P 500/Citigroup
Pure Growth Index
“Holdings Diversification (Market Exposure as % of Net Assets)” excludes any
temporary cash investments.
28
|
THE RYDEX VARIABLE TRUST ANNUAL REPORT

PERFORMANCE REPORTS AND FUND PROFILES (Unaudited)
PERFORMANCE REPORTS AND FUND PROFILES (Unaudited) (concluded)
U.S. GOVERNMENT MONEY MARKET FUND
OBJECTIVE: To provide security of principal, high current income and liquidity by investing in securities issued by the U.S.
Government, its agencies or instrumentalities.
Inception: May 7, 1997
During the first quarter of 2007, short-term rates moved slightly higher as economic indicators lent credence to the Fed’s inflation
worries.
Money market rates stabilized mid-year when the subprime mortgage crisis broke. Some money market funds were under scrutiny for
holding riskier investments, such as Structured Investment Vehicles (SIVs) and asset-backed securities collateralized by subprimes.
Rydex Government Money Market Fund holds government-sponsored agencies (GSEs) and government-collateralized securities only.
As the Fed responded to the subprime fallout by lowering the Fed funds and discount rates to encourage banks to lend, help the
consumer to delay mortgage resets, induce the consumer to spend and reduce the chance of recession, money markets yields
declined.
At year end, the Rydex Variable U.S. Government Money Market Fund provided a return of 3.90%.
AVERAGE ANNUAL TOTAL RETURNS FOR THE PERIOD ENDED 12/31/07
One
Five
Ten
Year
Year
Year
U.S. GOVERNMENT MONEY MARKET FUND
3.90%
1.98%
2.51%
Holdings Diversification (Market Exposure as % of Net Assets)
The Fund invests primarily in money
market instruments issued or guar-
100%
anteed as to principal and interest
by the U.S. Government, its agencies
Fannie Mae – FADN
or instrumentalities.
80%
Farmer Mac – FADN
Federal Farm Credit Bank – FADN
60%
Freddie Mac – FADN
40%
Repurchase Agreements
20%
0%
U.S. Government Money Market Fund
FADN - Federal Agency Discount Notes
THE RYDEX VARIABLE TRUST ANNUAL REPORT
|
29

December 31, 2007
NOVA FUND
MARKET
MARKET
VALUE
VALUE
SHARES
(NOTE 1)
SHARES
(NOTE 1)
COMMON STOCKS 75.6%
E*Trade Financial Corp.*†
7,900
$
28,045
AvalonBay Communities, Inc.†
270
25,418
FINANCIALS 13.1%
AFLAC, Inc.
290
18,163
Bank of America Corp.
23,280
$
960,533
Total Financials
10,771,809
JPMorgan Chase & Co.
19,010
829,786
INFORMATION TECHNOLOGY 12.2%
Wells Fargo & Co.†
20,190
609,536
Microsoft Corp.
42,450
1,511,220
American International
Cisco Systems, Inc.*
33,680
911,718
Group, Inc.
10,180
593,494
International Business
Citigroup, Inc.
19,940
587,034
Machines Corp.
7,710
833,451
American Express Co.
8,020
417,200
Hewlett-Packard Co.
14,850
749,628
Bank of New York Mellon Corp.
8,070
393,493
Apple, Inc.*
3,530
699,222
Morgan Stanley†
7,090
376,550
Google, Inc. — Class A*
940
649,991
Prudential Financial, Inc.
3,540
329,362
Intel Corp.
23,490
626,243
Travelers Cos, Inc.
5,470
294,286
Oracle Corp.*
24,770
559,307
Goldman Sachs Group, Inc.
1,360
292,468
Texas Instruments, Inc.
10,650
355,710
State Street Corp.
3,480
282,576
Qualcomm, Inc.
8,810
346,673
Hartford Financial Services
EMC Corp*†
16,490
305,560
Group, Inc.
2,920
254,595
Applied Materials, Inc.
13,480
239,405
Loews Corp.
4,760
239,618
Xerox Corp.
12,000
194,280
Wachovia Corp.
6,050
230,082
eBay, Inc.*
5,480
181,881
SunTrust Banks, Inc.†
3,590
224,339
Fiserv, Inc.*†
3,100
172,019
Franklin Resources, Inc.†
1,870
213,984
Electronic Data Systems Corp.
8,260
171,230
ACE Ltd.
3,290
203,256
KLA-Tencor Corp.
3,420
164,707
Regions Financial Corp.†
8,500
201,025
BMC Software, Inc.*
4,540
161,806
Lincoln National Corp.
3,450
200,859
Computer Sciences Corp.*
3,230
159,788
ProLogis†
3,060
193,943
Novellus Systems, Inc.*†
5,350
147,500
Capital One Financial Corp.†
3,860
182,424
Dell, Inc.*
5,680
139,217
Allstate Corp.
3,470
181,238
Convergys Corp.*
7,740
127,400
Genworth Financial, Inc. —
Compuware Corp.*
13,720
121,834
Class A
6,990
177,896
MEMC Electronic Materials,
Legg Mason, Inc.†
2,320
169,708
Inc.*
1,310
115,922
Bear Stearns Cos., Inc.†
1,810
159,733
Teradyne, Inc.*
9,510
98,333
Assurant, Inc.
2,380
159,222
Tellabs, Inc.*†
14,570
95,288
Torchmark Corp.†
2,500
151,325
Corning, Inc.
2,510
60,215
Marshall & Ilsley Corp.†
5,600
148,288
Motorola, Inc.
3,360
53,894
Janus Capital Group, Inc.†
4,400
144,540
Yahoo!, Inc.*
1,350
31,401
U.S. Bancorp†
4,510
143,147
Affiliated Computer
Zions Bancorporation†
2,970
138,669
Services, Inc. — Class A*
480
21,648
M&T Bank Corp.†
1,630
132,959
LSI Logic Corp.*
2,230
11,841
Safeco Corp.
2,140
119,155
Fannie Mae
2,840
113,543
Total Information Technology
10,018,332
Merrill Lynch & Co., Inc.†
2,010
107,897
ENERGY 9.9%
KIMCO Realty Corp.†
2,820
102,648
Exxon Mobil Corp.
28,060
2,628,941
MetLife, Inc.
1,570
96,743
Chevron Corp.
11,630
1,085,428
Washington Mutual, Inc.†
6,080
82,749
ConocoPhillips
9,340
824,722
Federated Investors, Inc. —
Schlumberger Ltd.
4,530
445,616
Class B†
1,990
81,908
Occidental Petroleum Corp.
5,740
441,923
SLM Corp.†
2,470
49,746
Transocean, Inc.†
2,399
343,417
CME Group Inc.†
70
48,020
Marathon Oil Corp.
5,560
338,382
Comerica, Inc.†
1,070
46,577
Valero Energy Corp.
4,560
319,337
Lehman Brothers Holdings,
Devon Energy Corp.
3,530
313,852
Inc.†
520
34,029
National-Oilwell Varco, Inc.*
3,390
249,029
30
|
THE RYDEX VARIABLE TRUST ANNUAL REPORT
See Notes to Financial Statements.

SCHEDULE OF INVESTMENTS (continued)
December 31, 2007
NOVA FUND
MARKET
MARKET
VALUE
VALUE
SHARES
(NOTE 1)
SHARES
(NOTE 1)
Noble Corp.
3,630
$
205,131
UnitedHealth Group, Inc.
8,570
$
498,774
ENSCO International, Inc.†
2,950
175,879
Merck & Co., Inc.
8,360
485,800
Tesoro Corp.
3,370
160,749
Medtronic, Inc.
7,980
401,155
BJ Services Co.†
6,300
152,838
Wyeth
9,060
400,361
Rowan Cos., Inc.†
3,770
148,764
WellPoint, Inc.*
4,240
371,975
Smith International, Inc.
1,930
142,530
Amgen, Inc.*†
7,460
346,442
Apache Corp.
400
43,016
Schering-Plough Corp.
12,140
323,410
Noble Energy, Inc.
540
42,941
Baxter International, Inc.
5,230
303,601
Halliburton Co.
1,020
38,668
Abbott Laboratories
5,270
295,910
Anadarko Petroleum Corp.
250
16,423
Aetna, Inc.
4,640
267,867
Baker Hughes, Inc.
70
5,677
Thermo Fisher Scientific, Inc.*
4,250
245,140
Total Energy
8,123,263
Biogen Idec, Inc.*†
3,050
173,606
INDUSTRIALS 9.1%
Coventry Health Care, Inc.*
2,920
173,010
General Electric Co.
45,930
1,702,625
Laboratory Corporation of
Boeing Co.
4,680
409,313
America Holdings*†
2,260
170,698
Honeywell International, Inc.
5,780
355,875
AmerisourceBergen Corp.
3,540
158,840
Caterpillar, Inc.
4,780
346,837
Mylan Laboratories, Inc.†
10,760
151,286
Emerson Electric Co.
6,050
342,793
King Pharmaceuticals, Inc.*†
13,460
137,830
Lockheed Martin Corp.
2,830
297,886
Bristol-Myers Squibb Co.
5,160
136,843
General Dynamics Corp.
3,330
296,337
PerkinElmer, Inc.
5,190
135,044
Union Pacific Corp.
2,230
280,133
Eli Lilly & Co.
2,420
129,204
Northrop Grumman Corp.
3,210
252,434
Watson Pharmaceuticals, Inc.*
4,740
128,644
United Technologies Corp.
3,180
243,397
Medco Health Solutions, Inc.*
1,260
127,764
United Parcel Service, Inc. —
Gilead Sciences, Inc.*
1,770
81,438
Class B†
3,350
236,912
Humana, Inc.*
690
51,964
Illinois Tool Works, Inc.†
4,270
228,616
Forest Laboratories, Inc.*
1,000
36,450
CSX Corp.
5,030
221,219
Zimmer Holdings, Inc.*
410
27,122
Norfolk Southern Corp.
4,370
220,423
C.R. Bard, Inc.†
280
26,544
Eaton Corp.
2,050
198,747
CIGNA Corp.
210
11,283
L-3 Communications Holdings,
Total Health Care
7,240,423
Inc.
1,760
186,454
CONSUMER DISCRETIONARY 7.1%
Parker Hannifin Corp.†
2,440
183,756
Walt Disney Co.
13,240
427,387
Dover Corp.
3,730
171,916
Time Warner, Inc.
25,370
418,859
Cooper Industries Ltd. —
Viacom, Inc. — Class A*
6,210
272,743
Class A†
3,250
171,860
News Corp. — Class A
13,000
266,370
3M Co.
1,990
167,797
Nike, Inc. — Class B
3,810
244,754
Danaher Corp.†
1,710
150,035
Carnival Corp.
4,920
218,891
W.W. Grainger, Inc.
1,670
146,158
McDonald’s Corp.
3,690
217,378
Robert Half International, Inc.†
4,940
133,578
CBS Corp.
7,930
216,092
Allied Waste Industries, Inc.*
11,510
126,840
Johnson Controls, Inc.
5,830
210,113
Cummins, Inc.
960
122,275
Comcast Corp. — Class A*†
9,450
172,557
Textron, Inc.
1,710
121,923
Genuine Parts Co.
3,430
158,809
Burlington Northern Santa Fe
Sherwin-Williams Co.†
2,590
150,324
Corp.
850
70,746
Expedia, Inc.*
4,730
149,563
Deere & Co.
700
65,184
AutoZone, Inc.*
1,230
147,489
FedEx Corp.†
500
44,585
Hasbro, Inc.†
5,510
140,946
Raytheon Co.†
430
26,101
Stanley Works†
2,860
138,653
Total Industrials
7,522,755
Snap-On, Inc.
2,830
136,519
HEALTH CARE 8.8%
IAC/ InterActiveCorp*
4,930
132,716
Johnson & Johnson, Inc.
12,070
805,069
RadioShack Corp.†
7,550
127,293
Pfizer, Inc.
28,040
637,349
Meredith Corp.
2,300
126,454
See Notes to Financial Statements.
THE RYDEX VARIABLE TRUST ANNUAL REPORT
|
31

SCHEDULE OF INVESTMENTS (continued)
December 31, 2007
NOVA FUND
MARKET
MARKET
VALUE
VALUE
SHARES
(NOTE 1)
SHARES
(NOTE 1)
Big Lots, Inc.*†
7,790
$
124,562
TELECOMMUNICATION SERVICES 3.2%
Polo Ralph Lauren Corp.†
1,980
122,344
AT&T, Inc.
32,370
$
1,345,297
Leggett & Platt, Inc.
6,890
120,162
Verizon Communications, Inc.
16,010
699,477
Harley-Davidson, Inc.†
2,460
114,907
American Tower Corp. —
Family Dollar Stores, Inc.†
5,650
108,649
Class A*
4,980
212,148
Black & Decker Corp.†
1,520
105,868
CenturyTel, Inc.
3,560
147,598
Office Depot, Inc.*
7,600
105,716
Citizens Communications Co.†
9,210
117,243
Darden Restaurants, Inc.†
3,790
105,021
Sprint Nextel Corp.†
6,520
85,608
Brunswick Corp.†
6,120
104,346
Total Telecommunication Services
2,607,371
Home Depot, Inc.
3,860
103,988
UTILITIES 2.9%
OfficeMax, Inc.†
4,440
91,730
FPL Group, Inc.
3,780
256,208
Target Corp.
1,710
85,500
Public Service Enterprise
Clear Channel
Group, Inc.
2,520
247,565
Communications, Inc.
2,400
82,848
Duke Energy Corp.
12,230
246,679
Harrah’s Entertainment, Inc.
900
79,875
FirstEnergy Corp.
3,200
231,488
DIRECTV Group, Inc.*
3,170
73,290
Edison International
3,820
203,873
Dillard’s, Inc. — Class A†
3,580
67,232
Consolidated Edison, Inc.
3,840
187,584
Lowe’s Cos., Inc.†
2,790
63,110
Pepco Holdings, Inc.
5,270
154,569
Centex Corp.†
1,560
39,406
DTE Energy Co.
3,410
149,904
Harman International
Pinnacle West Capital Corp.
3,390
143,770
Industries, Inc.
290
21,376
TECO Energy, Inc.†
8,260
142,155
Amazon.com, Inc.*†
90
8,338
Exelon Corp.
1,730
141,237
Total Consumer Discretionary
5,802,178
Entergy Corp.
1,130
135,058
CONSUMER STAPLES 7.0%
Dynegy Inc.*
16,160
115,382
Procter & Gamble Co.
13,380
982,360
Southern Co.†
370
14,337
PepsiCo, Inc.
9,320
707,388
Dominion Resources, Inc.
170
8,067
Altria Group, Inc.
8,510
643,186
Total Utilities
2,377,876
Coca-Cola Co.
7,600
466,412
MATERIALS 2.3%
Wal-Mart Stores, Inc.
8,940
424,918
Freeport-McMoRan Copper &
CVS Caremark Corp.
10,290
409,027
Gold, Inc
3,030
310,393
Anheuser-Busch Cos., Inc.
5,980
312,993
Dow Chemical Co.
7,500
295,650
Kroger Co.
8,250
220,357
Alcoa, Inc.
7,630
278,876
General Mills, Inc.
3,710
211,470
United States Steel Corp.†
1,680
203,129
Kellogg Co.
3,620
189,797
Monsanto Co.
1,400
156,366
Reynolds American, Inc.†
2,680
176,773
Pactiv Corp.*
5,470
145,666
SUPERVALU, Inc.
4,320
162,086
Sigma-Aldrich Corp.†
2,550
139,230
Coca-Cola Enterprises, Inc.†
6,220
161,907
Hercules, Inc.†
6,780
131,193
Pepsi Bottling Group, Inc.
3,770
148,764
Bemis Co.†
4,720
129,234
Kraft Foods, Inc. — Class A
4,010
130,846
E.I. du Pont de Nemours
Clorox Co.
1,570
102,317
and Co.
1,680
74,071
Colgate-Palmolive Co.†
880
68,605
Allegheny Technologies, Inc.
380
32,832
Walgreen Co.
1,380
52,550
Praxair, Inc.
100
8,871
Safeway, Inc.
1,010
34,552
Air Products & Chemicals, Inc.
70
6,904
Tyson Foods, Inc. — Class A
2,030
31,120
Sealed Air Corp.
270
6,248
H.J. Heinz Co.
650
30,342
Molson Coors Brewing Co. —
Total Materials
1,918,663
Class B
560
28,907
Total Common Stocks
Costco Wholesale Corp.†
310
21,626
(Cost $54,049,915)
62,117,615
Kimberly-Clark Corp.
240
16,642
Total Consumer Staples
5,734,945
32
|
THE RYDEX VARIABLE TRUST ANNUAL REPORT
See Notes to Financial Statements.

SCHEDULE OF INVESTMENTS (concluded)
December 31, 2007
NOVA FUND
MARKET
UNREALIZED
FACE
VALUE
GAIN (LOSS)
AMOUNT
(NOTE 1)
CONTRACTS
(NOTE 1)
REPURCHASE AGREEMENTS 17.2%
FUTURES CONTRACTS PURCHASED
Repurchase Agreement (Note 5)
March 2008 S&P 500 Index
Mizuho Financial Group, Inc.
Mini Futures Contracts
issued 12/31/07 at 1.40%
(Aggregate Market Value
due 01/02/08
$3,848,020
$
3,848,020
of Contracts $37,378,575)
507
$
233,232
Morgan Stanley
issued 12/31/07 at 1.20%
due 01/02/08
3,848,020
3,848,020
UNITS
UBS Financial Services, Inc.
EQUITY INDEX SWAP AGREEMENTS
issued 12/31/07 at 1.14%
March 2008 S&P 500 Index
due 01/02/08
3,848,020
3,848,020
Swap, Terminating 03/14/08**
Lehman Brothers Holdings, Inc.
(Notional Market Value
issued 12/31/07 at 1.00%
$9,217,986)
6,278
$
(77,342)
due 01/02/08††
2,596,331
2,596,331
March 2008 S&P 500 Index
Total Repurchase Agreements
Swap, Terminating 03/28/08**
(Cost $14,140,391)
14,140,391
(Notional Market Value
$15,050,216)
10,250
(109,299)
SECURITIES LENDING COLLATERAL 7.6%
(Total Notional Market
Investment in Securities Lending Short Term
Value $24,268,202)
$
(186,641)
Investment Portfolio Held by
U.S. Bank (Note 8)
6,277,357
6,277,357
Total Securities Lending Collateral
(Cost $6,277,357)
6,277,357
Total Investments 100.4%
(Cost $74,467,663)
$ 82,535,363
Liabilities in Excess of
Other Assets – (0.4)%
$
(344,037)
Net Assets – 100.0%
$ 82,191,326
*
Non-Income Producing Security.
**
Price Return based on S&P 500 Index +/- financing at a variable rate.
†
All or a portion of this security is on loan at December 31, 2007 — See Note 8.
††
All or a portion of this security is held as equity index swap collateral at December 31, 2007.
See Notes to Financial Statements.
THE RYDEX VARIABLE TRUST ANNUAL REPORT
|
33

SCHEDULE OF INVESTMENTS
December 31, 2007
INVERSE S&P 500 STRATEGY FUND
MARKET
UNREALIZED
FACE
VALUE
GAIN
AMOUNT
(NOTE 1)
CONTRACTS
(NOTE 1)
FEDERAL AGENCY DISCOUNT NOTES 37.1%
FUTURES CONTRACTS SOLD SHORT
Federal Home Loan Bank*
March 2008 S&P 500 Index
4.23% due 01/03/08
$3,000,000
$
2,999,648
Mini Futures Contracts
4.34% due 01/02/08
2,000,000
2,000,000
(Aggregate Market Value
Freddie Mac*
of Contracts $12,164,625)
165
$
102,045
4.26% due 01/08/08
3,000,000
2,997,870
Total Federal Agency Discount Notes
UNITS
(Cost $7,997,518)
7,997,518
EQUITY INDEX SWAP AGREEMENTS
REPURCHASE AGREEMENTS 99.0%
SOLD SHORT
Repurchase Agreement (Note 5)
March 2008 S&P 500 Index
Mizuho Financial Group, Inc.
Swap, Terminating 03/28/08**
issued 12/31/07 at 1.40%
(Notional Market Value
due 01/02/08
5,800,782
5,800,782
$7,437,648)
5,065
$
53,950
Morgan Stanley
March 2008 S&P 500 Index
issued 12/31/07 at 1.20%
Swap, Terminating 03/14/08**
due 01/02/08
5,800,782
5,800,782
(Notional Market Value
UBS Financial Services, Inc.
$1,848,980)
1,259
41,706
issued 12/31/07 at 1.14%
(Total Notional Market
due 01/02/08
5,800,782
5,800,782
Value $9,286,628)
$
95,656
Lehman Brothers Holdings, Inc.
issued 12/31/07 at 1.00%
due 01/02/08†
3,973,930
3,973,930
Total Repurchase Agreements
(Cost $21,376,276)
21,376,276
Total Investments 136.1%
(Cost $29,373,794)
$ 29,373,794
Liabilities in Excess of
Other Assets – (36.1)%
$
(7,792,485)
Net Assets – 100.0%
$ 21,581,309
*
The issuer is a publicly traded company that operates under a Congressional charter; its securities are neither issued nor guaranteed by the
U.S. Government.
**
Price Return based on S&P 500 Index +/- financing at a variable rate.
†
All or a portion of this security is pledged as equity index swap collateral at December 31, 2007.
34
|
THE RYDEX VARIABLE TRUST ANNUAL REPORT
See Notes to Financial Statements.

SCHEDULE OF INVESTMENTS
December 31, 2007
OTC FUND
MARKET
MARKET
VALUE
VALUE
SHARES
(NOTE 1)
SHARES
(NOTE 1)
COMMON STOCKS 78.5%
CONSUMER DISCRETIONARY 10.8%
Comcast Corp. — Class A*
66,860
$
1,220,864
INFORMATION TECHNOLOGY 51.0%
Sears Holdings Corp.*†
7,858
801,909
Apple, Inc.*
44,460
$
8,806,637
Amazon.com, Inc.*†
8,490
786,514
Microsoft Corp.
125,900
4,482,040
Garmin Ltd.
8,060
781,820
Google, Inc. — Class A*
4,993
3,452,560
Bed Bath & Beyond, Inc.*
21,450
630,416
Qualcomm, Inc.
80,533
3,168,974
Staples, Inc.
26,117
602,519
Cisco Systems, Inc.*
89,710
2,428,450
Wynn Resorts Ltd.†
5,180
580,833
Research In Motion Ltd.*
20,885
2,368,359
Expedia, Inc.*†
18,020
569,792
Oracle Corp.*
91,094
2,056,903
IAC/ InterActiveCorp*
20,704
557,352
Intel Corp.
65,480
1,745,697
Starbucks Corp.*†
26,220
536,723
eBay, Inc.*
33,770
1,120,826
Apollo Group, Inc. —
Nvidia Corp.*
26,813
912,178
Class A*†
6,620
464,393
Applied Materials, Inc.
40,960
727,450
Liberty Global, Inc. —
Fiserv, Inc.*†
12,480
692,515
Class A*†
7,070
277,073
Flextronics International Ltd.*†
55,888
674,009
Virgin Media, Inc.
14,690
251,787
KLA-Tencor Corp.
13,600
654,976
EchoStar Communications
Adobe Systems, Inc.*
15,310
654,196
Corp.*
6,600
248,952
Xilinx, Inc.†
26,729
584,563
Sirius Satellite Radio, Inc.*†
57,600
174,528
Network Appliance, Inc.*
22,593
563,921
Liberty Media Corp -
Symantec Corp.*
31,670
511,154
Interactive*
8,800
167,904
Intuit, Inc.*†
16,020
506,392
Ross Stores, Inc.
6,016
153,829
Dell, Inc.*
20,370
499,269
Discovery Holding Co. —
Check Point Software
Class A*
3,950
99,303
Technologies Ltd.*
21,268
467,045
Total Consumer Discretionary
8,906,511
Lam Research Corp.*†
10,708
462,907
HEALTH CARE 10.3%
Juniper Networks, Inc.*†
13,850
459,820
Gilead Sciences, Inc.*
33,740
1,552,378
Cadence Design Systems,
Amgen, Inc.*†
24,016
1,115,303
Inc.*†
26,196
445,594
Teva Pharmaceutical
Autodesk, Inc.*
8,480
421,965
Industries Ltd. — SP ADR†
22,660
1,053,237
Electronic Arts, Inc.*†
6,950
405,949
Biogen Idec, Inc.*†
15,060
857,215
Baidu.com - SP ADR*
930
363,063
Genzyme Corp.*
8,860
659,538
Altera Corp.
16,010
309,313
Express Scripts, Inc.*
9,010
657,730
Yahoo!, Inc.*
13,240
307,962
DENTSPLY International, Inc.
11,408
513,588
Sun Microsystems, Inc.*
16,720
303,134
Henry Schein, Inc.*
7,810
479,534
Cognizant Technology Solutions
Patterson Cos., Inc.*†
13,319
452,180
Corp. — Class A*
8,810
299,011
Intuitive Surgical, Inc.*†
1,390
451,055
Paychex, Inc.†
6,960
252,091
Celgene Corp.*
8,670
400,641
Citrix Systems, Inc.*
5,990
227,680
Sepracor, Inc.*
9,035
237,169
Logitech International SA*
4,930
180,635
Cephalon, Inc.*†
1,420
101,899
Broadcom Corp. — Class A*
6,610
172,785
Telefonaktiebolaget LM
Total Health Care
8,531,467
Ericsson — SP ADR
5,180
120,953
INDUSTRIALS 3.8%
Tellabs, Inc.*†
16,581
108,440
Paccar, Inc.†
15,050
819,924
Linear Technology Corp.
2,530
80,530
Foster Wheeler Ltd.*
2,720
421,654
Marvell Technology Group
CH Robinson Worldwide, Inc.
6,240
337,709
Ltd.*
3,110
43,478
Expeditors International
SanDisk Corp.*
870
28,858
Washington, Inc.
7,550
337,334
VeriSign, Inc.*†
740
27,831
Joy Global, Inc.
3,850
253,407
Total Information Technology
42,100,113
Cintas Corp.†
7,020
236,012
Fastenal Co.†
5,290
213,822
See Notes to Financial Statements.
THE RYDEX VARIABLE TRUST ANNUAL REPORT
|
35

SCHEDULE OF INVESTMENTS (concluded)
December 31, 2007
OTC FUND
MARKET
MARKET
VALUE
FACE
VALUE
SHARES
(NOTE 1)
AMOUNT
(NOTE 1)
Ryanair Holdings PLC —
SECURITIES LENDING COLLATERAL 9.2%
SP ADR*†
4,180
$
164,859
Investment in Securities Lending Short Term
Monster Worldwide, Inc.*
4,890
158,436
Investment Portfolio Held by
UAL Corp.*†
4,060
144,780
U.S. Bank (Note 8)
$7,604,902
$
7,604,902
Total Industrials
3,087,937
Total Securities Lending Collateral
TELECOMMUNICATION SERVICES 1.2%
(Cost $7,604,902)
7,604,902
Millicom International
Total Investments 108.8%
Cellular SA*
3,340
393,919
(Cost $66,160,557)
$ 89,767,636
NII Holdings, Inc. — Class B*†
6,600
318,912
Liabilities in Excess of
Level 3 Communications, Inc.*†
55,950
170,088
Other Assets – (8.8)%
$ (7,275,140)
Leap Wireless International,
Net Assets – 100.0%
$ 82,492,496
Inc. — Class B*†
2,450
114,268
Total Telecommunication Services
997,187
UNREALIZED
CONSUMER STAPLES 1.0%
GAIN (LOSS)
Costco Wholesale Corp.
8,560
597,146
CONTRACTS
(NOTE 1)
Whole Foods Market, Inc.†
4,990
203,592
FUTURES CONTRACTS PURCHASED
Total Consumer Staples
800,738
March 2008 Nasdaq 100 Index
MATERIALS 0.3%
Mini Futures Contracts
Sigma-Aldrich Corp.†
4,600
251,160
(Aggregate Market Value
of Contracts $11,779,600)
280
$
56,266
Total Materials
251,160
ENERGY 0.1%
Patterson-UTI Energy, Inc.†
5,680
110,874
UNITS
Total Energy
110,874
EQUITY INDEX SWAP AGREEMENTS
Total Common Stocks
March 2008 Nasdaq 100 Index
(Cost $41,178,908)
64,785,987
Swap, Terminating 03/28/08**
(Notional Market Value
FACE
AMOUNT
$197,268)
95
$
(2,169)
March 2008 Nasdaq 100 Index
REPURCHASE AGREEMENTS 21.1%
Swap, Terminating 03/14/08**
Repurchase Agreement (Note 5)
(Notional Market Value
Mizuho Financial Group, Inc.
$6,195,406)
2,972
(89,351)
issued 12/31/07 at 1.40%
(Total Notional Market
due 01/02/08
$4,788,005
4,788,005
Value $6,392,674)
$
(91,520)
Morgan Stanley
issued 12/31/07 at 1.20%
due 01/02/08
4,788,005
4,788,005
UBS Financial Services, Inc.
issued 12/31/07 at 1.14%
due 01/02/08
4,788,005
4,788,005
Lehman Brothers Holdings, Inc.
issued 12/31/07 at 1.00%
due 01/02/08††
3,012,732
3,012,732
Total Repurchase Agreements
(Cost $17,376,747)
17,376,747
*
Non-Income Producing Security.
**
Price Return based on Nasdaq 100 Index +/- financing at a variable rate.
†
All or a portion of this security is on loan at December 31, 2007 — See Note 8.
††
All or a portion of this security is pledged as equity index swap collateral at December 31, 2007.
ADR — American Depository Receipt.
36
|
THE RYDEX VARIABLE TRUST ANNUAL REPORT
See Notes to Financial Statements.

SCHEDULE OF INVESTMENTS
December 31, 2007
INVERSE OTC STRATEGY FUND
MARKET
UNREALIZED
FACE
VALUE
GAIN
AMOUNT
(NOTE 1)
CONTRACTS
(NOTE 1)
FEDERAL AGENCY DISCOUNT NOTES 29.3%
FUTURES CONTRACTS SOLD SHORT
Federal Home Loan Bank*
March 2008 Nasdaq 100 Index
4.23% due 01/03/08
$2,000,000
$
1,999,765
Mini Futures Contracts
Freddie Mac*
(Aggregate Market Value
4.26% due 01/08/08
2,000,000
1,998,580
of Contracts $5,048,400)
120
$
74,992
Total Federal Agency Discount Notes
UNITS
(Cost $3,998,345)
3,998,345
EQUITY INDEX SWAP AGREEMENTS
REPURCHASE AGREEMENTS 65.0%
SOLD SHORT†
Repurchase Agreement (Note 5)
March 2008 Nasdaq 100 Index
Mizuho Financial Group, Inc.
Swap, Terminating 3/28/08**
issued 12/31/07 at 1.40%
(Notional Market Value
due 01/02/08
2,309,981
2,309,981
$7,726,150)
3,706
$
103,748
Morgan Stanley
March 2008 Nasdaq 100 Index
issued 12/31/07 at 1.20%
Swap, Terminating 3/14/08**
due 01/02/08
2,309,981
2,309,981
(Notional Market Value
UBS Financial Services, Inc.
$776,395)
372
3,035
issued 12/31/07 at 1.14%
(Total Notional Market
due 01/02/08
2,309,981
2,309,981
Value $8,502,545)
$
106,783
Lehman Brothers Holdings, Inc.
issued 12/31/07 at 1.00%
due 01/02/08
1,931,394
1,931,394
Total Repurchase Agreements
(Cost $8,861,337)
8,861,337
Total Investments 94.3%
(Cost $12,859,682)
$ 12,859,682
Other Assets in Excess
of Liabilities – 5.7%
$
780,405
Net Assets – 100.0%
$ 13,640,087
*
The issuer is a publicly traded company that operates under a Congressional charter; its securities are neither issued nor guaranteed by the
U.S. Government.
**
Price Return based on Nasdaq 100 Index +/- financing at a variable rate.
†
Cash was pledged as equity index swap collateral at December 31, 2007.
See Notes to Financial Statements.
THE RYDEX VARIABLE TRUST ANNUAL REPORT
|
37

SCHEDULE OF INVESTMENTS
December 31, 2007
S&P 500 2x STRATEGY FUND
MARKET
MARKET
VALUE
VALUE
SHARES
(NOTE 1)
SHARES
(NOTE 1)
COMMON STOCKS 34.1%
Boston Properties, Inc.
120
$
11,017
Genworth Financial, Inc. —
FINANCIALS 6.0%
Class A
420
10,689
Bank of America Corp.
4,280
$
176,593
SLM Corp.†
500
10,070
American International
National City Corp.
610
10,041
Group, Inc.
2,450
142,835
General Growth Properties, Inc.
240
9,883
Citigroup, Inc.
4,820
141,901
Bear Stearns Cos., Inc.†
110
9,708
JPMorgan Chase & Co.
3,240
141,426
Legg Mason, Inc.†
130
9,510
Wells Fargo & Co.†
3,260
98,419
Equity Residential
260
9,482
Goldman Sachs Group, Inc.
380
81,719
KeyCorp†
380
8,911
Wachovia Corp.
1,910
72,637
Public Storage, Inc.
120
8,809
American Express Co.
1,130
58,783
KIMCO Realty Corp.
240
8,736
Morgan Stanley
1,020
54,172
XL Capital Ltd.
170
8,553
Bank of New York Mellon Corp.
1,100
53,636
Host Hotels & Resorts, Inc.
500
8,520
U.S. Bancorp†
1,670
53,006
UnumProvident Corp.†
350
8,327
Merrill Lynch & Co., Inc.†
830
44,554
Plum Creek Timber Co., Inc.
MetLife, Inc.
710
43,750
(REIT)†
170
7,827
Prudential Financial, Inc.
440
40,938
Synovus Financial Corp.
320
7,706
Fannie Mae
940
37,581
Leucadia National Corp.†
160
7,536
CME Group Inc.†
50
34,300
AvalonBay Communities, Inc.†
80
7,531
Lehman Brothers Holdings,
Hudson City Bancorp, Inc.
500
7,510
Inc.†
510
33,374
Moody’s Corp.†
210
7,497
Travelers Cos, Inc.
620
33,356
Commerce Bancorp, Inc.†
190
7,247
State Street Corp.
370
30,044
Discover Financial Services†
460
6,937
AFLAC, Inc.
470
29,436
Marshall & Ilsley Corp.†
250
6,620
Allstate Corp.
550
28,726
Comerica, Inc.†
150
6,530
Hartford Financial Services
Cincinnati Financial Corp.
160
6,326
Group, Inc.
300
26,157
American Capital Strategies
Charles Schwab Corp.
900
22,995
Ltd.†
190
6,262
NYSE Euronext†
260
22,820
Assurant, Inc.
90
6,021
PNC Financial Services Group,
M&T Bank Corp.
70
5,710
Inc.†
340
22,321
Torchmark Corp.
90
5,448
Freddie Mac
640
21,805
Huntington Bancshares, Inc.†
350
5,166
SunTrust Banks, Inc.†
340
21,247
Safeco Corp.
90
5,011
Loews Corp.
420
21,143
Countrywide Financial Corp.†
560
5,006
Chubb Corp.
370
20,195
Janus Capital Group, Inc.
150
4,928
ACE Ltd.
320
19,770
Zions Bancorporation†
100
4,669
Simon Property Group, Inc.†
220
19,109
Developers Diversified Realty
Franklin Resources, Inc.
160
18,309
Corp.†
120
4,595
Capital One Financial Corp.†
380
17,959
CIT Group, Inc.
180
4,325
Principal Financial Group, Inc.
250
17,210
CB Richard Ellis Group, Inc. —
BB&T Corp.
530
16,255
Class A*
190
4,095
Regions Financial Corp.†
670
15,845
Sovereign Bancorp, Inc.
350
3,990
ProLogis†
250
15,845
Federated Investors, Inc. —
T. Rowe Price Group, Inc.†
250
15,220
Class B†
80
3,293
Lincoln National Corp.
260
15,137
Apartment Investment &
Northern Trust Corp.
180
13,784
Management Co. —
IntercontinentalExchange, Inc.*
70
13,475
Class A†
88
3,056
Aon Corp.
280
13,353
Ambac Financial Group, Inc.†
100
2,577
Marsh & McLennan Cos., Inc.
500
13,235
MBIA, Inc.†
120
2,236
Progressive Corp.
670
12,837
First Horizon National Corp.†
120
2,178
Fifth Third Bancorp†
510
12,816
MGIC Investment Corp.†
80
1,794
Ameriprise Financial, Inc.
220
12,124
E*Trade Financial Corp.*†
410
1,456
Vornado Realty Trust†
130
11,433
Total Financials
2,188,356
Washington Mutual, Inc.†
840
11,432
38
|
THE RYDEX VARIABLE TRUST ANNUAL REPORT
See Notes to Financial Statements.

SCHEDULE OF INVESTMENTS (continued)
December 31, 2007
S&P 500 2x STRATEGY FUND
MARKET
MARKET
VALUE
VALUE
SHARES
(NOTE 1)
SHARES
(NOTE 1)
INFORMATION TECHNOLOGY 5.7%
Microchip Technology, Inc.
210
$
6,598
Microsoft Corp.
7,760
$
276,256
Altera Corp.
320
6,182
Apple, Inc.*
840
166,387
Xilinx, Inc.
280
6,124
Cisco Systems, Inc.*
5,850
158,359
Akamai Technologies, Inc.*†
160
5,536
Google, Inc. — Class A*
220
152,126
Micron Technology, Inc.*†
730
5,292
Intel Corp.
5,640
150,362
National Semiconductor Corp.
230
5,207
International Business
Teradata Corp.*
170
4,660
Machines Corp.
1,330
143,773
Affiliated Computer
Hewlett-Packard Co.
2,490
125,695
Services, Inc. — Class A*
100
4,510
Oracle Corp.*
3,810
86,030
Advanced Micro Devices,
Qualcomm, Inc.
1,580
62,173
Inc.*†
580
4,350
Dell, Inc.*
2,160
52,942
Molex, Inc.
140
3,822
Texas Instruments, Inc.
1,350
45,090
LSI Logic Corp.*
680
3,611
EMC Corp*†
2,020
37,431
Lexmark International, Inc.*†
90
3,137
eBay, Inc.*
1,100
36,509
Jabil Circuit, Inc.
200
3,054
Corning, Inc.
1,520
36,465
Novellus Systems, Inc.*†
110
3,033
Motorola, Inc.
2,200
35,288
JDS Uniphase Corp.*
210
2,793
Yahoo!, Inc.*
1,290
30,005
Tellabs, Inc.*†
420
2,747
Applied Materials, Inc.
1,330
23,621
Ciena Corp.*
80
2,729
Adobe Systems, Inc.*
550
23,501
Compuware Corp.*
280
2,486
Automatic Data Processing,
Novell, Inc.*
340
2,336
Inc.
510
22,710
Convergys Corp.*
130
2,140
MEMC Electronic Materials,
QLogic Corp.*
130
1,846
Inc.*
220
19,468
Teradyne, Inc.*
170
1,758
Nvidia Corp.*
540
18,371
Unisys Corp.*
340
1,608
Tyco Electronics Ltd.
480
17,822
Total System Services, Inc.
35
980
Electronic Arts, Inc.*†
300
17,523
Total Information Technology
2,074,003
Western Union Co.
720
17,482
ENERGY 4.4%
Juniper Networks, Inc.*
500
16,600
Exxon Mobil Corp.
5,270
493,746
Sun Microsystems, Inc.*
800
14,504
Chevron Corp.
2,040
190,393
Xerox Corp.
890
14,409
ConocoPhillips
1,540
135,982
Agilent Technologies, Inc.*
370
13,594
Schlumberger Ltd.
1,150
113,126
Symantec Corp.*
840
13,558
Occidental Petroleum Corp.
800
61,592
Broadcom Corp. — Class A*
450
11,763
Transocean, Inc.†
310
44,377
Paychex, Inc.†
320
11,590
Marathon Oil Corp.
690
41,993
Autodesk, Inc.*
220
10,947
Devon Energy Corp.
430
38,231
Electronic Data Systems Corp.
490
10,158
Valero Energy Corp.
530
37,116
Intuit, Inc.*†
320
10,115
Apache Corp.
320
34,413
Cognizant Technology Solutions
Halliburton Co.
850
32,224
Corp. — Class A*
280
9,503
Anadarko Petroleum Corp.
450
29,561
CA, Inc.
380
9,481
Hess Corp.†
270
27,232
Analog Devices, Inc.
290
9,193
Baker Hughes, Inc.
310
25,141
Fiserv, Inc.*†
160
8,878
National-Oilwell Varco, Inc.*
340
24,976
KLA-Tencor Corp.
180
8,669
XTO Energy, Inc.
470
24,139
Computer Sciences Corp.*
170
8,410
Weatherford International Ltd.*
330
22,638
Network Appliance, Inc.*
330
8,237
EOG Resources, Inc.
240
21,420
VeriSign, Inc.*†
210
7,898
Williams Cos., Inc.
570
20,395
SanDisk Corp.*
220
7,297
Chesapeake Energy Corp.†
440
17,248
Linear Technology Corp.†
220
7,003
Peabody Energy Corp.†
260
16,026
Citrix Systems, Inc.*†
180
6,842
Spectra Energy Corp.†
610
15,750
BMC Software, Inc.*
190
6,772
Murphy Oil Corp.†
180
15,271
Fidelity National Information
Noble Corp.
260
14,693
Services, Inc.
160
6,654
Smith International, Inc.
190
14,032
See Notes to Financial Statements.
THE RYDEX VARIABLE TRUST ANNUAL REPORT
|
39

SCHEDULE OF INVESTMENTS (continued)
December 31, 2007
S&P 500 2x STRATEGY FUND
MARKET
MARKET
VALUE
VALUE
SHARES
(NOTE 1)
SHARES
(NOTE 1)
Noble Energy, Inc.
170
$
13,518
Applera Corp. - Applied Biosystems
Consol Energy, Inc.
180
12,874
Group
160
$
5,427
El Paso Corp.
680
11,723
Barr Pharmaceuticals, Inc.*
100
5,310
ENSCO International, Inc.†
140
8,347
Patterson Cos., Inc.*†
130
4,414
Sunoco, Inc.†
110
7,968
IMS Health, Inc.
190
4,378
Nabors Industries Ltd.*
270
7,395
Mylan Laboratories, Inc.†
290
4,077
Range Resources Corp.
140
7,190
Millipore Corp.*†
50
3,659
BJ Services Co.†
280
6,793
PerkinElmer, Inc.
110
2,862
Tesoro Corp.
130
6,201
Watson Pharmaceuticals, Inc.*
100
2,714
Rowan Cos., Inc.†
110
4,341
King Pharmaceuticals, Inc.*†
240
2,458
Total Energy
1,598,065
Tenet Healthcare Corp.*
460
2,337
HEALTH CARE 4.1%
Total Health Care
1,485,963
Johnson & Johnson, Inc.
2,760
184,092
INDUSTRIALS 3.9%
Pfizer, Inc.
6,590
149,791
General Electric Co.
9,750
361,432
Merck & Co., Inc.
2,100
122,031
United Technologies Corp.
950
72,713
Abbott Laboratories
1,490
83,663
United Parcel Service, Inc. —
UnitedHealth Group, Inc.
1,250
72,750
Class B†
1,010
71,427
Wyeth
1,290
57,005
Boeing Co.
750
65,595
Medtronic, Inc.
1,090
54,794
3M Co.
690
58,181
Eli Lilly & Co.
950
50,720
Honeywell International, Inc.
720
44,330
Bristol-Myers Squibb Co.
1,910
50,653
Caterpillar, Inc.
610
44,261
Amgen, Inc.*
1,050
48,762
Emerson Electric Co.
760
43,061
WellPoint, Inc.*
550
48,251
Deere & Co.
430
40,042
Schering-Plough Corp.
1,560
41,558
Lockheed Martin Corp.
330
34,736
Gilead Sciences, Inc.*
900
41,409
General Dynamics Corp.
390
34,706
Baxter International, Inc.
610
35,410
Union Pacific Corp.
250
31,405
Aetna, Inc.
480
27,710
FedEx Corp.†
300
26,751
Medco Health Solutions, Inc.*
260
26,364
Northrop Grumman Corp.
330
25,951
Thermo Fisher Scientific, Inc.*
410
23,649
Raytheon Co.†
410
24,887
Covidien Ltd.
480
21,259
Burlington Northern Santa Fe
Cardinal Health, Inc.†
350
20,213
Corp.
290
24,137
Becton, Dickinson & Co.
240
20,059
Illinois Tool Works, Inc.†
400
21,416
Genzyme Corp.*
260
19,354
Danaher Corp.†
240
21,058
Allergan, Inc.
300
19,272
Paccar, Inc.†
360
19,613
McKesson Corp.
280
18,343
Tyco International Ltd.†
480
19,032
Express Scripts, Inc.*
240
17,520
Norfolk Southern Corp.
370
18,663
Stryker Corp.†
230
17,186
CSX Corp.
410
18,032
Celgene Corp.*
370
17,098
Precision Castparts Corp.
130
18,031
Biogen Idec, Inc.*†
280
15,938
Textron, Inc.
240
17,112
Zimmer Holdings, Inc.*
230
15,215
Waste Management, Inc.
490
16,008
Boston Scientific Corp.*
1,290
15,003
Eaton Corp.
140
13,573
CIGNA Corp.
270
14,507
Fluor Corp.†
90
13,115
St. Jude Medical, Inc.*
330
13,411
Cummins, Inc.
100
12,737
Humana, Inc.*
160
12,050
L-3 Communications Holdings,
Forest Laboratories, Inc.*
300
10,935
Inc.
120
12,713
C.R. Bard, Inc.†
100
9,480
Ingersoll-Rand Co. — Class A
260
12,082
Coventry Health Care, Inc.*
150
8,888
Parker Hannifin Corp.†
160
12,050
Laboratory Corporation of America
Rockwell Collins, Inc.
160
11,515
Holdings*†
110
8,308
Jacobs Engineering Group,
Quest Diagnostics, Inc.
150
7,935
Inc.*†
120
11,473
Waters Corp.*
100
7,907
ITT Industries, Inc.
170
11,227
AmerisourceBergen Corp.
160
7,179
Rockwell Automation, Inc.†
140
9,654
Hospira, Inc.*
150
6,396
Expeditors International
Varian Medical Systems, Inc.*
120
6,259
Washington, Inc.
210
9,383
40
|
THE RYDEX VARIABLE TRUST ANNUAL REPORT
See Notes to Financial Statements.

SCHEDULE OF INVESTMENTS (continued)
December 31, 2007
S&P 500 2x STRATEGY FUND
MARKET
MARKET
VALUE
VALUE
SHARES
(NOTE 1)
SHARES
(NOTE 1)
Cooper Industries Ltd. —
Hershey Co.
160
$
6,304
Class A†
170
$
8,990
Brown-Forman Corp. —
Dover Corp.
190
8,757
Class B†
80
5,929
Southwest Airlines Co.†
710
8,662
Whole Foods Market, Inc.†
130
5,304
CH Robinson Worldwide, Inc.
160
8,659
Pepsi Bottling Group, Inc.
130
5,130
Goodrich Corp.
120
8,473
Estee Lauder Cos., Inc. —
Pitney Bowes, Inc.†
210
7,988
Class A
110
4,797
Trane, Inc.
170
7,941
McCormick & Co., Inc.†
120
4,549
RR Donnelley & Sons Co.
210
7,925
Constellation Brands, Inc. —
Masco Corp.†
360
7,780
Class A*
190
4,492
Terex Corp.*
100
6,557
Tyson Foods, Inc. — Class A
260
3,986
Manitowoc Co., Inc.
130
6,348
Dean Foods Co.
130
3,362
Avery Dennison Corp.†
100
5,314
Total Consumer Staples
1,270,257
W.W. Grainger, Inc.
60
5,251
CONSUMER DISCRETIONARY 2.9%
Pall Corp.
120
4,838
McDonald’s Corp.
1,140
67,157
Equifax, Inc.
130
4,727
Walt Disney Co.
1,840
59,395
Cintas Corp.
130
4,371
Time Warner, Inc.
3,490
57,620
Robert Half International, Inc.†
160
4,326
Comcast Corp. — Class A*
2,970
54,232
Monster Worldwide, Inc.*
120
3,888
News Corp. — Class A
2,230
45,693
Allied Waste Industries, Inc.*
280
3,086
Home Depot, Inc.
1,630
43,912
Ryder System, Inc.
60
2,821
Target Corp.
800
40,000
Total Industrials
1,428,804
Lowe’s Cos., Inc.
1,410
31,894
CONSUMER STAPLES 3.5%
Amazon.com, Inc.*†
300
27,792
Procter & Gamble Co.
3,000
220,260
Viacom, Inc. — Class A*
630
27,670
Altria Group, Inc.
2,030
153,427
Nike, Inc. — Class B
370
23,769
Coca-Cola Co.
1,920
117,830
Johnson Controls, Inc.
570
20,543
PepsiCo, Inc.
1,550
117,645
Yum! Brands, Inc.
490
18,752
Wal-Mart Stores, Inc.
2,280
108,368
Carnival Corp.
420
18,686
CVS Caremark Corp.
1,430
56,843
CBS Corp.
660
17,985
Kraft Foods, Inc. — Class A
1,490
48,619
Best Buy Co., Inc.†
340
17,901
Colgate-Palmolive Co.
490
38,200
Clear Channel Communications,
Anheuser-Busch Cos., Inc.
710
37,161
Inc.
480
16,570
Walgreen Co.
960
36,557
Harrah’s Entertainment, Inc.
180
15,975
Costco Wholesale Corp.
420
29,299
DIRECTV Group, Inc.*
690
15,953
Archer-Daniels-Midland Co.
620
28,787
Staples, Inc.
680
15,688
Kimberly-Clark Corp.
410
28,429
Omnicom Group, Inc.†
320
15,210
General Mills, Inc.
330
18,810
Starbucks Corp.*†
700
14,329
Sysco Corp.
590
18,414
McGraw-Hill Cos., Inc.
320
14,019
Kroger Co.
660
17,629
Kohl’s Corp.*
300
13,740
Avon Products, Inc.†
410
16,207
Ford Motor Co.*†
2,040
13,729
Safeway, Inc.
430
14,710
General Motors Corp.†
550
13,689
H.J. Heinz Co.
310
14,471
International Game Technology,
Kellogg Co.
250
13,108
Inc.†
300
13,179
WM Wrigley Jr Co.
210
12,296
TJX Cos., Inc.
420
12,067
Sara Lee Corp.
700
11,242
Coach, Inc.*
360
11,009
Reynolds American, Inc.†
170
11,213
Macy’s, Inc.
420
10,865
ConAgra Foods, Inc.
470
11,181
Fortune Brands, Inc.
150
10,854
Clorox Co.
130
8,472
Harley-Davidson, Inc.
230
10,743
UST, Inc.†
150
8,220
Marriott International, Inc. —
SUPERVALU, Inc.
200
7,504
Class A
300
10,254
Campbell Soup Co.
210
7,503
The Gap, Inc.†
450
9,576
Coca-Cola Enterprises, Inc.†
280
7,288
GameStop Corp. — Class A*
150
9,316
Molson Coors Brewing Co. —
J.C. Penney Co., Inc.
210
9,238
Class B
130
6,711
Apollo Group, Inc. — Class A*†
130
9,120
See Notes to Financial Statements.
THE RYDEX VARIABLE TRUST ANNUAL REPORT
|
41

SCHEDULE OF INVESTMENTS (continued)
December 31, 2007
S&P 500 2x STRATEGY FUND
MARKET
MARKET
VALUE
VALUE
SHARES
(NOTE 1)
SHARES
(NOTE 1)
Gannett Co., Inc.
220
$
8,580
Jones Apparel Group, Inc.
80
$
1,279
Starwood Hotels & Resorts
Dillard’s, Inc. — Class A†
60
1,127
Worldwide, Inc.
190
8,366
Circuit City Stores, Inc.†
160
672
Washington Post Co. —
Total Consumer Discretionary
1,055,144
Class B
10
7,914
TELECOMMUNICATION SERVICES 1.3%
Bed Bath & Beyond, Inc.*
260
7,641
AT&T, Inc.
5,850
243,126
Genuine Parts Co.
160
7,408
Verizon Communications, Inc.
2,790
121,895
Sears Holdings Corp.*†
70
7,144
Sprint Nextel Corp.†
2,740
35,976
Newell Rubbermaid, Inc.
270
6,988
American Tower Corp. —
Mattel, Inc.
350
6,664
Class A*
390
16,614
Nordstrom, Inc.†
180
6,611
Qwest Communications
Goodyear Tire & Rubber Co.*
230
6,491
International, Inc.*†
1,520
10,655
Abercrombie & Fitch Co. —
Embarq Corp.†
150
7,429
Class A
80
6,398
Windstream Corp.†
460
5,989
Expedia, Inc.*†
200
6,324
CenturyTel, Inc.
110
4,561
Eastman Kodak Co.†
280
6,124
Citizens Communications Co.
320
4,074
Tiffany & Co.†
130
5,984
Sherwin-Williams Co.
100
5,804
Total Telecommunication Services
450,319
H&R Block, Inc.
310
5,757
UTILITIES 1.2%
Whirlpool Corp.
70
5,714
Exelon Corp.
640
52,250
Limited Brands, Inc.†
300
5,679
Southern Co.†
730
28,287
VF Corp.
80
5,493
Dominion Resources, Inc.
560
26,572
IAC/ InterActiveCorp*
180
4,846
FPL Group, Inc.
390
26,434
AutoZone, Inc.*
40
4,796
Duke Energy Corp.
1,220
24,607
Harman International Industries,
Public Service Enterprise
Inc.
60
4,423
Group, Inc.
250
24,560
Black & Decker Corp.†
60
4,179
Entergy Corp.
190
22,709
EW Scripps Co. — Class A†
90
4,051
FirstEnergy Corp.
290
20,979
Wyndham Worldwide Corp.
170
4,005
PPL Corp.
360
18,752
Darden Restaurants, Inc.†
140
3,879
American Electric Power Co.,
Stanley Works†
80
3,878
Inc.
390
18,158
Polo Ralph Lauren Corp.
60
3,707
Constellation Energy Group,
Interpublic Group of Cos.,
Inc.
170
17,430
Inc.*†
450
3,650
Edison International
310
16,545
Office Depot, Inc.*
260
3,617
Sempra Energy
250
15,470
Hasbro, Inc.
140
3,581
PG&E Corp.†
340
14,651
D.R. Horton, Inc.†
270
3,556
AES Corp.*
650
13,903
Centex Corp.†
120
3,031
Consolidated Edison, Inc.
260
12,701
Snap-On, Inc.
60
2,894
Progress Energy, Inc.†
250
12,108
Leggett & Platt, Inc.
160
2,790
Ameren Corp.
200
10,842
Family Dollar Stores, Inc.†
140
2,692
Allegheny Energy, Inc.
160
10,178
New York Times Co. —
Xcel Energy, Inc.†
410
9,254
Class A†
140
2,454
Questar Corp.
170
9,197
Lennar Corp. — Class A†
130
2,326
DTE Energy Co.
160
7,034
Pulte Homes, Inc.
210
2,213
Pepco Holdings, Inc.
190
5,573
Meredith Corp.
40
2,199
CenterPoint Energy, Inc.
310
5,310
RadioShack Corp.†
130
2,192
NiSource, Inc.
260
4,911
Wendy’s International, Inc.
80
2,067
Pinnacle West Capital Corp.
100
4,241
AutoNation, Inc.*†
130
2,036
CMS Energy Corp.†
220
3,824
Liz Claiborne, Inc.†
100
2,035
Integrys Energy Group, Inc.
70
3,618
KB HOME†
70
1,512
TECO Energy, Inc.
200
3,442
OfficeMax, Inc.†
70
1,446
Dynegy Inc.*
480
3,427
Big Lots, Inc.*†
90
1,439
Nicor, Inc.†
40
1,694
Brunswick Corp.†
80
1,364
Total Utilities
448,661
42
|
THE RYDEX VARIABLE TRUST ANNUAL REPORT
See Notes to Financial Statements.

SCHEDULE OF INVESTMENTS (concluded)
December 31, 2007
S&P 500 2x STRATEGY FUND
MARKET
MARKET
VALUE
FACE
VALUE
SHARES
(NOTE 1)
AMOUNT
(NOTE 1)
MATERIALS 1.1%
Lehman Brothers Holdings, Inc.
Monsanto Co.
530
$
59,196
issued 12/31/07 at 1.00%
E.I. du Pont de Nemours and
due 01/02/08††
$4,355,737
$
4,355,737
Co.
870
38,358
Total Repurchase Agreements
Freeport-McMoRan Copper &
(Cost $21,052,513)
21,052,513
Gold, Inc.
370
37,903
Dow Chemical Co.
910
35,872
SECURITIES LENDING COLLATERAL 2.8%
Alcoa, Inc.
820
29,971
Investment in Securities Lending Short Term
Praxair, Inc.
300
26,613
Investment Portfolio Held by
Newmont Mining Corp.
440
21,485
U.S. Bank (Note 8)
1,030,640
1,030,640
Air Products & Chemicals, Inc.
210
20,712
Total Securities Lending Collateral
Nucor Corp.
280
16,582
(Cost $1,030,640)
1,030,640
Weyerhaeuser Co.†
200
14,748
Total Investments 94.7%
United States Steel Corp.
110
13,300
(Cost $31,323,998)
$ 34,496,089
International Paper Co.
410
13,276
Other Assets in Excess
PPG Industries, Inc.
160
11,237
of Liabilities – 5.3%
$
1,932,833
Ecolab, Inc.
170
8,706
Allegheny Technologies, Inc.
100
8,640
Net Assets – 100.0%
$ 36,428,922
Vulcan Materials Co.†
100
7,909
UNREALIZED
Sigma-Aldrich Corp.†
130
7,098
GAIN (LOSS)
Rohm & Haas Co.
120
6,368
CONTRACTS
(NOTE 1)
MeadWestvaco Corp.
180
5,634
Eastman Chemical Co.†
80
4,887
FUTURES CONTRACTS PURCHASED
Ball Corp.
100
4,500
March 2008 S&P 500 Index
International Flavors & Fragrances,
Mini Futures Contracts
Inc.
80
3,850
(Aggregate Market Value
Sealed Air Corp.†
160
3,702
of Contracts $29,784,900)
404
$
195,094
Pactiv Corp.*
130
3,462
Bemis Co.†
100
2,738
UNITS
Ashland, Inc.
50
2,372
Hercules, Inc.†
110
2,129
EQUITY INDEX SWAP AGREEMENTS
Titanium Metals Corp.†
80
2,116
March 2008 S&P 500 Index
Swap, Terminating 03/28/08**
Total Materials
413,364
(Notional Market Value
Total Common Stocks
$14,863,256)
10,122
$
(107,941)
(Cost $9,240,845)
12,412,936
March 2008 S&P 500 Index
FACE
Swap, Terminating 03/14/08**
AMOUNT
(Notional Market Value
$16,228,537)
11,052
(239,237)
REPURCHASE AGREEMENTS 57.8%
Repurchase Agreement (Note 5)
(Total Notional Market
Mizuho Financial Group, Inc.
Value $31,091,793)
$
(347,178)
issued 12/31/07 at 1.40%
due 01/02/08
$5,565,592
5,565,592
Morgan Stanley
issued 12/31/07 at 1.20%
due 01/02/08
5,565,592
5,565,592
UBS Financial Services, Inc.
issued 12/31/07 at 1.14%
due 01/02/08
5,565,592
5,565,592
*
Non-Income Producing Security.
**
Price Return based on S&P 500 Index +/- financing at a variable data.
†
All or a portion of this security is on loan at December 31, 2007 — See Note 8.
††
All or a portion of this security is pledged as equity index swap collateral at December 31, 2007.
REIT — Real Estate Investment Trust.
See Notes to Financial Statements.
THE RYDEX VARIABLE TRUST ANNUAL REPORT
|
43

SCHEDULE OF INVESTMENTS
December 31, 2007
OTC 2x STRATEGY FUND
MARKET
MARKET
VALUE
FACE
VALUE
SHARES
(NOTE 1)
AMOUNT
(NOTE 1)
COMMON STOCKS 63.2%
CONSUMER DISCRETIONARY 8.1%
Comcast Corp. — Class A*†
33,980
$
620,475
INFORMATION TECHNOLOGY 41.5%
Amazon.com, Inc.*†
6,444
596,972
Apple, Inc.*
28,520
$
5,649,241
Starbucks Corp.*†
23,710
485,344
Microsoft Corp.
75,180
2,676,408
Garmin Ltd.
4,700
455,900
Google, Inc. — Class A*
3,353
2,318,532
Sears Holdings Corp.*†
3,360
342,888
Qualcomm, Inc.
46,090
1,813,641
Wynn Resorts Ltd.†
2,910
326,298
Research In Motion Ltd.*
13,080
1,483,272
Apollo Group, Inc. — Class A*†
3,940
276,391
Cisco Systems, Inc.*
50,610
1,370,013
Staples, Inc.
11,090
255,846
Intel Corp.
47,810
1,274,614
Liberty Media Corp -
Oracle Corp.*
49,860
1,125,839
Interactive*
13,030
248,612
eBay, Inc.*
23,570
782,288
Bed Bath & Beyond, Inc.*
8,320
244,525
Adobe Systems, Inc.*
13,130
561,045
Expedia, Inc.*†
6,530
206,479
Dell, Inc.*
19,250
471,817
EchoStar Communications
Nvidia Corp.*
12,743
433,517
Corp.*
5,060
190,863
Electronic Arts, Inc.*†
7,410
432,818
IAC/InterActiveCorp*
6,880
185,210
Yahoo!, Inc.*
15,000
348,900
Liberty Global, Inc. —
Symantec Corp.*
21,180
341,845
Class A*†
4,420
173,220
Intuit, Inc.*†
9,790
309,462
Virgin Media, Inc.
8,340
142,948
Paychex, Inc.†
8,300
300,626
Focus Media Holding —
Applied Materials, Inc.
16,640
295,526
SP ADR*†
2,500
142,025
Autodesk, Inc.*
5,620
279,651
Discovery Holding Co. —
Fiserv, Inc.*†
4,810
266,907
Class A*
5,580
140,281
Juniper Networks, Inc.*†
8,000
265,600
Sirius Satellite Radio, Inc.*†
37,150
112,564
Broadcom Corp. — Class A*
10,034
262,289
Lamar Advertising Co. —
Flextronics International Ltd.*
21,080
254,225
Class A†
1,770
85,084
KLA-Tencor Corp.†
5,150
248,024
Petsmart, Inc.
2,980
70,119
Cognizant Technology Solutions
Total Consumer Discretionary
5,302,044
Corp. — Class A*
6,610
224,343
HEALTH CARE 8.0%
Linear Technology Corp.†
6,970
221,855
Gilead Sciences, Inc.*
21,400
984,614
Baidu.com - SP ADR*
560
218,618
Teva Pharmaceutical
Altera Corp.
11,030
213,100
Industries Ltd. — SP ADR†
14,450
671,636
Network Appliance, Inc.*
8,400
209,664
Genzyme Corp.*
7,785
579,515
Citrix Systems, Inc.*†
5,260
199,933
Amgen, Inc.*†
11,840
549,850
Xilinx, Inc.†
9,110
199,236
Biogen Idec, Inc.*†
7,450
424,054
Marvell Technology Group
Celgene Corp.*
8,935
412,886
Ltd.*
13,210
184,676
Express Scripts, Inc.*
5,250
383,250
VeriSign, Inc.*†
4,860
182,785
Intuitive Surgical, Inc.*†
890
288,805
Activision, Inc.*
6,080
180,576
Hologic, Inc.*†
3,080
211,411
SanDisk Corp.*
4,910
162,865
DENTSPLY International, Inc.
3,390
152,618
Sun Microsystems, Inc.*
8,420
152,655
Henry Schein, Inc.*
2,080
127,712
Logitech International SA*†
4,130
151,323
Amylin Pharmaceuticals, Inc.*†
3,030
112,110
BEA Systems, Inc.*
8,770
138,391
Cephalon, Inc.*†
1,520
109,075
Microchip Technology, Inc.
4,160
130,707
Patterson Cos., Inc.*†
3,130
106,264
Lam Research Corp.*
3,000
129,690
Vertex Pharmaceuticals, Inc.*
3,230
75,033
Akamai Technologies, Inc.*†
3,720
128,712
Infosys Technologies Ltd. —
Total Health Care
5,188,833
SP ADR
2,610
118,390
INDUSTRIALS 3.2%
Check Point Software
Paccar, Inc.†
9,640
525,187
Technologies Ltd.*
5,140
112,874
Foster Wheeler Ltd.*
1,750
271,285
Cadence Design Systems,
Expeditors International
Inc.*†
6,580
111,926
Washington, Inc.
4,890
218,485
Tellabs, Inc.*†
5,840
38,194
CH Robinson Worldwide, Inc.
3,920
212,151
Total Information Technology
26,976,613
Joy Global, Inc.
2,480
163,234
44
|
THE RYDEX VARIABLE TRUST ANNUAL REPORT
See Notes to Financial Statements.

SCHEDULE OF INVESTMENTS (concluded)
December 31, 2007
OTC 2x STRATEGY FUND
MARKET
MARKET
VALUE
FACE
VALUE
SHARES
(NOTE 1)
AMOUNT
(NOTE 1)
Cintas Corp.
4,450
$
149,609
SECURITIES LENDING COLLATERAL 8.2%
Fastenal Co.†
3,350
135,407
Investment in Securities Lending Short Term
Stericycle, Inc.*†
2,120
125,928
Investment Portfolio Held by
Ryanair Holdings PLC —
U.S. Bank (Note 8)
$5,336,798
$
5,336,798
SP ADR*†
2,710
106,882
Total Securities Lending Collateral
Monster Worldwide, Inc.*
3,050
98,820
(Cost $5,336,798)
5,336,798
UAL Corp.*†
2,550
90,933
Total Investments 96.2%
Total Industrials
2,097,921
(Cost $52,494,686)
$ 62,571,528
TELECOMMUNICATION SERVICES 1.0%
Other Assets in Excess
Millicom International
of Liabilities – 3.8%
$
2,497,454
Cellular SA*
2,280
268,903
Net Assets – 100.0%
$ 65,068,982
NII Holdings, Inc. — Class B*†
3,930
189,898
Level 3 Communications, Inc.*†
34,980
106,339
UNREALIZED
Leap Wireless International,
GAIN (LOSS)
Inc. — Class B*†
1,580
73,691
CONTRACTS
(NOTE 1)
Total Telecommunication Services
638,831
FUTURES CONTRACTS PURCHASED
CONSUMER STAPLES 0.9%
March 2008 Nasdaq 100 Index
Costco Wholesale Corp.
5,340
372,518
Mini Futures Contracts
Whole Foods Market, Inc.†
3,190
130,152
(Aggregate Market Value
Hansen Natural Corp.*
2,120
93,895
of Contracts $22,633,660)
538
$
81,268
Total Consumer Staples
596,565
MATERIALS 0.5%
UNITS
Sigma-Aldrich Corp.†
2,920
159,432
Steel Dynamics, Inc.†
2,310
137,607
EQUITY INDEX SWAP AGREEMENTS
March 2008 Nasdaq 100 Index
Total Materials
297,039
Swap, Terminating 03/14/08**
Total Common Stocks
(Notional Market Value
(Cost $31,021,004)
41,097,846
$46,686,020)
22,392
$
115,180
FACE
March 2008 Nasdaq 100 Index
AMOUNT
Swap, Terminating 03/28/08**
(Notional Market Value
REPURCHASE AGREEMENTS 24.8%
$20,318,325)
9,745
(114,540)
Repurchase Agreement (Note 5)
Lehman Brothers Holdings, Inc.
(Total Notional Market
issued 12/31/07 at 1.00%
Value $67,004,345)
$
640
due 01/02/08††
$6,274,309
6,274,309
Mizuho Financial Group, Inc.
issued 12/31/07 at 1.40%
due 01/02/08
3,287,525
3,287,525
Morgan Stanley
issued 12/31/07 at 1.20%
due 01/02/08
3,287,525
3,287,525
UBS Financial Services, Inc.
issued 12/31/07 at 1.14%
due 01/02/08
3,287,525
3,287,525
Total Repurchase Agreements
(Cost $16,136,884)
16,136,884
*
Non-Income Producing Security.
**
Price Return based on Nasdaq 100 Index +/- financing at a variable rate.
†
All or a portion of this security is on loan at December 31, 2007 — See Note 8.
††
All or a portion of this security is pledged as equity index swap collateral at December 31, 2007.
ADR — American Depository Receipt.
See Notes to Financial Statements.
THE RYDEX VARIABLE TRUST ANNUAL REPORT
|
45

SCHEDULE OF INVESTMENTS
December 31, 2007
MID-CAP 1.5x STRATEGY FUND
MARKET
MARKET
VALUE
VALUE
SHARES
(NOTE 1)
SHARES
(NOTE 1)
COMMON STOCKS 88.2%
INDUSTRIALS 13.1%
Republic Services, Inc.
5,840
$
183,084
INFORMATION TECHNOLOGY 13.4%
URS Corp.*
3,200
173,856
Lam Research Corp.*
4,580
$
197,993
BE Aerospace, Inc.*†
3,200
169,280
Western Digital Corp.*
6,230
188,208
SPX Corp.
1,630
167,645
Avnet, Inc.*
5,270
184,292
Joy Global, Inc.
2,440
160,601
Arrow Electronics, Inc.*†
4,600
180,688
Roper Industries, Inc.†
2,520
157,601
Harris Corp.
2,730
171,116
Manpower, Inc.
2,650
150,785
Synopsys, Inc.*†
5,970
154,802
Pentair, Inc.
4,300
149,683
Cadence Design Systems,
Lincoln Electric Holdings, Inc.
1,970
140,225
Inc.*†
8,480
144,245
Oshkosh Truck Corp.†
2,940
138,944
Intersil Corp. — Class A
5,790
141,739
Dun & Bradstreet Corp.†
1,560
138,263
Alliance Data Systems Corp.*†
1,700
127,483
KBR Inc.*
3,510
136,188
CommScope, Inc.*
2,570
126,470
AGCO Corp.*
1,960
133,241
Sybase, Inc.*†
4,720
123,145
Thomas & Betts Corp.*
2,560
125,542
Vishay Intertechnology, Inc.*
10,510
119,919
AMETEK, Inc.
2,550
119,442
Metavante Technologies, Inc.*†
5,040
117,533
Herman Miller, Inc.
3,520
114,013
Jack Henry & Associates, Inc.
4,560
110,990
Con-way, Inc.
2,690
111,743
ADC Telecommunications,
IDEX Corp.
2,850
102,970
Inc.*†
7,030
109,317
Flowserve Corp.
1,000
96,200
Amphenol Corp. — Class A†
2,330
108,042
Kansas City Southern*†
2,690
92,348
F5 Networks, Inc.*†
3,710
105,809
Copart, Inc.*
1,750
74,463
Integrated Device Technology,
Quanta Services, Inc.*†
2,560
67,174
Inc.*
9,320
105,409
Hubbell, Inc. — Class B
1,290
66,564
DST Systems, Inc.*†
1,210
99,886
MSC Industrial Direct Co. —
Activision, Inc.*
3,340
99,198
Class A†
1,620
65,561
Cypress Semiconductor
Carlisle Cos., Inc.†
1,720
63,692
Corp.*†
2,750
99,083
Stericycle, Inc.*†
1,070
63,558
MPS Group, Inc.*†
8,560
93,646
Fastenal Co.†
1,470
59,417
Fair Isaac Corp.
2,910
93,557
Kennametal, Inc.
1,560
59,062
ValueClick, Inc.*
3,410
74,679
Korn/Ferry International, Inc.*
3,130
58,907
Global Payments, Inc.
1,600
74,432
Teleflex, Inc.
880
55,449
Polycom, Inc.*
2,270
63,061
Deluxe Corp.
1,500
49,335
McAfee, Inc.*
1,580
59,250
Harsco Corp.
690
44,208
Advent Software, Inc.*†
1,070
57,887
DRS Technologies, Inc.†
700
37,989
CSG Systems International,
Alliant Techsystems, Inc.*†
300
34,128
Inc.*
3,870
56,966
United Rentals, Inc.*
1,580
29,009
Foundry Networks, Inc.*
3,240
56,765
Wabtec Corp.
730
25,141
SRA International, Inc. —
Trinity Industries, Inc.†
720
19,987
Class A*
1,720
50,654
HNI Corp.†
440
15,426
Broadridge Financial
Granite Construction, Inc.
250
9,045
Solutions, Inc.
2,060
46,206
GATX Corp.†
150
5,502
RF Micro Devices, Inc.*†
6,640
37,914
Total Industrials
3,665,271
NCR Corp.*†
1,450
36,395
FINANCIALS 12.7%
Atmel Corp.*
8,130
35,122
AMB Property Corp.†
3,210
184,767
MoneyGram International,
HCC Insurance Holdings, Inc.
5,000
143,400
Inc.†
2,140
32,892
SEI Investments Co.†
4,290
138,009
Avocent Corp.*†
830
19,347
Eaton Vance Corp.
2,850
129,418
Acxiom Corp.
1,490
17,478
Hanover Insurance Group, Inc.
2,800
128,240
Imation Corp.†
230
4,830
W.R. Berkley Corp.
4,190
124,904
Cree, Inc.*†
120
3,296
Everest Re Group Ltd.
1,220
122,488
Total Information Technology
3,729,744
SVB Financial Group*†
2,240
112,896
46
|
THE RYDEX VARIABLE TRUST ANNUAL REPORT
See Notes to Financial Statements.

SCHEDULE OF INVESTMENTS (continued)
December 31, 2007
MID-CAP 1.5x STRATEGY FUND
MARKET
MARKET
VALUE
VALUE
SHARES
(NOTE 1)
SHARES
(NOTE 1)
Potlatch Corp.†
2,460
$
109,322
HEALTH CARE 11.6%
Cullen/Frost Bankers, Inc.†
2,150
108,919
Intuitive Surgical, Inc.*†
820
$
266,090
Wilmington Trust Corp.†
3,050
107,360
DENTSPLY International, Inc.
4,970
223,749
Federal Realty Investment Trust
1,260
103,509
Henry Schein, Inc.*
3,160
194,024
Hospitality Properties Trust†
3,070
98,915
Hologic, Inc.*†
2,630
180,523
First Community Bancorp
2,360
97,326
Invitrogen Corp.*†
1,810
169,072
Cathay General Bancorp†
3,620
95,894
Lincare Holdings, Inc.*†
3,780
132,905
First Niagara Financial Group,
Charles River Laboratories
Inc.†
7,670
92,347
International, Inc.*†
1,960
128,968
Horace Mann Educators Corp.
4,690
88,829
Techne Corp.*†
1,950
128,797
Stancorp Financial Group, Inc.
1,700
85,646
Edwards Lifesciences Corp.*†
2,790
128,312
Nationwide Health Properties,
Endo Pharmaceuticals Holdings,
Inc.†
2,730
85,640
Inc.*
4,400
117,348
Highwoods Properties, Inc.†
2,870
84,321
Steris Corp.†
4,050
116,802
Health Care REIT, Inc.†
1,740
77,761
VCA Antech, Inc.*
2,620
115,883
Raymond James Financial, Inc.
2,370
77,404
Varian, Inc.*
1,730
112,969
Jones Lang LaSalle, Inc.†
1,010
71,872
Cephalon, Inc.*†
1,530
109,793
Duke Realty Corp.†
2,750
71,720
Health Net, Inc.*
2,060
99,498
Liberty Property Trust
2,480
71,449
Covance, Inc.*
1,120
97,014
Old Republic International
Apria Healthcare Group, Inc.*
4,340
93,614
Corp.
4,540
69,961
Community Health Systems,
Alexandria Real Estate Equities,
Inc.*†
2,340
86,252
Inc.†
680
69,136
Par Pharmaceutical Cos., Inc.*
3,410
81,840
Associated Banc-Corp.
2,410
65,287
Perrigo Co.†
2,280
79,823
AmeriCredit Corp.*†
5,030
64,334
Sepracor, Inc.*
2,910
76,388
Regency Centers Corp.†
940
60,621
Hillenbrand Industries, Inc.
1,370
76,350
Realty Income Corp.†
2,160
58,363
Millennium Pharmaceuticals,
Protective Life Corp.
1,200
49,224
Inc.*†
4,880
73,102
New York Community Bancorp,
Ventana Medical Systems, Inc.*
630
54,955
Inc.†
2,700
47,466
WellCare Health Plans, Inc.*
1,170
49,620
Macerich Co.†
630
44,768
Omnicare, Inc.
2,010
45,848
BRE Properties, Inc. —
PDL BioPharma, Inc.*†
2,180
38,194
Class A†
1,090
44,178
Valeant Pharmaceuticals
Camden Property Trust†
740
35,631
International*†
2,820
33,755
The PMI Group, Inc.
2,670
35,458
Psychiatric Solutions, Inc.*†
940
30,550
Colonial BancGroup, Inc.
2,510
33,985
Beckman Coulter, Inc.
280
20,384
Webster Financial Corp.
990
31,650
Pharmaceutical Product
First American Corp.†
920
31,390
Development, Inc.†
480
19,378
Mack-Cali Realty Corp.
860
29,240
LifePoint Hospitals, Inc.*†
580
17,249
Fidelity National Financial, Inc. —
Medicis Pharmaceutical Corp. —
Class A†
2,000
29,220
Class A†
640
16,621
American Financial Group, Inc.
940
27,147
Gen-Probe, Inc.*
150
9,440
Waddell & Reed Financial, Inc. —
ResMed, Inc.*†
130
6,829
Class A†
710
25,624
Cerner Corp.*
100
5,640
City National Corp.
390
23,224
Health Management
Bank of Hawaii Corp.
420
21,479
Associates, Inc. — Class A
490
2,930
Radian Group, Inc.†
1,690
19,739
Total Health Care
3,240,509
Commerce Group, Inc.
170
6,117
CONSUMER DISCRETIONARY 11.3%
IndyMac Bancorp, Inc.†
900
5,355
BorgWarner, Inc.
3,340
161,689
FirstMerit Corp.†
200
4,002
Mohawk Industries, Inc.*†
2,170
161,448
Rayonier, Inc.
50
2,362
Advance Auto Parts, Inc.
4,120
156,519
Total Financials
3,547,317
See Notes to Financial Statements.
THE RYDEX VARIABLE TRUST ANNUAL REPORT
|
47

SCHEDULE OF INVESTMENTS (continued)
December 31, 2007
MID-CAP 1.5x STRATEGY FUND
MARKET
MARKET
VALUE
VALUE
SHARES
(NOTE 1)
SHARES
(NOTE 1)
Service Corporation
ENERGY 8.7%
International
9,030
$
126,871
Cameron International Corp.*
4,780
$
230,062
Barnes & Noble, Inc.†
3,210
110,585
Grant Prideco, Inc.*
3,340
185,403
Ross Stores, Inc.
4,120
105,348
Pride International, Inc.*†
4,930
167,127
Belo Corp. — Class A†
6,030
105,163
Cimarex Energy Co.†
3,630
154,384
Thor Industries, Inc.†
2,690
102,247
FMC Technologies, Inc.*
2,600
147,420
AnnTaylor Stores Corp.*
3,940
100,706
Denbury Resources, Inc.*
4,940
146,965
Callaway Golf Co.†
5,700
99,351
Frontier Oil Corp.†
3,550
144,059
Dollar Tree Stores, Inc.*
3,710
96,163
Plains Exploration &
Scholastic Corp.*
2,650
92,459
Production Co.*
2,550
137,700
American Eagle Outfitters, Inc.
4,450
92,427
Southwestern Energy Co.*
2,360
131,499
American Greetings Corp. —
Patterson-UTI Energy, Inc.†
6,470
126,294
Class A†
4,370
88,711
Tidewater, Inc.†
2,270
124,532
Bob Evans Farms, Inc.
3,260
87,792
Forest Oil Corp.*
2,070
105,239
Chipotle Mexican Grill, Inc. —
Exterran Holdings, Inc.*†
1,160
94,888
Class A*†
580
85,301
Overseas Shipholding Group,
DeVry, Inc.†
1,570
81,577
Inc.†
1,100
81,873
Regis Corp.
2,650
74,094
Arch Coal, Inc.†
1,740
78,178
Warnaco Group, Inc.*
2,100
73,080
Newfield Exploration Co.*
1,410
74,307
Phillips-Van Heusen Corp.
1,890
69,665
Bill Barrett Corp.*
1,750
73,273
NVR, Inc.*†
130
68,120
Helmerich & Payne, Inc.†
1,760
70,523
Charming Shoppes, Inc.*†
11,410
61,728
Pioneer Natural Resources
CarMax, Inc.*†
3,030
59,843
Co.†
1,400
68,376
Sotheby’s Holdings, Inc. —
Superior Energy Services*
1,330
45,779
Class A†
1,560
59,436
Quicksilver Resources, Inc.*†
410
24,432
Foot Locker, Inc.
4,340
59,284
Encore Acquisition Co.*†
70
2,336
ITT Educational Services, Inc.*
680
57,984
Total Energy
2,414,649
International Speedway
MATERIALS 6.6%
Corp. — Class A
1,350
55,593
Carpenter Technology Corp.
2,090
157,105
Lear Corp.*†
1,930
53,384
Lubrizol Corp.
2,700
146,232
Career Education Corp.*
1,810
45,503
Cytec Industries, Inc.
2,110
129,934
Aeropostale, Inc.*†
1,710
45,315
Steel Dynamics, Inc.†
2,120
126,288
Gentex Corp.†
2,480
44,070
CF Industries Holdings, Inc.†
1,120
123,267
Guess?, Inc.†
1,150
43,574
Reliance Steel & Aluminum Co.
2,270
123,034
Toll Brothers, Inc.*†
2,010
40,321
Cabot Corp.
3,650
121,691
Ruby Tuesday, Inc.†
3,980
38,805
Sonoco Products Co.
3,680
120,262
Hanesbrands, Inc.*†
1,340
36,408
Albemarle Corp.†
2,870
118,387
Getty Images, Inc.*
1,160
33,640
Minerals Technologies, Inc.
1,510
101,095
O’Reilly Automotive, Inc.*
1,010
32,754
Ferro Corp.
4,010
83,127
M.D.C. Holdings, Inc.†
860
31,932
Martin Marietta Materials, Inc.†
610
80,886
Collective Brands, Inc.*
1,720
29,911
Commercial Metals Co.
2,630
77,454
CBRL Group, Inc.
880
28,503
Airgas, Inc.
1,400
72,954
Strayer Education, Inc.†
150
25,587
Cleveland-Cliffs, Inc.†
720
72,576
Lee Enterprises, Inc.
1,680
24,612
Packaging Corporation
Rent-A-Center, Inc.*†
1,690
24,539
of America
2,570
72,474
Ryland Group, Inc.†
760
20,938
Sensient Technologies Corp.
2,300
65,044
Lamar Advertising Co. —
FMC Corp.†
630
34,367
Class A†
320
15,382
Olin Corp.
400
7,732
Brinker International, Inc.
580
11,345
Chico’s FAS, Inc.*
1,210
10,926
Total Materials
1,833,909
Dick’s Sporting Goods, Inc.*
340
9,438
UTILITIES 6.2%
Petsmart, Inc.
180
4,235
MDU Resources Group, Inc.
6,730
185,815
Total Consumer Discretionary
3,144,306
Energen Corp.
2,680
172,136
Alliant Energy Corp.
4,190
170,491
48
|
THE RYDEX VARIABLE TRUST ANNUAL REPORT
See Notes to Financial Statements.

SCHEDULE OF INVESTMENTS (concluded)
December 31, 2007
MID-CAP 1.5x STRATEGY FUND
MARKET
MARKET
VALUE
FACE
VALUE
SHARES
(NOTE 1)
AMOUNT
(NOTE 1)
NSTAR†
4,390
$
159,006
UBS Financial Services, Inc.
Sierra Pacific Resources†
9,190
156,046
issued 12/31/07 at 1.14%
Westar Energy, Inc.†
4,790
124,253
due 01/02/08
$
467,637
$
467,637
AGL Resources, Inc.
3,070
115,555
Lehman Brothers Holdings, Inc.
WGL Holdings, Inc.†
3,370
110,401
issued 12/31/07 at 1.00%
Aquila, Inc.*†
26,730
99,703
due 01/02/08
232,803
232,803
SCANA Corp.
2,230
93,994
Total Repurchase Agreements
Energy East Corp.
3,420
93,058
(Cost $1,635,714)
1,635,714
Equitable Resources, Inc.
1,570
83,650
Wisconsin Energy Corp.
1,000
48,710
SECURITIES LENDING COLLATERAL 23.9%
Black Hills Corp.
980
43,218
Investment in Securities Lending Short Term
Oneok, Inc.
780
34,921
Investment Portfolio Held by
Northeast Utilities
980
30,684
U.S. Bank (Note 8)
6,665,093
6,665,093
National Fuel Gas Co.†
250
11,670
Total Securities Lending Collateral
Hawaiian Electric Industries,
(Cost $6,665,093)
6,665,093
Inc.
280
6,376
Total Investments 117.9%
Total Utilities
1,739,687
(Cost $33,091,339)
$ 32,897,585
CONSUMER STAPLES 3.7%
Liabilities in Excess of
Church & Dwight Co., Inc.†
2,770
149,774
Other Assets – (17.9)%
$ (5,004,267)
Energizer Holdings, Inc.*
1,310
146,890
Net Assets – 100.0%
$ 27,893,318
J.M. Smucker Co.
2,750
141,460
Corn Products International,
UNREALIZED
Inc.
3,540
130,095
GAIN (LOSS)
BJ’s Wholesale Club, Inc.*
3,490
118,067
CONTRACTS
(NOTE 1)
Universal Corp.†
2,070
106,025
FUTURES CONTRACTS PURCHASED
PepsiAmericas, Inc.
2,980
99,293
March 2008 S&P MidCap 400 Index
NBTY, Inc.*
3,460
94,804
Mini Futures Contracts
Hansen Natural Corp.*†
1,140
50,491
(Aggregate Market Value
Total Consumer Staples
1,036,899
of Contracts $12,155,610)
141
$
(215,652)
TELECOMMUNICATION SERVICES 0.9%
Telephone & Data Systems, Inc.
3,470
217,222
UNITS
Cincinnati Bell, Inc.*†
5,740
27,265
Total Telecommunication Services
244,487
EQUITY INDEX SWAP AGREEMENT††
February 2008 S&P MidCap 400 Index
Total Common Stocks
Swap, Terminating 02/18/08**
(Cost $24,790,532)
24,596,778
(Notional Market Value
FACE
$5,063,637)
5,900
$
101,759
AMOUNT
REPURCHASE AGREEMENTS 5.8%
Repurchase Agreement (Note 5)
Mizuho Financial Group, Inc.
issued 12/31/07 at 1.40%
due 01/02/08
$
467,637
467,637
Morgan Stanley
issued 12/31/07 at 1.20%
due 01/02/08
467,637
467,637
*
Non-Income Producing Security.
**
Price Return based on S&P MidCap 400 Index +/- financing at a variable rate.
†
All or a portion of this security is on loan at December 31, 2007 — See Note 8.
††
Cash was pledged as equity index swap collateral at December 31, 2007.
See Notes to Financial Statements.
THE RYDEX VARIABLE TRUST ANNUAL REPORT
|
49

SCHEDULE OF INVESTMENTS
December 31, 2007
INVERSE MID-CAP STRATEGY FUND
MARKET
UNREALIZED
FACE
VALUE
GAIN
AMOUNT
(NOTE 1)
CONTRACTS
(NOTE 1)
FEDERAL AGENCY DISCOUNT NOTES 13.2%
FUTURES CONTRACTS SOLD SHORT
Federal Home Loan Bank*
March 2008 S&P MidCap 400 Index
4.23% due 01/03/08
$100,000
$
99,988
Mini Futures Contracts
Federal Farm Credit Bank*
(Aggregate Market Value
4.05% due 01/04/08
100,000
99,978
of Contracts $1,637,990)
19
$
30,185
Freddie Mac*
4.26% due 01/08/08
100,000
99,929
UNITS
Fannie Mae*
4.05% due 01/09/08
100,000
99,921
EQUITY INDEX SWAP AGREEMENT
Total Federal Agency Discount Notes
SOLD SHORT†
(Cost $399,816)
399,816
February 2008 S&P MidCap 400 Index
Swap, Terminating 02/18/08**
REPURCHASE AGREEMENTS 80.4%
(Notional Market Value
Repurchase Agreement (Note 5)
$1,356,548)
1,581
$
33,461
Mizuho Financial Group, Inc.
issued 12/31/07 at 1.40%
due 01/02/08
696,220
696,220
Morgan Stanley
issued 12/31/07 at 1.20%
due 01/02/08
696,220
696,220
UBS Financial Services, Inc.
issued 12/31/07 at 1.14%
due 01/02/08
696,220
696,220
Lehman Brothers Holdings, Inc.
issued 12/31/07 at 1.00%
due 01/02/08
346,597
346,597
Total Repurchase Agreements
(Cost $2,435,257)
2,435,257
Total Investments 93.6%
(Cost $2,835,073)
$ 2,835,073
Other Assets in Excess
of Liabilities – 6.4%
$
194,143
Net Assets – 100.0%
$ 3,029,216
*
The issuer is a publicly traded company that operates under a Congressional charter; its securities are neither issued nor guaranteed by the
U.S. Government.
**
Price Return based on S&P MidCap 400 Index +/- financing at a variable rate.
†
Cash was pledged as equity index swap collateral at December 31, 2007.
50
|
THE RYDEX VARIABLE TRUST ANNUAL REPORT
See Notes to Financial Statements.

SCHEDULE OF INVESTMENTS
December 31, 2007
RUSSELL 2000® 2x STRATEGY FUND
MARKET
MARKET
VALUE
VALUE
SHARES
(NOTE 1)
SHARES
(NOTE 1)
COMMON STOCKS 66.9%
j2 Global Communications, Inc.*†
250
$
5,293
FEI Co.*
210
5,214
INFORMATION TECHNOLOGY 12.2%
Entegris, Inc.*
600
5,178
Ansys, Inc.*
300
$
12,438
Macrovision Corp.*†
280
5,132
Flir Systems, Inc.*
360
11,268
Standard Microsystems Corp.*
130
5,079
Micros Systems, Inc.*†
160
11,226
Brooks Automation, Inc.*
380
5,020
Polycom, Inc.*
380
10,556
Semtech Corp.*†
320
4,966
Foundry Networks, Inc.*
590
10,337
Amkor Technology, Inc.*†
580
4,947
Equinix, Inc.*†
100
10,107
Synaptics, Inc.*
120
4,939
Sybase, Inc.*†
380
9,914
Insight Enterprises, Inc.*
270
4,925
ON Semiconductor Corp.*†
1,020
9,058
Mantech International Corp. —
Arris Group, Inc.*
898
8,963
Class A*
110
4,820
Parametric Technology Corp.*†
490
8,746
ViaSat, Inc.*
140
4,820
Anixter International, Inc.*
130
8,095
MicroStrategy, Inc. — Class A*
50
4,755
Jack Henry & Associates, Inc.
330
8,032
MTS Systems Corp.†
110
4,694
3Com Corp.*
1,710
7,729
Cabot Microelectronics Corp.*†
130
4,668
ValueClick, Inc.*
350
7,665
Ariba, Inc.*
410
4,572
Atheros Communications, Inc.*
250
7,635
SonicWALL, Inc.*
420
4,502
TIBCO Software, Inc.*†
900
7,263
Brightpoint, Inc.*
290
4,454
Informatica Corp.*
400
7,208
SPSS, Inc.*
120
4,309
RF Micro Devices, Inc.*†
1,210
6,909
Littelfuse, Inc.*
130
4,285
Concur Technologies, Inc.*
190
6,880
Blue Coat Systems, Inc.*
130
4,273
Progress Software Corp.*
200
6,736
Epicor Software Corp.*
360
4,241
Rofin-Sinar Technologies, Inc.*
140
6,735
Hutchinson Technology, Inc.*
160
4,211
Itron, Inc.*†
70
6,718
Tessera Technologies, Inc.*†
100
4,160
CACI International, Inc. — Class A*
150
6,715
Methode Electronics, Inc. —
Skyworks Solutions, Inc.*
750
6,375
Class A
250
4,110
PMC - Sierra, Inc.*
970
6,344
United Online, Inc.†
340
4,019
Euronet Worldwide, Inc.*†
210
6,300
Electro Scientific Industries, Inc.*
200
3,970
Electronics for Imaging, Inc.*†
280
6,294
THQ, Inc.*†
140
3,947
Quest Software, Inc.*
340
6,270
VistaPrint Ltd.*
90
3,857
Lawson Software, Inc.*
610
6,246
Bankrate, Inc.*†
80
3,847
SAIC, Inc.*†
310
6,237
Pericom Semiconductor Corp.*
200
3,740
Benchmark Electronics, Inc.*†
350
6,205
Novatel Wireless, Inc.*†
230
3,726
Net 1 UEPS Technologies, Inc.*†
210
6,166
Sycamore Networks, Inc.*
960
3,686
Netgear, Inc.*†
170
6,064
JDA Software Group, Inc.*
180
3,683
Technitrol, Inc.
210
6,002
EMS Technologies, Inc.*
120
3,629
Plantronics, Inc.†
230
5,980
Mattson Technology, Inc.*
420
3,595
Nuance Communications, Inc.*†
320
5,978
Microsemi Corp.*
160
3,542
Comtech Telecommunications
TheStreet.com, Inc.†
220
3,502
Corp.*
110
5,941
AMIS Holdings, Inc.*
340
3,407
Perot Systems Corp. — Class A*†
440
5,940
CMGI, Inc.*
260
3,403
SRA International, Inc. — Class A*
200
5,890
CSG Systems International, Inc.*
230
3,386
Cymer, Inc.*†
150
5,839
Immersion Corp.*†
260
3,367
Avocent Corp.*†
250
5,827
Vignette Corp.*
230
3,360
MPS Group, Inc.*†
530
5,798
Palm, Inc.†
530
3,360
Checkpoint Systems, Inc.*
220
5,716
Sigma Designs, Inc.*†
60
3,312
Zoran Corp.*
250
5,628
Formfactor, Inc.*†
100
3,310
Dycom Industries, Inc.*†
210
5,597
Sonus Networks, Inc.*†
560
3,265
ATMI, Inc.*
170
5,483
Black Box Corp.
90
3,255
Advent Software, Inc.*†
100
5,410
Excel Technology, Inc.*
120
3,252
MKS Instruments, Inc.*†
280
5,359
RealNetworks, Inc.*†
530
3,228
See Notes to Financial Statements.
THE RYDEX VARIABLE TRUST ANNUAL REPORT
|
51

SCHEDULE OF INVESTMENTS (continued)
December 31, 2007
RUSSELL 2000® 2x STRATEGY FUND
MARKET
MARKET
VALUE
VALUE
SHARES
(NOTE 1)
SHARES
(NOTE 1)
LoJack Corp.*
190
$
3,194
Manhattan Associates, Inc.*
80
$
2,109
AsiaInfo Holdings, Inc.*
290
3,190
Diodes, Inc.*†
70
2,105
CTS Corp.†
320
3,178
Trident Microsystems, Inc.*†
320
2,099
SYNNEX Corp.*
160
3,136
Harmonic, Inc.*
200
2,096
Digi International, Inc.*
220
3,122
Adaptec, Inc.*
620
2,096
Rimage Corp.*†
120
3,114
EPIQ Systems, Inc.*
120
2,089
Loral Space &
The Knot, Inc.*
130
2,072
Communications, Inc.*
90
3,083
Kulicke & Soffa Industries, Inc.*†
300
2,058
SYKES Enterprises, Inc.*
170
3,060
Intermec, Inc.*†
100
2,031
Gerber Scientific, Inc.*
280
3,024
Blackboard, Inc.*†
50
2,013
Digital River, Inc.*†
90
2,976
LivePerson, Inc.*
370
1,976
infoUSA, Inc. — Class B
330
2,947
L-1 Identity Solutions, Inc.*†
110
1,975
KEMET Corp.*
440
2,917
LoopNet, Inc.*†
140
1,967
Art Technology Group, Inc.*†
670
2,894
Blackbaud, Inc.
70
1,963
Keynote Systems, Inc.*
200
2,810
Mentor Graphics Corp.*
180
1,940
Vasco Data Security International*
100
2,792
Ness Technologies, Inc.*
210
1,938
SiRF Technology Holdings, Inc.*†
110
2,764
Gartner, Inc. — Class A*†
110
1,932
Sohu.com, Inc.*
50
2,726
MAXIMUS, Inc.
50
1,931
Quantum Corp.*
1,010
2,717
Rudolph Technologies, Inc.*†
170
1,924
iGate Corp.*
320
2,710
Greenfield Online, Inc.*
130
1,899
Cass Information Systems, Inc.
80
2,673
Ultimate Software Group, Inc.*
60
1,888
Smart Modular Technologies
Anadigics, Inc.*†
160
1,851
WWH, Inc.*
260
2,647
Marchex, Inc.†
170
1,846
Photronics, Inc.*†
210
2,619
Plexus Corp.*
70
1,838
Emulex Corp.*†
160
2,611
Ciber, Inc.*
300
1,833
Aspen Technology, Inc.*†
160
2,595
Imergent, Inc.†
170
1,800
Ultra Clean Holdings*
210
2,562
Measurement Specialties, Inc.*
80
1,768
Wright Express Corp.*†
70
2,484
DSP Group, Inc.*
140
1,708
Cogent, Inc.*
220
2,453
Avid Technology, Inc.*†
60
1,700
Micrel, Inc.
290
2,451
Wind River Systems, Inc.*†
190
1,697
TTM Technologies, Inc.*†
210
2,449
Exar Corp.*
210
1,674
Cirrus Logic, Inc.*†
460
2,429
DealerTrack Holdings, Inc.*†
50
1,674
CPI International, Inc.*
140
2,394
Chordiant Software, Inc.*
180
1,539
Hittite Microwave Corp.*†
50
2,388
Cybersource Corp.*†
80
1,422
Triquint Semiconductor, Inc.*†
360
2,387
Agilysys, Inc.
90
1,361
CNET Networks, Inc.*†
260
2,376
Omniture, Inc.*†
40
1,332
Advanced Energy Industries, Inc.*
180
2,354
Coherent, Inc.*
50
1,254
InterDigital, Inc.*
100
2,333
BearingPoint, Inc.*†
435
1,231
Radiant Systems, Inc.*
130
2,240
Cognex Corp.
60
1,209
Mastec, Inc.*†
220
2,237
OmniVision Technologies, Inc.*†
60
939
Take-Two Interactive
Rogers Corp.*
20
867
Software, Inc.*†
120
2,214
ACI Worldwide, Inc.*†
40
762
SI International, Inc.*
80
2,198
Mercadolibre, Inc.*†
10
739
Faro Technologies, Inc.*
80
2,174
Scansource, Inc.*†
20
647
Newport Corp.*†
170
2,174
CommScope, Inc.*
11
559
Extreme Networks, Inc.*
610
2,159
SAVVIS, Inc.*
20
558
Super Micro Computer, Inc.*
280
2,148
Websense, Inc.*†
30
509
Heartland Payment Systems, Inc.†
80
2,144
Daktronics, Inc.†
20
451
Cohu, Inc.
140
2,142
Sapient Corp.*
50
441
ADTRAN, Inc.†
100
2,138
Commvault Systems, Inc.*
20
424
EarthLink, Inc.*
300
2,121
Imation Corp.†
20
420
S1 Corp.*
290
2,117
Tekelec*
30
375
52
|
THE RYDEX VARIABLE TRUST ANNUAL REPORT
See Notes to Financial Statements.

SCHEDULE OF INVESTMENTS (continued)
December 31, 2007
RUSSELL 2000® 2x STRATEGY FUND
MARKET
MARKET
VALUE
VALUE
SHARES
(NOTE 1)
SHARES
(NOTE 1)
Synchronoss Technologies, Inc.*†
10
$
354
Boston Private Financial
Applied Micro Circuits Corp.*
40
350
Holdings, Inc.†
180
$
4,874
PC Connection, Inc.*
30
341
Pacific Capital Bancorp
240
4,831
Total Information Technology
758,376
Lexington Realty Trust†
330
4,798
FINANCIALS 12.1%
Provident Financial Services, Inc.
330
4,759
Alexandria Real Estate
Umpqua Holding Corp.†
310
4,755
Equities, Inc.†
120
12,200
Horace Mann Educators Corp.
250
4,735
Nationwide Health Properties, Inc.†
350
10,979
Stifel Financial Corp.*†
90
4,731
Aspen Insurance Holdings Ltd.†
350
10,094
Extra Space Storage, Inc.†
330
4,716
Platinum Underwriters
Sterling Savings Bank
280
4,701
Holdings Ltd.†
250
8,890
Alabama National Bancorporation
60
4,669
ProAssurance Corp.*†
150
8,238
Piper Jaffray Cos., Inc.*
100
4,632
Senior Housing Properties Trust
360
8,165
Acadia Realty Trust†
180
4,610
IPC Holdings Ltd.†
270
7,795
FNB Corp.†
310
4,557
Montpelier Re Holdings Ltd.†
450
7,654
Glacier Bancorp, Inc.†
235
4,404
Waddell & Reed Financial, Inc. —
Sterling Bancshares, Inc.
380
4,241
Class A
210
7,579
National Western Life
SVB Financial Group*
150
7,560
Insurance Co. — Class A
20
4,147
Max Capital Group Ltd.†
270
7,557
Parkway Properties, Inc.
110
4,068
Apollo Investment Corp.†
440
7,502
Commerce Group, Inc.†
110
3,958
National Retail Properties, Inc.†
320
7,482
Ashford Hospitality Trust, Inc.†
550
3,954
Delphi Financial Group, Inc. —
United Community Banks, Inc.
250
3,950
Class A
200
7,056
Harleysville Group, Inc.
110
3,892
BioMed Realty Trust, Inc.†
300
6,951
Gramercy Capital Corp.†
160
3,890
Knight Capital Group, Inc. —
MFA Mortgage Investments, Inc.†
420
3,885
Class A*†
470
6,768
The Midland Co.
60
3,881
Realty Income Corp.†
250
6,755
NBT Bancorp, Inc.
170
3,879
DiamondRock Hospitality Co.†
430
6,441
Chemical Financial Corp.†
160
3,806
Phoenix Cos., Inc.
540
6,410
IBERIABANK Corp.†
80
3,740
UCBH Holdings, Inc.†
450
6,372
MCG Capital Corp.
320
3,709
Cathay General Bancorp†
240
6,358
Renasant Corp.
170
3,667
Entertainment Properties Trust†
130
6,110
National Financial Partners Corp.†
80
3,649
Strategic Hotels & Resorts, Inc.†
360
6,023
Hercules Technology Growth
First Niagara Financial Group, Inc.†
500
6,020
Capital, Inc.
290
3,602
RLI Corp.
100
5,679
FirstFed Financial Corp.*†
100
3,582
Citizens Banking Corp.†
390
5,659
Medical Properties Trust Inc.†
350
3,566
South Financial Group, Inc.†
360
5,627
Potlatch Corp.
80
3,555
Prosperity Bancshares, Inc.
190
5,584
Highwoods Properties, Inc.†
120
3,526
MB Financial Corp.
180
5,549
First Merchants Corp.
160
3,494
Odyssey Re Holdings Corp.
150
5,506
GAMCO Investors, Inc. — Class A
50
3,460
Sunstone Hotel Investors, Inc.†
300
5,487
FBL Financial Group, Inc. —
American Financial Realty Trust
680
5,454
Class A
100
3,453
International Bancshares Corp.
259
5,423
Banco Latinoamericano de
First Community Bancorp
130
5,361
Exportaciones SA
210
3,425
United Bankshares, Inc.
190
5,324
First Financial Corp.
120
3,401
Ares Capital Corp.
360
5,267
Validus Holdings Ltd.*†
130
3,377
Navigators Group, Inc.*
80
5,200
Sandy Spring Bancorp, Inc.
120
3,338
Cash America International, Inc.†
160
5,168
Presidential Life Corp.
190
3,327
Omega Healthcare Investors, Inc.
320
5,136
American Physicians Capital, Inc.†
80
3,317
Signature Bank*†
150
5,062
Texas Capital Bancshares, Inc.*
180
3,285
Digital Realty Trust, Inc.†
130
4,988
First Charter Corp.†
110
3,285
Chittenden Corp.
90
3,206
See Notes to Financial Statements.
THE RYDEX VARIABLE TRUST ANNUAL REPORT
|
53

SCHEDULE OF INVESTMENTS (continued)
December 31, 2007
RUSSELL 2000® 2x STRATEGY FUND
MARKET
MARKET
VALUE
VALUE
SHARES
(NOTE 1)
SHARES
(NOTE 1)
Assured Guaranty Ltd.
120
$
3,185
Interactive Brokers Group, Inc. —
Portfolio Recovery Associates, Inc.†
80
3,174
Class A*
80
$
2,586
First Mercury Financial Corp.*
130
3,172
Arbor Realty Trust, Inc.
160
2,578
Amtrust Financial Services, Inc.†
230
3,167
Mission West Properties
270
2,568
SeaBright Insurance Holdings, Inc.*
210
3,167
Washington Real Estate
CNA Surety Corp.*
160
3,166
Investment Trust†
80
2,513
Post Properties, Inc.
90
3,161
Sierra Bancorp
100
2,489
First Bancorp Puerto Rico†
430
3,135
Anworth Mortgage Asset Corp.†
297
2,453
Zenith National Insurance Corp.†
70
3,131
Castlepoint Holdings Ltd.
200
2,400
Financial Federal Corp.†
140
3,121
United America Indemnity Ltd. —
First Industrial Realty Trust, Inc.†
90
3,114
Class A*
120
2,390
Amerisafe, Inc.*
200
3,102
Anthracite Capital, Inc.†
330
2,389
DCT Industrial Trust, Inc.
330
3,072
Columbia Banking Systems, Inc.†
80
2,378
Capital Trust, Inc. — Class A†
100
3,065
Cedar Shopping Centers, Inc.
230
2,353
Marathon Acquisition Corp.*†
390
3,034
Corus Bankshares, Inc.†
220
2,347
WSFS Financial Corp.
60
3,012
NewAlliance Bancshares, Inc.
200
2,304
LTC Properties, Inc.†
120
3,006
BRT Realty Trust†
150
2,295
FirstMerit Corp.†
150
3,001
WesBanco, Inc.
110
2,266
Prospect Capital Corp.
230
3,001
Advanta Corp.
280
2,260
Bancfirst Corp.
70
2,999
BankAtlantic Bancorp, Inc. —
AmericanWest Bancorp
170
2,997
Class A
550
2,255
Ramco-Gershenson Properties Trust
140
2,992
Triad Guaranty, Inc.*†
230
2,254
Peoples Bancorp, Inc.
120
2,987
LaSalle Hotel Properties†
70
2,233
Community Bank System, Inc.
150
2,981
National Health Investors, Inc.
80
2,232
Winthrop Realty Trust
560
2,962
Westamerica Bancorporation†
50
2,228
West Coast Bancorp
160
2,960
Hallmark Financial Services, Inc.*†
140
2,220
Central Pacific Financial Corp.
160
2,954
Corporate Office Properties
Susquehanna Bancshares, Inc.†
160
2,950
Trust SBI†
70
2,205
SWS Group, Inc.
230
2,914
Thomas Weisel Partners
United Fire & Casualty Co.
100
2,909
Group, Inc.*
160
2,197
Federal Agricultural
Deerfield Capital Corp.†
270
2,160
Mortgage Corp.
110
2,895
World Acceptance Corp.*†
80
2,158
GFI Group, Inc.*
30
2,872
Ezcorp, Inc. — Class A*
190
2,145
Berkshire Hills Bancorp, Inc.
110
2,860
Brookline Bancorp, Inc.
210
2,134
Great Southern Bancorp, Inc.
130
2,855
Bank Mutual Corp.
200
2,114
NorthStar Realty Finance Corp.†
320
2,854
Green Bankshares, Inc.
110
2,112
Sun Bancorp, Inc.*
180
2,840
Selective Insurance Group, Inc.
90
2,069
Hilb Rogal & Hobbs Co.
70
2,840
Ocwen Financial Corp.*†
370
2,050
First Bancorp
150
2,834
Resource Capital Corp.
220
2,048
JER Investors Trust, Inc.†
260
2,800
Frontier Financial Corp.†
110
2,043
PFF Bancorp, Inc.†
230
2,769
Healthcare Realty Trust, Inc.†
80
2,031
First Midwest Bancorp, Inc.†
90
2,754
Sovran Self Storage, Inc.†
50
2,005
Baldwind & Lyons, Inc. — Class B
100
2,746
Independent Bank Corp.
210
1,995
optionsXpress Holdings, Inc.†
80
2,706
Greenhill & Co., Inc.†
30
1,994
Home Properties, Inc.†
60
2,691
Midwest Banc Holdings, Inc.
160
1,987
Darwin Professional
TrustCo Bank Corp.†
200
1,984
Underwriters, Inc.*
110
2,659
Inland Real Estate Corp.†
140
1,982
Asta Funding, Inc.†
100
2,644
First State Bancorporation
140
1,946
Flagstone Reinsurance Holdings
190
2,641
Bankunited Financial Corp. —
Kohlberg Capital Corp.
220
2,640
Class A†
280
1,932
Hilltop Holdings, Inc.*
240
2,621
MarketAxess Holdings, Inc.*†
150
1,925
Community Bancorp*
150
2,606
UMB Financial Corp.†
50
1,918
54
|
THE RYDEX VARIABLE TRUST ANNUAL REPORT
See Notes to Financial Statements.

SCHEDULE OF INVESTMENTS (continued)
December 31, 2007
RUSSELL 2000® 2x STRATEGY FUND
MARKET
MARKET
VALUE
VALUE
SHARES
(NOTE 1)
SHARES
(NOTE 1)
Tanger Factory Outlet
HEALTH CARE 10.2%
Centers, Inc.†
50
$
1,886
Hologic, Inc.*†
430
$
29,515
Security Bank Corp.†
200
1,828
BioMarin Pharmaceuticals, Inc.*
380
13,452
Preferred Bank
70
1,821
MGI Pharma, Inc.*
310
12,564
Newcastle Investment Corp.†
140
1,814
Onyx Pharmaceuticals, Inc.*
210
11,680
Hanmi Financial Corp.
210
1,810
OSI Pharmaceuticals, Inc.*
230
11,157
Trustmark Corp.†
70
1,775
Perrigo Co.†
310
10,853
FelCor Lodging Trust, Inc.†
110
1,715
Inverness Medical
Mid-America Apartment
Innovations, Inc.*†
180
10,112
Communities, Inc.†
40
1,710
Adams Respiratory
Irwin Financial Corp.†
230
1,691
Therapeutics, Inc.*
150
8,961
Argo Group International
United Therapeutics Corp.*†
90
8,788
Holdings Ltd.*
40
1,685
Varian, Inc.*†
130
8,489
Saul Centers, Inc.
30
1,603
AMERIGROUP Corp.*†
230
8,383
Royal Bancshares of Pennsylvania,
Myriad Genetics, Inc.*†
180
8,356
Inc. — Class A
140
1,540
Illumina, Inc.*†
140
8,296
Maguire Properties, Inc.†
50
1,474
Bio-Rad Laboratories, Inc. —
First Indiana Corp.
40
1,280
Class A*
80
8,290
Eastgroup Properties, Inc.†
30
1,256
Steris Corp.†
280
8,075
Franklin Bank Corp.*
290
1,250
Magellan Health Services, Inc.*
170
7,927
Enstar Group*
10
1,224
Ventana Medical Systems, Inc.*
90
7,851
Pennsylvania Real Estate
Owens & Minor, Inc.†
180
7,637
Investment Trust
40
1,187
Haemonetics Corp.*
120
7,562
Hancock Holding Co.†
30
1,146
Psychiatric Solutions, Inc.*†
230
7,475
Old National Bancorp†
70
1,047
Dionex Corp.*
90
7,457
Meadowbrook Insurance
Affymetrix, Inc.*†
320
7,405
Group, Inc.*
100
941
Alkermes, Inc.*
460
7,171
Equity Lifestyle Properties, Inc.
20
913
LifeCell Corp.*†
160
6,898
Franklin Street Properties
Alexion Pharmaceuticals, Inc.*†
90
6,753
Corp., Inc.†
60
888
Medicis Pharmaceutical Corp. —
Cousins Properties, Inc.†
40
884
Class A†
260
6,752
Employers Holdings, Inc.
50
836
Universal American Financial Corp.*
250
6,397
Equity One, Inc.†
30
691
NuVasive, Inc.*
160
6,323
Wintrust Financial Corp.†
20
663
Amedisys, Inc.*†
130
6,308
Park National Corp.†
10
645
Parexel International Corp.*
130
6,279
American Campus
Applera Corp. - Celera Group*
390
6,189
Communities, Inc.
20
537
Chemed Corp.
110
6,147
First Commonwealth
XenoPort, Inc.*†
110
6,147
Financial Corp.†
50
533
Medarex, Inc.*†
580
6,044
Simmons First National Corp.
20
530
Centene Corp.*†
220
6,037
PS Business Parks, Inc.
10
526
Meridian Bioscience, Inc.
200
6,016
KBW, Inc.*†
20
512
Eclipsys Corp.*†
230
5,821
National Penn Bancshares, Inc.†
30
454
ArthroCare Corp.*†
120
5,766
Provident Bankshares Corp.
20
428
Valeant Pharmaceuticals
Investors Bancorp, Inc.*†
30
424
International*†
480
5,746
CVB Financial Corp.†
40
414
Cubist Pharmaceuticals, Inc.*†
280
5,743
First Financial Bankshares, Inc.
10
377
Martek Biosciences Corp.*†
190
5,620
RAIT Financial Trust†
40
345
Immucor, Inc.*
160
5,438
Redwood Trust, Inc.†
10
342
American Medical Systems
Downey Financial Corp.†
10
311
Holdings, Inc.*†
370
5,350
S&T Bancorp, Inc.
10
276
inVentiv Health, Inc.*
170
5,263
Alfa Corp.
10
217
Orthofix International NV*
90
5,217
Total Financials
749,992
Align Technology, Inc.*†
310
5,171
See Notes to Financial Statements.
THE RYDEX VARIABLE TRUST ANNUAL REPORT
|
55

SCHEDULE OF INVESTMENTS (continued)
December 31, 2007
RUSSELL 2000® 2x STRATEGY FUND
MARKET
MARKET
VALUE
VALUE
SHARES
(NOTE 1)
SHARES
(NOTE 1)
Omnicell, Inc.*
190
$
5,117
Emergency Medical Services
Par Pharmaceutical Cos., Inc.*
210
5,040
Corp. — Class A*†
100
$
2,928
Apria Healthcare Group, Inc.*
230
4,961
Quidel Corp.*
150
2,921
AmSurg Corp.*
180
4,871
Medical Action Industries, Inc.*†
140
2,919
Alpharma, Inc. — Class A*
240
4,836
Regeneron Pharmaceuticals, Inc.*†
120
2,898
Phase Forward, Inc.*
220
4,785
Viropharma, Inc.*†
360
2,858
Analogic Corp.
70
4,740
Dendreon Corp.*†
430
2,675
Healthways, Inc.*†
80
4,675
Zoll Medical Corp.*
100
2,672
Sun Healthcare Group, Inc.*
270
4,636
Cynosure, Inc.*†
100
2,646
Integra LifeSciences
Salix Pharmaceuticals Ltd.*†
330
2,600
Holdings Corp.*†
110
4,612
Isis Pharmaceuticals, Inc.*†
160
2,520
Healthspring, Inc.*
240
4,572
Human Genome Sciences, Inc.*†
240
2,506
Invacare Corp.†
180
4,536
Cantel Medical Corp.*
170
2,479
Kendle International, Inc.*†
90
4,403
Sunrise Senior Living, Inc.*
80
2,454
Bruker BioSciences Corp.*
330
4,389
Seattle Genetics, Inc.*†
210
2,394
PharmaNet Development
Halozyme Therapeutics, Inc.*†
330
2,346
Group, Inc.*
110
4,313
Mentor Corp.†
60
2,346
Sciele Pharma, Inc.*†
210
4,295
Cross Country Healthcare, Inc.*
160
2,278
Symmetry Medical, Inc.*
240
4,183
Geron Corp.*†
380
2,158
Conmed Corp.*†
180
4,160
PSS World Medical, Inc.*
110
2,153
AMN Healthcare Services, Inc.*
240
4,121
OraSure Technologies, Inc.*
240
2,134
Matria Healthcare, Inc.*
170
4,041
Exelixis, Inc.*
240
2,071
Res-Care, Inc.*
160
4,026
Nabi Biopharmaceuticals*†
570
2,058
Sirona Dental Systems, Inc.*†
120
4,018
Wright Medical Group, Inc.*†
70
2,042
The Trizetto Group, Inc.*†
230
3,995
West Pharmaceutical Services, Inc.
50
2,030
Air Methods Corp.*
80
3,974
KV Pharmaceutical Co.*†
70
1,998
Molina Healthcare, Inc.*†
100
3,870
Ariad Pharmaceuticals, Inc.*
450
1,913
Gentiva Health Services, Inc.*†
200
3,808
Obagi Medical Products, Inc.*
100
1,829
SurModics, Inc.*†
70
3,799
AMAG Pharmaceuticals, Inc.*†
30
1,804
Alnylam Pharmaceuticals, Inc.*†
130
3,780
CytRx Corp.*†
630
1,789
SonoSite, Inc.*†
110
3,704
Allscripts Healthcare
Datascope Corp.
100
3,640
Solutions, Inc.*
70
1,359
National Healthcare Corp.
70
3,619
Thoratec Corp.*
60
1,091
Greatbatch, Inc.*†
180
3,598
Medicines Co.*
50
958
Vital Signs, Inc.†
70
3,578
Neurocrine Biosciences, Inc.*
210
953
eResearch Technology, Inc.*
300
3,546
Auxilium Pharmaceuticals, Inc.*
30
900
Enzon Pharmaceuticals, Inc.*†
370
3,526
Incyte Corp.*
70
704
Natus Medical, Inc.*
180
3,483
Savient Pharmaceuticals, Inc.*†
30
689
Cepheid, Inc.*
130
3,426
HealthExtras, Inc.*
20
522
ICU Medical, Inc.*
95
3,421
Abaxis, Inc.*
10
359
RehabCare Group, Inc.*
150
3,384
Kindred Healthcare, Inc.*
10
250
LHC Group, Inc.*
130
3,247
Total Health Care
634,025
MWI Veterinary Supply, Inc.*
80
3,200
INDUSTRIALS 9.8%
Merit Medical Systems, Inc.*
230
3,197
FTI Consulting, Inc.*†
190
11,712
Bentley Pharmaceuticals, Inc.*†
210
3,169
Genlyte Group, Inc.*
110
10,472
Albany Molecular Research, Inc.*
220
3,164
Bucyrus International, Inc. —
Nektar Therapeutics*
470
3,154
Class A
100
9,939
Healthsouth Corp.*†
150
3,150
Herman Miller, Inc.
280
9,069
Pharmion Corp.*†
50
3,143
Waste Connections, Inc.*
280
8,652
Cypress Bioscience, Inc.*†
280
3,088
Acuity Brands, Inc.†
190
8,550
Medcath Corp.*
120
2,947
Belden, Inc.†
190
8,455
Watson Wyatt & Co. Holdings†
180
8,354
56
|
THE RYDEX VARIABLE TRUST ANNUAL REPORT
See Notes to Financial Statements.

SCHEDULE OF INVESTMENTS (continued)
December 31, 2007
RUSSELL 2000® 2x STRATEGY FUND
MARKET
MARKET
VALUE
VALUE
SHARES
(NOTE 1)
SHARES
(NOTE 1)
Actuant Corp. — Class A
240
$
8,162
Clarcor, Inc.
110
$
4,177
Teledyne Technologies, Inc.*
150
7,999
Old Dominion Freight Line, Inc.*†
180
4,160
GrafTech International Ltd.*
450
7,987
Werner Enterprises, Inc.†
240
4,087
Deluxe Corp.
230
7,565
Nordson Corp.†
70
4,057
SkyWest, Inc.†
280
7,518
NCI Building Systems, Inc.*†
140
4,031
Barnes Group, Inc.†
220
7,346
Comfort Systerms USA, Inc.
310
3,962
Esterline Technologies Corp.*
140
7,245
Walter Industries, Inc.†
110
3,952
EMCOR Group, Inc.*
290
6,853
Interline Brands, Inc.*
180
3,944
Regal-Beloit Corp.
150
6,742
Brady Corp. — Class A†
110
3,860
Baldor Electric Co.
200
6,732
School Specialty, Inc.*
110
3,800
IKON Office Solutions, Inc.
510
6,640
Bowne & Co., Inc.
210
3,696
Triumph Group, Inc.
80
6,588
Moog, Inc. — Class A*†
80
3,665
Wabtec Corp.
190
6,544
LB Foster Co. — Class A*
70
3,621
Granite Construction, Inc.
170
6,151
Superior Essex, Inc.*
150
3,600
Applied Industrial
Valmont Industries, Inc.
40
3,565
Technologies, Inc.
210
6,094
Dollar Thrifty Automotive
United Stationers, Inc.*
120
5,545
Group, Inc.*
150
3,552
Mueller Industries, Inc.
190
5,508
Twin Disc, Inc.
50
3,538
Mueller Water Products, Inc. —
Universal Forest Products, Inc.
120
3,535
Class A†
570
5,426
TrueBlue, Inc.*
240
3,475
Perini Corp.*†
130
5,385
Chart Industries, Inc.*
110
3,399
Hexcel Corp.*
220
5,342
Gibraltar Industries, Inc.
220
3,392
Robbins & Myers, Inc.
70
5,294
AirTran Holdings, Inc.*
470
3,365
Alaska Air Group, Inc.*
210
5,252
II-VI, Inc.*
110
3,360
Kaman Corp. — Class A
140
5,153
Spherion Corp.*
460
3,349
Goodman Global, Inc.*
210
5,153
Consolidated Graphics, Inc.*
70
3,347
Simpson Manufacturing Co., Inc.†
190
5,052
Michael Baker Corp.*
80
3,288
Curtiss-Wright Corp.†
100
5,020
Navigant Consulting, Inc.*
240
3,281
Watsco, Inc.†
130
4,779
Kadant, Inc.*
110
3,264
Woodward Governor Co.†
70
4,756
Apogee Enterprises, Inc.
190
3,251
Korn/Ferry International, Inc.*
250
4,705
Integrated Electrical Services, Inc.*
170
3,194
Circor International, Inc.
100
4,636
Encore Wire Corp.†
200
3,184
Interface, Inc. — Class A†
280
4,570
Northwest Pipe Co.*
80
3,131
G & K Services, Inc. — Class A
120
4,502
AZZ, Inc.*
110
3,118
ABM Industries, Inc.
220
4,486
LSI Industries, Inc.
170
3,094
Heidrick & Struggles
Hurco Cos., Inc.*†
70
3,055
International, Inc.†
120
4,453
Ampco-Pittsburgh Corp.
80
3,050
GeoEye, Inc.*†
130
4,374
Park-Ohio Holdings Corp.*
120
3,012
Atlas Air Worldwide
PHH Corp.*
170
2,999
Holdings Co., Inc.*
80
4,338
COMSYS IT Partners, Inc.*
190
2,998
Cubic Corp.
110
4,312
Dynamex, Inc.*
110
2,977
Republic Airways Holdings, Inc.*
220
4,310
Schawk, Inc.
190
2,949
M&F Worldwide Corp.*†
80
4,308
Kforce, Inc.*
300
2,925
DynCorp International, Inc. —
CDI Corp.†
120
2,911
Class A*
160
4,301
Waste Industries USA, Inc.
80
2,904
EnPro Industries, Inc.*
140
4,291
Pinnacle Airlines Corp.*
190
2,897
UAP Holding Corp.
110
4,246
Federal Signal Corp.
250
2,805
Columbus McKinnon Corp. —
EnerSys*
110
2,746
Class A*
130
4,241
Kaydon Corp.†
50
2,727
IHS, Inc.*
70
4,239
Hardinge, Inc.
160
2,685
A.O. Smith Corp.
120
4,206
Pacer International, Inc.
180
2,628
Rush Enterprises, Inc. — Class A*
230
4,181
Standex International Corp.
150
2,617
See Notes to Financial Statements.
THE RYDEX VARIABLE TRUST ANNUAL REPORT
|
57

SCHEDULE OF INVESTMENTS (continued)
December 31, 2007
RUSSELL 2000® 2x STRATEGY FUND
MARKET
MARKET
VALUE
VALUE
SHARES
(NOTE 1)
SHARES
(NOTE 1)
Mine Safety Appliances Co.†
50
$
2,594
Healthcare Services Group†
40
$
847
Tredegar Corp.
160
2,573
ACCO Brands Corp.*†
50
802
Celadon Group, Inc.*†
280
2,565
Heartland Express, Inc.†
50
709
American Reprographics Co.*†
150
2,472
Lindsay Manufacturing Co.†
10
707
Orbital Sciences Corp.*†
100
2,452
Amerco, Inc.*
10
657
Huron Consulting Group, Inc.*
30
2,419
Force Protection, Inc.*†
140
655
Arkansas Best Corp.†
110
2,413
American Commercial Lines, Inc.*†
40
650
ESCO Technologies, Inc.*†
60
2,396
Titan International, Inc.
20
625
Preformed Line Products Co.†
40
2,380
Dynamic Materials Corp.
10
589
Energy Conversion Devices, Inc.*†
70
2,356
Rollins, Inc.
30
576
Ceradyne, Inc.*
50
2,347
Clean Harbors, Inc.*†
10
517
Pike Electric Corp.*
140
2,346
Layne Christensen Co.*
10
492
Barrett Business Services, Inc.
130
2,341
Gencorp, Inc.*†
40
466
Ennis Inc.
130
2,340
Tennant Co.†
10
443
Blount International, Inc.*
190
2,339
RBC Bearings, Inc.*†
10
435
Kenexa Corp. — Class A*
120
2,330
FuelCell Energy, Inc.*†
40
397
Cascade Corp.
50
2,323
Franklin Electric Co., Inc.
10
383
AAR Corp.*
60
2,282
Astec Industries, Inc.*
10
372
TransDigm Group, Inc.*
50
2,259
Mobile Mini, Inc.*
20
371
Evergreen Solar, Inc.*†
130
2,245
Viad Corp.
10
316
Geo Group, Inc.*†
80
2,240
Administaff, Inc.
10
283
Kelly Services, Inc.
120
2,239
Total Industrials
605,006
Heico Corp.†
40
2,179
CONSUMER DISCRETIONARY 9.3%
Taser International, Inc.*†
150
2,159
Priceline.com, Inc.*†
140
16,080
Eagle Bulk Shipping, Inc.†
80
2,124
DeVry, Inc.†
230
11,951
Wabash National Corp.†
270
2,076
Chipotle Mexican Grill, Inc.*
90
11,074
Aecom Technology Corp.*
70
2,000
Bally Technologies Inc.*
220
10,938
NACCO Industries, Inc. — Class A
20
1,994
Sotheby’s Holdings, Inc. —
Courier Corp.
60
1,981
Class A†
270
10,287
Knoll, Inc.
120
1,972
Lear Corp.*†
320
8,851
Tetra Tech, Inc.*†
90
1,935
Aeropostale, Inc.*†
330
8,745
Genesee & Wyoming, Inc. —
J. Crew Group, Inc.*†
170
8,196
Class A*
80
1,934
Tempur-Pedic International, Inc.†
310
8,051
Advisory Board Co.*
30
1,926
Fossil, Inc.*†
190
7,976
Griffon Corp.*†
150
1,868
Polaris Industries, Inc.†
160
7,643
JetBlue Airways Corp.*†
290
1,711
Jack in the Box, Inc.*
280
7,216
Genco Shipping & Trading Ltd.
30
1,643
Belo Corp. — Class A†
400
6,976
Briggs & Stratton Corp.†
70
1,586
WMS Industries, Inc.*†
190
6,962
Middleby Corp.*†
20
1,532
Warnaco Group, Inc.*
200
6,960
Albany International Corp. —
Strayer Education, Inc.
40
6,823
Class A
40
1,484
Men’s Wearhouse, Inc.†
240
6,475
American Superconductor Corp.*†
50
1,367
Wolverine World Wide, Inc.
260
6,375
HUB Group, Inc. — Class A*†
50
1,329
Regis Corp.
220
6,151
Cenveo, Inc.*†
70
1,223
Interactive Data Corp.
180
5,942
Midwest Air Group, Inc.*
80
1,184
Callaway Golf Co.
330
5,752
CoStar Group, Inc.*
20
945
Collective Brands, Inc.*
330
5,739
Forward Air Corp.†
30
935
Gemstar-TV Guide
Ameron International Corp.
10
922
International, Inc.*†
1,190
5,664
Resources Connection, Inc.
50
908
Scholastic Corp.*
160
5,582
Watts Industries, Inc. — Class A†
30
894
American Greetings Corp. —
Knight Transportation, Inc.†
60
889
Class A†
270
5,481
Teletech Holdings, Inc.*
40
851
58
|
THE RYDEX VARIABLE TRUST ANNUAL REPORT
See Notes to Financial Statements.

SCHEDULE OF INVESTMENTS (continued)
December 31, 2007
RUSSELL 2000® 2x STRATEGY FUND
MARKET
MARKET
VALUE
VALUE
SHARES
(NOTE 1)
SHARES
(NOTE 1)
Cooper Tire & Rubber Co.
330
$
5,471
Fisher Communications, Inc.*
82
$
3,113
LKQ Corp.*†
260
5,465
Systemax, Inc.†
150
3,048
Rent-A-Center, Inc.*†
360
5,227
Movado Group, Inc.
120
3,035
Iconix Brand Group, Inc.*
260
5,112
Russ Berrie & Co., Inc.*
180
2,945
Bob Evans Farms, Inc.
180
4,847
CSS Industries, Inc.
80
2,936
Bright Horizons Family
Avatar Holdings, Inc.*†
70
2,927
Solutions, Inc.*†
140
4,836
Group 1 Automotive, Inc.†
120
2,850
Jackson Hewitt Tax Service, Inc.
150
4,762
Monaco Coach Corp.
320
2,842
Stewart Enterprises, Inc. —
Hooker Furniture Corp.†
140
2,814
Class A†
530
4,717
Matthews International Corp. —
American Axle & Manufacturing
Class A
60
2,812
Holdings, Inc.†
250
4,655
Steinway Musical Instruments
100
2,757
Deckers Outdoor Corp.*
30
4,652
Weyco Group, Inc.
100
2,750
Tupperware Brands Corp.†
140
4,624
Entravision Communications
Ethan Allen Interiors, Inc.†
160
4,560
Corp. — Class A*
350
2,740
Zale Corp.*†
280
4,497
Ruby Tuesday, Inc.†
280
2,730
Steiner Leisure Ltd.*†
100
4,416
FTD Group, Inc.
210
2,705
Lee Enterprises, Inc.
290
4,248
Marvel Entertainment, Inc.*
100
2,671
CEC Entertainment, Inc.*†
160
4,154
G-III Apparel Group Ltd.*
180
2,659
DG FastChannel, Inc.*
160
4,102
Build-A-Bear Workshop, Inc.*†
190
2,650
Aftermarket Technology Corp.*
150
4,089
Genesco, Inc.*†
70
2,646
Jakks Pacific, Inc.*
170
4,014
Modine Manufacturing Co.
160
2,642
Stage Stores, Inc.†
270
3,996
Pinnacle Entertainment, Inc.*†
110
2,592
Jos. A. Bank Clothiers, Inc.*†
140
3,983
Sealy Corp.†
230
2,574
Columbia Sportswear Co.†
90
3,968
Conn’s, Inc.*†
150
2,566
Brown Shoe Co., Inc.†
260
3,944
Exide Technologies*†
320
2,560
Blockbuster, Inc. — Class A*†
1,000
3,900
Amerigon, Inc.*
120
2,537
Dress Barn, Inc.*
310
3,878
Furniture Brands International, Inc.†
250
2,515
Pre-Paid Legal Services, Inc.*†
70
3,874
INVESTools, Inc.*
140
2,484
Champion Enterprises, Inc.*†
410
3,862
Global Sources Ltd.*
88
2,483
Unifirst Corp.
100
3,800
Charter Communications, Inc. —
Helen of Troy Ltd.*
220
3,771
Class A*
2,120
2,480
Cato Corp. — Class A†
240
3,758
Corinthian Colleges, Inc.*†
160
2,464
Valassis Communications, Inc.*†
320
3,741
Perry Ellis International, Inc.*
160
2,461
Blyth, Inc.
170
3,730
PEP Boys-Manny Moe & Jack†
210
2,411
Sonic Automotive, Inc.
190
3,678
Sonic Corp.*†
110
2,409
RC2 Corp.*
130
3,649
Netflix, Inc.*†
90
2,396
Media General, Inc.†
170
3,612
Hayes Lemmerz International, Inc.*
520
2,376
Drew Industries, Inc.*
130
3,562
Multimedia Games, Inc.*†
280
2,335
Red Robin Gourmet Burgers, Inc.*
110
3,519
Morningstar, Inc.*
30
2,333
Life Time Fitness, Inc.*†
70
3,478
Kellwood Co.
140
2,330
Speedway Motorsports, Inc.†
110
3,419
Ambassadors Group, Inc.
120
2,197
Charming Shoppes, Inc.*†
630
3,408
Premier Exhibitions, Inc.*†
200
2,188
Lin TV Corp. — Class A*
280
3,408
AFC Enterprises, Inc.*
190
2,151
Universal Electronics, Inc.*
100
3,344
Journal Communications, Inc. —
Skechers U.S.A., Inc. — Class A*
170
3,317
Class A†
240
2,146
Buckle, Inc.
100
3,300
Tenneco, Inc.*
80
2,086
Maidenform Brands, Inc.*
240
3,247
World Wrestling Entertainment, Inc.
140
2,066
Gaylord Entertainment Co.*†
80
3,238
Cox Radio Inc. — Class A*
170
2,066
Vail Resorts, Inc.*
60
3,229
Fred’s, Inc.†
210
2,022
Core-Mark Holding Co., Inc.*
110
3,159
Steven Madden, Ltd.*
100
2,000
Monro Muffler Brake, Inc.
160
3,118
NexCen Brands, Inc.*
410
1,984
See Notes to Financial Statements.
THE RYDEX VARIABLE TRUST ANNUAL REPORT
|
59

SCHEDULE OF INVESTMENTS (continued)
December 31, 2007
RUSSELL 2000® 2x STRATEGY FUND
MARKET
MARKET
VALUE
VALUE
SHARES
(NOTE 1)
SHARES
(NOTE 1)
Quiksilver, Inc.*
230
$
1,973
ENERGY 4.6%
Asbury Automotive Group, Inc.
130
1,957
Exterran Holdings, Inc.*
170
$
13,906
Denny’s Corp.*
520
1,950
Atwood Oceanics, Inc.*†
110
11,026
O’Charleys, Inc.
130
1,947
Whiting Petroleum Corp.*
170
9,802
CBRL Group, Inc.
60
1,943
Alpha Natural Resources, Inc.*
280
9,094
Citadel Broadcasting Corp.†
940
1,936
Mariner Energy, Inc.*†
370
8,466
Triarc Cos., Inc. — Class B
220
1,927
Hercules Offshore*†
350
8,323
Monarch Casino & Resort, Inc.*†
80
1,926
Berry Petroleum Co. — Class A†
180
8,001
Winnebago Industries, Inc.†
90
1,892
W-H Energy Services, Inc.*†
140
7,869
Bluegreen Corp.*†
260
1,869
Oil States International, Inc.*†
220
7,506
Buffalo Wild Wings, Inc.*
80
1,858
PetroHawk Energy Corp.*†
430
7,443
Gymboree Corp.*
60
1,828
Comstock Resources, Inc.*
210
7,140
Benihana, Inc.*
140
1,785
Swift Energy Co.*†
150
6,604
Under Armour, Inc.*†
40
1,747
Stone Energy Corp.*
140
6,567
Carter’s, Inc.*
90
1,742
ION Geophysical Corp.*†
360
5,681
Big 5 Sporting Goods Corp.
120
1,730
Bristow Group, Inc.*
100
5,665
Jo-Ann Stores, Inc.*†
130
1,700
GulfMark Offshore, Inc.*
120
5,615
Marcus Corp.†
110
1,700
NATCO Group, Inc.*†
100
5,415
DSW, Inc.*†
90
1,688
USEC, Inc.*†
580
5,220
Arbitron, Inc.†
40
1,663
Lufkin Industries, Inc.
90
5,156
Jamba, Inc.*†
440
1,628
Rosetta Resources, Inc.*†
260
5,156
Beazer Homes USA, Inc.†
210
1,560
Grey Wolf, Inc.*†
960
5,117
Live Nation, Inc.*†
100
1,452
Basic Energy Services, Inc.*†
230
5,048
CKX, Inc.*
120
1,440
EXCO Resources, Inc.*
310
4,799
Spartan Motors, Inc.†
180
1,375
Golar LNG Ltd.†
210
4,645
Pacific Sunwear of California, Inc.*†
90
1,270
Complete Production
National CineMedia, Inc.
50
1,261
Services, Inc.*†
250
4,492
CSK Auto Corp.*†
220
1,102
CARBO Ceramics, Inc.†
120
4,464
Riviera Holdings Corp.*
30
924
Parker Drilling Co.*
580
4,379
Sally Beauty Holdings, Inc.*†
100
905
Petroleum Development Corp.*†
70
4,139
Tween Brands, Inc.*†
30
794
Concho Resources, Inc.*
190
3,916
Salem Communications Corp. —
Encore Acquisition Co.*†
110
3,671
Class A
120
791
International Coal Group, Inc.*†
660
3,538
Aaron Rents, Inc.†
40
770
Bois d’Arc Energy, Inc.*
170
3,374
Timberland Co. — Class A*
40
723
Uranium Resources, Inc.*†
270
3,370
Cumulus Media, Inc. — Class A*†
87
699
Bronco Drilling Co., Inc.*
220
3,267
Blue Nile, Inc.*†
10
681
Pioneer Drilling Co.*
260
3,089
CKE Restaurants, Inc.
50
660
Matrix Service Co.*
140
3,055
Capella Education Co.*
10
655
Penn Virginia Corp.†
70
3,054
ArvinMeritor, Inc.†
50
587
Delek US Holdings, Inc.
150
3,034
TiVo, Inc.*
70
584
Union Drilling, Inc.*
190
2,996
Coinstar, Inc.*
20
563
Alon USA Energy, Inc.†
110
2,990
P.F. Chang’s China Bistro, Inc.*†
20
457
Trico Marine Services, Inc.*†
80
2,962
Hibbett Sports Inc.*†
20
400
Pacific Ethanol, Inc.*†
360
2,956
IHOP Corp.†
10
366
Allis-Chalmers Energy, Inc.*†
200
2,950
Texas Roadhouse, Inc.*†
30
332
T-3 Energy Services, Inc. —
Borders Group, Inc.†
30
320
Class A*
60
2,821
Ameristar Casinos, Inc.†
10
275
Aventine Renewable Energy
Total Consumer Discretionary
575,047
Holdings, Inc.*
220
2,807
Dril-Quip, Inc.*
50
2,783
Contango Oil & Gas Co.*
50
2,544
Newpark Resources, Inc.*
460
2,507
60
|
THE RYDEX VARIABLE TRUST ANNUAL REPORT
See Notes to Financial Statements.

SCHEDULE OF INVESTMENTS (continued)
December 31, 2007
RUSSELL 2000® 2x STRATEGY FUND
MARKET
MARKET
VALUE
VALUE
SHARES
(NOTE 1)
SHARES
(NOTE 1)
Arena Resources, Inc.*†
60
$
2,503
Century Aluminum Co.*†
60
$
3,236
Harvest Natural Resources, Inc.*
200
2,500
Calgon Carbon Corp.*†
200
3,178
Atlas America, Inc.
40
2,367
Olympic Steel, Inc.
100
3,171
Willbros Group, Inc.*
60
2,297
PolyOne Corp.*
480
3,158
Warren Resources, Inc.*
160
2,261
Universal Stainless & Alloy*
80
2,846
Crosstex Energy, Inc.†
60
2,234
A. Schulman, Inc.
130
2,801
Carrizo Oil & Gas, Inc.*
40
2,190
Coeur d’Alene Mines Corp.*†
520
2,569
Knightsbridge Tankers Ltd.†
90
2,173
Headwaters, Inc.*†
200
2,348
Callon Petroleum Co.*
130
2,139
Spartech Corp.†
160
2,256
Bill Barrett Corp.*
50
2,094
NewMarket Corp.
40
2,228
World Fuel Services Corp.
70
2,032
Koppers Holdings, Inc.
50
2,162
Energy Partners Ltd.*
160
1,890
Silgan Holdings, Inc.
40
2,078
Double Hull Tankers, Inc.†
150
1,836
Wausau Paper Corp.
230
2,068
Delta Petroleum Corp.*†
90
1,697
Innospec, Inc.
120
2,059
ATP Oil & Gas Corp.*†
30
1,516
Compass Minerals
Oilsands Quest, Inc.*†
370
1,510
International, Inc.
50
2,050
Hornbeck Offshore Services, Inc.*
30
1,349
GenTek, Inc.*
70
2,049
Nordic American Tanker Shipping†
40
1,313
Horsehead Holding Corp.*
120
2,036
Ship Finance International Ltd.†
20
554
Minerals Technologies, Inc.
30
2,008
General Maritime Corp.
20
489
AbitibiBowater, Inc.†
90
1,855
Parallel Petroleum Corp.*†
20
353
Metal Management, Inc.
40
1,821
BPZ Resources, Inc.*
30
335
Myers Industries, Inc.†
90
1,302
Total Energy
286,054
Zoltek Cos., Inc.*†
30
1,286
MATERIALS 3.7%
Arch Chemicals, Inc.
30
1,103
CF Industries Holdings, Inc.†
200
22,012
Amcol International Corp.
30
1,081
Terra Industries, Inc.*†
350
16,716
Apex Silver Mines Ltd.*†
60
914
AptarGroup, Inc.†
270
11,046
Haynes International, Inc.*
10
695
Hercules, Inc.†
480
9,288
Flotek Industries, Inc.*
10
360
Greif, Inc. — Class A
140
9,152
Royal Gold, Inc.†
10
305
Quanex Corp.†
160
8,304
Total Materials
231,731
OM Group, Inc.*
130
7,480
UTILITIES 2.0%
Schnitzer Steel Industries, Inc. —
Nicor, Inc.†
190
8,046
Class A†
100
6,913
Cleco Corp.†
270
7,506
Olin Corp.
340
6,572
Black Hills Corp.
170
7,497
Sensient Technologies Corp.
230
6,504
WGL Holdings, Inc.†
220
7,207
H.B. Fuller Co.†
280
6,286
New Jersey Resources Corp.
130
6,503
Rockwood Holdings, Inc.*†
180
5,980
Aquila, Inc.*†
1,740
6,490
Worthington Industries, Inc.
320
5,722
Northwest Natural Gas Co.†
130
6,326
Kaiser Aluminum Corp.†
70
5,564
Southwest Gas Corp.
210
6,252
Hecla Mining Co.*†
580
5,423
Westar Energy, Inc.†
240
6,226
Rock-Tenn Co. — Class A
190
4,828
El Paso Electric Co.*
230
5,881
Ferro Corp.
230
4,768
ITC Holdings Corp.
100
5,642
Glatfelter
280
4,287
NorthWestern Corp.
190
5,605
Texas Industries, Inc.†
60
4,206
South Jersey Industries, Inc.
150
5,413
Brush Engineered Materials, Inc.*
110
4,072
Portland General Electric Co.
180
5,000
LSB Industries, Inc.*†
140
3,951
Laclede Group, Inc.
130
4,451
W.R. Grace & Co.*†
150
3,927
Piedmont Natural Gas Co.†
160
4,186
Buckeye Technologies, Inc.*
280
3,500
PNM Resources, Inc.†
160
3,432
Neenah Paper, Inc.
120
3,498
Central Vermont Public
RTI International Metals, Inc.*†
50
3,446
Service Corp.†
100
3,084
A.M. Castle & Co.†
120
3,263
Consolidated Water Co., Inc.†
120
3,023
See Notes to Financial Statements.
THE RYDEX VARIABLE TRUST ANNUAL REPORT
|
61

SCHEDULE OF INVESTMENTS (continued)
December 31, 2007
RUSSELL 2000® 2x STRATEGY FUND
MARKET
MARKET
VALUE
VALUE
SHARES
(NOTE 1)
SHARES
(NOTE 1)
IDACORP, Inc.†
80
$
2,818
Vector Group Ltd.
20
$
401
Unisource Energy Corp.
70
2,209
Great Atlantic & Pacific Tea Co.*†
10
313
Empire District Electric Co.†
90
2,050
Pantry, Inc.*
10
261
Allete, Inc.†
50
1,979
Total Consumer Staples
118,541
American States Water Co.
50
1,884
TELECOMMUNICATION SERVICES 1.1%
Avista Corp.
70
1,508
Time Warner Telecom, Inc. —
Otter Tail Power Co.†
40
1,384
Class A*†
370
7,507
UIL Holding Corp.†
20
739
Golden Telecom, Inc.*†
70
7,066
Ormat Technologies, Inc.†
10
550
Cogent Communications
CH Energy Group, Inc.
10
445
Group, Inc.*†
250
5,927
California Water Service Group
10
370
Cincinnati Bell, Inc.*†
1,220
5,795
Mge Energy, Inc.
10
355
Premiere Global Services, Inc.*
350
5,197
Total Utilities
124,061
NTELOS Holdings Corp.
170
5,047
CONSUMER STAPLES 1.9%
Shenandoah
Flowers Foods, Inc.†
330
7,725
Telecommunications Co.
160
3,837
Casey’s General Stores, Inc.
240
7,106
Iowa Telecommunications
Universal Corp.†
130
6,659
Services, Inc.
230
3,740
Ruddick Corp.†
190
6,587
Syniverse Holdings, Inc.*
230
3,583
Pilgrim’s Pride Corp.†
210
6,079
USA Mobility, Inc.*
230
3,289
Fresh Del Monte Produce, Inc.*
160
5,373
Alaska Communications
Performance Food Group Co.*†
190
5,105
Systems Group, Inc.
210
3,150
Darling International, Inc.*
410
4,740
Atlantic Tele-Network, Inc.
90
3,040
Central European
General Communication, Inc. —
Distribution Corp.*†
80
4,646
Class A*
270
2,363
TreeHouse Foods, Inc.*
190
4,368
Rural Cellular Corp. — Class A*
40
1,764
WD-40 Co.
110
4,177
Fairpoint Communications, Inc.†
130
1,693
Sanderson Farms, Inc.†
120
4,054
Cbeyond, Inc.*
30
1,170
Winn-Dixie Stores, Inc.*†
230
3,880
North Pittsburgh Systems, Inc.
50
1,135
Nash Finch Co.†
100
3,528
PAETEC Holding Corp.*†
60
585
Elizabeth Arden, Inc.*
170
3,459
Global Crossing*
20
441
Longs Drug Stores Corp.
70
3,290
Total Telecommunication Services
66,329
Cal-Maine Foods, Inc.
120
3,184
Total Common Stocks
Arden Group, Inc.
20
3,094
(Cost $4,137,981)
4,149,162
Ralcorp Holdings, Inc.*
50
3,040
American Oriental
FACE
Bioengineering, Inc.*
270
2,992
AMOUNT
Central Garden and Pet Co. —
REPURCHASE AGREEMENTS 29.8%
Class A*†
520
2,787
Repurchase Agreement (Note 5)
Imperial Sugar Co., Inc.†
140
2,628
Mizuho Financial Group, Inc.
Village Super Market
50
2,545
issued 12/31/07 at 1.40%
Farmer Brothers Co.
110
2,529
due 01/02/08
$ 528,638
528,638
Chattem, Inc.*
30
2,266
Morgan Stanley
Hain Celestial Group, Inc.*†
70
2,240
issued 12/31/07
United Natural Foods, Inc.*†
70
2,220
at 1.20% due 01/02/08
528,638
528,638
Alliance One International, Inc.*
500
2,035
UBS Financial Services, Inc.
Reddy Ice Holdings, Inc.†
70
1,772
issued 12/31/07 at 1.14%
Tootsie Roll Industries, Inc.†
30
823
due 01/02/08
528,638
528,638
Lancaster Colony Corp.
20
794
Lehman Brothers Holdings, Inc.
Chiquita Brands
issued 12/31/07 at 1.00%
International, Inc.*†
40
736
due 01/02/08
263,171
263,171
Nu Skin Enterprises, Inc.
40
657
Total Repurchase Agreements
Andersons, Inc.†
10
448
(Cost $1,849,085)
1,849,085
62
|
THE RYDEX VARIABLE TRUST ANNUAL REPORT
See Notes to Financial Statements.

SCHEDULE OF INVESTMENTS (concluded)
December 31, 2007
RUSSELL 2000® 2x STRATEGY FUND
MARKET
FACE
VALUE
AMOUNT
(NOTE 1)
SECURITIES LENDING COLLATERAL 20.4%
Investment in Securities Lending Short Term
Investment Portfolio Held by
U.S. Bank (Note 8)
$1,267,411
$
1,267,411
Total Securities Lending Collateral
(Cost $1,267,411)
1,267,411
Total Investments 117.1%
(Cost $7,254,477)
$ 7,265,658
Liabilities in Excess of
Other Assets – (17.1)%
$ (1,061,054)
Net Assets – 100.0%
$ 6,204,604
UNREALIZED
GAIN (LOSS)
CONTRACTS
(NOTE 1)
FUTURES CONTRACTS PURCHASED
March 2008 Russell 2000 Index
Mini Futures Contracts
(Aggregate Market Value
of Contracts $6,699,000)
87
$
35,641
UNITS
EQUITY INDEX SWAP AGREEMENTS††
February 2008 Russell 2000 Index
Swap, Terminating 02/18/08**
(Notional Market Value
$353,178)
461
$
4,362
March 2008 Russell 2000 Index
Swap, Terminating 03/28/08**
(Notional Market Value
$1,207,018)
1,576
(9,849)
(Total Notional Market
Value $1,560,196)
$
(5,487)
*
Non-Income Producing Security.
**
Price Return based on Russell 2000 Index +/- financing at a variable rate.
†
All or a portion of this security is on loan at December 31, 2007 — See Note 8.
††
Cash was pledged as equity Index swap collateral at December 31, 2007.
See Notes to Financial Statements.
THE RYDEX VARIABLE TRUST ANNUAL REPORT
|
63

SCHEDULE OF INVESTMENTS
December 31, 2007
RUSSELL 2000® 1.5x STRATEGY FUND
MARKET
MARKET
VALUE
VALUE
SHARES
(NOTE 1)
SHARES
(NOTE 1)
COMMON STOCKS 65.3%
Zoran Corp.*†
860
$
19,359
ATMI, Inc.*
590
19,027
INFORMATION TECHNOLOGY 11.9%
Dycom Industries, Inc.*†
710
18,921
Ansys, Inc.*†
1,050
$
43,533
j2 Global
Flir Systems, Inc.*
1,250
39,125
Communications, Inc.*†
870
18,418
Micros Systems, Inc.*†
550
38,588
MKS Instruments, Inc.*†
950
18,183
Polycom, Inc.*
1,300
36,114
Advent Software, Inc.*†
330
17,853
Foundry Networks, Inc.*†
2,020
35,390
Macrovision Corp.*†
970
17,780
Sybase, Inc.*†
1,300
33,917
Entegris, Inc.*
2,060
17,778
Equinix, Inc.*†
330
33,353
FEI Co.*
710
17,629
ON Semiconductor Corp.*†
3,510
31,169
Standard Microsystems Corp.*
450
17,581
Arris Group, Inc.*
3,067
30,611
Brooks Automation, Inc.*
1,310
17,305
Parametric Technology Corp.*†
1,680
29,988
Synaptics, Inc.*†
420
17,287
Anixter International, Inc.*
460
28,644
Semtech Corp.*†
1,110
17,227
Jack Henry & Associates, Inc.
1,150
27,991
Amkor Technology, Inc.*†
1,990
16,975
3Com Corp.*
5,890
26,623
Insight Enterprises, Inc.*
930
16,963
ValueClick, Inc.*
1,200
26,280
ViaSat, Inc.*
490
16,871
Atheros Communications, Inc.*
850
25,959
Mantech International
TIBCO Software, Inc.*†
3,090
24,936
Corp. — Class A*
380
16,652
Informatica Corp.*
1,380
24,868
Cabot Microelectronics Corp.*
460
16,519
Rofin-Sinar Technologies, Inc.*
500
24,055
Ariba, Inc.*
1,400
15,610
Itron, Inc.*†
250
23,992
SonicWALL, Inc.*
1,440
15,437
RF Micro Devices, Inc.*†
4,150
23,696
MTS Systems Corp.†
360
15,361
Concur Technologies, Inc.*
640
23,174
MicroStrategy, Inc. — Class A*
160
15,216
Progress Software Corp.*
680
22,902
Brightpoint, Inc.*
990
15,206
CACI International, Inc. —
Littelfuse, Inc.*
460
15,162
Class A*
500
22,385
Tessera Technologies, Inc.*†
360
14,976
Skyworks Solutions, Inc.*
2,580
21,930
Blue Coat Systems, Inc.*
450
14,791
Euronet Worldwide, Inc.*†
730
21,900
Epicor Software Corp.*
1,250
14,725
PMC - Sierra, Inc.*
3,330
21,778
Hutchinson Technology, Inc.*
550
14,476
SAIC, Inc.*†
1,080
21,730
SPSS, Inc.*
400
14,364
Quest Software, Inc.*
1,170
21,575
Methode Electronics, Inc. —
Lawson Software, Inc.*
2,100
21,504
Class A
870
14,303
Benchmark Electronics, Inc.*†
1,210
21,453
United Online, Inc.†
1,180
13,948
Netgear, Inc.*†
600
21,402
THQ, Inc.*
480
13,531
Electronics for Imaging, Inc.*†
950
21,356
Electro Scientific
Comtech
Industries, Inc.*
680
13,498
Telecommunications Corp.*
390
21,064
VistaPrint Ltd.*
310
13,283
Net 1 UEPS
Bankrate, Inc.*†
270
12,984
Technologies, Inc.*†
710
20,846
Pericom Semiconductor Corp.*
690
12,903
Plantronics, Inc.†
800
20,800
JDA Software Group, Inc.*
630
12,890
Cymer, Inc.*†
530
20,633
Novatel Wireless, Inc.*†
780
12,636
SRA International, Inc. —
Sycamore Networks, Inc.*
3,290
12,634
Class A*
700
20,615
Mattson Technology, Inc.*
1,440
12,326
Technitrol, Inc.
720
20,578
TheStreet.com, Inc.†
760
12,099
Nuance
EMS Technologies, Inc.*
400
12,096
Communications, Inc.*†
1,100
20,548
Microsemi Corp.*
540
11,956
Perot Systems Corp. —
CMGI, Inc.*
910
11,912
Class A*
1,500
20,250
AMIS Holdings, Inc.*
1,180
11,824
Avocent Corp.*†
850
19,813
Palm, Inc.†
1,840
11,666
MPS Group, Inc.*†
1,810
19,801
Immersion Corp.*†
900
11,655
Checkpoint Systems, Inc.*
750
19,485
64
|
THE RYDEX VARIABLE TRUST ANNUAL REPORT
See Notes to Financial Statements.

SCHEDULE OF INVESTMENTS (continued)
December 31, 2007
RUSSELL 2000® 1.5x STRATEGY FUND
MARKET
MARKET
VALUE
VALUE
SHARES
(NOTE 1)
SHARES
(NOTE 1)
CSG Systems
Mastec, Inc.*†
740
$
7,526
International, Inc.*
780
$
11,482
Diodes, Inc.*
250
7,517
Vignette Corp.*
780
11,396
Cohu, Inc.
490
7,497
Formfactor, Inc.*†
340
11,254
Extreme Networks, Inc.*
2,110
7,469
Sonus Networks, Inc.*†
1,910
11,135
SI International, Inc.*
270
7,417
Sigma Designs, Inc.*†
200
11,040
Take-Two Interactive
RealNetworks, Inc.*†
1,810
11,023
Software, Inc.*†
400
7,380
AsiaInfo Holdings, Inc.*
1,000
11,000
Faro Technologies, Inc.*
270
7,339
Loral Space &
EPIQ Systems, Inc.*
420
7,312
Communications, Inc.*
320
10,960
Super Micro Computer, Inc.*
950
7,286
Excel Technology, Inc.*
400
10,840
Harmonic, Inc.*
690
7,231
CTS Corp.†
1,090
10,824
Trident Microsystems, Inc.*†
1,100
7,216
Digi International, Inc.*
760
10,784
EarthLink, Inc.*
1,020
7,211
LoJack Corp.*
640
10,758
Adaptec, Inc.*
2,130
7,199
Gerber Scientific, Inc.*
980
10,584
S1 Corp.*
980
7,154
SYNNEX Corp.*
540
10,584
Intermec, Inc.*†
350
7,109
Black Box Corp.
290
10,489
Kulicke & Soffa
SYKES Enterprises, Inc.*
580
10,440
Industries, Inc.*†
1,030
7,066
Rimage Corp.*†
400
10,380
ADTRAN, Inc.†
330
7,055
infoUSA, Inc. — Class B
1,150
10,269
Heartland Payment
KEMET Corp.*
1,500
9,945
Systems, Inc.†
260
6,968
Art Technology Group, Inc.*†
2,290
9,893
MAXIMUS, Inc.
180
6,950
Sohu.com, Inc.*
180
9,814
Ultimate Software Group, Inc.*
220
6,923
Keynote Systems, Inc.*
690
9,694
The Knot, Inc.*
430
6,854
Digital River, Inc.*†
290
9,590
Manhattan Associates, Inc.*
260
6,854
SiRF Technology
Blackboard, Inc.*†
170
6,843
Holdings, Inc.*†
380
9,549
Plexus Corp.*
260
6,828
Vasco Data Security
LivePerson, Inc.*
1,270
6,782
International*
340
9,493
LoopNet, Inc.*†
480
6,744
Quantum Corp.*
3,470
9,334
Ness Technologies, Inc.*
730
6,738
iGate Corp.*
1,090
9,232
Greenfield Online, Inc.*
460
6,721
Photronics, Inc.*†
740
9,228
L-1 Identity Solutions, Inc.*†
370
6,642
Aspen Technology, Inc.*
560
9,083
Mentor Graphics Corp.*
610
6,576
Smart Modular Technologies
Rudolph Technologies, Inc.*†
580
6,566
WWH, Inc.*
890
9,060
Marchex, Inc.†
600
6,516
Ultra Clean Holdings*
740
9,028
Anadigics, Inc.*†
560
6,479
Cass Information Systems, Inc.
270
9,021
Blackbaud, Inc.
230
6,449
Wright Express Corp.*
250
8,872
DealerTrack Holdings, Inc.*†
190
6,359
Emulex Corp.*†
540
8,813
Imergent, Inc.†
600
6,354
TTM Technologies, Inc.*†
740
8,628
Gartner, Inc. — Class A*†
360
6,322
CPI International, Inc.*
500
8,550
Ciber, Inc.*
1,020
6,232
Micrel, Inc.
990
8,365
DSP Group, Inc.*
490
5,978
CNET Networks, Inc.*†
910
8,317
Measurement Specialties, Inc.*
270
5,967
Cirrus Logic, Inc.*†
1,570
8,290
Exar Corp.*
740
5,898
Triquint Semiconductor, Inc.*†
1,250
8,287
Wind River Systems, Inc.*†
660
5,894
Cogent, Inc.*
740
8,251
Avid Technology, Inc.*†
200
5,668
Advanced Energy
Chordiant Software, Inc.*
630
5,387
Industries, Inc.*
610
7,979
Cybersource Corp.*†
280
4,976
InterDigital, Inc.*
340
7,932
Omniture, Inc.*†
140
4,661
Radiant Systems, Inc.*
450
7,753
Agilysys, Inc.
290
4,385
Hittite Microwave Corp.*†
160
7,642
BearingPoint, Inc.*†
1,520
4,302
Newport Corp.*†
590
7,546
Cognex Corp.
210
4,232
See Notes to Financial Statements.
THE RYDEX VARIABLE TRUST ANNUAL REPORT
|
65

SCHEDULE OF INVESTMENTS (continued)
December 31, 2007
RUSSELL 2000® 1.5x STRATEGY FUND
MARKET
MARKET
VALUE
VALUE
SHARES
(NOTE 1)
SHARES
(NOTE 1)
Coherent, Inc.*
160
$
4,011
First Niagara Financial
Rogers Corp.*
80
3,470
Group, Inc.†
1,740
$
20,950
OmniVision
Strategic Hotels &
Technologies, Inc.*†
200
3,130
Resorts, Inc.†
1,220
20,411
Mercadolibre, Inc.*†
40
2,955
RLI Corp.
350
19,876
Scansource, Inc.*†
80
2,588
MB Financial Corp.
630
19,423
ACI Worldwide, Inc.*†
120
2,285
South Financial Group, Inc.†
1,240
19,381
CommScope, Inc.*
39
1,940
Citizens Banking Corp.†
1,330
19,298
Imation Corp.†
80
1,680
First Community Bancorp
460
18,970
Websense, Inc.*†
90
1,528
International Bancshares Corp.
900
18,846
Tekelec*
120
1,500
Prosperity Bancshares, Inc.
640
18,810
Sapient Corp.*
170
1,498
Odyssey Re Holdings Corp.
510
18,722
Commvault Systems, Inc.*
70
1,483
Sunstone Hotel Investors, Inc.†
1,020
18,656
Synchronoss
American Financial Realty Trust
2,320
18,606
Technologies, Inc.*†
40
1,418
United Bankshares, Inc.
660
18,493
SAVVIS, Inc.*†
50
1,396
Ares Capital Corp.
1,250
18,287
Daktronics, Inc.
60
1,354
Omega Healthcare
Applied Micro Circuits Corp.*
150
1,311
Investors, Inc.†
1,110
17,815
PC Connection, Inc.*
110
1,249
Signature Bank*†
520
17,550
Total Information Technology
2,606,409
Cash America
FINANCIALS 11.8%
International, Inc.†
540
17,442
Alexandria Real Estate
Digital Realty Trust, Inc.†
450
17,266
Equities, Inc.†
420
42,701
Boston Private Financial
Nationwide Health
Holdings, Inc.†
630
17,060
Properties, Inc.†
1,220
38,271
Navigators Group, Inc.*
260
16,900
Aspen Insurance
Pacific Capital Bancorp
830
16,708
Holdings Ltd.†
1,220
35,185
Provident Financial
Platinum Underwriters
Services, Inc.
1,140
16,439
Holdings Ltd.†
870
30,937
Lexington Realty Trust†
1,130
16,430
Senior Housing Properties Trust
1,250
28,350
Umpqua Holding Corp.†
1,070
16,414
ProAssurance Corp.*†
500
27,460
Stifel Financial Corp.*†
310
16,297
Waddell & Reed
Piper Jaffray Cos., Inc.*
350
16,212
Financial, Inc. — Class A†
740
26,707
Extra Space Storage, Inc.†
1,130
16,148
Montpelier Re Holdings Ltd.†
1,550
26,365
Acadia Realty Trust†
630
16,134
IPC Holdings Ltd.†
910
26,272
Sterling Savings Bank
960
16,118
SVB Financial Group*†
520
26,208
Horace Mann Educators Corp.
850
16,099
Max Capital Group Ltd.†
930
26,031
FNB Corp.†
1,070
15,729
Apollo Investment Corp.†
1,510
25,745
Glacier Bancorp, Inc.†
830
15,554
National Retail Properties, Inc.†
1,100
25,718
Alabama National
Delphi Financial Group, Inc. —
Bancorporation
190
14,784
Class A
680
23,990
Sterling Bancshares, Inc.†
1,320
14,731
BioMed Realty Trust, Inc.†
1,020
23,633
The Midland Co.
220
14,232
Realty Income Corp.†
870
23,507
Commerce Group, Inc.
390
14,032
Knight Capital Group, Inc. —
United Community Banks, Inc.
880
13,904
Class A*†
1,620
23,328
Parkway Properties, Inc.
370
13,683
DiamondRock Hospitality Co.†
1,490
22,320
Ashford Hospitality Trust, Inc.†
1,880
13,517
Phoenix Cos., Inc.
1,860
22,078
NBT Bancorp, Inc.
590
13,464
UCBH Holdings, Inc.†
1,540
21,806
MFA Mortgage
Cathay General Bancorp†
820
21,722
Investments, Inc.†
1,450
13,413
Entertainment
Gramercy Capital Corp.†
550
13,371
Properties Trust†
450
21,150
Chemical Financial Corp.†
560
13,322
Harleysville Group, Inc.
370
13,091
66
|
THE RYDEX VARIABLE TRUST ANNUAL REPORT
See Notes to Financial Statements.

SCHEDULE OF INVESTMENTS (continued)
December 31, 2007
RUSSELL 2000® 1.5x STRATEGY FUND
MARKET
MARKET
VALUE
VALUE
SHARES
(NOTE 1)
SHARES
(NOTE 1)
IBERIABANK Corp.†
280
$
13,090
Post Properties, Inc.†
300
$
10,536
MCG Capital Corp.†
1,090
12,633
GFI Group, Inc.*
110
10,529
FirstFed Financial Corp.*†
350
12,537
Marathon Acquisition Corp.*†
1,350
10,503
GAMCO Investors, Inc. —
United Fire & Casualty Co.
360
10,472
Class A†
180
12,456
Peoples Bancorp, Inc.
420
10,454
Potlatch Corp.†
280
12,443
Prospect Capital Corp.
800
10,440
National Western Life
Berkshire Hills Bancorp, Inc.
400
10,400
Insurance Co. — Class A
60
12,442
Community Bank System, Inc.
520
10,332
FBL Financial Group, Inc. —
Susquehanna Bancshares, Inc.†
560
10,326
Class A
360
12,431
LTC Properties, Inc.†
410
10,271
Hercules Technology Growth
Federal Agricultural
Capital, Inc.
990
12,296
Mortgage Corp.
390
10,265
Renasant Corp.
570
12,295
Winthrop Realty Trust
1,930
10,210
Medical Properties Trust Inc.†
1,190
12,126
WSFS Financial Corp.
200
10,040
Highwoods Properties, Inc.†
410
12,046
First Bancorp
530
10,012
Validus Holdings Ltd.*†
460
11,951
SWS Group, Inc.
790
10,009
National Financial
Central Pacific Financial Corp.
540
9,968
Partners Corp.†
260
11,859
Sun Bancorp, Inc.*
630
9,941
First Merchants Corp.
540
11,794
Baldwind & Lyons, Inc. —
Sandy Spring Bancorp, Inc.
420
11,684
Class B
360
9,886
First Charter Corp.†
390
11,645
West Coast Bancorp
530
9,805
Banco Latinoamericano de
First Midwest Bancorp, Inc.†
320
9,792
Exportaciones SA
710
11,580
PFF Bancorp, Inc.†
810
9,752
Presidential Life Corp.
660
11,557
Hilb Rogal & Hobbs Co.
240
9,737
Portfolio Recovery
NorthStar Realty
Associates, Inc.†
290
11,504
Finance Corp.†
1,090
9,723
First Financial Corp.
400
11,336
JER Investors Trust, Inc.†
900
9,693
Texas Capital Bancshares, Inc.*
620
11,315
Great Southern Bancorp, Inc.
440
9,662
First Mercury Financial Corp.*
460
11,224
Home Properties, Inc.†
210
9,419
Amtrust Financial
Community Bancorp*
530
9,206
Services, Inc.†
810
11,154
Darwin Professional
Assured Guaranty Ltd.
420
11,147
Underwriters, Inc.*
380
9,185
First Industrial Realty
Kohlberg Capital Corp.
760
9,120
Trust, Inc.†
320
11,072
Hilltop Holdings, Inc.*
830
9,064
Chittenden Corp.
310
11,042
Flagstone Reinsurance H
Capital Trust, Inc. — Class A†
360
11,034
oldings
650
9,035
First Bancorp Puerto Rico†
1,480
10,789
Asta Funding, Inc.†
340
8,990
American Physicians
Sierra Bancorp
360
8,960
Capital, Inc.†
260
10,780
Arbor Realty Trust, Inc.
550
8,861
Zenith National
optionsXpress Holdings, Inc.†
260
8,793
Insurance Corp.†
240
10,735
Mission West Properties
910
8,654
Bancfirst Corp.
250
10,713
Washington Real Estate
SeaBright Insurance
Investment Trust†
270
8,481
Holdings, Inc.*
710
10,707
Anworth Mortgage
DCT Industrial Trust, Inc.
1,150
10,707
Asset Corp.†
1,019
8,417
Financial Federal Corp.†
480
10,699
Interactive Brokers Group,
CNA Surety Corp.*
540
10,687
Inc. — Class A*
260
8,403
Ramco-Gershenson
Castlepoint Holdings Ltd.
700
8,400
Properties Trust
500
10,685
LaSalle Hotel Properties†
260
8,294
FirstMerit Corp.†
530
10,605
Anthracite Capital, Inc.†
1,140
8,254
AmericanWest Bancorp
600
10,578
United America Indemnity
Amerisafe, Inc.*
680
10,547
Ltd. — Class A*
410
8,167
See Notes to Financial Statements.
THE RYDEX VARIABLE TRUST ANNUAL REPORT
|
67

SCHEDULE OF INVESTMENTS (continued)
December 31, 2007
RUSSELL 2000® 1.5x STRATEGY FUND
MARKET
MARKET
VALUE
VALUE
SHARES
(NOTE 1)
SHARES
(NOTE 1)
Corus Bankshares, Inc.†
760
$
8,109
FelCor Lodging Trust, Inc.†
390
$
6,080
NewAlliance Bancshares, Inc.
700
8,064
Mid-America Apartment
Columbia Banking
Communities, Inc.†
140
5,985
Systems, Inc.†
270
8,027
Irwin Financial Corp.†
790
5,807
Westamerica Bancorporation†
180
8,019
Royal Bancshares of
Cedar Shopping Centers, Inc.
780
7,979
Pennsylvania, Inc. — Class A
470
5,170
BRT Realty Trust†
520
7,956
Maguire Properties, Inc.†
160
4,715
Hallmark Financial
Eastgroup Properties, Inc.†
110
4,604
Services, Inc.*†
500
7,930
First Indiana Corp.
140
4,480
BankAtlantic Bancorp, Inc. —
Franklin Bank Corp.*
990
4,267
Class A
1,900
7,790
Hancock Holding Co.†
110
4,202
Advanta Corp.
960
7,747
Pennsylvania Real Estate
Thomas Weisel Partners
Investment Trust
140
4,155
Group, Inc.*
560
7,689
Old National Bancorp†
240
3,590
Triad Guaranty, Inc.*†
780
7,644
Meadowbrook Insurance
WesBanco, Inc.
370
7,622
Group, Inc.*
340
3,199
World Acceptance Corp.*†
280
7,554
Equity Lifestyle Properties, Inc.
70
3,197
Brookline Bancorp, Inc.†
740
7,518
Franklin Street
Deerfield Capital Corp.†
920
7,360
Properties Corp., Inc.†
210
3,108
Greenhill & Co., Inc.†
110
7,313
Cousins Properties, Inc.†
140
3,094
Green Bankshares, Inc.
380
7,296
Employers Holdings, Inc.
160
2,674
Bank Mutual Corp.
690
7,293
PS Business Parks, Inc.
50
2,628
National Health Investors, Inc.
260
7,254
Enstar Group*
20
2,448
Corporate Office Properties
Equity One, Inc.†
100
2,303
Trust SBI†
230
7,245
Wintrust Financial Corp.
60
1,988
Ezcorp, Inc. — Class A*
640
7,226
Park National Corp.†
30
1,935
Healthcare Realty Trust, Inc.†
280
7,109
First Commonwealth
Ocwen Financial Corp.*†
1,270
7,036
Financial Corp.†
180
1,917
TrustCo Bank Corp.†
700
6,944
First Financial Bankshares, Inc.
50
1,883
Inland Real Estate Corp.†
490
6,938
Simmons First National Corp.
60
1,590
UMB Financial Corp.†
180
6,905
Investors Bancorp, Inc.*†
100
1,414
Selective Insurance
S&T Bancorp, Inc.
50
1,382
Group, Inc.†
300
6,897
Redwood Trust, Inc.†
40
1,370
Resource Capital Corp.†
740
6,889
National Penn
Frontier Financial Corp.†
370
6,871
Bancshares, Inc.†
90
1,363
First State Bancorporation
490
6,811
CVB Financial Corp.†
130
1,344
MarketAxess Holdings, Inc.*†
530
6,800
American Campus
Tanger Factory Outlet
Communities, Inc.
50
1,343
Centers, Inc.†
180
6,788
Provident Bankshares Corp.
60
1,283
Preferred Bank
260
6,765
KBW, Inc.*†
50
1,280
Independent Bank Corp.
710
6,745
Downey Financial Corp.†
40
1,244
Midwest Banc Holdings, Inc.
540
6,707
RAIT Financial Trust†
140
1,207
Bankunited Financial Corp. —
Alfa Corp.
30
650
Class A†
960
6,624
Total Financials
2,586,735
Sovran Self Storage, Inc.†
160
6,416
HEALTH CARE 10.0%
Saul Centers, Inc.
120
6,412
Hologic, Inc.*†
1,470
100,901
Trustmark Corp.†
250
6,340
BioMarin
Argo Group International
Pharmaceuticals, Inc.*†
1,320
46,728
Holdings Ltd.*
150
6,320
MGI Pharma, Inc.*
1,070
43,367
Security Bank Corp.†
680
6,215
Onyx Pharmaceuticals, Inc.*
740
41,159
Hanmi Financial Corp.
710
6,120
OSI Pharmaceuticals, Inc.*
790
38,323
Newcastle Investment Corp.†
470
6,091
Perrigo Co.†
1,080
37,811
68
|
THE RYDEX VARIABLE TRUST ANNUAL REPORT
See Notes to Financial Statements.

SCHEDULE OF INVESTMENTS (continued)
December 31, 2007
RUSSELL 2000® 1.5x STRATEGY FUND
MARKET
MARKET
VALUE
VALUE
SHARES
(NOTE 1)
SHARES
(NOTE 1)
Inverness Medical
AmSurg Corp.*
620
$
16,777
Innovations, Inc.*†
620
$
34,832
Phase Forward, Inc.*
770
16,747
Adams Respiratory
Integra LifeSciences
Therapeutics, Inc.*
520
31,065
Holdings Corp.*†
380
15,933
United Therapeutics Corp.*†
300
29,295
Healthspring, Inc.*
830
15,811
Myriad Genetics, Inc.*†
630
29,245
Sun Healthcare Group, Inc.*
920
15,796
Bio-Rad Laboratories, Inc. —
Healthways, Inc.*†
270
15,779
Class A*
280
29,014
Bruker BioSciences Corp.*
1,140
15,162
AMERIGROUP Corp.*†
790
28,795
Invacare Corp.†
600
15,120
Varian, Inc.*
440
28,732
PharmaNet
Steris Corp.†
980
28,263
Development Group, Inc.*
380
14,900
Illumina, Inc.*†
470
27,852
Sciele Pharma, Inc.*†
710
14,519
Magellan Health Services, Inc.*
590
27,512
Res-Care, Inc.*
570
14,341
Owens & Minor, Inc.†
640
27,155
Symmetry Medical, Inc.*
820
14,293
Haemonetics Corp.*
420
26,468
Kendle International, Inc.*†
290
14,187
Ventana Medical Systems, Inc.*
300
26,169
Conmed Corp.*†
610
14,097
Psychiatric Solutions, Inc.*†
800
26,000
AMN Healthcare Services, Inc.*
820
14,079
Affymetrix, Inc.*†
1,090
25,223
Sirona Dental Systems, Inc.*†
410
13,727
Alkermes, Inc.*
1,600
24,944
Matria Healthcare, Inc.*
570
13,549
Dionex Corp.*
300
24,858
The Trizetto Group, Inc.*†
780
13,549
Medicis Pharmaceutical
SonoSite, Inc.*†
400
13,468
Corp. — Class A†
900
23,373
Vital Signs, Inc.†
260
13,291
Alexion Pharmaceuticals, Inc.*†
310
23,259
Molina Healthcare, Inc.*†
340
13,158
LifeCell Corp.*†
530
22,848
Alnylam Pharmaceuticals, Inc.*†
450
13,086
Chemed Corp.
400
22,352
SurModics, Inc.*†
240
13,025
Parexel International Corp.*
460
22,218
Gentiva Health Services, Inc.*†
680
12,947
NuVasive, Inc.*
560
22,131
Air Methods Corp.*
260
12,914
Amedisys, Inc.*†
450
21,834
eResearch Technology, Inc.*
1,050
12,411
Universal American
Greatbatch, Inc.*†
610
12,194
Financial Corp.*
840
21,496
Natus Medical, Inc.*
630
12,190
Applera Corp. - Celera Group*
1,340
21,266
Cepheid, Inc.*
460
12,121
Centene Corp.*†
770
21,129
ICU Medical, Inc.*†
335
12,063
XenoPort, Inc.*†
370
20,676
Datascope Corp.
330
12,012
ArthroCare Corp.*†
430
20,661
Enzon Pharmaceuticals, Inc.*†
1,260
12,008
Medarex, Inc.*†
1,980
20,632
RehabCare Group, Inc.*
530
11,957
Eclipsys Corp.*†
800
20,248
National Healthcare Corp.
220
11,374
Meridian Bioscience, Inc.
670
20,154
LHC Group, Inc.*
450
11,241
Valeant Pharmaceuticals
Bentley Pharmaceuticals, Inc.*†
740
11,167
International*†
1,660
19,870
Healthsouth Corp.*†
530
11,130
Cubist Pharmaceuticals, Inc.*†
950
19,484
Nektar Therapeutics*
1,630
10,937
Martek Biosciences Corp.*†
650
19,227
Albany Molecular
Immucor, Inc.*†
550
18,694
Research, Inc.*
760
10,929
American Medical Systems
Merit Medical Systems, Inc.*
780
10,842
Holdings, Inc.*
1,270
18,364
Cypress Bioscience, Inc.*†
980
10,809
Orthofix International NV*
310
17,971
MWI Veterinary Supply, Inc.*
270
10,800
inVentiv Health, Inc.*
580
17,957
Pharmion Corp.*†
170
10,686
Align Technology, Inc.*†
1,050
17,514
Medical Action
Par Pharmaceutical Cos., Inc.*
720
17,280
Industries, Inc.*†
500
10,425
Omnicell, Inc.*
640
17,235
Medcath Corp.*
410
10,070
Analogic Corp.
250
16,930
Quidel Corp.*
510
9,930
Alpharma, Inc. — Class A*†
840
16,926
Regeneron
Apria Healthcare Group, Inc.*
780
16,825
Pharmaceuticals, Inc.*†
410
9,901
See Notes to Financial Statements.
THE RYDEX VARIABLE TRUST ANNUAL REPORT
|
69

SCHEDULE OF INVESTMENTS (continued)
December 31, 2007
RUSSELL 2000® 1.5x STRATEGY FUND
MARKET
MARKET
VALUE
VALUE
SHARES
(NOTE 1)
SHARES
(NOTE 1)
Viropharma, Inc.*†
1,240
$
9,846
Teledyne Technologies, Inc.*
520
$
27,732
Emergency Medical
GrafTech International Ltd.*
1,560
27,690
Services Corp. — Class A*†
330
9,662
Deluxe Corp.
790
25,983
Cynosure, Inc.*†
350
9,261
SkyWest, Inc.
950
25,507
Dendreon Corp.*†
1,480
9,206
Barnes Group, Inc.†
750
25,042
Salix Pharmaceuticals Ltd.*†
1,130
8,904
Esterline Technologies Corp.*
470
24,322
Zoll Medical Corp.*
330
8,818
Baldor Electric Co.
710
23,899
Cantel Medical Corp.*
600
8,748
EMCOR Group, Inc.*
990
23,394
Isis Pharmaceuticals, Inc.*†
550
8,662
Regal-Beloit Corp.†
510
22,924
Human Genome
IKON Office Solutions, Inc.
1,760
22,915
Sciences, Inc.*†
810
8,456
Triumph Group, Inc.
270
22,234
Seattle Genetics, Inc.*†
740
8,436
Wabtec Corp.†
640
22,042
Halozyme Therapeutics, Inc.*†
1,140
8,105
Applied Industrial
Sunrise Senior Living, Inc.*
260
7,977
Technologies, Inc.†
730
21,185
Cross Country Healthcare, Inc.*
560
7,974
Granite Construction, Inc.
580
20,984
Wright Medical Group, Inc.*†
260
7,584
United Stationers, Inc.*
430
19,870
PSS World Medical, Inc.*
380
7,437
Mueller Industries, Inc.
660
19,133
Mentor Corp.†
190
7,429
Robbins & Myers, Inc.
250
18,907
Geron Corp.*†
1,300
7,384
Mueller Water Products, Inc. —
West Pharmaceutical
Class A†
1,980
18,850
Services, Inc.
180
7,306
Hexcel Corp.*†
770
18,696
AMAG Pharmaceuticals, Inc.*†
120
7,216
Alaska Air Group, Inc.*
730
18,257
OraSure Technologies, Inc.*
810
7,201
Perini Corp.*†
440
18,225
Exelixis, Inc.*
820
7,077
Curtiss-Wright Corp.†
360
18,072
Nabi Biopharmaceuticals*†
1,950
7,039
Kaman Corp. — Class A
490
18,037
KV Pharmaceutical Co.*†
240
6,850
Simpson
Ariad Pharmaceuticals, Inc.*
1,530
6,503
Manufacturing Co., Inc.†
670
17,815
Obagi Medical Products, Inc.*
350
6,402
Goodman Global, Inc.*
725
17,791
CytRx Corp.*†
2,180
6,191
Watsco, Inc.†
450
16,542
Allscripts Healthcare
G & K Services, Inc. — Class A
430
16,134
Solutions, Inc.*
230
4,467
Interface, Inc. — Class A†
980
15,994
Thoratec Corp.*
190
3,456
Korn/Ferry International, Inc.*
840
15,809
Medicines Co.*†
180
3,449
Circor International, Inc.
340
15,762
Neurocrine Biosciences, Inc.*
740
3,360
Woodward Governor Co.†
230
15,628
Auxilium Pharmaceuticals, Inc.*
100
2,999
ABM Industries, Inc.
760
15,496
Incyte Corp.*
250
2,513
Heidrick & Struggles
Savient Pharmaceuticals, Inc.*†
100
2,297
International, Inc.†
410
15,215
HealthExtras, Inc.*
80
2,086
Atlas Air Worldwide
Abaxis, Inc.*
40
1,434
Holdings Co., Inc.*
280
15,182
Kindred Healthcare, Inc.*
50
1,249
A.O. Smith Corp.
430
15,071
Total Health Care
2,182,701
UAP Holding Corp.
390
15,054
INDUSTRIALS 9.5%
Cubic Corp.
380
14,896
FTI Consulting, Inc.*†
650
40,066
Republic Airways
Genlyte Group, Inc.*
390
37,128
Holdings, Inc.*
760
14,888
Bucyrus International, Inc. —
Old Dominion Freight
Class A
340
33,793
Line, Inc.*†
630
14,559
Herman Miller, Inc.
960
31,094
M&F Worldwide Corp.*†
270
14,539
Waste Connections, Inc.*
980
30,282
IHS, Inc.*
240
14,534
Acuity Brands, Inc.†
650
29,250
DynCorp International,
Watson Wyatt & Co. Holdings†
630
29,238
Inc. — Class A*
540
14,515
Belden, Inc.†
650
28,925
GeoEye, Inc.*†
430
14,469
Actuant Corp. — Class A†
830
28,228
Clarcor, Inc.
380
14,429
70
|
THE RYDEX VARIABLE TRUST ANNUAL REPORT
See Notes to Financial Statements.

SCHEDULE OF INVESTMENTS (continued)
December 31, 2007
RUSSELL 2000® 1.5x STRATEGY FUND
MARKET
MARKET
VALUE
VALUE
SHARES
(NOTE 1)
SHARES
(NOTE 1)
EnPro Industries, Inc.*
470
$
14,406
EnerSys*
380
$
9,485
Columbus McKinnon Corp. —
Mine Safety Appliances Co.†
180
9,337
Class A*†
440
14,353
Pacer International, Inc.
630
9,198
Rush Enterprises, Inc. —
Standex International Corp.
520
9,074
Class A*
785
14,271
Hardinge, Inc.
540
9,061
Walter Industries, Inc.†
390
14,013
Tredegar Corp.
560
9,005
Nordson Corp.†
240
13,910
Preformed Line Products Co.†
150
8,925
NCI Building Systems, Inc.*†
480
13,819
Huron Consulting Group, Inc.*
110
8,869
Werner Enterprises, Inc.†
810
13,794
Orbital Sciences Corp.*†
360
8,827
Comfort Systerms USA, Inc.
1,070
13,675
Celadon Group, Inc.*†
950
8,702
Interline Brands, Inc.*
620
13,584
Arkansas Best Corp.†
390
8,557
Brady Corp. — Class A†
370
12,983
ESCO Technologies, Inc.*†
210
8,387
School Specialty, Inc.*
370
12,784
Cascade Corp.
180
8,363
Bowne & Co., Inc.
710
12,496
Blount International, Inc.*
670
8,248
LB Foster Co. — Class A*
240
12,415
American Reprographics Co.*†
500
8,240
Universal Forest Products, Inc.
420
12,373
Geo Group, Inc.*†
290
8,120
Dollar Thrifty Automotive
Barrett Business Services, Inc.
450
8,105
Group, Inc.*
520
12,314
NACCO Industries, Inc. —
Superior Essex, Inc.*
510
12,240
Class A
80
7,975
Chart Industries, Inc.*
390
12,051
Pike Electric Corp.*
470
7,877
TrueBlue, Inc.*
830
12,018
Evergreen Solar, Inc.*†
450
7,772
Consolidated Graphics, Inc.*
250
11,955
Kenexa Corp. — Class A*
400
7,768
II-VI, Inc.*
390
11,915
Ennis Inc.
430
7,740
Moog, Inc. — Class A*†
260
11,911
Kelly Services, Inc.†
410
7,651
AirTran Holdings, Inc.*†
1,630
11,671
Heico Corp.†
140
7,627
Valmont Industries, Inc.
130
11,586
AAR Corp.*†
200
7,606
Kadant, Inc.*
390
11,571
Ceradyne, Inc.*
160
7,509
Gibraltar Industries, Inc.
750
11,565
Taser International, Inc.*†
520
7,483
Spherion Corp.*
1,580
11,502
Energy Conversion
Apogee Enterprises, Inc.
670
11,464
Devices, Inc.*†
220
7,403
Northwest Pipe Co.*
290
11,351
Courier Corp.
220
7,262
Twin Disc, Inc.
160
11,323
TransDigm Group, Inc.*
160
7,227
Encore Wire Corp.†
700
11,144
Wabash National Corp.†
920
7,075
Navigant Consulting, Inc.*
810
11,073
Eagle Bulk Shipping, Inc.†
260
6,903
Integrated Electrical
Knoll, Inc.
420
6,901
Services, Inc.*
580
10,898
Tetra Tech, Inc.*†
320
6,880
Michael Baker Corp.*
260
10,686
Genesee & Wyoming, Inc. —
Ampco-Pittsburgh Corp.
280
10,676
Class A*
280
6,768
PHH Corp.*
600
10,584
Griffon Corp.*†
520
6,474
LSI Industries, Inc.
580
10,556
Aecom Technology Corp.*
220
6,285
AZZ, Inc.*
370
10,490
Genco Shipping & Trading Ltd.
110
6,024
CDI Corp.†
430
10,432
JetBlue Airways Corp.*†
1,010
5,959
COMSYS IT Partners, Inc.*
660
10,415
Advisory Board Co.*
90
5,777
Waste Industries USA, Inc.
280
10,164
Briggs & Stratton Corp.†
240
5,438
Kforce, Inc.*
1,040
10,140
American
Pinnacle Airlines Corp.*
660
10,065
Superconductor Corp.*†
180
4,921
Park-Ohio Holdings Corp.*
400
10,040
Albany International Corp. —
Hurco Cos., Inc.*
230
10,040
Class A†
130
4,823
Dynamex, Inc.*
370
10,012
HUB Group, Inc. — Class A*†
180
4,784
Schawk, Inc.
640
9,933
Cenveo, Inc.*†
250
4,368
Kaydon Corp.†
180
9,817
Midwest Air Group, Inc.*
270
3,996
Federal Signal Corp.
850
9,537
Middleby Corp.*†
50
3,831
See Notes to Financial Statements.
THE RYDEX VARIABLE TRUST ANNUAL REPORT
|
71

SCHEDULE OF INVESTMENTS (continued)
December 31, 2007
RUSSELL 2000® 1.5x STRATEGY FUND
MARKET
MARKET
VALUE
VALUE
SHARES
(NOTE 1)
SHARES
(NOTE 1)
Forward Air Corp.†
120
$
3,740
Regis Corp.
750
$
20,970
Resources Connection, Inc.
190
3,450
Interactive Data Corp.
630
20,796
Watts Industries, Inc. —
Strayer Education, Inc.†
120
20,470
Class A†
110
3,278
Callaway Golf Co.†
1,140
19,870
Teletech Holdings, Inc.*
140
2,978
Collective Brands, Inc.*
1,130
19,651
Knight Transportation, Inc.†
200
2,962
Gemstar-TV Guide
CoStar Group, Inc.*
60
2,835
International, Inc.*†
4,090
19,468
Ameron International Corp.
30
2,765
Scholastic Corp.*
550
19,189
Healthcare Services Group†
130
2,753
LKQ Corp.*†
900
18,918
ACCO Brands Corp.*†
170
2,727
Cooper Tire & Rubber Co.
1,130
18,735
Clean Harbors, Inc.*†
50
2,585
American Greetings Corp. —
Layne Christensen Co.*
50
2,461
Class A†
920
18,676
American Commercial
Rent-A-Center, Inc.*†
1,240
18,005
Lines, Inc.*†
150
2,436
Iconix Brand Group, Inc.*
880
17,301
Heartland Express, Inc.
170
2,411
Bob Evans Farms, Inc.
620
16,697
Force Protection, Inc.*†
480
2,246
Bright Horizons Family
RBC Bearings, Inc.*†
50
2,173
Solutions, Inc.*†
480
16,579
Rollins, Inc.
110
2,112
Jackson Hewitt Tax Service, Inc.
520
16,510
Viad Corp.
50
1,579
American Axle & Manufacturing
Titan International, Inc.
50
1,563
Holdings, Inc.†
870
16,199
Franklin Electric Co., Inc.†
40
1,531
Stewart Enterprises, Inc. —
Astec Industries, Inc.*
40
1,488
Class A†
1,820
16,198
Administaff, Inc.
50
1,414
Ethan Allen Interiors, Inc.†
550
15,675
Lindsay Manufacturing Co.†
20
1,414
Zale Corp.*†
970
15,578
Gencorp, Inc.*†
120
1,399
Tupperware Brands Corp.†
470
15,524
Tennant Co.†
30
1,329
Deckers Outdoor Corp.*
100
15,506
Amerco, Inc.*
20
1,314
Steiner Leisure Ltd.*†
350
15,456
Mobile Mini, Inc.*
70
1,298
Lee Enterprises, Inc.
980
14,357
FuelCell Energy, Inc.*
130
1,290
CEC Entertainment, Inc.*†
550
14,278
Dynamic Materials Corp.
20
1,178
Jakks Pacific, Inc.*
600
14,166
Total Industrials
2,083,560
DG FastChannel, Inc.*
550
14,102
CONSUMER DISCRETIONARY 9.0%
Brown Shoe Co., Inc.†
910
13,805
Priceline.com, Inc.*†
490
56,281
Stage Stores, Inc.†
930
13,764
790
41,048
Columbia Sportswear Co.†
310
13,668
Chipotle Mexican Grill, Inc.*
310
38,145
Jos. A. Bank Clothiers, Inc.*†
480
13,656
Bally Technologies Inc.*
760
37,787
Aftermarket Technology Corp.*
500
13,630
Sotheby’s Holdings, Inc. —
Blockbuster, Inc. — Class A*†
3,440
13,416
Class A†
920
35,052
Champion Enterprises, Inc.*†
1,420
13,376
Lear Corp.*†
1,100
30,426
Unifirst Corp.
350
13,300
Aeropostale, Inc.*†
1,130
29,945
Pre-Paid Legal Services, Inc.*†
240
13,284
J. Crew Group, Inc.*†
580
27,962
Dress Barn, Inc.*
1,060
13,261
Tempur-Pedic
Valassis
International, Inc.†
1,070
27,788
Communications, Inc.*†
1,110
12,976
Fossil, Inc.*
650
27,287
Blyth, Inc.
590
12,945
Polaris Industries, Inc.†
550
26,273
RC2 Corp.*
460
12,912
Jack in the Box, Inc.*
960
24,739
Helen of Troy Ltd.*
750
12,855
WMS Industries, Inc.*
670
24,549
Cato Corp. — Class A†
810
12,685
Warnaco Group, Inc.*
700
24,360
Sonic Automotive, Inc.
640
12,390
Belo Corp. — Class A†
1,370
23,893
Drew Industries, Inc.*
450
12,330
Men’s Wearhouse, Inc.†
830
22,393
Media General, Inc.†
570
12,112
Wolverine World Wide, Inc.†
880
21,578
Universal Electronics, Inc.*
360
12,038
72
|
THE RYDEX VARIABLE TRUST ANNUAL REPORT
See Notes to Financial Statements.

SCHEDULE OF INVESTMENTS (continued)
December 31, 2007
RUSSELL 2000® 1.5x STRATEGY FUND
MARKET
MARKET
VALUE
VALUE
SHARES
(NOTE 1)
SHARES
(NOTE 1)
Red Robin Gourmet
PEP Boys-Manny Moe & Jack†
710
$
8,151
Burgers, Inc.*
370
$
11,836
Multimedia Games, Inc.*†
960
8,006
Charming Shoppes, Inc.*†
2,180
11,794
Netflix, Inc.*†
300
7,986
Lin TV Corp. — Class A*
950
11,561
Kellwood Co.
470
7,821
Buckle, Inc.
350
11,550
Morningstar, Inc.*
100
7,775
Speedway Motorsports, Inc.†
370
11,500
Premier Exhibitions, Inc.*†
690
7,549
Life Time Fitness, Inc.*†
230
11,426
Ambassadors Group, Inc.
410
7,507
Gaylord Entertainment Co.*†
280
11,332
AFC Enterprises, Inc.*
660
7,471
Skechers U.S.A., Inc. —
Tenneco, Inc.*
280
7,300
Class A*
570
11,121
Journal Communications,
Maidenform Brands, Inc.*
820
11,095
Inc. — Class A†
810
7,241
Monro Muffler Brake, Inc.
560
10,914
Cox Radio Inc. — Class A*
590
7,168
Core-Mark Holding Co., Inc.*
380
10,914
World Wrestling
Movado Group, Inc.
430
10,875
Entertainment, Inc.
480
7,085
Vail Resorts, Inc.*†
200
10,762
O’Charleys, Inc.
460
6,891
Russ Berrie & Co., Inc.*
630
10,307
NexCen Brands, Inc.*
1,420
6,873
Systemax, Inc.†
500
10,160
Fred’s, Inc.†
710
6,837
Fisher Communications, Inc.*
265
10,059
CBRL Group, Inc.
210
6,802
Avatar Holdings, Inc.*†
240
10,037
Denny’s Corp.*
1,790
6,713
CSS Industries, Inc.
270
9,909
Quiksilver, Inc.*
780
6,692
Hooker Furniture Corp.†
490
9,849
Citadel Broadcasting Corp.†
3,240
6,674
Group 1 Automotive, Inc.†
410
9,737
Triarc Cos., Inc. — Class B
760
6,658
Monaco Coach Corp.
1,090
9,679
Steven Madden, Ltd.*
330
6,600
Weyco Group, Inc.
350
9,625
Bluegreen Corp.*†
910
6,543
Entravision Communications
Asbury Automotive Group, Inc.
430
6,472
Corp. — Class A*
1,210
9,474
Gymboree Corp.*
210
6,397
Genesco, Inc.*†
250
9,450
Carter’s, Inc.*
330
6,386
Matthews International
Winnebago Industries, Inc.†
300
6,306
Corp. — Class A
200
9,374
Buffalo Wild Wings, Inc.*
270
6,269
Steinway Musical Instruments
340
9,374
Monarch Casino & Resort, Inc.*
260
6,261
Ruby Tuesday, Inc.†
960
9,360
Benihana, Inc.*
480
6,120
Marvel Entertainment, Inc.*
350
9,348
DSW, Inc.*†
320
6,003
G-III Apparel Group Ltd.*
630
9,305
Marcus Corp.†
380
5,871
FTD Group, Inc.
720
9,274
Arbitron, Inc.†
140
5,820
Modine Manufacturing Co.
560
9,246
Big 5 Sporting Goods Corp.†
400
5,768
Build-A-Bear Workshop, Inc.*†
650
9,067
Jo-Ann Stores, Inc.*†
440
5,755
Pinnacle Entertainment, Inc.*†
380
8,953
Under Armour, Inc.*†
130
5,677
Amerigon, Inc.*
420
8,879
Jamba, Inc.*†
1,530
5,661
Sealy Corp.†
790
8,840
Beazer Homes USA, Inc.†
720
5,350
Perry Ellis International, Inc.*
570
8,767
CKX, Inc.*
420
5,040
Exide Technologies*†
1,090
8,720
Spartan Motors, Inc.†
630
4,813
Conn’s, Inc.*†
500
8,555
Live Nation, Inc.*†
330
4,792
Furniture Brands
National CineMedia, Inc.
180
4,538
International, Inc.†
850
8,551
Pacific Sunwear of
Charter Communications,
California, Inc.*
310
4,374
Inc. — Class A*†
7,290
8,529
CSK Auto Corp.*†
760
3,808
INVESTools, Inc.*
480
8,515
Blue Nile, Inc.*†
50
3,403
Corinthian Colleges, Inc.*†
550
8,470
Riviera Holdings Corp.*
110
3,388
Global Sources Ltd.*
297
8,381
Sally Beauty Holdings, Inc.*†
350
3,168
Sonic Corp.*
380
8,322
Tween Brands, Inc.*†
110
2,913
Hayes Lemmerz
Timberland Co. — Class A*
150
2,712
International, Inc.*
1,800
8,226
Aaron Rents, Inc.†
140
2,694
See Notes to Financial Statements.
THE RYDEX VARIABLE TRUST ANNUAL REPORT
|
73

SCHEDULE OF INVESTMENTS (continued)
December 31, 2007
RUSSELL 2000® 1.5x STRATEGY FUND
MARKET
MARKET
VALUE
VALUE
SHARES
(NOTE 1)
SHARES
(NOTE 1)
Salem Communications
International Coal
Corp. — Class A
400
$
2,636
Group, Inc.*†
2,260
$
12,114
Cumulus Media, Inc. —
Uranium Resources, Inc.*†
920
11,482
Class A*†
318
2,557
Bronco Drilling Co., Inc.*
770
11,434
CKE Restaurants, Inc.
160
2,112
Penn Virginia Corp.†
260
11,344
ArvinMeritor, Inc.†
170
1,994
Bois d’Arc Energy, Inc.*
570
11,314
TiVo, Inc.*
230
1,918
Delek US Holdings, Inc.
530
10,722
Coinstar, Inc.*
50
1,408
Alon USA Energy, Inc.†
390
10,600
Hibbett Sports Inc.*†
70
1,399
Pioneer Drilling Co.*
890
10,573
Ameristar Casinos, Inc.†
50
1,377
Trico Marine Services, Inc.*†
280
10,366
Capella Education Co.*
20
1,309
Allis-Chalmers Energy, Inc.*†
700
10,325
Borders Group, Inc.†
120
1,278
Pacific Ethanol, Inc.*†
1,250
10,262
Texas Roadhouse, Inc.*†
110
1,217
Matrix Service Co.*
470
10,255
P.F. Chang’s China Bistro, Inc.*†
50
1,142
Union Drilling, Inc.*
640
10,093
IHOP Corp.†
30
1,097
T-3 Energy Services, Inc. —
Total Consumer Discretionary
1,973,351
Class A*
210
9,872
ENERGY 4.5%
Aventine Renewable Energy
Exterran Holdings, Inc.*†
590
48,262
Holdings, Inc.*
770
9,825
Atwood Oceanics, Inc.*†
380
38,091
Dril-Quip, Inc.*
170
9,462
Whiting Petroleum Corp.*
600
34,596
Arena Resources, Inc.*†
220
9,176
Alpha Natural Resources, Inc.*†
960
31,181
Newpark Resources, Inc.*
1,590
8,665
Mariner Energy, Inc.*†
1,290
29,515
Contango Oil & Gas Co.*
170
8,651
Hercules Offshore*†
1,210
28,774
Willbros Group, Inc.*
220
8,424
W-H Energy Services, Inc.*†
480
26,981
Harvest Natural
Berry Petroleum Co. —
Resources, Inc.*
670
8,375
Class A†
600
26,670
Crosstex Energy, Inc.†
210
7,820
Oil States International, Inc.*†
770
26,272
Atlas America, Inc.
130
7,693
PetroHawk Energy Corp.*†
1,470
25,446
Warren Resources, Inc.*
540
7,630
Comstock Resources, Inc.*
710
24,140
Callon Petroleum Co.*
460
7,567
Stone Energy Corp.*
470
22,048
Bill Barrett Corp.*
170
7,118
Swift Energy Co.*†
500
22,015
Carrizo Oil & Gas, Inc.*
130
7,117
ION Geophysical Corp.*†
1,240
19,567
Knightsbridge Tankers Ltd.†
290
7,004
Bristow Group, Inc.*†
340
19,261
World Fuel Services Corp.
230
6,677
GulfMark Offshore, Inc.*
410
19,184
Energy Partners Ltd.*
540
6,377
NATCO Group, Inc.*†
340
18,411
Double Hull Tankers, Inc.
520
6,365
USEC, Inc.*†
2,000
18,000
Delta Petroleum Corp.*†
300
5,655
Grey Wolf, Inc.*
3,290
17,536
Oilsands Quest, Inc.*†
1,260
5,141
Rosetta Resources, Inc.*†
880
17,450
ATP Oil & Gas Corp.*†
90
4,549
Basic Energy Services, Inc.*†
790
17,340
Nordic American Tanker
Lufkin Industries, Inc.
300
17,187
Shipping†
130
4,267
EXCO Resources, Inc.*
1,070
16,564
Hornbeck Offshore
Golar LNG Ltd.†
730
16,148
Services, Inc.*†
90
4,046
CARBO Ceramics, Inc.†
410
15,252
Ship Finance International Ltd.†
80
2,217
Parker Drilling Co.*
2,000
15,100
Parallel Petroleum Corp.*†
70
1,234
Complete Production
BPZ Resources, Inc.*
110
1,230
Services, Inc.*†
840
15,095
General Maritime Corp.
50
1,223
Petroleum
Total Energy
980,412
Development Corp.*†
240
14,191
MATERIALS 3.7%
Concho Resources, Inc.*
640
13,190
CF Industries Holdings, Inc.†
690
75,941
Encore Acquisition Co.*†
380
12,681
Terra Industries, Inc.*†
1,220
58,267
74
|
THE RYDEX VARIABLE TRUST ANNUAL REPORT
See Notes to Financial Statements.

SCHEDULE OF INVESTMENTS (continued)
December 31, 2007
RUSSELL 2000® 1.5x STRATEGY FUND
MARKET
MARKET
VALUE
VALUE
SHARES
(NOTE 1)
SHARES
(NOTE 1)
AptarGroup, Inc.†
940
$
38,455
Apex Silver Mines Ltd.*†
200
$
3,048
Hercules, Inc.†
1,650
31,927
Royal Gold, Inc.†
50
1,526
Greif, Inc. — Class A
480
31,378
Flotek Industries, Inc.*†
40
1,442
Quanex Corp.†
550
28,545
Total Materials
801,916
OM Group, Inc.*
460
26,468
UTILITIES 2.0%
Schnitzer Steel Industries,
Nicor, Inc.†
670
28,386
Inc. — Class A†
350
24,195
Black Hills Corp.†
590
26,019
Olin Corp.
1,180
22,809
Cleco Corp.†
930
25,854
Sensient Technologies Corp.
770
21,776
WGL Holdings, Inc.†
770
25,225
H.B. Fuller Co.†
960
21,552
New Jersey Resources Corp.
460
23,009
Rockwood Holdings, Inc.*†
600
19,932
Aquila, Inc.*†
6,000
22,380
Kaiser Aluminum Corp.†
250
19,870
Northwest Natural Gas Co.†
450
21,897
Worthington Industries, Inc.
1,100
19,668
Westar Energy, Inc.†
830
21,530
Hecla Mining Co.*†
2,010
18,793
Southwest Gas Corp.
710
21,137
Rock-Tenn Co. — Class A
670
17,025
El Paso Electric Co.*
790
20,200
Ferro Corp.
810
16,791
ITC Holdings Corp.
340
19,183
Glatfelter
950
14,544
NorthWestern Corp.
650
19,175
Brush Engineered
South Jersey Industries, Inc.
530
19,128
Materials, Inc.*
390
14,438
Portland General Electric Co.
600
16,668
LSB Industries, Inc.*†
500
14,110
Laclede Group, Inc.
450
15,408
Texas Industries, Inc.†
200
14,020
Piedmont Natural Gas Co.†
560
14,649
W.R. Grace & Co.*†
500
13,090
PNM Resources, Inc.†
540
11,583
Buckeye Technologies, Inc.*
980
12,250
Central Vermont Public
Neenah Paper, Inc.
410
11,952
Service Corp.†
350
10,794
A.M. Castle & Co.†
420
11,420
IDACORP, Inc.†
290
10,214
Calgon Carbon Corp.*†
700
11,123
Consolidated Water Co., Inc.†
400
10,076
RTI International Metals, Inc.*†
160
11,029
Unisource Energy Corp.
230
7,256
PolyOne Corp.*
1,660
10,923
Empire District Electric Co.†
310
7,062
Century Aluminum Co.*†
200
10,788
Allete, Inc.†
170
6,729
Olympic Steel, Inc.
330
10,464
American States Water Co.
170
6,406
A. Schulman, Inc.
460
9,913
Avista Corp.
250
5,385
Universal Stainless & Alloy*
260
9,248
Otter Tail Power Co.†
120
4,152
Coeur d’Alene Mines Corp.*†
1,780
8,793
UIL Holding Corp.†
80
2,956
Headwaters, Inc.*†
700
8,218
Ormat Technologies, Inc.†
30
1,650
NewMarket Corp.
140
7,797
California Water Service Group
40
1,481
Koppers Holdings, Inc.
180
7,783
Mge Energy, Inc.
40
1,419
Spartech Corp.†
540
7,614
CH Energy Group, Inc.
30
1,336
Minerals Technologies, Inc.
110
7,365
Silgan Holdings, Inc.
140
7,272
Total Utilities
428,347
Innospec, Inc.
420
7,207
CONSUMER STAPLES 1.9%
Horsehead Holding Corp.*
420
7,127
Flowers Foods, Inc.†
1,150
26,921
GenTek, Inc.*
240
7,025
Casey’s General Stores, Inc.
810
23,984
Wausau Paper Corp.
780
7,012
Ruddick Corp.†
660
22,882
Compass Minerals
Universal Corp.†
440
22,537
International, Inc.
170
6,970
Pilgrim’s Pride Corp.†
710
20,554
Metal Management, Inc.
150
6,830
Fresh Del Monte Produce, Inc.*
560
18,805
AbitibiBowater, Inc.†
320
6,595
Performance Food
Zoltek Cos., Inc.*†
110
4,716
Group Co.*†
670
18,003
Myers Industries, Inc.†
310
4,486
Darling International, Inc.*
1,430
16,531
Amcol International Corp.
100
3,603
Central European
Haynes International, Inc.*
50
3,475
Distribution Corp.*†
260
15,101
Arch Chemicals, Inc.
90
3,308
TreeHouse Foods, Inc.*
650
14,943
See Notes to Financial Statements.
THE RYDEX VARIABLE TRUST ANNUAL REPORT
|
75

SCHEDULE OF INVESTMENTS (continued)
December 31, 2007
RUSSELL 2000® 1.5x STRATEGY FUND
MARKET
MARKET
VALUE
VALUE
SHARES
(NOTE 1)
SHARES
(NOTE 1)
WD-40 Co.
370
$
14,049
General Communication,
Sanderson Farms, Inc.†
410
13,850
Inc. — Class A*
920
$
8,050
Winn-Dixie Stores, Inc.*†
800
13,496
Rural Cellular Corp. — Class A*
140
6,173
Elizabeth Arden, Inc.*†
600
12,210
Fairpoint
Nash Finch Co.†
340
11,995
Communications, Inc.†
460
5,989
Longs Drug Stores Corp.
240
11,280
Cbeyond, Inc.*
110
4,289
Cal-Maine Foods, Inc.
420
11,143
North Pittsburgh Systems, Inc.†
170
3,857
Ralcorp Holdings, Inc.*
180
10,942
PAETEC Holding Corp.*†
220
2,145
American Oriental
Global Crossing*
70
1,544
Bioengineering, Inc.*
920
10,194
Total Telecommunication Services
228,716
Central Garden and Pet Co. —
Total Common Stocks
Class A*†
1,800
9,648
(Cost $13,913,073)
14,276,803
Arden Group, Inc.
60
9,281
Imperial Sugar Co., Inc.†
490
9,197
FACE
Farmer Brothers Co.
380
8,736
AMOUNT
Village Super Market
160
8,142
REPURCHASE AGREEMENTS 25.0%
Hain Celestial Group, Inc.*†
230
7,360
Repurchase Agreement (Note 5)
United Natural Foods, Inc.*†
230
7,296
Mizuho Financial Group, Inc.
Alliance One International, Inc.*
1,710
6,960
issued 12/31/07 at 1.40%
Chattem, Inc.*†
90
6,799
due 01/02/08
$1,563,744
1,563,744
Reddy Ice Holdings, Inc.†
240
6,074
Morgan Stanley issued
Tootsie Roll Industries, Inc.†
110
3,016
12/31/07 at 1.20% due
Lancaster Colony Corp.
70
2,779
01/02/08
1,563,744
1,563,744
Chiquita Brands
UBS Financial Services, Inc.
International, Inc.*†
130
2,391
issued 12/31/07 at 1.14%
Nu Skin Enterprises, Inc.
130
2,136
due 01/02/08
1,563,744
1,563,744
Great Atlantic & Pacific
Lehman Brothers Holdings, Inc.
Tea Co.*†
50
1,566
issued 12/31/07 at 1.00%
Andersons, Inc.†
30
1,344
due 01/02/08
778,475
778,475
Pantry, Inc.*
50
1,307
Total Repurchase Agreements
Vector Group Ltd.
60
1,204
(Cost $5,469,707)
5,469,707
Total Consumer Staples
404,656
TELECOMMUNICATION SERVICES 1.0%
SECURITIES LENDING COLLATERAL 20.2%
Time Warner Telecom, Inc. —
Investment in Securities Lending Short Term
Class A*†
1,270
25,768
Investment Portfolio Held by
Golden Telecom, Inc.*†
240
24,228
U.S. Bank (Note 8)
4,427,807
4,427,807
Cogent Communications
Total Securities Lending Collateral
Group, Inc.*†
870
20,628
(Cost $4,427,807)
4,427,807
Cincinnati Bell, Inc.*
4,200
19,950
Total Investments 110.5%
Premiere Global Services, Inc.*
1,200
17,820
(Cost $23,810,587)
$ 24,174,317
NTELOS Holdings Corp.
580
17,220
Liabilities in Excess of
Shenandoah
Other Assets – (10.5)%
$ (2,294,828)
Telecommunications Co.
550
13,189
Net Assets – 100.0%
$ 21,879,489
Iowa Telecommunications
Services, Inc.
790
12,845
UNREALIZED
Syniverse Holdings, Inc.*
780
12,152
GAIN
USA Mobility, Inc.*
790
11,297
CONTRACTS
(NOTE 1)
Alaska Communications
FUTURES CONTRACTS PURCHASED
Systems Group, Inc.
740
11,100
March 2008 Russell 2000 Index
Atlantic Tele-Network, Inc.
310
10,472
Mini Futures Contracts
(Aggregate Market Value
of Contracts $10,087,000)
131
$
100,330
76
|
THE RYDEX VARIABLE TRUST ANNUAL REPORT
See Notes to Financial Statements.

SCHEDULE OF INVESTMENTS (concluded)
December 31, 2007
RUSSELL 2000® 1.5x STRATEGY FUND
UNREALIZED
GAIN (LOSS)
UNITS
(NOTE 1)
EQUITY INDEX SWAP AGREEMENTS††
February 2008 Russell 2000 Index
Swap, Terminating 02/18/08**
(Notional Market Value
$2,554,595)
3,335
$
29,326
March 2008 Russell 2000 Index
Swap, Terminating 03/28/08**
(Notional Market Value
$5,900,379)
7,703
(46,063)
(Total Notional Market
Value $8,454,974)
$
(16,737)
*
Non-Income Producing Security.
**
Price Return based on Russell 2000 Index +/- financing at a variable rate.
†
All or a portion of this security is on loan at December 31, 2007 — See Note 8.
††
Cash was pledged as equity index swap collateral at December 31, 2007.
See Notes to Financial Statements.
THE RYDEX VARIABLE TRUST ANNUAL REPORT
|
77

SCHEDULE OF INVESTMENTS
December 31, 2007
INVERSE RUSSELL 2000® STRATEGY FUND
MARKET
UNREALIZED
FACE
VALUE
GAIN (LOSS)
AMOUNT
(NOTE 1)
UNITS
(NOTE 1)
FEDERAL AGENCY DISCOUNT NOTES 17.3%
EQUITY INDEX SWAP AGREEMENTS
Farmer Mac*
SOLD SHORT†
4.54% due 01/02/08
$1,000,000
$
1,000,000
March 2008 Russell 2000 Index
Federal Home Loan Bank*
Swap, Terminating 03/28/08**
4.34% due 01/02/08
1,000,000
1,000,000
(Notional Market Value
Total Federal Agency Discount Notes
$4,142,022)
5,407
$
32,197
(Cost $2,000,000)
2,000,000
February 2008 Russell 2000 Index
Swap, Terminating 02/18/08**
REPURCHASE AGREEMENTS 59.1%
(Notional Market Value
Repurchase Agreement (Note 5)
$6,323,394)
8,255
(39,142)
Mizuho Financial Group, Inc.
(Total Notional Market
issued 12/31/07 at 1.40%
Value $10,465,416)
$
(6,945)
due 01/02/08
1,947,001
1,947,001
Morgan Stanley
issued 12/31/07 at 1.20%
due 01/02/08
1,947,001
1,947,001
UBS Financial Services, Inc.
issued 12/31/07 at 1.14%
due 01/02/08
1,947,001
1,947,001
Lehman Brothers Holdings, Inc.
issued 12/31/07 at 1.00%
due 01/02/08
969,270
969,270
Total Repurchase Agreements
(Cost $6,810,273)
6,810,273
Total Investments 76.4%
(Cost $8,810,273)
$
8,810,273
Other Assets in Excess
of Liabilities – 23.6%
$
2,724,394
Net Assets – 100.0%
$ 11,534,667
UNREALIZED
LOSS
CONTRACTS
(NOTE 1)
FUTURES CONTRACTS SOLD SHORT
March 2008 Russell 2000 Index
Mini Futures Contracts
(Aggregate Market Value
of Contracts $1,078,000)
14
$
(1,845)
*
The issuer is a publicly traded company that operates under a Congressional charter; its securities are neither issued nor guaranteed by the U.S.
Government.
**
Price Return based on Russell 2000 Index +/- financing at a variable rate.
†
Cash was pledged as equity index swap collateral at December 31, 2007.
78
|
THE RYDEX VARIABLE TRUST ANNUAL REPORT
See Notes to Financial Statements.

SCHEDULE OF INVESTMENTS
December 31, 2007
GOVERNMENT LONG BOND 1.2x STRATEGY FUND
MARKET
FACE
VALUE
AMOUNT
(NOTE 1)
FEDERAL AGENCY DISCOUNT NOTES 23.0%
Federal Home Loan Bank*
4.23% due 01/03/08
$ 3,000,000
$
2,999,647
Federal Farm Credit Bank*
4.25% due 01/08/08
3,000,000
2,997,875
Freddie Mac*
4.26% due 01/08/08
3,000,000
2,997,870
Fannie Mae*
4.31% due 01/11/08
3,000,000
2,996,768
Total Federal Agency Discount Notes
(Cost $11,992,160)
11,992,160
U.S. TREASURY OBLIGATIONS 51.2%
U.S. Treasury Bond
5.00% due 05/15/37
24,553,000
26,735,915
Total U.S. Treasury Obligations
(Cost $24,861,611)
26,735,915
REPURCHASE AGREEMENTS 24.6%
Repurchase Agreement (Note 5)
Mizuho Financial Group, Inc.
issued 12/31/07 at 1.40%
due 01/02/08
3,680,897
3,680,897
Morgan Stanley
issued 12/31/07 at 1.20%
due 01/02/08
3,680,897
3,680,897
UBS Financial Services, Inc.
issued 12/31/07 at 1.14%
due 01/02/08
3,680,897
3,680,897
Lehman Brothers Holdings, Inc.
issued 12/31/07 at 1.00%
due 01/02/08
1,832,452
1,832,452
Total Repurchase Agreements
(Cost $12,875,143)
12,875,143
Total Investments 98.8%
(Cost $49,728,914)
$ 51,603,218
Other Assets in Excess
of Liabilities – 1.2%
$
646,339
Net Assets – 100.0%
$ 52,249,557
UNREALIZED
LOSS
CONTRACTS
(NOTE 1)
FUTURES CONTRACTS PURCHASED
March 2008 U.S. Treasury Bond
Futures Contracts
(Aggregate Market Value of
Contracts $54,827,344)
471
$
(65,686)
*
The issuer is a publicly traded company that operates under a Congressional charter; its securities are neither issued nor guaranteed by the
U.S. Government.
See Notes to Financial Statements.
THE RYDEX VARIABLE TRUST ANNUAL REPORT
|
79

SCHEDULE OF INVESTMENTS
December 31, 2007
INVERSE GOVERNMENT LONG BOND STRATEGY FUND
MARKET
MARKET
FACE
VALUE
FACE
VALUE
AMOUNT
(NOTE 1)
AMOUNT
(NOTE 1)
FEDERAL AGENCY DISCOUNT NOTES 45.4%
U.S. TREASURY OBLIGATIONS
Federal Home Loan Bank*
SOLD SHORT (75.2)%
4.15% due 01/03/08
$ 2,000,000
$
1,999,770
U.S. Treasury Bond
Freddie Mac*
5.00% due 05/15/37
$12,162,000
$ (13,243,278)
4.15% due 01/04/08
2,000,000
1,999,539
Total U.S. Treasury Obligations
Federal Farm Credit Bank*
Sold Short
4.25% due 01/08/08
2,000,000
1,998,583
(Proceeds $13,155,581)
(13,243,278)
Fannie Mae*
Total Short Sales (75.2)%
4.31% due 01/11/08
2,000,000
1,997,845
(Proceeds $13,155,581)
$ (13,243,278)
Total Federal Agency Discount Notes
Liabilities in Excess of
(Cost $7,995,737)
7,995,737
Other Assets – (1.9)%
$
(336,226)
REPURCHASE AGREEMENTS 131.7%
Net Assets – 100.0%
$
17,611,452
Joint Repurchase Agreement (Note 5)
Mizuho Financial Group, Inc.
UNREALIZED
issued 12/31/07 at 1.40%
GAIN
CONTRACTS
(NOTE 1)
due 01/02/08
2,863,269
2,863,269
Morgan Stanley
FUTURES CONTRACTS SOLD SHORT
issued 12/31/07 at 1.20%
March 2008 U.S. Treasury Bond
due 01/02/08
2,863,269
2,863,269
Futures Contracts
UBS Financial Services, Inc.
(Aggregate Market Value of
issued 12/31/07 at 1.14%
Contracts $6,751,563)
58
$
48,369
due 01/02/08
2,863,269
2,863,269
Lehman Brothers Holdings, Inc.
issued 12/31/07 at 1.00%
due 01/02/08†
1,425,412
1,425,412
Individual Repurchase Agreement†
Lehman Brothers Holdings, Inc.
issued 12/31/07 at 1.00%
due 01/02/08 (Secured by
U.S. Treasury Bonds, at a
rate of 5.00% and maturing
05/15/37 as collateral, with a
Market Value of $13,445,120)
to be repurchased at
$13,180,732
13,180,000
13,180,000
Total Repurchase Agreements
(Cost $23,195,219)
23,195,219
Total Long Securities 177.1%
(Cost $31,190,956)
$
31,190,956
*
The issuer is a publicly traded company that operates under a Congressional charter; its securities are neither issued nor guaranteed by the
U.S. Government.
†
All or a portion is pledged as short security collateral at December 31, 2007.
80
|
THE RYDEX VARIABLE TRUST ANNUAL REPORT
See Notes to Financial Statements.

SCHEDULE OF INVESTMENTS
December 31, 2007
EUROPE 1.25x STRATEGY FUND
MARKET
MARKET
VALUE
VALUE
SHARES
(NOTE 1)
SHARES
(NOTE 1)
COMMON STOCKS 71.0%
Anglo American PLC —
SP ADR†
37,880
$
1,150,416
FINANCIALS 19.4%
BHP Billiton Ltd. — SP ADR†
13,210
925,228
HSBC Holdings PLC — SP ADR†
36,290
$
3,037,836
ArcelorMittal†
9,770
755,709
Banco Santander Central
Total Materials
4,120,446
Hispano SA — SP ADR
95,370
2,054,270
CONSUMER STAPLES 4.2%
UBS AG — SP ADR†
34,560
1,589,760
Unilever NV†
40,990
1,494,495
Deutsche Bank AG— SP ADR†
11,130
1,440,333
Diageo PLC — SP ADR
15,700
1,347,531
Banco Bilbao Vizcaya
Cadbury Schweppes PLC —
Argentaria SA — SP ADR†
50,821
1,232,409
SP ADR
12,740
628,974
Allianz AG — SP ADR
57,911
1,230,609
Credit Suisse Group — SP ADR†
20,110
1,208,611
Total Consumer Staples
3,471,000
Lloyds TSB Group PLC —
INFORMATION TECHNOLOGY 3.5%
SP ADR
30,790
1,159,244
Nokia Oyj — SP ADR†
48,931
1,878,461
ING Groep NV — SP ADR
28,790
1,120,219
SAP AG — SP ADR†
11,380
580,949
Barclays PLC — SP ADR
26,890
1,085,549
Telefonaktiebolaget LM
AXA — SP ADR
23,080
916,507
Ericsson — SP ADR†
18,670
435,945
ABN AMRO Holding NV —
Total Information Technology
2,895,355
SP ADR†
2
108
INDUSTRIALS 3.1%
Total Financials
16,075,455
Siemens AG — SP ADR†
10,420
1,639,691
ENERGY 11.7%
Koninklijke Philips Electronics
BP PLC — SP ADR
40,450
2,959,727
NV — SP ADR
14,380
614,745
Total SA — SP ADR
33,190
2,741,494
Ryanair Holdings PLC —
Royal Dutch Shell PLC —
SP ADR*†
7,990
315,126
SP ADR†
27,390
2,306,238
Total Industrials
2,569,562
ENI-Ente Nazionale
CONSUMER DISCRETIONARY 2.2%
Idrocarburi — SP ADR
23,880
1,729,628
DaimlerChrysler AG— SP ADR†
15,230
1,456,445
Total Energy
9,737,087
Luxottica Group — SP ADR†
10,770
339,147
HEALTH CARE 11.1%
Total Consumer Discretionary
1,795,592
GlaxoSmithKline PLC —
Total Common Stocks
SP ADR†
50,081
2,523,582
(Cost $51,143,620)
58,777,169
Novartis AG — SP ADR†
42,710
2,319,580
Sanofi-Aventis — SP ADR
40,460
1,842,144
FACE
AMOUNT
AstraZeneca PLC — SP ADR
27,180
1,163,848
Alcon, Inc. — SP ADR
3,760
537,830
REPURCHASE AGREEMENTS 23.8%
Shire PLC — SP ADR†
6,930
477,823
Repurchase Agreement (Note 5)
Teva Pharmaceutical
Mizuho Financial Group, Inc.
Industries Ltd. — SP ADR†
6,880
319,782
issued 12/31/07 at 1.40%
Total Health Care
9,184,589
due 01/02/08
$ 5,252,538
5,252,538
TELECOMMUNICATION SERVICES 10.8%
Morgan Stanley
Vodafone Group PLC —
issued 12/31/07 at 1.20%
SP ADR
71,471
2,667,298
due 01/02/08
5,252,538
5,252,538
Telefonica SA — SP ADR
26,010
2,538,316
UBS Financial Services, Inc.
Deutsche Telekom AG —
issued 12/31/07 at 1.14%
SP ADR
53,331
1,155,683
due 01/02/08
5,252,538
5,252,538
BT Group PLC — SP ADR
20,980
1,131,242
Lehman Brothers Holdings, Inc.
France Telecom SA — SP ADR
22,780
811,651
issued 12/31/07 at 1.00%
Telecom Italia — SP ADR†
20,230
623,893
due 01/02/08††
3,944,536
3,944,536
Total Telecommunication Services
8,928,083
Total Repurchase Agreements
(Cost $19,702,150)
19,702,150
MATERIALS 5.0%
Rio Tinto PLC — SP ADR†
3,070
1,289,093
See Notes to Financial Statements.
THE RYDEX VARIABLE TRUST ANNUAL REPORT
|
81
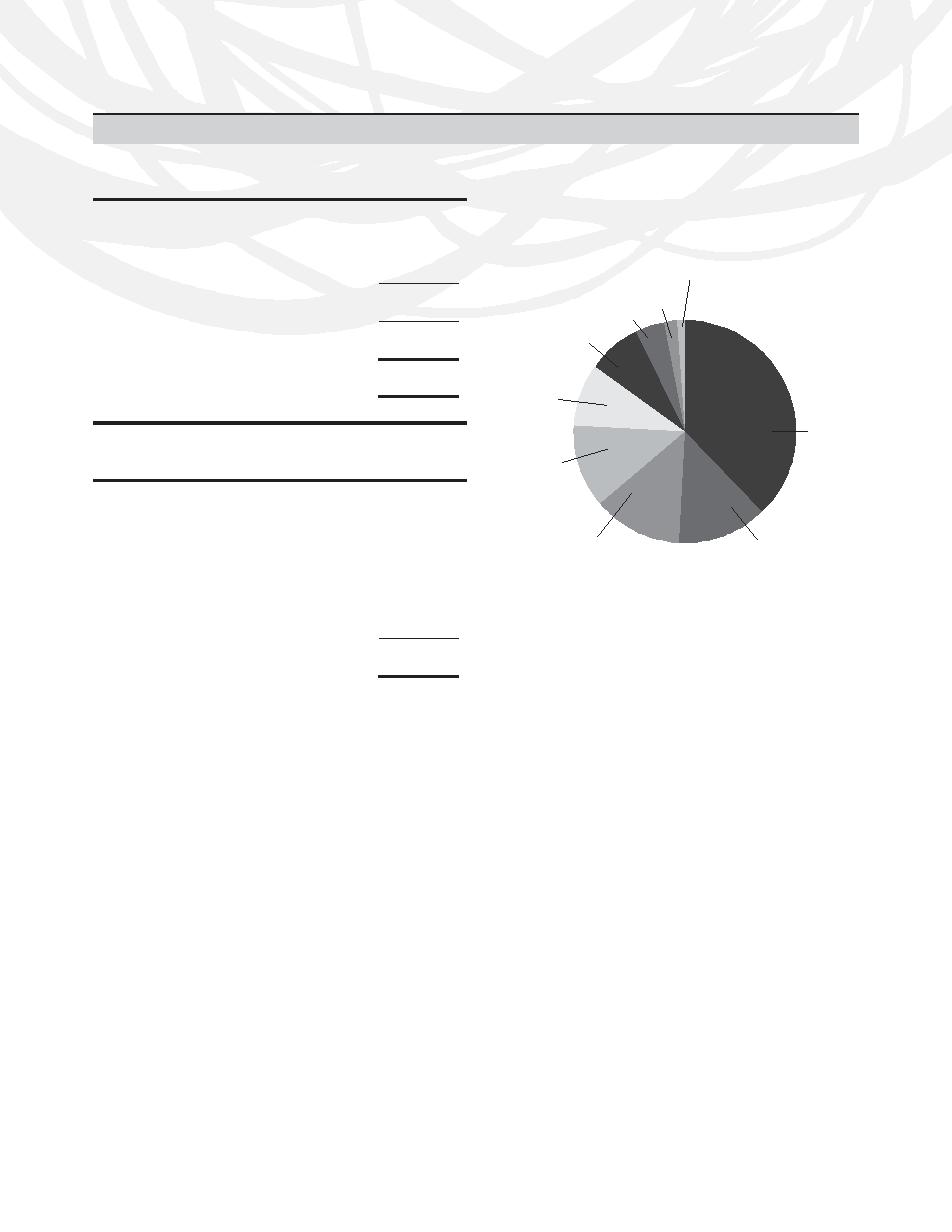
SCHEDULE OF INVESTMENTS (concluded)
December 31, 2007
EUROPE 1.25x STRATEGY FUND
MARKET
FACE
VALUE
AMOUNT
(NOTE 1)
SECURITIES LENDING COLLATERAL 17.9%
Country Diversification
Investment in Securities Lending Short Term
Investment Portfolio Held by
SWEDEN
U.S. Bank (Note 8)
$14,834,105
$
14,834,105
1%
FINLAND
Total Securities Lending Collateral
ITALY
2%
(Cost $14,834,105)
14,834,105
4%
Total Investments 112.7%
SPAIN
(Cost $85,679,875)
$
93,313,424
8%
Liabilities in Excess of
Other Assets – (12.7)%
$ (10,480,765)
FRANCE
Net Assets – 100.0%
$
82,832,659
9%
GREAT
BRITAIN
UNREALIZED
LOSS
38%
UNITS
(NOTE 1)
NETHERLANDS
EQUITY INDEX SWAP AGREEMENTS
12%
March 2008 Dow Jones STOXX 50
Index Swap, Terminating 03/14/08**
(Notional Market Value
SWITZERLAND
GERMANY
$8,668,245)
1,639
$
(167,094)
13%
13%
March 2008 Dow Jones STOXX 50
Index Swap, Terminating 03/28/08**
The pie chart above reflects percentages of
(Notional Market Value
the market value of Common Stocks.
$36,369,310)
6,818
(458,366)
(Total Notional Market Value
$45,037,555)
$
(625,460)
*
Non-Income Producing Security.
**
Price Return based on Dow Jones STOXX 50 Index +/- financing at a variable rate.
†
All or a portion of this security is on loan at December 31, 2007 — See Note 8.
††
All or a portion of this security is pledged as equity index swap collateral at December 31, 2007.
ADR — American Depository Receipt.
82
|
THE RYDEX VARIABLE TRUST ANNUAL REPORT
See Notes to Financial Statements.

SCHEDULE OF INVESTMENTS
December 31, 2007
JAPAN 1.25x STRATEGY FUND
MARKET
UNREALIZED
FACE
VALUE
GAIN (LOSS)
AMOUNT
(NOTE 1)
CONTRACTS
(NOTE 1)
FEDERAL AGENCY DISCOUNT NOTES 38.5%
FOREIGN CURRENCY FUTURES
Federal Farm Credit Bank*
CONTRACTS PURCHASED
4.25% due 01/08/08
$2,000,000
$
1,998,583
March 2008 Japanese Yen
Fannie Mae*
Futures Contracts
4.31% due 01/11/08
2,000,000
1,997,845
(Aggregate Market Value
Farmer Mac*
of Contracts $6,783,750)
60
$
65,870
4.54% due 01/02/08
1,000,000
1,000,000
Federal Home Loan Bank*
FUTURES CONTRACTS PURCHASED
4.34% due 01/02/08
1,000,000
1,000,000
March 2008 Nikkei 225 Index
Futures Contracts
Total Federal Agency Discount Notes
(Aggregate Market Value
(Cost $5,996,428)
5,996,428
of Contracts $6,369,300)
84
$
(227,133)
REPURCHASE AGREEMENTS 63.5%
Repurchase Agreement (Note 5)
UNITS
Lehman Brothers Holdings, Inc.
issued 12/31/07 at 1.00%
EQUITY INDEX SWAP AGREEMENT
due 01/02/08†
3,641,381
3,641,381
March 2008 Topix 100 Index
Mizuho Financial Group, Inc.
Swap, Terminating 03/14/08**
issued 12/31/07 at 1.40%
(Notional Market Value
due 01/02/08
2,082,111
2,082,111
$13,577,203)
1,416,825
$
(380,195)
Morgan Stanley
issued 12/31/07 at 1.20%
due 01/02/08
2,082,111
2,082,111
UBS Financial Services, Inc.
issued 12/31/07 at 1.14%
due 01/02/08
2,082,111
2,082,111
Total Repurchase Agreements
(Cost $9,887,714)
9,887,714
Total Investments 102.0%
(Cost $15,884,142)
$ 15,884,142
Liabilities in Excess of
Other Assets – (2.0)%
$
(315,921)
Net Assets – 100.0%
$ 15,568,221
*
The issuer is a publicly traded company that operates under a Congressional charter; its securities are neither issued nor guaranteed by the
U.S. Government.
**
Price Return based on Topix 100 Index +/- financing at a variable rate.
†
All or a portion of this security is pledged as equity index swap collateral at December 31, 2007.
See Notes to Financial Statements.
THE RYDEX VARIABLE TRUST ANNUAL REPORT
|
83

SCHEDULE OF INVESTMENTS
December 31, 2007
DOW 2x STRATEGY FUND
MARKET
MARKET
VALUE
VALUE
SHARES
(NOTE 1)
SHARES
(NOTE 1)
COMMON STOCKS 71.8%
MATERIALS 3.6%
E.I. du Pont de Nemours and Co.
19,710
$
869,014
INDUSTRIALS 18.4%
Alcoa, Inc.
19,710
720,400
Boeing Co.
19,710
$
1,723,836
Total Materials
1,589,414
3M Co.
19,710
1,661,947
Total Common Stocks
United Technologies Corp.
19,702
1,507,991
(Cost $28,201,914)
32,161,791
Caterpillar, Inc.
19,710
1,430,158
Honeywell International, Inc.
19,710
1,213,545
FACE
General Electric Co.
19,710
730,650
AMOUNT
Total Industrials
8,268,127
REPURCHASE AGREEMENTS 22.2%
CONSUMER STAPLES 11.3%
Repurchase Agreement (Note 5)
Altria Group, Inc.
19,710
1,489,682
Lehman Brothers Holdings, Inc.
Procter & Gamble Co.
19,708
1,446,961
issued 12/31/07 at 1.00%
Coca-Cola Co.
19,710
1,209,603
due 01/02/08††
$4,194,918
4,194,918
Wal-Mart Stores, Inc.
19,710
936,816
Mizuho Financial Group, Inc.
Total Consumer Staples
5,083,062
issued 12/31/07 at 1.40%
due 01/02/08
1,923,448
1,923,448
INFORMATION TECHNOLOGY 9.7%
Morgan Stanley
International Business
issued 12/31/07 at 1.20%
Machines Corp.
19,710
2,130,651
due 01/02/08
1,923,448
1,923,448
Hewlett-Packard Co.
19,710
994,961
UBS Financial Services, Inc.
Microsoft Corp.
19,710
701,676
issued 12/31/07 at 1.14%
Intel Corp.
19,710
525,469
due 01/02/08
1,923,448
1,923,448
Total Information Technology
4,352,757
Total Repurchase Agreements
FINANCIALS 8.1%
(Cost $9,965,262)
9,965,262
American International
Group, Inc.
19,710
1,149,093
SECURITIES LENDING COLLATERAL 0.6%
American Express Co.
19,710
1,025,314
Investment in Securities Lending Short Term
JPMorgan Chase & Co.
19,709
860,298
Investment Portfolio Held by
Citigroup, Inc.
19,703
580,056
U.S. Bank (Note 8)
271,752
271,752
Total Financials
3,614,761
Total Securities Lending Collateral
HEALTH CARE 6.5%
(Cost $271,752)
271,752
Johnson & Johnson, Inc.
19,710
1,314,657
Total Investments 94.6%
Merck & Co., Inc.
19,710
1,145,348
(Cost $38,438,928)
$ 42,398,805
Pfizer, Inc.
19,710
448,008
Other Assets in Excess
Total Health Care
2,908,013
of Liabilities – 5.4%
$
2,425,991
CONSUMER DISCRETIONARY 6.3%
Net Assets – 100.0%
$ 44,824,796
McDonald’s Corp.
19,710
1,161,116
Walt Disney Co.
19,710
636,239
UNREALIZED
Home Depot, Inc.
19,710
530,987
GAIN
CONTRACTS
(NOTE 1)
General Motors Corp.†
19,710
490,582
Total Consumer Discretionary
2,818,924
FUTURES CONTRACTS PURCHASED
ENERGY 4.1%
March 2008 Dow Jones Industrial
Exxon Mobil Corp.
19,710
1,846,630
Average Index Mini Futures
Contracts
Total Energy
1,846,630
(Aggregate Market Value of
TELECOMMUNICATION SERVICES 3.8%
Contracts $25,387,935)
381
$
62,353
Verizon Communications, Inc.
19,706
860,955
AT&T, Inc.
19,710
819,148
Total Telecommunication Services
1,680,103
84
|
THE RYDEX VARIABLE TRUST ANNUAL REPORT
See Notes to Financial Statements.

SCHEDULE OF INVESTMENTS (concluded)
December 31, 2007
DOW 2x STRATEGY FUND
UNREALIZED
LOSS
UNITS
(NOTE 1)
EQUITY INDEX SWAP AGREEMENT
March 2008 Dow Jones Industrial
Average Index Swap,
Terminating 03/14/08*
(Notional Market Value
$32,561,932)
2,455
$
(590,117)
*
Price Return based on Dow Jones Industrial Average Index +/- financing at a variable rate.
†
All or a portion of this security is on loan at December 31, 2007 — See Note 8.
††
All or a portion of this security is pledged as equity index swap collateral at December 31, 2007.
See Notes to Financial Statements.
THE RYDEX VARIABLE TRUST ANNUAL REPORT
|
85

SCHEDULE OF INVESTMENTS
December 31, 2007
INVERSE DOW 2x STRATEGY FUND
MARKET
UNREALIZED
FACE
VALUE
GAIN
AMOUNT
(NOTE 1)
CONTRACTS
(NOTE 1)
FEDERAL AGENCY DISCOUNT NOTES 33.6%
FUTURES CONTRACTS SOLD SHORT
Farmer Mac*
March 2008 Dow Jones Industrial
4.54% due 01/02/08
$1,000,000
$
1,000,000
Average Index Mini Futures
Federal Home Loan Bank*
Contracts
4.34% due 01/02/08
1,000,000
1,000,000
(Aggregate Market Value
Federal Farm Credit Bank*
of Contracts $4,930,990)
74
$
113,723
4.25% due 01/08/08
1,000,000
999,292
Fannie Mae*
4.31% due 01/11/08
1,000,000
998,922
UNITS
Total Federal Agency Discount Notes
EQUITY INDEX SWAP AGREEMENT
(Cost $3,998,214)
3,998,214
SOLD SHORT
March 2008 Dow Jones Industrial
REPURCHASE AGREEMENTS 63.0%
Average Index Swap,
Repurchase Agreement (Note 5)
Terminating 03/14/08**
Lehman Brothers Holdings, Inc.
(Notional Market Value
issued 12/31/07 at 1.00%
$18,694,599)
1,409
$
393,407
due 01/02/08†
2,722,866
2,722,866
Mizuho Financial Group, Inc.
issued 12/31/07 at 1.40%
due 01/02/08
1,587,577
1,587,577
Morgan Stanley
issued 12/31/07 at 1.20%
due 01/02/08
1,587,577
1,587,577
UBS Financial Services, Inc.
issued 12/31/07 at 1.14%
due 01/02/08
1,587,577
1,587,577
Total Repurchase Agreements
(Cost $7,485,597)
7,485,597
Total Investments 96.6%
(Cost $11,483,811)
$ 11,483,811
Other Assets in Excess
of Liabilities – 3.4%
$
400,799
Net Assets – 100.0%
$ 11, 884,610
*
The issuer is a publicly traded company that operates under a Congressional charter; its securities are neither issued nor guaranteed by the
U.S. Government.
**
Price Return based on Dow Jones Industrial Average Index +/- financing at a variable rate.
†
All or a portion of this security is pledged as equity index swap collateral at December 31, 2007.
86
|
THE RYDEX VARIABLE TRUST ANNUAL REPORT
See Notes to Financial Statements.

SCHEDULE OF INVESTMENTS
December 31, 2007
SMALL-CAP VALUE FUND
MARKET
MARKET
VALUE
VALUE
SHARES
(NOTE 1)
SHARES
(NOTE 1)
COMMON STOCKS 100.0%
Corus Bankshares, Inc.
11,100
$
118,437
Colonial Properties Trust†
4,141
93,711
CONSUMER DISCRETIONARY 29.2%
First Bancorp Puerto Rico†
12,567
91,613
Stein Mart, Inc.†
29,357
$
139,152
Franklin Bank Corp.*
19,030
82,019
La-Z-Boy, Inc.†
16,701
132,439
Bankunited Financial Corp. —
Lithia Motors, Inc. — Class A
9,511
130,586
Class A†
11,370
78,453
Kellwood Co.
7,766
129,226
BankAtlantic Bancorp, Inc. —
Standard Motor Products, Inc.†
15,728
128,340
Class A
18,510
75,891
Building Material
Independent Bank Corp.
7,449
70,765
Holding Corp.†
21,598
119,437
Central Pacific Financial Corp.
3,712
68,523
Bassett Furniture
Safety Insurance Group, Inc.
1,753
64,195
Industries, Inc.
12,115
113,154
Umpqua Holding Corp.†
4,090
62,741
Haverty Furniture Cos., Inc.
11,598
104,266
Triad Guaranty, Inc.*
6,360
62,328
Finish Line — Class A
40,510
98,034
SWS Group, Inc.
4,876
61,779
Tuesday Morning Corp.†
18,760
95,113
Irwin Financial Corp.†
7,939
58,352
Group 1 Automotive, Inc.†
3,993
94,834
Provident Bankshares Corp.†
2,538
54,288
PEP Boys-Manny Moe & Jack†
8,242
94,618
Parkway Properties, Inc.
1,457
53,880
Sonic Automotive, Inc.
4,723
91,437
Susquehanna Bancshares, Inc.†
2,883
53,163
Monaco Coach Corp.
9,936
88,232
South Financial Group, Inc.†
3,162
49,422
Arctic Cat, Inc.
7,187
85,813
BioMed Realty Trust, Inc.
2,110
48,889
Triarc Cos., Inc. — Class B
9,113
79,830
Downey Financial Corp.†
1,560
48,532
M/I Homes, Inc.†
7,583
79,621
Lexington Realty Trust†
3,308
48,098
Jo-Ann Stores, Inc.*
6,015
78,676
Medical Properties Trust Inc.†
4,690
47,791
Oxford Industries, Inc.
3,030
78,083
Presidential Life Corp.
2,725
47,715
MarineMax, Inc.*†
4,360
67,580
Mid-America Apartment
O’Charleys, Inc.
4,369
65,448
Communities, Inc.
1,038
44,374
Superior Industries
FirstFed Financial Corp.*
1,190
42,626
International, Inc.†
3,523
64,013
Kite Realty Group Trust
2,686
41,015
Fred’s, Inc.†
6,643
63,972
First Financial Bancorp
3,595
40,983
Cato Corp. — Class A
3,860
60,448
First Commonwealth
Nautilus, Inc.
12,190
59,121
Financial Corp.†
3,721
39,629
National Presto Industries, Inc.
1,099
57,873
Hanmi Financial Corp.
4,560
39,307
Brown Shoe Co., Inc.†
3,250
49,303
DiamondRock Hospitality Co.
2,610
39,098
Zale Corp.*
2,960
47,538
National Retail Properties, Inc.†
1,653
38,647
Live Nation, Inc.*
3,110
45,157
Sterling Bancorp
2,781
37,933
Landry’s Restaurants, Inc.†
2,283
44,975
Senior Housing Properties Trust
1,626
36,878
Libbey, Inc.
2,642
41,849
Sterling Savings Bank
2,190
36,770
Coachmen Industries, Inc.
6,106
36,331
Community Bank System, Inc.
1,807
35,905
Audiovox Corp. — Class A*
2,414
29,934
Guaranty Financial Group, Inc.*
2,180
34,880
Ethan Allen Interiors, Inc.†
1,017
28,985
Selective Insurance
Big 5 Sporting Goods Corp.
1,910
27,542
Group, Inc.†
1,506
34,623
Steak n Shake Co.*
2,400
26,160
Sovran Self Storage, Inc.†
857
34,366
CPI Corp.
1,090
25,670
Whitney Holding Corp.
1,288
33,681
Cabela’s, Inc. — Class A*†
1,310
19,742
Entertainment
CKE Restaurants, Inc.
1,320
17,424
Properties Trust†
647
30,409
Total Consumer Discretionary
2,839,956
LTC Properties, Inc.
1,206
30,210
FINANCIALS 28.4%
Inland Real Estate Corp.†
1,993
28,221
LandAmerica Financial
Brookline Bancorp, Inc.†
2,512
25,522
Group, Inc.†
4,340
145,173
Bank Mutual Corp.
2,377
25,125
Stewart Information
Financial Federal Corp.
1,100
24,519
Services Corp.†
5,005
130,580
Dime Community Bancshares
1,879
23,995
Flagstar Bancorp, Inc.†
18,052
125,822
United Fire & Casualty Co.
820
23,854
See Notes to Financial Statements.
THE RYDEX VARIABLE TRUST ANNUAL REPORT
|
87

SCHEDULE OF INVESTMENTS (continued)
December 31, 2007
SMALL-CAP VALUE FUND
MARKET
MARKET
VALUE
VALUE
SHARES
(NOTE 1)
SHARES
(NOTE 1)
TrustCo Bank Corp.
2,162
$
21,447
Material Sciences Corp.*
3,491
$
25,938
PS Business Parks, Inc.
340
17,867
Caraustar Industries, Inc.*
7,700
23,793
Anchor BanCorp
Omnova Solutions, Inc.*
5,113
22,548
Wisconsin, Inc.
750
17,640
Total Materials
766,552
First Midwest Bancorp, Inc.†
560
17,136
UTILITIES 6.9%
United Bankshares, Inc.
610
17,092
Atmos Energy Corp.†
3,494
97,972
Total Financials
2,755,912
Laclede Group, Inc.
2,029
69,473
INDUSTRIALS 14.4%
CH Energy Group, Inc.
1,498
66,721
Wabash National Corp.†
16,571
127,431
Southwest Gas Corp.
1,934
57,575
Mesa Air Group, Inc.*
30,846
95,314
Avista Corp.†
2,099
45,212
Volt Information Sciences, Inc.*
5,083
92,816
Central Vermont Public
Arkansas Best Corp.†
3,845
84,359
Service Corp.
1,305
40,246
Spherion Corp.*
10,859
79,053
UIL Holding Corp.
1,071
39,573
Standard Register Co.
6,438
75,067
Unisource Energy Corp.
1,237
39,027
Standex International Corp.
4,145
72,330
Allete, Inc.†
935
37,007
Gibraltar Industries, Inc.
4,568
70,438
UGI Corp.
1,334
36,352
Universal Forest Products, Inc.
2,287
67,375
New Jersey Resources Corp.
666
33,313
Angelica Corp.
3,144
60,050
Piedmont Natural Gas Co.†
1,179
30,843
Griffon Corp.*
4,760
59,262
Cleco Corp.
1,106
30,747
Briggs & Stratton Corp.†
2,257
51,144
Southern Union Co.
810
23,782
Frontier Airlines
Northwest Natural Gas Co.
427
20,778
Holdings, Inc.*†
9,692
50,980
Total Utilities
668,621
ABM Industries, Inc.
2,305
46,999
INFORMATION TECHNOLOGY 6.9%
Watsco, Inc.
1,200
44,112
Gevity HR, Inc.
17,397
133,783
Applied Signal Technology, Inc.
3,115
42,302
SYNNEX Corp.*
4,874
95,530
A.O. Smith Corp.
1,093
38,310
Bell Microproducts, Inc.*
11,129
66,885
Tredegar Corp.
2,374
38,174
Photronics, Inc.*†
4,280
53,372
Lydall, Inc.*
3,555
37,399
Insight Enterprises, Inc.*
2,243
40,912
CDI Corp.
1,353
32,824
Ciber, Inc.*
5,839
35,676
C&D Technologies, Inc.*†
4,077
26,949
Ditech Networks, Inc.*
9,100
31,577
NCI Building Systems, Inc.*
860
24,759
CTS Corp.
3,148
31,260
Mueller Industries, Inc.
812
23,540
Park Electrochemical Corp.
1,083
30,584
United Stationers, Inc.*
409
18,900
Benchmark Electronics, Inc.*
1,530
27,127
Lawson Products, Inc.
492
18,657
Rudolph Technologies, Inc.*
2,240
25,357
Insituform Technologies, Inc. —
Gerber Scientific, Inc.*
2,310
24,948
Class A*
1,190
17,612
Black Box Corp.
680
24,596
Total Industrials
1,396,156
Methode Electronics, Inc. —
MATERIALS 7.9%
Class A
1,466
24,101
Georgia Gulf Corp.†
18,598
123,119
Symmetricom, Inc.*
4,420
20,818
Tronox, Inc.
12,468
107,848
Total Information Technology
666,526
Chesapeake Corp.
18,606
96,565
CONSUMER STAPLES 4.4%
PolyOne Corp.*
11,762
77,394
Nash Finch Co.
2,415
85,201
Wausau Paper Corp.
7,456
67,029
Central Garden and Pet Co. —
A. Schulman, Inc.
2,580
55,599
Class A*
15,650
83,884
Quaker Chemical Corp.
2,477
54,420
Spartan Stores, Inc.†
2,559
58,473
Rock-Tenn Co. — Class A
2,107
53,539
Performance Food Group Co.*
2,143
57,582
A.M. Castle & Co.†
1,130
30,725
Alliance One International, Inc.*
12,584
51,217
Schweitzer-Mauduit
Spectrum Brands, Inc.*†
6,175
32,913
International, Inc.
1,082
28,035
Lance, Inc.
999
20,400
88
|
THE RYDEX VARIABLE TRUST ANNUAL REPORT
See Notes to Financial Statements.

SCHEDULE OF INVESTMENTS (concluded)
December 31, 2007
SMALL-CAP VALUE FUND
MARKET
VALUE
SHARES
(NOTE 1)
Great Atlantic & Pacific
Tea Co.*†
650
$
20,364
Longs Drug Stores Corp.
409
19,223
Total Consumer Staples
429,257
HEALTH CARE 1.9%
Cambrex Corp.
6,340
53,129
Owens & Minor, Inc.
843
35,769
Medcath Corp.*
1,108
27,212
Datascope Corp.
702
25,553
Hooper Holmes, Inc.*
13,020
22,394
Gentiva Health Services, Inc.*
909
17,308
Total Health Care
181,365
Total Common Stocks
(Cost $9,404,459)
9,704,345
FACE
AMOUNT
REPURCHASE AGREEMENT 0.1%
Repurchase Agreement (Note 5)
Lehman Brothers Holdings, Inc.
issued 12/31/07 at 1.00%
due 01/02/08
$
13,719
13,719
Total Repurchase Agreement
(Cost $13,719)
13,719
SECURITIES LENDING COLLATERAL 15.9%
Investment in Securities Lending Short Term
Investment Portfolio Held by
U.S. Bank (Note 8)
1,544,114
1,544,114
Total Securities Lending Collateral
(Cost $1,544,114)
1,544,114
Total Investments 116.0%
(Cost $10,962,292)
$ 11,262,178
Liabilities in Excess of
Other Assets – (16.0)%
$ (1,552,528)
Net Assets – 100.0%
$
9,709,650
*
Non-Income Producing Security.
†
All or a portion of this security is on loan at December 31, 2007 — See Note 8.
See Notes to Financial Statements.
THE RYDEX VARIABLE TRUST ANNUAL REPORT
|
89

SCHEDULE OF INVESTMENTS
December 31, 2007
MID-CAP VALUE FUND
MARKET
MARKET
VALUE
VALUE
SHARES
(NOTE 1)
SHARES
(NOTE 1)
COMMON STOCKS 99.5%
Furniture Brands
International, Inc.†
34,815
$
350,239
FINANCIALS 29.8%
Lee Enterprises, Inc.†
23,326
341,726
IndyMac Bancorp, Inc.
60,710
$
361,224
Charming Shoppes, Inc.*
52,410
283,538
Fidelity National Financial,
Ryland Group, Inc.†
10,230
281,836
Inc. — Class A†
21,079
307,964
Media General, Inc.†
12,920
274,550
First American Corp.
6,806
232,221
Foot Locker, Inc.†
19,329
264,034
Old Republic
Borders Group, Inc.†
20,858
222,138
International Corp.
13,195
203,335
Modine Manufacturing Co.
11,965
197,542
AmeriCredit Corp.*†
14,732
188,422
Entercom
The PMI Group, Inc.
11,970
158,962
Communications Corp.
14,050
192,345
Hospitality Properties Trust†
4,622
148,921
Ruby Tuesday, Inc.
19,090
186,128
Colonial BancGroup, Inc.
10,965
148,466
Lear Corp.*†
5,673
156,915
First Niagara Financial
Rent-A-Center, Inc.*
10,120
146,942
Group, Inc.†
11,805
142,132
Belo Corp. — Class A†
7,685
134,026
Highwoods Properties, Inc.†
4,740
139,261
Collective Brands, Inc.*
6,840
118,948
Mack-Cali Realty Corp.
4,072
138,448
Bob Evans Farms, Inc.
3,126
84,183
Protective Life Corp.
3,339
136,966
Regis Corp.
2,880
80,525
Unitrin, Inc.
2,688
128,997
Scholastic Corp.*
2,257
78,747
Webster Financial Corp.
3,973
127,017
Barnes & Noble, Inc.†
2,080
71,656
Liberty Property Trust
4,142
119,331
99 Cents Only Stores*
6,800
54,128
Mercury General Corp.
2,329
116,007
Boyd Gaming Corp.
1,490
50,764
TCF Financial Corp.
6,310
113,138
Total Consumer Discretionary
3,969,190
American Financial Group, Inc.
3,858
111,419
UTILITIES 13.5%
New York Community
PNM Resources, Inc.†
9,021
193,501
Bancorp, Inc.†
6,190
108,820
Energy East Corp.
6,614
179,967
Associated Banc-Corp.
3,945
106,870
Great Plains Energy, Inc.†
5,636
165,248
Duke Realty Corp.†
3,994
104,164
Hawaiian Electric
FirstMerit Corp.†
4,967
99,390
Industries, Inc.
6,444
146,730
Camden Property Trust
1,970
94,855
Vectren Corp.†
5,054
146,617
Health Care REIT, Inc.†
2,031
90,765
WGL Holdings, Inc.
4,435
145,291
Nationwide Health
Oneok, Inc.
3,021
135,250
Properties, Inc.†
2,779
87,177
AGL Resources, Inc.
3,527
132,756
Commerce Group, Inc.
2,400
86,352
Westar Energy, Inc.
4,815
124,901
Hanover Insurance Group, Inc.
1,710
78,318
SCANA Corp.
2,781
117,219
Cousins Properties, Inc.†
3,378
74,654
OGE Energy Corp.
2,767
100,415
Horace Mann Educators Corp.
3,892
73,714
Alliant Energy Corp.
2,347
95,499
Weingarten Realty Investors†
2,336
73,444
Black Hills Corp.
2,123
93,624
Equity One, Inc.†
3,188
73,420
IDACORP, Inc.†
2,656
93,544
First Community Bancorp
1,770
72,995
Puget Energy, Inc.
3,403
93,344
UDR, Inc.
3,670
72,850
NSTAR
2,507
90,804
Astoria Financial Corp.
3,128
72,789
Sierra Pacific Resources†
3,288
55,830
Arthur J. Gallagher & Co.†
2,920
70,635
Aquila, Inc.*
13,780
51,399
Everest Re Group Ltd.
700
70,280
Realty Income Corp.†
2,419
65,361
Total Utilities
2,161,939
Washington Federal, Inc.
2,875
60,691
INDUSTRIALS 11.8%
Wilmington Trust Corp.
1,590
55,968
YRC Worldwide, Inc.*†
19,086
326,180
BRE Properties, Inc. — Class A
1,290
52,284
Kelly Services, Inc.†
15,671
292,421
Total Financials
4,768,027
Avis Budget Group, Inc.*
20,108
261,404
Federal Signal Corp.
15,210
170,656
CONSUMER DISCRETIONARY 24.8%
Alaska Air Group, Inc.*
6,524
163,165
ArvinMeritor, Inc.†
33,954
398,280
GATX Corp.
2,950
108,206
90
|
THE RYDEX VARIABLE TRUST ANNUAL REPORT
See Notes to Financial Statements.

SCHEDULE OF INVESTMENTS (concluded)
December 31, 2007
MID-CAP VALUE FUND
MARKET
MARKET
VALUE
FACE
VALUE
SHARES
(NOTE 1)
AMOUNT
(NOTE 1)
Trinity Industries, Inc.†
3,570
$
99,103
REPURCHASE AGREEMENT 0.6%
Manpower, Inc.
1,719
97,811
Repurchase Agreement (Note 5)
United Rentals, Inc.*
4,737
86,971
Lehman Brothers Holdings, Inc.
Timken Co.
2,593
85,180
issued 12/31/07 at 1.00%
Werner Enterprises, Inc.†
4,493
76,516
due 01/02/08
$
97,313
$
97,313
JetBlue Airways Corp.*†
11,830
69,797
Total Repurchase Agreement
Teleflex, Inc.
880
55,449
(Cost $97,313)
97,313
Total Industrials
1,892,859
SECURITIES LENDING COLLATERAL 19.0%
INFORMATION TECHNOLOGY 7.1%
Investment in Securities Lending Short Term
Imation Corp.
11,350
238,350
Investment Portfolio Held by
Ingram Micro, Inc. — Class A*
9,235
166,599
U.S. Bank (Note 8)
3,035,322
3,035,322
Palm, Inc.†
23,960
151,906
Tech Data Corp.*
3,376
127,343
Total Securities Lending Collateral
Acxiom Corp.
10,430
122,344
(Cost $3,035,322)
3,035,322
Vishay Intertechnology, Inc.*
9,067
103,454
Total Investments 119.1%
KEMET Corp.*
15,258
101,161
(Cost $19,065,901)
$ 19,051,937
Arrow Electronics, Inc.*
1,882
73,925
Liabilities in Excess of
Diebold, Inc.
1,970
57,091
Other Assets – (19.1)%
$ (3,054,145)
Total Information Technology
1,142,173
Net Assets – 100.0%
$ 15,997,792
MATERIALS 7.0%
Chemtura Corp.
22,442
175,048
Louisiana-Pacific Corp.
10,550
144,324
Olin Corp.
6,656
128,660
RPM International, Inc.
6,187
125,596
Ferro Corp.
5,580
115,673
Worthington Industries, Inc.
5,687
101,684
Valspar Corp.
3,820
86,103
Sonoco Products Co.
2,426
79,282
Cabot Corp.
1,634
54,478
Sensient Technologies Corp.
1,862
52,657
Lubrizol Corp.
901
48,798
Total Materials
1,112,303
HEALTH CARE 3.2%
Health Management
Associates, Inc. — Class A
35,310
211,154
Kindred Healthcare, Inc.*
7,080
176,859
Omnicare, Inc.
5,140
117,243
Total Health Care
505,256
CONSUMER STAPLES 2.3%
Universal Corp.†
3,133
160,472
Smithfield Foods, Inc.*†
3,367
97,374
J.M. Smucker Co.
1,173
60,339
Ruddick Corp.
1,424
49,370
Total Consumer Staples
367,555
Total Common Stocks
(Cost $15,933,266)
15,919,302
*
Non-Income Producing Security.
†
All or a portion of this security is on loan at December 31, 2007 — See Note 8.
REIT — Real Estate Investment Trust.
See Notes to Financial Statements.
THE RYDEX VARIABLE TRUST ANNUAL REPORT
|
91

SCHEDULE OF INVESTMENTS
December 31, 2007
LARGE-CAP VALUE FUND
MARKET
MARKET
VALUE
VALUE
SHARES
(NOTE 1)
SHARES
(NOTE 1)
COMMON STOCKS 99.9%
M&T Bank Corp.
1,100
$
89,727
General Growth Properties, Inc.
2,030
83,595
FINANCIALS 36.3%
Lehman Brothers Holdings, Inc.
1,200
78,528
Washington Mutual, Inc.†
30,941
$
421,107
Chubb Corp.
1,392
75,975
Freddie Mac
11,740
399,982
PNC Financial
CIT Group, Inc.
16,475
395,894
Services Group, Inc.†
1,123
73,725
Countrywide Financial Corp.†
38,560
344,726
Total Financials
9,001,833
National City Corp.
20,541
338,105
CONSUMER DISCRETIONARY 26.5%
E*Trade Financial Corp.*†
84,920
301,466
KB HOME†
24,760
534,816
First Horizon National Corp.†
15,866
287,968
Lennar Corp. — Class A†
28,730
513,980
MBIA, Inc.†
13,650
254,300
D.R. Horton, Inc.
38,710
509,811
Huntington Bancshares, Inc.†
17,181
253,592
Dillard’s, Inc. — Class A†
24,922
468,035
Regions Financial Corp.†
10,675
252,464
OfficeMax, Inc.†
21,639
447,062
KeyCorp
10,629
249,250
Circuit City Stores, Inc.†
106,345
446,649
Wachovia Corp.†
6,287
239,095
Jones Apparel Group, Inc.
22,110
353,539
Ambac Financial Group, Inc.†
9,000
231,930
AutoNation, Inc.*†
21,141
331,068
Citigroup, Inc.
7,556
222,449
Centex Corp.
12,020
303,625
Comerica, Inc.†
5,090
221,568
Brunswick Corp.†
16,257
277,182
Sovereign Bancorp, Inc.†
19,320
220,248
Gannett Co., Inc.
7,060
275,340
XL Capital Ltd.†
4,327
217,691
New York Times Co. —
Allstate Corp.
3,979
207,823
Class A†
13,186
231,151
Bank of America Corp.
4,762
196,480
Whirlpool Corp.
2,524
206,034
American Capital
CBS Corp.
7,492
204,157
Strategies Ltd.
5,510
181,610
Ford Motor Co.*†
28,431
191,341
Marshall & Ilsley Corp.†
6,700
177,416
Leggett & Platt, Inc.†
10,553
184,044
Bear Stearns Cos., Inc.†
1,967
173,588
Macy’s, Inc.
7,019
181,581
BB&T Corp.†
5,579
171,108
Office Depot, Inc.*
10,260
142,717
Apartment Investment &
Eastman Kodak Co.†
5,898
128,989
Management Co. —
Limited Brands, Inc.†
6,140
116,230
Class A†
4,895
170,003
J.C. Penney Co., Inc.
2,400
105,576
Travelers Cos, Inc.
3,087
166,081
Liz Claiborne, Inc.†
5,010
101,953
Morgan Stanley
3,100
164,641
Time Warner, Inc.
6,142
101,404
Fifth Third Bancorp†
6,340
159,324
Carnival Corp.
1,700
75,633
Cincinnati Financial Corp.
3,921
155,036
Big Lots, Inc.*†
4,680
74,833
SunTrust Banks, Inc.†
2,391
149,414
Mattel, Inc.
3,870
73,685
JPMorgan Chase & Co.
3,354
146,402
Genworth Financial, Inc. —
Total Consumer Discretionary
6,580,435
Class A
5,614
142,876
UTILITIES 14.0%
Zions Bancorporation†
3,060
142,871
Integrys Energy Group, Inc.
6,738
348,287
Equity Residential
3,910
142,598
NiSource, Inc.†
17,880
337,753
Marsh & McLennan Cos., Inc.
5,290
140,026
DTE Energy Co.
5,997
263,628
Merrill Lynch & Co., Inc.†
2,160
115,949
Pinnacle West Capital Corp.†
5,698
241,652
Lincoln National Corp.
1,954
113,762
Duke Energy Corp.†
11,535
232,661
Developers Diversified
Progress Energy, Inc.†
4,638
224,618
Realty Corp.†
2,970
113,721
Consolidated Edison, Inc.
4,414
215,624
Hartford Financial
Pepco Holdings, Inc.
7,050
206,777
Services Group, Inc.
1,247
108,726
Nicor, Inc.†
4,747
201,036
Host Hotels & Resorts, Inc.
6,280
107,011
TECO Energy, Inc.†
11,620
199,980
Capital One Financial Corp.
2,230
105,390
Xcel Energy, Inc.
7,543
170,246
U.S. Bancorp†
3,310
105,059
Ameren Corp.†
3,091
167,563
ACE Ltd.
1,580
97,612
CenterPoint Energy, Inc.
7,949
136,166
Wells Fargo & Co.†
3,111
93,921
Southern Co.†
2,929
113,499
92
|
THE RYDEX VARIABLE TRUST ANNUAL REPORT
See Notes to Financial Statements.

SCHEDULE OF INVESTMENTS (concluded)
December 31, 2007
LARGE-CAP VALUE FUND
MARKET
MARKET
VALUE
VALUE
SHARES
(NOTE 1)
SHARES
(NOTE 1)
CMS Energy Corp.
6,435
$
111,840
INFORMATION TECHNOLOGY 2.4%
American Electric
Jabil Circuit, Inc.†
15,890
$
242,640
Power Co., Inc.
2,360
109,882
Electronic Data Systems Corp.
9,316
193,121
PG&E Corp.
2,413
103,976
Micron Technology, Inc.*†
21,452
155,527
Dominion Resources, Inc.
1,824
86,549
Total Information Technology
591,288
Total Utilities
3,471,737
ENERGY 1.8%
MATERIALS 4.2%
Spectra Energy Corp.†
17,080
441,006
Ashland, Inc.
5,069
240,422
Total Energy
441,006
Weyerhaeuser Co.†
2,893
213,330
Total Common Stocks
International Paper Co.†
6,302
204,059
(Cost $24,611,777)
24,777,998
Dow Chemical Co.
3,731
147,076
Bemis Co.†
4,973
136,161
FACE
MeadWestvaco Corp.
3,065
95,934
AMOUNT
Total Materials
1,036,982
REPURCHASE AGREEMENT 0.1%
CONSUMER STAPLES 4.1%
Repurchase Agreement (Note 5)
Tyson Foods, Inc. — Class A
21,324
326,897
Lehman Brothers Holdings, Inc.
SUPERVALU, Inc.
7,357
276,035
issued 12/31/07 at 1.00%
Dean Foods Co.
4,810
124,386
due 01/02/08
$
27,930
27,930
Kroger Co.
4,214
112,556
Total Repurchase Agreement
Reynolds American, Inc.
1,465
96,631
(Cost $27,930)
27,930
Safeway, Inc.
2,423
82,891
SECURITIES LENDING COLLATERAL 27.3%
Total Consumer Staples
1,019,396
Investment in Securities Lending Short Term
INDUSTRIALS 3.8%
Investment Portfolio Held by
Ryder System, Inc.†
5,154
242,290
U.S. Bank (Note 8)
6,754,697
6,754,697
Masco Corp.†
8,787
189,887
Total Securities Lending Collateral
Tyco International Ltd.†
3,580
141,947
(Cost $6,754,697)
6,754,697
Allied Waste Industries, Inc.*
10,425
114,884
RR Donnelley & Sons Co.
2,887
108,955
Total Investments 127.3%
Avery Dennison Corp.
1,430
75,990
(Cost $31,394,404)
$ 31,560,625
Northrop Grumman Corp.
886
69,675
Liabilities in Excess of
Total Industrials
943,628
Other Assets – (27.3)%
$ (6,761,341)
HEALTH CARE 3.5%
Net Assets – 100.0%
$ 24,799,284
AmerisourceBergen Corp.
6,480
290,758
McKesson Corp.
2,174
142,419
Cardinal Health, Inc.
2,010
116,078
Tenet Healthcare Corp.*†
21,756
110,520
Pfizer, Inc.
4,700
106,831
Covidien Ltd.
2,180
96,552
Total Health Care
863,158
TELECOMMUNICATION SERVICES 3.3%
Sprint Nextel Corp.†
13,940
183,032
Embarq Corp.†
3,108
153,939
Citizens Communications Co.
11,499
146,382
Verizon Communications, Inc.
3,250
141,993
Windstream Corp.
8,459
110,136
AT&T, Inc.
2,239
93,053
Total Telecommunication Services
828,535
*
Non-Income Producing Security.
†
All or a portion of this security is on loan at December 31, 2007 — See Note 8.
See Notes to Financial Statements.
THE RYDEX VARIABLE TRUST ANNUAL REPORT
|
93

SCHEDULE OF INVESTMENTS
December 31, 2007
SMALL-CAP GROWTH FUND
MARKET
MARKET
VALUE
VALUE
SHARES
(NOTE 1)
SHARES
(NOTE 1)
COMMON STOCKS 99.4%
Meritage Homes Corp.*†
7,281
$
106,084
Coinstar, Inc.*†
3,745
105,422
INFORMATION TECHNOLOGY 24.8%
Pre-Paid Legal Services, Inc.*†
1,859
102,896
Wright Express Corp.*
4,370
$
155,091
Zumiez, Inc.*
4,110
100,120
Netgear, Inc.*†
4,306
153,595
Panera Bread Co. — Class A*†
2,780
99,580
Bankrate, Inc.*†
3,153
151,628
Pool Corp.†
4,950
98,158
j2 Global
Drew Industries, Inc.*
3,105
85,077
Communications, Inc.*†
6,950
147,131
Gymboree Corp.*
2,775
84,527
DealerTrack Holdings, Inc.*†
3,860
129,194
Select Comfort Corp.*
11,670
81,807
Epicor Software Corp.*
10,500
123,690
Hibbett Sports Inc.*†
4,076
81,438
Flir Systems, Inc.*
3,730
116,749
Jos. A. Bank Clothiers, Inc.*†
2,757
78,437
Websense, Inc.*†
6,480
110,030
Standard-Pacific Corp.†
23,196
77,707
Quality Systems, Inc.†
3,532
107,691
Tractor Supply Co.*†
2,111
75,869
Secure Computing Corp.*
10,340
99,264
Sonic Corp.*†
3,318
72,664
InfoSpace, Inc.†
5,050
94,940
Polaris Industries, Inc.†
1,510
72,133
Ansoft Corp.*
3,630
93,835
Papa John’s International, Inc.*
3,155
71,619
United Online, Inc.†
7,820
92,432
Monarch Casino &
Factset Research Systems, Inc.†
1,521
84,720
Resort, Inc.*†
2,862
68,917
Smith Micro Software, Inc.*†
9,990
84,615
Arbitron, Inc.
1,650
68,591
Intevac, Inc.*
5,748
83,576
Stamps.com, Inc.*
5,560
67,721
Sonic Solutions, Inc.*†
7,959
82,694
P.F. Chang’s China Bistro, Inc.*
2,880
65,779
Comtech
CEC Entertainment, Inc.*†
2,438
63,290
Telecommunications Corp.*
1,489
80,421
Deckers Outdoor Corp.*
395
61,249
Concur Technologies, Inc.*
2,190
79,300
Dress Barn, Inc.*
4,885
61,111
Faro Technologies, Inc.*
2,790
75,832
Fossil, Inc.*†
1,368
57,429
Blackbaud, Inc.
2,678
75,091
Christopher & Banks Corp.†
4,682
53,609
SPSS, Inc.*
1,960
70,384
Universal Technical
Brightpoint, Inc.*
4,480
68,813
Institute, Inc.*
3,120
53,040
AMIS Holdings, Inc.*
6,659
66,723
Bright Horizons Family
EPIQ Systems, Inc.*
3,785
65,897
Solutions, Inc.*†
1,471
50,808
CACI International, Inc. —
LKQ Corp.*
1,650
34,683
Class A*
1,426
63,842
WMS Industries, Inc.*
890
32,610
Ansys, Inc.*†
1,462
60,614
Total Consumer Discretionary
2,874,013
Scansource, Inc.*
1,833
59,298
HEALTH CARE 21.2%
Daktronics, Inc.†
2,610
58,908
LCA-Vision, Inc.
7,670
153,170
Micros Systems, Inc.*†
805
56,479
LHC Group, Inc.*
6,080
151,878
Tyler Technologies, Inc.*
4,345
56,007
HealthExtras, Inc.*
5,744
149,804
LoJack Corp.*
3,280
55,137
Sierra Health Services, Inc.*
3,539
148,496
Diodes, Inc.*
1,627
48,924
LifeCell Corp.*
3,360
144,850
Stratasys, Inc.*†
1,780
45,995
Martek Biosciences Corp.*
4,530
133,997
Trimble Navigation Ltd.*†
1,470
44,453
Palomar Medical
ViaSat, Inc.*
1,270
43,726
Technologies, Inc.*†
8,145
124,781
Global Payments, Inc.
1
47
inVentiv Health, Inc.*
3,380
104,645
Total Information Technology
3,086,766
Immucor, Inc.*†
2,961
100,644
CONSUMER DISCRETIONARY 23.1%
Healthways, Inc.*
1,613
94,264
CROCS, Inc.*†
3,730
137,301
Molina Healthcare, Inc.*†
2,123
82,160
Stage Stores, Inc.†
8,853
131,024
AMN Healthcare Services, Inc.*
4,686
80,459
PetMed Express, Inc.*
10,533
127,449
Sunrise Senior Living, Inc.*
2,465
75,626
Shuffle Master, Inc.*†
10,379
124,444
Bradley Pharmaceuticals, Inc.*
3,790
74,663
Volcom, Inc.*
5,150
113,454
Integra LifeSciences
K-Swiss, Inc. — Class A†
5,965
107,966
Holdings Corp.*†
1,776
74,468
94
|
THE RYDEX VARIABLE TRUST ANNUAL REPORT
See Notes to Financial Statements.

SCHEDULE OF INVESTMENTS (continued)
December 31, 2007
SMALL-CAP GROWTH FUND
MARKET
MARKET
VALUE
VALUE
SHARES
(NOTE 1)
SHARES
(NOTE 1)
Dionex Corp.*
855
$
70,845
St. Mary Land &
Cooper Cos., Inc.†
1,705
64,790
Exploration Co.
2,846
$
109,884
Idexx Laboratories, Inc.*
1,084
63,555
Hornbeck Offshore
Kendle International, Inc.*
1,280
62,618
Services, Inc.*†
2,411
108,374
Sciele Pharma, Inc.*†
3,019
61,739
Unit Corp.*
2,279
105,404
Pediatrix Medical Group, Inc.*
896
61,062
Helix Energy Solutions
PharmaNet Development
Group, Inc.*†
2,455
101,882
Group, Inc.*
1,464
57,403
Penn Virginia Corp.†
1,692
73,822
Respironics, Inc.*
831
54,414
Cabot Oil & Gas Corp.
1,545
62,372
AmSurg Corp.*
1,930
52,226
CARBO Ceramics, Inc.†
1,546
57,511
SurModics, Inc.*†
901
48,897
Oceaneering
PharMerica Corp.*
3,270
45,388
International, Inc.*
826
55,631
ICU Medical, Inc.*†
1,206
43,428
Superior Well Services, Inc.*
2,450
51,989
Kensey Nash Corp.*
1,418
42,427
Dril-Quip, Inc.*
510
28,387
Amedisys, Inc.*
871
42,261
Total Energy
1,012,928
Merit Medical Systems, Inc.*
2,915
40,519
INDUSTRIALS 6.8%
American Medical Systems
Ceradyne, Inc.*
2,429
113,993
Holdings, Inc.*†
2,426
35,080
Landstar System, Inc.†
2,431
102,467
Possis Medical, Inc.*
2,209
32,207
ASV, Inc.*†
6,914
95,759
Haemonetics Corp.*
500
31,510
AAR Corp.*
1,840
69,975
MGI Pharma, Inc.*
680
27,560
Knight Transportation, Inc.†
4,648
68,837
Total Health Care
2,631,834
Toro Co.†
1,258
68,485
FINANCIALS 9.3%
Simpson
TradeStation Group, Inc.*
10,560
150,058
Manufacturing Co., Inc.†
2,484
66,049
optionsXpress Holdings, Inc.†
4,420
149,484
Curtiss-Wright Corp.†
1,305
65,511
Zenith National
Heartland Express, Inc.†
3,915
55,515
Insurance Corp.
2,520
112,720
Forward Air Corp.†
1,760
54,859
Portfolio Recovery
Teledyne Technologies, Inc.*
860
45,864
Associates, Inc.†
2,798
110,997
Waste Connections, Inc.*
1,394
43,075
Fremont General Corp.*†
29,102
101,857
Total Industrials
850,389
Wilshire Bancorp, Inc.
11,980
94,043
CONSUMER STAPLES 3.5%
Philadelphia Consolidated
Mannatech, Inc.
23,193
146,580
Holding Corp.*
2,049
80,628
USANA Health Sciences, Inc.*†
3,446
127,778
Infinity Property &
United Natural Foods, Inc.*
1,820
57,730
Casualty Corp.
2,173
78,511
Chattem, Inc.*
720
54,389
World Acceptance Corp.*†
2,394
64,590
Boston Beer Co., Inc. —
Nara Bancorp, Inc.†
5,217
60,882
Class A*
1,130
42,544
PrivateBancorp, Inc.†
1,614
52,697
UCBH Holdings, Inc.†
3,453
48,894
Total Consumer Staples
429,021
First Cash Financial
MATERIALS 2.5%
Services, Inc.*
3,210
47,123
Headwaters, Inc.*†
8,779
103,065
Rewards Network, Inc.*†
874
4,344
Deltic Timber Corp.
1,750
90,108
Total Financials
1,156,828
Quanex Corp.†
1,190
61,761
Brush Engineered
ENERGY 8.2%
Materials, Inc.*
1,420
52,568
Basic Energy Services, Inc.*†
6,680
146,626
Petroleum
Total Materials
307,502
Development Corp.*†
1,878
111,046
Total Common Stocks
(Cost $10,895,516)
12,349,281
See Notes to Financial Statements.
THE RYDEX VARIABLE TRUST ANNUAL REPORT
|
95

SCHEDULE OF INVESTMENTS (concluded)
December 31, 2007
SMALL-CAP GROWTH FUND
MARKET
FACE
VALUE
AMOUNT
(NOTE 1)
REPURCHASE AGREEMENT 0.6%
Repurchase Agreement (Note 5)
Lehman Brothers Holdings, Inc.
issued 12/31/07 at 1.00%
due 01/02/08
$
78,077
$
78,077
Total Repurchase Agreement
(Cost $78,077)
78,077
SECURITIES LENDING COLLATERAL 25.5%
Investment in Securities Lending Short Term
Investment Portfolio Held by
U.S. Bank (Note 8)
3,174,928
3,174,928
Total Securities Lending Collateral
(Cost $3,174,928)
3,174,928
Total Investments 125.5%
(Cost $14,148,521)
$ 15,602,286
Liabilities in Excess of
Other Assets – (25.5)%
$ (3,174,322)
Net Assets – 100.0%
$ 12,427,964
*
Non-Income Producing Security.
†
All or a portion of this security is on loan at December 31, 2007 — See Note 8.
96
|
THE RYDEX VARIABLE TRUST ANNUAL REPORT
See Notes to Financial Statements.

SCHEDULE OF INVESTMENTS
December 31, 2007
MID-CAP GROWTH FUND
MARKET
MARKET
VALUE
VALUE
SHARES
(NOTE 1)
SHARES
(NOTE 1)
COMMON STOCKS 99.3%
Lincare Holdings, Inc.*†
6,426
$
225,938
Par Pharmaceutical Cos., Inc.*
9,085
218,040
CONSUMER DISCRETIONARY 24.8%
Gen-Probe, Inc.*
3,338
210,060
Aeropostale, Inc.*†
14,549
$
385,548
Techne Corp.*†
3,061
202,179
NVR, Inc.*†
732
383,568
Community Health
Chico’s FAS, Inc.*†
39,376
355,565
Systems, Inc.*†
5,470
201,624
Urban Outfitters, Inc.*†
11,975
326,439
Pharmaceutical Product
Toll Brothers, Inc.*†
15,097
302,846
Development, Inc.
4,959
200,195
Career Education Corp.*
12,032
302,484
Cerner Corp.*†
2,626
148,106
Chipotle Mexican Grill, Inc. —
Henry Schein, Inc.*
2,369
145,457
Class A*
1,980
291,199
Medicis Pharmaceutical
ITT Educational Services, Inc.*
3,188
271,841
Corp. — Class A†
4,619
119,955
Strayer Education, Inc.
1,573
268,322
Covance, Inc.*
1,346
116,590
Getty Images, Inc.*
9,140
265,060
Charles River Laboratories
Corinthian Colleges, Inc.*
16,423
252,914
International, Inc.*
1,570
103,306
Ross Stores, Inc.
9,268
236,983
Total Health Care
6,018,766
Timberland Co. — Class A*†
12,931
233,792
INFORMATION TECHNOLOGY 16.5%
Pacific Sunwear of
Digital River, Inc.*
13,160
435,201
California, Inc.*†
15,633
220,582
F5 Networks, Inc.*
13,120
374,183
Advance Auto Parts, Inc.
5,536
210,313
DST Systems, Inc.*†
4,244
350,342
Valassis
Western Digital Corp.*
10,923
329,984
Communications, Inc.*†
17,250
201,653
Silicon Laboratories, Inc.*
8,004
299,590
Sotheby’s Holdings, Inc. —
Cree, Inc.*†
10,388
285,358
Class A†
5,230
199,263
ACI Worldwide, Inc.*
13,130
249,995
Matthews International
McAfee, Inc.*
5,823
218,363
Corp. — Class A
4,139
193,995
Plantronics, Inc.†
8,371
217,646
Williams-Sonoma, Inc.†
7,438
192,644
Amphenol Corp. — Class A†
4,667
216,409
American Eagle Outfitters, Inc.
9,209
191,271
ValueClick, Inc.*
9,840
215,496
Warnaco Group, Inc.*
5,150
179,220
Alliance Data Systems Corp.*†
2,701
202,548
Scientific Games Corp. —
Global Payments, Inc.
4,245
197,477
Class A*
5,348
177,821
SRA International, Inc. —
Dollar Tree Stores, Inc.*
6,833
177,111
Class A*
5,592
164,684
Cheesecake Factory, Inc.*†
7,461
176,900
Fair Isaac Corp.
4,854
156,056
John Wiley & Sons, Inc. —
Harris Corp.
2,390
149,805
Class A
4,032
172,731
Macrovision Corp.*†
6,820
125,011
O’Reilly Automotive, Inc.*
4,885
158,421
Gartner, Inc. — Class A*†
5,060
88,854
Guess?, Inc.
2,770
104,955
Total Information Technology
4,277,002
Total Consumer Discretionary
6,433,441
INDUSTRIALS 10.3%
HEALTH CARE 23.2%
Joy Global, Inc.
5,450
358,719
Sepracor, Inc.*
16,627
436,459
Alliant Techsystems, Inc.*†
2,567
292,022
Psychiatric Solutions, Inc.*
13,240
430,300
Navigant Consulting, Inc.*
17,550
239,909
Ventana Medical Systems, Inc.*
4,900
427,427
Corporate Executive Board Co.
3,854
231,625
Intuitive Surgical, Inc.*
1,160
376,420
Graco, Inc.†
6,097
227,174
Invitrogen Corp.*
4,004
374,014
Korn/Ferry International, Inc.*
11,420
214,924
Kinetic Concepts, Inc.*†
6,660
356,710
Dun & Bradstreet Corp.†
2,326
206,153
VCA Antech, Inc.*
7,580
335,263
Donaldson Co., Inc.
3,630
168,359
Endo Pharmaceuticals
Rollins, Inc.
8,503
163,258
Holdings, Inc.*
11,640
310,439
Fastenal Co.†
3,944
159,417
Affymetrix, Inc.*†
13,280
307,299
Copart, Inc.*
3,529
150,159
Hologic, Inc.*†
4,475
307,164
Mine Safety Appliances Co.†
2,822
146,377
Apria Healthcare Group, Inc.*
10,817
233,323
Stericycle, Inc.*
1,850
109,890
ResMed, Inc.*†
4,426
232,498
Total Industrials
2,667,986
See Notes to Financial Statements.
THE RYDEX VARIABLE TRUST ANNUAL REPORT
|
97

SCHEDULE OF INVESTMENTS (concluded)
December 31, 2007
MID-CAP GROWTH FUND
MARKET
MARKET
VALUE
FACE
VALUE
SHARES
(NOTE 1)
AMOUNT
(NOTE 1)
ENERGY 9.5%
REPURCHASE AGREEMENT 0.8%
Encore Acquisition Co.*†
13,500
$
450,495
Repurchase Agreement (Note 5)
Frontier Oil Corp.†
7,650
310,437
Lehman Brothers Holdings, Inc.
Cimarex Energy Co.
6,410
272,617
issued 12/31/07 at 1.00%
Grant Prideco, Inc.*
4,860
269,779
due 01/02/08
$
207,102
$
207,102
Denbury Resources, Inc.*
6,788
201,943
Total Repurchase Agreement
FMC Technologies, Inc.*
3,337
189,208
(Cost $207,102)
207,102
Newfield Exploration Co.*
3,406
179,496
Pioneer Natural
SECURITIES LENDING COLLATERAL 28.7%
Resources Co.†
3,511
171,477
Investment in Securities Lending Short Term
Quicksilver Resources, Inc.*†
2,735
162,979
Investment Portfolio Held by
Southwestern Energy Co.*
2,541
141,584
U.S. Bank (Note 8)
7,446,497
7,446,497
Cameron International Corp.*
2,160
103,961
Total Securities Lending Collateral
Total Energy
2,453,976
(Cost $7,446,497)
7,446,497
MATERIALS 6.0%
Total Investments 128.8%
Cleveland-Cliffs, Inc.†
3,695
372,456
(Cost $29,921,928)
$ 33,409,481
Steel Dynamics, Inc.†
6,186
368,500
Liabilities in Excess of
Commercial Metals Co.
11,427
336,525
Other Assets – (28.8)%
$ (7,469,773)
Terra Industries, Inc.*†
5,430
259,337
Net Assets – 100.0%
$25,939,708
CF Industries Holdings, Inc.†
1,990
219,019
Total Materials
1,555,837
FINANCIALS 4.8%
Jones Lang LaSalle, Inc.
4,630
329,471
W.R. Berkley Corp.
8,787
261,940
Brown & Brown, Inc.
9,839
231,217
Eaton Vance Corp.
4,865
220,920
SEI Investments Co.†
6,566
211,228
Total Financials
1,254,776
CONSUMER STAPLES 4.2%
Hansen Natural Corp.*†
9,444
418,275
Energizer Holdings, Inc.*
2,995
335,829
NBTY, Inc.*
6,966
190,869
Church & Dwight Co., Inc.†
2,758
149,125
Total Consumer Staples
1,094,098
Total Common Stocks
(Cost $22,268,329)
25,755,882
*
Non-Income Producing Security.
†
All or a portion of this security is on loan at December 31, 2007 — See Note 8.
98
|
THE RYDEX VARIABLE TRUST ANNUAL REPORT
See Notes to Financial Statements.

SCHEDULE OF INVESTMENTS
December 31, 2007
LARGE-CAP GROWTH FUND
MARKET
MARKET
VALUE
VALUE
SHARES
(NOTE 1)
SHARES
(NOTE 1)
COMMON STOCKS 99.3%
Microsoft Corp.
5,780
$
205,768
Network Appliance, Inc.*
7,687
191,868
CONSUMER DISCRETIONARY 19.3%
Symantec Corp.*
10,985
177,298
Sears Holdings Corp.*†
4,630
$
472,491
Citrix Systems, Inc.*†
4,609
175,188
Coach, Inc.*
13,735
420,016
Nvidia Corp.*
4,700
159,894
Amazon.com, Inc.*
4,529
419,567
Electronic Arts, Inc.*†
2,701
157,765
Expedia, Inc.*†
12,060
381,337
MEMC Electronic
Apollo Group, Inc. — Class A*†
5,401
378,880
Materials, Inc.*
1,718
152,026
Abercrombie & Fitch Co. —
QLogic Corp.*
10,327
146,643
Class A
4,148
331,716
Western Union Co.
5,870
142,524
Goodyear Tire & Rubber Co.*
11,480
323,966
National Semiconductor Corp.
5,648
127,871
Bed Bath & Beyond, Inc.*
10,403
305,744
BMC Software, Inc.*
2,690
95,872
Starbucks Corp.*†
14,282
292,352
Total Information Technology
6,857,736
TJX Cos., Inc.
10,171
292,213
HEALTH CARE 15.9%
Harley-Davidson, Inc.†
6,149
287,220
Express Scripts, Inc.*
5,006
365,438
AutoZone, Inc.*
2,380
285,386
Zimmer Holdings, Inc.*
5,449
360,451
Black & Decker Corp.†
3,687
256,800
Varian Medical Systems, Inc.*†
6,173
321,984
Harman International
Forest Laboratories, Inc.*
8,765
319,484
Industries, Inc.
3,285
242,137
Coventry Health Care, Inc.*
5,305
314,321
Yum! Brands, Inc.
6,276
240,182
UnitedHealth Group, Inc.
5,271
306,772
Lowe’s Cos., Inc.†
10,245
231,742
Waters Corp.*
3,652
288,764
H&R Block, Inc.†
12,456
231,308
IMS Health, Inc.
12,193
280,927
Darden Restaurants, Inc.†
8,005
221,819
Gilead Sciences, Inc.*
5,716
262,993
Best Buy Co., Inc.†
4,176
219,866
Amgen, Inc.*
5,258
244,181
Kohl’s Corp.*
4,238
194,100
St. Jude Medical, Inc.*
5,931
241,036
International Game
Patterson Cos., Inc.*†
6,768
229,774
Technology, Inc.
4,362
191,623
Stryker Corp.†
3,064
228,942
GameStop Corp. — Class A*
2,710
168,318
Medtronic, Inc.
4,524
227,421
Omnicom Group, Inc.†
3,508
166,735
Biogen Idec, Inc.*†
3,850
219,142
Nike, Inc. — Class B
2,544
163,427
Laboratory Corporation of
McGraw-Hill Cos., Inc.
3,660
160,345
America Holdings*†
2,801
211,560
Polo Ralph Lauren Corp.†
2,070
127,905
Hospira, Inc.*
4,709
200,792
Total Consumer Discretionary
7,007,195
Barr Pharmaceuticals, Inc.*
3,673
195,036
INFORMATION TECHNOLOGY 18.9%
Quest Diagnostics, Inc.
3,473
183,722
Google, Inc. — Class A*
712
492,334
Celgene Corp.*
3,746
173,103
Cognizant Technology
Johnson & Johnson, Inc.
2,512
167,550
Solutions Corp. — Class A*
11,142
378,159
C.R. Bard, Inc.†
1,632
154,714
Yahoo!, Inc.*
15,263
355,017
Becton, Dickinson & Co.
1,699
142,002
Apple, Inc.*
1,680
332,774
Genzyme Corp.*
1,860
138,458
Dell, Inc.*
12,684
310,885
Total Health Care
5,778,567
Intuit, Inc.*†
9,256
292,582
ENERGY 11.9%
eBay, Inc.*
8,237
273,386
Sunoco, Inc.
5,900
427,396
SanDisk Corp.*
8,065
267,516
XTO Energy, Inc.
7,402
380,167
Fiserv, Inc.*†
4,617
256,197
Valero Energy Corp.
4,330
303,230
Autodesk, Inc.*
5,118
254,672
Apache Corp.
2,803
301,435
Lexmark International, Inc.*†
7,240
252,386
ConocoPhillips
3,340
294,922
Adobe Systems, Inc.*
5,895
251,893
EOG Resources, Inc.†
3,257
290,687
Motorola, Inc.
15,670
251,347
Schlumberger Ltd.
2,830
278,387
Oracle Corp.*
10,739
242,487
Murphy Oil Corp.
3,080
261,307
Qualcomm, Inc.
5,969
234,880
Chesapeake Energy Corp.†
6,451
252,879
Total System Services, Inc.
8,340
233,520
Transocean, Inc.†
1,640
234,766
Cisco Systems, Inc.*
8,621
233,370
Exxon Mobil Corp.
2,485
232,820
Akamai Technologies, Inc.*†
6,116
211,614
Halliburton Co.
5,700
216,087
See Notes to Financial Statements.
THE RYDEX VARIABLE TRUST ANNUAL REPORT
|
99
SCHEDULE OF INVESTMENTS (concluded)
December 31, 2007
LARGE-CAP GROWTH FUND
MARKET
MARKET
VALUE
VALUE
SHARES
(NOTE 1)
SHARES
(NOTE 1)
BJ Services Co.†
8,439
$
204,730
Kellogg Co.†
4,157
$
217,951
Devon Energy Corp.
2,284
203,070
UST, Inc.†
3,830
209,884
Smith International, Inc.
2,341
172,883
Campbell Soup Co.†
5,597
199,981
Consol Energy, Inc.
2,030
145,186
Estee Lauder Cos., Inc. —
Baker Hughes, Inc.†
1,520
123,272
Class A
4,190
182,726
Total Energy
4,323,224
PepsiCo, Inc.
2,193
166,449
FINANCIALS 9.9%
WM Wrigley Jr Co.
2,516
147,312
IntercontinentalExchange, Inc.*
2,270
436,975
Total Consumer Staples
2,566,353
CB Richard Ellis Group, Inc. —
MATERIALS 6.1%
Class A*†
19,780
426,259
United States Steel Corp.
3,520
425,603
Moody’s Corp.†
10,270
366,639
Nucor Corp.
5,973
353,721
Progressive Corp.
18,100
346,796
Freeport-McMoRan Copper &
CME Group Inc.†
450
308,700
Gold, Inc.
3,310
339,077
SLM Corp.†
15,210
306,329
Titanium Metals Corp.
12,660
334,857
Safeco Corp.
5,400
300,672
Ball Corp.
6,631
298,395
Leucadia National Corp.†
5,430
255,753
Ecolab, Inc.†
3,328
170,427
Federated Investors, Inc. —
Sigma-Aldrich Corp.†
2,970
162,162
Class B†
5,750
236,670
Pactiv Corp.*
5,016
133,576
Commerce Bancorp, Inc.†
4,227
161,218
Total Materials
2,217,818
Franklin Resources, Inc.†
1,320
151,048
UTILITIES 1.7%
American Express Co.
2,830
147,217
Constellation Energy
NYSE Euronext
1,420
124,633
Group, Inc.
2,230
228,642
Total Financials
3,568,909
AES Corp.*
9,784
209,280
INDUSTRIALS 8.5%
Questar Corp.
2,970
160,677
Cummins, Inc.
1,960
249,645
Total Utilities
598,599
Caterpillar, Inc.
3,390
245,978
Total Common Stocks
Trane, Inc.
5,180
241,958
(Cost $32,385,500)
36,012,206
Expeditors International
Washington, Inc.
5,400
241,272
FACE
Rockwell Collins, Inc.
3,128
225,122
AMOUNT
Danaher Corp.†
2,368
207,768
REPURCHASE AGREEMENT 0.8%
L-3 Communications
Repurchase Agreement (Note 5)
Holdings, Inc.
1,910
202,345
Lehman Brothers Holdings, Inc.
Lockheed Martin Corp.
1,910
201,047
issued 12/31/07 at 1.00%
Pitney Bowes, Inc.†
5,010
190,580
due 01/02/08
$
280,296
280,296
CH Robinson Worldwide, Inc.
3,380
182,926
Total Repurchase Agreement
Terex Corp.*
2,740
179,662
(Cost $280,296)
280,296
General Dynamics Corp.
1,886
167,835
ITT Industries, Inc.
2,360
155,854
SECURITIES LENDING COLLATERAL 20.0%
Equifax, Inc.
4,120
149,803
Investment in Securities Lending Short Term
Rockwell Automation, Inc.
2,060
142,058
Investment Portfolio Held by
Jacobs Engineering
U.S. Bank (Note 8)
7,276,460
7,276,460
Group, Inc.*†
1,150
109,952
Total Securities Lending Collateral
Total Industrials
3,093,805
(Cost $7,276,460)
7,276,460
CONSUMER STAPLES 7.1%
Total Investments 120.1%
Clorox Co.
4,528
295,090
(Cost $39,942,256)
$ 43,568,962
Avon Products, Inc.†
6,239
246,628
Liabilities in Excess of
Anheuser-Busch Cos., Inc.
4,433
232,023
Other Assets – (20.1)%
$ (7,293,816)
Pepsi Bottling Group, Inc.†
5,680
224,133
Net Assets – 100.0%
$ 36,275,146
Hershey Co.†
5,660
223,004
Colgate-Palmolive Co.
2,837
221,172
*
Non-Income Producing Security.
†
All or a portion of this security is on loan at December 31, 2007 — See Note 8.
100
|
THE RYDEX VARIABLE TRUST ANNUAL REPORT
See Notes to Financial Statements.

SCHEDULE OF INVESTMENTS
December 31, 2007
U.S. GOVERNMENT MONEY MARKET FUND
MARKET
FACE
VALUE
AMOUNT
(NOTE 1)
FEDERAL AGENCY DISCOUNT NOTES 44.8%
Federal Farm Credit Bank*
4.54% due 01/03/08
$ 25,000,000
$24,996,847
Freddie Mac*
4.32% due 01/22/08
25,000,000
24,940,000
Fannie Mae*
4.26% due 02/13/08
25,000,000
24,875,750
4.59% due 03/28/08
25,000,000
24,726,174
4.31% due 01/11/08
10,000,000
9,989,225
Farmer Mac*
4.28% due 01/30/08
14,800,000
14,750,732
Total Federal Agency Discount Notes
(Cost $124,278,728)
124,278,728
REPURCHASE AGREEMENTS 53.5%
Repurchase Agreement (Note 5)
Mizuho Financial Group, Inc.
issued 12/31/07 at 1.40%
due 01/02/08
42,400,397
42,400,397
Morgan Stanley issued
12/31/07 at 1.20%
due 01/02/08
42,400,397
42,400,397
UBS Financial Services, Inc.
issued 12/31/07 at 1.14%
due 01/02/08
42,400,397
42,400,397
Lehman Brothers Holdings, Inc.
issued 12/31/07 at 1.00%
due 01/02/08
21,108,071
21,108,071
Total Repurchase Agreements
(Cost $148,309,262)
148,309,262
Total Investments 98.3%
(Cost $272,587,990)
$ 272,587,990
Other Assets in Excess
of Liabilities – 1.7%
$
4,757,547
Net Assets – 100.0%
$ 277,345,537
*
The issuer is a publicly traded company that operates under a Congressional charter; its securities are neither issued nor guaranteed by the
U.S. Government.
See Notes to Financial Statements.
THE RYDEX VARIABLE TRUST ANNUAL REPORT
|
101

STATEMENTS OF ASSETS AND LIABILITIES
Inverse
Inverse
S&P 500
OTC
Nova
Strategy
OTC
Strategy
Fund
Fund
Fund
Fund
ASSETS
Investment Securities* (Notes 1, 2 and 8)
$
68,394,972
$
7,997,518
$
72,390,889
$
3,998,345
Repurchase Agreements* (Note 5)
14,140,391
21,376,276
17,376,747
8,861,337
Segregated Cash with Broker
4,756,140
1,355,786
746,010
364,094
Receivable for Equity Index Swap Settlement (Note 1)
—
79,638
—
109,108
Variation Margin on Futures Contracts (Note 1)
—
90,750
—
51,600
Receivable for Fund Shares Sold
1,744,372
—
125,112
767,629
Investment Income Receivable (Note 1)
84,624
1,426
33,505
587
Other Assets
—
—
—
—
Total Assets
89,120,499
30,901,394
90,672,263
14,152,700
LIABILITIES
Payable for Equity Index Swap Settlement (Note 1)
213,478
—
102,891
—
Variation Margin on Futures Contracts (Note 1)
278,850
—
120,400
—
Payable upon Return of Securities Loaned (Note 8)
6,277,357
—
7,604,902
—
Payable for Securities Purchased (Note 1)
—
—
—
—
Payable for Fund Shares Redeemed
10,708
9,259,834
191,093
470,176
Investment Advisory Fees Payable (Note 3)
50,848
19,943
52,102
12,353
Transfer Agent and Administrative Fees Payable (Note 3)
16,949
5,540
17,367
3,431
Distribution and Service Fees Payable (Note 3)
16,949
5,540
17,367
3,431
Portfolio Accounting Fees Payable (Note 3)
6,780
2,216
6,947
1,373
Custody Fees Payable
2,034
665
2,084
412
Other Liabilities
55,220
26,347
64,614
21,437
Total Liabilities
6,929,173
9,320,085
8,179,767
512,613
NET ASSETS
$
82,191,326
$ 21,581,309
$
82,492,496
$ 13,640,087
NET ASSETS CONSIST OF
Paid-In Capital
$156,689,739
$ 51,919,785
$ 438,066,751
$ 30,944,688
Undistributed Net Investment Income
223,114
172,208
77,200
66,793
Accumulated Net Realized Loss on Investments, Equity Index
Swaps, and Futures Contracts
(82,835,818)
(30,708,385)
(379,223,280)
(17,553,169)
Net Unrealized Appreciation (Depreciation) on Investments,
Equity Index Swaps, and Futures Contracts
8,114,291
197,701
23,571,825
181,775
NET ASSETS
$
82,191,326
$ 21,581,309
$
82,492,496
$ 13,640,087
SHARES OUTSTANDING
8,168,022
511,231
4,552,214
802,897
NET ASSET VALUES
$10.06
$42.21
$18.12
$16.99
*
The cost of investments is $74,467,663, $29,373,794, $66,160,557, $12,859,682, $31,323,998, $52,494,686, $33,091,339, $2,835,073,
$7,254,477, $23,810,587, $8,810,273, and $49,728,914, respectively.
102
|
THE RYDEX VARIABLE TRUST ANNUAL REPORT
See Notes to Financial Statements.

December 31, 2007
Inverse
Inverse
Government
S&P 500
OTC
Mid-Cap
Mid-Cap
Russell 2000®
Russell 2000®
Russell 2000®
Long Bond
2x Strategy
2x Strategy
1.5x Strategy
Strategy
2x Strategy
1.5x Strategy
Strategy
1.2x Strategy
Fund
Fund
Fund
Fund
Fund
Fund
Fund
Fund
$13,443,576
$ 46,434,644
$31,261,871
$
399,816
$ 5,416,573
$ 18,704,610
$
2,000,000
$ 38,728,075
21,052,513
16,136,884
1,635,714
2,435,257
1,849,085
5,469,707
6,810,273
12,875,143
2,943,448
2,522,432
868,011
145,882
802,075
1,784,857
974,734
800,700
—
213,549
207,787
28,271
26,795
284,229
32,197
—
—
—
—
11,970
—
—
—
338,531
1,426,790
6,175,812
807,060
17,030
60,696
382,161
1,816,573
2,389
20,035
20,322
18,918
164
7,688
26,918
458
162,755
—
—
—
—
227
764
—
—
38,886,362
71,503,643
34,799,361
3,038,390
8,163,139
26,653,246
11,634,235
52,907,593
358,355
114,540
—
—
19,572
46,063
39,142
—
222,200
231,340
93,823
—
28,710
43,230
38,215
—
1,030,640
5,336,798
6,665,093
—
1,267,411
4,427,807
—
—
1,013
—
—
—
—
—
—
284,830
777,151
637,172
77,351
61
633,591
202,051
236
276,074
27,407
43,952
21,984
3,579
3,950
15,299
7,676
21,759
7,613
12,209
6,107
994
1,097
4,250
2,132
8,704
7,613
12,209
6,107
994
1,097
4,250
2,132
10,880
3,045
4,884
2,443
398
439
1,700
853
4,352
914
1,465
733
119
132
510
256
1,332
21,489
40,092
32,402
3,029
2,536
28,597
8,926
50,105
2,457,440
6,434,661
6,906,043
9,174
1,958,535
4,773,757
99,568
658,036
$36,428,922
$ 65,068,982
$27,893,318
$ 3,029,216
$ 6,204,604
$ 21,879,489
$11,534,667
$ 52,249,557
$34,703,155
$62,504,833
$29,022,146
$ 4,818,673
$ 7,115,844
$ 22,856,483
$19,297,399
$ 55,262,598
—
42,493
—
18,025
54,736
24,990
44,246
—
(1,294,240)
(7,637,094)
(821,181)
(1,871,128)
(1,007,311)
(1,449,307)
(7,798,188)
(4,821,659)
3,020,007
10,158,750
(307,647)
63,646
41,335
447,323
(8,790)
1,808,618
$36,428,922
$ 65,068,982
$27,893,318
$ 3,029,216
$ 6,204,604
$ 21,879,489
$11,534,667
$ 52,249,557
1,893,066
2,170,084
1,283,988
86,471
276,570
639,774
332,823
4,269,817
$19.24
$29.98
$21.72
$35.03
$22.43
$34.20
$34.66
$12.24
THE RYDEX VARIABLE TRUST ANNUAL REPORT
|
103

STATEMENTS OF ASSETS AND LIABILITIES (concluded)
Inverse
Government
Long Bond
Europe 1.25x
Japan 1.25x
Dow 2x
Strategy
Strategy
Strategy
Strategy
Fund
Fund
Fund
Fund
ASSETS
Investment Securities* (Notes 1, 2 and 8)
$
7,995,737
$ 73,611,274
$
5,996,428
$ 32,433,543
Repurchase Agreements* (Note 5)
23,195,219
19,702,150
9,887,714
9,965,262
Segregated Cash with Broker
98,600
4,962,477
456,000
1,067,562
Receivable for Equity Index Swap Settlement (Note 1)
—
—
—
—
Variation Margin on Futures Contracts (Note 1)
—
—
10,350
—
Receivable for Securities Sold (Note 1)
—
—
—
—
Receivable for Fund Shares Sold
515
128,900
72,026
2,450,478
Investment Income Receivable (Note 1)
1,406
114,765
635
35,203
Total Assets
31,291,477
98,519,566
16,423,153
45,952,048
LIABILITIES
Short Sales at Market Value** (Notes 1 and 2)
13,243,278
—
—
—
Payable to cover Short Sale
174,225
—
—
—
Payable for Equity Index Swap Settlement (Note 1)
—
635,419
508,563
590,118
Variation Margin on Futures Contracts (Note 1)
41,687
—
—
190,500
Payable upon Return of Securities Loaned (Note 8)
—
14,834,105
—
271,752
Payable for Securities Purchased (Note 1)
—
—
—
—
Payable for Fund Shares Redeemed
99,870
50,121
303,338
6,397
Investment Advisory Fees Payable (Note 3)
12,923
64,551
13,254
30,416
Transfer Agent and Administrative Fees Payable (Note 3)
3,590
17,931
3,682
8,449
Distribution and Service Fees Payable (Note 3)
3,590
17,931
3,682
8,449
Portfolio Accounting Fees Payable (Note 3)
1,436
7,172
1,473
3,380
Custody Fees Payable
431
2,152
442
1,048
Interest Payable
81,244
—
—
—
Other Liabilities
17,751
57,525
20,498
16,743
Total Liabilities
13,680,025
15,686,907
854,932
1,127,252
NET ASSETS
$17,611,452
$82,832,659
$15,568,221
$ 44,824,796
NET ASSETS CONSIST OF
Paid-In Capital
$28,361,302
$78,663,855
$18,999,130
$ 46,370,472
Undistributed Net Investment Income
57,414
154,313
76,368
136,108
Accumulated Net Realized Gain (Loss) on Investments,
Equity Index Swaps and Futures Contracts
(10,767,936)
(2,993,598)
(2,965,819)
(5,113,897)
Net Unrealized Appreciation (Depreciation) on Investments,
Equity Index Swaps and Futures Contracts
(39,328)
7,008,089
(541,458)
3,432,113
NET ASSETS
$17,611,452
$82,832,659
$15,568,221
$ 44,824,796
SHARES OUTSTANDING
899,363
2,766,139
684,993
1,744,433
NET ASSET VALUES
$19.58
$29.95
$22.73
$25.70
*
The cost of investments is $31,190,956, $85,679,875, $15,884,142, $38,438,928, $11,483,811, $10,962,292, $19,065,901, $31,394,404,
$14,148,521, $29,921,928, $39,942,256, and $272,587,990, respectively.
**
The proceeds from short sales are $13,155,581, $0, $0, $0, $0, $0, $0, $0, $0, $0, $0, and $0, respectively.
104
|
THE RYDEX VARIABLE TRUST ANNUAL REPORT
See Notes to Financial Statements.

December 31, 2007
Inverse
Dow 2x
Small-Cap
Mid-Cap
Large-Cap
Small-Cap
Mid-Cap
Large-Cap
U.S. Government
Strategy
Value
Value
Value
Growth
Growth
Growth
Money Market
Fund
Fund
Fund
Fund
Fund
Fund
Fund
Fund
$
3,998,214
$11,248,459
$18,954,624
$31,532,695
$15,524,209
$ 33,202,379
$43,288,666
$124,278,728
7,485,597
13,719
97,313
27,930
78,077
207,102
280,296
148,309,262
207,348
—
—
—
—
—
—
—
461,526
—
—
—
—
—
—
—
37,000
—
—
—
—
—
—
—
—
—
473,808
—
—
7,777,354
11,014,900
—
100,036
8
—
—
101,100
—
—
5,566,822
481
26,651
22,195
82,124
7,556
15,928
26,974
9,983
12,290,202
11,288,837
19,547,940
31,642,749
15,710,942
41,202,763
54,610,836
278,164,795
—
—
—
—
—
—
—
—
—
—
—
—
—
—
—
—
—
—
—
—
—
—
—
—
—
—
—
—
—
—
—
—
—
1,544,114
3,035,322
6,754,697
3,174,928
7,446,497
7,276,460
—
—
—
—
—
75,392
—
313,350
—
380,092
8,781
472,384
18,751
350
7,758,636
10,681,833
335,627
9,532
6,280
10,818
17,229
8,938
20,474
24,783
112,883
2,648
2,093
3,606
5,743
2,979
6,825
8,261
45,153
2,648
2,093
3,606
5,743
2,979
6,825
8,261
56,442
1,059
837
1,442
2,297
1,192
2,730
3,304
22,069
318
385
433
689
397
819
991
6,773
—
—
—
—
—
—
—
—
9,295
14,604
22,537
38,316
15,823
20,249
18,447
240,311
405,592
1,579,187
3,550,148
6,843,465
3,282,978
15,263,055
18,335,690
819,258
$11,884,610
$
9,709,650
$15,997,792
$24,799,284
$12,427,964
$ 25,939,708
$36,275,146
$277,345,537
$18,082,791
$12,227,429
$16,550,187
$24,214,254
$15,216,626
$ 27,573,178
$36,324,351
$277,339,586
59,582
117,535
—
173,272
—
—
—
7,497
(6,764,893)
(2,935,200)
(538,431)
245,537
(4,242,427)
(5,121,023)
(3,675,911)
(1,546)
507,130
299,886
(13,964)
166,221
1,453,765
3,487,553
3,626,706
—
$11,884,610
$
9,709,650
$15,997,792
$24,799,284
$12,427,964
$ 25,939,708
$36,275,146
$277,345,537
412,732
532,814
767,646
977,506
459,060
878,878
1,325,630
277,359,194
$28.79
$18.22
$20.84
$25.37
$27.07
$29.51
$27.36
$1.00
THE RYDEX VARIABLE TRUST ANNUAL REPORT
|
105

Inverse
Inverse
S&P 500
OTC
Nova
Strategy
OTC
Strategy
Fund
Fund
Fund
Fund
INVESTMENT INCOME
Interest (Note 1)
$ 1,032,591
$ 1,270,106
$ 1,042,910
$ 1,216,855
Income from Securities Lending, net (Note 8)
12,994
—
19,298
—
Dividends, Net of Foreign Tax Withheld* (Note 1)
1,438,901
—
251,478
—
Total Income
2,484,486
1,270,106
1,313,686
1,216,855
EXPENSES
Investment Advisory Fees (Note 3)
721,366
245,534
581,978
216,771
Transfer Agent and Administrative Fees (Note 3)
240,455
68,204
193,993
60,214
Audit and Outside Services
38,080
18,127
37,802
13,881
Portfolio Accounting Fees (Note 3)
96,182
27,282
77,597
24,086
Trustees’ Fees**
8,627
2,336
6,763
2,470
Service Fees (Note 3)
240,455
68,204
193,993
60,214
Custody Fees
24,641
7,097
23,476
6,280
Miscellaneous
34,351
7,687
57,716
18,906
Total Expenses
1,404,157
444,471
1,173,318
402,822
Net Investment Income
1,080,329
825,635
140,368
814,033
REALIZED AND UNREALIZED GAIN (LOSS) ON INVESTMENTS (NOTE 1)
Net Realized Gain (Loss) on:
Investment Securities
2,794,297
(2,905)
9,814,311
(6,687)
Equity Index Swaps
2,589,051
(1,162,457)
1,794,943
(2,461,657)
Futures Contracts
(228,530)
(599,299)
322,678
(2,695,502)
Total Net Realized Gain (Loss)
5,154,818
(1,764,661)
11,931,932
(5,163,846)
Net Change in Unrealized Appreciation (Depreciation) on:
Investment Securities
(2,095,528)
827
(506,601)
453
Equity Index Swaps
2,195
79,296
(81,958)
(35,109)
Futures Contracts
292,422
102,467
85,256
(167,161)
Net Change in Unrealized Appreciation (Depreciation)
(1,800,911)
182,590
(503,303)
(201,817)
Net Gain (Loss) on Investments
3,353,907
(1,582,071)
11,428,629
(5,365,663)
Net Increase (Decrease) in Net Assets from Operations
$ 4,434,236
$
(756,436)
$11,568,997
$(4,551,630)
*
Foreign tax withheld of $0, $0, $1,925, $0, $0, $1,041, $0, $0, $23, $169, $0, and $0, respectively.
**
Relates to Trustees not deemed “interested persons” within the meaning of Section 2(a)(19) of the 1940 Act.
106
|
THE RYDEX VARIABLE TRUST ANNUAL REPORT
See Notes to Financial Statements.

Year Ended December 31, 2007
Inverse
Inverse
Government
S&P 500
OTC
Mid-Cap
Mid-Cap
Russell 2000®
Russell 2000®
Russell 2000®
Long Bond
2x Strategy
2x Strategy
1.5x Strategy
Strategy
2x Strategy
1.5x Strategy
Strategy
1.2x Strategy
Fund
Fund
Fund
Fund
Fund
Fund
Fund
Fund
$
461,785
$
815,618
$
887,190
$ 164,012
$ 100,057
$
741,953
$523,664
$ 2,532,639
4,636
10,928
9,576
—
2,807
16,851
—
—
417,855
145,480
258,910
—
46,385
224,344
—
—
884,276
972,026
1,155,676
164,012
149,249
983,148
523,664
2,532,639
290,055
413,793
386,897
31,437
51,879
315,031
97,166
263,582
80,571
114,943
107,472
8,733
14,411
87,509
26,990
105,433
14,785
22,891
22,829
2,091
1,697
20,367
6,237
35,174
32,228
45,977
42,989
3,493
5,764
35,004
10,796
52,716
2,683
3,472
3,779
318
346
4,020
1,067
5,063
80,571
114,943
107,472
8,733
14,411
87,509
26,990
131,791
8,624
12,840
12,214
923
2,243
11,589
2,760
17,171
13,292
37,338
19,358
2,401
3,805
16,300
7,521
22,954
522,809
766,197
703,010
58,129
94,556
577,329
179,527
633,884
361,467
205,829
452,666
105,883
54,693
405,819
344,137
1,898,755
2,079,929
(1,937,756)
776,250
(9)
(74,666)
2,516,959
—
348,708
347,235
608,772
(1,090,536)
92,793
(188,418)
(2,134,667)
78,498
—
(1,285,937)
(2,682,481)
14,935
(329,487)
(724,547)
(538,423)
208,383
704,897
1,141,227
(4,011,465)
(299,351)
(236,703)
(987,631)
(156,131)
286,881
1,053,605
(1,463,231)
4,403,195
(2,360,479)
—
(46,605)
(3,939,946)
—
674,723
(206,676)
39,229
169,223
(22,892)
30,242
(3,482)
(68,843)
—
193,879
81,020
64,298
15,262
59,143
351,995
(23,879)
573,446
(1,476,028)
4,523,444
(2,126,958)
(7,630)
42,780
(3,591,433)
(92,722)
1,248,169
(334,801)
511,979
(2,426,309)
(244,333)
(944,851)
(3,747,564)
194,159
2,301,774
$
26,666
$
717,808
$(1,973,643)
$(138,450)
$(890,158)
$(3,341,745)
$538,296
$ 4,200,529
THE RYDEX VARIABLE TRUST ANNUAL REPORT
|
107

STATEMENTS OF OPERATIONS (concluded)
Inverse
Government
Long Bond
Europe 1.25x
Japan 1.25x
Dow 2x
Strategy
Strategy
Strategy
Strategy
Fund
Fund
Fund
Fund
INVESTMENT INCOME
Interest (Note 1)
$ 1,442,399
$2,006,514
$ 1,207,749
$
400,612
Income from Securities Lending, net (Note 8)
—
20,521
—
3,545
Dividends, Net of Foreign Tax Withheld* (Note 1)
—
1,209,111
—
629,090
Total Income
1,442,399
3,236,146
1,207,749
1,033,247
EXPENSES
Investment Advisory Fees (Note 3)
185,683
764,963
219,755
325,734
Transfer Agent and Administrative Fees (Note 3)
51,579
212,490
61,043
90,482
Audit and Outside Services
12,529
39,649
14,485
11,153
Portfolio Accounting Fees (Note 3)
20,631
84,996
24,417
36,193
Interest Expense
453,604
—
—
—
Trustees’ Fees**
2,224
6,338
2,484
2,146
Service Fees (Note 3)
51,579
212,490
61,043
90,482
Custody Fees
5,398
21,796
6,256
10,589
Miscellaneous
6,830
42,394
9,425
24,252
Total Expenses
790,057
1,385,116
398,908
591,031
Net Investment Income (Loss)
652,342
1,851,030
808,841
442,216
REALIZED AND UNREALIZED GAIN (LOSS) ON INVESTMENTS (NOTE 1)
Net Realized Gain (Loss) on:
Investment Securities
(5,243)
211,954
—
(381,843)
Equity Index Swaps
—
1,959,898
(2,212,040)
963,715
Futures Contracts
(2,061,795)
—
(195,274)
(2,080,166)
Securities Sold Short
93,562
—
—
—
Total Net Realized Gain (Loss)
(1,973,476)
2,171,852
(2,407,314)
(1,498,294)
Net Change in Unrealized Appreciation (Depreciation) on:
Investment Securities
696
1,361,718
—
939,952
Equity Index Swaps
—
(350,609)
(918,772)
(864,139)
Futures Contracts
(78,956)
—
(290,626)
(117,640)
Securities Sold Short
(748,852)
—
—
—
Net Change in Unrealized Appreciation (Depreciation)
(827,112)
1,011,109
(1,209,398)
(41,827)
Net Gain (Loss) on Investments
(2,800,588)
3,182,961
(3,616,712)
(1,540,121)
Net Increase (Decrease) in Net Assets from Operations
$(2,148,246)
$5,033,991
$ (2,807,871)
$(1,097,905)
*
Foreign tax withheld of $0, $151,502, $0, $0, $0, $387, $0, $0, $0, $0, $0, and $0, respectively.
**
Relates to Trustees not deemed “interested persons” within the meaning of Section 2(a)(19) of the 1940 Act.
108
|
THE RYDEX VARIABLE TRUST ANNUAL REPORT
See Notes to Financial Statements.

Year Ended December 31, 2007
Inverse
Dow 2x
Small-Cap
Mid-Cap
Large-Cap
Small-Cap
Mid-Cap
Large-Cap
U.S. Government
Strategy
Value
Value
Value
Growth
Growth
Growth
Money Market
Fund
Fund
Fund
Fund
Fund
Fund
Fund
Fund
$
868,253
$
4,214
$
7,110
$
11,862
$
5,719
$
8,811
$
7,316
$13,321,583
—
33,820
15,628
18,887
49,556
24,750
8,397
—
—
343,396
740,853
1,428,278
66,744
226,188
220,562
—
868,253
381,430
763,591
1,459,027
122,019
259,749
236,275
13,321,583
155,835
132,869
242,466
395,951
154,641
223,890
196,397
1,332,696
43,288
44,290
80,822
131,984
51,547
74,630
65,466
533,079
6,394
10,377
15,994
27,203
11,091
13,920
12,453
168,274
17,315
17,716
32,329
52,794
20,619
29,852
26,186
259,040
—
—
—
—
—
—
—
—
1,086
1,897
2,821
4,851
1,751
2,215
1,901
22,925
43,288
44,290
80,822
131,984
51,547
74,630
65,466
666,348
4,541
5,414
9,064
14,169
6,421
8,565
7,300
68,822
16,157
7,043
17,045
27,548
9,436
13,896
11,665
125,646
287,904
263,896
481,363
786,484
307,053
441,598
386,834
3,176,830
580,349
117,534
282,228
672,543
(185,034)
(181,849)
(150,559)
10,144,753
—
(875,146)
1,578,360
5,047,817
(146,038)
(828,789)
(1,379,474)
—
(1,787,285)
—
—
—
—
—
—
—
(836,440)
—
—
—
—
—
—
—
—
—
—
—
—
—
—
—
(2,623,725)
(875,146)
1,578,360
5,047,817
(146,038)
(828,789)
(1,379,474)
—
—
(2,300,846)
(2,259,896)
(5,927,846)
(1,001,524)
1,414,199
1,634,631
—
661,356
—
—
—
—
—
—
—
146,310
—
—
—
—
—
—
—
—
—
—
—
—
—
—
—
807,666
(2,300,846)
(2,259,896)
(5,927,846)
(1,001,524)
1,414,199
1,634,631
—
(1,816,059)
(3,175,992)
(681,536)
(880,029)
(1,147,562)
585,410
255,157
—
$
(1,235,710)
$ (3,058,458)
$
(399,308)
$
(207,486)
$ (1,332,596)
$
403,561
$
104,598
$10,144,753
THE RYDEX VARIABLE TRUST ANNUAL REPORT
|
109

STATEMENTS OF CHANGES IN NET ASSETS
Inverse S&P 500
Nova Fund
Strategy Fund
Year
Year
Year
Year
Ended
Ended
Ended
Ended
December 31,
December 31,
December 31,
December 31,
2007
2006
2007
2006
FROM OPERATIONS
Net Investment Income (Loss)
$
1,080,329
$
998,244
$
825,635
$
1,141,661
Net Realized Gain (Loss) on Investments
5,154,818
16,003,379
(1,764,661)
(4,609,692)
Net Change in Unrealized Appreciation (Depreciation)
on Investments
(1,800,911)
2,015,525
182,590
(522,300)
Net Increase (Decrease) in Net Assets from Operations
4,434,236
19,017,148
(756,436)
(3,990,331)
Distributions to Shareholders from: (Note 1)
Net Investment Income
(1,161,348)
(1,341,115)
(767,870)
(1,546,385)
Realized Gain on Investments
—
—
—
—
Total Distributions to Shareholders
(1,161,348)
(1,341,115)
(767,870)
(1,546,385)
SHARE TRANSACTIONS
Proceeds from Shares Purchased
273,549,727
330,789,125
352,463,997
323,687,307
Value of Shares Purchased through Dividend
Reinvestment
1,161,348
1,341,115
767,870
1,546,385
Cost of Shares Redeemed
(330,269,317)
(347,347,685)
(349,151,544)
(333,177,077)
Net Increase (Decrease) in Net Assets From Share
Transactions
(55,558,242)
(15,217,445)
4,080,323
(7,943,385)
Net Increase (Decrease) in Net Assets
(52,285,354)
2,458,588
2,556,017
(13,480,101)
NET ASSETS—BEGINNING OF PERIOD
134,476,680
132,018,092
19,025,292
32,505,393
NET ASSETS—END OF PERIOD
$
82,191,326
$ 134,476,680
$
21,581,309
$
19,025,292
Undistributed Net Investment Income—End
of Period
$
223,114
$
304,133
$
172,208
$
114,443
110
|
THE RYDEX VARIABLE TRUST ANNUAL REPORT
See Notes to Financial Statements.

Inverse OTC
S&P 500
OTC
OTC Fund
Strategy Fund
2x Strategy Fund
2x Strategy Fund
Year
Year
Year
Year
Year
Year
Year
Year
Ended
Ended
Ended
Ended
Ended
Ended
Ended
Ended
December 31,
December 31,
December 31,
December 31,
December 31,
December 31,
December 31,
December 31,
2007
2006
2007
2006
2007
2006
2007
2006
$
140,368
$
(394,473)
$
814,033
$
1,043,640
$
361,467
$
313,647
$
205,829
$
51,200
11,931,932
7,365,238
(5,163,846)
(1,601,916)
1,141,227
3,947,635
(4,011,465)
2,697,092
(503,303)
(3,044,627)
(201,817)
(77,041)
(1,476,028)
2,877,796
4,523,444
1,458,151
11,568,997
3,926,138
(4,551,630)
(635,317)
26,666
7,139,078
717,808
4,206,443
(63,168)
—
(906,240)
(1,363,464)
(354,038)
(352,813)
(186,716)
(27,820)
—
—
—
—
(3,786,307)
(1,389,756)
—
—
(63,168)
—
(906,240)
(1,363,464)
(4,140,345)
(1,742,569)
(186,716)
(27,820)
352,847,814
340,799,995
1,210,258,728
590,666,208
206,969,261
177,319,546
1,067,742,482
708,369,127
63,168
—
906,240
1,363,464
4,140,345
1,742,569
186,716
27,820
(354,795,402)
(374,342,089)
(1,215,995,634)
(585,750,595)
(208,230,256)
(172,192,682)
(1,033,063,920)
(727,215,523)
(1,884,420)
(33,542,094)
(4,830,666)
6,279,077
2,879,350
6,869,433
34,865,278
(18,818,576)
9,621,409
(29,615,956)
(10,288,536)
4,280,296
(1,234,329)
12,265,942
35,396,370
(14,639,953)
72,871,087
102,487,043
23,928,623
19,648,327
37,663,251
25,397,309
29,672,612
44,312,565
$
82,492,496
$
72,871,087
$
13,640,087
$
23,928,623
$
36,428,922
$
37,663,251
$
65,068,982
$
29,672,612
$
77,200
$
—
$
66,793
$
159,000
$
—
$
95,229
$
42,493
$
23,380
THE RYDEX VARIABLE TRUST ANNUAL REPORT
|
111

STATEMENTS OF CHANGES IN NET ASSETS (continued)
Mid-Cap
Inverse Mid-Cap
1.5x Strategy Fund
Strategy Fund
Year
Year
Year
Year
Ended
Ended
Ended
Ended
December 31,
December 31,
December 31,
December 31,
2007
2006
2007
2006
FROM OPERATIONS
Net Investment Income
$
452,666
$
136,623
$
105,883
$
151,793
Net Realized Gain (Loss) on Investments
(299,351)
2,811,108
(236,703)
(809,381)
Net Change in Unrealized Appreciation (Depreciation)
on Investments
(2,126,958)
(749,220)
(7,630)
45,113
Net Increase (Decrease) in Net Assets from Operations
(1,973,643)
2,198,511
(138,450)
(612,475)
Distributions to Shareholders from: (Note 1)
Net Investment Income
(470,418)
(109,605)
(119,992)
(122,428)
Realized Gain on Investments
(3,554,938)
(7,740,154)
—
—
Total Distributions to Shareholders
(4,025,356)
(7,849,759)
(119,992)
(122,428)
SHARE TRANSACTIONS
Proceeds from Shares Purchased
388,695,373
325,859,602
106,240,775
79,226,875
Value of Shares Purchased through Dividend
Reinvestment
4,025,356
7,849,759
119,992
122,428
Cost of Shares Redeemed
(397,814,356)
(340,269,215)
(109,031,843)
(75,502,029)
Net Increase (Decrease) in Net Assets From Share
Transactions
(5,093,627)
(6,559,854)
(2,671,076)
3,847,274
Net Increase (Decrease) in Net Assets
(11,092,626)
(12,211,102)
(2,929,518)
3,112,371
NET ASSETS—BEGINNING OF PERIOD
38,985,944
51,197,046
5,958,734
2,846,363
NET ASSETS—END OF PERIOD
$
27,893,318
$
38,985,944
$
3,029,216
$
5,958,734
Undistributed Net Investment Income—End
of Period
$
—
$
27,018
$
18,025
$
31,014
*
Since the commencement of operations: October 27, 2006.
112
|
THE RYDEX VARIABLE TRUST ANNUAL REPORT
See Notes to Financial Statements.

Russell 2000®
Russell 2000®
Inverse Russell 2000®
Government Long Bond
2x Strategy Fund
1.5x Strategy Fund
Strategy Fund
1.2x Strategy Fund
Year
Year
Year
Year
Year
Year
Year
Year
Ended
Ended
Ended
Ended
Ended
Ended
Ended
Ended
December 31,
December 31,
December 31,
December 31,
December 31,
December 31,
December 31,
December 31,
2007
2006*
2007
2006
2007
2006
2007
2006
$
54,693
$
8,434
$
405,819
$
290,811
$
344,137
$
550,676
$
1,898,755
$
2,342,620
(987,631)
36,123
(156,131)
5,542,274
286,881
(3,595,440)
1,053,605
(1,287,584)
42,780
(1,445)
(3,591,433)
1,091,905
(92,722)
(111,097)
1,248,169
(922,470)
(890,158)
43,112
(3,341,745)
6,924,990
538,296
(3,155,861)
4,200,529
132,566
(1,234)
(7,200)
(459,551)
(227,797)
(382,872)
(478,048)
(1,898,770)
(2,342,620)
(55,803)
—
(1,542,506)
—
—
—
—
—
(57,037)
(7,200)
(2,002,057)
(227,797)
(382,872)
(478,048)
(1,898,770)
(2,342,620)
51,531,314
11,344,299
367,099,100
540,992,356
207,784,835
220,791,019
463,570,772
601,286,045
57,037
7,200
2,002,057
227,797
382,872
478,048
1,898,770
2,342,620
(49,020,342)
(6,803,621)
(414,989,632)
(513,395,018)
(209,025,910)
(217,247,922)
(465,941,934)
(611,158,020)
2,568,009
4,547,878
(45,888,475)
27,825,135
(858,203)
4,021,145
(472,392)
(7,529,355)
1,620,814
4,583,790
(51,232,277)
34,522,328
(702,779)
387,236
1,829,367
(9,739,409)
4,583,790
—
73,111,766
38,589,438
12,237,446
11,850,210
50,420,190
60,159,599
$
6,204,604
$
4,583,790
$
21,879,489
$
73,111,766
$
11,534,667
$
12,237,446
$
52,249,557
$
50,420,190
$
54,736
$
1,234
$
24,990
$
78,722
$
44,246
$
80,213
$
—
$
—
THE RYDEX VARIABLE TRUST ANNUAL REPORT
|
113

STATEMENTS OF CHANGES IN NET ASSETS (continued)
Inverse Government
Europe
Long Bond Strategy Fund
1.25x Strategy Fund
Year
Year
Year
Year
Ended
Ended
Ended
Ended
December 31,
December 31,
December 31,
December 31,
2007
2006
2007
2006
FROM OPERATIONS
Net Investment Income
$
652,342
$
925,066
$
1,851,030
$
1,359,244
Net Realized Gain (Loss) on Investments
(1,973,476)
1,012,360
2,171,852
6,101,304
Net Change in Unrealized Appreciation (Depreciation)
on Investments
(827,112)
310,630
1,011,109
4,804,875
Net Increase (Decrease) in Net Assets from Operations
(2,148,246)
2,248,056
5,033,991
12,265,423
Distributions to Shareholders from: (Note 1)
Net Investment Income
(725,228)
(794,766)
(1,982,475)
(1,340,770)
Realized Gain on Investments
—
—
(8,037,155)
(2,181,876)
Total Distributions to Shareholders
(725,228)
(794,766)
(10,019,630)
(3,522,646)
SHARE TRANSACTIONS
Proceeds from Shares Purchased
178,977,020
170,305,300
219,995,801
200,327,455
Value of Shares Purchased through Dividend
Reinvestment
725,228
794,766
10,019,630
3,522,646
Cost of Shares Redeemed
(188,463,694)
(172,977,804)
(231,687,377)
(149,056,372)
Net Increase (Decrease) in Net Assets From Share
Transactions
(8,761,446)
(1,877,738)
(1,671,946)
54,793,729
Net Increase (Decrease) in Net Assets
(11,634,920)
(424,448)
(6,657,585)
63,536,506
NET ASSETS—BEGINNING OF PERIOD
29,246,372
29,670,820
89,490,244
25,953,738
NET ASSETS—END OF PERIOD
$
17,611,452
$
29,246,372
$
82,832,659
$
89,490,244
Undistributed Net Investment Income—End
of Period
$
57,414
$
130,300
$
154,313
$
285,758
114
|
THE RYDEX VARIABLE TRUST ANNUAL REPORT
See Notes to Financial Statements.

Japan
Dow
Inverse Dow
Small-Cap
1.25x Strategy Fund
2x Strategy Fund
2x Strategy Fund
Value Fund
Year
Year
Year
Year
Year
Year
Year
Year
Ended
Ended
Ended
Ended
Ended
Ended
Ended
Ended
December 31,
December 31,
December 31,
December 31,
December 31,
December 31,
December 31,
December 31,
2007
2006
2007
2006
2007
2006
2007
2006
$
808,841
$
1,051,644
$
442,216
$
311,984
$
580,349
$
373,015
$
117,534
$
173,885
(2,407,314)
20,050
(1,498,294)
5,080,243
(2,623,725)
(3,397,426)
(875,146)
1,000,837
(1,209,398)
(1,428,995)
(41,827)
3,041,742
807,666
(490,434)
(2,300,846)
1,860,179
(2,807,871)
(357,301)
(1,097,905)
8,433,969
(1,235,710)
(3,514,845)
(3,058,458)
3,034,901
(1,177,302)
(896,686)
(428,235)
(191,209)
(650,488)
(253,535)
(29,154)
(144,730)
—
(4,542,900)
(4,564,672)
(3,941,317)
—
—
(2,089,925)
(1,515,321)
(1,177,302)
(5,439,586)
(4,992,907)
(4,132,526)
(650,488)
(253,535)
(2,119,079)
(1,660,051)
136,271,443
199,922,255
210,572,797
205,483,794
148,035,616
112,560,241
47,931,806
144,403,437
1,177,302
5,439,586
4,992,907
4,132,526
650,488
253,535
2,119,079
1,660,051
(148,405,041)
(224,274,267)
(210,015,349)
(181,472,287)
(151,968,697)
(99,248,879)
(69,287,218)
(132,350,088)
(10,956,296)
(18,912,426)
5,550,355
28,144,033
(3,282,593)
13,564,897
(19,236,333)
13,713,400
(14,941,469)
(24,709,313)
(540,457)
32,445,476
(5,168,791)
9,796,517
(24,413,870)
15,088,250
30,509,690
55,219,003
45,365,253
12,919,777
17,053,401
7,256,884
34,123,520
19,035,270
$
15,568,221
$
30,509,690
$
44,824,796
$
45,365,253
$
11,884,610
$
17,053,401
$
9,709,650
$
34,123,520
$
76,368
$
444,829
$
136,108
$
120,775
$
59,582
$
124,886
$
117,535
$
29,155
THE RYDEX VARIABLE TRUST ANNUAL REPORT
|
115

STATEMENTS OF CHANGES IN NET ASSETS (concluded)
Mid-Cap
Large-Cap
Value Fund
Value Fund
Year
Year
Year
Year
Ended
Ended
Ended
Ended
December 31,
December 31,
December 31,
December 31,
2007
2006
2007
2006
FROM OPERATIONS
Net Investment Income (Loss)
$
282,228
$
286,721
$
672,543
$
554,773
Net Realized Gain (Loss) on Investments
1,578,360
138,273
5,047,817
1,020,513
Net Change in Unrealized Appreciation (Depreciation)
on Investments
(2,259,896)
1,884,835
(5,927,846)
5,455,621
Net Increase (Decrease) in Net Assets from Operations
(399,308)
2,309,829
(207,486)
7,030,907
Distributions to Shareholders from: (Note 1)
Net Investment Income
(366,943)
(212,382)
(639,172)
(420,965)
Realized Gain on Investments
(17,776)
—
(4,733,675)
(1,346,753)
Total Distributions to Shareholders
(384,719)
(212,382)
(5,372,847)
(1,767,718)
SHARE TRANSACTIONS
Proceeds from Shares Purchased
119,801,427
76,783,553
188,096,688
241,682,369
Value of Shares Purchased through Dividend
Reinvestment
384,719
212,382
5,372,847
1,767,718
Cost of Shares Redeemed
(131,658,649)
(65,070,840)
(246,412,645)
(189,937,692)
Net Increase (Decrease) in Net Assets From Share
Transactions
(11,472,503)
11,925,095
(52,943,110)
53,512,395
Net Increase (Decrease) in Net Assets
(12,256,530)
14,022,542
(58,523,443)
58,775,584
NET ASSETS—BEGINNING OF PERIOD
28,254,322
14,231,780
83,322,727
24,547,143
NET ASSETS—END OF PERIOD
$
15,997,792
$ 28,254,322
$
24,799,284
$
83,322,727
Undistributed Net Investment Income—End
of Period
$
—
$
74,339
$
173,272
$
139,901
116
|
THE RYDEX VARIABLE TRUST ANNUAL REPORT
See Notes to Financial Statements.

Small-Cap
Mid-Cap
Large-Cap
U.S. Government
Growth Fund
Growth Fund
Growth Fund
Money Market Fund
Year
Year
Year
Year
Year
Year
Year
Year
Ended
Ended
Ended
Ended
Ended
Ended
Ended
Ended
December 31,
December 31,
December 31,
December 31,
December 31,
December 31,
December 31,
December 31,
2007
2006
2007
2006
2007
2006
2007
2006
$
(185,034)
$
(170,071)
$
(181,849)
$
(171,410)
$
(150,559)
$
(119,624)
$
10,144,753
$
9,620,978
(146,038)
(724,911)
(828,789)
600,317
(1,379,474)
(498,552)
—
—
(1,001,524)
1,013,673
1,414,199
437,245
1,634,631
1,637,437
—
—
(1,332,596)
118,691
403,561
866,152
104,598
1,019,261
10,144,753
9,620,978
—
—
—
—
—
—
(10,144,753)
(9,620,977)
(1,579,622)
(747,457)
(2,700,731)
(1,071,590)
(715,291)
(363,547)
—
—
(1,579,622)
(747,457)
(2,700,731)
(1,071,590)
(715,291)
(363,547)
(10,144,753)
(9,620,977)
119,144,626
145,874,332
182,659,368
102,677,830
153,983,619
119,074,730
1,479,694,976
1,169,136,976
1,579,622
747,457
2,700,731
1,071,590
715,291
363,547
10,144,753
9,620,977
(128,683,642)
(147,001,756)
(172,563,004)
(141,139,057)
(141,380,688)
(119,064,356)
(1,420,642,029)
(1,155,974,652)
(7,959,394)
(379,967)
12,797,095
(37,389,637)
13,318,222
373,921
69,197,700
22,783,301
(10,871,612)
(1,008,733)
10,499,925
(37,595,075)
12,707,529
1,029,635
69,197,700
22,783,302
23,299,576
24,308,309
15,439,783
53,034,858
23,567,617
22,537,982
208,147,837
185,364,535
$
12,427,964
$
23,299,576
$
25,939,708
$
15,439,783
$
36,275,146
$
23,567,617
$
277,345,537
$
208,147,837
$
—
$
—
$
—
$
—
$
—
$
—
$
7,497
$
7,497
THE RYDEX VARIABLE TRUST ANNUAL REPORT
|
117

This table is presented to show selected data for a share outstanding throughout each period, and to assist shareholders in evaluating a Fund’s performance for the periods presented.
RATIOS TO
AVERAGE NET ASSETS:
Net Increase
Net Realized
(Decrease)
NET ASSET
Net
and
in Net Asset
Distributions
Distributions
Distributions
Net Increase
NET ASSET
Net
Net Assets,
VALUE,
Investment
Unrealized
Value
from Net
from Net
from
(Decrease) in
VALUE,
Total
Investment
Portfolio
End of
BEGINNING
Income
Gains (Losses)
Resulting from
Investment
Realized
Return
Total
Net Asset
END OF
Investment
Total
Income
Turnover
Period (000’s
Year Ended
OF PERIOD
(Loss)†
on Investments
Operations
Income
Gains
of Capital
Distributions
Value
PERIOD
Return††
Expenses
(Loss)
Rate
omitted)
Nova Fund
December 31, 2007
$10.09
$ .12
$
—
$
.12
$
(.15)
$
—
$
—
$
(.15)
$
(.03)
$10.06
1.13%
1.46%
1.12%
94%
$ 82,191
December 31, 2006
8.56
.11
1.54
1.65
(.12)
—
—
(.12)
1.53
10.09
19.27%
1.48%
1.18%
211%
134,477
December 31, 2005
8.26
.05
.28
.33
(.03)
—
—
(.03)
.30
8.56
3.97%
1.53%
0.60%
381%
132,018
December 31, 2004
7.21
.03
1.02
1.05
(—)§
—
—
(—)§
1.05
8.26
14.62%
1.46%
0.41%
654%
130,200
December 31, 2003
5.18
.01
2.02
2.03
—
—
—
—
2.03
7.21
39.19%
1.54%
0.09%
729%
81,816
Inverse S&P 500 Strategy Fund
December 31, 2007
43.90
1.35
(1.00)
.35
(2.04)
—
—
(2.04)
(1.69)
42.21
0.83%
1.63%
3.04%
—
21,581
December 31, 2006†††
51.50
1.70
(5.60)
(3.90)
(3.70)
—
—
(3.70)
(7.60)
43.90
(7.50)%
1.63%
3.29%
—
19,025
December 31, 2005†††
51.90
.80
(1.20)
(.40)
—
—
—
—
(.40)
51.50
(0.77)%
1.70%
1.46%
—
32,505
December 31, 2004†††
57.70
(.20)
(5.60)
(5.80)
—
—
—
—
(5.80)
51.90
(10.05)%
1.62%
(0.28)%
—
19,076
December 31, 2003†††
75.70
(.40)
(17.60)
(18.00)
—
—
—
—
(18.00)
57.70
(23.78)%
1.67%
(0.59)%
—
17,822
OTC Fund
December 31, 2007
15.39
.03
2.71
2.74
(.01)
—
—
(.01)
2.73
18.12
17.82%
1.51%
0.18%
110%
82,492
December 31, 2006
14.55
(.07)
.91
.84
—
—
—
—
.84
15.39
5.77%
1.49%
(0.50)%
152%
72,871
December 31, 2005
14.39
(.09)
.25
.16
—
—
—
—
.16
14.55
1.11%
1.50%
(0.68)%
294%
102,487
December 31, 2004
13.16
(.02)
1.25
1.23
—
—
—
—
1.23
14.39
9.35%
1.47%
(0.17)%
418%
191,476
December 31, 2003
9.05
(.13)
4.24
4.11
—
—
—
—
4.11
13.16
45.41%
1.53%
(1.20)%
482%
127,836
Inverse OTC Strategy Fund
December 31, 2007
19.79
.64
(2.87)
(2.23)
(.57)
—
—
(.57)
(2.80)
16.99
(11.28)%
1.68%
3.40%
—
13,640
December 31, 2006
21.51
.74
(1.07)
(.33)
(1.39)
—
—
(1.39)
(1.72)
19.79
(1.40)%
1.64%
3.35%
—
23,929
December 31, 2005
21.24
.33
(.06)
.27
—
—
—
—
.27
21.51
1.27%
1.63%
1.49%
—
19,648
December 31, 2004
24.09
(.08)
(2.77)
(2.85)
—
—
—
—
(2.85)
21.24
(11.83)%
1.64%
(0.35)%
—
23,928
December 31, 2003
39.04
(.22)
(14.33)
(14.55)
—
(.40)
—
(.40)
(14.95)
24.09
(37.37)%
1.68%
(0.73)%
—
34,563
S&P 500 2x Strategy Fund
December 31, 2007
21.71
.26
(.08)
.18
(.23)
(2.42)
—
(2.65)
(2.47)
19.24
0.61%
1.62%
1.12%
104%
36,429
December 31, 2006
18.37
.23
4.12
4.35
(.20)
(.81)
—
(1.01)
3.34
21.71
23.70%
1.64%
1.13%
168%
37,663
December 31, 2005
19.83
.10
.53
.63
(.02)
(2.07)
—
(2.09)
(1.46)
18.37
3.38%
1.65%
0.55%
585%
25,397
December 31, 2004
21.59
.02
2.98
3.00
—
(4.76)
—
(4.76)
(1.76)
19.83
16.90%
1.65%
0.09%
974%
29,053
December 31, 2003
16.09
(.11)
8.95
8.84
—
(3.34)
—
(3.34)
5.50
21.59
54.94%
1.69%
(0.55)%
1,085%
30,428
OTC 2x Strategy Fund
December 31, 2007
23.46
.13
6.49
6.62
(.10)
—
—
(.10)
6.52
29.98
28.20%
1.66%
0.45%
203%
65,069
December 31, 2006
22.39
.03
1.06
1.09
(.02)
—
—
(.02)
1.07
23.46
4.86%
1.65%
0.14%
250%
29,673
December 31, 2005
23.09
(.09)
(.61)
(.70)
—
—
—
—
(.70)
22.39
(3.03)%
1.65%
(0.42)%
343%
44,313
December 31, 2004
21.73
(.06)
2.76
2.70
(.97)
(.06)
(.31)
(1.34)
1.36
23.09
14.21%
1.65%
(0.29)%
662%
57,599
December 31, 2003
11.90
(.21)
11.95
11.74
—
(1.91)
—
(1.91)
9.83
21.73
98.63%
1.71%
(1.10)%
959%
40,632

FINANCIAL HIGHLIGHTS (continued)
This table is presented to show selected data for a share outstanding throughout each period, and to assist shareholders in evaluating a Fund’s performance for the periods presented.
RATIOS TO
AVERAGE NET ASSETS:
Net Increase
Net Realized
(Decrease)
NET ASSET
Net
and
in Net Asset
Distributions
Distributions
Net Increase
NET ASSET
Net
Net Assets,
VALUE,
Investment
Unrealized
Value
from Net
from Net
(Decrease) in
VALUE,
Total
Investment
Portfolio
End of Period
BEGINNING
Income
Gains (Losses)
Resulting from
Investment
Realized
Total
Net Asset
END OF
Investment
Total
Operating
Income
Turnover
(000’s
Year Ended
OF PERIOD
(Loss)†
on Investments
Operations
Income
Gains
Distributions
Value
PERIOD
Return††
Expenses
Expenses
(Loss)
Rate
omitted)
Mid-Cap 1.5x Strategy Fund
December 31, 2007
$24.20
$
.28
$
.65
$
.93
$
(.40)
$
(3.01)
$
(3.41)
$
(2.48)
$21.72
3.60%
1.64%
1.64%
1.05%
368%
$
27,893
December 31, 2006
30.15
.11
3.23
3.34
(.13)
(9.16)
(9.29)
(5.95)
24.20
10.46%
1.64%
1.64%
0.34%
478%
38,986
December 31, 2005
26.50
(.02)
3.75
3.73
—
(.08)
(.08)
3.65
30.15
14.07%
1.65%
1.65%
(0.05)%
573%
51,197
December 31, 2004
24.74
(.09)
4.96
4.87
—
(3.11)
(3.11)
1.76
26.50
22.14%
1.64%
1.64%
(0.37)%
866%
34,162
December 31, 2003
17.77
(.12)
9.44
9.32
—
(2.35)
(2.35)
6.97
24.74
52.43%
1.70%
1.70%
(0.54)%
1,665%
18,544
Inverse Mid-Cap Strategy Fund
December 31, 2007
36.96
1.06
(1.81)
(.75)
(1.18)
—
(1.18)
(1.93)
35.03
(1.98)%
1.67%
1.67%
3.04%
—
3,029
December 31, 2006
39.15
1.32
(2.83)
(1.51)
(.68)
—
(.68)
(2.19)
36.96
(3.83)%
1.65%
1.65%
3.49%
—
5,959
December 31, 2005
44.03
.70
(4.31)
(3.61)
(1.27)
—
(1.27)
(4.88)
39.15
(8.16)%
1.64%
1.64%
1.65%
—
2,846
December 31, 2004*
50.00
(.06)
(5.91)
(5.97)
—
—
—
(5.97)
44.03
(11.94)%
1.62%**
1.62%**
(0.17)%**
—
1,319
Russell 2000® 2x Strategy Fund
December 31, 2007
25.97
.25
(3.52)
(3.27)
(.01)
(.26)
(.27)
(3.54)
22.43
(12.59)%
1.64%
1.64%
0.95%
174%
6,205
December 31, 2006*
25.00
.05
.96
1.01
(.04)
—
(.04)
.97
25.97
4.06%
1.64%**
1.64%**
1.02%**
60%
4,584
Russell 2000® 1.5x Strategy Fund
December 31, 2007
41.14
.49
(3.26)
(2.77)
(.96)
(3.21)
(4.17)
(6.94)
34.20
(6.74)%
1.66%
1.66%
1.16%
354%
21,879
December 31, 2006
34.14
.19
6.93
7.12
(.12)
—
(.12)
7.00
41.14
20.85%
1.64%
1.64%
0.49%
380%
73,112
December 31, 2005
33.65
.01
1.31
1.32
(.83)
—
(.83)
.49
34.14
3.91%
1.63%
1.63%
0.04%
404%
38,589
December 31, 2004
29.75
(.10)
6.95
6.85
—
(2.95)
(2.95)
3.90
33.65
25.20%
1.65%
1.65%
(0.32)%
1,171%
112,649
December 31, 2003
20.11
(.18)
13.11
12.93
—
(3.29)
(3.29)
9.64
29.75
64.28%
1.70%
1.70%
(0.66)%
1,135%
122,995
Inverse Russell 2000® Strategy Fund
December 31, 2007
34.61
1.10
.76
1.86
(1.81)
—
(1.81)
.05
34.66
5.37%
1.67%
1.67%
3.19%
—
11,535
December 31, 2006
40.60
1.30
(6.16)
(4.86)
(1.13)
—
(1.13)
(5.99)
34.61
(11.95)%
1.64%
1.64%
3.48%
—
12,237
December 31, 2005
42.83
.65
(1.98)
(1.33)
(.90)
—
(.90)
(2.23)
40.60
(3.07)%
1.63%
1.63%
1.49%
—
11,850
December 31, 2004*
50.00
(.10)
(7.07)
(7.17)
—
—
—
(7.17)
42.83
(14.34)%
1.65%**
1.65%**
(0.29)%**
—
4,344
Government Long Bond 1.2x Strategy Fund
December 31, 2007
11.56
.41
.68
1.09
(.41)
—
(.41)
.68
12.24
9.77%
1.20%
1.20%
3.60%
1,367%
52,250
December 31, 2006
12.38
.42
(.82)
(.40)
(.42)
—
(.42)
(.82)
11.56
(3.14)%
1.20%
1.20%
3.66%
1,339%
50,420
December 31, 2005
11.88
.41
.50
.91
(.41)
—
(.41)
.50
12.38
7.71%
1.18%
1.18%
3.30%
1,284%
60,160
December 31, 2004
11.67
.40
.54
.94
(.40)
(.33)
(.73)
.21
11.88
8.42%
1.21%
1.21%
3.36%
1,318%
48,709
December 31, 2003
13.08
.41
(.52)
(.11)
(.41)
(.89)
(1.30)
(1.41)
11.67
(0.64)%
1.23%
1.23%
3.26%
1,272%
65,358
Inverse Government Long Bond Strategy Fund
December 31, 2007
21.55
.70
(1.67)
(.97)
(1.00)
—
(1.00)
(1.97)
19.58
(4.51)%
3.83%
1.63%◊
3.17%
1,123%
17,611
December 31, 2006
20.80
.69
.97
1.66
(.91)
—
(.91)
.75
21.55
8.11%
5.12%
1.63%◊
3.08%
597%
29,246
December 31, 2005
21.95
(.07)
(1.08)
(1.15)
—
—
—
(1.15)
20.80
(5.24)%
5.11%
1.63%◊
(0.33)%
589%
29,671
December 31, 2004
24.82
(.66)
(1.98)
(2.64)
—
(.23)
(.23)
(2.87)
21.95
(10.67)%
5.02%
1.63%◊
(2.86)%
—
41,098
December 31, 2003*
25.00
(.13)
(.05)
(.18)
—
—
—
(.18)
24.82
(0.72)%
1.69%**
1.69%**◊
(0.74)%**
—
22,355

FINANCIAL HIGHLIGHTS (continued)
This table is presented to show selected data for a share outstanding throughout each period, and to assist shareholders in evaluating a Fund’s performance for the periods presented.
RATIOS TO
AVERAGE NET ASSETS:
Net Increase
NET ASSET
Net
Net Realized and
(Decrease) in
Distributions
Distributions
Net Increase
NET ASSET
Net
Net Assets,
VALUE,
Investment
Unrealized Gains
Net Asset Value
from Net
from Net
(Decrease) in
VALUE,
Total
Investment
Portfolio
End of
BEGINNING
Income
(Losses) on
Resulting from
Investment
Realized
Total
Net Asset
END OF
Investment
Total
Income
Turnover
Period (000’s
Year Ended
OF PERIOD
(Loss)†
Investments
Operations
Income
Gains
Distributions
Value
PERIOD
Return††
Expenses
(Loss)
Rate
omitted)
Europe 1.25x Strategy Fund
December 31, 2007
$29.60
$
.70
$
3.26
$
3.96
$
(.71)
$
(2.90)
$
(3.61)
$
.35
$29.95
13.06%
1.63%
2.18%
220%
$ 82,833
December 31, 2006
23.84
.70
6.31
7.01
(.48)
(.77)
(1.25)
5.76
29.60
29.51%
1.65%
2.55%
219%
89,490
December 31, 2005
22.62
.21
1.23
1.44
(.09)
(.13)
(.22)
1.22
23.84
6.36%
1.63%
0.94%
399%
25,954
December 31, 2004
22.87
(.05)
3.71
3.66
(3.82)
(.09)
(3.91)
(.25)
22.62
16.15%
1.64%
(0.23)%
—
54,994
December 31, 2003
19.52
(.17)
8.58
8.41
—
(5.06)
(5.06)
3.35
22.87
43.08%
1.70%
(0.75)%
—
38,443
Japan 1.25x Strategy Fund
December 31, 2007
27.13
.88
(3.83)
(2.95)
(1.45)
—
(1.45)
(4.40)
22.73
(11.23)%
1.64%
3.32%
—
15,568
December 31, 2006
33.42
1.02
.50
1.52
(1.29)
(6.52)
(7.81)
(6.29)
27.13
5.14%
1.63%
2.99%
—
30,510
December 31, 2005
27.77
.48
5.17
5.65
—
—
—
5.65
33.42
20.35%
1.70%
1.72%
—
55,219
December 31, 2004
25.17
(.14)
2.74
2.60
—
—
—
2.60
27.77
10.33%
1.63%
(0.50)%
—
14,228
December 31, 2003
18.29
(.16)
7.04
6.88
—
—
—
6.88
25.17
37.62%
1.69%
(0.75)%
—
11,541
Dow 2x Strategy Fund
December 31, 2007
26.89
.36
1.93
2.29
(.30)
(3.18)
(3.48)
(1.19)
25.70
8.15%
1.63%
1.22%
105%
44,825
December 31, 2006
23.10
.40
6.58
6.98
(.15)
(3.04)
(3.19)
3.79
26.89
30.54%
1.65%
1.52%
224%
45,365
December 31, 2005
25.89
.24
(1.25)
(1.01)
(.17)
(1.61)
(1.78)
(2.79)
23.10
(3.81)%
1.67%
1.03%
666%
12,920
December 31, 2004*
25.00
.14
2.03
2.17
(1.16)
(.12)
(1.28)
.89
25.89
8.65%
1.63%**
0.91%**
907%
10,419
Inverse Dow 2x Strategy Fund
December 31, 2007
33.34
1.02
(4.06)
(3.04)
(1.51)
—
(1.51)
(4.55)
28.79
(8.99)%
1.66%
3.36%
—
11,885
December 31, 2006
43.20
1.35
(10.75)
(9.40)
(.46)
—
(.46)
(9.86)
33.34
(21.77)%
1.64%
3.61%
—
17,053
December 31, 2005
43.22
.74
(.06)
.68
(.70)
—
(.70)
(.02)
43.20
1.63%
1.65%
1.67%
—
7,257
December 31, 2004*
50.00
(.03)
(5.71)
(5.74)
—
(1.04)
(1.04)
(6.78)
43.22
(11.47)%
1.62%**
(0.09)%**
—
3,184
Small-Cap Value Fund
December 31, 2007
28.60
.19
(5.97)
(5.78)
(.06)
(4.54)
(4.60)
(10.38)
18.22
(20.36)%
1.49%
0.66%
241%
9,710
December 31, 2006
25.67
.18
4.74
4.92
(.17)
(1.82)
(1.99)
2.93
28.60
19.21%
1.49%
0.64%
433%
34,124
December 31, 2005
28.84
(.05)
1.13
1.08
—
(4.25)
(4.25)
(3.17)
25.67
3.64%
1.47%
(0.16)%
825%
19,035
December 31, 2004*
25.00
.01
4.50
4.51
(.01)
(.66)
(.67)
3.84
28.84
18.03%
1.46%**
0.07%**
507%
47,274
Mid-Cap Value Fund
December 31, 2007
22.38
.21
(1.29)
(1.08)
(.44)
(.02)
(.46)
(1.54)
20.84
(4.85)%
1.49%
0,87%
358%
15,998
December 31, 2006
19.27
.28
3.01
3.29
(.18)
—
(.18)
3.11
22.38
17.08%
1.49%
1.37%
307%
28,254
December 31, 2005
27.08
.07
2.28
2.35
(.20)
(9.96)
(10.16)
(7.81)
19.27
8.32%
1.48%
0.26%
1,133%
14,232
December 31, 2004*
25.00
—
3.80
3.80
(—)§
(1.72)
(1.72)
2.08
27.08
15.20%
1.48%**
0.01%**
1,173%
19,479
Large-Cap Value Fund
December 31, 2007
31.78
.42
(2.03)
(1.61)
(.57)
(4.23)
(4.80)
(6.41)
25.37
(5.37)%
1.49%
1.28%
307%
24,799
December 31, 2006
27.90
.39
4.53
4.92
(.25)
(.79)
(1.04)
3.88
31.78
17.66%
1.50%
1.29%
401%
83,323
December 31, 2005
27.68
.21
.95
1.16
(.15)
(.79)
(.94)
.22
27.90
4.19%
1.50%
0.77%
493%
24,547
December 31, 2004*
25.00
.12
3.00
3.12
(.11)
(.33)
(.44)
2.68
27.68
12.49%
1.45%**
0.69%**
983%
11,144

FINANCIAL HIGHLIGHTS (concluded)
This table is presented to show selected data for a share outstanding throughout each period, and to assist shareholders in evaluating a Fund’s performance for the periods presented.
RATIOS TO
AVERAGE NET ASSETS:
Net Realized
Net Increase
NET ASSET
Net
and
in Net Asset
Distributions
Distributions
Net Increase
NET ASSET
Net
Net Assets,
VALUE,
Investment
Unrealized
Value
from Net
from Net
(Decrease) in
VALUE,
Total
Investment
Portfolio
End of
BEGINNING
Income
Gains
Resulting from
Investment
Realized
Total
Net Asset
END OF
Investment
Total
Net
Income
Turnover
Period (000’s
Year Ended
OF PERIOD
(Loss)†
on Investments
Operations
Income
Gains
Distributions
Value
PERIOD
Return††
Expenses
Expenses
(Loss)
Rate
omitted)
Small-Cap Growth Fund
December 31, 2007
$29.92
$
(.28)
$
.30
$
.02
$
—
$
(2.87)
$
(2.87)
$
(2.85)
$27.07
(0.11)%
1.49%
1.49%
(0.90)%
573%
$ 12,428
December 31, 2006
28.64
(.31)
2.54
2.23
—
(.95)
(.95)
1.28
29.92
7.73%
1.49%
1.49%
(1.01)%
769%
23,300
December 31, 2005
28.55
(.21)
2.00
1.79
—
(1.70)
(1.70)
.09
28.64
6.20%
1.50%
1.50%
(0.72)%
737%
24,308
December 31, 2004*
25.00
(.17)
4.12
3.95
—
(.40)
(.40)
3.55
28.55
15.82%
1.46%**
1.46%**
(0.93)%**
733%
30,269
Mid-Cap Growth Fund
December 31, 2007
29.33
(.19)
2.69
2.50
—
(2.32)
(2.32)
.18
29.51
8.42%
1.48%
1.48%
(0.61)%
591%
25,940
December 31, 2006
30.24
(.28)
1.26
.98
—
(1.89)
(1.89)
(.91)
29.33
3.13%
1.47%
1.47%
(0.90)%
462%
15,440
December 31, 2005
27.13
(.20)
3.31
3.11
—
—
—
3.11
30.24
11.46%
1.52%
1.52%
(0.70)%
1,178%
53,035
December 31, 2004*
25.00
(.13)
2.26
2.13
—
—
—
2.13
27.13
8.52%
1.46%**
1.46%**
(0.75)%**
875%
20,702
Large-Cap Growth Fund
December 31, 2007
26.68
(.16)
1.46
1.30
—
(.62)
(.62)
.68
27.36
4.87%
1.48%
1.48%
(0.57)%
521%
36,275
December 31, 2006
25.69
(.17)
1.56
1.39
—
(.40)
(.40)
.99
26.68
5.40%
1.49%
1.49%
(0.66)%
612%
23,568
December 31, 2005
25.75
(.01)
.47
.46
(.02)
(.50)
(.52)
(.06)
25.69
1.77%
1.52%
1.52%
(0.03)%
1,111%
22,538
December 31, 2004*
25.00
.36
.71
1.07
(.15)
(.17)
(.32)
.75
25.75
4.26%
1.46%**
1.46%**
2.12%**
1,087%
20,012
U.S. Government Money Market Fund
December 31, 2007
1.00
.04
—
.04
(.04)
—
(.04)
—
1.00
3.90%
1.19%
1.19%
3.80%
—
277,346
December 31, 2006
1.00
.04
—
.04
(.04)
—
(.04)
—
1.00
3.82%
1.19%
1.19%
3.78%
—
208,148
December 31, 2005
1.00
.02
—
.02
(.02)
—
(.02)
—
1.00
2.00%
1.17%
1.17%
1.96%
—
185,365
December 31, 2004
1.00
—)§
—
—
(—)§
—
(—)§
—
1.00
0.23%
1.19%
1.10%
0.20%
—
167,678
December 31, 2003
1.00
—)§
—
—
(—)§
—
(—)§
—
1.00
0.01%
1.22%
1.11%
0.01%
—
232,493
*
Since the commencement of operations:
May 1, 2003 – Inverse Government Long Bond Strategy Fund;
May 3, 2004 – Inverse Mid-Cap Strategy Fund, Inverse Russell 2000® Strategy Fund, Dow 2x Strategy Fund, Inverse Dow 2x Strategy Fund, Small-Cap Value Fund,
Mid-Cap Value Fund, Large-Cap Value Fund, Small-Cap Growth Fund, Mid-Cap Growth Fund, and Large-Cap Growth Fund;
October 27, 2006 – Russell 2000® 2x Strategy Fund.
**
Annualized
†
Calculated using the average daily shares outstanding for the year.
††
Total investment return does not reflect the impact of any additional fees charged by insurance companies and has not been annualized.
†††
Per share amounts for periods ended December 31, 2003 — December 31, 2006 have been restated to reflect a 1:10 reverse stock split effective April 23, 2007 — See Note 10.
§
Less than $.01 per share.
◊
Operating Expenses exclude interest expense from securities sold short.

1.
Organization and Significant Accounting Policies
contracts that is determined by marking the contracts to
Organization
their current realized settlement prices. Financial futures
The Rydex Variable Trust (the “Trust”), a Delaware business
contracts are valued at the last quoted sales price, usually as
trust, is registered with the SEC under the Investment
of 4:00 p.m. on the valuation date. In the event that the
Company Act of 1940 (the “1940 Act”) as a non-diversified,
exchange for a specific futures contract closes earlier than
open-ended investment company and is authorized to issue
4:00 p.m., the futures contract is valued at the Official
an unlimited number of no par value shares. The Trust offers
Settlement Price of the exchange. However, the underlying
shares of the Funds to insurance companies for their
securities from which the futures contract value is derived
variable annuity and variable life insurance contracts.
are monitored until 4:00 p.m. to determine if fair valuation
would provide a more accurate valuation. Short-term
At December 31, 2007, the Trust consisted of fifty-five
securities, if any, are valued at amortized cost, which
separate Funds: twenty-three Benchmark Funds, one Money
approximates market value.
Market Fund, eight Alternative Strategy Funds, seventeen
Sector Funds, three Essential Portfolio Funds and three CLS
Debt securities with a maturity greater than 60 days are
AdvisorOne Funds. This report covers the Benchmark and
valued at the last traded fill price at the close of the Funds’
the Money Market Funds (the “Funds”), while the
pricing cycle, unless no trades were executed. If there are
Alternative Strategies Funds, the Sector Funds, the Essential
no trades, a security is valued at the reported bid price, at
Portfolio Funds and the CLS AdvisorOne Funds are
the close of the Funds’ pricing cycle, usually 4:00 p.m.
contained in separate reports.
Structured notes are valued in accordance with the terms of
Rydex Investments provides advisory, transfer agent and
their agreement at the value of the underlying index close,
administrative services, and accounting services to the Trust.
usually 4:00 p.m., adjusted for any interest accruals and
Rydex Distributors, Inc. (the “Distributor”) acts as principal
financing charges. If the securities comprising the
underwriter for the Trust. Both Rydex Investments and the
underlying index cease trading before a Fund’s close of
Distributor are affiliated entities.
business, the index will be fair valued with the use of an
appropriate market indicator.
Significant Accounting Policies
Traditional open-end investment companies (“Mutual
The following significant accounting policies are in
Funds”) are valued at their NAV as of the close of business,
conformity with U.S. generally accepted accounting
usually 4:00 p.m. on the valuation date. Exchange Traded
principles and are consistently followed by the Trust. All
Funds (“ETFs”) and closed-end investment companies are
time references are based on Eastern Time. The
valued at the last quoted sales price.
information contained in these notes may not apply to
every Fund in the Trust.
The value of domestic equity index and credit default swap
agreements entered into by a Fund is accounted for using
A. Effective August 31, 2007, the Trust ceased calculating a
the unrealized gain or loss on the agreements that is
NAV twice each business day, first in the morning and again
determined by marking the agreements to the last quoted
in the afternoon for the S&P 500 2x Strategy Fund, the OTC
value of the index that the swap pertains to at the close of
2x Strategy Fund, the Dow 2x Strategy Fund, and the
the NYSE, usually 4:00 p.m. The swap’s market value is then
Inverse Dow 2x Strategy Fund. All Funds in the Trust will
adjusted to include dividends accrued, financing charges
now price at the afternoon NAV, which is calculated at the
and/or interest associated with the swap agreements.
close of the New York Stock Exchange (“NYSE”), usually
4:00 p.m. The NAV is calculated using the current market
The value of foreign equity and index currency index swap
value of each Fund’s total assets as of the respective time of
agreements entered into by a Fund is accounted for using
calculation. These financial statements are based on the
the unrealized gain or loss on the agreements that is
December 31, 2007 afternoon NAV.
determined by marking the agreements to the price at which
orders are being filled at the close of the NYSE, usually 4:00
B. Equity securities listed on an exchange (NYSE or
p.m. In the event that no order is filled at 4:00 p.m., the
American Stock Exchange) are valued at the last quoted
security dealer provides a fair value quote at which the swap
sales price as of the close of business on the NYSE, usually
agreement is valued. The swap’s market value is then
4:00 p.m. on the valuation date. Equity securities listed on
adjusted to include dividends accrued, financing charges
the NASDAQ market system are valued at the NASDAQ
and/or interest associated with the swap agreements.
Official Closing Price, usually as of 4:00 p.m. on the
valuation date. Listed options held by the Trust are valued
Investments for which market quotations are not readily
at the Official Settlement Price listed by the exchange,
available are fair valued as determined in good faith by
usually as of 4:00 p.m. In the event that a settlement price is
Rydex Investments under the direction of the Board of
not available, fair valuation is enacted. Over-the-counter
Trustees using methods established or ratified by the Board
options held by the Trust are valued using the average bid
of Trustees. These methods include, but are not limited to:
price obtained from one or more security dealers. The value
(i) general information as to how these securities and assets
of futures contracts purchased and sold by the Trust is
trade; (ii) in connection with futures contracts and options
accounted for using the unrealized gain or loss on the
thereupon, and other derivative investments, information as
122
|
THE RYDEX VARIABLE TRUST ANNUAL REPORT

NOTES TO FINANCIAL STATEMENTS (continued)
to how (a) these contracts and other derivative investments
or less than the cost of the option. When a Fund exercises a
trade in the futures or other derivative markets, respectively,
put option, that Fund will realize a gain or loss from the sale
and (b) the securities underlying these contracts and other
of the underlying security and the proceeds from such sale
derivative investments trade in the cash market; and (iii)
will be decreased by the premium originally paid. When a
other information and considerations, including current
Fund exercises a call option, the cost of the security pur-
values in related-markets.
chased by that Fund upon exercise will be increased by the
C. Securities transactions are recorded on the trade date for
premium originally paid. When a Fund writes (sells) an
financial reporting purposes. Realized gains and losses from
option, an amount equal to the premium received is
securities transactions are recorded using the identified cost
entered in that Fund’s accounting records as an asset and
basis. Proceeds from lawsuits related to investment holdings
equivalent liability. The amount of the liability is subsequent-
are recorded as realized gains in the respective Fund.
ly marked-to-market to reflect the current value of the
Dividend income is recorded on the ex-dividend date, net
option written. When a written option expires, or if a Fund
of applicable taxes withheld by foreign countries. Interest
enters into a closing purchase transaction, that Fund realizes
income, including amortization of premiums and accretion
a gain (or loss if the cost of a closing purchase transaction
of discount, is accrued on a daily basis.
exceeds the premium received when the option was sold).
D. Net investment income is computed and dividends are
G. The Trust may enter into stock and bond index futures
declared daily in the Government Long Bond 1.2x Strategy
contracts and options on such futures contracts. Futures
Fund and the U.S. Government Money Market Fund.
contracts are contracts for delayed delivery of securities at a
Income dividends in these Funds are accrued daily.
specified future delivery date and at a specific price. Upon
Dividends are reinvested in additional shares unless
entering into a contract, a Fund deposits and maintains as
shareholders request payment in cash. Distributions of net
collateral such initial margin as required by the exchange on
investment income in the remaining Funds and distributions
which the transaction is effected. Pursuant to the contract,
of net realized capital gains in all Funds are recorded on the
the Fund agrees to receive from or pay to the broker an
ex-dividend date and are determined in accordance with
amount of cash equal to the daily fluctuation in value of the
income tax regulations which may differ from U.S. generally
contract. Such receipts or payments are known as variation
accepted accounting principles. These differences are
margin and are recorded by the Fund as unrealized gains or
primarily due to differing treatments for items such as
losses. When the contract is closed, the Fund records a
deferral of wash sales and post-October losses and
realized gain or loss equal to the difference between the
regulated futures contracts and options. Net investment
value of the contract at the time it was opened and the
income and loss, net realized gains and losses, and net
value at the time it was closed.
assets are not affected by these differences.
H. The Trust may enter into domestic equity index and
E. When a Fund engages in a short sale of an equity or
domestic currency index swap agreements, which are over-
fixed income security, an amount equal to the proceeds is
the-counter contracts in which one party agrees to make
reflected as an asset and an equivalent liability. The amount
periodic payments based on the change in market value of
of the liability is subsequently marked-to-market to reflect
a specified equity security, basket of equity securities,
the market value of the short sale. The Fund maintains a
equity index or domestic currency index, in return for
segregated account of cash and/or securities as collateral
periodic payments based on a fixed or variable interest rate
for short sales. The Fund is exposed to market risk based on
or the change in market value of a different equity security,
the amount, if any, that the market value of the security
basket of equity securities, equity index or domestic
exceeds the market value of the securities in the
currency index. Swap agreements are used to obtain
segregated account. Fees, if any, paid to brokers to borrow
exposure to an equity or market without owning or taking
securities in connection with short sales are considered part
physical custody of securities. The swap agreements are
of the cost of short sale transactions. In addition, the Fund
marked-to-market daily based upon quotations from market
must pay out the dividend rate of the equity or coupon rate
makers and the change, if any, is recorded as unrealized
of the treasury obligation to the lender and records this as
gain or loss. Payments received or made as a result of an
an expense. Short dividends or interest expense is a cost
agreement or termination of the agreement are recognized
associated with the investment objective of short sales
as realized gains or losses.
transactions, rather than an operational cost associated with
The Trust may enter into credit default swap agreements
the day-to-day management of any mutual fund.
where one party, the protection buyer, makes an upfront or
F. Upon the purchase of an option by a Fund, the premium
periodic payment to counterparty, the protection seller, in
paid is recorded as an investment, the value of which is
exchange for the right to receive a contingent payment.
marked-to-market daily. When a purchased option expires,
The maximum amount of the payment may equal the
that Fund will realize a loss in the amount of the cost of the
notional amount, at par, of the underlying index or security
option. When a Fund enters into a closing sale transaction,
as a result of a related credit event. Upfront payments
that Fund will realize a gain or loss depending on whether
received or made by a Fund, are amortized over the
the proceeds from the closing sale transaction are greater
expected life of the agreement. Periodic payments received
THE RYDEX VARIABLE TRUST ANNUAL REPORT
|
123

NOTES TO FINANCIAL STATEMENTS (continued)
or paid by a Fund are recorded as realized gains or losses.
gains and losses are included in the Statement of
The credit default contracts are marked-to-market daily
Operations.
based upon quotations from market makers and the
L. Certain U.S. Government and Agency Obligations are
change, if any, is recorded as unrealized gain or loss.
traded on a discount basis; the interest rates shown on the
Payments received or made as a result of a credit event or
Schedules of Investments reflect the discount rates paid at
termination of the contract are recognized, net of a
the time of purchase by the Funds. Other securities bear
proportional amount of the upfront payment, as realized
interest at the rates shown, payable at fixed dates through
gains or losses.
maturity.
I. The Trust may invest in structured notes, which are over-
The Funds may also purchase American Depository
the-counter contracts linked to the performance of an
Receipts, U.S. Government securities, and enter into
underlying benchmark such as interest rates, equity
repurchase agreements.
markets, equity indices, commodities indices, corporate
credits or foreign exchange markets. A structured note is a
M. The Funds may leave cash overnight in their cash
type of bond in which an issuer borrows money from
account with the custodian, U.S. Bank. Periodically, a Fund
investors and pays back the principal, adjusted for
may have cash due to the custodian bank as an overdraft
performance of the underlying benchmark, at a specified
balance. A fee is incurred on this overdraft, calculated by
maturity date. In addition, the contract may require periodic
multiplying the overdraft by a rate based on the federal
interest payments. Structured notes are used to obtain
funds rate. Segregated cash with the broker is held as
exposure to a market without owning or taking physical
collateral for investments in derivative instruments such as
custody of securities or commodities. Fluctuations in value
futures contracts and index swap agreements.
of the structured notes are recorded as unrealized gains and
N. The preparation of financial statements in conformity
losses in the accompanying financial statements. Coupon
with U.S. generally accepted accounting principles requires
payments are recorded as income while net payments are
management to make estimates and assumptions that affect
recorded as net realized gains or losses.
the reported amount of assets and liabilities and disclosure
J. Investment securities and other assets and liabilities
of contingent assets and liabilities at the date of the
denominated in foreign currencies are translated into U.S.
financial statements and the reported amounts of revenues
dollar amounts at the date of valuation. Purchases and sales
and expenses during the reporting period. Actual results
of investment securities and income and expense items
could differ from these estimates.
denominated in foreign currencies are translated into U.S.
2.
Financial Instruments
dollar amounts on the respective dates of such transactions.
The Trust does not isolate that portion of the results of
As part of its investment strategy, the Trust may utilize short
operations resulting from changes in foreign exchange rates
sales and a variety of derivative instruments, including
on investments from the fluctuations arising from changes in
options, futures, options on futures, structured notes, and
market prices of securities held. Such fluctuations are
swap agreements. These investments involve, to varying
included with the net realized and unrealized gain and loss
degrees, elements of market risk and risks in excess of the
from investments.
amounts recognized in the Statements of Assets and
Liabilities.
Reported net realized foreign exchange gains or losses arise
from sales of foreign currencies and currency gains or losses
Throughout the normal course of business, the Funds enter
realized between the trade and settlement dates on
into contracts that contain a variety of representations and
investment transactions. Net unrealized exchange gains and
warranties which provide general indemnifications. The
losses arise from changes in the fair values of assets and
Funds’ maximum exposure under these arrangements is
liabilities other than investments in securities at the fiscal
unknown, as this would involve future claims that may be
period end, resulting from changes in exchange rates.
made against the Funds and/or their affiliates that have not
yet occurred. However, based on experience, the Funds
K. The Trust may enter into forward currency contracts
expect the risk of loss to be remote.
primarily to hedge against foreign currency exchange rate
risks on its non-U.S. dollar denominated investment
Short sales are transactions in which a Fund sells an equity
securities. When entering into a forward currency contract, a
or fixed income security it does not own. If the security sold
Fund agrees to receive or deliver a fixed quantity of foreign
short decreases in price between the time the Fund sells the
currency for an agreed-upon price on an agreed future
security and closes its short position, that Fund will realize a
date. These contracts are valued daily and the
gain on the transaction. Conversely, if the security increases
corresponding unrealized gain or loss on the contracts, as
in price during the period, that Fund will realize a loss on
measured by the difference between the forward foreign
the transaction. The risk of such price increases is the
exchange rates at the dates of entry into the contracts and
principal risk of engaging in short sales.
the forward rates at the reporting date, is included in the
The risk associated with purchasing options is limited to the
Statement of Assets and Liabilities. Realized and unrealized
premium originally paid. The risk in writing a covered call
option is that a Fund may forego the opportunity for profit
124
|
THE RYDEX VARIABLE TRUST ANNUAL REPORT

NOTES TO FINANCIAL STATEMENTS (continued)
if the market price of the underlying security increases and
In conjunction with the use of short sales, options, futures,
the option is exercised. The risk in writing a covered put
options on futures, and swap agreements, the Funds are
option is that a Fund may incur a loss if the market price of
required to maintain collateral in various forms. The Funds
the underlying security decreases and the option is
use, where appropriate, depending on the financial
exercised. In addition, there is the risk that a Fund may not
instrument utilized and the broker involved, margin deposits
be able to enter into a closing transaction because of an
at the broker, cash and/or securities segregated at the
illiquid secondary market or, for over-the-counter options,
custodian bank, discount notes, or the repurchase
because of the counterparty’s inability to perform.
agreements allocated to each Fund.
There are several risks in connection with the use of futures
The risks inherent in the use of short sales, options, futures
contracts. Risks may be caused by an imperfect correlation
contracts, options on futures contracts, structured notes,
between movements in the price of the instruments and the
and swap agreements, include i) adverse changes in the
price of the underlying securities. In addition, there is the
value of such instruments; ii) imperfect correlation between
risk that a Fund may not be able to enter into a closing
the price of the instruments and movements in the price of
transaction because of an illiquid secondary market.
the underlying securities, indices, or futures contracts; iii)
There are several risks associated with the use of structured
the possible absence of a liquid secondary market for any
notes. Structured securities are leveraged, thereby
particular instrument at any time; and iv) the potential of
providing an exposure to the underlying benchmark of
counterparty default. The Trust has established strict
three times the face amount and increasing the volatility of
counterparty credit guidelines and enters into transactions
each note relative to the change in the underlying linked
only with financial institutions of investment grade or better.
financial instrument. A highly liquid secondary market may
3.
Fees And Other Transactions With Affiliates
not exist for the structured notes a Fund invests in, which
Under the terms of an investment advisory contract, the
may make it difficult for that Fund to sell the structured
Trust pays Rydex Investments investment advisory fees
notes it holds at an acceptable price or to accurately value
calculated at an annualized rate of 0.50% of the average
them. In addition, structured notes are subject to the risk
daily net assets of the Government Long Bond 1.2x
that the counterparty to the instrument, or issuer, might not
Strategy Fund and the U.S. Government Money Market
pay interest when due or repay principal at maturity of the
Fund; 0.75% of the average daily net assets of the Nova
obligation. Although the Trust will not invest in any
Fund, the OTC Fund, the Small-Cap Value Fund, the Mid-
structured notes unless Rydex Investments believes that the
Cap Value Fund, the Large-Cap Value Fund, the Small-Cap
issuer is creditworthy, a Fund does bear the risk of loss of
Growth Fund, the Mid-Cap Growth Fund and the Large-Cap
the amount expected to be received in the event of the
Growth Fund; and 0.90% of the average daily net assets of
default or bankruptcy of the issuer.
the remaining Funds covered in this report.
There are several risks associated with the use of swap
Rydex Investments provides transfer agent and administrative
agreements that are different from those associated with
services to the Funds calculated at an annualized rate of
ordinary portfolio securities transactions, due to the fact
0.20% of the average daily net assets of the Government
they could be considered illiquid. Although the Trust will not
Long Bond 1.2x Strategy Fund and the U.S. Government
enter into any swap agreement unless Rydex Investments
Money Market Fund; and 0.25% of the average daily net
believes that the other party to the transaction is
assets of the remaining Funds covered in this report.
creditworthy, the Funds bear the risk of loss of the amount
expected to be received under a swap agreement in the
Rydex Investments also provides accounting services to the
event of the default or bankruptcy of the agreement
Trust for fees calculated at an annualized rate of 0.10% on
counterparty.
the first $250 million of the average daily net assets, 0.075%
on the next $250 million of the average daily net assets,
There are several risks associated with credit default swaps.
0.05% on the next $250 million of the average daily net
Credit default swaps involve the exchange of a fixed-rate
assets, and 0.03% on the average daily net assets over $750
premium for protection against the loss in value of an
million of each Fund.
underlying debt instrument in the event of a defined credit
event (such as payment default or bankruptcy). Under the
Rydex Investments engages external service providers to
terms of the swap, one party acts as a “guarantor,”
perform other necessary services for the Trust, such as
receiving a periodic payment that is a fixed percentage
accounting and audit related services, legal services,
applied to a notional principal amount. In return, the party
custody, printing and mailing, etc., on a pass-through basis.
agrees to purchase the notional amount of the underlying
Such expenses vary from Fund to Fund and are allocated to
instrument, at par, if a credit event occurs during the term
the Funds based on relative net assets. Organizational and
of the swap. A Fund may enter into credit default swaps in
setup costs for new funds are paid by the Trust.
which that Fund or its counterparty acts as guarantor. By
The Trust has adopted a Distribution Services Plan for which
acting as the guarantor of a swap, that Fund assumes the
the Distributor and other firms that provide shareholder
market and credit risk of the underlying instrument,
services (“Service Providers”) may receive compensation.
including liquidity and loss of value.
The Trust will pay fees to the Distributor at an annual rate
not to exceed 0.25% of average daily net assets. The
THE RYDEX VARIABLE TRUST ANNUAL REPORT
|
125

NOTES TO FINANCIAL STATEMENTS (continued)
Distributor, in turn, will compensate Service Providers for providing such services, while retaining a portion of such payments to
compensate itself for shareholder services it performs.
Certain officers and trustees of the Trust are also officers of Rydex Investments.
4.
Federal Income Tax Information
The Funds intend to comply with the provisions of Subchapter M of the Internal Revenue Code applicable to regulated
investment companies and will distribute substantially all net investment income and capital gains to shareholders. Therefore, no
Federal income tax provision has been recorded.
Income and capital gain distributions are determined in accordance with Federal income tax regulations, which may differ from
U.S. generally accepted accounting principles. These differences are primarily due to differing treatments for derivatives, foreign
currency transactions, losses deferred due to wash sales, losses deferred due to post-October losses, and excise tax regulations.
Permanent book and tax basis differences, if any, relating to shareholder distributions will result in reclassifications to paid-in
capital. This includes net operating losses not utilized during the current period and capital loss carry forward expired. These
reclassifications have no effect on net assets or net asset values per share. Any taxable gain remaining at fiscal year end is
distributed in the following year.
The Fund’s tax basis capital gains and losses are determined only at the end of each fiscal year. Tax basis capital losses in excess
of capital gains are carried forward to offset future net capital gains. For the year ended December 31, 2007, the following Funds
expired or offset net realized capital gains with capital losses from previous years:
Fund
Amount
Nova Fund
$5,638,783
Inverse S&P 500 Strategy Fund
2,209,540
OTC Fund
9,540,671
Small-Cap Growth Fund
219,170
The tax character of distributions paid during 2007 was as follows:
Ordinary
Long-Term
Return of
Total
Fund
Income
Capital Gain
Capital
Distributions
Nova Fund
$
1,161,348
$
—
$
—
$
1,161,348
Inverse S&P 500 Strategy Fund
767,870
—
—
767,870
OTC Fund
63,168
—
—
63,168
Inverse OTC Strategy Fund
906,240
—
—
906,240
S&P 500 2x Strategy Fund
2,666,050
622,608
851,687
4,140,345
OTC 2x Strategy Fund
186,716
—
—
186,716
Mid-Cap 1.5x Strategy Fund
1,494,103
691,701
—
2,185,804
Inverse Mid-Cap Strategy Fund
119,992
—
—
119,992
Russell 2000® 2x Strategy Fund
57,037
—
—
57,037
Russell 2000® 1.5x Strategy Fund
459,551
1,542,506
—
2,002,057
Inverse Russell 2000® Strategy Fund
382,872
—
—
382,872
Government Long Bond 1.2x Strategy Fund
1,898,770
—
—
1,898,770
Inverse Government Long Bond Strategy Fund
725,228
—
—
725,228
Europe 1.25x Strategy Fund
9,030,437
989,193
—
10,019,630
Japan 1.25x Strategy Fund
1,177,302
—
—
1,177,302
Dow 2x Strategy Fund
4,715,887
277,020
—
4,992,907
Inverse Dow 2x Strategy Fund
650,488
—
—
650,488
Small-Cap Value Fund
1,261,225
857,854
—
2,119,079
Mid-Cap Value Fund
366,943
17,776
—
384,719
Large-Cap Value Fund
3,639,001
1,733,846
—
5,372,847
Small-Cap Growth Fund
924,827
654,795
—
1,579,622
Mid-Cap Growth Fund
1,416,965
1,250,505
33,261
2,700,731
Large-Cap Growth Fund
503,128
190,616
21,547
715,291
U.S. Government Money Market Fund
10,144,753
—
—
10,144,753
126
|
THE RYDEX VARIABLE TRUST ANNUAL REPORT

NOTES TO FINANCIAL STATEMENTS (continued)
The tax character of distributions paid during 2006 was as follows:
Ordinary
Long-Term
Total
Fund
Income
Capital Gain
Distributions
Nova Fund
$1,341,115
$
—
$1,341,115
Inverse S&P 500 Strategy Fund
1,546,385
—
1,546,385
OTC Fund
—
—
—
Inverse OTC Strategy Fund
1,363,464
—
1,363,464
S&P 500 2x Strategy Fund
1,742,569
—
1,742,569
OTC 2x Strategy Fund
27,820
—
27,820
Mid-Cap 1.5x Strategy Fund
6,443,388
1,406,371
7,849,759
Inverse Mid-Cap Strategy Fund
122,428
—
122,428
Russell 2000® 2x Strategy Fund
7,200
—
7,200
Russell 2000® 1.5x Strategy Fund
227,797
—
227,797
Inverse Russell 2000® Strategy Fund
478,048
—
478,048
Government Long Bond 1.2x Strategy Fund
2,342,620
—
2,342,620
Inverse Government Long Bond Strategy Fund
794,766
—
794,766
Europe 1.25x Strategy Fund
3,427,521
95,125
3,522,646
Japan 1.25x Strategy Fund
4,962,847
476,739
5,439,586
Dow 2x Strategy Fund
3,421,440
711,086
4,132,526
Inverse Dow 2x Strategy Fund
253,535
—
253,535
Small-Cap Value Fund
796,173
863,878
1,660,051
Mid-Cap Value Fund
212,382
—
212,382
Large-Cap Value Fund
933,005
834,713
1,767,718
Small-Cap Growth Fund
188,230
559,227
747,457
Mid-Cap Growth Fund
708,980
362,610
1,071,590
Large-Cap Growth Fund
300,944
62,603
363,547
U.S. Government Money Market Fund
9,620,977
—
9,620,977
The tax character of distributable earnings/(accumulated losses) at December 31, 2007, was as follows:
Undistributed
Undistributed
Net Unrealized
Ordinary
Long-Term
Appreciation/
Capital Loss
Fund
Income
Capital Gain
Depreciation
Carryforward
Nova Fund
$223,114
$
—
$ 4,722,205
$
(79,443,732)2
Inverse S&P 500 Strategy Fund
172,209
—
(78,849)
(30,431,836)2
OTC Fund
77,200
—
(854,363)
(354,797,092)2
Inverse OTC Strategy Fund
66,793
—
106,783
(17,478,177)2
S&P 500 2x Strategy Fund
—
—
1,725,767
—
OTC 2x Strategy Fund
42,493
—
6,293,117
(3,771,461)2
Mid-Cap 1.5x Strategy Fund
—
—
(970,843)
(157,985)1
Inverse Mid-Cap Strategy Fund
18,024
—
33,461
(1,791,885)2
Russell 2000® 2x Strategy Fund
54,736
—
(49,894)
(684,184)1
Russell 2000® 1.5x Strategy Fund
24,991
—
(153,247)
(848,738)1
Inverse Russell 2000® Strategy Fund
44,246
—
(6,945)
(7,800,033)2
Government Long Bond 1.2x Strategy Fund
—
—
1,624,233
(4,637,274)2
Inverse Government Long Bond Strategy Fund
57,414
—
(521,973)
(10,285,291)2
Europe 1.25x Strategy Fund
396,211
254,418
3,518,175
—
Japan 1.25x Strategy Fund
76,368
—
(380,195)
(3,127,082)2
Dow 2x Strategy Fund
136,108
—
2,344,452
—
Inverse Dow 2x Strategy Fund
59,582
—
393,407
(6,651,170)2
Small-Cap Value Fund
117,535
—
(2,141,218)
(494,096)1
Mid-Cap Value Fund
177,210
1,456,316
(2,185,921)
—
Large-Cap Value Fund
173,272
2,551,427
(2,139,669)
—
Small-Cap Growth Fund
—
172
(1,059,053)
—
Mid-Cap Growth Fund
—
—
(979,784)
—
Large-Cap Growth Fund
—
—
36,342
—
U.S. Government Money Market Fund
7,497
—
—
(1,546)2
Capital Loss Carryforward amounts may be limited due to Treasury Regulations.
1 Expires in 2015.
2 Nova Fund: $22,511,032 expires in 2008, $40,390,472 expires in 2009, and $16,542,228 expires in 2010.
Inverse S&P 500 Strategy Fund: $12,563,901 expires in 2011, $10,777,389 expires in 2012, $314,257 expires in 2013, $5,114,923 expires in
2014, and $1,661,366 expires in 2015.
OTC Fund: $65,045,522 expires in 2008, $180,736,125 expires in 2009, $98,591,246 expires in 2010, $10,118,266 expires in 2011, and
$305,933 expires in 2012.
THE RYDEX VARIABLE TRUST ANNUAL REPORT
|
127

NOTES TO FINANCIAL STATEMENTS (continued)
Inverse OTC Strategy Fund: $1,648,984 expires in 2009, $1,790,535 expires in 2011, $4,909,190 expires in 2012, $2,303,943 expires in 2003,
$1,494,971 expires in 2014, and $5,330,554 expires in 2015.
OTC 2x Strategy Fund: $798,838 expires in 2013 and $2,972,623 expires in 2015.
Inverse Mid-Cap Strategy Fund: $392,757 expires in 2012, $141,768 expires in 2013, $916,790 expires in 2014, and $340,570 expires in 2015.
Inverse Russell 2000® Strategy Fund: $2,561,018 expires in 2012, $955,067 expires in 2013, $3,912,378 expires in 2014, and $371,570 expires
in 2015.
Government Long Bond 1.2x Strategy Fund: $2,376,550 expires in 2012, $1,091,899 expires in 2014, $1,168,825 expires in 2015.
Inverse Government Long Bond Strategy Fund: $5,005,075 expires in 2012, $2,319,251 expires in 2013, $986,005 expires in 2014, and
$1,974,960 expires in 2015.
Japan 1.25x Strategy Fund: $429,142 expires in 2014 and $2,697,940 expires in 2015.
Inverse Dow 2x Strategy Fund: $261,996 expires in 2013, $2,445,007 expires in 2014, and $3,944,167 expires in 2015.
U.S. Government Money Market Fund: $1,127 expires in 2008, $386 expires in 2010, and $33 expires in 2011.
At December 31, 2007, the cost of securities for Federal income tax purposes, the aggregate gross unrealized gain for all
securities for which there was an excess of value over tax cost and the aggregate gross unrealized loss for all securities for which
there was an excess of tax cost over value, were as follows:
Tax
Tax
Net
Tax
Unrealized
Unrealized
Unrealized
Fund
Cost
Gain
Loss
Gain (Loss)
Nova Fund
$
77,626,516
$8,293,485
$(3,384,638)
$ 4,908,847
Inverse S&P 500 Strategy Fund
29,548,298
—
(174,504)
(174,504)
OTC Fund
90,530,480
338,274
(1,101,118)
(762,844)
Inverse OTC Strategy Fund
12,859,682
—
—
—
S&P 500 2x Strategy Fund
32,423,145
2,313,158
(240,214)
2,072,944
OTC 2x Strategy Fund
56,279,051
6,925,141
(632,664)
6,292,477
Mid-Cap 1.5x Strategy Fund
33,970,188
771,024
(1,843,627)
(1,072,603)
Inverse Mid-Cap Strategy Fund
2,835,073
—
—
—
Russell 2000® 2x Strategy Fund
7,310,065
270,214
(314,622)
(44,408)
Russell 2000® 1.5x Strategy Fund
24,310,827
742,263
(878,773)
(136,510)
Inverse Russell 2000® Strategy Fund
8,810,273
—
—
—
Government Long Bond 1.2x Strategy Fund
49,978,985
1,624,233
—
1,624,233
Inverse Government Long Bond Strategy Fund
31,625,233
—
(434,277)
(434,277)
Europe 1.25x Strategy Fund
89,169,790
4,653,289
(509,655)
4,143,634
Japan 1.25x Strategy Fund
15,884,142
—
—
—
Dow 2x Strategy Fund
39,464,236
3,611,008
(676,439)
2,934,569
Inverse Dow 2x Strategy Fund
11,483,811
—
—
—
Small-Cap Value Fund
13,403,396
—
(2,141,218)
(2,141,218)
Mid-Cap Value Fund
21,237,858
—
(2,185,921)
(2,185,921)
Large-Cap Value Fund
33,700,294
165,916
(2,305,585)
(2,139,669)
Small-Cap Growth Fund
16,661,339
—
(1,059,053)
(1,059,053)
Mid-Cap Growth Fund
34,389,265
—
(979,784)
(979,784)
Large-Cap Growth Fund
43,532,620
546,122
(509,780)
36,342
U.S. Government Money Market Fund
272,587,990
—
—
—
Post-October Losses Deferred
Pursuant to Federal income tax regulations applicable to investment companies, the Funds have elected to treat net capital losses
realized between November 1 and December 31 of each year as occurring on the first day of the following tax year. For the year
ended December 31, 2007, $49,057, $231,898, $4,026,235, $1,729,781, $653,686, and $85,547 of realized capital losses reflected
in the accompanying financial statements will not be recognized for Federal income tax purposes until 2008 for Inverse Mid-Cap
Fund, Russell 2000® 2x Strategy Fund, Dow 2x Strategy Fund, Small-Cap Growth Fund, Mid-Cap Growth Fund and Large-Cap
Growth Fund, respectively.
128
|
THE RYDEX VARIABLE TRUST ANNUAL REPORT

NOTES TO FINANCIAL STATEMENTS (continued)
5.
Repurchase Agreements
The Trust transfers uninvested cash balances into a single joint account, the daily aggregate balance of which is invested in one or
more repurchase agreements collateralized by obligations of the U.S. Treasury and U.S. Government Agencies. The collateral is in
the possession of the Trust’s custodian and is evaluated daily to ensure that its market value exceeds by, at a minimum, 102% of
the delivery value of the repurchase agreement at maturity. Each Fund holds a pro rata share of the collateral based on the dollar
amount of the repurchase agreement entered into by each Fund.
The repurchase agreements executed by the joint account and outstanding as of December 31, 2007, were as follows:
Counterparty
Terms of Agreement
Face Value
Market Value
Repurchase Price
Mizuho Financial Group, Inc.
1.40% due 01/02/08
$100,000,000
$100,000,000
$100,007,778
Morgan Stanley
1.20% due 01/02/08
100,000,000
100,000,000
100,006,667
UBS Financial Services, Inc.
1.14% due 01/02/08
100,000,000
100,000,000
100,006,333
Lehman Brothers Holdings, Inc.
1.00% due 01/02/08
76,214,183
76,214,183
76,218,418
$376,214,183
$376,239,196
As of December 31, 2007, the collateral for the repurchase agreements in the joint account was as follows:
Security Type
Maturity Dates
Range of Rates
Par Value
Market Value
U.S. Treasury Notes
11/15/08 – 11/15/16
3.375% – 4.750%
$193,110,000
$197,169,227
TIP Notes
01/15/09 – 07/15/17
1.875% – 4.250%
141,445,000
165,690,117
Federal Home Loan Bank
08/05/09 – 09/09/16
5.000% – 5.375%
7,755,000
8,203,002
TIP Bonds
01/15/25
2.375%
5,920,000
6,890,030
Federal Discount Note
02/29/08
0.000%
3,950,000
3,922,350
U.S. Treasury Bills
02/14/08 – 02/21/08
0.000%
1,883,000
1,875,790
$383,750,516
In the event of counterparty default, the Trust has the right to collect the collateral to offset losses incurred. There is potential loss
to the Trust in the event the Trust is delayed or prevented from exercising its rights to dispose of the collateral securities,
including the risk of a possible decline in the value of the underlying securities during the period while the Trust seeks to assert its
rights. The Trust’s investment advisor, acting under the supervision of the Board of Trustees, reviews the value of the collateral and
the creditworthiness of those banks and dealers with which the Trust enters into repurchase agreements to evaluate potential
risks.
6.
Securities Transactions
During the year ended December 31, 2007, the cost of purchases and proceeds from sales of investment securities, excluding
short-term and temporary cash investments, were:
Inverse
Inverse OTC
S&P 500 2x
OTC 2x
Mid-Cap 1.5x
Inverse
S&P 500
Strategy
Strategy
Strategy
Strategy
Mid-Cap
Nova Fund
Strategy Fund
OTC Fund
Fund
Fund
Fund
Fund
Strategy Fund
Purchases
$69,951,381
$
—
$ 61,733,329
$
—
$ 22,657,496
$
73,794,718
$
98,447,337
$
—
Sales
$98,317,283
$
—
$ 74,313,048
$
—
$ 34,902,159
$
58,733,415
$
98,531,937
$
—
Government
Inverse
Russell 2000® 2x
Russell 2000®
Inverse
Long Bond
Government
Europe 1.25x
Japan 1.25x
Dow 2x
Strategy
1.5x Strategy
Russell 2000®
1.2x Strategy
Long Bond
Strategy
Strategy
Strategy
Fund
Fund
Strategy Fund
Fund
Strategy Fund
Fund
Fund
Fund
Purchases
$
7,514,222
$ 79,731,959
$
—
$534,746,116
$111,213,370
$104,617,266
$
—
$30,109,888
Sales
$
6,067,586
$129,055,294
$
—
$532,965,704
$121,292,660
$
96,522,667
$
—
$32,171,784
U.S.
Inverse Dow 2x
Small-Cap
Mid-Cap
Large-Cap
Government
Strategy
Small-Cap
Mid-Cap
Large-Cap
Growth
Growth
Growth
Money Market
Fund
Value Fund
Value Fund
Value Fund
Fund
Fund
Fund
Fund
Purchases
$
—
$ 43,576,939
$116,405,244
$168,014,185
$115,846,628
$179,140,002
$150,325,829
$
—
Sales
$
—
$ 64,601,951
$127,844,109
$225,200,655
$125,556,206
$169,330,696
$138,032,881
$
—
THE RYDEX VARIABLE TRUST ANNUAL REPORT
|
129

NOTES TO FINANCIAL STATEMENTS (continued)
7.
Share Transactions
The Trust is authorized to distribute an unlimited number of no par value shares. Transactions in shares for the years presented were:
Purchased through
Net Shares
Shares Purchased
Dividend Reinvestment
Shares Redeemed
Purchased (Redeemed)
Year Ended
Year Ended
Year Ended
Year Ended
Year Ended
Year Ended
Year Ended
Year Ended
December 31,
December 31,
December 31,
December 31,
December 31,
December 31,
December 31,
December 31,
2007
2006
2007
2006
2007
2006
2007
2006
Nova Fund
26,120,576
36,391,385
114,081
134,112
(31,396,735)
(38,611,971)
(5,162,078)
(2,086,474)
Inverse S&P 500 Strategy Fund
19,376,299
6,349,104†
18,344
35,225†
(23,220,677)
(6,581,856)†
(3,826,034)
(197,527)†
OTC Fund
20,423,064
23,324,174
3,482
–
(20,609,419)
(25,634,991)
(182,873)
(2,310,817)
Inverse OTC Strategy Fund
64,675,490
27,146,402
53,434
70,318
(65,135,299)
(26,920,756)
(406,375)
295,964
S&P 500 2x Strategy Fund
9,149,129
8,927,290
211,350
80,824
(9,202,386)
(8,655,618)
158,093
352,496
OTC 2x Strategy Fund
39,415,461
32,871,270
6,199
1,149
(38,516,138)
(33,586,772)
905,522
(714,353)
Mid-Cap 1.5x Strategy Fund
14,637,784
10,365,935
182,225
318,062
(15,146,674)
(10,771,652)
(326,665)
(87,655)
Inverse Mid-Cap Strategy Fund
3,053,209
2,052,002
3,463
3,375
(3,131,417)
(1,966,866)
(74,745)
88,511
Russell 2000® 2x Strategy Fund
2,021,473
435,979*
2,538
281*
(1,923,950)
(259,751)*
100,061
176,509*
Russell 2000® 1.5x Strategy Fund
8,677,892
14,057,946
58,488
5,472
(9,873,791)
(13,416,501)
(1,137,411)
646,917
Inverse Russell 2000® Strategy Fund
6,055,699
5,804,634
11,037
13,949
(6,087,515)
(5,756,889)
(20,779)
61,694
Government Long Bond 1.2x
Strategy Fund
40,890,318
52,456,584
166,118
205,208
(41,149,330)
(53,159,906)
(92,894)
(498,114)
Inverse Government Long Bond
Strategy Fund
8,139,115
7,623,241
37,001
37,828
(8,633,879)
(7,730,453)
(457,763)
(69,384)
Europe 1.25x Strategy Fund
6,760,829
7,330,052
325,736
121,094
(7,343,936)
(5,516,268)
(257,371)
1,934,878
Japan 1.25x Strategy Fund
5,089,542
5,931,337
48,429
205,422
(5,577,430)
(6,664,739)
(439,459)
(527,980)
Dow 2x Strategy Fund
7,160,299
8,202,609
188,696
157,071
(7,291,478)
(7,232,030)
57,517
1,127,650
Inverse Dow 2x Strategy Fund
4,904,068
2,919,948
23,215
7,464
(5,026,052)
(2,583,888)
(98,769)
343,524
Small-Cap Value Fund
1,754,037
5,163,582
115,167
58,288
(2,529,670)
(4,770,195)
(660,466)
451,675
Mid-Cap Value Fund
5,074,565
3,686,972
18,096
9,490
(5,587,238)
(3,172,845)
(494,577)
523,617
Large-Cap Value Fund
5,719,976
8,054,378
207,526
56,065
(7,571,756)
(6,368,500)
(1,644,254)
1,741,943
Small-Cap Growth Fund
3,790,354
4,900,217
57,233
24,612
(4,167,256)
(4,994,748)
(319,669)
(69,919)
Mid-Cap Growth Fund
5,781,889
3,360,551
90,205
35,875
(5,519,616)
(4,623,670)
352,478
(1,227,244)
Large-Cap Growth Fund
5,518,742
4,582,138
26,086
13,495
(5,102,555)
(4,589,497)
442,273
6,136
U.S. Government Money
Market Fund
1,479,694,977
1,169,136,977
10,144,753
9,620,976
(1,420,642,030)
(1,155,974,653)
69,197,700
22,783,300
* Since the commencement of operations: October 27, 2006.
† Share amounts have been restated to reflect a 1:10 reverse stock split effective April 23, 2007 — See Note 10.

NOTES TO FINANCIAL STATEMENTS (continued)
8.
Portfolio Securities Loaned
The Trust may lend its securities to approved brokers to earn additional income. Security lending income shown on the statement
of operations is shown net of rebates paid to borrowers and earnings on cash collateral investments shared with the lending
agent. Within this arrangement, the Trust acts as the lender, U.S. Bank acts as the agent, and other approved registered broker
dealers act as the borrowers. The Trust receives cash collateral, valued at 100% of the value of the securities on loan, which is
initially held in a segregated account at U.S. Bank. Under the terms of the Trust’s securities lending agreement with U.S. Bank,
cash collateral may be invested by U.S. Bank in certain high quality, liquid investments. At December 31, 2007, the cash collateral
investments consisted of mutual funds. Collateral is maintained over the life of the loan in an amount not less than the value of
loaned securities, as determined at the close of fund business each day; any additional collateral required due to changes in
security values is delivered to the Fund the next business day. Although the collateral mitigates risk, the Trust could experience a
delay in recovering its securities and a possible loss of income or value if the borrower fails to return the securities. The Trust has
the right under the securities lending agreement to recover the securities from the borrower on demand.
The following represents a breakdown of the collateral, its rates, and maturities:
MUTUAL FUND
Issuer
Shares
Market Value
Mount Vernon Securities Lending Trust
76,947,883
$76,947,883
Total Mutual Fund
$76,947,883
At December 31, 2007, the following Funds participated in securities lending and received cash collateral:
Value of
Cash
Securities
Fund
Collateral
Loaned
Nova Fund
$
6,277,357
$
6,058,711
OTC Fund
7,604,902
7,217,291
S&P 500 2x Strategy Fund
1,030,640
994,618
OTC 2x Strategy Fund
5,336,798
5,081,055
Mid-Cap 1.5x Strategy Fund
6,665,093
6,413,491
Russell 2000® 2x Strategy Fund
1,267,411
1,204,139
Russell 2000® 1.5x Strategy Fund
4,427,807
4,208,262
Europe 1.25x Strategy Fund
14,834,105
14,313,026
Dow 2x Strategy Fund
271,752
260,150
Small-Cap Value Fund
1,544,114
1,435,489
Mid-Cap Value Fund
3,035,322
2,861,898
Large-Cap Value Fund
6,754,697
6,436,279
Small-Cap Growth Fund
3,174,928
3,012,601
Mid-Cap Growth Fund
7,446,497
7,142,581
Large-Cap Growth Fund
7,276,460
7,024,723
THE RYDEX VARIABLE TRUST ANNUAL REPORT
|
131

NOTES TO FINANCIAL STATEMENTS (concluded)
9.
New Accounting Pronouncements
On July 13, 2006, the Financial Accounting Standards Board (FASB) released FASB Interpretation No. 48 “Accounting for
Uncertainty in Income Taxes” (FIN 48). FIN 48 provides guidance for how uncertain tax positions should be recognized, measured,
presented and disclosed in the financial statements. FIN 48 requires the evaluation of tax positions taken or expected to be taken
in the course of preparing the Fund’s tax returns to determine whether the tax positions are “more-likely-than-not” of being
sustained by the applicable tax authority. Tax positions not deemed to meet the more-likely-than-not threshold would be recorded
as a tax benefit or expense in the current year. Adoption of FIN 48 is required for fiscal years beginning after December 15, 2006
and is to be applied to all open tax years as of the effective date. Recent SEC guidance allows implementing FIN 48 in fund net
asset value calculations as late as a fund’s last net asset value calculation in the first required financial statement reporting period.
Management adopted FIN 48 on June 29, 2007. There is no material impact to the financial statements or disclosures thereto as a
result of the adopting of this pronouncement.
The Funds file U.S. federal income tax returns and returns in various foreign jurisdictions in which it invests. While the statute of
limitations remains open to examine the Fund’s U.S. federal income tax returns filed for the fiscal years 2004 to 2007, no
examinations are in progress or anticipated at this time. The Funds are not aware of any tax positions for which it is reasonably
possible that the total amounts of unrecognized tax benefits will significantly change in the next twelve months.
On September 15, 2006, the FASB released Statement of Financial Accounting Standard No. 157 (“FAS 157”) Fair Value
Measurement which provided enhanced guidance for using fair value to measure assets and liabilities. The standard requires
companies to provide expanded information about the assets and liabilities measured at fair value and the potential effect of
these fair valuations on an entity’s financial performance. The standard does not expand the use of fair value in any new
circumstances, but provides clarification on acceptable fair valuation methods and applications. Adoption of FAS 157 is required
for fiscal years beginning after November 15, 2007. The standard is not expected to materially impact the Funds’ financial
statements.
10.
Inverse S&P 500 Fund 1-for-10 Reverse Split
Effective April 23, 2007, the Inverse S&P 500 Fund underwent a 1-for-10 reverse split. The effect of this transaction was to divide
the number of outstanding shares of the Fund by ten, while multiplying the net asset value per share by ten. There were no
changes in the aggregate market values of the outstanding shares as a result of this transaction.
11.
Subsequent Event
At the close of business on January 17, 2008, Rydex NV, Inc., comprised of Rydex Investments, together with several other Rydex
entities, was acquired by Security Benefit Corporation (“Security Benefit”), a financial services firm that provides a broad variety of
financial programs to investors in the advisor, banking, education, government, institutional, and qualified plan markets (the
“Transaction”). As a result of the Transaction’s completion, Rydex Investments and the Distributor are wholly-owned subsidiaries of
Security Benefit. While the Transaction has no material impact on the Funds or their shareholders, it resulted in a change of
control of Rydex Investments, which in turn caused the termination of the investment advisory agreement between Rydex
Investments and the Funds.
A new investment advisory agreement between Rydex Investments and the Funds was approved under substantially the same
terms as the previous investment advisory agreement (the “New Agreement”). This New Agreement was approved by
shareholders, via proxy, and took effect upon the closing of the Transaction.
The Transaction has no impact on the day-to-day operations of Rydex Investments, the fees payable to Rydex Investments under
the New Agreement, or the persons responsible for the management of the Funds.
132
|
THE RYDEX VARIABLE TRUST ANNUAL REPORT

REPORT OF INDEPENDENT REGISTERED PUBLIC
To the Board of Trustees and Shareholders
of Rydex Variable Trust:
In our opinion, the accompanying statements of assets and liabilities, including the schedules of investments, and the related
statements of operations and of changes in net assets and the financial highlights present fairly, in all material respects, the
financial position of the Nova Fund, Inverse S&P 500 Strategy Fund (formerly Inverse S&P 500 Fund), OTC Fund, Inverse OTC
Strategy Fund (formerly Inverse OTC Fund), S&P 500 2x Strategy Fund (formerly Dynamic S&P 500 Fund), OTC 2x Strategy Fund
(formerly Dynamic OTC Fund), Mid-Cap 1.5x Strategy Fund (formerly Mid-Cap Advantage Fund), Inverse Mid-Cap Strategy Fund
(formerly Inverse Mid-Cap Fund), Russell 2000® 2x Strategy Fund (formerly Dynamic Russell 2000® Fund), Russell 2000® 1.5x
Strategy Fund (formerly Russell 2000® Advantage Fund), Inverse Russell 2000® Strategy Fund (formerly Inverse Russell 2000® Fu nd),
Government Long Bond 1.2x Strategy Fund (formerly Government Long Bond Advantage Fund), Inverse Government Long Bond
Strategy Fund (formerly Inverse Government Long Bond Fund), Europe 1.25x Strategy Fund (formerly Europe Advantage Fund),
Japan 1.25x Strategy Fund (formerly Japan Advantage Fund), Dow 2x Strategy Fund (formerly Dynamic Dow Fund), Inverse Dow
2x Strategy Fund (formerly Inverse Dynamic Dow Fund), Small-Cap Value Fund, Mid-Cap Value Fund, Large-Cap Value Fund,
Small-Cap Growth Fund, Mid-Cap Growth Fund, Large-Cap Growth Fund and U.S Government Money Market Fund (twenty four
series of Rydex Variable Trust, hereafter referred to as the “Funds”) at December 31, 2007, the results of each of their operations
for the year then ended and the changes in each of their net assets and the financial highlights for each of the periods presented,
in conformity with accounting principles generally accepted in the United States of America. These financial statements and
financial highlights (hereafter referred to as “financial statements”) are the responsibility of the Funds’ management; our respon-
sibility is to express an opinion on these financial statements based on our audits. We conducted our audits of these financial
statements in accordance with the standards of the Public Company Accounting Oversight Board (United States). Those standards
require that we plan and perform the audits to obtain reasonable assurance about whether the financial statements are free of
material misstatement. An audit includes examining, on a test basis, evidence supporting the amounts and disclosures in the
financial statements, assessing the accounting principles used and significant estimates made by management, and evaluating the
overall financial statement presentation. We believe that our audits, which included confirmation of securities at December 31,
2007 by correspondence with the custodian and brokers, provide a reasonable basis for our opinion.
PricewaterhouseCoopers LLP
Baltimore, Maryland
February 26, 2008
THE RYDEX VARIABLE TRUST ANNUAL REPORT
|
133

Tax Information
This information is being provided as required by the Internal Revenue Code. Amounts shown may differ from those elsewhere in
the report because of differences in tax and financial reporting practice.
Of the ordinary income distributions paid during the year, the following funds had the corresponding percentages qualify for the
dividends received deduction for corporations:
Fund
% Qualifying
Nova Fund
73.81%
OTC Fund
100.00%
S&P 500 2x Strategy Fund
14.87%
OTC 2x Strategy Fund
56.99%
Mid-Cap 1.5x Strategy Fund
14.35%
Russell 2000® 1.5x Strategy Fund
24.93%
Dow 2x Strategy Fund
11.71%
Mid-Cap Value Fund
79.74%
Large-Cap Value Fund
15.98%
Small-Cap Growth Fund
6.20%
Mid-Cap Growth Fund
8.94%
Large-Cap Growth Fund
22.34%
The Funds’ distributions to shareholders included:
S&P 500 2x
Mid-Cap 1.5x
Russell 2000® 2x
Russell 2000® 1.5x
Strategy
Strategy
Strategy
Strategy
Fund
Fund
Fund
Fund
From short-term capital gains:
$2,209,353
$1,014,419
$
55,803
$
—
From long-term capital gains,
subject to the 15% rate gains category:
622,608
691,701
—
1,542,506
Return of Capital:
—
1,839,552
—
—
Europe 1.25x
Dow 2x
Small-Cap
Mid-Cap
Strategy
Strategy
Value
Value
Fund
Fund
Fund
Fund
From short-term capital gains:
$7,047,962
$4,287,651
$1,232,071
$
10,376
From long-term capital gains,
subject to the 15% rate gains category:
989,193
277,020
857,854
17,776
Large-Cap
Small-Cap
Mid-Cap
Large-Cap
Value
Growth
Growth
Growth
Fund
Fund
Fund
Fund
From short-term capital gains:
$2,999,829
$
924,827
$1,450,226
$
524,675
From long-term capital gains,
subject to the 15% rate gains category:
1,733,846
654,967
1,250,505
190,616
Proxy Voting Information
A description of the policies and procedures that the Trust uses to determine how to vote proxies relating to securities held in the
Funds' portfolios is available, without charge and upon request, by calling 1-800-820-0888. This information is also available from
the EDGAR database on the SEC's website at http://www.sec.gov.
Information regarding how the Funds voted proxies relating to portfolio securities during the most recent 12-month period ended
June 30 is available without charge, upon request, by calling 1-800-820-0888. This information is also available from the EDGAR
database on the SEC’s website at http://www.sec.gov.
Quarterly Portfolio Schedules Information
The Trust files its complete schedule of portfolio holdings with the SEC for the first and third quarters of each fiscal year on Form
N-Q, which is available on the SEC’s website at http://www.sec.gov. The Funds' Forms N-Q may be reviewed and copied at the
SEC’s Public Reference Room in Washington, DC, and that information on the operation of the Public Reference Room may be
obtained by calling 1-800-SEC-0330. Copies of the portfolio holdings are also available to shareholders, without charge and upon
request, by calling 1-800-820-0888.
Rydex Investments Board Review and Approval of the Investment Advisory Agreement
The Investment Company Act of 1940 (the “1940 Act”) requires that the initial approval of, as well as the continuation of, a fund’s
investment advisory agreement be specifically approved by the vote of a majority of the trustees who are not parties to the
134
|
THE RYDEX VARIABLE TRUST ANNUAL REPORT

OTHER INFORMATION (Unaudited) (continued)
investment advisory agreement or “interested persons” of any party (the “Independent Trustees”), cast in person at a meeting
called for the purpose of voting on such approval. In connection with such approvals, the fund’s trustees must request and
evaluate, and the investment adviser is required to furnish, such information as may be reasonably necessary to evaluate the terms
of the advisory agreement. In addition, the Securities and Exchange Commission (the “SEC”) takes the position that, as part of
their fiduciary duties with respect to fund fees, fund boards are required to evaluate the material factors applicable to a decision
to approve an investment advisory agreement.
Consistent with these responsibilities, the Rydex Variable Trust Board of Trustees (the “Board”) generally calls and holds one
meeting each year that is dedicated to considering whether to renew the investment advisory agreements between Rydex
Variable Trust (the “Trust”) and PADCO Advisors II, Inc., which does business under the name Rydex Investments (“Rydex
Investments”), (the “Current Agreements”) with respect to existing funds in the Trust, including the funds discussed in this Annual
Report (each a “Fund” and collectively, the “Funds”), and to reviewing certain other agreements pursuant to which Rydex
Investments provides investment advisory services to certain other registered investment companies. In preparation for the
meeting, the Board requests and reviews a wide variety of materials provided by Rydex Investments, including information about
Rydex Investments’ affiliates, personnel and operations. The Board also receives data provided by third parties. This information is
in addition to the detailed information about the Funds that the Board reviews during the course of each year, including
information that relates to Fund operations and performance. The Board also receives a memorandum from Fund counsel
regarding the responsibilities of the Board for the approval of investment advisory agreements. In addition, the Independent
Trustees receive advice from independent counsel to the Independent Trustees, meet in executive session outside the presence of
fund management, and participate in question and answer sessions with representatives of Rydex Investments.
At a Special Meeting of the Board held on July 10, 2007, and subsequently, during the Board’s regular quarterly meeting held on
August 27 and 28, 2007 (the “Annual Renewal Meeting” and together with the July 10, 2007 Meeting, the “Meetings”), the
Board considered and voted in favor of new investment advisory agreements for Rydex Variable Trust (each, a “New Agreement”
and collectively, the “New Agreements”), which, subject to their approval by each Fund’s shareholders, will enable Rydex
Investments to continue to serve as investment adviser to each Fund after the completion of the acquisition of Rydex Investments’
parent, Rydex Holdings, Inc. (the “Transaction”). During the Annual Renewal Meeting, the Board also considered and approved
the selection of Rydex Investments and the continuance of the Current Agreements for an additional one-year period or until the
closing of the Transaction, based on its review of qualitative and quantitative information provided by Rydex Investments.
Board Considerations in Approving the New Investment Advisory Agreements and the Continuation of the Current
Investment Advisory Agreements
In preparation for the Annual Renewal Meeting, the Board requested and received written materials from Rydex Investments
about: (a) the quality of Rydex Investments’ investment management and other services; (b) Rydex Investments’ investment
management personnel; (c) Rydex Investments’ operations and financial condition; (d) Rydex Investments’ brokerage practices
(including any soft dollar arrangements) and investment strategies; (e) the level of the advisory fees that Rydex Investments
charges the Funds compared with the fees it charges to comparable mutual funds or accounts; (f) each Fund’s overall fees and
operating expenses compared with similar mutual funds; (g) the level of Rydex Investments’ profitability from its Fund-related
operations; (h) Rydex Investments’ compliance systems; (i) Rydex Investments’ policies on and compliance procedures for personal
securities transactions; (j) Rydex Investments’ reputation, expertise and resources in domestic financial markets; and (k) Fund
performance compared with similar mutual funds. Certain of these considerations are discussed in more detail below.
In its deliberations at the Annual Renewal Meeting, the Board did not identify any single piece of information that was all-
important or controlling. Based on the Board’s deliberations and its evaluation of the information referenced above and described
in more detail below, the Board, including all of the Independent Trustees, unanimously: (a) concluded that terms of the Current
Agreements and New Agreements were fair and reasonable; (b) concluded that Rydex Investments’ fees were reasonable in light
of the services that Rydex Investments provides to the Funds; (c) agreed to renew each Current Agreement for an additional one-
year term; and (d) agreed to approve the New Agreements for an initial term of two years. In approving the New Agreements and
the continuation of the Current Agreements at the Annual Renewal Meeting, the Board, including the Independent Trustees,
advised by independent counsel, considered the factors discussed below.
Nature, Extent, and Quality of Services Provided by Rydex Investments
At the Annual Renewal Meeting, the Board reviewed the scope of services to be provided by Rydex Investments under each
Current Agreement and noted that there would be no significant differences between the scope of services required to be
provided by Rydex Investments for the past year and the scope of services required to be provided by Rydex Investments for
the upcoming year. In reviewing the scope of services provided to the Funds by Rydex Investments, the Board reviewed and
discussed Rydex Investments’ investment experience, noting that Rydex Investments and its affiliates have committed
significant resources over time to the support of the Funds. The Board also considered Rydex Investments’ compliance
program and its compliance record with respect to the Funds. In that regard, the Board noted that Rydex Investments provides
information regarding the portfolio management and compliance to the Board on a periodic basis in connection with regularly
THE RYDEX VARIABLE TRUST ANNUAL REPORT
|
135

OTHER INFORMATION (Unaudited) (continued)
scheduled meetings of the Board. In addition to the above considerations, the Board reviewed and considered Rydex
Investments’ investment processes and strategies, and matters related to Rydex Investments’ portfolio transaction policies and
procedures. With respect to those Funds that invest in unaffiliated ETFs in reliance on exemptive orders pursuant to Section
12(d)(1), the Board considered and determined that the advisory fees charged under the Current Agreements are based on
services provided that will be in addition to, rather than duplicative of, the services provides under the investment advisory
agreement of any ETF in which the Funds are invested. In particular, the Board recognized that Rydex Investments must
manage a Fund’s investment in an unaffiliated ETF in the same manner as other investments in the Fund’s portfolio in order to
ensure that the Fund achieves its investment objective. Thus, a Fund’s investment in an unaffiliated ETF does not alleviate
Rydex Investments’ duties and responsibilities as investment adviser to the Fund. The Board also noted the substantial volume
of portfolio trades and shareholder transaction activity, in general, processed by Rydex Investments due to the unlimited
exchange policy of the majority of the Funds. The Board further noted that the Funds have consistently met their investment
objectives since their respective inception dates. Based on this review, the Board concluded that the nature, extent, and quality
of services to be provided by Rydex Investments to the Funds under the Current Agreements were appropriate and continued
to support the Board’s original selection of Rydex Investments as investment adviser to the Funds.
Fund Expenses and Performance of the Funds and Rydex Investments
At the Annual Renewal Meeting, the Board reviewed statistical information prepared by Rydex Investments regarding the
expense ratio components, including actual advisory fees, waivers/reimbursements, and gross and net total expenses of each
Fund in comparison with the same information for other funds registered under the 1940 Act determined by Rydex
Investments to comprise each Fund’s applicable peer group. Because few funds seek to provide unlimited exchange
privileges similar to those of the majority of the Funds, each Fund’s applicable peer group is generally limited to the funds of
two unaffiliated mutual fund families. In addition, the Board reviewed statistical information prepared by Rydex Investments
relating to the performance of each Fund, as well as each Fund’s ability to successfully track its benchmark over time, and a
comparison of each Fund’s performance to funds with similar investment objectives for the same periods and to appropriate
indices/benchmarks, in light of total return, yield and market trends. The Board further noted that despite the unique nature
of the Funds, the peer fund information presented to the Board was meaningful because the peer funds’ investment
objectives and strategies were closely aligned with those of the Funds. The Board noted that most of the Funds either
outperformed their peer funds or performed in line with them over relevant periods. The Board also noted that the
investment advisory fees for the Funds were equivalent to those of their peers and that the overall expenses for the Funds
were only slightly higher than the total expenses of the peer funds, due in part to differing share classes and distribution fees.
Based on this review, the Board concluded that the investment advisory fees and expense levels and the historical
performance of the Funds, as managed by Rydex Investments, as compared to the investment advisory fees and expense
levels and performance of the peer funds, were satisfactory for the purposes of approving the continuance of the Current
Agreements.
Costs of Services Provided to the Funds and Profits Realized by Rydex Investments and its Affiliates
At the Annual Renewal Meeting, the Board reviewed information about the profitability of the Funds to Rydex Investments
based on the advisory fees payable under the Current Agreements for the last calendar year. Rydex Investments also
presented the Board with material discussing its methodology for determining the level of advisory fees assessable to the
Funds. The Board analyzed the Funds’ expenses, including the investment advisory fees paid to Rydex Investments. The
Board also reviewed information regarding direct revenue received by Rydex Investments and ancillary revenue received by
Rydex Investments and/or its affiliates in connection with the services provided to the Funds by Rydex Investments (as
discussed below) and/or its affiliates. The Board also discussed Rydex Investments’ profit margin as reflected in Rydex
Investments’ profitability analysis and reviewed information regarding economies of scale (as discussed below). Based on this
review, the Board concluded that the profits to be realized by Rydex Investments and its affiliates under the Current
Agreements and from other relationships between the Funds and Rydex Investments and/or its affiliates, if any, were within
the range the Board considered reasonable and appropriate.
Economies of Scale
In connection with its review of the Funds’ profitability analysis at the Annual Renewal Meeting, the Board reviewed
information regarding economies of scale or other efficiencies that may result from increases in the Funds’ asset levels. The
Board noted that neither the Current Agreements nor the New Agreements for the Funds provided for any breakpoints in
the investment advisory fees as a result of increases in the asset levels of the Funds. The Board also noted that though Rydex
Investments’ assets under management were significant, the amount is spread among more than 100 Funds. Further limiting
the realization of economies of scale, is the ability of shareholders of many of the Funds to engage in unlimited trading. The
Board also reviewed and considered Rydex Investments’ historic profitability as investment adviser to the Funds and
determined that reductions in advisory fees or additions of breakpoints were not warranted at this juncture. Based on this
136
|
THE RYDEX VARIABLE TRUST ANNUAL REPORT

OTHER INFORMATION (Unaudited) (continued)
review, the Board, recognizing its responsibility to consider this issue at least annually, determined that the economies of
scale, if any, were de minimis.
Other Benefits to Rydex Investments and/or its Affiliates
At the Annual Renewal Meeting, in addition to evaluating the services provided by Rydex Investments, the Board also
considered the nature, extent, quality and cost of the administrative, distribution, and shareholder services performed by
Rydex Investments’ affiliates under separate agreements. The Board noted that Rydex Investments reports its use of soft
dollars to the Board on a quarterly basis, as well as any portfolio transactions on behalf of the Funds placed through an
affiliate of the Funds or Rydex Investments pursuant to Rule 17e-1 under the 1940 Act. Based on its review, the Board
concluded that the nature and quality of the services provided by Rydex Investments’ affiliates to the Trust will benefit the
Funds’ shareholders, and that any ancillary benefits would not be disadvantageous to the Funds’ shareholders, particularly in
light of the Board’s view that the Funds’ shareholders benefit from investing in a fund that is part of a large family of funds
offering a variety of investment strategies and services.
Additional Considerations in Approving the New Agreements
On June 18, 2007, the Trustees met with representatives of Security Benefit and the management of Rydex Investments for the
purpose of learning more about Security Benefit and the proposed Transaction. Immediately following the announcement that
Rydex and Security Benefit entered into a purchase and sale agreement, the Trustees requested that Rydex Investments provide
the Board with additional information pertaining to the effect of the proposed change of control on Rydex Investments’ personnel
and operations and the terms of the New Agreements. Rydex Investments presented its response to the Board’s request for
additional information prior to and at a Special Meeting of the Boards of Trustees held on July 10, 2007. Rydex Investments
provided the Board with oral and written information to help the Board evaluate the impact of the change of control on Rydex
Investments, Rydex Investments’ ability to continue to provide investment advisory services to the Funds under the New
Agreements, and informed the Board that the contractual rate of Rydex Investments’ fees will not change under the New
Agreements. Rydex Investments also affirmed that the terms of the New Agreements were the same in all material respects to
those of the Current Agreements.
The Trustees deliberated on the approval of each New Agreement in light of the information provided. The Board determined
that the terms of the New Agreements set forth materially similar rights, duties and obligations on Rydex Investments with regard
to the services to be provided to the Trust, and provided at least the same level of protection to the Trust, the Funds and the
Funds’ shareholders as the Current Agreements. The Board also noted that Rydex Investments’ fees for their services to the Funds
under each New Agreement would be the same as their fees under the corresponding Current Agreement. The Board further
noted that all considerations, determinations and findings related to the approval of the continuation of the Current Agreements,
as discussed above, were equally relevant to their approval of the New Agreements along with the additional factors relevant to
the proposed change in control discussed below.
Nature, Extent and Quality of Services Provided by Rydex Investments; Performance of the Funds
The Board noted that Rydex Investments was taking appropriate steps to maintain its associates through the closing of the
Transaction by, in part, keeping them informed of the potential Transaction and awarding key personnel with incentives to
emphasize their value to Rydex Investments. As a result of these efforts, it is anticipated that the key investment and
management personnel servicing the Funds will remain with Rydex Investments following the Transaction and that the
investment and management services provided to the Funds by Rydex Investments will not change. The Board also
considered Rydex Investments’ and Security Benefit’s representations to the Board that Security Benefit intends for Rydex
Investments to continue to operate following the closing of the Transaction in much the same manner as it operates today,
and that the Transaction should have no impact on the day-to-day operations of Rydex Investments, or the persons
responsible for the management of the Funds. Based on this review, the Board concluded that the range and quality of
services provided by Rydex Investments to the Funds were appropriate and were expected to continue under the New
Agreements, and that there was no reason to expect the consummation of the Transaction to have any adverse effect on the
services provided by Rydex Investments and its affiliates or the future performance of the Funds.
Fund Expenses
The Board also considered the fact that the fees payable to Rydex Investments and other expenses of the Funds would be
the same under the New Agreements as they are under the Current Agreements, and on this basis, the Board concluded that
these fees and expenses continued to be satisfactory for the purposes of approving the New Agreements. More detailed
information regarding the fees under the New Agreements is contained in the Proxy Statement and accompanying materials
dated September 6, 2007.
THE RYDEX VARIABLE TRUST ANNUAL REPORT
|
137

OTHER INFORMATION
(Unaudited)
(concluded)
Costs of Services Provided to the Funds and Profits Realized by Rydex Investments and its Affiliates
Because Rydex Investments’ fees under the New Agreements are the same as those assessed under the Current
Agreements, the Board concluded that the profits to be realized by Rydex Investments and its affiliates under the New
Agreements and from other relationships between the Funds and Rydex Investments and/or its affiliates, if any, should remain
within the range the Board considered reasonable and appropriate. The Board further noted that, although it is not possible
to predict how the Transaction may affect Rydex Investments’ future profitability from its relationship with the Funds, this
matter would be given further consideration on an annual basis going forward.
Economies of Scale
The Board further considered the potential economies of scale that may result from the Transaction, and concluded that the
extent of such economies of scale could not be predicted in advance of the closing of the Transaction.
138
|
THE RYDEX VARIABLE TRUST ANNUAL REPORT

INFORMATION ON BOARD OF TRUSTEES AND OFFICERS (Unaudited)
A Board of Trustees oversees all Rydex Investments, in which its members have no stated term of service, and continue to serve
after election until resignation. The Statement of Additional Information includes further information about Fund Trustees and
Officers, and can be obtained without charge by calling 1-800-820-0888.
All Trustees and Officers may be reached c/o Rydex Investments, 9601 Blackwell Rd., Suite 500, Rockville, MD 20850.
TRUSTEES AND OFFICERS
Length of Service
Name, Position and
As Trustee
Number of
Year of Birth
(Year Began)
Funds Overseen
–––––––––––––––––––––––––
––––––––––––––––––––––––––––––––
––––––––––——––––––
Carl G. Verboncoeur*
Rydex Series Funds – 2004
147
Trustee, President (1952)
Rydex Variable Trust – 2004
Rydex Dynamic Funds – 2004
Rydex ETF Trust – 2004
Principal Occupations During Past Five Years: Chief Executive Officer and Treasurer of Rydex Specialized Products, LLC (2005 to
present); Chief Executive Officer of Rydex Investments and Rydex Distributors, Inc. (2003 to present); Executive Vice President of
Rydex Investments (2000 to 2003)
Michael P. Byrum*
Rydex Series Funds – 2005
147
Trustee, Vice President
Rydex Variable Trust – 2005
(1970)
Rydex Dynamic Funds – 2005
Rydex ETF Trust – 2005
Principal Occupations During Past Five Years: Secretary of Rydex Specialized Products, LLC (2005 to present); Vice President of
Rydex Series Funds (1997 to present); Vice President of Rydex Variable Trust (1998 to present); Vice President of Rydex Dynamic
Funds (1999 to present); Vice President of Rydex ETF Trust (2002 to present); President and Trustee of Rydex Capital Partners
SPhinX Fund (2003 to 2006); President of Rydex Investments (2004 to present); Chief Operating Officer of Rydex Investments and
Rydex Distributors, Inc. (2003 to 2004)
INDEPENDENT TRUSTEES
Length of Service
Name, Position and
As Trustee
Number of
Year of Birth
(Year Began)
Funds Overseen
–––––––––––––––––––––––––
––––––––––––––––––––––––––––––––
––––––––––——––––––
John O. Demaret
Rydex Series Funds – 1997
139
Trustee, Chairman of the
Rydex Variable Trust – 1998
Board (1940)
Rydex Dynamic Funds – 1999
Rydex ETF Trust – 2003
Principal Occupations During Past Five Years: Retired
Corey A. Colehour
Rydex Series Funds – 1993
139
Trustee (1945)
Rydex Variable Trust – 1998
Rydex Dynamic Funds – 1999
Rydex ETF Trust – 2003
Principal Occupations During Past Five Years: Retired (2006 to present); Owner and President of Schield Management
Company, registered investment adviser (2005 to 2006); Senior Vice President of Marketing and Co-Owner of Schield
Management Company, registered investment adviser (1985 to 2005)
J. Kenneth Dalton
Rydex Series Funds – 1995
139
Trustee (1941)
Rydex Variable Trust – 1998
Rydex Dynamic Funds – 1999
Rydex ETF Trust – 2003
Principal Occupations During Past Five Years: Mortgage Banking Consultant and Investor, The Dalton Group
Werner E. Keller
Rydex Series Funds – 2005
139
Trustee (1940)
Rydex Variable Trust – 2005
Rydex Dynamic Funds – 2005
Rydex ETF Trust – 2005
Principal Occupations During Past Five Years: Retired (2001 to present); Chairman, Centurion Capital Management (1991 to 2001)
THE RYDEX VARIABLE TRUST ANNUAL REPORT
|
139

INFORMATION ON BOARD OF TRUSTEES AND OFFICERS (Unaudited) (concluded)
Length of Service
Name, Position and
As Trustee
Number of
Year of Birth
(Year Began)
Funds Overseen
–––––––––––––––––––––––––
––––––––––––––––––––––––––––––––
––––––––––——––––––
Thomas F. Lydon, Jr.
Rydex Series Funds – 2005
139
Trustee (1960)
Rydex Variable Trust – 2005
Rydex Dynamic Funds – 2005
Rydex ETF Trust – 2005
Principal Occupations During Past Five Years: President, Global Trends Investments
Patrick T. McCarville
Rydex Series Funds – 1997
139
Trustee (1942)
Rydex Variable Trust – 1998
Rydex Dynamic Funds – 1999
Rydex ETF Trust – 2003
Principal Occupations During Past Five Years: Founder and Chief Executive Officer, Par Industries, Inc.
Roger Somers
Rydex Series Funds – 1993
139
Trustee (1944)
Rydex Variable Trust – 1998
Rydex Dynamic Funds – 1999
Rydex ETF Trust – 2003
Principal Occupations During Past Five Years: Owner, Arrow Limousine
EXECUTIVE OFFICERS
Name, Position and
Principal Occupations
––––––––––––––––––––––––––––––
Year of Birth
–––––––––––––––––––––––
During Past Five Years
Nick Bonos*
Chief Financial Officer of Rydex Specialized Products, LLC (2005 to
Vice President and Treasurer (1963)
present); Vice President and Treasurer of Rydex Series Funds,
Rydex Variable Trust, Rydex Dynamic Funds, and Rydex ETF Trust
(2003 to present); Senior Vice President of Rydex Investments
(2003 to present); Vice President and Treasurer of Rydex Capital
Partners SPhinX Fund (2003 to 2006); Vice President of
Accounting of Rydex Investments (2000 to 2003)
Joanna M. Haigney*
Chief Compliance Officer of Rydex Series Funds, Rydex Variable
Chief Compliance Officer and Secretary (1966)
Trust, and Rydex Dynamic Funds (2004 to present); Secretary of
Rydex Series Funds, Rydex Variable Trust, and Rydex Dynamic
Funds (2000 to present); Secretary of Rydex ETF Trust (2002 to
present); Vice President of Compliance of Rydex Investments
(2000 to present); Secretary of Rydex Capital Partners SPhinX
Fund (2003 to 2006)
Joseph Arruda*
Assistant Treasurer of Rydex Series Funds, Rydex Variable Trust,
Assistant Treasurer (1966)
Rydex Dynamic Funds, Rydex ETF Trust (2006 to present); Vice
President of Rydex Investments (2004 to present); Director of
Accounting of Rydex Investments (2003 to 2004); Vice President
of Mutual Funds, State Street Bank & Trust (2000 to 2003)
Paula Billos*
Controller of Rydex Series Funds, Rydex Variable Trust, Rydex
Controller (1974)
Dynamic Funds, Rydex ETF Trust (2006 to present); Director of
Fund Administration of Rydex Investments (2001 to present)
* Officers of the Fund are deemed to be “interested persons” of the Trust, within the meaning of Section 2(a)(19) of the 1940 Act, inasmuch as
this person is affiliated with Rydex Investments.
140
|
THE RYDEX VARIABLE TRUST ANNUAL REPORT

This page intentionally left blank.

9601 Blackwell Road, Suite 500
Rockville, MD 20850
www.rydexinvestments.com
800.820.0888
RVABENF-ANN-2-1207x1208