UNITED STATES
SECURITIES AND EXCHANGE COMMISSION
Washington, D.C. 20549
FORM N-CSR
CERTIFIED SHAREHOLDER REPORT
OF
REGISTERED MANAGEMENT INVESTMENT COMPANIES
| Investment Company Act file number: | 811-02368 | |
Name of Registrant: | Vanguard Fixed Income Securities Funds | |
Address of Registrant: | P.O. Box 2600 | |
| Valley Forge, PA 19482 | ||
Name and address of agent for service: | Anne E. Robinson, Esquire | |
| P.O. Box 876 | ||
| Valley Forge, PA 19482 | ||
Registrant’s telephone number, including area code: (610) 669-1000 | ||
Date of fiscal year end: January 31 | ||
Date of reporting period: February 1, 2018—July 31, 2018 | ||
Item 1: Reports to Shareholders | ||
Semiannual Report | July 31, 2018
Vanguard Corporate Bond Funds
Vanguard Short-Term Investment-Grade Fund
Vanguard Intermediate-Term Investment-Grade Fund
Vanguard Long-Term Investment-Grade Fund
Vanguard High-Yield Corporate Fund
Vanguard’s Principles for Investing Success
We want to give you the best chance of investment success. These principles, grounded in Vanguard’s research and experience, can put you on the right path.
Goals. Create clear, appropriate investment goals.
Balance. Develop a suitable asset allocation using broadly diversified funds.
Cost. Minimize cost.
Discipline. Maintain perspective and long-term discipline.
A single theme unites these principles: Focus on the things you can control.
We believe there is no wiser course for any investor.
| Contents | |
| Your Fund’s Performance at a Glance. | 1 |
| CEO’s Perspective. | 3 |
| Advisors’ Report. | 5 |
| Short-Term Investment-Grade Fund. | 12 |
| Intermediate-Term Investment-Grade Fund. | 52 |
| Long-Term Investment-Grade Fund. | 86 |
| High-Yield Corporate Fund. | 115 |
| About Your Fund’s Expenses. | 136 |
| Trustees Approve Advisory Arrangements. | 138 |
| Glossary. | 140 |
Please note: The opinions expressed in this report are just that—informed opinions. They should not be considered promises
or advice. Also, please keep in mind that the information and opinions cover the period through the date on the front of this
report. Of course, the risks of investing in your fund are spelled out in the prospectus.
See the Glossary for definitions of investment terms used in this report.
About the cover: Nautical images have been part of Vanguard’s rich heritage since its start in 1975. For an
incoming ship, a lighthouse offers a beacon and safe path to shore. You can similarly depend on Vanguard to put
you first––and light the way––as you strive to meet your financial goals. Our client focus and low costs,
stemming from our unique ownership structure, assure that your interests are paramount.
Your Fund’s Performance at a Glance
• For the six months ended July 31, 2018, returns of the funds in this report ranged from –3.36% for Investor Shares of Vanguard Long-Term Investment-Grade Fund to 0.21% for Institutional Shares of Vanguard Short-Term Investment-Grade Fund. Results versus the funds’ benchmarks were mixed; all four funds lagged or nearly matched their peer-group average returns.
• Federal Reserve rate hikes and a solid economic backdrop led bond yields to finish the period higher, resulting in lower prices. Corporate bond spreads widened versus U.S. Treasuries.
• An underweighting of corporate bonds helped relative performance of the Short-Term Fund and Vanguard Intermediate-Term Investment-Grade Fund. Security selection and asset allocation added value to varying degrees across most of the funds. Issuer selection and sector allocations contributed to Vanguard High-Yield Corporate Fund’s lagging its benchmark.
| Total Returns: Six Months Ended July 31, 2018 | ||||
| 30-Day SEC | Income | Capital | Total | |
| Yield | Returns | Returns | Returns | |
| Vanguard Short-Term Investment-Grade Fund | ||||
| Investor Shares | 3.09% | 1.28% | -1.14% | 0.14% |
| Admiral™ Shares | 3.19 | 1.33 | -1.14 | 0.19 |
| Institutional Shares | 3.22 | 1.35 | -1.14 | 0.21 |
| Bloomberg Barclays U.S. 1–5 Year Credit Bond Index | 0.21 | |||
| 1–5 Year Investment-Grade Debt Funds Average | 0.28 | |||
| 1–5 Year Investment-Grade Debt Funds Average: Derived from data provided by Lipper, a Thomson Reuters Company. | ||||
| Vanguard Intermediate-Term Investment-Grade Fund | ||||
| Investor Shares | 3.49% | 1.52% | -2.19% | -0.67% |
| Admiral Shares | 3.59 | 1.57 | -2.19 | -0.62 |
| Bloomberg Barclays U.S. 5–10 Year Credit Bond Index | -1.06 | |||
| Core Bond Funds Average | -0.62 | |||
| Core Bond Funds Average: Derived from data provided by Lipper, a Thomson Reuters Company. | ||||
| Vanguard Long-Term Investment-Grade Fund | ||||
| Investor Shares | 4.05% | 1.99% | -5.35% | -3.36% |
| Admiral Shares | 4.15 | 2.03 | -5.35 | -3.32 |
| Bloomberg Barclays U.S. Long Credit A or Better Bond Index | -3.56 | |||
| Corporate A-Rated Debt Funds Average | -1.03 | |||
| Corporate A-Rated Debt Funds Average: Derived from data provided by Lipper, a Thomson Reuters Company. | ||||
1
| Total Returns: Six Months Ended July 31, 2018 | ||||
| 30-Day SEC | Income | Capital | Total | |
| Yield | Returns | Returns | Returns | |
| Vanguard High-Yield Corporate Fund | ||||
| Investor Shares | 5.71% | 2.70% | -2.88% | -0.18% |
| Admiral Shares | 5.81 | 2.75 | -2.88 | -0.13 |
| High-Yield Corporate Composite Index | 0.19 | |||
| High Yield Funds Average | -0.01 |
For a benchmark description, see the Glossary.
High Yield Funds Average: Derived from data provided by Lipper, a Thomson Reuters Company.
Admiral Shares carry lower expenses and are available to investors who meet certain account-balance requirements. Institutional Shares
are available to certain institutional investors who meet specific administrative, service, and account-size criteria.
| Expense Ratios | ||||
| Your Fund Compared With Its Peer Group | ||||
| Investor | Admiral | Institutional | Peer Group | |
| Shares | Shares | Shares | Average | |
| Short-Term Investment-Grade Fund | 0.20% | 0.10% | 0.07% | 0.71% |
| Intermediate-Term Investment-Grade Fund | 0.20 | 0.10 | — | 0.74 |
| Long-Term Investment-Grade Fund | 0.22 | 0.12 | — | 0.81 |
| High-Yield Corporate Fund | 0.23 | 0.13 | — | 1.05 |
The fund expense ratios shown are from the prospectus dated May 24, 2018, and represent estimated costs for the current fiscal year. For
the six months ended July 31, 2018, the funds’ annualized expense ratios were: for the Short-Term Investment-Grade Fund, 0.20% for
Investor Shares, 0.10% for Admiral Shares, and 0.07% for Institutional Shares; for the Intermediate-Term Investment-Grade Fund, 0.20%
for Investor Shares and 0.10% for Admiral Shares; for the Long-Term Investment-Grade Fund, 0.22% for Investor Shares and 0.12% for
Admiral Shares; and for the High-Yield Corporate Fund, 0.23% for Investor Shares and 0.13% for Admiral Shares. Peer-group expense
ratios are derived from data provided by Lipper, a Thomson Reuters Company, and capture information through year-end 2017.
Peer groups: For the Short-Term Investment-Grade Fund, 1–5 Year Investment-Grade Debt Funds; for the Intermediate-Term
Investment-Grade Fund, Core Bond Funds; for the Long-Term Investment-Grade Fund, Corporate A-Rated Debt Funds; and for the
High-Yield Corporate Fund, High Yield Funds.
2
CEO’s Perspective

Tim Buckley
President and Chief Executive Officer
Dear Shareholder,
I feel extremely fortunate to have the chance to lead a company filled with people who come to work every day passionate about Vanguard’s core purpose: to take a stand for all investors, to treat them fairly, and to give them the best chance for investment success.
When I joined Vanguard in 1991, I found a mission-driven team focused on improving lives—helping people retire more comfortably, put their children through college, and achieve financial security. I also found a company with purpose in an industry ripe for improvement.
It was clear, even early in my career, that the cards were stacked against most investors. Hidden fees, performance-chasing, and poor advice were relentlessly eroding investors’ dreams.
We knew Vanguard could be different and, as a result, could make a real difference. We have lowered the costs of investing for our shareholders significantly. And we’re proud of the performance of our funds.
Vanguard is built for Vanguard investors—we focus solely on you, our fund shareholders. Everything we do is designed to give our clients the best chance for investment success. In my role as CEO, I’ll keep this priority
3
front and center. We’re proud of what we’ve achieved, but we’re even more excited about what’s to come.
Steady, time-tested guidance
Our guidance for investors, as always, is to stay the course, tune out the hyperbolic headlines, and focus on your goals and what you can control, such as costs and how much you save. This time-tested advice has served our clients well over the decades.
Regardless of how the markets perform in the short term, I’m incredibly optimistic about the future for our investors. We have a dedicated team serving you, and we will never stop striving to make
Vanguard the best place for you to invest through our high-quality funds and services, advice and guidance to help you meet your financial goals, and an experience that makes you feel good about entrusting us with your hard-earned savings.
Thank you for your continued loyalty.
Sincerely,

Mortimer J. Buckley
President and Chief Executive Officer
August 16, 2018
| Market Barometer | |||
| Total Returns | |||
| Periods Ended July 31, 2018 | |||
| Six | One | Five Years | |
| Months | Year | (Annualized) | |
| Stocks | |||
| Russell 1000 Index (Large-caps) | 0.86% | 16.19% | 12.96% |
| Russell 2000 Index (Small-caps) | 6.75 | 18.73 | 11.33 |
| Russell 3000 Index (Broad U.S. market) | 1.30 | 16.39 | 12.83 |
| FTSE All-World ex US Index (International) | -6.57 | 6.19 | 5.97 |
| Bonds | |||
| Bloomberg Barclays U.S. Aggregate Bond Index | |||
| (Broad taxable market) | -0.45% | -0.80% | 2.25% |
| Bloomberg Barclays Municipal Bond Index | |||
| (Broad tax-exempt market) | 1.18 | 0.99 | 3.76 |
| FTSE Three-Month U. S. Treasury Bill Index | 0.83 | 1.41 | 0.41 |
| CPI | |||
| Consumer Price Index | 1.67% | 2.95% | 1.53% |
4
Advisors’ Report
Vanguard Fixed Income Group
For the Short-, Intermediate-, and
Long-Term Investment-Grade Funds
For the six months ended July 31, 2018, Vanguard Short-Term Investment-Grade Fund returned 0.14% and Vanguard Intermediate-Term Investment-Grade Fund returned –0.67%. (All returns and yields cited are for the funds’ Investor Shares.) The Short-Term Fund performed roughly in line with its benchmark, and the Intermediate-Term Fund outperformed its benchmark. Both funds underperformed the average return of their peers.
We also manage about 10% of the assets of Vanguard Long-Term Investment-Grade Fund, which returned –3.36%. That result compared with the –3.56% return of its benchmark index but lagged the average return of its peer group, which includes funds that invest across the maturity spectrum.
The 30-day SEC yield for the Short-Term Fund rose 66 basis points over the period to 3.09%, and that of the Intermediate-Term Fund rose 60 basis points to 3.49%, while the yield of the Long-Term Fund rose 44 basis points to 4.05%. (A basis point is one-hundredth of a percentage point.)
Investment environment
Macroeconomic fundamentals were robust throughout the period. Business confidence held up even in the face of trade uncertainties, and consumer spending was supported by solid expansion in the job market. Unemployment reached a 17-year low, finishing the period at 3.9%. The tax cuts enacted late last year and the March passage of a bill increasing federal spending added to optimism about growth, which accelerated to a little over 3% in annualized, inflation-adjusted terms in the first six months of 2018. Price increases moved toward the Federal Reserve’s inflation target of 2% with some help from a rise in the price of oil.
| Yields of U.S. Treasury Securities | ||
| January 31, | July 31, | |
| Maturity | 2018 | 2018 |
| 2 years | 2.14% | 2.67% |
| 3 years | 2.29 | 2.77 |
| 5 years | 2.52 | 2.85 |
| 10 years | 2.71 | 2.96 |
| 30 years | 2.94 | 3.08 |
| Source: Vanguard. |
5
The Fed, acknowledging the economy’s health, moved further down the path toward monetary policy normalization. It continued shrinking the $4.5 trillion balance sheet it had amassed as part of the stimulus it began providing in the wake of the 2007–2009 financial crisis. The Fed also raised the federal funds target rate in March and again in June, to 1.75%–2%, and signaled two more hikes to come in 2018.
The Fed action pushed up shorter-term yields. The yield of the 2-year U.S. Treasury note climbed 53 basis points over the period to 2.67%.
Demand for longer-term Treasury bonds, which can increase as investors seek out safe-haven assets, was supported at times by escalating trade tensions, political uncertainty in Europe, and geopolitical flare-ups. Nonetheless, the outlook for continued growth and rising inflation expectations led yields on these securities to end the period higher as well, but not by as much as their shorter-term counterparts. The yield of the bellwether 10-year Treasury note ended the period up 25 basis points to 2.96%.
Investment-grade corporate bonds fared worse. Corporate fundamentals remained strong, and corporate earnings were robust in the first two quarters of 2018—helped by the tax cuts—but corporate bond valuations were high and technical support weakened. Given the tax changes for corporations, a number of large multinational companies that had been investing overseas money in high-quality corporate bonds withdrew from the market. With the Fed on a tightening path, rising hedging costs for foreign buyers led some to pull back as well.
Another challenge was uncertainty in the longer-term credit outlook. With the Fed continuing to wind down monetary stimulus and raise rates, bond investors seemed to pause during the period to assess the outlook.
Management of the funds
The Short-Term and Intermediate-Term Funds have a structural underweight to lower-quality corporate bonds. This added to relative performance during the period as BBB-rated securities underperformed corporates as a whole. The Intermediate-Term Fund’s structurally short duration compared with its benchmark also helped given the rising-rate environment.
Security selection played out well for both funds in communications, technology, and energy. For the Intermediate-Term Fund, selection was also strong in banking.
Our relatively small allocation to high-quality sovereign emerging-market debt was positive. Early in the period, we were quite defensive on these securities, which allowed us to increase our exposure to them later when their valuations fell to more attractive levels.
6
For diversification purposes, the Short-Term and Intermediate-Term Funds had exposure to segments of the investment-grade credit market that are not part of their benchmarks. These included an allocation to asset-backed securities (typically made up of pooled auto loans, credit-card debt, and student loans) and commercial mortgage-backed securities (pooled mortgages on commercial properties). We view both segments as having attractive return prospects, particularly on the short end of the yield curve.
Furthermore, high-quality asset-backed securities tend to be liquid when selling and, as a result, are a helpful tool for managing fund positioning. For the six months, asset-backed securities and commercial mortgage-backed securities added to the funds’ relative returns.
The funds also had an allocation to Treasuries for diversification and liquidity purposes. These securities also helped relative returns.
Outlook
In the absence of any external shocks, the U.S. economy is on pace to break above its long-term potential growth rate in 2018, given the recent tax cuts and increased government spending on top of solid fundamentals. That, along with some upward pressure on wages in the tight labor market, may push the U.S. core personal consumption expenditures price index a little above 2% by the end of 2018.
We see this as a cyclical bounce, though, and still expect long-term structural pressures from an aging population, global sourcing of goods and labor, and technological disruptions to result in moderate long-run growth and inflation.
Some upward adjustments to the Fed’s assumptions—the economy growing a little faster, unemployment falling a little lower, and inflation running a little higher—should justify two more rate hikes this year. The Fed has also penciled in more increases in 2019. The unwinding of its balance sheet is likely to keep following the framework and timetable laid out last September by policymakers, given the bond market’s limited reaction so far.
We may continue to see bouts of volatility related to inflation and interest rate expectations as well as concerns about whether we are approaching the end of the current credit cycle. Other potential triggers include the U.S. midterm elections, an intensification of trade disputes, flare-ups in geopolitical tensions, and missteps by central banks. The funds remain positioned to take advantage of any repricing of risk that those concerns may create.
It’s worth restating that investors should look beyond short-term volatility and adhere to their long-term investment strategies. And keep in mind that higher rates, on balance, benefit long-term investors in shorter-term bonds, as losses due to
7
spread widening are modest, and coupon payments and proceeds from maturing bonds can be reinvested at higher rates.
Whatever the markets may bring, our experienced team of portfolio managers, credit analysts, and traders will continue to seek out opportunities to add to the funds’ performance.
John Hollyer, CFA, Principal and
Global Head of Fixed Income Group
Daniel Shaykevich, Principal
and Portfolio Manager
Samuel C. Martinez, CFA,
Portfolio Manager
August 20, 2018
Wellington Management Company llp
For the Long-Term Investment-Grade Fund
Vanguard Long-Term Investment-Grade Fund returned –3.36% for Investor Shares and –3.32% for Admiral Shares for the six months ended July 31, 2018. That result was in line with the –3.56% return of its benchmark, the Bloomberg Barclays U.S. Long Credit A or Better Bond Index, but trailed the –1.03% average return of its peers.
The portion of the Long-Term Fund that we manage (the “portfolio”) invests primarily in corporate bonds with 10 to 30 years until maturity. The portfolio’s returns are influenced by the direction of interest rates and by economic conditions that affect the creditworthiness of the corporate bond issuers.
Investment environment
Fixed income markets generated negative returns over the six months. Rising rates hurt credit markets, as did widening credit spreads amid political uncertainty in Europe and escalating tensions between the U.S. and its trading partners. Stronger inflation data and the expected impact of trade tariffs increased inflation expectations, and this dynamic weighed on bond prices.
Investment-grade credit markets under-performed despite generally strong global economic data and positive earnings trends. Credit spreads widened amid concerns over increased leverage from a pickup in mergers and acquisitions, lower demand for credit as U.S. firms repatriated overseas funds held in high-quality corporate bonds, and higher currency hedging costs.
Monetary policy stayed on an incrementally less accommodative path as the Federal Reserve raised rates twice during the period and projected two more hikes later in 2018. The U.S. economy expanded at a 4.1% annualized rate in the second quarter of 2018, the labor market remained strong, and small-business and consumer surveys painted an optimistic economic picture. Low inventory and higher mortgage rates led to mixed U.S. housing market data.
8
The portfolio’s successes
In aggregate, security selection boosted relative results, most notably in the consumer cyclical, communications, and sovereign sectors. An overweight allocation to taxable municipal bonds also helped.
The portfolio’s shortfalls
Security selection in the electric utility, local agency, and capital goods sectors detracted from relative results. An overweight allocation to banking also hurt.
The outlook
The portfolio is positioned slightly overweight to risk, but with the majority of active risk coming from sector and single-name exposures. We are looking for opportunities to reduce risk over the balance of this year.
The U.S. economy remains on a positive growth trajectory, driven by consumer spending and investment. The labor market is still strong and wages have started to pick up. If fiscal stimulus does result in a growth boost at a time of full employment, the Fed could raise policy rates more aggressively to mitigate future inflation risk. The flat U.S. rate curve appears to be struggling with this push-pull.
Corporate fundamentals are on solid footing, but we expect them to deteriorate through the year as companies pursue debt-funded mergers and acquisitions. The best quarters of revenue growth are most likely behind us for this cycle. On a historical basis, net leverage remains at reasonable levels given elevated cash balances, but we expect companies to spend a lot of this cash now that they have access to it after repatriation rule changes under the new tax law.
Many debt-funded merger and acquisition transactions have pushed the investment-grade ratings limit. Rating agencies have given leeway for companies to add leverage with the promise to later reduce debt, resulting in higher leverage for the overall index. We do not expect this to change, and there is a risk that it will accelerate.
Despite the U.S. market’s relative yield advantage, demand from overseas investors has declined as a result of higher hedging costs. Recent episodic spikes in volatility (perhaps related to tightening monetary policy) and the “end of the cycle” signal that many market participants are gleaning from a flat yield curve has led dealers and total-return asset managers to behave more defensively and scale back on their use of balance sheet leverage. Market liquidity can change quickly, and we would expect it to deteriorate further if volatility increased for a sustained period. New-issue supply has exceeded expectations, particularly at the long end of the curve.
The portfolio remains positioned with a modestly pro-cyclical posture. We maintain an overweight allocation to banks, as their balance sheets are less risky in light of
9
improved capital ratios and regulation. The team maintains an overweight exposure to taxable municipal bonds, as valuations appear attractive given low historical default rates. The portfolio currently has underweight positions in retailers, health care, pharmaceuticals, and energy issuers.
Scott I. St. John, CFA
Senior Managing Director
and Fixed Income Portfolio Manager
August 20, 2018
Wellington Management Company llp
For the High-Yield Corporate Fund
For the six months ended July 31, 2018, the High-Yield Corporate Fund returned –0.18% for Investor Shares and –0.13% for Admiral Shares. Those results lagged the 0.19% return of its custom benchmark index and the average –0.01% return of its peer group.
Investment environment
High-yield markets were hurt by both increasing interest rates and widening credit spreads amid political uncertainty in Europe and escalating tensions between the U.S. and its trading partners. Monetary policy stayed on an incrementally less accommodative path as the Federal Reserve raised interest rates twice during the period and projected two more hikes later this year. The 10-year Treasury yield increased from 2.71% at the end of January to 2.96% at the end of July as stronger inflation data and the expected impact of trade tariffs increased inflation expectations. This dynamic weighed on bond prices, as bond yields and prices generally move in opposite directions.
Corporate credit spreads widened, further pressuring bond prices, as concerns about the impact of protectionist U.S. trade policy on global growth offset generally solid corporate earnings.
The spread of the high-yield market widened to 336 basis points over Treasuries as of July 31, 2018, from 319 basis points six months earlier. The average price of high-yield bonds fell by $2, to $99, over the period.
There was some dispersion in performance by credit quality. The high-yield market continued to favor relatively lower-credit-quality bonds amid the insatiable search for yield. CCC-rated bonds performed best, returning 2.44%, according to Bloomberg Barclays High Yield Index data, while higher-rated BB bonds returned –0.70%. B-rated bonds fell in between, returning 1.13%.
We remain positive on high yield given stable corporate fundamentals, a supportive macroeconomic landscape, and strong demand for yield-producing assets. We expect U.S. GDP to expand in 2018, driven by consumer spending and corporate investment, and we believe that most high-yield companies can sustain solid credit profiles in that environment.
10
Although global political risks remain, valuations appear reasonable relative to our outlook, in particular given our expectation for a benign default rate over 2018. Moody’s trailing 12-month global issuer-weighted speculative-grade default rate ended July at 2.8%, below the 4.2% average over the last 20 years. Although bouts of volatility may persist, we continue to take a long-term, issuer-specific approach to finding opportunities in this market.
Prevailing global political uncertainty and escalating trade tensions may contribute to such bouts of volatility. However, most of the high-yield companies within our opportunity set operate in domestically focused industries. Because we remain positive on U.S. conditions, we continue to favor issuers that are expected to benefit from a growing domestic economy. The new tax law provides fiscal stimulus at a time of full employment, and that could further spur GDP growth.
We have begun to see the law’s benefits in corporate earnings results, and we expect this to provide a bigger boost over the second half of the year. The tax law will affect companies differently depending on their current tax rate, leverage profile, and other factors, so we expect there will be winners and losers among individual high-yield issuers, and we will maintain an issuer-specific approach to investing in the high-yield market. Longer-term, we believe the tax bill could have an overall net effect of reducing corporate debt issuance—a reduction that could provide support to bond prices going forward.
The fund’s successes
The fund benefited from an overweight allocation to and positive credit selection in the energy sector, as well as from credit selection among retailers and pharmaceuticals.
The fund’s shortfalls
An overweight allocation to and security selection in the cable & satellite sector weighed on relative results, as did the fund’s positioning in the wirelines sector.
The fund’s positioning
The fund remains consistent in its investment objective and strategy and maintains a meaningful exposure to relatively higher-quality names within the high-yield market. We believe these companies have more stable credit profiles and greater predictability of cash flows than those at the lower end of the quality spectrum. We prefer higher-quality credits in an effort to minimize defaults and to provide stable income. We continue to diversify the fund’s holdings by issuer and industry. We also continue to deemphasize non-cash-paying securities, preferred stocks, and equity-linked securities, such as convertibles, because of their potential for volatility.
Michael L. Hong, CFA, Managing Director
and Fixed Income Portfolio Manager
August 20, 2018
11
Short-Term Investment-Grade Fund
Fund Profile
As of July 31, 2018
| Share-Class Characteristics | |||
| Investor | Admiral | Institutional | |
| Shares | Shares | Shares | |
| Ticker Symbol | VFSTX | VFSUX | VFSIX |
| Expense Ratio1 | 0.20% | 0.10% | 0.07% |
| 30-Day SEC Yield | 3.09% | 3.19% | 3.22% |
| Financial Attributes | |||
| Bloomberg | Bloomberg | ||
| Barclays | Barclays | ||
| 1–5 Year | US | ||
| Credit | Aggregate | ||
| Fund | Index | Bond Index | |
| Number of Bonds | 1,863 | 2,507 | 10,012 |
| Yield to Maturity | |||
| (before expenses) | 3.4% | 3.3% | 3.4% |
| Average Coupon | 2.6% | 3.1% | 3.1% |
| Average Duration | 2.6 years | 2.7 years | 6.0 years |
| Average Effective | |||
| Maturity | 3.5 years | 2.9 years | 8.4 years |
| Short-Term | |||
| Reserves | 4.4% | — | — |
| Sector Diversification (% of portfolio) | |
| Asset-Backed | 12.4% |
| Commercial Mortgage-Backed | 10.0 |
| Finance | 28.3 |
| Foreign | 9.2 |
| Government Mortgage-Backed | 0.7 |
| Industrial | 23.4 |
| Treasury/Agency | 11.4 |
| Utilities | 4.3 |
| Other | 0.3 |
The agency and mortgage-backed securities sectors may include
issues from government-sponsored enterprises; such issues are
generally not backed by the full faith and credit of the U.S.
government.
| Volatility Measures | ||
| Bloomberg | Bloomberg | |
| Barclays | Barclays US | |
| 1–5 Year | Aggregate | |
| Credit | Bond | |
| Index | Index | |
| R-Squared | 0.96 | 0.80 |
| Beta | 0.90 | 0.41 |
| These measures show the degree and timing of the fund’s | ||
| fluctuations compared with the indexes over 36 months. | ||
| Distribution by Effective Maturity | |
| (% of portfolio) | |
| Under 1 Year | 14.0% |
| 1 - 3 Years | 44.0 |
| 3 - 5 Years | 25.1 |
| 5 - 7 Years | 10.1 |
| 7 - 10 Years | 4.6 |
| 10 - 20 Years | 0.9 |
| 20 - 30 Years | 0.3 |
| Over 30 Years | 1.0 |
| Distribution by Credit Quality (% of portfolio) | |
| U.S. Government | 10.8% |
| Aaa | 20.7 |
| Aa | 14.6 |
| A | 29.8 |
| Baa | 19.5 |
| Ba | 1.7 |
| B | 0.3 |
| Not Rated | 2.6 |
Credit-quality ratings are obtained from Moody's and S&P, and the
higher rating for each issue is shown. "Not Rated" is used to classify
securities for which a rating is not available. Not rated securities
include a fund's investment in Vanguard Market Liquidity Fund or
Vanguard Municipal Cash Management Fund, each of which invests
in high-quality money market instruments and may serve as a cash
management vehicle for the Vanguard funds, trusts, and accounts.
For more information about these ratings, see the Glossary entry for
Credit Quality.
1 The expense ratios shown are from the prospectus dated May 24, 2018, and represent estimated costs for the current fiscal year. For the six
months ended July 31, 2018, the annualized expense ratios were 0.20% for Investor Shares, 0.10% for Admiral Shares, and 0.07% for
Institutional Shares.
12
Short-Term Investment-Grade Fund
Investment Focus
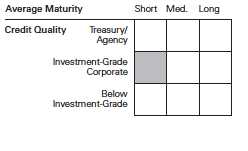
13
Short-Term Investment-Grade Fund
Performance Summary
All of the returns in this report represent past performance, which is not a guarantee of future results that may be achieved by the fund. (Current performance may be lower or higher than the performance data cited. For performance data current to the most recent month-end, visit our website at vanguard.com/performance.) Note, too, that both investment returns and principal value can fluctuate widely, so an investor’s shares, when sold, could be worth more or less than their original cost. The returns shown do not reflect taxes that a shareholder would pay on fund distributions or on the sale of fund shares.
| Fiscal-Year Total Returns (%): January 31, 2008, Through July 31, 2018 | ||||
| Bloomberg | ||||
| Barclays | ||||
| 1–5 Year | ||||
| Credit | ||||
| Investor Shares | Index | |||
| Fiscal Year | Income Returns | Capital Returns | Total Returns | Total Returns |
| 2009 | 4.48% | -8.83% | -4.35% | -1.17% |
| 2010 | 4.37 | 9.07 | 13.44 | 12.92 |
| 2011 | 3.39 | 0.99 | 4.38 | 4.78 |
| 2012 | 2.75 | -0.29 | 2.46 | 3.93 |
| 2013 | 2.21 | 1.27 | 3.48 | 3.98 |
| 2014 | 1.82 | -0.36 | 1.46 | 1.78 |
| 2015 | 1.88 | 0.15 | 2.03 | 2.36 |
| 2016 | 1.96 | -1.19 | 0.77 | 0.62 |
| 2017 | 1.95 | 0.57 | 2.52 | 2.42 |
| 2018 | 2.02 | -0.73 | 1.29 | 1.50 |
| 2019 | 1.28 | -1.14 | 0.14 | 0.21 |
| Note: For 2019, performance data reflect the six months ended July 31, 2018. | ||||
Average Annual Total Returns: Periods Ended June 30, 2018
This table presents returns through the latest calendar quarter—rather than through the end of the fiscal period.
Securities and Exchange Commission rules require that we provide this information.
| Ten Years | ||||||
| Inception Date | One Year | Five Years | Income | Capital | Total | |
| Investor Shares | 10/29/1982 | 0.12% | 1.73% | 2.60% | 0.11% | 2.71% |
| Admiral Shares | 2/12/2001 | 0.22 | 1.83 | 2.70 | 0.11 | 2.81 |
| Institutional Shares | 9/30/1997 | 0.25 | 1.86 | 2.74 | 0.11 | 2.85 |
See Financial Highlights for dividend and capital gains information.
14
Short-Term Investment-Grade Fund
Financial Statements (unaudited)
Statement of Net Assets—Investments Summary
As of July 31, 2018
This Statement summarizes the fund’s holdings by asset type. Details are reported for each of the fund’s 50 largest individual holdings and for investments that, in total for any issuer, represent more than 1% of the fund’s net assets. The total value of smaller holdings is reported as a single amount within each category.
The fund reports a complete list of its holdings in regulatory filings four times in each fiscal year, at the quarter-ends. For the second and fourth fiscal quarters, the complete listing of the fund’s holdings is available electronically on vanguard.com and on the Securities and Exchange Commission’s website (sec.gov), or you can have it mailed to you without charge by calling 800-662-7447. For the first and third fiscal quarters, the fund files the lists with the SEC on Form N-Q. Shareholders can look up the fund’s Forms N-Q on the SEC’s website. Forms N-Q may also be reviewed and copied at the SEC’s Public Reference Room (see the back cover of this report for further information).
| Face | Market | Percentage | |||||
| Maturity | Amount | Value • | of Net | ||||
| Coupon | Date | ($000) | ($000) | Assets | |||
| U. S. Government and Agency Obligations | |||||||
| U.S. Government Securities | |||||||
| 1 | United States Treasury Note/Bond | 2.375% | 4/15/21 | 1,300,000 | 1,287,000 | 2.1% | |
| 2 | United States Treasury Note/Bond | 1.125% | 2/28/21 | 748,000 | 717,960 | 1.2% | |
| United States Treasury Note/Bond | 2.125% | 8/15/21 | 530,000 | 519,898 | 0.9% | ||
| 2 | United States Treasury Note/Bond | 2.250% | 2/15/21 | 500,000 | 493,905 | 0.8% | |
| United States Treasury Note/Bond | 1.125% | 9/30/21 | 517,000 | 491,150 | 0.8% | ||
| United States Treasury Note/Bond | 2.000% | 10/31/21 | 495,000 | 482,932 | 0.8% | ||
| United States Treasury Note/Bond | 1.375% | 5/31/21 | 480,000 | 461,851 | 0.8% | ||
| United States Treasury Note/Bond | 1.875% | 1/31/22 | 466,000 | 451,657 | 0.7% | ||
| 2 | United States Treasury Note/Bond | 2.000% | 8/31/21 | 407,000 | 397,651 | 0.7% | |
| 2 | United States Treasury Note/Bond | 2.750% | 5/31/23 | 300,000 | 298,782 | 0.5% | |
| 2 | United States Treasury Note/Bond | 2.250% | 3/31/21 | 219,000 | 216,127 | 0.3% | |
| 3 | United States Treasury | ||||||
| Note/Bond | 0.875%–2.500% | 1/31/19–3/31/23 | 298,440 | 292,021 | 0.5% | ||
| 6,110,934 | 10.1% | ||||||
| Nonconventional Mortgage-Backed Securities † | 403,842 | 0.7% | |||||
| Total U.S. Government and Agency Obligations (Cost $6,535,618) | 6,514,776 | 10.8% | |||||
| Asset-Backed/Commercial Mortgage-Backed Securities | |||||||
| 4 | AmeriCredit Automobile | ||||||
| Receivables Trust 2014-1 | 2.150% | 3/9/20 | 424 | 423 | 0.0% | ||
| 4 | AmeriCredit Automobile | ||||||
| Receivables Trust 2014-2 | 2.180% | 6/8/20 | 3,143 | 3,141 | 0.0% | ||
| 4 | AmeriCredit Automobile | ||||||
| Receivables Trust | |||||||
| 2015-3 | 2.080%–3.340% | 9/8/20–8/8/21 | 14,768 | 14,775 | 0.0% | ||
15
| Short-Term Investment-Grade Fund | |||||||
| Face | Market | Percentage | |||||
| Maturity | Amount | Value • | of Net | ||||
| Coupon | Date | ($000) | ($000) | Assets | |||
| 4 | AmeriCredit Automobile | ||||||
| Receivables Trust | |||||||
| 2016-1 | 1.810%–3.590% | 10/8/20–2/8/22 | 11,652 | 11,672 | 0.0% | ||
| 4 | AmeriCredit Automobile | ||||||
| Receivables Trust 2016-2 | 3.650% | 5/9/22 | 9,390 | 9,438 | 0.0% | ||
| 4 | AmeriCredit Automobile | ||||||
| Receivables Trust 2016-3 | 2.710% | 9/8/22 | 10,170 | 9,987 | 0.0% | ||
| 4 | AmeriCredit Automobile | ||||||
| Receivables Trust 2016-4 | 2.410% | 7/8/22 | 25,630 | 25,202 | 0.0% | ||
| 4 | AmeriCredit Automobile | ||||||
| Receivables Trust 2017-3 | 1.690% | 12/18/20 | 47,602 | 47,439 | 0.1% | ||
| 4 | Banc of America | ||||||
| Commercial Mortgage | |||||||
| Trust 2015-UBS7 | 3.429%–4.362% | 9/15/48 | 16,700 | 16,689 | 0.0% | ||
| 4 | Banc of America | ||||||
| Commercial Mortgage | |||||||
| Trust 2017-BNK3 | 3.574% | 2/15/50 | 4,760 | 4,686 | 0.0% | ||
| 4 | Banc of America Funding | ||||||
| 2006-H Trust | 3.864% | 9/20/46 | 10,514 | 9,974 | 0.0% | ||
| 4 | Bank of America Mortgage | ||||||
| 2002-J Trust | 4.259% | 9/25/32 | 17 | 17 | 0.0% | ||
| 4,5 | Chrysler Capital Auto | ||||||
| Receivables Trust 2014-BA | 3.440% | 8/16/21 | 700 | 701 | 0.0% | ||
| 4,5 | Chrysler Capital Auto | ||||||
| Receivables Trust | |||||||
| 2015-BA | 2.260%–4.170% | 10/15/20–1/16/23 | 46,064 | 46,214 | 0.1% | ||
| 4,5 | Chrysler Capital Auto | ||||||
| Receivables Trust | |||||||
| 2016-AA | 2.880%–4.220% | 6/15/22–2/15/23 | 31,070 | 31,360 | 0.1% | ||
| 4,5 | Chrysler Capital Auto | ||||||
| Receivables Trust | |||||||
| 2016-BA | 1.640%–1.870% | 7/15/21–2/15/22 | 15,433 | 15,273 | 0.0% | ||
| 4 | Citibank Credit Card | ||||||
| Issuance Trust 2018-A1 | 2.490% | 1/20/23 | 107,425 | 105,993 | 0.2% | ||
| 4 | Citigroup Mortgage Loan | ||||||
| Trust 2007-AR8 | 4.096% | 7/25/37 | 681 | 666 | 0.0% | ||
| 4 | COMM 2012-CCRE2 | ||||||
| Mortgage Trust | 3.147%–3.791% | 8/15/45 | 7,025 | 6,982 | 0.0% | ||
| 4,5 | COMM 2012-CCRE3 | ||||||
| Mortgage Trust | 2.822%–3.416% | 10/15/45 | 35,512 | 34,825 | 0.1% | ||
| 4 | COMM 2012-CCRE4 | ||||||
| Mortgage Trust | 2.853%–3.251% | 10/15/45 | 12,961 | 12,609 | 0.0% | ||
| 4 | COMM 2012-CCRE5 | ||||||
| Mortgage Trust | 2.771% | 12/10/45 | 2,640 | 2,573 | 0.0% | ||
| 4 | COMM 2013-CCRE10 | ||||||
| Mortgage Trust | 2.972%–3.795% | 8/10/46 | 16,560 | 16,616 | 0.0% | ||
| 4 | COMM 2013-CCRE11 | ||||||
| Mortgage Trust | 3.983%–4.258% | 8/10/50 | 57,295 | 59,063 | 0.1% | ||
| 4 | COMM 2013-CCRE12 | ||||||
| Mortgage Trust | 3.623%–4.046% | 10/10/46 | 64,091 | 65,283 | 0.1% | ||
| 4 | COMM 2013-CCRE13 | ||||||
| Mortgage Trust | 4.194%–4.738% | 11/10/46 | 39,717 | 40,824 | 0.1% | ||
| 16 | |||||||
| Short-Term Investment-Grade Fund | ||||||
| Face | Market | Percentage | ||||
| Maturity | Amount | Value • | of Net | |||
| Coupon | Date | ($000) | ($000) | Assets | ||
| 4,5 | COMM 2013-CCRE6 | |||||
| Mortgage Trust | 3.147%–3.397% | 3/10/46 | 19,740 | 19,145 | 0.0% | |
| 4 | COMM 2013-CCRE8 | |||||
| Mortgage Trust | 3.334%–3.612% | 6/10/46 | 43,309 | 43,572 | 0.1% | |
| 4,5 | COMM 2013-CCRE9 | |||||
| Mortgage Trust | 4.239%–4.263% | 7/10/45 | 36,609 | 37,281 | 0.1% | |
| 4,5 | COMM 2013-LC13 | |||||
| Mortgage Trust | 3.009%–4.557% | 8/10/46 | 47,337 | 48,462 | 0.1% | |
| 4 | COMM 2013-LC6 | |||||
| Mortgage Trust | 2.941% | 1/10/46 | 4,100 | 4,019 | 0.0% | |
| 4,5 | COMM 2013-SFS | |||||
| Mortgage Trust | 2.987% | 4/12/35 | 5,490 | 5,342 | 0.0% | |
| 4,5 | COMM 2014-277P | |||||
| Mortgage Trust | 3.611% | 8/10/49 | 33,245 | 33,192 | 0.1% | |
| 4 | COMM 2014-CCRE14 | |||||
| Mortgage Trust | 3.955%–4.236% | 2/10/47 | 19,605 | 20,248 | 0.0% | |
| 4 | COMM 2014-CCRE15 | |||||
| Mortgage Trust | 2.928%–4.426% | 2/10/47 | 47,569 | 48,403 | 0.1% | |
| 4 | COMM 2014-CCRE17 | |||||
| Mortgage Trust | 3.700%–4.738% | 5/10/47 | 86,756 | 88,092 | 0.2% | |
| 4 | COMM 2014-CCRE18 | |||||
| Mortgage Trust | 3.550%–3.828% | 7/15/47 | 38,124 | 38,488 | 0.1% | |
| 4 | COMM 2014-CCRE20 | |||||
| Mortgage Trust | 3.326%–3.590% | 11/10/47 | 38,105 | 38,028 | 0.1% | |
| 4 | COMM 2014-CCRE21 | |||||
| Mortgage Trust | 3.528% | 12/10/47 | 36,723 | 36,543 | 0.1% | |
| 4 | COMM 2014-LC17 | |||||
| Mortgage Trust | 3.917% | 10/10/47 | 11,570 | 11,772 | 0.0% | |
| 4 | COMM 2015-CCRE22 | |||||
| Mortgage Trust | 3.309% | 3/10/48 | 36,015 | 35,334 | 0.1% | |
| 4 | COMM 2015-CCRE24 | |||||
| Mortgage Trust | 3.696% | 8/10/48 | 11,345 | 11,356 | 0.0% | |
| 4 | COMM 2015-CCRE25 | |||||
| Mortgage Trust | 3.759% | 8/10/48 | 38,840 | 39,003 | 0.1% | |
| 4 | COMM 2015-CCRE26 | |||||
| Mortgage Trust | 3.630% | 10/10/48 | 22,007 | 21,871 | 0.0% | |
| 4 | COMM 2015-CCRE27 | |||||
| Mortgage Trust | 3.612%–4.472% | 10/10/48 | 20,092 | 19,903 | 0.0% | |
| 4 | COMM 2015-LC19 | |||||
| Mortgage Trust | 3.183% | 2/10/48 | 9,930 | 9,691 | 0.0% | |
| 4,5 | Drive Auto Receivables | |||||
| Trust 2015-AA | 3.060%–4.120% | 5/17/21–7/15/22 | 7,497 | 7,549 | 0.0% | |
| 4,5 | Drive Auto Receivables | |||||
| Trust 2015-BA | 2.760%–3.840% | 7/15/21 | 11,106 | 11,164 | 0.0% | |
| 4,5 | Drive Auto Receivables | |||||
| Trust 2015-CA | 3.010%–4.200% | 5/17/21–9/15/21 | 17,390 | 17,516 | 0.0% | |
| 4,5 | Drive Auto Receivables | |||||
| Trust 2015-DA | 3.380%–4.590% | 11/15/21–1/17/23 | 33,844 | 34,216 | 0.1% | |
| 4,5 | Drive Auto Receivables | |||||
| Trust 2016-AA | 3.910% | 5/17/21 | 4,315 | 4,332 | 0.0% | |
| 4,5 | Drive Auto Receivables | |||||
| Trust 2016-BA | 4.530% | 8/15/23 | 22,190 | 22,542 | 0.0% | |
| 17 | ||||||
| Short-Term Investment-Grade Fund | |||||||
| Face | Market | Percentage | |||||
| Maturity | Amount | Value • | of Net | ||||
| Coupon | Date | ($000) | ($000) | Assets | |||
| 4,5 | Drive Auto Receivables | ||||||
| Trust 2016-C | 2.370%–4.180% | 11/16/20–3/15/24 | 28,954 | 29,208 | 0.1% | ||
| 4 | Drive Auto Receivables | ||||||
| Trust 2017-1 | 3.840% | 3/15/23 | 2,400 | 2,415 | 0.0% | ||
| 4 | Drive Auto Receivables | ||||||
| Trust 2017-3 | 2.300%–2.800% | 5/17/21–7/15/22 | 46,220 | 46,077 | 0.1% | ||
| 4 | Drive Auto Receivables | ||||||
| Trust 2018-2 | 3.220%–4.140% | 4/15/22–8/15/24 | 68,550 | 68,591 | 0.1% | ||
| 4 | Drive Auto Receivables | ||||||
| Trust 2018-3 | 3.370%–4.300% | 9/15/22–9/16/24 | 77,380 | 77,388 | 0.1% | ||
| 4,5,6 GMF Floorplan Owner | |||||||
| Revolving Trust 2016-1 | 2.410%–2.923% | 5/17/21 | 42,185 | 42,113 | 0.1% | ||
| 4,5,6 GMF Floorplan Owner | |||||||
| Revolving Trust 2017-1 | 2.643% | 1/18/22 | 330 | 331 | 0.0% | ||
| 4,5 | GMF Floorplan Owner | ||||||
| Revolving Trust 2017-2 | 2.130%–2.630% | 7/15/22 | 81,380 | 79,662 | 0.1% | ||
| 4,5 | GMF Floorplan Owner | ||||||
| Revolving Trust 2018-2 | 3.130% | 3/15/23 | 53,560 | 53,397 | 0.1% | ||
| 4,5 | GS Mortgage Securities | ||||||
| Corporation II 2012-BWTR | 2.954% | 11/5/34 | 36,047 | 34,895 | 0.1% | ||
| 4 | GS Mortgage Securities | ||||||
| Corporation II 2015-GC30 | 3.382% | 5/10/50 | 12,225 | 12,025 | 0.0% | ||
| 4,5 | GS Mortgage Securities | ||||||
| Corporation Trust | |||||||
| 2012-ALOHA | 3.551% | 4/10/34 | 32,716 | 32,852 | 0.1% | ||
| 4,5 | GS Mortgage Securities | ||||||
| Trust 2010-C2 | 5.182% | 12/10/43 | 3,530 | 3,636 | 0.0% | ||
| 4,5 | GS Mortgage Securities | ||||||
| Trust 2011-GC3 | 5.638% | 3/10/44 | 2,280 | 2,366 | 0.0% | ||
| 4,5 | GS Mortgage Securities | ||||||
| Trust 2012-GC6 | 4.948% | 1/10/45 | 1,000 | 1,037 | 0.0% | ||
| 4 | GS Mortgage Securities | ||||||
| Trust 2012-GCJ7 | 5.668% | 5/10/45 | 7,150 | 7,362 | 0.0% | ||
| 4,5 | GS Mortgage Securities | ||||||
| Trust 2013-GC13 | 4.048%–4.081% | 7/10/46 | 28,584 | 29,121 | 0.1% | ||
| 4 | GS Mortgage Securities | ||||||
| Trust 2013-GCJ12 | 3.135%–3.777% | 6/10/46 | 21,310 | 21,013 | 0.0% | ||
| 4 | GS Mortgage Securities | ||||||
| Trust 2013-GCJ14 | 2.995%–4.243% | 8/10/46 | 80,544 | 82,592 | 0.1% | ||
| 4 | GS Mortgage Securities | ||||||
| Trust 2014-GC20 | 3.998%–4.258% | 4/10/47 | 42,753 | 43,631 | 0.1% | ||
| 4 | GS Mortgage Securities | ||||||
| Trust 2014-GC24 | 3.931%–4.529% | 9/10/47 | 86,227 | 86,886 | 0.1% | ||
| 4 | GS Mortgage Securities | ||||||
| Trust 2014-GC26 | 3.364%–3.629% | 11/10/47 | 66,660 | 66,254 | 0.1% | ||
| 4 | GS Mortgage Securities | ||||||
| Trust 2015-GC28 | 3.136%–3.396% | 2/10/48 | 79,805 | 78,004 | 0.1% | ||
| 4 | GS Mortgage Securities | ||||||
| Trust 2015-GC32 | 3.764% | 7/10/48 | 4,636 | 4,668 | 0.0% | ||
| 4 | GS Mortgage Securities | ||||||
| Trust 2015-GC34 | 3.506%–4.653% | 10/10/48 | 38,812 | 38,455 | 0.1% | ||
| 4 | GS Mortgage Securities | ||||||
| Trust 2016-GS3 | 2.850% | 10/10/49 | 9,660 | 9,063 | 0.0% | ||
| 18 | |||||||
| Short-Term Investment-Grade Fund | |||||||
| Face | Market | Percentage | |||||
| Maturity | Amount | Value • | of Net | ||||
| Coupon | Date | ($000) | ($000) | Assets | |||
| 4 | GS Mortgage Securities | ||||||
| Trust 2018-GS10 | 4.155% | 7/10/51 | 36,220 | 37,094 | 0.1% | ||
| 4 | GS Mortgage Securities | ||||||
| Trust 2018-GS9 | 3.992% | 3/10/51 | 4,990 | 5,048 | 0.0% | ||
| 4,5,7 Holmes Master Issuer plc | |||||||
| 2018-1 | 2.699% | 10/15/54 | 33,040 | 33,009 | 0.1% | ||
| 4,5 | JP Morgan Chase Commercial | ||||||
| Mortgage Securities | |||||||
| Trust 2009-IWST | 5.633% | 12/5/27 | 6,185 | 6,405 | 0.0% | ||
| 4,5 | JP Morgan Chase Commercial | ||||||
| Mortgage Securities | |||||||
| Trust 2010-C1 | 4.608% | 6/15/43 | 1,288 | 1,319 | 0.0% | ||
| 4,5 | JP Morgan Chase Commercial | ||||||
| Mortgage Securities | |||||||
| Trust 2010-C2 | 4.070%–5.640% | 11/15/43 | 16,526 | 16,765 | 0.0% | ||
| 4,5 | JP Morgan Chase Commercial | ||||||
| Mortgage Securities | |||||||
| Trust 2011-C3 | 4.717% | 2/15/46 | 27,159 | 27,988 | 0.1% | ||
| 4,5 | JP Morgan Chase Commercial | ||||||
| Mortgage Securities | |||||||
| Trust 2011-C5 | 5.405% | 8/15/46 | 4,100 | 4,292 | 0.0% | ||
| 4,5 | JP Morgan Chase Commercial | ||||||
| Mortgage Securities | |||||||
| Trust 2011-RR1 | 4.717% | 3/16/46 | 2,778 | 2,842 | 0.0% | ||
| 4 | JP Morgan Chase Commercial | ||||||
| Mortgage Securities | |||||||
| Trust 2012-C6 | 3.507% | 5/15/45 | 15,645 | 15,679 | 0.0% | ||
| 4,5 | JP Morgan Chase Commercial | ||||||
| Mortgage Securities | |||||||
| Trust 2012-C8 | 2.829%–3.424% | 10/15/45 | 16,592 | 16,253 | 0.0% | ||
| 4 | JP Morgan Chase Commercial | ||||||
| Mortgage Securities | |||||||
| Trust 2012-CIBX | 4.271% | 6/15/45 | 27,000 | 27,476 | 0.1% | ||
| 4,5 | JP Morgan Chase Commercial | ||||||
| Mortgage Securities | |||||||
| Trust 2012-HSBC | 3.093% | 7/5/32 | 5,715 | 5,657 | 0.0% | ||
| 4 | JP Morgan Chase Commercial | ||||||
| Mortgage Securities | |||||||
| Trust 2012-LC9 | 2.840% | 12/15/47 | 40,130 | 39,162 | 0.1% | ||
| 4 | JP Morgan Chase Commercial | ||||||
| Mortgage Securities | |||||||
| Trust 2013-C13 | 3.994%–4.004% | 1/15/46 | 24,500 | 24,680 | 0.0% | ||
| 4 | JP Morgan Chase Commercial | ||||||
| Mortgage Securities | |||||||
| Trust 2013-C16 | 3.674%–5.010% | 12/15/46 | 72,360 | 74,526 | 0.1% | ||
| 4 | JP Morgan Chase Commercial | ||||||
| Mortgage Securities | |||||||
| Trust 2013-LC11 | 2.960% | 4/15/46 | 28,354 | 27,728 | 0.1% | ||
| 4 | JP Morgan Chase Commercial | ||||||
| Mortgage Securities | |||||||
| Trust 2014-C20 | 3.461% | 7/15/47 | 31,250 | 31,393 | 0.1% | ||
| 4 | JP Morgan Chase Commercial | ||||||
| Mortgage Securities | |||||||
| Trust 2016-JP3 | 2.870% | 8/15/49 | 1,330 | 1,249 | 0.0% | ||
| 19 | |||||||
| Short-Term Investment-Grade Fund | |||||||
| Face | Market | Percentage | |||||
| Maturity | Amount | Value • | of Net | ||||
| Coupon | Date | ($000) | ($000) | Assets | |||
| 4 JP Morgan Chase Commercial | |||||||
| Mortgage Securities | |||||||
| Trust 2016-JP4 | 3.648% | 12/15/49 | 14,370 | 14,156 | 0.0% | ||
| 4 JP Morgan Chase Commercial | |||||||
| Mortgage Securities | |||||||
| Trust 2017-JP6 | 3.490% | 7/15/50 | 12,517 | 12,238 | 0.0% | ||
| 4 JPMCC Commercial Mortgage | |||||||
| Securities Trust 2017-JP5 | 3.723% | 3/15/50 | 33,410 | 33,081 | 0.1% | ||
| 4 JPMCC Commercial Mortgage | |||||||
| Securities Trust 2017-JP7 | 3.454% | 9/15/50 | 10,675 | 10,401 | 0.0% | ||
| 4 Merrill Lynch Mortgage | |||||||
| Investors Trust MLMI | |||||||
| Series 2003-A2 | 4.001% | 2/25/33 | 956 | 958 | 0.0% | ||
| 4 Merrill Lynch Mortgage | |||||||
| Investors Trust MLMI | |||||||
| Series 2003-A4 | 4.388% | 7/25/33 | 491 | 502 | 0.0% | ||
| 4 Morgan Stanley Bank of | |||||||
| America Merrill Lynch | |||||||
| Trust 2012-C5 | 3.176%–3.792% | 8/15/45 | 23,548 | 23,303 | 0.0% | ||
| 4 Morgan Stanley Bank of | |||||||
| America Merrill Lynch | |||||||
| Trust 2012-C6 | 2.858% | 11/15/45 | 5,796 | 5,675 | 0.0% | ||
| 4 Morgan Stanley Bank of | |||||||
| America Merrill Lynch | |||||||
| Trust 2013-C10 | 4.083% | 7/15/46 | 31,865 | 32,393 | 0.1% | ||
| 4 Morgan Stanley Bank of | |||||||
| America Merrill Lynch | |||||||
| Trust 2013-C11 | 3.085%–4.158% | 8/15/46 | 36,414 | 37,234 | 0.1% | ||
| 4 Morgan Stanley Bank of | |||||||
| America Merrill Lynch | |||||||
| Trust 2013-C12 | 3.824%–4.259% | 10/15/46 | 11,910 | 12,141 | 0.0% | ||
| 4 Morgan Stanley Bank of | |||||||
| America Merrill Lynch | |||||||
| Trust 2013-C13 | 4.039% | 11/15/46 | 8,300 | 8,496 | 0.0% | ||
| 4 Morgan Stanley Bank of | |||||||
| America Merrill Lynch | |||||||
| Trust 2013-C7 | 2.918%–3.214% | 2/15/46 | 9,340 | 9,132 | 0.0% | ||
| 4 Morgan Stanley Bank of | |||||||
| America Merrill Lynch | |||||||
| Trust 2013-C9 | 3.102% | 5/15/46 | 27,425 | 26,888 | 0.0% | ||
| 4 Morgan Stanley Bank of | |||||||
| America Merrill Lynch | |||||||
| Trust 2014-C14 | 4.064%–4.384% | 2/15/47 | 34,100 | 35,045 | 0.1% | ||
| 4 Morgan Stanley Bank of | |||||||
| America Merrill Lynch | |||||||
| Trust 2014-C15 | 3.773%–4.891% | 4/15/47 | 67,415 | 68,421 | 0.1% | ||
| 4 Morgan Stanley Bank of | |||||||
| America Merrill Lynch | |||||||
| Trust 2014-C16 | 3.892%–4.754% | 6/15/47 | 83,605 | 84,443 | 0.1% | ||
| 4 Morgan Stanley Bank of | |||||||
| America Merrill Lynch | |||||||
| Trust 2014-C17 | 3.741%–4.011% | 8/15/47 | 39,638 | 39,762 | 0.1% | ||
| 20 | |||||||
| Short-Term Investment-Grade Fund | ||||||||
| Face | Market | Percentage | ||||||
| Maturity | Amount | Value • | of Net | |||||
| Coupon | Date | ($000) | ($000) | Assets | ||||
| 4 | Morgan Stanley Bank of | |||||||
| America Merrill Lynch | ||||||||
| Trust 2014-C18 | 3.923% | 10/15/47 | 13,400 | 13,572 | 0.0% | |||
| 4 | Morgan Stanley Bank of | |||||||
| America Merrill Lynch | ||||||||
| Trust 2014-C19 | 3.326%–3.526% | 12/15/47 | 40,570 | 40,301 | 0.1% | |||
| 4 | Morgan Stanley Bank of | |||||||
| America Merrill Lynch | ||||||||
| Trust 2015-C20 | 3.069%–3.249% | 2/15/48 | 59,741 | 58,625 | 0.1% | |||
| 4 | Morgan Stanley Bank of | |||||||
| America Merrill Lynch | ||||||||
| Trust 2015-C23 | 3.451%–3.719% | 7/15/50 | 16,058 | 16,001 | 0.0% | |||
| 4 | Morgan Stanley Bank of | |||||||
| America Merrill Lynch | ||||||||
| Trust 2015-C24 | 3.479%–3.732% | 5/15/48 | 48,384 | 48,181 | 0.1% | |||
| 4 | Morgan Stanley Bank of | |||||||
| America Merrill Lynch | ||||||||
| Trust 2015-C25 | 3.635% | 10/15/48 | 7,814 | 7,778 | 0.0% | |||
| 4 | Morgan Stanley Bank of | |||||||
| America Merrill Lynch | ||||||||
| Trust 2016-C29 | 4.751% | 5/15/49 | 2,210 | 2,213 | 0.0% | |||
| 4 | Morgan Stanley Bank of | |||||||
| America Merrill Lynch | ||||||||
| Trust 2016-C32 | 3.720% | 12/15/49 | 28,827 | 28,643 | 0.1% | |||
| 4 | Morgan Stanley Bank of | |||||||
| America Merrill Lynch | ||||||||
| Trust 2017-C34 | 3.536% | 11/15/52 | 19,660 | 19,192 | 0.0% | |||
| 4 | Morgan Stanley Capital I | |||||||
| Trust 2012-C4 | 3.244%–3.773% | 3/15/45 | 18,552 | 18,448 | 0.0% | |||
| 4,5 | Morgan Stanley Capital I | |||||||
| Trust 2012-STAR | 3.201% | 8/5/34 | 17,287 | 17,037 | 0.0% | |||
| 4,5 | Morgan Stanley Capital I | |||||||
| Trust 2014-150E | 3.912% | 9/9/32 | 27,955 | 28,212 | 0.1% | |||
| 4,5 | Morgan Stanley Capital I | |||||||
| Trust 2014-CPT | 3.350% | 7/13/29 | 24,440 | 24,442 | 0.0% | |||
| 4,5 | Morgan Stanley Capital I | |||||||
| Trust 2015-420 | 3.727% | 10/12/50 | 28,871 | 28,576 | 0.1% | |||
| 4 | Morgan Stanley Capital I | |||||||
| Trust 2015-UBS8 | 3.809%–4.589% | 12/15/48 | 51,474 | 51,264 | 0.1% | |||
| 4 | Morgan Stanley Capital I | |||||||
| Trust 2016-UB11 | 2.782% | 8/15/49 | 7,437 | 6,936 | 0.0% | |||
| 4 | Morgan Stanley Capital I | |||||||
| Trust 2016-UBS9 | 3.594% | 3/15/49 | 11,485 | 11,354 | 0.0% | |||
| 4 | Morgan Stanley Capital I | |||||||
| Trust 2017-HR2 | 3.509%–3.587% | 12/15/50 | 12,185 | 11,999 | 0.0% | |||
| 4,5 | MSBAM Commercial | |||||||
| Mortgage Securities | ||||||||
| Trust 2012-CKSV | 3.277% | 10/15/30 | 37,985 | 36,616 | 0.1% | |||
| 4 | Santander Drive Auto | |||||||
| Receivables Trust 2015-3 | 3.490% | 5/17/21 | 14,985 | 15,075 | 0.0% | |||
| 4 | Santander Drive Auto | |||||||
| Receivables Trust 2016-1 | 2.470% | 12/15/20 | 8,840 | 8,838 | 0.0% | |||
| 21 | ||||||||
| Short-Term Investment-Grade Fund | ||||||
| Face | Market | Percentage | ||||
| Maturity | Amount | Value • | of Net | |||
| Coupon | Date | ($000) | ($000) | Assets | ||
| 4 Santander Drive Auto | ||||||
| Receivables Trust | ||||||
| 2016-2 | 2.080%–3.390% | 2/16/21–4/15/22 | 13,645 | 13,614 | 0.0% | |
| 4 Santander Drive Auto | ||||||
| Receivables Trust 2016-3 | 2.460% | 3/15/22 | 33,200 | 32,891 | 0.1% | |
| 4 Santander Drive Auto | ||||||
| Receivables Trust | ||||||
| 2017-3 | 1.870%–2.760% | 6/15/21–12/15/22 | 17,310 | 17,176 | 0.0% | |
| 4 Santander Drive Auto | ||||||
| Receivables Trust | ||||||
| 2018-1 | 2.100%–3.320% | 11/16/20–3/15/24 | 167,111 | 165,553 | 0.3% | |
| 4 Santander Drive Auto | ||||||
| Receivables Trust | ||||||
| 2018-3 | 3.290%–4.070% | 10/17/22–8/15/24 | 65,600 | 65,546 | 0.1% | |
| 4 Wells Fargo Commercial | ||||||
| Mortgage Trust | ||||||
| 2012-LC5 | 2.918%–3.539% | 10/15/45 | 31,402 | 30,830 | 0.1% | |
| 4 Wells Fargo Commercial | ||||||
| Mortgage Trust | ||||||
| 2013-LC12 | 3.928%–4.288% | 7/15/46 | 48,243 | 49,559 | 0.1% | |
| 4 Wells Fargo Commercial | ||||||
| Mortgage Trust | ||||||
| 2014-LC16 | 3.817%–4.458% | 8/15/50 | 69,280 | 69,832 | 0.1% | |
| 4 Wells Fargo Commercial | ||||||
| Mortgage Trust 2014-LC18 | 3.405% | 12/15/47 | 3,285 | 3,237 | 0.0% | |
| 4 Wells Fargo Commercial | ||||||
| Mortgage Trust 2015-C26 | 3.166% | 2/15/48 | 26,570 | 25,797 | 0.0% | |
| 4 Wells Fargo Commercial | ||||||
| Mortgage Trust | ||||||
| 2015-C27 | 3.190%–3.451% | 2/15/48 | 85,975 | 84,393 | 0.1% | |
| 4 Wells Fargo Commercial | ||||||
| Mortgage Trust | ||||||
| 2015-C29 | 3.637%–4.225% | 6/15/48 | 66,613 | 66,169 | 0.1% | |
| 4 Wells Fargo Commercial | ||||||
| Mortgage Trust | ||||||
| 2015-C30 | 3.411%–4.497% | 9/15/58 | 71,536 | 71,190 | 0.1% | |
| 4 Wells Fargo Commercial | ||||||
| Mortgage Trust | ||||||
| 2015-LC22 | 3.839%–4.542% | 9/15/58 | 41,706 | 41,716 | 0.1% | |
| 4 Wells Fargo Commercial | ||||||
| Mortgage Trust 2015-SG1 | 3.789% | 9/15/48 | 33,065 | 33,226 | 0.1% | |
| 4 Wells Fargo Commercial | ||||||
| Mortgage Trust 2016-C32 | 3.560% | 1/15/59 | 21,780 | 21,568 | 0.0% | |
| 4 Wells Fargo Commercial | ||||||
| Mortgage Trust | ||||||
| 2016-C37 | 3.525%–3.794% | 12/15/49 | 21,090 | 20,920 | 0.0% | |
| 4 Wells Fargo Commercial | ||||||
| Mortgage Trust 2017-C38 | 3.453% | 7/15/50 | 15,680 | 15,254 | 0.0% | |
| 4 Wells Fargo Commercial | ||||||
| Mortgage Trust | ||||||
| 2017-C39 | 3.157%–3.418% | 9/15/50 | 71,030 | 68,834 | 0.1% | |
| 4 Wells Fargo Commercial | ||||||
| Mortgage Trust 2017-C40 | 3.581% | 10/15/50 | 45,250 | 44,432 | 0.1% | |
| 22 | ||||||
| Short-Term Investment-Grade Fund | |||||||
| Face | Market | Percentage | |||||
| Maturity | Amount | Value • | of Net | ||||
| Coupon | Date | ($000) | ($000) | Assets | |||
| 4 | Wells Fargo Commercial | ||||||
| Mortgage Trust 2017-C41 | 3.472% | 11/15/50 | 39,807 | 38,706 | 0.1% | ||
| 4 | Wells Fargo Commercial | ||||||
| Mortgage Trust 2017-C42 | 3.589% | 12/15/50 | 17,855 | 17,505 | 0.0% | ||
| 4 | Wells Fargo Commercial | ||||||
| Mortgage Trust 2017-RC1 | 3.631% | 1/15/60 | 6,900 | 6,796 | 0.0% | ||
| 4 | Wells Fargo Commercial | ||||||
| Mortgage Trust | |||||||
| 2018-C43 | 4.012%–4.514% | 3/15/51 | 60,983 | 61,358 | 0.1% | ||
| 4,6 | Wells Fargo Dealer | ||||||
| Floorplan Master Note | |||||||
| Trust Series 2015-2 | 2.736% | 1/20/22 | 17,030 | 17,118 | 0.0% | ||
| 5,8 | Asset-Backed/Commercial | ||||||
| Mortgage-Backed Securities—Other † | 8,749,798 | 14.5% | |||||
| Total Asset-Backed/Commercial Mortgage-Backed Securities | |||||||
| (Cost $13,631,940) | 13,431,686 | 22.3% | |||||
| Corporate Bonds | |||||||
| Finance | |||||||
| Banking | |||||||
| American Express Co. | 2.200% | 10/30/20 | 158,870 | 155,354 | 0.3% | ||
| 5 | Banco Santander Chile | 2.500% | 12/15/20 | 82,940 | 80,565 | 0.1% | |
| 4 | Bank of America Corp. | 2.369% | 7/21/21 | 170,765 | 167,855 | 0.3% | |
| 4 | Bank of America Corp. | 2.151%–3.875% | 10/19/20–8/1/25 | 511,333 | 500,836 | 0.8% | |
| Bank of Nova Scotia | 2.228% | 12/11/19 | 249,005 | 246,251 | 0.4% | ||
| 5 | Banque Federative du | ||||||
| Credit Mutuel SA | 3.750% | 7/20/23 | 166,800 | 165,918 | 0.3% | ||
| Citibank NA | 2.850% | 2/12/21 | 262,150 | 258,441 | 0.4% | ||
| Citibank NA | 2.125% | 10/20/20 | 216,530 | 211,138 | 0.4% | ||
| Citibank NA | 2.100% | 6/12/20 | 64,165 | 62,776 | 0.1% | ||
| 4 | Citigroup Inc. | 2.450%–4.044% | 4/8/19– 6/1/24 | 243,126 | 239,804 | 0.4% | |
| Goldman Sachs | |||||||
| Group Inc. | 2.600% | 12/27/20 | 237,295 | 233,710 | 0.4% | ||
| 4,9,10 Goldman Sachs | |||||||
| Group Inc. | 2.300%–5.750% | 1/31/19–9/29/25 | 992,486 | 971,697 | 1.6% | ||
| 4 | HSBC Holdings plc | 3.262% | 3/13/23 | 170,990 | 168,152 | 0.3% | |
| 4,11 | HSBC Holdings plc | 2.175%– 6.000% | 5/25/21–11/22/65 | 416,037 | 435,192 | 0.7% | |
| HSBC USA Inc. | 2.375%–2.750% | 11/13/19–8/7/20 | 119,740 | 118,693 | 0.2% | ||
| 4 | JPMorgan Chase | ||||||
| & Co. | 2.250%–4.250% | 1/23/20–4/23/29 | 850,416 | 835,891 | 1.4% | ||
| Mitsubishi UFJ | |||||||
| Financial Group Inc. | 2.665%–3.777% | 3/1/21–3/2/25 | 398,113 | 392,298 | 0.7% | ||
| 5 | Mitsubishi UFJ Trust | ||||||
| & Banking Corp. | 2.450%–2.650% | 10/16/19–10/19/20 | 71,015 | 70,241 | 0.1% | ||
| Mizuho Bank Ltd. | 2.340% | 12/4/19 | 185,675 | 183,417 | 0.3% | ||
| Morgan Stanley | 2.625% | 11/17/21 | 172,919 | 168,096 | 0.3% | ||
| 7 | Morgan Stanley | 2.450%–5.625% | 2/1/19–5/8/24 | 370,743 | 365,516 | 0.6% | |
| MUFG Americas | |||||||
| Holdings Corp. | 2.250% | 2/10/20 | 29,300 | 28,907 | 0.0% | ||
| 5 | MUFG Bank Ltd. | 2.300%–2.750% | 3/10/19–9/14/20 | 177,043 | 174,170 | 0.3% | |
| MUFG Union Bank NA | 2.250% | 5/6/19 | 24,420 | 24,312 | 0.0% | ||
| Royal Bank of Canada | 2.150% | 10/26/20 | 201,763 | 197,340 | 0.3% | ||
| Santander Holdings | |||||||
| USA Inc. | 3.400%–3.700% | 3/28/22–1/18/23 | 113,560 | 111,522 | 0.2% | ||
| 23 | |||||||
| Short-Term Investment-Grade Fund | |||||||
| Face | Market | Percentage | |||||
| Maturity | Amount | Value • | of Net | ||||
| Coupon | Date | ($000) | ($000) | Assets | |||
| Santander UK plc | 2.000%–2.500% | 8/24/18–9/10/19 | 96,810 | 96,235 | 0.2% | ||
| Toronto-Dominion Bank | 3.250% | 6/11/21 | 205,925 | 205,814 | 0.3% | ||
| Toronto-Dominion Bank | 1.900% | 10/24/19 | 182,690 | 180,512 | 0.3% | ||
| 5 | UBS AG | 2.450% | 12/1/20 | 167,065 | 163,191 | 0.3% | |
| 9,10 Wells Fargo & Co. | 2.100%–3.285% | 7/22/20–7/22/22 | 155,480 | 145,249 | 0.2% | ||
| Wells Fargo Bank NA | 2.400% | 1/15/20 | 303,485 | 300,411 | 0.5% | ||
| 4 | Wells Fargo Bank NA | 3.325% | 7/23/21 | 246,740 | 246,819 | 0.4% | |
| 5,8 | Banking—Other † | 5,744,626 | 9.5% | ||||
| 8 | Brokerage † | 106,739 | 0.2% | ||||
| Finance Companies | |||||||
| GE Capital International | |||||||
| Funding Co. Unlimited Co. | 2.342% | 11/15/20 | 240,208 | 235,156 | 0.4% | ||
| GE Capital International | |||||||
| Funding Co. Unlimited Co. | 4.418% | 11/15/35 | 38,095 | 37,039 | 0.1% | ||
| 5 | Finance Companies—Other † | 14,025 | 0.0% | ||||
| Insurance | |||||||
| 5 | Principal Life Global Funding II | 2.204% | 12/11/19 | 216,925 | 214,055 | 0.3% | |
| 5 | Insurance—Other † | 1,150,803 | 1.9% | ||||
| 5 | Real Estate Investment Trusts † | 648,922 | 1.1% | ||||
| 16,057,688 | 26.6% | ||||||
| Industrial | |||||||
| 5 | Basic Industry † | 441,253 | 0.7% | ||||
| Capital Goods | |||||||
| 4 | General Electric Co. | 5.000% | 12/31/49 | 435,969 | 428,339 | 0.7% | |
| 12 | General Electric Co. | 2.125%– 6.000% | 8/7/19–3/11/44 | 390,808 | 401,430 | 0.7% | |
| 5 | General Electric Co. / | ||||||
| LJ VP Holdings LLC | 3.800% | 6/18/19 | 15,205 | 15,301 | 0.0% | ||
| 5 | Capital Goods—Other † | 673,757 | 1.1% | ||||
| Communication | |||||||
| Verizon Communications Inc. | 3.125% | 3/16/22 | 154,084 | 152,297 | 0.2% | ||
| 5 | Communication—Other † | 1,133,728 | 1.9% | ||||
| Consumer Cyclical | |||||||
| General Motors Co. | 3.500%–4.875% | 10/2/18–10/2/23 | 56,419 | 56,958 | 0.1% | ||
| General Motors Financial | |||||||
| Co. Inc. | 2.400%–4.375% | 1/15/19–4/9/25 | 320,226 | 316,884 | 0.5% | ||
| 5 | Consumer Cyclical—Other † | 1,326,890 | 2.2% | ||||
| Consumer Noncyclical | |||||||
| Anheuser-Busch InBev | |||||||
| Finance Inc. | 2.650% | 2/1/21 | 347,656 | 342,945 | 0.6% | ||
| Campbell Soup Co. | 3.650% | 3/15/23 | 156,650 | 153,332 | 0.3% | ||
| CVS Health Corp. | 3.700% | 3/9/23 | 272,905 | 270,643 | 0.4% | ||
| CVS Health Corp. | 3.350% | 3/9/21 | 161,200 | 160,961 | 0.3% | ||
| 5 | Consumer Noncyclical—Other † | 1,817,840 | 3.0% | ||||
| Energy | |||||||
| Baker Hughes a GE Co. LLC / | |||||||
| Baker Hughes Co-Obligor Inc. | 2.773% | 12/15/22 | 158,124 | 153,352 | 0.3% | ||
| BP Capital Markets plc | 4.500% | 10/1/20 | 147,790 | 151,837 | 0.2% | ||
| BP Capital Markets plc | 1.676%–4.750% | 9/26/18–11/28/23 | 481,121 | 480,473 | 0.8% | ||
| 5 | Energy—Other † | 2,024,654 | 3.4% | ||||
| 5 | Other Industrial † | 344,942 | 0.6% | ||||
| 5 | Technology † | 1,915,279 | 3.2% | ||||
| 5 | Transportation † | 735,138 | 1.2% | ||||
| 13,498,233 | 22.4% | ||||||
| 24 | |||||||
| Short-Term Investment-Grade Fund | ||||||
| Face | Market | Percentage | ||||
| Maturity | Amount | Value • | of Net | |||
| Coupon | Date | ($000) | ($000) | Assets | ||
| Utilities | ||||||
| Electric | ||||||
| 5,7 | Dominion Energy Inc. | 2.700% | 12/1/20 | 195,160 | 195,016 | 0.3% |
| 7 | Florida Power & Light Co. | 2.643% | 11/6/20 | 162,660 | 162,696 | 0.3% |
| 5 | Electric—Other † | 1,921,295 | 3.2% | |||
| 5 | Natural Gas † | 189,643 | 0.3% | |||
| Other Utility † | 20,011 | 0.0% | ||||
| 2,488,661 | 4.1% | |||||
| Total Corporate Bonds (Cost $32,591,114) | 32,044,582 | 53.1% | ||||
| Sovereign Bonds | ||||||
| 5,12 Kingdom of Spain | 2.700% | 10/31/48 | 143,043 | 174,755 | 0.3% | |
| Petroleos Mexicanos | 8.000% | 5/3/19 | 198,437 | 204,872 | 0.3% | |
| Petroleos Mexicanos | 5.500% | 1/21/21 | 186,634 | 191,791 | 0.3% | |
| Petroleos Mexicanos | 6.000%– 6.875% | 3/5/20–3/13/27 | 60,490 | 63,020 | 0.1% | |
| Republic of Colombia | 7.375% | 3/18/19 | 244,945 | 251,899 | 0.4% | |
| Republic of Lithuania | 7.375% | 2/11/20 | 144,433 | 153,810 | 0.3% | |
| Republic of Turkey | 7.000% | 6/5/20 | 163,783 | 166,444 | 0.3% | |
| 13 | United Mexican States | 8.000% | 12/7/23 | 5,170,001 | 280,449 | 0.5% |
| 13 | United Mexican States | 10.000% | 12/5/24 | 326,000 | 19,441 | 0.0% |
| 5 | Sovereign Bonds—Other † | 3,839,995 | 6.4% | |||
| Total Sovereign Bonds (Cost $5,404,285) | 5,346,476 | 8.9% | ||||
| Taxable Municipal Bonds (Cost $74,664) † | 74,644 | 0.1% | ||||
| Tax-Exempt Municipal Bonds (Cost $10,000) † | 10,000 | 0.0% | ||||
| 8Convertible Preferred Stocks (Cost $28,923) † | — | 0.0% | ||||
| Shares | ||||||
| Temporary Cash Investments | ||||||
| Money Market Fund | ||||||
| 14 | Vanguard Market Liquidity Fund | 2.145% | 12,376,473 | 1,237,647 | 2.1% | |
| Face | ||||||
| Amount | ||||||
| ($000) | ||||||
| Certificates of Deposit | ||||||
| Cooperatieve Rabobank UA | 1.980% | 10/25/19 | 248,845 | 245,759 | 0.4% | |
| Commercial Paper | ||||||
| 15 | KFW | 2.103% | 1/17/19 | 243,830 | 241,084 | 0.4% |
| 15 | KFW | 2.098% | 1/18/19 | 97,545 | 96,441 | 0.2% |
| 15 | KFW | 2.103% | 1/22/19 | 292,550 | 289,159 | 0.5% |
| 15 | JP Morgan Securities LLC | 2.344% | 1/28/19 | 216,030 | 213,297 | 0.3% |
| 5,15 Commercial Paper—Other † | 326,739 | 0.5% | ||||
| 1,166,720 | 1.9% | |||||
| Total Temporary Cash Investments (Cost $2,654,929) | 2,650,126 | 4.4% | ||||
| 25 | ||||||
| Short-Term Investment-Grade Fund | ||||||
| Notional | ||||||
| Amount on | ||||||
| Underlying | Market | Percentage | ||||
| Expiration | Exercise | Swap | Value • | of Net | ||
| Counterparty | Date | Rate | ($000) | ($000) | Assets | |
| Options Purchased | ||||||
| Credit Default Swaptions Purchased | ||||||
| Put Swaptions on | ||||||
| CDX-NA-IG-S30-V1 | ||||||
| 5-Year Index | JPMC | 8/15/18 | 65.00% | 322,345 | 58 | 0.0% |
| Put Swaptions on | ||||||
| CDX-NA-IG-S30-V1 | ||||||
| 5-Year Index | DBAG | 8/15/18 | 70.00% | 189,900 | 11 | 0.0% |
| Total Credit Default Swaptions Purchased (Cost $407) | 69 | 0.0% | ||||
| Total Investments (Cost $60,931,880) | 60,072,359 | 99.6% | ||||
| Notional | ||||||
| Expiration | Exercise | Amount | ||||
| Date | Contracts | Price | ($000) | |||
| Liability for Options Written | ||||||
| Written Options on Futures | ||||||
| Call Options on 10-Year | ||||||
| U.S. Treasury Note | ||||||
| Futures Contracts | 8/10/18 | 522 | USD 119.25 | 62,249 | (204) | 0.0% |
| Call Options on 10-Year | ||||||
| U.S. Treasury Note | ||||||
| Futures Contracts | 8/24/18 | 525 | USD 120.00 | 63,000 | (98) | 0.0% |
| Call Options on 10-Year | ||||||
| U.S. Treasury Note | ||||||
| Futures Contracts | 8/27/18 | 1,566 | USD 119.50 | 187,137 | (587) | 0.0% |
| Put Options on 10-Year | ||||||
| U.S. Treasury Note | ||||||
| Futures Contracts | 8/10/18 | 522 | USD 119.25 | 62,249 | (114) | 0.0% |
| Put Options on 10-Year | ||||||
| U.S. Treasury Note | ||||||
| Futures Contracts | 8/24/18 | 525 | USD 120.00 | 63,000 | (402) | 0.0% |
| Put Options on 10-Year | ||||||
| U.S. Treasury Note | ||||||
| Futures Contracts | 8/24/18 | 1,044 | USD 119.00 | 124,236 | (245) | 0.0% |
| Put Options on 10-Year | ||||||
| U.S. Treasury Note | ||||||
| Futures Contracts | 8/27/18 | 522 | USD 119.50 | 62,379 | (237) | 0.0% |
| Total Written Option on Futures (Premiums Received $2,164) | (1,887) | 0.0% | ||||
| 26 | ||||||
| Short-Term Investment-Grade Fund | ||||||
| Notional | ||||||
| Amount on | ||||||
| Underlying | Market | Percentage | ||||
| Expiration | Exercise | Swap | Value • | of Net | ||
| Counterparty | Date | Rate | ($000) | ($000) | Assets | |
| Written Swaptions on Credit Default Index | ||||||
| Call Swaptions on | ||||||
| CDX-NA-IG-S30-V1 | ||||||
| 5-Year Index | DBAG | 8/15/18 | 65.00% | 189,900 | (570) | 0.0% |
| Call Swaptions on | ||||||
| CDX-NA-IG-S30-V1 | ||||||
| 5-Year Index | GSI | 8/15/18 | 67.50% | 129,300 | (524) | 0.0% |
| Put Swaptions on | ||||||
| CDX-NA-HY-S30-V1 | ||||||
| 5-Year Index | DBAG | 8/15/18 | 65.00% | 189,900 | (34) | 0.0% |
| Put Swaptions on | ||||||
| CDX-NA-HY-S30-V1 | ||||||
| 5-Year Index | GSI | 8/15/18 | 72.50% | 129,300 | (3) | 0.0% |
| Put Swaptions on | ||||||
| CDX-NA-IG-S30-V1 | ||||||
| 5-Year Index | JPMC | 9/19/18 | 75.00% | 322,345 | (105) | 0.0% |
| Total Written Swaptions on Credit Default Index (Premiums Received $1,191) | (1,236) | 0.0% | ||||
| Total Liability for Options Written (Premiums Received $3,355) | (3,123) | 0.0% | ||||
27
| Short-Term Investment-Grade Fund | ||
| Percentage | ||
| Amount | of Net | |
| ($000) | Assets | |
| Other Assets and Other Liabilities | ||
| Other Assets | ||
| Investment in Vanguard | 3,207 | |
| Receivables for Investment Securities Sold | 234,053 | |
| Receivables for Accrued Income | 377,617 | |
| Receivables for Capital Shares Issued | 112,164 | |
| Variation Margin Receivable—Futures Contracts | 4,166 | |
| Variation Margin Receivable—CC Swap Contracts | 102 | |
| Unrealized Appreciation—Forward Currency Contracts | 1,873 | |
| Unrealized Appreciation—OTC Swap Contracts | 9,497 | |
| Other Assets | 12,346 | |
| Total Other Assets | 755,025 | 1.2% |
| Other Liabilities | ||
| Payables for Investment Securities Purchased | (339,565) | |
| Payables for Capital Shares Redeemed | (80,251) | |
| Payables for Distributions | (22,889) | |
| Payables to Vanguard | (23,210) | |
| Variation Margin Payable—Futures Contracts | (3,021) | |
| Variation Margin Payable—CC Swap Contracts | (463) | |
| Unrealized Depreciation—Forward Currency Contracts | (8,321) | |
| Unrealized Depreciation—OTC Swap Contracts | (12,018) | |
| Other Liabilities | (1,623) | |
| Total Other Liabilities | (491,361) | (0.8%) |
| Net Assets | 60,332,900 | 100.0% |
| At July 31, 2018, net assets consisted of: | |
| Amount | |
| ($000) | |
| Paid-in Capital | 61,610,686 |
| Undistributed Net Investment Income | 29,778 |
| Accumulated Net Realized Losses | (428,205) |
| Unrealized Appreciation (Depreciation) | |
| Investment Securities | (859,183) |
| Futures Contracts | (4,047) |
| Options16 | (106) |
| Swap Contracts | (9,528) |
| Forward Currency Contracts | (6,448) |
| Foreign Currencies | (47) |
| Net Assets | 60,332,900 |
28
Short-Term Investment-Grade Fund
| Amount | |
| ($000) | |
| Investor Shares—Net Assets | |
| Applicable to 814,200,759 outstanding $.001 par value shares of | |
| beneficial interest (unlimited authorization) | 8,511,975 |
| Net Asset Value Per Share—Investor Shares | $10.45 |
| Admiral Shares—Net Assets | |
| Applicable to 3,916,705,276 outstanding $.001 par value shares of | |
| beneficial interest (unlimited authorization) | 40,946,772 |
| Net Asset Value Per Share—Admiral Shares | $10.45 |
| Institutional Shares—Net Assets | |
| Applicable to 1,040,151,675 outstanding $.001 par value shares of | |
| beneficial interest (unlimited authorization) | 10,874,153 |
| Net Asset Value Per Share—Institutional Shares | $10.45 |
• See Note A in Notes to Financial Statements.
† Represents the aggregate value, by category, of securities that are not among the 50 largest holdings and, in total for any issuer,
represent 1% or less of net assets.
1 Securities with a value of $25,848,000 have been segregated as initial margin for open futures contracts.
2 Securities with a value of $15,783,000 have been segregated as collateral for open forward currency contracts and open
over-the-counter swap contracts.
3 Securities with a value of $26,767,000 have been segregated as initial margin for open cleared swap contracts.
4 The average or expected maturity is shorter than the final maturity shown because of the possibility of interim principal payments
and prepayments or the possibility of the issue being called.
5 Certain of the fund’s securities are exempt from registration under Rule 144A of the Securities Act of 1933. Such securities may
be sold in transactions exempt from registration, normally to qualified institutional buyers. At July 31, 2018, the aggregate value
of these securities was $13,435,042,000, representing 22.3% of net assets.
6 Adjustable-rate security based upon 1-month USD LIBOR plus spread.
7 Adjustable-rate security based upon 3-month USD LIBOR plus spread.
8 Security value determined using significant unobservable inputs.
9 Face amount denominated in Australian dollars.
10 Adjustable-rate security based upon 3-month AUD Australian Bank Bill Rate plus spread.
11 Face amount denominated in British pounds.
12 Face amount denominated in euro.
13 Face amount denominated in Mexican peso.
14 Affiliated money market fund available only to Vanguard funds and certain trusts and accounts managed by Vanguard. Rate shown
is the 7-day yield.
15 Security exempt from registration under Section 4(2) of the Securities Act of 1933. Such securities may be sold in transactions
exempt from registration only to dealers in that program or other “accredited investors.” At July 31, 2018, the aggregate value of
these securities was $1,166,720,000, representing 1.9% of net assets.
16 Unrealized appreciation (depreciation) on options on futures contracts is required to be treated as realized gain (loss) for tax
purposes. Unrealized appreciation (depreciation) on open credit default swaptions is generally treated the same for financial
reporting and tax purposes.
CC—centrally cleared.
DBAG—Deutsche Bank AG.
GSI—Goldman Sachs International.
JPMC—JP Morgan Chase Bank.
OTC—over-the-counter.
29
Short-Term Investment-Grade Fund
| Derivative Financial Instruments Outstanding as of Period End | ||||
| Futures Contracts | ||||
| ($000) | ||||
| Value and | ||||
| Number of | Unrealized | |||
| Long (Short) | Notional | Appreciation | ||
| Expiration | Contracts | Amount | (Depreciation) | |
| Long Futures Contracts | ||||
| 5-Year U.S. Treasury Note | September 2018 | 30,260 | 3,423,163 | (10,077) |
| 2-Year U.S. Treasury Note | September 2018 | 343 | 72,502 | (1) |
| (10,078) | ||||
| Short Futures Contracts | ||||
| 10-Year U.S. Treasury Note | September 2018 | (6,044) | (721,786) | 2,844 |
| Ultra 10-Year U.S. Treasury Note | September 2018 | (4,286) | (544,791) | 3,947 |
| Euro-Buxl | September 2018 | (1,272) | (261,192) | (2,003) |
| Euro-Bund | September 2018 | (1,317) | (248,840) | 67 |
| Long Gilt | September 2018 | (628) | (101,124) | 121 |
| 30-Year U.S. Treasury Bond | September 2018 | (644) | (92,072) | 1,262 |
| AUD 3-Year Treasury Bond | September 2018 | (836) | (69,099) | (116) |
| Ultra Long U.S. Treasury Bond | September 2018 | (300) | (47,072) | 86 |
| Euro-Bobl | September 2018 | (286) | (44,015) | (59) |
| AUD 10-Year Treasury Bond | September 2018 | (174) | (16,703) | (118) |
| 6,031 | ||||
| (4,047) | ||||
Unrealized appreciation (depreciation) on open futures contracts, except for AUD 3-Year Treasury Bond and AUD 10-Year Treasury Bond futures contracts, is required to be treated as realized gain (loss) for tax purposes. Unrealized appreciation (depreciation) for AUD 3-Year Treasury Bond and AUD 10-Year Treasury Bond futures contracts are generally treated the same for financial reporting and tax purposes.
| Forward Currency Contracts | ||||||
| Unrealized | ||||||
| Contract | Appreciation | |||||
| Settlement | Contract Amount (000) | (Depreciation) | ||||
| Counterparty | Date | Receive | Deliver | ($000) | ||
| Toronto-Dominion Bank | 8/15/18 | AUD | 272,194 | USD | 201,696 | 548 |
| JPMorgan Chase Bank, N.A. | 8/15/18 | EUR | 14,901 | USD | 17,311 | 134 |
| Deutsche Bank AG | 8/15/18 | EUR | 7,767 | USD | 9,099 | (5) |
| Citibank, N.A. | 8/15/18 | EUR | 6,929 | USD | 8,107 | 5 |
| Deutsche Bank AG | 8/15/18 | EUR | 6,897 | USD | 8,069 | 6 |
30
Short-Term Investment-Grade Fund
| Forward Currency Contracts (continued) | ||||||
| Unrealized | ||||||
| Contract | Appreciation | |||||
| Settlement | Contract Amount (000) | (Depreciation) | ||||
| Counterparty | Date | Receive | Deliver | ($000) | ||
| Citibank, N.A. | 8/15/18 | EUR | 2,787 | USD | 3,271 | (8) |
| Citibank, N.A. | 8/15/18 | USD | 606,383 | EUR | 518,194 | (293) |
| Toronto-Dominion Bank | 8/15/18 | USD | 201,787 | AUD | 272,194 | (559) |
| JPMorgan Chase Bank, N.A. | 8/15/18 | USD | 198,974 | AUD | 269,687 | (1,407) |
| Toronto-Dominion Bank | 8/15/18 | USD | 190,663 | MXN | 3,631,603 | (3,665) |
| Goldman Sachs Bank AG | 8/15/18 | USD | 159,610 | GBP | 120,654 | 1,139 |
| Bank of America, N.A. | 8/15/18 | USD | 51,552 | MXN | 977,867 | (773) |
| Barclays Capital | 8/15/18 | USD | 34,632 | MXN | 667,686 | (1,096) |
| Citibank, N.A. | 8/15/18 | USD | 19,215 | MXN | 367,975 | (476) |
| Goldman Sachs Bank AG | 8/15/18 | USD | 14,326 | AUD | 19,250 | 15 |
| BNP Paribas | 8/15/18 | USD | 11,088 | EUR | 9,454 | 19 |
| Bank of America, N.A. | 8/15/18 | USD | 5,453 | EUR | 4,655 | 3 |
| Goldman Sachs Bank AG | 8/15/18 | USD | 4,839 | AUD | 6,553 | (30) |
| JPMorgan Chase Bank, N.A. | 8/15/18 | USD | 4,155 | EUR | 3,557 | (9) |
| Goldman Sachs Bank AG | 8/15/18 | USD | 2,553 | EUR | 2,177 | 4 |
| (6,448) | ||||||
| AUD—Australian dollar. | ||||||
| EUR—euro. | ||||||
| GBP—British pound. | ||||||
| MXN—Mexican peso. | ||||||
| USD—U.S. dollar. | ||||||
Unrealized appreciation (depreciation) on open forward currency contracts is treated as ordinary income for tax purposes.
| Centrally Cleared Credit Default Swaps | |||||
| Periodic | |||||
| Premium | Unrealized | ||||
| Received | Appreciation | ||||
| Termination | Notional Amount | (Paid)1 | Value | (Depreciation) | |
| Reference Entity | Date | (000) | (%) | ($000) | ($000) |
| Credit Protection Sold | |||||
| CDX-NA-IG-S30-V1 | 6/20/23 | USD 154,928 | 1.000 | 2,928 | 286 |
| Credit Protection Purchased | |||||
| iTraxx Europe-S29-V1 | 6/20/23 | EUR 150,000 | (1.000) | (3,313) | (313) |
| (385) | (27) | ||||
| 1 Periodic premium received/paid quarterly. | |||||
| EUR—euro. | |||||
| USD—U.S. dollar. | |||||
31
| Short-Term Investment-Grade Fund | |||||||
| Over-the-Counter Credit Default Swaps | |||||||
| Remaining | |||||||
| Periodic | Up-Front | ||||||
| Premium | Premium | Unrealized | |||||
| Notional | Received | Received | Appreciation | ||||
| Termination | Amount | (Paid)2 | Value | (Paid) | (Depreciation) | ||
| Reference Entity | Date | Counterparty | ($000) | (%) | ($000) | ($000) | ($000) |
| Credit Protection Sold/Moody’s Rating | |||||||
| Anheuser-Busch | |||||||
| InBev NV/A3 | 12/20/23 | BARC | 36,9001 | 1.000 | 730 | (955) | (225) |
| Anheuser-Busch | |||||||
| InBev NV/A3 | 12/20/23 | BARC | 13,9001 | 1.000 | 275 | (338) | (63) |
| Anheuser-Busch | |||||||
| InBev NV/A3 | 12/20/23 | BARC | 12,3001 | 1.000 | 243 | (231) | 12 |
| Anheuser-Busch | |||||||
| InBev NV/A3 | 12/20/23 | GSI | 12,3001 | 1.000 | 243 | (271) | (28) |
| Berkshire Hathaway | |||||||
| Inc./Aa2 | 6/20/21 | GSI | 6,675 | 1.000 | 125 | (30) | 95 |
| Berkshire Hathaway | |||||||
| Inc./Aa2 | 6/20/21 | JPMC | 10,030 | 1.000 | 187 | (27) | 160 |
| Berkshire Hathaway | |||||||
| Inc./Aa2 | 12/20/21 | GSI | 14,650 | 1.000 | 292 | (80) | 212 |
| Berkshire Hathaway | |||||||
| Inc./Aa2 | 6/20/22 | BARC | 32,955 | 1.000 | 679 | (438) | 241 |
| Berkshire Hathaway | |||||||
| Inc./Aa2 | 12/20/22 | BARC | 16,580 | 1.000 | 346 | (248) | 98 |
| Federative Republic | |||||||
| of Brazil/Ba2 | 9/20/18 | BNPSW | 19,510 | 1.000 | 10 | (12) | (2) |
| General Electric | |||||||
| Capital Corp./A2 | 12/20/19 | DBAG | 29,290 | 1.000 | 291 | (174) | 117 |
| International Lease | |||||||
| Finance Corp./Baa3 | 6/20/22 | BARC | 22,445 | 1.000 | 226 | (8) | 218 |
| Intesa Sanpaolo | |||||||
| SpA/Baa1 | 6/20/23 | CITNA | 29,0001 | 1.000 | (671) | 618 | (53) |
| Metlife Inc./A3 | 12/20/20 | GSCM | 14,025 | 1.000 | 236 | — | 236 |
| Metlife Inc./A3 | 12/20/21 | BARC | 6,575 | 1.000 | 129 | (8) | 121 |
| Ministry of Finance | |||||||
| Malaysia/A3 | 6/20/23 | BARC | 19,480 | 1.000 | 135 | 26 | 161 |
| Ministry of Finance | |||||||
| Malaysia/A3 | 6/20/23 | CITNA | 9,490 | 1.000 | 66 | 42 | 108 |
| People’s Republic | |||||||
| of China/A3 | 6/20/22 | BNPSW | 26,335 | 1.000 | 515 | (178) | 337 |
| People’s Republic | |||||||
| of China/A3 | 6/20/23 | BARC | 18,811 | 1.000 | 350 | (262) | 88 |
| People’s Republic | |||||||
| of China/A3 | 6/20/23 | GSI | 37,010 | 1.000 | 688 | (597) | 91 |
| Republic of Chile/Aa3 | 6/20/23 | BNPSW | 13,700 | 1.000 | 310 | (304) | 6 |
| 32 | |||||||
| Short-Term Investment-Grade Fund | |||||||
| Over-the-Counter Credit Default Swaps (continued) | |||||||
| Remaining | |||||||
| Periodic | Up-Front | ||||||
| Premium | Premium | Unrealized | |||||
| Notional | Received | Received | Appreciation | ||||
| Termination | Amount | (Paid)2 | Value | (Paid) | (Depreciation) | ||
| Reference Entity | Date | Counterparty | ($000) | (%) | ($000) | ($000) | ($000) |
| Credit Protection Sold/Moody’s Rating | |||||||
| Republic of Chile/Aa3 | 6/20/23 | BOANA | 20,400 | 1.000 | 462 | (443) | 19 |
| Republic of Chile/Aa3 | 6/20/23 | CITNA | 27,580 | 1.000 | 625 | (587) | 38 |
| Republic of Indonesia/ | |||||||
| Baa2 | 6/20/23 | BNPSW | 8,700 | 1.000 | (51) | 10 | (41) |
| Republic of Peru/A3 | 6/20/23 | BNPSW | 4,610 | 1.000 | 43 | (36) | 7 |
| Republic of Peru/A3 | 6/20/23 | HSBCC | 4,610 | 1.000 | 43 | (36) | 7 |
| Southern Co./Baa2 | 6/20/22 | JPMC | 131,955 | 1.000 | 2,477 | (1,719) | 758 |
| Verizon Communications | |||||||
| Inc./Baa1 | 12/20/22 | GSI | 33,580 | 1.000 | 631 | (510) | 121 |
| 9,635 | (6,796) | 2,839 | |||||
| Credit Protection Purchased | |||||||
| Aetna Inc. | 12/20/19 | CSFBI | 19,525 | (1.000) | (261) | 182 | (79) |
| Aetna Inc. | 6/20/20 | GSCM | 19,530 | (1.000) | (345) | 294 | (51) |
| Altria Group Inc. | 12/20/21 | GSI | 73,260 | (1.000) | (1,874) | 1,494 | (380) |
| Altria Group Inc. | 12/20/21 | GSI | 14,650 | (1.000) | (375) | 299 | (76) |
| Altria Group Inc. | 12/20/21 | GSI | 9,770 | (1.000) | (250) | 199 | (51) |
| American International | |||||||
| Group Inc. | 6/20/20 | BOANA | 11,720 | (1.000) | (174) | 83 | (91) |
| American International | |||||||
| Group Inc. | 6/20/20 | BOANA | 11,720 | (1.000) | (174) | 83 | (91) |
| American International | |||||||
| Group Inc. | 12/20/20 | GSCM | 14,025 | (1.000) | (242) | 153 | (89) |
| American International | |||||||
| Group Inc. | 12/20/20 | GSCM | 6,990 | (1.000) | (121) | (52) | (173) |
| Argentine Republic | 6/20/23 | HSBCC | 6,915 | (5.000) | (243) | 153 | (90) |
| Argentine Republic | 6/20/23 | JPMC | 3,410 | (5.000) | (120) | 96 | (24) |
| Autozone Inc. | 12/20/20 | GSCM | 9,760 | (1.000) | (191) | 167 | (24) |
| Banco Bilbao Vizcaya | |||||||
| Argentaria SA | 6/20/21 | BOANA | 24,415 | (1.000) | (389) | (103) | (492) |
| Bank of America Corp. | 3/20/20 | GSCM | 21,610 | (1.000) | (272) | 114 | (158) |
| Bank of China Ltd. | 12/20/21 | BNPSW | 13,100 | (1.000) | (227) | (31) | (258) |
| Bank of China Ltd. | 6/20/22 | BNPSW | 26,335 | (1.000) | (431) | 4 | (427) |
| Bank of China Ltd. | 6/20/23 | BNPSW | 19,485 | (1.000) | (227) | 307 | 80 |
| Barclays Bank plc | 6/20/22 | BOANA | 33,5351 | (1.000) | (789) | 556 | (233) |
| Barclays Bank plc | 6/20/22 | CSFBI | 33,5401 | (1.000) | (790) | 564 | (226) |
| Barclays Bank plc | 12/20/22 | CITNA | 13,3501 | (1.000) | 505 | (488) | 17 |
| 33 | |||||||
| Short-Term Investment-Grade Fund | |||||||
| Over-the-Counter Credit Default Swaps (continued) | |||||||
| Remaining | |||||||
| Periodic | Up-Front | ||||||
| Premium | Premium | Unrealized | |||||
| Notional | Received | Received | Appreciation | ||||
| Termination | Amount | (Paid)2 | Value | (Paid) | (Depreciation) | ||
| Reference Entity | Date | Counterparty | ($000) | (%) | ($000) | ($000) | ($000) |
| Credit Protection Purchased | |||||||
| CECONOMY AG | 6/20/22 | BARC | 23,0901 | (1.000) | (274) | (51) | (325) |
| CECONOMY AG | 6/20/22 | BARC | 16,5201 | (1.000) | (196) | (37) | (233) |
| CECONOMY AG | 6/20/22 | BARC | 16,5201 | (1.000) | (196) | (28) | (224) |
| CECONOMY AG | 6/20/22 | BARC | 6,5901 | (1.000) | (78) | (26) | (104) |
| CECONOMY AG | 6/20/22 | BARC | 6,5901 | (1.000) | (78) | (12) | (90) |
| CECONOMY AG | 6/20/22 | BARC | 6,5901 | (1.000) | (78) | 5 | (73) |
| Commerzbank AG | 6/20/21 | BOANA | 24,410 | (1.000) | (383) | (167) | (550) |
| CVS Health Corp. | 12/20/20 | BOANA | 9,760 | (1.000) | (165) | 165 | — |
| CVS Health Corp. | 12/20/20 | BOANA | 9,760 | (1.000) | (164) | 162 | (2) |
| CVS Health Corp. | 12/20/20 | BOANA | 4,880 | (1.000) | (82) | 61 | (21) |
| CVS Health Corp. | 12/20/20 | BOANA | 4,880 | (1.000) | (82) | 82 | — |
| CVS Health Corp. | 12/20/21 | BARC | 19,535 | (1.000) | (380) | 441 | 61 |
| CVS Health Corp. | 12/20/21 | BARC | 6,620 | (1.000) | (129) | 145 | 16 |
| CVS Health Corp. | 12/20/21 | JPMC | 29,300 | (1.000) | (571) | 577 | 6 |
| Deutsche Bank AG | 12/20/22 | JPMC | 33,535 | (1.000) | 329 | 142 | 471 |
| Dominion Energy Inc. | 12/20/20 | JPMC | 97,580 | (1.000) | (1,941) | 1,591 | (350) |
| Dominion Energy Inc. | 12/20/20 | JPMC | 97,580 | (1.000) | (1,941) | 1,660 | (281) |
| Dominion Energy Inc. | 6/20/22 | JPMC | 16,495 | (1.000) | (420) | 440 | 20 |
| EI du Pont de | |||||||
| Nemours & Co. | 12/20/20 | JPMC | 25,215 | (1.000) | (491) | 294 | (197) |
| Exelon Corp. | 6/20/22 | JPMC | 26,390 | (1.000) | (729) | 676 | (53) |
| Exelon Corp. | 6/20/22 | JPMC | 16,495 | (1.000) | (456) | 427 | (29) |
| Federal Express Corp. | 12/20/18 | GSCM | 21,640 | (1.000) | (84) | 27 | (57) |
| Federative Republic | |||||||
| of Brazil | 12/20/22 | CITNA | 2,521 | (1.000) | 91 | (75) | 16 |
| Federative Republic | |||||||
| of Brazil | 12/20/25 | BOANA | 23,222 | (1.000) | 2,208 | (4,931) | (2,723) |
| Federative Republic | |||||||
| of Brazil | 12/20/25 | GSCM | 10,925 | (1.000) | 1,039 | (2,164) | (1,125) |
| Lincoln National Corp. | 6/20/21 | BARC | 3,340 | (1.000) | (67) | (54) | (121) |
| Lincoln National Corp. | 6/20/21 | BARC | 3,335 | (1.000) | (67) | 53 | (14) |
| Lincoln National Corp. | 12/20/21 | BARC | 6,575 | (1.000) | (131) | (11) | (142) |
| McDonald’s Corp. | 6/20/22 | GSI | 26,675 | (1.000) | (795) | 665 | (130) |
| McKesson Corp. | 3/20/19 | JPMC | 18,210 | (1.000) | (106) | 82 | (24) |
| McKesson Corp. | 3/20/19 | JPMC | 18,210 | (1.000) | (106) | 84 | (22) |
| 34 | |||||||
| Short-Term Investment-Grade Fund | |||||||
| Over-the-Counter Credit Default Swaps (continued) | |||||||
| Remaining | |||||||
| Periodic | Up-Front | ||||||
| Premium | Premium | Unrealized | |||||
| Notional | Received | Received | Appreciation | ||||
| Termination | Amount | (Paid)2 | Value | (Paid) | (Depreciation) | ||
| Reference Entity | Date | Counterparty | ($000) | (%) | ($000) | ($000) | ($000) |
| Credit Protection Purchased | |||||||
| National Westminster | |||||||
| Bank | 12/20/20 | BNPSW | 9,030 | (1.000) | (115) | 37 | (78) |
| NatWest Markets | 12/20/20 | BNPSW | 9,030 | (1.000) | (116) | 37 | (79) |
| Raytheon Co. | 12/20/21 | GSI | 24,420 | (1.000) | (714) | 609 | (105) |
| Raytheon Co. | 12/20/21 | GSI | 24,415 | (1.000) | (715) | 604 | (111) |
| Republic of Korea | 9/20/18 | JPMC | 7,800 | (1.000) | (10) | 2 | (8) |
| Republic of Turkey | 3/20/19 | BNPSW | 19,520 | (1.000) | 124 | 1 | 125 |
| Republic of Turkey | 3/20/19 | BNPSW | 19,515 | (1.000) | 124 | 1 | 125 |
| Republic of Turkey | 12/20/19 | GSCM | 34,740 | (1.000) | 594 | (255) | 339 |
| Republic of Turkey | 12/20/19 | GSCM | 34,100 | (1.000) | 583 | (250) | 333 |
| Republic of Turkey | 6/20/20 | BNPSW | 48,800 | (1.000) | 1,257 | (217) | 1,040 |
| Republic of Turkey | 6/20/20 | BNPSW | 24,385 | (1.000) | 628 | (150) | 478 |
| Republic of Turkey | 6/20/20 | BNPSW | 19,510 | (1.000) | 503 | (51) | 452 |
| Republic of Turkey | 6/20/20 | GSCM | 19,500 | (1.000) | 502 | (65) | 437 |
| Republic of Turkey | 6/20/23 | BNPSW | 27,210 | (1.000) | 2,443 | (1,182) | 1,261 |
| Republic of Turkey | 6/20/23 | GSI | 19,000 | (1.000) | 1,706 | (802) | 904 |
| Sempra Energy | 6/20/22 | JPMC | 26,390 | (1.000) | (681) | 656 | (25) |
| Sempra Energy | 6/20/22 | JPMC | 16,495 | (1.000) | (426) | 421 | (5) |
| Societe Generale SA | 12/20/21 | JPMC | 9,765 | (1.000) | (227) | 41 | (186) |
| Standard Chartered | �� | ||||||
| Bank | 12/20/21 | JPMC | 16,475 | (1.000) | (380) | (26) | (406) |
| State of Qatar | 6/20/22 | BOANA | 1,500 | (1.000) | (22) | (14) | (36) |
| State of Qatar | 6/20/22 | CITNA | 3,450 | (1.000) | (49) | (32) | (81) |
| Telia Company AB | 6/20/23 | BARC | 25,1001 | (1.000) | (864) | 752 | (112) |
| United Mexican | |||||||
| States | 12/20/18 | DBAG | 4,900 | (1.000) | (12) | (2) | (14) |
| UnitedHealth Group | |||||||
| Inc. | 12/20/19 | CSFBI | 19,525 | (1.000) | (257) | 177 | (80) |
| UnitedHealth Group | |||||||
| Inc. | 6/20/20 | CSFBI | 19,530 | (1.000) | (339) | 282 | (57) |
| Walt Disney Co. | 12/20/22 | CITNA | 13,330 | (1.000) | (391) | 349 | (42) |
| Walt Disney Co. | 6/20/23 | CITNA | 19,955 | (1.000) | (593) | 636 | 43 |
| Walt Disney Co. | 6/20/23 | CITNA | 16,630 | (1.000) | (494) | 483 | (11) |
| Walt Disney Co. | 6/20/23 | CITNA | 13,295 | (1.000) | (395) | 417 | 22 |
| 35 | |||||||
| Short-Term Investment-Grade Fund | |||||||
| Over-the-Counter Credit Default Swaps (continued) | |||||||
| Remaining | |||||||
| Periodic | Up-Front | ||||||
| Premium | Premium | Unrealized | |||||
| Notional | Received | Received | Appreciation | ||||
| Termination | Amount | (Paid)2 | Value | (Paid) | (Depreciation) | ||
| Reference Entity | Date | Counterparty | ($000) | (%) | ($000) | ($000) | ($000) |
| Credit Protection Purchased | |||||||
| Walt Disney Co. | 6/20/23 | GSI | 65,940 | (1.000) | (1,957) | 1,881 | (76) |
| Wells Fargo & Co. | 9/20/20 | BOANA | 25,940 | (1.000) | (421) | 230 | (191) |
| (14,227) | 8,867 | (5,360) | |||||
| (4,592) | 2,071 | (2,521) | |||||
The notional amount represents the maximum potential amount the fund could be required to pay as a seller of credit protection if the reference entity was subject to a credit event.
1 Notional amount denominated in euro.
2 Periodic premium received/paid quarterly.
BARC—Barclays Bank plc.
BNPSW—BNP Paribas.
BOANA—Bank of America, N.A.
CITNA—Citibank N.A.
CSFBI—Credit Suisse First Boston International.
DBAG—Deutsche Bank AG.
GSCM—Goldman Sachs Bank USA.
GSI—Goldman Sachs International.
HSBCC—HSBC Bank USA, N.A.
JPMC—JP Morgan Chase Bank.
At July 31, 2018, the counterparties had deposited in segregated accounts securities with a value of $4,540,000 and cash of $2,260,000 in connection with open forward currency contracts and open over-the-counter swap contracts.
36
| Short-Term Investment-Grade Fund | ||||||
| Centrally Cleared Interest Rate Swaps | ||||||
| Fixed | Floating | |||||
| Interest | Interest | |||||
| Rate | Rate | Unrealized | ||||
| Future | Notional | Received | Received | Appreciation | ||
| Effective | Amount | (Paid)2 | (Paid) 3 | Value | (Depreciation) | |
| Termination Date | Date | ($000) | (%) | (%) | ($000) | ($000) |
| 7/16/19 | N/A | 83,000 | 2.088 | (2.339) | (443) | (443) |
| 9/19/19 | 9/19/181 | 191,787 | 2.000 | (0.000) | (1,443) | (110) |
| 11/21/19 | N/A | 130,000 | 1.891 | (2.331) | (1,456) | (1,458) |
| 9/21/20 | 9/19/181 | 37,052 | (2.250) | 0.000 | 494 | 55 |
| 12/18/20 | N/A | 195,160 | 2.117 | (2.335) | (3,610) | (3,612) |
| 12/18/20 | N/A | 97,570 | 2.110 | (2.335) | (1,821) | (1,822) |
| 9/20/21 | 9/19/181 | 66,565 | (2.250) | 0.000 | 1,401 | 128 |
| 9/20/21 | 9/19/181 | 37,111 | (2.920) | 0.000 | 70 | 69 |
| 9/19/22 | 9/19/181 | 263,544 | (2.250) | 0.000 | 7,463 | 592 |
| 9/19/23 | 9/19/181 | 39,431 | 2.250 | (0.000) | (1,394) | (78) |
| 4/30/25 | 9/28/181 | 258,950 | (3.034) | 0.000 | (452) | (454) |
| 9/19/25 | 9/19/181 | 320,068 | (2.250) | 0.000 | 15,837 | 651 |
| 11/16/43 | 9/28/181 | 74,714 | (3.098) | 0.000 | (495) | (498) |
| 14,151 | (6,980) | |||||
1 Forward interest rate swap. In a forward interest rate swap, the fund and the counterparty agree to make periodic net payments
beginning on a specified future effective date.
2 Fixed interest payment received/paid semiannually.
3 Based on 3-month London Interbank Offered Rate (LIBOR) as of the most recent payment date. Floating interest payment received/
paid quarterly
Unrealized appreciation (depreciation) on open swap contracts is generally treated the same for
financial reporting and tax purposes.
See accompanying Notes, which are an integral part of the Financial Statements.
37
Short-Term Investment-Grade Fund
Statement of Operations
| Six Months Ended | |
| July31,2018 | |
| ($000) | |
| Investment Income | |
| Income | |
| Interest1 | 857,428 |
| Total Income | 857,428 |
| Expenses | |
| The Vanguard Group—Note B | |
| Investment Advisory Services | 2,296 |
| Management and Administrative—Investor Shares | 7,540 |
| Management and Administrative—Admiral Shares | 17,297 |
| Management and Administrative—Institutional Shares | 3,272 |
| Marketing and Distribution—Investor Shares | 632 |
| Marketing and Distribution—Admiral Shares | 1,289 |
| Marketing and Distribution—Institutional Shares | 154 |
| Custodian Fees | 374 |
| Shareholders’ Reports—Investor Shares | 113 |
| Shareholders’ Reports—Admiral Shares | 213 |
| Shareholders’ Reports—Institutional Shares | 8 |
| Trustees’ Fees and Expenses | 20 |
| Total Expenses | 33,208 |
| Net Investment Income | 824,220 |
| Realized Net Gain (Loss) | |
| Investment Securities Sold1 | (242,678) |
| Futures Contracts | (49,539) |
| Purchased Options | (1,337) |
| Written Options | 531 |
| Swap Contracts | 1,688 |
| Forward Currency Contracts | 29,395 |
| Foreign Currencies | (4,542) |
| Realized Net Gain (Loss) | (266,482) |
| Change in Unrealized Appreciation (Depreciation) | |
| Investment Securities1 | (449,456) |
| Futures Contracts | 4,860 |
| Purchased Options | (402) |
| Written Options | 3,951 |
| Swap Contracts | 14,214 |
| Forward Currency Contracts | 10,553 |
| Foreign Currencies | (379) |
| Change in Unrealized Appreciation (Depreciation) | (416,659) |
| Net Increase (Decrease) in Net Assets Resulting from Operations | 141,079 |
1 Interest income, realized net gain (loss), and change in unrealized appreciation (depreciation) from an affiliated company of the fund
were $10,492,000, ($23,000), and ($29,000), respectively. Purchases and sales are for temporary cash investment purposes.
See accompanying Notes, which are an integral part of the Financial Statements.
38
Short-Term Investment-Grade Fund
Statement of Changes in Net Assets
| Six Months Ended | Year Ended | |
| July 31, | January 31, | |
| 2018 | 2018 | |
| ($000) | ($000) | |
| Increase (Decrease) in Net Assets | ||
| Operations | ||
| Net Investment Income | 824,220 | 1,358,706 |
| Realized Net Gain (Loss) | (266,482) | (192,043) |
| Change in Unrealized Appreciation (Depreciation) | (416,659) | (370,941) |
| Net Increase (Decrease) in Net Assets Resulting from Operations | 141,079 | 795,722 |
| Distributions | ||
| Net Investment Income | ||
| Investor Shares | (113,349) | (192,944) |
| Admiral Shares | (552,196) | (865,663) |
| Institutional Shares | (151,560) | (241,237) |
| Realized Capital Gain1 | ||
| Investor Shares | — | (2,084) |
| Admiral Shares | — | (8,541) |
| Institutional Shares | — | (2,200) |
| Total Distributions | (817,105) | (1,312,669) |
| Capital Share Transactions | ||
| Investor Shares | (723,233) | (152,433) |
| Admiral Shares | (755,986) | 3,934,349 |
| Institutional Shares | (566,624) | 1,719,250 |
| Net Increase (Decrease) from Capital Share Transactions | (2,045,843) | 5,501,166 |
| Total Increase (Decrease) | (2,721,869) | 4,984,219 |
| Net Assets | ||
| Beginning of Period | 63,054,769 | 58,070,550 |
| End of Period2 | 60,332,900 | 63,054,769 |
1 Includes fiscal 2019 and 2018 short-term gain distributions totaling $0 and $12,825,000, respectively. Short-term gain distributions
are treated as ordinary income dividends for tax purposes.
2 Net Assets—End of Period includes undistributed (overdistributed) net investment income of $29,778,000 and ($7,466,000).
See accompanying Notes, which are an integral part of the Financial Statements.
39
Short-Term Investment-Grade Fund
Financial Highlights
| Investor Shares | ||||||
| Six Months | ||||||
| Ended | ||||||
| For a Share Outstanding | July 31, | Year Ended January 31, | ||||
| Throughout Each Period | 2018 | 2018 | 2017 | 2016 | 2015 | 2014 |
| Net Asset Value, Beginning of Period | $10.57 | $10.65 | $10.60 | $10.73 | $10.74 | $10.82 |
| Investment Operations | ||||||
| Net Investment Income | .1361 | .2241 | .213 | .204 | .200 | .194 |
| Net Realized and Unrealized Gain (Loss) | ||||||
| on Investments | (.121) | (. 087) | . 053 | (.123) | . 016 | (. 039) |
| Total from Investment Operations | .015 | .137 | . 266 | .081 | . 216 | .155 |
| Distributions | ||||||
| Dividends from Net Investment Income | (.135) | (. 215) | (. 205) | (. 209) | (. 200) | (.194) |
| Distributions from Realized Capital Gains | — | (. 002) | (. 011) | (. 002) | (. 026) | (. 041) |
| Total Distributions | (.135) | (. 217) | (. 216) | (. 211) | (. 226) | (. 235) |
| Net Asset Value, End of Period | $10.45 | $10.57 | $10.65 | $10.60 | $10.73 | $10.74 |
| Total Return2 | 0.14% | 1.29% | 2.52% | 0.77% | 2.03% | 1.46% |
| Ratios/Supplemental Data | ||||||
| Net Assets, End of Period (Millions) | $8,512 | $9,333 | $9,558 | $9,840 | $10,943 | $11,752 |
| Ratio of Total Expenses to | ||||||
| Average Net Assets | 0.20% | 0.20% | 0.20% | 0.20% | 0.20% | 0.20% |
| Ratio of Net Investment Income to | ||||||
| Average Net Assets | 2.61% | 2.11% | 2.00% | 1.91% | 1.86% | 1.81% |
| Portfolio Turnover Rate | 87% | 86% | 68% | 75% | 79% | 122% |
The expense ratio, net investment income ratio, and turnover rate for the current period have been annualized.
1 Calculated based on average shares outstanding.
2 Total returns do not include account service fees that may have applied in the periods shown. Fund prospectuses provide information
about any applicable account service fees.
See accompanying Notes, which are an integral part of the Financial Statements.
40
Short-Term Investment-Grade Fund
Financial Highlights
| Admiral Shares | ||||||
| Six Months | ||||||
| Ended | ||||||
| For a Share Outstanding | July 31, | Year Ended January 31, | ||||
| Throughout Each Period | 2018 | 2018 | 2017 | 2016 | 2015 | 2014 |
| Net Asset Value, Beginning of Period | $10.57 | $10.65 | $10.60 | $10.73 | $10.74 | $10.82 |
| Investment Operations | ||||||
| Net Investment Income | .1411 | .2361 | .224 | .215 | .211 | .205 |
| Net Realized and Unrealized Gain (Loss) | ||||||
| on Investments | (.121) | (. 088) | . 053 | (.123) | . 016 | (. 039) |
| Total from Investment Operations | .020 | .148 | . 277 | .092 | . 227 | .166 |
| Distributions | ||||||
| Dividends from Net Investment Income | (.140) | (. 226) | (. 216) | (. 220) | (. 211) | (. 205) |
| Distributions from Realized Capital Gains | — | (. 002) | (. 011) | (. 002) | (. 026) | (. 041) |
| Total Distributions | (.140) | (. 228) | (. 227) | (. 222) | (. 237) | (. 246) |
| Net Asset Value, End of Period | $10.45 | $10.57 | $10.65 | $10.60 | $10.73 | $10.74 |
| Total Return2 | 0.19% | 1.39% | 2.62% | 0.87% | 2.13% | 1.56% |
| Ratios/Supplemental Data | ||||||
| Net Assets, End of Period (Millions) | $40,947 | $42,156 | $38,564 | $33,857 | $33,772 | $29,632 |
| Ratio of Total Expenses to | ||||||
| Average Net Assets | 0.10% | 0.10% | 0.10% | 0.10% | 0.10% | 0.10% |
| Ratio of Net Investment Income to | ||||||
| Average Net Assets | 2.71% | 2.21% | 2.10% | 2.01% | 1.96% | 1.91% |
| Portfolio Turnover Rate | 87% | 86% | 68% | 75% | 79% | 122% |
The expense ratio, net investment income ratio, and turnover rate for the current period have been annualized.
1 Calculated based on average shares outstanding.
2 Total returns do not include account service fees that may have applied in the periods shown. Fund prospectuses provide information
about any applicable account service fees.
See accompanying Notes, which are an integral part of the Financial Statements.
41
Short-Term Investment-Grade Fund
Financial Highlights
| Institutional Shares | ||||||
| Six Months | ||||||
| Ended | ||||||
| For a Share Outstanding | July 31, | Year Ended January 31, | ||||
| Throughout Each Period | 2018 | 2018 | 2017 | 2016 | 2015 | 2014 |
| Net Asset Value, Beginning of Period | $10.57 | $10.65 | $10.60 | $10.73 | $10.74 | $10.82 |
| Investment Operations | ||||||
| Net Investment Income | .1421 | .2401 | .227 | .218 | .214 | .208 |
| Net Realized and Unrealized Gain (Loss) | ||||||
| on Investments | (.121) | (. 089) | . 053 | (.123) | . 016 | (. 039) |
| Total from Investment Operations | .021 | .151 | . 280 | .095 | . 230 | .169 |
| Distributions | ||||||
| Dividends from Net Investment Income | (.141) | (. 229) | (. 219) | (. 223) | (. 214) | (. 208) |
| Distributions from Realized Capital Gains | — | (. 002) | (. 011) | (. 002) | (. 026) | (. 041) |
| Total Distributions | (.141) | (. 231) | (. 230) | (. 225) | (. 240) | (. 249) |
| Net Asset Value, End of Period | $10.45 | $10.57 | $10.65 | $10.60 | $10.73 | $10.74 |
| Total Return | 0.21% | 1.42% | 2.65% | 0.90% | 2.16% | 1.59% |
| Ratios/Supplemental Data | ||||||
| Net Assets, End of Period (Millions) | $10,874 | $11,566 | $9,949 | $9,205 | $8,337 | $6,802 |
| Ratio of Total Expenses to | ||||||
| Average Net Assets | 0.07% | 0.07% | 0.07% | 0.07% | 0.07% | 0.07% |
| Ratio of Net Investment Income to | ||||||
| Average Net Assets | 2.74% | 2.24% | 2.13% | 2.04% | 1.99% | 1.94% |
| Portfolio Turnover Rate | 87% | 86% | 68% | 75% | 79% | 122% |
The expense ratio, net investment income ratio, and turnover rate for the current period have been annualized.
1 Calculated based on average shares outstanding.
See accompanying Notes, which are an integral part of the Financial Statements.
42
Short-Term Investment-Grade Fund
Notes to Financial Statements
Vanguard Short-Term Investment-Grade Fund is registered under the Investment Company Act of 1940 as an open-end investment company, or mutual fund. Certain of the fund’s investments are in corporate debt instruments; the issuers’ abilities to meet their obligations may be affected by economic developments in their respective industries. The fund invests in securities of foreign issuers, which may subject it to investment risks not normally associated with investing in securities of U.S. corporations. To minimize the currency risk associated with investment in bonds denominated in currencies other than the U.S. dollar, the fund attempts to hedge its currency exposures. The fund offers three classes of shares: Investor Shares, Admiral Shares, and Institutional Shares. Investor Shares are available to any investor who meets the fund’s minimum purchase requirements. Admiral Shares and Institutional Shares are designed for investors who meet certain administrative, service, and account-size criteria.
A. The following significant accounting policies conform to generally accepted accounting principles for U.S. investment companies. The fund consistently follows such policies in preparing its financial statements.
1. Security Valuation: Securities are valued as of the close of trading on the New York Stock Exchange (generally 4 p.m., Eastern time) on the valuation date. Equity securities are valued at the latest quoted sales prices or official closing prices taken from the primary market in which each security trades; such securities not traded on the valuation date are valued at the mean of the latest quoted bid and asked prices. Bonds and temporary cash investments are valued using the latest bid prices or using valuations based on a matrix system (which considers such factors as security prices, yields, maturities, and ratings), both as furnished by independent pricing services. Structured debt securities, including mortgages and asset-backed securities, are valued using the latest bid prices or using valuations based on a matrix system that considers such factors as issuer, tranche, nominal or option-adjusted spreads, weighted average coupon, weighted average maturity, credit enhancements, and collateral. Investments in Vanguard Market Liquidity Fund are valued at that fund’s net asset value. Securities for which market quotations are not readily available, or whose values have been affected by events occurring before the fund’s pricing time but after the close of the securities’ primary markets, are valued at their fair values calculated according to procedures adopted by the board of trustees. These procedures include obtaining quotations from an independent pricing service, monitoring news to identify significant market-or security-specific events, and evaluating changes in the values of foreign market proxies (for example, ADRs, futures contracts, or exchange-traded funds), between the time the foreign markets close and the fund’s pricing time. When fair-value pricing is employed, the prices of securities used by a fund to calculate its net asset value may differ from quoted or published prices for the same securities.
2. Foreign Currency: Securities and other assets and liabilities denominated in foreign currencies are translated into U.S. dollars using exchange rates obtained from an independent third party as of the fund’s pricing time on the valuation date. Realized gains (losses) and unrealized appreciation (depreciation) on investment securities include the effects of changes in exchange rates since the securities were purchased, combined with the effects of changes in security prices. Fluctuations in the value of other assets and liabilities resulting from changes in exchange rates are recorded as unrealized foreign currency gains (losses) until the assets or liabilities are settled in cash, at which time they are recorded as realized foreign currency gains (losses).
43
Short-Term Investment-Grade Fund
3. Futures Contracts: The fund uses futures contracts to invest in fixed income asset classes with greater efficiency and lower cost than is possible through direct investment, to add value when these instruments are attractively priced, or to adjust sensitivity to changes in interest rates. The primary risks associated with the use of futures contracts are imperfect correlation between changes in market values of bonds held by the fund and the prices of futures contracts, and the possibility of an illiquid market. Counterparty risk involving futures is mitigated because a regulated clearinghouse is the counterparty instead of the clearing broker. To further mitigate counterparty risk, the fund trades futures contracts on an exchange, monitors the financial strength of its clearing brokers and clearinghouse, and has entered into clearing agreements with its clearing brokers. The clearinghouse imposes initial margin requirements to secure the fund’s performance and requires daily settlement of variation margin representing changes in the market value of each contract.
Any assets pledged as initial margin for open contracts are noted in the Statement of Net Assets.
Futures contracts are valued at their quoted daily settlement prices. The notional amounts of the contracts are not recorded in the Statement of Net Assets. Fluctuations in the value of the contracts are recorded in the Statement of Net Assets as an asset (liability) and in the Statement of Operations as unrealized appreciation (depreciation) until the contracts are closed, when they are recorded as realized futures gains (losses).
During the six months ended July 31, 2018, the fund’s average investments in long and short futures contracts represented 7% and 5% of net assets, respectively, based on the average of aggregate settlement values at each quarter-end during the period.
4. Forward Currency Contracts: The fund enters into forward currency contracts to protect the value of securities and related receivables and payables against changes in future foreign exchange rates. The fund’s risks in using these contracts include movement in the values of the foreign currencies relative to the U.S. dollar and the ability of the counterparties to fulfill their obligations under the contracts. The fund mitigates its counterparty risk by entering into forward currency contracts only with a diverse group of prequalified counterparties, monitoring their financial strength, entering into master netting arrangements with its counterparties, and requiring its counterparties to transfer collateral as security for their performance. In the absence of a default, the collateral pledged or received by the fund cannot be repledged, resold, or rehypothecated. The master netting arrangements provide that, in the event of a counterparty’s default (including bankruptcy), the fund may terminate the forward currency contracts, determine the net amount owed by either party in accordance with its master netting arrangements, and sell or retain any collateral held up to the net amount owed to the fund under the master netting arrangements. The forward currency contracts contain provisions whereby a counterparty may terminate open contracts if the fund’s net assets decline below a certain level, triggering a payment by the fund if the fund is in a net liability position at the time of the termination. The payment amount would be reduced by any collateral the fund has pledged. Any assets pledged as collateral for open contracts are noted in the Statement of Net Assets. The value of collateral received or pledged is compared daily to the value of the forward currency contracts exposure with each counterparty, and any difference, if in excess of a specified minimum transfer amount, is adjusted and settled within two business days.
Forward currency contracts are valued at their quoted daily prices obtained from an independent third party, adjusted for currency risk based on the expiration date of each contract. The notional amounts of the contracts are not recorded in the Statement of Net Assets. Fluctuations in the
44
Short-Term Investment-Grade Fund
value of the contracts are recorded in the Statement of Net Assets as an asset (liability) and in the Statement of Operations as unrealized appreciation (depreciation) until the contracts are closed, when they are recorded as realized forward currency contract gains (losses).
During the six months ended July 31, 2018, the fund’s average investment in forward currency contracts represented 2% of net assets, based on the average of notional amounts at each quarter-end during the period.
5. Swap Contracts: The fund invests in credit default swaps to adjust the overall credit risk of the fund or to actively overweight or underweight credit risk to a specific issuer or group of issuers. The fund may sell credit protection through credit default swaps to simulate investments in long positions that are either unavailable or considered to be less attractively priced in the bond market. The fund may purchase credit protection through credit default swaps to reduce credit exposure to a given issuer or issuers. Under the terms of the swaps, an up-front payment may be exchanged between the seller and buyer. In addition, the seller of the credit protection receives a periodic payment of premium from the buyer that is a fixed percentage applied to a notional amount. If, for example, the reference entity is subject to a credit event (such as bankruptcy, failure to pay, or obligation acceleration) during the term of the swap, the seller agrees to either physically settle or cash settle the swap contract. If the swap is physically settled, the seller agrees to pay the buyer an amount equal to the notional amount and take delivery of a debt instrument of the reference issuer with a par amount equal to such notional amount. If the swap is cash settled, the seller agrees to pay the buyer the difference between the notional amount and the final price for the relevant debt instrument, as determined either in a market auction or pursuant to a pre-agreed-upon valuation procedure.
The fund enters into interest rate swap transactions to adjust the fund’s sensitivity to changes in interest rates and maintain the ability to generate income at prevailing market rates. Under the terms of the swaps, one party pays the other an amount that is a fixed percentage rate applied to a notional amount. In return, the counterparty agrees to pay a floating rate, which is reset periodically based on short-term interest rates, applied to the same notional amount.
The notional amounts of swap contracts are not recorded in the Statement of Net Assets. Swaps are valued daily based on market quotations received from independent pricing services or recognized dealers and the change in value is recorded in the Statement of Net Assets as an asset (liability) and in the Statement of Operations as unrealized appreciation (depreciation) until the seller of credit protection is required to take delivery (or, in a cash settled swap, pay the settlement amount determined) upon occurrence of a credit event, periodic payments are made, or the swap terminates, at which time realized gain (loss) is recorded. The net premium to be received or paid by the fund under swap contracts is accrued daily and recorded as realized gain (loss) over the life of the contract.
The primary risk associated with selling credit protection is that, upon the occurrence of a defined credit event, the market value of the debt instrument received by the fund (or, in a cash settled swap, the debt instruments used to determine the settlement payment by the fund) will be significantly less than the amount paid by the fund and, in a physically settled swap, the fund may receive an illiquid debt instrument. A risk associated with all types of swaps is the possibility that a counterparty may default on its obligation to pay net amounts due to the fund. The fund’s maximum amount subject to counterparty risk is the unrealized appreciation on the swap contract. The fund
45
Short-Term Investment-Grade Fund
mitigates its counterparty risk by entering into swaps only with a diverse group of prequalified counterparties, monitoring their financial strength, entering into master netting arrangements with its counterparties, and requiring its counterparties to transfer collateral as security for their performance. In the absence of a default, the collateral pledged or received by the fund cannot be repledged, resold, or rehypothecated. In the event of a counterparty’s default (including bankruptcy), the fund may terminate any swap contracts with that counterparty, determine the net amount owed by either party in accordance with its master netting arrangements, and sell or retain any collateral held up to the net amount owed to the fund under the master netting arrangements. The swap contracts contain provisions whereby a counterparty may terminate open contracts if the fund’s net assets decline below a certain level, triggering a payment by the fund if the fund is in a net liability position at the time of the termination. The payment amount would be reduced by any collateral the fund has pledged. Any securities pledged as collateral for open contracts are noted in the Statement of Net Assets. The value of collateral received or pledged is compared daily to the value of the swap contracts exposure with each counterparty, and any difference, if in excess of a specified minimum transfer amount, is adjusted and settled within two business days.
The fund enters into centrally cleared interest rate and credit default swaps to achieve the same objectives specified with respect to the equivalent over-the-counter swaps but with less counterparty risk because a regulated clearinghouse is the counterparty instead of the clearing broker or executing broker. The clearinghouse imposes initial margin requirements to secure the fund’s performance, and requires daily settlement of variation margin representing changes in the market value of each contract. To further mitigate counterparty risk, the fund trades with a diverse group of prequalified executing brokers; monitors the financial strength of its clearing brokers, executing brokers, and clearinghouse; and has entered into agreements with its clearing brokers and executing brokers.
During the six months ended July 31, 2018, the fund’s average amounts of investments in credit protection sold and credit protection purchased represented 1% and 3% of net assets, respectively, based on the average of notional amounts at each quarter-end during the period. The average amount of investments in interest rate swaps represented 4% of net assets, based on the average of notional amounts at each quarter-end during the period.
6. Options: The fund invests in options contracts on futures and swaps to adjust its exposure to the underlying investments. The primary risk associated with purchasing options is that the value of the underlying investments may move in such a way that the option is out-of-the-money (the exercise price of the option exceeds the value of the underlying investment), the position is worthless at expiration, and the fund loses the premium paid. The primary risk associated with selling options is that the value of the underlying investments may move in such a way that the option is in-the-money (the exercise price of the option exceeds the value of the underlying investment), the counterparty exercises the option, and the fund loses an amount equal to the market value of the option written less the premium received.
The fund invests in options on futures, which are exchange-traded. Counterparty risk involving exchange-traded options on futures is mitigated because a regulated clearinghouse is the counterparty instead of the clearing broker. To further mitigate counterparty risk, the fund trades options on futures on an exchange, monitors the financial strength of its clearing brokers and clearinghouses, and has entered into clearing agreements with its clearing brokers.
46
Short-Term Investment-Grade Fund
The fund invests in options on swaps (swaptions), which are transacted over-the-counter (OTC) and not on an exchange. A receiver swaption gives the owner the right to receive the total return of a specified asset, reference rate, or index. A payer swaption gives the owner the right to pay the total return of a specified asset, reference rate, or index. Swaptions also include options that allow an existing swap to be terminated or extended by one of the counterparties. Unlike exchange-traded options, which are standardized with respect to the underlying instrument, expiration date, contract size, and strike price, the terms of OTC options generally are established through negotiation with the other party to the option contract. Although this type of arrangement allows the purchaser or writer greater flexibility to tailor an option to its needs, OTC options generally involve greater credit risk than exchange-traded options. Credit risk involves the possibility that a counterparty may default on its obligation to pay net amounts due to the fund. The fund mitigates its counterparty risk by entering into swaptions with a diverse group of prequalified counterparties and monitoring their financial strength.
Options on futures contracts are valued at their quoted daily settlement prices. Swaptions are valued daily based on market quotations received from independent pricing services or recognized dealers. The premium paid for a purchased option is recorded in the Statement of Net Assets as an asset that is subsequently adjusted daily to the current market value of the option purchased. The premium received for a written option is recorded in the Statement of Net Assets as an asset with an equal liability that is subsequently adjusted daily to the current market value of the option written. Fluctuations in the value of the options are recorded in the Statement of Operations as unrealized appreciation (depreciation) until expired, closed, or exercised, at which time realized gains (losses) are recognized.
During the six months ended July 31, 2018, the fund’s average value of options purchased and options written each represented less than 1% of net assets, based on the average market values at each quarter-end during the period.
7. Federal Income Taxes: The fund intends to continue to qualify as a regulated investment company and distribute all of its taxable income. Management has analyzed the fund’s tax positions taken for all open federal income tax years (January 31, 2015–2018), and for the period ended July 31, 2018, and has concluded that no provision for federal income tax is required in the fund’s financial statements.
8. Distributions: Distributions from net investment income are declared daily and paid on the first business day of the following month. Annual distributions from realized capital gains, if any, are recorded on the ex-dividend date.
9. Credit Facility: The fund and certain other funds managed by The Vanguard Group (“Vanguard”) participate in a $3.1 billion committed credit facility provided by a syndicate of lenders pursuant to a credit agreement that may be renewed annually; each fund is individually liable for its borrowings, if any, under the credit facility. Borrowings may be utilized for temporary and emergency purposes, and are subject to the fund’s regulatory and contractual borrowing restrictions. The participating funds are charged administrative fees and an annual commitment fee of 0.10% of the undrawn amount of the facility; these fees are allocated to the funds based on a method approved by the fund’s board of trustees and included in Management and Administrative expenses on the fund’s Statement of Operations. Any borrowings under this facility bear interest at a rate based upon the higher of the one-month London Interbank Offered Rate, federal funds effective rate, or overnight bank funding rate plus an agreed-upon spread.
47
Short-Term Investment-Grade Fund
The fund had no borrowings outstanding at July 31, 2018, or at any time during the period then ended.
10. Other: Interest income includes income distributions received from Vanguard Market Liquidity Fund and is accrued daily. Premiums and discounts on debt securities purchased are amortized and accreted, respectively, to interest income over the lives of the respective securities. Security transactions are accounted for on the date securities are bought or sold. Costs used to determine realized gains (losses) on the sale of investment securities are those of the specific securities sold
Each class of shares has equal rights as to assets and earnings, except that each class separately bears certain class-specific expenses related to maintenance of shareholder accounts (included in Management and Administrative expenses), shareholder reporting, and the proxy. Marketing and distribution expenses are allocated to each class of shares based on a method approved by the board of trustees. Income, other non-class-specific expenses, and gains and losses on investments are allocated to each class of shares based on its relative net assets.
B. In accordance with the terms of a Funds’ Service Agreement (the “FSA”) between Vanguard and the fund, Vanguard furnishes to the fund investment advisory, corporate management, administrative, marketing, and distribution services at Vanguard’s cost of operations (as defined by the FSA). These costs of operations are allocated to the fund based on methods and guidelines approved by the board of trustees. Vanguard does not require reimbursement in the current period for certain costs of operations (such as deferred compensation/benefits and risk/insurance costs); the fund’s liability for these costs of operations is included in Payables to Vanguard on the Statement of Net Assets. All other costs of operations payable to Vanguard are generally settled twice a month.
Upon the request of Vanguard, the fund may invest up to 0.40% of its net assets as capital in Vanguard. At July 31, 2018, the fund had contributed to Vanguard capital in the amount of $3,207,000, representing 0.01% of the fund’s net assets and 1.28% of Vanguard’s capitalization. The fund’s trustees and officers are also directors and employees, respectively, of Vanguard.
C. Various inputs may be used to determine the value of the fund’s investments. These inputs are summarized in three broad levels for financial statement purposes. The inputs or methodologies used to value securities are not necessarily an indication of the risk associated with investing in those securities.
Level 1—Quoted prices in active markets for identical securities.
Level 2—Other significant observable inputs (including quoted prices for similar securities, interest rates, prepayment speeds, credit risk, etc.).
Level 3—Significant unobservable inputs (including the fund’s own assumptions used to determine
the fair value of investments). Any investments valued with significant unobservable inputs are
noted on the Statement of Net Assets.
48
Short-Term Investment-Grade Fund
The following table summarizes the market value of the fund’s investments as of July 31, 2018, based on the inputs used to value them:
| Level 1 | Level 2 | Level 3 | |
| Investments | ($000) | ($000) | ($000) |
| U.S. Government and Agency Obligations | — | 6,514,776 | — |
| Asset-Backed/Commercial Mortgage-Backed Securities | — | 13,365,548 | 66,138 |
| Corporate Bonds | — | 32,044,579 | 3 |
| Sovereign Bonds | — | 5,346,476 | — |
| Taxable Municipal Bonds | — | 74,644 | — |
| Tax-Exempt Municipal Bonds | — | 10,000 | — |
| Convertible Preferred Stocks | — | — | —2 |
| Temporary Cash Investments | 1,237,647 | 1,412,479 | — |
| Options Purchased | — | 69 | — |
| Liability for Options Written | (1,887) | (1,236) | — |
| Futures Contracts—Assets1 | 4,166 | — | — |
| Futures Contracts—Liabilities1 | (3,021) | — | — |
| Forward Currency Contracts—Assets | — | 1,873 | — |
| Forward Currency Contracts—Liabilities | — | (8,321) | — |
| Swap Contracts—Assets | 1021 | 9,497 | — |
| Swap Contracts—Liabilities | (463)1 | (12,018) | — |
| Total | 1,236,544 | 58,758,366 | 66,141 |
| 1 Represents variation margin on the last day of the reporting period. | |||
| 2 Market value of convertible preferred stocks based on Level 3 input. |
D. At July 31, 2018, the fair values of derivatives were reflected in the Statement of Net Assets as follows:
| Interest Rate | Currency | Credit | ||
| Contracts | Contracts | Contracts | Total | |
| Statement of Net Assets Caption | ($000) | ($000) | ($000) | ($000) |
| Options Purchased | — | — | 69 | 69 |
| Variation Margin Receivable—Futures Contracts | 4,166 | — | — | 4,166 |
| Variation Margin Receivable— CC Swap Contracts | 31 | — | 71 | 102 |
| Unrealized Appreciation—Forward Currency Contracts | — | 1,873 | — | 1,873 |
| Unrealized Appreciation—OTC Swap Contracts | — | — | 9,497 | 9,497 |
| Total Assets | 4,197 | 1,873 | 9,637 | 15,707 |
| Liability for Options Written | (1,887) | — | (1,236) | (3,123) |
| Variation Margin Payable—Futures Contracts | (3,021) | — | — | (3,021) |
| Variation Margin Payable—CC Swap Contracts | (306) | — | (157) | (463) |
| Unrealized Depreciation—Forward Currency Contracts | — | (8,321) | — | (8,321) |
| Unrealized Depreciation—OTC Swap Contracts | — | — | (12,018) | (12,018) |
| Total Liabilities | (5,214) | (8,321) | (13,411) | (26,946) |
49
Short-Term Investment-Grade Fund
Realized net gain (loss) and the change in unrealized appreciation (depreciation) on derivatives for the six months ended July 31, 2018, were:
| Interest Rate | Currency | Credit | ||
| Contracts | Contracts | Contracts | Total | |
| Realized Net Gain (Loss) on Derivatives | ($000) | ($000) | ($000) | ($000) |
| Futures Contracts | (49,539) | — | — | (49,539) |
| Options | (4,552) | — | 3,746 | (806) |
| Forward Currency Contracts | — | 29,395 | — | 29,395 |
| Swap Contracts | 15,015 | — | (13,327) | 1,688 |
| Realized Net Gain (Loss) on Derivatives | (39,076) | 29,395 | (9,581) | (19,262) |
| Change in Unrealized Appreciation (Depreciation) on Derivatives | ||||
| Futures Contracts | 4,860 | — | — | 4,860 |
| Options | 3,866 | — | (317) | 3,549 |
| Forward Currency Contracts | — | 10,553 | — | 10,553 |
| Swap Contracts | (10,714) | — | 24,928 | 14,214 |
| Change in Unrealized Appreciation | ||||
| (Depreciation) on Derivatives | (1,988) | 10,553 | 24,611 | 33,176 |
E. Capital gain distributions are determined on a tax basis and may differ from realized capital gains for financial reporting purposes. Differences may be permanent or temporary. Permanent differences are reclassified among capital accounts in the financial statements to reflect their tax character. Temporary differences arise when gains or losses are recognized in different periods for financial statement and tax purposes. These differences will reverse at some time in the future.
During the six months ended July 31, 2018, the fund realized net foreign currency gains of $35,110,000 (including gains and losses on forward currency contracts and the foreign currency component on sales of foreign currency denominated bonds), which increased distributable net income for tax purposes; accordingly, such gains have been reclassified from accumulated net realized losses to undistributed net investment income.
The fund’s tax-basis capital gains and losses are determined only at the end of each fiscal year. For tax purposes, at January 31, 2018, the fund had available capital losses totaling $144,197,000 that may be carried forward indefinitely to offset future net capital gains. The fund will use these capital losses to offset net taxable capital gains, if any, realized during the year ending January 31, 2019; should the fund realize net capital losses for the year, the losses will be added to the loss carryforward balance above.
At July 31, 2018, the cost of investment securities for tax purposes was $60,932,086,000. Net unrealized depreciation of investment securities for tax purposes was $859,796,000, consisting of unrealized gains of $55,075,000 on securities that had risen in value since their purchase and $914,871,000 in unrealized losses on securities that had fallen in value since their purchase.
50
Short-Term Investment-Grade Fund
F. During the six months ended July 31, 2018, the fund purchased $13,343,685,000 of investment securities and sold $18,692,486,000 of investment securities, other than U.S. government securities and temporary cash investments. Purchases and sales of U.S. government securities were $10,883,311,000 and $8,687,149,000, respectively.
G. Capital share transactions for each class of shares were:
| Six Months Ended | Year Ended | |||
| July 31, 2018 | January 31, 2018 | |||
| Amount | Shares | Amount | Shares | |
| ($000) | (000) | ($000) | (000) | |
| Investor Shares | ||||
| Issued | 674,436 | 64,285 | 2,473,482 | 231,951 |
| Issued in Lieu of Cash Distributions | 99,923 | 9,536 | 178,077 | 16,694 |
| Redeemed | (1,497,592) | (142,730) | (2,803,992) | (262,856) |
| Net Increase (Decrease)—Investor Shares | (723,233) | (68,909) | (152,433) | (14,211) |
| Admiral Shares | ||||
| Issued | 5,629,769 | 536,814 | 13,625,496 | 1,277,349 |
| Issued in Lieu of Cash Distributions | 441,111 | 42,094 | 698,665 | 65,499 |
| Redeemed | (6,826,866) | (651,085) | (10,389,812) | (974,349) |
| Net Increase (Decrease)—Admiral Shares | (755,986) | (72,177) | 3,934,349 | 368,499 |
| Institutional Shares | ||||
| Issued | 1,499,894 | 142,923 | 5,379,998 | 503,938 |
| Issued in Lieu of Cash Distributions | 134,468 | 12,832 | 212,402 | 19,913 |
| Redeemed | (2,200,986) | (209,964) | (3,873,150) | (363,474) |
| Net Increase (Decrease)—Institutional Shares | (566,624) | (54,209) | 1,719,250 | 160,377 |
H. Management has determined that no events or transactions occurred subsequent to July 31, 2018, that would require recognition or disclosure in these financial statements.
51
Intermediate-Term Investment-Grade Fund
Fund Profile
As of July 31, 2018
| Share-Class Characteristics | ||
| Investor | Admiral | |
| Shares | Shares | |
| Ticker Symbol | VFICX | VFIDX |
| Expense Ratio1 | 0.20% | 0.10% |
| 30-Day SEC Yield | 3.49% | 3.59% |
| Financial Attributes | |||
| Bloomberg | Bloomberg | ||
| Barclays | Barclays | ||
| 5–10 Year | US | ||
| Credit | Aggregate | ||
| Fund | Index | Bond Index | |
| Number of Bonds | 1,833 | 1,855 | 10,012 |
| Yield to Maturity | |||
| (before expenses) | 3.9% | 4.0% | 3.4% |
| Average Coupon | 3.2% | 3.8% | 3.1% |
| Average Duration | 5.5 years | 6.3 years | 6.0 years |
| Average Effective | |||
| Maturity | 6.0 years | 7.4 years | 8.4 years |
| Short-Term | |||
| Reserves | 0.9% | — | — |
| Sector Diversification (% of portfolio) | |
| Asset-Backed | 11.3% |
| Commercial Mortgage-Backed | 7.4 |
| Finance | 30.1 |
| Foreign | 6.6 |
| Government Mortgage-Backed | 0.6 |
| Industrial | 29.3 |
| Treasury/Agency | 10.4 |
| Utilities | 4.1 |
| Other | 0.2 |
The agency and mortgage-backed securities sectors may include
issues from government-sponsored enterprises; such issues are
generally not backed by the full faith and credit of the U.S.
government.
| Volatility Measures | ||
| Bloomberg | Bloomberg | |
| Barclays | Barclays US | |
| 5–10 Year | Aggregate | |
| Credit | Bond | |
| Index | Index | |
| R-Squared | 0.97 | 0.91 |
| Beta | 0.83 | 1.06 |
| These measures show the degree and timing of the fund’s | ||
| fluctuations compared with the indexes over 36 months. | ||
| Distribution by Effective Maturity | |
| (% of portfolio) | |
| Under 1 Year | 3.1% |
| 1 - 3 Years | 14.3 |
| 3 - 5 Years | 26.9 |
| 5 - 7 Years | 24.2 |
| 7 - 10 Years | 27.2 |
| 10 - 20 Years | 2.8 |
| 20 - 30 Years | 1.0 |
| Over 30 Years | 0.5 |
| Distribution by Credit Quality (% of portfolio) | |
| U.S. Government | 9.3% |
| Aaa | 17.3 |
| Aa | 10.2 |
| A | 40.6 |
| Baa | 19.3 |
| Ba | 1.5 |
| B | 0.4 |
| Not Rated | 1.4 |
Credit-quality ratings are obtained from Moody's and S&P, and the
higher rating for each issue is shown. "Not Rated" is used to classify
securities for which a rating is not available. Not rated securities
include a fund's investment in Vanguard Market Liquidity Fund or
Vanguard Municipal Cash Management Fund, each of which invests
in high-quality money market instruments and may serve as a cash
management vehicle for the Vanguard funds, trusts, and accounts.
For more information about these ratings, see the Glossary entry for
Credit Quality.
1 The expense ratios shown are from the prospectus dated May 24, 2018, and represent estimated costs for the current fiscal year. For the six
months ended July 31, 2018, the annualized expense ratios were 0.20% for Investor Shares and 0.10% for Admiral Shares.
52
Intermediate-Term Investment-Grade Fund
Investment Focus

53
Intermediate-Term Investment-Grade Fund
Performance Summary
All of the returns in this report represent past performance, which is not a guarantee of future
results that may be achieved by the fund. (Current performance may be lower or higher than
the performance data cited. For performance data current to the most recent month-end, visit
our website at vanguard.com/performance.) Note, too, that both investment returns and
principal value can fluctuate widely, so an investor’s shares, when sold, could be worth more
or less than their original cost. The returns shown do not reflect taxes that a shareholder would pay
on fund distributions or on the sale of fund shares.
| Fiscal-Year Total Returns (%): January 31, 2008, Through July 31, 2018 | ||||
| Bloomberg | ||||
| Barclays | ||||
| 5–10 Year | ||||
| Credit | ||||
| Investor Shares | Index | |||
| Fiscal Year | Income Returns | Capital Returns | Total Returns | Total Returns |
| 2009 | 4.98% | -12.54% | -7.56% | -5.91% |
| 2010 | 6.06 | 14.05 | 20.11 | 20.79 |
| 2011 | 4.98 | 3.66 | 8.64 | 9.09 |
| 2012 | 4.56 | 4.62 | 9.18 | 10.37 |
| 2013 | 3.64 | 2.56 | 6.20 | 7.63 |
| 2014 | 3.16 | -2.31 | 0.85 | 0.53 |
| 2015 | 3.25 | 3.46 | 6.71 | 8.52 |
| 2016 | 2.98 | -2.95 | 0.03 | -1.39 |
| 2017 | 2.82 | 0.34 | 3.16 | 4.80 |
| 2018 | 2.82 | -0.35 | 2.47 | 3.87 |
| 2019 | 1.52 | -2.19 | -0.67 | -1.06 |
| Note: For 2019, performance data reflect the six months ended July 31, 2018. | ||||
Average Annual Total Returns: Periods Ended June 30, 2018
This table presents returns through the latest calendar quarter—rather than through the end of the fiscal period.
Securities and Exchange Commission rules require that we provide this information.
| Ten Years | ||||||
| Inception Date | One Year | Five Years | Income | Capital | Total | |
| Investor Shares | 11/1/1993 | -1.00% | 2.91% | 3.82% | 1.01% | 4.83% |
| Admiral Shares | 2/12/2001 | -0.90 | 3.02 | 3.93 | 1.01 | 4.94 |
See Financial Highlights for dividend and capital gains information.
54
Intermediate-Term Investment-Grade Fund
Financial Statements (unaudited)
Statement of Net Assets—Investments Summary
As of July 31, 2018
This Statement summarizes the fund’s holdings by asset type. Details are reported for each of the fund’s 50 largest individual holdings and for investments that, in total for any issuer, represent more than 1% of the fund’s net assets. The total value of smaller holdings is reported as a single amount within each category.
The fund reports a complete list of its holdings in regulatory filings four times in each fiscal year, at the quarter-ends. For the second and fourth fiscal quarters, the complete listing of the fund’s holdings is available electronically on vanguard.com and on the Securities and Exchange Commission’s website (sec.gov), or you can have it mailed to you without charge by calling 800-662-7447. For the first and third fiscal quarters, the fund files the lists with the SEC on Form N-Q. Shareholders can look up the fund’s Forms N-Q on the SEC’s website. Forms N-Q may also be reviewed and copied at the SEC’s Public Reference Room (see the back cover of this report for further information).
| Face | Market | Percentage | |||||
| Maturity | Amount | Value • | of Net | ||||
| Coupon | Date | ($000) | ($000) | Assets | |||
| U. S. Government and Agency Obligations | |||||||
| U.S. Government Securities | |||||||
| 1 | United States Treasury Note/Bond | 1.500% | 2/28/23 | 613,000 | 577,943 | 2.0% | |
| United States Treasury Note/Bond | 2.500% | 3/31/23 | 375,000 | 369,435 | 1.3% | ||
| United States Treasury Note/Bond | 2.625% | 2/28/23 | 265,000 | 262,639 | 0.9% | ||
| 1,2 | United States Treasury Note/Bond | 1.500% | 3/31/23 | 250,000 | 235,470 | 0.8% | |
| United States Treasury Note/Bond | 2.875% | 4/30/25 | 200,000 | 199,438 | 0.7% | ||
| 3 | United States Treasury Note/Bond | 2.875% | 5/15/28 | 200,000 | 198,562 | 0.7% | |
| 1,2 | United States Treasury Note/Bond | 1.750% | 5/15/23 | 170,000 | 161,712 | 0.6% | |
| 1 | United States Treasury Note/Bond | 2.750% | 5/31/23 | 150,000 | 149,391 | 0.5% | |
| United States Treasury Note/Bond | 1.625% | 2/15/26 | 161,000 | 146,737 | 0.5% | ||
| United States Treasury Note/Bond | 2.000% | 2/15/25 | 100,000 | 94,531 | 0.3% | ||
| United States Treasury Note/Bond | 2.750% | 6/30/25 | 90,000 | 89,015 | 0.3% | ||
| United States Treasury Note/Bond | 2.000% | 8/15/25 | 79,900 | 75,206 | 0.3% | ||
| 1 | United States Treasury | ||||||
| Note/Bond | 1.500%–2.750% | 5/31/23–2/15/28 | 162,167 | 151,831 | 0.5% | ||
| 2,711,910 | 9.4% | ||||||
| Nonconventional Mortgage-Backed Securities † | 172,842 | 0.6% | |||||
| Total U.S. Government and Agency Obligations (Cost $2,950,451) | 2,884,752 | 10.0% | |||||
| Asset-Backed/Commercial Mortgage-Backed Securities | |||||||
| 4 | AmeriCredit Automobile | ||||||
| Receivables Trust 2014-1 | 2.150% | 3/9/20 | 86 | 86 | 0.0% | ||
| 4 | AmeriCredit Automobile | ||||||
| Receivables Trust 2014-2 | 2.180% | 6/8/20 | 170 | 170 | 0.0% | ||
| 4 | AmeriCredit Automobile | ||||||
| Receivables Trust | |||||||
| 2015-3 | 2.080%–3.340% | 9/8/20–8/8/21 | 5,310 | 5,312 | 0.0% | ||
55
| Intermediate-Term Investment-Grade Fund | |||||||
| Face | Market | Percentage | |||||
| Maturity | Amount | Value • | of Net | ||||
| Coupon | Date | ($000) | ($000) | Assets | |||
| 4 | AmeriCredit Automobile | ||||||
| Receivables Trust | |||||||
| 2016-1 | 1.810%–3.590% | 10/8/20–2/8/22 | 5,157 | 5,166 | 0.0% | ||
| 4 | AmeriCredit Automobile | ||||||
| Receivables Trust 2016-2 | 3.650% | 5/9/22 | 3,280 | 3,297 | 0.0% | ||
| 4 | AmeriCredit Automobile | ||||||
| Receivables Trust 2016-3 | 2.710% | 9/8/22 | 3,390 | 3,329 | 0.0% | ||
| 4 | AmeriCredit Automobile | ||||||
| Receivables Trust 2016-4 | 2.410% | 7/8/22 | 7,205 | 7,085 | 0.0% | ||
| 4 | AmeriCredit Automobile | ||||||
| Receivables Trust 2017-3 | 1.690% | 12/18/20 | 37,017 | 36,890 | 0.1% | ||
| 4 | Banc of America Commercial | ||||||
| Mortgage Trust | |||||||
| 2015-UBS7 | 3.429%–4.362% | 9/15/48 | 5,516 | 5,513 | 0.0% | ||
| 4 | Banc of America Commercial | ||||||
| Mortgage Trust 2017-BNK3 | 3.574% | 2/15/50 | 1,520 | 1,496 | 0.0% | ||
| 4,5 | Chrysler Capital Auto | ||||||
| Receivables Trust 2014-BA | 3.440% | 8/16/21 | 290 | 291 | 0.0% | ||
| 4,5 | Chrysler Capital Auto | ||||||
| Receivables Trust | |||||||
| 2015-BA | 2.260%–4.170% | 10/15/20–1/16/23 | 17,628 | 17,680 | 0.1% | ||
| 4,5 | Chrysler Capital Auto | ||||||
| Receivables Trust | |||||||
| 2016-AA | 2.880%–4.220% | 6/15/22–2/15/23 | 10,900 | 10,995 | 0.1% | ||
| 4,5 | Chrysler Capital Auto | ||||||
| Receivables Trust | |||||||
| 2016-BA | 1.640%–1.870% | 7/15/21–2/15/22 | 9,430 | 9,320 | 0.0% | ||
| 4,5 | Drive Auto Receivables | ||||||
| Trust 2015-AA | 3.060%–4.120% | 5/17/21–7/15/22 | 2,559 | 2,576 | 0.0% | ||
| 4,5 | Drive Auto Receivables | ||||||
| Trust 2015-BA | 2.760%–3.840% | 7/15/21 | 3,811 | 3,831 | 0.0% | ||
| 4,5 | Drive Auto Receivables | ||||||
| Trust 2015-CA | 3.010%–4.200% | 5/17/21–9/15/21 | 6,179 | 6,224 | 0.0% | ||
| 4,5 | Drive Auto Receivables | ||||||
| Trust 2015-DA | 3.380%–4.590% | 11/15/21–1/17/23 | 12,504 | 12,642 | 0.1% | ||
| 4,5 | Drive Auto Receivables | ||||||
| Trust 2016-AA | 3.910% | 5/17/21 | 2,097 | 2,105 | 0.0% | ||
| 4,5 | Drive Auto Receivables | ||||||
| Trust 2016-BA | 4.530% | 8/15/23 | 11,330 | 11,510 | 0.1% | ||
| 4,5 | Drive Auto Receivables | ||||||
| Trust 2016-C | 2.370%–4.180% | 11/16/20–3/15/24 | 13,216 | 13,332 | 0.1% | ||
| 4 | Drive Auto Receivables | ||||||
| Trust 2017-1 | 3.840% | 3/15/23 | 1,640 | 1,650 | 0.0% | ||
| 4 | Drive Auto Receivables | ||||||
| Trust 2017-3 | 2.300%–2.800% | 5/17/21–7/15/22 | 23,300 | 23,228 | 0.1% | ||
| 4 | Drive Auto Receivables | ||||||
| Trust 2018-2 | 3.220%–4.140% | 4/15/22–8/15/24 | 28,720 | 28,737 | 0.1% | ||
| 4 | Drive Auto Receivables | ||||||
| Trust 2018-3 | 3.370%–4.300% | 9/15/22–9/16/24 | 38,680 | 38,685 | 0.1% | ||
| 4,5,6 GMF Floorplan Owner | |||||||
| Revolving Trust 2016-1 | 2.410%–2.923% | 5/17/21 | 19,666 | 19,639 | 0.1% | ||
| 4,5,6 GMF Floorplan Owner | |||||||
| Revolving Trust 2017-1 | 2.643% | 1/18/22 | 230 | 231 | 0.0% | ||
| 56 | |||||||
| Intermediate-Term Investment-Grade Fund | ||||||||
| Face | Market | Percentage | ||||||
| Maturity | Amount | Value • | of Net | |||||
| Coupon | Date | ($000) | ($000) | Assets | ||||
| 4,5 | GMF Floorplan Owner | |||||||
| Revolving Trust 2017-2 | 2.130%–2.630% | 7/15/22 | 62,850 | 61,523 | 0.2% | |||
| 4,5 | GMF Floorplan Owner | |||||||
| Revolving Trust 2018-2 | 3.130% | 3/15/23 | 19,810 | 19,750 | 0.1% | |||
| 4,5 | GS Mortgage Securities | |||||||
| Corporation II 2012-BWTR | 2.954% | 11/5/34 | 7,625 | 7,381 | 0.0% | |||
| 4 | GS Mortgage Securities | |||||||
| Corporation II 2015-GC30 | 3.382% | 5/10/50 | 2,398 | 2,358 | 0.0% | |||
| 4,5 | GS Mortgage Securities | |||||||
| Corporation Trust 2012-ALOHA | 3.551% | 4/10/34 | 5,430 | 5,453 | 0.0% | |||
| 4,5 | GS Mortgage Securities | |||||||
| Trust 2010-C2 | 5.182% | 12/10/43 | 1,370 | 1,411 | 0.0% | |||
| 4,5 | GS Mortgage Securities | |||||||
| Trust 2011-GC3 | 5.638% | 3/10/44 | 2,650 | 2,750 | 0.0% | |||
| 4,5 | GS Mortgage Securities | |||||||
| Trust 2012-GC6 | 4.948% | 1/10/45 | 1,025 | 1,063 | 0.0% | |||
| 4 | GS Mortgage Securities | |||||||
| Trust 2012-GCJ7 | 5.668% | 5/10/45 | 2,140 | 2,203 | 0.0% | |||
| 4,5 | GS Mortgage Securities | |||||||
| Trust 2013-GC13 | 4.048%–4.081% | 7/10/46 | 1,395 | 1,368 | 0.0% | |||
| 4 | GS Mortgage Securities | |||||||
| Trust 2013-GCJ12 | 3.135%–3.777% | 6/10/46 | 5,678 | 5,597 | 0.0% | |||
| 4 | GS Mortgage Securities | |||||||
| Trust 2013-GCJ14 | 2.995%–4.243% | 8/10/46 | 6,993 | 7,124 | 0.0% | |||
| 4 | GS Mortgage Securities | |||||||
| Trust 2014-GC20 | 3.998%–4.258% | 4/10/47 | 11,208 | 11,434 | 0.1% | |||
| 4 | GS Mortgage Securities | |||||||
| Trust 2014-GC24 | 3.931%–4.529% | 9/10/47 | 27,220 | 27,430 | 0.1% | |||
| 4 | GS Mortgage Securities | |||||||
| Trust 2014-GC26 | 3.364%–3.629% | 11/10/47 | 25,550 | 25,390 | 0.1% | |||
| 4 | GS Mortgage Securities | |||||||
| Trust 2015-GC28 | 3.136% | 2/10/48 | 9,200 | 8,920 | 0.0% | |||
| 4 | GS Mortgage Securities | |||||||
| Trust 2015-GC32 | 3.764% | 7/10/48 | 4,615 | 4,647 | 0.0% | |||
| 4 | GS Mortgage Securities | |||||||
| Trust 2015-GC34 | 3.506%–4.653% | 10/10/48 | 17,250 | 17,054 | 0.1% | |||
| 4 | GS Mortgage Securities | |||||||
| Trust 2016-GS3 | 2.850% | 10/10/49 | 750 | 704 | 0.0% | |||
| 4 | GS Mortgage Securities | |||||||
| Trust 2018-GS10 | 4.155% | 7/10/51 | 10,670 | 10,927 | 0.1% | |||
| 4,5,7 Holmes Master Issuer plc | ||||||||
| 2018-1 | 2.699% | 10/15/54 | 10,350 | 10,340 | 0.0% | |||
| 4,5 | JP Morgan Chase Commercial | |||||||
| Mortgage Securities | ||||||||
| Trust 2010-C1 | 4.608% | 6/15/43 | 5,618 | 5,754 | 0.0% | |||
| 4,5 | JP Morgan Chase Commercial | |||||||
| Mortgage Securities | ||||||||
| Trust 2010-C2 | 4.070%–5.640% | 11/15/43 | 6,237 | 6,327 | 0.0% | |||
| 4,5 | JP Morgan Chase Commercial | |||||||
| Mortgage Securities | ||||||||
| Trust 2011-C3 | 4.717% | 2/15/46 | 7,525 | 7,755 | 0.0% | |||
| 4,5 | JP Morgan Chase Commercial | |||||||
| Mortgage Securities | ||||||||
| Trust 2011-C5 | 5.405% | 8/15/46 | 4,000 | 4,188 | 0.0% | |||
| 57 | ||||||||
| Intermediate-Term Investment-Grade Fund | ||||||||
| Face | Market | Percentage | ||||||
| Maturity | Amount | Value • | of Net | |||||
| Coupon | Date | ($000) | ($000) | Assets | ||||
| 4,5 | JP Morgan Chase Commercial | |||||||
| Mortgage Securities | ||||||||
| Trust 2011-RR1 | 4.717% | 3/16/46 | 920 | 941 | 0.0% | |||
| 4 | JP Morgan Chase Commercial | |||||||
| Mortgage Securities | ||||||||
| Trust 2012-C6 | 3.507% | 5/15/45 | 3,807 | 3,815 | 0.0% | |||
| 4,5 | JP Morgan Chase Commercial | |||||||
| Mortgage Securities | ||||||||
| Trust 2012-C8 | 2.829%–3.424% | 10/15/45 | 27,359 | 26,942 | 0.1% | |||
| 4 | JP Morgan Chase Commercial | |||||||
| Mortgage Securities | ||||||||
| Trust 2012-CIBX | 4.271% | 6/15/45 | 1,350 | 1,374 | 0.0% | |||
| 4,5 | JP Morgan Chase Commercial | |||||||
| Mortgage Securities | ||||||||
| Trust 2012-HSBC | 3.093% | 7/5/32 | 5,972 | 5,911 | 0.0% | |||
| 4 | JP Morgan Chase Commercial | |||||||
| Mortgage Securities | ||||||||
| Trust 2012-LC9 | 2.840% | 12/15/47 | 4,670 | 4,557 | 0.0% | |||
| 4 | JP Morgan Chase Commercial | |||||||
| Mortgage Securities | ||||||||
| Trust 2013-C13 | 3.994%–4.004% | 1/15/46 | 2,873 | 2,841 | 0.0% | |||
| 4 | JP Morgan Chase Commercial | |||||||
| Mortgage Securities | ||||||||
| Trust 2013-C16 | 3.674%–5.010% | 12/15/46 | 34,771 | 35,733 | 0.1% | |||
| 4 | JP Morgan Chase Commercial | |||||||
| Mortgage Securities | �� | |||||||
| Trust 2013-LC11 | 2.960% | 4/15/46 | 10,979 | 10,737 | 0.1% | |||
| 4 | JP Morgan Chase Commercial | |||||||
| Mortgage Securities | ||||||||
| Trust 2014-C20 | 3.461% | 7/15/47 | 12,380 | 12,437 | 0.1% | |||
| 4 | JP Morgan Chase Commercial | |||||||
| Mortgage Securities | ||||||||
| Trust 2016-JP3 | 2.870% | 8/15/49 | 40 | 38 | 0.0% | |||
| 4 | JP Morgan Chase Commercial | |||||||
| Mortgage Securities | ||||||||
| Trust 2016-JP4 | 3.648% | 12/15/49 | 9,670 | 9,526 | 0.0% | |||
| 4 | JP Morgan Chase Commercial | |||||||
| Mortgage Securities | ||||||||
| Trust 2017-JP6 | 3.490% | 7/15/50 | 4,100 | 4,009 | 0.0% | |||
| 4 | JPMCC Commercial Mortgage | |||||||
| Securities Trust 2017-JP5 | 3.723% | 3/15/50 | 11,590 | 11,476 | 0.1% | |||
| 4 | JPMCC Commercial Mortgage | |||||||
| Securities Trust 2017-JP7 | 3.454% | 9/15/50 | 4,660 | 4,540 | 0.0% | |||
| 4 | Morgan Stanley Capital I | |||||||
| Trust 2012-C4 | 3.244%–3.773% | 3/15/45 | 4,700 | 4,677 | 0.0% | |||
| 4,5 | Morgan Stanley Capital I | |||||||
| Trust 2012-STAR | 3.201% | 8/5/34 | 6,407 | 6,314 | 0.0% | |||
| 4,5 | Morgan Stanley Capital I | |||||||
| Trust 2014-150E | 3.912% | 9/9/32 | 6,370 | 6,429 | 0.0% | |||
| 4,5 | Morgan Stanley Capital I | |||||||
| Trust 2014-CPT | 3.350% | 7/13/29 | 2,795 | 2,795 | 0.0% | |||
| 4,5 | Morgan Stanley Capital I | |||||||
| Trust 2015-420 | 3.727% | 10/12/50 | 4,430 | 4,385 | 0.0% | |||
| 58 | ||||||||
| Intermediate-Term Investment-Grade Fund | |||||||
| Face | Market | Percentage | |||||
| Maturity | Amount | Value • | of Net | ||||
| Coupon | Date | ($000) | ($000) | Assets | |||
| 4 | Morgan Stanley Capital I | ||||||
| Trust 2015-UBS8 | 3.809%–4.589% | 12/15/48 | 51,895 | 51,925 | 0.2% | ||
| 4 | Morgan Stanley Capital I | ||||||
| Trust 2016-UB11 | 2.782% | 8/15/49 | 21,780 | 20,314 | 0.1% | ||
| 4 | Morgan Stanley Capital I | ||||||
| Trust 2016-UBS9 | 3.594% | 3/15/49 | 7,410 | 7,325 | 0.0% | ||
| 4 | Morgan Stanley Capital I | ||||||
| Trust 2017-HR2 | 3.509%–3.587% | 12/15/50 | 6,286 | 6,190 | 0.0% | ||
| 4 | Santander Drive | ||||||
| Auto Receivables | |||||||
| Trust 2015-3 | 3.490% | 5/17/21 | 5,160 | 5,191 | 0.0% | ||
| 4 | Santander Drive Auto | ||||||
| Receivables Trust 2016-1 | 2.470% | 12/15/20 | 3,476 | 3,475 | 0.0% | ||
| 4 | Santander Drive Auto | ||||||
| Receivables Trust | |||||||
| 2016-2 | 2.080%–3.390% | 2/16/21–4/15/22 | 4,775 | 4,765 | 0.0% | ||
| 4 | Santander Drive Auto | ||||||
| Receivables Trust 2016-3 | 2.460% | 3/15/22 | 9,330 | 9,243 | 0.0% | ||
| 4 | Santander Drive Auto | ||||||
| Receivables Trust | |||||||
| 2017-3 | 1.870%–2.760% | 6/15/21–12/15/22 | 11,970 | 11,877 | 0.1% | ||
| 4 | Santander Drive Auto | ||||||
| Receivables Trust | |||||||
| 2018-1 | 2.100%–3.320% | 11/16/20–3/15/24 | 44,715 | 44,299 | 0.2% | ||
| 4 | Santander Drive Auto | ||||||
| Receivables Trust | |||||||
| 2018-3 | 3.290%–4.070% | 10/17/22–8/15/24 | 35,200 | 35,171 | 0.1% | ||
| 5,8 | Asset-Backed/Commercial | ||||||
| Mortgage-Backed Securities—Other † | 4,575,744 | 15.8% | |||||
| Total Asset-Backed/Commercial Mortgage-Backed Securities | |||||||
| (Cost $5,564,876) | 5,464,867 | 18.8% | |||||
| Corporate Bonds | |||||||
| Finance | |||||||
| Banking | |||||||
| Banco Santander SA | 4.379% | 4/12/28 | 4,415 | 4,309 | 0.0% | ||
| 4 | Bank of America Corp. | 3.824% | 1/20/28 | 73,730 | 71,823 | 0.2% | |
| 4 | Bank of America Corp. | 3.093% | 10/1/25 | 72,895 | 69,175 | 0.2% | |
| 4 | Bank of America | ||||||
| Corp. | 2.328%–4.125% | 7/21/21–1/23/26 | 248,110 | 243,363 | 0.8% | ||
| 5 | Banque Federative du | ||||||
| Credit Mutuel SA | 3.750% | 7/20/23 | 80,400 | 79,975 | 0.3% | ||
| Cooperatieve Rabobank UA | 4.625% | 12/1/23 | 95,134 | 96,055 | 0.3% | ||
| Goldman Sachs Group Inc. | 3.750% | 5/22/25 | 95,297 | 93,275 | 0.3% | ||
| 4 | Goldman Sachs Group Inc. | 3.272% | 9/29/25 | 92,815 | 89,020 | 0.3% | |
| 4 | Goldman Sachs Group | ||||||
| Inc. | 2.300%–5.750% | 12/13/19–4/23/29 | 428,290 | 422,466 | 1.5% | ||
| HSBC Bank USA NA | 4.875% | 8/24/20 | 24,478 | 25,206 | 0.1% | ||
| 4 | HSBC Holdings plc | 4.041% | 3/13/28 | 108,759 | 107,054 | 0.4% | |
| 4 | HSBC Holdings plc | 4.583% | 6/19/29 | 90,775 | 92,020 | 0.3% | |
| 4,9,10,11 HSBC Holdings plc | 2.175%– 6.500% | 3/30/22–9/23/66 | 307,135 | 310,481 | 1.1% | ||
| 4 | JPMorgan Chase & Co. | 3.220% | 3/1/25 | 80,536 | 77,907 | 0.3% | |
| 59 | |||||||
| Intermediate-Term Investment-Grade Fund | |||||||
| Face | Market | Percentage | |||||
| Maturity | Amount | Value • | of Net | ||||
| Coupon | Date | ($000) | ($000) | Assets | |||
| 4 | JPMorgan Chase & | ||||||
| Co. | 2.550%–4.500% | 10/29/20–7/24/38 | 438,418 | 427,702 | 1.5% | ||
| Mitsubishi UFJ Financial | |||||||
| Group Inc. | 3.761% | 7/26/23 | 79,890 | 79,936 | 0.3% | ||
| Mitsubishi UFJ Financial | |||||||
| Group Inc. | 2.190%–3.777% | 3/1/21–2/22/27 | 252,388 | 246,911 | 0.8% | ||
| 5 | Mitsubishi UFJ Trust & | ||||||
| Banking Corp. | 2.450%–2.650% | 10/16/19–10/19/20 | 47,640 | 47,077 | 0.2% | ||
| 4,7 | Morgan Stanley | 2.500%–7.300% | 5/13/19–7/22/28 | 444,355 | 439,807 | 1.5% | |
| MUFG Americas | |||||||
| Holdings Corp. | 2.250%–3.500% | 2/10/20–2/10/25 | 37,291 | 36,611 | 0.1% | ||
| 5 | MUFG Bank Ltd. | 2.300%–2.850% | 3/5/20–9/8/21 | 64,541 | 63,293 | 0.2% | |
| Santander Holdings | |||||||
| USA Inc. | 3.400%–4.400% | 3/28/22–7/13/27 | 79,853 | 77,814 | 0.3% | ||
| 5 | Santander UK Group | ||||||
| Holdings plc | 4.750% | 9/15/25 | 17,061 | 16,827 | 0.1% | ||
| Santander UK plc | 2.500%–4.000% | 3/14/19–3/13/24 | 10,686 | 10,754 | 0.0% | ||
| 4,5 | UBS Group Funding | ||||||
| Switzerland AG | 2.859% | 8/15/23 | 77,400 | 74,340 | 0.2% | ||
| 5,8 | Banking—Other † | 2,800,308 | 9.7% | ||||
| 5,8 | Brokerage † | 346,662 | 1.2% | ||||
| Finance Companies | |||||||
| GE Capital International | |||||||
| Funding Co. Unlimited Co. | 3.373% | 11/15/25 | 101,896 | 97,952 | 0.3% | ||
| GE Capital International | |||||||
| Funding Co. | |||||||
| Unlimited Co. | 2.342%–4.418% | 11/15/20–11/15/35 | 29,383 | 28,690 | 0.1% | ||
| 5 | Insurance † | 1,180,962 | 4.1% | ||||
| 5 | Real Estate Investment Trusts † | 856,414 | 3.0% | ||||
| 8,614,189 | 29.7% | ||||||
| Industrial | |||||||
| Basic Industry | |||||||
| 5 | Chevron Phillips Chemical Co. | ||||||
| LLC / Chevron Phillips | |||||||
| Chemical Co. LP | 3.700% | 6/1/28 | 80,881 | 79,309 | 0.3% | ||
| 5 | Basic Industry—Other † | 118,652 | 0.4% | ||||
| Capital Goods | |||||||
| General Electric Co. | 6.750% | 3/15/32 | 89,920 | 110,975 | 0.4% | ||
| 12 | General Electric Co. | 2.125%–4.500% | 9/7/22–3/11/44 | 183,846 | 185,721 | 0.6% | |
| 5 | Capital Goods—Other † | 366,218 | 1.3% | ||||
| Communication | |||||||
| Comcast Cable Communications | |||||||
| Holdings Inc. | 9.455% | 11/15/22 | 9,966 | 12,220 | 0.0% | ||
| Comcast Corp. | 3.375% | 8/15/25 | 99,453 | 95,910 | 0.3% | ||
| Comcast Corp. | 2.350%–3.600% | 2/1/24–2/15/28 | 203,609 | 193,948 | 0.7% | ||
| NBCUniversal Media | |||||||
| LLC | 2.875%–4.375% | 4/1/21–1/15/23 | 59,067 | 57,961 | 0.2% | ||
| 5 | Communication—Other † | 434,720 | 1.5% | ||||
| Consumer Cyclical | |||||||
| 5 | BMW US Capital LLC | 3.450% | 4/12/23 | 82,500 | 81,448 | 0.3% | |
| General Motors Co. | 4.200%–4.875% | 10/2/23–10/1/27 | 14,720 | 14,426 | 0.1% | ||
| 60 | |||||||
| Intermediate-Term Investment-Grade Fund | ||||||
| Face | Market | Percentage | ||||
| Maturity | Amount | Value • | of Net | |||
| Coupon | Date | ($000) | ($000) | Assets | ||
| General Motors Financial | ||||||
| Co. Inc. | 3.500%–5.250% | 9/25/21–1/17/27 | 125,499 | 123,930 | 0.4% | |
| Visa Inc. | 3.150% | 12/14/25 | 98,722 | 96,031 | 0.3% | |
| Walmart Inc. | 3.700% | 6/26/28 | 75,000 | 75,619 | 0.3% | |
| 5 | Consumer Cyclical—Other † | 764,704 | 2.6% | |||
| Consumer Noncyclical | ||||||
| Anheuser-Busch InBev | ||||||
| Finance Inc. | 3.650% | 2/1/26 | 170,090 | 167,025 | 0.6% | |
| Anheuser-Busch InBev | ||||||
| Finance Inc. | 3.300% | 2/1/23 | 105,460 | 104,771 | 0.4% | |
| Anheuser-Busch InBev | ||||||
| Finance Inc. | 2.625%–3.700% | 1/17/23–2/1/24 | 34,210 | 33,600 | 0.1% | |
| 12 | Anheuser-Busch InBev SA/NV 3.250% | 1/24/33 | 600 | 810 | 0.0% | |
| Anheuser-Busch InBev | ||||||
| Worldwide Inc. | 2.500%– 6.875% | 11/15/19–4/13/28 | 69,795 | 69,620 | 0.2% | |
| Campbell Soup Co. | 4.150% | 3/15/28 | 75,925 | 72,664 | 0.2% | |
| CVS Health Corp. | 4.300% | 3/25/28 | 87,500 | 87,185 | 0.3% | |
| Gilead Sciences Inc. | 3.700% | 4/1/24 | 139,860 | 140,082 | 0.5% | |
| Gilead Sciences Inc. | 3.500% | 2/1/25 | 82,807 | 81,812 | 0.3% | |
| Medtronic Inc. | 3.500% | 3/15/25 | 125,341 | 124,826 | 0.4% | |
| 5 | Consumer Noncyclical—Other † | 750,740 | 2.6% | |||
| Energy | ||||||
| Baker Hughes a GE Co. | ||||||
| LLC / Baker Hughes | ||||||
| Co-Obligor Inc. | 3.337% | 12/15/27 | 92,255 | 87,029 | 0.3% | |
| BP Capital Markets plc | 2.500%–3.994% | 9/19/22–9/19/27 | 328,743 | 321,960 | 1.1% | |
| ConocoPhillips Co. | 4.950% | 3/15/26 | 80,532 | 86,387 | 0.3% | |
| EQT Corp. | 3.900% | 10/1/27 | 82,950 | 78,348 | 0.3% | |
| 5 | Energy—Other † | 930,137 | 3.2% | |||
| 5 | Other Industrial † | 99,614 | 0.3% | |||
| Technology | ||||||
| Apple Inc. | 3.250% | 2/23/26 | 78,151 | 76,761 | 0.3% | |
| Apple Inc. | 2.150%–3.450% | 2/9/22–9/12/27 | 473,934 | 459,337 | 1.6% | |
| Microsoft Corp. | 3.300% | 2/6/27 | 74,356 | 73,595 | 0.3% | |
| Oracle Corp. | 2.400%–3.400% | 7/8/21–11/15/27 | 337,165 | 325,695 | 1.1% | |
| QUALCOMM Inc. | 2.900% | 5/20/24 | 95,587 | 90,770 | 0.3% | |
| 5 | Technology—Other † | 704,164 | 2.4% | |||
| Transportation | ||||||
| Delta Air Lines Inc. | 4.375% | 4/19/28 | 125,440 | 121,618 | 0.4% | |
| 5 | Transportation—Other † | 513,719 | 1.8% | |||
| 8,414,061 | 29.0% | |||||
| Utilities | ||||||
| 5 | Electric † | 1,111,264 | 3.9% | |||
| 5 | Natural Gas † | 57,678 | 0.2% | |||
| Other Utility † | 6,719 | 0.0% | ||||
| 1,175,661 | 4.1% | |||||
| Total Corporate Bonds (Cost $18,643,842) | 18,203,911 | 62.8% | ||||
| Sovereign Bonds | ||||||
| Kingdom of Saudi Arabia | 2.375% | 10/26/21 | 88,577 | 85,181 | 0.3% | |
| 5,12 Kingdom of Spain | 2.700% | 10/31/48 | 68,677 | 83,902 | 0.3% | |
| Petroleos Mexicanos | 5.500% | 1/21/21 | 171,586 | 176,327 | 0.6% | |
| 61 | ||||||
| Intermediate-Term Investment-Grade Fund | |||||||
| Face | Market | Percentage | |||||
| Maturity | Amount | Value • | of Net | ||||
| Coupon | Date | ($000) | ($000) | Assets | |||
| Petroleos Mexicanos | 5.625%–8.000% | 5/3/19–9/21/47 | 106,188 | 108,052 | 0.4% | ||
| Republic of Hungary | 6.250% | 1/29/20 | 69,735 | 72,955 | 0.3% | ||
| Republic of Indonesia | 3.750% | 4/25/22 | 87,908 | 87,725 | 0.3% | ||
| 13 | United Mexican States | 8.000% | 12/7/23 | 2,500,000 | 135,613 | 0.5% | |
| 13 | United Mexican States | 10.000% | 12/5/24 | 152,000 | 9,064 | 0.0% | |
| 5 | Sovereign Bonds—Other † | 1,402,935 | 4.8% | ||||
| Total Sovereign Bonds (Cost $2,189,681) | 2,161,754 | 7.5% | |||||
| Taxable Municipal Bonds (Cost $ 36,260) † | 36,345 | 0.1% | |||||
| Shares | |||||||
| 8Convertible Preferred Stocks (Cost $8,571) † | 8,740 | — | 0.0% | ||||
| Temporary Cash Investment | |||||||
| Money Market Fund | |||||||
| 14 | Vanguard Market Liquidity Fund | ||||||
| (Cost $274,970) | 2.145% | 2,749,726 | 274,973 | 0.9% | |||
| Notional | |||||||
| Amount on | |||||||
| Underlying | |||||||
| Expiration | Exercise | Swap | |||||
| Counterparty | Date | Rate | ($000) | ||||
| Options Purchased | |||||||
| Credit Default Swaptions Purchased | |||||||
| Put Swaptions on | |||||||
| CDX-NA-IG-S30-V1 | |||||||
| 5-Year Index | |||||||
| (Cost $131) | JPMC | 8/15/18 | 65.00% | 154,995 | 28 | 0.0% | |
| Total Investments (Cost $29,668,782) | 29,026,630 | 100.1% | |||||
| Liability for Options Written | |||||||
| Written Swaptions on Credit Default Index | |||||||
| Call Swaptions on | |||||||
| CDX-NA-IG-S30-V1 | |||||||
| 5-Year Index | GSI | 8/15/18 | 67.50% | 61,870 | (251) | 0.0% | |
| Put Swaptions on | |||||||
| CDX-NA-HY-S30-V1 | |||||||
| 5-Year Index | GSI | 8/15/18 | 72.50% | 61,870 | (2) | 0.0% | |
| Put Swaptions on | |||||||
| CDX-NA-IG-S30-V1 | |||||||
| 5-Year Index | JPMC | 9/19/18 | 75.00% | 154,995 | (51) | 0.0% | |
| Total Liability for Options Written (Premiums Received $326) | (304) | 0.0% | |||||
62
Intermediate-Term Investment-Grade Fund
| Percentage | ||
| Amount | of Net | |
| ($000) | Assetd | |
| Other Assets and Liabilities | ||
| Other Assets | ||
| Investment in Vanguard | 1,540 | |
| Receivables for Investment Securities Sold | 135,327 | |
| Receivables for Accrued Income | 230,515 | |
| Receivables for Capital Shares Issued | 22,270 | |
| Variation Margin Receivable—Futures Contracts | 5,287 | |
| Variation Margin Receivable—CC Swap Contracts | 30 | |
| Unrealized Appreciation—Forward Currency Contracts | 1,068 | |
| Unrealized Appreciation—OTC Swap Contracts | 3,191 | |
| Other Assets | 8,793 | |
| Total Other Assets | 408,021 | 1.4% |
| Other Liabilities | ||
| Payables for Investment Securities Purchased | (381,669) | |
| Payables for Capital Shares Redeemed | (22,522) | |
| Payables for Distributions | (10,977) | |
| Payables to Vanguard | (13,960) | |
| Variation Margin Payable—Futures Contracts | (2,751) | |
| Variation Margin Payable—CC Swap Contracts | (218) | |
| Unrealized Depreciation—Forward Currency Contracts | (4,661) | |
| Unrealized Depreciation—OTC Swap Contracts | (6,347) | |
| Other Liabilities | (133) | |
| Total Other Liabilities | (443,238) | (1.5%) |
| Net Assets | 28,991,109 | 100.0% |
| At July 31, 2018, net assets consisted of: | |
| Amount | |
| ($000) | |
| Paid-in Capital | 29,971,489 |
| Undistributed Net Investment Income | 13,523 |
| Accumulated Net Realized Losses | (350,771) |
| Unrealized Appreciation (Depreciation) | |
| Investment Securities | (642,049) |
| Futures Contracts | 6,557 |
| Options15 | (81) |
| Swap Contracts | (3,963) |
| Forward Currency Contracts | (3,593) |
| Foreign Currencies | (3) |
| Net Assets | 28,991,109 |
63
Intermediate-Term Investment-Grade Fund
| Amount | |
| ($000) | |
| Investor Shares—Net Assets | |
| Applicable to 231,381,185 outstanding $.001 par value shares of | |
| beneficial interest (unlimited authorization) | 2,174,199 |
| Net Asset Value Per Share—Investor Shares | $9.40 |
| Admiral Shares—Net Assets | |
| Applicable to 2,853,887,277 outstanding $.001 par value shares of | |
| beneficial interest (unlimited authorization) | 26,816,910 |
| Net Asset Value Per Share—Admiral Shares | $9.40 |
• See Note A in Notes to Financial Statements.
† Represents the aggregate value, by category, of securities that are not among the 50 largest holdings and, in total for any issuer,
represent 1% or less of net assets.
1 Securities with a value of $5,774,000 have been segregated as collateral for open forward currency contracts and open
over-the-counter swap contracts
2 Securities with a value of $14,394,000 have been segregated as initial margin for open cleared swap contracts.
3 Securities with a value of $50,077,000 have been segregated as initial margin for open futures contracts.
4 The average or expected maturity is shorter than the final maturity shown because of the possibility of interim principal payments
and prepayments or the possibility of the issue being called.
5 Certain of the fund’s securities are exempt from registration under Rule 144A of the Securities Act of 1933. Such securities may
be sold in transactions exempt from registration, normally to qualified institutional buyers. At July 31, 2018, the aggregate value
of these securities was $4,907,551,000, representing 16.9% of net assets.
6 Adjustable-rate security based upon 1-month USD LIBOR plus spread.
7 Adjustable-rate security based upon 3-month USD LIBOR plus spread.
8 Certain of the fund’s securities are valued using significant unobservable inputs.
9 Face amount denominated in Australian dollars.
10 Adjustable-rate security based upon 3-month AUD Australian Bank Bill Rate plus spread.
11 Face amount denominated in British pounds.
12 Face amount denominated in euro.
13 Face amount denominated in Mexican peso.
14 Affiliated money market fund available only to Vanguard funds and certain trusts and accounts managed by Vanguard. Rate shown
is the 7-day yield.
15 Unrealized appreciation (depreciation) on open credit default swaptions is generally treated the same for financial reporting and
tax purposes.
CC—centrally cleared.
GSI—Goldman Sachs International.
JPMC—JP Morgan Chase Bank.
OTC—over-the-counter.
64
Intermediate-Term Investment-Grade Fund
| Derivative Financial Instruments Outstanding as of Period End | ||||
| Futures Contracts | ||||
| ($000) | ||||
| Value and | ||||
| Number of | Unrealized | |||
| Long (Short) | Notional | Appreciation | ||
| Expiration | Contracts | Amount | (Depreciation) | |
| Long Futures Contracts | ||||
| 10-Year U.S. Treasury Note | September 2018 | 29,005 | 3,463,831 | 3,078 |
| Ultra 10-Year U.S. Treasury Note | September 2018 | 8,392 | 1,066,702 | (4,726) |
| 5-Year U.S. Treasury Note | September 2018 | 7,090 | 802,056 | (2,544) |
| Euro-Bobl | September 2018 | 2 | 308 | — |
| (4,192) | ||||
| Short Futures Contracts | ||||
| 2-Year U.S. Treasury Note | September 2018 | (9,035) | (1,909,773) | 7,796 |
| Euro-Buxl | September 2018 | (721) | (148,050) | (1,194) |
| Euro-Bund | September 2018 | (760) | (143,598) | 40 |
| 30-Year U.S. Treasury Bond | September 2018 | (1,352) | (193,294) | 2,589 |
| Ultra Long U.S. Treasury Bond | September 2018 | (1,052) | (165,065) | 1,673 |
| AUD 3-Year Treasury Bond | September 2018 | (411) | (33,971) | (57) |
| Long Gilt | September 2018 | (315) | (50,723) | 66 |
| AUD 10-Year Treasury Bond | September 2018 | (242) | (23,231) | (164) |
| 10,749 | ||||
| 6,557 | ||||
Unrealized appreciation (depreciation) on open futures contracts, except for AUD 3-Year Treasury Bond and AUD 10-Year Treasury Bond, is required to be treated as realized gain (loss) for tax purposes. Unrealized appreciation (depreciation) for AUD 3-Year Treasury Bond and AUD 10-Year Treasury Bond futures contracts are generally treated the same for financial reporting and tax purposes.
| Forward Currency Contracts | ||||||
| Unrealized | ||||||
| Contract | Appreciation | |||||
| Settlement | Contract Amount (000) | (Depreciation) | ||||
| Counterparty | Date | Receive | Deliver | ($000) | ||
| Toronto-Dominion Bank | 8/15/18 | AUD | 216,954 | USD | 160,763 | 437 |
| JPMorgan Chase Bank, N.A. | 8/15/18 | EUR | 7,037 | USD | 8,176 | 63 |
| Deutsche Bank AG | 8/15/18 | EUR | 6,315 | USD | 7,388 | 5 |
| Citibank, N.A. | 8/15/18 | EUR | 6,100 | USD | 7,137 | 4 |
| Citibank, N.A. | 8/15/18 | EUR | 5,863 | USD | 6,879 | (15) |
| Deutsche Bank AG | 8/15/18 | EUR | 3,007 | USD | 3,522 | (2) |
65
Intermediate-Term Investment-Grade Fund
| Forward Currency Contracts (continued) | ||||||
| Unrealized | ||||||
| Contract | Appreciation | |||||
| Settlement | Contract Amount (000) | (Depreciation) | ||||
| Counterparty | Date | Receive | Deliver | ($000) | ||
| Citibank, N.A. | 8/15/18 | USD | 340,303 | EUR | 290,811 | (164) |
| Toronto-Dominion Bank | 11/15/18 | USD | 160,836 | AUD | 216,954 | (446) |
| JPMorgan Chase Bank, N.A. | 8/15/18 | USD | 136,585 | AUD | 185,143 | (979) |
| Toronto-Dominion Bank | 8/15/18 | USD | 92,196 | MXN | 1,756,093 | (1,771) |
| Goldman Sachs Bank AG | 8/15/18 | USD | 76,494 | GBP | 57,824 | 546 |
| Bank of America, N.A. | 8/15/18 | USD | 24,928 | MXN | 472,850 | (374) |
| Goldman Sachs Bank AG | 8/15/18 | USD | 24,884 | AUD | 33,699 | (155) |
| Barclays Capital | 8/15/18 | USD | 16,747 | MXN | 322,873 | (530) |
| Citibank, N.A. | 8/15/18 | USD | 8,959 | MXN | 171,571 | (222) |
| BNP Paribas | 8/15/18 | USD | 5,652 | EUR | 4,819 | 10 |
| Bank of America, N.A. | 8/15/18 | USD | 2,669 | EUR | 2,278 | 2 |
| JPMorgan Chase Bank, N.A. | 8/15/18 | USD | 1,162 | EUR | 995 | (3) |
| JPMorgan Chase Bank, N.A. | 8/15/18 | USD | 829 | EUR | 707 | 1 |
| (3,593) | ||||||
| AUD—Australian dollar. | ||||||
| EUR—euro. | ||||||
| GBP—British pound. | ||||||
| MXN—Mexican peso. | ||||||
| USD—U.S. dollar. | ||||||
Unrealized appreciation (depreciation) on open forward currency contracts is treated as ordinary income for tax purposes.
| Centrally Cleared Credit Default Swaps | |||||
| Periodic | |||||
| Premium | Unrealized | ||||
| Received | Appreciation | ||||
| Termination | Notional Amount | (Paid)1 | Value | (Depreciation) | |
| Reference Entity | Date | (000) | (%) | ($000) | ($000) |
| Credit Protection Sold | |||||
| CDX-NA-IG-S30-V1 | 6/20/23 | USD 43,330 | 1.000 | 819 | 84 |
| Credit Protection Purchased | |||||
| iTraxx Europe-S29-V1 | 6/20/23 | EUR 70,000 | (1.000) | (1,546) | (146) |
| (727) | (62) | ||||
| 1 Periodic premium received/paid quarterly. | |||||
| EUR—euro. | |||||
| USD—U.S. dollar. | |||||
66
| Intermediate-Term Investment-Grade Fund | |||||||
| Over-the-Counter Credit Default Swaps | |||||||
| Remaining | |||||||
| Periodic | Up-Front | ||||||
| Premium | Premium | Unrealized | |||||
| Notional | Received | Received | Appreciation | ||||
| Termination | Amount | (Paid) | Value | (Paid) | (Depreciation) | ||
| Reference Entity | Date | Counterparty | ($000) | (%) | ($000) | ($000) | ($000) |
| Credit Protection Sold/Moody’s Rating | |||||||
| America Movil /A3 | 12/20/22 | BARC | 15,000 | 1.0002 | (114) | 127 | 13 |
| Berkshire Hathaway | |||||||
| Inc./Aa2 | 6/20/21 | GSI | 3,110 | 1.0002 | 58 | (14) | 44 |
| Berkshire Hathaway | |||||||
| Inc./Aa2 | 6/20/21 | JPMC | 15,000 | 1.0002 | 280 | 12 | 292 |
| Berkshire Hathaway | |||||||
| Inc./Aa2 | 6/20/21 | JPMC | 4,655 | 1.0002 | 87 | (13) | 74 |
| Berkshire Hathaway | |||||||
| Inc. /Aa2 | 6/20/22 | BARC | 15,760 | 1.000 2 | 325 | (209) | 116 |
| Berkshire Hathaway | |||||||
| Inc./Aa2 | 12/20/22 | BARC | 7,605 | 1.0002 | 159 | (114) | 45 |
| Berkshire Hathaway | |||||||
| Inc./Aa2 | 6/20/24 | BARC | 19,400 | 1.0002 | 303 | (210) | 93 |
| Berkshire Hathaway | |||||||
| Inc./Aa2 | 6/20/24 | JPMC | 9,400 | 1.0002 | 147 | (86) | 61 |
| Federative Republic | |||||||
| of Brazil/Ba2 | 9/20/18 | BNPSW | 21,500 | 1.0002 | 12 | (15) | (3) |
| International Lease | |||||||
| Finance Corp. /Baa3 | 6/20/22 | BARC | 7,000 | 1.000 2 | 71 | (3) | 68 |
| Intesa Sanpaolo | |||||||
| SpA/Baa1 | 6/20/23 | CITNA | 13,9001 | 1.0002 | (322) | 296 | (26) |
| Metlife Inc./A3 | 12/20/20 | GSCM | 5,625 | 1.0002 | 94 | — | 94 |
| Metlife Inc./A3 | 12/20/21 | BARC | 3,165 | 1.0002 | 62 | (4) | 58 |
| Metlife Inc./A3 | 6/20/24 | BARC | 24,300 | 1.0002 | 280 | (26) | 254 |
| Ministry of Finance | |||||||
| Malaysia/A3 | 6/20/23 | BARC | 10,000 | 1.0002 | 70 | 13 | 83 |
| Ministry of Finance | |||||||
| Malaysia/A3 | 6/20/23 | CITNA | 5,250 | 1.0002 | 37 | 23 | 60 |
| People’s Republic of | |||||||
| China/A3 | 6/20/22 | BNPSW | 22,800 | 1.0002 | 445 | (154) | 291 |
| People’s Republic of | |||||||
| China/A3 | 6/20/23 | BARC | 10,500 | 1.0002 | 195 | (146) | 49 |
| People’s Republic of | |||||||
| China/A3 | 6/20/23 | GSI | 20,300 | 1.0002 | 377 | (327) | 50 |
| Republic of Chile/Aa3 | 6/20/23 | BOANA | 3,300 | 1.0002 | 75 | (72) | 3 |
| Republic of Chile/Aa3 | 6/20/23 | CITNA | 4,700 | 1.0002 | 106 | (100) | 6 |
| Republic of | |||||||
| Indonesia/Baa2 | 6/20/23 | BNPSW | 45,560 | 1.000 2 | (266) | 50 | (216) |
| Republic of Peru/A3 | 6/20/23 | BNPSW | 4,745 | 1.0002 | 45 | (37) | 8 |
67
| Intermediate-Term Investment-Grade Fund | |||||||
| Over-the-Counter Credit Default Swaps (continued) | |||||||
| Remaining | |||||||
| Periodic | Up-Front | ||||||
| Premium | Premium | Unrealized | |||||
| Notional | Received | Received | Appreciation | ||||
| Termination | Amount | (Paid) | Value | (Paid) (Depreciation) | |||
| Reference Entity | Date | Counterparty | ($000) | (%) | ($000) | ($000) | ($000) |
| Credit Protection Sold/Moody’s Rating | |||||||
| Republic of Peru/A3 | 6/20/23 | HSBCC | 4,745 | 1.0002 | 45 | (37) | 8 |
| Saudi Arabia/A1 | 6/20/23 | MSCS | 47,500 | 1.0002 | 313 | (404) | (91) |
| Southern Co. /Baa2 | 6/20/22 | JPMC | 59,775 | 1.000 2 | 1,122 | (786) | 336 |
| United Mexican | |||||||
| States/A3 | 6/20/23 | BARC | 8,275 | 1.0002 | (55) | 59 | 4 |
| United Mexican | |||||||
| States/A3 | 6/20/23 | GSI | 23,000 | 1.0002 | (154) | 173 | 19 |
| Verizon Communications | |||||||
| Inc./Baa1 | 12/20/22 | GSI | 15,585 | 1.0002 | 293 | (237) | 56 |
| 4,090 | (2,241) | 1,849 | |||||
| Credit Protection Purchased | |||||||
| American International | |||||||
| Group Inc. | 12/20/20 | GSCM | 5,625 | (1.000)2 | (97) | 61 | (36) |
| American International | |||||||
| Group Inc. | 12/20/20 | GSCM | 2,835 | (1.000)2 | (49) | (21) | (70) |
| Banco Bilbao Vizcaya | |||||||
| Argentaria SA | 6/20/21 | BOANA | 24,495 | (1.000)2 | (390) | (429) | (819) |
| Bank of America Corp. | 3/20/20 | GSCM | 7,870 | (1.000)2 | (99) | 41 | (58) |
| Bank of China Ltd. | 12/20/21 | BNPSW | 6,200 | (1.000)2 | (107) | (15) | (122) |
| Bank of China Ltd. | 6/20/22 | BNPSW | 22,800 | (1.000)2 | (373) | 3 | (370) |
| Barclays Bank plc | 6/20/22 | BOANA | 15,1951 | (1.000)2 | (358) | 252 | (106) |
| Barclays Bank plc | 6/20/22 | CSFBI | 15,1901 | (1.000)2 | (358) | 257 | (101) |
| Barclays Bank plc | 12/20/22 | CITNA | 6,1301 | (1.000)2 | 232 | (225) | 7 |
| CECONOMY AG | 6/20/22 | BARC | 10,4851 | (1.000)2 | (125) | (23) | (148) |
| CECONOMY AG | 6/20/22 | BARC | 7,4651 | (1.000)2 | (88) | (17) | (105) |
| CECONOMY AG | 6/20/22 | BARC | 7,4651 | (1.000)2 | (89) | (12) | (101) |
| CECONOMY AG | 6/20/22 | BARC | 3,0001 | (1.000)2 | (36) | (5) | (41) |
| CECONOMY AG | 6/20/22 | BARC | 3,0001 | (1.000)2 | (35) | 2 | (33) |
| CECONOMY AG | 6/20/22 | BARC | 3,0001 | (1.000)2 | (35) | (12) | (47) |
| Commerzbank AG | 6/20/21 | BOANA | 24,495 | (1.000)2 | (384) | (267) | (651) |
| CVS Health Corp. | 12/20/21 | BARC | 3,220 | (1.000)2 | (63) | 71 | 8 |
| CVS Health Corp. | 12/20/21 | BOANA | 15,000 | (1.000)2 | (292) | 334 | 42 |
| Deutsche Bank AG | 12/20/22 | JPMC | 15,195 | (1.000)2 | 149 | 64 | 213 |
| Dominion Energy Inc. | 6/20/22 | JPMC | 7,470 | (1.000)2 | (190) | 199 | 9 |
| EI du Pont de | |||||||
| Nemours & Co. | 12/20/20 | JPMC | 10,230 | (1.000)2 | (199) | 119 | (80) |
| 68 | |||||||
| Intermediate-Term Investment-Grade Fund | |||||||
| Over-the-Counter Credit Default Swaps (continued) | |||||||
| Remaining | |||||||
| Periodic | Up-Front | ||||||
| Premium | Premium | Unrealized | |||||
| Notional | Received | Received | Appreciation | ||||
| Termination | Amount | (Paid) | Value | (Paid) | (Depreciation) | ||
| Reference Entity | Date | Counterparty | ($000) | (%) | ($000) | ($000) | ($000) |
| Credit Protection Purchased | |||||||
| Exelon Corp. | 6/20/22 | JPMC | 11,955 | (1.000)2 | (330) | 306 | (24) |
| Exelon Corp. | 6/20/22 | JPMC | 7,470 | (1.000)2 | (206) | 193 | (13) |
| Federal Express Corp. | 12/20/18 | GSCM | 7,840 | (1.000)2 | (30) | 9 | (21) |
| Federative Republic | |||||||
| of Brazil | 12/20/22 | GSI | 9,421 | (1.000)2 | 340 | (385) | (45) |
| Federative Republic | |||||||
| of Brazil | 6/20/23 | JPMC | 11,181 | (1.000)2 | 532 | (307) | 225 |
| Federative Republic | |||||||
| of Brazil | 12/20/25 | BOANA | 3,885 | (1.000) 2 | 369 | (825) | (456) |
| Federative Republic | |||||||
| of Brazil | 12/20/25 | GSCM | 2,485 | (1.000)2 | 236 | (492) | (256) |
| JPMorgan Chase | |||||||
| Bank N. A. | 12/20/20 | MSCS | 25,000 | (1.000)2 | (454) | 75 | (379) |
| Lincoln National Corp. | 6/20/21 | BARC | 10,000 | (1.000)2 | (201) | (128) | (329) |
| Lincoln National Corp. | 6/20/21 | BARC | 1,555 | (1.000)2 | (31) | (25) | (56) |
| Lincoln National Corp. | 6/20/21 | BARC | 1,550 | (1.000)2 | (31) | 25 | (6) |
| Lincoln National Corp. | 12/20/21 | BARC | 3,165 | (1.000)2 | (64) | (5) | (69) |
| McDonald’s Corp. | 6/20/22 | GSI | 12,325 | (1.000)2 | (367) | 307 | (60) |
| McKesson Corp. | 3/20/19 | JPMC | 6,360 | (1.000)2 | (37) | 29 | (8) |
| McKesson Corp. | 3/20/19 | JPMC | 6,360 | (1.000)2 | (37) | 29 | (8) |
| National Westminster | |||||||
| Bank | 12/20/20 | BNPSW | 3,255 | (1.000)2 | (41) | 13 | (28) |
| NatWest Markets | 12/20/20 | BNPSW | 3,255 | (1.000)2 | (42) | 13 | (29) |
| Republic of Colombia | 6/20/23 | GSI | 8,380 | (1.000)2 | 12 | (120) | (108) |
| Republic of Korea | 9/20/18 | JPMC | 2,000 | (1.000)2 | (3) | 1 | (2) |
| Republic of Turkey | 12/20/19 | GSCM | 26,350 | (1.000)2 | 450 | (193) | 257 |
| Republic of Turkey | 6/20/23 | GSI | 4,100 | (1.000)2 | 368 | (173) | 195 |
| Sempra Energy | 6/20/22 | JPMC | 11,955 | (1.000)2 | (308) | 297 | (11) |
| Sempra Energy | 6/20/22 | JPMC | 7,470 | (1.000)2 | (193) | 191 | (2) |
| Societe Generale SA | 12/20/21 | JPMC | 14,675 | (1.000)2 | (341) | 61 | (280) |
| Standard Chartered | |||||||
| Bank | 12/20/21 | JPMC | 7,945 | (1.000)2 | (183) | (12) | (195) |
| State of Qatar | 6/20/22 | BOANA | 1,360 | (1.000)2 | (20) | (13) | (33) |
| State of Qatar | 6/20/22 | CITNA | 2,640 | (1.000)2 | (38) | (24) | (62) |
| Telia Company AB | 6/20/23 | BARC | 11,8001 | (1.000)2 | (406) | 353 | (53) |
| Walt Disney Co. | 12/20/22 | CITNA | 6,150 | (1.000)2 | (180) | 161 | (19) |
| Walt Disney Co. | 6/20/23 | CITNA | 9,250 | (1.000)2 | (275) | 295 | 20 |
| 69 | |||||||
| Intermediate-Term Investment-Grade Fund | |||||||
| Over-the-Counter Credit Default Swaps (continued) | |||||||
| Remaining | |||||||
| Periodic | Up-Front | ||||||
| Premium | Premium | Unrealized | |||||
| Notional | Received | Received | Appreciation | ||||
| Termination | Amount | (Paid) | Value | (Paid) | (Depreciation) | ||
| Reference Entity | Date | Counterparty | ($000) | (%) | ($000) | ($000) | ($000) |
| Credit Protection Purchased | |||||||
| Walt Disney Co. | 6/20/23 | CITNA | 7,710 | (1.000)2 | (229) | 224 | (5) |
| Walt Disney Co. | 6/20/23 | CITNA | 6,170 | (1.000)2 | (183) | 193 | 10 |
| Walt Disney Co. | 6/20/23 | GSI | 31,305 | (1.000)2 | (929) | 893 | (36) |
| Wells Fargo & Co. | 9/20/20 | BOANA | 9,700 | (1.000)2 | (157) | 52 | (105) |
| (5,995) | 1,395 | (4,600) | |||||
| (2,751) | |||||||
The notional amount represents the maximum potential amount the fund could be required to pay as a seller of credit protection if the reference entity was subject to a credit event.
1 Notional amount denominated in euro.
2 Periodic premium received/paid quarterly.
BARC—Barclays Bank plc.
BNPSW—BNP Paribas.
BOANA—Bank of America, N.A.
CITNA—Citibank N.A.
CSFBI—Credit Suisse First Boston International.
GSCM—Goldman Sachs Bank USA.
GSI—Goldman Sachs International.
HSBCC—HSBC Bank USA, N.A.
JPMC—JP Morgan Chase Bank.
MSCS—Morgan Stanley Capital Services LLC.
At July 31, 2018, the counterparties had deposited in segregated accounts cash with a value of $500,000 in connection with open forward currency contracts and open over-the-counter swap contracts.
70
Intermediate-Term Investment-Grade Fund
| Centrally Cleared Interest Rate Swaps | ||||||
| Fixed | Floating | |||||
| Interest | Interest | |||||
| Rate | Rate | Unrealized | ||||
| Future | Notional | Received | Received | Appreciation | ||
| Effective | Amount | (Paid)2 | (Paid) | Value | (Depreciation) | |
| Termination Date | Date | ($000) | (%) | (%) | ($000) | ($000) |
| 9/19/19 | 9/19/181 | 71,141 | (2.000) | 0.0003 | (535) | (41) |
| 1/21/20 | N/A | 20,920 | 1.224 | (2.086)4 | (431) | (431) |
| 1/21/20 | N/A | 3,130 | 1.363 | (2.081)4 | (58) | (58) |
| 4/15/20 | N/A | 14,650 | 1.345 | (2.072)4 | (331) | (330) |
| 6/15/20 | N/A | 2,050 | .931 | (2.072)4 | (67) | (67) |
| 7/15/20 | N/A | 8,920 | 1.571 | (2.072)4 | (198) | (198) |
| 9/21/20 | 9/19/181 | 63,539 | (2.250) | 0.0003 | 848 | 95 |
| 9/20/21 | 9/19/181 | 24,607 | (2.250) | 0.0003 | 518 | 47 |
| 9/20/21 | 9/19/181 | 17,820 | (2.920) | 0.000 3 | 33 | 33 |
| 9/19/22 | 9/19/181 | 118,471 | (2.250) | 0.0003 | 3,355 | 266 |
| 9/19/23 | 9/19/181 | 17,373 | (2.250) | 0.0003 | 614 | 74 |
| 4/30/25 | 9/28/181 | 122,532 | (3.034) | 0.0003 | (214) | (215) |
| 9/19/25 | 9/19/181 | 153,362 | (2.250) | 0.0003 | 7,589 | 315 |
| 11/16/43 | 9/28/181 | 35,287 | (3.098) | 0.0003 | (234) | (235) |
| 10,889 | (745) |
1 Forward interest rate swap. In a forward interest rate swap, the fund and the counterparty agree to make periodic net payments
beginning on a specified future effective date.
2 Fixed interest payment received/paid semiannually.
3 Based on 3-month London Interbank Offered Rate (LIBOR) as of the most recent payment date. Floating interest payment received/
paid quarterly.
4 Based on 1-month London Interbank Offered Rate (LIBOR) as of the most recent payment date. Floating interest payment received/
paid monthly.
71
Intermediate-Term Investment-Grade Fund
| Over-the-Counter Interest Rate Swaps | |||||
| Fixed | Floating | ||||
| Interest | Interest | ||||
| Rate | Rate | Unrealized | |||
| Notional | Received | Received | Appreciation | ||
| Amount | (Paid) | (Paid) | (Depreciation) | ||
| Termination Date | Counterparty | ($000) | (%) | (%) | ($000) |
| 8/15/18 | BNPSW | 1,330 | 0.715 | (2.067)1 | 1 |
| 4/25/19 | WFC | 1,171 | 2.756 | (2.335)2 | 5 |
| 4/27/20 | GSCM | 1,399 | 2.794 | (2.335)2 | 6 |
| 4/1/21 | WFC | 3,087 | 0.965 | (2.092)1 | (61) |
| 6/25/21 | GSCM | 2,957 | 3.143 | (2.335)2 | (1) |
| 11/25/22 | BARC | 8,095 | 2.758 | (2.330)2 | 8 |
| 9/25/29 | GSCM | 8,452 | 1.794 | (2.077)1 | (363) |
| (405) | |||||
BARC—Barclays Bank plc.
BNPSW—BNP Paribas.
GSCM—Goldman Sachs Bank USA.
WFC—Wells Fargo Bank N.A.
1 Based on 1-month London Interbank Offered Rate (LIBOR) as of the most recent payment date. Floating interest payment received/
paid monthly.
2 Based on 3-month London Interbank Offered Rate (LIBOR) as of the most recent payment date. Floating interest payment received/
paid quarterly.
Unrealized appreciation (depreciation) on open swap contracts is generally treated the same for financial reporting and tax purposes.
See accompanying Notes, which are an integral part of the Financial Statements.
72
Intermediate-Term Investment-Grade Fund
Statement of Operations
| Six Months Ended | |
| July31,2018 | |
| ($000) | |
| Investment Income | |
| Income | |
| Interest1 | 478,316 |
| Total Income | 478,316 |
| Expenses | |
| The Vanguard Group—Note B | |
| Investment Advisory Services | 1,093 |
| Management and Administrative—Investor Shares | 1,923 |
| Management and Administrative—Admiral Shares | 11,081 |
| Marketing and Distribution—Investor Shares | 175 |
| Marketing and Distribution—Admiral Shares | 824 |
| Custodian Fees | 162 |
| Shareholders’ Reports—Investor Shares | 41 |
| Shareholders’ Reports—Admiral Shares | 271 |
| Trustees’ Fees and Expenses | 12 |
| Total Expenses | 15,582 |
| Net Investment Income | 462,734 |
| Realized Net Gain (Loss) | |
| Investment Securities Sold1 | (177,911) |
| Futures Contracts | (119,926) |
| Purchased Options | (693) |
| Written Options | 615 |
| Swap Contracts | 6,663 |
| Forward Currency Contracts | 18,450 |
| Foreign Currencies | (5,154) |
| Realized Net Gain (Loss) | (277,956) |
| Change in Unrealized Appreciation (Depreciation) | |
| Investment Securities1 | (454,330) |
| Futures Contracts | 60,734 |
| Purchased Options | (134) |
| Written Options | 1,746 |
| Swap Contracts | 2,501 |
| Forward Currency Contracts | 9,429 |
| Foreign Currencies | (280) |
| Change in Unrealized Appreciation (Depreciation) | (380,334) |
| Net Increase (Decrease) in Net Assets Resulting from Operations | (195,556) |
1 Interest income, realized net gain (loss), and change in unrealized appreciation (depreciation) from an affiliated company of the fund
were $2,950,000, ($68,000), and $2,000, respectively. Purchases and sales are for temporary cash investment purposes.
See accompanying Notes, which are an integral part of the Financial Statements.
73
Intermediate-Term Investment-Grade Fund
Statement of Changes in Net Assets
| Six Months Ended | Year Ended | |
| July 31, | January 31, | |
| 2018 | 2018 | |
| ($000) | ($000) | |
| Increase (Decrease) in Net Assets | ||
| Operations | ||
| Net Investment Income | 462,734 | 835,747 |
| Realized Net Gain (Loss) | (277,956) | 52,794 |
| Change in Unrealized Appreciation (Depreciation) | (380,334) | (204,621) |
| Net Increase (Decrease) in Net Assets Resulting from Operations | (195,556) | 683,920 |
| Distributions | ||
| Net Investment Income | ||
| Investor Shares | (35,427) | (73,469) |
| Admiral Shares | (425,634) | (750,112) |
| Realized Capital Gain1 | ||
| Investor Shares | — | (4,200) |
| Admiral Shares | — | (44,514) |
| Total Distributions | (461,061) | (872,295) |
| Capital Share Transactions | ||
| Investor Shares | (244,101) | (186,777) |
| Admiral Shares | 419,228 | 2,032,367 |
| Net Increase (Decrease) from Capital Share Transactions | 175,127 | 1,845,590 |
| Total Increase (Decrease) | (481,490) | 1,657,215 |
| Net Assets | ||
| Beginning of Period | 29,472,599 | 27,815,384 |
| End of Period2 | 28,991,109 | 29,472,599 |
1 Includes fiscal 2019 and 2018 short-term gain distributions totaling $0 and $0, respectively. Short-term gain distributions are
treated as ordinary income dividends for tax purposes.
2 Net Assets—End of Period includes undistributed (overdistributed) net investment income of $13,523,000 and ($8,053,000).
See accompanying Notes, which are an integral part of the Financial Statements.
74
Intermediate-Term Investment-Grade Fund
Financial Highlights
| Investor Shares | ||||||
| Six Months | ||||||
| Ended | ||||||
| For a Share Outstanding | July 31, | Year Ended January 31, | ||||
| Throughout Each Period | 2018 | 2018 | 2017 | 2016 | 2015 | 2014 |
| Net Asset Value, Beginning of Period | $9.61 | $9.66 | $9.72 | $10.06 | $9.81 | $10.24 |
| Investment Operations | ||||||
| Net Investment Income | .1461 | .2771 | .278 | .288 | .303 | .311 |
| Net Realized and Unrealized Gain (Loss) | ||||||
| on Investments | (. 210) | (. 034) | . 030 | (. 288) | . 341 | (. 229) |
| Total from Investment Operations | (.064) | .243 | .308 | .000 | .644 | .082 |
| Distributions | ||||||
| Dividends from Net Investment Income | (.146) | (. 274) | (. 276) | (. 296) | (. 307) | (. 317) |
| Distributions from Realized Capital Gains | — | (. 016) | (. 092) | (. 044) | (. 087) | (.195) |
| Total Distributions | (.146) | (. 290) | (. 368) | (. 340) | (. 394) | (. 512) |
| Net Asset Value, End of Period | $9.40 | $9.61 | $9.66 | $9.72 | $10.06 | $9.81 |
| Total Return2 | -0.67% | 2.47% | 3.16% | 0.03% | 6.71% | 0.85% |
| Ratios/Supplemental Data | ||||||
| Net Assets, End of Period (Millions) | $2,174 | $2,472 | $2,671 | $2,701 | $2,952 | $3,099 |
| Ratio of Total Expenses to | ||||||
| Average Net Assets | 0.20% | 0.20% | 0.20% | 0.20% | 0.20% | 0.20% |
| Ratio of Net Investment Income to | ||||||
| Average Net Assets | 3.11% | 2.84% | 2.80% | 2.94% | 3.05% | 3.12% |
| Portfolio Turnover Rate | 82% | 63% | 68% | 70% | 88% | 100% |
The expense ratio, net investment income ratio, and turnover rate for the current period have been annualized.
1 Calculated based on average shares outstanding.
2 Total returns do not include account service fees that may have applied in the periods shown. Fund prospectuses provide information
about any applicable account service fees.
See accompanying Notes, which are an integral part of the Financial Statements.
75
Intermediate-Term Investment-Grade Fund
Financial Highlights
| Admiral Shares | ||||||
| Six Months | ||||||
| Ended | ||||||
| For a Share Outstanding | July 31, | Year Ended January 31, | ||||
| Throughout Each Period | 2018 | 2018 | 2017 | 2016 | 2015 | 2014 |
| Net Asset Value, Beginning of Period | $9.61 | $9.66 | $9.72 | $10.06 | $9.81 | $10.24 |
| Investment Operations | ||||||
| Net Investment Income | .1501 | .2881 | .288 | .298 | .313 | .321 |
| Net Realized and Unrealized Gain (Loss) | ||||||
| on Investments | (. 210) | (. 039) | . 030 | (. 288) | . 341 | (. 229) |
| Total from Investment Operations | (.060) | .249 | .318 | .010 | .654 | .092 |
| Distributions | ||||||
| Dividends from Net Investment Income | (.150) | (. 283) | (. 286) | (. 306) | (. 317) | (. 327) |
| Distributions from Realized Capital Gains | — | (. 016) | (. 092) | (. 044) | (. 087) | (.195) |
| Total Distributions | (.150) | (. 299) | (. 378) | (. 350) | (. 404) | (. 522) |
| Net Asset Value, End of Period | $9.40 | $9.61 | $9.66 | $9.72 | $10.06 | $9.81 |
| Total Return2 | -0.62% | 2.58% | 3.27% | 0.13% | 6.81% | 0.95% |
| Ratios/Supplemental Data | ||||||
| Net Assets, End of Period (Millions) | $26,817 | $27,000 | $25,145 | $18,764 | $16,491 | $13,618 |
| Ratio of Total Expenses to | ||||||
| Average Net Assets | 0.10% | 0.10% | 0.10% | 0.10% | 0.10% | 0.10% |
| Ratio of Net Investment Income to | ||||||
| Average Net Assets | 3.21% | 2.94% | 2.90% | 3.04% | 3.15% | 3.22% |
| Portfolio Turnover Rate | 82% | 63% | 68% | 70% | 88% | 100% |
The expense ratio, net investment income ratio, and turnover rate for the current period have been annualized.
1 Calculated based on average shares outstanding.
2 Total returns do not include account service fees that may have applied in the periods shown. Fund prospectuses provide information
about any applicable account service fees.
See accompanying Notes, which are an integral part of the Financial Statements.
76
Intermediate-Term Investment-Grade Fund
Notes to Financial Statements
Vanguard Intermediate-Term Investment-Grade Fund is registered under the Investment Company Act of 1940 as an open-end investment company, or mutual fund. Certain of the fund’s investments are in corporate debt instruments; the issuers’ abilities to meet their obligations may be affected by economic developments in their respective industries. The fund invests in securities of foreign issuers, which may subject it to investment risks not normally associated with investing in securities of U.S. corporations. To minimize the currency risk associated with investment in bonds denominated in currencies other than the U.S. dollar, the fund attempts to hedge its currency exposures. The fund offers two classes of shares: Investor Shares and Admiral Shares. Investor Shares are available to any investor who meets the fund’s minimum purchase requirements. Admiral Shares are designed for investors who meet certain administrative, service, and account-size criteria.
A. The following significant accounting policies conform to generally accepted accounting principles for U.S. investment companies. The fund consistently follows such policies in preparing its financial statements.
1. Security Valuation: Securities are valued as of the close of trading on the New York Stock Exchange (generally 4 p.m., Eastern time) on the valuation date. Equity securities are valued at the latest quoted sales prices or official closing prices taken from the primary market in which each security trades; such securities not traded on the valuation date are valued at the mean of the latest quoted bid and asked prices. Bonds and temporary cash investments are valued using the latest bid prices or using valuations based on a matrix system (which considers such factors as security prices, yields, maturities, and ratings), both as furnished by independent pricing services. Structured debt securities, including mortgages and asset-backed securities, are valued using the latest bid prices or using valuations based on a matrix system that considers such factors as issuer, tranche, nominal or option-adjusted spreads, weighted average coupon, weighted average maturity, credit enhancements, and collateral. Investments in Vanguard Market Liquidity Fund are valued at that fund’s net asset value. Securities for which market quotations are not readily available, or whose values have been affected by events occurring before the fund’s pricing time but after the close of the securities’ primary markets, are valued at their fair values calculated according to procedures adopted by the board of trustees. These procedures include obtaining quotations from an independent pricing service, monitoring news to identify significant market-or security-specific events, and evaluating changes in the values of foreign market proxies (for example, ADRs, futures contracts, or exchange-traded funds), between the time the foreign markets close and the fund’s pricing time. When fair-value pricing is employed, the prices of securities used by a fund to calculate its net asset value may differ from quoted or published prices for the same securities.
2. Foreign Currency: Securities and other assets and liabilities denominated in foreign currencies are translated into U.S. dollars using exchange rates obtained from an independent third party as of the fund’s pricing time on the valuation date. Realized gains (losses) and unrealized appreciation (depreciation) on investment securities include the effects of changes in exchange rates since the securities were purchased, combined with the effects of changes in security prices. Fluctuations in the value of other assets and liabilities resulting from changes in exchange rates are recorded as unrealized foreign currency gains (losses) until the assets or liabilities are settled in cash, at which time they are recorded as realized foreign currency gains (losses).
77
Intermediate-Term Investment-Grade Fund
3. Futures Contracts: The fund uses futures contracts to invest in fixed income asset classes with greater efficiency and lower cost than is possible through direct investment, to add value when these instruments are attractively priced, or to adjust sensitivity to changes in interest rates. The primary risks associated with the use of futures contracts are imperfect correlation between changes in market values of bonds held by the fund and the prices of futures contracts, and the possibility of an illiquid market. Counterparty risk involving futures is mitigated because a regulated clearinghouse is the counterparty instead of the clearing broker. To further mitigate counterparty risk, the fund trades futures contracts on an exchange, monitors the financial strength of its clearing brokers and clearinghouse, and has entered into clearing agreements with its clearing brokers. The clearinghouse imposes initial margin requirements to secure the fund’s performance and requires daily settlement of variation margin representing changes in the market value of each contract.
Any assets pledged as initial margin for open contracts are noted in the Statement of Net Assets.
Futures contracts are valued at their quoted daily settlement prices. The notional amounts of the contracts are not recorded in the Statement of Net Assets. Fluctuations in the value of the contracts are recorded in the Statement of Net Assets as an asset (liability) and in the Statement of Operations as unrealized appreciation (depreciation) until the contracts are closed, when they are recorded as realized futures gains (losses).
During the six months ended July 31, 2018, the fund’s average investments in long and short futures contracts represented 18% and 10% of net assets, respectively, based on the average of the notional amounts at each quarter-end during the period.
4. Forward Currency Contracts: The fund enters into forward currency contracts to protect the value of securities and related receivables and payables against changes in future foreign exchange rates. The fund’s risks in using these contracts include movement in the values of the foreign currencies relative to the U.S. dollar and the ability of the counterparties to fulfill their obligations under the contracts. The fund mitigates its counterparty risk by entering into forward currency contracts only with a diverse group of prequalified counterparties, monitoring their financial strength, entering into master netting arrangements with its counterparties, and requiring its counterparties to transfer collateral as security for their performance. In the absence of a default, the collateral pledged or received by the fund cannot be repledged, resold, or rehypothecated. The master netting arrangements provide that, in the event of a counterparty’s default (including bankruptcy), the fund may terminate the forward currency contracts, determine the net amount owed by either party in accordance with its master netting arrangements, and sell or retain any collateral held up to the net amount owed to the fund under the master netting arrangements. The forward currency contracts contain provisions whereby a counterparty may terminate open contracts if the fund’s net assets decline below a certain level, triggering a payment by the fund if the fund is in a net liability position at the time of the termination. The payment amount would be reduced by any collateral the fund has pledged. Any assets pledged as collateral for open contracts are noted in the Statement of Net Assets. The value of collateral received or pledged is compared daily to the value of the forward currency contracts exposure with each counterparty, and any difference, if in excess of a specified minimum transfer amount, is adjusted and settled within two business days.
Forward currency contracts are valued at their quoted daily prices obtained from an independent third party, adjusted for currency risk based on the expiration date of each contract. The notional amounts of the contracts are not recorded in the Statement of Net Assets. Fluctuations in the
78
Intermediate-Term Investment-Grade Fund
value of the contracts are recorded in the Statement of Net Assets as an asset (liability) and in the Statement of Operations as unrealized appreciation (depreciation) until the contracts are closed, when they are recorded as realized forward currency contract gains (losses).
During the six months ended July 31, 2018, the fund’s average investment in forward currency contracts represented 2% of net assets, based on the average of notional amounts at each quarter-end during the period.
5. Swap Contracts: The fund invests in credit default swaps to adjust the overall credit risk of the fund or to actively overweight or underweight credit risk to a specific issuer or group of issuers. The fund may sell credit protection through credit default swaps to simulate investments in long positions that are either unavailable or considered to be less attractively priced in the bond market. The fund may purchase credit protection through credit default swaps to reduce credit exposure to a given issuer or issuers. Under the terms of the swaps, an up-front payment may be exchanged between the seller and buyer. In addition, the seller of the credit protection receives a periodic payment of premium from the buyer that is a fixed percentage applied to a notional amount. If, for example, the reference entity is subject to a credit event (such as bankruptcy, failure to pay, or obligation acceleration) during the term of the swap, the seller agrees to either physically settle or cash settle the swap contract. If the swap is physically settled, the seller agrees to pay the buyer an amount equal to the notional amount and take delivery of a debt instrument of the reference issuer with a par amount equal to such notional amount. If the swap is cash settled, the seller agrees to pay the buyer the difference between the notional amount and the final price for the relevant debt instrument, as determined either in a market auction or pursuant to a pre-agreed-upon valuation procedure.
The fund enters into interest rate swap transactions to adjust the fund’s sensitivity to changes in interest rates and maintain the ability to generate income at prevailing market rates. Under the terms of the swaps, one party pays the other an amount that is a fixed percentage rate applied to a notional amount. In return, the counterparty agrees to pay a floating rate, which is reset periodically based on short-term interest rates, applied to the same notional amount.
The notional amounts of swap contracts are not recorded in the Statement of Net Assets. Swaps are valued daily based on market quotations received from independent pricing services or recognized dealers and the change in value is recorded in the Statement of Net Assets as an asset (liability) and in the Statement of Operations as unrealized appreciation (depreciation) until the seller of credit protection is required to take delivery (or, in a cash settled swap, pay the settlement amount determined) upon occurrence of a credit event, periodic payments are made, or the swap terminates, at which time realized gain (loss) is recorded. The net premium to be received or paid by the fund under swap contracts is accrued daily and recorded as realized gain (loss) over the life of the contract.
The primary risk associated with selling credit protection is that, upon the occurrence of a defined credit event, the market value of the debt instrument received by the fund (or, in a cash settled swap, the debt instruments used to determine the settlement payment by the fund) will be significantly less than the amount paid by the fund and, in a physically settled swap, the fund may receive an illiquid debt instrument. A risk associated with all types of swaps is the possibility that a counterparty may default on its obligation to pay net amounts due to the fund. The fund’s maximum amount subject to counterparty risk is the unrealized appreciation on the swap contract. The fund
79
Intermediate-Term Investment-Grade Fund
mitigates its counterparty risk by entering into swaps only with a diverse group of prequalified counterparties, monitoring their financial strength, entering into master netting arrangements with its counterparties, and requiring its counterparties to transfer collateral as security for their performance. In the absence of a default, the collateral pledged or received by the fund cannot be repledged, resold, or rehypothecated. In the event of a counterparty’s default (including bankruptcy), the fund may terminate any swap contracts with that counterparty, determine the net amount owed by either party in accordance with its master netting arrangements, and sell or retain any collateral held up to the net amount owed to the fund under the master netting arrangements. The swap contracts contain provisions whereby a counterparty may terminate open contracts if the fund’s net assets decline below a certain level, triggering a payment by the fund if the fund is in a net liability position at the time of the termination. The payment amount would be reduced by any collateral the fund has pledged. Any securities pledged as collateral for open contracts are noted in the Statement of Net Assets. The value of collateral received or pledged is compared daily to the value of the swap contracts exposure with each counterparty, and any difference, if in excess of a specified minimum transfer amount, is adjusted and settled within two business days.
The fund enters into centrally cleared interest rate and credit default swaps to achieve the same objectives specified with respect to the equivalent over-the-counter swaps but with less counterparty risk because a regulated clearinghouse is the counterparty instead of the clearing broker or executing broker. The clearinghouse imposes initial margin requirements to secure the fund’s performance, and requires daily settlement of variation margin representing changes in the market value of each contract. To further mitigate counterparty risk, the fund trades with a diverse group of prequalified executing brokers; monitors the financial strength of its clearing brokers, executing brokers, and clearinghouse; and has entered into agreements with its clearing brokers and executing brokers.
During the six months ended July 31, 2018, the fund’s average amounts of investments in credit protection sold and credit protection purchased represented 2% and 2% of net assets, respectively, based on the average of notional amounts at each quarter-end during the period. The average amount of investments in interest rate swaps represented 3% of net assets, based on the average of notional amounts at each quarter-end during the period.
6. Options: The fund invests in options contracts on futures and swaps to adjust its exposure to the underlying investments. The primary risk associated with purchasing options is that the value of the underlying investments may move in such a way that the option is out-of-the-money (the exercise price of the option exceeds the value of the underlying investment), the position is worthless at expiration, and the fund loses the premium paid. The primary risk associated with selling options is that the value of the underlying investments may move in such a way that the option is in-the-money (the exercise price of the option exceeds the value of the underlying investment), the counterparty exercises the option, and the fund loses an amount equal to the market value of the option written less the premium received.
The fund invests in options on futures, which are exchange-traded. Counterparty risk involving exchange-traded options on futures is mitigated because a regulated clearinghouse is the counterparty instead of the clearing broker. To further mitigate counterparty risk, the fund trades options on futures on an exchange, monitors the financial strength of its clearing brokers and clearinghouses, and has entered into clearing agreements with its clearing brokers.
80
Intermediate-Term Investment-Grade Fund
The fund invests in options on swaps (swaptions), which are transacted over-the-counter (OTC) and not on an exchange. A receiver swaption gives the owner the right to receive the total return of a specified asset, reference rate, or index. A payer swaption gives the owner the right to pay the total return of a specified asset, reference rate, or index. Swaptions also include options that allow an existing swap to be terminated or extended by one of the counterparties. Unlike exchange-traded options, which are standardized with respect to the underlying instrument, expiration date, contract size, and strike price, the terms of OTC options generally are established through negotiation with the other party to the option contract. Although this type of arrangement allows the purchaser or writer greater flexibility to tailor an option to its needs, OTC options generally involve greater credit risk than exchange-traded options. Credit risk involves the possibility that a counterparty may default on its obligation to pay net amounts due to the fund. The fund mitigates its counterparty risk by entering into swaptions with a diverse group of prequalified counterparties and monitoring their financial strength.
Options on futures contracts are valued at their quoted daily settlement prices. Swaptions are valued daily based on market quotations received from independent pricing services or recognized dealers. The premium paid for a purchased option is recorded in the Statement of Net Assets as an asset that is subsequently adjusted daily to the current market value of the option purchased. The premium received for a written option is recorded in the Statement of Net Assets as an asset with an equal liability that is subsequently adjusted daily to the current market value of the option written. Fluctuations in the value of the options are recorded in the Statement of Operations as unrealized appreciation (depreciation) until expired, closed, or exercised, at which time realized gains (losses) are recognized.
During the six months ended July 31, 2018, the fund’s average value of options purchased and options written each represented less than 1% of net assets, based on the average market values at each quarter-end during the period.
7. Federal Income Taxes: The fund intends to continue to qualify as a regulated investment company and distribute all of its taxable income. Management has analyzed the fund’s tax positions taken for all open federal income tax years (January 31, 2015–2018), and for the period ended July 31, 2018, and has concluded that no provision for federal income tax is required in the fund’s financial statements.
8. Distributions: Distributions from net investment income are declared daily and paid on the first business day of the following month. Annual distributions from realized capital gains, if any, are recorded on the ex-dividend date.
9. Credit Facility: The fund and certain other funds managed by The Vanguard Group (“Vanguard”) participate in a $3.1 billion committed credit facility provided by a syndicate of lenders pursuant to a credit agreement that may be renewed annually; each fund is individually liable for its borrowings, if any, under the credit facility. Borrowings may be utilized for temporary and emergency purposes, and are subject to the fund’s regulatory and contractual borrowing restrictions. The participating funds are charged administrative fees and an annual commitment fee of 0.10% of the undrawn amount of the facility; these fees are allocated to the funds based on a method approved by the fund’s board of trustees and included in Management and Administrative expenses on the fund’s Statement of Operations. Any borrowings under this facility bear interest at a rate based upon the higher of the one-month London Interbank Offered Rate, federal funds effective rate, or overnight bank funding rate plus an agreed-upon spread.
81
Intermediate-Term Investment-Grade Fund
The fund had no borrowings outstanding at July 31, 2018, or at any time during the period then ended.
10. Other: Interest income includes income distributions received from Vanguard Market Liquidity Fund and is accrued daily. Premiums and discounts on debt securities purchased are amortized and accreted, respectively, to interest income over the lives of the respective securities. Security transactions are accounted for on the date securities are bought or sold. Costs used to determine realized gains (losses) on the sale of investment securities are those of the specific securities sold.
Each class of shares has equal rights as to assets and earnings, except that each class separately bears certain class-specific expenses related to maintenance of shareholder accounts (included in Management and Administrative expenses), shareholder reporting, and the proxy. Marketing and distribution expenses are allocated to each class of shares based on a method approved by the board of trustees. Income, other non-class-specific expenses, and gains and losses on investments are allocated to each class of shares based on its relative net assets.
B. In accordance with the terms of a Funds’ Service Agreement (the “FSA”) between Vanguard and the fund, Vanguard furnishes to the fund investment advisory, corporate management, administrative, marketing, and distribution services at Vanguard’s cost of operations (as defined by the FSA). These costs of operations are allocated to the fund based on methods and guidelines approved by the board of trustees. Vanguard does not require reimbursement in the current period for certain costs of operations (such as deferred compensation/benefits and risk/insurance costs); the fund’s liability for these costs of operations is included in Payables to Vanguard on the Statement of Net Assets. All other costs of operations payable to Vanguard are generally settled twice a month.
Upon the request of Vanguard, the fund may invest up to 0.40% of its net assets as capital in Vanguard. At July 31, 2018, the fund had contributed to Vanguard capital in the amount of $1,540,000, representing 0.01% of the fund’s net assets and 0.62% of Vanguard’s capitalization. The fund’s trustees and officers are also directors and employees, respectively, of Vanguard.
C. Various inputs may be used to determine the value of the fund’s investments. These inputs are summarized in three broad levels for financial statement purposes. The inputs or methodologies used to value securities are not necessarily an indication of the risk associated with investing in those securities.
Level 1—Quoted prices in active markets for identical securities.
Level 2—Other significant observable inputs (including quoted prices for similar securities, interest rates, prepayment speeds, credit risk, etc.).
Level 3—Significant unobservable inputs (including the fund’s own assumptions used to determine
the fair value of investments). Any investments valued with significant unobservable inputs are
noted on the Statement of Net Assets.
82
Intermediate-Term Investment-Grade Fund
The following table summarizes the market value of the fund’s investments as of July 31, 2018, based on the inputs used to value them:
| Level 1 | Level 2 | Level 3 | |
| Investments | ($000) | ($000) | ($000) |
| U.S. Government and Agency Obligations | — | 2,884,752 | — |
| Asset-Backed/Commercial Mortgage-Backed Securities | — | 5,431,883 | 32,984 |
| Corporate Bonds | — | 18,203,907 | 4 |
| Sovereign Bonds | — | 2,161,754 | — |
| Taxable Municipal Bonds | — | 36,345 | — |
| Convertible Preferred Stocks | — | — | —1 |
| Temporary Cash Investments | 274,973 | — | — |
| Options Purchased | — | 28 | — |
| Liability for Options Written | — | (304) | — |
| Futures Contracts—Assets 2 | 5,287 | — | — |
| Futures Contracts—Liabilities 2 | (2,751) | — | — |
| Forward Currency Contracts—Assets | — | 1,068 | — |
| Forward Currency Contracts—Liabilities | — | (4,661) | — |
| Swap Contracts—Assets | 30 2 | 3,191 | — |
| Swap Contracts—Liabilities | (218)2 | (6,347) | — |
| Total | 277,321 | 28,711,616 | 32,988 |
| 1 Market Value of Convertible Preferred Stock is less than $500 and is based on Level 3 inputs. | |||
| 2 Represents variation margin on the last day of the reporting period. | |||
D. At July 31, 2018, the fair values of derivatives were reflected in the Statement of Net Assets as follows:
| Interest Rate | Currency | Credit | ||
| Contracts | Contracts | Contracts | Total | |
| Statement of Net Assets Caption | ($000) | ($000) | ($000) | ($000) |
| Options Purchased | — | — | 28 | 28 |
| Variation Margin Receivable—Futures Contracts | 5,287 | — | — | 5,287 |
| Variation Margin Receivable—CC Swap Contracts | 10 | — | 20 | 30 |
| Unrealized Appreciation—Forward Currency Contracts — | 1,068 | — | 1,068 | |
| Unrealized Appreciation—OTC Swap Contracts | — | — | 3,191 | 3,191 |
| Total Assets | 5,297 | 1,068 | 3,239 | 9,604 |
| Liability for Options Written | — | — | (304) | (304) |
| Variation Margin Payable—Futures Contracts | (2,751) | — | — | (2,751) |
| Variation Margin Payable—CC Swap Contracts | (144) | — | (74) | (218) |
| Unrealized Depreciation—Forward Currency Contracts — | (4,661) | — | (4,661) | |
| Unrealized Depreciation—OTC Swap Contracts | — | — | (6,347) | (6,347) |
| Total Liabilities | (2,895) | (4,661) | (6,725) | (14,281) |
83
Intermediate-Term Investment-Grade Fund
Realized net gain (loss) and the change in unrealized appreciation (depreciation) on derivatives for the six months ended July 31, 2018, were:
| Interest Rate | Currency | Credit | ||
| Contracts | Contracts | Contracts | Total | |
| Realized Net Gain (Loss) on Derivatives | ($000) | ($000) | ($000) | ($000) |
| Futures Contracts | (119,926) | — | — | (119,926) |
| Options | (1,647) | — | 1,569 | (78) |
| Forward Currency Contracts | — | 18,450 | — | 18,450 |
| Swap Contracts | 7,791 | — | (1,128) | 6,663 |
| Realized Net Gain (Loss) on Derivatives | (112,213) | 18,450 | (1,128) | (94,891) |
| Change in Unrealized Appreciation (Depreciation) on Derivatives | ||||
| Futures Contracts | 60,734 | — | — | 60,734 |
| Options | 1,663 | — | (51) | 1,612 |
| Forward Currency Contracts | — | 9,429 | — | 9,429 |
| Swap Contracts | (3,766) | — | 6,267 | 2,501 |
| Change in Unrealized Appreciation | ||||
| (Depreciation) on Derivatives | 58,631 | 9,429 | 6,216 | 74,276 |
E. Capital gain distributions are determined on a tax basis and may differ from realized capital gains for financial reporting purposes. Differences may be permanent or temporary. Permanent differences are reclassified among capital accounts in the financial statements to reflect their tax character. Temporary differences arise when gains or losses are recognized in different periods for financial statement and tax purposes. These differences will reverse at some time in the future.
During the six months ended July 31, 2018, the fund realized net foreign currency gains of $21,730,000 (including gains and losses on forward currency contracts and the foreign currency component on sales of foreign currency denominated bonds), which increases distributable net income for tax purposes; accordingly, such gains have been reclassified from accumulated net realized losses to undistributed net investment income.
The fund’s tax-basis capital gains and losses are determined only at the end of each fiscal year. For tax purposes, at January 31, 2018, the fund had available capital losses totaling $107,065,000 that may be carried forward indefinitely to offset future net capital gains. The fund will use these capital losses to offset net taxable capital gains, if any, realized during the year ending January 31, 2019; should the fund realize net capital losses for the year, the losses will be added to the loss carryforward balance above.
At July 31, 2018, the cost of investment securities for tax purposes was $29,670,274,000. Net unrealized depreciation of investment securities for tax purposes was $643,672,000, consisting of unrealized gains of $54,822,000 on securities that had risen in value since their purchase and $698,494,000 in unrealized losses on securities that had fallen in value since their purchase.
84
Intermediate-Term Investment-Grade Fund
F. During the six months ended July 31, 2018, the fund purchased $8,573,441,000 of investment securities and sold $10,275,734,000 of investment securities, other than U.S. government securities and temporary cash investments. Purchases and sales of U.S. government securities were $3,040,112,000 and $1,284,237,000, respectively.
G. Capital share transactions for each class of shares were:
| Six Months Ended | Year Ended | |||
| July 31, 2018 | January 31, 2018 | |||
| Amount | Shares | Amount | Shares | |
| ($000) | (000) | ($000) | (000) | |
| Investor Shares | ||||
| Issued | 152,540 | 16,143 | 674,913 | 69,126 |
| Issued in Lieu of Cash Distributions | 31,218 | 3,308 | 68,232 | 6,982 |
| Redeemed | (427,859) | (45,338) | (929,922) | (95,247) |
| Net Increase (Decrease)—Investor Shares | (244,101) | (25,887) | (186,777) | (19,139) |
| Admiral Shares | ||||
| Issued | 3,227,056 | 341,711 | 7,657,969 | 784,117 |
| Issued in Lieu of Cash Distributions | 364,126 | 38,592 | 666,997 | 68,261 |
| Redeemed | (3,171,954) | (336,169) | (6,292,599) | (644,986) |
| Net Increase (Decrease)—Admiral Shares | 419,228 | 44,134 | 2,032,367 | 207,392 |
H. Management has determined that no events or transactions occurred subsequent to July 31, 2018, that would require recognition or disclosure in these financial statements.
85
Long-Term Investment-Grade Fund
Fund Profile
As of July 31, 2018
| Share-Class Characteristics | ||
| Investor | Admiral | |
| Shares | Shares | |
| Ticker Symbol | VWESX | VWETX |
| Expense Ratio1 | 0.22% | 0.12% |
| 30-Day SEC Yield | 4.05% | 4.15% |
| Financial Attributes | |||
| Bloomberg | |||
| Barclays | Bloomberg | ||
| Long | Barclays | ||
| Credit | US | ||
| A/Better | Aggregate | ||
| Fund | Index | Bond Index | |
| Number of Bonds | 816 | 1,118 | 10,012 |
| Yield to Maturity | |||
| (before expenses) | 4.1% | 4.3% | 3.4% |
| Average Coupon | 4.1% | 4.9% | 3.1% |
| Average Duration | 13.4 years | 13.9 years | 6.0 years |
| Average Effective | |||
| Maturity | 22.2 years | 23.4 years | 8.4 years |
| Short-Term | |||
| Reserves | 3.4% | — | — |
| Sector Diversification (% of portfolio) | |
| Commercial Mortgage-Backed | 0.6% |
| Finance | 20.8 |
| Foreign | 1.9 |
| Industrial | 45.8 |
| Treasury/Agency | 5.8 |
| Utilities | 14.1 |
| Other | 11.0 |
The agency and mortgage-backed securities sectors may include
issues from government-sponsored enterprises; such issues are
generally not backed by the full faith and credit of the U.S.
government.
| Volatility Measures | ||
| Bloomberg | Bloomberg | |
| Barclays | Barclays US | |
| Long Credit | Aggregate | |
| A/Better | Bond | |
| Index | Index | |
| R-Squared | 0.99 | 0.81 |
| Beta | 1.04 | 2.23 |
| These measures show the degree and timing of the fund’s | ||
| fluctuations compared with the indexes over 36 months. | ||
| Distribution by Effective Maturity | |
| (% of portfolio) | |
| Under 1 Year | 5.4% |
| 3 - 5 Years | 0.5 |
| 5 - 7 Years | 0.6 |
| 7 - 10 Years | 3.4 |
| 10 - 20 Years | 26.8 |
| 20 - 30 Years | 57.2 |
| Over 30 Years | 6.1 |
| Distribution by Credit Quality (% of portfolio) | |
| U.S. Government | 5.9% |
| Aaa | 6.9 |
| Aa | 25.5 |
| A | 55.1 |
| Baa | 4.3 |
| Not Rated | 2.3 |
Credit-quality ratings are obtained from Moody's and S&P, and the
higher rating for each issue is shown. "Not Rated" is used to classify
securities for which a rating is not available. Not rated securities
include a fund's investment in Vanguard Market Liquidity Fund or
Vanguard Municipal Cash Management Fund, each of which invests
in high-quality money market instruments and may serve as a cash
management vehicle for the Vanguard funds, trusts, and accounts.
For more information about these ratings, see the Glossary entry for
Credit Quality.
1 The expense ratios shown are from the prospectus dated May 24, 2018, and represent estimated costs for the current fiscal year. For the six
months ended July 31, 2018, the annualized expense ratios were 0.22% for Investor Shares and 0.12% for Admiral Shares.
86
Long-Term Investment-Grade Fund
Investment Focus
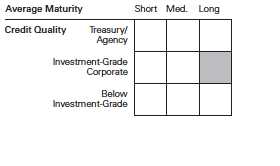
87
Long-Term Investment-Grade Fund
Performance Summary
All of the returns in this report represent past performance, which is not a guarantee of future results that may be achieved by the fund. (Current performance may be lower or higher than the performance data cited. For performance data current to the most recent month-end, visit our website at vanguard.com/performance.) Note, too, that both investment returns and principal value can fluctuate widely, so an investor’s shares, when sold, could be worth more or less than their original cost. The returns shown do not reflect taxes that a shareholder would pay on fund distributions or on the sale of fund shares.
| Fiscal-Year Total Returns (%): January 31, 2008, Through July 31, 2018 | ||||
| Bloomberg | ||||
| Barclays | ||||
| Long Credit | ||||
| A/Better | ||||
| Investor Shares | Index | |||
| Fiscal Year | Income Returns | Capital Returns | Total Returns | Total Returns |
| 2009 | 5.75% | -9.20% | -3.45% | -5.66% |
| 2010 | 6.91 | 10.38 | 17.29 | 17.13 |
| 2011 | 5.79 | 1.22 | 7.01 | 7.22 |
| 2012 | 6.29 | 15.68 | 21.97 | 22.56 |
| 2013 | 4.86 | 2.53 | 7.39 | 6.35 |
| 2014 | 4.64 | -5.05 | -0.41 | -1.10 |
| 2015 | 5.17 | 14.81 | 19.98 | 19.54 |
| 2016 | 3.97 | -10.30 | -6.33 | -6.18 |
| 2017 | 4.29 | 2.42 | 6.71 | 6.44 |
| 2018 | 4.31 | 4.97 | 9.28 | 9.35 |
| 2019 | 1.99 | -5.35 | -3.36 | -3.56 |
| Note: For 2019, performance data reflect the six months ended July 31, 2018. | ||||
Average Annual Total Returns: Periods Ended June 30, 2018
This table presents returns through the latest calendar quarter—rather than through the end of the fiscal period.
Securities and Exchange Commission rules require that we provide this information.
| Ten Years | ||||||
| Inception Date | One Year | Five Years | Income | Capital | Total | |
| Investor Shares | 7/9/1973 | -1.60% | 5.65% | 5.10% | 2.17% | 7.27% |
| Admiral Shares | 2/12/2001 | -1.50 | 5.75 | 5.21 | 2.17 | 7.38 |
See Financial Highlights for dividend and capital gains information.
88
Long-Term Investment-Grade Fund
Financial Statements (unaudited)
Statement of Net Assets—Investments Summary
As of July 31, 2018
This Statement summarizes the fund’s holdings by asset type. Details are reported for each of the fund’s 50 largest individual holdings and for investments that, in total for any issuer, represent more than 1% of the fund’s net assets. The total value of smaller holdings is reported as a single amount within each category.
The fund reports a complete list of its holdings in regulatory filings four times in each fiscal year, at the quarter-ends. For the second and fourth fiscal quarters, the complete listing of the fund’s holdings is available electronically on vanguard.com and on the Securities and Exchange Commission’s website (sec.gov), or you can have it mailed to you without charge by calling 800-662-7447. For the first and third fiscal quarters, the fund files the lists with the SEC on Form N-Q. Shareholders can look up the fund’s Forms N-Q on the SEC’s website. Forms N-Q may also be reviewed and copied at the SEC’s Public Reference Room (see the back cover of this report for further information).
| Face | Market | Percentage | |||||
| Maturity | Amount | Value • | of Net | ||||
| Coupon | Date | ($000) | ($000) | Assets | |||
| U. S. Government and Agency Obligations | |||||||
| U.S. Government Securities | |||||||
| 1,2 | United States Treasury Note/Bond | 4.500% | 2/15/36 | 215,530 | 259,612 | 1.6% | |
| United States Treasury Note/Bond | 4.375% | 11/15/39 | 99,100 | 119,679 | 0.7% | ||
| 1,2 | United States Treasury | ||||||
| Note/Bond | 1.375%– 6.250% | 4/30/21–5/15/48 | 428,358 | 418,056 | 2.5% | ||
| 797,347 | 4.8% | ||||||
| Agency Notes † | 52,874 | 0.3% | |||||
| §Conventional Mortgage-Backed Securities † | 113,045 | 0.7% | |||||
| Nonconventional Mortgage-Backed Securities † | 75,346 | 0.5% | |||||
| Total U.S. Government and Agency Obligations (Cost $1,062,823) | 1,038,612 | 6.3% | |||||
| Asset-Backed/Commercial Mortgage-Backed Securities (Cost $6,051) † | 6,043 | 0.1% | |||||
| Corporate Bonds | |||||||
| Finance | |||||||
| Banking | |||||||
| 3 | Bank of America Corp. | 4.244% | 4/24/38 | 80,790 | 79,585 | 0.5% | |
| 3 | Bank of America Corp. | 3.946% | 1/23/49 | 75,200 | 69,698 | 0.4% | |
| 3 | Bank of America Corp. | 3.248%–5.875% | 10/21/27–1/20/48 | 119,670 | 120,870 | 0.7% | |
| Bank of America NA | 6.000% | 10/15/36 | 20,450 | 24,230 | 0.1% | ||
| Bank One Corp. | 8.000% | 4/29/27 | 27,424 | 34,160 | 0.2% | ||
| 3 | Goldman Sachs Group Inc. | 4.017% | 10/31/38 | 133,540 | 125,753 | 0.8% | |
| 3 | Goldman Sachs Group Inc. | 3.691% | 6/5/28 | 66,500 | 63,404 | 0.4% | |
| 3 | Goldman Sachs Group | ||||||
| Inc. | 3.814%– 6.750% | 4/23/29–10/21/45 | 170,429 | 183,737 | 1.1% | ||
| HSBC Bank USA NA | 5.625%–5.875% | 11/1/34–8/15/35 | 67,630 | 76,604 | 0.5% | ||
| HSBC Holdings plc | 6.800% | 6/1/38 | 58,749 | 73,494 | 0.4% | ||
| 89 | |||||||
| Long-Term Investment-Grade Fund | ||||||
| Face | Market | Percentage | ||||
| Maturity | Amount | Value • | of Net | |||
| Coupon | Date | ($000) | ($000) | Assets | ||
| 3 HSBC Holdings plc | 4.041%–7.625% | 3/8/26–9/23/66 | 82,440 | 98,475 | 0.6% | |
| JPMorgan Chase & Co. | 6.400% | 5/15/38 | 59,415 | 74,358 | 0.4% | |
| 3 JPMorgan Chase & Co. | 3.964% | 11/15/48 | 72,910 | 67,015 | 0.4% | |
| 3 JPMorgan Chase & Co. | 3.882% | 7/24/38 | 65,990 | 61,615 | 0.4% | |
| 3 JPMorgan Chase & Co. | 3.897%–5.600% | 7/23/29–1/23/49 | 198,842 | 194,771 | 1.2% | |
| 3 Morgan Stanley | 3.971% | 7/22/38 | 83,445 | 78,350 | 0.5% | |
| 3 Morgan Stanley | 3.737%–7.250% | 4/24/24–1/22/47 | 199,365 | 213,255 | 1.3% | |
| Wachovia Corp. | 5.500% | 8/1/35 | 2,400 | 2,591 | 0.0% | |
| Wells Fargo & Co. | 5.606% | 1/15/44 | 141,958 | 159,771 | 1.0% | |
| Wells Fargo & Co. | 4.750% | 12/7/46 | 66,679 | 67,289 | 0.4% | |
| Wells Fargo & Co. | 5.375% | 11/2/43 | 55,167 | 60,281 | 0.4% | |
| 3 Wells Fargo & Co. | 3.584%–4.900% | 5/22/28– 6/14/46 | 95,907 | 93,633 | 0.6% | |
| Wells Fargo Bank NA | 6.600% | 1/15/38 | 500 | 631 | 0.0% | |
| 4 Banking—Other † | 155,007 | 0.9% | ||||
| 4 Brokerage † | 29,222 | 0.2% | ||||
| Finance Companies (1.3%) | ||||||
| GE Capital International | ||||||
| Funding Co. Unlimited Co. | 4.418% | 11/15/35 | 227,404 | 221,098 | 1.3% | |
| Insurance | ||||||
| Berkshire Hathaway Finance | ||||||
| Corp. | 5.750% | 1/15/40 | 1,935 | 2,325 | 0.0% | |
| Berkshire Hathaway Inc. | 4.500% | 2/11/43 | 58,057 | 61,075 | 0.4% | |
| UnitedHealth Group Inc. | 5.800% | 3/15/36 | 49,846 | 59,753 | 0.4% | |
| UnitedHealth Group Inc. | 3.750%– 6.875% | 7/15/35– 6/15/48 | 188,397 | 199,963 | 1.2% | |
| 4 Insurance—Other † | 445,949 | 2.7% | ||||
| Real Estate Investment Trusts † | 4,987 | 0.0% | ||||
| 3,202,949 | 19.4% | |||||
| Industrial | ||||||
| 4 Basic Industry † | 124,196 | 0.7% | ||||
| Capital Goods | ||||||
| 5 General Electric Co. | 2.125%– 6.750% | 3/15/32–3/11/44 | 114,351 | 125,667 | 0.7% | |
| United Technologies Corp. | 6.125% | 7/15/38 | 52,575 | 62,564 | 0.4% | |
| United Technologies | ||||||
| Corp. | 3.750%–5.700% | 5/1/35–5/4/47 | 116,100 | 114,790 | 0.7% | |
| 4 Capital Goods—Other † | 265,416 | 1.6% | ||||
| Communication | ||||||
| Comcast Corp. | 3.969% | 11/1/47 | 83,688 | 75,616 | 0.5% | |
| Comcast Corp. | 3.200%– 6.500% | 6/15/35–11/1/52 | 317,498 | 308,749 | 1.9% | |
| NBCUniversal Media | ||||||
| LLC | 4.450%–5.950% | 4/1/41–1/15/43 | 39,685 | 41,383 | 0.2% | |
| 4 Communication—Other † | 230,159 | 1.4% | ||||
| Consumer Cyclical | ||||||
| Amazon.com Inc. | 3.875% | 8/22/37 | 71,400 | 70,660 | 0.4% | |
| Amazon.com Inc. | 4.050% | 8/22/47 | 70,925 | 70,411 | 0.4% | |
| Amazon.com Inc. | 4.250%–4.950% | 12/5/44–8/22/57 | 45,390 | 46,128 | 0.3% | |
| Home Depot Inc. | 4.875% | 2/15/44 | 66,510 | 74,060 | 0.5% | |
| Home Depot Inc. | 3.500%–5.950% | 12/16/36–9/15/56 | 108,615 | 124,504 | 0.8% | |
| Walmart Inc. | 3.625% | 12/15/47 | 70,485 | 66,960 | 0.4% | |
| Walmart Inc. | 3.700%–5.625% | 6/26/28– 6/29/48 | 119,895 | 122,948 | 0.7% | |
| 4 Consumer Cyclical—Other † | 422,567 | 2.6% | ||||
| Consumer Noncyclical | ||||||
| Anheuser-Busch Cos. LLC | 6.750% | 12/15/27 | 400 | 476 | 0.0% | |
| Anheuser-Busch InBev | ||||||
| Finance Inc. | 4.900% | 2/1/46 | 161,615 | 168,548 | 1.0% | |
| 90 | ||||||
| Long-Term Investment-Grade Fund | |||||
| Face | Market | Percentage | |||
| Maturity | Amount | Value • | of Net | ||
| Coupon | Date | ($000) | ($000) | Assets | |
| Anheuser-Busch InBev | |||||
| Finance Inc. | 4.700% | 2/1/36 | 110,120 | 113,134 | 0.7% |
| Anheuser-Busch InBev | |||||
| Finance Inc. | 4.000% | 1/17/43 | 25,208 | 23,026 | 0.1% |
| Anheuser-Busch InBev | |||||
| Worldwide Inc. | 4.600% | 4/15/48 | 67,205 | 67,496 | 0.4% |
| Anheuser-Busch InBev | |||||
| Worldwide Inc. | 3.750%–8.200% | 4/15/38–4/15/58 | 189,408 | 200,626 | 1.2% |
| Gilead Sciences Inc. | 2.950%–5.650% | 3/1/27–3/1/47 | 173,467 | 176,777 | 1.1% |
| Medtronic Inc. | 4.625% | 3/15/45 | 89,925 | 97,792 | 0.6% |
| Medtronic Inc. | 4.375%– 6.500% | 3/15/35–3/15/44 | 80,913 | 90,472 | 0.6% |
| Merck & Co. Inc. | 3.700% | 2/10/45 | 77,020 | 74,083 | 0.5% |
| Pfizer Inc. | 4.125%–7.200% | 3/15/39–12/15/46 | 63,957 | 79,096 | 0.5% |
| Wyeth LLC | 5.950% | 4/1/37 | 67,685 | 82,674 | 0.5% |
| Wyeth LLC | 6.000%– 6.500% | 2/1/34–2/15/36 | 5,702 | 7,047 | 0.0% |
| 4 Consumer Noncyclical—Other † | 1,200,699 | 7.3% | |||
| Energy | |||||
| Baker Hughes a GE Co. | |||||
| LLC / Baker Hughes | |||||
| Co-Obligor Inc. | 4.080% | 12/15/47 | 13,479 | 12,385 | 0.1% |
| ConocoPhillips | 6.500% | 2/1/39 | 62,316 | 80,170 | 0.5% |
| Shell International | |||||
| Finance BV | 3.750%– 6.375% | 5/11/35–9/12/46 | 206,910 | 212,157 | 1.3% |
| Energy—Other † | 305,890 | 1.8% | |||
| 4 Other Industrial † | 51,965 | 0.3% | |||
| Technology | |||||
| Apple Inc. | 4.650% | 2/23/46 | 76,562 | 83,571 | 0.5% |
| Apple Inc. | 3.450%–4.500% | 2/23/36–11/13/47 | 246,704 | 243,052 | 1.5% |
| Microsoft Corp. | 4.450% | 11/3/45 | 70,670 | 77,370 | 0.5% |
| Microsoft Corp. | 3.750% | 2/12/45 | 74,350 | 73,087 | 0.4% |
| Microsoft Corp. | 4.250% | 2/6/47 | 66,743 | 71,186 | 0.4% |
| Microsoft Corp. | 3.700% | 8/8/46 | 65,330 | 63,519 | 0.4% |
| Microsoft Corp. | 4.750% | 11/3/55 | 50,365 | 57,402 | 0.4% |
| Microsoft Corp. | 3.450%–5.300% | 2/12/35–2/6/57 | 162,926 | 163,834 | 1.0% |
| Oracle Corp. | 4.000% | 7/15/46 | 74,945 | 73,061 | 0.4% |
| Oracle Corp. | 6.500% | 4/15/38 | 44,400 | 57,971 | 0.4% |
| Oracle Corp. | 5.375% | 7/15/40 | 49,740 | 57,420 | 0.4% |
| Oracle Corp. | 3.850%– 6.125% | 5/15/35–5/15/55 | 103,724 | 105,288 | 0.6% |
| 4 Technology—Other † | 299,350 | 1.8% | |||
| Transportation | |||||
| Burlington Northern | |||||
| Santa Fe LLC | 3.900%–7.950% | 8/15/30– 6/15/48 | 198,554 | 211,233 | 1.3% |
| Transportation—Other † | 160,106 | 1.0% | |||
| 7,188,741 | 43.7% | ||||
| Utilities | |||||
| Electric | |||||
| 4 Berkshire Hathaway | |||||
| Energy Co. | 4.450%– 6.125% | 4/1/36–1/15/49 | 95,652 | 104,028 | 0.6% |
| Consolidated Edison Co. | |||||
| of New York Inc. | 3.950%– 6.750% | 6/15/33–5/15/58 | 159,559 | 172,334 | 1.0% |
| Duke Energy Carolinas | |||||
| LLC | 6.100% | 6/1/37 | 51,000 | 63,285 | 0.4% |
| Duke Energy Carolinas | |||||
| LLC | 3.875%– 6.450% | 10/15/32–3/15/46 | 75,992 | 77,893 | 0.5% |
| 91 | |||||
| Long-Term Investment-Grade Fund | ||||||
| Face | Market | Percentage | ||||
| Maturity | Amount | Value • | of Net | |||
| Coupon | Date | ($000) | ($000) | Assets | ||
| Duke Energy Florida | ||||||
| LLC | 3.400%– 6.350% | 9/15/37–10/1/46 | 24,510 | 25,733 | 0.1% | |
| Duke Energy Indiana | ||||||
| LLC | 4.200%– 6.450% | 10/15/35–7/15/43 | 60,336 | 67,282 | 0.4% | |
| Duke Energy Ohio Inc. | 3.700% | 6/15/46 | 9,825 | 8,977 | 0.1% | |
| Duke Energy Progress | ||||||
| LLC | 3.700%–4.200% | 5/15/42–10/15/46 | 79,996 | 77,875 | 0.5% | |
| MidAmerican Energy Co. | 4.250%–5.800% | 10/15/36–5/1/46 | 31,920 | 34,576 | 0.2% | |
| Nevada Power Co. | 5.375%– 6.650% | 4/1/36–5/15/41 | 49,180 | 57,248 | 0.3% | |
| Pacific Gas & Electric Co. | 6.050% | 3/1/34 | 55,276 | 60,604 | 0.4% | |
| Pacific Gas & Electric | ||||||
| Co. | 4.000%– 6.350% | 3/1/37–12/1/46 | 115,158 | 118,520 | 0.7% | |
| PacifiCorp | 4.100%– 6.350% | 6/15/35–1/15/49 | 118,982 | 142,705 | 0.9% | |
| Virginia Electric & Power Co. | 6.000% | 5/15/37 | 57,330 | 69,126 | 0.4% | |
| 4 Electric—Other † | 1,129,469 | 6.9% | ||||
| Natural Gas † | 24,978 | 0.2% | ||||
| Other Utility † | 3,430 | 0.0% | ||||
| 2,238,063 | 13.6% | |||||
| Total Corporate Bonds (Cost $12,326,039) | 12,629,753 | 76.7% | ||||
| Sovereign Bonds | ||||||
| 4 State of Qatar | 5.103% | 4/23/48 | 68,230 | 69,736 | 0.4% | |
| 4 Sovereign Bonds—Other † | 243,491 | 1.5% | ||||
| Total Sovereign Bonds (Cost $317,167) | 313,227 | 1.9% | ||||
| Taxable Municipal Bonds | ||||||
| American Municipal Power | ||||||
| Ohio Inc. Revenue (Prairie | ||||||
| State Energy Campus Project) 6.270% | 2/15/50 | 45,510 | 56,938 | 0.3% | ||
| California GO | 7.300% | 10/1/39 | 75,945 | 107,196 | 0.7% | |
| California GO | 7.600% | 11/1/40 | 55,940 | 84,123 | 0.5% | |
| California GO | 4.500%–7.625% | 4/1/33–3/1/40 | 106,835 | 137,397 | 0.8% | |
| Los Angeles CA Unified | ||||||
| School District GO | 6.758% | 7/1/34 | 52,760 | 69,043 | 0.4% | |
| New Jersey Turnpike Authority | ||||||
| Revenue | 7.102% | 1/1/41 | 46,613 | 65,280 | 0.4% | |
| New York Metropolitan | ||||||
| Transportation Authority | ||||||
| Revenue (Dedicated Tax Fund) 7.336% | 11/15/39 | 65,035 | 94,139 | 0.6% | ||
| Taxable Municipal Bonds—Other † | 1,147,246 | 7.0% | ||||
| Total Taxable Municipal Bonds (Cost $1,537,771) | 1,761,362 | 10.7% | ||||
| Shares | ||||||
| Temporary Cash Investments | ||||||
| Money Market Fund | ||||||
| 6 Vanguard Market Liquidity Fund 2.145% | 3,832,599 | 383,260 | 2.3% | |||
| 92 | ||||||
| Long-Term Investment-Grade Fund | |||||
| Face | Market | Percentage | |||
| Maturity | Amount | Value • | of Net | ||
| Coupon | Date | ($000) | ($000) | Assets | |
| Repurchase Agreements | |||||
| Bank of America Securities, LLC | |||||
| (Dated 7/31/18, Repurchase Value | |||||
| $36,802,000, collateralized by | |||||
| Federal Home Loan Mortgage | |||||
| Corp. 4.000%, 3/1/48, with a | |||||
| value of $37,536,000) | 1.930% | 8/1/18 | 36,800 | 36,800 | 0.2% |
| Bank of Montreal (Dated 7/31/18, | |||||
| Repurchase Value $21,001,000, | |||||
| collateralized by U. S. Treasury | |||||
| Bill 0.00%, 1/31/19 and U.S. | |||||
| Treasury Note/Bond 1.500%– | |||||
| 3.625%, 5/15/19–2/15/47, | |||||
| with a value of $21,420,000) | 1.900% | 8/1/18 | 21,000 | 21,000 | 0.1% |
| Barclays Capital Inc. (Dated | |||||
| 7/31/18, Repurchase Value | |||||
| $66,804,000, collateralized | |||||
| by U. S. Treasury Bill 0.000%, | |||||
| 11/1/18–7/18/19 and U.S. | |||||
| Treasury Note/Bond 0.875%– | |||||
| 4.375%, 10/15/18–5/15/46, | |||||
| with a value of $68,136,000) | 1.900% | 8/1/18 | 66,800 | 66,800 | 0.4% |
| Citigroup Global Markets Inc. | |||||
| (Dated 7/31/18, Repurchase | |||||
| Value $20,601,000, collateralized | |||||
| by U. S. Treasury Note/Bond | |||||
| 2.375%, 4/30/20, with a value | |||||
| of $21,012,000) | 1.910% | 8/1/18 | 20,600 | 20,600 | 0.1% |
| RBC Capital Markets LLC (Dated | |||||
| 7/31/18, Repurchase Value | |||||
| $12,701,000, collateralized by | |||||
| Federal Home Loan Mortgage | |||||
| Corp. 3.500%, 3/1/48 and Federal | |||||
| National Mortgage Assn. 2.940%– | |||||
| 4.645%, 7/1/21–7/1/48, with a | |||||
| value of $12,954,000) | 1.900% | 8/1/18 | 12,700 | 12,700 | 0.1% |
| Wells Fargo & Co. (Dated 7/31/18, | |||||
| Repurchase Value $10,501,000, | |||||
| collateralized by Federal Home | |||||
| Loan Mortgage Corp. 3.000%– | |||||
| 4.000%, 5/1/33-5/1/48 and | |||||
| Federal National Mortgage Assn. | |||||
| 0.000%–4.000%, 3/1/22–8/1/48, | |||||
| with a value of $10,710,000) | 1.930% | 8/1/18 | 10,500 | 10,500 | 0.1% |
| 168,400 | 1.0% | ||||
| Total Temporary Cash Investments (Cost $551,659) | 551,660 | 3.3% | |||
| 93 | |||||
| Long-Term Investment-Grade Fund | ||||||
| Notional | ||||||
| Amount on | ||||||
| Underlying | Market | Percentage | ||||
| Expiration | Exercise | Swap | Value • | of Net | ||
| Counterparty | Date | Rate | ($000) | ($000) | Assets | |
| Credit Default Swaptions Purchased | ||||||
| Put Swaptions on | ||||||
| CDX-NA-IG-S30-V1 | ||||||
| 5-Year Index | JPMC | 8/15/18 | 65.00% | 8,400 | — | 0.0% |
| Put Swaptions on | ||||||
| CDX-NA-IG-S30-V1 | ||||||
| 5-Year Index | DBAG | 8/15/18 | 70.00% | 4,950 | 2 | 0.0% |
| Total Swaption Contracts Purchased (Cost $11) | 2 | 0.0% | ||||
| Total Investments (Cost $15,801,521) | 16,300,659 | 99.0% | ||||
| Notional | ||||||
| Expiration | Exercise | Amount | ||||
| Date | Contracts | Price | ($000) | |||
| Liability for Options Written | ||||||
| Written Options on Futures | ||||||
| Call Options on 10-Year | ||||||
| U.S. Treasury Note | ||||||
| Futures Contracts | 8/10/18 | 14 | USD $119.25 | 1,670 | (6) | 0.0% |
| Call Options on 10-Year | ||||||
| U.S. Treasury Note | ||||||
| Futures Contracts | 8/24/18 | 14 | USD $120.00 | 1,680 | (3) | 0.0% |
| Call Options on 10-Year | ||||||
| U.S. Treasury Note | ||||||
| Futures Contracts | 8/27/18 | 41 | USD $119.50 | 4,900 | (15) | 0.0% |
| Put Options on 10-Year | ||||||
| U.S. Treasury Note | ||||||
| Futures Contracts | 8/10/18 | 14 | USD $119.25 | 1,670 | (3) | 0.0% |
| Put Options on 10-Year | ||||||
| U.S. Treasury Note | ||||||
| Futures Contracts | 8/24/18 | 14 | USD $120.00 | 1,680 | (11) | 0.0% |
| Put Options on 10-Year | ||||||
| U.S. Treasury Note | ||||||
| Futures Contracts | 8/24/18 | 27 | USD $119.00 | 3,213 | (6) | 0.0% |
| Put Options on 10-Year | ||||||
| U.S. Treasury Note | ||||||
| Futures Contracts | 8/27/18 | 14 | USD $119.50 | 1,673 | (6) | 0.0% |
| Total Options on Futures Written (Premiums Received $57) | (50) | 0.0% | ||||
| 94 | ||||||
| Long-Term Investment-Grade Fund | ||||||
| Notional | ||||||
| Amount on | ||||||
| Underlying | Market | Percentage | ||||
| Expiration | Exercise | Swap | Value • | of Net | ||
| Counterparty | Date | Rate | ($000) | ($000) | Assets | |
| Written Swaptions on Credit Default Index | ||||||
| Call Swaptions on | ||||||
| CDX-NA-IG-S30-V1 | ||||||
| 5-Year Index | DBAG | 8/15/18 | 65.00% | 4,950 | (15) | 0.0% |
| Call Swaptions on | ||||||
| CDX-NA-IG-S30-V1 | ||||||
| 5-Year Index | GSI | 8/15/18 | 67.50% | 3,290 | (13) | 0.0% |
| Put Swaptions on | ||||||
| CDX-NA-IG-S30-V1 | ||||||
| 5-Year Index | DBAG | 8/15/18 | 65.00% | 4,950 | (1) | 0.0% |
| Put Swaptions on | ||||||
| CDX-NA-IG-S30-V1 | ||||||
| 5-Year Index | GSI | 8/15/18 | 72.50% | 3,290 | — | 0.0% |
| Put Swaptions on | ||||||
| CDX-NA-IG-S30-V1 | ||||||
| 5-Year Index | JPMC | 9/19/18 | 75.00% | 8,400 | (3) | 0.0% |
| Total Credit Default Swaptions Written (Premiums Received $31) | (32) | 0.0% | ||||
| Total Liability for Options Written (Premiums Received $88) | (82) | 0.0% | ||||
| Amount | ||||||
| ($000) | ||||||
| Other Assets and Other Liabilities | ||||||
| Other Assets | ||||||
| Investment in Vanguard | 863 | |||||
| Receivables for Investment Securities Sold | 21,288 | |||||
| Receivables for Accrued Income | 193,496 | |||||
| Receivables for Capital Shares Issued | 43,533 | |||||
| Variation Margin Receivable—Futures Contracts | 2,108 | |||||
| Variation Margin Receivable—CC Swap Contracts | 1,215 | |||||
| Unrealized Appreciation—Forward Currency Contracts | 5 | |||||
| Unrealized Appreciation—OTC Swap Contracts | 310 | |||||
| Other Assets | 264 | |||||
| Total Other Assets | 263,082 | 1.6% | ||||
| Other Liabilities | ||||||
| Payables for Investment Securities Purchased | (56,923) | |||||
| Payables to Investment Advisor | (633) | |||||
| Payables for Capital Shares Redeemed | (16,970) | |||||
| Payables for Distributions | (8,731) | |||||
| Payables to Vanguard | (13,051) | |||||
| Variation Margin Payable—Futures Contracts | (592) | |||||
| Variation Margin Payable—CC Swap Contracts | (123) | |||||
| Unrealized Depreciation—Forward Currency Contracts | (23) | |||||
| Unrealized Depreciation—OTC Swap Contracts | (135) | |||||
| Other Liabilities | (4,788) | |||||
| Total Other Liabilities | (101,969) | (0.6%) | ||||
| Net Assets | 16,461,690 | 100.0% | ||||
| 95 | ||||||
| Long-Term Investment-Grade Fund | |
| At July 31, 2018, net assets consisted of: | |
| Amount | |
| ($000) | |
| Paid-in Capital | 15,954,818 |
| Overdistributed Net Investment Income | (47) |
| Accumulated Net Realized Losses | (775) |
| Unrealized Appreciation (Depreciation) | |
| Investment Securities | 499,147 |
| Futures Contracts | 2,084 |
| Options7 | (3) |
| Swap Contracts | 6,485 |
| Forward Currency Contracts | (18) |
| Foreign Currencies | (1) |
| Net Assets | 16,461,690 |
| Investor Shares—Net Assets | |
| Applicable to 439,247,337 outstanding $.001 par value shares of | |
| beneficial interest (unlimited authorization) | 4,307,095 |
| Net Asset Value Per Share—Investor Shares | $9.81 |
| Admiral Shares—Net Assets | |
| Applicable to 1,239,526,353 outstanding $.001 par value shares of | |
| beneficial interest (unlimited authorization) | 12,154,595 |
| Net Asset Value Per Share—Admiral Shares | $9.81 |
• See Note A in Notes to Financial Statements.
§ Certain of the fund’s securities are valued using significant unobservable inputs.
† Represents the aggregate value, by category, of securities that are not among the 50 largest holdings and, in total for any issuer,
represent 1% or less of net assets.
1 Securities with a value of $52,398,000 have been segregated as initial margin for open cleared swap contracts.
2 Securities with a value of $12,697,000 have been segregated as initial margin for open futures contracts.
3 The average or expected maturity is shorter than the final maturity shown because of the possibility of interim principal payments
and prepayments or the possibility of the issue being called.
4 Certain of the fund’s securities are exempt from registration under Rule 144A of the Securities Act of 1933. Such securities may
be sold in transactions exempt from registration, normally to qualified institutional buyers. At July 31, 2018, the aggregate value
of these securities was $677,315,000, representing 4.1% of net assets.
5 Face amount denominated in euro.
6 Affiliated money market fund available only to Vanguard funds and certain trusts and accounts managed by Vanguard. Rate shown
is the 7-day yield.
7 Unrealized appreciation (depreciation) on options on futures contracts is required to be treated as realized gain (loss) for tax
purposes.
CC—centrally cleared.
GO—General Obligation Bond.
DBAG—Deutsche Bank AG.
GSI—Goldman Sachs International.
JPMC—JP Morgan Chase Bank.
OTC—over-the-counter.
96
| Long-Term Investment-Grade Fund | ||||
| Derivative Financial Instruments Outstanding as of Period End | ||||
| Futures Contracts | ||||
| ($000) | ||||
| Value and | ||||
| Number of | Unrealized | |||
| Long (Short) | Notional | Appreciation | ||
| Expiration | Contracts | Amount | (Depreciation) | |
| Long Futures Contracts | ||||
| 30-Year U.S. Treasury Bond | September 2018 | 2,885 | 412,465 | 76 |
| Ultra Long U.S. Treasury Bond | September 2018 | 1,652 | 259,209 | 873 |
| 10-Year U.S. Treasury Note | September 2018 | 1,532 | 182,954 | 380 |
| 5-Year U.S. Treasury Note | September 2018 | 193 | 21,833 | 8 |
| Ultra 10-Year U.S. Treasury Note | September 2018 | 99 | 12,584 | (13) |
| 1,324 | ||||
| Short Futures Contracts | ||||
| 5-Year U.S. Treasury Note | September 2018 | (3,706) | (419,241) | 989 |
| 10-Year U.S. Treasury Note | September 2018 | (740) | (88,372) | 376 |
| Ultra Long U.S. Treasury Bond | September 2018 | (439) | (68,882) | (618) |
| 2-Year U.S. Treasury Note | September 2018 | (133) | (28,113) | 67 |
| Euro-Buxl | September 2018 | (39) | (8,008) | (64) |
| Euro-Bund | September 2018 | (34) | (6,424) | 4 |
| Ultra 10-Year U.S. Treasury Note | September 2018 | (13) | (1,652) | 7 |
| Euro-Bobl | September 2018 | (4) | (616) | (1) |
| 760 | ||||
| 2,084 | ||||
Unrealized appreciation (depreciation) on open futures contracts is required to be treated as realized
gain (loss) for tax purposes.
97
| Long-Term Investment-Grade Fund | ||||||
| Forward Currency Contracts | ||||||
| Unrealized | ||||||
| Contract | Appreciation | |||||
| Settlement | Contract Amount (000) | (Depreciation) | ||||
| Counterparty | Date | Receive | Deliver | ($000) | ||
| Citibank, N.A. | 8/15/18 | EUR | 672 | USD | 788 | (2) |
| Citibank, N.A. | 8/15/18 | EUR | 609 | USD | 713 | — |
| Deutsche Bank | 8/15/18 | EUR | 675 | USD | 790 | 1 |
| Deutsche Bank | 8/15/18 | EUR | 74 | USD | 87 | — |
| JPMorgan Chase | 8/15/18 | EUR | 410 | USD | 476 | 4 |
| Citibank, N.A. | 8/15/18 | USD | 18,873 | EUR | 16,128 | (9) |
| Goldman Sachs | 8/15/18 | USD | 472 | MXN | 9,030 | (12) |
| JPMorgan Chase | 8/15/18 | USD | 45 | EUR | 38 | — |
| (18) | ||||||
| EUR—euro. | ||||||
| MXN—Mexican peso. | ||||||
| USD—U.S. dollar. | ||||||
Unrealized appreciation (depreciation) on open forward currency contracts is treated as ordinary income for tax purposes.
| Centrally Cleared Credit Default Swaps | ||||||
| Periodic | ||||||
| Premium | Unrealized | |||||
| Received | Appreciation | |||||
| Termination | Notional Amount | (Paid)1 | Value | (Depreciation) | ||
| Reference Entity | Date | (000) | (%) | ($000) | ($000) | |
| Credit Protection Sold | ||||||
| CDX-NA-IG-S30-V1 | 6/20/23 | USD | 2,544,300 | 1.000 | 48,087 | 6,192 |
| CDX-NA-IG-S30-V1 | 6/20/23 | USD | 3,992 | 1.000 | 76 | 7 |
| 48,163 | 6,199 | |||||
| Credit Protection Purchased | ||||||
| iTraxx Europe-S29-V1 | 6/20/23 | EUR | 3,785 | (1.000) | (84) | (8) |
| 48,079 | 6,191 | |||||
| 1 Periodic premium received/paid quarterly. | ||||||
| EUR—euro. | ||||||
| USD—U.S. dollar. | ||||||
98
| Long-Term Investment-Grade Fund | |||||||
| Over-the-Counter Credit Default Swaps | |||||||
| Remaining | |||||||
| Periodic | Up-Front | ||||||
| Premium | Premium | Unrealized | |||||
| Notional | Received | Received | Appreciation | ||||
| Termination | Amount | (Paid) | Value | (Paid) | (Depreciation) | ||
| Reference Entity | Date | Counterparty | ($000) | (%) | ($000) | ($000) | ($000) |
| Credit Protection Sold/Moody’s Rating | |||||||
| Anheuser-Busch | |||||||
| InBev NV/A3 | 12/20/23 | BARC | 900 | 1.0002 | 18 | (24) | (6) |
| Anheuser-Busch | |||||||
| InBev NV/A3 | 12/20/23 | BARC | 300 | 1.0002 | 6 | (7) | (1) |
| Anheuser-Busch | |||||||
| InBev NV/A3 | 12/20/23 | BARC | 300 | 1.0002 | 6 | (6) | — |
| Anheuser-Busch | |||||||
| InBev NV/A3 | 12/20/23 | GSI | 400 | 1.0002 | 8 | (9) | (1) |
| Berkshire Hathaway | |||||||
| Inc./Aa2 | 12/20/21 | CITNA | 6,000 | 1.0002 | 119 | (40) | 79 |
| Federative Republic | |||||||
| of Brazil/Ba2 | 9/20/18 | BNPSW | 2,000 | 1.0002 | 1 | (1) | (—) |
| Intesa Sanpaolo | |||||||
| SpA/Baa1 | 6/20/23 | CITNA | 750 | 1.0002 | (17) | 16 | (1) |
| Metlife Inc./A3 | 12/20/21 | GSI | 10,000 | 1.0002 | 196 | (22) | 174 |
| Petroleos Mexicanos/ | |||||||
| Baa3 | 6/20/23 | JPMC | 2,500 | 1.0002 | (147) | 165 | 18 |
| Republic of Chile/Aa3 | 6/20/23 | BNPSW | 6,200 | 1.0002 | 140 | (137) | 3 |
| Republic of Peru/A3 | 6/20/23 | BNPSW | 525 | 1.0002 | 5 | (4) | 1 |
| Republic of Peru/A3 | 6/20/23 | HSBCC | 525 | 1.0002 | 5 | (4) | 1 |
| Southern Co. /Baa2 | 6/20/22 | JPMC | 3,170 | 1.000 2 | 60 | (42) | 18 |
| 400 | (115) | 285 | |||||
| Credit Protection Purchased | |||||||
| Bank of China Ltd. | 12/20/21 | BNPSW | 300 | (1.000)2 | (5) | (1) | (6) |
| CECONOMY AG | 6/20/22 | BARC | 5551 | (1.000)2 | (7) | (1) | (8) |
| CECONOMY AG | 6/20/22 | BARC | 3901 | (1.000)2 | (4) | (1) | (5) |
| CECONOMY AG | 6/20/22 | BARC | 3901 | (1.000)2 | (4) | (1) | (5) |
| CECONOMY AG | 6/20/22 | BARC | 1601 | (1.000)2 | (2) | (1) | (3) |
| CECONOMY AG | 6/20/22 | BARC | 1601 | (1.000)2 | (2) | (—) | (2) |
| CECONOMY AG | 6/20/22 | BARC | 1601 | (1.000)2 | (2) | (—) | (2) |
| Dominion Energy Inc. | 6/20/22 | JPMC | 395 | (1.000)2 | (10) | 10 | — |
| Exelon Corp. | 6/20/22 | JPMC | 635 | (1.000)2 | (17) | 16 | (1) |
| Exelon Corp. | 6/20/22 | JPMC | 395 | (1.000)2 | (11) | 10 | (1) |
| Federative Republic | |||||||
| of Brazil | 12/20/22 | CITNA | 350 | (1.000)2 | 13 | (11) | 2 |
| 99 | |||||||
| Long-Term Investment-Grade Fund | |||||||
| Over-the-Counter Credit Default Swaps (continued) | |||||||
| Remaining | |||||||
| Periodic | Up-Front | ||||||
| Premium | Premium | Unrealized | |||||
| Notional | Received | Received | Appreciation | ||||
| Termination | Amount | (Paid) | Value | (Paid) | (Depreciation) | ||
| Reference Entity | Date | Counterparty | ($000) | (%) | ($000) | ($000) | ($000) |
| Credit Protection Purchased | |||||||
| Federative Republic | |||||||
| of Brazil | 6/20/23 | BOANA | 180 | (1.000)2 | 8 | (5) | 3 |
| Federative Republic | |||||||
| of Brazil | 6/20/23 | JPMC | 555 | (1.000)2 | 26 | (15) | 11 |
| Federative Republic | |||||||
| of Brazil | 12/20/25 | BOANA | 315 | (1.000)2 | 30 | (67) | (37) |
| Federative Republic | |||||||
| of Brazil | 12/20/25 | GSCM | 315 | (1.000)2 | 30 | (62) | (32) |
| Republic of Colombia | 6/20/23 | GSI | 1,600 | (1.000)2 | 2 | (23) | (21) |
| Sempra Energy | 6/20/22 | JPMC | 635 | (1.000)2 | (16) | 15 | (1) |
| Sempra Energy | 6/20/22 | JPMC | 395 | (1.000)2 | (10) | 10 | (—) |
| Telia Company AB | 6/20/23 | BARC | 6001 | (1.000)2 | (20) | 18 | (2) |
| (1) | (109) | (110) | |||||
| 175 | |||||||
The notional amount represents the maximum potential amount the fund could be required to pay as a seller of credit protection if the reference entity was subject to a credit event.
1 Notional amount denominated in euro.
2 Periodic premium received/paid quarterly.
BARC—Barclays Bank plc.
BOANA—Bank of America, N.A.
BNPSW—BNP Paribas.
CITNA—Citibank N.A.
GSCM—Goldman Sachs Bank USA.
GSI—Goldman Sachs International.
HSBCC—HSBC Holdings plc.
JPMC—JP Morgan Chase Bank.
At July 31, 2018, the counterparty had deposited in segregated accounts cash with a value of $350,000 in connection with open forward currency contracts and open over-the-counter swap contracts.
100
| Long-Term Investment-Grade Fund | ||||||
| Centrally Cleared Interest Rate Swaps | ||||||
| Fixed | Floating | |||||
| Interest | Interest | |||||
| Rate | Rate | Unrealized | ||||
| Future | Notional | Received | Received | Appreciation | ||
| Effective | Amount | (Paid)2 | (Paid) | Value | (Depreciation) | |
| Termination Date | Date | ($000) | (%) | (%) | ($000) | ($000) |
| 9/19/19 | 9/19/181 | 10,890 | (2.000) | 0.0003 | 82 | 6 |
| 9/19/20 | 9/19/181 | 12,332 | 2.250 | (0.000)3 | (165) | (19) |
| 9/19/23 | 9/19/181 | 4,021 | 2.250 | (0.000)3 | (142) | (8) |
| 4/30/25 | 9/28/181 | 6,498 | (3.034) | 0.0003 | (11) | (12) |
| 9/19/25 | 9/19/181 | 3,955 | 2.250 | (0.000)3 | (196) | (7) |
| 9/19/28 | 9/19/181 | 3,620 | 2.500 | (0.000)3 | (181) | (6) |
| 9/19/33 | 9/19/181 | 18,308 | (2.500) | 0.0003 | 1,369 | 27 |
| 9/19/38 | 9/19/181 | 31,816 | 2.500 | (0.000)3 | (2,993) | (54) |
| 11/16/43 | 9/28/181 | 1,875 | (3.098) | 0.0003 | (12) | (13) |
| 9/21/48 | 9/19/181 | 45,957 | (2.500) | 0.0003 | 5,518 | 205 |
| 3,269 | 119 | |||||
1 Forward interest rate swap. In a forward interest rate swap, the fund and the counterparty agree to make periodic net payments
beginning on a specified future effective date.
2 Fixed interest payment received/paid semi-annually.
3 Based on 3-month London Interbank Offered Rate (LIBOR) as of the most recent payment date. Floating interest payment received/
paid quarterly.
Unrealized appreciation (depreciation) on open swap contracts is generally treated the same for financial reporting and tax purposes.
See accompanying Notes, which are an integral part of the Financial Statements.
101
| Long-Term Investment-Grade Fund | |
| Statement of Operations | |
| Six Months Ended | |
| July31,2018 | |
| ($000) | |
| Investment Income | |
| Income | |
| Interest1 | 339,658 |
| Total Income | 339,658 |
| Expenses | |
| Investment Advisory Fees—Note B | 1,865 |
| The Vanguard Group—Note C | |
| Management and Administrative—Investor Shares | 3,817 |
| Management and Administrative—Admiral Shares | 4,993 |
| Marketing and Distribution—Investor Shares | 273 |
| Marketing and Distribution—Admiral Shares | 341 |
| Custodian Fees | 44 |
| Shareholders’ Reports—Investor Shares | 44 |
| Shareholders’ Reports—Admiral Shares | 18 |
| Trustees’ Fees and Expenses | 11 |
| Total Expenses | 11,406 |
| Net Investment Income | 328,252 |
| Realized Net Gain (Loss) | |
| Investment Securities Sold1 | 30,838 |
| Futures Contracts | (29,182) |
| Purchased Options | (32) |
| Written Options | 15 |
| Swap Contracts | 8,846 |
| Forward Currency Contracts | 706 |
| Foreign Currencies | (71) |
| Realized Net Gain (Loss) | 11,120 |
| Change in Unrealized Appreciation (Depreciation) | |
| Investment Securities1 | (897,696) |
| Futures Contracts | 11,204 |
| Purchased Options | (11) |
| Written Options | 96 |
| Swap Contracts | (2,301) |
| Forward Currency Contracts | 162 |
| Foreign Currencies | (5) |
| Change in Unrealized Appreciation (Depreciation) | (888,551) |
| Net Increase (Decrease) in Net Assets Resulting from Operations | (549,179) |
1 Interest income, realized net gain (loss), and change in unrealized appreciation (depreciation) from affiliated companies of the fund
were $3,285,000, ($7,000), and $1,000, respectively.
See accompanying Notes, which are an integral part of the Financial Statements.
102
Long-Term Investment-Grade Fund
Statement of Changes in Net Assets
| Six Months Ended | Year Ended | |
| July 31, | January 31, | |
| 2018 | 2018 | |
| ($000) | ($000) | |
| Increase (Decrease) in Net Assets | ||
| Operations | ||
| Net Investment Income | 328,252 | 616,748 |
| Realized Net Gain (Loss) | 11,120 | 357,673 |
| Change in Unrealized Appreciation (Depreciation) | (888,551) | 397,559 |
| Net Increase (Decrease) in Net Assets Resulting from Operations | (549,179) | 1,371,980 |
| Distributions | ||
| Net Investment Income | ||
| Investor Shares | (90,417) | (173,990) |
| Admiral Shares | (250,695) | (467,167) |
| Realized Capital Gain1 | ||
| Investor Shares | (15,039) | (68,060) |
| Admiral Shares | (40,061) | (182,382) |
| Total Distributions | (396,212) | (891,599) |
| Capital Share Transactions | ||
| Investor Shares | (4,508) | 365,223 |
| Admiral Shares | 915,703 | 1,244,648 |
| Net Increase (Decrease) from Capital Share Transactions | 911,195 | 1,609,871 |
| Total Increase (Decrease) | (34,196) | 2,090,252 |
| Net Assets | ||
| Beginning of Period | 16,495,886 | 14,405,634 |
| End of Period2 | 16,461,690 | 16,495,886 |
1 Includes fiscal 2019 and 2018 short-term gain distributions totaling $3,058,000 and $30,579,000, respectively. Short-term gain
distributions are treated as ordinary income dividends for tax purposes.
2 Net Assets—End of Period includes undistributed (overdistributed) net investment income of ($47,000) and ($76,000).
See accompanying Notes, which are an integral part of the Financial Statements.
103
Long-Term Investment-Grade Fund
Financial Highlights
| Investor Shares | ||||||
| Six Months | ||||||
| Ended | ||||||
| For a Share Outstanding | July 31, | Year Ended January 31, | ||||
| Throughout Each Period | 2018 | 2018 | 2017 | 2016 | 2015 | 2014 |
| Net Asset Value, Beginning of Period | $10.40 | $10.06 | $10.00 | $11.34 | $10.02 | $10.65 |
| Investment Operations | ||||||
| Net Investment Income | .1981 | .4051 | .416 | .430 | .453 | .469 |
| Net Realized and Unrealized Gain (Loss) | ||||||
| on Investments | (.548) | .520 | .260 | (1.148) | 1.487 | (.525) |
| Total from Investment Operations | (. 350) | . 925 | . 676 | (.718) | 1.940 | (. 056) |
| Distributions | ||||||
| Dividends from Net Investment Income | (. 206) | (. 421) | (. 435) | (. 446) | (. 466) | (. 481) |
| Distributions from Realized Capital Gains | (. 034) | (.164) | (.181) | (.176) | (.154) | (. 093) |
| Total Distributions | (. 240) | (. 585) | (. 616) | (. 622) | (. 620) | (. 574) |
| Net Asset Value, End of Period | $9.81 | $10.40 | $10.06 | $10.00 | $11.34 | $10.02 |
| Total Return2 | -3.36% | 9.28% | 6.71% | -6.33% | 19.98% | -0.41% |
| Ratios/Supplemental Data | ||||||
| Net Assets, End of Period (Millions) | $4,307 | $4,570 | $4,069 | $3,860 | $4,714 | $4,112 |
| Ratio of Total Expenses to | ||||||
| Average Net Assets | 0.22% | 0.22% | 0.22% | 0.21% | 0.22% | 0.22% |
| Ratio of Net Investment Income to | ||||||
| Average Net Assets | 4.03% | 3.87% | 3.92% | 4.18% | 4.30% | 4.64% |
| Portfolio Turnover Rate | 23% | 27% | 24% | 35%3 | 21% | 26% |
The expense ratio, net investment income ratio, and turnover rate for the current period have been annualized.
1 Calculated based on average shares outstanding.
2 Total returns do not include account service fees that may have applied in the periods shown. Fund prospectuses provide information
about any applicable account service fees.
3 Excludes the value of portfolio securities received or delivered as a result of in-kind purchases or redemptions of the fund’s capital shares.
See accompanying Notes, which are an integral part of the Financial Statements.
104
Long-Term Investment-Grade Fund
Financial Highlights
| Admiral Shares | ||||||
| Six Months | ||||||
| Ended | ||||||
| For a Share Outstanding | July 31, | Year Ended January 31, | ||||
| Throughout Each Period | 2018 | 2018 | 2017 | 2016 | 2015 | 2014 |
| Net Asset Value, Beginning of Period | $10.40 | $10.06 | $10.00 | $11.34 | $10.02 | $10.65 |
| Investment Operations | ||||||
| Net Investment Income | . 2021 | .4151 | .426 | .440 | .463 | .480 |
| Net Realized and Unrealized Gain (Loss) | ||||||
| on Investments | (.548) | .520 | .260 | (1.148) | 1.487 | (.525) |
| Total from Investment Operations | (. 346) | . 935 | . 686 | (.708) | 1.950 | (. 045) |
| Distributions | ||||||
| Dividends from Net Investment Income | (. 210) | (. 431) | (. 445) | (. 456) | (. 476) | (. 492) |
| Distributions from Realized Capital Gains | (. 034) | (.164) | (.181) | (.176) | (.154) | (. 093) |
| Total Distributions | (. 244) | (. 595) | (. 626) | (. 632) | (. 630) | (. 585) |
| Net Asset Value, End of Period | $9.81 | $10.40 | $10.06 | $10.00 | $11.34 | $10.02 |
| Total Return2 | -3.32% | 9.39% | 6.82% | -6.23% | 20.10% | -0.31% |
| Ratios/Supplemental Data | ||||||
| Net Assets, End of Period (Millions) | $12,155 | $11,925 | $10,336 | $9,946 | $12,342 | $10,026 |
| Ratio of Total Expenses to | ||||||
| Average Net Assets | 0.12% | 0.12% | 0.11% | 0.12% | 0.12% | 0.12% |
| Ratio of Net Investment Income to | ||||||
| Average Net Assets | 4.13% | 3.97% | 4.03% | 4.27% | 4.40% | 4.74% |
| Portfolio Turnover Rate | 23% | 27% | 24% | 35%3 | 21% | 26% |
The expense ratio, net investment income ratio, and turnover rate for the current period have been annualized.
1 Calculated based on average shares outstanding.
2 Total returns do not include account service fees that may have applied in the periods shown. Fund prospectuses provide information
about any applicable account service fees.
3 Excludes the value of portfolio securities received or delivered as a result of in-kind purchases or redemptions of the fund’s capital shares.
See accompanying Notes, which are an integral part of the Financial Statements.
105
Long-Term Investment-Grade Fund
Notes to Financial Statements
Vanguard Long-Term Investment-Grade Fund is registered under the Investment Company Act of 1940 as an open-end investment company, or mutual fund. Certain of the fund’s investments are in corporate debt instruments; the issuers’ abilities to meet their obligations may be affected by economic developments in their respective industries. The fund invests in securities of foreign issuers, which may subject it to investment risks not normally associated with investing in securities of U.S. corporations. To minimize currency risk associated with investment in bonds denominated in currencies other than the U.S. dollar, the fund attempts to hedge its currency exposures. The fund offers two classes of shares: Investor Shares and Admiral Shares. Investor Shares are available to any investor who meets the fund’s minimum purchase requirements. Admiral Shares are designed for investors who meet certain administrative, service, and account-size criteria.
A. The following significant accounting policies conform to generally accepted accounting principles for U.S. investment companies. The fund consistently follows such policies in preparing its financial statements.
1. Security Valuation: Securities are valued as of the close of trading on the New York Stock Exchange (generally 4 p.m., Eastern time) on the valuation date. Bonds and temporary cash investments are valued using the latest bid prices or using valuations based on a matrix system (which considers such factors as security prices, yields, maturities, and ratings), both as furnished by independent pricing services. Structured debt securities, including mortgages and asset-backed securities, are valued using the latest bid prices or using valuations based on a matrix system that considers such factors as issuer, tranche, nominal or option-adjusted spreads, weighted average coupon, weighted average maturity, credit enhancements, and collateral. Investments in Vanguard Market Liquidity Fund are valued at that fund’s net asset value. Securities for which market quotations are not readily available, or whose values have been affected by events occurring before the fund’s pricing time but after the close of the securities’ primary markets, are valued at their fair values calculated according to procedures adopted by the board of trustees. These procedures include obtaining quotations from an independent pricing service, monitoring news to identify significant market- or security-specific events, and evaluating changes in the values of foreign market proxies (for example, ADRs, futures contracts, or exchange-traded funds), between the time the foreign markets close and the fund’s pricing time. When fair-value pricing is employed, the prices of securities used by a fund to calculate its net asset value may differ from quoted or published prices for the same securities.
2. Foreign Currency: Securities and other assets and liabilities denominated in foreign currencies are translated into U.S. dollars using exchange rates obtained from an independent third party as of the fund’s pricing time on the valuation date. Realized gains (losses) and unrealized appreciation (depreciation) on investment securities include the effects of changes in exchange rates since the securities were purchased, combined with the effects of changes in security prices. Fluctuations in the value of other assets and liabilities resulting from changes in exchange rates are recorded as unrealized foreign currency gains (losses) until the assets or liabilities are settled in cash, at which time they are recorded as realized foreign currency gains (losses).
3. Futures Contracts: The fund uses futures contracts to invest in fixed income asset classes with greater efficiency and lower cost than is possible through direct investment, to add value when these instruments are attractively priced, or to adjust sensitivity to changes in interest rates. The primary risks associated with the use of futures contracts are imperfect correlation between
106
Long-Term Investment-Grade Fund
changes in market values of bonds held by the fund and the prices of futures contracts, and the possibility of an illiquid market. Counterparty risk involving futures is mitigated because a regulated clearinghouse is the counterparty instead of the clearing broker. To further mitigate counterparty risk, the fund trades futures contracts on an exchange, monitors the financial strength of its clearing brokers and clearinghouse, and has entered into clearing agreements with its clearing brokers. The clearinghouse imposes initial margin requirements to secure the fund’s performance and requires daily settlement of variation margin representing changes in the market value of each contract. Any assets pledged as initial margin for open contracts are noted in the Statement of Net Assets.
Futures contracts are valued at their quoted daily settlement prices. The notional amounts of the contracts are not recorded in the Statement of Net Assets. Fluctuations in the value of the contracts are recorded in the Statement of Net Assets as an asset (liability) and in the Statement of Operations as unrealized appreciation (depreciation) until the contracts are closed, when they are recorded as realized futures gains (losses).
During the six months ended July 31, 2018, the fund’s average investments in long and short futures contracts represented 6% and 4% of net assets, respectively, based on the average of the notional amounts at each quarter-end during the period.
4. Forward Currency Contracts: The fund enters into forward currency contracts to protect the value of securities and related receivables and payables against changes in future foreign exchange rates. The fund’s risks in using these contracts include movement in the values of the foreign currencies relative to the U.S. dollar and the ability of the counterparties to fulfill their obligations under the contracts. The fund mitigates its counterparty risk by entering into forward currency contracts only with a diverse group of prequalified counterparties, monitoring their financial strength, entering into master netting arrangements with its counterparties, and requiring its counterparties to transfer collateral as security for their performance. In the absence of a default, the collateral pledged or received by the fund cannot be repledged, resold, or rehypothecated. The master netting arrangements provide that, in the event of a counterparty’s default (including bankruptcy), the fund may terminate the forward currency contracts, determine the net amount owed by either party in accordance with its master netting arrangements, and sell or retain any collateral held up to the net amount owed to the fund under the master netting arrangements. The forward currency contracts contain provisions whereby a counterparty may terminate open contracts if the fund’s net assets decline below a certain level, triggering a payment by the fund if the fund is in a net liability position at the time of the termination. The payment amount would be reduced by any collateral the fund has pledged. Any assets pledged as collateral for open contracts are noted in the Statement of Net Assets. The value of collateral received or pledged is compared daily to the value of the forward currency contracts exposure with each counterparty, and any difference, if in excess of a specified minimum transfer amount, is adjusted and settled within two business days.
Forward currency contracts are valued at their quoted daily prices obtained from an independent third party, adjusted for currency risk based on the expiration date of each contract. The notional amounts of the contracts are not recorded in the Statement of Net Assets. Fluctuations in the value of the contracts are recorded in the Statement of Net Assets as an asset (liability) and in the Statement of Operations as unrealized appreciation (depreciation) until the contracts are closed, when they are recorded as realized forward currency contract gains (losses).
107
Long-Term Investment-Grade Fund
During the six months ended July 31, 2018, the fund’s average investment in forward currency contracts represented less than 1% of net assets, based on the average of notional amounts at each quarter-end during the period.
5. Swap Contracts: The fund invests in credit default swaps to adjust the overall credit risk of the fund or to actively overweight or underweight credit risk to a specific issuer or group of issuers. The fund may sell credit protection through credit default swaps to simulate investments in long positions that are either unavailable or considered to be less attractively priced in the bond market. The fund may purchase credit protection through credit default swaps to reduce credit exposure to a given issuer or issuers. Under the terms of the swaps, an up-front payment may be exchanged between the seller and buyer. In addition, the seller of the credit protection receives a periodic payment of premium from the buyer that is a fixed percentage applied to a notional amount. If, for example, the reference entity is subject to a credit event (such as bankruptcy, failure to pay, or obligation acceleration) during the term of the swap, the seller agrees to either physically settle or cash settle the swap contract. If the swap is physically settled, the seller agrees to pay the buyer an amount equal to the notional amount and take delivery of a debt instrument of the reference issuer with a par amount equal to such notional amount. If the swap is cash settled, the seller agrees to pay the buyer the difference between the notional amount and the final price for the relevant debt instrument, as determined either in a market auction or pursuant to a pre-agreed-upon valuation procedure.
The fund enters into interest rate swap transactions to adjust the fund’s sensitivity to changes in interest rates and maintain the ability to generate income at prevailing market rates. Under the terms of the swaps, one party pays the other an amount that is a fixed percentage rate applied to a notional amount. In return, the counterparty agrees to pay a floating rate, which is reset periodically based on short-term interest rates, applied to the same notional amount.
The notional amounts of swap contracts are not recorded in the Statement of Net Assets. Swaps are valued daily based on market quotations received from independent pricing services or recognized dealers and the change in value is recorded in the Statement of Net Assets as an asset (liability) and in the Statement of Operations as unrealized appreciation (depreciation) until the seller of credit protection is required to take delivery (or, in a cash settled swap, pay the settlement amount determined) upon occurrence of a credit event, periodic payments are made, or the swap terminates, at which time realized gain (loss) is recorded. The net premium to be received or paid by the fund under swap contracts is accrued daily and recorded as realized gain (loss) over the life of the contract.
The primary risk associated with selling credit protection is that, upon the occurrence of a defined credit event, the market value of the debt instrument received by the fund (or, in a cash settled swap, the debt instruments used to determine the settlement payment by the fund) will be significantly less than the amount paid by the fund and, in a physically settled swap, the fund may receive an illiquid debt instrument. A risk associated with all types of swaps is the possibility that a counterparty may default on its obligation to pay net amounts due to the fund. The fund’s maximum amount subject to counterparty risk is the unrealized appreciation on the swap contract. The fund mitigates its counterparty risk by entering into swaps only with a diverse group of prequalified counterparties, monitoring their financial strength, entering into master netting arrangements with its counterparties, and requiring its counterparties to transfer collateral as
108
Long-Term Investment-Grade Fund
security for their performance. In the absence of a default, the collateral pledged or received by the fund cannot be repledged, resold, or rehypothecated. In the event of a counterparty’s default (including bankruptcy), the fund may terminate any swap contracts with that counterparty, determine the net amount owed by either party in accordance with its master netting arrangements, and sell or retain any collateral held up to the net amount owed to the fund under the master netting arrangements. The swap contracts contain provisions whereby a counterparty may terminate open contracts if the fund’s net assets decline below a certain level, triggering a payment by the fund if the fund is in a net liability position at the time of the termination. The payment amount would be reduced by any collateral the fund has pledged. Any securities pledged as collateral for open contracts are noted in the Statement of Net Assets. The value of collateral received or pledged is compared daily to the value of the swap contracts exposure with each counterparty, and any difference, if in excess of a specified minimum transfer amount, is adjusted and settled within two business days.
The fund enters into centrally cleared interest rate and credit default swaps to achieve the same objectives specified with respect to the equivalent over-the-counter swaps but with less counterparty risk because a regulated clearinghouse is the counterparty instead of the clearing broker or executing broker. The clearinghouse imposes initial margin requirements to secure the fund’s performance, and requires daily settlement of variation margin representing changes in the market value of each contract. To further mitigate counterparty risk, the fund trades with a diverse group of prequalified executing brokers; monitors the financial strength of its clearing brokers, executing brokers, and clearinghouse; and has entered into agreements with its clearing brokers and executing brokers.
During the six months ended July 31, 2018, the fund’s average amounts of investments in credit protection sold and credit protection purchased represented 18% and less than 1% of net assets, respectively, based on the average of notional amounts at each quarter-end during the period. The average amount of investments in interest rate swaps represented less than 1% of net assets, based on the average of notional amounts at each quarter-end during the period.
6. Options: The fund invests in options contracts on futures and swaps to adjust its exposure to the underlying investments. The primary risk associated with purchasing options is that the value of the underlying investments may move in such a way that the option is out-of-the-money (the exercise price of the option exceeds the value of the underlying investment), the position is worthless at expiration, and the fund loses the premium paid. The primary risk associated with selling options is that the value of the underlying investments may move in such a way that the option is in-the-money (the exercise price of the option exceeds the value of the underlying investment), the counterparty exercises the option, and the fund loses an amount equal to the market value of the option written less the premium received.
The fund invests in options on futures, which are exchange-traded. Counterparty risk involving exchange-traded options on futures is mitigated because a regulated clearinghouse is the counterparty instead of the clearing broker. To further mitigate counterparty risk, the fund trades options on futures on an exchange, monitors the financial strength of its clearing brokers and clearinghouses, and has entered into clearing agreements with its clearing brokers.
The fund invests in options on swaps (swaptions), which are transacted over-the-counter (OTC) and not on an exchange. A receiver swaption gives the owner the right to receive the total return of a specified asset, reference rate, or index. A payer swaption gives the owner the right to pay the total
109
Long-Term Investment-Grade Fund
return of a specified asset, reference rate, or index. Swaptions also include options that allow an existing swap to be terminated or extended by one of the counterparties. Unlike exchange-traded options, which are standardized with respect to the underlying instrument, expiration date, contract size, and strike price, the terms of OTC options generally are established through negotiation with the other party to the option contract. Although this type of arrangement allows the purchaser or writer greater flexibility to tailor an option to its needs, OTC options generally involve greater credit risk than exchange-traded options. Credit risk involves the possibility that a counterparty may default on its obligation to pay net amounts due to the fund. The fund mitigates its counterparty risk by entering into swaptions with a diverse group of prequalified counterparties and monitoring their financial strength.
Options on futures contracts are valued at their quoted daily settlement prices. Swaptions are valued daily based on market quotations received from independent pricing services or recognized dealers. The premium paid for a purchased option is recorded in the Statement of Net Assets as an asset that is subsequently adjusted daily to the current market value of the option purchased. The premium received for a written option is recorded in the Statement of Net Assets as an asset with an equal liability that is subsequently adjusted daily to the current market value of the option written. Fluctuations in the value of the options are recorded in the Statement of Operations as unrealized appreciation (depreciation) until expired, closed, or exercised, at which time realized gains (losses) are recognized.
During the period ended July 31, 2018, the fund’s average value of investments in options purchased and options written each represented less than 1% of net assets, based on the average market values at each quarter-end during the period.
7. Repurchase Agreements: The fund enters into repurchase agreements with institutional counterparties. Securities pledged as collateral to the fund under repurchase agreements are held by a custodian bank until the agreements mature, and in the absence of a default, such collateral cannot be repledged, resold, or rehypothecated. Each agreement requires that the market value of the collateral be sufficient to cover payments of interest and principal. The fund further mitigates its counterparty risk by entering into repurchase agreements only with a diverse group of prequalified counterparties, monitoring their financial strength, and entering into master repurchase agreements with its counterparties. The master repurchase agreements provide that, in the event of a counterparty’s default (including bankruptcy), the fund may terminate any repurchase agreements with that counterparty, determine the net amount owed, and sell or retain the collateral up to the net amount owed to the fund. Such action may be subject to legal proceedings, which may delay or limit the disposition of collateral.
8. Federal Income Taxes: The fund intends to continue to qualify as a regulated investment company and distribute all of its taxable income. Management has analyzed the fund’s tax positions taken for all open federal income tax years (January 31, 2015–2018), and for the period ended July 31, 2018, and has concluded that no provision for federal income tax is required in the fund’s financial statements.
9. Distributions: Distributions from net investment income are declared daily and paid on the first business day of the following month. Annual distributions from realized capital gains, if any, are recorded on the ex-dividend date.
110
Long-Term Investment-Grade Fund
10. Credit Facility: The fund and certain other funds managed by The Vanguard Group (“Vanguard”) participate in a $3.1 billion committed credit facility provided by a syndicate of lenders pursuant to a credit agreement that may be renewed annually; each fund is individually liable for its borrowings, if any, under the credit facility. Borrowings may be utilized for temporary and emergency purposes, and are subject to the fund’s regulatory and contractual borrowing restrictions. The participating funds are charged administrative fees and an annual commitment fee of 0.10% of the undrawn amount of the facility; these fees are allocated to the funds based on a method approved by the fund’s board of trustees and included in Management and Administrative expenses on the fund’s Statement of Operations. Any borrowings under this facility bear interest at a rate based upon the higher of the one-month London Interbank Offered Rate, federal funds effective rate, or overnight bank funding rate plus an agreed-upon spread.
The fund had no borrowings outstanding at July 31, 2018, or at any time during the period then ended.
11. Other: Interest income includes income distributions received from Vanguard Market Liquidity Fund and is accrued daily. Premiums and discounts on debt securities purchased are amortized and accreted, respectively, to interest income over the lives of the respective securities. Security transactions are accounted for on the date securities are bought or sold. Costs used to determine realized gains (losses) on the sale of investment securities are those of the specific securities sold.
Each class of shares has equal rights as to assets and earnings, except that each class separately bears certain class-specific expenses related to maintenance of shareholder accounts (included in Management and Administrative expenses), shareholder reporting, and the proxy. Marketing and distribution expenses are allocated to each class of shares based on a method approved by the board of trustees. Income, other non-class-specific expenses, and gains and losses on investments are allocated to each class of shares based on its relative net assets.
B. Wellington Management Company LLP provides investment advisory services to a portion of the fund for a fee calculated at an annual percentage rate of average net assets managed by the advisor.
Vanguard provides investment advisory services to a portion of the fund as described below; the fund paid Vanguard advisory fees of $607,000 for the six months ended July 31, 2018.
For the six months ended July 31, 2018, the aggregate investment advisory fee paid to all advisors represented an effective annual rate of 0.02% of the fund’s average net assets.
C. In accordance with the terms of a Funds’ Service Agreement (the “FSA”) between Vanguard and the fund, Vanguard furnishes to the fund investment advisory, corporate management, administrative, marketing, and distribution services at Vanguard’s cost of operations (as defined by the FSA). These costs of operations are allocated to the fund based on methods and guidelines approved by the board of trustees. Vanguard does not require reimbursement in the current period for certain costs of operations (such as deferred compensation/benefits and risk/insurance costs); the fund’s liability for these costs of operations is included in Payables to Vanguard on the Statement of Net Assets. All other costs of operations payable to Vanguard are generally settled twice a month.
111
Long-Term Investment-Grade Fund
Upon the request of Vanguard, the fund may invest up to 0.40% of its net assets as capital in Vanguard. At July 31, 2018, the fund had contributed to Vanguard capital in the amount of $863,000, representing 0.01% of the fund’s net assets and 0.35% of Vanguard’s capitalization. The fund’s trustees and officers are also directors and employees, respectively, of Vanguard.
D. Various inputs may be used to determine the value of the fund’s investments. These inputs are summarized in three broad levels for financial statement purposes. The inputs or methodologies used to value securities are not necessarily an indication of the risk associated with investing in those securities.
Level 1—Quoted prices in active markets for identical securities.
Level 2—Other significant observable inputs (including quoted prices for similar securities, interest rates, prepayment speeds, credit risk, etc.).
Level 3—Significant unobservable inputs (including the fund’s own assumptions used to determine
the fair value of investments). Any investments valued with significant unobservable inputs are
noted on the Statement of Net Assets.
The following table summarizes the market value of the fund’s investments as of July 31, 2018, based on the inputs used to value them:
| Level 1 | Level 2 | Level 3 | |
| Investments | ($000) | ($000) | ($000) |
| U.S. Government and Agency Obligations | — | 1,008,030 | 30,582 |
| Asset-Backed/Commercial Mortgage-Backed Securities | — | 6,043 | — |
| Corporate Bonds | — | 12,629,753 | — |
| Sovereign Bonds | — | 313,227 | — |
| Taxable Municipal Bonds | — | 1,761,362 | — |
| Temporary Cash Investments | 383,260 | 168,400 | — |
| Options on Futures Purchased | 2 | — | — |
| Liability for Options Written | (82) | — | — |
| Futures Contracts—Assets1 | 2,108 | — | — |
| Futures Contracts—Liabilities1 | (592) | — | — |
| Forward Currency Contracts—Assets | — | 5 | — |
| Forward Currency Contracts—Liabilities | — | (23) | — |
| Swap Contracts—Assets | 1,2151 | 310 | — |
| Swap Contracts—Liabilities | (123)1 | (135) | — |
| Total | 385,788 | 15,886,972 | 30,582 |
| 1 Represents variation margin on the last day of the reporting period. |
112
Long-Term Investment-Grade Fund
E. At July 31, 2018, the fair values of derivatives were reflected in the Statement of Net Assets as follows:
| Interest Rate | Currency | Credit | |||
| Contracts | Contracts | Contracts | Total | ||
| Statement of Net Assets Caption | ($000) | ($000) | ($000) | ($000) | |
| Options Purchased | — | — | 2 | 2 | |
| Variation Margin Receivable—Futures Contracts | 2,108 | — | — | 2,108 | |
| Variation Margin Receivable—CC Swap Contracts | 43 | — | 1,172 | 1,215 | |
| Unrealized Appreciation—Forward Currency Contracts | — | 5 | — | 5 | |
| Unrealized Appreciation—OTC Swap Contracts | — | — | 310 | 310 | |
| Total Assets | 2,151 | 5 | 1,484 | 3,640 | |
| Liability for Options Written | (50) | — | (32) | (82) | |
| Variation Margin Payable—Futures Contracts | (592) | — | — | (592) | |
| Variation Margin Payable—CC Swap Contracts | (119) | — | (4) | (123) | |
| Unrealized Depreciation—Forward Currency Contracts | — | (23) | — | (23) | |
| Unrealized Depreciation—OTC Swap Contracts | — | — | (135) | (135) | |
| Total Liabilities | (761) | (23) | (171) | (955) | |
Realized net gain (loss) and the change in unrealized appreciation (depreciation) on derivatives for the six months ended July 31, 2018, were:
| Interest Rate | Currency | Credit | ||
| Contracts | Contracts | Contracts | Total | |
| Realized Net Gain (Loss) on Derivatives | ($000) | ($000) | ($000) | ($000) |
| Futures Contracts | (29,182) | — | — | (29,182) |
| Options | (108) | — | 91 | (17) |
| Forward Currency Contracts | — | 706 | — | 706 |
| Swap Contracts | 2,643 | — | 6,203 | 8,846 |
| Realized Net Gain (Loss) on Derivatives | (26,647) | 706 | 6,294 | (19,647) |
| Change in Unrealized Appreciation (Depreciation) on Derivatives | ||||
| Futures Contracts | 11,204 | — | — | 11,204 |
| Options | 94 | — | (9) | 85 |
| Forward Currency Contracts | — | 162 | — | 162 |
| Swap Contracts | (1,923) | — | (378) | (2,301) |
| Change in Unrealized Appreciation | ||||
| (Depreciation) on Derivatives | 9,375 | 162 | (387) | 9,150 |
113
Long-Term Investment-Grade Fund
F. Capital gain distributions are determined on a tax basis and may differ from realized capital gains for financial reporting purposes. Differences may be permanent or temporary. Permanent differences are reclassified among capital accounts in the financial statements to reflect their tax character. Temporary differences arise when gains or losses are recognized in different periods for financial statement and tax purposes. These differences will reverse at some time in the future. The fund’s tax-basis capital gains and losses are determined only at the end of each fiscal year.
Realized and unrealized gains (losses) on certain of the fund’s swap contracts are treated as ordinary income (loss) for tax purposes; the effect on the fund’s income dividends to shareholders is offset by a change in principal return. Realized gains of $12,236,000 on swap contracts have been reclassified from accumulated net realized losses to overdistributed net investment income.
At July 31, 2018, the cost of investment securities for tax purposes was $15,809,384,000. Net unrealized appreciation of investment securities for tax purposes was $491,273,000, consisting of unrealized gains of $802,161,000 on securities that had risen in value since their purchase and $310,888,000 in unrealized losses on securities that had fallen in value since their purchase.
G. During the six months ended July 31, 2018, the fund purchased $2,247,807,000 of investment securities and sold $1,570,136,000 of investment securities, other than U.S. government securities and temporary cash investments. Purchases and sales of U.S. government securities were $350,726,000 and $246,774,000, respectively.
H. Capital share transactions for each class of shares were:
| Six Months Ended | Year Ended | |||
| July 31, 2018 | January 31, 2018 | |||
| Amount | Shares | Amount | Shares | |
| ($000) | (000) | ($000) | (000) | |
| Investor Shares | ||||
| Issued | 340,962 | 34,495 | 645,634 | 61,978 |
| Issued in Lieu of Cash Distributions | 94,826 | 9,596 | 233,146 | 22,215 |
| Redeemed | (440,296) | (44,384) | (513,557) | (49,240) |
| Net Increase (Decrease)—Investor Shares | (4,508) | (293) | 365,223 | 34,953 |
| Admiral Shares | ||||
| Issued | 1,521,790 | 154,115 | 2,670,257 | 255,929 |
| Issued in Lieu of Cash Distributions | 235,304 | 23,794 | 519,774 | 49,510 |
| Redeemed | (841,391) | (85,254) | (1,945,383) | (186,197) |
| Net Increase (Decrease)—Admiral Shares | 915,703 | 92,655 | 1,244,648 | 119,242 |
I. Management has determined that no events or transactions occurred subsequent to July 31, 2018, that would require recognition or disclosure in these financial statements.
114
High-Yield Corporate Fund
Fund Profile
As of July 31, 2018
| Share-Class Characteristics | ||
| Investor | Admiral | |
| Shares | Shares | |
| Ticker Symbol | VWEHX | VWEAX |
| Expense Ratio1 | 0.23% | 0.13% |
| 30-Day SEC Yield | 5.71% | 5.81% |
| Financial Attributes | |||
| Bloomberg | |||
| High-Yield | Barclays | ||
| Corporate | Corporate | ||
| Composite | High Yield | ||
| Fund | Index | Index | |
| Number of Bonds | 484 | 1,813 | 1,995 |
| Yield to Maturity | |||
| (before expenses) | 6.0% | 5.9% | 6.5% |
| Average Coupon | 5.7% | 5.9% | 6.4% |
| Average Duration | 4.3 years | 3.9 years | 3.9 years |
| Average Effective | |||
| Maturity | 5.6 years | 5.3 years | 5.3 years |
| Short-Term | |||
| Reserves | 2.9% | — | — |
| Sector Diversification (% of portfolio) | |
| Basic Industry | 6.6% |
| Capital Goods | 9.6 |
| Communication | 20.4 |
| Consumer Cyclical | 10.1 |
| Consumer Non-Cyclical | 11.9 |
| Energy | 12.7 |
| Finance | 10.5 |
| Other Industrial | 0.6 |
| Other Corporate | 3.5 |
| Technology | 7.7 |
| Transportation | 0.8 |
| Treasury/Agency | 3.9 |
| Utilities | 1.7 |
The agency and mortgage-backed securities sectors may include
issues from government-sponsored enterprises; such issues are
generally not backed by the full faith and credit of the U.S.
government.
| Volatility Measures | ||
| Bloomberg | ||
| High-Yield | Barclays | |
| Corporate | Corporate | |
| Composite | High Yield | |
| Index | Index | |
| R-Squared | 0.97 | 0.94 |
| Beta | 0.90 | 0.74 |
| These measures show the degree and timing of the fund’s | ||
| fluctuations compared with the indexes over 36 months. | ||
| Distribution by Effective Maturity | |
| (% of portfolio) | |
| Under 1 Year | 6.0% |
| 1 - 5 Years | 27.3 |
| 5 - 10 Years | 57.5 |
| 10 - 20 Years | 3.5 |
| 20 - 30 Years | 3.3 |
| Over 30 Years | 2.4 |
| Distribution by Credit Quality (% of portfolio) | |
| U.S. Government | 3.6% |
| Baa | 3.2 |
| Ba | 43.5 |
| B | 41.6 |
| Caa | 7.0 |
| Ca | 0.3 |
| C | 0.6 |
| Not Rated | 0.2 |
Credit-quality ratings are obtained from Barclays and are from
Moody's, Fitch, and S&P. When ratings from all three agencies are
used, the median rating is shown. When ratings from two of the
agencies are used, the lower rating for each issue is shown. "Not
Rated" is used to classify securities for which a rating is not
available. Not rated securities include a fund's investment in
Vanguard Market Liquidity Fund or Vanguard Municipal Cash
Management Fund, each of which invests in high-quality money
market instruments and may serve as a cash management vehicle
for the Vanguard funds, trusts, and accounts. For more information
about these ratings, see the Glossary entry for Credit Quality.
1 The expense ratios shown are from the prospectus dated May 24, 2018, and represent estimated costs for the current fiscal year. For the six
months ended July 31, 2018, the annualized expense ratios were 0.23% for Investor Shares and 0.13% for Admiral Shares.
115
High-Yield Corporate Fund
Investment Focus
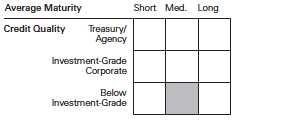
116
High-Yield Corporate Fund
Performance Summary
All of the returns in this report represent past performance, which is not a guarantee of future results that may be achieved by the fund. (Current performance may be lower or higher than the performance data cited. For performance data current to the most recent month-end, visit our website at vanguard.com/performance.) Note, too, that both investment returns and principal value can fluctuate widely, so an investor’s shares, when sold, could be worth more or less than their original cost. The returns shown do not reflect taxes that a shareholder would pay on fund distributions or on the sale of fund shares.
| Fiscal-Year Total Returns (%): January 31, 2008, Through July 31, 2018 | ||||
| High-Yield | ||||
| Corporate | ||||
| Composite | ||||
| Investor Shares | Index | |||
| Fiscal Year | Income Returns | Capital Returns | Total Returns | Total Returns |
| 2009 | 6.83% | -23.02% | -16.19% | -14.77% |
| 2010 | 10.36 | 22.32 | 32.68 | 34.94 |
| 2011 | 8.23 | 5.47 | 13.70 | 14.22 |
| 2012 | 7.35 | 0.69 | 8.04 | 6.68 |
| 2013 | 6.76 | 5.15 | 11.91 | 12.38 |
| 2014 | 5.84 | -1.31 | 4.53 | 5.60 |
| 2015 | 5.55 | -0.99 | 4.56 | 3.57 |
| 2016 | 5.23 | -8.22 | -2.99 | -4.45 |
| 2017 | 6.07 | 7.36 | 13.43 | 16.01 |
| 2018 | 5.34 | 0.85 | 6.19 | 5.69 |
| 2019 | 2.70 | -2.88 | -0.18 | -0.19 |
| For a benchmark description, see the Glossary. | ||||
| Note: For 2019, performance data reflect the six months ended July 31, 2018. | ||||
Average Annual Total Returns: Periods Ended June 30, 2018
This table presents returns through the latest calendar quarter—rather than through the end of the fiscal period.
Securities and Exchange Commission rules require that we provide this information.
| Ten Years | ||||||
| Inception Date | One Year | Five Years | Income | Capital | Total | |
| Investor Shares | 12/27/1978 | 0.94% | 4.96% | 6.62% | 0.30% | 6.92% |
| Admiral Shares | 11/12/2001 | 1.04 | 5.07 | 6.74 | 0.30 | 7.04 |
See Financial Highlights for dividend and capital gains information.
117
High-Yield Corporate Fund
Financial Statements (unaudited)
Statement of Net Assets—Investments Summary
As of July 31, 2018
This Statement summarizes the fund’s holdings by asset type. Details are reported for each of the fund’s 50 largest individual holdings and for investments that, in total for any issuer, represent more than 1% of the fund’s net assets. The total value of smaller holdings is reported as a single amount within each category.
The fund reports a complete list of its holdings in regulatory filings four times in each fiscal year, at the quarter-ends. For the second and fourth fiscal quarters, the complete listing of the fund’s holdings is available electronically on vanguard.com and on the Securities and Exchange Commission’s website (sec.gov), or you can have it mailed to you without charge by calling 800-662-7447. For the first and third fiscal quarters, the fund files the lists with the SEC on Form N-Q. Shareholders can look up the fund’s Forms N-Q on the SEC’s website. Forms N-Q may also be reviewed and copied at the SEC’s Public Reference Room (see the back cover of this report for further information).
| Face | Market | Percentage | |||||
| Maturity | Amount | Value • | of Net | ||||
| Coupon | Date | ($000) | ($000) | Assets | |||
| U. S. Government and Agency Obligations | |||||||
| U.S. Government Securities | |||||||
| United States Treasury Note/Bond | 0.875% | 10/15/18 | 250,000 | 249,415 | 1.1% | ||
| United States Treasury Note/Bond | 1.125% | 1/15/19 | 250,000 | 248,827 | 1.1% | ||
| United States Treasury Note/Bond | 0.875% | 4/15/19 | 250,000 | 247,500 | 1.0% | ||
| 1 | United States Treasury Note/Bond | 0.750% | 8/31/18 | 125,000 | 124,864 | 0.5% | |
| Total U.S. Government and Agency Obligations (Cost $871,873) | 870,606 | 3.7% | |||||
| Corporate Bonds | |||||||
| Finance | |||||||
| Banking | |||||||
| Ally Financial Inc. | 4.625%–8.000% | 5/19/22–11/1/31 | 114,213 | 117,967 | 0.5% | ||
| 2 | Credit Suisse AG | 6.250% | 12/31/50 | 143,170 | 144,065 | 0.6% | |
| 2 | UBS Group AG | 6.875% | 3/22/66 | 114,390 | 119,363 | 0.5% | |
| 3 | Banking—Other † | 325,167 | 1.4% | ||||
| 4 | Brokerage † | 65,197 | 0.3% | ||||
| Finance Companies | |||||||
| 2,3 | AerCap Global Aviation Trust | 6.500% | 6/15/45 | 125,050 | 128,801 | 0.5% | |
| Navient Corp. | 6.750% | 6/25/25 | 164,585 | 163,762 | 0.7% | ||
| Navient Corp. | 6.500% | 6/15/22 | 154,369 | 157,842 | 0.7% | ||
| Navient Corp. | 5.500%–7.250% | 1/25/22–8/1/33 | 164,726 | 161,818 | 0.7% | ||
| Springleaf Finance Corp. | 7.125% | 3/15/26 | 97,030 | 98,607 | 0.4% | ||
| Springleaf Finance Corp. | 6.125%–8.250% | 12/15/20–3/15/25 | 164,998 | 176,699 | 0.8% | ||
| 3 | Finance Companies—Other † | 174,732 | 0.7% | ||||
| Insurance | |||||||
| 4,5,6 Asurion LLC. Bank Loan | 5.077% | 11/29/24 | 101,340 | 101,141 | 0.4% | ||
| 3 | Insurance—Other † | 442,753 | 1.9% | ||||
| 4 | Other Finance † | 101,310 | 0.4% | ||||
| 3 | Real Estate Investment Trusts † | 48,311 | 0.2% | ||||
| 2,527,535 | 10.7% | ||||||
118
| High-Yield Corporate Fund | ||||||
| Face | Market | Percentage | ||||
| Maturity | Amount | Value • | of Net | |||
| Coupon | Date | ($000) | ($000) | Assets | ||
| Industrial | ||||||
| Basic Industry | ||||||
| 3 | Alliance Resource Operating | |||||
| Partners LP / Alliance | ||||||
| Resource Finance Corp. | 7.500% | 5/1/25 | 97,487 | 103,093 | 0.4% | |
| 3 | Basic Industry—Other † | 1,456,686 | 6.2% | |||
| Capital Goods | ||||||
| 3 | Cemex SAB de CV | 6.125% | 5/5/25 | 111,200 | 115,231 | 0.5% |
| 3 | Flex Acquisition Co. Inc. | 6.875% | 1/15/25 | 127,475 | 123,810 | 0.5% |
| 3 | Standard Industries Inc. | 6.000% | 10/15/25 | 139,715 | 141,811 | 0.6% |
| 3 | Standard Industries Inc. | 4.750%–5.500% | 2/15/23–1/15/28 | 104,867 | 100,841 | 0.4% |
| TransDigm Inc. | 6.500% | 7/15/24 | 96,400 | 98,569 | 0.4% | |
| United Rentals | ||||||
| North America Inc. | 4.625%–5.875% | 7/15/23–1/15/28 | 298,096 | 293,577 | 1.2% | |
| 3 | Capital Goods—Other † | 1,408,507 | 6.0% | |||
| Communication | ||||||
| 3 | Altice US Finance I Corp. | 5.500% | 5/15/26 | 83,145 | 81,378 | 0.3% |
| 3 | CCO Holdings LLC / CCO | |||||
| Holdings Capital Corp. | 5.125%–5.875% | 3/15/21–5/1/27 | 347,176 | 345,248 | 1.5% | |
| 3 | Cequel Communications | |||||
| Holdings I LLC / Cequel | ||||||
| Capital Corp. | 5.125% | 12/15/21 | 59,340 | 59,340 | 0.2% | |
| Charter Communications | ||||||
| Operating LLC / Charter | ||||||
| Communications Operating | ||||||
| Capital | 6.484% | 10/23/45 | 39,215 | 42,664 | 0.2% | |
| 4,5 | Crown Finance US Inc. | |||||
| Bank Loan | 4.577% | 2/22/25 | 120,408 | 120,024 | 0.5% | |
| 3 | CSC Holdings LLC | 5.500%– 6.750% | 11/15/21–4/15/27 | 137,179 | 136,971 | 0.6% |
| DISH DBS Corp. | 6.750% | 6/1/21 | 152,345 | 153,488 | 0.6% | |
| DISH DBS Corp. | 5.875% | 7/15/22 | 115,934 | 108,398 | 0.5% | |
| DISH DBS Corp. | 5.000%–7.750% | 3/15/23–7/1/26 | 238,356 | 203,743 | 0.9% | |
| Liberty Interactive LLC | 8.250% | 2/1/30 | 126,903 | 135,469 | 0.6% | |
| Sprint Capital Corp. | 6.875% | 11/15/28 | 147,060 | 141,913 | 0.6% | |
| Sprint Capital Corp. | 8.750% | 3/15/32 | 78,824 | 84,736 | 0.4% | |
| 3 | Sprint Communications | |||||
| Inc. | 6.000%–7.000% | 3/1/20–11/15/22 | 84,295 | 87,191 | 0.4% | |
| Sprint Corp. | 7.875% | 9/15/23 | 300,264 | 319,781 | 1.3% | |
| Sprint Corp. | 7.125%–7.625% | 6/15/24–2/15/25 | 125,517 | 129,788 | 0.5% | |
| T-Mobile USA Inc. | 5.375% | 4/15/27 | 102,055 | 100,524 | 0.4% | |
| 3 | Telenet Finance Luxembourg | |||||
| Notes Sarl | 5.500% | 3/1/28 | 110,200 | 101,089 | 0.4% | |
| Time Warner Cable LLC | 5.500%–5.875% | 11/15/40–9/1/41 | 52,896 | 51,433 | 0.2% | |
| 3 | Univision Communications Inc. | 5.125% | 2/15/25 | 200,720 | 185,666 | 0.8% |
| Videotron Ltd. | 5.000% | 7/15/22 | 108,654 | 110,555 | 0.5% | |
| 3 | Virgin Media | |||||
| Finance plc | 6.000%– 6.375% | 4/15/23–10/15/24 | 61,085 | 59,847 | 0.2% | |
| 3 | Virgin Media Secured | |||||
| Finance plc | 5.250%–5.500% | 1/15/25–8/15/26 | 114,760 | 108,607 | 0.5% | |
| Zayo Group LLC / | ||||||
| Zayo Capital Inc. | 6.000% | 4/1/23 | 104,300 | 106,777 | 0.4% | |
| 3,4 | Communication—Other † | 1,656,921 | 7.0% | |||
| 119 | ||||||
| High-Yield Corporate Fund | |||||||
| Face | Market | Percentage | |||||
| Maturity | Amount | Value • | of Net | ||||
| Coupon | Date | ($000) | ($000) | Assets | |||
| Consumer Cyclical | |||||||
| 3 | Adient Global Holdings Ltd. | 4.875% | 8/15/26 | 149,047 | 136,378 | 0.6% | |
| 3 | APX Group Inc. | 8.875% | 12/1/22 | 134,375 | 134,711 | 0.6% | |
| 3 | CRC Escrow Issuer LLC / | ||||||
| CRC Finco Inc. | 5.250% | 10/15/25 | 159,911 | 153,714 | 0.6% | ||
| Goodyear Tire & Rubber Co. | 4.875% | 3/15/27 | 112,833 | 102,960 | 0.4% | ||
| 3 | Hilton Domestic Operating | ||||||
| Co. Inc. | 4.250%–5.125% | 9/1/24–5/1/26 | 133,080 | 130,969 | 0.6% | ||
| Hilton Worldwide Finance LLC / | |||||||
| Hilton Worldwide Finance Corp. | 4.625% | 4/1/25 | 105,130 | 102,502 | 0.4% | ||
| Hilton Worldwide Finance LLC / | |||||||
| Hilton Worldwide Finance Corp. | 4.875% | 4/1/27 | 64,885 | 63,101 | 0.3% | ||
| 3,7 | LHMC Finco Sarl | 6.250%–7.875% | 12/20/23 | 100,410 | 109,008 | 0.5% | |
| 3,4 | Consumer Cyclical—Other † | 1,289,343 | 5.4% | ||||
| Consumer Noncyclical | |||||||
| CHS/Community Health | |||||||
| Systems Inc. | 6.250% | 3/31/23 | 120,190 | 111,777 | 0.5% | ||
| 3,7 | Diamond BC BV | 5.625% | 8/15/25 | 101,750 | 109,225 | 0.5% | |
| HCA Inc. | 4.750%–7.690% | 2/15/21– 6/15/26 | 350,815 | 360,347 | 1.5% | ||
| 3 | Post Holdings Inc. | 5.000% | 8/15/26 | 120,825 | 113,575 | 0.5% | |
| 3 | Post Holdings Inc. | 5.500%–5.750% | 3/1/25–1/15/28 | 155,221 | 149,576 | 0.6% | |
| Tenet Healthcare Corp. | 4.375% | 10/1/21 | 106,480 | 106,081 | 0.5% | ||
| 3 | Valeant Pharmaceuticals | ||||||
| International Inc. | 9.250% | 4/1/26 | 17,325 | 18,429 | 0.1% | ||
| 3 | Valeant Pharmaceuticals | ||||||
| International Inc. | 5.500%–9.000% | 3/15/22–1/31/27 | 145,135 | 150,993 | 0.6% | ||
| 3 | VRX Escrow Corp. | 6.125% | 4/15/25 | 154,710 | 144,654 | 0.6% | |
| 3 | West Street Merger Sub Inc. | 6.375% | 9/1/25 | 133,245 | 129,581 | 0.5% | |
| 3,4 | Consumer Noncyclical—Other † | 1,488,659 | 6.3% | ||||
| Energy | |||||||
| Chesapeake Energy Corp. | 8.000% | 6/15/27 | 100,395 | 102,654 | 0.4% | ||
| Energy Transfer Equity LP | 5.500% | 6/1/27 | 106,236 | 108,892 | 0.5% | ||
| Energy Transfer | |||||||
| Equity LP | 4.250%–7.500% | 10/15/20–1/15/24 | 218,861 | 224,247 | 0.9% | ||
| Matador Resources Co. | 6.875% | 4/15/23 | 102,250 | 107,362 | 0.4% | ||
| Sabine Pass Liquefaction LLC | 5.875% | 6/30/26 | 41,960 | 45,631 | 0.2% | ||
| Whiting Petroleum Corp. | 6.625% | 1/15/26 | 106,234 | 109,952 | 0.5% | ||
| WPX Energy Inc. | 5.250% | 9/15/24 | 112,100 | 111,259 | 0.5% | ||
| 3 | Energy—Other † | 2,206,706 | 9.3% | ||||
| Other Industrial | |||||||
| 3 | Brand Energy & Infrastructure | ||||||
| Services Inc. | 8.500% | 7/15/25 | 104,430 | 106,519 | 0.5% | ||
| 3,4 | Other Industrial—Other † | 53,006 | 0.2% | ||||
| Technology | |||||||
| Alcatel-Lucent USA Inc. | 6.450%– 6.500% | 1/15/28–3/15/29 | 144,767 | 149,311 | 0.6% | ||
| 7 | Equinix Inc. | 2.875% | 2/1/26 | 102,180 | 116,205 | 0.5% | |
| 3 | First Data Corp. | 7.000% | 12/1/23 | 170,875 | 178,778 | 0.8% | |
| 3 | First Data Corp. | 5.750% | 1/15/24 | 131,820 | 134,786 | 0.6% | |
| 3 | First Data Corp. | 5.000%–5.375% | 8/15/23–1/15/24 | 122,050 | 123,332 | 0.5% | |
| 4,5 | First Data Corp. Bank Loan | 4.069% | 7/8/22 | 19,077 | 19,073 | 0.1% | |
| Nokia Oyj | 4.375% | 6/12/27 | 39,230 | 36,980 | 0.2% | ||
| 120 | |||||||
| High-Yield Corporate Fund | ||||||
| Face | Market | Percentage | ||||
| Maturity | Amount | Value • | of Net | |||
| Coupon | Date | ($000) | ($000) | Assets | ||
| Nokia Oyj | 6.625% | 5/15/39 | 117,400 | 123,563 | 0.5% | |
| 3,4 Technology—Other † | 1,109,611 | 4.7% | ||||
| 3 Transportation † | 178,203 | 0.8% | ||||
| 18,925,329 | 80.0% | |||||
| Utilities (1.5%) | ||||||
| 3 Electric † | 361,286 | 1.5% | ||||
| Total Corporate Bonds (Cost $22,132,717) | 21,814,150 | 92.2% | ||||
| 3Sovereign Bonds (Cost $58,395) † | 57,519 | 0.2% | ||||
| Shares | ||||||
| Preferred Stocks | ||||||
| GMAC Capital Trust I Pfd. | ||||||
| (Cost $123,777) | 8.099% | 4,743,200 | 125,979 | 0.5% | ||
| Common Stocks | ||||||
| §Utilities † | 41,520 | 0.2% | ||||
| Total Common Stocks (Cost $41,520) | 41,520 | 0.2% | ||||
| Face | ||||||
| Amount | ||||||
| ($000) | ||||||
| Temporary Cash Investments | ||||||
| Repurchase Agreements | ||||||
| Bank of America Securities, LLC | ||||||
| (Dated 7/31/18, Repurchase | ||||||
| Value $23,301,000, collateralized | ||||||
| by Federal Home Loan Mortgage | ||||||
| Corp. 3.000%, 3/1/48, and | ||||||
| Federal National Mortgage | ||||||
| Assn. 4.000%, 7/1/47, with | ||||||
| a value of $23,766,000) | 1.930% | 8/1/18 | 23,300 | 23,300 | 0.1% | |
| Bank of Montreal (Dated 7/31/18, | ||||||
| Repurchase Value $100,005,000, | ||||||
| collateralized by U. S. Treasury | ||||||
| Bill 0.000%, 5/23/19, and U.S. | ||||||
| Treasury Note/Bond 1.375%– | ||||||
| 3.625%, 8/31/19–5/15/46, | ||||||
| with a value of $102,000,000) | 1.900% | 8/1/18 | 100,000 | 100,000 | 0.4% | |
| JP Morgan Securities LLC (Dated | ||||||
| 7/31/18, Repurchase Value | ||||||
| $347,118,000, collateralized | ||||||
| by U. S. Treasury Bill 0.000%, | ||||||
| 1/10/19–3/28/19, with a value | ||||||
| of $354,046,000) | 1.900% | 8/1/18 | 347,100 | 347,100 | 1.5% | |
| 121 | ||||||
| High-Yield Corporate Fund | |||||
| Face | Market | Percentage | |||
| Maturity | Amount | Value • | of Net | ||
| Coupon | Date | ($000) | ($000) | Assets | |
| RBC Capital Markets LLC (Dated | |||||
| 7/31/18, Repurchase Value | |||||
| $175,809,000, collateralized by | |||||
| Federal Home Loan Mortgage | |||||
| Corp. 2.500%–4.500%, 2/1/30– | |||||
| 4/1/48, Federal National Mortgage | |||||
| Assn. 2.301%-5.500%, 7/1/21– | |||||
| 7/1/48, and Government National | |||||
| Mortgage Assn. 2.500%–3.000%, | |||||
| 8/20/44–10/20/46, with a value | |||||
| of $179,316,000) | 1.900% | 8/1/18 | 175,800 | 175,800 | 0.7% |
| TD Securities (USA) LLC (Dated | |||||
| 7/31/18, Repurchase Value | |||||
| $48,203,000, collateralized by | |||||
| Federal National Mortgage Assn. | |||||
| 3.500%, 12/1/47, with a value of | |||||
| $49,164,000) | 1.910% | 8/1/18 | 48,200 | 48,200 | 0.2% |
| Total Temporary Cash Investments (Cost $694,400) | 694,400 | 2.9% | |||
| Total Investments (Cost $23,922,682) | 23,604,174 | 99.7% | |||
| Amount | ||
| ($000) | ||
| Other Assets and Liabilities | ||
| Other Assets | ||
| Investment in Vanguard | 1,249 | |
| Receivables for Investment Securities Sold | 13,606 | |
| Receivables for Accrued Income | 329,532 | |
| Receivables for Capital Shares Issued | 26,000 | |
| Variation Margin Receivable—CC Swap Contracts | 835 | |
| Other Assets | 3,516 | |
| Total Other Assets | 374,738 | 1.6% |
| Liabilities | ||
| Payables for Investment Securities Purchased | (222,962) | |
| Payables for Capital Shares Redeemed | (37,583) | |
| Payables to Investment Advisor | (1,749) | |
| Payables for Distributions | (26,385) | |
| Payables to Vanguard | (18,737) | |
| Unrealized Depreciation—Forward Currency Contracts | (4) | |
| Total Liabilities | (307,420) | (1.3%) |
| Net Assets | 23,671,492 | 100.0% |
122
High-Yield Corporate Fund
| At July 31, 2018, net assets consisted of: | |
| Amount | |
| ($000) | |
| Paid-in Capital | 24,208,740 |
| Undistributed Net Investment Income | 47,001 |
| Accumulated Net Realized Losses | (271,385) |
| Unrealized Appreciation (Depreciation) | |
| Investment Securities | (318,508) |
| Swap Contracts | 5,836 |
| Forward Currency Contracts | (4) |
| Foreign Currencies | (188) |
| Net Assets | 23,671,492 |
| Investor Shares—Net Assets | |
| Applicable to 660,020,237 outstanding $.001 par value shares of | |
| beneficial interest (unlimited authorization) | 3,790,839 |
| Net Asset Value Per Share—Investor Shares | $5.74 |
| Admiral Shares—Net Assets | |
| Applicable to 3,461,393,609 outstanding $.001 par value shares of | |
| beneficial interest (unlimited authorization) | 19,880,653 |
| Net Asset Value Per Share—Admiral Shares | $5.74 |
• See Note A in Notes to Financial Statements.
§ Certain of the fund’s securities are valued using significant unobservable inputs.
† Represents the aggregate value, by category, of securities that are not among the 50 largest holdings and, in total for any issuer,
represent 1% or less of net assets.
1 Securities with a value of $33,906,000 have been segregated as initial margin for open cleared swap contracts.
2 The average or expected maturity is shorter than the final maturity shown because of the possibility of interim principal payments
and prepayments or the possibility of the issue being called.
3 Certain of the fund’s securities are exempt from registration under Rule 144A of the Securities Act of 1933. Such securities may be
sold in transactions exempt from registration, normally to qualified institutional buyers. At July 31, 2018, the aggregate value of
these securities was $9,302,478,000, representing 39.3% of net assets.
4 Certain of the fund’s securities are senior, secured, high-yield floating-rate loans. These loans are debt obligations issued by public
and private companies and are comparable to high-yield bonds from a ratings and leverage perspective. At July 31, 2018, the
aggregate value of these securities was $685,960,000, representing 2.9% of net assets.
5 Adjustable-rate security based upon 3-month USD LIBOR plus spread.
6 Security purchased on a when-issued or delayed-delivery basis for which the fund has not taken delivery as of July 31, 2018.
7 Face amount denominated in euro.
123
| High-Yield Corporate Fund | ||||||
| Derivative Financial Instruments Outstanding as of Period End | ||||||
| Forward Currency Contracts | ||||||
| Unrealized | ||||||
| Contract | Appreciation | |||||
| Settlement | Contract Amount (000) | (Depreciation) | ||||
| Counterparty | Date | Receive | Deliver | ($000) | ||
| Barclays Bank plc | 8/31/18 | USD | 476,857 | EUR | 406,797 | (1) |
| Citibank, N.A. | 8/31/18 | USD | 65,381 | GBP | 49,746 | (3) |
| (4) | ||||||
| EUR—euro. | ||||||
| GBP—British pound. | ||||||
| USD—U.S. dollar. | ||||||
Unrealized appreciation (depreciation) on open forward currency contracts is treated as ordinary income for tax purposes.
| Centrally Cleared Credit Default Swaps | |||||
| Periodic | |||||
| Premium | Unrealized | ||||
| Received | Appreciation | ||||
| Termination | Notional Amount | (Paid)1 | Value | (Depreciation) | |
| Reference Entity | Date | ($000) | (%) | ($000) | ($000) |
| Credit Protection Sold | |||||
| CDX-NA-HY-S30-V1 | 6/20/23 | 675,000 | 5.000 | 47,619 | 5,836 |
The notional amount represents the maximum potential amount the fund could be required to pay as a seller of credit protection if the reference entity was subject to a credit event.
1 Periodic premium received/paid quarterly.
Unrealized appreciation (depreciation) on open swap contracts is generally treated the same for financial reporting and tax purposes.
See accompanying Notes, which are an integral part of the Financial Statements.
124
High-Yield Corporate Fund
Statement of Operations
| Six Months Ended | |
| July31,2018 | |
| ($000) | |
| Investment Income | |
| Income | |
| Dividends | 4,417 |
| Interest | 670,899 |
| Total Income | 675,316 |
| Expenses | |
| Investment Advisory Fees—Note B | 3,530 |
| The Vanguard Group—Note C | |
| Management and Administrative—Investor Shares | 3,449 |
| Management and Administrative—Admiral Shares | 9,185 |
| Marketing and Distribution—Investor Shares | 321 |
| Marketing and Distribution—Admiral Shares | 595 |
| Custodian Fees | 58 |
| Shareholders’ Reports—Investor Shares | 75 |
| Shareholders’ Reports—Admiral Shares | 103 |
| Trustees’ Fees and Expenses | 17 |
| Total Expenses | 17,333 |
| Expenses Paid Indirectly | (44) |
| Net Expenses | 17,289 |
| Net Investment Income | 658,027 |
| Realized Net Gain (Loss) | |
| Investment Securities Sold | 109,551 |
| Swap Contracts | 11,957 |
| Forward Currency Contracts | 32,380 |
| Foreign Currencies | (136) |
| Realized Net Gain (Loss) | 153,752 |
| Change in Unrealized Appreciation (Depreciation) | |
| Investment Securities | (854,295) |
| Swap Contracts | 308 |
| Forward Currency Contracts | 550 |
| Foreign Currencies | (332) |
| Change in Unrealized Appreciation (Depreciation) | (853,769) |
| Net Increase (Decrease) in Net Assets Resulting from Operations | (41,990) |
See accompanying Notes, which are an integral part of the Financial Statements.
125
High-Yield Corporate Fund
Statement of Changes in Net Assets
| Six Months Ended | Year Ended | |
| July 31, | January 31, | |
| 2018 | 2018 | |
| ($000) | ($000) | |
| Increase (Decrease) in Net Assets | ||
| Operations | ||
| Net Investment Income | 658,027 | 1,256,042 |
| Realized Net Gain (Loss) | 153,752 | 52,816 |
| Change in Unrealized Appreciation (Depreciation) | (853,769) | 118,245 |
| Net Increase (Decrease) in Net Assets Resulting from Operations | (41,990) | 1,427,103 |
| Distributions | ||
| Net Investment Income | ||
| Investor Shares | (107,028) | (218,764) |
| Admiral Shares | (555,900) | (1,029,787) |
| Realized Capital Gain | ||
| Investor Shares | — | — |
| Admiral Shares | — | — |
| Total Distributions | (662,928) | (1,248,551) |
| Capital Share Transactions | ||
| Investor Shares | (237,832) | 46,679 |
| Admiral Shares | (252,695) | 2,859,755 |
| Net Increase (Decrease) from Capital Share Transactions | (490,527) | 2,906,434 |
| Total Increase (Decrease) | (1,195,445) | 3,084,986 |
| Net Assets | ||
| Beginning of Period | 24,866,937 | 21,781,951 |
| End of Period1 | 23,671,492 | 24,866,937 |
| 1 Net Assets—End of Period includes undistributed (overdistributed) net investment income of $47,001,000 and $2,223,000. | ||
See accompanying Notes, which are an integral part of the Financial Statements.
126
| High-Yield Corporate Fund | ||||||
| Financial Highlights | ||||||
| Investor Shares | ||||||
| Six Months | ||||||
| Ended | ||||||
| For a Share Outstanding | July 31, | Year Ended January 31, | ||||
| Throughout Each Period | 2018 | 2018 | 2017 | 2016 | 2015 | 2014 |
| Net Asset Value, Beginning of Period | $5.91 | $5.86 | $5.46 | $5.98 | $6.04 | $6.12 |
| Investment Operations | ||||||
| Net Investment Income | .1561 | .3091 | .315 | .327 | .331 | .348 |
| Net Realized and Unrealized Gain (Loss) | ||||||
| on Investments | (.168) | . 048 | . 404 | (. 495) | (. 059) | (. 080) |
| Total from Investment Operations | (.012) | .357 | .719 | (.168) | .272 | .268 |
| Distributions | ||||||
| Dividends from Net Investment Income | (.158) | (. 307) | (. 317) | (. 323) | (. 332) | (. 348) |
| Distributions from Realized Capital Gains | — | — | (.002) | (.029) | — | — |
| Total Distributions | (.158) | (. 307) | (. 319) | (. 352) | (. 332) | (. 348) |
| Net Asset Value, End of Period | $5.74 | $5.91 | $5.86 | $5.46 | $5.98 | $6.04 |
| Total Return2 | -0.18% | 6.19% | 13.43% | -2.99% | 4.56% | 4.53% |
| Ratios/Supplemental Data | ||||||
| Net Assets, End of Period (Millions) | $3,791 | $4,146 | $4,064 | $3,604 | $4,176 | $4,394 |
| Ratio of Total Expenses to | ||||||
| Average Net Assets | 0.23% | 0.23% | 0.23% | 0.23% | 0.23% | 0.23% |
| Ratio of Net Investment Income to | ||||||
| Average Net Assets | 5.48% | 5.20% | 5.48% | 5.61% | 5.46% | 5.76% |
| Portfolio Turnover Rate | 27% | 27% | 26% | 34% | 35% | 28% |
The expense ratio, net investment income ratio, and turnover rate for the current period have been annualized.
1 Calculated based on average shares outstanding.
2 Total returns do not include account service fees that may have applied in the periods shown. Fund prospectuses provide information
about any applicable account service fees.
See accompanying Notes, which are an integral part of the Financial Statements.
127
| High-Yield Corporate Fund | ||||||
| Financial Highlights | ||||||
| Admiral Shares | ||||||
| Six Months | ||||||
| Ended | ||||||
| For a Share Outstanding | July 31, | Year Ended January 31, | ||||
| Throughout Each Period | 2018 | 2018 | 2017 | 2016 | 2015 | 2014 |
| Net Asset Value, Beginning of Period | $5.91 | $5.86 | $5.46 | $5.98 | $6.04 | $6.12 |
| Investment Operations | ||||||
| Net Investment Income | .1601 | .3141 | .320 | .333 | .337 | .354 |
| Net Realized and Unrealized Gain (Loss) | ||||||
| on Investments | (.169) | . 049 | . 404 | (. 495) | (. 059) | (. 080) |
| Total from Investment Operations | (.009) | .363 | .724 | (.162) | .278 | .274 |
| Distributions | ||||||
| Dividends from Net Investment Income | (.161) | (. 313) | (. 322) | (. 329) | (. 338) | (. 354) |
| Distributions from Realized Capital Gains | — | — | (.002) | (.029) | — | — |
| Total Distributions | (.161) | (. 313) | (. 324) | (. 358) | (. 338) | (. 354) |
| Net Asset Value, End of Period | $5.74 | $5.91 | $5.86 | $5.46 | $5.98 | $6.04 |
| Total Return2 | -0.13% | 6.29% | 13.54% | -2.90% | 4.66% | 4.64% |
| Ratios/Supplemental Data | ||||||
| Net Assets, End of Period (Millions) | $19,881 | $20,721 | $17,718 | $13,183 | $12,879 | $11,962 |
| Ratio of Total Expenses to | ||||||
| Average Net Assets | 0.13% | 0.13% | 0.13% | 0.13% | 0.13% | 0.13% |
| Ratio of Net Investment Income to | ||||||
| Average Net Assets | 5.58% | 5.30% | 5.58% | 5.71% | 5.56% | 5.86% |
| Portfolio Turnover Rate | 27% | 27% | 26% | 34% | 35% | 28% |
The expense ratio, net investment income ratio, and turnover rate for the current period have been annualized.
1 Calculated based on average shares outstanding.
2 Total returns do not include account service fees that may have applied in the periods shown. Fund prospectuses provide information
about any applicable account service fees.
See accompanying Notes, which are an integral part of the Financial Statements.
128
High-Yield Corporate Fund
Notes to Financial Statements
Vanguard High-Yield Corporate Fund is registered under the Investment Company Act of 1940 as an open-end investment company, or mutual fund. Certain of the fund’s investments are in corporate debt instruments; the issuers’ abilities to meet their obligations may be affected by economic developments in their respective industries. The fund invests in securities of foreign issuers, which may subject it to investment risks not normally associated with investing in securities of U.S. corporations. To minimize the currency risk associated with investment in bonds denominated in currencies other than the U.S. dollar, the fund attempts to hedge its currency exposures. The fund offers two classes of shares: Investor Shares and Admiral Shares. Investor Shares are available to any investor who meets the fund’s minimum purchase requirements. Admiral Shares are designed for investors who meet certain administrative, service, and account-size criteria.
A. The following significant accounting policies conform to generally accepted accounting principles for U.S. investment companies. The fund consistently follows such policies in preparing its financial statements.
1. Security Valuation: Securities are valued as of the close of trading on the New York Stock Exchange (generally 4 p.m., Eastern time) on the valuation date. Equity securities are valued at the latest quoted sales prices or official closing prices taken from the primary market in which each security trades; such securities not traded on the valuation date are valued at the mean of the latest quoted bid and asked prices. Bonds and temporary cash investments are valued using the latest bid prices or using valuations based on a matrix system (which considers such factors as security prices, yields, maturities, and ratings), both as furnished by independent pricing services. Securities for which market quotations are not readily available, or whose values have been affected by events occurring before the fund’s pricing time but after the close of the securities’ primary markets, are valued at their fair values calculated according to procedures adopted by the board of trustees. These procedures include obtaining quotations from an independent pricing service, monitoring news to identify significant market- or security-specific events, and evaluating changes in the values of foreign market proxies (for example, ADRs, futures contracts, or exchange-traded funds), between the time the foreign markets close and the fund’s pricing time. When fair-value pricing is employed, the prices of securities used by a fund to calculate its net asset value may differ from quoted or published prices for the same securities.
2. Foreign Currency: Securities and other assets and liabilities denominated in foreign currencies are translated into U.S. dollars using exchange rates obtained from an independent third party as of the fund’s pricing time on the valuation date. Realized gains (losses) and unrealized appreciation (depreciation) on investment securities include the effects of changes in exchange rates since the securities were purchased, combined with the effects of changes in security prices. Fluctuations in the value of other assets and liabilities resulting from changes in exchange rates are recorded as unrealized foreign currency gains (losses) until the assets or liabilities are settled in cash, at which time they are recorded as realized foreign currency gains (losses).
3. Forward Currency Contracts: The fund enters into forward currency contracts to protect the value of securities and related receivables and payables against changes in future foreign exchange rates. The fund’s risks in using these contracts include movement in the values of the foreign currencies relative to the U.S. dollar and the ability of the counterparties to fulfill their obligations under the contracts. The fund mitigates its counterparty risk by entering into forward currency contracts only with a diverse group of prequalified counterparties, monitoring their financial strength, entering into master netting arrangements with its counterparties, and requiring its
129
High-Yield Corporate Fund
counterparties to transfer collateral as security for their performance. In the absence of a default, the collateral pledged or received by the fund cannot be repledged, resold, or rehypothecated. The master netting arrangements provide that, in the event of a counterparty’s default (including bankruptcy), the fund may terminate the forward currency contracts, determine the net amount owed by either party in accordance with its master netting arrangements, and sell or retain any collateral held up to the net amount owed to the fund under the master netting arrangements. The forward currency contracts contain provisions whereby a counterparty may terminate open contracts if the fund’s net assets decline below a certain level, triggering a payment by the fund if the fund is in a net liability position at the time of the termination. The payment amount would be reduced by any collateral the fund has pledged. Any assets pledged as collateral for open contracts are noted in the Statement of Net Assets. The value of collateral received or pledged is compared daily to the value of the forward currency contracts exposure with each counterparty, and any difference, if in excess of a specified minimum transfer amount, is adjusted and settled within two business days.
Forward currency contracts are valued at their quoted daily prices obtained from an independent third party, adjusted for currency risk based on the expiration date of each contract. The notional amounts of the contracts are not recorded in the Statement of Net Assets. Fluctuations in the value of the contracts are recorded in the Statement of Net Assets as an asset (liability) and in the Statement of Operations as unrealized appreciation (depreciation) until the contracts are closed, when they are recorded as realized forward currency contract gains (losses).
During the six months ended July 31, 2018, the fund’s average investment in forward currency contracts represented 2% of net assets, based on the average of notional amounts at each quarter-end during the period.
4. Swap Contracts: The fund invests in credit default swaps to adjust the overall credit risk of the fund or to actively overweight or underweight credit risk to a specific issuer or group of issuers. The fund may sell credit protection through credit default swaps to simulate investments in long positions that are either unavailable or considered to be less attractively priced in the bond market. The fund may purchase credit protection through credit default swaps to reduce credit exposure to a given issuer or issuers. Under the terms of the swaps, an up-front payment may be exchanged between the seller and buyer. In addition, the seller of the credit protection receives a periodic payment of premium from the buyer that is a fixed percentage applied to a notional amount. If, for example, the reference entity is subject to a credit event (such as bankruptcy, failure to pay, or obligation acceleration) during the term of the swap, the seller agrees to either physically settle or cash settle the swap contract. If the swap is physically settled, the seller agrees to pay the buyer an amount equal to the notional amount and take delivery of a debt instrument of the reference issuer with a par amount equal to such notional amount. If the swap is cash settled, the seller agrees to pay the buyer the difference between the notional amount and the final price for the relevant debt instrument, as determined either in a market auction or pursuant to a pre-agreed-upon valuation procedure.
The notional amounts of swap contracts are not recorded in the Statement of Net Assets. Swaps are valued daily based on market quotations received from independent pricing services or recognized dealers and the change in value is recorded in the Statement of Net Assets as an asset (liability) and in the Statement of Operations as unrealized appreciation (depreciation) until the seller of credit protection is required to take delivery (or, in a cash settled swap, pay the settlement
130
High-Yield Corporate Fund
amount determined) upon occurrence of a credit event, periodic payments are made, or the swap terminates, at which time realized gain (loss) is recorded. The net premium to be received or paid by the fund under swap contracts is accrued daily and recorded as realized gain (loss) over the life of the contract.
The primary risk associated with selling credit protection is that, upon the occurrence of a defined credit event, the market value of the debt instrument received by the fund (or, in a cash settled swap, the debt instruments used to determine the settlement payment by the fund) will be significantly less than the amount paid by the fund and, in a physically settled swap, the fund may receive an illiquid debt instrument. A risk associated with all types of swaps is the possibility that a counterparty may default on its obligation to pay net amounts due to the fund. The fund’s maximum amount subject to counterparty risk is the unrealized appreciation on the swap contract. The fund mitigates its counterparty risk by entering into swaps only with a diverse group of prequalified counterparties, monitoring their financial strength, entering into master netting arrangements with its counterparties, and requiring its counterparties to transfer collateral as security for their performance. In the absence of a default, the collateral pledged or received by the fund cannot be repledged, resold, or rehypothecated. In the event of a counterparty’s default (including bankruptcy), the fund may terminate any swap contracts with that counterparty, determine the net amount owed by either party in accordance with its master netting arrangements, and sell or retain any collateral held up to the net amount owed to the fund under the master netting arrangements. The swap contracts contain provisions whereby a counterparty may terminate open contracts if the fund’s net assets decline below a certain level, triggering a payment by the fund if the fund is in a net liability position at the time of the termination. The payment amount would be reduced by any collateral the fund has pledged. Any securities pledged as collateral for open contracts are noted in the Statement of Net Assets. The value of collateral received or pledged is compared daily to the value of the swap contracts exposure with each counterparty, and any difference, if in excess of a specified minimum transfer amount, is adjusted and settled within two business days.
The fund enters into centrally cleared credit default swaps to achieve the same objectives specified with respect to the equivalent over-the-counter swaps but with less counterparty risk because a regulated clearinghouse is the counterparty instead of the clearing broker or executing broker. The clearinghouse imposes initial margin requirements to secure the fund’s performance, and requires daily settlement of variation margin representing changes in the market value of each contract. To further mitigate counterparty risk, the fund trades with a diverse group of prequalified executing brokers; monitors the financial strength of its clearing brokers, executing brokers, and clearinghouse; and has entered into agreements with its clearing brokers and executing brokers.
During the six months ended July 31, 2018, the fund’s average amounts of investments in credit protection sold and credit protection purchased represented 3% and 0% of net assets, respectively, based on the average of notional amounts at each quarter-end during the period.
5. Repurchase Agreements: The fund enters into repurchase agreements with institutional counterparties. Securities pledged as collateral to the fund under repurchase agreements are held by a custodian bank until the agreements mature, and in the absence of a default, such collateral cannot be repledged, resold, or rehypothecated. Each agreement requires that the market value of the collateral be sufficient to cover payments of interest and principal. The fund further mitigates its counterparty risk by entering into repurchase agreements only with a diverse group of prequalified counterparties, monitoring their financial strength, and entering into master repurchase agreements
131
High-Yield Corporate Fund
with its counterparties. The master repurchase agreements provide that, in the event of a counterparty’s default (including bankruptcy), the fund may terminate any repurchase agreements with that counterparty, determine the net amount owed, and sell or retain the collateral up to the net amount owed to the fund. Such action may be subject to legal proceedings, which may delay or limit the disposition of collateral.
6. Federal Income Taxes: The fund intends to continue to qualify as a regulated investment company and distribute all of its taxable income. Management has analyzed the fund’s tax positions taken for all open federal income tax years (January 31, 2015–2018), and for the period ended July 31, 2018, and has concluded that no provision for federal income tax is required in the fund’s financial statements.
7. Distributions: Distributions from net investment income are declared daily and paid on the first business day of the following month. Annual distributions from realized capital gains, if any, are recorded on the ex-dividend date.
8. Credit Facility: The fund and certain other funds managed by The Vanguard Group (“Vanguard”) participate in a $3.1 billion committed credit facility provided by a syndicate of lenders pursuant to a credit agreement that may be renewed annually; each fund is individually liable for its borrowings, if any, under the credit facility. Borrowings may be utilized for temporary and emergency purposes, and are subject to the fund’s regulatory and contractual borrowing restrictions. The participating funds are charged administrative fees and an annual commitment fee of 0.10% of the undrawn amount of the facility; these fees are allocated to the funds based on a method approved by the fund’s board of trustees and included in Management and Administrative expenses on the fund’s Statement of Operations. Any borrowings under this facility bear interest at a rate based upon the higher of the one-month London Interbank Offered Rate, federal funds effective rate, or overnight bank funding rate plus an agreed-upon spread.
The fund had no borrowings outstanding at July 31, 2018, or at any time during the period then ended.
9. Other: Dividend income is recorded on the ex-dividend date. Interest income is accrued daily. Premiums and discounts on debt securities purchased are amortized and accreted, respectively, to interest income over the lives of the respective securities. Security transactions are accounted for on the date securities are bought or sold. Costs used to determine realized gains (losses) on the sale of investment securities are those of the specific securities sold.
Each class of shares has equal rights as to assets and earnings, except that each class separately bears certain class-specific expenses related to maintenance of shareholder accounts (included in Management and Administrative expenses), shareholder reporting, and the proxy. Marketing and distribution expenses are allocated to each class of shares based on a method approved by the board of trustees. Income, other non-class-specific expenses, and gains and losses on investments are allocated to each class of shares based on its relative net assets.
B. Wellington Management Company LLP provides investment advisory services to the fund for a fee calculated at an annual percentage rate of average net assets. For the six months ended July 31, 2018, the investment advisory fee represented an effective annual rate of 0.03% of the fund’s average net assets.
132
High-Yield Corporate Fund
C. In accordance with the terms of a Funds’ Service Agreement (the “FSA”) between Vanguard and the fund, Vanguard furnishes to the fund corporate management, administrative, marketing, and distribution services at Vanguard’s cost of operations (as defined by the FSA). These costs of operations are allocated to the fund based on methods and guidelines approved by the board of trustees. Vanguard does not require reimbursement in the current period for certain costs of operations (such as deferred compensation/benefits and risk/insurance costs); the fund’s liability for these costs of operations is included in Payables to Vanguard on the Statement of Net Assets. All other costs of operations payable to Vanguard are generally settled twice a month.
Upon the request of Vanguard, the fund may invest up to 0.40% of its net assets as capital in Vanguard. At July 31, 2018, the fund had contributed to Vanguard capital in the amount of $1,249,000, representing 0.01% of the fund’s net assets and 0.50% of Vanguard’s capitalization. The fund’s trustees and officers are also directors and employees, respectively, of Vanguard.
D. The fund’s custodian bank has agreed to reduce its fees when the fund maintains cash on deposit in the non-interest-bearing custody account. For the six months ended July 31, 2018, custodian fee offset arrangements reduced the fund’s expenses by $44,000 (an annual rate of 0.00% of average net assets).
E. Various inputs may be used to determine the value of the fund’s investments. These inputs are summarized in three broad levels for financial statement purposes. The inputs or methodologies used to value securities are not necessarily an indication of the risk associated with investing in those securities.
Level 1—Quoted prices in active markets for identical securities.
Level 2—Other significant observable inputs (including quoted prices for similar securities, interest rates, prepayment speeds, credit risk, etc.).
Level 3—Significant unobservable inputs (including the fund’s own assumptions used to determine
the fair value of investments). Any investments valued with significant unobservable inputs are
noted on the Statement of Net Assets.
The following table summarizes the market value of the fund’s investments as of July 31, 2018, based on the inputs used to value them:
| Level 1 | Level 2 | Level 3 | |
| Investments | ($000) | ($000) | ($000) |
| U.S. Government and Agency Obligations | — | 870,606 | — |
| Corporate Bonds | — | 21,814,150 | — |
| Sovereign Bonds | — | 57,519 | — |
| Preferred Stocks | — | 125,979 | — |
| Common Stocks | — | — | 41,520 |
| Temporary Cash Investments | — | 694,400 | — |
| Swap Contracts—Assets1 | 835 | — | — |
| Forward Currency Contracts—Liabilities | — | (4) | — |
| Total | 835 | 23,562,650 | 41,520 |
| 1 Represents variation margin on the last day of the reporting period. |
133
High-Yield Corporate Fund
F. At July 31, 2018, the fair values of derivatives were reflected in the Statement of Net Assets as follows:
| Currency | Credit | ||
| Contracts | Contracts | Total | |
| Statement of Net Assets Caption | ($000) | ($000) | ($000) |
| Variation Margin Receivable—Swap Contracts | — | 835 | 835 |
| Unrealized Depreciation—Forward Currency Contracts | (4) | — | (4) |
Realized net gain (loss) and the change in unrealized appreciation (depreciation) on derivatives for the six months ended July 31, 2018, were:
| Currency | Credit | ||
| Contracts | Contracts | Total | |
| Realized Net Gain (Loss) on Derivatives | ($000) | ($000) | ($000) |
| Forward Currency Contracts | 32,380 | — | 32,380 |
| Swap Contracts | — | 11,957 | 11,957 |
| Realized Net Gain (Loss) on Derivatives | 32,380 | 11,957 | 44,337 |
| Change in Unrealized Appreciation (Depreciation) on Derivatives | |||
| Forward Currency Contracts | 550 | — | 550 |
| Swap Contracts | — | 308 | 308 |
| Change in Unrealized Appreciation (Depreciation) on Derivatives | 550 | 308 | 858 |
G. Capital gain distributions are determined on a tax basis and may differ from realized capital gains for financial reporting purposes. Differences may be permanent or temporary. Permanent differences are reclassified among capital accounts in the financial statements to reflect their tax character. Temporary differences arise when gains or losses are recognized in different periods for financial statement and tax purposes. These differences will reverse at some time in the future.
During the six months ended July 31, 2018, the fund realized net foreign currency gains of $33,330,000 (including gains and losses on forward currency contracts and the foreign currency component on sales of foreign currency denominated bonds), which increased distributable net income for tax purposes; accordingly, such losses have been reclassified from accumulated net realized losses to undistributed net investment income.
Realized and unrealized gains (losses) on certain of the fund’s swap contracts are treated as ordinary income (loss) for tax purposes; the effect on the fund’s income dividends to shareholders is offset by a change in principal return. Realized gains of $16,349,000 on swap contracts have been reclassified from accumulated net realized losses to undistributed net investment income.
134
High-Yield Corporate Fund
The fund’s tax-basis capital gains and losses are determined only at the end of each fiscal year. For tax purposes, at January 31, 2018, the fund had available capital losses totaling $371,912,000 that may be carried forward indefinitely to offset future net capital gains. The fund will use these capital losses to offset net taxable capital gains, if any, realized during the year ending January 31, 2019; should the fund realize net capital losses for the year, the losses will be added to the loss carryforward balance above.
At July 31, 2018, the cost of investment securities for tax purposes was $23,922,682,000. Net unrealized depreciation of investment securities for tax purposes was $318,508,000, consisting of unrealized gains of $326,218,000 on securities that had risen in value since their purchase and $644,726,000 in unrealized losses on securities that had fallen in value since their purchase.
H. During the six months ended July 31, 2018, the fund purchased $2,689,831,000 of investment securities and sold $3,009,828,000 of investment securities, other than U.S. government securities and temporary cash investments. Purchases and sales of U.S. government securities were $246,777,000 and $0, respectively.
I. Capital share transactions for each class of shares were:
| Six Months Ended | Year Ended | |||
| July 31, 2018 | January 31, 2018 | |||
| Amount | Shares | Amount | Shares | |
| ($000) | (000) | ($000) | (000) | |
| Investor Shares | ||||
| Issued | 335,585 | 58,165 | 1,286,829 | 216,908 |
| Issued in Lieu of Cash Distributions | 89,840 | 15,631 | 184,725 | 31,077 |
| Redeemed | (663,257) | (115,019) | (1,424,875) | (240,139) |
| Net Increase (Decrease)—Investor Shares | (237,832) | (41,223) | 46,679 | 7,846 |
| Admiral Shares | ||||
| Issued | 1,949,068 | 338,374 | 5,636,834 | 950,227 |
| Issued in Lieu of Cash Distributions | 419,026 | 72,910 | 768,182 | 129,231 |
| Redeemed | (2,620,789) | (454,651) | (3,545,261) | (597,975) |
| Net Increase (Decrease)—Admiral Shares | (252,695) | (43,367) | 2,859,755 | 481,483 |
J. Management has determined that no events or transactions occurred subsequent to July 31, 2018, that would require recognition or disclosure in these financial statements.
135
About Your Fund’s Expenses
As a shareholder of the fund, you incur ongoing costs, which include costs for portfolio management, administrative services, and shareholder reports (like this one), among others. Operating expenses, which are deducted from a fund’s gross income, directly reduce the investment return of the fund.
A fund’s expenses are expressed as a percentage of its average net assets. This figure is known as the expense ratio. The following examples are intended to help you understand the ongoing costs (in dollars) of investing in your fund and to compare these costs with those of other mutual funds. The examples are based on an investment of $1,000 made at the beginning of the period shown and held for the entire period.
The accompanying table illustrates your fund’s costs in two ways:
• Based on actual fund return. This section helps you to estimate the actual expenses that you paid over the period. The ”Ending Account Value“ shown is derived from the fund‘s actual return, and the third column shows the dollar amount that would have been paid by an investor who started with $1,000 in the fund. You may use the information here, together with the amount you invested, to estimate the expenses that you paid over the period.
To do so, simply divide your account value by $1,000 (for example, an $8,600 account value divided by $1,000 = 8.6), then multiply the result by the number given for your fund under the heading ”Expenses Paid During Period.“
• Based on hypothetical 5% yearly return. This section is intended to help you compare your fund‘s costs with those of other mutual funds. It assumes that the fund had a yearly return of 5% before expenses, but that the expense ratio is unchanged. In this case—because the return used is not the fund’s actual return—the results do not apply to your investment. The example is useful in making comparisons because the Securities and Exchange Commission requires all mutual funds to calculate expenses based on a 5% return. You can assess your fund’s costs by comparing this hypothetical example with the hypothetical examples that appear in shareholder reports of other funds.
Note that the expenses shown in the table are meant to highlight and help you compare ongoing costs only and do not reflect transaction costs incurred by the fund for buying and selling securities. Further, the expenses do not include any purchase, redemption, or account service fees described in the fund prospectus. If such fees were applied to your account, your costs would be higher. Your fund does not carry a “sales load.”
The calculations assume no shares were bought or sold during the period. Your actual costs may have been higher or lower, depending on the amount of your investment and the timing of any purchases or redemptions.
You can find more information about the fund’s expenses, including annual expense ratios, in the Financial Statements section of this report. For additional information on operating expenses and other shareholder costs, please refer to your fund’s current prospectus.
136
| Six Months Ended July 31, 2018 | |||
| Beginning | Ending | Expenses | |
| Account Value | Account Value | Paid During | |
| 1/31/2018 | 7/31/2018 | Period | |
| Based on Actual Fund Return | |||
| Short-Term Investment-Grade Fund | |||
| Investor Shares | $1,000.00 | $1,001.41 | $0.99 |
| Admiral Shares | 1,000.00 | 1,001.91 | 0.50 |
| Institutional Shares | 1,000.00 | 1,002.06 | 0.35 |
| Intermediate-Term Investment-Grade Fund | |||
| Investor Shares | $1,000.00 | $993.29 | $0.99 |
| Admiral Shares | 1,000.00 | 993.78 | 0.49 |
| Long-Term Investment-Grade Fund | |||
| Investor Shares | $1,000.00 | $966.36 | $1.07 |
| Admiral Shares | 1,000.00 | 966.84 | 0.59 |
| High-Yield Corporate Fund | |||
| Investor Shares | $1,000.00 | $998.22 | $1.14 |
| Admiral Shares | 1,000.00 | 998.72 | 0.64 |
| Based on Hypothetical 5% Yearly Return | |||
| Short-Term Investment-Grade Fund | |||
| Investor Shares | $1,000.00 | $1,023.80 | $1.00 |
| Admiral Shares | 1,000.00 | 1,024.30 | 0.50 |
| Institutional Shares | 1,000.00 | 1,024.45 | 0.35 |
| Intermediate-Term Investment-Grade Fund | |||
| Investor Shares | $1,000.00 | $1,023.80 | $1.00 |
| Admiral Shares | 1,000.00 | 1,024.30 | 0.50 |
| Long-Term Investment-Grade Fund | |||
| Investor Shares | $1,000.00 | $1,023.70 | $1.10 |
| Admiral Shares | 1,000.00 | 1,024.20 | 0.60 |
| High-Yield Corporate Fund | |||
| Investor Shares | $1,000.00 | $1,023.65 | $1.15 |
| Admiral Shares | 1,000.00 | 1,024.15 | 0.65 |
The calculations are based on expenses incurred in the most recent six-month period. The funds’ annualized six-month expense ratios for
that period are: for the Short-Term Investment-Grade Fund, 0.20% for Investor Shares, 0.10% for Admiral Shares, and 0.07% for
Institutional Shares; for the Intermediate-Term Investment-Grade Fund, 0.20% for Investor Shares and 0.10% for Admiral Shares; for the
Long-Term Investment-Grade Fund, 0.22% for Investor Shares and 0.12% for Admiral Shares; for the High-Yield Corporate Fund, 0.23% for
Investor Shares and 0.13% for Admiral Shares. The dollar amounts shown as “Expenses Paid” are equal to the annualized expense ratio
multiplied by the average account value over the period, multiplied by the number of days in the most recent six-month period, then
divided by the number of days in the most recent 12-month period (181/365).
137
Trustees Approve Advisory Arrangements
The board of trustees of Vanguard Short-Term Investment-Grade Fund, Vanguard Intermediate-Term Investment-Grade Fund, and Vanguard Long-Term Investment-Grade Fund has renewed each fund’s investment advisory arrangement with The Vanguard Group, Inc. (Vanguard), through its Fixed Income Group. The board also has renewed the investment advisory arrangements between Vanguard Long-Term Investment-Grade Fund and Vanguard High-Yield Corporate Fund and the funds’ advisor, Wellington Management Company LLP (Wellington Management). The board determined that renewing each fund’s advisory arrangement(s) was in the best interests of the fund and its shareholders.
The board based its decisions upon an evaluation of each advisor’s investment staff, portfolio management process, and performance. This evaluation included information provided to the board by Vanguard’s Portfolio Review Department, which is responsible for fund and advisor oversight and product management. The Portfolio Review Department met regularly with the advisors and made monthly presentations to the board during the fiscal year that directed the board’s focus to relevant information and topics.
The board, or an investment committee made up of board members, also received information throughout the year during advisor presentations. For each advisor presentation, the board was provided with letters and reports that included information about, among other things, the advisory firm and the advisor’s assessment of the investment environment, portfolio performance, and portfolio characteristics.
In addition, the board received monthly reports, which included a Market and Economic Report, a Fund Dashboard Monthly Summary, and a Fund Performance Report.
Prior to their meeting, the trustees were provided with a memo and materials that summarized the information they received over the course of the year. They also considered the factors discussed below, among others. However, no single factor determined whether the board approved the arrangements. Rather, it was the totality of the circumstances that drove the board’s decisions.
Nature, extent, and quality of services
The board reviewed the quality of each fund’s investment management services over both the short and long term and took into account the organizational depth and stability of each advisor. The board considered the following:
Vanguard. Vanguard has been managing investments for more than four decades and has advised the Short-Term Investment-Grade and Intermediate-Term Investment-Grade Funds since their inceptions, and a portion of the Long-Term Investment-Grade Fund since 2013. The Fixed Income Group adheres to a sound, disciplined investment management process; the team has considerable experience, stability, and depth.
Wellington Management. Founded in 1928, Wellington Management is among the nation’s oldest and most respected institutional investment managers. The portfolio managers of the funds are backed by well-tenured teams of research analysts who conduct detailed credit analysis. For the Long-Term Investment Grade Fund, the team conducts independent credit analysis on individual issuers in the universe of bonds considered for the fund. The portfolio manager draws upon the sector experience of these analysts and the broader fixed-income team at Wellington Management to manage the fund’s duration, sector, quality, and curve positioning. For the High-Yield Corporate Fund, the advisor focuses on higher quality high-yield bonds, as it expects these higher quality
138
issues to offer a more favorable risk/reward trade-off over the long term. The team’s credit analysis seeks to identify companies whose fundamentals are stable or improving and whose securities offer an attractive yield. The firm has managed the Long-Term Investment-Grade and High-Yield Corporate Funds since their inceptions.
The board concluded that each advisor’s experience, stability, depth, and performance, among other factors, warranted continuation of the advisory arrangements.
Investment performance
The board considered the short- and long-term performance of each fund, including any periods of outperformance or underperformance compared with a relevant benchmark index and peer group. The board concluded that the performance was such that the advisory arrangements should continue. Information about each fund’s most recent performance can be found on the Performance Summary pages of this report.
Cost
The board concluded that each fund’s expense ratio was well below the average expense ratio charged by funds in its peer group and that each fund’s advisory fee rate or expenses were also well below its peer-group average. Information about the funds’ expenses appears in the About Your Fund’s Expenses section of this report as well as in the Financial Statements sections, which also include information about the advisory expenses.
The board did not consider the profitability of Wellington Management in determining whether to approve the advisory fees for the Long-Term Investment-Grade and High-Yield Corporate Funds, because Wellington Management is independent of Vanguard and the advisory fees are the result of arm’s-length negotiations. The board does not conduct a profitability analysis of Vanguard because of Vanguard’s unique “at-cost” structure. Unlike most other mutual fund management companies, Vanguard is owned by the funds it oversees and produces “profits” only in the form of reduced expenses for fund shareholders.
The benefit of economies of scale
The board concluded that the Long-Term Investment-Grade and High-Yield Corporate Funds’ shareholders benefit from economies of scale because of the breakpoints in each fund’s advisory fee schedule with Wellington Management. The breakpoints reduce the effective rate of the fee as the fund’s assets increase.
The board also concluded that the Short-Term Investment-Grade, Intermediate-Term Investment-Grade, and Long-Term Investment-Grade Funds’ at-cost arrangements with Vanguard ensure that the funds will realize economies of scale as they grow, with the cost to shareholders declining as fund assets increase.
The board will consider whether to renew the advisory arrangements again after a one-year period.
139
Glossary
30-Day SEC Yield. A fund’s 30-day SEC yield is derived using a formula specified by the U.S. Securities and Exchange Commission. Under the formula, data related to the fund’s security holdings in the previous 30 days are used to calculate the fund’s hypothetical net income for that period, which is then annualized and divided by the fund’s estimated average net assets over the calculation period. For the purposes of this calculation, a security’s income is based on its current market yield to maturity (for bonds), its actual income (for asset-backed securities), or its projected dividend yield (for stocks). Because the SEC yield represents hypothetical annualized income, it will differ—at times significantly—from the fund’s actual experience. As a result, the fund’s income distributions may be higher or lower than implied by the SEC yield.
Average Coupon. The average interest rate paid on the fixed income securities held by a fund. It is expressed as a percentage of face value.
Average Duration. An estimate of how much the value of the bonds held by a fund will fluctuate in response to a change in interest rates. To see how the value could change, multiply the average duration by the change in rates. If interest rates rise by 1 percentage point, the value of the bonds in a fund with an average duration of five years would decline by about 5%. If rates decrease by a percentage point, the value would rise by 5%.
Average Effective Maturity. The average length of time until fixed income securities held by a fund reach maturity and are repaid, taking into consideration the possibility that the issuer may call the bond before its maturity date. The figure reflects the proportion of fund assets represented by each security; it also reflects any futures contracts held. In general, the longer the average effective maturity, the more a fund’s share price will fluctuate in response to changes in market interest rates.
Beta. A measure of the magnitude of a fund’s past share-price fluctuations in relation to the ups and downs of a given market index. The index is assigned a beta of 1.00. Compared with a given index, a fund with a beta of 1.20 typically would have seen its share price rise or fall by 12% when the index rose or fell by 10%. For this report, beta is based on returns over the past 36 months for both the fund and the index. Note that a fund’s beta should be reviewed in conjunction with its R-squared (see definition). The lower the R-squared, the less correlation there is between the fund and the index, and the less reliable beta is as an indicator of volatility.
Credit Quality. Credit-quality ratings are measured on a scale that generally ranges from AAA (highest) to D (lowest). U.S. Treasury, U.S. Agency, and U.S. Agency mortgage-backed securities appear under “U.S. Government.” For the three investment-grade funds, credit-quality ratings are obtained from Moody’s and S&P, and the higher rating for each issue is shown. For the High-Yield Corporate Fund, credit-quality ratings are obtained from Barclays and are from Moody’s, Fitch, and S&P. When ratings from all three agencies are used, the median rating is shown. When ratings from two of the agencies are used, the lower rating for each issue is shown. “Not Rated” is used to classify securities for which a rating is not available. Not rated securities include a fund’s investment in Vanguard Market Liquidity Fund or Vanguard Municipal Cash Management Fund, each of which invests in high-quality money market instruments and may serve as a cash management vehicle for the Vanguard funds, trusts, and accounts.
140
Expense Ratio. A fund’s total annual operating expenses expressed as a percentage of the fund’s average net assets. The expense ratio includes management and administrative expenses, but does not include the transaction costs of buying and selling portfolio securities.
Inception Date. The date on which the assets of a fund (or one of its share classes) are first invested in accordance with the fund’s investment objective. For funds with a subscription period, the inception date is the day after that period ends. Investment performance is measured from the inception date.
R-Squared. A measure of how much of a fund’s past returns can be explained by the returns from the market in general, as measured by a given index. If a fund’s total returns were precisely synchronized with an index’s returns, its R-squared would be 1.00. If the fund’s returns bore no relationship to the index’s returns, its R-squared would be 0. For this report, R-squared is based on returns over the past 36 months for both the fund and the index.
Short-Term Reserves. The percentage of a fund invested in highly liquid, short-term securities that can be readily converted to cash.
Yield to Maturity. The rate of return an investor would receive if the fixed income securities held by a fund were held to their maturity dates.
Benchmark Information
High-Yield Corporate Composite Index: Consists of 95% Bloomberg Barclays U.S. High-Yield Ba/B 2% Issuer Capped Index and 5% Bloomberg Barclays U.S. 1–5 Year Treasury Bond Index.
141
BLOOMBERG is a trademark and service mark of Bloomberg Finance L.P. BARCLAYS is a trademark and service mark of Barclays Bank Plc, used under license. Bloomberg Finance L.P. and its affiliates, including Bloomberg Index Services Limited (BISL) (collectively, Bloomberg), or Bloomberg’s licensors, own all proprietary rights in the Bloomberg Barclays U.S. 1–5 Year Credit Bond Index, Bloomberg Barclays U.S. 5–10 Year Credit Bond Index, Bloomberg Barclays U.S. Long Credit A or Better Bond Index, and High-Yield Corporate Composite Index (the Indices or Bloomberg Barclays Indices).
Neither Barclays Bank Plc, Barclays Capital Inc., or any affiliate (collectively Barclays) or Bloomberg is the issuer or producer of the Corporate Bond Funds and neither Bloomberg nor Barclays has any responsibilities, obligations or duties to investors in the Corporate Bond Funds. The Indices are licensed for use by The Vanguard Group, Inc. (Vanguard) as the sponsor of the Corporate Bond Funds. Bloomberg and Barclays’ only relationship with Vanguard in respect of the Indices is the licensing of the Indices, which are determined, composed and calculated by BISL, or any successor thereto, without regard to the Issuer or the Corporate Bond Funds or the owners of the Corporate Bond Funds.
Additionally, Vanguard may for itself execute transaction(s) with Barclays in or relating to the Indices in connection with the Corporate Bond Funds. Investors acquire the Corporate Bond Funds from Vanguard and investors neither acquire any interest in the Indices nor enter into any relationship of any kind whatsoever with Bloomberg or Barclays upon making an investment in the Corporate Bond Funds. The Corporate Bond Funds are not sponsored, endorsed, sold or promoted by Bloomberg or Barclays. Neither Bloomberg nor Barclays makes any representation or warranty, express or implied regarding the advisability of investing in the Corporate Bond Funds or the advisability of investing in securities generally or the ability of the Indices to track corresponding or relative market performance. Neither Bloomberg nor Barclays has passed on the legality or suitability of the Corporate Bond Funds with respect to any person or entity. Neither Bloomberg nor Barclays is responsible for and has not participated in the determination of the timing of, prices at, or quantities of the Corporate Bond Funds to be issued. Neither Bloomberg nor Barclays has any obligation to take the needs of the Issuer or the owners of the Corporate Bond Funds or any other third party into consideration in determining, composing or calculating the Indices. Neither Bloomberg nor Barclays has any obligation or liability in connection with administration, marketing or trading of the Corporate Bond Funds.
The licensing agreement between Bloomberg and Barclays is solely for the benefit of Bloomberg and Barclays and not for the benefit of the owners of the Corporate Bond Funds, investors or other third parties. In addition, the licensing agreement between Vanguard and Bloomberg is solely for the benefit of Vanguard and Bloomberg and not for the benefit of the owners of the Corporate Bond Funds, investors or other third parties.
NEITHER BLOOMBERG NOR BARCLAYS SHALL HAVE ANY LIABILITY TO THE ISSUER, INVESTORS OR TO OTHER THIRD PARTIES FOR THE QUALITY, ACCURACY AND/OR COMPLETENESS OF THE BLOOMBERG BARCLAYS INDICES OR ANY DATA INCLUDED THEREIN OR FOR INTERRUPTIONS IN THE DELIVERY OF THE BLOOMBERG BARCLAYS INDICES. NEITHER BLOOMBERG NOR BARCLAYS MAKES ANY WARRANTY, EXPRESS OR IMPLIED, AS TO RESULTS TO BE OBTAINED BY THE ISSUER, THE INVESTORS OR ANY OTHER PERSON OR ENTITY FROM THE USE OF THE BLOOMBERG BARCLAYS INDICES OR ANY DATA INCLUDED THEREIN. NEITHER BLOOMBERG NOR BARCLAYS MAKES ANY EXPRESS OR IMPLIED WARRANTIES, AND EACH HEREBY EXPRESSLY DISCLAIMS ALL WARRANTIES OF MERCHANTABILITY
OR FITNESS FOR A PARTICULAR PURPOSE OR USE WITH RESPECT TO THE BLOOMBERG BARCLAYS INDICES OR ANY DATA INCLUDED THEREIN. BLOOMBERG RESERVES THE RIGHT TO CHANGE THE METHODS OF CALCULATION OR PUBLICATION, OR TO CEASE THE CALCULATION OR PUBLICATION OF THE BLOOMBERG BARCLAYS INDICES, AND NEITHER BLOOMBERG NOR BARCLAYS SHALL BE LIABLE FOR ANY MISCALCULATION OF OR ANY INCORRECT, DELAYED OR INTERRUPTED PUBLICATION WITH RESPECT TO THE BLOOMBERG BARCLAYS INDICES. NEITHER BLOOMBERG NOR BARCLAYS SHALL BE LIABLE FOR ANY DAMAGES, INCLUDING, WITHOUT LIMITATION, ANY SPECIAL, INDIRECT OR CONSEQUENTIAL DAMAGES, OR ANY LOST PROFITS AND EVEN IF ADVISED OF THE POSSIBILITY OF SUCH, RESULTING FROM THE USE OF THE BLOOMBERG BARCLAYS INDICES OR ANY DATA INCLUDED THEREIN OR WITH RESPECT TO THE CORPORATE BOND FUNDS.
None of the information supplied by Bloomberg or Barclays and used in this publication may be reproduced in any manner without the prior written permission of both Bloomberg and Barclays Capital, the investment banking division of Barclays Bank Plc. Barclays Bank Plc is registered in England No. 1026167. Registered office 1 Churchill Place London E14 5HP.
© 2018 Bloomberg. Used with Permission.
Source: Bloomberg Index Services Limited. Copyright 2018, Bloomberg. All rights reserved.
142
This page intentionally left blank.
This page intentionally left blank.
This page intentionally left blank.
This page intentionally left blank.
The People Who Govern Your Fund
The trustees of your mutual fund are there to see that the fund is operated and managed in your best interests since, as a shareholder, you are a part owner of the fund. Your fund’s trustees also serve on the board of directors of The Vanguard Group, Inc., which is owned by the Vanguard funds and provides services to them on an at-cost basis.
A majority of Vanguard’s board members are independent, meaning that they have no affiliation with Vanguard or the funds they oversee, apart from the sizable personal investments they have made as private individuals. The independent board members have distinguished backgrounds in business, academia, and public service. Each of the trustees and executive officers oversees 208 Vanguard funds.
Information for each trustee and executive officer of the fund appears below. The mailing address of the trustees and officers is P.O. Box 876, Valley Forge, PA 19482. More information about the trustees is in the Statement of Additional Information, which can be obtained, without charge, by contacting Vanguard at 800-662-7447, or online at vanguard.com.
Interested Trustees1
F. William McNabb III
Born in 1957. Trustee since July 2009. Principal occupation(s) during the past five years and other experience: chairman of the board (January 2010–present) of Vanguard and of each of the investment companies served by Vanguard, trustee (2009–present) of each of the investment companies served by Vanguard, and director (2008–present) of Vanguard. Chief executive officer and president (2008–2017) of Vanguard and each of the investment companies served by Vanguard, managing director (1995–2008) of Vanguard, and director (1997–2018) of Vanguard Marketing Corporation. Director (2018–present) of UnitedHealth Group.
Mortimer J. Buckley
Born in 1969. Trustee since January 2018. Principal occupation(s) during the past five years and other experience: chief executive officer (January 2018–present) of Vanguard; chief executive officer, president, and trustee (January 2018–present) of each of the investment companies served by Vanguard; president and director (2017–present) of Vanguard; and president (February 2018–present) of Vanguard Marketing Corporation. Chief investment officer (2013–2017), managing director (2002–2017), head of the Retail Investor Group (2006–2012), and chief information officer (2001–2006) of Vanguard. Chairman of the board (2011–2017) of the Children’s Hospital of Philadelphia.
Independent Trustees
Emerson U. Fullwood
Born in 1948. Trustee since January 2008. Principal occupation(s) during the past five years and other experience: executive chief staff and marketing officer for North America and corporate vice president (retired 2008) of Xerox Corporation (document management products and services). Former president of the Worldwide Channels Group, Latin America, and Worldwide Customer Service and executive chief staff officer of Developing Markets of Xerox. Executive in residence and 2009–2010 Distinguished Minett Professor at the Rochester Institute of Technology. Lead director of SPX FLOW, Inc. (multi-industry manufacturing). Director of the University of Rochester Medical Center, the Monroe Community College Foundation, the United Way of Rochester, North Carolina A&T University, and Roberts Wesleyan College. Trustee of the University of Rochester.
Amy Gutmann
Born in 1949. Trustee since June 2006. Principal occupation(s) during the past five years and other experience: president (2004–present) of the University of Pennsylvania. Christopher H. Browne Distinguished Professor of Political Science, School of Arts and Sciences, and professor of communication, Annenberg School for Communication, with secondary faculty appointments in the Department of Philosophy, School of Arts and Sciences, and at the Graduate School of Education, University of Pennsylvania. Trustee of the National Constitution Center.
1 Mr. McNabb and Mr. Buckley are considered “interested persons,” as defined in the Investment Company Act of 1940, because they are officers of the Vanguard funds.
JoAnn Heffernan Heisen
Born in 1950. Trustee since July 1998. Principal occupation(s) during the past five years and other experience: corporate vice president of Johnson & Johnson (pharmaceuticals/medical devices/consumer products) and member of its executive committee (1997–2008). Chief global diversity officer (retired 2008), vice president and chief information officer (1997–2006), controller (1995–1997), treasurer (1991–1995), and assistant treasurer (1989–1991) of Johnson & Johnson. Director of Skytop Lodge Corporation (hotels) and the Robert Wood Johnson Foundation. Member of the advisory board of the Institute for Women’s Leadership at Rutgers University.
F. Joseph Loughrey
Born in 1949. Trustee since October 2009. Principal occupation(s) during the past five years and other experience: president and chief operating officer (retired 2009) and vice chairman of the board (2008–2009) of Cummins Inc. (industrial machinery). Chairman of the board of Hillenbrand, Inc. (specialized consumer services), Oxfam America, and the Lumina Foundation for Education. Director of the V Foundation for Cancer Research. Member of the advisory council for the College of Arts and Letters and chair of the advisory board to the Kellogg Institute for International Studies, both at the University of Notre Dame.
Mark Loughridge
Born in 1953. Trustee since March 2012. Principal occupation(s) during the past five years and other experience: senior vice president and chief financial officer (retired 2013) of IBM (information technology services). Fiduciary member of IBM’s Retirement Plan Committee (2004–2013), senior vice president and general manager (2002–2004) of IBM Global Financing, vice president and controller (1998–2002) of IBM, and a variety of other prior management roles at IBM. Member of the Council on Chicago Booth.
Scott C. Malpass
Born in 1962. Trustee since March 2012. Principal occupation(s) during the past five years and other experience: chief investment officer (1989–present) and vice president (1996–present) of the University of Notre Dame. Assistant professor of finance at the Mendoza College of Business, University of Notre Dame, and member of the Notre Dame 403(b) Investment Committee. Chairman of the board of TIFF Advisory Services, Inc. Member of the board of Catholic Investment Services, Inc. (investment advisors), the board of advisors for Spruceview Capital Partners, and the board of superintendence of the Institute for the Works of Religion.
Deanna Mulligan
Born in 1963. Trustee since January 2018. Principal occupation(s) during the past five years and other experience: president (2010–present) and chief executive officer (2011–present) of The Guardian Life Insurance Company of America. Chief operating officer (2010–2011) and executive vice president (2008–2010) of Individual Life and Disability of The Guardian Life Insurance Company of America. Member of the board of The Guardian Life Insurance Company of America, the American Council of Life Insurers, the Partnership for New York City (business leadership), and the Committee Encouraging Corporate Philanthropy. Trustee of the Economic Club of New York and the Bruce Museum (arts and science). Member of the Advisory Council for the Stanford Graduate School of Business.
André F. Perold
Born in 1952. Trustee since December 2004. Principal occupation(s) during the past five years and other experience: George Gund Professor of Finance and Banking, Emeritus at the Harvard Business School (retired 2011). Chief investment officer and co-managing partner of HighVista Strategies LLC (private investment firm). Overseer of the Museum of Fine Arts Boston.
Sarah Bloom Raskin
Born in 1961. Trustee since January 2018. Principal occupation(s) during the past five years and other experience: deputy secretary (2014–2017) of the United States Department of the Treasury. Governor (2010–2014) of the Federal Reserve Board. Commissioner (2007–2010) of financial regulation for the State of Maryland. Member of the board of directors (2012–2014) of Neighborhood Reinvestment Corporation. Director of i(x) Investments, LLC.
Peter F. Volanakis
Born in 1955. Trustee since July 2009. Principal occupation(s) during the past five years and other experience: president and chief operating officer (retired 2010) of Corning Incorporated (communications equipment) and director of Corning Incorporated (2000–2010) and Dow Corning (2001–2010). Director (2012) of SPX Corporation (multi-industry manufacturing). Overseer of the Amos Tuck School of Business Administration, Dartmouth College (2001–2013). Chairman of the board of trustees of Colby-Sawyer College. Member of the Board of Hypertherm Inc. (industrial cutting systems, software, and consumables).
Executive Officers
Glenn Booraem
Born in 1967. Principal occupation(s) during the past five years and other experience: principal of Vanguard. Investment stewardship officer (2017–present), treasurer (2015–2017), controller (2010–2015), and assistant controller (2001–2010) of each of the investment companies served by Vanguard.
Christine M. Buchanan
Born in 1970. Principal occupation(s) during the past five years and other experience: principal of Vanguard and global head of Fund Administration at Vanguard. Treasurer (2017–present) of each of the investment companies served by Vanguard. Partner (2005–2017) at KPMG LLP (audit, tax, and advisory services).
Brian Dvorak
Born in 1973. Principal occupation(s) during the past five years and other experience: principal of Vanguard. Chief compliance officer (2017–present) of Vanguard and each of the investment companies served by Vanguard. Assistant vice president (2017–present) of Vanguard Marketing Corporation. Vice president and director of Enterprise Risk Management (2011–2013) at Oppenheimer Funds, Inc.
Thomas J. Higgins
Born in 1957. Principal occupation(s) during the past five years and other experience: principal of Vanguard. Chief financial officer (2008–present) and treasurer (1998–2008) of each of the investment companies served by Vanguard.
Peter Mahoney
Born in 1974. Principal occupation(s) during the past five years and other experience: principal of Vanguard. Controller (2015–present) of each of the investment companies served by Vanguard. Head of International Fund Services (2008–2014) at Vanguard.
Anne E. Robinson
Born in 1970. Principal occupation(s) during the past five years and other experience: general counsel (2016–present) of Vanguard. Secretary (2016–present) of Vanguard and of each of the investment companies served by Vanguard. Managing director (2016–present) of Vanguard. Director and senior vice president (2016–2018) of Vanguard Marketing Corporation. Managing director and general counsel of Global Cards and Consumer Services (2014–2016) at Citigroup. Counsel (2003–2014) at American Express.
Michael Rollings
Born in 1963. Principal occupation(s) during the past five years and other experience: finance director (2017–present) and treasurer (2017) of each of the investment companies served by Vanguard. Managing director (2016–present) of Vanguard. Chief financial officer (2016–present) of Vanguard. Director (2016–present) of Vanguard Marketing Corporation. Executive vice president and chief financial officer (2006–2016) of MassMutual Financial Group.
| Vanguard Senior Management Team | |
| Mortimer J. Buckley | James M. Norris |
| Gregory Davis | Thomas M. Rampulla |
| John James | Karin A. Risi |
| Martha G. King | Anne E. Robinson |
| John T. Marcante | Michael Rollings |
| Chris D. McIsaac | |
| Chairman Emeritus and Senior Advisor | |
| John J. Brennan | |
| Chairman, 1996–2009 | |
| Chief Executive Officer and President, 1996–2008 | |
| Founder | |
| John C. Bogle | |
| Chairman and Chief Executive Officer, 1974–1996 | |
 | |
| P.O. Box 2600 | |
| Valley Forge, PA 19482-2600 | |
| Connect with Vanguard® > vanguard.com | |
| Fund Information > 800-662-7447 | CFA® is a registered trademark owned by CFA |
| Direct Investor Account Services > 800-662-2739 | Institute. |
| Institutional Investor Services > 800-523-1036 | |
| Text Telephone for People | |
| Who Are Deaf or Hard of Hearing > 800-749-7273 | |
| This material may be used in conjunction | |
| with the offering of shares of any Vanguard | |
| fund only if preceded or accompanied by | |
| the fund’s current prospectus. | |
| All comparative mutual fund data are from Lipper, a | |
| Thomson Reuters Company, or Morningstar, Inc., unless | |
| otherwise noted. | |
| You can obtain a free copy of Vanguard’s proxy voting | |
| guidelines by visiting vanguard.com/proxyreporting or by | |
| calling Vanguard at 800-662-2739. The guidelines are | |
| also available from the SEC’s website, sec.gov. In | |
| addition, you may obtain a free report on how your fund | |
| voted the proxies for securities it owned during the 12 | |
| months ended June 30. To get the report, visit either | |
| vanguard.com/proxyreporting or sec.gov. | |
| You can review and copy information about your fund at | |
| the SEC’s Public Reference Room in Washington, D.C. To | |
| find out more about this public service, call the SEC at | |
| 202-551-8090. Information about your fund is also | |
| available on the SEC’s website, and you can receive | |
| copies of this information, for a fee, by sending a | |
| request in either of two ways: via email addressed to | |
| publicinfo@sec.gov or via regular mail addressed to the | |
| Public Reference Section, Securities and Exchange | |
| Commission, Washington, DC 20549-1520. | |
| © 2018 The Vanguard Group, Inc. | |
| All rights reserved. | |
| Vanguard Marketing Corporation, Distributor. | |
| Q392 092018 | |
Semiannual Report | July 31, 2018
Vanguard Ultra-Short-Term Bond Fund
Vanguard’s Principles for Investing Success
We want to give you the best chance of investment success. These principles, grounded in Vanguard’s research and experience, can put you on the right path.
Goals. Create clear, appropriate investment goals.
Balance. Develop a suitable asset allocation using broadly diversified funds. Cost. Minimize cost.
Discipline. Maintain perspective and long-term discipline.
A single theme unites these principles: Focus on the things you can control.
We believe there is no wiser course for any investor.
| Contents | |
| Your Fund’s Performance at a Glance. | 1 |
| CEO’s Perspective. | 2 |
| Advisor’s Report. | 4 |
| Fund Profile. | 8 |
| Performance Summary. | 9 |
| Financial Statements. | 10 |
| About Your Fund’s Expenses. | 39 |
| Trustees Approve Advisory Arrangement. | 41 |
| Glossary. | 43 |
Please note: The opinions expressed in this report are just that—informed opinions. They should not be considered promises
or advice. Also, please keep in mind that the information and opinions cover the period through the date on the front of this
report. Of course, the risks of investing in your fund are spelled out in the prospectus.
See the Glossary for definitions of investment terms used in this report.
About the cover: Nautical images have been part of Vanguard’s rich heritage since its start in 1975. For an
incoming ship, a lighthouse offers a beacon and safe path to shore. You can similarly depend on Vanguard to put
you first––and light the way––as you strive to meet your financial goals. Our client focus and low costs,
stemming from our unique ownership structure, assure that your interests are paramount.
Your Fund’s Performance at a Glance
• For the six months ended July 31, 2018, Vanguard Ultra-Short-Term Bond Fund returned 0.80% for Investor Shares and 0.90% for Admiral Shares. These returns were in line with that of its benchmark index (+0.79%) and the average return of its peer funds (+0.86%).
• The benchmark index consists of a single bond (the most recently issued 1-year U.S. Treasury note). The fund, however, holds a broadly diversified portfolio of more than 500 securities that is actively managed to have a duration of about one year.
• During the period, external factors held back credit assets overall. Uncertainty related to global central bank policies, trade, and other macro factors weighed on returns.
• Credit assets’ yield advantage over U.S. Treasuries offset the negative impact of external factors. The fund’s largest allocation is to asset-backed securities. These holdings boosted returns. Bonds issued by banks, capital goods producers, energy companies, and consumer-oriented companies also helped performance.
| Total Returns: Six Months Ended July 31, 2018 | ||||
| 30-Day SEC | Income | Capital | Total | |
| Yield | Returns | Returns | Returns | |
| Vanguard Ultra-Short-Term Bond Fund | ||||
| Investor Shares | 2.45% | 1.00% | -0.20% | 0.80% |
| Admiral™ Shares | 2.55 | 1.05 | -0.15 | 0.90 |
| Bloomberg Barclays U.S. Treasury Bellwethers: 1 Year Index | 0.79 | |||
| Ultra-Short Obligations Funds Average | 0.86 | |||
| Ultra-Short Obligations Funds Average: Derived from data provided by Lipper, a Thomson Reuters Company. | ||||
| Admiral Shares carry lower expenses and are available to investors who meet certain account-balance requirements. | ||||
| Expense Ratios | |||
| Your Fund Compared With Its Peer Group | |||
| Investor | Admiral | Peer Group | |
| Shares | Shares | Average | |
| Ultra-Short-Term Bond Fund | 0.20% | 0.10% | 0.51% |
The fund expense ratios shown are from the prospectus dated May 24, 2018, and represent estimated costs for the current fiscal year. For
the six months ended July 31, 2018, the fund’s annualized expense ratios were 0.20% for Investor Shares and 0.10% for Admiral Shares.
The peer-group expense ratio is derived from data provided by Lipper, a Thomson Reuters Company, and captures information through
year-end 2017.
Peer group: Ultra-Short Obligations Funds.
1
CEO’s Perspective

Tim Buckley
President and Chief Executive Officer
Dear Shareholder,
I feel extremely fortunate to have the chance to lead a company filled with people who come to work every day passionate about Vanguard’s core purpose: to take a stand for all investors, to treat them fairly, and to give them the best chance for investment success.
When I joined Vanguard in 1991, I found a mission-driven team focused on improving lives—helping people retire more comfortably, put their children through college, and achieve financial security. I also found a company with purpose in an industry ripe for improvement.
It was clear, even early in my career, that the cards were stacked against most investors. Hidden fees, performance-chasing, and poor advice were relentlessly eroding investors’ dreams.
We knew Vanguard could be different and, as a result, could make a real difference. We have lowered the costs of investing for our shareholders significantly. And we’re proud of the performance of our funds.
Vanguard is built for Vanguard investors—we focus solely on you, our fund shareholders. Everything we do is designed to give our clients the best chance for investment success. In my role as CEO, I’ll keep this priority
2
front and center. We’re proud of what we’ve achieved, but we’re even more excited about what’s to come.
Steady, time-tested guidance
Our guidance for investors, as always, is to stay the course, tune out the hyperbolic headlines, and focus on your goals and what you can control, such as costs and how much you save. This time-tested advice has served our clients well over the decades.
Regardless of how the markets perform in the short term, I’m incredibly optimistic about the future for our investors. We have a dedicated team serving you, and we will never stop striving to make
Vanguard the best place for you to invest through our high-quality funds and services, advice and guidance to help you meet your financial goals, and an experience that makes you feel good about entrusting us with your hard-earned savings.
Thank you for your continued loyalty.
Sincerely,

Mortimer J. Buckley
President and Chief Executive Officer
August 16, 2018
| Market Barometer | |||
| Total Returns | |||
| Periods Ended July 31, 2018 | |||
| Six | One | Five Years | |
| Months | Year | (Annualized) | |
| Stocks | |||
| Russell 1000 Index (Large-caps) | 0.86% | 16.19% | 12.96% |
| Russell 2000 Index (Small-caps) | 6.75 | 18.73 | 11.33 |
| Russell 3000 Index (Broad U.S. market) | 1.30 | 16.39 | 12.83 |
| FTSE All-World ex US Index (International) | -6.57 | 6.19 | 5.97 |
| Bonds | |||
| Bloomberg Barclays U.S. Aggregate Bond Index | |||
| (Broad taxable market) | -0.45% | -0.80% | 2.25% |
| Bloomberg Barclays Municipal Bond Index | |||
| (Broad tax-exempt market) | 1.18 | 0.99 | 3.76 |
| FTSE Three-Month U. S. Treasury Bill Index | 0.83 | 1.41 | 0.41 |
| CPI | |||
| Consumer Price Index | 1.67% | 2.95% | 1.53% |
3
Advisor’s Report
For the six months ended July 31, 2018, Vanguard Ultra-Short-Term Bond Fund returned 0.80% for Investor Shares and 0.90% for Admiral Shares. The fund’s benchmark, the Bloomberg Barclays U.S. Treasury Bellwethers: 1 Year Index, which consists of a single 1-year Treasury note, returned 0.79%. The average return of peer funds was 0.86%.
The investment environment
Macroeconomic fundamentals were robust throughout the half year. Business confidence held up even in the face of trade uncertainties, and consumer spending was supported by solid expansion in the job market. Unemployment hit a 17-year low, finishing the period at 3.9%. The tax cuts enacted late last year and the March passage of a bill increasing federal government spending spurred optimism about growth, which accelerated to a little over 3% in inflation-adjusted terms on an annualized basis for the first six months of 2018. An increase in the price of oil helped inflation move toward the Federal Reserve’s target of 2%.
Responding to the health of the economy, the Fed moved further down the path toward monetary policy normalization.
It continued shrinking the $4.5 trillion balance sheet it had amassed as part of the stimulus begun in the wake of the 2008 global financial crisis. It also raised the federal funds target rate in March and
| Yields of U.S. Treasury Securities | ||
| January 31, | July 31, | |
| Maturity | 2018 | 2018 |
| 2 years | 2.14% | 2.67% |
| 3 years | 2.29 | 2.77 |
| 5 years | 2.52 | 2.85 |
| 10 years | 2.71 | 2.96 |
| 30 years | 2.94 | 3.08 |
| Source: Vanguard. |
4
again in June, to a range of 1.75%–2%, and signaled that two more hikes would come before the end of 2018.
The Fed’s actions pushed shorter-term yields higher. The yield of the 2-year Treasury note climbed 53 basis points to 2.67%. (A basis point is one-hundredth of a percentage point.)
Demand for longer-term bonds was supported at times by escalating trade tensions, political uncertainty in Europe, and geopolitical flare-ups. Nonetheless, the outlook for continuing growth and rising inflation expectations led yields on these securities to end the period higher as well, though not by as much as their shorter-term counterparts. The yield of the bellwether 10-year Treasury note ended the period 25 basis points higher at 2.96%.
Investment-grade corporate bonds fared worse, returning –3.3%. Corporate fundamentals remained strong and corporate earnings were very robust in the first two quarters of 2018—the tax cuts in the United States helped with that—but valuations were high and support from external factors weakened.
Management of the fund
Your fund is supported by the full resources of Vanguard’s Fixed Income Group: its credit analysts, risk managers, and bond traders. We use the same investment philosophy and processes that are in place at Vanguard’s other actively managed taxable bond funds. This includes investing in a diversified array of securities, including Treasury, agency, corporate, and asset-backed bonds, in our quest to provide income while maintaining limited price volatility.
A majority of the fund’s holdings have an expected maturity of three years or less, and we typically hold those bonds until they mature. We strive to maintain the fund’s duration (a measure of the sensitivity of bond, and bond mutual fund, prices to changes in interest rates) at or near one year. That duration is in line with the fund’s 1-year Treasury benchmark.
We seek to add value versus the benchmark through asset allocation and security selection. The choices we make in allocation by issuer, sector, and credit quality can lead to over- and underperformance relative to the benchmark.
During the period, we continued to have significant exposure to asset-backed securities and commercial mortgage-backed securities, both of which we view as having attractive return prospects, particularly on the short end of the yield curve. The asset-backed securities were primarily backed by automobile loans and credit card accounts. Both sectors are very liquid and help us manage positions in the fund.
Despite strong fundamentals, the performance of corporate bonds in the portfolio was held back by external factors. With the tax changes for corporations, a number of large multinational companies that had been investing overseas money
5
in high-quality corporate bonds withdrew from the market. And with the Fed on a tightening path, rising hedging costs for foreign buyers led some of them to pull back as well.
Another challenge was the market’s uncertainty about the longer-term credit outlook. With the Fed continuing to wind down monetary stimulus and raise rates, investors seemed to pause during the period to assess the outlook.
Despite these challenges, our positions in telecommunications, media, and energy helped performance. Financials held back results.
We remain optimistic regarding the next six months, as investor uncertainty over the credit cycle will limit how much the Fed can tighten. We believe high-quality corporate debt is well-positioned in the current environment, especially shorter-duration corporate bonds, which are less vulnerable to wider spreads. We will continue to take advantage of opportunities in an environment where fundamentals remain strong but uncertainty in the macro environment is prompting some volatility.
Outlook
Given the tax cuts and increased government spending that have come on top of solid fundamentals—and absent any external shocks—the U.S. economy is on track to break above its long-term potential growth rate in 2018. This growth, and some upward pressure on wages from the tightened labor market, may push the U.S. core personal consumption expenditures price index to a little above 2% by the end of 2018.
We see this as a cyclical bounce, however, and still expect long-term structural pressures from an aging population, global sourcing of goods and labor, and technological disruptions to result in moderate long-run growth and inflation.
Some upward adjustments to the Fed’s assumptions—the economy growing a little faster, unemployment falling a little lower, and inflation running a little higher—should justify another two rate hikes this year. The Fed has also penciled in additional rate hikes in 2019. The unwinding of its balance sheet is likely to continue in September given the bond market’s limited reaction so far.
We may continue to see bouts of volatility related to inflation and interest rate expectations as well as concerns about whether we are approaching the end of the current credit cycle. Other potential triggers include the U.S. midterm elections, an intensification of trade disputes, flare-ups in geopolitical tensions, and missteps by central banks. The funds remained positioned to take advantage of any repricing of risk that those concerns may create.
It’s worth restating that investors should look beyond short-term volatility and adhere to their long-term investment strategies. And it’s also worth noting that
6
higher rates are, on balance, beneficial for long-term investors in shorter-term bonds: Losses caused by widening spreads are modest, and coupon payments and proceeds from maturing bonds can be reinvested at higher rates.
Whatever the markets may bring, our experienced team of portfolio managers, credit analysts, and traders will continue to seek out opportunities to add to the fund’s performance.
Samuel C. Martinez, CFA,
Portfolio Manager
Daniel Shaykevich, Principal
and Portfolio Manager
Vanguard Fixed Income Group
August 9, 2018
7
Ultra-Short-Term Bond Fund
Fund Profile
As of July 31, 2018
| Share-Class Characteristics | ||
| Investor | Admiral | |
| Shares | Shares | |
| Ticker Symbol | VUBFX | VUSFX |
| Expense Ratio1 | 0.20% | 0.10% |
| 30-Day SEC Yield | 2.45% | 2.55% |
| Financial Attributes | |||
| Bloomberg | |||
| Barclays | Bloomberg | ||
| U.S. | Barclays | ||
| Treasury | Aggregate | ||
| Bellwethers: | Bond | ||
| Fund 1 Year Index | Index | ||
| Number of Bonds | 529 | 1 | 10,012 |
| Yield to Maturity | |||
| (before expenses) | 2.9% | 2.4% | 3.4% |
| Average Coupon | 2.7% | 0.0% | 3.1% |
| Average Duration | 1.0 years | 1.0 years | 6.0 years |
| Average Effective | |||
| Maturity | 0.9 years | 1.0 years | 8.4 years |
| Short-Term | |||
| Reserves | 7.0% | — | — |
| Sector Diversification (% of portfolio) | |
| Asset-Backed | 42.5% |
| Commercial Mortgage-Backed | 0.1 |
| Finance | 16.4 |
| Foreign | 6.3 |
| Government Mortgage-Backed | 0.2 |
| Industrial | 18.1 |
| Treasury/Agency | 4.6 |
| Utilities | 4.7 |
| Other | 0.1 |
| Short-Term Reserves | 7.0 |
The agency and mortgage-backed securities sectors may include
issues from government-sponsored enterprises; such issues are
generally not backed by the full faith and credit of the U.S.
government.
| Distribution by Effective Maturity | |
| (% of portfolio) | |
| Under 1 Year | 60.4% |
| 1 - 3 Years | 39.4 |
| 3 - 5 Years | 0.1 |
| 5 - 7 Years | 0.1 |
| Distribution by Credit Quality (% of portfolio) | |
| U.S. Government | 5.4% |
| Aaa | 39.5 |
| Aa | 11.3 |
| A | 22.0 |
| Baa | 15.0 |
| Ba | 0.8 |
| Not Rated | 6.0 |
Credit-quality ratings are obtained from Moody's and S&P, and the
higher rating for each issue is shown. "Not Rated" is used to classify
securities for which a rating is not available. Not rated securities
include a fund's investment in Vanguard Market Liquidity Fund or
Vanguard Municipal Cash Management Fund, each of which invests
in high-quality money market instruments and may serve as a cash
management vehicle for the Vanguard funds, trusts, and accounts.
For more information about these ratings, see the Glossary entry for
Credit Quality.
Investment Focus
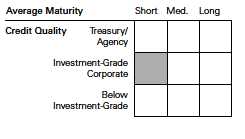
1 The expense ratios shown are from the prospectus dated May 24, 2018, and represent estimated costs for the current fiscal year. For the six
months ended July 31, 2018, the annualized expense ratios were 0.20% for Investor Shares and 0.10% for Admiral Shares.
8
Ultra-Short-Term Bond Fund
Performance Summary
All of the returns in this report represent past performance, which is not a guarantee of future results that may be achieved by the fund. (Current performance may be lower or higher than the performance data cited. For performance data current to the most recent month-end, visit our website at vanguard.com/performance.) Note, too, that both investment returns and principal value can fluctuate widely, so an investor’s shares, when sold, could be worth more or less than their original cost. The returns shown do not reflect taxes that a shareholder would pay on fund distributions or on the sale of fund shares.
| Fiscal-Year Total Returns (%): February 24, 2015, Through July 31, 2018 | ||||
| Bloomberg | ||||
| Barclays | ||||
| U.S. Treasury | ||||
| Bellwethers: | ||||
| Investor Shares | 1 Year Index | |||
| Fiscal Year | Income Returns | Capital Returns | Total Returns | Total Returns |
| 2016 | 0.54% | -0.10% | 0.44% | 0.48% |
| 2017 | 1.03 | 0.10 | 1.13 | 0.71 |
| 2018 | 1.45 | -0.28 | 1.17 | 0.63 |
| 2019 | 1.00 | -0.20 | 0.80 | 0.79 |
| Note: For 2019, performance data reflect the six months ended July 31, 2018. | ||||
Average Annual Total Returns: Periods Ended June 30, 2018
This table presents returns through the latest calendar quarter—rather than through the end of the fiscal period.
Securities and Exchange Commission rules require that we provide this information.
| Since Inception | |||||
| Inception Date | One Year | Income | Capital | Total | |
| Investor Shares | 2/24/2015 | 1.24% | 1.14% | -0.14% | 1.00% |
| Admiral Shares | 2/24/2015 | 1.43 | 1.23 | -0.13 | 1.10 |
See Financial Highlights for dividend and capital gains information.
9
Ultra-Short-Term Bond Fund
Financial Statements (unaudited)
Statement of Net Assets
As of July 31, 2018
The fund reports a complete list of its holdings in regulatory filings four times in each fiscal year, at the quarter-ends. For the second and fourth fiscal quarters, the lists appear in the fund’s semiannual and annual reports to shareholders. For the first and third fiscal quarters, the fund files the lists with the Securities and Exchange Commission on Form N-Q. Shareholders can look up the fund’s Forms N-Q on the SEC’s website at sec.gov. Forms N-Q may also be reviewed and copied at the SEC’s Public Reference Room (see the back cover of this report for further information).
| Face | Market | ||||
| Maturity | Amount | Value • | |||
| Coupon | Date | ($000) | ($000) | ||
| U. S. Government and Agency Obligations (4.7%) | |||||
| U. S. Government Securities (4.2%) | |||||
| United States Treasury Note/Bond | 1.500% | 12/31/18 | 15,000 | 14,958 | |
| United States Treasury Note/Bond | 1.125% | 1/31/19 | 115,000 | 114,371 | |
| United States Treasury Note/Bond | 1.250% | 4/30/19 | 50,000 | 49,594 | |
| 1 | United States Treasury Note/Bond | 1.250% | 5/31/19 | 400 | 396 |
| 1 | United States Treasury Note/Bond | 1.375% | 7/31/19 | 200 | 198 |
| United States Treasury Note/Bond | 1.500% | 10/31/19 | 4,800 | 4,739 | |
| United States Treasury Note/Bond | 1.750% | 11/30/19 | 200 | 198 | |
| United States Treasury Note/Bond | 1.875% | 12/31/19 | 1,860 | 1,842 | |
| United States Treasury Note/Bond | 2.000% | 1/31/20 | 1,090 | 1,080 | |
| United States Treasury Note/Bond | 2.250% | 2/29/20 | 300 | 298 | |
| United States Treasury Note/Bond | 2.375% | 4/30/20 | 1,100 | 1,095 | |
| 1 | United States Treasury Note/Bond | 2.500% | 5/31/20 | 1,000 | 997 |
| 189,766 | |||||
| Agency Bonds and Notes (0.4%) | |||||
| 2 | Federal Home Loan Banks | 1.750% | 12/14/18 | 7,500 | 7,489 |
| 2 | Federal Home Loan Banks | 1.375% | 5/28/19 | 500 | 496 |
| 2 | Federal Home Loan Banks | 0.875% | 8/5/19 | 6,000 | 5,905 |
| 3 | Federal National Mortgage Assn. | 0.875% | 8/2/19 | 3,350 | 3,297 |
| Private Export Funding Corp. | 4.375% | 3/15/19 | 1,000 | 1,012 | |
| 2 | Tennessee Valley Authority | 2.250% | 3/15/20 | 600 | 595 |
| 18,794 | |||||
| Nonconventional Mortgage-Backed Securities (0.1%) | |||||
| 3,4,5 Fannie Mae REMICS 2012-60 | 2.464% | 6/25/42 | 1,894 | 1,905 | |
| 3,4,5 Fannie Mae REMICS 2016-62 | 2.464% | 9/25/46 | 1,041 | 1,040 | |
| 3,4,5 Fannie Mae REMICS 2016-93 | 2.414% | 12/25/46 | 2,539 | 2,530 | |
| 5,475 | |||||
| Total U.S. Government and Agency Obligations (Cost $214,602) | 214,035 | ||||
| Asset-Backed/Commercial Mortgage-Backed Securities (42.6%) | |||||
| 4 | Ally Auto Receivables Trust 2015-1 | 2.260% | 10/15/20 | 40 | 40 |
| 4 | AmeriCredit Automobile Receivables | ||||
| Trust 2015-3 | 2.080% | 9/8/20 | 124 | 123 | |
| 4 | AmeriCredit Automobile Receivables | ||||
| Trust 2015-3 | 3.340% | 8/8/21 | 330 | 331 | |
10
| Ultra-Short-Term Bond Fund | |||||
| Face | Market | ||||
| Maturity | Amount | Value • | |||
| Coupon | Date | ($000) | ($000) | ||
| 4 | AmeriCredit Automobile Receivables | ||||
| Trust 2016-1 | 1.810% | 10/8/20 | 253 | 253 | |
| 4 | AmeriCredit Automobile Receivables | ||||
| Trust 2016-2 | 3.650% | 5/9/22 | 70 | 70 | |
| 4 | AmeriCredit Automobile Receivables | ||||
| Trust 2016-4 | 1.340% | 4/8/20 | 184 | 184 | |
| 4 | AmeriCredit Automobile Receivables | ||||
| Trust 2016-4 | 1.530% | 7/8/21 | 310 | 308 | |
| 4 | AmeriCredit Automobile Receivables | ||||
| Trust 2016-4 | 2.410% | 7/8/22 | 345 | 339 | |
| 4 | AmeriCredit Automobile Receivables | ||||
| Trust 2017-1 | 1.510% | 5/18/20 | 1,806 | 1,803 | |
| 4 | AmeriCredit Automobile Receivables | ||||
| Trust 2017-2 | 1.650% | 9/18/20 | 6,631 | 6,614 | |
| 4 | AmeriCredit Automobile Receivables | ||||
| Trust 2017-3 | 1.690% | 12/18/20 | 4,569 | 4,553 | |
| 4 | AmeriCredit Automobile Receivables | ||||
| Trust 2017-4 | 1.830% | 5/18/21 | 25,579 | 25,472 | |
| 4 | AmeriCredit Automobile Receivables | ||||
| Trust 2017-4 | 2.040% | 7/18/22 | 11,850 | 11,672 | |
| 4,6 | ARI Fleet Lease Trust 2017-A | 1.910% | 4/15/26 | 7,313 | 7,262 |
| 4,6 | ARL Second LLC 2014-1A | 2.920% | 6/15/44 | 234 | 229 |
| 4,6 | Avis Budget Rental Car Funding AESOP | ||||
| LLC 2013-1A | 1.920% | 9/20/19 | 50 | 50 | |
| 4,6 | Avis Budget Rental Car Funding AESOP | ||||
| LLC 2013-2A | 2.970% | 2/20/20 | 8,555 | 8,559 | |
| 4,6 | Avis Budget Rental Car Funding AESOP | ||||
| LLC 2014-1 | 2.460% | 7/20/20 | 23,382 | 23,280 | |
| 4,6 | Avis Budget Rental Car Funding AESOP | ||||
| LLC 2014-2A | 2.500% | 2/20/21 | 42,235 | 41,852 | |
| 4 | BMW Vehicle Lease Trust 2017-2 | 2.070% | 10/20/20 | 7,650 | 7,569 |
| 4,7 | Brazos Higher Education Authority Inc. | ||||
| Series 2011-1 | 3.130% | 2/25/30 | 145 | 146 | |
| 4,5 | Cabela’s Credit Card Master Note Trust | ||||
| 2016-1 | 2.922% | 6/15/22 | 2,780 | 2,796 | |
| 4,6 | California Republic Auto Receivables Trust | ||||
| 2015-4 | 2.580% | 6/15/21 | 72 | 72 | |
| 4 | California Republic Auto Receivables Trust | ||||
| 2016-2 | 1.560% | 7/15/20 | 447 | 447 | |
| 4 | California Republic Auto Receivables Trust | ||||
| 2016-2 | 1.830% | 12/15/21 | 240 | 238 | |
| 4 | California Republic Auto Receivables Trust | ||||
| 2018-1 | 3.140% | 8/15/22 | 17,000 | 16,988 | |
| 4 | California Republic Auto Receivables Trust | ||||
| 2018-1 | 2.860% | 3/15/21 | 22,000 | 22,003 | |
| 4,6 | Canadian Pacer Auto Receivables Trust A | ||||
| Series 2017 | 2.050% | 3/19/21 | 5,920 | 5,846 | |
| 4,6 | Canadian Pacer Auto Receiveable Trust A | ||||
| Series 2017 | 1.772% | 12/19/19 | 4,756 | 4,744 | |
| 4 | Capital Auto Receivables Asset Trust 2014-3 | 3.940% | 4/20/23 | 500 | 501 |
| 4 | Capital Auto Receivables Asset Trust 2015-1 | 2.100% | 1/21/20 | 3,332 | 3,331 |
| 4 | Capital Auto Receivables Asset Trust 2015-3 | 1.940% | 1/21/20 | 35 | 35 |
| 4 | Capital Auto Receivables Asset Trust 2016-1 | 1.980% | 10/20/20 | 1,500 | 1,495 |
| 4 | Capital Auto Receivables Asset Trust 2016-2 | 1.460% | 6/22/20 | 911 | 909 |
| 11 | |||||
| Ultra-Short-Term Bond Fund | |||||
| Face | Market | ||||
| Maturity | Amount | Value • | |||
| Coupon | Date | ($000) | ($000) | ||
| 4 | Capital Auto Receivables Asset Trust 2016-3 | 2.350% | 9/20/21 | 70 | 69 |
| 4 | Capital Auto Receivables Asset Trust 2016-3 | 2.650% | 1/20/24 | 40 | 40 |
| 4,6 | Capital Auto Receivables Asset Trust 2017-1 | 2.020% | 8/20/21 | 6,670 | 6,611 |
| 4,6 | Capital Auto Receivables Asset Trust 2018-1 | 2.790% | 1/20/22 | 25,000 | 24,917 |
| 4 | CarMax Auto Owner Trust 2015-3 | 2.280% | 4/15/21 | 73 | 72 |
| 4 | CarMax Auto Owner Trust 2015-3 | 2.680% | 6/15/21 | 95 | 95 |
| 4 | CarMax Auto Owner Trust 2016-1 | 1.610% | 11/16/20 | 593 | 590 |
| 4 | CarMax Auto Owner Trust 2016-3 | 1.390% | 5/17/21 | 4,316 | 4,271 |
| 4 | CarMax Auto Owner Trust 2018-1 | 2.230% | 5/17/21 | 11,300 | 11,253 |
| 4,6 | Chesapeake Funding II LLC 2016-1A | 2.110% | 3/15/28 | 398 | 397 |
| 4,6 | Chesapeake Funding II LLC 2016-2A | 1.880% | 6/15/28 | 1,191 | 1,185 |
| 4,6 | Chesapeake Funding II LLC 2017-3A | 1.910% | 8/15/29 | 17,234 | 17,044 |
| 4,6 | Chesapeake Funding II LLC 2017-4A | 2.120% | 11/15/29 | 17,402 | 17,203 |
| 4,6 | Chesapeake Funding II LLC 2018-1 | 3.040% | 4/15/30 | 12,500 | 12,445 |
| 4,6 | Chesapeake Funding II LLC 2018-2A | 1.990% | 5/15/29 | 6,582 | 6,514 |
| 4,6 | Chrysler Capital Auto Receivables Trust | ||||
| 2014-BA | 3.440% | 8/16/21 | 800 | 802 | |
| 4,6 | Chrysler Capital Auto Receivables Trust | ||||
| 2015-BA | 3.260% | 4/15/21 | 500 | 501 | |
| 4,6 | Chrysler Capital Auto Receivables Trust | ||||
| 2016-AA | 1.960% | 1/18/22 | 1,110 | 1,105 | |
| 4,6 | Chrysler Capital Auto Receivables Trust | ||||
| 2016-AA | 2.880% | 6/15/22 | 70 | 70 | |
| 4,6 | Chrysler Capital Auto Receivables Trust | ||||
| 2016-AA | 4.220% | 2/15/23 | 570 | 576 | |
| 4,6 | Chrysler Capital Auto Receivables Trust | ||||
| 2016-BA | 1.640% | 7/15/21 | 35 | 35 | |
| 4 | Citigroup Commercial Mortgage Trust | ||||
| 2013-GC15 | 3.161% | 9/10/46 | 426 | 426 | |
| 4,5,6 Colony American Homes 2015-1A | 3.278% | 7/17/32 | 196 | 196 | |
| 4 | COMM 2013-CCRE10 Mortgage Trust | 2.972% | 8/10/46 | 355 | 350 |
| 4 | COMM 2013-LC13 Mortgage Trust | 3.009% | 8/10/46 | 209 | 209 |
| 4 | COMM 2014-CCRE14 Mortgage Trust | 3.147% | 2/10/47 | 90 | 90 |
| 4 | COMM 2014-CCRE16 Mortgage Trust | 1.445% | 4/10/47 | 10 | 10 |
| 4 | COMM 2014-CCRE21 Mortgage Trust | 1.494% | 12/10/47 | 163 | 162 |
| 4 | COMM 2015-CCRE25 Mortgage Trust | 1.737% | 8/10/48 | 222 | 219 |
| 4,6 | Daimler Trucks Retail Trust 2018-1 | 2.850% | 7/15/21 | 16,670 | 16,640 |
| 4,6 | Dell Equipment Finance Trust 2016-1 | 1.650% | 7/22/21 | 794 | 793 |
| 4,6 | Dell Equipment Finance Trust 2017-1 | 1.860% | 6/24/19 | 1,259 | 1,257 |
| 4,6 | Dell Equipment Finance Trust 2017-2 | 1.970% | 2/24/20 | 8,079 | 8,051 |
| 4,6 | Dell Equipment Finance Trust 2018-1 | 2.970% | 10/22/20 | 8,310 | 8,316 |
| 4,6 | Dell Equipment Finance Trust 2018-1 | 3.180% | 6/22/23 | 3,990 | 3,987 |
| 4,6 | DLL Securitization Trust Series 2017-A | 1.890% | 7/15/20 | 11,031 | 10,992 |
| 4,6 | DLL Securitization Trust Series 2018-1 | 2.810% | 11/17/20 | 20,000 | 19,995 |
| 4,6 | DRB Prime Student Loan Trust 2017-C | 1.870% | 11/25/42 | 9,194 | 9,161 |
| 4,6 | Drive Auto Receivables Trust 2015-BA | 2.760% | 7/15/21 | 12 | 12 |
| 4,6 | Drive Auto Receivables Trust 2015-CA | 3.010% | 5/17/21 | 14 | 14 |
| 4,6 | Drive Auto Receivables Trust 2015-CA | 4.200% | 9/15/21 | 145 | 146 |
| 4,6 | Drive Auto Receivables Trust 2015-DA | 3.380% | 11/15/21 | 4,248 | 4,256 |
| 4,6 | Drive Auto Receivables Trust 2016-AA | 3.910% | 5/17/21 | 150 | 150 |
| 4,6 | Drive Auto Receivables Trust 2016-BA | 3.190% | 7/15/22 | 7,883 | 7,893 |
| 4,6 | Drive Auto Receivables Trust 2016-BA | 4.530% | 8/15/23 | 2,200 | 2,235 |
| 4,6 | Drive Auto Receivables Trust 2016-C | 2.370% | 11/16/20 | 313 | 313 |
| 4,6 | Drive Auto Receivables Trust 2016-C | 3.020% | 11/15/21 | 7,500 | 7,505 |
| 12 | |||||
| Ultra-Short-Term Bond Fund | |||||
| Face | Market | ||||
| Maturity | Amount | Value • | |||
| Coupon | Date | ($000) | ($000) | ||
| 4,6 | Drive Auto Receivables Trust 2016-C | 4.180% | 3/15/24 | 1,240 | 1,254 |
| 4 | Drive Auto Receivables Trust 2017-1 | 2.360% | 3/15/21 | 26,416 | 26,389 |
| 4 | Drive Auto Receivables Trust 2017-3 | 2.300% | 5/17/21 | 10,620 | 10,598 |
| 4 | Drive Auto Receivables Trust 2017-3 | 2.800% | 7/15/22 | 7,120 | 7,092 |
| 4,6 | Drive Auto Receivables Trust 2017-BA | 2.200% | 5/15/20 | 2,192 | 2,191 |
| 4 | Drive Auto Receivables Trust 2018-1 | 2.420% | 1/15/21 | 33,000 | 32,945 |
| 4 | Drive Auto Receivables Trust 2018-2 | 2.640% | 9/15/20 | 20,000 | 19,996 |
| 4 | Drive Auto Receivables Trust 2018-2 | 2.880% | 6/15/21 | 10,000 | 9,995 |
| 4 | Drive Auto Receivables Trust 2018-2 | 3.220% | 4/15/22 | 3,100 | 3,098 |
| 4 | Drive Auto Receivables Trust 2018-2 | 3.630% | 8/15/24 | 4,750 | 4,747 |
| 4 | Drive Auto Receivables Trust 2018-3 | 3.010% | 11/15/21 | 16,000 | 15,998 |
| 4 | Drive Auto Receivables Trust 2018-3 | 3.370% | 9/15/22 | 8,000 | 7,998 |
| 4,6 | Enterprise Fleet Financing LLC Series 2015-2 | 2.090% | 2/22/21 | 1,490 | 1,486 |
| 4,6 | Enterprise Fleet Financing LLC Series 2016-1 | 1.830% | 9/20/21 | 240 | 239 |
| 4,6 | Enterprise Fleet Financing LLC Series 2016-2 | 1.740% | 2/22/22 | 1,354 | 1,347 |
| 4,6 | Enterprise Fleet Financing LLC Series 2017-1 | 2.130% | 7/20/22 | 2,133 | 2,118 |
| 4,6 | Enterprise Fleet Financing LLC Series 2017-2 | 1.970% | 1/20/23 | 25,608 | 25,404 |
| 4,6 | Enterprise Fleet Financing LLC Series 2017-3 | 2.130% | 5/22/23 | 12,000 | 11,879 |
| 4,6 | Enterprise Fleet Financing LLC Series 2018-1 | 2.870% | 10/20/23 | 15,000 | 14,944 |
| 4,5,6 Evergreen Credit Card Trust Series 2017-1 | 2.332% | 10/15/21 | 4,000 | 4,001 | |
| 3,4,5 Fannie Mae Connecticut Avenue Securities | |||||
| 2016-C04 | 3.514% | 1/25/29 | 156 | 158 | |
| 3,4,5 Fannie Mae Connecticut Avenue Securities | |||||
| 2016-C05 | 3.414% | 1/25/29 | 304 | 305 | |
| 4,6 | Flagship Credit Auto Trust 2017-1 | 1.930% | 12/15/21 | 3,751 | 3,741 |
| 4,6 | Flagship Credit Auto Trust 2017-1 | 2.830% | 3/15/23 | 3,000 | 2,988 |
| 4,6 | Flagship Credit Auto Trust 2017-4 | 2.070% | 4/15/22 | 14,147 | 14,030 |
| 4,6 | Flagship Credit Auto Trust 2018-1 | 2.590% | 6/15/22 | 20,004 | 19,917 |
| 4 | Ford Credit Auto Lease Trust 2017-B | 2.030% | 12/15/20 | 9,210 | 9,121 |
| 4,6 | Ford Credit Auto Owner Trust 2014-REV1 | 2.260% | 11/15/25 | 9,200 | 9,163 |
| 4,6 | Ford Credit Auto Owner Trust 2014-REV1 | 2.410% | 11/15/25 | 800 | 797 |
| 4,6 | Ford Credit Auto Owner Trust 2014-REV2 | 2.310% | 4/15/26 | 1,700 | 1,687 |
| 4 | Ford Credit Auto Owner Trust 2016-B | 1.520% | 8/15/21 | 700 | 687 |
| 4 | Ford Credit Auto Owner Trust 2016-B | 1.850% | 9/15/21 | 160 | 157 |
| 4 | Ford Credit Floorplan Master Owner Trust A | ||||
| Series 2014-2 | 2.310% | 2/15/21 | 827 | 825 | |
| 4 | Ford Credit Floorplan Master Owner Trust A | ||||
| Series 2016-3 | 1.550% | 7/15/21 | 3,520 | 3,477 | |
| 3,4,5 Freddie Mac Structured Agency Credit Risk | |||||
| Debt Notes 2016-DNA2 | 4.264% | 10/25/28 | 160 | 162 | |
| 3,4,5 Freddie Mac Structured Agency Credit Risk | |||||
| Debt Notes 2016-DNA3 | 4.064% | 12/25/28 | 229 | 233 | |
| 3,4,6 Freddie Mac Structured Agency Credit Risk | |||||
| Debt Notes 2018-SPI1 | 3.745% | 2/25/48 | 1,452 | 1,447 | |
| 3,4,6 Freddie Mac Structured Agency Credit Risk | |||||
| Debt Notes 2018-SPI2 | 3.820% | 5/25/48 | 1,657 | 1,653 | |
| 4,6 | FRS I LLC 2013-1A | 1.800% | 4/15/43 | 12 | 12 |
| 4,6 | FRS I LLC 2013-1A | 3.080% | 4/15/43 | 1,725 | 1,719 |
| 4 | GM Financial Automobile Leasing Trust 2015-3 | 2.320% | 11/20/19 | 49 | 49 |
| 4 | GM Financial Automobile Leasing Trust 2015-3 | 2.980% | 11/20/19 | 120 | 120 |
| 4 | GM Financial Automobile Leasing Trust 2015-3 | 3.480% | 8/20/20 | 2,144 | 2,146 |
| 4 | GM Financial Automobile Leasing Trust 2016-1 | 1.790% | 3/20/20 | 150 | 150 |
| 4 | GM Financial Automobile Leasing Trust 2016-2 | 2.580% | 3/20/20 | 240 | 239 |
| 4 | GM Financial Automobile Leasing Trust 2017-1 | 2.260% | 8/20/20 | 1,800 | 1,787 |
| 13 | |||||
| Ultra-Short-Term Bond Fund | |||||
| Face | Market | ||||
| Maturity | Amount | Value • | |||
| Coupon | Date | ($000) | ($000) | ||
| 4 | GM Financial Automobile Leasing Trust 2017-2 | 2.020% | 9/21/20 | 16,250 | 16,106 |
| 4 | GM Financial Automobile Leasing Trust 2017-3 | 1.720% | 1/21/20 | 3,734 | 3,717 |
| 4 | GM Financial Automobile Leasing Trust 2017-3 | 2.010% | 11/20/20 | 730 | 722 |
| 4 | GM Financial Automobile Leasing Trust 2017-3 | 2.120% | 9/20/21 | 660 | 651 |
| 4 | GM Financial Automobile Leasing Trust 2017-3 | 2.400% | 9/20/21 | 1,150 | 1,131 |
| 4 | GM Financial Automobile Leasing Trust 2017-3 | 2.730% | 9/20/21 | 450 | 444 |
| 4 | GM Financial Automobile Leasing Trust 2018-1 | 2.610% | 1/20/21 | 18,500 | 18,389 |
| 4 | GM Financial Automobile Leasing Trust 2018-2 | 2.830% | 7/20/20 | 28,000 | 28,006 |
| 4 | GM Financial Automobile Leasing Trust 2018-2 | 3.060% | 6/21/21 | 10,250 | 10,243 |
| 4,6 | GM Financial Consumer Automobile 2017-3A | 1.970% | 5/16/22 | 10,500 | 10,327 |
| 4,6 | GMF Floorplan Owner Revolving Trust 2016-1 | 2.410% | 5/17/21 | 300 | 299 |
| 4,6 | GMF Floorplan Owner Revolving Trust 2016-1 | 2.850% | 5/17/21 | 220 | 217 |
| 4,5,6 GMF Floorplan Owner Revolving Trust 2016-1 | 2.923% | 5/17/21 | 592 | 595 | |
| 4,6 | GMF Floorplan Owner Revolving Trust 2018-1 | 3.060% | 3/15/22 | 3,250 | 3,244 |
| 4,6 | GMF Floorplan Owner Revolving Trust 2018-1 | 3.250% | 3/15/22 | 3,000 | 2,994 |
| 4,6 | GMF Floorplan Owner Revolving Trust 2018-1 | 3.500% | 3/15/22 | 4,624 | 4,615 |
| 4,6 | Golden Credit Card Trust 2016-5A | 1.600% | 9/15/21 | 7,740 | 7,616 |
| 4,6,7 Gosforth Funding 2016-1A plc | 3.043% | 2/15/58 | 498 | 499 | |
| 4,6,7 Gosforth Funding 2017-1A plc | 2.796% | 12/19/59 | 14,016 | 14,023 | |
| 4,6 | GreatAmerica Leasing Receivables Funding | ||||
| LLC Series 2017-1 | 1.720% | 4/22/19 | 1,289 | 1,288 | |
| 4,6 | GreatAmerica Leasing Receivables Funding | ||||
| LLC Series 2018-1 | 2.350% | 5/15/20 | 30,000 | 29,902 | |
| 4 | GS Mortgage Securities Trust 2013-GCJ14 | 2.995% | 8/10/46 | 43 | 43 |
| 4,5,6 Hertz Fleet Lease Funding LP 2016-1 | 3.186% | 4/10/30 | 1,291 | 1,293 | |
| 4,6 | Hertz Fleet Lease Funding LP 2018-1 | 3.230% | 5/10/32 | 7,900 | 7,894 |
| 4,6 | Hertz Vehicle Financing II LP 2015-1A | 2.730% | 3/25/21 | 34,664 | 34,293 |
| 4,6 | Hertz Vehicle Financing II LP 2015-2A | 2.020% | 9/25/19 | 2,135 | 2,133 |
| 4,6 | Hertz Vehicle Financing II LP 2016-1A | 2.320% | 3/25/20 | 2,100 | 2,091 |
| 4,6 | Hertz Vehicle Financing II LP 2016-3A | 2.270% | 7/25/20 | 420 | 416 |
| 4,6 | Hertz Vehicle Financing LLC 2013-1A | 1.830% | 8/25/19 | 927 | 926 |
| 4,6,7 Holmes Master Issuer plc 2018-1 | 2.699% | 10/15/54 | 12,600 | 12,588 | |
| 4 | Honda Auto Receivables 2015-2 Owner Trust | 1.470% | 8/23/21 | 491 | 491 |
| 4,6 | Hyundai Auto Lease Securitization Trust | ||||
| 2017-A | 2.130% | 4/15/21 | 7,600 | 7,548 | |
| 4,6 | Hyundai Auto Lease Securitization Trust | ||||
| 2017-B | 1.970% | 7/15/20 | 24,000 | 23,813 | |
| 4,6 | Hyundai Auto Lease Securitization Trust | ||||
| 2017-C | 1.890% | 3/16/20 | 15,542 | 15,444 | |
| 4,6 | Hyundai Auto Lease Securitization Trust | ||||
| 2017-C | 2.120% | 2/16/21 | 11,200 | 11,087 | |
| 4,6 | Hyundai Auto Lease Securitization Trust | ||||
| 2018-A | 2.810% | 4/15/21 | 15,655 | 15,601 | |
| 4,6 | Hyundai Auto Lease Securitization Trust | ||||
| 2018-B | 3.040% | 10/15/21 | 7,170 | 7,158 | |
| 4,6 | Hyundai Floorplan Master Owner Trust | ||||
| Series 2016-1A | 1.810% | 3/15/21 | 320 | 318 | |
| 4,7 | Illinois Student Assistance Commission | ||||
| Series 2010-1 | 3.385% | 4/25/22 | 6 | 6 | |
| 4 | John Deere Owner Trust 2015-B | 1.440% | 10/15/19 | 169 | 169 |
| 4 | John Deere Owner Trust 2016-B | 1.490% | 5/15/23 | 130 | 128 |
| 4 | JP Morgan Chase Commercial Mortgage | ||||
| Securities Trust 2014-C20 | 1.268% | 7/15/47 | 38 | 38 | |
| 14 | |||||
| Ultra-Short-Term Bond Fund | |||||
| Face | Market | ||||
| Maturity | Amount | Value • | |||
| Coupon | Date | ($000) | ($000) | ||
| 4 | JPMBB Commercial Mortgage Securities | ||||
| Trust 2013-C14 | 3.019% | 8/15/46 | 33 | 33 | |
| 4 | JPMBB Commercial Mortgage Securities | ||||
| Trust 2013-C15 | 2.977% | 11/15/45 | 179 | 179 | |
| 4,6 | Kubota Credit Owner Trust 2018-1A | 2.800% | 2/16/21 | 24,250 | 24,212 |
| 4,6,7 | Lanark Master Issuer plc 2018-1A | 2.749% | 12/22/69 | 6,016 | 6,013 |
| 4,5,6 | Lanark Master Issuer plc 2018-2A | 2.844% | 12/22/69 | 22,270 | 22,268 |
| 4,6 | Master Credit Card Trust II Series 2017-1A | 2.260% | 7/21/21 | 7,900 | 7,808 |
| 4 | Mercedes-Benz Auto Lease Trust 2018-A | 2.200% | 4/15/20 | 20,000 | 19,969 |
| 4 | Mercedes-Benz Auto Lease Trust 2018-A | 2.410% | 2/16/21 | 9,900 | 9,834 |
| 4,6 | MMAF Equipment Finance LLC 2012-AA | 1.980% | 6/10/32 | 15 | 15 |
| 4,6 | MMAF Equipment Finance LLC 2017-A | 1.730% | 5/18/20 | 2,025 | 2,020 |
| 4,6 | MMAF Equipment Finance LLC 2018-A | 2.920% | 7/12/21 | 10,000 | 9,987 |
| 4 | Morgan Stanley Bank of America Merrill | ||||
| Lynch Trust 2013-C11 | 3.085% | 8/15/46 | 508 | 503 | |
| 4 | Morgan Stanley Bank of America Merrill | ||||
| Lynch Trust 2014-C17 | 1.551% | 8/15/47 | 5 | 5 | |
| 4,5,6 | Motor plc 2017 1A | 2.594% | 9/25/24 | 12,940 | 12,952 |
| 4,5 | Navient Student Loan Trust 2015-3 | 2.384% | 7/25/30 | 4 | 4 |
| 4,5,6 | Navient Student Loan Trust 2016-2 | 2.814% | 6/25/65 | 68 | 68 |
| 4,5,6 | Navient Student Loan Trust 2016-3 | 2.664% | 6/25/65 | 46 | 46 |
| 4,5,6 | Navient Student Loan Trust 2016-6A | 2.544% | 3/25/66 | 2,192 | 2,194 |
| 4,5,6 | Navient Student Loan Trust 2017-3A | 2.364% | 7/26/66 | 5,795 | 5,795 |
| 4,5,6 | Navient Student Loan Trust 2017-4A | 2.304% | 9/27/66 | 9,442 | 9,444 |
| 4,5,6 | Navient Student Loan Trust 2017-A | 2.472% | 12/16/58 | 3,096 | 3,099 |
| 4,6 | Navient Student Loan Trust 2018-A | 2.530% | 2/18/42 | 36,779 | 36,456 |
| 4,6 | Navient Student Loan Trust 2018-CA | 3.010% | 6/16/42 | 9,000 | 8,999 |
| 4,5,6 | Navistar Financial Dealer Note Master Trust II | ||||
| 2016-1A | 3.414% | 9/27/21 | 1,480 | 1,482 | |
| 4,5,6 | Navistar Financial Dealer Note Master Trust II | ||||
| 2017-1A | 2.844% | 6/27/22 | 1,600 | 1,606 | |
| 5 | New Mexico Educational Assistance | ||||
| Foundation 2013-1 | 2.792% | 1/2/25 | 75 | 75 | |
| 4,6 | NextGear Floorplan Master Owner Trust | ||||
| 2016-1A | 2.740% | 4/15/21 | 1,850 | 1,848 | |
| 4 | Nissan Auto Lease Trust 2016-A | 1.650% | 10/15/21 | 1,060 | 1,059 |
| 4 | Nissan Auto Lease Trust 2016-B | 1.500% | 7/15/19 | 1,432 | 1,429 |
| 4 | Nissan Auto Lease Trust 2017-A | 1.910% | 4/15/20 | 1,530 | 1,518 |
| 4 | Nissan Auto Lease Trust 2017-B | 1.830% | 12/16/19 | 30,599 | 30,449 |
| 4 | Nissan Auto Lease Trust 2017-B | 2.050% | 9/15/20 | 12,250 | 12,134 |
| 4 | Nissan Auto Receivables 2016-B Owner Trust | 1.320% | 1/15/21 | 398 | 395 |
| 4,5,6 | Pepper Residential Securities Trust | ||||
| 2017A-A1UA | 3.186% | 3/10/58 | 2,415 | 2,418 | |
| 4,5,6 | Pepper Residential Securities Trust | ||||
| 2018A-A1UA | 3.017% | 3/12/47 | 19,113 | 19,132 | |
| 4,5,6 | Pepper Residential Securities Trust | ||||
| 2019A-A1U1 | 2.417% | 10/12/18 | 11,200 | 11,192 | |
| 4,5,6 | Pepper Residential Securities Trust | ||||
| 2020A-A1U1 | 2.572% | 3/16/19 | 3,580 | 3,563 | |
| §,4,5,6 Pepper Residential Securities Trust | |||||
| 2021-A1U | 0.000% | 1/16/60 | 18,230 | 18,230 | |
| 4,6,7 | Permanent Master Issuer plc 2018-1A | 2.747% | 7/15/58 | 19,700 | 19,701 |
| 4,5,6 | PFS Financing Corp. 2017-AA | 2.652% | 3/15/21 | 20,750 | 20,768 |
| 4,5,6 | PFS Financing Corp. 2017-C | 2.542% | 10/15/21 | 12,100 | 12,123 |
| 15 | |||||
| Ultra-Short-Term Bond Fund | |||||
| Face | Market | ||||
| Maturity | Amount | Value • | |||
| Coupon | Date | ($000) | ($000) | ||
| 4,5,6 Resimac Premier Series 2016-1A | 3.476% | 10/10/47 | 1,947 | 1,961 | |
| 4,5,6 Resimac Premier Series 2017-1A | 3.027% | 9/11/48 | 19,033 | 19,047 | |
| Royal Bank of Canada | 2.200% | 9/23/19 | 855 | 849 | |
| 4 | Santander Drive Auto Receivables Trust | ||||
| 2014-4 | 2.600% | 11/16/20 | 138 | 138 | |
| 4 | Santander Drive Auto Receivables Trust | ||||
| 2015-1 | 2.570% | 4/15/21 | 628 | 628 | |
| 4 | Santander Drive Auto Receivables Trust | ||||
| 2016-1 | 2.470% | 12/15/20 | 83 | 83 | |
| 4 | Santander Drive Auto Receivables Trust | ||||
| 2016-2 | 2.080% | 2/16/21 | 120 | 119 | |
| 4 | Santander Drive Auto Receivables Trust | ||||
| 2016-2 | 2.660% | 11/15/21 | 110 | 110 | |
| 4 | Santander Drive Auto Receivables Trust | ||||
| 2016-3 | 2.460% | 3/15/22 | 5,440 | 5,389 | |
| 4 | Santander Drive Auto Receivables Trust | ||||
| 2017-1 | 1.770% | 9/15/20 | 2,395 | 2,392 | |
| 4 | Santander Drive Auto Receivables Trust | ||||
| 2017-2 | 1.600% | 3/16/20 | 1,254 | 1,254 | |
| 4 | Santander Drive Auto Receivables Trust | ||||
| 2017-2 | 2.210% | 10/15/21 | 11,000 | 10,950 | |
| 4 | Santander Drive Auto Receivables Trust | ||||
| 2017-3 | 1.670% | 6/15/20 | 4,370 | 4,366 | |
| 4 | Santander Drive Auto Receivables Trust | ||||
| 2017-3 | 1.870% | 6/15/21 | 9,280 | 9,231 | |
| 4 | Santander Drive Auto Receivables Trust | ||||
| 2017-3 | 2.190% | 3/15/22 | 15,000 | 14,834 | |
| 4 | Santander Drive Auto Receivables Trust | ||||
| 2018-1 | 2.100% | 11/16/20 | 15,397 | 15,358 | |
| 4 | Santander Drive Auto Receivables Trust | ||||
| 2018-1 | 2.320% | 8/16/21 | 9,700 | 9,630 | |
| 4 | Santander Drive Auto Receivables Trust | ||||
| 2018-1 | 2.630% | 7/15/22 | 12,500 | 12,349 | |
| 4 | Santander Drive Auto Receivables Trust | ||||
| 2018-2 | 3.030% | 9/15/22 | 22,000 | 21,911 | |
| 4 | Santander Drive Auto Receivables Trust | ||||
| 2018-3 | 2.780% | 3/15/21 | 41,000 | 41,008 | |
| 4 | Santander Drive Auto Receivables Trust | ||||
| 2018-3 | 3.030% | 2/15/22 | 26,000 | 25,988 | |
| 4 | Santander Drive Auto Receivables Trust | ||||
| 2018-3 | 3.290% | 10/17/22 | 10,750 | 10,742 | |
| 4,6 | Santander Retail Auto Lease Trust 2017-A | 2.020% | 3/20/20 | 25,477 | 25,373 |
| 4,6 | Santander Retail Auto Lease Trust 2018-A | 2.930% | 5/20/21 | 12,600 | 12,567 |
| 4,6 | Securitized Term Auto Receivables Trust | ||||
| 2017-2A | 1.775% | 1/27/20 | 8,382 | 8,352 | |
| 4,6 | Securitized Term Auto Receivables Trust | ||||
| 2017-2A | 2.040% | 4/26/21 | 6,430 | 6,316 | |
| 4,6 | Securitized Term Auto Receivables Trust | ||||
| 2018-1A | 2.807% | 12/29/20 | 25,000 | 24,951 | |
| 4,6 | SLM Private Education Loan Trust 2011-A | 4.370% | 4/17/28 | 16 | 16 |
| 4,5,6 SLM Private Education Loan Trust 2013-A | 3.122% | 5/17/27 | 447 | 448 | |
| 4,6 | SLM Private Education Loan Trust 2013-B | 1.850% | 6/17/30 | 56 | 55 |
| 4,5,6 SLM Private Education Loan Trust 2013-C | 3.472% | 10/15/31 | 4,192 | 4,219 | |
| 4 | SMART ABS Series 2016-2US Trust | 1.450% | 8/14/19 | 1,281 | 1,282 |
| 16 | |||||
| Ultra-Short-Term Bond Fund | |||||
| Face | Market | ||||
| Maturity | Amount | Value • | |||
| Coupon | Date | ($000) | ($000) | ||
| 4,5,6 SMB Private Education Loan Trust 2016-C | 2.622% | 11/15/23 | 962 | 962 | |
| 4,5,6 SMB Private Education Loan Trust 2017-A | 2.522% | 6/17/24 | 1,500 | 1,500 | |
| 4,5,6 SMB Private Education Loan Trust 2018-A | 2.422% | 3/16/26 | 32,823 | 32,839 | |
| 4,6 | SoFi Professional Loan Program 2016-C LLC | 1.480% | 5/26/31 | 266 | 265 |
| 4,6 | SoFi Professional Loan Program 2016-D LLC | 1.530% | 4/25/33 | 1,163 | 1,159 |
| 4,6 | SoFi Professional Loan Program 2016-E LLC | 1.630% | 1/25/36 | 716 | 714 |
| 4,6 | SoFi Professional Loan Program 2017-A LLC | 1.550% | 3/26/40 | 1,792 | 1,777 |
| 4,6 | SoFi Professional Loan Program 2017-B LLC | 1.830% | 5/25/40 | 3,434 | 3,412 |
| 4,6 | SoFi Professional Loan Program 2017-C LLC | 1.750% | 7/25/40 | 3,456 | 3,428 |
| 4,6 | SoFi Professional Loan Program 2017-D LLC | 1.720% | 9/25/40 | 4,809 | 4,779 |
| 4,6 | SoFi Professional Loan Program 2017-E LLC | 1.860% | 11/26/40 | 10,288 | 10,148 |
| 4,6 | SoFi Professional Loan Program 2017-F LLC | 2.050% | 1/25/41 | 6,737 | 6,677 |
| 4,6 | SoFi Professional Loan Program 2018-A LLC | 2.390% | 2/25/42 | 7,149 | 7,088 |
| 4,6 | SoFi Professional Loan Program 2018-B LLC | 2.640% | 8/25/47 | 36,301 | 36,114 |
| 4 | Synchrony Credit Card Master Note Trust | ||||
| 2015-3 | 1.740% | 9/15/21 | 2,750 | 2,748 | |
| 4 | Synchrony Credit Card Master Note Trust | ||||
| 2015-3 | 1.940% | 9/15/21 | 9,209 | 9,203 | |
| 4 | Synchrony Credit Card Master Note Trust | ||||
| 2016-1 | 2.390% | 3/15/22 | 1,180 | 1,177 | |
| 4 | Synchrony Credit Card Master Note Trust | ||||
| 2016-3 | 1.580% | 9/15/22 | 4,640 | 4,572 | |
| 4 | Synchrony Credit Card Master Note Trust | ||||
| 2016-3 | 1.910% | 9/15/22 | 3,190 | 3,152 | |
| 4,6 | TCF Auto Receivables Owner Trust 2016-PT1 | 1.930% | 6/15/22 | 18,371 | 18,181 |
| 4,6 | Tesla Auto Lease Trust 2018-A | 2.320% | 12/20/19 | 3,733 | 3,720 |
| 4,6 | Tesla Auto Lease Trust 2018-A | 2.750% | 2/20/20 | 320 | 318 |
| 4,6 | Tesla Auto Lease Trust 2018-A | 2.970% | 4/20/20 | 260 | 259 |
| 4,6 | Tesla Auto Lease Trust 2018-A | 3.300% | 5/20/20 | 290 | 289 |
| 4,6 | Tidewater Auto Receivables Trust 2018-AA | 3.120% | 7/15/22 | 4,290 | 4,286 |
| 6 | Toronto-Dominion Bank | 1.950% | 4/2/20 | 15,081 | 14,798 |
| 4,6 | Trip Rail Master Funding LLC 2017-1A | 2.709% | 8/15/47 | 831 | 818 |
| 4,6 | Verizon Owner Trust 2017-1A | 2.060% | 9/20/21 | 8,500 | 8,404 |
| 4,6 | Verizon Owner Trust 2017-2A | 1.920% | 12/20/21 | 35,000 | 34,497 |
| 4,6 | Verizon Owner Trust 2017-3 | 2.060% | 4/20/22 | 7,500 | 7,373 |
| 4,6 | Verizon Owner Trust 2018-1 | 2.820% | 9/20/22 | 17,500 | 17,393 |
| 4,6 | Volvo Financial Equipment LLC Series 2016-1A | 1.890% | 9/15/20 | 160 | 158 |
| 4,6 | Volvo Financial Equipment LLC Series 2017-1A | 1.920% | 3/15/21 | 6,000 | 5,945 |
| 4 | Wells Fargo Commercial Mortgage Trust | ||||
| 2013-LC12 | 1.676% | 7/15/46 | 27 | 27 | |
| 4 | WFRBS Commercial Mortgage Trust | ||||
| 2013-C18 | 3.027% | 12/15/46 | 94 | 94 | |
| 4,6 | Wheels SPV 2 LLC 2015-1A | 1.810% | 4/22/24 | 95 | 95 |
| 4,6 | Wheels SPV 2 LLC 2016-1A | 1.590% | 5/20/25 | 510 | 508 |
| 4,6 | Wheels SPV 2 LLC 2017-1A | 1.880% | 4/20/26 | 16,849 | 16,697 |
| 4 | World Omni Auto Receivables Trust 2016-A | 1.770% | 9/15/21 | 336 | 334 |
| 4 | World Omni Automobile Lease Securitization | ||||
| Trust 2017-A | 2.320% | 8/15/22 | 1,530 | 1,513 | |
| 4 | World Omni Automobile Lease Securitization | ||||
| Trust 2018-A | 2.590% | 11/16/20 | 35,000 | 34,957 | |
| 4 | World Omni Automobile Lease Securitization | ||||
| Trust 2018-A | 2.830% | 7/15/21 | 13,950 | 13,877 | |
| 4 | World Omni Automobile Lease Securitization | ||||
| Trust 2018-A | 2.940% | 5/15/23 | 4,350 | 4,327 | |
| Total Asset-Backed/Commercial Mortgage-Backed Securities (Cost $1,949,786) | 1,941,805 | ||||
| 17 | |||||
| Ultra-Short-Term Bond Fund | |||||
| Face | Market | ||||
| Maturity | Amount | Value • | |||
| Coupon | Date | ($000) | ($000) | ||
| Corporate Bonds (30.8%) | |||||
| Finance (12.6%) | |||||
| Banking (12.3%) | |||||
| American Express Credit Corp. | 1.700% | 10/30/19 | 2,000 | 1,969 | |
| 6 | Australia & New Zealand Banking Group Ltd. | 2.250% | 12/19/19 | 6,605 | 6,530 |
| Bank of America Corp. | 2.600% | 1/15/19 | 4,035 | 4,034 | |
| Bank of America Corp. | 2.650% | 4/1/19 | 750 | 750 | |
| 7 | Bank of Montreal | 2.677% | 7/13/20 | 40,000 | 40,122 |
| Bank of Nova Scotia | 2.228% | 12/11/19 | 13,130 | 12,985 | |
| 6 | Banque Federative du Credit Mutuel SA | 2.000% | 4/12/19 | 27,231 | 27,048 |
| Branch Banking & Trust Co. | 2.100% | 1/15/20 | 8,500 | 8,378 | |
| Capital One Bank USA NA | 2.150% | 11/21/18 | 300 | 300 | |
| Capital One NA | 1.850% | 9/13/19 | 15,790 | 15,589 | |
| Citigroup Inc. | 2.500% | 9/26/18 | 1,500 | 1,500 | |
| Citigroup Inc. | 2.050% | 12/7/18 | 1,500 | 1,498 | |
| Citigroup Inc. | 2.550% | 4/8/19 | 625 | 624 | |
| 8,9 | Citigroup Inc. | 3.230% | 8/7/19 | 20,867 | 15,577 |
| Commonwealth Bank of Australia | 1.750% | 11/2/18 | 4,200 | 4,190 | |
| Commonwealth Bank of Australia | 2.250% | 3/13/19 | 5,650 | 5,635 | |
| Cooperatieve Rabobank UA | 2.250% | 1/14/19 | 14,500 | 14,464 | |
| 6 | Credit Agricole SA | 2.500% | 4/15/19 | 25,000 | 24,928 |
| Credit Suisse AG | 2.300% | 5/28/19 | 5,450 | 5,431 | |
| 6 | Danske Bank A/S | 1.650% | 9/6/19 | 1,500 | 1,476 |
| Discover Bank | 2.600% | 11/13/18 | 4,400 | 4,399 | |
| Goldman Sachs Group Inc. | 2.625% | 1/31/19 | 748 | 748 | |
| 8,9 | Goldman Sachs Group Inc. | 3.234% | 8/21/19 | 24,140 | 18,034 |
| Goldman Sachs Group Inc. | 2.550% | 10/23/19 | 3,472 | 3,453 | |
| Goldman Sachs Group Inc. | 2.300% | 12/13/19 | 2,755 | 2,731 | |
| 8,9 | Goldman Sachs Group Inc. | 3.142% | 8/26/20 | 3,450 | 2,579 |
| 7 | HSBC Holdings plc | 2.926% | 5/18/21 | 15,000 | 15,044 |
| HSBC USA Inc. | 2.375% | 11/13/19 | 5,550 | 5,504 | |
| Huntington National Bank | 2.200% | 11/6/18 | 1,300 | 1,299 | |
| 6 | ING Bank NV | 2.050% | 8/17/18 | 1,610 | 1,610 |
| 6 | ING Bank NV | 2.300% | 3/22/19 | 2,380 | 2,369 |
| 7 | Intesa Sanpaolo SPA | 2.966% | 7/17/19 | 17,000 | 17,008 |
| JPMorgan Chase & Co. | 6.300% | 4/23/19 | 3,000 | 3,077 | |
| KeyBank NA | 1.600% | 8/22/19 | 1,800 | 1,778 | |
| Lloyds Bank plc | 2.300% | 11/27/18 | 4,250 | 4,243 | |
| Mizuho Bank Ltd. | 2.340% | 12/4/19 | 9,720 | 9,602 | |
| Morgan Stanley | 2.500% | 1/24/19 | 7,322 | 7,319 | |
| Morgan Stanley | 2.450% | 2/1/19 | 27,213 | 27,180 | |
| Morgan Stanley | 2.650% | 1/27/20 | 7,561 | 7,514 | |
| 6 | MUFG Bank Ltd. | 2.700% | 9/9/18 | 1,000 | 1,000 |
| MUFG Union Bank NA | 2.250% | 5/6/19 | 35,590 | 35,433 | |
| National Bank of Canada | 2.100% | 12/14/18 | 2,100 | 2,095 | |
| PNC Bank NA | 1.700% | 12/7/18 | 4,000 | 3,988 | |
| PNC Bank NA | 1.450% | 7/29/19 | 2,600 | 2,570 | |
| Royal Bank of Canada | 2.150% | 3/15/19 | 6,936 | 6,921 | |
| Royal Bank of Canada | 1.500% | 7/29/19 | 2,500 | 2,467 | |
| Santander UK plc | 2.500% | 3/14/19 | 40,000 | 39,896 | |
| 6 | Skandinaviska Enskilda Banken AB | 2.375% | 11/20/18 | 2,800 | 2,797 |
| 6 | Skandinaviska Enskilda Banken AB | 2.375% | 3/25/19 | 720 | 717 |
| Sumitomo Mitsui Banking Corp. | 2.092% | 10/18/19 | 15,000 | 14,803 | |
| Sumitomo Mitsui Banking Corp. | 2.514% | 1/17/20 | 6,675 | 6,601 | |
| 18 | |||||
| Ultra-Short-Term Bond Fund | |||||
| Face | Market | ||||
| Maturity | Amount | Value • | |||
| Coupon | Date | ($000) | ($000) | ||
| Svenska Handelsbanken AB | 2.500% | 1/25/19 | 6,860 | 6,846 | |
| Svenska Handelsbanken AB | 2.250% | 6/17/19 | 5,000 | 4,969 | |
| 6 | Swedbank AB | 2.375% | 2/27/19 | 1,061 | 1,058 |
| Synchrony Financial | 3.000% | 8/15/19 | 1,685 | 1,682 | |
| Toronto-Dominion Bank | 2.625% | 9/10/18 | 1,100 | 1,100 | |
| Toronto-Dominion Bank | 1.450% | 8/13/19 | 13,973 | 13,781 | |
| 7 | Toronto-Dominion Bank | 2.606% | 6/11/20 | 20,000 | 20,040 |
| 6,7 | UBS AG | 2.639% | 12/7/18 | 14,000 | 14,010 |
| Wells Fargo & Co. | 2.150% | 1/15/19 | 11,000 | 10,977 | |
| 8,9 | Wells Fargo & Co. | 2.830% | 8/8/19 | 14,500 | 10,796 |
| Wells Fargo Bank NA | 1.750% | 5/24/19 | 1,600 | 1,588 | |
| Wells Fargo Bank NA | 2.150% | 12/6/19 | 470 | 465 | |
| Westpac Banking Corp. | 2.250% | 1/17/19 | 7,244 | 7,229 | |
| Westpac Banking Corp. | 1.650% | 5/13/19 | 6,500 | 6,436 | |
| Westpac Banking Corp. | 1.600% | 8/19/19 | 3,000 | 2,965 | |
| 7 | Westpac Banking Corp. | 2.622% | 5/15/20 | 10,000 | 10,000 |
| Insurance (0.3%) | |||||
| 6 | AIA Group Ltd. | 2.250% | 3/11/19 | 1,430 | 1,421 |
| Marsh & McLennan Cos. Inc. | 2.550% | 10/15/18 | 8,305 | 8,305 | |
| 6 | Metropolitan Life Global Funding I | 1.350% | 9/14/18 | 1,361 | 1,359 |
| 6 | Pricoa Global Funding I | 1.900% | 9/21/18 | 1,735 | 1,734 |
| 6 | Reliance Standard Life Global Funding II | 2.150% | 10/15/18 | 1,560 | 1,558 |
| Real Estate Investment Trusts (0.0%) | |||||
| HCP Inc. | 3.750% | 2/1/19 | 165 | 165 | |
| 576,291 | |||||
| Industrial (14.6%) | |||||
| Basic Industry (1.6%) | |||||
| 6 | Air Liquide Finance SA | 1.375% | 9/27/19 | 9,450 | 9,273 |
| Dow Chemical Co. | 8.550% | 5/15/19 | 3,555 | 3,710 | |
| Eastman Chemical Co. | 2.700% | 1/15/20 | 1,407 | 1,398 | |
| Ecolab Inc. | 2.000% | 1/14/19 | 1,875 | 1,869 | |
| EI du Pont de Nemours & Co. | 2.200% | 5/1/20 | 7,645 | 7,531 | |
| LyondellBasell Industries NV | 5.000% | 4/15/19 | 11,350 | 11,437 | |
| Nutrien Ltd. | 6.750% | 1/15/19 | 15,544 | 15,796 | |
| Nutrien Ltd. | 6.500% | 5/15/19 | 6,186 | 6,349 | |
| WestRock RKT Co. | 4.450% | 3/1/19 | 15,930 | 16,053 | |
| Capital Goods (0.5%) | |||||
| Acuity Brands Lighting Inc. | 6.000% | 12/15/19 | 1,400 | 1,450 | |
| Fortive Corp. | 1.800% | 6/15/19 | 1,600 | 1,580 | |
| General Electric Co. | 6.000% | 8/7/19 | 13,977 | 14,357 | |
| 6 | Siemens Financieringsmaatschappij NV | 1.300% | 9/13/19 | 2,500 | 2,451 |
| Communication (1.1%) | |||||
| America Movil SAB de CV | 5.000% | 10/16/19 | 25,042 | 25,566 | |
| Deutsche Telekom International Finance BV | 6.750% | 8/20/18 | 3,500 | 3,507 | |
| Discovery Communications LLC | 2.200% | 9/20/19 | 9,000 | 8,904 | |
| Moody’s Corp. | 2.750% | 7/15/19 | 3,000 | 2,998 | |
| Orange SA | 2.750% | 2/6/19 | 800 | 799 | |
| Orange SA | 1.625% | 11/3/19 | 2,200 | 2,159 | |
| Telefonos de Mexico SAB de CV | 5.500% | 11/15/19 | 6,000 | 6,152 | |
| Viacom Inc. | 5.625% | 9/15/19 | 1,400 | 1,432 | |
| 19 | |||||
| Ultra-Short-Term Bond Fund | |||||
| Face | Market | ||||
| Maturity | Amount | Value • | |||
| Coupon | Date | ($000) | ($000) | ||
| Consumer Cyclical (3.9%) | |||||
| 6 | Alimentation Couche-Tard Inc. | 2.350% | 12/13/19 | 19,000 | 18,775 |
| American Honda Finance Corp. | 1.700% | 2/22/19 | 5,988 | 5,956 | |
| 7 | American Honda Finance Corp. | 2.599% | 6/16/20 | 35,000 | 35,070 |
| 6 | BMW US Capital LLC | 1.500% | 4/11/19 | 800 | 793 |
| 6 | BMW US Capital LLC | 1.450% | 9/13/19 | 3,000 | 2,947 |
| 8 | Ford Motor Credit Co. LLC | 4.050% | 12/10/18 | 10,000 | 7,464 |
| General Motors Co. | 3.500% | 10/2/18 | 1,592 | 1,595 | |
| 7 | General Motors Financial Co. Inc. | 4.399% | 1/15/19 | 882 | 889 |
| General Motors Financial Co. Inc. | 2.400% | 5/9/19 | 7,000 | 6,989 | |
| 7 | General Motors Financial Co. Inc. | 3.819% | 5/9/19 | 7,010 | 7,064 |
| 6 | Harley-Davidson Financial Services Inc. | 2.250% | 1/15/19 | 9,550 | 9,530 |
| 6 | Harley-Davidson Financial Services Inc. | 2.400% | 9/15/19 | 9,625 | 9,541 |
| 6 | Harley-Davidson Financial Services Inc. | 2.150% | 2/26/20 | 8,000 | 7,855 |
| 6 | Hyundai Capital America | 2.875% | 8/9/18 | 4,250 | 4,250 |
| Marriott International Inc. | 3.000% | 3/1/19 | 12,450 | 12,439 | |
| 6 | Nissan Motor Acceptance Corp. | 2.650% | 9/26/18 | 4,729 | 4,729 |
| 6 | Nissan Motor Acceptance Corp. | 2.350% | 3/4/19 | 6,791 | 6,780 |
| 6 | Nissan Motor Acceptance Corp. | 2.000% | 3/8/19 | 5,850 | 5,819 |
| 6 | Nissan Motor Acceptance Corp. | 1.550% | 9/13/19 | 12,500 | 12,280 |
| 6,7 | Nissan Motor Acceptance Corp. | 2.853% | 9/13/19 | 3,578 | 3,586 |
| 8 | Volkswagen Financial Services Australia | ||||
| Pty Ltd. | 3.250% | 8/13/19 | 2,150 | 1,605 | |
| 6 | Volkswagen Group of America Finance LLC | 2.125% | 5/23/19 | 1,500 | 1,489 |
| Walgreen Co. | 5.250% | 1/15/19 | 3,914 | 3,949 | |
| 7 | Western Union Co. | 3.129% | 5/22/19 | 8,000 | 8,022 |
| Consumer Noncyclical (1.9%) | |||||
| Abbott Laboratories | 2.350% | 11/22/19 | 436 | 433 | |
| AbbVie Inc. | 2.000% | 11/6/18 | 800 | 799 | |
| Altria Group Inc. | 9.700% | 11/10/18 | 6,821 | 6,954 | |
| Anheuser-Busch InBev Worldwide Inc. | 2.200% | 8/1/18 | 1,125 | 1,125 | |
| 7 | Campbell Soup Co. | 2.835% | 3/16/20 | 15,000 | 15,012 |
| Coca-Cola Femsa SAB de CV | 2.375% | 11/26/18 | 1,222 | 1,219 | |
| Constellation Brands Inc. | 3.875% | 11/15/19 | 5,000 | 5,047 | |
| CVS Health Corp. | 3.125% | 3/9/20 | 12,000 | 11,991 | |
| Express Scripts Holding Co. | 2.250% | 6/15/19 | 9,500 | 9,443 | |
| Gilead Sciences Inc. | 1.850% | 9/4/18 | 500 | 500 | |
| Hershey Co. | 1.600% | 8/21/18 | 1,100 | 1,099 | |
| Kraft Foods Group Inc. | 6.125% | 8/23/18 | 8,000 | 8,017 | |
| Kroger Co. | 2.300% | 1/15/19 | 15,255 | 15,224 | |
| Newell Brands Inc. | 2.600% | 3/29/19 | 977 | 973 | |
| Shire Acquisitions Investments Ireland DAC | 1.900% | 9/23/19 | 2,200 | 2,169 | |
| 7 | Tyson Foods Inc. | 2.768% | 5/30/19 | 7,000 | 7,011 |
| Energy (3.5%) | |||||
| Anadarko Petroleum Corp. | 8.700% | 3/15/19 | 8,550 | 8,837 | |
| Anadarko Petroleum Corp. | 6.950% | 6/15/19 | 11,606 | 11,992 | |
| Apache Corp. | 3.625% | 2/1/21 | 9,655 | 9,666 | |
| BP Capital Markets plc | 2.241% | 9/26/18 | 2,900 | 2,899 | |
| BP Capital Markets plc | 4.750% | 3/10/19 | 24,350 | 24,633 | |
| BP Capital Markets plc | 2.521% | 1/15/20 | 5,400 | 5,359 | |
| Cenovus Energy Inc. | 5.700% | 10/15/19 | 8,000 | 8,190 | |
| EOG Resources Inc. | 5.625% | 6/1/19 | 20,986 | 21,447 | |
| 20 | |||||
| Ultra-Short-Term Bond Fund | |||||
| Face | Market | ||||
| Maturity | Amount | Value • | |||
| Coupon | Date | ($000) | ($000) | ||
| EQT Corp. | 8.125% | 6/1/19 | 9,259 | 9,648 | |
| Husky Energy Inc. | 6.150% | 6/15/19 | 3,792 | 3,891 | |
| Husky Energy Inc. | 7.250% | 12/15/19 | 16,000 | 16,820 | |
| Marathon Oil Corp. | 2.700% | 6/1/20 | 21,000 | 20,728 | |
| 6 | Schlumberger Holdings Corp. | 2.350% | 12/21/18 | 10,000 | 9,990 |
| Shell International Finance BV | 1.375% | 9/12/19 | 3,000 | 2,953 | |
| Technology (1.7%) | |||||
| Amphenol Corp. | 2.550% | 1/30/19 | 17,027 | 16,995 | |
| Broadcom Corp. / Broadcom Cayman | |||||
| Finance Ltd. | 2.375% | 1/15/20 | 5,000 | 4,933 | |
| CA Inc. | 2.875% | 8/15/18 | 7,220 | 7,219 | |
| DXC Technology Co. | 2.875% | 3/27/20 | 6,000 | 5,947 | |
| Hewlett Packard Enterprise Co. | 2.850% | 10/5/18 | 3,330 | 3,331 | |
| KLA-Tencor Corp. | 3.375% | 11/1/19 | 2,415 | 2,422 | |
| NetApp Inc. | 2.000% | 9/27/19 | 15,455 | 15,251 | |
| Tyco Electronics Group SA | 2.375% | 12/17/18 | 15,787 | 15,765 | |
| Tyco Electronics Group SA | 2.350% | 8/1/19 | 4,457 | 4,429 | |
| Verisk Analytics Inc. | 4.875% | 1/15/19 | 2,536 | 2,560 | |
| Transportation (0.4%) | |||||
| 4 | Burlington Northern and Santa Fe Railway | ||||
| Co. 1999-2 Pass Through Trust | 7.570% | 1/2/21 | 774 | 803 | |
| Canadian National Railway Co. | 5.550% | 3/1/19 | 5,000 | 5,080 | |
| 4 | Continental Airlines 2001-1 Class A-1 Pass | ||||
| Through Trust | 6.703% | 6/15/21 | 2,293 | 2,442 | |
| 4 | Continental Airlines 2009-2 Class A Pass | ||||
| Through Trust | 7.250% | 5/10/21 | 1,097 | 1,142 | |
| 4 | Continental Airlines 2010-1 Class A Pass | ||||
| Through Trust | 4.750% | 7/12/22 | 3,856 | 3,937 | |
| 4 | Delta Air Lines 2010-2 Class A Pass | ||||
| Through Trust | 4.950% | 11/23/20 | 3,350 | 3,375 | |
| 4 | Northwest Airlines 2007-1 Class A Pass | ||||
| Through Trust | 7.027% | 5/1/21 | 714 | 742 | |
| 4 | US Airways 2012-1 Class B Pass Through | ||||
| Trust | 8.000% | 10/1/19 | 2,123 | 2,208 | |
| 666,837 | |||||
| Utilities (3.6%) | |||||
| Electric (2.9%) | |||||
| Arizona Public Service Co. | 2.200% | 1/15/20 | 1,100 | 1,086 | |
| Consolidated Edison Co. of New York Inc. | 7.125% | 12/1/18 | 900 | 913 | |
| Consolidated Edison Co. of New York Inc. | 6.650% | 4/1/19 | 25,698 | 26,341 | |
| Consumers Energy Co. | 6.125% | 3/15/19 | 125 | 127 | |
| Dominion Energy Inc. | 1.875% | 1/15/19 | 1,045 | 1,041 | |
| Dominion Energy Inc. | 5.200% | 8/15/19 | 130 | 133 | |
| Duke Energy Carolinas LLC | 7.000% | 11/15/18 | 723 | 732 | |
| Duke Energy Ohio Inc. | 5.450% | 4/1/19 | 305 | 310 | |
| Duke Energy Progress LLC | 5.300% | 1/15/19 | 500 | 506 | |
| 6 | EDP Finance BV | 4.125% | 1/15/20 | 1,384 | 1,395 |
| Emera US Finance LP | 2.150% | 6/15/19 | 3,000 | 2,973 | |
| Entergy Louisiana LLC | 6.500% | 9/1/18 | 580 | 582 | |
| 8,9 | ETSA Utilities Finance Pty Ltd. | 2.222% | 10/15/19 | 2,400 | 1,762 |
| Exelon Generation Co. LLC | 2.950% | 1/15/20 | 16,380 | 16,216 | |
| 7 | Florida Power & Light Co. | 2.643% | 11/6/20 | 8,300 | 8,302 |
| 21 | |||||
| Ultra-Short-Term Bond Fund | ||||
| Face | Market | |||
| Maturity | Amount | Value • | ||
| Coupon | Date | ($000) | ($000) | |
| Georgia Power Co. | 1.950% | 12/1/18 | 10,275 | 10,254 |
| Georgia Power Co. | 4.250% | 12/1/19 | 5,500 | 5,577 |
| National Rural Utilities Cooperative | ||||
| Finance Corp. | 10.375% | 11/1/18 | 5,224 | 5,323 |
| Nevada Power Co. | 7.125% | 3/15/19 | 24,848 | 25,519 |
| Oncor Electric Delivery Co. LLC | 6.800% | 9/1/18 | 12,407 | 12,444 |
| Oncor Electric Delivery Co. LLC | 2.150% | 6/1/19 | 1,400 | 1,390 |
| South Carolina Electric & Gas Co. | 5.250% | 11/1/18 | 6,633 | 6,667 |
| South Carolina Electric & Gas Co. | 6.500% | 11/1/18 | 1,968 | 1,985 |
| Natural Gas (0.7%) | ||||
| Atmos Energy Corp. | 8.500% | 3/15/19 | 1,280 | 1,325 |
| ONE Gas Inc. | 2.070% | 2/1/19 | 28,500 | 28,386 |
| 161,289 | ||||
| Total Corporate Bonds (Cost $1,409,337) | 1,404,417 | |||
| Sovereign Bonds (6.1%) | ||||
| Abu Dhabi National Energy Co. PJSC | 6.250% | 9/16/19 | 7,375 | 7,623 |
| AK Transneft OJSC Via TransCapitalInvest Ltd. | 8.700% | 8/7/18 | 15,200 | 15,199 |
| Bermuda | 5.603% | 7/20/20 | 2,500 | 2,596 |
| Caixa Economica Federal | 4.250% | 5/13/19 | 6,000 | 6,015 |
| Corp. Financiera de Desarrollo SA | 4.750% | 2/8/22 | 4,000 | 4,094 |
| Corp. Nacional del Cobre de Chile | 7.500% | 1/15/19 | 2,200 | 2,242 |
| 6 Corp. Nacional del Cobre de Chile | 7.500% | 1/15/19 | 8,310 | 8,455 |
| Ecopetrol SA | 7.625% | 7/23/19 | 15,000 | 15,600 |
| Export-Import Bank of India | 3.875% | 10/2/19 | 4,800 | 4,812 |
| Export-Import Bank of Korea | 2.250% | 1/21/20 | 6,640 | 6,536 |
| First Abu Dhabi Bank PJSC | 3.000% | 8/13/19 | 7,000 | 6,993 |
| Gazprom OAO Via Gaz Capital SA | 9.250% | 4/23/19 | 13,500 | 14,024 |
| 6 Gazprom OAO Via Gaz Capital SA | 9.250% | 4/23/19 | 1,500 | 1,560 |
| ICBCIL Finance Co. Ltd. | 2.375% | 5/19/19 | 2,050 | 2,028 |
| ICBCIL Finance Co. Ltd. | 2.125% | 9/29/19 | 2,670 | 2,619 |
| 7 Korea Development Bank | 3.001% | 9/19/20 | 10,325 | 10,336 |
| 7 Korea Development Bank | 2.876% | 3/12/21 | 10,000 | 10,000 |
| North American Development Bank | 2.300% | 10/10/18 | 300 | 300 |
| Ooredoo Tamweel Ltd. | 3.039% | 12/3/18 | 7,300 | 7,295 |
| Petroleos Mexicanos | 8.000% | 5/3/19 | 19,153 | 19,774 |
| Petronas Capital Ltd. | 5.250% | 8/12/19 | 23,309 | 23,783 |
| Republic of Colombia | 7.375% | 3/18/19 | 20,750 | 21,339 |
| Republic of Croatia | 6.750% | 11/5/19 | 12,000 | 12,504 |
| Republic of Hungary | 6.250% | 1/29/20 | 422 | 442 |
| Republic of Poland | 6.375% | 7/15/19 | 1,000 | 1,034 |
| Republic of Serbia | 5.875% | 12/3/18 | 17,000 | 17,149 |
| Republic of Slovenia | 4.125% | 2/18/19 | 5,000 | 5,023 |
| Republic of the Philippines | 8.375% | 6/17/19 | 20,300 | 21,335 |
| State Grid Overseas Investment 2014 Ltd. | 2.750% | 5/7/19 | 15,000 | 14,938 |
| State of Qatar | 6.550% | 4/9/19 | 10,000 | 10,252 |
| State of Qatar | 5.250% | 1/20/20 | 5,000 | 5,142 |
| Total Sovereign Bonds (Cost $281,595) | 281,042 | |||
| 22 | ||||
| Ultra-Short-Term Bond Fund | ||||
| Face | Market | |||
| Maturity | Amount | Value • | ||
| Coupon | Date | ($000) | ($000) | |
| Taxable Municipal Bonds (0.1%) | ||||
| Louisiana Local Government Environmental | ||||
| Facilities & Community Development | ||||
| Authority Revenue 2010-EGSL | 3.220% | 2/1/21 | 56 | 56 |
| San Jose California Redevelopment Agency | ||||
| Successor Agency Tax Allocation | 1.898% | 8/1/18 | 2,424 | 2,424 |
| Total Taxable Municipal Bonds (Cost $2,480) | 2,480 | |||
| Shares | ||||
| Temporary Cash Investments (14.4%) | ||||
| Money Market Fund (5.9%) | ||||
| 10 Vanguard Market Liquidity Fund | 2.145% | 2,665,635 | 266,564 | |
| Face | ||||
| Amount | ||||
| ($000) | ||||
| Commercial Paper (7.5%) | ||||
| 6,11 Air Liquide US LLC | 2.471% | 11/19/18 | 30,000 | 29,767 |
| 11 AT&T Inc. | 3.093% | 5/30/19 | 22,000 | 21,435 |
| 6,11 BPCE SA | 2.818% | 5/2/19 | 40,000 | 39,172 |
| 6,11 CNH Industrial Capital LLC | 2.952% | 10/22/18 | 22,000 | 21,846 |
| 11 Engie SA | 1.937% | 11/8/18 | 2,390 | 2,376 |
| 6,11 Eni Finance USA Inc. | 2.490% | 2/1/19 | 19,000 | 18,732 |
| 6,11 ERP Operating LP | 2.339% | 10/1/18 | 34,000 | 33,862 |
| 6,11 Ford Motor Credit Co. LLC | 2.010% | 8/20/18 | 4,000 | 3,995 |
| 11 Ford Motor Credit Co. LLC | 2.041% | 11/5/18 | 7,000 | 6,953 |
| 6,11 Harley-Davidson-Financial Services Inc. | 2.485% | 8/3/18 | 8,000 | 7,999 |
| 11 HP Inc. | 2.638% | 10/24/18 | 17,000 | 16,892 |
| 6,11 JP Morgan Securities LLC | 1.730% | 10/1/18 | 12,000 | 11,953 |
| 6,11 JP Morgan Securities LLC | 2.344% | 1/28/19 | 6,500 | 6,418 |
| 6,11 JP Morgan Securities LLC | 2.776% | 5/6/19 | 15,000 | 14,686 |
| 6,11 National Grid USA | 2.721% | 10/11/18 | 20,000 | 19,891 |
| 11 Oncor Electric Delivery CO | 2.425% | 8/2/18 | 20,000 | 19,997 |
| 6,11 Oncor Electric Delivery CO | 2.546% | 9/25/18 | 10,000 | 9,960 |
| 11 Schlumberger Holdings Corp. | 2.578% | 10/10/18 | 12,000 | 11,938 |
| 6,11 Suncor Energy Inc. | 2.638% | 9/27/18 | 18,000 | 17,922 |
| 6,11 UBS AG | 1.812% | 10/12/18 | 12,000 | 11,943 |
| 6,11 Vodafone Group plc | 1.770% | 9/4/18 | 8,000 | 7,986 |
| 6,11 Vodafone Group plc | 1.780% | 9/25/18 | 8,000 | 7,976 |
| 343,699 | ||||
| Certificates of Deposit (1.0%) | ||||
| Cooperatieve Rabobank UA | 1.980% | 10/25/19 | 12,735 | 12,577 |
| Royal Bank of Canada (New York Branch) | 1.610% | 9/19/18 | 17,000 | 16,983 |
| Westpac Banking Corp. (New York Branch) | 1.600% | 9/19/18 | 17,000 | 16,983 |
| 46,543 | ||||
| Total Temporary Cash Investments (Cost $657,115) | 656,806 | |||
| Total Investments (98.7%) (Cost $4,514,915) | 4,500,585 | |||
| Other Assets and Liabilities (1.3%) | ||||
| Other Assets | 71,365 | |||
| Liabilities | (11,079) | |||
| 60,286 | ||||
| Net Assets (100%) | 4,560,871 | |||
| 23 | ||||
| Ultra-Short-Term Bond Fund | |
| Amount | |
| ($000) | |
| Statement of Assets and Liabilities | |
| Assets | |
| Investments in Securities, at Value | |
| Unaffiliated Issuers | 4,234,021 |
| Affiliated Issuers | 266,564 |
| Total Investments in Securities | 4,500,585 |
| Investment in Vanguard | 233 |
| Receivables for Investment Securities Sold | 31,709 |
| Receivables for Accrued Income | 19,621 |
| Receivables for Capital Shares Issued | 19,180 |
| Variation Margin Receivable—Futures Contracts | 28 |
| Unrealized Appreciation—Forward Currency Contracts | 512 |
| Unrealized Appreciation—OTC Swap Contracts | 72 |
| Other Assets | 10 |
| Total Assets | 4,571,950 |
| Liabilities | |
| Payables for Investment Securities Purchased | 2,075 |
| Payables for Capital Shares Redeemed | 6,948 |
| Payables for Distributions | 1,454 |
| Payables to Vanguard | 411 |
| Unrealized Appreciation—Forward Currency Contracts | 165 |
| Variation Margin Payable—Futures Contracts | 3 |
| Other Liabilities | 23 |
| Total Liabilities | 11,079 |
| Net Assets | 4,560,871 |
| At July 31, 2018, net assets consisted of: | |
| Amount | |
| ($000) | |
| Paid-in Capital | 4,580,169 |
| Undistributed Net Investment Income | 64 |
| Accumulated Net Realized Losses | (5,033) |
| Unrealized Appreciation (Depreciation) | |
| Investment Securities | (14,330) |
| Futures Contracts | (418) |
| Swap Contracts | 72 |
| Forward Currency Contracts | 347 |
| Foreign Currencies | — |
| Net Assets | 4,560,871 |
| 24 | |
Ultra-Short-Term Bond Fund
| Amount | |
| ($000) | |
| Investor Shares—Net Assets | |
| Applicable to 23,072,205 outstanding $.001 par value shares of | |
| beneficial interest (unlimited authorization) | 229,639 |
| Net Asset Value Per Share—Investor Shares | $9.95 |
| Admiral Shares—Net Assets | |
| Applicable to 217,561,696 outstanding $.001 par value shares of | |
| beneficial interest (unlimited authorization) | 4,331,232 |
| Net Asset Value Per Share—Admiral Shares | $19.91 |
• See Note A in Notes to Financial Statements.
§ Security value determined using significant unobservable inputs.
1 Securities with a value of $794,000 have been segregated as initial margin for open futures contracts.
2 The issuer operates under a congressional charter; its securities are generally neither guaranteed by the U.S. Treasury nor backed
by the full faith and credit of the U.S. government.
3 The issuer was placed under federal conservatorship in September 2008; since that time, its daily operations have been managed
by the Federal Housing Finance Agency and it receives capital from the U.S. Treasury, as needed to maintain a positive net worth,
in exchange for senior preferred stock.
4 The average or expected maturity is shorter than the final maturity shown because of the possibility of interim principal payments
and prepayments or the possibility of the issue being called.
5 Adjustable-rate security based upon 1-month USD LIBOR plus spread.
6 Security exempt from registration under Rule 144A of the Securities Act of 1933. Such securities may be sold in transactions
exempt from registration, normally to qualified institutional buyers. At July 31, 2018, the aggregate value of these securities was
$1,710,016,000, representing 37.5% of net assets.
7 Adjustable-rate security based upon 3-month USD LIBOR plus spread.
8 Face amount denominated in Australian dollars.
9 Adjustable-rate security based upon 3-month AUD Australian Bank Bill Rate plus spread.
10 Affiliated money market fund available only to Vanguard funds and certain trusts and accounts managed by Vanguard. Rate shown
is the 7-day yield.
11 Security exempt from registration under Section 4(2) of the Securities Act of 1933. Such securities may be sold in transactions
exempt from registration only to dealers in that program or other “accredited investors.” At July 31, 2018, the aggregate value of
these securities was $343,699,000, representing 7.5% of net assets.
OTC—Over-the-Counter.
REMICS—Real Estate Mortgage Investment Conduits.
25
Ultra-Short-Term Bond Fund
| Derivative Financial Instruments Outstanding as of Period End | ||||
| Futures Contracts | ||||
| ($000) | ||||
| Value and | ||||
| Number of | Unrealized | |||
| Long (Short) | Notional | Appreciation | ||
| Expiration | Contracts | Amount | (Depreciation) | |
| Long Futures Contracts | ||||
| 2-Year U.S. Treasury Note | September 2018 | 2,960 | 625,670 | (538) |
| Short Futures Contracts | ||||
| 5-Year U. S. Treasury Note | September 2018 | (158) | (17,874) | 116 |
| Ultra 10-Year U.S. Treasury Note | September 2018 | (4) | (508) | 2 |
| 10-Year U.S. Treasury Note | September 2018 | (3) | (358) | 2 |
| 120 | ||||
| (418) | ||||
Unrealized appreciation (depreciation) on open futures contracts is required to be treated as realized gain (loss) for tax purposes.
| Forward Currency Contracts | ||||||
| Unrealized | ||||||
| Contract | Appreciation | |||||
| Contract Amount (000) | ||||||
| Settlement | (Depreciation) | |||||
| Counterparty | Date | Receive | Deliver | ($000) | ||
| JPMorgan Chase Bank, N.A. | 9/20/18 | USD | 18,434 | AUD | 24,336 | 350 |
| Toronto-Dominion Bank | 9/20/18 | USD | 13,008 | AUD | 17,616 | (83) |
| Citibank, N.A. | 9/20/18 | USD | 9,223 | AUD | 12,478 | (49) |
| Bank of America, N.A. | 9/20/18 | USD | 7,233 | AUD | 9,559 | 130 |
| Toronto-Dominion Bank | 9/20/18 | USD | 6,809 | AUD | 9,121 | 32 |
| Bank of America, N.A. | 9/20/18 | USD | 3,704 | AUD | 5,028 | (33) |
| 347 | ||||||
| AUD—Australian dollar. | ||||||
| USD—U.S. dollar. | ||||||
Unrealized appreciation (depreciation) on open forward currency contracts is treated as ordinary income for tax purposes.
26
Ultra-Short-Term Bond Fund
| Over-the-Counter Credit Default Swaps | |||||||
| Remaining | |||||||
| Periodic | Up-Front | ||||||
| Premium | Premium | Unrealized | |||||
| Notional | Received | Received | Appreciation | ||||
| Termination | Amount | (Paid)1 | Value | (Paid) | (Depreciation) | ||
| Reference Entity | Date | Counterparty | ($000) | (%) | ($000) | ($000) | ($000) |
| Credit Protection | |||||||
| Sold/Moody’s Rating | |||||||
| Berkshire Hathaway | |||||||
| Inc./Aa2 | 12/20/21 | GSI | 5,000 | 1.000 | 100 | (28) | 72 |
The notional amount represents the maximum potential amount the fund could be required to pay
as a seller of credit protection if the reference entity was subject to a credit event.
1 Periodic premium received/paid quarterly.
GSI—Goldman Sachs International.
Unrealized appreciation (depreciation) on open swap contracts is generally treated the same for financial reporting and tax purposes.
At July 31, 2018, counterparties had deposited in segregated accounts securities and cash with a value of $555,000 in connection with open forward currency contracts and open over-the-counter swap contracts.
See accompanying Notes, which are an integral part of the Financial Statements.
27
Ultra-Short-Term Bond Fund
Statement of Operations
| Six Months Ended | |
| July31,2018 | |
| ($000) | |
| Investment Income | |
| Income | |
| Interest1 | 45,409 |
| Total Income | 45,409 |
| Expenses | |
| The Vanguard Group—Note B | |
| Investment Advisory Services | 155 |
| Management and Administrative—Investor Shares | 172 |
| Management and Administrative—Admiral Shares | 1,609 |
| Marketing and Distribution—Investor Shares | 20 |
| Marketing and Distribution—Admiral Shares | 128 |
| Custodian Fees | 31 |
| Shareholders’ Reports—Investor Shares | 3 |
| Shareholders’ Reports—Admiral Shares | 5 |
| Trustees’ Fees and Expenses | 1 |
| Total Expenses | 2,124 |
| Net Investment Income | 43,285 |
| Realized Net Gain (Loss) | |
| Investment Securities Sold1 | (653) |
| Futures Contracts | (2,061) |
| Swap Contracts | 21 |
| Foreign Currencies | 120 |
| Realized Net Gain (Loss) | (2,573) |
| Change in Unrealized Appreciation (Depreciation) | |
| Investment Securities1 | (4,448) |
| Futures Contracts | (44) |
| Swap Contracts | (11) |
| Forward Currency Contracts | 347 |
| Foreign Currencies | — |
| Change in Unrealized Appreciation (Depreciation) | (4,156) |
| Net Increase (Decrease) in Net Assets Resulting from Operations | 36,556 |
| 1 Interest income, realized net gain (loss), and change in unrealized appreciation (depreciation) from an affiliated company of the fund | |
| were $2,807,000, ($1,000), and $5,000, respectively. Purchases and sales are for temporary cash investment purposes. | |
See accompanying Notes, which are an integral part of the Financial Statements.
28
Ultra-Short-Term Bond Fund
Statement of Changes in Net Assets
| Six Months Ended | Year Ended | |
| July 31, | January 31, | |
| 2018 | 2018 | |
| ($000) | ($000) | |
| Increase (Decrease) in Net Assets | ||
| Operations | ||
| Net Investment Income | 43,285 | 48,739 |
| Realized Net Gain (Loss) | (2,573) | (4,531) |
| Change in Unrealized Appreciation (Depreciation) | (4,156) | (7,935) |
| Net Increase (Decrease) in Net Assets Resulting from Operations | 36,556 | 36,273 |
| Distributions | ||
| Net Investment Income | ||
| Investor Shares | (2,196) | (2,338) |
| Admiral Shares | (41,155) | (44,828) |
| Realized Capital Gain1 | ||
| Investor Shares | — | (30) |
| Admiral Shares | — | (485) |
| Total Distributions | (43,351) | (47,681) |
| Capital Share Transactions | ||
| Investor Shares | 51,453 | 47,961 |
| Admiral Shares | 863,448 | 1,461,017 |
| Net Increase (Decrease) from Capital Share Transactions | 914,901 | 1,508,978 |
| Total Increase (Decrease) | 908,106 | 1,497,570 |
| Net Assets | ||
| Beginning of Period | 3,652,765 | 2,155,195 |
| End of Period2 | 4,560,871 | 3,652,765 |
1 Includes fiscal 2019 and 2018 short-term gain distributions totaling $0 and $129,000, respectively. Short-term gain distributions are
treated as ordinary income dividends for tax purposes.
2 Net Assets—End of Period includes undistributed (overdistributed) net investment income of $64,000 and ($11,000).
See accompanying Notes, which are an integral part of the Financial Statements.
29
Ultra-Short-Term Bond Fund
Financial Highlights
| Investor Shares | ||||
| Six Months | Feb. 10, | |||
| Year Ended | ||||
| Ended | 20151 to | |||
| January 31, | ||||
| July 31, | Jan. 31, | |||
| For a Share Outstanding Throughout Each Period | 2018 | 2018 | 2017 | 2016 |
| Net Asset Value, Beginning of Period | $9.97 | $10.00 | $9.99 | $10.00 |
| Investment Operations | ||||
| Net Investment Income | .1012 | .1542 | .106 | .054 |
| Net Realized and Unrealized Gain (Loss) on Investments | (.022) | (.037) | .006 | (.010) |
| Total from Investment Operations | .079 | .117 | .112 | .044 |
| Distributions | ||||
| Dividends from Net Investment Income | (. 099) | (.145) | (.102) | (. 054) |
| Distributions from Realized Capital Gains | — | (.002) | — | — |
| Total Distributions | (. 099) | (.147) | (.102) | (. 054) |
| Net Asset Value, End of Period | $9.95 | $9.97 | $10.00 | $9.99 |
| Total Return3 | 0.80% | 1.17% | 1.13% | 0.44% |
| Ratios/Supplemental Data | ||||
| Net Assets, End of Period (Millions) | $230 | $179 | $131 | $47 |
| Ratio of Total Expenses to Average Net Assets | 0.20% | 0.20% | 0.20% | 0.20%4 |
| Ratio of Net Investment Income to Average Net Assets | 2.05% | 1.54% | 1.11% | 0.66%4 |
| Portfolio Turnover Rate | 68% | 70% | 81% | 24% |
The expense ratio, net investment income ratio, and turnover rate for the current period have been annualized.
1 Subscription period for the fund was February 10, 2015, to February 23, 2015, during which time all assets were held in money market
instruments. Performance measurement began February 24, 2015, at a net asset value of $10.00.
2 Calculated based on average shares outstanding.
3 Total returns do not include account service fees that may have applied in the periods shown. Fund prospectuses provide information
about any applicable account service fees.
4 Annualized.
See accompanying Notes, which are an integral part of the Financial Statements.
30
Ultra-Short-Term Bond Fund
Financial Highlights
| Admiral Shares | ||||
| Six Months | Feb. 10, | |||
| Ended | Year Ended | 20151 to | ||
| July 31, | January 31, | Jan. 31, | ||
| For a Share Outstanding Throughout Each Period | 2018 | 2018 | 2017 | 2016 |
| Net Asset Value, Beginning of Period | $19.94 | $20.00 | $19.98 | $20.00 |
| Investment Operations | ||||
| Net Investment Income | . 213 2 | . 328 2 | .228 | .122 |
| Net Realized and Unrealized Gain (Loss) on Investments | (.034) | (.077) | .015 | (.021) |
| Total from Investment Operations | .179 | .251 | .243 | .101 |
| Distributions | ||||
| Dividends from Net Investment Income | (.209) | (.307) | (.223) | (.121) |
| Distributions from Realized Capital Gains | — | (.004) | — | — |
| Total Distributions | (.209) | (.311) | (.223) | (.121) |
| Net Asset Value, End of Period | $19.91 | $19.94 | $20.00 | $19.98 |
| Total Return 3 | 0.90% | 1.26% | 1.22% | 0.51% |
| Ratios/Supplemental Data | ||||
| Net Assets, End of Period (Millions) | $4,331 | $3,474 | $2,024 | $465 |
| Ratio of Total Expenses to Average Net Assets | 0.10% | 0.10% | 0.12% | 0.12%4 |
| Ratio of Net Investment Income to Average Net Assets | 2.15% | 1.64% | 1.19% | 0.74%4 |
| Portfolio Turnover Rate | 68% | 70% | 81% | 24% |
The expense ratio, net investment income ratio, and turnover rate for the current period have been annualized.
1 Subscription period for the fund was February 10, 2015, to February 23, 2015, during which time all assets were held in money market
instruments. Performance measurement began February 24, 2015, at a net asset value of $10.00.
2 Calculated based on average shares outstanding.
3 Total returns do not include account service fees that may have applied in the periods shown. Fund prospectuses provide information
about any applicable account service fees.
4 Annualized.
See accompanying Notes, which are an integral part of the Financial Statements.
31
Ultra-Short-Term Bond Fund
Notes to Financial Statements
Vanguard Ultra-Short-Term Bond Fund is registered under the Investment Company Act of 1940 as an open-end investment company, or mutual fund. Certain of the fund’s investments are in corporate debt instruments; the issuers’ abilities to meet their obligations may be affected by economic developments in their respective industries. The fund offers two classes of shares: Investor Shares and Admiral Shares. Investor Shares are available to any investor who meets the fund’s minimum purchase requirements. Admiral Shares are designed for investors who meet certain administrative, service, and account-size criteria.
A. The following significant accounting policies conform to generally accepted accounting principles for U.S. investment companies. The fund consistently follows such policies in preparing its financial statements.
1. Security Valuation: Securities are valued as of the close of trading on the New York Stock Exchange (generally 4 p.m., Eastern time) on the valuation date. Bonds and temporary cash investments are valued using the latest bid prices or using valuations based on a matrix system (which considers such factors as security prices, yields, maturities, and ratings), both as furnished by independent pricing services. Structured debt securities, including mortgages and asset-backed securities, are valued using the latest bid prices or using valuations based on a matrix system that considers such factors as issuer, tranche, nominal or option-adjusted spreads, weighted average coupon, weighted average maturity, credit enhancements, and collateral. Investments in Vanguard Market Liquidity Fund are valued at that fund’s net asset value. Securities for which market quotations are not readily available, or whose values have been affected by events occurring before the fund’s pricing time but after the close of the securities’ primary markets, are valued by methods deemed by the board of trustees to represent fair value.
2. Foreign Currency: Securities and other assets and liabilities denominated in foreign currencies are translated into U.S. dollars using exchange rates obtained from an independent third party as of the fund’s pricing time on the valuation date. Realized gains (losses) and unrealized appreciation (depreciation) on investment securities include the effects of changes in exchange rates since the securities were purchased, combined with the effects of changes in security prices. Fluctuations in the value of other assets and liabilities resulting from changes in exchange rates are recorded as unrealized foreign currency gains (losses) until the assets or liabilities are settled in cash, at which time they are recorded as realized foreign currency gains (losses).
3. Futures Contracts: The fund uses futures contracts to invest in fixed income asset classes with greater efficiency and lower cost than is possible through direct investment, to add value when these instruments are attractively priced, or to adjust sensitivity to changes in interest rates. The primary risks associated with the use of futures contracts are imperfect correlation between changes in market values of bonds held by the fund and the prices of futures contracts, and the possibility of an illiquid market. Counterparty risk involving futures is mitigated because a regulated clearinghouse is the counterparty instead of the clearing broker. To further mitigate counterparty risk, the fund trades futures contracts on an exchange, monitors the financial strength of its clearing brokers and clearinghouse, and has entered into clearing agreements with its clearing brokers. The clearinghouse imposes initial margin requirements to secure the fund’s performance and requires daily settlement of variation margin representing changes in the market value of each contract. Any assets pledged as initial margin for open contracts are noted in the Statement of Net Assets.
32
Ultra-Short-Term Bond Fund
Futures contracts are valued at their quoted daily settlement prices. The notional amounts of the contracts are not recorded in the Statement of Net Assets. Fluctuations in the value of the contracts are recorded in the Statement of Assets and Liabilities as an asset (liability) and in the Statement of Operations as unrealized appreciation (depreciation) until the contracts are closed, when they are recorded as realized futures gains (losses).
During the six months ended July 31, 2018, the fund’s average investments in long and short futures contracts represented 12% and 1% of net assets, respectively, based on the average of the notional amounts at each quarter-end during the period.
4. Forward Currency Contracts: The fund enters into forward currency contracts to protect the value of securities and related receivables and payables against changes in future foreign exchange rates. The fund’s risks in using these contracts include movement in the values of the foreign currencies relative to the U.S. dollar and the ability of the counterparties to fulfill their obligations under the contracts. The fund mitigates its counterparty risk by entering into forward currency contracts only with a diverse group of prequalified counterparties, monitoring their financial strength, entering into master netting arrangements with its counterparties, and requiring its counterparties to transfer collateral as security for their performance. In the absence of a default, the collateral pledged or received by the fund cannot be repledged, resold, or rehypothecated.
The master netting arrangements provide that, in the event of a counterparty’s default (including bankruptcy), the fund may terminate the forward currency contracts, determine the net amount owed by either party in accordance with its master netting arrangements, and sell or retain any collateral held up to the net amount owed to the fund under the master netting arrangements. The forward currency contracts contain provisions whereby a counterparty may terminate open contracts if the fund’s net assets decline below a certain level, triggering a payment by the fund if the fund is in a net liability position at the time of the termination. The payment amount would be reduced by any collateral the fund has pledged. Any assets pledged as collateral for open contracts are noted in the Statement of Net Assets. The value of collateral received or pledged is compared daily to the value of the forward currency contracts exposure with each counterparty, and any difference, if in excess of a specified minimum transfer amount, is adjusted and settled within two business days.
Forward currency contracts are valued at their quoted daily prices obtained from an independent third party, adjusted for currency risk based on the expiration date of each contract. The notional amounts of the contracts are not recorded in the Statement of Net Assets. Fluctuations in the value of the contracts are recorded in the Statement of Assets and Liabilities as an asset (liability) and in the Statement of Operations as unrealized appreciation (depreciation) until the contracts are closed, when they are recorded as realized forward currency contract gains (losses).
During the six months ended July 31, 2018, the fund’s average investment in forward currency contracts represented less than 1% of net assets, based on the average of notional amounts at each quarter-end during the period.
5. Swap Contracts: The fund invests in credit default swaps to adjust the overall credit risk of the fund or to actively overweight or underweight credit risk to a specific issuer or group of issuers. The fund may sell credit protection through credit default swaps to simulate investments in long positions that are either unavailable or considered to be less attractively priced in the bond market.
33
Ultra-Short-Term Bond Fund
The fund may purchase credit protection through credit default swaps to reduce credit exposure to a given issuer or issuers. Under the terms of the swaps, an up-front payment may be exchanged between the seller and buyer. In addition, the seller of the credit protection receives a periodic payment of premium from the buyer that is a fixed percentage applied to a notional amount. If, for example, the reference entity is subject to a credit event (such as bankruptcy, failure to pay, or obligation acceleration) during the term of the swap, the seller agrees to either physically settle or cash settle the swap contract. If the swap is physically settled, the seller agrees to pay the buyer an amount equal to the notional amount and take delivery of a debt instrument of the reference issuer with a par amount equal to such notional amount. If the swap is cash settled, the seller agrees to pay the buyer the difference between the notional amount and the final price for the relevant debt instrument, as determined either in a market auction or pursuant to a pre-agreed-upon valuation procedure.
The notional amounts of swap contracts are not recorded in the Statement of Net Assets. Swaps are valued daily based on market quotations received from independent pricing services or recognized dealers and the change in value is recorded as an asset (liability) and as unrealized appreciation (depreciation) until the seller of credit protection is required to take delivery (or, in a cash settled swap, pay the settlement amount determined) upon occurrence of a credit event, periodic payments are made, or the swap terminates, at which time realized gain (loss) is recorded. The net premium to be received or paid by the fund under swap contracts is accrued daily and recorded as realized gain (loss) over the life of the contract.
The primary risk associated with selling credit protection is that, upon the occurrence of a defined credit event, the market value of the debt instrument received by the fund (or, in a cash settled swap, the debt instruments used to determine the settlement payment by the fund) will be significantly less than the amount paid by the fund and, in a physically settled swap, the fund may receive an illiquid debt instrument. A risk associated with all types of swaps is the possibility that a counterparty may default on its obligation to pay net amounts due to the fund. The fund’s maximum amount subject to counterparty risk is the unrealized appreciation on the swap contract. The fund mitigates its counterparty risk by entering into swaps only with a diverse group of prequalified counterparties, monitoring their financial strength, entering into master netting arrangements with its counterparties, and requiring its counterparties to transfer collateral as security for their performance. In the absence of a default, the collateral pledged or received by the fund cannot be repledged, resold, or rehypothecated. In the event of a counterparty’s default (including bankruptcy), the fund may terminate any swap contracts with that counterparty, determine the net amount owed by either party in accordance with its master netting arrangements, and sell or retain any collateral held up to the net amount owed to the fund under the master netting arrangements. The swap contracts contain provisions whereby a counterparty may terminate open contracts if the fund’s net assets decline below a certain level, triggering a payment by the fund if the fund is in a net liability position at the time of the termination. The payment amount would be reduced by any collateral the fund has pledged. Any securities pledged as collateral for open contracts are noted in the Schedule of Investments. The value of collateral received or pledged is compared daily to the value of the swap contracts exposure with each counterparty, and any difference, if in excess of a specified minimum transfer amount, is adjusted and settled within two business days.
34
Ultra-Short-Term Bond Fund
During the six months ended July 31, 2018, the fund’s average amounts of investments in credit protection sold and credit protection purchased represented less than 1% and 0% of net assets, respectively, based on the average of notional amounts at each quarter-end during the period.
6. Federal Income Taxes: The fund intends to continue to qualify as a regulated investment company and distribute all of its taxable income. Management has analyzed the fund’s tax positions taken for all open federal income tax years (December 31, 2014–2017), and for the period ended July 31, 2018, and has concluded that no provision for federal income tax is required in the fund’s financial statements.
7. Distributions: Distributions to shareholders are recorded on the ex-dividend date.
8. Credit Facility: The fund and certain other funds managed by The Vanguard Group (“Vanguard”) participate in a $3.1 billion committed credit facility provided by a syndicate of lenders pursuant to a credit agreement that may be renewed annually; each fund is individually liable for its borrowings, if any, under the credit facility. Borrowings may be utilized for temporary and emergency purposes, and are subject to the fund’s regulatory and contractual borrowing restrictions. The participating funds are charged administrative fees and an annual commitment fee of 0.10% of the undrawn amount of the facility; these fees are allocated to the funds based on a method approved by the fund’s board of trustees and included in Management and Administrative expenses on the fund’s Statement of Operations. Any borrowings under this facility bear interest at a rate based upon the higher of the one-month London Interbank Offered Rate, federal funds effective rate, or overnight bank funding rate plus an agreed-upon spread.
The fund had no borrowings outstanding at July 31, 2018, or at any time during the period then ended.
9. Other: Interest income includes income distributions received from Vanguard Market Liquidity Fund and is accrued daily. Premiums and discounts on debt securities purchased are amortized and accreted, respectively, to interest income over the lives of the respective securities. Security transactions are accounted for on the date securities are bought or sold. Costs used to determine realized gains (losses) on the sale of investment securities are those of the specific securities sold.
Each class of shares has equal rights as to assets and earnings, except that each class separately bears certain class-specific expenses related to maintenance of shareholder accounts (included in Management and Administrative expenses), shareholder reporting, and the proxy. Marketing and distribution expenses are allocated to each class of shares based on a method approved by the board of trustees. Income, other non-class-specific expenses, and gains and losses on investments are allocated to each class of shares based on its relative net assets.
B. In accordance with the terms of a Funds’ Service Agreement (the “FSA”) between Vanguard and the fund, Vanguard furnishes to the fund investment advisory, corporate management, administrative, marketing, and distribution services at Vanguard’s cost of operations (as defined by the FSA). These costs of operations are allocated to the fund based on methods and guidelines approved by the board of trustees. Vanguard does not require reimbursement in the current period for certain costs of operations (such as deferred compensation/benefits and risk/insurance costs); the fund’s liability for these costs of operations is included in Payables to Vanguard on the Statement of Assets and Liabilities. All other costs of operations payable to Vanguard are generally settled twice a month.
35
Ultra-Short-Term Bond Fund
Upon the request of Vanguard, the fund may invest up to 0.40% of its net assets as capital in Vanguard. At July 31, 2018, the fund had contributed to Vanguard capital in the amount of $233,000, representing 0.01% of the fund’s net assets and 0.09% of Vanguard’s capitalization. The fund’s trustees and officers are also directors and employees, respectively, of Vanguard.
C. Various inputs may be used to determine the value of the fund’s investments. These inputs are summarized in three broad levels for financial statement purposes. The inputs or methodologies used to value securities are not necessarily an indication of the risk associated with investing in those securities.
Level 1—Quoted prices in active markets for identical securities.
Level 2—Other significant observable inputs (including quoted prices for similar securities, interest rates, prepayment speeds, credit risk, etc.).
Level 3—Significant unobservable inputs (including the fund’s own assumptions used to determine
the fair value of investments). Any investments valued with significant unobservable inputs are
noted on the Statement of Net Assets.
The following table summarizes the market value of the fund’s investments as of July 31, 2018, based on the inputs used to value them:
| Level 1 | Level 2 | Level 3 | |
| Investments | ($000) | ($000) | ($000) |
| U.S. Government and Agency Obligations | — | 214,035 | — |
| Asset-Backed/Commercial Mortgage-Backed Securities | — | 1,923,575 | 18,230 |
| Corporate Bonds | — | 1,404,417 | — |
| Sovereign Bonds | — | 281,042 | — |
| Taxable Municipal Bonds | — | 2,480 | — |
| Temporary Cash Investments | 266,564 | 390,242 | — |
| Futures Contracts—Assets1 | 28 | — | — |
| Futures Contracts—Liabilities1 | (3) | — | — |
| Forward Currency Contracts—Assets | — | 512 | — |
| Forward Currency Contracts—Liabilities | — | (165) | — |
| Swap Contracts—Assets | — | 72 | — |
| Total | 266,589 | 4,216,210 | 18,230 |
| 1 Represents variation margin on the last day of the reporting period. |
36
Ultra-Short-Term Bond Fund
D. At July 31, 2018, the fair values of derivatives were reflected in the Statement of Assets and Liabilities as follows:
| Interest Rate | Currency | Credit | ||
| Contracts | Contracts | Contracts | Total | |
| Statement of Assets and Liabilities Caption | ($000) | ($000) | ($000) | ($000) |
| Variation Margin Receivable—Futures Contracts | 28 | — | — | 28 |
| Unrealized Appreciation—OTC Swap Contracts | — | — | 72 | 72 |
| Unrealized Appreciation—Forward | ||||
| Currency Contracts | — | 512 | — | 512 |
| Total Assets | 28 | 512 | 72 | 612 |
| Variation Margin Payable—Futures Contracts | (3) | — | — | (3) |
| Unrealized Depreciation—Forward | ||||
| Currency Contracts | — | (165) | — | (165) |
| Total Liabilities | (3) | (165) | — | (168) |
Realized net gain (loss) and the change in unrealized appreciation (depreciation) on derivatives for the six months ended July 31, 2018, were:
| Interest Rate | Currency | Credit | ||
| Contracts | Contracts | Contracts | Total | |
| Realized Net Gain (Loss) on Derivatives | ($000) | ($000) | ($000) | ($000) |
| Futures Contracts | (2,061) | — | — | (2,061) |
| Swap Contracts | — | — | 21 | 21 |
| Realized Net Gain (Loss) on Derivatives | (2,061) | — | 21 | (2,040) |
| Change in Unrealized Appreciation (Depreciation) on Derivatives | ||||
| Futures Contracts | (44) | — | — | (44) |
| Forward Currency Contracts | — | 347 | — | 347 |
| Swap Contracts | — | — | (11) | (11) |
| Change in Unrealized Appreciation | ||||
| (Depreciation) on Derivatives | (44) | 347 | (11) | 292 |
E. Distributions are determined on a tax basis and may differ from net investment income and realized capital gains for financial reporting purposes. Differences may be permanent or temporary. Permanent differences are reclassified among capital accounts in the financial statements to reflect their tax character. Temporary differences arise when gains or losses are recognized in different periods for financial statement and tax purposes. These differences will reverse at some time in the future. Differences in classification may also result from the treatment of short-term gains as ordinary income for tax purposes.
37
Ultra-Short-Term Bond Fund
The fund’s tax-basis capital gains and losses are determined only at the end of each fiscal year. For tax purposes, at January 31, 2018, the fund had available capital losses totaling $2,689,000 that may be carried forward indefinitely to offset future net capital gains. The fund will use these capital losses to offset future net taxable capital gains, if any, realized during the year ending January 31, 2019; should the fund realize net capital losses for the year, the losses will be added to the loss carryforward balance above.
At July 31, 2018, the cost of investment securities for tax purposes was $4,514,915,000. Net unrealized depreciation of investment securities for tax purposes was $14,330,000, consisting of unrealized gains of $850,000 on securities that had risen in value since their purchase and $15,180,000 in unrealized losses on securities that had fallen in value since their purchase.
F. During the six months ended July 31, 2018, the fund purchased $1,387,695,000 of investment securities and sold $932,412,000 of investment securities, other than U.S. government securities and temporary cash investments. Purchases and sales of U.S. government securities were $8,585,000 and $23,544,000, respectively.
G. Capital share transactions for each class of shares were:
| Six Months Ended | Year Ended | |||
| July 31, 2018 | January 31, 2018 | |||
| Amount | Shares | Amount | Shares | |
| ($000) | (000) | ($000) | (000) | |
| Investor Shares | ||||
| Issued | 173,557 | 17,422 | 208,452 | 20,840 |
| Issued in Lieu of Cash Distributions | 2,005 | 201 | 2,168 | 217 |
| Redeemed | (124,109) | (12,460) | (162,659) | (16,262) |
| Net Increase (Decrease)—Investor Shares | 51,453 | 5,163 | 47,961 | 4,795 |
| Admiral Shares | ||||
| Issued | 1,896,970 | 95,201 | 2,970,977 | 148,504 |
| Issued in Lieu of Cash Distributions | 34,100 | 1,713 | 37,385 | 1,870 |
| Redeemed | (1,067,622) | (53,574) | (1,547,345) | (77,342) |
| Net Increase (Decrease)—Admiral Shares | 863,448 | 43,340 | 1,461,017 | 73,032 |
H. Management has determined that no events or transactions occurred subsequent to July 31, 2018, that would require recognition or disclosure in these financial statements.
38
About Your Fund’s Expenses
As a shareholder of the fund, you incur ongoing costs, which include costs for portfolio management, administrative services, and shareholder reports (like this one), among others. Operating expenses, which are deducted from a fund’s gross income, directly reduce the investment return of the fund.
A fund’s expenses are expressed as a percentage of its average net assets. This figure is known as the expense ratio. The following examples are intended to help you understand the ongoing costs (in dollars) of investing in your fund and to compare these costs with those of other mutual funds. The examples are based on an investment of $1,000 made at the beginning of the period shown and held for the entire period.
The accompanying table illustrates your fund’s costs in two ways:
• Based on actual fund return. This section helps you to estimate the actual expenses that you paid over the period. The ”Ending Account Value“ shown is derived from the fund‘s actual return, and the third column shows the dollar amount that would have been paid by an investor who started with $1,000 in the fund. You may use the information here, together with the amount you invested, to estimate the expenses that you paid over the period.
To do so, simply divide your account value by $1,000 (for example, an $8,600 account value divided by $1,000 = 8.6), then multiply the result by the number given for your fund under the heading ”Expenses Paid During Period.“
• Based on hypothetical 5% yearly return. This section is intended to help you compare your fund‘s costs with those of other mutual funds. It assumes that the fund had a yearly return of 5% before expenses, but that the expense ratio is unchanged. In this case—because the return used is not the fund’s actual return—the results do not apply to your investment. The example is useful in making comparisons because the Securities and Exchange Commission requires all mutual funds to calculate expenses based on a 5% return. You can assess your fund’s costs by comparing this hypothetical example with the hypothetical examples that appear in shareholder reports of other funds.
Note that the expenses shown in the table are meant to highlight and help you compare ongoing costs only and do not reflect transaction costs incurred by the fund for buying and selling securities. Further, the expenses do not include any purchase, redemption, or account service fees described in the fund prospectus. If such fees were applied to your account, your costs would be higher. Your fund does not carry a “sales load.”
The calculations assume no shares were bought or sold during the period. Your actual costs may have been higher or lower, depending on the amount of your investment and the timing of any purchases or redemptions.
You can find more information about the fund’s expenses, including annual expense ratios, in the Financial Statements section of this report. For additional information on operating expenses and other shareholder costs, please refer to your fund’s current prospectus.
39
| Six Months Ended July 31, 2018 | |||
| Beginning | Ending | Expenses | |
| Account Value | Account Value | Paid During | |
| Ultra-Short-Term Bond Fund | 1/31/2018 | 7/31/2018 | Period |
| Based on Actual Fund Return | |||
| Investor Shares | $1,000.00 | $1,007.99 | $1.00 |
| Admiral Shares | 1,000.00 | 1,009.00 | 0.50 |
| Based on Hypothetical 5% Yearly Return | |||
| Investor Shares | $1,000.00 | $1,023.80 | $1.00 |
| Admiral Shares | 1,000.00 | 1,024.30 | 0.50 |
The calculations are based on expenses incurred in the most recent six-month period. The fund’s annualized six-month expense ratios for
that period are 0.20% for Investor Shares and 0.10% for Admiral Shares. The dollar amounts shown as “Expenses Paid” are equal to the
annualized expense ratio multiplied by the average account value over the period, multiplied by the number of days in the most recent
six-month period, then divided by the number of days in the most recent 12-month period (181/365).
40
Trustees Approve Advisory Arrangement
The board of trustees of Vanguard Ultra-Short-Term Bond Fund has renewed the fund’s investment advisory arrangement with The Vanguard Group, Inc. (Vanguard), through its Fixed Income Group. The board determined that continuing the fund’s internalized management structure was in the best interests of the fund and its shareholders.
The board based its decision upon an evaluation of the advisor’s investment staff, portfolio management process, and performance. This evaluation included information provided to the board by Vanguard’s Portfolio Review Department, which is responsible for fund and advisor oversight and product management. The Portfolio Review Department met regularly with the advisor and made monthly presentations to the board during the fiscal year that directed the board’s focus to relevant information and topics.
The board, or an investment committee made up of board members, also received information throughout the year during advisor presentations. For each advisor presentation, the board was provided with letters and reports that included information about, among other things, the advisory firm and the advisor’s assessment of the investment environment, portfolio performance, and portfolio characteristics.
In addition, the board received monthly reports, which included a Market and Economic Report, a Fund Dashboard Monthly Summary, and a Fund Performance Report.
Prior to their meeting, the trustees were provided with a memo and materials that summarized the information they received over the course of the year. They also considered the factors discussed below, among others. However, no single factor determined whether the board approved the arrangement. Rather, it was the totality of the circumstances that drove the board’s decision.
Nature, extent, and quality of services
The board reviewed the quality of the investment management services provided to the fund since its inception in 2015. The board considered that Vanguard has been managing investments for more than four decades. The Fixed Income Group adheres to a sound, disciplined investment management process; the team has considerable experience, stability, and depth.
The board concluded that Vanguard’s experience, stability, depth, and performance, among other factors, warranted approval of the advisory arrangement.
Investment performance
The board considered the fund’s performance since its inception, including any periods of outperformance or underperformance compared with a relevant benchmark index and peer group. The board concluded that the performance was such that the advisory arrangement should continue. Information about the fund’s most recent performance can be found in the Performance Summary section of this report.
Cost
The board concluded that the fund’s expense ratio was well below the average expense ratio charged by funds in its peer group and that the fund’s advisory expenses were also well below the peer-group average. Information about the fund’s expenses appears in the About Your Fund’s Expenses section of this report as well as in the Financial Statements section.
41
The board does not conduct a profitability analysis of Vanguard because of Vanguard’s unique “at-cost” structure. Unlike most other mutual fund management companies, Vanguard is owned by the funds it oversees and produces “profits” only in the form of reduced expenses for fund shareholders.
The benefit of economies of scale
The board concluded that the fund’s at-cost arrangement with Vanguard ensures that the fund will realize economies of scale as it grows, with the cost to shareholders declining as fund assets increase.
The board will consider whether to renew the advisory arrangement again after a one-year period.
42
Glossary
30-Day SEC Yield. A fund’s 30-day SEC yield is derived using a formula specified by the U.S. Securities and Exchange Commission. Under the formula, data related to the fund’s security holdings in the previous 30 days are used to calculate the fund’s hypothetical net income for that period, which is then annualized and divided by the fund’s estimated average net assets over the calculation period. For the purposes of this calculation, a security’s income is based on its current market yield to maturity (for bonds), its actual income (for asset-backed securities), or its projected dividend yield (for stocks). Because the SEC yield represents hypothetical annualized income, it will differ—at times significantly—from the fund’s actual experience. As a result, the fund’s income distributions may be higher or lower than implied by the SEC yield.
Average Coupon. The average interest rate paid on the fixed income securities held by a fund. It is expressed as a percentage of face value.
Average Duration. An estimate of how much the value of the bonds held by a fund will fluctuate in response to a change in interest rates. To see how the value could change, multiply the average duration by the change in rates. If interest rates rise by 1 percentage point, the value of the bonds in a fund with an average duration of five years would decline by about 5%. If rates decrease by a percentage point, the value would rise by 5%.
Average Effective Maturity. The average length of time until fixed income securities held by a fund reach maturity and are repaid, taking into consideration the possibility that the issuer may call the bond before its maturity date. The figure reflects the proportion of fund assets represented by each security; it also reflects any futures contracts held. In general, the longer the average effective maturity, the more a fund’s share price will fluctuate in response to changes in market interest rates.
Credit Quality. Credit-quality ratings are measured on a scale that generally ranges from AAA (highest) to D (lowest). U.S. Treasury, U.S. Agency, and U.S. Agency mortgage-backed securities appear under “U.S. Government.” Credit-quality ratings are obtained from Moody’s and S&P, and the higher rating for each issue is shown. ”Not Rated” is used to classify securities for which a rating is not available. Not rated securities include a fund’s investment in Vanguard Market Liquidity Fund or Vanguard Municipal Cash Management Fund, each of which invests in high-quality money market instruments and may serve as a cash management vehicle for the Vanguard funds, trusts, and accounts.
Expense Ratio. A fund’s total annual operating expenses expressed as a percentage of the fund’s average net assets. The expense ratio includes management and administrative expenses, but does not include the transaction costs of buying and selling portfolio securities.
Inception Date. The date on which the assets of a fund (or one of its share classes) are first invested in accordance with the fund’s investment objective. For funds with a subscription period, the inception date is the day after that period ends. Investment performance is measured from the inception date.
Short-Term Reserves. The percentage of a fund invested in highly liquid, short-term securities that can be readily converted to cash.
Yield to Maturity. The rate of return an investor would receive if the fixed income securities held by a fund were held to their maturity dates.
43
BLOOMBERG is a trademark and service mark of Bloomberg Finance L.P. BARCLAYS is a trademark and service mark of Barclays Bank Plc, used under license. Bloomberg Finance L.P. and its affiliates, including Bloomberg Index Services Limited (BISL) (collectively, Bloomberg), or Bloomberg’s licensors, own all proprietary rights in the Bloomberg Barclays U.S. Treasury Bellwethers: 1 Year Index (the Index or Bloomberg Barclays Index).
Neither Barclays Bank Plc, Barclays Capital Inc., or any affiliate (collectively Barclays) or Bloomberg is the issuer or producer of the Ultra-Short-Term Bond Fund and neither Bloomberg nor Barclays has any responsibilities, obligations or duties to investors in the Ultra-Short-Term Bond Fund. The Index is licensed for use by The Vanguard Group, Inc. (Vanguard) as the sponsor of the Ultra-Short-Term Bond Fund. Bloomberg and Barclays’ only relationship with Vanguard in respect of the Index is the licensing of the Index, which is determined, composed and calculated by BISL, or any successor thereto, without regard to the Issuer or the Ultra-Short-Term Bond Fund or the owners of the Ultra-Short-Term Bond Fund.
Additionally, Vanguard may for itself execute transaction(s) with Barclays in or relating to the Index in connection with the Ultra-Short-Term Bond Fund. Investors acquire the Ultra-Short-Term Bond Fund from Vanguard and investors neither acquire any interest in the Index nor enter into any relationship of any kind whatsoever with Bloomberg or Barclays upon making an investment in the Ultra-Short-Term Bond Fund. The Ultra-Short-Term Bond Fund is not sponsored, endorsed, sold or promoted by Bloomberg or Barclays. Neither Bloomberg nor Barclays makes any representation or warranty, express or implied regarding the advisability of investing in the Ultra-Short-Term Bond Fund or the advisability of investing in securities generally or the ability of the Index to track corresponding or relative market performance. Neither Bloomberg nor Barclays has passed on the legality or suitability of the Ultra-Short-Term Bond Fund with respect to any person or entity. Neither Bloomberg nor Barclays is responsible for and has not participated in the determination of the timing of, prices at, or quantities of the Ultra-Short-Term Bond Fund to be issued. Neither Bloomberg nor Barclays has any obligation to take the needs of the Issuer or the owners of the Ultra-Short-Term Bond Fund or any other third party into consideration in determining, composing or calculating the Index. Neither Bloomberg nor Barclays has any obligation or liability in connection with administration, marketing or trading of the Ultra-Short-Term Bond Fund.
The licensing agreement between Bloomberg and Barclays is solely for the benefit of Bloomberg and Barclays and not for the benefit of the owners of the Ultra-Short-Term Bond Fund, investors or other third parties. In addition, the licensing agreement between Vanguard and Bloomberg is solely for the benefit of Vanguard and Bloomberg and not for the benefit of the owners of the Ultra-Short-Term Bond Fund, investors or other third parties.
NEITHER BLOOMBERG NOR BARCLAYS SHALL HAVE ANY LIABILITY TO THE ISSUER, INVESTORS OR TO OTHER THIRD PARTIES FOR THE QUALITY, ACCURACY AND/OR COMPLETENESS OF THE BLOOMBERG BARCLAYS INDEX OR ANY DATA INCLUDED THEREIN OR FOR INTERRUPTIONS IN THE DELIVERY OF THE BLOOMBERG BARCLAYS INDEX.NEITHER BLOOMBERG NOR BARCLAYS MAKES ANY WARRANTY, EXPRESS OR IMPLIED, AS TO RESULTS TO BE OBTAINED BY THE ISSUER, THE INVESTORS OR ANY OTHER PERSON OR ENTITY FROM THE USE OF THE BLOOMBERG BARCLAYS INDEX OR ANY DATA INCLUDED THEREIN. NEITHER BLOOMBERG NOR BARCLAYS MAKES ANY EXPRESS OR IMPLIED WARRANTIES, AND EACH HEREBY EXPRESSLY DISCLAIMS ALL WARRANTIES OF MERCHANTABILITY OR FITNESS FOR A PARTICULAR PURPOSE OR USE WITH RESPECT TO THE BLOOMBERG BARCLAYS INDEX OR ANY DATA INCLUDED THEREIN. BLOOMBERG RESERVES THE RIGHT TO CHANGE THE METHODS OF CALCULATION OR PUBLICATION, OR TO CEASE THE CALCULATION OR PUBLICATION OF THE BLOOMBERG BARCLAYS INDEX, AND NEITHER BLOOMBERG NOR BARCLAYS SHALL BE LIABLE FOR ANY MISCALCULATION OF OR ANY INCORRECT, DELAYED OR INTERRUPTED PUBLICATION WITH RESPECT TO THE BLOOMBERG BARCLAYS INDEX. NEITHER BLOOMBERG NOR BARCLAYS SHALL BE LIABLE FOR ANY DAMAGES, INCLUDING, WITHOUT LIMITATION, ANY SPECIAL, INDIRECT OR CONSEQUENTIAL DAMAGES, OR ANY LOST PROFITS AND EVEN IF ADVISED OF THE POSSIBILITY OF SUCH, RESULTING FROM THE USE OF THE BLOOMBERG BARCLAYS INDEX OR ANY DATA INCLUDED THEREIN OR WITH RESPECT TO THE ULTRA-SHORT-TERM BOND FUND.
None of the information supplied by Bloomberg or Barclays and used in this publication may be reproduced in any manner without the prior written permission of both Bloomberg and Barclays Capital, the investment banking division of Barclays Bank Plc. Barclays Bank Plc is registered in England No. 1026167. Registered office 1 Churchill Place London E14 5HP.
© 2018 Bloomberg. Used with Permission.
Source: Bloomberg Index Services Limited.Copyright 2018, Bloomberg.All rights reserved.
44
This page intentionally left blank.
This page intentionally left blank.
The People Who Govern Your Fund
The trustees of your mutual fund are there to see that the fund is operated and managed in your best interests since, as a shareholder, you are a part owner of the fund. Your fund’s trustees also serve on the board of directors of The Vanguard Group, Inc., which is owned by the Vanguard funds and provides services to them on an at-cost basis.
A majority of Vanguard’s board members are independent, meaning that they have no affiliation with Vanguard or the funds they oversee, apart from the sizable personal investments they have made as private individuals. The independent board members have distinguished backgrounds in business, academia, and public service. Each of the trustees and executive officers oversees 208 Vanguard funds.
Information for each trustee and executive officer of the fund appears below. The mailing address of the trustees and officers is P.O. Box 876, Valley Forge, PA 19482. More information about the trustees is in the Statement of Additional Information, which can be obtained, without charge, by contacting Vanguard at 800-662-7447, or online at vanguard.com.
Interested Trustees1
F. William McNabb III
Born in 1957. Trustee since July 2009. Principal occupation(s) during the past five years and other experience: chairman of the board (January 2010–present) of Vanguard and of each of the investment companies served by Vanguard, trustee (2009–present) of each of the investment companies served by Vanguard, and director (2008–present) of Vanguard. Chief executive officer and president (2008–2017) of Vanguard and each of the investment companies served by Vanguard, managing director (1995–2008) of Vanguard, and director (1997–2018) of Vanguard Marketing Corporation. Director (2018–present) of UnitedHealth Group.
Mortimer J. Buckley
Born in 1969. Trustee since January 2018. Principal occupation(s) during the past five years and other experience: chief executive officer (January 2018–present) of Vanguard; chief executive officer, president, and trustee (January 2018–present) of each of the investment companies served by Vanguard; president and director (2017–present) of Vanguard; and president (February 2018–present) of Vanguard Marketing Corporation. Chief investment officer (2013–2017), managing director (2002–2017), head of the Retail Investor Group (2006–2012), and chief information officer (2001–2006) of Vanguard. Chairman of the board (2011–2017) of the Children’s Hospital of Philadelphia.
Independent Trustees
Emerson U. Fullwood
Born in 1948. Trustee since January 2008. Principal occupation(s) during the past five years and other experience: executive chief staff and marketing officer for North America and corporate vice president (retired 2008) of Xerox Corporation (document management products and services). Former president of the Worldwide Channels Group, Latin America, and Worldwide Customer Service and executive chief staff officer of Developing Markets of Xerox. Executive in residence and 2009–2010 Distinguished Minett Professor at the Rochester Institute of Technology. Lead director of SPX FLOW, Inc. (multi-industry manufacturing). Director of the University of Rochester Medical Center, the Monroe Community College Foundation, the United Way of Rochester, North Carolina A&T University, and Roberts Wesleyan College. Trustee of the University of Rochester.
Amy Gutmann
Born in 1949. Trustee since June 2006. Principal occupation(s) during the past five years and other experience: president (2004–present) of the University of Pennsylvania. Christopher H. Browne Distinguished Professor of Political Science, School of Arts and Sciences, and professor of communication, Annenberg School for Communication, with secondary faculty appointments in the Department of Philosophy, School of Arts and Sciences, and at the Graduate School of Education, University of Pennsylvania. Trustee of the National Constitution Center.
1 Mr. McNabb and Mr. Buckley are considered “interested persons,” as defined in the Investment Company Act of 1940, because they are officers of the Vanguard funds.
JoAnn Heffernan Heisen
Born in 1950. Trustee since July 1998. Principal occupation(s) during the past five years and other experience: corporate vice president of Johnson & Johnson (pharmaceuticals/medical devices/consumer products) and member of its executive committee (1997–2008). Chief global diversity officer (retired 2008), vice president and chief information officer (1997–2006), controller (1995–1997), treasurer (1991–1995), and assistant treasurer (1989–1991) of Johnson & Johnson. Director of Skytop Lodge Corporation (hotels) and the Robert Wood Johnson Foundation. Member of the advisory board of the Institute for Women’s Leadership at Rutgers University.
F. Joseph Loughrey
Born in 1949. Trustee since October 2009. Principal occupation(s) during the past five years and other experience: president and chief operating officer (retired 2009) and vice chairman of the board (2008–2009) of Cummins Inc. (industrial machinery). Chairman of the board of Hillenbrand, Inc. (specialized consumer services), Oxfam America, and the Lumina Foundation for Education. Director of the V Foundation for Cancer Research. Member of the advisory council for the College of Arts and Letters and chair of the advisory board to the Kellogg Institute for International Studies, both at the University of Notre Dame.
Mark Loughridge
Born in 1953. Trustee since March 2012. Principal occupation(s) during the past five years and other experience: senior vice president and chief financial officer (retired 2013) of IBM (information technology services). Fiduciary member of IBM’s Retirement Plan Committee (2004–2013), senior vice president and general manager (2002–2004) of IBM Global Financing, vice president and controller (1998–2002) of IBM, and a variety of other prior management roles at IBM. Member of the Council on Chicago Booth.
Scott C. Malpass
Born in 1962. Trustee since March 2012. Principal occupation(s) during the past five years and other experience: chief investment officer (1989–present) and vice president (1996–present) of the University of Notre Dame. Assistant professor of finance at the Mendoza College of Business, University of Notre Dame, and member of the Notre Dame 403(b) Investment Committee. Chairman of the board of TIFF Advisory Services, Inc. Member of the board of Catholic Investment Services, Inc. (investment advisors), the board of advisors for Spruceview Capital Partners, and the board of superintendence of the Institute for the Works of Religion.
Deanna Mulligan
Born in 1963. Trustee since January 2018. Principal occupation(s) during the past five years and other experience: president (2010–present) and chief executive officer (2011–present) of The Guardian Life Insurance Company of America. Chief operating officer (2010–2011) and executive vice president (2008–2010) of Individual Life and Disability of The Guardian Life Insurance Company of America. Member of the board of The Guardian Life Insurance Company of America, the American Council of Life Insurers, the Partnership for New York City (business leadership), and the Committee Encouraging Corporate Philanthropy. Trustee of the Economic Club of New York and the Bruce Museum (arts and science). Member of the Advisory Council for the Stanford Graduate School of Business.
André F. Perold
Born in 1952. Trustee since December 2004. Principal occupation(s) during the past five years and other experience: George Gund Professor of Finance and Banking, Emeritus at the Harvard Business School (retired 2011). Chief investment officer and co-managing partner of HighVista Strategies LLC (private investment firm). Overseer of the Museum of Fine Arts Boston.
Sarah Bloom Raskin
Born in 1961. Trustee since January 2018. Principal occupation(s) during the past five years and other experience: deputy secretary (2014–2017) of the United States Department of the Treasury. Governor (2010–2014) of the Federal Reserve Board. Commissioner (2007–2010) of financial regulation for the State of Maryland. Member of the board of directors (2012–2014) of Neighborhood Reinvestment Corporation. Director of i(x) Investments, LLC.
Peter F. Volanakis
Born in 1955. Trustee since July 2009. Principal occupation(s) during the past five years and other experience: president and chief operating officer (retired 2010) of Corning Incorporated (communications equipment) and director of Corning Incorporated (2000–2010) and Dow Corning (2001–2010). Director (2012) of SPX Corporation (multi-industry manufacturing). Overseer of the Amos Tuck School of Business Administration, Dartmouth College (2001–2013). Chairman of the board of trustees of Colby-Sawyer College. Member of the Board of Hypertherm Inc. (industrial cutting systems, software, and consumables).
Executive Officers
Glenn Booraem
Born in 1967. Principal occupation(s) during the past five years and other experience: principal of Vanguard. Investment stewardship officer (2017–present), treasurer (2015–2017), controller (2010–2015), and assistant controller (2001–2010) of each of the investment companies served by Vanguard.
Christine M. Buchanan
Born in 1970. Principal occupation(s) during the past five years and other experience: principal of Vanguard and global head of Fund Administration at Vanguard. Treasurer (2017–present) of each of the investment companies served by Vanguard. Partner (2005–2017) at KPMG LLP (audit, tax, and advisory services).
Brian Dvorak
Born in 1973. Principal occupation(s) during the past five years and other experience: principal of Vanguard. Chief compliance officer (2017–present) of Vanguard and each of the investment companies served by Vanguard. Assistant vice president (2017–present) of Vanguard Marketing Corporation. Vice president and director of Enterprise Risk Management (2011–2013) at Oppenheimer Funds, Inc.
Thomas J. Higgins
Born in 1957. Principal occupation(s) during the past five years and other experience: principal of Vanguard. Chief financial officer (2008–present) and treasurer (1998–2008) of each of the investment companies served by Vanguard.
Peter Mahoney
Born in 1974. Principal occupation(s) during the past five years and other experience: principal of Vanguard. Controller (2015–present) of each of the investment companies served by Vanguard. Head of International Fund Services (2008–2014) at Vanguard.
Anne E. Robinson
Born in 1970. Principal occupation(s) during the past five years and other experience: general counsel (2016–present) of Vanguard. Secretary (2016–present) of Vanguard and of each of the investment companies served by Vanguard. Managing director (2016–present) of Vanguard. Director and senior vice president (2016–2018) of Vanguard Marketing Corporation. Managing director and general counsel of Global Cards and Consumer Services (2014–2016) at Citigroup. Counsel (2003–2014) at American Express.
Michael Rollings
Born in 1963. Principal occupation(s) during the past five years and other experience: finance director (2017–present) and treasurer (2017) of each of the investment companies served by Vanguard. Managing director (2016–present) of Vanguard. Chief financial officer (2016–present) of Vanguard. Director (2016–present) of Vanguard Marketing Corporation. Executive vice president and chief financial officer (2006–2016) of MassMutual Financial Group.
| Vanguard Senior Management Team | |
| Mortimer J. Buckley | James M. Norris |
| Gregory Davis | Thomas M. Rampulla |
| John James | Karin A. Risi |
| Martha G. King | Anne E. Robinson |
| John T. Marcante | Michael Rollings |
| Chris D. McIsaac | |
| Chairman Emeritus and Senior Advisor | |
| John J. Brennan | |
| Chairman, 1996–2009 | |
| Chief Executive Officer and President, 1996–2008 | |
| Founder | |
| John C. Bogle | |
| Chairman and Chief Executive Officer, 1974–1996 | |
 | |
| P.O. Box 2600 | |
| Valley Forge, PA 19482-2600 | |
| Connect with Vanguard® > vanguard.com | |
| Fund Information > 800-662-7447 | CFA® is a registered trademark owned by CFA |
| Direct Investor Account Services > 800-662-2739 | Institute. |
| Institutional Investor Services > 800-523-1036 | |
| Text Telephone for People | |
| Who Are Deaf or Hard of Hearing > 800-749-7273 | |
| This material may be used in conjunction | |
| with the offering of shares of any Vanguard | |
| fund only if preceded or accompanied by | |
| the fund’s current prospectus. | |
| All comparative mutual fund data are from Lipper, a | |
| Thomson Reuters Company, or Morningstar, Inc., unless | |
| otherwise noted. | |
| You can obtain a free copy of Vanguard’s proxy voting | |
| guidelines by visiting vanguard.com/proxyreporting or by | |
| calling Vanguard at 800-662-2739. The guidelines are | |
| also available from the SEC’s website, sec.gov. In | |
| addition, you may obtain a free report on how your fund | |
| voted the proxies for securities it owned during the 12 | |
| months ended June 30. To get the report, visit either | |
| vanguard.com/proxyreporting or sec.gov. | |
| You can review and copy information about your fund at | |
| the SEC’s Public Reference Room in Washington, D.C. To | |
| find out more about this public service, call the SEC at | |
| 202-551-8090. Information about your fund is also | |
| available on the SEC’s website, and you can receive | |
| copies of this information, for a fee, by sending a | |
| request in either of two ways: via email addressed to | |
| publicinfo@sec.gov or via regular mail addressed to the | |
| Public Reference Section, Securities and Exchange | |
| Commission, Washington, DC 20549-1520. | |
| © 2018 The Vanguard Group, Inc. | |
| All rights reserved. | |
| Vanguard Marketing Corporation, Distributor. | |
| Q14922 092018 | |
Semiannual Report | July 31, 2018
Vanguard U.S. Government Bond Funds
Vanguard Short-Term Treasury Fund
Vanguard Short-Term Federal Fund
Vanguard Intermediate-Term Treasury Fund
Vanguard GNMA Fund
Vanguard Long-Term Treasury Fund
Vanguard’s Principles for Investing Success
We want to give you the best chance of investment success. These principles, grounded in Vanguard’s research and experience, can put you on the right path.
Goals. Create clear, appropriate investment goals.
Balance. Develop a suitable asset allocation using broadly diversified funds. Cost. Minimize cost.
Discipline. Maintain perspective and long-term discipline.
A single theme unites these principles: Focus on the things you can control.
We believe there is no wiser course for any investor.
| Contents | |
| Your Fund’s Performance at a Glance. | 1 |
| CEO’s Perspective. | 3 |
| Advisors’ Report. | 5 |
| Short-Term Treasury Fund. | 10 |
| Short-Term Federal Fund. | 27 |
| Intermediate-Term Treasury Fund. | 45 |
| GNMA Fund. | 63 |
| Long-Term Treasury Fund. | 83 |
| About Your Fund’s Expenses. | 99 |
| Trustees Approve Advisory Arrangements. | 102 |
| Glossary. | 104 |
Please note: The opinions expressed in this report are just that—informed opinions. They should not be considered promises or advice. Also, please keep in mind that the information and opinions cover the period through the date on the front of this report. Of course, the risks of investing in your fund are spelled out in the prospectus.
See the Glossary for definitions of investment terms used in this report.
About the cover: Nautical images have been part of Vanguard’s rich heritage since its start in 1975. For an incoming ship, a lighthouse offers a beacon and safe path to shore. You can similarly depend on Vanguard to put you first––and light the way––as you strive to meet your financial goals. Our client focus and low costs, stemming from our unique ownership structure, assure that your interests are paramount.
Your Fund’s Performance at a Glance
• For the six months ended July 31, 2018, the returns of the funds in this report ranged from –1.12% for Vanguard Long-Term Treasury Fund to 0.27% for both Vanguard Short-Term Treasury Fund and Vanguard GNMA Fund. (Returns cited are for Investor Shares.) All five funds outpaced their benchmarks; results versus their peer groups were mixed.
• Investor sentiment was dented at times by developments including escalating trade tensions, political uncertainty in Europe, and geopolitical flare-ups, which supported demand for bonds. The outlook for continuing growth and rising inflation expectations, however, led bond yields to finish the period higher and prices lower.
• In the Treasury Funds and Vanguard Short-Term Federal Fund, allocations to out-of-benchmark securities including Treasury inflation-protected securities, mortgage-backed securities, and agency debt generally added to relative performance.
• In the GNMA Fund, allocation and duration calls helped; security selection was the primary detractor.
| Total Returns: Six Months Ended July 31, 2018 | ||||
| 30-Day SEC | Income | Capital | Total | |
| Yield | Returns | Returns | Returns | |
| Vanguard Short-Term Treasury Fund | ||||
| Investor Shares | 2.27% | 1.03% | -0.76% | 0.27% |
| Admiral™ Shares | 2.37 | 1.07 | -0.76 | 0.31 |
| Bloomberg Barclays U.S. 1–5 Year Treasury Bond Index | 0.21 | |||
| Short-Term U.S. Treasury Funds Average | 0.79 | |||
| Short-Term U.S. Treasury Funds Average: Derived from data provided by Lipper, a Thomson Reuters Company. | ||||
| Vanguard Short-Term Federal Fund | ||||
| Investor Shares | 2.46% | 0.91% | -0.66% | 0.25% |
| Admiral Shares | 2.56 | 0.96 | -0.66 | 0.30 |
| Bloomberg Barclays U.S. 1–5 Year Government Bond Index | 0.22 | |||
| Short-Intermediate U.S. Government Funds Average | 0.09 | |||
| Short-Intermediate U.S. Government Funds Average: Derived from data provided by Lipper, a Thomson Reuters Company. | ||||
| Vanguard Intermediate-Term Treasury Fund | ||||
| Investor Shares | 2.65% | 1.13% | -1.29% | -0.16% |
| Admiral Shares | 2.75 | 1.18 | -1.29 | -0.11 |
| Bloomberg Barclays U.S. 5–10 Year Treasury Bond Index | -0.20 | |||
| General U.S. Treasury Funds Average | -0.68 | |||
| General U.S. Treasury Funds Average: Derived from data provided by Lipper, a Thomson Reuters Company. | ||||
1
| Total Returns: Six Months Ended July 31, 2018 | ||||
| 30-Day SEC | Income | Capital | Total | |
| Yield | Returns | Returns | Returns | |
| Vanguard GNMA Fund | ||||
| Investor Shares | 2.78% | 1.43% | -1.16% | 0.27% |
| Admiral Shares | 2.88 | 1.48 | -1.16 | 0.32 |
| Bloomberg Barclays U.S. GNMA Bond Index | 0.25 | |||
| GNMA Funds Average | -0.05 | |||
| GNMA Funds Average: Derived from data provided by Lipper, a Thomson Reuters Company. | ||||
| Vanguard Long-Term Treasury Fund | ||||
| Investor Shares | 2.86% | 1.39% | -2.51% | -1.12% |
| Admiral Shares | 2.96 | 1.44 | -2.51 | -1.07 |
| Bloomberg Barclays U.S. Long Treasury Bond Index | -1.23 | |||
| General U.S. Treasury Funds Average | -0.68 | |||
| General U.S. Treasury Funds Average: Derived from data provided by Lipper, a Thomson Reuters Company. | ||||
| Admiral Shares carry lower expenses and are available to investors who meet certain account-balance requirements. | ||||
| Expense Ratios | ||||
| Your Fund Compared With Its Peer Group | ||||
| Investor | Admiral | Peer Group | ||
| Shares | Shares | Average | ||
| Short-Term Treasury Fund | 0.20% | 0.10% | 0.47% | |
| Short-Term Federal Fund | 0.20 | 0.10 | 0.89 | |
| Intermediate-Term Treasury Fund | 0.20 | 0.10 | 0.37 | |
| GNMA Fund | 0.21 | 0.11 | 0.86 | |
| Long-Term Treasury Fund | 0.20 | 0.10 | 0.37 | |
The fund expense ratios shown are from the prospectus dated May 24, 2018, and represent estimated costs for the current fiscal year. For the six months ended July 31, 2018, the funds’ annualized expense ratios were: for the Short-Term Treasury Fund, 0.20% for Investor Shares and 0.10% for Admiral Shares; for the Short-Term Federal Fund, 0.20% for Investor Shares and 0.10% for Admiral Shares; for the Intermediate-Term Treasury Fund, 0.20% for Investor Shares and 0.10% for Admiral Shares; for the GNMA Fund, 0.21% for Investor Shares and 0.11% for Admiral Shares; and for the Long-Term Treasury Fund, 0.20% for Investor Shares and 0.10% for Admiral Shares. Peer-group expense ratios are derived from data provided by Lipper, a Thomson Reuters Company, and capture information through year-end 2017.
Peer groups: For the Short-Term Treasury Fund, Short-Term U.S. Treasury Funds; for the Short-Term Federal Fund, Short-Intermediate U.S. Government Funds; for the Intermediate-Term Treasury Fund, General U.S. Treasury Funds; for the GNMA Fund, GNMA Funds; and for the Long-Term Treasury Fund, General U.S. Treasury Funds.
2
CEO’s Perspective

Tim Buckley
President and Chief Executive Officer
Dear Shareholder,
I feel extremely fortunate to have the chance to lead a company filled with people who come to work every day passionate about Vanguard’s core purpose: to take a stand for all investors, to treat them fairly, and to give them the best chance for investment success.
When I joined Vanguard in 1991, I found a mission-driven team focused on improving lives—helping people retire more comfortably, put their children through college, and achieve financial security. I also found a company with purpose in an industry ripe for improvement.
It was clear, even early in my career, that the cards were stacked against most investors. Hidden fees, performance-chasing, and poor advice were relentlessly eroding investors’ dreams.
We knew Vanguard could be different and, as a result, could make a real difference. We have lowered the costs of investing for our shareholders significantly. And we’re proud of the performance of our funds.
Vanguard is built for Vanguard investors—we focus solely on you, our fund shareholders. Everything we do is designed to give our clients the best chance for investment success. In my role as CEO, I’ll keep this priority
3
front and center. We’re proud of what we’ve achieved, but we’re even more excited about what’s to come.
Steady, time-tested guidance
Our guidance for investors, as always, is to stay the course, tune out the hyperbolic headlines, and focus on your goals and what you can control, such as costs and how much you save. This time-tested advice has served our clients well over the decades.
Regardless of how the markets perform in the short term, I’m incredibly optimistic about the future for our investors. We have a dedicated team serving you, and we will never stop striving to make
Vanguard the best place for you to invest through our high-quality funds and services, advice and guidance to help you meet your financial goals, and an experience that makes you feel good about entrusting us with your hard-earned savings.
Thank you for your continued loyalty.
Sincerely,

Mortimer J. Buckley
President and Chief Executive Officer
August 16, 2018
| Market Barometer | |||
| Total Returns | |||
| Periods Ended July 31, 2018 | |||
| Six | One | Five Years | |
| Months | Year | (Annualized) | |
| Stocks | |||
| Russell 1000 Index (Large-caps) | 0.86% | 16.19% | 12.96% |
| Russell 2000 Index (Small-caps) | 6.75 | 18.73 | 11.33 |
| Russell 3000 Index (Broad U.S. market) | 1.30 | 16.39 | 12.83 |
| FTSE All-World ex US Index (International) | -6.57 | 6.19 | 5.97 |
| Bonds | |||
| Bloomberg Barclays U.S. Aggregate Bond Index | |||
| (Broad taxable market) | -0.45% | -0.80% | 2.25% |
| Bloomberg Barclays Municipal Bond Index | |||
| (Broad tax-exempt market) | 1.18 | 0.99 | 3.76 |
| FTSE Three-Month U. S. Treasury Bill Index | 0.83 | 1.41 | 0.41 |
| CPI | |||
| Consumer Price Index | 1.67% | 2.95% | 1.53% |
4
Advisors’ Report
For the Short-, Intermediate-, and Long-Term Treasury Funds and the Short-Term Federal Fund
The half year ended July 31, 2018, was a challenging period for bonds, marked by rising yields and bouts of volatility. Returns for the four U.S. Government Bond Funds managed by Vanguard’s Fixed Income Group ranged from –1.12% for Investor Shares of Vanguard Long-Term Treasury Fund to 0.31% for Admiral Shares of Vanguard Short-Term Treasury Fund.
All four funds outpaced their benchmarks. In comparison to the average return of their peers, the Short-Term and Long-Term Treasury Funds lagged while the Short-Term Federal and Intermediate-Term Treasury Funds outperformed.
The 30-day SEC yield for the Short-Term Federal Fund gained the most, rising 56 basis points to 2.46%. The Long-Term
Treasury Fund rose the least, edging up 18 basis points to 2.86%. (The yields cited here are for Investor Shares. A basis point is one-hundredth of a percentage point.)
Investment environment
Macroeconomic fundamentals were robust throughout the six months. Business confidence held up even in the face of trade uncertainties, and consumer spending was supported by solid expansion in the job market. Unemployment hit a 17-year low, finishing the period at 3.9%.
The tax cuts enacted late last year and the approval in March to increase federal government spending added to optimism about growth. It accelerated to a little over 3% in inflation-adjusted terms on an annualized basis for the first half of 2018. On the inflation front, price increases moved toward the Federal Reserve’s target of 2% with some help from an increase in the price of oil.
| Yields of U.S. Treasury Securities | ||
| January 31, | July 31, | |
| Maturity | 2018 | 2018 |
| 2 years | 2.14% | 2.67% |
| 3 years | 2.29 | 2.77 |
| 5 years | 2.52 | 2.85 |
| 10 years | 2.71 | 2.96 |
| 30 years | 2.94 | 3.08 |
| Source: Vanguard. |
5
Acknowledging the health of the economy, the Fed moved further down the path toward monetary policy normalization. It continued shrinking the $4.5 trillion balance sheet it had amassed as part of the stimulus begun in the wake of the 2008 financial crisis. It also raised the federal funds target rate in March and again in June, bringing it up to a range of 1.75%–2%, and signaled two more hikes to come before the end of 2018.
The Fed’s actions pushed shorter-term yields higher. The yield of the 2-year Treasury note climbed 53 basis points to 2.67%.
Demand for longer-term bonds was supported at times by escalating trade tensions, political uncertainty in Europe, and geopolitical flare-ups. Buying from pension funds and insurance companies also helped as they rebalanced their portfolios from equities and invested cash inflows from companies adding to underfunded pension plans. However, the outlook for growth and rising inflation expectations led yields on these securities higher, though not by as much as their shorter-term counterparts. The yield of the bellwether 10-year Treasury note ended the period 25 basis points higher at 2.96%.
Management of the funds
We were able to add value largely through limited positions in high-quality agency debt that falls outside of the funds’ benchmarks. We increased our holdings in Treasury inflation-protected securities early in the year to take advantage of the seasonal
upswing we usually see in the consumer price index. That exposure boosted the relative returns of all the funds and of the Short-Term Treasury Fund in particular. As this was a tactical move, we have since reduced our exposure to these securities.
Another out-of-benchmark allocation was to mortgage-backed securities, which made modestly positive contributions to relative returns. Agency debt, which was overweighted in the Federal Fund and an out-of-benchmark allocation in the three Treasury Funds, boosted performance in all but the Intermediate-Term Fund, which experienced some volatility from specific issuers.
In Treasuries, we had some success in curve positioning and identifying relative value opportunities. However, our duration exposure in the Short-Term and Intermediate-Term Treasury Funds, which have structurally short durations relative to their benchmarks, hurt. (Duration is a measure of a portfolio’s sensitivity to interest rate changes.) Having a little longer bias at the beginning of the year proved a drag when rates sold off in late January and into February.
Outlook
In the absence of any exogenous shocks, the U.S. economy is on pace to break above its long-term potential growth rate in 2018. The recent tax cuts and increased government spending should boost already solid fundamentals. Along with some upward pressure on wages due to the tight labor market, that may push the U.S. core
6
personal consumption expenditures price index a little above 2% by the end of the year.
We see this as a cyclical bounce, however. We still expect long-term structural pressures from an aging population, global sourcing of goods and labor, and technological disruptions to result in moderate long-run growth and inflation.
Upward adjustments to the Fed’s assumptions—the economy growing a little faster, unemployment falling a little lower, and inflation running a little higher—should justify another two rate hikes this year. The Fed has also penciled in rate hikes in 2019. The unwinding of its balance sheet is likely to continue in September given the limited reaction so far from the bond market.
We may continue to see bouts of volatility related to inflation and interest rate expectations as well as concerns about whether we are approaching the end of the current credit cycle. Other potential triggers include U.S. midterm elections, an intensification of trade disputes, flare-ups in geopolitical tensions, and missteps by central banks. The funds remained positioned to take advantage of any repricing of risk those concerns may create.
It’s worth restating that investors should look beyond short-term volatility and adhere to their long-term investment strategies. And keep in mind the silver lining in higher rates for long-term investors—coupon payments and proceeds from maturing bonds can be reinvested at higher rates.
Whatever the markets may bring, our experienced team of portfolio managers, credit analysts, and traders will continue to seek out opportunities to add to the funds’ performance.
John Hollyer, CFA, Principal Global Head of Fixed Income Group Gemma Wright-Casparius, Principal and Portfolio Manager Brian Quigley, Portfolio Manager Vanguard Fixed Income Group August 21, 2018
For the GNMA Fund
For the six months ended July 31, 2018, Investor Shares of Vanguard GNMA Fund returned 0.27% and Admiral Shares returned 0.32%. The fund’s benchmark, the Bloomberg Barclays GNMA Index, returned 0.25%.
Investment environment
Escalating geopolitical tensions from North Korea and populist politics in Europe, along with U.S. trade policy concerns, prompted occasional safe-haven flows into developed-market sovereign bonds during the period. Early-warning signs about a loss of economic momentum in the euro area and China also unsettled markets. However, the anticipated inflationary impact of U.S. trade tariffs and expectations of continued
7
monetary policy tightening pushed U.S. Treasury yields higher, despite elevated volatility in Europe. Against this backdrop, most credit sectors were adversely affected by increasing interest rates and widening credit spreads.
Global monetary policy remained on a less accommodative path as the U.S. Federal Reserve raised interest rates twice and projected two more hikes later this year. The European Central Bank announced a December 2018 end to quantitative easing but pledged to keep policy rates unchanged at least through the summer of 2019. The Bank of England raised its benchmark rate for the second time in a decade despite uncertainty over Brexit. And the Bank of Japan adjusted its policy framework because of slow progress toward its 2% inflation target. The People’s Bank of China was an outlier. It unexpectedly cut its reserve requirement ratio for most banks by 100 basis points to free up lending to small businesses.
In the United States, the labor market continued to strengthen and small business and consumer surveys remained elevated. Higher interest rates and low inventory led to mixed housing data. Meanwhile, the economic cycle in the euro area slowed, partly because of global trade frictions. U.K. core inflation dropped below the Bank of England’s target, and consumer confidence remained at relatively subdued levels. China’s Purchasing Managers’ Index was mixed, with an uptick in manufacturing activity but a drop in nonmanufacturing.
The agency mortgage-backed securities (MBS) market returned 0.11% as measured by the Bloomberg Barclays MBS Fixed Rate Index, underperforming duration-equivalent Treasuries by seven basis points (as measured by Wellington Management). An increase in volatility from extremely low levels and a widening in competing spread sectors weighed on performance early in the period. Various macro risks, including Italian politics and U.S. trade policy and protectionism, also pressured the sector, but it fared much better than investment-grade corporates. As volatility subsided, agency MBS were able to recoup a portion of their underperformance.
GNMA MBS returned 0.25% as measured by the Bloomberg Barclays GNMA Index, slightly outperforming duration-equivalent Treasuries by two basis points (as measured by Wellington Management). The GNMA sector performed better than conventionals (FNMA, FHLMC), aided by expectations of slowing prepayments after efforts to curb the aggressive refinancing of loans guaranteed by the U.S. Department of Veterans Affairs.
The fund’s successes
The fund’s allocation to agency collateralized mortgage obligations (CMOs) aided relative performance for the six months. Its tactical short duration bias and curve-flattening posture also helped as interest rates increased and short- to intermediate-term yields rose more than long-term yields.
8
The fund’s shortfalls
Security selection in 30-year GNMA pass-throughs was the primary detractor from relative performance. Our selection remained focused on identifying pools with attractive prepayment characteristics as a way to add value as MBS spreads remained relatively tight. The fund’s allocation to Fannie Mae multifamily Delegated Underwriting and Servicing (DUS) bonds also detracted when they underperformed on an excess return basis.
The fund’s positioning
We are underweighted in agency MBS pass-throughs and focused on replacing their income with less prepayment-sensitive sectors of the agency MBS market. We have a bias toward assets that can generate income and provide more stable cash flows, such as Fannie Mae DUS bonds, agency CMOs, and high-quality agency multifamily bonds.
MBS valuations are fair in our view. Mortgages have become more attractive as spreads relative to Treasuries are wider than their 2017 levels; however, nominal spreads are still near their long-term lows. This reflection of steady economic growth, benign inflation, and historically low volatility skews the risks to the downside should any of these factors revert. An increase in market volatility has pushed spreads wider in competing sectors. Concerns about further underperformance in some of these higher-beta sectors could cause investors to de-risk and shift into higher-quality assets. That could push agency MBS spreads wider, but they would likely still outperform on a relative basis.
We expect continued strength in employment and housing this year, and the Fed should tighten monetary conditions modestly. This market-consensus view should be consistent with a flattening yield curve and slightly higher Treasury rates. Risk seems most likely to pop up in political and trade-related areas.
The pace of the Fed’s balance sheet reduction will gradually increase. Reinvestments have provided support to the MBS market and spreads may still need to widen modestly to absorb the resulting net new supply. The Fed has been very transparent regarding the timing and measured pace of its policy normalization. As a result, we expect spreads will widen gradually and that MBS income will further slow the pace.
As we look further out, we still expect MBS spreads to remain toward the tight end of their long-term range based on their favorable supply relative to U.S. Treasuries. We also anticipate lower leverage in the economy, a more stable buyer base of long-term investors, a constrained mortgage credit environment, and lower refinancing risk.
Michael F. Garrett
Senior Managing Director and Fixed Income Portfolio Manager Wellington Management Company llp August 21, 2018
9
Short-Term Treasury Fund
Fund Profile
As of July 31, 2018
| Share-Class Characteristics | ||
| Investor | Admiral | |
| Shares | Shares | |
| Ticker Symbol | VFISX | VFIRX |
| Expense Ratio1 | 0.20% | 0.10% |
| 30-Day SEC Yield | 2.27% | 2.37% |
| Financial Attributes | |||
| Bloomberg | |||
| Barclays | Bloomberg | ||
| 1–5 Year | Barclays | ||
| Treasury | Aggregate | ||
| Fund | Index | Bond Index | |
| Number of Bonds | 79 | 156 | 10,012 |
| Yield to Maturity | |||
| (before expenses) | 2.8% | 2.7% | 3.4% |
| Average Coupon | 1.6% | 1.9% | 3.1% |
| Average Duration | 2.2 years | 2.7 years | 6.0 years |
| Average Effective | |||
| Maturity | 2.2 years | 2.8 years | 8.4 years |
| Short-Term | |||
| Reserves | 4.3% | — | — |
| Sector Diversification (% of portfolio) | |
| Government Mortgage-Backed | 3.0% |
| Treasury/Agency | 97.0 |
The agency and mortgage-backed securities sectors may include
issues from government-sponsored enterprises; such issues are
generally not backed by the full faith and credit of the U.S.
government.
| Volatility Measures | ||
| Bloomberg | ||
| Barclays | Bloomberg | |
| 1–5 Year | Barclays | |
| Treasury | Aggregate | |
| Index | Bond Index | |
| R-Squared | 0.95 | 0.69 |
| Beta | 0.73 | 0.32 |
| These measures show the degree and timing of the fund’s | ||
| fluctuations compared with the indexes over 36 months. | ||
| Distribution by Effective Maturity | |
| (% of portfolio) | |
| Under 1 Year | 8.3% |
| 1 - 3 Years | 81.4 |
| 3 - 5 Years | 7.3 |
| 5 - 7 Years | 0.5 |
| 7 - 10 Years | 2.5 |
| Distribution by Credit Quality (% of portfolio) | |
| U.S. Government | 95.4% |
| Not Rated | 4.6 |
Credit-quality ratings are obtained from Moody's and S&P, and the higher rating for each issue is shown. "Not Rated" is used to classify securities for which a rating is not available. Not rated securities include a fund's investment in Vanguard Market Liquidity Fund or Vanguard Municipal Cash Management Fund, each of which invests in high-quality money market instruments and may serve as a cash management vehicle for the Vanguard funds, trusts, and accounts. For more information about these ratings, see the Glossary entry for Credit Quality.
Investment Focus
Short-Term Treasury Fund
Performance Summary
All of the returns in this report represent past performance, which is not a guarantee of future results that may be achieved by the fund. (Current performance may be lower or higher than the performance data cited. For performance data current to the most recent month-end, visit our website at vanguard.com/performance.) Note, too, that both investment returns and principal value can fluctuate widely, so an investor’s shares, when sold, could be worth more or less than their original cost. The returns shown do not reflect taxes that a shareholder would pay on fund distributions or on the sale of fund shares.
| Fiscal-Year Total Returns (%): January 31, 2008, Through July 31, 2018 | ||||
| Bloomberg | ||||
| Barclays | ||||
| 1–5 Year | ||||
| Treasury | ||||
| Investor Shares | Index | |||
| Fiscal Year | Income Returns | Capital Returns | Total Returns | Total Returns |
| 2009 | 2.70% | 1.79% | 4.49% | 5.84% |
| 2010 | 1.60 | 0.90 | 2.50 | 1.95 |
| 2011 | 1.09 | 0.83 | 1.92 | 2.94 |
| 2012 | 0.68 | 1.56 | 2.24 | 3.38 |
| 2013 | 0.41 | -0.02 | 0.39 | 0.45 |
| 2014 | 0.36 | -0.08 | 0.28 | 0.38 |
| 2015 | 0.51 | 0.50 | 1.01 | 1.75 |
| 2016 | 0.70 | -0.04 | 0.66 | 1.04 |
| 2017 | 0.88 | -0.45 | 0.43 | 0.11 |
| 2018 | 1.19 | -1.50 | -0.31 | -0.10 |
| 2019 | 1.03 | -0.76 | 0.27 | 0.21 |
| Note: For 2019, performance data reflect the six months ended July 31, 2018. | ||||
Average Annual Total Returns: Periods Ended June 30, 2018
This table presents returns through the latest calendar quarter—rather than through the end of the fiscal period.
Securities and Exchange Commission rules require that we provide this information.
| Ten Years | ||||||
| Inception Date | One Year | Five Years | Income | Capital | Total | |
| Investor Shares | 10/28/1991 | -0.23% | 0.55% | 0.97% | 0.40% | 1.37% |
| Admiral Shares | 2/13/2001 | -0.13 | 0.65 | 1.07 | 0.40 | 1.47 |
See Financial Highlights for dividend and capital gains information.
11
Short-Term Treasury Fund
Financial Statements (unaudited)
Statement of Net Assets
As of July 31, 2018
The fund reports a complete list of its holdings in regulatory filings four times in each fiscal year, at the quarter-ends. For the second and fourth fiscal quarters, the lists appear in the fund’s semiannual and annual reports to shareholders. For the first and third fiscal quarters, the fund files the lists with the Securities and Exchange Commission on Form N-Q. Shareholders can look up the fund’s Forms N-Q on the SEC’s website at sec.gov. Forms N-Q may also be reviewed and copied at the SEC’s Public Reference Room (see the back cover of this report for further information).
| Face | Market | |||
| Maturity | Amount | Value • | ||
| Coupon | Date | ($000) | ($000) | |
| U. S. Government and Agency Obligations (101.3%) | ||||
| U.S. Government Securities (91.5%) | ||||
| United States Treasury Note/Bond | 1.625% | 3/31/19 | 3,000 | 2,987 |
| United States Treasury Note/Bond | 0.875% | 4/15/19 | 150,000 | 148,500 |
| United States Treasury Note/Bond | 1.625% | 4/30/19 | 350,000 | 348,085 |
| United States Treasury Note/Bond | 3.125% | 5/15/19 | 30,000 | 30,169 |
| United States Treasury Note/Bond | 0.750% | 7/15/19 | 198,000 | 194,844 |
| United States Treasury Note/Bond | 1.625% | 7/31/19 | 200,000 | 198,312 |
| United States Treasury Note/Bond | 1.000% | 8/31/19 | 362,000 | 356,230 |
| United States Treasury Note/Bond | 1.625% | 8/31/19 | 170,000 | 168,405 |
| United States Treasury Note/Bond | 0.875% | 9/15/19 | 50,000 | 49,102 |
| United States Treasury Note/Bond | 1.375% | 9/30/19 | 50,000 | 49,344 |
| United States Treasury Note/Bond | 1.750% | 9/30/19 | 173,000 | 171,486 |
| United States Treasury Note/Bond | 1.000% | 10/15/19 | 148,000 | 145,318 |
| United States Treasury Note/Bond | 1.500% | 10/31/19 | 101,000 | 99,706 |
| United States Treasury Note/Bond | 1.000% | 11/15/19 | 50,000 | 49,016 |
| United States Treasury Note/Bond | 3.375% | 11/15/19 | 75,000 | 75,773 |
| United States Treasury Note/Bond | 1.500% | 11/30/19 | 200,000 | 197,218 |
| United States Treasury Note/Bond | 1.750% | 11/30/19 | 325,000 | 321,549 |
| United States Treasury Note/Bond | 1.375% | 12/15/19 | 160,000 | 157,426 |
| United States Treasury Note/Bond | 1.125% | 12/31/19 | 200,000 | 195,968 |
| United States Treasury Note/Bond | 1.375% | 2/15/20 | 24,000 | 23,554 |
| United States Treasury Note/Bond | 1.125% | 3/31/20 | 13,000 | 12,681 |
| United States Treasury Note/Bond | 2.250% | 3/31/20 | 60,000 | 59,615 |
| United States Treasury Note/Bond | 1.375% | 4/30/20 | 74,350 | 72,747 |
| United States Treasury Note/Bond | 2.000% | 7/31/20 | 90,000 | 88,819 |
| United States Treasury Note/Bond | 1.500% | 8/15/20 | 45,000 | 43,945 |
| United States Treasury Note/Bond | 2.625% | 8/15/20 | 114,000 | 113,876 |
| United States Treasury Note/Bond | 1.375% | 8/31/20 | 85,000 | 82,742 |
| United States Treasury Note/Bond | 1.375% | 9/30/20 | 40,000 | 38,900 |
| United States Treasury Note/Bond | 2.000% | 9/30/20 | 175,000 | 172,429 |
| United States Treasury Note/Bond | 1.625% | 10/15/20 | 28,200 | 27,548 |
| United States Treasury Note/Bond | 1.375% | 10/31/20 | 60,000 | 58,256 |
| United States Treasury Note/Bond | 1.750% | 10/31/20 | 70,000 | 68,524 |
| United States Treasury Note/Bond | 2.625% | 11/15/20 | 104,750 | 104,505 |
| United States Treasury Note/Bond | 1.625% | 11/30/20 | 100,000 | 97,531 |
| United States Treasury Note/Bond | 2.000% | 11/30/20 | 47,000 | 46,236 |
| United States Treasury Note/Bond | 1.875% | 12/15/20 | 211,150 | 207,058 |
| 12 | ||||
| Short-Term Treasury Fund | |||||
| Face | Market | ||||
| Maturity | Amount | Value • | |||
| Coupon | Date | ($000) | ($000) | ||
| United States Treasury Note/Bond | 1.750% | 12/31/20 | 223,415 | 218,319 | |
| United States Treasury Note/Bond | 1.375% | 1/31/21 | 190,000 | 183,736 | |
| 1 | United States Treasury Note/Bond | 2.125% | 1/31/21 | 102,000 | 100,470 |
| United States Treasury Note/Bond | 2.250% | 2/15/21 | 225,000 | 222,257 | |
| United States Treasury Note/Bond | 3.625% | 2/15/21 | 32,000 | 32,680 | |
| United States Treasury Note/Bond | 1.125% | 2/28/21 | 150,000 | 143,976 | |
| United States Treasury Note/Bond | 2.000% | 2/28/21 | 250,000 | 245,313 | |
| United States Treasury Note/Bond | 1.250% | 3/31/21 | 200,000 | 192,312 | |
| United States Treasury Note/Bond | 2.250% | 3/31/21 | 200,000 | 197,376 | |
| United States Treasury Note/Bond | 1.375% | 4/30/21 | 285,000 | 274,580 | |
| United States Treasury Note/Bond | 2.625% | 5/15/21 | 85,000 | 84,668 | |
| United States Treasury Note/Bond | 3.125% | 5/15/21 | 46,000 | 46,438 | |
| United States Treasury Note/Bond | 1.375% | 5/31/21 | 190,000 | 182,816 | |
| United States Treasury Note/Bond | 1.125% | 6/30/21 | 93,000 | 88,742 | |
| United States Treasury Note/Bond | 1.125% | 7/31/21 | 50,000 | 47,641 | |
| United States Treasury Note/Bond | 2.125% | 8/15/21 | 170,000 | 166,760 | |
| United States Treasury Note/Bond | 1.750% | 11/30/21 | 225,000 | 217,548 | |
| United States Treasury Note/Bond | 1.750% | 4/30/22 | 35,000 | 33,688 | |
| United States Treasury Note/Bond | 1.875% | 4/30/22 | 5,000 | 4,834 | |
| United States Treasury Note/Bond | 2.000% | 11/30/22 | 53,530 | 51,732 | |
| 7,014,290 | |||||
| Agency Bonds and Notes (6.7%) | |||||
| 2 | AID-Iraq | 2.149% | 1/18/22 | 11,991 | 11,674 |
| 2 | AID-Tunisia | 1.416% | 8/5/21 | 16,500 | 15,754 |
| 3 | Fannie Mae Interest Strip | 0.000% | 1/15/19 | 2,197 | 2,174 |
| 3 | Fannie Mae Principal Strip | 0.000% | 2/1/19 | 9,900 | 9,787 |
| 3 | Federal National Mortgage Assn. | 0.000% | 10/9/19 | 162,100 | 157,117 |
| 4 | Financing Corp. | 0.000% | 11/2/18 | 2,150 | 2,138 |
| 4 | Financing Corp. | 0.000% | 3/7/19 | 5,475 | 5,398 |
| 4 | Financing Corp. | 9.700% | 4/5/19 | 9,060 | 9,500 |
| Government Trust Certificate | 0.000% | 10/1/20 | 12,119 | 11,369 | |
| Private Export Funding Corp. | 4.375% | 3/15/19 | 13,330 | 13,488 | |
| Private Export Funding Corp. | 1.450% | 8/15/19 | 30,534 | 30,175 | |
| Private Export Funding Corp. | 2.250% | 3/15/20 | 5,800 | 5,750 | |
| Private Export Funding Corp. | 2.300% | 9/15/20 | 7,550 | 7,464 | |
| Residual Funding Corp. Principal Strip | 0.000% | 1/15/21 | 61,200 | 57,079 | |
| Resolution Funding Corp. Principal Strip | 0.000% | 10/15/19 | 67,770 | 65,658 | |
| Resolution Funding Corp. Principal Strip | 0.000% | 7/15/20 | 27,490 | 26,046 | |
| Resolution Funding Corp. Principal Strip | 0.000% | 10/15/20 | 91,620 | 86,135 | |
| 516,706 | |||||
| Conventional Mortgage-Backed Securities (2.6%) | |||||
| 3,5,6 Fannie Mae Pool | 3.500% | 8/1/48 | 99,000 | 98,087 | |
| 3,5,6 Fannie Mae Pool | 4.000% | 8/1/48 | 46,000 | 46,719 | |
| 3,5,6 Fannie Mae Pool | 4.500% | 8/1/48 | 19,000 | 19,706 | |
| 3,5,6 Fannie Mae Pool | 5.000% | 10/1/48 | 30,000 | 31,580 | |
| 3,5 | Freddie Mac Gold Pool | 6.000% | 10/1/27–4/1/28 | 72 | 79 |
| 196,171 | |||||
| 13 | |||||
| Short-Term Treasury Fund | |||||
| Face | Market | ||||
| Maturity | Amount | Value • | |||
| Coupon | Date | ($000) | ($000) | ||
| Nonconventional Mortgage-Backed Securities (0.5%) | |||||
| 3,5,7 Fannie Mae REMICS 2016-1 | 2.414% | 2/25/46 | 10,839 | 10,917 | |
| 3,5,7 Fannie Mae REMICS 2016-6 | 2.514% | 2/25/46 | 7,417 | 7,537 | |
| 1,3,5,7 Fannie Mae REMICS 2016-93 | 2.414% | 12/25/46 | 7,799 | 7,771 | |
| 3,5,7 Freddie Mac REMICS | 2.472% | 5/15/46 | 7,401 | 7,424 | |
| 3,5,7 Freddie Mac REMICS | 2.522% | 10/15/46 | 7,127 | 7,193 | |
| 40,842 | |||||
| Total U.S. Government and Agency Obligations (Cost $7,818,417) | 7,768,009 | ||||
| Shares | |||||
| Temporary Cash Investment (4.6%) | |||||
| Money Market Fund (4.6%) | |||||
| 8 Vanguard Market Liquidity Fund | |||||
| (Cost $350,094) | 2.145% | 3,500,610 | 350,061 | ||
| Total Investments (105.9%) (Cost $8,168,511) | 8,118,070 | ||||
| Notional | |||||
| Expiration | Exercise | Amount | |||
| Date | Contracts | Price | ($000) | ||
| Liability for Options Written (0.0%) | |||||
| Call Options on 10-Year | |||||
| U.S. Treasury Note | |||||
| Futures Contracts | 8/10/18 | 66 | USD 119.25 | 7,871 | (26) |
| Call Options on 10-Year | |||||
| U.S. Treasury Note | |||||
| Futures Contracts | 8/24/18 | 573 | USD 120.00 | 68,760 | (108) |
| Call Options on 10-Year | |||||
| U.S. Treasury Note | |||||
| Futures Contracts | 8/27/18 | 198 | USD 119.50 | 23,661 | (74) |
| Put Options on 10-Year | |||||
| U.S. Treasury Note | |||||
| Futures Contracts | 8/10/18 | 66 | USD 119.25 | 7,871 | (14) |
| Put Options on 10-Year | |||||
| U.S. Treasury Note | |||||
| Futures Contracts | 8/24/18 | 506 | USD 118.50 | 59,961 | (63) |
| Put Options on 10-Year | |||||
| U.S. Treasury Note | |||||
| Futures Contracts | 8/24/18 | 67 | USD 120.00 | 8,040 | (51) |
| Put Options on 10-Year | |||||
| U.S. Treasury Note | |||||
| Futures Contracts | 8/24/18 | 132 | USD 119.00 | 15,708 | (31) |
| Put Options on 10-Year | |||||
| U.S. Treasury Note | |||||
| Futures Contracts | 8/27/18 | 66 | USD 119.50 | 7,887 | (30) |
| Total Liability for Options Written (Premiums Received $814) | (397) | ||||
| Other Assets and Other Liabilities (-5.9%) | |||||
| Other Assets | 775,240 | ||||
| Other Liabilities | (1,227,087) | ||||
| (451,847) | |||||
| Net Assets (100%) | 7,665,826 | ||||
| 14 | |||||
| Short-Term Treasury Fund | ||
| Amount | ||
| ($000) | ||
| Statement of Assets and Liabilities | ||
| Assets | ||
| Investments in Securities, at Value | ||
| Unaffiliated Issuers | 7,768,009 | |
| Affiliated Issuers | 350,061 | |
| Total Investments in Securities | 8,118,070 | |
| Investment in Vanguard | 406 | |
| Receivables for Investment Securities Sold | 718,424 | |
| Receivables for Accrued Income | 33,918 | |
| Receivables for Capital Shares Issued | 21,481 | |
| Variation Margin Receivable—Futures Contracts | 239 | |
| Other Assets | 772 | |
| Total Assets | 8,893,310 | |
| Liabilities | ||
| Payables for Investment Securities Purchased | 1,208,041 | |
| Payables for Capital Shares Redeemed | 13,475 | |
| Payables for Distributions | 2,633 | |
| Payables to Vanguard | 2,677 | |
| Liabilities for Options Written | 397 | |
| Variation Margin Payable—Futures Contracts | 261 | |
| Total Liabilities | 1,227,484 | |
| Net Assets | 7,665,826 | |
| At July 31, 2018, net assets consisted of: | ||
| Amount | ||
| ($000) | ||
| Paid-in Capital | 7,873,160 | |
| Undistributed Net Investment Income | 48 | |
| Accumulated Net Realized Losses | (156,428) | |
| Unrealized Appreciation (Depreciation) | ||
| Investment Securities | (50,441) | |
| Futures Contracts | (930) | |
| Options on Futures Contracts 9 | 417 | |
| Net Assets | 7,665,826 | |
| 15 | ||
Short-Term Treasury Fund
| Amount | |
| ($000) | |
| Investor Shares—Net Assets | |
| Applicable to 62,498,028 outstanding $.001 par value shares of | |
| beneficial interest (unlimited authorization) | 650,744 |
| Net Asset Value Per Share—Investor Shares | $10.41 |
| Admiral Shares—Net Assets | |
| Applicable to 673,737,447 outstanding $.001 par value shares of | |
| beneficial interest (unlimited authorization) | 7,015,082 |
| Net Asset Value Per Share—Admiral Shares | $10.41 |
• See Note A in Notes to Financial Statements.
1 Securities with a value of $7,087,000 have been segregated as initial margin for open futures contracts.
2 U.S. government-guaranteed.
3 The issuer was placed under federal conservatorship in September 2008; since that time, its daily operations have been managed
by the Federal Housing Finance Agency and it receives capital from the U.S. Treasury, as needed to maintain a positive net worth,
in exchange for senior preferred stock.
4 The issuer operates under a congressional charter; its securities are generally neither guaranteed by the U.S. Treasury nor backed
by the full faith and credit of the U.S. government.
5 The average or expected maturity is shorter than the final maturity shown because of the possibility of interim principal payments
and prepayments or the possibility of the issue being called.
6 Includes securities purchased on a when-issued or delayed-delivery basis for which the fund has not taken delivery as of
July 31, 2018.
7 Adjustable-rate security based upon 1-month USD LIBOR plus spread.
8 Affiliated money market fund available only to Vanguard funds and certain trusts and accounts managed by Vanguard. Rate shown
is the 7-day yield.
9 Unrealized appreciation (depreciation) on options on futures contracts is required to be treated as realized gain (loss) for tax purposes.
REMICS —Real Estate Mortgage Investment Conduits.
16
Short-Term Treasury Fund
| Derivative Financial Instruments Outstanding as of Period End | ||||
| Futures Contracts | ||||
| ($000) | ||||
| Value and | ||||
| Number of | Unrealized | |||
| Long (Short) | Notional | Appreciation | ||
| Expiration | Contracts | Amount | (Depreciation) | |
| Long Futures Contracts | ||||
| 2-Year U.S. Treasury Note | September 2018 | 4,954 | 1,047,152 | (1,538) |
| 5-Year U.S. Treasury Note | September 2018 | 3,660 | 414,038 | (718) |
| Ultra Long U. S. Treasury Bond | September 2018 | 145 | 22,751 | 22 |
| (2,234) | ||||
| Short Futures Contracts | ||||
| Ultra 10-Year U.S. Treasury Note | September 2018 | (1,625) | (206,553) | 1,286 |
| 10-Year U.S. Treasury Note | September 2018 | (567) | (67,712) | 18 |
| 1,304 | ||||
| (930) | ||||
Unrealized appreciation (depreciation) on open futures contracts is required to be treated as realized gain (loss) for tax purposes.
See accompanying Notes, which are an integral part of the Financial Statements.
17
Short-Term Treasury Fund
Statement of Operations
| Six Months Ended | |
| July31,2018 | |
| ($000) | |
| Investment Income | |
| Income | |
| Interest1 | 87,159 |
| Total Income | 87,159 |
| Expenses | |
| The Vanguard Group—Note B | |
| Investment Advisory Services | 289 |
| Management and Administrative—Investor Shares | 583 |
| Management and Administrative—Admiral Shares | 2,910 |
| Marketing and Distribution—Investor Shares | 59 |
| Marketing and Distribution—Admiral Shares | 233 |
| Custodian Fees | 47 |
| Shareholders’ Reports—Investor Shares | 9 |
| Shareholders’ Reports—Admiral Shares | 34 |
| Trustees’ Fees and Expenses | 3 |
| Total Expenses | 4,167 |
| Net Investment Income | 82,992 |
| Realized Net Gain (Loss) | |
| Investment Securities Sold1 | (62,794) |
| Futures Contracts | (8,411) |
| Purchased Options | (104) |
| Written Options | (200) |
| Realized Net Gain (Loss) | (71,509) |
| Change in Unrealized Appreciation (Depreciation) | |
| Investment Securities1 | 10,573 |
| Futures Contracts | 3,296 |
| Written Options | 857 |
| Change in Unrealized Appreciation (Depreciation) | 14,726 |
| Net Increase (Decrease) in Net Assets Resulting from Operations | 26,209 |
| 1 Interest income, realized net gain (loss), and change in unrealized appreciation (depreciation) from an affiliated company of the fund | |
| were $1,898,000, $9,000, and ($33,000), respectively. Purchases and sales are for temporary cash investment purposes. | |
See accompanying Notes, which are an integral part of the Financial Statements.
18
Short-Term Treasury Fund
Statement of Changes in Net Assets
| Six Months Ended | Year Ended | |
| July 31, | January 31, | |
| 2018 | 2018 | |
| ($000) | ($000) | |
| Increase (Decrease) in Net Assets | ||
| Operations | ||
| Net Investment Income | 82,992 | 100,507 |
| Realized Net Gain (Loss) | (71,509) | (72,823) |
| Change in Unrealized Appreciation (Depreciation) | 14,726 | (44,098) |
| Net Increase (Decrease) in Net Assets Resulting from Operations | 26,209 | (16,414) |
| Distributions | ||
| Net Investment Income | ||
| Investor Shares | (7,047) | (9,933) |
| Admiral Shares | (75,950) | (90,580) |
| Realized Capital Gain | ||
| Investor Shares | — | — |
| Admiral Shares | — | — |
| Total Distributions | (82,997) | (100,513) |
| Capital Share Transactions | ||
| Investor Shares | (81,059) | (151,453) |
| Admiral Shares | 23,123 | 344,449 |
| Net Increase (Decrease) from Capital Share Transactions | (57,936) | 192,996 |
| Total Increase (Decrease) | (114,724) | 76,069 |
| Net Assets | ||
| Beginning of Period | 7,780,550 | 7,704,481 |
| End of Period1 | 7,665,826 | 7,780,550 |
| 1 Net Assets—End of Period includes undistributed (overdistributed) net investment income of $48,000 and $17,000. | ||
See accompanying Notes, which are an integral part of the Financial Statements.
19
Short-Term Treasury Fund
Financial Highlights
| Investor Shares | ||||||
| Six Months | ||||||
| Ended | ||||||
| For a Share Outstanding | July 31, | Year Ended January 31, | ||||
| Throughout Each Period | 2018 | 2018 | 2017 | 2016 | 2015 | 2014 |
| Net Asset Value, Beginning of Period | $10.49 | $10.65 | $10.73 | $10.75 | $10.71 | $10.73 |
| Investment Operations | ||||||
| Net Investment Income | .1081 | .1271 | .094 | .074 | .055 | .039 |
| Net Realized and Unrealized Gain (Loss) | ||||||
| on Investments | (. 080) | (.160) | (. 048) | (. 004) | . 053 | (. 009) |
| Total from Investment Operations | .028 | (.033) | .046 | .070 | .108 | .030 |
| Distributions | ||||||
| Dividends from Net Investment Income | (.108) | (.127) | (. 094) | (. 074) | (. 055) | (. 039) |
| Distributions from Realized Capital Gains | — | — | (.032) | (.016) | (.013) | (.011) |
| Total Distributions | (.108) | (.127) | (.126) | (. 090) | (. 068) | (. 050) |
| Net Asset Value, End of Period | $10.41 | $10.49 | $10.65 | $10.73 | $10.75 | $10.71 |
| Total Return2 | 0.27% | -0.31% | 0.43% | 0.66% | 1.01% | 0.28% |
| Ratios/Supplemental Data | ||||||
| Net Assets, End of Period (Millions) | $651 | $737 | $900 | $1,005 | $1,044 | $1,151 |
| Ratio of Total Expenses to | ||||||
| Average Net Assets | 0.20% | 0.20% | 0.20% | 0.20% | 0.20% | 0.20% |
| Ratio of Net Investment Income to | ||||||
| Average Net Assets | 2.08% | 1.20% | 0.87% | 0.69% | 0.52% | 0.37% |
| Portfolio Turnover Rate 3 | 222% | 280% | 249% | 211% | 87% | 80% |
The expense ratio, net investment income ratio, and turnover rate for the current period have been annualized. 1 Calculated based on average shares outstanding.
2 Total returns do not include account service fees that may have applied in the periods shown. Fund prospectuses provide information about any applicable account service fees.
3 Includes 3%, 7%, 3%, 35%, 22%, and 0% attributable to mortgage-dollar-roll activity.
See accompanying Notes, which are an integral part of the Financial Statements.
20
Short-Term Treasury Fund
Financial Highlights
| Admiral Shares | ||||||
| Six Months | ||||||
| Ended | ||||||
| For a Share Outstanding | July 31, | Year Ended January 31, | ||||
| Throughout Each Period | 2018 | 2018 | 2017 | 2016 | 2015 | 2014 |
| Net Asset Value, Beginning of Period | $10.49 | $10.65 | $10.73 | $10.75 | $10.71 | $10.73 |
| Investment Operations | ||||||
| Net Investment Income | .1131 | .1381 | .105 | .085 | .066 | .050 |
| Net Realized and Unrealized Gain (Loss) | ||||||
| on Investments | (. 080) | (.160) | (. 048) | (. 004) | . 053 | (. 009) |
| Total from Investment Operations | .033 | (.022) | .057 | .081 | .119 | .041 |
| Distributions | ||||||
| Dividends from Net Investment Income | (.113) | (.138) | (.105) | (. 085) | (. 066) | (. 050) |
| Distributions from Realized Capital Gains | — | — | (.032) | (.016) | (.013) | (.011) |
| Total Distributions | (.113) | (.138) | (.137) | (.101) | (. 079) | (. 061) |
| Net Asset Value, End of Period | $10.41 | $10.49 | $10.65 | $10.73 | $10.75 | $10.71 |
| Total Return2 | 0.31% | -0.21% | 0.53% | 0.76% | 1.11% | 0.38% |
| Ratios/Supplemental Data | ||||||
| Net Assets, End of Period (Millions) | $7,015 | $7,044 | $6,805 | $6,271 | $5,915 | $5,360 |
| Ratio of Total Expenses to | ||||||
| Average Net Assets | 0.10% | 0.10% | 0.10% | 0.10% | 0.10% | 0.10% |
| Ratio of Net Investment Income to | ||||||
| Average Net Assets | 2.18% | 1.30% | 0.97% | 0.79% | 0.62% | 0.47% |
| Portfolio Turnover Rate 3 | 222% | 280% | 249% | 211% | 87% | 80% |
The expense ratio, net investment income ratio, and turnover rate for the current period have been annualized.
1 Calculated based on average shares outstanding.
2 Total returns do not include account service fees that may have applied in the periods shown. Fund prospectuses provide information
about any applicable account service fees.
3 Includes 3%, 7%, 3%, 35%, 22%, and 0% attributable to mortgage-dollar-roll activity.
See accompanying Notes, which are an integral part of the Financial Statements.
21
Short-Term Treasury Fund
Notes to Financial Statements
Vanguard Short-Term Treasury Fund is registered under the Investment Company Act of 1940 as an open-end investment company, or mutual fund. The fund offers two classes of shares: Investor Shares and Admiral Shares. Investor Shares are available to any investor who meets the fund’s minimum purchase requirements. Admiral Shares are designed for investors who meet certain administrative, service, and account-size criteria.
A. The following significant accounting policies conform to generally accepted accounting principles for U.S. investment companies. The fund consistently follows such policies in preparing its financial statements.
1. Security Valuation: Securities are valued as of the close of trading on the New York Stock Exchange (generally 4 p.m., Eastern time) on the valuation date. Bonds and temporary cash investments are valued using the latest bid prices or using valuations based on a matrix system (which considers such factors as security prices, yields, maturities, and ratings), both as furnished by independent pricing services. Structured debt securities, including mortgages and asset-backed securities, are valued using the latest bid prices or using valuations based on a matrix system that considers such factors as issuer, tranche, nominal or option-adjusted spreads, weighted average coupon, weighted average maturity, credit enhancements, and collateral. Investments in Vanguard Market Liquidity Fund are valued at that fund’s net asset value. Securities for which market quotations are not readily available, or whose values have been affected by events occurring before the fund’s pricing time but after the close of the securities’ primary markets, are valued by methods deemed by the board of trustees to represent fair value.
2. Futures and Options: The fund uses futures contracts and options on futures contracts to invest in fixed income asset classes with greater efficiency and lower cost than is possible through direct investment, to add value when these instruments are attractively priced, or to adjust sensitivity to changes in interest rates. The primary risks associated with the use of futures contracts are imperfect correlation between changes in market values of bonds held by the fund and the prices of futures contracts, and the possibility of an illiquid market. The primary risk associated with purchasing options is that interest rates move in such a way that the option is out-of-the-money, the position is worthless at expiration, and the fund loses the premium paid. The primary risk associated with writing options is that interest rates move in such a way that the option is in-the-money, the counterparty exercises the option, and the fund loses an amount equal to the market value of the option written less the premium received. Counterparty risk involving futures and exchange-traded options is mitigated because a regulated clearinghouse is the counterparty instead of the clearing broker. To further mitigate counterparty risk, the fund trades futures and options on an exchange, monitors the financial strength of its clearing brokers and clearinghouse, and has entered into clearing agreements with its clearing brokers. The clearinghouse imposes initial margin requirements to secure the fund’s performance and requires daily settlement of variation margin representing changes in the market value of each contract. Any assets pledged as initial margin for open contracts are noted in the Statement of Net Assets.
Futures contracts are valued at their quoted daily settlement prices. The notional amounts of the contracts are not recorded in the Statement of Net Assets. Fluctuations in the value of the contracts are recorded in the Statement of Assets and Liabilities as an asset (liability) and in the Statement of Operations as unrealized appreciation (depreciation) until the contracts are closed, when they are recorded as realized futures gains (losses).
22
Short-Term Treasury Fund
During the six months ended July 31, 2018, the fund’s average investments in long and short futures contracts represented 18% and 2% of net assets, respectively, based on the average of the notional amounts at each quarter-end during the period.
Options on futures contracts are also valued at their quoted daily settlement prices. The premium paid for a purchased option is recorded in the Statement of Assets and Liabilities as an asset that is subsequently adjusted daily to the current market value of the option purchased. The premium received for a written option is recorded in the Statement of Assets and Liabilities as an asset with an equal liability that is subsequently adjusted daily to the current market value of the option written. Fluctuations in the value of the options are recorded in the Statement of Operations as unrealized appreciation (depreciation) until expired, closed, or exercised, at which time realized gains (losses) are recognized.
During the six months ended July 31, 2018, the fund’s average investments in options purchased and options written each represented less than 1% of net assets, based on the average of the notional amounts at each quarter-end during the period.
3. To Be Announced (TBA) Transactions: A TBA transaction is an agreement to buy or sell mortgage-backed securities with agreed-upon characteristics (face amount, coupon, maturity) for settlement at a future date. The fund may be a seller of TBA transactions to reduce its exposure to the mortgage-backed securities market or in order to sell mortgage-backed securities it owns under delayed-delivery arrangements. When the fund is a buyer of TBA transactions, it maintains cash or short-term investments in an amount sufficient to meet the purchase price at the settlement date of the TBA transaction. The primary risk associated with TBA transactions is that a counterparty may default on its obligations. The fund mitigates its counterparty risk by, among other things, performing a credit analysis of counterparties, allocating transactions among numerous counterparties, and monitoring its exposure to each counterparty. The fund may also enter into a Master Securities Forward Transaction Agreement (MSFTA) with certain counterparties and require them to transfer collateral as security for their performance. In the absence of a default, the collateral pledged or received by the fund cannot be repledged, resold, or rehypothecated. Under an MSFTA, upon a counterparty default (including bankruptcy), the fund may terminate any TBA transactions with that counterparty, determine the net amount owed by either party in accordance with its master netting arrangements, and sell or retain any collateral held up to the net amount owed to the fund under the master netting arrangements.
4. Mortgage Dollar Rolls: The fund enters into mortgage-dollar-roll transactions, in which the fund sells mortgage-backed securities to a dealer and simultaneously agrees to purchase similar securities in the future at a predetermined price. The proceeds of the securities sold in mortgage-dollar-roll transactions are typically invested in high-quality short-term fixed income securities. The fund forgoes principal and interest paid on the securities sold, and is compensated by interest earned on the proceeds of the sale and by a lower price on the securities to be repurchased. The fund accounts for mortgage-dollar-roll transactions as purchases and sales; as such, these transactions may increase the fund’s portfolio turnover rate. Amounts to be received or paid in connection with open mortgage dollar rolls are included in Receivables for Investment Securities Sold or Payables for Investment Securities Purchased in the Statement of Assets and Liabilities.
23
Short-Term Treasury Fund
5. Federal Income Taxes: The fund intends to continue to qualify as a regulated investment company and distribute all of its taxable income. Management has analyzed the fund’s tax positions taken for all open federal income tax years (January 31, 2015–2018), and for the period ended July 31, 2018, and has concluded that no provision for federal income tax is required in the fund’s financial statements.
6. Distributions: Distributions from net investment income are declared daily and paid on the first business day of the following month. Annual distributions from realized capital gains, if any, are recorded on the ex-dividend date.
7. Credit Facility: The fund and certain other funds managed by The Vanguard Group (“Vanguard”) participate in a $3.1 billion committed credit facility provided by a syndicate of lenders pursuant to a credit agreement that may be renewed annually; each fund is individually liable for its borrowings, if any, under the credit facility. Borrowings may be utilized for temporary and emergency purposes, and are subject to the fund’s regulatory and contractual borrowing restrictions. The participating funds are charged administrative fees and an annual commitment fee of 0.10% of the undrawn amount of the facility; these fees are allocated to the funds based on a method approved by the fund’s board of trustees and included in Management and Administrative expenses on the fund’s Statement of Operations. Any borrowings under this facility bear interest at a rate based upon the higher of the one-month London Interbank Offered Rate, federal funds effective rate, or overnight bank funding rate plus an agreed-upon spread.
The fund had no borrowings outstanding at July 31, 2018, or at any time during the period then ended.
8. Other: Interest income includes income distributions received from Vanguard Market Liquidity Fund and is accrued daily. Premiums and discounts on debt securities purchased are amortized and accreted, respectively, to interest income over the lives of the respective securities. Security transactions are accounted for on the date securities are bought or sold. Costs used to determine realized gains (losses) on the sale of investment securities are those of the specific securities sold.
Each class of shares has equal rights as to assets and earnings, except that each class separately bears certain class-specific expenses related to maintenance of shareholder accounts (included in Management and Administrative expenses), shareholder reporting, and the proxy. Marketing and distribution expenses are allocated to each class of shares based on a method approved by the board of trustees. Income, other non-class-specific expenses, and gains and losses on investments are allocated to each class of shares based on its relative net assets.
B. In accordance with the terms of a Funds’ Service Agreement (the “FSA”) between Vanguard and the fund, Vanguard furnishes to the fund investment advisory, corporate management, administrative, marketing, and distribution services at Vanguard’s cost of operations (as defined by the FSA). These costs of operations are allocated to the fund based on methods and guidelines approved by the board of trustees. Vanguard does not require reimbursement in the current period for certain costs of operations (such as deferred compensation/benefits and risk/insurance costs); the fund’s liability for these costs of operations is included in Payables to Vanguard on the Statement of Assets and Liabilities. All other costs of operations payable to Vanguard are generally settled twice a month.
24
Short-Term Treasury Fund
Upon the request of Vanguard, the fund may invest up to 0.40% of its net assets as capital in Vanguard. At July 31, 2018, the fund had contributed to Vanguard capital in the amount of $406,000, representing 0.01% of the fund’s net assets and 0.16% of Vanguard’s capitalization. The fund’s trustees and officers are also directors and employees, respectively, of Vanguard.
C. Various inputs may be used to determine the value of the fund’s investments. These inputs are summarized in three broad levels for financial statement purposes. The inputs or methodologies used to value securities are not necessarily an indication of the risk associated with investing in those securities.
Level 1—Quoted prices in active markets for identical securities.
Level 2—Other significant observable inputs (including quoted prices for similar securities, interest rates, prepayment speeds, credit risk, etc.).
Level 3—Significant unobservable inputs (including the fund’s own assumptions used to determine
the fair value of investments). Any investments valued with significant unobservable inputs are
noted on the Statement of Net Assets.
The following table summarizes the market value of the fund’s investments as of July 31, 2018, based on the inputs used to value them:
| Level 1 | Level 2 | Level 3 | |
| Investments | ($000) | ($000) | ($000) |
| U.S. Government and Agency Obligations | — | 7,768,009 | — |
| Temporary Cash Investments | 350,061 | — | — |
| Liability of Options Written | (397) | — | — |
| Futures Contracts—Assets1 | 239 | — | — |
| Futures Contracts—Liabilities1 | (261) | — | — |
| Total | 349,642 | 7,768,009 | — |
| 1 Represents variation margin on the last day of the reporting period. |
D. Capital gain distributions are determined on a tax basis and may differ from realized capital gains for financial reporting purposes. Differences may be permanent or temporary. Permanent differences are reclassified among capital accounts in the financial statements to reflect their tax character. Temporary differences arise when gains or losses are recognized in different periods for financial statement and tax purposes. These differences will reverse at some time in the future.
The fund’s tax-basis capital gains and losses are determined only at the end of each fiscal year. For tax purposes, at January 31, 2018, the fund had available capital losses totaling $89,470,000 that may be carried forward indefinitely to offset future net capital gains. The fund will use these capital losses to offset net taxable capital gains, if any, realized during the year ending January 31, 2019; should the fund realize net capital losses for the year, the losses will be added to the loss carryforward balance above.
At July 31, 2018, the cost of investment securities for tax purposes was $8,168,511,000. Net unrealized depreciation of investment securities for tax purposes was $50,441,000, consisting of unrealized gains of $999,000 on securities that had risen in value since their purchase and $51,440,000 in unrealized losses on securities that had fallen in value since their purchase.
25
Short-Term Treasury Fund
E. During the six months ended July 31, 2018, the fund purchased $7,800,215,000 of investment securities and sold $8,667,562,000 of investment securities, other than temporary cash investments.
F. Capital share transactions for each class of shares were:
| Six Months Ended | Year Ended | |||
| July 31, 2018 | January 31, 2018 | |||
| Amount | Shares | Amount | Shares | |
| ($000) | (000) | ($000) | (000) | |
| Investor Shares | ||||
| Issued | 88,285 | 8,445 | 217,914 | 20,530 |
| Issued in Lieu of Cash Distributions | 6,253 | 599 | 8,783 | 828 |
| Redeemed | (175,597) | (16,802) | (378,150) | (35,620) |
| Net Increase (Decrease)—Investor Shares | (81,059) | (7,758) | (151,453) | (14,262) |
| Admiral Shares | ||||
| Issued | 673,026 | 64,409 | 1,626,582 | 153,201 |
| Issued in Lieu of Cash Distributions | 62,112 | 5,947 | 74,786 | 7,049 |
| Redeemed | (712,015) | (68,163) | (1,356,919) | (127,829) |
| Net Increase (Decrease)—Admiral Shares | 23,123 | 2,193 | 344,449 | 32,421 |
G. Management has determined that no events or transactions occurred subsequent to July 31, 2018, that would require recognition or disclosure in these financial statements.
26
Short-Term Federal Fund
Fund Profile
As of July 31, 2018
| Share-Class Characteristics | ||
| Investor | Admiral | |
| Shares | Shares | |
| Ticker Symbol | VSGBX | VSGDX |
| Expense Ratio1 | 0.20% | 0.10% |
| 30-Day SEC Yield | 2.46% | 2.56% |
| Financial Attributes | |||
| Bloomberg | |||
| Barclays | Bloomberg | ||
| 1–5 Year | Barclays | ||
| Gov’t | Aggregate | ||
| Fund | Index | Bond Index | |
| Number of Bonds | 123 | 375 | 10,012 |
| Yield to Maturity | |||
| (before expenses) | 2.9% | 2.7% | 3.4% |
| Average Coupon | 1.9% | 1.9% | 3.1% |
| Average Duration | 2.3 years | 2.7 years | 6.0 years |
| Average Effective | |||
| Maturity | 3.4 years | 2.8 years | 8.4 years |
| Short-Term | |||
| Reserves | 1.5% | — | — |
| Sector Diversification (% of portfolio) | |
| Asset-Backed | 4.9% |
| Government Mortgage-Backed | 20.1 |
| Treasury/Agency | 75.0 |
The agency and mortgage-backed securities sectors may include
issues from government-sponsored enterprises; such issues are
generally not backed by the full faith and credit of the U.S.
government.
| Volatility Measures | ||
| Bloomberg | ||
| Barclays | Bloomberg | |
| 1–5 Year | Barclays | |
| Gov’t | Aggregate | |
| Index | Bond Index | |
| R-Squared | 0.96 | 0.78 |
| Beta | 0.78 | 0.35 |
These measures show the degree and timing of the fund’s
fluctuations compared with the indexes over 36 months.
| Distribution by Effective Maturity | |
| (% of portfolio) | |
| Under 1 Year | 11.3% |
| 1 - 3 Years | 49.4 |
| 3 - 5 Years | 19.4 |
| 5 - 7 Years | 8.5 |
| 7 - 10 Years | 10.9 |
| 10 - 20 Years | 0.5 |
| Distribution by Credit Quality (% of portfolio) | |
| U.S. Government | 97.9% |
| Aa | 0.2 |
| Not Rated | 1.9 |
Credit-quality ratings are obtained from Moody's and S&P, and the higher rating for each issue is shown. "Not Rated" is used to classify securities for which a rating is not available. Not rated securities include a fund's investment in Vanguard Market Liquidity Fund or Vanguard Municipal Cash Management Fund, each of which invests in high-quality money market instruments and may serve as a cash management vehicle for the Vanguard funds, trusts, and accounts. For more information about these ratings, see the Glossary entry for Credit Quality.
Investment Focus
1 The expense ratios shown are from the prospectus dated May 24, 2018, and represent estimated costs for the current fiscal year. For the six
months ended July 31, 2018, the annualized expense ratios were 0.20% for Investor Shares and 0.10% for Admiral Shares.
27
Short-Term Federal Fund
Performance Summary
All of the returns in this report represent past performance, which is not a guarantee of future results that may be achieved by the fund. (Current performance may be lower or higher than the performance data cited. For performance data current to the most recent month-end, visit our website at vanguard.com/performance.) Note, too, that both investment returns and principal value can fluctuate widely, so an investor’s shares, when sold, could be worth more or less than their original cost. The returns shown do not reflect taxes that a shareholder would pay on fund distributions or on the sale of fund shares.
| Fiscal-Year Total Returns (%): January 31, 2008, Through July 31, 2018 | ||||
| Bloomberg | ||||
| Barclays | ||||
| 1–5 Year | ||||
| Gov’t | ||||
| Investor Shares | Index | |||
| Fiscal Year | Income Returns | Capital Returns | Total Returns | Total Returns |
| 2009 | 3.94% | 0.84% | 4.78% | 5.66% |
| 2010 | 2.39 | 1.62 | 4.01 | 2.56 |
| 2011 | 1.53 | 0.97 | 2.50 | 2.84 |
| 2012 | 1.00 | 2.09 | 3.09 | 3.26 |
| 2013 | 0.56 | 0.20 | 0.76 | 0.51 |
| 2014 | 0.54 | -0.32 | 0.22 | 0.40 |
| 2015 | 0.62 | 0.74 | 1.36 | 1.75 |
| 2016 | 0.88 | 0.05 | 0.93 | 1.05 |
| 2017 | 1.07 | -0.58 | 0.49 | 0.13 |
| 2018 | 1.32 | -1.34 | -0.02 | -0.08 |
| 2019 | 0.91 | -0.66 | 0.25 | 0.22 |
| Note: For 2019, performance data reflect the six months ended July 31, 2018. | ||||
Average Annual Total Returns: Periods Ended June 30, 2018
This table presents returns through the latest calendar quarter—rather than through the end of the fiscal period.
Securities and Exchange Commission rules require that we provide this information.
| Ten Years | ||||||
| Inception Date | One Year | Five Years | Income | Capital | Total | |
| Investor Shares | 12/31/1987 | -0.07% | 0.81% | 1.28% | 0.54% | 1.82% |
| Admiral Shares | 2/12/2001 | 0.03 | 0.91 | 1.39 | 0.54 | 1.93 |
See Financial Highlights for dividend and capital gains information.
28
Short-Term Federal Fund
Financial Statements (unaudited)
Statement of Net Assets
As of July 31, 2018
The fund reports a complete list of its holdings in regulatory filings four times in each fiscal year, at the quarter-ends. For the second and fourth fiscal quarters, the lists appear in the fund’s semiannual and annual reports to shareholders. For the first and third fiscal quarters, the fund files the lists with the Securities and Exchange Commission on Form N-Q. Shareholders can look up the fund’s Forms N-Q on the SEC’s website at sec.gov. Forms N-Q may also be reviewed and copied at the SEC’s Public Reference Room (see the back cover of this report for further information).
| Face | Market | ||||
| Maturity | Amount | Value • | |||
| Coupon | Date | ($000) | ($000) | ||
| U. S. Government and Agency Obligations (97.0%) | |||||
| U.S. Government Securities (21.9%) | |||||
| United States Treasury Note/Bond | 1.000% | 3/15/19 | 45,000 | 44,648 | |
| United States Treasury Note/Bond | 1.625% | 3/31/19 | 109,000 | 108,523 | |
| United States Treasury Note/Bond | 1.250% | 5/31/19 | 10,500 | 10,403 | |
| United States Treasury Note/Bond | 1.000% | 6/30/19 | 130,000 | 128,335 | |
| United States Treasury Note/Bond | 1.250% | 6/30/19 | 81,510 | 80,644 | |
| United States Treasury Note/Bond | 1.750% | 9/30/19 | 171,000 | 169,504 | |
| United States Treasury Note/Bond | 1.500% | 10/31/19 | 7,800 | 7,700 | |
| United States Treasury Note/Bond | 1.750% | 11/30/19 | 6,100 | 6,035 | |
| United States Treasury Note/Bond | 2.375% | 4/30/20 | 18,300 | 18,214 | |
| United States Treasury Note/Bond | 2.500% | 5/31/20 | 1,100 | 1,097 | |
| United States Treasury Note/Bond | 1.875% | 12/15/20 | 7,250 | 7,109 | |
| United States Treasury Note/Bond | 2.000% | 1/15/21 | 60,580 | 59,520 | |
| United States Treasury Note/Bond | 2.000% | 2/28/21 | 335,000 | 328,719 | |
| United States Treasury Note/Bond | 2.625% | 6/15/21 | 15,460 | 15,397 | |
| United States Treasury Note/Bond | 1.125% | 6/30/21 | 33,200 | 31,680 | |
| United States Treasury Note/Bond | 1.125% | 7/31/21 | 41,500 | 39,542 | |
| 1 | United States Treasury Note/Bond | 1.625% | 8/31/22 | 8,100 | 7,728 |
| United States Treasury Note/Bond | 1.875% | 9/30/22 | 14,700 | 14,153 | |
| United States Treasury Note/Bond | 2.250% | 8/15/27 | 3,100 | 2,927 | |
| 1,081,878 | |||||
| Agency Bonds and Notes (54.6%) | |||||
| 2 | AID-Iraq | 2.149% | 1/18/22 | 15,366 | 14,960 |
| 2 | AID-Israel | 0.000% | 11/1/19 | 14,470 | 13,972 |
| 2 | AID-Israel | 5.500% | 9/18/23 | 13,000 | 14,548 |
| 2 | AID-Israel | 5.500% | 12/4/23 | 200 | 225 |
| 2 | AID-Israel | 5.500% | 4/26/24 | 4,567 | 5,147 |
| 2 | AID-Israel | 0.000% | 11/1/24 | 6,905 | 5,637 |
| 2 | AID-Jordan | 2.503% | 10/30/20 | 2,600 | 2,569 |
| 2 | AID-Jordan | 2.578% | 6/30/22 | 33,500 | 32,802 |
| 2 | AID-Tunisia | 1.416% | 8/5/21 | 12,300 | 11,744 |
| 2 | AID-Ukraine | 1.844% | 5/16/19 | 11,665 | 11,636 |
| 3 | Fannie Mae Interest Strip | 0.000% | 1/15/19 | 1,560 | 1,544 |
| 3 | Fannie Mae Principal Strip | 0.000% | 2/1/19 | 25,682 | 25,387 |
| 4 | Federal Home Loan Banks | 0.625% | 8/7/18 | 6,440 | 6,439 |
| 4 | Federal Home Loan Banks | 1.750% | 12/14/18 | 3,000 | 2,996 |
| 4 | Federal Home Loan Banks | 1.250% | 1/16/19 | 45,400 | 45,194 |
| 4 | Federal Home Loan Banks | 1.375% | 3/18/19 | 21,000 | 20,879 |
| 29 | |||||
| Short-Term Federal Fund | |||||
| Face | Market | ||||
| Maturity | Amount | Value • | |||
| Coupon | Date | ($000) | ($000) | ||
| 4 | Federal Home Loan Banks | 5.375% | 5/15/19 | 46,000 | 47,058 |
| 4 | Federal Home Loan Banks | 1.375% | 5/28/19 | 34,300 | 34,012 |
| 4 | Federal Home Loan Banks | 0.875% | 8/5/19 | 83,500 | 82,172 |
| 4 | Federal Home Loan Banks | 1.750% | 6/12/20 | 20,000 | 19,652 |
| 4,5 | Federal Home Loan Banks | 1.800% | 8/28/20 | 50,000 | 48,985 |
| 4,5 | Federal Home Loan Banks | 1.800% | 8/28/20 | 123,250 | 120,749 |
| 3,5 | Federal Home Loan Mortgage Corp. | 1.800% | 4/13/20 | 75,000 | 73,808 |
| 3,5 | Federal Home Loan Mortgage Corp. | 1.700% | 9/29/20 | 164,060 | 160,224 |
| 3,5 | Federal Home Loan Mortgage Corp. | 1.800% | 9/29/20 | 75,000 | 73,387 |
| 3,5 | Federal Home Loan Mortgage Corp. | 2.753% | 1/30/23 | 50,000 | 49,213 |
| 3,5 | Federal Home Loan Mortgage Corp. | 3.250% | 6/14/23 | 123,979 | 123,663 |
| 3,5 | Federal Home Loan Mortgage Corp. | 3.270% | 6/14/23 | 100,000 | 99,746 |
| 3 | Federal Home Loan Mortgage Corp. | 2.750% | 6/19/23 | 103,000 | 102,076 |
| 3,5 | Federal National Mortgage Assn. | 1.250% | 9/27/18 | 10,000 | 9,988 |
| 3 | Federal National Mortgage Assn. | 1.375% | 1/28/19 | 33,750 | 33,606 |
| 3 | Federal National Mortgage Assn. | 0.875% | 8/2/19 | 16,950 | 16,683 |
| 3 | Federal National Mortgage Assn. | 0.000% | 10/9/19 | 275,300 | 266,837 |
| 3,5 | Federal National Mortgage Assn. | 1.250% | 11/25/19 | 75,000 | 73,623 |
| 3,5 | Federal National Mortgage Assn. | 1.150% | 11/29/19 | 77,500 | 76,058 |
| 3,5 | Federal National Mortgage Assn. | 1.750% | 1/17/20 | 50,000 | 49,285 |
| 3 | Federal National Mortgage Assn. | 2.750% | 6/22/21 | 67,100 | 66,971 |
| 3 | Federal National Mortgage Assn. | 1.875% | 9/24/26 | 75,650 | 68,664 |
| 4 | Financing Corp. | 0.000% | 11/2/18 | 1,540 | 1,532 |
| 4 | Financing Corp. | 0.000% | 12/6/18 | 32,496 | 32,250 |
| 4 | Financing Corp. | 0.000% | 3/7/19 | 3,910 | 3,855 |
| 4 | Financing Corp. | 9.700% | 4/5/19 | 5,820 | 6,103 |
| Government Trust Certificate | 0.000% | 4/1/20 | 10,419 | 9,935 | |
| Government Trust Certificate | 0.000% | 10/1/20 | 7,711 | 7,234 | |
| Private Export Funding Corp. | 4.375% | 3/15/19 | 9,570 | 9,684 | |
| Private Export Funding Corp. | 1.450% | 8/15/19 | 24,042 | 23,759 | |
| Private Export Funding Corp. | 2.250% | 3/15/20 | 12,393 | 12,285 | |
| Private Export Funding Corp. | 2.300% | 9/15/20 | 17,450 | 17,251 | |
| Private Export Funding Corp. | 4.300% | 12/15/21 | 4,430 | 4,619 | |
| Private Export Funding Corp. | 3.550% | 1/15/24 | 15,500 | 15,844 | |
| Private Export Funding Corp. | 2.450% | 7/15/24 | 5,300 | 5,107 | |
| Private Export Funding Corp. | 3.250% | 6/15/25 | 16,200 | 16,234 | |
| Residual Funding Corp. Principal Strip | 0.000% | 1/15/21 | 52,508 | 48,973 | |
| Resolution Funding Corp. Interest Strip | 0.000% | 4/15/26 | 12,990 | 10,141 | |
| Resolution Funding Corp. Interest Strip | 0.000% | 1/15/27 | 12,864 | 9,746 | |
| Resolution Funding Corp. Interest Strip | 0.000% | 4/15/27 | 13,756 | 10,337 | |
| Resolution Funding Corp. Interest Strip | 0.000% | 7/15/27 | 7,094 | 5,287 | |
| Resolution Funding Corp. Interest Strip | 0.000% | 10/15/27 | 7,094 | 5,234 | |
| Resolution Funding Corp. Principal Strip | 0.000% | 10/15/19 | 86,131 | 83,447 | |
| Resolution Funding Corp. Principal Strip | 0.000% | 7/15/20 | 98,370 | 93,202 | |
| Resolution Funding Corp. Principal Strip | 0.000% | 10/15/20 | 269,717 | 253,569 | |
| 4 | Tennessee Valley Authority | 2.250% | 3/15/20 | 61,100 | 60,625 |
| 4 | Tennessee Valley Authority | 4.700% | 7/15/33 | 20,990 | 23,930 |
| 4 | Tennessee Valley Authority Principal Strip | 0.000% | 11/1/25 | 17,342 | 13,674 |
| 2,695,996 | |||||
| Conventional Mortgage-Backed Securities (11.9%) | |||||
| 3,5 | Fannie Mae Pool | 2.000% | 10/1/27–1/1/32 | 20,895 | 19,718 |
| 3,5 | Fannie Mae Pool | 2.500% | 2/1/28–11/1/31 | 122,837 | 118,995 |
| 3,5 | Fannie Mae Pool | 3.000% | 12/1/20–8/1/33 | 48,264 | 47,969 |
| 3,5,6 Fannie Mae Pool | 3.500% | 8/1/20–8/1/48 | 112,550 | 112,436 | |
| 3,5,6 Fannie Mae Pool | 4.000% | 8/1/18–8/1/48 | 39,210 | 39,921 | |
| 30 | |||||
| Short-Term Federal Fund | |||||
| Face | Market | ||||
| Maturity | Amount | Value • | |||
| Coupon | Date | ($000) | ($000) | ||
| 3,5,6 Fannie Mae Pool | 4.500% | 8/1/18–8/1/48 | 14,107 | 14,607 | |
| 3,5,6 Fannie Mae Pool | 5.000% | 9/1/18–10/1/48 | 22,197 | 23,353 | |
| 3,5 | Fannie Mae Pool | 5.500% | 12/1/18–1/1/25 | 346 | 353 |
| 3,5 | Fannie Mae Pool | 6.000% | 5/1/24 | 1 | 1 |
| 3,5 | Freddie Mac Gold Pool | 2.000% | 9/1/28– 6/1/30 | 6,990 | 6,589 |
| 3,5 | Freddie Mac Gold Pool | 2.500% | 6/1/22–1/1/33 | 67,398 | 65,172 |
| 3,5,6 Freddie Mac Gold Pool | 3.000% | 4/1/27–8/1/33 | 113,388 | 112,314 | |
| 3,5 | Freddie Mac Gold Pool | 3.500% | 3/1/21–8/1/29 | 14,276 | 14,455 |
| 3,5 | Freddie Mac Gold Pool | 4.000% | 8/1/18–1/1/29 | 7,070 | 7,243 |
| 3,5 | Freddie Mac Gold Pool | 4.500% | 9/1/19–9/1/26 | 4,925 | 4,990 |
| 3,5 | Freddie Mac Gold Pool | 5.000% | 8/1/18– 6/1/25 | 1,751 | 1,793 |
| 3,5 | Freddie Mac Gold Pool | 5.500% | 2/1/19 | 6 | 6 |
| 3,5 | Freddie Mac Gold Pool | 6.000% | 10/1/18 | 2 | 2 |
| 589,917 | |||||
| Nonconventional Mortgage-Backed Securities (8.6%) | |||||
| 3,5,7 Fannie Mae Pool | 3.832% | 12/1/40 | 1,512 | 1,593 | |
| 3,5,8 Fannie Mae REMICS 2005-45 | 2.434% | 6/25/35 | 949 | 951 | |
| 3,5,8 Fannie Mae REMICS 2005-95 | 2.474% | 11/25/35 | 1,070 | 1,078 | |
| 3,5,8 Fannie Mae REMICS 2006-46 | 2.384% | 6/25/36 | 3,548 | 3,551 | |
| 3,5,8 Fannie Mae REMICS 2007-4 | 2.509% | 2/25/37 | 392 | 394 | |
| 3,5,8 Fannie Mae REMICS 2011-83 | 2.564% | 9/25/41 | 23,842 | 24,160 | |
| 3,5,8 Fannie Mae REMICS 2012-122 | 2.464% | 11/25/42 | 1,296 | 1,303 | |
| 3,5,8 Fannie Mae REMICS 2013-19 | 2.364% | 9/25/41 | 1,743 | 1,748 | |
| 3,5,8 Fannie Mae REMICS 2013-39 | 2.414% | 5/25/43 | 1,655 | 1,655 | |
| 3,5,8 Fannie Mae REMICS 2015-22 | 2.364% | 4/25/45 | 1,400 | 1,402 | |
| 3,5,8 Fannie Mae REMICS 2016-55 | 2.564% | 8/25/46 | 2,805 | 2,842 | |
| 3,5,8 Fannie Mae REMICS 2016-60 | 2.314% | 9/25/46 | 5,599 | 5,588 | |
| 3,5,8 Fannie Mae REMICS 2016-62 | 2.464% | 9/25/46 | 5,667 | 5,659 | |
| 3,5,8 Fannie Mae REMICS 2016-93 | 2.414% | 12/25/46 | 10,628 | 10,590 | |
| 3,5,8 Fannie Mae REMICS 2017-106 | 2.364% | 1/25/48 | 29,359 | 29,339 | |
| 3,5 | Fannie Mae REMICS 2018-15 | 3.500% | 10/25/44 | 4,788 | 4,795 |
| 3,5,8 Fannie Mae REMICS 2018-30 | 2.364% | 5/25/48 | 59,646 | 59,681 | |
| 3,5,7 Freddie Mac Non Gold Pool | 3.421% | 7/1/35 | 6,334 | 6,689 | |
| 3,5,7 Freddie Mac Non Gold Pool | 3.623% | 9/1/37 | 4,879 | 5,139 | |
| 3,5,7 Freddie Mac Non Gold Pool | 3.852% | 7/1/33 | 831 | 874 | |
| 3,5,8 Freddie Mac REMICS | 2.372% | 5/15/48 | 144,243 | 143,950 | |
| 3,5,8 Freddie Mac REMICS | 2.422% | 11/15/36–11/15/47 | 23,709 | 23,712 | |
| 3,5,8 Freddie Mac REMICS | 2.432% | 11/15/36 | 914 | 916 | |
| 3,5,8 Freddie Mac REMICS | 2.522% | 6/15/42 | 485 | 489 | |
| 5 | Ginnie Mae REMICS | 3.000% | 1/20/45–3/20/48 | 90,463 | 89,163 |
| 427,261 | |||||
| Total U. S. Government and Agency Obligations (Cost $4,868,557) | 4,795,052 | ||||
| Asset-Backed/Commercial Mortgage-Backed Securities (5.0%) | |||||
| 5 | Small Business Administration | ||||
| Participation Certs 2017-20 | 2.880% | 5/1/37 | 3,852 | 3,725 | |
| 5 | Small Business Administration | ||||
| Participation Certs 2017-20 | 2.850% | 10/1/37 | 20,297 | 19,526 | |
| 5 | Small Business Administration | ||||
| Participation Certs 2017-20 | 2.790% | 11/1/37 | 27,110 | 25,768 | |
| 5 | Small Business Administration | ||||
| Participation Certs 2017-20 | 2.780% | 12/1/37 | 22,938 | 21,944 | |
| 5 | Small Business Administration | ||||
| Participation Certs 2017-20 | 3.310% | 4/1/38 | 41,100 | 40,528 | |
| 31 | |||||
| Short-Term Federal Fund | |||||
| Face | Market | ||||
| Maturity | Amount | Value • | |||
| Coupon | Date | ($000) | ($000) | ||
| 5 Small Business Administration | |||||
| Participation Certs 2017-20 | 3.600% | 6/1/38 | 16,000 | 15,990 | |
| 5 Small Business Administration | |||||
| Participation Certs 2017-20B | 2.820% | 2/1/37 | 4,231 | 4,045 | |
| 5 Small Business Administration | |||||
| Participation Certs 2017-20F | 2.810% | 6/1/37 | 2,376 | 2,275 | |
| 5 Small Business Administration | |||||
| Participation Certs 2018-20 | 2.920% | 1/1/38 | 19,168 | 18,499 | |
| 5 Small Business Administration | |||||
| Participation Certs 2018-20 | 3.220% | 2/1/38 | 31,900 | 31,254 | |
| 5 Small Business Administration | |||||
| Participation Certs 2018-20C | 3.200% | 3/1/38 | 44,300 | 43,386 | |
| 5 Small Business Administration | |||||
| Participation Certs 2018-20E | 3.500% | 5/1/38 | 9,000 | 8,919 | |
| 5 Small Business Administration | |||||
| Participation Certs 2018-20G | 3.540% | 7/1/38 | 10,500 | 10,445 | |
| Total Asset-Backed/Commercial Mortgage-Backed Securities (Cost $252,236) | 246,304 | ||||
| Shares | |||||
| Temporary Cash Investment (1.6%) | |||||
| Money Market Fund (1.6%) | |||||
| 9 Vanguard Market Liquidity Fund | |||||
| (Cost $78,609) | 2.145% | 786,061 | 78,606 | ||
| Total Investments (103.6%) (Cost $5,199,402) | 5,119,962 | ||||
| Notional | |||||
| Expiration | Exercise | Amount | |||
| Date | Contracts | Price | ($000) | ||
| Liability for Options Written (0.0%) | |||||
| Call Options on 10-Year | |||||
| U. S. Treasury Note Futures | |||||
| Contracts | 8/10/18 | 43 | USD 119.25 | 5,128 | (17) |
| Call Options on 10-Year | |||||
| U. S. Treasury Note Futures | |||||
| Contracts | 8/24/18 | 43 | USD 120.00 | 5,160 | (8) |
| Call Options on 10-Year | |||||
| U. S. Treasury Note Futures | |||||
| Contracts | 8/27/18 | 129 | USD 119.50 | 15,416 | (49) |
| Put Options on 10-Year | |||||
| U. S. Treasury Note Futures | |||||
| Contracts | 8/10/18 | 43 | USD 119.25 | 5,128 | (9) |
| Put Options on 10-Year | |||||
| U. S. Treasury Note Futures | |||||
| Contracts | 8/24/18 | 43 | USD 120.00 | 5,160 | (33) |
| Put Options on 10-Year | |||||
| U. S. Treasury Note Futures | |||||
| Contracts | 8/24/18 | 86 | USD 119.00 | 10,234 | (20) |
| Put Options on 10-Year | |||||
| U. S. Treasury Note Futures | |||||
| Contracts | 8/27/18 | 43 | USD 119.50 | 5,139 | (19) |
| Total Liability for Options Written (Premiums Received $178) | (155) | ||||
| 32 | |||||
| Short-Term Federal Fund | |
| Market | |
| Value• | |
| ($000) | |
| Other Assets and Other Liabilities (-3.6%) | |
| Other Assets | 204,431 |
| Other Liabilities | (383,529) |
| (179,098) | |
| Net Assets (100%) | 4,940,709 |
| Amount | |
| ($000) | |
| Statement of Assets and Liabilities | |
| Assets | |
| Investments in Securities, at Value | |
| Unaffiliated Issuers | 5,041,356 |
| Affiliated Issuers | 78,606 |
| Total Investments in Securities | 5,119,962 |
| Investment in Vanguard | 264 |
| Receivables for Investment Securities Sold | 176,401 |
| Receivables for Accrued Income | 18,528 |
| Receivables for Capital Shares Issued | 8,551 |
| Variation Margin Receivable—Futures Contracts | 197 |
| Other Assets | 490 |
| Total Assets | 5,324,393 |
| Liabilities | |
| Payables for Investment Securities Purchased | 366,340 |
| Payables for Capital Shares Redeemed | 13,356 |
| Payables for Distributions | 946 |
| Payables to Vanguard | 2,494 |
| Liabilities for Options Written | 155 |
| Variation Margin Payable—Futures Contracts | 393 |
| Total Liabilities | 383,684 |
| Net Assets | 4,940,709 |
33
Short-Term Federal Fund
| At July 31, 2018, net assets consisted of: | |
| Amount | |
| ($000) | |
| Paid-in Capital | 5,079,001 |
| Overdistributed Net Investment Income | (82) |
| Accumulated Net Realized Losses | (59,386) |
| Unrealized Appreciation (Depreciation) | |
| Investment Securities | (79,440) |
| Futures Contracts | 593 |
| Options on Futures Contracts10 | 23 |
| Net Assets | 4,940,709 |
| Investor Shares—Net Assets | |
| Applicable to 64,890,146 outstanding $.001 par value shares of | |
| beneficial interest (unlimited authorization) | 680,321 |
| Net Asset Value Per Share—Investor Shares | $10.48 |
| Admiral Shares—Net Assets | |
| Applicable to 406,363,532 outstanding $.001 par value shares of | |
| beneficial interest (unlimited authorization) | 4,260,388 |
| Net Asset Value Per Share—Admiral Shares | $10.48 |
• See Note A in Notes to Financial Statements.
1 Securities with a value of $2,958,000 have been segregated as initial margin for open futures contracts.
2 U.S. government-guaranteed.
3 The issuer was placed under federal conservatorship in September 2008; since that time, its daily operations have been managed
by the Federal Housing Finance Agency and it receives capital from the U.S. Treasury, as needed to maintain a positive net worth,
in exchange for senior preferred stock.
4 The issuer operates under a congressional charter; its securities are generally neither guaranteed by the U.S. Treasury nor backed
by the full faith and credit of the U.S. government.
5 The average or expected maturity is shorter than the final maturity shown because of the possibility of interim principal payments
and prepayments or the possibility of the issue being called.
6 Includes securities purchased on a when-issued or delayed-delivery basis for which the fund has not taken delivery as of July 31, 2018.
7 Adjustable-rate security based upon one-year Constant Maturity Treasury yield plus spread.
8 Adjustable-rate security based upon 1-month USD LIBOR plus spread.
9 Affiliated money market fund available only to Vanguard funds and certain trusts and accounts managed by Vanguard. Rate shown
is the 7-day yield.
10 Unrealized appreciation (depreciation) on options on futures contracts is required to be treated as realized gain (loss) for tax purposes.
REMICS—Real Estate Mortgage Investment Conduits.
34
| Short-Term Federal Fund | ||||
| Derivative Financial Instruments Outstanding as of Period End | ||||
| Futures Contracts | ||||
| ($000) | ||||
| Value and | ||||
| Number of | Unrealized | |||
| Long (Short) | Notional | Appreciation | ||
| Expiration | Contracts | Amount | (Depreciation) | |
| Long Futures Contracts | ||||
| 2-Year U.S. Treasury Note | September 2018 | 4,042 | 854,378 | (1,349) |
| 5-Year U.S. Treasury Note | September 2018 | 926 | 104,754 | (35) |
| (1,384) | ||||
| Short Futures Contracts | ||||
| 10-Year U.S. Treasury Note | September 2018 | (2,798) | (334,142) | 1,432 |
| Ultra 10-Year U.S. Treasury Note | September 2018 | (343) | (43,599) | 242 |
| 30-Year U.S. Treasury Bond | September 2018 | (159) | (22,732) | 289 |
| Ultra Long U. S. Treasury Bond | September 2018 | (95) | (14,906) | 14 |
| 1977 | ||||
| 593 | ||||
Unrealized appreciation (depreciation) on open futures contracts is required to be treated as realized gain (loss) for tax purposes.
See accompanying Notes, which are an integral part of the Financial Statements.
35
| Short-Term Federal Fund | |
| Statement of Operations | |
| Six Months Ended | |
| July31,2018 | |
| ($000) | |
| Investment Income | |
| Income | |
| Interest1 | 49,894 |
| Total Income | 49,894 |
| Expenses | |
| The Vanguard Group—Note B | |
| Investment Advisory Services | 185 |
| Management and Administrative—Investor Shares | 597 |
| Management and Administrative—Admiral Shares | 1,765 |
| Marketing and Distribution—Investor Shares | 55 |
| Marketing and Distribution—Admiral Shares | 142 |
| Custodian Fees | 23 |
| Shareholders’ Reports—Investor Shares | 10 |
| Shareholders’ Reports—Admiral Shares | 15 |
| Trustees’ Fees and Expenses | 2 |
| Total Expenses | 2,794 |
| Net Investment Income | 47,100 |
| Realized Net Gain (Loss) | |
| Investment Securities Sold1 | (23,338) |
| Futures Contracts | (695) |
| Purchased Options | (429) |
| Written Options | (54) |
| Realized Net Gain (Loss) | (24,516) |
| Change in Unrealized Appreciation (Depreciation) | |
| Investment Securities1 | (10,058) |
| Futures Contracts | 1,382 |
| Written Options | 321 |
| Change in Unrealized Appreciation (Depreciation) | (8,355) |
| Net Increase (Decrease) in Net Assets Resulting from Operations | 14,229 |
1 Interest income, realized net gain (loss), and change in unrealized appreciation (depreciation) from an affiliated company of the fund were $964,000, ($31,000), and ($3,000), respectively. Purchases and sales are for temporary cash investment purposes.
See accompanying Notes, which are an integral part of the Financial Statements.
36
| Short-Term Federal Fund | ||
| Statement of Changes in Net Assets | ||
| Six Months Ended | Year Ended | |
| July 31, | January 31, | |
| 2018 | 2018 | |
| ($000) | ($000) | |
| Increase (Decrease) in Net Assets | ||
| Operations | ||
| Net Investment Income | 47,100 | 76,835 |
| Realized Net Gain (Loss) | (24,516) | (32,883) |
| Change in Unrealized Appreciation (Depreciation) | (8,355) | (34,932) |
| Net Increase (Decrease) in Net Assets Resulting from Operations | 14,229 | 9,020 |
| Distributions | ||
| Net Investment Income | ||
| Investor Shares | (6,363) | (10,473) |
| Admiral Shares | (40,796) | (66,401) |
| Realized Capital Gain | ||
| Investor Shares | — | (486) |
| Admiral Shares | — | (2,823) |
| Total Distributions | (47,159) | (80,183) |
| Capital Share Transactions | ||
| Investor Shares | (34,134) | (97,217) |
| Admiral Shares | 49,779 | (519,477) |
| Net Increase (Decrease) from Capital Share Transactions | 15,645 | (616,694) |
| Total Increase (Decrease) | (17,285) | (687,857) |
| Net Assets | ||
| Beginning of Period | 4,957,994 | 5,645,851 |
| End of Period1 | 4,940,709 | 4,957,994 |
1 Net Assets—End of Period includes undistributed (overdistributed) net investment income of ($82,000) and ($23,000).
See accompanying Notes, which are an integral part of the Financial Statements.
37
| Short-Term Federal Fund | ||||||
| Financial Highlights | ||||||
| Investor Shares | ||||||
| Six Months | ||||||
| Ended | ||||||
| For a Share Outstanding | July 31, | Year Ended January 31, | ||||
| Throughout Each Period | 2018 | 2018 | 2017 | 2016 | 2015 | 2014 |
| Net Asset Value, Beginning of Period | $10.55 | $10.70 | $10.79 | $10.82 | $10.74 | $10.78 |
| Investment Operations | ||||||
| Net Investment Income | . 0961 | .1421 | .116 | .095 | .066 | .058 |
| Net Realized and Unrealized Gain (Loss) | ||||||
| on Investments | (. 070) | (.144) | (. 063) | . 005 | . 080 | (. 034) |
| Total from Investment Operations | .026 | (.002) | .053 | .100 | .146 | .024 |
| Distributions | ||||||
| Dividends from Net Investment Income | (. 096) | (.142) | (.116) | (. 095) | (. 066) | (. 058) |
| Distributions from Realized Capital Gains | — | (.006) | (.027) | (.035) | — | (.006) |
| Total Distributions | (. 096) | (.148) | (.143) | (.130) | (. 066) | (. 064) |
| Net Asset Value, End of Period | $10.48 | $10.55 | $10.70 | $10.79 | $10.82 | $10.74 |
| Total Return2 | 0.25% | -0.02% | 0.49% | 0.93% | 1.36% | 0.22% |
| Ratios/Supplemental Data | ||||||
| Net Assets, End of Period (Millions) | $680 | $719 | $827 | $817 | $924 | $1,051 |
| Ratio of Total Expenses to | ||||||
| Average Net Assets | 0.20% | 0.20% | 0.20% | 0.20% | 0.20% | 0.20% |
| Ratio of Net Investment Income to | ||||||
| Average Net Assets | 1.84% | 1.33% | 1.07% | 0.88% | 0.61% | 0.54% |
| Portfolio Turnover Rate 3 | 232% | 211% | 304% | 314% | 361% | 418% |
The expense ratio, net investment income ratio, and turnover rate for the current period have been annualized.
1 Calculated based on average shares outstanding.
2 Total returns do not include account service fees that may have applied in the periods shown. Fund prospectuses provide information
about any applicable account service fees.
3 Includes 19%, 30%, 38%, 75%, 99%, and 87% attributable to mortgage-dollar-roll activity.
See accompanying Notes, which are an integral part of the Financial Statements.
38
| Short-Term Federal Fund | ||||||
| Financial Highlights | ||||||
| Admiral Shares | ||||||
| Six Months | ||||||
| Ended | ||||||
| For a Share Outstanding | July 31, | Year Ended January 31, | ||||
| Throughout Each Period | 2018 | 2018 | 2017 | 2016 | 2015 | 2014 |
| Net Asset Value, Beginning of Period | $10.55 | $10.70 | $10.79 | $10.82 | $10.74 | $10.78 |
| Investment Operations | ||||||
| Net Investment Income | .1011 | .1531 | .127 | .105 | .077 | .069 |
| Net Realized and Unrealized Gain (Loss) | ||||||
| on Investments | (. 070) | (.144) | (. 063) | . 005 | . 080 | (. 034) |
| Total from Investment Operations | .031 | .009 | .064 | .110 | .157 | .035 |
| Distributions | ||||||
| Dividends from Net Investment Income | (.101) | (.153) | (.127) | (.105) | (. 077) | (. 069) |
| Distributions from Realized Capital Gains | — | (.006) | (.027) | (.035) | — | (.006) |
| Total Distributions | (.101) | (.159) | (.154) | (.140) | (. 077) | (. 075) |
| Net Asset Value, End of Period | $10.48 | $10.55 | $10.70 | $10.79 | $10.82 | $10.74 |
| Total Return2 | 0.30% | 0.08% | 0.59% | 1.03% | 1.47% | 0.33% |
| Ratios/Supplemental Data | ||||||
| Net Assets, End of Period (Millions) | $4,260 | $4,239 | $4,819 | $4,342 | $4,122 | $4,205 |
| Ratio of Total Expenses to | ||||||
| Average Net Assets | 0.10% | 0.10% | 0.10% | 0.10% | 0.10% | 0.10% |
| Ratio of Net Investment Income to | ||||||
| Average Net Assets | 1.94% | 1.43% | 1.17% | 0.98% | 0.71% | 0.64% |
| Portfolio Turnover Rate 3 | 232% | 211% | 304% | 314% | 361% | 418% |
The expense ratio, net investment income ratio, and turnover rate for the current period have been annualized.
1 Calculated based on average shares outstanding.
2 Total returns do not include account service fees that may have applied in the periods shown. Fund prospectuses provide information
about any applicable account service fees.
3 Includes 19%, 30%, 38%, 75%, 99%, and 87% attributable to mortgage-dollar-roll activity.
See accompanying Notes, which are an integral part of the Financial Statements.
39
Short-Term Federal Fund
Notes to Financial Statements
Vanguard Short-Term Federal Fund is registered under the Investment Company Act of 1940 as an open-end investment company, or mutual fund. The fund offers two classes of shares: Investor Shares and Admiral Shares. Investor Shares are available to any investor who meets the fund’s minimum purchase requirements. Admiral Shares are designed for investors who meet certain administrative, service, and account-size criteria.
A. The following significant accounting policies conform to generally accepted accounting principles for U.S. investment companies. The fund consistently follows such policies in preparing its financial statements.
1. Security Valuation: Securities are valued as of the close of trading on the New York Stock Exchange (generally 4 p.m., Eastern time) on the valuation date. Bonds and temporary cash investments are valued using the latest bid prices or using valuations based on a matrix system (which considers such factors as security prices, yields, maturities, and ratings), both as furnished by independent pricing services. Structured debt securities, including mortgages and asset-backed securities, are valued using the latest bid prices or using valuations based on a matrix system that considers such factors as issuer, tranche, nominal or option-adjusted spreads, weighted average coupon, weighted average maturity, credit enhancements, and collateral. Investments in Vanguard Market Liquidity Fund are valued at that fund’s net asset value. Securities for which market quotations are not readily available, or whose values have been affected by events occurring before the fund’s pricing time but after the close of the securities’ primary markets, are valued by methods deemed by the board of trustees to represent fair value.
2. Futures and Options: The fund uses futures contracts and options on futures contracts to invest in fixed income asset classes with greater efficiency and lower cost than is possible through direct investment, to add value when these instruments are attractively priced, or to adjust sensitivity to changes in interest rates. The primary risks associated with the use of futures contracts are imperfect correlation between changes in market values of bonds held by the fund and the prices of futures contracts, and the possibility of an illiquid market. The primary risk associated with purchasing options is that interest rates move in such a way that the option is out-of-the-money, the position is worthless at expiration, and the fund loses the premium paid. The primary risk associated with writing options is that interest rates move in such a way that the option is in-the-money, the counterparty exercises the option, and the fund loses an amount equal to the market value of the option written less the premium received. Counterparty risk involving futures and exchange-traded options is mitigated because a regulated clearinghouse is the counterparty instead of the clearing broker. To further mitigate counterparty risk, the fund trades futures and options on an exchange, monitors the financial strength of its clearing brokers and clearinghouse, and has entered into clearing agreements with its clearing brokers. The clearinghouse imposes initial margin requirements to secure the fund’s performance and requires daily settlement of variation margin representing changes in the market value of each contract. Any assets pledged as initial margin for open contracts are noted in the Statement of Net Assets.
Futures contracts are valued at their quoted daily settlement prices. The notional amounts of the contracts are not recorded in the Statement of Net Assets. Fluctuations in the value of the contracts are recorded in the Statement of Assets and Liabilities as an asset (liability) and in the Statement of Operations as unrealized appreciation (depreciation) until the contracts are closed, when they are recorded as realized futures gains (losses).
40
Short-Term Federal Fund
During the six months ended July 31, 2018, the fund’s average investments in long and short futures contracts represented 16% and 7% of net assets, respectively, based on the average of the notional amounts at each quarter-end during the period.
Options on futures contracts are valued at their quoted daily settlement prices. The premium paid for a purchased option is recorded in the Statement of Assets and Liabilities as an asset that is subsequently adjusted daily to the current market value of the option purchased. The premium received for a written option is recorded in the Statement of Assets and Liabilities as an asset with an equal liability that is subsequently adjusted daily to the current market value of the option written. Fluctuations in the value of the options are recorded in the Statement of Operations as unrealized appreciation (depreciation) until expired, closed, or exercised, at which time realized gains (losses) are recognized.
During the six months ended July 31, 2018, the fund’s average value of investmets in options purchased and options written each represented less than 1% of net assets, based on the average market values at each quarter-end during the period.
3. To Be Announced (TBA) Transactions: A TBA transaction is an agreement to buy or sell mortgage-backed securities with agreed-upon characteristics (face amount, coupon, maturity) for settlement at a future date. The fund may be a seller of TBA transactions to reduce its exposure to the mortgage-backed securities market or in order to sell mortgage-backed securities it owns under delayed-delivery arrangements. When the fund is a buyer of TBA transactions, it maintains cash or short-term investments in an amount sufficient to meet the purchase price at the settlement date of the TBA transaction. The primary risk associated with TBA transactions is that a counterparty may default on its obligations. The fund mitigates its counterparty risk by, among other things, performing a credit analysis of counterparties, allocating transactions among numerous counterparties, and monitoring its exposure to each counterparty. The fund may also enter into a Master Securities Forward Transaction Agreement (MSFTA) with certain counterparties and require them to transfer collateral as security for their performance. In the absence of a default, the collateral pledged or received by the fund cannot be repledged, resold, or rehypothecated. Under an MSFTA, upon a counterparty default (including bankruptcy), the fund may terminate any TBA transactions with that counterparty, determine the net amount owed by either party in accordance with its master netting arrangements, and sell or retain any collateral held up to the net amount owed to the fund under the master netting arrangements.
At July 31, 2018, a counterparty had deposited in a segregated account cash of $225,000 in connection with TBA transactions.
4. Mortgage Dollar Rolls: The fund enters into mortgage-dollar-roll transactions, in which the fund sells mortgage-backed securities to a dealer and simultaneously agrees to purchase similar securities in the future at a predetermined price. The proceeds of the securities sold in mortgage-dollar-roll transactions are typically invested in high-quality short-term fixed income securities. The fund forgoes principal and interest paid on the securities sold, and is compensated by interest earned on the proceeds of the sale and by a lower price on the securities to be repurchased. The fund accounts for mortgage-dollar-roll transactions as purchases and sales; as such, these transactions may increase the fund’s portfolio turnover rate. Amounts to be received or paid in connection with open mortgage dollar rolls are included in Receivables for Investment Securities Sold or Payables for Investment Securities Purchased in the Statement of Assets and Liabilities.
41
Short-Term Federal Fund
5. Federal Income Taxes: The fund intends to continue to qualify as a regulated investment company and distribute all of its taxable income. Management has analyzed the fund’s tax positions taken for all open federal income tax years (January 31, 2015–2018), and for the period ended July 31, 2018, and has concluded that no provision for federal income tax is required in the fund’s financial statements.
6. Distributions: Distributions from net investment income are declared daily and paid on the first business day of the following month. Annual distributions from realized capital gains, if any, are recorded on the ex-dividend date.
7. Credit Facility: The fund and certain other funds managed by The Vanguard Group (“Vanguard”) participate in a $3.1 billion committed credit facility provided by a syndicate of lenders pursuant to a credit agreement that may be renewed annually; each fund is individually liable for its borrowings, if any, under the credit facility. Borrowings may be utilized for temporary and emergency purposes, and are subject to the fund’s regulatory and contractual borrowing restrictions. The participating funds are charged administrative fees and an annual commitment fee of 0.10% of the undrawn amount of the facility; these fees are allocated to the funds based on a method approved by the fund’s board of trustees and included in Management and Administrative expenses on the fund’s Statement of Operations. Any borrowings under this facility bear interest at a rate based upon the higher of the one-month London Interbank Offered Rate, federal funds effective rate, or overnight bank funding rate plus an agreed-upon spread.
The fund had no borrowings outstanding at July 31, 2018, or at any time during the period then ended.
8. Other: Interest income includes income distributions received from Vanguard Market Liquidity Fund and is accrued daily. Premiums and discounts on debt securities purchased are amortized and accreted, respectively, to interest income over the lives of the respective securities. Security transactions are accounted for on the date securities are bought or sold. Costs used to determine realized gains (losses) on the sale of investment securities are those of the specific securities sold.
Each class of shares has equal rights as to assets and earnings, except that each class separately bears certain class-specific expenses related to maintenance of shareholder accounts (included in Management and Administrative expenses), shareholder reporting, and the proxy. Marketing and distribution expenses are allocated to each class of shares based on a method approved by the board of trustees. Income, other non-class-specific expenses, and gains and losses on investments are allocated to each class of shares based on its relative net assets.
B. In accordance with the terms of a Funds’ Service Agreement (the “FSA”) between Vanguard and the fund, Vanguard furnishes to the fund investment advisory, corporate management, administrative, marketing, and distribution services at Vanguard’s cost of operations (as defined by the FSA). These costs of operations are allocated to the fund based on methods and guidelines approved by the board of trustees. Vanguard does not require reimbursement in the current period for certain costs of operations (such as deferred compensation/benefits and risk/insurance costs); the fund’s liability for these costs of operations is included in Payables to Vanguard on the Statement of Assets and Liabilities. All other costs of operations payable to Vanguard are generally settled twice a month.
42
Short-Term Federal Fund
Upon the request of Vanguard, the fund may invest up to 0.40% of its net assets as capital in Vanguard. At July 31, 2018, the fund had contributed to Vanguard capital in the amount of $264,000, representing 0.01% of the fund’s net assets and 0.11% of Vanguard’s capitalization. The fund’s trustees and officers are also directors and employees, respectively, of Vanguard.
C. Various inputs may be used to determine the value of the fund’s investments. These inputs are summarized in three broad levels for financial statement purposes. The inputs or methodologies used to value securities are not necessarily an indication of the risk associated with investing in those securities.
Level 1—Quoted prices in active markets for identical securities.
Level 2—Other significant observable inputs (including quoted prices for similar securities, interest rates, prepayment speeds, credit risk, etc.).
Level 3—Significant unobservable inputs (including the fund’s own assumptions used to determine
the fair value of investments). Any investments valued with significant unobservable inputs are
noted on the Statement of Net Assets.
The following table summarizes the market value of the fund’s investments as of July 31, 2018, based on the inputs used to value them:
| Level 1 | Level 2 | Level 3 | |
| Investments | ($000) | ($000) | ($000) |
| U.S. Government and Agency Obligations | — | 4,795,052 | — |
| Asset-Backed/Commercial Mortgage-Backed Securities | — | 246,304 | — |
| Temporary Cash Investments | 78,606 | — | — |
| Liability for Options Written | (155) | — | — |
| Futures Contracts—Assets1 | 197 | — | — |
| Futures Contracts—Liabilities1 | (393) | — | — |
| Total | 78,255 | 5,041,356 | — |
| 1 Represents variation margin on the last day of the reporting period. |
D. Capital gain distributions are determined on a tax basis and may differ from realized capital gains for financial reporting purposes. Differences may be permanent or temporary. Permanent differences are reclassified among capital accounts in the financial statements to reflect their tax character. Temporary differences arise when gains or losses are recognized in different periods for financial statement and tax purposes. These differences will reverse at some time in the future.
The fund’s tax-basis capital gains and losses are determined only at the end of each fiscal year. For tax purposes, at January 31, 2018, the fund had available capital losses totaling $35,428,000 that may be carried forward indefinitely to offset future net capital gains. The fund will use these capital losses to offset net taxable capital gains, if any, realized during the year ending January 31, 2019; should the fund realize net capital losses for the year, the losses will be added to the loss carryforward balance above.
At July 31, 2018, the cost of investment securities for tax purposes was $5,199,402,000. Net unrealized depreciation of investment securities for tax purposes was $79,440,000, consisting of unrealized gains of $855,000 on securities that had risen in value since their purchase and $80,295,000 in unrealized losses on securities that had fallen in value since their purchase.
43
Short-Term Federal Fund
E. During the six months ended July 31, 2018, the fund purchased $4,386,385,000 of investment securities and sold $4,212,126,000 of investment securities, other than temporary cash investments.
F. Capital share transactions for each class of shares were:
| Six Months Ended | Year Ended | |||
| July 31, 2018 | January 31, 2018 | |||
| Amount | Shares | Amount | Shares | |
| ($000) | (000) | ($000) | (000) | |
| Investor Shares | ||||
| Issued | 60,597 | 5,764 | 136,535 | 12,788 |
| Issued in Lieu of Cash Distributions | 5,806 | 552 | 10,071 | 944 |
| Redeemed | (100,537) | (9,560) | (243,823) | (22,844) |
| Net Increase (Decrease)—Investor Shares | (34,134) | (3,244) | (97,217) | (9,112) |
| Admiral Shares | ||||
| Issued | 590,568 | 56,159 | 1,255,782 | 117,654 |
| Issued in Lieu of Cash Distributions | 36,270 | 3,450 | 61,249 | 5,739 |
| Redeemed | (577,059) | (54,864) | (1,836,508) | (172,159) |
| Net Increase (Decrease)—Admiral Shares | 49,779 | 4,745 | (519,477) | (48,766) |
G. Management has determined that no events or transactions occurred subsequent to July 31, 2018, that would require recognition or disclosure in these financial statements.
44
Intermediate-Term Treasury Fund
Fund Profile
As of July 31, 2018
| Share-Class Characteristics | ||
| Investor | Admiral | |
| Shares | Shares | |
| Ticker Symbol | VFITX | VFIUX |
| Expense Ratio1 | 0.20% | 0.10% |
| 30-Day SEC Yield | 2.65% | 2.75% |
| Financial Attributes | |||
| Bloomberg | |||
| Barclays | Bloomberg | ||
| 5–10 Year | Barclays | ||
| Treasury | Aggregate | ||
| Fund | Index | Bond Index | |
| Number of Bonds | 118 | 54 | 10,012 |
| Yield to Maturity | |||
| (before expenses) | 3.0% | 2.9% | 3.4% |
| Average Coupon | 2.2% | 2.4% | 3.1% |
| Average Duration | 5.2 years | 6.3 years | 6.0 years |
| Average Effective | |||
| Maturity | 6.0 years | 7.0 years | 8.4 years |
| Short-Term | |||
| Reserves | 0.6% | — | — |
| Sector Diversification (% of portfolio) | |
| Asset-Backed | 5.1% |
| Government Mortgage-Backed | 3.0 |
| Treasury/Agency | 91.9 |
The agency and mortgage-backed securities sectors may include
issues from government-sponsored enterprises; such issues are
generally not backed by the full faith and credit of the U.S.
government.
| Volatility Measures | ||
| Bloomberg | ||
| Barclays | Bloomberg | |
| 5–10 Year | Barclays | |
| Treasury | Aggregate | |
| Index | Bond Index | |
| R-Squared | 0.99 | 0.86 |
| Beta | 0.80 | 1.10 |
| These measures show the degree and timing of the fund’s | ||
| fluctuations compared with the indexes over 36 months. | ||
| Distribution by Effective Maturity | |
| (% of portfolio) | |
| 1 - 3 Years | 0.2% |
| 3 - 5 Years | 33.6 |
| 5 - 7 Years | 43.8 |
| 7 - 10 Years | 22.4 |
| Distribution by Credit Quality (% of portfolio) | |
| U.S. Government | 99.3% |
| Not Rated | 0.7 |
Credit-quality ratings are obtained from Moody's and S&P, and the higher rating for each issue is shown. "Not Rated" is used to classify securities for which a rating is not available. Not rated securities include a fund's investment in Vanguard Market Liquidity Fund or Vanguard Municipal Cash Management Fund, each of which invests in high-quality money market instruments and may serve as a cash management vehicle for the Vanguard funds, trusts, and accounts. For more information about these ratings, see the Glossary entry for Credit Quality.
Investment Focus
1 The expense ratios shown are from the prospectus dated May 24, 2018, and represent estimated costs for the current fiscal year. For the six
months ended July 31, 2018, the annualized expense ratios were 0.20% for Investor Shares and 0.10% for Admiral Shares.
45
Intermediate-Term Treasury Fund
Performance Summary
All of the returns in this report represent past performance, which is not a guarantee of future results that may be achieved by the fund. (Current performance may be lower or higher than the performance data cited. For performance data current to the most recent month-end, visit our website at vanguard.com/performance.) Note, too, that both investment returns and principal value can fluctuate widely, so an investor’s shares, when sold, could be worth more or less than their original cost. The returns shown do not reflect taxes that a shareholder would pay on fund distributions or on the sale of fund shares.
| Fiscal-Year Total Returns (%): January 31, 2008, Through July 31, 2018 | ||||
| Bloomberg | ||||
| Barclays | ||||
| 5–10 Year | ||||
| Treasury | ||||
| Investor Shares | Index | |||
| Fiscal Year | Income Returns | Capital Returns | Total Returns | Total Returns |
| 2009 | 3.88% | 3.41% | 7.29% | 9.48% |
| 2010 | 3.10 | -0.39 | 2.71 | 0.47 |
| 2011 | 2.70 | 2.89 | 5.59 | 6.69 |
| 2012 | 2.11 | 8.25 | 10.36 | 13.95 |
| 2013 | 1.34 | -0.24 | 1.10 | 1.46 |
| 2014 | 1.47 | -2.21 | -0.74 | -1.47 |
| 2015 | 1.74 | 3.64 | 5.38 | 7.66 |
| 2016 | 1.65 | -0.48 | 1.17 | 1.38 |
| 2017 | 1.51 | -2.35 | -0.84 | -1.41 |
| 2018 | 1.76 | -2.07 | -0.31 | 0.07 |
| 2019 | 1.13 | -1.29 | -0.16 | -0.20 |
| Note: For 2019, performance data reflect the six months ended July 31, 2018. | ||||
Average Annual Total Returns: Periods Ended June 30, 2018
This table presents returns through the latest calendar quarter—rather than through the end of the fiscal period.
Securities and Exchange Commission rules require that we provide this information.
| Ten Years | ||||||
| Inception Date | One Year | Five Years | Income | Capital | Total | |
| Investor Shares | 10/28/1991 | -1.45% | 1.31% | 2.04% | 1.13% | 3.17% |
| Admiral Shares | 2/12/2001 | -1.35 | 1.41 | 2.15 | 1.13 | 3.28 |
See Financial Highlights for dividend and capital gains information.

Intermediate-Term Treasury Fund
Financial Statements (unaudited)
Statement of Net Assets
As of July 31, 2018
The fund reports a complete list of its holdings in regulatory filings four times in each fiscal year, at the quarter-ends. For the second and fourth fiscal quarters, the lists appear in the fund’s semiannual and annual reports to shareholders. For the first and third fiscal quarters, the fund files the lists with the Securities and Exchange Commission on Form N-Q. Shareholders can look up the fund’s Forms N-Q on the SEC’s website at sec.gov. Forms N-Q may also be reviewed and copied at the SEC’s Public Reference Room (see the back cover of this report for further information).
| Face | Market | |||
| Maturity | Amount | Value • | ||
| Coupon | Date | ($000) | ($000) | |
| U. S. Government and Agency Obligations (96.6%) | ||||
| U.S. Government Securities (89.4%) | ||||
| United States Treasury Note/Bond | 2.125% | 8/15/21 | 52,000 | 51,009 |
| United States Treasury Note/Bond | 1.125% | 8/31/21 | 8,000 | 7,610 |
| United States Treasury Note/Bond | 2.000% | 8/31/21 | 30,000 | 29,311 |
| United States Treasury Note/Bond | 1.125% | 9/30/21 | 35,000 | 33,250 |
| United States Treasury Note/Bond | 2.000% | 10/31/21 | 46,000 | 44,879 |
| United States Treasury Note/Bond | 8.000% | 11/15/21 | 10,000 | 11,628 |
| United States Treasury Note/Bond | 1.750% | 11/30/21 | 32,000 | 30,940 |
| United States Treasury Note/Bond | 1.875% | 11/30/21 | 37,000 | 35,925 |
| United States Treasury Note/Bond | 1.750% | 2/28/22 | 53,000 | 51,112 |
| United States Treasury Note/Bond | 1.875% | 2/28/22 | 93,000 | 90,065 |
| United States Treasury Note/Bond | 1.750% | 3/31/22 | 50,000 | 48,172 |
| United States Treasury Note/Bond | 1.875% | 3/31/22 | 71,000 | 68,704 |
| United States Treasury Note/Bond | 1.750% | 4/30/22 | 65,000 | 62,562 |
| United States Treasury Note/Bond | 1.875% | 4/30/22 | 137,000 | 132,463 |
| United States Treasury Note/Bond | 1.750% | 5/15/22 | 70,000 | 67,332 |
| United States Treasury Note/Bond | 1.875% | 5/31/22 | 23,000 | 22,224 |
| United States Treasury Note/Bond | 1.750% | 6/30/22 | 63,000 | 60,519 |
| United States Treasury Note/Bond | 1.875% | 7/31/22 | 84,000 | 81,008 |
| United States Treasury Note/Bond | 2.000% | 7/31/22 | 27,000 | 26,169 |
| United States Treasury Note/Bond | 1.625% | 8/15/22 | 51,000 | 48,689 |
| United States Treasury Note/Bond | 1.875% | 8/31/22 | 46,000 | 44,332 |
| United States Treasury Note/Bond | 1.750% | 9/30/22 | 83,000 | 79,512 |
| United States Treasury Note/Bond | 1.875% | 9/30/22 | 100,000 | 96,281 |
| United States Treasury Note/Bond | 1.875% | 10/31/22 | 57,500 | 55,317 |
| United States Treasury Note/Bond | 2.000% | 10/31/22 | 70,000 | 67,682 |
| United States Treasury Note/Bond | 1.625% | 11/15/22 | 58,000 | 55,190 |
| United States Treasury Note/Bond | 2.000% | 11/30/22 | 18,000 | 17,395 |
| United States Treasury Note/Bond | 2.125% | 12/31/22 | 91,000 | 88,326 |
| United States Treasury Note/Bond | 2.375% | 1/31/23 | 73,000 | 71,585 |
| United States Treasury Note/Bond | 2.000% | 2/15/23 | 30,000 | 28,941 |
| United States Treasury Note/Bond | 7.125% | 2/15/23 | 6,000 | 7,088 |
| United States Treasury Note/Bond | 1.500% | 2/28/23 | 30,000 | 28,284 |
| United States Treasury Note/Bond | 2.625% | 2/28/23 | 49,000 | 48,563 |
| United States Treasury Note/Bond | 1.500% | 3/31/23 | 35,000 | 32,966 |
| United States Treasury Note/Bond | 2.500% | 3/31/23 | 35,000 | 34,481 |
| United States Treasury Note/Bond | 1.625% | 4/30/23 | 43,000 | 40,682 |
| 47 | ||||
| Intermediate-Term Treasury Fund | ||||
| Face | Market | |||
| Maturity | Amount | Value • | ||
| Coupon | Date | ($000) | ($000) | |
| United States Treasury Note/Bond | 2.750% | 4/30/23 | 60,000 | 59,737 |
| United States Treasury Note/Bond | 1.750% | 5/15/23 | 76,000 | 72,295 |
| United States Treasury Note/Bond | 1.625% | 5/31/23 | 30,000 | 28,359 |
| United States Treasury Note/Bond | 1.250% | 7/31/23 | 20,000 | 18,512 |
| United States Treasury Note/Bond | 2.500% | 8/15/23 | 15,000 | 14,754 |
| United States Treasury Note/Bond | 1.375% | 8/31/23 | 40,000 | 37,206 |
| United States Treasury Note/Bond | 1.375% | 9/30/23 | 89,000 | 82,673 |
| United States Treasury Note/Bond | 1.625% | 10/31/23 | 91,000 | 85,525 |
| United States Treasury Note/Bond | 2.750% | 11/15/23 | 44,000 | 43,753 |
| United States Treasury Note/Bond | 2.125% | 11/30/23 | 65,000 | 62,613 |
| United States Treasury Note/Bond | 2.250% | 12/31/23 | 74,000 | 71,687 |
| United States Treasury Note/Bond | 2.250% | 1/31/24 | 82,000 | 79,386 |
| United States Treasury Note/Bond | 2.750% | 2/15/24 | 115,000 | 114,246 |
| United States Treasury Note/Bond | 2.125% | 2/29/24 | 68,000 | 65,354 |
| United States Treasury Note/Bond | 2.125% | 3/31/24 | 72,500 | 69,622 |
| United States Treasury Note/Bond | 2.000% | 4/30/24 | 57,000 | 54,328 |
| United States Treasury Note/Bond | 2.500% | 5/15/24 | 156,000 | 152,733 |
| United States Treasury Note/Bond | 2.000% | 5/31/24 | 72,000 | 68,580 |
| United States Treasury Note/Bond | 2.000% | 6/30/24 | 54,000 | 51,384 |
| United States Treasury Note/Bond | 2.125% | 7/31/24 | 54,000 | 51,705 |
| United States Treasury Note/Bond | 2.375% | 8/15/24 | 163,018 | 158,281 |
| United States Treasury Note/Bond | 2.125% | 9/30/24 | 62,000 | 59,287 |
| United States Treasury Note/Bond | 2.250% | 10/31/24 | 62,000 | 59,685 |
| United States Treasury Note/Bond | 2.250% | 11/15/24 | 110,200 | 106,033 |
| United States Treasury Note/Bond | 2.125% | 11/30/24 | 57,000 | 54,426 |
| United States Treasury Note/Bond | 2.250% | 12/31/24 | 39,000 | 37,495 |
| United States Treasury Note/Bond | 2.000% | 2/15/25 | 125,000 | 118,164 |
| United States Treasury Note/Bond | 7.625% | 2/15/25 | 12,000 | 15,349 |
| United States Treasury Note/Bond | 2.750% | 2/28/25 | 33,000 | 32,670 |
| United States Treasury Note/Bond | 2.625% | 3/31/25 | 60,000 | 58,931 |
| United States Treasury Note/Bond | 2.875% | 4/30/25 | 66,000 | 65,815 |
| United States Treasury Note/Bond | 2.125% | 5/15/25 | 116,800 | 111,070 |
| United States Treasury Note/Bond | 2.875% | 5/31/25 | 82,000 | 81,756 |
| United States Treasury Note/Bond | 2.750% | 6/30/25 | 63,000 | 62,311 |
| United States Treasury Note/Bond | 2.000% | 8/15/25 | 68,250 | 64,240 |
| United States Treasury Note/Bond | 2.250% | 11/15/25 | 70,000 | 66,872 |
| United States Treasury Note/Bond | 1.625% | 2/15/26 | 99,884 | 91,035 |
| United States Treasury Note/Bond | 1.625% | 5/15/26 | 92,891 | 84,415 |
| United States Treasury Note/Bond | 1.500% | 8/15/26 | 108,740 | 97,527 |
| United States Treasury Note/Bond | 2.000% | 11/15/26 | 128,000 | 119,080 |
| United States Treasury Note/Bond | 2.250% | 2/15/27 | 90,500 | 85,721 |
| United States Treasury Note/Bond | 2.375% | 5/15/27 | 100,000 | 95,547 |
| United States Treasury Note/Bond | 2.250% | 8/15/27 | 96,100 | 90,724 |
| United States Treasury Note/Bond | 2.250% | 11/15/27 | 116,000 | 109,330 |
| 1 United States Treasury Note/Bond | 6.125% | 11/15/27 | 17,000 | 21,346 |
| United States Treasury Note/Bond | 2.750% | 2/15/28 | 113,000 | 111,004 |
| United States Treasury Note/Bond | 2.875% | 5/15/28 | 58,000 | 57,583 |
| 5,200,345 | ||||
| Agency Bonds and Notes (4.1%) | ||||
| 2 AID-Iraq | 2.149% | 1/18/22 | 9,930 | 9,668 |
| 2 AID-Israel | 5.500% | 9/18/23 | 14,500 | 16,227 |
| 2 AID-Israel | 5.500% | 4/26/24 | 4,700 | 5,297 |
| 2 AID-Israel | 0.000% | 5/1/24 | 13,215 | 10,787 |
| 2 AID-Israel | 0.000% | 11/1/24 | 75,000 | 61,225 |
| 48 | ||||
| Intermediate-Term Treasury Fund | |||||
| Face | Market | ||||
| Maturity | Amount | Value • | |||
| Coupon | Date | ($000) | ($000) | ||
| 2 | AID-Israel | 0.000% | 8/15/25 | 15,929 | 12,579 |
| 2 | AID-Tunisia | 1.416% | 8/5/21 | 15,200 | 14,513 |
| Private Export Funding Corp. | 2.300% | 9/15/20 | 13,600 | 13,445 | |
| Private Export Funding Corp. | 4.300% | 12/15/21 | 4,150 | 4,327 | |
| Private Export Funding Corp. | 3.550% | 1/15/24 | 18,500 | 18,910 | |
| Private Export Funding Corp. | 2.450% | 7/15/24 | 6,085 | 5,863 | |
| Private Export Funding Corp. | 3.250% | 6/15/25 | 18,600 | 18,640 | |
| Resolution Funding Corp. Interest Strip | 0.000% | 4/15/26 | 15,950 | 12,451 | |
| Resolution Funding Corp. Interest Strip | 0.000% | 1/15/27 | 15,818 | 11,984 | |
| Resolution Funding Corp. Interest Strip | 0.000% | 4/15/27 | 16,673 | 12,529 | |
| Resolution Funding Corp. Interest Strip | 0.000% | 7/15/27 | 8,704 | 6,487 | |
| Resolution Funding Corp. Interest Strip | 0.000% | 10/15/27 | 8,704 | 6,422 | |
| 241,354 | |||||
| Conventional Mortgage-Backed Securities (2.6%) | |||||
| 3,4,5 Fannie Mae Pool | 3.500% | 8/1/48 | 75,000 | 74,309 | |
| 3,4,5 Fannie Mae Pool | 4.000% | 8/1/48 | 34,000 | 34,531 | |
| 3,4,5 Fannie Mae Pool | 4.500% | 8/1/48 | 15,000 | 15,558 | |
| 3,4,5 Fannie Mae Pool | 5.000% | 10/1/48 | 23,000 | 24,211 | |
| 148,609 | |||||
| Nonconventional Mortgage-Backed Securities (0.5%) | |||||
| 3,4,6 Fannie Mae REMICS 2016-1 | 2.414% | 2/25/46 | 9,712 | 9,782 | |
| 3,4,6 Fannie Mae REMICS 2016-6 | 2.514% | 2/25/46 | 6,646 | 6,754 | |
| 3,4,6 Freddie Mac REMICS | 2.472% | 5/15/46 | 6,583 | 6,604 | |
| 3,4,6 Freddie Mac REMICS | 2.522% | 10/15/46 | 6,294 | 6,352 | |
| 29,492 | |||||
| Total U.S. Government and Agency Obligations (Cost $5,716,516) | 5,619,800 | ||||
| Asset-Backed/Commercial Mortgage-Backed Securities (5.2%) | |||||
| 3 | Small Business Administration Participation | ||||
| Certs 2017-20 | 2.880% | 5/1/37 | 4,581 | 4,431 | |
| 3 | Small Business Administration Participation | ||||
| Certs 2017-20 | 2.850% | 10/1/37 | 24,807 | 23,865 | |
| 3 | Small Business Administration Participation | ||||
| Certs 2017-20 | 2.790% | 11/1/37 | 31,791 | 30,217 | |
| 3 | Small Business Administration Participation | ||||
| Certs 2017-20K | 2.780% | 12/1/37 | 27,055 | 25,882 | |
| 3 | Small Business Administration Participation | ||||
| Certs 2017-20 | 3.310% | 4/1/38 | 50,900 | 50,191 | |
| 3 | Small Business Administration Participation | ||||
| Certs 2017-20 | 3.600% | 6/1/38 | 19,000 | 18,988 | |
| 3 | Small Business Administration Participation | ||||
| Certs 2017-20B | 2.820% | 2/1/37 | 5,015 | 4,795 | |
| 3 | Small Business Administration Participation | ||||
| Certs 2017-20F | 2.810% | 6/1/37 | 2,810 | 2,691 | |
| 3 | Small Business Administration Participation | ||||
| Certs 2018-20 | 2.920% | 1/1/38 | 23,666 | 22,840 | |
| 3 | Small Business Administration Participation | ||||
| Certs 2018-20 | 3.220% | 2/1/38 | 38,900 | 38,112 | |
| 3 | Small Business Administration Participation | ||||
| Certs 2018-20C | 3.200% | 3/1/38 | 55,200 | 54,061 | |
| 49 | |||||
| Intermediate-Term Treasury Fund | ||||||
| Face | Market | |||||
| Maturity | Amount | Value • | ||||
| Coupon | Date | ($000) | ($000) | |||
| 3 | Small Business Administration Participation | |||||
| Certs 2018-20E | 3.500% | 5/1/38 | 11,000 | 10,902 | ||
| 3 | Small Business Administration Participation | |||||
| Certs 2018-20G | 3.540% | 7/1/38 | 12,500 | 12,435 | ||
| Total Asset-Backed/Commercial Mortgage-Backed Securities (Cost $306,581) | 299,410 | |||||
| Shares | ||||||
| Temporary Cash Investment (0.6%) | ||||||
| Money Market Fund (0.6%) | ||||||
| 7 | Vanguard Market Liquidity Fund (Cost $38,026) | 2.145% | 380,239 | 38,024 | ||
| Total Investments (102.4%) (Cost $6,061,123) | 5,957,234 | |||||
| Notional | ||||||
| Expiration | Exercise | Amount | ||||
| Date | Contracts | Price | ($000) | |||
| Liability for Options Written (0.0%) | ||||||
| Call Options on 10-Year | ||||||
| U. S. Treasury Note Futures | ||||||
| Contracts | 8/10/18 | 50 | USD 119.25 | 5,963 | (19) | |
| Call Options on 10-Year | ||||||
| U. S. Treasury Note Futures | ||||||
| Contracts | 8/24/18 | 443 | USD 120.00 | 53,160 | (83) | |
| Call Options on 10-Year | ||||||
| U. S. Treasury Note Futures | ||||||
| Contracts | 8/27/18 | 151 | USD 119.50 | 18,045 | (57) | |
| Put Options on 10-Year | ||||||
| U. S. Treasury Note Futures | ||||||
| Contracts | 8/10/18 | 50 | USD 119.25 | 5,963 | (11) | |
| Put Options on 10-Year | ||||||
| U. S. Treasury Note Futures | ||||||
| Contracts | 8/24/18 | 392 | USD 118.50 | 46,452 | (49) | |
| Put Options on 10-Year | ||||||
| U. S. Treasury Note Futures | ||||||
| Contracts | 8/24/18 | 51 | USD 120.00 | 6,120 | (39) | |
| Put Options on 10-Year | ||||||
| U. S. Treasury Note Futures | ||||||
| Contracts | 8/24/18 | 101 | USD 119.00 | 12,019 | (24) | |
| Put Options on 10-Year | ||||||
| U. S. Treasury Note Futures | ||||||
| Contracts | 8/27/18 | 50 | USD 119.50 | 5,975 | (23) | |
| Total Liability on Options Written (Premiums Received $627) | (305) | |||||
| Amount | ||||||
| ($000) | ||||||
| Other Assets and Other Liabilities (-2.4%) | ||||||
| Other Assets | 281,687 | |||||
| Other Liabilities | (422,862) | |||||
| (141,175) | ||||||
| Net Assets (100%) | 5,815,754 | |||||
| 50 | ||||||
| Intermediate-Term Treasury Fund | |
| Amount | |
| ($000) | |
| Statement of Assets and Liabilities | |
| Assets | |
| Investments in Securities, at Value | |
| Unaffiliated Issuers | 5,919,210 |
| Affiliated Issuers | 38,024 |
| Total Investments in Securities | 5,957,234 |
| Investment in Vanguard | 312 |
| Receivables for Investment Securities Sold | 234,081 |
| Receivables for Accrued Income | 36,012 |
| Receivables for Capital Shares Issued | 10,867 |
| Variation Margin Receivable—Futures Contracts | 162 |
| Other Assets | 253 |
| Total Assets | 6,238,921 |
| Liabilities | |
| Payables for Investment Securities Purchased | 392,080 |
| Payables for Capital Shares Redeemed | 25,842 |
| Payables for Distributions | 1,834 |
| Payables to Vanguard | 2,806 |
| Liabilities for Options Written | 305 |
| Variation Margin Payable—Futures Contracts | 300 |
| Total Liabilities | 423,167 |
| Net Assets | 5,815,754 |
| At July 31, 2018, net assets consisted of: | |
| Amount | |
| ($000) | |
| Paid-in Capital | 6,136,425 |
| Undistributed Net Investment Income | 40 |
| Accumulated Net Realized Losses | (218,066) |
| Unrealized Appreciation (Depreciation) | |
| Investment Securities | (103,889) |
| Futures Contracts | 922 |
| Options on Futures Contracts 8 | 322 |
| Net Assets | 5,815,754 |
51
| Intermediate-Term Treasury Fund | |
| Amount | |
| ($000) | |
| Investor Shares—Net Assets | |
| Applicable to 79,464,715 outstanding $.001 par value shares of | |
| beneficial interest (unlimited authorization) | 853,453 |
| Net Asset Value Per Share—Investor Shares | $10.74 |
| Admiral Shares—Net Assets | |
| Applicable to 462,036,096 outstanding $.001 par value shares of | |
| beneficial interest (unlimited authorization) | 4,962,301 |
| Net Asset Value Per Share—Admiral Shares | $10.74 |
• See Note A in Notes to Financial Statements.
1 Securities with a value of $2,917,000 have been segregated as initial margin for open futures contracts.
2 U.S. government-guaranteed.
3 The average or expected maturity is shorter than the final maturity shown because of the possibility of interim principal payments
and prepayments or the possibility of the issue being called.
4 The issuer was placed under federal conservatorship in September 2008; since that time, its daily operations have been managed
by the Federal Housing Finance Agency and it receives capital from the U.S. Treasury, as needed to maintain a positive net worth,
in exchange for senior preferred stock.
5 Includes securities purchased on a when-issued or delayed-delivery basis for which the fund has not taken delivery as of July 31, 2018.
6 Adjustable-rate security based upon 1-month USD LIBOR plus spread.
7 Affiliated money market fund available only to Vanguard funds and certain trusts and accounts managed by Vanguard. Rate shown
is the 7-day yield.
8 Unrealized appreciation (depreciation) on options contracts is required to be treated as realized gain (loss) for tax purposes.
REMICS—Real Estate Mortgage Investment Conduits.
52
Intermediate-Term Treasury Fund
| Derivative Financial Instruments Outstanding as of Period End | ||||
| Futures Contracts | ||||
| ($000) | ||||
| Value and | ||||
| Number of | Unrealized | |||
| Long (Short) | Notional | Appreciation | ||
| Expiration | Contracts | Amount | (Depreciation) | |
| Long Futures Contracts | ||||
| 2-Year U.S. Treasury Note | September 2018 | 1,382 | 292,120 | (446) |
| 5-Year U.S. Treasury Note | September 2018 | 1,719 | 194,462 | (271) |
| Ultra Long U.S. Treasury Bond | September 2018 | 114 | 17,887 | 6 |
| (711) | ||||
| Short Futures Contracts | ||||
| 10-Year U.S. Treasury Note | September 2018 | (2,221) | (265,236) | 663 |
| Ultra 10-Year U.S. Treasury Note | September 2018 | (1,332) | (169,310) | 970 |
| 1,633 | ||||
| 922 | ||||
Unrealized appreciation (depreciation) on open futures contracts is required to be treated as realized gain (loss) for tax purposes.
See accompanying Notes, which are an integral part of the Financial Statements.

| Intermediate-Term Treasury Fund | |
| Statement of Operations | |
| Six Months Ended | |
| July31,2018 | |
| ($000) | |
| Investment Income | |
| Income | |
| Interest1 | 73,820 |
| Total Income | 73,820 |
| Expenses | |
| The Vanguard Group—Note B | |
| Investment Advisory Services | 223 |
| Management and Administrative—Investor Shares | 784 |
| Management and Administrative—Admiral Shares | 2,091 |
| Marketing and Distribution—Investor Shares | 74 |
| Marketing and Distribution—Admiral Shares | 169 |
| Custodian Fees | 29 |
| Shareholders’ Reports—Investor Shares | 15 |
| Shareholders’ Reports—Admiral Shares | 23 |
| Trustees’ Fees and Expenses | 2 |
| Total Expenses | 3,410 |
| Net Investment Income | 70,410 |
| Realized Net Gain (Loss) | |
| Investment Securities Sold1 | (112,963) |
| Futures Contracts | (3,406) |
| Purchased Options | (94) |
| Written Options | (158) |
| Realized Net Gain (Loss) | (116,621) |
| Change in Unrealized Appreciation (Depreciation) | |
| Investment Securities1 | 33,708 |
| Futures Contracts | 2,748 |
| Written Options | 674 |
| Change in Unrealized Appreciation (Depreciation) | 37,130 |
| Net Increase (Decrease) in Net Assets Resulting from Operations | (9,081) |
1 Interest income, realized net gain (loss), and change in unrealized appreciation (depreciation) from an affiliated company of the fund were $284,000, ($23,000), and ($2,000), respectively. Purchases and sales are for temporary cash investment purposes.
See accompanying Notes, which are an integral part of the Financial Statements.
54
| Intermediate-Term Treasury Fund | ||
| Statement of Changes in Net Assets | ||
| Six Months Ended | Year Ended | |
| July 31, | January 31, | |
| 2018 | 2018 | |
| ($000) | ($000) | |
| Increase (Decrease) in Net Assets | ||
| Operations | ||
| Net Investment Income | 70,410 | 116,914 |
| Realized Net Gain (Loss) | (116,621) | (69,107) |
| Change in Unrealized Appreciation (Depreciation) | 37,130 | (58,052) |
| Net Increase (Decrease) in Net Assets Resulting from Operations | (9,081) | (10,245) |
| Distributions | ||
| Net Investment Income | ||
| Investor Shares | (10,487) | (19,267) |
| Admiral Shares | (59,919) | (97,614) |
| Realized Capital Gain | ||
| Investor Shares | — | — |
| Admiral Shares | — | — |
| Total Distributions | (70,406) | (116,881) |
| Capital Share Transactions | ||
| Investor Shares | (101,119) | (198,622) |
| Admiral Shares | (71,048) | 17,884 |
| Net Increase (Decrease) from Capital Share Transactions | (172,167) | (180,738) |
| Total Increase (Decrease) | (251,654) | (307,864) |
| Net Assets | ||
| Beginning of Period | 6,067,408 | 6,375,272 |
| End of Period1 | 5,815,754 | 6,067,408 |
1 Net Assets—End of Period includes undistributed (overdistributed) net investment income of $40,000 and ($6,000).
See accompanying Notes, which are an integral part of the Financial Statements.
55
| Intermediate-Term Treasury Fund | ||||||
| Financial Highlights | ||||||
| Investor Shares | ||||||
| Six Months | ||||||
| Ended | ||||||
| For a Share Outstanding | July 31, | Year Ended January 31, | ||||
| Throughout Each Period | 2018 | 2018 | 2017 | 2016 | 2015 | 2014 |
| Net Asset Value, Beginning of Period | $10.88 | $11.11 | $11.51 | $11.66 | $11.29 | $11.60 |
| Investment Operations | ||||||
| Net Investment Income | .1231 | .1981 | .177 | .188 | .188 | .170 |
| Net Realized and Unrealized Gain (Loss) | ||||||
| on Investments | (.140) | (. 230) | (. 271) | (. 057) | . 410 | (. 256) |
| Total from Investment Operations | (. 017) | (. 032) | (. 094) | .131 | . 598 | (. 086) |
| Distributions | ||||||
| Dividends from Net Investment Income | (.123) | (.198) | (.177) | (.188) | (.188) | (.170) |
| Distributions from Realized Capital Gains | — | — | (.129) | (.093) | (.040) | (.054) |
| Total Distributions | (.123) | (.198) | (. 306) | (. 281) | (. 228) | (. 224) |
| Net Asset Value, End of Period | $10.74 | $10.88 | $11.11 | $11.51 | $11.66 | $11.29 |
| Total Return2 | -0.16% | -0.31% | -0.84% | 1.17% | 5.38% | -0.74% |
| Ratios/Supplemental Data | ||||||
| Net Assets, End of Period (Millions) | $853 | $967 | $1,185 | $1,326 | $1,391 | $1,469 |
| Ratio of Total Expenses to | ||||||
| Average Net Assets | 0.20% | 0.20% | 0.20% | 0.20% | 0.20% | 0.20% |
| Ratio of Net Investment Income to | ||||||
| Average Net Assets | 2.30% | 1.78% | 1.53% | 1.64% | 1.66% | 1.48% |
| Portfolio Turnover Rate 3 | 213% | 181% | 152% | 142% | 63% | 42% |
The expense ratio, net investment income ratio, and turnover rate for the current period have been annualized.
1 Calculated based on average shares outstanding.
2 Total returns do not include account service fees that may have applied in the periods shown. Fund prospectuses provide information
about any applicable account service fees.
3 Includes 3%, 6%, 3%, 34%, 22%, and 0% attributable to mortgage-dollar-roll activity.
See accompanying Notes, which are an integral part of the Financial Statements.
56
| Intermediate-Term Treasury Fund | ||||||
| Financial Highlights | ||||||
| Admiral Shares | ||||||
| Six Months | ||||||
| Ended | ||||||
| For a Share Outstanding | July 31, | Year Ended January 31, | ||||
| Throughout Each Period | 2018 | 2018 | 2017 | 2016 | 2015 | 2014 |
| Net Asset Value, Beginning of Period | $10.88 | $11.11 | $11.51 | $11.66 | $11.29 | $11.60 |
| Investment Operations | ||||||
| Net Investment Income | .1281 | .2101 | .188 | .199 | .199 | .181 |
| Net Realized and Unrealized Gain (Loss) | ||||||
| on Investments | (.140) | (. 230) | (. 271) | (. 057) | . 410 | (. 256) |
| Total from Investment Operations | (. 012) | (. 020) | (. 083) | .142 | . 609 | (. 075) |
| Distributions | ||||||
| Dividends from Net Investment Income | (.128) | (. 210) | (.188) | (.199) | (.199) | (.181) |
| Distributions from Realized Capital Gains | — | — | (.129) | (.093) | (.040) | (.054) |
| Total Distributions | (.128) | (. 210) | (. 317) | (. 292) | (. 239) | (. 235) |
| Net Asset Value, End of Period | $10.74 | $10.88 | $11.11 | $11.51 | $11.66 | $11.29 |
| Total Return2 | -0.11% | -0.21% | -0.74% | 1.27% | 5.48% | -0.64% |
| Ratios/Supplemental Data | ||||||
| Net Assets, End of Period (Millions) | $4,962 | $5,100 | $5,190 | $4,849 | $4,287 | $3,619 |
| Ratio of Total Expenses to | ||||||
| Average Net Assets | 0.10% | 0.10% | 0.10% | 0.10% | 0.10% | 0.10% |
| Ratio of Net Investment Income to | ||||||
| Average Net Assets | 2.40% | 1.88% | 1.63% | 1.74% | 1.76% | 1.58% |
| Portfolio Turnover Rate 3 | 213% | 181% | 152% | 142% | 63% | 42% |
The expense ratio, net investment income ratio, and turnover rate for the current period have been annualized.
1 Calculated based on average shares outstanding.
2 Total returns do not include account service fees that may have applied in the periods shown. Fund prospectuses provide information
about any applicable account service fees.
3 Includes 3%, 6%, 3%, 34%, 22%, and 0% attributable to mortgage-dollar-roll activity.
See accompanying Notes, which are an integral part of the Financial Statements.
57
Intermediate-Term Treasury Fund
Notes to Financial Statements
Vanguard Intermediate-Term Treasury Fund is registered under the Investment Company Act of 1940 as an open-end investment company, or mutual fund. The fund offers two classes of shares: Investor Shares and Admiral Shares. Investor Shares are available to any investor who meets the fund’s minimum purchase requirements. Admiral Shares are designed for investors who meet certain administrative, service, and account-size criteria.
A. The following significant accounting policies conform to generally accepted accounting principles for U.S. investment companies. The fund consistently follows such policies in preparing its financial statements.
1. Security Valuation: Securities are valued as of the close of trading on the New York Stock Exchange (generally 4 p.m., Eastern time) on the valuation date. Bonds and temporary cash investments are valued using the latest bid prices or using valuations based on a matrix system (which considers such factors as security prices, yields, maturities, and ratings), both as furnished by independent pricing services. Structured debt securities, including mortgages and asset-backed securities, are valued using the latest bid prices or using valuations based on a matrix system that considers such factors as issuer, tranche, nominal or option-adjusted spreads, weighted average coupon, weighted average maturity, credit enhancements, and collateral. Investments in Vanguard Market Liquidity Fund are valued at that fund’s net asset value. Securities for which market quotations are not readily available, or whose values have been affected by events occurring before the fund’s pricing time but after the close of the securities’ primary markets, are valued by methods deemed by the board of trustees to represent fair value.
2. Futures and Options: The fund uses futures contracts and options on futures contracts to invest in fixed income asset classes with greater efficiency and lower cost than is possible through direct investment, to add value when these instruments are attractively priced, or to adjust sensitivity to changes in interest rates. The primary risks associated with the use of futures contracts are imperfect correlation between changes in market values of bonds held by the fund and the prices of futures contracts, and the possibility of an illiquid market. The primary risk associated with purchasing options is that interest rates move in such a way that the option is out-of-the-money, the position is worthless at expiration, and the fund loses the premium paid. The primary risk associated with writing options is that interest rates move in such a way that the option is in-the-money, the counterparty exercises the option, and the fund loses an amount equal to the market value of the option written less the premium received. Counterparty risk involving futures and exchange-traded options is mitigated because a regulated clearinghouse is the counterparty instead of the clearing broker. To further mitigate counterparty risk, the fund trades futures and options on an exchange, monitors the financial strength of its clearing brokers and clearinghouse, and has entered into clearing agreements with its clearing brokers. The clearinghouse imposes initial margin requirements to secure the fund’s performance and requires daily settlement of variation margin representing changes in the market value of each contract. Any assets pledged as initial margin for open contracts are noted in the Statement of Net Assets.
58
Intermediate-Term Treasury Fund
Futures contracts are valued at their quoted daily settlement prices. The notional amounts of the contracts are not recorded in the Statement of Net Assets. Fluctuations in the value of the contracts are recorded in the Statement of Assets and Liabilities as an asset (liability) and in the Statement of Operations as unrealized appreciation (depreciation) until the contracts are closed, when they are recorded as realized futures gains (losses).
During the six months ended July 31, 2018, the fund’s average investments in long and short futures contracts represented 8% and 5% of net assets, respectively, based on the average of the notional amounts at each quarter-end during the period.
Options on futures contracts are also valued at their quoted daily settlement prices. The premium paid for a purchased option is recorded in the Statement of Assets and Liabilities as an asset that is subsequently adjusted daily to the current market value of the option purchased. The premium received for a written option is recorded in the Statement of Assets and Liabilities as an asset with an equal liability that is subsequently adjusted daily to the current market value of the option written. Fluctuations in the value of the options are recorded in the Statement of Operations as unrealized appreciation (depreciation) until expired, closed, or exercised, at which time realized gains (losses) are recognized.
During the six months ended July 31, 2018, the fund’s average value of investments in options purchased and options written each represented less than 1% of net assets, respectively, based on the average market values at each quarter-end during the period.
3. To Be Announced (TBA) Transactions: A TBA transaction is an agreement to buy or sell mortgage-backed securities with agreed-upon characteristics (face amount, coupon, maturity) for settlement at a future date. The fund may be a seller of TBA transactions to reduce its exposure to the mortgage-backed securities market or in order to sell mortgage-backed securities it owns under delayed-delivery arrangements. When the fund is a buyer of TBA transactions, it maintains cash or short-term investments in an amount sufficient to meet the purchase price at the settlement date of the TBA transaction. The primary risk associated with TBA transactions is that a counterparty may default on its obligations. The fund mitigates its counterparty risk by, among other things, performing a credit analysis of counterparties, allocating transactions among numerous counterparties, and monitoring its exposure to each counterparty. The fund may also enter into a Master Securities Forward Transaction Agreement (MSFTA) with certain counterparties and require them to transfer collateral as security for their performance. In the absence of a default, the collateral pledged or received by the fund cannot be repledged, resold, or rehypothecated. Under an MSFTA, upon a counterparty default (including bankruptcy), the fund may terminate any TBA transactions with that counterparty, determine the net amount owed by either party in accordance with its master netting arrangements, and sell or retain any collateral held up to the net amount owed to the fund under the master netting arrangements.
4. Mortgage Dollar Rolls: The fund enters into mortgage-dollar-roll transactions, in which the fund sells mortgage-backed securities to a dealer and simultaneously agrees to purchase similar securities in the future at a predetermined price. The proceeds of the securities sold in mortgage-dollar-roll transactions are typically invested in high-quality short-term fixed income securities. The fund forgoes principal and interest paid on the securities sold, and is compensated by interest earned on the proceeds of the sale and by a lower price on the securities to be repurchased.
The fund accounts for mortgage-dollar-roll transactions as purchases and sales; as such, these
59
Intermediate-Term Treasury Fund
transactions may increase the fund’s portfolio turnover rate. Amounts to be received or paid in connection with open mortgage dollar rolls are included in Receivables for Investment Securities Sold or Payables for Investment Securities Purchased in the Statement of Assets and Liabilities.
5. Federal Income Taxes: The fund intends to continue to qualify as a regulated investment company and distribute all of its taxable income. Management has analyzed the fund’s tax positions taken for all open federal income tax years (January 31, 2015–2018), and for the period ended July 31, 2018, and has concluded that no provision for federal income tax is required in the fund’s financial statements.
6. Distributions: Distributions from net investment income are declared daily and paid on the first business day of the following month. Annual distributions from realized capital gains, if any, are recorded on the ex-dividend date.
7. Credit Facility: The fund and certain other funds managed by The Vanguard Group (“Vanguard”) participate in a $3.1 billion committed credit facility provided by a syndicate of lenders pursuant to a credit agreement that may be renewed annually; each fund is individually liable for its borrowings, if any, under the credit facility. Borrowings may be utilized for temporary and emergency purposes, and are subject to the fund’s regulatory and contractual borrowing restrictions. The participating funds are charged administrative fees and an annual commitment fee of 0.10% of the undrawn amount of the facility; these fees are allocated to the funds based on a method approved by the fund’s board of trustees and included in Management and Administrative expenses on the fund’s Statement of Operations. Any borrowings under this facility bear interest at a rate based upon the higher of the one-month London Interbank Offered Rate, federal funds effective rate, or overnight bank funding rate plus an agreed-upon spread.
The fund had no borrowings outstanding at July 31, 2018, or at any time during the period then ended.
8. Other: Interest income includes income distributions received from Vanguard Market Liquidity Fund and is accrued daily. Premiums and discounts on debt securities purchased are amortized and accreted, respectively, to interest income over the lives of the respective securities. Security transactions are accounted for on the date securities are bought or sold. Costs used to determine realized gains (losses) on the sale of investment securities are those of the specific securities sold.
Each class of shares has equal rights as to assets and earnings, except that each class separately bears certain class-specific expenses related to maintenance of shareholder accounts (included in Management and Administrative expenses), shareholder reporting, and the proxy. Marketing and distribution expenses are allocated to each class of shares based on a method approved by the board of trustees. Income, other non-class-specific expenses, and gains and losses on investments are allocated to each class of shares based on its relative net assets.
B. In accordance with the terms of a Funds’ Service Agreement (the “FSA”) between Vanguard and the fund, Vanguard furnishes to the fund investment advisory, corporate management, administrative, marketing, and distribution services at Vanguard’s cost of operations (as defined by the FSA). These costs of operations are allocated to the fund based on methods and guidelines approved by the board of trustees. Vanguard does not require reimbursement in the current period
60
Intermediate-Term Treasury Fund
for certain costs of operations (such as deferred compensation/benefits and risk/insurance costs); the fund’s liability for these costs of operations is included in Payables to Vanguard on the Statement of Assets and Liabilities. All other costs of operations payable to Vanguard are generally settled twice a month.
Upon the request of Vanguard, the fund may invest up to 0.40% of its net assets as capital in Vanguard. At July 31, 2018, the fund had contributed to Vanguard capital in the amount of $312,000, representing 0.01% of the fund’s net assets and 0.12% of Vanguard’s capitalization. The fund’s trustees and officers are also directors and employees, respectively, of Vanguard.
C. Various inputs may be used to determine the value of the fund’s investments. These inputs are summarized in three broad levels for financial statement purposes. The inputs or methodologies used to value securities are not necessarily an indication of the risk associated with investing in those securities.
Level 1—Quoted prices in active markets for identical securities.
Level 2—Other significant observable inputs (including quoted prices for similar securities, interest rates, prepayment speeds, credit risk, etc.).
Level 3—Significant unobservable inputs (including the fund’s own assumptions used to determine
the fair value of investments). Any investments valued with significant unobservable inputs are
noted on the Statement of Net Assets.
The following table summarizes the market value of the fund’s investments as of July 31, 2018, based on the inputs used to value them:
| Level 1 | Level 2 | Level 3 | |
| Investments | ($000) | ($000) | ($000) |
| U.S. Government and Agency Obligations | — | 5,619,800 | — |
| Asset-Backed/Commercial Mortgage-Backed Securities | — | 299,410 | — |
| Temporary Cash Investments | 38,024 | — | — |
| Liability for Options Written | (305) | — | — |
| Futures Contracts—Assets1 | 162 | — | — |
| Futures Contracts—Liabilities1 | (300) | — | — |
| Total | 37,581 | 5,919,210 | — |
| 1 Represents variation margin on the last day of the reporting period. |
D. Capital gain distributions are determined on a tax basis and may differ from realized capital gains for financial reporting purposes. Differences may be permanent or temporary. Permanent differences are reclassified among capital accounts in the financial statements to reflect their tax character. Temporary differences arise when gains or losses are recognized in different periods for financial statement and tax purposes. These differences will reverse at some time in the future.
The fund’s tax-basis capital gains and losses are determined only at the end of each fiscal year. For tax purposes, at January 31, 2018, the fund had available capital losses totaling $103,623,000 that may be carried forward indefinitely to offset future net capital gains. The fund will use these capital losses to offset net taxable capital gains, if any, realized during the year ending January 31, 2019; should the fund realize net capital losses for the year, the losses will be added to the loss carryforward balance above.
61
Intermediate-Term Treasury Fund
At July 31, 2018, the cost of investment securities for tax purposes was $6,061,123,000. Net unrealized depreciation of investment securities for tax purposes was $103,889,000, consisting of unrealized gains of $1,479,000 on securities that had risen in value since their purchase and $105,368,000 in unrealized losses on securities that had fallen in value since their purchase.
E. During the six months ended July 31, 2018, the fund purchased $6,346,164,000 of investment securities and sold $6,379,576,000 of investment securities, other than temporary cash investments.
F. Capital share transactions for each class of shares were:
| Six Months Ended | Year Ended | |||
| July 31, 2018 | January 31, 2018 | |||
| Amount | Shares | Amount | Shares | |
| ($000) | (000) | ($000) | (000) | |
| Investor Shares | ||||
| Issued | 108,687 | 10,049 | 223,142 | 20,010 |
| Issued in Lieu of Cash Distributions | 9,499 | 880 | 17,581 | 1,577 |
| Redeemed | (219,305) | (20,338) | (439,345) | (39,398) |
| Net Increase (Decrease)—Investor Shares | (101,119) | (9,409) | (198,622) | (17,811) |
| Admiral Shares | ||||
| Issued | 573,128 | 53,090 | 1,260,285 | 112,952 |
| Issued in Lieu of Cash Distributions | 49,838 | 4,616 | 80,863 | 7,258 |
| Redeemed | (694,014) | (64,301) | (1,323,264) | (118,721) |
| Net Increase (Decrease)—Admiral Shares | (71,048) | (6,595) | 17,884 | 1,489 |
G. Management has determined that no events or transactions occurred subsequent to July 31, 2018, that would require recognition or disclosure in these financial statements.
62
GNMA Fund
Fund Profile
As of July 31, 2018
| Share-Class Characteristics | ||
| Investor | Admiral | |
| Shares | Shares | |
| Ticker Symbol | VFIIX | VFIJX |
| Expense Ratio1 | 0.21% | 0.11% |
| 30-Day SEC Yield | 2.78% | 2.88% |
| Financial Attributes | |||
| Bloomberg | Bloomberg | ||
| Barclays | Barclays | ||
| GNMA | Aggregate | ||
| Fund | Index | Bond Index | |
| Number of Bonds | 43 | 91 | 10,012 |
| Yield to Maturity | |||
| (before expenses) | 3.5% | 3.4% | 3.4% |
| Average Coupon | 3.6% | 3.6% | 3.1% |
| Average Duration | 4.5 years | 5.2 years | 6.0 years |
| Average Effective | |||
| Maturity | 7.9 years | 7.7 years | 8.4 years |
| Short-Term | |||
| Reserves | 5.0% | — | — |
| Number of Bonds: Issues are mortgage pools grouped by coupon. | |||
| Sector Diversification (% of portfolio) | |
| Asset-Backed | 1.7% |
| Collateralized Mortgage Obligations | 3.1 |
| Government Mortgage-Backed | 93.5 |
| Other Government | 1.7 |
The agency and mortgage-backed securities sectors may include
issues from government-sponsored enterprises; such issues are
generally not backed by the full faith and credit of the U.S.
government.
| Volatility Measures | ||
| Bloomberg | Bloomberg | |
| Barclays | Barclays | |
| GNMA | Aggregate | |
| Index | Bond Index | |
| R-Squared | 0.98 | 0.85 |
| Beta | 1.02 | 0.65 |
| These measures show the degree and timing of the fund’s | ||
| fluctuations compared with the indexes over 36 months. | ||
| Distribution by Credit Quality (% of portfolio) | |
| U.S. Government | 100.0% |
Credit-quality ratings are obtained from Barclays and are from
Moody's, Fitch, and S&P. When ratings from all three agencies are
used, the median rating is shown. When ratings from two of the
agencies are used, the lower rating for each issue is shown. "Not
Rated" is used to classify securities for which a rating is not
available. Not rated securities include a fund's investment in
Vanguard Market Liquidity Fund or Vanguard Municipal Cash
Management Fund, each of which invests in high-quality money
market instruments and may serve as a cash management vehicle
for the Vanguard funds, trusts, and accounts. For more information
about these ratings, see the Glossary entry for Credit Quality.
| Distribution by Coupon (% of portfolio) | |
| Less Than 1.0% | 0.5% |
| 1.0% to 4.0% | 64.6 |
| 4.0% to 6.0% | 32.3 |
| 6.0% and above | 2.6 |
1 The expense ratios shown are from the prospectus dated May 24, 2018, and represent estimated costs for the current fiscal year. For the six months ended July 31, 2018, the annualized expense ratios were 0.21% for Investor Shares and 0.11% for Admiral Shares.
63
GNMA Fund
Performance Summary
All of the returns in this report represent past performance, which is not a guarantee of future results that may be achieved by the fund. (Current performance may be lower or higher than the performance data cited. For performance data current to the most recent month-end, visit our website at vanguard.com/performance.) Note, too, that both investment returns and principal value can fluctuate widely, so an investor’s shares, when sold, could be worth more or less than their original cost. The returns shown do not reflect taxes that a shareholder would pay on fund distributions or on the sale of fund shares.
| Fiscal-Year Total Returns (%): January 31, 2008, Through July 31, 2018 | ||||
| Bloomberg | ||||
| Barclays | ||||
| GNMA | ||||
| Investor Shares | Index | |||
| Fiscal Year | Income Returns | Capital Returns | Total Returns | Total Returns |
| 2009 | 5.08% | 0.57% | 5.65% | 5.98% |
| 2010 | 3.94 | 2.87 | 6.81 | 6.78 |
| 2011 | 3.42 | 2.29 | 5.71 | 5.33 |
| 2012 | 3.41 | 4.55 | 7.96 | 8.21 |
| 2013 | 2.61 | -1.26 | 1.35 | 1.54 |
| 2014 | 2.28 | -1.94 | 0.34 | 0.25 |
| 2015 | 2.66 | 2.63 | 5.29 | 4.56 |
| 2016 | 2.35 | -0.52 | 1.83 | 2.10 |
| 2017 | 2.19 | -1.70 | 0.49 | 0.28 |
| 2018 | 2.66 | -1.81 | 0.85 | 0.86 |
| 2019 | 1.43 | -1.16 | 0.27 | 0.25 |
| Note: For 2019, performance data reflect the six months ended July 31, 2018. | ||||
Average Annual Total Returns: Periods Ended June 30, 2018
This table presents returns through the latest calendar quarter—rather than through the end of the fiscal period.
Securities and Exchange Commission rules require that we provide this information.
| Ten Years | ||||||
| Inception Date | One Year | Five Years | Income | Capital | Total | |
| Investor Shares | 6/27/1980 | -0.01% | 2.26% | 2.96% | 0.66% | 3.62% |
| Admiral Shares | 2/12/2001 | 0.09 | 2.36 | 3.07 | 0.66 | 3.73 |
See Financial Highlights for dividend and capital gains information.
64
GNMA Fund
Financial Statements (unaudited)
Statement of Net Assets
As of July 31, 2018
The fund reports a complete list of its holdings in regulatory filings four times in each fiscal year, at the quarter-ends. For the second and fourth fiscal quarters, the lists appear in the fund’s semiannual and annual reports to shareholders. For the first and third fiscal quarters, the fund files the lists with the Securities and Exchange Commission on Form N-Q. Shareholders can look up the fund’s Forms N-Q on the SEC’s website at sec.gov. Forms N-Q may also be reviewed and copied at the SEC’s Public Reference Room (see the back cover of this report for further information).
| Face | Market | ||||
| Maturity | Amount | Value • | |||
| Coupon | Date | ($000) | ($000) | ||
| U. S. Government and Agency Obligations (97.2%) | |||||
| U.S. Government Securities (1.1%) | |||||
| United States Treasury Inflation Indexed | |||||
| Bonds | 0.625% | 1/15/26 | 239,900 | 250,003 | |
| Conventional Mortgage-Backed Securities (92.4%) | |||||
| 1,2 | Fannie Mae Pool | 2.500% | 10/1/26–8/1/46 | 19,630 | 18,605 |
| 1,2 | Fannie Mae Pool | 2.640% | 12/1/31 | 15,516 | 14,117 |
| 1,2 | Fannie Mae Pool | 2.690% | 10/1/27 | 33,670 | 31,543 |
| 1,2 | Fannie Mae Pool | 2.710% | 9/1/31 | 7,110 | 6,496 |
| 1,2 | Fannie Mae Pool | 2.720% | 9/1/31 | 1,451 | 1,333 |
| 1,2 | Fannie Mae Pool | 2.775% | 11/1/27 | 3,420 | 3,200 |
| 1,2 | Fannie Mae Pool | 2.870% | 12/1/27–1/1/28 | 147,601 | 140,600 |
| 1,2 | Fannie Mae Pool | 2.890% | 12/1/27 | 27,087 | 25,820 |
| 1,2 | Fannie Mae Pool | 2.920% | 2/1/28 | 7,502 | 7,159 |
| 1,2 | Fannie Mae Pool | 2.940% | 12/1/27 | 44,540 | 42,007 |
| 1,2 | Fannie Mae Pool | 2.950% | 6/1/31 | 1,925 | 1,787 |
| 1,2 | Fannie Mae Pool | 2.960% | 12/1/27– 6/1/31 | 100,512 | 95,569 |
| 1,2 | Fannie Mae Pool | 2.970% | 12/1/27 | 6,559 | 6,197 |
| 1,2 | Fannie Mae Pool | 3.000% | 4/1/25–1/1/31 | — | — |
| 1,2 | Fannie Mae Pool | 3.030% | 5/1/29–2/1/30 | 40,130 | 38,109 |
| 1,2 | Fannie Mae Pool | 3.050% | 7/1/31 | 2,000 | 1,878 |
| 1,2 | Fannie Mae Pool | 3.090% | 3/1/30 | 8,775 | 8,393 |
| 1,2 | Fannie Mae Pool | 3.100% | 9/1/29–2/1/33 | 41,830 | 39,023 |
| 1,2 | Fannie Mae Pool | 3.110% | 11/1/27–2/1/28 | 23,000 | 22,073 |
| 1,2 | Fannie Mae Pool | 3.160% | 12/1/32–2/1/33 | 28,358 | 26,671 |
| 1,2 | Fannie Mae Pool | 3.170% | 1/1/30 | 19,944 | 19,063 |
| 1,2 | Fannie Mae Pool | 3.190% | 9/1/29 | 3,725 | 3,560 |
| 1,2 | Fannie Mae Pool | 3.210% | 3/1/29–1/1/33 | 26,325 | 24,732 |
| 1,2 | Fannie Mae Pool | 3.220% | 1/1/33 | 21,438 | 20,713 |
| 1,2 | Fannie Mae Pool | 3.240% | 3/1/28 | 6,269 | 6,129 |
| 1,2 | Fannie Mae Pool | 3.250% | 5/1/32 | 16,500 | 15,766 |
| 1,2 | Fannie Mae Pool | 3.260% | 1/1/33 | 10,920 | 10,542 |
| 1,2 | Fannie Mae Pool | 3.270% | 7/1/30 | 40,538 | 39,081 |
| 1,2 | Fannie Mae Pool | 3.280% | 5/1/28–5/1/29 | 68,523 | 66,711 |
| 1,2 | Fannie Mae Pool | 3.290% | 6/1/29 | 22,065 | 21,279 |
| 1,2 | Fannie Mae Pool | 3.320% | 7/1/30 | 14,200 | 13,780 |
| 1,2 | Fannie Mae Pool | 3.330% | 4/1/32 | 10,818 | 10,317 |
| 1,2 | Fannie Mae Pool | 3.350% | 1/1/30–11/1/30 | 15,192 | 14,752 |
| 1,2 | Fannie Mae Pool | 3.370% | 4/1/28 | 6,000 | 5,925 |
| 65 | |||||
| GNMA Fund | |||||
| Face | Market | ||||
| Maturity | Amount | Value • | |||
| Coupon | Date | ($000) | ($000) | ||
| 1,2 | Fannie Mae Pool | 3.380% | 4/1/28 | 6,000 | 5,951 |
| 1,2 | Fannie Mae Pool | 3.410% | 5/1/32–2/1/33 | 22,025 | 21,280 |
| 1,2 | Fannie Mae Pool | 3.420% | 4/1/31 | 1,489 | 1,453 |
| 1,2 | Fannie Mae Pool | 3.425% | 2/1/30 | 15,850 | 15,359 |
| 1,2 | Fannie Mae Pool | 3.430% | 6/1/30 | 1,280 | 1,255 |
| 1,2,§ Fannie Mae Pool | 3.440% | 7/1/28 | 52,583 | 52,025 | |
| 1,2 | Fannie Mae Pool | 3.460% | 4/1/28–9/1/29 | 13,807 | 13,639 |
| 1,2 | Fannie Mae Pool | 3.490% | 7/1/30 | 9,736 | 9,578 |
| 1,2 | Fannie Mae Pool | 3.500% | 2/1/27–8/1/48 | 16,992 | 17,217 |
| 1,2 | Fannie Mae Pool | 3.510% | 3/1/33 | 7,125 | 7,053 |
| 1,2 | Fannie Mae Pool | 3.540% | 5/1/28– 6/1/30 | 64,504 | 64,560 |
| 1,2 | Fannie Mae Pool | 3.550% | 2/1/30 | 8,875 | 8,844 |
| 1,2 | Fannie Mae Pool | 3.570% | 5/1/28–10/1/29 | 12,553 | 12,531 |
| 1,2 | Fannie Mae Pool | 3.580% | 5/1/28–1/1/31 | 54,017 | 53,549 |
| 1,2 | Fannie Mae Pool | 3.590% | 9/1/30 | 50,357 | 49,697 |
| 1,2 | Fannie Mae Pool | 3.660% | 7/1/30 | 15,150 | 15,133 |
| 1,2 | Fannie Mae Pool | 3.725% | 4/1/33 | 9,594 | 9,618 |
| 1,2 | Fannie Mae Pool | 3.800% | 7/1/30 | 6,300 | 6,376 |
| 1,2 | Fannie Mae Pool | 3.830% | 6/1/34 | 3,291 | 3,316 |
| 1,2,§ Fannie Mae Pool | 3.840% | 7/1/30 | 7,500 | 7,652 | |
| 1,2 | Fannie Mae Pool | 3.890% | 5/1/30 | 14,113 | 14,163 |
| 1,2 | Fannie Mae Pool | 3.960% | 5/1/34 | 6,064 | 6,156 |
| 1,2 | Fannie Mae Pool | 4.000% | 5/1/46– 6/1/46 | 8,796 | 8,937 |
| 1,2 | Fannie Mae Pool | 4.060% | 3/1/29 | 3,962 | 4,024 |
| 1,2 | Fannie Mae Pool | 4.080% | 2/1/29 | 2,906 | 2,970 |
| 1,2 | Fannie Mae Pool | 4.150% | 10/1/28–1/1/31 | 73,865 | 75,583 |
| 1,2 | Fannie Mae Pool | 4.180% | 11/1/30 | 29,397 | 29,919 |
| 1,2 | Fannie Mae Pool | 4.250% | 10/1/28 | 1,230 | 1,276 |
| 1,2 | Fannie Mae Pool | 4.280% | 11/1/28 | 5,244 | 5,446 |
| 1,2 | Fannie Mae Pool | 4.380% | 10/1/28 | 9,635 | 10,074 |
| 1,2 | Fannie Mae Pool | 4.400% | 8/1/28 | 2,175 | 2,279 |
| 1,2 | Fannie Mae Pool | 4.500% | 12/1/40–3/1/44 | 3,149 | 3,291 |
| 1,2 | Fannie Mae Pool | 6.000% | 7/1/22 | 4 | 4 |
| 1,2 | Fannie Mae Pool | 6.500% | 2/1/29–5/1/40 | 2,498 | 2,746 |
| 1,2 | Freddie Mac Gold Pool | 3.000% | 6/1/43–8/1/48 | 18,084 | 17,499 |
| 1,2 | Freddie Mac Gold Pool | 3.500% | 12/1/47–7/1/48 | 3,717 | 3,817 |
| 1,2 | Freddie Mac Gold Pool | 4.000% | 9/1/30–4/1/44 | 7,593 | 7,757 |
| 1,2 | Freddie Mac Gold Pool | 4.500% | 4/1/34–8/1/48 | 2,092 | 2,512 |
| 1,2 | Freddie Mac Gold Pool | 5.000% | 11/1/23–8/1/48 | 26,667 | 28,479 |
| 1 | Ginnie Mae I Pool | 2.500% | 11/15/42–9/15/43 | 95,954 | 91,070 |
| 1 | Ginnie Mae I Pool | 3.000% | 1/15/26–8/1/48 | 1,135,587 | 1,111,100 |
| 1,3 | Ginnie Mae I Pool | 3.500% | 7/15/39–9/1/48 | 765,512 | 766,814 |
| 1 | Ginnie Mae I Pool | 3.750% | 7/15/42 | 3,397 | 3,441 |
| 1 | Ginnie Mae I Pool | 3.875% | 5/15/42– 6/15/42 | 5,703 | 5,838 |
| 1 | Ginnie Mae I Pool | 4.000% | 6/15/19–8/1/48 | 1,027,377 | 1,055,749 |
| 1 | Ginnie Mae I Pool | 4.500% | 4/15/33–1/15/45 | 667,413 | 699,887 |
| 1 | Ginnie Mae I Pool | 5.000% | 1/15/30–8/1/48 | 601,196 | 639,733 |
| 1 | Ginnie Mae I Pool | 5.500% | 9/15/23–8/1/48 | 411,137 | 438,132 |
| 1 | Ginnie Mae I Pool | 6.000% | 3/15/19–8/1/48 | 222,345 | 238,721 |
| 1 | Ginnie Mae I Pool | 6.500% | 4/15/23–7/15/40 | 159,157 | 170,606 |
| 1 | Ginnie Mae I Pool | 7.000% | 11/15/31–11/15/36 | 48,112 | 52,988 |
| 1 | Ginnie Mae I Pool | 7.250% | 1/15/27–2/15/27 | 24 | 24 |
| 1,3 | Ginnie Mae I Pool | 7.500% | 10/15/31 | 18,408 | 20,907 |
| 1 | Ginnie Mae I Pool | 8.000% | 8/15/31 | 6,720 | 7,687 |
| 66 | |||||
| GNMA Fund | |||||
| Face | Market | ||||
| Maturity | Amount | Value • | |||
| Coupon | Date | ($000) | ($000) | ||
| 1 | Ginnie Mae I Pool | 8.500% | 9/15/19– 6/15/28 | 784 | 822 |
| 1 | Ginnie Mae I Pool | 9.000% | 11/15/19–5/15/21 | 2 | 2 |
| 1 | Ginnie Mae I Pool | 9.500% | 11/15/18–8/15/21 | 125 | 132 |
| 1 | Ginnie Mae I Pool | 10.000% | 7/15/19 | — | — |
| 1 | Ginnie Mae II Pool | 1.500% | 6/20/39– 6/20/47 | 1,232 | 1,026 |
| 1 | Ginnie Mae II Pool | 2.000% | 10/20/43–2/20/47 | 891 | 769 |
| 1 | Ginnie Mae II Pool | 2.500% | 11/20/42–8/1/48 | 476,852 | 450,264 |
| 1 | Ginnie Mae II Pool | 3.000% | 4/20/31–8/1/48 | 2,674,816 | 2,615,744 |
| 1,4,5 Ginnie Mae II Pool | 3.500% | 10/20/40–8/1/48 | 6,654,900 | 6,664,353 | |
| 1,4 | Ginnie Mae II Pool | 4.000% | 4/20/39–8/1/48 | 2,839,766 | 2,909,346 |
| 1,4 | Ginnie Mae II Pool | 4.500% | 12/20/32–8/1/48 | 865,195 | 906,723 |
| 1 | Ginnie Mae II Pool | 5.000% | 10/20/32–3/20/45 | 305,476 | 326,567 |
| 1 | Ginnie Mae II Pool | 5.500% | 1/20/34–7/20/40 | 33,536 | 35,687 |
| 1 | Ginnie Mae II Pool | 6.000% | 4/20/28–8/20/40 | 43,125 | 46,541 |
| 1 | Ginnie Mae II Pool | 6.500% | 4/20/37–3/20/41 | 1,141 | 1,262 |
| 1 | Ginnie Mae II Pool | 7.500% | 6/20/25–8/20/25 | 99 | 111 |
| 20,667,994 | |||||
| Nonconventional Mortgage-Backed Securities (3.7%) | |||||
| 1,2 | Fannie Mae Pool | 2.322% | 8/1/43 | 12,615 | 12,438 |
| 1,2 | Fannie Mae Pool | 2.785% | 9/1/44 | 13,294 | 13,129 |
| 1,2 | Fannie Mae REMICS | 3.000% | 6/25/43–2/25/57 | 123,633 | 118,947 |
| 1,2 | Fannie Mae REMICS | 3.500% | 7/25/44–12/25/57 | 39,613 | 38,940 |
| 1,2 | Fannie Mae REMICS | 6.000% | 10/25/28–9/25/32 | 4,600 | 5,002 |
| 1,2 | Freddie Mac Non Gold Pool | 2.254% | 9/1/43 | 8,696 | 8,533 |
| 1,2 | Freddie Mac Non Gold Pool | 2.267% | 8/1/43 | 18,935 | 18,642 |
| 1,2 | Freddie Mac Non Gold Pool | 2.680% | 10/1/44 | 25,040 | 24,495 |
| 1,2 | Freddie Mac Non Gold Pool | 2.747% | 7/1/44 | 7,093 | 6,956 |
| 1,2 | Freddie Mac Non Gold Pool | 2.838% | 10/1/44 | 11,495 | 11,269 |
| 1,2 | Freddie Mac Non Gold Pool | 2.897% | 4/1/44 | 12,157 | 11,942 |
| 1,2 | Freddie Mac Non Gold Pool | 2.950% | 9/1/44 | 8,561 | 8,385 |
| 1,2 | Freddie Mac Non Gold Pool | 3.093% | 10/1/44 | 17,186 | 16,697 |
| 1,2 | Freddie Mac REMICS | 3.000% | 8/15/42–3/15/48 | 97,336 | 88,696 |
| 1,2 | Freddie Mac REMICS | 6.000% | 4/15/28–11/15/32 | 12,705 | 13,773 |
| 1 | Ginnie Mae REMICS | 2.000% | 7/20/42 | 19,397 | 18,034 |
| 1,6 | Ginnie Mae REMICS | 2.286% | 2/20/37 | 3,254 | 3,239 |
| 1 | Ginnie Mae REMICS | 2.350% | 5/17/46 | 35,302 | 33,857 |
| 1 | Ginnie Mae REMICS | 2.500% | 12/16/39–11/20/43 | 65,419 | 57,625 |
| 1 | Ginnie Mae REMICS | 2.650% | 11/17/48 | 16,220 | 15,396 |
| 1 | Ginnie Mae REMICS | 3.000% | 3/20/40–5/20/47 | 76,669 | 68,972 |
| 1 | Ginnie Mae REMICs | 3.000% | 4/20/47 | 12,915 | 12,527 |
| 1 | Ginnie Mae REMICS | 3.250% | 8/20/44 | 8,104 | 6,964 |
| 1 | Ginnie Mae REMICS | 3.500% | 7/20/43–9/20/44 | 32,109 | 31,558 |
| 1 | Ginnie Mae REMICS | 3.750% | 7/20/44 | 9 | 9 |
| 1 | Ginnie Mae REMICS | 4.500% | 6/20/39 | 4,238 | 4,497 |
| 1 | Ginnie Mae REMICS | 5.000% | 6/16/37 | 14,666 | 15,860 |
| 1 | Ginnie Mae REMICS | 5.500% | 8/16/36 | 12,832 | 13,236 |
| 1 | Government National Mortgage Assn. | 2.500% | 10/20/45–1/20/48 | 68,224 | 62,916 |
| 1 | Government National Mortgage Assn. | 3.000% | 7/20/43–11/20/47 | 73,598 | 69,434 |
| 1 | Government National Mortgage Assn. | 3.500% | 5/20/45 | 15,191 | 14,326 |
| 826,294 | |||||
| Total U.S. Government and Agency Obligations (Cost $22,220,650) | 21,744,291 | ||||
| 67 | |||||
| GNMA Fund | |||||
| Face | Market | ||||
| Maturity | Amount | Value • | |||
| Coupon | Date | ($000) | ($000) | ||
| Asset-Backed/Commercial Mortgage-Backed Securities (1.7%) | |||||
| 1,2 | Fannie Mae REMICS | 3.000% | 11/25/47 | 2,789 | 2,576 |
| 1,2,7 Fannie Mae-Aces | 3.090% | 2/25/30 | 107,935 | 102,299 | |
| 1,2 | Fannie Mae-Aces 2018-M2 | 2.902% | 1/25/28 | 77,000 | 73,459 |
| 1,2 | FHLMC Multifamily Structured Pass | ||||
| Through Certificates K064 | 3.224% | 3/25/27 | 5,500 | 5,398 | |
| 1,2 | FHLMC Multifamily Structured Pass | ||||
| Through Certificates K072 | 3.444% | 12/25/27 | 20,000 | 19,902 | |
| 1 | Government National Mortgage Assn. | 1.750% | 10/20/42 | 6,977 | 6,407 |
| 1 | Government National Mortgage Assn. | 3.500% | 8/16/44 | 4,621 | 4,516 |
| 1 | Government National Mortgage Assn. | 2.000% | 10/20/44 | 4,778 | 4,372 |
| 1 | Government National Mortgage Assn. | 3.000% | 1/20/48 | 165,075 | 163,820 |
| Total Asset-Backed/Commercial Mortgage-Backed Securities (Cost $387,412) | 382,749 | ||||
| Temporary Cash Investments (5.3%) | |||||
| Repurchase Agreements (2.5%) | |||||
| Bank of America Securities, LLC | |||||
| (Dated 7/31/18, Repurchase Value | |||||
| $25,501,000, collateralized by | |||||
| Federal Home Loan Mortgage | |||||
| Corp., 3.000%, 10/1/45–3/1/48, | |||||
| with a value of $26,010,000) | 1.930% | 8/1/18 | 25,500 | 25,500 | |
| Bank of Montreal | |||||
| (Dated 7/31/18, Repurchase Value | |||||
| $121,806,000, collateralized by | |||||
| U. S. Treasury Bill 0.000%, 4/25/19, | |||||
| and U.S. Treasury Note/Bond | |||||
| 0.875%–3.125%, 4/30/19–5/15/45, | |||||
| with a value of $124,236,000) | 1.900% | 8/1/18 | 121,800 | 121,800 | |
| Barclays Capital Inc. | |||||
| (Dated 7/31/18, Repurchase Value | |||||
| $130,407,000, by U. S. Treasury Bill | |||||
| 0.000%, 9/20/18–7/18/19, and U.S. | |||||
| Treasury Note/Bond 1.125%–8.125%, | |||||
| 2/15/21–5/15/46, with a value of | |||||
| $133,008,000) | 1.900% | 8/1/18 | 130,400 | 130,400 | |
| Citigroup Global Markets Inc. | |||||
| (Dated 7/31/18, Repurchase Value | |||||
| $128,507,000, collateralized by | |||||
| U.S. Treasury Note/Bond, | |||||
| 1.750%–2.625%, 9/30/22–2/28/23, | |||||
| with a value of $131,070,000) | 1.910% | 8/1/18 | 128,500 | 128,500 | |
| Societe Generale | |||||
| (Dated 7/31/18, Repurchase Value | |||||
| $20,401,000, collateralized by | |||||
| U. S. Treasury Bill 0.000%, 12/6/18, | |||||
| and U.S. Treasury Note/Bond | |||||
| 2.125%–8.500%, 2/15/20–11/15/44, | |||||
| with a value of $20,808,000) | 1.900% | 8/1/18 | 20,400 | 20,400 | |
| 68 | |||||
| GNMA Fund | ||||
| Face | Market | |||
| Maturity | Amount | Value • | ||
| Coupon | Date | ($000) | ($000) | |
| TD Securities (USA) LLC | ||||
| (Dated 7/31/18, Repurchase Value | ||||
| $9,801,000, collateralized by | ||||
| Federal Home Loan Mortgage Corp. | ||||
| 3.500%, 7/1/46, with a value of | ||||
| $9,996,000) | 1.910% | 8/1/18 | 9,800 | 9,800 |
| HSBC Securities USA | ||||
| (Dated 7/31/18, Repurchase Value | ||||
| $37,702,000, collateralized by | ||||
| U.S. Treasury Bill 0.000%, 1/24/19, | ||||
| and U.S. Treasury Note/Bond | ||||
| 2.625%–2.750%, 3/31/25–11/15/47, | ||||
| with a value of $38,454,000) | 1.900% | 8/1/18 | 37,700 | 37,700 |
| HSBC Securities USA | ||||
| (Dated 7/31/18, Repurchase Value | ||||
| $8,300,000, collateralized by | ||||
| Federal Home Loan Mortgage Corp. | ||||
| 4.500%, 1/1/47, and Federal National | ||||
| Mortgage Assn., 2.500%–5.000%, | ||||
| 7/1/23–2/1/46 with a value of | ||||
| $8,466,000) | 1.910% | 8/1/18 | 8,300 | 8,300 |
| Wells Fargo & Co. | ||||
| (Dated 7/31/18, Repurchase Value | ||||
| $66,004,000, collateralized by | ||||
| Federal National Mortgage Assn., | ||||
| 3.000%–4.500%, 4/1/31–2/1/48, | ||||
| with a value of $67,320,000) | 1.930% | 8/1/18 | 66,000 | 66,000 |
| 548,400 | ||||
| U. S. Government and Agency Obligations (1.3%) | ||||
| United States Treasury Bill | 1.831% | 8/9/18 | 293,736 | 293,616 |
| Shares | ||||
| Money Market Fund (1.5%) | ||||
| 8 Vanguard Market Liquidity Fund | 2.145% | 3,315,192 | 331,519 | |
| Total Temporary Cash Investments (Cost $1,173,537) | 1,173,535 | |||
| Total Investments (104.2%) (Cost $23,781,599) | 23,300,575 | |||
| Other Assets and Liabilities (-4.2%) | ||||
| Other Assets 9 | 2,545,457 | |||
| Liabilities | (3,476,924) | |||
| (931,467) | ||||
| Net Assets (100%) | 22,369,108 | |||
| 69 | ||||
| GNMA Fund | |
| Amount | |
| ($000) | |
| Statement of Assets and Liabilities | |
| Assets | |
| Investments in Securities, at Value | |
| Unaffiliated Issuers | 22,969,056 |
| Affiliated Issuers | 331,519 |
| Total Investments in Securities | 23,300,575 |
| Investment in Vanguard | 1,197 |
| Receivables for Investment Securities Sold | 2,396,601 |
| Receivables for Accrued Income | 71,078 |
| Receivables for Capital Shares Issued | 13,016 |
| Variation Margin Receivable—Futures Contracts | 1,523 |
| Other Assets 9 | 62,042 |
| Total Assets | 25,846,032 |
| Liabilities | |
| Payables for Investment Securities Purchased | 3,412,972 |
| Payables to Investment Advisor | 558 |
| Payables for Capital Shares Redeemed | 22,993 |
| Payables for Distributions | 8,849 |
| Payables to Vanguard | 30,785 |
| Variation Margin Payable—Futures Contracts | 135 |
| Variation Margin Payable—CC Swap Contracts | 632 |
| Total Liabilities | 3,476,924 |
| Net Assets | 22,369,108 |
| At July 31, 2018, net assets consisted of: | |
| Amount | |
| ($000) | |
| Paid-in Capital | 23,191,003 |
| Overdistributed Net Investment Income | (1,619) |
| Accumulated Net Realized Losses | (372,823) |
| Unrealized Appreciation (Depreciation) | |
| Investment Securities | (481,024) |
| Futures Contracts | (2,292) |
| Swap Contracts | 35,863 |
| Net Assets | 22,369,108 |
70
GNMA Fund
| Amount | |
| ($000) | |
| Investor Shares—Net Assets | |
| Applicable to 694,706,210 outstanding $.001 par value shares of | |
| beneficial interest (unlimited authorization) | 7,082,681 |
| Net Asset Value Per Share—Investor Shares | $10.20 |
| Admiral Shares—Net Assets | |
| Applicable to 1,499,369,593 outstanding $.001 par value shares of | |
| beneficial interest (unlimited authorization) | 15,286,427 |
| Net Asset Value Per Share—Admiral Shares | $10.20 |
• See Note A in Notes to Financial Statements.
§ Certain of the fund’s securities are valued using significant unobservable inputs.
1 The average or expected maturity is shorter than the final maturity shown because of the possibility of interim principal payments
and prepayments.
2 The issuer was placed under federal conservatorship in September 2008; since that time, its daily operations have been managed
by the Federal Housing Finance Agency and it receives capital from the U.S. Treasury, as needed to maintain a positive net worth,
in exchange for senior preferred stock.
3 Certain of the fund’s securities with a value of $22,722,000 have been segregated as initial margin for open futures contracts.
4 Includes securities purchased on a when-issued or delayed-delivery basis for which the fund has not taken delivery as of July 31, 2018.
5 Certain of the fund’s securities with a value of $86,167,000 have been segregated as initial margin for open centrally cleared
interest rate swap contracts.
6 Adjustable-rate security based upon 1-month USD LIBOR plus spread.
7 Adjustable-rate security.
8 Affiliated money market fund available only to Vanguard funds and certain trusts and accounts managed by Vanguard. Rate shown
is the 7-day yield.
9 Cash of $7,095,000 has been segregated as collateral for certain open To Be Announced (TBA) transactions.
REMICS—Real Estate Mortgage Investment Conduits.
| Derivative Financial Instruments Outstanding as of Period End | ||||
| Futures Contracts | ||||
| ($000) | ||||
| Value and | ||||
| Number of | Unrealized | |||
| Long (Short) | Notional | Appreciation | ||
| Expiration | Contracts | Amount | (Depreciation) | |
| Long Futures Contracts | ||||
| 10-Year U.S. Treasury Note | September 2018 | 7,025 | 838,939 | (1,835) |
| 5-Year U.S. Treasury Note | September 2018 | 1,748 | 197,743 | (17) |
| Ultra 10-Year U.S. Treasury Note | September 2018 | 1,491 | 189,520 | (203) |
| 30-Year U.S. Treasury Bond | September 2018 | 199 | 28,451 | (237) |
| (2,292) | ||||
Unrealized appreciation (depreciation) on open futures contracts is required to be treated as realized gain (loss) for tax purposes.
71
GNMA Fund
| Centrally Cleared Interest Rate Swaps | ||||||
| Fixed | Floating | |||||
| Interest | Interest | |||||
| Rate | Rate | Unrealized | ||||
| Future | Notional | Received | Received | Appreciation | ||
| Effective | Amount | (Paid)2 | (Paid) | Value | (Depreciation) | |
| Termination Date | Date | ($000) | (%) | (%) | ($000) | ($000) |
| 4/30/25 | 10/29/181 | 521,800 | (3.000) | 0.0003 | 157 | 161 |
| 3/15/28 | 9/17/181 | 130,575 | (2.893) | 2.3413 | 1,458 | 1,458 |
| 3/21/28 | N/A | 645,074 | (2.250) | 2.3303 | 42,281 | 33,805 |
| 6/19/28 | 9/18/181 | 190,535 | (3.002) | 2.3353 | 439 | 439 |
| 44,335 | 35,863 | |||||
1 Forward interest rate swap. In a forward interest rate swap, the fund and the counterparty agree to make periodic net payments
beginning on a specified future effective date.
2 Fixed interest payment received/paid semiannually.
3 Based on 3-month London Interbank Offered Rate (LIBOR) as of the most recent payment date. Floating interest payment
received/paid quarterly.
Unrealized appreciation (depreciation) on open swap contracts is generally treated the same for
financial reporting and tax purposes.
See accompanying Notes, which are an integral part of the Financial Statements.
72
| GNMA Fund | |
| Statement of Operations | |
| Six Months Ended | |
| July31,2018 | |
| ($000) | |
| Investment Income | |
| Income | |
| Interest1 | 357,148 |
| Total Income | 357,148 |
| Expenses | |
| Investment Advisory Fees—Note B | 1,132 |
| The Vanguard Group—Note C | |
| Management and Administrative—Investor Shares | 6,599 |
| Management and Administrative—Admiral Shares | 7,210 |
| Marketing and Distribution—Investor Shares | 433 |
| Marketing and Distribution—Admiral Shares | 383 |
| Custodian Fees | 233 |
| Shareholders’ Reports—Investor Shares | 88 |
| Shareholders’ Reports—Admiral Shares | 69 |
| Trustees’ Fees and Expenses | 18 |
| Total Expenses | 16,165 |
| Net Investment Income | 340,983 |
| Realized Net Gain (Loss) | |
| Investment Securities Sold1 | (100,338) |
| Futures Contracts | (30,542) |
| Swap Contracts | 38,686 |
| Realized Net Gain (Loss) | (92,194) |
| Change in Unrealized Appreciation (Depreciation) | |
| Investment Securities1 | (218,712) |
| Futures Contracts | 25,357 |
| Swap Contracts | (10,835) |
| Change in Unrealized Appreciation (Depreciation) | (204,190) |
| Net Increase (Decrease) in Net Assets Resulting from Operations | 44,599 |
1 Interest income, realized net gain (loss), and change in unrealized appreciation (depreciation) from affiliated companies of the fund
were $3,092,000, $0, and ($1,000), respectively.
See accompanying Notes, which are an integral part of the Financial Statements.
73
| GNMA Fund | ||
| Statement of Changes in Net Assets | ||
| Six Months Ended | Year Ended | |
| July 31, | January 31, | |
| 2018 | 2018 | |
| ($000) | ($000) | |
| Increase (Decrease) in Net Assets | ||
| Operations | ||
| Net Investment Income | 340,983 | 691,432 |
| Realized Net Gain (Loss) | (92,194) | (100,375) |
| Change in Unrealized Appreciation (Depreciation) | (204,190) | (339,281) |
| Net Increase (Decrease) in Net Assets Resulting from Operations | 44,599 | 251,776 |
| Distributions | ||
| Net Investment Income | ||
| Investor Shares | (104,452) | (209,136) |
| Admiral Shares | (235,194) | (476,434) |
| Realized Capital Gain | ||
| Investor Shares | — | — |
| Admiral Shares | — | — |
| Total Distributions | (339,646) | (685,570) |
| Capital Share Transactions | ||
| Investor Shares | (422,693) | (260,422) |
| Admiral Shares | (1,001,899) | (823,487) |
| Net Increase (Decrease) from Capital Share Transactions | (1,424,592) | (1,083,909) |
| Total Increase (Decrease) | (1,719,639) | (1,517,703) |
| Net Assets | ||
| Beginning of Period | 24,088,747 | 25,606,450 |
| End of Period1 | 22,369,108 | 24,088,747 |
1 Net Assets—End of Period includes undistributed (overdistributed) net investment income of ($1,619,000) and ($1,601,000).
See accompanying Notes, which are an integral part of the Financial Statements.
74
| GNMA Fund | ||||||
| Financial Highlights | ||||||
| Investor Shares | ||||||
| Six Months | ||||||
| Ended | ||||||
| For a Share Outstanding | July 31, | Year Ended January 31, | ||||
| Throughout Each Period | 2018 | 2018 | 2017 | 2016 | 2015 | 2014 |
| Net Asset Value, Beginning of Period | $10.32 | $10.51 | $10.77 | $10.88 | $10.61 | $10.83 |
| Investment Operations | ||||||
| Net Investment Income | .1481 | .2841 | .236 | .249 | .275 | .244 |
| Net Realized and Unrealized Gain (Loss) | ||||||
| on Investments | (.121) | (.193) | (.183) | (. 055) | . 278 | (. 210) |
| Total from Investment Operations | .027 | .091 | .053 | .194 | . 553 | .034 |
| Distributions | ||||||
| Dividends from Net Investment Income | (.147) | (. 281) | (. 237) | (. 250) | (. 274) | (. 244) |
| Distributions from Realized Capital Gains | — | — | (.076) | (.054) | (.009) | (.010) |
| Total Distributions | (.147) | (. 281) | (. 313) | (. 304) | (. 283) | (. 254) |
| Net Asset Value, End of Period | $10.20 | $10.32 | $10.51 | $10.77 | $10.88 | $10.61 |
| Total Return2 | 0.27% | 0.85% | 0.49% | 1.83% | 5.29% | 0.34% |
| Ratios/Supplemental Data | ||||||
| Net Assets, End of Period (Millions) | $7,083 | $7,598 | $7,993 | $8,483 | $9,163 | $9,535 |
| Ratio of Total Expenses to | ||||||
| Average Net Assets | 0.21% | 0.21% | 0.21% | 0.21% | 0.21% | 0.21% |
| Ratio of Net Investment Income to | ||||||
| Average Net Assets | 2.91% | 2.70% | 2.19% | 2.33% | 2.56% | 2.31% |
| Portfolio Turnover Rate 3 | 414% | 620% | 926% | 706% | 685% | 167% |
The expense ratio, net investment income ratio, and turnover rate for the current period have been annualized.
1 Calculated based on average shares outstanding.
2 Total returns do not include account service fees that may have applied in the periods shown. Fund prospectuses provide information
about any applicable account service fees.
3 Includes 196%, 156%, 300%, 219%, 268%, and 149% attributable to mortgage-dollar-roll activity.
See accompanying Notes, which are an integral part of the Financial Statements.
75
| GNMA Fund | ||||||
| Financial Highlights | ||||||
| Admiral Shares | ||||||
| Six Months | ||||||
| Ended | ||||||
| For a Share Outstanding | July 31, | Year Ended January 31, | ||||
| Throughout Each Period | 2018 | 2018 | 2017 | 2016 | 2015 | 2014 |
| Net Asset Value, Beginning of Period | $10.32 | $10.51 | $10.77 | $10.88 | $10.61 | $10.83 |
| Investment Operations | ||||||
| Net Investment Income | .1531 | .2941 | .247 | .260 | .286 | .255 |
| Net Realized and Unrealized Gain (Loss) | ||||||
| on Investments | (.121) | (.192) | (.183) | (. 055) | . 278 | (. 210) |
| Total from Investment Operations | .032 | .102 | .064 | . 205 | . 564 | .045 |
| Distributions | ||||||
| Dividends from Net Investment Income | (.152) | (. 292) | (. 248) | (. 261) | (. 285) | (. 255) |
| Distributions from Realized Capital Gains | — | — | (.076) | (.054) | (.009) | (.010) |
| Total Distributions | (.152) | (. 292) | (. 324) | (. 315) | (. 294) | (. 265) |
| Net Asset Value, End of Period | $10.20 | $10.32 | $10.51 | $10.77 | $10.88 | $10.61 |
| Total Return2 | 0.32% | 0.95% | 0.59% | 1.93% | 5.39% | 0.44% |
| Ratios/Supplemental Data | ||||||
| Net Assets, End of Period (Millions) | $15,286 | $16,491 | $17,613 | $17,419 | $17,544 | $17,277 |
| Ratio of Total Expenses to | ||||||
| Average Net Assets | 0.11% | 0.11% | 0.11% | 0.11% | 0.11% | 0.11% |
| Ratio of Net Investment Income to | ||||||
| Average Net Assets | 3.01% | 2.80% | 2.29% | 2.43% | 2.66% | 2.41% |
| Portfolio Turnover Rate 3 | 414% | 620% | 926% | 706% | 685% | 167% |
The expense ratio, net investment income ratio, and turnover rate for the current period have been annualized.
1 Calculated based on average shares outstanding.
2 Total returns do not include account service fees that may have applied in the periods shown. Fund prospectuses provide information
about any applicable account service fees.
3 Includes 196%, 156%, 300%, 219%, 268%, and 149% attributable to mortgage-dollar-roll activity.
See accompanying Notes, which are an integral part of the Financial Statements.
76
GNMA Fund
Notes to Financial Statements
Vanguard GNMA Fund is registered under the Investment Company Act of 1940 as an open-end investment company, or mutual fund. The fund offers two classes of shares: Investor Shares and Admiral Shares. Investor Shares are available to any investor who meets the fund’s minimum purchase requirements. Admiral Shares are designed for investors who meet certain administrative, service, and account-size criteria.
A. The following significant accounting policies conform to generally accepted accounting principles for U.S. investment companies. The fund consistently follows such policies in preparing its financial statements.
1. Security Valuation: Securities are valued as of the close of trading on the New York Stock Exchange (generally 4 p.m., Eastern time) on the valuation date. Bonds and temporary cash investments are valued using the latest bid prices or using valuations based on a matrix system (which considers such factors as security prices, yields, maturities, and ratings), both as furnished by independent pricing services. Structured debt securities, including mortgages and asset-backed securities, are valued using the latest bid prices or using valuations based on a matrix system that considers such factors as issuer, tranche, nominal or option-adjusted spreads, weighted average coupon, weighted average maturity, credit enhancements, and collateral. Investments in Vanguard Market Liquidity Fund are valued at that fund’s net asset value. Securities for which market quotations are not readily available, or whose values have been affected by events occurring before the fund’s pricing time but after the close of the securities’ primary markets, are valued by methods deemed by the board of trustees to represent fair value.
2. Futures Contracts: The fund uses futures contracts to invest in fixed income asset classes with greater efficiency and lower cost than is possible through direct investment, to add value when these instruments are attractively priced, or to adjust sensitivity to changes in interest rates. The primary risks associated with the use of futures contracts are imperfect correlation between changes in market values of bonds held by the fund and the prices of futures contracts, and the possibility of an illiquid market. Counterparty risk involving futures is mitigated because a regulated clearinghouse is the counterparty instead of the clearing broker. To further mitigate counterparty risk, the fund trades futures contracts on an exchange, monitors the financial strength of its clearing brokers and clearinghouse, and has entered into clearing agreements with its clearing brokers. The clearinghouse imposes initial margin requirements to secure the fund’s performance and requires daily settlement of variation margin representing changes in the market value of each contract.
Futures contracts are valued at their quoted daily settlement prices. The aggregate settlement values of the contracts are not recorded in the Statement of Net Assets. Fluctuations in the value of the contracts are recorded in the Statement of Net Assets as an asset (liability) and in the Statement of Operations as unrealized appreciation (depreciation) until the contracts are closed, when they are recorded as realized futures gains (losses).
During the six months ended July 31, 2018, the fund’s average investments in long and short futures contracts represented 7% and less than 1% of net assets, respectively, based on the average of aggregate settlement values at each quarter-end during the period.
3. Swap Contracts: The fund enters into interest rate swap transactions to adjust the fund’s sensitivity to changes in interest rates and maintain the ability to generate income at prevailing market rates. Under the terms of the swaps, one party pays the other an amount that is a fixed percentage rate applied to a notional amount. In return, the counterparty agrees to pay a floating rate, which is reset periodically based on short-term interest rates, applied to the same notional amount.
77
GNMA Fund
The notional amounts of swap contracts are not recorded in the Statement of Net Assets. Swaps are valued daily based on market quotations received from independent pricing services or recognized dealers and the change in value is recorded in the Statement of Net Assets as an asset (liability) and in the Statement of Operations as unrealized appreciation (depreciation) until periodic payments are made, or the swap terminates, at which time realized gain (loss) is recorded.
A risk associated with all types of swaps is the possibility that a counterparty may default on its obligation to pay net amounts due to the fund. The fund’s maximum amount subject to counterparty risk is the unrealized appreciation on the swap contract. The fund mitigates its counterparty risk by entering into swaps only with a diverse group of prequalified counterparties, monitoring their financial strength, entering into master netting arrangements with its counterparties, and requiring its counterparties to transfer collateral as security for their performance. In the absence of a default, the collateral pledged or received by the fund cannot be repledged, resold, or rehypothecated. In the event of a counterparty’s default (including bankruptcy), the fund may terminate any swap contracts with that counterparty, determine the net amount owed by either party in accordance with its master netting arrangements, and sell or retain any collateral held up to the net amount owed to the fund under the master netting arrangements. The swap contracts contain provisions whereby a counterparty may terminate open contracts if the fund’s net assets decline below a certain level, triggering a payment by the fund if the fund is in a net liability position at the time of the termination. The payment amount would be reduced by any collateral the fund has pledged. Any securities pledged as collateral for open contracts are noted in the Statement of Net Assets. The value of collateral received or pledged is compared daily to the value of the swap contracts exposure with each counterparty, and any difference, if in excess of a specified minimum transfer amount, is adjusted and settled within two business days.
The fund enters into centrally cleared interest rate swaps to achieve the same objectives specified with respect to the equivalent over-the-counter swaps but with less counterparty risk because a regulated clearinghouse is the counterparty instead of the clearing broker or executing broker. The clearinghouse imposes initial margin requirements to secure the fund’s performance, and requires daily settlement of variation margin representing changes in the market value of each contract. To further mitigate counterparty risk, the fund trades with a diverse group of prequalified executing brokers; monitors the financial strength of its clearing brokers, executing brokers, and clearinghouse; and has entered into agreements with its clearing brokers and executing brokers.
During the six months ended July 31, 2018, the average amount of investments in interest rate swaps represented 6% of net assets, based on the average of notional amounts at each quarter-end during the period.
4. To Be Announced (TBA) Transactions: A TBA transaction is an agreement to buy or sell mortgage-backed securities with agreed-upon characteristics (face amount, coupon, maturity) for settlement at a future date. The fund may be a seller of TBA transactions to reduce its exposure to the mortgage-backed securities market or in order to sell mortgage-backed securities it owns under delayed-delivery arrangements. When the fund is a buyer of TBA transactions, it maintains cash or short-term investments in an amount sufficient to meet the purchase price at the settlement date of the TBA transaction. The primary risk associated with TBA transactions is that a counterparty may default on its obligations. The fund mitigates its counterparty risk by, among other things, performing a credit analysis of counterparties, allocating transactions among numerous counterparties, and monitoring its exposure to each counterparty. The fund may also enter into a Master Securities Forward Transaction Agreement (MSFTA) with certain counterparties and require them to transfer collateral
78
GNMA Fund
as security for their performance. In the absence of a default, the collateral pledged or received by the fund cannot be repledged, resold, or rehypothecated. Under an MSFTA, upon a counterparty default (including bankruptcy), the fund may terminate any TBA transactions with that counterparty, determine the net amount owed by either party in accordance with its master netting arrangements, and sell or retain any collateral held up to the net amount owed to the fund under the master netting arrangements. At July 31, 2018, counterparties had deposited in segregated accounts securities and cash with a value of $1,631,000 in connection with TBA transactions.
5. Mortgage Dollar Rolls: The fund enters into mortgage-dollar-roll transactions, in which the fund sells mortgage-backed securities to a dealer and simultaneously agrees to purchase similar securities in the future at a predetermined price. The proceeds of the securities sold in mortgage-dollar-roll transactions are typically invested in high-quality short-term fixed income securities. The fund forgoes principal and interest paid on the securities sold, and is compensated by interest earned on the proceeds of the sale and by a lower price on the securities to be repurchased. The fund has also entered into mortgage-dollar-roll transactions in which the fund buys mortgage-backed securities from a dealer pursuant to a TBA transaction and simultaneously agrees to sell similar securities in the future at a predetermined price. The securities bought in mortgage-dollar-roll transactions are used to cover an open TBA sell position. The fund continues to earn interest on mortgage-backed security pools already held and receives a lower price on the securities to be sold in the future.
The fund accounts for mortgage-dollar-roll transactions as purchases and sales; as such, these transactions may increase the fund’s portfolio turnover rate. Amounts to be received or paid in connection with open mortgage dollar rolls are included in Receivables for Investment Securities Sold or Payables for Investment Securities Purchased in the Statement of Assets and Liabilities.
6. Repurchase Agreements: The fund enters into repurchase agreements with institutional counterparties. Securities pledged as collateral to the fund under repurchase agreements are held by a custodian bank until the agreements mature, and in the absence of a default, such collateral cannot be repledged, resold, or rehypothecated. Each agreement requires that the market value of the collateral be sufficient to cover payments of interest and principal. The fund further mitigates its counterparty risk by entering into repurchase agreements only with a diverse group of prequalified counterparties, monitoring their financial strength, and entering into master repurchase agreements with its counterparties. The master repurchase agreements provide that, in the event of a counterparty’s default (including bankruptcy), the fund may terminate any repurchase agreements with that counterparty, determine the net amount owed, and sell or retain the collateral up to the net amount owed to the fund. Such action may be subject to legal proceedings, which may delay or limit the disposition of collateral.
7. Federal Income Taxes: The fund intends to continue to qualify as a regulated investment company and distribute all of its taxable income. Management has analyzed the fund’s tax positions taken for all open federal income tax years (January 31, 2015–2018), and for the period ended July 31, 2018, and has concluded that no provision for federal income tax is required in the fund’s financial statements.
8. Distributions: Distributions from net investment income are declared daily and paid on the first business day of the following month. Annual distributions from realized capital gains, if any, are recorded on the ex-dividend date.
79
GNMA Fund
9. Credit Facility: The fund and certain other funds managed by The Vanguard Group (“Vanguard”) participate in a $3.1 billion committed credit facility provided by a syndicate of lenders pursuant to a credit agreement that may be renewed annually; each fund is individually liable for its borrowings, if any, under the credit facility. Borrowings may be utilized for temporary and emergency purposes, and are subject to the fund’s regulatory and contractual borrowing restrictions. The participating funds are charged administrative fees and an annual commitment fee of 0.10% of the undrawn amount of the facility; these fees are allocated to the funds based on a method approved by the fund’s board of trustees and included in Management and Administrative expenses on the fund’s Statement of Operations. Any borrowings under this facility bear interest at a rate based upon the higher of the one-month London Interbank Offered Rate, federal funds effective rate, or overnight bank funding rate plus an agreed-upon spread.
The fund had no borrowings outstanding at July 31, 2018, or at any time during the period then ended.
10. Other: Interest income includes income distributions received from Vanguard Market Liquidity Fund and is accrued daily. Premiums and discounts on debt securities purchased are amortized and accreted, respectively, to interest income over the lives of the respective securities. Security transactions are accounted for on the date securities are bought or sold. Costs used to determine realized gains (losses) on the sale of investment securities are those of the specific securities sold.
Each class of shares has equal rights as to assets and earnings, except that each class separately bears certain class-specific expenses related to maintenance of shareholder accounts (included in Management and Administrative expenses), and shareholder reporting, and the proxy. Marketing and distribution expenses are allocated to each class of shares based on a method approved by the board of trustees. Income, other non-class-specific expenses, and gains and losses on investments are allocated to each class of shares based on its relative net assets.
B. Wellington Management Company LLP provides investment advisory services to the fund for a fee calculated at an annual percentage rate of average net assets. For the six months ended July 31, 2018, the investment advisory fee represented an effective annual rate of 0.01% of the fund’s average net assets.
C. In accordance with the terms of a Funds’ Service Agreement (the “FSA”) between Vanguard and the fund, Vanguard furnishes to the fund corporate management, administrative, marketing, and distribution services at Vanguard’s cost of operations (as defined by the FSA). These costs of operations are allocated to the fund based on methods and guidelines approved by the board of trustees. Vanguard does not require reimbursement in the current period for certain costs of operations (such as deferred compensation/benefits and risk/insurance costs); the fund’s liability for these costs of operations is included in Payables to Vanguard on the Statement of Assets and Liabilities.
Upon the request of Vanguard, the fund may invest up to 0.40% of its net assets as capital in Vanguard. At July 31, 2018, the fund had contributed to Vanguard capital in the amount of $1,197,000, representing 0.01% of the fund’s net assets and 0.48% of Vanguard’s capitalization. The fund’s trustees and officers are also directors and employees, respectively, of Vanguard.
80
GNMA Fund
D. Various inputs may be used to determine the value of the fund’s investments. These inputs are summarized in three broad levels for financial statement purposes. The inputs or methodologies used to value securities are not necessarily an indication of the risk associated with investing in those securities.
Level 1—Quoted prices in active markets for identical securities.
Level 2—Other significant observable inputs (including quoted prices for similar securities, interest rates, prepayment speeds, credit risk, etc.).
Level 3—Significant unobservable inputs (including the fund’s own assumptions used to determine
the fair value of investments). Any investments valued with significant unobservable inputs are
noted on the Statement of Net Assets.
The following table summarizes the market value of the fund’s investments as of July 31, 2018, based on the inputs used to value them:
| Level 1 | Level 2 | Level 3 | |
| Investments | ($000) | ($000) | ($000) |
| U.S. Government and Agency Obligations | — | 21,684,615 | 59,676 |
| Asset-Backed/Commercial Mortgage-Backed Securities | — | 382,749 | — |
| Temporary Cash Investments | 331,519 | 842,016 | — |
| Futures Contracts —Assets1 | 1,523 | — | |
| Futures Contracts—Liabilities1 | (135) | — | — |
| Swap Contracts— Liabilities1 | (632) | — | — |
| Total | 332,275 | 22,909,380 | 59,676 |
| 1 Represents variation margin on the last day of the reporting period. | |||
E. Capital gain distributions are determined on a tax basis and may differ from realized capital gains for financial reporting purposes. Differences may be permanent or temporary. Permanent differences are reclassified among capital accounts in the financial statements to reflect their tax character. Temporary differences arise when gains or losses are recognized in different periods for financial statement and tax purposes. These differences will reverse at some time in the future.
The fund’s tax-basis capital gains and losses are determined only at the end of each fiscal year. For tax purposes, at January 31, 2018, the fund had available capital losses totaling $308,198,000 that may be carried forward indefinitely to offset future net capital gains. The fund will use these capital losses to offset net taxable capital gains, if any, realized during the year ending January 31, 2019; should the fund realize net capital losses for the year, the losses will be added to the loss carryforward balance above.
At July 31, 2018, the cost of investment securities for tax purposes was $23,783,034,000. Net unrealized depreciation of investment securities for tax purposes was $482,459,000, consisting of unrealized gains of $116,039,000 on securities that had risen in value since their purchase and $598,498,000 in unrealized losses on securities that had fallen in value since their purchase.
81
GNMA Fund
F. During the six months ended July 31, 2018, the fund purchased $47,225,153,000 of investment securities and sold $48,727,686,000 of investment securities, other than temporary cash investments.
G. Capital share transactions for each class of shares were:
| Six Months Ended | Year Ended | |||
| July 31, 2018 | January 31, 2018 | |||
| Amount | Shares | Amount | Shares | |
| ($000) | (000) | ($000) | (000) | |
| Investor Shares | ||||
| Issued | 297,880 | 29,146 | 1,032,418 | 98,416 |
| Issued in Lieu of Cash Distributions | 92,956 | 9,088 | 193,951 | 18,459 |
| Redeemed | (813,529) | (79,523) | (1,486,791) | (141,482) |
| Net Increase (Decrease)—Investor Shares | (422,693) | (41,289) | (260,422) | (24,607) |
| Admiral Shares | ||||
| Issued | 829,375 | 81,131 | 2,267,131 | 215,668 |
| Issued in Lieu of Cash Distributions | 185,459 | 18,129 | 372,462 | 35,450 |
| Redeemed | (2,016,733) | (197,323) | (3,463,080) | (329,749) |
| Net Increase (Decrease)—Admiral Shares | (1,001,899) | (98,063) | (823,487) | (78,631) |
H. Management has determined that no events or transactions occurred subsequent to July 31, 2018, that would require recognition or disclosure in these financial statements.
82
Long-Term Treasury Fund
Fund Profile
As of July 31, 2018
| Share-Class Characteristics | ||
| Investor | Admiral | |
| Shares | Shares | |
| Ticker Symbol | VUSTX | VUSUX |
| Expense Ratio1 | 0.20% | 0.10% |
| 30-Day SEC Yield | 2.86% | 2.96% |
| Financial Attributes | |||
| Bloomberg | |||
| Barclays | Bloomberg | ||
| U.S. Long | Barclays | ||
| Treasury | Aggregate | ||
| Fund Bond Index | Bond Index | ||
| Number of Bonds | 61 | 49 | 10,012 |
| Yield to Maturity | |||
| (before expenses) | 3.1% | 3.1% | 3.4% |
| Average Coupon | 3.2% | 3.3% | 3.1% |
| Average Duration | 16.8 years | 17.0 years | 6.0 years |
| Average Effective | |||
| Maturity | 25.0 years | 25.0 years | 8.4 years |
| Short-Term | |||
| Reserves | 0.4% | — | — |
| Sector Diversification (% of portfolio) | |
| Government Mortgage-Backed | 3.0% |
| Treasury/Agency | 97.0 |
The agency and mortgage-backed securities sectors may include
issues from government-sponsored enterprises; such issues are
generally not backed by the full faith and credit of the U.S.
government.
| Volatility Measures | ||
| Bloomberg | ||
| Barclays | Bloomberg | |
| U.S. Long | Barclays | |
| Treasury | Aggregate | |
| Bond Index | Bond Index | |
| R-Squared | 0.99 | 0.87 |
| Beta | 1.02 | 3.19 |
| These measures show the degree and timing of the fund’s | ||
| fluctuations compared with the indexes over 36 months. | ||
| Distribution by Effective Maturity | |
| (% of portfolio) | |
| 5 - 7 Years | 0.5% |
| 7 - 10 Years | 3.0 |
| 10 - 20 Years | 6.5 |
| 20 - 30 Years | 90.0 |
| Distribution by Credit Quality (% of portfolio) | |
| U.S. Government | 99.6% |
| Not Rated | 0.4 |
Credit-quality ratings are obtained from Moody's and S&P, and the
higher rating for each issue is shown. "Not Rated" is used to classify
securities for which a rating is not available. Not rated securities
include a fund's investment in Vanguard Market Liquidity Fund or
Vanguard Municipal Cash Management Fund, each of which invests
in high-quality money market instruments and may serve as a cash
management vehicle for the Vanguard funds, trusts, and accounts.
For more information about these ratings, see the Glossary entry for
Credit Quality.
Investment Focus
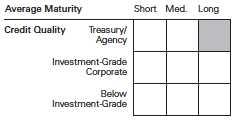
1 The expense ratios shown are from the prospectus dated May 24, 2018, and represent estimated costs for the current fiscal year. For the six
months ended July 31, 2018, the annualized expense ratios were 0.20% for Investor Shares and 0.10% for Admiral Shares.
83
Long-Term Treasury Fund
Performance Summary
All of the returns in this report represent past performance, which is not a guarantee of future results that may be achieved by the fund. (Current performance may be lower or higher than the performance data cited. For performance data current to the most recent month-end, visit our website at vanguard.com/performance.) Note, too, that both investment returns and principal value can fluctuate widely, so an investor’s shares, when sold, could be worth more or less than their original cost. The returns shown do not reflect taxes that a shareholder would pay on fund distributions or on the sale of fund shares.
| Fiscal-Year Total Returns (%): January 31, 2008, Through July 31, 2018 | ||||
| Bloomberg Barclays | ||||
| U.S. Long Treasury | ||||
| Investor Shares | Bond Index | |||
| Fiscal Year | Income Returns | Capital Returns | Total Returns | Total Returns |
| 2009 | 4.57% | 4.68% | 9.25% | 10.38% |
| 2010 | 3.98 | -5.33 | -1.35 | -2.19 |
| 2011 | 4.03 | -0.45 | 3.58 | 4.29 |
| 2012 | 4.13 | 28.40 | 32.53 | 32.74 |
| 2013 | 2.73 | -2.73 | 0.00 | -0.02 |
| 2014 | 2.97 | -7.42 | -4.45 | -4.49 |
| 2015 | 3.80 | 24.67 | 28.47 | 28.66 |
| 2016 | 2.59 | -7.50 | -4.91 | -4.43 |
| 2017 | 2.44 | -5.65 | -3.21 | -3.14 |
| 2018 | 2.77 | 1.44 | 4.21 | 4.62 |
| 2019 | 1.39 | -2.51 | -1.12 | -1.23 |
| Note: For 2019, performance data reflect the six months ended July 31, 2018. | ||||
Average Annual Total Returns: Periods Ended June 30, 2018
This table presents returns through the latest calendar quarter—rather than through the end of the fiscal period.
Securities and Exchange Commission rules require that we provide this information.
| Ten Years | ||||||
| Inception Date | One Year | Five Years | Income | Capital | Total | |
| Investor Shares | 5/19/1986 | -0.59% | 4.32% | 3.30% | 2.51% | 5.81% |
| Admiral Shares | 2/12/2001 | -0.49 | 4.42 | 3.42 | 2.51 | 5.93 |
See Financial Highlights for dividend and capital gains information.
84
Long-Term Treasury Fund
Financial Statements (unaudited)
Statement of Net Assets
As of July 31, 2018
The fund reports a complete list of its holdings in regulatory filings four times in each fiscal year, at the quarter-ends. For the second and fourth fiscal quarters, the lists appear in the fund’s semiannual and annual reports to shareholders. For the first and third fiscal quarters, the fund files the lists with the Securities and Exchange Commission on Form N-Q. Shareholders can look up the fund’s Forms N-Q on the SEC’s website at sec.gov. Forms N-Q may also be reviewed and copied at the SEC’s Public Reference Room (see the back cover of this report for further information).
| Face | Market | ||||
| Maturity | Amount | Value • | |||
| Coupon | Date | ($000) | ($000) | ||
| U. S. Government and Agency Obligations (101.2%) | |||||
| U.S. Government Securities (96.0%) | |||||
| United States Treasury Note/Bond | 5.500% | 8/15/28 | 13,000 | 15,842 | |
| United States Treasury Note/Bond | 5.250% | 11/15/28 | 23,500 | 28,222 | |
| United States Treasury Note/Bond | 5.250% | 2/15/29 | 13,000 | 15,669 | |
| United States Treasury Note/Bond | 6.125% | 8/15/29 | 16,500 | 21,368 | |
| United States Treasury Note/Bond | 6.250% | 5/15/30 | 9,000 | 11,911 | |
| United States Treasury Note/Bond | 4.500% | 2/15/36 | 25,000 | 30,113 | |
| United States Treasury Note/Bond | 5.000% | 5/15/37 | 8,500 | 10,927 | |
| United States Treasury Note/Bond | 4.375% | 2/15/38 | 11,000 | 13,195 | |
| United States Treasury Note/Bond | 4.500% | 5/15/38 | 14,000 | 17,073 | |
| United States Treasury Note/Bond | 3.500% | 2/15/39 | 18,000 | 19,285 | |
| United States Treasury Note/Bond | 4.250% | 5/15/39 | 30,000 | 35,592 | |
| United States Treasury Note/Bond | 4.500% | 8/15/39 | 37,900 | 46,451 | |
| United States Treasury Note/Bond | 4.375% | 11/15/39 | 35,500 | 42,872 | |
| United States Treasury Note/Bond | 4.625% | 2/15/40 | 62,000 | 77,403 | |
| United States Treasury Note/Bond | 4.375% | 5/15/40 | 48,500 | 58,685 | |
| United States Treasury Note/Bond | 3.875% | 8/15/40 | 35,000 | 39,588 | |
| United States Treasury Note/Bond | 4.250% | 11/15/40 | 45,222 | 53,913 | |
| United States Treasury Note/Bond | 4.750% | 2/15/41 | 49,500 | 63,097 | |
| United States Treasury Note/Bond | 4.375% | 5/15/41 | 51,000 | 61,957 | |
| United States Treasury Note/Bond | 3.750% | 8/15/41 | 53,195 | 59,188 | |
| United States Treasury Note/Bond | 3.125% | 11/15/41 | 43,576 | 43,985 | |
| United States Treasury Note/Bond | 3.125% | 2/15/42 | 36,000 | 36,338 | |
| United States Treasury Note/Bond | 3.000% | 5/15/42 | 33,000 | 32,608 | |
| United States Treasury Note/Bond | 2.750% | 8/15/42 | 60,000 | 56,700 | |
| United States Treasury Note/Bond | 2.750% | 11/15/42 | 71,400 | 67,417 | |
| United States Treasury Note/Bond | 3.125% | 2/15/43 | 80,000 | 80,638 | |
| 1 | United States Treasury Note/Bond | 2.875% | 5/15/43 | 107,911 | 104,117 |
| United States Treasury Note/Bond | 3.625% | 8/15/43 | 93,553 | 102,426 | |
| United States Treasury Note/Bond | 3.750% | 11/15/43 | 113,408 | 126,698 | |
| United States Treasury Note/Bond | 3.625% | 2/15/44 | 114,000 | 124,973 | |
| United States Treasury Note/Bond | 3.375% | 5/15/44 | 109,500 | 115,249 | |
| United States Treasury Note/Bond | 3.125% | 8/15/44 | 108,000 | 108,877 | |
| United States Treasury Note/Bond | 3.000% | 11/15/44 | 101,229 | 99,790 | |
| United States Treasury Note/Bond | 2.500% | 2/15/45 | 98,000 | 87,694 | |
| United States Treasury Note/Bond | 3.000% | 5/15/45 | 96,707 | 95,316 | |
| United States Treasury Note/Bond | 2.875% | 8/15/45 | 114,170 | 109,835 | |
| 85 | |||||
| Long-Term Treasury Fund | |||||
| Face | Market | ||||
| Maturity | Amount | Value • | |||
| Coupon | Date | ($000) | ($000) | ||
| United States Treasury Note/Bond | 3.000% | 11/15/45 | 101,500 | 100,009 | |
| United States Treasury Note/Bond | 2.500% | 2/15/46 | 103,450 | 92,280 | |
| United States Treasury Note/Bond | 2.500% | 5/15/46 | 105,723 | 94,243 | |
| United States Treasury Note/Bond | 2.250% | 8/15/46 | 95,800 | 80,861 | |
| United States Treasury Note/Bond | 2.875% | 11/15/46 | 111,126 | 106,733 | |
| United States Treasury Note/Bond | 3.000% | 2/15/47 | 100,250 | 98,730 | |
| United States Treasury Note/Bond | 3.000% | 5/15/47 | 110,250 | 108,510 | |
| United States Treasury Note/Bond | 2.750% | 8/15/47 | 105,100 | 98,417 | |
| United States Treasury Note/Bond | 2.750% | 11/15/47 | 104,750 | 98,055 | |
| United States Treasury Note/Bond | 3.000% | 2/15/48 | 112,200 | 110,447 | |
| United States Treasury Note/Bond | 3.125% | 5/15/48 | 96,500 | 97,344 | |
| 3,200,641 | |||||
| Agency Bonds and Notes (2.1%) | |||||
| 2 | Fannie Mae Interest Strip | 0.000% | 5/15/29 | 4,592 | 3,152 |
| 2 | Fannie Mae Principal Strip | 0.000% | 5/15/30 | 25,912 | 17,193 |
| 2 | Federal Home Loan Mortgage Corp. | 0.000% | 12/14/29 | 20,000 | 13,451 |
| 2 | Freddie Mac Coupon Strips | 0.000% | 3/15/28 | 1,771 | 1,271 |
| 2 | Freddie Mac Coupon Strips | 0.000% | 9/15/28 | 1,000 | 703 |
| 2 | Freddie Mac Coupon Strips | 0.000% | 1/15/30 | 15,658 | 10,464 |
| 2 | Freddie Mac Coupon Strips | 0.000% | 3/15/30 | 12,896 | 8,567 |
| Resolution Funding Corp. Interest Strip | 0.000% | 4/15/28 | 21,802 | 15,778 | |
| 70,579 | |||||
| Conventional Mortgage-Backed Securities (2.6%) | |||||
| 2,3,4 Fannie Mae Pool | 3.500% | 8/1/48 | 43,000 | 42,603 | |
| 2,3,4 Fannie Mae Pool | 4.000% | 8/1/48 | 20,000 | 20,313 | |
| 2,3,4 Fannie Mae Pool | 4.500% | 8/1/48 | 8,000 | 8,297 | |
| 2,3,4 Fannie Mae Pool | 5.000% | 10/1/48 | 13,000 | 13,685 | |
| 2,3 | Fannie Mae Pool | 6.000% | 2/1/26–11/1/28 | 11 | 12 |
| 84,910 | |||||
| Nonconventional Mortgage-Backed Securities (0.5%) | |||||
| 2,3,5 Fannie Mae REMICS 2016-1 | 2.414% | 2/25/46 | 5,891 | 5,934 | |
| 2,3,5 Fannie Mae REMICS 2016-6 | 2.514% | 2/25/46 | 4,031 | 4,097 | |
| 2,3,5 Freddie Mac REMICS | 2.472% | 5/15/46 | 3,899 | 3,911 | |
| 2,3,5 Freddie Mac REMICS | 2.522% | 10/15/46 | 3,708 | 3,742 | |
| 17,684 | |||||
| Total U.S. Government and Agency Obligations (Cost $3,384,619) | 3,373,814 | ||||
| Shares | |||||
| Temporary Cash Investment (0.4%) | |||||
| Money Market Fund (0.4%) | |||||
| 6 | Vanguard Market Liquidity Fund | ||||
| (Cost $14,400) | 2.145% | 144,002 | 14,400 | ||
| Total Investments (101.6%) (Cost $3,399,019) | 3,388,214 | ||||
| 86 | |||||
| Long-Term Treasury Fund | |||||
| Notional | Market | ||||
| Expiration | Exercise | Amount | Value • | ||
| Date | Contracts | Price | ($000) | ($000) | |
| Liability for Options Written (0.0%) | |||||
| Call Options on 10-Year | |||||
| U. S. Treasury Note Futures | |||||
| Contracts | 8/10/18 | 29 | USD 119.25 | 3,458 | (11) |
| Call Options on 10-Year | |||||
| U. S. Treasury Note Futures | |||||
| Contracts | 8/27/18 | 87 | USD 119.50 | 10,397 | (33) |
| Call Options on 10-Year | |||||
| U. S. Treasury Note Futures | |||||
| Contracts | 8/24/18 | 251 | USD 120.00 | 30,120 | (47) |
| Put Options on 10-Year | |||||
| U. S. Treasury Note Futures | |||||
| Contracts | 8/10/18 | 29 | USD 119.25 | 3,458 | (6) |
| Put Options on 10-Year | |||||
| U. S. Treasury Note Futures | |||||
| Contracts | 8/24/18 | 222 | USD 118.50 | 26,307 | (28) |
| Put Options on 10-Year | |||||
| U. S. Treasury Note Futures | |||||
| Contract | 8/24/18 | 58 | USD 119.00 | 6,902 | (14) |
| Put Options on 10-Year | |||||
| U. S. Treasury Note Futures | |||||
| Contracts | 8/24/18 | 29 | USD 120.00 | 3,480 | (22) |
| Put Options on 10-Year | |||||
| U. S. Treasury Note Futures | |||||
| Contracts | 8/27/18 | 29 | USD 119.50 | 3,466 | (13) |
| Total Liability for Options Written (Premiums Received $357) | (174) | ||||
| Amount | |||||
| ($000) | |||||
| Other Assets and Other Liabilities (-1.6%) | |||||
| Other Assets | |||||
| Investment in Vanguard | 179 | ||||
| Receivables for Investment Securities Sold | 92,909 | ||||
| Receivables for Accrued Income | 34,883 | ||||
| Receivables for Capital Shares Issued | 11,890 | ||||
| Variation Margin Receivable—Futures Contracts | 118 | ||||
| Other Assets | 98 | ||||
| Total Other Assets | 140,077 | ||||
| Other Liabilities | |||||
| Payables for Investment Securities Purchased | (177,040) | ||||
| Payables for Capital Shares Redeemed | (13,400) | ||||
| Payables for Distributions | (902) | ||||
| Payables to Vanguard | (2,569) | ||||
| Variation Margin Payable—Futures Contracts | (109) | ||||
| Total Other Liabilities | (194,020) | ||||
| Net Assets (100%) | 3,334,097 | ||||
| 87 | |||||
Long-Term Treasury Fund
| At July 31, 2018, net assets consisted of: | |
| Amount | |
| ($000) | |
| Paid-in Capital | 3,395,063 |
| Undistributed Net Investment Income | 45 |
| Accumulated Net Realized Losses | (50,481) |
| Unrealized Appreciation (Depreciation) | |
| Investment Securities | (10,805) |
| Futures Contracts | 92 |
| Options7 | 183 |
| Net Assets | 3,334,097 |
| Investor Shares—Net Assets | |
| Applicable to 67,359,130 outstanding $.001 par value shares of | |
| beneficial interest (unlimited authorization) | 785,104 |
| Net Asset Value Per Share—Investor Shares | $11.66 |
| Admiral Shares—Net Assets | |
| Applicable to 218,694,551 outstanding $.001 par value shares of | |
| beneficial interest (unlimited authorization) | 2,548,993 |
| Net Asset Value Per Share—Admiral Shares | $11.66 |
• See Note A in Notes to Financial Statements.
1 Securities with a value of $1,276,000 have been segregated as initial margin for open futures contracts.
2 The issuer was placed under federal conservatorship in September 2008; since that time, its daily operations have been managed
by the Federal Housing Finance Agency and it receives capital from the U.S. Treasury, as needed to maintain a positive net worth,
in exchange for senior preferred stock.
3 The average or expected maturity is shorter than the final maturity shown because of the possibility of interim principal payments
and prepayments or the possibility of the issue being called.
4 Includes securities purchased on a when-issued or delayed-delivery basis for which the fund has not taken delivery as of July 31, 2018.
5 Adjustable-rate security based upon 1-month USD LIBOR plus spread.
6 Affiliated money market fund available only to Vanguard funds and certain trusts and accounts managed by Vanguard. Rate shown
is the 7-day yield.
7 Unrealized appreciation (depreciation) on options on futures contracts is required to be treated as realized gain (loss) for tax purposes.
REMICS—Real Estate Mortgage Investment Conduits.
88
Long-Term Treasury Fund
| Derivative Financial Instruments Outstanding as of Period End | ||||
| Futures Contracts | ||||
| ($000) | ||||
| Value and | ||||
| Number of | Unrealized | |||
| Long (Short) | Notional | Appreciation | ||
| Expiration | Contracts | Amount | (Depreciation) | |
| Long Futures Contracts | ||||
| 2-Year U.S. Treasury Note | September 2018 | 779 | 164,661 | (248) |
| Ultra Long U. S. Treasury Bond | September 2018 | 137 | 21,496 | (208) |
| (456) | ||||
| Short Futures Contracts | ||||
| Ultra 10-Year U.S. Treasury Note | September 2018 | (586) | (74,486) | 511 |
| 10-Year U.S. Treasury Note | September 2018 | (245) | (29,258) | 8 |
| 5-Year U. S. Treasury Note | September 2018 | (118) | (13,349) | (4) |
| 30-Year U.S. Treasury Bond | September 2018 | (15) | (2,145) | 33 |
| 548 | ||||
| 92 | ||||
Unrealized appreciation (depreciation) on open futures contracts is required to be treated as realized
gain (loss) for tax purposes.
See accompanying Notes, which are an integral part of the Financial Statements.
89
| Long-Term Treasury Fund | |
| Statement of Operations | |
| Six Months Ended | |
| July31,2018 | |
| ($000) | |
| Investment Income | |
| Income | |
| Interest1 | 51,135 |
| Total Income | 51,135 |
| Expenses | |
| The Vanguard Group—Note B | |
| Investment Advisory Services | 127 |
| Management and Administrative—Investor Shares | 708 |
| Management and Administrative—Admiral Shares | 1,048 |
| Marketing and Distribution—Investor Shares | 63 |
| Marketing and Distribution—Admiral Shares | 85 |
| Custodian Fees | 17 |
| Shareholders’ Reports —Investor Shares | 14 |
| Shareholders’ Reports —Admiral Shares | 11 |
| Trustees’ Fees and Expenses | 1 |
| Total Expenses | 2,074 |
| Net Investment Income | 49,061 |
| Realized Net Gain (Loss) | |
| Investment Securities Sold1 | (47,637) |
| Futures Contracts | (1,216) |
| Purchased Options | (52) |
| Written Options | (98) |
| Realized Net Gain (Loss) | (49,003) |
| Change in Unrealized Appreciation (Depreciation) | |
| Investment Securities1 | (43,158) |
| Futures Contracts | 1,397 |
| Written Options | 385 |
| Change in Unrealized Appreciation (Depreciation) | (41,376) |
| Net Increase (Decrease) in Net Assets Resulting from Operations | (41,318) |
1 Interest income, realized net gain (loss), and change in unrealized appreciation (depreciation) from an affiliated company of the fund
were $160,000, ($1,000), and $1,000, respectively. Purchases and sales are for temporary cash investment purposes.
See accompanying Notes, which are an integral part of the Financial Statements.
90
| Long-Term Treasury Fund | ||
| Statement of Changes in Net Assets | ||
| Six Months Ended | Year Ended | |
| July 31, | January 31, | |
| 2018 | 2018 | |
| ($000) | ($000) | |
| Increase (Decrease) in Net Assets | ||
| Operations | ||
| Net Investment Income | 49,061 | 97,127 |
| Realized Net Gain (Loss) | (49,003) | 52,940 |
| Change in Unrealized Appreciation (Depreciation) | (41,376) | (8,932) |
| Net Increase (Decrease) in Net Assets Resulting from Operations | (41,318) | 141,135 |
| Distributions | ||
| Net Investment Income | ||
| Investor Shares | (11,798) | (26,119) |
| Admiral Shares | (37,260) | (70,970) |
| Realized Capital Gain | ||
| Investor Shares | — | — |
| Admiral Shares | — | — |
| Total Distributions | (49,058) | (97,089) |
| Capital Share Transactions | ||
| Investor Shares | (74,537) | (129,575) |
| Admiral Shares | 28,605 | 52,182 |
| Net Increase (Decrease) from Capital Share Transactions | (45,932) | (77,393) |
| Total Increase (Decrease) | (136,308) | (33,347) |
| Net Assets | ||
| Beginning of Period | 3,470,405 | 3,503,752 |
| End of Period1 | 3,334,097 | 3,470,405 |
1 Net Assets—End of Period includes undistributed (overdistributed) net investment income of $45,000 and ($5,000).
See accompanying Notes, which are an integral part of the Financial Statements.
91
| Long-Term Treasury Fund | ||||||
| Financial Highlights | ||||||
| Investor Shares | ||||||
| Six Months | ||||||
| Ended | ||||||
| For a Share Outstanding | July 31, | Year Ended January 31, | ||||
| Throughout Each Period | 2018 | 2018 | 2017 | 2016 | 2015 | 2014 |
| Net Asset Value, Beginning of Period | $11.96 | $11.79 | $12.80 | $14.19 | $11.55 | $12.61 |
| Investment Operations | ||||||
| Net Investment Income | .1661 | .3281 | .332 | .351 | .372 | .374 |
| Net Realized and Unrealized Gain (Loss) | ||||||
| on Investments | (.300) | .170 | (.725) | (1.070) | 2.833 | (.937) |
| Total from Investment Operations | (.134) | . 498 | (. 393) | (.719) | 3.205 | (. 563) |
| Distributions | ||||||
| Dividends from Net Investment Income | (.166) | (. 328) | (. 332) | (. 351) | (. 372) | (. 374) |
| Distributions from Realized Capital Gains | — | — | (.285) | (.320) | (.193) | (.123) |
| Total Distributions | (.166) | (. 328) | (. 617) | (. 671) | (. 565) | (. 497) |
| Net Asset Value, End of Period | $11.66 | $11.96 | $11.79 | $12.80 | $14.19 | $11.55 |
| Total Return2 | -1.12% | 4.21% | -3.21% | -4.91% | 28.47% | -4.45% |
| Ratios/Supplemental Data | ||||||
| Net Assets, End of Period (Millions) | $785 | $882 | $995 | $1,148 | $1,318 | $1,013 |
| Ratio of Total Expenses to | ||||||
| Average Net Assets | 0.20% | 0.20% | 0.20% | 0.20% | 0.20% | 0.20% |
| Ratio of Net Investment Income to | ||||||
| Average Net Assets | 2.87% | 2.70% | 2.53% | 2.76% | 3.02% | 3.14% |
| Portfolio Turnover Rate 3 | 103% | 103%4 | 94% | 117% | 59% | 44% |
The expense ratio, net investment income ratio, and turnover rate for the current period have been annualized.
1 Calculated based on average shares outstanding.
2 Total returns do not include account service fees that may have applied in the periods shown. Fund prospectuses provide information
about any applicable account service fees.
3 Includes 3%, 6%, 3%, 36%, 22%, and 0% attributable to mortgage-dollar-roll activity.
4 Excludes the value of portfolio securities received or delivered as a result of in-kind purchases or redemptions of the fund’s capital shares.
See accompanying Notes, which are an integral part of the Financial Statements.
92
| Long-Term Treasury Fund | ||||||
| Financial Highlights | ||||||
| Admiral Shares | ||||||
| Six Months | ||||||
| Ended | ||||||
| For a Share Outstanding | July 31, | Year Ended January 31, | ||||
| Throughout Each Period | 2018 | 2018 | 2017 | 2016 | 2015 | 2014 |
| Net Asset Value, Beginning of Period | $11.96 | $11.79 | $12.80 | $14.19 | $11.55 | $12.61 |
| Investment Operations | ||||||
| Net Investment Income | .1721 | .3401 | .345 | .363 | .384 | .386 |
| Net Realized and Unrealized Gain (Loss) | ||||||
| on Investments | (.300) | .170 | (.725) | (1.070) | 2.833 | (.937) |
| Total from Investment Operations | (.128) | . 510 | (. 380) | (.707) | 3.217 | (. 551) |
| Distributions | ||||||
| Dividends from Net Investment Income | (.172) | (. 340) | (. 345) | (. 363) | (. 384) | (. 386) |
| Distributions from Realized Capital Gains | — | — | (.285) | (.320) | (.193) | (.123) |
| Total Distributions | (.172) | (. 340) | (. 630) | (. 683) | (. 577) | (. 509) |
| Net Asset Value, End of Period | $11.66 | $11.96 | $11.79 | $12.80 | $14.19 | $11.55 |
| Total Return2 | -1.07% | 4.32% | -3.12% | -4.81% | 28.60% | -4.36% |
| Ratios/Supplemental Data | ||||||
| Net Assets, End of Period (Millions) | $2,549 | $2,588 | $2,509 | $2,400 | $2,448 | $1,563 |
| Ratio of Total Expenses to | ||||||
| Average Net Assets | 0.10% | 0.10% | 0.10% | 0.10% | 0.10% | 0.10% |
| Ratio of Net Investment Income to | ||||||
| Average Net Assets | 2.97% | 2.80% | 2.63% | 2.86% | 3.12% | 3.24% |
| Portfolio Turnover Rate 3 | 103% | 103%4 | 94% | 117% | 59% | 44% |
The expense ratio, net investment income ratio, and turnover rate for the current period have been annualized.
1 Calculated based on average shares outstanding.
2 Total returns do not include account service fees that may have applied in the periods shown. Fund prospectuses provide information
about any applicable account service fees.
3 Includes 3%, 6%, 3%, 36%, 22%, and 0% attributable to mortgage-dollar-roll activity.
4 Excludes the value of portfolio securities received or delivered as a result of in-kind purchases or redemptions of the fund’s capital shares.
See accompanying Notes, which are an integral part of the Financial Statements.
93
Long-Term Treasury Fund
Notes to Financial Statements
Vanguard Long-Term Treasury Fund is registered under the Investment Company Act of 1940 as an open-end investment company, or mutual fund. The fund offers two classes of shares: Investor Shares and Admiral Shares. Investor Shares are available to any investor who meets the fund’s minimum purchase requirements. Admiral Shares are designed for investors who meet certain administrative, service, and account-size criteria.
A. The following significant accounting policies conform to generally accepted accounting principles for U.S. investment companies. The fund consistently follows such policies in preparing its financial statements.
1. Security Valuation: Securities are valued as of the close of trading on the New York Stock Exchange (generally 4 p.m., Eastern time) on the valuation date. Bonds and temporary cash investments are valued using the latest bid prices or using valuations based on a matrix system (which considers such factors as security prices, yields, maturities, and ratings), both as furnished by independent pricing services. Structured debt securities, including mortgages and asset-backed securities, are valued using the latest bid prices or using valuations based on a matrix system that considers such factors as issuer, tranche, nominal or option-adjusted spreads, weighted average coupon, weighted average maturity, credit enhancements, and collateral. Investments in Vanguard Market Liquidity Fund are valued at that fund’s net asset value. Securities for which market quotations are not readily available, or whose values have been affected by events occurring before the fund’s pricing time but after the close of the securities’ primary markets, are valued by methods deemed by the board of trustees to represent fair value.
2. Futures and Options: The fund uses futures contracts and options on futures contracts to invest in fixed income asset classes with greater efficiency and lower cost than is possible through direct investment, to add value when these instruments are attractively priced, or to adjust sensitivity to changes in interest rates. The primary risks associated with the use of futures contracts are imperfect correlation between changes in market values of bonds held by the fund and the prices of futures contracts, and the possibility of an illiquid market. The primary risk associated with purchasing options is that interest rates move in such a way that the option is out-of-the-money, the position is worthless at expiration, and the fund loses the premium paid. The primary risk associated with writing options is that interest rates move in such a way that the option is in-the-money, the counterparty exercises the option, and the fund loses an amount equal to the market value of the option written less the premium received. Counterparty risk involving futures and exchange-traded options is mitigated because a regulated clearinghouse is the counterparty instead of the clearing broker. To further mitigate counterparty risk, the fund trades futures and options on an exchange, monitors the financial strength of its clearing brokers and clearinghouse, and has entered into clearing agreements with its clearing brokers. The clearinghouse imposes initial margin requirements to secure the fund’s performance and requires daily settlement of variation margin representing changes in the market value of each contract. Any assets pledged as initial margin for open contracts are noted in the Statement of Net Assets.
Futures contracts are valued at their quoted daily settlement prices. The notional amounts of the contracts are not recorded in the Statement of Net Assets. Fluctuations in the value of the contracts are recorded in the Statement of Net Assets as an asset (liability) and in the Statement of Operations as unrealized appreciation (depreciation) until the contracts are closed, when they are recorded as realized futures gains (losses).
94
Long-Term Treasury Fund
During the six months ended July 31, 2018, the fund’s average investments in long and short futures contracts represented 6% and 2% of net assets, respectively, based on the average of the notional amounts at each quarter-end during the period.
Options on futures contracts are also valued at their quoted daily settlement prices. The premium paid for a purchased option is recorded in the Statement of Net Assets as an asset that is subsequently adjusted daily to the current market value of the option purchased. The premium received for a written option is recorded in the Statement of Net Assets as an asset with an equal liability that is subsequently adjusted daily to the current market value of the option written. Fluctuations in the value of the options are recorded in the Statement of Operations as unrealized appreciation (depreciation) until expired, closed, or exercised, at which time realized gains (losses) are recognized.
During the six months ended July 31, 2018, the fund’s average value of investments in options purchased and options written each represented less than 1% of net assets, based on the average market values at each quarter-end during the period.
3. To Be Announced (TBA) Transactions: A TBA transaction is an agreement to buy or sell mortgage-backed securities with agreed-upon characteristics (face amount, coupon, maturity) for settlement at a future date. The fund may be a seller of TBA transactions to reduce its exposure to the mortgage-backed securities market or in order to sell mortgage-backed securities it owns under delayed-delivery arrangements. When the fund is a buyer of TBA transactions, it maintains cash or short-term investments in an amount sufficient to meet the purchase price at the settlement date of the TBA transaction. The primary risk associated with TBA transactions is that a counterparty may default on its obligations. The fund mitigates its counterparty risk by, among other things, performing a credit analysis of counterparties, allocating transactions among numerous counterparties, and monitoring its exposure to each counterparty. The fund may also enter into a Master Securities Forward Transaction Agreement (MSFTA) with certain counterparties and require them to transfer collateral as security for their performance. In the absence of a default, the collateral pledged or received by the fund cannot be repledged, resold, or rehypothecated. Under an MSFTA, upon a counterparty default (including bankruptcy), the fund may terminate any TBA transactions with that counterparty, determine the net amount owed by either party in accordance with its master netting arrangements, and sell or retain any collateral held up to the net amount owed to the fund under the master netting arrangements.
4. Mortgage Dollar Rolls: The fund enters into mortgage-dollar-roll transactions, in which the fund sells mortgage-backed securities to a dealer and simultaneously agrees to purchase similar securities in the future at a predetermined price. The proceeds of the securities sold in mortgage-dollar-roll transactions are typically invested in high-quality short-term fixed income securities. The fund forgoes principal and interest paid on the securities sold, and is compensated by interest earned on the proceeds of the sale and by a lower price on the securities to be repurchased.
The fund accounts for mortgage-dollar-roll transactions as purchases and sales; as such, these transactions may increase the fund’s portfolio turnover rate. Amounts to be received or paid in connection with open mortgage dollar rolls are included in Receivables for Investment Securities Sold or Payables for Investment Securities Purchased in the Statement of Net Assets.
95
Long-Term Treasury Fund
5. Federal Income Taxes: The fund intends to continue to qualify as a regulated investment company and distribute all of its taxable income. Management has analyzed the fund’s tax positions taken for all open federal income tax years (January 31, 2015–2018), and for the period ended July 31, 2018, and has concluded that no provision for federal income tax is required in the fund’s financial statements.
6. Distributions: Distributions from net investment income are declared daily and paid on the first business day of the following month. Annual distributions from realized capital gains, if any, are recorded on the ex-dividend date.
7. Credit Facility: The fund and certain other funds managed by The Vanguard Group (“Vanguard”) participate in a $3.1 billion committed credit facility provided by a syndicate of lenders pursuant to a credit agreement that may be renewed annually; each fund is individually liable for its borrowings, if any, under the credit facility. Borrowings may be utilized for temporary and emergency purposes, and are subject to the fund’s regulatory and contractual borrowing restrictions. The participating funds are charged administrative fees and an annual commitment fee of 0.10% of the undrawn amount of the facility; these fees are allocated to the funds based on a method approved by the fund’s board of trustees and included in Management and Administrative expenses on the fund’s Statement of Operations. Any borrowings under this facility bear interest at a rate based upon the higher of the one-month London Interbank Offered Rate, federal funds effective rate, or overnight bank funding rate plus an agreed-upon spread.
The fund had no borrowings outstanding at July 31, 2018, or at any time during the period then ended.
8. Other: Interest income includes income distributions received from Vanguard Market Liquidity Fund and is accrued daily. Premiums and discounts on debt securities purchased are amortized and accreted, respectively, to interest income over the lives of the respective securities. Security transactions are accounted for on the date securities are bought or sold. Costs used to determine realized gains (losses) on the sale of investment securities are those of the specific securities sold.
Each class of shares has equal rights as to assets and earnings, except that each class separately bears certain class-specific expenses related to maintenance of shareholder accounts (included in Management and Administrative expenses), shareholder reporting, and the proxy. Marketing and distribution expenses are allocated to each class of shares based on a method approved by the board of trustees. Income, other non-class-specific expenses, and gains and losses on investments are allocated to each class of shares based on its relative net assets.
B. In accordance with the terms of a Funds’ Service Agreement (the “FSA”) between Vanguard and the fund, Vanguard furnishes to the fund investment advisory, corporate management, administrative, marketing, and distribution services at Vanguard’s cost of operations (as defined by the FSA). These costs of operations are allocated to the fund based on methods and guidelines approved by the board of trustees. Vanguard does not require reimbursement in the current period for certain costs of operations (such as deferred compensation/benefits and risk/insurance costs); the fund’s liability for these costs of operations is included in Payables to Vanguard on the Statement of Net Assets.
Upon the request of Vanguard, the fund may invest up to 0.40% of its net assets as capital in Vanguard. At July 31, 2018, the fund had contributed to Vanguard capital in the amount of $179,000, representing 0.01% of the fund’s net assets and 0.07% of Vanguard’s capitalization. The fund’s trustees and officers are also directors and employees, respectively, of Vanguard.
96
Long-Term Treasury Fund
C. Various inputs may be used to determine the value of the fund’s investments. These inputs are summarized in three broad levels for financial statement purposes. The inputs or methodologies used to value securities are not necessarily an indication of the risk associated with investing in those securities.
Level 1—Quoted prices in active markets for identical securities.
Level 2—Other significant observable inputs (including quoted prices for similar securities, interest rates, prepayment speeds, credit risk, etc.).
Level 3—Significant unobservable inputs (including the fund’s own assumptions used to determine
the fair value of investments). Any investments valued with significant unobservable inputs are
noted on the Statement of Net Assets.
The following table summarizes the market value of the fund’s investments as of July 31, 2018, based on the inputs used to value them:
| Level 1 | Level 2 | Level 3 | |
| Investments | ($000) | ($000) | ($000) |
| U.S. Government and Agency Obligations | — | 3,373,814 | — |
| Temporary Cash Investments | 14,400 | — | — |
| Liability for Options Written | (174) | — | — |
| Futures Contracts—Assets1 | 118 | — | — |
| Futures Contracts—Liabilities1 | (109) | — | — |
| Total | 14,235 | 3,373,814 | — |
| 1 Represents variation margin on the last day of the reporting period. |
D. Capital gain distributions are determined on a tax basis and may differ from realized capital gains for financial reporting purposes. Differences may be permanent or temporary. Permanent differences are reclassified among capital accounts in the financial statements to reflect their tax character. Temporary differences arise when gains or losses are recognized in different periods for financial statement and tax purposes. These differences will reverse at some time in the future.
The fund’s tax-basis capital gains and losses are determined only at the end of each fiscal year. For tax purposes, at January 31, 2018, the fund had available capital losses totaling $2,985,000 that may be carried forward indefinitely to offset future net capital gains. The fund will use these capital losses to offset net taxable capital gains, if any, realized during the year ending January 31, 2019; should the fund realize net capital losses for the year, the losses will be added to the loss carryforward balance above.
At July 31, 2018, the cost of investment securities for tax purposes was $3,399,019,000. Net unrealized depreciation of investment securities for tax purposes was $10,805,000, consisting of unrealized gains of $47,265,000 on securities that had risen in value since their purchase and $58,070,000 in unrealized losses on securities that had fallen in value since their purchase.
E. During the six months ended July 31, 2018, the fund purchased $1,767,390,000 of investment securities and sold $1,732,408,000 of investment securities, other than temporary cash investments.
97
Long-Term Treasury Fund
| F. Capital share transactions for each class of shares were: | ||||
| Six Months Ended | Year Ended | |||
| July 31, 2018 | January 31, 2018 | |||
| Amount | Shares | Amount | Shares | |
| ($000) | (000) | ($000) | (000) | |
| Investor Shares | ||||
| Issued | 64,111 | 5,482 | 184,444 | 15,192 |
| Issued in Lieu of Cash Distributions | 11,086 | 945 | 24,600 | 2,025 |
| Redeemed | (149,734) | (12,829) | (338,619) | (27,882) |
| Net Increase (Decrease)—Investor Shares | (74,537) | (6,402) | (129,575) | (10,665) |
| Admiral Shares | ||||
| Issued | 356,047 | 30,459 | 867,209 | 71,229 |
| Issued in Lieu of Cash Distributions | 32,398 | 2,762 | 61,115 | 5,029 |
| Redeemed | (359,840) | (30,878) | (876,142) | (72,736) |
| Net Increase (Decrease)—Admiral Shares | 28,605 | 2,343 | 52,182 | 3,522 |
G. Management has determined that no events or transactions occurred subsequent to July 31, 2018, that would require recognition or disclosure in these financial statement
98
About Your Fund’s Expenses
As a shareholder of the fund, you incur ongoing costs, which include costs for portfolio management, administrative services, and shareholder reports (like this one), among others. Operating expenses, which are deducted from a fund’s gross income, directly reduce the investment return of the fund.
A fund’s expenses are expressed as a percentage of its average net assets. This figure is known as the expense ratio. The following examples are intended to help you understand the ongoing costs (in dollars) of investing in your fund and to compare these costs with those of other mutual funds. The examples are based on an investment of $1,000 made at the beginning of the period shown and held for the entire period.
The accompanying table illustrates your fund’s costs in two ways:
• Based on actual fund return. This section helps you to estimate the actual expenses that you paid over the period. The ”Ending Account Value“ shown is derived from the fund‘s actual return, and the third column shows the dollar amount that would have been paid by an investor who started with $1,000 in the fund. You may use the information here, together with the amount you invested, to estimate the expenses that you paid over the period.
To do so, simply divide your account value by $1,000 (for example, an $8,600 account value divided by $1,000 = 8.6), then multiply the result by the number given for your fund under the heading ”Expenses Paid During Period.“
• Based on hypothetical 5% yearly return. This section is intended to help you compare your fund‘s costs with those of other mutual funds. It assumes that the fund had a yearly return of 5% before expenses, but that the expense ratio is unchanged. In this case—because the return used is not the fund’s actual return—the results do not apply to your investment. The example is useful in making comparisons because the Securities and Exchange Commission requires all mutual funds to calculate expenses based on a 5% return. You can assess your fund’s costs by comparing this hypothetical example with the hypothetical examples that appear in shareholder reports of other funds.
Note that the expenses shown in the table are meant to highlight and help you compare ongoing costs only and do not reflect transaction costs incurred by the fund for buying and selling securities. Further, the expenses do not include any purchase, redemption, or account service fees described in the fund prospectus. If such fees were applied to your account, your costs would be higher. Your fund does not carry a “sales load.”
The calculations assume no shares were bought or sold during the period. Your actual costs may have been higher or lower, depending on the amount of your investment and the timing of any purchases or redemptions.
You can find more information about the fund’s expenses, including annual expense ratios, in the Financial Statements section of this report. For additional information on operating expenses and other shareholder costs, please refer to your fund’s current prospectus.
99
| Six Months Ended July 31, 2018 | |||
| Beginning | Ending | Expenses | |
| Account Value | Account Value | Paid During | |
| 1/31/2018 | 7/31/2018 | Period | |
| Based on Actual Fund Return | |||
| Short-Term Treasury Fund | |||
| Investor Shares | $1,000.00 | $1,002.65 | $0.99 |
| Admiral Shares | 1,000.00 | 1,003.15 | 0.50 |
| Short-Term Federal Fund | |||
| Investor Shares | $1,000.00 | $1,002.47 | $0.99 |
| Admiral Shares | 1,000.00 | 1,002.96 | 0.50 |
| Intermediate-Term Treasury Fund | |||
| Investor Shares | $1,000.00 | $998.44 | $0.99 |
| Admiral Shares | 1,000.00 | 998.94 | 0.50 |
| GNMA Fund | |||
| Investor Shares | $1,000.00 | $1,002.67 | $1.04 |
| Admiral Shares | 1,000.00 | 1,003.17 | 0.55 |
| Long-Term Treasury Fund | |||
| Investor Shares | $1,000.00 | $988.83 | $0.99 |
| Admiral Shares | 1,000.00 | 989.32 | 0.50 |
100
| Six Months Ended July 31, 2018 | |||
| Beginning | Ending | Expenses | |
| Account Value | Account Value | Paid During | |
| 1/31/2018 | 7/31/2018 | Period | |
| Based on Hypothetical 5% Yearly Return | |||
| Short-Term Treasury Fund | |||
| Investor Shares | $1,000.00 | $1,023.80 | $1.00 |
| Admiral Shares | 1,000.00 | 1,024.30 | 0.50 |
| Short-Term Federal Fund | |||
| Investor Shares | $1,000.00 | $1,023.80 | $1.00 |
| Admiral Shares | 1,000.00 | 1,024.30 | 0.50 |
| Intermediate-Term Treasury Fund | |||
| Investor Shares | $1,000.00 | $1,023.80 | $1.00 |
| Admiral Shares | 1,000.00 | 1,024.30 | 0.50 |
| GNMA Fund | |||
| Investor Shares | $1,000.00 | $1,023.75 | $1.05 |
| Admiral Shares | 1,000.00 | 1,024.25 | 0.55 |
| Long-Term Treasury Fund | |||
| Investor Shares | $1,000.00 | $1,023.80 | $1.00 |
| Admiral Shares | 1,000.00 | 1,024.30 | 0.50 |
The calculations are based on expenses incurred in the most recent six-month period. The funds’ annualized six-month expense ratios for
that period are: for the Short-Term Treasury Fund, 0.20% for Investor Shares and 0.10% for Admiral Shares; for the Short-Term Federal
Fund, 0.20% for Investor Shares and 0.10% for Admiral Shares; for the Intermediate-Term Treasury Fund, 0.20% for Investor Shares and
0.10% for Admiral Shares; for the GNMA Fund, 0.21% for Investor Shares and 0.11% for Admiral Shares; and for the Long-Term Treasury
Fund, 0.20% for Investor Shares and 0.10% for Admiral Shares. The dollar amounts shown as “Expenses Paid” are equal to the annualized
expense ratio multiplied by the average account value over the period, multiplied by the number of days in the most recent six-month
period, then divided by the number of days in the most recent 12-month period (181/365).
101
Trustees Approve Advisory Arrangements
The board of trustees of Vanguard Short-Term Treasury Fund, Vanguard Intermediate-Term Treasury Fund, Vanguard Long-Term Treasury Fund, and Vanguard Short-Term Federal Fund has renewed each fund’s investment advisory arrangement with The Vanguard Group, Inc. (Vanguard), through its Fixed Income Group. The board also has renewed the investment advisory arrangement between Vanguard GNMA Fund and Wellington Management Company LLP (Wellington Management). The board determined that renewing each fund’s advisory arrangement was in the best interests of the fund and its shareholders.
The board based its decisions upon an evaluation of each advisor’s investment staff, portfolio management process, and performance. This evaluation included information provided to the board by Vanguard’s Portfolio Review Department, which is responsible for fund and advisor oversight and product management. The Portfolio Review Department met regularly with the advisors and made monthly presentations to the board during the fiscal year that directed the board’s focus to relevant information and topics.
The board, or an investment committee made up of board members, also received information throughout the year during advisor presentations. For each advisor presentation, the board was provided with letters and reports that included information about, among other things, the advisory firm and the advisor’s assessment of the investment environment, portfolio performance, and portfolio characteristics.
In addition, the board received monthly reports, which included a Market and Economic Report, a Fund Dashboard Monthly Summary, and a Fund Performance Report.
Prior to their meeting, the trustees were provided with a memo and materials that summarized the information they received over the course of the year. They also considered the factors discussed below, among others. However, no single factor determined whether the board approved the arrangements. Rather, it was the totality of the circumstances that drove the board’s decision.
Nature, extent, and quality of services
The board reviewed the quality of each fund’s investment management services over both the short and long term and took into account the organizational depth and stability of each advisor. The board considered the following:
Vanguard. Vanguard has been managing investments for more than four decades and has advised the Short-Term Treasury, Intermediate-Term Treasury, Long-Term Treasury, and Short-Term Federal Funds since their inceptions. The Fixed Income Group adheres to a sound, disciplined investment management process; the team has considerable experience, stability, and depth.
Wellington Management. Founded in 1928, Wellington Management is among the nation’s oldest and most respected institutional investment managers. The portfolio manager is backed by a team of experienced analysts who help inform his strategic perspective and conduct statistical and cash-flow analysis. The team leverages its deep knowledge of the mortgage industry to analyze the relative value of various GNMA bonds and construct a portfolio with lower prepayment and extension risk than the benchmark but with similar interest rate risk. Wellington Management has advised the GNMA Fund since its inception in 1980.
The board concluded that each advisor’s experience, stability, depth, and performance, among other factors, warranted continuation of the advisory arrangements.
102
Investment performance
The board considered the short- and long-term performance of each fund, including any periods of outperformance or underperformance compared with a relevant benchmark index and peer group. The board concluded that the performance was such that the advisory arrangements should continue. Information about each fund’s most recent performance can be found on the Performance Summary pages of this report.
Cost
The board concluded that each fund’s expense ratio was well below the average expense ratio charged by funds in its peer group and that each fund’s advisory fee rate or expenses were also well below the peer-group average. Information about the funds’ expenses appears in the About Your Fund’s Expenses section of this report as well as in the Financial Statements sections, which also contain information about the advisory expenses.
The board did not consider the profitability of Wellington Management in determining whether to approve the advisory fee for the GNMA Fund, because Wellington Management is independent of Vanguard and the advisory fee is the result of arm’s-length negotiations. The board does not conduct a profitability analysis of Vanguard because of Vanguard’s unique “at-cost” structure. Unlike most other mutual fund management companies, Vanguard is owned by the funds it oversees and produces “profits” only in the form of reduced expenses for fund shareholders.
The benefit of economies of scale
The board concluded that the GNMA Fund shareholders benefit from economies of scale because of breakpoints in the fund’s advisory fee schedule with Wellington Management. The breakpoints reduce the effective rate of the fee as the fund’s assets increase.
The board also concluded that the Short-Term Treasury, Intermediate-Term Treasury, Long-Term Treasury, and Short-Term Federal Funds’ at-cost arrangements with Vanguard ensure that the funds will realize economies of scale as they grow, with the cost to shareholders declining as fund assets increase.
The board will consider whether to renew the advisory arrangements again after a one-year period.
103
Glossary
30-Day SEC Yield. A fund’s 30-day SEC yield is derived using a formula specified by the U.S. Securities and Exchange Commission. Under the formula, data related to the fund’s security holdings in the previous 30 days are used to calculate the fund’s hypothetical net income for that period, which is then annualized and divided by the fund’s estimated average net assets over the calculation period. For the purposes of this calculation, a security’s income is based on its current market yield to maturity (for bonds), its actual income (for asset-backed securities), or its projected dividend yield (for stocks). Because the SEC yield represents hypothetical annualized income, it will differ—at times significantly—from the fund’s actual experience. As a result, the fund’s income distributions may be higher or lower than implied by the SEC yield.
Average Coupon. The average interest rate paid on the fixed income securities held by a fund. It is expressed as a percentage of face value.
Average Duration. An estimate of how much the value of the bonds held by a fund will fluctuate in response to a change in interest rates. To see how the value could change, multiply the average duration by the change in rates. If interest rates rise by 1 percentage point, the value of the bonds in a fund with an average duration of five years would decline by about 5%. If rates decrease by a percentage point, the value would rise by 5%.
Average Effective Maturity. The average length of time until fixed income securities held by a fund reach maturity and are repaid, taking into consideration the possibility that the issuer may call the bond before its maturity date. The figure reflects the proportion of fund assets represented by each security; it also reflects any futures contracts held. In general, the longer the average effective maturity, the more a fund’s share price will fluctuate in response to changes in market interest rates.
Beta. A measure of the magnitude of a fund’s past share-price fluctuations in relation to the ups and downs of a given market index. The index is assigned a beta of 1.00. Compared with a given index, a fund with a beta of 1.20 typically would have seen its share price rise or fall by 12% when the index rose or fell by 10%. For this report, beta is based on returns over the past 36 months for both the fund and the index. Note that a fund’s beta should be reviewed in conjunction with its R-squared (see definition). The lower the R-squared, the less correlation there is between the fund and the index, and the less reliable beta is as an indicator of volatility.
Credit Quality. Credit-quality ratings are measured on a scale that generally ranges from AAA (highest) to D (lowest). U.S. Treasury, U.S. Agency, and U.S. Agency mortgage-backed securities appear under “U.S. Government.” For the federal and Treasury funds, credit-quality ratings are obtained from Moody’s and S&P, and the higher rating for each issue is shown. For the GNMA Fund, credit-quality ratings are obtained from Barclays and are from Moody’s, Fitch, and S&P. When ratings from all three agencies are used, the median rating is shown. When ratings from two of the agencies are used, the lower rating for each issue is shown. “Not Rated” is used to classify securities for which a rating is not available. Not rated securities include a fund’s investment in Vanguard Market Liquidity Fund or Vanguard Municipal Cash Management Fund, each of which invests in high-quality money market instruments and may serve as a cash management vehicle for the Vanguard funds, trusts, and accounts.
104
Distribution by Coupon. A breakdown of the securities in a fund according to coupon rate—the interest rate that an issuer promises to pay, expressed as an annual percentage of face value. Securities with unusually high coupon rates may be subject to call risk, the possibility that they will be redeemed (or “called”) early by the issuer.
Expense Ratio. A fund’s total annual operating expenses expressed as a percentage of the fund’s average net assets. The expense ratio includes management and administrative expenses, but does not include the transaction costs of buying and selling portfolio securities.
Inception Date. The date on which the assets of a fund (or one of its share classes) are first invested in accordance with the fund’s investment objective. For funds with a subscription period, the inception date is the day after that period ends. Investment performance is measured from the inception date.
R-Squared. A measure of how much of a fund’s past returns can be explained by the returns from the market in general, as measured by a given index. If a fund’s total returns were precisely synchronized with an index’s returns, its R-squared would be 1.00. If the fund’s returns bore no relationship to the index’s returns, its R-squared would be 0. For this report, R-squared is based on returns over the past 36 months for both the fund and the index.
Short-Term Reserves. The percentage of a fund invested in highly liquid, short-term securities that can be readily converted to cash.
Yield to Maturity. The rate of return an investor would receive if the fixed income securities held by a fund were held to their maturity dates.
105
BLOOMBERG is a trademark and service mark of Bloomberg Finance L.P. BARCLAYS is a trademark and service mark of Barclays Bank Plc, used under license. Bloomberg Finance L.P. and its affiliates, including Bloomberg Index Services Limited (BISL) (collectively, Bloomberg), or Bloomberg’s licensors, own all proprietary rights in the Bloomberg Barclays U.S. 1–5 Year Treasury Bond Index, Bloomberg Barclays U.S. 1–5 Year Government Bond Index, Bloomberg Barclays U.S. 5–10 Year Treasury Bond Index, Bloomberg Barclays U.S. GNMA Bond Index, and Bloomberg Barclays U.S. Long Treasury Bond Index (the Indices or Bloomberg Barclays Indices).
Neither Barclays Bank Plc, Barclays Capital Inc., or any affiliate (collectively Barclays) or Bloomberg is the issuer or producer of the U.S. Government Bond Funds and neither Bloomberg nor Barclays has any responsibilities, obligations or duties to investors in the U.S. Government Bond Funds. The Indices are licensed for use by The Vanguard Group, Inc. (Vanguard) as the sponsor of the U.S. Government Bond Funds. Bloomberg and Barclays’ only relationship with Vanguard in respect of the Indices is the licensing of the Indices, which are determined, composed and calculated by BISL, or any successor thereto, without regard to the Issuer or the U.S. Government Bond Funds or the owners of the U.S. Government Bond Funds.
Additionally, Vanguard may for itself execute transaction(s) with Barclays in or relating to the Indices in connection with the U.S. Government Bond Funds. Investors acquire the U.S. Government Bond Funds from Vanguard and investors neither acquire any interest in the Indices nor enter into any relationship of any kind whatsoever with Bloomberg or Barclays upon making an investment in the U.S. Government Bond Funds. The U.S. Government Bond Funds are not sponsored, endorsed, sold or promoted by Bloomberg or Barclays. Neither Bloomberg nor Barclays makes any representation or warranty, express or implied regarding the advisability of investing in the U.S. Government Bond Funds or the advisability of investing in securities generally or the ability of the Indices to track corresponding or relative market performance. Neither Bloomberg nor Barclays has passed on the legality or suitability of the U.S. Government Bond Funds with respect to any person or entity. Neither Bloomberg nor Barclays is responsible for and has not participated in the determination of the timing of, prices at, or quantities of the U.S. Government Bond Funds to be issued. Neither Bloomberg nor Barclays has any obligation to take the needs of the Issuer or the owners of the U.S. Government Bond Funds or any other third party into consideration in determining, composing or calculating the Indices. Neither Bloomberg nor Barclays has any obligation or liability in connection with administration, marketing or trading of the U.S. Government Bond Funds.
106
The licensing agreement between Bloomberg and Barclays is solely for the benefit of Bloomberg and Barclays and not for the benefit of the owners of the U.S. Government Bond Funds, investors or other third parties. In addition, the licensing agreement between Vanguard and Bloomberg is solely for the benefit of Vanguard and Bloomberg and not for the benefit of the owners of the U.S. Government Bond Funds, investors or other third parties.
NEITHER BLOOMBERG NOR BARCLAYS SHALL HAVE ANY LIABILITY TO THE ISSUER, INVESTORS OR TO OTHER THIRD PARTIES FOR THE QUALITY, ACCURACY AND/OR COMPLETENESS OF THE BLOOMBERG BARCLAYS INDICES OR ANY DATA INCLUDED THEREIN OR FOR INTERRUPTIONS IN THE DELIVERY OF THE BLOOMBERG BARCLAYS INDICES. NEITHER BLOOMBERG NOR BARCLAYS MAKES ANY WARRANTY, EXPRESS OR IMPLIED, AS TO RESULTS TO BE OBTAINED BY THE ISSUER, THE INVESTORS OR ANY OTHER PERSON OR ENTITY FROM THE USE OF THE BLOOMBERG BARCLAYS INDICES OR ANY DATA INCLUDED THEREIN. NEITHER BLOOMBERG NOR BARCLAYS MAKES ANY EXPRESS OR IMPLIED WARRANTIES, AND EACH HEREBY EXPRESSLY DISCLAIMS ALL WARRANTIES OF MERCHANTABILITY
OR FITNESS FOR A PARTICULAR PURPOSE OR USE WITH RESPECT TO THE BLOOMBERG BARCLAYS INDICES OR ANY DATA INCLUDED THEREIN. BLOOMBERG RESERVES THE RIGHT TO CHANGE THE METHODS OF CALCULATION OR PUBLICATION, OR TO CEASE THE CALCULATION OR PUBLICATION OF THE BLOOMBERG BARCLAYS INDICES, AND NEITHER BLOOMBERG NOR BARCLAYS SHALL BE LIABLE FOR ANY MISCALCULATION OF OR ANY INCORRECT, DELAYED OR INTERRUPTED PUBLICATION WITH RESPECT TO THE BLOOMBERG BARCLAYS INDICES. NEITHER BLOOMBERG NOR BARCLAYS SHALL BE LIABLE FOR ANY DAMAGES, INCLUDING, WITHOUT LIMITATION, ANY SPECIAL, INDIRECT OR CONSEQUENTIAL DAMAGES, OR ANY LOST PROFITS AND EVEN IF ADVISED OF THE POSSIBILITY OF SUCH, RESULTING FROM THE USEOF THE BLOOMBERG BARCLAYS INDICES OR ANY DATA INCLUDED THEREIN OR WITH RESPECT TO THE U.S. GOVERNMENT BOND FUNDS.
None of the information supplied by Bloomberg or Barclays and used in this publication may be reproduced in any manner without the prior written permission of both Bloomberg and Barclays Capital, the investment banking division of Barclays Bank Plc. Barclays Bank Plc is registered in England No. 1026167. Registered office 1 Churchill Place London E14 5HP.
© 2018 Bloomberg. Used with Permission.
Source: Bloomberg Index Services Limited. Copyright 2018, Bloomberg. All rights reserved.
107
This page intentionally left blank.
This page intentionally left blank.
This page intentionally left blank.
This page intentionally left blank.
This page intentionally left blank.
This page intentionally left blank.
This page intentionally left blank.
The People Who Govern Your Fund
The trustees of your mutual fund are there to see that the fund is operated and managed in your best interests since, as a shareholder, you are a part owner of the fund. Your fund’s trustees also serve on the board of directors of The Vanguard Group, Inc., which is owned by the Vanguard funds and provides services to them on an at-cost basis.
A majority of Vanguard’s board members are independent, meaning that they have no affiliation with Vanguard or the funds they oversee, apart from the sizable personal investments they have made as private individuals. The independent board members have distinguished backgrounds in business, academia, and public service. Each of the trustees and executive officers oversees 208 Vanguard funds.
Information for each trustee and executive officer of the fund appears below. The mailing address of the trustees and officers is P.O. Box 876, Valley Forge, PA 19482. More information about the trustees is in the Statement of Additional Information, which can be obtained, without charge, by contacting Vanguard at 800-662-7447, or online at vanguard.com.
Interested Trustees1
F. William McNabb III
Born in 1957. Trustee since July 2009. Principal occupation(s) during the past five years and other experience: chairman of the board (January 2010–present) of Vanguard and of each of the investment companies served by Vanguard, trustee (2009–present) of each of the investment companies served by Vanguard, and director (2008–present) of Vanguard. Chief executive officer and president (2008–2017) of Vanguard and each of the investment companies served by Vanguard, managing director (1995–2008) of Vanguard, and director (1997–2018) of Vanguard Marketing Corporation. Director (2018–present) of UnitedHealth Group.
Mortimer J. Buckley
Born in 1969. Trustee since January 2018. Principal occupation(s) during the past five years and other experience: chief executive officer (January 2018–present) of Vanguard; chief executive officer, president, and trustee (January 2018–present) of each of the investment companies served by Vanguard; president and director (2017–present) of Vanguard; and president (February 2018–present) of Vanguard Marketing Corporation. Chief investment officer (2013–2017), managing director (2002–2017), head of the Retail Investor Group (2006–2012), and chief information officer (2001–2006) of Vanguard. Chairman of the board (2011–2017) of the Children’s Hospital of Philadelphia.
Independent Trustees
Emerson U. Fullwood
Born in 1948. Trustee since January 2008. Principal occupation(s) during the past five years and other experience: executive chief staff and marketing officer for North America and corporate vice president (retired 2008) of Xerox Corporation (document management products and services). Former president of the Worldwide Channels Group, Latin America, and Worldwide Customer Service and executive chief staff officer of Developing Markets of Xerox. Executive in residence and 2009–2010 Distinguished Minett Professor at the Rochester Institute of Technology. Lead director of SPX FLOW, Inc. (multi-industry manufacturing). Director of the University of Rochester Medical Center, the Monroe Community College Foundation, the United Way of Rochester, North Carolina A&T University, and Roberts Wesleyan College. Trustee of the University of Rochester.
Amy Gutmann
Born in 1949. Trustee since June 2006. Principal occupation(s) during the past five years and other experience: president (2004–present) of the University of Pennsylvania. Christopher H. Browne Distinguished Professor of Political Science, School of Arts and Sciences, and professor of communication, Annenberg School for Communication, with secondary faculty appointments in the Department of Philosophy, School of Arts and Sciences, and at the Graduate School of Education, University of Pennsylvania. Trustee of the National Constitution Center.
1 Mr. McNabb and Mr. Buckley are considered “interested persons,” as defined in the Investment Company Act of 1940, because
they are officers of the Vanguard funds.
JoAnn Heffernan Heisen
Born in 1950. Trustee since July 1998. Principal occupation(s) during the past five years and other experience: corporate vice president of Johnson & Johnson (pharmaceuticals/medical devices/consumer products) and member of its executive committee (1997–2008). Chief global diversity officer (retired 2008), vice president and chief information officer (1997–2006), controller (1995–1997), treasurer (1991–1995), and assistant treasurer (1989–1991) of Johnson & Johnson. Director of Skytop Lodge Corporation (hotels) and the Robert Wood Johnson Foundation. Member of the advisory board of the Institute for Women’s Leadership at Rutgers University.
F. Joseph Loughrey
Born in 1949. Trustee since October 2009. Principal occupation(s) during the past five years and other experience: president and chief operating officer (retired 2009) and vice chairman of the board (2008–2009) of Cummins Inc. (industrial machinery). Chairman of the board of Hillenbrand, Inc. (specialized consumer services), Oxfam America, and the Lumina Foundation for Education. Director of the V Foundation for Cancer Research. Member of the advisory council for the College of Arts and Letters and chair of the advisory board to the Kellogg Institute for International Studies, both at the University of Notre Dame.
Mark Loughridge
Born in 1953. Trustee since March 2012. Principal occupation(s) during the past five years and other experience: senior vice president and chief financial officer (retired 2013) of IBM (information technology services). Fiduciary member of IBM’s Retirement Plan Committee (2004–2013), senior vice president and general manager (2002–2004) of IBM Global Financing, vice president and controller (1998–2002) of IBM, and a variety of other prior management roles at IBM. Member of the Council on Chicago Booth.
Scott C. Malpass
Born in 1962. Trustee since March 2012. Principal occupation(s) during the past five years and other experience: chief investment officer (1989–present) and vice president (1996–present) of the University of Notre Dame. Assistant professor of finance at the Mendoza College of Business, University of Notre Dame, and member of the Notre Dame 403(b) Investment Committee. Chairman of the board of TIFF Advisory Services, Inc. Member of the board of Catholic Investment Services, Inc. (investment advisors), the board of advisors for Spruceview Capital Partners, and the board of superintendence of the Institute for the Works of Religion.
Deanna Mulligan
Born in 1963. Trustee since January 2018. Principal occupation(s) during the past five years and other experience: president (2010–present) and chief executive officer (2011–present) of The Guardian Life Insurance Company of America. Chief operating officer (2010–2011) and executive vice president (2008–2010) of Individual Life and Disability of The Guardian Life Insurance Company of America. Member of the board of The Guardian Life Insurance Company of America, the American Council of Life Insurers, the Partnership for New York City (business leadership), and the Committee Encouraging Corporate Philanthropy. Trustee of the Economic Club of New York and the Bruce Museum (arts and science). Member of the Advisory Council for the Stanford Graduate School of Business.
André F. Perold
Born in 1952. Trustee since December 2004. Principal occupation(s) during the past five years and other experience: George Gund Professor of Finance and Banking, Emeritus at the Harvard Business School (retired 2011). Chief investment officer and co-managing partner of HighVista Strategies LLC (private investment firm). Overseer of the Museum of Fine Arts Boston.
Sarah Bloom Raskin
Born in 1961. Trustee since January 2018. Principal occupation(s) during the past five years and other experience: deputy secretary (2014–2017) of the United States Department of the Treasury. Governor (2010–2014) of the Federal Reserve Board. Commissioner (2007–2010) of financial regulation for the State of Maryland. Member of the board of directors (2012–2014) of Neighborhood Reinvestment Corporation. Director of i(x) Investments, LLC.
Peter F. Volanakis
Born in 1955. Trustee since July 2009. Principal occupation(s) during the past five years and other experience: president and chief operating officer (retired 2010) of Corning Incorporated (communications equipment) and director of Corning Incorporated (2000–2010) and Dow Corning (2001–2010). Director (2012) of SPX Corporation (multi-industry manufacturing). Overseer of the Amos Tuck School of Business Administration, Dartmouth College (2001–2013). Chairman of the board of trustees of Colby-Sawyer College. Member of the Board of Hypertherm Inc. (industrial cutting systems, software, and consumables).
Executive Officers
Glenn Booraem
Born in 1967. Principal occupation(s) during the past five years and other experience: principal of Vanguard. Investment stewardship officer (2017–present), treasurer (2015–2017), controller (2010–2015), and assistant controller (2001–2010) of each of the investment companies served by Vanguard.
Christine M. Buchanan
Born in 1970. Principal occupation(s) during the past five years and other experience: principal of Vanguard and global head of Fund Administration at Vanguard. Treasurer (2017–present) of each of the investment companies served by Vanguard. Partner (2005–2017) at KPMG LLP (audit, tax, and advisory services).
Brian Dvorak
Born in 1973. Principal occupation(s) during the past five years and other experience: principal of Vanguard. Chief compliance officer (2017–present) of Vanguard and each of the investment companies served by Vanguard. Assistant vice president (2017–present) of Vanguard Marketing Corporation. Vice president and director of Enterprise Risk Management (2011–2013) at Oppenheimer Funds, Inc.
Thomas J. Higgins
Born in 1957. Principal occupation(s) during the past five years and other experience: principal of Vanguard. Chief financial officer (2008–present) and treasurer (1998–2008) of each of the investment companies served by Vanguard.
Peter Mahoney
Born in 1974. Principal occupation(s) during the past five years and other experience: principal of Vanguard. Controller (2015–present) of each of the investment companies served by Vanguard. Head of International Fund Services (2008–2014) at Vanguard.
Anne E. Robinson
Born in 1970. Principal occupation(s) during the past five years and other experience: general counsel (2016–present) of Vanguard. Secretary (2016–present) of Vanguard and of each of the investment companies served by Vanguard. Managing director (2016–present) of Vanguard. Director and senior vice president (2016–2018) of Vanguard Marketing Corporation. Managing director and general counsel of Global Cards and Consumer Services (2014–2016) at Citigroup. Counsel (2003–2014) at American Express.
Michael Rollings
Born in 1963. Principal occupation(s) during the past five years and other experience: finance director (2017–present) and treasurer (2017) of each of the investment companies served by Vanguard. Managing director (2016–present) of Vanguard. Chief financial officer (2016–present) of Vanguard. Director (2016–present) of Vanguard Marketing Corporation. Executive vice president and chief financial officer (2006–2016) of MassMutual Financial Group.
| Vanguard Senior Management Team | |
| Mortimer J. Buckley | James M. Norris |
| Gregory Davis | Thomas M. Rampulla |
| John James | Karin A. Risi |
| Martha G. King | Anne E. Robinson |
| John T. Marcante | Michael Rollings |
| Chris D. McIsaac | |
| Chairman Emeritus and Senior Advisor | |
| John J. Brennan | |
| Chairman, 1996–2009 | |
| Chief Executive Officer and President, 1996–2008 | |
| Founder | |
| John C. Bogle | |
| Chairman and Chief Executive Officer, 1974–1996 | |
 | |
| P.O. Box 2600 | |
| Valley Forge, PA 19482-2600 | |
| Connect with Vanguard® > vanguard.com | |
| Fund Information > 800-662-7447 | CFA® is a registered trademark owned by CFA |
| Direct Investor Account Services > 800-662-2739 | Institute. |
| Institutional Investor Services > 800-523-1036 | |
| Text Telephone for People | |
| Who Are Deaf or Hard of Hearing > 800-749-7273 | |
| This material may be used in conjunction | |
| with the offering of shares of any Vanguard | |
| fund only if preceded or accompanied by | |
| the fund’s current prospectus. | |
| All comparative mutual fund data are from Lipper, a | |
| Thomson Reuters Company, or Morningstar, Inc., unless | |
| otherwise noted. | |
| You can obtain a free copy of Vanguard’s proxy voting | |
| guidelines by visiting vanguard.com/proxyreporting or by | |
| calling Vanguard at 800-662-2739. The guidelines are | |
| also available from the SEC’s website, sec.gov. In | |
| addition, you may obtain a free report on how your fund | |
| voted the proxies for securities it owned during the 12 | |
| months ended June 30. To get the report, visit either | |
| vanguard.com/proxyreporting or sec.gov. | |
| You can review and copy information about your fund at | |
| the SEC’s Public Reference Room in Washington, D.C. To | |
| find out more about this public service, call the SEC at | |
| 202-551-8090. Information about your fund is also | |
| available on the SEC’s website, and you can receive | |
| copies of this information, for a fee, by sending a | |
| request in either of two ways: via email addressed to | |
| publicinfo@sec.gov or via regular mail addressed to the | |
| Public Reference Section, Securities and Exchange | |
| Commission, Washington, DC 20549-1520. | |
| © 2018 The Vanguard Group, Inc. | |
| All rights reserved. | |
| Vanguard Marketing Corporation, Distributor. | |
| Q322 092018 | |
Item 2: Code of Ethics.
Not Applicable.
Item 3: Audit Committee Financial Expert.
Not Applicable.
Item 4: Principal Accountant Fees and Services.
(a) Audit Fees.
Not Applicable.
Item 5: Audit Committee of Listed Registrants.
Not Applicable.
Item 6: Investments.
| Vanguard® Short-Term Investment-Grade Fund | |||||
| Schedule of Investments | |||||
| July 31, 2018 | |||||
| Face | Market | ||||
| Maturity | Amount | Value | |||
| Coupon | Date | ($000) | ($000) | ||
| U.S. Government and Agency Obligations (10.8%) | |||||
| U.S. Government Securities (10.1%) | |||||
| United States Treasury Note/Bond | 1.250% | 1/31/19 | 90,000 | 89,550 | |
| United States Treasury Note/Bond | 0.875% | 9/15/19 | 50,000 | 49,102 | |
| 1 | United States Treasury Note/Bond | 1.375% | 1/31/21 | 150,000 | 145,054 |
| 2 | United States Treasury Note/Bond | 2.250% | 2/15/21 | 500,000 | 493,905 |
| 2 | United States Treasury Note/Bond | 1.125% | 2/28/21 | 748,000 | 717,960 |
| 2 | United States Treasury Note/Bond | 2.250% | 3/31/21 | 219,000 | 216,127 |
| 3 | United States Treasury Note/Bond | 2.375% | 4/15/21 | 1,300,000 | 1,287,000 |
| United States Treasury Note/Bond | 1.375% | 5/31/21 | 480,000 | 461,851 | |
| United States Treasury Note/Bond | 2.125% | 8/15/21 | 530,000 | 519,898 | |
| 2 | United States Treasury Note/Bond | 2.000% | 8/31/21 | 407,000 | 397,651 |
| United States Treasury Note/Bond | 1.125% | 9/30/21 | 517,000 | 491,150 | |
| United States Treasury Note/Bond | 2.000% | 10/31/21 | 495,000 | 482,932 | |
| United States Treasury Note/Bond | 1.875% | 1/31/22 | 466,000 | 451,657 | |
| United States Treasury Note/Bond | 2.500% | 3/31/23 | 8,440 | 8,315 | |
| 2 | United States Treasury Note/Bond | 2.750% | 5/31/23 | 300,000 | 298,782 |
| 6,110,934 | |||||
| Nonconventional Mortgage-Backed Securities (0.7%) | |||||
| 4,5 | Fannie Mae Grantor Trust 2017-T1 | 2.898% | 6/25/27 | 19,249 | 18,088 |
| 4,5,6 | Fannie Mae Pool | 3.293% | 12/1/32 | 235 | 240 |
| 4,5,7 | Fannie Mae Pool | 3.500% | 9/1/32 | 200 | 210 |
| 4,5,7 | Fannie Mae Pool | 3.535% | 8/1/33 | 1,258 | 1,315 |
| 4,5,7 | Fannie Mae Pool | 3.685% | 2/1/37 | 647 | 682 |
| 4,5,7 | Fannie Mae Pool | 3.851% | 8/1/37 | 458 | 465 |
| 4,5,6 | Fannie Mae Pool | 4.130% | 5/1/33 | 1,405 | 1,481 |
| 4,5,6 | Fannie Mae Pool | 4.159% | 6/1/33 | 1,326 | 1,376 |
| 4,5,6 | Fannie Mae Pool | 4.435% | 7/1/32 | 250 | 265 |
| 4,5,7 | Fannie Mae Pool | 4.463% | 5/1/33 | 307 | 325 |
| 4,5,7 | Fannie Mae Pool | 4.535% | 8/1/33 | 669 | 685 |
| 4,5,7 | Fannie Mae Pool | 4.643% | 7/1/33 | 1,897 | 1,952 |
| 4,5,8 | Fannie Mae REMICS | 3.986% | 3/25/46 | 79,935 | 13,160 |
| 4,5,9 | Fannie Mae REMICS | 4.000% | 2/25/48 | 48,450 | 11,728 |
| 4,5,8 | Fannie Mae REMICS | 4.086% | 5/25/47 | 112,694 | 18,411 |
| 4,5,8 | Fannie Mae REMICS | 4.136% | 10/25/47 | 72,432 | 13,658 |
| 4,5,9 | Fannie Mae REMICS | 4.500% | 9/25/47 | 37,810 | 8,990 |
| 4,5,9 | Fannie Mae REMICS | 5.000% | 6/25/45 | 52,221 | 10,925 |
| 4,5,9 | Fannie Mae REMICS | 5.500% | 2/25/46 | 28,217 | 6,131 |
| 4,5,9 | Fannie Mae REMICS | 6.000% | 12/25/47 | 33,145 | 7,957 |
| 4,5,9 | Fannie Mae REMICS 2012-138 | 4.500% | 12/25/42 | 21,408 | 5,329 |
| 4,5,9 | Fannie Mae REMICS 2013-20 | 4.000% | 3/25/43 | 50,851 | 11,134 |
| 4,5,9 | Fannie Mae REMICS 2013-39D | 4.000% | 6/25/42 | 22,188 | 4,143 |
| 4,5,9 | Fannie Mae REMICS 2013-43 | 4.000% | 5/25/43 | 65,199 | 14,220 |
| 4,5,9 | Fannie Mae REMICS 2015-22 | 6.000% | 4/25/45 | 29,516 | 6,895 |
| 4,5,9 | Fannie Mae REMICS 2015-28 | 4.000% | 5/25/45 | 24,528 | 5,600 |
| 4,5,9 | Fannie Mae REMICS 2016-3 | 4.000% | 2/25/46 | 56,398 | 12,730 |
| 4,5,9 | Fannie Mae REMICS 2016-3 | 6.000% | 2/25/46 | 26,268 | 6,232 |
| 4,5,6 | Freddie Mac Non Gold Pool | 3.375% | 8/1/32 | 558 | 574 |
| 4,5,7 | Freddie Mac Non Gold Pool | 3.500% | 8/1/37 | 1,436 | 1,481 |
| 4,5,6 | Freddie Mac Non Gold Pool | 3.504% | 9/1/32 | 52 | 56 |
| 4,5,6 | Freddie Mac Non Gold Pool | 3.540% | 8/1/32 | 516 | 548 |
| 4,5,7 | Freddie Mac Non Gold Pool | 3.643% | 9/1/32 | 751 | 767 |
| 4,5,7 | Freddie Mac Non Gold Pool | 3.711% | 10/1/32–8/1/33 | 766 | 808 |
| 4,5,7 | Freddie Mac Non Gold Pool | 3.777% | 1/1/33 | 269 | 288 |
| 4,5,7 | Freddie Mac Non Gold Pool | 3.961% | 2/1/33 | 158 | 162 |
| 4,5,9 | Freddie Mac REMICS | 3.500% | 12/15/42 | 85,462 | 16,343 |
| 4,5,9 | Freddie Mac REMICS | 4.000% | 10/15/42–12/15/47 | 81,563 | 16,199 |
| 4,5,8 | Freddie Mac REMICS | 4.078% | 1/15/42–1/15/45 | 55,699 | 8,596 |
| 4,5,8 | Freddie Mac REMICS | 4.128% | 12/15/47 | 28,043 | 5,044 |
| 4,9 | Ginnie Mae REMICS | 3.500% | 7/20/42 | 44,702 | 7,544 |
| 4,8 | Ginnie Mae REMICS | 3.564% | 8/20/45 | 47,593 | 6,772 |
| 4,9 | Ginnie Mae REMICS | 4.000% | 3/20/42–1/20/48 | 199,511 | 44,102 |
| 4,8 | Ginnie Mae REMICS | 4.014% | 9/20/46 | 34,976 | 6,099 |
| 1 | |||||
| Vanguard® Short-Term Investment-Grade Fund | |||||
| Schedule of Investments | |||||
| July 31, 2018 | |||||
| Face | Market | ||||
| Maturity | Amount | Value | |||
| Coupon | Date | ($000) | ($000) | ||
| 4,8 | Ginnie Mae REMICS | 4.114% | 9/20/47–12/20/47 | 259,107 | 43,642 |
| 4,9 | Ginnie Mae REMICS | 4.500% | 3/20/43–1/20/48 | 205,788 | 50,122 |
| 4,9 | Ginnie Mae REMICS | 5.000% | 2/20/40 | 46,090 | 10,368 |
| 403,842 | |||||
| Total U.S. Government and Agency Obligations (Cost $6,535,618) | 6,514,776 | ||||
| Asset-Backed/Commercial Mortgage-Backed Securities (22.3%) | |||||
| 4 | Ally Auto Receivables Trust 2015-1 | 2.260% | 10/15/20 | 4,315 | 4,304 |
| 4 | Ally Auto Receivables Trust 2017-5 | 2.220% | 10/17/22 | 12,620 | 12,373 |
| 4 | Ally Auto Receivables Trust 2018-1 | 2.350% | 6/15/22 | 86,660 | 85,903 |
| 4 | Ally Auto Receivables Trust 2018-1 | 2.530% | 2/15/23 | 23,100 | 22,665 |
| 4 | Ally Master Owner Trust Series 2017-3 | 2.040% | 6/15/22 | 20,510 | 20,123 |
| 4 | Ally Master Owner Trust Series 2018-2 | 3.290% | 5/15/23 | 45,290 | 45,371 |
| 4,10 | American Homes 4 Rent 2014-SFR2 | 3.786% | 10/17/36 | 12,613 | 12,652 |
| 4,10 | American Homes 4 Rent 2014-SFR2 | 4.290% | 10/17/36 | 3,360 | 3,408 |
| 4,10 | American Homes 4 Rent 2014-SFR3 | 3.678% | 12/17/36 | 17,054 | 17,009 |
| 4,10 | American Homes 4 Rent 2015-SFR | 3.467% | 4/17/52 | 15,171 | 14,934 |
| 4,10 | American Homes 4 Rent 2015-SFR2 | 3.732% | 10/17/45 | 6,572 | 6,564 |
| 4,10 | American Homes 4 Rent 2015-SFR2 | 4.295% | 10/17/45 | 2,830 | 2,867 |
| 10 | American Tower Trust #1 | 3.652% | 3/23/48 | 13,190 | 12,901 |
| 4,10 | Americold 2010 LLC Trust Series 2010-ARTA | 4.954% | 1/14/29 | 15,984 | 16,627 |
| 4,10 | Americold 2010 LLC Trust Series 2010-ARTA | 6.811% | 1/14/29 | 11,185 | 11,815 |
| 4 | AmeriCredit Automobile Receivables Trust 2014-1 | 2.150% | 3/9/20 | 424 | 423 |
| 4 | AmeriCredit Automobile Receivables Trust 2014-2 | 2.180% | 6/8/20 | 3,143 | 3,141 |
| 4 | AmeriCredit Automobile Receivables Trust 2015-3 | 2.080% | 9/8/20 | 5,868 | 5,861 |
| 4 | AmeriCredit Automobile Receivables Trust 2015-3 | 3.340% | 8/8/21 | 8,900 | 8,914 |
| 4 | AmeriCredit Automobile Receivables Trust 2016-1 | 1.810% | 10/8/20 | 4,832 | 4,825 |
| 4 | AmeriCredit Automobile Receivables Trust 2016-1 | 3.590% | 2/8/22 | 6,820 | 6,847 |
| 4 | AmeriCredit Automobile Receivables Trust 2016-2 | 3.650% | 5/9/22 | 9,390 | 9,438 |
| 4 | AmeriCredit Automobile Receivables Trust 2016-3 | 2.710% | 9/8/22 | 10,170 | 9,987 |
| 4 | AmeriCredit Automobile Receivables Trust 2016-4 | 2.410% | 7/8/22 | 25,630 | 25,202 |
| 4 | AmeriCredit Automobile Receivables Trust 2017-3 | 1.690% | 12/18/20 | 47,602 | 47,439 |
| 4,10 | AOA 2015-1177 Mortgage Trust | 2.957% | 12/13/29 | 13,390 | 13,189 |
| 4,10 | Applebee's Funding LLC/IHOP Funding LLC | 4.277% | 9/5/44 | 6,059 | 5,979 |
| 4,10 | ARL Second LLC 2014-1A | 2.920% | 6/15/44 | 13,996 | 13,702 |
| 4,10 | Aventura Mall Trust 2013-AVM | 3.743% | 12/5/32 | 15,105 | 15,330 |
| 4,10 | Aventura Mall Trust 2018-AVM | 4.112% | 7/5/40 | 1,630 | 1,669 |
| 4,10 | Avis Budget Rental Car Funding AESOP LLC 2013-1A | 1.920% | 9/20/19 | 5,070 | 5,067 |
| 4,10 | Avis Budget Rental Car Funding AESOP LLC 2013-2A | 2.970% | 2/20/20 | 29,200 | 29,214 |
| 4,10 | Avis Budget Rental Car Funding AESOP LLC 2015-1A | 2.500% | 7/20/21 | 34,860 | 34,358 |
| 4,10 | Avis Budget Rental Car Funding AESOP LLC 2015-2A | 2.630% | 12/20/21 | 43,123 | 42,480 |
| 4,10 | Avis Budget Rental Car Funding AESOP LLC 2016-1A | 2.990% | 6/20/22 | 3,181 | 3,141 |
| 4,10 | Avis Budget Rental Car Funding AESOP LLC 2017-1A | 3.070% | 9/20/23 | 7,640 | 7,497 |
| 4,10 | Avis Budget Rental Car Funding AESOP LLC 2017-2A | 2.970% | 3/20/24 | 12,850 | 12,490 |
| 4,10 | Avis Budget Rental Car Funding AESOP LLC 2018-1A | 3.700% | 9/20/24 | 14,210 | 14,216 |
| 4,10 | Avis Budget Rental Car Funding AESOP LLC 2018-1A | 4.730% | 9/20/24 | 2,540 | 2,527 |
| 4,10 | BAMLL Commercial Mortgage Securities Trust 2012- | ||||
| PARK | 2.959% | 12/10/30 | 4,900 | 4,802 | |
| 4 | Banc of America Commercial Mortgage Trust 2015- | ||||
| UBS7 | 3.429% | 9/15/48 | 8,360 | 8,363 | |
| 4 | Banc of America Commercial Mortgage Trust 2015- | ||||
| UBS7 | 3.705% | 9/15/48 | 6,740 | 6,734 | |
| 4 | Banc of America Commercial Mortgage Trust 2015- | ||||
| UBS7 | 4.362% | 9/15/48 | 1,600 | 1,592 | |
| 4 | Banc of America Commercial Mortgage Trust 2017- | ||||
| BNK3 | 3.574% | 2/15/50 | 4,760 | 4,686 | |
| 4,11 | Banc of America Funding 2006-H Trust | 3.864% | 9/20/46 | 10,514 | 9,974 |
| 4 | BANK 2017 - BNK4 | 3.625% | 5/15/50 | 8,435 | 8,332 |
| 4 | BANK 2017 - BNK5 | 3.390% | 6/15/60 | 8,150 | 7,893 |
| 4 | BANK 2017 - BNK6 | 3.254% | 7/15/60 | 13,450 | 12,896 |
| 4 | BANK 2017 - BNK6 | 3.518% | 7/15/60 | 13,190 | 12,896 |
| 4 | BANK 2017 - BNK6 | 3.741% | 7/15/60 | 3,080 | 3,013 |
| 4 | BANK 2017 - BNK7 | 3.435% | 9/15/60 | 16,580 | 16,097 |
| 2 | |||||
| Vanguard® Short-Term Investment-Grade Fund | |||||
| Schedule of Investments | |||||
| July 31, 2018 | |||||
| Face | Market | ||||
| Maturity | Amount | Value | |||
| Coupon | Date | ($000) | ($000) | ||
| 4 | BANK 2017 - BNK8 | 3.488% | 11/15/50 | 33,600 | 32,766 |
| 4 | BANK 2017 - BNK9 | 3.538% | 11/15/54 | 18,130 | 17,732 |
| 4 | BANK 2018 - BN12 | 4.255% | 5/15/61 | 19,620 | 20,254 |
| §,4 | BANK 2018 - BN13 | 4.217% | 8/15/61 | 18,330 | 18,879 |
| 4 | BANK 2018 - BNK10 | 3.641% | 2/15/61 | 11,860 | 11,847 |
| 4 | BANK 2018 - BNK10 | 3.688% | 2/15/61 | 31,470 | 31,164 |
| 4 | Bank of America Mortgage 2002-J Trust | 4.259% | 9/25/32 | 17 | 17 |
| 4,10,12 | Bank of America Student Loan Trust 2010-1A | 3.135% | 2/25/43 | 9,606 | 9,654 |
| Bank of Nova Scotia | 1.875% | 4/26/21 | 54,077 | 52,175 | |
| 4,11 | Bear Stearns ARM Trust 2006-4 | 3.755% | 10/25/36 | 18,192 | 17,228 |
| 4,11 | Bear Stearns ARM Trust 2007-3 | 3.975% | 5/25/47 | 11,858 | 11,209 |
| 4 | BENCHMARK 2018-B1 Mortgage Trust | 3.602% | 1/15/51 | 3,740 | 3,727 |
| 4 | BENCHMARK 2018-B1 Mortgage Trust | 3.666% | 1/15/51 | 17,710 | 17,525 |
| 4 | BENCHMARK 2018-B1 Mortgage Trust | 3.878% | 1/15/51 | 5,990 | 5,920 |
| 4 | BENCHMARK 2018-B1 Mortgage Trust | 4.059% | 1/15/51 | 2,700 | 2,682 |
| 4 | BENCHMARK 2018-B1 Mortgage Trust | 4.119% | 1/15/51 | 4,200 | 4,105 |
| 4 | BENCHMARK 2018-B3 Mortgage Trust | 4.025% | 4/10/51 | 18,190 | 18,478 |
| §,4 | BENCHMARK 2018-B5 Mortgage Trust | 4.208% | 7/15/51 | 9,310 | 9,589 |
| 4 | BMW Vehicle Lease Trust 2017-2 | 2.070% | 10/20/20 | 22,040 | 21,807 |
| 4 | BMW Vehicle Lease Trust 2017-2 | 2.190% | 3/22/21 | 6,860 | 6,765 |
| 4 | BMW Vehicle Owner Trust 2018-A | 2.510% | 6/25/24 | 15,840 | 15,621 |
| 4,12 | Brazos Higher Education Authority Inc. Series 2005-3 | 2.535% | 6/25/26 | 8,601 | 8,548 |
| 4,12 | Brazos Higher Education Authority Inc. Series 2011-1 | 3.130% | 2/25/30 | 16,505 | 16,607 |
| 4,10 | CAL Funding II Ltd. Series 2012-1A | 3.470% | 10/25/27 | 3,953 | 3,896 |
| 4,10 | CAL Funding II Ltd. Series 2013-1A | 3.350% | 3/27/28 | 7,513 | 7,432 |
| 4,10 | California Republic Auto Receivables Trust 2015-4 | 2.580% | 6/15/21 | 12,171 | 12,162 |
| 4 | California Republic Auto Receivables Trust 2016-2 | 1.560% | 7/15/20 | 2,511 | 2,508 |
| 4 | California Republic Auto Receivables Trust 2016-2 | 1.830% | 12/15/21 | 7,160 | 7,093 |
| 4 | California Republic Auto Receivables Trust 2016-2 | 2.520% | 5/16/22 | 6,520 | 6,409 |
| 4 | California Republic Auto Receivables Trust 2016-2 | 3.510% | 3/15/23 | 3,180 | 3,139 |
| 4,10 | Canadian Pacer Auto Receivables Trust A Series 2017 | 2.050% | 3/19/21 | 8,130 | 8,029 |
| 4,10 | Canadian Pacer Auto Receivables Trust A Series 2017 | 2.286% | 1/19/22 | 5,710 | 5,578 |
| 4,10 | Canadian Pacer Auto Receivables Trust A Series 2018 | 3.220% | 9/19/22 | 7,330 | 7,286 |
| 4 | Capital Auto Receivables Asset Trust 2014-3 | 3.940% | 4/20/23 | 5,440 | 5,450 |
| 4 | Capital Auto Receivables Asset Trust 2015-3 | 1.940% | 1/21/20 | 3,006 | 3,005 |
| 4 | Capital Auto Receivables Asset Trust 2015-3 | 2.430% | 9/21/20 | 6,170 | 6,160 |
| 4 | Capital Auto Receivables Asset Trust 2015-3 | 2.900% | 12/21/20 | 6,880 | 6,880 |
| 4 | Capital Auto Receivables Asset Trust 2016-2 | 3.160% | 11/20/23 | 1,630 | 1,626 |
| 4 | Capital Auto Receivables Asset Trust 2016-3 | 2.350% | 9/20/21 | 6,110 | 6,008 |
| 4 | Capital Auto Receivables Asset Trust 2016-3 | 2.650% | 1/20/24 | 3,360 | 3,329 |
| 4,10 | Capital Auto Receivables Asset Trust 2017-1 | 2.020% | 8/20/21 | 12,160 | 12,053 |
| 4,10 | Capital Auto Receivables Asset Trust 2017-1 | 2.220% | 3/21/22 | 8,480 | 8,325 |
| 4 | Capital One Multi-Asset Execution Trust 2017-A4 | 1.990% | 7/17/23 | 66,620 | 65,223 |
| 4,10,13 | CARDS II Trust 2017-2A | 2.332% | 10/17/22 | 23,075 | 23,079 |
| 4,10 | CARDS II Trust 2018-2A | 3.047% | 4/17/23 | 35,860 | 35,508 |
| 4 | CarMax Auto Owner Trust 2015-2 | 3.040% | 11/15/21 | 5,850 | 5,838 |
| 4 | CarMax Auto Owner Trust 2015-3 | 2.280% | 4/15/21 | 3,875 | 3,842 |
| 4 | CarMax Auto Owner Trust 2015-3 | 2.680% | 6/15/21 | 5,560 | 5,538 |
| 4 | CarMax Auto Owner Trust 2016-2 | 2.160% | 12/15/21 | 4,850 | 4,756 |
| 4 | CarMax Auto Owner Trust 2016-2 | 3.250% | 11/15/22 | 5,800 | 5,750 |
| 4 | CarMax Auto Owner Trust 2016-3 | 2.200% | 6/15/22 | 5,740 | 5,600 |
| 4 | CarMax Auto Owner Trust 2016-3 | 2.940% | 1/17/23 | 4,050 | 3,985 |
| 4 | CarMax Auto Owner Trust 2017-4 | 2.110% | 10/17/22 | 12,120 | 11,935 |
| 4 | CarMax Auto Owner Trust 2017-4 | 2.330% | 5/15/23 | 6,860 | 6,693 |
| 4 | CarMax Auto Owner Trust 2017-4 | 2.460% | 8/15/23 | 3,240 | 3,143 |
| 4 | CarMax Auto Owner Trust 2017-4 | 2.700% | 10/16/23 | 3,240 | 3,149 |
| 4 | CarMax Auto Owner Trust 2018-1 | 2.230% | 5/17/21 | 56,260 | 56,025 |
| 4 | CarMax Auto Owner Trust 2018-1 | 2.480% | 11/15/22 | 76,110 | 75,243 |
| 4 | CarMax Auto Owner Trust 2018-1 | 2.640% | 6/15/23 | 12,020 | 11,843 |
| 4 | CarMax Auto Owner Trust 2018-1 | 2.830% | 9/15/23 | 19,890 | 19,481 |
| 4 | CarMax Auto Owner Trust 2018-1 | 2.950% | 11/15/23 | 6,170 | 6,059 |
| 4 | CarMax Auto Owner Trust 2018-2 | 3.370% | 10/16/23 | 4,755 | 4,737 |
| 4 | CarMax Auto Owner Trust 2018-2 | 3.570% | 12/15/23 | 6,860 | 6,835 |
| 4 | CarMax Auto Owner Trust 2018-2 | 3.990% | 4/15/25 | 5,300 | 5,280 |
| 3 | |||||
| Vanguard® Short-Term Investment-Grade Fund | |||||
| Schedule of Investments | |||||
| July 31, 2018 | |||||
| Face | Market | ||||
| Maturity | Amount | Value | |||
| Coupon | Date | ($000) | ($000) | ||
| 4 | CarMax Auto Owner Trust 2018-3 | 3.130% | 6/15/23 | 26,590 | 26,569 |
| 4 | CarMax Auto Owner Trust 2018-3 | 3.270% | 3/15/24 | 13,310 | 13,304 |
| 4 | CD 2016-CD1 Commercial Mortgage Trust | 2.724% | 8/10/49 | 2,005 | 1,869 |
| 4 | CD 2016-CD1 Commercial Mortgage Trust | 3.631% | 8/10/49 | 6,299 | 5,892 |
| 4 | CD 2017-CD3 Commercial Mortgage Trust | 3.631% | 2/10/50 | 29,440 | 29,161 |
| 4 | CD 2017-CD4 Commercial Mortgage Trust | 3.514% | 5/10/50 | 12,810 | 12,566 |
| 4 | CD 2017-CD5 Commercial Mortgage Trust | 3.431% | 8/15/50 | 17,147 | 16,678 |
| 4 | CD 2017-CD6 Commercial Mortgage Trust | 3.456% | 11/13/50 | 6,715 | 6,540 |
| 4 | CenterPoint Energy Transition Bond Co. IV LLC 2012-1 | 2.161% | 10/15/21 | 14,363 | 14,264 |
| 4,10 | CFCRE Commercial Mortgage Trust 2011-C2 | 5.755% | 12/15/47 | 14,930 | 15,880 |
| 4 | CFCRE Commercial Mortgage Trust 2016-C4 | 3.283% | 5/10/58 | 25,764 | 24,878 |
| 4,10 | Chesapeake Funding II LLC 2016-2A | 1.880% | 6/15/28 | 45,044 | 44,814 |
| 4,10 | Chesapeake Funding II LLC 2018-1 | 3.040% | 4/15/30 | 30,010 | 29,879 |
| 4 | CHL Mortgage Pass-Through Trust 2003-HYB3 | 3.914% | 11/19/33 | 766 | 780 |
| 4,11 | CHL Mortgage Pass-Through Trust 2006-HYB1 | 3.615% | 3/20/36 | 7,722 | 6,941 |
| 4,11 | CHL Mortgage Pass-Through Trust 2007-HYB2 | 3.545% | 2/25/47 | 8,608 | 7,806 |
| 4,10 | Chrysler Capital Auto Receivables Trust 2014-BA | 3.440% | 8/16/21 | 700 | 701 |
| 4,10 | Chrysler Capital Auto Receivables Trust 2015-BA | 2.260% | 10/15/20 | 13,839 | 13,832 |
| 4,10 | Chrysler Capital Auto Receivables Trust 2015-BA | 2.700% | 12/15/20 | 6,525 | 6,522 |
| 4,10 | Chrysler Capital Auto Receivables Trust 2015-BA | 3.260% | 4/15/21 | 10,155 | 10,173 |
| 4,10 | Chrysler Capital Auto Receivables Trust 2015-BA | 4.170% | 1/16/23 | 15,545 | 15,687 |
| 4,10 | Chrysler Capital Auto Receivables Trust 2016-AA | 2.880% | 6/15/22 | 5,040 | 5,035 |
| 4,10 | Chrysler Capital Auto Receivables Trust 2016-AA | 4.220% | 2/15/23 | 26,030 | 26,325 |
| 4,10 | Chrysler Capital Auto Receivables Trust 2016-BA | 1.640% | 7/15/21 | 9,473 | 9,416 |
| 4,10 | Chrysler Capital Auto Receivables Trust 2016-BA | 1.870% | 2/15/22 | 5,960 | 5,857 |
| 4 | Citibank Credit Card Issuance Trust 2018-A1 | 2.490% | 1/20/23 | 107,425 | 105,993 |
| 4,10 | Citigroup Commercial Mortgage Trust 2012-GC8 | 3.683% | 9/10/45 | 2,100 | 2,104 |
| 4 | Citigroup Commercial Mortgage Trust 2013-GC11 | 3.093% | 4/10/46 | 6,350 | 6,232 |
| 4 | Citigroup Commercial Mortgage Trust 2013-GC15 | 3.161% | 9/10/46 | 9,791 | 9,791 |
| 4 | Citigroup Commercial Mortgage Trust 2013-GC15 | 3.942% | 9/10/46 | 7,270 | 7,381 |
| 4 | Citigroup Commercial Mortgage Trust 2013-GC15 | 4.371% | 9/10/46 | 3,786 | 3,922 |
| 4 | Citigroup Commercial Mortgage Trust 2014-GC19 | 4.023% | 3/10/47 | 19,843 | 20,342 |
| 4 | Citigroup Commercial Mortgage Trust 2014-GC21 | 3.575% | 5/10/47 | 6,489 | 6,517 |
| 4 | Citigroup Commercial Mortgage Trust 2014-GC21 | 3.855% | 5/10/47 | 40,226 | 40,785 |
| 4 | Citigroup Commercial Mortgage Trust 2014-GC23 | 3.622% | 7/10/47 | 25,685 | 25,708 |
| 4 | Citigroup Commercial Mortgage Trust 2014-GC23 | 3.863% | 7/10/47 | 12,426 | 12,272 |
| 4 | Citigroup Commercial Mortgage Trust 2014-GC23 | 4.175% | 7/10/47 | 5,394 | 5,441 |
| 4 | Citigroup Commercial Mortgage Trust 2014-GC23 | 4.460% | 7/10/47 | 6,380 | 6,147 |
| 4 | Citigroup Commercial Mortgage Trust 2014-GC25 | 3.372% | 10/10/47 | 18,100 | 17,737 |
| 4 | Citigroup Commercial Mortgage Trust 2014-GC25 | 3.635% | 10/10/47 | 40,950 | 40,927 |
| 4 | Citigroup Commercial Mortgage Trust 2014-GC25 | 4.345% | 10/10/47 | 6,146 | 6,148 |
| 4 | Citigroup Commercial Mortgage Trust 2014-GC25 | 4.529% | 10/10/47 | 1,035 | 999 |
| 4 | Citigroup Commercial Mortgage Trust 2015-GC27 | 3.137% | 2/10/48 | 38,271 | 37,174 |
| 4 | Citigroup Commercial Mortgage Trust 2015-GC31 | 3.762% | 6/10/48 | 48,907 | 49,149 |
| 4 | Citigroup Commercial Mortgage Trust 2015-GC33 | 3.778% | 9/10/58 | 30,456 | 30,619 |
| 4 | Citigroup Commercial Mortgage Trust 2015-GC33 | 4.570% | 9/10/58 | 4,000 | 3,924 |
| 4 | Citigroup Commercial Mortgage Trust 2016-C1 | 3.209% | 5/10/49 | 47,360 | 45,692 |
| 4 | Citigroup Commercial Mortgage Trust 2017-C4 | 3.471% | 10/12/50 | 19,500 | 18,916 |
| 4 | Citigroup Commercial Mortgage Trust 2017-P8 | 3.465% | 9/15/50 | 41,283 | 40,178 |
| 4 | Citigroup Commercial Mortgage Trust 2017-P8 | 4.192% | 9/15/50 | 9,500 | 9,498 |
| 4 | Citigroup Commercial Mortgage Trust 2017-P8 | 4.271% | 9/15/50 | 9,500 | 9,179 |
| 4 | Citigroup Commercial Mortgage Trust 2018-C5 | 4.228% | 6/10/51 | 8,750 | 8,998 |
| 4,11 | Citigroup Mortgage Loan Trust 2007-AR8 | 4.096% | 7/25/37 | 681 | 666 |
| 4,10 | CLI Funding V LLC 2013-1A | 2.830% | 3/18/28 | 12,126 | 11,834 |
| 4,10,13 | Colony American Homes 2015-1 | 3.578% | 7/17/32 | 821 | 821 |
| 4,10,13 | Colony American Homes 2015-1A | 3.278% | 7/17/32 | 10,596 | 10,610 |
| 4,10,13 | Colony Starwood Homes 2016-1A Trust | 3.573% | 7/17/33 | 5,126 | 5,127 |
| 4,10,13 | Colony Starwood Homes 2016-1A Trust | 4.223% | 7/17/33 | 2,323 | 2,323 |
| 4 | COMM 2012-CCRE2 Mortgage Trust | 3.147% | 8/15/45 | 2,925 | 2,896 |
| 4 | COMM 2012-CCRE2 Mortgage Trust | 3.791% | 8/15/45 | 4,100 | 4,086 |
| 4 | COMM 2012-CCRE3 Mortgage Trust | 2.822% | 10/15/45 | 23,196 | 22,676 |
| 4,10 | COMM 2012-CCRE3 Mortgage Trust | 3.416% | 10/15/45 | 12,316 | 12,149 |
| 4 | COMM 2012-CCRE4 Mortgage Trust | 2.853% | 10/15/45 | 10,971 | 10,663 |
| 4 | COMM 2012-CCRE4 Mortgage Trust | 3.251% | 10/15/45 | 1,990 | 1,946 |
| 4 | |||||
| Vanguard® Short-Term Investment-Grade Fund | |||||
| Schedule of Investments | |||||
| July 31, 2018 | |||||
| Face | Market | ||||
| Maturity | Amount | Value | |||
| Coupon | Date | ($000) | ($000) | ||
| 4 | COMM 2012-CCRE5 Mortgage Trust | 2.771% | 12/10/45 | 2,640 | 2,573 |
| 4 | COMM 2013-CCRE10 Mortgage Trust | 2.972% | 8/10/46 | 7,040 | 6,936 |
| 4 | COMM 2013-CCRE10 Mortgage Trust | 3.795% | 8/10/46 | 9,520 | 9,680 |
| 4 | COMM 2013-CCRE11 Mortgage Trust | 3.983% | 8/10/50 | 13,320 | 13,571 |
| 4 | COMM 2013-CCRE11 Mortgage Trust | 4.258% | 8/10/50 | 43,975 | 45,492 |
| 4 | COMM 2013-CCRE12 Mortgage Trust | 3.623% | 10/10/46 | 14,650 | 14,786 |
| 4 | COMM 2013-CCRE12 Mortgage Trust | 3.765% | 10/10/46 | 7,790 | 7,839 |
| 4 | COMM 2013-CCRE12 Mortgage Trust | 4.046% | 10/10/46 | 41,651 | 42,658 |
| 4 | COMM 2013-CCRE13 Mortgage Trust | 4.194% | 11/10/46 | 26,960 | 27,841 |
| 4 | COMM 2013-CCRE13 Mortgage Trust | 4.738% | 11/10/46 | 4,517 | 4,738 |
| 4 | COMM 2013-CCRE13 Mortgage Trust | 4.738% | 11/10/46 | 8,240 | 8,245 |
| 4,10 | COMM 2013-CCRE6 Mortgage Trust | 3.147% | 3/10/46 | 17,360 | 16,819 |
| 4,10 | COMM 2013-CCRE6 Mortgage Trust | 3.397% | 3/10/46 | 2,380 | 2,326 |
| 4 | COMM 2013-CCRE8 Mortgage Trust | 3.334% | 6/10/46 | 2,910 | 2,902 |
| 4 | COMM 2013-CCRE8 Mortgage Trust | 3.612% | 6/10/46 | 40,399 | 40,670 |
| 4 | COMM 2013-CCRE9 Mortgage Trust | 4.239% | 7/10/45 | 12,669 | 13,135 |
| 4,10 | COMM 2013-CCRE9 Mortgage Trust | 4.263% | 7/10/45 | 11,250 | 11,490 |
| 4,10 | COMM 2013-CCRE9 Mortgage Trust | 4.263% | 7/10/45 | 12,690 | 12,656 |
| 4 | COMM 2013-LC13 Mortgage Trust | 3.009% | 8/10/46 | 4,479 | 4,479 |
| 4,10 | COMM 2013-LC13 Mortgage Trust | 3.774% | 8/10/46 | 10,688 | 10,826 |
| 4 | COMM 2013-LC13 Mortgage Trust | 4.205% | 8/10/46 | 13,605 | 14,037 |
| 4,10 | COMM 2013-LC13 Mortgage Trust | 4.557% | 8/10/46 | 18,565 | 19,120 |
| 4 | COMM 2013-LC6 Mortgage Trust | 2.941% | 1/10/46 | 4,100 | 4,019 |
| 4,10 | COMM 2013-SFS Mortgage Trust | 2.987% | 4/12/35 | 5,490 | 5,342 |
| 4,10 | COMM 2014-277P Mortgage Trust | 3.611% | 8/10/49 | 33,245 | 33,192 |
| 4 | COMM 2014-CCRE14 Mortgage Trust | 3.955% | 2/10/47 | 1,915 | 1,951 |
| 4 | COMM 2014-CCRE14 Mortgage Trust | 4.236% | 2/10/47 | 17,690 | 18,297 |
| 4 | COMM 2014-CCRE15 Mortgage Trust | 2.928% | 2/10/47 | 13,869 | 13,883 |
| 4 | COMM 2014-CCRE15 Mortgage Trust | 4.074% | 2/10/47 | 20,250 | 20,790 |
| 4 | COMM 2014-CCRE15 Mortgage Trust | 4.426% | 2/10/47 | 13,450 | 13,730 |
| 4 | COMM 2014-CCRE17 Mortgage Trust | 3.700% | 5/10/47 | 1,930 | 1,929 |
| 4 | COMM 2014-CCRE17 Mortgage Trust | 3.977% | 5/10/47 | 47,271 | 48,223 |
| 4 | COMM 2014-CCRE17 Mortgage Trust | 4.174% | 5/10/47 | 27,380 | 27,876 |
| 4 | COMM 2014-CCRE17 Mortgage Trust | 4.738% | 5/10/47 | 10,175 | 10,064 |
| 4 | COMM 2014-CCRE18 Mortgage Trust | 3.550% | 7/15/47 | 9,572 | 9,572 |
| 4 | COMM 2014-CCRE18 Mortgage Trust | 3.828% | 7/15/47 | 28,552 | 28,916 |
| 4 | COMM 2014-CCRE20 Mortgage Trust | 3.326% | 11/10/47 | 1,520 | 1,495 |
| 4 | COMM 2014-CCRE20 Mortgage Trust | 3.590% | 11/10/47 | 36,585 | 36,533 |
| 4 | COMM 2014-CCRE21 Mortgage Trust | 3.528% | 12/10/47 | 36,723 | 36,543 |
| 4 | COMM 2014-LC17 Mortgage Trust | 3.917% | 10/10/47 | 11,570 | 11,772 |
| 4 | COMM 2015-CCRE22 Mortgage Trust | 3.309% | 3/10/48 | 36,015 | 35,334 |
| 4 | COMM 2015-CCRE24 Mortgage Trust | 3.696% | 8/10/48 | 11,345 | 11,356 |
| 4 | COMM 2015-CCRE25 Mortgage Trust | 3.759% | 8/10/48 | 38,840 | 39,003 |
| 4 | COMM 2015-CCRE26 Mortgage Trust | 3.630% | 10/10/48 | 22,007 | 21,871 |
| 4 | COMM 2015-CCRE27 Mortgage Trust | 3.612% | 10/10/48 | 11,974 | 11,900 |
| 4 | COMM 2015-CCRE27 Mortgage Trust | 4.472% | 10/10/48 | 8,118 | 8,003 |
| 4 | COMM 2015-LC19 Mortgage Trust | 3.183% | 2/10/48 | 9,930 | 9,691 |
| 10 | Commonwealth Bank of Australia | 2.125% | 7/22/20 | 38,040 | 37,326 |
| 4,10 | Core Industrial Trust 2015-TEXW | 3.077% | 2/10/34 | 42,700 | 42,375 |
| 4 | CSAIL 2015-C2 Commercial Mortgage Trust | 3.504% | 6/15/57 | 42,350 | 41,701 |
| 4 | CSAIL 2015-C3 Commercial Mortgage Trust | 3.718% | 8/15/48 | 16,636 | 16,586 |
| 4 | CSAIL 2015-C3 Commercial Mortgage Trust | 4.357% | 8/15/48 | 10,600 | 10,308 |
| 4 | CSAIL 2015-C4 Commercial Mortgage Trust | 3.808% | 11/15/48 | 40,542 | 40,738 |
| 4 | CSAIL 2016-C5 Commercial Mortgage Trust | 4.536% | 11/15/48 | 7,660 | 7,575 |
| 4 | CSAIL 2016-C7 Commercial Mortgage Trust | 3.502% | 11/15/49 | 39,930 | 38,998 |
| 4 | CSAIL 2017-C8 Commercial Mortgage Trust | 3.392% | 6/15/50 | 15,680 | 15,131 |
| 4,10 | Daimler Trucks Retail Trust 2018-1 | 3.030% | 11/15/24 | 19,110 | 19,099 |
| 4 | DBJPM 16-C1 Mortgage Trust | 3.350% | 5/10/49 | 2,050 | 1,881 |
| 4 | DBJPM 17-C6 Mortgage Trust | 3.328% | 6/10/50 | 21,940 | 21,204 |
| 4,10 | Dell Equipment Finance Trust 2017-2 | 1.970% | 2/24/20 | 14,855 | 14,803 |
| 4,10 | Dell Equipment Finance Trust 2017-2 | 2.190% | 10/24/22 | 10,090 | 9,974 |
| 4,10 | Dell Equipment Finance Trust 2018-1 | 3.180% | 6/22/23 | 11,040 | 11,031 |
| 4,10 | DLL Securitization Trust Series 2017-A | 2.140% | 12/15/21 | 11,710 | 11,535 |
| 4,10 | DLL Securitization Trust Series 2017-A | 2.430% | 11/17/25 | 6,950 | 6,775 |
| 5 | |||||
| Vanguard® Short-Term Investment-Grade Fund | |||||
| Schedule of Investments | |||||
| July 31, 2018 | |||||
| Face | Market | ||||
| Maturity | Amount | Value | |||
| Coupon | Date | ($000) | ($000) | ||
| 4,10 | DLL Securitization Trust Series 2018-1 | 3.270% | 4/17/26 | 10,540 | 10,528 |
| 10 | DNB Boligkreditt AS | 2.500% | 3/28/22 | 22,799 | 22,169 |
| 4,10 | DRB Prime Student Loan Trust 2017-C | 2.810% | 11/25/42 | 27,530 | 26,786 |
| 4,10 | Drive Auto Receivables Trust 2015-AA | 3.060% | 5/17/21 | 1,637 | 1,639 |
| 4,10 | Drive Auto Receivables Trust 2015-AA | 4.120% | 7/15/22 | 5,860 | 5,910 |
| 4,10 | Drive Auto Receivables Trust 2015-BA | 2.760% | 7/15/21 | 616 | 616 |
| 4,10 | Drive Auto Receivables Trust 2015-BA | 3.840% | 7/15/21 | 10,490 | 10,548 |
| 4,10 | Drive Auto Receivables Trust 2015-CA | 3.010% | 5/17/21 | 1,545 | 1,546 |
| 4,10 | Drive Auto Receivables Trust 2015-CA | 4.200% | 9/15/21 | 15,845 | 15,970 |
| 4,10 | Drive Auto Receivables Trust 2015-DA | 3.380% | 11/15/21 | 8,844 | 8,861 |
| 4,10 | Drive Auto Receivables Trust 2015-DA | 4.590% | 1/17/23 | 25,000 | 25,355 |
| 4,10 | Drive Auto Receivables Trust 2016-AA | 3.910% | 5/17/21 | 4,315 | 4,332 |
| 4,10 | Drive Auto Receivables Trust 2016-BA | 4.530% | 8/15/23 | 22,190 | 22,542 |
| 4,10 | Drive Auto Receivables Trust 2016-C | 2.370% | 11/16/20 | 5,864 | 5,862 |
| 4,10 | Drive Auto Receivables Trust 2016-C | 4.180% | 3/15/24 | 23,090 | 23,346 |
| 4 | Drive Auto Receivables Trust 2017-1 | 3.840% | 3/15/23 | 2,400 | 2,415 |
| 4 | Drive Auto Receivables Trust 2017-3 | 2.300% | 5/17/21 | 20,350 | 20,308 |
| 4 | Drive Auto Receivables Trust 2017-3 | 2.800% | 7/15/22 | 25,870 | 25,769 |
| 4 | Drive Auto Receivables Trust 2018-2 | 3.220% | 4/15/22 | 19,000 | 18,985 |
| 4 | Drive Auto Receivables Trust 2018-2 | 3.630% | 8/15/24 | 29,120 | 29,103 |
| 4 | Drive Auto Receivables Trust 2018-2 | 4.140% | 8/15/24 | 20,430 | 20,503 |
| 4 | Drive Auto Receivables Trust 2018-3 | 3.370% | 9/15/22 | 30,890 | 30,883 |
| 4 | Drive Auto Receivables Trust 2018-3 | 3.720% | 9/16/24 | 30,350 | 30,334 |
| 4 | Drive Auto Receivables Trust 2018-3 | 4.300% | 9/16/24 | 16,140 | 16,171 |
| 4,10,13 | Edsouth Indenture No 9 LLC 2015-1 | 2.864% | 10/25/56 | 18,563 | 18,642 |
| 4,10 | ELFI Graduate Loan Program 2018-A LLC | 3.430% | 8/25/42 | 32,490 | 32,328 |
| 4,10 | Enterprise Fleet Financing LLC Series 2015-1 | 1.740% | 9/20/20 | 5,299 | 5,297 |
| 4,10 | Enterprise Fleet Financing LLC Series 2015-2 | 2.090% | 2/22/21 | 21,507 | 21,453 |
| 4,10 | Enterprise Fleet Financing LLC Series 2016-2 | 2.040% | 2/22/22 | 9,650 | 9,518 |
| 4,10 | Enterprise Fleet Financing LLC Series 2017-3 | 2.360% | 5/20/23 | 11,710 | 11,475 |
| 4,10 | Enterprise Fleet Financing LLC Series 2018-1 | 3.100% | 10/20/23 | 15,190 | 15,114 |
| 4,10,13 | Evergreen Credit Card Trust Series 2017-1 | 2.332% | 10/15/21 | 14,545 | 14,547 |
| 4,5,13 | Fannie Mae Connecticut Avenue Securities 2016-C04 | 3.514% | 1/25/29 | 3,657 | 3,683 |
| 4,5,13 | Fannie Mae Connecticut Avenue Securities 2016-C05 | 3.414% | 1/25/29 | 1,324 | 1,329 |
| 4,11 | First Horizon Mortgage Pass-Through Trust 2006-AR3 | 3.072% | 11/25/36 | 5,715 | 5,355 |
| 11 | First Horizon Mortgage Pass-Through Trust 2006-AR4 | 3.679% | 1/25/37 | 10,643 | 9,193 |
| 4,13 | First National Master Note Trust 2017-2 | 2.512% | 10/16/23 | 17,910 | 17,927 |
| 4,10 | Flagship Credit Auto Trust 2016-4 | 1.960% | 2/16/21 | 15,234 | 15,203 |
| 4 | Ford Credit Auto Lease Trust 2017-B | 2.030% | 12/15/20 | 29,900 | 29,610 |
| 4 | Ford Credit Auto Lease Trust 2017-B | 2.170% | 2/15/21 | 15,130 | 14,938 |
| 4 | Ford Credit Auto Lease Trust 2018-A | 3.050% | 8/15/21 | 6,530 | 6,512 |
| 4 | Ford Credit Auto Lease Trust 2018-A | 3.170% | 9/15/21 | 11,780 | 11,745 |
| 4,10 | Ford Credit Auto Owner Trust 2014-REV1 | 2.260% | 11/15/25 | 20,498 | 20,416 |
| 4,10 | Ford Credit Auto Owner Trust 2014-REV1 | 2.410% | 11/15/25 | 9,831 | 9,793 |
| 4,10 | Ford Credit Auto Owner Trust 2014-REV2 | 2.310% | 4/15/26 | 29,520 | 29,294 |
| 4,10 | Ford Credit Auto Owner Trust 2014-REV2 | 2.510% | 4/15/26 | 7,475 | 7,428 |
| 4 | Ford Credit Auto Owner Trust 2015-C | 2.010% | 3/15/21 | 12,035 | 11,937 |
| 4 | Ford Credit Auto Owner Trust 2015-C | 2.260% | 3/15/22 | 5,380 | 5,353 |
| 4,10 | Ford Credit Auto Owner Trust 2015-REV2 | 2.440% | 1/15/27 | 61,000 | 60,145 |
| 4 | Ford Credit Auto Owner Trust 2016-B | 1.850% | 9/15/21 | 7,040 | 6,914 |
| 4,10 | Ford Credit Auto Owner Trust 2016-REV1 | 2.310% | 8/15/27 | 20,800 | 20,327 |
| 4,10 | Ford Credit Auto Owner Trust 2016-REV2 | 2.030% | 12/15/27 | 74,340 | 71,725 |
| 4,10 | Ford Credit Auto Owner Trust 2017-1 | 2.620% | 8/15/28 | 21,295 | 20,766 |
| 4,10 | Ford Credit Auto Owner Trust 2017-2 | 2.360% | 3/15/29 | 38,380 | 36,781 |
| 4,10 | Ford Credit Auto Owner Trust 2017-2 | 2.600% | 3/15/29 | 6,826 | 6,536 |
| 4,10 | Ford Credit Auto Owner Trust 2017-2 | 2.750% | 3/15/29 | 13,976 | 13,412 |
| 4,10 | Ford Credit Auto Owner Trust 2018-2 | 3.470% | 1/15/30 | 27,020 | 27,051 |
| 4,10 | Ford Credit Auto Owner Trust 2018-2 | 3.610% | 1/15/30 | 16,295 | 16,250 |
| 4,10 | Ford Credit Auto Owner Trust 2018-2 | 3.760% | 1/15/30 | 7,305 | 7,286 |
| 4 | Ford Credit Auto Owner Trust 2018-A | 3.030% | 11/15/22 | 37,580 | 37,592 |
| 4,10 | Ford Credit Auto Owner Trust 2018-REV1 | 3.190% | 7/15/31 | 101,570 | 98,918 |
| 4,10 | Ford Credit Auto Owner Trust 2018-REV1 | 3.340% | 7/15/31 | 32,080 | 31,447 |
| 4 | Ford Credit Floorplan Master Owner Trust A Series | ||||
| 2014-2 | 2.310% | 2/15/21 | 4,473 | 4,464 | |
| 6 | |||||
| Vanguard® Short-Term Investment-Grade Fund | |||||
| Schedule of Investments | |||||
| July 31, 2018 | |||||
| Face | Market | ||||
| Maturity | Amount | Value | |||
| Coupon | Date | ($000) | ($000) | ||
| 4 | Ford Credit Floorplan Master Owner Trust A Series | ||||
| 2015-5 | 2.390% | 8/15/22 | 23,545 | 23,231 | |
| 4 | Ford Credit Floorplan Master Owner Trust A Series | ||||
| 2017-2 | 2.160% | 9/15/22 | 60,820 | 59,658 | |
| 4 | Ford Credit Floorplan Master Owner Trust A Series | ||||
| 2018-1 | 2.950% | 5/15/23 | 83,210 | 82,759 | |
| 4,5,13 | Freddie Mac Structured Agency Credit Risk Debt Notes | ||||
| 2016-DNA2 | 4.264% | 10/25/28 | 1,646 | 1,664 | |
| 4,5,13 | Freddie Mac Structured Agency Credit Risk Debt Notes | ||||
| 2016-DNA3 | 4.064% | 12/25/28 | 5,957 | 6,038 | |
| 4,5,10 | Freddie Mac Structured Agency Credit Risk Debt Notes | ||||
| 2018-SPI1 | 3.745% | 2/25/48 | 8,884 | 8,853 | |
| 4,5,10 | Freddie Mac Structured Agency Credit Risk Debt Notes | ||||
| 2018-SPI2 | 3.820% | 5/25/48 | 9,421 | 9,402 | |
| 4,10 | FRS I LLC 2013-1A | 1.800% | 4/15/43 | 911 | 905 |
| 4,10 | FRS I LLC 2013-1A | 3.080% | 4/15/43 | 27,872 | 27,782 |
| 4 | GM Financial Automobile Leasing Trust 2015-3 | 2.320% | 11/20/19 | 3,446 | 3,445 |
| 4 | GM Financial Automobile Leasing Trust 2015-3 | 2.980% | 11/20/19 | 7,820 | 7,824 |
| 4 | GM Financial Automobile Leasing Trust 2015-3 | 3.480% | 8/20/20 | 7,820 | 7,826 |
| 4 | GM Financial Automobile Leasing Trust 2016-2 | 2.580% | 3/20/20 | 6,500 | 6,479 |
| 4 | GM Financial Automobile Leasing Trust 2017-3 | 2.010% | 11/20/20 | 21,480 | 21,246 |
| 4 | GM Financial Automobile Leasing Trust 2017-3 | 2.120% | 9/20/21 | 4,660 | 4,594 |
| 4 | GM Financial Automobile Leasing Trust 2017-3 | 2.400% | 9/20/21 | 8,440 | 8,302 |
| 4 | GM Financial Automobile Leasing Trust 2017-3 | 2.730% | 9/20/21 | 5,140 | 5,072 |
| 4 | GM Financial Automobile Leasing Trust 2018-2 | 3.060% | 6/21/21 | 25,400 | 25,382 |
| 4,10 | GM Financial Consumer Automobile 2017-3 | 2.130% | 3/16/23 | 8,590 | 8,354 |
| 4,10 | GM Financial Consumer Automobile 2017-3 | 2.330% | 3/16/23 | 2,650 | 2,581 |
| 4 | GM Financial Consumer Automobile 2018-3 | 3.160% | 1/16/24 | 7,250 | 7,235 |
| 4,11 | GMACM Mortgage Loan Trust 2005-AR6 | 3.779% | 11/19/35 | 2,020 | 1,945 |
| 4,10 | GMF Floorplan Owner Revolving Trust 2016-1 | 2.410% | 5/17/21 | 12,009 | 11,952 |
| 4,10 | GMF Floorplan Owner Revolving Trust 2016-1 | 2.850% | 5/17/21 | 8,830 | 8,714 |
| 4,10,13 | GMF Floorplan Owner Revolving Trust 2016-1 | 2.923% | 5/17/21 | 21,346 | 21,447 |
| 4,10,13 | GMF Floorplan Owner Revolving Trust 2017-1 | 2.643% | 1/18/22 | 330 | 331 |
| 4,10 | GMF Floorplan Owner Revolving Trust 2017-2 | 2.130% | 7/15/22 | 54,900 | 53,626 |
| 4,10 | GMF Floorplan Owner Revolving Trust 2017-2 | 2.440% | 7/15/22 | 17,100 | 16,816 |
| 4,10 | GMF Floorplan Owner Revolving Trust 2017-2 | 2.630% | 7/15/22 | 9,380 | 9,220 |
| 4,10 | GMF Floorplan Owner Revolving Trust 2018-2 | 3.130% | 3/15/23 | 53,560 | 53,397 |
| 4,10 | Golden Credit Card Trust 2015-2A | 2.020% | 4/15/22 | 53,490 | 52,513 |
| 4,10 | Golden Credit Card Trust 2016-5A | 1.600% | 9/15/21 | 76,602 | 75,374 |
| 4,10 | Golden Credit Card Trust 2018-1A | 2.620% | 1/15/23 | 153,710 | 151,661 |
| 4,10 | GRACE 2014-GRCE Mortgage Trust | 3.369% | 6/10/28 | 20,500 | 20,548 |
| 4,10 | GreatAmerica Leasing Receivables Funding LLC Series | ||||
| 2015-1 | 2.020% | 6/21/21 | 2,169 | 2,163 | |
| 4,10 | GreatAmerica Leasing Receivables Funding LLC Series | ||||
| 2018-1 | 2.600% | 6/15/21 | 7,910 | 7,840 | |
| 4,10 | GreatAmerica Leasing Receivables Funding LLC Series | ||||
| 2018-1 | 2.830% | 6/17/24 | 5,140 | 5,078 | |
| 4,10 | GS Mortgage Securities Corporation II 2012-BWTR | 2.954% | 11/5/34 | 36,047 | 34,895 |
| 4 | GS Mortgage Securities Corporation II 2015-GC30 | 3.382% | 5/10/50 | 12,225 | 12,025 |
| 4,10 | GS Mortgage Securities Corporation Trust 2012- | ||||
| ALOHA | 3.551% | 4/10/34 | 32,716 | 32,852 | |
| 4,10 | GS Mortgage Securities Trust 2010-C2 | 5.182% | 12/10/43 | 3,530 | 3,636 |
| 4,10 | GS Mortgage Securities Trust 2011-GC3 | 5.638% | 3/10/44 | 2,280 | 2,366 |
| 4,10 | GS Mortgage Securities Trust 2012-GC6 | 4.948% | 1/10/45 | 1,000 | 1,037 |
| 4 | GS Mortgage Securities Trust 2012-GCJ7 | 5.668% | 5/10/45 | 7,150 | 7,362 |
| 4 | GS Mortgage Securities Trust 2013-GC13 | 4.048% | 7/10/46 | 22,934 | 23,624 |
| 4,10 | GS Mortgage Securities Trust 2013-GC13 | 4.081% | 7/10/46 | 5,650 | 5,497 |
| 4 | GS Mortgage Securities Trust 2013-GCJ12 | 3.135% | 6/10/46 | 13,060 | 12,861 |
| 4 | GS Mortgage Securities Trust 2013-GCJ12 | 3.777% | 6/10/46 | 8,250 | 8,152 |
| 4 | GS Mortgage Securities Trust 2013-GCJ14 | 2.995% | 8/10/46 | 927 | 926 |
| 4 | GS Mortgage Securities Trust 2013-GCJ14 | 3.817% | 8/10/46 | 8,192 | 8,294 |
| 4 | GS Mortgage Securities Trust 2013-GCJ14 | 3.955% | 8/10/46 | 22,020 | 22,451 |
| 4 | GS Mortgage Securities Trust 2013-GCJ14 | 4.243% | 8/10/46 | 49,405 | 50,921 |
| 4 | GS Mortgage Securities Trust 2014-GC20 | 3.998% | 4/10/47 | 41,343 | 42,219 |
| 7 | |||||
| Vanguard® Short-Term Investment-Grade Fund | |||||
| Schedule of Investments | |||||
| July 31, 2018 | |||||
| Face | Market | ||||
| Maturity | Amount | Value | |||
| Coupon | Date | ($000) | ($000) | ||
| 4 | GS Mortgage Securities Trust 2014-GC20 | 4.258% | 4/10/47 | 1,410 | 1,412 |
| 4 | GS Mortgage Securities Trust 2014-GC24 | 3.931% | 9/10/47 | 44,760 | 45,473 |
| 4 | GS Mortgage Securities Trust 2014-GC24 | 4.162% | 9/10/47 | 13,246 | 13,296 |
| 4 | GS Mortgage Securities Trust 2014-GC24 | 4.508% | 9/10/47 | 10,665 | 10,816 |
| 4 | GS Mortgage Securities Trust 2014-GC24 | 4.529% | 9/10/47 | 17,556 | 17,301 |
| 4 | GS Mortgage Securities Trust 2014-GC26 | 3.364% | 11/10/47 | 19,370 | 19,035 |
| 4 | GS Mortgage Securities Trust 2014-GC26 | 3.629% | 11/10/47 | 47,290 | 47,219 |
| 4 | GS Mortgage Securities Trust 2015-GC28 | 3.136% | 2/10/48 | 39,290 | 38,093 |
| 4 | GS Mortgage Securities Trust 2015-GC28 | 3.396% | 2/10/48 | 40,515 | 39,911 |
| 4 | GS Mortgage Securities Trust 2015-GC32 | 3.764% | 7/10/48 | 4,636 | 4,668 |
| 4 | GS Mortgage Securities Trust 2015-GC34 | 3.506% | 10/10/48 | 26,732 | 26,374 |
| 4 | GS Mortgage Securities Trust 2015-GC34 | 4.653% | 10/10/48 | 12,080 | 12,081 |
| 4 | GS Mortgage Securities Trust 2016-GS3 | 2.850% | 10/10/49 | 9,660 | 9,063 |
| 4 | GS Mortgage Securities Trust 2018-GS10 | 4.155% | 7/10/51 | 36,220 | 37,094 |
| 4 | GS Mortgage Securities Trust 2018-GS9 | 3.992% | 3/10/51 | 4,990 | 5,048 |
| 10 | GTP Acquisition Partners I LLC | 3.482% | 6/16/25 | 26,340 | 25,604 |
| 4,10 | Hardee's Funding LLC | 5.710% | 6/20/48 | 27,900 | 28,149 |
| 4,10 | Harley Marine Financing LLC Barge 2018-1 | 5.682% | 5/15/43 | 18,676 | 18,648 |
| 4,10 | Hertz Fleet Lease Funding LP 2018-1 | 3.230% | 5/10/32 | 37,080 | 37,051 |
| 4,10 | Hertz Vehicle Financing II LP 2015-3A | 2.670% | 9/25/21 | 6,785 | 6,665 |
| 4,10 | Hertz Vehicle Financing II LP 2016-2A | 2.950% | 3/25/22 | 14,756 | 14,515 |
| 4,10 | Hertz Vehicle Financing II LP 2016-3A | 2.270% | 7/25/20 | 5,330 | 5,284 |
| 4,10 | Hertz Vehicle Financing II LP 2018-1A | 3.290% | 2/25/24 | 17,360 | 16,838 |
| 4,10 | Hertz Vehicle Financing II LP 2018-1A | 3.600% | 2/25/24 | 24,170 | 23,541 |
| 4,10 | Hertz Vehicle Financing II LP 2018-1A | 4.390% | 2/25/24 | 3,670 | 3,594 |
| 4,10 | Hertz Vehicle Financing LLC 2013-1A | 1.830% | 8/25/19 | 10,135 | 10,130 |
| 4,10 | Hertz Vehicle Financing LLC 2017-2A | 3.290% | 10/25/23 | 5,306 | 5,178 |
| 4,10 | Hertz Vehicle Financing LLC 2017-2A | 4.200% | 10/25/23 | 18,190 | 18,290 |
| 4,10 | Hilton USA Trust 2016-HHV | 3.719% | 11/5/38 | 3,950 | 3,904 |
| 4,10,12 | Holmes Master Issuer plc 2018-1 | 2.699% | 10/15/54 | 33,040 | 33,009 |
| 4 | Honda Auto Receivables 2017-4 Owner Trust | 2.050% | 11/22/21 | 43,040 | 42,442 |
| 4 | Honda Auto Receivables 2017-4 Owner Trust | 2.210% | 3/21/24 | 6,410 | 6,289 |
| 4 | Honda Auto Receivables 2018-2 Owner Trust | 3.010% | 5/18/22 | 14,140 | 14,135 |
| 4,10 | Houston Galleria Mall Trust 2015-HGLR | 3.087% | 3/5/37 | 40,670 | 38,898 |
| 4,10 | Hudsons Bay Simon JV Trust 2015-HB7 | 3.914% | 8/5/34 | 14,750 | 14,530 |
| 4,10 | Hyundai Auto Lease Securitization Trust 2017-C | 2.120% | 2/16/21 | 36,130 | 35,764 |
| 4,10 | Hyundai Auto Lease Securitization Trust 2017-C | 2.210% | 9/15/21 | 7,090 | 6,997 |
| 4,10 | Hyundai Auto Lease Securitization Trust 2017-C | 2.460% | 7/15/22 | 6,480 | 6,388 |
| 4,10 | Hyundai Auto Lease Securitization Trust 2018-A | 2.810% | 4/15/21 | 47,455 | 47,290 |
| 4,10 | Hyundai Auto Lease Securitization Trust 2018-A | 2.890% | 3/15/22 | 15,010 | 14,915 |
| 4,10 | Hyundai Auto Lease Securitization Trust 2018-B | 3.200% | 6/15/22 | 3,870 | 3,864 |
| 4 | Hyundai Auto Receivables Trust 2014-B | 2.100% | 11/15/19 | 9,180 | 9,178 |
| 4 | Hyundai Auto Receivables Trust 2015-C | 2.150% | 11/15/21 | 3,510 | 3,472 |
| 4 | Hyundai Auto Receivables Trust 2015-C | 2.550% | 11/15/21 | 8,360 | 8,300 |
| 4,12 | Illinois Student Assistance Commission Series 2010-1 | 3.385% | 4/25/22 | 976 | 977 |
| 4,10,13 | Invitation Homes 2017-SFR2 Trust | 2.923% | 12/17/36 | 29,142 | 29,162 |
| 4,10,13 | Invitation Homes 2017-SFR2 Trust | 3.223% | 12/17/36 | 9,957 | 9,990 |
| 4,10,13 | Invitation Homes 2018-SFR1 Trust | 2.773% | 3/17/37 | 40,997 | 41,056 |
| 4,10,13 | Invitation Homes 2018-SFR1 Trust | 3.023% | 3/17/37 | 9,890 | 9,811 |
| 4,10 | Irvine Core Office Trust 2013-IRV | 3.279% | 5/15/48 | 14,791 | 14,557 |
| 4 | John Deere Owner Trust 2018-B | 3.230% | 6/16/25 | 10,350 | 10,335 |
| 4,10 | JP Morgan Chase Commercial Mortgage Securities | ||||
| Trust 2009-IWST | 5.633% | 12/5/27 | 6,185 | 6,405 | |
| 4,10 | JP Morgan Chase Commercial Mortgage Securities | ||||
| Trust 2010-C1 | 4.608% | 6/15/43 | 1,288 | 1,319 | |
| 4,10 | JP Morgan Chase Commercial Mortgage Securities | ||||
| Trust 2010-C2 | 4.070% | 11/15/43 | 3,201 | 3,247 | |
| 4,10 | JP Morgan Chase Commercial Mortgage Securities | ||||
| Trust 2010-C2 | 5.640% | 11/15/43 | 7,100 | 7,143 | |
| 4,10 | JP Morgan Chase Commercial Mortgage Securities | ||||
| Trust 2010-C2 | 5.640% | 11/15/43 | 6,225 | 6,375 | |
| 4,10 | JP Morgan Chase Commercial Mortgage Securities | ||||
| Trust 2011-C3 | 4.717% | 2/15/46 | 27,159 | 27,988 | |
| 8 | |||||
| Vanguard® Short-Term Investment-Grade Fund | |||||
| Schedule of Investments | |||||
| July 31, 2018 | |||||
| Face | Market | ||||
| Maturity | Amount | Value | |||
| Coupon | Date | ($000) | ($000) | ||
| 4,10 | JP Morgan Chase Commercial Mortgage Securities | ||||
| Trust 2011-C5 | 5.405% | 8/15/46 | 4,100 | 4,292 | |
| 4,10 | JP Morgan Chase Commercial Mortgage Securities | ||||
| Trust 2011-RR1 | 4.717% | 3/16/46 | 2,778 | 2,842 | |
| 4 | JP Morgan Chase Commercial Mortgage Securities | ||||
| Trust 2012-C6 | 3.507% | 5/15/45 | 15,645 | 15,679 | |
| 4 | JP Morgan Chase Commercial Mortgage Securities | ||||
| Trust 2012-C8 | 2.829% | 10/15/45 | 12,562 | 12,278 | |
| 4,10 | JP Morgan Chase Commercial Mortgage Securities | ||||
| Trust 2012-C8 | 3.424% | 10/15/45 | 4,030 | 3,975 | |
| 4 | JP Morgan Chase Commercial Mortgage Securities | ||||
| Trust 2012-CIBX | 4.271% | 6/15/45 | 27,000 | 27,476 | |
| 4,10 | JP Morgan Chase Commercial Mortgage Securities | ||||
| Trust 2012-HSBC | 3.093% | 7/5/32 | 5,715 | 5,657 | |
| 4 | JP Morgan Chase Commercial Mortgage Securities | ||||
| Trust 2012-LC9 | 2.840% | 12/15/47 | 40,130 | 39,162 | |
| 4 | JP Morgan Chase Commercial Mortgage Securities | ||||
| Trust 2013-C13 | 3.994% | 1/15/46 | 15,150 | 15,474 | |
| 4 | JP Morgan Chase Commercial Mortgage Securities | ||||
| Trust 2013-C13 | 4.004% | 1/15/46 | 9,350 | 9,206 | |
| 4 | JP Morgan Chase Commercial Mortgage Securities | ||||
| Trust 2013-C16 | 3.674% | 12/15/46 | 9,630 | 9,733 | |
| 4 | JP Morgan Chase Commercial Mortgage Securities | ||||
| Trust 2013-C16 | 3.881% | 12/15/46 | 2,330 | 2,373 | |
| 4 | JP Morgan Chase Commercial Mortgage Securities | ||||
| Trust 2013-C16 | 4.166% | 12/15/46 | 14,880 | 15,290 | |
| 4 | JP Morgan Chase Commercial Mortgage Securities | ||||
| Trust 2013-C16 | 4.517% | 12/15/46 | 14,600 | 15,053 | |
| 4 | JP Morgan Chase Commercial Mortgage Securities | ||||
| Trust 2013-C16 | 4.945% | 12/15/46 | 21,150 | 22,063 | |
| 4 | JP Morgan Chase Commercial Mortgage Securities | ||||
| Trust 2013-C16 | 5.010% | 12/15/46 | 9,770 | 10,014 | |
| 4 | JP Morgan Chase Commercial Mortgage Securities | ||||
| Trust 2013-LC11 | 2.960% | 4/15/46 | 28,354 | 27,728 | |
| 4 | JP Morgan Chase Commercial Mortgage Securities | ||||
| Trust 2014-C20 | 3.461% | 7/15/47 | 31,250 | 31,393 | |
| 4 | JP Morgan Chase Commercial Mortgage Securities | ||||
| Trust 2016-JP3 | 2.870% | 8/15/49 | 1,330 | 1,249 | |
| 4 | JP Morgan Chase Commercial Mortgage Securities | ||||
| Trust 2016-JP4 | 3.648% | 12/15/49 | 14,370 | 14,156 | |
| 4 | JP Morgan Chase Commercial Mortgage Securities | ||||
| Trust 2017-JP6 | 3.490% | 7/15/50 | 12,517 | 12,238 | |
| 4 | JPMBB Commercial Mortgage Securities Trust 2013- | ||||
| C12 | 3.664% | 7/15/45 | 17,866 | 18,009 | |
| 4 | JPMBB Commercial Mortgage Securities Trust 2013- | ||||
| C12 | 4.033% | 7/15/45 | 7,520 | 7,612 | |
| 4 | JPMBB Commercial Mortgage Securities Trust 2013- | ||||
| C14 | 3.761% | 8/15/46 | 17,400 | 17,623 | |
| 4 | JPMBB Commercial Mortgage Securities Trust 2013- | ||||
| C14 | 4.133% | 8/15/46 | 13,870 | 14,250 | |
| 4 | JPMBB Commercial Mortgage Securities Trust 2013- | ||||
| C15 | 2.977% | 11/15/45 | 3,583 | 3,582 | |
| 4 | JPMBB Commercial Mortgage Securities Trust 2013- | ||||
| C15 | 3.659% | 11/15/45 | 4,050 | 4,092 | |
| 4 | JPMBB Commercial Mortgage Securities Trust 2013- | ||||
| C15 | 4.131% | 11/15/45 | 27,200 | 27,932 | |
| 4 | JPMBB Commercial Mortgage Securities Trust 2013- | ||||
| C15 | 4.927% | 11/15/45 | 17,820 | 18,489 | |
| 4 | JPMBB Commercial Mortgage Securities Trust 2013- | ||||
| C15 | 5.085% | 11/15/45 | 13,495 | 13,932 | |
| 4 | JPMBB Commercial Mortgage Securities Trust 2013- | ||||
| C17 | 4.199% | 1/15/47 | 22,860 | 23,514 | |
| 4 | JPMBB Commercial Mortgage Securities Trust 2014- | ||||
| C18 | 4.079% | 2/15/47 | 36,630 | 37,601 | |
| 9 | |||||
| Vanguard® Short-Term Investment-Grade Fund | |||||
| Schedule of Investments | |||||
| July 31, 2018 | |||||
| Face | Market | ||||
| Maturity | Amount | Value | |||
| Coupon | Date | ($000) | ($000) | ||
| 4 | JPMBB Commercial Mortgage Securities Trust 2014- | ||||
| C18 | 4.439% | 2/15/47 | 12,950 | 13,294 | |
| 4 | JPMBB Commercial Mortgage Securities Trust 2014- | ||||
| C18 | 4.814% | 2/15/47 | 13,200 | 13,645 | |
| 4 | JPMBB Commercial Mortgage Securities Trust 2014- | ||||
| C18 | 4.814% | 2/15/47 | 5,850 | 5,879 | |
| 4 | JPMBB Commercial Mortgage Securities Trust 2014- | ||||
| C24 | 3.639% | 11/15/47 | 10,310 | 10,346 | |
| 4 | JPMBB Commercial Mortgage Securities Trust 2014- | ||||
| C26 | 3.231% | 1/15/48 | 29,560 | 29,001 | |
| 4 | JPMBB Commercial Mortgage Securities Trust 2014- | ||||
| C26 | 3.494% | 1/15/48 | 48,480 | 48,204 | |
| 4 | JPMBB Commercial Mortgage Securities Trust 2015- | ||||
| C27 | 3.179% | 2/15/48 | 16,945 | 16,522 | |
| 4 | JPMBB Commercial Mortgage Securities Trust 2015- | ||||
| C30 | 3.551% | 7/15/48 | 23,680 | 23,280 | |
| 4 | JPMBB Commercial Mortgage Securities Trust 2015- | ||||
| C30 | 3.822% | 7/15/48 | 51,330 | 51,838 | |
| 4 | JPMBB Commercial Mortgage Securities Trust 2015- | ||||
| C30 | 4.226% | 7/15/48 | 15,901 | 16,131 | |
| 4 | JPMBB Commercial Mortgage Securities Trust 2015- | ||||
| C31 | 3.801% | 8/15/48 | 21,082 | 21,253 | |
| 4 | JPMBB Commercial Mortgage Securities Trust 2015- | ||||
| C32 | 3.598% | 11/15/48 | 12,061 | 12,000 | |
| 4 | JPMBB Commercial Mortgage Securities Trust 2015- | ||||
| C33 | 3.770% | 12/15/48 | 22,187 | 22,297 | |
| 4 | JPMCC Commercial Mortgage Securities Trust 2017- | ||||
| JP5 | 3.723% | 3/15/50 | 33,410 | 33,081 | |
| 4 | JPMCC Commercial Mortgage Securities Trust 2017- | ||||
| JP7 | 3.454% | 9/15/50 | 10,675 | 10,401 | |
| 4 | JPMDB Commercial Mortgage Securities Trust 2017- | ||||
| C7 | 3.409% | 10/15/50 | 10,453 | 10,152 | |
| 4 | JPMDB Commercial Mortgage Securities Trust 2018- | ||||
| C8 | 4.211% | 6/15/51 | 8,500 | 8,737 | |
| Korea Housing Finance Corp. | 1.625% | 9/15/18 | 13,550 | 13,526 | |
| 4,10,12 | Lanark Master Issuer plc 2018-1A | 2.749% | 12/22/69 | 28,623 | 28,608 |
| 4,10,13 | Lanark Master Issuer plc 2018-2A | 2.844% | 12/22/69 | 13,530 | 13,529 |
| 4,10 | Laurel Road Prime Student Loan Trust 2018-B | 3.540% | 5/26/43 | 30,280 | 30,237 |
| 4,10 | LCCM 2014-909 Mortgage Trust | 3.388% | 5/15/31 | 18,640 | 18,641 |
| 4,10 | Madison Avenue Trust 2013-650M | 3.843% | 10/12/32 | 12,460 | 12,586 |
| 4,10,13 | Master Credit Card Trust II Series 2018-1A | 2.571% | 7/22/24 | 58,850 | 58,966 |
| 4 | MASTR Adjustable Rate Mortgages Trust 2004-3 | 3.724% | 4/25/34 | 576 | 577 |
| 4 | Mercedes-Benz Auto Lease Trust 2018-A | 2.200% | 4/15/20 | 50,740 | 50,661 |
| 4 | Mercedes-Benz Auto Lease Trust 2018-A | 2.410% | 2/16/21 | 76,170 | 75,663 |
| 4 | Mercedes-Benz Auto Lease Trust 2018-A | 2.510% | 10/16/23 | 7,580 | 7,504 |
| 4 | Mercedes-Benz Auto Receivables Trust 2018-1 | 3.150% | 10/15/24 | 10,430 | 10,416 |
| 4 | Merrill Lynch Mortgage Investors Trust MLMI Series | ||||
| 2003-A2 | 4.001% | 2/25/33 | 956 | 958 | |
| 4 | Merrill Lynch Mortgage Investors Trust MLMI Series | ||||
| 2003-A4 | 4.388% | 7/25/33 | 491 | 502 | |
| 4,10 | MMAF Equipment Finance LLC 2012-AA | 1.980% | 6/10/32 | 2,102 | 2,101 |
| 4,10 | MMAF Equipment Finance LLC 2015-AA | 2.490% | 2/19/36 | 33,860 | 33,247 |
| 4,10 | MMAF Equipment Finance LLC 2018-A | 3.390% | 1/10/25 | 6,560 | 6,564 |
| 4,10 | MMAF Equipment Finance LLC 2018-A | 3.610% | 3/10/42 | 3,580 | 3,585 |
| 4 | Morgan Stanley Bank of America Merrill Lynch Trust | ||||
| 2012-C5 | 3.176% | 8/15/45 | 21,548 | 21,313 | |
| 4 | Morgan Stanley Bank of America Merrill Lynch Trust | ||||
| 2012-C5 | 3.792% | 8/15/45 | 2,000 | 1,990 | |
| 4 | Morgan Stanley Bank of America Merrill Lynch Trust | ||||
| 2012-C6 | 2.858% | 11/15/45 | 5,796 | 5,675 | |
| 4 | Morgan Stanley Bank of America Merrill Lynch Trust | ||||
| 2013-C10 | 4.083% | 7/15/46 | 3,372 | 3,227 | |
| 4 | Morgan Stanley Bank of America Merrill Lynch Trust | ||||
| 2013-C10 | 4.083% | 7/15/46 | 28,493 | 29,166 | |
| 10 | |||||
| Vanguard® Short-Term Investment-Grade Fund | |||||
| Schedule of Investments | |||||
| July 31, 2018 | |||||
| Face | Market | ||||
| Maturity | Amount | Value | |||
| Coupon | Date | ($000) | ($000) | ||
| 4 | Morgan Stanley Bank of America Merrill Lynch Trust | ||||
| 2013-C11 | 3.085% | 8/15/46 | 3,753 | 3,716 | |
| 4 | Morgan Stanley Bank of America Merrill Lynch Trust | ||||
| 2013-C11 | 3.960% | 8/15/46 | 8,445 | 8,551 | |
| 4 | Morgan Stanley Bank of America Merrill Lynch Trust | ||||
| 2013-C11 | 4.158% | 8/15/46 | 24,216 | 24,967 | |
| 4 | Morgan Stanley Bank of America Merrill Lynch Trust | ||||
| 2013-C12 | 3.824% | 10/15/46 | 8,080 | 8,196 | |
| 4 | Morgan Stanley Bank of America Merrill Lynch Trust | ||||
| 2013-C12 | 4.259% | 10/15/46 | 3,830 | 3,945 | |
| 4 | Morgan Stanley Bank of America Merrill Lynch Trust | ||||
| 2013-C13 | 4.039% | 11/15/46 | 8,300 | 8,496 | |
| 4 | Morgan Stanley Bank of America Merrill Lynch Trust | ||||
| 2013-C7 | 2.918% | 2/15/46 | 6,400 | 6,262 | |
| 4 | Morgan Stanley Bank of America Merrill Lynch Trust | ||||
| 2013-C7 | 3.214% | 2/15/46 | 2,940 | 2,870 | |
| 4 | Morgan Stanley Bank of America Merrill Lynch Trust | ||||
| 2013-C9 | 3.102% | 5/15/46 | 27,425 | 26,888 | |
| 4 | Morgan Stanley Bank of America Merrill Lynch Trust | ||||
| 2014-C14 | 4.064% | 2/15/47 | 16,600 | 17,021 | |
| 4 | Morgan Stanley Bank of America Merrill Lynch Trust | ||||
| 2014-C14 | 4.384% | 2/15/47 | 17,500 | 18,024 | |
| 4 | Morgan Stanley Bank of America Merrill Lynch Trust | ||||
| 2014-C15 | 3.773% | 4/15/47 | 43,080 | 43,595 | |
| 4 | Morgan Stanley Bank of America Merrill Lynch Trust | ||||
| 2014-C15 | 4.051% | 4/15/47 | 22,440 | 22,894 | |
| 4 | Morgan Stanley Bank of America Merrill Lynch Trust | ||||
| 2014-C15 | 4.891% | 4/15/47 | 1,895 | 1,932 | |
| 4 | Morgan Stanley Bank of America Merrill Lynch Trust | ||||
| 2014-C16 | 3.892% | 6/15/47 | 38,845 | 39,338 | |
| 4 | Morgan Stanley Bank of America Merrill Lynch Trust | ||||
| 2014-C16 | 4.094% | 6/15/47 | 9,540 | 9,634 | |
| 4 | Morgan Stanley Bank of America Merrill Lynch Trust | ||||
| 2014-C16 | 4.321% | 6/15/47 | 22,920 | 23,221 | |
| 4 | Morgan Stanley Bank of America Merrill Lynch Trust | ||||
| 2014-C16 | 4.754% | 6/15/47 | 12,300 | 12,250 | |
| 4 | Morgan Stanley Bank of America Merrill Lynch Trust | ||||
| 2014-C17 | 3.741% | 8/15/47 | 32,178 | 32,325 | |
| 4 | Morgan Stanley Bank of America Merrill Lynch Trust | ||||
| 2014-C17 | 4.011% | 8/15/47 | 7,460 | 7,437 | |
| 4 | Morgan Stanley Bank of America Merrill Lynch Trust | ||||
| 2014-C18 | 3.923% | 10/15/47 | 13,400 | 13,572 | |
| 4 | Morgan Stanley Bank of America Merrill Lynch Trust | ||||
| 2014-C19 | 3.326% | 12/15/47 | 17,350 | 17,285 | |
| 4 | Morgan Stanley Bank of America Merrill Lynch Trust | ||||
| 2014-C19 | 3.526% | 12/15/47 | 23,220 | 23,016 | |
| 4 | Morgan Stanley Bank of America Merrill Lynch Trust | ||||
| 2015-C20 | 3.069% | 2/15/48 | 21,800 | 21,573 | |
| 4 | Morgan Stanley Bank of America Merrill Lynch Trust | ||||
| 2015-C20 | 3.249% | 2/15/48 | 37,941 | 37,052 | |
| 4 | Morgan Stanley Bank of America Merrill Lynch Trust | ||||
| 2015-C23 | 3.451% | 7/15/50 | 4,230 | 4,151 | |
| 4 | Morgan Stanley Bank of America Merrill Lynch Trust | ||||
| 2015-C23 | 3.719% | 7/15/50 | 11,828 | 11,850 | |
| 4 | Morgan Stanley Bank of America Merrill Lynch Trust | ||||
| 2015-C24 | 3.479% | 5/15/48 | 20,280 | 20,020 | |
| 4 | Morgan Stanley Bank of America Merrill Lynch Trust | ||||
| 2015-C24 | 3.732% | 5/15/48 | 28,104 | 28,161 | |
| 4 | Morgan Stanley Bank of America Merrill Lynch Trust | ||||
| 2015-C25 | 3.635% | 10/15/48 | 7,814 | 7,778 | |
| 4 | Morgan Stanley Bank of America Merrill Lynch Trust | ||||
| 2016-C29 | 4.751% | 5/15/49 | 2,210 | 2,213 | |
| 4 | Morgan Stanley Bank of America Merrill Lynch Trust | ||||
| 2016-C32 | 3.720% | 12/15/49 | 28,827 | 28,643 | |
| 11 | |||||
| Vanguard® Short-Term Investment-Grade Fund | |||||
| Schedule of Investments | |||||
| July 31, 2018 | |||||
| Face | Market | ||||
| Maturity | Amount | Value | |||
| Coupon | Date | ($000) | ($000) | ||
| 4 | Morgan Stanley Bank of America Merrill Lynch Trust | ||||
| 2017-C34 | 3.536% | 11/15/52 | 19,660 | 19,192 | |
| 4 | Morgan Stanley Capital I Trust 2012-C4 | 3.244% | 3/15/45 | 16,052 | 15,958 |
| 4 | Morgan Stanley Capital I Trust 2012-C4 | 3.773% | 3/15/45 | 2,500 | 2,490 |
| 4,10 | Morgan Stanley Capital I Trust 2012-STAR | 3.201% | 8/5/34 | 17,287 | 17,037 |
| 4,10 | Morgan Stanley Capital I Trust 2014-150E | 3.912% | 9/9/32 | 27,955 | 28,212 |
| 4,10 | Morgan Stanley Capital I Trust 2014-CPT | 3.350% | 7/13/29 | 24,440 | 24,442 |
| 4,10 | Morgan Stanley Capital I Trust 2015-420 | 3.727% | 10/12/50 | 28,871 | 28,576 |
| 4 | Morgan Stanley Capital I Trust 2015-UBS8 | 3.809% | 12/15/48 | 40,034 | 40,130 |
| 4 | Morgan Stanley Capital I Trust 2015-UBS8 | 4.589% | 12/15/48 | 11,440 | 11,134 |
| 4 | Morgan Stanley Capital I Trust 2016-UB11 | 2.782% | 8/15/49 | 7,437 | 6,936 |
| 4 | Morgan Stanley Capital I Trust 2016-UBS9 | 3.594% | 3/15/49 | 11,485 | 11,354 |
| 4 | Morgan Stanley Capital I Trust 2017-HR2 | 3.509% | 12/15/50 | 5,420 | 5,368 |
| 4 | Morgan Stanley Capital I Trust 2017-HR2 | 3.587% | 12/15/50 | 6,765 | 6,631 |
| 4 | Morgan Stanley Mortgage Loan Trust 2006-8AR | 3.901% | 6/25/36 | 5,638 | 5,834 |
| 4,10,13 | Motor plc 2017 1A | 2.594% | 9/25/24 | 45,520 | 45,561 |
| 4,10 | MSBAM Commercial Mortgage Securities Trust 2012- | ||||
| CKSV | 3.277% | 10/15/30 | 37,985 | 36,616 | |
| 10 | National Australia Bank Ltd. | 2.250% | 3/16/21 | 29,260 | 28,523 |
| 4,13 | Navient Student Loan Trust 2015-3 | 2.714% | 6/26/56 | 23,540 | 23,596 |
| 4,10,13 | Navient Student Loan Trust 2016-3 | 2.914% | 6/25/65 | 7,990 | 8,049 |
| 4,10,13 | Navient Student Loan Trust 2016-6A | 2.814% | 3/25/66 | 30,520 | 30,774 |
| 4,10,13 | Navient Student Loan Trust 2017-4A | 2.564% | 9/27/66 | 11,080 | 11,112 |
| 4,10,13 | Navient Student Loan Trust 2017-A | 2.472% | 12/16/58 | 11,567 | 11,579 |
| 4,10 | Navient Student Loan Trust 2017-A | 2.880% | 12/16/58 | 17,580 | 17,064 |
| 4,10,13 | Navient Student Loan Trust 2018-1 | 2.150% | 3/25/67 | 22,216 | 22,210 |
| 4,10,13 | Navient Student Loan Trust 2018-1 | 2.414% | 3/25/67 | 36,100 | 36,078 |
| 4,10,13 | Navient Student Loan Trust 2018-1 | 2.784% | 3/25/67 | 44,620 | 44,746 |
| 4,10 | Navient Student Loan Trust 2018-BA | 3.610% | 12/15/59 | 12,150 | 12,138 |
| 4,10 | Navient Student Loan Trust 2018-CA | 3.010% | 6/16/42 | 12,260 | 12,259 |
| 4,10 | Navient Student Loan Trust 2018-CA | 3.520% | 6/16/42 | 54,450 | 54,445 |
| 4,10,13 | Navistar Financial Dealer Note Master Trust II 2016-1A | 3.414% | 9/27/21 | 28,280 | 28,321 |
| 13 | New Mexico Educational Assistance Foundation 2013-1 | 2.792% | 1/2/25 | 14,796 | 14,845 |
| 4,10 | NextGear Floorplan Master Owner Trust 2016-1A | 2.740% | 4/15/21 | 15,220 | 15,200 |
| 4 | Nissan Auto Lease Trust 2017-B | 2.050% | 9/15/20 | 30,500 | 30,210 |
| 4 | Nissan Auto Lease Trust 2017-B | 2.170% | 12/15/21 | 8,520 | 8,410 |
| 4 | Nissan Auto Receivables 2017-C Owner Trust | 2.120% | 4/18/22 | 39,090 | 38,499 |
| 4 | Nissan Auto Receivables 2017-C Owner Trust | 2.280% | 2/15/24 | 22,040 | 21,530 |
| 4 | Nissan Auto Receivables 2018-B Owner Trust | 3.160% | 12/16/24 | 10,430 | 10,415 |
| 4,13 | Nissan Master Owner Trust Receivables Series 2017-C | 2.392% | 10/17/22 | 78,440 | 78,478 |
| 4,10 | OBP Depositor LLC Trust 2010-OBP | 4.646% | 7/15/45 | 10,065 | 10,253 |
| 4,10 | Palisades Center Trust 2016-PLSD | 2.713% | 4/13/33 | 8,360 | 8,159 |
| 4,10,13 | Pepper Residential Securities Trust 2017A-A1UA | 3.186% | 3/10/58 | 12,038 | 12,052 |
| 4,10,13 | Pepper Residential Securities Trust 2018A-A1UA | 3.017% | 3/12/47 | 2,243 | 2,246 |
| 4,10,13 | Pepper Residential Securities Trust 2019A-A1U1 | 2.417% | 10/12/18 | 28,700 | 28,679 |
| 4,10,13 | Pepper Residential Securities Trust 2020A-A1U1 | 2.572% | 3/16/19 | 22,020 | 21,916 |
| §,4,10,13 Pepper Residential Securities Trust 2021-A1U | 0.000% | 1/16/60 | 37,670 | 37,670 | |
| 4,10,12 | Permanent Master Issuer plc 2018-1A | 2.747% | 7/15/58 | 12,200 | 12,201 |
| 4,10 | PFS Financing Corp 2017-B | 2.220% | 7/15/22 | 20,500 | 20,056 |
| 4,10,13 | PFS Financing Corp. 2017-C | 2.542% | 10/15/21 | 32,830 | 32,893 |
| 4,10 | PFS Financing Corp. 2017-D | 2.400% | 10/17/22 | 34,130 | 33,475 |
| 4,10 | PFS Financing Corp. 2018-D | 3.190% | 4/17/23 | 12,740 | 12,676 |
| 4,10,13 | PHEAA Student Loan Trust 2016-2A | 3.014% | 11/25/65 | 29,912 | 30,294 |
| 4,10 | Progress Residential 2015-SFR2 Trust | 2.740% | 6/12/32 | 7,195 | 7,090 |
| 4,10 | Progress Residential 2015-SFR3 Trust | 3.067% | 11/12/32 | 25,018 | 24,740 |
| 4,10 | Progress Residential 2015-SFR3 Trust | 3.733% | 11/12/32 | 9,310 | 9,300 |
| 4,10 | Progress Residential 2017-SFR2 Trust | 2.897% | 12/17/34 | 15,540 | 15,016 |
| 4,10 | Progress Residential 2017-SFR2 Trust | 3.196% | 12/17/34 | 4,030 | 3,898 |
| 4,10 | Progress Residential 2018-SFR1 Trust | 3.255% | 3/17/35 | 17,818 | 17,453 |
| 4,10 | Progress Residential 2018-SFR1 Trust | 3.484% | 3/17/35 | 2,220 | 2,170 |
| 4 | Public Service New Hampshire Funding LLC 2018-1 | 3.094% | 2/1/26 | 11,380 | 11,365 |
| 4 | Public Service New Hampshire Funding LLC 2018-1 | 3.506% | 8/1/28 | 3,900 | 3,907 |
| 4 | Public Service New Hampshire Funding LLC 2018-1 | 3.814% | 2/1/35 | 3,680 | 3,675 |
| 12 | |||||
| Vanguard® Short-Term Investment-Grade Fund | |||||
| Schedule of Investments | |||||
| July 31, 2018 | |||||
| Face | Market | ||||
| Maturity | Amount | Value | |||
| Coupon | Date | ($000) | ($000) | ||
| 4,10,12 | Resimac Premier Series 2014-1A | 3.026% | 12/12/45 | 7,068 | 7,025 |
| 4,10,13 | Resimac Premier Series 2016-1A | 3.476% | 10/10/47 | 43,146 | 43,446 |
| 4,10,13 | Resimac Premier Series 2018-1A | 2.886% | 11/10/49 | 34,908 | 34,353 |
| 4,11 | RFMSI Series 2006-SA2 Trust | 4.848% | 8/25/36 | 13,003 | 11,223 |
| 4,11 | RFMSI Series 2006-SA3 Trust | 4.839% | 9/25/36 | 4,580 | 4,066 |
| Royal Bank of Canada | 2.200% | 9/23/19 | 7,813 | 7,754 | |
| Royal Bank of Canada | 2.100% | 10/14/20 | 2,287 | 2,235 | |
| 4 | Royal Bank of Canada | 1.875% | 2/5/21 | 8,785 | 8,641 |
| Royal Bank of Canada | 2.300% | 3/22/21 | 7,976 | 7,786 | |
| 4 | Santander Drive Auto Receivables Trust 2015-3 | 3.490% | 5/17/21 | 14,985 | 15,075 |
| 4 | Santander Drive Auto Receivables Trust 2016-1 | 2.470% | 12/15/20 | 8,840 | 8,838 |
| 4 | Santander Drive Auto Receivables Trust 2016-2 | 2.080% | 2/16/21 | 4,925 | 4,916 |
| 4 | Santander Drive Auto Receivables Trust 2016-2 | 2.660% | 11/15/21 | 4,600 | 4,582 |
| 4 | Santander Drive Auto Receivables Trust 2016-2 | 3.390% | 4/15/22 | 4,120 | 4,116 |
| 4 | Santander Drive Auto Receivables Trust 2016-3 | 2.460% | 3/15/22 | 33,200 | 32,891 |
| 4 | Santander Drive Auto Receivables Trust 2017-3 | 1.870% | 6/15/21 | 11,550 | 11,489 |
| 4 | Santander Drive Auto Receivables Trust 2017-3 | 2.760% | 12/15/22 | 5,760 | 5,687 |
| 4 | Santander Drive Auto Receivables Trust 2018-1 | 2.100% | 11/16/20 | 58,661 | 58,514 |
| 4 | Santander Drive Auto Receivables Trust 2018-1 | 2.320% | 8/16/21 | 17,650 | 17,522 |
| 4 | Santander Drive Auto Receivables Trust 2018-1 | 2.630% | 7/15/22 | 40,300 | 39,812 |
| 4 | Santander Drive Auto Receivables Trust 2018-1 | 2.960% | 3/15/24 | 35,160 | 34,645 |
| 4 | Santander Drive Auto Receivables Trust 2018-1 | 3.320% | 3/15/24 | 15,340 | 15,060 |
| 4 | Santander Drive Auto Receivables Trust 2018-3 | 3.290% | 10/17/22 | 24,700 | 24,681 |
| 4 | Santander Drive Auto Receivables Trust 2018-3 | 4.070% | 8/15/24 | 40,900 | 40,865 |
| 4,10 | Santander Retail Auto Lease Trust 2017-A | 2.370% | 1/20/22 | 7,110 | 7,004 |
| 4,10 | Santander Retail Auto Lease Trust 2017-A | 2.680% | 1/20/22 | 5,660 | 5,582 |
| 4,10 | Santander Retail Auto Lease Trust 2018-A | 2.930% | 5/20/21 | 31,400 | 31,319 |
| 4,10 | Santander Retail Auto Lease Trust 2018-A | 3.060% | 4/20/22 | 11,010 | 10,959 |
| 4,10 | Santander Retail Auto Lease Trust 2018-A | 3.200% | 4/20/22 | 9,390 | 9,344 |
| 4,10 | Santander Retail Auto Lease Trust 2018-A | 3.490% | 5/20/22 | 21,865 | 21,755 |
| 10 | SBA Tower Trust | 3.156% | 10/8/20 | 10,760 | 10,615 |
| 4,10 | Securitized Term Auto Receivables Trust 2016-1A | 1.524% | 3/25/20 | 8,099 | 8,062 |
| 4,10 | Securitized Term Auto Receivables Trust 2016-1A | 1.794% | 2/25/21 | 12,930 | 12,706 |
| 4,10 | Securitized Term Auto Receivables Trust 2017-2A | 2.289% | 3/25/22 | 10,240 | 9,922 |
| 4,10 | Securitized Term Auto Receivables Trust 2018-1A | 3.298% | 11/25/22 | 5,360 | 5,312 |
| 4,10 | SLM Private Education Loan Trust 2011-A | 4.370% | 4/17/28 | 1,957 | 1,963 |
| 4,10 | SLM Private Education Loan Trust 2011-B | 3.740% | 2/15/29 | 19,325 | 19,401 |
| 4,10 | SLM Private Education Loan Trust 2011-C | 4.540% | 10/17/44 | 8,443 | 8,539 |
| 4,10,13 | SLM Private Education Loan Trust 2013-A | 3.122% | 5/17/27 | 8,648 | 8,664 |
| 4,10 | SLM Private Education Loan Trust 2013-A | 2.500% | 3/15/47 | 8,000 | 7,902 |
| 4,10 | SLM Private Education Loan Trust 2013-B | 1.850% | 6/17/30 | 8,169 | 8,108 |
| 4,10 | SLM Private Education Loan Trust 2013-B | 3.000% | 5/16/44 | 14,700 | 14,416 |
| 4,10 | SLM Private Education Loan Trust 2013-C | 3.500% | 6/15/44 | 5,860 | 5,845 |
| 4,10 | SLM Private Education Loan Trust 2014-A | 2.590% | 1/15/26 | 2,066 | 2,061 |
| 4,10 | SLM Private Education Loan Trust 2014-A | 3.500% | 11/15/44 | 4,100 | 4,060 |
| 4 | SMART ABS Series 2016-2US Trust | 2.050% | 12/14/22 | 4,780 | 4,637 |
| 4,10 | SMB Private Education Loan Trust 2016-A | 2.700% | 5/15/31 | 12,487 | 12,191 |
| 4,10,13 | SMB Private Education Loan Trust 2016-B | 3.522% | 2/17/32 | 11,619 | 11,837 |
| 4,10,13 | SMB Private Education Loan Trust 2016-C | 3.172% | 9/15/34 | 12,920 | 13,090 |
| 4,10,13 | SMB Private Education Loan Trust 2017-A | 2.972% | 9/15/34 | 15,573 | 15,713 |
| 4,10 | SMB Private Education Loan Trust 2017-B | 2.820% | 10/15/35 | 19,780 | 19,236 |
| 4,10 | SMB Private Education Loan Trust 2018-A | 3.500% | 2/15/36 | 51,170 | 50,922 |
| 4,10 | SMB Private Education Loan Trust 2018-B | 3.600% | 1/15/37 | 21,900 | 21,925 |
| 4,10 | SoFi Professional Loan Program 2016-B LLC | 2.740% | 10/25/32 | 9,652 | 9,615 |
| 4,10 | SoFi Professional Loan Program 2016-C LLC | 2.360% | 12/27/32 | 6,120 | 5,982 |
| 4,10 | SoFi Professional Loan Program 2016-D LLC | 2.340% | 4/25/33 | 6,405 | 6,273 |
| 4,10,13 | SoFi Professional Loan Program 2016-D LLC | 3.014% | 1/25/39 | 3,765 | 3,789 |
| 4,10 | SoFi Professional Loan Program 2017-A LLC | 2.400% | 3/26/40 | 2,112 | 2,046 |
| 4,10 | SoFi Professional Loan Program 2017-B LLC | 2.740% | 5/25/40 | 14,150 | 13,904 |
| 4,10,13 | SoFi Professional Loan Program 2017-C LLC | 2.664% | 7/25/40 | 2,170 | 2,176 |
| 4,10 | SoFi Professional Loan Program 2017-D LLC | 2.650% | 9/25/40 | 7,540 | 7,325 |
| 4,10 | SoFi Professional Loan Program 2017-E LLC | 1.860% | 11/26/40 | 30,445 | 30,032 |
| 4,10 | SoFi Professional Loan Program 2017-E LLC | 2.720% | 11/26/40 | 9,940 | 9,640 |
| 4,10 | SoFi Professional Loan Program 2017-F LLC | 2.050% | 1/25/41 | 26,887 | 26,649 |
| 13 | |||||
| Vanguard® Short-Term Investment-Grade Fund | |||||
| Schedule of Investments | |||||
| July 31, 2018 | |||||
| Face | Market | ||||
| Maturity | Amount | Value | |||
| Coupon | Date | ($000) | ($000) | ||
| 4,10 | SoFi Professional Loan Program 2017-F LLC | 2.840% | 1/25/41 | 12,320 | 12,008 |
| 4,10 | SoFi Professional Loan Program 2018-A LLC | 2.390% | 2/25/42 | 33,022 | 32,740 |
| 4,10 | SoFi Professional Loan Program 2018-A LLC | 2.950% | 2/25/42 | 15,490 | 15,116 |
| 4,10 | SoFi Professional Loan Program 2018-B LLC | 3.340% | 8/25/47 | 27,178 | 26,986 |
| 10 | Stadshypotek AB | 1.750% | 4/9/20 | 15,923 | 15,584 |
| 10 | Stadshypotek AB | 2.500% | 4/5/22 | 32,630 | 31,733 |
| 4 | Synchrony Credit Card Master Note Trust 2015-1 | 2.370% | 3/15/23 | 8,025 | 7,938 |
| 4 | Synchrony Credit Card Master Note Trust 2015-4 | 2.380% | 9/15/23 | 34,390 | 33,847 |
| 4 | Synchrony Credit Card Master Note Trust 2016-1 | 2.390% | 3/15/22 | 48,153 | 48,034 |
| 4 | Synchrony Credit Card Master Note Trust 2016-2 | 2.950% | 5/15/24 | 10,715 | 10,495 |
| 4 | Synchrony Credit Card Master Note Trust 2016-3 | 1.580% | 9/15/22 | 16,935 | 16,688 |
| 4 | Synchrony Credit Card Master Note Trust 2016-3 | 1.910% | 9/15/22 | 29,333 | 28,984 |
| 4 | Synchrony Credit Card Master Note Trust 2017-2 | 2.620% | 10/15/25 | 31,940 | 30,944 |
| 4 | Synchrony Credit Card Master Note Trust 2017-2 | 2.820% | 10/15/25 | 9,688 | 9,392 |
| 4 | Synchrony Credit Card Master Note Trust 2017-2 | 3.010% | 10/15/25 | 13,000 | 12,601 |
| 4 | Synchrony Credit Card Master Note Trust Series 2012- | ||||
| 2 | 2.220% | 1/15/22 | 43,200 | 43,124 | |
| 4,10 | Taco Bell Funding LLC 2016-1A | 4.377% | 5/25/46 | 8,426 | 8,513 |
| 4,10 | Taco Bell Funding LLC 2016-1A | 4.970% | 5/25/46 | 13,513 | 13,848 |
| 4,10 | Tesla Auto Lease Trust 2018-A | 2.320% | 12/20/19 | 35,306 | 35,180 |
| 4,10 | Tesla Auto Lease Trust 2018-A | 2.750% | 2/20/20 | 1,480 | 1,472 |
| 4,10 | Tesla Auto Lease Trust 2018-A | 2.970% | 4/20/20 | 1,180 | 1,175 |
| 4,10 | Tesla Auto Lease Trust 2018-A | 3.300% | 5/20/20 | 1,330 | 1,324 |
| 4,10 | Tidewater Auto Receivables Trust 2018-AA | 3.120% | 7/15/22 | 20,770 | 20,749 |
| 4,10 | Tidewater Auto Receivables Trust 2018-AA | 3.450% | 11/15/24 | 4,346 | 4,336 |
| 4,10 | Tidewater Auto Receivables Trust 2018-AA | 3.840% | 11/15/24 | 4,873 | 4,861 |
| 4,10 | Tidewater Auto Receivables Trust 2018-AA | 4.300% | 11/15/24 | 1,449 | 1,445 |
| 4,10 | TMSQ 2014-1500 Mortgage Trust | 3.680% | 10/10/36 | 24,260 | 23,925 |
| 10 | Toronto-Dominion Bank | 2.250% | 3/15/21 | 2,210 | 2,157 |
| 4 | Toyota Auto Receivables 2017-D Owner Trust | 2.120% | 2/15/23 | 2,790 | 2,719 |
| 4 | Toyota Auto Receivables 2018-A Owner Trust | 2.350% | 5/16/22 | 110,490 | 109,217 |
| 4 | Toyota Auto Receivables 2018-A Owner Trust | 2.520% | 5/15/23 | 7,287 | 7,164 |
| 4 | Toyota Auto Receivables 2018-B Owner Trust | 3.110% | 11/15/23 | 13,640 | 13,647 |
| 4,10 | Trafigura Securitisation Finance plc 2017-1A | 2.470% | 12/15/20 | 47,250 | 46,332 |
| 4,10 | Trinity Rail Leasing LP TRL-18-1 | 4.620% | 6/17/48 | 21,060 | 21,274 |
| 4,10 | Trip Rail Master Funding LLC 2017-1A | 2.709% | 8/15/47 | 3,603 | 3,546 |
| 4,10 | Triton Container Finance LLC 2018-A2 | 4.190% | 6/22/43 | 32,140 | 32,183 |
| 4 | UBS Commercial Mortgage Trust 2012-C1 | 4.171% | 5/10/45 | 1,250 | 1,269 |
| 4 | UBS Commercial Mortgage Trust 2017-C7 | 3.679% | 12/15/50 | 13,995 | 13,754 |
| 4,10 | UBS-BAMLL Trust 2012-WRM | 3.663% | 6/10/30 | 25,038 | 24,741 |
| 4 | UBS-Barclays Commercial Mortgage Trust 2012-C4 | 2.850% | 12/10/45 | 9,054 | 8,825 |
| 4 | UBS-Barclays Commercial Mortgage Trust 2013-C6 | 3.244% | 4/10/46 | 7,560 | 7,467 |
| 4 | UBS-Barclays Commercial Mortgage Trust 2013-C6 | 3.469% | 4/10/46 | 2,304 | 2,282 |
| 4,10 | Vantage Data Centers Issuer, LLC 2018-1A | 4.072% | 2/16/43 | 15,650 | 15,462 |
| 4,10 | Verizon Owner Trust 2016-2A | 1.680% | 5/20/21 | 41,285 | 40,852 |
| 4,10 | Verizon Owner Trust 2017-2A | 1.920% | 12/20/21 | 40,800 | 40,213 |
| 4,10 | Verizon Owner Trust 2017-3 | 2.060% | 4/20/22 | 30,000 | 29,491 |
| 4,10 | Verizon Owner Trust 2017-3 | 2.380% | 4/20/22 | 17,380 | 17,056 |
| 4,10 | Verizon Owner Trust 2017-3 | 2.530% | 4/20/22 | 18,650 | 18,332 |
| 4,10 | Verizon Owner Trust 2018-1 | 2.820% | 9/20/22 | 65,060 | 64,662 |
| 4,10 | Verizon Owner Trust 2018-1 | 3.050% | 9/20/22 | 23,660 | 23,453 |
| 4,10 | VNDO 2012-6AVE Mortgage Trust | 2.996% | 11/15/30 | 13,561 | 13,256 |
| 4,10 | VNDO 2013-PENN Mortgage Trust | 3.808% | 12/13/29 | 11,130 | 11,227 |
| 4,10 | VNDO 2013-PENN Mortgage Trust | 3.947% | 12/13/29 | 3,270 | 3,280 |
| 4,10 | VNDO 2013-PENN Mortgage Trust | 3.947% | 12/13/29 | 2,450 | 2,447 |
| 4 | Volkswagen Auto Loan Enhanced Trust 2018-1 | 3.020% | 11/21/22 | 15,280 | 15,235 |
| 4 | Volkswagen Auto Loan Enhanced Trust 2018-1 | 3.150% | 7/22/24 | 6,970 | 6,940 |
| 4,10 | Volvo Financial Equipment LLC Series 2016-1A | 1.890% | 9/15/20 | 9,220 | 9,133 |
| 4,10,13 | Volvo Financial Equipment Master Owner Trust 2017-A | 2.572% | 11/15/22 | 9,810 | 9,828 |
| 4 | WaMu Mortgage Pass-Through Certificates Series | ||||
| 2002-AR18 Trust | 3.648% | 1/25/33 | 113 | 114 | |
| 4 | WaMu Mortgage Pass-Through Certificates Series | ||||
| 2003-AR7 Trust | 4.111% | 8/25/33 | 594 | 601 | |
| 14 | |||||
| Vanguard® Short-Term Investment-Grade Fund | |||||
| Schedule of Investments | |||||
| July 31, 2018 | |||||
| Face | Market | ||||
| Maturity | Amount | Value | |||
| Coupon | Date | ($000) | ($000) | ||
| 4 | WaMu Mortgage Pass-Through Certificates Series | ||||
| 2003-AR9 Trust | 3.385% | 9/25/33 | 946 | 975 | |
| 4 | Wells Fargo Commercial Mortgage Trust 2012-LC5 | 2.918% | 10/15/45 | 29,752 | 29,194 |
| 4 | Wells Fargo Commercial Mortgage Trust 2012-LC5 | 3.539% | 10/15/45 | 1,650 | 1,636 |
| 4 | Wells Fargo Commercial Mortgage Trust 2013-LC12 | 3.928% | 7/15/46 | 8,075 | 8,213 |
| 4 | Wells Fargo Commercial Mortgage Trust 2013-LC12 | 4.218% | 7/15/46 | 35,262 | 36,328 |
| 4 | Wells Fargo Commercial Mortgage Trust 2013-LC12 | 4.288% | 7/15/46 | 4,906 | 5,018 |
| 4 | Wells Fargo Commercial Mortgage Trust 2014-LC16 | 3.817% | 8/15/50 | 43,100 | 43,620 |
| Wells Fargo Commercial Mortgage Trust 2014-LC16 | 4.020% | 8/15/50 | 7,100 | 7,032 | |
| Wells Fargo Commercial Mortgage Trust 2014-LC16 | 4.322% | 8/15/50 | 12,250 | 12,483 | |
| Wells Fargo Commercial Mortgage Trust 2014-LC16 | 4.458% | 8/15/50 | 6,830 | 6,697 | |
| 4 | Wells Fargo Commercial Mortgage Trust 2014-LC18 | 3.405% | 12/15/47 | 3,285 | 3,237 |
| 4 | Wells Fargo Commercial Mortgage Trust 2015-C26 | 3.166% | 2/15/48 | 26,570 | 25,797 |
| 4 | Wells Fargo Commercial Mortgage Trust 2015-C27 | 3.190% | 2/15/48 | 36,515 | 35,576 |
| 4 | Wells Fargo Commercial Mortgage Trust 2015-C27 | 3.451% | 2/15/48 | 49,460 | 48,817 |
| 4 | Wells Fargo Commercial Mortgage Trust 2015-C29 | 3.637% | 6/15/48 | 54,193 | 54,028 |
| 4 | Wells Fargo Commercial Mortgage Trust 2015-C29 | 4.225% | 6/15/48 | 12,420 | 12,141 |
| 4 | Wells Fargo Commercial Mortgage Trust 2015-C30 | 3.411% | 9/15/58 | 22,214 | 21,938 |
| 4 | Wells Fargo Commercial Mortgage Trust 2015-C30 | 3.664% | 9/15/58 | 20,610 | 20,579 |
| 4 | Wells Fargo Commercial Mortgage Trust 2015-C30 | 4.067% | 9/15/58 | 17,222 | 17,420 |
| 4 | Wells Fargo Commercial Mortgage Trust 2015-C30 | 4.497% | 9/15/58 | 11,490 | 11,253 |
| 4 | Wells Fargo Commercial Mortgage Trust 2015-LC22 | 3.839% | 9/15/58 | 18,856 | 19,041 |
| 4 | Wells Fargo Commercial Mortgage Trust 2015-LC22 | 4.207% | 9/15/58 | 8,550 | 8,718 |
| 4 | Wells Fargo Commercial Mortgage Trust 2015-LC22 | 4.542% | 9/15/58 | 14,300 | 13,957 |
| 4 | Wells Fargo Commercial Mortgage Trust 2015-SG1 | 3.789% | 9/15/48 | 33,065 | 33,226 |
| 4 | Wells Fargo Commercial Mortgage Trust 2016-C32 | 3.560% | 1/15/59 | 21,780 | 21,568 |
| 4 | Wells Fargo Commercial Mortgage Trust 2016-C37 | 3.525% | 12/15/49 | 9,590 | 9,409 |
| 4 | Wells Fargo Commercial Mortgage Trust 2016-C37 | 3.794% | 12/15/49 | 11,500 | 11,511 |
| 4 | Wells Fargo Commercial Mortgage Trust 2017-C38 | 3.453% | 7/15/50 | 15,680 | 15,254 |
| 4 | Wells Fargo Commercial Mortgage Trust 2017-C39 | 3.157% | 9/15/50 | 5,750 | 5,457 |
| 4 | Wells Fargo Commercial Mortgage Trust 2017-C39 | 3.418% | 9/15/50 | 65,280 | 63,377 |
| 4 | Wells Fargo Commercial Mortgage Trust 2017-C40 | 3.581% | 10/15/50 | 45,250 | 44,432 |
| 4 | Wells Fargo Commercial Mortgage Trust 2017-C41 | 3.472% | 11/15/50 | 39,807 | 38,706 |
| 4 | Wells Fargo Commercial Mortgage Trust 2017-C42 | 3.589% | 12/15/50 | 17,855 | 17,505 |
| 4 | Wells Fargo Commercial Mortgage Trust 2017-RC1 | 3.631% | 1/15/60 | 6,900 | 6,796 |
| 4 | Wells Fargo Commercial Mortgage Trust 2018-C43 | 4.012% | 3/15/51 | 55,010 | 55,490 |
| 4 | Wells Fargo Commercial Mortgage Trust 2018-C43 | 4.514% | 3/15/51 | 5,973 | 5,868 |
| 4,13 | Wells Fargo Dealer Floorplan Master Note Trust Series | ||||
| 2015-2 | 2.736% | 1/20/22 | 17,030 | 17,118 | |
| 4,11 | Wells Fargo Mortgage Backed Securities 2006-AR14 | ||||
| Trust | 3.641% | 10/25/36 | 8,324 | 8,109 | |
| 4,10 | Wendys Funding LLC 2015-1A | 4.080% | 6/15/45 | 5,968 | 5,963 |
| 4,10 | Wendys Funding LLC 2015-1A | 4.497% | 6/15/45 | 6,312 | 6,311 |
| 4,10 | Wendys Funding LLC 2018-1 | 3.573% | 3/15/48 | 6,458 | 6,253 |
| 4,10 | Wendys Funding LLC 2018-1 | 3.884% | 3/15/48 | 9,711 | 9,438 |
| 10 | Westpac Banking Corp. | 2.100% | 2/25/21 | 2,395 | 2,326 |
| 4,10 | WFLD 2014-MONT Mortgage Trust | 3.755% | 8/10/31 | 35,485 | 35,348 |
| 4,10 | WFRBS Commercial Mortgage Trust 2011-C3 | 4.375% | 3/15/44 | 11,719 | 12,001 |
| 4 | WFRBS Commercial Mortgage Trust 2012-C10 | 2.875% | 12/15/45 | 10,955 | 10,696 |
| 4 | WFRBS Commercial Mortgage Trust 2012-C7 | 3.431% | 6/15/45 | 11,800 | 11,802 |
| 4 | WFRBS Commercial Mortgage Trust 2012-C7 | 4.090% | 6/15/45 | 5,056 | 5,045 |
| 4 | WFRBS Commercial Mortgage Trust 2012-C8 | 3.001% | 8/15/45 | 4,491 | 4,425 |
| 4 | WFRBS Commercial Mortgage Trust 2012-C9 | 2.870% | 11/15/45 | 24,344 | 23,813 |
| 4 | WFRBS Commercial Mortgage Trust 2012-C9 | 3.388% | 11/15/45 | 2,860 | 2,818 |
| 4 | WFRBS Commercial Mortgage Trust 2013-C13 | 3.345% | 5/15/45 | 2,230 | 2,179 |
| 4 | WFRBS Commercial Mortgage Trust 2013-C15 | 3.720% | 8/15/46 | 22,490 | 22,744 |
| 4 | WFRBS Commercial Mortgage Trust 2013-C15 | 4.153% | 8/15/46 | 14,980 | 15,407 |
| 4 | WFRBS Commercial Mortgage Trust 2013-C16 | 4.415% | 9/15/46 | 14,650 | 15,249 |
| 4 | WFRBS Commercial Mortgage Trust 2013-C17 | 3.558% | 12/15/46 | 3,500 | 3,523 |
| 4 | WFRBS Commercial Mortgage Trust 2013-C17 | 4.023% | 12/15/46 | 9,770 | 9,997 |
| 4 | WFRBS Commercial Mortgage Trust 2013-C18 | 3.676% | 12/15/46 | 6,710 | 6,776 |
| 4 | WFRBS Commercial Mortgage Trust 2013-C18 | 4.162% | 12/15/46 | 27,830 | 28,626 |
| 4 | WFRBS Commercial Mortgage Trust 2013-C18 | 4.656% | 12/15/46 | 5,775 | 6,034 |
| 4 | WFRBS Commercial Mortgage Trust 2014-C19 | 3.829% | 3/15/47 | 30,300 | 30,558 |
| 15 | |||||
| Vanguard® Short-Term Investment-Grade Fund | |||||
| Schedule of Investments | |||||
| July 31, 2018 | |||||
| Face | Market | ||||
| Maturity | Amount | Value | |||
| Coupon | Date | ($000) | ($000) | ||
| 4 | WFRBS Commercial Mortgage Trust 2014-C19 | 4.101% | 3/15/47 | 23,553 | 24,209 |
| 4 | WFRBS Commercial Mortgage Trust 2014-C20 | 3.995% | 5/15/47 | 40,481 | 41,376 |
| 4 | WFRBS Commercial Mortgage Trust 2014-C20 | 4.378% | 5/15/47 | 11,110 | 11,177 |
| 4 | WFRBS Commercial Mortgage Trust 2014-C20 | 4.513% | 5/15/47 | 4,500 | 4,339 |
| 4 | WFRBS Commercial Mortgage Trust 2014-C21 | 3.410% | 8/15/47 | 1,665 | 1,645 |
| 4 | WFRBS Commercial Mortgage Trust 2014-C21 | 3.678% | 8/15/47 | 45,230 | 45,407 |
| 4 | WFRBS Commercial Mortgage Trust 2014-C21 | 3.891% | 8/15/47 | 7,130 | 7,026 |
| 4 | WFRBS Commercial Mortgage Trust 2014-C21 | 4.234% | 8/15/47 | 12,290 | 11,803 |
| 4 | WFRBS Commercial Mortgage Trust 2014-C23 | 3.650% | 10/15/57 | 13,000 | 12,956 |
| 4 | WFRBS Commercial Mortgage Trust 2014-C23 | 3.917% | 10/15/57 | 10,655 | 10,795 |
| 4 | WFRBS Commercial Mortgage Trust 2014-C24 | 3.607% | 11/15/47 | 24,615 | 24,563 |
| 4 | WFRBS Commercial Mortgage Trust 2014-LC14 | 3.766% | 3/15/47 | 2,690 | 2,708 |
| 4 | WFRBS Commercial Mortgage Trust 2014-LC14 | 4.045% | 3/15/47 | 46,983 | 48,092 |
| 4 | World Omni Auto Receivables Trust 2016-B | 1.300% | 2/15/22 | 17,456 | 17,228 |
| 4 | World Omni Auto Receivables Trust 2018-A | 2.730% | 2/15/24 | 16,040 | 15,839 |
| 4 | World Omni Auto Receivables Trust 2018-A | 2.890% | 4/15/25 | 8,670 | 8,555 |
| 4 | World Omni Automobile Lease Securitization Trust | ||||
| 2018-A | 2.830% | 7/15/21 | 41,890 | 41,670 | |
| 4 | World Omni Automobile Lease Securitization Trust | ||||
| 2018-A | 2.940% | 5/15/23 | 12,590 | 12,523 | |
| Total Asset-Backed/Commercial Mortgage-Backed Securities (Cost $13,631,940) | 13,431,686 | ||||
| Corporate Bonds (53.1%) | |||||
| Finance (26.6%) | |||||
| Banking (22.6%) | |||||
| American Express Co. | 2.200% | 10/30/20 | 158,870 | 155,354 | |
| American Express Co. | 3.700% | 8/3/23 | 137,910 | 137,767 | |
| American Express Credit Corp. | 1.700% | 10/30/19 | 13,020 | 12,817 | |
| American Express Credit Corp. | 2.200% | 3/3/20 | 44,955 | 44,334 | |
| American Express Credit Corp. | 2.250% | 5/5/21 | 24,988 | 24,328 | |
| 10 | ANZ New Zealand International Ltd. | 2.200% | 7/17/20 | 29,275 | 28,656 |
| 10 | ASB Bank Ltd. | 3.750% | 6/14/23 | 39,160 | 38,836 |
| 10 | Australia & New Zealand Banking Group Ltd. | 2.250% | 12/19/19 | 124,445 | 123,035 |
| Australia & New Zealand Banking Group Ltd. | 2.625% | 11/9/22 | 77,968 | 74,988 | |
| 10 | Banco Santander Chile | 2.500% | 12/15/20 | 82,940 | 80,565 |
| Bank of America Corp. | 2.625% | 10/19/20 | 43,700 | 43,149 | |
| Bank of America Corp. | 2.151% | 11/9/20 | 4,515 | 4,411 | |
| Bank of America Corp. | 2.625% | 4/19/21 | 37,900 | 37,183 | |
| 4 | Bank of America Corp. | 2.369% | 7/21/21 | 170,765 | 167,855 |
| 4 | Bank of America Corp. | 2.328% | 10/1/21 | 146,370 | 142,854 |
| 4 | Bank of America Corp. | 3.124% | 1/20/23 | 44,075 | 43,203 |
| Bank of America Corp. | 3.004% | 12/20/23 | 102,823 | 99,751 | |
| 4 | Bank of America Corp. | 3.550% | 3/5/24 | 128,765 | 127,109 |
| Bank of America Corp. | 3.875% | 8/1/25 | 3,185 | 3,176 | |
| Bank of Montreal | 3.100% | 7/13/20 | 21,650 | 21,636 | |
| Bank of New York Mellon Corp. | 2.600% | 8/17/20 | 13,355 | 13,240 | |
| Bank of Nova Scotia | 2.228% | 12/11/19 | 249,005 | 246,251 | |
| Bank of Nova Scotia | 2.150% | 7/14/20 | 18,590 | 18,216 | |
| Bank of Nova Scotia | 2.500% | 1/8/21 | 36,955 | 36,254 | |
| 10 | Banque Federative du Credit Mutuel SA | 2.200% | 7/20/20 | 66,200 | 64,709 |
| 10 | Banque Federative du Credit Mutuel SA | 2.750% | 10/15/20 | 52,970 | 52,184 |
| 10 | Banque Federative du Credit Mutuel SA | 2.500% | 4/13/21 | 25,495 | 24,787 |
| 10 | Banque Federative du Credit Mutuel SA | 2.700% | 7/20/22 | 34,855 | 33,545 |
| 10 | Banque Federative du Credit Mutuel SA | 3.750% | 7/20/23 | 166,800 | 165,918 |
| BB&T Corp. | 2.450% | 1/15/20 | 46,684 | 46,264 | |
| 10 | BNP Paribas SA | 3.375% | 1/9/25 | 84,330 | 80,098 |
| BPCE SA | 2.500% | 7/15/19 | 7,500 | 7,474 | |
| 14,15 | BPCE SA | 3.268% | 4/24/20 | 19,310 | 14,465 |
| 14 | BPCE SA | 3.500% | 4/24/20 | 7,950 | 5,960 |
| Branch Banking & Trust Co. | 2.100% | 1/15/20 | 21,000 | 20,698 | |
| Branch Banking & Trust Co. | 2.250% | 6/1/20 | 86,765 | 85,221 | |
| Branch Banking & Trust Co. | 2.625% | 1/15/22 | 55,389 | 53,917 | |
| Canadian Imperial Bank of Commerce | 2.550% | 6/16/22 | 26,845 | 25,902 | |
| 16 | |||||
| Vanguard® Short-Term Investment-Grade Fund | |||||
| Schedule of Investments | |||||
| July 31, 2018 | |||||
| Face | Market | ||||
| Maturity | Amount | Value | |||
| Coupon | Date | ($000) | ($000) | ||
| Capital One Bank USA NA | 2.250% | 2/13/19 | 24,420 | 24,360 | |
| Capital One Bank USA NA | 2.300% | 6/5/19 | 22,420 | 22,303 | |
| Capital One Financial Corp. | 3.050% | 3/9/22 | 26,645 | 26,050 | |
| Citibank NA | 2.100% | 6/12/20 | 64,165 | 62,776 | |
| Citibank NA | 2.125% | 10/20/20 | 216,530 | 211,138 | |
| Citibank NA | 2.850% | 2/12/21 | 262,150 | 258,441 | |
| Citigroup Inc. | 2.550% | 4/8/19 | 29,097 | 29,064 | |
| Citigroup Inc. | 2.450% | 1/10/20 | 25,170 | 24,938 | |
| Citigroup Inc. | 2.650% | 10/26/20 | 68,589 | 67,565 | |
| Citigroup Inc. | 2.700% | 3/30/21 | 13,175 | 12,936 | |
| Citigroup Inc. | 2.750% | 4/25/22 | 63,390 | 61,377 | |
| 4 | Citigroup Inc. | 4.044% | 6/1/24 | 43,705 | 43,924 |
| Comerica Inc. | 3.700% | 7/31/23 | 87,415 | 87,534 | |
| Commonwealth Bank of Australia | 2.300% | 9/6/19 | 46,435 | 46,194 | |
| Commonwealth Bank of Australia | 2.300% | 3/12/20 | 21,490 | 21,194 | |
| 10 | Commonwealth Bank of Australia | 2.050% | 9/18/20 | 71,235 | 69,357 |
| Commonwealth Bank of Australia | 2.400% | 11/2/20 | 18,055 | 17,685 | |
| 10 | Commonwealth Bank of Australia | 2.000% | 9/6/21 | 13,615 | 13,017 |
| 10 | Commonwealth Bank of Australia | 2.750% | 3/10/22 | 68,580 | 66,606 |
| 10 | Commonwealth Bank of Australia | 2.500% | 9/18/22 | 51,168 | 48,916 |
| 10 | Commonwealth Bank of Australia | 3.450% | 3/16/23 | 125,009 | 123,700 |
| 14,15 | Commonwealth Bank of Australia | 3.945% | 11/5/24 | 14,900 | 11,198 |
| Compass Bank | 2.875% | 6/29/22 | 63,420 | 61,133 | |
| Cooperatieve Rabobank UA | 2.250% | 1/14/20 | 80,199 | 79,168 | |
| Cooperatieve Rabobank UA | 4.625% | 12/1/23 | 7,800 | 7,876 | |
| 14,15 | Cooperatieve Rabobank UA | 4.600% | 7/2/25 | 23,650 | 17,891 |
| 14 | Cooperatieve Rabobank UA | 5.000% | 7/2/25 | 10,800 | 8,224 |
| Credit Suisse AG | 2.300% | 5/28/19 | 40,490 | 40,346 | |
| 4,10 | Credit Suisse Group AG | 4.207% | 6/12/24 | 73,000 | 73,217 |
| Credit Suisse Group Funding Guernsey Ltd. | 3.125% | 12/10/20 | 13,670 | 13,514 | |
| Credit Suisse Group Funding Guernsey Ltd. | 3.800% | 9/15/22 | 11,110 | 11,077 | |
| 10 | Danske Bank A/S | 2.750% | 9/17/20 | 23,273 | 22,921 |
| 10 | Danske Bank A/S | 3.875% | 9/12/23 | 38,800 | 38,405 |
| Deutsche Bank AG | 2.500% | 2/13/19 | 7,225 | 7,199 | |
| Deutsche Bank AG | 2.700% | 7/13/20 | 34,375 | 33,568 | |
| Deutsche Bank AG | 3.150% | 1/22/21 | 57,440 | 55,920 | |
| Discover Bank | 2.600% | 11/13/18 | 24,412 | 24,407 | |
| 10 | DNB Bank ASA | 2.125% | 10/2/20 | 71,230 | 69,255 |
| 4,16 | DNB Bank ASA | 1.125% | 3/20/28 | 4,700 | 5,418 |
| 10 | Federation des Caisses Desjardins du Quebec | 2.250% | 10/30/20 | 86,625 | 84,445 |
| Fifth Third Bank | 1.625% | 9/27/19 | 42,565 | 41,921 | |
| Fifth Third Bank | 2.200% | 10/30/20 | 46,125 | 45,027 | |
| Fifth Third Bank | 2.250% | 6/14/21 | 28,181 | 27,408 | |
| First Republic Bank | 2.375% | 6/17/19 | 47,605 | 47,375 | |
| First Republic Bank | 2.500% | 6/6/22 | 86,865 | 83,559 | |
| Goldman Sachs Group Inc. | 2.625% | 1/31/19 | 68,810 | 68,797 | |
| Goldman Sachs Group Inc. | 2.550% | 10/23/19 | 52,555 | 52,273 | |
| Goldman Sachs Group Inc. | 2.300% | 12/13/19 | 123,150 | 122,056 | |
| Goldman Sachs Group Inc. | 2.750% | 9/15/20 | 73,455 | 72,829 | |
| Goldman Sachs Group Inc. | 2.600% | 12/27/20 | 237,295 | 233,710 | |
| Goldman Sachs Group Inc. | 2.875% | 2/25/21 | 143,874 | 141,585 | |
| Goldman Sachs Group Inc. | 2.625% | 4/25/21 | 77,334 | 75,744 | |
| 14,15 | Goldman Sachs Group Inc. | 3.425% | 9/8/21 | 19,280 | 14,458 |
| Goldman Sachs Group Inc. | 2.350% | 11/15/21 | 900 | 868 | |
| Goldman Sachs Group Inc. | 5.750% | 1/24/22 | 37,173 | 39,666 | |
| Goldman Sachs Group Inc. | 3.000% | 4/26/22 | 93,455 | 91,229 | |
| 4 | Goldman Sachs Group Inc. | 2.876% | 10/31/22 | 90,995 | 88,733 |
| 4 | Goldman Sachs Group Inc. | 2.908% | 6/5/23 | 151,010 | 145,438 |
| 4 | Goldman Sachs Group Inc. | 3.272% | 9/29/25 | 60,495 | 58,021 |
| HSBC Holdings plc | 2.950% | 5/25/21 | 69,510 | 68,457 | |
| HSBC Holdings plc | 2.650% | 1/5/22 | 75,105 | 72,735 | |
| 4 | HSBC Holdings plc | 3.262% | 3/13/23 | 170,990 | 168,152 |
| HSBC Holdings plc | 3.600% | 5/25/23 | 6,295 | 6,268 | |
| 4,17 | HSBC Holdings plc | 2.175% | 6/27/23 | 78,100 | 102,191 |
| 17 | |||||
| Vanguard® Short-Term Investment-Grade Fund | |||||
| Schedule of Investments | |||||
| July 31, 2018 | |||||
| Face | Market | ||||
| Maturity | Amount | Value | |||
| Coupon | Date | ($000) | ($000) | ||
| 4 | HSBC Holdings plc | 3.033% | 11/22/23 | 56,355 | 54,373 |
| 4 | HSBC Holdings plc | 3.950% | 5/18/24 | 46,702 | 46,585 |
| 4 | HSBC Holdings plc | 4.041% | 3/13/28 | 1,335 | 1,314 |
| 4 | HSBC Holdings plc | 4.583% | 6/19/29 | 71,875 | 72,860 |
| 4 | HSBC Holdings plc | 6.000% | 11/22/65 | 10,760 | 10,409 |
| HSBC USA Inc. | 2.375% | 11/13/19 | 48,435 | 48,034 | |
| HSBC USA Inc. | 2.750% | 8/7/20 | 71,305 | 70,659 | |
| Huntington National Bank | 2.375% | 3/10/20 | 54,920 | 54,133 | |
| Huntington National Bank | 2.875% | 8/20/20 | 33,581 | 33,288 | |
| Huntington National Bank | 2.500% | 8/7/22 | 55,115 | 52,932 | |
| 10 | ICICI Bank Ltd. | 4.800% | 5/22/19 | 4,800 | 4,848 |
| ICICI Bank Ltd. | 4.000% | 3/18/26 | 10,895 | 10,290 | |
| 10 | ING Bank NV | 2.500% | 10/1/19 | 25,080 | 24,894 |
| 10 | ING Bank NV | 2.450% | 3/16/20 | 24,430 | 24,095 |
| 10 | ING Bank NV | 2.700% | 8/17/20 | 3,907 | 3,855 |
| ING Groep NV | 3.150% | 3/29/22 | 32,120 | 31,587 | |
| 12 | Intesa Sanpaolo SPA | 2.966% | 7/17/19 | 129,745 | 129,806 |
| 10 | Intesa Sanpaolo SPA | 3.125% | 7/14/22 | 5,000 | 4,659 |
| 10 | Intesa Sanpaolo SPA | 3.375% | 1/12/23 | 43,900 | 40,925 |
| 10 | Intesa Sanpaolo SPA | 3.875% | 7/14/27 | 25,201 | 22,076 |
| JPMorgan Chase & Co. | 2.250% | 1/23/20 | 48,138 | 47,588 | |
| JPMorgan Chase & Co. | 2.750% | 6/23/20 | 118,678 | 117,492 | |
| JPMorgan Chase & Co. | 4.250% | 10/15/20 | 25,589 | 26,118 | |
| JPMorgan Chase & Co. | 2.550% | 10/29/20 | 120,454 | 118,570 | |
| JPMorgan Chase & Co. | 2.550% | 3/1/21 | 24,825 | 24,348 | |
| 4 | JPMorgan Chase & Co. | 3.514% | 6/18/22 | 130,215 | 130,194 |
| JPMorgan Chase & Co. | 2.972% | 1/15/23 | 41,642 | 40,595 | |
| 4 | JPMorgan Chase & Co. | 2.776% | 4/25/23 | 77,650 | 75,227 |
| JPMorgan Chase & Co. | 2.700% | 5/18/23 | 16,765 | 16,064 | |
| 4 | JPMorgan Chase & Co. | 3.559% | 4/23/24 | 86,030 | 84,870 |
| 4 | JPMorgan Chase & Co. | 3.220% | 3/1/25 | 80,315 | 77,694 |
| JPMorgan Chase & Co. | 3.200% | 6/15/26 | 38,225 | 36,302 | |
| 4 | JPMorgan Chase & Co. | 3.782% | 2/1/28 | 15,845 | 15,420 |
| 4 | JPMorgan Chase & Co. | 3.509% | 1/23/29 | 5,695 | 5,390 |
| 4 | JPMorgan Chase & Co. | 4.005% | 4/23/29 | 20,350 | 20,019 |
| KeyBank NA | 2.500% | 11/22/21 | 5,765 | 5,592 | |
| 4 | Lloyds Banking Group plc | 2.907% | 11/7/23 | 78,040 | 74,582 |
| 14,15 | Lloyds Banking Group plc | 3.450% | 3/7/25 | 7,790 | 5,667 |
| 14 | Lloyds Banking Group plc | 4.000% | 3/7/25 | 29,240 | 21,541 |
| Macquarie Bank Ltd. | 6.625% | 4/7/21 | 6,530 | 6,953 | |
| 4,10 | Macquarie Group Ltd. | 3.189% | 11/28/23 | 18,141 | 17,354 |
| 4 | Macquarie Group Ltd. | 3.189% | 11/28/23 | 17,040 | 16,301 |
| Manufacturers & Traders Trust Co. | 2.050% | 8/17/20 | 34,335 | 33,515 | |
| 12 | Manufacturers & Traders Trust Co. | 2.940% | 12/1/21 | 9,755 | 9,737 |
| Manufacturers & Traders Trust Co. | 2.500% | 5/18/22 | 14,920 | 14,400 | |
| Mitsubishi UFJ Financial Group Inc. | 2.950% | 3/1/21 | 29,613 | 29,200 | |
| Mitsubishi UFJ Financial Group Inc. | 3.535% | 7/26/21 | 38,965 | 39,015 | |
| Mitsubishi UFJ Financial Group Inc. | 2.665% | 7/25/22 | 134,270 | 129,180 | |
| Mitsubishi UFJ Financial Group Inc. | 3.761% | 7/26/23 | 119,190 | 119,259 | |
| Mitsubishi UFJ Financial Group Inc. | 3.777% | 3/2/25 | 76,075 | 75,644 | |
| 10 | Mitsubishi UFJ Trust & Banking Corp. | 2.450% | 10/16/19 | 40,390 | 40,041 |
| 10 | Mitsubishi UFJ Trust & Banking Corp. | 2.650% | 10/19/20 | 30,625 | 30,200 |
| Mizuho Bank Ltd. | 2.340% | 12/4/19 | 185,675 | 183,417 | |
| Morgan Stanley | 2.450% | 2/1/19 | 36,506 | 36,462 | |
| Morgan Stanley | 5.625% | 9/23/19 | 7,458 | 7,676 | |
| Morgan Stanley | 2.650% | 1/27/20 | 55,713 | 55,369 | |
| Morgan Stanley | 2.800% | 6/16/20 | 50,742 | 50,349 | |
| Morgan Stanley | 2.500% | 4/21/21 | 42,819 | 41,728 | |
| Morgan Stanley | 2.625% | 11/17/21 | 172,919 | 168,096 | |
| Morgan Stanley | 2.750% | 5/19/22 | 79,850 | 77,410 | |
| Morgan Stanley | 3.125% | 1/23/23 | 65,955 | 64,356 | |
| 12 | Morgan Stanley | 3.583% | 5/8/24 | 31,700 | 32,166 |
| MUFG Americas Holdings Corp. | 2.250% | 2/10/20 | 29,300 | 28,907 | |
| 10 | MUFG Bank Ltd. | 2.300% | 3/10/19 | 11,750 | 11,711 |
| 18 | |||||
| Vanguard® Short-Term Investment-Grade Fund | |||||
| Schedule of Investments | |||||
| July 31, 2018 | |||||
| Face | Market | ||||
| Maturity | Amount | Value | |||
| Coupon | Date | ($000) | ($000) | ||
| 10 | MUFG Bank Ltd. | 2.300% | 3/5/20 | 86,293 | 84,934 |
| 10 | MUFG Bank Ltd. | 2.750% | 9/14/20 | 79,000 | 77,525 |
| MUFG Union Bank NA | 2.250% | 5/6/19 | 24,420 | 24,312 | |
| National Australia Bank Ltd. | 1.875% | 7/12/21 | 16,016 | 15,294 | |
| National Bank of Canada | 2.150% | 6/12/20 | 39,130 | 38,356 | |
| National Bank of Canada | 2.200% | 11/2/20 | 151,645 | 147,657 | |
| National City Corp. | 6.875% | 5/15/19 | 8,085 | 8,340 | |
| 10 | Nordea Bank AB | 2.500% | 9/17/20 | 12,568 | 12,332 |
| 4 | Oversea-Chinese Banking Corp. Ltd. | 4.000% | 10/15/24 | 19,600 | 19,625 |
| PNC Bank NA | 2.400% | 10/18/19 | 71,148 | 70,725 | |
| PNC Bank NA | 2.300% | 6/1/20 | 14,636 | 14,399 | |
| PNC Bank NA | 2.600% | 7/21/20 | 43,010 | 42,474 | |
| PNC Bank NA | 2.450% | 11/5/20 | 15,636 | 15,356 | |
| PNC Bank NA | 2.150% | 4/29/21 | 14,236 | 13,799 | |
| PNC Bank NA | 2.550% | 12/9/21 | 29,340 | 28,520 | |
| PNC Bank NA | 2.625% | 2/17/22 | 89,020 | 86,568 | |
| PNC Funding Corp. | 5.125% | 2/8/20 | 7,230 | 7,440 | |
| Regions Financial Corp. | 2.750% | 8/14/22 | 10,605 | 10,216 | |
| Royal Bank of Canada | 1.500% | 7/29/19 | 32,100 | 31,678 | |
| Royal Bank of Canada | 2.150% | 10/26/20 | 201,763 | 197,340 | |
| Royal Bank of Canada | 2.350% | 10/30/20 | 7,170 | 7,044 | |
| Santander Holdings USA Inc. | 3.700% | 3/28/22 | 60,955 | 60,505 | |
| Santander Holdings USA Inc. | 3.400% | 1/18/23 | 52,605 | 51,017 | |
| Santander UK plc | 2.000% | 8/24/18 | 16,087 | 16,079 | |
| Santander UK plc | 2.500% | 3/14/19 | 16,184 | 16,142 | |
| Santander UK plc | 2.350% | 9/10/19 | 64,539 | 64,014 | |
| Skandinaviska Enskilda Banken AB | 2.300% | 3/11/20 | 42,260 | 41,620 | |
| 4 | Skandinaviska Enskilda Banken AB | 5.750% | 12/31/49 | 19,975 | 19,939 |
| Sumitomo Mitsui Banking Corp. | 2.092% | 10/18/19 | 90,305 | 89,120 | |
| Sumitomo Mitsui Banking Corp. | 2.514% | 1/17/20 | 124,290 | 122,903 | |
| Sumitomo Mitsui Financial Group Inc. | 2.784% | 7/12/22 | 62,735 | 60,625 | |
| Sumitomo Mitsui Financial Group Inc. | 2.778% | 10/18/22 | 28,480 | 27,412 | |
| Sumitomo Mitsui Financial Group Inc. | 3.748% | 7/19/23 | 36,675 | 36,721 | |
| SunTrust Bank | 2.250% | 1/31/20 | 34,185 | 33,737 | |
| SunTrust Bank | 2.450% | 8/1/22 | 55,075 | 52,900 | |
| SunTrust Banks Inc. | 2.900% | 3/3/21 | 16,407 | 16,186 | |
| Svenska Handelsbanken AB | 2.500% | 1/25/19 | 22,830 | 22,784 | |
| Svenska Handelsbanken AB | 1.500% | 9/6/19 | 14,415 | 14,182 | |
| Svenska Handelsbanken AB | 1.950% | 9/8/20 | 34,155 | 33,244 | |
| Svenska Handelsbanken AB | 2.450% | 3/30/21 | 62,135 | 60,646 | |
| Svenska Handelsbanken AB | 1.875% | 9/7/21 | 35,465 | 33,818 | |
| 10 | Swedbank AB | 2.800% | 3/14/22 | 53,955 | 52,542 |
| Synchrony Bank | 3.000% | 6/15/22 | 60,010 | 57,321 | |
| Synchrony Financial | 3.000% | 8/15/19 | 72,335 | 72,211 | |
| Synchrony Financial | 2.700% | 2/3/20 | 39,200 | 38,684 | |
| Synchrony Financial | 4.500% | 7/23/25 | 4,050 | 3,927 | |
| Synchrony Financial | 3.950% | 12/1/27 | 13,595 | 12,388 | |
| Toronto-Dominion Bank | 1.900% | 10/24/19 | 182,690 | 180,512 | |
| Toronto-Dominion Bank | 2.250% | 11/5/19 | 41,410 | 41,077 | |
| Toronto-Dominion Bank | 3.250% | 6/11/21 | 205,925 | 205,814 | |
| Toronto-Dominion Bank | 3.500% | 7/19/23 | 117,890 | 117,688 | |
| UBS AG | 2.350% | 3/26/20 | 8,300 | 8,192 | |
| 10 | UBS AG | 2.200% | 6/8/20 | 85,550 | 83,748 |
| 10 | UBS AG | 2.450% | 12/1/20 | 167,065 | 163,191 |
| 10 | UBS Group Funding Jersey Ltd. | 2.950% | 9/24/20 | 9,507 | 9,411 |
| 10 | UBS Group Funding Jersey Ltd. | 3.000% | 4/15/21 | 40,062 | 39,560 |
| 10 | UBS Group Funding Jersey Ltd. | 2.650% | 2/1/22 | 23,120 | 22,251 |
| 10 | UBS Group Funding Switzerland AG | 3.491% | 5/23/23 | 64,690 | 63,627 |
| 4,10 | UBS Group Funding Switzerland AG | 2.859% | 8/15/23 | 53,058 | 50,960 |
| 4 | United Overseas Bank Ltd. | 3.750% | 9/19/24 | 11,360 | 11,347 |
| US Bank NA | 2.125% | 10/28/19 | 20,765 | 20,566 | |
| US Bank NA | 2.050% | 10/23/20 | 73,201 | 71,470 | |
| §,18 | Washington Mutual Bank / Debt not acquired by | ||||
| JPMorgan | 6.875% | 6/15/11 | 21,983 | 2 | |
| 19 | |||||
| Vanguard® Short-Term Investment-Grade Fund | |||||
| Schedule of Investments | |||||
| July 31, 2018 | |||||
| Face | Market | ||||
| Maturity | Amount | Value | |||
| Coupon | Date | ($000) | ($000) | ||
| Wells Fargo & Co. | 2.600% | 7/22/20 | 16,480 | 16,284 | |
| Wells Fargo & Co. | 2.100% | 7/26/21 | 19,560 | 18,840 | |
| 14,15 | Wells Fargo & Co. | 3.285% | 7/27/21 | 23,240 | 17,430 |
| Wells Fargo & Co. | 2.625% | 7/22/22 | 96,200 | 92,695 | |
| Wells Fargo Bank NA | 2.400% | 1/15/20 | 303,485 | 300,411 | |
| 4 | Wells Fargo Bank NA | 3.325% | 7/23/21 | 246,740 | 246,819 |
| Westpac Banking Corp. | 1.600% | 8/19/19 | 40,090 | 39,624 | |
| Westpac Banking Corp. | 4.875% | 11/19/19 | 35,464 | 36,319 | |
| Westpac Banking Corp. | 2.300% | 5/26/20 | 3,665 | 3,615 | |
| Westpac Banking Corp. | 2.600% | 11/23/20 | 8,810 | 8,662 | |
| Westpac Banking Corp. | 2.650% | 1/25/21 | 86,705 | 85,213 | |
| Westpac Banking Corp. | 2.100% | 5/13/21 | 29,034 | 27,973 | |
| Westpac Banking Corp. | 2.000% | 8/19/21 | 81,740 | 78,250 | |
| Westpac Banking Corp. | 2.750% | 1/11/23 | 108,480 | 104,604 | |
| Westpac Banking Corp. | 3.650% | 5/15/23 | 86,900 | 86,867 | |
| Westpac Banking Corp. | 3.350% | 3/8/27 | 15,340 | 14,631 | |
| 4 | Westpac Banking Corp. | 4.322% | 11/23/31 | 37,950 | 36,487 |
| Brokerage (0.2%) | |||||
| Jefferies Financial Group Inc. | 5.500% | 10/18/23 | 36,520 | 37,653 | |
| Jefferies Group LLC / Jefferies Group Capital Finance | |||||
| Inc. | 4.150% | 1/23/30 | 6,945 | 6,249 | |
| Legg Mason Inc. | 2.700% | 7/15/19 | 5,860 | 5,842 | |
| §,18 | Lehman Brothers Holdings E-Capital Trust I | 3.589% | 8/19/65 | 9,410 | 1 |
| Nomura Holdings Inc. | 2.750% | 3/19/19 | 26,430 | 26,342 | |
| Stifel Financial Corp. | 3.500% | 12/1/20 | 10,695 | 10,643 | |
| Stifel Financial Corp. | 4.250% | 7/18/24 | 2,880 | 2,864 | |
| TD Ameritrade Holding Corp. | 2.950% | 4/1/22 | 17,515 | 17,145 | |
| Finance Companies (0.5%) | |||||
| GE Capital International Funding Co. Unlimited Co. | 2.342% | 11/15/20 | 240,208 | 235,156 | |
| GE Capital International Funding Co. Unlimited Co. | 4.418% | 11/15/35 | 38,095 | 37,039 | |
| 10 | SMBC Aviation Capital Finance DAC | 2.650% | 7/15/21 | 14,555 | 14,025 |
| Insurance (2.2%) | |||||
| Aetna Inc. | 2.800% | 6/15/23 | 9,565 | 9,152 | |
| Aflac Inc. | 3.625% | 6/15/23 | 3,420 | 3,429 | |
| 10 | AIG Global Funding | 2.150% | 7/2/20 | 14,635 | 14,305 |
| 10 | AIG Global Funding | 2.700% | 12/15/21 | 13,080 | 12,718 |
| Alleghany Corp. | 5.625% | 9/15/20 | 8,890 | 9,267 | |
| American International Group Inc. | 2.300% | 7/16/19 | 5,036 | 5,003 | |
| Aspen Insurance Holdings Ltd. | 6.000% | 12/15/20 | 12,954 | 13,535 | |
| AXIS Specialty Finance LLC | 5.875% | 6/1/20 | 1,508 | 1,566 | |
| AXIS Specialty Finance plc | 2.650% | 4/1/19 | 14,650 | 14,566 | |
| Berkshire Hathaway Finance Corp. | 1.300% | 8/15/19 | 36,720 | 36,156 | |
| Berkshire Hathaway Inc. | 2.100% | 8/14/19 | 4,875 | 4,836 | |
| Berkshire Hathaway Inc. | 2.750% | 3/15/23 | 50,323 | 49,065 | |
| Brighthouse Financial Inc. | 3.700% | 6/22/27 | 16,720 | 15,220 | |
| Chubb INA Holdings Inc. | 2.300% | 11/3/20 | 20,385 | 19,998 | |
| Chubb INA Holdings Inc. | 2.700% | 3/13/23 | 5,875 | 5,667 | |
| 16 | Chubb INA Holdings Inc. | 2.500% | 3/15/38 | 74,589 | 88,371 |
| Marsh & McLennan Cos. Inc. | 2.550% | 10/15/18 | 9,875 | 9,875 | |
| Marsh & McLennan Cos. Inc. | 2.350% | 3/6/20 | 19,265 | 18,998 | |
| Marsh & McLennan Cos. Inc. | 4.800% | 7/15/21 | 3,325 | 3,441 | |
| Marsh & McLennan Cos. Inc. | 2.750% | 1/30/22 | 38,840 | 37,868 | |
| 10 | MassMutual Global Funding II | 2.100% | 8/2/18 | 12,735 | 12,735 |
| 10 | MassMutual Global Funding II | 1.950% | 9/22/20 | 43,160 | 41,914 |
| 10 | MassMutual Global Funding II | 2.500% | 10/17/22 | 24,955 | 24,016 |
| 10 | MassMutual Global Funding II | 2.750% | 6/22/24 | 24,695 | 23,590 |
| 10 | Metropolitan Life Global Funding I | 2.300% | 4/10/19 | 21,731 | 21,668 |
| 10 | Metropolitan Life Global Funding I | 1.550% | 9/13/19 | 18,115 | 17,813 |
| 10 | Metropolitan Life Global Funding I | 2.400% | 1/8/21 | 149,585 | 146,361 |
| 10 | Metropolitan Life Global Funding I | 1.950% | 9/15/21 | 19,535 | 18,676 |
| 10 | Metropolitan Life Global Funding I | 3.000% | 1/10/23 | 11,200 | 10,932 |
| 10 | New York Life Global Funding | 1.950% | 2/11/20 | 17,975 | 17,682 |
| 10 | New York Life Global Funding | 1.950% | 9/28/20 | 51,900 | 50,465 |
| 20 | |||||
| Vanguard® Short-Term Investment-Grade Fund | |||||
| Schedule of Investments | |||||
| July 31, 2018 | |||||
| Face | Market | ||||
| Maturity | Amount | Value | |||
| Coupon | Date | ($000) | ($000) | ||
| 10 | New York Life Global Funding | 2.900% | 1/17/24 | 9,918 | 9,555 |
| 10 | Nuveen Finance LLC | 2.950% | 11/1/19 | 60,100 | 60,008 |
| 10 | Pricoa Global Funding I | 2.550% | 11/24/20 | 6,830 | 6,710 |
| 10 | Pricoa Global Funding I | 2.200% | 6/3/21 | 9,790 | 9,470 |
| 10 | Pricoa Global Funding I | 2.450% | 9/21/22 | 17,390 | 16,603 |
| 10 | Principal Life Global Funding II | 2.204% | 12/11/19 | 216,925 | 214,055 |
| 10 | Principal Life Global Funding II | 2.200% | 4/8/20 | 28,665 | 28,194 |
| Prudential Financial Inc. | 7.375% | 6/15/19 | 10,442 | 10,831 | |
| Prudential Financial Inc. | 4.500% | 11/15/20 | 1,423 | 1,462 | |
| Prudential Financial Inc. | 4.500% | 11/16/21 | 10,789 | 11,145 | |
| 4 | Prudential Financial Inc. | 5.375% | 5/15/45 | 6,145 | 6,102 |
| Reinsurance Group of America Inc. | 6.450% | 11/15/19 | 21,183 | 22,003 | |
| Reinsurance Group of America Inc. | 3.950% | 9/15/26 | 21,496 | 20,984 | |
| 10 | Reliance Standard Life Global Funding II | 2.150% | 10/15/18 | 27,320 | 27,290 |
| 10 | Reliance Standard Life Global Funding II | 2.500% | 1/15/20 | 52,630 | 52,034 |
| 10 | Reliance Standard Life Global Funding II | 2.375% | 5/4/20 | 18,020 | 17,682 |
| 10 | Reliance Standard Life Global Funding II | 3.050% | 1/20/21 | 8,275 | 8,171 |
| 10 | Securian Financial Group Inc. | 4.800% | 4/15/48 | 60,733 | 60,161 |
| 10 | Swiss Re Treasury US Corp. | 2.875% | 12/6/22 | 9,070 | 8,741 |
| Torchmark Corp. | 9.250% | 6/15/19 | 7,053 | 7,412 | |
| Travelers Cos. Inc. | 5.900% | 6/2/19 | 2,930 | 2,999 | |
| Travelers Cos. Inc. | 3.900% | 11/1/20 | 4,300 | 4,358 | |
| Real Estate Investment Trusts (1.1%) | |||||
| Alexandria Real Estate Equities Inc. | 2.750% | 1/15/20 | 29,896 | 29,629 | |
| Alexandria Real Estate Equities Inc. | 3.450% | 4/30/25 | 45,115 | 43,144 | |
| Brandywine Operating Partnership LP | 4.100% | 10/1/24 | 7,205 | 7,101 | |
| Brixmor Operating Partnership LP | 3.650% | 6/15/24 | 23,350 | 22,454 | |
| Brixmor Operating Partnership LP | 3.850% | 2/1/25 | 5,895 | 5,685 | |
| Brixmor Operating Partnership LP | 4.125% | 6/15/26 | 32,938 | 31,871 | |
| Brixmor Operating Partnership LP | 3.900% | 3/15/27 | 19,510 | 18,440 | |
| Camden Property Trust | 4.875% | 6/15/23 | 2,400 | 2,518 | |
| Camden Property Trust | 4.250% | 1/15/24 | 5,900 | 5,984 | |
| Camden Property Trust | 3.500% | 9/15/24 | 1,785 | 1,741 | |
| DDR Corp. | 3.625% | 2/1/25 | 2,951 | 2,797 | |
| DDR Corp. | 4.250% | 2/1/26 | 13,025 | 12,723 | |
| Digital Realty Trust LP | 3.400% | 10/1/20 | 22,047 | 22,017 | |
| Digital Realty Trust LP | 3.950% | 7/1/22 | 34,798 | 35,051 | |
| ERP Operating LP | 2.375% | 7/1/19 | 4,875 | 4,853 | |
| ERP Operating LP | 4.750% | 7/15/20 | 2,349 | 2,407 | |
| Federal Realty Investment Trust | 2.550% | 1/15/21 | 9,351 | 9,172 | |
| 10 | Goodman Australia Industrial Fund | 3.400% | 9/30/26 | 17,000 | 15,833 |
| HCP Inc. | 2.625% | 2/1/20 | 12,357 | 12,216 | |
| HCP Inc. | 4.250% | 11/15/23 | 7,420 | 7,431 | |
| HCP Inc. | 4.200% | 3/1/24 | 7,815 | 7,770 | |
| HCP Inc. | 3.400% | 2/1/25 | 11,470 | 10,884 | |
| HCP Inc. | 4.000% | 6/1/25 | 8,880 | 8,688 | |
| Healthcare Trust of America Holdings LP | 2.950% | 7/1/22 | 14,635 | 14,120 | |
| Healthcare Trust of America Holdings LP | 3.700% | 4/15/23 | 13,139 | 12,873 | |
| Healthcare Trust of America Holdings LP | 3.500% | 8/1/26 | 9,850 | 9,249 | |
| Liberty Property LP | 4.750% | 10/1/20 | 10,940 | 11,198 | |
| Liberty Property LP | 3.750% | 4/1/25 | 3,575 | 3,482 | |
| 16 | Prologis Euro Finance LLC | 1.875% | 1/5/29 | 11,140 | 12,999 |
| Realty Income Corp. | 5.750% | 1/15/21 | 3,905 | 4,094 | |
| Realty Income Corp. | 3.250% | 10/15/22 | 63,430 | 62,283 | |
| Realty Income Corp. | 3.875% | 4/15/25 | 19,295 | 19,009 | |
| Realty Income Corp. | 4.125% | 10/15/26 | 19,045 | 18,907 | |
| 10 | Scentre Group Trust 1 / Scentre Group Trust 2 | 3.750% | 3/23/27 | 28,575 | 27,289 |
| Senior Housing Properties Trust | 3.250% | 5/1/19 | 36,150 | 36,183 | |
| Simon Property Group LP | 4.375% | 3/1/21 | 7,375 | 7,562 | |
| Simon Property Group LP | 2.350% | 1/30/22 | 12,290 | 11,849 | |
| Ventas Realty LP | 3.500% | 2/1/25 | 3,330 | 3,193 | |
| VEREIT Operating Partnership LP | 3.000% | 2/6/19 | 22,495 | 22,499 | |
| VEREIT Operating Partnership LP | 4.875% | 6/1/26 | 4,445 | 4,451 | |
| 21 | |||||
| Vanguard® Short-Term Investment-Grade Fund | |||||
| Schedule of Investments | |||||
| July 31, 2018 | |||||
| Face | Market | ||||
| Maturity | Amount | Value | |||
| Coupon | Date | ($000) | ($000) | ||
| VEREIT Operating Partnership LP | 3.950% | 8/15/27 | 185 | 173 | |
| Welltower Inc. | 4.125% | 4/1/19 | 46,860 | 47,100 | |
| 16,057,688 | |||||
| Industrial (22.4%) | |||||
| Basic Industry (0.7%) | |||||
| 10 | Air Liquide Finance SA | 1.375% | 9/27/19 | 44,940 | 44,096 |
| 10 | Air Liquide Finance SA | 1.750% | 9/27/21 | 110,530 | 105,540 |
| 10 | Air Liquide Finance SA | 2.250% | 9/27/23 | 8,407 | 7,898 |
| Airgas Inc. | 2.375% | 2/15/20 | 14,825 | 14,655 | |
| 10 | Chevron Phillips Chemical Co. LLC / Chevron Phillips | ||||
| Chemical Co. LP | 3.300% | 5/1/23 | 56,095 | 55,249 | |
| EI du Pont de Nemours & Co. | 2.200% | 5/1/20 | 106,169 | 104,583 | |
| 14 | Glencore Australia Holdings Pty Ltd. | 4.500% | 9/19/19 | 4,160 | 3,135 |
| Nutrien Ltd. | 6.750% | 1/15/19 | 31,740 | 32,254 | |
| Nutrien Ltd. | 6.500% | 5/15/19 | 13,111 | 13,456 | |
| WestRock MWV LLC | 7.375% | 9/1/19 | 23,265 | 24,216 | |
| WestRock RKT Co. | 4.450% | 3/1/19 | 11,114 | 11,200 | |
| WestRock RKT Co. | 4.900% | 3/1/22 | 2,745 | 2,855 | |
| WestRock RKT Co. | 4.000% | 3/1/23 | 21,986 | 22,116 | |
| Capital Goods (2.5%) | |||||
| Acuity Brands Lighting Inc. | 6.000% | 12/15/19 | 8,400 | 8,704 | |
| 10 | Berry Global Inc. | 4.500% | 2/15/26 | 7,875 | 7,334 |
| Caterpillar Financial Services Corp. | 1.800% | 11/13/18 | 25,314 | 25,269 | |
| Caterpillar Financial Services Corp. | 1.900% | 3/22/19 | 11,936 | 11,873 | |
| Caterpillar Financial Services Corp. | 2.000% | 11/29/19 | 39,145 | 38,668 | |
| Caterpillar Financial Services Corp. | 1.850% | 9/4/20 | 9,755 | 9,498 | |
| Caterpillar Financial Services Corp. | 1.931% | 10/1/21 | 70,845 | 67,913 | |
| Caterpillar Financial Services Corp. | 2.400% | 6/6/22 | 7,020 | 6,774 | |
| Caterpillar Financial Services Corp. | 3.300% | 6/9/24 | 21,550 | 21,247 | |
| CNH Industrial Capital LLC | 3.375% | 7/15/19 | 16,065 | 16,105 | |
| CNH Industrial Capital LLC | 4.375% | 11/6/20 | 63,398 | 64,111 | |
| CNH Industrial Capital LLC | 4.875% | 4/1/21 | 3,830 | 3,911 | |
| CNH Industrial Capital LLC | 3.875% | 10/15/21 | 8,470 | 8,428 | |
| CNH Industrial Capital LLC | 4.375% | 4/5/22 | 23,205 | 23,350 | |
| Embraer Netherlands Finance BV | 5.050% | 6/15/25 | 6,200 | 6,261 | |
| Embraer Netherlands Finance BV | 5.400% | 2/1/27 | 2,365 | 2,440 | |
| Embraer SA | 5.150% | 6/15/22 | 9,350 | 9,648 | |
| General Electric Co. | 6.000% | 8/7/19 | 30,727 | 31,562 | |
| General Electric Co. | 5.500% | 1/8/20 | 24,796 | 25,580 | |
| General Electric Co. | 2.200% | 1/9/20 | 61,468 | 60,642 | |
| General Electric Co. | 5.550% | 5/4/20 | 22,442 | 23,290 | |
| General Electric Co. | 4.625% | 1/7/21 | 115,359 | 118,493 | |
| General Electric Co. | 5.300% | 2/11/21 | 20,191 | 21,033 | |
| General Electric Co. | 4.650% | 10/17/21 | 46,909 | 48,691 | |
| General Electric Co. | 2.700% | 10/9/22 | 11,411 | 11,007 | |
| 16 | General Electric Co. | 2.125% | 5/17/37 | 44,225 | 48,129 |
| General Electric Co. | 4.500% | 3/11/44 | 13,280 | 13,003 | |
| 4 | General Electric Co. | 5.000% | 12/31/49 | 435,969 | 428,339 |
| 10 | General Electric Co. / LJ VP Holdings LLC | 3.800% | 6/18/19 | 15,205 | 15,301 |
| Illinois Tool Works Inc. | 3.375% | 9/15/21 | 17,075 | 17,113 | |
| John Deere Capital Corp. | 2.300% | 9/16/19 | 32,065 | 31,877 | |
| John Deere Capital Corp. | 1.250% | 10/9/19 | 18,800 | 18,431 | |
| John Deere Capital Corp. | 1.950% | 6/22/20 | 14,590 | 14,295 | |
| John Deere Capital Corp. | 2.375% | 7/14/20 | 41,528 | 40,947 | |
| John Deere Capital Corp. | 2.450% | 9/11/20 | 43,491 | 42,936 | |
| Raytheon Co. | 4.400% | 2/15/20 | 2,070 | 2,116 | |
| 19 | Reynolds Group Issuer Inc. / Reynolds Group Issuer | ||||
| LLC / Reynolds Group Issuer Lu | 6.875% | 2/15/21 | 1,802 | 1,822 | |
| Spirit AeroSystems Inc. | 4.600% | 6/15/28 | 101,920 | 103,183 | |
| Textron Inc. | 7.250% | 10/1/19 | 12,114 | 12,639 | |
| United Rentals North America Inc. | 4.625% | 7/15/23 | 40,455 | 40,556 | |
| United Rentals North America Inc. | 5.875% | 9/15/26 | 3,400 | 3,464 | |
| United Rentals North America Inc. | 5.500% | 5/15/27 | 9,830 | 9,744 | |
| 22 | |||||
| Vanguard® Short-Term Investment-Grade Fund | |||||
| Schedule of Investments | |||||
| July 31, 2018 | |||||
| Face | Market | ||||
| Maturity | Amount | Value | |||
| Coupon | Date | ($000) | ($000) | ||
| United Rentals North America Inc. | 4.875% | 1/15/28 | 3,320 | 3,100 | |
| Communication (2.1%) | |||||
| 10 | Activision Blizzard Inc. | 6.125% | 9/15/23 | 22,008 | 22,723 |
| America Movil SAB de CV | 5.000% | 10/16/19 | 19,268 | 19,671 | |
| America Movil SAB de CV | 5.000% | 3/30/20 | 52,683 | 54,045 | |
| AT&T Inc. | 5.800% | 2/15/19 | 27,420 | 27,861 | |
| AT&T Inc. | 5.875% | 10/1/19 | 62,076 | 64,104 | |
| AT&T Inc. | 5.200% | 3/15/20 | 14,209 | 14,653 | |
| CBS Corp. | 2.300% | 8/15/19 | 1,980 | 1,968 | |
| Charter Communications Operating LLC / Charter | |||||
| Communications Operating Capital | 3.579% | 7/23/20 | 81,995 | 82,065 | |
| Charter Communications Operating LLC / Charter | |||||
| Communications Operating Capital | 4.908% | 7/23/25 | 1,390 | 1,410 | |
| Comcast Corp. | 5.150% | 3/1/20 | 13,900 | 14,337 | |
| Comcast Corp. | 1.625% | 1/15/22 | 4,400 | 4,130 | |
| Comcast Corp. | 3.125% | 7/15/22 | 32,935 | 32,437 | |
| Comcast Corp. | 3.375% | 8/15/25 | 25,570 | 24,659 | |
| Crown Castle International Corp. | 3.400% | 2/15/21 | 38,418 | 38,262 | |
| Crown Castle International Corp. | 2.250% | 9/1/21 | 4,700 | 4,506 | |
| Crown Castle International Corp. | 4.875% | 4/15/22 | 11,800 | 12,165 | |
| Deutsche Telekom International Finance BV | 6.750% | 8/20/18 | 10,804 | 10,825 | |
| Discovery Communications LLC | 2.200% | 9/20/19 | 24,315 | 24,056 | |
| 10 | Discovery Communications LLC | 2.750% | 11/15/19 | 16,550 | 16,445 |
| Electronic Arts Inc. | 3.700% | 3/1/21 | 11,730 | 11,837 | |
| 10 | NBCUniversal Enterprise Inc. | 1.974% | 4/15/19 | 86,650 | 86,218 |
| NBCUniversal Media LLC | 5.150% | 4/30/20 | 18,305 | 18,917 | |
| NBCUniversal Media LLC | 4.375% | 4/1/21 | 34,190 | 35,084 | |
| NBCUniversal Media LLC | 2.875% | 1/15/23 | 23,890 | 23,166 | |
| Omnicom Group Inc. | 6.250% | 7/15/19 | 5,860 | 6,044 | |
| Orange SA | 2.750% | 2/6/19 | 29,240 | 29,220 | |
| Qwest Corp. | 6.750% | 12/1/21 | 21,579 | 22,893 | |
| 10 | SES Global Americas Holdings GP | 2.500% | 3/25/19 | 53,705 | 53,413 |
| 10 | Sirius XM Radio Inc. | 6.000% | 7/15/24 | 18,825 | 19,507 |
| 10 | Sky plc | 2.625% | 9/16/19 | 12,200 | 12,093 |
| T-Mobile USA Inc. | 6.000% | 3/1/23 | 25,187 | 25,943 | |
| T-Mobile USA Inc. | 6.500% | 1/15/24 | 10,710 | 11,165 | |
| T-Mobile USA Inc. | 4.500% | 2/1/26 | 8,080 | 7,595 | |
| 14 | Telstra Corp. Ltd. | 7.750% | 7/15/20 | 14,600 | 11,858 |
| Time Warner Cable LLC | 8.750% | 2/14/19 | 18,305 | 18,854 | |
| Time Warner Cable LLC | 8.250% | 4/1/19 | 23,445 | 24,235 | |
| Time Warner Inc. | 4.875% | 3/15/20 | 14,940 | 15,279 | |
| Verizon Communications Inc. | 3.450% | 3/15/21 | 80,047 | 80,326 | |
| Verizon Communications Inc. | 3.000% | 11/1/21 | 25,266 | 25,081 | |
| Verizon Communications Inc. | 3.500% | 11/1/21 | 54,413 | 54,595 | |
| Verizon Communications Inc. | 3.125% | 3/16/22 | 154,084 | 152,297 | |
| Viacom Inc. | 5.625% | 9/15/19 | 3,195 | 3,267 | |
| Viacom Inc. | 4.500% | 3/1/21 | 1,215 | 1,236 | |
| Viacom Inc. | 5.850% | 9/1/43 | 21,065 | 21,848 | |
| Vodafone Group plc | 4.125% | 5/30/25 | 43,695 | 43,732 | |
| Consumer Cyclical (2.8%) | |||||
| 10 | 1011778 BC ULC / New Red Finance Inc. | 4.625% | 1/15/22 | 16,190 | 16,129 |
| Alibaba Group Holding Ltd. | 2.500% | 11/28/19 | 9,314 | 9,220 | |
| 10 | Alimentation Couche-Tard Inc. | 2.700% | 7/26/22 | 59,525 | 57,215 |
| American Axle & Manufacturing Inc. | 7.750% | 11/15/19 | 5,808 | 6,120 | |
| American Honda Finance Corp. | 2.250% | 8/15/19 | 41,660 | 41,487 | |
| American Honda Finance Corp. | 2.000% | 11/13/19 | 24,385 | 24,095 | |
| American Honda Finance Corp. | 3.000% | 6/16/20 | 55,250 | 55,173 | |
| American Honda Finance Corp. | 1.950% | 7/20/20 | 14,640 | 14,303 | |
| American Honda Finance Corp. | 2.450% | 9/24/20 | 16,675 | 16,435 | |
| American Honda Finance Corp. | 3.450% | 7/14/23 | 29,280 | 29,322 | |
| AutoZone Inc. | 2.875% | 1/15/23 | 4,544 | 4,384 | |
| 10 | BMW US Capital LLC | 3.450% | 4/12/23 | 86,000 | 84,903 |
| 10 | BMW US Capital LLC | 3.750% | 4/12/28 | 43,000 | 42,346 |
| 23 | |||||
| Vanguard® Short-Term Investment-Grade Fund | |||||
| Schedule of Investments | |||||
| July 31, 2018 | |||||
| Face | Market | ||||
| Maturity | Amount | Value | |||
| Coupon | Date | ($000) | ($000) | ||
| Ford Motor Credit Co. LLC | 2.597% | 11/4/19 | 7,615 | 7,555 | |
| Ford Motor Credit Co. LLC | 2.459% | 3/27/20 | 19,535 | 19,221 | |
| 14 | Ford Motor Credit Co. LLC | 3.588% | 6/2/20 | 17,762 | 13,325 |
| Ford Motor Credit Co. LLC | 5.750% | 2/1/21 | 11,559 | 12,097 | |
| Ford Motor Credit Co. LLC | 2.979% | 8/3/22 | 8,780 | 8,421 | |
| General Motors Co. | 3.500% | 10/2/18 | 36,615 | 36,677 | |
| General Motors Co. | 4.875% | 10/2/23 | 19,804 | 20,281 | |
| General Motors Financial Co. Inc. | 3.100% | 1/15/19 | 5,220 | 5,230 | |
| General Motors Financial Co. Inc. | 2.400% | 5/9/19 | 38,333 | 38,272 | |
| General Motors Financial Co. Inc. | 3.500% | 7/10/19 | 29,234 | 29,401 | |
| General Motors Financial Co. Inc. | 3.700% | 11/24/20 | 29,280 | 29,412 | |
| General Motors Financial Co. Inc. | 4.200% | 3/1/21 | 36,658 | 37,145 | |
| General Motors Financial Co. Inc. | 3.200% | 7/6/21 | 38,623 | 38,082 | |
| General Motors Financial Co. Inc. | 4.375% | 9/25/21 | 2,660 | 2,703 | |
| General Motors Financial Co. Inc. | 3.450% | 1/14/22 | 42,190 | 41,545 | |
| General Motors Financial Co. Inc. | 3.250% | 1/5/23 | 19,510 | 18,823 | |
| General Motors Financial Co. Inc. | 3.700% | 5/9/23 | 10,461 | 10,264 | |
| General Motors Financial Co. Inc. | 4.250% | 5/15/23 | 9,107 | 9,139 | |
| General Motors Financial Co. Inc. | 3.950% | 4/13/24 | 14,750 | 14,398 | |
| General Motors Financial Co. Inc. | 3.500% | 11/7/24 | 25,300 | 23,868 | |
| General Motors Financial Co. Inc. | 4.350% | 4/9/25 | 18,900 | 18,602 | |
| 10 | Harley-Davidson Financial Services Inc. | 2.250% | 1/15/19 | 73,515 | 73,364 |
| 10 | Harley-Davidson Financial Services Inc. | 2.400% | 9/15/19 | 67,134 | 66,549 |
| 10 | Harley-Davidson Financial Services Inc. | 2.150% | 2/26/20 | 62,102 | 60,975 |
| 10 | Harley-Davidson Financial Services Inc. | 2.400% | 6/15/20 | 69,387 | 67,994 |
| 10 | Harley-Davidson Financial Services Inc. | 2.850% | 1/15/21 | 6,244 | 6,132 |
| 10 | Harley-Davidson Financial Services Inc. | 2.550% | 6/9/22 | 41,944 | 39,997 |
| 10 | Harley-Davidson Financial Services Inc. | 3.350% | 2/15/23 | 26,785 | 26,148 |
| 10 | Hyundai Capital America | 3.100% | 4/5/22 | 5,150 | 4,992 |
| 17 | Jaguar Land Rover Automotive plc | 5.000% | 2/15/22 | 11,441 | 15,243 |
| Lowe's Companies, Inc. | 1.150% | 4/15/19 | 12,150 | 12,028 | |
| Lowe's Companies, Inc. | 4.625% | 4/15/20 | 19,120 | 19,518 | |
| Macy's Retail Holdings Inc. | 3.450% | 1/15/21 | 14,640 | 14,509 | |
| Mastercard Inc. | 2.000% | 4/1/19 | 9,620 | 9,566 | |
| McDonald's Corp. | 2.100% | 12/7/18 | 11,710 | 11,694 | |
| 10 | Nissan Motor Acceptance Corp. | 2.000% | 3/8/19 | 32,910 | 32,735 |
| 10 | Nissan Motor Acceptance Corp. | 1.550% | 9/13/19 | 2,365 | 2,323 |
| 10 | Nissan Motor Acceptance Corp. | 2.550% | 3/8/21 | 6,380 | 6,214 |
| 10 | Nissan Motor Acceptance Corp. | 1.900% | 9/14/21 | 11,962 | 11,327 |
| PACCAR Financial Corp. | 2.500% | 8/14/20 | 2,930 | 2,897 | |
| Smithsonian Institute Washington DC GO | 3.434% | 9/1/23 | 5,250 | 5,124 | |
| TJX Cos. Inc. | 2.750% | 6/15/21 | 41,445 | 41,072 | |
| TJX Cos. Inc. | 2.500% | 5/15/23 | 6,245 | 5,986 | |
| Toyota Motor Corp. | 3.183% | 7/20/21 | 52,000 | 52,123 | |
| Toyota Motor Credit Corp. | 2.100% | 1/17/19 | 19,530 | 19,502 | |
| Toyota Motor Credit Corp. | 2.125% | 7/18/19 | 104,075 | 103,600 | |
| Toyota Motor Credit Corp. | 2.200% | 1/10/20 | 58,555 | 57,844 | |
| Toyota Motor Credit Corp. | 1.900% | 4/8/21 | 3,610 | 3,495 | |
| Toyota Motor Credit Corp. | 2.750% | 5/17/21 | 11,710 | 11,580 | |
| Toyota Motor Credit Corp. | 3.400% | 9/15/21 | 9,683 | 9,737 | |
| Visa Inc. | 2.800% | 12/14/22 | 21,570 | 21,136 | |
| Walmart Inc. | 2.350% | 12/15/22 | 30,910 | 29,836 | |
| Walmart Inc. | 3.400% | 6/26/23 | 19,800 | 19,899 | |
| Consumer Noncyclical (4.6%) | |||||
| Altria Group Inc. | 9.250% | 8/6/19 | 69,792 | 74,210 | |
| Altria Group Inc. | 4.750% | 5/5/21 | 40,225 | 41,761 | |
| AmerisourceBergen Corp. | 3.500% | 11/15/21 | 7,200 | 7,189 | |
| Anheuser-Busch InBev Finance Inc. | 2.650% | 2/1/21 | 347,656 | 342,945 | |
| Anheuser-Busch InBev Finance Inc. | 2.625% | 1/17/23 | 11,750 | 11,325 | |
| Anheuser-Busch InBev Finance Inc. | 3.300% | 2/1/23 | 72,170 | 71,699 | |
| Anheuser-Busch InBev Worldwide Inc. | 6.875% | 11/15/19 | 21,145 | 22,153 | |
| Anheuser-Busch InBev Worldwide Inc. | 2.500% | 7/15/22 | 25,250 | 24,409 | |
| Anheuser-Busch InBev Worldwide Inc. | 3.500% | 1/12/24 | 63,432 | 63,344 | |
| 24 | |||||
| Vanguard® Short-Term Investment-Grade Fund | |||||
| Schedule of Investments | |||||
| July 31, 2018 | |||||
| Face | Market | ||||
| Maturity | Amount | Value | |||
| Coupon | Date | ($000) | ($000) | ||
| 10 | Aramark Services Inc. | 5.000% | 2/1/28 | 4,045 | 3,893 |
| 10 | BAT Capital Corp. | 3.222% | 8/15/24 | 68,335 | 65,173 |
| Becton Dickinson & Co. | 2.675% | 12/15/19 | 49,652 | 49,309 | |
| Becton Dickinson & Co. | 3.125% | 11/8/21 | 34,675 | 34,214 | |
| Becton Dickinson & Co. | 2.894% | 6/6/22 | 34,200 | 33,258 | |
| Campbell Soup Co. | 3.650% | 3/15/23 | 156,650 | 153,332 | |
| Campbell Soup Co. | 3.950% | 3/15/25 | 10,230 | 9,945 | |
| Campbell Soup Co. | 4.150% | 3/15/28 | 23,250 | 22,251 | |
| 10 | Cargill Inc. | 3.050% | 4/19/21 | 71,700 | 71,164 |
| 10 | Cargill Inc. | 3.250% | 11/15/21 | 9,750 | 9,696 |
| 10 | Cargill Inc. | 3.250% | 3/1/23 | 24,500 | 24,255 |
| Catholic Health Initiatives Colorado GO | 2.600% | 8/1/18 | 2,900 | 2,900 | |
| Coca-Cola Femsa SAB de CV | 2.375% | 11/26/18 | 9,800 | 9,776 | |
| Conagra Brands Inc. | 4.950% | 8/15/20 | 2,679 | 2,722 | |
| CVS Health Corp. | 2.250% | 12/5/18 | 19,520 | 19,493 | |
| CVS Health Corp. | 3.350% | 3/9/21 | 161,200 | 160,961 | |
| CVS Health Corp. | 3.700% | 3/9/23 | 272,905 | 270,643 | |
| Dignity Health California GO | 2.637% | 11/1/19 | 2,000 | 1,982 | |
| Edwards Lifesciences Corp. | 2.875% | 10/15/18 | 24,400 | 24,401 | |
| Express Scripts Holding Co. | 2.600% | 11/30/20 | 40,693 | 39,859 | |
| Express Scripts Holding Co. | 4.750% | 11/15/21 | 32,200 | 33,156 | |
| Express Scripts Holding Co. | 3.900% | 2/15/22 | 12,600 | 12,621 | |
| Express Scripts Holding Co. | 3.000% | 7/15/23 | 34,100 | 32,540 | |
| Express Scripts Holding Co. | 3.500% | 6/15/24 | 33,000 | 31,745 | |
| 14 | FBG Finance Pty Ltd. | 3.750% | 8/7/20 | 18,740 | 14,206 |
| Gilead Sciences Inc. | 1.850% | 9/20/19 | 28,785 | 28,458 | |
| Gilead Sciences Inc. | 4.400% | 12/1/21 | 26,350 | 27,165 | |
| Gilead Sciences Inc. | 3.700% | 4/1/24 | 32,980 | 33,032 | |
| 10 | Grupo Bimbo SAB de CV | 4.500% | 1/25/22 | 11,180 | 11,437 |
| HCA Inc. | 3.750% | 3/15/19 | 19,233 | 19,281 | |
| HCA Inc. | 4.250% | 10/15/19 | 23,157 | 23,331 | |
| HCA Inc. | 6.500% | 2/15/20 | 21,455 | 22,340 | |
| HCA Inc. | 5.875% | 3/15/22 | 4,880 | 5,124 | |
| Hershey Co. | 1.600% | 8/21/18 | 3,060 | 3,058 | |
| 10 | Hologic Inc. | 4.375% | 10/15/25 | 14,000 | 13,510 |
| 10 | Keurig Dr Pepper Inc. | 3.551% | 5/25/21 | 97,445 | 97,447 |
| Kraft Foods Group Inc. | 6.125% | 8/23/18 | 14,240 | 14,270 | |
| Kroger Co. | 6.800% | 12/15/18 | 5,950 | 6,042 | |
| Kroger Co. | 2.000% | 1/15/19 | 14,700 | 14,650 | |
| Kroger Co. | 2.300% | 1/15/19 | 31,250 | 31,186 | |
| Kroger Co. | 6.150% | 1/15/20 | 17,950 | 18,697 | |
| Kroger Co. | 2.600% | 2/1/21 | 39,050 | 38,263 | |
| Kroger Co. | 2.950% | 11/1/21 | 30,288 | 29,744 | |
| Kroger Co. | 2.800% | 8/1/22 | 13,900 | 13,445 | |
| McKesson Corp. | 2.284% | 3/15/19 | 34,250 | 34,110 | |
| Medtronic Inc. | 2.500% | 3/15/20 | 31,135 | 30,860 | |
| Merck Sharp & Dohme Corp. | 5.000% | 6/30/19 | 7,320 | 7,466 | |
| Newell Brands Inc. | 2.600% | 3/29/19 | 3,286 | 3,274 | |
| Newell Brands Inc. | 2.875% | 12/1/19 | 36,585 | 36,339 | |
| 10 | Pernod Ricard SA | 5.750% | 4/7/21 | 4,850 | 5,117 |
| Perrigo Finance Unlimited Co. | 3.500% | 12/15/21 | 338 | 333 | |
| Pharmacia LLC | 6.500% | 12/1/18 | 8,300 | 8,403 | |
| 10 | Reckitt Benckiser Treasury Services plc | 2.375% | 6/24/22 | 79,300 | 75,820 |
| 10 | Reckitt Benckiser Treasury Services plc | 2.750% | 6/26/24 | 13,549 | 12,822 |
| Reynolds American Inc. | 8.125% | 6/23/19 | 53,388 | 55,802 | |
| 10 | Roche Holdings Inc. | 2.250% | 9/30/19 | 23,490 | 23,332 |
| Shire Acquisitions Investments Ireland DAC | 1.900% | 9/23/19 | 79,748 | 78,626 | |
| Shire Acquisitions Investments Ireland DAC | 2.400% | 9/23/21 | 24,610 | 23,638 | |
| Stryker Corp. | 2.000% | 3/8/19 | 9,850 | 9,801 | |
| Teva Pharmaceutical Finance Netherlands III BV | 2.200% | 7/21/21 | 40,435 | 37,696 | |
| Zimmer Biomet Holdings Inc. | 2.700% | 4/1/20 | 59,883 | 59,272 | |
| Energy (4.7%) | |||||
| Andeavor | 4.750% | 12/15/23 | 18,500 | 19,217 | |
| 25 | |||||
| Vanguard® Short-Term Investment-Grade Fund | |||||
| Schedule of Investments | |||||
| July 31, 2018 | |||||
| Face | Market | ||||
| Maturity | Amount | Value | |||
| Coupon | Date | ($000) | ($000) | ||
| Andeavor Logistics LP / Tesoro Logistics Finance Corp. | 5.500% | 10/15/19 | 33,520 | 34,232 | |
| Andeavor Logistics LP / Tesoro Logistics Finance Corp. | 3.500% | 12/1/22 | 31,634 | 31,080 | |
| Baker Hughes a GE Co. LLC / Baker Hughes Co-Obligor | |||||
| Inc. | 2.773% | 12/15/22 | 158,124 | 153,352 | |
| BP Capital Markets plc | 2.241% | 9/26/18 | 24,638 | 24,626 | |
| BP Capital Markets plc | 4.750% | 3/10/19 | 50,286 | 50,871 | |
| BP Capital Markets plc | 1.676% | 5/3/19 | 10,250 | 10,161 | |
| BP Capital Markets plc | 2.237% | 5/10/19 | 42,131 | 41,933 | |
| BP Capital Markets plc | 2.521% | 1/15/20 | 42,059 | 41,739 | |
| BP Capital Markets plc | 2.315% | 2/13/20 | 129,675 | 128,224 | |
| BP Capital Markets plc | 4.500% | 10/1/20 | 147,790 | 151,837 | |
| BP Capital Markets plc | 4.742% | 3/11/21 | 69,755 | 72,499 | |
| BP Capital Markets plc | 2.112% | 9/16/21 | 7,700 | 7,440 | |
| BP Capital Markets plc | 3.062% | 3/17/22 | 29,265 | 28,971 | |
| BP Capital Markets plc | 3.245% | 5/6/22 | 32,095 | 31,933 | |
| BP Capital Markets plc | 2.500% | 11/6/22 | 13,704 | 13,188 | |
| BP Capital Markets plc | 2.750% | 5/10/23 | 8,508 | 8,230 | |
| BP Capital Markets plc | 3.216% | 11/28/23 | 21,055 | 20,658 | |
| Cenovus Energy Inc. | 5.700% | 10/15/19 | 94,961 | 97,216 | |
| Cenovus Energy Inc. | 3.000% | 8/15/22 | 14,725 | 14,081 | |
| Continental Resources Inc. | 5.000% | 9/15/22 | 57,368 | 58,300 | |
| Continental Resources Inc. | 4.500% | 4/15/23 | 8,079 | 8,220 | |
| Continental Resources Inc. | 3.800% | 6/1/24 | 31,880 | 31,242 | |
| Dominion Energy Gas Holdings LLC | 2.500% | 12/15/19 | 21,500 | 21,327 | |
| Dominion Energy Gas Holdings LLC | 2.800% | 11/15/20 | 11,700 | 11,553 | |
| Dominion Energy Gas Holdings LLC | 3.550% | 11/1/23 | 12,700 | 12,539 | |
| Enbridge Energy Partners LP | 4.375% | 10/15/20 | 975 | 991 | |
| 4,12 | Enbridge Energy Partners LP | 6.135% | 10/1/77 | 1,860 | 1,858 |
| Energy Transfer LP | 4.150% | 10/1/20 | 39,715 | 40,203 | |
| Energy Transfer LP | 4.650% | 6/1/21 | 13,760 | 14,101 | |
| Energy Transfer LP | 5.200% | 2/1/22 | 32,447 | 33,740 | |
| Energy Transfer Partners LP | 4.200% | 9/15/23 | 29,220 | 29,330 | |
| Enterprise Products Operating LLC | 5.200% | 9/1/20 | 29,415 | 30,581 | |
| EQT Corp. | 2.500% | 10/1/20 | 29,300 | 28,680 | |
| EQT Corp. | 4.875% | 11/15/21 | 1,995 | 2,050 | |
| EQT Corp. | 3.000% | 10/1/22 | 72,296 | 69,605 | |
| Kinder Morgan Energy Partners LP | 2.650% | 2/1/19 | 2,050 | 2,048 | |
| Kinder Morgan Energy Partners LP | 9.000% | 2/1/19 | 5,285 | 5,443 | |
| Kinder Morgan Energy Partners LP | 6.850% | 2/15/20 | 39,327 | 41,338 | |
| Kinder Morgan Energy Partners LP | 6.500% | 4/1/20 | 32,665 | 34,254 | |
| Kinder Morgan Energy Partners LP | 5.300% | 9/15/20 | 4,875 | 5,051 | |
| Kinder Morgan Energy Partners LP | 5.000% | 8/15/42 | 2,640 | 2,554 | |
| Kinder Morgan Energy Partners LP | 5.000% | 3/1/43 | 6,935 | 6,715 | |
| Kinder Morgan Inc. | 3.050% | 12/1/19 | 1,760 | 1,758 | |
| Kinder Morgan Inc. | 3.150% | 1/15/23 | 12,050 | 11,690 | |
| Kinder Morgan Inc. | 7.750% | 1/15/32 | 16,320 | 20,203 | |
| Nabors Industries Inc. | 5.000% | 9/15/20 | 9,800 | 9,849 | |
| ONEOK Partners LP | 3.200% | 9/15/18 | 11,720 | 11,720 | |
| Regency Energy Partners LP / Regency Energy Finance | |||||
| Corp. | 5.750% | 9/1/20 | 8,167 | 8,473 | |
| Regency Energy Partners LP / Regency Energy Finance | |||||
| Corp. | 5.875% | 3/1/22 | 26,307 | 27,787 | |
| Regency Energy Partners LP / Regency Energy Finance | |||||
| Corp. | 5.000% | 10/1/22 | 8,500 | 8,774 | |
| Regency Energy Partners LP / Regency Energy Finance | |||||
| Corp. | 4.500% | 11/1/23 | 12,535 | 12,707 | |
| Sabine Pass Liquefaction LLC | 5.625% | 2/1/21 | 68,901 | 72,002 | |
| Sabine Pass Liquefaction LLC | 6.250% | 3/15/22 | 2,318 | 2,501 | |
| Sabine Pass Liquefaction LLC | 5.625% | 4/15/23 | 58,670 | 62,572 | |
| 10 | Schlumberger Holdings Corp. | 2.350% | 12/21/18 | 2,150 | 2,148 |
| Shell International Finance BV | 2.000% | 11/15/18 | 15,675 | 15,650 | |
| Shell International Finance BV | 1.375% | 5/10/19 | 55,960 | 55,399 | |
| Shell International Finance BV | 1.375% | 9/12/19 | 70,500 | 69,390 | |
| Shell International Finance BV | 4.300% | 9/22/19 | 10,797 | 10,973 | |
| 26 | |||||
| Vanguard® Short-Term Investment-Grade Fund | |||||
| Schedule of Investments | |||||
| July 31, 2018 | |||||
| Face | Market | ||||
| Maturity | Amount | Value | |||
| Coupon | Date | ($000) | ($000) | ||
| Shell International Finance BV | 2.125% | 5/11/20 | 53,700 | 53,008 | |
| Shell International Finance BV | 2.250% | 11/10/20 | 19,510 | 19,193 | |
| Shell International Finance BV | 1.875% | 5/10/21 | 73,830 | 71,503 | |
| Shell International Finance BV | 1.750% | 9/12/21 | 23,600 | 22,649 | |
| Shell International Finance BV | 2.250% | 1/6/23 | 47,415 | 45,345 | |
| Shell International Finance BV | 3.250% | 5/11/25 | 14,000 | 13,740 | |
| Southern Natural Gas Co. LLC / Southern Natural | |||||
| Issuing Corp. | 4.400% | 6/15/21 | 6,395 | 6,506 | |
| Spectra Energy Partners LP | 2.950% | 9/25/18 | 9,770 | 9,771 | |
| 12 | Spectra Energy Partners LP | 3.018% | 6/5/20 | 97,570 | 98,056 |
| Sunoco Logistics Partners Operations LP | 4.950% | 1/15/43 | 4,032 | 3,606 | |
| Tennessee Gas Pipeline Co. LLC | 7.625% | 4/1/37 | 8,289 | 10,194 | |
| Total Capital International SA | 2.125% | 1/10/19 | 47,850 | 47,731 | |
| Total Capital International SA | 2.100% | 6/19/19 | 14,600 | 14,516 | |
| Total Capital International SA | 2.875% | 2/17/22 | 30,553 | 30,178 | |
| Total Capital SA | 4.450% | 6/24/20 | 54,215 | 55,582 | |
| Total Capital SA | 4.250% | 12/15/21 | 19,525 | 20,138 | |
| TransCanada PipeLines Ltd. | 3.125% | 1/15/19 | 24,385 | 24,428 | |
| TransCanada PipeLines Ltd. | 2.125% | 11/15/19 | 133,475 | 131,987 | |
| 12 | TransCanada PipeLines Ltd. | 2.617% | 11/15/19 | 130,065 | 130,222 |
| TransCanada PipeLines Ltd. | 2.500% | 8/1/22 | 14,125 | 13,558 | |
| Williams Partners LP | 5.250% | 3/15/20 | 68,835 | 70,895 | |
| Williams Partners LP | 4.125% | 11/15/20 | 2,000 | 2,025 | |
| Williams Partners LP | 4.000% | 11/15/21 | 16,585 | 16,748 | |
| Williams Partners LP | 3.600% | 3/15/22 | 17,204 | 17,147 | |
| Williams Partners LP | 3.350% | 8/15/22 | 4,875 | 4,783 | |
| Other Industrial (0.6%) | |||||
| 16 | Aroundtown SA | 1.875% | 1/19/26 | 36,700 | 42,298 |
| 17 | Aroundtown SA | 3.000% | 10/16/29 | 23,706 | 29,490 |
| 10 | CK Hutchison International 17 Ltd. | 2.250% | 9/29/20 | 95,155 | 93,354 |
| 16 | CPI Property Group SA | 2.125% | 10/4/24 | 50,116 | 57,675 |
| 10 | Hutchison Whampoa International 09 Ltd. | 7.625% | 4/9/19 | 118,427 | 122,125 |
| Technology (3.2%) | |||||
| Apple Inc. | 2.100% | 5/6/19 | 48,285 | 48,167 | |
| Apple Inc. | 1.550% | 2/7/20 | 19,535 | 19,192 | |
| Apple Inc. | 1.550% | 8/4/21 | 9,000 | 8,623 | |
| Apple Inc. | 2.150% | 2/9/22 | 19,500 | 18,882 | |
| Apple Inc. | 2.500% | 2/9/22 | 106,447 | 104,270 | |
| Apple Inc. | 2.400% | 1/13/23 | 56,570 | 54,598 | |
| Apple Inc. | 2.400% | 5/3/23 | 15,145 | 14,616 | |
| Apple Inc. | 3.000% | 2/9/24 | 8,405 | 8,250 | |
| Apple Inc. | 3.450% | 5/6/24 | 6,830 | 6,848 | |
| Apple Inc. | 2.850% | 5/11/24 | 65,670 | 63,829 | |
| Apple Inc. | 2.750% | 1/13/25 | 40,910 | 39,244 | |
| Applied Materials Inc. | 2.625% | 10/1/20 | 23,420 | 23,177 | |
| Baidu Inc. | 3.250% | 8/6/18 | 31,200 | 31,200 | |
| Baidu Inc. | 2.750% | 6/9/19 | 17,575 | 17,508 | |
| Broadcom Corp. / Broadcom Cayman Finance Ltd. | 2.375% | 1/15/20 | 72,270 | 71,305 | |
| Broadcom Corp. / Broadcom Cayman Finance Ltd. | 2.200% | 1/15/21 | 11,720 | 11,306 | |
| Broadcom Corp. / Broadcom Cayman Finance Ltd. | 3.000% | 1/15/22 | 67,989 | 66,034 | |
| Broadcom Corp. / Broadcom Cayman Finance Ltd. | 2.650% | 1/15/23 | 34,150 | 32,076 | |
| Broadcom Corp. / Broadcom Cayman Finance Ltd. | 3.625% | 1/15/24 | 20,701 | 20,030 | |
| CA Inc. | 2.875% | 8/15/18 | 2,195 | 2,195 | |
| 10 | Dell International LLC / EMC Corp. | 5.450% | 6/15/23 | 122,276 | 128,222 |
| 10 | Diamond 1 Finance Corp. / Diamond 2 Finance Corp. | 3.480% | 6/1/19 | 80,605 | 80,770 |
| 10 | Diamond 1 Finance Corp. / Diamond 2 Finance Corp. | 4.420% | 6/15/21 | 121,987 | 123,791 |
| DXC Technology Co. | 2.875% | 3/27/20 | 26,340 | 26,105 | |
| DXC Technology Co. | 4.250% | 4/15/24 | 29,295 | 29,179 | |
| 10 | First Data Corp. | 7.000% | 12/1/23 | 41,273 | 43,182 |
| Hewlett Packard Enterprise Co. | 2.850% | 10/5/18 | 17,872 | 17,879 | |
| 10 | Hewlett Packard Enterprise Co. | 2.100% | 10/4/19 | 95,065 | 93,984 |
| Hewlett Packard Enterprise Co. | 3.600% | 10/15/20 | 40,957 | 41,194 | |
| Hewlett Packard Enterprise Co. | 4.400% | 10/15/22 | 24,250 | 24,821 | |
| 27 | |||||
| Vanguard® Short-Term Investment-Grade Fund | |||||
| Schedule of Investments | |||||
| July 31, 2018 | |||||
| Face | Market | ||||
| Maturity | Amount | Value | |||
| Coupon | Date | ($000) | ($000) | ||
| International Business Machines Corp. | 2.500% | 1/27/22 | 4,900 | 4,783 | |
| Marvell Technology Group Ltd. | 4.200% | 6/22/23 | 29,250 | 29,214 | |
| Microsoft Corp. | 2.400% | 2/6/22 | 62,415 | 60,996 | |
| Microsoft Corp. | 2.875% | 2/6/24 | 76,255 | 74,717 | |
| Microsoft Corp. | 2.400% | 8/8/26 | 4,900 | 4,529 | |
| 10 | MSCI Inc. | 5.250% | 11/15/24 | 50,095 | 51,097 |
| Oracle Corp. | 2.800% | 7/8/21 | 24,400 | 24,292 | |
| Oracle Corp. | 2.625% | 2/15/23 | 55,752 | 54,228 | |
| Oracle Corp. | 3.625% | 7/15/23 | 8,000 | 8,086 | |
| Oracle Corp. | 2.400% | 9/15/23 | 27,063 | 25,828 | |
| Oracle Corp. | 2.950% | 11/15/24 | 43,755 | 42,315 | |
| QUALCOMM Inc. | 2.600% | 1/30/23 | 81,650 | 78,133 | |
| QUALCOMM Inc. | 2.900% | 5/20/24 | 9,750 | 9,259 | |
| Tyco Electronics Group SA | 2.375% | 12/17/18 | 14,650 | 14,629 | |
| Tyco Electronics Group SA | 2.350% | 8/1/19 | 18,380 | 18,265 | |
| Tyco Electronics Group SA | 4.875% | 1/15/21 | 2,020 | 2,090 | |
| Tyco Electronics Group SA | 3.500% | 2/3/22 | 15,220 | 15,256 | |
| Tyco Electronics Group SA | 3.450% | 8/1/24 | 9,347 | 9,110 | |
| Verisk Analytics Inc. | 5.800% | 5/1/21 | 12,428 | 13,123 | |
| Verisk Analytics Inc. | 4.125% | 9/12/22 | 18,719 | 18,921 | |
| VMware Inc. | 2.300% | 8/21/20 | 29,350 | 28,718 | |
| VMware Inc. | 2.950% | 8/21/22 | 39,030 | 37,726 | |
| Xilinx Inc. | 2.125% | 3/15/19 | 19,555 | 19,487 | |
| Transportation (1.2%) | |||||
| 10 | Air Canada | 7.750% | 4/15/21 | 48,164 | 51,535 |
| 4,10 | Air Canada 2013-1 Class B Pass Through Trust | 5.375% | 5/15/21 | 6,375 | 6,509 |
| 4,10 | Air Canada 2017-1 Class A Pass Through Trust | 3.550% | 1/15/30 | 23,015 | 21,626 |
| 4,10 | Air Canada 2017-1 Class AA Pass Through Trust | 3.300% | 1/15/30 | 40,285 | 38,178 |
| 4,10 | Air Canada 2017-1 Class B Pass Through Trust | 3.700% | 1/15/26 | 33,765 | 32,070 |
| 4 | American Airlines 2016-3 Class B Pass Through Trust | 3.750% | 10/15/25 | 48,655 | 46,888 |
| 4 | American Airlines 2017-2B Class B Pass Through Trust | 3.700% | 10/15/25 | 54,255 | 52,030 |
| 14 | Asciano Finance Ltd. | 5.400% | 5/12/27 | 14,270 | 10,978 |
| 14 | Aurizon Network Pty Ltd. | 5.750% | 10/28/20 | 19,570 | 15,378 |
| 14 | Aurizon Network Pty Ltd. | 4.000% | 6/21/24 | 9,320 | 6,888 |
| 4 | Continental Airlines 1999-1 Class B Pass Through Trust | 6.795% | 2/2/20 | 155 | 155 |
| 4 | Continental Airlines 2000-1 Class A-1 Pass Through | ||||
| Trust | 8.048% | 11/1/20 | 2,126 | 2,224 | |
| 4 | Continental Airlines 2005-ERJ1 Pass Through Trust | 9.798% | 10/1/22 | 21,826 | 22,917 |
| 4 | Continental Airlines 2012-2 Class B Pass Through Trust | 5.500% | 4/29/22 | 1,992 | 2,032 |
| 4,20 | Delta Air Lines 2002-1 Class G-1 Pass Through Trust | 6.718% | 7/2/24 | 20,333 | 21,551 |
| 4 | Delta Air Lines 2007-1 Class A Pass Through Trust | 6.821% | 2/10/24 | 37,871 | 41,135 |
| 4 | Delta Air Lines 2007-1 Class B Pass Through Trust | 8.021% | 8/10/22 | 7,474 | 8,155 |
| 4 | Delta Air Lines 2009-1 Class A Pass Through Trust | 7.750% | 6/17/21 | 14,606 | 15,243 |
| 4 | Delta Air Lines 2010-2 Class A Pass Through Trust | 4.950% | 11/23/20 | 2,585 | 2,605 |
| 4 | Delta Air Lines 2012-1 Class A Pass Through Trust | 4.750% | 11/7/21 | 1,484 | 1,498 |
| Delta Air Lines Inc. | 3.400% | 4/19/21 | 75,055 | 74,650 | |
| Delta Air Lines Inc. | 3.800% | 4/19/23 | 97,465 | 96,268 | |
| 10 | ERAC USA Finance LLC | 2.800% | 11/1/18 | 16,645 | 16,649 |
| 4,10 | Heathrow Funding Ltd. | 4.875% | 7/15/23 | 29,550 | 30,766 |
| Norfolk Southern Corp. | 5.100% | 8/1/18 | 7,160 | 7,140 | |
| 14 | Qantas Airways Ltd. | 7.500% | 6/11/21 | 15,560 | 12,861 |
| 4 | Southwest Airlines Co. 2007-1 Pass Through Trust | 6.650% | 8/1/22 | 11,201 | 11,786 |
| 4 | Southwest Airlines Co. 2007-1 Pass Through Trust | 6.150% | 2/1/24 | 3,927 | 4,133 |
| 4 | Spirit Airlines 2015-1 Pass Through Trust B | 4.450% | 10/1/25 | 11,094 | 10,938 |
| 4 | Spirit Airlines Pass Through Trust 2017-1B | 3.800% | 2/15/26 | 48,790 | 46,726 |
| 4 | UAL 2007-1 Pass Through Trust | 6.636% | 7/2/22 | 16,148 | 16,891 |
| 4 | US Airways 2001-1C Pass Through Trust | 7.346% | 9/20/23 | 6,355 | 6,735 |
| 13,498,233 | |||||
| Utilities (4.1%) | |||||
| Electric (3.8%) | |||||
| Alabama Power Co. | 3.375% | 10/1/20 | 21,260 | 21,313 | |
| American Electric Power Co. Inc. | 2.150% | 11/13/20 | 42,780 | 41,648 | |
| Arizona Public Service Co. | 8.750% | 3/1/19 | 29,145 | 30,137 | |
| 28 | |||||
| Vanguard® Short-Term Investment-Grade Fund | |||||
| Schedule of Investments | |||||
| July 31, 2018 | |||||
| Face | Market | ||||
| Maturity | Amount | Value | |||
| Coupon | Date | ($000) | ($000) | ||
| Baltimore Gas & Electric Co. | 3.500% | 11/15/21 | 9,535 | 9,567 | |
| Baltimore Gas & Electric Co. | 2.800% | 8/15/22 | 3,555 | 3,466 | |
| Berkshire Hathaway Energy Co. | 2.000% | 11/15/18 | 39,110 | 39,071 | |
| Berkshire Hathaway Energy Co. | 2.375% | 1/15/21 | 26,020 | 25,506 | |
| Berkshire Hathaway Energy Co. | 2.800% | 1/15/23 | 50,295 | 48,859 | |
| Berkshire Hathaway Energy Co. | 3.750% | 11/15/23 | 24,240 | 24,473 | |
| CMS Energy Corp. | 6.250% | 2/1/20 | 9,141 | 9,507 | |
| Commonwealth Edison Co. | 2.150% | 1/15/19 | 6,840 | 6,826 | |
| Commonwealth Edison Co. | 4.000% | 8/1/20 | 27,778 | 28,203 | |
| Connecticut Light & Power Co. | 5.500% | 2/1/19 | 11,695 | 11,847 | |
| Constellation Energy Group Inc. | 5.150% | 12/1/20 | 16,530 | 17,025 | |
| Dominion Energy Inc. | 1.875% | 1/15/19 | 33,170 | 33,038 | |
| Dominion Energy Inc. | 5.200% | 8/15/19 | 4,175 | 4,267 | |
| 10,12 | Dominion Energy Inc. | 2.700% | 12/1/20 | 195,160 | 195,016 |
| Duke Energy Ohio Inc. | 5.450% | 4/1/19 | 5,930 | 6,031 | |
| Duke Energy Progress LLC | 5.300% | 1/15/19 | 2,980 | 3,016 | |
| Edison International | 2.400% | 9/15/22 | 5,375 | 5,105 | |
| 10 | EDP Finance BV | 4.125% | 1/15/20 | 47,918 | 48,291 |
| 10 | EDP Finance BV | 5.250% | 1/14/21 | 59,720 | 61,573 |
| 10 | EDP Finance BV | 3.625% | 7/15/24 | 23,905 | 23,065 |
| Emera US Finance LP | 2.150% | 6/15/19 | 19,105 | 18,932 | |
| Emera US Finance LP | 2.700% | 6/15/21 | 39,324 | 38,191 | |
| 10 | Enel Finance International NV | 2.875% | 5/25/22 | 132,720 | 128,039 |
| Exelon Corp. | 2.850% | 6/15/20 | 29,290 | 29,030 | |
| Exelon Corp. | 2.450% | 4/15/21 | 8,638 | 8,399 | |
| Exelon Corp. | 3.497% | 6/1/22 | 7,263 | 7,185 | |
| Exelon Generation Co. LLC | 2.950% | 1/15/20 | 57,215 | 56,642 | |
| FirstEnergy Corp. | 2.850% | 7/15/22 | 77,498 | 74,769 | |
| FirstEnergy Corp. | 4.250% | 3/15/23 | 27,693 | 28,136 | |
| 10 | FirstEnergy Transmission LLC | 4.350% | 1/15/25 | 21,743 | 22,197 |
| 12 | Florida Power & Light Co. | 2.643% | 11/6/20 | 162,660 | 162,696 |
| Fortis Inc. | 2.100% | 10/4/21 | 22,465 | 21,418 | |
| Georgia Power Co. | 2.000% | 9/8/20 | 50,060 | 48,865 | |
| Georgia Power Co. | 2.400% | 4/1/21 | 50,514 | 49,175 | |
| ITC Holdings Corp. | 2.700% | 11/15/22 | 29,250 | 28,113 | |
| 10 | Kallpa Generacion SA | 4.125% | 8/16/27 | 8,100 | 7,652 |
| LG&E & KU Energy LLC | 3.750% | 11/15/20 | 13,482 | 13,566 | |
| National Rural Utilities Cooperative Finance Corp. | 10.375% | 11/1/18 | 2,011 | 2,049 | |
| National Rural Utilities Cooperative Finance Corp. | 1.500% | 11/1/19 | 3,900 | 3,835 | |
| National Rural Utilities Cooperative Finance Corp. | 2.350% | 6/15/20 | 27,320 | 26,916 | |
| Nevada Power Co. | 6.500% | 8/1/18 | 9,683 | 9,682 | |
| Oncor Electric Delivery Co. LLC | 6.800% | 9/1/18 | 8,010 | 8,034 | |
| Oncor Electric Delivery Co. LLC | 7.000% | 9/1/22 | 11,014 | 12,460 | |
| Pacific Gas & Electric Co. | 3.500% | 10/1/20 | 121,069 | 120,731 | |
| Pacific Gas & Electric Co. | 4.250% | 5/15/21 | 16,350 | 16,469 | |
| Pacific Gas & Electric Co. | 3.250% | 9/15/21 | 58,129 | 56,497 | |
| Pacific Gas & Electric Co. | 6.050% | 3/1/34 | 33,800 | 37,058 | |
| PacifiCorp | 5.500% | 1/15/19 | 4,630 | 4,690 | |
| Pinnacle West Capital Corp. | 2.250% | 11/30/20 | 60,500 | 58,976 | |
| PPL Capital Funding Inc. | 4.200% | 6/15/22 | 2,050 | 2,083 | |
| PPL Capital Funding Inc. | 3.500% | 12/1/22 | 9,215 | 9,153 | |
| Puget Energy Inc. | 6.500% | 12/15/20 | 15,190 | 16,176 | |
| Puget Energy Inc. | 6.000% | 9/1/21 | 4,135 | 4,398 | |
| Puget Energy Inc. | 5.625% | 7/15/22 | 28,065 | 29,716 | |
| South Carolina Electric & Gas Co. | 5.250% | 11/1/18 | 4,500 | 4,523 | |
| South Carolina Electric & Gas Co. | 6.500% | 11/1/18 | 69,981 | 70,576 | |
| Southern California Edison Co. | 2.900% | 3/1/21 | 43,695 | 43,203 | |
| Southern Co. | 1.850% | 7/1/19 | 72,290 | 71,710 | |
| Southern Co. | 2.150% | 9/1/19 | 14,449 | 14,319 | |
| Southern Co. | 2.750% | 6/15/20 | 48,140 | 47,651 | |
| Southern Co. | 2.350% | 7/1/21 | 76,255 | 74,156 | |
| Southern Power Co. | 1.950% | 12/15/19 | 32,735 | 32,211 | |
| Southwestern Electric Power Co. | 6.450% | 1/15/19 | 48,811 | 49,591 | |
| 14,15 | Victoria Power Networks Finance Pty Ltd. | 2.303% | 1/17/22 | 7,300 | 5,288 |
| 29 | |||||
| Vanguard® Short-Term Investment-Grade Fund | |||||
| Schedule of Investments | |||||
| July 31, 2018 | |||||
| Face | Market | ||||
| Maturity | Amount | Value | |||
| Coupon | Date | ($000) | ($000) | ||
| Western Massachusetts Electric Co. | 3.500% | 9/15/21 | 6,985 | 7,001 | |
| Natural Gas (0.3%) | |||||
| 10 | Engie SA | 2.875% | 10/10/22 | 7,269 | 7,077 |
| 12 | Sempra Energy | 2.589% | 7/15/19 | 82,915 | 82,913 |
| Sempra Energy | 2.400% | 2/1/20 | 58,530 | 57,663 | |
| Sempra Energy | 2.400% | 3/15/20 | 10,265 | 10,114 | |
| Sempra Energy | 2.850% | 11/15/20 | 9,770 | 9,639 | |
| Sempra Energy | 2.900% | 2/1/23 | 16,585 | 16,055 | |
| Southern Co. Gas Capital Corp. | 2.450% | 10/1/23 | 6,570 | 6,182 | |
| Other Utility (0.0%) | |||||
| 17 | Anglian Water Services Financing plc | 2.625% | 6/15/27 | 10,305 | 12,860 |
| 14 | DBNGP Finance Co. Pty Ltd. | 6.000% | 10/11/19 | 6,190 | 4,688 |
| 14 | Energy Partnership Gas Pty Ltd. | 4.250% | 6/15/20 | 3,270 | 2,463 |
| 2,488,661 | |||||
| Total Corporate Bonds (Cost $32,591,114) | 32,044,582 | ||||
| Sovereign Bonds (8.9%) | |||||
| 10 | Abu Dhabi National Energy Co. PJSC | 4.875% | 4/23/30 | 14,350 | 14,613 |
| AK Transneft OJSC Via TransCapitalInvest Ltd. | 8.700% | 8/7/18 | 5,479 | 5,479 | |
| Arab Republic of Egypt | 6.125% | 1/31/22 | 4,985 | 5,052 | |
| 16 | Arab Republic of Egypt | 4.750% | 4/16/26 | 6,000 | 6,860 |
| 16 | Argentine Republic | 3.875% | 1/15/22 | 14,400 | 16,162 |
| Argentine Republic | 5.625% | 1/26/22 | 58,925 | 56,126 | |
| 16 | Argentine Republic | 3.375% | 1/15/23 | 16,309 | 17,386 |
| Argentine Republic | 7.500% | 4/22/26 | 4,950 | 4,715 | |
| Argentine Republic | 6.875% | 1/26/27 | 7,068 | 6,450 | |
| 4 | Argentine Republic | 2.500% | 12/31/38 | 2,300 | 1,383 |
| Argentine Republic | 6.875% | 1/11/48 | 397 | 314 | |
| 10 | Avi Funding Co. Ltd. | 2.850% | 9/16/20 | 11,075 | 10,880 |
| Avi Funding Co. Ltd. | 2.850% | 9/16/20 | 8,875 | 8,706 | |
| 10 | Banco de Costa Rica | 5.250% | 8/12/18 | 4,800 | 4,790 |
| 10 | Banco do Brasil SA | 4.625% | 1/15/25 | 8,000 | 7,582 |
| Banco Nacional de Desenvolvimento Economico e | |||||
| Social | 6.500% | 6/10/19 | 48,800 | 50,069 | |
| 10 | Bank Nederlandse Gemeenten NV | 2.125% | 12/14/20 | 50,737 | 49,725 |
| 10 | Banque Ouest Africaine de Developpement | 5.500% | 5/6/21 | 6,500 | 6,670 |
| 10 | Banque Ouest Africaine de Developpement | 5.000% | 7/27/27 | 17,455 | 16,891 |
| 10 | Bermuda | 5.603% | 7/20/20 | 19,045 | 19,784 |
| 10 | Bermuda | 4.138% | 1/3/23 | 6,000 | 6,082 |
| 10 | Bermuda | 4.854% | 2/6/24 | 5,800 | 5,997 |
| 10 | BOC Aviation Ltd. | 2.375% | 9/15/21 | 14,650 | 13,987 |
| Caixa Economica Federal | 4.500% | 10/3/18 | 21,303 | 21,330 | |
| CCBL Cayman Corp. Ltd. | 3.250% | 7/28/20 | 19,500 | 19,211 | |
| 10 | CDP Financial Inc. | 4.400% | 11/25/19 | 51,960 | 52,980 |
| 10 | CDP Financial Inc. | 3.150% | 7/24/24 | 24,580 | 24,181 |
| Centrais Eletricas Brasileiras SA | 5.750% | 10/27/21 | 7,000 | 7,071 | |
| 4 | City of Buenos Aires | 8.950% | 2/19/21 | 7,410 | 7,570 |
| CNOOC Finance 2015 Australia Pty Ltd. | 2.625% | 5/5/20 | 6,100 | 6,008 | |
| 10 | CNPC General Capital Ltd. | 2.750% | 5/14/19 | 9,765 | 9,716 |
| CNPC General Capital Ltd. | 2.700% | 11/25/19 | 8,000 | 7,924 | |
| Corp. Andina de Fomento | 2.200% | 7/18/20 | 65,526 | 64,127 | |
| Corp. Andina de Fomento | 2.125% | 9/27/21 | 31,495 | 30,237 | |
| Corp. Andina de Fomento | 4.375% | 6/15/22 | 30,472 | 31,341 | |
| Corp. Financiera de Desarrollo SA | 3.250% | 7/15/19 | 2,000 | 2,000 | |
| 10 | Corp. Financiera de Desarrollo SA | 4.750% | 2/8/22 | 4,825 | 4,940 |
| Corp. Financiera de Desarrollo SA | 4.750% | 2/8/22 | 9,500 | 9,724 | |
| 10 | Corp. Nacional del Cobre de Chile | 3.875% | 11/3/21 | 9,896 | 9,967 |
| Corp. Nacional del Cobre de Chile | 3.875% | 11/3/21 | 18,415 | 18,528 | |
| Corp. Nacional del Cobre de Chile | 3.000% | 7/17/22 | 9,269 | 8,993 | |
| Corp. Nacional del Cobre de Chile | 4.500% | 8/13/23 | 8,800 | 8,980 | |
| 10 | CPPIB Capital Inc. | 1.250% | 9/20/19 | 78,037 | 76,727 |
| Development Bank of Kazakhstan JSC | 4.125% | 12/10/22 | 2,705 | 2,664 | |
| 30 | |||||
| Vanguard® Short-Term Investment-Grade Fund | |||||
| Schedule of Investments | |||||
| July 31, 2018 | |||||
| Face | Market | ||||
| Maturity | Amount | Value | |||
| Coupon | Date | ($000) | ($000) | ||
| 10,21 | Dexia Credit Local SA | 2.250% | 1/30/19 | 48,775 | 48,653 |
| 10 | Dexia Credit Local SA | 2.500% | 1/25/21 | 97,550 | 96,188 |
| 10,21 | Dexia Credit Local SA | 1.875% | 9/15/21 | 9,765 | 9,384 |
| 10 | Dexia Credit Local SA | 2.375% | 9/20/22 | 5,800 | 5,603 |
| Dominican Republic | 6.600% | 1/28/24 | 4,125 | 4,355 | |
| Ecopetrol SA | 7.625% | 7/23/19 | 39,000 | 40,560 | |
| 10 | Electricite de France SA | 2.150% | 1/22/19 | 34,190 | 34,103 |
| Emirate of Abu Dhabi | 3.125% | 10/11/27 | 41,730 | 39,294 | |
| 4,10 | ENA Norte Trust | 4.950% | 4/25/28 | 1,356 | 1,368 |
| Equinor ASA | 2.250% | 11/8/19 | 19,500 | 19,304 | |
| Equinor ASA | 2.900% | 11/8/20 | 10,000 | 9,962 | |
| Equinor ASA | 3.150% | 1/23/22 | 2,000 | 1,995 | |
| Export-Import Bank of China | 2.500% | 7/31/19 | 6,395 | 6,350 | |
| Export-Import Bank of India | 2.750% | 4/1/20 | 3,870 | 3,795 | |
| Export-Import Bank of India | 2.750% | 8/12/20 | 5,317 | 5,190 | |
| Export-Import Bank of Korea | 2.875% | 9/17/18 | 14,540 | 14,536 | |
| 12 | Export-Import Bank of Korea | 3.019% | 5/26/19 | 11,506 | 11,521 |
| Export-Import Bank of Korea | 2.375% | 8/12/19 | 14,980 | 14,860 | |
| Export-Import Bank of Korea | 1.500% | 10/21/19 | 56,405 | 55,185 | |
| 12 | Export-Import Bank of Korea | 2.807% | 10/21/19 | 4,510 | 4,505 |
| Export-Import Bank of Korea | 5.125% | 6/29/20 | 20,000 | 20,608 | |
| Export-Import Bank of Korea | 4.000% | 1/29/21 | 2,000 | 2,022 | |
| Export-Import Bank of Korea | 4.375% | 9/15/21 | 5,460 | 5,568 | |
| Export-Import Bank of Korea | 2.750% | 1/25/22 | 2,500 | 2,425 | |
| Export-Import Bank of Korea | 3.000% | 11/1/22 | 16,878 | 16,367 | |
| 12 | Export-Import Bank of Korea | 3.288% | 11/1/22 | 6,950 | 7,002 |
| Federative Republic of Brazil | 5.000% | 1/27/45 | 6,715 | 5,716 | |
| First Abu Dhabi Bank PJSC | 3.000% | 8/13/19 | 19,500 | 19,480 | |
| Fondo MIVIVIENDA SA | 3.375% | 4/2/19 | 4,850 | 4,842 | |
| 10 | Fondo MIVIVIENDA SA | 3.375% | 4/2/19 | 19,500 | 19,502 |
| Gazprom OAO Via Gaz Capital SA | 9.250% | 4/23/19 | 7,405 | 7,693 | |
| ICBCIL Finance Co. Ltd. | 2.600% | 11/13/18 | 4,800 | 4,789 | |
| 12 | ICBCIL Finance Co. Ltd. | 4.025% | 11/13/18 | 5,276 | 5,291 |
| 10 | ICBCIL Finance Co. Ltd. | 2.375% | 5/19/19 | 7,900 | 7,821 |
| ICBCIL Finance Co. Ltd. | 3.250% | 3/17/20 | 5,400 | 5,343 | |
| ICBCIL Finance Co. Ltd. | 3.000% | 4/5/20 | 22,740 | 22,405 | |
| Industrial & Commercial Bank of China Ltd. | 1.875% | 5/23/19 | 4,800 | 4,740 | |
| Industrial & Commercial Bank of China Ltd. | 3.231% | 11/13/19 | 22,300 | 22,207 | |
| 12 | Industrial & Commercial Bank of China Ltd. | 3.113% | 11/8/20 | 20,000 | 20,000 |
| Industrial & Commercial Bank of China Ltd. | 2.905% | 11/13/20 | 7,050 | 6,919 | |
| 22 | Japan Bank for International Cooperation | 2.125% | 7/21/20 | 38,055 | 37,384 |
| 12,22 | Japan Bank for International Cooperation | 2.737% | 7/21/20 | 5,856 | 5,878 |
| 22 | Japan Finance Organization for Municipalities | 4.000% | 1/13/21 | 9,750 | 9,918 |
| 10 | KazMunayGas National Co. JSC | 3.875% | 4/19/22 | 11,120 | 11,037 |
| 10 | KazMunayGas National Co. JSC | 6.375% | 10/24/48 | 2,800 | 2,940 |
| Kingdom of Saudi Arabia | 2.375% | 10/26/21 | 59,110 | 56,844 | |
| 10 | Kingdom of Saudi Arabia | 2.375% | 10/26/21 | 1,615 | 1,552 |
| Kingdom of Saudi Arabia | 5.000% | 4/17/49 | 1,100 | 1,084 | |
| 10,16 | Kingdom of Spain | 1.400% | 4/30/28 | 16,698 | 19,673 |
| 10,16 | Kingdom of Spain | 2.700% | 10/31/48 | 143,043 | 174,755 |
| 12 | Korea Development Bank | 2.686% | 7/3/19 | 37,070 | 37,069 |
| Korea Development Bank | 1.375% | 9/12/19 | 19,715 | 19,318 | |
| Korea Development Bank | 2.500% | 3/11/20 | 4,550 | 4,483 | |
| Korea Development Bank | 4.625% | 11/16/21 | 2,795 | 2,879 | |
| Korea National Oil Corp. | 2.750% | 1/23/19 | 14,650 | 14,631 | |
| 10 | Korea Southern Power Co. Ltd. | 3.000% | 1/29/21 | 19,505 | 19,211 |
| 10 | Korea Western Power Co. Ltd. | 2.875% | 10/10/18 | 7,800 | 7,792 |
| KSA Sukuk Ltd. | 2.894% | 4/20/22 | 79,355 | 77,102 | |
| National Savings Bank | 8.875% | 9/18/18 | 15,360 | 15,426 | |
| 10 | Nederlandse Waterschapsbank NV | 1.250% | 9/9/19 | 19,725 | 19,392 |
| NongHyup Bank | 2.625% | 11/1/18 | 4,300 | 4,294 | |
| North American Development Bank | 2.300% | 10/10/18 | 3,675 | 3,673 | |
| North American Development Bank | 2.400% | 10/26/22 | 2,700 | 2,599 | |
| NTPC Ltd. | 4.250% | 2/26/26 | 5,300 | 5,153 | |
| 31 | |||||
| Vanguard® Short-Term Investment-Grade Fund | |||||
| Schedule of Investments | |||||
| July 31, 2018 | |||||
| Face | Market | ||||
| Maturity | Amount | Value | |||
| Coupon | Date | ($000) | ($000) | ||
| 10 | OCP SA | 5.625% | 4/25/24 | 7,800 | 8,161 |
| 10 | Ontario Teachers' Cadillac Fairview Properties Trust | 3.125% | 3/20/22 | 54,524 | 53,561 |
| 10 | Ontario Teachers' Cadillac Fairview Properties Trust | 3.875% | 3/20/27 | 6,000 | 5,890 |
| Ooredoo International Finance Ltd. | 7.875% | 6/10/19 | 18,391 | 19,160 | |
| Ooredoo Tamweel Ltd. | 3.039% | 12/3/18 | 49,560 | 49,524 | |
| 10 | Perusahaan Penerbit SBSN Indonesia II | 4.000% | 11/21/18 | 4,800 | 4,806 |
| Petrobras Global Finance BV | 6.125% | 1/17/22 | 31,019 | 32,105 | |
| 10 | Petrobras Global Finance BV | 5.299% | 1/27/25 | 31,291 | 29,961 |
| Petrobras Global Finance BV | 7.375% | 1/17/27 | 12,760 | 13,254 | |
| Petroleos Mexicanos | 8.000% | 5/3/19 | 198,437 | 204,872 | |
| Petroleos Mexicanos | 6.000% | 3/5/20 | 1,933 | 2,000 | |
| Petroleos Mexicanos | 5.500% | 1/21/21 | 186,634 | 191,791 | |
| Petroleos Mexicanos | 6.875% | 8/4/26 | 37,757 | 39,907 | |
| Petroleos Mexicanos | 6.500% | 3/13/27 | 20,800 | 21,113 | |
| Petronas Capital Ltd. | 5.250% | 8/12/19 | 10,580 | 10,795 | |
| Petronas Global Sukuk Ltd. | 2.707% | 3/18/20 | 2,050 | 2,024 | |
| 10,16 | Portugal Obrigacoes do Tesouro OT | 2.125% | 10/17/28 | 59,400 | 71,888 |
| Province of Alberta | 1.900% | 12/6/19 | 24,370 | 24,011 | |
| Province of Alberta | 1.750% | 8/26/20 | 1,300 | 1,266 | |
| 10 | Province of Alberta | 1.750% | 8/26/20 | 149,451 | 145,694 |
| Province of Nova Scotia | 8.250% | 7/30/22 | 12,785 | 14,980 | |
| Province of Ontario | 1.625% | 1/18/19 | 71,920 | 71,592 | |
| Province of Ontario | 2.000% | 1/30/19 | 15,393 | 15,345 | |
| Province of Ontario | 1.250% | 6/17/19 | 24,405 | 24,063 | |
| Province of Ontario | 4.400% | 4/14/20 | 25,595 | 26,234 | |
| Province of Ontario | 1.875% | 5/21/20 | 9,770 | 9,586 | |
| 13 | Province of Quebec | 2.460% | 9/21/20 | 17,600 | 17,644 |
| Province of Quebec | 2.750% | 8/25/21 | 16,785 | 16,615 | |
| 4 | Ras Laffan Liquefied Natural Gas Co. Ltd. II | 5.298% | 9/30/20 | 8,368 | 8,549 |
| 4,10 | Ras Laffan Liquefied Natural Gas Co. Ltd. II | 5.298% | 9/30/20 | 2,651 | 2,707 |
| Republic of Angola | 9.375% | 5/8/48 | 3,445 | 3,652 | |
| Republic of Colombia | 7.375% | 3/18/19 | 244,945 | 251,899 | |
| Republic of Colombia | 4.375% | 7/12/21 | 58,400 | 59,889 | |
| Republic of Colombia | 10.375% | 1/28/33 | 2,581 | 4,071 | |
| Republic of Croatia | 6.750% | 11/5/19 | 118,569 | 123,550 | |
| Republic of Guatemala | 5.750% | 6/6/22 | 3,873 | 4,053 | |
| Republic of Hungary | 4.000% | 3/25/19 | 9,800 | 9,873 | |
| Republic of Hungary | 6.250% | 1/29/20 | 114,828 | 120,131 | |
| Republic of Hungary | 6.375% | 3/29/21 | 27,433 | 29,422 | |
| Republic of Hungary | 5.750% | 11/22/23 | 11,505 | 12,526 | |
| Republic of Indonesia | 11.625% | 3/4/19 | 9,595 | 10,084 | |
| Republic of Indonesia | 4.875% | 5/5/21 | 28,504 | 29,427 | |
| 10 | Republic of Indonesia | 3.700% | 1/8/22 | 10,072 | 10,059 |
| Republic of Indonesia | 3.750% | 4/25/22 | 11,700 | 11,676 | |
| Republic of Indonesia | 2.950% | 1/11/23 | 9,735 | 9,323 | |
| Republic of Indonesia | 3.375% | 4/15/23 | 4,300 | 4,177 | |
| Republic of Indonesia | 5.875% | 1/15/24 | 34,090 | 36,867 | |
| Republic of Kazakhstan | 4.875% | 10/14/44 | 6,300 | 6,402 | |
| Republic of Korea | 7.125% | 4/16/19 | 8,800 | 9,053 | |
| 10 | Republic of Latvia | 2.750% | 1/12/20 | 4,000 | 3,975 |
| Republic of Lithuania | 7.375% | 2/11/20 | 144,433 | 153,810 | |
| Republic of Lithuania | 6.125% | 3/9/21 | 48,840 | 52,324 | |
| 10 | Republic of Lithuania | 6.125% | 3/9/21 | 8,205 | 8,789 |
| Republic of Panama | 9.375% | 4/1/29 | 2,345 | 3,324 | |
| Republic of Paraguay | 4.625% | 1/25/23 | 7,200 | 7,350 | |
| Republic of Poland | 6.375% | 7/15/19 | 43,705 | 45,178 | |
| Republic of Poland | 5.125% | 4/21/21 | 28,230 | 29,641 | |
| Republic of Poland | 5.000% | 3/23/22 | 46,710 | 49,284 | |
| Republic of Serbia | 5.875% | 12/3/18 | 71,641 | 72,268 | |
| Republic of Serbia | 4.875% | 2/25/20 | 31,129 | 31,674 | |
| Republic of Serbia | 7.250% | 9/28/21 | 30,720 | 33,594 | |
| Republic of Slovenia | 5.500% | 10/26/22 | 11,740 | 12,701 | |
| Republic of Slovenia | 5.850% | 5/10/23 | 2,100 | 2,327 | |
| 10 | Republic of Slovenia | 5.250% | 2/18/24 | 8,600 | 9,353 |
| 32 | |||||
| Vanguard® Short-Term Investment-Grade Fund | |||||
| Schedule of Investments | |||||
| July 31, 2018 | |||||
| Face | Market | ||||
| Maturity | Amount | Value | |||
| Coupon | Date | ($000) | ($000) | ||
| Republic of the Philippines | 8.375% | 6/17/19 | 32,877 | 34,554 | |
| Republic of the Philippines | 9.500% | 2/2/30 | 10,000 | 14,762 | |
| Republic of Turkey | 7.000% | 3/11/19 | 39,035 | 39,474 | |
| Republic of Turkey | 7.500% | 11/7/19 | 9,750 | 9,982 | |
| Republic of Turkey | 7.000% | 6/5/20 | 163,783 | 166,444 | |
| Republic of Turkey | 5.750% | 3/22/24 | 7,285 | 6,893 | |
| Republic of Turkey | 4.250% | 4/14/26 | 6,900 | 5,753 | |
| Republic of Turkey | 4.875% | 10/9/26 | 810 | 695 | |
| Republic of Turkey | 6.125% | 10/24/28 | 7,863 | 7,185 | |
| Republic of Turkey | 5.750% | 5/11/47 | 2,950 | 2,305 | |
| Russian Federation | 4.375% | 3/21/29 | 2,600 | 2,543 | |
| Russian Federation | 5.250% | 6/23/47 | 36,400 | 36,155 | |
| SABIC Capital II BV | 2.625% | 10/3/18 | 9,600 | 9,582 | |
| Sinopec Group Overseas Development 2013 Ltd. | 2.500% | 10/17/18 | 9,765 | 9,753 | |
| 10 | Sinopec Group Overseas Development 2013 Ltd. | 4.375% | 10/17/23 | 20,200 | 20,573 |
| Sinopec Group Overseas Development 2013 Ltd. | 4.375% | 10/17/23 | 6,200 | 6,322 | |
| Sinopec Group Overseas Development 2014 Ltd. | 4.375% | 4/10/24 | 13,200 | 13,458 | |
| Sinopec Group Overseas Development 2015 Ltd. | 2.500% | 4/28/20 | 4,800 | 4,722 | |
| 10 | Sinopec Group Overseas Development 2017 Ltd. | 2.375% | 4/12/20 | 35,215 | 34,585 |
| 10 | Slovak Government International Bond | 4.375% | 5/21/22 | 5,500 | 5,720 |
| Slovak Republic | 4.375% | 5/21/22 | 3,000 | 3,119 | |
| 12 | State Bank of India | 3.287% | 4/6/20 | 42,900 | 42,993 |
| State Grid Overseas Investment 2014 Ltd. | 2.750% | 5/7/19 | 2,234 | 2,225 | |
| State Grid Overseas Investment 2016 Ltd. | 2.250% | 5/4/20 | 2,800 | 2,741 | |
| State of Israel | 4.000% | 6/30/22 | 22,255 | 22,799 | |
| State of Israel | 3.150% | 6/30/23 | 15,800 | 15,589 | |
| State of Israel | 2.875% | 3/16/26 | 9,635 | 9,148 | |
| State of Israel | 3.250% | 1/17/28 | 36,514 | 35,241 | |
| State of Kuwait | 2.750% | 3/20/22 | 42,883 | 41,827 | |
| State of Qatar | 6.550% | 4/9/19 | 14,721 | 15,092 | |
| State of Qatar | 5.250% | 1/20/20 | 39,600 | 40,725 | |
| State of Qatar | 3.875% | 4/23/23 | 3,800 | 3,813 | |
| State of Qatar | 5.103% | 4/23/48 | 3,100 | 3,163 | |
| Sultanate of Oman | 5.375% | 3/8/27 | 6,100 | 5,919 | |
| 10 | Temasek Financial I Ltd. | 4.300% | 10/25/19 | 7,250 | 7,359 |
| 10 | Temasek Financial I Ltd. | 2.375% | 1/23/23 | 5,000 | 4,788 |
| 23 | United Mexican States | 8.000% | 12/7/23 | 5,170,001 | 280,449 |
| 23 | United Mexican States | 10.000% | 12/5/24 | 326,000 | 19,441 |
| YPF SA | 8.875% | 12/19/18 | 6,231 | 6,301 | |
| Total Sovereign Bonds (Cost $5,404,285) | 5,346,476 | ||||
| Taxable Municipal Bonds (0.1%) | |||||
| California Department of Water Resources Water | |||||
| System Revenue (Central Valley Project) | 1.871% | 12/1/19 | 255 | 252 | |
| California GO | 6.200% | 10/1/19 | 13,650 | 14,207 | |
| JobsOhio Beverage System Statewide Liquor Profits | |||||
| Revenue | 2.217% | 1/1/19 | 1,850 | 1,848 | |
| Louisiana Local Government Environmental Facilities & | |||||
| Community Development Authority Revenue 2010- | |||||
| EGSL | 3.220% | 2/1/21 | 6,523 | 6,528 | |
| Louisiana Local Government Environmental Facilities & | |||||
| Community Development Authority Revenue 2010- | |||||
| ELL | 3.450% | 2/1/22 | 7,866 | 7,883 | |
| San Jose California Redevelopment Agency Successor | |||||
| Agency Tax Allocation | 1.898% | 8/1/18 | 21,224 | 21,224 | |
| San Jose California Redevelopment Agency Successor | |||||
| Agency Tax Allocation | 2.098% | 8/1/19 | 16,589 | 16,495 | |
| University of California Revenue | 1.745% | 5/15/19 | 6,250 | 6,207 | |
| Total Taxable Municipal Bonds (Cost $74,664) | 74,644 | ||||
| 33 | |||||
| Vanguard® Short-Term Investment-Grade Fund | ||||||
| Schedule of Investments | ||||||
| July 31, 2018 | ||||||
| Face | Market | |||||
| Maturity | Amount | Value | ||||
| Coupon | Date | ($000) | ($000) | |||
| Tax-Exempt Municipal Bonds (0.0%) | ||||||
| Calhoun County TX Navigation Industrial Development | ||||||
| Authority Port Revenue (BP plc) VRDO (Cost | ||||||
| $10,000) | 1.040% | 8/7/18 | 10,000 | 10,000 | ||
| Convertible Preferred Stocks (0.0%) | ||||||
| §,18 | Lehman Brothers Holdings Inc. Pfd. (Cost $28,923) | 7.250% | Perpetual | 29,160 | — | |
| Shares | ||||||
| Temporary Cash Investments (4.4%) | ||||||
| Money Market Fund (2.1%) | ||||||
| 24 | Vanguard Market Liquidity Fund | 2.145% | 12,376,473 | 1,237,647 | ||
| Face | ||||||
| Amount | ||||||
| ($000) | ||||||
| Certificates of Deposit (0.4%) | ||||||
| Cooperatieve Rabobank UA | 1.980% | 10/25/19 | 248,845 | 245,759 | ||
| Commercial Paper (1.9%) | ||||||
| 10,25 | Air Liquide US LLC | 2.471% | 11/19/18 | 19,500 | 19,349 | |
| 10,25 | CNH Industrial Capital LLC | 2.952% | 10/22/18 | 2,920 | 2,900 | |
| 25 | CNH Industrial Capital LLC | 2.952% | 10/23/18 | 24,340 | 24,169 | |
| 25 | Engie SA | 1.937% | 11/8/18 | 46,455 | 46,183 | |
| 25 | Eni Finance USA Inc | 2.365% | 11/30/18 | 48,740 | 48,311 | |
| 25 | Eni Finance USA Inc | 2.490% | 1/29/19 | 19,500 | 19,231 | |
| 10,25 | Eni Finance USA Inc | 2.489% | 2/1/19 | 147,190 | 145,112 | |
| 10,25 | ERP Operating LP | 2.339% | 10/1/18 | 13,875 | 13,819 | |
| 10,25 | JP Morgan Securities LLC | 2.344% | 1/28/19 | 216,030 | 213,297 | |
| 25 | KFW | 2.103% | 1/17/19 | 243,830 | 241,084 | |
| 10,25 | KFW | 2.098% | 1/18/19 | 97,545 | 96,441 | |
| 10,25 | KFW | 2.103% | 1/22/19 | 292,550 | 289,159 | |
| 10,25 | Vodafone Group plc | 1.770% | 9/4/18 | 7,679 | 7,665 | |
| 1,166,720 | ||||||
| Total Temporary Cash Investments (Cost $2,654,929) | 2,650,126 | |||||
| Notional | ||||||
| Amount on | ||||||
| Underlying | ||||||
| Expiration | Exercise | Swap | ||||
| Counterparty | Date | Rate | ($000) | |||
| Options Purchased (0.0%) | ||||||
| Credit Default Swaptions Purchased (0.0%) | ||||||
| Put Swaptions on CDX-NA-IG-S30-V1 5- | ||||||
| Year Index | JPMC | 8/15/18 | 65.00% | 322,345 | 58 | |
| Put Swaptions on CDX-NA-IG-S30-V1 5- | ||||||
| Year Index | DBAG | 8/15/18 | 70.00% | 189,900 | 11 | |
| Total Credit Default Swaptions Purchased (Cost $407) | 69 | |||||
| Total Investments (99.6%) (Cost $60,931,880) | 60,072,359 | |||||
| 34 | ||||||
| Vanguard® Short-Term Investment-Grade Fund | |||||
| Schedule of Investments | |||||
| July 31, 2018 | |||||
| Notional | |||||
| Expiration | Exercise | Amount | |||
| Date | Contracts | Price | ($000) | ||
| Liability for Options Written (0.0%) | |||||
| Written Options on Futures (0.0%) | |||||
| Call Options on 10-Year U.S. Treasury | |||||
| Note Futures Contracts | 8/10/18 | 522 | USD 119.25 | 62,249 | (204) |
| Call Options on 10-Year U.S. Treasury | |||||
| Note Futures Contracts | 8/24/18 | 525 | USD 120.00 | 63,000 | (98) |
| Call Options on 10-Year U.S. Treasury | |||||
| Note Futures Contracts | 8/27/18 | 1,566 | USD 119.50 | 187,137 | (587) |
| Put Options on 10-Year U.S. Treasury | |||||
| Note Futures Contracts | 8/10/18 | 522 | USD 119.25 | 62,249 | (114) |
| Put Options on 10-Year U.S. Treasury | |||||
| Note Futures Contracts | 8/24/18 | 525 | USD 120.00 | 63,000 | (402) |
| Put Options on 10-Year U.S. Treasury | |||||
| Note Futures Contracts | 8/24/18 | 1,044 | USD 119.00 | 124,236 | (245) |
| Put Options on 10-Year U.S. Treasury | |||||
| Note Futures Contracts | 8/27/18 | 522 | USD 119.50 | 62,379 | (237) |
| Total Written Options on Futures (Premiums Received $2,164) | (1,887) | ||||
| Notional | |||||
| Amount on | |||||
| Underlying | |||||
| Expiration | Exercise | Swap | |||
| Counterparty | Date | Rate | ($000) | ||
| Written Swaptions on Credit Default Index (0.0%) | |||||
| Call Swaptions on CDX-NA-IG-S30-V1 5- | |||||
| Year Index | DBAG | 8/15/18 | 65.00% | 189,900 | (570) |
| Call Swaptions on CDX-NA-IG-S30-V1 5- | |||||
| Year Index | GSI | 8/15/18 | 67.50% | 129,300 | (524) |
| Put Swaptions on CDX-NA-IG-S30-V1 5- | |||||
| Year Index | DBAG | 8/15/18 | 65.00% | 189,900 | (34) |
| Put Swaptions on CDX-NA-IG-S30-V1 5- | |||||
| Year Index | GSI | 8/15/18 | 72.50% | 129,300 | (3) |
| Put Swaptions on CDX-NA-IG-S30-V1 5- | |||||
| Year Index | JPMC | 9/19/18 | 75.00% | 322,345 | (105) |
| Total Written Swaptions on Credit Default Index (Premiums Received $1,191) | (1,236) | ||||
| Total Liability for Options Written (Premiums Received $3,355) | (3,123) | ||||
| Other Assets and Liabilities—Net (0.4%) | 263,664 | ||||
| Net Assets (100%) | 60,332,900 | ||||
§ Security value determined using significant unobservable inputs.
1 Securities with a value of $26,767,000 have been segregated as initial margin for open cleared swap contracts.
2 Securities with a value of $15,783,000 have been segregated as collateral for open forward currency contracts and open over-the-counter swap
contracts.
3 Securities with a value of $25,848,000 have been segregated as initial margin for open futures contracts.
4 The average or expected maturity is shorter than the final maturity shown because of the possibility of interim principal payments and
prepayments or the possibility of the issue being called.
5 The issuer was placed under federal conservatorship in September 2008; since that time, its daily operations have been managed by the Federal
Housing Finance Agency and it receives capital from the U.S. Treasury, as needed to maintain a positive net worth, in exchange for senior
preferred stock.
6 Adjustable-rate security based upon one-year Constant Maturity Treasury yield plus spread.
7 Adjustable-rate security based upon 12-month USD LIBOR plus spread.
8 Inverse floating rate Interest-only security whose interest rate is derived by subtracting 1-month USD LIBOR from a given cap.
9 Interest-only security.
10 Security exempt from registration under Rule 144A of the Securities Act of 1933. Such securities may be sold in transactions exempt from
registration, normally to qualified institutional buyers. At July 31, 2018, the aggregate value of these securities was $13,435,042,000,
representing 22.3% of net assets.
11 Security made only partial principal and/or interest payments during the period ended July 31, 2018.
35
Vanguard® Short-Term Investment-Grade Fund
Schedule of Investments
July 31, 2018
12 Adjustable-rate security based upon 3-month USD LIBOR plus spread.
13 Adjustable-rate security based upon 1-month USD LIBOR plus spread.
14 Face amount denominated in Australian dollars.
15 Adjustable-rate security based upon 3-month AUD Australian Bank Bill Rate plus spread.
16 Face amount denominated in euro.
17 Face amount denominated in British pounds.
18 Non-income-producing security--security in default.
19 Scheduled principal and interest payments are guaranteed by bank letter of credit.
20 Scheduled principal and interest payments are guaranteed by Municipal Bond Insurance Association.
21 Guaranteed by multiple countries.
22 Guaranteed by the Government of Japan.
23 Face amount denominated in Mexican peso.
24 Affiliated money market fund available only to Vanguard funds and certain trusts and accounts managed by Vanguard. Rate shown is the 7-day
yield.
25 Security exempt from registration under Section 4(2) of the Securities Act of 1933. Such securities may be sold in transactions exempt from
registration only to dealers in that program or other "accredited investors." At July 31, 2018, the aggregate value of these securities was
$1,166,720,000, representing 1.9% of net assets.
DBAG—Deutsche Bank AG.
GO—General Obligation Bond.
GSI—Goldman Sachs International.
JPMC—JP Morgan Chase Bank.
REMICS—Real Estate Mortgage Investment Conduits.
USD—U.S. dollar.
VRDO—Variable Rate Demand Obligation.
36
| Vanguard® Intermediate-Term Investment-Grade Fund | |||||
| Schedule of Investments | |||||
| July 31, 2018 | |||||
| Face | Market | ||||
| Maturity | Amount | Value | |||
| Coupon | Date | ($000) | ($000) | ||
| U.S. Government and Agency Obligations (10.0%) | |||||
| U.S. Government Securities (9.4%) | |||||
| 1 | United States Treasury Note/Bond | 1.500% | 2/28/23 | 613,000 | 577,943 |
| United States Treasury Note/Bond | 2.625% | 2/28/23 | 265,000 | 262,639 | |
| 1,2 | United States Treasury Note/Bond | 1.500% | 3/31/23 | 250,000 | 235,470 |
| United States Treasury Note/Bond | 2.500% | 3/31/23 | 375,000 | 369,435 | |
| 1,2 | United States Treasury Note/Bond | 1.750% | 5/15/23 | 170,000 | 161,712 |
| United States Treasury Note/Bond | 1.625% | 5/31/23 | 31,000 | 29,305 | |
| 1 | United States Treasury Note/Bond | 2.750% | 5/31/23 | 150,000 | 149,391 |
| United States Treasury Note/Bond | 2.000% | 2/15/25 | 100,000 | 94,531 | |
| United States Treasury Note/Bond | 2.875% | 4/30/25 | 200,000 | 199,438 | |
| United States Treasury Note/Bond | 2.750% | 6/30/25 | 90,000 | 89,015 | |
| United States Treasury Note/Bond | 2.000% | 8/15/25 | 79,900 | 75,206 | |
| United States Treasury Note/Bond | 1.625% | 2/15/26 | 161,000 | 146,737 | |
| United States Treasury Note/Bond | 1.500% | 8/15/26 | 60,015 | 53,826 | |
| 1 | United States Treasury Note/Bond | 2.250% | 11/15/27 | 30,000 | 28,275 |
| United States Treasury Note/Bond | 2.750% | 2/15/28 | 41,152 | 40,425 | |
| 3 | United States Treasury Note/Bond | 2.875% | 5/15/28 | 200,000 | 198,562 |
| 2,711,910 | |||||
| Nonconventional Mortgage-Backed Securities (0.6%) | |||||
| 4,5,6 | Fannie Mae REMICS | 3.986% | 3/25/46 | 37,065 | 6,102 |
| 5,7 | Fannie Mae REMICS | 4.000% | 2/25/48 | 22,446 | 5,433 |
| 4,5,6 | Fannie Mae REMICS | 4.086% | 5/25/47 | 52,254 | 8,537 |
| 4,5,6 | Fannie Mae REMICS | 4.136% | 10/25/47 | 33,510 | 6,319 |
| 5,7 | Fannie Mae REMICS | 4.500% | 9/25/47 | 17,532 | 4,168 |
| 5,7 | Fannie Mae REMICS | 5.000% | 6/25/45 | 24,164 | 5,055 |
| 5,7 | Fannie Mae REMICS | 5.500% | 2/25/46 | 13,083 | 2,843 |
| 5,7 | Fannie Mae REMICS | 6.000% | 12/25/47 | 15,369 | 3,690 |
| 5,7 | Fannie Mae REMICS 2012-138 | 4.500% | 12/25/42 | 9,900 | 2,464 |
| 5,7 | Fannie Mae REMICS 2013-20 | 4.000% | 3/25/43 | 23,548 | 5,156 |
| 5,7 | Fannie Mae REMICS 2013-39D | 4.000% | 6/25/42 | 10,290 | 1,922 |
| 5,7 | Fannie Mae REMICS 2013-43 | 4.000% | 5/25/43 | 30,232 | 6,594 |
| 5,7 | Fannie Mae REMICS 2015-22 | 6.000% | 4/25/45 | 13,686 | 3,197 |
| 5,7 | Fannie Mae REMICS 2015-28 | 4.000% | 5/25/45 | 11,364 | 2,595 |
| 5,7 | Fannie Mae REMICS 2016-3 | 4.000% | 2/25/46 | 26,366 | 5,951 |
| 5,7 | Fannie Mae REMICS 2016-3 | 6.000% | 2/25/46 | 12,150 | 2,882 |
| 4,5,8 | Freddie Mac Non Gold Pool | 3.375% | 8/1/32 | 222 | 228 |
| 4,5,9 | Freddie Mac Non Gold Pool | 3.643% | 9/1/32 | 136 | 139 |
| 5,7 | Freddie Mac REMICS | 3.500% | 12/15/42 | 39,990 | 7,647 |
| 5,7 | Freddie Mac REMICS | 4.000% | 10/15/42–12/15/47 | 37,779 | 7,502 |
| 4,5,6 | Freddie Mac REMICS | 4.078% | 1/15/42–1/15/45 | 25,746 | 3,975 |
| 4,5,6 | Freddie Mac REMICS | 4.128% | 12/15/47 | 12,971 | 2,333 |
| 7 | Ginnie Mae REMICS | 3.500% | 7/20/42 | 20,728 | 3,498 |
| 4,6 | Ginnie Mae REMICS | 3.564% | 8/20/45 | 22,049 | 3,137 |
| 7 | Ginnie Mae REMICS | 4.000% | 3/20/42–1/20/48 | 92,502 | 20,446 |
| 4,6 | Ginnie Mae REMICS | 4.014% | 9/20/46 | 16,204 | 2,826 |
| 4,6 | Ginnie Mae REMICS | 4.114% | 9/20/47–12/20/47 | 119,741 | 20,169 |
| 7 | Ginnie Mae REMICS | 4.500% | 3/20/43–1/20/48 | 95,362 | 23,227 |
| 7 | Ginnie Mae REMICS | 5.000% | 2/20/40 | 21,371 | 4,807 |
| 172,842 | |||||
| Total U.S. Government and Agency Obligations (Cost $2,950,451) | 2,884,752 | ||||
| Asset-Backed/Commercial Mortgage-Backed Securities (18.8%) | |||||
| 4 | Ally Auto Receivables Trust 2015-1 | 2.260% | 10/15/20 | 1,545 | 1,541 |
| 4 | Ally Auto Receivables Trust 2017-5 | 2.220% | 10/17/22 | 6,140 | 6,020 |
| 4 | Ally Auto Receivables Trust 2018-1 | 2.350% | 6/15/22 | 18,930 | 18,765 |
| 4 | Ally Auto Receivables Trust 2018-1 | 2.530% | 2/15/23 | 5,050 | 4,955 |
| 4 | Ally Master Owner Trust Series 2017-3 | 2.040% | 6/15/22 | 19,100 | 18,740 |
| 4 | Ally Master Owner Trust Series 2018-2 | 3.290% | 5/15/23 | 20,040 | 20,076 |
| 4,10 | American Homes 4 Rent 2014-SFR2 | 3.786% | 10/17/36 | 3,933 | 3,945 |
| 4,10 | American Homes 4 Rent 2014-SFR2 | 4.290% | 10/17/36 | 1,060 | 1,075 |
| 4,10 | American Homes 4 Rent 2014-SFR3 | 3.678% | 12/17/36 | 6,630 | 6,613 |
| 4,10 | American Homes 4 Rent 2015-SFR1 | 3.467% | 4/17/52 | 5,164 | 5,083 |
| 37 | |||||
| Vanguard® Intermediate-Term Investment-Grade Fund | |||||
| Schedule of Investments | |||||
| July 31, 2018 | |||||
| Face | Market | ||||
| Maturity | Amount | Value | |||
| Coupon | Date | ($000) | ($000) | ||
| 4,10 | American Homes 4 Rent 2015-SFR2 | 3.732% | 10/17/45 | 2,788 | 2,785 |
| 4,10 | American Homes 4 Rent 2015-SFR2 | 4.295% | 10/17/45 | 1,070 | 1,084 |
| 10 | American Tower Trust #1 | 3.652% | 3/23/48 | 5,300 | 5,184 |
| 4,10 | Americold 2010 LLC Trust Series 2010-ARTA | 4.954% | 1/14/29 | 6,402 | 6,660 |
| 4,10 | Americold 2010 LLC Trust Series 2010-ARTA | 6.811% | 1/14/29 | 3,540 | 3,739 |
| 4 | AmeriCredit Automobile Receivables Trust 2014-1 | 2.150% | 3/9/20 | 86 | 86 |
| 4 | AmeriCredit Automobile Receivables Trust 2014-2 | 2.180% | 6/8/20 | 170 | 170 |
| 4 | AmeriCredit Automobile Receivables Trust 2015-3 | 2.080% | 9/8/20 | 2,110 | 2,107 |
| 4 | AmeriCredit Automobile Receivables Trust 2015-3 | 3.340% | 8/8/21 | 3,200 | 3,205 |
| 4 | AmeriCredit Automobile Receivables Trust 2016-1 | 1.810% | 10/8/20 | 2,177 | 2,174 |
| 4 | AmeriCredit Automobile Receivables Trust 2016-1 | 3.590% | 2/8/22 | 2,980 | 2,992 |
| 4 | AmeriCredit Automobile Receivables Trust 2016-2 | 3.650% | 5/9/22 | 3,280 | 3,297 |
| 4 | AmeriCredit Automobile Receivables Trust 2016-3 | 2.710% | 9/8/22 | 3,390 | 3,329 |
| 4 | AmeriCredit Automobile Receivables Trust 2016-4 | 2.410% | 7/8/22 | 7,205 | 7,085 |
| 4 | AmeriCredit Automobile Receivables Trust 2017-3 | 1.690% | 12/18/20 | 37,017 | 36,890 |
| 4,10 | AOA 2015-1177 Mortgage Trust | 2.957% | 12/13/29 | 1,330 | 1,310 |
| 4,10 | Applebee's Funding LLC/IHOP Funding LLC | 4.277% | 9/5/44 | 1,251 | 1,234 |
| 4,10 | ARL Second LLC 2014-1A | 2.920% | 6/15/44 | 5,344 | 5,232 |
| 4,10 | Aventura Mall Trust 2013-AVM | 3.743% | 12/5/32 | 1,482 | 1,504 |
| 4,10 | Aventura Mall Trust 2018-AVM | 4.112% | 7/5/40 | 36,180 | 37,040 |
| 4,10 | Avis Budget Rental Car Funding AESOP LLC 2013-1A | 1.920% | 9/20/19 | 1,827 | 1,826 |
| 4,10 | Avis Budget Rental Car Funding AESOP LLC 2013-2A | 2.970% | 2/20/20 | 10,300 | 10,305 |
| 4,10 | Avis Budget Rental Car Funding AESOP LLC 2015-1A | 2.500% | 7/20/21 | 14,310 | 14,104 |
| 4,10 | Avis Budget Rental Car Funding AESOP LLC 2015-2A | 2.630% | 12/20/21 | 15,725 | 15,491 |
| 4,10 | Avis Budget Rental Car Funding AESOP LLC 2016-1A | 2.990% | 6/20/22 | 1,540 | 1,521 |
| 4,10 | Avis Budget Rental Car Funding AESOP LLC 2017-1A | 3.070% | 9/20/23 | 4,220 | 4,141 |
| 4,10 | Avis Budget Rental Car Funding AESOP LLC 2017-2A | 2.970% | 3/20/24 | 6,370 | 6,192 |
| 4,10 | Avis Budget Rental Car Funding AESOP LLC 2018-1A | 3.700% | 9/20/24 | 6,200 | 6,203 |
| 4,10 | Avis Budget Rental Car Funding AESOP LLC 2018-1A | 4.730% | 9/20/24 | 1,110 | 1,104 |
| 4,10 | BAMLL Commercial Mortgage Securities Trust 2012- | ||||
| PARK | 2.959% | 12/10/30 | 4,975 | 4,876 | |
| 4 | Banc of America Commercial Mortgage Trust 2015- | ||||
| UBS7 | 3.429% | 9/15/48 | 3,350 | 3,351 | |
| 4 | Banc of America Commercial Mortgage Trust 2015- | ||||
| UBS7 | 3.705% | 9/15/48 | 1,806 | 1,804 | |
| 4 | Banc of America Commercial Mortgage Trust 2015- | ||||
| UBS7 | 4.362% | 9/15/48 | 360 | 358 | |
| 4 | Banc of America Commercial Mortgage Trust 2017- | ||||
| BNK3 | 3.574% | 2/15/50 | 1,520 | 1,496 | |
| 4 | BANK 2017 - BNK4 | 3.625% | 5/15/50 | 3,435 | 3,393 |
| 4 | BANK 2017 - BNK5 | 3.390% | 6/15/60 | 3,585 | 3,472 |
| 4 | BANK 2017 - BNK6 | 3.254% | 7/15/60 | 4,620 | 4,430 |
| 4 | BANK 2017 - BNK6 | 3.518% | 7/15/60 | 5,740 | 5,612 |
| 4 | BANK 2017 - BNK6 | 3.741% | 7/15/60 | 1,310 | 1,281 |
| 4 | BANK 2017 - BNK7 | 3.435% | 9/15/60 | 5,490 | 5,330 |
| 4 | BANK 2017 - BNK8 | 3.488% | 11/15/50 | 11,520 | 11,234 |
| 4 | BANK 2017 - BNK9 | 3.538% | 11/15/54 | 8,545 | 8,357 |
| 4 | BANK 2018 - BN12 | 4.255% | 5/15/61 | 3,960 | 4,088 |
| 4,11 | BANK 2018 - BN13 | 4.217% | 8/15/61 | 7,560 | 7,786 |
| 4 | BANK 2018 - BNK10 | 3.641% | 2/15/61 | 4,430 | 4,425 |
| 4 | BANK 2018 - BNK10 | 3.688% | 2/15/61 | 11,760 | 11,646 |
| 4,10,12 Bank of America Student Loan Trust 2010-1A | 3.135% | 2/25/43 | 3,897 | 3,916 | |
| Bank of Nova Scotia | 1.875% | 4/26/21 | 32,820 | 31,666 | |
| 4 | BENCHMARK 2018-B1 Mortgage Trust | 3.602% | 1/15/51 | 2,910 | 2,900 |
| 4 | BENCHMARK 2018-B1 Mortgage Trust | 3.666% | 1/15/51 | 6,570 | 6,501 |
| 4 | BENCHMARK 2018-B1 Mortgage Trust | 3.878% | 1/15/51 | 2,350 | 2,322 |
| 4 | BENCHMARK 2018-B1 Mortgage Trust | 4.059% | 1/15/51 | 6,320 | 6,277 |
| 4 | BENCHMARK 2018-B1 Mortgage Trust | 4.119% | 1/15/51 | 9,810 | 9,588 |
| 4 | BENCHMARK 2018-B2 Mortgage Trust | 3.882% | 2/15/51 | 33,400 | 33,559 |
| 4 | BENCHMARK 2018-B3 Mortgage Trust | 4.025% | 4/10/51 | 7,230 | 7,344 |
| 4,11 | BENCHMARK 2018-B5 Mortgage Trust | 4.208% | 7/15/51 | 5,920 | 6,098 |
| 4 | BMW Vehicle Lease Trust 2017-2 | 2.070% | 10/20/20 | 11,120 | 11,003 |
| 4 | BMW Vehicle Lease Trust 2017-2 | 2.190% | 3/22/21 | 3,460 | 3,412 |
| 4 | BMW Vehicle Owner Trust 2018-A | 2.510% | 6/25/24 | 4,010 | 3,955 |
| 38 | |||||
| Vanguard® Intermediate-Term Investment-Grade Fund | |||||
| Schedule of Investments | |||||
| July 31, 2018 | |||||
| Face | Market | ||||
| Maturity | Amount | Value | |||
| Coupon | Date | ($000) | ($000) | ||
| 4,12 | Brazos Higher Education Authority Inc. Series 2005-3 | 2.535% | 6/25/26 | 3,248 | 3,227 |
| 4,12 | Brazos Higher Education Authority Inc. Series 2011-1 | 3.130% | 2/25/30 | 6,158 | 6,196 |
| 4,10 | CAL Funding II Ltd. Series 2012-1A | 3.470% | 10/25/27 | 1,063 | 1,047 |
| 4,10 | CAL Funding II Ltd. Series 2013-1A | 3.350% | 3/27/28 | 1,657 | 1,639 |
| 4,10 | California Republic Auto Receivables Trust 2015-4 | 2.580% | 6/15/21 | 5,254 | 5,250 |
| 4 | California Republic Auto Receivables Trust 2016-1 | 3.430% | 2/15/22 | 8,000 | 7,976 |
| 4 | California Republic Auto Receivables Trust 2016-1 | 4.560% | 12/15/22 | 8,320 | 8,364 |
| 4 | California Republic Auto Receivables Trust 2016-2 | 1.560% | 7/15/20 | 3,163 | 3,159 |
| 4 | California Republic Auto Receivables Trust 2016-2 | 1.830% | 12/15/21 | 2,430 | 2,407 |
| 4 | California Republic Auto Receivables Trust 2016-2 | 2.520% | 5/16/22 | 1,120 | 1,101 |
| 4 | California Republic Auto Receivables Trust 2016-2 | 3.510% | 3/15/23 | 540 | 533 |
| 4,10 | Canadian Pacer Auto Receivables Trust A Series 2017 | 2.050% | 3/19/21 | 4,910 | 4,849 |
| 4,10 | Canadian Pacer Auto Receivables Trust A Series 2017 | 2.286% | 1/19/22 | 3,450 | 3,370 |
| 4,10 | Canadian Pacer Auto Receivables Trust A Series 2018 | 3.220% | 9/19/22 | 3,310 | 3,290 |
| 4 | Capital Auto Receivables Asset Trust 2014-3 | 3.940% | 4/20/23 | 2,410 | 2,415 |
| 4 | Capital Auto Receivables Asset Trust 2015-3 | 1.940% | 1/21/20 | 1,156 | 1,155 |
| 4 | Capital Auto Receivables Asset Trust 2015-3 | 2.430% | 9/21/20 | 2,430 | 2,426 |
| 4 | Capital Auto Receivables Asset Trust 2015-3 | 2.900% | 12/21/20 | 2,700 | 2,700 |
| 4 | Capital Auto Receivables Asset Trust 2016-2 | 3.160% | 11/20/23 | 360 | 359 |
| 4 | Capital Auto Receivables Asset Trust 2016-3 | 2.350% | 9/20/21 | 1,630 | 1,603 |
| 4 | Capital Auto Receivables Asset Trust 2016-3 | 2.650% | 1/20/24 | 900 | 892 |
| 4,10 | Capital Auto Receivables Asset Trust 2017-1 | 2.020% | 8/20/21 | 5,830 | 5,779 |
| 4,10 | Capital Auto Receivables Asset Trust 2017-1 | 2.220% | 3/21/22 | 4,060 | 3,986 |
| 4 | Capital One Multi-Asset Execution Trust 2017-A4 | 1.990% | 7/17/23 | 40,235 | 39,391 |
| 4,10,13 CARDS II Trust 2017-2A | 2.332% | 10/17/22 | 11,460 | 11,462 | |
| 4,10 | CARDS II Trust 2018-2A | 3.047% | 4/17/23 | 16,110 | 15,952 |
| 4 | CarMax Auto Owner Trust 2014-4 | 1.810% | 7/15/20 | 3,132 | 3,124 |
| 4 | CarMax Auto Owner Trust 2015-2 | 3.040% | 11/15/21 | 2,010 | 2,006 |
| 4 | CarMax Auto Owner Trust 2015-3 | 2.280% | 4/15/21 | 1,945 | 1,928 |
| 4 | CarMax Auto Owner Trust 2015-3 | 2.680% | 6/15/21 | 2,795 | 2,784 |
| 4 | CarMax Auto Owner Trust 2016-2 | 2.160% | 12/15/21 | 1,930 | 1,893 |
| 4 | CarMax Auto Owner Trust 2016-2 | 3.250% | 11/15/22 | 2,160 | 2,141 |
| 4 | CarMax Auto Owner Trust 2016-3 | 2.200% | 6/15/22 | 1,930 | 1,883 |
| 4 | CarMax Auto Owner Trust 2016-3 | 2.940% | 1/17/23 | 1,360 | 1,338 |
| 4 | CarMax Auto Owner Trust 2017-4 | 2.110% | 10/17/22 | 6,110 | 6,017 |
| 4 | CarMax Auto Owner Trust 2017-4 | 2.330% | 5/15/23 | 3,460 | 3,376 |
| 4 | CarMax Auto Owner Trust 2017-4 | 2.460% | 8/15/23 | 1,640 | 1,591 |
| 4 | CarMax Auto Owner Trust 2017-4 | 2.700% | 10/16/23 | 1,640 | 1,594 |
| 4 | CarMax Auto Owner Trust 2018-1 | 2.230% | 5/17/21 | 14,210 | 14,151 |
| 4 | CarMax Auto Owner Trust 2018-1 | 2.480% | 11/15/22 | 19,230 | 19,011 |
| 4 | CarMax Auto Owner Trust 2018-1 | 2.640% | 6/15/23 | 3,040 | 2,995 |
| 4 | CarMax Auto Owner Trust 2018-1 | 2.830% | 9/15/23 | 5,020 | 4,917 |
| 4 | CarMax Auto Owner Trust 2018-1 | 2.950% | 11/15/23 | 1,560 | 1,532 |
| 4 | CarMax Auto Owner Trust 2018-2 | 3.370% | 10/16/23 | 2,140 | 2,132 |
| 4 | CarMax Auto Owner Trust 2018-2 | 3.570% | 12/15/23 | 3,090 | 3,079 |
| 4 | CarMax Auto Owner Trust 2018-2 | 3.990% | 4/15/25 | 2,390 | 2,381 |
| 4 | CarMax Auto Owner Trust 2018-3 | 3.130% | 6/15/23 | 13,490 | 13,479 |
| 4 | CarMax Auto Owner Trust 2018-3 | 3.270% | 3/15/24 | 6,740 | 6,737 |
| 4 | CD 2016-CD1 Commercial Mortgage Trust | 2.724% | 8/10/49 | 17,440 | 16,255 |
| 4 | CD 2016-CD1 Commercial Mortgage Trust | 3.631% | 8/10/49 | 5,510 | 5,154 |
| 4 | CD 2017-CD3 Commercial Mortgage Trust | 3.631% | 2/10/50 | 9,825 | 9,732 |
| 4 | CD 2017-CD4 Commercial Mortgage Trust | 3.514% | 5/10/50 | 4,970 | 4,875 |
| 4 | CD 2017-CD5 Commercial Mortgage Trust | 3.431% | 8/15/50 | 6,270 | 6,098 |
| 4 | CD 2017-CD6 Commercial Mortgage Trust | 3.456% | 11/13/50 | 2,315 | 2,255 |
| 4,10 | CFCRE Commercial Mortgage Trust 2011-C2 | 5.755% | 12/15/47 | 5,260 | 5,595 |
| 4 | CFCRE Commercial Mortgage Trust 2016-C4 | 3.283% | 5/10/58 | 4,826 | 4,660 |
| 4,10 | Chesapeake Funding II LLC 2016-2A | 1.880% | 6/15/28 | 19,416 | 19,317 |
| 4,10 | Chesapeake Funding II LLC 2018-1 | 3.040% | 4/15/30 | 12,860 | 12,804 |
| 4,10 | Chrysler Capital Auto Receivables Trust 2014-BA | 3.440% | 8/16/21 | 290 | 291 |
| 4,10 | Chrysler Capital Auto Receivables Trust 2015-BA | 2.260% | 10/15/20 | 6,203 | 6,200 |
| 4,10 | Chrysler Capital Auto Receivables Trust 2015-BA | 2.700% | 12/15/20 | 2,315 | 2,314 |
| 4,10 | Chrysler Capital Auto Receivables Trust 2015-BA | 3.260% | 4/15/21 | 3,600 | 3,606 |
| 4,10 | Chrysler Capital Auto Receivables Trust 2015-BA | 4.170% | 1/16/23 | 5,510 | 5,560 |
| 4,10 | Chrysler Capital Auto Receivables Trust 2016-AA | 2.880% | 6/15/22 | 2,370 | 2,368 |
| 39 | |||||
| Vanguard® Intermediate-Term Investment-Grade Fund | |||||
| Schedule of Investments | |||||
| July 31, 2018 | |||||
| Face | Market | ||||
| Maturity | Amount | Value | |||
| Coupon | Date | ($000) | ($000) | ||
| 4,10 | Chrysler Capital Auto Receivables Trust 2016-AA | 4.220% | 2/15/23 | 8,530 | 8,627 |
| 4,10 | Chrysler Capital Auto Receivables Trust 2016-BA | 1.640% | 7/15/21 | 4,750 | 4,721 |
| 4,10 | Chrysler Capital Auto Receivables Trust 2016-BA | 1.870% | 2/15/22 | 4,680 | 4,599 |
| 4 | Citibank Credit Card Issuance Trust 2018-A1 | 2.490% | 1/20/23 | 23,950 | 23,631 |
| 4,10 | Citigroup Commercial Mortgage Trust 2012-GC8 | 3.683% | 9/10/45 | 2,017 | 2,021 |
| 4 | Citigroup Commercial Mortgage Trust 2013-GC11 | 3.093% | 4/10/46 | 6,015 | 5,903 |
| 4 | Citigroup Commercial Mortgage Trust 2013-GC15 | 3.161% | 9/10/46 | 957 | 957 |
| 4 | Citigroup Commercial Mortgage Trust 2013-GC15 | 3.942% | 9/10/46 | 878 | 891 |
| 4 | Citigroup Commercial Mortgage Trust 2013-GC15 | 4.371% | 9/10/46 | 1,910 | 1,978 |
| 4 | Citigroup Commercial Mortgage Trust 2014-GC19 | 3.753% | 3/10/47 | 885 | 886 |
| 4 | Citigroup Commercial Mortgage Trust 2014-GC19 | 4.023% | 3/10/47 | 16,273 | 16,682 |
| 4 | Citigroup Commercial Mortgage Trust 2014-GC21 | 3.575% | 5/10/47 | 26,287 | 26,401 |
| 4 | Citigroup Commercial Mortgage Trust 2014-GC21 | 3.855% | 5/10/47 | 9,060 | 9,186 |
| 4 | Citigroup Commercial Mortgage Trust 2014-GC23 | 3.622% | 7/10/47 | 8,949 | 8,957 |
| 4 | Citigroup Commercial Mortgage Trust 2014-GC23 | 3.863% | 7/10/47 | 2,020 | 1,995 |
| 4 | Citigroup Commercial Mortgage Trust 2014-GC23 | 4.175% | 7/10/47 | 800 | 807 |
| 4 | Citigroup Commercial Mortgage Trust 2014-GC23 | 4.460% | 7/10/47 | 1,250 | 1,204 |
| 4 | Citigroup Commercial Mortgage Trust 2014-GC25 | 3.372% | 10/10/47 | 4,729 | 4,634 |
| 4 | Citigroup Commercial Mortgage Trust 2014-GC25 | 3.635% | 10/10/47 | 13,083 | 13,076 |
| 4 | Citigroup Commercial Mortgage Trust 2014-GC25 | 4.345% | 10/10/47 | 2,170 | 2,171 |
| 4 | Citigroup Commercial Mortgage Trust 2014-GC25 | 4.529% | 10/10/47 | 3,270 | 3,158 |
| 4 | Citigroup Commercial Mortgage Trust 2015-GC27 | 3.137% | 2/10/48 | 6,418 | 6,233 |
| 4 | Citigroup Commercial Mortgage Trust 2015-GC31 | 3.762% | 6/10/48 | 37,530 | 37,715 |
| 4 | Citigroup Commercial Mortgage Trust 2015-GC33 | 3.778% | 9/10/58 | 17,447 | 17,541 |
| 4 | Citigroup Commercial Mortgage Trust 2015-GC33 | 4.570% | 9/10/58 | 900 | 883 |
| 4 | Citigroup Commercial Mortgage Trust 2016-C1 | 3.209% | 5/10/49 | 9,456 | 9,123 |
| 4 | Citigroup Commercial Mortgage Trust 2016-P4 | 2.902% | 7/10/49 | 17,560 | 16,539 |
| 4 | Citigroup Commercial Mortgage Trust 2017-C4 | 3.471% | 10/12/50 | 6,325 | 6,136 |
| 4 | Citigroup Commercial Mortgage Trust 2017-P8 | 3.465% | 9/15/50 | 13,140 | 12,788 |
| 4 | Citigroup Commercial Mortgage Trust 2017-P8 | 4.192% | 9/15/50 | 3,150 | 3,149 |
| 4 | Citigroup Commercial Mortgage Trust 2017-P8 | 4.271% | 9/15/50 | 3,150 | 3,043 |
| 4 | Citigroup Commercial Mortgage Trust 2018-C5 | 4.228% | 6/10/51 | 900 | 925 |
| 4,10 | CLI Funding V LLC 2013-1A | 2.830% | 3/18/28 | 2,707 | 2,642 |
| 4,10,13 Colony American Homes 2015-1 | 3.578% | 7/17/32 | 440 | 440 | |
| 4,10,13 Colony American Homes 2015-1A | 3.278% | 7/17/32 | 3,635 | 3,640 | |
| 4,10,13 Colony Starwood Homes 2016-1A Trust | 3.573% | 7/17/33 | 4,064 | 4,064 | |
| 4,10,13 Colony Starwood Homes 2016-1A Trust | 4.223% | 7/17/33 | 1,845 | 1,845 | |
| 4 | COMM 2012-CCRE2 Mortgage Trust | 3.147% | 8/15/45 | 2,971 | 2,941 |
| 4 | COMM 2012-CCRE2 Mortgage Trust | 3.791% | 8/15/45 | 3,900 | 3,887 |
| 4 | COMM 2012-CCRE3 Mortgage Trust | 2.822% | 10/15/45 | 6,714 | 6,564 |
| 4,10 | COMM 2012-CCRE3 Mortgage Trust | 3.416% | 10/15/45 | 6,160 | 6,077 |
| 4 | COMM 2012-CCRE4 Mortgage Trust | 2.853% | 10/15/45 | 6,899 | 6,705 |
| 4 | COMM 2012-CCRE4 Mortgage Trust | 3.251% | 10/15/45 | 420 | 411 |
| 4 | COMM 2012-CCRE5 Mortgage Trust | 2.771% | 12/10/45 | 2,919 | 2,845 |
| 4,10 | COMM 2013-300P Mortgage Trust | 4.353% | 8/10/30 | 12,270 | 12,658 |
| 4 | COMM 2013-CCRE10 Mortgage Trust | 2.972% | 8/10/46 | 579 | 571 |
| 4 | COMM 2013-CCRE10 Mortgage Trust | 3.795% | 8/10/46 | 800 | 813 |
| 4 | COMM 2013-CCRE11 Mortgage Trust | 3.983% | 8/10/50 | 4,876 | 4,968 |
| 4 | COMM 2013-CCRE11 Mortgage Trust | 4.258% | 8/10/50 | 4,757 | 4,921 |
| 4 | COMM 2013-CCRE12 Mortgage Trust | 3.623% | 10/10/46 | 1,737 | 1,753 |
| 4 | COMM 2013-CCRE12 Mortgage Trust | 3.765% | 10/10/46 | 5,860 | 5,897 |
| 4 | COMM 2013-CCRE12 Mortgage Trust | 4.046% | 10/10/46 | 13,048 | 13,364 |
| 4 | COMM 2013-CCRE13 Mortgage Trust | 4.194% | 11/10/46 | 15,127 | 15,621 |
| 4 | COMM 2013-CCRE13 Mortgage Trust | 4.738% | 11/10/46 | 1,560 | 1,561 |
| 4 | COMM 2013-CCRE13 Mortgage Trust | 4.738% | 11/10/46 | 855 | 897 |
| 4,10 | COMM 2013-CCRE6 Mortgage Trust | 3.147% | 3/10/46 | 9,240 | 8,952 |
| 4,10 | COMM 2013-CCRE6 Mortgage Trust | 3.397% | 3/10/46 | 1,400 | 1,368 |
| 4 | COMM 2013-CCRE8 Mortgage Trust | 3.334% | 6/10/46 | 1,020 | 1,017 |
| 4 | COMM 2013-CCRE8 Mortgage Trust | 3.612% | 6/10/46 | 8,560 | 8,617 |
| 4 | COMM 2013-CCRE9 Mortgage Trust | 4.239% | 7/10/45 | 5,388 | 5,586 |
| 4,10 | COMM 2013-CCRE9 Mortgage Trust | 4.263% | 7/10/45 | 2,780 | 2,772 |
| 4 | COMM 2013-LC13 Mortgage Trust | 3.009% | 8/10/46 | 441 | 441 |
| 4,10 | COMM 2013-LC13 Mortgage Trust | 3.774% | 8/10/46 | 1,308 | 1,325 |
| 4 | COMM 2013-LC13 Mortgage Trust | 4.205% | 8/10/46 | 585 | 604 |
| 40 | |||||
| Vanguard® Intermediate-Term Investment-Grade Fund | |||||
| Schedule of Investments | |||||
| July 31, 2018 | |||||
| Face | Market | ||||
| Maturity | Amount | Value | |||
| Coupon | Date | ($000) | ($000) | ||
| 4 | COMM 2013-LC6 Mortgage Trust | 2.941% | 1/10/46 | 3,883 | 3,806 |
| 4,10 | COMM 2013-SFS Mortgage Trust | 2.987% | 4/12/35 | 6,702 | 6,521 |
| 4,10 | COMM 2014-277P Mortgage Trust | 3.611% | 8/10/49 | 18,320 | 18,291 |
| 4 | COMM 2014-CCRE14 Mortgage Trust | 3.955% | 2/10/47 | 500 | 509 |
| 4 | COMM 2014-CCRE14 Mortgage Trust | 4.236% | 2/10/47 | 4,432 | 4,584 |
| 4 | COMM 2014-CCRE15 Mortgage Trust | 2.928% | 2/10/47 | 1,362 | 1,363 |
| 4 | COMM 2014-CCRE15 Mortgage Trust | 4.074% | 2/10/47 | 4,350 | 4,466 |
| 4 | COMM 2014-CCRE15 Mortgage Trust | 4.426% | 2/10/47 | 1,300 | 1,327 |
| 4 | COMM 2014-CCRE17 Mortgage Trust | 3.700% | 5/10/47 | 1,010 | 1,009 |
| 4 | COMM 2014-CCRE17 Mortgage Trust | 3.977% | 5/10/47 | 6,335 | 6,463 |
| 4 | COMM 2014-CCRE17 Mortgage Trust | 4.174% | 5/10/47 | 1,290 | 1,313 |
| 4 | COMM 2014-CCRE17 Mortgage Trust | 4.738% | 5/10/47 | 4,400 | 4,352 |
| 4 | COMM 2014-CCRE18 Mortgage Trust | 3.550% | 7/15/47 | 6,260 | 6,260 |
| 4 | COMM 2014-CCRE18 Mortgage Trust | 3.828% | 7/15/47 | 10,820 | 10,958 |
| 4 | COMM 2014-CCRE20 Mortgage Trust | 3.326% | 11/10/47 | 5,200 | 5,113 |
| 4 | COMM 2014-CCRE20 Mortgage Trust | 3.590% | 11/10/47 | 15,433 | 15,411 |
| 4 | COMM 2014-CCRE21 Mortgage Trust | 3.528% | 12/10/47 | 22,572 | 22,461 |
| 4 | COMM 2014-LC17 Mortgage Trust | 3.917% | 10/10/47 | 2,438 | 2,481 |
| 4 | COMM 2015-CCRE24 Mortgage Trust | 3.696% | 8/10/48 | 2,465 | 2,467 |
| 4 | COMM 2015-CCRE25 Mortgage Trust | 3.759% | 8/10/48 | 4,100 | 4,117 |
| 4 | COMM 2015-CCRE27 Mortgage Trust | 3.612% | 10/10/48 | 3,748 | 3,725 |
| 4 | COMM 2015-CCRE27 Mortgage Trust | 4.472% | 10/10/48 | 1,760 | 1,735 |
| 4 | COMM 2015-LC19 Mortgage Trust | 3.183% | 2/10/48 | 7,183 | 7,009 |
| 10 | Commonwealth Bank of Australia | 2.125% | 7/22/20 | 17,695 | 17,363 |
| 4,10 | Core Industrial Trust 2015-TEXW | 3.077% | 2/10/34 | 5,580 | 5,537 |
| 4 | CSAIL 2015-C2 Commercial Mortgage Trust | 3.504% | 6/15/57 | 6,650 | 6,548 |
| 4 | CSAIL 2015-C3 Commercial Mortgage Trust | 3.718% | 8/15/48 | 6,150 | 6,132 |
| 4 | CSAIL 2015-C3 Commercial Mortgage Trust | 4.357% | 8/15/48 | 2,160 | 2,101 |
| 4 | CSAIL 2015-C4 Commercial Mortgage Trust | 3.808% | 11/15/48 | 9,110 | 9,154 |
| 4 | CSAIL 2016-C5 Commercial Mortgage Trust | 4.536% | 11/15/48 | 3,620 | 3,580 |
| 4 | CSAIL 2016-C7 Commercial Mortgage Trust | 3.502% | 11/15/49 | 6,280 | 6,133 |
| 4 | CSAIL 2017-C8 Commercial Mortgage Trust | 3.392% | 6/15/50 | 6,880 | 6,639 |
| 4,10 | Daimler Trucks Retail Trust 2018-1 | 3.030% | 11/15/24 | 7,290 | 7,286 |
| 4 | DBJPM 16-C1 Mortgage Trust | 3.350% | 5/10/49 | 1,250 | 1,147 |
| 4 | DBJPM 17-C6 Mortgage Trust | 3.328% | 6/10/50 | 9,640 | 9,317 |
| 4,10 | Dell Equipment Finance Trust 2017-2 | 1.970% | 2/24/20 | 7,491 | 7,465 |
| 4,10 | Dell Equipment Finance Trust 2017-2 | 2.190% | 10/24/22 | 5,090 | 5,031 |
| 4,10 | Dell Equipment Finance Trust 2018-1 | 3.180% | 6/22/23 | 5,380 | 5,376 |
| 4,10 | DLL Securitization Trust Series 2017-A | 2.140% | 12/15/21 | 5,720 | 5,634 |
| 4,10 | DLL Securitization Trust Series 2017-A | 2.430% | 11/17/25 | 3,380 | 3,295 |
| 4,10 | DLL Securitization Trust Series 2018-1 | 3.270% | 4/17/26 | 4,660 | 4,655 |
| 10 | DNB Boligkreditt AS | 2.500% | 3/28/22 | 11,200 | 10,891 |
| 4,10 | DRB Prime Student Loan Trust 2017-C | 2.810% | 11/25/42 | 13,420 | 13,057 |
| 4,10 | Drive Auto Receivables Trust 2015-AA | 3.060% | 5/17/21 | 559 | 559 |
| 4,10 | Drive Auto Receivables Trust 2015-AA | 4.120% | 7/15/22 | 2,000 | 2,017 |
| 4,10 | Drive Auto Receivables Trust 2015-BA | 2.760% | 7/15/21 | 211 | 211 |
| 4,10 | Drive Auto Receivables Trust 2015-BA | 3.840% | 7/15/21 | 3,600 | 3,620 |
| 4,10 | Drive Auto Receivables Trust 2015-CA | 3.010% | 5/17/21 | 549 | 549 |
| 4,10 | Drive Auto Receivables Trust 2015-CA | 4.200% | 9/15/21 | 5,630 | 5,675 |
| 4,10 | Drive Auto Receivables Trust 2015-DA | 3.380% | 11/15/21 | 3,254 | 3,260 |
| 4,10 | Drive Auto Receivables Trust 2015-DA | 4.590% | 1/17/23 | 9,250 | 9,382 |
| 4,10 | Drive Auto Receivables Trust 2016-AA | 3.910% | 5/17/21 | 2,097 | 2,105 |
| 4,10 | Drive Auto Receivables Trust 2016-BA | 4.530% | 8/15/23 | 11,330 | 11,510 |
| 4,10 | Drive Auto Receivables Trust 2016-C | 2.370% | 11/16/20 | 2,676 | 2,675 |
| 4,10 | Drive Auto Receivables Trust 2016-C | 4.180% | 3/15/24 | 10,540 | 10,657 |
| 4 | Drive Auto Receivables Trust 2017-1 | 3.840% | 3/15/23 | 1,640 | 1,650 |
| 4 | Drive Auto Receivables Trust 2017-3 | 2.300% | 5/17/21 | 10,260 | 10,239 |
| 4 | Drive Auto Receivables Trust 2017-3 | 2.800% | 7/15/22 | 13,040 | 12,989 |
| 4 | Drive Auto Receivables Trust 2018-2 | 3.220% | 4/15/22 | 7,960 | 7,954 |
| 4 | Drive Auto Receivables Trust 2018-2 | 3.630% | 8/15/24 | 12,200 | 12,193 |
| 4 | Drive Auto Receivables Trust 2018-2 | 4.140% | 8/15/24 | 8,560 | 8,590 |
| 4 | Drive Auto Receivables Trust 2018-3 | 3.370% | 9/15/22 | 15,440 | 15,437 |
| 4 | Drive Auto Receivables Trust 2018-3 | 3.720% | 9/16/24 | 15,170 | 15,162 |
| 4 | Drive Auto Receivables Trust 2018-3 | 4.300% | 9/16/24 | 8,070 | 8,086 |
| 41 | |||||
| Vanguard® Intermediate-Term Investment-Grade Fund | |||||
| Schedule of Investments | |||||
| July 31, 2018 | |||||
| Face | Market | ||||
| Maturity | Amount | Value | |||
| Coupon | Date | ($000) | ($000) | ||
| 4,10,13 Edsouth Indenture No 9 LLC 2015-1 | 2.864% | 10/25/56 | 6,330 | 6,357 | |
| 4,10 | ELFI Graduate Loan Program 2018-A LLC | 3.430% | 8/25/42 | 13,747 | 13,678 |
| 4,10 | Enterprise Fleet Financing LLC Series 2015-1 | 1.740% | 9/20/20 | 7,896 | 7,894 |
| 4,10 | Enterprise Fleet Financing LLC Series 2015-2 | 2.090% | 2/22/21 | 6,340 | 6,324 |
| 4,10 | Enterprise Fleet Financing LLC Series 2016-1 | 2.080% | 9/20/21 | 18,140 | 18,021 |
| 4,10 | Enterprise Fleet Financing LLC Series 2016-2 | 2.040% | 2/22/22 | 2,750 | 2,712 |
| 4,10 | Enterprise Fleet Financing LLC Series 2017-3 | 2.360% | 5/20/23 | 5,910 | 5,791 |
| 4,10 | Enterprise Fleet Financing LLC Series 2018-1 | 3.100% | 10/20/23 | 4,940 | 4,915 |
| 4,10,13 Evergreen Credit Card Trust Series 2017-1 | 2.332% | 10/15/21 | 7,330 | 7,331 | |
| 4,5,13 | Fannie Mae Connecticut Avenue Securities 2016-C04 | 3.514% | 1/25/29 | 1,139 | 1,147 |
| 4,5,13 | Fannie Mae Connecticut Avenue Securities 2016-C05 | 3.414% | 1/25/29 | 489 | 491 |
| 4,5 | Fannie Mae Grantor Trust 2017-T1 | 2.898% | 6/25/27 | 10,264 | 9,645 |
| 4,13 | First National Master Note Trust 2017-2 | 2.512% | 10/16/23 | 9,120 | 9,129 |
| 4,10 | Flagship Credit Auto Trust 2016-4 | 1.960% | 2/16/21 | 6,003 | 5,991 |
| 4 | Ford Credit Auto Lease Trust 2017-B | 2.030% | 12/15/20 | 14,340 | 14,201 |
| 4 | Ford Credit Auto Lease Trust 2017-B | 2.170% | 2/15/21 | 7,250 | 7,158 |
| 4 | Ford Credit Auto Lease Trust 2018-A | 3.050% | 8/15/21 | 2,860 | 2,852 |
| 4 | Ford Credit Auto Lease Trust 2018-A | 3.170% | 9/15/21 | 5,150 | 5,135 |
| 4,10 | Ford Credit Auto Owner Trust 2014-REV1 | 2.260% | 11/15/25 | 17,458 | 17,389 |
| 4,10 | Ford Credit Auto Owner Trust 2014-REV1 | 2.410% | 11/15/25 | 2,900 | 2,889 |
| 4,10 | Ford Credit Auto Owner Trust 2014-REV2 | 2.310% | 4/15/26 | 10,300 | 10,221 |
| 4,10 | Ford Credit Auto Owner Trust 2014-REV2 | 2.510% | 4/15/26 | 2,160 | 2,147 |
| 4 | Ford Credit Auto Owner Trust 2015-C | 2.010% | 3/15/21 | 4,670 | 4,632 |
| 4 | Ford Credit Auto Owner Trust 2015-C | 2.260% | 3/15/22 | 2,085 | 2,075 |
| 4,10 | Ford Credit Auto Owner Trust 2015-REV2 | 2.440% | 1/15/27 | 26,000 | 25,635 |
| 4 | Ford Credit Auto Owner Trust 2016-B | 1.850% | 9/15/21 | 2,430 | 2,387 |
| 4,10 | Ford Credit Auto Owner Trust 2016-REV1 | 2.310% | 8/15/27 | 13,820 | 13,505 |
| 4,10 | Ford Credit Auto Owner Trust 2016-REV2 | 2.030% | 12/15/27 | 20,230 | 19,519 |
| 4,10 | Ford Credit Auto Owner Trust 2017-1 | 2.620% | 8/15/28 | 24,010 | 23,414 |
| 4,10 | Ford Credit Auto Owner Trust 2017-2 | 2.360% | 3/15/29 | 26,970 | 25,846 |
| 4,10 | Ford Credit Auto Owner Trust 2017-2 | 2.600% | 3/15/29 | 4,800 | 4,596 |
| 4,10 | Ford Credit Auto Owner Trust 2017-2 | 2.750% | 3/15/29 | 9,830 | 9,433 |
| 4,10 | Ford Credit Auto Owner Trust 2018-2 | 3.470% | 1/15/30 | 13,500 | 13,516 |
| 4,10 | Ford Credit Auto Owner Trust 2018-2 | 3.610% | 1/15/30 | 8,140 | 8,117 |
| 4,10 | Ford Credit Auto Owner Trust 2018-2 | 3.760% | 1/15/30 | 3,660 | 3,650 |
| 4 | Ford Credit Auto Owner Trust 2018-A | 3.030% | 11/15/22 | 16,310 | 16,315 |
| 4,10 | Ford Credit Auto Owner Trust 2018-REV1 | 3.190% | 7/15/31 | 22,190 | 21,611 |
| 4,10 | Ford Credit Auto Owner Trust 2018-REV1 | 3.340% | 7/15/31 | 7,010 | 6,872 |
| 4 | Ford Credit Floorplan Master Owner Trust A Series | ||||
| 2014-2 | 2.310% | 2/15/21 | 900 | 898 | |
| 4 | Ford Credit Floorplan Master Owner Trust A Series | ||||
| 2015-5 | 2.390% | 8/15/22 | 8,480 | 8,367 | |
| 4 | Ford Credit Floorplan Master Owner Trust A Series | ||||
| 2017-1 | 2.070% | 5/15/22 | 56,020 | 55,040 | |
| 4 | Ford Credit Floorplan Master Owner Trust A Series | ||||
| 2017-2 | 2.160% | 9/15/22 | 37,850 | 37,127 | |
| 4 | Ford Credit Floorplan Master Owner Trust A Series | ||||
| 2018-1 | 2.950% | 5/15/23 | 27,090 | 26,943 | |
| 4,5,13 | Freddie Mac Structured Agency Credit Risk Debt Notes | ||||
| 2016-DNA2 | 4.264% | 10/25/28 | 724 | 731 | |
| 4,5,13 | Freddie Mac Structured Agency Credit Risk Debt Notes | ||||
| 2016-DNA3 | 4.064% | 12/25/28 | 2,533 | 2,568 | |
| 4,5,10 | Freddie Mac Structured Agency Credit Risk Debt Notes | ||||
| 2018-SPI1 | 3.745% | 2/25/48 | 3,391 | 3,380 | |
| 4,5,10 | Freddie Mac Structured Agency Credit Risk Debt Notes | ||||
| 2018-SPI2 | 3.820% | 5/25/48 | 4,541 | 4,532 | |
| 4,10 | FRS I LLC 2013-1A | 1.800% | 4/15/43 | 202 | 201 |
| 4,10 | FRS I LLC 2013-1A | 3.080% | 4/15/43 | 5,951 | 5,932 |
| 4 | GM Financial Automobile Leasing Trust 2015-3 | 2.320% | 11/20/19 | 1,272 | 1,271 |
| 4 | GM Financial Automobile Leasing Trust 2015-3 | 2.980% | 11/20/19 | 2,870 | 2,872 |
| 4 | GM Financial Automobile Leasing Trust 2015-3 | 3.480% | 8/20/20 | 2,870 | 2,872 |
| 4 | GM Financial Automobile Leasing Trust 2016-1 | 1.790% | 3/20/20 | 17,520 | 17,496 |
| 4 | GM Financial Automobile Leasing Trust 2016-2 | 2.580% | 3/20/20 | 1,920 | 1,914 |
| 4 | GM Financial Automobile Leasing Trust 2017-2 | 2.180% | 6/21/21 | 5,010 | 4,948 |
| 42 | |||||
| Vanguard® Intermediate-Term Investment-Grade Fund | |||||
| Schedule of Investments | |||||
| July 31, 2018 | |||||
| Face | Market | ||||
| Maturity | Amount | Value | |||
| Coupon | Date | ($000) | ($000) | ||
| 4 | GM Financial Automobile Leasing Trust 2017-3 | 2.010% | 11/20/20 | 10,470 | 10,356 |
| 4 | GM Financial Automobile Leasing Trust 2017-3 | 2.120% | 9/20/21 | 3,290 | 3,243 |
| 4 | GM Financial Automobile Leasing Trust 2017-3 | 2.400% | 9/20/21 | 4,120 | 4,053 |
| 4 | GM Financial Automobile Leasing Trust 2017-3 | 2.730% | 9/20/21 | 2,240 | 2,210 |
| 4 | GM Financial Automobile Leasing Trust 2018-2 | 3.060% | 6/21/21 | 13,160 | 13,151 |
| 4,10 | GM Financial Consumer Automobile 2017-3 | 2.130% | 3/16/23 | 5,350 | 5,203 |
| 4,10 | GM Financial Consumer Automobile 2017-3 | 2.330% | 3/16/23 | 1,640 | 1,598 |
| 4 | GM Financial Consumer Automobile 2018-3 | 3.160% | 1/16/24 | 3,690 | 3,682 |
| 4,10 | GMF Floorplan Owner Revolving Trust 2016-1 | 2.410% | 5/17/21 | 5,290 | 5,265 |
| 4,10 | GMF Floorplan Owner Revolving Trust 2016-1 | 2.850% | 5/17/21 | 3,900 | 3,849 |
| 4,10,13 GMF Floorplan Owner Revolving Trust 2016-1 | 2.923% | 5/17/21 | 10,476 | 10,525 | |
| 4,10,13 GMF Floorplan Owner Revolving Trust 2017-1 | 2.643% | 1/18/22 | 230 | 231 | |
| 4,10 | GMF Floorplan Owner Revolving Trust 2017-2 | 2.130% | 7/15/22 | 42,410 | 41,426 |
| 4,10 | GMF Floorplan Owner Revolving Trust 2017-2 | 2.440% | 7/15/22 | 13,200 | 12,981 |
| 4,10 | GMF Floorplan Owner Revolving Trust 2017-2 | 2.630% | 7/15/22 | 7,240 | 7,116 |
| 4,10 | GMF Floorplan Owner Revolving Trust 2018-2 | 3.130% | 3/15/23 | 19,810 | 19,750 |
| 4,10 | Golden Credit Card Trust 2015-2A | 2.020% | 4/15/22 | 13,530 | 13,283 |
| 4,10 | Golden Credit Card Trust 2016-5A | 1.600% | 9/15/21 | 26,780 | 26,351 |
| 4,10 | Golden Credit Card Trust 2018-1A | 2.620% | 1/15/23 | 58,610 | 57,829 |
| 4,10 | GRACE 2014-GRCE Mortgage Trust | 3.369% | 6/10/28 | 1,000 | 1,002 |
| 4,10 | GreatAmerica Leasing Receivables Funding LLC Series | ||||
| 2015-1 | 2.020% | 6/21/21 | 740 | 739 | |
| 4,10 | GreatAmerica Leasing Receivables Funding LLC Series | ||||
| 2016-1 | 1.990% | 4/20/22 | 10,580 | 10,497 | |
| 4,10 | GreatAmerica Leasing Receivables Funding LLC Series | ||||
| 2018-1 | 2.600% | 6/15/21 | 2,020 | 2,002 | |
| 4,10 | GreatAmerica Leasing Receivables Funding LLC Series | ||||
| 2018-1 | 2.830% | 6/17/24 | 1,310 | 1,294 | |
| 4,10 | GS Mortgage Securities Corporation II 2012-BWTR | 2.954% | 11/5/34 | 7,625 | 7,381 |
| 4 | GS Mortgage Securities Corporation II 2015-GC30 | 3.382% | 5/10/50 | 2,398 | 2,358 |
| 4,10 | GS Mortgage Securities Corporation Trust 2012- | ||||
| ALOHA | 3.551% | 4/10/34 | 5,430 | 5,453 | |
| 4,10 | GS Mortgage Securities Trust 2010-C2 | 5.182% | 12/10/43 | 1,370 | 1,411 |
| 4,10 | GS Mortgage Securities Trust 2011-GC3 | 5.638% | 3/10/44 | 2,650 | 2,750 |
| 4,10 | GS Mortgage Securities Trust 2012-GC6 | 4.948% | 1/10/45 | 1,025 | 1,063 |
| 4 | GS Mortgage Securities Trust 2012-GCJ7 | 5.668% | 5/10/45 | 2,140 | 2,203 |
| 4 | GS Mortgage Securities Trust 2013-GC13 | 4.048% | 7/10/46 | 185 | 191 |
| 4,10 | GS Mortgage Securities Trust 2013-GC13 | 4.081% | 7/10/46 | 1,210 | 1,177 |
| 4 | GS Mortgage Securities Trust 2013-GCJ12 | 3.135% | 6/10/46 | 4,128 | 4,065 |
| 4 | GS Mortgage Securities Trust 2013-GCJ12 | 3.777% | 6/10/46 | 1,550 | 1,532 |
| 4 | GS Mortgage Securities Trust 2013-GCJ14 | 2.995% | 8/10/46 | 83 | 83 |
| 4 | GS Mortgage Securities Trust 2013-GCJ14 | 3.817% | 8/10/46 | 800 | 810 |
| 4 | GS Mortgage Securities Trust 2013-GCJ14 | 3.955% | 8/10/46 | 6,005 | 6,123 |
| 4 | GS Mortgage Securities Trust 2013-GCJ14 | 4.243% | 8/10/46 | 105 | 108 |
| 4 | GS Mortgage Securities Trust 2014-GC20 | 3.998% | 4/10/47 | 10,638 | 10,863 |
| 4 | GS Mortgage Securities Trust 2014-GC20 | 4.258% | 4/10/47 | 570 | 571 |
| 4 | GS Mortgage Securities Trust 2014-GC24 | 3.931% | 9/10/47 | 13,475 | 13,690 |
| 4 | GS Mortgage Securities Trust 2014-GC24 | 4.162% | 9/10/47 | 6,520 | 6,545 |
| 4 | GS Mortgage Securities Trust 2014-GC24 | 4.508% | 9/10/47 | 2,610 | 2,647 |
| 4 | GS Mortgage Securities Trust 2014-GC24 | 4.529% | 9/10/47 | 4,615 | 4,548 |
| 4 | GS Mortgage Securities Trust 2014-GC26 | 3.364% | 11/10/47 | 7,680 | 7,547 |
| 4 | GS Mortgage Securities Trust 2014-GC26 | 3.629% | 11/10/47 | 17,870 | 17,843 |
| 4 | GS Mortgage Securities Trust 2015-GC28 | 3.136% | 2/10/48 | 9,200 | 8,920 |
| 4 | GS Mortgage Securities Trust 2015-GC32 | 3.764% | 7/10/48 | 4,615 | 4,647 |
| 4 | GS Mortgage Securities Trust 2015-GC34 | 3.506% | 10/10/48 | 14,640 | 14,444 |
| 4 | GS Mortgage Securities Trust 2015-GC34 | 4.653% | 10/10/48 | 2,610 | 2,610 |
| 4 | GS Mortgage Securities Trust 2016-GS3 | 2.850% | 10/10/49 | 750 | 704 |
| 4 | GS Mortgage Securities Trust 2018-GS10 | 4.155% | 7/10/51 | 10,670 | 10,927 |
| 4,10 | GTP Acquisition Partners I LLC | 3.482% | 6/16/25 | 9,030 | 8,778 |
| 4,10 | Hardee's Funding LLC | 5.710% | 6/20/48 | 12,680 | 12,793 |
| 4,10 | Harley Marine Financing LLC Barge 2018-1 | 5.682% | 5/15/43 | 7,910 | 7,898 |
| 4,10 | Hertz Fleet Lease Funding LP 2018-1 | 3.230% | 5/10/32 | 16,220 | 16,208 |
| 4,10 | Hertz Vehicle Financing II LP 2015-1A | 2.730% | 3/25/21 | 11,150 | 11,031 |
| 4,10 | Hertz Vehicle Financing II LP 2015-3A | 2.670% | 9/25/21 | 4,700 | 4,617 |
| 43 | |||||
| Vanguard® Intermediate-Term Investment-Grade Fund | |||||
| Schedule of Investments | |||||
| July 31, 2018 | |||||
| Face | Market | ||||
| Maturity | Amount | Value | |||
| Coupon | Date | ($000) | ($000) | ||
| 4,10 | Hertz Vehicle Financing II LP 2016-2A | 2.950% | 3/25/22 | 6,858 | 6,746 |
| 4,10 | Hertz Vehicle Financing II LP 2016-3A | 2.270% | 7/25/20 | 1,650 | 1,636 |
| 4,10 | Hertz Vehicle Financing II LP 2018-1A | 3.290% | 2/25/24 | 4,390 | 4,258 |
| 4,10 | Hertz Vehicle Financing II LP 2018-1A | 3.600% | 2/25/24 | 6,110 | 5,951 |
| 4,10 | Hertz Vehicle Financing II LP 2018-1A | 4.390% | 2/25/24 | 930 | 911 |
| 4,10 | Hertz Vehicle Financing LLC 2013-1A | 1.830% | 8/25/19 | 2,725 | 2,724 |
| 4,10 | Hertz Vehicle Financing LLC 2017-2A | 3.290% | 10/25/23 | 3,458 | 3,374 |
| 4,10 | Hertz Vehicle Financing LLC 2017-2A | 4.200% | 10/25/23 | 12,380 | 12,448 |
| 4,10 | Hilton USA Trust 2016-HHV | 3.719% | 11/5/38 | 7,780 | 7,690 |
| 4,10,12 Holmes Master Issuer plc 2018-1 | 2.699% | 10/15/54 | 10,350 | 10,340 | |
| 4 | Honda Auto Receivables 2017-4 Owner Trust | 2.050% | 11/22/21 | 20,890 | 20,600 |
| 4 | Honda Auto Receivables 2017-4 Owner Trust | 2.210% | 3/21/24 | 3,110 | 3,051 |
| 4 | Honda Auto Receivables 2018-2 Owner Trust | 3.010% | 5/18/22 | 6,260 | 6,258 |
| 4,10 | Houston Galleria Mall Trust 2015-HGLR | 3.087% | 3/5/37 | 10,910 | 10,435 |
| 4,10 | Hudsons Bay Simon JV Trust 2015-HB7 | 3.914% | 8/5/34 | 4,750 | 4,679 |
| 4,10 | Hyundai Auto Lease Securitization Trust 2017-B | 2.130% | 3/15/21 | 10,930 | 10,817 |
| 4,10 | Hyundai Auto Lease Securitization Trust 2017-C | 2.120% | 2/16/21 | 17,620 | 17,442 |
| 4,10 | Hyundai Auto Lease Securitization Trust 2017-C | 2.210% | 9/15/21 | 3,470 | 3,424 |
| 4,10 | Hyundai Auto Lease Securitization Trust 2017-C | 2.460% | 7/15/22 | 3,160 | 3,115 |
| 4,10 | Hyundai Auto Lease Securitization Trust 2018-A | 2.810% | 4/15/21 | 14,880 | 14,828 |
| 4,10 | Hyundai Auto Lease Securitization Trust 2018-A | 2.890% | 3/15/22 | 4,710 | 4,680 |
| 4,10 | Hyundai Auto Lease Securitization Trust 2018-B | 3.200% | 6/15/22 | 1,870 | 1,867 |
| 4 | Hyundai Auto Receivables Trust 2014-B | 2.100% | 11/15/19 | 2,009 | 2,009 |
| 4 | Hyundai Auto Receivables Trust 2015-C | 2.150% | 11/15/21 | 1,400 | 1,385 |
| 4 | Hyundai Auto Receivables Trust 2015-C | 2.550% | 11/15/21 | 3,290 | 3,266 |
| 4,12 | Illinois Student Assistance Commission Series 2010-1 | 3.385% | 4/25/22 | 397 | 397 |
| 4,10,13 Invitation Homes 2017-SFR2 Trust | 2.923% | 12/17/36 | 14,427 | 14,437 | |
| 4,10,13 Invitation Homes 2017-SFR2 Trust | 3.223% | 12/17/36 | 4,930 | 4,946 | |
| 4,10,13 Invitation Homes 2018-SFR1 Trust | 2.773% | 3/17/37 | 9,339 | 9,353 | |
| 4,10,13 Invitation Homes 2018-SFR1 Trust | 3.023% | 3/17/37 | 2,250 | 2,232 | |
| 4,10 | Irvine Core Office Trust 2013-IRV | 3.173% | 5/15/48 | 6,631 | 6,526 |
| 4 | John Deere Owner Trust 2018-B | 3.230% | 6/16/25 | 5,250 | 5,242 |
| 4,10 | JP Morgan Chase Commercial Mortgage Securities | ||||
| Trust 2010-C1 | 4.608% | 6/15/43 | 5,618 | 5,754 | |
| 4,10 | JP Morgan Chase Commercial Mortgage Securities | ||||
| Trust 2010-C2 | 4.070% | 11/15/43 | 1,194 | 1,211 | |
| 4,10 | JP Morgan Chase Commercial Mortgage Securities | ||||
| Trust 2010-C2 | 5.640% | 11/15/43 | 2,313 | 2,369 | |
| 4,10 | JP Morgan Chase Commercial Mortgage Securities | ||||
| Trust 2010-C2 | 5.640% | 11/15/43 | 2,730 | 2,747 | |
| 4,10 | JP Morgan Chase Commercial Mortgage Securities | ||||
| Trust 2011-C3 | 4.717% | 2/15/46 | 7,525 | 7,755 | |
| 4,10 | JP Morgan Chase Commercial Mortgage Securities | ||||
| Trust 2011-C5 | 5.405% | 8/15/46 | 4,000 | 4,188 | |
| 4,10 | JP Morgan Chase Commercial Mortgage Securities | ||||
| Trust 2011-RR1 | 4.717% | 3/16/46 | 920 | 941 | |
| 4 | JP Morgan Chase Commercial Mortgage Securities | ||||
| Trust 2012-C6 | 3.507% | 5/15/45 | 3,807 | 3,815 | |
| 4 | JP Morgan Chase Commercial Mortgage Securities | ||||
| Trust 2012-C8 | 2.829% | 10/15/45 | 4,729 | 4,622 | |
| 4,10 | JP Morgan Chase Commercial Mortgage Securities | ||||
| Trust 2012-C8 | 3.424% | 10/15/45 | 22,630 | 22,320 | |
| 4 | JP Morgan Chase Commercial Mortgage Securities | ||||
| Trust 2012-CIBX | 4.271% | 6/15/45 | 1,350 | 1,374 | |
| 4,10 | JP Morgan Chase Commercial Mortgage Securities | ||||
| Trust 2012-HSBC | 3.093% | 7/5/32 | 5,972 | 5,911 | |
| 4 | JP Morgan Chase Commercial Mortgage Securities | ||||
| Trust 2012-LC9 | 2.840% | 12/15/47 | 4,670 | 4,557 | |
| 4 | JP Morgan Chase Commercial Mortgage Securities | ||||
| Trust 2013-C13 | 3.994% | 1/15/46 | 323 | 330 | |
| 4 | JP Morgan Chase Commercial Mortgage Securities | ||||
| Trust 2013-C13 | 4.004% | 1/15/46 | 2,550 | 2,511 | |
| 4 | JP Morgan Chase Commercial Mortgage Securities | ||||
| Trust 2013-C16 | 3.674% | 12/15/46 | 1,215 | 1,228 | |
| 44 | |||||
| Vanguard® Intermediate-Term Investment-Grade Fund | |||||
| Schedule of Investments | |||||
| July 31, 2018 | |||||
| Face | Market | ||||
| Maturity | Amount | Value | |||
| Coupon | Date | ($000) | ($000) | ||
| 4 | JP Morgan Chase Commercial Mortgage Securities | ||||
| Trust 2013-C16 | 3.881% | 12/15/46 | 651 | 663 | |
| 4 | JP Morgan Chase Commercial Mortgage Securities | ||||
| Trust 2013-C16 | 4.166% | 12/15/46 | 29,810 | 30,631 | |
| 4 | JP Morgan Chase Commercial Mortgage Securities | ||||
| Trust 2013-C16 | 4.945% | 12/15/46 | 2,135 | 2,227 | |
| 4 | JP Morgan Chase Commercial Mortgage Securities | ||||
| Trust 2013-C16 | 5.010% | 12/15/46 | 960 | 984 | |
| 4 | JP Morgan Chase Commercial Mortgage Securities | ||||
| Trust 2013-LC11 | 2.960% | 4/15/46 | 10,979 | 10,737 | |
| 4 | JP Morgan Chase Commercial Mortgage Securities | ||||
| Trust 2014-C20 | 3.461% | 7/15/47 | 12,380 | 12,437 | |
| 4 | JP Morgan Chase Commercial Mortgage Securities | ||||
| Trust 2016-JP3 | 2.870% | 8/15/49 | 40 | 38 | |
| 4 | JP Morgan Chase Commercial Mortgage Securities | ||||
| Trust 2016-JP4 | 3.648% | 12/15/49 | 9,670 | 9,526 | |
| 4 | JP Morgan Chase Commercial Mortgage Securities | ||||
| Trust 2017-JP6 | 3.490% | 7/15/50 | 4,100 | 4,009 | |
| 4 | JPMBB Commercial Mortgage Securities Trust 2013- | ||||
| C12 | 3.363% | 7/15/45 | 6,780 | 6,747 | |
| 4 | JPMBB Commercial Mortgage Securities Trust 2013- | ||||
| C12 | 3.664% | 7/15/45 | 5,515 | 5,559 | |
| 4 | JPMBB Commercial Mortgage Securities Trust 2013- | ||||
| C12 | 4.033% | 7/15/45 | 5,000 | 5,061 | |
| 4 | JPMBB Commercial Mortgage Securities Trust 2013- | ||||
| C14 | 3.761% | 8/15/46 | 1,572 | 1,592 | |
| 4 | JPMBB Commercial Mortgage Securities Trust 2013- | ||||
| C14 | 4.133% | 8/15/46 | 6,118 | 6,286 | |
| 4 | JPMBB Commercial Mortgage Securities Trust 2013- | ||||
| C15 | 2.977% | 11/15/45 | 341 | 341 | |
| 4 | JPMBB Commercial Mortgage Securities Trust 2013- | ||||
| C15 | 3.659% | 11/15/45 | 400 | 404 | |
| 4 | JPMBB Commercial Mortgage Securities Trust 2013- | ||||
| C15 | 4.927% | 11/15/45 | 1,750 | 1,816 | |
| 4 | JPMBB Commercial Mortgage Securities Trust 2013- | ||||
| C15 | 5.085% | 11/15/45 | 1,340 | 1,383 | |
| 4 | JPMBB Commercial Mortgage Securities Trust 2013- | ||||
| C17 | 4.199% | 1/15/47 | 4,363 | 4,488 | |
| 4 | JPMBB Commercial Mortgage Securities Trust 2014- | ||||
| C18 | 4.079% | 2/15/47 | 14,680 | 15,069 | |
| 4 | JPMBB Commercial Mortgage Securities Trust 2014- | ||||
| C18 | 4.439% | 2/15/47 | 600 | 616 | |
| 4 | JPMBB Commercial Mortgage Securities Trust 2014- | ||||
| C18 | 4.814% | 2/15/47 | 2,500 | 2,584 | |
| 4 | JPMBB Commercial Mortgage Securities Trust 2014- | ||||
| C18 | 4.814% | 2/15/47 | 1,000 | 1,005 | |
| 4 | JPMBB Commercial Mortgage Securities Trust 2014- | ||||
| C19 | 3.997% | 4/15/47 | 2,910 | 2,974 | |
| 4 | JPMBB Commercial Mortgage Securities Trust 2014- | ||||
| C21 | 3.493% | 8/15/47 | 5,570 | 5,539 | |
| 4 | JPMBB Commercial Mortgage Securities Trust 2014- | ||||
| C24 | 3.639% | 11/15/47 | 2,117 | 2,124 | |
| 4 | JPMBB Commercial Mortgage Securities Trust 2014- | ||||
| C26 | 3.231% | 1/15/48 | 13,220 | 12,970 | |
| 4 | JPMBB Commercial Mortgage Securities Trust 2014- | ||||
| C26 | 3.494% | 1/15/48 | 5,120 | 5,091 | |
| 4 | JPMBB Commercial Mortgage Securities Trust 2015- | ||||
| C27 | 3.179% | 2/15/48 | 9,823 | 9,577 | |
| 4 | JPMBB Commercial Mortgage Securities Trust 2015- | ||||
| C30 | 3.551% | 7/15/48 | 4,640 | 4,562 | |
| 4 | JPMBB Commercial Mortgage Securities Trust 2015- | ||||
| C30 | 3.822% | 7/15/48 | 3,450 | 3,484 | |
| 4 | JPMBB Commercial Mortgage Securities Trust 2015- | ||||
| C30 | 4.226% | 7/15/48 | 2,245 | 2,277 | |
| 45 | |||||
| Vanguard® Intermediate-Term Investment-Grade Fund | |||||
| Schedule of Investments | |||||
| July 31, 2018 | |||||
| Face | Market | ||||
| Maturity | Amount | Value | |||
| Coupon | Date | ($000) | ($000) | ||
| 4 | JPMBB Commercial Mortgage Securities Trust 2015- | ||||
| C31 | 3.801% | 8/15/48 | 11,540 | 11,633 | |
| 4 | JPMBB Commercial Mortgage Securities Trust 2015- | ||||
| C32 | 3.598% | 11/15/48 | 3,783 | 3,764 | |
| 4 | JPMBB Commercial Mortgage Securities Trust 2015- | ||||
| C33 | 3.770% | 12/15/48 | 7,300 | 7,336 | |
| 4 | JPMCC Commercial Mortgage Securities Trust 2017- | ||||
| JP5 | 3.723% | 3/15/50 | 11,590 | 11,476 | |
| 4 | JPMCC Commercial Mortgage Securities Trust 2017- | ||||
| JP7 | 3.454% | 9/15/50 | 4,660 | 4,540 | |
| 4 | JPMDB Commercial Mortgage Securities Trust 2017- | ||||
| C7 | 3.409% | 10/15/50 | 3,460 | 3,360 | |
| 4 | JPMDB Commercial Mortgage Securities Trust 2018- | ||||
| C8 | 4.211% | 6/15/51 | 150 | 154 | |
| 4,10,12 Lanark Master Issuer plc 2018-1A | 2.749% | 12/22/69 | 6,392 | 6,389 | |
| 4,10,13 Lanark Master Issuer plc 2018-2A | 2.844% | 12/22/69 | 6,830 | 6,829 | |
| 4,10 | Laurel Road Prime Student Loan Trust 2018-B | 3.540% | 5/26/43 | 13,250 | 13,231 |
| 4,10 | LCCM 2014-909 Mortgage Trust | 3.388% | 5/15/31 | 910 | 910 |
| 4,10 | Madison Avenue Trust 2013-650M | 3.843% | 10/12/32 | 1,245 | 1,258 |
| 4,10,13 Master Credit Card Trust II Series 2018-1A | 2.571% | 7/22/24 | 21,490 | 21,532 | |
| 4 | Mercedes-Benz Auto Lease Trust 2018-A | 2.200% | 4/15/20 | 12,820 | 12,800 |
| 4 | Mercedes-Benz Auto Lease Trust 2018-A | 2.410% | 2/16/21 | 19,250 | 19,122 |
| 4 | Mercedes-Benz Auto Lease Trust 2018-A | 2.510% | 10/16/23 | 1,920 | 1,901 |
| 4 | Mercedes-Benz Auto Receivables Trust 2018-1 | 3.150% | 10/15/24 | 5,220 | 5,213 |
| 4,10 | MMAF Equipment Finance LLC 2012-AA | 1.980% | 6/10/32 | 442 | 442 |
| 4,10 | MMAF Equipment Finance LLC 2015-AA | 2.490% | 2/19/36 | 13,600 | 13,354 |
| 4,10 | MMAF Equipment Finance LLC 2018-A | 3.390% | 1/10/25 | 2,900 | 2,902 |
| 4,10 | MMAF Equipment Finance LLC 2018-A | 3.610% | 3/10/42 | 1,580 | 1,582 |
| 4 | Morgan Stanley Bank of America Merrill Lynch Trust | ||||
| 2012-C5 | 3.176% | 8/15/45 | 8,462 | 8,370 | |
| 4 | Morgan Stanley Bank of America Merrill Lynch Trust | ||||
| 2012-C5 | 3.792% | 8/15/45 | 16,040 | 15,957 | |
| 4 | Morgan Stanley Bank of America Merrill Lynch Trust | ||||
| 2012-C6 | 2.858% | 11/15/45 | 6,337 | 6,205 | |
| 4 | Morgan Stanley Bank of America Merrill Lynch Trust | ||||
| 2013-C10 | 4.083% | 7/15/46 | 1,830 | 1,752 | |
| 4 | Morgan Stanley Bank of America Merrill Lynch Trust | ||||
| 2013-C10 | 4.083% | 7/15/46 | 1,244 | 1,273 | |
| 4 | Morgan Stanley Bank of America Merrill Lynch Trust | ||||
| 2013-C11 | 3.085% | 8/15/46 | 307 | 304 | |
| 4 | Morgan Stanley Bank of America Merrill Lynch Trust | ||||
| 2013-C11 | 3.960% | 8/15/46 | 11,427 | 11,571 | |
| 4 | Morgan Stanley Bank of America Merrill Lynch Trust | ||||
| 2013-C11 | 4.158% | 8/15/46 | 3,937 | 4,059 | |
| 4 | Morgan Stanley Bank of America Merrill Lynch Trust | ||||
| 2013-C12 | 3.824% | 10/15/46 | 1,005 | 1,019 | |
| 4 | Morgan Stanley Bank of America Merrill Lynch Trust | ||||
| 2013-C12 | 4.259% | 10/15/46 | 1,940 | 1,998 | |
| 4 | Morgan Stanley Bank of America Merrill Lynch Trust | ||||
| 2013-C13 | 4.039% | 11/15/46 | 400 | 409 | |
| 4 | Morgan Stanley Bank of America Merrill Lynch Trust | ||||
| 2013-C7 | 2.918% | 2/15/46 | 2,470 | 2,417 | |
| 4 | Morgan Stanley Bank of America Merrill Lynch Trust | ||||
| 2013-C7 | 3.214% | 2/15/46 | 2,000 | 1,953 | |
| 4 | Morgan Stanley Bank of America Merrill Lynch Trust | ||||
| 2013-C9 | 3.102% | 5/15/46 | 12,980 | 12,726 | |
| 4 | Morgan Stanley Bank of America Merrill Lynch Trust | ||||
| 2014-C14 | 4.064% | 2/15/47 | 2,300 | 2,358 | |
| 4 | Morgan Stanley Bank of America Merrill Lynch Trust | ||||
| 2014-C14 | 4.384% | 2/15/47 | 1,600 | 1,648 | |
| 4 | Morgan Stanley Bank of America Merrill Lynch Trust | ||||
| 2014-C15 | 3.773% | 4/15/47 | 11,716 | 11,856 | |
| 4 | Morgan Stanley Bank of America Merrill Lynch Trust | ||||
| 2014-C15 | 4.051% | 4/15/47 | 20,825 | 21,247 | |
| 46 | |||||
| Vanguard® Intermediate-Term Investment-Grade Fund | |||||
| Schedule of Investments | |||||
| July 31, 2018 | |||||
| Face | Market | ||||
| Maturity | Amount | Value | |||
| Coupon | Date | ($000) | ($000) | ||
| 4 | Morgan Stanley Bank of America Merrill Lynch Trust | ||||
| 2014-C15 | 4.891% | 4/15/47 | 1,140 | 1,162 | |
| 4 | Morgan Stanley Bank of America Merrill Lynch Trust | ||||
| 2014-C16 | 3.892% | 6/15/47 | 8,646 | 8,756 | |
| 4 | Morgan Stanley Bank of America Merrill Lynch Trust | ||||
| 2014-C16 | 4.094% | 6/15/47 | 935 | 944 | |
| 4 | Morgan Stanley Bank of America Merrill Lynch Trust | ||||
| 2014-C16 | 4.321% | 6/15/47 | 7,090 | 7,183 | |
| 4 | Morgan Stanley Bank of America Merrill Lynch Trust | ||||
| 2014-C16 | 4.754% | 6/15/47 | 2,400 | 2,390 | |
| 4 | Morgan Stanley Bank of America Merrill Lynch Trust | ||||
| 2014-C17 | 3.741% | 8/15/47 | 28,696 | 28,827 | |
| 4 | Morgan Stanley Bank of America Merrill Lynch Trust | ||||
| 2014-C17 | 4.011% | 8/15/47 | 1,380 | 1,376 | |
| 4 | Morgan Stanley Bank of America Merrill Lynch Trust | ||||
| 2014-C18 | 3.923% | 10/15/47 | 5,430 | 5,500 | |
| 4 | Morgan Stanley Bank of America Merrill Lynch Trust | ||||
| 2014-C19 | 3.326% | 12/15/47 | 6,880 | 6,854 | |
| 4 | Morgan Stanley Bank of America Merrill Lynch Trust | ||||
| 2014-C19 | 3.526% | 12/15/47 | 3,940 | 3,905 | |
| 4 | Morgan Stanley Bank of America Merrill Lynch Trust | ||||
| 2015-C20 | 3.069% | 2/15/48 | 8,640 | 8,550 | |
| 4 | Morgan Stanley Bank of America Merrill Lynch Trust | ||||
| 2015-C20 | 3.249% | 2/15/48 | 10,453 | 10,208 | |
| 4 | Morgan Stanley Bank of America Merrill Lynch Trust | ||||
| 2015-C23 | 3.451% | 7/15/50 | 3,420 | 3,356 | |
| 4 | Morgan Stanley Bank of America Merrill Lynch Trust | ||||
| 2015-C24 | 3.479% | 5/15/48 | 4,300 | 4,245 | |
| 4 | Morgan Stanley Bank of America Merrill Lynch Trust | ||||
| 2015-C24 | 3.732% | 5/15/48 | 34,430 | 34,500 | |
| 4 | Morgan Stanley Bank of America Merrill Lynch Trust | ||||
| 2015-C25 | 3.635% | 10/15/48 | 7,598 | 7,563 | |
| 4 | Morgan Stanley Bank of America Merrill Lynch Trust | ||||
| 2016-C29 | 3.325% | 5/15/49 | 700 | 679 | |
| 4 | Morgan Stanley Bank of America Merrill Lynch Trust | ||||
| 2016-C29 | 4.751% | 5/15/49 | 1,090 | 1,091 | |
| 4 | Morgan Stanley Bank of America Merrill Lynch Trust | ||||
| 2016-C32 | 3.720% | 12/15/49 | 19,390 | 19,266 | |
| 4 | Morgan Stanley Bank of America Merrill Lynch Trust | ||||
| 2017-C34 | 3.536% | 11/15/52 | 6,520 | 6,365 | |
| 4 | Morgan Stanley Capital I Trust 2012-C4 | 3.244% | 3/15/45 | 2,260 | 2,247 |
| 4 | Morgan Stanley Capital I Trust 2012-C4 | 3.773% | 3/15/45 | 2,440 | 2,430 |
| 4,10 | Morgan Stanley Capital I Trust 2012-STAR | 3.201% | 8/5/34 | 6,407 | 6,314 |
| 4,10 | Morgan Stanley Capital I Trust 2014-150E | 3.912% | 9/9/32 | 6,370 | 6,429 |
| 4,10 | Morgan Stanley Capital I Trust 2014-CPT | 3.350% | 7/13/29 | 2,795 | 2,795 |
| 4,10 | Morgan Stanley Capital I Trust 2015-420 | 3.727% | 10/12/50 | 4,430 | 4,385 |
| 4 | Morgan Stanley Capital I Trust 2015-UBS8 | 3.809% | 12/15/48 | 48,685 | 48,801 |
| 4 | Morgan Stanley Capital I Trust 2015-UBS8 | 4.589% | 12/15/48 | 3,210 | 3,124 |
| 4 | Morgan Stanley Capital I Trust 2016-UBS11 | 2.782% | 8/15/49 | 21,780 | 20,314 |
| 4 | Morgan Stanley Capital I Trust 2016-UBS9 | 3.594% | 3/15/49 | 7,410 | 7,325 |
| 4 | Morgan Stanley Capital I Trust 2017-HR2 | 3.509% | 12/15/50 | 2,800 | 2,773 |
| 4 | Morgan Stanley Capital I Trust 2017-HR2 | 3.587% | 12/15/50 | 3,486 | 3,417 |
| 4,10,13 Motor plc 2017 1A | 2.594% | 9/25/24 | 31,470 | 31,499 | |
| 4,10 | MSBAM Commercial Mortgage Securities Trust 2012- | ||||
| CKSV | 3.277% | 10/15/30 | 11,190 | 10,787 | |
| 10 | National Australia Bank Ltd. | 2.250% | 3/16/21 | 15,800 | 15,402 |
| 4,10,13 Navient Student Loan Trust 2016-2 | 3.114% | 6/25/65 | 2,420 | 2,445 | |
| 4,10,13 Navient Student Loan Trust 2016-3 | 2.914% | 6/25/65 | 2,050 | 2,065 | |
| 4,10,13 Navient Student Loan Trust 2016-6A | 2.814% | 3/25/66 | 12,400 | 12,503 | |
| 4,10,13 Navient Student Loan Trust 2017-4A | 2.564% | 9/27/66 | 8,390 | 8,414 | |
| 4,10,13 Navient Student Loan Trust 2017-A | 2.472% | 12/16/58 | 5,885 | 5,892 | |
| 4,10,13 Navient Student Loan Trust 2017-A | 2.880% | 12/16/58 | 8,940 | 8,678 | |
| 4,10,13 Navient Student Loan Trust 2018-1 | 2.254% | 3/25/67 | 4,856 | 4,855 | |
| 4,10,13 Navient Student Loan Trust 2018-1 | 2.414% | 3/25/67 | 7,890 | 7,885 | |
| 47 | |||||
| Vanguard® Intermediate-Term Investment-Grade Fund | |||||
| Schedule of Investments | |||||
| July 31, 2018 | |||||
| Face | Market | ||||
| Maturity | Amount | Value | |||
| Coupon | Date | ($000) | ($000) | ||
| 4,10,13 Navient Student Loan Trust 2018-1 | 2.784% | 3/25/67 | 9,750 | 9,777 | |
| 4,10 | Navient Student Loan Trust 2018-BA | 3.610% | 12/15/59 | 5,260 | 5,255 |
| 4,10 | Navient Student Loan Trust 2018-CA | 3.010% | 6/16/42 | 5,290 | 5,290 |
| 4,10 | Navient Student Loan Trust 2018-CA | 3.520% | 6/16/42 | 23,520 | 23,518 |
| 4,10,13 Navistar Financial Dealer Note Master Trust II 2016-1A | 3.414% | 9/27/21 | 15,350 | 15,372 | |
| 4,13 | New Mexico Educational Assistance Foundation 2013-1 | 2.792% | 1/2/25 | 2,675 | 2,684 |
| 4,10 | NextGear Floorplan Master Owner Trust 2016-1A | 2.740% | 4/15/21 | 6,720 | 6,711 |
| 4 | Nissan Auto Lease Trust 2017-A | 1.910% | 4/15/20 | 24,810 | 24,614 |
| 4 | Nissan Auto Lease Trust 2017-A | 2.040% | 9/15/22 | 8,960 | 8,864 |
| 4 | Nissan Auto Lease Trust 2017-B | 2.050% | 9/15/20 | 18,990 | 18,809 |
| 4 | Nissan Auto Lease Trust 2017-B | 2.170% | 12/15/21 | 5,300 | 5,231 |
| 4 | Nissan Auto Receivables 2017-C Owner Trust | 2.120% | 4/18/22 | 19,280 | 18,989 |
| 4 | Nissan Auto Receivables 2017-C Owner Trust | 2.280% | 2/15/24 | 10,870 | 10,619 |
| 4 | Nissan Auto Receivables 2018-B Owner Trust | 3.160% | 12/16/24 | 5,220 | 5,212 |
| 4,13 | Nissan Master Owner Trust Receivables Series 2017-C | 2.392% | 10/17/22 | 38,830 | 38,849 |
| 4,10 | OBP Depositor LLC Trust 2010-OBP | 4.646% | 7/15/45 | 121 | 123 |
| 4,10 | Palisades Center Trust 2016-PLSD | 2.713% | 4/13/33 | 8,980 | 8,764 |
| 4,10,13 Pepper Residential Securities Trust 2017A-A1UA | 3.186% | 3/10/58 | 4,598 | 4,604 | |
| 4,10,13 Pepper Residential Securities Trust 2018A-A1UA | 3.017% | 3/12/47 | 1,133 | 1,134 | |
| 4,10,13 Pepper Residential Securities Trust 2019A-A1U1 | 2.417% | 10/12/18 | 13,610 | 13,600 | |
| 4,10,13 Pepper Residential Securities Trust 2020A-A1U1 | 2.572% | 3/16/19 | 8,390 | 8,351 | |
| 4,10,11, | |||||
| Pepper Residential Securities Trust 2021-A1U | |||||
| 13 | 0.000% | 1/16/60 | 19,100 | 19,100 | |
| 4,10,12 Permanent Master Issuer plc 2018-1A | 2.747% | 7/15/58 | 6,540 | 6,540 | |
| 4,10 | PFS Financing Corp. 2017-B | 2.220% | 7/15/22 | 15,980 | 15,634 |
| 4,10,13 PFS Financing Corp. 2017-C | 2.542% | 10/15/21 | 16,560 | 16,592 | |
| 4,10 | PFS Financing Corp. 2017-D | 2.400% | 10/17/22 | 17,210 | 16,880 |
| 4,10 | PFS Financing Corp. 2018-D | 3.190% | 4/17/23 | 5,460 | 5,433 |
| 4,10,13 PHEAA Student Loan Trust 2016-2A | 3.014% | 11/25/65 | 13,204 | 13,372 | |
| 4,10 | Progress Residential 2015-SFR2 Trust | 2.740% | 6/12/32 | 2,457 | 2,421 |
| 4,10 | Progress Residential 2015-SFR3 Trust | 3.067% | 11/12/32 | 9,320 | 9,216 |
| 4,10 | Progress Residential 2015-SFR3 Trust | 3.733% | 11/12/32 | 3,460 | 3,456 |
| 4,10 | Progress Residential 2017-SFR2 Trust | 2.897% | 12/17/34 | 7,770 | 7,508 |
| 4,10 | Progress Residential 2017-SFR2 Trust | 3.196% | 12/17/34 | 2,020 | 1,954 |
| 4,10 | Progress Residential 2018-SFR1 Trust | 3.255% | 3/17/35 | 4,580 | 4,486 |
| 4,10 | Progress Residential 2018-SFR1 Trust | 3.484% | 3/17/35 | 580 | 567 |
| 4 | Public Service New Hampshire Funding LLC 2018-1 | 3.094% | 2/1/26 | 5,020 | 5,013 |
| 4 | Public Service New Hampshire Funding LLC 2018-1 | 3.506% | 8/1/28 | 1,720 | 1,723 |
| 4 | Public Service New Hampshire Funding LLC 2018-1 | 3.814% | 2/1/35 | 1,630 | 1,628 |
| 4,10,12 Resimac Premier Series 2014-1A | 3.026% | 12/12/45 | 1,534 | 1,524 | |
| 4,10,13 Resimac Premier Series 2016-1A | 3.476% | 10/10/47 | 20,176 | 20,316 | |
| 4,10,13 Resimac Premier Series 2018-1A | 2.886% | 11/10/49 | 15,363 | 15,119 | |
| Royal Bank of Canada | 2.200% | 9/23/19 | 2,573 | 2,554 | |
| Royal Bank of Canada | 2.100% | 10/14/20 | 1,090 | 1,065 | |
| 4 | Royal Bank of Canada | 1.875% | 2/5/21 | 4,800 | 4,721 |
| Royal Bank of Canada | 2.300% | 3/22/21 | 5,540 | 5,408 | |
| 4 | Santander Drive Auto Receivables Trust 2015-3 | 3.490% | 5/17/21 | 5,160 | 5,191 |
| 4 | Santander Drive Auto Receivables Trust 2016-1 | 2.470% | 12/15/20 | 3,476 | 3,475 |
| 4 | Santander Drive Auto Receivables Trust 2016-2 | 2.080% | 2/16/21 | 1,725 | 1,722 |
| 4 | Santander Drive Auto Receivables Trust 2016-2 | 2.660% | 11/15/21 | 1,610 | 1,604 |
| 4 | Santander Drive Auto Receivables Trust 2016-2 | 3.390% | 4/15/22 | 1,440 | 1,439 |
| 4 | Santander Drive Auto Receivables Trust 2016-3 | 2.460% | 3/15/22 | 9,330 | 9,243 |
| 4 | Santander Drive Auto Receivables Trust 2017-3 | 1.870% | 6/15/21 | 7,990 | 7,948 |
| 4 | Santander Drive Auto Receivables Trust 2017-3 | 2.760% | 12/15/22 | 3,980 | 3,929 |
| 4 | Santander Drive Auto Receivables Trust 2018-1 | 2.100% | 11/16/20 | 15,695 | 15,656 |
| 4 | Santander Drive Auto Receivables Trust 2018-1 | 2.320% | 8/16/21 | 4,720 | 4,686 |
| 4 | Santander Drive Auto Receivables Trust 2018-1 | 2.630% | 7/15/22 | 10,780 | 10,650 |
| 4 | Santander Drive Auto Receivables Trust 2018-1 | 2.960% | 3/15/24 | 9,410 | 9,272 |
| 4 | Santander Drive Auto Receivables Trust 2018-1 | 3.320% | 3/15/24 | 4,110 | 4,035 |
| 4 | Santander Drive Auto Receivables Trust 2018-3 | 3.290% | 10/17/22 | 13,250 | 13,240 |
| 4 | Santander Drive Auto Receivables Trust 2018-3 | 4.070% | 8/15/24 | 21,950 | 21,931 |
| 4,10 | Santander Retail Auto Lease Trust 2017-A | 2.370% | 1/20/22 | 3,460 | 3,409 |
| 4,10 | Santander Retail Auto Lease Trust 2017-A | 2.680% | 1/20/22 | 2,750 | 2,712 |
| 4,10 | Santander Retail Auto Lease Trust 2018-A | 2.930% | 5/20/21 | 11,150 | 11,121 |
| 48 | |||||
| Vanguard® Intermediate-Term Investment-Grade Fund | |||||
| Schedule of Investments | |||||
| July 31, 2018 | |||||
| Face | Market | ||||
| Maturity | Amount | Value | |||
| Coupon | Date | ($000) | ($000) | ||
| 4,10 | Santander Retail Auto Lease Trust 2018-A | 3.060% | 4/20/22 | 3,910 | 3,892 |
| 4,10 | Santander Retail Auto Lease Trust 2018-A | 3.200% | 4/20/22 | 3,340 | 3,324 |
| 4,10 | Santander Retail Auto Lease Trust 2018-A | 3.490% | 5/20/22 | 7,760 | 7,721 |
| 4,10 | SBA Tower Trust | 3.156% | 10/8/20 | 3,970 | 3,917 |
| 4,10 | Securitized Term Auto Receivables Trust 2016-1A | 1.524% | 3/25/20 | 3,418 | 3,403 |
| 4,10 | Securitized Term Auto Receivables Trust 2016-1A | 1.794% | 2/25/21 | 5,460 | 5,365 |
| 4,10 | Securitized Term Auto Receivables Trust 2017-2A | 2.289% | 3/25/22 | 6,400 | 6,201 |
| 4,10 | Securitized Term Auto Receivables Trust 2018-1A | 3.298% | 11/25/22 | 2,350 | 2,329 |
| 4,10 | SLM Private Education Loan Trust 2011-A | 4.370% | 4/17/28 | 275 | 276 |
| 4,10 | SLM Private Education Loan Trust 2011-B | 3.740% | 2/15/29 | 3,382 | 3,395 |
| 4,10 | SLM Private Education Loan Trust 2011-C | 4.540% | 10/17/44 | 2,073 | 2,096 |
| 4,10,13 SLM Private Education Loan Trust 2013-A | 3.122% | 5/17/27 | 1,946 | 1,949 | |
| 4,10 | SLM Private Education Loan Trust 2013-A | 2.500% | 3/15/47 | 1,800 | 1,778 |
| 4,10 | SLM Private Education Loan Trust 2013-B | 1.850% | 6/17/30 | 1,673 | 1,660 |
| 4,10 | SLM Private Education Loan Trust 2013-B | 3.000% | 5/16/44 | 3,000 | 2,942 |
| 4,10 | SLM Private Education Loan Trust 2013-C | 3.500% | 6/15/44 | 2,000 | 1,995 |
| 4,10 | SLM Private Education Loan Trust 2014-A | 2.590% | 1/15/26 | 413 | 412 |
| 4,10 | SLM Private Education Loan Trust 2014-A | 3.500% | 11/15/44 | 800 | 792 |
| 4 | SMART ABS Series 2016-2US Trust | 2.050% | 12/14/22 | 1,830 | 1,775 |
| 4,10 | SMB Private Education Loan Trust 2016-A | 2.700% | 5/15/31 | 5,523 | 5,392 |
| 4,10,13 SMB Private Education Loan Trust 2016-B | 3.522% | 2/17/32 | 4,102 | 4,179 | |
| 4,10,13 SMB Private Education Loan Trust 2016-C | 3.172% | 9/15/34 | 5,600 | 5,674 | |
| 4,10,13 SMB Private Education Loan Trust 2017-A | 2.972% | 9/15/34 | 8,230 | 8,304 | |
| 4,10 | SMB Private Education Loan Trust 2017-B | 2.820% | 10/15/35 | 9,810 | 9,540 |
| 4,10 | SMB Private Education Loan Trust 2018-A | 3.500% | 2/15/36 | 18,170 | 18,082 |
| 4,10 | SMB Private Education Loan Trust 2018-B | 3.600% | 1/15/37 | 10,670 | 10,682 |
| 4,10 | SoFi Professional Loan Program 2016-B LLC | 2.740% | 10/25/32 | 4,155 | 4,139 |
| 4,10 | SoFi Professional Loan Program 2016-C LLC | 2.360% | 12/27/32 | 2,235 | 2,185 |
| 4,10 | SoFi Professional Loan Program 2016-D LLC | 2.340% | 4/25/33 | 2,340 | 2,292 |
| 4,10,13 SoFi Professional Loan Program 2016-D LLC | 3.014% | 1/25/39 | 1,376 | 1,385 | |
| 4,10 | SoFi Professional Loan Program 2017-A LLC | 2.400% | 3/26/40 | 1,280 | 1,240 |
| 4,10 | SoFi Professional Loan Program 2017-B LLC | 2.740% | 5/25/40 | 7,170 | 7,045 |
| 4,10,13 SoFi Professional Loan Program 2017-C LLC | 2.664% | 7/25/40 | 1,142 | 1,144 | |
| 4,10 | SoFi Professional Loan Program 2017-D LLC | 2.650% | 9/25/40 | 5,700 | 5,537 |
| 4,10 | SoFi Professional Loan Program 2017-E LLC | 1.860% | 11/26/40 | 15,561 | 15,350 |
| 4,10 | SoFi Professional Loan Program 2017-E LLC | 2.720% | 11/26/40 | 5,080 | 4,927 |
| 4,10 | SoFi Professional Loan Program 2017-F LLC | 2.050% | 1/25/41 | 13,344 | 13,226 |
| 4,10 | SoFi Professional Loan Program 2017-F LLC | 2.840% | 1/25/41 | 6,120 | 5,965 |
| 4,10 | SoFi Professional Loan Program 2018-A LLC | 2.390% | 2/25/42 | 12,061 | 11,959 |
| 4,10 | SoFi Professional Loan Program 2018-A LLC | 2.950% | 2/25/42 | 5,660 | 5,523 |
| 4,10 | SoFi Professional Loan Program 2018-B LLC | 3.340% | 8/25/47 | 8,850 | 8,787 |
| 10 | Stadshypotek AB | 1.750% | 4/9/20 | 3,689 | 3,610 |
| 10 | Stadshypotek AB | 2.500% | 4/5/22 | 16,050 | 15,609 |
| 4 | Synchrony Credit Card Master Note Trust 2015-1 | 2.370% | 3/15/23 | 3,690 | 3,650 |
| 4 | Synchrony Credit Card Master Note Trust 2015-4 | 2.380% | 9/15/23 | 20,127 | 19,809 |
| 4 | Synchrony Credit Card Master Note Trust 2016-1 | 2.390% | 3/15/22 | 21,070 | 21,018 |
| 4 | Synchrony Credit Card Master Note Trust 2016-2 | 2.950% | 5/15/24 | 5,300 | 5,191 |
| 4 | Synchrony Credit Card Master Note Trust 2016-3 | 1.580% | 9/15/22 | 5,710 | 5,627 |
| 4 | Synchrony Credit Card Master Note Trust 2016-3 | 1.910% | 9/15/22 | 9,890 | 9,772 |
| 4 | Synchrony Credit Card Master Note Trust 2017-2 | 2.620% | 10/15/25 | 15,680 | 15,191 |
| 4 | Synchrony Credit Card Master Note Trust 2017-2 | 2.820% | 10/15/25 | 4,770 | 4,624 |
| 4 | Synchrony Credit Card Master Note Trust 2017-2 | 3.010% | 10/15/25 | 6,390 | 6,194 |
| 4 | Synchrony Credit Card Master Note Trust 2012-2 | 2.220% | 1/15/22 | 18,000 | 17,968 |
| 4,10 | Taco Bell Funding LLC 2016-1A | 4.377% | 5/25/46 | 3,645 | 3,682 |
| 4,10 | Taco Bell Funding LLC 2016-1A | 4.970% | 5/25/46 | 5,831 | 5,976 |
| 4,10 | Tesla Auto Lease Trust 2018-A | 2.320% | 12/20/19 | 16,383 | 16,325 |
| 4,10 | Tesla Auto Lease Trust 2018-A | 2.750% | 2/20/20 | 700 | 696 |
| 4,10 | Tesla Auto Lease Trust 2018-A | 2.970% | 4/20/20 | 560 | 558 |
| 4,10 | Tesla Auto Lease Trust 2018-A | 3.300% | 5/20/20 | 630 | 627 |
| 4,10 | Tidewater Auto Receivables Trust 2018-AA | 3.120% | 7/15/22 | 8,940 | 8,931 |
| 4,10 | Tidewater Auto Receivables Trust 2018-AA | 3.450% | 11/15/24 | 1,880 | 1,876 |
| 4,10 | Tidewater Auto Receivables Trust 2018-AA | 3.840% | 11/15/24 | 2,100 | 2,095 |
| 4,10 | Tidewater Auto Receivables Trust 2018-AA | 4.300% | 11/15/24 | 630 | 628 |
| 49 | |||||
| Vanguard® Intermediate-Term Investment-Grade Fund | |||||
| Schedule of Investments | |||||
| July 31, 2018 | |||||
| Face | Market | ||||
| Maturity | Amount | Value | |||
| Coupon | Date | ($000) | ($000) | ||
| 4,10 | TMSQ 2014-1500 Mortgage Trust | 3.680% | 10/10/36 | 2,800 | 2,761 |
| 10 | Toronto-Dominion Bank | 2.250% | 3/15/21 | 1,700 | 1,659 |
| 4 | Toyota Auto Receivables 2017-D Owner Trust | 2.120% | 2/15/23 | 1,345 | 1,311 |
| 4 | Toyota Auto Receivables 2018-A Owner Trust | 2.350% | 5/16/22 | 24,140 | 23,862 |
| 4 | Toyota Auto Receivables 2018-A Owner Trust | 2.520% | 5/15/23 | 1,590 | 1,563 |
| 4 | Toyota Auto Receivables 2018-B Owner Trust | 3.110% | 11/15/23 | 5,780 | 5,783 |
| 4,10 | Trafigura Securitisation Finance plc 2017-1A | 2.470% | 12/15/20 | 43,600 | 42,753 |
| 4,10 | Trinity Rail Leasing LP TRL_18-1 | 4.620% | 6/17/48 | 10,260 | 10,364 |
| 4,10 | Trip Rail Master Funding LLC 2017-1A | 2.709% | 8/15/47 | 2,788 | 2,745 |
| 4,10 | Triton Container Finance LLC 2018-A2 | 4.190% | 6/22/43 | 15,649 | 15,669 |
| 4 | UBS Commercial Mortgage Trust 2012-C1 | 4.171% | 5/10/45 | 1,200 | 1,218 |
| 4 | UBS Commercial Mortgage Trust 2017-C7 | 3.679% | 12/15/50 | 3,705 | 3,641 |
| 4,10 | UBS-BAMLL Trust 2012-WRM | 3.663% | 6/10/30 | 6,673 | 6,594 |
| 4 | UBS-Barclays Commercial Mortgage Trust 2012-C4 | 2.850% | 12/10/45 | 5,703 | 5,559 |
| 4 | UBS-Barclays Commercial Mortgage Trust 2013-C6 | 3.244% | 4/10/46 | 3,970 | 3,921 |
| 4 | UBS-Barclays Commercial Mortgage Trust 2013-C6 | 3.469% | 4/10/46 | 1,160 | 1,149 |
| 4,10 | Vantage Data Centers Issuer, LLC 2018-1A | 4.072% | 2/16/43 | 6,214 | 6,140 |
| 4,10 | Verizon Owner Trust 2016-2A | 1.680% | 5/20/21 | 30,310 | 29,992 |
| 4,10 | Verizon Owner Trust 2017-2A | 1.920% | 12/20/21 | 45,090 | 44,442 |
| 4,10 | Verizon Owner Trust 2017-3 | 2.060% | 4/20/22 | 15,460 | 15,198 |
| 4,10 | Verizon Owner Trust 2017-3 | 2.380% | 4/20/22 | 8,950 | 8,783 |
| 4,10 | Verizon Owner Trust 2017-3 | 2.530% | 4/20/22 | 9,610 | 9,446 |
| 4,10 | Verizon Owner Trust 2018-1 | 2.820% | 9/20/22 | 20,120 | 19,997 |
| 4,10 | Verizon Owner Trust 2018-1 | 3.050% | 9/20/22 | 7,320 | 7,256 |
| 4,10 | VNDO 2012-6AVE Mortgage Trust | 2.996% | 11/15/30 | 9,070 | 8,866 |
| 4,10 | VNDO 2013-PENN Mortgage Trust | 3.808% | 12/13/29 | 1,100 | 1,110 |
| 4,10 | VNDO 2013-PENN Mortgage Trust | 3.947% | 12/13/29 | 490 | 489 |
| 4,10 | VNDO 2013-PENN Mortgage Trust | 3.947% | 12/13/29 | 650 | 652 |
| 4 | Volkswagen Auto Loan Enhanced Trust 2018-1 | 3.020% | 11/21/22 | 8,050 | 8,026 |
| 4 | Volkswagen Auto Loan Enhanced Trust 2018-1 | 3.150% | 7/22/24 | 3,680 | 3,664 |
| 4,10 | Volvo Financial Equipment LLC Series 2016-1A | 1.890% | 9/15/20 | 3,450 | 3,417 |
| 4,10,13 Volvo Financial Equipment Master Owner Trust 2017-A | 2.572% | 11/15/22 | 4,880 | 4,889 | |
| 4 | Wells Fargo Commercial Mortgage Trust 2012-LC5 | 2.918% | 10/15/45 | 6,343 | 6,224 |
| 4 | Wells Fargo Commercial Mortgage Trust 2012-LC5 | 3.539% | 10/15/45 | 7,210 | 7,148 |
| 4 | Wells Fargo Commercial Mortgage Trust 2013-LC12 | 3.928% | 7/15/46 | 954 | 970 |
| 4 | Wells Fargo Commercial Mortgage Trust 2013-LC12 | 4.218% | 7/15/46 | 7,883 | 8,121 |
| 4 | Wells Fargo Commercial Mortgage Trust 2014-LC16 | 3.548% | 8/15/50 | 11,500 | 11,498 |
| 4 | Wells Fargo Commercial Mortgage Trust 2014-LC16 | 3.817% | 8/15/50 | 8,920 | 9,028 |
| 4 | Wells Fargo Commercial Mortgage Trust 2014-LC16 | 4.020% | 8/15/50 | 700 | 693 |
| 4 | Wells Fargo Commercial Mortgage Trust 2014-LC16 | 4.322% | 8/15/50 | 2,400 | 2,446 |
| 4 | Wells Fargo Commercial Mortgage Trust 2014-LC16 | 4.458% | 8/15/50 | 1,450 | 1,422 |
| 4 | Wells Fargo Commercial Mortgage Trust 2014-LC18 | 3.405% | 12/15/47 | 1,470 | 1,448 |
| 4 | Wells Fargo Commercial Mortgage Trust 2015-C26 | 3.166% | 2/15/48 | 29,385 | 28,530 |
| 4 | Wells Fargo Commercial Mortgage Trust 2015-C27 | 3.451% | 2/15/48 | 15,822 | 15,616 |
| 4 | Wells Fargo Commercial Mortgage Trust 2015-C29 | 3.637% | 6/15/48 | 16,385 | 16,335 |
| 4 | Wells Fargo Commercial Mortgage Trust 2015-C29 | 4.225% | 6/15/48 | 2,310 | 2,258 |
| 4 | Wells Fargo Commercial Mortgage Trust 2015-C30 | 3.411% | 9/15/58 | 7,300 | 7,209 |
| 4 | Wells Fargo Commercial Mortgage Trust 2015-C30 | 3.664% | 9/15/58 | 4,380 | 4,373 |
| 4 | Wells Fargo Commercial Mortgage Trust 2015-C30 | 4.067% | 9/15/58 | 2,250 | 2,276 |
| 4 | Wells Fargo Commercial Mortgage Trust 2015-C30 | 4.497% | 9/15/58 | 2,740 | 2,683 |
| 4 | Wells Fargo Commercial Mortgage Trust 2015-LC22 | 3.839% | 9/15/58 | 5,269 | 5,321 |
| 4 | Wells Fargo Commercial Mortgage Trust 2015-LC22 | 4.207% | 9/15/58 | 2,045 | 2,085 |
| 4 | Wells Fargo Commercial Mortgage Trust 2015-LC22 | 4.542% | 9/15/58 | 5,225 | 5,100 |
| 4 | Wells Fargo Commercial Mortgage Trust 2015-SG1 | 3.789% | 9/15/48 | 22,686 | 22,796 |
| 4 | Wells Fargo Commercial Mortgage Trust 2016-C32 | 3.560% | 1/15/59 | 5,750 | 5,694 |
| 4 | Wells Fargo Commercial Mortgage Trust 2016-C37 | 3.525% | 12/15/49 | 1,390 | 1,364 |
| 4 | Wells Fargo Commercial Mortgage Trust 2016-C37 | 3.794% | 12/15/49 | 7,730 | 7,737 |
| 4 | Wells Fargo Commercial Mortgage Trust 2017-C38 | 3.453% | 7/15/50 | 6,875 | 6,688 |
| 4 | Wells Fargo Commercial Mortgage Trust 2017-C39 | 3.157% | 9/15/50 | 1,400 | 1,329 |
| 4 | Wells Fargo Commercial Mortgage Trust 2017-C39 | 3.418% | 9/15/50 | 21,190 | 20,572 |
| 4 | Wells Fargo Commercial Mortgage Trust 2017-C40 | 3.581% | 10/15/50 | 15,120 | 14,847 |
| 4 | Wells Fargo Commercial Mortgage Trust 2017-C41 | 3.472% | 11/15/50 | 10,700 | 10,404 |
| 4 | Wells Fargo Commercial Mortgage Trust 2017-C42 | 3.589% | 12/15/50 | 9,205 | 9,025 |
| 4 | Wells Fargo Commercial Mortgage Trust 2017-RC1 | 3.631% | 1/15/60 | 2,332 | 2,297 |
| 50 | |||||
| Vanguard® Intermediate-Term Investment-Grade Fund | |||||
| Schedule of Investments | |||||
| July 31, 2018 | |||||
| Face | Market | ||||
| Maturity | Amount | Value | |||
| Coupon | Date | ($000) | ($000) | ||
| 4 | Wells Fargo Commercial Mortgage Trust 2018-C43 | 4.012% | 3/15/51 | 5,470 | 5,518 |
| 4 | Wells Fargo Commercial Mortgage Trust 2018-C43 | 4.514% | 3/15/51 | 12,380 | 12,163 |
| 4,13 | Wells Fargo Dealer Floorplan Master Note Trust Series | ||||
| 2015-2 | 2.736% | 1/20/22 | 19,025 | 19,124 | |
| 4,10 | Wendys Funding LLC 2015-1A | 4.080% | 6/15/45 | 2,694 | 2,691 |
| 4,10 | Wendys Funding LLC 2015-1A | 4.497% | 6/15/45 | 2,246 | 2,246 |
| 4,10 | Wendys Funding LLC 2018-1 | 3.573% | 3/15/48 | 3,184 | 3,083 |
| 4,10 | Wendys Funding LLC 2018-1 | 3.884% | 3/15/48 | 4,786 | 4,651 |
| 10 | Westpac Banking Corp. | 2.100% | 2/25/21 | 1,860 | 1,806 |
| 4,10 | WFLD 2014-MONT Mortgage Trust | 3.755% | 8/10/31 | 4,640 | 4,622 |
| 4,10 | WFRBS Commercial Mortgage Trust 2011-C3 | 4.375% | 3/15/44 | 6,202 | 6,351 |
| 4 | WFRBS Commercial Mortgage Trust 2012-C10 | 2.875% | 12/15/45 | 5,280 | 5,155 |
| 4 | WFRBS Commercial Mortgage Trust 2012-C7 | 3.431% | 6/15/45 | 6,130 | 6,131 |
| 4 | WFRBS Commercial Mortgage Trust 2012-C7 | 4.090% | 6/15/45 | 4,170 | 4,161 |
| 4 | WFRBS Commercial Mortgage Trust 2012-C8 | 3.001% | 8/15/45 | 3,789 | 3,734 |
| 4 | WFRBS Commercial Mortgage Trust 2012-C9 | 2.870% | 11/15/45 | 11,307 | 11,060 |
| 4 | WFRBS Commercial Mortgage Trust 2012-C9 | 3.388% | 11/15/45 | 2,870 | 2,828 |
| 4 | WFRBS Commercial Mortgage Trust 2013-C13 | 3.345% | 5/15/45 | 2,220 | 2,169 |
| 4 | WFRBS Commercial Mortgage Trust 2013-C15 | 3.720% | 8/15/46 | 2,133 | 2,157 |
| 4 | WFRBS Commercial Mortgage Trust 2013-C15 | 4.153% | 8/15/46 | 6,044 | 6,216 |
| 4 | WFRBS Commercial Mortgage Trust 2013-C17 | 3.558% | 12/15/46 | 357 | 359 |
| 4 | WFRBS Commercial Mortgage Trust 2013-C18 | 3.676% | 12/15/46 | 2,116 | 2,137 |
| 4 | WFRBS Commercial Mortgage Trust 2013-C18 | 4.162% | 12/15/46 | 7,778 | 8,000 |
| 4 | WFRBS Commercial Mortgage Trust 2013-C18 | 4.656% | 12/15/46 | 1,085 | 1,134 |
| 4 | WFRBS Commercial Mortgage Trust 2014-C19 | 3.829% | 3/15/47 | 12,930 | 13,040 |
| 4 | WFRBS Commercial Mortgage Trust 2014-C19 | 4.101% | 3/15/47 | 10,595 | 10,890 |
| 4 | WFRBS Commercial Mortgage Trust 2014-C20 | 3.995% | 5/15/47 | 14,675 | 14,999 |
| 4 | WFRBS Commercial Mortgage Trust 2014-C20 | 4.378% | 5/15/47 | 2,410 | 2,425 |
| 4 | WFRBS Commercial Mortgage Trust 2014-C20 | 4.513% | 5/15/47 | 1,410 | 1,359 |
| 4 | WFRBS Commercial Mortgage Trust 2014-C21 | 3.410% | 8/15/47 | 1,520 | 1,502 |
| 4 | WFRBS Commercial Mortgage Trust 2014-C21 | 3.678% | 8/15/47 | 13,235 | 13,287 |
| 4 | WFRBS Commercial Mortgage Trust 2014-C21 | 3.891% | 8/15/47 | 700 | 690 |
| 4 | WFRBS Commercial Mortgage Trust 2014-C21 | 4.234% | 8/15/47 | 2,410 | 2,314 |
| 4 | WFRBS Commercial Mortgage Trust 2014-C23 | 3.917% | 10/15/57 | 4,167 | 4,222 |
| 4 | WFRBS Commercial Mortgage Trust 2014-C24 | 3.607% | 11/15/47 | 14,179 | 14,149 |
| 4 | WFRBS Commercial Mortgage Trust 2014-LC14 | 3.766% | 3/15/47 | 920 | 926 |
| 4 | WFRBS Commercial Mortgage Trust 2014-LC14 | 4.045% | 3/15/47 | 13,996 | 14,326 |
| 4 | World Omni Auto Receivables Trust 2016-A | 1.770% | 9/15/21 | 9,598 | 9,533 |
| 4 | World Omni Auto Receivables Trust 2016-B | 1.300% | 2/15/22 | 5,334 | 5,264 |
| 4 | World Omni Auto Receivables Trust 2018-A | 2.730% | 2/15/24 | 7,680 | 7,584 |
| 4 | World Omni Auto Receivables Trust 2018-A | 2.890% | 4/15/25 | 3,820 | 3,770 |
| 4 | World Omni Automobile Lease Securitization Trust | ||||
| 2018-A | 2.830% | 7/15/21 | 12,960 | 12,892 | |
| 4 | World Omni Automobile Lease Securitization Trust | ||||
| 2018-A | 2.940% | 5/15/23 | 3,890 | 3,869 | |
| Total Asset-Backed/Commercial Mortgage-Backed Securities (Cost $5,564,876) | 5,464,867 | ||||
| Corporate Bonds (62.8%) | |||||
| Finance (29.7%) | |||||
| Banking (21.0%) | |||||
| American Express Co. | 3.700% | 8/3/23 | 66,175 | 66,106 | |
| American Express Co. | 3.000% | 10/30/24 | 35,385 | 33,871 | |
| American Express Credit Corp. | 1.700% | 10/30/19 | 4,669 | 4,596 | |
| American Express Credit Corp. | 2.200% | 3/3/20 | 13,535 | 13,348 | |
| American Express Credit Corp. | 2.700% | 3/3/22 | 16,000 | 15,626 | |
| 10 | ASB Bank Ltd. | 3.750% | 6/14/23 | 18,810 | 18,654 |
| Australia & New Zealand Banking Group Ltd. | 2.625% | 11/9/22 | 35,734 | 34,368 | |
| 10 | Banco de Credito del Peru | 4.250% | 4/1/23 | 5,000 | 5,055 |
| Banco Santander SA | 4.379% | 4/12/28 | 4,415 | 4,309 | |
| 4 | Bank of America Corp. | 2.369% | 7/21/21 | 5,480 | 5,387 |
| 4 | Bank of America Corp. | 2.328% | 10/1/21 | 16,865 | 16,460 |
| 4 | Bank of America Corp. | 3.124% | 1/20/23 | 20,890 | 20,477 |
| Bank of America Corp. | 3.004% | 12/20/23 | 45,150 | 43,801 | |
| 51 | |||||
| Vanguard® Intermediate-Term Investment-Grade Fund | |||||
| Schedule of Investments | |||||
| July 31, 2018 | |||||
| Face | Market | ||||
| Maturity | Amount | Value | |||
| Coupon | Date | ($000) | ($000) | ||
| Bank of America Corp. | 4.125% | 1/22/24 | 33,430 | 33,949 | |
| 4 | Bank of America Corp. | 3.550% | 3/5/24 | 60,205 | 59,431 |
| Bank of America Corp. | 3.875% | 8/1/25 | 1,535 | 1,531 | |
| 4 | Bank of America Corp. | 3.093% | 10/1/25 | 72,895 | 69,175 |
| 4 | Bank of America Corp. | 3.366% | 1/23/26 | 64,555 | 62,327 |
| 4 | Bank of America Corp. | 3.824% | 1/20/28 | 73,730 | 71,823 |
| Bank of New York Mellon Corp. | 2.600% | 8/17/20 | 297 | 294 | |
| Bank of New York Mellon Corp. | 4.150% | 2/1/21 | 17,664 | 18,039 | |
| Bank of New York Mellon Corp. | 2.050% | 5/3/21 | 10,780 | 10,414 | |
| Bank of New York Mellon Corp. | 3.550% | 9/23/21 | 16,040 | 16,165 | |
| Bank of New York Mellon Corp. | 3.650% | 2/4/24 | 17,000 | 17,027 | |
| Bank of New York Mellon Corp. | 3.400% | 5/15/24 | 20,200 | 19,940 | |
| Bank of New York Mellon Corp. | 3.250% | 9/11/24 | 11,142 | 10,907 | |
| Bank of New York Mellon Corp. | 3.000% | 2/24/25 | 15,800 | 15,205 | |
| 4 | Bank of New York Mellon Corp. | 3.442% | 2/7/28 | 5,000 | 4,864 |
| Bank of New York Mellon Corp. | 3.000% | 10/30/28 | 7,000 | 6,444 | |
| Bank of Nova Scotia | 2.150% | 7/14/20 | 4,025 | 3,944 | |
| Bank of Nova Scotia | 4.375% | 1/13/21 | 7,990 | 8,181 | |
| 10 | Banque Federative du Credit Mutuel SA | 2.750% | 10/15/20 | 18,410 | 18,137 |
| 10 | Banque Federative du Credit Mutuel SA | 2.500% | 4/13/21 | 23,830 | 23,168 |
| 10 | Banque Federative du Credit Mutuel SA | 2.700% | 7/20/22 | 60,025 | 57,769 |
| 10 | Banque Federative du Credit Mutuel SA | 3.750% | 7/20/23 | 80,400 | 79,975 |
| BB&T Corp. | 5.250% | 11/1/19 | 12,000 | 12,314 | |
| BB&T Corp. | 3.950% | 3/22/22 | 4,400 | 4,451 | |
| BNP Paribas SA | 3.250% | 3/3/23 | 6,235 | 6,141 | |
| 10 | BNP Paribas SA | 3.375% | 1/9/25 | 38,570 | 36,635 |
| 14,15 | BPCE SA | 3.268% | 4/24/20 | 10,260 | 7,686 |
| 14 | BPCE SA | 3.500% | 4/24/20 | 13,500 | 10,121 |
| 14,15 | BPCE SA | 3.065% | 4/26/23 | 22,200 | 16,499 |
| BPCE SA | 4.000% | 4/15/24 | 5,090 | 5,121 | |
| 10 | BPCE SA | 3.250% | 1/11/28 | 20,000 | 18,532 |
| Branch Banking & Trust Co. | 2.625% | 1/15/22 | 35,175 | 34,240 | |
| Branch Banking & Trust Co. | 3.625% | 9/16/25 | 22,495 | 22,113 | |
| Canadian Imperial Bank of Commerce | 2.550% | 6/16/22 | 2,415 | 2,330 | |
| Capital One Financial Corp. | 3.050% | 3/9/22 | 12,715 | 12,431 | |
| Citigroup Inc. | 3.375% | 3/1/23 | 16,000 | 15,698 | |
| 4 | Citigroup Inc. | 4.044% | 6/1/24 | 20,755 | 20,859 |
| Citigroup Inc. | 3.200% | 10/21/26 | 44,200 | 41,388 | |
| Comerica Inc. | 3.700% | 7/31/23 | 42,000 | 42,057 | |
| 10 | Commonwealth Bank of Australia | 5.000% | 10/15/19 | 2,702 | 2,762 |
| Commonwealth Bank of Australia | 2.300% | 3/12/20 | 3,000 | 2,959 | |
| 10 | Commonwealth Bank of Australia | 5.000% | 3/19/20 | 11,560 | 11,870 |
| Commonwealth Bank of Australia | 2.400% | 11/2/20 | 7,120 | 6,974 | |
| 10 | Commonwealth Bank of Australia | 2.000% | 9/6/21 | 6,480 | 6,196 |
| 10 | Commonwealth Bank of Australia | 2.750% | 3/10/22 | 10,890 | 10,577 |
| 10 | Commonwealth Bank of Australia | 2.500% | 9/18/22 | 26,115 | 24,966 |
| 10 | Commonwealth Bank of Australia | 3.450% | 3/16/23 | 10,251 | 10,144 |
| 14,15 | Commonwealth Bank of Australia | 3.945% | 11/5/24 | 7,200 | 5,411 |
| 10 | Commonwealth Bank of Australia | 3.150% | 9/19/27 | 26,935 | 25,178 |
| Cooperatieve Rabobank UA | 2.500% | 1/19/21 | 21,455 | 21,022 | |
| Cooperatieve Rabobank UA | 3.875% | 2/8/22 | 7,757 | 7,843 | |
| Cooperatieve Rabobank UA | 2.750% | 1/10/23 | 58,590 | 56,545 | |
| Cooperatieve Rabobank UA | 4.625% | 12/1/23 | 95,134 | 96,055 | |
| 14,15 | Cooperatieve Rabobank UA | 4.600% | 7/2/25 | 3,500 | 2,648 |
| Credit Suisse AG | 2.300% | 5/28/19 | 9,820 | 9,785 | |
| Credit Suisse AG | 3.625% | 9/9/24 | 60,915 | 60,247 | |
| 4,10 | Credit Suisse Group AG | 3.869% | 1/12/29 | 35,000 | 33,524 |
| 10 | Danske Bank A/S | 4.375% | 6/12/28 | 30,000 | 29,774 |
| Discover Bank | 7.000% | 4/15/20 | 3,665 | 3,856 | |
| 4,16 | DNB Bank ASA | 1.125% | 3/20/28 | 2,300 | 2,651 |
| Fifth Third Bank | 2.875% | 10/1/21 | 12,105 | 11,912 | |
| First Republic Bank | 2.375% | 6/17/19 | 11,791 | 11,734 | |
| First Republic Bank | 2.500% | 6/6/22 | 39,370 | 37,872 | |
| Goldman Sachs Group Inc. | 2.300% | 12/13/19 | 58,075 | 57,559 | |
| 52 | |||||
| Vanguard® Intermediate-Term Investment-Grade Fund | |||||
| Schedule of Investments | |||||
| July 31, 2018 | |||||
| Face | Market | ||||
| Maturity | Amount | Value | |||
| Coupon | Date | ($000) | ($000) | ||
| Goldman Sachs Group Inc. | 2.750% | 9/15/20 | 15,522 | 15,390 | |
| Goldman Sachs Group Inc. | 2.600% | 12/27/20 | 19,840 | 19,540 | |
| Goldman Sachs Group Inc. | 2.875% | 2/25/21 | 15,632 | 15,383 | |
| Goldman Sachs Group Inc. | 2.625% | 4/25/21 | 21,894 | 21,444 | |
| Goldman Sachs Group Inc. | 5.750% | 1/24/22 | 52,535 | 56,058 | |
| Goldman Sachs Group Inc. | 3.000% | 4/26/22 | 36,960 | 36,080 | |
| 4 | Goldman Sachs Group Inc. | 2.876% | 10/31/22 | 41,745 | 40,707 |
| 4 | Goldman Sachs Group Inc. | 2.908% | 6/5/23 | 53,680 | 51,699 |
| 4 | Goldman Sachs Group Inc. | 2.905% | 7/24/23 | 29,410 | 28,344 |
| Goldman Sachs Group Inc. | 3.850% | 7/8/24 | 25,937 | 25,776 | |
| Goldman Sachs Group Inc. | 3.750% | 5/22/25 | 95,297 | 93,275 | |
| 4 | Goldman Sachs Group Inc. | 3.272% | 9/29/25 | 92,815 | 89,020 |
| 4 | Goldman Sachs Group Inc. | 3.691% | 6/5/28 | 26,930 | 25,676 |
| 4 | Goldman Sachs Group Inc. | 3.814% | 4/23/29 | 30,130 | 28,810 |
| HSBC Bank USA NA | 4.875% | 8/24/20 | 24,478 | 25,206 | |
| HSBC Holdings plc | 4.000% | 3/30/22 | 25,000 | 25,341 | |
| 4 | HSBC Holdings plc | 3.262% | 3/13/23 | 58,065 | 57,101 |
| HSBC Holdings plc | 3.600% | 5/25/23 | 27,990 | 27,869 | |
| 4,17 | HSBC Holdings plc | 2.175% | 6/27/23 | 37,000 | 48,413 |
| 4 | HSBC Holdings plc | 3.033% | 11/22/23 | 24,260 | 23,407 |
| 14,15 | HSBC Holdings plc | 3.000% | 2/16/24 | 18,000 | 13,213 |
| 4 | HSBC Holdings plc | 3.950% | 5/18/24 | 31,310 | 31,232 |
| HSBC Holdings plc | 4.250% | 8/18/25 | 4,700 | 4,641 | |
| HSBC Holdings plc | 4.300% | 3/8/26 | 4,200 | 4,238 | |
| HSBC Holdings plc | 3.900% | 5/25/26 | 24,665 | 24,176 | |
| HSBC Holdings plc | 4.375% | 11/23/26 | 9,010 | 8,920 | |
| 4 | HSBC Holdings plc | 4.041% | 3/13/28 | 108,759 | 107,054 |
| 4 | HSBC Holdings plc | 4.583% | 6/19/29 | 90,775 | 92,020 |
| 4 | HSBC Holdings plc | 6.000% | 11/22/65 | 13,930 | 13,476 |
| 4 | HSBC Holdings plc | 6.500% | 9/23/66 | 29,005 | 28,454 |
| Huntington Bancshares Inc. | 4.350% | 2/4/23 | 9,000 | 9,063 | |
| Huntington National Bank | 2.400% | 4/1/20 | 7,000 | 6,898 | |
| Huntington National Bank | 2.500% | 8/7/22 | 28,610 | 27,477 | |
| ICICI Bank Ltd. | 4.000% | 3/18/26 | 3,500 | 3,306 | |
| 10 | ICICI Bank Ltd. | 3.800% | 12/14/27 | 6,000 | 5,458 |
| 10 | Intesa Sanpaolo SPA | 3.875% | 7/14/27 | 28,550 | 25,010 |
| 10 | Intesa Sanpaolo SPA | 3.875% | 1/12/28 | 56,095 | 48,660 |
| JPMorgan Chase & Co. | 2.550% | 10/29/20 | 61,384 | 60,424 | |
| JPMorgan Chase & Co. | 2.550% | 3/1/21 | 17,560 | 17,222 | |
| JPMorgan Chase & Co. | 4.500% | 1/24/22 | 18,655 | 19,237 | |
| JPMorgan Chase & Co. | 3.250% | 9/23/22 | 23,500 | 23,339 | |
| JPMorgan Chase & Co. | 2.972% | 1/15/23 | 37,062 | 36,130 | |
| 4 | JPMorgan Chase & Co. | 2.776% | 4/25/23 | 19,805 | 19,187 |
| JPMorgan Chase & Co. | 2.700% | 5/18/23 | 26,538 | 25,429 | |
| 4 | JPMorgan Chase & Co. | 3.559% | 4/23/24 | 41,175 | 40,620 |
| JPMorgan Chase & Co. | 3.625% | 5/13/24 | 24,485 | 24,329 | |
| JPMorgan Chase & Co. | 3.125% | 1/23/25 | 17,320 | 16,520 | |
| 4 | JPMorgan Chase & Co. | 3.220% | 3/1/25 | 80,536 | 77,907 |
| JPMorgan Chase & Co. | 3.300% | 4/1/26 | 3,910 | 3,738 | |
| JPMorgan Chase & Co. | 3.200% | 6/15/26 | 23,561 | 22,375 | |
| 4 | JPMorgan Chase & Co. | 3.782% | 2/1/28 | 45,130 | 43,920 |
| 4 | JPMorgan Chase & Co. | 3.540% | 5/1/28 | 27,820 | 26,565 |
| 4 | JPMorgan Chase & Co. | 3.509% | 1/23/29 | 19,908 | 18,842 |
| 4 | JPMorgan Chase & Co. | 4.005% | 4/23/29 | 24,965 | 24,559 |
| 4 | JPMorgan Chase & Co. | 3.882% | 7/24/38 | 5,640 | 5,266 |
| KeyBank NA | 3.300% | 6/1/25 | 20,000 | 19,356 | |
| 4 | Lloyds Banking Group plc | 2.907% | 11/7/23 | 35,695 | 34,113 |
| 14,15 | Lloyds Banking Group plc | 3.450% | 3/7/25 | 19,000 | 13,823 |
| 14 | Lloyds Banking Group plc | 4.000% | 3/7/25 | 2,300 | 1,694 |
| Lloyds Banking Group plc | 4.375% | 3/22/28 | 15,000 | 14,796 | |
| 14,15 | Macquarie Group Ltd. | 3.209% | 12/15/22 | 8,250 | 6,097 |
| 4,10 | Macquarie Group Ltd. | 3.189% | 11/28/23 | 13,440 | 12,857 |
| 4 | Macquarie Group Ltd. | 3.189% | 11/28/23 | 12,500 | 11,958 |
| Manufacturers & Traders Trust Co. | 2.500% | 5/18/22 | 6,740 | 6,505 | |
| 53 | |||||
| Vanguard® Intermediate-Term Investment-Grade Fund | |||||
| Schedule of Investments | |||||
| July 31, 2018 | |||||
| Face | Market | ||||
| Maturity | Amount | Value | |||
| Coupon | Date | ($000) | ($000) | ||
| Mitsubishi UFJ Financial Group Inc. | 2.950% | 3/1/21 | 59,343 | 58,516 | |
| Mitsubishi UFJ Financial Group Inc. | 2.190% | 9/13/21 | 10,705 | 10,261 | |
| Mitsubishi UFJ Financial Group Inc. | 2.998% | 2/22/22 | 8,925 | 8,733 | |
| Mitsubishi UFJ Financial Group Inc. | 2.665% | 7/25/22 | 32,975 | 31,725 | |
| Mitsubishi UFJ Financial Group Inc. | 3.761% | 7/26/23 | 79,890 | 79,936 | |
| Mitsubishi UFJ Financial Group Inc. | 2.527% | 9/13/23 | 8,975 | 8,445 | |
| Mitsubishi UFJ Financial Group Inc. | 3.777% | 3/2/25 | 63,095 | 62,738 | |
| Mitsubishi UFJ Financial Group Inc. | 3.677% | 2/22/27 | 68,370 | 66,493 | |
| 10 | Mitsubishi UFJ Trust & Banking Corp. | 2.450% | 10/16/19 | 18,585 | 18,425 |
| 10 | Mitsubishi UFJ Trust & Banking Corp. | 2.650% | 10/19/20 | 29,055 | 28,652 |
| Morgan Stanley | 7.300% | 5/13/19 | 5,000 | 5,170 | |
| Morgan Stanley | 5.625% | 9/23/19 | 20,500 | 21,099 | |
| Morgan Stanley | 5.500% | 7/24/20 | 12,000 | 12,485 | |
| Morgan Stanley | 5.750% | 1/25/21 | 24,000 | 25,290 | |
| Morgan Stanley | 2.500% | 4/21/21 | 2,449 | 2,387 | |
| Morgan Stanley | 5.500% | 7/28/21 | 26,800 | 28,348 | |
| Morgan Stanley | 2.625% | 11/17/21 | 56,720 | 55,138 | |
| Morgan Stanley | 2.750% | 5/19/22 | 44,275 | 42,922 | |
| Morgan Stanley | 3.125% | 1/23/23 | 30,590 | 29,848 | |
| Morgan Stanley | 3.875% | 4/29/24 | 21,900 | 21,863 | |
| 12 | Morgan Stanley | 3.583% | 5/8/24 | 14,865 | 15,084 |
| Morgan Stanley | 3.700% | 10/23/24 | 15,525 | 15,348 | |
| Morgan Stanley | 4.000% | 7/23/25 | 30,681 | 30,681 | |
| Morgan Stanley | 3.875% | 1/27/26 | 48,504 | 47,807 | |
| Morgan Stanley | 3.625% | 1/20/27 | 50,495 | 48,410 | |
| 4 | Morgan Stanley | 3.591% | 7/22/28 | 40,051 | 37,927 |
| MUFG Americas Holdings Corp. | 2.250% | 2/10/20 | 3,400 | 3,354 | |
| MUFG Americas Holdings Corp. | 3.500% | 6/18/22 | 21,891 | 21,814 | |
| MUFG Americas Holdings Corp. | 3.000% | 2/10/25 | 12,000 | 11,443 | |
| 10 | MUFG Bank Ltd. | 2.300% | 3/5/20 | 11,110 | 10,935 |
| 10 | MUFG Bank Ltd. | 2.750% | 9/14/20 | 31,431 | 30,844 |
| 10 | MUFG Bank Ltd. | 2.850% | 9/8/21 | 22,000 | 21,514 |
| 4,16 | NIBC Bank NV | 6.000% | 12/31/49 | 9,500 | 10,976 |
| 10 | Nordea Bank AB | 2.500% | 9/17/20 | 4,715 | 4,626 |
| Northern Trust Co. | 6.500% | 8/15/18 | 4,000 | 4,006 | |
| PNC Bank NA | 2.600% | 7/21/20 | 15,120 | 14,932 | |
| PNC Bank NA | 2.150% | 4/29/21 | 268 | 260 | |
| PNC Bank NA | 2.550% | 12/9/21 | 9,040 | 8,787 | |
| PNC Bank NA | 2.625% | 2/17/22 | 2,980 | 2,898 | |
| PNC Bank NA | 2.700% | 11/1/22 | 41,080 | 39,513 | |
| PNC Bank NA | 3.800% | 7/25/23 | 15,750 | 15,780 | |
| PNC Bank NA | 3.300% | 10/30/24 | 19,634 | 19,201 | |
| PNC Bank NA | 2.950% | 2/23/25 | 16,680 | 15,939 | |
| PNC Bank NA | 3.250% | 6/1/25 | 61,052 | 59,191 | |
| PNC Financial Services Group Inc. | 2.854% | 11/9/22 | 12,493 | 12,119 | |
| PNC Financial Services Group Inc. | 3.900% | 4/29/24 | 6,525 | 6,515 | |
| PNC Funding Corp. | 6.700% | 6/10/19 | 12,000 | 12,390 | |
| PNC Funding Corp. | 5.125% | 2/8/20 | 21,243 | 21,860 | |
| PNC Funding Corp. | 4.375% | 8/11/20 | 23,000 | 23,490 | |
| Regions Financial Corp. | 2.750% | 8/14/22 | 4,170 | 4,017 | |
| Royal Bank of Canada | 2.350% | 10/30/20 | 11,539 | 11,337 | |
| Royal Bank of Scotland Group plc | 3.875% | 9/12/23 | 1,000 | 979 | |
| 4 | Royal Bank of Scotland Group plc | 4.892% | 5/18/29 | 68,780 | 69,043 |
| Santander Holdings USA Inc. | 3.700% | 3/28/22 | 24,870 | 24,686 | |
| Santander Holdings USA Inc. | 3.400% | 1/18/23 | 24,325 | 23,591 | |
| Santander Holdings USA Inc. | 4.400% | 7/13/27 | 30,658 | 29,537 | |
| 10 | Santander UK Group Holdings plc | 4.750% | 9/15/25 | 17,061 | 16,827 |
| Santander UK plc | 2.500% | 3/14/19 | 4,126 | 4,115 | |
| Santander UK plc | 4.000% | 3/13/24 | 6,560 | 6,639 | |
| 4 | Skandinaviska Enskilda Banken AB | 5.750% | 12/31/49 | 9,210 | 9,193 |
| State Street Corp. | 3.100% | 5/15/23 | 15,025 | 14,744 | |
| State Street Corp. | 3.700% | 11/20/23 | 32,620 | 32,998 | |
| State Street Corp. | 3.300% | 12/16/24 | 19,435 | 19,108 | |
| State Street Corp. | 3.550% | 8/18/25 | 31,058 | 30,962 | |
| 54 | |||||
| Vanguard® Intermediate-Term Investment-Grade Fund | |||||
| Schedule of Investments | |||||
| July 31, 2018 | |||||
| Face | Market | ||||
| Maturity | Amount | Value | |||
| Coupon | Date | ($000) | ($000) | ||
| 14,15 | Sumitomo Mitsui Financial Group Inc. | 3.381% | 3/29/22 | 4,599 | 3,421 |
| Sumitomo Mitsui Financial Group Inc. | 2.784% | 7/12/22 | 50,685 | 48,980 | |
| Sumitomo Mitsui Financial Group Inc. | 2.778% | 10/18/22 | 24,000 | 23,100 | |
| Sumitomo Mitsui Financial Group Inc. | 3.748% | 7/19/23 | 17,660 | 17,682 | |
| SunTrust Bank | 2.450% | 8/1/22 | 24,950 | 23,965 | |
| SunTrust Banks Inc. | 2.900% | 3/3/21 | 3,188 | 3,145 | |
| Svenska Handelsbanken AB | 2.450% | 3/30/21 | 22,515 | 21,975 | |
| Svenska Handelsbanken AB | 1.875% | 9/7/21 | 1,895 | 1,807 | |
| 10 | Swedbank AB | 2.800% | 3/14/22 | 16,390 | 15,961 |
| Synchrony Bank | 3.000% | 6/15/22 | 27,245 | 26,024 | |
| Synchrony Financial | 4.500% | 7/23/25 | 16,044 | 15,558 | |
| Synchrony Financial | 3.700% | 8/4/26 | 42,185 | 38,395 | |
| Synchrony Financial | 3.950% | 12/1/27 | 43,820 | 39,931 | |
| Toronto-Dominion Bank | 3.500% | 7/19/23 | 56,760 | 56,663 | |
| 10 | UBS Group Funding Jersey Ltd. | 3.000% | 4/15/21 | 4,805 | 4,745 |
| 10 | UBS Group Funding Jersey Ltd. | 2.650% | 2/1/22 | 20,971 | 20,183 |
| 4,10 | UBS Group Funding Switzerland AG | 2.859% | 8/15/23 | 77,400 | 74,340 |
| 4 | United Overseas Bank Ltd. | 3.750% | 9/19/24 | 5,000 | 4,994 |
| 4 | United Overseas Bank Ltd. | 2.880% | 3/8/27 | 3,000 | 2,863 |
| US Bancorp | 2.350% | 1/29/21 | 4,250 | 4,159 | |
| US Bancorp | 4.125% | 5/24/21 | 19,555 | 20,003 | |
| US Bancorp | 3.000% | 3/15/22 | 23,724 | 23,452 | |
| US Bancorp | 2.950% | 7/15/22 | 35,200 | 34,366 | |
| US Bancorp | 3.700% | 1/30/24 | 41,765 | 42,018 | |
| US Bancorp | 3.600% | 9/11/24 | 14,800 | 14,641 | |
| US Bank NA | 2.800% | 1/27/25 | 14,400 | 13,651 | |
| *,11 | Washington Mutual Bank / Debt not acquired by | ||||
| JPMorgan | 5.500% | 1/15/13 | 6,147 | 1 | |
| *,11 | Washington Mutual Bank / Debt not acquired by | ||||
| JPMorgan | 5.650% | 8/15/14 | 7,500 | 1 | |
| *,11 | Washington Mutual Bank / Debt not acquired by | ||||
| JPMorgan | 5.125% | 1/15/15 | 9,000 | 1 | |
| Wells Fargo & Co. | 2.600% | 7/22/20 | 8,915 | 8,809 | |
| Wells Fargo & Co. | 4.600% | 4/1/21 | 7,673 | 7,902 | |
| Wells Fargo & Co. | 2.100% | 7/26/21 | 32,370 | 31,178 | |
| 14,15 | Wells Fargo & Co. | 3.065% | 4/27/22 | 17,641 | 13,112 |
| Wells Fargo & Co. | 2.625% | 7/22/22 | 45,900 | 44,228 | |
| Wells Fargo & Co. | 3.450% | 2/13/23 | 36,700 | 35,978 | |
| Wells Fargo & Co. | 4.125% | 8/15/23 | 13,100 | 13,134 | |
| Wells Fargo & Co. | 3.300% | 9/9/24 | 29,199 | 28,429 | |
| Wells Fargo & Co. | 3.000% | 2/19/25 | 50,700 | 48,058 | |
| Wells Fargo & Co. | 3.550% | 9/29/25 | 17,459 | 17,037 | |
| Westpac Banking Corp. | 4.875% | 11/19/19 | 10,795 | 11,055 | |
| Westpac Banking Corp. | 2.600% | 11/23/20 | 2,035 | 2,001 | |
| Westpac Banking Corp. | 2.100% | 5/13/21 | 14,030 | 13,517 | |
| Westpac Banking Corp. | 2.000% | 8/19/21 | 23,105 | 22,118 | |
| Westpac Banking Corp. | 2.750% | 1/11/23 | 50,195 | 48,402 | |
| Westpac Banking Corp. | 3.350% | 3/8/27 | 48,060 | 45,839 | |
| 4 | Westpac Banking Corp. | 4.322% | 11/23/31 | 44,804 | 43,077 |
| 10 | Woori Bank | 5.125% | 8/6/28 | 5,650 | 5,626 |
| Brokerage (1.2%) | |||||
| Affiliated Managers Group Inc. | 4.250% | 2/15/24 | 10,340 | 10,499 | |
| Ameriprise Financial Inc. | 3.700% | 10/15/24 | 25,000 | 24,903 | |
| 10 | Apollo Management Holdings LP | 5.000% | 3/15/48 | 39,138 | 37,782 |
| BlackRock Inc. | 4.250% | 5/24/21 | 4,250 | 4,371 | |
| BlackRock Inc. | 3.200% | 3/15/27 | 25,455 | 24,559 | |
| Charles Schwab Corp. | 3.225% | 9/1/22 | 11,150 | 11,069 | |
| Charles Schwab Corp. | 3.850% | 5/21/25 | 24,190 | 24,408 | |
| Franklin Resources Inc. | 2.800% | 9/15/22 | 11,000 | 10,683 | |
| Intercontinental Exchange Inc. | 4.000% | 10/15/23 | 34,330 | 34,913 | |
| Invesco Finance plc | 3.125% | 11/30/22 | 30,485 | 29,971 | |
| Invesco Finance plc | 4.000% | 1/30/24 | 21,300 | 21,379 | |
| Invesco Finance plc | 3.750% | 1/15/26 | 6,673 | 6,592 | |
| 55 | |||||
| Vanguard® Intermediate-Term Investment-Grade Fund | |||||
| Schedule of Investments | |||||
| July 31, 2018 | |||||
| Face | Market | ||||
| Maturity | Amount | Value | |||
| Coupon | Date | ($000) | ($000) | ||
| Jefferies Group LLC / Jefferies Group Capital Finance | |||||
| Inc. | 4.150% | 1/23/30 | 63,570 | 57,193 | |
| Legg Mason Inc. | 3.950% | 7/15/24 | 5,000 | 4,940 | |
| *,11 | Lehman Brothers Holdings Inc. | 6.500% | 7/19/17 | 20,000 | 2 |
| Stifel Financial Corp. | 3.500% | 12/1/20 | 4,035 | 4,015 | |
| Stifel Financial Corp. | 4.250% | 7/18/24 | 11,830 | 11,764 | |
| TD Ameritrade Holding Corp. | 2.950% | 4/1/22 | 16,715 | 16,362 | |
| TD Ameritrade Holding Corp. | 3.625% | 4/1/25 | 11,400 | 11,257 | |
| Finance Companies (0.4%) | |||||
| GE Capital International Funding Co. Unlimited Co. | 2.342% | 11/15/20 | 18,283 | 17,898 | |
| GE Capital International Funding Co. Unlimited Co. | 3.373% | 11/15/25 | 101,896 | 97,952 | |
| GE Capital International Funding Co. Unlimited Co. | 4.418% | 11/15/35 | 11,100 | 10,792 | |
| Insurance (4.1%) | |||||
| Aetna Inc. | 2.750% | 11/15/22 | 19,260 | 18,534 | |
| Aetna Inc. | 2.800% | 6/15/23 | 35,010 | 33,499 | |
| Aetna Inc. | 3.500% | 11/15/24 | 10,000 | 9,724 | |
| Aflac Inc. | 4.000% | 2/15/22 | 2,000 | 2,037 | |
| Aflac Inc. | 3.625% | 6/15/23 | 3,500 | 3,509 | |
| Aflac Inc. | 3.625% | 11/15/24 | 5,000 | 4,962 | |
| 10 | AIA Group Ltd. | 3.200% | 3/11/25 | 40,589 | 38,699 |
| 10 | AIG Global Funding | 2.700% | 12/15/21 | 3,910 | 3,802 |
| 4 | Allstate Corp. | 5.750% | 8/15/53 | 5,000 | 5,190 |
| Anthem Inc. | 3.650% | 12/1/27 | 25,000 | 23,835 | |
| Assurant Inc. | 4.200% | 9/27/23 | 10,000 | 9,956 | |
| 10 | AXA Equitable Holdings Inc. | 4.350% | 4/20/28 | 42,780 | 41,817 |
| 10 | AXA Equitable Holdings Inc. | 5.000% | 4/20/48 | 30,700 | 29,372 |
| AXIS Specialty Finance LLC | 5.875% | 6/1/20 | 4,600 | 4,777 | |
| Berkshire Hathaway Inc. | 2.750% | 3/15/23 | 69,993 | 68,243 | |
| Berkshire Hathaway Inc. | 3.125% | 3/15/26 | 15,511 | 15,003 | |
| Brighthouse Financial Inc. | 3.700% | 6/22/27 | 22,860 | 20,809 | |
| Chubb INA Holdings Inc. | 2.700% | 3/13/23 | 20,325 | 19,605 | |
| Chubb INA Holdings Inc. | 3.350% | 5/15/24 | 39,741 | 39,082 | |
| Chubb INA Holdings Inc. | 3.150% | 3/15/25 | 18,312 | 17,715 | |
| Chubb INA Holdings Inc. | 3.350% | 5/3/26 | 38,170 | 37,025 | |
| 16 | Chubb INA Holdings Inc. | 2.500% | 3/15/38 | 34,975 | 41,437 |
| Coventry Health Care Inc. | 5.450% | 6/15/21 | 8,500 | 8,911 | |
| 10 | Five Corners Funding Trust | 4.419% | 11/15/23 | 27,362 | 28,102 |
| Humana Inc. | 3.950% | 3/15/27 | 7,300 | 7,190 | |
| Loews Corp. | 2.625% | 5/15/23 | 8,000 | 7,677 | |
| Manulife Financial Corp. | 4.900% | 9/17/20 | 24,150 | 24,814 | |
| Manulife Financial Corp. | 4.150% | 3/4/26 | 17,855 | 17,878 | |
| Marsh & McLennan Cos. Inc. | 2.350% | 3/6/20 | 5,275 | 5,202 | |
| Marsh & McLennan Cos. Inc. | 4.800% | 7/15/21 | 4,850 | 5,019 | |
| Marsh & McLennan Cos. Inc. | 2.750% | 1/30/22 | 5,425 | 5,289 | |
| Marsh & McLennan Cos. Inc. | 3.300% | 3/14/23 | 8,345 | 8,208 | |
| Marsh & McLennan Cos. Inc. | 4.050% | 10/15/23 | 10,087 | 10,225 | |
| Marsh & McLennan Cos. Inc. | 3.500% | 6/3/24 | 42,110 | 41,531 | |
| Marsh & McLennan Cos. Inc. | 3.500% | 3/10/25 | 41,901 | 41,100 | |
| 10 | MassMutual Global Funding II | 2.500% | 10/17/22 | 10,500 | 10,105 |
| 10 | MassMutual Global Funding II | 2.750% | 6/22/24 | 30,285 | 28,929 |
| 10 | Metropolitan Life Global Funding I | 3.000% | 1/10/23 | 22,728 | 22,184 |
| 10 | Metropolitan Life Global Funding I | 3.450% | 12/18/26 | 23,455 | 22,772 |
| 10 | Metropolitan Life Global Funding I | 3.000% | 9/19/27 | 35,965 | 33,341 |
| 10 | New York Life Global Funding | 1.950% | 2/11/20 | 1,595 | 1,569 |
| 10 | New York Life Global Funding | 2.900% | 1/17/24 | 4,800 | 4,624 |
| 10 | New York Life Global Funding | 3.000% | 1/10/28 | 44,860 | 42,002 |
| 10 | Nuveen Finance LLC | 4.125% | 11/1/24 | 34,863 | 34,474 |
| PartnerRe Finance B LLC | 5.500% | 6/1/20 | 16,550 | 17,062 | |
| 10 | Pricoa Global Funding I | 2.200% | 6/3/21 | 1,950 | 1,886 |
| 10 | Pricoa Global Funding I | 2.450% | 9/21/22 | 7,880 | 7,523 |
| 4 | Principal Financial Group Inc. | 4.700% | 5/15/55 | 1,500 | 1,508 |
| 10 | Principal Life Global Funding II | 2.200% | 4/8/20 | 10,650 | 10,475 |
| Progressive Corp. | 4.200% | 3/15/48 | 8,750 | 8,534 | |
| 56 | |||||
| Vanguard® Intermediate-Term Investment-Grade Fund | |||||
| Schedule of Investments | |||||
| July 31, 2018 | |||||
| Face | Market | ||||
| Maturity | Amount | Value | |||
| Coupon | Date | ($000) | ($000) | ||
| Prudential Financial Inc. | 4.500% | 11/16/21 | 4,025 | 4,158 | |
| 4 | Prudential Financial Inc. | 5.200% | 3/15/44 | 2,500 | 2,513 |
| 4 | Prudential Financial Inc. | 5.375% | 5/15/45 | 3,575 | 3,550 |
| Reinsurance Group of America Inc. | 5.000% | 6/1/21 | 5,000 | 5,187 | |
| Reinsurance Group of America Inc. | 3.950% | 9/15/26 | 24,825 | 24,234 | |
| 10 | Reliance Standard Life Global Funding II | 2.500% | 1/15/20 | 19,115 | 18,899 |
| 10 | Reliance Standard Life Global Funding II | 2.375% | 5/4/20 | 6,785 | 6,658 |
| 10 | Reliance Standard Life Global Funding II | 3.050% | 1/20/21 | 3,320 | 3,278 |
| 10 | Securian Financial Group Inc. | 4.800% | 4/15/48 | 29,496 | 29,218 |
| Swiss Re Solutions Holding Corp. | 6.450% | 3/1/19 | 11,250 | 11,454 | |
| 10 | Swiss Re Treasury US Corp. | 2.875% | 12/6/22 | 7,640 | 7,363 |
| UnitedHealth Group Inc. | 4.700% | 2/15/21 | 13,000 | 13,445 | |
| UnitedHealth Group Inc. | 2.750% | 2/15/23 | 12,000 | 11,582 | |
| UnitedHealth Group Inc. | 2.875% | 3/15/23 | 9,000 | 8,793 | |
| UnitedHealth Group Inc. | 3.750% | 7/15/25 | 51,692 | 51,868 | |
| UnitedHealth Group Inc. | 3.450% | 1/15/27 | 22,000 | 21,488 | |
| UnitedHealth Group Inc. | 3.375% | 4/15/27 | 6,580 | 6,379 | |
| Voya Financial Inc. | 5.700% | 7/15/43 | 3,758 | 4,129 | |
| Real Estate Investment Trusts (3.0%) | |||||
| Alexandria Real Estate Equities Inc. | 3.450% | 4/30/25 | 20,715 | 19,810 | |
| AvalonBay Communities Inc. | 2.850% | 3/15/23 | 12,400 | 11,957 | |
| AvalonBay Communities Inc. | 2.950% | 5/11/26 | 20,000 | 18,710 | |
| AvalonBay Communities Inc. | 3.350% | 5/15/27 | 12,040 | 11,534 | |
| AvalonBay Communities Inc. | 3.200% | 1/15/28 | 17,750 | 16,897 | |
| Brandywine Operating Partnership LP | 4.100% | 10/1/24 | 20,570 | 20,274 | |
| Brixmor Operating Partnership LP | 3.650% | 6/15/24 | 10,535 | 10,131 | |
| Brixmor Operating Partnership LP | 3.850% | 2/1/25 | 9,855 | 9,503 | |
| Brixmor Operating Partnership LP | 4.125% | 6/15/26 | 24,960 | 24,152 | |
| Brixmor Operating Partnership LP | 3.900% | 3/15/27 | 20,221 | 19,112 | |
| Camden Property Trust | 4.625% | 6/15/21 | 630 | 647 | |
| Camden Property Trust | 4.875% | 6/15/23 | 960 | 1,007 | |
| Camden Property Trust | 4.250% | 1/15/24 | 3,860 | 3,915 | |
| Camden Property Trust | 3.500% | 9/15/24 | 1,105 | 1,078 | |
| Columbia Property Trust Operating Partnership LP | 4.150% | 4/1/25 | 7,985 | 7,789 | |
| Columbia Property Trust Operating Partnership LP | 3.650% | 8/15/26 | 9,787 | 9,044 | |
| DDR Corp. | 3.625% | 2/1/25 | 1,372 | 1,301 | |
| DDR Corp. | 4.250% | 2/1/26 | 11,670 | 11,399 | |
| Digital Realty Trust LP | 3.400% | 10/1/20 | 2,247 | 2,244 | |
| Digital Realty Trust LP | 5.250% | 3/15/21 | 12,225 | 12,678 | |
| Digital Realty Trust LP | 3.950% | 7/1/22 | 9,362 | 9,430 | |
| Digital Realty Trust LP | 4.750% | 10/1/25 | 5,645 | 5,803 | |
| Digital Realty Trust LP | 3.700% | 8/15/27 | 28,700 | 27,380 | |
| ERP Operating LP | 3.375% | 6/1/25 | 21,000 | 20,504 | |
| Federal Realty Investment Trust | 2.550% | 1/15/21 | 5,417 | 5,313 | |
| Federal Realty Investment Trust | 3.000% | 8/1/22 | 22,448 | 21,961 | |
| Federal Realty Investment Trust | 2.750% | 6/1/23 | 3,000 | 2,864 | |
| Federal Realty Investment Trust | 3.950% | 1/15/24 | 8,269 | 8,314 | |
| Federal Realty Investment Trust | 3.250% | 7/15/27 | 3,665 | 3,431 | |
| 10 | Goodman Australia Industrial Fund | 3.400% | 9/30/26 | 12,090 | 11,260 |
| HCP Inc. | 2.625% | 2/1/20 | 7,000 | 6,920 | |
| HCP Inc. | 4.250% | 11/15/23 | 5,400 | 5,408 | |
| HCP Inc. | 4.200% | 3/1/24 | 8,055 | 8,008 | |
| HCP Inc. | 3.400% | 2/1/25 | 5,605 | 5,319 | |
| HCP Inc. | 4.000% | 6/1/25 | 8,710 | 8,521 | |
| Healthcare Trust of America Holdings LP | 3.375% | 7/15/21 | 4,705 | 4,674 | |
| Healthcare Trust of America Holdings LP | 3.700% | 4/15/23 | 14,912 | 14,610 | |
| Healthcare Trust of America Holdings LP | 3.500% | 8/1/26 | 4,700 | 4,413 | |
| Healthcare Trust of America Holdings LP | 3.750% | 7/1/27 | 19,455 | 18,311 | |
| Highwoods Realty LP | 3.200% | 6/15/21 | 6,000 | 5,905 | |
| Highwoods Realty LP | 3.875% | 3/1/27 | 19,500 | 18,775 | |
| Highwoods Realty LP | 4.125% | 3/15/28 | 37,255 | 36,343 | |
| Kilroy Realty LP | 4.375% | 10/1/25 | 5,160 | 5,155 | |
| Liberty Property LP | 4.400% | 2/15/24 | 9,900 | 10,042 | |
| 57 | |||||
| Vanguard® Intermediate-Term Investment-Grade Fund | |||||
| Schedule of Investments | |||||
| July 31, 2018 | |||||
| Face | Market | ||||
| Maturity | Amount | Value | |||
| Coupon | Date | ($000) | ($000) | ||
| Liberty Property LP | 3.750% | 4/1/25 | 1,340 | 1,305 | |
| Mid-America Apartments LP | 4.300% | 10/15/23 | 2,135 | 2,168 | |
| Mid-America Apartments LP | 4.000% | 11/15/25 | 7,620 | 7,515 | |
| National Retail Properties Inc. | 4.000% | 11/15/25 | 2,100 | 2,056 | |
| Omega Healthcare Investors Inc. | 4.950% | 4/1/24 | 9,000 | 9,090 | |
| Physicians Realty LP | 3.950% | 1/15/28 | 68,325 | 64,151 | |
| 16 | Prologis Euro Finance LLC | 1.875% | 1/5/29 | 5,265 | 6,143 |
| Realty Income Corp. | 4.650% | 8/1/23 | 6,000 | 6,198 | |
| Realty Income Corp. | 3.875% | 4/15/25 | 25,140 | 24,767 | |
| Realty Income Corp. | 4.125% | 10/15/26 | 10,500 | 10,424 | |
| Realty Income Corp. | 3.650% | 1/15/28 | 15,000 | 14,362 | |
| 10 | Scentre Group Trust 1 / Scentre Group Trust 2 | 3.750% | 3/23/27 | 13,925 | 13,298 |
| Simon Property Group LP | 4.375% | 3/1/21 | 28,394 | 29,115 | |
| Simon Property Group LP | 4.125% | 12/1/21 | 20,822 | 21,254 | |
| Simon Property Group LP | 3.375% | 3/15/22 | 4,328 | 4,322 | |
| Simon Property Group LP | 2.750% | 2/1/23 | 5,500 | 5,319 | |
| Simon Property Group LP | 3.750% | 2/1/24 | 28,466 | 28,441 | |
| Simon Property Group LP | 3.375% | 10/1/24 | 4,000 | 3,912 | |
| Simon Property Group LP | 3.500% | 9/1/25 | 12,997 | 12,678 | |
| Simon Property Group LP | 3.250% | 11/30/26 | 24,545 | 23,385 | |
| Simon Property Group LP | 3.375% | 12/1/27 | 23,145 | 22,167 | |
| Ventas Realty LP | 3.500% | 2/1/25 | 1,590 | 1,525 | |
| VEREIT Operating Partnership LP | 4.875% | 6/1/26 | 2,145 | 2,148 | |
| VEREIT Operating Partnership LP | 3.950% | 8/15/27 | 48,690 | 45,548 | |
| Welltower Inc. | 3.750% | 3/15/23 | 13,439 | 13,277 | |
| 8,614,189 | |||||
| Industrial (29.0%) | |||||
| Basic Industry (0.7%) | |||||
| 10 | Air Liquide Finance SA | 2.250% | 9/27/23 | 45,308 | 42,563 |
| 10 | Air Liquide Finance SA | 2.500% | 9/27/26 | 17,850 | 16,354 |
| Airgas Inc. | 3.650% | 7/15/24 | 3,500 | 3,489 | |
| Celulosa Arauco y Constitucion SA | 5.500% | 11/2/47 | 5,200 | 5,140 | |
| 10 | Chevron Phillips Chemical Co. LLC / Chevron Phillips | ||||
| Chemical Co. LP | 3.400% | 12/1/26 | 15,950 | 15,476 | |
| 10 | Chevron Phillips Chemical Co. LLC / Chevron Phillips | ||||
| Chemical Co. LP | 3.700% | 6/1/28 | 80,881 | 79,309 | |
| 10 | Eagle Intermediate Global Holding BV/Ruyi US Finance | ||||
| LLC | 7.500% | 5/1/25 | 9,350 | 9,280 | |
| 14 | Glencore Australia Holdings Pty Ltd. | 4.500% | 9/19/19 | 2,500 | 1,884 |
| 10 | WestRock Co. | 3.000% | 9/15/24 | 10,000 | 9,426 |
| WestRock RKT Co. | 4.900% | 3/1/22 | 1,250 | 1,300 | |
| WestRock RKT Co. | 4.000% | 3/1/23 | 13,660 | 13,740 | |
| Capital Goods (2.3%) | |||||
| Acuity Brands Lighting Inc. | 6.000% | 12/15/19 | 10,000 | 10,362 | |
| 10 | BBA US Holdings Inc. | 5.375% | 5/1/26 | 5,190 | 5,216 |
| 10 | Berry Global Inc. | 4.500% | 2/15/26 | 6,225 | 5,797 |
| Caterpillar Financial Services Corp. | 2.850% | 6/1/22 | 16,600 | 16,340 | |
| Caterpillar Financial Services Corp. | 2.400% | 6/6/22 | 23,820 | 22,986 | |
| Caterpillar Financial Services Corp. | 2.625% | 3/1/23 | 14,845 | 14,288 | |
| Caterpillar Financial Services Corp. | 3.750% | 11/24/23 | 24,995 | 25,297 | |
| Caterpillar Financial Services Corp. | 3.300% | 6/9/24 | 305 | 301 | |
| CNH Industrial NV | 4.500% | 8/15/23 | 29,691 | 29,951 | |
| CNH Industrial NV | 3.850% | 11/15/27 | 15,320 | 14,324 | |
| Eagle Materials Inc. | 4.500% | 8/1/26 | 43,305 | 43,088 | |
| Embraer Netherlands Finance BV | 5.050% | 6/15/25 | 10,900 | 11,007 | |
| Embraer Netherlands Finance BV | 5.400% | 2/1/27 | 4,100 | 4,230 | |
| Embraer SA | 5.150% | 6/15/22 | 8,000 | 8,255 | |
| General Electric Co. | 3.150% | 9/7/22 | 57,843 | 57,101 | |
| General Electric Co. | 2.700% | 10/9/22 | 10,000 | 9,646 | |
| General Electric Co. | 3.375% | 3/11/24 | 24,629 | 24,229 | |
| General Electric Co. | 3.450% | 5/15/24 | 12,806 | 12,542 | |
| General Electric Co. | 6.750% | 3/15/32 | 89,920 | 110,975 | |
| 16 | General Electric Co. | 2.125% | 5/17/37 | 48,323 | 52,589 |
| 58 | |||||
| Vanguard® Intermediate-Term Investment-Grade Fund | |||||
| Schedule of Investments | |||||
| July 31, 2018 | |||||
| Face | Market | ||||
| Maturity | Amount | Value | |||
| Coupon | Date | ($000) | ($000) | ||
| General Electric Co. | 4.500% | 3/11/44 | 30,245 | 29,614 | |
| John Deere Capital Corp. | 2.750% | 3/15/22 | 18,350 | 18,028 | |
| 10 | Mueller Water Products Inc. | 5.500% | 6/15/26 | 14,595 | 14,686 |
| Oshkosh Corp. | 4.600% | 5/15/28 | 7,000 | 6,965 | |
| Parker-Hannifin Corp. | 3.300% | 11/21/24 | 11,899 | 11,634 | |
| 18 | Reynolds Group Issuer Inc. / Reynolds Group Issuer | ||||
| LLC / Reynolds Group Issuer Lu | 6.875% | 2/15/21 | 260 | 263 | |
| Spirit AeroSystems Inc. | 3.850% | 6/15/26 | 35,100 | 33,751 | |
| Spirit AeroSystems Inc. | 4.600% | 6/15/28 | 43,455 | 43,993 | |
| United Rentals North America Inc. | 4.625% | 7/15/23 | 17,585 | 17,629 | |
| United Rentals North America Inc. | 5.875% | 9/15/26 | 1,525 | 1,554 | |
| United Rentals North America Inc. | 5.500% | 5/15/27 | 4,830 | 4,788 | |
| United Rentals North America Inc. | 4.875% | 1/15/28 | 1,590 | 1,485 | |
| Communication (2.7%) | |||||
| America Movil SAB de CV | 5.000% | 10/16/19 | 12,000 | 12,251 | |
| America Movil SAB de CV | 5.000% | 3/30/20 | 15,000 | 15,388 | |
| American Tower Corp. | 3.000% | 6/15/23 | 32,000 | 30,572 | |
| CBS Corp. | 4.000% | 1/15/26 | 10,000 | 9,785 | |
| CBS Corp. | 2.900% | 1/15/27 | 7,000 | 6,238 | |
| 10 | Cequel Communications Holdings I LLC / Cequel | ||||
| Capital Corp. | 7.500% | 4/1/28 | 14,300 | 14,747 | |
| Charter Communications Operating LLC / Charter | |||||
| Communications Operating Capital | 4.464% | 7/23/22 | 55,917 | 56,578 | |
| Charter Communications Operating LLC / Charter | |||||
| Communications Operating Capital | 4.908% | 7/23/25 | 52,327 | 53,061 | |
| Comcast Cable Communications Holdings Inc. | 9.455% | 11/15/22 | 9,966 | 12,220 | |
| Comcast Corp. | 3.000% | 2/1/24 | 38,307 | 36,693 | |
| Comcast Corp. | 3.600% | 3/1/24 | 45,407 | 45,003 | |
| Comcast Corp. | 3.375% | 2/15/25 | 29,895 | 28,913 | |
| Comcast Corp. | 3.375% | 8/15/25 | 99,453 | 95,910 | |
| Comcast Corp. | 3.150% | 3/1/26 | 51,000 | 48,381 | |
| Comcast Corp. | 2.350% | 1/15/27 | 29,400 | 26,028 | |
| Comcast Corp. | 3.150% | 2/15/28 | 9,600 | 8,930 | |
| Crown Castle International Corp. | 2.250% | 9/1/21 | 7,100 | 6,807 | |
| Electronic Arts Inc. | 4.800% | 3/1/26 | 11,020 | 11,584 | |
| Interpublic Group of Cos. Inc. | 4.200% | 4/15/24 | 14,750 | 14,684 | |
| NBCUniversal Media LLC | 4.375% | 4/1/21 | 12,110 | 12,427 | |
| NBCUniversal Media LLC | 2.875% | 1/15/23 | 46,957 | 45,534 | |
| Qwest Corp. | 6.750% | 12/1/21 | 21,248 | 22,542 | |
| Qwest Corp. | 7.250% | 9/15/25 | 9,354 | 9,906 | |
| T-Mobile USA Inc. | 4.500% | 2/1/26 | 10,500 | 9,870 | |
| T-Mobile USA Inc. | 4.750% | 2/1/28 | 4,800 | 4,446 | |
| Time Warner Cable LLC | 8.250% | 4/1/19 | 4,500 | 4,652 | |
| Time Warner Entertainment Co. LP | 8.375% | 3/15/23 | 9,000 | 10,461 | |
| Time Warner Inc. | 4.875% | 3/15/20 | 6,930 | 7,087 | |
| Verizon Communications Inc. | 3.500% | 11/1/24 | 15,000 | 14,704 | |
| 14 | Verizon Communications Inc. | 4.050% | 2/17/25 | 9,430 | 7,057 |
| Verizon Communications Inc. | 2.625% | 8/15/26 | 17,160 | 15,475 | |
| 10 | Verizon Communications Inc. | 4.329% | 9/21/28 | 20,587 | 20,766 |
| Viacom Inc. | 3.450% | 10/4/26 | 55,000 | 51,336 | |
| Viacom Inc. | 5.850% | 9/1/43 | 10,110 | 10,486 | |
| Vodafone Group plc | 4.125% | 5/30/25 | 14,225 | 14,237 | |
| Consumer Cyclical (4.0%) | |||||
| 10 | 1011778 BC ULC / New Red Finance Inc. | 4.250% | 5/15/24 | 4,845 | 4,609 |
| 10 | 1011778 BC ULC / New Red Finance Inc. | 5.000% | 10/15/25 | 26,850 | 25,742 |
| 10 | Alimentation Couche-Tard Inc. | 3.550% | 7/26/27 | 27,738 | 26,420 |
| Amazon.com Inc. | 3.150% | 8/22/27 | 35,000 | 33,740 | |
| American Honda Finance Corp. | 1.650% | 7/12/21 | 11,165 | 10,683 | |
| American Honda Finance Corp. | 2.900% | 2/16/24 | 7,500 | 7,232 | |
| AutoZone Inc. | 3.125% | 4/21/26 | 13,622 | 12,665 | |
| AutoZone Inc. | 3.750% | 6/1/27 | 10,000 | 9,649 | |
| 10 | BMW US Capital LLC | 3.450% | 4/12/23 | 82,500 | 81,448 |
| 10 | BMW US Capital LLC | 3.750% | 4/12/28 | 20,000 | 19,696 |
| 59 | |||||
| Vanguard® Intermediate-Term Investment-Grade Fund | |||||
| Schedule of Investments | |||||
| July 31, 2018 | |||||
| Face | Market | ||||
| Maturity | Amount | Value | |||
| Coupon | Date | ($000) | ($000) | ||
| 10 | Boyd Gaming Corp. | 6.000% | 8/15/26 | 4,300 | 4,316 |
| 10 | Churchill Downs Inc. | 4.750% | 1/15/28 | 8,150 | 7,620 |
| Costco Wholesale Corp. | 2.750% | 5/18/24 | 16,620 | 16,023 | |
| Costco Wholesale Corp. | 3.000% | 5/18/27 | 20,775 | 19,903 | |
| Cummins Inc. | 3.650% | 10/1/23 | 7,500 | 7,525 | |
| 14 | Ford Motor Credit Co. LLC | 3.588% | 6/2/20 | 10,690 | 8,019 |
| General Motors Co. | 4.875% | 10/2/23 | 5,000 | 5,121 | |
| General Motors Co. | 4.200% | 10/1/27 | 9,720 | 9,305 | |
| General Motors Financial Co. Inc. | 4.375% | 9/25/21 | 20,000 | 20,326 | |
| General Motors Financial Co. Inc. | 3.700% | 5/9/23 | 10,000 | 9,812 | |
| General Motors Financial Co. Inc. | 4.250% | 5/15/23 | 10,000 | 10,035 | |
| General Motors Financial Co. Inc. | 3.950% | 4/13/24 | 14,000 | 13,666 | |
| General Motors Financial Co. Inc. | 3.500% | 11/7/24 | 15,685 | 14,797 | |
| General Motors Financial Co. Inc. | 4.350% | 4/9/25 | 15,750 | 15,502 | |
| General Motors Financial Co. Inc. | 4.300% | 7/13/25 | 14,123 | 13,881 | |
| General Motors Financial Co. Inc. | 5.250% | 3/1/26 | 10,941 | 11,335 | |
| General Motors Financial Co. Inc. | 4.350% | 1/17/27 | 15,000 | 14,576 | |
| GLP Capital LP / GLP Financing II Inc. | 5.750% | 6/1/28 | 9,150 | 9,299 | |
| 10 | Harley-Davidson Financial Services Inc. | 2.150% | 2/26/20 | 3,945 | 3,873 |
| 10 | Harley-Davidson Financial Services Inc. | 2.550% | 6/9/22 | 15,320 | 14,609 |
| 10 | Harley-Davidson Financial Services Inc. | 3.350% | 2/15/23 | 12,520 | 12,222 |
| Harley-Davidson Inc. | 3.500% | 7/28/25 | 22,000 | 21,127 | |
| 10 | Hilton Domestic Operating Co. Inc. | 5.125% | 5/1/26 | 25,410 | 25,410 |
| Hilton Worldwide Finance LLC / Hilton Worldwide | |||||
| Finance Corp. | 4.875% | 4/1/27 | 4,350 | 4,230 | |
| Home Depot Inc. | 2.625% | 6/1/22 | 20,960 | 20,641 | |
| Home Depot Inc. | 2.700% | 4/1/23 | 17,254 | 16,862 | |
| Home Depot Inc. | 3.750% | 2/15/24 | 4,000 | 4,066 | |
| Home Depot Inc. | 2.125% | 9/15/26 | 5,000 | 4,481 | |
| 10 | Hyundai Capital America | 3.100% | 4/5/22 | 9,455 | 9,164 |
| 17 | Jaguar Land Rover Automotive plc | 5.000% | 2/15/22 | 3,751 | 4,998 |
| 10 | Live Nation Entertainment Inc. | 5.625% | 3/15/26 | 4,750 | 4,750 |
| Lowe's Cos Inc. | 3.750% | 4/15/21 | 21,595 | 21,883 | |
| Lowe's Cos Inc. | 3.120% | 4/15/22 | 21,949 | 21,836 | |
| Lowe's Cos Inc. | 3.875% | 9/15/23 | 9,750 | 9,967 | |
| Lowe's Cos Inc. | 3.125% | 9/15/24 | 3,505 | 3,413 | |
| Lowe's Cos Inc. | 3.375% | 9/15/25 | 31,130 | 30,539 | |
| Lowe's Cos Inc. | 2.500% | 4/15/26 | 62,835 | 57,661 | |
| Lowe's Cos Inc. | 3.100% | 5/3/27 | 17,335 | 16,513 | |
| Macy's Retail Holdings Inc. | 2.875% | 2/15/23 | 7,500 | 7,050 | |
| Mastercard Inc. | 3.375% | 4/1/24 | 16,000 | 15,955 | |
| MGM Resorts International | 5.750% | 6/15/25 | 12,940 | 13,037 | |
| 10 | Nissan Motor Acceptance Corp. | 2.550% | 3/8/21 | 3,785 | 3,686 |
| 10 | Nissan Motor Acceptance Corp. | 2.600% | 9/28/22 | 5,310 | 5,064 |
| 10 | Performance Food Group Inc. | 5.500% | 6/1/24 | 14,580 | 14,452 |
| Smithsonian Institute Washington DC GO | 3.434% | 9/1/23 | 1,600 | 1,562 | |
| TJX Cos. Inc. | 2.500% | 5/15/23 | 13,400 | 12,844 | |
| TJX Cos. Inc. | 2.250% | 9/15/26 | 58,055 | 52,159 | |
| Toyota Motor Credit Corp. | 4.500% | 6/17/20 | 9,000 | 9,225 | |
| Toyota Motor Credit Corp. | 4.250% | 1/11/21 | 5,155 | 5,275 | |
| Toyota Motor Credit Corp. | 2.750% | 5/17/21 | 8,625 | 8,529 | |
| Toyota Motor Credit Corp. | 3.400% | 9/15/21 | 24,460 | 24,597 | |
| Toyota Motor Credit Corp. | 3.300% | 1/12/22 | 7,375 | 7,373 | |
| Visa Inc. | 3.150% | 12/14/25 | 98,722 | 96,031 | |
| Walmart Inc. | 2.350% | 12/15/22 | 4,160 | 4,015 | |
| Walmart Inc. | 2.550% | 4/11/23 | 32,421 | 31,347 | |
| Walmart Inc. | 2.650% | 12/15/24 | 17,930 | 17,148 | |
| Walmart Inc. | 3.700% | 6/26/28 | 75,000 | 75,619 | |
| Consumer Noncyclical (5.6%) | |||||
| Altria Group Inc. | 9.250% | 8/6/19 | 8,014 | 8,521 | |
| Altria Group Inc. | 4.000% | 1/31/24 | 31,491 | 31,957 | |
| AmerisourceBergen Corp. | 3.400% | 5/15/24 | 17,000 | 16,565 | |
| AmerisourceBergen Corp. | 3.450% | 12/15/27 | 47,216 | 43,664 | |
| 60 | |||||
| Vanguard® Intermediate-Term Investment-Grade Fund | |||||
| Schedule of Investments | |||||
| July 31, 2018 | |||||
| Face | Market | ||||
| Maturity | Amount | Value | |||
| Coupon | Date | ($000) | ($000) | ||
| Anheuser-Busch InBev Finance Inc. | 2.625% | 1/17/23 | 19,347 | 18,647 | |
| Anheuser-Busch InBev Finance Inc. | 3.300% | 2/1/23 | 105,460 | 104,771 | |
| Anheuser-Busch InBev Finance Inc. | 3.700% | 2/1/24 | 14,863 | 14,953 | |
| Anheuser-Busch InBev Finance Inc. | 3.650% | 2/1/26 | 170,090 | 167,025 | |
| 16 | Anheuser-Busch InBev SA/NV | 3.250% | 1/24/33 | 600 | 810 |
| Anheuser-Busch InBev Worldwide Inc. | 6.875% | 11/15/19 | 8,514 | 8,920 | |
| Anheuser-Busch InBev Worldwide Inc. | 2.500% | 7/15/22 | 19,381 | 18,735 | |
| Anheuser-Busch InBev Worldwide Inc. | 4.000% | 4/13/28 | 41,900 | 41,965 | |
| 10 | Aramark Services Inc. | 5.000% | 2/1/28 | 19,310 | 18,586 |
| Baxalta Inc. | 3.600% | 6/23/22 | 7,000 | 6,890 | |
| Baxalta Inc. | 4.000% | 6/23/25 | 48,729 | 47,778 | |
| Becton Dickinson & Co. | 3.734% | 12/15/24 | 7,800 | 7,638 | |
| Becton Dickinson & Co. | 3.700% | 6/6/27 | 14,250 | 13,677 | |
| Campbell Soup Co. | 3.950% | 3/15/25 | 4,750 | 4,618 | |
| Campbell Soup Co. | 4.150% | 3/15/28 | 75,925 | 72,664 | |
| Cardinal Health Inc. | 3.500% | 11/15/24 | 7,000 | 6,740 | |
| 10 | Cargill Inc. | 3.250% | 11/15/21 | 10,515 | 10,457 |
| 10 | Cargill Inc. | 3.300% | 3/1/22 | 10,000 | 10,017 |
| Catholic Health Initiatives Colorado GO | 4.200% | 8/1/23 | 2,000 | 2,036 | |
| Coca-Cola Femsa SAB de CV | 2.375% | 11/26/18 | 1,595 | 1,591 | |
| Coca-Cola Femsa SAB de CV | 4.625% | 2/15/20 | 2,900 | 2,951 | |
| Coca-Cola Femsa SAB de CV | 3.875% | 11/26/23 | 4,000 | 4,028 | |
| Covidien International Finance SA | 4.200% | 6/15/20 | 7,735 | 7,890 | |
| Covidien International Finance SA | 3.200% | 6/15/22 | 13,500 | 13,407 | |
| CVS Health Corp. | 3.700% | 3/9/23 | 17,800 | 17,652 | |
| CVS Health Corp. | 4.100% | 3/25/25 | 60,000 | 59,859 | |
| CVS Health Corp. | 4.300% | 3/25/28 | 87,500 | 87,185 | |
| Diageo Capital plc | 4.828% | 7/15/20 | 5,689 | 5,873 | |
| Dignity Health California GO | 3.812% | 11/1/24 | 1,000 | 995 | |
| Express Scripts Holding Co. | 3.000% | 7/15/23 | 5,959 | 5,686 | |
| Express Scripts Holding Co. | 3.500% | 6/15/24 | 27,333 | 26,294 | |
| Express Scripts Holding Co. | 4.500% | 2/25/26 | 18,000 | 18,114 | |
| Express Scripts Holding Co. | 3.400% | 3/1/27 | 5,000 | 4,653 | |
| Gilead Sciences Inc. | 3.700% | 4/1/24 | 139,860 | 140,082 | |
| Gilead Sciences Inc. | 3.500% | 2/1/25 | 82,807 | 81,812 | |
| Gilead Sciences Inc. | 3.650% | 3/1/26 | 13,800 | 13,665 | |
| 10 | Hologic Inc. | 4.375% | 10/15/25 | 5,325 | 5,139 |
| 10 | Hologic Inc. | 4.625% | 2/1/28 | 8,650 | 8,163 |
| Hormel Foods Corp. | 4.125% | 4/15/21 | 625 | 640 | |
| Kimberly-Clark Corp. | 3.625% | 8/1/20 | 3,300 | 3,332 | |
| Kraft Foods Group Inc. | 6.125% | 8/23/18 | 6,000 | 6,013 | |
| Kroger Co. | 2.950% | 11/1/21 | 3,000 | 2,946 | |
| Laboratory Corp. of America Holdings | 3.600% | 2/1/25 | 2,000 | 1,955 | |
| McKesson Corp. | 2.850% | 3/15/23 | 5,000 | 4,778 | |
| Medtronic Inc. | 3.150% | 3/15/22 | 18,638 | 18,519 | |
| Medtronic Inc. | 3.625% | 3/15/24 | 15,590 | 15,658 | |
| Medtronic Inc. | 3.500% | 3/15/25 | 125,341 | 124,826 | |
| 10 | Minerva Luxembourg SA | 5.875% | 1/19/28 | 14,000 | 12,285 |
| Perrigo Finance Unlimited Co. | 3.900% | 12/15/24 | 25,000 | 24,230 | |
| Perrigo Finance Unlimited Co. | 4.375% | 3/15/26 | 37,476 | 36,679 | |
| Providence St. Joseph Health Obligated Group | 2.746% | 10/1/26 | 7,500 | 6,895 | |
| Quest Diagnostics Inc. | 4.750% | 1/30/20 | 1,000 | 1,022 | |
| Quest Diagnostics Inc. | 4.700% | 4/1/21 | 4,000 | 4,109 | |
| Quest Diagnostics Inc. | 4.250% | 4/1/24 | 2,000 | 2,023 | |
| Quest Diagnostics Inc. | 3.450% | 6/1/26 | 6,900 | 6,540 | |
| 10 | Reckitt Benckiser Treasury Services plc | 3.625% | 9/21/23 | 7,021 | 6,988 |
| 10 | Reckitt Benckiser Treasury Services plc | 2.750% | 6/26/24 | 54,205 | 51,298 |
| 10 | Reckitt Benckiser Treasury Services plc | 3.000% | 6/26/27 | 11,295 | 10,521 |
| Reynolds American Inc. | 6.875% | 5/1/20 | 8,304 | 8,806 | |
| Reynolds American Inc. | 4.450% | 6/12/25 | 40,000 | 40,447 | |
| SSM Health Care Corp. | 3.688% | 6/1/23 | 24,865 | 24,831 | |
| Stryker Corp. | 3.375% | 5/15/24 | 5,000 | 4,922 | |
| The Kroger Co. | 3.400% | 4/15/22 | 3,000 | 2,977 | |
| The Kroger Co. | 3.500% | 2/1/26 | 12,475 | 11,911 | |
| 61 | |||||
| Vanguard® Intermediate-Term Investment-Grade Fund | |||||
| Schedule of Investments | |||||
| July 31, 2018 | |||||
| Face | Market | ||||
| Maturity | Amount | Value | |||
| Coupon | Date | ($000) | ($000) | ||
| Zimmer Biomet Holdings Inc. | 3.550% | 4/1/25 | 16,000 | 15,311 | |
| Energy (5.2%) | |||||
| Andeavor | 4.750% | 12/15/23 | 10,000 | 10,387 | |
| Andeavor | 5.125% | 12/15/26 | 24,530 | 25,910 | |
| Andeavor Logistics LP / Tesoro Logistics Finance Corp. | 4.250% | 12/1/27 | 44,270 | 43,551 | |
| Baker Hughes a GE Co. LLC / Baker Hughes Co-Obligor | |||||
| Inc. | 3.337% | 12/15/27 | 92,255 | 87,029 | |
| BP Capital Markets plc | 2.520% | 9/19/22 | 10,000 | 9,660 | |
| BP Capital Markets plc | 2.500% | 11/6/22 | 16,852 | 16,217 | |
| BP Capital Markets plc | 2.750% | 5/10/23 | 64,532 | 62,426 | |
| BP Capital Markets plc | 3.994% | 9/26/23 | 22,000 | 22,414 | |
| BP Capital Markets plc | 3.216% | 11/28/23 | 29,455 | 28,899 | |
| BP Capital Markets plc | 3.814% | 2/10/24 | 36,910 | 37,284 | |
| BP Capital Markets plc | 3.224% | 4/14/24 | 26,774 | 26,198 | |
| BP Capital Markets plc | 3.535% | 11/4/24 | 40,500 | 40,285 | |
| BP Capital Markets plc | 3.506% | 3/17/25 | 5,125 | 5,073 | |
| BP Capital Markets plc | 3.119% | 5/4/26 | 26,335 | 25,116 | |
| BP Capital Markets plc | 3.017% | 1/16/27 | 13,065 | 12,395 | |
| BP Capital Markets plc | 3.588% | 4/14/27 | 10,000 | 9,863 | |
| BP Capital Markets plc | 3.279% | 9/19/27 | 27,195 | 26,130 | |
| Buckeye Partners LP | 3.950% | 12/1/26 | 3,025 | 2,760 | |
| Buckeye Partners LP | 4.125% | 12/1/27 | 22,550 | 20,721 | |
| Cenovus Energy Inc. | 4.250% | 4/15/27 | 50,000 | 48,500 | |
| ConocoPhillips Co. | 4.950% | 3/15/26 | 80,532 | 86,387 | |
| Continental Resources Inc. | 4.375% | 1/15/28 | 31,400 | 31,282 | |
| Dominion Energy Gas Holdings LLC | 3.600% | 12/15/24 | 25,000 | 24,458 | |
| Enable Midstream Partners LP | 4.950% | 5/15/28 | 18,405 | 18,446 | |
| 4,12 | Enbridge Energy Partners LP | 6.135% | 10/1/77 | 1,110 | 1,109 |
| Energy Transfer LP | 9.700% | 3/15/19 | 4,432 | 4,614 | |
| Energy Transfer LP | 4.650% | 6/1/21 | 2,130 | 2,183 | |
| Energy Transfer LP | 5.200% | 2/1/22 | 9,605 | 9,988 | |
| Energy Transfer LP | 3.600% | 2/1/23 | 8,439 | 8,265 | |
| Energy Transfer LP | 4.900% | 2/1/24 | 10,046 | 10,281 | |
| Energy Transfer LP | 4.050% | 3/15/25 | 15,988 | 15,571 | |
| Energy Transfer LP | 4.750% | 1/15/26 | 15,223 | 15,394 | |
| Energy Transfer LP | 4.200% | 4/15/27 | 9,665 | 9,363 | |
| Energy Transfer Partners LP | 4.950% | 6/15/28 | 22,605 | 23,073 | |
| EQT Corp. | 3.900% | 10/1/27 | 82,950 | 78,348 | |
| Kinder Morgan Energy Partners LP | 5.800% | 3/1/21 | 5,000 | 5,267 | |
| Kinder Morgan Inc. | 7.750% | 1/15/32 | 7,820 | 9,681 | |
| MPLX LP | 4.875% | 12/1/24 | 49,105 | 50,874 | |
| 10 | Patterson-UTI Energy Inc. | 3.950% | 2/1/28 | 15,000 | 14,004 |
| Regency Energy Partners LP / Regency Energy Finance | |||||
| Corp. | 5.875% | 3/1/22 | 6,025 | 6,364 | |
| Regency Energy Partners LP / Regency Energy Finance | |||||
| Corp. | 5.000% | 10/1/22 | 26,484 | 27,337 | |
| Regency Energy Partners LP / Regency Energy Finance | |||||
| Corp. | 4.500% | 11/1/23 | 4,036 | 4,091 | |
| Sabine Pass Liquefaction LLC | 6.250% | 3/15/22 | 20,000 | 21,575 | |
| Sabine Pass Liquefaction LLC | 5.625% | 4/15/23 | 9,965 | 10,628 | |
| Sabine Pass Liquefaction LLC | 5.625% | 3/1/25 | 33,870 | 36,241 | |
| Sabine Pass Liquefaction LLC | 5.875% | 6/30/26 | 24,145 | 26,258 | |
| Sabine Pass Liquefaction LLC | 5.000% | 3/15/27 | 16,021 | 16,542 | |
| Shell International Finance BV | 2.375% | 8/21/22 | 29,609 | 28,678 | |
| Shell International Finance BV | 2.250% | 1/6/23 | 10,500 | 10,042 | |
| Shell International Finance BV | 3.400% | 8/12/23 | 10,000 | 10,028 | |
| Shell International Finance BV | 3.250% | 5/11/25 | 68,378 | 67,110 | |
| Shell International Finance BV | 2.875% | 5/10/26 | 28,750 | 27,377 | |
| Sunoco Logistics Partners Operations LP | 4.250% | 4/1/24 | 10,000 | 9,915 | |
| Sunoco Logistics Partners Operations LP | 4.000% | 10/1/27 | 26,507 | 25,299 | |
| Tennessee Gas Pipeline Co. LLC | 7.625% | 4/1/37 | 3,960 | 4,870 | |
| Total Capital Canada Ltd. | 2.750% | 7/15/23 | 14,570 | 14,155 | |
| Total Capital International SA | 2.700% | 1/25/23 | 9,660 | 9,385 | |
| 62 | |||||
| Vanguard® Intermediate-Term Investment-Grade Fund | |||||
| Schedule of Investments | |||||
| July 31, 2018 | |||||
| Face | Market | ||||
| Maturity | Amount | Value | |||
| Coupon | Date | ($000) | ($000) | ||
| Total Capital International SA | 3.700% | 1/15/24 | 5,000 | 5,039 | |
| Total Capital International SA | 3.750% | 4/10/24 | 7,185 | 7,258 | |
| TransCanada PipeLines Ltd. | 3.800% | 10/1/20 | 4,292 | 4,340 | |
| TransCanada PipeLines Ltd. | 2.500% | 8/1/22 | 8,025 | 7,703 | |
| TransCanada PipeLines Ltd. | 3.750% | 10/16/23 | 19,615 | 19,662 | |
| TransCanada PipeLines Ltd. | 4.875% | 1/15/26 | 35,680 | 37,417 | |
| TransCanada PipeLines Ltd. | 4.250% | 5/15/28 | 37,190 | 37,682 | |
| Valero Energy Partners LP | 4.500% | 3/15/28 | 38,795 | 38,140 | |
| Williams Partners LP | 4.500% | 11/15/23 | 6,133 | 6,281 | |
| Williams Partners LP | 3.900% | 1/15/25 | 5,116 | 5,038 | |
| Other Industrial (0.3%) | |||||
| 16 | Aroundtown SA | 1.875% | 1/19/26 | 17,300 | 19,939 |
| 17 | Aroundtown SA | 3.000% | 10/16/29 | 13,209 | 16,432 |
| CBRE Services Inc. | 4.875% | 3/1/26 | 10,000 | 10,329 | |
| 16 | CPI Property Group SA | 2.125% | 10/4/24 | 23,736 | 27,316 |
| 10 | Hi-Crush Partners LP | 9.500% | 8/1/26 | 4,300 | 4,241 |
| 10 | Hutchison Whampoa International 09 Ltd. | 7.625% | 4/9/19 | 20,710 | 21,357 |
| Technology (6.0%) | |||||
| Apple Inc. | 2.150% | 2/9/22 | 6,000 | 5,810 | |
| Apple Inc. | 2.850% | 2/23/23 | 8,490 | 8,380 | |
| Apple Inc. | 2.400% | 5/3/23 | 8,602 | 8,301 | |
| Apple Inc. | 3.000% | 2/9/24 | 64,300 | 63,117 | |
| Apple Inc. | 3.450% | 5/6/24 | 64,000 | 64,171 | |
| Apple Inc. | 2.850% | 5/11/24 | 60,147 | 58,461 | |
| Apple Inc. | 2.750% | 1/13/25 | 58,358 | 55,982 | |
| Apple Inc. | 2.500% | 2/9/25 | 52,463 | 49,458 | |
| Apple Inc. | 3.200% | 5/13/25 | 15,370 | 15,084 | |
| Apple Inc. | 3.250% | 2/23/26 | 78,151 | 76,761 | |
| Apple Inc. | 2.450% | 8/4/26 | 27,739 | 25,629 | |
| Apple Inc. | 3.350% | 2/9/27 | 43,175 | 42,452 | |
| Apple Inc. | 3.200% | 5/11/27 | 27,300 | 26,524 | |
| Apple Inc. | 2.900% | 9/12/27 | 37,990 | 35,968 | |
| Applied Materials Inc. | 3.900% | 10/1/25 | 25,000 | 25,375 | |
| Broadcom Corp. / Broadcom Cayman Finance Ltd. | 3.625% | 1/15/24 | 29,750 | 28,786 | |
| Broadcom Corp. / Broadcom Cayman Finance Ltd. | 3.125% | 1/15/25 | 19,450 | 17,905 | |
| Broadcom Corp. / Broadcom Cayman Finance Ltd. | 3.875% | 1/15/27 | 4,750 | 4,460 | |
| Broadcom Corp. / Broadcom Cayman Finance Ltd. | 3.500% | 1/15/28 | 36,135 | 32,701 | |
| 10 | Dell International LLC / EMC Corp. | 5.450% | 6/15/23 | 28,545 | 29,933 |
| 10 | Diamond 1 Finance Corp. / Diamond 2 Finance Corp. | 6.020% | 6/15/26 | 63,320 | 66,970 |
| DXC Technology Co. | 4.250% | 4/15/24 | 9,350 | 9,313 | |
| DXC Technology Co. | 4.750% | 4/15/27 | 10,000 | 10,142 | |
| Hewlett Packard Enterprise Co. | 4.400% | 10/15/22 | 8,500 | 8,700 | |
| Hewlett Packard Enterprise Co. | 4.900% | 10/15/25 | 34,990 | 35,798 | |
| International Business Machines Corp. | 3.625% | 2/12/24 | 37,000 | 37,197 | |
| Marvell Technology Group Ltd. | 4.875% | 6/22/28 | 40,000 | 40,450 | |
| Microsoft Corp. | 2.375% | 2/12/22 | 33,070 | 32,266 | |
| Microsoft Corp. | 2.000% | 8/8/23 | 30,000 | 28,360 | |
| Microsoft Corp. | 2.700% | 2/12/25 | 41,755 | 40,152 | |
| Microsoft Corp. | 3.125% | 11/3/25 | 49,685 | 48,718 | |
| Microsoft Corp. | 2.400% | 8/8/26 | 53,277 | 49,247 | |
| Microsoft Corp. | 3.300% | 2/6/27 | 74,356 | 73,595 | |
| Oracle Corp. | 2.800% | 7/8/21 | 33,000 | 32,853 | |
| Oracle Corp. | 2.500% | 5/15/22 | 17,635 | 17,187 | |
| Oracle Corp. | 2.500% | 10/15/22 | 21,287 | 20,633 | |
| Oracle Corp. | 2.400% | 9/15/23 | 51,877 | 49,509 | |
| Oracle Corp. | 3.400% | 7/8/24 | 22,400 | 22,271 | |
| Oracle Corp. | 2.950% | 11/15/24 | 44,875 | 43,398 | |
| Oracle Corp. | 2.950% | 5/15/25 | 49,591 | 47,955 | |
| Oracle Corp. | 2.650% | 7/15/26 | 52,000 | 48,610 | |
| Oracle Corp. | 3.250% | 11/15/27 | 44,500 | 43,279 | |
| QUALCOMM Inc. | 2.600% | 1/30/23 | 13,330 | 12,756 | |
| QUALCOMM Inc. | 2.900% | 5/20/24 | 95,587 | 90,770 | |
| QUALCOMM Inc. | 3.250% | 5/20/27 | 29,706 | 28,045 | |
| 63 | |||||
| Vanguard® Intermediate-Term Investment-Grade Fund | |||||
| Schedule of Investments | |||||
| July 31, 2018 | |||||
| Face | Market | ||||
| Maturity | Amount | Value | |||
| Coupon | Date | ($000) | ($000) | ||
| Tyco Electronics Group SA | 4.875% | 1/15/21 | 4,335 | 4,485 | |
| Tyco Electronics Group SA | 3.500% | 2/3/22 | 19,370 | 19,416 | |
| Tyco Electronics Group SA | 3.450% | 8/1/24 | 8,710 | 8,489 | |
| Tyco Electronics Group SA | 3.700% | 2/15/26 | 7,483 | 7,353 | |
| Tyco Electronics Group SA | 3.125% | 8/15/27 | 22,000 | 20,539 | |
| 10 | Vantiv LLC / Vanity Issuer Corp. | 4.375% | 11/15/25 | 14,620 | 13,798 |
| Verisk Analytics Inc. | 4.000% | 6/15/25 | 16,000 | 15,707 | |
| VMware Inc. | 2.950% | 8/21/22 | 9,720 | 9,395 | |
| Western Digital Corp. | 4.750% | 2/15/26 | 18,000 | 17,708 | |
| Transportation (2.2%) | |||||
| 10 | Air Canada | 7.750% | 4/15/21 | 20,731 | 22,182 |
| 4,10 | Air Canada 2013-1 Class B Pass Through Trust | 5.375% | 5/15/21 | 834 | 852 |
| 4,10 | Air Canada 2017-1 Class A Pass Through Trust | 3.550% | 1/15/30 | 10,640 | 9,998 |
| 4,10 | Air Canada 2017-1 Class AA Pass Through Trust | 3.300% | 1/15/30 | 43,625 | 41,343 |
| 4,10 | Air Canada 2017-1 Class B Pass Through Trust | 3.700% | 1/15/26 | 15,395 | 14,622 |
| 4 | American Airlines 2016-3 Class B Pass Through Trust | 3.750% | 10/15/25 | 21,831 | 21,038 |
| 4 | American Airlines 2017-2B Class B Pass Through Trust | 3.700% | 10/15/25 | 24,410 | 23,409 |
| 14 | Asciano Finance Ltd. | 5.400% | 5/12/27 | 6,680 | 5,139 |
| 14 | Aurizon Network Pty Ltd. | 4.000% | 6/21/24 | 21,090 | 15,587 |
| 4,10 | British Airways 2018-1 Class A Pass Through Trust | 4.125% | 9/20/31 | 13,105 | 12,893 |
| Burlington Northern Santa Fe LLC | 7.000% | 12/15/25 | 16,231 | 19,542 | |
| 4 | Continental Airlines 2000-1 Class A-1 Pass Through | ||||
| Trust | 8.048% | 11/1/20 | 521 | 545 | |
| 4 | Continental Airlines 2005-ERJ1 Pass Through Trust | 9.798% | 10/1/22 | 581 | 610 |
| 4 | Continental Airlines 2009-2 Class A Pass Through Trust | 7.250% | 5/10/21 | 3,047 | 3,172 |
| 4 | Continental Airlines 2010-1 Class A Pass Through Trust | 4.750% | 7/12/22 | 4,341 | 4,433 |
| 4 | Continental Airlines 2012-1 Class A Pass Through Trust | 4.150% | 10/11/25 | 6,649 | 6,735 |
| 4 | Continental Airlines 2012-2 Class A Pass Through Trust | 4.000% | 4/29/26 | 5,226 | 5,226 |
| 4 | Continental Airlines 2012-2 Class B Pass Through Trust | 5.500% | 4/29/22 | 915 | 933 |
| 4 | CSX Transportation Inc. | 6.251% | 1/15/23 | 2,412 | 2,608 |
| 4 | Delta Air Lines 2002-1 Class G-1 Pass Through Trust | 6.718% | 7/2/24 | 8,171 | 8,661 |
| 4 | Delta Air Lines 2007-1 Class A Pass Through Trust | 6.821% | 2/10/24 | 31,639 | 34,365 |
| 4 | Delta Air Lines 2009-1 Class A Pass Through Trust | 7.750% | 6/17/21 | 1,857 | 1,938 |
| 4 | Delta Air Lines 2012-1 Class A Pass Through Trust | 4.750% | 11/7/21 | 1,823 | 1,841 |
| 4 | Delta Air Lines 2015-1 Class A Pass Through Trust | 3.875% | 1/30/29 | 7,836 | 7,680 |
| Delta Air Lines Inc. | 4.375% | 4/19/28 | 125,440 | 121,618 | |
| 10 | ERAC USA Finance LLC | 3.850% | 11/15/24 | 8,000 | 7,960 |
| 10 | ERAC USA Finance LLC | 3.800% | 11/1/25 | 9,000 | 8,837 |
| 4 | Hawaiian Airlines 2013-1 Class A Pass Through | ||||
| Certificates | 3.900% | 1/15/26 | 44,730 | 43,936 | |
| 4,10 | Heathrow Funding Ltd. | 4.875% | 7/15/23 | 330 | 344 |
| Kansas City Southern | 3.125% | 6/1/26 | 42,750 | 39,171 | |
| Kirby Corp. | 4.200% | 3/1/28 | 27,000 | 26,622 | |
| Norfolk Southern Corp. | 5.100% | 8/1/18 | 3,445 | 3,435 | |
| 14 | Qantas Airways Ltd. | 7.500% | 6/11/21 | 21,790 | 18,010 |
| 14 | Qantas Airways Ltd. | 7.750% | 5/19/22 | 4,780 | 4,072 |
| Southwest Airlines Co. | 7.375% | 3/1/27 | 4,930 | 5,930 | |
| 4 | Southwest Airlines Co. 2007-1 Pass Through Trust | 6.650% | 8/1/22 | 5,187 | 5,459 |
| 4 | Southwest Airlines Co. 2007-1 Pass Through Trust | 6.150% | 2/1/24 | 11,491 | 12,093 |
| 4 | Spirit Airlines Class A Pass Through Certificates Series | ||||
| 2015-1 | 4.100% | 10/1/29 | 29,291 | 28,709 | |
| 4 | Spirit Airlines Pass Through Trust 2017-1A | 3.650% | 2/15/30 | 29,670 | 28,327 |
| 4 | United Airlines 2013-1 Class A Pass Through Trust | 4.300% | 2/15/27 | 4,687 | 4,734 |
| 4 | US Airways 2001-1C Pass Through Trust | 7.346% | 9/20/23 | 2,924 | 3,099 |
| 14 | WSO Finance Pty Ltd. | 3.500% | 7/14/23 | 10,260 | 7,629 |
| 8,414,061 | |||||
| Utilities (4.1%) | |||||
| Electric (3.9%) | |||||
| AEP Transmission Co. LLC | 3.100% | 12/1/26 | 10,100 | 9,669 | |
| Ameren Illinois Co. | 2.700% | 9/1/22 | 7,449 | 7,252 | |
| Ameren Illinois Co. | 3.250% | 3/1/25 | 11,680 | 11,402 | |
| Baltimore Gas & Electric Co. | 2.800% | 8/15/22 | 16,840 | 16,420 | |
| Baltimore Gas & Electric Co. | 3.350% | 7/1/23 | 10,627 | 10,495 | |
| 64 | |||||
| Vanguard® Intermediate-Term Investment-Grade Fund | |||||
| Schedule of Investments | |||||
| July 31, 2018 | |||||
| Face | Market | ||||
| Maturity | Amount | Value | |||
| Coupon | Date | ($000) | ($000) | ||
| Berkshire Hathaway Energy Co. | 2.800% | 1/15/23 | 7,955 | 7,728 | |
| Berkshire Hathaway Energy Co. | 3.750% | 11/15/23 | 47,864 | 48,324 | |
| Berkshire Hathaway Energy Co. | 3.250% | 4/15/28 | 16,025 | 15,202 | |
| Commonwealth Edison Co. | 3.100% | 11/1/24 | 5,790 | 5,592 | |
| Connecticut Light & Power Co. | 2.500% | 1/15/23 | 26,960 | 25,945 | |
| DTE Electric Co. | 3.900% | 6/1/21 | 14,650 | 14,814 | |
| DTE Electric Co. | 2.650% | 6/15/22 | 1,000 | 970 | |
| Duke Energy Florida LLC | 3.200% | 1/15/27 | 8,403 | 8,118 | |
| Duke Energy Florida LLC | 3.800% | 7/15/28 | 14,211 | 14,304 | |
| Edison International | 2.400% | 9/15/22 | 4,500 | 4,274 | |
| 10 | EDP Finance BV | 4.125% | 1/15/20 | 13,664 | 13,770 |
| 10 | EDP Finance BV | 5.250% | 1/14/21 | 12,300 | 12,682 |
| 10 | EDP Finance BV | 3.625% | 7/15/24 | 10,885 | 10,503 |
| Emera US Finance LP | 3.550% | 6/15/26 | 22,000 | 20,809 | |
| 10 | Enel Finance International NV | 2.875% | 5/25/22 | 15,105 | 14,572 |
| 10 | Enel Finance International NV | 3.625% | 5/25/27 | 31,991 | 29,729 |
| 10 | Enel Finance International NV | 3.500% | 4/6/28 | 5,000 | 4,559 |
| Entergy Arkansas Inc. | 3.750% | 2/15/21 | 8,770 | 8,857 | |
| Entergy Arkansas Inc. | 3.050% | 6/1/23 | 7,410 | 7,234 | |
| Entergy Arkansas Inc. | 3.700% | 6/1/24 | 3,318 | 3,343 | |
| Entergy Arkansas Inc. | 3.500% | 4/1/26 | 24,414 | 23,946 | |
| Entergy Gulf States Louisiana LLC | 5.590% | 10/1/24 | 12,935 | 14,175 | |
| Entergy Louisiana LLC | 4.800% | 5/1/21 | 12,780 | 13,077 | |
| Entergy Louisiana LLC | 3.300% | 12/1/22 | 6,915 | 6,830 | |
| Entergy Louisiana LLC | 4.050% | 9/1/23 | 6,400 | 6,542 | |
| Entergy Louisiana LLC | 5.400% | 11/1/24 | 8,562 | 9,318 | |
| Entergy Louisiana LLC | 2.400% | 10/1/26 | 14,120 | 12,743 | |
| Entergy Louisiana LLC | 3.120% | 9/1/27 | 18,025 | 17,131 | |
| Entergy Louisiana LLC | 4.950% | 1/15/45 | 9,250 | 9,326 | |
| Exelon Corp. | 3.497% | 6/1/22 | 3,631 | 3,592 | |
| Exelon Corp. | 3.950% | 6/15/25 | 23,652 | 23,539 | |
| FirstEnergy Corp. | 2.850% | 7/15/22 | 20,230 | 19,518 | |
| FirstEnergy Corp. | 4.250% | 3/15/23 | 23,472 | 23,847 | |
| FirstEnergy Corp. | 3.900% | 7/15/27 | 18,380 | 17,918 | |
| 10 | FirstEnergy Transmission LLC | 4.350% | 1/15/25 | 17,035 | 17,391 |
| Georgia Power Co. | 2.400% | 4/1/21 | 4,735 | 4,610 | |
| Georgia Power Co. | 2.850% | 5/15/22 | 16,559 | 16,187 | |
| Georgia Power Co. | 3.250% | 3/30/27 | 22,090 | 20,871 | |
| ITC Holdings Corp. | 3.250% | 6/30/26 | 9,700 | 9,104 | |
| ITC Holdings Corp. | 3.350% | 11/15/27 | 18,745 | 17,571 | |
| 10 | Kallpa Generacion SA | 4.125% | 8/16/27 | 11,000 | 10,391 |
| LG&E & KU Energy LLC | 4.375% | 10/1/21 | 9,785 | 9,989 | |
| 10 | Mid-Atlantic Interstate Transmission LLC | 4.100% | 5/15/28 | 23,395 | 23,375 |
| MidAmerican Energy Co. | 3.700% | 9/15/23 | 5,500 | 5,535 | |
| NSTAR Electric Co. | 2.375% | 10/15/22 | 7,700 | 7,382 | |
| NSTAR Electric Co. | 3.250% | 11/15/25 | 10,000 | 9,690 | |
| NSTAR Electric Co. | 3.200% | 5/15/27 | 16,330 | 15,639 | |
| Oncor Electric Delivery Co. LLC | 7.000% | 9/1/22 | 22,322 | 25,252 | |
| Oncor Electric Delivery Co. LLC | 2.950% | 4/1/25 | 1,200 | 1,151 | |
| Pacific Gas & Electric Co. | 2.450% | 8/15/22 | 6,500 | 6,094 | |
| Pacific Gas & Electric Co. | 3.250% | 6/15/23 | 30,505 | 29,622 | |
| Pacific Gas & Electric Co. | 3.850% | 11/15/23 | 5,795 | 5,692 | |
| Pacific Gas & Electric Co. | 2.950% | 3/1/26 | 6,561 | 5,922 | |
| Pacific Gas & Electric Co. | 3.300% | 12/1/27 | 58,974 | 53,967 | |
| Pacific Gas & Electric Co. | 6.050% | 3/1/34 | 32,775 | 35,934 | |
| PacifiCorp | 3.600% | 4/1/24 | 14,000 | 14,051 | |
| PacifiCorp | 3.350% | 7/1/25 | 17,720 | 17,387 | |
| Potomac Electric Power Co. | 3.050% | 4/1/22 | 2,270 | 2,209 | |
| Potomac Electric Power Co. | 3.600% | 3/15/24 | 15,690 | 15,731 | |
| Puget Energy Inc. | 5.625% | 7/15/22 | 19,769 | 20,932 | |
| Puget Energy Inc. | 3.650% | 5/15/25 | 13,665 | 13,288 | |
| Southern California Edison Co. | 3.650% | 3/1/28 | 19,380 | 19,087 | |
| Southern Co. | 2.350% | 7/1/21 | 2,307 | 2,243 | |
| Southwestern Electric Power Co. | 3.550% | 2/15/22 | 16,530 | 16,542 | |
| 65 | |||||
| Vanguard® Intermediate-Term Investment-Grade Fund | |||||
| Schedule of Investments | |||||
| July 31, 2018 | |||||
| Face | Market | ||||
| Maturity | Amount | Value | |||
| Coupon | Date | ($000) | ($000) | ||
| Southwestern Public Service Co. | 3.300% | 6/15/24 | 41,070 | 40,192 | |
| Tampa Electric Co. | 5.400% | 5/15/21 | 13,000 | 13,632 | |
| 10 | Trans-Allegheny Interstate Line Co. | 3.850% | 6/1/25 | 11,000 | 10,960 |
| Virginia Electric & Power Co. | 3.450% | 9/1/22 | 9,000 | 8,994 | |
| Virginia Electric & Power Co. | 2.750% | 3/15/23 | 4,744 | 4,602 | |
| Virginia Electric & Power Co. | 3.450% | 2/15/24 | 7,000 | 6,945 | |
| Virginia Electric & Power Co. | 3.100% | 5/15/25 | 8,885 | 8,562 | |
| Virginia Electric & Power Co. | 3.150% | 1/15/26 | 7,950 | 7,672 | |
| Virginia Electric & Power Co. | 2.950% | 11/15/26 | 12,185 | 11,421 | |
| Westar Energy Inc. | 2.550% | 7/1/26 | 2,000 | 1,837 | |
| Westar Energy Inc. | 3.100% | 4/1/27 | 5,800 | 5,515 | |
| Western Massachusetts Electric Co. | 3.500% | 9/15/21 | 10,000 | 10,024 | |
| Natural Gas (0.2%) | |||||
| 10 | Engie SA | 2.875% | 10/10/22 | 3,480 | 3,388 |
| Sempra Energy | 4.050% | 12/1/23 | 10,455 | 10,581 | |
| Sempra Energy | 3.400% | 2/1/28 | 42,092 | 39,794 | |
| Southern Co. Gas Capital Corp. | 3.250% | 6/15/26 | 4,125 | 3,915 | |
| Other Utility (0.0%) | |||||
| 17 | Anglian Water Services Financing plc | 2.625% | 6/15/27 | 5,384 | 6,719 |
| 1,175,661 | |||||
| Total Corporate Bonds (Cost $18,643,842) | 18,203,911 | ||||
| Sovereign Bonds (7.5%) | |||||
| 10 | Abu Dhabi National Energy Co. PJSC | 4.875% | 4/23/30 | 9,450 | 9,623 |
| 16 | Arab Republic of Egypt | 4.750% | 4/16/26 | 4,400 | 5,030 |
| Argentine Republic | 5.625% | 1/26/22 | 15,118 | 14,400 | |
| Argentine Republic | 7.500% | 4/22/26 | 2,550 | 2,429 | |
| Argentine Republic | 6.875% | 1/26/27 | 16,105 | 14,696 | |
| 4 | Argentine Republic | 2.500% | 12/31/38 | 4,440 | 2,670 |
| Argentine Republic | 6.875% | 1/11/48 | 1,515 | 1,197 | |
| 10 | Banco Latinoamericano de Comercio Exterior SA | 3.250% | 5/7/20 | 4,000 | 3,945 |
| 10 | Banque Ouest Africaine de Developpement | 5.000% | 7/27/27 | 4,929 | 4,770 |
| 10 | Bermuda | 4.138% | 1/3/23 | 2,000 | 2,027 |
| 10 | Bermuda | 4.854% | 2/6/24 | 1,000 | 1,034 |
| Bermuda | 4.854% | 2/6/24 | 17,825 | 18,440 | |
| BOC Aviation Ltd. | 3.875% | 5/9/19 | 800 | 802 | |
| 10 | BOC Aviation Ltd. | 2.375% | 9/15/21 | 15,000 | 14,322 |
| BOC Aviation Ltd. | 3.875% | 4/27/26 | 3,700 | 3,534 | |
| Cayman Islands | 5.950% | 11/24/19 | 500 | 517 | |
| 10 | CDP Financial Inc. | 3.150% | 7/24/24 | 8,000 | 7,870 |
| Centrais Eletricas Brasileiras SA | 5.750% | 10/27/21 | 6,300 | 6,364 | |
| 4 | City of Buenos Aires | 8.950% | 2/19/21 | 2,200 | 2,247 |
| CNOOC Nexen Finance 2014 ULC | 4.250% | 4/30/24 | 4,000 | 4,045 | |
| 10 | CNPC General Capital Ltd. | 3.400% | 4/16/23 | 1,000 | 979 |
| Corp. Financiera de Desarrollo SA | 3.250% | 7/15/19 | 5,000 | 5,000 | |
| 10 | Corp. Financiera de Desarrollo SA | 4.750% | 2/8/22 | 1,400 | 1,433 |
| Corp. Financiera de Desarrollo SA | 4.750% | 2/8/22 | 4,885 | 5,000 | |
| Corp. Nacional del Cobre de Chile | 3.875% | 11/3/21 | 29,660 | 29,843 | |
| 10 | Corp. Nacional del Cobre de Chile | 3.875% | 11/3/21 | 3,000 | 3,021 |
| Corp. Nacional del Cobre de Chile | 4.500% | 9/16/25 | 29,200 | 29,697 | |
| Development Bank of Kazakhstan JSC | 4.125% | 12/10/22 | 1,295 | 1,276 | |
| 10,19 | Dexia Credit Local SA | 1.875% | 9/15/21 | 10,000 | 9,610 |
| 10 | Dexia Credit Local SA | 2.375% | 9/20/22 | 1,750 | 1,691 |
| Emirate of Abu Dhabi | 3.125% | 10/11/27 | 45,700 | 43,032 | |
| Emirate of Abu Dhabi | 4.125% | 10/11/47 | 6,800 | 6,446 | |
| 4,10 | ENA Norte Trust | 4.950% | 4/25/28 | 1,356 | 1,368 |
| Equinor ASA | 3.150% | 1/23/22 | 3,000 | 2,992 | |
| Equinor ASA | 2.450% | 1/17/23 | 3,000 | 2,888 | |
| Equinor ASA | 3.950% | 5/15/43 | 3,191 | 3,045 | |
| 10 | Export Credit Bank of Turkey | 6.125% | 5/3/24 | 12,200 | 10,917 |
| Export-Import Bank of China | 3.625% | 7/31/24 | 5,000 | 4,919 | |
| Export-Import Bank of China | 3.375% | 3/14/27 | 5,319 | 5,001 | |
| 66 | |||||
| Vanguard® Intermediate-Term Investment-Grade Fund | |||||
| Schedule of Investments | |||||
| July 31, 2018 | |||||
| Face | Market | ||||
| Maturity | Amount | Value | |||
| Coupon | Date | ($000) | ($000) | ||
| Export-Import Bank of India | 4.000% | 1/14/23 | 8,550 | 8,449 | |
| Export-Import Bank of India | 3.375% | 8/5/26 | 5,000 | 4,594 | |
| 10 | Export-Import Bank of India | 3.875% | 2/1/28 | 9,675 | 9,205 |
| Export-Import Bank of Korea | 2.875% | 9/17/18 | 3,000 | 2,999 | |
| Export-Import Bank of Korea | 5.125% | 6/29/20 | 17,000 | 17,517 | |
| Export-Import Bank of Korea | 4.000% | 1/29/21 | 1,000 | 1,011 | |
| Export-Import Bank of Korea | 4.375% | 9/15/21 | 2,570 | 2,621 | |
| Export-Import Bank of Korea | 2.750% | 1/25/22 | 2,500 | 2,425 | |
| Export-Import Bank of Korea | 3.000% | 11/1/22 | 45,108 | 43,741 | |
| Federative Republic of Brazil | 5.000% | 1/27/45 | 4,190 | 3,567 | |
| Gazprom OAO Via Gaz Capital SA | 9.250% | 4/23/19 | 27,800 | 28,880 | |
| Gazprom OAO Via Gaz Capital SA | 7.288% | 8/16/37 | 7,000 | 8,017 | |
| ICBCIL Finance Co. Ltd. | 3.250% | 3/17/20 | 4,800 | 4,749 | |
| ICBCIL Finance Co. Ltd. | 3.000% | 4/5/20 | 3,538 | 3,486 | |
| ICBCIL Finance Co. Ltd. | 3.200% | 11/10/20 | 5,000 | 4,910 | |
| ICBCIL Finance Co. Ltd. | 3.375% | 4/5/22 | 10,000 | 9,705 | |
| Indian Railway Finance Corp. Ltd. | 3.835% | 12/13/27 | 10,000 | 9,342 | |
| Industrial & Commercial Bank of China Ltd. | 3.231% | 11/13/19 | 2,400 | 2,390 | |
| 20 | Japan Bank for International Cooperation | 2.000% | 11/4/21 | 37,500 | 36,087 |
| Japan Finance Organization for Municipalities | 2.500% | 9/12/18 | 6,200 | 6,195 | |
| 10 | KazMunayGas National Co. JSC | 3.875% | 4/19/22 | 8,600 | 8,536 |
| 10 | KazMunayGas National Co. JSC | 6.375% | 10/24/48 | 5,400 | 5,670 |
| 10 | Kingdom of Saudi Arabia | 2.375% | 10/26/21 | 785 | 755 |
| Kingdom of Saudi Arabia | 2.375% | 10/26/21 | 88,577 | 85,181 | |
| Kingdom of Saudi Arabia | 5.000% | 4/17/49 | 2,450 | 2,415 | |
| 16 | Kingdom of Spain | 1.400% | 4/30/28 | 7,948 | 9,364 |
| 10,16 | Kingdom of Spain | 2.700% | 10/31/48 | 68,677 | 83,902 |
| Korea Development Bank | 4.625% | 11/16/21 | 3,285 | 3,383 | |
| 10 | Korea Western Power Co. Ltd. | 2.875% | 10/10/18 | 2,000 | 1,998 |
| 10 | Kowloon-Canton Railway Corp. | 5.125% | 5/20/19 | 2,500 | 2,541 |
| KSA Sukuk Ltd. | 2.894% | 4/20/22 | 9,000 | 8,744 | |
| Nexen Energy ULC | 6.200% | 7/30/19 | 2,000 | 2,059 | |
| North American Development Bank | 2.300% | 10/10/18 | 1,500 | 1,499 | |
| North American Development Bank | 2.400% | 10/26/22 | 1,300 | 1,251 | |
| NTPC Ltd. | 4.250% | 2/26/26 | 6,250 | 6,077 | |
| OCP SA | 5.625% | 4/25/24 | 1,520 | 1,588 | |
| 10 | Ontario Teachers' Cadillac Fairview Properties Trust | 3.125% | 3/20/22 | 6,000 | 5,894 |
| 10 | Ontario Teachers' Cadillac Fairview Properties Trust | 3.875% | 3/20/27 | 7,000 | 6,871 |
| Ooredoo Tamweel Ltd. | 3.039% | 12/3/18 | 10,000 | 9,993 | |
| 4 | Oriental Republic of Uruguay | 5.100% | 6/18/50 | 4,300 | 4,375 |
| 10 | Pertamina Persero PT | 6.000% | 5/3/42 | 1,000 | 1,044 |
| Petrobras Global Finance BV | 6.125% | 1/17/22 | 18,738 | 19,394 | |
| Petrobras Global Finance BV | 5.299% | 1/27/25 | 25,240 | 24,167 | |
| Petrobras Global Finance BV | 7.375% | 1/17/27 | 21,700 | 22,541 | |
| Petroleos Mexicanos | 8.000% | 5/3/19 | 33,183 | 34,259 | |
| Petroleos Mexicanos | 5.500% | 1/21/21 | 171,586 | 176,327 | |
| Petroleos Mexicanos | 6.375% | 2/4/21 | 2,695 | 2,825 | |
| Petroleos Mexicanos | 6.875% | 8/4/26 | 28,220 | 29,827 | |
| Petroleos Mexicanos | 6.500% | 3/13/27 | 28,500 | 28,929 | |
| Petroleos Mexicanos | 5.625% | 1/23/46 | 3,800 | 3,135 | |
| Petroleos Mexicanos | 6.750% | 9/21/47 | 9,790 | 9,077 | |
| 10,16 | Portugal Obrigacoes do Tesouro OT | 2.125% | 10/17/28 | 28,400 | 34,371 |
| Province of Ontario | 4.000% | 10/7/19 | 4,500 | 4,555 | |
| Republic of Angola | 9.375% | 5/8/48 | 4,705 | 4,987 | |
| Republic of Colombia | 10.375% | 1/28/33 | 32,175 | 50,750 | |
| 4 | Republic of Colombia | 5.000% | 6/15/45 | 2,620 | 2,607 |
| Republic of Croatia | 6.375% | 3/24/21 | 7,250 | 7,719 | |
| 16 | Republic of Croatia | 3.000% | 3/20/27 | 12,582 | 15,521 |
| Republic of Guatemala | 4.375% | 6/5/27 | 11,485 | 11,031 | |
| Republic of Hungary | 6.250% | 1/29/20 | 69,735 | 72,955 | |
| Republic of Hungary | 6.375% | 3/29/21 | 5,980 | 6,414 | |
| Republic of Indonesia | 4.875% | 5/5/21 | 29,441 | 30,394 | |
| 10 | Republic of Indonesia | 3.700% | 1/8/22 | 3,124 | 3,120 |
| Republic of Indonesia | 3.750% | 4/25/22 | 87,908 | 87,725 | |
| 67 | |||||
| Vanguard® Intermediate-Term Investment-Grade Fund | |||||
| Schedule of Investments | |||||
| July 31, 2018 | |||||
| Face | Market | ||||
| Maturity | Amount | Value | |||
| Coupon | Date | ($000) | ($000) | ||
| Republic of Indonesia | 3.375% | 4/15/23 | 3,000 | 2,914 | |
| Republic of Indonesia | 5.375% | 10/17/23 | 6,400 | 6,768 | |
| Republic of Indonesia | 5.875% | 1/15/24 | 34,830 | 37,667 | |
| Republic of Kazakhstan | 4.875% | 10/14/44 | 4,600 | 4,674 | |
| 10 | Republic of Latvia | 2.750% | 1/12/20 | 1,000 | 994 |
| Republic of Lithuania | 7.375% | 2/11/20 | 30,806 | 32,806 | |
| 10 | Republic of Lithuania | 6.125% | 3/9/21 | 7,400 | 7,927 |
| Republic of Lithuania | 6.125% | 3/9/21 | 42,564 | 45,600 | |
| Republic of Panama | 9.375% | 4/1/29 | 300 | 425 | |
| Republic of Panama | 8.125% | 4/28/34 | 9,136 | 12,269 | |
| 4 | Republic of Panama | 6.700% | 1/26/36 | 2,400 | 2,975 |
| Republic of Poland | 5.125% | 4/21/21 | 16,505 | 17,330 | |
| Republic of Poland | 5.000% | 3/23/22 | 10,730 | 11,321 | |
| Republic of Serbia | 5.875% | 12/3/18 | 14,500 | 14,627 | |
| Republic of Serbia | 4.875% | 2/25/20 | 9,000 | 9,158 | |
| Republic of Serbia | 7.250% | 9/28/21 | 14,500 | 15,857 | |
| Republic of Slovenia | 5.500% | 10/26/22 | 36,554 | 39,545 | |
| Republic of the Philippines | 4.200% | 1/21/24 | 4,425 | 4,541 | |
| Republic of the Philippines | 5.500% | 3/30/26 | 20,000 | 22,350 | |
| Republic of the Philippines | 9.500% | 2/2/30 | 4,750 | 7,012 | |
| Republic of Turkey | 7.000% | 6/5/20 | 16,800 | 17,073 | |
| Republic of Turkey | 5.750% | 3/22/24 | 2,500 | 2,366 | |
| Republic of Turkey | 4.875% | 10/9/26 | 1,690 | 1,449 | |
| Republic of Turkey | 5.750% | 5/11/47 | 9,840 | 7,688 | |
| Russian Federation | 5.250% | 6/23/47 | 31,200 | 30,990 | |
| Sinopec Capital 2013 Ltd. | 3.125% | 4/24/23 | 13,170 | 12,691 | |
| 10 | Sinopec Group Overseas Development 2012 Ltd. | 4.875% | 5/17/42 | 5,000 | 5,197 |
| Sinopec Group Overseas Development 2012 Ltd. | 4.875% | 5/17/42 | 8,656 | 9,046 | |
| Sinopec Group Overseas Development 2013 Ltd. | 2.500% | 10/17/18 | 5,310 | 5,304 | |
| 10 | Sinopec Group Overseas Development 2013 Ltd. | 4.375% | 10/17/23 | 1,800 | 1,833 |
| Sinopec Group Overseas Development 2013 Ltd. | 4.375% | 10/17/23 | 34,570 | 35,251 | |
| Sinopec Group Overseas Development 2014 Ltd. | 4.375% | 4/10/24 | 8,650 | 8,819 | |
| Sinopec Group Overseas Development 2017 Ltd. | 2.500% | 9/13/22 | 5,000 | 4,746 | |
| 10 | Sinopec Group Overseas Development 2017 Ltd. | 3.625% | 4/12/27 | 17,500 | 16,822 |
| Socialist Republic of Vietnam | 6.750% | 1/29/20 | 16,900 | 17,593 | |
| State of Israel | 3.150% | 6/30/23 | 2,000 | 1,973 | |
| State of Israel | 2.875% | 3/16/26 | 3,980 | 3,779 | |
| State of Israel | 4.125% | 1/17/48 | 9,350 | 9,048 | |
| State of Kuwait | 2.750% | 3/20/22 | 19,406 | 18,928 | |
| State of Qatar | 5.250% | 1/20/20 | 40,300 | 41,445 | |
| State of Qatar | 2.375% | 6/2/21 | 775 | 751 | |
| State of Qatar | 3.875% | 4/23/23 | 3,500 | 3,512 | |
| State of Qatar | 4.500% | 4/23/28 | 6,000 | 6,123 | |
| State of Qatar | 5.103% | 4/23/48 | 8,790 | 8,969 | |
| Sultanate of Oman | 6.750% | 1/17/48 | 12,200 | 11,655 | |
| 10 | Temasek Financial I Ltd. | 2.375% | 1/23/23 | 1,000 | 958 |
| 21 | United Mexican States | 8.000% | 12/7/23 | 2,500,000 | 135,613 |
| 21 | United Mexican States | 10.000% | 12/5/24 | 152,000 | 9,064 |
| YPF SA | 8.875% | 12/19/18 | 2,500 | 2,528 | |
| Total Sovereign Bonds (Cost $2,189,681) | 2,161,754 | ||||
| Taxable Municipal Bonds (0.1%) | |||||
| Allentown PA Neighborhood Improvement Zone | |||||
| Development Authority Revenue | 5.420% | 5/1/21 | 4,000 | 3,952 | |
| Florida Hurricane Catastrophe Fund Finance Corp. | |||||
| Revenue | 2.995% | 7/1/20 | 1,250 | 1,249 | |
| Illinois GO | 5.000% | 1/1/23 | 1,835 | 1,868 | |
| JobsOhio Beverage System Statewide Liquor Profits | |||||
| Revenue | 2.885% | 1/1/21 | 1,000 | 994 | |
| Johns Hopkins University Maryland GO | 5.250% | 7/1/19 | 199 | 203 | |
| Louisiana Local Government Environmental Facilities & | |||||
| Community Development Authority Revenue 2010- | |||||
| EGSL | 3.220% | 2/1/21 | 2,699 | 2,701 | |
| 68 | |||||
| Vanguard® Intermediate-Term Investment-Grade Fund | |||||
| Schedule of Investments | |||||
| July 31, 2018 | |||||
| Face | Market | ||||
| Maturity | Amount | Value | |||
| Coupon | Date | ($000) | ($000) | ||
| Louisiana Local Government Environmental Facilities & | |||||
| Community Development Authority Revenue 2010- | |||||
| ELL | 3.450% | 2/1/22 | 3,121 | 3,128 | |
| New York City NY Transitional Finance Authority Future | |||||
| Tax Revenue | 5.125% | 2/1/24 | 1,500 | 1,636 | |
| New York State Dormitory Authority Revenue | |||||
| (Employer Assessment) | 3.892% | 12/1/24 | 2,000 | 2,068 | |
| Port Authority of New York & New Jersey Revenue | 5.859% | 12/1/24 | 2,000 | 2,277 | |
| San Diego County CA Regional Airport Authority | |||||
| Revenue | 3.730% | 7/1/21 | 800 | 808 | |
| San Diego County CA Regional Airport Authority | |||||
| Revenue | 5.594% | 7/1/43 | 6,200 | 6,782 | |
| Sonoma County CA Pension Obligation Revenue | 6.000% | 12/1/29 | 4,960 | 5,662 | |
| Texas GO | 3.682% | 8/1/24 | 2,000 | 2,037 | |
| University of California Revenue | 2.300% | 5/15/21 | 1,000 | 980 | |
| Total Taxable Municipal Bonds (Cost $36,260) | 36,345 | ||||
| Shares | |||||
| Convertible Preferred Stocks (0.0%) | |||||
| *,11 Lehman Brothers Holdings Inc. Pfd. | 7.250% | Perpetual | 8,740 | — | |
| Temporary Cash Investment (0.9%) | |||||
| Money Market Fund (0.9%) | |||||
| 22 Vanguard Market Liquidity Fund (Cost | |||||
| $274,970) | 2.145% | 2,749,726 | 274,973 | ||
| Notional | |||||
| Amount on | |||||
| Counterparty | Underlying | ||||
| Expiration | Exercise | Swap | |||
| Date | Rate | ($000) | |||
| Options Purchased (0.0%) 23 | |||||
| Credit Default Swaptions Purchased (0.0%) | |||||
| Put Swaptions on CDX-NA-IG-S30-V1 5- | |||||
| Year Index (Cost $131) | JPMC | 8/15/18 | 65.00% | 154,995 | 28 |
| Total Investments (100.1%) (Cost $29,668,782) | 29,026,630 | ||||
| Notional | |||||
| Amount on | |||||
| Underlying | |||||
| Expiration | Exercise | Swap | |||
| Counterparty | Date | Rate | ($000) | ||
| Liability for Options Written | |||||
| Written Swaptions on Credit Default Index (0.0%) | |||||
| Call Swaptions on CDX-NA-IG-S30-V1 5- | |||||
| Year Index | GSI | 8/15/18 | 67.50% | 61,870 | (251) |
| Put Swaptions on CDX-NA-IG-S30-V1 5- | |||||
| Year Index | GSI | 8/15/18 | 72.50% | 61,870 | (2) |
| Put Swaptions on CDX-NA-IG-S30-V1 5- | |||||
| Year Index | JPMC | 9/19/18 | 75.00% | 154,995 | (51) |
| Total Liability for Options Written (Premiums Received $326) | (304) | ||||
| Other Assets and Liabilities—Net (-0.1%) | (35,217) | ||||
| Net Assets (100%) | 28,991,109 | ||||
| * Non-income-producing security--security in default. | |||||
| 69 | |||||
Vanguard® Intermediate-Term Investment-Grade Fund
Schedule of Investments
July 31, 2018
1 Securities with a value of $5,774,000 have been segregated as collateral for open forward currency contracts and open over-the-counter swap
contracts.
2 Securities with a value of $14,394,000 have been segregated as initial margin for open cleared swap contracts.
3 Securities with a value of $50,077,000 have been segregated as initial margin for open futures contracts.
4 The average or expected maturity is shorter than the final maturity shown because of the possibility of interim principal payments and
prepayments or the possibility of the issue being called.
5 The issuer was placed under federal conservatorship in September 2008; since that time, its daily operations have been managed by the Federal
Housing Finance Agency and it receives capital from the U.S. Treasury, as needed to maintain a positive net worth, in exchange for senior
preferred stock.
6 Inverse floating rate Interest-only security whose interest rate is derived by subtracting 1-month USD LIBOR from a given cap.
7 Interest-only security.
8 Adjustable-rate security based upon one-year Constant Maturity Treasury yield plus spread.
9 Adjustable-rate security based upon 12-month USD LIBOR plus spread.
10 Security exempt from registration under Rule 144A of the Securities Act of 1933. Such securities may be sold in transactions exempt from
registration, normally to qualified institutional buyers. At July 31, 2018, the aggregate value of these securities was $4,907,551,000,
representing 16.9% of net assets.
11 Security value determined using significant unobservable inputs.
12 Adjustable-rate security based upon 3-month USD LIBOR plus spread.
13 Adjustable-rate security based upon 1-month USD LIBOR plus spread.
14 Face amount denominated in Australian dollars.
15 Adjustable-rate security based upon 3-month AUD Australian Bank Bill Rate plus spread.
16 Face amount denominated in euro.
17 Face amount denominated in British pounds.
18 Scheduled principal and interest payments are guaranteed by bank letter of credit.
19 Guaranteed by multiple countries.
20 Guaranteed by the Government of Japan.
21 Face amount denominated in Mexican peso.
22 Affiliated money market fund available only to Vanguard funds and certain trusts and accounts managed by Vanguard. Rate shown is the 7-day
yield.
23 Unrealized appreciation (depreciation) on options on futures contracts is required to be treated as realized gain (loss) for tax purposes.
Unrealized appreciation (depreciation) on open credit default swaptions is generally treated the same for financial reporting and tax purposes.
GO—General Obligation Bond.
GSI—Goldman Sachs International.
JPMC—JP Morgan Chase Bank.
REMICS—Real Estate Mortgage Investment Conduits.
70
| Vanguard® Long-Term Investment-Grade Fund | |||||
| Schedule of Investments | |||||
| July 31, 2018 | |||||
| Face | Market | ||||
| Maturity | Amount | Value | |||
| Coupon | Date | ($000) | ($000) | ||
| U.S. Government and Agency Obligations (6.3%) | |||||
| U.S. Government Securities (4.8%) | |||||
| United States Treasury Note/Bond | 1.375% | 4/30/21 | 4,200 | 4,046 | |
| United States Treasury Note/Bond | 2.625% | 6/30/23 | 1,000 | 990 | |
| United States Treasury Note/Bond | 2.250% | 11/15/24 | 11,600 | 11,161 | |
| United States Treasury Note/Bond | 2.000% | 8/15/25 | 8,900 | 8,377 | |
| United States Treasury Note/Bond | 1.625% | 5/15/26 | 1,250 | 1,136 | |
| United States Treasury Note/Bond | 1.500% | 8/15/26 | 59,000 | 52,916 | |
| United States Treasury Note/Bond | 2.375% | 5/15/27 | 26,000 | 24,842 | |
| 1 | United States Treasury Note/Bond | 6.125% | 8/15/29 | 20,000 | 25,900 |
| United States Treasury Note/Bond | 6.250% | 5/15/30 | 2,174 | 2,877 | |
| 1,2 | United States Treasury Note/Bond | 4.500% | 2/15/36 | 215,530 | 259,612 |
| United States Treasury Note/Bond | 4.750% | 2/15/37 | 9,000 | 11,232 | |
| United States Treasury Note/Bond | 5.000% | 5/15/37 | 6,700 | 8,613 | |
| United States Treasury Note/Bond | 3.500% | 2/15/39 | 5,120 | 5,486 | |
| United States Treasury Note/Bond | 4.250% | 5/15/39 | 600 | 712 | |
| United States Treasury Note/Bond | 4.500% | 8/15/39 | 250 | 306 | |
| United States Treasury Note/Bond | 4.375% | 11/15/39 | 99,100 | 119,679 | |
| United States Treasury Note/Bond | 2.875% | 5/15/43 | 3,100 | 2,991 | |
| United States Treasury Note/Bond | 3.750% | 11/15/43 | 2,500 | 2,793 | |
| United States Treasury Note/Bond | 3.000% | 11/15/44 | 9,210 | 9,079 | |
| 2 | United States Treasury Note/Bond | 2.500% | 2/15/45 | 28,662 | 25,648 |
| United States Treasury Note/Bond | 2.875% | 8/15/45 | 3,700 | 3,560 | |
| 1 | United States Treasury Note/Bond | 3.000% | 11/15/45 | 40,000 | 39,412 |
| United States Treasury Note/Bond | 2.500% | 2/15/46 | 26,892 | 23,989 | |
| United States Treasury Note/Bond | 2.250% | 8/15/46 | 19,500 | 16,459 | |
| United States Treasury Note/Bond | 3.000% | 2/15/47 | 11,000 | 10,833 | |
| 1,2 | United States Treasury Note/Bond | 3.000% | 5/15/47 | 41,000 | 40,353 |
| United States Treasury Note/Bond | 2.750% | 11/15/47 | 42,000 | 39,316 | |
| United States Treasury Note/Bond | 3.000% | 2/15/48 | 15,000 | 14,766 | |
| United States Treasury Note/Bond | 3.125% | 5/15/48 | 30,000 | 30,263 | |
| 797,347 | |||||
| Agency Bonds and Notes (0.3%) | |||||
| 3 | Tennessee Valley Authority | 5.250% | 9/15/39 | 33,800 | 41,772 |
| 3 | Tennessee Valley Authority | 4.250% | 9/15/65 | 10,000 | 11,102 |
| 52,874 | |||||
| Conventional Mortgage-Backed Securities (0.7%) | |||||
| 4,5 | Fannie Mae Pool | 3.050% | 10/1/32 | 1,745 | 1,648 |
| 4,5 | Fannie Mae Pool | 3.100% | 6/1/32–10/1/32 | 20,730 | 19,343 |
| 4,5 | Fannie Mae Pool | 3.180% | 9/1/32 | 10,750 | 10,110 |
| 4,5 | Fannie Mae Pool | 3.200% | 9/1/32 | 5,660 | 5,317 |
| 4,5 | Fannie Mae Pool | 3.220% | 7/1/32 | 2,230 | 2,118 |
| 4,5 | Fannie Mae Pool | 3.230% | 7/1/32–8/1/32 | 5,953 | 5,668 |
| 4,5 | Fannie Mae Pool | 3.250% | 6/1/32 | 6,115 | 5,788 |
| 4,5 | Fannie Mae Pool | 3.260% | 9/1/32 | 26,625 | 25,386 |
| 4,5 | Fannie Mae Pool | 3.300% | 7/1/32 | 1,615 | 1,561 |
| 4,5 | Fannie Mae Pool | 3.490% | 2/1/32 | 5,695 | 5,524 |
| §,4,5 | Fannie Mae Pool | 3.580% | 9/1/30 | 12,810 | 12,796 |
| §,4,5 | Fannie Mae Pool | 3.620% | 8/1/30 | 9,055 | 9,080 |
| §,4,5 | Fannie Mae Pool | 3.690% | 8/1/30 | 8,625 | 8,706 |
| 113,045 | |||||
| Nonconventional Mortgage-Backed Securities (0.5%) | |||||
| 4,5 | Fannie Mae Pool | 3.135% | 10/1/32 | 6,300 | 5,946 |
| 4,5 | Fannie Mae REMICS | 3.000% | 7/25/47 | 12,564 | 11,533 |
| 4,5,6 | Fannie Mae REMICS | 3.986% | 3/25/46 | 1,955 | 322 |
| 5,7 | Fannie Mae REMICS | 4.000% | 2/25/48 | 1,173 | 284 |
| 4,5,6 | Fannie Mae REMICS | 4.086% | 5/25/47 | 2,750 | 449 |
| 4,5,6 | Fannie Mae REMICS | 4.136% | 10/25/47 | 1,762 | 332 |
| 5,7 | Fannie Mae REMICS | 4.500% | 9/25/47 | 912 | 217 |
| 5,7 | Fannie Mae REMICS | 5.000% | 6/25/45 | 1,254 | 262 |
| 5,7 | Fannie Mae REMICS | 5.500% | 2/25/46 | 681 | 148 |
| 5,7 | Fannie Mae REMICS | 6.000% | 12/25/47 | 800 | 192 |
| 5,7 | Fannie Mae REMICS 2012-138 | 4.500% | 12/25/42 | 513 | 128 |
| 71 | |||||
| Vanguard® Long-Term Investment-Grade Fund | |||||
| Schedule of Investments | |||||
| July 31, 2018 | |||||
| Face | Market | ||||
| Maturity | Amount | Value | |||
| Coupon | Date | ($000) | ($000) | ||
| 5,7 | Fannie Mae REMICS 2013-20 | 4.000% | 3/25/43 | 1,222 | 268 |
| 5,7 | Fannie Mae REMICS 2013-39D | 4.000% | 6/25/42 | 534 | 100 |
| 5,7 | Fannie Mae REMICS 2013-43 | 4.000% | 5/25/43 | 1,573 | 343 |
| 5,7 | Fannie Mae REMICS 2015-22 | 6.000% | 4/25/45 | 712 | 166 |
| 5,7 | Fannie Mae REMICS 2015-28 | 4.000% | 5/25/45 | 594 | 136 |
| 5,7 | Fannie Mae REMICS 2016-3 | 4.000% | 2/25/46 | 1,353 | 305 |
| 5,7 | Fannie Mae REMICS 2016-3 | 6.000% | 2/25/46 | 630 | 149 |
| 4,5 | Freddie Mac REMICS | 3.000% | 4/15/47 | 11,716 | 10,744 |
| 5,7 | Freddie Mac REMICS | 3.500% | 12/15/42 | 2,101 | 402 |
| 5,7 | 10/15/42– | ||||
| Freddie Mac REMICS | |||||
| 4.000% | 12/15/47 | 1,960 | 389 | ||
| 4,5,6 | Freddie Mac REMICS | 4.078% | 1/15/42–1/15/45 | 1,330 | 206 |
| 4,5,6 | Freddie Mac REMICS | 4.128% | 12/15/47 | 674 | 121 |
| 4 | Ginnie Mae REMICS | 3.000% | 7/20/47–8/20/47 | 43,243 | 38,146 |
| 7 | Ginnie Mae REMICS | 3.500% | 7/20/42 | 1,078 | 182 |
| 4,6 | Ginnie Mae REMICS | 3.564% | 8/20/45 | 1,152 | 164 |
| 7 | Ginnie Mae REMICS | 4.000% | 3/20/42–1/20/48 | 4,801 | 1,060 |
| 4,6 | Ginnie Mae REMICS | 4.014% | 9/20/46 | 847 | 148 |
| 4,6 | 9/20/47– | ||||
| Ginnie Mae REMICS | |||||
| 4.114% | 12/20/47 | 6,192 | 1,043 | ||
| 7 | Ginnie Mae REMICS | 4.500% | 3/20/43–1/20/48 | 4,968 | 1,211 |
| 7 | Ginnie Mae REMICS | 5.000% | 2/20/40 | 1,112 | 250 |
| 75,346 | |||||
| Total U.S. Government and Agency Obligations (Cost $1,062,823) | 1,038,612 | ||||
| Asset-Backed/Commercial Mortgage-Backed Security (0.1%) | |||||
| 4 | Public Service New Hampshire Funding LLC 2018-1 (Cost $6,051) | 3.814% | 2/1/35 | 6,051 | 6,043 |
| Corporate Bonds (76.7%) | |||||
| Finance (19.4%) | |||||
| Banking (13.2%) | |||||
| Bank of America Corp. | 3.248% | 10/21/27 | 14,160 | 13,169 | |
| 4 | Bank of America Corp. | 3.824% | 1/20/28 | 12,200 | 11,885 |
| 4 | Bank of America Corp. | 3.705% | 4/24/28 | 35,080 | 33,796 |
| 4 | Bank of America Corp. | 3.970% | 3/5/29 | 6,000 | 5,864 |
| 4 | Bank of America Corp. | 4.244% | 4/24/38 | 80,790 | 79,585 |
| Bank of America Corp. | 5.875% | 2/7/42 | 19,230 | 23,039 | |
| 4 | Bank of America Corp. | 4.443% | 1/20/48 | 33,000 | 33,117 |
| 4 | Bank of America Corp. | 3.946% | 1/23/49 | 75,200 | 69,698 |
| Bank of America NA | 6.000% | 10/15/36 | 20,450 | 24,230 | |
| Bank One Corp. | 8.000% | 4/29/27 | 27,424 | 34,160 | |
| 4 | Citigroup Inc. | 3.887% | 1/10/28 | 21,905 | 21,225 |
| 4 | Citigroup Inc. | 3.878% | 1/24/39 | 52,275 | 48,336 |
| Citigroup Inc. | 4.650% | 7/30/45 | 13,983 | 14,241 | |
| 4 | Citigroup Inc. | 4.281% | 4/24/48 | 18,570 | 17,972 |
| Citigroup Inc. | 4.650% | 7/23/48 | 3,430 | 3,485 | |
| 8 | Commonwealth Bank of Australia | 3.900% | 7/12/47 | 3,500 | 3,237 |
| Cooperatieve Rabobank UA | 5.750% | 12/1/43 | 25,781 | 29,307 | |
| 8 | Credit Suisse Group AG | 4.282% | 1/9/28 | 10,000 | 9,864 |
| 4 | Goldman Sachs Group Inc. | 3.691% | 6/5/28 | 66,500 | 63,404 |
| 4 | Goldman Sachs Group Inc. | 3.814% | 4/23/29 | 23,695 | 22,657 |
| 4 | Goldman Sachs Group Inc. | 4.223% | 5/1/29 | 16,545 | 16,366 |
| Goldman Sachs Group Inc. | 6.125% | 2/15/33 | 38,270 | 44,585 | |
| Goldman Sachs Group Inc. | 6.750% | 10/1/37 | 12,371 | 14,949 | |
| 4 | Goldman Sachs Group Inc. | 4.017% | 10/31/38 | 133,540 | 125,753 |
| 4 | Goldman Sachs Group Inc. | 4.411% | 4/23/39 | 13,285 | 13,010 |
| Goldman Sachs Group Inc. | 6.250% | 2/1/41 | 23,149 | 27,950 | |
| Goldman Sachs Group Inc. | 4.800% | 7/8/44 | 15,000 | 15,467 | |
| Goldman Sachs Group Inc. | 4.750% | 10/21/45 | 28,114 | 28,753 | |
| HSBC Bank USA NA | 5.875% | 11/1/34 | 45,205 | 51,573 | |
| HSBC Bank USA NA | 5.625% | 8/15/35 | 22,425 | 25,031 | |
| HSBC Holdings plc | 4.300% | 3/8/26 | 500 | 505 | |
| HSBC Holdings plc | 4.375% | 11/23/26 | 1,505 | 1,490 | |
| 72 | |||||
| Vanguard® Long-Term Investment-Grade Fund | |||||
| Schedule of Investments | |||||
| July 31, 2018 | |||||
| Face | Market | ||||
| Maturity | Amount | Value | |||
| Coupon | Date | ($000) | ($000) | ||
| 4 | HSBC Holdings plc | 4.041% | 3/13/28 | 1,840 | 1,811 |
| HSBC Holdings plc | 7.625% | 5/17/32 | 21,200 | 27,015 | |
| HSBC Holdings plc | 6.500% | 9/15/37 | 36,245 | 43,949 | |
| HSBC Holdings plc | 6.800% | 6/1/38 | 58,749 | 73,494 | |
| HSBC Holdings plc | 6.100% | 1/14/42 | 12,220 | 14,954 | |
| 4 | HSBC Holdings plc | 6.000% | 11/22/65 | 685 | 663 |
| 4 | HSBC Holdings plc | 6.500% | 9/23/66 | 8,245 | 8,088 |
| 8 | ICICI Bank Ltd. | 3.800% | 12/14/27 | 3,800 | 3,457 |
| 4 | JPMorgan Chase & Co. | 4.203% | 7/23/29 | 23,255 | 23,298 |
| JPMorgan Chase & Co. | 6.400% | 5/15/38 | 59,415 | 74,358 | |
| 4 | JPMorgan Chase & Co. | 3.882% | 7/24/38 | 65,990 | 61,615 |
| JPMorgan Chase & Co. | 5.500% | 10/15/40 | 20,955 | 24,066 | |
| JPMorgan Chase & Co. | 5.600% | 7/15/41 | 11,247 | 13,004 | |
| 4 | JPMorgan Chase & Co. | 4.260% | 2/22/48 | 51,885 | 50,048 |
| 4 | JPMorgan Chase & Co. | 4.032% | 7/24/48 | 39,500 | 36,820 |
| 4 | JPMorgan Chase & Co. | 3.964% | 11/15/48 | 72,910 | 67,015 |
| 4 | JPMorgan Chase & Co. | 3.897% | 1/23/49 | 52,000 | 47,535 |
| 4 | Morgan Stanley | 3.737% | 4/24/24 | 13,755 | 13,660 |
| Morgan Stanley | 3.875% | 1/27/26 | 10,000 | 9,856 | |
| 4 | Morgan Stanley | 3.772% | 1/24/29 | 24,285 | 23,277 |
| Morgan Stanley | 7.250% | 4/1/32 | 29,820 | 38,262 | |
| 4 | Morgan Stanley | 3.971% | 7/22/38 | 83,445 | 78,350 |
| Morgan Stanley | 6.375% | 7/24/42 | 33,880 | 42,670 | |
| Morgan Stanley | 4.300% | 1/27/45 | 39,380 | 38,103 | |
| Morgan Stanley | 4.375% | 1/22/47 | 48,245 | 47,427 | |
| 4 | Royal Bank of Scotland Group plc | 4.892% | 5/18/29 | 3,670 | 3,684 |
| Wachovia Corp. | 5.500% | 8/1/35 | 2,400 | 2,591 | |
| 4 | Wells Fargo & Co. | 3.584% | 5/22/28 | 24,915 | 23,900 |
| Wells Fargo & Co. | 5.375% | 11/2/43 | 55,167 | 60,281 | |
| Wells Fargo & Co. | 5.606% | 1/15/44 | 141,958 | 159,771 | |
| Wells Fargo & Co. | 4.650% | 11/4/44 | 15,937 | 15,720 | |
| Wells Fargo & Co. | 4.900% | 11/17/45 | 21,035 | 21,576 | |
| Wells Fargo & Co. | 4.400% | 6/14/46 | 34,020 | 32,437 | |
| Wells Fargo & Co. | 4.750% | 12/7/46 | 66,679 | 67,289 | |
| Wells Fargo Bank NA | 6.600% | 1/15/38 | 500 | 631 | |
| 8 | Woori Bank | 5.125% | 8/6/28 | 200 | 199 |
| Brokerage (0.2%) | |||||
| 8 | Apollo Management Holdings LP | 5.000% | 3/15/48 | 9,550 | 9,219 |
| 8 | FMR LLC | 6.450% | 11/15/39 | 16,010 | 20,003 |
| Finance Companies (1.3%) | |||||
| GE Capital International Funding Co. Unlimited Co. | 4.418% | 11/15/35 | 227,404 | 221,098 | |
| Insurance (4.7%) | |||||
| ACE Capital Trust II | 9.700% | 4/1/30 | 7,050 | 9,859 | |
| Aetna Inc. | 4.125% | 11/15/42 | 24,995 | 22,984 | |
| Aetna Inc. | 3.875% | 8/15/47 | 13,450 | 12,015 | |
| Aon plc | 4.750% | 5/15/45 | 3,000 | 2,985 | |
| 8 | AXA Equitable Holdings Inc. | 4.350% | 4/20/28 | 2,220 | 2,170 |
| 8 | AXA Equitable Holdings Inc. | 5.000% | 4/20/48 | 4,300 | 4,114 |
| Berkshire Hathaway Finance Corp. | 5.750% | 1/15/40 | 1,935 | 2,325 | |
| Berkshire Hathaway Inc. | 4.500% | 2/11/43 | 58,057 | 61,075 | |
| 9 | Chubb INA Holdings Inc. | 2.500% | 3/15/38 | 1,772 | 2,099 |
| Chubb INA Holdings Inc. | 4.350% | 11/3/45 | 15,000 | 15,303 | |
| 8 | Jackson National Life Insurance Co. | 8.150% | 3/15/27 | 200 | 249 |
| Marsh & McLennan Cos. Inc. | 5.875% | 8/1/33 | 1,600 | 1,868 | |
| Marsh & McLennan Cos. Inc. | 4.350% | 1/30/47 | 14,595 | 14,518 | |
| 8 | Massachusetts Mutual Life Insurance Co. | 8.875% | 6/1/39 | 4,370 | 6,753 |
| 8 | Massachusetts Mutual Life Insurance Co. | 4.500% | 4/15/65 | 310 | 286 |
| 8 | Massachusetts Mutual Life Insurance Co. | 4.900% | 4/1/77 | 15,838 | 15,618 |
| MetLife Inc. | 4.125% | 8/13/42 | 49,795 | 47,401 | |
| MetLife Inc. | 4.875% | 11/13/43 | 15,000 | 15,884 | |
| MetLife Inc. | 4.050% | 3/1/45 | 8,365 | 7,905 | |
| MetLife Inc. | 4.600% | 5/13/46 | 9,700 | 9,877 | |
| 73 | |||||
| Vanguard® Long-Term Investment-Grade Fund | |||||
| Schedule of Investments | |||||
| July 31, 2018 | |||||
| Face | Market | ||||
| Maturity | Amount | Value | |||
| Coupon | Date | ($000) | ($000) | ||
| 8 | Metropolitan Life Insurance Co. | 7.800% | 11/1/25 | 23,750 | 28,976 |
| 8 | Nationwide Mutual Insurance Co. | 9.375% | 8/15/39 | 26,031 | 40,595 |
| 8 | Nationwide Mutual Insurance Co. | 4.950% | 4/22/44 | 13,215 | 13,291 |
| 8 | New York Life Insurance Co. | 5.875% | 5/15/33 | 46,585 | 55,266 |
| 8 | Northwestern Mutual Life Insurance Co. | 6.063% | 3/30/40 | 19,090 | 23,586 |
| 8 | Northwestern Mutual Life Insurance Co. | 3.850% | 9/30/47 | 8,944 | 8,154 |
| 4,8 | Pacific Life Insurance Co. | 4.300% | 10/24/67 | 7,830 | 7,138 |
| Progressive Corp. | 4.125% | 4/15/47 | 4,615 | 4,443 | |
| Progressive Corp. | 4.200% | 3/15/48 | 6,250 | 6,096 | |
| Prudential Financial Inc. | 5.700% | 12/14/36 | 2,031 | 2,319 | |
| Prudential Financial Inc. | 4.600% | 5/15/44 | 5,000 | 5,058 | |
| 4 | Prudential Financial Inc. | 5.375% | 5/15/45 | 135 | 134 |
| Prudential Financial Inc. | 3.905% | 12/7/47 | 19,374 | 17,892 | |
| Prudential Financial Inc. | 3.935% | 12/7/49 | 17,974 | 16,560 | |
| 8 | Securian Financial Group Inc. | 4.800% | 4/15/48 | 8,211 | 8,134 |
| 8 | Swiss Re Treasury US Corp. | 4.250% | 12/6/42 | 13,645 | 13,381 |
| 8 | Teachers Insurance & Annuity Assn. of America | 4.900% | 9/15/44 | 2,250 | 2,390 |
| Travelers Cos. Inc. | 6.750% | 6/20/36 | 500 | 648 | |
| UnitedHealth Group Inc. | 4.625% | 7/15/35 | 17,955 | 19,137 | |
| UnitedHealth Group Inc. | 5.800% | 3/15/36 | 49,846 | 59,753 | |
| UnitedHealth Group Inc. | 6.500% | 6/15/37 | 1,100 | 1,420 | |
| UnitedHealth Group Inc. | 6.625% | 11/15/37 | 800 | 1,043 | |
| UnitedHealth Group Inc. | 6.875% | 2/15/38 | 18,457 | 24,569 | |
| UnitedHealth Group Inc. | 4.375% | 3/15/42 | 25,000 | 25,782 | |
| UnitedHealth Group Inc. | 4.750% | 7/15/45 | 50,840 | 55,215 | |
| UnitedHealth Group Inc. | 4.250% | 4/15/47 | 31,500 | 31,952 | |
| UnitedHealth Group Inc. | 3.750% | 10/15/47 | 29,705 | 27,515 | |
| UnitedHealth Group Inc. | 4.250% | 6/15/48 | 13,040 | 13,330 | |
| Real Estate Investment Trusts (0.0%) | |||||
| Federal Realty Investment Trust | 4.500% | 12/1/44 | 1,000 | 1,006 | |
| 9 | Prologis Euro Finance LLC | 1.875% | 1/5/29 | 285 | 332 |
| Simon Property Group LP | 4.250% | 10/1/44 | 3,755 | 3,649 | |
| 3,202,949 | |||||
| Industrial (43.7%) | |||||
| Basic Industry (0.7%) | |||||
| BHP Billiton Finance USA Ltd. | 4.125% | 2/24/42 | 16,000 | 16,036 | |
| BHP Billiton Finance USA Ltd. | 5.000% | 9/30/43 | 36,820 | 41,865 | |
| Celulosa Arauco y Constitucion SA | 5.500% | 11/2/47 | 375 | 371 | |
| 8 | Eagle Intermediate Global Holding BV/Ruyi US Finance | ||||
| LLC | 7.500% | 5/1/25 | 950 | 943 | |
| Rio Tinto Finance USA Ltd. | 5.200% | 11/2/40 | 20,335 | 23,033 | |
| Rio Tinto Finance USA plc | 4.750% | 3/22/42 | 1,400 | 1,502 | |
| Rio Tinto Finance USA plc | 4.125% | 8/21/42 | 40,840 | 40,446 | |
| Capital Goods (3.4%) | |||||
| 3M Co. | 3.125% | 9/19/46 | 15,000 | 12,841 | |
| 3M Co. | 3.625% | 10/15/47 | 10,345 | 9,805 | |
| 8 | BBA US Holdings Inc. | 5.375% | 5/1/26 | 480 | 482 |
| 8 | Berry Global Inc. | 4.500% | 2/15/26 | 375 | 349 |
| Boeing Co. | 6.125% | 2/15/33 | 13,565 | 16,890 | |
| Boeing Co. | 3.550% | 3/1/38 | 15,725 | 15,116 | |
| Boeing Co. | 6.875% | 3/15/39 | 6,420 | 8,902 | |
| Boeing Co. | 5.875% | 2/15/40 | 3,940 | 4,952 | |
| Boeing Co. | 7.875% | 4/15/43 | 5,900 | 8,696 | |
| Boeing Co. | 3.625% | 3/1/48 | 7,275 | 6,922 | |
| Caterpillar Inc. | 6.050% | 8/15/36 | 3,082 | 3,806 | |
| Caterpillar Inc. | 3.803% | 8/15/42 | 36,112 | 34,574 | |
| Caterpillar Inc. | 4.750% | 5/15/64 | 15,639 | 16,385 | |
| Deere & Co. | 7.125% | 3/3/31 | 13,500 | 17,484 | |
| Deere & Co. | 3.900% | 6/9/42 | 5,000 | 4,884 | |
| Emerson Electric Co. | 5.250% | 11/15/39 | 1,000 | 1,142 | |
| General Electric Co. | 6.750% | 3/15/32 | 41,214 | 50,864 | |
| 9 | General Electric Co. | 2.125% | 5/17/37 | 2,829 | 3,079 |
| General Electric Co. | 5.875% | 1/14/38 | 20,823 | 23,940 | |
| 74 | |||||
| Vanguard® Long-Term Investment-Grade Fund | |||||
| Schedule of Investments | |||||
| July 31, 2018 | |||||
| Face | Market | ||||
| Maturity | Amount | Value | |||
| Coupon | Date | ($000) | ($000) | ||
| General Electric Co. | 4.125% | 10/9/42 | 11,875 | 10,959 | |
| General Electric Co. | 4.500% | 3/11/44 | 37,610 | 36,825 | |
| John Deere Capital Corp. | 3.450% | 6/7/23 | 11,185 | 11,171 | |
| Lockheed Martin Corp. | 3.600% | 3/1/35 | 5,870 | 5,490 | |
| Lockheed Martin Corp. | 4.070% | 12/15/42 | 10,120 | 9,871 | |
| Lockheed Martin Corp. | 3.800% | 3/1/45 | 13,625 | 12,730 | |
| Lockheed Martin Corp. | 4.090% | 9/15/52 | 20,857 | 20,138 | |
| 8 | Mueller Water Products Inc. | 5.500% | 6/15/26 | 1,470 | 1,479 |
| Raytheon Co. | 4.700% | 12/15/41 | 37,524 | 41,307 | |
| United Technologies Corp. | 5.400% | 5/1/35 | 6,500 | 7,140 | |
| United Technologies Corp. | 6.125% | 7/15/38 | 52,575 | 62,564 | |
| United Technologies Corp. | 5.700% | 4/15/40 | 20,900 | 24,088 | |
| United Technologies Corp. | 4.500% | 6/1/42 | 19,110 | 19,241 | |
| United Technologies Corp. | 4.150% | 5/15/45 | 2,560 | 2,455 | |
| United Technologies Corp. | 3.750% | 11/1/46 | 30,415 | 27,177 | |
| United Technologies Corp. | 4.050% | 5/4/47 | 36,615 | 34,689 | |
| Communication (4.0%) | |||||
| 21st Century Fox America Inc. | 7.900% | 12/1/95 | 2,975 | 4,330 | |
| America Movil SAB de CV | 6.125% | 3/30/40 | 28,925 | 33,964 | |
| Charter Communications Operating LLC / Charter | |||||
| Communications Operating Capital | 4.200% | 3/15/28 | 10,000 | 9,581 | |
| Charter Communications Operating LLC / Charter | |||||
| Communications Operating Capital | 5.375% | 5/1/47 | 4,500 | 4,308 | |
| Charter Communications Operating LLC / Charter | |||||
| Communications Operating Capital | 5.750% | 4/1/48 | 3,865 | 3,892 | |
| Comcast Corp. | 5.650% | 6/15/35 | 40,124 | 44,878 | |
| Comcast Corp. | 6.500% | 11/15/35 | 18,600 | 22,680 | |
| Comcast Corp. | 3.200% | 7/15/36 | 16,810 | 14,343 | |
| Comcast Corp. | 3.900% | 3/1/38 | 29,335 | 27,313 | |
| Comcast Corp. | 6.400% | 5/15/38 | 3,545 | 4,290 | |
| Comcast Corp. | 4.500% | 1/15/43 | 1,250 | 1,205 | |
| Comcast Corp. | 4.750% | 3/1/44 | 55,670 | 56,247 | |
| Comcast Corp. | 4.600% | 8/15/45 | 17,375 | 17,190 | |
| Comcast Corp. | 3.400% | 7/15/46 | 20,295 | 16,708 | |
| Comcast Corp. | 4.000% | 8/15/47 | 18,875 | 17,282 | |
| Comcast Corp. | 3.969% | 11/1/47 | 83,688 | 75,616 | |
| Comcast Corp. | 4.000% | 3/1/48 | 38,180 | 34,784 | |
| Comcast Corp. | 3.999% | 11/1/49 | 37,466 | 33,867 | |
| Comcast Corp. | 4.049% | 11/1/52 | 19,973 | 17,962 | |
| 8 | Cox Communications Inc. | 6.450% | 12/1/36 | 9,000 | 9,804 |
| 8 | Cox Communications Inc. | 8.375% | 3/1/39 | 13,850 | 18,123 |
| NBCUniversal Media LLC | 5.950% | 4/1/41 | 17,035 | 19,774 | |
| NBCUniversal Media LLC | 4.450% | 1/15/43 | 22,650 | 21,609 | |
| Qwest Corp. | 6.875% | 9/15/33 | 1,699 | 1,603 | |
| T-Mobile USA Inc. | 4.500% | 2/1/26 | 720 | 677 | |
| T-Mobile USA Inc. | 4.750% | 2/1/28 | 450 | 417 | |
| Thomson Reuters Corp. | 5.850% | 4/15/40 | 2,000 | 2,167 | |
| Time Warner Cable LLC | 6.550% | 5/1/37 | 16,975 | 18,643 | |
| Verizon Communications Inc. | 4.500% | 8/10/33 | 11,370 | 11,272 | |
| Verizon Communications Inc. | 5.250% | 3/16/37 | 17,950 | 19,251 | |
| Verizon Communications Inc. | 4.125% | 8/15/46 | 15,375 | 13,844 | |
| Verizon Communications Inc. | 4.862% | 8/21/46 | 15,125 | 15,146 | |
| Viacom Inc. | 4.375% | 3/15/43 | 9,055 | 7,854 | |
| Viacom Inc. | 5.850% | 9/1/43 | 2,060 | 2,137 | |
| Vodafone Group plc | 4.125% | 5/30/25 | 34,600 | 34,629 | |
| Walt Disney Co. | 7.550% | 7/15/93 | 15,750 | 18,517 | |
| Consumer Cyclical (6.1%) | |||||
| Alibaba Group Holding Ltd. | 4.000% | 12/6/37 | 28,770 | 26,960 | |
| Alibaba Group Holding Ltd. | 4.200% | 12/6/47 | 46,490 | 43,582 | |
| Alibaba Group Holding Ltd. | 4.400% | 12/6/57 | 29,105 | 27,257 | |
| Amazon.com Inc. | 3.875% | 8/22/37 | 71,400 | 70,660 | |
| Amazon.com Inc. | 4.950% | 12/5/44 | 2,000 | 2,264 | |
| Amazon.com Inc. | 4.050% | 8/22/47 | 70,925 | 70,411 | |
| 75 | |||||
| Vanguard® Long-Term Investment-Grade Fund | |||||
| Schedule of Investments | |||||
| July 31, 2018 | |||||
| Face | Market | ||||
| Maturity | Amount | Value | |||
| Coupon | Date | ($000) | ($000) | ||
| Amazon.com Inc. | 4.250% | 8/22/57 | 43,390 | 43,864 | |
| 8 | Boyd Gaming Corp. | 6.000% | 8/15/26 | 425 | 427 |
| Cummins Inc. | 4.875% | 10/1/43 | 1,000 | 1,098 | |
| Daimler Finance North America LLC | 8.500% | 1/18/31 | 265 | 373 | |
| General Motors Co. | 5.150% | 4/1/38 | 8,100 | 7,789 | |
| GLP Capital LP / GLP Financing II Inc. | 5.750% | 6/1/28 | 480 | 488 | |
| Harley-Davidson Inc. | 4.625% | 7/28/45 | 4,000 | 3,762 | |
| 8 | Hilton Domestic Operating Co. Inc. | 5.125% | 5/1/26 | 1,545 | 1,545 |
| Hilton Worldwide Finance LLC / Hilton Worldwide | |||||
| Finance Corp. | 4.875% | 4/1/27 | 410 | 399 | |
| Home Depot Inc. | 5.875% | 12/16/36 | 40,575 | 50,105 | |
| Home Depot Inc. | 5.400% | 9/15/40 | 1,000 | 1,182 | |
| Home Depot Inc. | 5.950% | 4/1/41 | 22,170 | 27,804 | |
| Home Depot Inc. | 4.200% | 4/1/43 | 6,035 | 6,118 | |
| Home Depot Inc. | 4.875% | 2/15/44 | 66,510 | 74,060 | |
| Home Depot Inc. | 4.400% | 3/15/45 | 12,900 | 13,523 | |
| Home Depot Inc. | 4.250% | 4/1/46 | 20,015 | 20,575 | |
| Home Depot Inc. | 3.500% | 9/15/56 | 5,920 | 5,197 | |
| Lowe's Companies, Inc. | 4.650% | 4/15/42 | 1,250 | 1,313 | |
| Lowe's Companies, Inc. | 4.250% | 9/15/44 | 800 | 791 | |
| Lowe's Companies, Inc. | 4.375% | 9/15/45 | 1,000 | 1,015 | |
| Lowe's Companies, Inc. | 3.700% | 4/15/46 | 53,780 | 49,151 | |
| Lowe's Companies, Inc. | 4.050% | 5/3/47 | 42,885 | 41,535 | |
| Mastercard Inc. | 3.950% | 2/26/48 | 25,075 | 25,294 | |
| McDonald's Corp. | 3.700% | 1/30/26 | 5,190 | 5,180 | |
| McDonald's Corp. | 6.300% | 3/1/38 | 16,940 | 20,723 | |
| MGM Resorts International | 5.750% | 6/15/25 | 1,250 | 1,259 | |
| NIKE Inc. | 3.625% | 5/1/43 | 30,604 | 28,355 | |
| NIKE Inc. | 3.875% | 11/1/45 | 25,000 | 24,040 | |
| NIKE Inc. | 3.375% | 11/1/46 | 13,090 | 11,591 | |
| Target Corp. | 7.000% | 1/15/38 | 1,100 | 1,447 | |
| Target Corp. | 4.000% | 7/1/42 | 500 | 485 | |
| Target Corp. | 3.625% | 4/15/46 | 700 | 636 | |
| Visa Inc. | 4.150% | 12/14/35 | 21,915 | 22,903 | |
| Visa Inc. | 4.300% | 12/14/45 | 39,960 | 42,128 | |
| Visa Inc. | 3.650% | 9/15/47 | 32,445 | 31,041 | |
| Walmart Inc. | 3.700% | 6/26/28 | 25,000 | 25,206 | |
| Walmart Inc. | 3.950% | 6/28/38 | 41,085 | 41,408 | |
| Walmart Inc. | 5.625% | 4/1/40 | 1,890 | 2,309 | |
| Walmart Inc. | 4.875% | 7/8/40 | 2,000 | 2,241 | |
| Walmart Inc. | 5.000% | 10/25/40 | 1,700 | 1,951 | |
| Walmart Inc. | 5.625% | 4/15/41 | 3,850 | 4,736 | |
| Walmart Inc. | 4.000% | 4/11/43 | 1,400 | 1,399 | |
| Walmart Inc. | 3.625% | 12/15/47 | 70,485 | 66,960 | |
| Walmart Inc. | 4.050% | 6/29/48 | 42,970 | 43,698 | |
| Consumer Noncyclical (14.5%) | |||||
| Altria Group Inc. | 4.250% | 8/9/42 | 7,100 | 6,718 | |
| Altria Group Inc. | 4.500% | 5/2/43 | 2,380 | 2,327 | |
| Altria Group Inc. | 5.375% | 1/31/44 | 51,770 | 56,737 | |
| Altria Group Inc. | 3.875% | 9/16/46 | 56,370 | 50,838 | |
| AmerisourceBergen Corp. | 4.300% | 12/15/47 | 6,500 | 5,791 | |
| Anheuser-Busch Cos. LLC | 6.750% | 12/15/27 | 400 | 476 | |
| Anheuser-Busch InBev Finance Inc. | 4.700% | 2/1/36 | 110,120 | 113,134 | |
| Anheuser-Busch InBev Finance Inc. | 4.000% | 1/17/43 | 25,208 | 23,026 | |
| Anheuser-Busch InBev Finance Inc. | 4.900% | 2/1/46 | 161,615 | 168,548 | |
| Anheuser-Busch InBev Worldwide Inc. | 4.375% | 4/15/38 | 33,800 | 33,543 | |
| Anheuser-Busch InBev Worldwide Inc. | 8.200% | 1/15/39 | 27,675 | 39,695 | |
| Anheuser-Busch InBev Worldwide Inc. | 8.000% | 11/15/39 | 9,220 | 12,982 | |
| Anheuser-Busch InBev Worldwide Inc. | 4.950% | 1/15/42 | 1,000 | 1,051 | |
| Anheuser-Busch InBev Worldwide Inc. | 3.750% | 7/15/42 | 33,995 | 30,176 | |
| Anheuser-Busch InBev Worldwide Inc. | 4.600% | 4/15/48 | 67,205 | 67,496 | |
| Anheuser-Busch InBev Worldwide Inc. | 4.439% | 10/6/48 | 40,638 | 39,816 | |
| Anheuser-Busch InBev Worldwide Inc. | 4.750% | 4/15/58 | 43,080 | 43,363 | |
| 76 | |||||
| Vanguard® Long-Term Investment-Grade Fund | |||||
| Schedule of Investments | |||||
| July 31, 2018 | |||||
| Face | Market | ||||
| Maturity | Amount | Value | |||
| Coupon | Date | ($000) | ($000) | ||
| 8 | Aramark Services Inc. | 5.000% | 2/1/28 | 1,425 | 1,372 |
| Ascension Health | 3.945% | 11/15/46 | 15,385 | 14,955 | |
| 4 | Ascension Health | 4.847% | 11/15/53 | 8,855 | 9,767 |
| AstraZeneca plc | 6.450% | 9/15/37 | 30,775 | 38,552 | |
| 8 | BAT Capital Corp. | 4.390% | 8/15/37 | 12,500 | 11,984 |
| 8 | Bayer US Finance II LLC | 3.950% | 4/15/45 | 12,300 | 11,021 |
| 8 | Bayer US Finance II LLC | 4.700% | 7/15/64 | 19,565 | 17,916 |
| Bristol-Myers Squibb Co. | 4.500% | 3/1/44 | 17,500 | 18,537 | |
| Campbell Soup Co. | 4.800% | 3/15/48 | 4,500 | 4,083 | |
| 8 | Cargill Inc. | 4.760% | 11/23/45 | 39,699 | 43,681 |
| 4 | Catholic Health Initiatives Colorado GO | 4.350% | 11/1/42 | 19,000 | 17,652 |
| Children's Hospital Medical Center Ohio GO | 4.268% | 5/15/44 | 500 | 516 | |
| City of Hope | 5.623% | 11/15/43 | 2,000 | 2,394 | |
| Cleveland Clinic Foundation Ohio Revenue | 4.858% | 1/1/14 | 6,894 | 7,164 | |
| Colgate-Palmolive Co. | 3.700% | 8/1/47 | 20,240 | 19,029 | |
| CVS Health Corp. | 4.780% | 3/25/38 | 15,070 | 15,127 | |
| CVS Health Corp. | 5.050% | 3/25/48 | 30,850 | 31,962 | |
| Dignity Health California GO | 4.500% | 11/1/42 | 21,483 | 20,291 | |
| Dignity Health California GO | 5.267% | 11/1/64 | 9,240 | 9,198 | |
| Eli Lilly & Co. | 3.700% | 3/1/45 | 27,130 | 25,665 | |
| Gilead Sciences Inc. | 2.950% | 3/1/27 | 10,000 | 9,383 | |
| Gilead Sciences Inc. | 4.600% | 9/1/35 | 24,025 | 24,911 | |
| Gilead Sciences Inc. | 4.000% | 9/1/36 | 20,000 | 19,342 | |
| Gilead Sciences Inc. | 5.650% | 12/1/41 | 12,977 | 15,009 | |
| Gilead Sciences Inc. | 4.800% | 4/1/44 | 19,560 | 20,499 | |
| Gilead Sciences Inc. | 4.500% | 2/1/45 | 27,930 | 28,328 | |
| Gilead Sciences Inc. | 4.750% | 3/1/46 | 26,920 | 28,359 | |
| Gilead Sciences Inc. | 4.150% | 3/1/47 | 32,055 | 30,946 | |
| GlaxoSmithKline Capital Inc. | 3.875% | 5/15/28 | 41,765 | 42,359 | |
| GlaxoSmithKline Capital Inc. | 5.375% | 4/15/34 | 15,000 | 17,230 | |
| GlaxoSmithKline Capital Inc. | 6.375% | 5/15/38 | 37,680 | 48,978 | |
| 8 | Hologic Inc. | 4.625% | 2/1/28 | 850 | 802 |
| Johnson & Johnson | 3.550% | 3/1/36 | 47,310 | 45,845 | |
| Johnson & Johnson | 3.625% | 3/3/37 | 40,815 | 39,907 | |
| Johnson & Johnson | 3.400% | 1/15/38 | 43,125 | 40,809 | |
| Johnson & Johnson | 4.500% | 12/5/43 | 5,725 | 6,214 | |
| Johnson & Johnson | 3.700% | 3/1/46 | 21,545 | 20,881 | |
| Johnson & Johnson | 3.750% | 3/3/47 | 10,000 | 9,772 | |
| Kaiser Foundation Hospitals | 4.875% | 4/1/42 | 12,365 | 13,623 | |
| Kaiser Foundation Hospitals | 4.150% | 5/1/47 | 23,225 | 23,369 | |
| Kimberly-Clark Corp. | 6.625% | 8/1/37 | 4,800 | 6,371 | |
| Kimberly-Clark Corp. | 3.200% | 7/30/46 | 4,700 | 4,033 | |
| 4 | Mayo Clinic | 3.774% | 11/15/43 | 12,595 | 12,009 |
| Mead Johnson Nutrition Co. | 4.600% | 6/1/44 | 8,000 | 8,279 | |
| Medtronic Inc. | 4.375% | 3/15/35 | 44,113 | 46,036 | |
| Medtronic Inc. | 6.500% | 3/15/39 | 21,200 | 27,490 | |
| Medtronic Inc. | 5.550% | 3/15/40 | 4,600 | 5,438 | |
| Medtronic Inc. | 4.500% | 3/15/42 | 9,000 | 9,370 | |
| Medtronic Inc. | 4.625% | 3/15/44 | 2,000 | 2,138 | |
| Medtronic Inc. | 4.625% | 3/15/45 | 89,925 | 97,792 | |
| Memorial Sloan-Kettering Cancer Center New York GO | 5.000% | 7/1/42 | 13,405 | 15,116 | |
| Memorial Sloan-Kettering Cancer Center New York GO | 4.125% | 7/1/52 | 355 | 351 | |
| Merck & Co. Inc. | 3.600% | 9/15/42 | 4,900 | 4,640 | |
| Merck & Co. Inc. | 4.150% | 5/18/43 | 6,880 | 7,137 | |
| Merck & Co. Inc. | 3.700% | 2/10/45 | 77,020 | 74,083 | |
| New York & Presbyterian Hospital | 4.024% | 8/1/45 | 19,585 | 19,209 | |
| New York & Presbyterian Hospital | 4.063% | 8/1/56 | 3,000 | 2,932 | |
| New York & Presbyterian Hospital | 4.763% | 8/1/16 | 10,000 | 10,001 | |
| North Shore-Long Island Jewish Health Care Inc. | |||||
| Revenue | 4.800% | 11/1/42 | 1,100 | 1,123 | |
| Northwell Healthcare Inc. | 3.979% | 11/1/46 | 2,000 | 1,810 | |
| Northwell Healthcare Inc. | 4.260% | 11/1/47 | 3,340 | 3,148 | |
| Novartis Capital Corp. | 4.400% | 5/6/44 | 24,840 | 26,582 | |
| NYU Hospitals Center | 4.784% | 7/1/44 | 2,000 | 2,156 | |
| 77 | |||||
| Vanguard® Long-Term Investment-Grade Fund | |||||
| Schedule of Investments | |||||
| July 31, 2018 | |||||
| Face | Market | ||||
| Maturity | Amount | Value | |||
| Coupon | Date | ($000) | ($000) | ||
| PepsiCo Inc. | 5.500% | 1/15/40 | 20,915 | 25,020 | |
| PepsiCo Inc. | 4.875% | 11/1/40 | 10,375 | 11,472 | |
| PepsiCo Inc. | 4.000% | 3/5/42 | 16,372 | 16,119 | |
| PepsiCo Inc. | 3.600% | 8/13/42 | 1,000 | 938 | |
| PepsiCo Inc. | 4.450% | 4/14/46 | 20,000 | 21,176 | |
| PepsiCo Inc. | 3.450% | 10/6/46 | 32,440 | 29,222 | |
| PepsiCo Inc. | 4.000% | 5/2/47 | 22,305 | 21,956 | |
| Pfizer Inc. | 7.200% | 3/15/39 | 34,912 | 49,005 | |
| Pfizer Inc. | 4.300% | 6/15/43 | 7,780 | 7,968 | |
| Pfizer Inc. | 4.400% | 5/15/44 | 8,615 | 9,148 | |
| Pfizer Inc. | 4.125% | 12/15/46 | 12,650 | 12,975 | |
| Philip Morris International Inc. | 6.375% | 5/16/38 | 34,215 | 41,692 | |
| Philip Morris International Inc. | 4.500% | 3/20/42 | 5,000 | 4,957 | |
| Philip Morris International Inc. | 3.875% | 8/21/42 | 4,620 | 4,217 | |
| Philip Morris International Inc. | 4.125% | 3/4/43 | 20,170 | 19,109 | |
| Philip Morris International Inc. | 4.875% | 11/15/43 | 22,455 | 23,406 | |
| Philip Morris International Inc. | 4.250% | 11/10/44 | 37,135 | 35,991 | |
| Procter & Gamble Co. | 3.500% | 10/25/47 | 36,505 | 33,299 | |
| 4 | Providence St. Joseph Health Obligated Group | 3.744% | 10/1/47 | 5,675 | 5,239 |
| 4 | Providence St. Joseph Health Obligated Group | 3.930% | 10/1/48 | 6,985 | 6,688 |
| 8 | SC Johnson & Son Inc. | 4.000% | 5/15/43 | 21,645 | 21,135 |
| Southern Baptist Hospital of Florida Inc. | 4.857% | 7/15/45 | 1,000 | 1,100 | |
| Wyeth LLC | 6.500% | 2/1/34 | 1,310 | 1,652 | |
| Wyeth LLC | 6.000% | 2/15/36 | 4,392 | 5,395 | |
| Wyeth LLC | 5.950% | 4/1/37 | 67,685 | 82,674 | |
| Energy (3.7%) | |||||
| Andeavor Logistics LP / Tesoro Logistics Finance Corp. | 5.200% | 12/1/47 | 4,145 | 4,124 | |
| Baker Hughes a GE Co. LLC / Baker Hughes Co-Obligor | |||||
| Inc. | 4.080% | 12/15/47 | 13,479 | 12,385 | |
| Canadian Natural Resources Ltd. | 7.200% | 1/15/32 | 820 | 1,008 | |
| Cenovus Energy Inc. | 4.450% | 9/15/42 | 4,000 | 3,550 | |
| ConocoPhillips | 7.000% | 3/30/29 | 9,550 | 11,663 | |
| ConocoPhillips | 5.900% | 10/15/32 | 1,400 | 1,633 | |
| ConocoPhillips | 5.900% | 5/15/38 | 1,000 | 1,204 | |
| ConocoPhillips | 6.500% | 2/1/39 | 62,316 | 80,170 | |
| ConocoPhillips Canada Funding Co. I | 5.950% | 10/15/36 | 1,500 | 1,820 | |
| ConocoPhillips Co. | 4.300% | 11/15/44 | 11,330 | 11,599 | |
| ConocoPhillips Co. | 5.950% | 3/15/46 | 27,300 | 34,781 | |
| Dominion Energy Gas Holdings LLC | 4.800% | 11/1/43 | 1,575 | 1,586 | |
| Energy Transfer LP | 6.050% | 6/1/41 | 780 | 805 | |
| Energy Transfer LP | 5.300% | 4/15/47 | 2,320 | 2,202 | |
| Energy Transfer Partners LP | 6.000% | 6/15/48 | 1,910 | 1,997 | |
| Exxon Mobil Corp. | 3.567% | 3/6/45 | 12,625 | 11,823 | |
| Exxon Mobil Corp. | 4.114% | 3/1/46 | 45,770 | 47,012 | |
| Kinder Morgan Energy Partners LP | 5.000% | 8/15/42 | 65 | 63 | |
| Kinder Morgan Energy Partners LP | 5.000% | 3/1/43 | 165 | 160 | |
| Kinder Morgan Inc. | 7.750% | 1/15/32 | 395 | 489 | |
| Occidental Petroleum Corp. | 4.400% | 4/15/46 | 22,385 | 22,923 | |
| Petro-Canada | 6.800% | 5/15/38 | 19,388 | 24,919 | |
| Shell International Finance BV | 4.125% | 5/11/35 | 30,515 | 31,240 | |
| Shell International Finance BV | 6.375% | 12/15/38 | 4,300 | 5,600 | |
| Shell International Finance BV | 5.500% | 3/25/40 | 13,990 | 16,648 | |
| Shell International Finance BV | 4.550% | 8/12/43 | 18,195 | 19,381 | |
| Shell International Finance BV | 4.375% | 5/11/45 | 53,555 | 55,845 | |
| Shell International Finance BV | 4.000% | 5/10/46 | 45,240 | 44,716 | |
| Shell International Finance BV | 3.750% | 9/12/46 | 41,115 | 38,727 | |
| Spectra Energy Partners LP | 5.950% | 9/25/43 | 3,000 | 3,368 | |
| Spectra Energy Partners LP | 4.500% | 3/15/45 | 1,515 | 1,436 | |
| Tennessee Gas Pipeline Co. LLC | 7.625% | 4/1/37 | 195 | 240 | |
| TransCanada PipeLines Ltd. | 4.625% | 3/1/34 | 25,000 | 25,180 | |
| TransCanada PipeLines Ltd. | 6.200% | 10/15/37 | 5,630 | 6,658 | |
| TransCanada PipeLines Ltd. | 7.625% | 1/15/39 | 37,230 | 49,715 | |
| TransCanada PipeLines Ltd. | 6.100% | 6/1/40 | 16,675 | 19,437 | |
| 78 | |||||
| Vanguard® Long-Term Investment-Grade Fund | |||||
| Schedule of Investments | |||||
| July 31, 2018 | |||||
| Face | Market | ||||
| Maturity | Amount | Value | |||
| Coupon | Date | ($000) | ($000) | ||
| TransCanada PipeLines Ltd. | 5.000% | 10/16/43 | 8,000 | 8,232 | |
| TransCanada PipeLines Ltd. | 4.875% | 5/15/48 | 6,000 | 6,263 | |
| Other Industrial (0.3%) | |||||
| 9 | Aroundtown SA | 1.875% | 1/19/26 | 900 | 1,037 |
| 9 | CPI Property Group SA | 2.125% | 10/4/24 | 1,200 | 1,381 |
| 8 | Hi-Crush Partners LP | 9.500% | 8/1/26 | 425 | 419 |
| 4 | Massachusetts Institute of Technology GO | 3.959% | 7/1/38 | 25,200 | 25,557 |
| Massachusetts Institute of Technology GO | 5.600% | 7/1/11 | 1,100 | 1,413 | |
| Massachusetts Institute of Technology GO | 3.885% | 7/1/16 | 18,335 | 16,814 | |
| 8 | President & Fellows of Harvard College Massachusetts | ||||
| GO | 6.500% | 1/15/39 | 3,865 | 5,344 | |
| Technology (8.7%) | |||||
| Apple Inc. | 4.500% | 2/23/36 | 15,000 | 16,250 | |
| Apple Inc. | 3.850% | 5/4/43 | 38,205 | 36,826 | |
| Apple Inc. | 3.450% | 2/9/45 | 38,360 | 34,681 | |
| Apple Inc. | 4.375% | 5/13/45 | 45,875 | 47,814 | |
| Apple Inc. | 4.650% | 2/23/46 | 76,562 | 83,571 | |
| Apple Inc. | 3.850% | 8/4/46 | 42,559 | 41,053 | |
| Apple Inc. | 4.250% | 2/9/47 | 39,230 | 40,195 | |
| Apple Inc. | 3.750% | 9/12/47 | 2,475 | 2,360 | |
| Apple Inc. | 3.750% | 11/13/47 | 25,000 | 23,873 | |
| Applied Materials Inc. | 5.100% | 10/1/35 | 100 | 112 | |
| Applied Materials Inc. | 5.850% | 6/15/41 | 6,695 | 8,109 | |
| Applied Materials Inc. | 4.350% | 4/1/47 | 18,945 | 19,448 | |
| Cisco Systems Inc. | 5.900% | 2/15/39 | 36,695 | 45,846 | |
| Cisco Systems Inc. | 5.500% | 1/15/40 | 11,338 | 13,739 | |
| Intel Corp. | 4.800% | 10/1/41 | 1,000 | 1,099 | |
| Intel Corp. | 4.100% | 5/19/46 | 18,330 | 18,511 | |
| Intel Corp. | 4.100% | 5/11/47 | 30,360 | 30,663 | |
| Intel Corp. | 3.734% | 12/8/47 | 57,279 | 54,376 | |
| International Business Machines Corp. | 4.000% | 6/20/42 | 14,900 | 14,601 | |
| International Business Machines Corp. | 4.700% | 2/19/46 | 8,000 | 8,826 | |
| Microsoft Corp. | 3.500% | 2/12/35 | 7,835 | 7,593 | |
| Microsoft Corp. | 3.450% | 8/8/36 | 32,325 | 31,011 | |
| Microsoft Corp. | 4.100% | 2/6/37 | 46,065 | 47,873 | |
| Microsoft Corp. | 4.500% | 10/1/40 | 1,900 | 2,055 | |
| Microsoft Corp. | 5.300% | 2/8/41 | 1,500 | 1,789 | |
| Microsoft Corp. | 3.500% | 11/15/42 | 1,750 | 1,651 | |
| Microsoft Corp. | 3.750% | 5/1/43 | 10,000 | 9,743 | |
| Microsoft Corp. | 4.875% | 12/15/43 | 500 | 574 | |
| Microsoft Corp. | 3.750% | 2/12/45 | 74,350 | 73,087 | |
| Microsoft Corp. | 4.450% | 11/3/45 | 70,670 | 77,370 | |
| Microsoft Corp. | 3.700% | 8/8/46 | 65,330 | 63,519 | |
| Microsoft Corp. | 4.250% | 2/6/47 | 66,743 | 71,186 | |
| Microsoft Corp. | 4.000% | 2/12/55 | 10,075 | 10,128 | |
| Microsoft Corp. | 4.750% | 11/3/55 | 50,365 | 57,402 | |
| Microsoft Corp. | 3.950% | 8/8/56 | 46,076 | 46,051 | |
| Microsoft Corp. | 4.500% | 2/6/57 | 4,900 | 5,366 | |
| Oracle Corp. | 3.900% | 5/15/35 | 2,100 | 2,069 | |
| Oracle Corp. | 3.850% | 7/15/36 | 5,250 | 5,109 | |
| Oracle Corp. | 6.500% | 4/15/38 | 44,400 | 57,971 | |
| Oracle Corp. | 6.125% | 7/8/39 | 12,129 | 15,158 | |
| Oracle Corp. | 5.375% | 7/15/40 | 49,740 | 57,420 | |
| Oracle Corp. | 4.125% | 5/15/45 | 23,450 | 23,307 | |
| Oracle Corp. | 4.000% | 7/15/46 | 74,945 | 73,061 | |
| Oracle Corp. | 4.000% | 11/15/47 | 35,795 | 34,636 | |
| Oracle Corp. | 4.375% | 5/15/55 | 25,000 | 25,009 | |
| QUALCOMM Inc. | 4.650% | 5/20/35 | 7,950 | 7,993 | |
| QUALCOMM Inc. | 4.800% | 5/20/45 | 500 | 501 | |
| QUALCOMM Inc. | 4.300% | 5/20/47 | 23,245 | 21,950 | |
| 8 | Tencent Holdings Ltd. | 3.595% | 1/19/28 | 26,555 | 25,291 |
| 8 | Tencent Holdings Ltd. | 3.925% | 1/19/38 | 27,410 | 25,354 |
| Verisk Analytics Inc. | 5.500% | 6/15/45 | 2,000 | 2,046 | |
| 79 | |||||
| Vanguard® Long-Term Investment-Grade Fund | ||||
| Schedule of Investments | ||||
| July 31, 2018 | ||||
| Face | Market | |||
| Maturity | Amount | Value | ||
| Coupon | Date | ($000) | ($000) | |
| Western Digital Corp. | 4.750% | 2/15/26 | 900 | 885 |
| Transportation (2.3%) | ||||
| Burlington Northern Santa Fe LLC | 7.950% | 8/15/30 | 3,728 | 5,013 |
| Burlington Northern Santa Fe LLC | 5.750% | 5/1/40 | 15,000 | 18,100 |
| Burlington Northern Santa Fe LLC | 5.050% | 3/1/41 | 6,000 | 6,739 |
| Burlington Northern Santa Fe LLC | 4.950% | 9/15/41 | 2,266 | 2,509 |
| Burlington Northern Santa Fe LLC | 4.400% | 3/15/42 | 24,790 | 25,602 |
| Burlington Northern Santa Fe LLC | 4.375% | 9/1/42 | 31,150 | 32,163 |
| Burlington Northern Santa Fe LLC | 4.450% | 3/15/43 | 11,200 | 11,679 |
| Burlington Northern Santa Fe LLC | 5.150% | 9/1/43 | 2,000 | 2,223 |
| Burlington Northern Santa Fe LLC | 4.900% | 4/1/44 | 24,560 | 27,203 |
| Burlington Northern Santa Fe LLC | 4.550% | 9/1/44 | 43,085 | 45,459 |
| Burlington Northern Santa Fe LLC | 4.150% | 4/1/45 | 12,335 | 12,295 |
| Burlington Northern Santa Fe LLC | 3.900% | 8/1/46 | 7,265 | 7,025 |
| Burlington Northern Santa Fe LLC | 4.125% | 6/15/47 | 11,910 | 11,980 |
| Burlington Northern Santa Fe LLC | 4.050% | 6/15/48 | 3,265 | 3,243 |
| Canadian National Railway Co. | 3.650% | 2/3/48 | 25,000 | 23,493 |
| Norfolk Southern Corp. | 5.100% | 8/1/18 | 725 | 723 |
| Union Pacific Corp. | 3.375% | 2/1/35 | 6,200 | 5,630 |
| Union Pacific Corp. | 4.050% | 3/1/46 | 10,045 | 9,673 |
| Union Pacific Corp. | 4.000% | 4/15/47 | 11,500 | 11,156 |
| Union Pacific Corp. | 3.799% | 10/1/51 | 28,550 | 25,799 |
| Union Pacific Corp. | 4.375% | 11/15/65 | 29,995 | 28,257 |
| Union Pacific Corp. | 4.100% | 9/15/67 | 15,550 | 13,772 |
| United Parcel Service Inc. | 6.200% | 1/15/38 | 14,700 | 18,400 |
| United Parcel Service Inc. | 4.875% | 11/15/40 | 2,700 | 2,941 |
| United Parcel Service Inc. | 3.625% | 10/1/42 | 5,820 | 5,332 |
| United Parcel Service Inc. | 3.750% | 11/15/47 | 16,000 | 14,930 |
| 7,188,741 | ||||
| Utilities (13.6%) | ||||
| Electric (13.4%) | ||||
| AEP Texas Inc. | 3.800% | 10/1/47 | 2,455 | 2,287 |
| AEP Transmission Co. LLC | 4.000% | 12/1/46 | 2,615 | 2,537 |
| AEP Transmission Co. LLC | 3.750% | 12/1/47 | 33,965 | 31,509 |
| Alabama Power Co. | 6.000% | 3/1/39 | 4,875 | 5,930 |
| Alabama Power Co. | 5.500% | 3/15/41 | 26,943 | 30,946 |
| Alabama Power Co. | 5.200% | 6/1/41 | 15,000 | 16,395 |
| Alabama Power Co. | 3.750% | 3/1/45 | 22,325 | 20,789 |
| Alabama Power Co. | 4.300% | 7/15/48 | 5,285 | 5,429 |
| Appalachian Power Co. | 6.700% | 8/15/37 | 35,900 | 45,235 |
| Baltimore Gas & Electric Co. | 6.350% | 10/1/36 | 1,230 | 1,544 |
| Berkshire Hathaway Energy Co. | 6.125% | 4/1/36 | 15,877 | 19,571 |
| Berkshire Hathaway Energy Co. | 5.950% | 5/15/37 | 3,000 | 3,633 |
| Berkshire Hathaway Energy Co. | 5.150% | 11/15/43 | 27,000 | 30,080 |
| Berkshire Hathaway Energy Co. | 4.500% | 2/1/45 | 43,625 | 44,511 |
| 8 Berkshire Hathaway Energy Co. | 4.450% | 1/15/49 | 6,150 | 6,233 |
| CenterPoint Energy Houston Electric LLC | 3.550% | 8/1/42 | 14,175 | 13,030 |
| Commonwealth Edison Co. | 5.900% | 3/15/36 | 2,450 | 2,968 |
| Commonwealth Edison Co. | 3.800% | 10/1/42 | 20,805 | 19,727 |
| Commonwealth Edison Co. | 4.600% | 8/15/43 | 12,560 | 13,352 |
| Commonwealth Edison Co. | 4.700% | 1/15/44 | 15,955 | 17,192 |
| Commonwealth Edison Co. | 3.700% | 3/1/45 | 13,990 | 13,130 |
| Commonwealth Edison Co. | 3.650% | 6/15/46 | 6,825 | 6,338 |
| Commonwealth Edison Co. | 4.000% | 3/1/48 | 8,765 | 8,690 |
| Connecticut Light & Power Co. | 6.350% | 6/1/36 | 14,500 | 18,133 |
| Connecticut Light & Power Co. | 4.300% | 4/15/44 | 940 | 969 |
| Connecticut Light & Power Co. | 4.150% | 6/1/45 | 8,445 | 8,553 |
| Consolidated Edison Co. of New York Inc. | 5.100% | 6/15/33 | 730 | 797 |
| Consolidated Edison Co. of New York Inc. | 5.850% | 3/15/36 | 10,000 | 11,858 |
| Consolidated Edison Co. of New York Inc. | 6.200% | 6/15/36 | 10,637 | 13,077 |
| Consolidated Edison Co. of New York Inc. | 6.750% | 4/1/38 | 12,990 | 17,412 |
| Consolidated Edison Co. of New York Inc. | 5.500% | 12/1/39 | 8,729 | 10,180 |
| Consolidated Edison Co. of New York Inc. | 5.700% | 6/15/40 | 7,995 | 9,558 |
| 80 | ||||
| Vanguard® Long-Term Investment-Grade Fund | |||||
| Schedule of Investments | |||||
| July 31, 2018 | |||||
| Face | Market | ||||
| Maturity | Amount | Value | |||
| Coupon | Date | ($000) | ($000) | ||
| Consolidated Edison Co. of New York Inc. | 4.200% | 3/15/42 | 10,828 | 10,746 | |
| Consolidated Edison Co. of New York Inc. | 3.950% | 3/1/43 | 10,935 | 10,502 | |
| Consolidated Edison Co. of New York Inc. | 4.450% | 3/15/44 | 49,600 | 51,036 | |
| Consolidated Edison Co. of New York Inc. | 4.500% | 12/1/45 | 6,335 | 6,548 | |
| Consolidated Edison Co. of New York Inc. | 4.300% | 12/1/56 | 17,780 | 17,352 | |
| Consolidated Edison Co. of New York Inc. | 4.500% | 5/15/58 | 13,000 | 13,268 | |
| Consumers Energy Co. | 4.100% | 11/15/45 | 1,500 | 1,488 | |
| DTE Electric Co. | 6.625% | 6/1/36 | 860 | 1,107 | |
| Duke Energy Carolinas LLC | 6.450% | 10/15/32 | 8,200 | 10,238 | |
| Duke Energy Carolinas LLC | 6.100% | 6/1/37 | 51,000 | 63,285 | |
| Duke Energy Carolinas LLC | 5.300% | 2/15/40 | 4,900 | 5,666 | |
| Duke Energy Carolinas LLC | 4.250% | 12/15/41 | 16,200 | 16,414 | |
| Duke Energy Carolinas LLC | 4.000% | 9/30/42 | 41,047 | 40,167 | |
| Duke Energy Carolinas LLC | 3.875% | 3/15/46 | 5,645 | 5,408 | |
| Duke Energy Florida LLC | 6.350% | 9/15/37 | 800 | 1,027 | |
| Duke Energy Florida LLC | 5.650% | 4/1/40 | 11,860 | 14,326 | |
| Duke Energy Florida LLC | 3.400% | 10/1/46 | 11,850 | 10,380 | |
| Duke Energy Indiana LLC | 6.120% | 10/15/35 | 5,723 | 6,963 | |
| Duke Energy Indiana LLC | 6.350% | 8/15/38 | 818 | 1,049 | |
| Duke Energy Indiana LLC | 6.450% | 4/1/39 | 10,485 | 13,566 | |
| Duke Energy Indiana LLC | 4.200% | 3/15/42 | 14,700 | 14,395 | |
| Duke Energy Indiana LLC | 4.900% | 7/15/43 | 28,610 | 31,309 | |
| Duke Energy Ohio Inc. | 3.700% | 6/15/46 | 9,825 | 8,977 | |
| Duke Energy Progress LLC | 4.100% | 5/15/42 | 2,250 | 2,233 | |
| Duke Energy Progress LLC | 4.100% | 3/15/43 | 23,186 | 23,004 | |
| Duke Energy Progress LLC | 4.150% | 12/1/44 | 10,000 | 9,982 | |
| Duke Energy Progress LLC | 4.200% | 8/15/45 | 17,560 | 17,585 | |
| Duke Energy Progress LLC | 3.700% | 10/15/46 | 27,000 | 25,071 | |
| Entergy Louisiana LLC | 3.120% | 9/1/27 | 340 | 323 | |
| Entergy Louisiana LLC | 4.950% | 1/15/45 | 1,105 | 1,114 | |
| Florida Power & Light Co. | 5.960% | 4/1/39 | 16,100 | 20,062 | |
| Florida Power & Light Co. | 5.690% | 3/1/40 | 700 | 842 | |
| Florida Power & Light Co. | 5.250% | 2/1/41 | 21,662 | 25,157 | |
| Florida Power & Light Co. | 4.125% | 2/1/42 | 9,000 | 9,114 | |
| Florida Power & Light Co. | 3.800% | 12/15/42 | 22,725 | 21,983 | |
| Florida Power & Light Co. | 3.700% | 12/1/47 | 10,855 | 10,296 | |
| Florida Power & Light Co. | 3.950% | 3/1/48 | 2,000 | 1,983 | |
| Georgia Power Co. | 4.750% | 9/1/40 | 24,270 | 25,353 | |
| Georgia Power Co. | 4.300% | 3/15/42 | 6,609 | 6,667 | |
| 4 | John Sevier Combined Cycle Generation LLC | 4.626% | 1/15/42 | 21,501 | 22,359 |
| Kentucky Utilities Co. | 5.125% | 11/1/40 | 1,000 | 1,130 | |
| Kentucky Utilities Co. | 4.650% | 11/15/43 | 1,000 | 1,063 | |
| 8 | Massachusetts Electric Co. | 4.004% | 8/15/46 | 10,890 | 10,366 |
| MidAmerican Energy Co. | 5.800% | 10/15/36 | 500 | 601 | |
| MidAmerican Energy Co. | 4.800% | 9/15/43 | 27,525 | 30,023 | |
| MidAmerican Energy Co. | 4.250% | 5/1/46 | 3,895 | 3,952 | |
| 8 | Monongahela Power Co. | 5.400% | 12/15/43 | 15,640 | 18,521 |
| National Rural Utilities Cooperative Finance Corp. | 8.000% | 3/1/32 | 2,725 | 3,757 | |
| National Rural Utilities Cooperative Finance Corp. | 4.023% | 11/1/32 | 30,641 | 30,716 | |
| Nevada Power Co. | 6.650% | 4/1/36 | 5,830 | 7,487 | |
| Nevada Power Co. | 5.375% | 9/15/40 | 18,230 | 20,836 | |
| Nevada Power Co. | 5.450% | 5/15/41 | 25,120 | 28,925 | |
| Northern States Power Co. | 6.200% | 7/1/37 | 27,900 | 35,048 | |
| Northern States Power Co. | 5.350% | 11/1/39 | 800 | 935 | |
| Northern States Power Co. | 3.600% | 9/15/47 | 9,675 | 8,980 | |
| Oklahoma Gas & Electric Co. | 4.550% | 3/15/44 | 500 | 530 | |
| Oncor Electric Delivery Co. LLC | 7.250% | 1/15/33 | 1,300 | 1,733 | |
| Oncor Electric Delivery Co. LLC | 7.500% | 9/1/38 | 1,500 | 2,110 | |
| Oncor Electric Delivery Co. LLC | 5.250% | 9/30/40 | 1,500 | 1,735 | |
| Oncor Electric Delivery Co. LLC | 4.550% | 12/1/41 | 11,755 | 12,488 | |
| Oncor Electric Delivery Co. LLC | 3.750% | 4/1/45 | 28,000 | 26,721 | |
| Oncor Electric Delivery Co. LLC | 3.800% | 9/30/47 | 16,425 | 15,726 | |
| Pacific Gas & Electric Co. | 6.050% | 3/1/34 | 55,276 | 60,604 | |
| Pacific Gas & Electric Co. | 5.800% | 3/1/37 | 2,900 | 3,088 | |
| 81 | |||||
| Vanguard® Long-Term Investment-Grade Fund | ||||
| Schedule of Investments | ||||
| July 31, 2018 | ||||
| Face | Market | |||
| Maturity | Amount | Value | ||
| Coupon | Date | ($000) | ($000) | |
| Pacific Gas & Electric Co. | 6.350% | 2/15/38 | 8,192 | 9,029 |
| Pacific Gas & Electric Co. | 6.250% | 3/1/39 | 36,120 | 40,333 |
| Pacific Gas & Electric Co. | 5.400% | 1/15/40 | 24,650 | 25,506 |
| Pacific Gas & Electric Co. | 4.500% | 12/15/41 | 4,235 | 3,847 |
| Pacific Gas & Electric Co. | 4.750% | 2/15/44 | 23,305 | 22,532 |
| Pacific Gas & Electric Co. | 4.250% | 3/15/46 | 4,661 | 4,301 |
| Pacific Gas & Electric Co. | 4.000% | 12/1/46 | 11,095 | 9,884 |
| PacifiCorp | 5.250% | 6/15/35 | 1,301 | 1,477 |
| PacifiCorp | 6.100% | 8/1/36 | 15,000 | 18,510 |
| PacifiCorp | 6.250% | 10/15/37 | 7,815 | 9,911 |
| PacifiCorp | 6.350% | 7/15/38 | 36,000 | 46,210 |
| PacifiCorp | 6.000% | 1/15/39 | 32,296 | 40,268 |
| PacifiCorp | 4.100% | 2/1/42 | 22,570 | 22,332 |
| PacifiCorp | 4.125% | 1/15/49 | 4,000 | 3,997 |
| PECO Energy Co. | 4.800% | 10/15/43 | 15,530 | 16,690 |
| PECO Energy Co. | 3.700% | 9/15/47 | 15,500 | 14,424 |
| PECO Energy Co. | 3.900% | 3/1/48 | 14,350 | 13,933 |
| Potomac Electric Power Co. | 6.500% | 11/15/37 | 1,225 | 1,570 |
| Potomac Electric Power Co. | 7.900% | 12/15/38 | 150 | 217 |
| Potomac Electric Power Co. | 4.150% | 3/15/43 | 15,575 | 15,501 |
| PPL Electric Utilities Corp. | 6.250% | 5/15/39 | 10,975 | 13,965 |
| PPL Electric Utilities Corp. | 5.200% | 7/15/41 | 1,250 | 1,423 |
| Public Service Co. of Colorado | 3.600% | 9/15/42 | 15,055 | 14,082 |
| Public Service Electric & Gas Co. | 3.650% | 9/1/42 | 21,083 | 19,729 |
| Puget Sound Energy Inc. | 5.483% | 6/1/35 | 200 | 229 |
| Puget Sound Energy Inc. | 6.274% | 3/15/37 | 500 | 629 |
| Puget Sound Energy Inc. | 5.757% | 10/1/39 | 1,100 | 1,323 |
| Puget Sound Energy Inc. | 5.795% | 3/15/40 | 18,130 | 22,062 |
| Puget Sound Energy Inc. | 5.764% | 7/15/40 | 1,100 | 1,311 |
| Puget Sound Energy Inc. | 5.638% | 4/15/41 | 1,150 | 1,377 |
| Puget Sound Energy Inc. | 4.300% | 5/20/45 | 400 | 410 |
| Puget Sound Energy Inc. | 4.223% | 6/15/48 | 14,125 | 14,349 |
| San Diego Gas & Electric Co. | 3.950% | 11/15/41 | 3,400 | 3,211 |
| San Diego Gas & Electric Co. | 4.150% | 5/15/48 | 2,500 | 2,479 |
| South Carolina Electric & Gas Co. | 6.625% | 2/1/32 | 34,000 | 39,779 |
| South Carolina Electric & Gas Co. | 6.050% | 1/15/38 | 11,775 | 13,572 |
| South Carolina Electric & Gas Co. | 4.350% | 2/1/42 | 9,873 | 9,658 |
| South Carolina Electric & Gas Co. | 4.100% | 6/15/46 | 7,705 | 7,068 |
| South Carolina Electric & Gas Co. | 4.500% | 6/1/64 | 19,430 | 17,979 |
| Southern California Edison Co. | 6.000% | 1/15/34 | 19,684 | 22,944 |
| Southern California Edison Co. | 5.550% | 1/15/37 | 3,473 | 3,903 |
| Southern California Edison Co. | 5.950% | 2/1/38 | 16,100 | 19,107 |
| Southern California Edison Co. | 6.050% | 3/15/39 | 845 | 1,017 |
| Southern California Edison Co. | 4.500% | 9/1/40 | 12,000 | 12,269 |
| Southern California Edison Co. | 3.900% | 12/1/41 | 7,131 | 6,468 |
| Southern California Edison Co. | 4.050% | 3/15/42 | 800 | 766 |
| Southern California Edison Co. | 3.900% | 3/15/43 | 19,427 | 18,223 |
| Southern California Edison Co. | 4.650% | 10/1/43 | 27,150 | 28,468 |
| Southern California Edison Co. | 4.000% | 4/1/47 | 2,349 | 2,252 |
| Southern California Edison Co. | 4.125% | 3/1/48 | 27,167 | 26,332 |
| Southwestern Public Service Co. | 4.500% | 8/15/41 | 24,055 | 25,110 |
| Southwestern Public Service Co. | 3.700% | 8/15/47 | 20,540 | 19,117 |
| Tampa Electric Co. | 6.150% | 5/15/37 | 32,050 | 38,885 |
| Union Electric Co. | 4.000% | 4/1/48 | 12,180 | 12,013 |
| Virginia Electric & Power Co. | 6.000% | 5/15/37 | 57,330 | 69,126 |
| Virginia Electric & Power Co. | 6.350% | 11/30/37 | 2,000 | 2,498 |
| Virginia Electric & Power Co. | 4.000% | 11/15/46 | 8,725 | 8,352 |
| Virginia Electric & Power Co. | 3.800% | 9/15/47 | 29,319 | 27,494 |
| Westar Energy Inc. | 4.125% | 3/1/42 | 1,175 | 1,170 |
| Westar Energy Inc. | 4.625% | 9/1/43 | 1,300 | 1,389 |
| Wisconsin Electric Power Co. | 5.625% | 5/15/33 | 550 | 632 |
| Natural Gas (0.2%) | ||||
| Atmos Energy Corp. | 4.150% | 1/15/43 | 1,500 | 1,500 |
| 82 | ||||
| Vanguard® Long-Term Investment-Grade Fund | |||||
| Schedule of Investments | |||||
| July 31, 2018 | |||||
| Face | Market | ||||
| Maturity | Amount | Value | |||
| Coupon | Date | ($000) | ($000) | ||
| 8 | KeySpan Gas East Corp. | 5.819% | 4/1/41 | 4,035 | 4,877 |
| Southern California Gas Co. | 5.125% | 11/15/40 | 1,922 | 2,162 | |
| Southern California Gas Co. | 4.125% | 6/1/48 | 13,645 | 13,587 | |
| Southwest Gas Corp. | 3.800% | 9/29/46 | 3,115 | 2,852 | |
| Other Utility (0.0%) | |||||
| American Water Capital Corp. | 6.593% | 10/15/37 | 1,000 | 1,300 | |
| American Water Capital Corp. | 3.750% | 9/1/47 | 2,290 | 2,130 | |
| 2,238,063 | |||||
| Total Corporate Bonds (Cost $12,326,039) | 12,629,753 | ||||
| Sovereign Bonds (1.9%) | |||||
| Argentine Republic | 6.875% | 1/26/27 | 1,082 | 987 | |
| 4 | Argentine Republic | 2.500% | 12/31/38 | 420 | 253 |
| Argentine Republic | 6.875% | 1/11/48 | 153 | 121 | |
| Bermuda | 4.854% | 2/6/24 | 1,280 | 1,324 | |
| 8 | CDP Financial Inc. | 5.600% | 11/25/39 | 1,500 | 1,882 |
| 8 | CNPC HK Overseas Capital Ltd. | 5.950% | 4/28/41 | 700 | 838 |
| Emirate of Abu Dhabi | 3.125% | 10/11/27 | 800 | 753 | |
| 8 | Emirate of Abu Dhabi | 4.125% | 10/11/47 | 53,020 | 50,302 |
| 8 | Empresa Nacional del Petroleo | 4.500% | 9/14/47 | 600 | 548 |
| Equinor ASA | 4.250% | 11/23/41 | 7,615 | 7,593 | |
| Equinor ASA | 3.950% | 5/15/43 | 39,680 | 37,866 | |
| Equinor ASA | 4.800% | 11/8/43 | 15,930 | 17,331 | |
| Export-Import Bank of China | 3.375% | 3/14/27 | 265 | 249 | |
| 8 | Export-Import Bank of India | 3.875% | 2/1/28 | 960 | 913 |
| Federative Republic of Brazil | 5.000% | 1/27/45 | 980 | 834 | |
| Industrial & Commercial Bank of China Ltd. | 3.538% | 11/8/27 | 430 | 401 | |
| 8 | KazMunayGas National Co. JSC | 6.375% | 10/24/48 | 750 | 788 |
| 8 | Kingdom of Saudi Arabia | 4.625% | 10/4/47 | 16,120 | 15,411 |
| 8 | Kingdom of Saudi Arabia | 5.000% | 4/17/49 | 16,425 | 16,221 |
| 8,9 | Kingdom of Spain | 1.400% | 4/30/28 | 425 | 501 |
| 8,9 | Kingdom of Spain | 2.700% | 10/31/48 | 3,669 | 4,482 |
| 4 | Oriental Republic of Uruguay | 5.100% | 6/18/50 | 1,000 | 1,018 |
| Pertamina Persero PT | 6.000% | 5/3/42 | 450 | 470 | |
| 8 | Pertamina Persero PT | 6.450% | 5/30/44 | 300 | 330 |
| Petrobras Global Finance BV | 7.375% | 1/17/27 | 1,600 | 1,662 | |
| Petroleos Mexicanos | 6.875% | 8/4/26 | 2,250 | 2,378 | |
| Petroleos Mexicanos | 6.500% | 3/13/27 | 13,600 | 13,805 | |
| Petroleos Mexicanos | 5.625% | 1/23/46 | 500 | 412 | |
| 8,9 | Portugal Obrigacoes do Tesouro OT | 2.125% | 10/17/28 | 1,500 | 1,815 |
| Province of Quebec | 7.500% | 9/15/29 | 9,000 | 12,322 | |
| Republic of Angola | 9.375% | 5/8/48 | 400 | 424 | |
| Republic of Chile | 3.860% | 6/21/47 | 30,535 | 28,807 | |
| Republic of Colombia | 10.375% | 1/28/33 | 1,330 | 2,098 | |
| 9 | Republic of Cote d'Ivoire | 6.625% | 3/22/48 | 500 | 569 |
| 9 | Republic of Croatia | 3.000% | 3/20/27 | 300 | 370 |
| Russian Federation | 5.250% | 6/23/47 | 600 | 596 | |
| Sinopec Group Overseas Development 2014 Ltd. | 4.375% | 4/10/24 | 4,880 | 4,976 | |
| State of Israel | 2.875% | 3/16/26 | 155 | 147 | |
| State of Israel | 4.500% | 1/30/43 | 6,300 | 6,471 | |
| State of Israel | 4.125% | 1/17/48 | 3,850 | 3,726 | |
| 8 | State of Qatar | 5.103% | 4/23/48 | 68,230 | 69,736 |
| State of Qatar | 5.103% | 4/23/48 | 1,000 | 1,020 | |
| 10 | United Mexican States | 10.000% | 12/5/24 | 8,000 | 477 |
| Total Sovereign Bonds (Cost $317,167) | 313,227 | ||||
| Taxable Municipal Bonds (10.7%) | |||||
| Allentown PA Neighborhood Improvement Zone | |||||
| Development Authority Revenue | 5.420% | 5/1/21 | 1,000 | 988 | |
| Allentown PA Neighborhood Improvement Zone | |||||
| Development Authority Revenue | 5.620% | 5/1/22 | 1,930 | 1,908 | |
| 83 | |||||
| Vanguard® Long-Term Investment-Grade Fund | |||||
| Schedule of Investments | |||||
| July 31, 2018 | |||||
| Face | Market | ||||
| Maturity | Amount | Value | |||
| Coupon | Date | ($000) | ($000) | ||
| American Municipal Power Ohio Inc. Revenue (Prairie | |||||
| State Energy Campus Project) | 6.270% | 2/15/50 | 45,510 | 56,938 | |
| Bay Area Toll Authority California Toll Bridge Revenue | |||||
| (San Francisco Bay Area) | 6.793% | 4/1/30 | 1,800 | 2,121 | |
| Bay Area Toll Authority California Toll Bridge Revenue | |||||
| (San Francisco Bay Area) | 6.918% | 4/1/40 | 31,060 | 41,969 | |
| Bay Area Toll Authority California Toll Bridge Revenue | |||||
| (San Francisco Bay Area) | 6.263% | 4/1/49 | 25,730 | 35,228 | |
| Bay Area Toll Authority California Toll Bridge Revenue | |||||
| (San Francisco Bay Area) | 7.043% | 4/1/50 | 1,400 | 2,040 | |
| California GO | 4.500% | 4/1/33 | 9,605 | 9,976 | |
| California GO | 7.500% | 4/1/34 | 25,400 | 35,495 | |
| California GO | 4.600% | 4/1/38 | 32,410 | 33,763 | |
| California GO | 7.550% | 4/1/39 | 36,120 | 53,315 | |
| California GO | 7.300% | 10/1/39 | 75,945 | 107,196 | |
| California GO | 7.350% | 11/1/39 | 200 | 283 | |
| California GO | 7.625% | 3/1/40 | 3,100 | 4,565 | |
| California GO | 7.600% | 11/1/40 | 55,940 | 84,123 | |
| California Public Works Board Lease Revenue (Various | |||||
| Capital Projects) | 8.361% | 10/1/34 | 1,200 | 1,754 | |
| Chicago IL Board of Education GO | 6.319% | 11/1/29 | 3,900 | 3,873 | |
| Chicago IL O'Hare International Airport Revenue | 6.395% | 1/1/40 | 15,440 | 20,184 | |
| Chicago IL Transit Authority | 6.899% | 12/1/40 | 10,115 | 13,077 | |
| Chicago IL Transit Authority Sales Tax Receipts | |||||
| Revenue | 6.200% | 12/1/40 | 1,080 | 1,332 | |
| Chicago IL Transit Authority Transfer Tax Receipts | |||||
| Revenue | 6.899% | 12/1/40 | 31,590 | 40,840 | |
| Clark County NV Airport System Revenue | 6.820% | 7/1/45 | 5,700 | 8,182 | |
| Commonwealth Financing Authority | 4.144% | 6/1/38 | 17,060 | 17,018 | |
| 11 | Commonwealth Financing Authority Pennsylvania | ||||
| Revenue | 5.197% | 6/1/26 | 9,515 | 10,203 | |
| Commonwealth Financing Authority Pennsylvania | |||||
| Revenue | 3.864% | 6/1/38 | 19,285 | 18,819 | |
| Dallas TX Area Rapid Transit Revenue | 5.999% | 12/1/44 | 200 | 257 | |
| District of Columbia Water & Sewer Authority Public | |||||
| Utility Revenue | 4.814% | 10/1/14 | 2,000 | 2,161 | |
| Duke University North Carolina Revenue | 5.850% | 4/1/37 | 30,450 | 38,464 | |
| George Washington University District of Columbia GO | 4.300% | 9/15/44 | 3,000 | 3,060 | |
| Georgia Municipal Electric Power Authority Revenue | 6.637% | 4/1/57 | 42,805 | 53,725 | |
| Georgia Municipal Electric Power Authority Revenue | 6.655% | 4/1/57 | 1,996 | 2,486 | |
| Grand Parkway Transportation Corp. Texas System Toll | |||||
| Revenue | 5.184% | 10/1/42 | 1,500 | 1,756 | |
| Houston TX GO | 6.290% | 3/1/32 | 22,140 | 25,282 | |
| Illinois Toll Highway Authority Revenue | 6.184% | 1/1/34 | 17,400 | 21,486 | |
| Kansas Development Finance Authority Revenue | 4.727% | 4/15/37 | 2,500 | 2,632 | |
| Kansas Development Finance Authority Revenue | 4.927% | 4/15/45 | 22,745 | 24,593 | |
| Los Angeles CA Department of Water & Power | |||||
| Revenue | 5.716% | 7/1/39 | 400 | 492 | |
| Los Angeles CA Department of Water & Power | |||||
| Revenue | 6.008% | 7/1/39 | 1,200 | 1,472 | |
| Los Angeles CA Department of Water & Power | |||||
| Revenue | 6.574% | 7/1/45 | 29,305 | 40,883 | |
| Los Angeles CA Department of Water & Power | |||||
| Revenue | 6.603% | 7/1/50 | 1,900 | 2,702 | |
| Los Angeles CA Unified School District GO | 5.755% | 7/1/29 | 2,000 | 2,310 | |
| Los Angeles CA Unified School District GO | 5.750% | 7/1/34 | 8,825 | 10,606 | |
| Los Angeles CA Unified School District GO | 6.758% | 7/1/34 | 52,760 | 69,043 | |
| Los Angeles County CA Metropolitan Transportation | |||||
| Authority Sales Tax Revenue | 5.735% | 6/1/39 | 15,100 | 18,251 | |
| 12 | New Jersey Economic Development Authority | ||||
| Revenue (State Pension Funding) | 7.425% | 2/15/29 | 5,100 | 6,171 | |
| New Jersey Turnpike Authority | 3.729% | 1/1/36 | 6,750 | 6,474 | |
| New Jersey Turnpike Authority Revenue | 7.414% | 1/1/40 | 30,051 | 43,328 | |
| New Jersey Turnpike Authority Revenue | 7.102% | 1/1/41 | 46,613 | 65,280 | |
| 84 | |||||
| Vanguard® Long-Term Investment-Grade Fund | |||||
| Schedule of Investments | |||||
| July 31, 2018 | |||||
| Face | Market | ||||
| Maturity | Amount | Value | |||
| Coupon | Date | ($000) | ($000) | ||
| New York City NY Municipal Water Finance Authority | |||||
| Water & Sewer System Revenue | 5.724% | 6/15/42 | 12,780 | 16,033 | |
| New York City NY Municipal Water Finance Authority | |||||
| Water & Sewer System Revenue | 5.952% | 6/15/42 | 18,210 | 23,433 | |
| New York City NY Municipal Water Finance Authority | |||||
| Water & Sewer System Revenue | 6.011% | 6/15/42 | 6,980 | 9,035 | |
| New York City NY Municipal Water Finance Authority | |||||
| Water & Sewer System Revenue | 6.282% | 6/15/42 | 700 | 747 | |
| New York City NY Municipal Water Finance Authority | |||||
| Water & Sewer System Revenue | 5.882% | 6/15/44 | 32,580 | 42,054 | |
| New York City NY Transitional Finance Authority Future | |||||
| Tax Revenue | 5.508% | 8/1/37 | 2,875 | 3,366 | |
| New York City Transitional Finance Authority Future | |||||
| Tax Secured Revenue | 3.140% | 8/1/28 | 8,600 | 8,159 | |
| New York City Transitional Finance Authority Future | |||||
| Tax Secured Revenue | 3.240% | 8/1/29 | 12,635 | 11,868 | |
| New York City Transitional Finance Authority Future | |||||
| Tax Secured Revenue | 3.430% | 8/1/30 | 14,540 | 13,891 | |
| New York Metropolitan Transportation Authority | |||||
| Revenue (Dedicated Tax Fund) | 7.336% | 11/15/39 | 65,035 | 94,139 | |
| New York Metropolitan Transportation Authority | |||||
| Revenue (Dedicated Tax Fund) | 6.089% | 11/15/40 | 5,950 | 7,506 | |
| New York State Dormitory Authority Revenue (Personal | |||||
| Income Tax) | 5.289% | 3/15/33 | 7,325 | 8,292 | |
| New York State Dormitory Authority Revenue (Personal | |||||
| Income Tax) | 5.628% | 3/15/39 | 15,975 | 18,833 | |
| New York State Dormitory Authority Revenue (Personal | |||||
| Income Tax) | 5.600% | 3/15/40 | 200 | 240 | |
| New York State GO | 5.590% | 3/1/35 | 1,000 | 1,205 | |
| New York State Urban Development Corp | 3.370% | 3/15/30 | 19,175 | 18,306 | |
| North Texas Tollway Authority System Revenue | 6.718% | 1/1/49 | 25,471 | 35,874 | |
| Ohio State University General Receipts Revenue | 4.910% | 6/1/40 | 12,300 | 13,965 | |
| Ohio State University General Receipts Revenue | 4.800% | 6/1/11 | 20,195 | 21,520 | |
| 13 | Oregon School Boards Association GO | 4.759% | 6/30/28 | 1,000 | 1,070 |
| Port Authority of New York & New Jersey Revenue | 6.040% | 12/1/29 | 17,495 | 20,957 | |
| Port Authority of New York & New Jersey Revenue | 5.647% | 11/1/40 | 10,250 | 12,585 | |
| Port Authority of New York & New Jersey Revenue | 5.647% | 11/1/40 | 21,245 | 26,052 | |
| Port Authority of New York & New Jersey Revenue | 5.310% | 8/1/46 | 8,525 | 9,182 | |
| Port Authority of New York & New Jersey Revenue | 4.926% | 10/1/51 | 25,005 | 28,766 | |
| Port Authority of New York & New Jersey Revenue | 4.458% | 10/1/62 | 35,940 | 37,796 | |
| President & Fellows of Harvard College Massachusetts | |||||
| GO | 3.150% | 7/15/46 | 17,450 | 15,586 | |
| Sacramento CA Municipal Utility District Revenue | 6.156% | 5/15/36 | 905 | 1,106 | |
| Sales Tax Securitization Corp. Illinois Revenue | 3.587% | 1/1/43 | 30,000 | 27,874 | |
| San Antonio TX Electric & Gas Systems Revenue | 5.985% | 2/1/39 | 10,450 | 13,361 | |
| San Antonio TX Electric & Gas Systems Revenue | 4.427% | 2/1/42 | 13,370 | 14,334 | |
| San Diego County CA Regional Airport Authority | |||||
| Revenue | 5.594% | 7/1/43 | 800 | 875 | |
| San Francisco CA City & County Public Utilities | |||||
| Commission Water Revenue | 6.950% | 11/1/50 | 1,400 | 1,995 | |
| Sonoma County CA Pension Obligation Revenue | 6.000% | 12/1/29 | 500 | 571 | |
| University of California Regents Medical Center | |||||
| Revenue | 6.548% | 5/15/48 | 25,770 | 34,401 | |
| University of California Regents Medical Center | |||||
| Revenue | 6.583% | 5/15/49 | 8,465 | 11,236 | |
| University of California Revenue | 4.601% | 5/15/31 | 1,100 | 1,167 | |
| University of California Revenue | 5.770% | 5/15/43 | 500 | 611 | |
| University of California Revenue | 3.931% | 5/15/45 | 17,840 | 17,670 | |
| University of California Revenue | 4.858% | 5/15/12 | 31,025 | 32,258 | |
| University of California Revenue | 4.767% | 5/15/15 | 14,875 | 15,053 | |
| University of North Carolina University System | |||||
| Revenue | 3.327% | 12/1/36 | 9,715 | 9,148 | |
| University of Texas System Revenue Financing System | |||||
| Revenue | 5.262% | 7/1/39 | 11,500 | 14,011 | |
| 85 | |||||
| Vanguard® Long-Term Investment-Grade Fund | ||||||
| Schedule of Investments | ||||||
| July 31, 2018 | ||||||
| Face | Market | |||||
| Maturity | Amount | Value | ||||
| Coupon | Date | ($000) | ($000) | |||
| University of Texas System Revenue Financing System | ||||||
| Revenue | 4.794% | 8/15/46 | 8,915 | 9,982 | ||
| Washington GO | 5.481% | 8/1/39 | 900 | 1,088 | ||
| Wisconsin Annual Appropriation Revenue | 3.954% | 5/1/36 | 3,500 | 3,521 | ||
| 11 Wisconsin GO | 5.700% | 5/1/26 | 2,300 | 2,536 | ||
| Total Taxable Municipal Bonds (Cost $1,537,771) | 1,761,362 | |||||
| Shares | ||||||
| Temporary Cash Investments (3.3%) | ||||||
| Money Market Fund (2.3%) | ||||||
| 14 Vanguard Market Liquidity Fund | 2.145% | 3,832,599 | 383,260 | |||
| Face | ||||||
| Maturity | Amount | |||||
| Coupon | Date | ($000) | ||||
| Repurchase Agreements (1.0%) | ||||||
| Bank of America Securities, LLC (Dated 7/31/18, | ||||||
| Repurchase Value $36,802,000, collateralized by | ||||||
| Federal Home Loan Mortgage Corp. 4.000%, 3/1/48, | ||||||
| with a value of $37,536,000) | 1.930% | 8/1/18 | 36,800 | 36,800 | ||
| Bank of Montreal (Dated 7/31/18, Repurchase Value | ||||||
| $21,001,000, collateralized by U.S. Treasury Bill | ||||||
| 0.000%, 1/31/19 and U.S. Treasury Note/Bond | ||||||
| 1.500%-3.625%, 5/15/19-2/15/47, with a value of | ||||||
| $21,420,000) | 1.900% | 8/1/18 | 21,000 | 21,000 | ||
| Barclays Capital Inc. (Dated 7/31/18, Repurchase Value | ||||||
| $66,804,000, collateralized U.S. Treasury Bill 0.000% | ||||||
| 11/1/18-7/18/19 and U.S. Treasury Note/Bond | ||||||
| 0.875%-4.375%, 10/15/18-5/15/46, with a value of | ||||||
| $68,136,000) | 1.900% | 8/1/18 | 66,800 | 66,800 | ||
| Citigroup Global Markets Inc. (Dated 7/31/18, | ||||||
| Repurchase Value $20,601,000, collateralized by U.S. | ||||||
| Treasury Note/Bond 2.375%, 4/30/20, with a value of | ||||||
| $21,012,000) | 1.910% | 8/1/18 | 20,600 | 20,600 | ||
| RBC Capital Markets LLC (Dated 7/31/18, Repurchase | ||||||
| Value $12,701,000, collateralized by Federal Home | ||||||
| Loan Mortgage Corp. 3.500%, 3/1/48 and Federal | ||||||
| National Mortgage Assn. 2.940%-4.645%, 7/1/21- | ||||||
| 7/1/48, with a value of $12,954,000) | 1.900% | 8/1/18 | 12,700 | 12,700 | ||
| Wells Fargo & Co. (Dated 7/31/18, Repurchase Value | ||||||
| $10,501,000, collateralized by Federal Home Loan | ||||||
| Mortgage Corp. 3.000%-4.000%, 5/1/33-5/1/48 and | ||||||
| Federal National Mortgage Assn. 0.000%-4.000%, | ||||||
| 3/1/22-8/1/48, with a value of $10,710,000) | 1.930% | 8/1/18 | 10,500 | 10,500 | ||
| 168,400 | ||||||
| Total Temporary Cash Investments (Cost $551,659) | 551,660 | |||||
| Notional | ||||||
| Amount on | ||||||
| Expiration | Underlying | |||||
| Counterparty | Date | Exercise Rate | Swap ($000) | |||
| Credit Default Swaptions Purchased (0.0%) | ||||||
| Put Swaptions on CDX-NA-IG-S30-V1 5-Year Index | JPMC | 8/15/18 | 65.00% | 8,400 | — | |
| Put Swaptions on CDX-NA-IG-S30-V1 5-Year Index | DBAG | 8/15/18 | 70.00% | 4,950 | 2 | |
| Total Swaption Contracts Purchased (Cost $11) | 2 | |||||
| Total Investments (99.0%) (Cost $15,801,521) | 16,300,659 | |||||
| 86 | ||||||
| Vanguard® Long-Term Investment-Grade Fund | |||||
| Schedule of Investments | |||||
| July 31, 2018 | |||||
| Notional | Market | ||||
| Amount | Value | ||||
| Expiration Date | Contracts | Exercise Price | ($000) | ($000) | |
| Liability for Options Written (0.0%) | |||||
| Written Options on Futures (0.0%) | |||||
| Call Options on 10-Year U.S. Treasury Note Futures Contracts | 8/10/18 | 14 | USD $119.25 | 1,670 | (6) |
| Call Options on 10-Year U.S. Treasury Note Futures Contracts | 8/24/18 | 14 | USD $120.00 | 1,680 | (3) |
| Call Options on 10-Year U.S. Treasury Note Futures Contracts | 8/27/18 | 41 | USD $119.50 | 4,900 | (15) |
| Put Options on 10-Year U.S. Treasury Note Futures Contracts | 8/10/18 | 14 | USD $119.25 | 1,670 | (3) |
| Put Options on 10-Year U.S. Treasury Note Futures Contracts | 8/24/18 | 14 | USD $120.00 | 1,680 | (11) |
| Put Options on 10-Year U.S. Treasury Note Futures Contracts | 8/24/18 | 27 | USD $119.00 | 3,213 | (6) |
| Put Options on 10-Year U.S. Treasury Note Futures Contracts | 8/27/18 | 14 | USD $119.50 | 1,673 | (6) |
| Total Options on Futures Written (Premiums Received $57) | (50) | ||||
| Notional | |||||
| Amount on | |||||
| Expiration | Underlying | ||||
| Counterparty | Date | Exercise Rate | Swap ($000) | ||
| Written Swaptions on Credit Default Index (0.0%) | |||||
| Call Swaptions on CDX-NA-IG-S30-V1 5-Year Index | DBAG | 8/15/18 | 65.00% | 4,950 | (15) |
| Call Swaptions on CDX-NA-IG-S30-V1 5-Year Index | GSI | 8/15/18 | 67.50% | 3,290 | (13) |
| Put Swaptions on CDX-NA-IG-S30-V1 5-Year Index | DBAG | 8/15/18 | 65.00% | 4,950 | (1) |
| Put Swaptions on CDX-NA-IG-S30-V1 5-Year Index | GSI | 8/15/18 | 72.50% | 3,290 | — |
| Put Swaptions on CDX-NA-IG-S30-V1 5-Year Index | JPMC | 9/19/18 | 75.00% | 8,400 | (3) |
| Total Credit Default Swaptions Written (Premiums Received $31) | (32) | ||||
| Total Liability for Options Written (Premiums Received $88) | (82) | ||||
| Other Assets and Liabilities—Net (1.0%) | 161,113 | ||||
| Net Assets (100%) | 16,461,690 | ||||
§ Security value determined using significant unobservable inputs.
1 Securities with a value of $52,398,000 have been segregated as initial margin for open cleared swap contracts.
2 Securities with a value of $12,697,000 have been segregated as initial margin for open futures contracts.
3 The issuer operates under a congressional charter; its securities are generally neither guaranteed by the U.S. Treasury nor backed by the full
faith and credit of the U.S. government.
4 The average or expected maturity is shorter than the final maturity shown because of the possibility of interim principal payments and
prepayments or the possibility of the issue being called.
5 The issuer was placed under federal conservatorship in September 2008; since that time, its daily operations have been managed by the Federal
Housing Finance Agency and it receives capital from the U.S. Treasury, as needed to maintain a positive net worth, in exchange for senior
preferred stock.
6 Inverse floating rate Interest-only security whose interest rate is derived by subtracting 1-month USD LIBOR from a given cap.
7 Interest-only security.
8 Security exempt from registration under Rule 144A of the Securities Act of 1933. Such securities may be sold in transactions exempt from
registration, normally to qualified institutional buyers. At July 31, 2018, the aggregate value of these securities was $677,315,000, representing
4.1% of net assets.
9 Face amount denominated in euro.
10 Face amount denominated in Mexican peso.
11 Scheduled principal and interest payments are guaranteed by AGM (Assured Guaranty Municipal Corporation).
12 Scheduled principal and interest payments are guaranteed by National Public Finance Guarantee Corp.
13 Scheduled principal and interest payments are guaranteed by AMBAC (Ambac Assurance Corporation).
14 Affiliated money market fund available only to Vanguard funds and certain trusts and accounts managed by Vanguard. Rate shown is the 7-day
yield.
GO—General Obligation Bond.
DBAG—Deutsche Bank AG.
GSI—Goldman Sachs International.
JPMC—JP Morgan Chase Bank.
REMICS—Real Esate Mortgage Investment Conduits.
87
| Vanguard® High-Yield Corporate Fund | |||||
| Schedule of Investments | |||||
| July 31, 2018 | |||||
| Face | Market | ||||
| Maturity | Amount | Value | |||
| Coupon | Date | ($000) | ($000) | ||
| U.S. Government and Agency Obligations (3.7%) | |||||
| U.S. Government Securities (3.7%) | |||||
| 1 | United States Treasury Note/Bond | 0.750% | 8/31/18 | 125,000 | 124,864 |
| United States Treasury Note/Bond | 0.875% | 10/15/18 | 250,000 | 249,415 | |
| United States Treasury Note/Bond | 1.125% | 1/15/19 | 250,000 | 248,827 | |
| United States Treasury Note/Bond | 0.875% | 4/15/19 | 250,000 | 247,500 | |
| Total U.S. Government and Agency Obligations (Cost $871,873) | 870,606 | ||||
| Corporate Bonds (92.2%) | |||||
| Finance (10.7%) | |||||
| Banking (3.0%) | |||||
| Ally Financial Inc. | 4.625% | 5/19/22 | 3,595 | 3,613 | |
| Ally Financial Inc. | 5.125% | 9/30/24 | 16,315 | 16,662 | |
| Ally Financial Inc. | 4.625% | 3/30/25 | 30,420 | 30,154 | |
| Ally Financial Inc. | 5.750% | 11/20/25 | 56,528 | 58,648 | |
| Ally Financial Inc. | 8.000% | 11/1/31 | 7,355 | 8,890 | |
| 2 | Banco Bilbao Vizcaya Argentaria SA | 6.125% | 2/16/66 | 98,600 | 90,712 |
| 2,3 | BNP Paribas SA | 6.750% | 3/14/66 | 57,750 | 58,869 |
| 2 | Credit Suisse AG | 6.250% | 12/31/50 | 143,170 | 144,065 |
| 2 | ING Groep NV | 6.875% | 4/16/66 | 71,510 | 73,444 |
| 4 | Intesa Sanpaolo SPA | 5.710% | 1/15/26 | 50,000 | 46,437 |
| Royal Bank of Scotland Group plc | 6.125% | 12/15/22 | 52,705 | 55,705 | |
| 2 | UBS Group AG | 6.875% | 3/22/66 | 114,390 | 119,363 |
| Brokerage (0.3%) | |||||
| 3,5,6 | Brookfield WEC Holdings Inc. Bank Loan | 5.832% | 8/1/25 | 64,765 | 65,197 |
| Finance Companies (4.5%) | |||||
| 2,4 | AerCap Global Aviation Trust | 6.500% | 6/15/45 | 125,050 | 128,801 |
| Aircastle Ltd. | 5.500% | 2/15/22 | 25,900 | 26,839 | |
| Aircastle Ltd. | 5.000% | 4/1/23 | 41,450 | 42,227 | |
| Aircastle Ltd. | 4.125% | 5/1/24 | 46,230 | 44,901 | |
| CIT Group Inc. | 5.000% | 8/15/22 | 36,429 | 37,112 | |
| 4 | Freedom Mortgage Corp. | 8.250% | 4/15/25 | 24,260 | 23,653 |
| Navient Corp. | 7.250% | 1/25/22 | 43,900 | 45,930 | |
| Navient Corp. | 6.500% | 6/15/22 | 154,369 | 157,842 | |
| Navient Corp. | 5.500% | 1/25/23 | 38,420 | 37,652 | |
| Navient Corp. | 7.250% | 9/25/23 | 24,615 | 25,846 | |
| Navient Corp. | 6.750% | 6/25/25 | 164,585 | 163,762 | |
| Navient Corp. | 6.750% | 6/15/26 | 23,565 | 23,212 | |
| Navient Corp. | 5.625% | 8/1/33 | 34,226 | 29,178 | |
| Springleaf Finance Corp. | 8.250% | 12/15/20 | 41,230 | 44,776 | |
| Springleaf Finance Corp. | 7.750% | 10/1/21 | 69,567 | 75,132 | |
| Springleaf Finance Corp. | 6.125% | 5/15/22 | 13,610 | 14,005 | |
| Springleaf Finance Corp. | 8.250% | 10/1/23 | 17,136 | 19,038 | |
| Springleaf Finance Corp. | 6.875% | 3/15/25 | 23,455 | 23,748 | |
| Springleaf Finance Corp. | 7.125% | 3/15/26 | 97,030 | 98,607 | |
| Insurance (2.3%) | |||||
| 2 | Aegon NV | 5.500% | 4/11/48 | 72,780 | 70,961 |
| 3,5,6 | Asurion LLC. Bank Loan | 5.077% | 11/29/24 | 101,340 | 101,141 |
| Genworth Holdings Inc. | 7.700% | 6/15/20 | 2,480 | 2,582 | |
| Genworth Holdings Inc. | 7.200% | 2/15/21 | 28,015 | 29,031 | |
| Genworth Holdings Inc. | 7.625% | 9/24/21 | 25,505 | 26,640 | |
| Genworth Holdings Inc. | 4.900% | 8/15/23 | 49,580 | 44,870 | |
| Genworth Holdings Inc. | 4.800% | 2/15/24 | 15,900 | 14,151 | |
| 4 | Liberty Mutual Group Inc. | 7.800% | 3/15/37 | 58,440 | 69,032 |
| MGIC Investment Corp. | 5.750% | 8/15/23 | 24,695 | 25,374 | |
| Radian Group Inc. | 4.500% | 10/1/24 | 74,205 | 71,701 | |
| 2 | Voya Financial Inc. | 5.650% | 5/15/53 | 87,753 | 88,411 |
| Other Finance (0.4%) | |||||
| CNO Financial Group Inc. | 4.500% | 5/30/20 | 4,865 | 4,865 | |
| CNO Financial Group Inc. | 5.250% | 5/30/25 | 60,468 | 59,107 | |
| 88 | |||||
| Vanguard® High-Yield Corporate Fund | |||||
| Schedule of Investments | |||||
| July 31, 2018 | |||||
| Face | Market | ||||
| Maturity | Amount | Value | |||
| Coupon | Date | ($000) | ($000) | ||
| 3,5 | Trans Union LLC Bank Loan | 4.085% | 6/19/25 | 37,285 | 37,338 |
| Real Estate Investment Trusts (0.2%) | |||||
| Felcor Lodging LP | 6.000% | 6/1/25 | 46,055 | 47,091 | |
| 4 | Starwood Property Trust Inc. | 4.750% | 3/15/25 | 1,235 | 1,220 |
| 2,527,535 | |||||
| Industrial (80.0%) | |||||
| Basic Industry (6.6%) | |||||
| AK Steel Corp. | 7.625% | 10/1/21 | 9,925 | 10,099 | |
| AK Steel Corp. | 7.500% | 7/15/23 | 79,875 | 82,770 | |
| AK Steel Corp. | 6.375% | 10/15/25 | 10,000 | 9,225 | |
| AK Steel Corp. | 7.000% | 3/15/27 | 80,325 | 76,108 | |
| 4 | Alliance Resource Operating Partners LP / Alliance | ||||
| Resource Finance Corp. | 7.500% | 5/1/25 | 97,487 | 103,093 | |
| ArcelorMittal | 6.125% | 6/1/25 | 21,830 | 23,631 | |
| Chemours Co. | 6.625% | 5/15/23 | 44,094 | 46,244 | |
| Chemours Co. | 7.000% | 5/15/25 | 78,620 | 84,025 | |
| Chemours Co. | 5.375% | 5/15/27 | 22,045 | 21,466 | |
| 4 | Commercial Metals Co. | 5.750% | 4/15/26 | 26,615 | 25,750 |
| Commercial Metals Co. | 5.375% | 7/15/27 | 19,735 | 18,329 | |
| 4 | Constellium NV | 5.750% | 5/15/24 | 34,862 | 34,383 |
| 4 | Constellium NV | 6.625% | 3/1/25 | 78,600 | 79,976 |
| 4,7 | Constellium NV | 4.250% | 2/15/26 | 4,170 | 4,862 |
| 4 | Constellium NV | 5.875% | 2/15/26 | 10,195 | 10,004 |
| 4,7 | CTC BondCo GmbH | 5.250% | 12/15/25 | 13,800 | 15,779 |
| 4 | First Quantum Minerals Ltd. | 7.000% | 2/15/21 | 70,470 | 71,175 |
| 4 | First Quantum Minerals Ltd. | 7.250% | 5/15/22 | 47,870 | 48,169 |
| 4 | First Quantum Minerals Ltd. | 6.500% | 3/1/24 | 22,980 | 22,377 |
| 4 | First Quantum Minerals Ltd. | 6.875% | 3/1/26 | 18,955 | 18,481 |
| 4 | FMG Resources August 2006 Pty Ltd. | 4.750% | 5/15/22 | 22,335 | 21,637 |
| 4 | FMG Resources August 2006 Pty Ltd. | 5.125% | 3/15/23 | 61,180 | 59,336 |
| 4 | FMG Resources August 2006 Pty Ltd. | 5.125% | 5/15/24 | 21,510 | 20,517 |
| Graphic Packaging International Inc. | 4.125% | 8/15/24 | 25,860 | 25,084 | |
| 4 | New Gold Inc. | 6.250% | 11/15/22 | 38,365 | 36,063 |
| 4 | New Gold Inc. | 6.375% | 5/15/25 | 46,920 | 42,932 |
| 4 | Novelis Corp. | 6.250% | 8/15/24 | 53,590 | 53,657 |
| 4 | Novelis Corp. | 5.875% | 9/30/26 | 73,010 | 69,907 |
| Olin Corp. | 5.125% | 9/15/27 | 58,305 | 57,139 | |
| Olin Corp. | 5.000% | 2/1/30 | 10,215 | 9,628 | |
| Steel Dynamics Inc. | 5.125% | 10/1/21 | 41,770 | 42,240 | |
| Steel Dynamics Inc. | 5.500% | 10/1/24 | 40,885 | 41,907 | |
| Steel Dynamics Inc. | 4.125% | 9/15/25 | 3,305 | 3,160 | |
| Steel Dynamics Inc. | 5.000% | 12/15/26 | 9,730 | 9,681 | |
| Teck Resources Ltd. | 3.750% | 2/1/23 | 9,705 | 9,462 | |
| 4 | Teck Resources Ltd. | 8.500% | 6/1/24 | 46,560 | 51,274 |
| Teck Resources Ltd. | 6.125% | 10/1/35 | 7,765 | 8,056 | |
| Teck Resources Ltd. | 6.000% | 8/15/40 | 6,650 | 6,717 | |
| Teck Resources Ltd. | 6.250% | 7/15/41 | 21,350 | 22,204 | |
| Teck Resources Ltd. | 5.200% | 3/1/42 | 4,850 | 4,474 | |
| Teck Resources Ltd. | 5.400% | 2/1/43 | 48,295 | 45,277 | |
| 4 | Tronox Finance plc | 5.750% | 10/1/25 | 9,105 | 8,764 |
| 4 | Tronox Inc. | 6.500% | 4/15/26 | 70,640 | 70,287 |
| United States Steel Corp. | 6.650% | 6/1/37 | 13,760 | 12,487 | |
| 4 | Versum Materials Inc. | 5.500% | 9/30/24 | 21,566 | 21,943 |
| Capital Goods (9.6%) | |||||
| 4 | American Builders & Contractors Supply Co. Inc. | 5.875% | 5/15/26 | 59,970 | 59,670 |
| ARD Finance SA | 7.125% | 9/15/23 | 13,860 | 14,051 | |
| 4 | ARD Finance SA | 7.125% | 9/15/23 | 21,790 | 22,090 |
| 4 | Ardagh Packaging Finance PLC / Ardagh Holdings USA | ||||
| Inc. | 7.250% | 5/15/24 | 70,023 | 72,999 | |
| 4 | Ardagh Packaging Finance PLC / Ardagh Holdings USA | ||||
| Inc. | 6.000% | 2/15/25 | 93,082 | 90,871 | |
| 4,8 | Ardagh Packaging Finance PLC / Ardagh Holdings USA | ||||
| Inc. | 4.750% | 7/15/27 | 5,520 | 7,011 | |
| 89 | |||||
| Vanguard® High-Yield Corporate Fund | |||||
| Schedule of Investments | |||||
| July 31, 2018 | |||||
| Face | Market | ||||
| Maturity | Amount | Value | |||
| Coupon | Date | ($000) | ($000) | ||
| 4 | Ashtead Capital Inc. | 4.125% | 8/15/25 | 46,175 | 43,751 |
| 4 | Ashtead Capital Inc. | 5.250% | 8/1/26 | 17,715 | 17,804 |
| 4 | Ashtead Capital Inc. | 4.375% | 8/15/27 | 46,175 | 43,924 |
| 7 | Ball Corp. | 4.375% | 12/15/23 | 17,385 | 22,948 |
| Ball Corp. | 4.875% | 3/15/26 | 66,920 | 66,585 | |
| 4 | Beacon Escrow Corp. | 4.875% | 11/1/25 | 71,460 | 66,547 |
| 4 | Berry Global Inc. | 4.500% | 2/15/26 | 46,645 | 43,438 |
| 4 | Bombardier Inc. | 7.750% | 3/15/20 | 80,000 | 84,600 |
| 4 | Bombardier Inc. | 6.125% | 1/15/23 | 52,884 | 53,611 |
| 4 | Bombardier Inc. | 7.500% | 3/15/25 | 47,116 | 49,413 |
| 4 | CD&R Waterworks Merger Sub LLC | 6.125% | 8/15/25 | 5,535 | 5,314 |
| 4 | Cemex Finance LLC | 6.000% | 4/1/24 | 21,210 | 21,873 |
| 4 | Cemex SAB de CV | 6.125% | 5/5/25 | 111,200 | 115,231 |
| 4 | Cemex SAB de CV | 7.750% | 4/16/26 | 24,265 | 26,752 |
| Clean Harbors Inc. | 5.125% | 6/1/21 | 57,864 | 58,009 | |
| CNH Industrial NV | 4.500% | 8/15/23 | 35,290 | 35,599 | |
| 4 | Crown Americas LLC / Crown Americas Capital Corp. | ||||
| VI | 4.750% | 2/1/26 | 23,465 | 22,116 | |
| 4,7 | Crown European Holdings SA | 2.875% | 2/1/26 | 51,200 | 57,952 |
| 4 | Flex Acquisition Co. Inc. | 6.875% | 1/15/25 | 127,475 | 123,810 |
| 4 | Jeld-Wen Inc. | 4.625% | 12/15/25 | 11,180 | 10,649 |
| 4 | Jeld-Wen Inc. | 4.875% | 12/15/27 | 11,465 | 10,662 |
| Lennar Corp. | 4.750% | 11/29/27 | 44,610 | 41,933 | |
| 4,7 | Loxam SAS | 4.250% | 4/15/24 | 5,520 | 6,749 |
| 4,7 | Loxam SAS | 6.000% | 4/15/25 | 6,480 | 8,048 |
| 4 | OI European Group BV | 4.000% | 3/15/23 | 21,630 | 20,440 |
| 4 | Owens-Brockway Glass Container Inc. | 5.875% | 8/15/23 | 29,295 | 29,734 |
| 4 | Owens-Brockway Glass Container Inc. | 6.375% | 8/15/25 | 11,675 | 11,967 |
| PulteGroup Inc. | 5.500% | 3/1/26 | 41,055 | 40,439 | |
| Reynolds Group Issuer Inc. / Reynolds Group Issuer | |||||
| LLC / Reynolds Group Issuer Lu | 5.750% | 10/15/20 | 30,604 | 30,681 | |
| 9 | Reynolds Group Issuer Inc. / Reynolds Group Issuer | ||||
| LLC / Reynolds Group Issuer Lu | 6.875% | 2/15/21 | 13,417 | 13,567 | |
| 4 | Reynolds Group Issuer Inc. / Reynolds Group Issuer | ||||
| LLC / Reynolds Group Issuer Lu | 5.125% | 7/15/23 | 49,930 | 49,556 | |
| 4 | Reynolds Group Issuer Inc. / Reynolds Group Issuer | ||||
| LLC / Reynolds Group Issuer Lu | 7.000% | 7/15/24 | 14,670 | 14,872 | |
| 4 | Standard Industries Inc. | 5.500% | 2/15/23 | 9,705 | 9,887 |
| 4 | Standard Industries Inc. | 5.375% | 11/15/24 | 46,177 | 45,831 |
| 4 | Standard Industries Inc. | 6.000% | 10/15/25 | 139,715 | 141,811 |
| 4 | Standard Industries Inc. | 5.000% | 2/15/27 | 16,990 | 15,928 |
| 4 | Standard Industries Inc. | 4.750% | 1/15/28 | 31,995 | 29,195 |
| TransDigm Inc. | 6.000% | 7/15/22 | 44,150 | 44,757 | |
| TransDigm Inc. | 6.500% | 7/15/24 | 96,400 | 98,569 | |
| TransDigm Inc. | 6.375% | 6/15/26 | 41,650 | 41,754 | |
| United Rentals North America Inc. | 4.625% | 7/15/23 | 22,111 | 22,166 | |
| United Rentals North America Inc. | 5.750% | 11/15/24 | 20,000 | 20,450 | |
| United Rentals North America Inc. | 5.500% | 7/15/25 | 33,095 | 33,674 | |
| United Rentals North America Inc. | 4.625% | 10/15/25 | 47,360 | 45,702 | |
| United Rentals North America Inc. | 5.875% | 9/15/26 | 38,755 | 39,482 | |
| United Rentals North America Inc. | 5.500% | 5/15/27 | 76,330 | 75,662 | |
| United Rentals North America Inc. | 4.875% | 1/15/28 | 60,445 | 56,441 | |
| 4 | USG Corp. | 5.500% | 3/1/25 | 8,590 | 8,805 |
| 4 | USG Corp. | 4.875% | 6/1/27 | 36,420 | 36,966 |
| Communication (19.6%) | |||||
| 4 | Altice Financing SA | 6.625% | 2/15/23 | 58,671 | 59,111 |
| 4 | Altice France SA | 6.250% | 5/15/24 | 20,000 | 19,875 |
| 4 | Altice France SA | 7.375% | 5/1/26 | 41,640 | 41,224 |
| 4 | Altice Luxembourg SA | 7.625% | 2/15/25 | 40,000 | 37,200 |
| 4 | Altice US Finance I Corp. | 5.500% | 5/15/26 | 83,145 | 81,378 |
| Belo Corp. | 7.750% | 6/1/27 | 29,475 | 31,391 | |
| Belo Corp. | 7.250% | 9/15/27 | 22,207 | 22,762 | |
| CCO Holdings LLC / CCO Holdings Capital Corp. | 5.250% | 3/15/21 | 8,380 | 8,464 | |
| 90 | |||||
| Vanguard® High-Yield Corporate Fund | |||||
| Schedule of Investments | |||||
| July 31, 2018 | |||||
| Face | Market | ||||
| Maturity | Amount | Value | |||
| Coupon | Date | ($000) | ($000) | ||
| CCO Holdings LLC / CCO Holdings Capital Corp. | 5.250% | 9/30/22 | 12,635 | 12,761 | |
| CCO Holdings LLC / CCO Holdings Capital Corp. | 5.125% | 2/15/23 | 13,406 | 13,373 | |
| 4 | CCO Holdings LLC / CCO Holdings Capital Corp. | 5.125% | 5/1/23 | 97,010 | 96,768 |
| CCO Holdings LLC / CCO Holdings Capital Corp. | 5.750% | 9/1/23 | 33,450 | 33,994 | |
| CCO Holdings LLC / CCO Holdings Capital Corp. | 5.750% | 1/15/24 | 4,855 | 4,916 | |
| 4 | CCO Holdings LLC / CCO Holdings Capital Corp. | 5.375% | 5/1/25 | 69,205 | 67,994 |
| 4 | CCO Holdings LLC / CCO Holdings Capital Corp. | 5.750% | 2/15/26 | 47,140 | 46,845 |
| 4 | CCO Holdings LLC / CCO Holdings Capital Corp. | 5.500% | 5/1/26 | 46,840 | 46,020 |
| 4 | CCO Holdings LLC / CCO Holdings Capital Corp. | 5.875% | 5/1/27 | 14,255 | 14,113 |
| 4 | Cequel Communications Holdings I LLC / Cequel | ||||
| Capital Corp. | 5.125% | 12/15/21 | 59,340 | 59,340 | |
| Charter Communications Operating LLC / Charter | |||||
| Communications Operating Capital | 6.484% | 10/23/45 | 39,215 | 42,664 | |
| 3,5 | Crown Finance US Inc. Bank Loan | 4.577% | 2/22/25 | 120,408 | 120,024 |
| CSC Holdings LLC | 6.750% | 11/15/21 | 60,764 | 63,422 | |
| 4 | CSC Holdings LLC | 5.500% | 4/15/27 | 76,415 | 73,549 |
| DISH DBS Corp. | 6.750% | 6/1/21 | 152,345 | 153,488 | |
| DISH DBS Corp. | 5.875% | 7/15/22 | 115,934 | 108,398 | |
| DISH DBS Corp. | 5.000% | 3/15/23 | 43,776 | 37,757 | |
| DISH DBS Corp. | 5.875% | 11/15/24 | 87,950 | 73,218 | |
| DISH DBS Corp. | 7.750% | 7/1/26 | 106,630 | 92,768 | |
| Embarq Corp. | 7.995% | 6/1/36 | 23,035 | 21,682 | |
| Gannett Co. Inc. | 6.375% | 10/15/23 | 31,721 | 32,752 | |
| 4 | Gannett Co. Inc. | 5.500% | 9/15/24 | 11,145 | 11,229 |
| 4 | Gray Television Inc. | 5.125% | 10/15/24 | 59,942 | 57,544 |
| 4 | Gray Television Inc. | 5.875% | 7/15/26 | 38,675 | 37,708 |
| Lamar Media Corp. | 5.750% | 2/1/26 | 5,740 | 5,876 | |
| Level 3 Financing Inc. | 5.375% | 8/15/22 | 75,480 | 75,763 | |
| Level 3 Financing Inc. | 5.625% | 2/1/23 | 26,620 | 26,786 | |
| Level 3 Financing Inc. | 5.125% | 5/1/23 | 36,380 | 35,925 | |
| Liberty Interactive LLC | 8.500% | 7/15/29 | 42,553 | 45,532 | |
| Liberty Interactive LLC | 8.250% | 2/1/30 | 126,903 | 135,469 | |
| Netflix Inc. | 5.500% | 2/15/22 | 30,950 | 31,879 | |
| Netflix Inc. | 5.875% | 2/15/25 | 46,935 | 47,991 | |
| Netflix Inc. | 4.375% | 11/15/26 | 11,905 | 11,161 | |
| 4 | Numericable Group SA | 6.000% | 5/15/22 | 47,955 | 49,394 |
| Quebecor Media Inc. | 5.750% | 1/15/23 | 87,855 | 90,381 | |
| Qwest Corp. | 6.875% | 9/15/33 | 25,162 | 23,747 | |
| Sinclair Television Group Inc. | 6.125% | 10/1/22 | 6,795 | 6,922 | |
| 4 | Sinclair Television Group Inc. | 5.625% | 8/1/24 | 6,795 | 6,710 |
| 4 | Sinclair Television Group Inc. | 5.875% | 3/15/26 | 90,410 | 89,054 |
| 4 | Sinclair Television Group Inc. | 5.125% | 2/15/27 | 57,340 | 53,183 |
| 3,5,6 | Sinclair Television Group Inc. Bank Loan | 4.113% | 12/12/24 | 4,850 | 4,840 |
| 3,5,6 | Sinclair Television Group Inc. Bank Loan | 4.113% | 12/12/24 | 4,850 | 4,840 |
| 3,5,6 | Sinclair Television Group Inc. Bank Loan | 4.113% | 12/12/24 | 48,090 | 47,994 |
| 4 | Sirius XM Radio Inc. | 4.625% | 5/15/23 | 11,110 | 10,943 |
| Sprint Capital Corp. | 6.875% | 11/15/28 | 147,060 | 141,913 | |
| Sprint Capital Corp. | 8.750% | 3/15/32 | 78,824 | 84,736 | |
| 4 | Sprint Communications Inc. | 7.000% | 3/1/20 | 73,700 | 76,464 |
| Sprint Communications Inc. | 6.000% | 11/15/22 | 10,595 | 10,727 | |
| Sprint Corp. | 7.875% | 9/15/23 | 300,264 | 319,781 | |
| Sprint Corp. | 7.125% | 6/15/24 | 70,886 | 72,835 | |
| Sprint Corp. | 7.625% | 2/15/25 | 54,631 | 56,953 | |
| T-Mobile USA Inc. | 5.375% | 4/15/27 | 102,055 | 100,524 | |
| Telecom Italia Capital SA | 6.375% | 11/15/33 | 12,326 | 12,372 | |
| Telecom Italia Capital SA | 6.000% | 9/30/34 | 33,530 | 33,111 | |
| Telecom Italia Capital SA | 7.721% | 6/4/38 | 42,725 | 46,944 | |
| 4 | Telenet Finance Luxembourg Notes Sarl | 5.500% | 3/1/28 | 110,200 | 101,089 |
| Time Warner Cable LLC | 5.875% | 11/15/40 | 2,050 | 2,061 | |
| Time Warner Cable LLC | 5.500% | 9/1/41 | 50,846 | 49,372 | |
| Tribune Media Co. | 5.875% | 7/15/22 | 64,190 | 64,591 | |
| 4 | Univision Communications Inc. | 5.125% | 5/15/23 | 17,900 | 17,095 |
| 4 | Univision Communications Inc. | 5.125% | 2/15/25 | 200,720 | 185,666 |
| 4 | UPCB Finance IV Ltd. | 5.375% | 1/15/25 | 30,000 | 29,100 |
| 91 | |||||
| Vanguard® High-Yield Corporate Fund | |||||
| Schedule of Investments | |||||
| July 31, 2018 | |||||
| Face | Market | ||||
| Maturity | Amount | Value | |||
| Coupon | Date | ($000) | ($000) | ||
| 2 | Viacom Inc. | 5.875% | 2/28/57 | 64,106 | 62,263 |
| 2 | Viacom Inc. | 6.250% | 2/28/57 | 33,146 | 32,483 |
| Videotron Ltd. | 5.000% | 7/15/22 | 108,654 | 110,555 | |
| 4 | Videotron Ltd. | 5.375% | 6/15/24 | 8,633 | 8,914 |
| 4 | Virgin Media Finance plc | 6.375% | 4/15/23 | 5,085 | 5,247 |
| 4 | Virgin Media Finance plc | 6.000% | 10/15/24 | 56,000 | 54,600 |
| 4 | Virgin Media Secured Finance plc | 5.500% | 1/15/25 | 22,325 | 21,655 |
| 4 | Virgin Media Secured Finance plc | 5.250% | 1/15/26 | 82,210 | 77,277 |
| 4 | Virgin Media Secured Finance plc | 5.500% | 8/15/26 | 10,225 | 9,675 |
| 4 | VTR Finance BV | 6.875% | 1/15/24 | 88,555 | 90,769 |
| 4 | WMG Acquisition Corp. | 5.000% | 8/1/23 | 25,381 | 25,096 |
| 4 | WMG Acquisition Corp. | 4.875% | 11/1/24 | 37,336 | 36,589 |
| 4 | WMG Acquisition Corp. | 5.500% | 4/15/26 | 81,404 | 80,590 |
| Zayo Group LLC / Zayo Capital Inc. | 6.000% | 4/1/23 | 104,300 | 106,777 | |
| Zayo Group LLC / Zayo Capital Inc. | 6.375% | 5/15/25 | 55,032 | 56,958 | |
| 4 | Zayo Group LLC / Zayo Capital Inc. | 5.750% | 1/15/27 | 18,835 | 18,647 |
| Consumer Cyclical (9.4%) | |||||
| 4 | 1011778 BC ULC / New Red Finance Inc. | 4.250% | 5/15/24 | 61,725 | 58,716 |
| 4 | 1011778 BC ULC / New Red Finance Inc. | 5.000% | 10/15/25 | 88,290 | 84,648 |
| 4 | Adient Global Holdings Ltd. | 4.875% | 8/15/26 | 149,047 | 136,378 |
| 4 | APX Group Inc. | 8.875% | 12/1/22 | 134,375 | 134,711 |
| 3,5 | Bass Pro Group, LLC. Bank Loan | 7.077% | 12/15/23 | 63,862 | 64,246 |
| Cedar Fair LP / Canada's Wonderland Co. / Magnum | |||||
| Management Corp. / Millennium Op | 5.375% | 4/15/27 | 27,005 | 26,465 | |
| Cedar Fair LP / Canada's Wonderland Co. / Magnum | |||||
| Management Corp. | 5.375% | 6/1/24 | 25,675 | 25,803 | |
| 4 | CRC Escrow Issuer LLC / CRC Finco Inc. | 5.250% | 10/15/25 | 159,911 | 153,714 |
| Dana Holding Corp. | 5.500% | 12/15/24 | 34,460 | 33,771 | |
| GLP Capital LP / GLP Financing II Inc. | 5.250% | 6/1/25 | 14,310 | 14,560 | |
| GLP Capital LP / GLP Financing II Inc. | 5.375% | 4/15/26 | 60,235 | 60,988 | |
| Goodyear Tire & Rubber Co. | 5.000% | 5/31/26 | 52,202 | 48,678 | |
| Goodyear Tire & Rubber Co. | 4.875% | 3/15/27 | 112,833 | 102,960 | |
| Group 1 Automotive Inc. | 5.000% | 6/1/22 | 42,445 | 41,967 | |
| 4 | GW Honos Security Corp. | 8.750% | 5/15/25 | 48,615 | 48,676 |
| 4 | Hanesbrands Inc. | 4.625% | 5/15/24 | 24,270 | 23,572 |
| 4 | Hanesbrands Inc. | 4.875% | 5/15/26 | 24,510 | 23,744 |
| Hilton Domestic Operating Co. Inc. | 4.250% | 9/1/24 | 60,310 | 58,199 | |
| 4 | Hilton Domestic Operating Co. Inc. | 5.125% | 5/1/26 | 72,770 | 72,770 |
| Hilton Worldwide Finance LLC / Hilton Worldwide | |||||
| Finance Corp. | 4.625% | 4/1/25 | 105,130 | 102,502 | |
| Hilton Worldwide Finance LLC / Hilton Worldwide | |||||
| Finance Corp. | 4.875% | 4/1/27 | 64,885 | 63,101 | |
| KB Home | 7.000% | 12/15/21 | 7,810 | 8,240 | |
| KB Home | 7.500% | 9/15/22 | 6,935 | 7,438 | |
| KB Home | 7.625% | 5/15/23 | 41,775 | 44,699 | |
| 4 | KFC Holding Co./Pizza Hut Holdings LLC/Taco Bell of | ||||
| America LLC | 5.000% | 6/1/24 | 27,130 | 26,859 | |
| 4 | KFC Holding Co./Pizza Hut Holdings LLC/Taco Bell of | ||||
| America LLC | 5.250% | 6/1/26 | 29,156 | 28,719 | |
| 4 | KFC Holding Co./Pizza Hut Holdings LLC/Taco Bell of | ||||
| America LLC | 4.750% | 6/1/27 | 32,290 | 30,474 | |
| 4 | L Brands Inc. | 6.694% | 1/15/27 | 38,191 | 36,281 |
| L Brands Inc. | 5.250% | 2/1/28 | 42,804 | 37,561 | |
| Lennar Corp. | 4.125% | 1/15/22 | 35,495 | 35,140 | |
| Lennar Corp. | 4.875% | 12/15/23 | 19,825 | 19,775 | |
| Lennar Corp. | 4.500% | 4/30/24 | 72,365 | 70,194 | |
| Lennar Corp. | 5.875% | 11/15/24 | 4,860 | 5,018 | |
| Lennar Corp. | 5.250% | 6/1/26 | 9,460 | 9,247 | |
| Lennar Corp. | 5.000% | 6/15/27 | 42,955 | 40,592 | |
| 4,7 | LHMC Finco Sarl | 6.250% | 12/20/23 | 41,210 | 49,512 |
| 4 | LHMC Finco Sarl | 7.875% | 12/20/23 | 59,200 | 59,496 |
| Meritage Homes Corp. | 5.125% | 6/6/27 | 17,560 | 16,243 | |
| Neiman Marcus Group Inc. | 7.125% | 6/1/28 | 64,195 | 52,640 | |
| 92 | |||||
| Vanguard® High-Yield Corporate Fund | |||||
| Schedule of Investments | |||||
| July 31, 2018 | |||||
| Face | Market | ||||
| Maturity | Amount | Value | |||
| Coupon | Date | ($000) | ($000) | ||
| Penske Automotive Group Inc. | 5.375% | 12/1/24 | 37,070 | 36,329 | |
| 4 | PetSmart Inc. | 5.875% | 6/1/25 | 25,000 | 19,813 |
| PulteGroup Inc. | 5.000% | 1/15/27 | 4,315 | 4,056 | |
| Service Corp. International | 5.375% | 1/15/22 | 27,630 | 27,906 | |
| Service Corp. International | 4.625% | 12/15/27 | 13,735 | 13,048 | |
| 4 | Shea Homes LP / Shea Homes Funding Corp. | 5.875% | 4/1/23 | 14,550 | 14,441 |
| 4 | Shea Homes LP / Shea Homes Funding Corp. | 6.125% | 4/1/25 | 14,550 | 14,441 |
| Toll Brothers Finance Corp. | 4.875% | 11/15/25 | 9,595 | 9,307 | |
| Toll Brothers Finance Corp. | 4.875% | 3/15/27 | 68,200 | 64,449 | |
| William Lyon Homes Inc. | 7.000% | 8/15/22 | 15,000 | 15,263 | |
| William Lyon Homes Inc. | 5.875% | 1/31/25 | 48,230 | 45,336 | |
| Consumer Noncyclical (12.2%) | |||||
| Aramark Services Inc. | 5.125% | 1/15/24 | 32,435 | 32,719 | |
| 4 | Aramark Services Inc. | 5.000% | 4/1/25 | 48,595 | 48,716 |
| Aramark Services Inc. | 4.750% | 6/1/26 | 19,420 | 18,886 | |
| 4 | Aramark Services Inc. | 5.000% | 2/1/28 | 47,085 | 45,319 |
| 4 | Catalent Pharma Solutions Inc. | 4.875% | 1/15/26 | 15,140 | 14,837 |
| 4 | Change Healthcare Holdings LLC / Change Healthcare | ||||
| Finance Inc. | 5.750% | 3/1/25 | 69,800 | 67,532 | |
| 4 | Charles River Laboratories International Inc. | 5.500% | 4/1/26 | 10,070 | 10,196 |
| CHS/Community Health Systems Inc. | 5.125% | 8/1/21 | 15,235 | 14,416 | |
| CHS/Community Health Systems Inc. | 6.875% | 2/1/22 | 124,942 | 61,222 | |
| CHS/Community Health Systems Inc. | 6.250% | 3/31/23 | 120,190 | 111,777 | |
| 4 | CHS/Community Health Systems Inc. | 8.125% | 6/30/24 | 47,651 | 39,193 |
| 4 | Coty Inc. | 6.500% | 4/15/26 | 24,260 | 22,713 |
| 4,7 | Darling Global Finance BV | 3.625% | 5/15/26 | 12,945 | 15,408 |
| 4,7 | Diamond BC BV | 5.625% | 8/15/25 | 101,750 | 109,225 |
| 3,4 | Endo Dac / Endo Finance LLC / Endo Finco Inc. | 6.000% | 2/1/25 | 79,855 | 63,884 |
| 4 | Endo Finance LLC / Endo Ltd. / Endo Finco Inc. | 6.000% | 7/15/23 | 106,343 | 90,392 |
| 4,7 | Energizer Gamma Acquisition BV | 4.625% | 7/15/26 | 45,080 | 53,807 |
| 4 | Energizer Gamma Acquisition Inc. | 6.375% | 7/15/26 | 50,785 | 52,055 |
| 4 | Envision Healthcare Corp. | 5.125% | 7/1/22 | 4,806 | 4,866 |
| Envision Healthcare Corp. | 5.625% | 7/15/22 | 9,474 | 9,687 | |
| HCA Inc. | 6.250% | 2/15/21 | 23,130 | 24,084 | |
| HCA Inc. | 5.875% | 3/15/22 | 60,405 | 63,425 | |
| HCA Inc. | 4.750% | 5/1/23 | 72,500 | 73,316 | |
| HCA Inc. | 5.375% | 2/1/25 | 49,375 | 49,992 | |
| HCA Inc. | 5.250% | 4/15/25 | 45,000 | 46,013 | |
| HCA Inc. | 7.690% | 6/15/25 | 4,510 | 4,984 | |
| HCA Inc. | 5.875% | 2/15/26 | 64,000 | 66,160 | |
| HCA Inc. | 5.250% | 6/15/26 | 31,895 | 32,373 | |
| 4 | Hologic Inc. | 4.625% | 2/1/28 | 18,855 | 17,794 |
| 4 | inVentiv Group Holdings Inc/inVentiv Health | ||||
| Inc/inVentiv Health Clinical Inc. | 7.500% | 10/1/24 | 16,178 | 16,946 | |
| 4 | Kinetic Concepts Inc / KCI USA Inc. | 7.875% | 2/15/21 | 52,240 | 53,415 |
| 4 | Lamb Weston Holdings Inc. | 4.625% | 11/1/24 | 34,870 | 34,216 |
| 4 | Lamb Weston Holdings Inc. | 4.875% | 11/1/26 | 34,870 | 34,303 |
| 3,5 | Lands' End, Inc. Bank Loan | 5.322% | 3/12/21 | 79,148 | 75,626 |
| 4 | MEDNAX Inc. | 5.250% | 12/1/23 | 19,125 | 18,934 |
| 4 | MPH Acquisition Holdings LLC | 7.125% | 6/1/24 | 53,485 | 55,223 |
| 4 | Polaris Intermediate Corp. | 8.500% | 12/1/22 | 82,880 | 85,677 |
| 4 | Post Holdings Inc. | 5.500% | 3/1/25 | 27,480 | 27,068 |
| 4 | Post Holdings Inc. | 5.000% | 8/15/26 | 120,825 | 113,575 |
| 4 | Post Holdings Inc. | 5.750% | 3/1/27 | 37,091 | 36,164 |
| 4 | Post Holdings Inc. | 5.625% | 1/15/28 | 90,650 | 86,344 |
| 4 | Quintiles IMS Inc. | 5.000% | 10/15/26 | 48,285 | 47,561 |
| 4 | Quintiles Transnational Holdings Inc. | 4.875% | 5/15/23 | 24,350 | 24,715 |
| Revlon Consumer Products Corp. | 5.750% | 2/15/21 | 19,165 | 14,757 | |
| Revlon Consumer Products Corp. | 6.250% | 8/1/24 | 67,860 | 35,966 | |
| 3,5 | Revlon Consumer Products Corp. Bank Loan | 5.577% | 9/7/23 | 133 | 98 |
| 3,5 | Revlon Consumer Products Corp. Bank Loan | 5.577% | 9/7/23 | 5,921 | 4,370 |
| 3,5 | Revlon Consumer Products Corp. Bank Loan | 5.577% | 9/7/23 | 20,124 | 14,853 |
| 4 | Sterigenics-Nordion Holdings LLC | 6.500% | 5/15/23 | 62,435 | 63,840 |
| 93 | |||||
| Vanguard® High-Yield Corporate Fund | |||||
| Schedule of Investments | |||||
| July 31, 2018 | |||||
| Face | Market | ||||
| Maturity | Amount | Value | |||
| Coupon | Date | ($000) | ($000) | ||
| 4 | Sterigenics-Nordion Topco LLC | 8.125% | 11/1/21 | 24,400 | 24,705 |
| Tenet Healthcare Corp. | 4.750% | 6/1/20 | 16,875 | 17,086 | |
| Tenet Healthcare Corp. | 4.500% | 4/1/21 | 42,147 | 42,147 | |
| Tenet Healthcare Corp. | 4.375% | 10/1/21 | 106,480 | 106,081 | |
| Tenet Healthcare Corp. | 4.625% | 7/15/24 | 9,660 | 9,358 | |
| Teva Pharmaceutical Finance IV LLC | 2.250% | 3/18/20 | 73,031 | 71,221 | |
| 4 | TreeHouse Foods Inc. | 6.000% | 2/15/24 | 60,000 | 60,000 |
| 4 | Valeant Pharmaceuticals International Inc. | 6.500% | 3/15/22 | 21,490 | 22,376 |
| 4 | Valeant Pharmaceuticals International Inc. | 7.000% | 3/15/24 | 48,315 | 51,274 |
| 4 | Valeant Pharmaceuticals International Inc. | 5.500% | 11/1/25 | 33,080 | 33,080 |
| 4 | Valeant Pharmaceuticals International Inc. | 9.000% | 12/15/25 | 26,760 | 28,366 |
| 4 | Valeant Pharmaceuticals International Inc. | 9.250% | 4/1/26 | 17,325 | 18,429 |
| 4 | Valeant Pharmaceuticals International Inc. | 8.500% | 1/31/27 | 15,490 | 15,897 |
| 4 | VRX Escrow Corp. | 6.125% | 4/15/25 | 154,710 | 144,654 |
| 4 | West Street Merger Sub Inc. | 6.375% | 9/1/25 | 133,245 | 129,581 |
| Energy (12.7%) | |||||
| AmeriGas Finance LLC / AmeriGas Finance Corp. | 5.625% | 5/20/24 | 46,910 | 46,089 | |
| AmeriGas Finance LLC / AmeriGas Finance Corp. | 5.875% | 8/20/26 | 46,910 | 45,855 | |
| AmeriGas Partners LP / AmeriGas Finance Corp. | 5.500% | 5/20/25 | 20,635 | 19,913 | |
| AmeriGas Partners LP / AmeriGas Finance Corp. | 5.750% | 5/20/27 | 59,170 | 56,507 | |
| Andeavor Logistics LP / Tesoro Logistics Finance Corp. | 6.375% | 5/1/24 | 44,365 | 47,127 | |
| Andeavor Logistics LP / Tesoro Logistics Finance Corp. | 5.250% | 1/15/25 | 51,601 | 53,343 | |
| Antero Resources Corp. | 5.125% | 12/1/22 | 48,330 | 48,572 | |
| Cheniere Corpus Christi Holdings LLC | 5.125% | 6/30/27 | 43,385 | 43,493 | |
| Chesapeake Energy Corp. | 8.000% | 6/15/27 | 100,395 | 102,654 | |
| Continental Resources Inc. | 5.000% | 9/15/22 | 22,203 | 22,564 | |
| 4 | DCP Midstream LLC | 5.350% | 3/15/20 | 11,125 | 11,389 |
| 4 | DCP Midstream Operating LP | 4.750% | 9/30/21 | 19,999 | 20,249 |
| DCP Midstream Operating LP | 4.950% | 4/1/22 | 45,799 | 46,371 | |
| DCP Midstream Operating LP | 3.875% | 3/15/23 | 26,988 | 26,280 | |
| DCP Midstream Operating LP | 5.600% | 4/1/44 | 26,895 | 25,685 | |
| Diamondback Energy Inc. | 4.750% | 11/1/24 | 5,895 | 5,689 | |
| Diamondback Energy Inc. | 5.375% | 5/31/25 | 47,860 | 47,860 | |
| Energy Transfer Equity LP | 7.500% | 10/15/20 | 76,385 | 81,541 | |
| Energy Transfer Equity LP | 4.250% | 3/15/23 | 84,735 | 82,511 | |
| Energy Transfer Equity LP | 5.875% | 1/15/24 | 57,741 | 60,195 | |
| Energy Transfer Equity LP | 5.500% | 6/1/27 | 106,236 | 108,892 | |
| Ferrellgas LP / Ferrellgas Finance Corp. | 6.500% | 5/1/21 | 82,009 | 74,833 | |
| Ferrellgas LP / Ferrellgas Finance Corp. | 6.750% | 1/15/22 | 16,317 | 14,563 | |
| Ferrellgas LP / Ferrellgas Finance Corp. | 6.750% | 6/15/23 | 26,720 | 23,046 | |
| Laredo Petroleum Inc. | 5.625% | 1/15/22 | 69,522 | 69,435 | |
| Laredo Petroleum Inc. | 6.250% | 3/15/23 | 70,158 | 70,509 | |
| Matador Resources Co. | 6.875% | 4/15/23 | 102,250 | 107,362 | |
| 4 | MEG Energy Corp. | 6.375% | 1/30/23 | 30,650 | 27,585 |
| 4 | MEG Energy Corp. | 7.000% | 3/31/24 | 47,348 | 42,732 |
| 4 | MEG Energy Corp. | 6.500% | 1/15/25 | 97,700 | 96,234 |
| Newfield Exploration Co. | 5.750% | 1/30/22 | 10,890 | 11,353 | |
| Newfield Exploration Co. | 5.625% | 7/1/24 | 13,045 | 13,697 | |
| 4 | NGPL PipeCo LLC | 4.375% | 8/15/22 | 13,995 | 13,995 |
| 4 | NGPL PipeCo LLC | 4.875% | 8/15/27 | 16,650 | 16,650 |
| 4 | Noble Holding International Ltd. | 7.875% | 2/1/26 | 15,185 | 15,565 |
| 4 | Parsley Energy LLC / Parsley Finance Corp. | 5.375% | 1/15/25 | 47,585 | 47,228 |
| 4 | Parsley Energy LLC / Parsley Finance Corp. | 5.250% | 8/15/25 | 6,810 | 6,725 |
| QEP Resources Inc. | 6.800% | 3/1/20 | 7,370 | 7,628 | |
| QEP Resources Inc. | 5.375% | 10/1/22 | 42,485 | 43,122 | |
| QEP Resources Inc. | 5.250% | 5/1/23 | 42,925 | 42,388 | |
| 4 | Rockies Express Pipeline LLC | 7.500% | 7/15/38 | 38,048 | 45,658 |
| 4 | Rockies Express Pipeline LLC | 6.875% | 4/15/40 | 13,880 | 16,135 |
| Sabine Pass Liquefaction LLC | 5.875% | 6/30/26 | 41,960 | 45,631 | |
| SESI LLC | 7.125% | 12/15/21 | 34,425 | 35,113 | |
| SESI LLC | 7.750% | 9/15/24 | 36,570 | 37,667 | |
| SM Energy Co. | 6.125% | 11/15/22 | 30,015 | 30,765 | |
| SM Energy Co. | 6.500% | 1/1/23 | 2,525 | 2,563 | |
| 94 | |||||
| Vanguard® High-Yield Corporate Fund | |||||
| Schedule of Investments | |||||
| July 31, 2018 | |||||
| Face | Market | ||||
| Maturity | Amount | Value | |||
| Coupon | Date | ($000) | ($000) | ||
| SM Energy Co. | 5.000% | 1/15/24 | 69,110 | 66,518 | |
| SM Energy Co. | 5.625% | 6/1/25 | 54,040 | 52,689 | |
| SM Energy Co. | 6.750% | 9/15/26 | 17,855 | 18,212 | |
| 4 | Southern Star Central Corp. | 5.125% | 7/15/22 | 14,790 | 14,827 |
| Southwestern Energy Co. | 6.200% | 1/23/25 | 87,271 | 86,071 | |
| Southwestern Energy Co. | 7.750% | 10/1/27 | 19,207 | 19,975 | |
| 4 | Sunoco LP / Sunoco Finance Corp. | 5.500% | 2/15/26 | 25,690 | 24,470 |
| 4 | Sunoco LP / Sunoco Finance Corp. | 5.875% | 3/15/28 | 16,180 | 15,209 |
| 4 | Tallgrass Energy Partners LP / Tallgrass Energy Finance | ||||
| Corp. | 5.500% | 1/15/28 | 59,770 | 59,919 | |
| 2,4 | Transocean Guardian Ltd. | 5.875% | 1/15/24 | 35,810 | 36,079 |
| 2,4 | Transocean Phoenix 2 Ltd. | 7.750% | 10/15/24 | 17,259 | 18,252 |
| 2,4 | Transocean Pontus Ltd. | 6.125% | 8/1/25 | 29,033 | 29,541 |
| 2,4 | Transocean Proteus Ltd. | 6.250% | 12/1/24 | 22,806 | 23,091 |
| 4 | Vine Oil & Gas LP / Vine Oil & Gas Finance Corp. | 8.750% | 4/15/23 | 62,530 | 58,153 |
| Weatherford International Ltd. | 7.000% | 3/15/38 | 17,963 | 14,505 | |
| Weatherford International Ltd. | 6.750% | 9/15/40 | 67,387 | 53,573 | |
| Weatherford International Ltd. | 5.950% | 4/15/42 | 57,093 | 42,249 | |
| Whiting Petroleum Corp. | 6.625% | 1/15/26 | 106,234 | 109,952 | |
| Williams Cos. Inc. | 7.875% | 9/1/21 | 14,740 | 16,343 | |
| Williams Cos. Inc. | 3.700% | 1/15/23 | 50,730 | 49,652 | |
| Williams Cos. Inc. | 4.550% | 6/24/24 | 52,152 | 53,586 | |
| Williams Cos. Inc. | 5.750% | 6/24/44 | 41,255 | 44,040 | |
| WPX Energy Inc. | 6.000% | 1/15/22 | 24,648 | 25,572 | |
| WPX Energy Inc. | 5.250% | 9/15/24 | 112,100 | 111,259 | |
| WPX Energy Inc. | 5.750% | 6/1/26 | 11,975 | 12,005 | |
| Other Industrial (0.7%) | |||||
| 4 | Brand Energy & Infrastructure Services Inc. | 8.500% | 7/15/25 | 104,430 | 106,519 |
| 3,5 | HD Supply Waterworks Ltd. Bank Loan | 5.211% | 8/1/24 | 5,013 | 5,025 |
| 3,5 | HD Supply Waterworks Ltd. Bank Loan | 5.300% | 8/1/24 | 4,421 | 4,432 |
| 4 | KAR Auction Services Inc. | 5.125% | 6/1/25 | 44,780 | 43,549 |
| Technology (8.4%) | |||||
| Alcatel-Lucent USA Inc. | 6.500% | 1/15/28 | 56,315 | 58,427 | |
| Alcatel-Lucent USA Inc. | 6.450% | 3/15/29 | 88,452 | 90,884 | |
| 4 | Camelot Finance SA | 7.875% | 10/15/24 | 54,464 | 54,124 |
| CDK Global Inc. | 5.875% | 6/15/26 | 19,700 | 20,192 | |
| CDK Global Inc. | 4.875% | 6/1/27 | 20,545 | 20,083 | |
| CDW LLC / CDW Finance Corp. | 5.000% | 9/1/23 | 31,905 | 32,184 | |
| CDW LLC / CDW Finance Corp. | 5.500% | 12/1/24 | 15,155 | 15,647 | |
| CDW LLC / CDW Finance Corp. | 5.000% | 9/1/25 | 26,405 | 26,075 | |
| Equinix Inc. | 5.375% | 4/1/23 | 20,864 | 21,386 | |
| Equinix Inc. | 5.875% | 1/15/26 | 13,310 | 13,759 | |
| 7 | Equinix Inc. | 2.875% | 2/1/26 | 102,180 | 116,205 |
| Equinix Inc. | 5.375% | 5/15/27 | 47,030 | 47,383 | |
| 4 | First Data Corp. | 5.375% | 8/15/23 | 73,250 | 74,349 |
| 4 | First Data Corp. | 7.000% | 12/1/23 | 170,875 | 178,778 |
| 4 | First Data Corp. | 5.000% | 1/15/24 | 48,800 | 48,983 |
| 4 | First Data Corp. | 5.750% | 1/15/24 | 131,820 | 134,786 |
| 3,5 | First Data Corp. Bank Loan | 4.069% | 7/8/22 | 19,077 | 19,073 |
| Infor US Inc. | 6.500% | 5/15/22 | 97,200 | 98,415 | |
| Iron Mountain Inc. | 5.750% | 8/15/24 | 30,304 | 30,039 | |
| 4 | Iron Mountain Inc. | 4.875% | 9/15/27 | 28,670 | 26,269 |
| 3,5 | Microchip Technology Inc. Bank Loan | 4.080% | 5/24/25 | 36,050 | 36,140 |
| 4 | MSCI Inc. | 5.250% | 11/15/24 | 12,975 | 13,234 |
| 4 | MSCI Inc. | 5.750% | 8/15/25 | 51,525 | 53,715 |
| 4 | MSCI Inc. | 4.750% | 8/1/26 | 18,330 | 18,101 |
| NCR Corp. | 4.625% | 2/15/21 | 47,305 | 46,595 | |
| NCR Corp. | 5.000% | 7/15/22 | 20,000 | 19,700 | |
| NCR Corp. | 6.375% | 12/15/23 | 15,145 | 15,429 | |
| Nokia Oyj | 4.375% | 6/12/27 | 39,230 | 36,980 | |
| Nokia Oyj | 6.625% | 5/15/39 | 117,400 | 123,563 | |
| 4 | Open Text Corp. | 5.625% | 1/15/23 | 34,150 | 35,004 |
| 4 | Open Text Corp. | 5.875% | 6/1/26 | 46,495 | 47,774 |
| 95 | |||||
| Vanguard® High-Yield Corporate Fund | |||||
| Schedule of Investments | |||||
| July 31, 2018 | |||||
| Face | Market | ||||
| Maturity | Amount | Value | |||
| Coupon | Date | ($000) | ($000) | ||
| Pitney Bowes Inc. | 4.700% | 4/1/23 | 65,515 | 58,718 | |
| 4 | Sensata Technologies BV | 5.625% | 11/1/24 | 19,290 | 19,941 |
| 4 | Sensata Technologies BV | 5.000% | 10/1/25 | 52,750 | 52,618 |
| 4 | Sensata Technologies UK Financing Co. plc | 6.250% | 2/15/26 | 49,705 | 52,004 |
| 3,5 | SS&C Technologies Holdings Inc. Bank Loan | 4.577% | 4/16/25 | 22,313 | 22,379 |
| 3,5 | SS&C Technologies Holdings Inc. Bank Loan | 4.577% | 4/16/25 | 58,172 | 58,344 |
| 4 | Symantec Corp. | 5.000% | 4/15/25 | 66,150 | 65,258 |
| 4,8 | Vantiv LLC / Vanity Issuer Corp. | 3.875% | 11/15/25 | 43,820 | 55,103 |
| 4 | Vantiv LLC / Vanity Issuer Corp. | 4.375% | 11/15/25 | 36,025 | 33,998 |
| Transportation (0.8%) | |||||
| 4 | Avis Budget Car Rental LLC / Avis Budget Finance Inc. | 5.125% | 6/1/22 | 77,088 | 76,124 |
| Avis Budget Car Rental LLC / Avis Budget Finance Inc. | 5.500% | 4/1/23 | 69,036 | 67,655 | |
| 4 | Avis Budget Car Rental LLC / Avis Budget Finance Inc. | 6.375% | 4/1/24 | 24,490 | 24,184 |
| 4 | Avis Budget Car Rental LLC / Avis Budget Finance Inc. | 5.250% | 3/15/25 | 11,070 | 10,240 |
| 18,925,329 | |||||
| Utilities (1.5%) | |||||
| Electric (1.5%) | |||||
| AES Corp. | 4.500% | 3/15/23 | 44,805 | 44,693 | |
| AES Corp. | 4.875% | 5/15/23 | 25,000 | 25,156 | |
| AES Corp. | 5.500% | 4/15/25 | 5,475 | 5,571 | |
| AES Corp. | 6.000% | 5/15/26 | 920 | 961 | |
| AES Corp. | 5.125% | 9/1/27 | 58,610 | 59,196 | |
| 4 | NextEra Energy Operating Partners LP | 4.250% | 9/15/24 | 22,350 | 21,568 |
| 4 | NextEra Energy Operating Partners LP | 4.500% | 9/15/27 | 24,185 | 22,764 |
| NRG Energy Inc. | 6.250% | 7/15/22 | 49,845 | 51,403 | |
| NRG Energy Inc. | 6.250% | 5/1/24 | 76,640 | 78,939 | |
| NRG Energy Inc. | 7.250% | 5/15/26 | 47,920 | 51,035 | |
| 361,286 | |||||
| Total Corporate Bonds (Cost $22,132,717) | 21,814,150 | ||||
| Sovereign Bonds (0.2%) | |||||
| 4 | DAE Funding LLC | 4.500% | 8/1/22 | 28,790 | 28,358 |
| 4 | DAE Funding LLC | 5.000% | 8/1/24 | 29,605 | 29,161 |
| Total Sovereign Bonds (Cost $58,395) | 57,519 | ||||
| Shares | |||||
| Preferred Stocks (0.5%) | |||||
| GMAC Capital Trust I Pfd. (Cost $123,777) | 8.099% | 4,743,200 | 125,979 | ||
| Common Stocks (0.2%) | |||||
| Utilities (0.2%) | |||||
| § | Homer City Generation LP (Cost $41,520) | 2,020,431 | 41,520 | ||
| Face | |||||
| Maturity | Amount | ||||
| Coupon | Date | ($000 | |||
| Temporary Cash Investments (2.9%) | |||||
| Repurchase Agreements (2.9%) | |||||
| Bank of America Securities, LLC (Dated 7/31/18, | |||||
| Repurchase Value $23,301,000, collateralized by | |||||
| Federal Home Loan Mortgage Corp. 3.000%, 3/1/48, | |||||
| and Federal National Mortgage Assn. 4.000%, 7/1/47, | |||||
| with a value of $23,766,000) | 1.930% | 8/1/18 | 23,300 | 23,300 | |
| 96 | |||||
| Vanguard® High-Yield Corporate Fund | ||||
| Schedule of Investments | ||||
| July 31, 2018 | ||||
| Face | Market | |||
| Maturity | Amount | Value | ||
| Coupon | Date | ($000 | ($000) | |
| Bank of Montreal (Dated 7/31/18, Repurchase Value | ||||
| $100,005,000, collateralized by U.S. Treasury Bill | ||||
| 0.000%, 5/23/19, and U.S. Treasury Note/Bond | ||||
| 1.375%-3.625%, 8/31/19-5/15/46, with a value of | ||||
| $102,000,000) | 1.900% | 8/1/18 | 100,000 | 100,000 |
| JP Morgan Securities LLC (Dated 7/31/18, Repurchase | ||||
| Value $347,118,000, collateralized by U.S. Treasury | ||||
| Bill 0.000%, 1/10/19-3/28/19, with a value of | ||||
| $354,046,000) | 1.900% | 8/1/18 | 347,100 | 347,100 |
| RBC Capital Markets LLC (Dated 7/31/18, Repurchase | ||||
| Value $175,809,000, collateralized by Federal Home | ||||
| Loan Mortgage Corp. 2.500%-4.500%, 2/1/30-4/1/48, | ||||
| Federal National Mortgage Assn. 2.301%-5.500%, | ||||
| 7/1/21-7/1/48, and Government National Mortgage | ||||
| Assn. 2.500%-3.000%, 8/20/44-10/20/46, with a | ||||
| value of $179,316,000) | 1.900% | 8/1/18 | 175,800 | 175,800 |
| TD Securities (USA) LLC (Dated 7/31/18, Repurchase | ||||
| Value $48,203,000, collateralized by Federal National | ||||
| Mortgage Assn. 3.500%, 12/1/47, with a value of | ||||
| $49,164,000) | 1.910% | 8/1/18 | 48,200 | 48,200 |
| Total Temporary Cash Investments (Cost $694,400) | 694,400 | |||
| Total Investments (99.7%) (Cost $23,922,682) | 23,604,174 | |||
| Other Assets and Liabilities—Net (0.3%) | 67,318 | |||
| Net Assets (100%) | 23,671,492 | |||
§ Security value determined using significant unobservable inputs.
1 Securities with a value of $33,906,000 have been segregated as initial margin for open cleared swap contracts.
2 The average or expected maturity is shorter than the final maturity shown because of the possibility of interim principal payments and
prepayments or the possibility of the issue being called.
3 Adjustable-rate security based upon 3-month USD LIBOR plus spread.
4 Security exempt from registration under Rule 144A of the Securities Act of 1933. Such securities may be sold in transactions exempt from
registration, normally to qualified institutional buyers. At July 31, 2018, the aggregate value of these securities was $9,302,478,000,
representing 39.3% of net assets.
5 Security is a senior, secured, high-yield floating-rate loan. These loans are debt obligations issued by public and private companies and are
comparable to high-yield bonds from a ratings and leverage perspective. At July 31, 2018, the aggregate value of these securities was
$685,960,000, representing 2.9% of net assets.
6 Security purchased on a when-issued or delayed-delivery basis for which the fund has not taken delivery as of July 31, 2018.
7 Face amount denominated in euro.
8 Face amount denominated in British pounds.
9 Scheduled principal and interest payments are guaranteed by bank letter of credit.
97
© 2018 The Vanguard Group, Inc.
All rights reserved.
Vanguard Marketing Corporation, Distributor.
SNA392 092018
Item 7: Disclosure of Proxy Voting Policies and Procedures for Closed-End Management Investment
Companies.
Not Applicable.
Item 8: Portfolio Managers of Closed-End Management Investment Companies.
Not Applicable.
Item 9: Purchase of Equity Securities by Closed-End Management Investment Company and
Affiliated Purchasers.
Not Applicable.
Item 10: Submission of Matters to a Vote of Security Holders.
Not Applicable.
Item 11: Controls and Procedures.
(a) Disclosure Controls and Procedures. The Principal Executive and Financial Officers concluded that the Registrant’s Disclosure Controls and Procedures are effective based on their evaluation of the Disclosure Controls and Procedures as of a date within 90 days of the filing date of this report.
(b) Internal Control Over Financial Reporting. There were no significant changes in Registrant’s Internal Control Over Financial Reporting or in other factors that could significantly affect this control subsequent to the date of the evaluation, including any corrective actions with regard to significant deficiencies and material weaknesses.
Item 12: Disclosure of Securities Lending Activities for Closed-End Management Investment Companies.
Not Applicable.
Item 13: Exhibits.
(a) Certifications.
Pursuant to the requirements of the Securities Exchange Act of 1934 and the Investment Company Act of 1940, the registrant has duly caused this report to be signed on its behalf by the undersigned, thereunto duly authorized.
| VANGUARD FIXED INCOME SECURITIES FUNDS | |
| BY: | /s/ MORTIMER J. BUCKLEY* |
| MORTIMER J. BUCKLEY | |
| CHIEF EXECUTIVE OFFICER | |
| Date: September 13, 2018 | |
Pursuant to the requirements of the Securities Exchange Act of 1934 and the Investment Company Act of 1940, this report has been signed below by the following persons on behalf of the registrant and in the capacities and on the dates indicated.
| VANGUARD FIXED INCOME SECURITIES FUNDS | |
| BY: | /s/ MORTIMER J. BUCKLEY* |
| MORTIMER J. BUCKLEY | |
| CHIEF EXECUTIVE OFFICER | |
| Date: September 13, 2018 | |
| VANGUARD FIXED INCOME SECURITIES FUNDS | |
| BY: | /s/ THOMAS J. HIGGINS* |
| THOMAS J. HIGGINS | |
| CHIEF FINANCIAL OFFICER | |
| Date: September 13, 2018 | |
* By: /s/ Anne E. Robinson
Anne E. Robinson, pursuant to a Power of Attorney filed on January 18, 2018; see file Number
33-32216, Incorporated by Reference.