UNITED STATES
SECURITIES AND EXCHANGE COMMISSION
Washington, D.C. 20549
FORM N-CSR
CERTIFIED SHAREHOLDER REPORT
OF
REGISTERED MANAGEMENT INVESTMENT COMPANIES
Investment Company Act file number: 811-02368
| Name of Registrant: | Vanguard Fixed Income Securities Funds |
| Address of Registrant: | P.O. Box 2600 |
| Valley Forge, PA 19482 |
| Name and address of agent for service: | Anne E. Robinson, Esquire |
| P.O. Box 876 | |
| Valley Forge, PA 19482 |
Registrant’s telephone number, including area code: (610) 669-1000
Date of fiscal year end: January 31
Date of reporting period: February 1, 2023—January 31, 2024
Item 1: Reports to Shareholders

| Vanguard Short-Term Treasury Fund |
| Vanguard Short-Term Federal Fund |
| Vanguard Intermediate-Term Treasury Fund |
| Vanguard Long-Term Treasury Fund |
Your Fund’s Performance at a Glance | 1 |
Advisor's Report | 2 |
About Your Fund’s Expenses | 5 |
Short-Term Treasury Fund | 7 |
Short-Term Federal Fund | 24 |
Intermediate-Term Treasury Fund | 41 |
Long-Term Treasury Fund | 58 |
| • | For the 12 months ended January 31, 2024, returns of the four funds in this report ranged from –5.59% to 3.14%. While all share classes of the Short-Term Federal Fund, Short-Term Treasury Fund, and Intermediate-Term Treasury Fund posted positive returns, Investor and Admiral Shares of the Long-Term Treasury Fund were in negative territory. |
| • | Both Investor and Admiral Shares of the Intermediate-Term Treasury Fund outperformed the fund’s benchmark. The returns of all share classes of the three other funds trailed their respective benchmarks. |
| • | With inflation continuing to ease over the period, the Federal Reserve slowed and eventually stopped hiking interest rates. Economic growth, the labor market, and consumer spending proved resilient, but the prospect of rates remaining high for an extended period spurred volatility at times. U.S. bonds rallied toward the end of 2023 as sentiment improved amid market expectations for rate cuts in 2024. |
| • | Our positions in mortgage-backed securities and duration generally held back performance, while our holdings in agency debentures helped results. |
| • | The Short-Term Federal Fund’s holdings of futures contracts helped its performance for the 12 months. The fund regularly uses derivatives to hedge portfolio risks. |
| Average Annual Total Returns Periods Ended January 31, 2024 | |||
| One Year | Three Years | Five Years | |
| Stocks | |||
| Russell 1000 Index (Large-caps) | 20.23% | 9.78% | 13.99% |
| Russell 2000 Index (Small-caps) | 2.40 | -0.76 | 6.80 |
| Russell 3000 Index (Broad U.S. market) | 19.15 | 9.10 | 13.53 |
| FTSE All-World ex US Index (International) | 6.29 | 1.57 | 5.77 |
| Bonds | |||
| Bloomberg U.S. Aggregate Float Adjusted Index (Broad taxable market) | 2.23% | -3.15% | 0.90% |
| Bloomberg Municipal Bond Index (Broad tax-exempt market) | 2.90 | -0.78 | 2.00 |
| FTSE Three-Month U.S. Treasury Bill Index | 5.36 | 2.40 | 1.96 |
| CPI | |||
| Consumer Price Index | 3.09% | 5.64% | 4.15% |
| Yields of U.S. Treasury Securities | ||
| Maturity | January 31, 2023 | January 31, 2024 |
| 2 years | 4.20% | 4.21% |
| 5 years | 3.62 | 3.84 |
| 10 years | 3.51 | 3.91 |
| 30 years | 3.63 | 4.17 |
| Source: Vanguard. | ||
| • | Based on actual fund return. This section helps you to estimate the actual expenses that you paid over the period. The ”Ending Account Value“ shown is derived from the fund‘s actual return, and the third column shows the dollar amount that would have been paid by an investor who started with $1,000 in the fund. You may use the information here, together with the amount you invested, to estimate the expenses that you paid over the period. |
| • | Based on hypothetical 5% yearly return. This section is intended to help you compare your fund‘s costs with those of other mutual funds. It assumes that the fund had a yearly return of 5% before expenses, but that the expense ratio is unchanged. In this case—because the return used is not the fund’s actual return—the results do not apply to your investment. The example is useful in making comparisons because the Securities and Exchange Commission requires all mutual funds to calculate expenses based on a 5% return. You can assess your fund’s costs by comparing this hypothetical example with the hypothetical examples that appear in shareholder reports of other funds. |
| Six Months Ended January 31, 2024 | |||
| Beginning Account Value 7/31/2023 | Ending Account Value 1/31/2024 | Expenses Paid During Period | |
| Based on Actual Fund Return | |||
| Short-Term Treasury Fund | |||
| Investor Shares | $1,000.00 | $1,030.70 | $1.02 |
| Admiral™ Shares | 1,000.00 | 1,031.20 | 0.51 |
| Short-Term Federal Fund | |||
| Investor Shares | $1,000.00 | $1,033.10 | $1.02 |
| Admiral Shares | 1,000.00 | 1,033.60 | 0.51 |
| Intermediate-Term Treasury Fund | |||
| Investor Shares | $1,000.00 | $1,032.20 | $1.02 |
| Admiral Shares | 1,000.00 | 1,032.80 | 0.51 |
| Long-Term Treasury Fund | |||
| Investor Shares | $1,000.00 | $991.80 | $1.00 |
| Admiral Shares | 1,000.00 | 992.30 | 0.50 |
| Based on Hypothetical 5% Yearly Return | |||
| Short-Term Treasury Fund | |||
| Investor Shares | $1,000.00 | $1,024.20 | $1.02 |
| Admiral Shares | 1,000.00 | 1,024.70 | 0.51 |
| Short-Term Federal Fund | |||
| Investor Shares | $1,000.00 | $1,024.20 | $1.02 |
| Admiral Shares | 1,000.00 | 1,024.70 | 0.51 |
| Intermediate-Term Treasury Fund | |||
| Investor Shares | $1,000.00 | $1,024.20 | $1.02 |
| Admiral Shares | 1,000.00 | 1,024.70 | 0.51 |
| Long-Term Treasury Fund | |||
| Investor Shares | $1,000.00 | $1,024.20 | $1.02 |
| Admiral Shares | 1,000.00 | 1,024.70 | 0.51 |

| Average Annual Total Returns Periods Ended January 31, 2024 | |||||
| One Year | Five Years | Ten Years | Final Value of a $10,000 Investment | ||
 | Short-Term Treasury Fund Investor Shares | 2.87% | 1.05% | 0.91% | $10,950 |
 | Bloomberg U.S. 1-5 Year Treasury Bond Index | 3.54 | 1.18 | 1.11 | 11,169 |
 | Bloomberg U.S. Aggregate Bond Index | 2.10 | 0.83 | 1.63 | 11,758 |
| One Year | Five Years | Ten Years | Final Value of a $50,000 Investment | ||
| Short-Term Treasury Fund Admiral Shares | 2.97% | 1.15% | 1.01% | $55,301 | |
| Bloomberg U.S. 1-5 Year Treasury Bond Index | 3.54 | 1.18 | 1.11 | 55,847 | |
| Bloomberg U.S. Aggregate Bond Index | 2.10 | 0.83 | 1.63 | 58,788 | |
| Agency Bonds and Notes | 0.4% |
| Asset-Backed/Commercial Mortgage-Backed Securities | 9.0 |
| Government Mortgage-Backed Securities | 7.4 |
| U.S. Government Securities | 83.2 |
| Coupon | Maturity Date | Face Amount ($000) | Market Value• ($000) | |||
| U.S. Government and Agency Obligations (90.0%) | ||||||
| U.S. Government Securities (82.3%) | ||||||
| United States Treasury Note/Bond | 1.750% | 3/15/25 | 208,000 | 201,435 | ||
| United States Treasury Note/Bond | 0.375% | 4/30/25 | 100,000 | 94,953 | ||
| United States Treasury Note/Bond | 2.875% | 4/30/25 | 121,000 | 118,504 | ||
| United States Treasury Note/Bond | 3.875% | 4/30/25 | 119,700 | 118,709 | ||
| United States Treasury Note/Bond | 0.250% | 5/31/25 | 175,600 | 165,997 | ||
| United States Treasury Note/Bond | 2.875% | 5/31/25 | 50,000 | 48,945 | ||
| United States Treasury Note/Bond | 4.250% | 5/31/25 | 153,000 | 152,474 | ||
| United States Treasury Note/Bond | 0.250% | 6/30/25 | 17,000 | 16,028 | ||
| 1 | United States Treasury Note/Bond | 3.000% | 7/15/25 | 10,300 | 10,092 | |
| United States Treasury Note/Bond | 0.250% | 7/31/25 | 266,131 | 250,122 | ||
| United States Treasury Note/Bond | 3.125% | 8/15/25 | 45,500 | 44,633 | ||
| United States Treasury Note/Bond | 0.250% | 8/31/25 | 263,000 | 246,480 | ||
| United States Treasury Note/Bond | 2.750% | 8/31/25 | 165,100 | 160,998 | ||
| United States Treasury Note/Bond | 3.500% | 9/15/25 | 180,100 | 177,624 | ||
| United States Treasury Note/Bond | 0.250% | 9/30/25 | 60,000 | 56,091 | ||
| United States Treasury Note/Bond | 5.000% | 9/30/25 | 50,000 | 50,508 | ||
| United States Treasury Note/Bond | 3.000% | 10/31/25 | 3,900 | 3,814 | ||
| United States Treasury Note/Bond | 5.000% | 10/31/25 | 7,000 | 7,079 | ||
| United States Treasury Note/Bond | 0.375% | 11/30/25 | 73,000 | 68,027 | ||
| United States Treasury Note/Bond | 2.875% | 11/30/25 | 43,000 | 41,932 | ||
| United States Treasury Note/Bond | 4.875% | 11/30/25 | 32,000 | 32,330 | ||
| United States Treasury Note/Bond | 0.375% | 12/31/25 | 57,600 | 53,550 | ||
| United States Treasury Note/Bond | 0.375% | 1/31/26 | 189,200 | 175,394 | ||
| United States Treasury Note/Bond | 4.250% | 1/31/26 | 40,000 | 40,019 | ||
| United States Treasury Note/Bond | 0.500% | 2/28/26 | 259,800 | 240,802 | ||
| United States Treasury Note/Bond | 0.750% | 4/30/26 | 158,300 | 146,873 | ||
| United States Treasury Note/Bond | 0.750% | 5/31/26 | 223,000 | 206,414 | ||
| United States Treasury Note/Bond | 0.875% | 6/30/26 | 49,200 | 45,618 | ||
| United States Treasury Note/Bond | 0.625% | 7/31/26 | 21,000 | 19,287 | ||
| United States Treasury Note/Bond | 1.500% | 8/15/26 | 89,000 | 83,479 | ||
| United States Treasury Note/Bond | 4.375% | 8/15/26 | 10,000 | 10,069 | ||
| United States Treasury Note/Bond | 1.375% | 8/31/26 | 12,000 | 11,213 | ||
| United States Treasury Note/Bond | 4.625% | 9/15/26 | 100 | 101 | ||
| United States Treasury Note/Bond | 0.875% | 9/30/26 | 26,000 | 23,944 | ||
| United States Treasury Note/Bond | 1.250% | 11/30/26 | 45,000 | 41,681 | ||
| United States Treasury Note/Bond | 1.250% | 12/31/26 | 82,000 | 75,863 | ||
| United States Treasury Note/Bond | 1.875% | 2/28/27 | 120,600 | 113,232 | ||
| Coupon | Maturity Date | Face Amount ($000) | Market Value• ($000) | |||
| United States Treasury Note/Bond | 2.500% | 3/31/27 | 20,000 | 19,128 | ||
| United States Treasury Note/Bond | 0.500% | 4/30/27 | 107,000 | 95,765 | ||
| United States Treasury Note/Bond | 2.750% | 4/30/27 | 111,000 | 106,855 | ||
| United States Treasury Note/Bond | 2.375% | 5/15/27 | 28,000 | 26,626 | ||
| United States Treasury Note/Bond | 2.625% | 5/31/27 | 130,000 | 124,556 | ||
| United States Treasury Note/Bond | 0.500% | 6/30/27 | 120,000 | 106,856 | ||
| United States Treasury Note/Bond | 3.250% | 6/30/27 | 78,700 | 76,929 | ||
| United States Treasury Note/Bond | 0.375% | 7/31/27 | 140,000 | 123,769 | ||
| United States Treasury Note/Bond | 2.750% | 7/31/27 | 120,000 | 115,275 | ||
| United States Treasury Note/Bond | 0.500% | 8/31/27 | 55,000 | 48,727 | ||
| United States Treasury Note/Bond | 0.375% | 9/30/27 | 82,400 | 72,461 | ||
| United States Treasury Note/Bond | 4.125% | 9/30/27 | 30,000 | 30,178 | ||
| United States Treasury Note/Bond | 0.500% | 10/31/27 | 117,000 | 103,106 | ||
| United States Treasury Note/Bond | 0.625% | 11/30/27 | 80,000 | 70,675 | ||
| United States Treasury Note/Bond | 0.750% | 1/31/28 | 30,000 | 26,508 | ||
| United States Treasury Note/Bond | 1.250% | 3/31/28 | 63,100 | 56,691 | ||
| United States Treasury Note/Bond | 1.250% | 4/30/28 | 56,000 | 50,208 | ||
| United States Treasury Note/Bond | 1.250% | 5/31/28 | 60,000 | 53,700 | ||
| United States Treasury Note/Bond | 1.250% | 6/30/28 | 25,000 | 22,336 | ||
| United States Treasury Note/Bond | 1.000% | 7/31/28 | 46,608 | 41,073 | ||
| United States Treasury Note/Bond | 1.125% | 8/31/28 | 39,400 | 34,863 | ||
| United States Treasury Note/Bond | 1.250% | 9/30/28 | 70,700 | 62,791 | ||
| United States Treasury Note/Bond | 4.625% | 9/30/28 | 21,000 | 21,646 | ||
| United States Treasury Note/Bond | 1.375% | 10/31/28 | 18,000 | 16,048 | ||
| United States Treasury Note/Bond | 2.375% | 3/31/29 | 61,500 | 57,157 | ||
| United States Treasury Note/Bond | 2.875% | 4/30/29 | 30,000 | 28,556 | ||
| United States Treasury Note/Bond | 3.250% | 6/30/29 | 30,500 | 29,537 | ||
| United States Treasury Note/Bond | 2.625% | 7/31/29 | 19,500 | 18,281 | ||
| United States Treasury Note/Bond | 3.875% | 9/30/29 | 30,000 | 29,944 | ||
| 5,024,559 | ||||||
| Agency Bonds and Notes (0.4%) | ||||||
| Federal Home Loan Banks | 1.220% | 6/30/27 | 25,000 | 22,745 | ||
| Conventional Mortgage-Backed Securities (7.3%) | ||||||
| 2,3 | UMBS Pool | 2.000% | 10/1/30–10/1/31 | 205,723 | 192,524 | |
| 2,3 | UMBS Pool | 1.500% | 11/1/30–1/1/32 | 277,666 | 255,866 | |
| 448,390 | ||||||
| Nonconventional Mortgage-Backed Securities (0.0%) | ||||||
| 2 | Ginnie Mae REMICS | 3.000% | 9/20/51–12/20/51 | 37 | 24 | |
| 2 | Ginnie Mae REMICS | 2.000% | 11/20/51 | 12 | 6 | |
| 30 | ||||||
| Total U.S. Government and Agency Obligations (Cost $5,476,407) | 5,495,724 | |||||
| Asset-Backed/Commercial Mortgage-Backed Securities (8.9%) | ||||||
| 2,3 | FHLMC Multifamily Structured Pass-Through Certificates Class A2 Series K056 | 2.525% | 5/25/26 | 33,500 | 32,066 | |
| 2,3 | FHLMC Multifamily Structured Pass-Through Certificates Class A2 Series K057 | 2.570% | 7/25/26 | 48,200 | 46,109 | |
| 2,3 | FHLMC Multifamily Structured Pass-Through Certificates Class A2 Series K065 | 3.243% | 4/25/27 | 33,900 | 32,714 | |
| 2,3 | FHLMC Multifamily Structured Pass-Through Certificates Class A2 Series K066 | 3.117% | 6/25/27 | 75,721 | 72,701 | |
| 2,3 | FHLMC Multifamily Structured Pass-Through Certificates Class A2 Series K067 | 3.194% | 7/25/27 | 58,750 | 56,444 | |
| Coupon | Maturity Date | Face Amount ($000) | Market Value• ($000) | |||
| 2,3,4 | FHLMC Multifamily Structured Pass-Through Certificates Class A2 Series K070 | 3.303% | 11/25/27 | 17,200 | 16,546 | |
| 2,3 | FHLMC Multifamily Structured Pass-Through Certificates Class A2 Series K072 | 3.444% | 12/25/27 | 6,200 | 5,987 | |
| 2,3,4 | FHLMC Multifamily Structured Pass-Through Certificates Class A2 Series K508 | 4.740% | 8/25/28 | 24,000 | 24,304 | |
| 2,3 | FHLMC Multifamily Structured Pass-Through Certificates Class A2 Series K509 | 4.850% | 9/25/28 | 26,500 | 26,958 | |
| 2,3,4 | FHLMC Multifamily Structured Pass-Through Certificates Class A2 Series K510 | 5.069% | 10/25/28 | 24,000 | 24,638 | |
| 2,3 | FHLMC Multifamily Structured Pass-Through Certificates Class A2 Series K511 | 4.860% | 10/25/28 | 50,900 | 51,829 | |
| 2,3 | FHLMC Multifamily Structured Pass-Through Certificates Class A2 Series K512 | 5.000% | 11/25/28 | 48,700 | 49,861 | |
| 2,3,4 | FHLMC Multifamily Structured Pass-Through Certificates Class A2 Series K513 | 4.724% | 12/25/28 | 76,700 | 77,576 | |
| 2,3 | FHLMC Multifamily Structured Pass-Through Certificates Class A2 Series K734 | 3.208% | 2/25/26 | 6,970 | 6,793 | |
| 2,3 | FHLMC Multifamily Structured Pass-Through Certificates Class A2 Series K736 | 2.282% | 7/25/26 | 8,000 | 7,604 | |
| 2,3 | FHLMC Multifamily Structured Pass-Through Certificates Class A2 Series K737 | 2.525% | 10/25/26 | 9,578 | 9,104 | |
| Total Asset-Backed/Commercial Mortgage-Backed Securities (Cost $533,062) | 541,234 | |||||
| Shares | ||||||
| Temporary Cash Investments (0.5%) | ||||||
| Money Market Fund (0.5%) | ||||||
| 5 | Vanguard Market Liquidity Fund (Cost $32,828) | 5.410% | 328,349 | 32,831 | ||
| Total Investments (99.4%) (Cost $6,042,297) | 6,069,789 | |||||
| Other Assets and Liabilities—Net (0.6%) | 36,771 | |||||
| Net Assets (100%) | 6,106,560 | |||||
| Cost is in $000. | ||||||
| • | See Note A in Notes to Financial Statements. |
| 1 | Securities with a value of $7,383,000 have been segregated as initial margin for open futures contracts. |
| 2 | The average or expected maturity is shorter than the final maturity shown because of the possibility of interim principal payments and prepayments or the possibility of the issue being called. |
| 3 | The issuer was placed under federal conservatorship in September 2008; since that time, its daily operations have been managed by the Federal Housing Finance Agency and it receives capital from the U.S. Treasury, as needed to maintain a positive net worth, in exchange for senior preferred stock. |
| 4 | Variable-rate security; rate shown is effective rate at period end. Certain variable-rate securities are not based on a published reference rate and spread but are determined by the issuer or agent based on current market conditions. |
| 5 | Affiliated money market fund available only to Vanguard funds and certain trusts and accounts managed by Vanguard. Rate shown is the 7-day yield. |
| REMICS—Real Estate Mortgage Investment Conduits. | |
| UMBS—Uniform Mortgage-Backed Securities. |
| Futures Contracts | ||||
| ($000) | ||||
| Expiration | Number of Long (Short) Contracts | Notional Amount | Value and Unrealized Appreciation (Depreciation) | |
| Long Futures Contracts | ||||
| 2-Year U.S. Treasury Note | March 2024 | 1,398 | 287,507 | (122) |
| 10-Year U.S. Treasury Note | March 2024 | 551 | 61,893 | 273 |
| Ultra 10-Year U.S. Treasury Note | March 2024 | 671 | 78,423 | 891 |
| 1,042 | ||||
| Short Futures Contracts | ||||
| 5-Year U.S. Treasury Note | March 2024 | (5,161) | (559,404) | (1,279) |
| Ultra Long U.S. Treasury Bond | March 2024 | (434) | (56,081) | (1,087) |
| (2,366) | ||||
| (1,324) | ||||
| ($000s, except shares, footnotes, and per-share amounts) | Amount |
| Assets | |
| Investments in Securities, at Value | |
| Unaffiliated Issuers (Cost $6,009,469) | 6,036,958 |
| Affiliated Issuers (Cost $32,828) | 32,831 |
| Total Investments in Securities | 6,069,789 |
| Investment in Vanguard | 195 |
| Cash | 37 |
| Receivables for Investment Securities Sold | 408,121 |
| Receivables for Accrued Income | 24,039 |
| Receivables for Capital Shares Issued | 3,692 |
| Other Assets | 130 |
| Total Assets | 6,506,003 |
| Liabilities | |
| Payables for Investment Securities Purchased | 375,770 |
| Payables for Capital Shares Redeemed | 19,203 |
| Payables for Distributions | 2,963 |
| Payables to Vanguard | 289 |
| Variation Margin Payable—Futures Contracts | 1,218 |
| Total Liabilities | 399,443 |
| Net Assets | 6,106,560 |
| At January 31, 2024, net assets consisted of: | |
| Paid-in Capital | 6,693,611 |
| Total Distributable Earnings (Loss) | (587,051) |
| Net Assets | 6,106,560 |
| Investor Shares—Net Assets | |
| Applicable to 51,518,814 outstanding $.001 par value shares of beneficial interest (unlimited authorization) | 508,956 |
| Net Asset Value Per Share—Investor Shares | $9.88 |
| Admiral Shares—Net Assets | |
| Applicable to 566,614,179 outstanding $.001 par value shares of beneficial interest (unlimited authorization) | 5,597,604 |
| Net Asset Value Per Share—Admiral Shares | $9.88 |
| Year Ended January 31, 2024 | |
| ($000) | |
| Investment Income | |
| Income | |
| Interest1 | 276,002 |
| Total Income | 276,002 |
| Expenses | |
| The Vanguard Group—Note B | |
| Investment Advisory Services | 698 |
| Management and Administrative—Investor Shares | 954 |
| Management and Administrative—Admiral Shares | 4,902 |
| Marketing and Distribution—Investor Shares | 42 |
| Marketing and Distribution—Admiral Shares | 330 |
| Custodian Fees | 31 |
| Auditing Fees | 36 |
| Shareholders’ Reports—Investor Shares | 26 |
| Shareholders’ Reports—Admiral Shares | 49 |
| Trustees’ Fees and Expenses | 4 |
| Other Expenses | 16 |
| Total Expenses | 7,088 |
| Expenses Paid Indirectly | (33) |
| Net Expenses | 7,055 |
| Net Investment Income | 268,947 |
| Realized Net Gain (Loss) | |
| Investment Securities Sold1 | (304,758) |
| Futures Contracts | 20,797 |
| Realized Net Gain (Loss) | (283,961) |
| Change in Unrealized Appreciation (Depreciation) | |
| Investment Securities1 | 185,748 |
| Futures Contracts | 8,947 |
| Change in Unrealized Appreciation (Depreciation) | 194,695 |
| Net Increase (Decrease) in Net Assets Resulting from Operations | 179,681 |
| 1 | Interest income, realized net gain (loss), capital gain distributions received, and change in unrealized appreciation (depreciation) from an affiliated company of the fund were $3,493,000, $24,000, less than $1,000, and $1,000, respectively. Purchases and sales are for temporary cash investment purposes. |
| Year Ended January 31, | ||
| 2024 ($000) | 2023 ($000) | |
| Increase (Decrease) in Net Assets | ||
| Operations | ||
| Net Investment Income | 268,947 | 153,413 |
| Realized Net Gain (Loss) | (283,961) | (300,398) |
| Change in Unrealized Appreciation (Depreciation) | 194,695 | (72,988) |
| Net Increase (Decrease) in Net Assets Resulting from Operations | 179,681 | (219,973) |
| Distributions | ||
| Investor Shares | (21,888) | (11,429) |
| Admiral Shares | (246,934) | (141,900) |
| Total Distributions | (268,822) | (153,329) |
| Capital Share Transactions | ||
| Investor Shares | (53,952) | 15,629 |
| Admiral Shares | (495,323) | (330,361) |
| Net Increase (Decrease) from Capital Share Transactions | (549,275) | (314,732) |
| Total Increase (Decrease) | (638,416) | (688,034) |
| Net Assets | ||
| Beginning of Period | 6,744,976 | 7,433,010 |
| End of Period | 6,106,560 | 6,744,976 |
| Investor Shares | |||||
| For a Share Outstanding Throughout Each Period | Year Ended January 31, | ||||
| 2024 | 2023 | 2022 | 2021 | 2020 | |
| Net Asset Value, Beginning of Period | $10.00 | $10.54 | $10.77 | $10.64 | $10.48 |
| Investment Operations | |||||
| Net Investment Income1 | .397 | .215 | .036 | .070 | .245 |
| Net Realized and Unrealized Gain (Loss) on Investments | (.120) | (.540) | (.207) | .286 | .160 |
| Total from Investment Operations | .277 | (.325) | (.171) | .356 | .405 |
| Distributions | |||||
| Dividends from Net Investment Income | (.397) | (.215) | (.035) | (.070) | (.245) |
| Distributions from Realized Capital Gains | — | — | (.024) | (.156) | — |
| Total Distributions | (.397) | (.215) | (.059) | (.226) | (.245) |
| Net Asset Value, End of Period | $9.88 | $10.00 | $10.54 | $10.77 | $10.64 |
| Total Return2 | 2.87% | -3.08% | -1.60% | 3.35% | 3.91% |
| Ratios/Supplemental Data | |||||
| Net Assets, End of Period (Millions) | $509 | $570 | $582 | $701 | $655 |
| Ratio of Total Expenses to Average Net Assets | 0.20%3 | 0.20%3 | 0.20% | 0.20% | 0.20% |
| Ratio of Net Investment Income to Average Net Assets | 4.04% | 2.12% | 0.34% | 0.64% | 2.30% |
| Portfolio Turnover Rate4 | 314% | 284% | 213% | 357% | 340% |
| 1 | Calculated based on average shares outstanding. |
| 2 | Total returns do not include account service fees that may have applied in the periods shown. Fund prospectuses provide information about any applicable account service fees. |
| 3 | The ratio of expenses to average net assets for the period net of reduction from custody fee offset arrangements was 0.20%. |
| 4 | Includes 23%, 27%, 4%, 57%, and 5%, respectively, attributable to mortgage-dollar-roll activity. |
| Admiral Shares | |||||
| For a Share Outstanding Throughout Each Period | Year Ended January 31, | ||||
| 2024 | 2023 | 2022 | 2021 | 2020 | |
| Net Asset Value, Beginning of Period | $10.00 | $10.54 | $10.77 | $10.64 | $10.48 |
| Investment Operations | |||||
| Net Investment Income1 | .407 | .224 | .047 | .079 | .254 |
| Net Realized and Unrealized Gain (Loss) on Investments | (.120) | (.539) | (.207) | .288 | .162 |
| Total from Investment Operations | .287 | (.315) | (.160) | .367 | .416 |
| Distributions | |||||
| Dividends from Net Investment Income | (.407) | (.225) | (.046) | (.081) | (.256) |
| Distributions from Realized Capital Gains | — | — | (.024) | (.156) | — |
| Total Distributions | (.407) | (.225) | (.070) | (.237) | (.256) |
| Net Asset Value, End of Period | $9.88 | $10.00 | $10.54 | $10.77 | $10.64 |
| Total Return2 | 2.97% | -2.99% | -1.50% | 3.46% | 4.01% |
| Ratios/Supplemental Data | |||||
| Net Assets, End of Period (Millions) | $5,598 | $6,175 | $6,851 | $7,818 | $8,243 |
| Ratio of Total Expenses to Average Net Assets | 0.10%3 | 0.10%3 | 0.10% | 0.10% | 0.10% |
| Ratio of Net Investment Income to Average Net Assets | 4.14% | 2.20% | 0.44% | 0.73% | 2.40% |
| Portfolio Turnover Rate4 | 314% | 284% | 213% | 357% | 340% |
| 1 | Calculated based on average shares outstanding. |
| 2 | Total returns do not include account service fees that may have applied in the periods shown. Fund prospectuses provide information about any applicable account service fees. |
| 3 | The ratio of expenses to average net assets for the period net of reduction from custody fee offset arrangements was 0.10%. |
| 4 | Includes 23%, 27%, 4%, 57%, and 5%, respectively, attributable to mortgage-dollar-roll activity. |
| A. | The following significant accounting policies conform to generally accepted accounting principles for U.S. investment companies. The fund consistently follows such policies in preparing its financial statements. |
| B. | In accordance with the terms of a Funds' Service Agreement (the “FSA”) between Vanguard and the fund, Vanguard furnishes to the fund investment advisory, corporate management, administrative, marketing, and distribution services at Vanguard’s cost of operations (as defined by the FSA). These costs of operations are allocated to the fund based on methods and guidelines approved by the board of trustees and are generally settled twice a month. |
| C. | The fund’s custodian bank has agreed to reduce its fees when the fund maintains cash on deposit in the non-interest-bearing custody account. For the year ended January 31, 2024, custodian fee offset arrangements reduced the fund’s expenses by $33,000 (an annual rate of less than 0.01% of average net assets). |
| D. | Various inputs may be used to determine the value of the fund’s investments and derivatives. These inputs are summarized in three broad levels for financial statement purposes. The inputs or methodologies used to value securities are not necessarily an indication of the risk associated with investing in those securities. |
| Level 1 ($000) | Level 2 ($000) | Level 3 ($000) | Total ($000) | |
| Investments | ||||
| Assets | ||||
| U.S. Government and Agency Obligations | — | 5,495,724 | — | 5,495,724 |
| Asset-Backed/Commercial Mortgage-Backed Securities | — | 541,234 | — | 541,234 |
| Temporary Cash Investments | 32,831 | — | — | 32,831 |
| Total | 32,831 | 6,036,958 | — | 6,069,789 |
| Derivative Financial Instruments | ||||
| Assets | ||||
| Futures Contracts1 | 1,164 | — | — | 1,164 |
| Liabilities | ||||
| Futures Contracts1 | 2,488 | — | — | 2,488 |
| 1 | Includes cumulative appreciation (depreciation) on futures contracts and centrally cleared swaps, if any, as reported in the Schedule of Investments. Only current day’s variation margin is reported within the Statement of Assets and Liabilities. |
| E. | Permanent differences between book-basis and tax-basis components of net assets, if any, are reclassified among capital accounts in the financial statements to reflect their tax character. These reclassifications have no effect on net assets or net asset value per share. |
| Amount ($000) | |
| Undistributed Ordinary Income | 3,453 |
| Undistributed Long-Term Gains | — |
| Net Unrealized Gains (Losses) | 24,101 |
| Capital Loss Carryforwards | (611,642) |
| Qualified Late-Year Losses | — |
| Other Temporary Differences | (2,963) |
| Total | (587,051) |
| Year Ended January 31, | ||
| 2024 Amount ($000) | 2023 Amount ($000) | |
| Ordinary Income* | 268,822 | 153,329 |
| Long-Term Capital Gains | — | — |
| Total | 268,822 | 153,329 |
| * | Includes short-term capital gains, if any. |
| Amount ($000) | |
| Tax Cost | 6,045,688 |
| Gross Unrealized Appreciation | 53,957 |
| Gross Unrealized Depreciation | (29,856) |
| Net Unrealized Appreciation (Depreciation) | 24,101 |
| F. | During the year ended January 31, 2024, the fund purchased $20,281,293,000 of investment securities and sold $20,939,366,000 of investment securities, other than temporary cash investments. |
| G. | Capital share transactions for each class of shares were: |
| Year Ended January 31, | |||||
| 2024 | 2023 | ||||
| Amount ($000) | Shares (000) | Amount ($000) | Shares (000) | ||
| Investor Shares | |||||
| Issued | 205,936 | 20,918 | 246,805 | 24,453 | |
| Issued in Lieu of Cash Distributions | 19,534 | 1,986 | 10,550 | 1,046 | |
| Redeemed | (279,422) | (28,372) | (241,726) | (23,778) | |
| Net Increase (Decrease)—Investor Shares | (53,952) | (5,468) | 15,629 | 1,721 | |
| Admiral Shares | |||||
| Issued | 1,828,371 | 185,498 | 2,281,386 | 225,040 | |
| Issued in Lieu of Cash Distributions | 206,964 | 21,046 | 120,863 | 11,976 | |
| Redeemed | (2,530,658) | (257,345) | (2,732,610) | (269,877) | |
| Net Increase (Decrease)—Admiral Shares | (495,323) | (50,801) | (330,361) | (32,861) | |
| H. | Significant market disruptions, such as those caused by pandemics (e.g., COVID-19 pandemic), natural or environmental disasters, war (e.g., Russia’s invasion of Ukraine), acts of terrorism, or other events, can adversely affect local and global markets and normal market operations. Any such disruptions could have an adverse impact on the value of the fund’s investments and fund performance. |
| I. | Management has determined that no events or transactions occurred subsequent to January 31, 2024, that would require recognition or disclosure in these financial statements. |

| Average Annual Total Returns Periods Ended January 31, 2024 | |||||
| One Year | Five Years | Ten Years | Final Value of a $10,000 Investment | ||
| Short-Term Federal Fund Investor Shares | 3.03% | 1.22% | 1.10% | $11,161 |
| Bloomberg U.S. 1-5 Year Government Bond Index | 3.57 | 1.18 | 1.12 | 11,176 |
| Bloomberg U.S. Aggregate Bond Index | 2.10 | 0.83 | 1.63 | 11,758 |
| One Year | Five Years | Ten Years | Final Value of a $50,000 Investment | ||
| Short-Term Federal Fund Admiral Shares | 3.14% | 1.32% | 1.21% | $56,364 | |
| Bloomberg U.S. 1-5 Year Government Bond Index | 3.57 | 1.18 | 1.12 | 55,878 | |
| Bloomberg U.S. Aggregate Bond Index | 2.10 | 0.83 | 1.63 | 58,788 | |
| Agency Bonds and Notes | 46.9% |
| Asset-Backed/Commercial Mortgage-Backed Securities | 10.0 |
| Government Mortgage-Backed Securities | 26.1 |
| U.S. Government Securities | 17.0 |
| Coupon | Maturity Date | Face Amount ($000) | Market Value• ($000) | |||
| U.S. Government and Agency Obligations (90.4%) | ||||||
| U.S. Government Securities (16.8%) | ||||||
| 1 | United States Treasury Note/Bond | 2.750% | 5/15/25 | 557,000 | 544,641 | |
| United States Treasury Note/Bond | 4.250% | 5/31/25 | 75,000 | 74,742 | ||
| United States Treasury Note/Bond | 3.125% | 8/15/25 | 30,000 | 29,428 | ||
| 2 | United States Treasury Note/Bond | 2.125% | 5/31/26 | 167,000 | 159,642 | |
| United States Treasury Note/Bond | 4.125% | 6/15/26 | 11,000 | 11,002 | ||
| 819,455 | ||||||
| Agency Bonds and Notes (46.6%) | ||||||
| 3 | Fannie Mae Interest Strip | 0.000% | 11/15/25 | 8,000 | 7,395 | |
| 3 | Fannie Mae Principal Strip | 0.000% | 11/15/30 | 7,000 | 5,240 | |
| Federal Farm Credit Banks Funding Corp. | 0.680% | 3/9/26 | 275,000 | 255,009 | ||
| Federal Home Loan Banks | 0.830% | 2/10/27 | 136,475 | 123,771 | ||
| Federal Home Loan Banks | 0.850% | 2/17/27 | 100,000 | 90,699 | ||
| Federal Home Loan Banks | 1.020% | 2/24/27 | 10,570 | 9,630 | ||
| Federal Home Loan Banks | 0.900% | 2/26/27 | 105,695 | 95,921 | ||
| Federal Home Loan Banks | 0.920% | 2/26/27 | 25,900 | 23,520 | ||
| Federal Home Loan Banks | 1.115% | 2/26/27 | 49,145 | 44,899 | ||
| 3 | Federal Home Loan Mortgage Corp. | 4.320% | 3/21/25 | 150,000 | 149,054 | |
| 3 | Federal Home Loan Mortgage Corp. | 0.680% | 8/6/25 | 73,100 | 69,055 | |
| 3 | Federal Home Loan Mortgage Corp. | 4.160% | 8/28/25 | 52,950 | 52,424 | |
| 3 | Federal Home Loan Mortgage Corp. | 5.570% | 8/28/25 | 200,000 | 200,394 | |
| 3 | Federal Home Loan Mortgage Corp. | 0.640% | 11/24/25 | 174,650 | 163,170 | |
| 3 | Federal Home Loan Mortgage Corp. | 0.700% | 12/30/25 | 194,850 | 181,821 | |
| 3 | Federal National Mortgage Assn. | 0.650% | 12/17/25 | 138,500 | 129,234 | |
| 3 | Federal National Mortgage Assn. | 0.650% | 12/17/25 | 180,495 | 168,419 | |
| 3 | Freddie Mac Principal Strips | 0.000% | 3/15/31 | 19,983 | 14,736 | |
| Private Export Funding Corp. | 4.300% | 12/15/28 | 45,000 | 45,303 | ||
| Resolution Funding Corp. Principal Strip | 0.000% | 1/15/30 | 394,377 | 305,557 | ||
| Resolution Funding Corp. Principal Strip | 0.000% | 4/15/30 | 171,307 | 131,238 | ||
| 2,266,489 | ||||||
| Conventional Mortgage-Backed Securities (19.6%) | ||||||
| 3,4 | Freddie Mac Gold Pool | 2.000% | 9/1/28–6/1/30 | 1,718 | 1,548 | |
| 3,4,5 | UMBS Pool | 2.000% | 10/1/27–1/1/37 | 504,157 | 460,619 | |
| 3,4 | UMBS Pool | 1.500% | 11/1/30–2/1/36 | 266,664 | 244,495 | |
| 3,4,5 | UMBS Pool | 3.000% | 1/1/33–2/1/52 | 33,052 | 31,943 | |
| 3,4,5 | UMBS Pool | 3.500% | 1/1/33–9/1/34 | 44,589 | 43,657 | |
| 3,4 | UMBS Pool | 2.500% | 2/1/35–4/1/37 | 72,208 | 67,659 | |
| Coupon | Maturity Date | Face Amount ($000) | Market Value• ($000) | |||
| 3,4,5 | UMBS Pool | 4.500% | 2/15/39 | 1,500 | 1,488 | |
| 3,4,5 | UMBS Pool | 5.000% | 2/13/54 | 49,500 | 48,858 | |
| 3,4,5 | UMBS Pool | 6.000% | 2/13/54 | 53,000 | 53,696 | |
| 953,963 | ||||||
| Nonconventional Mortgage-Backed Securities (7.4%) | ||||||
| 3,4 | Fannie Mae REMICS | 5.500% | 9/25/33 | 5,716 | 5,881 | |
| 3,4 | Fannie Mae REMICS | 2.000% | 4/25/42–5/25/45 | 81,600 | 75,414 | |
| 3,4 | Fannie Mae REMICS | 3.000% | 6/25/48 | 24,503 | 22,357 | |
| 3,4 | Fannie Mae REMICS | 4.500% | 8/25/49–10/25/49 | 74,541 | 72,846 | |
| 3,4 | Fannie Mae REMICS | 2.500% | 11/25/49 | 21,194 | 19,588 | |
| 3,4 | Freddie Mac REMICS | 3.000% | 9/15/32–11/25/48 | 70,289 | 64,615 | |
| 3,4 | Freddie Mac REMICS | 4.500% | 10/25/44–3/25/48 | 42,372 | 41,459 | |
| 3,4 | Freddie Mac REMICS | 2.500% | 9/25/48–12/25/48 | 19,194 | 16,781 | |
| 4 | Ginnie Mae REMICS | 3.000% | 11/20/50–12/20/51 | 5 | 4 | |
| 4 | Ginnie Mae REMICS | 4.500% | 5/20/51 | 39,154 | 38,651 | |
| 4 | Ginnie Mae REMICS | 2.500% | 9/20/51 | 5 | 4 | |
| 4 | Ginnie Mae REMICS | 1.500% | 12/20/51 | 1 | 1 | |
| 357,601 | ||||||
| Total U.S. Government and Agency Obligations (Cost $4,535,099) | 4,397,508 | |||||
| Asset-Backed/Commercial Mortgage-Backed Securities (10.0%) | ||||||
| 3,4 | FHLMC Multifamily Structured Pass-Through Certificates Class A2 Series K055 | 2.673% | 3/25/26 | 2,000 | 1,924 | |
| 3,4 | FHLMC Multifamily Structured Pass-Through Certificates Class A2 Series K056 | 2.525% | 5/25/26 | 16,500 | 15,794 | |
| 3,4 | FHLMC Multifamily Structured Pass-Through Certificates Class A2 Series K057 | 2.570% | 7/25/26 | 23,800 | 22,767 | |
| 3,4,6 | FHLMC Multifamily Structured Pass-Through Certificates Class A2 Series K063 | 3.430% | 1/25/27 | 2,690 | 2,615 | |
| 3,4 | FHLMC Multifamily Structured Pass-Through Certificates Class A2 Series K064 | 3.224% | 3/25/27 | 4,245 | 4,099 | |
| 3,4 | FHLMC Multifamily Structured Pass-Through Certificates Class A2 Series K065 | 3.243% | 4/25/27 | 28,088 | 27,105 | |
| 3,4 | FHLMC Multifamily Structured Pass-Through Certificates Class A2 Series K066 | 3.117% | 6/25/27 | 73,639 | 70,702 | |
| 3,4 | FHLMC Multifamily Structured Pass-Through Certificates Class A2 Series K067 | 3.194% | 7/25/27 | 27,013 | 25,953 | |
| 3,4,6 | FHLMC Multifamily Structured Pass-Through Certificates Class A2 Series K070 | 3.303% | 11/25/27 | 42,021 | 40,424 | |
| 3,4 | FHLMC Multifamily Structured Pass-Through Certificates Class A2 Series K072 | 3.444% | 12/25/27 | 4,800 | 4,635 | |
| 3,4,6 | FHLMC Multifamily Structured Pass-Through Certificates Class A2 Series K077 | 3.850% | 5/25/28 | 1,800 | 1,760 | |
| 3,4,6 | FHLMC Multifamily Structured Pass-Through Certificates Class A2 Series K080 | 3.926% | 7/25/28 | 3,873 | 3,796 | |
| 3,4,6 | FHLMC Multifamily Structured Pass-Through Certificates Class A2 Series K507 | 4.800% | 9/25/28 | 30,550 | 31,006 | |
| 3,4,6 | FHLMC Multifamily Structured Pass-Through Certificates Class A2 Series K508 | 4.740% | 8/25/28 | 33,000 | 33,418 | |
| 3,4 | FHLMC Multifamily Structured Pass-Through Certificates Class A2 Series K509 | 4.850% | 9/25/28 | 23,000 | 23,398 | |
| 3,4,6 | FHLMC Multifamily Structured Pass-Through Certificates Class A2 Series K510 | 5.069% | 10/25/28 | 6,000 | 6,159 | |
| 3,4 | FHLMC Multifamily Structured Pass-Through Certificates Class A2 Series K511 | 4.860% | 10/25/28 | 31,600 | 32,177 | |
| Coupon | Maturity Date | Face Amount ($000) | Market Value• ($000) | |||
| 3,4 | FHLMC Multifamily Structured Pass-Through Certificates Class A2 Series K512 | 5.000% | 11/25/28 | 60,500 | 61,942 | |
| 3,4,6 | FHLMC Multifamily Structured Pass-Through Certificates Class A2 Series K513 | 4.724% | 12/25/28 | 60,700 | 61,393 | |
| 3,4 | FHLMC Multifamily Structured Pass-Through Certificates Class A2 Series K734 | 3.208% | 2/25/26 | 4,900 | 4,776 | |
| 3,4 | FHLMC Multifamily Structured Pass-Through Certificates Class A2 Series K736 | 2.282% | 7/25/26 | 4,000 | 3,802 | |
| 3,4 | FHLMC Multifamily Structured Pass-Through Certificates Class A2 Series K737 | 2.525% | 10/25/26 | 5,000 | 4,752 | |
| Total Asset-Backed/Commercial Mortgage-Backed Securities (Cost $475,913) | 484,397 | |||||
| Shares | ||||||
| Temporary Cash Investments (0.8%) | ||||||
| Money Market Fund (0.8%) | ||||||
| 7 | Vanguard Market Liquidity Fund (Cost $37,035) | 5.410% | 370,429 | 37,039 | ||
| Total Investments (101.2%) (Cost $5,048,047) | 4,918,944 | |||||
| Maturity Date | Face Amount ($000) | |||||
| Conventional Mortgage-Backed Securities—Liability for Sale Commitments (-1.1%) | ||||||
| 3,4,5 | UMBS Pool (Proceeds ($52,998) | 5.500% | 2/13/54 | (53,000) | (53,157) | |
| Other Assets and Liabilities—Net (-0.1%) | (3,649) | |||||
| Net Assets (100%) | 4,862,138 | |||||
| Cost is in $000. | ||||||
| • | See Note A in Notes to Financial Statements. |
| 1 | Securities with a value of $62,000 have been segregated as collateral for certain open To Be Announced (TBA) transactions. |
| 2 | Securities with a value of $12,403,000 have been segregated as initial margin for open futures contracts. |
| 3 | The issuer was placed under federal conservatorship in September 2008; since that time, its daily operations have been managed by the Federal Housing Finance Agency and it receives capital from the U.S. Treasury, as needed to maintain a positive net worth, in exchange for senior preferred stock. |
| 4 | The average or expected maturity is shorter than the final maturity shown because of the possibility of interim principal payments and prepayments or the possibility of the issue being called. |
| 5 | Includes securities purchased on a when-issued or delayed-delivery basis for which the fund has not taken delivery as of January 31, 2024. |
| 6 | Variable-rate security; rate shown is effective rate at period end. Certain variable-rate securities are not based on a published reference rate and spread but are determined by the issuer or agent based on current market conditions. |
| 7 | Affiliated money market fund available only to Vanguard funds and certain trusts and accounts managed by Vanguard. Rate shown is the 7-day yield. |
| REMICS—Real Estate Mortgage Investment Conduits. | |
| UMBS—Uniform Mortgage-Backed Securities. |
| Futures Contracts | ||||
| ($000) | ||||
| Expiration | Number of Long (Short) Contracts | Notional Amount | Value and Unrealized Appreciation (Depreciation) | |
| Long Futures Contracts | ||||
| 2-Year U.S. Treasury Note | March 2024 | 3,116 | 640,825 | 426 |
| Short Futures Contracts | ||||
| 5-Year U.S. Treasury Note | March 2024 | (2,305) | (249,840) | (809) |
| 10-Year U.S. Treasury Note | March 2024 | (3,987) | (447,852) | (11,786) |
| Ultra 10-Year U.S. Treasury Note | March 2024 | (185) | (21,622) | (285) |
| (12,880) | ||||
| (12,454) | ||||
| ($000s, except shares, footnotes, and per-share amounts) | Amount |
| Assets | |
| Investments in Securities, at Value | |
| Unaffiliated Issuers (Cost $5,011,012) | 4,881,905 |
| Affiliated Issuers (Cost $37,035) | 37,039 |
| Total Investments in Securities | 4,918,944 |
| Investment in Vanguard | 154 |
| Cash | 29 |
| Receivables for Investment Securities Sold | 196,180 |
| Receivables for Accrued Income | 21,265 |
| Receivables for Capital Shares Issued | 6,424 |
| Other Assets | 111 |
| Total Assets | 5,143,107 |
| Liabilities | |
| Payables for Investment Securities Purchased | 212,699 |
| Payables for Capital Shares Redeemed | 10,839 |
| Payables for Distributions | 1,579 |
| Payables to Vanguard | 231 |
| Liability for Sale Commitments, at Value (Proceeds $52,998) | 53,157 |
| Variation Margin Payable—Futures Contracts | 2,464 |
| Total Liabilities | 280,969 |
| Net Assets | 4,862,138 |
| At January 31, 2024, net assets consisted of: | |
| Paid-in Capital | 5,439,327 |
| Total Distributable Earnings (Loss) | (577,189) |
| Net Assets | 4,862,138 |
| Investor Shares—Net Assets | |
| Applicable to 41,722,916 outstanding $.001 par value shares of beneficial interest (unlimited authorization) | 421,805 |
| Net Asset Value Per Share—Investor Shares | $10.11 |
| Admiral Shares—Net Assets | |
| Applicable to 439,216,203 outstanding $.001 par value shares of beneficial interest (unlimited authorization) | 4,440,333 |
| Net Asset Value Per Share—Admiral Shares | $10.11 |
| Year Ended January 31, 2024 | |
| ($000) | |
| Investment Income | |
| Income | |
| Interest1 | 184,906 |
| Total Income | 184,906 |
| Expenses | |
| The Vanguard Group—Note B | |
| Investment Advisory Services | 552 |
| Management and Administrative—Investor Shares | 778 |
| Management and Administrative—Admiral Shares | 3,747 |
| Marketing and Distribution—Investor Shares | 30 |
| Marketing and Distribution—Admiral Shares | 259 |
| Custodian Fees | 70 |
| Auditing Fees | 38 |
| Shareholders’ Reports—Investor Shares | 23 |
| Shareholders’ Reports—Admiral Shares | 78 |
| Trustees’ Fees and Expenses | 3 |
| Other Expenses | 16 |
| Total Expenses | 5,594 |
| Expenses Paid Indirectly | (16) |
| Net Expenses | 5,578 |
| Net Investment Income | 179,328 |
| Realized Net Gain (Loss) | |
| Investment Securities Sold1 | (255,421) |
| Futures Contracts | 35,418 |
| Realized Net Gain (Loss) | (220,003) |
| Change in Unrealized Appreciation (Depreciation) | |
| Investment Securities1 | 187,932 |
| Futures Contracts | 3,794 |
| Change in Unrealized Appreciation (Depreciation) | 191,726 |
| Net Increase (Decrease) in Net Assets Resulting from Operations | 151,051 |
| 1 | Interest income, realized net gain (loss), capital gain distributions received, and change in unrealized appreciation (depreciation) from an affiliated company of the fund were $6,668,000, $58,000, less than $1,000, and ($7,000), respectively. Purchases and sales are for temporary cash investment purposes. |
| Year Ended January 31, | ||
| 2024 ($000) | 2023 ($000) | |
| Increase (Decrease) in Net Assets | ||
| Operations | ||
| Net Investment Income | 179,328 | 123,862 |
| Realized Net Gain (Loss) | (220,003) | (195,098) |
| Change in Unrealized Appreciation (Depreciation) | 191,726 | (208,194) |
| Net Increase (Decrease) in Net Assets Resulting from Operations | 151,051 | (279,430) |
| Distributions | ||
| Investor Shares | (14,996) | (9,215) |
| Admiral Shares | (163,428) | (114,891) |
| Total Distributions | (178,424) | (124,106) |
| Capital Share Transactions | ||
| Investor Shares | (55,173) | (103,279) |
| Admiral Shares | (587,541) | (1,830,715) |
| Net Increase (Decrease) from Capital Share Transactions | (642,714) | (1,933,994) |
| Total Increase (Decrease) | (670,087) | (2,337,530) |
| Net Assets | ||
| Beginning of Period | 5,532,225 | 7,869,755 |
| End of Period | 4,862,138 | 5,532,225 |
| Investor Shares | |||||
| For a Share Outstanding Throughout Each Period | Year Ended January 31, | ||||
| 2024 | 2023 | 2022 | 2021 | 2020 | |
| Net Asset Value, Beginning of Period | $10.15 | $10.70 | $11.02 | $10.79 | $10.57 |
| Investment Operations | |||||
| Net Investment Income1 | .340 | .182 | .054 | .125 | .246 |
| Net Realized and Unrealized Gain (Loss) on Investments | (.041) | (.545) | (.215) | .274 | .221 |
| Total from Investment Operations | .299 | (.363) | (.161) | .399 | .467 |
| Distributions | |||||
| Dividends from Net Investment Income | (.339) | (.187) | (.053) | (.127) | (.247) |
| Distributions from Realized Capital Gains | — | — | (.106) | (.042) | — |
| Total Distributions | (.339) | (.187) | (.159) | (.169) | (.247) |
| Net Asset Value, End of Period | $10.11 | $10.15 | $10.70 | $11.02 | $10.79 |
| Total Return2 | 3.03% | -3.39% | -1.48% | 3.71% | 4.46% |
| Ratios/Supplemental Data | |||||
| Net Assets, End of Period (Millions) | $422 | $479 | $612 | $767 | $623 |
| Ratio of Total Expenses to Average Net Assets | |||||
| Ratio of Total Expenses to Average Net Assets | 0.20%3 | 0.20%3 | 0.20% | 0.20% | 0.20% |
| Ratio of Net Investment Income to Average Net Assets | 3.40% | 1.76% | 0.50% | 1.14% | 2.30% |
| Portfolio Turnover Rate4 | 342% | 442% | 424% | 663% | 499% |
| 1 | Calculated based on average shares outstanding. |
| 2 | Total returns do not include account service fees that may have applied in the periods shown. Fund prospectuses provide information about any applicable account service fees. |
| 3 | The ratio of expenses to average net assets for the period net of reduction from custody fee offset arrangements was 0.20%. |
| 4 | Includes 79%, 86%, 87%, 180%, and 32%, respectively, attributable to mortgage-dollar-roll activity. |
| Admiral Shares | |||||
| For a Share Outstanding Throughout Each Period | Year Ended January 31, | ||||
| 2024 | 2023 | 2022 | 2021 | 2020 | |
| Net Asset Value, Beginning of Period | $10.15 | $10.70 | $11.02 | $10.79 | $10.57 |
| Investment Operations | |||||
| Net Investment Income1 | .350 | .189 | .065 | .130 | .257 |
| Net Realized and Unrealized Gain (Loss) on Investments | (.041) | (.542) | (.215) | .280 | .220 |
| Total from Investment Operations | .309 | (.353) | (.150) | .410 | .477 |
| Distributions | |||||
| Dividends from Net Investment Income | (.349) | (.197) | (.064) | (.138) | (.257) |
| Distributions from Realized Capital Gains | — | — | (.106) | (.042) | — |
| Total Distributions | (.349) | (.197) | (.170) | (.180) | (.257) |
| Net Asset Value, End of Period | $10.11 | $10.15 | $10.70 | $11.02 | $10.79 |
| Total Return2 | 3.14% | -3.29% | -1.38% | 3.81% | 4.56% |
| Ratios/Supplemental Data | |||||
| Net Assets, End of Period (Millions) | $4,440 | $5,053 | $7,258 | $7,280 | $4,371 |
| Ratio of Total Expenses to Average Net Assets | 0.10%3 | 0.10%3 | 0.10% | 0.10% | 0.10% |
| Ratio of Net Investment Income to Average Net Assets | 3.50% | 1.84% | 0.59% | 1.19% | 2.40% |
| Portfolio Turnover Rate4 | 342% | 442% | 424% | 663% | 499% |
| 1 | Calculated based on average shares outstanding. |
| 2 | Total returns do not include account service fees that may have applied in the periods shown. Fund prospectuses provide information about any applicable account service fees. |
| 3 | The ratio of expenses to average net assets for the period net of reduction from custody fee offset arrangements was 0.10%. |
| 4 | Includes 79%, 86%, 87%, 180%, and 32%, respectively, attributable to mortgage-dollar-roll activity. |
| A. | The following significant accounting policies conform to generally accepted accounting principles for U.S. investment companies. The fund consistently follows such policies in preparing its financial statements. |
| B. | In accordance with the terms of a Funds' Service Agreement (the “FSA”) between Vanguard and the fund, Vanguard furnishes to the fund investment advisory, corporate management, administrative, marketing, and distribution services at Vanguard’s cost of operations (as defined by the FSA). These costs of operations are allocated to the fund based on methods and guidelines approved by the board of trustees and are generally settled twice a month. |
| C. | The fund’s custodian bank has agreed to reduce its fees when the fund maintains cash on deposit in the non-interest-bearing custody account. For the year ended January 31, 2024, custodian fee offset arrangements reduced the fund’s expenses by $16,000 (an annual rate of less than 0.01% of average net assets). |
| D. | Various inputs may be used to determine the value of the fund’s investments and derivatives. These inputs are summarized in three broad levels for financial statement purposes. The inputs or methodologies used to value securities are not necessarily an indication of the risk associated with investing in those securities. |
| Level 1 ($000) | Level 2 ($000) | Level 3 ($000) | Total ($000) | |
| Investments | ||||
| Assets | ||||
| U.S. Government and Agency Obligations | — | 4,397,508 | — | 4,397,508 |
| Asset-Backed/Commercial Mortgage-Backed Securities | — | 484,397 | — | 484,397 |
| Temporary Cash Investments | 37,039 | — | — | 37,039 |
| Total | 37,039 | 4,881,905 | — | 4,918,944 |
| Liabilities | ||||
| Conventional Mortgage-Backed Securities—Liability for Sale Commitments | — | 53,157 | — | 53,157 |
| Derivative Financial Instruments | ||||
| Assets | ||||
| Futures Contracts1 | 426 | — | — | 426 |
| Liabilities | ||||
| Futures Contracts1 | 12,880 | — | — | 12,880 |
| 1 | Includes cumulative appreciation (depreciation) on futures contracts and centrally cleared swaps, if any, as reported in the Schedule of Investments. Only current day’s variation margin is reported within the Statement of Assets and Liabilities. |
| E. | Permanent differences between book-basis and tax-basis components of net assets, if any, are reclassified among capital accounts in the financial statements to reflect their tax character. These reclassifications have no effect on net assets or net asset value per share. |
| Amount ($000) | |
| Undistributed Ordinary Income | 3,490 |
| Undistributed Long-Term Gains | — |
| Net Unrealized Gains (Losses) | (129,262) |
| Capital Loss Carryforwards | (449,838) |
| Qualified Late-Year Losses | — |
| Other Temporary Differences | (1,579) |
| Total | (577,189) |
| Year Ended January 31, | ||
| 2024 Amount ($000) | 2023 Amount ($000) | |
| Ordinary Income* | 178,424 | 124,106 |
| Long-Term Capital Gains | — | — |
| Total | 178,424 | 124,106 |
| * | Includes short-term capital gains, if any. |
| Amount ($000) | |
| Tax Cost | 5,048,047 |
| Gross Unrealized Appreciation | 34,627 |
| Gross Unrealized Depreciation | (163,889) |
| Net Unrealized Appreciation (Depreciation) | (129,262) |
| F. | During the year ended January 31, 2024, the fund purchased $18,092,350,000 of investment securities and sold $18,984,518,000 of investment securities, other than temporary cash investments. |
| G. | Capital share transactions for each class of shares were: |
| Year Ended January 31, | |||||
| 2024 | 2023 | ||||
| Amount ($000) | Shares (000) | Amount ($000) | Shares (000) | ||
| Investor Shares | |||||
| Issued | 77,246 | 7,717 | 105,918 | 10,330 | |
| Issued in Lieu of Cash Distributions | 13,524 | 1,352 | 8,218 | 807 | |
| Redeemed | (145,943) | (14,584) | (217,415) | (21,103) | |
| Net Increase (Decrease)—Investor Shares | (55,173) | (5,515) | (103,279) | (9,966) | |
| Admiral Shares | |||||
| Issued | 1,266,249 | 126,614 | 2,647,414 | 255,182 | |
| Issued in Lieu of Cash Distributions | 139,568 | 13,955 | 98,482 | 9,653 | |
| Redeemed | (1,993,358) | (199,332) | (4,576,611) | (444,960) | |
| Net Increase (Decrease)—Admiral Shares | (587,541) | (58,763) | (1,830,715) | (180,125) | |
| H. | Significant market disruptions, such as those caused by pandemics (e.g., COVID-19 pandemic), natural or environmental disasters, war (e.g., Russia’s invasion of Ukraine), acts of terrorism, or other events, can adversely affect local and global markets and normal market operations. Any such disruptions could have an adverse impact on the value of the fund’s investments and fund performance. |
| I. | Management has determined that no events or transactions occurred subsequent to January 31, 2024, that would require recognition or disclosure in these financial statements. |

| Average Annual Total Returns Periods Ended January 31, 2024 | |||||
| One Year | Five Years | Ten Years | Final Value of a $10,000 Investment | ||
| Intermediate-Term Treasury Fund Investor Shares | 1.80% | 0.86% | 1.27% | $11,350 |
| Bloomberg U.S. 5-10 Year Treasury Bond Index | 1.35 | 0.56 | 1.40 | 11,494 |
| Bloomberg U.S. Aggregate Bond Index | 2.10 | 0.83 | 1.63 | 11,758 |
| One Year | Five Years | Ten Years | Final Value of a $50,000 Investment | ||
| Intermediate-Term Treasury Fund Admiral Shares | 1.90% | 0.96% | 1.38% | $57,317 | |
| Bloomberg U.S. 5-10 Year Treasury Bond Index | 1.35 | 0.56 | 1.40 | 57,472 | |
| Bloomberg U.S. Aggregate Bond Index | 2.10 | 0.83 | 1.63 | 58,788 | |
| Agency Bonds and Notes | 3.6% |
| Asset-Backed/Commercial Mortgage-Backed Securities | 6.2 |
| Government Mortgage-Backed Securities | 5.4 |
| U.S. Government Securities | 84.8 |
| Coupon | Maturity Date | Face Amount ($000) | Market Value• ($000) | |||
| U.S. Government and Agency Obligations (92.7%) | ||||||
| U.S. Government Securities (83.8%) | ||||||
| United States Treasury Note/Bond | 1.875% | 2/28/27 | 172,000 | 161,492 | ||
| United States Treasury Note/Bond | 0.625% | 3/31/27 | 51,000 | 45,948 | ||
| United States Treasury Note/Bond | 2.500% | 3/31/27 | 20,000 | 19,128 | ||
| United States Treasury Note/Bond | 0.500% | 4/30/27 | 10,000 | 8,950 | ||
| United States Treasury Note/Bond | 2.750% | 4/30/27 | 117,000 | 112,631 | ||
| United States Treasury Note/Bond | 0.500% | 5/31/27 | 55,600 | 49,632 | ||
| United States Treasury Note/Bond | 2.625% | 5/31/27 | 148,500 | 142,282 | ||
| United States Treasury Note/Bond | 0.500% | 6/30/27 | 126,700 | 112,822 | ||
| United States Treasury Note/Bond | 3.250% | 6/30/27 | 47,200 | 46,138 | ||
| United States Treasury Note/Bond | 0.375% | 7/31/27 | 148,000 | 130,841 | ||
| United States Treasury Note/Bond | 2.750% | 7/31/27 | 98,000 | 94,141 | ||
| United States Treasury Note/Bond | 0.500% | 8/31/27 | 40,000 | 35,438 | ||
| United States Treasury Note/Bond | 0.375% | 9/30/27 | 120,000 | 105,525 | ||
| United States Treasury Note/Bond | 4.125% | 9/30/27 | 31,000 | 31,184 | ||
| United States Treasury Note/Bond | 0.500% | 10/31/27 | 100,000 | 88,125 | ||
| United States Treasury Note/Bond | 0.625% | 12/31/27 | 39,000 | 34,369 | ||
| United States Treasury Note/Bond | 1.250% | 4/30/28 | 138,700 | 124,353 | ||
| United States Treasury Note/Bond | 1.250% | 5/31/28 | 38,500 | 34,458 | ||
| United States Treasury Note/Bond | 1.250% | 6/30/28 | 18,600 | 16,618 | ||
| United States Treasury Note/Bond | 1.125% | 8/31/28 | 6,150 | 5,442 | ||
| United States Treasury Note/Bond | 1.250% | 9/30/28 | 7,000 | 6,217 | ||
| United States Treasury Note/Bond | 1.375% | 10/31/28 | 20,530 | 18,304 | ||
| United States Treasury Note/Bond | 3.125% | 11/15/28 | 30,100 | 29,103 | ||
| United States Treasury Note/Bond | 5.250% | 11/15/28 | 24,000 | 25,358 | ||
| United States Treasury Note/Bond | 1.500% | 11/30/28 | 93,589 | 83,806 | ||
| United States Treasury Note/Bond | 1.375% | 12/31/28 | 9,700 | 8,621 | ||
| United States Treasury Note/Bond | 1.750% | 1/31/29 | 46,600 | 42,107 | ||
| United States Treasury Note/Bond | 4.000% | 1/31/29 | 22,000 | 22,131 | ||
| United States Treasury Note/Bond | 2.625% | 2/15/29 | 78,000 | 73,503 | ||
| United States Treasury Note/Bond | 1.875% | 2/28/29 | 80,891 | 73,434 | ||
| United States Treasury Note/Bond | 2.375% | 3/31/29 | 96,050 | 89,266 | ||
| United States Treasury Note/Bond | 2.875% | 4/30/29 | 108,400 | 103,183 | ||
| United States Treasury Note/Bond | 2.375% | 5/15/29 | 98,700 | 91,606 | ||
| United States Treasury Note/Bond | 2.750% | 5/31/29 | 126,900 | 119,940 | ||
| United States Treasury Note/Bond | 3.250% | 6/30/29 | 114,500 | 110,886 | ||
| United States Treasury Note/Bond | 2.625% | 7/31/29 | 129,800 | 121,687 | ||
| United States Treasury Note/Bond | 3.125% | 8/31/29 | 126,500 | 121,598 | ||
| Coupon | Maturity Date | Face Amount ($000) | Market Value• ($000) | |||
| United States Treasury Note/Bond | 3.875% | 9/30/29 | 99,200 | 99,014 | ||
| United States Treasury Note/Bond | 4.000% | 10/31/29 | 105,300 | 105,761 | ||
| United States Treasury Note/Bond | 3.875% | 11/30/29 | 111,500 | 111,291 | ||
| United States Treasury Note/Bond | 3.875% | 12/31/29 | 102,000 | 101,777 | ||
| United States Treasury Note/Bond | 3.500% | 1/31/30 | 85,000 | 83,141 | ||
| United States Treasury Note/Bond | 1.500% | 2/15/30 | 25,000 | 21,789 | ||
| United States Treasury Note/Bond | 4.000% | 2/28/30 | 101,800 | 102,245 | ||
| United States Treasury Note/Bond | 3.625% | 3/31/30 | 99,500 | 97,914 | ||
| United States Treasury Note/Bond | 3.500% | 4/30/30 | 68,200 | 66,623 | ||
| United States Treasury Note/Bond | 0.625% | 5/15/30 | 141,000 | 115,356 | ||
| United States Treasury Note/Bond | 3.750% | 5/31/30 | 113,000 | 111,923 | ||
| United States Treasury Note/Bond | 3.750% | 6/30/30 | 100,700 | 99,740 | ||
| United States Treasury Note/Bond | 4.000% | 7/31/30 | 48,800 | 49,021 | ||
| 1 | United States Treasury Note/Bond | 0.625% | 8/15/30 | 137,300 | 111,406 | |
| United States Treasury Note/Bond | 4.125% | 8/31/30 | 35,000 | 35,399 | ||
| United States Treasury Note/Bond | 4.625% | 9/30/30 | 48,000 | 49,950 | ||
| United States Treasury Note/Bond | 4.375% | 11/30/30 | 9,500 | 9,752 | ||
| United States Treasury Note/Bond | 1.625% | 5/15/31 | 73,800 | 63,237 | ||
| United States Treasury Note/Bond | 1.250% | 8/15/31 | 117,600 | 97,314 | ||
| United States Treasury Note/Bond | 1.375% | 11/15/31 | 96,000 | 79,695 | ||
| United States Treasury Note/Bond | 1.875% | 2/15/32 | 108,900 | 93,569 | ||
| United States Treasury Note/Bond | 2.875% | 5/15/32 | 107,000 | 98,958 | ||
| United States Treasury Note/Bond | 2.750% | 8/15/32 | 84,800 | 77,473 | ||
| United States Treasury Note/Bond | 4.125% | 11/15/32 | 90,300 | 91,499 | ||
| United States Treasury Note/Bond | 3.500% | 2/15/33 | 104,900 | 101,360 | ||
| United States Treasury Note/Bond | 3.375% | 5/15/33 | 95,000 | 90,814 | ||
| United States Treasury Note/Bond | 3.875% | 8/15/33 | 144,700 | 143,886 | ||
| United States Treasury Note/Bond | 4.500% | 11/15/33 | 99,500 | 103,915 | ||
| 4,954,089 | ||||||
| Agency Bonds and Notes (3.6%) | ||||||
| 2 | Fannie Mae Principal Strip | 0.000% | 11/15/30 | 6,000 | 4,491 | |
| Federal Home Loan Banks | 2.250% | 3/4/36 | 33,640 | 26,029 | ||
| 2 | Federal Home Loan Mortgage Corp. | 1.500% | 7/27/32 | 18,340 | 14,564 | |
| 2 | Freddie Mac Principal Strips | 0.000% | 3/15/31 | 26,475 | 19,524 | |
| Private Export Funding Corp. | 4.600% | 2/15/34 | 60,000 | 60,591 | ||
| Resolution Funding Corp. Principal Strip | 0.000% | 1/15/30 | 15,000 | 11,622 | ||
| Resolution Funding Corp. Principal Strip | 0.000% | 4/15/30 | 98,000 | 75,077 | ||
| 211,898 | ||||||
| Conventional Mortgage-Backed Securities (0.7%) | ||||||
| 2,3,4 | UMBS Pool | 3.000% | 2/1/43–2/1/47 | 46,097 | 42,174 | |
| Nonconventional Mortgage-Backed Securities (4.6%) | ||||||
| 2,3 | Fannie Mae REMICS | 2.500% | 11/25/47 | 32,046 | 28,677 | |
| 2,3 | Fannie Mae REMICS | 4.000% | 5/25/49 | 21,808 | 20,849 | |
| 2,3 | Freddie Mac REMICS | 2.000% | 7/25/47–5/25/51 | 58,316 | 49,450 | |
| 2,3 | Freddie Mac REMICS | 3.000% | 7/25/48–10/25/49 | 44,622 | 40,412 | |
| 2,3 | Freddie Mac REMICS | 2.500% | 9/25/48–1/25/51 | 117,382 | 100,036 | |
| 3 | Ginnie Mae REMICS | 2.000% | 10/20/50 | 17,407 | 14,015 | |
| 3 | Ginnie Mae REMICS | 1.100% | 1/20/51 | 23,596 | 17,666 | |
| 271,105 | ||||||
| Total U.S. Government and Agency Obligations (Cost $5,500,946) | 5,479,266 | |||||
| Asset-Backed/Commercial Mortgage-Backed Securities (6.1%) | ||||||
| 2,3 | FHLMC Multifamily Structured Pass Through Certificates Class A2 Series K096 | 2.519% | 7/25/29 | 980 | 892 | |
| Coupon | Maturity Date | Face Amount ($000) | Market Value• ($000) | |||
| 2,3 | FHLMC Multifamily Structured Pass Through Certificates Class A2 Series K099 | 2.595% | 9/25/29 | 10,000 | 9,111 | |
| 2,3 | FHLMC Multifamily Structured Pass Through Certificates Class A2 Series K102 | 2.537% | 10/25/29 | 34,402 | 31,186 | |
| 2,3 | FHLMC Multifamily Structured Pass Through Certificates Class A2 Series K116 | 1.378% | 7/25/30 | 2,600 | 2,159 | |
| 2,3 | FHLMC Multifamily Structured Pass Through Certificates Class A2 Series K120 | 1.500% | 10/25/30 | 21,000 | 17,441 | |
| 2,3 | FHLMC Multifamily Structured Pass Through Certificates Class A2 Series K122 | 1.521% | 11/25/30 | 15,000 | 12,440 | |
| 2,3,5 | FHLMC Multifamily Structured Pass Through Certificates Class A2 Series K754 | 4.940% | 11/25/30 | 50,000 | 51,221 | |
| 2,3,5 | FHLMC Multifamily Structured Pass-Through Certificates Class A2 Series K080 | 3.926% | 7/25/28 | 905 | 887 | |
| 2,3 | FHLMC Multifamily Structured Pass-Through Certificates Class A2 Series K509 | 4.850% | 9/25/28 | 25,500 | 25,941 | |
| 2,3 | FHLMC Multifamily Structured Pass-Through Certificates Class A2 Series K511 | 4.860% | 10/25/28 | 37,500 | 38,185 | |
| 2,3 | FHLMC Multifamily Structured Pass-Through Certificates Class A2 Series K512 | 5.000% | 11/25/28 | 70,800 | 72,488 | |
| 2,3,5 | FHLMC Multifamily Structured Pass-Through Certificates Class A2 Series K513 | 4.724% | 12/25/28 | 72,600 | 73,429 | |
| 2,3,6 | FHLMC Multifamily WI Certificates Class A2 Series K162 | 5.150% | 3/25/34 | 26,105 | 27,277 | |
| Total Asset-Backed/Commercial Mortgage-Backed Securities (Cost $358,056) | 362,657 | |||||
| Shares | ||||||
| Temporary Cash Investments (0.9%) | ||||||
| Money Market Fund (0.9%) | ||||||
| 7 | Vanguard Market Liquidity Fund (Cost $50,097) | 5.410% | 501,073 | 50,102 | ||
| Total Investments (99.7%) (Cost $5,909,099) | 5,892,025 | |||||
| Other Assets and Liabilities—Net (0.3%) | 19,203 | |||||
| Net Assets (100%) | 5,911,228 | |||||
| Cost is in $000. | ||||||
| • | See Note A in Notes to Financial Statements. |
| 1 | Securities with a value of $5,841,000 have been segregated as initial margin for open futures contracts. |
| 2 | The issuer was placed under federal conservatorship in September 2008; since that time, its daily operations have been managed by the Federal Housing Finance Agency and it receives capital from the U.S. Treasury, as needed to maintain a positive net worth, in exchange for senior preferred stock. |
| 3 | The average or expected maturity is shorter than the final maturity shown because of the possibility of interim principal payments and prepayments or the possibility of the issue being called. |
| 4 | Includes securities purchased on a when-issued or delayed-delivery basis for which the fund has not taken delivery as of January 31, 2024. |
| 5 | Variable-rate security; rate shown is effective rate at period end. Certain variable-rate securities are not based on a published reference rate and spread but are determined by the issuer or agent based on current market conditions. |
| 6 | Security exempt from registration under Rule 144A of the Securities Act of 1933. Such securities may be sold in transactions exempt from registration, normally to qualified institutional buyers. At January 31, 2024, the aggregate value was $27,277,000, representing 0.5% of net assets. |
| 7 | Affiliated money market fund available only to Vanguard funds and certain trusts and accounts managed by Vanguard. Rate shown is the 7-day yield. |
| REMICS—Real Estate Mortgage Investment Conduits. | |
| UMBS—Uniform Mortgage-Backed Securities. |
| Futures Contracts | ||||
| ($000) | ||||
| Expiration | Number of Long (Short) Contracts | Notional Amount | Value and Unrealized Appreciation (Depreciation) | |
| Long Futures Contracts | ||||
| 10-Year U.S. Treasury Note | March 2024 | 3,598 | 404,157 | 3,994 |
| Ultra 10-Year U.S. Treasury Note | March 2024 | 508 | 59,373 | 724 |
| 4,718 | ||||
| Short Futures Contracts | ||||
| 2-Year U.S. Treasury Note | March 2024 | (1,582) | (325,348) | (151) |
| 5-Year U.S. Treasury Note | March 2024 | (2,005) | (217,323) | (790) |
| Long U.S. Treasury Bond | March 2024 | (218) | (26,671) | (1,042) |
| Ultra Long U.S. Treasury Bond | March 2024 | (423) | (54,660) | (490) |
| (2,473) | ||||
| 2,245 | ||||
| ($000s, except shares, footnotes, and per-share amounts) | Amount |
| Assets | |
| Investments in Securities, at Value | |
| Unaffiliated Issuers (Cost $5,859,002) | 5,841,923 |
| Affiliated Issuers (Cost $50,097) | 50,102 |
| Total Investments in Securities | 5,892,025 |
| Investment in Vanguard | 184 |
| Cash | 415 |
| Receivables for Investment Securities Sold | 364,755 |
| Receivables for Accrued Income | 35,438 |
| Receivables for Capital Shares Issued | 4,558 |
| Variation Margin Receivable—Futures Contracts | 556 |
| Other Assets | 67 |
| Total Assets | 6,297,998 |
| Liabilities | |
| Payables for Investment Securities Purchased | 377,833 |
| Payables for Capital Shares Redeemed | 6,294 |
| Payables for Distributions | 2,360 |
| Payables to Vanguard | 283 |
| Total Liabilities | 386,770 |
| Net Assets | 5,911,228 |
| At January 31, 2024, net assets consisted of: | |
| Paid-in Capital | 6,731,938 |
| Total Distributable Earnings (Loss) | (820,710) |
| Net Assets | 5,911,228 |
| Investor Shares—Net Assets | |
| Applicable to 58,670,765 outstanding $.001 par value shares of beneficial interest (unlimited authorization) | 585,352 |
| Net Asset Value Per Share—Investor Shares | $9.98 |
| Admiral Shares—Net Assets | |
| Applicable to 533,821,365 outstanding $.001 par value shares of beneficial interest (unlimited authorization) | 5,325,876 |
| Net Asset Value Per Share—Admiral Shares | $9.98 |
| Year Ended January 31, 2024 | |
| ($000) | |
| Investment Income | |
| Income | |
| Interest1 | 213,227 |
| Total Income | 213,227 |
| Expenses | |
| The Vanguard Group—Note B | |
| Investment Advisory Services | 608 |
| Management and Administrative—Investor Shares | 1,024 |
| Management and Administrative—Admiral Shares | 4,105 |
| Marketing and Distribution—Investor Shares | 35 |
| Marketing and Distribution—Admiral Shares | 281 |
| Custodian Fees | 28 |
| Auditing Fees | 38 |
| Shareholders’ Reports—Investor Shares | 27 |
| Shareholders’ Reports—Admiral Shares | 70 |
| Trustees’ Fees and Expenses | 4 |
| Other Expenses | 16 |
| Total Expenses | 6,236 |
| Expenses Paid Indirectly | (25) |
| Net Expenses | 6,211 |
| Net Investment Income | 207,016 |
| Realized Net Gain (Loss) | |
| Investment Securities Sold1 | (267,493) |
| Futures Contracts | (2,448) |
| Realized Net Gain (Loss) | (269,941) |
| Change in Unrealized Appreciation (Depreciation) | |
| Investment Securities1 | 169,629 |
| Futures Contracts | 4,410 |
| Change in Unrealized Appreciation (Depreciation) | 174,039 |
| Net Increase (Decrease) in Net Assets Resulting from Operations | 111,114 |
| 1 | Interest income, realized net gain (loss), capital gain distributions received, and change in unrealized appreciation (depreciation) from an affiliated company of the fund were $3,563,000, $44,000, less than $1,000, and ($11,000), respectively. Purchases and sales are for temporary cash investment purposes. |
| Year Ended January 31, | ||
| 2024 ($000) | 2023 ($000) | |
| Increase (Decrease) in Net Assets | ||
| Operations | ||
| Net Investment Income | 207,016 | 117,580 |
| Realized Net Gain (Loss) | (269,941) | (481,878) |
| Change in Unrealized Appreciation (Depreciation) | 174,039 | (43,258) |
| Net Increase (Decrease) in Net Assets Resulting from Operations | 111,114 | (407,556) |
| Distributions | ||
| Investor Shares | (20,615) | (13,002) |
| Admiral Shares | (186,197) | (104,545) |
| Total Distributions | (206,812) | (117,547) |
| Capital Share Transactions | ||
| Investor Shares | (9,774) | (89,101) |
| Admiral Shares | 555,434 | (35,077) |
| Net Increase (Decrease) from Capital Share Transactions | 545,660 | (124,178) |
| Total Increase (Decrease) | 449,962 | (649,281) |
| Net Assets | ||
| Beginning of Period | 5,461,266 | 6,110,547 |
| End of Period | 5,911,228 | 5,461,266 |
| Investor Shares | |||||
| For a Share Outstanding Throughout Each Period | Year Ended January 31, | ||||
| 2024 | 2023 | 2022 | 2021 | 2020 | |
| Net Asset Value, Beginning of Period | $10.16 | $11.12 | $11.65 | $11.57 | $10.96 |
| Investment Operations | |||||
| Net Investment Income1 | .354 | .208 | .107 | .129 | .255 |
| Net Realized and Unrealized Gain (Loss) on Investments | (.181) | (.959) | (.511) | .507 | .611 |
| Total from Investment Operations | .173 | (.751) | (.404) | .636 | .866 |
| Distributions | |||||
| Dividends from Net Investment Income | (.353) | (.209) | (.107) | (.127) | (.256) |
| Distributions from Realized Capital Gains | — | — | (.019) | (.429) | — |
| Total Distributions | (.353) | (.209) | (.126) | (.556) | (.256) |
| Net Asset Value, End of Period | $9.98 | $10.16 | $11.12 | $11.65 | $11.57 |
| Total Return2 | 1.80% | -6.75% | -3.49% | 5.50% | 7.98% |
| Ratios/Supplemental Data | |||||
| Net Assets, End of Period (Millions) | $585 | $605 | $757 | $953 | $917 |
| Ratio of Total Expenses to Average Net Assets | 0.20%3 | 0.20%3 | 0.20% | 0.20% | 0.20% |
| Ratio of Net Investment Income to Average Net Assets | 3.58% | 2.00% | 0.93% | 1.07% | 2.27% |
| Portfolio Turnover Rate4 | 217% | 175% | 181% | 309% | 214% |
| 1 | Calculated based on average shares outstanding. |
| 2 | Total returns do not include account service fees that may have applied in the periods shown. Fund prospectuses provide information about any applicable account service fees. |
| 3 | The ratio of expenses to average net assets for the period net of reduction from custody fee offset arrangements was 0.20%. |
| 4 | Includes 21%, 12%, 3%, 37%, and 5%, respectively, attributable to mortgage-dollar-roll activity. |
| Admiral Shares | |||||
| For a Share Outstanding Throughout Each Period | Year Ended January 31, | ||||
| 2024 | 2023 | 2022 | 2021 | 2020 | |
| Net Asset Value, Beginning of Period | $10.16 | $11.12 | $11.65 | $11.57 | $10.96 |
| Investment Operations | |||||
| Net Investment Income1 | .364 | .219 | .118 | .139 | .267 |
| Net Realized and Unrealized Gain (Loss) on Investments | (.181) | (.959) | (.511) | .509 | .610 |
| Total from Investment Operations | .183 | (.740) | (.393) | .648 | .877 |
| Distributions | |||||
| Dividends from Net Investment Income | (.363) | (.220) | (.118) | (.139) | (.267) |
| Distributions from Realized Capital Gains | — | — | (.019) | (.429) | — |
| Total Distributions | (.363) | (.220) | (.137) | (.568) | (.267) |
| Net Asset Value, End of Period | $9.98 | $10.16 | $11.12 | $11.65 | $11.57 |
| Total Return2 | 1.90% | -6.66% | -3.39% | 5.60% | 8.09% |
| Ratios/Supplemental Data | |||||
| Net Assets, End of Period (Millions) | $5,326 | $4,856 | $5,353 | $6,237 | $5,452 |
| Ratio of Total Expenses to Average Net Assets | 0.10%3 | 0.10%3 | 0.10% | 0.10% | 0.10% |
| Ratio of Net Investment Income to Average Net Assets | 3.68% | 2.12% | 1.03% | 1.16% | 2.37% |
| Portfolio Turnover Rate4 | 217% | 175% | 181% | 309% | 214% |
| 1 | Calculated based on average shares outstanding. |
| 2 | Total returns do not include account service fees that may have applied in the periods shown. Fund prospectuses provide information about any applicable account service fees. |
| 3 | The ratio of expenses to average net assets for the period net of reduction from custody fee offset arrangements was 0.10%. |
| 4 | Includes 21%, 12%, 3%, 37%, and 5%, respectively, attributable to mortgage-dollar-roll activity. |
| A. | The following significant accounting policies conform to generally accepted accounting principles for U.S. investment companies. The fund consistently follows such policies in preparing its financial statements. |
| B. | In accordance with the terms of a Funds' Service Agreement (the “FSA”) between Vanguard and the fund, Vanguard furnishes to the fund investment advisory, corporate management, administrative, marketing, and distribution services at Vanguard’s cost of operations (as defined by the FSA). These costs of operations are allocated to the fund based on methods and guidelines approved by the board of trustees and are generally settled twice a month. |
| C. | The fund’s custodian bank has agreed to reduce its fees when the fund maintains cash on deposit in the non-interest-bearing custody account. For the year ended January 31, 2024, custodian fee offset arrangements reduced the fund’s expenses by $25,000 (an annual rate of less than 0.01% of average net assets). |
| D. | Various inputs may be used to determine the value of the fund’s investments and derivatives. These inputs are summarized in three broad levels for financial statement purposes. The inputs or methodologies used to value securities are not necessarily an indication of the risk associated with investing in those securities. |
| Level 1 ($000) | Level 2 ($000) | Level 3 ($000) | Total ($000) | |
| Investments | ||||
| Assets | ||||
| U.S. Government and Agency Obligations | — | 5,479,266 | — | 5,479,266 |
| Asset-Backed/Commercial Mortgage-Backed Securities | — | 362,657 | — | 362,657 |
| Temporary Cash Investments | 50,102 | — | — | 50,102 |
| Total | 50,102 | 5,841,923 | — | 5,892,025 |
| Derivative Financial Instruments | ||||
| Assets | ||||
| Futures Contracts1 | 4,718 | — | — | 4,718 |
| Liabilities | ||||
| Futures Contracts1 | 2,473 | — | — | 2,473 |
| 1 | Includes cumulative appreciation (depreciation) on futures contracts and centrally cleared swaps, if any, as reported in the Schedule of Investments. Only current day’s variation margin is reported within the Statement of Assets and Liabilities. |
| E. | Permanent differences between book-basis and tax-basis components of net assets, if any, are reclassified among capital accounts in the financial statements to reflect their tax character. These reclassifications have no effect on net assets or net asset value per share. |
| Amount ($000) | |
| Undistributed Ordinary Income | 3,757 |
| Undistributed Long-Term Gains | — |
| Net Unrealized Gains (Losses) | (35,322) |
| Capital Loss Carryforwards | (786,785) |
| Qualified Late-Year Losses | — |
| Other Temporary Differences | (2,360) |
| Total | (820,710) |
| Year Ended January 31, | ||
| 2024 Amount ($000) | 2023 Amount ($000) | |
| Ordinary Income* | 206,812 | 117,547 |
| Long-Term Capital Gains | — | — |
| Total | 206,812 | 117,547 |
| * | Includes short-term capital gains, if any. |
| Amount ($000) | |
| Tax Cost | 5,927,347 |
| Gross Unrealized Appreciation | 66,134 |
| Gross Unrealized Depreciation | (101,456) |
| Net Unrealized Appreciation (Depreciation) | (35,322) |
| F. | During the year ended January 31, 2024, the fund purchased $12,542,639,000 of investment securities and sold $12,114,624,000 of investment securities, other than temporary cash investments. |
| G. | Capital share transactions for each class of shares were: |
| Year Ended January 31, | |||||
| 2024 | 2023 | ||||
| Amount ($000) | Shares (000) | Amount ($000) | Shares (000) | ||
| Investor Shares | |||||
| Issued | 143,763 | 14,627 | 113,533 | 11,014 | |
| Issued in Lieu of Cash Distributions | 18,417 | 1,864 | 11,764 | 1,145 | |
| Redeemed | (171,954) | (17,401) | (214,398) | (20,652) | |
| Net Increase (Decrease)—Investor Shares | (9,774) | (910) | (89,101) | (8,493) | |
| Admiral Shares | |||||
| Issued | 1,865,453 | 189,135 | 1,596,237 | 154,834 | |
| Issued in Lieu of Cash Distributions | 162,618 | 16,470 | 89,471 | 8,721 | |
| Redeemed | (1,472,637) | (149,633) | (1,720,785) | (167,012) | |
| Net Increase (Decrease)—Admiral Shares | 555,434 | 55,972 | (35,077) | (3,457) | |
| H. | Significant market disruptions, such as those caused by pandemics (e.g., COVID-19 pandemic), natural or environmental disasters, war (e.g., Russia’s invasion of Ukraine), acts of terrorism, or other events, can adversely affect local and global markets and normal market operations. Any such disruptions could have an adverse impact on the value of the fund’s investments and fund performance. |
| I. | Management has determined that no events or transactions occurred subsequent to January 31, 2024, that would require recognition or disclosure in these financial statements. |

| Average Annual Total Returns Periods Ended January 31, 2024 | |||||
| One Year | Five Years | Ten Years | Final Value of a $10,000 Investment | ||
| Long-Term Treasury Fund Investor Shares | -5.59% | -1.86% | 1.36% | $11,449 |
| Bloomberg U.S. Long Treasury Bond Index | -5.28 | -1.81 | 1.51 | 11,615 |
| Bloomberg U.S. Aggregate Bond Index | 2.10 | 0.83 | 1.63 | 11,758 |
| One Year | Five Years | Ten Years | Final Value of a $50,000 Investment | ||
| Long-Term Treasury Fund Admiral Shares | -5.50% | -1.76% | 1.46% | $57,816 | |
| Bloomberg U.S. Long Treasury Bond Index | -5.28 | -1.81 | 1.51 | 58,073 | |
| Bloomberg U.S. Aggregate Bond Index | 2.10 | 0.83 | 1.63 | 58,788 | |
| Agency Bonds and Notes | 6.4% |
| Asset-Backed/Commercial Mortgage-Backed Securities | 0.2 |
| Government Mortgage-Backed Securities | 1.3 |
| U.S. Government Securities | 92.1 |
| Coupon | Maturity Date | Face Amount ($000) | Market Value• ($000) | |||
| U.S. Government and Agency Obligations (98.1%) | ||||||
| U.S. Government Securities (90.5%) | ||||||
| United States Treasury Note/Bond | 4.250% | 5/15/39 | 3,700 | 3,758 | ||
| United States Treasury Note/Bond | 4.375% | 11/15/39 | 28,600 | 29,360 | ||
| United States Treasury Note/Bond | 4.625% | 2/15/40 | 7,000 | 7,385 | ||
| United States Treasury Note/Bond | 1.125% | 5/15/40 | 44,650 | 28,304 | ||
| United States Treasury Note/Bond | 4.375% | 5/15/40 | 6,500 | 6,649 | ||
| 1 | United States Treasury Note/Bond | 1.125% | 8/15/40 | 93,800 | 58,874 | |
| United States Treasury Note/Bond | 3.875% | 8/15/40 | 44,791 | 42,999 | ||
| United States Treasury Note/Bond | 1.375% | 11/15/40 | 81,900 | 53,453 | ||
| United States Treasury Note/Bond | 4.250% | 11/15/40 | 41,000 | 41,173 | ||
| United States Treasury Note/Bond | 1.875% | 2/15/41 | 105,800 | 74,854 | ||
| United States Treasury Note/Bond | 4.750% | 2/15/41 | 41,400 | 44,091 | ||
| United States Treasury Note/Bond | 2.250% | 5/15/41 | 103,700 | 77,791 | ||
| United States Treasury Note/Bond | 4.375% | 5/15/41 | 18,363 | 18,655 | ||
| United States Treasury Note/Bond | 1.750% | 8/15/41 | 108,390 | 74,315 | ||
| United States Treasury Note/Bond | 3.750% | 8/15/41 | 24,770 | 23,207 | ||
| United States Treasury Note/Bond | 2.000% | 11/15/41 | 113,200 | 80,726 | ||
| United States Treasury Note/Bond | 3.125% | 11/15/41 | 21,900 | 18,731 | ||
| United States Treasury Note/Bond | 2.375% | 2/15/42 | 43,500 | 32,883 | ||
| United States Treasury Note/Bond | 3.125% | 2/15/42 | 34,500 | 29,438 | ||
| United States Treasury Note/Bond | 3.000% | 5/15/42 | 18,800 | 15,680 | ||
| United States Treasury Note/Bond | 3.250% | 5/15/42 | 66,780 | 57,744 | ||
| United States Treasury Note/Bond | 2.750% | 8/15/42 | 17,000 | 13,592 | ||
| United States Treasury Note/Bond | 3.375% | 8/15/42 | 68,000 | 59,776 | ||
| United States Treasury Note/Bond | 2.750% | 11/15/42 | 5,400 | 4,305 | ||
| United States Treasury Note/Bond | 4.000% | 11/15/42 | 32,900 | 31,548 | ||
| United States Treasury Note/Bond | 3.125% | 2/15/43 | 55,111 | 46,474 | ||
| United States Treasury Note/Bond | 3.875% | 2/15/43 | 51,000 | 48,004 | ||
| United States Treasury Note/Bond | 2.875% | 5/15/43 | 60,446 | 48,905 | ||
| United States Treasury Note/Bond | 3.875% | 5/15/43 | 18,500 | 17,384 | ||
| United States Treasury Note/Bond | 3.625% | 8/15/43 | 5,000 | 4,530 | ||
| United States Treasury Note/Bond | 4.375% | 8/15/43 | 10,000 | 10,067 | ||
| United States Treasury Note/Bond | 3.750% | 11/15/43 | 36,557 | 33,689 | ||
| United States Treasury Note/Bond | 3.625% | 2/15/44 | 26,000 | 23,502 | ||
| United States Treasury Note/Bond | 3.375% | 5/15/44 | 29,500 | 25,637 | ||
| United States Treasury Note/Bond | 3.125% | 8/15/44 | 59,449 | 49,565 | ||
| United States Treasury Note/Bond | 3.000% | 11/15/44 | 64,651 | 52,711 | ||
| United States Treasury Note/Bond | 2.500% | 2/15/45 | 56,900 | 42,355 | ||
| Coupon | Maturity Date | Face Amount ($000) | Market Value• ($000) | |||
| United States Treasury Note/Bond | 3.000% | 5/15/45 | 40,205 | 32,629 | ||
| United States Treasury Note/Bond | 2.875% | 8/15/45 | 57,963 | 45,936 | ||
| United States Treasury Note/Bond | 3.000% | 11/15/45 | 32,100 | 25,961 | ||
| United States Treasury Note/Bond | 2.500% | 2/15/46 | 29,295 | 21,559 | ||
| United States Treasury Note/Bond | 2.500% | 5/15/46 | 810 | 595 | ||
| United States Treasury Note/Bond | 2.250% | 8/15/46 | 45,600 | 31,763 | ||
| United States Treasury Note/Bond | 2.875% | 11/15/46 | 19,969 | 15,672 | ||
| United States Treasury Note/Bond | 3.000% | 2/15/47 | 39,998 | 32,048 | ||
| United States Treasury Note/Bond | 3.000% | 5/15/47 | 2,636 | 2,110 | ||
| United States Treasury Note/Bond | 2.750% | 8/15/47 | 25,230 | 19,238 | ||
| United States Treasury Note/Bond | 2.750% | 11/15/47 | 22,690 | 17,273 | ||
| United States Treasury Note/Bond | 3.125% | 5/15/48 | 33,000 | 26,885 | ||
| United States Treasury Note/Bond | 3.000% | 8/15/48 | 27,533 | 21,889 | ||
| United States Treasury Note/Bond | 3.375% | 11/15/48 | 3,561 | 3,030 | ||
| United States Treasury Note/Bond | 3.000% | 2/15/49 | 22,920 | 18,203 | ||
| 1 | United States Treasury Note/Bond | 2.875% | 5/15/49 | 11,761 | 9,117 | |
| United States Treasury Note/Bond | 2.250% | 8/15/49 | 84,800 | 57,585 | ||
| United States Treasury Note/Bond | 2.375% | 11/15/49 | 50,400 | 35,138 | ||
| United States Treasury Note/Bond | 2.000% | 2/15/50 | 87,500 | 55,809 | ||
| United States Treasury Note/Bond | 1.250% | 5/15/50 | 85,500 | 44,473 | ||
| United States Treasury Note/Bond | 1.375% | 8/15/50 | 117,797 | 63,316 | ||
| United States Treasury Note/Bond | 1.625% | 11/15/50 | 103,012 | 59,264 | ||
| United States Treasury Note/Bond | 1.875% | 2/15/51 | 136,600 | 83,753 | ||
| United States Treasury Note/Bond | 2.375% | 5/15/51 | 84,800 | 58,645 | ||
| United States Treasury Note/Bond | 2.000% | 8/15/51 | 121,000 | 76,381 | ||
| United States Treasury Note/Bond | 1.875% | 11/15/51 | 88,700 | 54,135 | ||
| United States Treasury Note/Bond | 2.250% | 2/15/52 | 113,000 | 75,745 | ||
| United States Treasury Note/Bond | 2.875% | 5/15/52 | 89,000 | 68,697 | ||
| United States Treasury Note/Bond | 3.000% | 8/15/52 | 89,500 | 70,929 | ||
| United States Treasury Note/Bond | 4.000% | 11/15/52 | 49,800 | 47,808 | ||
| United States Treasury Note/Bond | 3.625% | 2/15/53 | 85,700 | 76,862 | ||
| United States Treasury Note/Bond | 3.625% | 5/15/53 | 74,800 | 67,168 | ||
| United States Treasury Note/Bond | 4.125% | 8/15/53 | 38,500 | 37,832 | ||
| United States Treasury Note/Bond | 4.750% | 11/15/53 | 75,000 | 81,844 | ||
| 2,771,406 | ||||||
| Agency Bonds and Notes (6.3%) | ||||||
| 2 | Fannie Mae Principal Strip | 0.000% | 8/6/38 | 36,000 | 18,557 | |
| Federal Farm Credit Banks Funding Corp. | 3.820% | 6/15/37 | 25,000 | 23,381 | ||
| Federal Farm Credit Banks Funding Corp. | 4.000% | 9/8/37 | 25,000 | 23,791 | ||
| 2 | Federal Home Loan Mortgage Corp. | 0.000% | 12/14/29 | 20,000 | 15,659 | |
| 2 | Federal Home Loan Mortgage Corp. | 0.000% | 11/15/38 | 14,465 | 7,363 | |
| 2 | Federal National Mortgage Assn. | 0.000% | 11/15/30 | 49,591 | 37,120 | |
| 2 | Freddie Mac Principal Strips | 0.000% | 3/15/31 | 68,687 | 50,652 | |
| Resolution Funding Corp. Principal Strip | 0.000% | 1/15/30 | 20,000 | 15,496 | ||
| 192,019 | ||||||
| Nonconventional Mortgage-Backed Securities (1.3%) | ||||||
| 2,3 | Fannie Mae REMICS | 2.000% | 8/25/50 | 42,860 | 30,823 | |
| 3 | Ginnie Mae REMICS | 1.100% | 1/20/51 | 12,706 | 9,513 | |
| 40,336 | ||||||
| Total U.S. Government and Agency Obligations (Cost $3,533,170) | 3,003,761 | |||||
| Coupon | Maturity Date | Face Amount ($000) | Market Value• ($000) | |||
| Asset-Backed/Commercial Mortgage-Backed Securities (0.2%) | ||||||
| 2,3 | FHLMC Multifamily Structured Pass Through Certificates Class A2 Series K-1515 (Cost $5,873) | 1.940% | 2/25/35 | 7,595 | 5,896 | |
| Shares | ||||||
| Temporary Cash Investments (0.8%) | ||||||
| Money Market Fund (0.8%) | ||||||
| 4 | Vanguard Market Liquidity Fund (Cost $23,050) | 5.410% | 230,526 | 23,050 | ||
| Total Investments (99.1%) (Cost $3,562,093) | 3,032,707 | |||||
| Other Assets and Liabilities—Net (0.9%) | 27,584 | |||||
| Net Assets (100%) | 3,060,291 | |||||
| Cost is in $000. | ||||||
| • | See Note A in Notes to Financial Statements. |
| 1 | Securities with a value of $8,433,000 have been segregated as initial margin for open futures contracts. |
| 2 | The issuer was placed under federal conservatorship in September 2008; since that time, its daily operations have been managed by the Federal Housing Finance Agency and it receives capital from the U.S. Treasury, as needed to maintain a positive net worth, in exchange for senior preferred stock. |
| 3 | The average or expected maturity is shorter than the final maturity shown because of the possibility of interim principal payments and prepayments or the possibility of the issue being called. |
| 4 | Affiliated money market fund available only to Vanguard funds and certain trusts and accounts managed by Vanguard. Rate shown is the 7-day yield. |
| REMICS—Real Estate Mortgage Investment Conduits. |
| Futures Contracts | ||||
| ($000) | ||||
| Expiration | Number of Long (Short) Contracts | Notional Amount | Value and Unrealized Appreciation (Depreciation) | |
| Long Futures Contracts | ||||
| Ultra 10-Year U.S. Treasury Note | March 2024 | 290 | 33,894 | 66 |
| Ultra Long U.S. Treasury Bond | March 2024 | 1,007 | 130,123 | 1,551 |
| 1,617 | ||||
| Short Futures Contracts | ||||
| 2-Year U.S. Treasury Note | March 2024 | (831) | (170,900) | 6 |
| 5-Year U.S. Treasury Note | March 2024 | (43) | (4,661) | (9) |
| 10-Year U.S. Treasury Note | March 2024 | (547) | (61,443) | (1,282) |
| Long U.S. Treasury Bond | March 2024 | (493) | (60,315) | 129 |
| (1,156) | ||||
| 461 | ||||
| ($000s, except shares, footnotes, and per-share amounts) | Amount |
| Assets | |
| Investments in Securities, at Value | |
| Unaffiliated Issuers (Cost $3,539,043) | 3,009,657 |
| Affiliated Issuers (Cost $23,050) | 23,050 |
| Total Investments in Securities | 3,032,707 |
| Investment in Vanguard | 99 |
| Cash | 1,491 |
| Receivables for Investment Securities Sold | 77,399 |
| Receivables for Accrued Income | 33,748 |
| Receivables for Capital Shares Issued | 7,110 |
| Variation Margin Receivable—Futures Contracts | 937 |
| Other Assets | 39 |
| Total Assets | 3,153,530 |
| Liabilities | |
| Payables for Investment Securities Purchased | 90,134 |
| Payables for Capital Shares Redeemed | 1,849 |
| Payables for Distributions | 1,098 |
| Payables to Vanguard | 158 |
| Total Liabilities | 93,239 |
| Net Assets | 3,060,291 |
| At January 31, 2024, net assets consisted of: | |
| Paid-in Capital | 4,255,189 |
| Total Distributable Earnings (Loss) | (1,194,898) |
| Net Assets | 3,060,291 |
| Investor Shares—Net Assets | |
| Applicable to 74,592,676 outstanding $.001 par value shares of beneficial interest (unlimited authorization) | 637,344 |
| Net Asset Value Per Share—Investor Shares | $8.54 |
| Admiral Shares—Net Assets | |
| Applicable to 283,574,257 outstanding $.001 par value shares of beneficial interest (unlimited authorization) | 2,422,947 |
| Net Asset Value Per Share—Admiral Shares | $8.54 |
| Year Ended January 31, 2024 | |
| ($000) | |
| Investment Income | |
| Income | |
| Interest1 | 107,414 |
| Total Income | 107,414 |
| Expenses | |
| The Vanguard Group—Note B | |
| Investment Advisory Services | 321 |
| Management and Administrative—Investor Shares | 965 |
| Management and Administrative—Admiral Shares | 1,942 |
| Marketing and Distribution—Investor Shares | 38 |
| Marketing and Distribution—Admiral Shares | 132 |
| Custodian Fees | 14 |
| Auditing Fees | 35 |
| Shareholders’ Reports—Investor Shares | 53 |
| Shareholders’ Reports—Admiral Shares | 33 |
| Trustees’ Fees and Expenses | 2 |
| Other Expenses | 16 |
| Total Expenses | 3,551 |
| Expenses Paid Indirectly | (15) |
| Net Expenses | 3,536 |
| Net Investment Income | 103,878 |
| Realized Net Gain (Loss) | |
| Investment Securities Sold1 | (227,502) |
| Futures Contracts | (20,945) |
| Realized Net Gain (Loss) | (248,447) |
| Change in Unrealized Appreciation (Depreciation) | |
| Investment Securities1 | (19,719) |
| Futures Contracts | (741) |
| Change in Unrealized Appreciation (Depreciation) | (20,460) |
| Net Increase (Decrease) in Net Assets Resulting from Operations | (165,029) |
| 1 | Interest income, realized net gain (loss), capital gain distributions received, and change in unrealized appreciation (depreciation) from an affiliated company of the fund were $1,439,000, ($1,000), less than $1,000, and ($1,000), respectively. Purchases and sales are for temporary cash investment purposes. |
| Year Ended January 31, | ||
| 2024 ($000) | 2023 ($000) | |
| Increase (Decrease) in Net Assets | ||
| Operations | ||
| Net Investment Income | 103,878 | 81,317 |
| Realized Net Gain (Loss) | (248,447) | (286,651) |
| Change in Unrealized Appreciation (Depreciation) | (20,460) | (579,884) |
| Net Increase (Decrease) in Net Assets Resulting from Operations | (165,029) | (785,218) |
| Distributions | ||
| Investor Shares | (19,243) | (15,599) |
| Admiral Shares | (84,529) | (65,502) |
| Total Distributions | (103,772) | (81,101) |
| Capital Share Transactions | ||
| Investor Shares | 106,984 | 897 |
| Admiral Shares | 184,479 | 198,905 |
| Net Increase (Decrease) from Capital Share Transactions | 291,463 | 199,802 |
| Total Increase (Decrease) | 22,662 | (666,517) |
| Net Assets | ||
| Beginning of Period | 3,037,629 | 3,704,146 |
| End of Period | 3,060,291 | 3,037,629 |
| Investor Shares | |||||
| For a Share Outstanding Throughout Each Period | Year Ended January 31, | ||||
| 2024 | 2023 | 2022 | 2021 | 2020 | |
| Net Asset Value, Beginning of Period | $9.36 | $12.29 | $13.55 | $14.05 | $11.86 |
| Investment Operations | |||||
| Net Investment Income1 | .294 | .261 | .239 | .273 | .331 |
| Net Realized and Unrealized Gain (Loss) on Investments | (.821) | (2.931) | (.923) | .677 | 2.226 |
| Total from Investment Operations | (.527) | (2.670) | (.684) | .950 | 2.557 |
| Distributions | |||||
| Dividends from Net Investment Income | (.293) | (.260) | (.239) | (.273) | (.331) |
| Distributions from Realized Capital Gains | — | — | (.337) | (1.177) | (.036) |
| Total Distributions | (.293) | (.260) | (.576) | (1.450) | (.367) |
| Net Asset Value, End of Period | $8.54 | $9.36 | $12.29 | $13.55 | $14.05 |
| Total Return2 | -5.59% | -21.78% | -4.92% | 6.41% | 21.84% |
| Ratios/Supplemental Data | |||||
| Net Assets, End of Period (Millions) | $637 | $574 | $750 | $931 | $971 |
| Ratio of Total Expenses to Average Net Assets | 0.20%3 | 0.20%3 | 0.20% | 0.20% | 0.20% |
| Ratio of Net Investment Income to Average Net Assets | 3.42% | 2.62% | 1.90% | 1.79% | 2.55% |
| Portfolio Turnover Rate4 | 136% | 107% | 106% | 172% | 96%5 |
| 1 | Calculated based on average shares outstanding. |
| 2 | Total returns do not include account service fees that may have applied in the periods shown. Fund prospectuses provide information about any applicable account service fees. |
| 3 | The ratio of expenses to average net assets for the period net of reduction from custody fee offset arrangements was 0.20%. |
| 4 | Includes 23%, 17%, 2%, 26%, and 4%, respectively, attributable to mortgage-dollar-roll activity. |
| 5 | Excludes the value of portfolio securities received or delivered as a result of in-kind purchases or redemptions of the fund’s capital shares. |
| Admiral Shares | |||||
| For a Share Outstanding Throughout Each Period | Year Ended January 31, | ||||
| 2024 | 2023 | 2022 | 2021 | 2020 | |
| Net Asset Value, Beginning of Period | $9.36 | $12.29 | $13.55 | $14.05 | $11.86 |
| Investment Operations | |||||
| Net Investment Income1 | .302 | .271 | .252 | .288 | .344 |
| Net Realized and Unrealized Gain (Loss) on Investments | (.820) | (2.931) | (.923) | .677 | 2.226 |
| Total from Investment Operations | (.518) | (2.660) | (.671) | .965 | 2.570 |
| Distributions | |||||
| Dividends from Net Investment Income | (.302) | (.270) | (.252) | (.288) | (.344) |
| Distributions from Realized Capital Gains | — | — | (.337) | (1.177) | (.036) |
| Total Distributions | (.302) | (.270) | (.589) | (1.465) | (.380) |
| Net Asset Value, End of Period | $8.54 | $9.36 | $12.29 | $13.55 | $14.05 |
| Total Return2 | -5.50% | -21.70% | -4.82% | 6.51% | 21.96% |
| Ratios/Supplemental Data | |||||
| Net Assets, End of Period (Millions) | $2,423 | $2,464 | $2,954 | $3,292 | $3,071 |
| Ratio of Total Expenses to Average Net Assets | 0.10%3 | 0.10%3 | 0.10% | 0.10% | 0.10% |
| Ratio of Net Investment Income to Average Net Assets | 3.51% | 2.73% | 2.00% | 1.89% | 2.65% |
| Portfolio Turnover Rate4 | 136% | 107% | 106% | 172% | 96%5 |
| 1 | Calculated based on average shares outstanding. |
| 2 | Total returns do not include account service fees that may have applied in the periods shown. Fund prospectuses provide information about any applicable account service fees. |
| 3 | The ratio of expenses to average net assets for the period net of reduction from custody fee offset arrangements was 0.10%. |
| 4 | Includes 23%, 17%, 2%, 26%, and 4%, respectively, attributable to mortgage-dollar-roll activity. |
| 5 | Excludes the value of portfolio securities received or delivered as a result of in-kind purchases or redemptions of the fund’s capital shares. |
| A. | The following significant accounting policies conform to generally accepted accounting principles for U.S. investment companies. The fund consistently follows such policies in preparing its financial statements. |
| B. | In accordance with the terms of a Funds' Service Agreement (the “FSA”) between Vanguard and the fund, Vanguard furnishes to the fund investment advisory, corporate management, administrative, marketing, and distribution services at Vanguard’s cost of operations (as defined by the FSA). These costs of operations are allocated to the fund based on methods and guidelines approved by the board of trustees and are generally settled twice a month. |
| C. | The fund’s custodian bank has agreed to reduce its fees when the fund maintains cash on deposit in the non-interest-bearing custody account. For the year ended January 31, 2024, custodian fee offset arrangements reduced the fund’s expenses by $15,000 (an annual rate of less than 0.01% of average net assets). |
| D. | Various inputs may be used to determine the value of the fund’s investments and derivatives. These inputs are summarized in three broad levels for financial statement purposes. The inputs or methodologies used to value securities are not necessarily an indication of the risk associated with investing in those securities. |
| Level 1 ($000) | Level 2 ($000) | Level 3 ($000) | Total ($000) | |
| Investments | ||||
| Assets | ||||
| U.S. Government and Agency Obligations | — | 3,003,761 | — | 3,003,761 |
| Asset-Backed/Commercial Mortgage-Backed Securities | — | 5,896 | — | 5,896 |
| Temporary Cash Investments | 23,050 | — | — | 23,050 |
| Total | 23,050 | 3,009,657 | — | 3,032,707 |
| Derivative Financial Instruments | ||||
| Assets | ||||
| Futures Contracts1 | 1,752 | — | — | 1,752 |
| Liabilities | ||||
| Futures Contracts1 | 1,291 | — | — | 1,291 |
| 1 | Includes cumulative appreciation (depreciation) on futures contracts and centrally cleared swaps, if any, as reported in the Schedule of Investments. Only current day’s variation margin is reported within the Statement of Assets and Liabilities. |
| E. | Permanent differences between book-basis and tax-basis components of net assets, if any, are reclassified among capital accounts in the financial statements to reflect their tax character. These reclassifications have no effect on net assets or net asset value per share. |
| Amount ($000) | |
| Undistributed Ordinary Income | 1,274 |
| Undistributed Long-Term Gains | — |
| Net Unrealized Gains (Losses) | (580,922) |
| Capital Loss Carryforwards | (614,152) |
| Qualified Late-Year Losses | — |
| Other Temporary Differences | (1,098) |
| Total | (1,194,898) |
| Year Ended January 31, | ||
| 2024 Amount ($000) | 2023 Amount ($000) | |
| Ordinary Income* | 103,772 | 81,101 |
| Long-Term Capital Gains | — | — |
| Total | 103,772 | 81,101 |
| * | Includes short-term capital gains, if any. |
| Amount ($000) | |
| Tax Cost | 3,613,629 |
| Gross Unrealized Appreciation | 44,978 |
| Gross Unrealized Depreciation | (625,900) |
| Net Unrealized Appreciation (Depreciation) | (580,922) |
| F. | During the year ended January 31, 2024, the fund purchased $4,200,070,000 of investment securities and sold $4,078,138,000 of investment securities, other than temporary cash investments. |
| G. | Capital share transactions for each class of shares were: |
| Year Ended January 31, | |||||
| 2024 | 2023 | ||||
| Amount ($000) | Shares (000) | Amount ($000) | Shares (000) | ||
| Investor Shares | |||||
| Issued | 261,970 | 31,238 | 158,597 | 16,242 | |
| Issued in Lieu of Cash Distributions | 17,795 | 2,079 | 14,592 | 1,500 | |
| Redeemed | (172,781) | (20,045) | (172,292) | (17,446) | |
| Net Increase (Decrease)—Investor Shares | 106,984 | 13,272 | 897 | 296 | |
| Admiral Shares | |||||
| Issued | 906,892 | 106,012 | 762,171 | 79,384 | |
| Issued in Lieu of Cash Distributions | 73,195 | 8,544 | 57,321 | 5,902 | |
| Redeemed | (795,608) | (94,140) | (620,587) | (62,587) | |
| Net Increase (Decrease)—Admiral Shares | 184,479 | 20,416 | 198,905 | 22,699 | |
| H. | Significant market disruptions, such as those caused by pandemics (e.g., COVID-19 pandemic), natural or environmental disasters, war (e.g., Russia’s invasion of Ukraine), acts of terrorism, or other events, can adversely affect local and global markets and normal market operations. Any such disruptions could have an adverse impact on the value of the fund’s investments and fund performance. |
| I. | Management has determined that no events or transactions occurred subsequent to January 31, 2024, that would require recognition or disclosure in these financial statements. |
Philadelphia, Pennsylvania
March 20, 2024
| Fund | ($000) |
| Short-Term Treasury Fund | 245,341 |
| Short-Term Federal Fund | 82,934 |
| Intermediate-Term Treasury Fund | 191,918 |
| Long-Term Treasury Fund | 97,083 |
| Fund | Percentage |
| Short-Term Treasury Fund | 100.0% |
| Short-Term Federal Fund | 100.0 |
| Intermediate-Term Treasury Fund | 100.0 |
| Long-Term Treasury Fund | 100.0 |
| Fund | Percentage |
| Short-Term Treasury Fund | 99.7% |
| Short-Term Federal Fund | 99.5 |
| Intermediate-Term Treasury Fund | 99.6 |
| Long-Term Treasury Fund | 99.7 |
limitation, to U.S. Government Bond Funds customers, in connection with the administration, marketing or trading of the U.S. Government Bond Funds.
WARRANTIES AND EXPRESSLY DISCLAIMS ALL WARRANTIES OF MERCHANTABILITY OR FITNESS FOR A PARTICULAR PURPOSE OR USE WITH RESPECT TO THE INDICES OR ANY DATA RELATED THERETO. WITHOUT LIMITING ANY OF THE FOREGOING, TO THE MAXIMUM EXTENT ALLOWED BY LAW, BLOOMBERG, ITS LICENSORS, AND ITS AND THEIR RESPECTIVE EMPLOYEES, CONTRACTORS, AGENTS, SUPPLIERS, AND VENDORS SHALL HAVE NO LIABILITY OR RESPONSIBILITY WHATSOEVER FOR ANY INJURY OR DAMAGES—WHETHER DIRECT, INDIRECT, CONSEQUENTIAL,
INCIDENTAL, PUNITIVE OR OTHERWISE—ARISING IN CONNECTION WITH THE U.S. GOVERNMENT BOND FUNDS OR THE INDICES OR ANY DATA OR VALUES RELATING THERETO—WHETHER ARISING FROM THEIR NEGLIGENCE OR OTHERWISE, EVEN IF NOTIFIED OF THE POSSIBILITY THEREOF.
| Matthew Benchener | Thomas M. Rampulla |
| Amma Boateng | Karin A. Risi |
| Joseph Brennan | Anne E. Robinson |
| Mortimer J. Buckley | Michael Rollings |
| Gregory Davis | Nitin Tandon |
| John James | Lauren Valente |
| Chris D. Mclsaac |

All rights reserved.
Vanguard Marketing Corporation, Distributor.

| Vanguard Short-Term Investment-Grade Fund |
| Vanguard Intermediate-Term Investment-Grade Fund |
| Vanguard Long-Term Investment-Grade Fund |
Your Fund’s Performance at a Glance | 1 |
Advisors' Report | 2 |
About Your Fund’s Expenses | 5 |
Short-Term Investment-Grade Fund | 7 |
Intermediate-Term Investment-Grade Fund | 48 |
Long-Term Investment-Grade Fund | 84 |
| • | For the 12 months ended January 31, 2024, the returns of the funds in this report ranged from 1.21% for Investor Shares of Vanguard Long-Term Investment-Grade Fund to 4.93% for Institutional Shares of Vanguard Short-Term Investment-Grade Fund. Fund results compared to those of their benchmarks were mixed. |
| • | With inflation continuing to ease, the Federal Reserve slowed and eventually stopped hiking interest rates. Economic growth, the labor market, and consumer spending proved resilient, but the prospect of rates remaining high for an extended period spurred volatility at times. U.S. bonds rallied toward the end of 2023 as sentiment improved amid market expectations for rate cuts in 2024. |
| • | With yields rising and prices falling, investment-grade U.S. bonds overall returned 2.23%, as measured by the Bloomberg U.S. Aggregate Float-Adjusted Index. |
| • | For the Short-Term Fund and Vanguard Intermediate-Term Investment-Grade Fund, security selection, notably within the banking sector, helped relative performance. Treasury holdings detracted. |
| • | In the Long-Term Fund, security selection benefited relative results, while sector positioning detracted. |
| Average Annual Total Returns Periods Ended January 31, 2024 | |||
| One Year | Three Years | Five Years | |
| Stocks | |||
| Russell 1000 Index (Large-caps) | 20.23% | 9.78% | 13.99% |
| Russell 2000 Index (Small-caps) | 2.40 | -0.76 | 6.80 |
| Russell 3000 Index (Broad U.S. market) | 19.15 | 9.10 | 13.53 |
| FTSE All-World ex US Index (International) | 6.29 | 1.57 | 5.77 |
| Bonds | |||
| Bloomberg U.S. Aggregate Float Adjusted Index (Broad taxable market) | 2.23% | -3.15% | 0.90% |
| Bloomberg Municipal Bond Index (Broad tax-exempt market) | 2.90 | -0.78 | 2.00 |
| FTSE Three-Month U.S. Treasury Bill Index | 5.36 | 2.40 | 1.96 |
| CPI | |||
| Consumer Price Index | 3.09% | 5.64% | 4.15% |
| Yields of U.S. Treasury Securities | ||
| Maturity | January 31, 2023 | January 31, 2024 |
| 2 years | 4.20% | 4.21% |
| 5 years | 3.62 | 3.84 |
| 10 years | 3.51 | 3.91 |
| 30 years | 3.63 | 4.71 |
| Source: Vanguard. | ||
| • | Based on actual fund return. This section helps you to estimate the actual expenses that you paid over the period. The ”Ending Account Value“ shown is derived from the fund‘s actual return, and the third column shows the dollar amount that would have been paid by an investor who started with $1,000 in the fund. You may use the information here, together with the amount you invested, to estimate the expenses that you paid over the period. |
| • | Based on hypothetical 5% yearly return. This section is intended to help you compare your fund‘s costs with those of other mutual funds. It assumes that the fund had a yearly return of 5% before expenses, but that the expense ratio is unchanged. In this case—because the return used is not the fund’s actual return—the results do not apply to your investment. The example is useful in making comparisons because the Securities and Exchange Commission requires all mutual funds to calculate expenses based on a 5% return. You can assess your fund’s costs by comparing this hypothetical example with the hypothetical examples that appear in shareholder reports of other funds. |
| Six Months Ended January 31, 2024 | |||
| Beginning Account Value 7/31/2023 | Ending Account Value 1/31/2024 | Expenses Paid During Period | |
| Based on Actual Fund Return | |||
| Short-Term Investment-Grade Fund | |||
| Investor Shares | $1,000.00 | $1,039.90 | $1.03 |
| Admiral™ Shares | 1,000.00 | 1,040.40 | 0.51 |
| Institutional Shares | 1,000.00 | 1,040.60 | 0.36 |
| Intermediate-Term Investment-Grade Fund | |||
| Investor Shares | $1,000.00 | $1,046.80 | $1.03 |
| Admiral Shares | 1,000.00 | 1,047.30 | 0.52 |
| Long-Term Investment-Grade Fund | |||
| Investor Shares | $1,000.00 | $1,037.80 | $1.08 |
| Admiral Shares | 1,000.00 | 1,038.30 | 0.57 |
| Six Months Ended January 31, 2024 | |||
| Beginning Account Value 7/31/2023 | Ending Account Value 1/31/2024 | Expenses Paid During Period | |
| Based on Hypothetical 5% Yearly Return | |||
| Short-Term Investment-Grade Fund | |||
| Investor Shares | $1,000.00 | $1,024.20 | $1.02 |
| Admiral Shares | 1,000.00 | 1,024.70 | 0.51 |
| Institutional Shares | 1,000.00 | 1,024.85 | 0.36 |
| Intermediate-Term Investment-Grade Fund | |||
| Investor Shares | $1,000.00 | $1,024.20 | $1.02 |
| Admiral Shares | 1,000.00 | 1,024.70 | 0.51 |
| Long-Term Investment-Grade Fund | |||
| Investor Shares | $1,000.00 | $1,024.15 | $1.07 |
| Admiral Shares | 1,000.00 | 1,024.65 | 0.56 |

| Average Annual Total Returns Periods Ended January 31, 2024 | |||||
| One Year | Five Years | Ten Years | Final Value of a $10,000 Investment | ||
 | Short-Term Investment-Grade Fund Investor Shares | 4.79% | 1.94% | 1.84% | $11,996 |
 | Bloomberg U.S. 1-5 Year Credit Bond Index | 4.78 | 2.08 | 1.99 | 12,174 |
 | Bloomberg U.S. Aggregate Bond Index | 2.10 | 0.83 | 1.63 | 11,758 |
| One Year | Five Years | Ten Years | Final Value of a $50,000 Investment | ||
| Short-Term Investment-Grade Fund Admiral Shares | 4.90% | 2.04% | 1.94% | $60,579 | |
| Bloomberg U.S. 1-5 Year Credit Bond Index | 4.78 | 2.08 | 1.99 | 60,868 | |
| Bloomberg U.S. Aggregate Bond Index | 2.10 | 0.83 | 1.63 | 58,788 | |
| One Year | Five Years | Ten Years | Final Value of a $5,000,000 Investment | ||
| Short-Term Investment-Grade Fund Institutional Shares | 4.93% | 2.07% | 1.97% | $6,076,034 | |
| Bloomberg U.S. 1-5 Year Credit Bond Index | 4.78 | 2.08 | 1.99 | 6,086,769 | |
| Bloomberg U.S. Aggregate Bond Index | 2.10 | 0.83 | 1.63 | 5,878,799 | |
| Asset-Backed/Commercial Mortgage-Backed Securities | 3.1% |
| Corporate Bonds - Communications | 7.3 |
| Corporate Bonds - Consumer Discretionary | 6.3 |
| Corporate Bonds - Consumer Staples | 4.7 |
| Corporate Bonds - Energy | 6.7 |
| Corporate Bonds - Financials | 29.7 |
| Corporate Bonds - Health Care | 8.3 |
| Corporate Bonds - Industrials | 7.0 |
| Corporate Bonds - Materials | 2.6 |
| Corporate Bonds - Real Estate | 4.3 |
| Corporate Bonds - Technology | 5.1 |
| Corporate Bonds - Utilities | 6.5 |
| Floating Rate Loan Interests | 0.3 |
| Sovereign Bonds | 1.8 |
| Taxable Municipal Bonds | 0.1 |
| U.S. Government and Agency Obligations | 6.2 |
| Coupon | Maturity Date | Face Amount ($000) | Market Value• ($000) | |||
| U.S. Government and Agency Obligations (6.1%) | ||||||
| U.S. Government Securities (6.1%) | ||||||
| United States Treasury Note/Bond | 0.250% | 6/30/25 | 85,956 | 81,040 | ||
| United States Treasury Note/Bond | 4.750% | 7/31/25 | 128,610 | 129,213 | ||
| United States Treasury Note/Bond | 0.250% | 10/31/25 | 59,401 | 55,373 | ||
| 1,2 | United States Treasury Note/Bond | 0.375% | 11/30/25 | 76,018 | 70,839 | |
| United States Treasury Note/Bond | 4.000% | 12/15/25 | 100,000 | 99,516 | ||
| United States Treasury Note/Bond | 0.375% | 1/31/26 | 216,269 | 200,488 | ||
| United States Treasury Note/Bond | 0.500% | 2/28/26 | 372,425 | 345,192 | ||
| United States Treasury Note/Bond | 0.750% | 3/31/26 | 203,000 | 188,854 | ||
| United States Treasury Note/Bond | 3.750% | 4/15/26 | 244,646 | 242,505 | ||
| United States Treasury Note/Bond | 3.625% | 5/15/26 | 126,578 | 125,173 | ||
| United States Treasury Note/Bond | 2.125% | 5/31/26 | 160,000 | 152,950 | ||
| United States Treasury Note/Bond | 4.375% | 8/15/26 | 63,798 | 64,237 | ||
| United States Treasury Note/Bond | 4.000% | 1/15/27 | 215,000 | 214,933 | ||
| United States Treasury Note/Bond | 1.875% | 2/28/27 | 93,643 | 87,922 | ||
| United States Treasury Note/Bond | 2.625% | 5/31/27 | 275,000 | 263,484 | ||
| United States Treasury Note/Bond | 3.250% | 6/30/27 | 40,000 | 39,100 | ||
| 1 | United States Treasury Note/Bond | 2.750% | 7/31/27 | 170,130 | 163,431 | |
| United States Treasury Note/Bond | 3.875% | 11/30/27 | 14,616 | 14,580 | ||
| United States Treasury Note/Bond | 3.875% | 12/31/27 | 205 | 205 | ||
| United States Treasury Note/Bond | 0.750% | 1/31/28 | 50,286 | 44,432 | ||
| United States Treasury Note/Bond | 1.250% | 3/31/28 | 93,938 | 84,397 | ||
| United States Treasury Note/Bond | 2.875% | 5/15/28 | 70,000 | 67,156 | ||
| United States Treasury Note/Bond | 1.250% | 5/31/28 | 32,898 | 29,444 | ||
| United States Treasury Note/Bond | 1.250% | 6/30/28 | 135,819 | 121,346 | ||
| United States Treasury Note/Bond | 1.000% | 7/31/28 | 78,784 | 69,428 | ||
| United States Treasury Note/Bond | 1.125% | 8/31/28 | 44,865 | 39,699 | ||
| United States Treasury Note/Bond | 1.250% | 9/30/28 | 90,942 | 80,768 | ||
| United States Treasury Note/Bond | 1.500% | 11/30/28 | 120,000 | 107,456 | ||
| United States Treasury Note/Bond | 1.375% | 12/31/28 | 88,564 | 78,711 | ||
| Total U.S. Government and Agency Obligations (Cost $3,311,240) | 3,261,872 | |||||
| Coupon | Maturity Date | Face Amount ($000) | Market Value• ($000) | |||
| Asset-Backed/Commercial Mortgage-Backed Securities (3.1%) | ||||||
| 3,4 | Ally Auto Receivables Trust Class B Series 2023-1 | 5.760% | 1/15/29 | 6,240 | 6,359 | |
| 3,4 | Ally Auto Receivables Trust Class C Series 2023-1 | 5.960% | 3/15/29 | 5,013 | 5,074 | |
| 3,4 | Ally Auto Receivables Trust Class D Series 2023-1 | 6.740% | 4/15/34 | 3,260 | 3,281 | |
| 3,4 | Ally Auto Receivables Trust Class D Series 2023-A | 7.330% | 1/17/34 | 3,460 | 3,530 | |
| 3,4 | American Homes 4 Rent Trust Class A Series 2014-SFR2 | 3.786% | 10/17/36 | 11,229 | 11,073 | |
| 3,4 | American Homes 4 Rent Trust Class A Series 2015-SFR2 | 3.732% | 10/17/52 | 3,074 | 2,996 | |
| 3,4 | American Homes 4 Rent Trust Class B Series 2014-SFR2 | 4.290% | 10/17/36 | 3,360 | 3,319 | |
| 3,4 | American Homes 4 Rent Trust Class B Series 2015-SFR2 | 4.295% | 10/17/52 | 2,830 | 2,773 | |
| 4 | Americredit Automobile Receivables Trust Class C Series 2023-2 | 6.000% | 7/18/29 | 10,250 | 10,487 | |
| 3,4 | Avis Budget Rental Car Funding AESOP LLC Class A Series 2021-2A | 1.660% | 2/20/28 | 2,660 | 2,412 | |
| 3,4 | Avis Budget Rental Car Funding AESOP LLC Class A Series 2023-5A | 5.780% | 4/20/28 | 7,030 | 7,156 | |
| 3,4 | Avis Budget Rental Car Funding AESOP LLC Class A Series 2023-7A | 5.900% | 8/21/28 | 2,580 | 2,635 | |
| 3,4 | Avis Budget Rental Car Funding AESOP LLC Class A Series 2023-8A | 6.020% | 2/20/30 | 12,710 | 13,223 | |
| 3,4 | Avis Budget Rental Car Funding AESOP LLC Class A Series 2024-1A | 5.360% | 6/20/30 | 24,490 | 24,768 | |
| 3,4 | Avis Budget Rental Car Funding AESOP LLC Class B Series 2024-1A | 5.850% | 6/20/30 | 5,960 | 6,019 | |
| 3,4 | Avis Budget Rental Car Funding AESOP LLC Class C Series 2022-5A | 9.270% | 4/20/27 | 3,070 | 3,174 | |
| 3,4 | Avis Budget Rental Car Funding AESOP LLC Class C Series 2023-1A | 8.700% | 4/20/29 | 5,100 | 5,112 | |
| 3,4 | Avis Budget Rental Car Funding AESOP LLC Class C Series 2023-2A | 8.550% | 10/20/27 | 1,480 | 1,482 | |
| 3,4 | Avis Budget Rental Car Funding AESOP LLC Class C Series 2024-1A | 6.480% | 6/20/30 | 4,490 | 4,529 | |
| 4 | BA Credit Card Trust Class A2 Series 2023-A2 | 4.980% | 11/15/28 | 81,270 | 82,188 | |
| 4,5 | Banc of America Commercial Mortgage Trust Class C Series 2015-UBS7 | 4.343% | 9/15/48 | 1,600 | 1,242 | |
| Coupon | Maturity Date | Face Amount ($000) | Market Value• ($000) | |||
| 4,5 | Banc of America Funding Trust Class 2A2 Series 2006-H | 4.653% | 9/20/46 | 2,671 | 2,135 | |
| 4 | BANK Class A4 Series 2017-BNK4 | 3.625% | 5/15/50 | 3,890 | 3,667 | |
| 4 | BANK Class A4 Series 2017-BNK7 | 3.175% | 9/15/60 | 830 | 774 | |
| 4 | BANK Class A4 Series 2017-BNK8 | 3.488% | 11/15/50 | 5,500 | 5,041 | |
| 4 | BANK Class A5 Series 2017-BNK7 | 3.435% | 9/15/60 | 3,120 | 2,957 | |
| 3,4 | Bank of America Auto Trust Class A4 Series 2023-1A | 5.390% | 7/16/29 | 3,450 | 3,495 | |
| 4 | Bank of America Merrill Lynch Commercial Mortgage Trust Class A4 Series 2017-BNK3 | 3.574% | 2/15/50 | 4,760 | 4,551 | |
| 4 | BBCMS Mortgage Trust Class A1 Series 2022-C16 | 4.021% | 6/15/55 | 6,376 | 6,197 | |
| 4,5 | BBCMS Mortgage Trust Class A3 Series 2023-5C23 | 6.675% | 12/15/56 | 1,030 | 1,106 | |
| 4,5 | Bear Stearns ARM Trust Class 1A1 Series 2007-3 | 3.877% | 5/25/47 | 3,823 | 3,373 | |
| 4,5 | Bear Stearns ARM Trust Class 2A1 Series 2006-4 | 4.419% | 10/25/36 | 4,229 | 3,690 | |
| 4 | Benchmark Mortgage Trust Class A4 Series 2018-B8 | 3.963% | 1/15/52 | 2,620 | 2,474 | |
| 4,5 | Benchmark Mortgage Trust Class A5 Series 2018-B1 | 3.666% | 1/15/51 | 6,333 | 5,939 | |
| 4,6 | BMO Mortgage Trust Class A3 Series 2024-5C3 | 5.739% | 2/15/57 | 17,260 | 17,883 | |
| 3,4,5 | BPR Trust Class A Series 2023-BRK2 | 6.899% | 11/5/28 | 4,500 | 4,749 | |
| 4 | Capital One Prime Auto Receivables Trust Class A4 Series 2022-2 | 3.690% | 12/15/27 | 13,160 | 12,780 | |
| 4 | Capital One Prime Auto Receivables Trust Class A4 Series 2023-1 | 4.760% | 8/15/28 | 5,010 | 4,989 | |
| 4 | CarMax Auto Owner Trust Class A4 Series 2023-1 | 4.650% | 1/16/29 | 6,400 | 6,350 | |
| 4 | CarMax Auto Owner Trust Class C Series 2020-4 | 1.300% | 8/17/26 | 6,190 | 5,969 | |
| 4 | Carvana Auto Receivables Trust Class A4 Series 2021-P3 | 1.030% | 6/10/27 | 9,760 | 9,014 | |
| 3,4 | CCG Receivables Trust Class A2 Series 2023-2 | 6.280% | 4/14/32 | 3,110 | 3,163 | |
| 4 | CD Mortgage Trust Class A3 Series 2018-CD7 | 4.013% | 8/15/51 | 6,365 | 6,051 | |
| 4 | CD Mortgage Trust Class A4 Series 2016-CD1 | 2.724% | 8/10/49 | 3,650 | 3,353 | |
| 4 | CD Mortgage Trust Class A4 Series 2017-CD3 | 3.631% | 2/10/50 | 5,355 | 4,917 | |
| 4,5 | CD Mortgage Trust Class A4 Series 2017-CD4 | 3.514% | 5/10/50 | 7,020 | 6,573 | |
| 4,5 | CD Mortgage Trust Class AM Series 2017-CD6 | 3.709% | 11/13/50 | 2,840 | 2,543 | |
| 4,5 | CD Mortgage Trust Class AS Series 2017-CD5 | 3.684% | 8/15/50 | 2,092 | 1,920 | |
| 4,5 | CD Mortgage Trust Class C Series 2016-CD1 | 3.631% | 8/10/49 | 3,319 | 2,191 | |
| Coupon | Maturity Date | Face Amount ($000) | Market Value• ($000) | |||
| 4,5 | CD Mortgage Trust Class C Series 2018-CD7 | 4.843% | 8/15/51 | 2,830 | 2,233 | |
| 4 | CFCRE Commercial Mortgage Trust Class A4 Series 2016-C4 | 3.283% | 5/10/58 | 5,064 | 4,734 | |
| 4 | Chase Issuance Trust Class A Series 2024-A2 | 4.630% | 1/15/31 | 40,980 | 41,330 | |
| 4,5 | CHL Mortgage Class 1A1 Series 2006-HYB1 Pass-Through Trust | 4.271% | 3/20/36 | 2,624 | 2,332 | |
| 4,5 | CHL Mortgage Class 3A1 Series 2007-HYB2 Pass-Through Trust | 4.159% | 2/25/47 | 3,010 | 2,530 | |
| 4 | Citibank Credit Card Issuance Trust Class A1 Series 2023-A1 | 5.230% | 12/8/27 | 17,460 | 17,616 | |
| 4 | Citigroup Commercial Mortgage Trust Class A3 Series 2017-P8 | 3.203% | 9/15/50 | 2,641 | 2,487 | |
| 4 | Citigroup Commercial Mortgage Trust Class A4 Series 2015-GC31 | 3.762% | 6/10/48 | 6,298 | 6,096 | |
| 4 | Citigroup Commercial Mortgage Trust Class A4 Series 2016-GC36 | 3.349% | 2/10/49 | 5,412 | 5,196 | |
| 4 | Citigroup Commercial Mortgage Trust Class A4 Series 2017-C4 | 3.471% | 10/12/50 | 4,800 | 4,539 | |
| 4,5 | Citigroup Commercial Mortgage Trust Class A4 Series 2018-C5 | 4.228% | 6/10/51 | 4,260 | 4,085 | |
| 4 | Citigroup Commercial Mortgage Trust Class B Series 2017-P8 | 4.192% | 9/15/50 | 3,800 | 3,230 | |
| 4,5 | Citigroup Commercial Mortgage Trust Class C Series 2015-GC33 | 4.574% | 9/10/58 | 4,000 | 3,109 | |
| 4,5 | Citigroup Commercial Mortgage Trust Class C Series 2017-P8 | 4.257% | 9/15/50 | 2,160 | 1,663 | |
| 4,5 | Citigroup Mortgage Loan Trust Class 2A1A Series 2007-AR8 | 4.504% | 7/25/37 | 191 | 161 | |
| 3,4 | Citizens Auto Receivables Trust Class A4 Series 2024-1 | 5.030% | 10/15/30 | 3,630 | 3,637 | |
| 4 | CNH Equipment Trust Class A3 Series 2022-B | 3.890% | 8/16/27 | 8,260 | 8,124 | |
| 4 | CNH Equipment Trust Class A4 Series 2022-B | 3.910% | 3/15/28 | 4,270 | 4,153 | |
| 3,4 | COMM Mortgage Trust Class B Series 2013-CR6 | 3.397% | 3/10/46 | 1,106 | 1,057 | |
| 4 | CSAIL Commercial Mortgage Trust Class A5 Series 2016-C7 | 3.502% | 11/15/49 | 5,173 | 4,888 | |
| 4,5 | CSAIL Commercial Mortgage Trust Class C Series 2015-C3 | 4.351% | 8/15/48 | 4,400 | 3,403 | |
| 4 | DBJPM Mortgage Trust Class A5 Series 2017-C6 | 3.328% | 6/10/50 | 3,540 | 3,309 | |
| 3,4 | DLLAA LLC Class A4 Series 2023-1A | 5.730% | 10/20/31 | 2,730 | 2,783 | |
| 3,4 | DLLAD LLC Class A3 Series 2023-1A | 5.640% | 2/22/28 | 4,820 | 4,911 | |
| 3,4 | DLLST LLC Class A4 Series 2024-1A | 4.930% | 4/22/30 | 1,120 | 1,119 | |
| 3,4,5 | Edsouth Indenture No. 9 LLC Class A Series 2015-1, SOFR30A + 0.914% | 6.252% | 10/25/56 | 6,170 | 6,158 | |
| Coupon | Maturity Date | Face Amount ($000) | Market Value• ($000) | |||
| 3,4 | EDvestinU Private Education Loan Issue No. 1 LLC Class A Series 2019-A | 3.580% | 11/25/38 | 2,598 | 2,514 | |
| 3,4 | Enterprise Fleet Financing LLC Class A3 Series 2023-3 | 6.410% | 6/20/30 | 2,500 | 2,578 | |
| 3,4,5,7 | Fannie Mae Connecticut Avenue Securities Trust Class 1M1 Series 2023-R06, SOFR30A + 1.700% | 7.037% | 7/25/43 | 2,553 | 2,580 | |
| 3,4,5,7 | Fannie Mae Connecticut Avenue Securities Trust Class 1M1 Series 2023-R08, SOFR30A + 1.500% | 6.845% | 10/25/43 | 4,231 | 4,251 | |
| 3,4,5,7 | Fannie Mae Connecticut Avenue Securities Trust Class 1M1 Series 2024-R01, SOFR30A + 1.050% | 6.395% | 1/25/44 | 31,020 | 31,052 | |
| 3,4,5,7 | Fannie Mae Connecticut Avenue Securities Trust Class 2M1 Series 2023-R07, SOFR30A + 1.950% | 7.287% | 9/25/43 | 9,405 | 9,507 | |
| 4,5 | First Horizon Mortgage Pass-Through Trust Class 1A1 Series 2006-AR3 | 4.022% | 11/25/36 | 1,559 | 1,007 | |
| 4,5 | First Horizon Mortgage Pass-Through Trust Class 1A1 Series 2006-AR4 | 4.682% | 1/25/37 | 2,993 | 1,608 | |
| 4 | First National Master Note Trust Class A Series 2023-2 | 5.770% | 9/15/29 | 3,900 | 3,989 | |
| 4,5 | Five Mortgage Trust Class A3 Series 2023-V1 | 5.668% | 2/10/56 | 850 | 871 | |
| 4 | Ford Credit Auto Lease Trust Class B Series 2023-B | 6.200% | 2/15/27 | 7,390 | 7,475 | |
| 4 | Ford Credit Auto Lease Trust Class B Series 2024-A | 5.290% | 6/15/27 | 4,100 | 4,107 | |
| 4 | Ford Credit Auto Lease Trust Class C Series 2023-B | 6.430% | 4/15/27 | 10,240 | 10,436 | |
| 3,4 | Ford Credit Auto Owner Trust Class A Series 2023-1 | 4.850% | 8/15/35 | 32,740 | 32,933 | |
| 4 | Ford Credit Auto Owner Trust Class A4 Series 2022-D | 5.300% | 3/15/28 | 6,810 | 6,870 | |
| 3,4 | Ford Credit Auto Owner Trust Class B Series 2020-2 | 1.490% | 4/15/33 | 6,100 | 5,700 | |
| 4 | Ford Credit Auto Owner Trust Class B Series 2023-C | 5.930% | 8/15/29 | 11,230 | 11,612 | |
| 3,4 | Ford Credit Auto Owner Trust Class C Series 2020-1 | 2.540% | 8/15/31 | 7,484 | 7,267 | |
| 4 | Ford Credit Auto Owner Trust Class C Series 2020-C | 1.040% | 5/15/28 | 4,930 | 4,733 | |
| 3,4 | Ford Credit Auto Owner Trust Class C Series 2021-1 | 1.910% | 10/17/33 | 6,400 | 5,849 | |
| 4 | Ford Credit Auto Owner Trust Class C Series 2023-C | 6.370% | 5/15/31 | 12,460 | 12,938 | |
| Coupon | Maturity Date | Face Amount ($000) | Market Value• ($000) | |||
| 3,4 | Ford Credit Floorplan Master Owner Trust Class A1 Series 2023-1 | 4.920% | 5/15/28 | 15,430 | 15,466 | |
| 3,4,5,7 | Freddie Mac STACR REMICS Trust Class A1 Series 2023-HQA3, SOFR30A + 1.850% | 7.187% | 11/25/43 | 4,311 | 4,381 | |
| 3,4,5,7 | Freddie Mac STACR REMICS Trust Class M1 Series 2023-HQA3, SOFR30A + 1.850% | 7.195% | 11/25/43 | 3,095 | 3,125 | |
| 3,4,5,7 | Freddie Mac STACR REMICS Trust Class M1A Series 2022-HQA1, SOFR30A + 2.100% | 7.437% | 3/25/42 | 2,784 | 2,816 | |
| 4 | GM Financial Automobile Leasing Trust Class B Series 2023-3 | 5.880% | 8/20/27 | 4,600 | 4,636 | |
| 4 | GM Financial Consumer Automobile Receivables Trust Class A3 Series 2023-1 | 4.660% | 2/16/28 | 13,150 | 13,096 | |
| 4 | GM Financial Consumer Automobile Receivables Trust Class A4 Series 2021-4 | 0.990% | 10/18/27 | 11,410 | 10,633 | |
| 4 | GM Financial Consumer Automobile Receivables Trust Class A4 Series 2022-3 | 3.710% | 12/16/27 | 15,490 | 15,099 | |
| 4 | GM Financial Consumer Automobile Receivables Trust Class A4 Series 2022-4 | 4.880% | 8/16/28 | 6,220 | 6,213 | |
| 4 | GM Financial Consumer Automobile Receivables Trust Class A4 Series 2023-1 | 4.590% | 7/17/28 | 860 | 854 | |
| 4 | GM Financial Consumer Automobile Receivables Trust Class B Series 2021-1 | 0.750% | 5/17/27 | 3,250 | 3,115 | |
| 4 | GM Financial Consumer Automobile Receivables Trust Class B Series 2021-2 | 1.090% | 12/16/26 | 7,270 | 6,896 | |
| 4 | GM Financial Consumer Automobile Receivables Trust Class B Series 2024-1 | 5.160% | 8/16/29 | 2,320 | 2,333 | |
| 4 | GM Financial Consumer Automobile Receivables Trust Class C Series 2023-1 | 5.320% | 10/16/28 | 3,540 | 3,551 | |
| 3,4 | GM Financial Revolving Receivables Trust Class A Series 2023-1 | 5.120% | 4/11/35 | 9,005 | 9,106 | |
| 3,4 | GM Financial Revolving Receivables Trust Class A Series 2023-2 | 5.770% | 8/11/36 | 9,980 | 10,444 | |
| 3,4 | GM Financial Revolving Receivables Trust Class B Series 2021-1 | 1.490% | 6/12/34 | 1,870 | 1,710 | |
| 3,4 | GM Financial Revolving Receivables Trust Class B Series 2023-2 | 6.210% | 8/11/36 | 3,940 | 4,102 | |
| 3,4 | GM Financial Revolving Receivables Trust Class C Series 2021-1 | 1.670% | 6/12/34 | 3,380 | 3,083 | |
| 4,5 | GMACM Mortgage Loan Trust Class 3A1 Series 2005-AR6 | 4.264% | 11/19/35 | 412 | 349 | |
| Coupon | Maturity Date | Face Amount ($000) | Market Value• ($000) | |||
| 3,4 | GMF Floorplan Owner Revolving Trust Class A Series 2023-2 | 5.340% | 6/15/30 | 7,830 | 7,993 | |
| 3,4 | Golden Credit Card Trust Class A Series 2021-1A | 1.140% | 8/15/28 | 31,290 | 28,503 | |
| 3,4 | GreatAmerica Leasing Receivables Clas A4, Series 2024-1 | 5.080% | 12/16/30 | 5,005 | 5,031 | |
| 4 | GS Mortgage Securities Trust Class A3 Series 2017-GS6 | 3.433% | 5/10/50 | 2,501 | 2,321 | |
| 4 | GS Mortgage Securities Trust Class A4 Series 2015-GC32 | 3.764% | 7/10/48 | 9,121 | 8,877 | |
| 4,5 | GS Mortgage Securities Trust Class A4 Series 2018-GS9 | 3.992% | 3/10/51 | 4,990 | 4,642 | |
| 4,5 | GS Mortgage Securities Trust Class A5 Series 2018-GS10 | 4.155% | 7/10/51 | 3,865 | 3,633 | |
| 4 | GS Mortgage Securities Trust Class AS Series 2014-GC20 | 4.258% | 4/10/47 | 1,410 | 1,401 | |
| 4,5 | GS Mortgage Securities Trust Class C Series 2014-GC24 | 4.518% | 9/10/47 | 17,556 | 13,960 | |
| 4,5 | GS Mortgage Securities Trust Class C Series 2015-GC34 | 4.637% | 10/10/48 | 3,980 | 2,903 | |
| 3,4 | Hertz Vehicle Financing III LLC Class A Series 2022-1A | 1.990% | 6/25/26 | 11,420 | 10,986 | |
| 3,4 | Hertz Vehicle Financing III LLC Class A Series 2023-3A | 5.940% | 2/25/28 | 6,300 | 6,417 | |
| 3,4 | Hertz Vehicle Financing III LLC Class C Series 2022-1A | 2.630% | 6/25/26 | 4,980 | 4,747 | |
| 3,4 | Hertz Vehicle Financing III LLC Class C Series 2022-3A | 4.350% | 3/25/25 | 1,120 | 1,118 | |
| 3,4 | Hertz Vehicle Financing LLC Class A Series 2022-2A | 2.330% | 6/26/28 | 6,630 | 6,052 | |
| 4 | Honda Auto Receivables Owner Trust Class A4 Series 2022-2 | 3.760% | 12/18/28 | 4,760 | 4,660 | |
| 4 | Honda Auto Receivables Owner Trust Class A4 Series 2023-1 | 4.970% | 6/21/29 | 7,510 | 7,541 | |
| 3,4 | HPEFS Equipment Trust Class C Series 2024-1 | 5.330% | 5/20/31 | 6,030 | 6,044 | |
| 3,4 | HPEFS Equipment Trust Class D Series 2024-1 | 5.820% | 11/20/31 | 7,510 | 7,541 | |
| 3,4 | Hyundai Auto Lease Securitization Trust Class B Series 2024-A | 5.350% | 5/15/28 | 13,360 | 13,403 | |
| 4 | Hyundai Auto Receivables Trust Class A4 Series 2021-C | 1.030% | 12/15/27 | 13,120 | 12,352 | |
| 4 | Hyundai Auto Receivables Trust Class A4 Series 2022-B | 3.800% | 8/15/28 | 15,460 | 15,117 | |
| 4 | Hyundai Auto Receivables Trust Class B Series 2020-C | 0.810% | 11/16/26 | 8,220 | 7,881 | |
| 4 | Hyundai Auto Receivables Trust Class B Series 2021-A | 1.090% | 5/17/27 | 8,510 | 8,064 | |
| 4 | Hyundai Auto Receivables Trust Class B Series 2021-B | 0.910% | 2/16/27 | 7,900 | 7,360 | |
| Coupon | Maturity Date | Face Amount ($000) | Market Value• ($000) | |||
| 4 | Hyundai Auto Receivables Trust Class B Series 2023-C | 6.010% | 12/17/29 | 13,890 | 14,325 | |
| 4 | Hyundai Auto Receivables Trust Class C Series 2020-C | 1.080% | 12/15/27 | 7,250 | 6,908 | |
| 4 | John Deere Owner Trust Class A4 Series 2023-A | 5.010% | 12/17/29 | 12,389 | 12,481 | |
| 3,4,5 | JP Morgan Chase Commercial Mortgage Securities Trust Class D Series 2010-C2 | 5.583% | 11/15/43 | 641 | 587 | |
| 4 | JPMBB Commercial Mortgage Securities Trust Class A4 Series 2014-C21 | 3.493% | 8/15/47 | 1,325 | 1,319 | |
| 4 | JPMBB Commercial Mortgage Securities Trust Class A5 Series 2015-C32 | 3.598% | 11/15/48 | 7,642 | 7,283 | |
| 4 | JPMCC Commercial Mortgage Securities Trust Class A4 Series 2017-JP6 | 3.224% | 7/15/50 | 6,030 | 5,618 | |
| 4 | JPMCC Commercial Mortgage Securities Trust Class A5 Series 2017-JP5 | 3.723% | 3/15/50 | 5,970 | 5,673 | |
| 4 | JPMDB Commercial Mortgage Securities Trust Class A4 Series 2018-C8 | 4.211% | 6/15/51 | 4,000 | 3,769 | |
| 4 | JPMDB Commercial Mortgage Securities Trust Class A5 Series 2017-C7 | 3.409% | 10/15/50 | 5,693 | 5,252 | |
| 3,4 | Kubota Credit Owner Trust Class A4 Series 2023-1A | 5.070% | 2/15/29 | 3,730 | 3,753 | |
| 3,4 | Laurel Road Prime Student Loan Trust Class A2B Series 2017-C | 2.810% | 11/25/42 | 110 | 110 | |
| 3,4 | Laurel Road Prime Student Loan Trust Class A2FX Series 2018-B | 3.540% | 5/26/43 | 442 | 439 | |
| 3,4 | Master Credit Card Trust II Class A Series 2023-1A | 4.700% | 6/21/27 | 8,560 | 8,535 | |
| 4,5 | MASTR Adjustable Rate Mortgages Trust Class 5A1 Series 2004-3 | 5.091% | 4/25/34 | 24 | 23 | |
| 4 | Mercedes-Benz Auto Receivables Trust Class A4 Series 2022-1 | 5.250% | 2/15/29 | 5,930 | 5,988 | |
| 4 | Mercedes-Benz Auto Receivables Trust Class A4 Series 2023-1 | 4.310% | 4/16/29 | 4,620 | 4,561 | |
| 4,5 | Merrill Lynch Mortgage Investors Trust MLMI Class 2A Series 2003-A4 | 6.243% | 7/25/33 | 137 | 127 | |
| 4,5 | Merrill Lynch Mortgage Investors Trust MLMI Class 2A2 Series 2003-A2, TSFR6M + 1.928% | 7.299% | 2/25/33 | 194 | 181 | |
| 4 | Morgan Stanley Bank of America Merrill Lynch Trust Class A4 Series 2017-C34 | 3.536% | 11/15/52 | 2,475 | 2,289 | |
| 4 | Morgan Stanley Bank of America Merrill Lynch Trust Class A5 Series 2015-C25 | 3.635% | 10/15/48 | 5,857 | 5,679 | |
| Coupon | Maturity Date | Face Amount ($000) | Market Value• ($000) | |||
| 4,5 | Morgan Stanley Bank of America Merrill Lynch Trust Class C Series 2013-C10 | 3.997% | 7/15/46 | 3,372 | 2,707 | |
| 4,5 | Morgan Stanley Bank of America Merrill Lynch Trust Class C Series 2014-C15 | 5.011% | 4/15/47 | 36 | 36 | |
| 4 | Morgan Stanley Capital I Class ASB Series 2017-HR2 | 3.509% | 12/15/50 | 4,272 | 4,126 | |
| 3,4 | Morgan Stanley Capital I Trust Class A Series 2014-150E | 3.912% | 9/9/32 | 7,955 | 6,638 | |
| 4,5 | Morgan Stanley Mortgage Loan Trust Class 5A1 Series 2006-8AR | 7.035% | 6/25/36 | 1,609 | 1,554 | |
| 3,4 | MSBAM Commercial Mortgage Securities Trust Class A2 Series 2012-CKSV | 3.277% | 10/15/30 | 13,916 | 12,021 | |
| 3,4 | Navient Private Education Loan Trust Class A2A Series 2017-A | 2.880% | 12/16/58 | 48 | 48 | |
| 3,4 | Navient Private Education Loan Trust Class A2A Series 2018-BA | 3.610% | 12/15/59 | 3,339 | 3,271 | |
| 3,4,5 | Navient Student Loan Trust Class A1B Series 2023-BA, SOFR30A + 1.700% | 7.046% | 3/15/72 | 1,403 | 1,418 | |
| 3,4 | Navistar Financial Dealer Note Master Owner Trust II Class A Series 2023-1 | 6.180% | 8/25/28 | 3,840 | 3,867 | |
| 4 | Nissan Auto Receivables Owner Trust Class A4 Series 2023-A | 4.850% | 6/17/30 | 4,580 | 4,583 | |
| 3,4 | Palisades Center Trust Class A Series 2016-PLSD | 2.713% | 4/13/33 | 8,240 | 4,711 | |
| 3,4 | PFS Financing Corp. Class A Series 2023-B | 5.270% | 5/15/28 | 9,240 | 9,265 | |
| 3,4 | PFS Financing Corp. Class A Series 2023-C | 5.520% | 10/15/28 | 4,200 | 4,238 | |
| 3,4 | Progress Residential Trust Class A Series 2022-SFR3 | 3.200% | 4/17/39 | 3,644 | 3,436 | |
| 3,4 | Progress Residential Trust Class A Series 2022-SFR5 | 4.451% | 6/17/39 | 3,029 | 2,965 | |
| 3,4,6 | Progress Residential Trust Class A Series 2024-SFR1 | 3.350% | 2/17/41 | 8,110 | 7,501 | |
| 3,4 | Progress Residential Trust Class B Series 2022-SFR3 | 3.600% | 4/17/39 | 1,590 | 1,502 | |
| 3,4 | Progress Residential Trust Class B Series 2022-SFR5 | 4.896% | 6/17/39 | 2,850 | 2,794 | |
| 4,5 | RFMSI Series Trust Class 2A1 Series 2006-SA2 | 5.363% | 8/25/36 | 5,354 | 3,726 | |
| 4,5 | RFMSI Series Trust Class 2A1 Series 2006-SA3 | 5.721% | 9/25/36 | 2,080 | 1,162 | |
| 3,4 | Santander Bank Auto Credit-Linked Notes Class B Series 2023-B | 5.640% | 12/15/33 | 1,190 | 1,194 | |
| 3,4 | Santander Bank Auto Credit-Linked Notes Class C Series 2023-B | 5.933% | 12/15/33 | 2,560 | 2,569 | |
| Coupon | Maturity Date | Face Amount ($000) | Market Value• ($000) | |||
| 3,4 | Santander Bank Auto Credit-Linked Notes Class D Series 2023-B | 6.663% | 12/15/33 | 2,788 | 2,800 | |
| 4 | Santander Drive Auto Receivables Trust Class B Series 2023-6 | 5.980% | 4/16/29 | 8,380 | 8,568 | |
| 4 | Santander Drive Auto Receivables Trust Class B Series 2024 -1 | 5.230% | 12/15/28 | 5,830 | 5,848 | |
| 3,4 | Santander Drive Auto Receivables Trust Class B Series 2024-1A | 5.380% | 1/21/31 | 3,850 | 3,797 | |
| 4 | Santander Drive Auto Receivables Trust Class C Series 2023-1 | 5.090% | 5/15/30 | 2,000 | 1,982 | |
| 4 | Santander Drive Auto Receivables Trust Class C Series 2023-6 | 6.400% | 3/17/31 | 6,660 | 6,806 | |
| 4 | Santander Drive Auto Receivables Trust Class C Series 2024 -1 | 5.450% | 3/15/30 | 4,405 | 4,407 | |
| 3,4 | Santander Drive Auto Receivables Trust Class C Series 2024-1A | 5.510% | 1/20/32 | 5,410 | 5,421 | |
| 3,4 | Santander Retail Auto Lease Trust Class B Series 2022-B | 3.850% | 3/22/27 | 6,030 | 5,922 | |
| 3,4 | Santander Retail Auto Lease Trust Class D Series 2021-B | 1.410% | 11/20/25 | 14,530 | 14,318 | |
| 3,4 | SBNA Auto Lease Trust Class A4 Series 2023-A | 6.520% | 4/20/28 | 5,010 | 5,167 | |
| 3,4 | SCCU Auto Receivables Trust Class A4 Series 2023-1A | 5.700% | 8/15/29 | 1,190 | 1,203 | |
| 3,4 | SCOTT Trust Class A Series 2023-SFS | 5.910% | 3/15/40 | 2,230 | 2,251 | |
| 3,4 | SMB Private Education Loan Trust Class A2A Series 2016-A | 2.700% | 5/15/31 | 927 | 915 | |
| 3,4 | SMB Private Education Loan Trust Class A2A Series 2017-B | 2.820% | 10/15/35 | 4,369 | 4,248 | |
| 3,4 | SMB Private Education Loan Trust Class A2A Series 2018-B | 3.600% | 1/15/37 | 6,712 | 6,542 | |
| 3,4 | SMB Private Education Loan Trust Class A2A Series 2018-C | 3.630% | 11/15/35 | 8,289 | 8,075 | |
| 3,4 | SoFi Professional Loan Program LLC Class A2FX Series 2017-D | 2.650% | 9/25/40 | 1,463 | 1,410 | |
| 3,4 | SoFi Professional Loan Program LLC Class A2FX Series 2017-F | 2.840% | 1/25/41 | 1,526 | 1,487 | |
| 4 | Synchrony Card Funding LLC Class A Series 2023-A1 | 5.540% | 7/15/29 | 9,870 | 10,047 | |
| 4 | Synchrony Card Funding LLC Class A Series 2023-A2 | 5.740% | 10/15/29 | 49,170 | 50,401 | |
| 3,4 | Tesla Auto Lease Trust Class A4 Series 2023-A | 5.940% | 7/20/27 | 3,430 | 3,440 | |
| 3,4 | Tesla Auto Lease Trust Class A4 Series 2023-B | 6.220% | 3/22/27 | 3,210 | 3,252 | |
| 3,4 | Tesla Auto Lease Trust Class C Series 2021-B | 1.120% | 9/22/25 | 7,770 | 7,600 | |
| 3,4 | Tesla Electric Vehicle Trust Class A4 Series 2023-1 | 5.380% | 2/20/29 | 4,810 | 4,877 | |
| Coupon | Maturity Date | Face Amount ($000) | Market Value• ($000) | |||
| 3,4 | Tesla Electric Vehicle Trust Class B Series 2023-1 | 5.820% | 5/20/31 | 4,790 | 4,877 | |
| 3,4 | TMSQ Mortgage Trust Class A Series 2014-1500 | 3.680% | 10/10/36 | 21,960 | 20,275 | |
| 4 | Toyota Auto Receivables Owner Trust Class A4 Series 2021-D | 1.020% | 3/15/27 | 11,100 | 10,380 | |
| 4 | Toyota Auto Receivables Owner Trust Class A4 Series 2022-C | 3.770% | 2/15/28 | 10,080 | 9,819 | |
| 4 | Toyota Auto Receivables Owner Trust Class A4 Series 2022-D | 5.430% | 4/17/28 | 10,710 | 10,904 | |
| 4 | Toyota Auto Receivables Owner Trust Class A4 Series 2023-A | 4.420% | 8/15/28 | 7,865 | 7,796 | |
| 4 | UBS Commercial Mortgage Trust Class A4 Series 2017-C7 | 3.679% | 12/15/50 | 5,515 | 5,096 | |
| 3,4 | UBS-BAMLL Trust Class A Series 2012-WRM | 3.663% | 6/10/30 | 794 | 723 | |
| 3,4 | US Bank NA Class B Series 2023-1 | 6.789% | 8/25/32 | 4,139 | 4,166 | |
| 4 | Verizon Master Trust Class A Series 2023-1 | 4.490% | 1/22/29 | 17,220 | 17,150 | |
| 3,4 | Verizon Master Trust Class A Series 2023-6 | 5.350% | 9/22/31 | 7,490 | 7,689 | |
| 3,4 | Verizon Master Trust Class A Series 2024-2 | 4.830% | 12/22/31 | 46,940 | 47,395 | |
| 3,4 | Verizon Master Trust Class B Series 2024-2 | 5.080% | 12/22/31 | 9,440 | 9,495 | |
| 3,4 | Verizon Master Trust Class C Series 2024-2 | 5.320% | 12/22/31 | 11,700 | 11,765 | |
| 4,5 | WaMu Mortgage Pass-Through Certificates Class 1A7 Series 2003-AR9 Trust | 5.662% | 9/25/33 | 279 | 256 | |
| 4,5 | WaMu Mortgage Pass-Through Certificates Class A Series 2002-AR18 Trust | 6.157% | 1/25/33 | 43 | 41 | |
| 4,5 | WaMu Mortgage Pass-Through Certificates Class A7 Series 2003-AR7 Trust | 5.582% | 8/25/33 | 188 | 172 | |
| 4 | Wells Fargo Commercial Mortgage Trust Class A3 Series 2017-C40 | 3.317% | 10/15/50 | 6,950 | 6,535 | |
| 4 | Wells Fargo Commercial Mortgage Trust Class A4 Series 2015-C30 | 3.664% | 9/15/58 | 5,260 | 5,095 | |
| 4 | Wells Fargo Commercial Mortgage Trust Class A4 Series 2017-C39 | 3.157% | 9/15/50 | 5,750 | 5,338 | |
| 4 | Wells Fargo Commercial Mortgage Trust Class A4 Series 2017-C40 | 3.581% | 10/15/50 | 2,495 | 2,367 | |
| 4 | Wells Fargo Commercial Mortgage Trust Class A4 Series 2017-RC1 | 3.631% | 1/15/60 | 2,479 | 2,372 | |
| 4 | Wells Fargo Commercial Mortgage Trust Class A4 Series 2018-C46 | 4.152% | 8/15/51 | 3,435 | 3,285 | |
| 4 | Wells Fargo Commercial Mortgage Trust Class A4 Series 2018-C47 | 4.442% | 9/15/61 | 3,040 | 2,975 | |
| 4 | Wells Fargo Commercial Mortgage Trust Class AS Series 2014-LC16 | 4.020% | 8/15/50 | 7,100 | 6,977 | |
| Coupon | Maturity Date | Face Amount ($000) | Market Value• ($000) | |||
| 4 | Wells Fargo Commercial Mortgage Trust Class B Series 2014-LC16 | 4.322% | 8/15/50 | 6,550 | 5,216 | |
| 4 | Wells Fargo Commercial Mortgage Trust Class C Series 2014-LC16 | 4.458% | 8/15/50 | 6,830 | 2,530 | |
| 4,5 | Wells Fargo Commercial Mortgage Trust Class C Series 2015-LC22 | 4.545% | 9/15/58 | 4,885 | 4,253 | |
| 4,5 | Wells Fargo Commercial Mortgage Trust Class C Series 2018-C43 | 4.514% | 3/15/51 | 3,490 | 2,723 | |
| 4,5 | Wells Fargo Mortgage Backed Securities Trust Class 2A1 Series 2006-AR14 | 6.376% | 10/25/36 | 1,876 | 1,640 | |
| 3,4,5 | WFLD Mortgage Trust Class A Series 2014-MONT | 3.755% | 8/10/31 | 35,485 | 30,939 | |
| 4 | WFRBS Commercial Mortgage Trust Class A4 Series 2014-C21 | 3.410% | 8/15/47 | 1,852 | 1,838 | |
| 4 | WFRBS Commercial Mortgage Trust Class AS Series 2014-C21 | 3.891% | 8/15/47 | 7,130 | 6,829 | |
| 4 | WFRBS Commercial Mortgage Trust Class B Series 2014-C20 | 4.378% | 5/15/47 | 11,110 | 8,724 | |
| 4,5 | WFRBS Commercial Mortgage Trust Class C Series 2014-C20 | 4.513% | 5/15/47 | 4,500 | 2,399 | |
| 4 | World Omni Auto Receivables Trust Class A4 Series 2021-D | 1.100% | 11/15/27 | 13,110 | 12,245 | |
| 4 | World Omni Auto Receivables Trust Class A4 Series 2022-C | 3.680% | 9/15/28 | 10,970 | 10,653 | |
| 4 | World Omni Auto Receivables Trust Class A4 Series 2022-D | 5.700% | 2/15/29 | 6,510 | 6,673 | |
| 4 | World Omni Auto Receivables Trust Class A4 Series 2023-A | 4.660% | 5/15/29 | 7,050 | 7,011 | |
| 4 | World Omni Auto Receivables Trust Class B Series 2021-B | 1.040% | 6/15/27 | 4,360 | 4,110 | |
| 4 | World Omni Auto Receivables Trust Class B Series 2021-C | 0.840% | 9/15/27 | 5,360 | 4,980 | |
| 4 | World Omni Auto Receivables Trust Class C Series 2021-B | 1.290% | 12/15/27 | 4,270 | 4,023 | |
| 4 | World Omni Auto Receivables Trust Class C Series 2021-D | 1.720% | 6/15/28 | 4,640 | 4,340 | |
| Total Asset-Backed/Commercial Mortgage-Backed Securities (Cost $1,713,549) | 1,650,076 | |||||
| Corporate Bonds (87.3%) | ||||||
| Communications (7.2%) | ||||||
| AT&T Inc. | 3.875% | 1/15/26 | 10,870 | 10,668 | ||
| AT&T Inc. | 1.700% | 3/25/26 | 215,590 | 201,930 | ||
| AT&T Inc. | 2.300% | 6/1/27 | 59,437 | 55,106 | ||
| AT&T Inc. | 1.650% | 2/1/28 | 53,362 | 47,565 | ||
| AT&T Inc. | 4.100% | 2/15/28 | 28,492 | 27,873 | ||
| 8 | AT&T Inc. | 1.600% | 5/19/28 | 22,700 | 22,957 | |
| Booking Holdings Inc. | 3.600% | 6/1/26 | 16,000 | 15,631 | ||
| British Telecommunications plc | 5.125% | 12/4/28 | 22,032 | 22,343 | ||
| 3 | CCO Holdings LLC / CCO Holdings Capital Corp. | 5.375% | 6/1/29 | 1,322 | 1,230 | |
| Coupon | Maturity Date | Face Amount ($000) | Market Value• ($000) | |||
| 3 | CCO Holdings LLC / CCO Holdings Capital Corp. | 6.375% | 9/1/29 | 3,875 | 3,771 | |
| Charter Communications Operating LLC / Charter Communications Operating Capital | 4.908% | 7/23/25 | 234,157 | 232,079 | ||
| Charter Communications Operating LLC / Charter Communications Operating Capital | 6.150% | 11/10/26 | 47,630 | 48,650 | ||
| Charter Communications Operating LLC / Charter Communications Operating Capital | 3.750% | 2/15/28 | 27,070 | 25,544 | ||
| Charter Communications Operating LLC / Charter Communications Operating Capital | 4.200% | 3/15/28 | 26,804 | 25,762 | ||
| 9 | CK Hutchison Group Telecom Finance SA | 2.000% | 10/17/27 | 30,110 | 33,987 | |
| Comcast Corp. | 3.375% | 8/15/25 | 65,109 | 63,834 | ||
| Comcast Corp. | 3.950% | 10/15/25 | 46,925 | 46,342 | ||
| Comcast Corp. | 3.150% | 3/1/26 | 29,510 | 28,704 | ||
| 8 | Comcast Corp. | 0.000% | 9/14/26 | 24,105 | 24,076 | |
| Comcast Corp. | 2.350% | 1/15/27 | 51,431 | 48,421 | ||
| Comcast Corp. | 5.350% | 11/15/27 | 17,950 | 18,474 | ||
| Comcast Corp. | 3.150% | 2/15/28 | 21,995 | 20,896 | ||
| Comcast Corp. | 3.550% | 5/1/28 | 29,295 | 28,204 | ||
| 3 | CSC Holdings LLC | 11.750% | 1/31/29 | 625 | 635 | |
| 3 | CSC Holdings LLC | 4.125% | 12/1/30 | 1,930 | 1,398 | |
| 3 | CSC Holdings LLC | 4.500% | 11/15/31 | 2,415 | 1,733 | |
| 8 | Deutsche Telekom International Finance BV | 1.500% | 4/3/28 | 3,000 | 3,066 | |
| 3 | Directv Financing LLC / Directv Financing Co-Obligor Inc. | 5.875% | 8/15/27 | 2,546 | 2,419 | |
| Discovery Communications LLC | 3.450% | 3/15/25 | 5,993 | 5,852 | ||
| Discovery Communications LLC | 3.950% | 6/15/25 | 6,790 | 6,659 | ||
| Discovery Communications LLC | 4.900% | 3/11/26 | 77,970 | 77,691 | ||
| Discovery Communications LLC | 3.950% | 3/20/28 | 17,026 | 16,270 | ||
| 3 | DISH Network Corp. | 11.750% | 11/15/27 | 6,310 | 6,584 | |
| Expedia Group Inc. | 4.625% | 8/1/27 | 75,510 | 74,925 | ||
| Fox Corp. | 3.050% | 4/7/25 | 56,576 | 55,182 | ||
| Fox Corp. | 4.709% | 1/25/29 | 19,269 | 19,109 | ||
| 3 | Frontier Communications Holdings LLC | 5.000% | 5/1/28 | 3,378 | 3,118 | |
| 3 | Level 3 Financing Inc. | 4.625% | 9/15/27 | 1,640 | 863 | |
| 3 | Level 3 Financing Inc. | 4.250% | 7/1/28 | 1,490 | 499 | |
| 3 | Level 3 Financing Inc. | 3.625% | 1/15/29 | 1,415 | 423 | |
| Meta Platforms Inc. | 3.500% | 8/15/27 | 188,211 | 182,701 | ||
| Meta Platforms Inc. | 4.600% | 5/15/28 | 76,600 | 77,366 | ||
| Netflix Inc. | 5.875% | 2/15/25 | 50,833 | 51,196 | ||
| 3 | Netflix Inc. | 3.625% | 6/15/25 | 12,468 | 12,240 | |
| Netflix Inc. | 4.375% | 11/15/26 | 52,595 | 52,204 | ||
| Netflix Inc. | 4.875% | 4/15/28 | 79,258 | 79,897 | ||
| Netflix Inc. | 5.875% | 11/15/28 | 173,549 | 182,880 | ||
| 8 | Netflix Inc. | 3.875% | 11/15/29 | 9,900 | 10,999 | |
| 3 | Nexstar Media Inc. | 5.625% | 7/15/27 | 3,875 | 3,769 | |
| 3 | NTT Finance Corp. | 1.162% | 4/3/26 | 87,855 | 81,373 | |
| Omnicom Group Inc. / Omnicom Capital Inc. | 3.600% | 4/15/26 | 21,539 | 21,020 | ||
| 3 | Outfront Media Capital LLC / Outfront Media Capital Corp. | 7.375% | 2/15/31 | 2,415 | 2,529 | |
| Paramount Global | 2.900% | 1/15/27 | 10,815 | 10,053 | ||
| Paramount Global | 3.375% | 2/15/28 | 2,890 | 2,655 | ||
| Coupon | Maturity Date | Face Amount ($000) | Market Value• ($000) | |||
| Paramount Global | 3.700% | 6/1/28 | 6,596 | 6,115 | ||
| Paramount Global | 4.200% | 6/1/29 | 9,750 | 9,105 | ||
| Paramount Global | 6.375% | 3/30/62 | 1,920 | 1,714 | ||
| Rogers Communications Inc. | 3.200% | 3/15/27 | 38,720 | 37,033 | ||
| 8 | Sky Ltd. | 2.500% | 9/15/26 | 11,015 | 11,716 | |
| Sprint Capital Corp. | 6.875% | 11/15/28 | 124,740 | 134,869 | ||
| Sprint LLC | 7.625% | 3/1/26 | 29,590 | 30,887 | ||
| Take-Two Interactive Software Inc. | 3.550% | 4/14/25 | 24,260 | 23,796 | ||
| Take-Two Interactive Software Inc. | 3.700% | 4/14/27 | 29,000 | 28,179 | ||
| Take-Two Interactive Software Inc. | 4.950% | 3/28/28 | 24,100 | 24,274 | ||
| TCI Communications Inc. | 7.125% | 2/15/28 | 920 | 999 | ||
| Telefonica Emisiones SA | 4.103% | 3/8/27 | 69,063 | 67,570 | ||
| T-Mobile USA Inc. | 3.500% | 4/15/25 | 216,601 | 212,331 | ||
| T-Mobile USA Inc. | 1.500% | 2/15/26 | 53,049 | 49,654 | ||
| T-Mobile USA Inc. | 2.250% | 2/15/26 | 40,115 | 38,066 | ||
| T-Mobile USA Inc. | 2.625% | 4/15/26 | 6,695 | 6,379 | ||
| T-Mobile USA Inc. | 3.750% | 4/15/27 | 126,754 | 122,912 | ||
| T-Mobile USA Inc. | 5.375% | 4/15/27 | 6,553 | 6,589 | ||
| T-Mobile USA Inc. | 4.750% | 2/1/28 | 19,250 | 19,165 | ||
| T-Mobile USA Inc. | 2.050% | 2/15/28 | 7,260 | 6,545 | ||
| T-Mobile USA Inc. | 4.950% | 3/15/28 | 58,608 | 59,050 | ||
| T-Mobile USA Inc. | 4.800% | 7/15/28 | 24,100 | 24,157 | ||
| T-Mobile USA Inc. | 4.850% | 1/15/29 | 52,680 | 52,752 | ||
| 3 | Univision Communications Inc. | 8.000% | 8/15/28 | 3,660 | 3,722 | |
| 3 | UPC Holding BV | 5.500% | 1/15/28 | 1,940 | 1,855 | |
| Verizon Communications Inc. | 1.450% | 3/20/26 | 85,215 | 79,477 | ||
| Verizon Communications Inc. | 2.625% | 8/15/26 | 44,140 | 42,032 | ||
| Verizon Communications Inc. | 4.125% | 3/16/27 | 43,382 | 42,683 | ||
| Verizon Communications Inc. | 3.000% | 3/22/27 | 49,871 | 47,400 | ||
| Verizon Communications Inc. | 2.100% | 3/22/28 | 111,679 | 100,977 | ||
| Verizon Communications Inc. | 4.329% | 9/21/28 | 54,362 | 53,566 | ||
| 3 | Virgin Media Finance plc | 5.000% | 7/15/30 | 1,840 | 1,636 | |
| Vodafone Group plc | 4.125% | 5/30/25 | 22,338 | 22,094 | ||
| Walt Disney Co. | 1.750% | 1/13/26 | 18,328 | 17,353 | ||
| Walt Disney Co. | 3.375% | 11/15/26 | 43,428 | 42,228 | ||
| Walt Disney Co. | 2.200% | 1/13/28 | 4,818 | 4,454 | ||
| Warnermedia Holdings Inc. | 3.638% | 3/15/25 | 102,841 | 100,844 | ||
| Warnermedia Holdings Inc. | 3.755% | 3/15/27 | 222,413 | 213,630 | ||
| Warnermedia Holdings Inc. | 4.054% | 3/15/29 | 27,174 | 25,723 | ||
| 3,874,886 | ||||||
| Consumer Discretionary (6.2%) | ||||||
| Amazon.com Inc. | 3.150% | 8/22/27 | 19,500 | 18,743 | ||
| Amazon.com Inc. | 4.550% | 12/1/27 | 91,190 | 91,958 | ||
| American Honda Finance Corp. | 1.200% | 7/8/25 | 18,296 | 17,370 | ||
| American Honda Finance Corp. | 5.800% | 10/3/25 | 50,585 | 51,432 | ||
| American Honda Finance Corp. | 4.950% | 1/9/26 | 52,915 | 53,169 | ||
| American Honda Finance Corp. | 4.750% | 1/12/26 | 13,090 | 13,118 | ||
| American Honda Finance Corp. | 5.250% | 7/7/26 | 5,905 | 6,009 | ||
| 8 | American Honda Finance Corp. | 3.750% | 10/25/27 | 25,400 | 28,022 | |
| Coupon | Maturity Date | Face Amount ($000) | Market Value• ($000) | |||
| Asbury Automotive Group Inc. | 4.500% | 3/1/28 | 479 | 451 | ||
| AutoZone Inc. | 3.625% | 4/15/25 | 50,197 | 49,351 | ||
| AutoZone Inc. | 3.750% | 6/1/27 | 15,500 | 15,030 | ||
| AutoZone Inc. | 4.500% | 2/1/28 | 42,025 | 41,639 | ||
| AutoZone Inc. | 6.250% | 11/1/28 | 20,420 | 21,675 | ||
| 8 | BMW Finance NV | 1.000% | 5/22/28 | 1,200 | 1,195 | |
| 3 | BMW US Capital LLC | 1.250% | 8/12/26 | 22,850 | 21,034 | |
| 3 | BMW US Capital LLC | 3.450% | 4/1/27 | 9,875 | 9,543 | |
| 3 | Boyne USA Inc. | 4.750% | 5/15/29 | 3,520 | 3,225 | |
| 3 | Caesars Entertainment Inc. | 6.250% | 7/1/25 | 2,420 | 2,432 | |
| 3 | Carnival Corp. | 9.875% | 8/1/27 | 1,250 | 1,312 | |
| 3 | Churchill Downs Inc. | 5.500% | 4/1/27 | 2,489 | 2,460 | |
| 3 | Churchill Downs Inc. | 4.750% | 1/15/28 | 2,831 | 2,698 | |
| 3 | Clarios Global LP | 6.750% | 5/15/25 | 2,269 | 2,269 | |
| eBay Inc. | 5.900% | 11/22/25 | 17,260 | 17,526 | ||
| eBay Inc. | 1.400% | 5/10/26 | 28,500 | 26,409 | ||
| eBay Inc. | 5.950% | 11/22/27 | 26,329 | 27,399 | ||
| 3 | ERAC USA Finance LLC | 3.800% | 11/1/25 | 18,585 | 18,180 | |
| 3 | ERAC USA Finance LLC | 3.300% | 12/1/26 | 2,965 | 2,844 | |
| 3 | ERAC USA Finance LLC | 4.600% | 5/1/28 | 20,520 | 20,414 | |
| Ford Motor Co. | 6.625% | 10/1/28 | 17,974 | 18,928 | ||
| Ford Motor Credit Co. LLC | 4.134% | 8/4/25 | 52,685 | 51,470 | ||
| Ford Motor Credit Co. LLC | 3.375% | 11/13/25 | 25,854 | 24,815 | ||
| Ford Motor Credit Co. LLC | 6.950% | 3/6/26 | 35,610 | 36,411 | ||
| Ford Motor Credit Co. LLC | 6.950% | 6/10/26 | 6,740 | 6,915 | ||
| Ford Motor Credit Co. LLC | 2.700% | 8/10/26 | 9,395 | 8,733 | ||
| Ford Motor Credit Co. LLC | 4.271% | 1/9/27 | 4,800 | 4,619 | ||
| Ford Motor Credit Co. LLC | 5.800% | 3/5/27 | 62,465 | 62,838 | ||
| Ford Motor Credit Co. LLC | 4.950% | 5/28/27 | 34,032 | 33,309 | ||
| Ford Motor Credit Co. LLC | 4.125% | 8/17/27 | 17,141 | 16,282 | ||
| Ford Motor Credit Co. LLC | 3.815% | 11/2/27 | 993 | 931 | ||
| Ford Motor Credit Co. LLC | 7.350% | 11/4/27 | 16,360 | 17,201 | ||
| Ford Motor Credit Co. LLC | 2.900% | 2/16/28 | 5,680 | 5,111 | ||
| Ford Motor Credit Co. LLC | 6.800% | 5/12/28 | 25,975 | 26,965 | ||
| Ford Motor Credit Co. LLC | 6.798% | 11/7/28 | 53,050 | 55,390 | ||
| General Motors Co. | 6.125% | 10/1/25 | 107,602 | 109,191 | ||
| General Motors Financial Co. Inc. | 2.900% | 2/26/25 | 42,345 | 41,288 | ||
| General Motors Financial Co. Inc. | 3.800% | 4/7/25 | 10,544 | 10,368 | ||
| General Motors Financial Co. Inc. | 4.350% | 4/9/25 | 25,075 | 24,817 | ||
| General Motors Financial Co. Inc. | 2.750% | 6/20/25 | 34,453 | 33,359 | ||
| General Motors Financial Co. Inc. | 6.050% | 10/10/25 | 72,603 | 73,639 | ||
| General Motors Financial Co. Inc. | 1.250% | 1/8/26 | 153,293 | 142,600 | ||
| General Motors Financial Co. Inc. | 5.250% | 3/1/26 | 45,289 | 45,439 | ||
| General Motors Financial Co. Inc. | 5.400% | 4/6/26 | 53,040 | 53,392 | ||
| General Motors Financial Co. Inc. | 1.500% | 6/10/26 | 10,377 | 9,563 | ||
| General Motors Financial Co. Inc. | 4.000% | 10/6/26 | 22,140 | 21,597 | ||
| General Motors Financial Co. Inc. | 4.350% | 1/17/27 | 22,693 | 22,365 | ||
| General Motors Financial Co. Inc. | 2.350% | 2/26/27 | 38,865 | 35,951 | ||
| General Motors Financial Co. Inc. | 5.000% | 4/9/27 | 58,979 | 58,936 | ||
| General Motors Financial Co. Inc. | 2.700% | 8/20/27 | 31,583 | 29,257 | ||
| General Motors Financial Co. Inc. | 6.000% | 1/9/28 | 18,139 | 18,726 | ||
| Coupon | Maturity Date | Face Amount ($000) | Market Value• ($000) | |||
| General Motors Financial Co. Inc. | 2.400% | 4/10/28 | 23,344 | 20,978 | ||
| General Motors Financial Co. Inc. | 5.800% | 1/7/29 | 48,100 | 49,384 | ||
| Goodyear Tire & Rubber Co. | 5.000% | 7/15/29 | 1,025 | 962 | ||
| 3 | Harley-Davidson Financial Services Inc. | 3.350% | 6/8/25 | 14,500 | 14,026 | |
| 3 | Harley-Davidson Financial Services Inc. | 3.050% | 2/14/27 | 103,662 | 96,559 | |
| Harley-Davidson Inc. | 3.500% | 7/28/25 | 16,500 | 16,025 | ||
| 3 | Hilton Domestic Operating Co. Inc. | 5.375% | 5/1/25 | 7,959 | 7,954 | |
| Home Depot Inc. | 2.800% | 9/14/27 | 8,635 | 8,197 | ||
| Home Depot Inc. | 3.900% | 12/6/28 | 14,460 | 14,190 | ||
| Honda Motor Co. Ltd. | 2.534% | 3/10/27 | 38,590 | 36,377 | ||
| Lennar Corp. | 4.750% | 5/30/25 | 22,084 | 21,968 | ||
| Lennar Corp. | 5.250% | 6/1/26 | 52,497 | 52,699 | ||
| 3 | Lithia Motors Inc. | 4.625% | 12/15/27 | 2,405 | 2,305 | |
| 3 | Lithia Motors Inc. | 3.875% | 6/1/29 | 2,415 | 2,169 | |
| 3 | Live Nation Entertainment Inc. | 4.875% | 11/1/24 | 2,380 | 2,367 | |
| 3 | Live Nation Entertainment Inc. | 6.500% | 5/15/27 | 10,115 | 10,225 | |
| Lowe's Cos. Inc. | 4.400% | 9/8/25 | 17,185 | 17,071 | ||
| Lowe's Cos. Inc. | 4.800% | 4/1/26 | 75,610 | 75,698 | ||
| Lowe's Cos. Inc. | 3.350% | 4/1/27 | 32,480 | 31,346 | ||
| Lowe's Cos. Inc. | 1.300% | 4/15/28 | 19,005 | 16,683 | ||
| Lowe's Cos. Inc. | 1.700% | 9/15/28 | 9,645 | 8,520 | ||
| 8 | LVMH Moet Hennessy Louis Vuitton SE | 3.375% | 10/21/25 | 8,000 | 8,669 | |
| Marriott International Inc. | 3.750% | 10/1/25 | 15,325 | 15,000 | ||
| Marriott International Inc. | 3.125% | 6/15/26 | 6,390 | 6,141 | ||
| Marriott International Inc. | 5.000% | 10/15/27 | 14,150 | 14,279 | ||
| McDonald's Corp. | 1.450% | 9/1/25 | 24,300 | 23,078 | ||
| McDonald's Corp. | 3.500% | 7/1/27 | 21,500 | 20,857 | ||
| 3 | Mercedes-Benz Finance North America LLC | 1.450% | 3/2/26 | 17,440 | 16,308 | |
| 3 | Mercedes-Benz Finance North America LLC | 4.800% | 3/30/26 | 47,645 | 47,671 | |
| 3 | Mercedes-Benz Finance North America LLC | 5.200% | 8/3/26 | 24,770 | 25,070 | |
| 3 | Mercedes-Benz Finance North America LLC | 4.800% | 3/30/28 | 54,000 | 54,289 | |
| 3 | Mercedes-Benz Finance North America LLC | 5.100% | 8/3/28 | 62,585 | 63,706 | |
| 8 | Mercedes-Benz Group AG | 1.000% | 11/15/27 | 3,000 | 3,015 | |
| 3 | Merlin Entertainments Group US Holdings Inc. | 7.375% | 2/15/31 | 465 | 466 | |
| Mohawk Industries Inc. | 5.850% | 9/18/28 | 11,550 | 11,962 | ||
| 3 | NCL Corp. Ltd. | 5.875% | 2/15/27 | 1,298 | 1,279 | |
| Newell Brands Inc. | 5.200% | 4/1/26 | 1,052 | 1,023 | ||
| Newell Brands Inc. | 6.375% | 9/15/27 | 6,802 | 6,695 | ||
| 3 | Nissan Motor Acceptance Co. LLC | 1.050% | 3/8/24 | 50,400 | 50,140 | |
| 3 | Nissan Motor Acceptance Co. LLC | 1.125% | 9/16/24 | 23,960 | 23,231 | |
| O'Reilly Automotive Inc. | 5.750% | 11/20/26 | 24,050 | 24,655 | ||
| 3 | Penn Entertainment Inc. | 5.625% | 1/15/27 | 1,225 | 1,184 | |
| 8 | RCI Banque SA | 4.625% | 10/2/26 | 15,300 | 16,866 | |
| 8 | RCI Banque SA | 4.875% | 6/14/28 | 1,000 | 1,130 | |
| Ross Stores Inc. | 0.875% | 4/15/26 | 20,065 | 18,447 | ||
| 3 | Royal Caribbean Cruises Ltd. | 8.250% | 1/15/29 | 15,369 | 16,305 | |
| 3 | Royal Caribbean Cruises Ltd. | 9.250% | 1/15/29 | 405 | 435 | |
| Starbucks Corp. | 4.750% | 2/15/26 | 28,825 | 28,901 | ||
| Starbucks Corp. | 2.000% | 3/12/27 | 3,813 | 3,527 | ||
| Tapestry Inc. | 7.000% | 11/27/26 | 19,245 | 19,851 | ||
| Coupon | Maturity Date | Face Amount ($000) | Market Value• ($000) | |||
| 8 | Tapestry Inc. | 5.375% | 11/27/27 | 1,000 | 1,125 | |
| Tapestry Inc. | 7.350% | 11/27/28 | 12,700 | 13,318 | ||
| Toyota Motor Credit Corp. | 5.400% | 11/10/25 | 6,762 | 6,850 | ||
| Toyota Motor Credit Corp. | 4.800% | 1/5/26 | 39,920 | 40,094 | ||
| Toyota Motor Credit Corp. | 4.450% | 5/18/26 | 42,200 | 42,126 | ||
| Toyota Motor Credit Corp. | 1.900% | 1/13/27 | 67,445 | 62,683 | ||
| Toyota Motor Credit Corp. | 3.050% | 3/22/27 | 110,905 | 106,311 | ||
| Toyota Motor Credit Corp. | 4.550% | 9/20/27 | 66,140 | 66,405 | ||
| 8 | Toyota Motor Credit Corp. | 0.125% | 11/5/27 | 6,159 | 5,956 | |
| Toyota Motor Credit Corp. | 4.625% | 1/12/28 | 29,051 | 29,282 | ||
| Toyota Motor Credit Corp. | 1.900% | 4/6/28 | 23,933 | 21,681 | ||
| Toyota Motor Credit Corp. | 4.650% | 1/5/29 | 28,830 | 28,949 | ||
| 3 | Volkswagen Group of America Finance LLC | 3.350% | 5/13/25 | 4,500 | 4,394 | |
| 3 | Volkswagen Group of America Finance LLC | 5.800% | 9/12/25 | 48,130 | 48,596 | |
| 3 | Volkswagen Group of America Finance LLC | 5.700% | 9/12/26 | 38,505 | 39,120 | |
| 3 | Volkswagen Group of America Finance LLC | 3.200% | 9/26/26 | 5,000 | 4,774 | |
| 3 | Volkswagen Group of America Finance LLC | 6.000% | 11/16/26 | 19,500 | 19,992 | |
| 3 | Volkswagen Group of America Finance LLC | 5.650% | 9/12/28 | 28,875 | 29,631 | |
| 8 | Volkswagen International Finance NV | 4.125% | 11/15/25 | 5,000 | 5,449 | |
| 8 | Volkswagen International Finance NV | 3.875% | 3/29/26 | 8,300 | 9,023 | |
| 8 | Volkswagen Leasing GmbH | 0.375% | 7/20/26 | 51,800 | 52,009 | |
| 3 | Wyndham Hotels & Resorts Inc. | 4.375% | 8/15/28 | 1,101 | 1,028 | |
| 3,335,992 | ||||||
| Consumer Staples (4.7%) | ||||||
| 3 | 7-Eleven Inc. | 0.950% | 2/10/26 | 67,700 | 62,643 | |
| Altria Group Inc. | 2.350% | 5/6/25 | 51,609 | 49,908 | ||
| Altria Group Inc. | 4.400% | 2/14/26 | 16,727 | 16,560 | ||
| Altria Group Inc. | 2.625% | 9/16/26 | 25,076 | 23,828 | ||
| Altria Group Inc. | 6.200% | 11/1/28 | 9,620 | 10,140 | ||
| Altria Group Inc. | 4.800% | 2/14/29 | 7,692 | 7,712 | ||
| Anheuser-Busch Cos. LLC / Anheuser-Busch InBev Worldwide Inc. | 3.650% | 2/1/26 | 17,852 | 17,525 | ||
| Anheuser-Busch InBev Worldwide Inc. | 4.000% | 4/13/28 | 35,572 | 34,962 | ||
| 9 | BAT Capital Corp. | 2.125% | 8/15/25 | 1,750 | 2,107 | |
| BAT Capital Corp. | 3.215% | 9/6/26 | 86,263 | 82,549 | ||
| BAT Capital Corp. | 4.700% | 4/2/27 | 82,543 | 81,800 | ||
| BAT Capital Corp. | 3.557% | 8/15/27 | 8,126 | 7,766 | ||
| BAT Capital Corp. | 2.259% | 3/25/28 | 28,895 | 25,932 | ||
| BAT International Finance plc | 1.668% | 3/25/26 | 136,697 | 127,422 | ||
| BAT International Finance plc | 4.448% | 3/16/28 | 55,366 | 54,101 | ||
| BAT International Finance plc | 5.931% | 2/2/29 | 186,490 | 193,490 | ||
| 8 | BAT International Finance plc | 3.125% | 3/6/29 | 8,000 | 8,438 | |
| Campbell Soup Co. | 3.950% | 3/15/25 | 20,050 | 19,755 | ||
| Campbell Soup Co. | 4.150% | 3/15/28 | 28,158 | 27,546 | ||
| 3 | Cargill Inc. | 4.500% | 6/24/26 | 12,055 | 12,027 | |
| 8 | CK Hutchison Europe Finance 18 Ltd. | 1.250% | 4/13/25 | 15,010 | 15,681 | |
| 8 | CK Hutchison Finance 16 Ltd. | 2.000% | 4/6/28 | 10,300 | 10,525 | |
| Conagra Brands Inc. | 5.300% | 10/1/26 | 32,880 | 33,214 | ||
| Conagra Brands Inc. | 1.375% | 11/1/27 | 1,240 | 1,089 | ||
| Constellation Brands Inc. | 4.400% | 11/15/25 | 23,350 | 23,109 | ||
| Constellation Brands Inc. | 4.750% | 12/1/25 | 4,000 | 3,983 | ||
| Coupon | Maturity Date | Face Amount ($000) | Market Value• ($000) | |||
| Constellation Brands Inc. | 3.700% | 12/6/26 | 8,315 | 8,094 | ||
| Constellation Brands Inc. | 3.500% | 5/9/27 | 15,790 | 15,205 | ||
| Constellation Brands Inc. | 4.350% | 5/9/27 | 53,230 | 52,708 | ||
| Costco Wholesale Corp. | 1.375% | 6/20/27 | 11,901 | 10,804 | ||
| 3 | Coty Inc. | 5.000% | 4/15/26 | 609 | 598 | |
| Diageo Capital plc | 5.200% | 10/24/25 | 30,885 | 31,175 | ||
| Diageo Capital plc | 5.300% | 10/24/27 | 38,960 | 39,911 | ||
| 8 | Diageo Finance plc | 3.500% | 6/26/25 | 5,000 | 5,406 | |
| Dollar General Corp. | 4.625% | 11/1/27 | 18,750 | 18,619 | ||
| 3 | Energizer Holdings Inc. | 4.750% | 6/15/28 | 2,905 | 2,703 | |
| 3 | Fiesta Purchaser Inc. | 7.875% | 3/1/31 | 275 | 275 | |
| General Mills Inc. | 4.700% | 1/30/27 | 13,790 | 13,809 | ||
| General Mills Inc. | 4.200% | 4/17/28 | 15,925 | 15,693 | ||
| Haleon UK Capital plc | 3.125% | 3/24/25 | 142,486 | 139,381 | ||
| Haleon US Capital LLC | 3.375% | 3/24/27 | 18,794 | 18,077 | ||
| J M Smucker Co. | 3.500% | 3/15/25 | 9,370 | 9,209 | ||
| J M Smucker Co. | 5.900% | 11/15/28 | 19,245 | 20,126 | ||
| JBS USA LUX SA/JBS USA Food Co. / JBS USA Finance Inc. | 5.125% | 2/1/28 | 12,287 | 12,176 | ||
| 3,6 | KeHE Distributors LLC/KeHE Finance Corp. / NextWave Distribution Inc. | 9.000% | 2/15/29 | 1,840 | 1,858 | |
| Kenvue Inc. | 5.350% | 3/22/26 | 19,285 | 19,580 | ||
| Kenvue Inc. | 5.050% | 3/22/28 | 17,725 | 18,138 | ||
| Keurig Dr Pepper Inc. | 4.417% | 5/25/25 | 30,055 | 29,790 | ||
| Keurig Dr Pepper Inc. | 4.597% | 5/25/28 | 57,443 | 57,396 | ||
| Kimberly-Clark de Mexico SAB de CV | 3.250% | 3/12/25 | 9,650 | 9,420 | ||
| Kraft Heinz Foods Co. | 3.000% | 6/1/26 | 20,400 | 19,593 | ||
| Kraft Heinz Foods Co. | 3.875% | 5/15/27 | 69,087 | 67,531 | ||
| Kroger Co. | 3.500% | 2/1/26 | 26,000 | 25,351 | ||
| Kroger Co. | 2.650% | 10/15/26 | 620 | 586 | ||
| 3 | Lamb Weston Holdings Inc. | 4.875% | 5/15/28 | 2,315 | 2,253 | |
| 3 | Mars Inc. | 4.550% | 4/20/28 | 43,075 | 43,126 | |
| McCormick & Co. Inc. | 3.400% | 8/15/27 | 19,385 | 18,503 | ||
| Mead Johnson Nutrition Co. | 4.125% | 11/15/25 | 4,900 | 4,832 | ||
| Molson Coors Beverage Co. | 3.000% | 7/15/26 | 24,500 | 23,484 | ||
| 3 | Mondelez International Holdings Netherlands BV | 1.250% | 9/24/26 | 48,010 | 43,874 | |
| Mondelez International Inc. | 1.500% | 5/4/25 | 61,425 | 58,850 | ||
| Mondelez International Inc. | 2.625% | 3/17/27 | 29,030 | 27,414 | ||
| 8 | Nestle Holdings Inc. | 0.875% | 7/18/25 | 5,000 | 5,231 | |
| Pepsico Inc. | 3.600% | 2/18/28 | 4,421 | 4,311 | ||
| 3 | Performance Food Group Inc. | 6.875% | 5/1/25 | 997 | 1,000 | |
| 3 | Performance Food Group Inc. | 5.500% | 10/15/27 | 2,690 | 2,629 | |
| Philip Morris International Inc. | 1.500% | 5/1/25 | 25,645 | 24,623 | ||
| Philip Morris International Inc. | 5.000% | 11/17/25 | 57,630 | 57,873 | ||
| Philip Morris International Inc. | 4.875% | 2/13/26 | 103,645 | 103,967 | ||
| Philip Morris International Inc. | 2.750% | 2/25/26 | 15,557 | 14,945 | ||
| Philip Morris International Inc. | 0.875% | 5/1/26 | 33,850 | 31,109 | ||
| Philip Morris International Inc. | 5.125% | 11/17/27 | 91,345 | 92,779 | ||
| Philip Morris International Inc. | 4.875% | 2/15/28 | 89,950 | 90,589 | ||
| Coupon | Maturity Date | Face Amount ($000) | Market Value• ($000) | |||
| Philip Morris International Inc. | 3.125% | 3/2/28 | 21,106 | 19,897 | ||
| Philip Morris International Inc. | 5.250% | 9/7/28 | 53,020 | 54,315 | ||
| 3 | Reckitt Benckiser Treasury Services plc | 3.000% | 6/26/27 | 11,951 | 11,398 | |
| Reynolds American Inc. | 4.450% | 6/12/25 | 89,434 | 88,506 | ||
| 8 | Swedish Match AB | 0.875% | 2/26/27 | 4,659 | 4,636 | |
| Sysco Corp. | 3.250% | 7/15/27 | 28,860 | 27,555 | ||
| Tyson Foods Inc. | 4.000% | 3/1/26 | 31,486 | 30,909 | ||
| 3 | United Natural Foods Inc. | 6.750% | 10/15/28 | 645 | 542 | |
| 3 | US Foods Inc. | 6.875% | 9/15/28 | 2,410 | 2,473 | |
| 2,508,647 | ||||||
| Energy (6.6%) | ||||||
| 3 | Antero Midstream Partners LP / Antero Midstream Finance Corp. | 6.625% | 2/1/32 | 1,445 | 1,439 | |
| Baker Hughes Holdings LLC / Baker Hughes Co-Obligor Inc. | 2.061% | 12/15/26 | 14,200 | 13,233 | ||
| Baker Hughes Holdings LLC / Baker Hughes Co-Obligor Inc. | 3.337% | 12/15/27 | 51,533 | 49,054 | ||
| BP Capital Markets America Inc. | 3.410% | 2/11/26 | 15,058 | 14,698 | ||
| BP Capital Markets America Inc. | 3.119% | 5/4/26 | 63,745 | 61,670 | ||
| BP Capital Markets America Inc. | 3.017% | 1/16/27 | 28,626 | 27,461 | ||
| BP Capital Markets America Inc. | 3.937% | 9/21/28 | 32,384 | 31,594 | ||
| BP Capital Markets America Inc. | 4.234% | 11/6/28 | 12,588 | 12,450 | ||
| 8 | BP Capital Markets BV | 3.773% | 5/12/30 | 6,000 | 6,649 | |
| BP Capital Markets plc | 3.279% | 9/19/27 | 47,594 | 45,608 | ||
| BP Capital Markets plc | 3.723% | 11/28/28 | 11,893 | 11,483 | ||
| Canadian Natural Resources Ltd. | 3.900% | 2/1/25 | 12,950 | 12,760 | ||
| Canadian Natural Resources Ltd. | 2.050% | 7/15/25 | 18,312 | 17,522 | ||
| Canadian Natural Resources Ltd. | 3.850% | 6/1/27 | 81,987 | 79,324 | ||
| Cenovus Energy Inc. | 4.250% | 4/15/27 | 800 | 781 | ||
| Cheniere Corpus Christi Holdings LLC | 5.875% | 3/31/25 | 126,164 | 126,499 | ||
| Cheniere Corpus Christi Holdings LLC | 5.125% | 6/30/27 | 52,787 | 53,048 | ||
| Cheniere Energy Inc. | 4.625% | 10/15/28 | 55,607 | 53,859 | ||
| 3 | Civitas Resources Inc. | 8.375% | 7/1/28 | 1,925 | 2,024 | |
| 3 | Civitas Resources Inc. | 8.750% | 7/1/31 | 360 | 384 | |
| 3 | CNX Resources Corp. | 7.250% | 3/14/27 | 446 | 448 | |
| 3 | Continental Resources Inc. | 2.268% | 11/15/26 | 26,650 | 24,602 | |
| Coterra Energy Inc. | 3.900% | 5/15/27 | 16,269 | 15,833 | ||
| 3 | CrownRock LP / CrownRock Finance Inc. | 5.625% | 10/15/25 | 2,280 | 2,272 | |
| DCP Midstream Operating LP | 5.625% | 7/15/27 | 1,801 | 1,839 | ||
| Devon Energy Corp. | 5.850% | 12/15/25 | 13,303 | 13,440 | ||
| Diamondback Energy Inc. | 3.250% | 12/1/26 | 76,025 | 73,501 | ||
| 3 | DT Midstream Inc. | 4.125% | 6/15/29 | 3,795 | 3,487 | |
| Empresa Nacional del Petroleo | 3.750% | 8/5/26 | 33,289 | 31,618 | ||
| Empresa Nacional del Petroleo | 5.250% | 11/6/29 | 5,318 | 5,153 | ||
| Enbridge Energy Partners LP | 5.875% | 10/15/25 | 24,941 | 25,204 | ||
| Enbridge Inc. | 2.500% | 2/14/25 | 9,714 | 9,452 | ||
| Enbridge Inc. | 1.600% | 10/4/26 | 29,100 | 26,815 | ||
| Coupon | Maturity Date | Face Amount ($000) | Market Value• ($000) | |||
| Enbridge Inc. | 5.900% | 11/15/26 | 47,590 | 48,892 | ||
| Enbridge Inc. | 4.250% | 12/1/26 | 4,461 | 4,405 | ||
| Enbridge Inc. | 3.700% | 7/15/27 | 33,084 | 31,968 | ||
| Enbridge Inc. | 6.000% | 11/15/28 | 47,035 | 49,339 | ||
| Energy Transfer LP | 4.050% | 3/15/25 | 53,734 | 53,001 | ||
| Energy Transfer LP | 2.900% | 5/15/25 | 16,772 | 16,275 | ||
| Energy Transfer LP | 5.950% | 12/1/25 | 10,655 | 10,765 | ||
| Energy Transfer LP | 4.750% | 1/15/26 | 3,155 | 3,135 | ||
| Energy Transfer LP | 3.900% | 7/15/26 | 13,256 | 12,900 | ||
| Energy Transfer LP | 6.050% | 12/1/26 | 52,930 | 54,364 | ||
| Energy Transfer LP | 4.400% | 3/15/27 | 115,279 | 113,161 | ||
| Energy Transfer LP | 5.500% | 6/1/27 | 62,135 | 62,972 | ||
| Energy Transfer LP | 4.000% | 10/1/27 | 13,000 | 12,549 | ||
| Energy Transfer LP | 5.550% | 2/15/28 | 45,295 | 46,155 | ||
| Energy Transfer LP | 4.950% | 5/15/28 | 42,434 | 42,282 | ||
| Energy Transfer LP | 4.950% | 6/15/28 | 10,336 | 10,311 | ||
| Energy Transfer LP | 6.100% | 12/1/28 | 32,004 | 33,595 | ||
| EnLink Midstream Partners LP | 4.850% | 7/15/26 | 2,915 | 2,861 | ||
| Enterprise Products Operating LLC | 5.050% | 1/10/26 | 33,775 | 34,023 | ||
| 3 | EQM Midstream Partners LP | 7.500% | 6/1/27 | 3,429 | 3,526 | |
| EQT Corp. | 6.125% | 2/1/25 | 10,047 | 10,082 | ||
| 3 | EQT Corp. | 3.125% | 5/15/26 | 2,748 | 2,613 | |
| EQT Corp. | 3.900% | 10/1/27 | 45,957 | 44,025 | ||
| EQT Corp. | 5.000% | 1/15/29 | 6,290 | 6,217 | ||
| Harvest Operations Corp. | 1.000% | 4/26/24 | 19,240 | 19,041 | ||
| Kinder Morgan Inc. | 4.300% | 6/1/25 | 25,844 | 25,544 | ||
| Kinder Morgan Inc. | 1.750% | 11/15/26 | 29,100 | 26,796 | ||
| Kinder Morgan Inc. | 4.300% | 3/1/28 | 11,565 | 11,327 | ||
| Kinder Morgan Inc. | 5.000% | 2/1/29 | 38,425 | 38,539 | ||
| 3 | Kinetik Holdings LP | 6.625% | 12/15/28 | 2,063 | 2,093 | |
| Marathon Oil Corp. | 4.400% | 7/15/27 | 1,855 | 1,817 | ||
| Marathon Petroleum Corp. | 4.700% | 5/1/25 | 103,522 | 102,827 | ||
| Marathon Petroleum Corp. | 5.125% | 12/15/26 | 59,506 | 59,947 | ||
| Marathon Petroleum Corp. | 3.800% | 4/1/28 | 15,594 | 15,000 | ||
| MPLX LP | 4.875% | 6/1/25 | 20,170 | 20,075 | ||
| MPLX LP | 1.750% | 3/1/26 | 85,686 | 80,248 | ||
| MPLX LP | 4.000% | 3/15/28 | 13,710 | 13,276 | ||
| 3 | NGL Energy Operating LLC / NGL Energy Finance Corp. | 8.375% | 2/15/32 | 775 | 781 | |
| Occidental Petroleum Corp. | 5.875% | 9/1/25 | 4,445 | 4,478 | ||
| Occidental Petroleum Corp. | 5.500% | 12/1/25 | 18,886 | 18,978 | ||
| Occidental Petroleum Corp. | 6.375% | 9/1/28 | 71,579 | 75,221 | ||
| ONEOK Inc. | 2.200% | 9/15/25 | 23,012 | 21,978 | ||
| ONEOK Inc. | 5.850% | 1/15/26 | 69,178 | 70,172 | ||
| ONEOK Inc. | 5.550% | 11/1/26 | 24,575 | 24,990 | ||
| ONEOK Inc. | 4.000% | 7/13/27 | 7,369 | 7,163 | ||
| ONEOK Inc. | 4.550% | 7/15/28 | 21,835 | 21,568 | ||
| ONEOK Inc. | 5.650% | 11/1/28 | 24,595 | 25,361 | ||
| ONEOK Inc. | 4.350% | 3/15/29 | 22,156 | 21,569 | ||
| ONEOK Partners LP | 4.900% | 3/15/25 | 9,680 | 9,635 | ||
| Ovintiv Inc. | 5.650% | 5/15/25 | 20,890 | 20,987 | ||
| Ovintiv Inc. | 5.375% | 1/1/26 | 32,854 | 32,874 | ||
| Ovintiv Inc. | 5.650% | 5/15/28 | 38,555 | 39,235 | ||
| 3 | Permian Resources Operating LLC | 5.375% | 1/15/26 | 1,935 | 1,906 | |
| 3 | Permian Resources Operating LLC | 8.000% | 4/15/27 | 2,910 | 3,014 | |
| 3 | Permian Resources Operating LLC | 7.000% | 1/15/32 | 1,235 | 1,275 | |
| Pertamina Persero PT | 1.400% | 2/9/26 | 19,433 | 18,050 | ||
| Phillips 66 | 3.850% | 4/9/25 | 18,475 | 18,204 | ||
| Coupon | Maturity Date | Face Amount ($000) | Market Value• ($000) | |||
| Phillips 66 | 1.300% | 2/15/26 | 31,103 | 28,938 | ||
| Phillips 66 | 3.900% | 3/15/28 | 9,640 | 9,390 | ||
| Phillips 66 Co. | 3.605% | 2/15/25 | 21,326 | 20,992 | ||
| Phillips 66 Co. | 4.950% | 12/1/27 | 48,220 | 48,593 | ||
| Pioneer Natural Resources Co. | 1.125% | 1/15/26 | 31,105 | 28,997 | ||
| Pioneer Natural Resources Co. | 5.100% | 3/29/26 | 81,975 | 82,553 | ||
| Plains All American Pipeline LP / PAA Finance Corp. | 4.650% | 10/15/25 | 60,277 | 59,811 | ||
| Plains All American Pipeline LP / PAA Finance Corp. | 4.500% | 12/15/26 | 29,582 | 29,305 | ||
| QazaqGaz NC JSC | 4.375% | 9/26/27 | 2,699 | 2,576 | ||
| Range Resources Corp. | 8.250% | 1/15/29 | 3,300 | 3,429 | ||
| Sabine Pass Liquefaction LLC | 5.625% | 3/1/25 | 109,015 | 109,197 | ||
| Sabine Pass Liquefaction LLC | 5.875% | 6/30/26 | 88,460 | 89,959 | ||
| Sabine Pass Liquefaction LLC | 5.000% | 3/15/27 | 60,353 | 60,538 | ||
| Sabine Pass Liquefaction LLC | 4.200% | 3/15/28 | 20,923 | 20,466 | ||
| Saudi Arabian Oil Co. | 3.500% | 4/16/29 | 36,812 | 34,440 | ||
| Schlumberger Investment SA | 4.500% | 5/15/28 | 31,570 | 31,619 | ||
| 10 | Southern Gas Corridor CJSC | 6.875% | 3/24/26 | 24,005 | 24,329 | |
| Spectra Energy Partners LP | 3.500% | 3/15/25 | 11,985 | 11,750 | ||
| Spectra Energy Partners LP | 3.375% | 10/15/26 | 20,242 | 19,507 | ||
| 3 | Sunoco LP / Sunoco Finance Corp. | 7.000% | 9/15/28 | 2,778 | 2,844 | |
| 3 | Tallgrass Energy Partners LP / Tallgrass Energy Finance Corp. | 7.375% | 2/15/29 | 3,445 | 3,436 | |
| Targa Resources Corp. | 5.200% | 7/1/27 | 36,635 | 36,815 | ||
| Targa Resources Partners LP / Targa Resources Partners Finance Corp. | 6.500% | 7/15/27 | 4,121 | 4,192 | ||
| Targa Resources Partners LP / Targa Resources Partners Finance Corp. | 6.875% | 1/15/29 | 3,937 | 4,059 | ||
| 8 | TotalEnergies SE | 2.000% | Perpetual | 1,400 | 1,409 | |
| TransCanada PipeLines Ltd. | 4.875% | 1/15/26 | 28,389 | 28,331 | ||
| TransCanada PipeLines Ltd. | 4.250% | 5/15/28 | 27,026 | 26,363 | ||
| Transcontinental Gas Pipe Line Co. LLC | 4.000% | 3/15/28 | 28,270 | 27,484 | ||
| 3 | Valaris Ltd. | 8.375% | 4/30/30 | 4,835 | 4,951 | |
| 3 | Venture Global Calcasieu Pass LLC | 3.875% | 8/15/29 | 1,650 | 1,474 | |
| 3 | Venture Global LNG Inc. | 8.125% | 6/1/28 | 4,325 | 4,376 | |
| 3 | Venture Global LNG Inc. | 9.500% | 2/1/29 | 10,925 | 11,606 | |
| Western Midstream Operating LP | 3.950% | 6/1/25 | 22,439 | 21,979 | ||
| Western Midstream Operating LP | 4.650% | 7/1/26 | 3,620 | 3,565 | ||
| Western Midstream Operating LP | 4.500% | 3/1/28 | 9,635 | 9,364 | ||
| Williams Cos. Inc. | 4.000% | 9/15/25 | 9,899 | 9,739 | ||
| Williams Cos. Inc. | 5.400% | 3/2/26 | 24,115 | 24,364 | ||
| Williams Cos. Inc. | 3.750% | 6/15/27 | 23,300 | 22,485 | ||
| Williams Cos. Inc. | 5.300% | 8/15/28 | 59,155 | 60,311 | ||
| Coupon | Maturity Date | Face Amount ($000) | Market Value• ($000) | |||
| Williams Cos. Inc. | 4.900% | 3/15/29 | 85,890 | 85,957 | ||
| 3,530,082 | ||||||
| Financials (29.3%) | ||||||
| AerCap Ireland Capital DAC / AerCap Global Aviation Trust | 4.450% | 10/1/25 | 18,100 | 17,808 | ||
| AerCap Ireland Capital DAC / AerCap Global Aviation Trust | 1.750% | 1/30/26 | 67,076 | 62,465 | ||
| AerCap Ireland Capital DAC / AerCap Global Aviation Trust | 2.450% | 10/29/26 | 77,240 | 71,641 | ||
| AerCap Ireland Capital DAC / AerCap Global Aviation Trust | 6.100% | 1/15/27 | 50,650 | 51,759 | ||
| AerCap Ireland Capital DAC / AerCap Global Aviation Trust | 3.650% | 7/21/27 | 22,393 | 21,288 | ||
| AerCap Ireland Capital DAC / AerCap Global Aviation Trust | 4.625% | 10/15/27 | 36,881 | 36,140 | ||
| AerCap Ireland Capital DAC / AerCap Global Aviation Trust | 5.750% | 6/6/28 | 63,750 | 64,999 | ||
| AerCap Ireland Capital DAC / AerCap Global Aviation Trust | 3.000% | 10/29/28 | 19,300 | 17,480 | ||
| AerCap Ireland Capital DAC / AerCap Global Aviation Trust | 5.100% | 1/19/29 | 24,020 | 23,860 | ||
| Affiliated Managers Group Inc. | 3.500% | 8/1/25 | 9,700 | 9,455 | ||
| Aflac Inc. | 1.125% | 3/15/26 | 43,772 | 40,464 | ||
| Air Lease Corp. | 3.375% | 7/1/25 | 17,583 | 17,072 | ||
| Air Lease Corp. | 2.875% | 1/15/26 | 53,365 | 50,973 | ||
| Air Lease Corp. | 3.750% | 6/1/26 | 4,000 | 3,873 | ||
| Air Lease Corp. | 2.200% | 1/15/27 | 29,100 | 26,710 | ||
| Air Lease Corp. | 5.300% | 2/1/28 | 25,500 | 25,682 | ||
| Air Lease Corp. | 4.625% | 10/1/28 | 14,616 | 14,327 | ||
| Air Lease Corp. | 5.100% | 3/1/29 | 48,050 | 47,705 | ||
| Allstate Corp. | 0.750% | 12/15/25 | 9,670 | 8,967 | ||
| Ally Financial Inc. | 4.750% | 6/9/27 | 29,000 | 28,223 | ||
| Ally Financial Inc. | 6.992% | 6/13/29 | 41,330 | 42,743 | ||
| American Express Co. | 2.550% | 3/4/27 | 62,526 | 58,608 | ||
| American International Group Inc. | 3.900% | 4/1/26 | 7,411 | 7,251 | ||
| American International Group Inc. | 4.200% | 4/1/28 | 4,810 | 4,716 | ||
| American International Group Inc. | 5.750% | 4/1/48 | 7,059 | 7,009 | ||
| Ameriprise Financial Inc. | 3.000% | 4/2/25 | 20,610 | 20,141 | ||
| Ameriprise Financial Inc. | 2.875% | 9/15/26 | 11,645 | 11,147 | ||
| Ameriprise Financial Inc. | 5.700% | 12/15/28 | 43,300 | 45,340 | ||
| 3 | Antares Holdings LP | 2.750% | 1/15/27 | 33,939 | 30,402 | |
| 3 | Antares Holdings LP | 7.950% | 8/11/28 | 19,250 | 20,097 | |
| Aon Corp. / Aon Global Holdings plc | 2.850% | 5/28/27 | 26,800 | 25,316 | ||
| Aon Global Ltd. | 3.875% | 12/15/25 | 10,782 | 10,583 | ||
| Ares Capital Corp. | 2.150% | 7/15/26 | 31,073 | 28,372 | ||
| Ares Capital Corp. | 7.000% | 1/15/27 | 38,640 | 39,644 | ||
| Ares Capital Corp. | 2.875% | 6/15/28 | 17,600 | 15,616 | ||
| Ares Capital Corp. | 5.875% | 3/1/29 | 26,220 | 25,976 | ||
| 8 | Argenta Spaarbank NV | 1.000% | 10/13/26 | 17,600 | 17,936 | |
| Athene Holding Ltd. | 4.125% | 1/12/28 | 31,391 | 30,265 | ||
| 8 | Australia & New Zealand Banking Group Ltd. | 0.669% | 5/5/31 | 2,000 | 1,993 | |
| 9 | Aviva plc | 6.125% | 11/14/36 | 7,200 | 9,279 | |
| Banco Santander SA | 5.147% | 8/18/25 | 8,550 | 8,514 | ||
| Banco Santander SA | 5.179% | 11/19/25 | 5,225 | 5,194 | ||
| Coupon | Maturity Date | Face Amount ($000) | Market Value• ($000) | |||
| Banco Santander SA | 1.849% | 3/25/26 | 28,290 | 26,359 | ||
| Banco Santander SA | 5.294% | 8/18/27 | 23,240 | 23,269 | ||
| Banco Santander SA | 1.722% | 9/14/27 | 17,840 | 16,179 | ||
| 8 | Banco Santander SA | 2.125% | 2/8/28 | 1,000 | 1,018 | |
| Banco Santander SA | 6.607% | 11/7/28 | 24,060 | 25,554 | ||
| Bank of America Corp. | 3.950% | 4/21/25 | 45,470 | 44,756 | ||
| Bank of America Corp. | 2.015% | 2/13/26 | 32,644 | 31,482 | ||
| Bank of America Corp. | 4.450% | 3/3/26 | 53,863 | 53,378 | ||
| Bank of America Corp. | 3.384% | 4/2/26 | 92,240 | 90,177 | ||
| Bank of America Corp. | 1.319% | 6/19/26 | 65,000 | 61,506 | ||
| Bank of America Corp. | 4.827% | 7/22/26 | 53,104 | 52,827 | ||
| Bank of America Corp. | 4.250% | 10/22/26 | 27,110 | 26,729 | ||
| Bank of America Corp. | 1.197% | 10/24/26 | 42,600 | 39,729 | ||
| Bank of America Corp. | 5.080% | 1/20/27 | 25,800 | 25,792 | ||
| Bank of America Corp. | 1.658% | 3/11/27 | 48,515 | 45,152 | ||
| Bank of America Corp. | 3.559% | 4/23/27 | 28,110 | 27,155 | ||
| Bank of America Corp. | 1.734% | 7/22/27 | 137,745 | 126,964 | ||
| Bank of America Corp. | 5.933% | 9/15/27 | 54,420 | 55,572 | ||
| Bank of America Corp. | 3.824% | 1/20/28 | 73,909 | 71,657 | ||
| Bank of America Corp. | 2.551% | 2/4/28 | 83,171 | 77,397 | ||
| Bank of America Corp. | 3.705% | 4/24/28 | 45,747 | 43,962 | ||
| Bank of America Corp. | 4.376% | 4/27/28 | 71,450 | 70,027 | ||
| Bank of America Corp. | 4.948% | 7/22/28 | 71,115 | 71,207 | ||
| Bank of America Corp. | 6.204% | 11/10/28 | 40,360 | 42,154 | ||
| Bank of America Corp. | 3.419% | 12/20/28 | 87,302 | 82,534 | ||
| Bank of America Corp. | 3.970% | 3/5/29 | 14,167 | 13,617 | ||
| Bank of America Corp. | 5.202% | 4/25/29 | 101,809 | 102,557 | ||
| Bank of America Corp. | 2.087% | 6/14/29 | 18,643 | 16,511 | ||
| Bank of America Corp. | 4.271% | 7/23/29 | 13,195 | 12,782 | ||
| Bank of America Corp. | 5.819% | 9/15/29 | 48,100 | 49,725 | ||
| Bank of America NA | 5.526% | 8/18/26 | 24,150 | 24,602 | ||
| Bank of Montreal | 5.300% | 6/5/26 | 20,323 | 20,536 | ||
| Bank of Montreal | 1.250% | 9/15/26 | 17,001 | 15,544 | ||
| Bank of Montreal | 5.266% | 12/11/26 | 38,480 | 38,971 | ||
| Bank of Montreal | 5.203% | 2/1/28 | 6,910 | 7,019 | ||
| Bank of Montreal | 5.717% | 9/25/28 | 9,625 | 9,988 | ||
| Bank of New York Mellon Corp. | 4.947% | 4/26/27 | 90,000 | 90,156 | ||
| Bank of New York Mellon Corp. | 3.400% | 1/29/28 | 25,829 | 24,711 | ||
| Bank of New York Mellon Corp. | 3.442% | 2/7/28 | 49,964 | 48,178 | ||
| Bank of New York Mellon Corp. | 5.802% | 10/25/28 | 37,675 | 39,008 | ||
| Bank of New York Mellon Corp. | 4.543% | 2/1/29 | 39,500 | 39,287 | ||
| Bank of New York Mellon Corp. | 6.317% | 10/25/29 | 19,250 | 20,433 | ||
| Bank of Nova Scotia | 4.500% | 12/16/25 | 47,180 | 46,525 | ||
| Bank of Nova Scotia | 4.750% | 2/2/26 | 16,869 | 16,845 | ||
| Bank of Nova Scotia | 1.050% | 3/2/26 | 40,210 | 37,195 | ||
| Bank of Nova Scotia | 2.700% | 8/3/26 | 23,248 | 22,096 | ||
| Bank of Nova Scotia | 1.950% | 2/2/27 | 27,540 | 25,480 | ||
| Bank of Nova Scotia | 5.250% | 6/12/28 | 30,490 | 31,055 | ||
| 8 | Banque Federative du Credit Mutuel SA | 1.625% | 11/15/27 | 2,000 | 2,005 | |
| 8 | Banque Federative du Credit Mutuel SA | 2.500% | 5/25/28 | 12,400 | 12,770 | |
| Barclays plc | 4.375% | 1/12/26 | 51,772 | 51,064 | ||
| Barclays plc | 2.852% | 5/7/26 | 18,726 | 18,124 | ||
| Barclays plc | 5.200% | 5/12/26 | 27,955 | 27,801 | ||
| Barclays plc | 5.304% | 8/9/26 | 54,190 | 54,132 | ||
| Barclays plc | 5.829% | 5/9/27 | 57,800 | 58,283 | ||
| Barclays plc | 6.496% | 9/13/27 | 9,620 | 9,891 | ||
| Barclays plc | 2.279% | 11/24/27 | 9,930 | 9,135 | ||
| Barclays plc | 4.836% | 5/9/28 | 5,930 | 5,766 | ||
| Barclays plc | 5.501% | 8/9/28 | 25,200 | 25,314 | ||
| Barclays plc | 7.385% | 11/2/28 | 48,160 | 51,411 | ||
| Coupon | Maturity Date | Face Amount ($000) | Market Value• ($000) | |||
| Barclays plc | 4.972% | 5/16/29 | 35,000 | 34,405 | ||
| Barclays plc | 6.490% | 9/13/29 | 47,666 | 49,774 | ||
| 9 | Barclays plc | 8.407% | 11/14/32 | 700 | 944 | |
| Blue Owl Capital Corp. | 3.750% | 7/22/25 | 9,580 | 9,257 | ||
| Blue Owl Capital Corp. | 4.250% | 1/15/26 | 1,940 | 1,873 | ||
| Blue Owl Capital Corp. | 3.400% | 7/15/26 | 19,355 | 18,101 | ||
| Blue Owl Capital Corp. | 5.950% | 3/15/29 | 24,220 | 24,034 | ||
| 3 | BPCE SA | 5.716% | 1/18/30 | 19,220 | 19,342 | |
| Canadian Imperial Bank of Commerce | 1.250% | 6/22/26 | 28,855 | 26,571 | ||
| Canadian Imperial Bank of Commerce | 5.001% | 4/28/28 | 53,100 | 53,471 | ||
| Canadian Imperial Bank of Commerce | 5.986% | 10/3/28 | 38,510 | 40,300 | ||
| Capital One Financial Corp. | 4.200% | 10/29/25 | 23,563 | 23,164 | ||
| Capital One Financial Corp. | 2.636% | 3/3/26 | 72,400 | 70,041 | ||
| Capital One Financial Corp. | 3.750% | 3/9/27 | 43,898 | 42,155 | ||
| Capital One Financial Corp. | 7.149% | 10/29/27 | 43,760 | 45,599 | ||
| Capital One Financial Corp. | 1.878% | 11/2/27 | 47,290 | 42,990 | ||
| Capital One Financial Corp. | 4.927% | 5/10/28 | 38,600 | 38,059 | ||
| Capital One Financial Corp. | 5.468% | 2/1/29 | 58,615 | 58,694 | ||
| Capital One Financial Corp. | 6.312% | 6/8/29 | 131,490 | 135,510 | ||
| Capital One Financial Corp. | 5.700% | 2/1/30 | 53,020 | 53,505 | ||
| Charles Schwab Corp. | 3.625% | 4/1/25 | 44,839 | 44,053 | ||
| Charles Schwab Corp. | 3.850% | 5/21/25 | 49,262 | 48,495 | ||
| Charles Schwab Corp. | 0.900% | 3/11/26 | 26,115 | 24,041 | ||
| Charles Schwab Corp. | 1.150% | 5/13/26 | 29,150 | 26,813 | ||
| Charles Schwab Corp. | 2.450% | 3/3/27 | 42,975 | 40,130 | ||
| Charles Schwab Corp. | 3.300% | 4/1/27 | 20,174 | 19,338 | ||
| Charles Schwab Corp. | 2.000% | 3/20/28 | 1,145 | 1,024 | ||
| Charles Schwab Corp. | 5.643% | 5/19/29 | 64,370 | 65,851 | ||
| Charles Schwab Corp. | 6.196% | 11/17/29 | 80,402 | 84,040 | ||
| Chubb INA Holdings Inc. | 3.350% | 5/3/26 | 85,281 | 82,852 | ||
| Citibank NA | 5.488% | 12/4/26 | 28,720 | 29,274 | ||
| Citibank NA | 5.803% | 9/29/28 | 48,000 | 50,010 | ||
| Citigroup Inc. | 4.600% | 3/9/26 | 54,240 | 53,817 | ||
| Citigroup Inc. | 3.290% | 3/17/26 | 24,200 | 23,642 | ||
| Citigroup Inc. | 3.400% | 5/1/26 | 28,800 | 27,887 | ||
| Citigroup Inc. | 3.200% | 10/21/26 | 84,303 | 80,650 | ||
| Citigroup Inc. | 4.300% | 11/20/26 | 26,104 | 25,667 | ||
| Citigroup Inc. | 1.122% | 1/28/27 | 23,523 | 21,728 | ||
| Citigroup Inc. | 1.462% | 6/9/27 | 42,850 | 39,358 | ||
| Citigroup Inc. | 4.450% | 9/29/27 | 33,114 | 32,438 | ||
| Citigroup Inc. | 3.887% | 1/10/28 | 38,540 | 37,431 | ||
| Citigroup Inc. | 3.070% | 2/24/28 | 48,150 | 45,540 | ||
| Citigroup Inc. | 3.668% | 7/24/28 | 68,196 | 65,260 | ||
| Citigroup Inc. | 4.125% | 7/25/28 | 4,700 | 4,538 | ||
| Citigroup Inc. | 3.520% | 10/27/28 | 16,040 | 15,229 | ||
| Citigroup Inc. | 4.075% | 4/23/29 | 8,580 | 8,277 | ||
| 9 | Close Brothers Finance plc | 2.750% | 10/19/26 | 2,200 | 2,570 | |
| CNO Financial Group Inc. | 5.250% | 5/30/25 | 22,250 | 22,209 | ||
| Comerica Inc. | 5.982% | 1/30/30 | 482 | 480 | ||
| 5,11 | Commonwealth Bank of Australia, 3M Australian Bank Bill Rate + 0.700% | 4.852% | 1/14/27 | 19,300 | 12,638 | |
| 5,11 | Commonwealth Bank of Australia, 3M Australian Bank Bill Rate + 1.320% | 5.703% | 8/20/31 | 36,700 | 23,899 | |
| 5,11 | Commonwealth Bank of Australia, 3M Australian Bank Bill Rate + 1.800% | 6.160% | 9/10/30 | 7,300 | 4,814 | |
| Cooperatieve Rabobank UA | 4.375% | 8/4/25 | 18,700 | 18,414 | ||
| Cooperatieve Rabobank UA | 3.750% | 7/21/26 | 48,131 | 46,349 | ||
| Cooperatieve Rabobank UA | 4.800% | 1/9/29 | 28,830 | 29,014 | ||
| Corebridge Financial Inc. | 3.500% | 4/4/25 | 54,043 | 52,873 | ||
| Coupon | Maturity Date | Face Amount ($000) | Market Value• ($000) | |||
| Corebridge Financial Inc. | 3.650% | 4/5/27 | 84,327 | 80,965 | ||
| Credit Suisse AG | 3.700% | 2/21/25 | 32,578 | 32,062 | ||
| Credit Suisse AG | 2.950% | 4/9/25 | 29,340 | 28,536 | ||
| 8 | Credit Suisse AG | 0.250% | 1/5/26 | 17,000 | 17,254 | |
| Credit Suisse AG | 1.250% | 8/7/26 | 69,350 | 63,124 | ||
| Credit Suisse AG | 5.000% | 7/9/27 | 77,009 | 77,140 | ||
| Credit Suisse AG | 7.500% | 2/15/28 | 32,831 | 35,882 | ||
| 8 | Danske Bank A/S | 1.500% | 9/2/30 | 2,000 | 2,062 | |
| 8 | Danske Bank A/S | 1.000% | 5/15/31 | 4,500 | 4,544 | |
| Deutsche Bank AG | 4.500% | 4/1/25 | 13,780 | 13,562 | ||
| Deutsche Bank AG | 6.119% | 7/14/26 | 7,962 | 8,016 | ||
| Deutsche Bank AG | 2.129% | 11/24/26 | 69,850 | 65,742 | ||
| 8 | Deutsche Bank AG | 1.625% | 1/20/27 | 4,000 | 4,078 | |
| Deutsche Bank AG | 7.146% | 7/13/27 | 57,500 | 59,546 | ||
| Deutsche Bank AG | 2.311% | 11/16/27 | 44,216 | 40,447 | ||
| Deutsche Bank AG | 2.552% | 1/7/28 | 3,966 | 3,643 | ||
| Deutsche Bank AG | 6.720% | 1/18/29 | 33,670 | 35,043 | ||
| Deutsche Bank AG | 6.819% | 11/20/29 | 45,970 | 48,215 | ||
| Discover Bank | 3.450% | 7/27/26 | 34,435 | 32,797 | ||
| Discover Bank | 5.974% | 8/9/28 | 14,450 | 14,056 | ||
| 12,13 | DPS Lehman Brothers Holdings | 3.500% | 8/19/65 | 9,410 | 1 | |
| Eaton Vance Corp. | 3.500% | 4/6/27 | 138 | 132 | ||
| Equitable Holdings Inc. | 4.350% | 4/20/28 | 14,455 | 14,068 | ||
| 3 | F&G Global Funding | 1.750% | 6/30/26 | 18,649 | 16,961 | |
| Fidelity National Financial Inc. | 4.500% | 8/15/28 | 1,230 | 1,197 | ||
| Fifth Third Bancorp | 2.550% | 5/5/27 | 10,075 | 9,340 | ||
| Fifth Third Bancorp | 1.707% | 11/1/27 | 36,393 | 32,946 | ||
| Fifth Third Bancorp | 3.950% | 3/14/28 | 39,275 | 37,853 | ||
| Fifth Third Bancorp | 6.361% | 10/27/28 | 76,859 | 79,416 | ||
| Fifth Third Bancorp | 6.339% | 7/27/29 | 107,065 | 111,342 | ||
| Fifth Third Bancorp | 4.772% | 7/28/30 | 28,111 | 27,362 | ||
| Fifth Third Bank NA | 3.950% | 7/28/25 | 27,670 | 27,184 | ||
| Fifth Third Bank NA | 3.850% | 3/15/26 | 11,645 | 11,288 | ||
| Fifth Third Bank NA | 2.250% | 2/1/27 | 4,750 | 4,395 | ||
| FS KKR Capital Corp. | 3.400% | 1/15/26 | 17,880 | 17,012 | ||
| GATX Corp. | 3.250% | 3/30/25 | 2,109 | 2,055 | ||
| GATX Corp. | 3.250% | 9/15/26 | 9,710 | 9,319 | ||
| 3 | GGAM Finance Ltd. | 8.000% | 2/15/27 | 5,090 | 5,244 | |
| 3 | GGAM Finance Ltd. | 8.000% | 6/15/28 | 960 | 1,001 | |
| 3 | Global Atlantic Fin Co. | 4.400% | 10/15/29 | 10,305 | 9,481 | |
| 3 | Global Atlantic Fin Co. | 3.125% | 6/15/31 | 9,600 | 7,872 | |
| Goldman Sachs Group Inc. | 3.500% | 4/1/25 | 50,929 | 49,972 | ||
| 8 | Goldman Sachs Group Inc. | 1.250% | 5/1/25 | 5,000 | 5,242 | |
| Goldman Sachs Group Inc. | 3.750% | 5/22/25 | 58,690 | 57,684 | ||
| Goldman Sachs Group Inc. | 4.250% | 10/21/25 | 46,769 | 46,085 | ||
| Goldman Sachs Group Inc. | 5.798% | 8/10/26 | 35,380 | 35,717 | ||
| Goldman Sachs Group Inc. | 3.500% | 11/16/26 | 15,485 | 14,976 | ||
| Goldman Sachs Group Inc. | 1.093% | 12/9/26 | 15,861 | 14,726 | ||
| Goldman Sachs Group Inc. | 1.431% | 3/9/27 | 99,088 | 91,677 | ||
| Goldman Sachs Group Inc. | 1.542% | 9/10/27 | 33,900 | 30,924 | ||
| Goldman Sachs Group Inc. | 1.948% | 10/21/27 | 64,400 | 59,211 | ||
| Goldman Sachs Group Inc. | 2.640% | 2/24/28 | 61,082 | 56,894 | ||
| Goldman Sachs Group Inc. | 3.615% | 3/15/28 | 57,214 | 54,868 | ||
| 9 | Goldman Sachs Group Inc. | 7.250% | 4/10/28 | 4,700 | 6,449 | |
| Goldman Sachs Group Inc. | 3.691% | 6/5/28 | 25,357 | 24,321 | ||
| Goldman Sachs Group Inc. | 4.482% | 8/23/28 | 82,840 | 81,489 | ||
| Goldman Sachs Group Inc. | 6.484% | 10/24/29 | 38,400 | 40,757 | ||
| Golub Capital BDC Inc. | 7.050% | 12/5/28 | 29,920 | 31,035 | ||
| Hanover Insurance Group Inc. | 4.500% | 4/15/26 | 9,700 | 9,552 | ||
| Horace Mann Educators Corp. | 7.250% | 9/15/28 | 19,300 | 20,955 | ||
| HSBC Holdings plc | 4.250% | 8/18/25 | 39,693 | 39,096 | ||
| HSBC Holdings plc | 4.300% | 3/8/26 | 24,965 | 24,578 | ||
| HSBC Holdings plc | 2.999% | 3/10/26 | 41,330 | 40,182 | ||
| Coupon | Maturity Date | Face Amount ($000) | Market Value• ($000) | |||
| HSBC Holdings plc | 1.645% | 4/18/26 | 65,094 | 62,118 | ||
| HSBC Holdings plc | 3.900% | 5/25/26 | 29,850 | 29,097 | ||
| HSBC Holdings plc | 2.099% | 6/4/26 | 72,592 | 69,420 | ||
| HSBC Holdings plc | 4.292% | 9/12/26 | 54,263 | 53,283 | ||
| HSBC Holdings plc | 1.589% | 5/24/27 | 78,926 | 72,620 | ||
| 9 | HSBC Holdings plc | 1.750% | 7/24/27 | 8,200 | 9,529 | |
| HSBC Holdings plc | 5.887% | 8/14/27 | 30,000 | 30,425 | ||
| HSBC Holdings plc | 2.251% | 11/22/27 | 31,640 | 29,153 | ||
| HSBC Holdings plc | 4.041% | 3/13/28 | 58,858 | 56,871 | ||
| 8 | HSBC Holdings plc | 3.125% | 6/7/28 | 1,000 | 1,057 | |
| HSBC Holdings plc | 4.755% | 6/9/28 | 44,881 | 44,271 | ||
| HSBC Holdings plc | 5.210% | 8/11/28 | 36,420 | 36,382 | ||
| HSBC Holdings plc | 2.013% | 9/22/28 | 9,650 | 8,620 | ||
| HSBC Holdings plc | 7.390% | 11/3/28 | 41,230 | 44,281 | ||
| HSBC Holdings plc | 6.161% | 3/9/29 | 41,012 | 42,386 | ||
| HSBC Holdings plc | 4.583% | 6/19/29 | 16,061 | 15,614 | ||
| HSBC Holdings plc | 2.206% | 8/17/29 | 33,710 | 29,481 | ||
| 3 | HUB International Ltd. | 7.250% | 6/15/30 | 390 | 401 | |
| Huntington Bancshares Inc. | 4.443% | 8/4/28 | 37,512 | 36,425 | ||
| Huntington Bancshares Inc. | 6.208% | 8/21/29 | 81,070 | 83,767 | ||
| Huntington National Bank | 4.008% | 5/16/25 | 16,996 | 16,832 | ||
| Huntington National Bank | 5.699% | 11/18/25 | 16,162 | 16,074 | ||
| Huntington National Bank | 4.552% | 5/17/28 | 6,160 | 5,986 | ||
| ING Groep NV | 3.950% | 3/29/27 | 9,600 | 9,316 | ||
| ING Groep NV | 1.726% | 4/1/27 | 10,720 | 9,954 | ||
| ING Groep NV | 6.083% | 9/11/27 | 9,627 | 9,824 | ||
| ING Groep NV | 4.550% | 10/2/28 | 14,424 | 14,223 | ||
| Intercontinental Exchange Inc. | 3.750% | 12/1/25 | 25,590 | 25,105 | ||
| Intercontinental Exchange Inc. | 4.000% | 9/15/27 | 52,800 | 51,743 | ||
| Invesco Finance plc | 3.750% | 1/15/26 | 13,760 | 13,424 | ||
| 8 | JAB Holdings BV | 1.000% | 12/20/27 | 17,800 | 17,656 | |
| Jefferies Financial Group Inc. | 5.875% | 7/21/28 | 19,260 | 19,916 | ||
| JPMorgan Chase & Co. | 2.005% | 3/13/26 | 14,947 | 14,395 | ||
| JPMorgan Chase & Co. | 3.200% | 6/15/26 | 10,994 | 10,633 | ||
| JPMorgan Chase & Co. | 2.950% | 10/1/26 | 4,919 | 4,710 | ||
| JPMorgan Chase & Co. | 1.045% | 11/19/26 | 71,335 | 66,327 | ||
| JPMorgan Chase & Co. | 4.125% | 12/15/26 | 19,304 | 19,009 | ||
| JPMorgan Chase & Co. | 1.040% | 2/4/27 | 52,069 | 48,081 | ||
| JPMorgan Chase & Co. | 1.578% | 4/22/27 | 69,650 | 64,644 | ||
| JPMorgan Chase & Co. | 1.470% | 9/22/27 | 52,510 | 47,922 | ||
| JPMorgan Chase & Co. | 5.040% | 1/23/28 | 26,840 | 26,958 | ||
| JPMorgan Chase & Co. | 3.782% | 2/1/28 | 52,032 | 50,348 | ||
| JPMorgan Chase & Co. | 2.947% | 2/24/28 | 4,953 | 4,675 | ||
| JPMorgan Chase & Co. | 4.323% | 4/26/28 | 82,806 | 81,375 | ||
| JPMorgan Chase & Co. | 3.540% | 5/1/28 | 16,489 | 15,799 | ||
| JPMorgan Chase & Co. | 2.182% | 6/1/28 | 26,100 | 23,961 | ||
| JPMorgan Chase & Co. | 4.005% | 4/23/29 | 48,886 | 47,247 | ||
| JPMorgan Chase & Co. | 2.069% | 6/1/29 | 14,430 | 12,859 | ||
| JPMorgan Chase & Co. | 4.203% | 7/23/29 | 35,620 | 34,675 | ||
| JPMorgan Chase & Co. | 6.087% | 10/23/29 | 24,090 | 25,274 | ||
| JPMorgan Chase & Co. | 5.012% | 1/23/30 | 35,440 | 35,627 | ||
| JPMorgan Chase Bank NA | 5.110% | 12/8/26 | 82,160 | 83,204 | ||
| 8 | KBC Group NV | 4.875% | 4/25/33 | 1,000 | 1,100 | |
| Kemper Corp. | 4.350% | 2/15/25 | 9,059 | 8,919 | ||
| KeyBank NA | 4.700% | 1/26/26 | 20,000 | 19,612 | ||
| KeyBank NA | 5.850% | 11/15/27 | 41,553 | 41,695 | ||
| 3 | Ladder Capital Finance Holdings LLLP / Ladder Capital Finance Corp. | 5.250% | 10/1/25 | 4,075 | 4,006 | |
| Lazard Group LLC | 3.750% | 2/13/25 | 7,625 | 7,479 | ||
| Lloyds Banking Group plc | 4.582% | 12/10/25 | 37,563 | 36,956 | ||
| Lloyds Banking Group plc | 4.650% | 3/24/26 | 1,080 | 1,062 | ||
| Lloyds Banking Group plc | 4.716% | 8/11/26 | 27,220 | 26,930 | ||
| Coupon | Maturity Date | Face Amount ($000) | Market Value• ($000) | |||
| Lloyds Banking Group plc | 3.750% | 1/11/27 | 33,555 | 32,345 | ||
| Lloyds Banking Group plc | 1.627% | 5/11/27 | 18,455 | 16,985 | ||
| Lloyds Banking Group plc | 5.985% | 8/7/27 | 28,950 | 29,391 | ||
| Lloyds Banking Group plc | 5.462% | 1/5/28 | 28,830 | 28,999 | ||
| Lloyds Banking Group plc | 3.750% | 3/18/28 | 9,700 | 9,286 | ||
| Lloyds Banking Group plc | 5.871% | 3/6/29 | 20,200 | 20,676 | ||
| 5,11 | Lloyds Banking Group plc, 3M Australian Bank Bill Rate + 2.000% | 6.363% | 3/17/29 | 19,860 | 13,169 | |
| LPL Holdings Inc. | 6.750% | 11/17/28 | 8,500 | 8,980 | ||
| M&T Bank Corp. | 4.553% | 8/16/28 | 99,932 | 96,516 | ||
| M&T Bank Corp. | 7.413% | 10/30/29 | 184,787 | 199,112 | ||
| 5,11 | Macquarie Bank Ltd., 3M Australian Bank Bill Rate + 1.550% | 5.913% | 6/17/31 | 2,890 | 1,890 | |
| 5,11 | Macquarie Bank Ltd., 3M Australian Bank Bill Rate + 2.900% | 7.274% | 5/28/30 | 25,530 | 17,043 | |
| Manufacturers & Traders Trust Co. | 2.900% | 2/6/25 | 4,750 | 4,625 | ||
| Manufacturers & Traders Trust Co. | 5.400% | 11/21/25 | 14,890 | 14,850 | ||
| Manufacturers & Traders Trust Co. | 4.650% | 1/27/26 | 92,570 | 91,348 | ||
| Manufacturers & Traders Trust Co. | 4.700% | 1/27/28 | 98,623 | 96,749 | ||
| Marsh & McLennan Cos. Inc. | 3.500% | 3/10/25 | 19,790 | 19,476 | ||
| Mitsubishi UFJ Financial Group Inc. | 1.412% | 7/17/25 | 25,085 | 23,786 | ||
| Mitsubishi UFJ Financial Group Inc. | 2.757% | 9/13/26 | 10,340 | 9,796 | ||
| Mitsubishi UFJ Financial Group Inc. | 1.538% | 7/20/27 | 63,638 | 58,556 | ||
| Mitsubishi UFJ Financial Group Inc. | 1.640% | 10/13/27 | 26,740 | 24,474 | ||
| Mitsubishi UFJ Financial Group Inc. | 2.341% | 1/19/28 | 46,740 | 43,485 | ||
| Mitsubishi UFJ Financial Group Inc. | 5.017% | 7/20/28 | 18,600 | 18,614 | ||
| Mitsubishi UFJ Financial Group Inc. | 5.354% | 9/13/28 | 3,840 | 3,890 | ||
| Mitsubishi UFJ Financial Group Inc. | 5.422% | 2/22/29 | 35,720 | 36,385 | ||
| Mitsubishi UFJ Financial Group Inc. | 5.242% | 4/19/29 | 36,450 | 36,991 | ||
| Mizuho Financial Group Inc. | 1.234% | 5/22/27 | 32,831 | 30,053 | ||
| Mizuho Financial Group Inc. | 1.554% | 7/9/27 | 39,740 | 36,451 | ||
| Mizuho Financial Group Inc. | 5.667% | 5/27/29 | 18,877 | 19,289 | ||
| Morgan Stanley | 4.000% | 7/23/25 | 10,692 | 10,553 | ||
| Morgan Stanley | 5.000% | 11/24/25 | 25,000 | 24,996 | ||
| Morgan Stanley | 3.875% | 1/27/26 | 73,795 | 72,475 | ||
| Morgan Stanley | 3.125% | 7/27/26 | 12,619 | 12,107 | ||
| Morgan Stanley | 4.350% | 9/8/26 | 41,130 | 40,509 | ||
| Morgan Stanley | 6.138% | 10/16/26 | 27,614 | 28,116 | ||
| Morgan Stanley | 3.625% | 1/20/27 | 47,257 | 45,977 | ||
| Morgan Stanley | 3.950% | 4/23/27 | 25,965 | 25,270 | ||
| Morgan Stanley | 1.593% | 5/4/27 | 54,835 | 50,767 | ||
| Morgan Stanley | 1.512% | 7/20/27 | 66,650 | 61,162 | ||
| 8 | Morgan Stanley | 0.406% | 10/29/27 | 8,226 | 8,193 | |
| Morgan Stanley | 2.475% | 1/21/28 | 74,740 | 69,673 | ||
| Morgan Stanley | 4.210% | 4/20/28 | 29,100 | 28,418 | ||
| 5 | Morgan Stanley | 3.591% | 7/22/28 | 16,409 | 15,694 | |
| Morgan Stanley | 6.296% | 10/18/28 | 80,140 | 83,753 | ||
| Morgan Stanley | 3.772% | 1/24/29 | 26,000 | 24,830 | ||
| Morgan Stanley | 5.123% | 2/1/29 | 47,700 | 47,838 | ||
| Morgan Stanley | 5.164% | 4/20/29 | 122,260 | 122,876 | ||
| Coupon | Maturity Date | Face Amount ($000) | Market Value• ($000) | |||
| Morgan Stanley | 5.449% | 7/20/29 | 29,795 | 30,308 | ||
| Morgan Stanley | 6.407% | 11/1/29 | 24,060 | 25,492 | ||
| Morgan Stanley | 5.173% | 1/16/30 | 25,700 | 25,907 | ||
| Morgan Stanley Bank NA | 4.754% | 4/21/26 | 34,469 | 34,477 | ||
| Morgan Stanley Bank NA | 5.882% | 10/30/26 | 38,500 | 39,584 | ||
| Morgan Stanley Bank NA | 4.952% | 1/14/28 | 37,380 | 37,482 | ||
| Nasdaq Inc. | 5.650% | 6/28/25 | 56,888 | 57,420 | ||
| Nasdaq Inc. | 5.350% | 6/28/28 | 84,700 | 86,802 | ||
| National Australia Bank Ltd. | 4.787% | 1/10/29 | 19,230 | 19,344 | ||
| National Bank of Canada | 5.600% | 12/18/28 | 28,860 | 29,562 | ||
| 3 | Nationstar Mortgage Holdings Inc. | 5.000% | 2/1/26 | 4,830 | 4,706 | |
| 8 | NatWest Group plc | 1.750% | 3/2/26 | 14,500 | 15,291 | |
| NatWest Group plc | 5.847% | 3/2/27 | 28,240 | 28,503 | ||
| NatWest Group plc | 1.642% | 6/14/27 | 21,640 | 19,868 | ||
| NatWest Group plc | 3.073% | 5/22/28 | 10,846 | 10,128 | ||
| NatWest Group plc | 5.516% | 9/30/28 | 9,700 | 9,776 | ||
| NatWest Group plc | 4.892% | 5/18/29 | 10,541 | 10,355 | ||
| NatWest Group plc | 3.754% | 11/1/29 | 30,835 | 30,214 | ||
| NatWest Group plc | 5.076% | 1/27/30 | 10,580 | 10,455 | ||
| 9 | NatWest Group plc | 3.622% | 8/14/30 | 2,000 | 2,438 | |
| 9 | NatWest Group plc | 2.105% | 11/28/31 | 7,300 | 8,292 | |
| 8 | NatWest Markets plc | 0.125% | 11/12/25 | 9,700 | 9,889 | |
| 8 | NN Group NV | 6.000% | 11/3/43 | 2,000 | 2,298 | |
| Nomura Holdings Inc. | 1.851% | 7/16/25 | 13,236 | 12,589 | ||
| Nomura Holdings Inc. | 2.329% | 1/22/27 | 24,300 | 22,383 | ||
| Nomura Holdings Inc. | 5.386% | 7/6/27 | 19,400 | 19,498 | ||
| Nomura Holdings Inc. | 5.842% | 1/18/28 | 16,310 | 16,694 | ||
| Nomura Holdings Inc. | 6.070% | 7/12/28 | 21,123 | 21,855 | ||
| Nomura Holdings Inc. | 2.172% | 7/14/28 | 1,311 | 1,154 | ||
| OneMain Finance Corp. | 3.500% | 1/15/27 | 2,438 | 2,238 | ||
| OneMain Finance Corp. | 3.875% | 9/15/28 | 1,330 | 1,166 | ||
| OneMain Finance Corp. | 7.875% | 3/15/30 | 755 | 767 | ||
| 8 | OP Corporate Bank plc | 1.625% | 6/9/30 | 500 | 519 | |
| 3 | Penske Truck Leasing Co. LP / PTL Finance Corp. | 1.200% | 11/15/25 | 58,335 | 54,273 | |
| 3 | Penske Truck Leasing Co. LP / PTL Finance Corp. | 5.750% | 5/24/26 | 33,730 | 34,047 | |
| 3 | Penske Truck Leasing Co. LP / PTL Finance Corp. | 5.350% | 1/12/27 | 13,350 | 13,415 | |
| 3 | Penske Truck Leasing Co. LP / PTL Finance Corp. | 5.875% | 11/15/27 | 1,959 | 2,007 | |
| 3 | Penske Truck Leasing Co. LP / PTL Finance Corp. | 6.050% | 8/1/28 | 28,725 | 29,833 | |
| 9 | Phoenix Group Holdings plc | 6.625% | 12/18/25 | 23,593 | 30,394 | |
| PNC Financial Services Group Inc. | 5.812% | 6/12/26 | 23,870 | 24,010 | ||
| PNC Financial Services Group Inc. | 4.758% | 1/26/27 | 71,067 | 70,616 | ||
| PNC Financial Services Group Inc. | 6.615% | 10/20/27 | 36,382 | 37,814 | ||
| PNC Financial Services Group Inc. | 5.300% | 1/21/28 | 33,410 | 33,703 | ||
| PNC Financial Services Group Inc. | 5.354% | 12/2/28 | 81,530 | 82,522 | ||
| PNC Financial Services Group Inc. | 5.582% | 6/12/29 | 197,095 | 201,213 | ||
| Principal Financial Group Inc. | 3.100% | 11/15/26 | 5,935 | 5,672 | ||
| Progressive Corp. | 2.500% | 3/15/27 | 34,943 | 32,882 | ||
| 3 | Protective Life Global Funding | 1.618% | 4/15/26 | 22,570 | 20,947 | |
| 8 | Raiffeisen Schweiz Genossenschaft | 5.230% | 11/1/27 | 6,900 | 7,832 | |
| Regions Financial Corp. | 1.800% | 8/12/28 | 6,284 | 5,406 | ||
| Coupon | Maturity Date | Face Amount ($000) | Market Value• ($000) | |||
| 3 | Rocket Mortgage LLC / Rocket Mortgage Co-Issuer Inc. | 2.875% | 10/15/26 | 2,840 | 2,633 | |
| 9 | Rothesay Life plc | 8.000% | 10/30/25 | 19,730 | 25,765 | |
| 9 | Rothesay Life plc | 3.375% | 7/12/26 | 1,862 | 2,238 | |
| Royal Bank of Canada | 1.150% | 7/14/26 | 23,045 | 21,161 | ||
| Royal Bank of Canada | 1.400% | 11/2/26 | 24,074 | 22,017 | ||
| Royal Bank of Canada | 4.875% | 1/19/27 | 19,150 | 19,239 | ||
| Royal Bank of Canada | 3.625% | 5/4/27 | 20,530 | 19,862 | ||
| Royal Bank of Canada | 4.240% | 8/3/27 | 10,600 | 10,450 | ||
| Royal Bank of Canada | 6.000% | 11/1/27 | 48,300 | 50,481 | ||
| Royal Bank of Canada | 4.900% | 1/12/28 | 35,390 | 35,726 | ||
| Royal Bank of Canada | 5.200% | 8/1/28 | 24,080 | 24,527 | ||
| Royal Bank of Canada | 4.950% | 2/1/29 | 19,250 | 19,400 | ||
| Santander Holdings USA Inc. | 3.450% | 6/2/25 | 36,885 | 35,866 | ||
| Santander Holdings USA Inc. | 6.499% | 3/9/29 | 24,430 | 25,198 | ||
| Santander Holdings USA Inc. | 6.174% | 1/9/30 | 28,830 | 28,980 | ||
| Santander UK Group Holdings plc | 1.532% | 8/21/26 | 18,395 | 17,238 | ||
| Santander UK Group Holdings plc | 6.833% | 11/21/26 | 48,880 | 49,919 | ||
| Santander UK Group Holdings plc | 1.673% | 6/14/27 | 63,415 | 57,953 | ||
| Santander UK Group Holdings plc | 2.469% | 1/11/28 | 23,571 | 21,624 | ||
| Santander UK Group Holdings plc | 6.534% | 1/10/29 | 19,270 | 19,983 | ||
| Sixth Street Specialty Lending Inc. | 2.500% | 8/1/26 | 9,700 | 8,917 | ||
| Sixth Street Specialty Lending Inc. | 6.950% | 8/14/28 | 28,628 | 29,503 | ||
| Sixth Street Specialty Lending Inc. | 6.125% | 3/1/29 | 24,520 | 24,456 | ||
| 8 | Standard Chartered plc | 2.500% | 9/9/30 | 1,000 | 1,049 | |
| 5,11 | Standard Chartered plc, 3M Australian Bank Bill Rate + 1.850% | 6.210% | 6/28/25 | 20,500 | 13,482 | |
| State Street Corp. | 5.820% | 11/4/28 | 12,460 | 12,910 | ||
| State Street Corp. | 5.684% | 11/21/29 | 1,677 | 1,732 | ||
| Sumitomo Mitsui Financial Group Inc. | 0.948% | 1/12/26 | 2,800 | 2,596 | ||
| Sumitomo Mitsui Financial Group Inc. | 5.464% | 1/13/26 | 7,840 | 7,922 | ||
| Sumitomo Mitsui Financial Group Inc. | 3.784% | 3/9/26 | 23,160 | 22,640 | ||
| Sumitomo Mitsui Financial Group Inc. | 5.880% | 7/13/26 | 21,540 | 22,008 | ||
| Sumitomo Mitsui Financial Group Inc. | 2.632% | 7/14/26 | 58,324 | 55,355 | ||
| Sumitomo Mitsui Financial Group Inc. | 1.402% | 9/17/26 | 47,940 | 43,836 | ||
| Sumitomo Mitsui Financial Group Inc. | 3.446% | 1/11/27 | 23,285 | 22,453 | ||
| Sumitomo Mitsui Financial Group Inc. | 2.174% | 1/14/27 | 19,400 | 17,998 | ||
| Sumitomo Mitsui Financial Group Inc. | 3.364% | 7/12/27 | 9,700 | 9,253 | ||
| Sumitomo Mitsui Financial Group Inc. | 5.520% | 1/13/28 | 33,190 | 33,948 | ||
| Sumitomo Mitsui Financial Group Inc. | 5.800% | 7/13/28 | 9,630 | 9,965 | ||
| Sumitomo Mitsui Financial Group Inc. | 1.902% | 9/17/28 | 12,670 | 11,136 | ||
| 5,11 | Sumitomo Mitsui Financial Group Inc., 3M Australian Bank Bill Rate + 1.250% | 5.402% | 10/16/24 | 13,821 | 9,086 | |
| Coupon | Maturity Date | Face Amount ($000) | Market Value• ($000) | |||
| Synchrony Bank | 5.400% | 8/22/25 | 24,600 | 24,414 | ||
| Synchrony Financial | 4.500% | 7/23/25 | 31,729 | 31,038 | ||
| Synchrony Financial | 3.700% | 8/4/26 | 23,619 | 22,383 | ||
| Synovus Bank | 5.625% | 2/15/28 | 21,284 | 20,824 | ||
| Toronto-Dominion Bank | 1.200% | 6/3/26 | 25,466 | 23,468 | ||
| Toronto-Dominion Bank | 5.532% | 7/17/26 | 48,720 | 49,581 | ||
| Toronto-Dominion Bank | 1.250% | 9/10/26 | 55,126 | 50,506 | ||
| Toronto-Dominion Bank | 5.264% | 12/11/26 | 4,813 | 4,893 | ||
| Toronto-Dominion Bank | 2.800% | 3/10/27 | 88,455 | 83,691 | ||
| Toronto-Dominion Bank | 4.108% | 6/8/27 | 43,250 | 42,404 | ||
| Toronto-Dominion Bank | 5.156% | 1/10/28 | 46,885 | 47,526 | ||
| Toronto-Dominion Bank | 5.523% | 7/17/28 | 48,080 | 49,461 | ||
| Toronto-Dominion Bank | 3.625% | 9/15/31 | 11,000 | 10,567 | ||
| Trinity Acquisition plc | 4.400% | 3/15/26 | 1,367 | 1,348 | ||
| Truist Bank | 3.625% | 9/16/25 | 20,650 | 20,104 | ||
| Truist Financial Corp. | 6.047% | 6/8/27 | 67,457 | 68,706 | ||
| Truist Financial Corp. | 4.873% | 1/26/29 | 80,020 | 79,013 | ||
| Truist Financial Corp. | 7.161% | 10/30/29 | 16,166 | 17,448 | ||
| UBS AG | 5.800% | 9/11/25 | 60,749 | 61,524 | ||
| UBS AG | 5.650% | 9/11/28 | 84,810 | 87,660 | ||
| 3 | UBS Group AG | 4.282% | 1/9/28 | 52,310 | 50,930 | |
| 3 | UBS Group AG | 5.428% | 2/8/30 | 139,110 | 140,216 | |
| 3 | United Wholesale Mortgage LLC | 5.500% | 11/15/25 | 1,510 | 1,490 | |
| US Bancorp | 5.727% | 10/21/26 | 33,181 | 33,516 | ||
| US Bancorp | 4.548% | 7/22/28 | 147,258 | 145,319 | ||
| US Bancorp | 4.653% | 2/1/29 | 62,230 | 61,213 | ||
| US Bancorp | 5.775% | 6/12/29 | 55,175 | 56,542 | ||
| US Bancorp | 5.384% | 1/23/30 | 42,650 | 43,145 | ||
| Voya Financial Inc. | 3.650% | 6/15/26 | 11,895 | 11,510 | ||
| 12,13 | Washington Mutual Bank / Debt not acquired by JPMorgan | 6.875% | 6/15/11 | 21,983 | 2 | |
| Wells Fargo & Co. | 3.550% | 9/29/25 | 78,882 | 77,160 | ||
| Wells Fargo & Co. | 2.164% | 2/11/26 | 50,000 | 48,306 | ||
| Wells Fargo & Co. | 3.000% | 4/22/26 | 59,157 | 56,798 | ||
| Wells Fargo & Co. | 2.188% | 4/30/26 | 77,800 | 74,846 | ||
| Wells Fargo & Co. | 4.100% | 6/3/26 | 91,330 | 89,513 | ||
| Wells Fargo & Co. | 3.000% | 10/23/26 | 63,585 | 60,582 | ||
| 8 | Wells Fargo & Co. | 1.375% | 10/26/26 | 43,590 | 44,698 | |
| Wells Fargo & Co. | 3.196% | 6/17/27 | 22,050 | 21,125 | ||
| Wells Fargo & Co. | 4.300% | 7/22/27 | 25,615 | 25,159 | ||
| Wells Fargo & Co. | 3.526% | 3/24/28 | 86,305 | 82,678 | ||
| Wells Fargo & Co. | 3.584% | 5/22/28 | 94,297 | 90,223 | ||
| Wells Fargo & Co. | 2.393% | 6/2/28 | 56,429 | 52,071 | ||
| Wells Fargo & Co. | 4.808% | 7/25/28 | 61,680 | 61,331 | ||
| Wells Fargo & Co. | 5.574% | 7/25/29 | 84,910 | 86,768 | ||
| Wells Fargo & Co. | 6.303% | 10/23/29 | 19,250 | 20,290 | ||
| Wells Fargo Bank NA | 5.450% | 8/7/26 | 34,530 | 35,073 | ||
| Wells Fargo Bank NA | 5.254% | 12/11/26 | 86,570 | 87,768 | ||
| Westpac Banking Corp. | 5.535% | 11/17/28 | 28,870 | 30,001 | ||
| Westpac Banking Corp. | 2.894% | 2/4/30 | 39,369 | 38,171 | ||
| Westpac Banking Corp. | 4.322% | 11/23/31 | 27,918 | 27,020 | ||
| 5,11 | Westpac Banking Corp., 3M Australian Bank Bill Rate + 1.230% | 5.649% | 11/11/27 | 33,800 | 22,448 | |
| 5,11 | Westpac Banking Corp., 3M Australian Bank Bill Rate + 1.550% | 5.892% | 1/29/31 | 10,800 | 7,085 | |
| Willis North America Inc. | 4.650% | 6/15/27 | 19,400 | 19,250 | ||
| Willis North America Inc. | 4.500% | 9/15/28 | 12,510 | 12,237 | ||
| 15,707,832 | ||||||
| Health Care (8.2%) | ||||||
| AbbVie Inc. | 3.800% | 3/15/25 | 55,056 | 54,384 | ||
| AbbVie Inc. | 3.600% | 5/14/25 | 26,347 | 25,911 | ||
| AbbVie Inc. | 3.200% | 5/14/26 | 24,750 | 24,020 | ||
| AbbVie Inc. | 2.950% | 11/21/26 | 139,102 | 133,353 | ||
| Coupon | Maturity Date | Face Amount ($000) | Market Value• ($000) | |||
| AbbVie Inc. | 4.250% | 11/14/28 | 6,854 | 6,815 | ||
| Agilent Technologies Inc. | 3.050% | 9/22/26 | 2,000 | 1,916 | ||
| 3 | Alcon Finance Corp. | 2.750% | 9/23/26 | 19,350 | 18,311 | |
| Amgen Inc. | 5.250% | 3/2/25 | 119,440 | 119,729 | ||
| Amgen Inc. | 3.125% | 5/1/25 | 15,679 | 15,314 | ||
| Amgen Inc. | 2.200% | 2/21/27 | 39,766 | 37,042 | ||
| Amgen Inc. | 3.200% | 11/2/27 | 10,314 | 9,834 | ||
| Amgen Inc. | 5.150% | 3/2/28 | 166,208 | 169,313 | ||
| Astrazeneca Finance LLC | 1.200% | 5/28/26 | 76,530 | 70,936 | ||
| Astrazeneca Finance LLC | 4.875% | 3/3/28 | 45,765 | 46,517 | ||
| Astrazeneca Finance LLC | 1.750% | 5/28/28 | 9,555 | 8,561 | ||
| Baxalta Inc. | 4.000% | 6/23/25 | 12,304 | 12,133 | ||
| Baxter International Inc. | 1.915% | 2/1/27 | 158,915 | 145,527 | ||
| Baxter International Inc. | 2.272% | 12/1/28 | 61,195 | 54,535 | ||
| 8 | Bayer AG | 1.125% | 1/6/30 | 1,000 | 917 | |
| Becton Dickinson & Co. | 3.700% | 6/6/27 | 77,616 | 75,160 | ||
| Becton Dickinson & Co. | 4.693% | 2/13/28 | 20,700 | 20,712 | ||
| Boston Scientific Corp. | 1.900% | 6/1/25 | 43,755 | 42,044 | ||
| Bristol-Myers Squibb Co. | 3.900% | 2/20/28 | 8,801 | 8,639 | ||
| Cardinal Health Inc. | 3.410% | 6/15/27 | 981 | 939 | ||
| Cencora Inc. | 3.450% | 12/15/27 | 14,815 | 14,229 | ||
| Centene Corp. | 4.250% | 12/15/27 | 7,025 | 6,766 | ||
| Centene Corp. | 2.450% | 7/15/28 | 19,114 | 17,045 | ||
| 3 | CHS/Community Health Systems Inc. | 8.000% | 3/15/26 | 2,390 | 2,353 | |
| 3 | CHS/Community Health Systems Inc. | 5.625% | 3/15/27 | 1,260 | 1,167 | |
| Cigna Group | 3.250% | 4/15/25 | 24,000 | 23,474 | ||
| Cigna Group | 4.125% | 11/15/25 | 91,744 | 90,358 | ||
| Cigna Group | 4.500% | 2/25/26 | 9,900 | 9,822 | ||
| Cigna Group | 1.250% | 3/15/26 | 22,550 | 20,879 | ||
| Cigna Group | 3.400% | 3/1/27 | 36,217 | 34,845 | ||
| Cigna Group | 4.375% | 10/15/28 | 31,470 | 31,039 | ||
| CommonSpirit Health | 1.547% | 10/1/25 | 32,150 | 30,211 | ||
| 3 | CSL Finance plc | 3.850% | 4/27/27 | 9,680 | 9,447 | |
| CVS Health Corp. | 3.875% | 7/20/25 | 45,617 | 44,891 | ||
| CVS Health Corp. | 5.000% | 2/20/26 | 48,255 | 48,380 | ||
| CVS Health Corp. | 2.875% | 6/1/26 | 24,200 | 23,138 | ||
| CVS Health Corp. | 3.000% | 8/15/26 | 41,970 | 40,168 | ||
| CVS Health Corp. | 3.625% | 4/1/27 | 99,162 | 95,924 | ||
| CVS Health Corp. | 1.300% | 8/21/27 | 49,763 | 44,197 | ||
| CVS Health Corp. | 4.300% | 3/25/28 | 162,702 | 159,938 | ||
| CVS Health Corp. | 5.000% | 1/30/29 | 38,100 | 38,527 | ||
| Elevance Health Inc. | 5.350% | 10/15/25 | 11,600 | 11,663 | ||
| Elevance Health Inc. | 1.500% | 3/15/26 | 38,795 | 36,224 | ||
| Elevance Health Inc. | 4.101% | 3/1/28 | 36,708 | 35,997 | ||
| GE HealthCare Technologies Inc. | 5.600% | 11/15/25 | 123,315 | 124,510 | ||
| GE HealthCare Technologies Inc. | 5.650% | 11/15/27 | 116,024 | 119,650 | ||
| Gilead Sciences Inc. | 3.650% | 3/1/26 | 88,187 | 86,219 | ||
| Gilead Sciences Inc. | 2.950% | 3/1/27 | 7,064 | 6,739 | ||
| GlaxoSmithKline Capital Inc. | 3.875% | 5/15/28 | 52,159 | 51,334 | ||
| HCA Inc. | 5.375% | 2/1/25 | 43,772 | 43,771 | ||
| HCA Inc. | 5.250% | 4/15/25 | 47,142 | 47,094 | ||
| HCA Inc. | 5.875% | 2/15/26 | 9,625 | 9,716 | ||
| HCA Inc. | 5.250% | 6/15/26 | 44,900 | 45,036 | ||
| HCA Inc. | 4.500% | 2/15/27 | 33,403 | 32,967 | ||
| HCA Inc. | 3.125% | 3/15/27 | 28,845 | 27,429 | ||
| 3 | Highmark Inc. | 1.450% | 5/10/26 | 50,353 | 46,132 | |
| Humana Inc. | 4.500% | 4/1/25 | 29,165 | 28,940 | ||
| Humana Inc. | 1.350% | 2/3/27 | 9,750 | 8,807 | ||
| Humana Inc. | 5.750% | 3/1/28 | 16,461 | 16,990 | ||
| 3 | LifePoint Health Inc. | 11.000% | 10/15/30 | 1,095 | 1,165 | |
| McKesson Corp. | 0.900% | 12/3/25 | 33,440 | 31,159 | ||
| McKesson Corp. | 1.300% | 8/15/26 | 33,850 | 31,116 | ||
| McKesson Corp. | 3.950% | 2/16/28 | 26,350 | 25,867 | ||
| Coupon | Maturity Date | Face Amount ($000) | Market Value• ($000) | |||
| Merck & Co. Inc. | 1.700% | 6/10/27 | 42,980 | 39,522 | ||
| Merck & Co. Inc. | 1.900% | 12/10/28 | 5,815 | 5,215 | ||
| 3 | Organon & Co. / Organon Foreign Debt Co.-Issuer BV | 4.125% | 4/30/28 | 5,905 | 5,395 | |
| 3 | Organon & Co. / Organon Foreign Debt Co.-Issuer BV | 5.125% | 4/30/31 | 1,925 | 1,655 | |
| Pfizer Investment Enterprises Pte Ltd. | 4.450% | 5/19/26 | 372,185 | 370,420 | ||
| Pfizer Investment Enterprises Pte Ltd. | 4.450% | 5/19/28 | 333,245 | 332,404 | ||
| Providence St. Joseph Health Obligated Group | 2.746% | 10/1/26 | 12,893 | 12,164 | ||
| Quest Diagnostics Inc. | 3.500% | 3/30/25 | 11,655 | 11,444 | ||
| Quest Diagnostics Inc. | 3.450% | 6/1/26 | 6,800 | 6,600 | ||
| 3 | Roche Holdings Inc. | 2.314% | 3/10/27 | 65,590 | 61,698 | |
| Royalty Pharma plc | 1.200% | 9/2/25 | 36,950 | 34,653 | ||
| Royalty Pharma plc | 1.750% | 9/2/27 | 26,975 | 24,241 | ||
| Shire Acquisitions Investments Ireland DAC | 3.200% | 9/23/26 | 137,061 | 131,894 | ||
| 3 | Star Parent Inc. | 9.000% | 10/1/30 | 1,398 | 1,469 | |
| Stryker Corp. | 1.150% | 6/15/25 | 29,100 | 27,633 | ||
| Stryker Corp. | 3.375% | 11/1/25 | 2,960 | 2,887 | ||
| Stryker Corp. | 3.650% | 3/7/28 | 757 | 730 | ||
| Takeda Pharmaceutical Co. Ltd. | 5.000% | 11/26/28 | 7,645 | 7,752 | ||
| Tenet Healthcare Corp. | 4.875% | 1/1/26 | 8,155 | 8,082 | ||
| Tenet Healthcare Corp. | 4.250% | 6/1/29 | 1,184 | 1,098 | ||
| Teva Pharmaceutical Finance Netherlands III BV | 3.150% | 10/1/26 | 800 | 746 | ||
| Teva Pharmaceutical Finance Netherlands III BV | 4.750% | 5/9/27 | 780 | 753 | ||
| Teva Pharmaceutical Finance Netherlands III BV | 5.125% | 5/9/29 | 340 | 328 | ||
| Thermo Fisher Scientific Inc. | 5.000% | 12/5/26 | 28,700 | 29,084 | ||
| Thermo Fisher Scientific Inc. | 4.800% | 11/21/27 | 51,576 | 52,451 | ||
| Thermo Fisher Scientific Inc. | 5.000% | 1/31/29 | 24,955 | 25,526 | ||
| UnitedHealth Group Inc. | 3.700% | 5/15/27 | 13,950 | 13,645 | ||
| UnitedHealth Group Inc. | 5.250% | 2/15/28 | 50,721 | 52,343 | ||
| UnitedHealth Group Inc. | 3.850% | 6/15/28 | 14,545 | 14,216 | ||
| UnitedHealth Group Inc. | 3.875% | 12/15/28 | 9,545 | 9,296 | ||
| UnitedHealth Group Inc. | 4.250% | 1/15/29 | 56,280 | 55,799 | ||
| Utah Acquisition Sub Inc. | 3.950% | 6/15/26 | 84,040 | 81,610 | ||
| Viatris Inc. | 1.650% | 6/22/25 | 56,546 | 53,686 | ||
| Zimmer Biomet Holdings Inc. | 3.050% | 1/15/26 | 73,410 | 70,995 | ||
| Zimmer Biomet Holdings Inc. | 5.350% | 12/1/28 | 33,655 | 34,653 | ||
| Zoetis Inc. | 4.500% | 11/13/25 | 38,800 | 38,584 | ||
| Zoetis Inc. | 5.400% | 11/14/25 | 26,740 | 26,993 | ||
| Zoetis Inc. | 3.000% | 9/12/27 | 18,825 | 17,858 | ||
| 4,423,407 | ||||||
| Industrials (6.9%) | ||||||
| 3 | Air Canada | 3.875% | 8/15/26 | 1,660 | 1,579 | |
| Amphenol Corp. | 4.750% | 3/30/26 | 11,570 | 11,580 | ||
| Boeing Co. | 1.433% | 2/4/24 | 52,160 | 52,160 | ||
| Boeing Co. | 4.875% | 5/1/25 | 202,401 | 201,060 | ||
| Boeing Co. | 2.600% | 10/30/25 | 9,593 | 9,173 | ||
| Boeing Co. | 2.750% | 2/1/26 | 124,695 | 118,999 | ||
| Boeing Co. | 2.196% | 2/4/26 | 402,571 | 379,441 | ||
| Boeing Co. | 2.250% | 6/15/26 | 8,748 | 8,181 | ||
| Coupon | Maturity Date | Face Amount ($000) | Market Value• ($000) | |||
| Boeing Co. | 2.700% | 2/1/27 | 26,698 | 24,996 | ||
| Boeing Co. | 5.040% | 5/1/27 | 6,358 | 6,368 | ||
| Boeing Co. | 3.250% | 2/1/28 | 24,090 | 22,596 | ||
| Boeing Co. | 3.450% | 11/1/28 | 382 | 358 | ||
| 11 | Brisbane Airport Corp. Pty Ltd. | 3.900% | 4/24/25 | 12,200 | 7,920 | |
| Burlington Northern Santa Fe LLC | 3.250% | 6/15/27 | 13,706 | 13,220 | ||
| Canadian Pacific Railway Co. | 2.900% | 2/1/25 | 9,568 | 9,356 | ||
| Canadian Pacific Railway Co. | 1.750% | 12/2/26 | 36,800 | 34,016 | ||
| Canadian Pacific Railway Co. | 4.000% | 6/1/28 | 24,890 | 24,262 | ||
| 3 | Cargo Aircraft Management Inc. | 4.750% | 2/1/28 | 1,242 | 1,133 | |
| Carrier Global Corp. | 2.242% | 2/15/25 | 16,409 | 15,917 | ||
| 3 | Carrier Global Corp. | 5.800% | 11/30/25 | 41,730 | 42,318 | |
| Caterpillar Financial Services Corp. | 4.800% | 1/6/26 | 24,929 | 25,047 | ||
| Caterpillar Financial Services Corp. | 1.150% | 9/14/26 | 16,810 | 15,465 | ||
| Caterpillar Financial Services Corp. | 4.500% | 1/8/27 | 48,050 | 48,274 | ||
| CNH Industrial Capital LLC | 1.875% | 1/15/26 | 73,092 | 68,797 | ||
| CNH Industrial Capital LLC | 1.450% | 7/15/26 | 37,880 | 34,869 | ||
| CNH Industrial Capital LLC | 4.550% | 4/10/28 | 19,000 | 18,834 | ||
| CNH Industrial Capital LLC | 5.500% | 1/12/29 | 24,070 | 24,748 | ||
| CSX Corp. | 3.800% | 3/1/28 | 14,756 | 14,414 | ||
| 3 | Daimler Truck Finance North America LLC | 5.600% | 8/8/25 | 33,320 | 33,576 | |
| 3 | Daimler Truck Finance North America LLC | 5.125% | 1/19/28 | 14,470 | 14,624 | |
| 3 | Daimler Truck Finance North America LLC | 5.400% | 9/20/28 | 26,670 | 27,278 | |
| 3,4 | Delta Air Lines Inc. / SkyMiles IP Ltd. | 4.750% | 10/20/28 | 111,824 | 109,986 | |
| 8 | Deutsche Lufthansa AG | 2.875% | 5/16/27 | 7,000 | 7,284 | |
| 8 | Deutsche Lufthansa AG | 3.750% | 2/11/28 | 1,500 | 1,599 | |
| Dover Corp. | 3.150% | 11/15/25 | 6,115 | 5,933 | ||
| Emerson Electric Co. | 1.800% | 10/15/27 | 19,500 | 17,802 | ||
| FedEx Corp. | 3.400% | 2/15/28 | 14,739 | 14,069 | ||
| General Dynamics Corp. | 3.500% | 4/1/27 | 29,360 | 28,571 | ||
| General Dynamics Corp. | 2.625% | 11/15/27 | 11,880 | 11,106 | ||
| 9 | Heathrow Funding Ltd. | 6.750% | 12/3/28 | 9,715 | 12,814 | |
| 8 | Honeywell International Inc. | 3.500% | 5/17/27 | 28,100 | 30,777 | |
| Honeywell International Inc. | 4.950% | 2/15/28 | 60,347 | 61,853 | ||
| Huntington Ingalls Industries Inc. | 3.844% | 5/1/25 | 60,217 | 59,095 | ||
| Huntington Ingalls Industries Inc. | 3.483% | 12/1/27 | 31,306 | 29,642 | ||
| Huntington Ingalls Industries Inc. | 2.043% | 8/16/28 | 2,245 | 1,980 | ||
| 3 | Husky Injection Molding Systems Ltd. / Titan Co.-Borrower LLC | 9.000% | 2/15/29 | 1,125 | 1,125 | |
| Ingersoll Rand Inc. | 5.400% | 8/14/28 | 5,960 | 6,106 | ||
| John Deere Capital Corp. | 4.800% | 1/9/26 | 49,676 | 49,972 | ||
| John Deere Capital Corp. | 5.050% | 3/3/26 | 9,655 | 9,762 | ||
| John Deere Capital Corp. | 4.750% | 6/8/26 | 20,078 | 20,210 | ||
| John Deere Capital Corp. | 1.300% | 10/13/26 | 10,208 | 9,407 | ||
| John Deere Capital Corp. | 4.500% | 1/8/27 | 48,050 | 48,143 | ||
| John Deere Capital Corp. | 2.350% | 3/8/27 | 30,820 | 28,980 | ||
| John Deere Capital Corp. | 2.800% | 9/8/27 | 1,341 | 1,270 | ||
| John Deere Capital Corp. | 4.150% | 9/15/27 | 74,938 | 74,399 | ||
| John Deere Capital Corp. | 4.750% | 1/20/28 | 53,080 | 53,792 | ||
| John Deere Capital Corp. | 4.500% | 1/16/29 | 39,860 | 39,930 | ||
| Coupon | Maturity Date | Face Amount ($000) | Market Value• ($000) | |||
| Johnson Controls International plc | 3.900% | 2/14/26 | 2,541 | 2,486 | ||
| L3Harris Technologies Inc. | 3.832% | 4/27/25 | 4,620 | 4,546 | ||
| L3Harris Technologies Inc. | 3.850% | 12/15/26 | 26,108 | 25,544 | ||
| L3Harris Technologies Inc. | 5.400% | 1/15/27 | 72,292 | 73,727 | ||
| L3Harris Technologies Inc. | 4.400% | 6/15/28 | 554 | 546 | ||
| Lennox International Inc. | 1.350% | 8/1/25 | 6,770 | 6,398 | ||
| Lennox International Inc. | 1.700% | 8/1/27 | 6,800 | 6,134 | ||
| Lockheed Martin Corp. | 5.100% | 11/15/27 | 16,460 | 16,881 | ||
| Lockheed Martin Corp. | 4.450% | 5/15/28 | 23,520 | 23,537 | ||
| Lockheed Martin Corp. | 4.500% | 2/15/29 | 28,360 | 28,415 | ||
| 11 | Lonsdale Finance Pty Ltd. | 2.450% | 11/20/26 | 32,470 | 19,967 | |
| 3 | Mileage Plus Holdings LLC / Mileage Plus Intellectual Property Assets Ltd. | 6.500% | 6/20/27 | 167,893 | 168,304 | |
| MISC Capital Two Labuan Ltd. | 3.750% | 4/6/27 | 6,795 | 6,530 | ||
| 3 | Mueller Water Products Inc. | 4.000% | 6/15/29 | 960 | 875 | |
| Norfolk Southern Corp. | 3.650% | 8/1/25 | 7,852 | 7,703 | ||
| Norfolk Southern Corp. | 2.900% | 6/15/26 | 16,309 | 15,644 | ||
| Northrop Grumman Corp. | 3.250% | 1/15/28 | 63,139 | 60,171 | ||
| Northrop Grumman Corp. | 4.600% | 2/1/29 | 72,050 | 72,218 | ||
| Otis Worldwide Corp. | 2.056% | 4/5/25 | 106,183 | 102,401 | ||
| Otis Worldwide Corp. | 2.293% | 4/5/27 | 1,220 | 1,139 | ||
| Otis Worldwide Corp. | 5.250% | 8/16/28 | 33,685 | 34,449 | ||
| PACCAR Financial Corp. | 1.100% | 5/11/26 | 2,584 | 2,396 | ||
| 11 | Pacific National Finance Pty Ltd. | 5.250% | 5/19/25 | 28,500 | 18,605 | |
| Parker-Hannifin Corp. | 3.250% | 3/1/27 | 1,660 | 1,595 | ||
| Parker-Hannifin Corp. | 4.250% | 9/15/27 | 29,080 | 28,751 | ||
| 11 | Qantas Airways Ltd. | 4.750% | 10/12/26 | 5,810 | 3,777 | |
| 11 | Qantas Airways Ltd. | 3.150% | 9/27/28 | 9,650 | 5,737 | |
| 3 | Regal Rexnord Corp. | 6.050% | 4/15/28 | 12,740 | 12,918 | |
| Republic Services Inc. | 3.200% | 3/15/25 | 10,293 | 10,089 | ||
| Republic Services Inc. | 0.875% | 11/15/25 | 14,500 | 13,511 | ||
| Republic Services Inc. | 2.900% | 7/1/26 | 4,860 | 4,670 | ||
| Republic Services Inc. | 3.375% | 11/15/27 | 19,500 | 18,739 | ||
| Republic Services Inc. | 4.875% | 4/1/29 | 24,340 | 24,636 | ||
| 3 | Roller Bearing Co. of America Inc. | 4.375% | 10/15/29 | 955 | 878 | |
| 3 | Rolls-Royce plc | 3.625% | 10/14/25 | 2,640 | 2,545 | |
| 3 | Rolls-Royce plc | 5.750% | 10/15/27 | 2,476 | 2,472 | |
| RTX Corp. | 3.950% | 8/16/25 | 80,973 | 79,889 | ||
| RTX Corp. | 5.000% | 2/27/26 | 13,490 | 13,556 | ||
| RTX Corp. | 5.750% | 11/8/26 | 45,830 | 47,013 | ||
| RTX Corp. | 3.500% | 3/15/27 | 38,900 | 37,527 | ||
| RTX Corp. | 3.125% | 5/4/27 | 24,137 | 22,981 | ||
| RTX Corp. | 4.125% | 11/16/28 | 3,560 | 3,470 | ||
| RTX Corp. | 5.750% | 1/15/29 | 29,030 | 30,282 | ||
| Ryder System Inc. | 1.750% | 9/1/26 | 24,290 | 22,455 | ||
| Ryder System Inc. | 2.850% | 3/1/27 | 31,003 | 29,205 | ||
| Ryder System Inc. | 5.650% | 3/1/28 | 14,460 | 14,888 | ||
| Ryder System Inc. | 5.250% | 6/1/28 | 20,500 | 20,845 | ||
| Ryder System Inc. | 6.300% | 12/1/28 | 62,550 | 66,281 | ||
| 3 | Sensata Technologies BV | 5.000% | 10/1/25 | 1,935 | 1,917 | |
| 3 | Siemens Financieringsmaatschappij NV | 1.200% | 3/11/26 | 42,600 | 39,668 | |
| 3 | Siemens Financieringsmaatschappij NV | 1.700% | 3/11/28 | 14,100 | 12,663 | |
| Southwest Airlines Co. | 5.250% | 5/4/25 | 41,341 | 41,353 | ||
| Southwest Airlines Co. | 3.000% | 11/15/26 | 6,800 | 6,456 | ||
| Southwest Airlines Co. | 5.125% | 6/15/27 | 56,783 | 57,177 | ||
| Southwest Airlines Co. | 3.450% | 11/16/27 | 10,479 | 9,968 | ||
| Coupon | Maturity Date | Face Amount ($000) | Market Value• ($000) | |||
| Stanley Black & Decker Inc. | 3.400% | 3/1/26 | 21,105 | 20,460 | ||
| 3 | TransDigm Inc. | 6.250% | 3/15/26 | 5,965 | 5,933 | |
| TransDigm Inc. | 5.500% | 11/15/27 | 760 | 741 | ||
| 3 | TransDigm Inc. | 6.750% | 8/15/28 | 1,740 | 1,768 | |
| 8 | Traton Finance Luxembourg SA | 4.000% | 9/16/25 | 25,000 | 27,022 | |
| 3 | Triumph Group Inc. | 9.000% | 3/15/28 | 4,167 | 4,401 | |
| Tyco Electronics Group SA | 4.500% | 2/13/26 | 43,330 | 43,180 | ||
| Tyco Electronics Group SA | 3.700% | 2/15/26 | 24,334 | 23,810 | ||
| Tyco Electronics Group SA | 3.125% | 8/15/27 | 23,841 | 22,778 | ||
| Union Pacific Corp. | 2.750% | 3/1/26 | 8,717 | 8,409 | ||
| Union Pacific Corp. | 3.000% | 4/15/27 | 18,214 | 17,413 | ||
| 4 | United Airlines Class B Series 2020-1 Pass Through Trust | 4.875% | 7/15/27 | 5,393 | 5,266 | |
| 3 | United Airlines Inc. | 4.375% | 4/15/26 | 5,035 | 4,861 | |
| 4 | United Airlines Pass Through Trust Class A Series 2020-1 | 5.875% | 4/15/29 | 2,077 | 2,088 | |
| 3 | Veralto Corp. | 5.500% | 9/18/26 | 36,810 | 37,300 | |
| 3 | Veralto Corp. | 5.350% | 9/18/28 | 15,311 | 15,612 | |
| Waste Management Inc. | 3.150% | 11/15/27 | 19,991 | 19,115 | ||
| Waste Management Inc. | 1.150% | 3/15/28 | 2,900 | 2,542 | ||
| 3,695,393 | ||||||
| Materials (2.6%) | ||||||
| Albemarle Corp. | 4.650% | 6/1/27 | 16,240 | 16,039 | ||
| ArcelorMittal SA | 4.550% | 3/11/26 | 8,995 | 8,901 | ||
| ArcelorMittal SA | 6.550% | 11/29/27 | 3,226 | 3,381 | ||
| 3 | Ardagh Packaging Finance plc / Ardagh Holdings USA Inc. | 5.250% | 4/30/25 | 4,167 | 4,074 | |
| Ball Corp. | 4.875% | 3/15/26 | 2,775 | 2,744 | ||
| Berry Global Inc. | 0.950% | 2/15/24 | 67,135 | 67,002 | ||
| Berry Global Inc. | 1.570% | 1/15/26 | 113,233 | 105,731 | ||
| 3 | Berry Global Inc. | 4.500% | 2/15/26 | 2,355 | 2,292 | |
| 3 | Berry Global Inc. | 4.875% | 7/15/26 | 15,149 | 14,907 | |
| Berry Global Inc. | 1.650% | 1/15/27 | 21,744 | 19,706 | ||
| BHP Billiton Finance USA Ltd. | 4.875% | 2/27/26 | 103,900 | 104,455 | ||
| BHP Billiton Finance USA Ltd. | 5.250% | 9/8/26 | 24,060 | 24,513 | ||
| BHP Billiton Finance USA Ltd. | 4.750% | 2/28/28 | 116,835 | 117,822 | ||
| BHP Billiton Finance USA Ltd. | 5.100% | 9/8/28 | 38,500 | 39,403 | ||
| 3 | Big River Steel LLC / BRS Finance Corp. | 6.625% | 1/31/29 | 4,090 | 4,137 | |
| 3 | Canpack SA / Canpack US LLC | 3.875% | 11/15/29 | 2,535 | 2,233 | |
| Celanese US Holdings LLC | 6.350% | 11/15/28 | 24,060 | 25,061 | ||
| 3 | Chemours Co. | 5.750% | 11/15/28 | 3,050 | 2,883 | |
| 3 | Chevron Phillips Chemical Co. LLC / Chevron Phillips Chemical Co. LP | 3.400% | 12/1/26 | 35,216 | 33,832 | |
| Dow Chemical Co. | 4.550% | 11/30/25 | 24,580 | 24,384 | ||
| DuPont de Nemours Inc. | 4.493% | 11/15/25 | 59,612 | 59,154 | ||
| Eastman Chemical Co. | 3.800% | 3/15/25 | 22,587 | 22,237 | ||
| EIDP Inc. | 1.700% | 7/15/25 | 14,540 | 13,869 | ||
| EIDP Inc. | 4.500% | 5/15/26 | 38,555 | 38,471 | ||
| 3 | Element Solutions Inc. | 3.875% | 9/1/28 | 4,608 | 4,214 | |
| FMC Corp. | 5.150% | 5/18/26 | 19,130 | 19,137 | ||
| FMC Corp. | 3.200% | 10/1/26 | 12,000 | 11,408 | ||
| Freeport Indonesia PT | 4.763% | 4/14/27 | 22,710 | 22,284 | ||
| Freeport-McMoRan Inc. | 4.375% | 8/1/28 | 17,528 | 16,913 | ||
| 3 | Georgia-Pacific LLC | 1.750% | 9/30/25 | 66,065 | 62,819 | |
| 3 | Georgia-Pacific LLC | 0.950% | 5/15/26 | 71,895 | 65,986 | |
| 3 | Georgia-Pacific LLC | 2.100% | 4/30/27 | 49,882 | 46,010 | |
| Coupon | Maturity Date | Face Amount ($000) | Market Value• ($000) | |||
| 3 | Graphic Packaging International LLC | 3.500% | 3/15/28 | 625 | 581 | |
| 3 | Hudbay Minerals Inc. | 4.500% | 4/1/26 | 2,454 | 2,378 | |
| Indonesia Asahan Aluminium PT / Mineral Industri Indonesia Persero PT | 4.750% | 5/15/25 | 37,106 | 36,586 | ||
| 3 | Kaiser Aluminum Corp. | 4.625% | 3/1/28 | 1,650 | 1,520 | |
| LYB International Finance III LLC | 1.250% | 10/1/25 | 51,849 | 48,622 | ||
| Mosaic Co. | 5.375% | 11/15/28 | 14,430 | 14,702 | ||
| 3 | NOVA Chemicals Corp. | 8.500% | 11/15/28 | 490 | 514 | |
| Nucor Corp. | 3.950% | 5/23/25 | 9,700 | 9,565 | ||
| Nucor Corp. | 2.000% | 6/1/25 | 26,034 | 25,037 | ||
| Nucor Corp. | 4.300% | 5/23/27 | 9,700 | 9,614 | ||
| Nutrien Ltd. | 3.000% | 4/1/25 | 35,822 | 34,912 | ||
| Nutrien Ltd. | 5.950% | 11/7/25 | 17,260 | 17,545 | ||
| Nutrien Ltd. | 4.900% | 3/27/28 | 44,319 | 44,522 | ||
| 3 | Olympus Water US Holding Corp. | 9.750% | 11/15/28 | 5,433 | 5,763 | |
| PPG Industries Inc. | 1.200% | 3/15/26 | 31,210 | 28,960 | ||
| RPM International Inc. | 3.750% | 3/15/27 | 37,821 | 36,609 | ||
| 3 | Sealed Air Corp. | 6.125% | 2/1/28 | 8,375 | 8,415 | |
| Sherwin-Williams Co. | 4.250% | 8/8/25 | 24,040 | 23,793 | ||
| 3 | SNF Group SACA | 3.125% | 3/15/27 | 2,170 | 2,007 | |
| 3 | SNF Group SACA | 3.375% | 3/15/30 | 1,234 | 1,058 | |
| Steel Dynamics Inc. | 2.400% | 6/15/25 | 15,855 | 15,230 | ||
| Westlake Corp. | 3.600% | 8/15/26 | 1,657 | 1,604 | ||
| 3 | WR Grace Holdings LLC | 5.625% | 8/15/29 | 710 | 626 | |
| 3 | WR Grace Holdings LLC | 7.375% | 3/1/31 | 230 | 234 | |
| WRKCo Inc. | 3.750% | 3/15/25 | 8,107 | 7,967 | ||
| WRKCo Inc. | 3.375% | 9/15/27 | 3,050 | 2,891 | ||
| 1,387,257 | ||||||
| Real Estate (4.2%) | ||||||
| 8 | Akelius Residential Property AB | 1.750% | 2/7/25 | 3,000 | 3,147 | |
| 9 | Akelius Residential Property AB | 2.375% | 8/15/25 | 26,941 | 32,211 | |
| Alexandria Real Estate Equities Inc. | 3.450% | 4/30/25 | 44,536 | 43,608 | ||
| Alexandria Real Estate Equities Inc. | 4.300% | 1/15/26 | 9,080 | 8,964 | ||
| American Tower Corp. | 2.400% | 3/15/25 | 69,903 | 67,754 | ||
| American Tower Corp. | 4.000% | 6/1/25 | 31,725 | 31,233 | ||
| American Tower Corp. | 4.400% | 2/15/26 | 2,356 | 2,330 | ||
| American Tower Corp. | 1.600% | 4/15/26 | 67,714 | 62,958 | ||
| American Tower Corp. | 1.450% | 9/15/26 | 34,406 | 31,459 | ||
| American Tower Corp. | 3.375% | 10/15/26 | 25,308 | 24,306 | ||
| 8 | American Tower Corp. | 0.450% | 1/15/27 | 19,437 | 19,248 | |
| American Tower Corp. | 2.750% | 1/15/27 | 28,920 | 27,274 | ||
| 8 | American Tower Corp. | 0.400% | 2/15/27 | 8,744 | 8,632 | |
| American Tower Corp. | 3.550% | 7/15/27 | 10,995 | 10,546 | ||
| American Tower Corp. | 3.600% | 1/15/28 | 11,760 | 11,227 | ||
| American Tower Corp. | 5.800% | 11/15/28 | 12,978 | 13,448 | ||
| 8 | Aroundtown SA | 0.625% | 7/9/25 | 7,800 | 7,906 | |
| 8 | Aroundtown SA | 3.375% | Perpetual | 3,600 | 1,981 | |
| AvalonBay Communities Inc. | 2.950% | 5/11/26 | 19,400 | 18,645 | ||
| AvalonBay Communities Inc. | 2.900% | 10/15/26 | 6,300 | 6,010 | ||
| AvalonBay Communities Inc. | 1.900% | 12/1/28 | 950 | 838 | ||
| 8 | Blackstone Property Partners Europe Holdings Sarl | 2.200% | 7/24/25 | 5,850 | 6,115 | |
| 8 | Blackstone Property Partners Europe Holdings Sarl | 1.000% | 10/20/26 | 3,900 | 3,832 | |
| Coupon | Maturity Date | Face Amount ($000) | Market Value• ($000) | |||
| 8 | Blackstone Property Partners Europe Holdings Sarl | 1.250% | 4/26/27 | 4,700 | 4,558 | |
| 8 | Blackstone Property Partners Europe Holdings Sarl | 3.625% | 10/29/29 | 2,700 | 2,761 | |
| Boston Properties LP | 2.750% | 10/1/26 | 16,974 | 15,808 | ||
| Boston Properties LP | 6.750% | 12/1/27 | 14,500 | 15,159 | ||
| Boston Properties LP | 4.500% | 12/1/28 | 4,510 | 4,306 | ||
| Brixmor Operating Partnership LP | 3.850% | 2/1/25 | 22,431 | 22,031 | ||
| Brixmor Operating Partnership LP | 3.900% | 3/15/27 | 9,690 | 9,304 | ||
| Brixmor Operating Partnership LP | 2.250% | 4/1/28 | 5,806 | 5,204 | ||
| Camden Property Trust | 5.850% | 11/3/26 | 26,940 | 27,724 | ||
| Corporate Office Properties LP | 2.250% | 3/15/26 | 59,075 | 55,462 | ||
| Corporate Office Properties LP | 2.000% | 1/15/29 | 3,387 | 2,844 | ||
| Crown Castle Inc. | 1.350% | 7/15/25 | 29,140 | 27,584 | ||
| Crown Castle Inc. | 4.450% | 2/15/26 | 41,232 | 40,714 | ||
| Crown Castle Inc. | 3.700% | 6/15/26 | 56,235 | 54,457 | ||
| Crown Castle Inc. | 1.050% | 7/15/26 | 56,719 | 51,469 | ||
| Crown Castle Inc. | 4.000% | 3/1/27 | 7,199 | 6,978 | ||
| Crown Castle Inc. | 2.900% | 3/15/27 | 19,430 | 18,205 | ||
| Crown Castle Inc. | 3.650% | 9/1/27 | 1,190 | 1,133 | ||
| Crown Castle Inc. | 5.000% | 1/11/28 | 43,891 | 43,715 | ||
| Crown Castle Inc. | 3.800% | 2/15/28 | 8,670 | 8,247 | ||
| CubeSmart LP | 4.000% | 11/15/25 | 7,260 | 7,102 | ||
| CubeSmart LP | 3.125% | 9/1/26 | 2,680 | 2,547 | ||
| CubeSmart LP | 2.250% | 12/15/28 | 16,092 | 14,199 | ||
| CubeSmart LP | 4.375% | 2/15/29 | 12,122 | 11,777 | ||
| 8 | Digital Dutch Finco BV | 0.625% | 7/15/25 | 13,205 | 13,601 | |
| 8 | Digital Euro Finco LLC | 2.625% | 4/15/24 | 3,744 | 4,030 | |
| Digital Realty Trust LP | 3.700% | 8/15/27 | 15,729 | 15,201 | ||
| Digital Realty Trust LP | 5.550% | 1/15/28 | 48,500 | 49,553 | ||
| Equinix Inc. | 1.450% | 5/15/26 | 9,710 | 9,000 | ||
| Equinix Inc. | 2.900% | 11/18/26 | 18,180 | 17,267 | ||
| Equinix Inc. | 1.800% | 7/15/27 | 14,550 | 13,203 | ||
| Equinix Inc. | 2.000% | 5/15/28 | 9,600 | 8,566 | ||
| ERP Operating LP | 3.375% | 6/1/25 | 20,200 | 19,759 | ||
| ERP Operating LP | 2.850% | 11/1/26 | 7,965 | 7,590 | ||
| ERP Operating LP | 4.150% | 12/1/28 | 2,740 | 2,683 | ||
| Essex Portfolio LP | 3.500% | 4/1/25 | 8,231 | 8,060 | ||
| Essex Portfolio LP | 3.625% | 5/1/27 | 9,640 | 9,199 | ||
| Essex Portfolio LP | 1.700% | 3/1/28 | 8,760 | 7,672 | ||
| Extra Space Storage LP | 5.700% | 4/1/28 | 35,178 | 35,966 | ||
| Federal Realty OP LP | 1.250% | 2/15/26 | 13,240 | 12,261 | ||
| Federal Realty OP LP | 3.250% | 7/15/27 | 9,677 | 9,100 | ||
| Healthcare Realty Holdings LP | 3.875% | 5/1/25 | 5,800 | 5,660 | ||
| Healthcare Realty Holdings LP | 3.750% | 7/1/27 | 19,305 | 18,308 | ||
| Healthpeak OP LLC | 4.000% | 6/1/25 | 10,352 | 10,188 | ||
| Healthpeak OP LLC | 1.350% | 2/1/27 | 24,300 | 21,939 | ||
| 8 | Heimstaden Bostad AB | 1.125% | 1/21/26 | 17,200 | 16,532 | |
| Highwoods Realty LP | 3.875% | 3/1/27 | 22,853 | 21,309 | ||
| Highwoods Realty LP | 4.125% | 3/15/28 | 8,923 | 8,334 | ||
| Host Hotels & Resorts LP | 4.000% | 6/15/25 | 12,046 | 11,817 | ||
| Kilroy Realty LP | 4.375% | 10/1/25 | 5,685 | 5,555 | ||
| Kilroy Realty LP | 4.750% | 12/15/28 | 33,847 | 32,581 | ||
| Kimco Realty OP LLC | 3.300% | 2/1/25 | 32,730 | 32,059 | ||
| Kimco Realty OP LLC | 2.800% | 10/1/26 | 7,258 | 6,859 | ||
| Kimco Realty OP LLC | 3.800% | 4/1/27 | 9,684 | 9,333 | ||
| 8 | Kojamo OYJ | 1.500% | 6/19/24 | 4,850 | 5,171 | |
| 8 | Logicor Financing Sarl | 0.750% | 7/15/24 | 5,068 | 5,372 | |
| 8 | Logicor Financing Sarl | 2.250% | 5/13/25 | 4,855 | 5,083 | |
| Coupon | Maturity Date | Face Amount ($000) | Market Value• ($000) | |||
| Mid-America Apartments LP | 4.000% | 11/15/25 | 11,320 | 11,119 | ||
| Mid-America Apartments LP | 1.100% | 9/15/26 | 25,735 | 23,396 | ||
| Mid-America Apartments LP | 3.600% | 6/1/27 | 2,618 | 2,532 | ||
| Mid-America Apartments LP | 3.950% | 3/15/29 | 27,380 | 26,502 | ||
| NNN REIT Inc. | 4.000% | 11/15/25 | 19,893 | 19,518 | ||
| NNN REIT Inc. | 4.300% | 10/15/28 | 1,491 | 1,452 | ||
| Omega Healthcare Investors Inc. | 5.250% | 1/15/26 | 35,244 | 35,120 | ||
| Omega Healthcare Investors Inc. | 4.500% | 4/1/27 | 4,250 | 4,131 | ||
| Omega Healthcare Investors Inc. | 4.750% | 1/15/28 | 9,757 | 9,464 | ||
| 3 | Ontario Teachers' Cadillac Fairview Properties Trust | 3.875% | 3/20/27 | 6,000 | 5,696 | |
| Physicians Realty LP | 4.300% | 3/15/27 | 12,027 | 11,758 | ||
| 8 | Prologis International Funding II SA | 3.625% | 3/7/30 | 5,100 | 5,422 | |
| Prologis LP | 3.250% | 6/30/26 | 11,070 | 10,712 | ||
| Prologis LP | 2.125% | 4/15/27 | 9,885 | 9,149 | ||
| Prologis LP | 3.375% | 12/15/27 | 10,600 | 10,143 | ||
| Prologis LP | 4.875% | 6/15/28 | 38,520 | 39,026 | ||
| Prologis LP | 3.875% | 9/15/28 | 314 | 305 | ||
| Prologis LP | 4.375% | 2/1/29 | 8,618 | 8,528 | ||
| Public Storage Operating Co. | 1.500% | 11/9/26 | 17,225 | 15,860 | ||
| Public Storage Operating Co. | 1.850% | 5/1/28 | 29,889 | 26,872 | ||
| Public Storage Operating Co. | 5.125% | 1/15/29 | 16,690 | 17,123 | ||
| Realty Income Corp. | 3.875% | 4/15/25 | 13,495 | 13,298 | ||
| Realty Income Corp. | 4.625% | 11/1/25 | 57,806 | 57,483 | ||
| Realty Income Corp. | 0.750% | 3/15/26 | 9,020 | 8,255 | ||
| Realty Income Corp. | 4.875% | 6/1/26 | 103,847 | 103,820 | ||
| Realty Income Corp. | 4.125% | 10/15/26 | 44,580 | 43,877 | ||
| 9 | Realty Income Corp. | 1.875% | 1/14/27 | 6,214 | 7,178 | |
| Realty Income Corp. | 3.000% | 1/15/27 | 12,520 | 11,913 | ||
| Realty Income Corp. | 3.200% | 1/15/27 | 5,350 | 5,108 | ||
| 9 | Realty Income Corp. | 1.125% | 7/13/27 | 13,900 | 15,475 | |
| Realty Income Corp. | 2.200% | 6/15/28 | 7,220 | 6,494 | ||
| Realty Income Corp. | 4.750% | 2/15/29 | 28,840 | 28,776 | ||
| 8 | Realty Income Corp. | 4.875% | 7/6/30 | 2,658 | 3,035 | |
| Regency Centers LP | 3.600% | 2/1/27 | 1,392 | 1,342 | ||
| Sabra Health Care LP | 5.125% | 8/15/26 | 24,249 | 23,916 | ||
| Simon Property Group LP | 3.500% | 9/1/25 | 48,883 | 47,937 | ||
| Simon Property Group LP | 3.250% | 11/30/26 | 23,542 | 22,725 | ||
| Simon Property Group LP | 1.375% | 1/15/27 | 24,250 | 22,212 | ||
| STORE Capital Corp. | 4.500% | 3/15/28 | 5,018 | 4,723 | ||
| Sun Communities Operating LP | 2.300% | 11/1/28 | 2,452 | 2,159 | ||
| Sun Communities Operating LP | 5.500% | 1/15/29 | 28,170 | 28,437 | ||
| UDR Inc. | 2.950% | 9/1/26 | 1,500 | 1,424 | ||
| Ventas Realty LP | 3.500% | 2/1/25 | 4,820 | 4,729 | ||
| Ventas Realty LP | 3.250% | 10/15/26 | 25,055 | 23,788 | ||
| 3 | VICI Properties LP / VICI Note Co. Inc. | 4.625% | 6/15/25 | 7,927 | 7,814 | |
| Welltower OP LLC | 4.000% | 6/1/25 | 67,934 | 66,892 | ||
| Welltower OP LLC | 4.250% | 4/1/26 | 6,180 | 6,105 | ||
| Welltower OP LLC | 2.050% | 1/15/29 | 34,210 | 30,050 | ||
| 9 | Westfield America Management Ltd. | 2.125% | 3/30/25 | 6,499 | 7,890 | |
| 2,256,454 | ||||||
| Coupon | Maturity Date | Face Amount ($000) | Market Value• ($000) | |||
| Technology (5.0%) | ||||||
| 3 | Black Knight InfoServ LLC | 3.625% | 9/1/28 | 10,790 | 10,208 | |
| Broadcom Corp. / Broadcom Cayman Finance Ltd. | 3.875% | 1/15/27 | 71,450 | 69,756 | ||
| Broadcom Corp. / Broadcom Cayman Finance Ltd. | 3.500% | 1/15/28 | 8,356 | 7,982 | ||
| Broadcom Inc. | 3.150% | 11/15/25 | 39,911 | 38,706 | ||
| Broadcom Inc. | 3.459% | 9/15/26 | 31,621 | 30,574 | ||
| 3 | Broadcom Inc. | 1.950% | 2/15/28 | 18,373 | 16,471 | |
| Broadcom Inc. | 4.110% | 9/15/28 | 55,695 | 54,198 | ||
| 3 | Cloud Software Group Inc. | 6.500% | 3/31/29 | 3,390 | 3,165 | |
| Dell International LLC / EMC Corp. | 5.850% | 7/15/25 | 55,947 | 56,514 | ||
| Dell International LLC / EMC Corp. | 6.020% | 6/15/26 | 174,807 | 178,619 | ||
| Dell International LLC / EMC Corp. | 4.900% | 10/1/26 | 37,793 | 37,810 | ||
| Dell International LLC / EMC Corp. | 6.100% | 7/15/27 | 6,800 | 7,075 | ||
| Dell International LLC / EMC Corp. | 5.250% | 2/1/28 | 29,575 | 30,201 | ||
| DXC Technology Co. | 1.800% | 9/15/26 | 32,770 | 29,933 | ||
| DXC Technology Co. | 2.375% | 9/15/28 | 24,060 | 21,013 | ||
| 3 | Entegris Escrow Corp. | 4.750% | 4/15/29 | 3,880 | 3,710 | |
| Equifax Inc. | 2.600% | 12/1/24 | 16,452 | 16,076 | ||
| Equifax Inc. | 2.600% | 12/15/25 | 48,400 | 46,373 | ||
| Fidelity National Information Services Inc. | 1.150% | 3/1/26 | 19,430 | 18,066 | ||
| 8 | Fidelity National Information Services Inc. | 1.000% | 12/3/28 | 5,400 | 5,259 | |
| Fiserv Inc. | 3.200% | 7/1/26 | 50,813 | 48,991 | ||
| Fiserv Inc. | 5.450% | 3/2/28 | 38,045 | 39,030 | ||
| Fiserv Inc. | 5.375% | 8/21/28 | 28,870 | 29,596 | ||
| Global Payments Inc. | 1.200% | 3/1/26 | 74,837 | 69,130 | ||
| Global Payments Inc. | 2.150% | 1/15/27 | 79,130 | 73,246 | ||
| 3 | GTCR W-2 Merger Sub LLC | 7.500% | 1/15/31 | 815 | 849 | |
| HP Inc. | 2.200% | 6/17/25 | 81,466 | 78,242 | ||
| HP Inc. | 1.450% | 6/17/26 | 1,828 | 1,684 | ||
| HP Inc. | 3.000% | 6/17/27 | 9,830 | 9,290 | ||
| HP Inc. | 4.750% | 1/15/28 | 7,110 | 7,107 | ||
| Intel Corp. | 4.875% | 2/10/26 | 40,440 | 40,678 | ||
| Intel Corp. | 3.750% | 3/25/27 | 5,190 | 5,084 | ||
| Intel Corp. | 3.150% | 5/11/27 | 5,139 | 4,939 | ||
| Intel Corp. | 3.750% | 8/5/27 | 98,440 | 96,230 | ||
| Intel Corp. | 4.875% | 2/10/28 | 59,567 | 60,295 | ||
| International Business Machines Corp. | 3.300% | 5/15/26 | 114,464 | 111,067 | ||
| International Business Machines Corp. | 4.500% | 2/6/28 | 38,520 | 38,561 | ||
| Intuit Inc. | 0.950% | 7/15/25 | 1,950 | 1,845 | ||
| Juniper Networks Inc. | 1.200% | 12/10/25 | 13,730 | 12,779 | ||
| NXP BV / NXP Funding LLC | 5.350% | 3/1/26 | 17,480 | 17,568 | ||
| NXP BV / NXP Funding LLC | 5.550% | 12/1/28 | 780 | 801 | ||
| NXP BV / NXP Funding LLC / NXP USA Inc. | 2.700% | 5/1/25 | 10,346 | 10,007 | ||
| NXP BV / NXP Funding LLC / NXP USA Inc. | 4.400% | 6/1/27 | 23,523 | 23,239 | ||
| Oracle Corp. | 2.500% | 4/1/25 | 120,121 | 116,508 | ||
| Oracle Corp. | 2.950% | 5/15/25 | 47,433 | 46,166 | ||
| Oracle Corp. | 5.800% | 11/10/25 | 34,400 | 34,915 | ||
| Coupon | Maturity Date | Face Amount ($000) | Market Value• ($000) | |||
| Oracle Corp. | 1.650% | 3/25/26 | 130,629 | 122,095 | ||
| Oracle Corp. | 2.650% | 7/15/26 | 91,643 | 87,012 | ||
| Oracle Corp. | 2.800% | 4/1/27 | 35,092 | 33,094 | ||
| Oracle Corp. | 3.250% | 11/15/27 | 19,500 | 18,496 | ||
| Oracle Corp. | 2.300% | 3/25/28 | 14,450 | 13,114 | ||
| Oracle Corp. | 4.500% | 5/6/28 | 52,590 | 52,333 | ||
| PayPal Holdings Inc. | 3.900% | 6/1/27 | 9,420 | 9,232 | ||
| QUALCOMM Inc. | 3.250% | 5/20/27 | 30,971 | 29,889 | ||
| Roper Technologies Inc. | 3.800% | 12/15/26 | 12,272 | 11,990 | ||
| S&P Global Inc. | 2.450% | 3/1/27 | 60,795 | 57,238 | ||
| Skyworks Solutions Inc. | 1.800% | 6/1/26 | 90,504 | 84,239 | ||
| 3 | SS&C Technologies Inc. | 5.500% | 9/30/27 | 2,564 | 2,517 | |
| Teledyne Technologies Inc. | 1.600% | 4/1/26 | 64,850 | 60,364 | ||
| Teledyne Technologies Inc. | 2.250% | 4/1/28 | 22,816 | 20,630 | ||
| Texas Instruments Inc. | 2.900% | 11/3/27 | 22,960 | 21,804 | ||
| 3 | UKG Inc. | 6.875% | 2/1/31 | 4,025 | 4,072 | |
| Verisk Analytics Inc. | 4.000% | 6/15/25 | 85,224 | 84,042 | ||
| VMware LLC | 4.500% | 5/15/25 | 144,807 | 143,652 | ||
| VMware LLC | 1.400% | 8/15/26 | 78,669 | 71,980 | ||
| VMware LLC | 4.650% | 5/15/27 | 3,392 | 3,359 | ||
| VMware LLC | 3.900% | 8/21/27 | 17,921 | 17,312 | ||
| VMware LLC | 1.800% | 8/15/28 | 68,753 | 60,322 | ||
| Western Digital Corp. | 2.850% | 2/1/29 | 3,850 | 3,296 | ||
| Workday Inc. | 3.500% | 4/1/27 | 40,650 | 39,335 | ||
| 2,710,973 | ||||||
| Utilities (6.4%) | ||||||
| AEP Transmission Co. LLC | 3.100% | 12/1/26 | 13,890 | 13,373 | ||
| AES Corp. | 5.450% | 6/1/28 | 29,050 | 29,427 | ||
| 5,11 | AGI Finance Pty Ltd., 3M Australian Bank Bill Rate + 1.000% | 5.139% | 1/8/26 | 14,500 | 9,455 | |
| Alabama Power Co. | 3.750% | 9/1/27 | 48,385 | 47,195 | ||
| Ameren Corp. | 3.650% | 2/15/26 | 9,007 | 8,768 | ||
| Ameren Corp. | 5.700% | 12/1/26 | 100,910 | 103,205 | ||
| Ameren Corp. | 1.950% | 3/15/27 | 26,375 | 24,200 | ||
| Ameren Corp. | 1.750% | 3/15/28 | 14,460 | 12,817 | ||
| Ameren Corp. | 5.000% | 1/15/29 | 126,010 | 126,717 | ||
| American Electric Power Co. Inc. | 5.699% | 8/15/25 | 29,930 | 30,159 | ||
| American Electric Power Co. Inc. | 1.000% | 11/1/25 | 9,675 | 9,010 | ||
| American Electric Power Co. Inc. | 5.750% | 11/1/27 | 17,250 | 17,777 | ||
| American Electric Power Co. Inc. | 5.200% | 1/15/29 | 28,680 | 29,109 | ||
| 8 | Amprion GmbH | 3.450% | 9/22/27 | 11,100 | 12,067 | |
| 8 | Amprion GmbH | 3.875% | 9/7/28 | 3,400 | 3,761 | |
| 11 | Ausgrid Finance Pty Ltd. | 1.814% | 2/5/27 | 23,520 | 14,039 | |
| 5,11 | Australian Gas Networks Ltd., 3M Australian Bank Bill Rate + 0.400% | 4.755% | 7/1/24 | 9,500 | 6,219 | |
| Berkshire Hathaway Energy Co. | 4.050% | 4/15/25 | 19,699 | 19,504 | ||
| 9 | Cadent Finance plc | 2.125% | 9/22/28 | 5,400 | 6,076 | |
| 3 | Calpine Corp. | 4.500% | 2/15/28 | 1,935 | 1,841 | |
| CenterPoint Energy Houston Electric LLC | 5.200% | 10/1/28 | 20,400 | 20,906 | ||
| CenterPoint Energy Inc. | 1.450% | 6/1/26 | 46,620 | 43,296 | ||
| CenterPoint Energy Inc. | 5.250% | 8/10/26 | 44,760 | 45,373 | ||
| CenterPoint Energy Resources Corp. | 5.250% | 3/1/28 | 9,640 | 9,862 | ||
| Consumers Energy Co. | 4.650% | 3/1/28 | 61,435 | 61,696 | ||
| Consumers Energy Co. | 4.600% | 5/30/29 | 31,007 | 31,074 | ||
| 11 | DBNGP Finance Co. Pty Ltd. | 4.225% | 5/28/25 | 8,050 | 5,209 | |
| Dominion Energy Inc. | 3.300% | 3/15/25 | 47,212 | 46,224 | ||
| Dominion Energy Inc. | 1.450% | 4/15/26 | 39,762 | 36,926 | ||
| Dominion Energy Inc. | 2.850% | 8/15/26 | 4,500 | 4,266 | ||
| Coupon | Maturity Date | Face Amount ($000) | Market Value• ($000) | |||
| Dominion Energy Inc. | 4.250% | 6/1/28 | 1,568 | 1,534 | ||
| DTE Energy Co. | 1.050% | 6/1/25 | 35,045 | 33,178 | ||
| DTE Energy Co. | 2.850% | 10/1/26 | 36,880 | 34,948 | ||
| DTE Energy Co. | 4.875% | 6/1/28 | 20,000 | 20,035 | ||
| Duke Energy Carolinas LLC | 6.000% | 12/1/28 | 193 | 203 | ||
| Duke Energy Corp. | 0.900% | 9/15/25 | 33,565 | 31,487 | ||
| Duke Energy Corp. | 5.000% | 12/8/25 | 24,130 | 24,185 | ||
| Duke Energy Corp. | 2.650% | 9/1/26 | 21,838 | 20,764 | ||
| Duke Energy Corp. | 4.850% | 1/5/27 | 33,630 | 33,802 | ||
| Duke Energy Corp. | 3.150% | 8/15/27 | 529 | 500 | ||
| Duke Energy Corp. | 5.000% | 12/8/27 | 19,290 | 19,479 | ||
| Duke Energy Corp. | 4.300% | 3/15/28 | 24,820 | 24,353 | ||
| 3 | East Ohio Gas Co. | 1.300% | 6/15/25 | 9,715 | 9,222 | |
| 3 | Electricite de France SA | 5.700% | 5/23/28 | 8,180 | 8,440 | |
| 3 | Electricite de France SA | 4.500% | 9/21/28 | 16,050 | 15,794 | |
| 8 | Elia Transmission Belgium SA | 3.000% | 4/7/29 | 5,900 | 6,290 | |
| 8 | Enel Finance International NV | 0.000% | 6/17/27 | 36,800 | 35,805 | |
| Entergy Arkansas LLC | 3.500% | 4/1/26 | 23,522 | 22,952 | ||
| Entergy Corp. | 0.900% | 9/15/25 | 48,695 | 45,590 | ||
| Entergy Corp. | 2.950% | 9/1/26 | 90,000 | 85,730 | ||
| Entergy Corp. | 1.900% | 6/15/28 | 10,570 | 9,389 | ||
| Entergy Louisiana LLC | 2.400% | 10/1/26 | 16,976 | 15,926 | ||
| 8 | Eurogrid GmbH | 3.722% | 4/27/30 | 500 | 549 | |
| Evergy Kansas Central Inc. | 2.550% | 7/1/26 | 16,138 | 15,330 | ||
| Eversource Energy | 0.800% | 8/15/25 | 11,595 | 10,836 | ||
| Eversource Energy | 4.750% | 5/15/26 | 38,600 | 38,365 | ||
| Eversource Energy | 1.400% | 8/15/26 | 21,290 | 19,469 | ||
| Eversource Energy | 2.900% | 3/1/27 | 42,422 | 39,974 | ||
| Eversource Energy | 4.600% | 7/1/27 | 24,200 | 23,936 | ||
| Eversource Energy | 5.450% | 3/1/28 | 40,980 | 41,727 | ||
| Exelon Corp. | 3.950% | 6/15/25 | 30,194 | 29,738 | ||
| Exelon Corp. | 3.400% | 4/15/26 | 4,845 | 4,701 | ||
| Exelon Corp. | 2.750% | 3/15/27 | 36,944 | 34,749 | ||
| Exelon Corp. | 5.150% | 3/15/28 | 67,255 | 68,210 | ||
| FirstEnergy Corp. | 2.050% | 3/1/25 | 5,635 | 5,406 | ||
| FirstEnergy Corp. | 1.600% | 1/15/26 | 12,317 | 11,518 | ||
| FirstEnergy Corp. | 4.150% | 7/15/27 | 3,995 | 3,844 | ||
| Georgia Power Co. | 4.650% | 5/16/28 | 86,760 | 86,870 | ||
| ITC Holdings Corp. | 3.250% | 6/30/26 | 9,400 | 9,040 | ||
| 3 | ITC Holdings Corp. | 4.950% | 9/22/27 | 14,778 | 14,831 | |
| ITC Holdings Corp. | 3.350% | 11/15/27 | 24,269 | 23,135 | ||
| 3 | Metropolitan Edison Co. | 5.200% | 4/1/28 | 14,460 | 14,610 | |
| 3 | Mid-Atlantic Interstate Transmission LLC | 4.100% | 5/15/28 | 9,650 | 9,337 | |
| National Fuel Gas Co. | 5.500% | 1/15/26 | 9,705 | 9,746 | ||
| National Fuel Gas Co. | 5.500% | 10/1/26 | 19,275 | 19,413 | ||
| 8 | National Grid Electricity Distribution East Midlands plc | 3.530% | 9/20/28 | 20,310 | 22,099 | |
| 9 | National Grid Electricity Distribution plc | 3.500% | 10/16/26 | 3,168 | 3,851 | |
| National Grid plc | 5.602% | 6/12/28 | 27,030 | 27,826 | ||
| National Rural Utilities Cooperative Finance Corp. | 1.875% | 2/7/25 | 17,750 | 17,186 | ||
| National Rural Utilities Cooperative Finance Corp. | 3.400% | 2/7/28 | 11,203 | 10,746 | ||
| 11 | Network Finance Co. Pty. Ltd. | 2.579% | 10/3/28 | 33,730 | 19,739 | |
| NextEra Energy Capital Holdings Inc. | 5.749% | 9/1/25 | 24,130 | 24,369 | ||
| NextEra Energy Capital Holdings Inc. | 4.950% | 1/29/26 | 48,030 | 48,060 | ||
| NextEra Energy Capital Holdings Inc. | 1.875% | 1/15/27 | 20,853 | 19,202 | ||
| Coupon | Maturity Date | Face Amount ($000) | Market Value• ($000) | |||
| NextEra Energy Capital Holdings Inc. | 4.625% | 7/15/27 | 29,000 | 28,919 | ||
| 3 | NextEra Energy Operating Partners LP | 4.250% | 7/15/24 | 3,810 | 3,772 | |
| 3 | NextEra Energy Operating Partners LP | 3.875% | 10/15/26 | 235 | 223 | |
| NiSource Inc. | 5.250% | 3/30/28 | 35,410 | 36,130 | ||
| NRG Energy Inc. | 6.625% | 1/15/27 | 1,514 | 1,518 | ||
| NSTAR Electric Co. | 3.250% | 11/15/25 | 9,710 | 9,420 | ||
| NSTAR Electric Co. | 3.200% | 5/15/27 | 33,850 | 32,644 | ||
| NTPC Ltd. | 4.375% | 11/26/24 | 4,300 | 4,260 | ||
| Oncor Electric Delivery Co. LLC | 0.550% | 10/1/25 | 10,212 | 9,531 | ||
| Oncor Electric Delivery Co. LLC | 4.300% | 5/15/28 | 43,210 | 42,631 | ||
| Pacific Gas and Electric Co. | 3.500% | 6/15/25 | 16,285 | 15,857 | ||
| Pacific Gas and Electric Co. | 3.450% | 7/1/25 | 14,525 | 14,161 | ||
| Pacific Gas and Electric Co. | 3.150% | 1/1/26 | 100,743 | 96,845 | ||
| Pacific Gas and Electric Co. | 2.100% | 8/1/27 | 13,019 | 11,781 | ||
| PacifiCorp | 5.100% | 2/15/29 | 24,020 | 24,306 | ||
| 3 | Pennsylvania Electric Co. | 5.150% | 3/30/26 | 7,690 | 7,681 | |
| PG&E Recovery Funding LLC | 5.045% | 7/15/34 | 22,410 | 22,582 | ||
| Public Service Enterprise Group Inc. | 0.800% | 8/15/25 | 45,565 | 42,741 | ||
| Public Service Enterprise Group Inc. | 5.850% | 11/15/27 | 59,480 | 61,799 | ||
| Public Service Enterprise Group Inc. | 5.875% | 10/15/28 | 33,690 | 35,253 | ||
| Puget Energy Inc. | 3.650% | 5/15/25 | 13,272 | 12,969 | ||
| 3 | Rayburn Country Securitization LLC | 2.307% | 12/1/32 | 8,988 | 8,169 | |
| Sempra | 3.300% | 4/1/25 | 36,889 | 36,092 | ||
| Southern California Edison Co. | 3.700% | 8/1/25 | 13,471 | 13,223 | ||
| Southern California Edison Co. | 1.200% | 2/1/26 | 6,329 | 5,907 | ||
| Southern California Edison Co. | 4.875% | 2/1/27 | 47,480 | 47,592 | ||
| Southern California Edison Co. | 5.300% | 3/1/28 | 20,960 | 21,486 | ||
| Southern California Edison Co. | 5.650% | 10/1/28 | 21,250 | 22,107 | ||
| Southern California Gas Co. | 2.600% | 6/15/26 | 16,150 | 15,435 | ||
| Southern California Gas Co. | 2.950% | 4/15/27 | 19,425 | 18,470 | ||
| Southern Co. | 5.150% | 10/6/25 | 14,885 | 14,935 | ||
| Southern Co. | 3.250% | 7/1/26 | 8,900 | 8,589 | ||
| Southern Co. | 5.113% | 8/1/27 | 49,075 | 49,641 | ||
| Southern Co. | 1.750% | 3/15/28 | 931 | 831 | ||
| Southern Co. | 4.850% | 6/15/28 | 48,190 | 48,465 | ||
| Southern Co. Gas Capital Corp. | 3.250% | 6/15/26 | 4,025 | 3,879 | ||
| Southern Power Co. | 0.900% | 1/15/26 | 9,700 | 8,967 | ||
| Southwestern Electric Power Co. | 1.650% | 3/15/26 | 35,070 | 32,785 | ||
| Southwestern Electric Power Co. | 4.100% | 9/15/28 | 16,360 | 15,871 | ||
| Tampa Electric Co. | 4.900% | 3/1/29 | 28,630 | 28,930 | ||
| Union Electric Co. | 2.950% | 6/15/27 | 12,496 | 11,886 | ||
| 11 | United Energy Distribution Pty Ltd. | 3.850% | 10/23/24 | 9,730 | 6,340 | |
| 11 | Victoria Power Networks Finance Pty. Ltd. | 2.132% | 4/21/28 | 14,400 | 8,337 | |
| Coupon | Maturity Date | Face Amount ($000) | Market Value• ($000) | |||
| Virginia Electric and Power Co. | 3.100% | 5/15/25 | 8,585 | 8,385 | ||
| Virginia Electric and Power Co. | 3.150% | 1/15/26 | 12,295 | 11,934 | ||
| Virginia Electric and Power Co. | 2.950% | 11/15/26 | 46,542 | 44,600 | ||
| Virginia Electric and Power Co. | 3.500% | 3/15/27 | 19,467 | 18,812 | ||
| Virginia Electric and Power Co. | 3.750% | 5/15/27 | 18,494 | 18,037 | ||
| Virginia Electric and Power Co. | 3.800% | 4/1/28 | 14,460 | 14,037 | ||
| 3 | Vistra Operations Co. LLC | 5.500% | 9/1/26 | 6,844 | 6,780 | |
| WEC Energy Group Inc. | 5.000% | 9/27/25 | 13,350 | 13,357 | ||
| WEC Energy Group Inc. | 4.750% | 1/9/26 | 133,110 | 132,807 | ||
| WEC Energy Group Inc. | 5.150% | 10/1/27 | 24,180 | 24,497 | ||
| WEC Energy Group Inc. | 4.750% | 1/15/28 | 75,649 | 75,594 | ||
| Wisconsin Public Service Corp. | 5.350% | 11/10/25 | 19,850 | 20,038 | ||
| Xcel Energy Inc. | 3.350% | 12/1/26 | 20,814 | 20,057 | ||
| Xcel Energy Inc. | 1.750% | 3/15/27 | 31,596 | 28,913 | ||
| Xcel Energy Inc. | 4.000% | 6/15/28 | 28,930 | 28,134 | ||
| 3,466,511 | ||||||
| Total Corporate Bonds (Cost $47,878,700) | 46,897,434 | |||||
| Floating Rate Loan Interests (0.3%) | ||||||
| 5 | American Airlines Inc. Term Loan, TSFR3M + 4.750% | 10.329% | 4/20/28 | 5,693 | 5,825 | |
| 5 | Asurion LLC Term Loan B-11, TSFR1M + 4.250% | 9.683% | 8/19/28 | 3,840 | 3,794 | |
| 5 | Bausch & Lomb Corp. Term Loan, TSFR1M + 3.250% | 8.683% | 5/10/27 | 5,390 | 5,263 | |
| 5 | Central Parent Inc. Term Loan B, TSFR3M + 4.000% | 9.348% | 7/6/29 | 2,895 | 2,898 | |
| 5 | Chemours Co. Term Loan B, TSFR1M + 3.500% | 8.833% | 8/18/28 | 5,402 | 5,380 | |
| 5 | Clarios Global LP Term Loan, TSFR1M + 3.000% | 1.000% | 5/6/30 | 2,442 | 2,441 | |
| 5 | Cloud Software Group Inc. Term Loan B, TSFR3M + 4.500% | 9.948% | 3/30/29 | 2,740 | 2,685 | |
| 5 | DaVita Inc. Term Loan B, TSFR1M +1.750% | 7.197% | 8/12/26 | 2,667 | 2,660 | |
| 5 | GTCR W Merger Sub LLC Term Loan B, TSFR3M + 3.000% | 8.333% | 9/20/30 | 965 | 963 | |
| 5 | HUB International Ltd. Term Loan B, TSFR3M + 3.250% | 8.574% | 6/20/30 | 960 | 960 | |
| 5 | McAfee LLC Term Loan B, TSFR1M + 3.750% | 9.203% | 3/1/29 | 1,414 | 1,396 | |
| 5 | Medline Borrower LP Term Loan B, TSFR1M + 3.000% | 8.451% | 10/23/28 | 1,437 | 1,434 | |
| 5 | Mileage Plus Holdings LLC Term Loan B, TSFR3M + 5.250% | 10.770% | 6/21/27 | 3,019 | 3,108 | |
| 5 | NCR Atleos LLC Term Loan B, TSFR1M + 4.750% | 10.087% | 3/27/29 | 1,310 | 1,308 | |
| 5 | Oracle Corp. Term Loan A-1, TSFR1M + 1.600% | 6.935% | 8/16/27 | 95,000 | 94,287 | |
| 5 | Setanta Aircraft Leasing DAC Term Loan B, TSFR3M + 2.000% | 7.610% | 11/5/28 | 35,555 | 35,555 | |
| Coupon | Maturity Date | Face Amount ($000) | Market Value• ($000) | |||
| 5 | SkyMiles IP Ltd. Term Loan B, TSFR3M + 3.750% | 9.068% | 10/20/27 | 2,375 | 2,427 | |
| 5 | Star Parent Inc. Term Loan B, TSFR3M + 4.000% | 9.348% | 9/27/30 | 2,740 | 2,674 | |
| 5 | Wyndham Hotels & Resorts Inc. Term Loan B, TSFR1M + 2.250% | 7.683% | 5/24/30 | 1,539 | 1,539 | |
| Total Floating Rate Loan Interests (Cost $176,543) | 176,597 | |||||
| Sovereign Bonds (1.8%) | ||||||
| 3 | Airport Authority | 4.875% | 1/12/26 | 28,945 | 29,109 | |
| Banque Ouest Africaine de Developpement | 5.000% | 7/27/27 | 8,358 | 7,850 | ||
| Corp. Andina de Fomento | 1.250% | 10/26/24 | 67,162 | 65,158 | ||
| Corp. Andina de Fomento | 4.750% | 4/1/26 | 19,296 | 19,206 | ||
| Corp. Financiera de Desarrollo SA | 4.750% | 7/15/25 | 6,018 | 5,943 | ||
| Corp. Financiera de Desarrollo SA | 2.400% | 9/28/27 | 2,117 | 1,902 | ||
| Dominican Republic | 6.875% | 1/29/26 | 14,868 | 15,116 | ||
| Dominican Republic | 6.000% | 7/19/28 | 5,795 | 5,822 | ||
| Dominican Republic | 5.500% | 2/22/29 | 14,168 | 13,725 | ||
| Federative Republic of Brazil | 8.750% | 2/4/25 | 17,095 | 17,695 | ||
| Fondo MIVIVIENDA SA | 4.625% | 4/12/27 | 9,758 | 9,481 | ||
| Kingdom of Morocco | 2.375% | 12/15/27 | 14,770 | 13,212 | ||
| 3 | Kingdom of Saudi Arabia | 4.750% | 1/16/30 | 158,230 | 157,613 | |
| 3 | Korea Electric Power Corp. | 5.375% | 7/31/26 | 38,520 | 38,950 | |
| Korea National Oil Corp. | 0.875% | 10/5/25 | 19,400 | 18,124 | ||
| Magyar Export-Import Bank Zrt | 6.125% | 12/4/27 | 18,860 | 19,047 | ||
| 8 | MFB Magyar Fejlesztesi Bank Zrt | 1.375% | 6/24/25 | 16,459 | 17,020 | |
| 8 | Republic of Chile | 0.100% | 1/26/27 | 18,930 | 18,525 | |
| 8 | Republic of Hungary | 1.125% | 4/28/26 | 30,800 | 31,296 | |
| 8 | Republic of Hungary | 5.000% | 2/22/27 | 2,580 | 2,883 | |
| Republic of Hungary | 6.125% | 5/22/28 | 5,036 | 5,186 | ||
| 8 | Republic of Korea | 0.000% | 10/15/26 | 8,743 | 8,682 | |
| Republic of Panama | 4.000% | 9/22/24 | 6,378 | 6,279 | ||
| Republic of Panama | 3.750% | 3/16/25 | 37,165 | 36,271 | ||
| Republic of Paraguay | 5.000% | 4/15/26 | 9,900 | 9,870 | ||
| Republic of Paraguay | 4.700% | 3/27/27 | 1,000 | 985 | ||
| Republic of Peru | 7.350% | 7/21/25 | 16,458 | 16,981 | ||
| Republic of Peru | 2.844% | 6/20/30 | 44,394 | 39,284 | ||
| Republic of Peru | 2.783% | 1/23/31 | 27,083 | 23,470 | ||
| Republic of Uzbekistan | 4.750% | 2/20/24 | 8,540 | 8,529 | ||
| 8 | Romania | 2.750% | 2/26/26 | 9,689 | 10,292 | |
| 3 | Romania | 5.250% | 11/25/27 | 19,185 | 19,031 | |
| Romania | 5.250% | 11/25/27 | 10,662 | 10,566 | ||
| Romania | 6.625% | 2/17/28 | 6,450 | 6,688 | ||
| 8 | Romania | 6.625% | 9/27/29 | 10,355 | 11,984 | |
| 8 | Romania | 2.500% | 2/8/30 | 6,632 | 6,297 | |
| 8 | Romania | 1.750% | 7/13/30 | 4,220 | 3,716 | |
| Sharjah Sukuk Program Ltd. | 3.854% | 4/3/26 | 16,074 | 15,514 | ||
| 8 | State of Israel | 1.500% | 1/16/29 | 14,400 | 13,703 | |
| Sultanate of Oman | 4.750% | 6/15/26 | 16,065 | 15,828 | ||
| United Mexican States | 5.400% | 2/9/28 | 61,823 | 62,960 | ||
| United Mexican States | 5.000% | 5/7/29 | 96,100 | 95,953 | ||
| United Mexican States | 2.659% | 5/24/31 | 9,657 | 8,112 | ||
| Total Sovereign Bonds (Cost $956,646) | 943,858 | |||||
| Taxable Municipal Bonds (0.1%) | ||||||
| 14 | New Jersey Economic Development Authority Appropriations Revenue | 7.425% | 2/15/29 | 13,409 | 14,498 | |
| Coupon | Maturity Date | Face Amount ($000) | Market Value• ($000) | |||
| New York Transportation Development Corp. Miscellaneous Revenue | 4.248% | 9/1/35 | 3,295 | 3,211 | ||
| State Board of Administration Finance Corp. Miscellaneous Revenue | 1.705% | 7/1/27 | 22,350 | 20,316 | ||
| Total Taxable Municipal Bonds (Cost $39,213) | 38,025 | |||||
| Shares | ||||||
| Temporary Cash Investments (0.7%) | ||||||
| Money Market Fund (0.7%) | ||||||
| 15 | Vanguard Market Liquidity Fund (Cost $404,969) | 5.410% | 4,050,479 | 405,007 | ||
| Counterparty | Expiration Date | Exercise Rate | Notional Amount on Underlying Swap ($000) | |||
| Options Purchased (0.0%) | ||||||
| Over-the-Counter Swaptions (0.0%) | ||||||
| Put Swaptions | ||||||
| 5-Year CDX-NA-IG-S41-V1, Credit Protection Purchased, Pays 1.000% Quarterly | GSI | 3/20/24 | 0.700% | 604,480 | 230 | |
| 5-Year CDX-NA-IG-S41-V1, Credit Protection Purchased, Pays 1.000% Quarterly | GSI | 3/20/24 | 0.700% | 604,500 | 230 | |
| 5-Year CDX-NA-IG-S41-V1, Credit Protection Purchased, Pays 1.000% Quarterly | GSI | 4/17/24 | 0.600% | 1,208,970 | 1,948 | |
| 5-Year CDX-NA-IG-S41-V1, Credit Protection Purchased, Pays 1.000% Quarterly | GSI | 4/17/24 | 0.600% | 1,204,020 | 1,940 | |
| Counterparty | Expiration Date | Exercise Rate | Notional Amount on Underlying Swap ($000) | Market Value• ($000) | ||
| 5-Year CDX-NA-IG-S41-V1, Credit Protection Purchased, Pays 1.000% Quarterly | BANA | 5/15/24 | 0.575% | 1,181,530 | 2,796 | |
| Total Options Purchased (Cost $12,037) | 7,144 | |||||
| Total Investments (99.4%) (Cost $54,492,897) | 53,380,013 | |||||
| Other Assets and Liabilities—Net (0.6%) | 305,473 | |||||
| Net Assets (100%) | 53,685,486 | |||||
| Cost is in $000. | ||||||
| • | See Note A in Notes to Financial Statements. |
| 1 | Securities with a value of $49,329,000 have been segregated as initial margin for open centrally cleared swap contracts. |
| 2 | Securities with a value of $32,311,000 have been segregated as initial margin for open futures contracts. |
| 3 | Security exempt from registration under Rule 144A of the Securities Act of 1933. Such securities may be sold in transactions exempt from registration, normally to qualified institutional buyers. At January 31, 2024, the aggregate value was $3,590,797,000, representing 6.7% of net assets. |
| 4 | The average or expected maturity is shorter than the final maturity shown because of the possibility of interim principal payments and prepayments or the possibility of the issue being called. |
| 5 | Variable-rate security; rate shown is effective rate at period end. Certain variable-rate securities are not based on a published reference rate and spread but are determined by the issuer or agent based on current market conditions. |
| 6 | Includes securities purchased on a when-issued or delayed-delivery basis for which the fund has not taken delivery as of January 31, 2024. |
| 7 | The issuer was placed under federal conservatorship in September 2008; since that time, its daily operations have been managed by the Federal Housing Finance Agency and it receives capital from the U.S. Treasury, as needed to maintain a positive net worth, in exchange for senior preferred stock. |
| 8 | Face amount denominated in euro. |
| 9 | Face amount denominated in British pounds. |
| 10 | Guaranteed by the Republic of Azerbaijan. |
| 11 | Face amount denominated in Australian dollars. |
| 12 | Non-income-producing security—security in default. |
| 13 | Security value determined using significant unobservable inputs. |
| 14 | Scheduled principal and interest payments are guaranteed by National Public Finance Guarantee Corp. |
| 15 | Affiliated money market fund available only to Vanguard funds and certain trusts and accounts managed by Vanguard. Rate shown is the 7-day yield. |
| 3M—3-month. | |
| BANA—Bank of America, N.A. | |
| DAC—Designated Activity Company. | |
| GSI—Goldman Sachs International. | |
| REIT—Real Estate Investment Trust. | |
| REMICS—Real Estate Mortgage Investment Conduits. | |
| SOFR30A—30 Day Average Secured Overnight Financing Rate. | |
| TSFR1M—CME Term Secured Overnight Financing Rate 1-Month. | |
| TSFR3M—CME Term Secured Overnight Financing Rate 3-Month. | |
| TSFR6M—CME Term Secured Overnight Financing Rate 6-Month. |
| Options Written |
| Counterparty | Expiration Date | Exercise Rate | Notional Amount on Underlying Swap ($000) | Market Value ($000) | |
| Over-the-Counter Swaptions | |||||
| Put Swaptions | |||||
| 5-Year CDX-NA-IG-S41-V1, Credit Protection Sold, Receives 1.000% Quarterly | GSI | 4/17/24 | 0.850% | 1,787,950 | (648) |
| Total Options Written (Premiums Received $1,707) | (648) | ||||
| GSI—Goldman Sachs International. |
| Futures Contracts | ||||
| Expiration | Number of Long (Short) Contracts | ($000) | ||
| Notional Amount | Value and Unrealized Appreciation (Depreciation) | |||
| Long Futures Contracts | ||||
| 2-Year U.S. Treasury Note | March 2024 | 3,742 | 769,566 | 1,115 |
| 5-Year U.S. Treasury Note | March 2024 | 2,878 | 311,948 | (126) |
| Euro-Schatz | March 2024 | 201 | 23,067 | 42 |
| 1,031 | ||||
| Short Futures Contracts | ||||
| 10-Year Japanese Government Bond | March 2024 | (350) | (347,788) | 499 |
| 10-Year U.S. Treasury Note | March 2024 | (406) | (45,605) | (404) |
| AUD 3-Year Treasury Bond | March 2024 | (1,035) | (72,616) | (711) |
| Euro-Bobl | March 2024 | (4,064) | (520,580) | (3,777) |
| Long Gilt | March 2024 | (376) | (47,636) | (1,900) |
| Long U.S. Treasury Bond | March 2024 | (38) | (4,649) | (243) |
| Ultra 10-Year U.S. Treasury Note | March 2024 | (62) | (7,246) | (241) |
| (6,777) | ||||
| (5,746) | ||||
| Forward Currency Contracts | |||||||
| Counterparty | Contract Settlement Date | Contract Amount (000) | Unrealized Appreciation ($000) | Unrealized Depreciation ($000) | |||
| Receive | Deliver | ||||||
| JPMorgan Chase Bank, N.A. | 3/20/24 | EUR | 10,062 | USD | 10,901 | — | (4) |
| UBS AG | 3/20/24 | USD | 253,167 | AUD | 383,682 | 1,041 | — |
| UBS AG | 3/20/24 | USD | 522,109 | EUR | 479,753 | 2,535 | — |
| Royal Bank of Canada | 3/20/24 | USD | 314,912 | EUR | 289,285 | 1,616 | — |
| State Street Bank & Trust Co. | 3/20/24 | USD | 17,699 | EUR | 16,290 | 57 | — |
| UBS AG | 3/20/24 | USD | 220,043 | GBP | 172,993 | 722 | — |
| Toronto-Dominion Bank | 3/21/24 | USD | 1,505 | JPY | 220,932 | — | (8) |
| 5,971 | (12) | ||||||
| AUD—Australian dollar. |
| EUR—euro. |
| GBP—British pound. |
| JPY—Japanese yen. |
| USD—U.S. dollar. |
| Centrally Cleared Credit Default Swaps | ||||||
| Reference Entity | Termination Date | Notional Amount (000) | Periodic Premium Received (Paid)1 (%) | Value ($000) | Unrealized Appreciation (Depreciation) ($000) | |
| Credit Protection Sold | ||||||
| CDX-NA-HY-S41-V2 | 12/21/28 | USD | 643,500 | 5.000 | 40,890 | 2,976 |
| 1 Periodic premium received/paid quarterly. |
| USD—U.S. dollar. |
| Over-the-Counter Credit Default Swaps | ||||||||
| Reference Entity | Termination Date | Counterparty | Notional Amount ($000) | Periodic Premium Received (Paid)1 (%) | Value ($000) | Remaining Up-Front Premium Paid (Received) ($000) | Unrealized Appreciation ($000) | Unrealized Depreciation ($000) |
| Credit Protection Sold/Moody's Rating | ||||||||
| Ally Financial Inc./Baa3 | 12/23/25 | GSI | 3,270 | 1.000 | 2 | 9 | — | (7) |
| American Express Co./A2 | 12/23/25 | GSI | 3,270 | 1.000 | 53 | 41 | 12 | — |
| American International Group Inc./Baa2 | 12/23/25 | GSI | 3,270 | 1.000 | 43 | 17 | 26 | — |
| Boeing Co./Baa2 | 6/21/24 | GSI | 24,365 | 1.000 | 92 | 46 | 46 | — |
| Boeing Co./Baa2 | 12/23/25 | GSI | 3,270 | 1.000 | 32 | (7) | 39 | — |
| Chubb INA Holdings Inc./A3 | 12/23/25 | GSI | 3,270 | 1.000 | 56 | 46 | 10 | — |
| Comcast Corp./A3 | 12/23/25 | GSI | 3,270 | 1.000 | 52 | 37 | 15 | — |
| CVS Health Corp./Baa2 | 12/23/25 | GSI | 3,270 | 1.000 | 50 | 29 | 21 | — |
| Dominion Energy Inc./Baa2 | 12/23/25 | GSI | 3,270 | 1.000 | 46 | 36 | 10 | — |
| Dow Chemical Co./Baa1 | 12/23/25 | GSI | 3,270 | 1.000 | 48 | 23 | 25 | — |
| Enbridge Inc./Baa1 | 12/23/25 | GSI | 3,270 | 1.000 | 36 | 21 | 15 | — |
| General Electric Co./Baa1 | 12/23/25 | GSI | 3,270 | 1.000 | 51 | 7 | 44 | — |
| General Motors Co./Baa3 | 12/23/25 | GSI | 3,270 | 1.000 | 33 | (1) | 34 | — |
| International Business Machines Corp./A3 | 12/23/25 | GSI | 3,270 | 1.000 | 54 | 38 | 16 | — |
| Kroger Co./Baa1 | 12/23/25 | GSI | 3,270 | 1.000 | 51 | 29 | 22 | — |
| Lincoln National Corp./Baa2 | 12/23/25 | GSI | 3,270 | 1.000 | — | 16 | — | (16) |
| Lowe's Cos. Inc./Baa1 | 12/23/25 | GSI | 3,270 | 1.000 | 53 | 38 | 15 | — |
| Marathon Petroleum Corp./Baa2 | 12/23/25 | GSI | 3,270 | 1.000 | 48 | 11 | 37 | — |
| Marsh & McLennan Cos. Inc./A3 | 12/23/25 | GSI | 3,270 | 1.000 | 55 | 44 | 11 | — |
| Metlife Inc./A3 | 12/23/25 | GSI | 3,270 | 1.000 | 36 | 28 | 8 | — |
| Mondelez International Inc./Baa1 | 12/23/25 | GSI | 3,270 | 1.000 | 52 | 34 | 18 | — |
| People’s Republic of China/A1 | 6/21/24 | GSI | 20,715 | 1.000 | 88 | 37 | 51 | — |
| Prudential Financial Inc./A3 | 12/23/25 | GSI | 3,270 | 1.000 | 36 | 28 | 8 | — |
| Simon Property Group LP/A3 | 12/23/25 | GSI | 3,270 | 1.000 | 42 | 17 | 25 | — |
| Over-the-Counter Credit Default Swaps (continued) | ||||||||
| Reference Entity | Termination Date | Counterparty | Notional Amount ($000) | Periodic Premium Received (Paid)1 (%) | Value ($000) | Remaining Up-Front Premium Paid (Received) ($000) | Unrealized Appreciation ($000) | Unrealized Depreciation ($000) |
| UnitedHealth Group Inc./A3 | 12/23/25 | GSI | 3,270 | 1.000 | 53 | 40 | 13 | — |
| Verizon Communications Inc./Baa1 | 12/23/25 | GSI | 3,270 | 1.000 | 35 | 28 | 7 | — |
| 1,197 | 692 | 528 | (23) | |||||
| Credit Protection Purchased | ||||||||
| Boeing Co. | 12/21/24 | JPMC | 9,690 | (1.000) | (62) | 146 | — | (208) |
| 1,135 | 838 | 528 | (231) | |||||
| 1 | Periodic premium received/paid quarterly. |
| GSI—Goldman Sachs International. | |
| JPMC—JPMorgan Chase Bank, N.A. |
| ($000s, except shares, footnotes, and per-share amounts) | Amount |
| Assets | |
| Investments in Securities, at Value | |
| Unaffiliated Issuers (Cost $54,087,928) | 52,975,006 |
| Affiliated Issuers (Cost $404,969) | 405,007 |
| Total Investments in Securities | 53,380,013 |
| Investment in Vanguard | 1,698 |
| Cash | 91 |
| Foreign Currency, at Value (Cost $9,161) | 9,092 |
| Receivables for Investment Securities Sold | 44,022 |
| Receivables for Accrued Income | 504,718 |
| Receivables for Capital Shares Issued | 84,527 |
| Swap Premiums Paid | 846 |
| Unrealized Appreciation—Forward Currency Contracts | 5,971 |
| Unrealized Appreciation—Over-the-Counter Swap Contracts | 528 |
| Other Assets | 680 |
| Total Assets | 54,032,186 |
| Liabilities | |
| Payables for Investment Securities Purchased | 248,051 |
| Payables for Capital Shares Redeemed | 64,815 |
| Payables for Distributions | 23,607 |
| Payables to Vanguard | 2,489 |
| Options Written, at Value (Premiums Received $1,707) | 648 |
| Swap Premiums Received | 8 |
| Variation Margin Payable—Futures Contracts | 5,426 |
| Unrealized Depreciation—Forward Currency Contracts | 12 |
| Variation Margin Payable—Centrally Cleared Swap Contracts | 1,413 |
| Unrealized Depreciation—Over-the-Counter Swap Contracts | 231 |
| Total Liabilities | 346,700 |
| Net Assets | 53,685,486 |
| At January 31, 2024, net assets consisted of: | |
| Paid-in Capital | 57,859,625 |
| Total Distributable Earnings (Loss) | (4,174,139) |
| Net Assets | 53,685,486 |
| Investor Shares—Net Assets | |
| Applicable to 617,094,000 outstanding $.001 par value shares of beneficial interest (unlimited authorization) | 6,321,694 |
| Net Asset Value Per Share—Investor Shares | $10.24 |
| Admiral Shares—Net Assets | |
| Applicable to 3,661,461,000 outstanding $.001 par value shares of beneficial interest (unlimited authorization) | 37,509,033 |
| Net Asset Value Per Share—Admiral Shares | $10.24 |
| Institutional Shares—Net Assets | |
| Applicable to 961,975,809 outstanding $.001 par value shares of beneficial interest (unlimited authorization) | 9,854,759 |
| Net Asset Value Per Share—Institutional Shares | $10.24 |
| Year Ended January 31, 2024 | |
| ($000) | |
| Investment Income | |
| Income | |
| Interest1 | 1,882,693 |
| Total Income | 1,882,693 |
| Expenses | |
| The Vanguard Group—Note B | |
| Investment Advisory Services | 6,357 |
| Management and Administrative— Investor Shares | 11,407 |
| Management and Administrative— Admiral Shares | 31,996 |
| Management and Administrative— Institutional Shares | 6,070 |
| Marketing and Distribution— Investor Shares | 335 |
| Marketing and Distribution— Admiral Shares | 2,166 |
| Marketing and Distribution— Institutional Shares | 424 |
| Custodian Fees | 440 |
| Auditing Fees | 53 |
| Shareholders’ Reports—Investor Shares | 136 |
| Shareholders’ Reports—Admiral Shares | 399 |
| Shareholders’ Reports—Institutional Shares | 14 |
| Trustees’ Fees and Expenses | 38 |
| Other Expenses | 23 |
| Total Expenses | 59,858 |
| Expenses Paid Indirectly | (219) |
| Net Expenses | 59,639 |
| Net Investment Income | 1,823,054 |
| Realized Net Gain (Loss) | |
| Investment Securities Sold1 | (1,230,855) |
| Futures Contracts | (8,920) |
| Options Purchased | (6,236) |
| Swap Contracts | 29,452 |
| Forward Currency Contracts | 42,549 |
| Foreign Currencies | 3,707 |
| Realized Net Gain (Loss) | (1,170,303) |
| Change in Unrealized Appreciation (Depreciation) | |
| Investment Securities1 | 2,029,329 |
| Futures Contracts | (12,232) |
| Options Purchased | 942 |
| Options Written | 1,059 |
| Swap Contracts | (213) |
| Forward Currency Contracts | 1,932 |
| Foreign Currencies | (829) |
| Change in Unrealized Appreciation (Depreciation) | 2,019,988 |
| Net Increase (Decrease) in Net Assets Resulting from Operations | 2,672,739 |
| 1 | Interest income, realized net gain (loss), and change in unrealized appreciation (depreciation) from an affiliated company of the fund were $11,363,000, $98,000, and $1,000, respectively. Purchases and sales are for temporary cash investment purposes. |
| Year Ended January 31, | ||
| 2024 ($000) | 2023 ($000) | |
| Increase (Decrease) in Net Assets | ||
| Operations | ||
| Net Investment Income | 1,823,054 | 1,341,629 |
| Realized Net Gain (Loss) | (1,170,303) | (1,856,600) |
| Change in Unrealized Appreciation (Depreciation) | 2,019,988 | (2,056,882) |
| Net Increase (Decrease) in Net Assets Resulting from Operations | 2,672,739 | (2,571,853) |
| Distributions | ||
| Investor Shares | (202,974) | (138,688) |
| Admiral Shares | (1,295,060) | (963,438) |
| Institutional Shares | (372,392) | (268,221) |
| Total Distributions | (1,870,426) | (1,370,347) |
| Capital Share Transactions | ||
| Investor Shares | (304,790) | (1,451,328) |
| Admiral Shares | (4,883,993) | (9,570,838) |
| Institutional Shares | (1,839,710) | (1,824,378) |
| Net Increase (Decrease) from Capital Share Transactions | (7,028,493) | (12,846,544) |
| Total Increase (Decrease) | (6,226,180) | (16,788,744) |
| Net Assets | ||
| Beginning of Period | 59,911,666 | 76,700,410 |
| End of Period | 53,685,486 | 59,911,666 |
| Investor Shares | |||||
| For a Share Outstanding Throughout Each Period | Year Ended January 31, | ||||
| 2024 | 2023 | 2022 | 2021 | 2020 | |
| Net Asset Value, Beginning of Period | $10.09 | $10.63 | $11.02 | $10.80 | $10.50 |
| Investment Operations | |||||
| Net Investment Income1 | .314 | .194 | .161 | .233 | .297 |
| Net Realized and Unrealized Gain (Loss) on Investments | .159 | (.534) | (.341) | .225 | .304 |
| Total from Investment Operations | .473 | (.340) | (.180) | .458 | .601 |
| Distributions | |||||
| Dividends from Net Investment Income | (.323) | (.200) | (.171) | (.238) | (.301) |
| Distributions from Realized Capital Gains | — | — | (.039) | — | — |
| Total Distributions | (.323) | (.200) | (.210) | (.238) | (.301) |
| Net Asset Value, End of Period | $10.24 | $10.09 | $10.63 | $11.02 | $10.80 |
| Total Return2 | 4.79% | -3.18% | -1.66% | 4.29% | 5.79% |
| Ratios/Supplemental Data | |||||
| Net Assets, End of Period (Millions) | $6,322 | $6,532 | $8,400 | $8,617 | $8,179 |
| Ratio of Total Expenses to Average Net Assets | 0.20%3 | 0.20%3 | 0.20% | 0.20% | 0.20% |
| Ratio of Net Investment Income to Average Net Assets | 3.13% | 1.92% | 1.47% | 2.14% | 2.78% |
| Portfolio Turnover Rate4 | 70% | 77% | 65% | 89% | 76% |
| 1 | Calculated based on average shares outstanding. |
| 2 | Total returns do not include account service fees that may have applied in the periods shown. Fund prospectuses provide information about any applicable account service fees. |
| 3 | The ratio of expenses to average net assets for the period net of reduction from custody fee offset arrangements was 0.20%. |
| 4 | Includes 3%, 11%, 3%, 13%, and 1%, respectively, attributable to mortgage-dollar-roll activity. |
| Admiral Shares | |||||
| For a Share Outstanding Throughout Each Period | Year Ended January 31, | ||||
| 2024 | 2023 | 2022 | 2021 | 2020 | |
| Net Asset Value, Beginning of Period | $10.09 | $10.63 | $11.02 | $10.80 | $10.50 |
| Investment Operations | |||||
| Net Investment Income1 | .323 | .204 | .171 | .244 | .308 |
| Net Realized and Unrealized Gain (Loss) on Investments | .160 | (.534) | (.341) | .225 | .304 |
| Total from Investment Operations | .483 | (.330) | (.170) | .469 | .612 |
| Distributions | |||||
| Dividends from Net Investment Income | (.333) | (.210) | (.181) | (.249) | (.312) |
| Distributions from Realized Capital Gains | — | — | (.039) | — | — |
| Total Distributions | (.333) | (.210) | (.220) | (.249) | (.312) |
| Net Asset Value, End of Period | $10.24 | $10.09 | $10.63 | $11.02 | $10.80 |
| Total Return2 | 4.90% | -3.09% | -1.56% | 4.39% | 5.90% |
| Ratios/Supplemental Data | |||||
| Net Assets, End of Period (Millions) | $37,509 | $41,848 | $54,200 | $51,282 | $44,211 |
| Ratio of Total Expenses to Average Net Assets | 0.10%3 | 0.10%3 | 0.10% | 0.10% | 0.10% |
| Ratio of Net Investment Income to Average Net Assets | 3.22% | 2.01% | 1.57% | 2.23% | 2.88% |
| Portfolio Turnover Rate4 | 70% | 77% | 65% | 89% | 76% |
| 1 | Calculated based on average shares outstanding. |
| 2 | Total returns do not include account service fees that may have applied in the periods shown. Fund prospectuses provide information about any applicable account service fees. |
| 3 | The ratio of expenses to average net assets for the period net of reduction from custody fee offset arrangements was 0.10%. |
| 4 | Includes 3%, 11%, 3%, 13%, and 1%, respectively, attributable to mortgage-dollar-roll activity. |
| Institutional Shares | |||||
| For a Share Outstanding Throughout Each Period | Year Ended January 31, | ||||
| 2024 | 2023 | 2022 | 2021 | 2020 | |
| Net Asset Value, Beginning of Period | $10.09 | $10.63 | $11.02 | $10.80 | $10.50 |
| Investment Operations | |||||
| Net Investment Income1 | .326 | .207 | .175 | .246 | .311 |
| Net Realized and Unrealized Gain (Loss) on Investments | .160 | (.534) | (.341) | .226 | .304 |
| Total from Investment Operations | .486 | (.327) | (.166) | .472 | .615 |
| Distributions | |||||
| Dividends from Net Investment Income | (.336) | (.213) | (.185) | (.252) | (.315) |
| Distributions from Realized Capital Gains | — | — | (.039) | — | — |
| Total Distributions | (.336) | (.213) | (.224) | (.252) | (.315) |
| Net Asset Value, End of Period | $10.24 | $10.09 | $10.63 | $11.02 | $10.80 |
| Total Return | 4.93% | -3.06% | -1.53% | 4.42% | 5.93% |
| Ratios/Supplemental Data | |||||
| Net Assets, End of Period (Millions) | $9,855 | $11,531 | $14,101 | $14,267 | $10,830 |
| Ratio of Total Expenses to Average Net Assets | 0.07%2 | 0.07%2 | 0.07% | 0.07% | 0.07% |
| Ratio of Net Investment Income to Average Net Assets | 3.25% | 2.05% | 1.60% | 2.25% | 2.91% |
| Portfolio Turnover Rate3 | 70% | 77% | 65% | 89% | 76% |
| 1 | Calculated based on average shares outstanding. |
| 2 | The ratio of expenses to average net assets for the period net of reduction from custody fee offset arrangements was 0.07%. |
| 3 | Includes 3%, 11%, 3%, 13%, and 1%, respectively, attributable to mortgage-dollar-roll activity. |
| A. | The following significant accounting policies conform to generally accepted accounting principles for U.S. investment companies. The fund consistently follows such policies in preparing its financial statements. |
| B. | In accordance with the terms of a Funds' Service Agreement (the “FSA”) between Vanguard and the fund, Vanguard furnishes to the fund investment advisory, corporate management, administrative, marketing, and distribution services at Vanguard’s cost of operations (as defined by the FSA). These costs of operations are allocated to the fund based on methods and guidelines approved by the board of trustees and are generally settled twice a month. |
| C. | The fund’s custodian bank has agreed to reduce its fees when the fund maintains cash on deposit in the non-interest-bearing custody account. For the year ended January 31, 2024, custodian fee offset arrangements reduced the fund’s expenses by $219,000 (an annual rate of less than 0.01% of average net assets). |
| D. | Various inputs may be used to determine the value of the fund’s investments and derivatives. These inputs are summarized in three broad levels for financial statement purposes. The inputs or methodologies used to value securities are not necessarily an indication of the risk associated with investing in those securities. |
| Level 1 ($000) | Level 2 ($000) | Level 3 ($000) | Total ($000) | |
| Investments | ||||
| Assets | ||||
| U.S. Government and Agency Obligations | — | 3,261,872 | — | 3,261,872 |
| Asset-Backed/Commercial Mortgage-Backed Securities | — | 1,650,076 | — | 1,650,076 |
| Corporate Bonds | — | 46,897,431 | 3 | 46,897,434 |
| Floating Rate Loan Interests | — | 176,597 | — | 176,597 |
| Sovereign Bonds | — | 943,858 | — | 943,858 |
| Taxable Municipal Bonds | — | 38,025 | — | 38,025 |
| Temporary Cash Investments | 405,007 | — | — | 405,007 |
| Options Purchased | — | 7,144 | — | 7,144 |
| Total | 405,007 | 52,975,003 | 3 | 53,380,013 |
| Derivative Financial Instruments | ||||
| Assets | ||||
| Futures Contracts1 | 1,656 | — | — | 1,656 |
| Forward Currency Contracts | — | 5,971 | — | 5,971 |
| Swap Contracts | 2,9761 | 528 | — | 3,504 |
| Total | 4,632 | 6,499 | — | 11,131 |
| Liabilities | ||||
| Options Written | — | 648 | — | 648 |
| Futures Contracts1 | 7,402 | — | — | 7,402 |
| Forward Currency Contracts | — | 12 | — | 12 |
| Swap Contracts | — | 231 | — | 231 |
| Total | 7,402 | 891 | — | 8,293 |
| 1 | Includes cumulative appreciation (depreciation) on futures contracts and centrally cleared swaps, if any, as reported in the Schedule of Investments. Only current day’s variation margin is reported within the Statement of Assets and Liabilities. |
| E. | At January 31, 2024, the fair values of derivatives were reflected in the Statement of Assets and Liabilities as follows: |
| Statement of Assets and Liabilities | Interest Rate Contracts ($000) | Foreign Exchange Contracts ($000) | Credit Contracts ($000) | Total ($000) |
| Investments in Secuties, at Value—Unaffiliated Issuers (Options Purchased) | — | — | 7,144 | 7,144 |
| Swap Premiums Paid | — | — | 846 | 846 |
| Unrealized Appreciation—Futures Contracts1 | 1,656 | — | — | 1,656 |
| Unrealized Appreciation—Centrally Cleared Swap Contracts1 | — | — | 2,976 | 2,976 |
| Unrealized Appreciation—Forward Currency Contracts | — | 5,971 | — | 5,971 |
| Unrealized Appreciation— Over-the-Counter Swap Contracts | — | — | 528 | 528 |
| Total Assets | 1,656 | 5,971 | 11,494 | 19,121 |
| Options Written, at Value | — | — | 648 | 648 |
| Swap Premiums Received | — | — | 8 | 8 |
| Unrealized Depreciation—Futures Contracts1 | 7,402 | — | — | 7,402 |
| Unrealized Depreciation—Forward Currency Contracts | — | 12 | — | 12 |
| Interest Rate Contracts ($000) | Foreign Exchange Contracts ($000) | Credit Contracts ($000) | Total ($000) | |
| Unrealized Depreciation— Over-the-Counter Swap Contracts | — | — | 231 | 231 |
| Total Liabilities | 7,402 | 12 | 887 | 8,301 |
| 1 | Includes cumulative appreciation (depreciation) on futures contracts and centrally cleared swaps, if any, as reported in the Schedule of Investments. Only current day’s variation margin is reported within the Statement of Assets and Liabilities. |
| Realized Net Gain (Loss) on Derivatives | Interest Rate Contracts ($000) | Foreign Exchange Contracts ($000) | Credit Contracts ($000) | Total ($000) |
| Futures Contracts | (8,920) | — | — | (8,920) |
| Options Purchased | (5,668) | — | (568) | (6,236) |
| Swap Contracts | (675) | — | 30,127 | 29,452 |
| Forward Currency Contracts | — | 42,549 | — | 42,549 |
| Realized Net Gain (Loss) on Derivatives | (15,263) | 42,549 | 29,559 | 56,845 |
| Change in Unrealized Appreciation (Depreciation) on Derivatives | ||||
| Futures Contracts | (12,232) | — | — | (12,232) |
| Options Purchased | 5,669 | — | (4,727) | 942 |
| Options Written | — | — | 1,059 | 1,059 |
| Swap Contracts | — | — | (213) | (213) |
| Forward Currency Contracts | — | 1,932 | — | 1,932 |
| Change in Unrealized Appreciation (Depreciation) on Derivatives | (6,563) | 1,932 | (3,881) | (8,512) |
| F. | Permanent differences between book-basis and tax-basis components of net assets are reclassified among capital accounts in the financial statements to reflect their tax character. These reclassifications have no effect on net assets or net asset value per share. As of period end, permanent differences primarily attributable to the accounting for applicable foreign currency transactions and swap agreements were reclassified between the individual components of total distributable earnings (loss). |
| Amount ($000) | |
| Undistributed Ordinary Income | 37,099 |
| Undistributed Long-Term Gains | — |
| Net Unrealized Gains (Losses) | (1,068,746) |
| Capital Loss Carryforwards | (3,118,885) |
| Qualified Late-Year Losses | — |
| Other Temporary Differences | (23,607) |
| Total | (4,174,139) |
| Year Ended January 31, | ||
| 2024 Amount ($000) | 2023 Amount ($000) | |
| Ordinary Income* | 1,870,426 | 1,370,347 |
| Long-Term Capital Gains | — | — |
| Total | 1,870,426 | 1,370,347 |
| * | Includes short-term capital gains, if any. |
| Amount ($000) | |
| Tax Cost | 54,448,242 |
| Gross Unrealized Appreciation | 455,174 |
| Gross Unrealized Depreciation | (1,523,920) |
| Net Unrealized Appreciation (Depreciation) | (1,068,746) |
| G. | During the year ended January 31, 2024, the fund purchased $23,250,949,000 of investment securities and sold $25,993,832,000 of investment securities, other than U.S. government securities and temporary cash investments. Purchases and sales of U.S. government securities were $15,964,302,000 and $21,214,447,000, respectively. |
| H. | Capital share transactions for each class of shares were: |
| Year Ended January 31, | |||||
| 2024 | 2023 | ||||
| Amount ($000) | Shares (000) | Amount ($000) | Shares (000) | ||
| Investor Shares | |||||
| Issued | 730,553 | 72,791 | 664,217 | 65,470 | |
| Issued in Lieu of Cash Distributions | 190,872 | 18,998 | 129,822 | 12,868 | |
| Redeemed | (1,226,215) | (122,371) | (2,245,367) | (221,029) | |
| Net Increase (Decrease)—Investor Shares | (304,790) | (30,582) | (1,451,328) | (142,691) | |
| Admiral Shares | |||||
| Issued | 6,859,776 | 683,238 | 10,354,155 | 1,021,772 | |
| Issued in Lieu of Cash Distributions | 1,050,829 | 104,606 | 766,035 | 75,924 | |
| Redeemed | (12,794,598) | (1,275,713) | (20,691,028) | (2,048,397) | |
| Net Increase (Decrease)—Admiral Shares | (4,883,993) | (487,869) | (9,570,838) | (950,701) | |
| Institutional Shares | |||||
| Issued | 2,516,904 | 250,688 | 2,932,351 | 288,413 | |
| Issued in Lieu of Cash Distributions | 336,484 | 33,509 | 248,275 | 24,614 | |
| Redeemed | (4,693,098) | (465,582) | (5,005,004) | (496,496) | |
| Net Increase (Decrease)—Institutional Shares | (1,839,710) | (181,385) | (1,824,378) | (183,469) | |
| I. | Significant market disruptions, such as those caused by pandemics (e.g., COVID-19 pandemic), natural or environmental disasters, war (e.g., Russia’s invasion of Ukraine), acts of terrorism, or other events, can adversely affect local and global markets and normal market operations. Any such disruptions could have an adverse impact on the value of the fund’s investments and fund performance. |
| J. | Management has determined that no events or transactions occurred subsequent to January 31, 2024, that would require recognition or disclosure in these financial statements. |

| Average Annual Total Returns Periods Ended January 31, 2024 | |||||
| One Year | Five Years | Ten Years | Final Value of a $10,000 Investment | ||
| Intermediate-Term Investment-Grade Fund Investor Shares | 4.44% | 2.03% | 2.47% | $12,761 |
| Bloomberg U.S. 5-10 Year Credit Bond Index | 4.50 | 2.29 | 2.91 | 13,326 |
| Bloomberg U.S. Aggregate Bond Index | 2.10 | 0.83 | 1.63 | 11,758 |
| One Year | Five Years | Ten Years | Final Value of a $50,000 Investment | ||
| Intermediate-Term Investment-Grade Fund Admiral Shares | 4.54% | 2.13% | 2.57% | $64,443 | |
| Bloomberg U.S. 5-10 Year Credit Bond Index | 4.50 | 2.29 | 2.91 | 66,629 | |
| Bloomberg U.S. Aggregate Bond Index | 2.10 | 0.83 | 1.63 | 58,788 | |
| Asset-Backed/Commercial Mortgage-Backed Securities | 0.5% |
| Corporate Bonds - Communications | 6.7 |
| Corporate Bonds - Consumer Discretionary | 4.2 |
| Corporate Bonds - Consumer Staples | 5.4 |
| Corporate Bonds - Energy | 7.6 |
| Corporate Bonds - Financials | 30.5 |
| Corporate Bonds - Health Care | 7.6 |
| Corporate Bonds - Industrials | 5.2 |
| Corporate Bonds - Materials | 2.4 |
| Corporate Bonds - Real Estate | 5.7 |
| Corporate Bonds - Technology | 5.6 |
| Corporate Bonds - Utilities | 7.3 |
| Floating Rate Loan Interests | 0.1 |
| Sovereign Bonds | 2.5 |
| Taxable Municipal Bonds | 0.3 |
| U.S. Government and Agency Obligations | 8.4 |
| Coupon | Maturity Date | Face Amount ($000) | Market Value• ($000) | |||
| U.S. Government and Agency Obligations (8.2%) | ||||||
| U.S. Government Securities (8.2%) | ||||||
| United States Treasury Note/Bond | 4.625% | 9/30/28 | 175,000 | 180,387 | ||
| United States Treasury Note/Bond | 3.500% | 1/31/30 | 250,492 | 245,012 | ||
| United States Treasury Note/Bond | 4.000% | 2/28/30 | 60,000 | 60,263 | ||
| United States Treasury Note/Bond | 3.500% | 4/30/30 | 265,635 | 259,492 | ||
| United States Treasury Note/Bond | 3.750% | 5/31/30 | 349,358 | 346,028 | ||
| 1,2 | United States Treasury Note/Bond | 3.750% | 6/30/30 | 231,530 | 229,323 | |
| United States Treasury Note/Bond | 4.000% | 7/31/30 | 230,490 | 231,534 | ||
| United States Treasury Note/Bond | 4.125% | 8/31/30 | 180,000 | 182,053 | ||
| United States Treasury Note/Bond | 4.625% | 9/30/30 | 75,000 | 78,047 | ||
| United States Treasury Note/Bond | 4.875% | 10/31/30 | 250,000 | 263,906 | ||
| 1 | United States Treasury Note/Bond | 4.375% | 11/30/30 | 52,000 | 53,381 | |
| United States Treasury Note/Bond | 1.625% | 5/15/31 | 165,124 | 141,491 | ||
| 3 | United States Treasury Note/Bond | 1.250% | 8/15/31 | 350,000 | 289,625 | |
| United States Treasury Note/Bond | 1.375% | 11/15/31 | 100,000 | 83,016 | ||
| Total U.S. Government and Agency Obligations (Cost $2,726,069) | 2,643,558 | |||||
| Asset-Backed/Commercial Mortgage-Backed Securities (0.5%) | ||||||
| 4,5 | Banc of America Commercial Mortgage Trust Class C Series 2015-UBS7 | 4.343% | 9/15/48 | 360 | 279 | |
| 4 | BANK Class A4 Series 2019-BNK18 | 3.584% | 5/15/62 | 4,000 | 3,556 | |
| 4,5 | BANK Class A4 Series 2022-BNK40 | 3.393% | 3/15/64 | 5,390 | 4,872 | |
| 4 | BANK Class A5 Series 2022-BNK43 | 4.399% | 8/15/55 | 18,680 | 18,028 | |
| 4 | Bank of America Merrill Lynch Commercial Mortgage Trust Class A4 Series 2017-BNK3 | 3.574% | 2/15/50 | 1,540 | 1,472 | |
| 4,6 | Barclays Commercial Mortgage Trust Class A5 Series 2024-C24 | 5.419% | 2/15/57 | 7,170 | 7,489 | |
| 4,5 | BBCMS Mortagage Trust Class A5 Series 2022-C16 | 4.600% | 6/15/55 | 3,830 | 3,761 | |
| 4 | BBCMS Mortgage Trust Class A4 Series 2020-C6 | 2.639% | 2/15/53 | 2,285 | 2,019 | |
| 4 | BBCMS Mortgage Trust Class A5 Series 2021-C9 | 2.299% | 2/15/54 | 7,114 | 6,033 | |
| 4 | BBCMS Mortgage Trust Class A5 Series 2022-C17 | 4.441% | 9/15/55 | 4,250 | 4,125 | |
| Coupon | Maturity Date | Face Amount ($000) | Market Value• ($000) | |||
| 4,5 | BBCMS Mortgage Trust Class A5 Series 2023-C22 | 6.804% | 11/15/56 | 2,600 | 2,977 | |
| 4 | BBCMS Trust Class A5 Series 2021-C10 | 2.492% | 7/15/54 | 4,250 | 3,650 | |
| 4 | Benchmark Mortgage Trust Class A4 Series 2018-B8 | 3.963% | 1/15/52 | 1,200 | 1,133 | |
| 4 | Benchmark Mortgage Trust Class A4 Series 2023-B38 | 5.525% | 4/15/56 | 2,600 | 2,715 | |
| 4 | Benchmark Mortgage Trust Class A5 Series 2019-B15 | 2.928% | 12/15/72 | 4,000 | 3,459 | |
| 4 | Benchmark Mortgage Trust Class A5 Series 2020-B16 | 2.732% | 2/15/53 | 3,660 | 3,236 | |
| 4,5 | Benchmark Mortgage Trust Class A5 Series 2022-B36 | 4.470% | 7/15/55 | 17,800 | 17,228 | |
| 4 | BMO Mortgage Trust Class A5 Series 2023-C7 | 6.160% | 12/15/56 | 11,800 | 12,907 | |
| 4 | Cantor Commercial Real Estate Lending Class A4 Series 2019-CF3 | 3.006% | 1/15/53 | 4,000 | 3,515 | |
| 4,5 | CD Mortgage Trust Class AM Series 2017-CD6 | 3.709% | 11/13/50 | 1,340 | 1,200 | |
| 4,5 | CD Mortgage Trust Class AS Series 2017-CD5 | 3.684% | 8/15/50 | 820 | 753 | |
| 4,5 | CD Mortgage Trust Class C Series 2016-CD1 | 3.631% | 8/10/49 | 1,000 | 660 | |
| 4,5 | CD Mortgage Trust Class C Series 2018-CD7 | 4.843% | 8/15/51 | 1,350 | 1,065 | |
| 4 | CFCRE Commercial Mortgage Trust Class A4 Series 2016-C4 | 3.283% | 5/10/58 | 925 | 865 | |
| 4 | Citigroup Commercial Mortgage Trust Class A3 Series 2019-C7 | 2.860% | 12/15/72 | 4,000 | 3,518 | |
| 4,5 | Citigroup Commercial Mortgage Trust Class A4 Series 2018-C5 | 4.228% | 6/10/51 | 400 | 384 | |
| 4 | Citigroup Commercial Mortgage Trust Class B Series 2017-P8 | 4.192% | 9/15/50 | 1,000 | 850 | |
| 4,5 | Citigroup Commercial Mortgage Trust Class C Series 2015-GC33 | 4.574% | 9/10/58 | 900 | 700 | |
| 4,5 | Citigroup Commercial Mortgage Trust Class C Series 2017-P8 | 4.257% | 9/15/50 | 1,000 | 770 | |
| 4,7 | COMM Mortgage Trust Class B Series 2013-CR6 | 3.397% | 3/10/46 | 651 | 622 | |
| 4 | CSAIL Commercial Mortgage Trust Class A3 Series 2020-C19 | 2.561% | 3/15/53 | 5,250 | 4,486 | |
| 4,5 | CSAIL Commercial Mortgage Trust Class C Series 2015-C3 | 4.351% | 8/15/48 | 960 | 743 | |
| Coupon | Maturity Date | Face Amount ($000) | Market Value• ($000) | |||
| 4,5 | GS Mortgage Securities Trust Class A5 Series 2018-GS10 | 4.155% | 7/10/51 | 1,065 | 1,001 | |
| 4 | GS Mortgage Securities Trust Class A5 Series 2020-GC45 | 2.911% | 2/13/53 | 3,170 | 2,798 | |
| 4 | GS Mortgage Securities Trust Class AS Series 2014-GC20 | 4.258% | 4/10/47 | 570 | 566 | |
| 4,5 | GS Mortgage Securities Trust Class C Series 2014-GC24 | 4.518% | 9/10/47 | 4,615 | 3,670 | |
| 4,5 | GS Mortgage Securities Trust Class C Series 2015-GC34 | 4.637% | 10/10/48 | 910 | 664 | |
| 4,5,7 | JP Morgan Chase Commercial Mortgage Securities Trust Class D Series 2010-C2 | 5.583% | 11/15/43 | 246 | 226 | |
| 4 | JPMDB Commercial Mortgage Securities Trust Class A4 Series 2018-C8 | 4.211% | 6/15/51 | 150 | 141 | |
| 4,5 | Morgan Stanley Bank of America Merrill Lynch Trust Class C Series 2013-C10 | 3.997% | 7/15/46 | 1,830 | 1,469 | |
| 4,5 | Morgan Stanley Bank of America Merrill Lynch Trust Class C Series 2014-C15 | 5.011% | 4/15/47 | 22 | 22 | |
| 4,7 | Morgan Stanley Capital I Trust Class A Series 2014-150E | 3.912% | 9/9/32 | 1,870 | 1,560 | |
| 4,5 | Morgan Stanley Capital I Trust Class A4 Series 2021-L6 | 2.444% | 6/15/54 | 1,900 | 1,593 | |
| 4,7 | MSBAM Commercial Mortgage Securities Trust Class A2 Series 2012-CKSV | 3.277% | 10/15/30 | 3,372 | 2,913 | |
| 4,5 | MSWF Commercial Mortgage Trust Class A5 Series 2023-2 | 6.014% | 12/15/56 | 7,400 | 8,034 | |
| 4,7 | Palisades Center Trust Class A Series 2016-PLSD | 2.713% | 4/13/33 | 5,780 | 3,305 | |
| 4,7 | TMSQ Mortgage Trust Class A Series 2014-1500 | 3.680% | 10/10/36 | 2,500 | 2,308 | |
| 4,7 | UBS-BAMLL Trust Class A Series 2012-WRM | 3.663% | 6/10/30 | 211 | 193 | |
| 4 | Wells Fargo Commercial Mortgage Trust Class A4 Series 2018-C46 | 4.152% | 8/15/51 | 1,115 | 1,066 | |
| 4 | Wells Fargo Commercial Mortgage Trust Class A4 Series 2018-C47 | 4.442% | 9/15/61 | 1,090 | 1,067 | |
| 4 | Wells Fargo Commercial Mortgage Trust Class A4 Series 2019-C54 | 3.146% | 12/15/52 | 2,390 | 2,166 | |
| 4 | Wells Fargo Commercial Mortgage Trust Class AS Series 2014-LC16 | 4.020% | 8/15/50 | 700 | 688 | |
| 4 | Wells Fargo Commercial Mortgage Trust Class B Series 2014-LC16 | 4.322% | 8/15/50 | 1,300 | 1,035 | |
| 4 | Wells Fargo Commercial Mortgage Trust Class C Series 2014-LC16 | 4.458% | 8/15/50 | 1,450 | 537 | |
| Coupon | Maturity Date | Face Amount ($000) | Market Value• ($000) | |||
| 4,5 | Wells Fargo Commercial Mortgage Trust Class C Series 2018-C43 | 4.514% | 3/15/51 | 1,380 | 1,077 | |
| 4,5,7 | WFLD Mortgage Trust Class A Series 2014-MONT | 3.755% | 8/10/31 | 4,640 | 4,046 | |
| 4 | WFRBS Commercial Mortgage Trust Class AS Series 2014-C21 | 3.891% | 8/15/47 | 700 | 670 | |
| 4 | WFRBS Commercial Mortgage Trust Class B Series 2014-C20 | 4.378% | 5/15/47 | 2,410 | 1,892 | |
| 4,5 | WFRBS Commercial Mortgage Trust Class C Series 2014-C20 | 4.513% | 5/15/47 | 1,410 | 752 | |
| Total Asset-Backed/Commercial Mortgage-Backed Securities (Cost $180,645) | 164,529 | |||||
| Corporate Bonds (86.7%) | ||||||
| Communications (6.6%) | ||||||
| AT&T Inc. | 4.350% | 3/1/29 | 32,776 | 32,229 | ||
| AT&T Inc. | 4.300% | 2/15/30 | 58,644 | 57,031 | ||
| AT&T Inc. | 2.750% | 6/1/31 | 37,000 | 32,111 | ||
| AT&T Inc. | 2.250% | 2/1/32 | 69,781 | 57,382 | ||
| AT&T Inc. | 2.550% | 12/1/33 | 9,970 | 8,092 | ||
| AT&T Inc. | 5.400% | 2/15/34 | 13,344 | 13,692 | ||
| 8 | AT&T Inc. | 4.300% | 11/18/34 | 4,400 | 5,022 | |
| 8 | AT&T Inc. | 3.150% | 9/4/36 | 4,700 | 4,757 | |
| Booking Holdings Inc. | 4.625% | 4/13/30 | 35,630 | 35,713 | ||
| 7 | British Telecommunications plc | 3.250% | 11/8/29 | 30,000 | 27,366 | |
| British Telecommunications plc | 9.625% | 12/15/30 | 6,194 | 7,650 | ||
| 7 | Cable One Inc. | 4.000% | 11/15/30 | 503 | 406 | |
| 7 | CCO Holdings LLC / CCO Holdings Capital Corp. | 6.375% | 9/1/29 | 2,270 | 2,209 | |
| 7 | CCO Holdings LLC / CCO Holdings Capital Corp. | 4.750% | 3/1/30 | 5,885 | 5,229 | |
| Charter Communications Operating LLC / Charter Communications Operating Capital | 5.050% | 3/30/29 | 34,184 | 33,630 | ||
| Charter Communications Operating LLC / Charter Communications Operating Capital | 2.800% | 4/1/31 | 14,025 | 11,593 | ||
| Charter Communications Operating LLC / Charter Communications Operating Capital | 2.300% | 2/1/32 | 12,000 | 9,380 | ||
| Charter Communications Operating LLC / Charter Communications Operating Capital | 6.650% | 2/1/34 | 12,000 | 12,482 | ||
| 9 | CK Hutchison Group Telecom Finance SA | 2.625% | 10/17/34 | 7,295 | 6,600 | |
| Comcast Corp. | 2.650% | 2/1/30 | 15,290 | 13,752 | ||
| Comcast Corp. | 3.400% | 4/1/30 | 65,765 | 61,224 | ||
| Comcast Corp. | 4.250% | 10/15/30 | 6,753 | 6,611 | ||
| Comcast Corp. | 1.950% | 1/15/31 | 32,500 | 27,214 | ||
| Comcast Corp. | 1.500% | 2/15/31 | 12,000 | 9,760 | ||
| Comcast Corp. | 5.500% | 11/15/32 | 20,760 | 21,883 | ||
| 7 | CSC Holdings LLC | 11.750% | 1/31/29 | 465 | 472 | |
| 7 | CSC Holdings LLC | 5.750% | 1/15/30 | 930 | 493 | |
| 7 | CSC Holdings LLC | 4.625% | 12/1/30 | 987 | 510 | |
| 7 | CSC Holdings LLC | 3.375% | 2/15/31 | 1,465 | 1,003 | |
| Deutsche Telekom International Finance BV | 8.750% | 6/15/30 | 59,722 | 71,108 | ||
| 7 | Directv Financing LLC | 8.875% | 2/1/30 | 390 | 398 | |
| Coupon | Maturity Date | Face Amount ($000) | Market Value• ($000) | |||
| 7 | Directv Financing LLC / Directv Financing Co-Obligor Inc. | 5.875% | 8/15/27 | 3,569 | 3,391 | |
| Discovery Communications LLC | 4.125% | 5/15/29 | 35,025 | 33,182 | ||
| Discovery Communications LLC | 3.625% | 5/15/30 | 25,186 | 22,790 | ||
| 7 | DISH Network Corp. | 11.750% | 11/15/27 | 2,690 | 2,807 | |
| Electronic Arts Inc. | 1.850% | 2/15/31 | 34,437 | 28,606 | ||
| Expedia Group Inc. | 3.250% | 2/15/30 | 5,020 | 4,563 | ||
| Expedia Group Inc. | 2.950% | 3/15/31 | 7,278 | 6,371 | ||
| Fox Corp. | 4.709% | 1/25/29 | 25,031 | 24,823 | ||
| Fox Corp. | 3.500% | 4/8/30 | 14,000 | 12,870 | ||
| Fox Corp. | 6.500% | 10/13/33 | 22,340 | 24,101 | ||
| 7 | Frontier Communications Holdings LLC | 5.000% | 5/1/28 | 2,180 | 2,012 | |
| 7 | Frontier Communications Holdings LLC | 6.000% | 1/15/30 | 958 | 812 | |
| Interpublic Group of Cos. Inc. | 4.750% | 3/30/30 | 364 | 358 | ||
| Interpublic Group of Cos. Inc. | 2.400% | 3/1/31 | 16,016 | 13,524 | ||
| 7 | Level 3 Financing Inc. | 4.625% | 9/15/27 | 316 | 166 | |
| 7 | Level 3 Financing Inc. | 4.250% | 7/1/28 | 545 | 183 | |
| 7 | Level 3 Financing Inc. | 3.625% | 1/15/29 | 1,155 | 345 | |
| 7 | Level 3 Financing Inc. | 3.875% | 11/15/29 | 540 | 411 | |
| 7 | Level 3 Financing Inc. | 10.500% | 5/15/30 | 350 | 349 | |
| Meta Platforms Inc. | 4.800% | 5/15/30 | 39,640 | 40,334 | ||
| Meta Platforms Inc. | 3.850% | 8/15/32 | 50,635 | 47,889 | ||
| Meta Platforms Inc. | 4.950% | 5/15/33 | 12,500 | 12,787 | ||
| 8 | Netflix Inc. | 4.625% | 5/15/29 | 10,500 | 12,042 | |
| Netflix Inc. | 6.375% | 5/15/29 | 25,225 | 27,238 | ||
| 7 | Netflix Inc. | 5.375% | 11/15/29 | 11,561 | 11,930 | |
| 7 | Netflix Inc. | 4.875% | 6/15/30 | 15,938 | 16,066 | |
| 7 | News Corp. | 3.875% | 5/15/29 | 4,843 | 4,450 | |
| 7 | Nexstar Media Inc. | 5.625% | 7/15/27 | 1,510 | 1,469 | |
| 7 | Nexstar Media Inc. | 4.750% | 11/1/28 | 3,455 | 3,164 | |
| 7 | NTT Finance Corp. | 2.065% | 4/3/31 | 4,955 | 4,143 | |
| Omnicom Group Inc. | 4.200% | 6/1/30 | 2,000 | 1,928 | ||
| Omnicom Group Inc. | 2.600% | 8/1/31 | 29,000 | 24,689 | ||
| Orange SA | 9.000% | 3/1/31 | 11,803 | 14,583 | ||
| Orange SA | 5.375% | 1/13/42 | 2,500 | 2,533 | ||
| 7 | Outfront Media Capital LLC / Outfront Media Capital Corp. | 7.375% | 2/15/31 | 615 | 644 | |
| Paramount Global | 4.200% | 6/1/29 | 9,627 | 8,991 | ||
| Paramount Global | 4.950% | 1/15/31 | 48,236 | 45,622 | ||
| Paramount Global | 4.200% | 5/19/32 | 27,322 | 24,249 | ||
| Rogers Communications Inc. | 3.800% | 3/15/32 | 74,778 | 67,983 | ||
| 7 | Scripps Escrow II Inc. | 5.375% | 1/15/31 | 768 | 590 | |
| 7 | Scripps Escrow Inc. | 5.875% | 7/15/27 | 1,843 | 1,662 | |
| 7 | Sirius XM Radio Inc. | 5.000% | 8/1/27 | 1,810 | 1,738 | |
| Sprint Capital Corp. | 8.750% | 3/15/32 | 89,820 | 110,341 | ||
| T-Mobile USA Inc. | 3.375% | 4/15/29 | 31,773 | 29,523 | ||
| T-Mobile USA Inc. | 3.875% | 4/15/30 | 134,735 | 127,304 | ||
| T-Mobile USA Inc. | 2.550% | 2/15/31 | 17,145 | 14,692 | ||
| T-Mobile USA Inc. | 2.875% | 2/15/31 | 31,920 | 27,950 | ||
| T-Mobile USA Inc. | 3.500% | 4/15/31 | 55,000 | 50,066 | ||
| T-Mobile USA Inc. | 2.250% | 11/15/31 | 26,520 | 21,952 | ||
| T-Mobile USA Inc. | 5.200% | 1/15/33 | 15,000 | 15,255 | ||
| T-Mobile USA Inc. | 5.050% | 7/15/33 | 27,160 | 27,194 | ||
| T-Mobile USA Inc. | 5.150% | 4/15/34 | 24,830 | 25,022 | ||
| 7 | Univision Communications Inc. | 8.000% | 8/15/28 | 1,120 | 1,139 | |
| 7 | Univision Communications Inc. | 4.500% | 5/1/29 | 110 | 98 | |
| 7 | Univision Communications Inc. | 7.375% | 6/30/30 | 1,841 | 1,805 | |
| Coupon | Maturity Date | Face Amount ($000) | Market Value• ($000) | |||
| 7 | UPC Broadband Finco BV | 4.875% | 7/15/31 | 1,620 | 1,423 | |
| Verizon Communications Inc. | 3.875% | 2/8/29 | 1,000 | 966 | ||
| Verizon Communications Inc. | 4.016% | 12/3/29 | 52,000 | 49,973 | ||
| Verizon Communications Inc. | 3.150% | 3/22/30 | 30,626 | 27,886 | ||
| Verizon Communications Inc. | 1.500% | 9/18/30 | 10,107 | 8,298 | ||
| Verizon Communications Inc. | 1.680% | 10/30/30 | 19,550 | 16,059 | ||
| Verizon Communications Inc. | 1.750% | 1/20/31 | 45,139 | 36,837 | ||
| Verizon Communications Inc. | 2.550% | 3/21/31 | 105,107 | 90,357 | ||
| Verizon Communications Inc. | 2.355% | 3/15/32 | 86,142 | 71,435 | ||
| Verizon Communications Inc. | 4.500% | 8/10/33 | 10,000 | 9,665 | ||
| 7 | Videotron Ltd. | 3.625% | 6/15/29 | 2,618 | 2,388 | |
| 7 | Virgin Media Finance plc | 5.000% | 7/15/30 | 1,400 | 1,245 | |
| 7 | VZ Secured Financing BV | 5.000% | 1/15/32 | 2,228 | 1,946 | |
| Walt Disney Co. | 2.000% | 9/1/29 | 20,664 | 18,181 | ||
| Walt Disney Co. | 2.650% | 1/13/31 | 24,000 | 21,282 | ||
| Warnermedia Holdings Inc. | 4.054% | 3/15/29 | 38,114 | 36,079 | ||
| Warnermedia Holdings Inc. | 4.279% | 3/15/32 | 156,137 | 142,947 | ||
| 7 | WMG Acquisition Corp. | 3.750% | 12/1/29 | 7,825 | 7,065 | |
| 2,131,763 | ||||||
| Consumer Discretionary (4.1%) | ||||||
| 7 | 1011778 BC ULC / New Red Finance Inc. | 4.375% | 1/15/28 | 3,469 | 3,307 | |
| American Axle & Manufacturing Inc. | 5.000% | 10/1/29 | 1,130 | 989 | ||
| 7 | American Builders & Contractors Supply Co. Inc. | 3.875% | 11/15/29 | 1,460 | 1,301 | |
| American Honda Finance Corp. | 4.600% | 4/17/30 | 49,420 | 49,313 | ||
| American Honda Finance Corp. | 1.800% | 1/13/31 | 19,825 | 16,578 | ||
| American Honda Finance Corp. | 4.900% | 1/10/34 | 12,500 | 12,499 | ||
| Asbury Automotive Group Inc. | 4.500% | 3/1/28 | 4,277 | 4,025 | ||
| AutoZone Inc. | 4.000% | 4/15/30 | 14,868 | 14,222 | ||
| AutoZone Inc. | 1.650% | 1/15/31 | 24,357 | 19,627 | ||
| AutoZone Inc. | 4.750% | 8/1/32 | 15,000 | 14,693 | ||
| 7 | Beacon Roofing Supply Inc. | 4.125% | 5/15/29 | 105 | 95 | |
| 7 | BMW US Capital LLC | 2.550% | 4/1/31 | 19,659 | 17,000 | |
| 7 | Boyne USA Inc. | 4.750% | 5/15/29 | 250 | 229 | |
| 7 | Caesars Entertainment Inc. | 6.500% | 2/15/32 | 395 | 399 | |
| 7 | Camelot Return Merger Sub Inc. | 8.750% | 8/1/28 | 3,702 | 3,802 | |
| 7 | Carnival Corp. | 5.750% | 3/1/27 | 2,669 | 2,629 | |
| 7 | Carnival Corp. | 9.875% | 8/1/27 | 460 | 483 | |
| 7 | Carnival Corp. | 4.000% | 8/1/28 | 3,216 | 2,978 | |
| 7 | Carnival Corp. | 6.000% | 5/1/29 | 425 | 411 | |
| 7 | Carnival Corp. | 10.500% | 6/1/30 | 120 | 132 | |
| 7 | Carnival Holdings Bermuda Ltd. | 10.375% | 5/1/28 | 1,005 | 1,100 | |
| 7 | Churchill Downs Inc. | 5.500% | 4/1/27 | 1,467 | 1,450 | |
| 7 | Churchill Downs Inc. | 4.750% | 1/15/28 | 6,159 | 5,870 | |
| 7 | Churchill Downs Inc. | 5.750% | 4/1/30 | 640 | 619 | |
| 7 | Clarios Global LP | 6.750% | 5/15/25 | 585 | 585 | |
| Coupon | Maturity Date | Face Amount ($000) | Market Value• ($000) | |||
| 7 | Clarios Global LP / Clarios US Finance Co. | 8.500% | 5/15/27 | 2,428 | 2,423 | |
| Dana Inc. | 4.500% | 2/15/32 | 1,993 | 1,711 | ||
| eBay Inc. | 2.700% | 3/11/30 | 11,017 | 9,822 | ||
| eBay Inc. | 2.600% | 5/10/31 | 15,000 | 12,959 | ||
| eBay Inc. | 6.300% | 11/22/32 | 5,790 | 6,287 | ||
| 7 | ERAC USA Finance LLC | 4.900% | 5/1/33 | 20,000 | 19,936 | |
| Ford Motor Co. | 9.625% | 4/22/30 | 140 | 164 | ||
| Ford Motor Co. | 3.250% | 2/12/32 | 35,757 | 29,613 | ||
| Ford Motor Co. | 6.100% | 8/19/32 | 40,000 | 39,996 | ||
| Ford Motor Credit Co. LLC | 5.113% | 5/3/29 | 9,000 | 8,738 | ||
| Ford Motor Credit Co. LLC | 7.200% | 6/10/30 | 21,000 | 22,320 | ||
| Ford Motor Credit Co. LLC | 4.000% | 11/13/30 | 43,000 | 38,339 | ||
| Ford Motor Credit Co. LLC | 6.050% | 3/5/31 | 30,000 | 30,164 | ||
| Ford Motor Credit Co. LLC | 3.625% | 6/17/31 | 5,000 | 4,303 | ||
| Ford Motor Credit Co. LLC | 7.122% | 11/7/33 | 32,405 | 34,742 | ||
| General Motors Co. | 5.400% | 10/15/29 | 25,000 | 25,403 | ||
| General Motors Co. | 5.950% | 4/1/49 | 10,000 | 9,832 | ||
| General Motors Financial Co. Inc. | 5.850% | 4/6/30 | 49,310 | 50,648 | ||
| General Motors Financial Co. Inc. | 3.600% | 6/21/30 | 15,000 | 13,580 | ||
| General Motors Financial Co. Inc. | 2.350% | 1/8/31 | 31,000 | 25,697 | ||
| General Motors Financial Co. Inc. | 3.100% | 1/12/32 | 38,856 | 33,016 | ||
| General Motors Financial Co. Inc. | 6.400% | 1/9/33 | 23,075 | 24,420 | ||
| General Motors Financial Co. Inc. | 6.100% | 1/7/34 | 67,000 | 69,051 | ||
| Goodyear Tire & Rubber Co. | 9.500% | 5/31/25 | 290 | 294 | ||
| Goodyear Tire & Rubber Co. | 5.000% | 7/15/29 | 1,653 | 1,552 | ||
| 7 | Hanesbrands Inc. | 9.000% | 2/15/31 | 393 | 396 | |
| Home Depot Inc. | 2.950% | 6/15/29 | 19,220 | 17,917 | ||
| Home Depot Inc. | 1.375% | 3/15/31 | 10,000 | 8,089 | ||
| Home Depot Inc. | 1.875% | 9/15/31 | 32,630 | 27,016 | ||
| Home Depot Inc. | 3.250% | 4/15/32 | 26,820 | 24,440 | ||
| Hyatt Hotels Corp. | 5.750% | 4/23/30 | 553 | 574 | ||
| 7 | Lithia Motors Inc. | 4.625% | 12/15/27 | 1,632 | 1,564 | |
| 7 | Lithia Motors Inc. | 3.875% | 6/1/29 | 7,084 | 6,362 | |
| 7 | Lithia Motors Inc. | 4.375% | 1/15/31 | 100 | 90 | |
| 7 | Live Nation Entertainment Inc. | 5.625% | 3/15/26 | 545 | 541 | |
| 7 | Live Nation Entertainment Inc. | 6.500% | 5/15/27 | 3,302 | 3,338 | |
| 7 | Live Nation Entertainment Inc. | 3.750% | 1/15/28 | 473 | 437 | |
| Lowe's Cos. Inc. | 1.700% | 10/15/30 | 30,190 | 25,023 | ||
| Lowe's Cos. Inc. | 2.625% | 4/1/31 | 32,000 | 27,825 | ||
| Lowe's Cos. Inc. | 3.750% | 4/1/32 | 25,090 | 23,289 | ||
| 8 | LVMH Moet Hennessy Louis Vuitton SE | 3.250% | 9/7/29 | 8,800 | 9,663 | |
| 8 | LVMH Moet Hennessy Louis Vuitton SE | 3.500% | 9/7/33 | 4,800 | 5,353 | |
| Marriott International Inc. | 4.900% | 4/15/29 | 5,000 | 5,033 | ||
| Marriott International Inc. | 4.625% | 6/15/30 | 39,345 | 38,751 | ||
| Marriott International Inc. | 2.850% | 4/15/31 | 35,554 | 30,846 | ||
| McDonald's Corp. | 2.625% | 9/1/29 | 23,736 | 21,616 | ||
| McDonald's Corp. | 2.125% | 3/1/30 | 15,311 | 13,368 | ||
| McDonald's Corp. | 3.600% | 7/1/30 | 8,000 | 7,558 | ||
| 8 | McDonald's Corp. | 4.125% | 11/28/35 | 4,600 | 5,166 | |
| 7 | Mercedes-Benz Finance North America LLC | 5.050% | 8/3/33 | 25,000 | 25,319 | |
| 7 | Merlin Entertainments Group US Holdings Inc. | 7.375% | 2/15/31 | 273 | 274 | |
| 7 | NCL Corp. Ltd. | 5.875% | 2/15/27 | 1,840 | 1,813 | |
| 7 | NCL Corp. Ltd. | 8.125% | 1/15/29 | 170 | 178 | |
| Coupon | Maturity Date | Face Amount ($000) | Market Value• ($000) | |||
| 7 | NCL Corp. Ltd. | 7.750% | 2/15/29 | 1,040 | 1,050 | |
| Newell Brands Inc. | 5.200% | 4/1/26 | 80 | 78 | ||
| Newell Brands Inc. | 6.375% | 9/15/27 | 1,972 | 1,941 | ||
| Newell Brands Inc. | 6.625% | 9/15/29 | 1,383 | 1,346 | ||
| 7 | Ontario Gaming GTA LP | 8.000% | 8/1/30 | 495 | 516 | |
| O'Reilly Automotive Inc. | 3.900% | 6/1/29 | 18,000 | 17,344 | ||
| O'Reilly Automotive Inc. | 1.750% | 3/15/31 | 10,250 | 8,314 | ||
| O'Reilly Automotive Inc. | 4.700% | 6/15/32 | 8,000 | 7,861 | ||
| 7 | Penn Entertainment Inc. | 5.625% | 1/15/27 | 580 | 560 | |
| 8 | Richemont International Holding SA | 1.500% | 3/26/30 | 700 | 693 | |
| 7 | Royal Caribbean Cruises Ltd. | 8.250% | 1/15/29 | 1,898 | 2,014 | |
| 7 | Royal Caribbean Cruises Ltd. | 9.250% | 1/15/29 | 275 | 296 | |
| 7 | Royal Caribbean Cruises Ltd. | 7.250% | 1/15/30 | 312 | 325 | |
| Service Corp. International | 4.000% | 5/15/31 | 100 | 89 | ||
| Starbucks Corp. | 2.250% | 3/12/30 | 13,250 | 11,571 | ||
| Starbucks Corp. | 2.550% | 11/15/30 | 34,866 | 30,622 | ||
| Starbucks Corp. | 4.800% | 2/15/33 | 25,000 | 25,223 | ||
| 7 | Studio City Co. Ltd. | 7.000% | 2/15/27 | 1,403 | 1,390 | |
| Tapestry Inc. | 7.700% | 11/27/30 | 18,185 | 19,322 | ||
| Tapestry Inc. | 7.850% | 11/27/33 | 15,300 | 16,361 | ||
| TJX Cos. Inc. | 3.875% | 4/15/30 | 4,686 | 4,534 | ||
| Toll Brothers Finance Corp. | 3.800% | 11/1/29 | 6,411 | 5,989 | ||
| Toyota Motor Credit Corp. | 3.375% | 4/1/30 | 25,000 | 23,394 | ||
| Toyota Motor Credit Corp. | 5.550% | 11/20/30 | 37,295 | 39,139 | ||
| Toyota Motor Credit Corp. | 1.650% | 1/10/31 | 5,000 | 4,129 | ||
| Toyota Motor Credit Corp. | 1.900% | 9/12/31 | 7,000 | 5,807 | ||
| Toyota Motor Credit Corp. | 2.400% | 1/13/32 | 15,000 | 12,834 | ||
| Toyota Motor Credit Corp. | 4.800% | 1/5/34 | 17,205 | 17,191 | ||
| 7 | Volkswagen Group of America Finance LLC | 6.450% | 11/16/30 | 19,800 | 21,103 | |
| 7 | Volkswagen Group of America Finance LLC | 5.900% | 9/12/33 | 15,000 | 15,509 | |
| 7 | Wyndham Hotels & Resorts Inc. | 4.375% | 8/15/28 | 2,185 | 2,040 | |
| 1,319,770 | ||||||
| Consumer Staples (5.3%) | ||||||
| Altria Group Inc. | 3.400% | 5/6/30 | 61,525 | 55,987 | ||
| Altria Group Inc. | 2.450% | 2/4/32 | 67,090 | 54,884 | ||
| 8 | Anheuser-Busch InBev SA NV | 1.500% | 4/18/30 | 1,000 | 992 | |
| Anheuser-Busch InBev Worldwide Inc. | 3.500% | 6/1/30 | 49,890 | 47,122 | ||
| Archer-Daniels-Midland Co. | 2.900% | 3/1/32 | 20,000 | 17,423 | ||
| Archer-Daniels-Midland Co. | 4.500% | 8/15/33 | 6,430 | 6,260 | ||
| 7 | B&G Foods Inc. | 8.000% | 9/15/28 | 635 | 662 | |
| BAT Capital Corp. | 3.462% | 9/6/29 | 40,690 | 37,314 | ||
| BAT Capital Corp. | 4.906% | 4/2/30 | 16,723 | 16,465 | ||
| BAT Capital Corp. | 6.343% | 8/2/30 | 30,000 | 31,582 | ||
| BAT Capital Corp. | 2.726% | 3/25/31 | 70,729 | 59,231 | ||
| BAT Capital Corp. | 4.742% | 3/16/32 | 16,000 | 15,287 | ||
| BAT Capital Corp. | 7.750% | 10/19/32 | 18,000 | 20,368 | ||
| BAT Capital Corp. | 6.421% | 8/2/33 | 42,915 | 44,876 | ||
| BAT Capital Corp. | 4.758% | 9/6/49 | 5,000 | 3,923 | ||
| 8 | BAT International Finance plc | 2.250% | 1/16/30 | 3,700 | 3,592 | |
| 8 | BAT Netherlands Finance BV | 5.375% | 2/16/31 | 2,500 | 2,886 | |
| Brown-Forman Corp. | 4.750% | 4/15/33 | 8,620 | 8,702 | ||
| Campbell Soup Co. | 2.375% | 4/24/30 | 19,700 | 17,024 | ||
| 7 | Cargill Inc. | 4.750% | 4/24/33 | 7,145 | 7,085 | |
| 8 | Coca-Cola Co. | 0.950% | 5/6/36 | 500 | 418 | |
| Constellation Brands Inc. | 3.150% | 8/1/29 | 20,705 | 19,073 | ||
| Constellation Brands Inc. | 2.875% | 5/1/30 | 14,970 | 13,348 | ||
| Constellation Brands Inc. | 2.250% | 8/1/31 | 24,709 | 20,571 | ||
| Coupon | Maturity Date | Face Amount ($000) | Market Value• ($000) | |||
| Constellation Brands Inc. | 4.900% | 5/1/33 | 7,115 | 7,070 | ||
| Costco Wholesale Corp. | 1.600% | 4/20/30 | 23,935 | 20,296 | ||
| 7 | Coty Inc. | 5.000% | 4/15/26 | 87 | 85 | |
| 7 | Coty Inc. / HFC Prestige Products Inc. / HFC Prestige International US LLC | 6.625% | 7/15/30 | 345 | 353 | |
| Diageo Capital plc | 2.000% | 4/29/30 | 11,765 | 10,162 | ||
| Diageo Capital plc | 5.500% | 1/24/33 | 11,755 | 12,359 | ||
| Dollar General Corp. | 3.500% | 4/3/30 | 29,752 | 27,364 | ||
| Dollar General Corp. | 5.000% | 11/1/32 | 10,000 | 9,937 | ||
| 7 | Energizer Holdings Inc. | 4.750% | 6/15/28 | 3,802 | 3,538 | |
| Estee Lauder Cos. Inc. | 2.375% | 12/1/29 | 7,250 | 6,438 | ||
| Estee Lauder Cos. Inc. | 2.600% | 4/15/30 | 8,000 | 7,088 | ||
| Estee Lauder Cos. Inc. | 4.650% | 5/15/33 | 5,315 | 5,283 | ||
| 7 | Fiesta Purchaser Inc. | 7.875% | 3/1/31 | 85 | 85 | |
| General Mills Inc. | 2.875% | 4/15/30 | 22,125 | 19,931 | ||
| General Mills Inc. | 2.250% | 10/14/31 | 5,799 | 4,829 | ||
| General Mills Inc. | 4.950% | 3/29/33 | 15,000 | 15,006 | ||
| Haleon US Capital LLC | 3.375% | 3/24/29 | 45,000 | 42,490 | ||
| Haleon US Capital LLC | 3.625% | 3/24/32 | 20,320 | 18,717 | ||
| Hershey Co. | 1.700% | 6/1/30 | 5,000 | 4,234 | ||
| Hershey Co. | 4.500% | 5/4/33 | 8,555 | 8,567 | ||
| Hormel Foods Corp. | 1.800% | 6/11/30 | 16,695 | 14,108 | ||
| J M Smucker Co. | 2.125% | 3/15/32 | 9,915 | 8,062 | ||
| J M Smucker Co. | 6.200% | 11/15/33 | 14,905 | 16,125 | ||
| 7 | JBS USA LUX SA / JBS USA Food Co. / JBS Luxembourg SARL | 6.750% | 3/15/34 | 39,470 | 41,571 | |
| JBS USA LUX SA / JBS USA Food Co. / JBS USA Finance Inc. | 5.500% | 1/15/30 | 43,710 | 42,744 | ||
| JBS USA LUX SA / JBS USA Food Co. / JBS USA Finance Inc. | 3.625% | 1/15/32 | 7,000 | 5,960 | ||
| JBS USA LUX SA / JBS USA Food Co. / JBS USA Finance Inc. | 3.000% | 5/15/32 | 42,775 | 34,814 | ||
| JBS USA LUX SA / JBS USA Food Co. / JBS USA Finance Inc. | 5.750% | 4/1/33 | 52,084 | 51,590 | ||
| 6,7 | KeHE Distributors LLC/KeHE Finance Corp. / NextWave Distribution Inc. | 9.000% | 2/15/29 | 705 | 712 | |
| Kellanova | 2.100% | 6/1/30 | 38,264 | 32,749 | ||
| Kellanova | 7.450% | 4/1/31 | 568 | 649 | ||
| Kenvue Inc. | 5.000% | 3/22/30 | 34,940 | 35,729 | ||
| Kenvue Inc. | 4.900% | 3/22/33 | 40,000 | 40,811 | ||
| Keurig Dr Pepper Inc. | 3.200% | 5/1/30 | 21,496 | 19,646 | ||
| Keurig Dr Pepper Inc. | 2.250% | 3/15/31 | 13,000 | 11,016 | ||
| Keurig Dr Pepper Inc. | 4.050% | 4/15/32 | 27,860 | 26,415 | ||
| Kraft Heinz Foods Co. | 3.750% | 4/1/30 | 22,419 | 21,256 | ||
| Kroger Co. | 2.200% | 5/1/30 | 30,618 | 26,146 | ||
| Kroger Co. | 1.700% | 1/15/31 | 3,875 | 3,138 | ||
| 7 | Lamb Weston Holdings Inc. | 4.875% | 5/15/28 | 1,464 | 1,425 | |
| 7 | Mars Inc. | 4.650% | 4/20/31 | 14,265 | 14,226 | |
| 7 | Mars Inc. | 4.750% | 4/20/33 | 28,310 | 28,174 | |
| McCormick & Co. Inc. | 2.500% | 4/15/30 | 1,200 | 1,051 | ||
| McCormick & Co. Inc. | 4.950% | 4/15/33 | 15,000 | 14,963 | ||
| Mondelez International Inc. | 2.750% | 4/13/30 | 29,469 | 26,537 | ||
| Mondelez International Inc. | 1.500% | 2/4/31 | 26,471 | 21,421 | ||
| 8 | Nestle Finance International Ltd. | 1.250% | 11/2/29 | 1,000 | 991 | |
| Coupon | Maturity Date | Face Amount ($000) | Market Value• ($000) | |||
| 8 | Nestle Finance International Ltd. | 3.250% | 1/15/31 | 8,100 | 8,982 | |
| PepsiCo Inc. | 1.625% | 5/1/30 | 3,355 | 2,834 | ||
| 7 | Performance Food Group Inc. | 6.875% | 5/1/25 | 765 | 767 | |
| 7 | Performance Food Group Inc. | 4.250% | 8/1/29 | 525 | 481 | |
| 8 | Pernod Ricard SA | 1.750% | 4/8/30 | 1,000 | 1,000 | |
| Philip Morris International Inc. | 3.375% | 8/15/29 | 16,460 | 15,376 | ||
| Philip Morris International Inc. | 5.625% | 11/17/29 | 30,015 | 31,330 | ||
| Philip Morris International Inc. | 5.125% | 2/15/30 | 80,590 | 81,935 | ||
| Philip Morris International Inc. | 2.100% | 5/1/30 | 19,800 | 17,023 | ||
| Philip Morris International Inc. | 5.500% | 9/7/30 | 46,700 | 48,330 | ||
| Philip Morris International Inc. | 1.750% | 11/1/30 | 24,300 | 20,028 | ||
| Philip Morris International Inc. | 5.750% | 11/17/32 | 34,219 | 35,757 | ||
| Philip Morris International Inc. | 5.375% | 2/15/33 | 57,325 | 58,536 | ||
| Philip Morris International Inc. | 5.625% | 9/7/33 | 15,000 | 15,570 | ||
| 8 | Philip Morris International Inc. | 1.450% | 8/1/39 | 4,800 | 3,405 | |
| Pilgrim's Pride Corp. | 3.500% | 3/1/32 | 4,682 | 3,954 | ||
| 8 | Procter & Gamble Co. | 0.350% | 5/5/30 | 1,200 | 1,115 | |
| 8 | Procter & Gamble Co. | 3.250% | 8/2/31 | 15,910 | 17,630 | |
| Procter & Gamble Co. | 4.550% | 1/29/34 | 20,000 | 20,264 | ||
| Sysco Corp. | 2.400% | 2/15/30 | 13,391 | 11,747 | ||
| Target Corp. | 2.350% | 2/15/30 | 3,090 | 2,752 | ||
| Target Corp. | 2.650% | 9/15/30 | 6,067 | 5,433 | ||
| Tyson Foods Inc. | 4.350% | 3/1/29 | 11,113 | 10,831 | ||
| Unilever Capital Corp. | 2.125% | 9/6/29 | 28,483 | 25,196 | ||
| 7 | United Natural Foods Inc. | 6.750% | 10/15/28 | 1,187 | 998 | |
| 7 | US Foods Inc. | 6.875% | 9/15/28 | 120 | 123 | |
| 7 | US Foods Inc. | 7.250% | 1/15/32 | 250 | 262 | |
| 1,712,595 | ||||||
| Energy (7.5%) | ||||||
| 7 | Antero Midstream Partners LP / Antero Midstream Finance Corp. | 6.625% | 2/1/32 | 675 | 672 | |
| 7 | Antero Resources Corp. | 5.375% | 3/1/30 | 1,977 | 1,886 | |
| Boardwalk Pipelines LP | 3.600% | 9/1/32 | 5,000 | 4,413 | ||
| BP Capital Markets America Inc. | 3.633% | 4/6/30 | 11,351 | 10,788 | ||
| BP Capital Markets America Inc. | 1.749% | 8/10/30 | 37,671 | 31,642 | ||
| BP Capital Markets America Inc. | 2.721% | 1/12/32 | 63,000 | 54,468 | ||
| BP Capital Markets America Inc. | 4.812% | 2/13/33 | 52,000 | 52,019 | ||
| BP Capital Markets America Inc. | 4.893% | 9/11/33 | 15,000 | 15,046 | ||
| 8 | BP Capital Markets BV | 4.323% | 5/12/35 | 5,000 | 5,667 | |
| Canadian Natural Resources Ltd. | 2.950% | 7/15/30 | 33,970 | 29,954 | ||
| Canadian Natural Resources Ltd. | 7.200% | 1/15/32 | 16,118 | 17,988 | ||
| Canadian Natural Resources Ltd. | 6.450% | 6/30/33 | 11,935 | 12,754 | ||
| Cenovus Energy Inc. | 2.650% | 1/15/32 | 20,000 | 16,628 | ||
| Cheniere Corpus Christi Holdings LLC | 3.700% | 11/15/29 | 22,749 | 21,405 | ||
| Coupon | Maturity Date | Face Amount ($000) | Market Value• ($000) | |||
| Cheniere Energy Partners LP | 4.000% | 3/1/31 | 21,385 | 19,409 | ||
| Cheniere Energy Partners LP | 3.250% | 1/31/32 | 81,403 | 69,173 | ||
| 7 | Cheniere Energy Partners LP | 5.950% | 6/30/33 | 36,065 | 36,854 | |
| 7 | Civitas Resources Inc. | 8.625% | 11/1/30 | 383 | 409 | |
| 7 | Civitas Resources Inc. | 8.750% | 7/1/31 | 903 | 963 | |
| 7 | CNX Resources Corp. | 7.375% | 1/15/31 | 828 | 840 | |
| 7 | Columbia Pipelines Holding Co. LLC | 5.681% | 1/15/34 | 17,890 | 17,966 | |
| ConocoPhillips Co. | 5.050% | 9/15/33 | 20,000 | 20,350 | ||
| Coterra Energy Inc. | 4.375% | 3/15/29 | 30,073 | 29,300 | ||
| 7 | CrownRock LP / CrownRock Finance Inc. | 5.625% | 10/15/25 | 1,515 | 1,510 | |
| DCP Midstream Operating LP | 5.125% | 5/15/29 | 26,890 | 27,102 | ||
| DCP Midstream Operating LP | 3.250% | 2/15/32 | 7,888 | 6,854 | ||
| Devon Energy Corp. | 4.500% | 1/15/30 | 28,745 | 27,683 | ||
| 7 | Diamond Foreign Asset Co. / Diamond Finance LLC | 8.500% | 10/1/30 | 838 | 861 | |
| Diamondback Energy Inc. | 3.500% | 12/1/29 | 55,846 | 51,876 | ||
| Diamondback Energy Inc. | 3.125% | 3/24/31 | 34,730 | 30,778 | ||
| Diamondback Energy Inc. | 6.250% | 3/15/33 | 13,000 | 13,869 | ||
| 7 | DT Midstream Inc. | 4.125% | 6/15/29 | 3,254 | 2,990 | |
| 7 | DT Midstream Inc. | 4.375% | 6/15/31 | 2,395 | 2,142 | |
| Ecopetrol SA | 8.625% | 1/19/29 | 18,513 | 19,583 | ||
| Empresa Nacional del Petroleo | 3.750% | 8/5/26 | 17,930 | 17,030 | ||
| Empresa Nacional del Petroleo | 5.250% | 11/6/29 | 31,480 | 30,505 | ||
| Enbridge Inc. | 3.125% | 11/15/29 | 15,998 | 14,667 | ||
| Enbridge Inc. | 6.200% | 11/15/30 | 33,760 | 36,085 | ||
| Enbridge Inc. | 5.700% | 3/8/33 | 27,000 | 27,890 | ||
| 7 | Endeavor Energy Resources LP / EER Finance Inc. | 5.750% | 1/30/28 | 2,670 | 2,657 | |
| Energy Transfer LP | 5.250% | 4/15/29 | 29,465 | 29,745 | ||
| Energy Transfer LP | 4.150% | 9/15/29 | 37,887 | 36,135 | ||
| Energy Transfer LP | 3.750% | 5/15/30 | 10,487 | 9,693 | ||
| Energy Transfer LP | 6.400% | 12/1/30 | 22,195 | 23,684 | ||
| Energy Transfer LP | 5.750% | 2/15/33 | 54,210 | 55,623 | ||
| Energy Transfer LP | 6.550% | 12/1/33 | 47,340 | 51,109 | ||
| Energy Transfer LP | 5.550% | 5/15/34 | 20,000 | 20,190 | ||
| 7 | EnLink Midstream LLC | 5.625% | 1/15/28 | 915 | 906 | |
| EnLink Midstream LLC | 5.375% | 6/1/29 | 2,020 | 1,969 | ||
| Enterprise Products Operating LLC | 3.125% | 7/31/29 | 15,250 | 14,176 | ||
| Enterprise Products Operating LLC | 2.800% | 1/31/30 | 25,327 | 22,855 | ||
| Enterprise Products Operating LLC | 5.350% | 1/31/33 | 17,135 | 17,850 | ||
| Enterprise Products Operating LLC | 6.875% | 3/1/33 | 8,660 | 9,878 | ||
| Enterprise Products Operating LLC | 4.850% | 1/31/34 | 30,910 | 30,954 | ||
| EOG Resources Inc. | 4.375% | 4/15/30 | 19,262 | 19,088 | ||
| 7 | EQM Midstream Partners LP | 7.500% | 6/1/27 | 1,205 | 1,239 | |
| 7 | EQM Midstream Partners LP | 6.500% | 7/1/27 | 2,604 | 2,637 | |
| EQM Midstream Partners LP | 5.500% | 7/15/28 | 1,938 | 1,922 | ||
| 7 | EQM Midstream Partners LP | 7.500% | 6/1/30 | 1,033 | 1,108 | |
| EQT Corp. | 7.000% | 2/1/30 | 5,000 | 5,369 | ||
| 7 | EQT Corp. | 3.625% | 5/15/31 | 18,000 | 16,037 | |
| Coupon | Maturity Date | Face Amount ($000) | Market Value• ($000) | |||
| Equinor ASA | 3.950% | 5/15/43 | 3,191 | 2,768 | ||
| Galaxy Pipeline Assets Bidco Ltd. | 2.625% | 3/31/36 | 25,900 | 21,121 | ||
| Genesis Energy LP / Genesis Energy Finance Corp. | 8.250% | 1/15/29 | 495 | 508 | ||
| Halliburton Co. | 2.920% | 3/1/30 | 21,241 | 19,230 | ||
| Helmerich & Payne Inc. | 2.900% | 9/29/31 | 35,625 | 30,183 | ||
| Hess Corp. | 7.300% | 8/15/31 | 3,738 | 4,312 | ||
| 7 | Hilcorp Energy I LP / Hilcorp Finance Co. | 5.750% | 2/1/29 | 695 | 675 | |
| 7 | Hilcorp Energy I LP / Hilcorp Finance Co. | 6.000% | 2/1/31 | 827 | 796 | |
| KazMunayGas National Co. JSC | 6.375% | 10/24/48 | 3,918 | 3,615 | ||
| Kinder Morgan Inc. | 2.000% | 2/15/31 | 5,000 | 4,118 | ||
| Kinder Morgan Inc. | 7.750% | 1/15/32 | 990 | 1,129 | ||
| Kinder Morgan Inc. | 4.800% | 2/1/33 | 32,555 | 31,201 | ||
| 7 | Kinetik Holdings LP | 6.625% | 12/15/28 | 385 | 391 | |
| Magellan Midstream Partners LP | 3.250% | 6/1/30 | 3,607 | 3,275 | ||
| MPLX LP | 2.650% | 8/15/30 | 31,530 | 27,330 | ||
| MPLX LP | 4.950% | 9/1/32 | 5,000 | 4,881 | ||
| MPLX LP | 5.000% | 3/1/33 | 24,800 | 24,276 | ||
| 7 | NGL Energy Operating LLC / NGL Energy Finance Corp. | 8.375% | 2/15/32 | 460 | 463 | |
| Nustar Logistics LP | 6.375% | 10/1/30 | 2,525 | 2,538 | ||
| Occidental Petroleum Corp. | 6.625% | 9/1/30 | 52,732 | 56,237 | ||
| Occidental Petroleum Corp. | 6.125% | 1/1/31 | 36,577 | 38,007 | ||
| Occidental Petroleum Corp. | 7.500% | 5/1/31 | 17,195 | 19,213 | ||
| ONEOK Inc. | 4.350% | 3/15/29 | 4,183 | 4,072 | ||
| ONEOK Inc. | 3.400% | 9/1/29 | 19,767 | 18,268 | ||
| ONEOK Inc. | 3.100% | 3/15/30 | 6,129 | 5,506 | ||
| ONEOK Inc. | 5.800% | 11/1/30 | 14,915 | 15,482 | ||
| ONEOK Inc. | 6.350% | 1/15/31 | 8,757 | 9,300 | ||
| ONEOK Inc. | 6.100% | 11/15/32 | 16,679 | 17,554 | ||
| ONEOK Inc. | 6.050% | 9/1/33 | 25,330 | 26,584 | ||
| Ovintiv Inc. | 8.125% | 9/15/30 | 3,000 | 3,417 | ||
| Ovintiv Inc. | 7.200% | 11/1/31 | 4,750 | 5,187 | ||
| Ovintiv Inc. | 7.375% | 11/1/31 | 15,232 | 16,862 | ||
| 7 | Permian Resources Operating LLC | 7.750% | 2/15/26 | 1,445 | 1,465 | |
| 7 | Permian Resources Operating LLC | 5.875% | 7/1/29 | 3,851 | 3,777 | |
| 7 | Permian Resources Operating LLC | 7.000% | 1/15/32 | 745 | 769 | |
| Petroleos del Peru SA | 5.625% | 6/19/47 | 25,083 | 15,683 | ||
| Petroleos Mexicanos | 4.500% | 1/23/26 | 1,870 | 1,759 | ||
| Petroleos Mexicanos | 6.500% | 6/2/41 | 1,961 | 1,318 | ||
| Petroleos Mexicanos | 6.750% | 9/21/47 | 18,917 | 12,046 | ||
| Petroleos Mexicanos | 6.950% | 1/28/60 | 421 | 270 | ||
| Petronas Capital Ltd. | 3.500% | 4/21/30 | 42,432 | 39,482 | ||
| Phillips 66 | 2.150% | 12/15/30 | 8,800 | 7,436 | ||
| Phillips 66 Co. | 3.150% | 12/15/29 | 21,299 | 19,490 | ||
| Phillips 66 Co. | 5.300% | 6/30/33 | 10,000 | 10,215 | ||
| Pioneer Natural Resources Co. | 1.900% | 8/15/30 | 54,250 | 46,201 | ||
| Pioneer Natural Resources Co. | 2.150% | 1/15/31 | 34,625 | 29,483 | ||
| Plains All American Pipeline LP / PAA Finance Corp. | 3.550% | 12/15/29 | 16,733 | 15,384 | ||
| QazaqGaz NC JSC | 4.375% | 9/26/27 | 2,627 | 2,507 | ||
| Range Resources Corp. | 8.250% | 1/15/29 | 945 | 982 | ||
| Coupon | Maturity Date | Face Amount ($000) | Market Value• ($000) | |||
| Sabine Pass Liquefaction LLC | 4.500% | 5/15/30 | 69,785 | 68,111 | ||
| Saudi Arabian Oil Co. | 3.500% | 4/16/29 | 13,700 | 12,817 | ||
| Schlumberger Investment SA | 2.650% | 6/26/30 | 12,000 | 10,754 | ||
| Schlumberger Investment SA | 4.850% | 5/15/33 | 16,130 | 16,260 | ||
| Shell International Finance BV | 2.375% | 11/7/29 | 14,118 | 12,631 | ||
| Shell International Finance BV | 2.750% | 4/6/30 | 40,535 | 36,751 | ||
| 10 | Southern Gas Corridor CJSC | 6.875% | 3/24/26 | 10,873 | 11,020 | |
| Suncor Energy Inc. | 7.150% | 2/1/32 | 13,858 | 15,496 | ||
| 7 | Sunoco LP / Sunoco Finance Corp. | 7.000% | 9/15/28 | 1,520 | 1,556 | |
| 7 | Tallgrass Energy Partners LP / Tallgrass Energy Finance Corp. | 7.375% | 2/15/29 | 1,050 | 1,047 | |
| Targa Resources Corp. | 6.150% | 3/1/29 | 29,640 | 30,964 | ||
| Targa Resources Corp. | 4.200% | 2/1/33 | 11,509 | 10,522 | ||
| Targa Resources Corp. | 6.125% | 3/15/33 | 24,500 | 25,635 | ||
| Targa Resources Corp. | 6.500% | 3/30/34 | 49,825 | 53,711 | ||
| Targa Resources Partners LP / Targa Resources Partners Finance Corp. | 4.875% | 2/1/31 | 40,937 | 39,270 | ||
| Targa Resources Partners LP / Targa Resources Partners Finance Corp. | 4.000% | 1/15/32 | 38,238 | 34,598 | ||
| 8 | TotalEnergies Capital Canada Ltd. | 2.125% | 9/18/29 | 8,900 | 9,171 | |
| TotalEnergies Capital International SA | 2.829% | 1/10/30 | 3,785 | 3,469 | ||
| TransCanada PipeLines Ltd. | 4.100% | 4/15/30 | 33,153 | 31,598 | ||
| TransCanada PipeLines Ltd. | 2.500% | 10/12/31 | 37,311 | 31,167 | ||
| Transcontinental Gas Pipe Line Co. LLC | 3.250% | 5/15/30 | 24,065 | 21,926 | ||
| 7 | Transocean Inc. | 8.750% | 2/15/30 | 993 | 1,038 | |
| 7 | Transocean Titan Financing Ltd. | 8.375% | 2/1/28 | 690 | 713 | |
| 7 | Valaris Ltd. | 8.375% | 4/30/30 | 1,160 | 1,188 | |
| Valero Energy Corp. | 2.800% | 12/1/31 | 27,000 | 23,159 | ||
| 7 | Venture Global Calcasieu Pass LLC | 3.875% | 8/15/29 | 3,135 | 2,801 | |
| 7 | Venture Global Calcasieu Pass LLC | 6.250% | 1/15/30 | 600 | 601 | |
| 7 | Venture Global LNG Inc. | 8.125% | 6/1/28 | 317 | 321 | |
| 7 | Venture Global LNG Inc. | 9.500% | 2/1/29 | 2,033 | 2,160 | |
| 7 | Venture Global LNG Inc. | 8.375% | 6/1/31 | 1,267 | 1,283 | |
| 7 | Venture Global LNG Inc. | 9.875% | 2/1/32 | 1,245 | 1,309 | |
| 7 | Viper Energy Inc. | 7.375% | 11/1/31 | 613 | 636 | |
| Western Midstream Operating LP | 4.050% | 2/1/30 | 10,000 | 9,382 | ||
| Williams Cos. Inc. | 3.500% | 11/15/30 | 20,000 | 18,334 | ||
| Williams Cos. Inc. | 7.500% | 1/15/31 | 3,660 | 4,115 | ||
| Williams Cos. Inc. | 2.600% | 3/15/31 | 50,025 | 42,764 | ||
| Williams Cos. Inc. | 8.750% | 3/15/32 | 3,000 | 3,643 | ||
| Williams Cos. Inc. | 4.650% | 8/15/32 | 29,500 | 28,592 | ||
| 2,404,122 | ||||||
| Financials (29.9%) | ||||||
| AerCap Ireland Capital DAC / AerCap Global Aviation Trust | 6.150% | 9/30/30 | 65,000 | 67,731 | ||
| AerCap Ireland Capital DAC / AerCap Global Aviation Trust | 3.300% | 1/30/32 | 92,465 | 79,074 | ||
| Coupon | Maturity Date | Face Amount ($000) | Market Value• ($000) | |||
| AerCap Ireland Capital DAC / AerCap Global Aviation Trust | 3.400% | 10/29/33 | 7,645 | 6,454 | ||
| Affiliated Managers Group Inc. | 3.300% | 6/15/30 | 25,223 | 22,559 | ||
| Aflac Inc. | 3.600% | 4/1/30 | 10,000 | 9,409 | ||
| Air Lease Corp. | 3.250% | 10/1/29 | 2,000 | 1,808 | ||
| Air Lease Corp. | 3.000% | 2/1/30 | 24,670 | 21,712 | ||
| Air Lease Corp. | 3.125% | 12/1/30 | 5,298 | 4,613 | ||
| Air Lease Corp. | 2.875% | 1/15/32 | 1,773 | 1,500 | ||
| Alleghany Corp. | 3.625% | 5/15/30 | 13,328 | 12,726 | ||
| 8 | Allianz SE | 4.597% | 9/7/38 | 3,400 | 3,754 | |
| Allstate Corp. | 1.450% | 12/15/30 | 1,903 | 1,527 | ||
| Allstate Corp. | 5.250% | 3/30/33 | 86,682 | 88,212 | ||
| Allstate Corp. | 5.350% | 6/1/33 | 10,000 | 10,248 | ||
| Ally Financial Inc. | 8.000% | 11/1/31 | 25,000 | 27,674 | ||
| American Express Co. | 6.489% | 10/30/31 | 34,000 | 36,812 | ||
| American Express Co. | 4.989% | 5/26/33 | 5,000 | 4,954 | ||
| American Express Co. | 4.420% | 8/3/33 | 36,720 | 35,203 | ||
| American Express Co. | 5.043% | 5/1/34 | 40,000 | 40,053 | ||
| American International Group Inc. | 3.400% | 6/30/30 | 6,138 | 5,662 | ||
| American International Group Inc. | 5.125% | 3/27/33 | 15,000 | 15,156 | ||
| Aon Corp. | 2.800% | 5/15/30 | 17,426 | 15,463 | ||
| Aon Corp. / Aon Global Holdings plc | 2.050% | 8/23/31 | 11,500 | 9,405 | ||
| Aon Corp. / Aon Global Holdings plc | 2.600% | 12/2/31 | 7,000 | 5,935 | ||
| Aon Corp. / Aon Global Holdings plc | 5.000% | 9/12/32 | 12,000 | 12,001 | ||
| Aon Corp. / Aon Global Holdings plc | 5.350% | 2/28/33 | 23,520 | 24,023 | ||
| Ares Capital Corp. | 5.875% | 3/1/29 | 17,480 | 17,318 | ||
| Ares Capital Corp. | 3.200% | 11/15/31 | 2,000 | 1,667 | ||
| Arthur J Gallagher & Co. | 5.500% | 3/2/33 | 11,600 | 11,799 | ||
| Arthur J Gallagher & Co. | 6.500% | 2/15/34 | 12,000 | 13,145 | ||
| Athene Holding Ltd. | 3.500% | 1/15/31 | 6,561 | 5,773 | ||
| Athene Holding Ltd. | 5.875% | 1/15/34 | 22,500 | 22,616 | ||
| AXA SA | 8.600% | 12/15/30 | 10,468 | 12,547 | ||
| 8 | Banco Bilbao Vizcaya Argentaria SA | 3.500% | 2/10/27 | 1,000 | 1,080 | |
| 8 | Banco Santander SA | 2.125% | 2/8/28 | 500 | 509 | |
| Banco Santander SA | 2.749% | 12/3/30 | 27,133 | 22,379 | ||
| Banco Santander SA | 6.921% | 8/8/33 | 29,040 | 30,630 | ||
| Banco Santander SA | 6.938% | 11/7/33 | 32,700 | 36,186 | ||
| Bank of America Corp. | 3.974% | 2/7/30 | 42,723 | 40,761 | ||
| Bank of America Corp. | 3.194% | 7/23/30 | 34,921 | 31,764 | ||
| Bank of America Corp. | 2.884% | 10/22/30 | 32,946 | 29,341 | ||
| Bank of America Corp. | 2.496% | 2/13/31 | 37,013 | 31,969 | ||
| Bank of America Corp. | 2.592% | 4/29/31 | 45,990 | 39,811 | ||
| Bank of America Corp. | 1.898% | 7/23/31 | 53,792 | 44,321 | ||
| Bank of America Corp. | 1.922% | 10/24/31 | 49,206 | 40,275 | ||
| Bank of America Corp. | 2.651% | 3/11/32 | 53,320 | 45,276 | ||
| Bank of America Corp. | 2.687% | 4/22/32 | 73,107 | 62,071 | ||
| Bank of America Corp. | 2.299% | 7/21/32 | 68,325 | 56,035 | ||
| Bank of America Corp. | 2.572% | 10/20/32 | 51,630 | 42,974 | ||
| Bank of America Corp. | 2.972% | 2/4/33 | 95,945 | 81,863 | ||
| Bank of America Corp. | 4.571% | 4/27/33 | 72,690 | 69,456 | ||
| Bank of America Corp. | 5.015% | 7/22/33 | 25,750 | 25,542 | ||
| Bank of America Corp. | 5.288% | 4/25/34 | 90,520 | 90,857 | ||
| Bank of America Corp. | 5.872% | 9/15/34 | 50,000 | 52,334 | ||
| Bank of America Corp. | 5.468% | 1/23/35 | 116,260 | 118,496 | ||
| Bank of America Corp. | 2.482% | 9/21/36 | 27,908 | 22,389 | ||
| Bank of America Corp. | 3.846% | 3/8/37 | 40,000 | 35,471 | ||
| Bank of Montreal | 3.088% | 1/10/37 | 17,000 | 13,907 | ||
| Bank of New York Mellon Corp. | 4.596% | 7/26/30 | 16,635 | 16,484 | ||
| Coupon | Maturity Date | Face Amount ($000) | Market Value• ($000) | |||
| Bank of New York Mellon Corp. | 4.289% | 6/13/33 | 19,466 | 18,462 | ||
| Bank of New York Mellon Corp. | 5.834% | 10/25/33 | 57,578 | 60,893 | ||
| Bank of New York Mellon Corp. | 4.706% | 2/1/34 | 36,050 | 35,147 | ||
| Bank of New York Mellon Corp. | 4.967% | 4/26/34 | 81,477 | 80,930 | ||
| Bank of New York Mellon Corp. | 6.474% | 10/25/34 | 39,252 | 43,370 | ||
| Bank of Nova Scotia | 4.850% | 2/1/30 | 22,902 | 22,832 | ||
| Bank of Nova Scotia | 2.150% | 8/1/31 | 5,000 | 4,130 | ||
| Bank of Nova Scotia | 2.450% | 2/2/32 | 7,500 | 6,229 | ||
| Bank of Nova Scotia | 5.650% | 2/1/34 | 25,000 | 25,859 | ||
| Bank of Nova Scotia | 4.588% | 5/4/37 | 15,000 | 13,576 | ||
| 8 | Banque Federative du Credit Mutuel SA | 4.125% | 6/14/33 | 6,500 | 7,331 | |
| 8 | Barclays plc | 0.577% | 8/9/29 | 3,700 | 3,451 | |
| Barclays plc | 5.088% | 6/20/30 | 22,000 | 21,163 | ||
| 8 | Barclays plc | 4.918% | 8/8/30 | 3,500 | 3,936 | |
| Barclays plc | 2.645% | 6/24/31 | 15,000 | 12,664 | ||
| Barclays plc | 2.667% | 3/10/32 | 17,000 | 14,020 | ||
| Barclays plc | 2.894% | 11/24/32 | 22,000 | 18,151 | ||
| Barclays plc | 5.746% | 8/9/33 | 16,100 | 16,166 | ||
| Barclays plc | 7.437% | 11/2/33 | 47,500 | 52,960 | ||
| Barclays plc | 6.224% | 5/9/34 | 45,000 | 46,355 | ||
| Barclays plc | 7.119% | 6/27/34 | 28,550 | 30,080 | ||
| Barclays plc | 3.564% | 9/23/35 | 13,075 | 11,194 | ||
| BlackRock Inc. | 1.900% | 1/28/31 | 20,000 | 16,759 | ||
| BlackRock Inc. | 4.750% | 5/25/33 | 30,575 | 30,541 | ||
| 7 | Blackstone Holdings Finance Co. LLC | 2.000% | 1/30/32 | 13,627 | 10,739 | |
| Blue Owl Capital Corp. | 5.950% | 3/15/29 | 14,340 | 14,230 | ||
| Brighthouse Financial Inc. | 5.625% | 5/15/30 | 1,550 | 1,568 | ||
| Brown & Brown Inc. | 4.500% | 3/15/29 | 2,182 | 2,146 | ||
| Brown & Brown Inc. | 2.375% | 3/15/31 | 9,294 | 7,700 | ||
| Brown & Brown Inc. | 4.200% | 3/17/32 | 13,000 | 12,023 | ||
| Canadian Imperial Bank of Commerce | 6.092% | 10/3/33 | 25,000 | 26,551 | ||
| Capital One Financial Corp. | 3.273% | 3/1/30 | 41,980 | 37,755 | ||
| Capital One Financial Corp. | 7.624% | 10/30/31 | 53,420 | 59,003 | ||
| Capital One Financial Corp. | 2.359% | 7/29/32 | 23,000 | 17,366 | ||
| Capital One Financial Corp. | 2.618% | 11/2/32 | 24,315 | 19,532 | ||
| Capital One Financial Corp. | 5.817% | 2/1/34 | 49,000 | 48,851 | ||
| Capital One Financial Corp. | 6.377% | 6/8/34 | 72,570 | 75,450 | ||
| Capital One Financial Corp. | 6.051% | 2/1/35 | 66,440 | 67,337 | ||
| Cboe Global Markets Inc. | 1.625% | 12/15/30 | 7,719 | 6,338 | ||
| Cboe Global Markets Inc. | 3.000% | 3/16/32 | 8,342 | 7,348 | ||
| Charles Schwab Corp. | 3.250% | 5/22/29 | 4,000 | 3,732 | ||
| Charles Schwab Corp. | 2.750% | 10/1/29 | 9,625 | 8,698 | ||
| Charles Schwab Corp. | 1.650% | 3/11/31 | 10,000 | 8,028 | ||
| Charles Schwab Corp. | 2.300% | 5/13/31 | 5,000 | 4,170 | ||
| Charles Schwab Corp. | 2.900% | 3/3/32 | 20,500 | 17,599 | ||
| Charles Schwab Corp. | 5.853% | 5/19/34 | 29,330 | 30,349 | ||
| Charles Schwab Corp. | 6.136% | 8/24/34 | 20,239 | 21,364 | ||
| Chubb INA Holdings Inc. | 1.375% | 9/15/30 | 17,048 | 14,016 | ||
| Citigroup Inc. | 3.980% | 3/20/30 | 39,793 | 37,902 | ||
| Citigroup Inc. | 2.976% | 11/5/30 | 35,076 | 31,444 | ||
| Citigroup Inc. | 2.666% | 1/29/31 | 37,659 | 32,823 | ||
| Citigroup Inc. | 4.412% | 3/31/31 | 63,000 | 60,601 | ||
| Citigroup Inc. | 2.572% | 6/3/31 | 51,648 | 44,478 | ||
| Citigroup Inc. | 2.561% | 5/1/32 | 47,000 | 39,316 | ||
| Citigroup Inc. | 6.625% | 6/15/32 | 10,383 | 11,341 | ||
| Citigroup Inc. | 3.057% | 1/25/33 | 47,394 | 40,494 | ||
| Citigroup Inc. | 3.785% | 3/17/33 | 41,244 | 37,222 | ||
| Citigroup Inc. | 4.910% | 5/24/33 | 10,000 | 9,779 | ||
| Citigroup Inc. | 6.270% | 11/17/33 | 43,000 | 46,170 | ||
| Citigroup Inc. | 6.174% | 5/25/34 | 43,570 | 45,210 | ||
| Coupon | Maturity Date | Face Amount ($000) | Market Value• ($000) | |||
| Citizens Financial Group Inc. | 2.500% | 2/6/30 | 5,948 | 5,018 | ||
| CNA Financial Corp. | 2.050% | 8/15/30 | 12,000 | 10,075 | ||
| CNO Financial Group Inc. | 5.250% | 5/30/29 | 16,377 | 16,100 | ||
| 5,11 | Commonwealth Bank of Australia, 3M Australian Bank Bill Rate + 1.320% | 5.703% | 8/20/31 | 20,100 | 13,089 | |
| 5,11 | Commonwealth Bank of Australia, 3M Australian Bank Bill Rate + 1.900% | 6.052% | 4/14/32 | 5,000 | 3,303 | |
| 5,11 | Commonwealth Bank of Australia, 3M Australian Bank Bill Rate + 2.700% | 7.103% | 11/9/32 | 5,000 | 3,389 | |
| Corebridge Financial Inc. | 3.850% | 4/5/29 | 45,120 | 42,630 | ||
| Corebridge Financial Inc. | 3.900% | 4/5/32 | 57,210 | 51,598 | ||
| 7 | Corebridge Financial Inc. | 6.050% | 9/15/33 | 35,000 | 36,678 | |
| Corebridge Financial Inc. | 5.750% | 1/15/34 | 25,000 | 25,658 | ||
| 8 | Credit Agricole SA | 4.000% | 1/18/33 | 16,300 | 18,404 | |
| Credit Suisse USA Inc. | 7.125% | 7/15/32 | 10,888 | 12,379 | ||
| 8 | Danske Bank A/S | 4.125% | 1/10/31 | 4,400 | 4,914 | |
| Deutsche Bank AG | 5.882% | 7/8/31 | 7,000 | 6,819 | ||
| Deutsche Bank AG | 3.547% | 9/18/31 | 36,000 | 31,694 | ||
| Deutsche Bank AG | 3.729% | 1/14/32 | 18,200 | 15,267 | ||
| Deutsche Bank AG | 3.742% | 1/7/33 | 24,200 | 19,746 | ||
| Deutsche Bank AG | 7.079% | 2/10/34 | 22,000 | 22,439 | ||
| Discover Bank | 2.700% | 2/6/30 | 23,788 | 20,321 | ||
| Enstar Group Ltd. | 4.950% | 6/1/29 | 10,000 | 9,769 | ||
| Enstar Group Ltd. | 3.100% | 9/1/31 | 13,500 | 11,264 | ||
| Equitable Holdings Inc. | 5.594% | 1/11/33 | 28,767 | 29,475 | ||
| Fairfax Financial Holdings Ltd. | 4.625% | 4/29/30 | 4,830 | 4,655 | ||
| Fairfax Financial Holdings Ltd. | 3.375% | 3/3/31 | 7,650 | 6,717 | ||
| Fidelity National Financial Inc. | 3.400% | 6/15/30 | 20,371 | 18,184 | ||
| Fifth Third Bancorp | 4.772% | 7/28/30 | 15,327 | 14,919 | ||
| Fifth Third Bancorp | 5.631% | 1/29/32 | 54,050 | 54,569 | ||
| Fifth Third Bancorp | 4.337% | 4/25/33 | 10,000 | 9,243 | ||
| 7 | Five Corners Funding Trust II | 2.850% | 5/15/30 | 15,000 | 13,143 | |
| 7 | Five Corners Funding Trust III | 5.791% | 2/15/33 | 30,000 | 31,521 | |
| Franklin Resources Inc. | 1.600% | 10/30/30 | 15,000 | 12,246 | ||
| GATX Corp. | 4.000% | 6/30/30 | 4,093 | 3,844 | ||
| GATX Corp. | 1.900% | 6/1/31 | 25,000 | 19,914 | ||
| GATX Corp. | 3.500% | 6/1/32 | 15,985 | 13,996 | ||
| 7 | GGAM Finance Ltd. | 8.000% | 2/15/27 | 878 | 905 | |
| 7 | Global Atlantic Fin Co. | 3.125% | 6/15/31 | 20,000 | 16,399 | |
| 7 | Global Atlantic Fin Co. | 7.950% | 6/15/33 | 43,662 | 48,530 | |
| Goldman Sachs Group Inc. | 2.600% | 2/7/30 | 42,416 | 37,260 | ||
| Goldman Sachs Group Inc. | 3.800% | 3/15/30 | 9,636 | 9,059 | ||
| Goldman Sachs Group Inc. | 1.992% | 1/27/32 | 38,460 | 31,190 | ||
| Goldman Sachs Group Inc. | 2.615% | 4/22/32 | 60,000 | 50,627 | ||
| Goldman Sachs Group Inc. | 2.383% | 7/21/32 | 81,361 | 67,000 | ||
| Goldman Sachs Group Inc. | 2.650% | 10/21/32 | 47,450 | 39,656 | ||
| Goldman Sachs Group Inc. | 3.102% | 2/24/33 | 29,600 | 25,477 | ||
| Hanover Insurance Group Inc. | 2.500% | 9/1/30 | 5,000 | 4,159 | ||
| Hartford Financial Services Group Inc. | 2.800% | 8/19/29 | 3,926 | 3,570 | ||
| 8 | HSBC Holdings plc | 0.641% | 9/24/29 | 13,500 | 12,775 | |
| HSBC Holdings plc | 4.950% | 3/31/30 | 12,320 | 12,286 | ||
| HSBC Holdings plc | 3.973% | 5/22/30 | 62,323 | 58,357 | ||
| HSBC Holdings plc | 2.848% | 6/4/31 | 47,495 | 41,049 | ||
| HSBC Holdings plc | 2.357% | 8/18/31 | 23,560 | 19,658 | ||
| 9 | HSBC Holdings plc | 6.800% | 9/14/31 | 4,811 | 6,584 | |
| HSBC Holdings plc | 2.804% | 5/24/32 | 58,067 | 48,782 | ||
| HSBC Holdings plc | 2.871% | 11/22/32 | 34,000 | 28,402 | ||
| HSBC Holdings plc | 4.762% | 3/29/33 | 18,000 | 16,722 | ||
| Coupon | Maturity Date | Face Amount ($000) | Market Value• ($000) | |||
| HSBC Holdings plc | 5.402% | 8/11/33 | 25,700 | 25,802 | ||
| HSBC Holdings plc | 8.113% | 11/3/33 | 30,000 | 34,362 | ||
| HSBC Holdings plc | 6.254% | 3/9/34 | 18,000 | 19,108 | ||
| HSBC Holdings plc | 6.547% | 6/20/34 | 34,380 | 35,777 | ||
| HSBC Holdings plc | 7.399% | 11/13/34 | 45,100 | 49,256 | ||
| 7 | HUB International Ltd. | 7.250% | 6/15/30 | 330 | 339 | |
| 7 | HUB International Ltd. | 7.375% | 1/31/32 | 350 | 358 | |
| Huntington Bancshares Inc. | 2.550% | 2/4/30 | 12,000 | 10,270 | ||
| Huntington Bancshares Inc. | 5.023% | 5/17/33 | 44,013 | 42,396 | ||
| Huntington Bancshares Inc. | 5.709% | 2/2/35 | 15,000 | 15,105 | ||
| Huntington Bancshares Inc. | 2.487% | 8/15/36 | 2,000 | 1,525 | ||
| Huntington National Bank | 5.650% | 1/10/30 | 21,600 | 21,879 | ||
| ING Groep NV | 4.252% | 3/28/33 | 5,000 | 4,657 | ||
| ING Groep NV | 6.114% | 9/11/34 | 30,000 | 31,486 | ||
| Intercontinental Exchange Inc. | 4.350% | 6/15/29 | 20,300 | 20,006 | ||
| Intercontinental Exchange Inc. | 2.100% | 6/15/30 | 24,270 | 20,770 | ||
| Intercontinental Exchange Inc. | 1.850% | 9/15/32 | 4,800 | 3,796 | ||
| Intercontinental Exchange Inc. | 4.600% | 3/15/33 | 17,500 | 17,160 | ||
| 8 | JAB Holdings BV | 4.750% | 6/29/32 | 1,700 | 1,945 | |
| 8 | JAB Holdings BV | 2.250% | 12/19/39 | 2,000 | 1,642 | |
| Jefferies Financial Group Inc. | 4.150% | 1/23/30 | 15,440 | 14,592 | ||
| Jefferies Financial Group Inc. | 2.625% | 10/15/31 | 7,243 | 6,023 | ||
| Jefferies Financial Group Inc. | 2.750% | 10/15/32 | 25,100 | 20,577 | ||
| JPMorgan Chase & Co. | 3.702% | 5/6/30 | 50,239 | 47,364 | ||
| JPMorgan Chase & Co. | 4.565% | 6/14/30 | 30,000 | 29,498 | ||
| JPMorgan Chase & Co. | 2.739% | 10/15/30 | 81,229 | 72,294 | ||
| JPMorgan Chase & Co. | 4.493% | 3/24/31 | 15,100 | 14,733 | ||
| JPMorgan Chase & Co. | 2.522% | 4/22/31 | 32,000 | 27,861 | ||
| JPMorgan Chase & Co. | 2.956% | 5/13/31 | 45,985 | 40,529 | ||
| JPMorgan Chase & Co. | 1.764% | 11/19/31 | 45,000 | 36,664 | ||
| JPMorgan Chase & Co. | 1.953% | 2/4/32 | 33,570 | 27,394 | ||
| JPMorgan Chase & Co. | 2.580% | 4/22/32 | 67,950 | 57,569 | ||
| JPMorgan Chase & Co. | 2.545% | 11/8/32 | 65,000 | 54,360 | ||
| JPMorgan Chase & Co. | 2.963% | 1/25/33 | 81,430 | 69,954 | ||
| JPMorgan Chase & Co. | 4.586% | 4/26/33 | 56,100 | 54,215 | ||
| JPMorgan Chase & Co. | 4.912% | 7/25/33 | 87,670 | 86,549 | ||
| JPMorgan Chase & Co. | 5.350% | 6/1/34 | 60,000 | 60,886 | ||
| JPMorgan Chase & Co. | 6.254% | 10/23/34 | 45,000 | 48,784 | ||
| JPMorgan Chase & Co. | 5.336% | 1/23/35 | 82,400 | 83,795 | ||
| Kemper Corp. | 3.800% | 2/23/32 | 5,000 | 4,234 | ||
| KeyBank NA | 4.900% | 8/8/32 | 10,000 | 8,950 | ||
| KeyBank NA | 5.000% | 1/26/33 | 11,445 | 10,644 | ||
| KeyCorp | 4.789% | 6/1/33 | 26,000 | 23,869 | ||
| 7 | Ladder Capital Finance Holdings LLLP / Ladder Capital Finance Corp. | 4.750% | 6/15/29 | 2,664 | 2,384 | |
| Lloyds Banking Group plc | 4.976% | 8/11/33 | 24,100 | 23,378 | ||
| Lloyds Banking Group plc | 7.953% | 11/15/33 | 8,785 | 9,941 | ||
| Lloyds Banking Group plc | 5.679% | 1/5/35 | 20,000 | 20,289 | ||
| M&T Bank Corp. | 5.053% | 1/27/34 | 88,047 | 83,210 | ||
| 5,11 | Macquarie Bank Ltd., 3M Australian Bank Bill Rate + 2.700% | 7.050% | 6/7/32 | 3,070 | 2,068 | |
| Markel Group Inc. | 3.350% | 9/17/29 | 5,000 | 4,592 | ||
| Marsh & McLennan Cos. Inc. | 2.250% | 11/15/30 | 18,675 | 16,028 | ||
| Marsh & McLennan Cos. Inc. | 5.750% | 11/1/32 | 18,000 | 19,240 | ||
| Coupon | Maturity Date | Face Amount ($000) | Market Value• ($000) | |||
| MetLife Inc. | 6.500% | 12/15/32 | 9,856 | 11,027 | ||
| MetLife Inc. | 5.375% | 7/15/33 | 17,690 | 18,292 | ||
| 8 | Metropolitan Life Global Funding I | 3.750% | 12/5/30 | 6,100 | 6,743 | |
| 7 | Metropolitan Life Global Funding I | 5.050% | 1/8/34 | 10,000 | 9,978 | |
| 7 | Midcap Financial Issuer Trust | 5.625% | 1/15/30 | 2,360 | 2,026 | |
| Mitsubishi UFJ Financial Group Inc. | 3.195% | 7/18/29 | 41,735 | 38,361 | ||
| Mitsubishi UFJ Financial Group Inc. | 2.559% | 2/25/30 | 37,878 | 33,220 | ||
| Mitsubishi UFJ Financial Group Inc. | 5.475% | 2/22/31 | 16,540 | 16,913 | ||
| Mitsubishi UFJ Financial Group Inc. | 2.309% | 7/20/32 | 54,920 | 45,449 | ||
| Mitsubishi UFJ Financial Group Inc. | 2.494% | 10/13/32 | 11,562 | 9,681 | ||
| Mitsubishi UFJ Financial Group Inc. | 2.852% | 1/19/33 | 5,000 | 4,268 | ||
| Mitsubishi UFJ Financial Group Inc. | 4.315% | 4/19/33 | 2,000 | 1,905 | ||
| Mitsubishi UFJ Financial Group Inc. | 5.133% | 7/20/33 | 16,200 | 16,300 | ||
| Mitsubishi UFJ Financial Group Inc. | 5.472% | 9/13/33 | 5,000 | 5,152 | ||
| Mitsubishi UFJ Financial Group Inc. | 5.441% | 2/22/34 | 20,000 | 20,532 | ||
| Mizuho Financial Group Inc. | 3.153% | 7/16/30 | 21,400 | 19,328 | ||
| Mizuho Financial Group Inc. | 2.869% | 9/13/30 | 10,620 | 9,414 | ||
| Mizuho Financial Group Inc. | 2.591% | 5/25/31 | 19,607 | 16,829 | ||
| Mizuho Financial Group Inc. | 5.739% | 5/27/31 | 25,000 | 25,745 | ||
| Mizuho Financial Group Inc. | 2.201% | 7/10/31 | 20,000 | 16,714 | ||
| Mizuho Financial Group Inc. | 2.172% | 5/22/32 | 2,000 | 1,630 | ||
| Mizuho Financial Group Inc. | 2.260% | 7/9/32 | 12,000 | 9,816 | ||
| Mizuho Financial Group Inc. | 5.748% | 7/6/34 | 11,570 | 11,970 | ||
| 8 | Morgan Stanley | 0.495% | 10/26/29 | 2,500 | 2,343 | |
| Morgan Stanley | 4.431% | 1/23/30 | 35,640 | 34,736 | ||
| Morgan Stanley | 2.699% | 1/22/31 | 51,418 | 45,200 | ||
| Morgan Stanley | 3.622% | 4/1/31 | 56,573 | 52,252 | ||
| Morgan Stanley | 1.794% | 2/13/32 | 47,634 | 38,263 | ||
| Morgan Stanley | 1.928% | 4/28/32 | 56,429 | 45,526 | ||
| Morgan Stanley | 2.239% | 7/21/32 | 62,078 | 50,748 | ||
| Morgan Stanley | 2.511% | 10/20/32 | 40,000 | 33,297 | ||
| Morgan Stanley | 2.943% | 1/21/33 | 25,000 | 21,340 | ||
| Morgan Stanley | 4.889% | 7/20/33 | 58,354 | 57,029 | ||
| Morgan Stanley | 6.342% | 10/18/33 | 60,993 | 65,732 | ||
| Morgan Stanley | 5.250% | 4/21/34 | 50,805 | 50,825 | ||
| Morgan Stanley | 5.424% | 7/21/34 | 49,420 | 50,041 | ||
| Morgan Stanley | 6.627% | 11/1/34 | 33,210 | 36,757 | ||
| Morgan Stanley | 5.466% | 1/18/35 | 131,020 | 133,787 | ||
| Morgan Stanley | 2.484% | 9/16/36 | 30,000 | 23,937 | ||
| Morgan Stanley | 5.297% | 4/20/37 | 30,652 | 29,949 | ||
| Morgan Stanley | 5.948% | 1/19/38 | 42,820 | 43,601 | ||
| Nasdaq Inc. | 1.650% | 1/15/31 | 21,156 | 17,158 | ||
| Nasdaq Inc. | 5.550% | 2/15/34 | 81,350 | 84,250 | ||
| 7 | Nationstar Mortgage Holdings Inc. | 7.125% | 2/1/32 | 900 | 893 | |
| NatWest Group plc | 5.076% | 1/27/30 | 24,601 | 24,310 | ||
| NatWest Group plc | 4.445% | 5/8/30 | 7,550 | 7,251 | ||
| NatWest Group plc | 6.016% | 3/2/34 | 15,000 | 15,691 | ||
| Coupon | Maturity Date | Face Amount ($000) | Market Value• ($000) | |||
| NatWest Group plc | 3.032% | 11/28/35 | 15,000 | 12,561 | ||
| Navient Corp. | 9.375% | 7/25/30 | 588 | 613 | ||
| 7 | New York Life Global Funding | 5.000% | 1/9/34 | 9,250 | 9,272 | |
| 8 | NN Group NV | 6.000% | 11/3/43 | 1,800 | 2,068 | |
| Nomura Holdings Inc. | 3.103% | 1/16/30 | 14,947 | 13,288 | ||
| Nomura Holdings Inc. | 2.679% | 7/16/30 | 24,829 | 21,263 | ||
| Nomura Holdings Inc. | 2.608% | 7/14/31 | 13,000 | 10,789 | ||
| Nomura Holdings Inc. | 2.999% | 1/22/32 | 10,000 | 8,429 | ||
| 8 | Nordea Bank Abp | 2.500% | 5/23/29 | 9,300 | 9,611 | |
| Northern Trust Corp. | 6.125% | 11/2/32 | 15,000 | 16,116 | ||
| OneMain Finance Corp. | 3.500% | 1/15/27 | 1,855 | 1,703 | ||
| OneMain Finance Corp. | 7.875% | 3/15/30 | 210 | 213 | ||
| ORIX Corp. | 2.250% | 3/9/31 | 5,217 | 4,443 | ||
| 7 | Penske Truck Leasing Co. Lp / PTL Finance Corp. | 6.200% | 6/15/30 | 14,686 | 15,428 | |
| PNC Bank NA | 2.700% | 10/22/29 | 29,415 | 25,961 | ||
| PNC Financial Services Group Inc. | 2.550% | 1/22/30 | 50,012 | 43,705 | ||
| PNC Financial Services Group Inc. | 2.307% | 4/23/32 | 2,000 | 1,659 | ||
| PNC Financial Services Group Inc. | 4.626% | 6/6/33 | 10,000 | 9,367 | ||
| PNC Financial Services Group Inc. | 6.037% | 10/28/33 | 68,750 | 71,862 | ||
| PNC Financial Services Group Inc. | 5.068% | 1/24/34 | 27,580 | 27,173 | ||
| PNC Financial Services Group Inc. | 5.939% | 8/18/34 | 35,360 | 36,931 | ||
| PNC Financial Services Group Inc. | 6.875% | 10/20/34 | 106,126 | 118,178 | ||
| PNC Financial Services Group Inc. | 5.676% | 1/22/35 | 84,280 | 86,524 | ||
| Principal Financial Group Inc. | 3.700% | 5/15/29 | 18,767 | 17,747 | ||
| Principal Financial Group Inc. | 5.500% | 3/15/53 | 7,838 | 7,887 | ||
| Progressive Corp. | 3.200% | 3/26/30 | 14,172 | 13,109 | ||
| Progressive Corp. | 4.950% | 6/15/33 | 34,500 | 35,225 | ||
| Prudential Financial Inc. | 3.700% | 10/1/50 | 6,495 | 5,716 | ||
| Prudential Financial Inc. | 5.125% | 3/1/52 | 12,000 | 11,215 | ||
| Prudential Financial Inc. | 6.000% | 9/1/52 | 9,328 | 9,292 | ||
| Prudential Financial Inc. | 6.750% | 3/1/53 | 20,000 | 20,758 | ||
| Reinsurance Group of America Inc. | 3.900% | 5/15/29 | 6,800 | 6,452 | ||
| Reinsurance Group of America Inc. | 3.150% | 6/15/30 | 2,925 | 2,619 | ||
| RenaissanceRe Holdings Ltd. | 5.750% | 6/5/33 | 15,290 | 15,508 | ||
| 7 | RGA Global Funding | 5.500% | 1/11/31 | 24,600 | 24,655 | |
| 9 | Rothesay Life plc | 7.734% | 5/16/33 | 800 | 1,080 | |
| Royal Bank of Canada | 5.150% | 2/1/34 | 46,950 | 47,056 | ||
| Sixth Street Specialty Lending Inc. | 6.125% | 3/1/29 | 14,490 | 14,452 | ||
| State Street Corp. | 2.623% | 2/7/33 | 8,000 | 6,721 | ||
| State Street Corp. | 4.421% | 5/13/33 | 12,000 | 11,423 | ||
| State Street Corp. | 4.821% | 1/26/34 | 26,240 | 25,718 | ||
| State Street Corp. | 5.159% | 5/18/34 | 30,000 | 30,186 | ||
| Stifel Financial Corp. | 4.000% | 5/15/30 | 4,000 | 3,664 | ||
| Sumitomo Mitsui Financial Group Inc. | 3.040% | 7/16/29 | 44,665 | 40,652 | ||
| Sumitomo Mitsui Financial Group Inc. | 2.724% | 9/27/29 | 3,000 | 2,666 | ||
| Sumitomo Mitsui Financial Group Inc. | 5.710% | 1/13/30 | 25,249 | 26,185 | ||
| Sumitomo Mitsui Financial Group Inc. | 2.750% | 1/15/30 | 32,727 | 29,008 | ||
| Sumitomo Mitsui Financial Group Inc. | 2.130% | 7/8/30 | 29,868 | 25,215 | ||
| Coupon | Maturity Date | Face Amount ($000) | Market Value• ($000) | |||
| Sumitomo Mitsui Financial Group Inc. | 5.852% | 7/13/30 | 25,000 | 26,132 | ||
| Sumitomo Mitsui Financial Group Inc. | 1.710% | 1/12/31 | 11,400 | 9,182 | ||
| Sumitomo Mitsui Financial Group Inc. | 2.222% | 9/17/31 | 9,500 | 7,805 | ||
| Sumitomo Mitsui Financial Group Inc. | 5.766% | 1/13/33 | 25,450 | 26,700 | ||
| Synchrony Financial | 2.875% | 10/28/31 | 12,000 | 9,554 | ||
| Toronto-Dominion Bank | 2.450% | 1/12/32 | 4,000 | 3,332 | ||
| Toronto-Dominion Bank | 3.200% | 3/10/32 | 38,055 | 33,489 | ||
| Toronto-Dominion Bank | 4.456% | 6/8/32 | 22,190 | 21,362 | ||
| Truist Bank | 2.250% | 3/11/30 | 24,140 | 20,114 | ||
| Truist Financial Corp. | 1.950% | 6/5/30 | 8,419 | 7,023 | ||
| Truist Financial Corp. | 4.916% | 7/28/33 | 11,373 | 10,681 | ||
| Truist Financial Corp. | 6.123% | 10/28/33 | 13,125 | 13,623 | ||
| Truist Financial Corp. | 5.122% | 1/26/34 | 20,020 | 19,475 | ||
| Truist Financial Corp. | 5.867% | 6/8/34 | 25,000 | 25,560 | ||
| 7 | UBS Group AG | 4.194% | 4/1/31 | 20,950 | 19,616 | |
| 7 | UBS Group AG | 6.537% | 8/12/33 | 12,000 | 12,782 | |
| 7 | UBS Group AG | 5.699% | 2/8/35 | 105,350 | 107,025 | |
| US Bancorp | 3.000% | 7/30/29 | 15,000 | 13,520 | ||
| US Bancorp | 1.375% | 7/22/30 | 32,000 | 25,769 | ||
| US Bancorp | 4.967% | 7/22/33 | 34,728 | 32,901 | ||
| US Bancorp | 5.850% | 10/21/33 | 86,770 | 89,761 | ||
| US Bancorp | 4.839% | 2/1/34 | 54,265 | 52,265 | ||
| US Bancorp | 5.836% | 6/12/34 | 82,590 | 85,181 | ||
| US Bancorp | 5.678% | 1/23/35 | 102,470 | 104,890 | ||
| US Bancorp | 2.491% | 11/3/36 | 7,250 | 5,679 | ||
| 7 | USI Inc. | 7.500% | 1/15/32 | 350 | 356 | |
| 12,13 | Washington Mutual Bank / Debt not acquired by JPMorgan | 5.500% | 1/15/13 | 6,147 | 1 | |
| 12,13 | Washington Mutual Bank / Debt not acquired by JPMorgan | 5.650% | 8/15/14 | 7,500 | 1 | |
| 12,13 | Washington Mutual Bank / Debt not acquired by JPMorgan | 5.125% | 1/15/15 | 9,000 | 1 | |
| 11 | Wells Fargo & Co. | 4.000% | 4/27/27 | 8,972 | 5,706 | |
| 8 | Wells Fargo & Co. | 1.741% | 5/4/30 | 6,400 | 6,309 | |
| Wells Fargo & Co. | 2.879% | 10/30/30 | 71,832 | 63,960 | ||
| Wells Fargo & Co. | 2.572% | 2/11/31 | 47,900 | 41,633 | ||
| Wells Fargo & Co. | 4.478% | 4/4/31 | 33,500 | 32,433 | ||
| Wells Fargo & Co. | 3.350% | 3/2/33 | 67,030 | 58,835 | ||
| Wells Fargo & Co. | 4.897% | 7/25/33 | 69,655 | 68,091 | ||
| Wells Fargo & Co. | 5.389% | 4/24/34 | 82,000 | 82,743 | ||
| Wells Fargo & Co. | 5.557% | 7/25/34 | 82,415 | 84,234 | ||
| Wells Fargo & Co. | 6.491% | 10/23/34 | 51,575 | 56,199 | ||
| 9 | Wells Fargo & Co. | 4.875% | 11/29/35 | 1,600 | 1,885 | |
| Westpac Banking Corp. | 5.405% | 8/10/33 | 15,000 | 14,870 | ||
| Westpac Banking Corp. | 6.820% | 11/17/33 | 30,000 | 32,709 | ||
| Westpac Banking Corp. | 4.110% | 7/24/34 | 11,175 | 10,380 | ||
| Westpac Banking Corp. | 2.668% | 11/15/35 | 20,000 | 16,603 | ||
| Willis North America Inc. | 2.950% | 9/15/29 | 51,892 | 46,627 | ||
| Willis North America Inc. | 5.350% | 5/15/33 | 15,000 | 15,045 | ||
| 9,636,737 | ||||||
| Health Care (7.5%) | ||||||
| AbbVie Inc. | 3.200% | 11/21/29 | 91,974 | 85,678 | ||
| Agilent Technologies Inc. | 2.750% | 9/15/29 | 10,000 | 9,084 | ||
| Agilent Technologies Inc. | 2.300% | 3/12/31 | 25,000 | 21,362 | ||
| Amgen Inc. | 4.050% | 8/18/29 | 65,000 | 63,287 | ||
| Amgen Inc. | 2.450% | 2/21/30 | 29,420 | 26,030 | ||
| Amgen Inc. | 5.250% | 3/2/30 | 28,665 | 29,391 | ||
| Amgen Inc. | 2.300% | 2/25/31 | 46,020 | 39,214 | ||
| Amgen Inc. | 3.350% | 2/22/32 | 19,065 | 17,263 | ||
| Amgen Inc. | 5.250% | 3/2/33 | 77,000 | 78,624 | ||
| Ascension Health | 2.532% | 11/15/29 | 2,500 | 2,254 | ||
| Coupon | Maturity Date | Face Amount ($000) | Market Value• ($000) | |||
| AstraZeneca plc | 1.375% | 8/6/30 | 93,854 | 77,719 | ||
| Baxter International Inc. | 3.950% | 4/1/30 | 14,000 | 13,211 | ||
| Baxter International Inc. | 1.730% | 4/1/31 | 10,000 | 8,059 | ||
| Baxter International Inc. | 2.539% | 2/1/32 | 23,700 | 19,757 | ||
| 8 | Bayer AG | 4.625% | 5/26/33 | 500 | 552 | |
| Becton Dickinson & Co. | 2.823% | 5/20/30 | 21,220 | 18,959 | ||
| Becton Dickinson & Co. | 1.957% | 2/11/31 | 22,587 | 18,738 | ||
| Becton Dickinson & Co. | 4.298% | 8/22/32 | 27,000 | 25,991 | ||
| Boston Scientific Corp. | 2.650% | 6/1/30 | 76,567 | 68,137 | ||
| Bristol-Myers Squibb Co. | 1.450% | 11/13/30 | 26,570 | 21,752 | ||
| Bristol-Myers Squibb Co. | 2.950% | 3/15/32 | 18,345 | 16,174 | ||
| 7 | Catalent Pharma Solutions Inc. | 3.125% | 2/15/29 | 1,598 | 1,405 | |
| 7 | Catalent Pharma Solutions Inc. | 3.500% | 4/1/30 | 1,023 | 899 | |
| Cedars-Sinai Health System | 2.288% | 8/15/31 | 2,000 | 1,690 | ||
| Cencora Inc. | 2.800% | 5/15/30 | 6,000 | 5,375 | ||
| Cencora Inc. | 2.700% | 3/15/31 | 71,871 | 62,572 | ||
| Centene Corp. | 4.625% | 12/15/29 | 40,000 | 38,308 | ||
| Centene Corp. | 3.375% | 2/15/30 | 41,231 | 36,927 | ||
| Centene Corp. | 3.000% | 10/15/30 | 31,830 | 27,529 | ||
| Centene Corp. | 2.500% | 3/1/31 | 40,000 | 33,259 | ||
| Centene Corp. | 2.625% | 8/1/31 | 20,959 | 17,393 | ||
| Cigna Group | 2.400% | 3/15/30 | 35,139 | 30,685 | ||
| Cigna Group | 2.375% | 3/15/31 | 37,985 | 32,259 | ||
| CommonSpirit Health | 2.782% | 10/1/30 | 509 | 446 | ||
| 7 | CSL Finance plc | 4.250% | 4/27/32 | 26,665 | 25,788 | |
| CVS Health Corp. | 3.250% | 8/15/29 | 53,383 | 49,349 | ||
| CVS Health Corp. | 5.125% | 2/21/30 | 51,095 | 51,616 | ||
| CVS Health Corp. | 3.750% | 4/1/30 | 17,849 | 16,742 | ||
| CVS Health Corp. | 1.750% | 8/21/30 | 44,635 | 36,865 | ||
| CVS Health Corp. | 5.250% | 1/30/31 | 20,000 | 20,332 | ||
| CVS Health Corp. | 1.875% | 2/28/31 | 37,668 | 30,889 | ||
| CVS Health Corp. | 5.250% | 2/21/33 | 15,000 | 15,135 | ||
| CVS Health Corp. | 5.300% | 6/1/33 | 36,900 | 37,416 | ||
| 7 | DaVita Inc. | 3.750% | 2/15/31 | 1,430 | 1,178 | |
| Elevance Health Inc. | 2.875% | 9/15/29 | 39,704 | 36,234 | ||
| Elevance Health Inc. | 2.250% | 5/15/30 | 6,441 | 5,560 | ||
| Elevance Health Inc. | 4.100% | 5/15/32 | 10,000 | 9,465 | ||
| Elevance Health Inc. | 5.500% | 10/15/32 | 32,000 | 33,201 | ||
| 7 | Fortrea Holdings Inc. | 7.500% | 7/1/30 | 535 | 544 | |
| GE HealthCare Technologies Inc. | 5.857% | 3/15/30 | 47,180 | 49,557 | ||
| GE HealthCare Technologies Inc. | 5.905% | 11/22/32 | 31,925 | 33,700 | ||
| HCA Inc. | 3.375% | 3/15/29 | 15,000 | 13,829 | ||
| HCA Inc. | 3.500% | 9/1/30 | 61,425 | 55,708 | ||
| HCA Inc. | 2.375% | 7/15/31 | 40,000 | 33,154 | ||
| HCA Inc. | 3.625% | 3/15/32 | 40,495 | 36,103 | ||
| 7 | Highmark Inc. | 2.550% | 5/10/31 | 20,000 | 15,747 | |
| Humana Inc. | 4.875% | 4/1/30 | 1,758 | 1,755 | ||
| Humana Inc. | 2.150% | 2/3/32 | 5,000 | 4,047 | ||
| Humana Inc. | 5.875% | 3/1/33 | 22,000 | 23,008 | ||
| 7 | IQVIA Inc. | 6.250% | 2/1/29 | 1,488 | 1,551 | |
| 7 | IQVIA Inc. | 6.500% | 5/15/30 | 755 | 770 | |
| 8 | Johnson & Johnson | 1.650% | 5/20/35 | 800 | 771 | |
| 7 | LifePoint Health Inc. | 11.000% | 10/15/30 | 495 | 527 | |
| 7 | Medline Borrower LP | 3.875% | 4/1/29 | 1,070 | 969 | |
| 7 | Medline Borrower LP | 5.250% | 10/1/29 | 489 | 456 | |
| Merck & Co. Inc. | 1.450% | 6/24/30 | 17,000 | 14,189 | ||
| Merck & Co. Inc. | 2.150% | 12/10/31 | 60,631 | 51,213 | ||
| 7 | Organon & Co. / Organon Foreign Debt Co.-Issuer BV | 4.125% | 4/30/28 | 1,762 | 1,610 | |
| 7 | Organon & Co. / Organon Foreign Debt Co.-Issuer BV | 5.125% | 4/30/31 | 1,107 | 952 | |
| Coupon | Maturity Date | Face Amount ($000) | Market Value• ($000) | |||
| 7 | Owens & Minor Inc. | 6.625% | 4/1/30 | 245 | 234 | |
| Pfizer Inc. | 1.700% | 5/28/30 | 14,272 | 12,124 | ||
| Pfizer Inc. | 1.750% | 8/18/31 | 13,540 | 11,139 | ||
| 9 | Pfizer Inc. | 2.735% | 6/15/43 | 400 | 365 | |
| Pfizer Investment Enterprises Pte Ltd. | 4.650% | 5/19/30 | 97,450 | 97,739 | ||
| Pfizer Investment Enterprises Pte Ltd. | 4.750% | 5/19/33 | 102,235 | 102,181 | ||
| Providence St. Joseph Health Obligated Group | 2.532% | 10/1/29 | 9,129 | 8,024 | ||
| Quest Diagnostics Inc. | 2.950% | 6/30/30 | 16,761 | 14,979 | ||
| Quest Diagnostics Inc. | 2.800% | 6/30/31 | 6,655 | 5,803 | ||
| Regeneron Pharmaceuticals Inc. | 1.750% | 9/15/30 | 15,000 | 12,389 | ||
| Revvity Inc. | 3.300% | 9/15/29 | 5,000 | 4,560 | ||
| Revvity Inc. | 2.250% | 9/15/31 | 11,000 | 9,089 | ||
| 7 | Roche Holdings Inc. | 2.076% | 12/13/31 | 36,730 | 30,721 | |
| Royalty Pharma plc | 2.200% | 9/2/30 | 24,500 | 20,546 | ||
| Royalty Pharma plc | 2.150% | 9/2/31 | 4,000 | 3,256 | ||
| 8 | Sanofi SA | 1.375% | 3/21/30 | 400 | 397 | |
| Stanford Health Care | 3.310% | 8/15/30 | 17,000 | 15,661 | ||
| 7 | Star Parent Inc. | 9.000% | 10/1/30 | 760 | 799 | |
| STERIS Irish FinCo Unlimited Co. | 2.700% | 3/15/31 | 22,000 | 19,045 | ||
| Stryker Corp. | 1.950% | 6/15/30 | 13,250 | 11,280 | ||
| Sutter Health | 5.164% | 8/15/33 | 3,715 | 3,781 | ||
| Takeda Pharmaceutical Co. Ltd. | 2.050% | 3/31/30 | 93,085 | 79,770 | ||
| Tenet Healthcare Corp. | 4.875% | 1/1/26 | 3,474 | 3,443 | ||
| Tenet Healthcare Corp. | 6.250% | 2/1/27 | 1,641 | 1,636 | ||
| Tenet Healthcare Corp. | 4.250% | 6/1/29 | 1,804 | 1,672 | ||
| 7 | Tenet Healthcare Corp. | 6.750% | 5/15/31 | 1,467 | 1,501 | |
| Teva Pharmaceutical Finance Netherlands III BV | 5.125% | 5/9/29 | 573 | 552 | ||
| Teva Pharmaceutical Finance Netherlands III BV | 7.875% | 9/15/29 | 810 | 874 | ||
| Teva Pharmaceutical Finance Netherlands III BV | 8.125% | 9/15/31 | 1,020 | 1,122 | ||
| Teva Pharmaceutical Finance Netherlands III BV | 4.100% | 10/1/46 | 350 | 238 | ||
| Thermo Fisher Scientific Inc. | 2.600% | 10/1/29 | 25,879 | 23,485 | ||
| Thermo Fisher Scientific Inc. | 2.000% | 10/15/31 | 46,981 | 39,273 | ||
| Thermo Fisher Scientific Inc. | 4.950% | 11/21/32 | 23,525 | 24,046 | ||
| UnitedHealth Group Inc. | 5.300% | 2/15/30 | 70,780 | 73,410 | ||
| UnitedHealth Group Inc. | 2.000% | 5/15/30 | 10,000 | 8,595 | ||
| UnitedHealth Group Inc. | 4.200% | 5/15/32 | 16,697 | 16,169 | ||
| UnitedHealth Group Inc. | 5.350% | 2/15/33 | 33,535 | 35,075 | ||
| UnitedHealth Group Inc. | 4.500% | 4/15/33 | 14,815 | 14,588 | ||
| Viatris Inc. | 2.700% | 6/22/30 | 3,969 | 3,385 | ||
| Zoetis Inc. | 2.000% | 5/15/30 | 19,148 | 16,319 | ||
| Zoetis Inc. | 5.600% | 11/16/32 | 23,590 | 24,924 | ||
| 2,414,102 | ||||||
| Industrials (5.1%) | ||||||
| 3M Co. | 3.375% | 3/1/29 | 10,922 | 10,189 | ||
| 3M Co. | 2.375% | 8/26/29 | 8,000 | 7,014 | ||
| 3M Co. | 3.050% | 4/15/30 | 15,359 | 13,846 | ||
| 8 | 3M Co. | 1.750% | 5/15/30 | 500 | 484 | |
| 7 | Air Canada | 3.875% | 8/15/26 | 2,580 | 2,454 | |
| 7 | Allison Transmission Inc. | 4.750% | 10/1/27 | 3,940 | 3,791 | |
| 7 | American Airlines Inc. | 7.250% | 2/15/28 | 672 | 683 | |
| 7 | American Airlines Inc. | 8.500% | 5/15/29 | 685 | 726 | |
| Coupon | Maturity Date | Face Amount ($000) | Market Value• ($000) | |||
| 7 | American Airlines Inc. / AAdvantage Loyalty IP Ltd. | 5.500% | 4/20/26 | 2,201 | 2,179 | |
| 4,7 | American Airlines Inc. / AAdvantage Loyalty IP Ltd. | 5.750% | 4/20/29 | 5,073 | 4,984 | |
| 8 | AP Moller - Maersk A/S | 0.750% | 11/25/31 | 4,800 | 4,257 | |
| 11 | Aurizon Finance Pty Ltd. | 3.000% | 3/9/28 | 40,230 | 23,890 | |
| 8 | Autostrade per l'Italia SpA | 2.000% | 1/15/30 | 500 | 481 | |
| Boeing Co. | 3.200% | 3/1/29 | 36,191 | 33,311 | ||
| Boeing Co. | 5.150% | 5/1/30 | 159,841 | 160,130 | ||
| Boeing Co. | 3.625% | 2/1/31 | 55,600 | 50,823 | ||
| Boeing Co. | 6.125% | 2/15/33 | 9,182 | 9,732 | ||
| Canadian National Railway Co. | 3.850% | 8/5/32 | 26,585 | 25,060 | ||
| Canadian Pacific Railway Co. | 2.050% | 3/5/30 | 3,000 | 2,577 | ||
| 7 | Cargo Aircraft Management Inc. | 4.750% | 2/1/28 | 1,564 | 1,427 | |
| Carrier Global Corp. | 2.722% | 2/15/30 | 21,000 | 18,745 | ||
| 7 | Carrier Global Corp. | 5.900% | 3/15/34 | 17,570 | 18,777 | |
| 7 | Chart Industries Inc. | 7.500% | 1/1/30 | 385 | 396 | |
| 7 | Chart Industries Inc. | 9.500% | 1/1/31 | 276 | 295 | |
| CSX Corp. | 2.400% | 2/15/30 | 8,663 | 7,665 | ||
| CSX Corp. | 4.100% | 11/15/32 | 30,000 | 28,691 | ||
| 7 | Daimler Truck Finance North America LLC | 5.500% | 9/20/33 | 21,530 | 22,091 | |
| Deere & Co. | 3.100% | 4/15/30 | 2,000 | 1,849 | ||
| Delta Air Lines Inc. | 2.900% | 10/28/24 | 1,255 | 1,228 | ||
| Delta Air Lines Inc. | 3.750% | 10/28/29 | 1,429 | 1,313 | ||
| Dover Corp. | 2.950% | 11/4/29 | 3,000 | 2,705 | ||
| Eaton Corp. | 4.150% | 3/15/33 | 50,000 | 48,169 | ||
| 7 | Embraer Netherlands Finance BV | 7.000% | 7/28/30 | 4,000 | 4,201 | |
| 7 | Emerald Debt Merger Sub LLC | 6.625% | 12/15/30 | 1,175 | 1,187 | |
| Emerson Electric Co. | 2.200% | 12/21/31 | 17,775 | 15,086 | ||
| FedEx Corp. | 3.100% | 8/5/29 | 12,359 | 11,410 | ||
| FedEx Corp. | 2.400% | 5/15/31 | 32,544 | 27,719 | ||
| 7 | Gates Global LLC / Gates Corp. | 6.250% | 1/15/26 | 639 | 639 | |
| GE Capital Funding LLC | 4.550% | 5/15/32 | 12,131 | 11,850 | ||
| General Dynamics Corp. | 3.625% | 4/1/30 | 13,207 | 12,561 | ||
| 8 | Heathrow Funding Ltd. | 1.125% | 10/8/32 | 8,900 | 8,238 | |
| 8 | Heathrow Funding Ltd. | 1.875% | 3/14/36 | 4,500 | 4,087 | |
| Honeywell International Inc. | 1.950% | 6/1/30 | 5,224 | 4,500 | ||
| Honeywell International Inc. | 1.750% | 9/1/31 | 19,142 | 15,753 | ||
| Honeywell International Inc. | 5.000% | 2/15/33 | 42,975 | 44,257 | ||
| Hubbell Inc. | 2.300% | 3/15/31 | 15,000 | 12,597 | ||
| Huntington Ingalls Industries Inc. | 4.200% | 5/1/30 | 14,053 | 13,424 | ||
| 7 | Husky Injection Molding Systems Ltd. / Titan Co.-Borrower LLC | 9.000% | 2/15/29 | 295 | 295 | |
| Ingersoll Rand Inc. | 5.700% | 8/14/33 | 20,000 | 20,914 | ||
| Jacobs Engineering Group Inc. | 5.900% | 3/1/33 | 11,580 | 11,793 | ||
| John Deere Capital Corp. | 4.700% | 6/10/30 | 15,000 | 15,168 | ||
| John Deere Capital Corp. | 5.150% | 9/8/33 | 19,280 | 20,034 | ||
| L3Harris Technologies Inc. | 2.900% | 12/15/29 | 7,831 | 7,072 | ||
| L3Harris Technologies Inc. | 1.800% | 1/15/31 | 14,540 | 11,938 | ||
| L3Harris Technologies Inc. | 5.400% | 7/31/33 | 52,985 | 54,528 | ||
| Lockheed Martin Corp. | 1.850% | 6/15/30 | 7,138 | 6,107 | ||
| Lockheed Martin Corp. | 5.250% | 1/15/33 | 13,340 | 13,947 | ||
| Lockheed Martin Corp. | 4.800% | 8/15/34 | 30,000 | 30,229 | ||
| 11 | Lonsdale Finance Pty Ltd. | 2.100% | 10/15/27 | 32,000 | 18,922 | |
| Coupon | Maturity Date | Face Amount ($000) | Market Value• ($000) | |||
| 8 | Motability Operations Group plc | 3.500% | 7/17/31 | 7,200 | 7,882 | |
| 9 | Motability Operations Group plc | 2.375% | 7/3/39 | 500 | 451 | |
| 9 | Motability Operations Group plc | 4.875% | 1/17/43 | 1,800 | 2,173 | |
| Norfolk Southern Corp. | 2.550% | 11/1/29 | 7,509 | 6,737 | ||
| Norfolk Southern Corp. | 2.300% | 5/15/31 | 10,000 | 8,520 | ||
| Northrop Grumman Corp. | 4.400% | 5/1/30 | 31,630 | 31,245 | ||
| Northrop Grumman Corp. | 4.700% | 3/15/33 | 25,740 | 25,599 | ||
| Northrop Grumman Corp. | 4.900% | 6/1/34 | 30,000 | 30,190 | ||
| Otis Worldwide Corp. | 2.565% | 2/15/30 | 28,769 | 25,455 | ||
| 11 | Pacific National Finance Pty Ltd. | 5.400% | 5/12/27 | 22,860 | 14,575 | |
| 11 | Pacific National Finance Pty Ltd. | 3.700% | 9/24/29 | 18,940 | 10,744 | |
| Parker-Hannifin Corp. | 3.250% | 6/14/29 | 3,000 | 2,809 | ||
| Parker-Hannifin Corp. | 4.500% | 9/15/29 | 25,000 | 24,989 | ||
| 11 | Qantas Airways Ltd. | 4.750% | 10/12/26 | 32,930 | 21,407 | |
| 11 | Qantas Airways Ltd. | 3.150% | 9/27/28 | 20,500 | 12,186 | |
| 11 | Qantas Airways Ltd. | 2.950% | 11/27/29 | 4,270 | 2,413 | |
| Quanta Services Inc. | 2.900% | 10/1/30 | 8,400 | 7,369 | ||
| Quanta Services Inc. | 2.350% | 1/15/32 | 7,000 | 5,702 | ||
| 7 | Regal Rexnord Corp. | 6.400% | 4/15/33 | 6,750 | 7,003 | |
| Republic Services Inc. | 1.450% | 2/15/31 | 10,000 | 8,028 | ||
| Republic Services Inc. | 1.750% | 2/15/32 | 12,620 | 10,121 | ||
| Republic Services Inc. | 5.000% | 4/1/34 | 10,250 | 10,361 | ||
| Rockwell Automation Inc. | 1.750% | 8/15/31 | 7,500 | 6,157 | ||
| 7 | Roller Bearing Co. of America Inc. | 4.375% | 10/15/29 | 745 | 685 | |
| 7 | Rolls-Royce plc | 3.625% | 10/14/25 | 392 | 378 | |
| 7 | Rolls-Royce plc | 5.750% | 10/15/27 | 1,974 | 1,970 | |
| RTX Corp. | 2.250% | 7/1/30 | 38,811 | 33,537 | ||
| RTX Corp. | 6.000% | 3/15/31 | 50,000 | 53,139 | ||
| RTX Corp. | 1.900% | 9/1/31 | 47,566 | 38,618 | ||
| RTX Corp. | 2.375% | 3/15/32 | 15,351 | 12,759 | ||
| RTX Corp. | 5.150% | 2/27/33 | 51,088 | 51,786 | ||
| RTX Corp. | 6.100% | 3/15/34 | 10,000 | 10,855 | ||
| Ryder System Inc. | 6.600% | 12/1/33 | 39,914 | 43,565 | ||
| Southwest Airlines Co. | 7.375% | 3/1/27 | 4,930 | 5,186 | ||
| Southwest Airlines Co. | 2.625% | 2/10/30 | 39,303 | 34,487 | ||
| 7 | Spirit AeroSystems Inc. | 9.375% | 11/30/29 | 1,007 | 1,091 | |
| 7 | Spirit AeroSystems Inc. | 9.750% | 11/15/30 | 1,153 | 1,209 | |
| 7 | TopBuild Corp. | 3.625% | 3/15/29 | 628 | 570 | |
| 7 | TopBuild Corp. | 4.125% | 2/15/32 | 1,494 | 1,311 | |
| 7 | TransDigm Inc. | 6.250% | 3/15/26 | 3,889 | 3,868 | |
| 7 | TransDigm Inc. | 6.750% | 8/15/28 | 745 | 757 | |
| 7 | TransDigm Inc. | 6.875% | 12/15/30 | 1,225 | 1,259 | |
| 7 | TransDigm Inc. | 7.125% | 12/1/31 | 1,638 | 1,708 | |
| Trimble Inc. | 6.100% | 3/15/33 | 5,500 | 5,793 | ||
| Triton Container International Ltd. / TAL International Container Corp. | 3.250% | 3/15/32 | 3,930 | 3,194 | ||
| 7 | Triumph Group Inc. | 9.000% | 3/15/28 | 983 | 1,038 | |
| Union Pacific Corp. | 2.400% | 2/5/30 | 35,200 | 31,213 | ||
| Union Pacific Corp. | 2.800% | 2/14/32 | 13,000 | 11,419 | ||
| 7 | United Airlines Inc. | 4.375% | 4/15/26 | 6,300 | 6,083 | |
| 7 | United Airlines Inc. | 4.625% | 4/15/29 | 4,865 | 4,506 | |
| Waste Management Inc. | 4.625% | 2/15/30 | 22,000 | 22,059 | ||
| Waste Management Inc. | 1.500% | 3/15/31 | 37,356 | 30,225 | ||
| Waste Management Inc. | 4.150% | 4/15/32 | 10,000 | 9,633 | ||
| Waste Management Inc. | 4.625% | 2/15/33 | 4,856 | 4,814 | ||
| 11 | WestConnex Finance Co. Pty Ltd. | 3.150% | 3/31/31 | 30,000 | 16,792 | |
| 7 | Williams Scotsman Inc. | 7.375% | 10/1/31 | 245 | 257 | |
| 1,636,298 | ||||||
| Coupon | Maturity Date | Face Amount ($000) | Market Value• ($000) | |||
| Materials (2.4%) | ||||||
| 7 | Advanced Drainage Systems Inc. | 6.375% | 6/15/30 | 645 | 650 | |
| Amcor Flexibles North America Inc. | 2.690% | 5/25/31 | 20,000 | 17,183 | ||
| ArcelorMittal SA | 4.250% | 7/16/29 | 10,000 | 9,619 | ||
| 7 | Ardagh Metal Packaging Finance USA LLC / Ardagh Metal Packaging Finance plc | 4.000% | 9/1/29 | 1,050 | 854 | |
| 7 | Ardagh Packaging Finance plc / Ardagh Holdings USA Inc. | 5.250% | 4/30/25 | 954 | 933 | |
| 7 | Arsenal AIC Parent LLC | 8.000% | 10/1/30 | 610 | 638 | |
| 7 | ASP Unifrax Holdings Inc. | 5.250% | 9/30/28 | 2,342 | 1,520 | |
| 7 | Axalta Coating Systems Dutch Holding B BV | 7.250% | 2/15/31 | 338 | 352 | |
| Ball Corp. | 2.875% | 8/15/30 | 1,725 | 1,475 | ||
| Ball Corp. | 3.125% | 9/15/31 | 2,270 | 1,921 | ||
| BHP Billiton Finance USA Ltd. | 5.250% | 9/8/30 | 20,000 | 20,584 | ||
| BHP Billiton Finance USA Ltd. | 4.900% | 2/28/33 | 40,000 | 40,435 | ||
| BHP Billiton Finance USA Ltd. | 5.250% | 9/8/33 | 15,000 | 15,398 | ||
| 7 | Big River Steel LLC / BRS Finance Corp. | 6.625% | 1/31/29 | 2,801 | 2,833 | |
| Braskem Netherlands Finance BV | 5.875% | 1/31/50 | 10,000 | 7,048 | ||
| 7 | Canpack SA / Canpack US LLC | 3.875% | 11/15/29 | 5,823 | 5,129 | |
| Celanese US Holdings LLC | 6.550% | 11/15/30 | 25,000 | 26,435 | ||
| Celanese US Holdings LLC | 6.700% | 11/15/33 | 15,000 | 16,113 | ||
| 7 | Chemours Co. | 4.625% | 11/15/29 | 4,943 | 4,324 | |
| 7 | Corp. Nacional del Cobre de Chile | 5.950% | 1/8/34 | 5,150 | 5,163 | |
| Dow Chemical Co. | 2.100% | 11/15/30 | 44,000 | 37,451 | ||
| Dow Chemical Co. | 6.300% | 3/15/33 | 8,000 | 8,776 | ||
| Eastman Chemical Co. | 5.750% | 3/8/33 | 15,000 | 15,421 | ||
| Ecolab Inc. | 1.300% | 1/30/31 | 21,853 | 17,575 | ||
| 7 | Element Solutions Inc. | 3.875% | 9/1/28 | 1,913 | 1,749 | |
| FMC Corp. | 3.450% | 10/1/29 | 8,000 | 7,246 | ||
| FMC Corp. | 5.650% | 5/18/33 | 19,940 | 19,830 | ||
| Freeport-McMoRan Inc. | 5.250% | 9/1/29 | 22,881 | 22,966 | ||
| Freeport-McMoRan Inc. | 4.250% | 3/1/30 | 12,603 | 11,844 | ||
| Freeport-McMoRan Inc. | 4.625% | 8/1/30 | 5,933 | 5,733 | ||
| 7 | Georgia-Pacific LLC | 2.300% | 4/30/30 | 33,445 | 28,891 | |
| 7 | Graphic Packaging International LLC | 3.500% | 3/15/28 | 2,015 | 1,873 | |
| 7 | Graphic Packaging International LLC | 3.750% | 2/1/30 | 205 | 184 | |
| 7 | Hudbay Minerals Inc. | 4.500% | 4/1/26 | 4,465 | 4,327 | |
| 7 | Inversiones CMPC SA | 6.125% | 6/23/33 | 15,644 | 15,866 | |
| 7 | Kaiser Aluminum Corp. | 4.500% | 6/1/31 | 2,933 | 2,507 | |
| 8 | Linde plc | 1.625% | 3/31/35 | 10,600 | 9,719 | |
| LYB International Finance III LLC | 2.250% | 10/1/30 | 5,000 | 4,253 | ||
| LYB International Finance III LLC | 5.625% | 5/15/33 | 12,000 | 12,459 | ||
| Martin Marietta Materials Inc. | 2.400% | 7/15/31 | 25,000 | 21,101 | ||
| Newmont Corp. | 2.800% | 10/1/29 | 32,675 | 29,610 | ||
| Newmont Corp. | 2.250% | 10/1/30 | 37,770 | 32,360 | ||
| 7 | NOVA Chemicals Corp. | 8.500% | 11/15/28 | 265 | 278 | |
| 7 | Novelis Corp. | 4.750% | 1/30/30 | 953 | 884 | |
| 7 | Novelis Corp. | 3.875% | 8/15/31 | 2,415 | 2,096 | |
| Nucor Corp. | 2.700% | 6/1/30 | 15,060 | 13,583 | ||
| Nucor Corp. | 3.125% | 4/1/32 | 15,620 | 13,922 | ||
| Nutrien Ltd. | 4.200% | 4/1/29 | 17,656 | 17,277 | ||
| Coupon | Maturity Date | Face Amount ($000) | Market Value• ($000) | |||
| Nutrien Ltd. | 2.950% | 5/13/30 | 26,207 | 23,576 | ||
| 7 | Olympus Water US Holding Corp. | 4.250% | 10/1/28 | 405 | 370 | |
| 7 | Olympus Water US Holding Corp. | 9.750% | 11/15/28 | 2,320 | 2,461 | |
| 7 | Owens-Brockway Glass Container Inc. | 7.250% | 5/15/31 | 435 | 438 | |
| Packaging Corp. of America | 3.000% | 12/15/29 | 13,000 | 11,784 | ||
| 7 | Pactiv Evergreen Group Issuer LLC / Pactiv Evergreen Group Issuer Inc. | 4.375% | 10/15/28 | 1,635 | 1,525 | |
| PPG Industries Inc. | 2.800% | 8/15/29 | 11,000 | 10,030 | ||
| PPG Industries Inc. | 2.550% | 6/15/30 | 9,435 | 8,234 | ||
| Rio Tinto Finance USA plc | 5.000% | 3/9/33 | 30,000 | 30,756 | ||
| RPM International Inc. | 4.550% | 3/1/29 | 17,250 | 16,897 | ||
| RPM International Inc. | 2.950% | 1/15/32 | 3,415 | 2,918 | ||
| 7 | Sealed Air Corp. | 6.125% | 2/1/28 | 233 | 234 | |
| 7 | Sealed Air Corp. | 5.000% | 4/15/29 | 511 | 493 | |
| 7 | Sealed Air Corp. | 7.250% | 2/15/31 | 520 | 545 | |
| Sherwin-Williams Co. | 2.950% | 8/15/29 | 12,106 | 11,070 | ||
| Sherwin-Williams Co. | 2.300% | 5/15/30 | 20,563 | 17,891 | ||
| Sherwin-Williams Co. | 2.200% | 3/15/32 | 8,193 | 6,770 | ||
| 7 | SNF Group SACA | 3.125% | 3/15/27 | 1,093 | 1,011 | |
| 7 | SNF Group SACA | 3.375% | 3/15/30 | 2,925 | 2,508 | |
| 7 | Sociedad Quimica y Minera de Chile SA | 6.500% | 11/7/33 | 15,000 | 15,514 | |
| Steel Dynamics Inc. | 3.450% | 4/15/30 | 27,891 | 25,704 | ||
| Steel Dynamics Inc. | 3.250% | 1/15/31 | 2,950 | 2,654 | ||
| 7 | Summit Materials LLC / Summit Materials Finance Corp. | 7.250% | 1/15/31 | 305 | 317 | |
| Vale Overseas Ltd. | 3.750% | 7/8/30 | 5,000 | 4,536 | ||
| Vale Overseas Ltd. | 6.125% | 6/12/33 | 24,355 | 24,900 | ||
| 7 | WR Grace Holdings LLC | 5.625% | 8/15/29 | 418 | 369 | |
| 7 | WR Grace Holdings LLC | 7.375% | 3/1/31 | 340 | 346 | |
| WRKCo Inc. | 4.900% | 3/15/29 | 12,000 | 12,051 | ||
| 774,290 | ||||||
| Real Estate (5.6%) | ||||||
| Agree LP | 2.900% | 10/1/30 | 6,500 | 5,619 | ||
| Agree LP | 4.800% | 10/1/32 | 7,000 | 6,649 | ||
| Agree LP | 2.600% | 6/15/33 | 6,435 | 5,099 | ||
| Alexandria Real Estate Equities Inc. | 2.750% | 12/15/29 | 27,005 | 23,890 | ||
| Alexandria Real Estate Equities Inc. | 4.900% | 12/15/30 | 20,060 | 19,869 | ||
| Alexandria Real Estate Equities Inc. | 3.375% | 8/15/31 | 12,881 | 11,530 | ||
| Alexandria Real Estate Equities Inc. | 2.000% | 5/18/32 | 12,233 | 9,687 | ||
| Alexandria Real Estate Equities Inc. | 1.875% | 2/1/33 | 5,000 | 3,852 | ||
| American Assets Trust LP | 3.375% | 2/1/31 | 11,292 | 9,347 | ||
| American Homes 4 Rent LP | 2.375% | 7/15/31 | 10,000 | 8,213 | ||
| American Homes 4 Rent LP | 3.625% | 4/15/32 | 5,000 | 4,454 | ||
| American Homes 4 Rent LP | 5.500% | 2/1/34 | 10,000 | 10,106 | ||
| American Tower Corp. | 3.950% | 3/15/29 | 9,000 | 8,599 | ||
| American Tower Corp. | 3.800% | 8/15/29 | 41,188 | 38,884 | ||
| American Tower Corp. | 2.900% | 1/15/30 | 25,100 | 22,338 | ||
| American Tower Corp. | 2.100% | 6/15/30 | 14,909 | 12,517 | ||
| American Tower Corp. | 2.700% | 4/15/31 | 20,000 | 17,117 | ||
| American Tower Corp. | 2.300% | 9/15/31 | 10,000 | 8,257 | ||
| American Tower Corp. | 5.550% | 7/15/33 | 15,000 | 15,381 | ||
| 8 | ATF Netherlands BV | 7.078% | Perpetual | 2,300 | 1,387 | |
| Coupon | Maturity Date | Face Amount ($000) | Market Value• ($000) | |||
| AvalonBay Communities Inc. | 3.300% | 6/1/29 | 5,000 | 4,681 | ||
| AvalonBay Communities Inc. | 2.300% | 3/1/30 | 14,752 | 12,879 | ||
| AvalonBay Communities Inc. | 2.450% | 1/15/31 | 5,000 | 4,317 | ||
| AvalonBay Communities Inc. | 5.000% | 2/15/33 | 6,700 | 6,768 | ||
| AvalonBay Communities Inc. | 5.300% | 12/7/33 | 10,000 | 10,276 | ||
| 8 | Blackstone Property Partners Europe Holdings Sarl | 3.625% | 10/29/29 | 2,200 | 2,250 | |
| Boston Properties LP | 3.400% | 6/21/29 | 3,000 | 2,690 | ||
| Boston Properties LP | 2.900% | 3/15/30 | 11,000 | 9,463 | ||
| Boston Properties LP | 3.250% | 1/30/31 | 29,185 | 25,083 | ||
| Boston Properties LP | 2.550% | 4/1/32 | 17,155 | 13,658 | ||
| Boston Properties LP | 2.450% | 10/1/33 | 3,000 | 2,278 | ||
| Boston Properties LP | 6.500% | 1/15/34 | 24,000 | 25,092 | ||
| Brixmor Operating Partnership LP | 4.125% | 5/15/29 | 8,000 | 7,591 | ||
| Brixmor Operating Partnership LP | 4.050% | 7/1/30 | 16,218 | 15,164 | ||
| Brixmor Operating Partnership LP | 2.500% | 8/16/31 | 20,000 | 16,647 | ||
| Brixmor Operating Partnership LP | 5.500% | 2/15/34 | 23,000 | 23,052 | ||
| Camden Property Trust | 4.900% | 1/15/34 | 10,000 | 9,853 | ||
| Corporate Office Properties LP | 2.750% | 4/15/31 | 27,226 | 22,231 | ||
| Crown Castle Inc. | 3.100% | 11/15/29 | 20,966 | 18,779 | ||
| Crown Castle Inc. | 2.250% | 1/15/31 | 13,715 | 11,317 | ||
| Crown Castle Inc. | 2.100% | 4/1/31 | 3,000 | 2,442 | ||
| 8 | CTP NV | 1.250% | 6/21/29 | 2,000 | 1,824 | |
| CubeSmart LP | 2.000% | 2/15/31 | 21,804 | 17,769 | ||
| 8 | Digital Dutch Finco BV | 1.000% | 1/15/32 | 2,400 | 2,051 | |
| Digital Realty Trust LP | 3.600% | 7/1/29 | 29,880 | 27,999 | ||
| Equinix Inc. | 3.200% | 11/18/29 | 13,614 | 12,433 | ||
| Equinix Inc. | 2.150% | 7/15/30 | 10,000 | 8,445 | ||
| Equinix Inc. | 2.500% | 5/15/31 | 10,000 | 8,494 | ||
| Equinix Inc. | 3.900% | 4/15/32 | 3,740 | 3,460 | ||
| ERP Operating LP | 3.000% | 7/1/29 | 7,000 | 6,443 | ||
| ERP Operating LP | 2.500% | 2/15/30 | 11,000 | 9,748 | ||
| ERP Operating LP | 1.850% | 8/1/31 | 1,251 | 1,028 | ||
| Essential Properties LP | 2.950% | 7/15/31 | 20,000 | 15,910 | ||
| Essex Portfolio LP | 3.000% | 1/15/30 | 10,000 | 8,924 | ||
| Essex Portfolio LP | 1.650% | 1/15/31 | 7,533 | 5,970 | ||
| Essex Portfolio LP | 2.550% | 6/15/31 | 1,900 | 1,594 | ||
| Extra Space Storage LP | 3.900% | 4/1/29 | 15,000 | 14,183 | ||
| Extra Space Storage LP | 4.000% | 6/15/29 | 10,525 | 9,975 | ||
| Extra Space Storage LP | 5.500% | 7/1/30 | 7,590 | 7,742 | ||
| Extra Space Storage LP | 2.200% | 10/15/30 | 7,000 | 5,807 | ||
| Extra Space Storage LP | 5.900% | 1/15/31 | 35,540 | 36,880 | ||
| Extra Space Storage LP | 2.550% | 6/1/31 | 20,485 | 17,093 | ||
| Extra Space Storage LP | 2.400% | 10/15/31 | 13,000 | 10,656 | ||
| Extra Space Storage LP | 2.350% | 3/15/32 | 34,196 | 27,664 | ||
| Extra Space Storage LP | 5.400% | 2/1/34 | 25,000 | 25,011 | ||
| Federal Realty OP LP | 3.200% | 6/15/29 | 10,000 | 9,086 | ||
| Federal Realty OP LP | 3.500% | 6/1/30 | 1,990 | 1,820 | ||
| Healthcare Realty Holdings LP | 3.100% | 2/15/30 | 501 | 439 | ||
| Healthcare Realty Holdings LP | 2.400% | 3/15/30 | 1,000 | 818 | ||
| Healthcare Realty Holdings LP | 2.000% | 3/15/31 | 28,349 | 22,642 | ||
| Healthpeak OP LLC | 3.500% | 7/15/29 | 16,479 | 15,365 | ||
| Healthpeak OP LLC | 3.000% | 1/15/30 | 14,900 | 13,311 | ||
| Healthpeak OP LLC | 2.875% | 1/15/31 | 18,507 | 16,044 | ||
| Healthpeak OP LLC | 5.250% | 12/15/32 | 25,355 | 25,390 | ||
| Coupon | Maturity Date | Face Amount ($000) | Market Value• ($000) | |||
| Highwoods Realty LP | 4.200% | 4/15/29 | 10,406 | 9,572 | ||
| Highwoods Realty LP | 3.050% | 2/15/30 | 18,362 | 15,494 | ||
| Highwoods Realty LP | 2.600% | 2/1/31 | 4,161 | 3,310 | ||
| Highwoods Realty LP | 7.650% | 2/1/34 | 56,348 | 62,051 | ||
| Host Hotels & Resorts LP | 3.375% | 12/15/29 | 3,252 | 2,922 | ||
| Host Hotels & Resorts LP | 3.500% | 9/15/30 | 11,023 | 9,912 | ||
| Host Hotels & Resorts LP | 2.900% | 12/15/31 | 16,025 | 13,467 | ||
| Invitation Homes Operating Partnership LP | 2.000% | 8/15/31 | 4,000 | 3,167 | ||
| Invitation Homes Operating Partnership LP | 4.150% | 4/15/32 | 10,000 | 9,186 | ||
| Kilroy Realty LP | 4.250% | 8/15/29 | 3,500 | 3,279 | ||
| Kilroy Realty LP | 3.050% | 2/15/30 | 31,759 | 27,257 | ||
| Kilroy Realty LP | 2.500% | 11/15/32 | 20,200 | 15,433 | ||
| Kilroy Realty LP | 6.250% | 1/15/36 | 16,220 | 16,215 | ||
| Kimco Realty OP LLC | 2.700% | 10/1/30 | 11,343 | 9,845 | ||
| Kimco Realty OP LLC | 2.250% | 12/1/31 | 10,000 | 8,136 | ||
| Kimco Realty OP LLC | 3.200% | 4/1/32 | 2,657 | 2,309 | ||
| Kite Realty Group LP | 5.500% | 3/1/34 | 20,000 | 19,940 | ||
| LXP Industrial Trust | 2.375% | 10/1/31 | 5,000 | 4,024 | ||
| Mid-America Apartments LP | 2.750% | 3/15/30 | 4,800 | 4,276 | ||
| Mid-America Apartments LP | 1.700% | 2/15/31 | 1,900 | 1,544 | ||
| Mid-America Apartments LP | 5.000% | 3/15/34 | 22,150 | 22,142 | ||
| MPT Operating Partnership LP / MPT Finance Corp. | 3.500% | 3/15/31 | 3,512 | 2,160 | ||
| NNN REIT Inc. | 2.500% | 4/15/30 | 13,948 | 12,035 | ||
| NNN REIT Inc. | 5.600% | 10/15/33 | 19,950 | 20,408 | ||
| Omega Healthcare Investors Inc. | 3.625% | 10/1/29 | 10,000 | 8,917 | ||
| Omega Healthcare Investors Inc. | 3.375% | 2/1/31 | 7,198 | 6,133 | ||
| Omega Healthcare Investors Inc. | 3.250% | 4/15/33 | 16,900 | 13,599 | ||
| 7 | Ontario Teachers' Cadillac Fairview Properties Trust | 3.875% | 3/20/27 | 7,000 | 6,645 | |
| 7 | Ontario Teachers' Cadillac Fairview Properties Trust | 4.125% | 2/1/29 | 11,900 | 11,148 | |
| Phillips Edison Grocery Center Operating Partnership I LP | 2.625% | 11/15/31 | 20,000 | 16,348 | ||
| Physicians Realty LP | 2.625% | 11/1/31 | 20,000 | 16,478 | ||
| Prologis LP | 2.875% | 11/15/29 | 5,000 | 4,556 | ||
| Prologis LP | 2.250% | 4/15/30 | 14,022 | 12,245 | ||
| Prologis LP | 1.250% | 10/15/30 | 10,000 | 8,083 | ||
| Prologis LP | 1.750% | 2/1/31 | 7,266 | 5,986 | ||
| Prologis LP | 2.250% | 1/15/32 | 9,320 | 7,758 | ||
| Prologis LP | 4.625% | 1/15/33 | 8,324 | 8,205 | ||
| Prologis LP | 5.125% | 1/15/34 | 15,000 | 15,240 | ||
| Prologis LP | 5.000% | 3/15/34 | 49,850 | 50,090 | ||
| 8 | Public Storage Operating Co. | 0.500% | 9/9/30 | 4,235 | 3,752 | |
| Public Storage Operating Co. | 2.300% | 5/1/31 | 10,830 | 9,277 | ||
| Public Storage Operating Co. | 2.250% | 11/9/31 | 18,742 | 15,766 | ||
| Public Storage Operating Co. | 5.100% | 8/1/33 | 12,500 | 12,715 | ||
| Realty Income Corp. | 2.100% | 3/15/28 | 10,000 | 8,985 | ||
| Realty Income Corp. | 3.250% | 6/15/29 | 3,200 | 2,973 | ||
| Realty Income Corp. | 4.000% | 7/15/29 | 5,000 | 4,797 | ||
| Realty Income Corp. | 3.100% | 12/15/29 | 21,990 | 20,088 | ||
| Realty Income Corp. | 3.400% | 1/15/30 | 3,421 | 3,142 | ||
| Realty Income Corp. | 4.850% | 3/15/30 | 29,715 | 29,700 | ||
| Coupon | Maturity Date | Face Amount ($000) | Market Value• ($000) | |||
| 8 | Realty Income Corp. | 4.875% | 7/6/30 | 2,181 | 2,491 | |
| Realty Income Corp. | 3.250% | 1/15/31 | 15,607 | 14,077 | ||
| Realty Income Corp. | 2.700% | 2/15/32 | 10,000 | 8,373 | ||
| Realty Income Corp. | 5.625% | 10/13/32 | 15,000 | 15,515 | ||
| Realty Income Corp. | 5.125% | 2/15/34 | 14,600 | 14,477 | ||
| Regency Centers LP | 2.950% | 9/15/29 | 9,841 | 8,861 | ||
| Regency Centers LP | 3.700% | 6/15/30 | 32,008 | 29,672 | ||
| Regency Centers LP | 5.250% | 1/15/34 | 26,600 | 26,638 | ||
| Rexford Industrial Realty LP | 2.125% | 12/1/30 | 5,488 | 4,510 | ||
| Rexford Industrial Realty LP | 2.150% | 9/1/31 | 17,430 | 14,028 | ||
| Sabra Health Care LP | 3.200% | 12/1/31 | 42,064 | 34,342 | ||
| SBA Communications Corp. | 3.125% | 2/1/29 | 1,845 | 1,644 | ||
| Simon Property Group LP | 2.650% | 7/15/30 | 17,630 | 15,586 | ||
| Simon Property Group LP | 2.200% | 2/1/31 | 5,999 | 5,025 | ||
| Simon Property Group LP | 2.250% | 1/15/32 | 10,000 | 8,257 | ||
| STORE Capital Corp. | 2.750% | 11/18/30 | 7,294 | 5,763 | ||
| Sun Communities Operating LP | 2.700% | 7/15/31 | 10,000 | 8,301 | ||
| Sun Communities Operating LP | 4.200% | 4/15/32 | 7,079 | 6,433 | ||
| Tanger Properties LP | 2.750% | 9/1/31 | 12,000 | 9,820 | ||
| UDR Inc. | 3.200% | 1/15/30 | 4,882 | 4,433 | ||
| UDR Inc. | 3.000% | 8/15/31 | 7,660 | 6,671 | ||
| UDR Inc. | 2.100% | 6/15/33 | 4,773 | 3,676 | ||
| Ventas Realty LP | 3.000% | 1/15/30 | 2,877 | 2,554 | ||
| Ventas Realty LP | 4.750% | 11/15/30 | 3,000 | 2,931 | ||
| Ventas Realty LP | 2.500% | 9/1/31 | 6,000 | 4,933 | ||
| Welltower OP LLC | 3.100% | 1/15/30 | 19,120 | 17,315 | ||
| Welltower OP LLC | 2.750% | 1/15/32 | 7,000 | 5,936 | ||
| Welltower OP LLC | 3.850% | 6/15/32 | 11,104 | 10,174 | ||
| 9 | Westfield America Management Ltd. | 2.625% | 3/30/29 | 2,537 | 2,788 | |
| Weyerhaeuser Co. | 4.000% | 11/15/29 | 19,017 | 18,071 | ||
| WP Carey Inc. | 2.450% | 2/1/32 | 10,000 | 8,147 | ||
| 1,803,476 | ||||||
| Technology (5.5%) | ||||||
| Analog Devices Inc. | 2.100% | 10/1/31 | 15,970 | 13,493 | ||
| 8 | Apple Inc. | 1.375% | 5/24/29 | 1,000 | 1,014 | |
| Block Inc. | 3.500% | 6/1/31 | 285 | 246 | ||
| Broadcom Inc. | 4.750% | 4/15/29 | 35,843 | 35,839 | ||
| Broadcom Inc. | 5.000% | 4/15/30 | 37,571 | 38,122 | ||
| Broadcom Inc. | 4.150% | 11/15/30 | 20,850 | 19,888 | ||
| 7 | Broadcom Inc. | 2.450% | 2/15/31 | 79,537 | 67,585 | |
| 7 | Broadcom Inc. | 4.150% | 4/15/32 | 54,650 | 51,428 | |
| Broadcom Inc. | 4.300% | 11/15/32 | 35,806 | 34,028 | ||
| 7 | Broadcom Inc. | 2.600% | 2/15/33 | 15,000 | 12,329 | |
| 7 | Broadcom Inc. | 3.419% | 4/15/33 | 56,315 | 49,408 | |
| 7 | Cloud Software Group Inc. | 6.500% | 3/31/29 | 275 | 257 | |
| 7 | CommScope Inc. | 7.125% | 7/1/28 | 2,517 | 1,093 | |
| Dell International LLC / EMC Corp. | 5.300% | 10/1/29 | 5,000 | 5,122 | ||
| Dell International LLC / EMC Corp. | 6.200% | 7/15/30 | 41,995 | 44,733 | ||
| Dell International LLC / EMC Corp. | 5.750% | 2/1/33 | 13,126 | 13,759 | ||
| 7 | Entegris Escrow Corp. | 4.750% | 4/15/29 | 24,932 | 23,841 | |
| 7 | Entegris Escrow Corp. | 5.950% | 6/15/30 | 5,945 | 5,870 | |
| Equifax Inc. | 3.100% | 5/15/30 | 17,000 | 15,269 | ||
| Equifax Inc. | 2.350% | 9/15/31 | 10,000 | 8,298 | ||
| Fidelity National Information Services Inc. | 3.750% | 5/21/29 | 3,000 | 2,900 | ||
| Fidelity National Information Services Inc. | 2.250% | 3/1/31 | 19,692 | 16,606 | ||
| Coupon | Maturity Date | Face Amount ($000) | Market Value• ($000) | |||
| Fiserv Inc. | 3.500% | 7/1/29 | 55,450 | 51,958 | ||
| Fiserv Inc. | 2.650% | 6/1/30 | 36,950 | 32,477 | ||
| Fiserv Inc. | 5.625% | 8/21/33 | 20,000 | 20,821 | ||
| Global Payments Inc. | 3.200% | 8/15/29 | 9,480 | 8,587 | ||
| Global Payments Inc. | 2.900% | 5/15/30 | 11,675 | 10,261 | ||
| Global Payments Inc. | 2.900% | 11/15/31 | 35,000 | 29,805 | ||
| Global Payments Inc. | 5.400% | 8/15/32 | 5,000 | 5,046 | ||
| 7 | GTCR W-2 Merger Sub LLC | 7.500% | 1/15/31 | 443 | 462 | |
| HP Inc. | 4.000% | 4/15/29 | 28,960 | 27,978 | ||
| HP Inc. | 3.400% | 6/17/30 | 9,725 | 8,874 | ||
| HP Inc. | 2.650% | 6/17/31 | 35,381 | 29,976 | ||
| HP Inc. | 5.500% | 1/15/33 | 38,650 | 39,467 | ||
| 7 | Imola Merger Corp. | 4.750% | 5/15/29 | 2,324 | 2,164 | |
| Intel Corp. | 2.450% | 11/15/29 | 58,413 | 52,264 | ||
| Intel Corp. | 5.125% | 2/10/30 | 48,840 | 50,316 | ||
| Intel Corp. | 3.900% | 3/25/30 | 6,363 | 6,110 | ||
| Intel Corp. | 2.000% | 8/12/31 | 9,300 | 7,740 | ||
| Intel Corp. | 4.150% | 8/5/32 | 10,200 | 9,835 | ||
| Intel Corp. | 5.200% | 2/10/33 | 27,290 | 28,105 | ||
| Intuit Inc. | 5.200% | 9/15/33 | 35,000 | 36,297 | ||
| Juniper Networks Inc. | 3.750% | 8/15/29 | 9,827 | 9,256 | ||
| Juniper Networks Inc. | 2.000% | 12/10/30 | 15,554 | 12,706 | ||
| KLA Corp. | 4.650% | 7/15/32 | 14,510 | 14,575 | ||
| KLA Corp. | 5.250% | 7/15/62 | 5,000 | 5,076 | ||
| Leidos Inc. | 5.750% | 3/15/33 | 17,821 | 18,327 | ||
| 7 | McAfee Corp. | 7.375% | 2/15/30 | 1,549 | 1,403 | |
| Micron Technology Inc. | 6.750% | 11/1/29 | 12,000 | 12,955 | ||
| Micron Technology Inc. | 5.300% | 1/15/31 | 35,000 | 35,374 | ||
| Micron Technology Inc. | 2.703% | 4/15/32 | 34,354 | 28,798 | ||
| Micron Technology Inc. | 5.875% | 2/9/33 | 12,000 | 12,485 | ||
| Motorola Solutions Inc. | 2.750% | 5/24/31 | 25,000 | 21,293 | ||
| NXP BV / NXP Funding LLC / NXP USA Inc. | 4.300% | 6/18/29 | 15,000 | 14,535 | ||
| NXP BV / NXP Funding LLC / NXP USA Inc. | 3.400% | 5/1/30 | 41,815 | 38,206 | ||
| NXP BV / NXP Funding LLC / NXP USA Inc. | 2.500% | 5/11/31 | 30,000 | 25,226 | ||
| NXP BV / NXP Funding LLC / NXP USA Inc. | 2.650% | 2/15/32 | 10,000 | 8,357 | ||
| NXP BV / NXP Funding LLC / NXP USA Inc. | 5.000% | 1/15/33 | 69,030 | 68,082 | ||
| Oracle Corp. | 6.150% | 11/9/29 | 29,535 | 31,488 | ||
| Oracle Corp. | 2.950% | 4/1/30 | 26,231 | 23,591 | ||
| Oracle Corp. | 4.650% | 5/6/30 | 19,010 | 18,808 | ||
| Oracle Corp. | 2.875% | 3/25/31 | 57,257 | 50,370 | ||
| Oracle Corp. | 6.250% | 11/9/32 | 36,667 | 39,543 | ||
| PayPal Holdings Inc. | 2.850% | 10/1/29 | 6,007 | 5,459 | ||
| PayPal Holdings Inc. | 2.300% | 6/1/30 | 17,000 | 14,741 | ||
| PayPal Holdings Inc. | 4.400% | 6/1/32 | 5,000 | 4,917 | ||
| RELX Capital Inc. | 3.000% | 5/22/30 | 8,800 | 8,006 | ||
| Roper Technologies Inc. | 2.000% | 6/30/30 | 18,380 | 15,586 | ||
| S&P Global Inc. | 2.700% | 3/1/29 | 49,410 | 45,450 | ||
| S&P Global Inc. | 2.500% | 12/1/29 | 9,438 | 8,468 | ||
| S&P Global Inc. | 1.250% | 8/15/30 | 6,750 | 5,488 | ||
| S&P Global Inc. | 2.900% | 3/1/32 | 27,147 | 23,846 | ||
| 7 | Seagate HDD Cayman | 8.250% | 12/15/29 | 450 | 484 | |
| 7 | Seagate HDD Cayman | 8.500% | 7/15/31 | 350 | 380 | |
| Skyworks Solutions Inc. | 3.000% | 6/1/31 | 31,290 | 26,709 | ||
| 7 | SS&C Technologies Inc. | 5.500% | 9/30/27 | 1,629 | 1,599 | |
| Teledyne FLIR LLC | 2.500% | 8/1/30 | 14,900 | 12,828 | ||
| Teledyne Technologies Inc. | 2.750% | 4/1/31 | 22,767 | 19,681 | ||
| Texas Instruments Inc. | 3.650% | 8/16/32 | 13,635 | 12,803 | ||
| Coupon | Maturity Date | Face Amount ($000) | Market Value• ($000) | |||
| 7 | UKG Inc. | 6.875% | 2/1/31 | 1,035 | 1,047 | |
| Verisk Analytics Inc. | 4.125% | 3/15/29 | 22,755 | 22,140 | ||
| Verisk Analytics Inc. | 5.750% | 4/1/33 | 10,000 | 10,597 | ||
| VMware LLC | 4.700% | 5/15/30 | 40,665 | 40,014 | ||
| VMware LLC | 2.200% | 8/15/31 | 30,859 | 25,462 | ||
| Workday Inc. | 3.700% | 4/1/29 | 18,140 | 17,288 | ||
| Workday Inc. | 3.800% | 4/1/32 | 25,914 | 24,022 | ||
| 1,757,140 | ||||||
| Utilities (7.2%) | ||||||
| 8 | 2i Rete Gas SpA | 4.375% | 6/6/33 | 2,900 | 3,212 | |
| AEP Texas Inc. | 5.400% | 6/1/33 | 20,330 | 20,713 | ||
| AEP Transmission Co. LLC | 5.400% | 3/15/53 | 14,820 | 15,110 | ||
| 11 | AGI Finance Pty Ltd. | 1.815% | 11/23/28 | 3,390 | 1,910 | |
| 11 | AGI Finance Pty Ltd. | 6.109% | 6/28/30 | 7,180 | 4,882 | |
| 5,11 | AGI Finance Pty Ltd., 3M Australian Bank Bill Rate + 1.000% | 5.139% | 1/8/26 | 7,260 | 4,734 | |
| Alabama Power Co. | 3.050% | 3/15/32 | 3,300 | 2,920 | ||
| Alabama Power Co. | 3.940% | 9/1/32 | 24,000 | 22,573 | ||
| Alabama Power Co. | 5.850% | 11/15/33 | 10,000 | 10,707 | ||
| Ameren Corp. | 3.500% | 1/15/31 | 25,245 | 23,033 | ||
| Ameren Illinois Co. | 1.550% | 11/15/30 | 9,785 | 7,997 | ||
| Ameren Illinois Co. | 3.850% | 9/1/32 | 30,000 | 27,914 | ||
| Ameren Illinois Co. | 4.950% | 6/1/33 | 41,838 | 42,264 | ||
| American Water Capital Corp. | 2.800% | 5/1/30 | 4,000 | 3,582 | ||
| American Water Capital Corp. | 4.450% | 6/1/32 | 5,000 | 4,918 | ||
| Appalachian Power Co. | 4.500% | 8/1/32 | 22,030 | 21,049 | ||
| Atmos Energy Corp. | 5.900% | 11/15/33 | 10,760 | 11,636 | ||
| 11 | AusNet Services Holdings Pty Ltd. | 6.134% | 5/31/33 | 5,000 | 3,377 | |
| Berkshire Hathaway Energy Co. | 3.700% | 7/15/30 | 24,742 | 23,234 | ||
| Berkshire Hathaway Energy Co. | 1.650% | 5/15/31 | 23,079 | 18,558 | ||
| 7 | Calpine Corp. | 5.125% | 3/15/28 | 3,930 | 3,756 | |
| CenterPoint Energy Houston Electric LLC | 2.350% | 4/1/31 | 9,920 | 8,419 | ||
| CenterPoint Energy Houston Electric LLC | 3.000% | 3/1/32 | 12,002 | 10,583 | ||
| CenterPoint Energy Houston Electric LLC | 4.450% | 10/1/32 | 37,034 | 36,144 | ||
| CenterPoint Energy Houston Electric LLC | 4.950% | 4/1/33 | 8,360 | 8,431 | ||
| CenterPoint Energy Inc. | 2.950% | 3/1/30 | 11,305 | 10,108 | ||
| CenterPoint Energy Inc. | 2.650% | 6/1/31 | 22,800 | 19,373 | ||
| CenterPoint Energy Resources Corp. | 1.750% | 10/1/30 | 9,000 | 7,510 | ||
| CenterPoint Energy Resources Corp. | 4.400% | 7/1/32 | 5,000 | 4,821 | ||
| 7,14 | Chile Electricity Lux MPC Sarl | 6.010% | 1/20/33 | 17,734 | 18,167 | |
| 7 | Clearway Energy Operating LLC | 3.750% | 1/15/32 | 149 | 127 | |
| 4 | Comision Federal de Electricidad | 5.000% | 9/29/36 | 6,354 | 5,560 | |
| Commonwealth Edison Co. | 3.150% | 3/15/32 | 11,850 | 10,516 | ||
| Commonwealth Edison Co. | 4.900% | 2/1/33 | 14,705 | 14,787 | ||
| Connecticut Light and Power Co. | 2.050% | 7/1/31 | 3,000 | 2,481 | ||
| Consolidated Edison Co. of New York Inc. | 3.350% | 4/1/30 | 10,000 | 9,320 | ||
| Consumers Energy Co. | 3.600% | 8/15/32 | 4,430 | 4,083 | ||
| Consumers Energy Co. | 4.625% | 5/15/33 | 5,000 | 4,950 | ||
| Consumers Energy Co. | 4.200% | 9/1/52 | 4,690 | 4,038 | ||
| Coupon | Maturity Date | Face Amount ($000) | Market Value• ($000) | |||
| 11 | DBNGP Finance Co. Pty Ltd. | 4.225% | 5/28/25 | 10,550 | 6,826 | |
| Dominion Energy Inc. | 3.375% | 4/1/30 | 33,274 | 30,417 | ||
| Dominion Energy Inc. | 2.250% | 8/15/31 | 5,000 | 4,122 | ||
| Dominion Energy Inc. | 4.350% | 8/15/32 | 11,346 | 10,793 | ||
| Dominion Energy South Carolina Inc. | 2.300% | 12/1/31 | 10,291 | 8,615 | ||
| DTE Electric Co. | 2.250% | 3/1/30 | 30,694 | 26,916 | ||
| DTE Electric Co. | 2.625% | 3/1/31 | 11,500 | 10,071 | ||
| DTE Electric Co. | 3.000% | 3/1/32 | 12,237 | 10,794 | ||
| DTE Electric Co. | 5.200% | 4/1/33 | 15,000 | 15,439 | ||
| DTE Energy Co. | 3.400% | 6/15/29 | 25,883 | 24,104 | ||
| DTE Energy Co. | 2.950% | 3/1/30 | 13,783 | 12,222 | ||
| Duke Energy Carolinas LLC | 2.450% | 8/15/29 | 10,375 | 9,327 | ||
| Duke Energy Carolinas LLC | 2.450% | 2/1/30 | 25,081 | 22,198 | ||
| Duke Energy Carolinas LLC | 2.550% | 4/15/31 | 7,190 | 6,222 | ||
| Duke Energy Carolinas LLC | 2.850% | 3/15/32 | 8,250 | 7,153 | ||
| Duke Energy Carolinas LLC | 4.950% | 1/15/33 | 19,547 | 19,696 | ||
| Duke Energy Carolinas LLC | 4.850% | 1/15/34 | 25,000 | 24,848 | ||
| Duke Energy Corp. | 2.450% | 6/1/30 | 16,000 | 13,924 | ||
| Duke Energy Corp. | 2.550% | 6/15/31 | 30,000 | 25,492 | ||
| Duke Energy Corp. | 4.500% | 8/15/32 | 39,000 | 37,496 | ||
| Duke Energy Florida LLC | 2.500% | 12/1/29 | 15,380 | 13,684 | ||
| Duke Energy Florida LLC | 1.750% | 6/15/30 | 34,710 | 28,963 | ||
| Duke Energy Florida LLC | 2.400% | 12/15/31 | 10,000 | 8,392 | ||
| Duke Energy Florida LLC | 5.875% | 11/15/33 | 14,850 | 15,901 | ||
| Duke Energy Ohio Inc. | 2.125% | 6/1/30 | 11,650 | 9,905 | ||
| Duke Energy Ohio Inc. | 5.250% | 4/1/33 | 1,930 | 1,973 | ||
| Duke Energy Progress LLC | 3.450% | 3/15/29 | 4,221 | 4,009 | ||
| Duke Energy Progress LLC | 2.000% | 8/15/31 | 12,500 | 10,270 | ||
| Duke Energy Progress LLC | 3.400% | 4/1/32 | 15,000 | 13,509 | ||
| Duke Energy Progress LLC | 5.250% | 3/15/33 | 5,446 | 5,571 | ||
| 7 | Electricite de France SA | 5.700% | 5/23/28 | 4,385 | 4,525 | |
| 7 | Electricite de France SA | 4.500% | 9/21/28 | 5,000 | 4,920 | |
| 7 | Electricite de France SA | 6.250% | 5/23/33 | 4,965 | 5,300 | |
| 8 | Elia Transmission Belgium SA | 0.875% | 4/28/30 | 5,600 | 5,241 | |
| 8 | Enel Finance International NV | 0.375% | 5/28/29 | 1,000 | 928 | |
| 8 | Enel Finance International NV | 4.500% | 2/20/43 | 2,700 | 3,007 | |
| 8 | Engie SA | 3.875% | 1/6/31 | 9,700 | 10,742 | |
| Entergy Arkansas LLC | 5.150% | 1/15/33 | 4,230 | 4,322 | ||
| Entergy Arkansas LLC | 5.300% | 9/15/33 | 15,000 | 15,370 | ||
| Entergy Corp. | 2.800% | 6/15/30 | 16,000 | 14,055 | ||
| Entergy Corp. | 2.400% | 6/15/31 | 23,559 | 19,769 | ||
| Entergy Louisiana LLC | 1.600% | 12/15/30 | 5,050 | 4,061 | ||
| Entergy Louisiana LLC | 2.350% | 6/15/32 | 6,442 | 5,333 | ||
| Entergy Texas Inc. | 4.000% | 3/30/29 | 3,129 | 3,047 | ||
| Entergy Texas Inc. | 1.750% | 3/15/31 | 5,000 | 4,075 | ||
| Eskom Holdings SOC Ltd. | 7.125% | 2/11/25 | 2,800 | 2,789 | ||
| 8 | Eurogrid GmbH | 3.722% | 4/27/30 | 500 | 549 | |
| Evergy Inc. | 2.900% | 9/15/29 | 25,674 | 23,123 | ||
| Eversource Energy | 1.650% | 8/15/30 | 16,165 | 13,067 | ||
| Eversource Energy | 2.550% | 3/15/31 | 8,610 | 7,228 | ||
| Eversource Energy | 3.375% | 3/1/32 | 25,000 | 21,800 | ||
| Exelon Corp. | 4.050% | 4/15/30 | 49,530 | 47,230 | ||
| Exelon Corp. | 3.350% | 3/15/32 | 33,000 | 29,235 | ||
| FirstEnergy Corp. | 2.650% | 3/1/30 | 20,526 | 17,887 | ||
| FirstEnergy Corp. | 2.250% | 9/1/30 | 7,896 | 6,636 | ||
| Florida Power & Light Co. | 2.450% | 2/3/32 | 22,500 | 19,165 | ||
| Georgia Power Co. | 4.700% | 5/15/32 | 24,199 | 23,898 | ||
| Coupon | Maturity Date | Face Amount ($000) | Market Value• ($000) | |||
| Georgia Power Co. | 4.950% | 5/17/33 | 59,290 | 59,300 | ||
| Idaho Power Co. | 5.500% | 3/15/53 | 5,000 | 5,038 | ||
| 7 | ITC Holdings Corp. | 2.950% | 5/14/30 | 10,000 | 8,877 | |
| 7 | ITC Holdings Corp. | 5.400% | 6/1/33 | 17,360 | 17,666 | |
| Kentucky Utilities Co. | 5.450% | 4/15/33 | 7,370 | 7,613 | ||
| Louisville Gas and Electric Co. | 5.450% | 4/15/33 | 5,900 | 6,105 | ||
| National Grid plc | 5.809% | 6/12/33 | 23,970 | 24,887 | ||
| National Grid plc | 5.418% | 1/11/34 | 24,400 | 24,451 | ||
| 8 | National Grid plc | 3.245% | 3/30/34 | 11,400 | 11,646 | |
| National Rural Utilities Cooperative Finance Corp. | 3.700% | 3/15/29 | 32,016 | 30,614 | ||
| National Rural Utilities Cooperative Finance Corp. | 5.800% | 1/15/33 | 9,250 | 9,766 | ||
| Nevada Power Co. | 2.400% | 5/1/30 | 11,640 | 10,114 | ||
| NextEra Energy Capital Holdings Inc. | 3.500% | 4/1/29 | 8,191 | 7,708 | ||
| NextEra Energy Capital Holdings Inc. | 2.750% | 11/1/29 | 25,000 | 22,352 | ||
| NextEra Energy Capital Holdings Inc. | 2.250% | 6/1/30 | 30,000 | 25,612 | ||
| NextEra Energy Capital Holdings Inc. | 2.440% | 1/15/32 | 15,850 | 13,157 | ||
| NextEra Energy Capital Holdings Inc. | 5.000% | 7/15/32 | 5,630 | 5,608 | ||
| 7 | NextEra Energy Operating Partners LP | 4.250% | 7/15/24 | 175 | 173 | |
| Nisource Inc. | 5.400% | 6/30/33 | 5,500 | 5,631 | ||
| NiSource Inc. | 2.950% | 9/1/29 | 5,136 | 4,702 | ||
| NRG Energy Inc. | 6.625% | 1/15/27 | 471 | 472 | ||
| NSTAR Electric Co. | 3.950% | 4/1/30 | 6,616 | 6,324 | ||
| NSTAR Electric Co. | 1.950% | 8/15/31 | 850 | 694 | ||
| 11 | NSW Electricity Networks Finance Pty Ltd. | 2.732% | 4/23/29 | 10,000 | 5,763 | |
| 11 | NSW Electricity Networks Finance Pty Ltd. | 2.543% | 9/23/30 | 30,000 | 16,231 | |
| Ohio Power Co. | 1.625% | 1/15/31 | 18,491 | 15,017 | ||
| Oncor Electric Delivery Co. LLC | 7.000% | 5/1/32 | 3,000 | 3,407 | ||
| Oncor Electric Delivery Co. LLC | 4.550% | 9/15/32 | 17,000 | 16,707 | ||
| Oncor Electric Delivery Co. LLC | 7.250% | 1/15/33 | 3,000 | 3,491 | ||
| Oncor Electric Delivery Co. LLC | 5.650% | 11/15/33 | 30,000 | 31,799 | ||
| Pacific Gas and Electric Co. | 4.550% | 7/1/30 | 15,000 | 14,341 | ||
| Pacific Gas and Electric Co. | 2.500% | 2/1/31 | 67,175 | 55,758 | ||
| Pacific Gas and Electric Co. | 3.250% | 6/1/31 | 20,357 | 17,687 | ||
| Pacific Gas and Electric Co. | 5.900% | 6/15/32 | 7,000 | 7,153 | ||
| Pacific Gas and Electric Co. | 6.150% | 1/15/33 | 5,220 | 5,418 | ||
| Pacific Gas and Electric Co. | 6.950% | 3/15/34 | 34,056 | 37,508 | ||
| PacifiCorp | 3.500% | 6/15/29 | 16,425 | 15,353 | ||
| PacifiCorp | 2.700% | 9/15/30 | 13,815 | 12,025 | ||
| PacifiCorp | 5.300% | 2/15/31 | 20,000 | 20,293 | ||
| PacifiCorp | 5.450% | 2/15/34 | 20,090 | 20,356 | ||
| PECO Energy Co. | 4.900% | 6/15/33 | 15,000 | 15,127 | ||
| PECO Energy Co. | 4.375% | 8/15/52 | 5,000 | 4,410 | ||
| Perusahaan Perseroan Persero PT Perusahaan Listrik Negara | 3.000% | 6/30/30 | 4,500 | 3,956 | ||
| Coupon | Maturity Date | Face Amount ($000) | Market Value• ($000) | |||
| 8 | Perusahaan Perseroan Persero PT Perusahaan Listrik Negara | 1.875% | 11/5/31 | 13,940 | 12,187 | |
| Piedmont Natural Gas Co. Inc. | 3.500% | 6/1/29 | 10,000 | 9,335 | ||
| Piedmont Natural Gas Co. Inc. | 2.500% | 3/15/31 | 5,000 | 4,254 | ||
| PPL Electric Utilities Corp. | 5.000% | 5/15/33 | 10,000 | 10,171 | ||
| Progress Energy Inc. | 7.750% | 3/1/31 | 3,339 | 3,832 | ||
| Public Service Co. of Colorado | 1.900% | 1/15/31 | 300 | 248 | ||
| Public Service Co. of Oklahoma | 5.250% | 1/15/33 | 10,290 | 10,374 | ||
| Public Service Electric and Gas Co. | 3.200% | 5/15/29 | 17,458 | 16,387 | ||
| Public Service Electric and Gas Co. | 2.450% | 1/15/30 | 10,900 | 9,628 | ||
| Public Service Electric and Gas Co. | 1.900% | 8/15/31 | 10,044 | 8,224 | ||
| Public Service Electric and Gas Co. | 4.900% | 12/15/32 | 15,000 | 15,157 | ||
| Public Service Enterprise Group Inc. | 1.600% | 8/15/30 | 53,551 | 43,724 | ||
| Public Service Enterprise Group Inc. | 2.450% | 11/15/31 | 5,000 | 4,160 | ||
| 8 | RWE AG | 2.750% | 5/24/30 | 4,460 | 4,645 | |
| Sempra | 3.700% | 4/1/29 | 20,000 | 18,891 | ||
| 8 | Snam SpA | 0.750% | 6/17/30 | 500 | 458 | |
| Southern California Edison Co. | 4.200% | 3/1/29 | 9,000 | 8,804 | ||
| Southern California Edison Co. | 2.250% | 6/1/30 | 10,000 | 8,578 | ||
| Southern California Edison Co. | 2.500% | 6/1/31 | 8,000 | 6,829 | ||
| Southern California Edison Co. | 2.750% | 2/1/32 | 7,000 | 6,007 | ||
| Southern California Edison Co. | 5.200% | 6/1/34 | 24,160 | 24,370 | ||
| Southern California Gas Co. | 2.550% | 2/1/30 | 5,790 | 5,098 | ||
| Southern Co. | 3.700% | 4/30/30 | 2,415 | 2,270 | ||
| Southern Co. | 5.700% | 10/15/32 | 11,788 | 12,299 | ||
| Southern Co. | 5.200% | 6/15/33 | 12,023 | 12,164 | ||
| Southern Co. Gas Capital Corp. | 1.750% | 1/15/31 | 10,833 | 8,789 | ||
| Southern Co. Gas Capital Corp. | 5.750% | 9/15/33 | 20,000 | 20,912 | ||
| Southwestern Electric Power Co. | 5.300% | 4/1/33 | 15,000 | 15,030 | ||
| Union Electric Co. | 3.500% | 3/15/29 | 8,552 | 8,126 | ||
| Union Electric Co. | 2.950% | 3/15/30 | 18,000 | 16,279 | ||
| Virginia Electric & Power Co. | 5.300% | 8/15/33 | 25,000 | 25,609 | ||
| Virginia Electric and Power Co. | 2.300% | 11/15/31 | 10,000 | 8,371 | ||
| Virginia Electric and Power Co. | 2.400% | 3/30/32 | 8,000 | 6,693 | ||
| Virginia Electric and Power Co. | 5.000% | 4/1/33 | 14,810 | 14,853 | ||
| Virginia Electric and Power Co. | 5.000% | 1/15/34 | 19,800 | 19,727 | ||
| Virginia Electric and Power Co. | 4.600% | 12/1/48 | 5,176 | 4,594 | ||
| 7 | Vistra Operations Co. LLC | 5.500% | 9/1/26 | 2,379 | 2,357 | |
| 7 | Vistra Operations Co. LLC | 5.625% | 2/15/27 | 1,769 | 1,744 | |
| 7 | Vistra Operations Co. LLC | 5.000% | 7/31/27 | 995 | 964 | |
| 7 | Vistra Operations Co. LLC | 7.750% | 10/15/31 | 410 | 426 | |
| WEC Energy Group Inc. | 1.800% | 10/15/30 | 17,178 | 14,079 | ||
| Xcel Energy Inc. | 2.600% | 12/1/29 | 5,000 | 4,467 | ||
| Xcel Energy Inc. | 3.400% | 6/1/30 | 10,000 | 9,224 | ||
| Coupon | Maturity Date | Face Amount ($000) | Market Value• ($000) | |||
| Xcel Energy Inc. | 2.350% | 11/15/31 | 21,000 | 17,298 | ||
| Xcel Energy Inc. | 4.600% | 6/1/32 | 12,000 | 11,625 | ||
| Xcel Energy Inc. | 5.450% | 8/15/33 | 10,000 | 10,244 | ||
| 2,323,466 | ||||||
| Total Corporate Bonds (Cost $29,004,374) | 27,913,759 | |||||
| Floating Rate Loan Interests (0.1%) | ||||||
| 5 | American Airlines Inc. Term Loan, TSFR3M + 4.750% | 10.329% | 4/20/28 | 3,117 | 3,189 | |
| 5 | Bausch & Lomb Corp. Term Loan, TSFR1M + 3.250% | 8.683% | 5/10/27 | 485 | 474 | |
| 5 | Cloud Software Group Inc. Term Loan B, TSFR3M + 4.500% | 9.948% | 3/30/29 | 652 | 639 | |
| 5 | DirecTV Financing LLC Term Loan, TSFR3M + 5.000% | 10.650% | 8/2/27 | 143 | 143 | |
| 5 | First Student Bidco Inc. Term Loan B, TSFR3M + 4.000% | 9.448% | 7/21/28 | 2,819 | 2,802 | |
| 5 | McAfee LLC Term Loan B, TSFR1M + 3.750% | 9.203% | 3/1/29 | 1,059 | 1,046 | |
| 5 | Medline Borrower LP Term Loan B, TSFR1M + 3.000% | 8.451% | 10/23/28 | 1,667 | 1,665 | |
| 5 | SBA Senior Finance II LLC Term Loan B, TSFR1M + 2.000% | 7.340% | 1/25/31 | 115 | 114 | |
| 5 | Setanta Aircraft Leasing DAC Term Loan B, TSFR3M + 2.000% | 7.610% | 11/5/28 | 11,145 | 11,145 | |
| 5 | SkyMiles IP Ltd. Term Loan B, TSFR3M + 3.750% | 9.068% | 10/20/27 | 459 | 469 | |
| 5 | SS&C Technologies Inc. Term Loan B-6, TSFR1M + 2.250% | 7.683% | 3/22/29 | 475 | 475 | |
| 5 | SS&C Technologies Inc. Term Loan B-7, TSFR1M + 2.250% | 7.683% | 3/22/29 | 924 | 923 | |
| 5 | Wyndham Hotels & Resorts Inc. Term Loan B, TSFR1M + 2.250% | 7.683% | 5/24/30 | 1,427 | 1,426 | |
| Total Floating Rate Loan Interests (Cost $24,253) | 24,510 | |||||
| Sovereign Bonds (2.5%) | ||||||
| Banque Ouest Africaine de Developpement | 5.000% | 7/27/27 | 626 | 588 | ||
| Corp. Financiera de Desarrollo SA | 4.750% | 7/15/25 | 3,226 | 3,186 | ||
| Corp. Financiera de Desarrollo SA | 2.400% | 9/28/27 | 8,234 | 7,397 | ||
| Dominican Republic | 5.500% | 2/22/29 | 33,398 | 32,354 | ||
| Export-Import Bank of India | 3.250% | 1/15/30 | 15,050 | 13,682 | ||
| Government of Bermuda | 4.750% | 2/15/29 | 18,860 | 18,487 | ||
| Government of Bermuda | 5.000% | 7/15/32 | 17,180 | 16,700 | ||
| 7 | Kingdom of Saudi Arabia | 5.750% | 1/16/54 | 65,000 | 63,847 | |
| 8 | Republic of Bulgaria | 4.375% | 5/13/31 | 20,001 | 22,654 | |
| Republic of Guatemala | 4.875% | 2/13/28 | 4,490 | 4,339 | ||
| 7 | Republic of Guatemala | 7.050% | 10/4/32 | 12,000 | 12,644 | |
| Republic of Guatemala | 6.600% | 6/13/36 | 8,400 | 8,505 | ||
| 8 | Republic of Hungary | 1.125% | 4/28/26 | 11,200 | 11,380 | |
| 8 | Republic of Hungary | 5.000% | 2/22/27 | 9,000 | 10,058 | |
| Republic of Hungary | 6.125% | 5/22/28 | 17,555 | 18,079 | ||
| 8 | Republic of Korea | 0.000% | 10/15/26 | 9,000 | 8,938 | |
| Republic of Panama | 3.875% | 3/17/28 | 9,455 | 8,650 | ||
| Republic of Panama | 8.125% | 4/28/34 | 9,236 | 10,121 | ||
| Coupon | Maturity Date | Face Amount ($000) | Market Value• ($000) | |||
| 4 | Republic of Panama | 4.500% | 4/16/50 | 350 | 231 | |
| 4 | Republic of Panama | 3.870% | 7/23/60 | 13,375 | 7,510 | |
| Republic of Peru | 2.844% | 6/20/30 | 30,996 | 27,428 | ||
| Republic of Peru | 2.783% | 1/23/31 | 59,746 | 51,775 | ||
| Republic of South Africa | 4.850% | 9/30/29 | 32,855 | 29,982 | ||
| Republic of South Africa | 5.750% | 9/30/49 | 6,600 | 4,899 | ||
| 8 | Romania | 6.625% | 9/27/29 | 9,450 | 10,937 | |
| 8 | Romania | 1.750% | 7/13/30 | 28,160 | 24,797 | |
| 8 | Romania | 2.750% | 4/14/41 | 8,916 | 6,444 | |
| Sharjah Sukuk Program Ltd. | 3.854% | 4/3/26 | 4,057 | 3,916 | ||
| Socialist Republic of Vietnam | 4.800% | 11/19/24 | 10,000 | 9,915 | ||
| 8 | State of Israel | 1.500% | 1/16/29 | 80,000 | 76,128 | |
| 9 | United Kingdom Gilt | 2.750% | 9/7/24 | 8,959 | 11,222 | |
| United Mexican States | 4.500% | 4/22/29 | 16,169 | 15,813 | ||
| United Mexican States | 5.000% | 5/7/29 | 50,000 | 49,923 | ||
| United Mexican States | 2.659% | 5/24/31 | 80,182 | 67,356 | ||
| United Mexican States | 6.350% | 2/9/35 | 60,687 | 63,270 | ||
| United Mexican States | 6.000% | 5/7/36 | 54,549 | 55,378 | ||
| Uzbekneftegaz JSC | 4.750% | 11/16/28 | 18,889 | 15,736 | ||
| Total Sovereign Bonds (Cost $814,281) | 804,269 | |||||
| Taxable Municipal Bonds (0.3%) | ||||||
| Massachusetts School Building Authority Sales Tax Revenue | 1.753% | 8/15/30 | 25,540 | 21,920 | ||
| 15 | New Jersey Economic Development Authority Appropriations Revenue | 7.425% | 2/15/29 | 10,675 | 11,542 | |
| New York State Dormitory Authority Income Tax Revenue | 5.289% | 3/15/33 | 663 | 675 | ||
| New York State Urban Development Corp. Income Tax Revenue | 3.900% | 3/15/33 | 400 | 380 | ||
| New York Transportation Development Corp. Miscellaneous Revenue | 4.248% | 9/1/35 | 3,425 | 3,337 | ||
| San Diego County Regional Airport Authority Port, Airport & Marina Revenue | 5.594% | 7/1/43 | 5,880 | 5,771 | ||
| Sonoma County CA Miscellaneous Revenue | 6.000% | 12/1/29 | 3,595 | 3,748 | ||
| State Board of Administration Finance Corp. Miscellaneous Revenue | 2.154% | 7/1/30 | 19,000 | 16,232 | ||
| Texas Natural Gas Securitization Finance Corp. | 5.102% | 4/1/35 | 5,000 | 5,107 | ||
| University of California College & University Revenue | 1.614% | 5/15/30 | 5,025 | 4,283 | ||
| University of California Regents Medical Center Pooled Health, Hospital, Nursing Home Revenue | 4.132% | 5/15/32 | 8,000 | 7,687 | ||
| Total Taxable Municipal Bonds (Cost $82,230) | 80,682 | |||||
| Shares | ||||||
| Temporary Cash Investments (0.9%) | ||||||
| Money Market Fund (0.9%) | ||||||
| 16 | Vanguard Market Liquidity Fund (Cost $301,254) | 5.410% | 3,012,993 | 301,269 | ||
| Counterparty | Expiration Date | Exercise Rate | Notional Amount on Underlying Swap ($000) | Market Value• ($000) | ||
| Options Purchased (0.0%) | ||||||
| Over-the-Counter Swaptions (0.0%) | ||||||
| Put Swaptions | ||||||
| 5-Year CDX-NA-IG-S41-V1, Credit Protection Purchased, Pays 1.000% Quarterly | GSI | 3/20/24 | 0.700% | 342,930 | 131 | |
| 5-Year CDX-NA-IG-S41-V1, Credit Protection Purchased, Pays 1.000% Quarterly | GSI | 3/20/24 | 0.700% | 342,920 | 130 | |
| 5-Year CDX-NA-IG-S41-V1, Credit Protection Purchased, Pays 1.000% Quarterly | GSI | 4/17/24 | 0.600% | 685,850 | 1,105 | |
| 5-Year CDX-NA-IG-S41-V1, Credit Protection Purchased, Pays 1.000% Quarterly | GSI | 4/17/24 | 0.600% | 755,450 | 1,217 | |
| Counterparty | Expiration Date | Exercise Rate | Notional Amount on Underlying Swap ($000) | Market Value• ($000) | ||
| 5-Year CDX-NA-IG-S41-V1, Credit Protection Purchased, Pays 1.000% Quarterly | BANA | 5/15/24 | 0.575% | 698,590 | 1,653 | |
| Total Options Purchased (Cost $7,082) | 4,236 | |||||
| Total Investments (99.2%) (Cost $33,140,188) | 31,936,812 | |||||
| Other Assets and Liabilities—Net (0.8%) | 251,055 | |||||
| Net Assets (100%) | 32,187,867 | |||||
| Cost is in $000. | ||||||
| • | See Note A in Notes to Financial Statements. |
| 1 | Securities with a value of $46,481,000 have been segregated as initial margin for open centrally cleared swap contracts. |
| 2 | Securities with a value of $415,000 have been segregated as collateral for open forward currency contracts and over-the-counter swap contracts. |
| 3 | Securities with a value of $32,639,000 have been segregated as initial margin for open futures contracts. |
| 4 | The average or expected maturity is shorter than the final maturity shown because of the possibility of interim principal payments and prepayments or the possibility of the issue being called. |
| 5 | Variable-rate security; rate shown is effective rate at period end. Certain variable-rate securities are not based on a published reference rate and spread but are determined by the issuer or agent based on current market conditions. |
| 6 | Includes securities purchased on a when-issued or delayed-delivery basis for which the fund has not taken delivery as of January 31, 2024. |
| 7 | Security exempt from registration under Rule 144A of the Securities Act of 1933. Such securities may be sold in transactions exempt from registration, normally to qualified institutional buyers. At January 31, 2024, the aggregate value was $1,528,091,000, representing 4.7% of net assets. |
| 8 | Face amount denominated in euro. |
| 9 | Face amount denominated in British pounds. |
| 10 | Guaranteed by the Republic of Azerbaijan. |
| 11 | Face amount denominated in Australian dollars. |
| 12 | Non-income-producing security—security in default. |
| 13 | Security value determined using significant unobservable inputs. |
| 14 | Guaranteed by the Republic of Chile. |
| 15 | Scheduled principal and interest payments are guaranteed by National Public Finance Guarantee Corp. |
| 16 | Affiliated money market fund available only to Vanguard funds and certain trusts and accounts managed by Vanguard. Rate shown is the 7-day yield. |
| 3M—3-month. | |
| BANA—Bank of America, N.A. | |
| DAC—Designated Activity Company. | |
| GSI—Goldman Sachs International. | |
| REIT—Real Estate Investment Trust. | |
| TSFR1M—CME Term Secured Overnight Financing Rate 1-Month. | |
| TSFR3M—CME Term Secured Overnight Financing Rate 3-Month. |
| Options Written |
| Counterparty | Expiration Date | Exercise Rate | Notional Amount on Underlying Swap ($000) | Market Value ($000) | |
| Over-the-Counter Swaptions | |||||
| Put Swaptions | |||||
| 5-Year CDX-NA-IG-S41-V1, Credit Protection Sold, Receives 1.000% Quarterly | GSI | 4/17/24 | 0.850% | 1,050,040 | (380) |
| Total Options Written (Premiums Received $1,003) | (380) | ||||
| GSI—Goldman Sachs International. |
| Futures Contracts | ||||
| Expiration | Number of Long (Short) Contracts | ($000) | ||
| Notional Amount | Value and Unrealized Appreciation (Depreciation) | |||
| Long Futures Contracts | ||||
| 5-Year U.S. Treasury Note | March 2024 | 8,609 | 933,135 | 2,737 |
| 10-Year U.S. Treasury Note | March 2024 | 6,563 | 737,209 | 3,365 |
| Euro-Schatz | March 2024 | 141 | 16,181 | 20 |
| 6,122 | ||||
| Short Futures Contracts | ||||
| 2-Year U.S. Treasury Note | March 2024 | (1,200) | (246,788) | (323) |
| 10-Year Japanese Government Bond | March 2024 | (189) | (187,806) | 269 |
| AUD 3-Year Treasury Bond | March 2024 | (1,177) | (82,579) | (809) |
| AUD 10-Year Treasury Bond | March 2024 | (753) | (57,368) | (1,217) |
| Euro-Bobl | March 2024 | (1,215) | (155,636) | (1,035) |
| Euro-Bund | March 2024 | (1,273) | (186,893) | (2,901) |
| Euro-Buxl | March 2024 | (158) | (23,488) | (970) |
| Long Gilt | March 2024 | (124) | (15,710) | (518) |
| Long U.S. Treasury Bond | March 2024 | (690) | (84,417) | (1,958) |
| Ultra 10-Year U.S. Treasury Note | March 2024 | (677) | (79,124) | (625) |
| Ultra Long U.S. Treasury Bond | March 2024 | (798) | (103,117) | (3,409) |
| (13,496) | ||||
| (7,374) | ||||
| Forward Currency Contracts | |||||||
| Counterparty | Contract Settlement Date | Contract Amount (000) | Unrealized Appreciation ($000) | Unrealized Depreciation ($000) | |||
| Receive | Deliver | ||||||
| State Street Bank & Trust Co. | 3/20/24 | EUR | 4,028 | USD | 4,376 | — | (13) |
| UBS AG | 3/20/24 | USD | 194,237 | AUD | 294,372 | 799 | — |
| Deutsche Bank AG | 3/20/24 | USD | 468,707 | EUR | 430,523 | 2,449 | — |
| UBS AG | 3/20/24 | USD | 33,580 | GBP | 26,400 | 110 | — |
| Toronto-Dominion Bank | 3/21/24 | USD | 4,680 | JPY | 686,857 | — | (25) |
| 3,358 | (38) | ||||||
| AUD—Australian dollar. |
| EUR—euro. |
| GBP—British pound. |
| JPY—Japanese yen. |
| USD—U.S. dollar. |
| Centrally Cleared Credit Default Swaps | ||||||
| Reference Entity | Termination Date | Notional Amount (000) | Periodic Premium Received (Paid)1 (%) | Value ($000) | Unrealized Appreciation (Depreciation) ($000) | |
| Credit Protection Sold | ||||||
| CDX-NA-HY-S41-V2 | 12/21/28 | USD | 376,200 | 5.000 | 23,905 | 1,739 |
| CDX-NA-IG-S41-V1 | 12/21/28 | USD | 601,500 | 1.000 | 12,454 | 1,131 |
| 36,359 | 2,870 | |||||
| 1 Periodic premium received/paid quarterly. |
| USD—U.S. dollar. |
| Over-the-Counter Credit Default Swaps | ||||||||
| Reference Entity | Termination Date | Counterparty | Notional Amount ($000) | Periodic Premium Received (Paid)1 (%) | Value ($000) | Remaining Up-Front Premium Paid (Received) ($000) | Unrealized Appreciation ($000) | Unrealized Depreciation ($000) |
| Credit Protection Sold/Moody's Rating | ||||||||
| Ally Financial Inc./Baa3 | 12/23/25 | GSI | 1,630 | 1.000 | 1 | 4 | — | (3) |
| American Express Co./A2 | 12/23/25 | GSI | 1,630 | 1.000 | 26 | 20 | 6 | — |
| American International Group Inc./Baa2 | 12/23/25 | GSI | 1,630 | 1.000 | 22 | 9 | 13 | — |
| Berkshire Hathaway Inc./Aa2 | 12/21/24 | BARC | 19,400 | 1.000 | 183 | 102 | 81 | — |
| Berkshire Hathaway Inc./Aa2 | 12/21/24 | JPMC | 9,400 | 1.000 | 89 | 48 | 41 | — |
| Boeing Co./Baa2 | 12/23/25 | GSI | 1,630 | 1.000 | 15 | (4) | 19 | — |
| Chubb INA Holdings Inc./A3 | 12/23/25 | GSI | 1,630 | 1.000 | 28 | 23 | 5 | — |
| Comcast Corp./A3 | 12/23/25 | GSI | 1,630 | 1.000 | 25 | 18 | 7 | — |
| CVS Health Corp./Baa2 | 12/23/25 | GSI | 1,630 | 1.000 | 25 | 14 | 11 | — |
| Dominion Energy Inc./Baa2 | 12/23/25 | GSI | 1,630 | 1.000 | 23 | 18 | 5 | — |
| Dow Chemical Co./Baa1 | 12/23/25 | GSI | 1,630 | 1.000 | 25 | 12 | 13 | — |
| Enbridge Inc./Baa1 | 12/23/25 | GSI | 1,630 | 1.000 | 17 | 10 | 7 | — |
| General Electric Co./Baa1 | 12/23/25 | GSI | 1,630 | 1.000 | 26 | 4 | 22 | — |
| General Motors Co./Baa3 | 12/23/25 | GSI | 1,630 | 1.000 | 16 | (1) | 17 | — |
| International Business Machines Corp./A3 | 12/23/25 | GSI | 1,630 | 1.000 | 27 | 19 | 8 | — |
| Kroger Co./Baa1 | 12/23/25 | GSI | 1,630 | 1.000 | 25 | 14 | 11 | — |
| Lincoln National Corp./Baa2 | 12/23/25 | GSI | 1,630 | 1.000 | — | 8 | — | (8) |
| Lowe's Cos. Inc./Baa1 | 12/23/25 | GSI | 1,630 | 1.000 | 27 | 19 | 8 | — |
| Marathon Petroleum Corp./Baa2 | 12/23/25 | GSI | 1,630 | 1.000 | 24 | 6 | 18 | — |
| Marsh & McLennan Cos. Inc./A3 | 12/23/25 | GSI | 1,630 | 1.000 | 28 | 22 | 6 | — |
| Metlife Inc./A3 | 6/21/24 | BARC | 24,300 | 1.000 | 98 | 2 | 96 | — |
| Metlife Inc./A3 | 12/23/25 | GSI | 1,630 | 1.000 | 18 | 14 | 4 | — |
| Mondelez International Inc./Baa1 | 12/23/25 | GSI | 1,630 | 1.000 | 26 | 17 | 9 | — |
| Over-the-Counter Credit Default Swaps (continued) | ||||||||
| Reference Entity | Termination Date | Counterparty | Notional Amount ($000) | Periodic Premium Received (Paid)1 (%) | Value ($000) | Remaining Up-Front Premium Paid (Received) ($000) | Unrealized Appreciation ($000) | Unrealized Depreciation ($000) |
| Prudential Financial Inc./A3 | 12/23/25 | GSI | 1,630 | 1.000 | 18 | 14 | 4 | — |
| Simon Property Group LP/A3 | 12/23/25 | GSI | 1,630 | 1.000 | 21 | 9 | 12 | — |
| UnitedHealth Group Inc./A3 | 12/23/25 | GSI | 1,630 | 1.000 | 26 | 20 | 6 | — |
| Verizon Communications Inc./Baa1 | 12/23/25 | GSI | 1,630 | 1.000 | 18 | 14 | 4 | — |
| 877 | 455 | 433 | (11) | |||||
| Credit Protection Purchased | ||||||||
| Bouygues SA | 6/21/28 | JPMC | 23,3002 | (1.000) | (778) | (426) | — | (352) |
| Republic of Panama | 12/21/28 | BANA | 7,800 | (1.000) | 312 | 201 | 111 | — |
| Standard Chartered plc | 12/21/28 | MSCS | 3,2002 | (1.000) | (41) | (21) | — | (20) |
| Unibail-Rodamco-Westfield SE | 6/21/28 | JPMC | 3,3002 | (1.000) | 32 | 155 | — | (123) |
| (475) | (91) | 111 | (495) | |||||
| 402 | 364 | 544 | (506) | |||||
| 1 | Periodic premium received/paid quarterly. |
| 2 | Notional amount denominated in euro. |
| BANA—Bank of America, N.A. | |
| BARC—Barclays Bank plc. | |
| GSI—Goldman Sachs International. | |
| JPMC—JPMorgan Chase Bank, N.A. | |
| MSCS—Morgan Stanley Capital Services LLC. |
| Centrally Cleared Interest Rate Swaps | ||||||
| Termination Date | Future Effective Date | Notional Amount ($000) | Interest Rate Received (%) | Interest Rate (Paid) (%) | Value ($000) | Unrealized Appreciation (Depreciation) ($000) |
| 5/31/29 | N/A | 1,845,7021 | 8.6902 | (11.503)3 | (65) | (65) |
| 1 | Notional amount denominated in Mexican Peso. |
| 2 | Interest payment received/paid every 28 days. |
| 3 | Based on 28-day Mexican Interbank Rate (TIIE) as of the most recent reset date. Interest payment received/paid every 28 days. |
| ($000s, except shares, footnotes, and per-share amounts) | Amount |
| Assets | |
| Investments in Securities, at Value | |
| Unaffiliated Issuers (Cost $32,838,934) | 31,635,543 |
| Affiliated Issuers (Cost $301,254) | 301,269 |
| Total Investments in Securities | 31,936,812 |
| Investment in Vanguard | 1,016 |
| Cash | 105 |
| Foreign Currency, at Value (Cost $10,659) | 10,662 |
| Receivables for Investment Securities Sold | 128,036 |
| Receivables for Accrued Income | 335,451 |
| Receivables for Capital Shares Issued | 27,317 |
| Swap Premiums Paid | 816 |
| Variation Margin Receivable—Futures Contracts | 779 |
| Unrealized Appreciation—Forward Currency Contracts | 3,358 |
| Unrealized Appreciation—Over-the-Counter Swap Contracts | 544 |
| Other Assets | 100 |
| Total Assets | 32,444,996 |
| Liabilities | |
| Payables for Investment Securities Purchased | 172,378 |
| Payables for Capital Shares Redeemed | 65,793 |
| Payables for Distributions | 15,523 |
| Payables to Vanguard | 1,463 |
| Options Written, at Value (Premiums Received $1,003) | 380 |
| Swap Premiums Received | 452 |
| Unrealized Depreciation—Forward Currency Contracts | 38 |
| Variation Margin Payable—Centrally Cleared Swap Contracts | 596 |
| Unrealized Depreciation—Over-the-Counter Swap Contracts | 506 |
| Total Liabilities | 257,129 |
| Net Assets | 32,187,867 |
| At January 31, 2024, net assets consisted of: | |
| Paid-in Capital | 36,689,264 |
| Total Distributable Earnings (Loss) | (4,501,397) |
| Net Assets | 32,187,867 |
| Investor Shares—Net Assets | |
| Applicable to 186,428,247 outstanding $.001 par value shares of beneficial interest (unlimited authorization) | 1,613,136 |
| Net Asset Value Per Share—Investor Shares | $8.65 |
| Admiral Shares—Net Assets | |
| Applicable to 3,533,484,339 outstanding $.001 par value shares of beneficial interest (unlimited authorization) | 30,574,731 |
| Net Asset Value Per Share—Admiral Shares | $8.65 |
| Year Ended January 31, 2024 | |
| ($000) | |
| Investment Income | |
| Income | |
| Interest1 | 1,282,182 |
| Total Income | 1,282,182 |
| Expenses | |
| The Vanguard Group—Note B | |
| Investment Advisory Services | 3,503 |
| Management and Administrative— Investor Shares | 2,652 |
| Management and Administrative— Admiral Shares | 24,010 |
| Marketing and Distribution— Investor Shares | 81 |
| Marketing and Distribution— Admiral Shares | 1,537 |
| Custodian Fees | 200 |
| Auditing Fees | 49 |
| Shareholders’ Reports—Investor Shares | 47 |
| Shareholders’ Reports—Admiral Shares | 342 |
| Trustees’ Fees and Expenses | 21 |
| Other Expenses | 21 |
| Total Expenses | 32,463 |
| Expenses Paid Indirectly | (90) |
| Net Expenses | 32,373 |
| Net Investment Income | 1,249,809 |
| Realized Net Gain (Loss) | |
| Investment Securities Sold1 | (1,431,702) |
| Futures Contracts | 3,377 |
| Options Purchased | (3,466) |
| Swap Contracts | 27,879 |
| Forward Currency Contracts | 21,659 |
| Foreign Currencies | (1,664) |
| Realized Net Gain (Loss) | (1,383,917) |
| Change in Unrealized Appreciation (Depreciation) | |
| Investment Securities1 | 1,551,243 |
| Futures Contracts | (11,907) |
| Options Purchased | 205 |
| Options Written | 623 |
| Swap Contracts | (7,486) |
| Forward Currency Contracts | 663 |
| Foreign Currencies | (459) |
| Change in Unrealized Appreciation (Depreciation) | 1,532,882 |
| Net Increase (Decrease) in Net Assets Resulting from Operations | 1,398,774 |
| 1 | Interest income, realized net gain (loss), capital gain distributions received, and change in unrealized appreciation (depreciation) from an affiliated company of the fund were $8,390,000, ($14,000), $1,000, and $16,000, respectively. Purchases and sales are for temporary cash investment purposes. |
| Year Ended January 31, | ||
| 2024 ($000) | 2023 ($000) | |
| Increase (Decrease) in Net Assets | ||
| Operations | ||
| Net Investment Income | 1,249,809 | 938,958 |
| Realized Net Gain (Loss) | (1,383,917) | (1,878,583) |
| Change in Unrealized Appreciation (Depreciation) | 1,532,882 | (1,917,336) |
| Net Increase (Decrease) in Net Assets Resulting from Operations | 1,398,774 | (2,856,961) |
| Distributions | ||
| Investor Shares | (59,278) | (48,031) |
| Admiral Shares | (1,208,846) | (928,367) |
| Total Distributions | (1,268,124) | (976,398) |
| Capital Share Transactions | ||
| Investor Shares | 81,789 | (173,065) |
| Admiral Shares | 884,863 | (810,969) |
| Net Increase (Decrease) from Capital Share Transactions | 966,652 | (984,034) |
| Total Increase (Decrease) | 1,097,302 | (4,817,393) |
| Net Assets | ||
| Beginning of Period | 31,090,565 | 35,907,958 |
| End of Period | 32,187,867 | 31,090,565 |
| Investor Shares | |||||
| For a Share Outstanding Throughout Each Period | Year Ended January 31, | ||||
| 2024 | 2023 | 2022 | 2021 | 2020 | |
| Net Asset Value, Beginning of Period | $8.62 | $9.67 | $10.39 | $10.23 | $9.52 |
| Investment Operations | |||||
| Net Investment Income1 | .332 | .253 | .218 | .252 | .300 |
| Net Realized and Unrealized Gain (Loss) on Investments | .034 | (1.039) | (.550) | .500 | .711 |
| Total from Investment Operations | .366 | (.786) | (.332) | .752 | 1.011 |
| Distributions | |||||
| Dividends from Net Investment Income | (.336) | (.264) | (.224) | (.257) | (.301) |
| Distributions from Realized Capital Gains | — | — | (.164) | (.335) | — |
| Total Distributions | (.336) | (.264) | (.388) | (.592) | (.301) |
| Net Asset Value, End of Period | $8.65 | $8.62 | $9.67 | $10.39 | $10.23 |
| Total Return2 | 4.44% | -8.09% | -3.27% | 7.49% | 10.76% |
| Ratios/Supplemental Data | |||||
| Net Assets, End of Period (Millions) | $1,613 | $1,521 | $1,895 | $2,305 | $2,459 |
| Ratio of Total Expenses to Average Net Assets | 0.20%3 | 0.20%3 | 0.20% | 0.20% | 0.20% |
| Ratio of Net Investment Income to Average Net Assets | 3.95% | 2.91% | 2.16% | 2.41% | 3.03% |
| Portfolio Turnover Rate4 | 73% | 93% | 82% | 113%5 | 114% |
| 1 | Calculated based on average shares outstanding. |
| 2 | Total returns do not include account service fees that may have applied in the periods shown. Fund prospectuses provide information about any applicable account service fees. |
| 3 | The ratio of expenses to average net assets for the period net of reduction from custody fee offset arrangements was 0.20%. |
| 4 | Includes 2%, 11%, 1%, 12%, and 1%, respectively, attributable to mortgage-dollar-roll activity. |
| 5 | Excludes the value of portfolio securities received or delivered as a result of in-kind purchases or redemptions of the fund’s capital shares. |
| Admiral Shares | |||||
| For a Share Outstanding Throughout Each Period | Year Ended January 31, | ||||
| 2024 | 2023 | 2022 | 2021 | 2020 | |
| Net Asset Value, Beginning of Period | $8.62 | $9.67 | $10.39 | $10.23 | $9.52 |
| Investment Operations | |||||
| Net Investment Income1 | .340 | .262 | .228 | .261 | .309 |
| Net Realized and Unrealized Gain (Loss) on Investments | .035 | (1.040) | (.550) | .501 | .712 |
| Total from Investment Operations | .375 | (.778) | (.322) | .762 | 1.021 |
| Distributions | |||||
| Dividends from Net Investment Income | (.345) | (.272) | (.234) | (.267) | (.311) |
| Distributions from Realized Capital Gains | — | — | (.164) | (.335) | — |
| Total Distributions | (.345) | (.272) | (.398) | (.602) | (.311) |
| Net Asset Value, End of Period | $8.65 | $8.62 | $9.67 | $10.39 | $10.23 |
| Total Return2 | 4.54% | -8.00% | -3.17% | 7.59% | 10.87% |
| Ratios/Supplemental Data | |||||
| Net Assets, End of Period (Millions) | $30,575 | $29,569 | $34,013 | $35,093 | $31,146 |
| Ratio of Total Expenses to Average Net Assets | 0.10%3 | 0.10%3 | 0.10% | 0.10% | 0.10% |
| Ratio of Net Investment Income to Average Net Assets | 4.05% | 3.02% | 2.25% | 2.50% | 3.13% |
| Portfolio Turnover Rate4 | 73% | 93% | 82% | 113%5 | 114% |
| 1 | Calculated based on average shares outstanding. |
| 2 | Total returns do not include account service fees that may have applied in the periods shown. Fund prospectuses provide information about any applicable account service fees. |
| 3 | The ratio of expenses to average net assets for the period net of reduction from custody fee offset arrangements was 0.10%. |
| 4 | Includes 2%, 11%, 1%, 12%, and 1%, respectively, attributable to mortgage-dollar-roll activity. |
| 5 | Excludes the value of portfolio securities received or delivered as a result of in-kind purchases or redemptions of the fund’s capital shares. |
| A. | The following significant accounting policies conform to generally accepted accounting principles for U.S. investment companies. The fund consistently follows such policies in preparing its financial statements. |
| B. | In accordance with the terms of a Funds' Service Agreement (the “FSA”) between Vanguard and the fund, Vanguard furnishes to the fund investment advisory, corporate management, administrative, marketing, and distribution services at Vanguard’s cost of operations (as defined by the FSA). These costs of operations are allocated to the fund based on methods and guidelines approved by the board of trustees and are generally settled twice a month. |
| C. | The fund’s custodian bank has agreed to reduce its fees when the fund maintains cash on deposit in the non-interest-bearing custody account. For the year ended January 31, 2024, custodian fee offset arrangements reduced the fund’s expenses by $90,000 (an annual rate of less than 0.01% of average net assets). |
| Level 1 ($000) | Level 2 ($000) | Level 3 ($000) | Total ($000) | |
| Investments | ||||
| Assets | ||||
| U.S. Government and Agency Obligations | — | 2,643,558 | — | 2,643,558 |
| Asset-Backed/Commercial Mortgage-Backed Securities | — | 164,529 | — | 164,529 |
| Corporate Bonds | — | 27,913,756 | 3 | 27,913,759 |
| Floating Rate Loan Interests | — | 24,510 | — | 24,510 |
| Sovereign Bonds | — | 804,269 | — | 804,269 |
| Taxable Municipal Bonds | — | 80,682 | — | 80,682 |
| Temporary Cash Investments | 301,269 | — | — | 301,269 |
| Options Purchased | — | 4,236 | — | 4,236 |
| Total | 301,269 | 31,635,540 | 3 | 31,936,812 |
| Derivative Financial Instruments | ||||
| Assets | ||||
| Futures Contracts1 | 6,391 | — | — | 6,391 |
| Forward Currency Contracts | — | 3,358 | — | 3,358 |
| Swap Contracts | 2,8701 | 544 | — | 3,414 |
| Total | 9,261 | 3,902 | — | 13,163 |
| Liabilities | ||||
| Options Written | — | 380 | — | 380 |
| Futures Contracts1 | 13,765 | — | — | 13,765 |
| Forward Currency Contracts | — | 38 | — | 38 |
| Swap Contracts | 651 | 506 | — | 571 |
| Total | 13,830 | 924 | — | 14,754 |
| 1 | Includes cumulative appreciation (depreciation) on futures contracts and centrally cleared swaps, if any, as reported in the Schedule of Investments. Only current day’s variation margin is reported within the Statement of Assets and Liabilities. |
| E. | At January 31, 2024, the fair values of derivatives were reflected in the Statement of Assets and Liabilities as follows: |
| Statement of Assets and Liabilities | Interest Rate Contracts ($000) | Foreign Exchange Contracts ($000) | Credit Contracts ($000) | Total ($000) |
| Investments in Secuties, at Value—Unaffiliated Issuers (Options Purchased) | — | — | 4,236 | 4,236 |
| Swap Premiums Paid | — | — | 816 | 816 |
| Unrealized Appreciation—Futures Contracts1 | 6,391 | — | — | 6,391 |
| Unrealized Appreciation—Centrally Cleared Swap Contracts1 | — | — | 2,870 | 2,870 |
| Unrealized Appreciation—Forward Currency Contracts | — | 3,358 | — | 3,358 |
| Unrealized Appreciation— Over-the-Counter Swap Contracts | — | — | 544 | 544 |
| Interest Rate Contracts ($000) | Foreign Exchange Contracts ($000) | Credit Contracts ($000) | Total ($000) | |
| Total Assets | 6,391 | 3,358 | 8,466 | 18,215 |
| Options Written, at Value | — | — | 380 | 380 |
| Swap Premiums Received | — | — | 452 | 452 |
| Unrealized Depreciation—Futures Contracts1 | 13,765 | — | — | 13,765 |
| Unrealized Depreciation—Centrally Cleared Swap Contracts | 65 | — | — | 65 |
| Unrealized Depreciation—Forward Currency Contracts | — | 38 | — | 38 |
| Unrealized Depreciation— Over-the-Counter Swap Contracts | — | — | 506 | 506 |
| Total Liabilities | 13,830 | 38 | 1,338 | 15,206 |
| 1 | Includes cumulative appreciation (depreciation) on futures contracts and centrally cleared swaps, if any, as reported in the Schedule of Investments. Only current day’s variation margin is reported within the Statement of Assets and Liabilities. |
| Realized Net Gain (Loss) on Derivatives | Interest Rate Contracts ($000) | Foreign Exchange Contracts ($000) | Credit Contracts ($000) | Total ($000) |
| Futures Contracts | 3,377 | — | — | 3,377 |
| Options Purchased | (2,880) | — | (586) | (3,466) |
| Swap Contracts | (586) | — | 28,465 | 27,879 |
| Forward Currency Contracts | — | 21,659 | — | 21,659 |
| Realized Net Gain (Loss) on Derivatives | (89) | 21,659 | 27,879 | 49,449 |
| Change in Unrealized Appreciation (Depreciation) on Derivatives | ||||
| Futures Contracts | (11,907) | — | — | (11,907) |
| Options Purchased | 2,880 | — | (2,675) | 205 |
| Options Written | — | — | 623 | 623 |
| Swap Contracts | (65) | — | (7,421) | (7,486) |
| Forward Currency Contracts | — | 663 | — | 663 |
| Change in Unrealized Appreciation (Depreciation) on Derivatives | (9,092) | 663 | (9,473) | (17,902) |
| F. | Permanent differences between book-basis and tax-basis components of net assets are reclassified among capital accounts in the financial statements to reflect their tax character. These reclassifications have no effect on net assets or net asset value per share. As of period end, permanent differences primarily attributable to the accounting for applicable foreign currency transactions and swap agreements were reclassified between the individual components of total distributable earnings (loss). |
| Amount ($000) | |
| Undistributed Ordinary Income | 24,007 |
| Undistributed Long-Term Gains | — |
| Net Unrealized Gains (Losses) | (1,203,705) |
| Capital Loss Carryforwards | (3,306,176) |
| Qualified Late-Year Losses | — |
| Other Temporary Differences | (15,523) |
| Total | (4,501,397) |
| Year Ended January 31, | ||
| 2024 Amount ($000) | 2023 Amount ($000) | |
| Ordinary Income* | 1,268,124 | 976,398 |
| Long-Term Capital Gains | — | — |
| Total | 1,268,124 | 976,398 |
| * | Includes short-term capital gains, if any. |
| Amount ($000) | |
| Tax Cost | 33,140,512 |
| Gross Unrealized Appreciation | 528,177 |
| Gross Unrealized Depreciation | (1,731,882) |
| Net Unrealized Appreciation (Depreciation) | (1,203,705) |
| G. | During the year ended January 31, 2024, the fund purchased $15,619,513,000 of investment securities and sold $15,116,062,000 of investment securities, other than U.S. government securities and temporary cash investments. Purchases and sales of U.S. government securities were $7,004,767,000 and $7,292,165,000, respectively. |
| H. | Capital share transactions for each class of shares were: |
| Year Ended January 31, | |||||
| 2024 | 2023 | ||||
| Amount ($000) | Shares (000) | Amount ($000) | Shares (000) | ||
| Investor Shares | |||||
| Issued | 411,869 | 49,345 | 242,343 | 28,167 | |
| Issued in Lieu of Cash Distributions | 52,316 | 6,220 | 42,584 | 4,941 | |
| Redeemed | (382,396) | (45,575) | (457,992) | (52,676) | |
| Net Increase (Decrease)—Investor Shares | 81,789 | 9,990 | (173,065) | (19,568) | |
| Admiral Shares | |||||
| Issued | 6,606,660 | 785,912 | 6,368,494 | 736,413 | |
| Issued in Lieu of Cash Distributions | 1,039,114 | 123,599 | 795,930 | 92,412 | |
| Redeemed | (6,760,911) | (804,953) | (7,975,393) | (917,389) | |
| Net Increase (Decrease)—Admiral Shares | 884,863 | 104,558 | (810,969) | (88,564) | |
| I. | Significant market disruptions, such as those caused by pandemics (e.g., COVID-19 pandemic), natural or environmental disasters, war (e.g., Russia’s invasion of Ukraine), acts of terrorism, or other events, can adversely affect local and global markets and normal market operations. Any such disruptions could have an adverse impact on the value of the fund’s investments and fund performance. |
| J. | Management has determined that no events or transactions occurred subsequent to January 31, 2024, that would require recognition or disclosure in these financial statements. |

| Average Annual Total Returns Periods Ended January 31, 2024 | |||||
| One Year | Five Years | Ten Years | Final Value of a $10,000 Investment | ||
| Long-Term Investment-Grade Fund Investor Shares | 1.21% | 1.26% | 3.23% | $13,749 |
| Bloomberg U.S. Long Credit A or Better Bond Index | 1.35 | 1.09 | 3.08 | 13,549 |
| Bloomberg U.S. Aggregate Bond Index | 2.10 | 0.83 | 1.63 | 11,758 |
| One Year | Five Years | Ten Years | Final Value of a $50,000 Investment | ||
| Long-Term Investment-Grade Fund Admiral Shares | 1.31% | 1.36% | 3.34% | $69,430 | |
| Bloomberg U.S. Long Credit A or Better Bond Index | 1.35 | 1.09 | 3.08 | 67,746 | |
| Bloomberg U.S. Aggregate Bond Index | 2.10 | 0.83 | 1.63 | 58,788 | |
| Asset-Backed/Commercial Mortgage-Backed Securities | 0.2% |
| Corporate Bonds - Communications | 5.5 |
| Corporate Bonds - Consumer Discretionary | 5.2 |
| Corporate Bonds - Consumer Staples | 5.2 |
| Corporate Bonds - Energy | 6.3 |
| Corporate Bonds - Financials | 17.4 |
| Corporate Bonds - Health Care | 11.4 |
| Corporate Bonds - Industrials | 4.1 |
| Corporate Bonds - Materials | 1.1 |
| Corporate Bonds - Real Estate | 0.6 |
| Corporate Bonds - Technology | 10.0 |
| Corporate Bonds - Utilities | 15.7 |
| Floating Rate Loan Interests | 0.0 |
| Sovereign Bonds | 1.5 |
| Taxable Municipal Bonds | 9.1 |
| U.S. Government and Agency Obligations | 6.7 |
| Coupon | Maturity Date | Face Amount ($000) | Market Value• ($000) | |||
| U.S. Government and Agency Obligations (6.5%) | ||||||
| U.S. Government Securities (5.9%) | ||||||
| United States Treasury Note/Bond | 3.750% | 4/15/26 | 1,995 | 1,978 | ||
| United States Treasury Note/Bond | 1.250% | 4/30/28 | 3,732 | 3,346 | ||
| United States Treasury Note/Bond | 1.250% | 6/30/28 | 2,757 | 2,463 | ||
| United States Treasury Note/Bond | 4.125% | 8/31/30 | 8,396 | 8,492 | ||
| United States Treasury Note/Bond | 3.875% | 8/15/33 | 21,328 | 21,208 | ||
| United States Treasury Note/Bond | 4.375% | 2/15/38 | 8,118 | 8,420 | ||
| 1 | United States Treasury Note/Bond | 4.500% | 5/15/38 | 56,616 | 59,358 | |
| United States Treasury Note/Bond | 4.250% | 5/15/39 | 45,791 | 46,507 | ||
| United States Treasury Note/Bond | 4.500% | 8/15/39 | 12,987 | 13,549 | ||
| United States Treasury Note/Bond | 4.375% | 11/15/39 | 35,499 | 36,442 | ||
| 2 | United States Treasury Note/Bond | 1.125% | 8/15/40 | 8,590 | 5,392 | |
| United States Treasury Note/Bond | 1.375% | 11/15/40 | 27,000 | 17,622 | ||
| United States Treasury Note/Bond | 4.750% | 2/15/41 | 55,896 | 59,529 | ||
| United States Treasury Note/Bond | 4.375% | 5/15/41 | 35,827 | 36,398 | ||
| United States Treasury Note/Bond | 2.000% | 11/15/41 | 16,505 | 11,770 | ||
| United States Treasury Note/Bond | 2.375% | 2/15/42 | 48,475 | 36,644 | ||
| United States Treasury Note/Bond | 3.000% | 5/15/42 | 9,822 | 8,192 | ||
| 1,2 | United States Treasury Note/Bond | 3.250% | 5/15/42 | 68,209 | 58,979 | |
| 1 | United States Treasury Note/Bond | 3.375% | 8/15/42 | 46,951 | 41,273 | |
| United States Treasury Note/Bond | 2.750% | 11/15/42 | 19,134 | 15,253 | ||
| United States Treasury Note/Bond | 3.875% | 2/15/43 | 20,251 | 19,061 | ||
| United States Treasury Note/Bond | 3.875% | 5/15/43 | 80,994 | 76,109 | ||
| 2 | United States Treasury Note/Bond | 4.375% | 8/15/43 | 55,031 | 55,401 | |
| United States Treasury Note/Bond | 3.125% | 8/15/44 | 5,000 | 4,169 | ||
| United States Treasury Note/Bond | 3.000% | 5/15/45 | 40,415 | 32,799 | ||
| United States Treasury Note/Bond | 2.500% | 2/15/46 | 28,700 | 21,121 | ||
| United States Treasury Note/Bond | 2.250% | 8/15/46 | 20,000 | 13,931 | ||
| United States Treasury Note/Bond | 3.000% | 5/15/47 | 5,604 | 4,484 | ||
| United States Treasury Note/Bond | 2.750% | 8/15/47 | 22,000 | 16,775 | ||
| Coupon | Maturity Date | Face Amount ($000) | Market Value• ($000) | |||
| United States Treasury Note/Bond | 3.000% | 8/15/48 | 10,000 | 7,950 | ||
| United States Treasury Note/Bond | 3.375% | 11/15/48 | 15,000 | 12,764 | ||
| United States Treasury Note/Bond | 3.000% | 2/15/49 | 25,000 | 19,855 | ||
| United States Treasury Note/Bond | 2.875% | 5/15/49 | 33,000 | 25,580 | ||
| United States Treasury Note/Bond | 1.625% | 11/15/50 | 8,500 | 4,890 | ||
| United States Treasury Note/Bond | 2.375% | 5/15/51 | 28,500 | 19,710 | ||
| 2 | United States Treasury Note/Bond | 2.000% | 8/15/51 | 16,483 | 10,405 | |
| 1 | United States Treasury Note/Bond | 2.250% | 2/15/52 | 5,333 | 3,575 | |
| United States Treasury Note/Bond | 2.875% | 5/15/52 | 3,918 | 3,024 | ||
| United States Treasury Note/Bond | 3.000% | 8/15/52 | 11,935 | 9,459 | ||
| United States Treasury Note/Bond | 4.000% | 11/15/52 | 5,597 | 5,373 | ||
| United States Treasury Note/Bond | 3.625% | 2/15/53 | 29,291 | 26,270 | ||
| United States Treasury Note/Bond | 3.625% | 5/15/53 | 34,989 | 31,419 | ||
| United States Treasury Note/Bond | 4.125% | 8/15/53 | 31,279 | 30,737 | ||
| 2 | United States Treasury Strip Principal | 0.000% | 2/15/48 | 15,000 | 5,272 | |
| 952,948 | ||||||
| Agency Bonds and Notes (0.3%) | ||||||
| Tennessee Valley Authority | 5.250% | 9/15/39 | 33,800 | 35,585 | ||
| Tennessee Valley Authority | 4.250% | 9/15/65 | 10,000 | 8,900 | ||
| 44,485 | ||||||
| Conventional Mortgage-Backed Securities (0.3%) | ||||||
| 3,4 | UMBS Pool | 2.320% | 4/1/36 | 37,423 | 29,502 | |
| 3,4 | UMBS Pool | 2.120% | 10/1/36 | 23,000 | 17,522 | |
| 47,024 | ||||||
| Total U.S. Government and Agency Obligations (Cost $1,063,398) | 1,044,457 | |||||
| Asset-Backed/Commercial Mortgage-Backed Securities (0.2%) | ||||||
| 3,4 | Freddie Mac Multifamily Structured Pass Through Certificates Class A2 Series K-1521 | 2.184% | 8/25/36 | 21,675 | 16,451 | |
| 3,4 | Freddie Mac Multifamily Structured Pass Through Certificates Class A2 Series K-1522 | 2.361% | 10/25/36 | 29,170 | 22,128 | |
| Total Asset-Backed/Commercial Mortgage-Backed Securities (Cost $52,170) | 38,579 | |||||
| Corporate Bonds (80.6%) | ||||||
| Communications (5.4%) | ||||||
| America Movil SAB de CV | 4.375% | 4/22/49 | 34,805 | 30,546 | ||
| AT&T Inc. | 5.400% | 2/15/34 | 1,051 | 1,078 | ||
| 5 | AT&T Inc. | 3.150% | 9/4/36 | 800 | 810 | |
| AT&T Inc. | 3.500% | 6/1/41 | 15,700 | 12,446 | ||
| Coupon | Maturity Date | Face Amount ($000) | Market Value• ($000) | |||
| AT&T Inc. | 4.650% | 6/1/44 | 1,520 | 1,348 | ||
| AT&T Inc. | 3.650% | 6/1/51 | 13,690 | 10,184 | ||
| AT&T Inc. | 3.500% | 9/15/53 | 11,890 | 8,467 | ||
| AT&T Inc. | 3.800% | 12/1/57 | 3,697 | 2,722 | ||
| 6 | Cable One Inc. | 4.000% | 11/15/30 | 32 | 26 | |
| 6 | CCO Holdings LLC / CCO Holdings Capital Corp. | 6.375% | 9/1/29 | 240 | 234 | |
| 6 | CCO Holdings LLC / CCO Holdings Capital Corp. | 4.750% | 3/1/30 | 220 | 195 | |
| 7 | CK Hutchison Group Telecom Finance SA | 2.625% | 10/17/34 | 500 | 452 | |
| Comcast Corp. | 5.650% | 6/15/35 | 6,492 | 6,906 | ||
| Comcast Corp. | 6.500% | 11/15/35 | 4,320 | 4,901 | ||
| Comcast Corp. | 3.900% | 3/1/38 | 29,335 | 26,050 | ||
| Comcast Corp. | 4.600% | 10/15/38 | 7,024 | 6,775 | ||
| Comcast Corp. | 3.250% | 11/1/39 | 5,540 | 4,450 | ||
| Comcast Corp. | 3.750% | 4/1/40 | 12,100 | 10,326 | ||
| Comcast Corp. | 4.500% | 1/15/43 | 1,184 | 1,045 | ||
| Comcast Corp. | 4.750% | 3/1/44 | 5,045 | 4,733 | ||
| Comcast Corp. | 3.400% | 7/15/46 | 14,755 | 11,321 | ||
| Comcast Corp. | 4.000% | 8/15/47 | 18,875 | 15,763 | ||
| Comcast Corp. | 3.969% | 11/1/47 | 80,688 | 66,768 | ||
| Comcast Corp. | 4.700% | 10/15/48 | 6,335 | 5,956 | ||
| Comcast Corp. | 3.999% | 11/1/49 | 30,176 | 24,777 | ||
| Comcast Corp. | 3.450% | 2/1/50 | 8,500 | 6,391 | ||
| Comcast Corp. | 2.887% | 11/1/51 | 48,403 | 32,017 | ||
| Comcast Corp. | 2.450% | 8/15/52 | 2,000 | 1,203 | ||
| Comcast Corp. | 4.049% | 11/1/52 | 3,837 | 3,164 | ||
| Comcast Corp. | 5.350% | 5/15/53 | 32,620 | 33,176 | ||
| Comcast Corp. | 2.937% | 11/1/56 | 122,325 | 79,025 | ||
| Comcast Corp. | 4.950% | 10/15/58 | 1,266 | 1,219 | ||
| Comcast Corp. | 2.650% | 8/15/62 | 3,000 | 1,760 | ||
| Comcast Corp. | 2.987% | 11/1/63 | 112,190 | 70,849 | ||
| Comcast Corp. | 5.500% | 5/15/64 | 23,220 | 23,831 | ||
| 6 | Cox Communications Inc. | 5.800% | 12/15/53 | 13,210 | 13,314 | |
| 6 | CSC Holdings LLC | 5.750% | 1/15/30 | 100 | 53 | |
| 6 | CSC Holdings LLC | 3.375% | 2/15/31 | 105 | 72 | |
| 6 | Deutsche Telekom AG | 3.625% | 1/21/50 | 3,180 | 2,480 | |
| Discovery Communications LLC | 4.650% | 5/15/50 | 10,820 | 8,678 | ||
| Discovery Communications LLC | 4.000% | 9/15/55 | 1,525 | 1,072 | ||
| 6 | DISH Network Corp. | 11.750% | 11/15/27 | 215 | 224 | |
| 6 | Level 3 Financing Inc. | 4.625% | 9/15/27 | 98 | 51 | |
| 6 | Level 3 Financing Inc. | 3.625% | 1/15/29 | 70 | 21 | |
| 6 | Level 3 Financing Inc. | 3.875% | 11/15/29 | 45 | 34 | |
| Meta Platforms Inc. | 4.450% | 8/15/52 | 11,380 | 10,220 | ||
| Meta Platforms Inc. | 5.600% | 5/15/53 | 84,285 | 89,821 | ||
| Meta Platforms Inc. | 5.750% | 5/15/63 | 29,380 | 31,768 | ||
| NBCUniversal Media LLC | 4.450% | 1/15/43 | 8,827 | 7,988 | ||
| Orange SA | 5.375% | 1/13/42 | 1,000 | 1,013 | ||
| Telefonica Emisiones SA | 4.665% | 3/6/38 | 950 | 870 | ||
| Telefonica Emisiones SA | 5.213% | 3/8/47 | 2,000 | 1,851 | ||
| Time Warner Cable LLC | 7.300% | 7/1/38 | 1,390 | 1,457 | ||
| T-Mobile USA Inc. | 3.000% | 2/15/41 | 2,000 | 1,495 | ||
| T-Mobile USA Inc. | 6.000% | 6/15/54 | 1,900 | 2,075 | ||
| T-Mobile USA Inc. | 5.500% | 1/15/55 | 3,725 | 3,762 | ||
| T-Mobile USA Inc. | 5.800% | 9/15/62 | 14,850 | 15,570 | ||
| TWDC Enterprises 18 Corp. | 3.000% | 7/30/46 | 5,837 | 4,191 | ||
| 6 | UPC Broadband Finco BV | 4.875% | 7/15/31 | 135 | 119 | |
| 5 | Verizon Communications Inc. | 2.875% | 1/15/38 | 500 | 494 | |
| 5 | Verizon Communications Inc. | 1.850% | 5/18/40 | 200 | 167 | |
| Verizon Communications Inc. | 3.400% | 3/22/41 | 5,528 | 4,370 | ||
| Verizon Communications Inc. | 4.862% | 8/21/46 | 2,280 | 2,162 | ||
| Vodafone Group plc | 5.625% | 2/10/53 | 3,205 | 3,227 | ||
| 5 | Vodafone International Financing DAC | 4.000% | 2/10/43 | 200 | 217 | |
| 6 | VZ Secured Financing BV | 5.000% | 1/15/32 | 170 | 148 | |
| Coupon | Maturity Date | Face Amount ($000) | Market Value• ($000) | |||
| Walt Disney Co. | 6.200% | 12/15/34 | 3,326 | 3,723 | ||
| Walt Disney Co. | 6.400% | 12/15/35 | 15,718 | 17,839 | ||
| Walt Disney Co. | 6.650% | 11/15/37 | 2,710 | 3,159 | ||
| Walt Disney Co. | 3.500% | 5/13/40 | 48,715 | 40,344 | ||
| Walt Disney Co. | 4.750% | 9/15/44 | 10,464 | 9,948 | ||
| Walt Disney Co. | 2.750% | 9/1/49 | 58,270 | 38,783 | ||
| Walt Disney Co. | 3.600% | 1/13/51 | 2,995 | 2,342 | ||
| Warnermedia Holdings Inc. | 5.050% | 3/15/42 | 16,565 | 14,685 | ||
| Warnermedia Holdings Inc. | 5.141% | 3/15/52 | 13,015 | 11,200 | ||
| Warnermedia Holdings Inc. | 5.391% | 3/15/62 | 1,130 | 974 | ||
| 862,895 | ||||||
| Consumer Discretionary (5.1%) | ||||||
| Alibaba Group Holding Ltd. | 4.000% | 12/6/37 | 27,000 | 23,534 | ||
| Alibaba Group Holding Ltd. | 4.200% | 12/6/47 | 14,873 | 12,020 | ||
| Alibaba Group Holding Ltd. | 3.150% | 2/9/51 | 10,000 | 6,542 | ||
| Alibaba Group Holding Ltd. | 4.400% | 12/6/57 | 13,080 | 10,576 | ||
| Amazon.com Inc. | 3.875% | 8/22/37 | 10,000 | 9,227 | ||
| Amazon.com Inc. | 4.050% | 8/22/47 | 75,667 | 67,275 | ||
| Amazon.com Inc. | 2.500% | 6/3/50 | 28,720 | 18,637 | ||
| Amazon.com Inc. | 3.100% | 5/12/51 | 22,740 | 16,574 | ||
| Amazon.com Inc. | 4.250% | 8/22/57 | 46,971 | 41,766 | ||
| Amazon.com Inc. | 2.700% | 6/3/60 | 22,830 | 14,569 | ||
| Amazon.com Inc. | 3.250% | 5/12/61 | 28,475 | 20,399 | ||
| Amazon.com Inc. | 4.100% | 4/13/62 | 33,035 | 28,337 | ||
| 6 | American Builders & Contractors Supply Co. Inc. | 3.875% | 11/15/29 | 65 | 58 | |
| 3 | American University | 3.672% | 4/1/49 | 2,563 | 2,012 | |
| Brown University | 2.924% | 9/1/50 | 1,600 | 1,136 | ||
| California Institute of Technology | 3.650% | 9/1/19 | 4,242 | 3,047 | ||
| 6 | Camelot Return Merger Sub Inc. | 8.750% | 8/1/28 | 310 | 318 | |
| 6 | Carnival Corp. | 10.500% | 6/1/30 | 10 | 11 | |
| 6 | Carnival Holdings Bermuda Ltd. | 10.375% | 5/1/28 | 70 | 77 | |
| Case Western Reserve University | 5.405% | 6/1/22 | 1,893 | 1,854 | ||
| 3 | Duke University | 2.682% | 10/1/44 | 3,100 | 2,279 | |
| 3 | Duke University | 2.832% | 10/1/55 | 10,635 | 7,253 | |
| 6 | ERAC USA Finance LLC | 7.000% | 10/15/37 | 2,850 | 3,329 | |
| 6 | ERAC USA Finance LLC | 5.400% | 5/1/53 | 3,072 | 3,183 | |
| Ford Foundation | 2.815% | 6/1/70 | 1,950 | 1,202 | ||
| Ford Motor Co. | 9.625% | 4/22/30 | 10 | 12 | ||
| Ford Motor Credit Co. LLC | 3.815% | 11/2/27 | 195 | 183 | ||
| Ford Motor Credit Co. LLC | 6.800% | 5/12/28 | 165 | 171 | ||
| General Motors Co. | 5.150% | 4/1/38 | 1,000 | 946 | ||
| General Motors Co. | 5.200% | 4/1/45 | 1,500 | 1,359 | ||
| General Motors Co. | 5.400% | 4/1/48 | 1,000 | 912 | ||
| General Motors Co. | 5.950% | 4/1/49 | 2,000 | 1,966 | ||
| George Washington University | 4.300% | 9/15/44 | 2,890 | 2,568 | ||
| Georgetown University | 4.315% | 4/1/49 | 14,755 | 12,883 | ||
| Georgetown University | 2.943% | 4/1/50 | 18,790 | 13,016 | ||
| Georgetown University | 5.215% | 10/1/18 | 5,945 | 5,516 | ||
| 6 | Hanesbrands Inc. | 9.000% | 2/15/31 | 215 | 217 | |
| Home Depot Inc. | 5.875% | 12/16/36 | 2,595 | 2,873 | ||
| Home Depot Inc. | 3.300% | 4/15/40 | 1,000 | 818 | ||
| Home Depot Inc. | 5.400% | 9/15/40 | 947 | 990 | ||
| Home Depot Inc. | 5.950% | 4/1/41 | 18,480 | 20,455 | ||
| Home Depot Inc. | 4.875% | 2/15/44 | 45,115 | 44,214 | ||
| Home Depot Inc. | 4.400% | 3/15/45 | 12,900 | 11,846 | ||
| Home Depot Inc. | 4.250% | 4/1/46 | 21,515 | 19,267 | ||
| Home Depot Inc. | 3.900% | 6/15/47 | 31,240 | 26,372 | ||
| Home Depot Inc. | 4.500% | 12/6/48 | 12,020 | 11,064 | ||
| Home Depot Inc. | 3.125% | 12/15/49 | 1,450 | 1,056 | ||
| Home Depot Inc. | 3.350% | 4/15/50 | 4,030 | 3,053 | ||
| Home Depot Inc. | 2.375% | 3/15/51 | 500 | 308 | ||
| Coupon | Maturity Date | Face Amount ($000) | Market Value• ($000) | |||
| Home Depot Inc. | 2.750% | 9/15/51 | 26,130 | 17,430 | ||
| Home Depot Inc. | 3.625% | 4/15/52 | 3,120 | 2,464 | ||
| Home Depot Inc. | 3.500% | 9/15/56 | 947 | 726 | ||
| Indiana University Foundation Inc. | 2.820% | 10/1/51 | 6,000 | 3,921 | ||
| 3 | Johns Hopkins University | 2.813% | 1/1/60 | 2,000 | 1,326 | |
| Leland Stanford Junior University | 3.647% | 5/1/48 | 16,833 | 14,026 | ||
| Leland Stanford Junior University | 2.413% | 6/1/50 | 1,600 | 1,035 | ||
| 6 | Lithia Motors Inc. | 3.875% | 6/1/29 | 279 | 251 | |
| 6 | Lithia Motors Inc. | 4.375% | 1/15/31 | 250 | 224 | |
| Lowe's Cos. Inc. | 5.125% | 4/15/50 | 1,905 | 1,819 | ||
| Lowe's Cos. Inc. | 4.250% | 4/1/52 | 1,525 | 1,283 | ||
| 3 | Massachusetts Institute of Technology | 3.959% | 7/1/38 | 24,140 | 22,027 | |
| Massachusetts Institute of Technology | 2.989% | 7/1/50 | 1,600 | 1,184 | ||
| Massachusetts Institute of Technology | 3.067% | 4/1/52 | 1,600 | 1,192 | ||
| Massachusetts Institute of Technology | 5.600% | 7/1/11 | 1,920 | 2,137 | ||
| Massachusetts Institute of Technology | 4.678% | 7/1/14 | 1,305 | 1,224 | ||
| 5 | McDonald's Corp. | 4.125% | 11/28/35 | 400 | 449 | |
| McDonald's Corp. | 3.625% | 9/1/49 | 4,400 | 3,437 | ||
| McDonald's Corp. | 5.450% | 8/14/53 | 24,590 | 25,504 | ||
| 6 | NCL Corp. Ltd. | 5.875% | 2/15/27 | 135 | 133 | |
| 6 | NCL Corp. Ltd. | 7.750% | 2/15/29 | 75 | 76 | |
| NIKE Inc. | 3.625% | 5/1/43 | 10,604 | 8,965 | ||
| NIKE Inc. | 3.375% | 11/1/46 | 19,180 | 15,155 | ||
| 3 | Northeastern University | 2.894% | 10/1/50 | 17,647 | 12,039 | |
| President and Fellows of Harvard College | 5.625% | 10/1/38 | 2,500 | 2,752 | ||
| 6 | President and Fellows of Harvard College | 6.500% | 1/15/39 | 3,709 | 4,393 | |
| President and Fellows of Harvard College | 4.875% | 10/15/40 | 750 | 754 | ||
| President and Fellows of Harvard College | 3.150% | 7/15/46 | 17,450 | 13,457 | ||
| President and Fellows of Harvard College | 3.745% | 11/15/52 | 29,635 | 25,059 | ||
| 5 | Robert Bosch GmbH | 4.375% | 6/2/43 | 300 | 342 | |
| Rockefeller Foundation | 2.492% | 10/1/50 | 38,532 | 25,023 | ||
| 6 | Royal Caribbean Cruises Ltd. | 8.250% | 1/15/29 | 36 | 38 | |
| Thomas Jefferson University | 3.847% | 11/1/57 | 25,990 | 19,542 | ||
| Toyota Motor Credit Corp. | 4.800% | 1/5/34 | 4,300 | 4,296 | ||
| Trustees of Princeton University | 2.516% | 7/1/50 | 3,115 | 2,133 | ||
| Trustees of Princeton University | 4.201% | 3/1/52 | 16,947 | 15,768 | ||
| 3 | University of Chicago | 2.761% | 4/1/45 | 11,735 | 9,084 | |
| 3 | University of Chicago | 2.547% | 4/1/50 | 10,000 | 6,766 | |
| University of Chicago | 3.000% | 10/1/52 | 5,695 | 4,034 | ||
| 3 | University of Southern California | 3.028% | 10/1/39 | 2,500 | 2,074 | |
| University of Southern California | 4.976% | 10/1/53 | 17,610 | 17,984 | ||
| 5 | Volkswagen International Finance NV | 1.500% | 1/21/41 | 100 | 74 | |
| Washington University | 3.524% | 4/15/54 | 2,300 | 1,828 | ||
| Washington University | 4.349% | 4/15/22 | 1,830 | 1,508 | ||
| 6 | WK Kellogg Foundation Trust | 2.443% | 10/1/50 | 42,390 | 26,753 | |
| Yale University | 2.402% | 4/15/50 | 19,845 | 13,030 | ||
| 811,999 | ||||||
| Consumer Staples (5.0%) | ||||||
| Altria Group Inc. | 5.800% | 2/14/39 | 5,250 | 5,363 | ||
| Altria Group Inc. | 3.400% | 2/4/41 | 3,750 | 2,770 | ||
| Altria Group Inc. | 4.450% | 5/6/50 | 1,130 | 896 | ||
| Coupon | Maturity Date | Face Amount ($000) | Market Value• ($000) | |||
| Anheuser-Busch Cos. LLC / Anheuser-Busch InBev Worldwide Inc. | 4.700% | 2/1/36 | 23,950 | 23,662 | ||
| Anheuser-Busch Cos. LLC / Anheuser-Busch InBev Worldwide Inc. | 4.900% | 2/1/46 | 152,420 | 148,214 | ||
| Anheuser-Busch InBev Finance Inc. | 4.625% | 2/1/44 | 2,000 | 1,868 | ||
| Anheuser-Busch InBev Worldwide Inc. | 4.375% | 4/15/38 | 5,500 | 5,203 | ||
| Anheuser-Busch InBev Worldwide Inc. | 8.200% | 1/15/39 | 12,383 | 16,510 | ||
| Anheuser-Busch InBev Worldwide Inc. | 5.450% | 1/23/39 | 6,000 | 6,312 | ||
| Anheuser-Busch InBev Worldwide Inc. | 4.350% | 6/1/40 | 6,588 | 6,105 | ||
| Anheuser-Busch InBev Worldwide Inc. | 4.950% | 1/15/42 | 3,800 | 3,765 | ||
| Anheuser-Busch InBev Worldwide Inc. | 4.600% | 4/15/48 | 10,831 | 10,024 | ||
| Anheuser-Busch InBev Worldwide Inc. | 4.439% | 10/6/48 | 3,130 | 2,828 | ||
| Anheuser-Busch InBev Worldwide Inc. | 5.550% | 1/23/49 | 72,770 | 77,079 | ||
| Anheuser-Busch InBev Worldwide Inc. | 4.500% | 6/1/50 | 2,685 | 2,494 | ||
| Anheuser-Busch InBev Worldwide Inc. | 4.750% | 4/15/58 | 14,975 | 13,991 | ||
| Anheuser-Busch InBev Worldwide Inc. | 5.800% | 1/23/59 | 3,805 | 4,181 | ||
| Archer-Daniels-Midland Co. | 4.500% | 3/15/49 | 18,749 | 16,749 | ||
| Archer-Daniels-Midland Co. | 2.700% | 9/15/51 | 21,850 | 14,040 | ||
| 6 | Bacardi Ltd. / Bacardi-Martini BV | 5.900% | 6/15/43 | 12,715 | 12,935 | |
| BAT Capital Corp. | 4.390% | 8/15/37 | 1,375 | 1,160 | ||
| BAT Capital Corp. | 7.079% | 8/2/43 | 1,800 | 1,899 | ||
| BAT Capital Corp. | 4.540% | 8/15/47 | 3,535 | 2,694 | ||
| BAT Capital Corp. | 4.758% | 9/6/49 | 5,915 | 4,640 | ||
| BAT Capital Corp. | 7.081% | 8/2/53 | 2,190 | 2,314 | ||
| 7 | BAT International Finance plc | 2.250% | 9/9/52 | 300 | 164 | |
| 6 | Cargill Inc. | 4.760% | 11/23/45 | 20,000 | 18,797 | |
| 6 | Cargill Inc. | 3.125% | 5/25/51 | 13,715 | 9,722 | |
| 6 | Cargill Inc. | 4.375% | 4/22/52 | 6,210 | 5,523 | |
| Coca-Cola Co. | 2.875% | 5/5/41 | 10,925 | 8,480 | ||
| Coca-Cola Co. | 2.600% | 6/1/50 | 30,500 | 20,506 | ||
| Coca-Cola Co. | 3.000% | 3/5/51 | 37,160 | 27,085 | ||
| Coca-Cola Co. | 2.500% | 3/15/51 | 17,750 | 11,558 | ||
| Estee Lauder Cos. Inc. | 5.150% | 5/15/53 | 1,820 | 1,817 | ||
| Hershey Co. | 3.125% | 11/15/49 | 25,500 | 18,984 | ||
| J M Smucker Co. | 6.500% | 11/15/43 | 1,455 | 1,623 | ||
| J M Smucker Co. | 6.500% | 11/15/53 | 2,555 | 2,890 | ||
| 6 | JBS USA LUX SA / JBS USA Food Co. / JBS Luxembourg Sarl | 7.250% | 11/15/53 | 2,300 | 2,501 | |
| Kenvue Inc. | 5.100% | 3/22/43 | 12,905 | 13,214 | ||
| Kenvue Inc. | 5.050% | 3/22/53 | 20,555 | 20,699 | ||
| Kenvue Inc. | 5.200% | 3/22/63 | 13,235 | 13,369 | ||
| Keurig Dr Pepper Inc. | 4.500% | 11/15/45 | 1,000 | 889 | ||
| Kimberly-Clark Corp. | 3.200% | 7/30/46 | 14,400 | 10,852 | ||
| Kraft Heinz Foods Co. | 4.875% | 10/1/49 | 2,150 | 1,989 | ||
| 5 | Nestle Finance International Ltd. | 3.750% | 11/14/35 | 500 | 570 | |
| 6 | Nestle Holdings Inc. | 3.900% | 9/24/38 | 20,775 | 18,873 | |
| 6 | Nestle Holdings Inc. | 4.000% | 9/24/48 | 22,130 | 19,277 | |
| PepsiCo Inc. | 2.750% | 10/21/51 | 13,335 | 9,095 | ||
| PepsiCo Inc. | 4.650% | 2/15/53 | 44,960 | 43,410 | ||
| Philip Morris International Inc. | 6.375% | 5/16/38 | 14,871 | 16,614 | ||
| 5 | Philip Morris International Inc. | 1.450% | 8/1/39 | 600 | 426 | |
| Philip Morris International Inc. | 4.375% | 11/15/41 | 4,890 | 4,344 | ||
| Coupon | Maturity Date | Face Amount ($000) | Market Value• ($000) | |||
| Philip Morris International Inc. | 3.875% | 8/21/42 | 6,750 | 5,524 | ||
| Philip Morris International Inc. | 4.125% | 3/4/43 | 26,645 | 22,476 | ||
| Philip Morris International Inc. | 4.875% | 11/15/43 | 9,345 | 8,758 | ||
| Philip Morris International Inc. | 4.250% | 11/10/44 | 4,290 | 3,686 | ||
| 6 | SC Johnson & Son Inc. | 4.000% | 5/15/43 | 28,110 | 23,086 | |
| Target Corp. | 3.900% | 11/15/47 | 2,000 | 1,701 | ||
| Target Corp. | 2.950% | 1/15/52 | 23,895 | 16,677 | ||
| Target Corp. | 4.800% | 1/15/53 | 2,370 | 2,295 | ||
| Unilever Capital Corp. | 2.625% | 8/12/51 | 2,000 | 1,327 | ||
| Walmart Inc. | 5.625% | 4/1/40 | 1,840 | 2,016 | ||
| Walmart Inc. | 5.625% | 4/15/41 | 5,585 | 6,152 | ||
| Walmart Inc. | 3.625% | 12/15/47 | 12,145 | 10,058 | ||
| Walmart Inc. | 4.500% | 4/15/53 | 17,530 | 16,635 | ||
| 811,358 | ||||||
| Energy (6.2%) | ||||||
| Baker Hughes Holdings LLC / Baker Hughes Co-Obligor Inc. | 4.080% | 12/15/47 | 2,500 | 2,080 | ||
| BP Capital Markets America Inc. | 4.989% | 4/10/34 | 18,245 | 18,372 | ||
| BP Capital Markets America Inc. | 3.060% | 6/17/41 | 25,555 | 19,596 | ||
| BP Capital Markets America Inc. | 3.000% | 2/24/50 | 9,160 | 6,366 | ||
| BP Capital Markets America Inc. | 2.772% | 11/10/50 | 37,140 | 24,507 | ||
| BP Capital Markets America Inc. | 2.939% | 6/4/51 | 64,545 | 44,075 | ||
| BP Capital Markets America Inc. | 3.001% | 3/17/52 | 32,280 | 22,262 | ||
| BP Capital Markets America Inc. | 3.379% | 2/8/61 | 51,895 | 36,587 | ||
| 5 | BP Capital Markets BV | 4.323% | 5/12/35 | 300 | 340 | |
| 5 | BP Capital Markets BV | 1.467% | 9/21/41 | 300 | 225 | |
| Burlington Resources LLC | 5.950% | 10/15/36 | 2,000 | 2,154 | ||
| Cheniere Corpus Christi Holdings LLC | 2.742% | 12/31/39 | 968 | 770 | ||
| Chevron Corp. | 3.078% | 5/11/50 | 19,305 | 14,092 | ||
| 6 | Civitas Resources Inc. | 8.750% | 7/1/31 | 75 | 80 | |
| 6 | CNX Resources Corp. | 7.375% | 1/15/31 | 65 | 66 | |
| 6 | Columbia Pipelines Operating Co. LLC | 6.544% | 11/15/53 | 12,945 | 14,208 | |
| ConocoPhillips Co. | 3.758% | 3/15/42 | 7,900 | 6,609 | ||
| ConocoPhillips Co. | 4.300% | 11/15/44 | 9,348 | 8,300 | ||
| ConocoPhillips Co. | 5.950% | 3/15/46 | 1,000 | 1,074 | ||
| ConocoPhillips Co. | 3.800% | 3/15/52 | 41,665 | 33,030 | ||
| ConocoPhillips Co. | 5.300% | 5/15/53 | 22,090 | 22,274 | ||
| ConocoPhillips Co. | 5.550% | 3/15/54 | 16,680 | 17,399 | ||
| ConocoPhillips Co. | 4.025% | 3/15/62 | 37,905 | 30,126 | ||
| ConocoPhillips Co. | 5.700% | 9/15/63 | 12,740 | 13,425 | ||
| 6 | DCP Midstream Operating LP | 6.750% | 9/15/37 | 6,085 | 6,664 | |
| DCP Midstream Operating LP | 5.600% | 4/1/44 | 2,270 | 2,225 | ||
| 6 | EIG Pearl Holdings Sarl | 4.387% | 11/30/46 | 15,940 | 12,240 | |
| Enbridge Inc. | 6.700% | 11/15/53 | 15,840 | 18,288 | ||
| Energy Transfer LP | 5.300% | 4/15/47 | 3,056 | 2,813 | ||
| Energy Transfer LP | 6.000% | 6/15/48 | 2,295 | 2,304 | ||
| Energy Transfer LP | 5.000% | 5/15/50 | 6,455 | 5,736 | ||
| Energy Transfer LP | 5.950% | 5/15/54 | 2,835 | 2,852 | ||
| Enterprise Products Operating LLC | 4.850% | 1/31/34 | 6,170 | 6,179 | ||
| Enterprise Products Operating LLC | 5.100% | 2/15/45 | 5,695 | 5,563 | ||
| Enterprise Products Operating LLC | 4.900% | 5/15/46 | 3,375 | 3,215 | ||
| Enterprise Products Operating LLC | 4.200% | 1/31/50 | 22,265 | 19,099 | ||
| Enterprise Products Operating LLC | 3.700% | 1/31/51 | 2,305 | 1,813 | ||
| Coupon | Maturity Date | Face Amount ($000) | Market Value• ($000) | |||
| Enterprise Products Operating LLC | 3.200% | 2/15/52 | 4,000 | 2,857 | ||
| Enterprise Products Operating LLC | 3.300% | 2/15/53 | 1,800 | 1,313 | ||
| Enterprise Products Operating LLC | 4.950% | 10/15/54 | 1,500 | 1,418 | ||
| Enterprise Products Operating LLC | 3.950% | 1/31/60 | 2,000 | 1,593 | ||
| EOG Resources Inc. | 3.900% | 4/1/35 | 1,650 | 1,517 | ||
| EOG Resources Inc. | 4.950% | 4/15/50 | 16,580 | 16,111 | ||
| Equinor ASA | 3.625% | 4/6/40 | 19,225 | 16,397 | ||
| Equinor ASA | 4.250% | 11/23/41 | 1,944 | 1,779 | ||
| Equinor ASA | 3.950% | 5/15/43 | 35,350 | 30,663 | ||
| Equinor ASA | 3.250% | 11/18/49 | 18,640 | 13,812 | ||
| Equinor ASA | 3.700% | 4/6/50 | 19,800 | 16,030 | ||
| Exxon Mobil Corp. | 2.995% | 8/16/39 | 5,178 | 4,150 | ||
| Exxon Mobil Corp. | 4.227% | 3/19/40 | 5,000 | 4,605 | ||
| Exxon Mobil Corp. | 4.114% | 3/1/46 | 23,530 | 20,620 | ||
| Exxon Mobil Corp. | 3.095% | 8/16/49 | 14,590 | 10,543 | ||
| Exxon Mobil Corp. | 4.327% | 3/19/50 | 55,042 | 49,181 | ||
| Exxon Mobil Corp. | 3.452% | 4/15/51 | 3,550 | 2,730 | ||
| 6 | Galaxy Pipeline Assets Bidco Ltd. | 2.940% | 9/30/40 | 22,101 | 17,715 | |
| 3,6 | Greensaif Pipelines Bidco Sarl | 6.129% | 2/23/38 | 7,850 | 8,012 | |
| 3,6 | Greensaif Pipelines Bidco Sarl | 6.510% | 2/23/42 | 25,680 | 26,291 | |
| Halliburton Co. | 4.500% | 11/15/41 | 960 | 870 | ||
| Halliburton Co. | 5.000% | 11/15/45 | 4,580 | 4,422 | ||
| Hess Corp. | 5.800% | 4/1/47 | 8,157 | 8,761 | ||
| KazMunayGas National Co. JSC | 6.375% | 10/24/48 | 989 | 913 | ||
| 6 | Northern Natural Gas Co. | 5.625% | 2/1/54 | 6,750 | 6,890 | |
| Occidental Petroleum Corp. | 4.400% | 4/15/46 | 2,290 | 1,870 | ||
| Ovintiv Inc. | 6.500% | 2/1/38 | 891 | 922 | ||
| 6 | Permian Resources Operating LLC | 7.750% | 2/15/26 | 120 | 122 | |
| 6 | Permian Resources Operating LLC | 5.875% | 7/1/29 | 285 | 280 | |
| Petroleos del Peru SA | 5.625% | 6/19/47 | 4,570 | 2,857 | ||
| Petroleos Mexicanos | 6.500% | 6/2/41 | 711 | 478 | ||
| Petroleos Mexicanos | 6.375% | 1/23/45 | 77 | 49 | ||
| Petroleos Mexicanos | 6.750% | 9/21/47 | 397 | 253 | ||
| Petroleos Mexicanos | 6.950% | 1/28/60 | 912 | 584 | ||
| Petronas Capital Ltd. | 3.500% | 4/21/30 | 8,245 | 7,672 | ||
| Shell International Finance BV | 4.125% | 5/11/35 | 8,890 | 8,433 | ||
| Shell International Finance BV | 6.375% | 12/15/38 | 4,211 | 4,846 | ||
| Shell International Finance BV | 5.500% | 3/25/40 | 13,990 | 14,772 | ||
| Shell International Finance BV | 2.875% | 11/26/41 | 15,345 | 11,492 | ||
| Shell International Finance BV | 3.625% | 8/21/42 | 1,000 | 837 | ||
| Shell International Finance BV | 4.550% | 8/12/43 | 15,195 | 14,191 | ||
| Shell International Finance BV | 4.375% | 5/11/45 | 42,595 | 38,818 | ||
| Shell International Finance BV | 4.000% | 5/10/46 | 37,137 | 31,812 | ||
| Shell International Finance BV | 3.750% | 9/12/46 | 63,375 | 51,953 | ||
| Shell International Finance BV | 3.125% | 11/7/49 | 5,000 | 3,595 | ||
| Shell International Finance BV | 3.250% | 4/6/50 | 16,730 | 12,292 | ||
| Shell International Finance BV | 3.000% | 11/26/51 | 33,789 | 23,512 | ||
| Suncor Energy Inc. | 6.500% | 6/15/38 | 656 | 706 | ||
| Suncor Energy Inc. | 3.750% | 3/4/51 | 325 | 243 | ||
| Targa Resources Corp. | 6.500% | 3/30/34 | 3,980 | 4,290 | ||
| Targa Resources Corp. | 6.500% | 2/15/53 | 13,500 | 14,506 | ||
| TotalEnergies Capital International SA | 2.986% | 6/29/41 | 28,045 | 21,514 | ||
| TotalEnergies Capital International SA | 3.461% | 7/12/49 | 500 | 386 | ||
| TotalEnergies Capital International SA | 3.127% | 5/29/50 | 28,725 | 20,702 | ||
| TransCanada PipeLines Ltd. | 6.100% | 6/1/40 | 1,798 | 1,883 | ||
| 6 | Transocean Inc. | 8.750% | 2/15/30 | 238 | 248 | |
| Coupon | Maturity Date | Face Amount ($000) | Market Value• ($000) | |||
| 6 | Transocean Titan Financing Ltd. | 8.375% | 2/1/28 | 20 | 21 | |
| 6 | Valaris Ltd. | 8.375% | 4/30/30 | 105 | 108 | |
| 6 | Venture Global Calcasieu Pass LLC | 6.250% | 1/15/30 | 45 | 45 | |
| 6 | Venture Global LNG Inc. | 8.375% | 6/1/31 | 200 | 203 | |
| 992,696 | ||||||
| Financials (17.0%) | ||||||
| ACE Capital Trust II | 9.700% | 4/1/30 | 3,745 | 4,398 | ||
| Aflac Inc. | 4.000% | 10/15/46 | 900 | 742 | ||
| Aflac Inc. | 4.750% | 1/15/49 | 800 | 755 | ||
| Allstate Corp. | 5.250% | 3/30/33 | 7,110 | 7,236 | ||
| Allstate Corp. | 4.200% | 12/15/46 | 12,485 | 10,531 | ||
| Allstate Corp. | 3.850% | 8/10/49 | 1,956 | 1,559 | ||
| American International Group Inc. | 4.375% | 6/30/50 | 3,305 | 2,929 | ||
| Arthur J Gallagher & Co. | 6.750% | 2/15/54 | 3,800 | 4,387 | ||
| 7 | Aviva plc | 6.875% | 5/20/58 | 200 | 261 | |
| Bank of America Corp. | 5.872% | 9/15/34 | 21,160 | 22,148 | ||
| Bank of America Corp. | 5.468% | 1/23/35 | 34,135 | 34,792 | ||
| Bank of America Corp. | 6.110% | 1/29/37 | 3,957 | 4,270 | ||
| Bank of America Corp. | 4.244% | 4/24/38 | 68,876 | 62,685 | ||
| Bank of America Corp. | 7.750% | 5/14/38 | 2,300 | 2,823 | ||
| Bank of America Corp. | 4.078% | 4/23/40 | 23,960 | 21,206 | ||
| Bank of America Corp. | 2.676% | 6/19/41 | 64,163 | 46,331 | ||
| Bank of America Corp. | 5.875% | 2/7/42 | 4,000 | 4,377 | ||
| Bank of America Corp. | 3.311% | 4/22/42 | 57,690 | 45,370 | ||
| Bank of America Corp. | 5.000% | 1/21/44 | 3,330 | 3,272 | ||
| Bank of America Corp. | 4.443% | 1/20/48 | 28,155 | 25,206 | ||
| Bank of America Corp. | 3.946% | 1/23/49 | 64,760 | 54,007 | ||
| Bank of America Corp. | 4.330% | 3/15/50 | 24,571 | 21,629 | ||
| Bank of America Corp. | 4.083% | 3/20/51 | 31,765 | 26,405 | ||
| Bank of America Corp. | 2.831% | 10/24/51 | 22,445 | 14,900 | ||
| Bank of America Corp. | 3.483% | 3/13/52 | 1,000 | 758 | ||
| Bank of America Corp. | 2.972% | 7/21/52 | 3,500 | 2,402 | ||
| Bank of New York Mellon Corp. | 6.474% | 10/25/34 | 34,275 | 37,871 | ||
| Berkshire Hathaway Finance Corp. | 4.300% | 5/15/43 | 2,000 | 1,857 | ||
| Berkshire Hathaway Finance Corp. | 4.200% | 8/15/48 | 4,000 | 3,611 | ||
| Berkshire Hathaway Finance Corp. | 4.250% | 1/15/49 | 10,100 | 9,219 | ||
| Berkshire Hathaway Finance Corp. | 2.850% | 10/15/50 | 3,000 | 2,060 | ||
| Berkshire Hathaway Finance Corp. | 3.850% | 3/15/52 | 8,900 | 7,342 | ||
| 6 | BNP Paribas SA | 5.894% | 12/5/34 | 15,935 | 16,657 | |
| 6 | BPCE SA | 7.003% | 10/19/34 | 25,215 | 27,520 | |
| Capital One Financial Corp. | 6.051% | 2/1/35 | 6,560 | 6,649 | ||
| Capital One Financial Corp. | 6.051% | 2/1/35 | 7,505 | 7,606 | ||
| Chubb INA Holdings Inc. | 4.150% | 3/13/43 | 1,500 | 1,353 | ||
| Chubb INA Holdings Inc. | 4.350% | 11/3/45 | 20,125 | 18,587 | ||
| Chubb INA Holdings Inc. | 2.850% | 12/15/51 | 1,000 | 701 | ||
| Chubb INA Holdings Inc. | 3.050% | 12/15/61 | 7,235 | 4,994 | ||
| Citigroup Inc. | 3.878% | 1/24/39 | 63,980 | 55,501 | ||
| Citigroup Inc. | 8.125% | 7/15/39 | 2,000 | 2,599 | ||
| Citigroup Inc. | 5.316% | 3/26/41 | 10,000 | 10,058 | ||
| Citigroup Inc. | 5.875% | 1/30/42 | 5,270 | 5,679 | ||
| Citigroup Inc. | 2.904% | 11/3/42 | 1,560 | 1,138 | ||
| Citigroup Inc. | 4.650% | 7/30/45 | 11,342 | 10,456 | ||
| Citigroup Inc. | 4.281% | 4/24/48 | 1,900 | 1,652 | ||
| Citigroup Inc. | 4.650% | 7/23/48 | 7,072 | 6,532 | ||
| Corebridge Financial Inc. | 4.350% | 4/5/42 | 4,000 | 3,411 | ||
| Corebridge Financial Inc. | 4.400% | 4/5/52 | 3,990 | 3,336 | ||
| 6 | FMR LLC | 6.450% | 11/15/39 | 16,010 | 17,182 | |
| GATX Corp. | 3.100% | 6/1/51 | 2,725 | 1,793 | ||
| 6 | Global Atlantic Fin Co. | 7.950% | 6/15/33 | 6,210 | 6,902 | |
| Coupon | Maturity Date | Face Amount ($000) | Market Value• ($000) | |||
| Goldman Sachs Group Inc. | 6.561% | 10/24/34 | 8,995 | 9,909 | ||
| Goldman Sachs Group Inc. | 4.017% | 10/31/38 | 115,690 | 101,995 | ||
| Goldman Sachs Group Inc. | 4.411% | 4/23/39 | 31,315 | 28,545 | ||
| Goldman Sachs Group Inc. | 6.250% | 2/1/41 | 8,200 | 9,112 | ||
| Goldman Sachs Group Inc. | 3.210% | 4/22/42 | 2,300 | 1,774 | ||
| Goldman Sachs Group Inc. | 2.908% | 7/21/42 | 21,261 | 15,719 | ||
| Goldman Sachs Group Inc. | 3.436% | 2/24/43 | 22,570 | 17,684 | ||
| Goldman Sachs Group Inc. | 4.800% | 7/8/44 | 4,600 | 4,371 | ||
| Goldman Sachs Group Inc. | 4.750% | 10/21/45 | 1,000 | 947 | ||
| HSBC Bank USA NA | 5.625% | 8/15/35 | 750 | 750 | ||
| HSBC Holdings plc | 6.547% | 6/20/34 | 8,965 | 9,329 | ||
| HSBC Holdings plc | 6.500% | 9/15/37 | 20,523 | 21,488 | ||
| HSBC Holdings plc | 6.800% | 6/1/38 | 38,749 | 41,671 | ||
| HSBC Holdings plc | 6.332% | 3/9/44 | 44,075 | 47,630 | ||
| Huntington Bancshares Inc. | 5.709% | 2/2/35 | 25,510 | 25,689 | ||
| Intercontinental Exchange Inc. | 2.650% | 9/15/40 | 1,000 | 735 | ||
| Intercontinental Exchange Inc. | 4.250% | 9/21/48 | 9,125 | 7,972 | ||
| Intercontinental Exchange Inc. | 3.000% | 6/15/50 | 11,420 | 7,922 | ||
| Intercontinental Exchange Inc. | 4.950% | 6/15/52 | 57,395 | 55,474 | ||
| Intercontinental Exchange Inc. | 3.000% | 9/15/60 | 2,211 | 1,437 | ||
| Intercontinental Exchange Inc. | 5.200% | 6/15/62 | 44,205 | 44,396 | ||
| Invesco Finance plc | 5.375% | 11/30/43 | 5,163 | 5,089 | ||
| 5 | JAB Holdings BV | 2.250% | 12/19/39 | 400 | 328 | |
| JPMorgan Chase & Co. | 6.254% | 10/23/34 | 26,390 | 28,609 | ||
| JPMorgan Chase & Co. | 5.336% | 1/23/35 | 4,905 | 4,988 | ||
| JPMorgan Chase & Co. | 6.400% | 5/15/38 | 25,899 | 29,704 | ||
| JPMorgan Chase & Co. | 3.882% | 7/24/38 | 52,342 | 45,974 | ||
| JPMorgan Chase & Co. | 5.500% | 10/15/40 | 24,480 | 25,660 | ||
| JPMorgan Chase & Co. | 3.109% | 4/22/41 | 18,000 | 14,015 | ||
| JPMorgan Chase & Co. | 5.600% | 7/15/41 | 6,286 | 6,673 | ||
| JPMorgan Chase & Co. | 2.525% | 11/19/41 | 1,910 | 1,359 | ||
| JPMorgan Chase & Co. | 5.400% | 1/6/42 | 2,730 | 2,817 | ||
| JPMorgan Chase & Co. | 3.157% | 4/22/42 | 27,500 | 21,291 | ||
| JPMorgan Chase & Co. | 4.260% | 2/22/48 | 36,921 | 32,310 | ||
| JPMorgan Chase & Co. | 4.032% | 7/24/48 | 33,990 | 28,657 | ||
| JPMorgan Chase & Co. | 3.964% | 11/15/48 | 108,610 | 90,385 | ||
| JPMorgan Chase & Co. | 3.897% | 1/23/49 | 43,555 | 35,914 | ||
| JPMorgan Chase & Co. | 3.109% | 4/22/51 | 19,160 | 13,623 | ||
| JPMorgan Chase & Co. | 3.328% | 4/22/52 | 28,605 | 21,057 | ||
| Lloyds Banking Group plc | 5.679% | 1/5/35 | 28,245 | 28,653 | ||
| 6 | LSEGA Financing plc | 3.200% | 4/6/41 | 23,170 | 17,843 | |
| M&T Bank Corp. | 5.053% | 1/27/34 | 5,720 | 5,406 | ||
| Marsh & McLennan Cos. Inc. | 4.200% | 3/1/48 | 1,200 | 1,034 | ||
| Marsh & McLennan Cos. Inc. | 4.900% | 3/15/49 | 2,500 | 2,392 | ||
| Marsh & McLennan Cos. Inc. | 2.900% | 12/15/51 | 700 | 462 | ||
| Marsh & McLennan Cos. Inc. | 6.250% | 11/1/52 | 1,500 | 1,707 | ||
| Marsh & McLennan Cos. Inc. | 5.450% | 3/15/53 | 9,300 | 9,625 | ||
| Marsh & McLennan Cos. Inc. | 5.700% | 9/15/53 | 1,200 | 1,288 | ||
| 6 | Massachusetts Mutual Life Insurance Co. | 3.375% | 4/15/50 | 7,366 | 5,311 | |
| 6 | Massachusetts Mutual Life Insurance Co. | 3.729% | 10/15/70 | 15,195 | 10,559 | |
| MetLife Inc. | 6.375% | 6/15/34 | 3,000 | 3,345 | ||
| MetLife Inc. | 4.125% | 8/13/42 | 31,131 | 27,365 | ||
| MetLife Inc. | 4.875% | 11/13/43 | 10,000 | 9,731 | ||
| MetLife Inc. | 4.600% | 5/13/46 | 1,500 | 1,410 | ||
| MetLife Inc. | 5.000% | 7/15/52 | 4,000 | 3,939 | ||
| MetLife Inc. | 5.250% | 1/15/54 | 16,560 | 16,843 | ||
| Mitsubishi UFJ Financial Group Inc. | 3.751% | 7/18/39 | 3,000 | 2,645 | ||
| Morgan Stanley | 5.424% | 7/21/34 | 17,260 | 17,477 | ||
| Morgan Stanley | 6.627% | 11/1/34 | 24,170 | 26,751 | ||
| Morgan Stanley | 5.466% | 1/18/35 | 28,835 | 29,444 | ||
| Morgan Stanley | 5.948% | 1/19/38 | 8,990 | 9,154 | ||
| 8 | Morgan Stanley | 3.971% | 7/22/38 | 83,115 | 72,883 | |
| Morgan Stanley | 4.457% | 4/22/39 | 2,380 | 2,197 | ||
| Morgan Stanley | 3.217% | 4/22/42 | 4,380 | 3,399 | ||
| Coupon | Maturity Date | Face Amount ($000) | Market Value• ($000) | |||
| Morgan Stanley | 6.375% | 7/24/42 | 37,300 | 42,507 | ||
| Morgan Stanley | 4.300% | 1/27/45 | 16,955 | 15,145 | ||
| Morgan Stanley | 4.375% | 1/22/47 | 5,600 | 5,001 | ||
| Morgan Stanley | 5.597% | 3/24/51 | 4,390 | 4,686 | ||
| Morgan Stanley | 2.802% | 1/25/52 | 4,000 | 2,657 | ||
| Nasdaq Inc. | 5.550% | 2/15/34 | 5,000 | 5,178 | ||
| Nasdaq Inc. | 2.500% | 12/21/40 | 6,042 | 4,180 | ||
| Nasdaq Inc. | 5.950% | 8/15/53 | 8,860 | 9,449 | ||
| Nasdaq Inc. | 6.100% | 6/28/63 | 16,605 | 17,897 | ||
| 6 | Nationwide Mutual Insurance Co. | 9.375% | 8/15/39 | 19,046 | 25,230 | |
| 6 | Nationwide Mutual Insurance Co. | 4.950% | 4/22/44 | 13,215 | 11,225 | |
| 6 | Nationwide Mutual Insurance Co. | 4.350% | 4/30/50 | 13,720 | 11,085 | |
| 6 | New York Life Insurance Co. | 4.450% | 5/15/69 | 2,500 | 2,095 | |
| 6 | Northwestern Mutual Life Insurance Co. | 3.850% | 9/30/47 | 8,944 | 7,156 | |
| 6 | Northwestern Mutual Life Insurance Co. | 3.625% | 9/30/59 | 33,074 | 24,094 | |
| Progressive Corp. | 4.125% | 4/15/47 | 1,800 | 1,584 | ||
| Progressive Corp. | 3.950% | 3/26/50 | 1,000 | 832 | ||
| Progressive Corp. | 3.700% | 3/15/52 | 700 | 561 | ||
| Prudential Financial Inc. | 3.000% | 3/10/40 | 1,000 | 774 | ||
| Prudential Financial Inc. | 4.600% | 5/15/44 | 1,769 | 1,630 | ||
| Prudential Financial Inc. | 3.905% | 12/7/47 | 1,920 | 1,574 | ||
| Prudential Financial Inc. | 4.418% | 3/27/48 | 390 | 339 | ||
| Prudential Financial Inc. | 3.935% | 12/7/49 | 2,110 | 1,718 | ||
| Prudential Financial Inc. | 4.350% | 2/25/50 | 2,098 | 1,842 | ||
| Prudential Financial Inc. | 3.700% | 3/13/51 | 5,284 | 4,159 | ||
| Royal Bank of Canada | 5.150% | 2/1/34 | 6,000 | 6,014 | ||
| 6 | Societe Generale SA | 7.132% | 1/19/55 | 16,085 | 15,982 | |
| State Street Corp. | 6.123% | 11/21/34 | 5,565 | 5,871 | ||
| 6 | Teachers Insurance & Annuity Assn. of America | 3.300% | 5/15/50 | 16,150 | 11,599 | |
| Travelers Cos. Inc. | 4.600% | 8/1/43 | 1,100 | 1,052 | ||
| Travelers Cos. Inc. | 3.750% | 5/15/46 | 2,954 | 2,439 | ||
| Travelers Cos. Inc. | 4.000% | 5/30/47 | 2,600 | 2,241 | ||
| Travelers Cos. Inc. | 4.100% | 3/4/49 | 15,000 | 13,026 | ||
| Travelers Cos. Inc. | 3.050% | 6/8/51 | 41,465 | 29,741 | ||
| Travelers Cos. Inc. | 5.450% | 5/25/53 | 12,875 | 13,695 | ||
| Truist Financial Corp. | 5.711% | 1/24/35 | 17,135 | 17,398 | ||
| 6 | UBS Group AG | 5.959% | 1/12/34 | 10,140 | 10,470 | |
| 6 | UBS Group AG | 6.301% | 9/22/34 | 16,165 | 17,116 | |
| 6 | UBS Group AG | 5.699% | 2/8/35 | 35,090 | 35,648 | |
| UBS Group AG | 4.875% | 5/15/45 | 4,000 | 3,845 | ||
| Wachovia Corp. | 5.500% | 8/1/35 | 1,600 | 1,623 | ||
| Wells Fargo & Co. | 3.350% | 3/2/33 | 22,700 | 19,925 | ||
| Wells Fargo & Co. | 5.557% | 7/25/34 | 43,375 | 44,332 | ||
| Wells Fargo & Co. | 6.491% | 10/23/34 | 25,205 | 27,465 | ||
| Wells Fargo & Co. | 5.499% | 1/23/35 | 27,815 | 28,363 | ||
| Wells Fargo & Co. | 3.068% | 4/30/41 | 12,410 | 9,443 | ||
| Wells Fargo & Co. | 5.375% | 11/2/43 | 49,267 | 48,430 | ||
| Wells Fargo & Co. | 5.606% | 1/15/44 | 117,092 | 117,675 | ||
| Wells Fargo & Co. | 4.650% | 11/4/44 | 4,127 | 3,670 | ||
| Wells Fargo & Co. | 3.900% | 5/1/45 | 4,087 | 3,399 | ||
| Wells Fargo & Co. | 4.900% | 11/17/45 | 21,949 | 20,182 | ||
| Wells Fargo & Co. | 4.400% | 6/14/46 | 27,292 | 23,318 | ||
| Wells Fargo & Co. | 4.750% | 12/7/46 | 46,559 | 41,462 | ||
| Wells Fargo & Co. | 5.013% | 4/4/51 | 54,288 | 51,895 | ||
| Wells Fargo & Co. | 4.611% | 4/25/53 | 29,630 | 26,477 | ||
| Wells Fargo Bank NA | 5.850% | 2/1/37 | 2,000 | 2,114 | ||
| Wells Fargo Bank NA | 6.600% | 1/15/38 | 3,000 | 3,345 | ||
| 2,733,363 | ||||||
| Health Care (11.1%) | ||||||
| Abbott Laboratories | 4.750% | 11/30/36 | 3,000 | 3,032 | ||
| Abbott Laboratories | 5.300% | 5/27/40 | 15,015 | 15,878 | ||
| Coupon | Maturity Date | Face Amount ($000) | Market Value• ($000) | |||
| Abbott Laboratories | 4.900% | 11/30/46 | 49,345 | 49,338 | ||
| AbbVie Inc. | 4.300% | 5/14/36 | 1,000 | 953 | ||
| AbbVie Inc. | 4.050% | 11/21/39 | 7,635 | 6,910 | ||
| AbbVie Inc. | 4.400% | 11/6/42 | 3,055 | 2,810 | ||
| AbbVie Inc. | 4.850% | 6/15/44 | 38,585 | 37,321 | ||
| AbbVie Inc. | 4.700% | 5/14/45 | 6,105 | 5,794 | ||
| AbbVie Inc. | 4.450% | 5/14/46 | 6,155 | 5,625 | ||
| AbbVie Inc. | 4.875% | 11/14/48 | 3,055 | 2,948 | ||
| AbbVie Inc. | 4.250% | 11/21/49 | 87,683 | 77,011 | ||
| AdventHealth Obligated Group | 2.795% | 11/15/51 | 3,000 | 2,006 | ||
| Advocate Health & Hospitals Corp. | 4.272% | 8/15/48 | 7,315 | 6,501 | ||
| Advocate Health & Hospitals Corp. | 3.387% | 10/15/49 | 15,205 | 11,290 | ||
| Aetna Inc. | 4.750% | 3/15/44 | 1,653 | 1,474 | ||
| 3 | Allina Health System | 3.887% | 4/15/49 | 3,569 | 2,893 | |
| Amgen Inc. | 4.950% | 10/1/41 | 2,415 | 2,316 | ||
| Amgen Inc. | 5.600% | 3/2/43 | 4,901 | 5,045 | ||
| Amgen Inc. | 4.400% | 5/1/45 | 1,020 | 899 | ||
| Amgen Inc. | 4.875% | 3/1/53 | 9,150 | 8,430 | ||
| Amgen Inc. | 5.650% | 3/2/53 | 20,190 | 20,814 | ||
| Amgen Inc. | 5.750% | 3/2/63 | 5,770 | 5,941 | ||
| Ascension Health | 3.106% | 11/15/39 | 3,000 | 2,364 | ||
| AstraZeneca plc | 4.375% | 11/16/45 | 9,000 | 8,281 | ||
| AstraZeneca plc | 3.000% | 5/28/51 | 20,190 | 14,611 | ||
| Baptist Health South Florida Obligated Group | 3.115% | 11/15/71 | 2,200 | 1,321 | ||
| Baptist Healthcare System Obligated Group | 3.540% | 8/15/50 | 1,400 | 1,028 | ||
| Baxter International Inc. | 3.132% | 12/1/51 | 21,800 | 14,606 | ||
| Baylor Scott & White Holdings | 2.839% | 11/15/50 | 12,850 | 8,779 | ||
| 5 | Becton Dickinson Euro Finance Sarl | 1.336% | 8/13/41 | 300 | 220 | |
| Beth Israel Lahey Health Inc. | 3.080% | 7/1/51 | 11,255 | 7,292 | ||
| Boston Scientific Corp. | 4.700% | 3/1/49 | 2,280 | 2,142 | ||
| Bristol-Myers Squibb Co. | 4.125% | 6/15/39 | 21,177 | 19,048 | ||
| Bristol-Myers Squibb Co. | 2.350% | 11/13/40 | 28,285 | 19,589 | ||
| Bristol-Myers Squibb Co. | 4.350% | 11/15/47 | 3,300 | 2,886 | ||
| Bristol-Myers Squibb Co. | 4.550% | 2/20/48 | 777 | 703 | ||
| Bristol-Myers Squibb Co. | 4.250% | 10/26/49 | 97,990 | 83,579 | ||
| Bristol-Myers Squibb Co. | 2.550% | 11/13/50 | 3,180 | 1,976 | ||
| Bristol-Myers Squibb Co. | 3.700% | 3/15/52 | 7,380 | 5,730 | ||
| Bristol-Myers Squibb Co. | 6.250% | 11/15/53 | 6,405 | 7,249 | ||
| Bristol-Myers Squibb Co. | 3.900% | 3/15/62 | 39,835 | 30,488 | ||
| Bristol-Myers Squibb Co. | 6.400% | 11/15/63 | 18,715 | 21,486 | ||
| 6 | Catalent Pharma Solutions Inc. | 3.125% | 2/15/29 | 125 | 110 | |
| 6 | Catalent Pharma Solutions Inc. | 3.500% | 4/1/30 | 70 | 62 | |
| Children's Health System of Texas | 2.511% | 8/15/50 | 2,500 | 1,559 | ||
| Children's Hospital of Philadelphia | 2.704% | 7/1/50 | 1,250 | 832 | ||
| City of Hope | 5.623% | 11/15/43 | 1,944 | 1,944 | ||
| City of Hope | 4.378% | 8/15/48 | 1,671 | 1,384 | ||
| CommonSpirit Health | 4.187% | 10/1/49 | 1,412 | 1,166 | ||
| 6 | CSL Finance plc | 4.750% | 4/27/52 | 14,200 | 13,358 | |
| CVS Health Corp. | 2.700% | 8/21/40 | 2,100 | 1,477 | ||
| CVS Health Corp. | 5.125% | 7/20/45 | 2,805 | 2,619 | ||
| CVS Health Corp. | 5.875% | 6/1/53 | 4,290 | 4,407 | ||
| Danaher Corp. | 2.600% | 10/1/50 | 2,000 | 1,305 | ||
| Danaher Corp. | 2.800% | 12/10/51 | 2,275 | 1,530 | ||
| 6 | DaVita Inc. | 3.750% | 2/15/31 | 140 | 115 | |
| Dignity Health | 4.500% | 11/1/42 | 1,041 | 883 | ||
| Dignity Health | 5.267% | 11/1/64 | 758 | 719 | ||
| Elevance Health Inc. | 6.100% | 10/15/52 | 3,130 | 3,467 | ||
| 5 | Eli Lilly & Co. | 1.700% | 11/1/49 | 400 | 314 | |
| Coupon | Maturity Date | Face Amount ($000) | Market Value• ($000) | |||
| Eli Lilly & Co. | 4.950% | 2/27/63 | 10,460 | 10,577 | ||
| GE HealthCare Technologies Inc. | 6.377% | 11/22/52 | 5,320 | 6,071 | ||
| Gilead Sciences Inc. | 5.550% | 10/15/53 | 10,145 | 10,754 | ||
| GlaxoSmithKline Capital Inc. | 6.375% | 5/15/38 | 33,294 | 38,714 | ||
| Hackensack Meridian Health Inc. | 2.875% | 9/1/50 | 1,250 | 834 | ||
| Inova Health System Foundation | 4.068% | 5/15/52 | 11,245 | 9,506 | ||
| Johnson & Johnson | 3.625% | 3/3/37 | 31,215 | 28,298 | ||
| Johnson & Johnson | 3.400% | 1/15/38 | 43,125 | 37,867 | ||
| Johnson & Johnson | 3.750% | 3/3/47 | 16,965 | 14,531 | ||
| Kaiser Foundation Hospitals | 2.810% | 6/1/41 | 17,350 | 13,049 | ||
| Kaiser Foundation Hospitals | 4.875% | 4/1/42 | 10,390 | 10,050 | ||
| Kaiser Foundation Hospitals | 4.150% | 5/1/47 | 17,944 | 15,664 | ||
| Kaiser Foundation Hospitals | 3.002% | 6/1/51 | 45,155 | 31,615 | ||
| Mass General Brigham Inc. | 3.765% | 7/1/48 | 6,455 | 5,199 | ||
| Mass General Brigham Inc. | 3.192% | 7/1/49 | 12,725 | 9,361 | ||
| Mass General Brigham Inc. | 3.342% | 7/1/60 | 39,084 | 27,583 | ||
| Mayo Clinic | 3.774% | 11/15/43 | 11,795 | 10,136 | ||
| Mayo Clinic | 3.196% | 11/15/61 | 23,785 | 16,581 | ||
| Memorial Sloan-Kettering Cancer Center | 2.955% | 1/1/50 | 2,050 | 1,419 | ||
| Memorial Sloan-Kettering Cancer Center | 4.125% | 7/1/52 | 2,000 | 1,711 | ||
| Merck & Co. Inc. | 3.900% | 3/7/39 | 4,400 | 3,978 | ||
| Merck & Co. Inc. | 4.900% | 5/17/44 | 19,955 | 19,863 | ||
| Merck & Co. Inc. | 3.700% | 2/10/45 | 70,945 | 59,339 | ||
| Merck & Co. Inc. | 2.750% | 12/10/51 | 23,400 | 15,687 | ||
| Merck & Co. Inc. | 5.000% | 5/17/53 | 35,990 | 36,050 | ||
| Merck & Co. Inc. | 2.900% | 12/10/61 | 2,180 | 1,410 | ||
| Merck & Co. Inc. | 5.150% | 5/17/63 | 17,520 | 17,773 | ||
| Mount Sinai Hospital | 3.391% | 7/1/50 | 2,000 | 1,371 | ||
| New York and Presbyterian Hospital | 2.256% | 8/1/40 | 4,777 | 3,270 | ||
| New York and Presbyterian Hospital | 4.024% | 8/1/45 | 12,210 | 10,658 | ||
| New York and Presbyterian Hospital | 4.063% | 8/1/56 | 3,743 | 3,050 | ||
| New York and Presbyterian Hospital | 4.763% | 8/1/16 | 5,250 | 4,620 | ||
| Northwell Healthcare Inc. | 4.800% | 11/1/42 | 1,041 | 946 | ||
| Northwell Healthcare Inc. | 3.979% | 11/1/46 | 1,944 | 1,574 | ||
| Northwell Healthcare Inc. | 4.260% | 11/1/47 | 947 | 790 | ||
| Northwell Healthcare Inc. | 3.809% | 11/1/49 | 2,284 | 1,754 | ||
| Northwestern Memorial Healthcare Obligated Group | 2.633% | 7/15/51 | 3,500 | 2,263 | ||
| Novant Health Inc. | 2.637% | 11/1/36 | 2,000 | 1,530 | ||
| Novant Health Inc. | 3.168% | 11/1/51 | 5,500 | 3,823 | ||
| Novant Health Inc. | 3.318% | 11/1/61 | 26,665 | 17,692 | ||
| Novartis Capital Corp. | 4.400% | 5/6/44 | 24,840 | 23,342 | ||
| NYU Langone Hospitals | 4.784% | 7/1/44 | 1,944 | 1,814 | ||
| OhioHealth Corp. | 2.834% | 11/15/41 | 4,875 | 3,629 | ||
| 6 | Organon & Co. / Organon Foreign Debt Co.-Issuer BV | 5.125% | 4/30/31 | 95 | 82 | |
| 3 | Orlando Health Obligated Group | 3.327% | 10/1/50 | 1,350 | 977 | |
| PeaceHealth Obligated Group | 4.787% | 11/15/48 | 1,515 | 1,330 | ||
| Pfizer Inc. | 4.100% | 9/15/38 | 20,280 | 18,512 | ||
| Pfizer Inc. | 3.900% | 3/15/39 | 34,185 | 30,178 | ||
| Pfizer Inc. | 7.200% | 3/15/39 | 33,687 | 41,561 | ||
| Pfizer Inc. | 2.550% | 5/28/40 | 5,000 | 3,624 | ||
| Pfizer Inc. | 4.300% | 6/15/43 | 2,865 | 2,597 | ||
| Pfizer Inc. | 4.400% | 5/15/44 | 8,165 | 7,647 | ||
| Pfizer Inc. | 4.125% | 12/15/46 | 7,734 | 6,797 | ||
| Pfizer Inc. | 4.200% | 9/15/48 | 16,686 | 14,682 | ||
| Pfizer Investment Enterprises Pte Ltd. | 5.110% | 5/19/43 | 53,140 | 52,856 | ||
| Coupon | Maturity Date | Face Amount ($000) | Market Value• ($000) | |||
| Pfizer Investment Enterprises Pte Ltd. | 5.300% | 5/19/53 | 39,890 | 40,396 | ||
| Pfizer Investment Enterprises Pte Ltd. | 5.340% | 5/19/63 | 49,085 | 49,224 | ||
| Piedmont Healthcare Inc. | 2.719% | 1/1/42 | 2,000 | 1,394 | ||
| 3 | Providence St. Joseph Health Obligated Group | 3.744% | 10/1/47 | 4,605 | 3,472 | |
| Providence St. Joseph Health Obligated Group | 2.700% | 10/1/51 | 8,725 | 5,227 | ||
| 5 | Roche Finance Europe BV | 3.586% | 12/4/36 | 500 | 562 | |
| 6 | Roche Holdings Inc. | 2.607% | 12/13/51 | 15,380 | 10,048 | |
| Stanford Health Care | 3.027% | 8/15/51 | 25,000 | 17,388 | ||
| 6 | Star Parent Inc. | 9.000% | 10/1/30 | 60 | 63 | |
| Sutter Health | 3.161% | 8/15/40 | 22,915 | 18,027 | ||
| Sutter Health | 3.361% | 8/15/50 | 11,962 | 8,944 | ||
| Sutter Health | 5.547% | 8/15/53 | 6,485 | 6,865 | ||
| Teva Pharmaceutical Finance Netherlands III BV | 8.125% | 9/15/31 | 250 | 275 | ||
| Teva Pharmaceutical Finance Netherlands III BV | 4.100% | 10/1/46 | 29 | 20 | ||
| 5 | Thermo Fisher Scientific Finance I BV | 2.000% | 10/18/51 | 200 | 152 | |
| Thermo Fisher Scientific Inc. | 2.800% | 10/15/41 | 5,460 | 4,090 | ||
| 5 | Thermo Fisher Scientific Inc. | 1.875% | 10/1/49 | 400 | 301 | |
| 3 | Trinity Health Corp. | 3.434% | 12/1/48 | 1,045 | 812 | |
| UnitedHealth Group Inc. | 6.875% | 2/15/38 | 4,322 | 5,185 | ||
| UnitedHealth Group Inc. | 3.500% | 8/15/39 | 20,796 | 17,604 | ||
| UnitedHealth Group Inc. | 2.750% | 5/15/40 | 1,520 | 1,144 | ||
| UnitedHealth Group Inc. | 3.050% | 5/15/41 | 21,325 | 16,583 | ||
| UnitedHealth Group Inc. | 4.625% | 11/15/41 | 158 | 151 | ||
| UnitedHealth Group Inc. | 4.375% | 3/15/42 | 23,917 | 22,122 | ||
| UnitedHealth Group Inc. | 3.950% | 10/15/42 | 1,346 | 1,178 | ||
| UnitedHealth Group Inc. | 4.750% | 7/15/45 | 48,920 | 47,283 | ||
| UnitedHealth Group Inc. | 4.250% | 4/15/47 | 14,906 | 13,202 | ||
| UnitedHealth Group Inc. | 3.750% | 10/15/47 | 25,610 | 20,848 | ||
| UnitedHealth Group Inc. | 4.250% | 6/15/48 | 29,232 | 25,770 | ||
| UnitedHealth Group Inc. | 4.450% | 12/15/48 | 2,890 | 2,616 | ||
| UnitedHealth Group Inc. | 3.700% | 8/15/49 | 21,722 | 17,330 | ||
| UnitedHealth Group Inc. | 2.900% | 5/15/50 | 3,000 | 2,083 | ||
| UnitedHealth Group Inc. | 3.250% | 5/15/51 | 25,845 | 18,960 | ||
| UnitedHealth Group Inc. | 4.750% | 5/15/52 | 11,165 | 10,564 | ||
| UnitedHealth Group Inc. | 5.875% | 2/15/53 | 32,365 | 36,019 | ||
| UnitedHealth Group Inc. | 5.050% | 4/15/53 | 2,100 | 2,080 | ||
| UnitedHealth Group Inc. | 6.050% | 2/15/63 | 3,400 | 3,863 | ||
| UnitedHealth Group Inc. | 5.200% | 4/15/63 | 6,125 | 6,142 | ||
| Wyeth LLC | 6.500% | 2/1/34 | 1,240 | 1,402 | ||
| Wyeth LLC | 5.950% | 4/1/37 | 53,438 | 58,573 | ||
| Yale-New Haven Health Services Corp. | 2.496% | 7/1/50 | 1,250 | 753 | ||
| 1,781,162 | ||||||
| Industrials (4.0%) | ||||||
| Boeing Co. | 3.500% | 3/1/39 | 760 | 597 | ||
| Boeing Co. | 5.705% | 5/1/40 | 1,500 | 1,509 | ||
| Boeing Co. | 5.805% | 5/1/50 | 4,500 | 4,511 | ||
| Boeing Co. | 5.930% | 5/1/60 | 2,300 | 2,293 | ||
| Burlington Northern Santa Fe LLC | 4.950% | 9/15/41 | 2,000 | 1,965 | ||
| Burlington Northern Santa Fe LLC | 4.400% | 3/15/42 | 24,790 | 22,768 | ||
| Burlington Northern Santa Fe LLC | 4.375% | 9/1/42 | 41,150 | 37,750 | ||
| Burlington Northern Santa Fe LLC | 4.450% | 3/15/43 | 11,200 | 10,343 | ||
| Burlington Northern Santa Fe LLC | 5.150% | 9/1/43 | 2,470 | 2,497 | ||
| Burlington Northern Santa Fe LLC | 4.900% | 4/1/44 | 16,500 | 16,111 | ||
| Coupon | Maturity Date | Face Amount ($000) | Market Value• ($000) | |||
| Burlington Northern Santa Fe LLC | 4.550% | 9/1/44 | 43,085 | 40,087 | ||
| Burlington Northern Santa Fe LLC | 4.150% | 4/1/45 | 12,335 | 10,814 | ||
| Burlington Northern Santa Fe LLC | 4.125% | 6/15/47 | 11,910 | 10,276 | ||
| Burlington Northern Santa Fe LLC | 4.050% | 6/15/48 | 5,081 | 4,324 | ||
| Burlington Northern Santa Fe LLC | 4.150% | 12/15/48 | 18,399 | 15,865 | ||
| Burlington Northern Santa Fe LLC | 3.550% | 2/15/50 | 19,445 | 15,310 | ||
| Burlington Northern Santa Fe LLC | 3.050% | 2/15/51 | 4,000 | 2,839 | ||
| Burlington Northern Santa Fe LLC | 3.300% | 9/15/51 | 17,015 | 12,617 | ||
| Burlington Northern Santa Fe LLC | 2.875% | 6/15/52 | 5,830 | 3,977 | ||
| Burlington Northern Santa Fe LLC | 5.200% | 4/15/54 | 4,450 | 4,532 | ||
| Canadian National Railway Co. | 3.200% | 8/2/46 | 1,000 | 761 | ||
| Canadian National Railway Co. | 3.650% | 2/3/48 | 28,169 | 22,906 | ||
| Canadian National Railway Co. | 4.450% | 1/20/49 | 1,000 | 921 | ||
| Canadian National Railway Co. | 4.400% | 8/5/52 | 2,405 | 2,191 | ||
| Canadian Pacific Railway Co. | 3.100% | 12/2/51 | 4,490 | 3,171 | ||
| 6 | Carrier Global Corp. | 6.200% | 3/15/54 | 2,570 | 2,906 | |
| 6 | Carrier Global Corp. | 6.200% | 3/15/54 | 4,990 | 5,642 | |
| Caterpillar Inc. | 6.050% | 8/15/36 | 2,968 | 3,344 | ||
| Caterpillar Inc. | 3.803% | 8/15/42 | 26,112 | 22,591 | ||
| CSX Corp. | 4.750% | 5/30/42 | 878 | 832 | ||
| CSX Corp. | 3.800% | 4/15/50 | 1,109 | 887 | ||
| Delta Air Lines Inc. | 2.900% | 10/28/24 | 70 | 68 | ||
| Eaton Corp. | 4.700% | 8/23/52 | 2,335 | 2,235 | ||
| Emerson Electric Co. | 2.800% | 12/21/51 | 4,130 | 2,757 | ||
| 6 | Gates Global LLC / Gates Corp. | 6.250% | 1/15/26 | 53 | 53 | |
| General Dynamics Corp. | 4.250% | 4/1/40 | 8,325 | 7,655 | ||
| 5 | Heathrow Funding Ltd. | 1.875% | 3/14/36 | 700 | 636 | |
| Honeywell International Inc. | 4.500% | 1/15/34 | 3,840 | 3,798 | ||
| Honeywell International Inc. | 5.700% | 3/15/36 | 10,300 | 11,143 | ||
| Honeywell International Inc. | 5.700% | 3/15/37 | 6,250 | 6,768 | ||
| 3 | JetBlue Pass Through Trust Class AA Series 2019-1 | 2.750% | 11/15/33 | 1,169 | 987 | |
| Lockheed Martin Corp. | 4.750% | 2/15/34 | 4,000 | 4,016 | ||
| Lockheed Martin Corp. | 3.600% | 3/1/35 | 2,000 | 1,808 | ||
| Lockheed Martin Corp. | 4.500% | 5/15/36 | 12,189 | 11,913 | ||
| Lockheed Martin Corp. | 4.070% | 12/15/42 | 7,394 | 6,576 | ||
| Lockheed Martin Corp. | 3.800% | 3/1/45 | 8,572 | 7,234 | ||
| Lockheed Martin Corp. | 4.700% | 5/15/46 | 4,544 | 4,362 | ||
| Lockheed Martin Corp. | 2.800% | 6/15/50 | 26,945 | 18,524 | ||
| Lockheed Martin Corp. | 4.090% | 9/15/52 | 29,552 | 25,449 | ||
| Lockheed Martin Corp. | 4.150% | 6/15/53 | 58,665 | 50,787 | ||
| Lockheed Martin Corp. | 4.300% | 6/15/62 | 4,070 | 3,530 | ||
| Lockheed Martin Corp. | 5.900% | 11/15/63 | 12,770 | 14,323 | ||
| Lockheed Martin Corp. | 5.200% | 2/15/64 | 16,285 | 16,535 | ||
| 6 | Mileage Plus Holdings LLC / Mileage Plus Intellectual Property Assets Ltd. | 6.500% | 6/20/27 | 285 | 286 | |
| 7 | Motability Operations Group plc | 4.875% | 1/17/43 | 500 | 604 | |
| Norfolk Southern Corp. | 4.550% | 6/1/53 | 3,390 | 3,054 | ||
| Norfolk Southern Corp. | 5.950% | 3/15/64 | 5,330 | 5,817 | ||
| Northrop Grumman Corp. | 5.250% | 5/1/50 | 700 | 705 | ||
| Northrop Grumman Corp. | 4.950% | 3/15/53 | 12,410 | 12,016 | ||
| Northrop Grumman Corp. | 5.199% | 6/1/54 | 30,255 | 30,383 | ||
| Rockwell Automation Inc. | 2.800% | 8/15/61 | 16,045 | 10,020 | ||
| 6 | Rolls-Royce plc | 3.625% | 10/14/25 | 50 | 48 | |
| RTX Corp. | 5.700% | 4/15/40 | 1,000 | 1,039 | ||
| RTX Corp. | 4.875% | 10/15/40 | 7,130 | 6,823 | ||
| Coupon | Maturity Date | Face Amount ($000) | Market Value• ($000) | |||
| RTX Corp. | 6.400% | 3/15/54 | 7,240 | 8,330 | ||
| 6 | TransDigm Inc. | 6.750% | 8/15/28 | 60 | 61 | |
| 6 | TransDigm Inc. | 6.875% | 12/15/30 | 105 | 108 | |
| Union Pacific Corp. | 3.375% | 2/14/42 | 20,855 | 16,811 | ||
| Union Pacific Corp. | 3.500% | 2/14/53 | 10,370 | 8,055 | ||
| Union Pacific Corp. | 3.550% | 5/20/61 | 7,500 | 5,576 | ||
| Union Pacific Corp. | 5.150% | 1/20/63 | 31,730 | 31,619 | ||
| Union Pacific Corp. | 3.850% | 2/14/72 | 8,140 | 6,309 | ||
| 3 | United Airlines Class AA Series 2019-2 Pass Through Trust | 2.700% | 11/1/33 | 1,620 | 1,380 | |
| 6 | United Airlines Inc. | 4.625% | 4/15/29 | 300 | 278 | |
| United Parcel Service Inc. | 4.875% | 11/15/40 | 3,000 | 2,957 | ||
| 640,573 | ||||||
| Materials (1.1%) | ||||||
| Air Products and Chemicals Inc. | 2.700% | 5/15/40 | 1,830 | 1,370 | ||
| 6 | Ardagh Metal Packaging Finance USA LLC / Ardagh Metal Packaging Finance plc | 4.000% | 9/1/29 | 93 | 76 | |
| 5 | BASF SE | 4.500% | 3/8/35 | 200 | 231 | |
| BHP Billiton Finance USA Ltd. | 4.125% | 2/24/42 | 29,647 | 26,461 | ||
| BHP Billiton Finance USA Ltd. | 5.000% | 9/30/43 | 6,250 | 6,208 | ||
| BHP Billiton Finance USA Ltd. | 5.500% | 9/8/53 | 11,165 | 11,841 | ||
| 6 | Canpack SA / Canpack US LLC | 3.875% | 11/15/29 | 203 | 179 | |
| 6 | Chemours Co. | 4.625% | 11/15/29 | 193 | 169 | |
| 6 | Corp. Nacional del Cobre de Chile | 6.300% | 9/8/53 | 25,565 | 25,178 | |
| Ecolab Inc. | 3.950% | 12/1/47 | 1,558 | 1,336 | ||
| Ecolab Inc. | 2.125% | 8/15/50 | 10,990 | 6,595 | ||
| Ecolab Inc. | 2.700% | 12/15/51 | 40,570 | 26,725 | ||
| Linde Inc. | 3.550% | 11/7/42 | 1,799 | 1,485 | ||
| 5 | Linde plc | 1.625% | 3/31/35 | 800 | 733 | |
| Nutrien Ltd. | 5.875% | 12/1/36 | 1,520 | 1,598 | ||
| Nutrien Ltd. | 5.800% | 3/27/53 | 1,655 | 1,725 | ||
| 6 | Olympus Water US Holding Corp. | 9.750% | 11/15/28 | 195 | 207 | |
| Rio Tinto Finance USA Ltd. | 5.200% | 11/2/40 | 2,000 | 2,038 | ||
| Rio Tinto Finance USA Ltd. | 2.750% | 11/2/51 | 27,410 | 18,138 | ||
| Rio Tinto Finance USA plc | 4.125% | 8/21/42 | 29,895 | 26,588 | ||
| Rio Tinto Finance USA plc | 5.125% | 3/9/53 | 21,575 | 21,730 | ||
| 6 | SNF Group SACA | 3.125% | 3/15/27 | 305 | 282 | |
| 6 | SNF Group SACA | 3.375% | 3/15/30 | 120 | 103 | |
| 6 | WR Grace Holdings LLC | 5.625% | 8/15/29 | 230 | 203 | |
| 6 | WR Grace Holdings LLC | 7.375% | 3/1/31 | 30 | 31 | |
| 181,230 | ||||||
| Real Estate (0.6%) | ||||||
| Agree LP | 2.600% | 6/15/33 | 1,760 | 1,395 | ||
| Alexandria Real Estate Equities Inc. | 4.750% | 4/15/35 | 3,420 | 3,295 | ||
| American Homes 4 Rent LP | 3.375% | 7/15/51 | 1,925 | 1,310 | ||
| Essex Portfolio LP | 4.500% | 3/15/48 | 1,700 | 1,453 | ||
| Highwoods Realty LP | 7.650% | 2/1/34 | 5,000 | 5,506 | ||
| Kilroy Realty LP | 6.250% | 1/15/36 | 3,240 | 3,239 | ||
| Mid-America Apartments LP | 2.875% | 9/15/51 | 2,250 | 1,466 | ||
| MPT Operating Partnership LP / MPT Finance Corp. | 3.500% | 3/15/31 | 435 | 268 | ||
| 5 | Prologis Euro Finance LLC | 4.250% | 1/31/43 | 500 | 535 | |
| Prologis LP | 5.125% | 1/15/34 | 5,598 | 5,687 | ||
| Prologis LP | 5.250% | 6/15/53 | 5,937 | 5,971 | ||
| Prologis LP | 5.250% | 3/15/54 | 13,685 | 13,773 | ||
| Public Storage Operating Co. | 5.350% | 8/1/53 | 3,930 | 4,026 | ||
| 5 | Realty Income Corp. | 5.125% | 7/6/34 | 300 | 350 | |
| Simon Property Group LP | 6.750% | 2/1/40 | 1,100 | 1,251 | ||
| Simon Property Group LP | 4.250% | 10/1/44 | 3,005 | 2,507 | ||
| Coupon | Maturity Date | Face Amount ($000) | Market Value• ($000) | |||
| Simon Property Group LP | 3.250% | 9/13/49 | 33,520 | 24,134 | ||
| Simon Property Group LP | 3.800% | 7/15/50 | 1,600 | 1,259 | ||
| Simon Property Group LP | 5.850% | 3/8/53 | 1,300 | 1,380 | ||
| Simon Property Group LP | 6.650% | 1/15/54 | 11,535 | 13,586 | ||
| 92,391 | ||||||
| Technology (9.8%) | ||||||
| Advanced Micro Devices Inc. | 4.393% | 6/1/52 | 3,410 | 3,117 | ||
| Apple Inc. | 2.375% | 2/8/41 | 9,100 | 6,624 | ||
| Apple Inc. | 3.850% | 5/4/43 | 41,670 | 36,935 | ||
| Apple Inc. | 3.450% | 2/9/45 | 32,295 | 26,645 | ||
| Apple Inc. | 4.375% | 5/13/45 | 19,275 | 18,201 | ||
| Apple Inc. | 4.650% | 2/23/46 | 33,320 | 32,714 | ||
| Apple Inc. | 3.850% | 8/4/46 | 32,830 | 28,342 | ||
| Apple Inc. | 4.250% | 2/9/47 | 33,690 | 31,210 | ||
| Apple Inc. | 3.750% | 9/12/47 | 5,000 | 4,212 | ||
| Apple Inc. | 3.750% | 11/13/47 | 24,095 | 20,307 | ||
| Apple Inc. | 2.950% | 9/11/49 | 33,382 | 24,070 | ||
| Apple Inc. | 2.650% | 2/8/51 | 59,650 | 40,006 | ||
| Apple Inc. | 2.700% | 8/5/51 | 46,125 | 31,072 | ||
| Apple Inc. | 3.950% | 8/8/52 | 8,965 | 7,685 | ||
| Apple Inc. | 4.850% | 5/10/53 | 25,395 | 25,494 | ||
| Apple Inc. | 4.100% | 8/8/62 | 19,210 | 16,620 | ||
| Applied Materials Inc. | 5.100% | 10/1/35 | 95 | 99 | ||
| 6 | Broadcom Inc. | 3.137% | 11/15/35 | 2,500 | 2,049 | |
| 6 | Broadcom Inc. | 3.187% | 11/15/36 | 2,230 | 1,810 | |
| 6 | Broadcom Inc. | 4.926% | 5/15/37 | 3,880 | 3,738 | |
| Cisco Systems Inc. | 5.900% | 2/15/39 | 13,465 | 14,917 | ||
| Cisco Systems Inc. | 5.500% | 1/15/40 | 17,202 | 18,290 | ||
| 6 | Cloud Software Group Inc. | 6.500% | 3/31/29 | 25 | 23 | |
| 6 | CommScope Inc. | 7.125% | 7/1/28 | 136 | 59 | |
| Dell International LLC / EMC Corp. | 8.100% | 7/15/36 | 1,727 | 2,128 | ||
| Dell International LLC / EMC Corp. | 3.375% | 12/15/41 | 3,000 | 2,277 | ||
| 6 | Entegris Escrow Corp. | 4.750% | 4/15/29 | 1,625 | 1,554 | |
| Global Payments Inc. | 5.950% | 8/15/52 | 3,820 | 3,885 | ||
| 6 | GTCR W-2 Merger Sub LLC | 7.500% | 1/15/31 | 35 | 36 | |
| IBM International Capital Pte. Ltd. | 5.250% | 2/5/44 | 42,955 | 42,968 | ||
| IBM International Capital Pte. Ltd. | 5.300% | 2/5/54 | 25,070 | 25,136 | ||
| Intel Corp. | 5.625% | 2/10/43 | 18,350 | 19,442 | ||
| Intel Corp. | 4.100% | 5/19/46 | 7,330 | 6,374 | ||
| Intel Corp. | 4.100% | 5/11/47 | 33,355 | 28,572 | ||
| Intel Corp. | 3.734% | 12/8/47 | 57,997 | 46,287 | ||
| Intel Corp. | 3.250% | 11/15/49 | 42,600 | 30,795 | ||
| Intel Corp. | 4.750% | 3/25/50 | 9,620 | 8,903 | ||
| Intel Corp. | 3.050% | 8/12/51 | 17,768 | 12,287 | ||
| Intel Corp. | 4.900% | 8/5/52 | 30,465 | 29,199 | ||
| Intel Corp. | 5.700% | 2/10/53 | 34,325 | 36,144 | ||
| Intel Corp. | 3.100% | 2/15/60 | 19,740 | 13,038 | ||
| Intel Corp. | 3.200% | 8/12/61 | 3,400 | 2,279 | ||
| Intel Corp. | 5.050% | 8/5/62 | 23,310 | 22,353 | ||
| Intel Corp. | 5.900% | 2/10/63 | 14,300 | 15,474 | ||
| International Business Machines Corp. | 4.150% | 5/15/39 | 29,305 | 26,538 | ||
| International Business Machines Corp. | 4.000% | 6/20/42 | 4,443 | 3,866 | ||
| International Business Machines Corp. | 4.250% | 5/15/49 | 35,713 | 31,055 | ||
| International Business Machines Corp. | 3.430% | 2/9/52 | 13,845 | 10,227 | ||
| International Business Machines Corp. | 4.900% | 7/27/52 | 21,500 | 20,539 | ||
| Intuit Inc. | 5.500% | 9/15/53 | 19,955 | 21,276 | ||
| KLA Corp. | 5.000% | 3/15/49 | 1,256 | 1,232 | ||
| KLA Corp. | 4.950% | 7/15/52 | 3,790 | 3,717 | ||
| Mastercard Inc. | 3.950% | 2/26/48 | 20,075 | 17,542 | ||
| Coupon | Maturity Date | Face Amount ($000) | Market Value• ($000) | |||
| 6 | McAfee Corp. | 7.375% | 2/15/30 | 114 | 103 | |
| Microsoft Corp. | 2.525% | 6/1/50 | 185,072 | 123,276 | ||
| Microsoft Corp. | 2.921% | 3/17/52 | 94,207 | 67,697 | ||
| Microsoft Corp. | 2.675% | 6/1/60 | 58,124 | 38,084 | ||
| Microsoft Corp. | 3.041% | 3/17/62 | 36,210 | 25,423 | ||
| NVIDIA Corp. | 3.500% | 4/1/40 | 22,525 | 19,413 | ||
| NVIDIA Corp. | 3.500% | 4/1/50 | 29,900 | 24,324 | ||
| NVIDIA Corp. | 3.700% | 4/1/60 | 13,140 | 10,835 | ||
| Oracle Corp. | 6.500% | 4/15/38 | 17,605 | 19,411 | ||
| Oracle Corp. | 5.375% | 7/15/40 | 19,240 | 18,999 | ||
| Oracle Corp. | 4.125% | 5/15/45 | 24,805 | 20,358 | ||
| Oracle Corp. | 4.000% | 7/15/46 | 22,790 | 18,223 | ||
| Oracle Corp. | 3.950% | 3/25/51 | 13,200 | 10,244 | ||
| QUALCOMM Inc. | 4.800% | 5/20/45 | 12,300 | 12,063 | ||
| QUALCOMM Inc. | 4.300% | 5/20/47 | 43,145 | 39,057 | ||
| QUALCOMM Inc. | 4.500% | 5/20/52 | 26,500 | 24,208 | ||
| QUALCOMM Inc. | 6.000% | 5/20/53 | 25,365 | 28,769 | ||
| S&P Global Inc. | 3.250% | 12/1/49 | 2,000 | 1,460 | ||
| S&P Global Inc. | 3.700% | 3/1/52 | 59,428 | 47,373 | ||
| Salesforce Inc. | 2.700% | 7/15/41 | 5,150 | 3,833 | ||
| Salesforce Inc. | 2.900% | 7/15/51 | 30,670 | 21,233 | ||
| Salesforce Inc. | 3.050% | 7/15/61 | 20,640 | 14,014 | ||
| Texas Instruments Inc. | 3.875% | 3/15/39 | 6,056 | 5,531 | ||
| Texas Instruments Inc. | 4.100% | 8/16/52 | 1,250 | 1,078 | ||
| Texas Instruments Inc. | 5.000% | 3/14/53 | 21,310 | 21,251 | ||
| Texas Instruments Inc. | 5.050% | 5/18/63 | 18,850 | 18,653 | ||
| Visa Inc. | 2.700% | 4/15/40 | 4,500 | 3,446 | ||
| Visa Inc. | 4.300% | 12/14/45 | 30,390 | 27,968 | ||
| Visa Inc. | 3.650% | 9/15/47 | 37,123 | 30,777 | ||
| 1,576,466 | ||||||
| Utilities (15.3%) | ||||||
| AEP Transmission Co. LLC | 3.750% | 12/1/47 | 38,300 | 30,470 | ||
| AEP Transmission Co. LLC | 4.250% | 9/15/48 | 5,580 | 4,737 | ||
| AEP Transmission Co. LLC | 3.800% | 6/15/49 | 5,436 | 4,261 | ||
| AEP Transmission Co. LLC | 3.650% | 4/1/50 | 3,525 | 2,727 | ||
| AEP Transmission Co. LLC | 4.500% | 6/15/52 | 11,240 | 9,967 | ||
| AEP Transmission Co. LLC | 5.400% | 3/15/53 | 1,130 | 1,152 | ||
| Alabama Power Co. | 6.000% | 3/1/39 | 9,745 | 10,454 | ||
| Alabama Power Co. | 5.500% | 3/15/41 | 26,874 | 26,814 | ||
| Alabama Power Co. | 5.200% | 6/1/41 | 14,920 | 14,597 | ||
| Alabama Power Co. | 3.850% | 12/1/42 | 1,065 | 887 | ||
| Alabama Power Co. | 3.750% | 3/1/45 | 23,325 | 18,877 | ||
| Alabama Power Co. | 3.450% | 10/1/49 | 1,944 | 1,457 | ||
| Alabama Power Co. | 3.125% | 7/15/51 | 2,700 | 1,890 | ||
| Ameren Illinois Co. | 4.500% | 3/15/49 | 27,960 | 25,116 | ||
| Ameren Illinois Co. | 2.900% | 6/15/51 | 6,730 | 4,510 | ||
| Ameren Illinois Co. | 5.900% | 12/1/52 | 2,625 | 2,872 | ||
| Appalachian Power Co. | 6.700% | 8/15/37 | 17,970 | 20,021 | ||
| Appalachian Power Co. | 4.400% | 5/15/44 | 1,995 | 1,674 | ||
| Appalachian Power Co. | 3.700% | 5/1/50 | 3,760 | 2,790 | ||
| Arizona Public Service Co. | 2.650% | 9/15/50 | 3,251 | 1,987 | ||
| Atmos Energy Corp. | 4.150% | 1/15/43 | 1,420 | 1,263 | ||
| Atmos Energy Corp. | 4.125% | 10/15/44 | 2,150 | 1,891 | ||
| Atmos Energy Corp. | 3.375% | 9/15/49 | 2,890 | 2,153 | ||
| Atmos Energy Corp. | 6.200% | 11/15/53 | 2,620 | 2,999 | ||
| Baltimore Gas and Electric Co. | 6.350% | 10/1/36 | 1,165 | 1,278 | ||
| Baltimore Gas and Electric Co. | 4.250% | 9/15/48 | 26,475 | 22,567 | ||
| Baltimore Gas and Electric Co. | 4.550% | 6/1/52 | 5,690 | 5,113 | ||
| Berkshire Hathaway Energy Co. | 5.950% | 5/15/37 | 4,890 | 5,226 | ||
| Berkshire Hathaway Energy Co. | 5.150% | 11/15/43 | 25,000 | 24,717 | ||
| Berkshire Hathaway Energy Co. | 4.500% | 2/1/45 | 45,725 | 41,928 | ||
| Coupon | Maturity Date | Face Amount ($000) | Market Value• ($000) | |||
| Berkshire Hathaway Energy Co. | 4.450% | 1/15/49 | 10,604 | 9,174 | ||
| 6 | Brooklyn Union Gas Co. | 4.487% | 3/4/49 | 35,000 | 27,590 | |
| 7 | Cadent Finance plc | 2.250% | 10/10/35 | 400 | 364 | |
| CenterPoint Energy Houston Electric LLC | 2.900% | 7/1/50 | 5,200 | 3,558 | ||
| CenterPoint Energy Houston Electric LLC | 3.350% | 4/1/51 | 1,330 | 985 | ||
| CenterPoint Energy Houston Electric LLC | 3.600% | 3/1/52 | 2,000 | 1,551 | ||
| CenterPoint Energy Houston Electric LLC | 4.850% | 10/1/52 | 3,800 | 3,622 | ||
| CenterPoint Energy Houston Electric LLC | 5.300% | 4/1/53 | 5,720 | 5,839 | ||
| CenterPoint Energy Inc. | 3.700% | 9/1/49 | 1,244 | 931 | ||
| CenterPoint Energy Resources Corp. | 4.100% | 9/1/47 | 2,615 | 2,151 | ||
| 6 | Clearway Energy Operating LLC | 3.750% | 1/15/32 | 12 | 10 | |
| CMS Energy Corp. | 4.875% | 3/1/44 | 2,902 | 2,742 | ||
| Commonwealth Edison Co. | 5.900% | 3/15/36 | 2,810 | 3,023 | ||
| Commonwealth Edison Co. | 3.800% | 10/1/42 | 20,733 | 17,106 | ||
| Commonwealth Edison Co. | 4.600% | 8/15/43 | 15,205 | 13,998 | ||
| Commonwealth Edison Co. | 4.700% | 1/15/44 | 15,891 | 14,633 | ||
| Commonwealth Edison Co. | 3.700% | 3/1/45 | 17,765 | 14,249 | ||
| Commonwealth Edison Co. | 4.350% | 11/15/45 | 11,060 | 9,625 | ||
| Commonwealth Edison Co. | 3.650% | 6/15/46 | 13,732 | 10,733 | ||
| Commonwealth Edison Co. | 4.000% | 3/1/48 | 8,765 | 7,270 | ||
| Commonwealth Edison Co. | 4.000% | 3/1/49 | 13,485 | 11,079 | ||
| Commonwealth Edison Co. | 3.000% | 3/1/50 | 2,000 | 1,367 | ||
| Commonwealth Edison Co. | 3.125% | 3/15/51 | 2,060 | 1,431 | ||
| Commonwealth Edison Co. | 2.750% | 9/1/51 | 1,500 | 960 | ||
| Commonwealth Edison Co. | 3.850% | 3/15/52 | 1,500 | 1,191 | ||
| Commonwealth Edison Co. | 5.300% | 2/1/53 | 2,170 | 2,183 | ||
| Connecticut Light and Power Co. | 6.350% | 6/1/36 | 14,382 | 15,818 | ||
| Connecticut Light and Power Co. | 4.300% | 4/15/44 | 1,390 | 1,223 | ||
| Connecticut Light and Power Co. | 4.150% | 6/1/45 | 16,885 | 14,745 | ||
| Connecticut Light and Power Co. | 4.000% | 4/1/48 | 6,645 | 5,569 | ||
| Consolidated Edison Co. of New York Inc. | 5.100% | 6/15/33 | 691 | 678 | ||
| Consolidated Edison Co. of New York Inc. | 5.850% | 3/15/36 | 9,947 | 10,473 | ||
| Consolidated Edison Co. of New York Inc. | 6.200% | 6/15/36 | 10,637 | 11,534 | ||
| Consolidated Edison Co. of New York Inc. | 6.750% | 4/1/38 | 9,925 | 11,332 | ||
| Consolidated Edison Co. of New York Inc. | 5.500% | 12/1/39 | 8,668 | 8,790 | ||
| Consolidated Edison Co. of New York Inc. | 5.700% | 6/15/40 | 852 | 875 | ||
| Consolidated Edison Co. of New York Inc. | 4.200% | 3/15/42 | 10,501 | 9,030 | ||
| Consolidated Edison Co. of New York Inc. | 3.950% | 3/1/43 | 8,740 | 7,332 | ||
| Consolidated Edison Co. of New York Inc. | 4.450% | 3/15/44 | 50,016 | 44,497 | ||
| Consolidated Edison Co. of New York Inc. | 4.500% | 12/1/45 | 5,715 | 5,090 | ||
| Consolidated Edison Co. of New York Inc. | 3.850% | 6/15/46 | 7,000 | 5,649 | ||
| Consolidated Edison Co. of New York Inc. | 3.875% | 6/15/47 | 3,715 | 2,986 | ||
| Consolidated Edison Co. of New York Inc. | 4.650% | 12/1/48 | 2,995 | 2,684 | ||
| Consolidated Edison Co. of New York Inc. | 4.125% | 5/15/49 | 1,000 | 828 | ||
| Coupon | Maturity Date | Face Amount ($000) | Market Value• ($000) | |||
| Consolidated Edison Co. of New York Inc. | 3.950% | 4/1/50 | 2,000 | 1,652 | ||
| Consolidated Edison Co. of New York Inc. | 3.200% | 12/1/51 | 38,421 | 26,931 | ||
| Consolidated Edison Co. of New York Inc. | 5.900% | 11/15/53 | 16,935 | 18,451 | ||
| Consolidated Edison Co. of New York Inc. | 4.625% | 12/1/54 | 5,425 | 4,842 | ||
| Consolidated Edison Co. of New York Inc. | 4.300% | 12/1/56 | 2,285 | 1,918 | ||
| Consolidated Edison Co. of New York Inc. | 4.500% | 5/15/58 | 947 | 824 | ||
| Consolidated Edison Co. of New York Inc. | 3.000% | 12/1/60 | 25,563 | 16,267 | ||
| Constellation Energy Generation LLC | 6.500% | 10/1/53 | 2,460 | 2,748 | ||
| Consumers Energy Co. | 3.750% | 2/15/50 | 1,944 | 1,569 | ||
| Consumers Energy Co. | 3.100% | 8/15/50 | 33,646 | 24,169 | ||
| Consumers Energy Co. | 2.650% | 8/15/52 | 11,455 | 7,380 | ||
| Consumers Energy Co. | 4.200% | 9/1/52 | 11,380 | 9,799 | ||
| Consumers Energy Co. | 2.500% | 5/1/60 | 12,610 | 7,377 | ||
| Dominion Energy Inc. | 4.900% | 8/1/41 | 6,000 | 5,503 | ||
| Dominion Energy South Carolina Inc. | 6.050% | 1/15/38 | 11,775 | 12,718 | ||
| Dominion Energy South Carolina Inc. | 5.450% | 2/1/41 | 3,000 | 3,024 | ||
| Dominion Energy South Carolina Inc. | 4.600% | 6/15/43 | 2,340 | 2,126 | ||
| Dominion Energy South Carolina Inc. | 6.250% | 10/15/53 | 2,935 | 3,335 | ||
| DTE Electric Co. | 4.300% | 7/1/44 | 3,320 | 2,919 | ||
| DTE Electric Co. | 3.700% | 3/15/45 | 2,910 | 2,344 | ||
| DTE Electric Co. | 2.950% | 3/1/50 | 2,235 | 1,540 | ||
| DTE Electric Co. | 3.250% | 4/1/51 | 2,000 | 1,432 | ||
| DTE Electric Co. | 3.650% | 3/1/52 | 10,715 | 8,296 | ||
| DTE Electric Co. | 5.400% | 4/1/53 | 2,260 | 2,318 | ||
| Duke Energy Carolinas LLC | 5.300% | 2/15/40 | 8,910 | 8,977 | ||
| Duke Energy Carolinas LLC | 4.250% | 12/15/41 | 16,300 | 14,288 | ||
| Duke Energy Carolinas LLC | 4.000% | 9/30/42 | 42,092 | 35,511 | ||
| Duke Energy Carolinas LLC | 3.750% | 6/1/45 | 2,373 | 1,881 | ||
| Duke Energy Carolinas LLC | 3.875% | 3/15/46 | 2,000 | 1,606 | ||
| Duke Energy Carolinas LLC | 3.700% | 12/1/47 | 1,500 | 1,162 | ||
| Duke Energy Carolinas LLC | 3.200% | 8/15/49 | 947 | 674 | ||
| Duke Energy Carolinas LLC | 3.450% | 4/15/51 | 10,945 | 8,084 | ||
| Duke Energy Carolinas LLC | 3.550% | 3/15/52 | 1,300 | 973 | ||
| Duke Energy Florida LLC | 6.350% | 9/15/37 | 758 | 837 | ||
| Duke Energy Florida LLC | 5.650% | 4/1/40 | 3,350 | 3,445 | ||
| Duke Energy Florida LLC | 3.850% | 11/15/42 | 1,466 | 1,199 | ||
| Duke Energy Florida LLC | 3.400% | 10/1/46 | 2,000 | 1,484 | ||
| Duke Energy Florida LLC | 4.200% | 7/15/48 | 2,950 | 2,487 | ||
| Duke Energy Florida LLC | 3.000% | 12/15/51 | 2,450 | 1,638 | ||
| Duke Energy Florida LLC | 6.200% | 11/15/53 | 12,305 | 13,769 | ||
| Duke Energy Indiana LLC | 6.120% | 10/15/35 | 1,000 | 1,066 | ||
| Duke Energy Indiana LLC | 6.350% | 8/15/38 | 775 | 855 | ||
| Duke Energy Indiana LLC | 6.450% | 4/1/39 | 1,311 | 1,457 | ||
| Duke Energy Indiana LLC | 4.200% | 3/15/42 | 12,700 | 10,867 | ||
| Duke Energy Indiana LLC | 4.900% | 7/15/43 | 29,514 | 27,928 | ||
| Duke Energy Indiana LLC | 3.250% | 10/1/49 | 2,465 | 1,743 | ||
| Duke Energy Indiana LLC | 2.750% | 4/1/50 | 13,461 | 8,580 | ||
| Duke Energy Indiana LLC | 5.400% | 4/1/53 | 9,060 | 9,037 | ||
| Duke Energy Ohio Inc. | 3.700% | 6/15/46 | 10,325 | 8,017 | ||
| Duke Energy Ohio Inc. | 4.300% | 2/1/49 | 1,000 | 836 | ||
| Duke Energy Ohio Inc. | 5.650% | 4/1/53 | 3,305 | 3,415 | ||
| Duke Energy Progress LLC | 4.100% | 5/15/42 | 2,250 | 1,912 | ||
| Duke Energy Progress LLC | 4.100% | 3/15/43 | 23,186 | 19,664 | ||
| Duke Energy Progress LLC | 4.150% | 12/1/44 | 29,945 | 25,337 | ||
| Duke Energy Progress LLC | 4.200% | 8/15/45 | 22,105 | 18,759 | ||
| Duke Energy Progress LLC | 3.700% | 10/15/46 | 22,000 | 17,089 | ||
| Coupon | Maturity Date | Face Amount ($000) | Market Value• ($000) | |||
| Duke Energy Progress LLC | 3.600% | 9/15/47 | 2,000 | 1,527 | ||
| Duke Energy Progress LLC | 2.500% | 8/15/50 | 1,000 | 614 | ||
| Duke Energy Progress LLC | 2.900% | 8/15/51 | 28,945 | 19,088 | ||
| Duke Energy Progress LLC | 4.000% | 4/1/52 | 7,295 | 5,919 | ||
| 5 | Enel Finance International NV | 4.500% | 2/20/43 | 500 | 557 | |
| 5 | Engie SA | 4.250% | 1/11/43 | 700 | 776 | |
| Entergy Arkansas LLC | 2.650% | 6/15/51 | 2,665 | 1,660 | ||
| Entergy Louisiana LLC | 4.000% | 3/15/33 | 651 | 605 | ||
| Entergy Louisiana LLC | 4.200% | 9/1/48 | 1,400 | 1,166 | ||
| Entergy Louisiana LLC | 4.200% | 4/1/50 | 1,500 | 1,249 | ||
| Entergy Louisiana LLC | 2.900% | 3/15/51 | 2,800 | 1,836 | ||
| Entergy Texas Inc. | 5.000% | 9/15/52 | 400 | 374 | ||
| Entergy Texas Inc. | 5.800% | 9/1/53 | 930 | 989 | ||
| Evergy Kansas Central Inc. | 4.125% | 3/1/42 | 1,112 | 948 | ||
| Evergy Kansas Central Inc. | 4.625% | 9/1/43 | 1,231 | 1,067 | ||
| Evergy Kansas Central Inc. | 3.250% | 9/1/49 | 8,050 | 5,610 | ||
| Evergy Kansas Central Inc. | 3.450% | 4/15/50 | 500 | 364 | ||
| Exelon Corp. | 4.450% | 4/15/46 | 450 | 389 | ||
| Exelon Corp. | 4.100% | 3/15/52 | 2,365 | 1,897 | ||
| FirstEnergy Corp. | 2.650% | 3/1/30 | 1,475 | 1,285 | ||
| Florida Power & Light Co. | 5.650% | 2/1/37 | 1,500 | 1,583 | ||
| Florida Power & Light Co. | 5.960% | 4/1/39 | 947 | 1,046 | ||
| Florida Power & Light Co. | 5.690% | 3/1/40 | 663 | 704 | ||
| Florida Power & Light Co. | 5.250% | 2/1/41 | 2,779 | 2,815 | ||
| Florida Power & Light Co. | 3.950% | 3/1/48 | 5,859 | 4,909 | ||
| Florida Power & Light Co. | 3.990% | 3/1/49 | 2,890 | 2,420 | ||
| Georgia Power Co. | 4.750% | 9/1/40 | 33,945 | 31,801 | ||
| Georgia Power Co. | 4.300% | 3/15/42 | 15,551 | 13,716 | ||
| Georgia Power Co. | 3.700% | 1/30/50 | 17,230 | 13,528 | ||
| Georgia Power Co. | 5.125% | 5/15/52 | 540 | 531 | ||
| Idaho Power Co. | 5.500% | 3/15/53 | 1,530 | 1,542 | ||
| Indiana Michigan Power Co. | 3.750% | 7/1/47 | 1,000 | 764 | ||
| Indiana Michigan Power Co. | 4.250% | 8/15/48 | 1,164 | 966 | ||
| Indiana Michigan Power Co. | 5.625% | 4/1/53 | 4,945 | 5,095 | ||
| 3 | John Sevier Combined Cycle Generation LLC | 4.626% | 1/15/42 | 17,104 | 15,973 | |
| Kentucky Utilities Co. | 5.125% | 11/1/40 | 5,084 | 4,927 | ||
| Kentucky Utilities Co. | 4.375% | 10/1/45 | 18,000 | 15,535 | ||
| Kentucky Utilities Co. | 3.300% | 6/1/50 | 1,900 | 1,357 | ||
| Louisville Gas and Electric Co. | 4.250% | 4/1/49 | 17,050 | 14,267 | ||
| 6 | Massachusetts Electric Co. | 4.004% | 8/15/46 | 10,890 | 8,491 | |
| MidAmerican Energy Co. | 5.800% | 10/15/36 | 1,473 | 1,562 | ||
| MidAmerican Energy Co. | 4.800% | 9/15/43 | 22,525 | 21,096 | ||
| MidAmerican Energy Co. | 4.250% | 5/1/46 | 24,721 | 21,372 | ||
| MidAmerican Energy Co. | 3.950% | 8/1/47 | 2,000 | 1,650 | ||
| MidAmerican Energy Co. | 4.250% | 7/15/49 | 15,510 | 13,394 | ||
| MidAmerican Energy Co. | 3.150% | 4/15/50 | 1,000 | 708 | ||
| MidAmerican Energy Co. | 2.700% | 8/1/52 | 1,250 | 794 | ||
| MidAmerican Energy Co. | 5.300% | 2/1/55 | 1,970 | 1,996 | ||
| 6 | Monongahela Power Co. | 5.400% | 12/15/43 | 10,640 | 10,347 | |
| 5 | National Grid plc | 4.275% | 1/16/35 | 300 | 332 | |
| National Rural Utilities Cooperative Finance Corp. | 4.023% | 11/1/32 | 2,100 | 1,967 | ||
| National Rural Utilities Cooperative Finance Corp. | 4.300% | 3/15/49 | 13,055 | 11,211 | ||
| Nevada Power Co. | 5.450% | 5/15/41 | 21,620 | 21,377 | ||
| Nevada Power Co. | 3.125% | 8/1/50 | 1,500 | 1,016 | ||
| Nevada Power Co. | 6.000% | 3/15/54 | 950 | 1,022 | ||
| 6 | New England Power Co. | 2.807% | 10/6/50 | 15,615 | 9,852 | |
| 6 | Niagara Mohawk Power Corp. | 5.664% | 1/17/54 | 1,230 | 1,241 | |
| Northern States Power Co. | 6.250% | 6/1/36 | 780 | 864 | ||
| Northern States Power Co. | 6.200% | 7/1/37 | 1,944 | 2,140 | ||
| Northern States Power Co. | 5.350% | 11/1/39 | 758 | 774 | ||
| Northern States Power Co. | 3.400% | 8/15/42 | 1,000 | 786 | ||
| Northern States Power Co. | 4.000% | 8/15/45 | 805 | 668 | ||
| Northern States Power Co. | 3.600% | 9/15/47 | 12,525 | 9,779 | ||
| Northern States Power Co. | 4.200% | 9/1/48 | 12,250 | 9,957 | ||
| Coupon | Maturity Date | Face Amount ($000) | Market Value• ($000) | |||
| Northern States Power Co. | 2.600% | 6/1/51 | 14,765 | 9,440 | ||
| Northern States Power Co. | 4.500% | 6/1/52 | 3,000 | 2,708 | ||
| Northern States Power Co. | 5.100% | 5/15/53 | 21,580 | 21,366 | ||
| NSTAR Electric Co. | 3.100% | 6/1/51 | 1,000 | 691 | ||
| Oglethorpe Power Corp. | 5.050% | 10/1/48 | 8,535 | 7,696 | ||
| 6 | Oglethorpe Power Corp. | 6.200% | 12/1/53 | 8,155 | 8,643 | |
| Ohio Power Co. | 4.000% | 6/1/49 | 2,724 | 2,174 | ||
| Oncor Electric Delivery Co. LLC | 7.500% | 9/1/38 | 1,420 | 1,741 | ||
| Oncor Electric Delivery Co. LLC | 5.250% | 9/30/40 | 3,103 | 3,157 | ||
| Oncor Electric Delivery Co. LLC | 3.800% | 9/30/47 | 16,908 | 13,551 | ||
| Oncor Electric Delivery Co. LLC | 3.800% | 6/1/49 | 1,420 | 1,156 | ||
| Oncor Electric Delivery Co. LLC | 3.700% | 5/15/50 | 2,195 | 1,735 | ||
| Oncor Electric Delivery Co. LLC | 2.700% | 11/15/51 | 10,080 | 6,482 | ||
| Pacific Gas and Electric Co. | 4.950% | 7/1/50 | 11,500 | 10,003 | ||
| Pacific Gas and Electric Co. | 3.500% | 8/1/50 | 2,415 | 1,686 | ||
| Pacific Gas and Electric Co. | 6.750% | 1/15/53 | 16,081 | 17,725 | ||
| Pacific Gas and Electric Co. | 6.700% | 4/1/53 | 2,676 | 2,945 | ||
| PacifiCorp | 5.250% | 6/15/35 | 1,232 | 1,220 | ||
| PacifiCorp | 6.100% | 8/1/36 | 1,420 | 1,494 | ||
| PacifiCorp | 6.250% | 10/15/37 | 1,957 | 2,098 | ||
| PacifiCorp | 6.350% | 7/15/38 | 29,744 | 32,163 | ||
| PacifiCorp | 6.000% | 1/15/39 | 12,981 | 13,593 | ||
| PacifiCorp | 4.125% | 1/15/49 | 5,737 | 4,580 | ||
| PacifiCorp | 4.150% | 2/15/50 | 22,050 | 17,573 | ||
| PacifiCorp | 5.350% | 12/1/53 | 3,060 | 2,892 | ||
| PacifiCorp | 5.800% | 1/15/55 | 3,830 | 3,844 | ||
| PECO Energy Co. | 4.800% | 10/15/43 | 10,365 | 9,537 | ||
| PECO Energy Co. | 4.150% | 10/1/44 | 396 | 341 | ||
| PECO Energy Co. | 3.700% | 9/15/47 | 15,500 | 12,376 | ||
| PECO Energy Co. | 3.900% | 3/1/48 | 5,890 | 4,877 | ||
| PECO Energy Co. | 3.050% | 3/15/51 | 3,000 | 2,087 | ||
| PECO Energy Co. | 4.600% | 5/15/52 | 3,040 | 2,790 | ||
| PECO Energy Co. | 4.375% | 8/15/52 | 3,800 | 3,352 | ||
| Potomac Electric Power Co. | 6.500% | 11/15/37 | 1,160 | 1,317 | ||
| Potomac Electric Power Co. | 7.900% | 12/15/38 | 142 | 184 | ||
| Potomac Electric Power Co. | 4.150% | 3/15/43 | 13,575 | 11,911 | ||
| PPL Electric Utilities Corp. | 6.450% | 8/15/37 | 10,200 | 11,091 | ||
| PPL Electric Utilities Corp. | 6.250% | 5/15/39 | 10,924 | 12,218 | ||
| PPL Electric Utilities Corp. | 5.200% | 7/15/41 | 1,183 | 1,156 | ||
| PPL Electric Utilities Corp. | 3.950% | 6/1/47 | 12,500 | 10,375 | ||
| PPL Electric Utilities Corp. | 5.250% | 5/15/53 | 2,210 | 2,227 | ||
| Public Service Co. of Colorado | 6.250% | 9/1/37 | 960 | 1,040 | ||
| Public Service Co. of Colorado | 3.600% | 9/15/42 | 20,555 | 16,196 | ||
| Public Service Co. of Colorado | 4.300% | 3/15/44 | 2,761 | 2,370 | ||
| Public Service Co. of Colorado | 3.800% | 6/15/47 | 2,260 | 1,774 | ||
| Public Service Co. of Colorado | 4.050% | 9/15/49 | 34,010 | 27,155 | ||
| Public Service Co. of Colorado | 4.500% | 6/1/52 | 5,660 | 4,866 | ||
| Public Service Co. of New Hampshire | 5.150% | 1/15/53 | 1,050 | 1,042 | ||
| Public Service Electric and Gas Co. | 3.600% | 12/1/47 | 2,000 | 1,591 | ||
| Public Service Electric and Gas Co. | 3.850% | 5/1/49 | 2,890 | 2,381 | ||
| Public Service Electric and Gas Co. | 3.200% | 8/1/49 | 1,065 | 777 | ||
| Public Service Electric and Gas Co. | 2.700% | 5/1/50 | 19,725 | 13,133 | ||
| Public Service Electric and Gas Co. | 3.000% | 3/1/51 | 8,875 | 6,203 | ||
| Public Service Electric and Gas Co. | 5.125% | 3/15/53 | 19,940 | 20,058 | ||
| Puget Sound Energy Inc. | 6.274% | 3/15/37 | 473 | 512 | ||
| Coupon | Maturity Date | Face Amount ($000) | Market Value• ($000) | |||
| Puget Sound Energy Inc. | 5.757% | 10/1/39 | 1,042 | 1,075 | ||
| Puget Sound Energy Inc. | 5.795% | 3/15/40 | 15,992 | 16,455 | ||
| Puget Sound Energy Inc. | 4.300% | 5/20/45 | 379 | 325 | ||
| Puget Sound Energy Inc. | 4.223% | 6/15/48 | 22,045 | 18,299 | ||
| Puget Sound Energy Inc. | 3.250% | 9/15/49 | 35,150 | 24,563 | ||
| Puget Sound Energy Inc. | 2.893% | 9/15/51 | 14,200 | 9,284 | ||
| 3,6 | Rayburn Country Securitization LLC | 3.025% | 12/1/43 | 8,724 | 7,111 | |
| San Diego Gas & Electric Co. | 4.500% | 8/15/40 | 2,000 | 1,820 | ||
| San Diego Gas & Electric Co. | 3.750% | 6/1/47 | 1,000 | 792 | ||
| San Diego Gas & Electric Co. | 4.100% | 6/15/49 | 2,081 | 1,725 | ||
| San Diego Gas & Electric Co. | 2.950% | 8/15/51 | 1,500 | 1,047 | ||
| San Diego Gas & Electric Co. | 3.700% | 3/15/52 | 21,475 | 16,478 | ||
| Southern California Edison Co. | 5.950% | 2/1/38 | 12,915 | 13,596 | ||
| Southern California Edison Co. | 4.500% | 9/1/40 | 14,228 | 12,749 | ||
| Southern California Edison Co. | 4.050% | 3/15/42 | 1,704 | 1,433 | ||
| Southern California Edison Co. | 3.900% | 3/15/43 | 21,775 | 17,665 | ||
| Southern California Edison Co. | 4.650% | 10/1/43 | 21,739 | 19,693 | ||
| Southern California Edison Co. | 3.600% | 2/1/45 | 3,837 | 2,943 | ||
| Southern California Edison Co. | 4.000% | 4/1/47 | 41,120 | 33,306 | ||
| Southern California Edison Co. | 4.125% | 3/1/48 | 40,632 | 33,462 | ||
| Southern California Edison Co. | 4.875% | 3/1/49 | 3,435 | 3,150 | ||
| Southern California Edison Co. | 3.650% | 2/1/50 | 12,650 | 9,626 | ||
| Southern California Edison Co. | 2.950% | 2/1/51 | 1,505 | 999 | ||
| Southern California Edison Co. | 3.450% | 2/1/52 | 23,965 | 17,254 | ||
| Southern California Edison Co. | 5.450% | 6/1/52 | 23,110 | 22,967 | ||
| Southern California Edison Co. | 5.700% | 3/1/53 | 4,381 | 4,501 | ||
| Southern California Edison Co. | 5.875% | 12/1/53 | 16,812 | 17,631 | ||
| Southern California Gas Co. | 5.125% | 11/15/40 | 1,870 | 1,831 | ||
| Southern California Gas Co. | 4.125% | 6/1/48 | 30,835 | 25,717 | ||
| Southern California Gas Co. | 4.300% | 1/15/49 | 15,075 | 12,676 | ||
| Southern California Gas Co. | 6.350% | 11/15/52 | 6,090 | 6,889 | ||
| Southern California Gas Co. | 5.750% | 6/1/53 | 27,605 | 28,734 | ||
| Southwestern Public Service Co. | 4.500% | 8/15/41 | 18,975 | 16,830 | ||
| Southwestern Public Service Co. | 3.700% | 8/15/47 | 20,540 | 15,447 | ||
| Southwestern Public Service Co. | 3.750% | 6/15/49 | 3,490 | 2,630 | ||
| Southwestern Public Service Co. | 3.150% | 5/1/50 | 10,750 | 7,266 | ||
| Tampa Electric Co. | 3.450% | 3/15/51 | 2,000 | 1,433 | ||
| Tampa Electric Co. | 5.000% | 7/15/52 | 1,380 | 1,289 | ||
| Tucson Electric Power Co. | 3.250% | 5/1/51 | 20,000 | 13,736 | ||
| Tucson Electric Power Co. | 5.500% | 4/15/53 | 12,165 | 12,165 | ||
| Union Electric Co. | 3.900% | 9/15/42 | 4,326 | 3,617 | ||
| Union Electric Co. | 4.000% | 4/1/48 | 21,550 | 17,307 | ||
| Union Electric Co. | 3.250% | 10/1/49 | 2,025 | 1,404 | ||
| Union Electric Co. | 3.900% | 4/1/52 | 9,575 | 7,699 | ||
| Union Electric Co. | 5.450% | 3/15/53 | 7,415 | 7,504 | ||
| Union Electric Co. | 5.250% | 1/15/54 | 7,660 | 7,530 | ||
| Virginia Electric & Power Co. | 5.700% | 8/15/53 | 13,080 | 13,678 | ||
| Virginia Electric and Power Co. | 6.000% | 5/15/37 | 52,203 | 55,584 | ||
| Coupon | Maturity Date | Face Amount ($000) | Market Value• ($000) | |||
| Virginia Electric and Power Co. | 6.350% | 11/30/37 | 1,944 | 2,133 | ||
| Virginia Electric and Power Co. | 8.875% | 11/15/38 | 920 | 1,256 | ||
| Virginia Electric and Power Co. | 4.450% | 2/15/44 | 15,490 | 13,684 | ||
| Virginia Electric and Power Co. | 4.200% | 5/15/45 | 2,000 | 1,694 | ||
| Virginia Electric and Power Co. | 4.000% | 11/15/46 | 8,725 | 7,164 | ||
| Virginia Electric and Power Co. | 3.800% | 9/15/47 | 34,972 | 27,416 | ||
| Virginia Electric and Power Co. | 4.600% | 12/1/48 | 7,310 | 6,488 | ||
| Virginia Electric and Power Co. | 3.300% | 12/1/49 | 1,400 | 1,010 | ||
| Virginia Electric and Power Co. | 2.450% | 12/15/50 | 19,151 | 11,508 | ||
| Virginia Electric and Power Co. | 2.950% | 11/15/51 | 26,662 | 17,883 | ||
| Virginia Electric and Power Co. | 4.625% | 5/15/52 | 20,570 | 18,311 | ||
| Virginia Electric and Power Co. | 5.450% | 4/1/53 | 16,222 | 16,448 | ||
| Virginia Electric and Power Co. | 5.350% | 1/15/54 | 2,790 | 2,780 | ||
| 6 | Vistra Operations Co. LLC | 7.750% | 10/15/31 | 35 | 36 | |
| Wisconsin Electric Power Co. | 5.625% | 5/15/33 | 521 | 558 | ||
| Wisconsin Public Service Corp. | 3.300% | 9/1/49 | 4,034 | 2,889 | ||
| 2,462,213 | ||||||
| Total Corporate Bonds (Cost $14,716,479) | 12,946,346 | |||||
| Floating Rate Loan Interests (0.0%) | ||||||
| 8 | American Airlines Inc. Term Loan, TSFR3M + 4.750% (Cost $4) | 10.329% | 4/20/28 | 3 | 3 | |
| Sovereign Bonds (1.4%) | ||||||
| 6 | CDP Financial Inc. | 5.600% | 11/25/39 | 1,500 | 1,604 | |
| Federative Republic of Brazil | 7.125% | 5/13/54 | 10,857 | 10,882 | ||
| 6 | Kingdom of Saudi Arabia | 5.000% | 1/18/53 | 36,390 | 32,370 | |
| 6 | Kingdom of Saudi Arabia | 5.750% | 1/16/54 | 44,585 | 43,794 | |
| 6 | OMERS Finance Trust | 4.000% | 4/19/52 | 14,000 | 11,291 | |
| Republic of Chile | 3.100% | 5/7/41 | 34,285 | 25,717 | ||
| Republic of Chile | 3.500% | 1/25/50 | 10,784 | 7,976 | ||
| Republic of Chile | 3.500% | 4/15/53 | 17,590 | 12,987 | ||
| Republic of Chile | 5.330% | 1/5/54 | 24,235 | 23,548 | ||
| Republic of Chile | 3.100% | 1/22/61 | 24,795 | 15,886 | ||
| Republic of Chile | 3.250% | 9/21/71 | 24,130 | 15,510 | ||
| 3 | Republic of Panama | 3.870% | 7/23/60 | 7,712 | 4,330 | |
| Republic of Panama | 4.500% | 1/19/63 | 1,330 | 829 | ||
| 5 | Republic of Poland | 4.250% | 2/14/43 | 2,200 | 2,442 | |
| Republic of Poland | 5.500% | 4/4/53 | 3,213 | 3,246 | ||
| State of Israel | 4.500% | 1/17/33 | 12,215 | 11,448 | ||
| United Mexican States | 6.400% | 5/7/54 | 3,820 | 3,831 | ||
| Total Sovereign Bonds (Cost $261,809) | 227,691 | |||||
| Taxable Municipal Bonds (8.9%) | ||||||
| American Municipal Power Inc. Electric Power & Light Revenue | 6.270% | 2/15/50 | 39,426 | 42,971 | ||
| Bay Area Toll Authority Highway Revenue | 6.918% | 4/1/40 | 23,745 | 27,745 | ||
| Bay Area Toll Authority Highway Revenue | 6.263% | 4/1/49 | 13,365 | 15,540 | ||
| California GO | 5.125% | 3/1/38 | 2,300 | 2,321 | ||
| California GO | 4.600% | 4/1/38 | 21,195 | 20,401 | ||
| California GO | 7.550% | 4/1/39 | 6,500 | 8,218 | ||
| Coupon | Maturity Date | Face Amount ($000) | Market Value• ($000) | |||
| California GO | 7.300% | 10/1/39 | 21,336 | 25,837 | ||
| California GO | 7.350% | 11/1/39 | 1,000 | 1,217 | ||
| California GO | 7.625% | 3/1/40 | 3,770 | 4,741 | ||
| California GO | 7.600% | 11/1/40 | 60,685 | 77,416 | ||
| California GO | 5.875% | 10/1/41 | 12,060 | 12,691 | ||
| California GO | 5.200% | 3/1/43 | 13,435 | 13,386 | ||
| California Health Facilities Financing Authority Intergovernmental Agreement Revenue | 4.353% | 6/1/41 | 1,950 | 1,770 | ||
| California State Public Works Board Lease (Abatement) Revenue | 8.361% | 10/1/34 | 1,066 | 1,331 | ||
| California State University College & University Revenue | 3.899% | 11/1/47 | 1,620 | 1,383 | ||
| California State University College & University Revenue | 2.975% | 11/1/51 | 27,825 | 19,559 | ||
| California State University College & University Revenue | 2.719% | 11/1/52 | 10,925 | 7,486 | ||
| Chicago Transit Authority Sales & Transfer Tax Receipts Sales Tax Revenue | 6.899% | 12/1/40 | 43,828 | 49,819 | ||
| Chicago Transit Authority Sales & Transfer Tax Receipts Sales Tax Revenue | 6.899% | 12/1/40 | 9,082 | 10,402 | ||
| Commonwealth Financing Authority Appropriations Revenue | 4.144% | 6/1/38 | 17,060 | 15,832 | ||
| Commonwealth Financing Authority Appropriations Revenue (Plancon Program) | 3.864% | 6/1/38 | 19,285 | 17,603 | ||
| Commonwealth of Massachusetts GO | 5.456% | 12/1/39 | 1,265 | 1,325 | ||
| Commonwealth of Massachusetts GO | 2.514% | 7/1/41 | 6,670 | 4,968 | ||
| Commonwealth of Massachusetts GO | 2.813% | 9/1/43 | 40,910 | 30,520 | ||
| Commonwealth of Massachusetts GO | 2.900% | 9/1/49 | 6,540 | 4,688 | ||
| Dallas Area Rapid Transit Sales Tax Revenue | 5.999% | 12/1/44 | 189 | 208 | ||
| Dallas Area Rapid Transit Sales Tax Revenue | 2.613% | 12/1/48 | 25,470 | 17,310 | ||
| Dallas County Hospital District GO | 5.621% | 8/15/44 | 1,100 | 1,161 | ||
| Dallas Fort Worth International Airport Port, Airport & Marina Revenue | 2.843% | 11/1/46 | 16,740 | 12,476 | ||
| Dallas Fort Worth International Airport Port, Airport & Marina Revenue | 4.087% | 11/1/51 | 2,160 | 1,882 | ||
| Dallas Fort Worth International Airport Port, Airport & Marina Revenue | 4.507% | 11/1/51 | 11,465 | 10,677 | ||
| District of Columbia Water & Sewer Authority Water Revenue | 4.814% | 10/1/14 | 1,944 | 1,885 | ||
| Duke University College & University Revenue | 5.850% | 4/1/37 | 29,490 | 32,154 | ||
| Georgia Municipal Electric Authority Electric Power & Light Revenue | 6.637% | 4/1/57 | 901 | 1,020 | ||
| Georgia Municipal Electric Authority Electric Power & Light Revenue | 6.655% | 4/1/57 | 324 | 366 | ||
| Golden State Tobacco Securitization Corp. Tobacco Settlement Funded Revenue | 4.214% | 6/1/50 | 26,160 | 19,512 | ||
| Coupon | Maturity Date | Face Amount ($000) | Market Value• ($000) | |||
| Grand Parkway Transportation Corp. Highway Revenue | 5.184% | 10/1/42 | 1,420 | 1,448 | ||
| Grand Parkway Transportation Corp. Highway Revenue | 3.236% | 10/1/52 | 2,690 | 1,998 | ||
| Houston TX GO | 3.961% | 3/1/47 | 1,500 | 1,332 | ||
| Kansas Development Finance Authority Appropriations Revenue | 4.727% | 4/15/37 | 2,417 | 2,373 | ||
| Kansas Development Finance Authority Appropriations Revenue | 4.927% | 4/15/45 | 20,480 | 20,019 | ||
| 9 | Kansas Development Finance Authority Appropriations Revenue | 2.774% | 5/1/51 | 14,225 | 10,015 | |
| Los Angeles CA Unified School District GO | 6.758% | 7/1/34 | 3,175 | 3,592 | ||
| Los Angeles County Metropolitan Transportation Authority Sales Tax Revenue | 5.735% | 6/1/39 | 15,020 | 15,766 | ||
| Los Angeles Department of Water & Power Electric Power & Light Revenue | 5.716% | 7/1/39 | 1,024 | 1,084 | ||
| Los Angeles Department of Water & Power Electric Power & Light Revenue | 6.574% | 7/1/45 | 1,500 | 1,779 | ||
| Los Angeles Department of Water & Power Water Revenue | 6.603% | 7/1/50 | 1,849 | 2,229 | ||
| Los Angeles Department of Water & Power Water System Water Revenue | 6.008% | 7/1/39 | 1,136 | 1,216 | ||
| Louisiana Local Government Environmental Facilities & Community Development Authority | 5.198% | 12/1/39 | 2,300 | 2,376 | ||
| Maryland Health & Higher Educational Facilities Authority Health, Hospital, Nursing Home Revenue | 3.052% | 7/1/40 | 1,165 | 884 | ||
| Massachusetts Water Resources Authority Water Revenue | 2.823% | 8/1/41 | 16,390 | 12,972 | ||
| Metropolitan Transportation Authority Fuel Sales Tax Revenue | 6.089% | 11/15/40 | 3,833 | 4,163 | ||
| Metropolitan Transportation Authority Miscellaneous Taxes Revenue | 7.336% | 11/15/39 | 52,780 | 64,556 | ||
| Metropolitan Transportation Authority Transit Revenue | 5.871% | 11/15/39 | 210 | 221 | ||
| Metropolitan Transportation Authority Transit Revenue | 6.814% | 11/15/40 | 750 | 846 | ||
| Metropolitan Transportation Authority Transit Revenue | 5.175% | 11/15/49 | 1,525 | 1,471 | ||
| Michigan Finance Authority Health, Hospital, Nursing Home Revenue | 3.384% | 12/1/40 | 3,230 | 2,634 | ||
| Michigan Strategic Fund Lease (Appropriation) Revenue | 3.225% | 9/1/47 | 8,310 | 6,452 | ||
| New Jersey Turnpike Authority Highway Revenue | 7.414% | 1/1/40 | 3,607 | 4,486 | ||
| New Jersey Turnpike Authority Highway Revenue | 7.102% | 1/1/41 | 40,361 | 48,830 | ||
| New York City Municipal Water Finance Authority Water Revenue | 5.724% | 6/15/42 | 12,711 | 13,826 | ||
| New York City Municipal Water Finance Authority Water Revenue | 5.952% | 6/15/42 | 18,114 | 20,174 | ||
| Coupon | Maturity Date | Face Amount ($000) | Market Value• ($000) | |||
| New York City Municipal Water Finance Authority Water Revenue | 6.011% | 6/15/42 | 6,843 | 7,672 | ||
| New York City Municipal Water Finance Authority Water Revenue | 5.440% | 6/15/43 | 1,200 | 1,261 | ||
| New York City Municipal Water Finance Authority Water Revenue | 5.882% | 6/15/44 | 32,580 | 36,099 | ||
| New York City Transitional Finance Authority Future Tax Secured Sales Tax Revenue | 5.508% | 8/1/37 | 2,859 | 2,974 | ||
| New York NY GO | 5.590% | 3/1/35 | 947 | 1,009 | ||
| New York NY GO | 6.271% | 12/1/37 | 550 | 614 | ||
| New York NY GO | 5.263% | 10/1/52 | 10,670 | 11,244 | ||
| New York NY GO | 5.828% | 10/1/53 | 22,280 | 25,134 | ||
| New York State Dormitory Authority Income Tax Revenue | 5.628% | 3/15/39 | 15,919 | 16,688 | ||
| New York State Dormitory Authority Income Tax Revenue | 5.600% | 3/15/40 | 189 | 197 | ||
| New York State Thruway Authority Highway Revenue | 3.500% | 1/1/42 | 10,945 | 9,124 | ||
| North Texas Tollway Authority Highway Revenue | 6.718% | 1/1/49 | 22,942 | 27,812 | ||
| Ohio State University College & University Revenue | 4.910% | 6/1/40 | 13,800 | 13,721 | ||
| Ohio State University College & University Revenue | 4.800% | 6/1/11 | 17,638 | 16,401 | ||
| Pennsylvania State University College & University Revenue | 2.790% | 9/1/43 | 1,000 | 756 | ||
| Permanent University Fund - Texas A&M University System College & University Revenue | 3.100% | 7/1/49 | 565 | 437 | ||
| Permanent University Fund - University of Texas System College & University Revenue | 5.262% | 7/1/39 | 11,500 | 11,925 | ||
| Port Authority of New York & New Jersey Port, Airport & Marina Revenue | 5.647% | 11/1/40 | 15,253 | 16,214 | ||
| Port Authority of New York & New Jersey Port, Airport & Marina Revenue | 5.647% | 11/1/40 | 10,176 | 10,817 | ||
| Port Authority of New York & New Jersey Port, Airport & Marina Revenue | 4.926% | 10/1/51 | 25,005 | 24,812 | ||
| Port Authority of New York & New Jersey Port, Airport & Marina Revenue | 5.072% | 7/15/53 | 5,730 | 5,844 | ||
| Port Authority of New York & New Jersey Port, Airport & Marina Revenue | 4.458% | 10/1/62 | 46,790 | 41,770 | ||
| Port Authority of New York & New Jersey Port, Airport & Marina Revenue | 3.287% | 8/1/69 | 32,799 | 22,327 | ||
| Rutgers State University of New Jersey College & University Revenue | 3.915% | 5/1/19 | 44,030 | 31,958 | ||
| Sacramento Municipal Utility District Electric Power & Light Revenue | 6.156% | 5/15/36 | 857 | 932 | ||
| Sales Tax Securitization Corp. Intergovernmental Agreement Revenue | 3.238% | 1/1/42 | 25,400 | 20,420 | ||
| Sales Tax Securitization Corp. Sales Tax Revenue | 4.637% | 1/1/40 | 14,900 | 14,317 | ||
| Sales Tax Securitization Corp. Sales Tax Revenue | 3.587% | 1/1/43 | 36,460 | 30,405 | ||
| Coupon | Maturity Date | Face Amount ($000) | Market Value• ($000) | |||
| San Antonio TX Electric & Gas Systems Electric Power & Light Revenue | 5.985% | 2/1/39 | 10,450 | 11,407 | ||
| San Antonio TX Electric & Gas Systems Electric Power & Light Revenue | 5.808% | 2/1/41 | 1,000 | 1,075 | ||
| San Antonio TX Electric & Gas Systems Electric Power & Light Revenue | 4.427% | 2/1/42 | 1,326 | 1,266 | ||
| San Diego County Regional Airport Authority Port, Airport & Marina Revenue | 5.594% | 7/1/43 | 717 | 704 | ||
| San Francisco CA Public Utilities Commission Water Revenue | 6.950% | 11/1/50 | 1,326 | 1,609 | ||
| 10 | San Joaquin Hills Transportation Corridor Agency Highway Revenue | 3.492% | 1/15/50 | 3,975 | 3,033 | |
| Texas GO | 5.517% | 4/1/39 | 3,500 | 3,743 | ||
| Texas Natural Gas Securitization Finance Corp. | 5.169% | 4/1/41 | 3,450 | 3,593 | ||
| Texas Private Activity Bond Surface Transportation Corp. Highway Revenue | 3.922% | 12/31/49 | 4,150 | 3,446 | ||
| Texas Transportation Commission GO | 2.472% | 10/1/44 | 8,625 | 6,083 | ||
| University of California College & University Revenue | 5.770% | 5/15/43 | 1,573 | 1,673 | ||
| University of California College & University Revenue | 3.931% | 5/15/45 | 17,840 | 16,557 | ||
| University of California College & University Revenue | 4.858% | 5/15/12 | 32,223 | 30,377 | ||
| University of California College & University Revenue | 4.767% | 5/15/15 | 14,875 | 13,762 | ||
| University of California Regents Medical Center Pooled Health, Hospital, Nursing Home Revenue | 6.548% | 5/15/48 | 8,918 | 10,334 | ||
| University of California Regents Medical Center Pooled Health, Hospital, Nursing Home Revenue | 6.583% | 5/15/49 | 852 | 988 | ||
| University of California Regents Medical Center Pooled Health, Hospital, Nursing Home Revenue | 3.006% | 5/15/50 | 32,500 | 22,643 | ||
| University of California Regents Medical Center Pooled Health, Hospital, Nursing Home Revenue | 4.563% | 5/15/53 | 9,765 | 8,976 | ||
| University of California Regents Medical Center Pooled Health, Hospital, Nursing Home Revenue | 3.706% | 5/15/20 | 790 | 549 | ||
| University of Michigan College & University Revenue | 2.437% | 4/1/40 | 1,500 | 1,117 | ||
| University of Michigan College & University Revenue | 3.599% | 4/1/47 | 26,363 | 22,700 | ||
| University of Michigan College & University Revenue | 3.504% | 4/1/52 | 19,835 | 15,902 | ||
| University of Michigan College & University Revenue | 3.504% | 4/1/52 | 14,898 | 11,944 | ||
| Coupon | Maturity Date | Face Amount ($000) | Market Value• ($000) | |||
| University of Minnesota College & University Revenue | 4.048% | 4/1/52 | 21,515 | 18,592 | ||
| University of Texas System Regents College & University Revenue | 4.794% | 8/15/46 | 8,915 | 8,774 | ||
| University of Virginia College & University Revenue | 2.256% | 9/1/50 | 17,580 | 10,897 | ||
| University of Virginia College & University Revenue | 2.584% | 11/1/51 | 2,025 | 1,351 | ||
| University of Virginia College & University Revenue | 3.227% | 9/1/19 | 35,640 | 22,946 | ||
| Washington GO | 5.481% | 8/1/39 | 852 | 903 | ||
| Wisconsin Appropriations Revenue | 3.954% | 5/1/36 | 3,364 | 3,160 | ||
| Total Taxable Municipal Bonds (Cost $1,534,727) | 1,427,551 | |||||
| Shares | ||||||
| Temporary Cash Investments (1.8%) | ||||||
| Money Market Fund (0.3%) | ||||||
| 11 | Vanguard Market Liquidity Fund | 5.410% | 493,785 | 49,374 | ||
| Maturity Date | Face Amount ($000) | |||||
| Repurchase Agreements (0.9%) | ||||||
| Bank of America Securities, LLC (Dated 1/31/24, Repurchase Value $23,303,000, collateralized by Fannie Mae 2.000%–4.500%, 10/1/30–9/1/53, and Freddie Mac 1.500%–6.500%, 8/1/36–12/1/53., with a value of $23,766,000) | 5.320% | 2/1/24 | 23,300 | 23,300 | ||
| Barclays Capital Inc. (Dated 1/31/24, Repurchase Value $28,804,000, collateralized by U.S. Treasury Note/Bond 0.375%, 7/31/27, with a value of $29,376,000) | 5.300% | 2/1/24 | 28,800 | 28,800 | ||
| Citigroup Global Markets Inc. (Dated 1/31/24, Repurchase Value $23,603,000, collateralized by U.S. Treasury Note/Bond 1.625%, 5/15/31, with a value of $24,072,000) | 5.300% | 2/1/24 | 23,600 | 23,600 | ||
| JP Morgan Securities LLC (Dated 1/31/24, Repurchase Value $12,002,000, collateralized by U.S. Treasury Note/Bond 2.625%, 1/31/26, with a value of $12,240,000) | 5.310% | 2/1/24 | 12,000 | 12,000 | ||
| RBC Capital Markets LLC (Dated 1/31/24, Repurchase Value $30,905,000, collateralized by U.S. Treasury Bill 0.000%, 2/13/24–2/20/24, with a value of $31,518,000) | 5.310% | 2/1/24 | 30,900 | 30,900 | ||
| Coupon | Maturity Date | Face Amount ($000) | Market Value• ($000) | |||
| Wells Fargo & Co. (Dated 1/31/24, Repurchase Value $23,203,000, collateralized by Freddie Mac 6.000%, 1/1/54, with a value of $23,664,000) | 5.320% | 2/1/24 | 23,200 | 23,200 | ||
| 141,800 | ||||||
| U.S. Government and Agency Obligations (0.6%) | ||||||
| United States Treasury Bill | 4.919% | 2/20/24 | 26,275 | 26,202 | ||
| United States Treasury Bill | 5.279% | 3/26/24 | 70,930 | 70,369 | ||
| 96,571 | ||||||
| Total Temporary Cash Investments (Cost $287,742) | 287,745 | |||||
| Counterparty | Expiration Date | Exercise Rate | Notional Amount on Underlying Swap ($000) | |||
| Options Purchased (0.0%) | ||||||
| Over-the-Counter Swaptions (0.0%) | ||||||
| Put Swaptions | ||||||
| 5-Year CDX-NA-IG-S41-V1, Credit Protection Purchased, Pays 1.000% Quarterly | GSI | 3/20/24 | 0.700% | 28,710 | 11 | |
| 5-Year CDX-NA-IG-S41-V1, Credit Protection Purchased, Pays 1.000% Quarterly | GSI | 3/20/24 | 0.700% | 28,710 | 11 | |
| 5-Year CDX-NA-IG-S41-V1, Credit Protection Purchased, Pays 1.000% Quarterly | GSI | 4/17/24 | 0.600% | 57,430 | 93 | |
| 5-Year CDX-NA-IG-S41-V1, Credit Protection Purchased, Pays 1.000% Quarterly | GSI | 4/17/24 | 0.600% | 66,250 | 107 | |
| Counterparty | Expiration Date | Exercise Rate | Notional Amount on Underlying Swap ($000) | Market Value• ($000) | ||
| 5-Year CDX-NA-IG-S41-V1, Credit Protection Purchased, Pays 1.000% Quarterly | BANA | 5/15/24 | 0.575% | 60,200 | 142 | |
| Total Options Purchased (Cost $605) | 364 | |||||
| Total Investments (99.4%) (Cost $17,916,934) | 15,972,736 | |||||
| Other Assets and Liabilities—Net (0.6%) | 98,178 | |||||
| Net Assets (100%) | 16,070,914 | |||||
| Cost is in $000. | ||||||
| • | See Note A in Notes to Financial Statements. |
| 1 | Securities with a value of $41,608,000 have been segregated as initial margin for open centrally cleared swap contracts. |
| 2 | Securities with a value of $13,977,000 have been segregated as initial margin for open futures contracts. |
| 3 | The average or expected maturity is shorter than the final maturity shown because of the possibility of interim principal payments and prepayments or the possibility of the issue being called. |
| 4 | The issuer was placed under federal conservatorship in September 2008; since that time, its daily operations have been managed by the Federal Housing Finance Agency and it receives capital from the U.S. Treasury, as needed to maintain a positive net worth, in exchange for senior preferred stock. |
| 5 | Face amount denominated in euro. |
| 6 | Security exempt from registration under Rule 144A of the Securities Act of 1933. Such securities may be sold in transactions exempt from registration, normally to qualified institutional buyers. At January 31, 2024, the aggregate value was $765,013,000, representing 4.8% of net assets. |
| 7 | Face amount denominated in British pounds. |
| 8 | Variable-rate security; rate shown is effective rate at period end. Certain variable-rate securities are not based on a published reference rate and spread but are determined by the issuer or agent based on current market conditions. |
| 9 | Scheduled principal and interest payments are guaranteed by Build America Mutual Assurance Co. |
| 10 | Scheduled principal and interest payments are guaranteed by Assured Guaranty Municipal Corp. |
| 11 | Affiliated money market fund available only to Vanguard funds and certain trusts and accounts managed by Vanguard. Rate shown is the 7-day yield. |
| BANA—Bank of America, N.A. | |
| DAC—Designated Activity Company. | |
| GO—General Obligation Bond. | |
| GSI—Goldman Sachs International. | |
| TSFR3M—CME Term Secured Overnight Financing Rate 3-Month. | |
| UMBS—Uniform Mortgage-Backed Securities. |
| Options Written |
| Counterparty | Expiration Date | Exercise Rate | Notional Amount on Underlying Swap ($000) | Market Value ($000) | |
| Over-the-Counter Swaptions | |||||
| Put Swaptions | |||||
| 5-Year CDX-NA-IG-S41-V1, Credit Protection Sold, Receives 1.000% Quarterly | GSI | 4/17/24 | 0.850% | 89,400 | (32) |
| Total Options Written (Premiums Received $85) | (32) | ||||
| GSI—Goldman Sachs International. |
| Futures Contracts | ||||
| Expiration | Number of Long (Short) Contracts | ($000) | ||
| Notional Amount | Value and Unrealized Appreciation (Depreciation) | |||
| Long Futures Contracts | ||||
| 5-Year U.S. Treasury Note | March 2024 | 5 | 542 | 2 |
| Long U.S. Treasury Bond | March 2024 | 196 | 23,979 | 218 |
| Ultra 10-Year U.S. Treasury Note | March 2024 | 1,562 | 182,559 | 1,124 |
| Ultra Long U.S. Treasury Bond | March 2024 | 799 | 103,246 | (334) |
| 1,010 | ||||
| Short Futures Contracts | ||||
| 2-Year U.S. Treasury Note | March 2024 | (80) | (16,453) | (28) |
| 5-Year U.S. Treasury Note | March 2024 | (47) | (5,094) | (21) |
| 10-Year Japanese Government Bond | March 2024 | (16) | (15,899) | 23 |
| 10-Year U.S. Treasury Note | March 2024 | (797) | (89,526) | (741) |
| Euro-Bund | March 2024 | (41) | (6,019) | (80) |
| Euro-Buxl | March 2024 | (28) | (4,163) | (172) |
| Long Gilt | March 2024 | (14) | (1,774) | (49) |
| Long U.S. Treasury Bond | March 2024 | (1,202) | (147,057) | (1,578) |
| Ultra Long U.S. Treasury Bond | March 2024 | (476) | (61,508) | (86) |
| (2,732) | ||||
| (1,722) | ||||
| Forward Currency Contracts | |||||||
| Counterparty | Contract Settlement Date | Contract Amount (000) | Unrealized Appreciation ($000) | Unrealized Depreciation ($000) | |||
| Receive | Deliver | ||||||
| UBS AG | 3/20/24 | USD | 168 | AUD | 254 | 1 | — |
| Deutsche Bank AG | 3/20/24 | USD | 11,188 | EUR | 10,276 | 59 | — |
| UBS AG | 3/20/24 | USD | 554 | EUR | 509 | 3 | — |
| JPMorgan Chase Bank, N.A. | 3/20/24 | USD | 548 | EUR | 506 | — | — |
| State Street Bank & Trust Co. | 3/20/24 | USD | 71 | EUR | 66 | — | — |
| UBS AG | 3/20/24 | USD | 1,587 | GBP | 1,248 | 5 | — |
| Toronto-Dominion Bank | 3/21/24 | USD | 78 | JPY | 11,393 | — | — |
| 68 | — | ||||||
| AUD—Australian dollar. |
| EUR—euro. |
| GBP—British pound. |
| JPY—Japanese yen. |
| USD—U.S. dollar. |
| Centrally Cleared Credit Default Swaps | ||||||
| Reference Entity | Termination Date | Notional Amount (000) | Periodic Premium Received (Paid)1 (%) | Value ($000) | Unrealized Appreciation (Depreciation) ($000) | |
| Credit Protection Sold | ||||||
| CDX-NA-HY-S41-V2 | 12/21/28 | USD | 33,660 | 5.000 | 2,139 | 156 |
| CDX-NA-IG-S41-V1 | 12/21/28 | USD | 1,452,270 | 1.000 | 30,066 | 12,786 |
| 32,205 | 12,942 | |||||
| 1 Periodic premium received/paid quarterly. |
| USD—U.S. dollar. |
| ($000s, except shares, footnotes, and per-share amounts) | Amount |
| Assets | |
| Investments in Securities, at Value | |
| Unaffiliated Issuers (Cost $17,867,565) | 15,923,362 |
| Affiliated Issuers (Cost $49,369) | 49,374 |
| Total Investments in Securities | 15,972,736 |
| Investment in Vanguard | 521 |
| Foreign Currency, at Value (Cost $348) | 348 |
| Receivables for Investment Securities Sold | 152,038 |
| Receivables for Accrued Income | 200,916 |
| Receivables for Capital Shares Issued | 6,278 |
| Variation Margin Receivable—Futures Contracts | 78 |
| Unrealized Appreciation—Forward Currency Contracts | 68 |
| Other Assets | 54 |
| Total Assets | 16,333,037 |
| Liabilities | |
| Due to Custodian | 1,181 |
| Payables for Investment Securities Purchased | 178,470 |
| Payables to Investment Advisor | 576 |
| Payables for Capital Shares Redeemed | 70,298 |
| Payables for Distributions | 8,108 |
| Payables to Vanguard | 872 |
| Options Written, at Value (Premiums Received $85) | 32 |
| Variation Margin Payable—Centrally Cleared Swap Contracts | 2,586 |
| Total Liabilities | 262,123 |
| Net Assets | 16,070,914 |
| At January 31, 2024, net assets consisted of: | |
| Paid-in Capital | 19,425,099 |
| Total Distributable Earnings (Loss) | (3,354,185) |
| Net Assets | 16,070,914 |
| Investor Shares—Net Assets | |
| Applicable to 502,291,822 outstanding $.001 par value shares of beneficial interest (unlimited authorization) | 4,032,284 |
| Net Asset Value Per Share—Investor Shares | $8.03 |
| Admiral Shares—Net Assets | |
| Applicable to 1,499,625,294 outstanding $.001 par value shares of beneficial interest (unlimited authorization) | 12,038,630 |
| Net Asset Value Per Share—Admiral Shares | $8.03 |
| Year Ended January 31, 2024 | |
| ($000) | |
| Investment Income | |
| Income | |
| Interest1 | 760,488 |
| Total Income | 760,488 |
| Expenses | |
| Investment Advisory Fees—Note B | 2,613 |
| The Vanguard Group—Note C | |
| Management and Administrative— Investor Shares | 7,132 |
| Management and Administrative— Admiral Shares | 10,796 |
| Marketing and Distribution— Investor Shares | 181 |
| Marketing and Distribution— Admiral Shares | 641 |
| Custodian Fees | 94 |
| Auditing Fees | 53 |
| Shareholders’ Reports—Investor Shares | 95 |
| Shareholders’ Reports—Admiral Shares | 62 |
| Trustees’ Fees and Expenses | 11 |
| Other Expenses | 23 |
| Total Expenses | 21,701 |
| Net Investment Income | 738,787 |
| Realized Net Gain (Loss) | |
| Investment Securities Sold1 | (703,717) |
| Futures Contracts | (56,689) |
| Swap Contracts | 42,420 |
| Forward Currency Contracts | 128 |
| Foreign Currencies | 91 |
| Realized Net Gain (Loss) | (717,767) |
| Change in Unrealized Appreciation (Depreciation) | |
| Investment Securities1 | 151,048 |
| Futures Contracts | (3,208) |
| Options Purchased | (241) |
| Options Written | 53 |
| Swap Contracts | (9,979) |
| Forward Currency Contracts | 46 |
| Foreign Currencies | (21) |
| Change in Unrealized Appreciation (Depreciation) | 137,698 |
| Net Increase (Decrease) in Net Assets Resulting from Operations | 158,718 |
| 1 | Interest income, realized net gain (loss), capital gain distributions received, and change in unrealized appreciation (depreciation) from an affiliated company of the fund were $6,303,000, $16,000, $2,000, and ($2,000), respectively. Purchases and sales are for temporary cash investment purposes. |
| Year Ended January 31, | ||
| 2024 ($000) | 2023 ($000) | |
| Increase (Decrease) in Net Assets | ||
| Operations | ||
| Net Investment Income | 738,787 | 669,307 |
| Realized Net Gain (Loss) | (717,767) | (664,202) |
| Change in Unrealized Appreciation (Depreciation) | 137,698 | (3,188,163) |
| Net Increase (Decrease) in Net Assets Resulting from Operations | 158,718 | (3,183,058) |
| Distributions | ||
| Investor Shares | (179,550) | (161,314) |
| Admiral Shares | (576,482) | (524,700) |
| Total Distributions | (756,032) | (686,014) |
| Capital Share Transactions | ||
| Investor Shares | 271,850 | (16,768) |
| Admiral Shares | 36,717 | 636,679 |
| Net Increase (Decrease) from Capital Share Transactions | 308,567 | 619,911 |
| Total Increase (Decrease) | (288,747) | (3,249,161) |
| Net Assets | ||
| Beginning of Period | 16,359,661 | 19,608,822 |
| End of Period | 16,070,914 | 16,359,661 |
| Investor Shares | |||||
| For a Share Outstanding Throughout Each Period | Year Ended January 31, | ||||
| 2024 | 2023 | 2022 | 2021 | 2020 | |
| Net Asset Value, Beginning of Period | $8.32 | $10.33 | $11.42 | $11.48 | $9.79 |
| Investment Operations | |||||
| Net Investment Income1 | .363 | .339 | .323 | .349 | .381 |
| Net Realized and Unrealized Gain (Loss) on Investments | (.281) | (2.001) | (.836) | .399 | 1.854 |
| Total from Investment Operations | .082 | (1.662) | (.513) | .748 | 2.235 |
| Distributions | |||||
| Dividends from Net Investment Income | (.372) | (.348) | (.340) | (.368) | (.399) |
| Distributions from Realized Capital Gains | — | — | (.237) | (.440) | (.146) |
| Total Distributions | (.372) | (.348) | (.577) | (.808) | (.545) |
| Net Asset Value, End of Period | $8.03 | $8.32 | $10.33 | $11.42 | $11.48 |
| Total Return2 | 1.21% | -16.05% | -4.64% | 6.54% | 23.31% |
| Ratios/Supplemental Data | |||||
| Net Assets, End of Period (Millions) | $4,032 | $3,884 | $4,840 | $5,070 | $4,942 |
| Ratio of Total Expenses to Average Net Assets | 0.21% | 0.21% | 0.22% | 0.22% | 0.22% |
| Ratio of Net Investment Income to Average Net Assets | 4.66% | 3.98% | 2.94% | 2.97% | 3.57% |
| Portfolio Turnover Rate | 38% | 26% | 24% | 30% | 34%3 |
| 1 | Calculated based on average shares outstanding. |
| 2 | Total returns do not include account service fees that may have applied in the periods shown. Fund prospectuses provide information about any applicable account service fees. |
| 3 | Includes 1% attributable to mortgage-dollar-roll activity. |
| Admiral Shares | |||||
| For a Share Outstanding Throughout Each Period | Year Ended January 31, | ||||
| 2024 | 2023 | 2022 | 2021 | 2020 | |
| Net Asset Value, Beginning of Period | $8.32 | $10.33 | $11.42 | $11.48 | $9.79 |
| Investment Operations | |||||
| Net Investment Income1 | .371 | .348 | .334 | .361 | .392 |
| Net Realized and Unrealized Gain (Loss) on Investments | (.282) | (2.001) | (.836) | .399 | 1.853 |
| Total from Investment Operations | .089 | (1.653) | (.502) | .760 | 2.245 |
| Distributions | |||||
| Dividends from Net Investment Income | (.379) | (.357) | (.351) | (.380) | (.409) |
| Distributions from Realized Capital Gains | — | — | (.237) | (.440) | (.146) |
| Total Distributions | (.379) | (.357) | (.588) | (.820) | (.555) |
| Net Asset Value, End of Period | $8.03 | $8.32 | $10.33 | $11.42 | $11.48 |
| Total Return2 | 1.31% | -15.97% | -4.54% | 6.64% | 23.43% |
| Ratios/Supplemental Data | |||||
| Net Assets, End of Period (Millions) | $12,039 | $12,475 | $14,769 | $15,455 | $15,335 |
| Ratio of Total Expenses to Average Net Assets | 0.11% | 0.12% | 0.12% | 0.12% | 0.12% |
| Ratio of Net Investment Income to Average Net Assets | 4.75% | 4.08% | 3.04% | 3.07% | 3.67% |
| Portfolio Turnover Rate | 38% | 26% | 24% | 30% | 34%3 |
| 1 | Calculated based on average shares outstanding. |
| 2 | Total returns do not include account service fees that may have applied in the periods shown. Fund prospectuses provide information about any applicable account service fees. |
| 3 | Includes 1% attributable to mortgage-dollar-roll activity. |
| A. | The following significant accounting policies conform to generally accepted accounting principles for U.S. investment companies. The fund consistently follows such policies in preparing its financial statements. |
| B. | Wellington Management Company llp provides investment advisory services to a portion of the fund for a fee calculated at an annual percentage rate of average net assets managed by the advisor. |
| C. | In accordance with the terms of a Funds' Service Agreement (the “FSA”) between Vanguard and the fund, Vanguard furnishes to the fund investment advisory, corporate management, administrative, marketing, and distribution services at Vanguard’s cost of operations (as defined by the FSA). These costs of operations are allocated to the fund based on methods and guidelines approved by the board of trustees and are generally settled twice a month. |
| D. | Various inputs may be used to determine the value of the fund’s investments and derivatives. These inputs are summarized in three broad levels for financial statement purposes. The inputs or methodologies used to value securities are not necessarily an indication of the risk associated with investing in those securities. |
| Level 1 ($000) | Level 2 ($000) | Level 3 ($000) | Total ($000) | |
| Investments | ||||
| Assets | ||||
| U.S. Government and Agency Obligations | — | 1,044,457 | — | 1,044,457 |
| Asset-Backed/Commercial Mortgage-Backed Securities | — | 38,579 | — | 38,579 |
| Corporate Bonds | — | 12,946,346 | — | 12,946,346 |
| Floating Rate Loan Interests | — | 3 | — | 3 |
| Sovereign Bonds | — | 227,691 | — | 227,691 |
| Taxable Municipal Bonds | — | 1,427,551 | — | 1,427,551 |
| Temporary Cash Investments | 49,374 | 238,371 | — | 287,745 |
| Options Purchased | — | 364 | — | 364 |
| Total | 49,374 | 15,923,362 | — | 15,972,736 |
| Derivative Financial Instruments | ||||
| Assets | ||||
| Futures Contracts1 | 1,367 | — | — | 1,367 |
| Forward Currency Contracts | — | 68 | — | 68 |
| Swap Contracts | 12,9421 | — | — | 12,942 |
| Total | 14,309 | 68 | — | 14,377 |
| Liabilities | ||||
| Options Written | — | 32 | — | 32 |
| Futures Contracts1 | 3,089 | — | — | 3,089 |
| Total | 3,089 | 32 | — | 3,121 |
| 1 | Includes cumulative appreciation (depreciation) on futures contracts and centrally cleared swaps, if any, as reported in the Schedule of Investments. Only current day’s variation margin is reported within the Statement of Assets and Liabilities. |
| E. | At January 31, 2024, the fair values of derivatives were reflected in the Statement of Assets and Liabilities as follows: |
| Statement of Assets and Liabilities | Interest Rate Contracts ($000) | Foreign Exchange Contracts ($000) | Credit Contracts ($000) | Total ($000) |
| Investments in Secuties, at Value—Unaffiliated Issuers (Options Purchased) | — | — | 364 | 364 |
| Unrealized Appreciation—Futures Contracts1 | 1,367 | — | — | 1,367 |
| Unrealized Appreciation—Centrally Cleared Swap Contracts | — | — | 12,942 | 12,942 |
| Unrealized Appreciation—Forward Currency Contracts | — | 68 | — | 68 |
| Total Assets | 1,367 | 68 | 13,306 | 14,741 |
| Options Written, at Value | — | — | 32 | 32 |
| Unrealized Depreciation—Futures Contracts1 | 3,089 | — | — | 3,089 |
| Total Liabilities | 3,089 | — | 32 | 3,121 |
| 1 | Includes cumulative appreciation (depreciation) on futures contracts and centrally cleared swaps, if any, as reported in the Schedule of Investments. Only current day’s variation margin is reported within the Statement of Assets and Liabilities. |
| Realized Net Gain (Loss) on Derivatives | Interest Rate Contracts ($000) | Foreign Exchange Contracts ($000) | Credit Contracts ($000) | Total ($000) |
| Futures Contracts | (56,689) | — | — | (56,689) |
| Swap Contracts | (34) | — | 42,454 | 42,420 |
| Forward Currency Contracts | — | 128 | — | 128 |
| Realized Net Gain (Loss) on Derivatives | (56,723) | 128 | 42,454 | (14,141) |
| Change in Unrealized Appreciation (Depreciation) on Derivatives | ||||
| Futures Contracts | (3,208) | — | — | (3,208) |
| Options Purchased | — | — | (241) | (241) |
| Options Written | — | — | 53 | 53 |
| Swap Contracts | — | — | (9,979) | (9,979) |
| Forward Currency Contracts | — | 46 | — | 46 |
| Change in Unrealized Appreciation (Depreciation) on Derivatives | (3,208) | 46 | (10,167) | (13,329) |
| F. | Permanent differences between book-basis and tax-basis components of net assets are reclassified among capital accounts in the financial statements to reflect their tax character. These reclassifications have no effect on net assets or net asset value per share. As of period end, permanent differences primarily attributable to the accounting for applicable foreign currency transactions and swap agreements were reclassified between the individual components of total distributable earnings (loss). |
| Amount ($000) | |
| Undistributed Ordinary Income | 10,588 |
| Undistributed Long-Term Gains | — |
| Net Unrealized Gains (Losses) | (1,957,831) |
| Capital Loss Carryforwards | (1,398,834) |
| Qualified Late-Year Losses | — |
| Other Temporary Differences | (8,108) |
| Total | (3,354,185) |
| Year Ended January 31, | ||
| 2024 Amount ($000) | 2023 Amount ($000) | |
| Ordinary Income* | 756,032 | 686,014 |
| Long-Term Capital Gains | — | — |
| Total | 756,032 | 686,014 |
| * | Includes short-term capital gains, if any. |
| Amount ($000) | |
| Tax Cost | 17,941,545 |
| Gross Unrealized Appreciation | 340,445 |
| Gross Unrealized Depreciation | (2,298,276) |
| Net Unrealized Appreciation (Depreciation) | (1,957,831) |
| G. | During the year ended January 31, 2024, the fund purchased $4,599,208,000 of investment securities and sold $4,203,320,000 of investment securities, other than U.S. government securities and temporary cash investments. Purchases and sales of U.S. government securities were $1,381,588,000 and $1,500,345,000, respectively. |
| H. | Capital share transactions for each class of shares were: |
| Year Ended January 31, | |||||
| 2024 | 2023 | ||||
| Amount ($000) | Shares (000) | Amount ($000) | Shares (000) | ||
| Investor Shares | |||||
| Issued | 377,250 | 48,826 | 259,888 | 29,766 | |
| Issued in Lieu of Cash Distributions | 174,552 | 22,383 | 156,937 | 18,689 | |
| Redeemed | (279,952) | (35,690) | (433,593) | (50,028) | |
| Net Increase (Decrease)—Investor Shares | 271,850 | 35,519 | (16,768) | (1,573) | |
| Admiral Shares | |||||
| Issued | 2,634,826 | 338,861 | 2,561,188 | 296,703 | |
| Issued in Lieu of Cash Distributions | 488,334 | 62,581 | 444,560 | 53,034 | |
| Redeemed | (3,086,443) | (401,020) | (2,369,069) | (279,594) | |
| Net Increase (Decrease)—Admiral Shares | 36,717 | 422 | 636,679 | 70,143 | |
| I. | Significant market disruptions, such as those caused by pandemics (e.g., COVID-19 pandemic), natural or environmental disasters, war (e.g., Russia’s invasion of Ukraine), acts of terrorism, or other events, can adversely affect local and global markets and normal market operations. Any such disruptions could have an adverse impact on the value of the fund’s investments and fund performance. |
| J. | Management has determined that no events or transactions occurred subsequent to January 31, 2024, that would require recognition or disclosure in these financial statements. |
Philadelphia, Pennsylvania
March 21, 2024
| Fund | ($000) |
| Short-Term Investment-Grade Fund | 178,065 |
| Intermediate-Term Investment-Grade Fund | 82,730 |
| Long-Term Investment-Grade Fund | 39,670 |
| Fund | Percentage |
| Short-Term Investment-Grade Fund | 97.6% |
| Intermediate-Term Investment-Grade Fund | 98.6 |
| Long-Term Investment-Grade Fund | 97.8 |
| Fund | Percentage |
| Short-Term Investment-Grade Fund | 78.1% |
| Intermediate-Term Investment-Grade Fund | 79.6 |
| Long-Term Investment-Grade Fund | 79.0 |
| Matthew Benchener | Thomas M. Rampulla |
| Amma Boateng | Karin A. Risi |
| Joseph Brennan | Anne E. Robinson |
| Mortimer J. Buckley | Michael Rollings |
| Gregory Davis | Nitin Tandon |
| John James | Lauren Valente |
| Chris D. Mclsaac |

All rights reserved.
Vanguard Marketing Corporation, Distributor.

Your Fund’s Performance at a Glance | 1 |
Advisor's Report | 2 |
About Your Fund’s Expenses | 5 |
Performance Summary | 7 |
Financial Statements | 9 |
| • | For the 12 months ended January 31, 2024, Vanguard Ultra-Short-Term Bond Fund returned 5.26% for Investor Shares and 5.42% for Admiral Shares. The fund outpaced its benchmark index, which returned 5.08%. |
| • | With inflation continuing to ease, the Federal Reserve slowed and eventually stopped hiking interest rates. Economic growth, the labor market, and consumer spending proved resilient, but the prospect of rates remaining high for an extended period spurred volatility at times. U.S. bonds rallied toward the end of 2023 as sentiment improved amid market expectations for rate cuts in 2024. |
| • | In this environment, the broad U.S. investment-grade bond market returned more than 2%, as measured by the Bloomberg U.S. Aggregate Float Adjusted Index. |
| • | Unlike its benchmark, which consists of the most recently issued U.S. Treasury note, the fund invests in a diversified portfolio of primarily high-quality securities in the credit sector, including investment-grade corporates and asset-backed securities. |
| • | The higher yields from holding credit over Treasuries and the narrowing in credit spreads during the period drove the fund’s outperformance relative to its benchmark. |
| Average Annual Total Returns Periods Ended January 31, 2024 | |||
| One Year | Three Years | Five Years | |
| Stocks | |||
| Russell 1000 Index (Large-caps) | 20.23% | 9.78% | 13.99% |
| Russell 2000 Index (Small-caps) | 2.40 | -0.76 | 6.80 |
| Russell 3000 Index (Broad U.S. market) | 19.15 | 9.10 | 13.53 |
| FTSE All-World ex US Index (International) | 6.29 | 1.57 | 5.77 |
| Bonds | |||
| Bloomberg U.S. Aggregate Float Adjusted Index (Broad taxable market) | 2.23% | -3.15% | 0.90% |
| Bloomberg Municipal Bond Index (Broad tax-exempt market) | 2.90 | -0.78 | 2.00 |
| FTSE Three-Month U.S. Treasury Bill Index | 5.36 | 2.40 | 1.96 |
| CPI | |||
| Consumer Price Index | 3.09% | 5.64% | 4.15% |
| Yields of U.S. Treasury Securities | ||
| Maturity | January 31, 2023 | January 31, 2024 |
| 2 years | 4.20% | 4.21% |
| 5 years | 3.62 | 3.84 |
| 10 years | 3.51 | 3.91 |
| 30 years | 3.63 | 4.17 |
| Source: Vanguard. | ||
| • | Based on actual fund return. This section helps you to estimate the actual expenses that you paid over the period. The ”Ending Account Value“ shown is derived from the fund‘s actual return, and the third column shows the dollar amount that would have been paid by an investor who started with $1,000 in the fund. You may use the information here, together with the amount you invested, to estimate the expenses that you paid over the period. |
| • | Based on hypothetical 5% yearly return. This section is intended to help you compare your fund‘s costs with those of other mutual funds. It assumes that the fund had a yearly return of 5% before expenses, but that the expense ratio is unchanged. In this case—because the return used is not the fund’s actual return—the results do not apply to your investment. The example is useful in making comparisons because the Securities and Exchange Commission requires all mutual funds to calculate expenses based on a 5% return. You can assess your fund’s costs by comparing this hypothetical example with the hypothetical examples that appear in shareholder reports of other funds. |
| Six Months Ended January 31, 2024 | |||
| Ultra-Short-Term Bond Fund | Beginning Account Value 7/31/2023 | Ending Account Value 1/31/2024 | Expenses Paid During Period |
| Based on Actual Fund Return | |||
| Investor Shares | $1,000.00 | $1,032.10 | $1.02 |
| Admiral™ Shares | 1,000.00 | 1,033.20 | 0.51 |
| Based on Hypothetical 5% Yearly Return | |||
| Investor Shares | $1,000.00 | $1,024.20 | $1.02 |
| Admiral Shares | 1,000.00 | 1,024.70 | 0.51 |

| Average Annual Total Returns Periods Ended January 31, 2024 | |||||
| One Year | Five Years | Since Inception (2/24/2015) | Final Value of a $10,000 Investment | ||
 | Ultra-Short-Term Bond Fund Investor Shares | 5.26% | 2.05% | 1.72% | $11,642 |
 | Bloomberg U.S. Treasury Bellwethers: 1 Year Index | 5.08 | 1.97 | 1.54 | 11,465 |
 | Bloomberg U.S. Aggregate Bond Index | 2.10 | 0.83 | 1.21 | 11,130 |
| One Year | Five Years | Since Inception (2/24/2015) | Final Value of a $50,000 Investment | ||
| Ultra-Short-Term Bond Fund Admiral Shares | 5.42% | 2.17% | 1.82% | $58,732 | |
| Bloomberg U.S. Treasury Bellwethers: 1 Year Index | 5.08 | 1.97 | 1.54 | 57,327 | |
| Bloomberg U.S. Aggregate Bond Index | 2.10 | 0.83 | 1.21 | 55,652 | |
| Asset-Backed/Commercial Mortgage-Backed Securities | 25.2% |
| Corporate Bonds | 63.9 |
| Short-Term Reserves | 1.8 |
| Sovereign Bonds | 1.5 |
| Treasury/Agency | 6.6 |
| Commercial Paper | 1.0 |
| Coupon | Maturity Date | Face Amount ($000) | Market Value• ($000) | |||
| Asset-Backed/Commercial Mortgage-Backed Securities (25.3%) | ||||||
| 1 | Ally Auto Receivables Trust Class A2 Series 2022-2 | 4.620% | 10/15/25 | 9,577 | 9,562 | |
| 1 | Ally Auto Receivables Trust Class A2 Series 2022-3 | 5.290% | 6/16/25 | 5,201 | 5,198 | |
| 1 | Ally Auto Receivables Trust Class A3 Series 2023-1 | 5.460% | 5/15/28 | 12,590 | 12,730 | |
| 1,2 | Ally Auto Receivables Trust Class B Series 2023-A | 6.010% | 1/17/34 | 9,029 | 9,087 | |
| 1 | American Express Credit Account Master Trust Class A Series 2022-2 | 3.390% | 5/15/27 | 37,312 | 36,574 | |
| 1 | American Express Credit Account Master Trust Class A Series 2022-3 | 3.750% | 8/15/27 | 34,644 | 34,102 | |
| 1 | Americredit Automobile Receivables Trust Class A2 Series 2023-2 | 6.190% | 4/19/27 | 9,000 | 9,018 | |
| 1 | AmeriCredit Automobile Receivables Trust Class A2A Series 2022-2 | 4.200% | 12/18/25 | 7,662 | 7,643 | |
| 1 | AmeriCredit Automobile Receivables Trust Class A3 Series 2021-2 | 0.340% | 12/18/26 | 1,609 | 1,594 | |
| 1 | AmeriCredit Automobile Receivables Trust Class A3 Series 2023-1 | 5.620% | 11/18/27 | 11,150 | 11,289 | |
| 1 | Americredit Automobile Receivables Trust Class A3 Series 2023-2 | 5.810% | 5/18/28 | 36,000 | 36,577 | |
| 1 | AmeriCredit Automobile Receivables Trust Class C Series 2020-2 | 1.480% | 2/18/26 | 1,918 | 1,889 | |
| 1 | AmeriCredit Automobile Receivables Trust Class D Series 2020-2 | 2.130% | 3/18/26 | 6,060 | 5,898 | |
| 1,2 | ARI Fleet Lease Trust Class A2 Series 2021-A | 0.370% | 3/15/30 | 100 | 100 | |
| 1,2 | ARI Fleet Lease Trust Class A2 Series 2022-A | 3.120% | 1/15/31 | 1,264 | 1,251 | |
| 1,2 | ARI Fleet Lease Trust Class A2 Series 2023-A | 5.410% | 2/17/32 | 8,270 | 8,256 | |
| 1,2 | ARI Fleet Lease Trust Class A2 Series 2023-B | 6.050% | 7/15/32 | 12,260 | 12,372 | |
| 1,2 | ARI Fleet Lease Trust Class A3 Series 2022-A | 3.430% | 1/15/31 | 1,950 | 1,908 | |
| 1,2 | Avis Budget Rental Car Funding AESOP LLC Class A Series 2019-3A | 2.360% | 3/20/26 | 20,545 | 19,969 | |
| 1,2 | Avis Budget Rental Car Funding AESOP LLC Class A Series 2020-1A | 2.330% | 8/20/26 | 13,712 | 13,182 | |
| 1,2 | Avis Budget Rental Car Funding AESOP LLC Class A Series 2020-2A | 2.020% | 2/20/27 | 8,030 | 7,573 | |
| 1,2 | Avis Budget Rental Car Funding AESOP LLC Class C Series 2022-5A | 9.270% | 4/20/27 | 430 | 445 | |
| 1,2 | Avis Budget Rental Car Funding AESOP LLC Class C Series 2023-2A | 8.550% | 10/20/27 | 1,390 | 1,392 | |
| 1 | BA Credit Card Trust Class A1 Series 2022-A1 | 3.530% | 11/15/27 | 45,485 | 44,713 | |
| 1 | BA Credit Card Trust Class A2 Series 2022-A2 | 5.000% | 4/15/28 | 11,426 | 11,494 | |
| Coupon | Maturity Date | Face Amount ($000) | Market Value• ($000) | |||
| 1,2 | Bank of America Auto Trust Class A2 Series 2023-2A | 5.850% | 8/17/26 | 14,500 | 14,582 | |
| 1,2 | Bank of America Auto Trust Class A3 Series 2023-1A | 5.530% | 2/15/28 | 17,200 | 17,378 | |
| 1,2 | Bank of America Auto Trust Class A3 Series 2023-2A | 5.740% | 6/15/28 | 13,780 | 14,063 | |
| 1 | BMW Vehicle Lease Trust Class A3 Series 2023-1 | 5.160% | 11/25/25 | 7,750 | 7,741 | |
| 1 | BMW Vehicle Lease Trust Class A3 Series 2023-2 | 5.990% | 9/25/26 | 22,300 | 22,586 | |
| 1 | BMW Vehicle Owner Trust Class A3 Series 2023-A | 5.470% | 2/25/28 | 10,030 | 10,134 | |
| 1 | BMW Vehicle Owner Trust Class A4 Series 2020-A | 0.620% | 4/26/27 | 2,110 | 2,090 | |
| 1,2,3 | Brass No. 10 plc Class A1 Series 10A | 0.669% | 4/16/69 | 3,600 | 3,486 | |
| 1 | Capital One Multi-Asset Execution Trust Class A Series 2022-A3 | 4.950% | 10/15/27 | 5,150 | 5,155 | |
| 1 | Capital One Multi-Asset Execution Trust Class A3 Series 2021-A3 | 1.040% | 11/15/26 | 4,900 | 4,743 | |
| 1 | Capital One Prime Auto Receivables Trust Class A2 Series 2023-1 | 5.200% | 5/15/26 | 14,650 | 14,621 | |
| 1 | Capital One Prime Auto Receivables Trust Class A2A Series 2022-2 | 3.740% | 9/15/25 | 3,165 | 3,154 | |
| 1 | CarMax Auto Owner Trust Class A2A Series 2023-1 | 5.230% | 1/15/26 | 6,427 | 6,418 | |
| 1 | Carmax Auto Owner Trust Class A2A Series 2023-3 | 5.720% | 11/16/26 | 18,680 | 18,712 | |
| 1 | CarMax Auto Owner Trust Class A2A Series 2023-4 | 6.080% | 12/15/26 | 22,100 | 22,259 | |
| 1 | CarMax Auto Owner Trust Class A2A Series 2024-1 | 5.300% | 3/15/27 | 8,630 | 8,637 | |
| 1 | CarMax Auto Owner Trust Class A3 Series 2022-2 | 3.490% | 2/16/27 | 3,432 | 3,381 | |
| 1 | Carmax Auto Owner Trust Class A3 Series 2023-2 | 5.050% | 1/18/28 | 20,260 | 20,310 | |
| 1 | CarMax Auto Owner Trust Class A4 Series 2020-3 | 0.770% | 3/16/26 | 3,263 | 3,220 | |
| 1 | Carvana Auto Receivables Trust Class A3 Series 2022-P1 | 3.350% | 2/10/27 | 5,118 | 5,034 | |
| 1,2 | CCG Receivables Trust Class A2 Series 2023-2 | 6.280% | 4/14/32 | 4,870 | 4,952 | |
| 1,2 | Chase Auto Owner Trust Class A2 Series 2022-AA | 3.860% | 10/27/25 | 2,464 | 2,458 | |
| 1,2 | Chase Auto Owner Trust Class A2 Series 2023-AA | 5.900% | 3/25/27 | 19,624 | 19,682 | |
| 1,2 | Chesapeake Funding II LLC Class A1 Series 2020-1A | 0.870% | 8/15/32 | 1,153 | 1,147 | |
| 1,2 | Chesapeake Funding II LLC Class A1 Series 2023-1A | 5.650% | 5/15/35 | 8,378 | 8,389 | |
| 1,2 | Chesapeake Funding II LLC Class A1 Series 2023-2A | 6.160% | 10/15/35 | 12,587 | 12,707 | |
| 1 | Citibank Credit Card Issuance Trust Class A1 Series 2023-A1 | 5.230% | 12/8/27 | 15,250 | 15,387 | |
| 1,2 | Citizens Auto Receivables Trust Class A3 Series 2023-1 | 5.840% | 1/18/28 | 16,760 | 16,987 | |
| 1,2 | Citizens Auto Receivables Trust Class A3 Series 2023-2 | 5.830% | 2/15/28 | 18,500 | 18,780 | |
| 1,2 | Citizens Auto Receivables Trust Class A3 Series 2024-1 | 5.110% | 4/17/28 | 22,210 | 22,254 | |
| 1 | CNH Equipment Trust Class A2 Series 2022-B | 3.940% | 12/15/25 | 2,559 | 2,547 | |
| 1 | CNH Equipment Trust Class A2 Series 2022-C | 5.420% | 7/15/26 | 11,675 | 11,664 | |
| 1 | CNH Equipment Trust Class A2 Series 2023-A | 5.340% | 9/15/26 | 3,913 | 3,906 | |
| 1 | CNH Equipment Trust Class A2 Series 2023-B | 5.900% | 2/16/27 | 17,650 | 17,758 | |
| 1 | CNH Equipment Trust Class A2 Series 2024-A | 5.190% | 7/15/27 | 11,990 | 12,005 | |
| 1 | CNH Equipment Trust Class A3 Series 2022-A | 2.940% | 7/15/27 | 11,425 | 11,163 | |
| 1 | CNH Equipment Trust Class A4 Series 2020-A | 1.510% | 4/15/27 | 1,691 | 1,684 | |
| 1 | Daimler Trucks Retail Trust Class A2 Series 2022-1 | 5.070% | 9/16/24 | 1,213 | 1,212 | |
| Coupon | Maturity Date | Face Amount ($000) | Market Value• ($000) | |||
| 1,2 | Dell Equipment Finance Trust Class A2 Series 2022-2 | 4.030% | 7/22/27 | 3,968 | 3,958 | |
| 1,2 | Dell Equipment Finance Trust Class A2 Series 2023-3 | 6.100% | 4/23/29 | 8,300 | 8,336 | |
| 1,2 | Dell Equipment Finance Trust Class A3 Series 2023-1 | 5.650% | 9/22/28 | 25,160 | 25,319 | |
| 1,2 | Dell Equipment Finance Trust Class A3 Series 2023-2 | 5.650% | 1/22/29 | 4,710 | 4,759 | |
| 1,2 | Dell Equipment Finance Trust Class A3 Series 2023-3 | 5.930% | 4/23/29 | 26,169 | 26,600 | |
| 1 | Discover Card Execution Note Trust Class A Series 2022-A4 | 5.030% | 10/15/27 | 17,500 | 17,546 | |
| 1 | Discover Card Execution Note Trust Class A3 Series 2022-A3 | 3.560% | 7/15/27 | 41,150 | 40,387 | |
| 1,2 | DLLAA LLC Class A2 Series 2023-1A | 5.930% | 7/20/26 | 7,700 | 7,741 | |
| 1,2 | DLLAD LLC Class A2 Series 2023-1A | 5.190% | 4/20/26 | 6,272 | 6,251 | |
| 1,2 | DLLMT LLC Class A2 Series 2023-1A | 5.780% | 11/20/25 | 15,820 | 15,820 | |
| 1,2 | DLLST LLC Class A2 Series 2024-1A | 5.330% | 1/20/26 | 9,310 | 9,322 | |
| 1,2 | DLLST LLC Class A3 Series 2022-1A | 3.400% | 1/21/25 | 5,603 | 5,571 | |
| 1,2 | DLLST LLC Class A3 Series 2024-1A | 5.050% | 8/20/27 | 8,190 | 8,183 | |
| 1,2 | DLLST LLC Class A4 Series 2022-1A | 3.690% | 9/20/28 | 2,810 | 2,769 | |
| 1,2 | Donlen Fleet Lease Funding 2 LLC Class A2 Series 2021-2 | 0.560% | 12/11/34 | 1,366 | 1,351 | |
| 1 | Drive Auto Receivables Trust Class D Series 2020-1 | 2.700% | 5/17/27 | 961 | 954 | |
| 1,2 | DT Auto Owner Trust Class A Series 2022-2A | 2.880% | 6/15/26 | 479 | 478 | |
| 1,2 | Ent Auto Receivables Trust Class A2 Series 2023-1A | 6.220% | 8/16/27 | 5,770 | 5,790 | |
| 1,2 | Enterprise Fleet Financing LLC Class A2 Series 2021-1 | 0.440% | 12/21/26 | 622 | 616 | |
| 1,2 | Enterprise Fleet Financing LLC Class A2 Series 2021-2 | 0.480% | 5/20/27 | 4,596 | 4,509 | |
| 1,2 | Enterprise Fleet Financing LLC Class A2 Series 2021-3 | 0.770% | 8/20/27 | 4,209 | 4,121 | |
| 1,2 | Enterprise Fleet Financing LLC Class A2 Series 2023-1 | 5.510% | 1/22/29 | 9,235 | 9,257 | |
| 1,2 | Enterprise Fleet Financing LLC Class A2 Series 2023-2 | 5.560% | 4/22/30 | 11,720 | 11,740 | |
| 1,2 | Enterprise Fleet Financing LLC Class A2 Series 2023-3 | 6.400% | 3/20/30 | 13,600 | 13,875 | |
| 1,2 | Enterprise Fleet Financing LLC Class A2 Series 2024-1 | 5.230% | 3/20/30 | 6,910 | 6,929 | |
| 1,2,3,4 | Fannie Mae Connecticut Avenue Securities Class 2M1 Series 2021-R02, SOFR30A + 0.900% | 6.237% | 11/25/41 | 9,592 | 9,596 | |
| 1,2,3,4 | Fannie Mae Connecticut Avenue Securities Trust Class 1M1 Series 2021-R01, SOFR30A + 0.750% | 6.087% | 10/25/41 | 1,373 | 1,373 | |
| 1,2,3,4 | Fannie Mae Connecticut Avenue Securities Trust Class 1M1 Series 2023-R06, SOFR30A + 1.700% | 7.037% | 7/25/43 | 3,536 | 3,573 | |
| 1,2,3,4 | Fannie Mae Connecticut Avenue Securities Trust Class 1M1 Series 2023-R08, SOFR30A + 1.500% | 6.845% | 10/25/43 | 7,429 | 7,462 | |
| 1,2,3,4 | Fannie Mae Connecticut Avenue Securities Trust Class 1M1 Series 2024-R01, SOFR30A + 1.050% | 6.395% | 1/25/44 | 16,840 | 16,857 | |
| Coupon | Maturity Date | Face Amount ($000) | Market Value• ($000) | |||
| 1,2,3,4 | Fannie Mae Connecticut Avenue Securities Trust Class 2M1 Series 2023-R07, SOFR30A + 1.950% | 7.287% | 9/25/43 | 9,543 | 9,646 | |
| 1 | Fifth Third Auto Trust Class A3 Series 2023-1 | 5.530% | 8/15/28 | 39,870 | 40,234 | |
| 1,2 | Flagship Credit Auto Trust Class A Series 2021-3 | 0.360% | 7/15/27 | 3,705 | 3,664 | |
| 1,2 | Flagship Credit Auto Trust Class A Series 2021-4 | 0.810% | 7/17/26 | 3,020 | 2,973 | |
| 1 | Ford Credit Auto Lease Trust Class A2A Series 2023-B | 5.900% | 2/15/26 | 5,800 | 5,817 | |
| 1 | Ford Credit Auto Lease Trust Class A3 Series 2023-B | 5.910% | 10/15/26 | 40,370 | 40,779 | |
| 1 | Ford Credit Auto Lease Trust Class A3 Series 2024-A | 5.060% | 5/15/27 | 19,390 | 19,412 | |
| 1 | Ford Credit Auto Lease Trust Class A4 Series 2022-A | 3.370% | 7/15/25 | 2,630 | 2,609 | |
| 1 | Ford Credit Auto Lease Trust Class A4 Series 2023-B | 5.870% | 1/15/27 | 8,270 | 8,351 | |
| 1 | Ford Credit Auto Lease Trust Class A4 Series 2024-A | 5.050% | 6/15/27 | 1,710 | 1,717 | |
| 1 | Ford Credit Auto Lease Trust Class B Series 2023-B | 6.200% | 2/15/27 | 10,010 | 10,125 | |
| 1 | Ford Credit Auto Lease Trust Class B Series 2024-A | 5.290% | 6/15/27 | 8,430 | 8,444 | |
| 1 | Ford Credit Auto Lease Trust Class C Series 2022-A | 4.180% | 10/15/25 | 8,350 | 8,221 | |
| 1,2 | Ford Credit Auto Owner Trust Class A Series 2018-1 | 3.190% | 7/15/31 | 8,568 | 8,419 | |
| 1,2 | Ford Credit Auto Owner Trust Class A Series 2020-1 | 2.040% | 8/15/31 | 31,214 | 30,230 | |
| 1,2 | Ford Credit Auto Owner Trust Class A Series 2020-2 | 1.060% | 4/15/33 | 46,724 | 43,789 | |
| 1 | Ford Credit Auto Owner Trust Class A2A Series 2022-B | 3.440% | 2/15/25 | 601 | 601 | |
| 1 | Ford Credit Auto Owner Trust Class A2A Series 2022-C | 4.520% | 4/15/25 | 2,987 | 2,982 | |
| 1 | Ford Credit Auto Owner Trust Class A2A Series 2022-D | 5.370% | 8/15/25 | 5,256 | 5,252 | |
| 1 | Ford Credit Auto Owner Trust Class A3 Series 2023-A | 4.650% | 2/15/28 | 9,420 | 9,381 | |
| 1 | Ford Credit Auto Owner Trust Class A3 Series 2023-B | 5.230% | 5/15/28 | 13,290 | 13,412 | |
| 1 | Ford Credit Floorplan Master Owner Trust Class A Series 2019-4 | 2.440% | 9/15/26 | 7,980 | 7,836 | |
| 1 | Ford Credit Floorplan Master Owner Trust Class A Series 2020-2 | 1.060% | 9/15/27 | 45,424 | 42,584 | |
| 1,2,3,4 | Freddie Mac STACR REMICS Trust Class M1 Series 2021-DNA6, SOFR30A + 0.800% | 6.137% | 10/25/41 | 9,486 | 9,492 | |
| 1,2,3,4 | Freddie Mac STACR REMICS Trust Class M1 Series 2023-HQA3, SOFR30A + 1.850% | 7.195% | 11/25/43 | 5,752 | 5,807 | |
| 1 | GM Financial Automobile Leasing Trust Class A3 Series 2023-1 | 5.160% | 4/20/26 | 12,500 | 12,495 | |
| 1 | GM Financial Automobile Leasing Trust Class A3 Series 2023-2 | 5.050% | 7/20/26 | 9,320 | 9,326 | |
| 1 | GM Financial Automobile Leasing Trust Class A3 Series 2023-3 | 5.380% | 11/20/26 | 8,750 | 8,805 | |
| 1 | GM Financial Automobile Leasing Trust Class A4 Series 2022-2 | 3.540% | 5/20/26 | 7,470 | 7,389 | |
| 1 | GM Financial Automobile Leasing Trust Class A4 Series 2023-2 | 5.090% | 5/20/27 | 2,600 | 2,593 | |
| Coupon | Maturity Date | Face Amount ($000) | Market Value• ($000) | |||
| 1 | GM Financial Automobile Leasing Trust Class A4 Series 2023-3 | 5.440% | 8/20/27 | 6,000 | 6,050 | |
| 1 | GM Financial Automobile Leasing Trust Class B Series 2022-2 | 4.020% | 5/20/26 | 5,250 | 5,180 | |
| 1 | GM Financial Automobile Leasing Trust Class B Series 2023-3 | 5.880% | 8/20/27 | 6,290 | 6,340 | |
| 1 | GM Financial Consumer Automobile Receivables Trust Class A2A Series 2022-4 | 4.600% | 11/17/25 | 4,282 | 4,271 | |
| 1 | GM Financial Consumer Automobile Receivables Trust Class A2A Series 2023-1 | 5.190% | 3/16/26 | 8,123 | 8,110 | |
| 1 | GM Financial Consumer Automobile Receivables Trust Class A3 Series 2023-3 | 5.450% | 6/16/28 | 4,770 | 4,835 | |
| 1 | GM Financial Consumer Automobile Receivables Trust Class A3 Series 2024-1 | 4.850% | 12/18/28 | 8,760 | 8,781 | |
| 1 | GM Financial Consumer Automobile Receivables Trust Class B Series 2020-3 | 0.810% | 1/16/26 | 2,100 | 2,017 | |
| 1 | GM Financial Consumer Automobile Receivables Trust Class C Series 2020-3 | 1.370% | 1/16/26 | 900 | 868 | |
| 1,2 | GreatAmerica Leasing Receivables Clas A2, Series 2024-1 | 5.320% | 8/17/26 | 16,814 | 16,838 | |
| 1 | Harley-Davidson Motorcycle Trust Class A2 Series 2023-B | 5.920% | 12/15/26 | 21,310 | 21,393 | |
| 1 | Harley-Davidson Motorcycle Trust Class A2A Series 2023-A | 5.320% | 6/15/26 | 5,948 | 5,939 | |
| 1 | Harley-Davidson Motorcycle Trust Class A3 Series 2021-A | 0.370% | 4/15/26 | 1,668 | 1,647 | |
| 1 | Harley-Davidson Motorcycle Trust Class A3 Series 2022-A | 3.060% | 2/15/27 | 4,600 | 4,523 | |
| 1,2 | Hertz Vehicle Financing III LLC Class A Series 2022-3A | 3.370% | 3/25/25 | 4,927 | 4,914 | |
| 1,2 | Hertz Vehicle Financing III LLC Class C Series 2022-3A | 4.350% | 3/25/25 | 920 | 919 | |
| 1,2 | Hertz Vehicle Financing LLC Class A Series 2022-4A | 3.730% | 9/25/26 | 15,870 | 15,483 | |
| 1 | Honda Auto Receivables Owner Trust Class A2 Series 2022-2 | 3.810% | 3/18/25 | 2,407 | 2,402 | |
| 1 | Honda Auto Receivables Owner Trust Class A2 Series 2023-4 | 5.870% | 6/22/26 | 20,940 | 21,085 | |
| 1 | Honda Auto Receivables Owner Trust Class A3 Series 2023-1 | 5.040% | 4/21/27 | 12,250 | 12,270 | |
| 1 | Honda Auto Receivables Owner Trust Class A3 Series 2023-2 | 4.930% | 11/15/27 | 9,880 | 9,880 | |
| 1 | Honda Auto Receivables Owner Trust Class A3 Series 2023-3 | 5.410% | 2/18/28 | 17,110 | 17,308 | |
| 1 | Honda Auto Receivables Owner Trust Class A3 Series 2023-4 | 5.670% | 6/21/28 | 9,030 | 9,216 | |
| 1 | Honda Auto Receivables Owner Trust Class A4 Series 2020-3 | 0.460% | 4/19/27 | 10,210 | 10,186 | |
| 1,2 | HPEFS Equipment Trust Class A2 Series 2023-2A | 6.040% | 1/21/31 | 12,900 | 12,996 | |
| 1,2 | HPEFS Equipment Trust Class A3 Series 2023-2A | 5.990% | 1/21/31 | 4,180 | 4,239 | |
| 1,2 | HPEFS Equipment Trust Class A3 Series 2024-1 | 5.180% | 5/20/31 | 19,310 | 19,343 | |
| 1,2 | HPEFS Equipment Trust Class B Series 2024-1 | 5.180% | 5/20/31 | 3,955 | 3,964 | |
| 1,2 | HPEFS Equipment Trust Class C Series 2024-1 | 5.330% | 5/20/31 | 5,560 | 5,573 | |
| 1,2 | Hyundai Auto Lease Securitization Trust Class A3 Series 2023-B | 5.150% | 6/15/26 | 14,720 | 14,731 | |
| 1,2 | Hyundai Auto Lease Securitization Trust Class A3 Series 2023-C | 5.800% | 12/15/26 | 10,000 | 10,137 | |
| Coupon | Maturity Date | Face Amount ($000) | Market Value• ($000) | |||
| 1,2 | Hyundai Auto Lease Securitization Trust Class A3 Series 2024-A | 5.020% | 3/15/27 | 11,360 | 11,380 | |
| 1,2 | Hyundai Auto Lease Securitization Trust Class A4 Series 2022-B | 3.500% | 4/15/26 | 22,270 | 22,003 | |
| 1,2 | Hyundai Auto Lease Securitization Trust Class A4 Series 2022-C | 4.480% | 8/17/26 | 16,042 | 15,924 | |
| 1,2 | Hyundai Auto Lease Securitization Trust Class A4 Series 2023-B | 5.170% | 4/15/27 | 10,460 | 10,398 | |
| 1 | Hyundai Auto Receivables Trust Class A2A Series 2020-C | 5.350% | 11/17/25 | 12,921 | 12,907 | |
| 1 | Hyundai Auto Receivables Trust Class A2A Series 2022-B | 3.640% | 5/15/25 | 2,267 | 2,262 | |
| 1 | Hyundai Auto Receivables Trust Class A2A Series 2023-C | 5.800% | 1/15/27 | 15,420 | 15,484 | |
| 1 | Hyundai Auto Receivables Trust Class A3 Series 2023-A | 4.580% | 4/15/27 | 4,900 | 4,876 | |
| 1 | Hyundai Auto Receivables Trust Class A3 Series 2023-B | 5.480% | 4/17/28 | 9,040 | 9,142 | |
| 1 | Hyundai Auto Receivables Trust Class A4 Series 2020-A | 1.720% | 6/15/26 | 4,636 | 4,608 | |
| 1 | Hyundai Auto Receivables Trust Class A4 Series 2020-B | 0.620% | 12/15/25 | 2,676 | 2,661 | |
| 1 | John Deere Owner Trust Class A2 Series 2022-B | 3.730% | 6/16/25 | 3,119 | 3,111 | |
| 1 | John Deere Owner Trust Class A2 Series 2023-A | 5.280% | 3/16/26 | 15,550 | 15,522 | |
| 1 | John Deere Owner Trust Class A2 Series 2023-B | 5.590% | 6/15/26 | 7,460 | 7,463 | |
| 1 | John Deere Owner Trust Class A3 Series 2023-A | 5.010% | 11/15/27 | 12,750 | 12,775 | |
| 1 | John Deere Owner Trust Class A4 Series 2020-B | 0.720% | 6/15/27 | 2,886 | 2,881 | |
| 1,2 | JPMorgan Chase Bank NA - CACLN Class B Series 2021-1 | 0.875% | 9/25/28 | 2,382 | 2,336 | |
| 1,2 | JPMorgan Chase Bank NA - CACLN Class B Series 2021-2 | 0.889% | 12/26/28 | 1,805 | 1,766 | |
| 1,2 | JPMorgan Chase Bank NA - CACLN Class B Series 2021-3 | 0.760% | 2/26/29 | 4,922 | 4,765 | |
| 1,2 | JPMorgan Chase Bank NA - CACLN Class C Series 2021-1 | 1.024% | 9/25/28 | 1,477 | 1,456 | |
| 1,2 | Kubota Credit Owner Trust Class A2 Series 2022-2A | 4.070% | 6/17/25 | 6,025 | 6,001 | |
| 1,2 | Kubota Credit Owner Trust Class A2 Series 2023-1A | 5.400% | 2/17/26 | 7,611 | 7,606 | |
| 1,2 | Kubota Credit Owner Trust Class A2 Series 2023-2A | 5.610% | 7/15/26 | 13,190 | 13,205 | |
| 1,2 | Kubota Credit Owner Trust Class A3 Series 2022-2A | 4.090% | 12/15/26 | 8,540 | 8,422 | |
| 1,2 | Kubota Credit Owner Trust Class A4 Series 2020-2A | 0.730% | 6/15/26 | 3,802 | 3,782 | |
| 1,2 | Master Credit Card Trust II Class A Series 2022-1A | 1.660% | 7/21/26 | 8,150 | 7,877 | |
| 1,2,3 | Master Credit Card Trust II Class A Series 2024-1A | 6.095% | 1/21/28 | 35,050 | 35,050 | |
| 1 | Mercedes-Benz Auto Lease Trust Class A3 Series 2023-A | 4.740% | 1/15/27 | 32,340 | 32,212 | |
| 1 | Mercedes-Benz Auto Receivables Trust Class A2 Series 2023-1 | 5.090% | 1/15/26 | 7,062 | 7,049 | |
| 1,2 | MMAF Equipment Finance LLC Class A2 Series 2024-A | 5.200% | 9/13/27 | 20,830 | 20,856 | |
| 1,2 | Navistar Financial Dealer Note Master Owner Trust II Class A Series 2023-1 | 6.180% | 8/25/28 | 5,200 | 5,237 | |
| 1 | Nissan Auto Lease Trust Class A3 Series 2023-B | 5.690% | 7/15/26 | 5,540 | 5,570 | |
| 1 | Nissan Auto Lease Trust Class A3 Series 2024-A | 4.910% | 4/15/27 | 26,040 | 26,060 | |
| 1 | Nissan Auto Lease Trust Class A4 Series 2024-A | 4.970% | 9/15/28 | 3,090 | 3,093 | |
| Coupon | Maturity Date | Face Amount ($000) | Market Value• ($000) | |||
| 1 | Nissan Auto Receivables Owner Trust Class A3 Series 2023-A | 4.910% | 11/15/27 | 27,790 | 27,757 | |
| 1 | Nissan Auto Receivables Owner Trust Class A3 Series 2023-B | 5.930% | 3/15/28 | 16,650 | 17,029 | |
| 1 | Nissan Auto Receivables Owner Trust Class A4 Series 2020-A | 1.700% | 5/17/27 | 5,048 | 4,990 | |
| 1 | Nissan Auto Receivables Owner Trust Class A4 Series 2020-B | 0.710% | 2/16/27 | 2,080 | 2,067 | |
| 1,2,3 | Pepper Residential Securities Trust No. 24 Class A1U Series 24A, SOFR + 1.014% | 6.380% | 11/18/60 | 63 | 63 | |
| 1,2 | PFS Financing Corp. Class A Series 2022-C | 3.890% | 5/15/27 | 5,015 | 4,930 | |
| 1,2 | PFS Financing Corp. Class A Series 2022-D | 4.270% | 8/15/27 | 19,468 | 19,183 | |
| 1,2,3 | PFS Financing Corp. Class A Series 2024-A, SOFR30A + 0.850% | 6.380% | 1/15/28 | 25,980 | 25,980 | |
| 1,2 | Porsche Financial Auto Securitization Trust Class A2A Series 2023-2A | 5.880% | 11/23/26 | 14,540 | 14,603 | |
| 1,2 | Porsche Financial Auto Securitization Trust Class A3 Series 2023-1A | 4.810% | 9/22/28 | 11,900 | 11,880 | |
| 1,2 | Porsche Financial Auto Securitization Trust Class A3 Series 2023-2A | 5.790% | 1/22/29 | 10,540 | 10,744 | |
| 1,2 | Progress Residential Trust Class A Series 2020-SFR1 | 1.732% | 4/17/37 | 11,485 | 11,000 | |
| 1,2,3 | RESIMAC Bastille Trust Class A1B Series 2021-2NCA, SOFR + 0.740% | 6.148% | 2/3/53 | 5,652 | 5,602 | |
| 1,2 | RESIMAC Premier Class A1B Series 2020-1 | 1.274% | 2/7/52 | 576 | 569 | |
| 1,2 | Santander Bank Auto Credit-Linked Notes Class B Series 2023-B | 5.640% | 12/15/33 | 980 | 984 | |
| 1,2 | Santander Bank Auto Credit-Linked Notes Class C Series 2023-B | 5.933% | 12/15/33 | 2,100 | 2,108 | |
| 1,2 | Santander Bank Auto Credit-Linked Notes Class D Series 2023-B | 6.663% | 12/15/33 | 2,290 | 2,300 | |
| 1,2 | Santander Bank NA - SBCLN Class B Series 2021-1A | 1.833% | 12/15/31 | 3,214 | 3,139 | |
| 1,2 | Santander Drive Auto Receivables Trust Class A2 Series 2024-1A | 5.350% | 6/21/27 | 14,550 | 14,563 | |
| 1 | Santander Drive Auto Receivables Trust Class A3 Series 2022-2 | 2.980% | 10/15/26 | 1,972 | 1,964 | |
| 1 | Santander Drive Auto Receivables Trust Class A3 Series 2022-3 | 3.400% | 12/15/26 | 397 | 394 | |
| 1 | Santander Drive Auto Receivables Trust Class A3 Series 2022-4 | 4.140% | 2/16/27 | 12,383 | 12,313 | |
| 1 | Santander Drive Auto Receivables Trust Class A3 Series 2022-5 | 4.110% | 8/17/26 | 4,767 | 4,747 | |
| 1 | Santander Drive Auto Receivables Trust Class A3 Series 2022-6 | 4.490% | 11/16/26 | 953 | 949 | |
| 1 | Santander Drive Auto Receivables Trust Class A3 Series 2023-1 | 4.880% | 4/15/27 | 15,610 | 15,541 | |
| 1 | Santander Drive Auto Receivables Trust Class A3 Series 2023-2 | 5.210% | 7/15/27 | 12,910 | 12,884 | |
| 1 | Santander Drive Auto Receivables Trust Class A3 Series 2023-3 | 5.610% | 10/15/27 | 8,270 | 8,321 | |
| 1 | Santander Drive Auto Receivables Trust Class A3 Series 2023-4 | 5.730% | 4/17/28 | 5,760 | 5,828 | |
| 1 | Santander Drive Auto Receivables Trust Class A3 Series 2023-6 | 5.930% | 7/17/28 | 2,180 | 2,203 | |
| 1 | Santander Drive Auto Receivables Trust Class A3 Series 2024 -1 | 5.250% | 4/17/28 | 19,000 | 19,011 | |
| Coupon | Maturity Date | Face Amount ($000) | Market Value• ($000) | |||
| 1,2 | Santander Drive Auto Receivables Trust Class A3 Series 2024-1A | 4.950% | 5/21/29 | 16,410 | 16,437 | |
| 1 | Santander Drive Auto Receivables Trust Class B Series 2022-2 | 3.440% | 9/15/27 | 10,000 | 9,838 | |
| 1 | Santander Drive Auto Receivables Trust Class B Series 2024 -1 | 5.230% | 12/15/28 | 5,950 | 5,968 | |
| 1,2 | Santander Retail Auto Lease Trust Class A4 Series 2022-B | 3.330% | 10/20/26 | 16,150 | 15,852 | |
| 1,2 | Santander Retail Auto Lease Trust Class B Series 2022-B | 3.850% | 3/22/27 | 12,140 | 11,922 | |
| 1,2 | SBNA Auto Lease Trust Class A3 Series 2023-A | 6.510% | 4/20/27 | 17,670 | 18,020 | |
| 1,2 | SBNA Auto Lease Trust Class A3 Series 2024-A | 5.390% | 11/20/26 | 20,790 | 20,848 | |
| 1,2 | SBNA Auto Lease Trust Class A4 Series 2024-A | 5.240% | 1/22/29 | 8,650 | 8,691 | |
| 1,2 | SCCU Auto Receivables Trust Class A2 Series 2023-1A | 5.850% | 5/17/27 | 6,620 | 6,653 | |
| 1,2 | SCCU Auto Receivables Trust Class A3 Series 2023-1A | 5.700% | 10/16/28 | 9,560 | 9,728 | |
| 1,2 | SFS Auto Receivables Securitization Trust Class A2A Series 2023-1A | 5.890% | 3/22/27 | 8,302 | 8,322 | |
| 1 | Synchrony Card Funding LLC Class A Series 2022-A1 | 3.370% | 4/15/28 | 38,115 | 37,333 | |
| 1 | Synchrony Card Funding LLC Class A Series 2022-A2 | 3.860% | 7/15/28 | 31,708 | 31,180 | |
| 1,2 | Tesla Auto Lease Trust Class A3 Series 2023-A | 5.890% | 6/22/26 | 18,980 | 19,146 | |
| 1,2 | Tesla Auto Lease Trust Class A3 Series 2023-B | 6.130% | 9/21/26 | 34,390 | 34,924 | |
| 1,2 | Tesla Auto Lease Trust Class A4 Series 2023-A | 5.940% | 7/20/27 | 4,750 | 4,763 | |
| 1,2 | Tesla Auto Lease Trust Class A4 Series 2023-B | 6.220% | 3/22/27 | 4,340 | 4,397 | |
| 1,2 | Tesla Electric Vehicle Trust Class A3 Series 2023-1 | 5.380% | 6/20/28 | 11,030 | 11,150 | |
| 1,2 | Toyota Auto Loan Extended Note Trust Class A Series 2020-1A | 1.350% | 5/25/33 | 36,173 | 34,494 | |
| 1 | Toyota Auto Receivables Owner Trust Class A2 Series 2023-A | 5.050% | 1/15/26 | 7,569 | 7,552 | |
| 1 | Toyota Auto Receivables Owner Trust Class A2A Series 2022-C | 3.830% | 8/15/25 | 4,773 | 4,755 | |
| 1 | Toyota Auto Receivables Owner Trust Class A2A Series 2022-D | 5.270% | 1/15/26 | 9,196 | 9,189 | |
| 1 | Toyota Auto Receivables Owner Trust Class A3 Series 2023-B | 4.710% | 2/15/28 | 11,900 | 11,895 | |
| 1 | Toyota Auto Receivables Owner Trust Class A3 Series 2023-C | 5.160% | 4/17/28 | 7,390 | 7,428 | |
| 1 | Toyota Auto Receivables Owner Trust Class A3 Series 2024-A | 4.830% | 10/16/28 | 20,780 | 20,826 | |
| 1 | Toyota Auto Receivables Owner Trust Class A4 Series 2020-B | 1.660% | 9/15/25 | 1,983 | 1,975 | |
| 1 | Toyota Auto Receivables Owner Trust Class A4 Series 2020-C | 0.570% | 10/15/25 | 4,728 | 4,668 | |
| 1,2 | Toyota Lease Owner Trust Class A2A Series 2023-B | 5.730% | 4/20/26 | 9,120 | 9,155 | |
| 1,2 | Toyota Lease Owner Trust Class A3 Series 2023-A | 4.930% | 4/20/26 | 40,920 | 40,863 | |
| 1,2 | Toyota Lease Owner Trust Class A3 Series 2023-B | 5.660% | 11/20/26 | 35,870 | 36,435 | |
| 1,2,3 | Trillium Credit Card Trust II Class A Series 2024-1A | 6.073% | 12/27/28 | 25,990 | 26,029 | |
| 1,2 | US Bank NA Class B Series 2023-1 | 6.789% | 8/25/32 | 3,321 | 3,342 | |
| 1,2 | USAA Auto Owner Trust Class A2 Series 2022-A | 4.600% | 2/18/25 | 1,335 | 1,335 | |
| 1,2 | USAA Auto Owner Trust Class A3 Series 2023-A | 5.580% | 5/15/28 | 24,640 | 24,970 | |
| 1 | Verizon Master Trust Class A Series 2021-2 | 0.990% | 4/20/28 | 29,130 | 28,254 | |
| 1 | Verizon Master Trust Class A Series 2022-6 | 3.670% | 1/22/29 | 16,180 | 15,833 | |
| 1 | Verizon Master Trust Class A Series 2023-2 | 4.890% | 4/13/28 | 19,120 | 19,055 | |
| 1 | Verizon Master Trust Class A1A Series 2023-5 | 5.610% | 9/8/28 | 22,000 | 22,094 | |
| Coupon | Maturity Date | Face Amount ($000) | Market Value• ($000) | |||
| 1 | Verizon Master Trust Class A1A Series 2024-1 | 5.000% | 12/20/28 | 31,920 | 32,025 | |
| 1 | Verizon Master Trust Class C Series 2021-2 | 1.380% | 4/20/28 | 6,710 | 6,498 | |
| 1 | Verizon Master Trust Class C Series 2024-1 | 5.490% | 12/20/28 | 11,380 | 11,407 | |
| 1 | Volkswagen Auto Lease Trust Class A3 Series 2023-A | 5.810% | 10/20/26 | 36,800 | 37,287 | |
| 1 | Volkswagen Auto Loan Enhanced Trust Class A2A Series 2023-1 | 5.500% | 12/21/26 | 17,871 | 17,888 | |
| 1,2 | Volvo Financial Equipment LLC Class A4 Series 2020-1A | 0.600% | 3/15/28 | 3,484 | 3,431 | |
| 1,2 | Westlake Automobile Receivables Trust Class A3 Series 2022-1A | 2.420% | 7/15/25 | 6,388 | 6,375 | |
| 1,2 | Wheels Fleet Lease Funding 1 LLC Class A Series 2022-1A | 2.470% | 10/18/36 | 1,834 | 1,805 | |
| 1,2 | Wheels SPV 2 LLC Class A3 Series 2020-1A | 0.620% | 8/20/29 | 1,360 | 1,352 | |
| 1 | World Omni Auto Receivables Trust Class A2 Series 2022-C | 3.730% | 3/16/26 | 3,194 | 3,176 | |
| 1 | World Omni Auto Receivables Trust Class A2A Series 2022-D | 5.510% | 3/16/26 | 14,858 | 14,850 | |
| 1 | World Omni Auto Receivables Trust Class A2A Series 2023-A | 5.180% | 7/15/26 | 7,530 | 7,516 | |
| 1 | World Omni Auto Receivables Trust Class A2A Series 2023-C | 5.570% | 12/15/26 | 16,500 | 16,524 | |
| 1 | World Omni Auto Receivables Trust Class A2A Series 2023-D | 5.910% | 2/16/27 | 16,820 | 16,938 | |
| 1 | World Omni Auto Receivables Trust Class A3 Series 2023-B | 4.660% | 5/15/28 | 9,200 | 9,167 | |
| 1 | World Omni Automobile Lease Securitization Trust Class A3 Series 2023-A | 5.070% | 9/15/26 | 28,384 | 28,386 | |
| 1 | World Omni Automobile Lease Securitization Trust Class A4 Series 2022-A | 3.340% | 6/15/27 | 1,200 | 1,188 | |
| 1 | World Omni Automobile Lease Securitization Trust Class A4 Series 2023-A | 5.040% | 7/17/28 | 10,150 | 10,153 | |
| 1 | World Omni Automobile Lease Securitization Trust Class B Series 2022-A | 3.670% | 6/15/27 | 3,890 | 3,833 | |
| Total Asset-Backed/Commercial Mortgage-Backed Securities (Cost $3,061,360) | 3,075,572 | |||||
| Corporate Bonds (64.2%) | ||||||
| Communications (4.2%) | ||||||
| Charter Communications Operating LLC / Charter Communications Operating Capital | 4.908% | 7/23/25 | 81,492 | 80,769 | ||
| Comcast Corp. | 3.375% | 8/15/25 | 42,500 | 41,667 | ||
| Discovery Communications LLC | 4.900% | 3/11/26 | 13,503 | 13,455 | ||
| Netflix Inc. | 5.875% | 2/15/25 | 5,000 | 5,036 | ||
| 2 | Netflix Inc. | 3.625% | 6/15/25 | 36,903 | 36,228 | |
| 2 | NTT Finance Corp. | 0.583% | 3/1/24 | 83,588 | 83,240 | |
| Omnicom Group Inc. / Omnicom Capital Inc. | 3.650% | 11/1/24 | 7,200 | 7,099 | ||
| Rogers Communications Inc. | 2.950% | 3/15/25 | 18,700 | 18,235 | ||
| Rogers Communications Inc. | 3.625% | 12/15/25 | 8,656 | 8,433 | ||
| Sprint LLC | 7.625% | 2/15/25 | 37,265 | 37,879 | ||
| Sprint LLC | 7.625% | 3/1/26 | 8,274 | 8,637 | ||
| Take-Two Interactive Software Inc. | 3.300% | 3/28/24 | 1,632 | 1,626 | ||
| Take-Two Interactive Software Inc. | 3.550% | 4/14/25 | 19,050 | 18,686 | ||
| Take-Two Interactive Software Inc. | 5.000% | 3/28/26 | 4,883 | 4,902 | ||
| T-Mobile USA Inc. | 3.500% | 4/15/25 | 13,691 | 13,421 | ||
| T-Mobile USA Inc. | 1.500% | 2/15/26 | 12,796 | 11,977 | ||
| T-Mobile USA Inc. | 2.250% | 2/15/26 | 7,405 | 7,027 | ||
| Verizon Communications Inc. | 0.750% | 3/22/24 | 3,521 | 3,497 | ||
| Coupon | Maturity Date | Face Amount ($000) | Market Value• ($000) | |||
| Verizon Communications Inc. | 0.850% | 11/20/25 | 41,764 | 38,922 | ||
| Walt Disney Co. | 3.700% | 9/15/24 | 8,130 | 8,050 | ||
| Warnermedia Holdings Inc. | 3.638% | 3/15/25 | 26,509 | 25,994 | ||
| Warnermedia Holdings Inc. | 3.788% | 3/15/25 | 43,977 | 43,163 | ||
| 517,943 | ||||||
| Consumer Discretionary (6.0%) | ||||||
| American Honda Finance Corp. | 2.900% | 2/16/24 | 2,697 | 2,694 | ||
| American Honda Finance Corp. | 4.600% | 4/17/25 | 100,000 | 99,718 | ||
| American Honda Finance Corp. | 5.000% | 5/23/25 | 32,985 | 33,079 | ||
| American Honda Finance Corp. | 4.950% | 1/9/26 | 15,540 | 15,614 | ||
| AutoZone Inc. | 3.250% | 4/15/25 | 14,889 | 14,570 | ||
| 2 | BMW Finance NV | 2.400% | 8/14/24 | 7,480 | 7,363 | |
| 2 | BMW US Capital LLC | 3.900% | 4/9/25 | 29,360 | 29,052 | |
| Ford Motor Credit Co. LLC | 5.125% | 6/16/25 | 36,002 | 35,684 | ||
| Ford Motor Credit Co. LLC | 4.134% | 8/4/25 | 13,570 | 13,257 | ||
| Ford Motor Credit Co. LLC | 3.375% | 11/13/25 | 16,250 | 15,597 | ||
| General Motors Co. | 6.125% | 10/1/25 | 14,090 | 14,298 | ||
| General Motors Financial Co. Inc. | 2.900% | 2/26/25 | 23,041 | 22,466 | ||
| General Motors Financial Co. Inc. | 3.800% | 4/7/25 | 35,920 | 35,320 | ||
| Marriott International Inc. | 3.750% | 10/1/25 | 3,634 | 3,557 | ||
| 2 | Mercedes-Benz Finance North America LLC | 3.650% | 2/22/24 | 23,810 | 23,780 | |
| 2 | Mercedes-Benz Finance North America LLC | 5.375% | 8/1/25 | 46,665 | 47,111 | |
| 2 | Mercedes-Benz Finance North America LLC | 4.900% | 1/9/26 | 74,000 | 74,196 | |
| Tapestry Inc. | 7.050% | 11/27/25 | 39,806 | 40,728 | ||
| Toyota Motor Credit Corp. | 2.500% | 3/22/24 | 46,595 | 46,404 | ||
| Toyota Motor Credit Corp. | 4.400% | 9/20/24 | 30,228 | 30,061 | ||
| Toyota Motor Credit Corp. | 4.800% | 1/5/26 | 42,160 | 42,343 | ||
| 5 | Volkswagen Financial Services Australia Pty Ltd. | 2.400% | 8/28/24 | 12,100 | 7,821 | |
| 2 | Volkswagen Group of America Finance LLC | 3.350% | 5/13/25 | 46,766 | 45,662 | |
| 2 | Volkswagen Group of America Finance LLC | 5.800% | 9/12/25 | 16,602 | 16,763 | |
| 2 | Volkswagen Group of America Finance LLC | 1.250% | 11/24/25 | 12,004 | 11,198 | |
| 728,336 | ||||||
| Consumer Staples (4.6%) | ||||||
| 2 | 7-Eleven Inc. | 0.800% | 2/10/24 | 73,354 | 73,248 | |
| Altria Group Inc. | 3.800% | 2/14/24 | 1,623 | 1,622 | ||
| Altria Group Inc. | 4.400% | 2/14/26 | 10,850 | 10,742 | ||
| BAT Capital Corp. | 3.222% | 8/15/24 | 4,524 | 4,463 | ||
| BAT Capital Corp. | 2.789% | 9/6/24 | 3,577 | 3,516 | ||
| 2 | BAT International Finance plc | 3.950% | 6/15/25 | 7,370 | 7,234 | |
| BAT International Finance plc | 1.668% | 3/25/26 | 52,207 | 48,665 | ||
| Coca-Cola Co. | 1.750% | 9/6/24 | 17,370 | 17,035 | ||
| Constellation Brands Inc. | 3.600% | 5/9/24 | 14,000 | 13,919 | ||
| Constellation Brands Inc. | 4.750% | 11/15/24 | 9,153 | 9,097 | ||
| Constellation Brands Inc. | 4.400% | 11/15/25 | 9,195 | 9,100 | ||
| Diageo Capital plc | 2.125% | 10/24/24 | 7,700 | 7,525 | ||
| Dollar General Corp. | 4.150% | 11/1/25 | 6,980 | 6,874 | ||
| Haleon UK Capital plc | 3.125% | 3/24/25 | 28,245 | 27,630 | ||
| Haleon US Capital LLC | 3.024% | 3/24/24 | 22,450 | 22,361 | ||
| Hershey Co. | 2.050% | 11/15/24 | 11,539 | 11,263 | ||
| Kenvue Inc. | 5.500% | 3/22/25 | 62,553 | 63,045 | ||
| Keurig Dr Pepper Inc. | 0.750% | 3/15/24 | 59,858 | 59,517 | ||
| 2 | Mars Inc. | 2.700% | 4/1/25 | 8,730 | 8,513 | |
| McCormick & Co. Inc. | 0.900% | 2/15/26 | 5,104 | 4,711 | ||
| Mondelez International Inc. | 2.125% | 3/17/24 | 8,475 | 8,435 | ||
| Mondelez International Inc. | 1.500% | 5/4/25 | 12,544 | 12,018 | ||
| Coupon | Maturity Date | Face Amount ($000) | Market Value• ($000) | |||
| Philip Morris International Inc. | 2.875% | 5/1/24 | 1,281 | 1,272 | ||
| Philip Morris International Inc. | 5.125% | 11/15/24 | 95,809 | 95,717 | ||
| Philip Morris International Inc. | 5.000% | 11/17/25 | 11,400 | 11,448 | ||
| Reynolds American Inc. | 4.450% | 6/12/25 | 16,810 | 16,636 | ||
| 555,606 | ||||||
| Energy (3.2%) | ||||||
| Canadian Natural Resources Ltd. | 3.800% | 4/15/24 | 4,100 | 4,082 | ||
| Cheniere Corpus Christi Holdings LLC | 5.875% | 3/31/25 | 8,120 | 8,141 | ||
| Enbridge Energy Partners LP | 5.875% | 10/15/25 | 11,628 | 11,750 | ||
| Energy Transfer LP | 4.900% | 2/1/24 | 8,314 | 8,314 | ||
| Energy Transfer LP | 4.500% | 4/15/24 | 1,149 | 1,146 | ||
| Energy Transfer LP | 3.900% | 5/15/24 | 3,000 | 2,984 | ||
| Energy Transfer LP | 4.050% | 3/15/25 | 5,000 | 4,932 | ||
| Energy Transfer LP | 2.900% | 5/15/25 | 25,816 | 25,051 | ||
| EOG Resources Inc. | 3.150% | 4/1/25 | 2,400 | 2,354 | ||
| 2 | EQT Corp. | 3.125% | 5/15/26 | 3,366 | 3,200 | |
| Equinor ASA | 3.250% | 11/10/24 | 8,000 | 7,883 | ||
| Galaxy Pipeline Assets Bidco Ltd. | 1.750% | 9/30/27 | 18,331 | 17,211 | ||
| Kinder Morgan Energy Partners LP | 4.150% | 2/1/24 | 11,031 | 11,031 | ||
| Kinder Morgan Energy Partners LP | 4.300% | 5/1/24 | 8,460 | 8,429 | ||
| Kinder Morgan Inc. | 4.300% | 6/1/25 | 7,001 | 6,920 | ||
| Marathon Petroleum Corp. | 4.700% | 5/1/25 | 28,662 | 28,470 | ||
| MPLX LP | 4.875% | 6/1/25 | 52,052 | 51,807 | ||
| Occidental Petroleum Corp. | 5.875% | 9/1/25 | 12,420 | 12,512 | ||
| Ovintiv Inc. | 5.650% | 5/15/25 | 16,715 | 16,793 | ||
| Phillips 66 | 0.900% | 2/15/24 | 34,862 | 34,802 | ||
| Plains All American Pipeline LP / PAA Finance Corp. | 4.650% | 10/15/25 | 38,420 | 38,123 | ||
| Sabine Pass Liquefaction LLC | 5.750% | 5/15/24 | 65 | 65 | ||
| Sabine Pass Liquefaction LLC | 5.625% | 3/1/25 | 2,046 | 2,049 | ||
| Sabine Pass Liquefaction LLC | 5.875% | 6/30/26 | 4,975 | 5,059 | ||
| Shell International Finance BV | 2.000% | 11/7/24 | 9,464 | 9,249 | ||
| Spectra Energy Partners LP | 4.750% | 3/15/24 | 1,129 | 1,128 | ||
| Spectra Energy Partners LP | 3.500% | 3/15/25 | 1,742 | 1,708 | ||
| TransCanada PipeLines Ltd. | 1.000% | 10/12/24 | 8,747 | 8,479 | ||
| Western Midstream Operating LP | 3.100% | 2/1/25 | 11,950 | 11,651 | ||
| Western Midstream Operating LP | 3.950% | 6/1/25 | 1,775 | 1,739 | ||
| Williams Cos. Inc. | 4.300% | 3/4/24 | 24,974 | 24,943 | ||
| Williams Cos. Inc. | 3.900% | 1/15/25 | 6,190 | 6,115 | ||
| Williams Cos. Inc. | 5.400% | 3/2/26 | 10,000 | 10,103 | ||
| 388,223 | ||||||
| Financials (27.1%) | ||||||
| AerCap Ireland Capital DAC / AerCap Global Aviation Trust | 1.650% | 10/29/24 | 40,000 | 38,847 | ||
| AerCap Ireland Capital DAC / AerCap Global Aviation Trust | 6.500% | 7/15/25 | 14,686 | 14,887 | ||
| AerCap Ireland Capital DAC / AerCap Global Aviation Trust | 4.450% | 10/1/25 | 9,875 | 9,716 | ||
| AerCap Ireland Capital DAC / AerCap Global Aviation Trust | 1.750% | 1/30/26 | 11,500 | 10,710 | ||
| Affiliated Managers Group Inc. | 4.250% | 2/15/24 | 9,420 | 9,411 | ||
| Air Lease Corp. | 2.875% | 1/15/26 | 27,050 | 25,837 | ||
| Allstate Corp. | 0.750% | 12/15/25 | 6,959 | 6,453 | ||
| American Express Co. | 3.950% | 8/1/25 | 8,500 | 8,376 | ||
| American Express Co. | 4.990% | 5/1/26 | 103,773 | 103,673 | ||
| Coupon | Maturity Date | Face Amount ($000) | Market Value• ($000) | |||
| American Express Co. | 6.338% | 10/30/26 | 27,171 | 27,730 | ||
| Ameriprise Financial Inc. | 3.000% | 4/2/25 | 25,675 | 25,091 | ||
| 2 | Athene Global Funding | 2.514% | 3/8/24 | 2,250 | 2,242 | |
| Australia & New Zealand Banking Group Ltd. | 5.375% | 7/3/25 | 28,240 | 28,464 | ||
| Australia & New Zealand Banking Group Ltd. | 5.671% | 10/3/25 | 29,880 | 30,340 | ||
| 3,5 | Australia & New Zealand Banking Group Ltd., 3M Australian Bank Bill Rate + 2.000% | 6.333% | 7/26/29 | 25,894 | 17,055 | |
| Banco Santander SA | 2.746% | 5/28/25 | 11,200 | 10,821 | ||
| Banco Santander SA | 5.147% | 8/18/25 | 2,573 | 2,562 | ||
| Bank of America Corp. | 3.950% | 4/21/25 | 15,169 | 14,931 | ||
| Bank of America Corp. | 3.366% | 1/23/26 | 20,000 | 19,582 | ||
| Bank of America Corp. | 2.015% | 2/13/26 | 15,600 | 15,045 | ||
| Bank of America Corp. | 3.384% | 4/2/26 | 24,989 | 24,430 | ||
| Bank of America Corp. | 1.197% | 10/24/26 | 7,645 | 7,130 | ||
| Bank of America NA | 5.650% | 8/18/25 | 35,000 | 35,456 | ||
| Bank of Montreal | 5.200% | 12/12/24 | 22,200 | 22,197 | ||
| Bank of Montreal | 5.920% | 9/25/25 | 104,000 | 105,689 | ||
| Bank of New York Mellon | 5.148% | 5/22/26 | 33,940 | 34,001 | ||
| Bank of New York Mellon Corp. | 4.414% | 7/24/26 | 12,440 | 12,332 | ||
| Bank of Nova Scotia | 5.450% | 6/12/25 | 120,500 | 121,180 | ||
| Bank of Nova Scotia | 4.750% | 2/2/26 | 3,373 | 3,368 | ||
| Bank of Nova Scotia | 1.050% | 3/2/26 | 5,743 | 5,312 | ||
| 2 | Banque Federative du Credit Mutuel SA | 5.896% | 7/13/26 | 36,000 | 36,731 | |
| Barclays plc | 2.852% | 5/7/26 | 11,000 | 10,647 | ||
| 2 | BPCE SA | 5.100% | 1/26/26 | 37,500 | 37,556 | |
| Canadian Imperial Bank of Commerce | 5.144% | 4/28/25 | 82,000 | 82,085 | ||
| Citibank NA | 5.864% | 9/29/25 | 40,000 | 40,697 | ||
| Citigroup Inc. | 3.700% | 1/12/26 | 7,870 | 7,693 | ||
| Citigroup Inc. | 2.014% | 1/25/26 | 9,450 | 9,123 | ||
| Citigroup Inc. | 3.290% | 3/17/26 | 19,058 | 18,619 | ||
| Citigroup Inc. | 5.610% | 9/29/26 | 10,000 | 10,077 | ||
| Cooperatieve Rabobank UA | 5.000% | 1/13/25 | 39,700 | 39,689 | ||
| Cooperatieve Rabobank UA | 5.500% | 7/18/25 | 52,360 | 52,917 | ||
| Cooperatieve Rabobank UA | 4.850% | 1/9/26 | 50,000 | 50,189 | ||
| Credit Suisse AG | 7.950% | 1/9/25 | 14,680 | 15,029 | ||
| Credit Suisse AG | 3.700% | 2/21/25 | 10,000 | 9,842 | ||
| Credit Suisse AG | 2.950% | 4/9/25 | 19,800 | 19,258 | ||
| 2 | Danske Bank AS | 6.259% | 9/22/26 | 60,075 | 61,068 | |
| Franklin Resources Inc. | 2.850% | 3/30/25 | 4,895 | 4,775 | ||
| 2 | GA Global Funding Trust | 1.000% | 4/8/24 | 45,015 | 44,589 | |
| 2 | GA Global Funding Trust | 3.850% | 4/11/25 | 3,239 | 3,182 | |
| Goldman Sachs Group Inc. | 5.700% | 11/1/24 | 40,177 | 40,309 | ||
| Goldman Sachs Group Inc. | 5.798% | 8/10/26 | 47,150 | 47,599 | ||
| Goldman Sachs Group Inc. | 1.093% | 12/9/26 | 18,112 | 16,816 | ||
| 3 | Goldman Sachs Group Inc., SOFR + 0.486% | 5.861% | 10/21/24 | 38,426 | 38,452 | |
| HSBC Holdings plc | 2.999% | 3/10/26 | 31,360 | 30,489 | ||
| HSBC Holdings plc | 1.645% | 4/18/26 | 25,970 | 24,783 | ||
| HSBC Holdings plc | 4.292% | 9/12/26 | 37,825 | 37,142 | ||
| HSBC USA Inc. | 5.625% | 3/17/25 | 22,695 | 22,837 | ||
| Huntington Bancshares Inc. | 4.000% | 5/15/25 | 16,995 | 16,726 | ||
| Huntington National Bank | 5.699% | 11/18/25 | 21,688 | 21,571 | ||
| 2 | ING Groep NV | 1.400% | 7/1/26 | 10,240 | 9,691 | |
| Intercontinental Exchange Inc. | 3.650% | 5/23/25 | 75,290 | 74,040 | ||
| Invesco Finance plc | 3.750% | 1/15/26 | 15,437 | 15,060 | ||
| JPMorgan Chase & Co. | 2.595% | 2/24/26 | 1,860 | 1,808 | ||
| Coupon | Maturity Date | Face Amount ($000) | Market Value• ($000) | |||
| JPMorgan Chase & Co. | 2.005% | 3/13/26 | 20,163 | 19,419 | ||
| JPMorgan Chase & Co. | 2.083% | 4/22/26 | 6,484 | 6,237 | ||
| JPMorgan Chase & Co. | 1.040% | 2/4/27 | 7,185 | 6,635 | ||
| Legg Mason Inc. | 3.950% | 7/15/24 | 10,000 | 9,919 | ||
| Lloyds Banking Group plc | 4.716% | 8/11/26 | 14,940 | 14,781 | ||
| 2 | Macquarie Group Ltd. | 6.207% | 11/22/24 | 62,000 | 62,343 | |
| Manufacturers & Traders Trust Co. | 2.900% | 2/6/25 | 2,551 | 2,484 | ||
| Manufacturers & Traders Trust Co. | 4.650% | 1/27/26 | 3,326 | 3,282 | ||
| Marsh & McLennan Cos. Inc. | 3.875% | 3/15/24 | 22,940 | 22,881 | ||
| Marsh & McLennan Cos. Inc. | 3.500% | 6/3/24 | 24,356 | 24,165 | ||
| Mitsubishi UFJ Financial Group Inc. | 2.193% | 2/25/25 | 46,962 | 45,512 | ||
| Mitsubishi UFJ Financial Group Inc. | 3.777% | 3/2/25 | 13,364 | 13,165 | ||
| Mitsubishi UFJ Financial Group Inc. | 5.719% | 2/20/26 | 55,720 | 55,938 | ||
| Mitsubishi UFJ Financial Group Inc. | 3.837% | 4/17/26 | 225 | 221 | ||
| Mitsubishi UFJ Financial Group Inc. | 5.541% | 4/17/26 | 16,233 | 16,283 | ||
| Mizuho Financial Group Inc. | 2.226% | 5/25/26 | 6,370 | 6,110 | ||
| Morgan Stanley | 4.000% | 7/23/25 | 3,500 | 3,454 | ||
| Morgan Stanley | 3.875% | 1/27/26 | 11,499 | 11,293 | ||
| Morgan Stanley | 2.630% | 2/18/26 | 23,380 | 22,719 | ||
| Morgan Stanley | 2.188% | 4/28/26 | 3,531 | 3,404 | ||
| Morgan Stanley Bank NA | 5.479% | 7/16/25 | 25,030 | 25,266 | ||
| Nasdaq Inc. | 5.650% | 6/28/25 | 56,200 | 56,725 | ||
| Nasdaq Inc. | 3.850% | 6/30/26 | 6,000 | 5,863 | ||
| National Australia Bank Ltd. | 4.750% | 12/10/25 | 52,280 | 52,374 | ||
| National Bank of Canada | 5.250% | 1/17/25 | 36,650 | 36,678 | ||
| 2 | New York Life Global Funding | 0.550% | 4/26/24 | 350 | 346 | |
| 2 | Nordea Bank Abp | 4.750% | 9/22/25 | 2,691 | 2,684 | |
| 2 | Nuveen Finance LLC | 4.125% | 11/1/24 | 9,060 | 8,951 | |
| ORIX Corp. | 3.250% | 12/4/24 | 1,163 | 1,142 | ||
| 2 | Penske Truck Leasing Co. LP / PTL Finance Corp. | 3.900% | 2/1/24 | 747 | 747 | |
| 2 | Penske Truck Leasing Co. LP / PTL Finance Corp. | 4.000% | 7/15/25 | 16,890 | 16,550 | |
| 2 | Penske Truck Leasing Co. LP / PTL Finance Corp. | 5.350% | 1/12/27 | 5,010 | 5,034 | |
| PNC Bank NA | 3.250% | 6/1/25 | 22,745 | 22,197 | ||
| PNC Financial Services Group Inc. | 2.200% | 11/1/24 | 2,000 | 1,956 | ||
| PNC Financial Services Group Inc. | 5.671% | 10/28/25 | 51,371 | 51,338 | ||
| PNC Financial Services Group Inc. | 5.812% | 6/12/26 | 56,573 | 56,905 | ||
| Royal Bank of Canada | 4.950% | 4/25/25 | 46,899 | 46,971 | ||
| Santander UK Group Holdings plc | 1.089% | 3/15/25 | 5,000 | 4,968 | ||
| 3,5 | Standard Chartered plc, 3M Australian Bank Bill Rate + 1.850% | 6.210% | 6/28/25 | 29,000 | 19,072 | |
| State Street Corp. | 2.354% | 11/1/25 | 20,980 | 20,507 | ||
| State Street Corp. | 4.857% | 1/26/26 | 7,610 | 7,578 | ||
| State Street Corp. | 5.104% | 5/18/26 | 120,000 | 120,081 | ||
| Sumitomo Mitsui Financial Group Inc. | 2.348% | 1/15/25 | 12,212 | 11,890 | ||
| Sumitomo Mitsui Financial Group Inc. | 1.474% | 7/8/25 | 29,142 | 27,695 | ||
| Toronto-Dominion Bank | 3.766% | 6/6/25 | 23,438 | 23,096 | ||
| Toronto-Dominion Bank | 1.150% | 6/12/25 | 11,872 | 11,295 | ||
| Toronto-Dominion Bank | 0.750% | 9/11/25 | 36,240 | 34,033 | ||
| Toronto-Dominion Bank | 0.750% | 1/6/26 | 39,184 | 36,374 | ||
| Toronto-Dominion Bank | 1.200% | 6/3/26 | 15,522 | 14,305 | ||
| Truist Bank | 1.500% | 3/10/25 | 22,255 | 21,349 | ||
| Truist Financial Corp. | 3.700% | 6/5/25 | 11,930 | 11,696 | ||
| Truist Financial Corp. | 1.200% | 8/5/25 | 780 | 736 | ||
| Truist Financial Corp. | 4.260% | 7/28/26 | 4,579 | 4,514 | ||
| UBS AG | 5.800% | 9/11/25 | 75,000 | 75,956 | ||
| Coupon | Maturity Date | Face Amount ($000) | Market Value• ($000) | |||
| 2 | UBS Group AG | 2.193% | 6/5/26 | 10,000 | 9,565 | |
| 2 | UBS Group AG | 5.711% | 1/12/27 | 1,433 | 1,441 | |
| 2 | UBS Group AG | 1.305% | 2/2/27 | 44,440 | 40,923 | |
| US Bancorp | 1.450% | 5/12/25 | 32,632 | 31,228 | ||
| US Bancorp | 3.950% | 11/17/25 | 6,863 | 6,764 | ||
| US Bancorp | 5.727% | 10/21/26 | 60,000 | 60,605 | ||
| US Bank NA | 2.050% | 1/21/25 | 25,270 | 24,542 | ||
| Wells Fargo & Co. | 3.550% | 9/29/25 | 5,439 | 5,320 | ||
| Wells Fargo & Co. | 2.406% | 10/30/25 | 15,316 | 14,959 | ||
| Wells Fargo & Co. | 2.188% | 4/30/26 | 48,375 | 46,538 | ||
| Wells Fargo & Co. | 4.540% | 8/15/26 | 7,672 | 7,595 | ||
| Wells Fargo Bank NA | 5.550% | 8/1/25 | 27,640 | 27,928 | ||
| Wells Fargo Bank NA | 4.811% | 1/15/26 | 44,500 | 44,578 | ||
| Westpac Banking Corp. | 5.512% | 11/17/25 | 22,020 | 22,337 | ||
| 3,5 | Westpac Banking Corp., 3M Australian Bank Bill Rate + 1.980% | 6.358% | 8/27/29 | 7,400 | 4,876 | |
| Willis North America Inc. | 3.600% | 5/15/24 | 10,566 | 10,494 | ||
| 3,290,767 | ||||||
| Health Care (5.2%) | ||||||
| AbbVie Inc. | 2.600% | 11/21/24 | 65,122 | 63,760 | ||
| AbbVie Inc. | 3.600% | 5/14/25 | 7,803 | 7,674 | ||
| Aetna Inc. | 3.500% | 11/15/24 | 976 | 962 | ||
| Amgen Inc. | 3.625% | 5/22/24 | 21,412 | 21,277 | ||
| Amgen Inc. | 5.250% | 3/2/25 | 11,945 | 11,974 | ||
| Amgen Inc. | 3.125% | 5/1/25 | 29,803 | 29,109 | ||
| Becton Dickinson & Co. | 3.363% | 6/6/24 | 6,452 | 6,400 | ||
| Cardinal Health Inc. | 3.079% | 6/15/24 | 16,250 | 16,083 | ||
| Cencora Inc. | 3.400% | 5/15/24 | 22,674 | 22,515 | ||
| Cigna Group | 0.613% | 3/15/24 | 10,215 | 10,158 | ||
| Cigna Group | 4.125% | 11/15/25 | 9,639 | 9,493 | ||
| CVS Health Corp. | 3.875% | 7/20/25 | 19,588 | 19,276 | ||
| CVS Health Corp. | 5.000% | 2/20/26 | 21,822 | 21,879 | ||
| Elevance Health Inc. | 5.350% | 10/15/25 | 14,260 | 14,337 | ||
| Elevance Health Inc. | 1.500% | 3/15/26 | 14,885 | 13,899 | ||
| GE HealthCare Technologies Inc. | 5.600% | 11/15/25 | 73,885 | 74,601 | ||
| HCA Inc. | 5.375% | 2/1/25 | 53,404 | 53,403 | ||
| HCA Inc. | 5.875% | 2/15/26 | 5,000 | 5,047 | ||
| Humana Inc. | 3.850% | 10/1/24 | 11,929 | 11,791 | ||
| Pfizer Investment Enterprises Pte Ltd. | 4.650% | 5/19/25 | 135,215 | 134,893 | ||
| Quest Diagnostics Inc. | 3.500% | 3/30/25 | 48,375 | 47,498 | ||
| Stryker Corp. | 1.150% | 6/15/25 | 7,034 | 6,679 | ||
| Stryker Corp. | 3.375% | 11/1/25 | 17,232 | 16,805 | ||
| Thermo Fisher Scientific Inc. | 1.215% | 10/18/24 | 1,364 | 1,326 | ||
| Wyeth LLC | 6.450% | 2/1/24 | 4,863 | 4,863 | ||
| Zoetis Inc. | 5.400% | 11/14/25 | 6,779 | 6,843 | ||
| 632,545 | ||||||
| Industrials (4.2%) | ||||||
| 5 | Aurizon Network Pty Ltd. | 4.000% | 6/21/24 | 29,340 | 19,169 | |
| 2 | BAE Systems Holdings Inc. | 3.800% | 10/7/24 | 12,060 | 11,917 | |
| Boeing Co. | 1.433% | 2/4/24 | 3,211 | 3,211 | ||
| Boeing Co. | 4.875% | 5/1/25 | 74,689 | 74,194 | ||
| Boeing Co. | 2.196% | 2/4/26 | 5,000 | 4,713 | ||
| 5 | Brisbane Airport Corp. Pty Ltd. | 3.900% | 4/24/25 | 13,540 | 8,790 | |
| Burlington Northern Santa Fe LLC | 3.400% | 9/1/24 | 8,130 | 8,030 | ||
| Canadian Pacific Railway Co. | 1.350% | 12/2/24 | 24,420 | 23,624 | ||
| Coupon | Maturity Date | Face Amount ($000) | Market Value• ($000) | |||
| Canadian Pacific Railway Co. | 2.900% | 2/1/25 | 33,100 | 32,368 | ||
| Carrier Global Corp. | 2.242% | 2/15/25 | 41,255 | 40,019 | ||
| 2 | Carrier Global Corp. | 5.800% | 11/30/25 | 36,584 | 37,100 | |
| Caterpillar Financial Services Corp. | 0.600% | 9/13/24 | 4,847 | 4,713 | ||
| CNH Industrial Capital LLC | 5.450% | 10/14/25 | 10,580 | 10,659 | ||
| 2 | Daimler Truck Finance North America LLC | 5.200% | 1/17/25 | 25,600 | 25,608 | |
| 2 | Daimler Truck Finance North America LLC | 5.600% | 8/8/25 | 26,187 | 26,388 | |
| 2 | Daimler Truck Finance North America LLC | 5.000% | 1/15/27 | 14,925 | 15,019 | |
| GE Capital International Funding Co. Unlimited Co. | 3.373% | 11/15/25 | 6,144 | 5,970 | ||
| Huntington Ingalls Industries Inc. | 3.844% | 5/1/25 | 25,046 | 24,579 | ||
| 5 | Lonsdale Finance Pty Ltd. | 3.900% | 10/15/25 | 13,730 | 8,868 | |
| 5 | Pacific National Finance Pty Ltd. | 5.250% | 5/19/25 | 3,680 | 2,402 | |
| Parker-Hannifin Corp. | 3.650% | 6/15/24 | 12,280 | 12,189 | ||
| RTX Corp. | 3.200% | 3/15/24 | 67,924 | 67,683 | ||
| RTX Corp. | 3.950% | 8/16/25 | 10,989 | 10,842 | ||
| RTX Corp. | 5.000% | 2/27/26 | 3,279 | 3,295 | ||
| Ryder System Inc. | 2.500% | 9/1/24 | 3,740 | 3,672 | ||
| Ryder System Inc. | 4.625% | 6/1/25 | 9,462 | 9,401 | ||
| Ryder System Inc. | 3.350% | 9/1/25 | 10,709 | 10,419 | ||
| 2 | Siemens Financieringsmaatschappij NV | 3.125% | 3/16/24 | 5,097 | 5,080 | |
| 509,922 | ||||||
| Materials (0.8%) | ||||||
| Berry Global Inc. | 0.950% | 2/15/24 | 5,500 | 5,489 | ||
| Celanese US Holdings LLC | 3.500% | 5/8/24 | 2,581 | 2,565 | ||
| DuPont de Nemours Inc. | 4.493% | 11/15/25 | 39,419 | 39,116 | ||
| Eastman Chemical Co. | 3.800% | 3/15/25 | 12,068 | 11,881 | ||
| 2 | Georgia-Pacific LLC | 3.600% | 3/1/25 | 9,050 | 8,912 | |
| 2 | Glencore Funding LLC | 4.000% | 4/16/25 | 3,304 | 3,256 | |
| LyondellBasell Industries NV | 5.750% | 4/15/24 | 14,198 | 14,198 | ||
| Nutrien Ltd. | 5.950% | 11/7/25 | 13,126 | 13,343 | ||
| 98,760 | ||||||
| Real Estate (3.2%) | ||||||
| Alexandria Real Estate Equities Inc. | 4.300% | 1/15/26 | 4,000 | 3,949 | ||
| American Tower Corp. | 5.000% | 2/15/24 | 2,870 | 2,869 | ||
| American Tower Corp. | 2.950% | 1/15/25 | 24,602 | 24,057 | ||
| American Tower Corp. | 2.400% | 3/15/25 | 8,660 | 8,394 | ||
| American Tower Corp. | 4.000% | 6/1/25 | 12,807 | 12,608 | ||
| American Tower Corp. | 1.300% | 9/15/25 | 6,059 | 5,707 | ||
| AvalonBay Communities Inc. | 3.450% | ��6/1/25 | 4,595 | 4,503 | ||
| AvalonBay Communities Inc. | 3.500% | 11/15/25 | 2,540 | 2,483 | ||
| Boston Properties LP | 3.800% | 2/1/24 | 7,850 | 7,850 | ||
| Boston Properties LP | 3.650% | 2/1/26 | 4,158 | 4,014 | ||
| Equinix Inc. | 1.250% | 7/15/25 | 20,846 | 19,713 | ||
| ERP Operating LP | 3.375% | 6/1/25 | 6,628 | 6,483 | ||
| Essex Portfolio LP | 3.875% | 5/1/24 | 1,050 | 1,045 | ||
| Essex Portfolio LP | 3.500% | 4/1/25 | 31,767 | 31,105 | ||
| 5 | General Property Trust | 3.673% | 9/19/24 | 2,420 | 1,575 | |
| Healthpeak OP LLC | 4.000% | 6/1/25 | 8,595 | 8,458 | ||
| Kilroy Realty LP | 3.450% | 12/15/24 | 10,203 | 10,006 | ||
| Mid-America Apartments LP | 4.000% | 11/15/25 | 12,387 | 12,167 | ||
| NNN REIT Inc. | 3.900% | 6/15/24 | 16,746 | 16,616 | ||
| NNN REIT Inc. | 4.000% | 11/15/25 | 6,741 | 6,614 | ||
| Realty Income Corp. | 4.600% | 2/6/24 | 40,935 | 40,935 | ||
| Realty Income Corp. | 3.875% | 4/15/25 | 14,524 | 14,312 | ||
| Realty Income Corp. | 4.625% | 11/1/25 | 13,903 | 13,825 | ||
| Coupon | Maturity Date | Face Amount ($000) | Market Value• ($000) | |||
| 5 | Region Retail Trust | 3.900% | 6/7/24 | 10,680 | 6,978 | |
| Simon Property Group LP | 3.750% | 2/1/24 | 29,723 | 29,723 | ||
| Simon Property Group LP | 3.375% | 10/1/24 | 32,256 | 31,794 | ||
| Simon Property Group LP | 3.500% | 9/1/25 | 5,520 | 5,413 | ||
| 5 | Stockland Trust | 3.300% | 3/22/24 | 7,780 | 5,093 | |
| Ventas Realty LP | 3.500% | 4/15/24 | 10,040 | 9,991 | ||
| Ventas Realty LP | 3.750% | 5/1/24 | 5,000 | 4,972 | ||
| Ventas Realty LP | 2.650% | 1/15/25 | 7,802 | 7,602 | ||
| Welltower OP LLC | 3.625% | 3/15/24 | 1,495 | 1,491 | ||
| Welltower OP LLC | 4.000% | 6/1/25 | 27,787 | 27,361 | ||
| 389,706 | ||||||
| Technology (2.6%) | ||||||
| Broadcom Inc. | 3.625% | 10/15/24 | 49,538 | 48,890 | ||
| Global Payments Inc. | 2.650% | 2/15/25 | 15,574 | 15,124 | ||
| Global Payments Inc. | 1.200% | 3/1/26 | 10,000 | 9,237 | ||
| Hewlett Packard Enterprise Co. | 5.900% | 10/1/24 | 64,110 | 64,190 | ||
| HP Inc. | 2.200% | 6/17/25 | 19,613 | 18,837 | ||
| Oracle Corp. | 3.400% | 7/8/24 | 1,622 | 1,606 | ||
| Oracle Corp. | 2.500% | 4/1/25 | 55,216 | 53,555 | ||
| Oracle Corp. | 5.800% | 11/10/25 | 4,666 | 4,736 | ||
| PayPal Holdings Inc. | 2.400% | 10/1/24 | 45,776 | 44,864 | ||
| Roper Technologies Inc. | 1.000% | 9/15/25 | 26,555 | 24,920 | ||
| Verisk Analytics Inc. | 4.000% | 6/15/25 | 28,092 | 27,703 | ||
| 313,662 | ||||||
| Utilities (3.1%) | ||||||
| Abu Dhabi National Energy Co. PJSC | 3.875% | 5/6/24 | 10,100 | 10,041 | ||
| American Electric Power Co. Inc. | 5.699% | 8/15/25 | 17,790 | 17,926 | ||
| Appalachian Power Co. | 3.400% | 6/1/25 | 920 | 901 | ||
| 5 | Ausgrid Finance Pty Ltd. | 3.750% | 10/30/24 | 36,370 | 23,655 | |
| 3,5 | Australian Gas Networks Ltd., 3M Australian Bank Bill Rate + 0.400% | 4.755% | 7/1/24 | 12,500 | 8,183 | |
| Berkshire Hathaway Energy Co. | 4.050% | 4/15/25 | 68,123 | 67,448 | ||
| 5 | DBNGP Finance Co. Pty Ltd. | 4.225% | 5/28/25 | 15,830 | 10,243 | |
| DTE Electric Co. | 3.650% | 3/15/24 | 5,180 | 5,167 | ||
| DTE Energy Co. | 1.050% | 6/1/25 | 15,379 | 14,560 | ||
| Duke Energy Corp. | 0.900% | 9/15/25 | 10,000 | 9,381 | ||
| 5 | Energy Partnership Gas Pty Ltd. | 3.642% | 12/11/24 | 24,380 | 15,825 | |
| Exelon Corp. | 3.950% | 6/15/25 | 4,480 | 4,412 | ||
| 5 | Network Finance Co. Pty Ltd. | 3.500% | 12/6/24 | 24,350 | 15,803 | |
| NextEra Energy Capital Holdings Inc. | 4.255% | 9/1/24 | 29,862 | 29,638 | ||
| NextEra Energy Capital Holdings Inc. | 5.749% | 9/1/25 | 16,030 | 16,189 | ||
| NextEra Energy Capital Holdings Inc. | 4.950% | 1/29/26 | 22,280 | 22,294 | ||
| NiSource Inc. | 0.950% | 8/15/25 | 9,498 | 8,917 | ||
| Public Service Enterprise Group Inc. | 0.800% | 8/15/25 | 14,130 | 13,254 | ||
| Sempra | 3.300% | 4/1/25 | 1,980 | 1,937 | ||
| Southern Co. | 0.600% | 2/26/24 | 1,296 | 1,292 | ||
| Southern Co. | 5.150% | 10/6/25 | 25,611 | 25,696 | ||
| 5 | United Energy Distribution Pty Ltd. | 3.850% | 10/23/24 | 13,120 | 8,549 | |
| 3,5 | Victoria Power Networks Finance Pty Ltd., 3M Australian Bank Bill Rate + 0.500% | 4.898% | 8/23/24 | 11,900 | 7,798 | |
| Virginia Electric and Power Co. | 3.150% | 1/15/26 | 7,680 | 7,455 | ||
| WEC Energy Group Inc. | 5.000% | 9/27/25 | 7,522 | 7,526 | ||
| Coupon | Maturity Date | Face Amount ($000) | Market Value• ($000) | |||
| WEC Energy Group Inc. | 4.750% | 1/9/26 | 22,937 | 22,885 | ||
| 376,975 | ||||||
| Total Corporate Bonds (Cost $7,773,742) | 7,802,445 | |||||
| Sovereign Bonds (1.5%) | ||||||
| 6 | Japan Treasury Discount Bill | 0.000% | 2/13/24 | 20,000,000 | 135,892 | |
| Republic of Hungary | 5.375% | 3/25/24 | 12,640 | 12,624 | ||
| 7 | Republic of Indonesia | 1.750% | 4/24/25 | 7,500 | 7,877 | |
| Republic of Panama | 4.000% | 9/22/24 | 845 | 832 | ||
| Socialist Republic of Vietnam | 4.800% | 11/19/24 | 21,904 | 21,719 | ||
| Total Sovereign Bonds (Cost $182,389) | 178,944 | |||||
| Shares | ||||||
| Temporary Cash Investments (9.4%) | ||||||
| Money Market Fund (1.8%) | ||||||
| 8 | Vanguard Market Liquidity Fund | 5.410% | 2,175,056 | 217,484 | ||
| Maturity Date | Face Amount ($000) | |||||
| Commercial Paper (1.0%) | ||||||
| 2,9 | AT&T Inc. | 5.960% | 2/21/24 | 61,000 | 60,802 | |
| 2 | CDP Financial Inc. | 5.497% | 4/15/24 | 59,730 | 59,065 | |
| 119,867 | ||||||
| Coupon | Maturity Date | Face Amount ($000) | Market Value• ($000) | |||
| U.S. Government and Agency Obligations (6.6%) | ||||||
| 10 | United States Treasury Bill | 4.845%–4.860% | 2/6/24 | 234,566 | 224,769 | |
| United States Treasury Bill | 4.791%–4.821% | 2/6/24 | 608,360 | 581,182 | ||
| 805,951 | ||||||
| Total Temporary Cash Investments (Cost $1,143,072) | 1,143,302 | |||||
| Total Investments (100.4%) (Cost $12,160,563) | 12,200,263 | |||||
| Other Assets and Liabilities—Net (-0.4%) | (50,704) | |||||
| Net Assets (100%) | 12,149,559 | |||||
| Cost is in $000. | ||||||
| • | See Note A in Notes to Financial Statements. |
| 1 | The average or expected maturity is shorter than the final maturity shown because of the possibility of interim principal payments and prepayments or the possibility of the issue being called. |
| 2 | Security exempt from registration under Rule 144A of the Securities Act of 1933. Such securities may be sold in transactions exempt from registration, normally to qualified institutional buyers. At January 31, 2024, the aggregate value was $2,427,442,000, representing 20.0% of net assets. |
| 3 | Variable-rate security; rate shown is effective rate at period end. Certain variable-rate securities are not based on a published reference rate and spread but are determined by the issuer or agent based on current market conditions. |
| 4 | The issuer was placed under federal conservatorship in September 2008; since that time, its daily operations have been managed by the Federal Housing Finance Agency and it receives capital from the U.S. Treasury, as needed to maintain a positive net worth, in exchange for senior preferred stock. |
| 5 | Face amount denominated in Australian dollars. |
| 6 | Face amount denominated in Japanese yen. |
| 7 | Face amount denominated in euro. |
| 8 | Affiliated money market fund available only to Vanguard funds and certain trusts and accounts managed by Vanguard. Rate shown is the 7-day yield. |
| 9 | Security exempt from registration under Section 4(2) of the Securities Act of 1933. Such securities may be sold in transactions exempt from registration only to dealers in that program or other “accredited investors.“ At January 31, 2024, the aggregate value of these securities was $60,802,000, representing 0.5% of net assets. |
| 10 | Securities with a value of $7,607,000 have been segregated as initial margin for open futures contracts. |
| 3M—3-month. | |
| DAC—Designated Activity Company. | |
| REIT—Real Estate Investment Trust. | |
| REMICS—Real Estate Mortgage Investment Conduits. | |
| SOFR—Secured Overnight Financing Rate. | |
| SOFR30A—30 Day Average Secured Overnight Financing Rate. |
| Futures Contracts | ||||
| ($000) | ||||
| Expiration | Number of Long (Short) Contracts | Notional Amount | Value and Unrealized Appreciation (Depreciation) | |
| Short Futures Contracts | ||||
| 2-Year U.S. Treasury Note | March 2024 | (2,843) | (584,681) | (803) |
| 5-Year U.S. Treasury Note | March 2024 | (1,172) | (127,034) | (1,103) |
| AUD 3-Year Treasury Bond | March 2024 | (200) | (14,032) | (138) |
| (2,044) | ||||
| Forward Currency Contracts | |||||||
| Contract Settlement Date | Contract Amount (000) | Unrealized Appreciation ($000) | Unrealized Depreciation ($000) | ||||
| Counterparty | Receive | Deliver | |||||
| JPMorgan Chase Bank, N.A. | 2/13/24 | JPY | 4,875 | USD | 34 | — | (1) |
| UBS AG | 3/20/24 | USD | 191,647 | AUD | 290,447 | 788 | — |
| UBS AG | 3/20/24 | USD | 8,045 | EUR | 7,390 | 42 | — |
| BNP Paribas | 3/20/24 | USD | 499 | GBP | 392 | 2 | — |
| JPMorgan Chase Bank, N.A. | 2/13/24 | USD | 144,130 | JPY | 20,020,000 | 7,825 | — |
| 8,657 | (1) | ||||||
| AUD—Australian dollar. |
| EUR—euro. |
| GBP—British pound. |
| JPY—Japanese yen. |
| USD—U.S. dollar. |
| ($000s, except shares, footnotes, and per-share amounts) | Amount |
| Assets | |
| Investments in Securities, at Value | |
| Unaffiliated Issuers (Cost $11,943,090) | 11,982,779 |
| Affiliated Issuers (Cost $217,473) | 217,484 |
| Total Investments in Securities | 12,200,263 |
| Investment in Vanguard | 383 |
| Foreign Currency, at Value (Cost $1,474) | 1,464 |
| Receivables for Investment Securities Sold | 81,470 |
| Receivables for Accrued Income | 87,253 |
| Receivables for Capital Shares Issued | 20,009 |
| Unrealized Appreciation—Forward Currency Contracts | 8,657 |
| Total Assets | 12,399,499 |
| Liabilities | |
| Due to Custodian | 1,185 |
| Payables for Investment Securities Purchased | 119,892 |
| Payables for Capital Shares Redeemed | 118,009 |
| Payables for Distributions | 7,506 |
| Payables to Vanguard | 547 |
| Variation Margin Payable—Futures Contracts | 2,800 |
| Unrealized Depreciation—Forward Currency Contracts | 1 |
| Total Liabilities | 249,940 |
| Net Assets | 12,149,559 |
| At January 31, 2024, net assets consisted of: | |
| Paid-in Capital | 12,364,904 |
| Total Distributable Earnings (Loss) | (215,345) |
| Net Assets | 12,149,559 |
| Investor Shares—Net Assets | |
| Applicable to 32,203,214 outstanding $.001 par value shares of beneficial interest (unlimited authorization) | 321,537 |
| Net Asset Value Per Share—Investor Shares | $9.98 |
| Admiral Shares—Net Assets | |
| Applicable to 592,231,811 outstanding $.001 par value shares of beneficial interest (unlimited authorization) | 11,828,022 |
| Net Asset Value Per Share—Admiral Shares | $19.97 |
| Year Ended January 31, 2024 | |
| ($000) | |
| Investment Income | |
| Income | |
| Interest1 | 539,698 |
| Total Income | 539,698 |
| Expenses | |
| The Vanguard Group—Note B | |
| Investment Advisory Services | 1,400 |
| Management and Administrative—Investor Shares | 685 |
| Management and Administrative—Admiral Shares | 9,962 |
| Marketing and Distribution—Investor Shares | 30 |
| Marketing and Distribution—Admiral Shares | 667 |
| Custodian Fees | 91 |
| Auditing Fees | 38 |
| Shareholders’ Reports—Investor Shares | 16 |
| Shareholders’ Reports—Admiral Shares | 72 |
| Trustees’ Fees and Expenses | 8 |
| Other Expenses | 23 |
| Total Expenses | 12,992 |
| Expenses Paid Indirectly | (89) |
| Net Expenses | 12,903 |
| Net Investment Income | 526,795 |
| Realized Net Gain (Loss) | |
| Investment Securities Sold1 | (50,200) |
| Futures Contracts | (4,652) |
| Forward Currency Contracts | 7,087 |
| Foreign Currencies | 462 |
| Realized Net Gain (Loss) | (47,303) |
| Change in Unrealized Appreciation (Depreciation) | |
| Investment Securities1 | 149,757 |
| Futures Contracts | (2,594) |
| Forward Currency Contracts | 28,396 |
| Foreign Currencies | (434) |
| Change in Unrealized Appreciation (Depreciation) | 175,125 |
| Net Increase (Decrease) in Net Assets Resulting from Operations | 654,617 |
| 1 | Interest income, realized net gain (loss), capital gain distributions received, and change in unrealized appreciation (depreciation) from an affiliated company of the fund were $7,725,000, $21,000, less than $1,000, and $11,000, respectively. Purchases and sales are for temporary cash investment purposes. |
| Year Ended January 31, | ||
| 2024 ($000) | 2023 ($000) | |
| Increase (Decrease) in Net Assets | ||
| Operations | ||
| Net Investment Income | 526,795 | 249,047 |
| Realized Net Gain (Loss) | (47,303) | (215,866) |
| Change in Unrealized Appreciation (Depreciation) | 175,125 | (1,986) |
| Net Increase (Decrease) in Net Assets Resulting from Operations | 654,617 | 31,195 |
| Distributions | ||
| Investor Shares | (15,784) | (7,678) |
| Admiral Shares | (517,155) | (242,810) |
| Total Distributions | (532,939) | (250,488) |
| Capital Share Transactions | ||
| Investor Shares | (185,296) | (167,644) |
| Admiral Shares | (1,778,557) | (5,774,177) |
| Net Increase (Decrease) from Capital Share Transactions | (1,963,853) | (5,941,821) |
| Total Increase (Decrease) | (1,842,175) | (6,161,114) |
| Net Assets | ||
| Beginning of Period | 13,991,734 | 20,152,848 |
| End of Period | 12,149,559 | 13,991,734 |
| Investor Shares | |||||
| For a Share Outstanding Throughout Each Period | Year Ended January 31, | ||||
| 2024 | 2023 | 2022 | 2021 | 2020 | |
| Net Asset Value, Beginning of Period | $9.89 | $9.99 | $10.08 | $10.04 | $9.98 |
| Investment Operations | |||||
| Net Investment Income1 | .402 | .141 | .047 | .127 | .252 |
| Net Realized and Unrealized Gain (Loss) on Investments | .107 | (.093) | (.086) | .053 | .065 |
| Total from Investment Operations | .509 | .048 | (.039) | .180 | .317 |
| Distributions | |||||
| Dividends from Net Investment Income | (.419) | (.148) | (.050) | (.140) | (.257) |
| Distributions from Realized Capital Gains | — | — | (.001) | — | — |
| Total Distributions | (.419) | (.148) | (.051) | (.140) | (.257) |
| Net Asset Value, End of Period | $9.98 | $9.89 | $9.99 | $10.08 | $10.04 |
| Total Return2 | 5.26% | 0.49% | -0.39% | 1.81% | 3.21% |
| Ratios/Supplemental Data | |||||
| Net Assets, End of Period (Millions) | $322 | $503 | $677 | $728 | $471 |
| Ratio of Total Expenses to Average Net Assets | 0.20%3 | 0.20%3 | 0.20% | 0.20% | 0.20% |
| Ratio of Net Investment Income to Average Net Assets | 4.05% | 1.42% | 0.47% | 1.27% | 2.53% |
| Portfolio Turnover Rate | 91% | 61% | 57%4 | 60%4 | 70% |
| 1 | Calculated based on average shares outstanding. |
| 2 | Total returns do not include account service fees that may have applied in the periods shown. Fund prospectuses provide information about any applicable account service fees. |
| 3 | The ratio of expenses to average net assets for the period net of reduction from custody fee offset arrangements was 0.20%. |
| 4 | Includes 1% and 3%, respectively, attributable to mortgage-dollar-roll activity. |
| Admiral Shares | |||||
| For a Share Outstanding Throughout Each Period | Year Ended January 31, | ||||
| 2024 | 2023 | 2022 | 2021 | 2020 | |
| Net Asset Value, Beginning of Period | $19.78 | $19.99 | $20.15 | $20.08 | $19.96 |
| Investment Operations | |||||
| Net Investment Income1 | .836 | .294 | .113 | .263 | .527 |
| Net Realized and Unrealized Gain (Loss) on Investments | .212 | (.188) | (.152) | .107 | .126 |
| Total from Investment Operations | 1.048 | .106 | (.039) | .370 | .653 |
| Distributions | |||||
| Dividends from Net Investment Income | (.858) | (.316) | (.119) | (.300) | (.533) |
| Distributions from Realized Capital Gains | — | — | (.002) | — | — |
| Total Distributions | (.858) | (.316) | (.121) | (.300) | (.533) |
| Net Asset Value, End of Period | $19.97 | $19.78 | $19.99 | $20.15 | $20.08 |
| Total Return2 | 5.42% | 0.54% | -0.20% | 1.86% | 3.31% |
| Ratios/Supplemental Data | |||||
| Net Assets, End of Period (Millions) | $11,828 | $13,489 | $19,476 | $16,060 | $6,443 |
| Ratio of Total Expenses to Average Net Assets | 0.10%3 | 0.10%3 | 0.10% | 0.10% | 0.10% |
| Ratio of Net Investment Income to Average Net Assets | 4.21% | 1.49% | 0.56% | 1.31% | 2.63% |
| Portfolio Turnover Rate | 91% | 61% | 57%4 | 60%4 | 70% |
| 1 | Calculated based on average shares outstanding. |
| 2 | Total returns do not include account service fees that may have applied in the periods shown. Fund prospectuses provide information about any applicable account service fees. |
| 3 | The ratio of expenses to average net assets for the period net of reduction from custody fee offset arrangements was 0.10%. |
| 4 | Includes 1% and 3%, respectively, attributable to mortgage-dollar-roll activity. |
| A. | The following significant accounting policies conform to generally accepted accounting principles for U.S. investment companies. The fund consistently follows such policies in preparing its financial statements. |
| B. | In accordance with the terms of a Funds' Service Agreement (the “FSA”) between Vanguard and the fund, Vanguard furnishes to the fund investment advisory, corporate management, administrative, marketing, and distribution services at Vanguard’s cost of operations (as defined by the FSA). These costs of operations are allocated to the fund based on methods and guidelines approved by the board of trustees and are generally settled twice a month. |
| C. | The fund’s custodian bank has agreed to reduce its fees when the fund maintains cash on deposit in the non-interest-bearing custody account. For the year ended January 31, 2024, custodian fee offset arrangements reduced the fund’s expenses by $89,000 (an annual rate of less than 0.01% of average net assets). |
| D. | Various inputs may be used to determine the value of the fund’s investments and derivatives. These inputs are summarized in three broad levels for financial statement purposes. The inputs or methodologies used to value securities are not necessarily an indication of the risk associated with investing in those securities. |
| Level 1 ($000) | Level 2 ($000) | Level 3 ($000) | Total ($000) | |
| Investments | ||||
| Assets | ||||
| Asset-Backed/Commercial Mortgage-Backed Securities | — | 3,075,572 | — | 3,075,572 |
| Corporate Bonds | — | 7,802,445 | — | 7,802,445 |
| Sovereign Bonds | — | 178,944 | — | 178,944 |
| Temporary Cash Investments | 217,484 | 925,818 | — | 1,143,302 |
| Total | 217,484 | 11,982,779 | — | 12,200,263 |
| Derivative Financial Instruments | ||||
| Assets | ||||
| Forward Currency Contracts | — | 8,657 | — | 8,657 |
| Liabilities | ||||
| Futures Contracts1 | 2,044 | — | — | 2,044 |
| Forward Currency Contracts | — | 1 | — | 1 |
| Total | 2,044 | 1 | — | 2,045 |
| 1 | Includes cumulative appreciation (depreciation) on futures contracts and centrally cleared swaps, if any, as reported in the Schedule of Investments. Only current day’s variation margin is reported within the Statement of Assets and Liabilities. |
| E. | At January 31, 2024, the fair values of derivatives were reflected in the Statement of Assets and Liabilities as follows: |
| Statement of Assets and Liabilities | Interest Rate Contracts ($000) | Foreign Exchange Contracts ($000) | Total ($000) |
| Unrealized Appreciation—Forward Currency Contracts | — | 8,657 | 8,657 |
| Total Assets | — | 8,657 | 8,657 |
| Unrealized Depreciation—Futures Contracts1 | 2,044 | — | 2,044 |
| Unrealized Depreciation—Forward Currency Contracts | — | 1 | 1 |
| Total Liabilities | 2,044 | 1 | 2,045 |
| 1 | Includes cumulative appreciation (depreciation) on futures contracts and centrally cleared swaps, if any, as reported in the Schedule of Investments. Only current day’s variation margin is reported within the Statement of Assets and Liabilities. |
| Realized Net Gain (Loss) on Derivatives | Interest Rate Contracts ($000) | Foreign Exchange Contracts ($000) | Total ($000) |
| Futures Contracts | (4,652) | — | (4,652) |
| Forward Currency Contracts | — | 7,087 | 7,087 |
| Realized Net Gain (Loss) on Derivatives | (4,652) | 7,087 | 2,435 |
| Change in Unrealized Appreciation (Depreciation) on Derivatives | |||
| Futures Contracts | (2,594) | — | (2,594) |
| Forward Currency Contracts | — | 28,396 | 28,396 |
| Change in Unrealized Appreciation (Depreciation) on Derivatives | (2,594) | 28,396 | 25,802 |
| F. | Permanent differences between book-basis and tax-basis components of net assets are reclassified among capital accounts in the financial statements to reflect their tax character. These reclassifications have no effect on net assets or net asset value per share. As of period end, permanent differences primarily attributable to the accounting for applicable foreign currency transactions were reclassified between the individual components of total distributable earnings (loss). |
| Amount ($000) | |
| Undistributed Ordinary Income | 10,603 |
| Undistributed Long-Term Gains | — |
| Net Unrealized Gains (Losses) | 43,945 |
| Capital Loss Carryforwards | (262,387) |
| Qualified Late-Year Losses | — |
| Other Temporary Differences | (7,506) |
| Total | (215,345) |
| Year Ended January 31, | ||
| 2024 Amount ($000) | 2023 Amount ($000) | |
| Ordinary Income* | 532,939 | 250,488 |
| Long-Term Capital Gains | — | — |
| Total | 532,939 | 250,488 |
| * | Includes short-term capital gains, if any. |
| Amount ($000) | |
| Tax Cost | 12,156,318 |
| Gross Unrealized Appreciation | 59,182 |
| Gross Unrealized Depreciation | (15,237) |
| Net Unrealized Appreciation (Depreciation) | 43,945 |
| G. | During the year ended January 31, 2024, the fund purchased $9,289,956,000 of investment securities and sold $9,872,039,000 of investment securities, other than U.S. government securities and temporary cash investments. Purchases and sales of U.S. government securities were $44,614,000 and $24,545,000, respectively. |
| H. | Capital share transactions for each class of shares were: |
| Year Ended January 31, | |||||
| 2024 | 2023 | ||||
| Amount ($000) | Shares (000) | Amount ($000) | Shares (000) | ||
| Investor Shares | |||||
| Issued | 159,141 | 16,048 | 332,662 | 33,704 | |
| Issued in Lieu of Cash Distributions | 14,313 | 1,444 | 7,063 | 716 | |
| Redeemed | (358,750) | (36,164) | (507,369) | (51,293) | |
| Net Increase (Decrease)—Investor Shares | (185,296) | (18,672) | (167,644) | (16,873) | |
| Admiral Shares | |||||
| Issued | 4,384,147 | 220,825 | 8,320,891 | 420,395 | |
| Issued in Lieu of Cash Distributions | 428,948 | 21,640 | 200,018 | 10,135 | |
| Redeemed | (6,591,652) | (332,314) | (14,295,086) | (722,648) | |
| Net Increase (Decrease)—Admiral Shares | (1,778,557) | (89,849) | (5,774,177) | (292,118) | |
| I. | Significant market disruptions, such as those caused by pandemics (e.g., COVID-19 pandemic), natural or environmental disasters, war (e.g., Russia’s invasion of Ukraine), acts of terrorism, or other events, can adversely affect local and global markets and normal market operations. Any such disruptions could have an adverse impact on the value of the fund’s investments and fund performance. |
| J. | Management has determined that no events or transactions occurred subsequent to January 31, 2024, that would require recognition or disclosure in these financial statements. |
Philadelphia, Pennsylvania
March 21, 2024
| Matthew Benchener | Thomas M. Rampulla |
| Amma Boateng | Karin A. Risi |
| Joseph Brennan | Anne E. Robinson |
| Mortimer J. Buckley | Michael Rollings |
| Gregory Davis | Nitin Tandon |
| John James | Lauren Valente |
| Chris D. Mclsaac |

All rights reserved.
Vanguard Marketing Corporation, Distributor.

Your Fund’s Performance at a Glance | 1 |
Advisors’ Report | 2 |
About Your Fund’s Expenses | 6 |
Performance Summary | 8 |
Financial Statements | 10 |
| • | For the 12 months ended January 31, 2024, Vanguard High-Yield Corporate Fund returned 7.71% for Investor Shares and 7.82% for Admiral Shares, lagging the 8.54% return of the fund’s benchmark composite index. |
| • | With inflation continuing to ease, the Federal Reserve slowed and eventually stopped hiking interest rates. Economic growth, the labor market, and consumer spending proved resilient, but the prospect of rates remaining high for an extended period spurred volatility at times. U.S. bonds rallied toward the end of 2023 as sentiment improved amid market expectations for rate cuts in 2024. |
| • | Below-investment-grade bonds outperformed all other major bond market segments. Credit spreads tightened. Within high yield, CCC-rated bonds outperformed BB- and B-rated bonds. Falling Treasury yields and a narrowing of spreads toward year-end provided the biggest boost to the fund’s results. On the other hand, the fund’s bias toward bonds of higher credit quality hindered relative performance. |
| • | The fund benefited from an underweight allocation to wirelines and security selection within that sector, as well as selection within airlines and leisure. Selection within financials and midstream detracted from relative returns. |
| Average Annual Total Returns Periods Ended January 31, 2024 | |||
| One Year | Three Years | Five Years | |
| Stocks | |||
| Russell 1000 Index (Large-caps) | 20.23% | 9.78% | 13.99% |
| Russell 2000 Index (Small-caps) | 2.40 | -0.76 | 6.80 |
| Russell 3000 Index (Broad U.S. market) | 19.15 | 9.10 | 13.53 |
| FTSE All-World ex US Index (International) | 6.29 | 1.57 | 5.77 |
| Bonds | |||
| Bloomberg U.S. Aggregate Float Adjusted Index (Broad taxable market) | 2.23% | -3.15% | 0.90% |
| Bloomberg Municipal Bond Index (Broad tax-exempt market) | 2.90 | -0.78 | 2.00 |
| FTSE Three-Month U.S. Treasury Bill Index | 5.36 | 2.40 | 1.96 |
| CPI | |||
| Consumer Price Index | 3.09% | 5.64% | 4.15% |
Senior Managing Director
| Fund Assets Managed | |||
| Investment Advisor | % | $ Million | Investment Strategy |
| Wellington Management Company llp | 65 | 15,410 | Combines bottom-up fundamental research with top-down strategy, comprehensive risk management, and a long-term investment horizon. Seeks to identify companies whose prospects are stable or improving and whose bonds offer an attractive yield. |
| Vanguard Fixed Income Group | 32 | 7,561 | Combines bottom-up fundamental research with top-down strategy. Security selection is based on a proprietary assessment of issuers and securities to identify durable business models and avoid excess credit losses and defaults. |
| Cash Investments | 3 | 662 | These short-term reserves are invested by Vanguard in fixed income securities and derivative products to simulate investment in bonds. Each advisor may also maintain a modest cash position. |
| • | Based on actual fund return. This section helps you to estimate the actual expenses that you paid over the period. The ”Ending Account Value“ shown is derived from the fund‘s actual return, and the third column shows the dollar amount that would have been paid by an investor who started with $1,000 in the fund. You may use the information here, together with the amount you invested, to estimate the expenses that you paid over the period. |
| • | Based on hypothetical 5% yearly return. This section is intended to help you compare your fund‘s costs with those of other mutual funds. It assumes that the fund had a yearly return of 5% before expenses, but that the expense ratio is unchanged. In this case—because the return used is not the fund’s actual return—the results do not apply to your investment. The example is useful in making comparisons because the Securities and Exchange Commission requires all mutual funds to calculate expenses based on a 5% return. You can assess your fund’s costs by comparing this hypothetical example with the hypothetical examples that appear in shareholder reports of other funds. |
| Six Months Ended January 31, 2024 | |||
| Beginning Account Value 7/31/2023 | Ending Account Value 1/31/2024 | Expenses Paid During Period | |
| Based on Actual Fund Return | |||
| High-Yield Corporate Fund | |||
| Investor Shares | $1,000.00 | $1,056.30 | $1.14 |
| Admiral™ Shares | 1,000.00 | 1,056.80 | 0.62 |
| Based on Hypothetical 5% Yearly Return | |||
| Investor Shares | $1,000.00 | $1,024.10 | $1.12 |
| Admiral Shares | 1,000.00 | 1,024.60 | 0.61 |
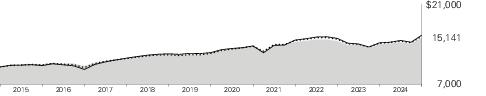
| Average Annual Total Returns Periods Ended January 31, 2024 | |||||
| One Year | Five Years | Ten Years | Final Value of a $10,000 Investment | ||
 | High-Yield Corporate Fund Investor Shares | 7.71% | 4.05% | 4.24% | $15,141 |
 | High-Yield Corporate Composite Index | 8.54 | 4.44 | 4.40 | 15,388 |
 | Bloomberg U.S. Corporate High Yield Bond Index | 9.28 | 4.44 | 4.52 | 15,564 |
| One Year | Five Years | Ten Years | Final Value of a $50,000 Investment | ||
| High-Yield Corporate Fund Admiral Shares | 7.82% | 4.16% | 4.34% | $76,460 | |
| High-Yield Corporate Composite Index | 8.54 | 4.44 | 4.40 | 76,940 | |
| Bloomberg U.S. Corporate High Yield Bond Index | 9.28 | 4.44 | 4.52 | 77,822 | |
| Corporate Bonds - Communications | 15.3% |
| Corporate Bonds - Consumer Discretionary | 16.5 |
| Corporate Bonds - Consumer Staples | 3.3 |
| Corporate Bonds - Energy | 11.1 |
| Corporate Bonds - Financials | 7.4 |
| Corporate Bonds - Health Care | 8.6 |
| Corporate Bonds - Industrials | 9.0 |
| Corporate Bonds - Materials | 9.2 |
| Corporate Bonds - Real Estate | 1.5 |
| Corporate Bonds - Technology | 7.4 |
| Corporate Bonds - Utilities | 2.4 |
| Floating Rate Loan Interests | 2.8 |
| U.S. Government and Agency Obligations | 5.5 |
| Coupon | Maturity Date | Face Amount ($000) | Market Value• ($000) | |||
| U.S. Government and Agency Obligations (5.3%) | ||||||
| U.S. Government Securities (5.3%) | ||||||
| United States Treasury Note/Bond | 2.500% | 5/15/24 | 155,325 | 154,087 | ||
| United States Treasury Note/Bond | 4.250% | 12/31/24 | 29,000 | 28,855 | ||
| United States Treasury Note/Bond | 1.750% | 3/15/25 | 47,302 | 45,809 | ||
| United States Treasury Note/Bond | 5.000% | 8/31/25 | 909 | 917 | ||
| 1 | United States Treasury Note/Bond | 3.500% | 9/15/25 | 23,200 | 22,881 | |
| United States Treasury Note/Bond | 4.000% | 2/15/26 | 147,400 | 146,801 | ||
| 1 | United States Treasury Note/Bond | 3.750% | 4/15/26 | 318,832 | 316,043 | |
| 1,2 | United States Treasury Note/Bond | 3.625% | 5/15/26 | 58,515 | 57,866 | |
| United States Treasury Note/Bond | 4.375% | 8/15/26 | 120,667 | 121,497 | ||
| United States Treasury Note/Bond | 4.625% | 10/15/26 | 23,178 | 23,511 | ||
| United States Treasury Note/Bond | 4.375% | 12/15/26 | 8,000 | 8,078 | ||
| United States Treasury Note/Bond | 2.750% | 7/31/27 | 7,015 | 6,739 | ||
| United States Treasury Note/Bond | 1.250% | 4/30/28 | 22,955 | 20,581 | ||
| 2 | United States Treasury Note/Bond | 1.250% | 6/30/28 | 53,685 | 47,964 | |
| United States Treasury Note/Bond | 1.125% | 8/31/28 | 10,831 | 9,584 | ||
| United States Treasury Note/Bond | 4.375% | 8/31/28 | 3,670 | 3,745 | ||
| United States Treasury Note/Bond | 4.625% | 9/30/28 | 41,280 | 42,551 | ||
| United States Treasury Note/Bond | 4.875% | 10/31/28 | 18,706 | 19,495 | ||
| United States Treasury Note/Bond | 1.750% | 1/31/29 | 12,000 | 10,843 | ||
| United States Treasury Note/Bond | 4.000% | 2/28/30 | 10,719 | 10,766 | ||
| United States Treasury Note/Bond | 3.500% | 4/30/30 | 14,812 | 14,469 | ||
| United States Treasury Note/Bond | 3.750% | 6/30/30 | 2,714 | 2,688 | ||
| United States Treasury Note/Bond | 4.000% | 7/31/30 | 6,066 | 6,094 | ||
| United States Treasury Note/Bond | 4.125% | 8/31/30 | 25,339 | 25,628 | ||
| United States Treasury Note/Bond | 4.625% | 9/30/30 | 23,163 | 24,104 | ||
| United States Treasury Note/Bond | 3.500% | 2/15/33 | 4,730 | 4,570 | ||
| United States Treasury Note/Bond | 3.875% | 8/15/33 | 5,559 | 5,528 | ||
| United States Treasury Note/Bond | 4.500% | 5/15/38 | 4,672 | 4,898 | ||
| United States Treasury Note/Bond | 4.500% | 8/15/39 | 32,320 | 33,719 | ||
| United States Treasury Note/Bond | 3.250% | 5/15/42 | 1,017 | 879 | ||
| United States Treasury Note/Bond | 3.375% | 8/15/42 | 2,454 | 2,157 | ||
| United States Treasury Note/Bond | 3.875% | 2/15/43 | 1,236 | 1,163 | ||
| United States Treasury Note/Bond | 3.875% | 5/15/43 | 20,640 | 19,395 | ||
| United States Treasury Note/Bond | 3.125% | 5/15/48 | 1,711 | 1,394 | ||
| United States Treasury Note/Bond | 3.375% | 11/15/48 | 382 | 325 | ||
| United States Treasury Note/Bond | 3.000% | 2/15/49 | 641 | 509 | ||
| Coupon | Maturity Date | Face Amount ($000) | Market Value• ($000) | |||
| United States Treasury Note/Bond | 3.625% | 5/15/53 | 115 | 103 | ||
| Total U.S. Government and Agency Obligations (Cost $1,238,793) | 1,246,236 | |||||
| Corporate Bonds (88.4%) | ||||||
| Communications (14.8%) | ||||||
| 3 | Altice Financing SA | 5.000% | 1/15/28 | 1,250 | 1,121 | |
| 3 | Altice Financing SA | 5.750% | 8/15/29 | 61,150 | 53,346 | |
| 3,4 | Altice France SA | 2.125% | 2/15/25 | 16,315 | 16,664 | |
| 3 | Altice France SA | 8.125% | 2/1/27 | 18,300 | 16,360 | |
| 3 | Altice France SA | 5.500% | 1/15/28 | 27,905 | 21,843 | |
| 3 | Altice France SA | 5.125% | 7/15/29 | 99,560 | 72,871 | |
| 3 | Altice France SA | 5.500% | 10/15/29 | 48,260 | 35,596 | |
| 3,4 | Banijay Entertainment SASU | 7.000% | 5/1/29 | 14,790 | 16,801 | |
| 3 | Banijay Entertainment SASU | 8.125% | 5/1/29 | 29,875 | 31,027 | |
| Belo Corp. | 7.750% | 6/1/27 | 24,745 | 25,358 | ||
| Belo Corp. | 7.250% | 9/15/27 | 11,942 | 12,098 | ||
| 3 | Cable One Inc. | 4.000% | 11/15/30 | 12,171 | 9,822 | |
| 3 | CCO Holdings LLC / CCO Holdings Capital Corp. | 5.500% | 5/1/26 | 47,125 | 46,678 | |
| 3 | CCO Holdings LLC / CCO Holdings Capital Corp. | 5.125% | 5/1/27 | 51,977 | 50,112 | |
| 3 | CCO Holdings LLC / CCO Holdings Capital Corp. | 5.000% | 2/1/28 | 8,150 | 7,691 | |
| 3 | CCO Holdings LLC / CCO Holdings Capital Corp. | 5.375% | 6/1/29 | 26,345 | 24,505 | |
| 3 | CCO Holdings LLC / CCO Holdings Capital Corp. | 6.375% | 9/1/29 | 40,000 | 38,930 | |
| 3 | CCO Holdings LLC / CCO Holdings Capital Corp. | 4.500% | 8/15/30 | 89,870 | 78,022 | |
| 3 | CCO Holdings LLC / CCO Holdings Capital Corp. | 4.250% | 2/1/31 | 78,165 | 65,871 | |
| 3 | CCO Holdings LLC / CCO Holdings Capital Corp. | 7.375% | 3/1/31 | 48,650 | 49,147 | |
| 3 | CCO Holdings LLC / CCO Holdings Capital Corp. | 4.750% | 2/1/32 | 4,325 | 3,709 | |
| CCO Holdings LLC / CCO Holdings Capital Corp. | 4.500% | 5/1/32 | 117,893 | 98,381 | ||
| 3 | CCO Holdings LLC / CCO Holdings Capital Corp. | 4.500% | 6/1/33 | 10,620 | 8,706 | |
| 3 | CCO Holdings LLC / CCO Holdings Capital Corp. | 4.250% | 1/15/34 | 27,600 | 21,982 | |
| 3 | Clear Channel Outdoor Holdings Inc. | 5.125% | 8/15/27 | 19,135 | 18,049 | |
| 3 | Clear Channel Outdoor Holdings Inc. | 9.000% | 9/15/28 | 44,850 | 46,835 | |
| 3 | CSC Holdings LLC | 5.500% | 4/15/27 | 19,220 | 17,257 | |
| 3 | CSC Holdings LLC | 11.250% | 5/15/28 | 7,475 | 7,578 | |
| 3 | CSC Holdings LLC | 11.750% | 1/31/29 | 22,880 | 23,233 | |
| 3 | CSC Holdings LLC | 5.750% | 1/15/30 | 2,455 | 1,301 | |
| 3 | CSC Holdings LLC | 4.125% | 12/1/30 | 74,628 | 54,066 | |
| 3 | CSC Holdings LLC | 4.625% | 12/1/30 | 3,348 | 1,729 | |
| 3 | CSC Holdings LLC | 3.375% | 2/15/31 | 71,240 | 48,764 | |
| 3 | CSC Holdings LLC | 4.500% | 11/15/31 | 94,190 | 67,597 | |
| 3 | CSC Holdings LLC | 5.000% | 11/15/31 | 26,470 | 13,368 | |
| 3 | Directv Financing LLC | 8.875% | 2/1/30 | 7,015 | 7,156 | |
| 3 | Directv Financing LLC / Directv Financing Co-Obligor Inc. | 5.875% | 8/15/27 | 29,060 | 27,608 | |
| DISH DBS Corp. | 5.875% | 11/15/24 | 26,100 | 24,277 | ||
| DISH DBS Corp. | 7.375% | 7/1/28 | 14,150 | 6,240 | ||
| 3 | DISH DBS Corp. | 5.750% | 12/1/28 | 23,512 | 15,837 | |
| 3 | DISH Network Corp. | 11.750% | 11/15/27 | 44,270 | 46,192 | |
| Embarq Corp. | 7.995% | 6/1/36 | 6,625 | 3,859 | ||
| 3 | Frontier Communications Holdings LLC | 5.875% | 10/15/27 | 16,240 | 15,619 | |
| 3 | Frontier Communications Holdings LLC | 5.000% | 5/1/28 | 126,099 | 116,390 | |
| 3 | Frontier Communications Holdings LLC | 6.750% | 5/1/29 | 13,467 | 11,920 | |
| Frontier Communications Holdings LLC | 5.875% | 11/1/29 | 42,213 | 35,829 | ||
| 3 | Frontier Communications Holdings LLC | 8.750% | 5/15/30 | 1,460 | 1,495 | |
| 3 | Frontier Communications Holdings LLC | 8.625% | 3/15/31 | 28,915 | 29,340 | |
| 3 | Go Daddy Operating Co. LLC / GD Finance Co. Inc. | 3.500% | 3/1/29 | 72,140 | 65,277 | |
| 3 | Iliad Holding SASU | 6.500% | 10/15/26 | 20,325 | 19,924 | |
| Coupon | Maturity Date | Face Amount ($000) | Market Value• ($000) | |||
| 3 | Iliad Holding SASU | 7.000% | 10/15/28 | 42,275 | 41,844 | |
| Lamar Media Corp. | 3.750% | 2/15/28 | 30,000 | 28,042 | ||
| Lamar Media Corp. | 4.875% | 1/15/29 | 2,920 | 2,825 | ||
| Lamar Media Corp. | 4.000% | 2/15/30 | 67,275 | 61,541 | ||
| Lamar Media Corp. | 3.625% | 1/15/31 | 59,108 | 51,901 | ||
| 3 | Level 3 Financing Inc. | 3.625% | 1/15/29 | 25,302 | 7,563 | |
| 3 | Level 3 Financing Inc. | 3.875% | 11/15/29 | 6,815 | 5,186 | |
| 3 | Level 3 Financing Inc. | 10.500% | 5/15/30 | 21,660 | 21,587 | |
| 3,4 | Lorca Telecom Bondco SA | 4.000% | 9/18/27 | 55,975 | 58,749 | |
| 3 | Match Group Holdings II LLC | 4.625% | 6/1/28 | 5,480 | 5,174 | |
| 3 | Match Group Holdings II LLC | 4.125% | 8/1/30 | 14,026 | 12,567 | |
| 3 | Match Group Holdings II LLC | 3.625% | 10/1/31 | 12,425 | 10,634 | |
| 3 | News Corp. | 3.875% | 5/15/29 | 33,192 | 30,500 | |
| 3 | Nexstar Media Inc. | 4.750% | 11/1/28 | 12,325 | 11,288 | |
| 3 | Outfront Media Capital LLC / Outfront Media Capital Corp. | 5.000% | 8/15/27 | 21,296 | 20,481 | |
| 3 | Outfront Media Capital LLC / Outfront Media Capital Corp. | 4.250% | 1/15/29 | 10,100 | 8,983 | |
| 3 | Outfront Media Capital LLC / Outfront Media Capital Corp. | 4.625% | 3/15/30 | 77,418 | 68,382 | |
| 3 | Outfront Media Capital LLC / Outfront Media Capital Corp. | 7.375% | 2/15/31 | 28,800 | 30,164 | |
| Paramount Global | 6.250% | 2/28/57 | 31,776 | 27,511 | ||
| Paramount Global | 6.375% | 3/30/62 | 33,700 | 30,078 | ||
| 3 | ROBLOX Corp. | 3.875% | 5/1/30 | 92,140 | 80,912 | |
| 3 | Scripps Escrow II Inc. | 3.875% | 1/15/29 | 47,785 | 41,487 | |
| 3 | Scripps Escrow II Inc. | 5.375% | 1/15/31 | 9,800 | 7,522 | |
| 3 | Scripps Escrow Inc. | 5.875% | 7/15/27 | 27,830 | 25,092 | |
| 3 | Sirius XM Radio Inc. | 3.125% | 9/1/26 | 12,245 | 11,444 | |
| 3 | Sirius XM Radio Inc. | 4.000% | 7/15/28 | 26,945 | 24,462 | |
| 3 | Sirius XM Radio Inc. | 4.125% | 7/1/30 | 46,385 | 40,586 | |
| 3 | Sirius XM Radio Inc. | 3.875% | 9/1/31 | 31,110 | 25,956 | |
| Sprint LLC | 7.125% | 6/15/24 | 35,947 | 36,108 | ||
| TEGNA Inc. | 4.625% | 3/15/28 | 14,555 | 13,593 | ||
| TEGNA Inc. | 5.000% | 9/15/29 | 48,200 | 44,512 | ||
| Telecom Italia Capital SA | 6.375% | 11/15/33 | 8,235 | 7,974 | ||
| Telecom Italia Capital SA | 6.000% | 9/30/34 | 22,450 | 21,038 | ||
| Telecom Italia Capital SA | 7.200% | 7/18/36 | 21,816 | 21,862 | ||
| Telecom Italia Capital SA | 7.721% | 6/4/38 | 22,295 | 23,017 | ||
| 3 | Telecom Italia SpA | 5.303% | 5/30/24 | 22,518 | 22,408 | |
| 3 | Telenet Finance Luxembourg Notes Sarl | 5.500% | 3/1/28 | 20,000 | 18,992 | |
| 3,4 | TMNL Holding BV | 3.750% | 1/15/29 | 33,365 | 33,908 | |
| 3 | Uber Technologies Inc. | 8.000% | 11/1/26 | 14,270 | 14,524 | |
| 3 | Uber Technologies Inc. | 7.500% | 9/15/27 | 12,020 | 12,323 | |
| 3 | Uber Technologies Inc. | 6.250% | 1/15/28 | 10,000 | 10,053 | |
| 3 | Uber Technologies Inc. | 4.500% | 8/15/29 | 48,425 | 45,899 | |
| 3 | Univision Communications Inc. | 8.000% | 8/15/28 | 39,125 | 39,783 | |
| 3 | Univision Communications Inc. | 4.500% | 5/1/29 | 1,810 | 1,611 | |
| 3 | Univision Communications Inc. | 7.375% | 6/30/30 | 5,045 | 4,946 | |
| 3 | UPC Broadband Finco BV | 4.875% | 7/15/31 | 67,944 | 59,666 | |
| 3 | UPC Holding BV | 5.500% | 1/15/28 | 87,652 | 83,816 | |
| 3 | Videotron Ltd. | 5.375% | 6/15/24 | 7,848 | 7,822 | |
| 5 | Videotron Ltd. | 5.625% | 6/15/25 | 9,725 | 7,229 | |
| 3 | Videotron Ltd. | 5.125% | 4/15/27 | 20,535 | 20,215 | |
| 3,5 | Videotron Ltd. | 3.625% | 6/15/28 | 97,435 | 67,326 | |
| 3 | Videotron Ltd. | 3.625% | 6/15/29 | 77,456 | 70,650 | |
| 3 | Virgin Media Finance plc | 5.000% | 7/15/30 | 2,758 | 2,452 | |
| 3 | Virgin Media Secured Finance plc | 5.500% | 5/15/29 | 43,280 | 41,652 | |
| 3 | Virgin Media Secured Finance plc | 4.500% | 8/15/30 | 42,595 | 38,044 | |
| Coupon | Maturity Date | Face Amount ($000) | Market Value• ($000) | |||
| 3,6 | Virgin Media Vendor Financing Notes III DAC | 4.875% | 7/15/28 | 37,010 | 42,712 | |
| 3 | Virgin Media Vendor Financing Notes IV DAC | 5.000% | 7/15/28 | 38,325 | 36,084 | |
| 3 | Vmed O2 UK Financing I plc | 4.250% | 1/31/31 | 94,695 | 82,676 | |
| 3 | VZ Secured Financing BV | 5.000% | 1/15/32 | 58,570 | 51,151 | |
| 3,4 | WMG Acquisition Corp. | 2.750% | 7/15/28 | 18,490 | 18,944 | |
| 3 | WMG Acquisition Corp. | 3.875% | 7/15/30 | 72,440 | 64,577 | |
| 3 | WMG Acquisition Corp. | 3.000% | 2/15/31 | 39,585 | 33,565 | |
| 3 | Ziggo BV | 4.875% | 1/15/30 | 66,840 | 59,768 | |
| 3,486,742 | ||||||
| Consumer Discretionary (15.9%) | ||||||
| 3 | 1011778 BC ULC / New Red Finance Inc. | 3.875% | 1/15/28 | 44,747 | 42,152 | |
| 3 | 1011778 BC ULC / New Red Finance Inc. | 4.375% | 1/15/28 | 8,000 | 7,627 | |
| 3 | 1011778 BC ULC / New Red Finance Inc. | 3.500% | 2/15/29 | 37,240 | 34,083 | |
| 3 | 1011778 BC ULC / New Red Finance Inc. | 4.000% | 10/15/30 | 133,629 | 119,389 | |
| 3 | Adient Global Holdings Ltd. | 4.875% | 8/15/26 | 14,507 | 14,139 | |
| American Axle & Manufacturing Inc. | 5.000% | 10/1/29 | 26,947 | 23,583 | ||
| 3 | American Builders & Contractors Supply Co. Inc. | 4.000% | 1/15/28 | 30,213 | 28,339 | |
| 3 | American Builders & Contractors Supply Co. Inc. | 3.875% | 11/15/29 | 53,730 | 47,874 | |
| Asbury Automotive Group Inc. | 4.500% | 3/1/28 | 22,880 | 21,534 | ||
| 3 | Asbury Automotive Group Inc. | 4.625% | 11/15/29 | 17,900 | 16,553 | |
| Asbury Automotive Group Inc. | 4.750% | 3/1/30 | 11,463 | 10,610 | ||
| 3 | Asbury Automotive Group Inc. | 5.000% | 2/15/32 | 26,865 | 24,267 | |
| 3 | Ashton Woods USA LLC / Ashton Woods Finance Co. | 6.625% | 1/15/28 | 3,335 | 3,302 | |
| 3 | Ashton Woods USA LLC / Ashton Woods Finance Co. | 4.625% | 8/1/29 | 5,580 | 5,078 | |
| 3 | Ashton Woods USA LLC / Ashton Woods Finance Co. | 4.625% | 4/1/30 | 34,479 | 31,200 | |
| Bath & Body Works Inc. | 6.694% | 1/15/27 | 17,487 | 17,734 | ||
| Bath & Body Works Inc. | 5.250% | 2/1/28 | 1,550 | 1,517 | ||
| 3 | Bath & Body Works Inc. | 6.625% | 10/1/30 | 34,950 | 35,419 | |
| Bath & Body Works Inc. | 6.875% | 11/1/35 | 5,565 | 5,565 | ||
| Bath & Body Works Inc. | 6.750% | 7/1/36 | 700 | 690 | ||
| 3 | Beacon Roofing Supply Inc. | 4.125% | 5/15/29 | 17,978 | 16,288 | |
| 3 | Beacon Roofing Supply Inc. | 6.500% | 8/1/30 | 14,745 | 14,967 | |
| Boyd Gaming Corp. | 4.750% | 12/1/27 | 121,735 | 117,540 | ||
| 3 | Boyd Gaming Corp. | 4.750% | 6/15/31 | 6,005 | 5,522 | |
| 3 | Boyne USA Inc. | 4.750% | 5/15/29 | 5,755 | 5,273 | |
| 3 | Builders FirstSource Inc. | 5.000% | 3/1/30 | 5,000 | 4,790 | |
| 3 | Builders FirstSource Inc. | 4.250% | 2/1/32 | 28,500 | 25,520 | |
| 3 | Caesars Entertainment Inc. | 6.250% | 7/1/25 | 108,325 | 108,849 | |
| 3 | Caesars Entertainment Inc. | 8.125% | 7/1/27 | 74,280 | 76,229 | |
| 3 | Caesars Entertainment Inc. | 4.625% | 10/15/29 | 41,390 | 37,797 | |
| 3 | Caesars Entertainment Inc. | 7.000% | 2/15/30 | 102,010 | 105,072 | |
| 3 | Caesars Entertainment Inc. | 6.500% | 2/15/32 | 22,105 | 22,323 | |
| 3 | Caesars Resort Collection LLC / CRC Finco Inc. | 5.750% | 7/1/25 | 53,882 | 53,968 | |
| 3 | Camelot Return Merger Sub Inc. | 8.750% | 8/1/28 | 8,770 | 9,007 | |
| 3 | Carnival Corp. | 7.625% | 3/1/26 | 14,950 | 15,177 | |
| 3 | Carnival Corp. | 5.750% | 3/1/27 | 22,955 | 22,611 | |
| 3 | Carnival Corp. | 9.875% | 8/1/27 | 10,645 | 11,173 | |
| 3 | Carnival Corp. | 4.000% | 8/1/28 | 105,830 | 97,996 | |
| 3 | Carnival Corp. | 6.000% | 5/1/29 | 107,092 | 103,678 | |
| 3 | Carnival Corp. | 7.000% | 8/15/29 | 10,405 | 10,826 | |
| 3 | Carnival Corp. | 10.500% | 6/1/30 | 41,275 | 45,216 | |
| 3 | Carnival Holdings Bermuda Ltd. | 10.375% | 5/1/28 | 27,818 | 30,459 | |
| Cedar Fair LP | 5.250% | 7/15/29 | 44,886 | 42,905 | ||
| 3 | Cedar Fair LP / Canada's Wonderland Co. / Magnum Management Corp. / Millennium Op | 5.500% | 5/1/25 | 10,480 | 10,461 | |
| Coupon | Maturity Date | Face Amount ($000) | Market Value• ($000) | |||
| Cedar Fair LP / Canada's Wonderland Co. / Magnum Management Corp. / Millennium Op | 5.375% | 4/15/27 | 19,805 | 19,614 | ||
| Century Communities Inc. | 6.750% | 6/1/27 | 9,993 | 10,066 | ||
| 3 | Century Communities Inc. | 3.875% | 8/15/29 | 34,362 | 30,935 | |
| 3 | Churchill Downs Inc. | 5.500% | 4/1/27 | 2,527 | 2,498 | |
| 3 | Churchill Downs Inc. | 4.750% | 1/15/28 | 11,690 | 11,142 | |
| 3 | Churchill Downs Inc. | 5.750% | 4/1/30 | 34,716 | 33,588 | |
| 3 | Churchill Downs Inc. | 6.750% | 5/1/31 | 4,860 | 4,926 | |
| 3 | Cinemark USA Inc. | 8.750% | 5/1/25 | 2,082 | 2,096 | |
| 3 | Cinemark USA Inc. | 5.875% | 3/15/26 | 7,325 | 7,254 | |
| 3 | Cinemark USA Inc. | 5.250% | 7/15/28 | 39,770 | 36,685 | |
| 3 | Clarios Global LP / Clarios US Finance Co. | 6.250% | 5/15/26 | 30,723 | 30,503 | |
| 3 | Clarios Global LP / Clarios US Finance Co. | 8.500% | 5/15/27 | 33,237 | 33,169 | |
| 3 | Clarios Global LP / Clarios US Finance Co. | 6.750% | 5/15/28 | 28,505 | 28,864 | |
| Dana Inc. | 5.625% | 6/15/28 | 3,718 | 3,628 | ||
| Dana Inc. | 4.500% | 2/15/32 | 3,215 | 2,760 | ||
| Ford Motor Co. | 4.346% | 12/8/26 | 2,205 | 2,154 | ||
| Ford Motor Co. | 9.625% | 4/22/30 | 2,271 | 2,664 | ||
| Ford Motor Co. | 3.250% | 2/12/32 | 30,290 | 25,085 | ||
| Ford Motor Credit Co. LLC | 4.134% | 8/4/25 | 9,450 | 9,232 | ||
| Ford Motor Credit Co. LLC | 3.375% | 11/13/25 | 9,945 | 9,545 | ||
| Ford Motor Credit Co. LLC | 4.389% | 1/8/26 | 4,800 | 4,679 | ||
| Ford Motor Credit Co. LLC | 6.950% | 3/6/26 | 15,000 | 15,337 | ||
| Ford Motor Credit Co. LLC | 2.700% | 8/10/26 | 42,825 | 39,809 | ||
| Ford Motor Credit Co. LLC | 2.900% | 2/16/28 | 2,880 | 2,592 | ||
| Ford Motor Credit Co. LLC | 6.800% | 5/12/28 | 19,222 | 19,955 | ||
| 3 | Gap Inc. | 3.625% | 10/1/29 | 21,580 | 18,481 | |
| 3 | Gap Inc. | 3.875% | 10/1/31 | 19,660 | 16,227 | |
| Goodyear Tire & Rubber Co. | 9.500% | 5/31/25 | 15,395 | 15,620 | ||
| Goodyear Tire & Rubber Co. | 4.875% | 3/15/27 | 2,460 | 2,371 | ||
| Goodyear Tire & Rubber Co. | 5.000% | 7/15/29 | 29,648 | 27,830 | ||
| Goodyear Tire & Rubber Co. | 5.250% | 4/30/31 | 2,420 | 2,204 | ||
| Goodyear Tire & Rubber Co. | 5.250% | 7/15/31 | 16,230 | 14,758 | ||
| Goodyear Tire & Rubber Co. | 5.625% | 4/30/33 | 3,475 | 3,145 | ||
| Griffon Corp. | 5.750% | 3/1/28 | 11,490 | 11,263 | ||
| 3 | Hanesbrands Inc. | 4.875% | 5/15/26 | 93,794 | 90,351 | |
| 3 | Hanesbrands Inc. | 9.000% | 2/15/31 | 28,680 | 28,912 | |
| 3 | Hilton Domestic Operating Co. Inc. | 5.750% | 5/1/28 | 9,746 | 9,756 | |
| 3 | Hilton Domestic Operating Co. Inc. | 3.750% | 5/1/29 | 13,415 | 12,318 | |
| KB Home | 4.800% | 11/15/29 | 15,825 | 14,931 | ||
| KB Home | 7.250% | 7/15/30 | 5,000 | 5,162 | ||
| KB Home | 4.000% | 6/15/31 | 38,745 | 34,259 | ||
| 3 | KFC Holding Co. / Pizza Hut Holdings LLC / Taco Bell of America LLC | 4.750% | 6/1/27 | 24,360 | 23,823 | |
| 3 | LCM Investments Holdings II LLC | 8.250% | 8/1/31 | 28,750 | 29,487 | |
| 3 | Light & Wonder International Inc. | 7.000% | 5/15/28 | 20,020 | 20,093 | |
| 3 | Lithia Motors Inc. | 4.625% | 12/15/27 | 66,275 | 63,512 | |
| 3 | Lithia Motors Inc. | 3.875% | 6/1/29 | 7,615 | 6,838 | |
| 3 | Lithia Motors Inc. | 4.375% | 1/15/31 | 22,880 | 20,498 | |
| 3 | Live Nation Entertainment Inc. | 4.875% | 11/1/24 | 14,775 | 14,697 | |
| 3 | Live Nation Entertainment Inc. | 3.750% | 1/15/28 | 8,085 | 7,468 | |
| 3 | Masonite International Corp. | 5.375% | 2/1/28 | 8,715 | 8,462 | |
| 3 | Mattel Inc. | 3.375% | 4/1/26 | 26,200 | 24,990 | |
| 3 | Mattel Inc. | 5.875% | 12/15/27 | 755 | 757 | |
| 3 | Melco Resorts Finance Ltd. | 4.875% | 6/6/25 | 16,555 | 16,138 | |
| 3 | Melco Resorts Finance Ltd. | 5.250% | 4/26/26 | 5,370 | 5,141 | |
| Coupon | Maturity Date | Face Amount ($000) | Market Value• ($000) | |||
| 3 | Merlin Entertainments Group US Holdings Inc. | 7.375% | 2/15/31 | 32,085 | 32,151 | |
| MGM Resorts International | 6.750% | 5/1/25 | 10,080 | 10,103 | ||
| MGM Resorts International | 5.750% | 6/15/25 | 55,431 | 55,489 | ||
| 3 | Michaels Cos. Inc. | 5.250% | 5/1/28 | 51,204 | 40,180 | |
| 3 | Michaels Cos. Inc. | 7.875% | 5/1/29 | 29,995 | 19,132 | |
| 3,4 | Motion Finco Sarl | 7.375% | 6/15/30 | 6,700 | 7,465 | |
| 3 | NCL Corp. Ltd. | 8.375% | 2/1/28 | 41,980 | 44,052 | |
| 3 | NCL Corp. Ltd. | 8.125% | 1/15/29 | 21,835 | 22,904 | |
| 3 | NCL Corp. Ltd. | 7.750% | 2/15/29 | 20,930 | 21,124 | |
| Newell Brands Inc. | 5.200% | 4/1/26 | 4,936 | 4,799 | ||
| Newell Brands Inc. | 6.375% | 9/15/27 | 42,972 | 42,297 | ||
| Newell Brands Inc. | 6.625% | 9/15/29 | 10,936 | 10,644 | ||
| 3 | Ontario Gaming GTA LP | 8.000% | 8/1/30 | 8,960 | 9,341 | |
| 3 | Openlane Inc. | 5.125% | 6/1/25 | 10,007 | 9,866 | |
| 3 | PetSmart Inc. / PetSmart Finance Corp. | 4.750% | 2/15/28 | 43,611 | 40,681 | |
| 3 | PetSmart Inc. / PetSmart Finance Corp. | 7.750% | 2/15/29 | 7,215 | 7,001 | |
| 3 | Royal Caribbean Cruises Ltd. | 4.250% | 7/1/26 | 11,360 | 10,915 | |
| 3 | Royal Caribbean Cruises Ltd. | 5.500% | 8/31/26 | 96,080 | 95,118 | |
| 3 | Royal Caribbean Cruises Ltd. | 5.375% | 7/15/27 | 19,070 | 18,755 | |
| 3 | Royal Caribbean Cruises Ltd. | 11.625% | 8/15/27 | 26,350 | 28,657 | |
| 3 | Royal Caribbean Cruises Ltd. | 5.500% | 4/1/28 | 24,065 | 23,720 | |
| 3 | Royal Caribbean Cruises Ltd. | 8.250% | 1/15/29 | 66,645 | 70,705 | |
| 3 | Royal Caribbean Cruises Ltd. | 9.250% | 1/15/29 | 5,030 | 5,409 | |
| 3 | Royal Caribbean Cruises Ltd. | 7.250% | 1/15/30 | 5,210 | 5,430 | |
| Sands China Ltd. | 5.375% | 8/8/25 | 25,700 | 25,423 | ||
| Sands China Ltd. | 5.650% | 8/8/28 | 11,350 | 11,173 | ||
| Sands China Ltd. | 3.500% | 8/8/31 | 5,455 | 4,538 | ||
| Service Corp. International | 4.625% | 12/15/27 | 20,770 | 20,140 | ||
| Service Corp. International | 5.125% | 6/1/29 | 44,190 | 43,220 | ||
| Service Corp. International | 3.375% | 8/15/30 | 28,585 | 24,915 | ||
| Service Corp. International | 4.000% | 5/15/31 | 67,405 | 59,950 | ||
| 3 | Speedway Motorsports LLC / Speedway Funding II Inc. | 4.875% | 11/1/27 | 38,311 | 36,342 | |
| Tapestry Inc. | 7.350% | 11/27/28 | 9,335 | 9,789 | ||
| Tapestry Inc. | 7.700% | 11/27/30 | 9,700 | 10,307 | ||
| Tapestry Inc. | 7.850% | 11/27/33 | 8,905 | 9,523 | ||
| 3 | Taylor Morrison Communities Inc. | 5.875% | 6/15/27 | 5,967 | 5,967 | |
| 3 | Taylor Morrison Communities Inc. | 5.125% | 8/1/30 | 23,777 | 22,710 | |
| 3 | Tempur Sealy International Inc. | 3.875% | 10/15/31 | 19,802 | 16,708 | |
| Under Armour Inc. | 3.250% | 6/15/26 | 42,005 | 39,460 | ||
| 3 | Viking Cruises Ltd. | 9.125% | 7/15/31 | 31,220 | 33,407 | |
| 3 | Wand NewCo 3 Inc. | 7.625% | 1/30/32 | 31,045 | 32,068 | |
| 3 | William Carter Co. | 5.625% | 3/15/27 | 12,968 | 12,778 | |
| 3 | Wynn Las Vegas LLC / Wynn Las Vegas Capital Corp. | 5.500% | 3/1/25 | 37,777 | 37,729 | |
| 3 | Wynn Las Vegas LLC / Wynn Las Vegas Capital Corp. | 5.250% | 5/15/27 | 30,990 | 30,299 | |
| 3 | Wynn Macau Ltd. | 5.500% | 1/15/26 | 15,750 | 15,275 | |
| 3 | Wynn Macau Ltd. | 5.500% | 10/1/27 | 12,800 | 12,030 | |
| 3 | Wynn Macau Ltd. | 5.125% | 12/15/29 | 57,836 | 51,422 | |
| 3 | Wynn Resorts Finance LLC / Wynn Resorts Capital Corp. | 5.125% | 10/1/29 | 2,872 | 2,718 | |
| 3 | Wynn Resorts Finance LLC / Wynn Resorts Capital Corp. | 7.125% | 2/15/31 | 38,525 | 39,738 | |
| 3 | Yum! Brands Inc. | 4.750% | 1/15/30 | 39,610 | 38,049 | |
| Yum! Brands Inc. | 3.625% | 3/15/31 | 55,732 | 49,299 | ||
| Yum! Brands Inc. | 4.625% | 1/31/32 | 18,090 | 16,768 | ||
| 3,770,257 | ||||||
| Coupon | Maturity Date | Face Amount ($000) | Market Value• ($000) | |||
| Consumer Staples (3.2%) | ||||||
| 3 | Albertsons Cos. Inc. / Safeway Inc. / New Albertsons LP / Albertsons LLC | 6.500% | 2/15/28 | 12,300 | 12,430 | |
| B&G Foods Inc. | 5.250% | 4/1/25 | 13,103 | 12,860 | ||
| B&G Foods Inc. | 5.250% | 9/15/27 | 47,340 | 42,690 | ||
| 3 | B&G Foods Inc. | 8.000% | 9/15/28 | 28,345 | 29,532 | |
| 3 | Coty Inc. | 5.000% | 4/15/26 | 1,293 | 1,269 | |
| 3 | Coty Inc. / HFC Prestige Products Inc. / HFC Prestige International US LLC | 4.750% | 1/15/29 | 4,755 | 4,536 | |
| 3 | Coty Inc. / HFC Prestige Products Inc. / HFC Prestige International US LLC | 6.625% | 7/15/30 | 25,020 | 25,566 | |
| 3,4 | Darling Global Finance BV | 3.625% | 5/15/26 | 12,945 | 13,896 | |
| 3 | Darling Ingredients Inc. | 5.250% | 4/15/27 | 12,745 | 12,524 | |
| 3 | Darling Ingredients Inc. | 6.000% | 6/15/30 | 13,430 | 13,346 | |
| 3 | Energizer Holdings Inc. | 4.750% | 6/15/28 | 58,571 | 54,502 | |
| 3 | Energizer Holdings Inc. | 4.375% | 3/31/29 | 76,351 | 68,990 | |
| 3 | Fiesta Purchaser Inc. | 7.875% | 3/1/31 | 1,545 | 1,545 | |
| 3,7 | KeHE Distributors LLC/KeHE Finance Corp. / NextWave Distribution Inc. | 9.000% | 2/15/29 | 12,675 | 12,800 | |
| 3 | Lamb Weston Holdings Inc. | 4.875% | 5/15/28 | 5,974 | 5,814 | |
| 3 | Lamb Weston Holdings Inc. | 4.125% | 1/31/30 | 11,413 | 10,417 | |
| 3 | Performance Food Group Inc. | 6.875% | 5/1/25 | 10,425 | 10,454 | |
| 3 | Performance Food Group Inc. | 5.500% | 10/15/27 | 90,660 | 88,608 | |
| 3 | Performance Food Group Inc. | 4.250% | 8/1/29 | 46,604 | 42,706 | |
| 3 | Post Holdings Inc. | 5.750% | 3/1/27 | 5,920 | 5,894 | |
| 3 | Post Holdings Inc. | 5.625% | 1/15/28 | 86,750 | 85,327 | |
| 3 | Post Holdings Inc. | 5.500% | 12/15/29 | 46,461 | 44,940 | |
| 3 | Post Holdings Inc. | 4.625% | 4/15/30 | 55,173 | 50,746 | |
| 3 | Post Holdings Inc. | 4.500% | 9/15/31 | 39,590 | 35,548 | |
| 3 | United Natural Foods Inc. | 6.750% | 10/15/28 | 21,527 | 18,092 | |
| 3 | US Foods Inc. | 6.875% | 9/15/28 | 2,254 | 2,313 | |
| 3 | US Foods Inc. | 4.750% | 2/15/29 | 3,395 | 3,221 | |
| 3 | US Foods Inc. | 4.625% | 6/1/30 | 23,863 | 22,237 | |
| 3 | US Foods Inc. | 7.250% | 1/15/32 | 19,181 | 20,091 | |
| 752,894 | ||||||
| Energy (10.7%) | ||||||
| 3 | Antero Midstream Partners LP / Antero Midstream Finance Corp. | 6.625% | 2/1/32 | 12,155 | 12,108 | |
| Apache Corp. | 4.875% | 11/15/27 | 33,110 | 31,876 | ||
| Apache Corp. | 4.375% | 10/15/28 | 2,625 | 2,480 | ||
| Apache Corp. | 4.250% | 1/15/30 | 8,425 | 7,844 | ||
| 3 | Baytex Energy Corp. | 8.500% | 4/30/30 | 6,740 | 6,994 | |
| 3 | Blue Racer Midstream LLC / Blue Racer Finance Corp. | 7.625% | 12/15/25 | 9,330 | 9,429 | |
| 3 | Blue Racer Midstream LLC / Blue Racer Finance Corp. | 6.625% | 7/15/26 | 11,960 | 11,914 | |
| Buckeye Partners LP | 4.350% | 10/15/24 | 4,850 | 4,772 | ||
| 3 | Buckeye Partners LP | 4.125% | 3/1/25 | 50,184 | 49,080 | |
| Buckeye Partners LP | 3.950% | 12/1/26 | 21,628 | 20,561 | ||
| Buckeye Partners LP | 4.125% | 12/1/27 | 23,220 | 22,012 | ||
| 3 | Buckeye Partners LP | 4.500% | 3/1/28 | 88,628 | 83,219 | |
| Buckeye Partners LP | 5.850% | 11/15/43 | 16,000 | 13,184 | ||
| 3 | Chesapeake Energy Corp. | 5.875% | 2/1/29 | 17,045 | 16,927 | |
| 3 | Chesapeake Energy Corp. | 6.750% | 4/15/29 | 21,240 | 21,481 | |
| 3 | Civitas Resources Inc. | 8.625% | 11/1/30 | 11,895 | 12,712 | |
| 3 | Civitas Resources Inc. | 8.750% | 7/1/31 | 27,370 | 29,180 | |
| 3 | CNX Resources Corp. | 6.000% | 1/15/29 | 6,825 | 6,595 | |
| 3 | CNX Resources Corp. | 7.375% | 1/15/31 | 16,440 | 16,688 | |
| Coupon | Maturity Date | Face Amount ($000) | Market Value• ($000) | |||
| Continental Resources Inc. | 4.375% | 1/15/28 | 21,625 | 20,994 | ||
| 3 | Continental Resources Inc. | 5.750% | 1/15/31 | 1,730 | 1,721 | |
| Continental Resources Inc. | 4.900% | 6/1/44 | 32,184 | 26,321 | ||
| 3 | CrownRock LP / CrownRock Finance Inc. | 5.625% | 10/15/25 | 14,908 | 14,859 | |
| 3 | Diamond Foreign Asset Co. / Diamond Finance LLC | 8.500% | 10/1/30 | 23,435 | 24,091 | |
| 3 | DT Midstream Inc. | 4.125% | 6/15/29 | 95,524 | 87,765 | |
| 3 | DT Midstream Inc. | 4.375% | 6/15/31 | 121,695 | 108,839 | |
| 3 | Enerflex Ltd. | 9.000% | 10/15/27 | 43,835 | 44,046 | |
| 3 | EnLink Midstream LLC | 5.625% | 1/15/28 | 27,875 | 27,604 | |
| EnLink Midstream LLC | 5.375% | 6/1/29 | 28,150 | 27,434 | ||
| 3 | EnLink Midstream LLC | 6.500% | 9/1/30 | 27,820 | 28,491 | |
| EnLink Midstream Partners LP | 4.150% | 6/1/25 | 27,661 | 27,073 | ||
| EnLink Midstream Partners LP | 4.850% | 7/15/26 | 27,144 | 26,637 | ||
| EnLink Midstream Partners LP | 5.050% | 4/1/45 | 34,405 | 28,342 | ||
| EnLink Midstream Partners LP | 5.450% | 6/1/47 | 25,380 | 22,246 | ||
| EQM Midstream Partners LP | 4.000% | 8/1/24 | 8,934 | 8,842 | ||
| 3 | EQM Midstream Partners LP | 6.000% | 7/1/25 | 51,523 | 51,523 | |
| EQM Midstream Partners LP | 4.125% | 12/1/26 | 11,328 | 10,915 | ||
| 3 | EQM Midstream Partners LP | 7.500% | 6/1/27 | 6,490 | 6,674 | |
| 3 | EQM Midstream Partners LP | 6.500% | 7/1/27 | 61,070 | 61,845 | |
| EQM Midstream Partners LP | 5.500% | 7/15/28 | 27,997 | 27,770 | ||
| 3 | EQM Midstream Partners LP | 4.500% | 1/15/29 | 34,140 | 32,218 | |
| 3 | EQM Midstream Partners LP | 7.500% | 6/1/30 | 3,860 | 4,140 | |
| 3 | EQM Midstream Partners LP | 4.750% | 1/15/31 | 90,662 | 84,597 | |
| Genesis Energy LP / Genesis Energy Finance Corp. | 8.250% | 1/15/29 | 16,695 | 17,149 | ||
| 3 | Hess Midstream Operations LP | 4.250% | 2/15/30 | 2,225 | 2,052 | |
| 3 | Kinetik Holdings LP | 6.625% | 12/15/28 | 15,190 | 15,411 | |
| 3 | Matador Resources Co. | 6.875% | 4/15/28 | 37,900 | 38,810 | |
| 3 | Nabors Industries Inc. | 9.125% | 1/31/30 | 37,125 | 37,843 | |
| 3 | NGL Energy Operating LLC / NGL Energy Finance Corp. | 8.375% | 2/15/32 | 8,285 | 8,348 | |
| 3 | Noble Finance II LLC | 8.000% | 4/15/30 | 61,580 | 63,964 | |
| Occidental Petroleum Corp. | 5.550% | 3/15/26 | 7,040 | 7,091 | ||
| Occidental Petroleum Corp. | 3.200% | 8/15/26 | 3,125 | 2,958 | ||
| Occidental Petroleum Corp. | 3.000% | 2/15/27 | 9,320 | 8,699 | ||
| Occidental Petroleum Corp. | 6.375% | 9/1/28 | 5,115 | 5,375 | ||
| Ovintiv Inc. | 7.200% | 11/1/31 | 2,757 | 3,011 | ||
| Ovintiv Inc. | 7.375% | 11/1/31 | 26,708 | 29,566 | ||
| Ovintiv Inc. | 6.500% | 8/15/34 | 10,685 | 11,393 | ||
| 3 | Permian Resources Operating LLC | 5.375% | 1/15/26 | 2,655 | 2,616 | |
| 3 | Permian Resources Operating LLC | 7.750% | 2/15/26 | 2,540 | 2,575 | |
| 3 | Permian Resources Operating LLC | 6.875% | 4/1/27 | 10,465 | 10,424 | |
| 3 | Permian Resources Operating LLC | 8.000% | 4/15/27 | 30,495 | 31,580 | |
| 3 | Permian Resources Operating LLC | 5.875% | 7/1/29 | 64,319 | 63,091 | |
| 3 | Permian Resources Operating LLC | 9.875% | 7/15/31 | 17,980 | 19,964 | |
| 3 | Permian Resources Operating LLC | 7.000% | 1/15/32 | 43,220 | 44,621 | |
| Range Resources Corp. | 8.250% | 1/15/29 | 31,447 | 32,675 | ||
| 3 | Range Resources Corp. | 4.750% | 2/15/30 | 56,221 | 52,326 | |
| 3 | Rockies Express Pipeline LLC | 4.950% | 7/15/29 | 4,050 | 3,891 | |
| 3 | Rockies Express Pipeline LLC | 4.800% | 5/15/30 | 3,250 | 3,048 | |
| 3 | Rockies Express Pipeline LLC | 7.500% | 7/15/38 | 4,100 | 4,149 | |
| 3 | Seadrill Finance Ltd. | 8.375% | 8/1/30 | 4,810 | 4,987 | |
| SM Energy Co. | 6.750% | 9/15/26 | 23,350 | 23,337 | ||
| SM Energy Co. | 6.625% | 1/15/27 | 1,295 | 1,292 | ||
| SM Energy Co. | 6.500% | 7/15/28 | 14,800 | 14,791 | ||
| Southwestern Energy Co. | 5.375% | 2/1/29 | 25,600 | 25,044 | ||
| Coupon | Maturity Date | Face Amount ($000) | Market Value• ($000) | |||
| Southwestern Energy Co. | 5.375% | 3/15/30 | 55,763 | 53,979 | ||
| Southwestern Energy Co. | 4.750% | 2/1/32 | 20,532 | 19,017 | ||
| Sunoco LP / Sunoco Finance Corp. | 6.000% | 4/15/27 | 60,590 | 60,577 | ||
| Sunoco LP / Sunoco Finance Corp. | 5.875% | 3/15/28 | 11,360 | 11,288 | ||
| 3 | Sunoco LP / Sunoco Finance Corp. | 7.000% | 9/15/28 | 9,705 | 9,935 | |
| Sunoco LP / Sunoco Finance Corp. | 4.500% | 5/15/29 | 32,920 | 30,701 | ||
| Sunoco LP / Sunoco Finance Corp. | 4.500% | 4/30/30 | 51,930 | 48,066 | ||
| 3 | Tallgrass Energy Partners LP / Tallgrass Energy Finance Corp. | 7.375% | 2/15/29 | 18,875 | 18,825 | |
| 3 | Transocean Inc. | 11.500% | 1/30/27 | 2,870 | 2,999 | |
| 3 | Transocean Inc. | 8.750% | 2/15/30 | 83,648 | 87,451 | |
| 3 | Transocean Titan Financing Ltd. | 8.375% | 2/1/28 | 12,422 | 12,843 | |
| 3 | Valaris Ltd. | 8.375% | 4/30/30 | 40,527 | 41,498 | |
| 3 | Venture Global Calcasieu Pass LLC | 3.875% | 8/15/29 | 62,200 | 55,565 | |
| 3 | Venture Global Calcasieu Pass LLC | 6.250% | 1/15/30 | 23,783 | 23,831 | |
| 3 | Venture Global Calcasieu Pass LLC | 4.125% | 8/15/31 | 49,305 | 43,647 | |
| 3 | Venture Global Calcasieu Pass LLC | 3.875% | 11/1/33 | 30,940 | 26,255 | |
| 3 | Venture Global LNG Inc. | 8.125% | 6/1/28 | 5,585 | 5,650 | |
| 3 | Venture Global LNG Inc. | 9.500% | 2/1/29 | 35,718 | 37,944 | |
| 3 | Venture Global LNG Inc. | 8.375% | 6/1/31 | 34,520 | 34,954 | |
| 3 | Venture Global LNG Inc. | 9.875% | 2/1/32 | 22,520 | 23,673 | |
| 3 | Viper Energy Inc. | 7.375% | 11/1/31 | 8,920 | 9,251 | |
| 3 | Weatherford International Ltd. | 8.625% | 4/30/30 | 55,350 | 56,626 | |
| Western Midstream Operating LP | 3.950% | 6/1/25 | 4,070 | 3,987 | ||
| Western Midstream Operating LP | 4.650% | 7/1/26 | 24,081 | 23,716 | ||
| Western Midstream Operating LP | 4.750% | 8/15/28 | 4,715 | 4,623 | ||
| Western Midstream Operating LP | 4.050% | 2/1/30 | 2,205 | 2,069 | ||
| Western Midstream Operating LP | 5.450% | 4/1/44 | 13,155 | 11,941 | ||
| 2,537,035 | ||||||
| Financials (7.1%) | ||||||
| 3 | Acrisure LLC / Acrisure Finance Inc. | 8.250% | 2/1/29 | 44,800 | 44,939 | |
| 3 | Acrisure LLC / Acrisure Finance Inc. | 4.250% | 2/15/29 | 85,650 | 76,902 | |
| 3 | Acrisure LLC / Acrisure Finance Inc. | 6.000% | 8/1/29 | 17,115 | 15,690 | |
| 3 | AerCap Global Aviation Trust | 6.500% | 6/15/45 | 125,005 | 124,901 | |
| 3 | Alliant Holdings Intermediate LLC / Alliant Holdings Co. | 6.750% | 4/15/28 | 38,525 | 38,875 | |
| 3 | Alliant Holdings Intermediate LLC / Alliant Holdings Co. | 7.000% | 1/15/31 | 13,825 | 13,994 | |
| 3 | Avolon Holdings Funding Ltd. | 5.250% | 5/15/24 | 50,695 | 50,624 | |
| 3 | Compass Group Diversified Holdings LLC | 5.250% | 4/15/29 | 13,305 | 12,675 | |
| 3 | Credit Acceptance Corp. | 9.250% | 12/15/28 | 35,110 | 36,966 | |
| 3 | Enact Holdings Inc. | 6.500% | 8/15/25 | 45,900 | 45,804 | |
| 3 | FirstCash Inc. | 4.625% | 9/1/28 | 18,915 | 17,684 | |
| 3 | FirstCash Inc. | 5.625% | 1/1/30 | 14,515 | 13,852 | |
| 3 | Freedom Mortgage Corp. | 7.625% | 5/1/26 | 12,095 | 12,045 | |
| 3 | Freedom Mortgage Corp. | 6.625% | 1/15/27 | 9,360 | 8,988 | |
| 3 | Freedom Mortgage Corp. | 12.000% | 10/1/28 | 30,500 | 33,462 | |
| 3 | Freedom Mortgage Corp. | 12.250% | 10/1/30 | 30,500 | 33,990 | |
| 3,7 | Freedom Mortgage Holdings LLC | 9.250% | 2/1/29 | 6,215 | 6,294 | |
| 3 | GGAM Finance Ltd. | 7.750% | 5/15/26 | 14,975 | 15,277 | |
| 3 | GGAM Finance Ltd. | 8.000% | 2/15/27 | 25,708 | 26,485 | |
| 3 | GGAM Finance Ltd. | 8.000% | 6/15/28 | 22,475 | 23,425 | |
| 3 | goeasy Ltd. | 4.375% | 5/1/26 | 29,748 | 28,383 | |
| 3 | goeasy Ltd. | 9.250% | 12/1/28 | 20,735 | 22,081 | |
| 3 | HUB International Ltd. | 5.625% | 12/1/29 | 19,965 | 18,830 | |
| 3 | HUB International Ltd. | 7.250% | 6/15/30 | 80,600 | 82,846 | |
| 3 | HUB International Ltd. | 7.375% | 1/31/32 | 30,610 | 31,312 | |
| Coupon | Maturity Date | Face Amount ($000) | Market Value• ($000) | |||
| 3 | Intesa Sanpaolo SpA | 5.017% | 6/26/24 | 27,090 | 26,926 | |
| 3 | Intesa Sanpaolo SpA | 5.710% | 1/15/26 | 53,100 | 52,940 | |
| 3 | Ladder Capital Finance Holdings LLLP / Ladder Capital Finance Corp. | 5.250% | 10/1/25 | 1,953 | 1,920 | |
| 3 | Ladder Capital Finance Holdings LLLP / Ladder Capital Finance Corp. | 4.250% | 2/1/27 | 14,704 | 13,621 | |
| 3 | Ladder Capital Finance Holdings LLLP / Ladder Capital Finance Corp. | 4.750% | 6/15/29 | 30,140 | 26,975 | |
| 3 | Macquarie Airfinance Holdings Ltd. | 8.125% | 3/30/29 | 17,035 | 17,677 | |
| MGIC Investment Corp. | 5.250% | 8/15/28 | 14,730 | 14,341 | ||
| 3 | Nationstar Mortgage Holdings Inc. | 5.500% | 8/15/28 | 22,500 | 21,419 | |
| 3 | Nationstar Mortgage Holdings Inc. | 5.125% | 12/15/30 | 82,619 | 74,392 | |
| 3 | Nationstar Mortgage Holdings Inc. | 5.750% | 11/15/31 | 36,298 | 33,492 | |
| 3 | Nationstar Mortgage Holdings Inc. | 7.125% | 2/1/32 | 35,060 | 34,801 | |
| Navient Corp. | 5.875% | 10/25/24 | 3,725 | 3,719 | ||
| Navient Corp. | 6.750% | 6/15/26 | 910 | 915 | ||
| Navient Corp. | 4.875% | 3/15/28 | 9,301 | 8,456 | ||
| Navient Corp. | 5.500% | 3/15/29 | 48,340 | 43,685 | ||
| Navient Corp. | 9.375% | 7/25/30 | 8,885 | 9,266 | ||
| Navient Corp. | 5.625% | 8/1/33 | 6,576 | 5,227 | ||
| OneMain Finance Corp. | 7.125% | 3/15/26 | 99,246 | 100,573 | ||
| OneMain Finance Corp. | 3.500% | 1/15/27 | 20,735 | 19,038 | ||
| OneMain Finance Corp. | 3.875% | 9/15/28 | 36,560 | 32,062 | ||
| OneMain Finance Corp. | 9.000% | 1/15/29 | 43,654 | 45,971 | ||
| OneMain Finance Corp. | 7.875% | 3/15/30 | 3,778 | 3,838 | ||
| OneMain Finance Corp. | 4.000% | 9/15/30 | 28,880 | 24,414 | ||
| 3 | Park Aerospace Holdings Ltd. | 5.500% | 2/15/24 | 4,970 | 4,971 | |
| 3 | PennyMac Financial Services Inc. | 5.375% | 10/15/25 | 38,913 | 38,365 | |
| 3 | PennyMac Financial Services Inc. | 4.250% | 2/15/29 | 30,140 | 27,336 | |
| 3 | PennyMac Financial Services Inc. | 7.875% | 12/15/29 | 17,180 | 17,727 | |
| 3 | PennyMac Financial Services Inc. | 5.750% | 9/15/31 | 3,885 | 3,603 | |
| Radian Group Inc. | 4.500% | 10/1/24 | 45,300 | 44,704 | ||
| Radian Group Inc. | 6.625% | 3/15/25 | 3,250 | 3,260 | ||
| Radian Group Inc. | 4.875% | 3/15/27 | 22,275 | 21,721 | ||
| 3 | Rocket Mortgage LLC / Rocket Mortgage Co-Issuer Inc. | 2.875% | 10/15/26 | 1,945 | 1,803 | |
| 3 | Rocket Mortgage LLC / Rocket Mortgage Co-Issuer Inc. | 3.625% | 3/1/29 | 6,810 | 6,069 | |
| 3 | Rocket Mortgage LLC / Rocket Mortgage Co-Issuer Inc. | 3.875% | 3/1/31 | 13,055 | 11,459 | |
| 3 | Rocket Mortgage LLC / Rocket Mortgage Co-Issuer Inc. | 4.000% | 10/15/33 | 975 | 827 | |
| 3 | United Wholesale Mortgage LLC | 5.500% | 11/15/25 | 17,200 | 16,976 | |
| 3 | United Wholesale Mortgage LLC | 5.750% | 6/15/27 | 24,350 | 23,899 | |
| 3 | United Wholesale Mortgage LLC | 5.500% | 4/15/29 | 4,720 | 4,461 | |
| 3 | USI Inc. | 7.500% | 1/15/32 | 6,225 | 6,331 | |
| 1,685,504 | ||||||
| Health Care (8.3%) | ||||||
| 3 | Acadia Healthcare Co. Inc. | 5.500% | 7/1/28 | 26,060 | 25,570 | |
| 3 | Acadia Healthcare Co. Inc. | 5.000% | 4/15/29 | 23,232 | 22,255 | |
| 3,4 | Avantor Funding Inc. | 2.625% | 11/1/25 | 69,885 | 73,769 | |
| 3 | Avantor Funding Inc. | 4.625% | 7/15/28 | 50,815 | 48,406 | |
| 3 | Avantor Funding Inc. | 3.875% | 11/1/29 | 4,230 | 3,837 | |
| 3 | Bausch & Lomb Escrow Corp. | 8.375% | 10/1/28 | 54,655 | 56,879 | |
| 3 | Bausch Health Cos. Inc. | 5.500% | 11/1/25 | 19,675 | 18,071 | |
| 3 | Catalent Pharma Solutions Inc. | 5.000% | 7/15/27 | 24,770 | 23,889 | |
| 3,4 | Catalent Pharma Solutions Inc. | 2.375% | 3/1/28 | 45,735 | 43,833 | |
| 3 | Catalent Pharma Solutions Inc. | 3.125% | 2/15/29 | 19,369 | 17,028 | |
| 3 | Catalent Pharma Solutions Inc. | 3.500% | 4/1/30 | 44,752 | 39,324 | |
| Coupon | Maturity Date | Face Amount ($000) | Market Value• ($000) | |||
| 3 | Charles River Laboratories International Inc. | 4.250% | 5/1/28 | 16,625 | 15,707 | |
| 3 | Charles River Laboratories International Inc. | 3.750% | 3/15/29 | 12,415 | 11,315 | |
| 3 | Charles River Laboratories International Inc. | 4.000% | 3/15/31 | 9,500 | 8,443 | |
| 3 | CHS/Community Health Systems Inc. | 8.000% | 3/15/26 | 22,142 | 21,799 | |
| 3 | CHS/Community Health Systems Inc. | 5.625% | 3/15/27 | 85,570 | 79,235 | |
| 3 | CHS/Community Health Systems Inc. | 8.000% | 12/15/27 | 2,925 | 2,876 | |
| 3 | CHS/Community Health Systems Inc. | 6.000% | 1/15/29 | 19,614 | 17,721 | |
| 3 | CHS/Community Health Systems Inc. | 5.250% | 5/15/30 | 29,280 | 24,305 | |
| 3 | CHS/Community Health Systems Inc. | 4.750% | 2/15/31 | 27,345 | 21,809 | |
| 3 | CHS/Community Health Systems Inc. | 10.875% | 1/15/32 | 30,175 | 31,679 | |
| 3 | DaVita Inc. | 3.750% | 2/15/31 | 34,490 | 28,406 | |
| 3 | Fortrea Holdings Inc. | 7.500% | 7/1/30 | 9,193 | 9,345 | |
| 3,4 | Grifols SA | 2.250% | 11/15/27 | 42,955 | 42,152 | |
| 3,4 | Grifols SA | 3.875% | 10/15/28 | 7,650 | 6,976 | |
| 3 | Grifols SA | 4.750% | 10/15/28 | 29,995 | 25,745 | |
| HCA Inc. | 5.875% | 2/15/26 | 2,245 | 2,266 | ||
| HCA Inc. | 5.875% | 2/1/29 | 16,720 | 17,238 | ||
| HCA Inc. | 3.500% | 9/1/30 | 15,355 | 13,926 | ||
| 3 | Hologic Inc. | 3.250% | 2/15/29 | 45,365 | 40,771 | |
| 3 | IQVIA Inc. | 5.000% | 10/15/26 | 44,808 | 43,931 | |
| 3 | IQVIA Inc. | 5.000% | 5/15/27 | 86,257 | 84,349 | |
| 3,4 | IQVIA Inc. | 2.250% | 1/15/28 | 36,995 | 37,298 | |
| 3,4 | IQVIA Inc. | 2.875% | 6/15/28 | 51,395 | 52,616 | |
| 3 | IQVIA Inc. | 6.250% | 2/1/29 | 24,500 | 25,532 | |
| 3 | IQVIA Inc. | 6.500% | 5/15/30 | 9,536 | 9,724 | |
| 3 | Jazz Securities DAC | 4.375% | 1/15/29 | 22,850 | 21,098 | |
| 3 | LifePoint Health Inc. | 11.000% | 10/15/30 | 17,536 | 18,658 | |
| 3 | Medline Borrower LP | 3.875% | 4/1/29 | 148,808 | 134,749 | |
| 3 | Medline Borrower LP | 5.250% | 10/1/29 | 77,159 | 71,950 | |
| 3 | Organon & Co. / Organon Foreign Debt Co.-Issuer BV | 4.125% | 4/30/28 | 96,986 | 88,611 | |
| 3 | Organon & Co. / Organon Foreign Debt Co.-Issuer BV | 5.125% | 4/30/31 | 86,890 | 74,718 | |
| 3 | Owens & Minor Inc. | 4.500% | 3/31/29 | 16,645 | 14,679 | |
| 3 | Owens & Minor Inc. | 6.625% | 4/1/30 | 45,354 | 43,229 | |
| 3 | Prestige Brands Inc. | 5.125% | 1/15/28 | 18,350 | 17,951 | |
| 3 | Prestige Brands Inc. | 3.750% | 4/1/31 | 5,398 | 4,700 | |
| 3 | Star Parent Inc. | 9.000% | 10/1/30 | 16,872 | 17,735 | |
| 3 | Teleflex Inc. | 4.250% | 6/1/28 | 34,312 | 32,526 | |
| Tenet Healthcare Corp. | 4.875% | 1/1/26 | 13,025 | 12,908 | ||
| Tenet Healthcare Corp. | 5.125% | 11/1/27 | 8,670 | 8,428 | ||
| Tenet Healthcare Corp. | 4.625% | 6/15/28 | 14,205 | 13,471 | ||
| Tenet Healthcare Corp. | 6.125% | 10/1/28 | 39,180 | 38,788 | ||
| Tenet Healthcare Corp. | 4.250% | 6/1/29 | 10,405 | 9,645 | ||
| Tenet Healthcare Corp. | 4.375% | 1/15/30 | 27,970 | 25,857 | ||
| Tenet Healthcare Corp. | 6.125% | 6/15/30 | 56,250 | 56,257 | ||
| 3 | Tenet Healthcare Corp. | 6.750% | 5/15/31 | 58,115 | 59,476 | |
| Teva Pharmaceutical Finance Netherlands III BV | 3.150% | 10/1/26 | 45,030 | 42,012 | ||
| Teva Pharmaceutical Finance Netherlands III BV | 4.750% | 5/9/27 | 8,850 | 8,547 | ||
| Teva Pharmaceutical Finance Netherlands III BV | 6.750% | 3/1/28 | 35,135 | 36,005 | ||
| Teva Pharmaceutical Finance Netherlands III BV | 5.125% | 5/9/29 | 15,195 | 14,651 | ||
| Teva Pharmaceutical Finance Netherlands III BV | 7.875% | 9/15/29 | 13,128 | 14,163 | ||
| Teva Pharmaceutical Finance Netherlands III BV | 8.125% | 9/15/31 | 22,096 | 24,312 | ||
| Teva Pharmaceutical Finance Netherlands III BV | 4.100% | 10/1/46 | 6,145 | 4,179 | ||
| 1,957,328 | ||||||
| Coupon | Maturity Date | Face Amount ($000) | Market Value• ($000) | |||
| Industrials (8.7%) | ||||||
| 3 | Air Canada | 3.875% | 8/15/26 | 45,780 | 43,543 | |
| 3 | Allison Transmission Inc. | 5.875% | 6/1/29 | 2,340 | 2,326 | |
| 3 | Allison Transmission Inc. | 3.750% | 1/30/31 | 1,461 | 1,278 | |
| 3 | American Airlines Inc. | 7.250% | 2/15/28 | 10,312 | 10,474 | |
| 3 | American Airlines Inc. | 8.500% | 5/15/29 | 11,148 | 11,812 | |
| 3 | American Airlines Inc. / AAdvantage Loyalty IP Ltd. | 5.500% | 4/20/26 | 22,290 | 22,069 | |
| 3,8 | American Airlines Inc. / AAdvantage Loyalty IP Ltd. | 5.750% | 4/20/29 | 32,172 | 31,610 | |
| 3 | Aramark Services Inc. | 5.000% | 4/1/25 | 65,663 | 65,233 | |
| 3 | Aramark Services Inc. | 5.000% | 2/1/28 | 44,167 | 42,643 | |
| 3 | Bombardier Inc. | 8.750% | 11/15/30 | 11,350 | 11,933 | |
| 3 | BWX Technologies Inc. | 4.125% | 6/30/28 | 29,906 | 28,057 | |
| 3 | BWX Technologies Inc. | 4.125% | 4/15/29 | 48,969 | 45,347 | |
| 3 | Chart Industries Inc. | 7.500% | 1/1/30 | 6,290 | 6,473 | |
| 3 | Chart Industries Inc. | 9.500% | 1/1/31 | 8,690 | 9,282 | |
| 3 | Clean Harbors Inc. | 4.875% | 7/15/27 | 48,605 | 47,126 | |
| 3 | Clean Harbors Inc. | 5.125% | 7/15/29 | 25,851 | 24,707 | |
| 3 | Clean Harbors Inc. | 6.375% | 2/1/31 | 20,716 | 20,983 | |
| 3 | Covanta Holding Corp. | 4.875% | 12/1/29 | 46,025 | 39,772 | |
| Delta Air Lines Inc. | 3.750% | 10/28/29 | 5,335 | 4,901 | ||
| 3 | Emerald Debt Merger Sub LLC | 6.625% | 12/15/30 | 121,477 | 122,681 | |
| 3 | First Student Bidco Inc. / First Transit Parent Inc. | 4.000% | 7/31/29 | 83,972 | 73,941 | |
| 3 | Garda World Security Corp. | 7.750% | 2/15/28 | 3,670 | 3,743 | |
| 3 | Gates Global LLC / Gates Corp. | 6.250% | 1/15/26 | 23,814 | 23,808 | |
| 3 | Hawaiian Brand Intellectual Property Ltd. / HawaiianMiles Loyalty Ltd. | 5.750% | 1/20/26 | 78,010 | 73,301 | |
| 3 | Herc Holdings Inc. | 5.500% | 7/15/27 | 148,472 | 145,769 | |
| 3 | Husky Injection Molding Systems Ltd. / Titan Co.-Borrower LLC | 9.000% | 2/15/29 | 5,263 | 5,263 | |
| 4 | Loxam SAS | 2.875% | 4/15/26 | 19,380 | 20,244 | |
| 4 | Loxam SAS | 3.750% | 7/15/26 | 14,790 | 15,767 | |
| 3 | Mileage Plus Holdings LLC / Mileage Plus Intellectual Property Assets Ltd. | 6.500% | 6/20/27 | 7,121 | 7,139 | |
| 3 | Mueller Water Products Inc. | 4.000% | 6/15/29 | 2,375 | 2,164 | |
| 3,4 | Q-Park Holding I BV | 1.500% | 3/1/25 | 27,330 | 28,981 | |
| 3,4 | Q-Park Holding I BV | 2.000% | 3/1/27 | 26,765 | 27,033 | |
| 3,4 | Q-Park Holding I BV | 5.125% | 3/1/29 | 19,705 | 21,331 | |
| 3 | Roller Bearing Co. of America Inc. | 4.375% | 10/15/29 | 9,610 | 8,831 | |
| 3 | Rolls-Royce plc | 3.625% | 10/14/25 | 24,995 | 24,094 | |
| 3 | Rolls-Royce plc | 5.750% | 10/15/27 | 39,450 | 39,380 | |
| 3 | Sensata Technologies BV | 5.000% | 10/1/25 | 45,100 | 44,682 | |
| 3 | Sensata Technologies Inc. | 4.375% | 2/15/30 | 4,875 | 4,494 | |
| 3 | Sensata Technologies Inc. | 3.750% | 2/15/31 | 23,500 | 20,448 | |
| Spirit AeroSystems Inc. | 3.850% | 6/15/26 | 1,960 | 1,855 | ||
| 3 | Spirit AeroSystems Inc. | 9.375% | 11/30/29 | 54,451 | 59,002 | |
| 3 | Spirit AeroSystems Inc. | 9.750% | 11/15/30 | 47,980 | 50,329 | |
| 3,4 | TK Elevator Midco GmbH | 4.375% | 7/15/27 | 20,249 | 21,292 | |
| 3 | TK Elevator US Newco Inc. | 5.250% | 7/15/27 | 35,331 | 34,080 | |
| 3 | TopBuild Corp. | 3.625% | 3/15/29 | 1,940 | 1,762 | |
| 3 | TopBuild Corp. | 4.125% | 2/15/32 | 9,025 | 7,922 | |
| 3 | TransDigm Inc. | 6.250% | 3/15/26 | 75,260 | 74,852 | |
| TransDigm Inc. | 5.500% | 11/15/27 | 16,970 | 16,538 | ||
| 3 | TransDigm Inc. | 6.750% | 8/15/28 | 98,530 | 100,110 | |
| TransDigm Inc. | 4.625% | 1/15/29 | 72,866 | 68,047 | ||
| TransDigm Inc. | 4.875% | 5/1/29 | 16,188 | 15,156 | ||
| 3 | TransDigm Inc. | 6.875% | 12/15/30 | 41,280 | 42,414 | |
| Coupon | Maturity Date | Face Amount ($000) | Market Value• ($000) | |||
| 3 | TransDigm Inc. | 7.125% | 12/1/31 | 37,160 | 38,738 | |
| 3 | Triumph Group Inc. | 9.000% | 3/15/28 | 20,348 | 21,488 | |
| 3 | United Airlines Inc. | 4.375% | 4/15/26 | 29,626 | 28,605 | |
| 3 | United Airlines Inc. | 4.625% | 4/15/29 | 32,680 | 30,271 | |
| 8 | United Airlines Pass Through Trust Class A Series 2020-1 | 5.875% | 4/15/29 | 17,322 | 17,415 | |
| United Rentals North America Inc. | 5.500% | 5/15/27 | 27,616 | 27,550 | ||
| United Rentals North America Inc. | 4.875% | 1/15/28 | 58,416 | 57,007 | ||
| United Rentals North America Inc. | 5.250% | 1/15/30 | 5,110 | 5,020 | ||
| United Rentals North America Inc. | 4.000% | 7/15/30 | 35,560 | 32,527 | ||
| United Rentals North America Inc. | 3.875% | 2/15/31 | 37,979 | 34,260 | ||
| United Rentals North America Inc. | 3.750% | 1/15/32 | 39,400 | 34,674 | ||
| 3 | WESCO Distribution Inc. | 7.125% | 6/15/25 | 9,630 | 9,681 | |
| 3 | Williams Scotsman Inc. | 4.625% | 8/15/28 | 12,035 | 11,349 | |
| 3 | Williams Scotsman Inc. | 7.375% | 10/1/31 | 20,315 | 21,286 | |
| 2,045,893 | ||||||
| Materials (8.9%) | ||||||
| 3 | Advanced Drainage Systems Inc. | 5.000% | 9/30/27 | 2,435 | 2,356 | |
| 3 | Advanced Drainage Systems Inc. | 6.375% | 6/15/30 | 18,336 | 18,474 | |
| 3 | Ardagh Metal Packaging Finance USA LLC / Ardagh Metal Packaging Finance plc | 3.250% | 9/1/28 | 26,400 | 23,107 | |
| 3 | Ardagh Metal Packaging Finance USA LLC / Ardagh Metal Packaging Finance plc | 4.000% | 9/1/29 | 47,902 | 38,953 | |
| 3 | Ardagh Packaging Finance plc / Ardagh Holdings USA Inc. | 5.250% | 4/30/25 | 6,300 | 6,160 | |
| 3 | Ardagh Packaging Finance plc / Ardagh Holdings USA Inc. | 4.125% | 8/15/26 | 41,525 | 37,339 | |
| 3 | Ardagh Packaging Finance plc / Ardagh Holdings USA Inc. | 5.250% | 8/15/27 | 18,333 | 13,753 | |
| 3 | Ardagh Packaging Finance plc / Ardagh Holdings USA Inc. | 5.250% | 8/15/27 | 57,582 | 43,070 | |
| 3 | Arsenal AIC Parent LLC | 8.000% | 10/1/30 | 28,940 | 30,274 | |
| 3 | ASP Unifrax Holdings Inc. | 5.250% | 9/30/28 | 3,330 | 2,161 | |
| ATI Inc. | 7.250% | 8/15/30 | 30,100 | 31,021 | ||
| 3 | Avient Corp. | 7.125% | 8/1/30 | 47,805 | 49,085 | |
| 3 | Axalta Coating Systems Dutch Holding B BV | 7.250% | 2/15/31 | 25,430 | 26,472 | |
| 3 | Axalta Coating Systems LLC | 3.375% | 2/15/29 | 54,059 | 48,045 | |
| Ball Corp. | 5.250% | 7/1/25 | 15,590 | 15,550 | ||
| Ball Corp. | 4.875% | 3/15/26 | 25,000 | 24,721 | ||
| 4 | Ball Corp. | 1.500% | 3/15/27 | 68,205 | 68,664 | |
| Ball Corp. | 6.875% | 3/15/28 | 24,045 | 24,818 | ||
| Ball Corp. | 6.000% | 6/15/29 | 26,845 | 27,090 | ||
| Ball Corp. | 2.875% | 8/15/30 | 13,655 | 11,674 | ||
| Ball Corp. | 3.125% | 9/15/31 | 975 | 825 | ||
| 3 | Berry Global Inc. | 4.500% | 2/15/26 | 52,709 | 51,304 | |
| 3 | Berry Global Inc. | 4.875% | 7/15/26 | 22,330 | 21,973 | |
| 3 | Berry Global Inc. | 5.625% | 7/15/27 | 6,575 | 6,510 | |
| 3 | Canpack SA / Canpack US LLC | 3.125% | 11/1/25 | 8,385 | 8,000 | |
| 3 | Canpack SA / Canpack US LLC | 3.875% | 11/15/29 | 12,200 | 10,746 | |
| Celanese US Holdings LLC | 6.350% | 11/15/28 | 14,950 | 15,572 | ||
| Celanese US Holdings LLC | 6.550% | 11/15/30 | 15,025 | 15,888 | ||
| Celanese US Holdings LLC | 6.700% | 11/15/33 | 15,100 | 16,220 | ||
| Chemours Co. | 5.375% | 5/15/27 | 25,240 | 24,532 | ||
| 3 | Chemours Co. | 5.750% | 11/15/28 | 25,435 | 24,038 | |
| 3 | Chemours Co. | 4.625% | 11/15/29 | 38,721 | 33,869 | |
| 3 | Cleveland-Cliffs Inc. | 6.750% | 3/15/26 | 24,153 | 24,264 | |
| 3 | Clydesdale Acquisition Holdings Inc. | 6.625% | 4/15/29 | 24,725 | 24,609 | |
| 3 | Clydesdale Acquisition Holdings Inc. | 8.750% | 4/15/30 | 11,210 | 10,652 | |
| Commercial Metals Co. | 4.125% | 1/15/30 | 8,740 | 7,967 | ||
| Commercial Metals Co. | 3.875% | 2/15/31 | 2,885 | 2,541 | ||
| Coupon | Maturity Date | Face Amount ($000) | Market Value• ($000) | |||
| Commercial Metals Co. | 4.375% | 3/15/32 | 19,045 | 17,002 | ||
| 3 | Constellium SE | 5.875% | 2/15/26 | 10,026 | 9,961 | |
| 3 | Constellium SE | 5.625% | 6/15/28 | 22,629 | 22,134 | |
| 3 | Constellium SE | 3.750% | 4/15/29 | 36,000 | 32,423 | |
| Crown Americas LLC | 5.250% | 4/1/30 | 25,415 | 24,612 | ||
| Crown Americas LLC / Crown Americas Capital Corp. V | 4.250% | 9/30/26 | 10,184 | 9,835 | ||
| Crown Americas LLC / Crown Americas Capital Corp. VI | 4.750% | 2/1/26 | 12,455 | 12,216 | ||
| 3,4 | Crown European Holdings SA | 2.875% | 2/1/26 | 31,200 | 32,881 | |
| 3 | Element Solutions Inc. | 3.875% | 9/1/28 | 42,212 | 38,603 | |
| 3 | FMG Resources August 2006 Pty Ltd. | 5.875% | 4/15/30 | 21,375 | 21,160 | |
| 3 | FMG Resources August 2006 Pty Ltd. | 4.375% | 4/1/31 | 33,653 | 30,343 | |
| 3 | FMG Resources August 2006 Pty Ltd. | 6.125% | 4/15/32 | 21,227 | 20,994 | |
| Graphic Packaging International LLC | 4.125% | 8/15/24 | 18,940 | 18,760 | ||
| 3 | Graphic Packaging International LLC | 4.750% | 7/15/27 | 7,870 | 7,652 | |
| 3 | Graphic Packaging International LLC | 3.500% | 3/15/28 | 71,362 | 66,326 | |
| 3 | Graphic Packaging International LLC | 3.500% | 3/1/29 | 10,705 | 9,669 | |
| 3 | Graphic Packaging International LLC | 3.750% | 2/1/30 | 15,803 | 14,166 | |
| 3 | Hudbay Minerals Inc. | 6.125% | 4/1/29 | 30,156 | 29,742 | |
| 3 | Kaiser Aluminum Corp. | 4.625% | 3/1/28 | 11,598 | 10,684 | |
| 3 | Kaiser Aluminum Corp. | 4.500% | 6/1/31 | 11,879 | 10,152 | |
| 3 | NOVA Chemicals Corp. | 5.250% | 6/1/27 | 29,979 | 27,893 | |
| 3 | NOVA Chemicals Corp. | 8.500% | 11/15/28 | 15,590 | 16,338 | |
| 3 | NOVA Chemicals Corp. | 4.250% | 5/15/29 | 4,855 | 4,084 | |
| 3 | Novelis Corp. | 3.250% | 11/15/26 | 30,210 | 28,284 | |
| 3 | Novelis Corp. | 4.750% | 1/30/30 | 46,755 | 43,376 | |
| 3 | Novelis Corp. | 3.875% | 8/15/31 | 47,047 | 40,835 | |
| 3 | OCI NV | 4.625% | 10/15/25 | 22,514 | 22,024 | |
| Olin Corp. | 5.125% | 9/15/27 | 3,635 | 3,535 | ||
| 3 | Olympus Water US Holding Corp. | 7.125% | 10/1/27 | 11,505 | 11,584 | |
| 3 | Olympus Water US Holding Corp. | 4.250% | 10/1/28 | 22,793 | 20,797 | |
| 3 | Olympus Water US Holding Corp. | 9.750% | 11/15/28 | 41,620 | 44,147 | |
| 3 | Olympus Water US Holding Corp. | 6.250% | 10/1/29 | 4,875 | 4,498 | |
| 3 | Owens-Brockway Glass Container Inc. | 6.375% | 8/15/25 | 42,000 | 42,029 | |
| 3 | Owens-Brockway Glass Container Inc. | 6.625% | 5/13/27 | 26,440 | 26,439 | |
| 3 | Owens-Brockway Glass Container Inc. | 7.250% | 5/15/31 | 14,265 | 14,378 | |
| 3 | Pactiv Evergreen Group Issuer Inc./Pactiv Evergreen Group Issuer LLC | 4.000% | 10/15/27 | 15,475 | 14,438 | |
| 3 | Pactiv Evergreen Group Issuer LLC / Pactiv Evergreen Group Issuer Inc. | 4.375% | 10/15/28 | 4,765 | 4,446 | |
| 3 | Sealed Air Corp. | 4.000% | 12/1/27 | 6,025 | 5,636 | |
| 3 | Sealed Air Corp. | 6.125% | 2/1/28 | 9,285 | 9,330 | |
| 3 | Sealed Air Corp. | 5.000% | 4/15/29 | 13,129 | 12,659 | |
| 3 | Sealed Air Corp. | 7.250% | 2/15/31 | 9,415 | 9,859 | |
| 3 | Sealed Air Corp. | 6.875% | 7/15/33 | 3,745 | 3,908 | |
| Silgan Holdings Inc. | 4.125% | 2/1/28 | 8,800 | 8,275 | ||
| 4 | Silgan Holdings Inc. | 2.250% | 6/1/28 | 43,070 | 42,255 | |
| 3 | SNF Group SACA | 3.125% | 3/15/27 | 16,729 | 15,477 | |
| 3 | Standard Industries Inc. | 5.000% | 2/15/27 | 14,735 | 14,313 | |
| 3 | Standard Industries Inc. | 4.750% | 1/15/28 | 31,779 | 30,385 | |
| 3 | Standard Industries Inc. | 4.375% | 7/15/30 | 53,906 | 48,987 | |
| 3 | Standard Industries Inc. | 3.375% | 1/15/31 | 72,685 | 61,737 | |
| 3 | Summit Materials LLC / Summit Materials Finance Corp. | 7.250% | 1/15/31 | 5,515 | 5,731 | |
| 3,4 | Trivium Packaging Finance BV | 3.750% | 8/15/26 | 16,095 | 16,907 | |
| 3 | Trivium Packaging Finance BV | 5.500% | 8/15/26 | 62,555 | 61,069 | |
| 3 | Trivium Packaging Finance BV | 8.500% | 8/15/27 | 9,078 | 8,878 | |
| 3 | Tronox Inc. | 4.625% | 3/15/29 | 44,100 | 38,944 | |
| Coupon | Maturity Date | Face Amount ($000) | Market Value• ($000) | |||
| 3 | Windsor Holdings III LLC | 8.500% | 6/15/30 | 29,775 | 30,675 | |
| 3 | WR Grace Holdings LLC | 5.625% | 8/15/29 | 18,763 | 16,551 | |
| 3 | WR Grace Holdings LLC | 7.375% | 3/1/31 | 13,718 | 13,963 | |
| 2,106,276 | ||||||
| Real Estate (1.4%) | ||||||
| 3 | Cushman & Wakefield US Borrower LLC | 8.875% | 9/1/31 | 22,130 | 23,209 | |
| 3 | Greystar Real Estate Partners LLC | 7.750% | 9/1/30 | 8,685 | 9,248 | |
| 3 | Iron Mountain Inc. | 4.875% | 9/15/27 | 36,420 | 35,234 | |
| 3 | Iron Mountain Inc. | 5.250% | 3/15/28 | 910 | 882 | |
| 3 | Iron Mountain Inc. | 7.000% | 2/15/29 | 37,900 | 38,753 | |
| 3 | Iron Mountain Inc. | 4.875% | 9/15/29 | 58,106 | 54,321 | |
| 3 | Iron Mountain Inc. | 5.250% | 7/15/30 | 29,500 | 27,823 | |
| 3 | Iron Mountain Inc. | 4.500% | 2/15/31 | 11,180 | 10,038 | |
| 3 | Iron Mountain Inc. | 5.625% | 7/15/32 | 7,825 | 7,354 | |
| 3 | Iron Mountain Information Management Services Inc. | 5.000% | 7/15/32 | 429 | 387 | |
| MPT Operating Partnership LP / MPT Finance Corp. | 4.625% | 8/1/29 | 25,640 | 17,345 | ||
| MPT Operating Partnership LP / MPT Finance Corp. | 3.500% | 3/15/31 | 17,340 | 10,665 | ||
| SBA Communications Corp. | 3.875% | 2/15/27 | 11,065 | 10,549 | ||
| SBA Communications Corp. | 3.125% | 2/1/29 | 10,805 | 9,629 | ||
| 3 | VICI Properties LP / VICI Note Co. Inc. | 5.625% | 5/1/24 | 1,900 | 1,898 | |
| 3 | VICI Properties LP / VICI Note Co. Inc. | 4.250% | 12/1/26 | 54,073 | 52,125 | |
| 3 | VICI Properties LP / VICI Note Co. Inc. | 3.750% | 2/15/27 | 9,724 | 9,207 | |
| 3 | VICI Properties LP / VICI Note Co. Inc. | 4.625% | 12/1/29 | 14,375 | 13,601 | |
| 332,268 | ||||||
| Technology (7.1%) | ||||||
| 3 | AthenaHealth Group Inc. | 6.500% | 2/15/30 | 74,058 | 66,258 | |
| 3 | Black Knight InfoServ LLC | 3.625% | 9/1/28 | 51,266 | 48,502 | |
| Block Inc. | 2.750% | 6/1/26 | 55,353 | 51,796 | ||
| Block Inc. | 3.500% | 6/1/31 | 8,280 | 7,134 | ||
| CDW LLC / CDW Finance Corp. | 4.250% | 4/1/28 | 23,899 | 22,917 | ||
| CDW LLC / CDW Finance Corp. | 3.250% | 2/15/29 | 27,159 | 24,626 | ||
| 3 | Central Parent LLC / CDK Global II LLC/CDK Financing Co. Inc. | 8.000% | 6/15/29 | 14,345 | 14,889 | |
| 3 | Cloud Software Group Inc. | 6.500% | 3/31/29 | 10,940 | 10,215 | |
| 3 | Cloud Software Group Inc. | 9.000% | 9/30/29 | 10,335 | 9,783 | |
| 3 | Coherent Corp. | 5.000% | 12/15/29 | 61,155 | 57,247 | |
| 3 | CommScope Inc. | 7.125% | 7/1/28 | 14,055 | 6,101 | |
| 3 | CommScope Technologies LLC | 6.000% | 6/15/25 | 6,315 | 5,021 | |
| 3 | CommScope Technologies LLC | 5.000% | 3/15/27 | 3,880 | 1,430 | |
| 3 | Entegris Escrow Corp. | 4.750% | 4/15/29 | 42,480 | 40,621 | |
| 3 | Entegris Escrow Corp. | 5.950% | 6/15/30 | 16,995 | 16,780 | |
| 3 | Entegris Inc. | 4.375% | 4/15/28 | 61,825 | 58,791 | |
| 3 | Entegris Inc. | 3.625% | 5/1/29 | 18,735 | 16,891 | |
| 3 | Fair Isaac Corp. | 4.000% | 6/15/28 | 32,367 | 30,078 | |
| 3 | Gartner Inc. | 3.625% | 6/15/29 | 4,725 | 4,294 | |
| 3 | Gartner Inc. | 3.750% | 10/1/30 | 9,028 | 8,088 | |
| 3 | Gen Digital Inc. | 5.000% | 4/15/25 | 107,805 | 107,207 | |
| 3 | GTCR W-2 Merger Sub LLC | 7.500% | 1/15/31 | 48,475 | 50,506 | |
| 3 | Imola Merger Corp. | 4.750% | 5/15/29 | 210,017 | 195,558 | |
| 3 | McAfee Corp. | 7.375% | 2/15/30 | 76,397 | 69,213 | |
| 3 | MSCI Inc. | 4.000% | 11/15/29 | 24,320 | 22,597 | |
| 3 | MSCI Inc. | 3.625% | 9/1/30 | 6,790 | 6,094 | |
| 3 | MSCI Inc. | 3.625% | 11/1/31 | 840 | 738 | |
| 3 | NCR Atleos Corp. | 9.500% | 4/1/29 | 36,210 | 38,850 | |
| Nokia of America Corp. | 6.500% | 1/15/28 | 56,315 | 54,380 | ||
| Coupon | Maturity Date | Face Amount ($000) | Market Value• ($000) | |||
| Nokia of America Corp. | 6.450% | 3/15/29 | 88,747 | 87,060 | ||
| Nokia OYJ | 6.625% | 5/15/39 | 7,573 | 7,441 | ||
| 3 | Open Text Corp. | 3.875% | 2/15/28 | 61,342 | 56,978 | |
| 3 | Open Text Corp. | 3.875% | 12/1/29 | 31,195 | 28,154 | |
| 3 | Open Text Holdings Inc. | 4.125% | 2/15/30 | 63,245 | 57,246 | |
| 3 | Open Text Holdings Inc. | 4.125% | 12/1/31 | 28,055 | 24,819 | |
| 3 | Presidio Holdings Inc. | 4.875% | 2/1/27 | 83,750 | 81,226 | |
| 3 | Presidio Holdings Inc. | 8.250% | 2/1/28 | 10,000 | 9,913 | |
| 3 | PTC Inc. | 3.625% | 2/15/25 | 15,330 | 15,036 | |
| 3 | PTC Inc. | 4.000% | 2/15/28 | 12,620 | 11,912 | |
| 3 | Seagate HDD Cayman | 8.250% | 12/15/29 | 8,056 | 8,671 | |
| 3 | Seagate HDD Cayman | 8.500% | 7/15/31 | 6,279 | 6,823 | |
| 3 | SS&C Technologies Inc. | 5.500% | 9/30/27 | 139,816 | 137,239 | |
| 3 | UKG Inc. | 6.875% | 2/1/31 | 90,845 | 91,907 | |
| Western Digital Corp. | 4.750% | 2/15/26 | 16,371 | 15,945 | ||
| Western Digital Corp. | 2.850% | 2/1/29 | 3,105 | 2,658 | ||
| 1,689,633 | ||||||
| Utilities (2.3%) | ||||||
| AmeriGas Partners LP / AmeriGas Finance Corp. | 5.500% | 5/20/25 | 31,676 | 31,138 | ||
| AmeriGas Partners LP / AmeriGas Finance Corp. | 5.875% | 8/20/26 | 57,552 | 55,644 | ||
| AmeriGas Partners LP / AmeriGas Finance Corp. | 5.750% | 5/20/27 | 34,064 | 32,643 | ||
| 3 | AmeriGas Partners LP / AmeriGas Finance Corp. | 9.375% | 6/1/28 | 35,790 | 36,783 | |
| 3 | Calpine Corp. | 4.500% | 2/15/28 | 14,600 | 13,889 | |
| 3 | Calpine Corp. | 5.125% | 3/15/28 | 17,300 | 16,535 | |
| 3 | Calpine Corp. | 4.625% | 2/1/29 | 6,270 | 5,793 | |
| 3 | Clearway Energy Operating LLC | 4.750% | 3/15/28 | 18,731 | 17,843 | |
| 3 | Clearway Energy Operating LLC | 3.750% | 2/15/31 | 90,235 | 78,324 | |
| 3 | Clearway Energy Operating LLC | 3.750% | 1/15/32 | 19,426 | 16,516 | |
| FirstEnergy Corp. | 4.150% | 7/15/27 | 1,315 | 1,265 | ||
| 3 | NextEra Energy Operating Partners LP | 4.250% | 7/15/24 | 34,699 | 34,351 | |
| 3 | NextEra Energy Operating Partners LP | 4.250% | 9/15/24 | 3,532 | 3,417 | |
| 3 | NextEra Energy Operating Partners LP | 3.875% | 10/15/26 | 71,250 | 67,485 | |
| 3 | NextEra Energy Operating Partners LP | 4.500% | 9/15/27 | 14,960 | 14,097 | |
| 3 | NextEra Energy Operating Partners LP | 7.250% | 1/15/29 | 33,650 | 34,656 | |
| 3 | Suburban Propane Partners LP / Suburban Energy Finance Corp. | 5.000% | 6/1/31 | 12,970 | 11,657 | |
| 3 | Vistra Operations Co. LLC | 5.625% | 2/15/27 | 10,829 | 10,678 | |
| 3 | Vistra Operations Co. LLC | 4.375% | 5/1/29 | 23,069 | 21,305 | |
| 3 | Vistra Operations Co. LLC | 7.750% | 10/15/31 | 30,253 | 31,435 | |
| 535,454 | ||||||
| Total Corporate Bonds (Cost $21,540,680) | 20,899,284 | |||||
| Floating Rate Loan Interests (2.7%) | ||||||
| 9 | American Airlines Inc. Term Loan, TSFR3M + 4.750% | 10.329% | 4/20/28 | 27,440 | 28,076 | |
| 9 | Arsenal AIC Parent LLC Term Loan, TSFR1M + 4.500% | 9.833% | 8/18/30 | 8,608 | 8,606 | |
| 9 | Asurion LLC Term Loan B-11, TSFR1M + 4.250% | 9.683% | 8/19/28 | 12,789 | 12,634 | |
| 9 | Athenahealth Group Inc. Term Loan B, TSFR1M + 3.250% | 8.583% | 2/15/29 | 27,897 | 27,462 | |
| 9 | Bausch & Lomb Corp. Term Loan, TSFR1M + 3.250% | 8.683% | 5/10/27 | 17,415 | 17,004 | |
| 9 | Brown Group Holding LLC Term Loan B, TSFR1M + 2.750% | 8.183% | 6/7/28 | 20,560 | 20,402 | |
| 9 | Chemours Co. Term Loan B, TSFR1M + 3.500% | 8.833% | 8/18/28 | 10,855 | 10,811 | |
| 9 | Cloud Software Group Inc. Term Loan B, TSFR3M + 4.500% | 9.948% | 3/30/29 | 37,941 | 37,179 | |
| 9 | CommScope Inc. Term Loan B, TSFR1M + 3.250% | 8.697% | 4/6/26 | 11,365 | 9,908 | |
| Coupon | Maturity Date | Face Amount ($000) | Market Value• ($000) | |||
| 9 | Cushman & Wakefield US Borrower LLC Term Loan B, TSFR1M + 4.000% | 9.333% | 1/31/30 | 13,685 | 13,565 | |
| 9 | DirecTV Financing LLC Term Loan, TSFR3M + 5.000% | 10.650% | 8/2/27 | 1,505 | 1,503 | |
| 9 | Dun & Bradstreet Corp. Term Loan B, TSFR1M + 2.750% | 8.085% | 2/6/26 | 52,984 | 52,961 | |
| 9 | First Student Bidco Inc. Term Loan B, TSFR3M + 3.000% | 8.610% | 7/21/28 | 17,319 | 17,071 | |
| 9 | First Student Bidco Inc. Term Loan C, TSFR3M + 3.000% | 8.360% | 7/21/28 | 5,242 | 5,167 | |
| 9 | GTCR W Merger Sub LLC Term Loan B, TSFR3M + 3.000% | 8.333% | 9/20/30 | 17,830 | 17,801 | |
| 9 | HUB International Ltd. Term Loan B, TSFR1M + 4.250% | 9.587% | 6/20/30 | 25,986 | 25,984 | |
| 9 | HUB International Ltd. Term Loan B, TSFR3M + 3.250% | 8.574% | 6/20/30 | 7,092 | 7,089 | |
| 9 | IRB Holding Corp. Term Loan B, TSFR3M + 2.750% | 8.074% | 12/15/27 | 44,502 | 44,411 | |
| 9 | McAfee LLC Term Loan B, TSFR1M + 3.750% | 9.203% | 3/1/29 | 35,860 | 35,412 | |
| 9 | Medline Borrower LP Term Loan B, TSFR1M + 3.000% | 8.451% | 10/23/28 | 55,539 | 55,440 | |
| 9 | Mileage Plus Holdings LLC Term Loan B, TSFR3M + 5.250% | 10.770% | 6/21/27 | 23,442 | 24,134 | |
| 9 | NCR Atleos LLC Term Loan B, TSFR1M + 4.750% | 10.087% | 3/27/29 | 13,100 | 13,080 | |
| 9 | NorthRiver Midstream Finance LP Term Loan B, TSFR3M + 3.000% | 8.330% | 8/16/30 | 16,134 | 16,112 | |
| 9 | Peraton Corp. Term Loan B, TSFR1M + 3.750% | 9.183% | 2/1/28 | 16,384 | 16,345 | |
| 9 | PetSmart LLC Term Loan B, TSFR1M + 3.750% | 9.183% | 2/29/24 | 4,975 | 4,946 | |
| 9 | SBA Senior Finance II LLC Term Loan B, TSFR1M + 2.000% | 7.340% | 1/25/31 | 21,183 | 21,130 | |
| 9 | SkyMiles IP Ltd. Term Loan B, TSFR3M + 3.750% | 9.068% | 10/20/27 | 28,856 | 29,483 | |
| 9 | SS&C Technologies Inc. Term Loan B-5, TSFR1M + 1.750% | 7.197% | 4/16/25 | 21,245 | 21,249 | |
| 9 | Star Parent Inc. Term Loan B, TSFR3M + 4.000% | 9.348% | 9/27/30 | 5,400 | 5,269 | |
| 9 | Trans Union LLC Term Loan B-6, TSFR1M + 2.250% | 7.701% | 12/1/28 | 11,233 | 11,221 | |
| 9 | Trans Union LLC Term Loan, TSFR1M + 2.000% | 7.323% | 2/29/24 | 15,040 | 14,946 | |
| 9 | Wand NewCo 3, Inc. Term Loan, TSFR1M + 2.000% | 7.323% | 2/29/24 | 24,725 | 24,733 | |
| Total Floating Rate Loan Interests (Cost $647,906) | 651,134 | |||||
| Shares | ||||||
| Temporary Cash Investments (3.3%) | ||||||
| Money Market Fund (0.6%) | ||||||
| 10 | Vanguard Market Liquidity Fund | 5.410% | 1,521,019 | 152,087 | ||
| Maturity Date | Face Amount ($000) | |||||
| Repurchase Agreements (2.0%) | ||||||
| Bank of America Securities, LLC (Dated 1/31/24, Repurchase Value $68,110,000, collateralized by Fannie Mae 2.000%–6.000%, 11/1/28–7/1/53, Freddie Mac 2.500%–5.500%, 1/1/39–10/1/52, and Ginnie Mae 3.000%–5.000%, 1/15/42–12/20/51, with a value of $69,462,000) | 5.320% | 2/1/24 | 68,100 | 68,100 | ||
| Credit Agricole Securities Inc. (Dated 1/31/24, Repurchase Value $104,315,000, collateralized by U.S. Treasury Note/Bond 4.000%, 1/31/31, with a value of $106,386,000) | 5.300% | 2/1/24 | 104,300 | 104,300 | ||
| JP Morgan Securities LLC (Dated 1/31/24, Repurchase Value $ 26,004,000, collateralized by U.S. Treasury Note/Bond 0.500%–4.750%, 2/29/24–11/15/53, with a value of $26,520,000) | 5.310% | 2/1/24 | 26,000 | 26,000 | ||
| Coupon | Maturity Date | Face Amount ($000) | Market Value• ($000) | |||
| JP Morgan Securities LLC (Dated 1/31/24, Repurchase Value $103,915,000, collateralized by U.S. Treasury Note/Bond 2.750%, 5/15/25, with a value of $105,978,000) | 5.300% | 2/1/24 | 103,900 | 103,900 | ||
| RBC Capital Markets LLC (Dated 1/31/24, Repurchase Value $83,712,000, collateralized by U.S. Treasury Bill 0.000%, 2/6/24–2/13/24, with a value of $85,374,000) | 5.310% | 2/1/24 | 83,700 | 83,700 | ||
| TD Securities (USA) LLC (Dated 1/31/24, Repurchase Value $83,412,000, collateralized by Ginnie Mae 3.500%–8.000%, 4/20/44–1/20/54, with a value of $85,068,000) | 5.310% | 2/1/24 | 83,400 | 83,400 | ||
| 469,400 | ||||||
| U.S. Government and Agency Obligations (0.7%) | ||||||
| United States Treasury Bill | 5.097% | 4/11/24 | 156,375 | 154,786 | ||
| Total Temporary Cash Investments (Cost $776,273) | 776,273 | |||||
| Total Investments (99.7%) (Cost $24,203,652) | 23,572,927 | |||||
| Other Assets and Liabilities—Net (0.3%) | 60,467 | |||||
| Net Assets (100%) | 23,633,394 | |||||
| Cost is in $000. | ||||||
| • | See Note A in Notes to Financial Statements. |
| 1 | Securities with a value of $59,894,000 have been segregated as initial margin for open centrally cleared swap contracts. |
| 2 | Securities with a value of $5,259,000 have been segregated as initial margin for open futures contracts. |
| 3 | Security exempt from registration under Rule 144A of the Securities Act of 1933. Such securities may be sold in transactions exempt from registration, normally to qualified institutional buyers. At January 31, 2024, the aggregate value was $16,549,423,000, representing 70.0% of net assets. |
| 4 | Face amount denominated in euro. |
| 5 | Face amount denominated in Canadian dollars. |
| 6 | Face amount denominated in British pounds. |
| 7 | Includes securities purchased on a when-issued or delayed-delivery basis for which the fund has not taken delivery as of January 31, 2024. |
| 8 | The average or expected maturity is shorter than the final maturity shown because of the possibility of interim principal payments and prepayments or the possibility of the issue being called. |
| 9 | Variable-rate security; rate shown is effective rate at period end. Certain variable-rate securities are not based on a published reference rate and spread but are determined by the issuer or agent based on current market conditions. |
| 10 | Affiliated money market fund available only to Vanguard funds and certain trusts and accounts managed by Vanguard. Rate shown is the 7-day yield. |
| DAC—Designated Activity Company. | |
| TSFR1M—CME Term Secured Overnight Financing Rate 1-Month. | |
| TSFR3M—CME Term Secured Overnight Financing Rate 3-Month. |
| Futures Contracts | ||||
| ($000) | ||||
| Expiration | Number of Long (Short) Contracts | Notional Amount | Value and Unrealized Appreciation (Depreciation) | |
| Long Futures Contracts | ||||
| 2-Year U.S. Treasury Note | March 2024 | 1,021 | 209,975 | 534 |
| 5-Year U.S. Treasury Note | March 2024 | 1,715 | 185,890 | 788 |
| 10-Year U.S. Treasury Note | March 2024 | 152 | 17,074 | 89 |
| Ultra 10-Year U.S. Treasury Note | March 2024 | 595 | 69,541 | 1,576 |
| Ultra Long U.S. Treasury Bond | March 2024 | 86 | 11,113 | 245 |
| 3,232 | ||||
| Short Futures Contracts | ||||
| 2-Year U.S. Treasury Note | March 2024 | (394) | (81,029) | (101) |
| 10-Year U.S. Treasury Note | March 2024 | (2,783) | (312,609) | (7,551) |
| Long U.S. Treasury Bond | March 2024 | (51) | (6,240) | (192) |
| Ultra Long U.S. Treasury Bond | March 2024 | (5) | (646) | (15) |
| (7,859) | ||||
| (4,627) | ||||
| Forward Currency Contracts | |||||||
| Contract Settlement Date | Contract Amount (000) | Unrealized Appreciation ($000) | Unrealized Depreciation ($000) | ||||
| Counterparty | Receive | Deliver | |||||
| JPMorgan Chase Bank, N.A. | 2/29/24 | USD | 79,692 | CAD | 107,251 | — | (112) |
| Toronto-Dominion Bank | 2/29/24 | USD | 728,834 | EUR | 671,883 | 1,791 | — |
| Barclays Bank plc | 2/29/24 | USD | 48,165 | GBP | 37,919 | 99 | — |
| 1,890 | (112) | ||||||
| CAD—Canadian dollar. |
| EUR—euro. |
| GBP—British pound. |
| USD—U.S. dollar. |
| Centrally Cleared Credit Default Swaps | ||||||
| Reference Entity | Termination Date | Notional Amount (000) | Periodic Premium Received (Paid)1 (%) | Value ($000) | Unrealized Appreciation (Depreciation) ($000) | |
| Credit Protection Sold | ||||||
| CDX-NA-HY-S41-V2 | 12/21/28 | USD | 788,391 | 5.000 | 49,906 | 47,037 |
| 1 Periodic premium received/paid quarterly. |
| USD—U.S. dollar. |
| ($000s, except shares, footnotes, and per-share amounts) | Amount |
| Assets | |
| Investments in Securities, at Value | |
| Unaffiliated Issuers (Cost $24,051,574) | 23,420,840 |
| Affiliated Issuers (Cost $152,078) | 152,087 |
| Total Investments in Securities | 23,572,927 |
| Investment in Vanguard | 751 |
| Cash | 615 |
| Foreign Currency, at Value (Cost $3) | 3 |
| Receivables for Investment Securities Sold | 88,367 |
| Receivables for Accrued Income | 322,207 |
| Receivables for Capital Shares Issued | 16,549 |
| Unrealized Appreciation—Forward Currency Contracts | 1,890 |
| Total Assets | 24,003,309 |
| Liabilities | |
| Payables for Investment Securities Purchased | 315,037 |
| Payables to Investment Advisor | 1,218 |
| Payables for Capital Shares Redeemed | 23,676 |
| Payables for Distributions | 23,338 |
| Payables to Vanguard | 1,164 |
| Variation Margin Payable—Futures Contracts | 453 |
| Unrealized Depreciation—Forward Currency Contracts | 112 |
| Variation Margin Payable—Centrally Cleared Swap Contracts | 4,917 |
| Total Liabilities | 369,915 |
| Net Assets | 23,633,394 |
| Statement of Assets and Liabilities (continued) | |
| At January 31, 2024, net assets consisted of: | |
| ($000s, except shares, footnotes, and per-share amounts) | Amount |
| Paid-in Capital | 26,266,831 |
| Total Distributable Earnings (Loss) | (2,633,437) |
| Net Assets | 23,633,394 |
| Investor Shares—Net Assets | |
| Applicable to 569,687,701 outstanding $.001 par value shares of beneficial interest (unlimited authorization) | 3,067,742 |
| Net Asset Value Per Share—Investor Shares | $5.38 |
| Admiral Shares—Net Assets | |
| Applicable to 3,819,092,674 outstanding $.001 par value shares of beneficial interest (unlimited authorization) | 20,565,652 |
| Net Asset Value Per Share—Admiral Shares | $5.38 |
| Year Ended January 31, 2024 | |
| ($000) | |
| Investment Income | |
| Income | |
| Interest1 | 1,365,477 |
| Total Income | 1,365,477 |
| Expenses | |
| Investment Advisory Fees—Note B | 5,658 |
| The Vanguard Group—Note C | |
| Management and Administrative—Investor Shares | 5,494 |
| Management and Administrative—Admiral Shares | 17,917 |
| Marketing and Distribution—Investor Shares | 177 |
| Marketing and Distribution—Admiral Shares | 1,104 |
| Custodian Fees | 139 |
| Auditing Fees | 40 |
| Shareholders’ Reports—Investor Shares | 91 |
| Shareholders’ Reports—Admiral Shares | 207 |
| Trustees’ Fees and Expenses | 16 |
| Other Expenses | 17 |
| Total Expenses | 30,860 |
| Expenses Paid Indirectly | (118) |
| Net Expenses | 30,742 |
| Net Investment Income | 1,334,735 |
| Realized Net Gain (Loss) | |
| Investment Securities Sold1 | (649,065) |
| Futures Contracts | (7,215) |
| Swap Contracts | 60,001 |
| Forward Currency Contracts | 18,458 |
| Foreign Currencies | 482 |
| Realized Net Gain (Loss) | (577,339) |
| Change in Unrealized Appreciation (Depreciation) | |
| Investment Securities1 | 984,459 |
| Floating Rate Loan Commitments | 324 |
| Futures Contracts | (2,889) |
| Swap Contracts | 11,334 |
| Forward Currency Contracts | (1,157) |
| Foreign Currencies | (330) |
| Change in Unrealized Appreciation (Depreciation) | 991,741 |
| Net Increase (Decrease) in Net Assets Resulting from Operations | 1,749,137 |
| 1 | Interest income, realized net gain (loss), capital gain distributions received, and change in unrealized appreciation (depreciation) from an affiliated company of the fund were $8,942,000, ($14,000), $1,000, and ($1,000), respectively. Purchases and sales are for temporary cash investment purposes. |
| Year Ended January 31, | ||
| 2024($000) | 2023($000) | |
| Increase (Decrease) in Net Assets | ||
| Operations | ||
| Net Investment Income | 1,334,735 | 1,244,219 |
| Realized Net Gain (Loss) | (577,339) | (787,055) |
| Change in Unrealized Appreciation (Depreciation) | 991,741 | (1,539,235) |
| Net Increase (Decrease) in Net Assets Resulting from Operations | 1,749,137 | (1,082,071) |
| Distributions | ||
| Investor Shares | (175,056) | (157,825) |
| Admiral Shares | (1,212,514) | (1,120,494) |
| Total Distributions | (1,387,570) | (1,278,319) |
| Capital Share Transactions | ||
| Investor Shares | (20,626) | (281,664) |
| Admiral Shares | (320,971) | (2,367,257) |
| Net Increase (Decrease) from Capital Share Transactions | (341,597) | (2,648,921) |
| Total Increase (Decrease) | 19,970 | (5,009,311) |
| Net Assets | ||
| Beginning of Period | 23,613,424 | 28,622,735 |
| End of Period | 23,633,394 | 23,613,424 |
| Investor Shares | |||||
| For a Share Outstanding Throughout Each Period | Year Ended January 31, | ||||
| 2024 | 2023 | 2022 | 2021 | 2020 | |
| Net Asset Value, Beginning of Period | $5.30 | $5.77 | $5.96 | $5.94 | $5.67 |
| Investment Operations | |||||
| Net Investment Income1 | .299 | .261 | .238 | .259 | .302 |
| Net Realized and Unrealized Gain (Loss) on Investments | .092 | (.462) | (.185) | .034 | .278 |
| Total from Investment Operations | .391 | (.201) | .053 | .293 | .580 |
| Distributions | |||||
| Dividends from Net Investment Income | (.311) | (.269) | (.243) | (.273) | (.310) |
| Distributions from Realized Capital Gains | — | — | — | — | — |
| Total Distributions | (.311) | (.269) | (.243) | (.273) | (.310) |
| Net Asset Value, End of Period | $5.38 | $5.30 | $5.77 | $5.96 | $5.94 |
| Total Return2 | 7.71% | -3.37% | 0.84% | 5.22% | 10.45% |
| Ratios/Supplemental Data | |||||
| Net Assets, End of Period (Millions) | $3,068 | $3,041 | $3,612 | $3,877 | $4,102 |
| Ratio of Total Expenses to Average Net Assets | 0.22%3 | 0.23%3 | 0.23% | 0.23% | 0.23% |
| Ratio of Net Investment Income to Average Net Assets | 5.73% | 4.90% | 4.00% | 4.51% | 5.16% |
| Portfolio Turnover Rate | 36% | 36% | 31% | 38% | 28% |
| 1 | Calculated based on average shares outstanding. |
| 2 | Total returns do not include account service fees that may have applied in the periods shown. Fund prospectuses provide information about any applicable account service fees. |
| 3 | The ratio of expenses to average net assets for the period net of reduction from custody fee offset arrangements was 0.22% and 0.23%, respectively. |
| Admiral Shares | |||||
| For a Share Outstanding Throughout Each Period | Year Ended January 31, | ||||
| 2024 | 2023 | 2022 | 2021 | 2020 | |
| Net Asset Value, Beginning of Period | $5.30 | $5.77 | $5.96 | $5.94 | $5.67 |
| Investment Operations | |||||
| Net Investment Income1 | .304 | .266 | .244 | .265 | .308 |
| Net Realized and Unrealized Gain (Loss) on Investments | .092 | (.462) | (.185) | .033 | .278 |
| Total from Investment Operations | .396 | (.196) | .059 | .298 | .586 |
| Distributions | |||||
| Dividends from Net Investment Income | (.316) | (.274) | (.249) | (.278) | (.316) |
| Distributions from Realized Capital Gains | — | — | — | — | — |
| Total Distributions | (.316) | (.274) | (.249) | (.278) | (.316) |
| Net Asset Value, End of Period | $5.38 | $5.30 | $5.77 | $5.96 | $5.94 |
| Total Return2 | 7.82% | -3.27% | 0.94% | 5.32% | 10.55% |
| Ratios/Supplemental Data | |||||
| Net Assets, End of Period (Millions) | $20,565 | $20,573 | $25,011 | $24,798 | $22,701 |
| Ratio of Total Expenses to Average Net Assets | 0.12%3 | 0.13%3 | 0.13% | 0.13% | 0.13% |
| Ratio of Net Investment Income to Average Net Assets | 5.83% | 5.00% | 4.10% | 4.60% | 5.26% |
| Portfolio Turnover Rate | 36% | 36% | 31% | 38% | 28% |
| 1 | Calculated based on average shares outstanding. |
| 2 | Total returns do not include account service fees that may have applied in the periods shown. Fund prospectuses provide information about any applicable account service fees. |
| 3 | The ratio of expenses to average net assets for the period net of reduction from custody fee offset arrangements was 0.12% and 0.13%, respectively. |
| A. | The following significant accounting policies conform to generally accepted accounting principles for U.S. investment companies. The fund consistently follows such policies in preparing its financial statements. |
| B. | Wellington Management Company llp provides investment advisory services to a portion of the fund for a fee calculated at an annual percentage rate of average net assets managed by the advisor. |
| C. | In accordance with the terms of a Funds' Service Agreement (the “FSA”) between Vanguard and the fund, Vanguard furnishes to the fund corporate management, administrative, marketing, and distribution services at Vanguard’s cost of operations (as defined by the FSA). These costs of operations are allocated to the fund based on methods and guidelines approved by the board of trustees and are generally settled twice a month. |
| D. | The fund’s custodian bank has agreed to reduce its fees when the fund maintains cash on deposit in the non-interest-bearing custody account. For the year ended January 31, 2024, custodian fee offset arrangements reduced the fund’s expenses by $118,000 (an annual rate of less than 0.01% of average net assets). |
| E. | Various inputs may be used to determine the value of the fund’s investments and derivatives. These inputs are summarized in three broad levels for financial statement purposes. The inputs or methodologies used to value securities are not necessarily an indication of the risk associated with investing in those securities. |
| Level 1 ($000) | Level 2 ($000) | Level 3 ($000) | Total ($000) | |
| Investments | ||||
| Assets | ||||
| U.S. Government and Agency Obligations | — | 1,246,236 | — | 1,246,236 |
| Corporate Bonds | — | 20,899,284 | — | 20,899,284 |
| Floating Rate Loan Interests | — | 651,134 | — | 651,134 |
| Temporary Cash Investments | 152,087 | 624,186 | — | 776,273 |
| Total | 152,087 | 23,420,840 | — | 23,572,927 |
| Derivative Financial Instruments | ||||
| Assets | ||||
| Futures Contracts1 | 3,232 | — | — | 3,232 |
| Forward Currency Contracts | — | 1,890 | — | 1,890 |
| Swap Contracts | 47,0371 | — | — | 47,037 |
| Total | 50,269 | 1,890 | — | 52,159 |
| Liabilities | ||||
| Futures Contracts1 | 7,859 | — | — | 7,859 |
| Forward Currency Contracts | — | 112 | — | 112 |
| Total | 7,859 | 112 | — | 7,971 |
| 1 | Includes cumulative appreciation (depreciation) on futures contracts and centrally cleared swaps, if any, as reported in the Schedule of Investments. Only current day’s variation margin is reported within the Statement of Assets and Liabilities. |
| F. | At January 31, 2024, the fair values of derivatives were reflected in the Statement of Assets and Liabilities as follows: |
| Statement of Assets and Liabilities | Interest Rate Contracts ($000) | Foreign Exchange Contracts ($000) | Credit Contracts ($000) | Total ($000) |
| Unrealized Appreciation—Futures Contracts1 | 3,232 | — | — | 3,232 |
| Unrealized Appreciation—Centrally Cleared Swap Contracts1 | — | — | 47,037 | 47,037 |
| Unrealized Appreciation—Forward Currency Contracts | — | 1,890 | — | 1,890 |
| Total Assets | 3,232 | 1,890 | 47,037 | 52,159 |
| Unrealized Depreciation—Futures Contracts1 | 7,859 | — | — | 7,859 |
| Unrealized Depreciation—Forward Currency Contracts | — | 112 | — | 112 |
| Total Liabilities | 7,859 | 112 | — | 7,971 |
| 1 | Includes cumulative appreciation (depreciation) on futures contracts and centrally cleared swaps, if any, as reported in the Schedule of Investments. Only current day’s variation margin is reported within the Statement of Assets and Liabilities. |
| Realized Net Gain (Loss) on Derivatives | Interest Rate Contracts ($000) | Foreign Exchange Contracts ($000) | Credit Contracts ($000) | Total ($000) |
| Futures Contracts | (7,215) | — | — | (7,215) |
| Swap Contracts | — | — | 60,001 | 60,001 |
| Forward Currency Contracts | — | 18,458 | — | 18,458 |
| Realized Net Gain (Loss) on Derivatives | (7,215) | 18,458 | 60,001 | 71,244 |
| Change in Unrealized Appreciation (Depreciation) on Derivatives | ||||
| Futures Contracts | (2,889) | — | — | (2,889) |
| Swap Contracts | — | — | 11,334 | 11,334 |
| Forward Currency Contracts | — | (1,157) | — | (1,157) |
| Change in Unrealized Appreciation (Depreciation) on Derivatives | (2,889) | (1,157) | 11,334 | 7,288 |
| G. | Permanent differences between book-basis and tax-basis components of net assets are reclassified among capital accounts in the financial statements to reflect their tax character. These reclassifications have no effect on net assets or net asset value per share. As of period end, permanent differences primarily attributable to the accounting for applicable foreign currency transactions, swap agreements, and amortization were reclassified between the individual components of total distributable earnings (loss). |
| Amount ($000) | |
| Undistributed Ordinary Income | 37,122 |
| Undistributed Long-Term Gains | — |
| Net Unrealized Gains (Losses) | (573,358) |
| Capital Loss Carryforwards | (2,073,863) |
| Qualified Late-Year Losses | — |
| Other Temporary Differences | (23,338) |
| Total | (2,633,437) |
| Year Ended January 31, | ||
| 2024 Amount ($000) | 2023 Amount ($000) | |
| Ordinary Income* | 1,387,570 | 1,278,319 |
| Long-Term Capital Gains | — | — |
| Total | 1,387,570 | 1,278,319 |
| * | Includes short-term capital gains, if any. |
| Amount ($000) | |
| Tax Cost | 24,188,803 |
| Gross Unrealized Appreciation | 438,692 |
| Gross Unrealized Depreciation | (1,012,050) |
| Net Unrealized Appreciation (Depreciation) | (573,358) |
| H. | During the year ended January 31, 2024, the fund purchased $6,018,543,000 of investment securities and sold $6,081,730,000 of investment securities, other than U.S. government securities and temporary cash investments. Purchases and sales of U.S. government securities were $1,946,236,000 and $2,090,612,000, respectively. |
| I. | Capital share transactions for each class of shares were: |
| Year Ended January 31, | |||||
| 2024 | 2023 | ||||
| Amount ($000) | Shares (000) | Amount ($000) | Shares (000) | ||
| Investor Shares | |||||
| Issued | 599,707 | 114,460 | 497,489 | 93,790 | |
| Issued in Lieu of Cash Distributions | 149,508 | 28,556 | 133,453 | 25,232 | |
| Redeemed | (769,841) | (147,324) | (912,606) | (171,056) | |
| Net Increase (Decrease)—Investor Shares | (20,626) | (4,308) | (281,664) | (52,034) | |
| Admiral Shares | |||||
| Issued | 3,282,267 | 627,272 | 4,440,999 | 830,126 | |
| Issued in Lieu of Cash Distributions | 946,453 | 180,799 | 868,371 | 164,160 | |
| Redeemed | (4,549,691) | (872,691) | (7,676,627) | (1,445,674) | |
| Net Increase (Decrease)—Admiral Shares | (320,971) | (64,620) | (2,367,257) | (451,388) | |
| J. | Significant market disruptions, such as those caused by pandemics (e.g., COVID-19 pandemic), natural or environmental disasters, war (e.g., Russia’s invasion of Ukraine), acts of terrorism, or other events, can adversely affect local and global markets and normal market operations. Any such disruptions could have an adverse impact on the value of the fund’s investments and fund performance. |
| K. | Management has determined that no other events or transactions occurred subsequent to January 31, 2024, that would require recognition or disclosure in these financial statements. |
Philadelphia, Pennsylvania
March 21, 2024
| Matthew Benchener | Thomas M. Rampulla |
| Amma Boateng | Karin A. Risi |
| Joseph Brennan | Anne E. Robinson |
| Mortimer J. Buckley | Michael Rollings |
| Gregory Davis | Nitin Tandon |
| John James | Lauren Valente |
| Chris D. Mclsaac |

All rights reserved.
Vanguard Marketing Corporation, Distributor.

| 1 | |
| 2 | |
| 6 | |
| 8 | |
| 10 |
| • | For the 12 months ended January 31, 2024, Vanguard GNMA Fund returned 1.62% for Investor Shares and 1.73% for Admiral Shares. The fund outpaced its benchmark, the Bloomberg U.S. GNMA Bond Index, which returned 1.55%. |
| • | With inflation easing, the Federal Reserve stopped hiking interest rates. Economic growth, the labor market, and consumer spending proved resilient, but the prospect of rates remaining high for an extended period spurred volatility at times. U.S. bonds rallied toward the end of 2023 amid market expectations for rate cuts in 2024. |
| • | U.S. Treasury yields rose across the maturity spectrum—the bellwether 10-year note added 41 basis points (0.41 percentage point) to end the period at 3.91%—and lower-quality debt returned more than higher-quality debt. Amid that backdrop, mortgage-backed securities, which generally are viewed as very high in credit quality, slightly outpaced Treasuries but lagged corporate bonds. |
| • | The fund outperformed its benchmark thanks largely to security selection in GNMA 30-year pass-throughs, particularly some of the lowest-yielding securities. |
| • | For the 10 years ended January 31, 2024, Investor Shares in the GNMA Fund returned 1.16%, annualized, while Admiral Shares returned 1.27% and the Bloomberg U.S. GNMA Bond Index returned 1.11%. |
| Average Annual Total Returns Periods Ended January 31, 2024 | |||
| One Year | Three Years | Five Years | |
| Stocks | |||
| Russell 1000 Index (Large-caps) | 20.23% | 9.78% | 13.99% |
| Russell 2000 Index (Small-caps) | 2.40 | -0.76 | 6.80 |
| Russell 3000 Index (Broad U.S. market) | 19.15 | 9.10 | 13.53 |
| FTSE All-World ex US Index (International) | 6.29 | 1.57 | 5.77 |
| Bonds | |||
| Bloomberg U.S. Aggregate Float Adjusted Index (Broad taxable market) | 2.23% | -3.15% | 0.90% |
| Bloomberg Municipal Bond Index (Broad tax-exempt market) | 2.90 | -0.78 | 2.00 |
| FTSE Three-Month U.S. Treasury Bill Index | 5.36 | 2.40 | 1.96 |
| CPI | |||
| Consumer Price Index | 3.09% | 5.64% | 4.15% |
Fixed Income Portfolio Manager
| • | Based on actual fund return. This section helps you to estimate the actual expenses that you paid over the period. The ”Ending Account Value“ shown is derived from the fund’s actual return, and the third column shows the dollar amount that would have been paid by an investor who started with $1,000 in the fund. You may use the information here, together with the amount you invested, to estimate the expenses that you paid over the period. |
| • | Based on hypothetical 5% yearly return. This section is intended to help you compare your fund‘s costs with those of other mutual funds. It assumes that the fund had a yearly return of 5% before expenses, but that the expense ratio is unchanged. In this case—because the return used is not the fund’s actual return—the results do not apply to your investment. The example is useful in making comparisons because the Securities and Exchange Commission requires all mutual funds to calculate expenses based on a 5% return. You can assess your fund’s costs by comparing this hypothetical example with the hypothetical examples that appear in shareholder reports of other funds. |
| Six Months Ended January 31, 2024 | |||
| Beginning Account Value 7/31/2023 | Ending Account Value 1/31/2024 | Expenses Paid During Period | |
| Based on Actual Fund Return | |||
| GNMA Fund | |||
| Investor Shares | $1,000.00 | $1,028.40 | $1.07 |
| Admiral™ Shares | 1,000.00 | 1,028.90 | 0.56 |
| Based on Hypothetical 5% Yearly Return | |||
| GNMA Fund | |||
| Investor Shares | $1,000.00 | $1,024.15 | $1.07 |
| Admiral Shares | 1,000.00 | 1,024.65 | 0.56 |

| Average Annual Total Returns Periods Ended January 31, 2024 | |||||
| One Year | Five Years | Ten Years | Final Value of a $10,000 Investment | ||
 | GNMA Fund Investor Shares | 1.62% | 0.09% | 1.16% | $11,227 |
 | Bloomberg U.S. GNMA Bond Index | 1.55 | 0.08 | 1.11 | 11,166 |
 | Bloomberg U.S. Aggregate Bond Index | 2.10 | 0.83 | 1.63 | 11,758 |
| One Year | Five Years | Ten Years | Final Value of a $50,000 Investment | ||
| GNMA Fund Admiral Shares | 1.73% | 0.19% | 1.27% | $56,698 | |
| Bloomberg U.S. GNMA Bond Index | 1.55 | 0.08 | 1.11 | 55,831 | |
| Bloomberg U.S. Aggregate Bond Index | 2.10 | 0.83 | 1.63 | 58,788 | |
| 0 - 5 Years | 0.7% |
| 5 - 10 Years | 2.5 |
| 10 - 15 Years | 1.6 |
| 15 - 20 Years | 13.5 |
| 20 - 25 Years | 22.5 |
| Over 25 Years | 59.2 |
| Coupon | Maturity Date | Face Amount ($000) | Market Value• ($000) | |||
| U.S. Government and Agency Obligations (96.5%) | ||||||
| Conventional Mortgage-Backed Securities (90.2%) | ||||||
| 1,2 | Fannie Mae Pool | 2.120% | 5/1/31 | 20,825 | 17,860 | |
| 1,2 | Fannie Mae Pool | 2.250% | 4/1/33 | 27,145 | 22,741 | |
| 1,2 | Fannie Mae Pool | 2.690% | 3/1/37 | 7,914 | 6,608 | |
| 1,2 | Fannie Mae Pool | 2.950% | 6/1/31 | 1,908 | 1,737 | |
| 1,2 | Fannie Mae Pool | 2.960% | 6/1/31 | 2,270 | 2,076 | |
| 1,2 | Fannie Mae Pool | 3.010% | 8/1/34 | 2,045 | 1,793 | |
| 1,2 | Fannie Mae Pool | 3.050% | 7/1/31 | 1,955 | 1,790 | |
| 1,2 | Fannie Mae Pool | 3.240% | 3/1/28 | 5,799 | 5,539 | |
| 1,2 | Fannie Mae Pool | 3.260% | 12/1/37 | 4,175 | 3,603 | |
| 1,2 | Fannie Mae Pool | 3.410% | 5/1/32 | 4,100 | 3,796 | |
| 1,2 | Fannie Mae Pool | 3.420% | 4/1/31 | 1,313 | 1,235 | |
| 1,2 | Fannie Mae Pool | 3.460% | 9/1/29 | 6,122 | 5,842 | |
| 1,2 | Fannie Mae Pool | 3.520% | 11/1/32 | 21,125 | 19,658 | |
| 1,2 | Fannie Mae Pool | 4.125% | 6/1/28 | 28,792 | 28,408 | |
| 1,2 | Fannie Mae Pool | 4.370% | 5/1/28 | 18,127 | 18,064 | |
| 1,2 | Fannie Mae Pool | 4.510% | 5/1/33 | 22,923 | 22,959 | |
| 1,2 | Fannie Mae Pool | 4.625% | 6/1/28 | 16,874 | 16,992 | |
| 1,2 | Freddie Mac Gold Pool | 3.000% | 6/1/43–1/1/47 | 9,898 | 8,883 | |
| 1,2 | Freddie Mac Gold Pool | 3.500% | 11/1/47–8/1/48 | 1,451 | 1,342 | |
| 1,2 | Freddie Mac Gold Pool | 4.000% | 9/1/30–4/1/44 | 1,738 | 1,671 | |
| 1,2 | Freddie Mac Gold Pool | 4.500% | 4/1/34–2/1/46 | 18,941 | 18,875 | |
| 1,2 | Freddie Mac Gold Pool | 5.000% | 1/1/38–4/1/44 | 6,798 | 6,960 | |
| 1 | Ginnie Mae I Pool | 2.500% | 11/15/42–12/15/46 | 45,571 | 39,930 | |
| 1 | Ginnie Mae I Pool | 3.000% | 1/15/26–3/15/46 | 369,894 | 333,642 | |
| 1 | Ginnie Mae I Pool | 3.250% | 8/15/42 | 8,297 | 7,738 | |
| 1 | Ginnie Mae I Pool | 3.500% | 7/15/39–6/15/48 | 297,479 | 279,094 | |
| 1 | Ginnie Mae I Pool | 3.750% | 7/15/42 | 944 | 919 | |
| 1 | Ginnie Mae I Pool | 3.875% | 10/15/40–6/15/42 | 13,879 | 13,405 | |
| 1 | Ginnie Mae I Pool | 4.000% | 8/15/24–7/15/46 | 405,139 | 394,149 | |
| 1 | Ginnie Mae I Pool | 4.500% | 4/15/33–4/15/44 | 208,481 | 206,798 | |
| 1 | Ginnie Mae I Pool | 5.000% | 11/15/32–7/15/52 | 201,748 | 203,962 | |
| 1 | Ginnie Mae I Pool | 5.500% | 10/15/24–9/15/45 | 147,388 | 151,322 | |
| 1 | Ginnie Mae I Pool | 6.000% | 2/15/24–3/15/40 | 58,619 | 59,745 | |
| 1 | Ginnie Mae I Pool | 6.500% | 2/15/24–7/15/40 | 52,485 | 53,385 | |
| 1 | Ginnie Mae I Pool | 7.000% | 11/15/31–11/15/36 | 7,182 | 7,367 | |
| 1 | Ginnie Mae I Pool | 7.250% | 1/15/27 | 4 | 5 | |
| 1 | Ginnie Mae I Pool | 7.500% | 10/15/31 | 3,875 | 4,005 | |
| 1 | Ginnie Mae I Pool | 8.000% | 8/15/31 | 1,361 | 1,431 | |
| 1 | Ginnie Mae I Pool | 8.500% | 11/15/26–6/15/28 | 5 | 5 | |
| Coupon | Maturity Date | Face Amount ($000) | Market Value• ($000) | |||
| 1 | Ginnie Mae II Pool | 1.500% | 4/20/44–4/20/52 | 135,551 | 108,294 | |
| 1,3,4 | Ginnie Mae II Pool | 2.000% | 10/20/43–2/15/54 | 2,617,821 | 2,184,990 | |
| 1,3,4 | Ginnie Mae II Pool | 2.500% | 6/20/37–2/15/54 | 3,094,969 | 2,681,185 | |
| 1,3,4 | Ginnie Mae II Pool | 3.000% | 4/20/31–2/15/54 | 2,415,011 | 2,174,621 | |
| 1,4,5 | Ginnie Mae II Pool | 3.500% | 10/20/40–2/15/54 | 1,725,626 | 1,617,796 | |
| 1,4 | Ginnie Mae II Pool | 4.000% | 4/20/39–2/15/54 | 735,354 | 711,711 | |
| 1,4 | Ginnie Mae II Pool | 4.500% | 12/20/32–2/15/54 | 589,069 | 581,475 | |
| 1,4 | Ginnie Mae II Pool | 5.000% | 10/20/32–2/15/54 | 598,638 | 597,425 | |
| 1,4 | Ginnie Mae II Pool | 5.500% | 1/20/34–2/15/54 | 529,921 | 533,776 | |
| 1,4 | Ginnie Mae II Pool | 6.000% | 4/20/28–2/15/54 | 229,771 | 233,117 | |
| 1,4 | Ginnie Mae II Pool | 6.500% | 4/20/37–2/15/54 | 150,427 | 153,736 | |
| 1 | Ginnie Mae II Pool | 7.500% | 6/20/25–8/20/25 | 9 | 9 | |
| 1,2,4 | UMBS Pool | 2.000% | 11/1/46–2/25/54 | 4,725 | 3,823 | |
| 1,2,4 | UMBS Pool | 2.500% | 7/1/27–2/25/54 | 69,030 | 59,030 | |
| 1,2 | UMBS Pool | 3.000% | 12/1/25–10/1/51 | 63,602 | 57,052 | |
| 1,2,4 | UMBS Pool | 3.500% | 9/1/46–2/25/54 | 1,628 | 2,031 | |
| 1,2 | UMBS Pool | 4.000% | 5/1/46–6/1/46 | 1,879 | 1,802 | |
| 1,2,4 | UMBS Pool | 4.500% | 12/1/40–2/25/54 | 3,167 | 3,080 | |
| 1,2 | UMBS Pool | 5.000% | 9/1/35 | 3,613 | 3,615 | |
| 1,2,4 | UMBS Pool | 5.500% | 6/1/53–2/25/54 | 16,406 | 16,548 | |
| 1,2,4 | UMBS Pool | 6.000% | 12/1/52–2/25/54 | 179,486 | 182,258 | |
| 1,2 | UMBS Pool | 6.500% | 2/1/29–5/1/40 | 780 | 810 | |
| 13,883,518 | ||||||
| Nonconventional Mortgage-Backed Securities (6.3%) | ||||||
| 1,2,6 | Fannie Mae Pool, RFUCCT1Y + 1.560% | 5.810% | 8/1/43 | 1,111 | 1,119 | |
| 1,2,6 | Fannie Mae Pool, RFUCCT1Y + 1.580% | 5.830% | 9/1/44 | 2,650 | 2,706 | |
| 1,2 | Fannie Mae REMICS | 1.500% | 11/25/50–1/25/51 | 27,625 | 15,820 | |
| 1,2 | Fannie Mae REMICS | 2.000% | 9/25/42 | 3,263 | 2,975 | |
| 1,2 | Fannie Mae REMICS | 2.500% | 10/25/42 | 2,608 | 2,412 | |
| 1,2 | Fannie Mae REMICS | 3.000% | 4/25/40–7/25/49 | 65,623 | 58,136 | |
| 1,2 | Fannie Mae REMICS | 3.500% | 7/25/44–4/25/59 | 68,338 | 58,597 | |
| 1,2 | Fannie Mae REMICS | 6.000% | 10/25/28–9/25/32 | 1,175 | 1,193 | |
| 1,2 | Freddie Mac Non Gold Pool | 2.907% | 10/1/44 | 1,594 | 1,562 | |
| 1,2,6 | Freddie Mac Non Gold Pool, RFUCCT1Y + 1.600% | 5.850% | 10/1/44 | 3,514 | 3,578 | |
| 1,2,6 | Freddie Mac Non Gold Pool, RFUCCT1Y + 1.614% | 5.832% | 9/1/44 | 1,963 | 2,003 | |
| 1,2,6 | Freddie Mac Non Gold Pool, RFUCCT1Y + 1.620% | 5.807% | 7/1/44 | 940 | 959 | |
| 1,2,6 | Freddie Mac Non Gold Pool, RFUCCT1Y + 1.620% | 5.870% | 9/1/43–10/1/44 | 4,311 | 4,415 | |
| 1,2,6 | Freddie Mac Non Gold Pool, RFUCCT1Y + 1.630% | 4.787% | 4/1/44 | 2,266 | 2,314 | |
| 1,2,6 | Freddie Mac Non Gold Pool, RFUCCT1Y + 1.638% | 5.721% | 8/1/43 | 2,448 | 2,526 | |
| 1,2 | Freddie Mac REMICS | 2.000% | 4/15/42 | 3,491 | 3,132 | |
| 1,2 | Freddie Mac REMICS | 2.500% | 3/25/52 | 5,369 | 3,783 | |
| 1,2 | Freddie Mac REMICS | 3.000% | 8/15/42 | 35,160 | 31,717 | |
| 1,2 | Freddie Mac REMICS | 3.500% | 8/15/45–1/25/46 | 18,480 | 16,719 | |
| 1,2 | Freddie Mac REMICS | 4.000% | 6/15/54 | 3,963 | 3,212 | |
| 1,2 | Freddie Mac REMICS | 6.000% | 4/15/28–11/15/32 | 3,200 | 3,255 | |
| 1 | Ginnie Mae REMICS | 1.000% | 8/20/50–6/20/51 | 30,904 | 23,592 | |
| 1 | Ginnie Mae REMICS | 1.500% | 11/20/49–4/16/50 | 24,062 | 19,994 | |
| 1 | Ginnie Mae REMICS | 1.650% | 11/20/45 | 29,793 | 27,041 | |
| 1 | Ginnie Mae REMICS | 2.000% | 7/20/42–1/20/52 | 71,461 | 60,676 | |
| 1 | Ginnie Mae REMICS | 2.250% | 3/16/45–2/20/52 | 13,691 | 12,313 | |
| Coupon | Maturity Date | Face Amount ($000) | Market Value• ($000) | |||
| 1 | Ginnie Mae REMICS | 2.375% | 4/20/44 | 4,947 | 4,518 | |
| 1 | Ginnie Mae REMICS | 2.500% | 12/16/39–2/20/52 | 251,143 | 216,801 | |
| 1 | Ginnie Mae REMICS | 2.650% | 11/17/48 | 2,506 | 2,334 | |
| 1 | Ginnie Mae REMICS | 3.000% | 6/20/39–2/20/52 | 249,053 | 216,628 | |
| 1 | Ginnie Mae REMICS | 3.000% | 7/20/43 | 3,660 | 3,366 | |
| 1 | Ginnie Mae REMICS | 3.250% | 8/20/44–2/20/49 | 12,989 | 10,626 | |
| 1 | Ginnie Mae REMICS | 3.500% | 8/16/44–2/20/49 | 61,586 | 56,207 | |
| 1 | Ginnie Mae REMICS | 3.681% | 10/20/48 | 11,167 | 10,327 | |
| 1 | Ginnie Mae REMICS | 3.750% | 12/16/39 | 2,315 | 2,100 | |
| 1 | Ginnie Mae REMICS | 4.000% | 1/20/45–12/20/48 | 60,816 | 57,956 | |
| 1 | Ginnie Mae REMICS | 4.500% | 6/20/39–4/16/41 | 18,552 | 18,374 | |
| 1 | Ginnie Mae REMICS | 5.000% | 6/16/37 | 4,668 | 4,679 | |
| 1,6 | Ginnie Mae REMICS, TSFR1M + 0.314% | 5.651% | 2/20/37 | 1,127 | 1,119 | |
| 970,784 | ||||||
| Total U.S. Government and Agency Obligations (Cost $16,153,836) | 14,854,302 | |||||
| Asset-Backed/Commercial Mortgage-Backed Securities (1.4%) | ||||||
| 1,2 | FHLMC Multifamily Structured Pass-Through Certificates Series K160 | 4.500% | 8/25/33 | 68,870 | 68,650 | |
| 1 | Seasoned Credit Risk Transfer Trust Series 2018-3 | 3.500% | 8/25/57 | 10,292 | 7,736 | |
| 1 | Seasoned Credit Risk Transfer Trust Series 2018-4 | 3.500% | 3/25/58 | 10,823 | 8,000 | |
| 1 | Seasoned Credit Risk Transfer Trust Series 2019-1 | 3.500% | 7/25/58 | 14,909 | 11,107 | |
| 1 | Seasoned Credit Risk Transfer Trust Series 2019-3 | 3.500% | 10/25/58 | 60,750 | 54,533 | |
| 1 | Seasoned Credit Risk Transfer Trust Series 2019-3 | 3.500% | 10/25/58 | 13,898 | 10,399 | |
| 1 | Seasoned Credit Risk Transfer Trust Series 2020-1 | 2.500% | 8/25/59 | 66,193 | 55,095 | |
| Total Asset-Backed/Commercial Mortgage-Backed Securities (Cost $251,214) | 215,520 | |||||
| Shares | ||||||
| Temporary Cash Investments (1.9%) | ||||||
| Money Market Fund (0.7%) | ||||||
| 7 | Vanguard Market Liquidity Fund | 5.410% | 1,119,412 | 111,930 | ||
| Maturity Date | Face Amount ($000) | |||||
| Repurchase Agreements (1.2%) | ||||||
| Bank of America Securities, LLC (Dated 1/31/24, Repurchase Value $13,102,000, collateralized by Fannie Mae 3.000%–5.000%, 2/1/27–2/1/48, Freddie Mac 2.500%, 7/1/41, and Ginnie Mae 7.000%, 12/20/53, with a value of $13,362,000) | 5.320% | 2/1/24 | 13,100 | 13,100 | ||
| Bank of Nova Scotia (Dated 1/31/24, Repurchase Value $13,102,000, collateralized by U.S. Treasury Bill 0.000%, 2/29/24–5/7/24, U.S. Treasury Note/Bond 0.250%–4.750%, 2/28/25–11/15/53, with a value of $13,364,000) | 5.300% | 2/1/24 | 13,100 | 13,100 | ||
| Coupon | Maturity Date | Face Amount ($000) | Market Value• ($000) | |||
| Barclays Capital Inc. (Dated 1/31/24, Repurchase Value $22,003,000, collateralized by U.S. Treasury Note/Bond 0.375%, 7/31/27, with a value of $22,440,000) | 5.300% | 2/1/24 | 22,000 | 22,000 | ||
| Citigroup Global Markets Inc. (Dated 1/31/24, Repurchase Value $13,102,000, collateralized by U.S. Treasury Note/Bond 2.875%, 11/30/25, with a value of $13,362,000) | 5.300% | 2/1/24 | 13,100 | 13,100 | ||
| Credit Agricole Securities (USA) Inc. (Dated 1/31/24, Repurchase Value $8,101,000, collateralized by Treasury Inflation Indexed Note/Bond 0.125%, 4/15/25, with a value of $8,262,000) | 5.300% | 2/1/24 | 8,100 | 8,100 | ||
| HSBC Bank USA (Dated 1/31/24, Repurchase Value $13,102,000, collateralized by Treasury Inflation Indexed Note/Bond 0.125%, 1/15/30, with a value of $13,362,000) | 5.290% | 2/1/24 | 13,100 | 13,100 | ||
| HSBC Bank USA (Dated 1/31/24, Repurchase Value $29,804,000, collateralized by Fannie Mae 3.500%–5.500%, 7/1/25–11/1/49, and Freddie Mac 4.500%, 7/1/52–6/1/53, with a value of $30,396,000) | 5.310% | 2/1/24 | 29,800 | 29,800 | ||
| JP Morgan Securities LLC (Dated 1/31/24, Repurchase Value $2,000,000, collateralized by U.S. Treasury Bill 0.000%, 2/8/24, and U.S. Treasury Note/Bond 1.250%–4.250%, 12/31/24–10/31/28, with a value of $2,040,000) | 5.310% | 2/1/24 | 2,000 | 2,000 | ||
| Natixis SA (Dated 1/31/24, Repurchase Value $23,103,000, collateralized by U.S. Treasury Note/Bond 0.500%, 2/28/26, with a value of $23,562,000) | 5.300% | 2/1/24 | 23,100 | 23,100 | ||
| Societe Generale (Dated 1/31/24, Repurchase Value $12,202,000, collateralized by U.S. Treasury Note/Bond 5.000%, 8/31/25, with a value of $12,444,000) | 5.290% | 2/1/24 | 12,200 | 12,200 | ||
| Coupon | Maturity Date | Face Amount ($000) | Market Value• ($000) | |||
| TD Securities (USA) LLC (Dated 1/31/24, Repurchase Value $13,102,000, collateralized by Ginnie Mae 2.500%–5.000%, 10/20/50–1/20/54, with a value of $13,362,000) | 5.310% | 2/1/24 | 13,100 | 13,100 | ||
| Wells Fargo & Co. (Dated 1/31/24, Repurchase Value $18,103,000, collateralized by Freddie Mac 6.000%–7.000%, 12/1/53–1/1/54, with a value of $18,462,000) | 5.320% | 2/1/24 | 18,100 | 18,100 | ||
| 180,800 | ||||||
| Total Temporary Cash Investments (Cost $292,737) | 292,730 | |||||
| Total Investments (99.8%) (Cost $16,697,787) | 15,362,552 | |||||
| Other Assets and Liabilities—Net (0.2%) | 28,126 | |||||
| Net Assets (100%) | 15,390,678 | |||||
| Cost is in $000. |
| • | See Note A in Notes to Financial Statements. |
| 1 | The average or expected maturity is shorter than the final maturity shown because of the possibility of interim principal payments and prepayments or the possibility of the issue being called. |
| 2 | The issuer was placed under federal conservatorship in September 2008; since that time, its daily operations have been managed by the Federal Housing Finance Agency and it receives capital from the U.S. Treasury, as needed to maintain a positive net worth, in exchange for senior preferred stock. |
| 3 | Securities with a value of $1,526,000 have been segregated as collateral for certain open To Be Announced (TBA) transactions. |
| 4 | Includes securities purchased on a when-issued or delayed-delivery basis for which the fund has not taken delivery as of January 31, 2024. |
| 5 | Securities with a value of $15,436,000 have been segregated as initial margin for open futures contracts. |
| 6 | Variable-rate security; rate shown is effective rate at period end. Certain variable-rate securities are not based on a published reference rate and spread but are determined by the issuer or agent based on current market conditions. |
| 7 | Affiliated money market fund available only to Vanguard funds and certain trusts and accounts managed by Vanguard. Rate shown is the 7-day yield. |
| REMICS—Real Estate Mortgage Investment Conduits. | |
| RFUCCT1Y—Refinitiv USD IBOR Consumer Cash Fallbacks Term 1-year. | |
| TSFR1M—CME Term Secured Overnight Financing Rate 1-Month. | |
| UMBS—Uniform Mortgage-Backed Securities. |
| Futures Contracts | ||||
| ($000) | ||||
| Expiration | Number of Long (Short) Contracts | Notional Amount | Value and Unrealized Appreciation (Depreciation) | |
| Long Futures Contracts | ||||
| 2-Year U.S. Treasury Note | March 2024 | 1,384 | 284,628 | (106) |
| 5-Year U.S. Treasury Note | March 2024 | 1,778 | 192,719 | 1,414 |
| 10-Year U.S. Treasury Note | March 2024 | 1,402 | 157,484 | 1,028 |
| 2,336 | ||||
| Short Futures Contracts | ||||
| Long U.S. Treasury Bond | March 2024 | (2,266) | (277,231) | (12,065) |
| Ultra 10-Year U.S. Treasury Note | March 2024 | (2,136) | (249,645) | (5,434) |
| (17,499) | ||||
| (15,163) | ||||
| ($000s, except shares, footnotes, and per-share amounts) | Amount |
| Assets | |
| Investments in Securities, at Value | |
| Unaffiliated Issuers (Cost $16,585,850) | 15,250,622 |
| Affiliated Issuers (Cost $111,937) | 111,930 |
| Total Investments in Securities | 15,362,552 |
| Investment in Vanguard | 491 |
| Cash | 13 |
| Receivables for Investment Securities Sold | 1,270,128 |
| Receivables for Accrued Income | 43,398 |
| Receivables for Capital Shares Issued | 7,184 |
| Other Assets | 615 |
| Total Assets | 16,684,381 |
| Liabilities | |
| Payables for Investment Securities Purchased | 1,273,967 |
| Payables for Capital Shares Redeemed | 9,396 |
| Payables for Distributions | 7,319 |
| Payables to Investment Advisor | 408 |
| Payables to Vanguard | 891 |
| Variation Margin Payable—Futures Contracts | 1,722 |
| Total Liabilities | 1,293,703 |
| Net Assets | 15,390,678 |
| Statement of Assets and Liabilities (continued) | |
| At January 31, 2024, net assets consisted of: | |
| ($000s, except shares, footnotes, and per-share amounts) | Amount |
| Paid-in Capital | 18,097,232 |
| Total Distributable Earnings (Loss) | (2,706,554) |
| Net Assets | 15,390,678 |
| Investor Shares—Net Assets | |
| Applicable to 555,824,667 outstanding $.001 par value shares of beneficial interest (unlimited authorization) | 5,157,189 |
| Net Asset Value Per Share—Investor Shares | $9.28 |
| Admiral Shares—Net Assets | |
| Applicable to 1,102,936,055 outstanding $.001 par value shares of beneficial interest (unlimited authorization) | 10,233,489 |
| Net Asset Value Per Share—Admiral Shares | $9.28 |
| Year Ended January 31, 2024 | |
| ($000) | |
| Investment Income | |
| Income | |
| Interest1 | 558,403 |
| Total Income | 558,403 |
| Expenses | |
| Investment Advisory Fees—Note B | 1,737 |
| The Vanguard Group—Note C | |
| Management and Administrative—Investor Shares | 9,519 |
| Management and Administrative—Admiral Shares | 9,820 |
| Marketing and Distribution—Investor Shares | 228 |
| Marketing and Distribution—Admiral Shares | 480 |
| Custodian Fees | 528 |
| Auditing Fees | 40 |
| Shareholders’ Reports—Investor Shares | 123 |
| Shareholders’ Reports—Admiral Shares | 108 |
| Trustees’ Fees and Expenses | 11 |
| Other Expenses | 19 |
| Total Expenses | 22,613 |
| Expenses Paid Indirectly | (81) |
| Net Expenses | 22,532 |
| Net Investment Income | 535,871 |
| Realized Net Gain (Loss) | |
| Investment Securities Sold1 | (212,162) |
| Futures Contracts | 33,811 |
| Realized Net Gain (Loss) | (178,351) |
| Change in Unrealized Appreciation (Depreciation) | |
| Investment Securities1 | (138,334) |
| Futures Contracts | (13,976) |
| Change in Unrealized Appreciation (Depreciation) | (152,310) |
| Net Increase (Decrease) in Net Assets Resulting from Operations | 205,210 |
| 1 | Interest income, realized net gain (loss), capital gain distributions received, and change in unrealized appreciation (depreciation) from an affiliated company of the fund were $5,624,000, $0, $1,000, and less than $1,000, respectively. Purchases and sales are for temporary cash investment purposes. |
| Year Ended January 31, | ||
| 2024 ($000) | 2023 ($000) | |
| Increase (Decrease) in Net Assets | ||
| Operations | ||
| Net Investment Income | 535,871 | 457,158 |
| Realized Net Gain (Loss) | (178,351) | (744,685) |
| Change in Unrealized Appreciation (Depreciation) | (152,310) | (1,248,827) |
| Net Increase (Decrease) in Net Assets Resulting from Operations | 205,210 | (1,536,354) |
| Distributions | ||
| Investor Shares | (167,790) | (134,234) |
| Admiral Shares | (367,806) | (319,199) |
| Total Distributions | (535,596) | (453,433) |
| Capital Share Transactions | ||
| Investor Shares | (25,298) | (847,109) |
| Admiral Shares | (1,208,416) | (2,506,168) |
| Net Increase (Decrease) from Capital Share Transactions | (1,233,714) | (3,353,277) |
| Total Increase (Decrease) | (1,564,100) | (5,343,064) |
| Net Assets | ||
| Beginning of Period | 16,954,778 | 22,297,842 |
| End of Period | 15,390,678 | 16,954,778 |
| Investor Shares | |||||
| For a Share Outstanding Throughout Each Period | Year Ended January 31, | ||||
| 2024 | 2023 | 2022 | 2021 | 2020 | |
| Net Asset Value, Beginning of Period | $9.44 | $10.41 | $10.73 | $10.58 | $10.31 |
| Investment Operations | |||||
| Net Investment Income1 | .304 | .230 | .085 | .178 | .285 |
| Net Realized and Unrealized Gain (Loss) on Investments | (.160) | (.969) | (.321) | .157 | .272 |
| Total from Investment Operations | .144 | (.739) | (.236) | .335 | .557 |
| Distributions | |||||
| Dividends from Net Investment Income | (.304) | (.231) | (.084) | (.176) | (.287) |
| Distributions from Realized Capital Gains | — | — | — | — | — |
| Return of Capital | — | — | — | (.009) | — |
| Total Distributions | (.304) | (.231) | (.084) | (.185) | (.287) |
| Net Asset Value, End of Period | $9.28 | $9.44 | $10.41 | $10.73 | $10.58 |
| Total Return2 | 1.62% | -7.09% | -2.21% | 3.17% | 5.46% |
| Ratios/Supplemental Data | |||||
| Net Assets, End of Period (Millions) | $5,157 | $5,270 | $6,711 | $7,719 | $7,365 |
| Ratio of Total Expenses to Average Net Assets | 0.21%3 | 0.21%3 | 0.21% | 0.21% | 0.21% |
| Ratio of Net Investment Income to Average Net Assets | 3.33% | 2.40% | 0.80% | 1.66% | 2.71% |
| Portfolio Turnover Rate4 | 305% | 478% | 800% | 638% | 616% |
| 1 | Calculated based on average shares outstanding. |
| 2 | Total returns do not include account service fees that may have applied in the periods shown. Fund prospectuses provide information about any applicable account service fees. |
| 3 | The ratio of expenses to average net assets for the period net of reduction from custody fee offset arrangements was 0.21%. |
| 4 | Includes 180%, 206%, 298%, 182%, and 198%, respectively, attributable to mortgage-dollar-roll activity. |
| Admiral Shares | |||||
| For a Share Outstanding Throughout Each Period | Year Ended January 31, | ||||
| 2024 | 2023 | 2022 | 2021 | 2020 | |
| Net Asset Value, Beginning of Period | $9.44 | $10.41 | $10.73 | $10.58 | $10.31 |
| Investment Operations | |||||
| Net Investment Income1 | .313 | .239 | .098 | .184 | .295 |
| Net Realized and Unrealized Gain (Loss) on Investments | (.160) | (.969) | (.323) | .161 | .272 |
| Total from Investment Operations | .153 | (.730) | (.225) | .345 | .567 |
| Distributions | |||||
| Dividends from Net Investment Income | (.313) | (.240) | (.095) | (.185) | (.297) |
| Distributions from Realized Capital Gains | — | — | — | — | — |
| Return of Capital | — | — | — | (.010) | — |
| Total Distributions | (.313) | (.240) | (.095) | (.195) | (.297) |
| Net Asset Value, End of Period | $9.28 | $9.44 | $10.41 | $10.73 | $10.58 |
| Total Return2 | 1.73% | -7.00% | -2.11% | 3.28% | 5.57% |
| Ratios/Supplemental Data | |||||
| Net Assets, End of Period (Millions) | $10,233 | $11,685 | $15,587 | $19,602 | $17,356 |
| Ratio of Total Expenses to Average Net Assets | 0.11%3 | 0.11%3 | 0.11% | 0.11% | 0.11% |
| Ratio of Net Investment Income to Average Net Assets | 3.42% | 2.49% | 0.92% | 1.72% | 2.81% |
| Portfolio Turnover Rate4 | 305% | 478% | 800% | 638% | 616% |
| 1 | Calculated based on average shares outstanding. |
| 2 | Total returns do not include account service fees that may have applied in the periods shown. Fund prospectuses provide information about any applicable account service fees. |
| 3 | The ratio of expenses to average net assets for the period net of reduction from custody fee offset arrangements was 0.11%. |
| 4 | Includes 180%, 206%, 298%, 182%, and 198%, respectively, attributable to mortgage-dollar-roll activity. |
| Level 1 ($000) | Level 2 ($000) | Level 3 ($000) | Total ($000) | |
| Investments | ||||
| Assets | ||||
| U.S. Government and Agency Obligations | — | 14,854,302 | — | 14,854,302 |
| Asset-Backed/Commercial Mortgage-Backed Securities | — | 215,520 | — | 215,520 |
| Temporary Cash Investments | 111,930 | 180,800 | — | 292,730 |
| Total | 111,930 | 15,250,622 | — | 15,362,552 |
| Derivative Financial Instruments | ||||
| Assets | ||||
| Futures Contracts1 | 2,442 | — | — | 2,442 |
| Liabilities | ||||
| Futures Contracts1 | 17,605 | — | — | 17,605 |
| 1 | Includes cumulative appreciation (depreciation) on futures contracts and centrally cleared swaps, if any, as reported in the Schedule of Investments. Only current day’s variation margin is reported within the Statement of Assets and Liabilities. | |||
| Amount ($000) | |
| Undistributed Ordinary Income | 15,861 |
| Undistributed Long-Term Gains | — |
| Net Unrealized Gains (Losses) | (1,352,538) |
| Capital Loss Carryforwards | (1,362,558) |
| Qualified Late-Year Losses | — |
| Other Temporary Differences | (7,319) |
| Total | (2,706,554) |
| Year Ended January 31, | ||
| 2024 Amount ($000) | 2023 Amount ($000) | |
| Ordinary Income* | 535,596 | 453,433 |
| Long-Term Capital Gains | — | — |
| Total | 535,596 | 453,433 |
| * | Includes short-term capital gains, if any. |
| Amount ($000) | |
| Tax Cost | 16,715,090 |
| Gross Unrealized Appreciation | 70,982 |
| Gross Unrealized Depreciation | (1,423,520) |
| Net Unrealized Appreciation (Depreciation) | (1,352,538) |
| Year Ended January 31, | |||||
| 2024 | 2023 | ||||
| Amount ($000) | Shares (000) | Amount ($000) | Shares (000) | ||
| Investor Shares | |||||
| Issued | 347,914 | 38,502 | 286,688 | 29,390 | |
| Issued in Lieu of Cash Distributions | 160,202 | 17,531 | 127,545 | 13,438 | |
| Redeemed | (533,414) | (58,335) | (1,261,342) | (129,326) | |
| Net Increase (Decrease)—Investor Shares | (25,298) | (2,302) | (847,109) | (86,498) | |
| Admiral Shares | |||||
| Issued | 1,358,325 | 148,334 | 1,210,417 | 126,390 | |
| Issued in Lieu of Cash Distributions | 281,905 | 30,844 | 247,028 | 26,013 | |
| Redeemed | (2,848,646) | (313,873) | (3,963,613) | (411,886) | |
| Net Increase (Decrease)—Admiral Shares | (1,208,416) | (134,695) | (2,506,168) | (259,483) | |
Philadelphia, Pennsylvania
March 20, 2024
| Matthew Benchener | Thomas M. Rampulla |
| Amma Boateng | Karin A. Risi |
| Joseph Brennan | Anne E. Robinson |
| Mortimer J. Buckley | Michael Rollings |
| Gregory Davis | Nitin Tandon |
| John James | Lauren Valente |
| Chris D. McIsaac |

Who Are Deaf or Hard of Hearing > 800-749-7273
All rights reserved.
Vanguard Marketing Corporation, Distributor.

| Vanguard Real Estate Index Fund |
| Vanguard Real Estate II Index Fund |
| 1 | |
| 2 | |
| 4 | |
| 28 |
| • | For the 12 months ended January 31, 2024, returns for Vanguard Real Estate Index Fund ranged from –3.91% for Investor Shares to –3.81% for ETF Shares (based on net asset value), –3.75% for Admiral Shares, and –3.73% for Institutional Shares. Vanguard Real Estate II Index Fund returned –3.68%. The funds’ benchmark index returned –3.62%. |
| • | With inflation continuing to ease, the Federal Reserve slowed and eventually stopped hiking interest rates. Economic growth, the labor market, and consumer spending proved resilient, but the prospect of rates remaining high for an extended period spurred volatility at times. U.S. stocks rallied toward the end of 2023, however, as sentiment improved amid market expectations for rate cuts in 2024. |
| • | Many of the sectors recorded negative returns for the 12 months. Telecom tower REITs, office REITs, and multifamily residential REITs contributed most to the negative performance. |
| • | For the 10 years ended January 31, 2024, average annual returns for the Real Estate Index Fund ranged from 6.23% for Investor Shares to 6.36% for the Real Estate ETF, 6.38% for Admiral Shares, and 6.39% for Institutional Shares. The benchmark returned 6.48% for the period. The Real Estate II Index Fund launched in 2017 and doesn’t have a 10-year record. |
| Average Annual Total Returns Periods Ended January 31, 2024 | |||
| One Year | Three Years | Five Years | |
| Stocks | |||
| Russell 1000 Index (Large-caps) | 20.23% | 9.78% | 13.99% |
| Russell 2000 Index (Small-caps) | 2.40 | -0.76 | 6.80 |
| Russell 3000 Index (Broad U.S. market) | 19.15 | 9.10 | 13.53 |
| FTSE All-World ex US Index (International) | 6.29 | 1.57 | 5.77 |
| Bonds | |||
| Bloomberg U.S. Aggregate Float Adjusted Index (Broad taxable market) | 2.23% | -3.15% | 0.90% |
| Bloomberg Municipal Bond Index (Broad tax-exempt market) | 2.90 | -0.78 | 2.00 |
| FTSE Three-Month U.S. Treasury Bill Index | 5.36 | 2.40 | 1.96 |
| CPI | |||
| Consumer Price Index | 3.09% | 5.64% | 4.15% |
| • | Based on actual fund return. This section helps you to estimate the actual expenses that you paid over the period. The ”Ending Account Value“ shown is derived from the fund’s actual return, and the third column shows the dollar amount that would have been paid by an investor who started with $1,000 in the fund. You may use the information here, together with the amount you invested, to estimate the expenses that you paid over the period. |
| • | Based on hypothetical 5% yearly return. This section is intended to help you compare your fund‘s costs with those of other mutual funds. It assumes that the fund had a yearly return of 5% before expenses, but that the expense ratio is unchanged. In this case—because the return used is not the fund’s actual return—the results do not apply to your investment. The example is useful in making comparisons because the Securities and Exchange Commission requires all mutual funds to calculate expenses based on a 5% return. You can assess your fund’s costs by comparing this hypothetical example with the hypothetical examples that appear in shareholder reports of other funds. |
| Six Months Ended January 31, 2024 | |||
| Beginning Account Value 7/31/2023 | Ending Account Value 1/31/2024 | Expenses Paid During Period | |
| Based on Actual Fund Return | |||
| Real Estate Index Fund | |||
| Investor Shares | $1,000.00 | $1,005.30 | $1.31 |
| ETF Shares | 1,000.00 | 1,006.20 | 0.66 |
| Admiral™ Shares | 1,000.00 | 1,006.30 | 0.66 |
| Institutional Shares | 1,000.00 | 1,006.40 | 0.51 |
| Real Estate II Index Fund | $1,000.00 | $1,006.60 | $0.40 |
| Based on Hypothetical 5% Yearly Return | |||
| Real Estate Index Fund | |||
| Investor Shares | $1,000.00 | $1,023.89 | $1.33 |
| ETF Shares | 1,000.00 | 1,024.55 | 0.66 |
| Admiral Shares | 1,000.00 | 1,024.55 | 0.66 |
| Institutional Shares | 1,000.00 | 1,024.70 | 0.51 |
| Real Estate II Index Fund | $1,000.00 | $1,024.80 | $0.41 |

| Average Annual Total Returns Periods Ended January 31, 2024 | |||||
| One Year | Five Years | Ten Years | Final Value of a $10,000 Investment | ||
 | Real Estate Index Fund Investor Shares | -3.91% | 3.76% | 6.23% | $18,297 |
 | Real Estate Spliced Index | -3.62 | 4.02 | 6.48 | 18,744 |
 | Dow Jones U.S. Total Stock Market Float Adjusted Index | 19.14 | 13.41 | 11.87 | 30,709 |
| One Year | Five Years | Ten Years | Final Value of a $10,000 Investment | ||
| Real Estate Index Fund ETF Shares Net Asset Value | -3.81% | 3.88% | 6.36% | $18,526 | |
| Real Estate Index Fund ETF Shares Market Price | -3.83 | 3.86 | 6.37 | 18,535 | |
| Real Estate Spliced Index | -3.62 | 4.02 | 6.48 | 18,744 | |
| Dow Jones U.S. Total Stock Market Float Adjusted Index | 19.14 | 13.41 | 11.87 | 30,709 | |
| Average Annual Total Returns Periods Ended January 31, 2024 | |||||
| One Year | Five Years | Ten Years | Final Value of a $10,000 Investment | ||
| Real Estate Index Fund Admiral Shares | -3.75% | 3.91% | 6.38% | $18,556 | |
| Real Estate Spliced Index | -3.62 | 4.02 | 6.48 | 18,744 | |
| Dow Jones U.S. Total Stock Market Float Adjusted Index | 19.14 | 13.41 | 11.87 | 30,709 | |
| One Year | Five Years | Ten Years | Final Value of a $5,000,000 Investment | ||
| Real Estate Index Fund Institutional Shares | -3.73% | 3.93% | 6.39% | $9,292,836 | |
| Real Estate Spliced Index | -3.62 | 4.02 | 6.48 | 9,372,140 | |
| Dow Jones U.S. Total Stock Market Float Adjusted Index | 19.14 | 13.41 | 11.87 | 15,354,326 | |
| Cumulative Returns of ETF Shares: January 31, 2014, Through January 31, 2024 | |||
| One Year | Five Years | Ten Years | |
| Real Estate Index Fund ETF Shares Market Price | -3.83% | 20.83% | 85.35% |
| Real Estate Index Fund ETF Shares Net Asset Value | -3.81 | 20.95 | 85.26 |
| Real Estate Spliced Index | -3.62 | 21.80 | 87.44 |
| Data Center REITs | 9.0% |
| Diversified Real Estate Activities | 0.2 |
| Diversified REITs | 2.1 |
| Health Care REITs | 7.7 |
| Hotel & Resort REITs | 2.9 |
| Industrial REITs | 12.7 |
| Multi-Family Residential REITs | 8.4 |
| Office REITs | 4.7 |
| Other Specialized REITs | 6.0 |
| Real Estate Development | 0.3 |
| Real Estate Operating Companies | 0.3 |
| Real Estate Services | 6.9 |
| Retail REITs | 12.9 |
| Self-Storage REITs | 6.7 |
| Single-Family Residential REITs | 4.5 |
| Telecom Tower REITs | 12.3 |
| Timber REITs | 2.4 |
| Shares | Market Value• ($000) | |||||
| Equity Real Estate Investment Trusts (REITs) (93.0%) | ||||||
| Data Center REITs (7.8%) | ||||||
| Equinix Inc. | 3,811,615 | 3,162,764 | ||||
| Digital Realty Trust Inc. | 11,956,364 | 1,679,391 | ||||
| 4,842,155 | ||||||
| Diversified REITs (1.8%) | ||||||
| WP Carey Inc. | 8,716,202 | 540,056 | ||||
| Essential Properties Realty Trust Inc. | 6,357,432 | 158,364 | ||||
| Broadstone Net Lease Inc. | 7,636,108 | 122,712 | ||||
| Global Net Lease Inc. | 7,964,708 | 67,302 | ||||
| Empire State Realty Trust Inc. Class A | 5,543,705 | 52,776 | ||||
| Alexander & Baldwin Inc. | 2,963,220 | 51,323 | ||||
| American Assets Trust Inc. | 1,977,034 | 44,345 | ||||
| Armada Hoffler Properties Inc. | 2,763,638 | 33,053 | ||||
| Gladstone Commercial Corp. | 1,626,224 | 20,848 | ||||
| One Liberty Properties Inc. | 702,181 | 14,212 | ||||
| 1 | NexPoint Diversified Real Estate Trust | 1,313,538 | 9,063 | |||
| 1,114,054 | ||||||
| Health Care REITs (6.6%) | ||||||
| Welltower Inc. | 20,383,501 | 1,763,377 | ||||
| Ventas Inc. | 16,394,697 | 760,550 | ||||
| Healthpeak Properties Inc. | 22,281,028 | 412,199 | ||||
| Omega Healthcare Investors Inc. | 9,981,231 | 289,456 | ||||
| Healthcare Realty Trust Inc. Class A | 15,520,118 | 250,029 | ||||
| Sabra Health Care REIT Inc. | 9,423,531 | 125,710 | ||||
| Physicians Realty Trust | 9,717,091 | 118,937 | ||||
| Shares | Market Value• ($000) | |||||
| National Health Investors Inc. | 1,771,764 | 94,222 | ||||
| CareTrust REIT Inc. | 4,059,530 | 84,925 | ||||
| 1 | Medical Properties Trust Inc. | 24,355,296 | 75,501 | |||
| LTC Properties Inc. | 1,693,035 | 52,772 | ||||
| Community Healthcare Trust Inc. | 1,030,782 | 26,378 | ||||
| Global Medical REIT Inc. | 2,534,288 | 25,622 | ||||
| Universal Health Realty Income Trust | 536,266 | 21,349 | ||||
| Diversified Healthcare Trust | 6,832,781 | 19,610 | ||||
| 4,120,637 | ||||||
| Hotel & Resort REITs (2.5%) | ||||||
| Host Hotels & Resorts Inc. | 28,985,560 | 557,102 | ||||
| Ryman Hospitality Properties Inc. | 2,309,753 | 253,842 | ||||
| Apple Hospitality REIT Inc. | 8,856,884 | 142,241 | ||||
| Park Hotels & Resorts Inc. | 8,781,555 | 132,426 | ||||
| Sunstone Hotel Investors Inc. | 8,018,986 | 85,563 | ||||
| DiamondRock Hospitality Co. | 8,530,293 | 77,967 | ||||
| Pebblebrook Hotel Trust | 4,900,568 | 74,587 | ||||
| RLJ Lodging Trust | 6,412,540 | 74,257 | ||||
| Xenia Hotels & Resorts Inc. | 4,356,483 | 58,072 | ||||
| Service Properties Trust | 6,733,788 | 52,052 | ||||
| Summit Hotel Properties Inc. | 4,374,069 | 28,344 | ||||
| Chatham Lodging Trust | 1,990,829 | 20,904 | ||||
| 1,557,357 | ||||||
| Industrial REITs (11.0%) | ||||||
| Prologis Inc. | 37,634,936 | 4,767,970 | ||||
| Rexford Industrial Realty Inc. | 8,395,321 | 441,510 | ||||
| EastGroup Properties Inc. | 1,849,315 | 328,124 | ||||
| Americold Realty Trust Inc. | 11,006,959 | 302,691 | ||||
| Shares | Market Value• ($000) | |||||
| First Industrial Realty Trust Inc. | 5,386,820 | 277,529 | ||||
| STAG Industrial Inc. | 7,318,318 | 270,339 | ||||
| Terreno Realty Corp. | 3,418,955 | 204,214 | ||||
| LXP Industrial Trust | 11,920,542 | 108,358 | ||||
| Innovative Industrial Properties Inc. | 1,141,276 | 106,401 | ||||
| Plymouth Industrial REIT Inc. | 1,618,020 | 35,823 | ||||
| Industrial Logistics Properties Trust | 2,272,947 | 9,046 | ||||
| 6,852,005 | ||||||
| Multi-Family Residential REITs (7.3%) | ||||||
| AvalonBay Communities Inc. | 5,786,131 | 1,035,775 | ||||
| Equity Residential | 14,671,754 | 883,093 | ||||
| Essex Property Trust Inc. | 2,614,732 | 609,939 | ||||
| Mid-America Apartment Communities Inc. | 4,753,024 | 600,687 | ||||
| UDR Inc. | 12,750,704 | 459,280 | ||||
| Camden Property Trust | 4,348,838 | 408,095 | ||||
| Apartment Income REIT Corp. Class A | 6,078,430 | 198,704 | ||||
| Independence Realty Trust Inc. | 9,144,955 | 134,339 | ||||
| Elme Communities | 3,581,189 | 51,856 | ||||
| Veris Residential Inc. | 2,999,117 | 45,737 | ||||
| * | Apartment Investment & Management Co. Class A | 5,412,129 | 40,212 | |||
| Centerspace | 608,727 | 33,334 | ||||
| NexPoint Residential Trust Inc. | 939,314 | 28,696 | ||||
| 4,529,747 | ||||||
| Office REITs (4.1%) | ||||||
| Alexandria Real Estate Equities Inc. | 6,695,575 | 809,495 | ||||
| Boston Properties Inc. | 6,067,484 | 403,488 | ||||
| Vornado Realty Trust | 6,592,498 | 179,250 | ||||
| Kilroy Realty Corp. | 4,530,466 | 162,009 | ||||
| Cousins Properties Inc. | 6,173,572 | 141,436 | ||||
| 1 | SL Green Realty Corp. | 2,619,575 | 117,750 | |||
| COPT Defense Properties | 4,583,714 | 107,992 | ||||
| Highwoods Properties Inc. | 4,295,778 | 98,674 | ||||
| Douglas Emmett Inc. | 6,782,012 | 91,896 | ||||
| Equity Commonwealth | 4,490,765 | 85,818 | ||||
| JBG SMITH Properties | 3,999,490 | 63,992 | ||||
| Easterly Government Properties Inc. Class A | 3,803,083 | 46,702 | ||||
| Hudson Pacific Properties Inc. | 5,157,336 | 42,239 | ||||
| Piedmont Office Realty Trust Inc. Class A | 5,023,497 | 34,160 | ||||
| Shares | Market Value• ($000) | |||||
| Brandywine Realty Trust | 6,991,372 | 33,139 | ||||
| Paramount Group Inc. | 6,632,146 | 31,503 | ||||
| 1 | Peakstone Realty Trust | 1,463,673 | 21,194 | |||
| NET Lease Office Properties | 590,278 | 14,627 | ||||
| Orion Office REIT Inc. | 2,174,470 | 11,177 | ||||
| City Office REIT Inc. | 1,626,011 | 8,537 | ||||
| Franklin Street Properties Corp. | 3,360,615 | 8,267 | ||||
| 1 | Office Properties Income Trust | 1,976,303 | 7,253 | |||
| *,2 | New York REIT Liquidating LLC | 1,208 | 8 | |||
| 2,520,606 | ||||||
| Other (13.1%)3 | ||||||
| 4,5 | Vanguard Real Estate II Index Fund | 404,732,304 | 8,159,403 | |||
| Other Specialized REITs (5.2%) | ||||||
| VICI Properties Inc. Class A | 37,895,023 | 1,141,398 | ||||
| Iron Mountain Inc. | 11,888,410 | 802,705 | ||||
| Gaming & Leisure Properties Inc. | 10,703,507 | 488,615 | ||||
| Lamar Advertising Co. Class A | 3,564,881 | 373,172 | ||||
| EPR Properties | 3,070,449 | 135,929 | ||||
| Four Corners Property Trust Inc. | 3,694,425 | 86,487 | ||||
| Outfront Media Inc. | 6,038,151 | 78,617 | ||||
| Uniti Group Inc. | 9,706,535 | 51,056 | ||||
| Safehold Inc. | 1,876,448 | 37,266 | ||||
| 1 | Farmland Partners Inc. | 1,891,103 | 21,218 | |||
| Gladstone Land Corp. | 1,392,770 | 19,722 | ||||
| 3,236,185 | ||||||
| Retail REITs (11.2%) | ||||||
| Simon Property Group Inc. | 13,328,208 | 1,847,423 | ||||
| Realty Income Corp. | 33,888,615 | 1,843,202 | ||||
| Kimco Realty Corp. | 27,361,288 | 552,698 | ||||
| Regency Centers Corp. | 6,771,211 | 424,352 | ||||
| Federal Realty Investment Trust | 2,988,406 | 304,011 | ||||
| NNN REIT Inc. | 7,434,203 | 299,896 | ||||
| Brixmor Property Group Inc. | 12,245,812 | 274,796 | ||||
| Agree Realty Corp. | 3,925,306 | 233,987 | ||||
| Kite Realty Group Trust | 8,933,217 | 191,171 | ||||
| Phillips Edison & Co. Inc. | 4,787,024 | 166,158 | ||||
| Macerich Co. | 8,757,350 | 138,279 | ||||
| Tanger Inc. | 4,285,150 | 115,270 | ||||
| SITE Centers Corp. | 7,666,423 | 102,117 | ||||
| Urban Edge Properties | 4,786,384 | 82,661 | ||||
| Retail Opportunity Investments Corp. | 5,126,739 | 69,672 | ||||
| InvenTrust Properties Corp. | 2,757,805 | 68,476 | ||||
| Shares | Market Value• ($000) | |||||
| Acadia Realty Trust | 3,878,481 | 66,167 | ||||
| Getty Realty Corp. | 1,958,504 | 54,172 | ||||
| 1 | NETSTREIT Corp. | 2,732,679 | 49,653 | |||
| Whitestone REIT | 1,915,187 | 24,744 | ||||
| Alexander's Inc. | 93,992 | 20,658 | ||||
| Saul Centers Inc. | 538,971 | 20,621 | ||||
| CBL & Associates Properties Inc. | 460,357 | 10,763 | ||||
| *,2 | Spirit MTA REIT | 2,071,263 | — | |||
| 6,960,947 | ||||||
| Self-Storage REITs (5.8%) | ||||||
| Public Storage | 6,446,801 | 1,825,670 | ||||
| Extra Space Storage Inc. | 8,606,690 | 1,243,150 | ||||
| CubeSmart | 9,157,913 | 395,805 | ||||
| National Storage Affiliates Trust | 3,452,126 | 128,937 | ||||
| 3,593,562 | ||||||
| Single-Family Residential REITs (3.9%) | ||||||
| Invitation Homes Inc. | 24,932,285 | 821,020 | ||||
| Sun Communities Inc. | 5,068,258 | 635,306 | ||||
| Equity LifeStyle Properties Inc. | 7,209,867 | 488,036 | ||||
| American Homes 4 Rent Class A | 13,249,307 | 464,388 | ||||
| UMH Properties Inc. | 2,523,616 | 38,132 | ||||
| 2,446,882 | ||||||
| Telecom Tower REITs (10.6%) | ||||||
| American Tower Corp. | 18,989,374 | 3,715,271 | ||||
| Crown Castle Inc. | 17,666,470 | 1,912,396 | ||||
| SBA Communications Corp. Class A | 4,414,676 | 988,269 | ||||
| 6,615,936 | ||||||
| Timber REITs (2.1%) | ||||||
| Weyerhaeuser Co. | 29,771,099 | 975,599 | ||||
| Rayonier Inc. | 5,736,847 | 173,826 | ||||
| PotlatchDeltic Corp. | 3,256,769 | 145,675 | ||||
| 1,295,100 | ||||||
| Total Equity Real Estate Investment Trusts (REITs) (Cost $58,240,294) | 57,844,576 | |||||
| Real Estate Management & Development (6.6%) | ||||||
| Diversified Real Estate Activities (0.2%) | ||||||
| St. Joe Co. | 1,424,920 | 78,656 | ||||
| RMR Group Inc. Class A | 637,545 | 16,633 | ||||
| 95,289 | ||||||
| Real Estate Development (0.2%) | ||||||
| * | Howard Hughes Holdings Inc. | 1,425,136 | 114,125 | |||
| * | Forestar Group Inc. | 812,865 | 25,410 | |||
| 139,535 | ||||||
| Real Estate Operating Companies (0.3%) | ||||||
| DigitalBridge Group Inc. | 6,611,711 | 129,854 | ||||
| Shares | Market Value• ($000) | |||||
| Kennedy-Wilson Holdings Inc. | 4,533,233 | 47,372 | ||||
| *,1 | Seritage Growth Properties Class A | 1,483,545 | 13,575 | |||
| 190,801 | ||||||
| Real Estate Services (5.9%) | ||||||
| * | CoStar Group Inc. | 16,633,272 | 1,388,546 | |||
| * | CBRE Group Inc. Class A | 12,618,205 | 1,089,077 | |||
| * | Zillow Group Inc. Class C | 6,239,196 | 354,636 | |||
| * | Jones Lang LaSalle Inc. | 1,940,704 | 343,621 | |||
| * | Zillow Group Inc. Class A | 2,295,035 | 126,434 | |||
| * | Opendoor Technologies Inc. | 21,459,707 | 73,392 | |||
| * | Cushman & Wakefield plc | 6,455,509 | 67,912 | |||
| Newmark Group Inc. Class A | 5,880,767 | 59,690 | ||||
| * | Compass Inc. Class A | 14,207,385 | 48,873 | |||
| 1 | eXp World Holdings Inc. | 3,123,439 | 38,668 | |||
| Marcus & Millichap Inc. | 1,014,417 | 38,639 | ||||
| *,1 | Redfin Corp. | 4,268,060 | 34,827 | |||
| * | Anywhere Real Estate Inc. | 4,039,244 | 28,760 | |||
| *,1 | Offerpad Solutions Inc. | 381,467 | 3,555 | |||
| *,1 | Doma Holdings Inc. | 215,562 | 895 | |||
| 3,697,525 | ||||||
| Total Real Estate Management & Development (Cost $4,818,906) | 4,123,150 | |||||
| Shares | Market Value• ($000) | |||||
| Temporary Cash Investments (0.8%) | ||||||
| Money Market Fund (0.8%) | ||||||
| 6,7 | Vanguard Market Liquidity Fund, 5.410% (Cost $488,429) | 4,885,464 | 488,498 | |||
| Total Investments (100.4%) (Cost $63,547,629) | 62,456,224 | |||||
| Other Assets and Liabilities—Net (-0.4%) | (247,269) | |||||
| Net Assets (100%) | 62,208,955 | |||||
| Cost is in $000. |
| • | See Note A in Notes to Financial Statements. |
| * | Non-income-producing security. |
| 1 | Includes partial security positions on loan to broker-dealers. The total value of securities on loan is $178,904,000. |
| 2 | Security value determined using significant unobservable inputs. |
| 3 | “Other” represents securities that are not classified by the fund’s benchmark index. |
| 4 | Considered an affiliated company of the fund as the issuer is another member of The Vanguard Group. |
| 5 | Represents a wholly owned subsidiary of the fund. See accompanying financial statements for Vanguard Real Estate II Index Fund's Schedule of Investments. |
| 6 | Affiliated money market fund available only to Vanguard funds and certain trusts and accounts managed by Vanguard. Rate shown is the 7-day yield. |
| 7 | Collateral of $206,131,000 was received for securities on loan. |
| REIT—Real Estate Investment Trust. |
| Over-the-Counter Total Return Swaps | ||||||
| Reference Entity | Termination Date | Counterparty | Notional Amount ($000) | Floating Interest Rate Received (Paid)1 (%) | Value and Unrealized Appreciation ($000) | Value and Unrealized (Depreciation) ($000) |
| Digital Realty Trust Inc. | 8/30/24 | BANA | 50,468 | (5.476) | 2,440 | — |
| Redfin Corp. | 1/31/25 | GSI | 2,856 | (5.323) | — | — |
| VICI Properties Inc. Class A | 8/30/24 | BANA | 108,392 | (5.976) | — | (5,095) |
| Welltower Inc. | 8/30/24 | BANA | 67,628 | (5.476) | — | (3,043) |
| 2,440 | (8,138) | |||||
| 1 | Based on USD Overnight Bank Funding Rate as of the most recent reset date. Floating interest payment received/paid monthly. |
| BANA—Bank of America, N.A. | |
| GSI—Goldman Sachs International. |
| ($000s, except shares, footnotes, and per-share amounts) | Amount |
| Assets | |
| Investments in Securities, at Value1 | |
| Unaffiliated Issuers (Cost $55,435,308) | 53,808,323 |
| Affiliated Issuers (Cost $488,429) | 488,498 |
| Vanguard Real Estate II Index Fund (Cost $7,623,892) | 8,159,403 |
| Total Investments in Securities | 62,456,224 |
| Investment in Vanguard | 1,772 |
| Cash | 3,260 |
| Cash Collateral Pledged—Over-the-Counter Swap Contracts | 3,509 |
| Receivables for Investment Securities Sold | 2,862 |
| Receivables for Accrued Income | 52,907 |
| Receivables for Capital Shares Issued | 329,885 |
| Unrealized Appreciation—Over-the-Counter Swap Contracts | 2,440 |
| Total Assets | 62,852,859 |
| Liabilities | |
| Payables for Investment Securities Purchased | 407,268 |
| Collateral for Securities on Loan | 206,131 |
| Payables for Capital Shares Redeemed | 19,283 |
| Payables to Vanguard | 3,084 |
| Unrealized Depreciation—Over-the-Counter Swap Contracts | 8,138 |
| Total Liabilities | 643,904 |
| Net Assets | 62,208,955 |
| 1 Includes $178,904,000 of securities on loan. | |
| Statement of Assets and Liabilities (continued) | |
| At January 31, 2024, net assets consisted of: | |
| ($000s, except shares, footnotes, and per-share amounts) | Amount |
| Paid-in Capital | 67,382,731 |
| Total Distributable Earnings (Loss) | (5,173,776) |
| Net Assets | 62,208,955 |
| Investor Shares—Net Assets | |
| Applicable to 3,099,956 outstanding $.001 par value shares of beneficial interest (unlimited authorization) | 86,471 |
| Net Asset Value Per Share—Investor Shares | $27.89 |
| ETF Shares—Net Assets | |
| Applicable to 385,505,685 outstanding $.001 par value shares of beneficial interest (unlimited authorization) | 32,358,555 |
| Net Asset Value Per Share—ETF Shares | $83.94 |
| Admiral Shares—Net Assets | |
| Applicable to 167,104,066 outstanding $.001 par value shares of beneficial interest (unlimited authorization) | 19,878,937 |
| Net Asset Value Per Share—Admiral Shares | $118.96 |
| Institutional Shares—Net Assets | |
| Applicable to 536,877,804 outstanding $.001 par value shares of beneficial interest (unlimited authorization) | 9,884,992 |
| Net Asset Value Per Share—Institutional Shares | $18.41 |
| Year Ended January 31, 2024 | |
| ($000) | |
| Investment Income | |
| Income | |
| Dividends—Unaffiliated Issuers | 1,703,683 |
| Dividends—Vanguard Real Estate II Index Fund | 246,388 |
| Interest—Unaffiliated Issuers | 1 |
| Interest—Affiliated Issuers | 15,865 |
| Securities Lending—Net | 2,187 |
| Total Income | 1,968,124 |
| Expenses | |
| The Vanguard Group—Note B | |
| Investment Advisory Services | 1,304 |
| Management and Administrative—Investor Shares | 228 |
| Management and Administrative—ETF Shares | 33,288 |
| Management and Administrative—Admiral Shares | 21,025 |
| Management and Administrative—Institutional Shares | 8,377 |
| Marketing and Distribution—Investor Shares | 6 |
| Marketing and Distribution—ETF Shares | 1,489 |
| Marketing and Distribution—Admiral Shares | 937 |
| Marketing and Distribution—Institutional Shares | 343 |
| Custodian Fees | 83 |
| Auditing Fees | 40 |
| Shareholders’ Reports—Investor Shares | 1 |
| Shareholders’ Reports—ETF Shares | 1,287 |
| Shareholders’ Reports—Admiral Shares | 355 |
| Shareholders’ Reports—Institutional Shares | 158 |
| Trustees’ Fees and Expenses | 42 |
| Other Expenses | 42 |
| Total Expenses | 69,005 |
| Net Investment Income | 1,899,119 |
| Realized Net Gain (Loss) | |
| Capital Gain Distributions Received—Unaffiliated Issuers | 262,809 |
| Capital Gain Distributions Received—Affiliated Issuers | 1 |
| Capital Gain Distributions Received—Vanguard Real Estate II Index Fund | — |
| Investment Securities Sold—Unaffiliated Issuers1 | (33,190) |
| Investment Securities Sold—Affiliated Issuers | 105 |
| Investment Securities Sold—Vanguard Real Estate II Index Fund | — |
| Futures Contracts | 99 |
| Swap Contracts | 47,246 |
| Realized Net Gain (Loss) | 277,070 |
| Statement of Operations (continued) | |
| Year Ended January 31, 2024 | |
| ($000) | |
| Change in Unrealized Appreciation (Depreciation) | |
| Investment Securities—Unaffiliated Issuers | (4,566,799) |
| Investment Securities—Affiliated Issuers | (9) |
| Investment Securities—Vanguard Real Estate II Index Fund | (558,172) |
| Swap Contracts | (36,695) |
| Change in Unrealized Appreciation (Depreciation) | (5,161,675) |
| Net Increase (Decrease) in Net Assets Resulting from Operations | (2,985,486) |
| 1 | Includes $1,592,774,000 of net gain (loss) resulting from in-kind redemptions. |
| Year Ended January 31, | ||
| 2024 ($000) | 2023 ($000) | |
| Increase (Decrease) in Net Assets | ||
| Operations | ||
| Net Investment Income | 1,899,119 | 1,757,360 |
| Realized Net Gain (Loss) | 277,070 | 2,948,495 |
| Change in Unrealized Appreciation (Depreciation) | (5,161,675) | (14,507,077) |
| Net Increase (Decrease) in Net Assets Resulting from Operations | (2,985,486) | (9,801,222) |
| Distributions | ||
| Net Investment Income and/or Realized Capital Gains | ||
| Investor Shares | (2,871) | (3,184) |
| ETF Shares | (1,004,365) | (893,338) |
| Admiral Shares | (620,267) | (518,210) |
| Institutional Shares | (301,203) | (253,055) |
| Return of Capital | ||
| Investor Shares | (994) | (1,590) |
| ETF Shares | (347,576) | (446,081) |
| Admiral Shares | (214,652) | (258,764) |
| Institutional Shares | (104,235) | (126,361) |
| Total Distributions | (2,596,163) | (2,500,583) |
| Capital Share Transactions | ||
| Investor Shares | (30,815) | (41,427) |
| ETF Shares | (1,415,940) | (3,046,898) |
| Admiral Shares | (516,200) | 34,532 |
| Institutional Shares | 80,493 | 306,763 |
| Net Increase (Decrease) from Capital Share Transactions | (1,882,462) | (2,747,030) |
| Total Increase (Decrease) | (7,464,111) | (15,048,835) |
| Net Assets | ||
| Beginning of Period | 69,673,066 | 84,721,901 |
| End of Period | 62,208,955 | 69,673,066 |
| Investor Shares | |||||
| For a Share Outstanding Throughout Each Period | Year Ended January 31, | ||||
| 2024 | 2023 | 2022 | 2021 | 2020 | |
| Net Asset Value, Beginning of Period | $30.26 | $35.37 | $28.23 | $31.21 | $27.69 |
| Investment Operations | |||||
| Net Investment Income1 | .787 | .684 | .602 | .586 | .719 |
| Net Realized and Unrealized Gain (Loss) on Investments | (2.036) | (4.766) | 7.475 | (2.498) | 3.801 |
| Total from Investment Operations | (1.249) | (4.082) | 8.077 | (1.912) | 4.520 |
| Distributions | |||||
| Dividends from Net Investment Income | (.833) | (.686) | (.620) | (.624) | (.752) |
| Distributions from Realized Capital Gains | — | — | — | — | — |
| Return of Capital | (.288) | (.342) | (.317) | (.444) | (.248) |
| Total Distributions | (1.121) | (1.028) | (.937) | (1.068) | (1.000) |
| Net Asset Value, End of Period | $27.89 | $30.26 | $35.37 | $28.23 | $31.21 |
| Total Return2 | -3.91% | -11.39% | 28.73% | -5.88% | 16.59% |
| Ratios/Supplemental Data | |||||
| Net Assets, End of Period (Millions) | $86 | $127 | $196 | $188 | $243 |
| Ratio of Total Expenses to Average Net Assets | 0.26% | 0.26%3 | 0.26% | 0.26% | 0.26% |
| Acquired Fund Fees and Expenses4 | 0.01% | — | — | — | — |
| Ratio of Net Investment Income to Average Net Assets | 2.87% | 2.18% | 1.77% | 2.18% | 2.48% |
| Portfolio Turnover Rate5 | 9% | 7% | 7% | 8% | 6% |
| 1 | Calculated based on average shares outstanding. |
| 2 | Total returns do not include account service fees that may have applied in the periods shown. Fund prospectuses provide information about any applicable account service fees. |
| 3 | The ratio of expenses to average net assets for the period net of reduction from custody fee offset arrangements was 0.25%. |
| 4 | For the fiscal year ended January 31, 2023, and for each prior period, the acquired fund fees and expenses were less than 0.01%. |
| 5 | Excludes the value of portfolio securities received or delivered as a result of in-kind purchases or redemptions of the fund’s capital shares, including ETF Creation Units. |
| ETF Shares | |||||
| For a Share Outstanding Throughout Each Period | Year Ended January 31, | ||||
| 2024 | 2023 | 2022 | 2021 | 2020 | |
| Net Asset Value, Beginning of Period | $91.06 | $106.44 | $84.96 | $93.93 | $83.36 |
| Investment Operations | |||||
| Net Investment Income1 | 2.527 | 2.240 | 1.960 | 1.889 | 2.335 |
| Net Realized and Unrealized Gain (Loss) on Investments | (6.154) | (14.394) | 22.486 | (7.525) | 11.379 |
| Total from Investment Operations | (3.627) | (12.154) | 24.446 | (5.636) | 13.714 |
| Distributions | |||||
| Dividends from Net Investment Income | (2.595) | (2.152) | (1.943) | (1.947) | (2.364) |
| Distributions from Realized Capital Gains | — | — | — | — | — |
| Return of Capital | (.898) | (1.074) | (1.023) | (1.387) | (.780) |
| Total Distributions | (3.493) | (3.226) | (2.966) | (3.334) | (3.144) |
| Net Asset Value, End of Period | $83.94 | $91.06 | $106.44 | $84.96 | $93.93 |
| Total Return | -3.81% | -11.25% | 28.88% | -5.80% | 16.70% |
| Ratios/Supplemental Data | |||||
| Net Assets, End of Period (Millions) | $32,359 | $36,825 | $46,673 | $32,064 | $37,682 |
| Ratio of Total Expenses to Average Net Assets | 0.12% | 0.12%2 | 0.12% | 0.12% | 0.12% |
| Acquired Fund Fees and Expenses3 | 0.01% | — | — | — | — |
| Ratio of Net Investment Income to Average Net Assets | 3.07% | 2.38% | 1.90% | 2.33% | 2.60% |
| Portfolio Turnover Rate4 | 9% | 7% | 7% | 8% | 6% |
| 1 | Calculated based on average shares outstanding. |
| 2 | The ratio of expenses to average net assets for the period net of reduction from custody fee offset arrangements was 0.12%. |
| 3 | For the fiscal year ended January 31, 2023, and for each prior period, the acquired fund fees and expenses were less than 0.01%. |
| 4 | Excludes the value of portfolio securities received or delivered as a result of in-kind purchases or redemptions of the fund’s capital shares, including ETF Creation Units. |
| Admiral Shares | |||||
| For a Share Outstanding Throughout Each Period | Year Ended January 31, | ||||
| 2024 | 2023 | 2022 | 2021 | 2020 | |
| Net Asset Value, Beginning of Period | $129.05 | $150.85 | $120.40 | $133.12 | $118.14 |
| Investment Operations | |||||
| Net Investment Income1 | 3.613 | 3.201 | 2.761 | 2.677 | 3.315 |
| Net Realized and Unrealized Gain (Loss) on Investments | (8.752) | (20.428) | 31.890 | (10.672) | 16.121 |
| Total from Investment Operations | (5.139) | (17.227) | 34.651 | (7.995) | 19.436 |
| Distributions | |||||
| Dividends from Net Investment Income | (3.678) | (3.050) | (2.770) | (2.759) | (3.350) |
| Distributions from Realized Capital Gains | — | — | — | — | — |
| Return of Capital | (1.273) | (1.523) | (1.431) | (1.966) | (1.106) |
| Total Distributions | (4.951) | (4.573) | (4.201) | (4.725) | (4.456) |
| Net Asset Value, End of Period | $118.96 | $129.05 | $150.85 | $120.40 | $133.12 |
| Total Return2 | -3.75% | -11.26% | 28.91% | -5.74% | 16.73% |
| Ratios/Supplemental Data | |||||
| Net Assets, End of Period (Millions) | $19,879 | $22,110 | $25,764 | $19,702 | $23,274 |
| Ratio of Total Expenses to Average Net Assets | 0.12% | 0.12%3 | 0.12% | 0.12% | 0.12% |
| Acquired Fund Fees and Expenses4 | 0.01% | — | — | — | — |
| Ratio of Net Investment Income to Average Net Assets | 3.10% | 2.41% | 1.90% | 2.33% | 2.60% |
| Portfolio Turnover Rate5 | 9% | 7% | 7% | 8% | 6% |
| 1 | Calculated based on average shares outstanding. |
| 2 | Total returns do not include account service fees that may have applied in the periods shown. Fund prospectuses provide information about any applicable account service fees. |
| 3 | The ratio of expenses to average net assets for the period net of reduction from custody fee offset arrangements was 0.12%. |
| 4 | For the fiscal year ended January 31, 2023, and for each prior period, the acquired fund fees and expenses were less than 0.01%. |
| 5 | Excludes the value of portfolio securities received or delivered as a result of in-kind purchases or redemptions of the fund’s capital shares, including ETF Creation Units. |
| Institutional Shares | |||||
| For a Share Outstanding Throughout Each Period | Year Ended January 31, | ||||
| 2024 | 2023 | 2022 | 2021 | 2020 | |
| Net Asset Value, Beginning of Period | $19.97 | $23.35 | $18.64 | $20.60 | $18.28 |
| Investment Operations | |||||
| Net Investment Income1 | .565 | .500 | .432 | .421 | .518 |
| Net Realized and Unrealized Gain (Loss) on Investments | (1.355) | (3.168) | 4.933 | (1.646) | 2.496 |
| Total from Investment Operations | (.790) | (2.668) | 5.365 | (1.225) | 3.014 |
| Distributions | |||||
| Dividends from Net Investment Income | (.572) | (.475) | (.432) | (.429) | (.522) |
| Distributions from Realized Capital Gains | — | — | — | — | — |
| Return of Capital | (.198) | (.237) | (.223) | (.306) | (.172) |
| Total Distributions | (.770) | (.712) | (.655) | (.735) | (.694) |
| Net Asset Value, End of Period | $18.41 | $19.97 | $23.35 | $18.64 | $20.60 |
| Total Return | -3.73% | -11.27% | 28.91% | -5.68% | 16.77% |
| Ratios/Supplemental Data | |||||
| Net Assets, End of Period (Millions) | $9,885 | $10,610 | $12,089 | $9,478 | $10,027 |
| Ratio of Total Expenses to Average Net Assets | 0.10% | 0.10%2 | 0.10% | 0.10% | 0.10% |
| Acquired Fund Fees and Expenses3 | 0.01% | — | — | — | — |
| Ratio of Net Investment Income to Average Net Assets | 3.13% | 2.43% | 1.92% | 2.37% | 2.63% |
| Portfolio Turnover Rate4 | 9% | 7% | 7% | 8% | 6% |
| 1 | Calculated based on average shares outstanding. |
| 2 | The ratio of expenses to average net assets for the period net of reduction from custody fee offset arrangements was 0.10%. |
| 3 | For the fiscal year ended January 31, 2023, and for each prior period, the acquired fund fees and expenses were less than 0.01%. |
| 4 | Excludes the value of portfolio securities received or delivered as a result of in-kind purchases or redemptions of the fund’s capital shares, including ETF Creation Units. |
| Level 1 ($000) | Level 2 ($000) | Level 3 ($000) | Total ($000) | |
| Investments | ||||
| Assets | ||||
| Common Stocks | 61,967,718 | — | 8 | 61,967,726 |
| Temporary Cash Investments | 488,498 | — | — | 488,498 |
| Total | 62,456,216 | — | 8 | 62,456,224 |
| Derivative Financial Instruments | ||||
| Assets | ||||
| Swap Contracts | — | 2,440 | — | 2,440 |
| Liabilities | ||||
| Swap Contracts | — | 8,138 | — | 8,138 |
| Amount ($000) | |
| Paid-in Capital | 1,596,236 |
| Total Distributable Earnings (Loss) | (1,596,236) |
| Amount ($000) | |
| Undistributed Ordinary Income | — |
| Undistributed Long-Term Gains | — |
| Net Unrealized Gains (Losses) | (1,361,819) |
| Capital Loss Carryforwards | (3,972,566) |
| Qualified Late-Year Losses | — |
| Other Temporary Differences | 160,609 |
| Total | (5,173,776) |
| Year Ended January 31, | ||
| 2024 Amount ($000) | 2023 Amount ($000) | |
| Ordinary Income* | 1,928,706 | 1,667,787 |
| Long-Term Capital Gains | — | — |
| Return of Capital | 667,457 | 832,796 |
| Total | 2,596,163 | 2,500,583 |
| * | Includes short-term capital gains, if any. |
| Amount ($000) | |
| Tax Cost | 63,818,043 |
| Gross Unrealized Appreciation | 7,425,022 |
| Gross Unrealized Depreciation | (8,786,841) |
| Net Unrealized Appreciation (Depreciation) | (1,361,819) |
| Year Ended January 31, | |||||
| 2024 | 2023 | ||||
| Amount ($000) | Shares (000) | Amount ($000) | Shares (000) | ||
| Investor Shares | |||||
| Issued | 7,901 | 286 | 12,156 | 378 | |
| Issued in Lieu of Cash Distributions | 3,865 | 145 | 4,774 | 163 | |
| Redeemed | (42,581) | (1,536) | (58,357) | (1,875) | |
| Net Increase (Decrease)—Investor Shares | (30,815) | (1,105) | (41,427) | (1,334) | |
| ETF Shares | |||||
| Issued | 5,219,768 | 62,577 | 6,166,911 | 65,225 | |
| Issued in Lieu of Cash Distributions | — | — | — | — | |
| Redeemed | (6,635,708) | (81,500) | (9,213,809) | (99,300) | |
| Net Increase (Decrease)—ETF Shares | (1,415,940) | (18,923) | (3,046,898) | (34,075) | |
| Admiral Shares | |||||
| Issued | 2,321,785 | 19,988 | 2,666,411 | 20,054 | |
| Issued in Lieu of Cash Distributions | 735,078 | 6,445 | 682,639 | 5,494 | |
| Redeemed | (3,573,063) | (30,661) | (3,314,518) | (25,007) | |
| Net Increase (Decrease)—Admiral Shares | (516,200) | (4,228) | 34,532 | 541 | |
| Institutional Shares | |||||
| Issued | 1,713,612 | 95,042 | 2,009,244 | 97,409 | |
| Issued in Lieu of Cash Distributions | 384,847 | 21,798 | 357,630 | 18,606 | |
| Redeemed | (2,017,966) | (111,179) | (2,060,111) | (102,593) | |
| Net Increase (Decrease)—Institutional Shares | 80,493 | 5,661 | 306,763 | 13,422 | |
| Current Period Transactions | ||||||||
| Jan. 31, 2023 Market Value ($000) | Purchases at Cost ($000) | Proceeds from Securities Sold1 ($000) | Realized Net Gain (Loss) ($000) | Change in Unrealized App. (Dep.) ($000) | Income ($000) | Capital Gain Distributions Received ($000) | Jan. 31, 2024 Market Value ($000) | |
| Vanguard Market Liquidity Fund | 399,890 | NA2 | NA2 | 105 | (9) | 15,865 | 1 | 488,498 |
| Vanguard Real Estate II Index Fund | 8,471,187 | 332,462 | — | — | (558,172) | 246,388 | — | 8,159,403 |
| Total | 8,871,077 | 332,462 | — | 105 | (558,181) | 262,253 | 1 | 8,647,901 |
| 1 | Does not include adjustments related to return of capital. |
| 2 | Not applicable—purchases and sales are for temporary cash investment purposes. |

| Average Annual Total Returns Periods Ended January 31, 2024 | |||||
| One Year | Five Years | Since Inception (9/26/2017) | Final Value of a $100,000,000 Investment | ||
| Real Estate II Index Fund | -3.68% | 3.96% | 4.14% | $129,343,260 |
| Real Estate Spliced Index | -3.62 | 4.02 | 4.20 | 129,880,850 |
| Dow Jones U.S. Total Stock Market Float Adjusted Index | 19.14 | 13.41 | 12.17 | 207,351,750 |
| Data Center REITs | 9.1% |
| Diversified Real Estate Activities | 0.2 |
| Diversified REITs | 2.1 |
| Health Care REITs | 7.8 |
| Hotel & Resort REITs | 2.8 |
| Industrial REITs | 12.7 |
| Multi-Family Residential REITs | 8.4 |
| Office REITs | 4.7 |
| Other Specialized REITs | 6.2 |
| Real Estate Development | 0.2 |
| Real Estate Operating Companies | 0.3 |
| Real Estate Services | 6.9 |
| Retail REITs | 12.7 |
| Self-Storage REITs | 6.7 |
| Single-Family Residential REITs | 4.5 |
| Telecom Tower REITs | 12.3 |
| Timber REITs | 2.4 |
| Shares | Market Value• ($000) | |||||
| Equity Real Estate Investment Trusts (REITs) (92.1%) | ||||||
| Data Center REITs (9.1%) | ||||||
| Equinix Inc. | 594,309 | 493,140 | ||||
| Digital Realty Trust Inc. | 1,922,801 | 270,076 | ||||
| 763,216 | ||||||
| Diversified REITs (2.1%) | ||||||
| WP Carey Inc. | 1,358,638 | 84,181 | ||||
| Essential Properties Realty Trust Inc. | 990,790 | 24,680 | ||||
| Broadstone Net Lease Inc. | 1,189,585 | 19,117 | ||||
| Global Net Lease Inc. | 1,242,289 | 10,497 | ||||
| Empire State Realty Trust Inc. Class A | 864,313 | 8,228 | ||||
| Alexander & Baldwin Inc. | 461,700 | 7,997 | ||||
| American Assets Trust Inc. | 308,464 | 6,919 | ||||
| Armada Hoffler Properties Inc. | 431,661 | 5,163 | ||||
| Gladstone Commercial Corp. | 253,246 | 3,247 | ||||
| One Liberty Properties Inc. | 108,677 | 2,200 | ||||
| 1 | NexPoint Diversified Real Estate Trust | 204,132 | 1,408 | |||
| 173,637 | ||||||
| Health Care REITs (7.7%) | ||||||
| Welltower Inc. | 3,294,935 | 285,045 | ||||
| Ventas Inc. | 2,556,225 | 118,583 | ||||
| Healthpeak Properties Inc. | 3,476,743 | 64,320 | ||||
| Omega Healthcare Investors Inc. | 1,555,050 | 45,096 | ||||
| Healthcare Realty Trust Inc. Class A | 2,418,877 | 38,968 | ||||
| Sabra Health Care REIT Inc. | 1,468,745 | 19,593 | ||||
| Physicians Realty Trust | 1,514,162 | 18,533 | ||||
| National Health Investors Inc. | 275,622 | 14,658 | ||||
| CareTrust REIT Inc. | 632,005 | 13,222 | ||||
| 1 | Medical Properties Trust Inc. | 3,800,035 | 11,780 | |||
| LTC Properties Inc. | 263,283 | 8,206 | ||||
| Shares | Market Value• ($000) | |||||
| Community Healthcare Trust Inc. | 160,396 | 4,105 | ||||
| Global Medical REIT Inc. | 394,653 | 3,990 | ||||
| Universal Health Realty Income Trust | 83,126 | 3,309 | ||||
| Diversified Healthcare Trust | 1,067,117 | 3,063 | ||||
| 652,471 | ||||||
| Hotel & Resort REITs (2.8%) | ||||||
| Host Hotels & Resorts Inc. | 4,519,151 | 86,858 | ||||
| Ryman Hospitality Properties Inc. | 360,206 | 39,587 | ||||
| Apple Hospitality REIT Inc. | 1,380,435 | 22,170 | ||||
| Park Hotels & Resorts Inc. | 969,947 | 14,627 | ||||
| Sunstone Hotel Investors Inc. | 1,250,828 | 13,346 | ||||
| DiamondRock Hospitality Co. | 1,330,993 | 12,165 | ||||
| Pebblebrook Hotel Trust | 765,411 | 11,650 | ||||
| RLJ Lodging Trust | 1,000,343 | 11,584 | ||||
| Xenia Hotels & Resorts Inc. | 680,077 | 9,065 | ||||
| Service Properties Trust | 1,051,769 | 8,130 | ||||
| Summit Hotel Properties Inc. | 684,283 | 4,434 | ||||
| Chatham Lodging Trust | 309,965 | 3,255 | ||||
| 236,871 | ||||||
| Industrial REITs (12.7%) | ||||||
| Prologis Inc. | 5,868,325 | 743,458 | ||||
| Rexford Industrial Realty Inc. | 1,309,034 | 68,842 | ||||
| EastGroup Properties Inc. | 288,309 | 51,155 | ||||
| Americold Realty Trust Inc. | 1,716,260 | 47,197 | ||||
| First Industrial Realty Trust Inc. | 839,886 | 43,271 | ||||
| STAG Industrial Inc. | 1,140,961 | 42,147 | ||||
| Terreno Realty Corp. | 532,874 | 31,829 | ||||
| LXP Industrial Trust | 1,857,442 | 16,884 | ||||
| Innovative Industrial Properties Inc. | 178,185 | 16,612 | ||||
| Shares | Market Value• ($000) | |||||
| Plymouth Industrial REIT Inc. | 252,863 | 5,598 | ||||
| Industrial Logistics Properties Trust | 356,192 | 1,418 | ||||
| 1,068,411 | ||||||
| Multi-Family Residential REITs (8.4%) | ||||||
| AvalonBay Communities Inc. | 902,223 | 161,507 | ||||
| Equity Residential | 2,287,677 | 137,695 | ||||
| Essex Property Trust Inc. | 407,610 | 95,083 | ||||
| Mid-America Apartment Communities Inc. | 740,993 | 93,647 | ||||
| UDR Inc. | 1,987,824 | 71,601 | ||||
| Camden Property Trust | 678,061 | 63,629 | ||||
| Apartment Income REIT Corp. Class A | 947,655 | 30,979 | ||||
| Independence Realty Trust Inc. | 1,427,196 | 20,966 | ||||
| Elme Communities | 558,517 | 8,087 | ||||
| Veris Residential Inc. | 468,438 | 7,144 | ||||
| * | Apartment Investment & Management Co. Class A | 844,769 | 6,277 | |||
| Centerspace | 94,967 | 5,200 | ||||
| NexPoint Residential Trust Inc. | 146,857 | 4,487 | ||||
| 706,302 | ||||||
| Office REITs (4.7%) | ||||||
| Alexandria Real Estate Equities Inc. | 1,044,306 | 126,256 | ||||
| Boston Properties Inc. | 947,054 | 62,979 | ||||
| Vornado Realty Trust | 1,028,545 | 27,966 | ||||
| Kilroy Realty Corp. | 706,979 | 25,281 | ||||
| Cousins Properties Inc. | 964,039 | 22,086 | ||||
| 1 | SL Green Realty Corp. | 408,873 | 18,379 | |||
| COPT Defense Properties | 714,590 | 16,836 | ||||
| Highwoods Properties Inc. | 671,021 | 15,413 | ||||
| Douglas Emmett Inc. | 1,058,911 | 14,348 | ||||
| Equity Commonwealth | 696,431 | 13,309 | ||||
| JBG SMITH Properties | 624,163 | 9,987 | ||||
| Easterly Government Properties Inc. Class A | 593,094 | 7,283 | ||||
| Hudson Pacific Properties Inc. | 805,447 | 6,597 | ||||
| Piedmont Office Realty Trust Inc. Class A | 785,430 | 5,341 | ||||
| Brandywine Realty Trust | 1,092,599 | 5,179 | ||||
| Paramount Group Inc. | 1,034,880 | 4,916 | ||||
| 1 | Peakstone Realty Trust | 228,849 | 3,314 | |||
| NET Lease Office Properties | 91,309 | 2,263 | ||||
| Orion Office REIT Inc. | 340,988 | 1,753 | ||||
| City Office REIT Inc. | 254,132 | 1,334 | ||||
| Shares | Market Value• ($000) | |||||
| Franklin Street Properties Corp. | 522,527 | 1,285 | ||||
| Office Properties Income Trust | 307,574 | 1,129 | ||||
| 393,234 | ||||||
| Other Specialized REITs (6.2%) | ||||||
| VICI Properties Inc. Class A | 6,438,025 | 193,913 | ||||
| Iron Mountain Inc. | 1,854,093 | 125,188 | ||||
| Gaming & Leisure Properties Inc. | 1,667,918 | 76,140 | ||||
| Lamar Advertising Co. Class A | 555,924 | 58,194 | ||||
| EPR Properties | 478,333 | 21,176 | ||||
| Four Corners Property Trust Inc. | 574,969 | 13,460 | ||||
| Outfront Media Inc. | 942,960 | 12,277 | ||||
| Uniti Group Inc. | 1,515,737 | 7,973 | ||||
| Safehold Inc. | 293,216 | 5,823 | ||||
| 1 | Farmland Partners Inc. | 293,811 | 3,297 | |||
| Gladstone Land Corp. | 215,507 | 3,052 | ||||
| 520,493 | ||||||
| Retail REITs (12.7%) | ||||||
| Simon Property Group Inc. | 2,078,411 | 288,089 | ||||
| Realty Income Corp. | 4,982,369 | 270,991 | ||||
| Kimco Realty Corp. | 4,268,536 | 86,224 | ||||
| Regency Centers Corp. | 1,055,363 | 66,140 | ||||
| Federal Realty Investment Trust | 465,941 | 47,400 | ||||
| NNN REIT Inc. | 1,158,405 | 46,730 | ||||
| Brixmor Property Group Inc. | 1,908,888 | 42,835 | ||||
| Agree Realty Corp. | 611,353 | 36,443 | ||||
| Kite Realty Group Trust | 1,393,341 | 29,818 | ||||
| Phillips Edison & Co. Inc. | 745,515 | 25,877 | ||||
| Macerich Co. | 1,366,917 | 21,584 | ||||
| Tanger Inc. | 667,932 | 17,967 | ||||
| SITE Centers Corp. | 1,195,719 | 15,927 | ||||
| Urban Edge Properties | 747,710 | 12,913 | ||||
| Retail Opportunity Investments Corp. | 800,153 | 10,874 | ||||
| InvenTrust Properties Corp. | 429,123 | 10,655 | ||||
| Acadia Realty Trust | 605,355 | 10,327 | ||||
| Getty Realty Corp. | 305,149 | 8,440 | ||||
| NETSTREIT Corp. | 425,554 | 7,732 | ||||
| Whitestone REIT | 299,339 | 3,868 | ||||
| Alexander's Inc. | 14,612 | 3,212 | ||||
| Saul Centers Inc. | 83,545 | 3,196 | ||||
| 1 | CBL & Associates Properties Inc. | 71,303 | 1,667 | |||
| *,2 | Spirit MTA REIT | 257,871 | — | |||
| 1,068,909 | ||||||
| Self-Storage REITs (6.6%) | ||||||
| Public Storage | 1,005,175 | 284,655 | ||||
| Extra Space Storage Inc. | 1,342,057 | 193,847 | ||||
| Shares | Market Value• ($000) | |||||
| CubeSmart | 1,427,647 | 61,703 | ||||
| National Storage Affiliates Trust | 538,490 | 20,113 | ||||
| 560,318 | ||||||
| Single-Family Residential REITs (4.5%) | ||||||
| Invitation Homes Inc. | 3,887,859 | 128,027 | ||||
| Sun Communities Inc. | 790,210 | 99,053 | ||||
| Equity LifeStyle Properties Inc. | 1,123,824 | 76,072 | ||||
| American Homes 4 Rent Class A | 2,065,414 | 72,393 | ||||
| UMH Properties Inc. | 394,791 | 5,965 | ||||
| 381,510 | ||||||
| Telecom Tower REITs (12.2%) | ||||||
| American Tower Corp. | 2,960,968 | 579,313 | ||||
| Crown Castle Inc. | 2,754,766 | 298,203 | ||||
| SBA Communications Corp. Class A | 688,482 | 154,124 | ||||
| 1,031,640 | ||||||
| Timber REITs (2.4%) | ||||||
| Weyerhaeuser Co. | 4,641,939 | 152,116 | ||||
| Rayonier Inc. | 894,808 | 27,113 | ||||
| PotlatchDeltic Corp. | 507,555 | 22,703 | ||||
| 201,932 | ||||||
| Total Equity Real Estate Investment Trusts (REITs) (Cost $7,075,007) | 7,758,944 | |||||
| Real Estate Management & Development (7.6%) | ||||||
| Diversified Real Estate Activities (0.2%) | ||||||
| St. Joe Co. | 222,290 | 12,270 | ||||
| RMR Group Inc. Class A | 99,368 | 2,593 | ||||
| 14,863 | ||||||
| Real Estate Development (0.3%) | ||||||
| * | Howard Hughes Holdings Inc. | 222,748 | 17,838 | |||
| * | Forestar Group Inc. | 126,457 | 3,953 | |||
| 21,791 | ||||||
| Real Estate Operating Companies (0.3%) | ||||||
| DigitalBridge Group Inc. | 1,032,239 | 20,273 | ||||
| Kennedy-Wilson Holdings Inc. | 708,197 | 7,401 | ||||
| * | Seritage Growth Properties Class A | 231,116 | 2,115 | |||
| 29,789 | ||||||
| Real Estate Services (6.8%) | ||||||
| * | CoStar Group Inc. | 2,593,881 | 216,537 | |||
| Shares | Market Value• ($000) | |||||
| * | CBRE Group Inc. Class A | 1,968,514 | 169,902 | |||
| * | Zillow Group Inc. Class C | 971,603 | 55,226 | |||
| * | Jones Lang LaSalle Inc. | 302,799 | 53,614 | |||
| * | Zillow Group Inc. Class A | 359,535 | 19,807 | |||
| * | Opendoor Technologies Inc. | 3,349,456 | 11,455 | |||
| * | Cushman & Wakefield plc | 1,009,647 | 10,621 | |||
| Newmark Group Inc. Class A | 919,264 | 9,331 | ||||
| * | Compass Inc. Class A | 2,222,372 | 7,645 | |||
| 1 | eXp World Holdings Inc. | 488,366 | 6,046 | |||
| Marcus & Millichap Inc. | 158,687 | 6,044 | ||||
| * | Redfin Corp. | 723,745 | 5,906 | |||
| * | Anywhere Real Estate Inc. | 631,362 | 4,495 | |||
| *,1 | Offerpad Solutions Inc. | 59,854 | 558 | |||
| * | Doma Holdings Inc. | 33,504 | 139 | |||
| 577,326 | ||||||
| Total Real Estate Management & Development (Cost $703,015) | 643,769 | |||||
| Temporary Cash Investments (0.5%) | ||||||
| Money Market Fund (0.5%) | ||||||
| 3,4 | Vanguard Market Liquidity Fund, 5.410% (Cost $43,204) | 432,117 | 43,208 | |||
| Total Investments (100.2%) (Cost $7,821,226) | 8,445,921 | |||||
| Other Assets and Liabilities—Net (-0.2%) | (20,057) | |||||
| Net Assets (100%) | 8,425,864 | |||||
| Cost is in $000. |
| • | See Note A in Notes to Financial Statements. |
| * | Non-income-producing security. |
| 1 | Includes partial security positions on loan to broker-dealers. The total value of securities on loan is $14,243,000. |
| 2 | Security value determined using significant unobservable inputs. |
| 3 | Affiliated money market fund available only to Vanguard funds and certain trusts and accounts managed by Vanguard. Rate shown is the 7-day yield. |
| 4 | Collateral of $17,105,000 was received for securities on loan. |
| REIT—Real Estate Investment Trust. |
| Over-the-Counter Total Return Swaps | ||||||
| Reference Entity | Termination Date | Counterparty | Notional Amount ($000) | Floating Interest Rate Received (Paid)1 (%) | Value and Unrealized Appreciation ($000) | Value and Unrealized (Depreciation) ($000) |
| Park Hotels & Resorts Inc. | 1/31/25 | GSI | 6,032 | (5.323) | — | — |
| Realty Income Corp. | 8/30/24 | BANA | 17,226 | (5.426) | — | (830) |
| — | (830) | |||||
| 1 | Based on USD Overnight Bank Funding Rate as of the most recent reset date. Floating interest payment received/paid monthly. |
| BANA—Bank of America, N.A. | |
| GSI—Goldman Sachs International. |
| ($000s, except shares, footnotes, and per-share amounts) | Amount |
| Assets | |
| Investments in Securities, at Value1 | |
| Unaffiliated Issuers (Cost $7,778,022) | 8,402,713 |
| Affiliated Issuers (Cost $43,204) | 43,208 |
| Total Investments in Securities | 8,445,921 |
| Investment in Vanguard | 281 |
| Cash Collateral Pledged—Over-the-Counter Swap Contracts | 970 |
| Receivables for Accrued Income | 8,161 |
| Receivables for Capital Shares Issued | 377 |
| Total Assets | 8,455,710 |
| Liabilities | |
| Due to Custodian | 156 |
| Payables for Investment Securities Purchased | 11,447 |
| Collateral for Securities on Loan | 17,105 |
| Payables for Capital Shares Redeemed | 7 |
| Payables to Vanguard | 301 |
| Unrealized Depreciation—Over-the-Counter Swap Contracts | 830 |
| Total Liabilities | 29,846 |
| Net Assets | 8,425,864 |
| 1 Includes $14,243,000 of securities on loan. | |
| At January 31, 2024, net assets consisted of: | |
| Paid-in Capital | 7,891,750 |
| Total Distributable Earnings (Loss) | 534,114 |
| Net Assets | 8,425,864 |
| Net Assets | |
| Applicable to 418,019,455 outstanding $.001 par value shares of beneficial interest (unlimited authorization) | 8,425,864 |
| Net Asset Value Per Share | $20.16 |
| Year Ended January 31, 2024 | |
| ($000) | |
| Investment Income | |
| Income | |
| Dividends | 258,812 |
| Interest1 | 451 |
| Securities Lending—Net | 300 |
| Total Income | 259,563 |
| Expenses | |
| The Vanguard Group—Note B | |
| Investment Advisory Services | 160 |
| Management and Administrative | 5,874 |
| Marketing and Distribution | 132 |
| Custodian Fees | 207 |
| Auditing Fees | 40 |
| Shareholders’ Reports | 17 |
| Trustees’ Fees and Expenses | 6 |
| Other Expenses | 20 |
| Total Expenses | 6,456 |
| Net Investment Income | 253,107 |
| Realized Net Gain (Loss) | |
| Capital Gain Distributions Received | 38,730 |
| Investment Securities Sold1 | (115,624) |
| Futures Contracts | 14 |
| Swap Contracts | 1,826 |
| Realized Net Gain (Loss) | (75,054) |
| Change in Unrealized Appreciation (Depreciation) | |
| Investment Securities1 | (496,060) |
| Swap Contracts | (830) |
| Change in Unrealized Appreciation (Depreciation) | (496,890) |
| Net Increase (Decrease) in Net Assets Resulting from Operations | (318,837) |
| 1 | Interest income, realized net gain (loss), capital gain distributions received, and change in unrealized appreciation (depreciation) from an affiliated company of the fund were $451,000, ($1,000), less than $1,000, and $2,000, respectively. Purchases and sales are for temporary cash investment purposes. |
| Year Ended January 31, | ||
| 2024 ($000) | 2023 ($000) | |
| Increase (Decrease) in Net Assets | ||
| Operations | ||
| Net Investment Income | 253,107 | 211,725 |
| Realized Net Gain (Loss) | (75,054) | 70,280 |
| Change in Unrealized Appreciation (Depreciation) | (496,890) | (1,336,365) |
| Net Increase (Decrease) in Net Assets Resulting from Operations | (318,837) | (1,054,360) |
| Distributions | ||
| Net Investment Income and/or Realized Capital Gains | (254,199) | (291,773) |
| Return of Capital | (88,901) | (48,996) |
| Total Distributions | (343,100) | (340,769) |
| Capital Share Transactions | ||
| Issued | 70,851 | 203,267 |
| Issued in Lieu of Cash Distributions | 343,100 | 340,769 |
| Redeemed | (15,985) | (1,113) |
| Net Increase (Decrease) from Capital Share Transactions | 397,966 | 542,923 |
| Total Increase (Decrease) | (263,971) | (852,206) |
| Net Assets | ||
| Beginning of Period | 8,689,835 | 9,542,041 |
| End of Period | 8,425,864 | 8,689,835 |
| For a Share Outstanding Throughout Each Period | Year Ended January 31, | ||||
| 2024 | 2023 | 2022 | 2021 | 2020 | |
| Net Asset Value, Beginning of Period | $21.86 | $25.69 | $20.50 | $22.64 | $20.10 |
| Investment Operations | |||||
| Net Investment Income1 | .620 | .558 | .484 | .471 | .571 |
| Net Realized and Unrealized Gain (Loss) on Investments | (1.476) | (3.493) | 5.427 | (1.808) | 2.752 |
| Total from Investment Operations | (.856) | (2.935) | 5.911 | (1.337) | 3.323 |
| Distributions | |||||
| Dividends from Net Investment Income | (.625) | (.528) | (.477) | (.465) | (.590) |
| Distributions from Realized Capital Gains | — | (.238) | (.034) | — | — |
| Return of Capital | (.219) | (.129) | (.210) | (.338) | (.193) |
| Total Distributions | (.844) | (.895) | (.721) | (.803) | (.783) |
| Net Asset Value, End of Period | $20.16 | $21.86 | $25.69 | $20.50 | $22.64 |
| Total Return | -3.68% | -11.23% | 28.96% | -5.70% | 16.78% |
| Ratios/Supplemental Data | |||||
| Net Assets, End of Period (Millions) | $8,426 | $8,690 | $9,542 | $7,400 | $7,848 |
| Ratio of Total Expenses to Average Net Assets | 0.08% | 0.08%2 | 0.08% | 0.08% | 0.08% |
| Ratio of Net Investment Income to Average Net Assets | 3.14% | 2.47% | 1.95% | 2.41% | 2.63% |
| Portfolio Turnover Rate | 6% | 5%3 | 6% | 4% | 3% |
| 1 | Calculated based on average shares outstanding. |
| 2 | The ratio of expenses to average net assets for the period net of reduction from custody fee offset arrangements was 0.08%. |
| 3 | Excludes the value of portfolio securities received or delivered as a result of in-kind purchases or redemptions of the fund’s capital shares. |
| Level 1 ($000) | Level 2 ($000) | Level 3 ($000) | Total ($000) | |
| Investments | ||||
| Assets | ||||
| Common Stocks | 8,402,713 | — | — | 8,402,713 |
| Temporary Cash Investments | 43,208 | — | — | 43,208 |
| Total | 8,445,921 | — | — | 8,445,921 |
| Derivative Financial Instruments | ||||
| Liabilities | ||||
| Swap Contracts | — | 830 | — | 830 |
| Amount ($000) | |
| Undistributed Ordinary Income | — |
| Undistributed Long-Term Gains | — |
| Net Unrealized Gains (Losses) | 567,667 |
| Capital Loss Carryforwards | (59,114) |
| Qualified Late-Year Losses | — |
| Other Temporary Differences | 25,561 |
| Total | 534,114 |
| Year Ended January 31, | ||
| 2024 Amount ($000) | 2023 Amount ($000) | |
| Ordinary Income* | 254,199 | 198,902 |
| Long-Term Capital Gains | — | 92,871 |
| Return of Capital | 88,901 | 48,996 |
| Total | 343,100 | 340,769 |
| * | Includes short-term capital gains, if any. |
| Amount ($000) | |
| Tax Cost | 7,878,254 |
| Gross Unrealized Appreciation | 1,664,309 |
| Gross Unrealized Depreciation | (1,096,642) |
| Net Unrealized Appreciation (Depreciation) | 567,667 |
| Year Ended January 31, | ||
| 2024 Shares (000) | 2023 Shares (000) | |
| Issued | 3,562 | 9,838 |
| Issued in Lieu of Cash Distributions | 17,762 | 16,244 |
| Redeemed | (786) | (52) |
| Net Increase (Decrease) in Shares Outstanding | 20,538 | 26,030 |
Philadelphia, Pennsylvania
March 20, 2024
| Fund | ($000) |
| Real Estate Index Fund | 46,269 |
| Real Estate II Index Fund | 6,113 |
| Fund | ($000) |
| Real Estate Index Fund | 6,237 |
| Real Estate II Index Fund | 179 |
| Fund | ($000) |
| Real Estate Index Fund | 1,835,112 |
| Real Estate II Index Fund | 243,350 |
| Matthew Benchener | Thomas M. Rampulla |
| Amma Boateng | Karin A. Risi |
| Joseph Brennan | Anne E. Robinson |
| Mortimer J. Buckley | Michael Rollings |
| Gregory Davis | Nitin Tandon |
| John James | Lauren Valente |
| Chris D. McIsaac |

Who Are Deaf or Hard of Hearing > 800-749-7273
All rights reserved.
Vanguard Marketing Corporation, Distributor.
Item 2: Code of Ethics.
The Registrant has adopted a code of ethics that applies to the Registrant’s principal executive officer, principal financial officer, principal accounting officer or controller or persons performing similar functions. The Code of Ethics was amended during the reporting period covered by this report to make certain technical, non-material changes.
Item 3: Audit Committee Financial Expert.
All members of the Audit Committee have been determined by the Registrant’s Board of Trustees to be Audit Committee Financial Experts and to be independent: F. Joseph Loughrey, Mark Loughridge, Sarah Bloom Raskin, and Peter F. Volanakis.
Item 4: Principal Accountant Fees and Services.
| (a) | Audit Fees. |
Audit Fees of the Registrant.
Fiscal Year Ended January 31, 2024: $460,000
Fiscal Year Ended January 31, 2023: $424,000
Aggregate Audit Fees of Registered Investment Companies in the Vanguard Group.
Fiscal Year Ended January 31, 2024: $9,326,156
Fiscal Year Ended January 31, 2023: $10,494,508
Includes fees billed in connection with audits of the Registrant, other registered investment companies in the Vanguard complex, The Vanguard Group, Inc., and Vanguard Marketing Corporation.
| (b) | Audit-Related Fees. |
Fiscal Year Ended January 31, 2024: $3,295,934
Fiscal Year Ended January 31, 2023: $2,757,764
Includes fees billed in connection with assurance and related services provided to the Registrant, other registered investment companies in the Vanguard complex, The Vanguard Group, Inc., and Vanguard Marketing Corporation.
| (c) | Tax Fees. |
Fiscal Year Ended January 31, 2024: $1,678,928
Fiscal Year Ended January 31, 2023: $5,202,689
Includes fees billed in connection with tax compliance, planning, and advice services provided to the Registrant, other registered investment companies in the Vanguard complex, The Vanguard Group, Inc., and Vanguard Marketing Corporation.
| (d) | All Other Fees. |
Fiscal Year Ended January 31, 2024: $25,000
Fiscal Year Ended January 31, 2023: $298,000
Includes fees billed for services related to tax reported information provided to the Registrant, other registered investment companies in the Vanguard complex, The Vanguard Group, Inc., and Vanguard Marketing Corporation.
(e) (1) Pre-Approval Policies. The policy of the Registrant’s Audit Committee is to consider, and, if appropriate, approve before the principal accountant is engaged for such services, all specific audit and non-audit services provided to: the Registrant, other registered investment companies in the Vanguard complex, The Vanguard Group, Inc., and entities controlled by The Vanguard Group, Inc. that provide ongoing services to the Registrant. In making a determination, the Audit Committee considers whether the services are consistent with maintaining the principal accountant’s independence.
In the event of a contingency situation in which the principal accountant is needed to provide services in between scheduled Audit Committee meetings, the Chairman of the Audit Committee would be called on to consider and, if appropriate, pre-approve audit or permitted non-audit services in an amount sufficient to complete services through the next Audit Committee meeting, and to determine if such services would be consistent with maintaining the accountant’s independence. At the next scheduled Audit Committee meeting, services and fees would be presented to the Audit Committee for formal consideration, and, if appropriate, approval by the entire Audit Committee. The Audit Committee would again consider whether such services and fees are consistent with maintaining the principal accountant’s independence.
The Registrant’s Audit Committee is informed at least annually of all audit and non-audit services provided by the principal accountant to the Vanguard complex, whether such services are provided to: the Registrant, other registered investment companies in the Vanguard complex, The Vanguard Group, Inc., or other entities controlled by The Vanguard Group, Inc. that provide ongoing services to the Registrant.
(2) No percentage of the principal accountant’s fees or services were approved pursuant to the waiver provision of paragraph (c)(7)(i)(C) of Rule 2-01 of Regulation S-X.
(f) For the most recent fiscal year, over 50% of the hours worked under the principal accountant’s engagement were not performed by persons other than full-time, permanent employees of the principal accountant.
(g) Aggregate Non-Audit Fees.
Fiscal Year Ended January 31, 2024: $1,703,928
Fiscal Year Ended January 31, 2023: $5,500,689
Includes fees billed for non-audit services provided to the Registrant, other registered investment companies in the Vanguard complex, The Vanguard Group, Inc., and Vanguard Marketing Corporation.
(h) For the most recent fiscal year, the Audit Committee has determined that the provision of all non-audit services was consistent with maintaining the principal accountant’s independence.
Item 5: Audit Committee of Listed Registrants.
The Registrant is a listed issuer as defined in rule 10A-3 under the Securities Exchange Act of 1934 (“Exchange Act”). The Registrant has a separately-designated standing audit committee established in accordance with Section 3(a)(58)(A) of the Exchange Act. The Registrant’s audit committee members are: F. Joseph Loughrey, Mark Loughridge, Sarah Bloom Raskin, and Peter F. Volanakis.
Item 6: Investments.
Not applicable. The complete schedule of investments is included as part of the report to shareholders filed under Item 1 of this Form.
Item 7: Disclosure of Proxy Voting Policies and Procedures for Closed-End Management Investment Companies.
Not applicable.
Item 8: Portfolio Managers of Closed-End Management Investment Companies.
Not applicable.
Item 9: Purchase of Equity Securities by Closed-End Management Investment Company and Affiliated Purchasers.
Not applicable.
Item 10: Submission of Matters to a Vote of Security Holders.
Not applicable.
Item 11: Controls and Procedures.
(a) Disclosure Controls and Procedures. The Principal Executive and Financial Officers concluded that the Registrant’s Disclosure Controls and Procedures are effective based on their evaluation of the Disclosure Controls and Procedures as of a date within 90 days of the filing date of this report.
(b) Internal Control Over Financial Reporting. There were no significant changes in the Registrant’s Internal Control Over Financial Reporting or in other factors that could significantly affect this control during the period covered by this report, including any corrective actions with regard to significant deficiencies and material weaknesses.
Item 12: Disclosure of Securities Lending Activities for Closed-End Management Investment Companies.
Not applicable.
Item 13: Exhibits.
| (a)(1) | Code of Ethics filed herewith. |
| (a)(2) | Certifications filed herewith. |
| (a)(2) | Certifications filed herewith. |
Pursuant to the requirements of the Securities Exchange Act of 1934 and the Investment Company Act of 1940, the registrant has duly caused this report to be signed on its behalf by the undersigned, thereunto duly authorized.
| VANGUARD FIXED INCOME SECURITIES FUNDS | ||
| BY: | /s/ MORTIMER J. BUCKLEY* | |
| MORTIMER J. BUCKLEY | ||
| CHIEF EXECUTIVE OFFICER | ||
Date: March 22, 2024
Pursuant to the requirements of the Securities Exchange Act of 1934 and the Investment Company Act of 1940, this report has been signed below by the following persons on behalf of the registrant and in the capacities and on the dates indicated.
| VANGUARD FIXED INCOME SECURITIES FUNDS | ||
| BY: | /s/ MORTIMER J. BUCKLEY* | |
| MORTIMER J. BUCKLEY | ||
| CHIEF EXECUTIVE OFFICER | ||
Date: March 22, 2024
| VANGUARD variable insurance FUNDS | ||
| BY: | /s/ CHRISTINE BUCHANAN* | |
| CHRISTINE BUCHANAN | ||
| CHIEF FINANCIAL OFFICER | ||
Date: March 22, 2024
* By: /s/ Anne E. Robinson
Anne E. Robinson, pursuant to a Power of Attorney filed on July 21, 2023 (see File Number 33-53683) and to a Power of Attorney filed on March 29, 2023 (see File Number 2-11444), Incorporated by Reference.