UNITED STATES
SECURITIES AND EXCHANGE COMMISSION
Washington, D.C. 20549
FORM N-CSR
CERTIFIED SHAREHOLDER REPORT OF REGISTERED
MANAGEMENT INVESTMENT COMPANIES
Investment Company Act file number: 811-08839
SPDR® SERIES TRUST
(Exact name of registrant as specified in charter)
One Iron Street, Boston, Massachusetts 02210
(Address of principal executive offices) (zip code)
Sean O’Malley, Esq.
Senior Vice President and Deputy General Counsel
c/o SSGA Funds Management, Inc.
One Iron Street
Boston, Massachusetts 02210
(Name and address of agent for service)
Copy to:
W. John McGuire, Esq.
Morgan, Lewis & Bockius LLP
1111 Pennsylvania Avenue, NW
Washington, DC 20004
Registrant’s telephone number, including area code: (617) 664-1465
Date of fiscal year end: December 31
Date of reporting period: December 31, 2020
Item 1. Reports to Shareholders.
(a) The Report to Shareholders is attached herewith.
(b) Not applicable.
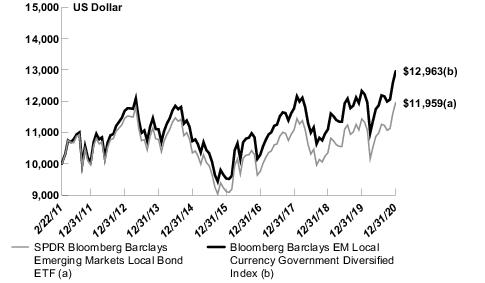
| SPDR Bloomberg Barclays Emerging Markets Local Bond ETF |
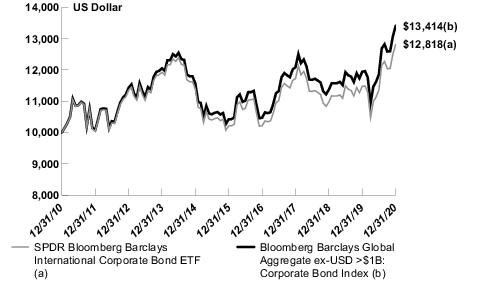
| SPDR Bloomberg Barclays International Corporate Bond ETF |
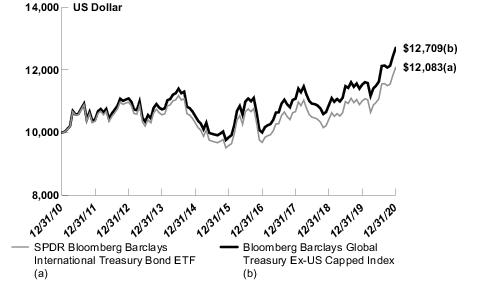
| SPDR Bloomberg Barclays International Treasury Bond ETF |
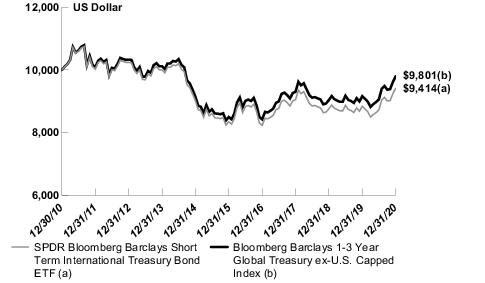
| SPDR Bloomberg Barclays Short Term International Treasury Bond ETF |
| SPDR FTSE International Government Inflation-Protected Bond ETF |

| Management’s Discussion of Fund Performance, Performance Summaries & Portfolio Statistics (Unaudited) | |
| 2 | |
| 5 | |
| 8 | |
| 11 | |
| 14 | |
| Schedules of Investments | |
| 17 | |
| 28 | |
| 44 | |
| 61 | |
| 66 | |
| 72 | |
| 80 | |
| 85 | |
| 96 | |
| 98 |
| Cumulative Total Return | Average Annual Total Return | ||||||
| Net Asset Value | Market Value | Bloomberg Barclays EM Local Currency Government Diversified Index | Net Asset Value | Market Value | Bloomberg Barclays EM Local Currency Government Diversified Index | ||
| ONE YEAR | 4.59 | 4.55 | 5.13 | 4.59 | 4.55 | 5.13 | |
| FIVE YEARS | 31.27 | 32.49 | 36.02 | 5.59 | 5.79 | 6.35 | |
| SINCE INCEPTION(1) | 19.59 | 19.88 | 29.63 | 1.83 | 1.86 | 2.67 | |
| (1) | For the period February 23, 2011 to December 31, 2020. Since shares of the Fund did not trade in the secondary market until one day after the Fund’s inception, for the period from inception to the first day of secondary market trading in shares of the Fund (2/23/11, 2/24/11, respectively),the NAV of the Fund is used as a proxy for the secondary market trading price to calculate market returns. |
(Based on Net Asset Value)
| Description | % of Net Assets | ||
| Brazil Letras do Tesouro Nacional Zero Coupon, 1/1/2024 | 1.4% | ||
| South Africa Government Bond 10.50% 12/21/2026 | 0.9 | ||
| Brazil Notas do Tesouro Nacional Serie F 10.00% 1/1/2023 | 0.8 | ||
| Colombian TES 6.25% 11/26/2025 | 0.8 | ||
| Korea Treasury Bond 1.50% 3/10/2050 | 0.8 | ||
| TOTAL | 4.7% |
| % of Net Assets | |||
| Foreign Government Obligations | 97.6% | ||
| Short-Term Investment | 1.0 | ||
| Other Assets in Excess of Liabilities | 1.4 | ||
| TOTAL | 100.0% |
| Description | % of Total Investments | ||
| South Korea | 12.5% | ||
| China | 12.5 | ||
| Indonesia | 6.4 | ||
| Brazil | 5.6 | ||
| Malaysia | 5.5 | ||
| Thailand | 5.4 | ||
| Mexico | 4.6 | ||
| Poland | 4.6 | ||
| South Africa | 4.5 | ||
| Israel | 4.5 | ||
| TOTAL | 66.1% |
| Cumulative Total Return | Average Annual Total Return | ||||||
| Net Asset Value | Market Value | Bloomberg Barclays Global Aggregate ex-USD >$1B: Corporate Bond Index | Net Asset Value | Market Value | Bloomberg Barclays Global Aggregate ex-USD >$1B: Corporate Bond Index | ||
| ONE YEAR | 11.69 | 11.97 | 12.31 | 11.69 | 11.97 | 12.31 | |
| FIVE YEARS | 25.44 | 25.80 | 28.71 | 4.64 | 4.70 | 5.18 | |
| TEN YEARS | 28.18 | 29.55 | 34.14 | 2.51 | 2.62 | 2.98 | |
(Based on Net Asset Value)
| Description | % of Net Assets | ||
| Volkswagen International Finance NV 1.88% 3/30/2027 | 0.6% | ||
| Orange SA 8.13% 1/28/2033 | 0.5 | ||
| Deutsche Bank AG 1.63% 1/20/2027 | 0.5 | ||
| Cooperatieve Rabobank UA 1.25% 3/23/2026 | 0.5 | ||
| AT&T, Inc. 4.88% 6/1/2044 | 0.4 | ||
| TOTAL | 2.5% |
| % of Net Assets | |||
| Corporate Bonds & Notes | 98.1% | ||
| Short-Term Investments | 0.2 | ||
| Other Assets in Excess of Liabilities | 1.7 | ||
| TOTAL | 100.0% |
| Cumulative Total Return | Average Annual Total Return | ||||||
| Net Asset Value | Market Value | Bloomberg Barclays Global Treasury ex-US Capped Index | Net Asset Value | Market Value | Bloomberg Barclays Global Treasury ex-US Capped Index | ||
| ONE YEAR | 9.73 | 9.63 | 10.13 | 9.73 | 9.63 | 10.13 | |
| FIVE YEARS | 26.07 | 25.59 | 29.06 | 4.74 | 4.66 | 5.23 | |
| TEN YEARS | 20.83 | 21.44 | 27.09 | 1.91 | 1.96 | 2.43 | |
(Based on Net Asset Value)
| Description | % of Net Assets | ||
| China Government Bond 3.29% 10/18/2023 | 1.7% | ||
| China Government Bond 3.25% 11/22/2028 | 1.2 | ||
| China Government Bond 4.08% 10/22/2048 | 1.1 | ||
| Korea Treasury Bond 5.50% 3/10/2028 | 0.5 | ||
| Korea Treasury Bond 2.00% 3/10/2049 | 0.5 | ||
| TOTAL | 5.0% |
| % of Net Assets | |||
| Foreign Government Obligations | 98.2% | ||
| Short-Term Investment | 0.0 * | ||
| Other Assets in Excess of Liabilities | 1.8 | ||
| TOTAL | 100.0% |
| * | Amount shown represents less than 0.05% of net assets. |
| Description | % of Total Investments | ||
| Japan | 22.5% | ||
| United Kingdom | 5.4 | ||
| France | 4.9 | ||
| Australia | 4.7 | ||
| Italy | 4.7 | ||
| Spain | 4.7 | ||
| Canada | 4.7 | ||
| Belgium | 4.6 | ||
| Germany | 4.6 | ||
| China | 4.6 | ||
| TOTAL | 65.4% |
| Cumulative Total Return | Average Annual Total Return | ||||||
| Net Asset Value | Market Value | Bloomberg Barclays 1-3 Year Global Treasury ex-US Capped Index | Net Asset Value | Market Value | Bloomberg Barclays 1-3 Year Global Treasury ex-US Capped Index | ||
| ONE YEAR | 6.49 | 6.33 | 7.01 | 6.49 | 6.33 | 7.01 | |
| FIVE YEARS | 12.81 | 13.02 | 15.39 | 2.44 | 2.48 | 2.90 | |
| TEN YEARS | (5.86) | (6.09) | (1.99) | (0.60) | (0.63) | (0.20) | |
(Based on Net Asset Value)
| Description | % of Net Assets | ||
| Korea Treasury Bond 1.25% 12/10/2022 | 4.6% | ||
| China Government Bond 2.36% 7/2/2023 | 4.4 | ||
| Government of Japan 5 Year Bond 0.10% 3/20/2022 | 2.9 | ||
| Government of Japan 5 Year Bond 0.10% 6/20/2023 | 2.5 | ||
| Government of Japan 5 Year Bond 0.10% 9/20/2023 | 2.1 | ||
| TOTAL | 16.5% |
| % of Net Assets | |||
| Foreign Government Obligations | 95.3% | ||
| Short-Term Investment | 0.0 * | ||
| Other Assets in Excess of Liabilities | 4.7 | ||
| TOTAL | 100.0% |
| * | Amount shown represents less than 0.05% of net assets. |
| Description | % of Total Investments | ||
| Japan | 21.5% | ||
| Italy | 7.7 | ||
| France | 6.6 | ||
| Germany | 5.5 | ||
| United Kingdom | 4.8 | ||
| South Korea | 4.8 | ||
| Canada | 4.8 | ||
| Spain | 4.7 | ||
| China | 4.7 | ||
| Australia | 3.8 | ||
| TOTAL | 68.9% |
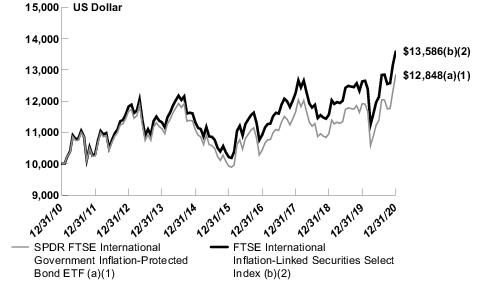
| Cumulative Total Return | Average Annual Total Return | ||||||
| Net Asset Value | Market Value | FTSE International Inflation-Linked Securities Select Index | Net Asset Value | Market Value | FTSE International Inflation-Linked Securities Select Index | ||
| ONE YEAR | 7.76 | 8.49 | 8.71 | 7.76 | 8.49 | 8.71 | |
| FIVE YEARS(1) (2) | 29.42 | 30.55 | 32.99 | 5.29 | 5.48 | 5.87 | |
| TEN YEARS(1) (2) | 28.48 | 29.08 | 35.86 | 2.54 | 2.59 | 3.11 | |
| (1) | Effective February 15, 2016, the Fund changed its benchmark index from the DB Global Government ex-US Inflation-Linked Securities Select Index. The Fund's performance in the tables is based on the Fund's prior investment strategy to track a different benchmark index for periods prior to February 15, 2016. |
| (2) | The FTSE International Inflation-Linked Securities Select Index (formerly, Citi International Inflation-Linked Securities Select Index) inception date is January 15, 2016. Index returns in the line graph below represent the Fund’s prior benchmark index from December 31, 2009 through February 14, 2016 and the FTSE International Inflation-Linked Securities Select Index (formerly, Citi International Inflation-Linked Securities Select Index from February 15, 2016 through December 31, 2020. |
(Based on Net Asset Value)
| Description | % of Net Assets | ||
| United Kingdom Gilt Inflation Linked 1.13% 11/22/2037 | 1.6% | ||
| United Kingdom Gilt Inflation Linked 0.38% 3/22/2062 | 1.5 | ||
| Deutsche Bundesrepublik Inflation Linked Bond 0.50% 4/15/2030 | 1.4 | ||
| Bonos de la Tesoreria de la Republica 3.00% 1/1/2044 | 1.3 | ||
| Deutsche Bundesrepublik Inflation Linked Bond 0.10% 4/15/2026 | 1.2 | ||
| TOTAL | 7.0% |
| % of Net Assets | |||
| Foreign Government Obligations | 99.5% | ||
| Short-Term Investment | 0.0 * | ||
| Other Assets in Excess of Liabilities | 0.5 | ||
| TOTAL | 100.0% |
| * | Amount shown represents less than 0.05% of net assets. |
| Description | % of Total Investments | ||
| United Kingdom | 22.1% | ||
| France | 8.2 | ||
| Brazil | 5.9 | ||
| Italy | 5.6 | ||
| Turkey | 5.5 | ||
| Chile | 4.8 | ||
| South Africa | 4.7 | ||
| Australia | 4.6 | ||
| Colombia | 4.6 | ||
| Israel | 4.5 | ||
| TOTAL | 70.5% |
| Security Description | Principal Amount | Value | ||||
| FOREIGN GOVERNMENT OBLIGATIONS — 97.6% | ||||||
| BRAZIL — 5.5% | ||||||
| Brazil Letras do Tesouro Nacional: | ||||||
Series LTN, Zero Coupon, 1/1/2022 | BRL | 2,235,000 | $ 418,276 | |||
Series LTN, Zero Coupon, 4/1/2022 | BRL | 15,500,000 | 2,863,777 | |||
Series LTN, Zero Coupon, 7/1/2022 | BRL | 23,000,000 | 4,190,476 | |||
Series LTN, Zero Coupon, 10/1/2022 | BRL | 21,000,000 | 3,765,593 | |||
Series LTN, Zero Coupon, 7/1/2023 | BRL | 42,400,000 | 7,233,453 | |||
Series LTN, Zero Coupon, 1/1/2024 | BRL | 87,800,000 | 14,468,620 | |||
| Brazil Notas do Tesouro Nacional Serie F: | ||||||
Series NTNF, 10.00%, 1/1/2023 | BRL | 38,810,000 | 8,251,086 | |||
Series NTNF, 10.00%, 1/1/2025 | BRL | 28,850,000 | 6,421,008 | |||
Series NTNF, 10.00%, 1/1/2027 | BRL | 19,575,000 | 4,448,477 | |||
Series NTNF, 10.00%, 1/1/2029 | BRL | 11,890,000 | 2,758,366 | |||
Series NTNF, 10.00%, 1/1/2031 | BRL | 3,800,000 | 889,515 | |||
| Brazilian Government International Bond: | ||||||
8.50%, 1/5/2024 | BRL | 350,000 | 73,144 | |||
10.25%, 1/10/2028 | BRL | 1,000,000 | 227,252 | |||
12.50%, 1/5/2022 | BRL | 350,000 | 73,831 | |||
| 56,082,874 | ||||||
| CHILE — 2.8% | ||||||
| Bonos de la Tesoreria de la Republica en pesos: | ||||||
2.50%, 3/1/2025 | CLP | 1,735,000,000 | 2,556,162 | |||
4.00%, 3/1/2023 (a) | CLP | 2,200,000,000 | 3,319,096 | |||
4.50%, 3/1/2026 | CLP | 3,065,000,000 | 4,939,920 | |||
4.70%, 9/1/2030 (a) | CLP | 3,265,000,000 | 5,379,864 | |||
5.00%, 3/1/2035 | CLP | 3,250,000,000 | 5,499,196 | |||
5.10%, 7/15/2050 | CLP | 950,000,000 | 1,613,522 | |||
Series 10YR, 6.00%, 1/1/2022 | CLP | 65,000,000 | 96,601 | |||
Series 30YR, 6.00%, 1/1/2043 | CLP | 2,745,000,000 | 5,226,758 | |||
| 28,631,119 | ||||||
| Security Description | Principal Amount | Value | |||
| CHINA — 12.3% | |||||
| China Development Bank: | |||||
Series 1903, 3.30%, 2/1/2024 | CNY | 21,000,000 | $ 3,233,296 | ||
Series 1908, 3.42%, 7/2/2024 | CNY | 11,300,000 | 1,743,415 | ||
Series 1518, 3.74%, 9/10/2025 | CNY | 2,000,000 | 311,477 | ||
Series 1605, 3.80%, 1/25/2036 | CNY | 6,500,000 | 982,074 | ||
Series 1516, 3.94%, 7/10/2022 | CNY | 3,000,000 | 465,860 | ||
Series 1213, 4.21%, 3/22/2022 | CNY | 10,000,000 | 1,555,618 | ||
Series 1510, 4.21%, 4/13/2025 | CNY | 9,000,000 | 1,427,800 | ||
Series 1708, 4.30%, 8/21/2024 | CNY | 10,000,000 | 1,585,679 | ||
Series 1712, 4.44%, 11/9/2022 | CNY | 1,000,000 | 157,100 | ||
Series 1804, 4.69%, 3/23/2023 | CNY | 11,000,000 | 1,741,552 | ||
Series 1805, 4.88%, 2/9/2028 | CNY | 3,000,000 | 499,884 | ||
Series 1421, 5.10%, 8/7/2021 | CNY | 6,000,000 | 930,287 | ||
| China Government Bond: | |||||
Series INBK, 1.99%, 4/9/2025 | CNY | 38,000,000 | 5,583,266 | ||
Series INBK, 2.20%, 2/13/2022 | CNY | 20,000,000 | 3,042,912 | ||
Series INBK, 2.24%, 3/5/2023 | CNY | 30,000,000 | 4,527,017 | ||
Series INBK, 2.36%, 7/2/2023 | CNY | 30,500,000 | 4,608,066 | ||
Series INBK, 2.64%, 8/13/2022 | CNY | 24,000,000 | 3,663,268 | ||
Series INBK, 2.68%, 5/21/2030 | CNY | 24,000,000 | 3,520,548 | ||
Series 1903, 2.69%, 3/7/2022 | CNY | 25,000,000 | 3,823,880 | ||
Series 1911, 2.75%, 8/8/2022 | CNY | 23,000,000 | 3,516,349 | ||
Series INBK, 2.85%, 6/4/2027 | CNY | 38,000,000 | 5,703,544 | ||
Series INBK, 2.88%, 11/5/2023 | CNY | 20,000,000 | 3,062,968 | ||
Series 1610, 2.90%, 5/5/2026 | CNY | 10,000,000 | 1,514,277 | ||
Series 1913, 2.94%, 10/17/2024 | CNY | 27,000,000 | 4,126,833 | ||
Series INBK, 3.02%, 10/22/2025 | CNY | 24,000,000 | 3,682,938 | ||
Series 1916, 3.12%, 12/5/2026 | CNY | 7,600,000 | 1,161,446 |
| Security Description | Principal Amount | Value | |||
Series 1915, 3.13%, 11/21/2029 | CNY | 22,000,000 | $ 3,335,591 | ||
Series 1904, 3.19%, 4/11/2024 | CNY | 27,000,000 | 4,162,008 | ||
Series 1828, 3.22%, 12/6/2025 | CNY | 7,790,000 | 1,204,025 | ||
Series 1907, 3.25%, 6/6/2026 | CNY | 29,800,000 | 4,606,431 | ||
Series 1827, 3.25%, 11/22/2028 | CNY | 10,000,000 | 1,532,233 | ||
Series INBK, 3.27%, 11/19/2030 | CNY | 17,000,000 | 2,625,697 | ||
Series INBK, 3.28%, 12/3/2027 | CNY | 23,400,000 | 3,597,627 | ||
Series 1823, 3.29%, 10/18/2023 | CNY | 20,000,000 | 3,095,832 | ||
Series 1906, 3.29%, 5/23/2029 | CNY | 18,600,000 | 2,855,910 | ||
Series INBK, 3.39%, 3/16/2050 | CNY | 27,000,000 | 3,845,182 | ||
Series 1626, 3.48%, 11/21/2066 | CNY | 6,700,000 | 937,582 | ||
Series 1710, 3.52%, 5/4/2027 | CNY | 5,000,000 | 787,517 | ||
Series 1608, 3.52%, 4/25/2046 | CNY | 6,000,000 | 882,481 | ||
Series 1819, 3.54%, 8/16/2028 | CNY | 10,000,000 | 1,579,154 | ||
Series INBK, 3.73%, 5/25/2070 | CNY | 17,000,000 | 2,553,275 | ||
Series 1521, 3.74%, 9/22/2035 | CNY | 17,800,000 | 2,768,162 | ||
Series 1525, 3.74%, 10/20/2045 | CNY | 3,000,000 | 458,317 | ||
Series INBK, 3.81%, 9/14/2050 | CNY | 24,000,000 | 3,722,132 | ||
Series 1910, 3.86%, 7/22/2049 | CNY | 11,500,000 | 1,781,341 | ||
Series 1817, 3.97%, 7/23/2048 | CNY | 10,000,000 | 1,579,728 | ||
Series 1908, 4.00%, 6/24/2069 | CNY | 9,000,000 | 1,425,208 | ||
Series 1715, 4.05%, 7/24/2047 | CNY | 15,000,000 | 2,391,653 | ||
Series 1824, 4.08%, 10/22/2048 | CNY | 5,300,000 | 850,199 | ||
Series 1508, 4.09%, 4/27/2035 | CNY | 1,000,000 | 162,010 | ||
Series 1806, 4.22%, 3/19/2048 | CNY | 8,000,000 | 1,313,730 | ||
Series 1722, 4.28%, 10/23/2047 | CNY | 3,250,000 | 550,050 | ||
Series 1116, 4.50%, 6/23/2041 | CNY | 19,000,000 | 3,299,582 | ||
Series 1319, 4.76%, 9/16/2043 | CNY | 2,000,000 | 355,756 | ||
| 124,429,767 |
| Security Description | Principal Amount | Value | |||
| COLOMBIA — 4.3% | |||||
| Colombia Government International Bond: | |||||
4.38%, 3/21/2023 | COP | 1,610,000,000 | $ 479,905 | ||
9.85%, 6/28/2027 | COP | 115,000,000 | 43,720 | ||
| Colombian TES: | |||||
Series B, 5.75%, 11/3/2027 | COP | 6,900,000,000 | 2,136,631 | ||
Series B, 6.00%, 4/28/2028 | COP | 16,715,000,000 | 5,229,951 | ||
Series B, 6.25%, 11/26/2025 | COP | 25,595,000,000 | 8,196,031 | ||
Series B, 7.00%, 5/4/2022 | COP | 12,854,000,000 | 3,991,476 | ||
Series B, 7.00%, 6/30/2032 | COP | 14,964,000,000 | 4,825,087 | ||
Series B, 7.25%, 10/18/2034 | COP | 13,325,000,000 | 4,353,984 | ||
Series B, 7.25%, 10/26/2050 | COP | 3,200,000,000 | 1,004,597 | ||
Series B, 7.50%, 8/26/2026 | COP | 18,102,000,000 | 6,109,138 | ||
Series B, 7.75%, 9/18/2030 | COP | 13,200,000,000 | 4,528,753 | ||
Series B, 10.00%, 7/24/2024 | COP | 7,590,000,000 | 2,693,950 | ||
| 43,593,223 | |||||
| CZECH REPUBLIC — 4.2% | |||||
| Czech Republic Government Bond: | |||||
Series 130, 0.05%, 11/29/2029 | CZK | 10,000,000 | 417,911 | ||
Series 126, 0.10%, 4/17/2022 | CZK | 8,000,000 | 371,728 | ||
Series 100, 0.25%, 2/10/2027 | CZK | 70,100,000 | 3,117,169 | ||
Series 97, 0.45%, 10/25/2023 | CZK | 70,840,000 | 3,304,665 | ||
Series 94, 0.95%, 5/15/2030 | CZK | 99,970,000 | 4,520,873 | ||
Series 95, 1.00%, 6/26/2026 | CZK | 53,470,000 | 2,498,719 | ||
Series 121, 1.20%, 3/13/2031 | CZK | 64,000,000 | 2,943,683 | ||
Series 120, 1.25%, 2/14/2025 | CZK | 51,500,000 | 2,446,678 | ||
Series 125, 1.50%, 4/24/2040 | CZK | 8,000,000 | 362,285 | ||
Series 103, 2.00%, 10/13/2033 | CZK | 28,850,000 | 1,434,721 | ||
Series 89, 2.40%, 9/17/2025 | CZK | 110,820,000 | 5,542,614 | ||
Series 78, 2.50%, 8/25/2028 | CZK | 84,240,000 | 4,330,420 | ||
Series 105, 2.75%, 7/23/2029 | CZK | 62,650,000 | 3,294,509 |
| Security Description | Principal Amount | Value | |||
Series 61, 3.85%, 9/29/2021 | CZK | 12,070,000 | $ 577,527 | ||
Series 49, 4.20%, 12/4/2036 | CZK | 38,830,000 | 2,518,697 | ||
Series 52, 4.70%, 9/12/2022 | CZK | 17,200,000 | 862,013 | ||
Series 53, 4.85%, 11/26/2057 | CZK | 12,300,000 | 957,295 | ||
Series 58, 5.70%, 5/25/2024 | CZK | 61,750,000 | 3,386,738 | ||
| 42,888,245 | |||||
| HUNGARY — 3.5% | |||||
| Hungary Government Bond: | |||||
Series 25/C, 1.00%, 11/26/2025 | HUF | 812,000,000 | 2,714,974 | ||
Series 22/C, 1.50%, 8/24/2022 | HUF | 115,000,000 | 394,189 | ||
Series 23/C, 1.50%, 8/23/2023 | HUF | 470,000,000 | 1,616,358 | ||
Series 26/E, 1.50%, 4/22/2026 | HUF | 400,000,000 | 1,358,714 | ||
Series 22/B, 1.75%, 10/26/2022 | HUF | 798,500,000 | 2,752,199 | ||
Series 29/A, 2.00%, 5/23/2029 | HUF | 80,000,000 | 271,093 | ||
Series 24/C, 2.50%, 10/24/2024 | HUF | 902,600,000 | 3,219,434 | ||
Series 26/D, 2.75%, 12/22/2026 | HUF | 761,000,000 | 2,759,248 | ||
Series 24/B, 3.00%, 6/26/2024 | HUF | 740,330,000 | 2,670,650 | ||
Series 27/A, 3.00%, 10/27/2027 | HUF | 1,113,880,000 | 4,112,958 | ||
Series 30/A, 3.00%, 8/21/2030 | HUF | 871,000,000 | 3,181,651 | ||
Series 38/A, 3.00%, 10/27/2038 | HUF | 170,000,000 | 632,065 | ||
Series 31/A, 3.25%, 10/22/2031 | HUF | 929,200,000 | 3,469,529 | ||
Series 25/B, 5.50%, 6/24/2025 | HUF | 639,220,000 | 2,565,547 | ||
Series 23/A, 6.00%, 11/24/2023 | HUF | 469,340,000 | 1,820,548 | ||
Series 28/A, 6.75%, 10/22/2028 | HUF | 217,000,000 | 998,542 | ||
Series 22/A, 7.00%, 6/24/2022 | HUF | 192,790,000 | 711,856 | ||
| 35,249,555 | |||||
| INDONESIA — 6.3% | |||||
| Indonesia Treasury Bond: | |||||
Series FR86, 5.50%, 4/15/2026 | IDR | 42,900,000,000 | 3,097,638 | ||
Series FR63, 5.63%, 5/15/2023 | IDR | 21,555,000,000 | 1,583,801 |
| Security Description | Principal Amount | Value | |||
Series FR64, 6.13%, 5/15/2028 | IDR | 41,000,000,000 | $ 2,956,961 | ||
Series FR62, 6.38%, 4/15/2042 | IDR | 1,700,000,000 | 112,153 | ||
Series FR81, 6.50%, 6/15/2025 | IDR | 70,000,000,000 | 5,248,256 | ||
Series FR87, 6.50%, 2/15/2031 | IDR | 39,200,000,000 | 2,915,207 | ||
Series FR61, 7.00%, 5/15/2022 | IDR | 20,633,000,000 | 1,528,898 | ||
Series FR59, 7.00%, 5/15/2027 | IDR | 50,000,000,000 | 3,830,306 | ||
Series FR82, 7.00%, 9/15/2030 | IDR | 53,600,000,000 | 4,129,680 | ||
Series FR76, 7.38%, 5/15/2048 | IDR | 16,700,000,000 | 1,257,552 | ||
Series FR74, 7.50%, 8/15/2032 | IDR | 26,300,000,000 | 2,035,332 | ||
Series FR80, 7.50%, 6/15/2035 | IDR | 23,600,000,000 | 1,864,484 | ||
Series FR75, 7.50%, 5/15/2038 | IDR | 16,910,000,000 | 1,312,009 | ||
Series FR83, 7.50%, 4/15/2040 | IDR | 43,000,000,000 | 3,396,541 | ||
Series FR85, 7.75%, 4/15/2031 | IDR | 3,000,000,000 | 238,659 | ||
Series FR77, 8.13%, 5/15/2024 | IDR | 71,600,000,000 | 5,616,848 | ||
Series FR78, 8.25%, 5/15/2029 | IDR | 37,400,000,000 | 3,062,791 | ||
Series FR58, 8.25%, 6/15/2032 | IDR | 3,710,000,000 | 303,912 | ||
Series FR72, 8.25%, 5/15/2036 | IDR | 33,090,000,000 | 2,736,095 | ||
Series FR70, 8.38%, 3/15/2024 | IDR | 56,100,000,000 | 4,391,010 | ||
Series FR68, 8.38%, 3/15/2034 | IDR | 44,400,000,000 | 3,680,340 | ||
Series FR79, 8.38%, 4/15/2039 | IDR | 21,000,000,000 | 1,763,674 | ||
Series FR73, 8.75%, 5/15/2031 | IDR | 9,050,000,000 | 764,192 | ||
Series FR67, 8.75%, 2/15/2044 | IDR | 7,050,000,000 | 580,512 | ||
Series FR71, 9.00%, 3/15/2029 | IDR | 6,000,000,000 | 509,466 | ||
Series FR57, 9.50%, 5/15/2041 | IDR | 1,000,000,000 | 90,516 | ||
Series FR45, 9.75%, 5/15/2037 | IDR | 1,250,000,000 | 111,333 | ||
| Perusahaan Penerbit SBSN Indonesia: | |||||
Series PBS, 6.63%, 10/15/2024 | IDR | 16,000,000,000 | 1,200,583 | ||
Series PBS, 8.75%, 8/15/2023 | IDR | 3,800,000,000 | 297,132 |
| Security Description | Principal Amount | Value | |||
Series PBS, 8.88%, 11/15/2031 | IDR | 34,200,000,000 | $ 2,920,831 | ||
| 63,536,712 | |||||
| ISRAEL — 4.5% | |||||
| Israel Government Bond: | |||||
Series 0723, 0.15%, 7/31/2023 | ILS | 5,600,000 | 1,742,312 | ||
Series 0425, 0.50%, 4/30/2025 | ILS | 3,500,000 | 1,100,023 | ||
Series 0722, 0.75%, 7/31/2022 | ILS | 4,400,000 | 1,384,813 | ||
Series 0330, 1.00%, 3/31/2030 | ILS | 5,800,000 | 1,841,788 | ||
Series 1122, 1.25%, 11/30/2022 | ILS | 7,760,000 | 2,471,232 | ||
Series 1123, 1.50%, 11/30/2023 | ILS | 9,335,000 | 3,018,393 | ||
Series 0537, 1.50%, 5/31/2037 | ILS | 6,200,000 | 1,949,162 | ||
Series 0825, 1.75%, 8/31/2025 | ILS | 3,780,000 | 1,255,981 | ||
Series 0327, 2.00%, 3/31/2027 | ILS | 14,850,000 | 5,076,309 | ||
Series 0928, 2.25%, 9/28/2028 | ILS | 10,595,000 | 3,715,962 | ||
Series 0324, 3.75%, 3/31/2024 | ILS | 12,000,000 | 4,165,855 | ||
Series 0347, 3.75%, 3/31/2047 | ILS | 10,175,000 | 4,422,626 | ||
Series 0323, 4.25%, 3/31/2023 | ILS | 9,350,000 | 3,180,721 | ||
Series 0122, 5.50%, 1/31/2022 | ILS | 5,595,000 | 1,844,269 | ||
Series 0142, 5.50%, 1/31/2042 | ILS | 9,010,000 | 4,802,789 | ||
Series 1026, 6.25%, 10/30/2026 | ILS | 8,125,000 | 3,388,020 | ||
| 45,360,255 | |||||
| MALAYSIA — 5.4% | |||||
| Malaysia Government Bond: | |||||
Series 0220, 2.63%, 4/15/2031 | MYR | 850,000 | 210,401 | ||
Series 0313, 3.48%, 3/15/2023 | MYR | 1,860,000 | 478,116 | ||
Series 0313, 3.48%, 3/15/2023 | MYR | 7,400,000 | 1,902,182 | ||
Series 0319, 3.48%, 6/14/2024 | MYR | 2,800,000 | 730,138 | ||
Series 0307, 3.50%, 5/31/2027 | MYR | 5,400,000 | 1,429,762 | ||
Series 0218, 3.76%, 4/20/2023 | MYR | 5,600,000 | 1,449,278 | ||
Series 0519, 3.76%, 5/22/2040 | MYR | 4,950,000 | 1,291,639 |
| Security Description | Principal Amount | Value | |||
Series 0116, 3.80%, 8/17/2023 | MYR | 4,131,000 | $ 1,075,466 | ||
Series 0419, 3.83%, 7/5/2034 | MYR | 3,200,000 | 846,805 | ||
Series 0413, 3.84%, 4/15/2033 | MYR | 6,360,000 | 1,688,794 | ||
Series 0117, 3.88%, 3/10/2022 | MYR | 800,000 | 203,701 | ||
Series 0118, 3.88%, 3/14/2025 | MYR | 2,800,000 | 744,736 | ||
Series 0212, 3.89%, 3/15/2027 | MYR | 600,000 | 162,606 | ||
Series 0219, 3.89%, 8/15/2029 | MYR | 10,550,000 | 2,884,479 | ||
Series 0316, 3.90%, 11/30/2026 | MYR | 3,315,000 | 895,524 | ||
Series 0417, 3.90%, 11/16/2027 | MYR | 2,930,000 | 799,032 | ||
Series 0119, 3.91%, 7/15/2026 | MYR | 2,240,000 | 603,034 | ||
Series 0115, 3.96%, 9/15/2025 | MYR | 11,412,000 | 3,067,069 | ||
Series 0217, 4.06%, 9/30/2024 | MYR | 915,000 | 243,634 | ||
Series 0120, 4.07%, 6/15/2050 | MYR | 2,000,000 | 516,375 | ||
Series 0412, 4.13%, 4/15/2032 | MYR | 800,000 | 220,357 | ||
Series 0114, 4.18%, 7/15/2024 | MYR | 3,797,000 | 1,012,804 | ||
Series 0415, 4.25%, 5/31/2035 | MYR | 1,650,000 | 456,751 | ||
Series 0318, 4.64%, 11/7/2033 | MYR | 4,180,000 | 1,187,599 | ||
Series 0216, 4.74%, 3/15/2046 | MYR | 6,425,000 | 1,824,103 | ||
Series 0317, 4.76%, 4/7/2037 | MYR | 5,535,000 | 1,599,413 | ||
Series 3/05, 4.84%, 7/15/2025 | MYR | 170,000 | 47,094 | ||
Series 0418, 4.89%, 6/8/2038 | MYR | 4,000,000 | 1,172,499 | ||
Series 0518, 4.92%, 7/6/2048 | MYR | 3,000,000 | 880,433 | ||
Series 0713, 4.94%, 9/30/2043 | MYR | 300,000 | 88,111 | ||
| Malaysia Government Investment Issue: | |||||
Series 0719, 3.15%, 5/15/2023 | MYR | 1,000,000 | 255,573 | ||
Series 0120, 3.42%, 9/30/2027 | MYR | 3,600,000 | 944,659 | ||
Series 0220, 3.47%, 10/15/2030 | MYR | 3,000,000 | 788,188 | ||
Series 0419, 3.66%, 10/15/2024 | MYR | 7,500,000 | 1,970,622 |
| Security Description | Principal Amount | Value | |||
Series 0418, 3.73%, 3/31/2022 | MYR | 1,630,000 | $ 414,626 | ||
Series 0319, 3.73%, 3/31/2026 | MYR | 3,600,000 | 959,392 | ||
Series 0317, 3.95%, 4/14/2022 | MYR | 2,120,000 | 541,017 | ||
Series 0217, 4.05%, 8/15/2024 | MYR | 3,400,000 | 901,798 | ||
Series 0316, 4.07%, 9/30/2026 | MYR | 4,425,000 | 1,198,503 | ||
Series 0318, 4.09%, 11/30/2023 | MYR | 4,570,000 | 1,201,490 | ||
Series 0619, 4.12%, 11/30/2034 | MYR | 3,500,000 | 945,991 | ||
Series 0118, 4.13%, 8/15/2025 | MYR | 3,350,000 | 902,504 | ||
Series 0119, 4.13%, 7/9/2029 | MYR | 4,500,000 | 1,235,144 | ||
Series 0115, 4.19%, 7/15/2022 | MYR | 4,020,000 | 1,034,334 | ||
Series 0117, 4.26%, 7/26/2027 | MYR | 5,920,000 | 1,627,613 | ||
Series 0218, 4.37%, 10/31/2028 | MYR | 5,680,000 | 1,581,332 | ||
Series 0116, 4.39%, 7/7/2023 | MYR | 2,390,000 | 629,439 | ||
Series 0813, 4.44%, 5/22/2024 | MYR | 2,300,000 | 615,651 | ||
Series 0219, 4.47%, 9/15/2039 | MYR | 4,200,000 | 1,175,608 | ||
Series 0513, 4.58%, 8/30/2033 | MYR | 7,400,000 | 2,079,871 | ||
Series 0519, 4.64%, 11/15/2049 | MYR | 3,500,000 | 975,834 | ||
Series 0617, 4.72%, 6/15/2033 | MYR | 4,200,000 | 1,198,088 | ||
Series 0517, 4.76%, 8/4/2037 | MYR | 3,300,000 | 930,207 | ||
Series 0615, 4.79%, 10/31/2035 | MYR | 810,000 | 230,882 | ||
Series 0417, 4.90%, 5/8/2047 | MYR | 1,500,000 | 426,260 | ||
| 54,476,561 | |||||
| MEXICO — 4.6% | |||||
| Mexican Bonos: | |||||
Series M, 5.75%, 3/5/2026 | MXN | 75,640,000 | 3,967,081 | ||
Series M, 6.50%, 6/9/2022 | MXN | 68,278,000 | 3,527,819 | ||
Series M, 6.75%, 3/9/2023 | MXN | 76,000,000 | 4,000,723 | ||
Series M 20, 7.50%, 6/3/2027 | MXN | 89,430,000 | 5,106,875 | ||
Series M, 7.75%, 5/29/2031 | MXN | 48,328,000 | 2,849,667 | ||
Series M, 7.75%, 11/23/2034 | MXN | 8,000,000 | 472,857 |
| Security Description | Principal Amount | Value | |||
Series M, 7.75%, 11/13/2042 | MXN | 53,980,000 | $ 3,120,142 | ||
Series M, 8.00%, 12/7/2023 | MXN | 57,680,000 | 3,176,388 | ||
Series M, 8.00%, 9/5/2024 | MXN | 66,200,000 | 3,713,718 | ||
Series M, 8.00%, 11/7/2047 | MXN | 37,420,000 | 2,216,354 | ||
Series M 20, 8.50%, 5/31/2029 | MXN | 69,485,000 | 4,250,597 | ||
Series M 30, 8.50%, 11/18/2038 | MXN | 80,240,000 | 4,992,595 | ||
Series M 20, 10.00%, 12/5/2024 | MXN | 66,695,000 | 4,003,541 | ||
Series M 30, 10.00%, 11/20/2036 | MXN | 10,000,000 | 703,229 | ||
| 46,101,586 | |||||
| PERU — 2.9% | |||||
| Peru Government Bond: | |||||
5.35%, 8/12/2040 | PEN | 3,900,000 | 1,120,784 | ||
5.40%, 8/12/2034 | PEN | 9,000,000 | 2,743,259 | ||
5.70%, 8/12/2024 | PEN | 900,000 | 290,852 | ||
5.94%, 2/12/2029 | PEN | 11,125,000 | 3,839,391 | ||
6.15%, 8/12/2032 | PEN | 14,457,000 | 4,858,489 | ||
6.35%, 8/12/2028 | PEN | 1,400,000 | 491,757 | ||
6.71%, 2/12/2055 | PEN | 1,000,000 | 346,626 | ||
6.90%, 8/12/2037 | PEN | 11,075,000 | 3,775,533 | ||
6.95%, 8/12/2031 | PEN | 9,670,000 | 3,475,930 | ||
8.20%, 8/12/2026 | PEN | 2,700,000 | 1,013,216 | ||
| Peruvian Government International Bond: | |||||
Series REGS, 5.70%, 8/12/2024 | PEN | 1,400,000 | 452,436 | ||
Series REGS, 6.35%, 8/12/2028 | PEN | 7,810,000 | 2,743,299 | ||
Series REGS, 6.71%, 2/12/2055 | PEN | 475,000 | 164,648 | ||
Series REGS, 6.85%, 2/12/2042 | PEN | 5,125,000 | 1,734,890 | ||
Series REGS, 8.20%, 8/12/2026 | PEN | 6,935,000 | 2,602,464 | ||
| 29,653,574 | |||||
| PHILIPPINES — 4.3% | |||||
| Philippine Government Bond: | |||||
Series 0325, 2.38%, 9/10/2023 | PHP | 129,000,000 | 2,715,754 | ||
Series R513, 2.63%, 8/12/2025 | PHP | 30,000,000 | 626,327 | ||
Series 1065, 2.88%, 7/9/2030 | PHP | 73,000,000 | 1,507,558 | ||
Series 7-57, 3.50%, 3/20/2021 | PHP | 45,450,000 | 950,565 | ||
Series 7-58, 3.50%, 4/21/2023 | PHP | 3,500,000 | 75,453 |
| Security Description | Principal Amount | Value | |||
Series R105, 3.50%, 9/20/2026 | PHP | 22,000,000 | $ 474,924 | ||
Series 2020, 3.63%, 3/21/2033 | PHP | 43,150,000 | 912,088 | ||
Series 5-74, 4.00%, 1/26/2022 | PHP | 173,800,000 | 3,702,636 | ||
Series 1059, 4.13%, 8/20/2024 | PHP | 13,700,000 | 305,378 | ||
Series 7-59, 4.50%, 4/20/2024 | PHP | 68,200,000 | 1,529,237 | ||
Series R511, 4.63%, 12/4/2022 | PHP | 41,850,000 | 916,641 | ||
Series 2511, 4.63%, 9/9/2040 | PHP | 68,100,000 | 1,507,957 | ||
Series 3-24, 4.75%, 7/4/2022 | PHP | 27,000,000 | 586,628 | ||
Series 1061, 4.75%, 5/4/2027 | PHP | 158,450,000 | 3,691,810 | ||
Series 2021, 5.25%, 5/18/2037 | PHP | 48,800,000 | 1,151,498 | ||
Series 5-75, 5.50%, 3/8/2023 | PHP | 32,000,000 | 716,315 | ||
Series 7-61, 5.75%, 4/12/2025 | PHP | 89,500,000 | 2,116,825 | ||
Series R251, 6.13%, 10/24/2037 | PHP | 67,000,000 | 1,740,834 | ||
Series 7-62, 6.25%, 2/14/2026 | PHP | 105,000,000 | 2,568,845 | ||
Series 1063, 6.25%, 3/22/2028 | PHP | 97,700,000 | 2,466,753 | ||
Series 1054, 6.38%, 1/19/2022 | PHP | 4,700,000 | 102,491 | ||
Series 2023, 6.75%, 1/24/2039 | PHP | 57,000,000 | 1,609,464 | ||
Series 1064, 6.88%, 1/10/2029 | PHP | 150,000,000 | 4,049,162 | ||
Series 2017, 8.00%, 7/19/2031 | PHP | 191,737,338 | 5,779,446 | ||
Series 25-8, 8.13%, 12/16/2035 | PHP | 13,300,000 | 408,276 | ||
| Philippine Government International Bond: | |||||
3.90%, 11/26/2022 | PHP | 31,000,000 | 656,538 | ||
6.25%, 1/14/2036 | PHP | 20,000,000 | 531,856 | ||
| 43,401,259 | |||||
| POLAND — 4.5% | |||||
| Poland Government Bond: | |||||
Series 0722, Zero Coupon, 7/25/2022 | PLN | 19,820,000 | 5,316,253 | ||
Series 0425, 0.75%, 4/25/2025 | PLN | 14,500,000 | 3,948,956 | ||
Series 1030, 1.25%, 10/25/2030 | PLN | 3,200,000 | 861,638 | ||
Series 0422, 2.25%, 4/25/2022 | PLN | 8,900,000 | 2,458,622 |
| Security Description | Principal Amount | Value | |||
Series 1024, 2.25%, 10/25/2024 | PLN | 2,700,000 | $ 777,726 | ||
Series 0123, 2.50%, 1/25/2023 | PLN | 8,080,000 | 2,277,344 | ||
Series 0424, 2.50%, 4/25/2024 | PLN | 16,000,000 | 4,615,379 | ||
Series 0726, 2.50%, 7/25/2026 | PLN | 13,400,000 | 3,974,395 | ||
Series 0727, 2.50%, 7/25/2027 | PLN | 12,600,000 | 3,760,663 | ||
Series 0428, 2.75%, 4/25/2028 | PLN | 20,700,000 | 6,295,990 | ||
Series 1029, 2.75%, 10/25/2029 | PLN | 14,840,000 | 4,546,419 | ||
Series 0725, 3.25%, 7/25/2025 | PLN | 5,700,000 | 1,725,922 | ||
Series 1023, 4.00%, 10/25/2023 | PLN | 9,350,000 | 2,780,508 | ||
Series 0922, 5.75%, 9/23/2022 | PLN | 8,200,000 | 2,417,085 | ||
| 45,756,900 | |||||
| ROMANIA — 3.2% | |||||
| Romania Government Bond: | |||||
Series 7Y, 3.25%, 4/29/2024 | RON | 2,700,000 | 692,587 | ||
Series 5Y, 3.40%, 3/8/2022 | RON | 11,410,000 | 2,898,541 | ||
Series 7Y, 3.50%, 12/19/2022 | RON | 1,800,000 | 460,684 | ||
Series 5Y, 3.65%, 7/28/2025 | RON | 4,400,000 | 1,150,393 | ||
Series 15Y, 3.65%, 9/24/2031 | RON | 8,250,000 | 2,144,816 | ||
Series 4YR, 3.70%, 11/25/2024 | RON | 3,300,000 | 862,178 | ||
Series 3Y, 4.00%, 8/8/2022 | RON | 2,750,000 | 707,203 | ||
Series 3Y, 4.00%, 10/25/2023 | RON | 5,050,000 | 1,317,428 | ||
Series 8Y, 4.15%, 1/26/2028 | RON | 3,800,000 | 1,029,757 | ||
Series 5Y, 4.25%, 6/28/2023 | RON | 10,590,000 | 2,768,017 | ||
Series 4.3Y, 4.40%, 9/25/2023 | RON | 5,400,000 | 1,421,674 | ||
Series 5Y, 4.50%, 6/17/2024 | RON | 14,200,000 | 3,788,023 | ||
Series 10Y, 4.75%, 2/24/2025 | RON | 18,125,000 | 4,926,962 | ||
Series 7Y, 4.85%, 4/22/2026 | RON | 9,175,000 | 2,542,219 | ||
Series 10Y, 5.00%, 2/12/2029 | RON | 10,825,000 | 3,118,914 | ||
Series 15YR, 5.80%, 7/26/2027 | RON | 1,640,000 | 483,645 |
| Security Description | Principal Amount | Value | |||
Series 10Y, 5.85%, 4/26/2023 | RON | 7,000,000 | $ 1,887,483 | ||
| 32,200,524 | |||||
| RUSSIA — 4.4% | |||||
| Russian Federal Bond - OFZ: | |||||
Series 6234, 4.50%, 7/16/2025 | RUB | 112,000,000 | 1,468,838 | ||
Series 5084, 5.30%, 10/4/2023 | RUB | 78,000,000 | 1,069,711 | ||
Series 6232, 6.00%, 10/6/2027 | RUB | 180,400,000 | 2,485,736 | ||
Series 6233, 6.10%, 7/18/2035 | RUB | 172,000,000 | 2,273,074 | ||
Series 6223, 6.50%, 2/28/2024 | RUB | 48,000,000 | 679,365 | ||
Series 6224, 6.90%, 5/23/2029 | RUB | 65,000,000 | 943,833 | ||
Series 6215, 7.00%, 8/16/2023 | RUB | 192,500,000 | 2,744,445 | ||
Series 6212, 7.05%, 1/19/2028 | RUB | 43,115,000 | 629,665 | ||
Series 6222, 7.10%, 10/16/2024 | RUB | 179,241,000 | 2,598,113 | ||
Series 6229, 7.15%, 11/12/2025 | RUB | 362,500,000 | 5,301,006 | ||
Series 6225, 7.25%, 5/10/2034 | RUB | 174,270,000 | 2,563,473 | ||
Series 6220, 7.40%, 12/7/2022 | RUB | 58,951,000 | 842,426 | ||
Series 6227, 7.40%, 7/17/2024 | RUB | 324,500,000 | 4,738,260 | ||
Series 6209, 7.60%, 7/20/2022 | RUB | 172,630,000 | 2,449,492 | ||
Series 6228, 7.65%, 4/10/2030 | RUB | 165,000,000 | 2,518,688 | ||
Series 6221, 7.70%, 3/23/2033 | RUB | 221,060,000 | 3,366,960 | ||
Series 6230, 7.70%, 3/16/2039 | RUB | 32,500,000 | 501,848 | ||
Series 6219, 7.75%, 9/16/2026 | RUB | 107,790,000 | 1,619,158 | ||
Series 6226, 7.95%, 10/7/2026 | RUB | 144,400,000 | 2,192,116 | ||
Series 6207, 8.15%, 2/3/2027 | RUB | 77,000,000 | 1,183,588 | ||
Series 6218, 8.50%, 9/17/2031 | RUB | 163,892,000 | 2,658,960 | ||
| 44,828,755 | |||||
| SOUTH AFRICA — 4.5% | |||||
| South Africa Government Bond: | |||||
Series R209, 6.25%, 3/31/2036 | ZAR | 14,761,000 | 691,740 |
| Security Description | Principal Amount | Value | |||
Series R214, 6.50%, 2/28/2041 | ZAR | 14,330,000 | $ 638,040 | ||
Series R214, 6.50%, 2/28/2041 | ZAR | 24,400,000 | 1,086,405 | ||
Series R213, 7.00%, 2/28/2031 | ZAR | 23,352,000 | 1,362,130 | ||
Series R213, 7.00%, 2/28/2031 | ZAR | 20,000,000 | 1,166,607 | ||
Series 2023, 7.75%, 2/28/2023 | ZAR | 36,580,000 | 2,650,937 | ||
Series 2030, 8.00%, 1/31/2030 | ZAR | 92,855,000 | 6,028,603 | ||
Series 2032, 8.25%, 3/31/2032 | ZAR | 42,370,000 | 2,596,899 | ||
Series 2037, 8.50%, 1/31/2037 | ZAR | 81,847,000 | 4,611,140 | ||
Series 2044, 8.75%, 1/31/2044 | ZAR | 60,626,000 | 3,379,782 | ||
Series 2048, 8.75%, 2/28/2048 | ZAR | 35,180,000 | 1,969,684 | ||
Series 2048, 8.75%, 2/28/2048 | ZAR | 57,000,000 | 3,191,358 | ||
Series 2035, 8.88%, 2/28/2035 | ZAR | 78,230,000 | 4,680,804 | ||
Series 2040, 9.00%, 1/31/2040 | ZAR | 30,790,000 | 1,783,953 | ||
Series R186, 10.50%, 12/21/2026 | ZAR | 119,005,000 | 9,586,525 | ||
| 45,424,607 | |||||
| SOUTH KOREA — 12.3% | |||||
| Korea Treasury Bond: | |||||
Series 2312, 0.88%, 12/10/2023 | KRW | 1,000,000,000 | 917,341 | ||
Series 2306, 1.00%, 6/10/2023 | KRW | 4,980,000,000 | 4,584,353 | ||
Series 2509, 1.13%, 9/10/2025 | KRW | 2,750,000,000 | 2,505,325 | ||
Series 3909, 1.13%, 9/10/2039 | KRW | 3,550,000,000 | 2,899,638 | ||
Series 2212, 1.25%, 12/10/2022 | KRW | 5,509,000,000 | 5,103,887 | ||
Series 2109, 1.38%, 9/10/2021 | KRW | 1,962,800,000 | 1,816,118 | ||
Series 2409, 1.38%, 9/10/2024 | KRW | 2,360,000,000 | 2,187,076 | ||
Series 2912, 1.38%, 12/10/2029 | KRW | 5,900,000,000 | 5,272,152 | ||
Series 3006, 1.38%, 6/10/2030 | KRW | 6,680,000,000 | 5,950,431 | ||
Series 2503, 1.50%, 3/10/2025 | KRW | 3,840,000,000 | 3,566,357 | ||
Series 2612, 1.50%, 12/10/2026 | KRW | 4,344,000,000 | 4,005,557 | ||
Series 3012, 1.50%, 12/10/2030 | KRW | 2,450,000,000 | 2,204,828 |
| Security Description | Principal Amount | Value | |||
Series 3609, 1.50%, 9/10/2036 | KRW | 6,003,000,000 | $ 5,289,432 | ||
Series 4009, 1.50%, 9/10/2040 | KRW | 1,900,000,000 | 1,651,046 | ||
Series 5003, 1.50%, 3/10/2050 | KRW | 9,380,000,000 | 7,971,216 | ||
Series 2206, 1.63%, 6/10/2022 | KRW | 2,450,000,000 | 2,280,850 | ||
Series 2203, 1.88%, 3/10/2022 | KRW | 1,000,000,000 | 932,682 | ||
Series 2403, 1.88%, 3/10/2024 | KRW | 2,650,000,000 | 2,498,905 | ||
Series 2606, 1.88%, 6/10/2026 | KRW | 2,209,000,000 | 2,080,396 | ||
Series 2906, 1.88%, 6/10/2029 | KRW | 4,280,000,000 | 3,996,124 | ||
Series 2209, 2.00%, 9/10/2022 | KRW | 200,000 | 188 | ||
Series 4603, 2.00%, 3/10/2046 | KRW | 1,370,000,000 | 1,301,363 | ||
Series 4903, 2.00%, 3/10/2049 | KRW | 5,635,000,000 | 5,367,423 | ||
Series 2706, 2.13%, 6/10/2027 | KRW | 4,282,000,000 | 4,087,914 | ||
Series 4703, 2.13%, 3/10/2047 | KRW | 5,812,000,000 | 5,664,414 | ||
Series 2309, 2.25%, 9/10/2023 | KRW | 3,890,000,000 | 3,697,609 | ||
Series 2506, 2.25%, 6/10/2025 | KRW | 30,000,000 | 28,709 | ||
Series 3709, 2.25%, 9/10/2037 | KRW | 3,570,000,000 | 3,486,985 | ||
Series 2303, 2.38%, 3/10/2023 | KRW | 3,918,000,000 | 3,715,071 | ||
Series 2712, 2.38%, 12/10/2027 | KRW | 5,600,000,000 | 5,442,671 | ||
Series 2812, 2.38%, 12/10/2028 | KRW | 1,839,000,000 | 1,787,295 | ||
Series 3809, 2.38%, 9/10/2038 | KRW | 2,609,000,000 | 2,597,646 | ||
Series 2806, 2.63%, 6/10/2028 | KRW | 5,735,000,000 | 5,666,277 | ||
Series 3509, 2.63%, 9/10/2035 | KRW | 870,000,000 | 885,107 | ||
Series 4803, 2.63%, 3/10/2048 | KRW | 6,754,000,000 | 7,255,545 | ||
Series 2303, 3.00%, 3/10/2023 | KRW | 2,580,000,000 | 2,478,008 | ||
Series 4212, 3.00%, 12/10/2042 | KRW | 265,000,000 | 294,762 | ||
Series 2403, 3.50%, 3/10/2024 | KRW | 2,640,000,000 | 2,612,200 | ||
Series 2206, 3.75%, 6/10/2022 | KRW | 580,000,000 | 556,010 | ||
Series 3112, 4.00%, 12/10/2031 | KRW | 395,000,000 | 444,301 | ||
| 125,083,212 |
| Security Description | Principal Amount | Value | |||
| SUPRANATIONAL — 0.1% | |||||
International Bank for Reconstruction & Development Series GDIF, 4.00%, 5/30/2023 | PEN | 3,500,000 | $ 1,038,631 | ||
| THAILAND — 5.3% | |||||
| Thailand Government Bond: | |||||
0.75%, 6/17/2024 | THB | 10,500,000 | 353,403 | ||
0.95%, 6/17/2025 | THB | 35,000,000 | 1,186,848 | ||
1.45%, 12/17/2024 | THB | 115,180,000 | 3,978,937 | ||
1.59%, 12/17/2035 | THB | 12,000,000 | 408,067 | ||
1.60%, 12/17/2029 | THB | 69,400,000 | 2,403,488 | ||
1.60%, 6/17/2035 | THB | 31,500,000 | 1,067,342 | ||
1.88%, 6/17/2022 | THB | 47,380,000 | 1,615,806 | ||
1.88%, 6/17/2049 | THB | 9,000,000 | 289,805 | ||
2.00%, 12/17/2022 | THB | 36,602,000 | 1,260,268 | ||
2.13%, 12/17/2026 | THB | 96,880,000 | 3,493,497 | ||
2.40%, 12/17/2023 | THB | 112,400,000 | 3,965,164 | ||
2.88%, 12/17/2028 | THB | 87,510,000 | 3,323,849 | ||
2.88%, 6/17/2046 | THB | 56,715,000 | 2,257,304 | ||
3.30%, 6/17/2038 | THB | 91,000,000 | 3,771,983 | ||
3.40%, 6/17/2036 | THB | 56,460,000 | 2,348,733 | ||
3.58%, 12/17/2027 | THB | 4,650,000 | 183,157 | ||
3.60%, 6/17/2067 | THB | 30,200,000 | 1,354,984 | ||
3.63%, 6/16/2023 | THB | 9,000 | 324 | ||
3.65%, 12/17/2021 | THB | 34,611,000 | 1,191,483 | ||
3.65%, 6/20/2031 | THB | 19,575,000 | 806,939 | ||
3.78%, 6/25/2032 | THB | 98,120,000 | 4,133,804 | ||
3.80%, 6/14/2041 | THB | 12,750,000 | 577,755 | ||
3.85%, 12/12/2025 | THB | 18,882,000 | 729,336 | ||
4.00%, 6/17/2066 | THB | 54,280,000 | 2,640,233 | ||
4.68%, 6/29/2044 | THB | 64,500,000 | 3,314,824 | ||
4.75%, 12/20/2024 | THB | 14,000,000 | 543,959 | ||
4.85%, 6/17/2061 | THB | 48,195,000 | 2,651,506 | ||
4.88%, 6/22/2029 | THB | 22,564,000 | 975,639 | ||
4.88%, 6/22/2029 | THB | 55,720,000 | 2,409,262 | ||
5.67%, 3/13/2028 | THB | 10,000,000 | 443,326 | ||
| 53,681,025 | |||||
| TURKEY — 2.7% | |||||
| Turkey Government Bond: | |||||
7.10%, 3/8/2023 | TRY | 2,225,000 | 261,641 | ||
8.00%, 3/12/2025 | TRY | 8,130,000 | 925,940 | ||
8.50%, 9/14/2022 | TRY | 22,050,000 | 2,711,564 | ||
8.80%, 9/27/2023 | TRY | 2,300,000 | 275,412 | ||
9.00%, 5/4/2022 | TRY | 21,200,000 | 2,651,379 | ||
9.00%, 7/24/2024 | TRY | 22,650,000 | 2,712,210 | ||
10.40%, 3/20/2024 | TRY | 1,760,000 | 219,036 | ||
10.50%, 8/11/2027 | TRY | 23,580,000 | 2,894,955 | ||
10.60%, 2/11/2026 | TRY | 27,104,000 | 3,409,652 | ||
10.70%, 8/17/2022 | TRY | 11,190,000 | 1,421,239 | ||
11.00%, 3/2/2022 | TRY | 22,200,000 | 2,859,940 |
| Security Description | Principal Amount | Value | |||
11.00%, 2/24/2027 | TRY | 13,298,000 | $ 1,672,873 | ||
12.20%, 1/18/2023 | TRY | 24,470,000 | 3,191,882 | ||
12.40%, 3/8/2028 | TRY | 8,050,000 | 1,074,958 | ||
16.20%, 6/14/2023 | TRY | 5,850,000 | 823,684 | ||
| 27,106,365 | |||||
TOTAL FOREIGN GOVERNMENT OBLIGATIONS (Cost $945,983,194) | 988,524,749 |
| Shares | |||
| SHORT-TERM INVESTMENT — 1.0% | |||
State Street Institutional U.S. Government Money Market Fund, Class G Shares 0.05% (b) (c) (Cost $10,227,948) | 10,227,948 | 10,227,948 | |
TOTAL INVESTMENTS — 98.6% (Cost $956,211,142) | 998,752,697 | ||
OTHER ASSETS IN EXCESS OF LIABILITIES — 1.4% | 14,690,654 | ||
NET ASSETS — 100.0% | $ 1,013,443,351 | ||
| (a) | Securities purchased pursuant to Rule 144A of the Securities Act of 1933, as amended. These securities, which represent 0.9% of net assets as of December 31, 2020, are considered liquid and may be resold in transactions exempt from registration, normally to qualified institutional buyers. |
| (b) | The Fund invested in certain money market funds managed by SSGA Funds Management, Inc. Amounts related to these transactions during the period ended December 31, 2020 are shown in the Affiliate Table below. |
| (c) | The rate shown is the annualized seven-day yield at December 31, 2020. |
| GDIF | Global Debt Issuance Facility |
| BRL | Brazilian Real |
| CLP | Chilean Peso |
| CNY | China Yuan Renminbi |
| COP | Colombian Peso |
| CZK | Czech Koruna |
| HUF | Hungary Forint |
| IDR | Indonesia Rupiah |
| ILS | Israeli New Shekel |
| KRW | South Korean Won |
| MXN | Mexican Peso |
| MYR | Malaysian Ringgit |
| PEN | Peru Nuevo Sol |
| PHP | Philippines Peso |
| PLN | Polish Zloty |
| RON | Romania New Leu |
| RUB | Russian Ruble |
| THB | Thai Baht |
| TRY | Turkish New Lira |
| ZAR | South African Rand |
| Counterparty | Amount Sold | Amount Bought | Settlement Date | Net Unrealized Appreciation/ (Depreciation) | ||||
| Citibank N.A. | USD 7,509,030 | MXN 150,000,000 | 02/04/2021 | $ (6,434) | ||||
| HSBC Bank USA | USD 1,937,998 | THB 58,000,000 | 02/04/2021 | (1,895) | ||||
| HSBC Bank USA | THB 58,000,000 | USD 1,934,797 | 02/04/2021 | (1,305) | ||||
| Societe Generale | USD 415,529 | COP 1,500,000,000 | 01/07/2021 | 23,006 | ||||
| Societe Generale | USD 415,062 | PHP 20,000,000 | 01/07/2021 | 1,457 | ||||
| Societe Generale | PHP 20,000,000 | USD 414,206 | 01/07/2021 | (2,313) | ||||
| Societe Generale | COP 1,500,000,000 | USD 436,265 | 01/07/2021 | (2,270) | ||||
| Societe Generale | USD 436,047 | COP 1,500,000,000 | 02/04/2021 | 2,671 | ||||
| Societe Generale | USD 596,659 | IDR 8,300,000,000 | 02/04/2021 | — | ||||
| Societe Generale | USD 1,694,369 | KRW 1,840,000,000 | 02/04/2021 | — | ||||
| Societe Generale | USD 2,495,321 | PHP 120,000,000 | 02/04/2021 | 4,976 |
| Counterparty | Amount Sold | Amount Bought | Settlement Date | Net Unrealized Appreciation/ (Depreciation) | ||||
| Societe Generale | PHP 20,000,000 | USD 414,315 | 02/04/2021 | $ (2,402) | ||||
| Standard Chartered Bank | USD 207,182 | COP 750,000,000 | 01/07/2021 | 12,085 | ||||
| Standard Chartered Bank | USD 435,564 | COP 1,500,000,000 | 01/07/2021 | 2,971 | ||||
| Standard Chartered Bank | USD 829,652 | PHP 40,000,000 | 01/07/2021 | 3,385 | ||||
| Standard Chartered Bank | COP 2,250,000,000 | USD 630,128 | 01/07/2021 | (27,674) | ||||
| Standard Chartered Bank | PHP 40,000,000 | USD 830,237 | 01/07/2021 | (2,800) | ||||
| Standard Chartered Bank | USD 8,695,652 | BRL 45,000,000 | 02/04/2021 | (35,109) | ||||
| Standard Chartered Bank | USD 829,067 | PHP 40,000,000 | 02/04/2021 | 4,365 | ||||
| Standard Chartered Bank | USD 623,441 | PHP 30,000,000 | 02/04/2021 | 1,633 | ||||
| Standard Chartered Bank | USD 2,561,683 | RUB 190,000,000 | 02/04/2021 | — | ||||
| Standard Chartered Bank | COP 1,500,000,000 | USD 435,127 | 02/04/2021 | (3,590) | ||||
| Standard Chartered Bank | BRL 45,000,000 | USD 8,687,259 | 02/04/2021 | 26,716 | ||||
| Westpac Banking Corp. | MXN 150,000,000 | USD 7,501,129 | 02/04/2021 | (1,467) | ||||
| Total | $ (3,994) | |||||||
| BRL | Brazilian Real |
| COP | Colombian Peso |
| IDR | Indonesia Rupiah |
| KRW | South Korean Won |
| MXN | Mexican Peso |
| PHP | Philippines Peso |
| RUB | Russian Ruble |
| THB | Thai Baht |
| Description | Level 1 – Quoted Prices | Level 2 – Other Significant Observable Inputs | Level 3 – Significant Unobservable Inputs | Total | ||||
| ASSETS: | ||||||||
| INVESTMENTS: | ||||||||
Foreign Government Obligations | $ — | $988,524,749 | $— | $988,524,749 | ||||
Short-Term Investment | 10,227,948 | — | — | 10,227,948 | ||||
TOTAL INVESTMENTS | $10,227,948 | $988,524,749 | $— | $998,752,697 | ||||
| OTHER FINANCIAL INSTRUMENTS: | ||||||||
Foreign Currency Exchange Contracts(a) | — | 83,265 | — | 83,265 | ||||
TOTAL OTHER FINANCIAL INSTRUMENTS: | $ — | $ 83,265 | $— | $ 83,265 | ||||
TOTAL INVESTMENTS AND OTHER FINANCIAL INSTRUMENTS | $10,227,948 | $988,520,755 | $— | $998,748,703 | ||||
| LIABILITIES: | ||||||||
| OTHER FINANCIAL INSTRUMENTS: | ||||||||
Foreign Currency Exchange Contracts(a) | — | (87,259) | — | (87,259) | ||||
TOTAL OTHER FINANCIAL INSTRUMENTS: | $ — | $ (87,259) | $— | $ (87,259) |
| (a) | Forward Foreign Currency Exchange Contracts are valued at unrealized appreciation (depreciation). |
| Number of Shares Held at 12/31/19 | Value at 12/31/19 | Cost of Purchases | Proceeds from Shares Sold | Realized Gain (Loss) | Change in Unrealized Appreciation/ Depreciation | Number of Shares Held at 12/31/20 | Value at 12/31/20 | Dividend Income | |||||||||
State Street Institutional U.S. Government Money Market Fund, Class G Shares | 5,199,472 | $5,199,472 | $250,805,776 | $245,777,300 | $— | $— | 10,227,948 | $10,227,948 | $29,435 | ||||||||
State Street Navigator Securities Lending Portfolio II | — | — | 90,715,943 | 90,715,943 | — | — | — | — | 3,588 | ||||||||
Total | $5,199,472 | $341,521,719 | $336,493,243 | $— | $— | $10,227,948 | $33,023 |
| Security Description | Principal Amount | Value | ||||
| CORPORATE BONDS & NOTES — 98.1% | ||||||
| AUSTRALIA — 0.9% | ||||||
Australia & New Zealand Banking Group, Ltd. 0.75%, 9/29/2026 | EUR | 100,000 | $ 128,365 | |||
BHP Billiton Finance, Ltd. Series 12, 4.30%, 9/25/2042 | GBP | 300,000 | 616,850 | |||
| National Australia Bank, Ltd.: | ||||||
Series GMTN, 1.25%, 5/18/2026 | EUR | 400,000 | 524,960 | |||
Series GMTN, 1.38%, 8/30/2028 | EUR | 100,000 | 135,162 | |||
Series EMTN, 2.75%, 8/8/2022 | EUR | 250,000 | 320,746 | |||
| Telstra Corp., Ltd.: | ||||||
Series EMTN, 2.50%, 9/15/2023 | EUR | 200,000 | 262,320 | |||
Series EMTN, 3.50%, 9/21/2022 | EUR | 200,000 | 260,348 | |||
Westpac Banking Corp. Series EMTN, 0.25%, 1/17/2022 | EUR | 150,000 | 184,796 | |||
| 2,433,547 | ||||||
| AUSTRIA — 0.1% | ||||||
OMV AG Series EMTN, 1.00%, 12/14/2026 | EUR | 300,000 | 390,469 | |||
| BELGIUM — 2.4% | ||||||
| Anheuser-Busch InBev SA: | ||||||
Series EMTN, 1.13%, 7/1/2027 | EUR | 200,000 | 261,325 | |||
Series EMTN, 1.15%, 1/22/2027 | EUR | 200,000 | 260,763 | |||
Series EMTN, 1.50%, 3/17/2025 | EUR | 490,000 | 640,260 | |||
Series EMTN, 1.50%, 4/18/2030 | EUR | 300,000 | 409,923 | |||
Series EMTN, 1.65%, 3/28/2031 | EUR | 500,000 | 687,239 | |||
Series EMTN, 2.00%, 3/17/2028 | EUR | 380,000 | 527,441 | |||
Series EMTN, 2.13%, 12/2/2027 | EUR | 400,000 | 556,423 | |||
Series EMTN, 2.25%, 5/24/2029 | GBP | 300,000 | 452,758 | |||
Series EMTN, 2.75%, 3/17/2036 | EUR | 600,000 | 922,699 | |||
Series EMTN, 2.85%, 5/25/2037 | GBP | 200,000 | 319,493 | |||
Series EMTN, 2.88%, 4/2/2032 | EUR | 300,000 | 459,847 | |||
3.70%, 4/2/2040 | EUR | 100,000 | 172,757 | |||
| KBC Group NV: | ||||||
Series EMTN, 0.75%, 3/1/2022 | EUR | 400,000 | 495,236 | |||
| Security Description | Principal Amount | Value | |||
Series EMTN, 1.13%, 1/25/2024 | EUR | 100,000 | $ 126,814 | ||
| 6,292,978 | |||||
| CANADA — 0.5% | |||||
Bank of Nova Scotia Series EMTN, 0.50%, 4/30/2024 | EUR | 100,000 | 124,853 | ||
Canadian Imperial Bank of Commerce 0.75%, 3/22/2023 | EUR | 300,000 | 375,318 | ||
Royal Bank of Canada 0.13%, 7/23/2024 | EUR | 100,000 | 123,355 | ||
| Toronto-Dominion Bank: | |||||
Series EMTN, 0.38%, 4/25/2024 | EUR | 100,000 | 124,192 | ||
Series EMTN, 0.63%, 7/20/2023 | EUR | 400,000 | 500,344 | ||
| 1,248,062 | |||||
| DENMARK — 0.6% | |||||
Carlsberg Breweries A/S Series EMTN, 2.50%, 5/28/2024 | EUR | 200,000 | 265,058 | ||
| Danske Bank A/S: | |||||
Series EMTN, 0.63%, 5/26/2025 | EUR | 100,000 | 125,539 | ||
Series EMTN, 0.75%, 6/2/2023 | EUR | 100,000 | 125,120 | ||
Series EMTN, 0.88%, 5/22/2023 | EUR | 200,000 | 249,489 | ||
0.88%, 5/22/2023 | EUR | 100,000 | 124,745 | ||
1 year GBP Swap + 1.15%, 0.50%, 8/27/2025 (a) | EUR | 400,000 | 492,680 | ||
Series EMTN, UK 10 year Gilt + 1.65%, 2.25%, 1/14/2028 (a) | GBP | 100,000 | 143,023 | ||
| 1,525,654 | |||||
| FINLAND — 0.9% | |||||
| Nordea Bank Abp: | |||||
Series EMTN, 0.50%, 5/14/2027 | EUR | 300,000 | 379,352 | ||
Series EMTN, 0.88%, 6/26/2023 | EUR | 400,000 | 502,438 | ||
Series EMTN, 1.00%, 2/22/2023 | EUR | 400,000 | 502,681 | ||
Series EMTN, 1.13%, 2/12/2025 | EUR | 100,000 | 129,095 | ||
Series EMTN, 1.13%, 9/27/2027 | EUR | 100,000 | 132,194 | ||
| OP Corporate Bank PLC: | |||||
Series EMTN, 0.50%, 8/12/2025 | EUR | 300,000 | 376,376 | ||
Series EMTN, 0.75%, 3/3/2022 | EUR | 200,000 | 247,768 | ||
| 2,269,904 |
| Security Description | Principal Amount | Value | |||
| FRANCE — 18.8% | |||||
Air Liquide Finance SA Series EMTN, 1.25%, 6/13/2028 | EUR | 200,000 | $ 270,340 | ||
Airbus Finance B.V. Series EMTN, 2.38%, 4/2/2024 | EUR | 300,000 | 393,061 | ||
| Airbus SE: | |||||
Series EMTN, 1.63%, 6/9/2030 | EUR | 200,000 | 268,584 | ||
Series EMTN, 2.38%, 4/7/2032 | EUR | 100,000 | 144,734 | ||
Series EMTN, 2.38%, 4/7/2032 | EUR | 400,000 | 578,935 | ||
Auchan Holding SA Series EMTN, 2.88%, 1/29/2026 | EUR | 200,000 | 270,874 | ||
| Autoroutes du Sud de la France SA: | |||||
Series EMTN, 1.25%, 1/18/2027 | EUR | 200,000 | 265,026 | ||
Series EMTN, 1.38%, 1/22/2030 | EUR | 200,000 | 274,366 | ||
Series EMTN, 1.38%, 2/21/2031 | EUR | 300,000 | 411,682 | ||
Series EMTN, 5.63%, 7/4/2022 | EUR | 200,000 | 266,244 | ||
| Banque Federative du Credit Mutuel SA: | |||||
Series EMTN, 0.13%, 2/5/2024 | EUR | 100,000 | 123,687 | ||
0.63%, 2/21/2031 | EUR | 200,000 | 248,552 | ||
Series EMTN, 0.75%, 7/17/2025 | EUR | 700,000 | 889,734 | ||
Series EMTN, 0.75%, 6/8/2026 | EUR | 600,000 | 765,524 | ||
0.75%, 1/17/2030 | EUR | 100,000 | 126,907 | ||
Series EMTN, 1.25%, 1/14/2025 | EUR | 500,000 | 645,889 | ||
Series EMTN, 1.25%, 5/26/2027 | EUR | 200,000 | 264,540 | ||
1.25%, 6/3/2030 | EUR | 300,000 | 396,455 | ||
Series EMTN, 1.38%, 7/16/2028 | EUR | 100,000 | 134,908 | ||
Series EMTN, 1.63%, 1/19/2026 | EUR | 300,000 | 398,746 | ||
Series EMTN, 1.75%, 3/15/2029 | EUR | 300,000 | 412,586 | ||
Series EMTN, 2.63%, 3/18/2024 | EUR | 500,000 | 667,297 | ||
Series EMTN, 3.00%, 11/28/2023 | EUR | 200,000 | 267,894 | ||
Series EMTN, 3.25%, 8/23/2022 | EUR | 200,000 | 259,133 | ||
| BNP Paribas SA: | |||||
Series EMTN, 0.13%, 9/4/2026 | EUR | 200,000 | 243,393 |
| Security Description | Principal Amount | Value | |||
Series EMTN, 0.75%, 11/11/2022 | EUR | 450,000 | $ 561,512 | ||
Series EMTN, 1.13%, 1/15/2023 | EUR | 392,000 | 493,107 | ||
Series EMTN, 1.13%, 10/10/2023 | EUR | 150,000 | 189,883 | ||
Series EMTN, 1.13%, 6/11/2026 | EUR | 300,000 | 384,733 | ||
Series EMTN, 1.38%, 5/28/2029 | EUR | 600,000 | 797,133 | ||
Series EMTN, 1.50%, 11/17/2025 | EUR | 200,000 | 261,106 | ||
Series EMTN, 1.50%, 5/23/2028 | EUR | 200,000 | 267,399 | ||
Series EMTN, 1.50%, 5/25/2028 | EUR | 400,000 | 541,242 | ||
Series EMTN, 1.63%, 2/23/2026 | EUR | 100,000 | 133,289 | ||
1.88%, 12/14/2027 | GBP | 200,000 | 289,961 | ||
Series EMTN, 2.38%, 5/20/2024 | EUR | 100,000 | 132,910 | ||
Series EMTN, 2.88%, 10/24/2022 | EUR | 600,000 | 776,862 | ||
Series EMTN, 2.88%, 9/26/2023 | EUR | 100,000 | 132,793 | ||
Series EMTN, 3.38%, 1/23/2026 | GBP | 300,000 | 461,663 | ||
Series EMTN, 4.50%, 3/21/2023 | EUR | 200,000 | 270,504 | ||
Series EMTN, 3 Month USD LIBOR + 0.73%, 0.50%, 2/19/2028 (a) | EUR | 200,000 | 247,338 | ||
Series EMTN, 3 Month USD LIBOR + 0.87%, 1.13%, 4/17/2029 (a) | EUR | 300,000 | 387,099 | ||
Series EMTN, 3 Month USD LIBOR + 1.80%, 2.13%, 1/23/2027 (a) | EUR | 200,000 | 268,126 | ||
Bouygues SA 1.13%, 7/24/2028 | EUR | 200,000 | 264,890 | ||
Bpce SA 1.00%, 7/15/2024 | EUR | 700,000 | 891,837 | ||
| BPCE SA: | |||||
0.25%, 1/15/2026 | EUR | 200,000 | 248,155 | ||
Series EMTN, 0.63%, 9/26/2023 | EUR | 300,000 | 375,933 | ||
0.63%, 4/28/2025 | EUR | 300,000 | 378,053 | ||
Series EMTN, 0.88%, 1/31/2024 | EUR | 200,000 | 251,410 | ||
Series EMTN, 1.00%, 4/1/2025 | EUR | 100,000 | 127,181 | ||
Series EMTN, 1.00%, 10/5/2028 | EUR | 300,000 | 393,874 | ||
Series EMTN, 1.13%, 1/18/2023 | EUR | 500,000 | 627,701 | ||
3 Month USD LIBOR + 1.00%, 0.50%, 9/15/2027 (a) | EUR | 200,000 | 248,256 |
| Security Description | Principal Amount | Value | |||
| Capgemini SE: | |||||
2.00%, 4/15/2029 | EUR | 100,000 | $ 138,785 | ||
2.38%, 4/15/2032 | EUR | 400,000 | 582,494 | ||
2.50%, 7/1/2023 | EUR | 100,000 | 129,619 | ||
| Carrefour SA: | |||||
Series EMTN, 1.75%, 7/15/2022 | EUR | 300,000 | 376,147 | ||
Series EMTN, 2.63%, 12/15/2027 | EUR | 100,000 | 142,725 | ||
Cie de Saint-Gobain Series EMTN, 1.88%, 3/15/2031 | EUR | 200,000 | 281,655 | ||
Cie Generale des Etablissements Michelin SCA 1.75%, 9/3/2030 | EUR | 100,000 | 141,956 | ||
| Credit Agricole SA: | |||||
0.13%, 12/9/2027 | EUR | 200,000 | 244,145 | ||
Series EMTN, 0.75%, 12/5/2023 | EUR | 100,000 | 125,830 | ||
0.88%, 1/14/2032 | EUR | 400,000 | 512,868 | ||
1.00%, 7/3/2029 | EUR | 400,000 | 528,847 | ||
Series EMTN, 1.25%, 4/14/2026 | EUR | 600,000 | 786,149 | ||
Series EMTN, 1.38%, 3/13/2025 | EUR | 200,000 | 258,385 | ||
Series EMTN, 1.38%, 5/3/2027 | EUR | 400,000 | 532,978 | ||
Series EMTN, 1.75%, 3/5/2029 | EUR | 100,000 | 136,679 | ||
Series EMTN, 1.88%, 12/20/2026 | EUR | 100,000 | 134,764 | ||
Series EMTN, 2.38%, 5/20/2024 | EUR | 300,000 | 399,123 | ||
Series EMTN, 3.13%, 7/17/2023 | EUR | 400,000 | 533,688 | ||
Series EMTN, 3.13%, 2/5/2026 | EUR | 300,000 | 427,834 | ||
Series EMTN, 3 Month USD LIBOR + 1.25%, 1.00%, 4/22/2026 (a) | EUR | 400,000 | 508,840 | ||
| Danone SA: | |||||
Series EMTN, 0.42%, 11/3/2022 | EUR | 400,000 | 495,319 | ||
Series EMTN, 0.71%, 11/3/2024 | EUR | 300,000 | 380,226 | ||
Series EMTN, 1.21%, 11/3/2028 | EUR | 100,000 | 134,618 | ||
Dassault Systemes SE 0.38%, 9/16/2029 | EUR | 200,000 | 252,173 | ||
Engie Alliance GIE Series EMTN, 5.75%, 6/24/2023 | EUR | 250,000 | 350,327 | ||
| Engie SA: | |||||
1.38%, 3/27/2025 | EUR | 200,000 | 259,552 | ||
Series EMTN, 2.38%, 5/19/2026 | EUR | 300,000 | 415,462 |
| Security Description | Principal Amount | Value | |||
Series EMTN, 5.00%, 10/1/2060 | GBP | 200,000 | $ 535,525 | ||
| EssilorLuxottica SA: | |||||
Series EMTN, Zero Coupon, 5/27/2023 | EUR | 400,000 | 491,084 | ||
Series EMTN, 0.13%, 5/27/2025 | EUR | 200,000 | 246,693 | ||
Series EMTN, 0.38%, 1/5/2026 | EUR | 500,000 | 625,359 | ||
Series EMTN, 0.38%, 11/27/2027 | EUR | 100,000 | 124,633 | ||
0.75%, 11/27/2031 | EUR | 200,000 | 255,590 | ||
HSBC Continental Europe SA Series EMTN, 0.25%, 5/17/2024 (b) | EUR | 600,000 | 744,138 | ||
| LVMH Moet Hennessy Louis Vuitton SE: | |||||
Series EMTN, Zero Coupon, 2/11/2024 | EUR | 200,000 | 246,085 | ||
Zero Coupon, 2/11/2026 | EUR | 100,000 | 123,319 | ||
0.13%, 2/11/2028 | EUR | 200,000 | 247,443 | ||
0.38%, 2/11/2031 | EUR | 600,000 | 749,899 | ||
Series EMTN, 0.75%, 5/26/2024 | EUR | 500,000 | 630,715 | ||
Series EMTN, 1.00%, 2/11/2023 | GBP | 100,000 | 138,455 | ||
Series EMTN, 1.13%, 2/11/2027 | GBP | 200,000 | 279,585 | ||
| Orange SA: | |||||
Series EMTN, 1.13%, 7/15/2024 | EUR | 300,000 | 382,416 | ||
Series EMTN, 1.38%, 3/20/2028 | EUR | 100,000 | 134,145 | ||
Series EMTN, 1.38%, 1/16/2030 | EUR | 100,000 | 136,655 | ||
Series EMTN, 2.00%, 1/15/2029 | EUR | 500,000 | 705,039 | ||
Series EMTN, 3.25%, 1/15/2032 | GBP | 100,000 | 165,380 | ||
Series EMTN, 8.13%, 1/28/2033 | EUR | 550,000 | 1,280,361 | ||
| Pernod Ricard SA: | |||||
1.13%, 4/7/2025 | EUR | 300,000 | 385,793 | ||
1.75%, 4/8/2030 | EUR | 100,000 | 139,674 | ||
Peugeot SA 2.75%, 5/15/2026 | EUR | 200,000 | 273,211 | ||
| Sanofi: | |||||
Series EMTN, 0.50%, 1/13/2027 | EUR | 600,000 | 765,190 | ||
Series EMTN, 1.13%, 3/10/2022 | EUR | 400,000 | 496,194 | ||
Series 12FX, 1.38%, 3/21/2030 | EUR | 200,000 | 276,887 | ||
Series EMTN, 1.50%, 4/1/2030 | EUR | 100,000 | 139,506 | ||
Series EMTN, 1.75%, 9/10/2026 | EUR | 700,000 | 950,344 |
| Security Description | Principal Amount | Value | |||
Series 20FX, 1.88%, 3/21/2038 | EUR | 200,000 | $ 315,054 | ||
Series EMTN, 2.50%, 11/14/2023 | EUR | 300,000 | 394,044 | ||
Schneider Electric SE Series EMTN, 0.25%, 9/9/2024 | EUR | 200,000 | 248,929 | ||
| Societe Generale SA: | |||||
Series ., Zero Coupon, 5/27/2022 | EUR | 100,000 | 122,875 | ||
0.13%, 2/24/2026 | EUR | 600,000 | 739,918 | ||
Series EMTN, 0.25%, 1/18/2022 | EUR | 100,000 | 123,153 | ||
Series EMTN, 0.75%, 5/26/2023 | EUR | 400,000 | 501,211 | ||
0.75%, 1/25/2027 | EUR | 100,000 | 125,336 | ||
Series EMTN, 1.00%, 4/1/2022 | EUR | 300,000 | 372,682 | ||
Series EMTN, 1.13%, 1/23/2025 | EUR | 300,000 | 382,227 | ||
Series EMTN, 1.25%, 2/15/2024 | EUR | 100,000 | 126,960 | ||
1.25%, 6/12/2030 | EUR | 100,000 | 129,270 | ||
Series EMTN, 1.75%, 3/22/2029 | EUR | 500,000 | 671,805 | ||
Series ETMN, 2.13%, 9/27/2028 | EUR | 400,000 | 549,746 | ||
Series EMTN, 4.25%, 7/13/2022 | EUR | 300,000 | 392,286 | ||
| Total Capital Canada, Ltd.: | |||||
Series EMTN, 1.13%, 3/18/2022 | EUR | 100,000 | 124,539 | ||
Series EMTN, 2.13%, 9/18/2029 | EUR | 600,000 | 870,091 | ||
| Total Capital International SA: | |||||
Series EMTN, 0.25%, 7/12/2023 | EUR | 500,000 | 620,351 | ||
Series EMTN, 0.75%, 7/12/2028 | EUR | 100,000 | 129,525 | ||
Series EMTN, 1.49%, 4/8/2027 | EUR | 500,000 | 670,197 | ||
Series EMTN, 1.62%, 5/18/2040 | EUR | 200,000 | 286,668 | ||
Series EMTN, 1.99%, 4/8/2032 | EUR | 100,000 | 146,251 | ||
Series EMTN, 2.50%, 3/25/2026 | EUR | 200,000 | 279,691 | ||
Vinci SA Series EMTN, 1.75%, 9/26/2030 | EUR | 200,000 | 283,920 | ||
| 48,880,276 | |||||
| GERMANY — 10.9% | |||||
| Allianz Finance II B.V.: | |||||
Series EMTN, 3.50%, 2/14/2022 | EUR | 400,000 | 510,716 | ||
Series 62, 4.50%, 3/13/2043 | GBP | 100,000 | 224,347 |
| Security Description | Principal Amount | Value | |||
| BASF SE: | |||||
Series EMTN, 0.25%, 6/5/2027 | EUR | 400,000 | $ 499,889 | ||
0.88%, 11/15/2027 | EUR | 200,000 | 261,523 | ||
Series 10Y, 2.00%, 12/5/2022 | EUR | 200,000 | 255,257 | ||
| Bayer AG: | |||||
0.38%, 7/6/2024 | EUR | 100,000 | 123,985 | ||
1.13%, 1/6/2030 | EUR | 300,000 | 385,647 | ||
1.38%, 7/6/2032 | EUR | 200,000 | 260,893 | ||
| BMW Finance NV: | |||||
Series EMTN, Zero Coupon, 4/14/2023 | EUR | 200,000 | 245,428 | ||
Series EMTN, 0.50%, 11/22/2022 | EUR | 100,000 | 123,963 | ||
Series EMTN, 0.63%, 10/6/2023 | EUR | 400,000 | 499,656 | ||
Series EMTN, 1.00%, 11/14/2024 | EUR | 100,000 | 127,563 | ||
BMW US Capital LLC Series EMTN, 0.63%, 4/20/2022 | EUR | 400,000 | 495,101 | ||
| Commerzbank AG: | |||||
Series EMTN, 0.50%, 8/28/2023 | EUR | 300,000 | 373,502 | ||
Series EMTN, 0.50%, 9/13/2023 | EUR | 100,000 | 124,336 | ||
Series EMTN, 0.63%, 8/28/2024 | EUR | 100,000 | 125,538 | ||
Series EMTN, 1.00%, 3/4/2026 | EUR | 500,000 | 639,678 | ||
| Daimler AG: | |||||
Series EMTN, 1.00%, 11/15/2027 | EUR | 200,000 | 257,505 | ||
Series EMTN, 1.13%, 11/6/2031 | EUR | 300,000 | 388,530 | ||
Series EMTN, 1.38%, 5/11/2028 | EUR | 300,000 | 396,391 | ||
Series EMTN, 1.40%, 1/12/2024 | EUR | 193,000 | 246,288 | ||
Series EMTN, 1.50%, 3/9/2026 | EUR | 200,000 | 262,520 | ||
Series EMTN, 1.50%, 7/3/2029 | EUR | 400,000 | 538,811 | ||
Series EMTN, 1.63%, 8/22/2023 | EUR | 400,000 | 511,095 | ||
Series EMTN, 2.13%, 7/3/2037 | EUR | 250,000 | 374,682 | ||
Series EMTN, 2.63%, 4/7/2025 | EUR | 300,000 | 406,505 | ||
| Daimler International Finance B.V.: | |||||
Series EMTN, 0.25%, 5/11/2022 | EUR | 200,000 | 246,291 | ||
Series EMTN, 0.63%, 5/6/2027 | EUR | 200,000 | 250,272 |
| Security Description | Principal Amount | Value | |||
Series EMTN, 0.85%, 2/28/2025 | EUR | 500,000 | $ 631,577 | ||
Series EMTN, 0.88%, 4/9/2024 | EUR | 600,000 | 753,488 | ||
Series EMTN, 1.00%, 11/11/2025 | EUR | 400,000 | 510,852 | ||
| Deutsche Bank AG: | |||||
Series MTN, 1.13%, 8/30/2023 | EUR | 400,000 | 505,449 | ||
Series EMTN, 1.50%, 1/20/2022 | EUR | 500,000 | 620,972 | ||
Series EMTN, 1.63%, 1/20/2027 | EUR | 1,000,000 | 1,276,461 | ||
Series EMTN, 2.38%, 1/11/2023 | EUR | 200,000 | 256,222 | ||
Series EMTN, 2.63%, 12/16/2024 | GBP | 200,000 | 288,001 | ||
| Deutsche Telekom AG: | |||||
Series EMTN, 0.50%, 7/5/2027 | EUR | 300,000 | 380,104 | ||
Series EMTN, 1.75%, 3/25/2031 | EUR | 200,000 | 282,090 | ||
| Deutsche Telekom International Finance B.V.: | |||||
Series EMTN, 0.88%, 1/30/2024 | EUR | 100,000 | 126,455 | ||
Series EMTN, 1.38%, 12/1/2025 | EUR | 100,000 | 131,448 | ||
Series EMTN, 1.38%, 1/30/2027 | EUR | 400,000 | 531,779 | ||
Series EMTN, 1.50%, 4/3/2028 | EUR | 350,000 | 473,059 | ||
Series EMTN, 2.00%, 12/1/2029 | EUR | 100,000 | 142,961 | ||
Series EMTN, 4.25%, 7/13/2022 | EUR | 150,000 | 196,147 | ||
Series EMTN, 4.25%, 7/13/2022 | EUR | 200,000 | 261,529 | ||
Series EMTN, 6.50%, 4/8/2022 | GBP | 40,000 | 59,018 | ||
Series EMTN, 6.50%, 4/8/2022 | GBP | 70,000 | 103,281 | ||
| E.ON International Finance B.V.: | |||||
Series EMTN, 5.88%, 10/30/2037 | GBP | 100,000 | 219,905 | ||
Series EMTN, 6.13%, 7/6/2039 | GBP | 50,000 | 115,620 | ||
Series EMTN, 6.38%, 6/7/2032 | GBP | 440,000 | 916,944 | ||
Series EMTN, 6.75%, 1/27/2039 | GBP | 100,000 | 242,426 | ||
| E.ON SE: | |||||
Series EMTN, 0.38%, 4/20/2023 | EUR | 100,000 | 123,945 |
| Security Description | Principal Amount | Value | |||
Series EMTN, 0.38%, 9/29/2027 | EUR | 100,000 | $ 125,697 | ||
| HeidelbergCement AG: | |||||
Series EMTN, 1.50%, 2/7/2025 | EUR | 100,000 | 129,002 | ||
Series EMTN, 2.25%, 3/30/2023 | EUR | 248,000 | 317,413 | ||
innogy Finance B.V. Series EMTN, 6.25%, 6/3/2030 | GBP | 350,000 | 689,658 | ||
Linde Finance B.V. Series EMTN, 0.25%, 1/18/2022 | EUR | 100,000 | 122,995 | ||
| SAP SE: | |||||
Series EMTN, 1.13%, 2/20/2023 | EUR | 100,000 | 125,529 | ||
1.25%, 3/10/2028 | EUR | 200,000 | 267,714 | ||
1.63%, 3/10/2031 | EUR | 300,000 | 424,644 | ||
Series EMTN, 1.75%, 2/22/2027 | EUR | 250,000 | 340,085 | ||
| Siemens Financieringsmaatschappij NV: | |||||
Series EMTN, Zero Coupon, 2/20/2023 | EUR | 300,000 | 368,849 | ||
0.13%, 9/5/2029 | EUR | 300,000 | 373,296 | ||
Series EMTN, 0.38%, 6/5/2026 | EUR | 100,000 | 125,810 | ||
Series EMTN, 1.00%, 2/20/2025 | GBP | 100,000 | 140,373 | ||
Series EMTN, 2.88%, 3/10/2028 | EUR | 400,000 | 597,519 | ||
Volkswagen Financial Services AG Series EMTN, 1.50%, 10/1/2024 | EUR | 300,000 | 384,522 | ||
| Volkswagen International Finance NV: | |||||
Series EMTN, 0.88%, 1/16/2023 | EUR | 50,000 | 62,297 | ||
1.13%, 10/2/2023 | EUR | 500,000 | 631,012 | ||
Series EMTN, 1.63%, 1/16/2030 | EUR | 100,000 | 134,143 | ||
Series 10Y, 1.88%, 3/30/2027 | EUR | 1,100,000 | 1,471,857 | ||
3.25%, 11/18/2030 | EUR | 100,000 | 152,798 | ||
4.13%, 11/16/2038 | EUR | 100,000 | 175,019 | ||
| Volkswagen Leasing GmbH: | |||||
0.50%, 6/20/2022 | EUR | 100,000 | 123,350 | ||
Series EMTN, 1.13%, 4/4/2024 | EUR | 200,000 | 252,152 | ||
Series EMTN, 1.38%, 1/20/2025 | EUR | 300,000 | 383,826 | ||
Series EMTN, 2.38%, 9/6/2022 | EUR | 100,000 | 127,226 |
| Security Description | Principal Amount | Value | |||
Series EMTN, 2.63%, 1/15/2024 | EUR | 335,000 | $ 440,634 | ||
| Vonovia Finance B.V.: | |||||
Series EMTN, 1.25%, 12/6/2024 | EUR | 300,000 | 387,154 | ||
Series EMTN, 2.25%, 12/15/2023 | EUR | 100,000 | 131,052 | ||
| Wintershall Dea Finance B.V.: | |||||
0.45%, 9/25/2023 | EUR | 200,000 | 246,677 | ||
0.45%, 9/25/2023 | EUR | 100,000 | 123,338 | ||
0.84%, 9/25/2025 | EUR | 100,000 | 124,778 | ||
1.33%, 9/25/2028 | EUR | 200,000 | 252,652 | ||
1.82%, 9/25/2031 | EUR | 200,000 | 256,884 | ||
| 28,315,600 | |||||
| IRELAND — 0.2% | |||||
| Abbott Ireland Financing DAC: | |||||
0.88%, 9/27/2023 | EUR | 150,000 | 189,022 | ||
1.50%, 9/27/2026 | EUR | 250,000 | 332,162 | ||
| 521,184 | |||||
| ITALY — 4.7% | |||||
Assicurazioni Generali SpA Series EMTN, 5.13%, 9/16/2024 | EUR | 350,000 | 514,739 | ||
| Enel Finance International NV: | |||||
Series EMTN, Zero Coupon, 6/17/2024 | EUR | 400,000 | 491,618 | ||
Series EMTN, 0.38%, 6/17/2027 | EUR | 100,000 | 124,629 | ||
Series EMTN, 1.00%, 9/16/2024 | EUR | 400,000 | 509,563 | ||
Series EMTN, 1.13%, 9/16/2026 | EUR | 200,000 | 260,831 | ||
1.38%, 6/1/2026 | EUR | 400,000 | 525,666 | ||
Series EMTN, 1.50%, 7/21/2025 | EUR | 200,000 | 261,345 | ||
Series EMTN, 1.97%, 1/27/2025 | EUR | 250,000 | 330,964 | ||
Series EMTN, 5.00%, 9/14/2022 | EUR | 150,000 | 199,830 | ||
Series EMTN, 5.63%, 8/14/2024 | GBP | 150,000 | 242,439 | ||
Series EMTN, 5.75%, 9/14/2040 | GBP | 250,000 | 557,261 | ||
| Eni SpA: | |||||
Series EMTN, 3.25%, 7/10/2023 | EUR | 100,000 | 133,009 | ||
Series EMTN, 3.63%, 1/29/2029 | EUR | 500,000 | 777,015 | ||
Series EMTN, 3.75%, 9/12/2025 | EUR | 650,000 | 936,274 | ||
| Intesa Sanpaolo SpA: | |||||
Series EMTN, 1.00%, 7/4/2024 | EUR | 200,000 | 252,301 |
| Security Description | Principal Amount | Value | |||
Series EMTN, 1.13%, 3/4/2022 | EUR | 527,000 | $ 654,395 | ||
Series EMTN, 1.38%, 1/18/2024 | EUR | 500,000 | 635,671 | ||
Series EMTN, 1.75%, 3/20/2028 | EUR | 300,000 | 397,917 | ||
Series EMTN, 1.75%, 7/4/2029 | EUR | 300,000 | 400,440 | ||
Series EMTN, 2.13%, 8/30/2023 | EUR | 100,000 | 129,140 | ||
2.13%, 5/26/2025 | EUR | 100,000 | 132,236 | ||
Series EMTN, 4.00%, 10/30/2023 | EUR | 100,000 | 136,029 | ||
Snam SpA Series EMTN, 0.88%, 10/25/2026 | EUR | 300,000 | 385,734 | ||
| Terna Rete Elettrica Nazionale SpA: | |||||
Series EMTN, 0.88%, 2/2/2022 | EUR | 248,000 | 307,224 | ||
Series EMTN, 1.00%, 7/23/2023 | EUR | 100,000 | 126,277 | ||
Series EMTN, 1.38%, 7/26/2027 | EUR | 200,000 | 267,070 | ||
| UniCredit SpA: | |||||
Series EMTN, 0.50%, 4/9/2025 | EUR | 100,000 | 123,897 | ||
Series EMTN, 1.00%, 1/18/2023 | EUR | 250,000 | 311,702 | ||
Series EMTN, 2.00%, 3/4/2023 | EUR | 257,000 | 328,930 | ||
Series EMTN, 2.13%, 10/24/2026 | EUR | 200,000 | 270,760 | ||
Series EMTN, 3 Month USD LIBOR + 1.35%, 1.20%, 1/20/2026 (a) | EUR | 300,000 | 372,605 | ||
Series EMTN, 3 Month USD LIBOR + 1.55%, 1.25%, 6/25/2025 (a) | EUR | 400,000 | 505,337 | ||
Series EMTN, 3 Month USD LIBOR + 2.55%, 2.20%, 7/22/2027 (a) | EUR | 550,000 | 713,880 | ||
| 12,316,728 | |||||
| JAPAN — 1.4% | |||||
Mizuho Financial Group, Inc. 0.69%, 10/7/2030 | EUR | 300,000 | 378,447 | ||
Panasonic Corp. Series 17, 0.47%, 9/18/2026 | JPY | 100,000,000 | 978,609 | ||
| Sumitomo Mitsui Financial Group, Inc.: | |||||
Series EMTN, 0.63%, 10/23/2029 | EUR | 300,000 | 378,561 | ||
1.55%, 6/15/2026 | EUR | 200,000 | 264,697 | ||
| Takeda Pharmaceutical Co., Ltd.: | |||||
Series REGS, 1.13%, 11/21/2022 | EUR | 300,000 | 375,455 | ||
1.38%, 7/9/2032 | EUR | 200,000 | 262,526 |
| Security Description | Principal Amount | Value | |||
2.00%, 7/9/2040 | EUR | 200,000 | $ 277,795 | ||
Series REGS, 2.25%, 11/21/2026 | EUR | 200,000 | 275,034 | ||
Series REGS, 3.00%, 11/21/2030 | EUR | 350,000 | 526,934 | ||
| 3,718,058 | |||||
| LUXEMBOURG — 1.3% | |||||
| CK Hutchison Group Telecom Finance SA: | |||||
0.38%, 10/17/2023 | EUR | 200,000 | 246,872 | ||
1.13%, 10/17/2028 | EUR | 400,000 | 514,071 | ||
HeidelbergCement Finance Luxembourg SA Series EMTN, 1.63%, 4/7/2026 | EUR | 200,000 | 262,751 | ||
Holcim Finance Luxembourg SA Series EMTN, 2.25%, 5/26/2028 | EUR | 200,000 | 278,919 | ||
Logicor Financing Sarl Series EMTN, 1.63%, 7/15/2027 | EUR | 400,000 | 519,811 | ||
| Novartis Finance SA: | |||||
Zero Coupon, 9/23/2028 | EUR | 300,000 | 368,706 | ||
0.13%, 9/20/2023 | EUR | 200,000 | 247,855 | ||
| Richemont International Holding SA: | |||||
1.00%, 3/26/2026 | EUR | 100,000 | 129,556 | ||
1.50%, 3/26/2030 | EUR | 300,000 | 415,958 | ||
2.00%, 3/26/2038 | EUR | 300,000 | 455,978 | ||
| 3,440,477 | |||||
| MEXICO — 0.3% | |||||
| America Movil SAB de CV: | |||||
Series EMTN, 0.75%, 6/26/2027 | EUR | 200,000 | 251,660 | ||
4.38%, 8/7/2041 | GBP | 100,000 | 192,671 | ||
Fomento Economico Mexicano SAB de CV 1.75%, 3/20/2023 | EUR | 300,000 | 381,120 | ||
| 825,451 | |||||
| NETHERLANDS — 8.5% | |||||
| ABN AMRO Bank NV: | |||||
Series EMTN, 0.50%, 7/17/2023 | EUR | 400,000 | 498,553 | ||
0.60%, 1/15/2027 | EUR | 300,000 | 377,320 | ||
Series EMTN, 1.00%, 4/16/2025 | EUR | 443,000 | 568,956 | ||
Series EMTN, 1.25%, 5/28/2025 | EUR | 100,000 | 128,847 | ||
Series EMTN, 2.50%, 11/29/2023 | EUR | 300,000 | 395,916 | ||
Series EMTN, 4.13%, 3/28/2022 | EUR | 360,000 | 464,797 | ||
ASML Holding NV 1.38%, 7/7/2026 | EUR | 200,000 | 264,603 |
| Security Description | Principal Amount | Value | |||
Bayer Capital Corp B.V. 2.13%, 12/15/2029 | EUR | 600,000 | $ 839,115 | ||
| Bayer Capital Corp. B.V.: | |||||
0.63%, 12/15/2022 | EUR | 100,000 | 124,109 | ||
1.50%, 6/26/2026 | EUR | 600,000 | 785,152 | ||
| BMW Finance NV: | |||||
Series EMTN, 0.38%, 7/10/2023 | EUR | 557,000 | 690,609 | ||
Series EMTN, 1.50%, 2/6/2029 | EUR | 300,000 | 408,736 | ||
| Cooperatieve Rabobank UA: | |||||
Series GMTN, 0.50%, 12/6/2022 | EUR | 100,000 | 124,340 | ||
Series EMTN, 0.63%, 2/27/2024 | EUR | 400,000 | 501,000 | ||
Series GMTN, 0.75%, 8/29/2023 | EUR | 100,000 | 125,324 | ||
Series GMTN, 1.13%, 5/7/2031 | EUR | 200,000 | 268,500 | ||
Series GMTN, 1.25%, 3/23/2026 | EUR | 900,000 | 1,177,931 | ||
Series GMTN, 1.38%, 2/3/2027 | EUR | 100,000 | 132,843 | ||
Series GMTN, 2.25%, 3/23/2022 | GBP | 50,000 | 70,082 | ||
Series EMTN, 2.38%, 5/22/2023 | EUR | 370,000 | 481,728 | ||
Series GMTN, 4.00%, 1/11/2022 | EUR | 200,000 | 255,795 | ||
4.13%, 7/14/2025 | EUR | 350,000 | 511,482 | ||
Series EMTN, 4.75%, 6/6/2022 | EUR | 500,000 | 656,277 | ||
3 Month USD LIBOR + 1.18%, 0.88%, 5/5/2028 (a) | EUR | 200,000 | 256,400 | ||
Daimler International Finance B.V. Series EMTN, 0.63%, 2/27/2023 | EUR | 200,000 | 248,488 | ||
Deutsche Telekom International Finance B.V. Series EMTN, 0.63%, 4/3/2023 | EUR | 300,000 | 374,256 | ||
EDP Finance B.V. Series EMTN, 1.13%, 2/12/2024 | EUR | 300,000 | 379,549 | ||
Heineken NV Series EMTN, 1.00%, 5/4/2026 | EUR | 200,000 | 258,485 | ||
| ING Groep NV: | |||||
Series EMTN, 0.75%, 3/9/2022 | EUR | 200,000 | 247,507 | ||
Series EMTN, 1.00%, 9/20/2023 | EUR | 200,000 | 252,541 | ||
Series EMTN, 1.13%, 2/14/2025 | EUR | 100,000 | 127,973 |
| Security Description | Principal Amount | Value | |||
Series EMTN, 1.38%, 1/11/2028 | EUR | 200,000 | $ 266,791 | ||
Series EMTN, 2.00%, 9/20/2028 | EUR | 600,000 | 837,202 | ||
Series EMTN, 2.50%, 11/15/2030 | EUR | 100,000 | 151,127 | ||
Series EMTN, 3.00%, 2/18/2026 | GBP | 200,000 | 303,384 | ||
Series EMTN, 3 Month USD LIBOR + 0.60%, 0.10%, 9/3/2025 (a) | EUR | 600,000 | 736,321 | ||
innogy Finance B.V. Series EMTN, 1.50%, 7/31/2029 | EUR | 100,000 | 135,860 | ||
Koninklijke KPN NV Series GMTN, 5.75%, 9/17/2029 | GBP | 150,000 | 250,507 | ||
LeasePlan Corp. NV 0.13%, 9/13/2023 | EUR | 300,000 | 367,764 | ||
Naturgy Finance B.V. Series EMTN, 1.25%, 1/15/2026 | EUR | 300,000 | 388,833 | ||
Schlumberger Finance B.V. 1.38%, 10/28/2026 | EUR | 300,000 | 395,418 | ||
| Shell International Finance B.V.: | |||||
Series EMTN, 0.13%, 11/8/2027 | EUR | 200,000 | 247,664 | ||
Series EMTN, 0.38%, 2/15/2025 | EUR | 200,000 | 250,561 | ||
0.50%, 5/11/2024 | EUR | 100,000 | 125,345 | ||
Series EMTN, 0.75%, 8/15/2028 | EUR | 100,000 | 128,831 | ||
Series EMTN, 0.88%, 11/8/2039 | EUR | 100,000 | 124,858 | ||
Series EMTN, 1.00%, 4/6/2022 | EUR | 100,000 | 124,387 | ||
Series EMTN, 1.13%, 4/7/2024 | EUR | 100,000 | 127,810 | ||
Series EMTN, 1.25%, 5/12/2028 | EUR | 400,000 | 533,294 | ||
Series EMTN, 1.25%, 11/11/2032 | EUR | 200,000 | 270,282 | ||
Series EMTN, 1.50%, 4/7/2028 | EUR | 300,000 | 406,856 | ||
Series EMTN, 1.50%, 4/7/2028 | EUR | 200,000 | 271,237 | ||
Series EMTN, 1.63%, 1/20/2027 | EUR | 400,000 | 539,629 | ||
Series EMTN, 1.88%, 9/15/2025 | EUR | 200,000 | 268,717 | ||
Series EMTN, 1.88%, 4/7/2032 | EUR | 460,000 | 659,891 | ||
Series EMTN, 2.50%, 3/24/2026 | EUR | 100,000 | 139,458 |
| Security Description | Principal Amount | Value | |||
| Siemens Financieringsmaatschappij NV: | |||||
Series EMTN, Zero Coupon, 2/20/2026 | EUR | 100,000 | $ 123,544 | ||
Series EMTN, 0.38%, 9/6/2023 | EUR | 500,000 | 622,794 | ||
Series EMTN, 1.38%, 9/6/2030 | EUR | 600,000 | 833,380 | ||
| Unilever Finance Netherlands B.V.: | |||||
Series EMTN, 1.25%, 3/25/2025 | EUR | 200,000 | 259,143 | ||
1.75%, 3/25/2030 | EUR | 200,000 | 282,130 | ||
| 22,170,232 | |||||
| NORWAY — 0.2% | |||||
DNB Bank ASA Series EMTN, 4.25%, 1/18/2022 | EUR | 500,000 | 641,347 | ||
| PORTUGAL — 0.1% | |||||
EDP Finance B.V. Series EMTN, 2.63%, 1/18/2022 | EUR | 127,000 | 159,974 | ||
| SPAIN — 5.5% | |||||
| Abertis Infraestructuras SA: | |||||
Series EMTN, 2.38%, 9/27/2027 | EUR | 400,000 | 541,359 | ||
Series EMTN, 3.00%, 3/27/2031 | EUR | 100,000 | 142,397 | ||
| Banco Bilbao Vizcaya Argentaria SA: | |||||
Series EMTN, 0.38%, 10/2/2024 | EUR | 100,000 | 123,586 | ||
Series EMTN, 0.38%, 11/15/2026 | EUR | 300,000 | 374,314 | ||
Series GMTN, 0.50%, 1/14/2027 | EUR | 200,000 | 249,477 | ||
Series GMTN, 0.75%, 9/11/2022 | EUR | 100,000 | 124,320 | ||
Series GMTN, 0.75%, 6/4/2025 | EUR | 200,000 | 253,960 | ||
1.00%, 6/21/2026 | EUR | 400,000 | 514,478 | ||
Series GMTN, 1.13%, 2/28/2024 | EUR | 100,000 | 126,336 | ||
Series GMTN, 1.38%, 5/14/2025 | EUR | 100,000 | 129,868 | ||
| Banco de Sabadell SA: | |||||
Series EMTN, 0.88%, 3/5/2023 | EUR | 100,000 | 124,456 | ||
Series REGS, 0.88%, 7/22/2025 | EUR | 100,000 | 124,967 | ||
Series EMTN, 1.75%, 5/10/2024 | EUR | 400,000 | 506,133 | ||
| Banco Santander SA: | |||||
Series EMTN, 0.25%, 6/19/2024 | EUR | 300,000 | 371,785 |
| Security Description | Principal Amount | Value | |||
Series EMTN, 0.30%, 10/4/2026 | EUR | 100,000 | $ 124,643 | ||
Series EMTN, 1.13%, 1/17/2025 | EUR | 500,000 | 635,793 | ||
Series EMTN, 1.13%, 6/23/2027 | EUR | 200,000 | 258,961 | ||
1.38%, 2/9/2022 | EUR | 100,000 | 124,551 | ||
Series EMTN, 1.38%, 12/14/2022 | EUR | 200,000 | 252,494 | ||
1.38%, 7/31/2024 | GBP | 100,000 | 140,065 | ||
Series EMTN, 1.38%, 1/5/2026 | EUR | 100,000 | 129,663 | ||
Series EMTN, 1.38%, 1/5/2026 | EUR | 400,000 | 518,650 | ||
| CaixaBank SA: | |||||
Series EMTN, 0.38%, 2/3/2025 | EUR | 500,000 | 619,055 | ||
Series EMTN, 1.13%, 1/12/2023 | EUR | 200,000 | 250,279 | ||
Series EMTN, 1.13%, 5/17/2024 | EUR | 400,000 | 508,229 | ||
Series EMTN, 1.13%, 3/27/2026 | EUR | 200,000 | 256,975 | ||
Series EMTN, 1.38%, 6/19/2026 | EUR | 300,000 | 386,812 | ||
Series EMTN, 2.38%, 2/1/2024 | EUR | 300,000 | 392,771 | ||
3 Month USD LIBOR + 1.17%, 0.75%, 7/10/2026 (a) | EUR | 300,000 | 376,670 | ||
Criteria Caixa SA Series EMTN, 1.63%, 4/21/2022 | EUR | 200,000 | 250,240 | ||
Iberdrola Finanzas SA Series EMTN, 1.00%, 3/7/2025 | EUR | 300,000 | 383,550 | ||
Iberdrola International B.V. Series EMTN, 1.13%, 4/21/2026 | EUR | 100,000 | 130,063 | ||
Mapfre SA 1.63%, 5/19/2026 | EUR | 100,000 | 134,036 | ||
Naturgy Finance B.V. Series EMTN, 1.38%, 1/19/2027 | EUR | 100,000 | 131,226 | ||
Santan Consumer Finance SA Series EMTN, 1.00%, 2/27/2024 | EUR | 100,000 | 126,427 | ||
| Santander Consumer Finance SA: | |||||
Series EMTN, 0.38%, 6/27/2024 | EUR | 100,000 | 123,999 | ||
Series EMTN, 0.38%, 1/17/2025 | EUR | 400,000 | 496,217 | ||
0.88%, 1/24/2022 | EUR | 400,000 | 495,336 | ||
| Telefonica Emisiones SA: | |||||
0.66%, 2/3/2030 | EUR | 100,000 | 125,606 |
| Security Description | Principal Amount | Value | |||
Series EMTN, 1.07%, 2/5/2024 | EUR | 400,000 | $ 506,512 | ||
Series EMTN, 1.20%, 8/21/2027 | EUR | 400,000 | 522,898 | ||
Series EMTN, 1.45%, 1/22/2027 | EUR | 200,000 | 263,782 | ||
Series EMTN, 1.46%, 4/13/2026 | EUR | 300,000 | 395,477 | ||
Series EMTN, 1.50%, 9/11/2025 | EUR | 200,000 | 261,612 | ||
Series EMTN, 1.53%, 1/17/2025 | EUR | 300,000 | 391,106 | ||
Series EMTN, 1.72%, 1/12/2028 | EUR | 300,000 | 406,588 | ||
Series EMTN, 1.79%, 3/12/2029 | EUR | 200,000 | 274,704 | ||
Series EMTN, 2.24%, 5/27/2022 | EUR | 200,000 | 253,201 | ||
| 14,355,627 | |||||
| SWEDEN — 1.2% | |||||
| Skandinaviska Enskilda Banken AB: | |||||
0.05%, 7/1/2024 | EUR | 200,000 | 246,761 | ||
Series GMTN, 0.25%, 5/19/2023 | EUR | 200,000 | 247,646 | ||
Series GMTN, 0.50%, 3/13/2023 | EUR | 100,000 | 124,428 | ||
Series EMTN, 0.63%, 11/12/2029 (b) | EUR | 500,000 | 636,919 | ||
| Svenska Handelsbanken AB: | |||||
Series EMTN, 0.25%, 2/28/2022 | EUR | 200,000 | 246,598 | ||
0.50%, 2/18/2030 | EUR | 300,000 | 377,393 | ||
0.50%, 2/18/2030 | EUR | 200,000 | 251,595 | ||
Series EMTN, 1.13%, 12/14/2022 | EUR | 400,000 | 503,840 | ||
Series EMTN, 2.63%, 8/23/2022 | EUR | 200,000 | 256,669 | ||
Swedbank AB Series EMTN, 0.75%, 5/5/2025 | EUR | 100,000 | 126,625 | ||
| 3,018,474 | |||||
| SWITZERLAND — 3.2% | |||||
| Credit Suisse AG: | |||||
Series EMTN, 1.00%, 6/7/2023 | EUR | 100,000 | 126,081 | ||
Series EMTN, 1.38%, 1/31/2022 | EUR | 400,000 | 498,686 | ||
Series EMTN, 1.50%, 4/10/2026 | EUR | 300,000 | 396,172 | ||
| Credit Suisse Group AG: | |||||
Series EMTN, 1.00%, 4/14/2023 | CHF | 125,000 | 144,678 |
| Security Description | Principal Amount | Value | |||
Series EMTN, 1 year GBP Swap + 0.75%, 1.25%, 7/17/2025 (a) | EUR | 300,000 | $ 381,872 | ||
Series EMTN, 1 year GBP Swap + 1.05%, 1.00%, 6/24/2027 (a) | EUR | 400,000 | 509,317 | ||
1 year GBP Swap + 1.23%, 2.13%, 9/12/2025 (a) | GBP | 400,000 | 573,482 | ||
Series EMTN, 1 year GBP Swap + 3.50%, 3.25%, 4/2/2026 (a) | EUR | 400,000 | 553,094 | ||
Series EMTN, UK 10 year Gilt + 2.23%, 2.25%, 6/9/2028 (a) | GBP | 200,000 | 289,657 | ||
Series EMTN, 1 year GBP Swap + 0.77%, 0.65%, 1/14/2028 (a) | EUR | 400,000 | 500,340 | ||
Credit Suisse Group Funding Guernsey, Ltd. Series EMTN, 1.25%, 4/14/2022 | EUR | 255,000 | 317,655 | ||
Glencore Finance Europe, Ltd. Series EMTN, 1.88%, 9/13/2023 | EUR | 200,000 | 255,517 | ||
| Nestle Finance International, Ltd.: | |||||
0.38%, 5/12/2032 | EUR | 200,000 | 252,896 | ||
Series EMTN, 1.13%, 4/1/2026 | EUR | 100,000 | 130,539 | ||
Series EMTN, 1.50%, 4/1/2030 | EUR | 300,000 | 417,598 | ||
Roche Finance Europe B.V. Series EMTN, 0.88%, 2/25/2025 | EUR | 100,000 | 128,035 | ||
UBS AG Series EMTN, 0.75%, 4/21/2023 | EUR | 600,000 | 750,290 | ||
| UBS Group AG: | |||||
Series EMTN, 1.25%, 9/1/2026 | EUR | 500,000 | 650,862 | ||
1.50%, 11/30/2024 | EUR | 500,000 | 639,218 | ||
1.75%, 11/16/2022 | EUR | 300,000 | 380,798 | ||
Series EMTN, 1 year GBP Swap + 0.55%, 0.25%, 1/29/2026 (a) | EUR | 200,000 | 246,469 | ||
1 year GBP Swap + 0.75%, 1.25%, 4/17/2025 (a) | EUR | 200,000 | 254,786 | ||
| 8,398,042 | |||||
| UNITED KINGDOM — 10.1% | |||||
| Barclays PLC: | |||||
Series EMTN, 1.88%, 12/8/2023 | EUR | 100,000 | 128,933 | ||
Series EMTN, 3.13%, 1/17/2024 | GBP | 100,000 | 145,370 |
| Security Description | Principal Amount | Value | |||
Series EMTN, 3.25%, 2/12/2027 | GBP | 100,000 | $ 152,069 | ||
Series EMTN, 3.25%, 1/17/2033 | GBP | 300,000 | 481,904 | ||
Series EMTN, 1 year GBP Swap + 0.78%, 1.38%, 1/24/2026 (a) | EUR | 500,000 | 640,265 | ||
Series ., 1 year GBP Swap + 1.32%, 2.38%, 10/6/2023 (a) | GBP | 200,000 | 280,982 | ||
Series EMTN, 1 year GBP Swap + 3.70%, 3.38%, 4/2/2025 (a) | EUR | 400,000 | 539,585 | ||
Series EMTN, 1 year GBP Swap + 3.70%, 3.38%, 4/2/2025 (a) | EUR | 200,000 | 269,793 | ||
BAT International Finance PLC Series EMTN, 2.25%, 1/16/2030 | EUR | 200,000 | 268,425 | ||
| BG Energy Capital PLC: | |||||
Series EMTN, 5.00%, 11/4/2036 | GBP | 100,000 | 209,309 | ||
Series EMTN, 5.13%, 12/1/2025 | GBP | 100,000 | 168,330 | ||
| BP Capital Markets PLC: | |||||
Series EMTN, 1.23%, 5/8/2031 | EUR | 300,000 | 397,077 | ||
Series EMTN, 1.57%, 2/16/2027 | EUR | 500,000 | 664,553 | ||
1.88%, 4/7/2024 | EUR | 100,000 | 130,140 | ||
2.82%, 4/7/2032 | EUR | 300,000 | 462,934 | ||
Series EMTN, 2.97%, 2/27/2026 | EUR | 300,000 | 422,606 | ||
| British Telecommunications PLC: | |||||
Series EMTN, 1.00%, 11/21/2024 | EUR | 200,000 | 253,094 | ||
Series EMTN, 1.50%, 6/23/2027 | EUR | 200,000 | 263,184 | ||
Series EMTN, 1.75%, 3/10/2026 | EUR | 500,000 | 662,463 | ||
| Cadent Finance PLC: | |||||
Series EMTN, 2.13%, 9/22/2028 | GBP | 100,000 | 147,539 | ||
Series EMTN, 2.63%, 9/22/2038 | GBP | 100,000 | 155,253 | ||
Series EMTN, 2.75%, 9/22/2046 | GBP | 200,000 | 315,932 | ||
Centrica PLC Series EMTN, 7.00%, 9/19/2033 | GBP | 100,000 | 224,541 | ||
CK Hutchison Finance 16 II, Ltd. 0.88%, 10/3/2024 | EUR | 200,000 | 251,352 | ||
CK Hutchison Finance 16, Ltd. Series A, 1.25%, 4/6/2023 | EUR | 300,000 | 376,822 |
| Security Description | Principal Amount | Value | |||
CK Hutchison Group Telecom Finance SA 0.75%, 4/17/2026 | EUR | 100,000 | $ 126,001 | ||
Connect Plus M25 Issuer PLC 2.61%, 3/31/2039 | GBP | 95,003 | 150,346 | ||
Diageo Finance PLC Series EMTN, 2.50%, 3/27/2032 | EUR | 200,000 | 298,938 | ||
| GlaxoSmithKline Capital PLC: | |||||
Series EMTN, 1.25%, 5/21/2026 | EUR | 200,000 | 261,304 | ||
Series EMTN, 1.25%, 10/12/2028 | GBP | 100,000 | 142,189 | ||
Series EMTN, 1.38%, 12/2/2024 | EUR | 250,000 | 324,186 | ||
Series EMTN, 1.63%, 5/12/2035 | GBP | 300,000 | 431,015 | ||
Series EMTN, 4.25%, 12/18/2045 | GBP | 100,000 | 215,303 | ||
Series EMTN, 4.25%, 12/18/2045 | GBP | 100,000 | 215,303 | ||
Series EMTN, 5.25%, 12/19/2033 | GBP | 168,000 | 346,869 | ||
Series EMTN, 5.25%, 4/10/2042 | GBP | 100,000 | 231,934 | ||
Series EMTN, 6.38%, 3/9/2039 | GBP | 100,000 | 247,002 | ||
| Heathrow Funding, Ltd.: | |||||
Series EMTN, 4.63%, 10/31/2046 | GBP | 100,000 | 191,711 | ||
Series REGS, 5.23%, 2/15/2023 | GBP | 100,000 | 148,631 | ||
Series EMTN, 5.88%, 5/13/2043 | GBP | 100,000 | 207,851 | ||
Series REGS, 6.45%, 12/10/2031 | GBP | 350,000 | 692,732 | ||
Series EMTN, 6.75%, 12/3/2028 | GBP | 100,000 | 175,855 | ||
| HSBC Holdings PLC: | |||||
0.88%, 9/6/2024 | EUR | 500,000 | 633,225 | ||
Series EMTN, 1.50%, 3/15/2022 | EUR | 400,000 | 500,352 | ||
Series EMTN, 2.50%, 3/15/2027 | EUR | 300,000 | 423,060 | ||
2.63%, 8/16/2028 | GBP | 200,000 | 303,669 | ||
1 year GBP Swap + 0.94%, 2.18%, 6/27/2023 (a) | GBP | 100,000 | 139,886 | ||
1 year GBP Swap + 1.04%, 2.26%, 11/13/2026 (a) | GBP | 300,000 | 436,670 | ||
1 year GBP Swap + 1.65%, 3.00%, 7/22/2028 (a) | GBP | 200,000 | 305,241 | ||
1 year GBP Swap + 1.77%, 3.00%, 5/29/2030 (a) | GBP | 200,000 | 311,189 |
| Security Description | Principal Amount | Value | |||
Series EMTN, 3 Month USD LIBOR + 1.36%, 1.50%, 12/4/2024 (a) | EUR | 250,000 | $ 320,398 | ||
Imperial Brands Finance PLC Series EMTN, 9.00%, 2/17/2022 | GBP | 50,000 | 74,824 | ||
Lloyds Bank Corporate Markets PLC Series EMTN, 0.25%, 10/4/2022 | EUR | 200,000 | 246,168 | ||
Lloyds Bank PLC Series EMTN, 6.50%, 9/17/2040 | GBP | 90,000 | 230,610 | ||
| Lloyds Banking Group PLC: | |||||
Series EMTN, 1.50%, 9/12/2027 | EUR | 400,000 | 534,918 | ||
Series EMTN, 2.25%, 10/16/2024 | GBP | 400,000 | 573,362 | ||
Series EMTN, 1 year GBP Swap + 0.47%, 0.63%, 1/15/2024 (a) | EUR | 600,000 | 741,906 | ||
Series EMTN, 1 year GBP Swap + 3.75%, 3.50%, 4/1/2026 (a) | EUR | 200,000 | 278,091 | ||
UK 10 year Gilt + 1.30%, 1.88%, 1/15/2026 (a) | GBP | 100,000 | 141,252 | ||
| Logicor 2019-1 UK PLC: | |||||
1.88%, 11/17/2026 | GBP | 100,000 | 145,460 | ||
1.88%, 11/17/2026 | GBP | 100,000 | 145,460 | ||
| Nationwide Building Society: | |||||
0.25%, 7/22/2025 | EUR | 200,000 | 246,934 | ||
3 Month USD LIBOR + 0.93%, 1.50%, 3/8/2026 (a) | EUR | 200,000 | 258,993 | ||
| Natwest Group PLC: | |||||
Series EMTN, 2.50%, 3/22/2023 | EUR | 222,000 | 286,619 | ||
Series EMTN, 1 year GBP Swap + 1.49%, 2.88%, 9/19/2026 (a) | GBP | 100,000 | 148,376 | ||
Series EMTN, 3 Month USD LIBOR - 2.04%, 2.00%, 3/8/2023 (a) | EUR | 400,000 | 501,214 | ||
Series EMTN, 3 Month USD LIBOR + 1.08%, 1.75%, 3/2/2026 (a) | EUR | 600,000 | 778,332 | ||
NatWest Markets PLC Series EMTN, 2.75%, 4/2/2025 | EUR | 400,000 | 543,188 | ||
Santander UK Group Holdings PLC 1.13%, 9/8/2023 | EUR | 200,000 | 251,781 | ||
Sky, Ltd. Series EMTN, 2.50%, 9/15/2026 | EUR | 100,000 | 139,964 | ||
THFC Funding No. 3 PLC Series EMTN, 5.20%, 10/11/2043 | GBP | 150,000 | 333,641 |
| Security Description | Principal Amount | Value | |||
University of Oxford 2.54%, 12/8/2117 | GBP | 150,000 | $ 321,048 | ||
| Vodafone Group PLC: | |||||
Series EMTN, 1.13%, 11/20/2025 | EUR | 300,000 | 387,198 | ||
Series EMTN, 1.60%, 7/29/2031 | EUR | 100,000 | 136,858 | ||
1.63%, 11/24/2030 | EUR | 300,000 | 410,260 | ||
Series EMTN, 1.75%, 8/25/2023 | EUR | 300,000 | 385,408 | ||
Series EMTN, 1.88%, 9/11/2025 | EUR | 150,000 | 199,153 | ||
Series EMTN, 2.20%, 8/25/2026 | EUR | 328,000 | 449,381 | ||
Series EMTN, 3.00%, 8/12/2056 | GBP | 250,000 | 396,773 | ||
Series EMTN, 3.38%, 8/8/2049 | GBP | 200,000 | 336,586 | ||
Series EMTN, 4.65%, 1/20/2022 | EUR | 100,000 | 128,581 | ||
Wellcome Trust, Ltd. 2.52%, 2/7/2118 | GBP | 100,000 | 218,618 | ||
Western Power Distribution East Midlands PLC Series EMTN, 5.25%, 1/17/2023 | GBP | 200,000 | 299,894 | ||
Western Power Distribution West Midlands PLC Series EMTN, 5.75%, 4/16/2032 | GBP | 100,000 | 201,591 | ||
| 26,265,757 | |||||
| UNITED STATES — 26.3% | |||||
AbbVie, Inc. 1.38%, 5/17/2024 | EUR | 214,000 | 273,309 | ||
| Altria Group, Inc.: | |||||
1.00%, 2/15/2023 | EUR | 300,000 | 374,383 | ||
2.20%, 6/15/2027 | EUR | 200,000 | 266,862 | ||
3.13%, 6/15/2031 (b) | EUR | 200,000 | 291,233 | ||
| American Honda Finance Corp.: | |||||
0.35%, 8/26/2022 | EUR | 100,000 | 123,453 | ||
1.95%, 10/18/2024 | EUR | 300,000 | 394,441 | ||
American International Group, Inc. 1.88%, 6/21/2027 | EUR | 200,000 | 269,175 | ||
| Amgen, Inc.: | |||||
1.25%, 2/25/2022 | EUR | 200,000 | 247,926 | ||
4.00%, 9/13/2029 | GBP | 100,000 | 171,323 | ||
| Apple, Inc.: | |||||
0.50%, 11/15/2031 | EUR | 300,000 | 384,831 | ||
0.88%, 5/24/2025 | EUR | 100,000 | 127,989 | ||
Series EMTN, 1.00%, 11/10/2022 | EUR | 400,000 | 501,388 | ||
Series EMTN, 1.00%, 11/10/2022 | EUR | 50,000 | 62,674 | ||
1.38%, 1/17/2024 | EUR | 100,000 | 128,594 |
| Security Description | Principal Amount | Value | |||
1.38%, 5/24/2029 | EUR | 300,000 | $ 408,422 | ||
1.63%, 11/10/2026 | EUR | 440,000 | 594,050 | ||
2.00%, 9/17/2027 | EUR | 100,000 | 139,698 | ||
3.05%, 7/31/2029 | GBP | 200,000 | 333,169 | ||
Series MTN, 3.70%, 8/28/2022 | AUD | 150,000 | 122,284 | ||
| AT&T, Inc.: | |||||
0.80%, 3/4/2030 | EUR | 100,000 | 125,623 | ||
1.30%, 9/5/2023 | EUR | 100,000 | 126,541 | ||
1.45%, 6/1/2022 | EUR | 700,000 | 873,113 | ||
1.60%, 5/19/2028 | EUR | 600,000 | 800,479 | ||
2.35%, 9/5/2029 | EUR | 200,000 | 283,422 | ||
2.40%, 3/15/2024 | EUR | 400,000 | 524,468 | ||
2.45%, 3/15/2035 | EUR | 100,000 | 143,658 | ||
2.50%, 3/15/2023 | EUR | 400,000 | 514,859 | ||
2.90%, 12/4/2026 | GBP | 100,000 | 151,534 | ||
3.15%, 9/4/2036 | EUR | 603,000 | 933,393 | ||
3.50%, 12/17/2025 | EUR | 100,000 | 142,280 | ||
3.55%, 12/17/2032 | EUR | 300,000 | 479,678 | ||
4.25%, 6/1/2043 | GBP | 100,000 | 181,084 | ||
4.38%, 9/14/2029 | GBP | 50,000 | 84,687 | ||
4.88%, 6/1/2044 | GBP | 550,000 | 1,088,202 | ||
Series EMTN, 7.00%, 4/30/2040 | GBP | 100,000 | 236,066 | ||
| Bank of America Corp.: | |||||
Series EMTN, 0.75%, 7/26/2023 | EUR | 100,000 | 125,199 | ||
Series EMTN, 1.63%, 9/14/2022 | EUR | 400,000 | 504,984 | ||
Series EMTN, 2.30%, 7/25/2025 | GBP | 200,000 | 295,766 | ||
Series EMTN, 7.00%, 7/31/2028 | GBP | 250,000 | 497,676 | ||
Series EMTN, 3 Month USD LIBOR + 0.73%, 0.58%, 8/8/2029 (a) | EUR | 100,000 | 125,155 | ||
Series EMTN, 3 Month USD LIBOR + 0.75%, 0.81%, 5/9/2026 (a) | EUR | 200,000 | 252,409 | ||
Series EMTN, 3 Month USD LIBOR + 0.89%, 1.66%, 4/25/2028 (a) | EUR | 400,000 | 534,095 | ||
Series EMTN, 3 Month USD LIBOR + 0.91%, 1.38%, 5/9/2030 (a) | EUR | 300,000 | 400,093 | ||
3 Month USD LIBOR + 0.94%, 0.65%, 10/26/2031 (a) | EUR | 200,000 | 250,412 | ||
Series EMTN, 3 Month USD LIBOR + 1.03%, 1.38%, 2/7/2025 (a) | EUR | 700,000 | 892,461 | ||
Series EMTN, 3 Month USD LIBOR + 1.20%, 1.78%, 5/4/2027 (a) | EUR | 300,000 | 399,257 | ||
Series EMTN, 3 Month USD LIBOR + 3.67%, 3.65%, 3/31/2029 (a) | EUR | 200,000 | 303,954 |
| Security Description | Principal Amount | Value | |||
| Berkshire Hathaway Finance Corp.: | |||||
2.38%, 6/19/2039 | GBP | 200,000 | $ 322,154 | ||
2.63%, 6/19/2059 | GBP | 200,000 | 363,811 | ||
| Berkshire Hathaway, Inc.: | |||||
Zero Coupon, 3/12/2025 | EUR | 500,000 | 614,938 | ||
1.13%, 3/16/2027 | EUR | 300,000 | 392,105 | ||
1.30%, 3/15/2024 | EUR | 50,000 | 63,904 | ||
1.63%, 3/16/2035 | EUR | 200,000 | 287,986 | ||
| Booking Holdings, Inc.: | |||||
0.80%, 3/10/2022 | EUR | 100,000 | 123,578 | ||
0.80%, 3/10/2022 | EUR | 100,000 | 123,578 | ||
1.80%, 3/3/2027 | EUR | 300,000 | 403,457 | ||
2.38%, 9/23/2024 | EUR | 100,000 | 132,223 | ||
| Citigroup, Inc.: | |||||
Series EMTN, 0.75%, 10/26/2023 | EUR | 200,000 | 250,606 | ||
1.25%, 4/10/2029 | EUR | 300,000 | 394,521 | ||
Series EMTN, 1.50%, 10/26/2028 | EUR | 200,000 | 266,881 | ||
1.75%, 1/28/2025 | EUR | 450,000 | 589,641 | ||
Series EMTN, 2.38%, 5/22/2024 | EUR | 100,000 | 132,427 | ||
2.75%, 1/24/2024 | GBP | 100,000 | 145,551 | ||
Series EMTN, 3 Month USD LIBOR + 1.07%, 1.50%, 7/24/2026 (a) | EUR | 600,000 | 779,653 | ||
Series EMTN, 3 Month USD LIBOR + 1.66%, 1.25%, 7/6/2026 (a) | EUR | 600,000 | 772,452 | ||
| Coca-Cola Co.: | |||||
0.13%, 3/15/2029 | EUR | 200,000 | 246,401 | ||
0.75%, 3/9/2023 | EUR | 600,000 | 747,645 | ||
1.13%, 3/9/2027 | EUR | 300,000 | 393,698 | ||
1.63%, 3/9/2035 | EUR | 400,000 | 571,461 | ||
1.88%, 9/22/2026 | EUR | 100,000 | 136,460 | ||
| Comcast Corp.: | |||||
0.75%, 2/20/2032 | EUR | 300,000 | 381,581 | ||
1.88%, 2/20/2036 | GBP | 225,000 | 332,938 | ||
| DH Europe Finance II Sarl: | |||||
0.20%, 3/18/2026 | EUR | 200,000 | 246,881 | ||
0.45%, 3/18/2028 | EUR | 300,000 | 373,724 | ||
0.75%, 9/18/2031 | EUR | 400,000 | 503,912 | ||
1.35%, 9/18/2039 | EUR | 200,000 | 262,788 | ||
| Digital Euro Finco LLC: | |||||
2.50%, 1/16/2026 | EUR | 100,000 | 136,208 | ||
2.50%, 1/16/2026 | EUR | 100,000 | 136,208 | ||
Dow Chemical Co. 0.50%, 3/15/2027 | EUR | 200,000 | 246,849 | ||
Eli Lilly & Co. 1.70%, 11/1/2049 | EUR | 200,000 | 288,728 | ||
| Exxon Mobil Corp.: | |||||
0.14%, 6/26/2024 | EUR | 500,000 | 617,508 | ||
0.52%, 6/26/2028 | EUR | 100,000 | 125,359 | ||
0.84%, 6/26/2032 | EUR | 200,000 | 251,274 | ||
1.41%, 6/26/2039 | EUR | 100,000 | 128,216 |
| Security Description | Principal Amount | Value | |||
FedEx Corp. 1.63%, 1/11/2027 | EUR | 200,000 | $ 266,936 | ||
| Fidelity National Information Services, Inc.: | |||||
0.75%, 5/21/2023 | EUR | 100,000 | 124,776 | ||
1.50%, 5/21/2027 | EUR | 300,000 | 395,606 | ||
2.00%, 5/21/2030 | EUR | 400,000 | 556,064 | ||
| General Electric Co.: | |||||
0.88%, 5/17/2025 | EUR | 400,000 | 503,566 | ||
1.50%, 5/17/2029 | EUR | 400,000 | 520,370 | ||
2.13%, 5/17/2037 | EUR | 300,000 | 391,823 | ||
Goldman Sachs Group Inc Series EMTN, 2.00%, 11/1/2028 | EUR | 300,000 | 415,796 | ||
| Goldman Sachs Group, Inc.: | |||||
Series EMTN, 0.13%, 8/19/2024 | EUR | 200,000 | 245,500 | ||
Series EMTN, 0.88%, 1/21/2030 | EUR | 200,000 | 256,554 | ||
Series EMTN, 1.25%, 5/1/2025 | EUR | 300,000 | 381,435 | ||
Series EMTN, 1.38%, 5/15/2024 | EUR | 496,000 | 626,334 | ||
Series EMTN, 1.63%, 7/27/2026 | EUR | 300,000 | 396,552 | ||
Series EMTN, 2.00%, 7/27/2023 | EUR | 300,000 | 387,022 | ||
Series EMTN, 2.13%, 9/30/2024 | EUR | 100,000 | 131,677 | ||
Series EMTN, 3.00%, 2/12/2031 | EUR | 250,000 | 385,831 | ||
Series EMTN, 3.13%, 7/25/2029 | GBP | 100,000 | 159,863 | ||
Series EMTN, 3.25%, 2/1/2023 | EUR | 200,000 | 262,148 | ||
3.38%, 3/27/2025 | EUR | 300,000 | 417,885 | ||
Series EMTN, 4.25%, 1/29/2026 | GBP | 400,000 | 638,856 | ||
Honeywell International, Inc. 1.30%, 2/22/2023 | EUR | 200,000 | 252,497 | ||
| International Business Machines Corp.: | |||||
0.30%, 2/11/2028 | EUR | 500,000 | 621,153 | ||
0.38%, 1/31/2023 | EUR | 500,000 | 619,088 | ||
0.65%, 2/11/2032 | EUR | 400,000 | 505,708 | ||
Series EMTN, 0.88%, 1/31/2025 | EUR | 100,000 | 127,545 | ||
0.95%, 5/23/2025 | EUR | 200,000 | 256,667 | ||
1.25%, 5/26/2023 | EUR | 230,000 | 291,316 | ||
1.50%, 5/23/2029 | EUR | 100,000 | 136,451 | ||
1.75%, 1/31/2031 | EUR | 200,000 | 280,472 | ||
Series EMTN, 2.88%, 11/7/2025 | EUR | 100,000 | 140,220 | ||
| Johnson & Johnson: | |||||
0.25%, 1/20/2022 | EUR | 100,000 | 123,103 |
| Security Description | Principal Amount | Value | |||
1.65%, 5/20/2035 | EUR | 300,000 | $ 449,268 | ||
| JPMorgan Chase & Co.: | |||||
Series EMTN, 0.63%, 1/25/2024 | EUR | 400,000 | 499,614 | ||
Series EMTN, 1.50%, 10/26/2022 | EUR | 300,000 | 379,046 | ||
Series EMTN, 1.50%, 1/27/2025 | EUR | 100,000 | 130,051 | ||
Series EMTN, 1.50%, 10/29/2026 | EUR | 100,000 | 133,229 | ||
Series EMTN, 2.75%, 8/24/2022 | EUR | 300,000 | 385,243 | ||
Series EMTN, 2.75%, 2/1/2023 | EUR | 200,000 | 259,943 | ||
Series EMTN, 2.88%, 5/24/2028 | EUR | 100,000 | 147,242 | ||
Series EMTN, 3 Month USD LIBOR + 0.65%, 0.39%, 2/24/2028 (a) | EUR | 650,000 | 807,402 | ||
Series EMTN, 3 Month USD LIBOR + 0.76%, 1.09%, 3/11/2027 (a) | EUR | 700,000 | 900,123 | ||
Series EMTN, 3 Month USD LIBOR + 0.84%, 1.64%, 5/18/2028 (a) | EUR | 600,000 | 803,520 | ||
Series EMTN, 3 Month USD LIBOR + 0.85%, 1.00%, 7/25/2031 (a) | EUR | 300,000 | 391,346 | ||
Series EMTN, 3 Month USD LIBOR + 0.87%, 1.05%, 11/4/2032 (a) | EUR | 300,000 | 394,378 | ||
Series EMTN, 3 Month USD LIBOR + 0.95%, 1.81%, 6/12/2029 (a) | EUR | 100,000 | 137,264 | ||
McDonald's Corp. Series GMTN, 1.00%, 11/15/2023 | EUR | 200,000 | 253,006 | ||
| Medtronic Global Holdings SCA: | |||||
Zero Coupon, 3/15/2023 | EUR | 300,000 | 368,607 | ||
0.25%, 7/2/2025 | EUR | 300,000 | 372,463 | ||
Series 0000, 0.38%, 3/7/2023 | EUR | 200,000 | 247,676 | ||
0.38%, 10/15/2028 | EUR | 300,000 | 376,524 | ||
0.75%, 10/15/2032 | EUR | 200,000 | 256,346 | ||
1.13%, 3/7/2027 | EUR | 500,000 | 653,367 | ||
1.38%, 10/15/2040 | EUR | 200,000 | 266,418 | ||
1.50%, 7/2/2039 | EUR | 300,000 | 408,492 | ||
1.63%, 3/7/2031 | EUR | 100,000 | 139,284 | ||
1.63%, 10/15/2050 | EUR | 200,000 | 272,490 | ||
1.75%, 7/2/2049 | EUR | 100,000 | 141,442 | ||
2.25%, 3/7/2039 | EUR | 300,000 | 454,655 | ||
Merck & Co., Inc. 1.88%, 10/15/2026 | EUR | 200,000 | 272,059 | ||
Metropolitan Life Global Funding I 0.38%, 4/9/2024 | EUR | 200,000 | 248,776 |
| Security Description | Principal Amount | Value | |||
Microsoft Corp. 3.13%, 12/6/2028 | EUR | 300,000 | $ 462,017 | ||
| Morgan Stanley: | |||||
Series GMTN, 1.00%, 12/2/2022 | EUR | 100,000 | 125,075 | ||
Series GMTN, 1.38%, 10/27/2026 | EUR | 50,000 | 65,700 | ||
Series GMTN, 1.75%, 3/11/2024 | EUR | 300,000 | 388,160 | ||
Series GMTN, 1.75%, 1/30/2025 | EUR | 300,000 | 392,584 | ||
1.88%, 3/30/2023 | EUR | 200,000 | 255,959 | ||
Series GMTN, 1.88%, 4/27/2027 | EUR | 500,000 | 680,081 | ||
Series GMTN, 2.63%, 3/9/2027 | GBP | 100,000 | 151,964 | ||
Series EMTN, 3 Month USD LIBOR + 0.75%, 0.64%, 7/26/2024 (a) | EUR | 640,000 | 796,854 | ||
Series EMTN, 3 Month USD LIBOR + 0.83%, 1.34%, 10/23/2026 (a) | EUR | 100,000 | 129,717 | ||
3 Month USD LIBOR + 0.88%, 0.50%, 10/26/2029 (a) | EUR | 500,000 | 621,319 | ||
| PepsiCo, Inc.: | |||||
0.25%, 5/6/2024 | EUR | 100,000 | 124,168 | ||
Series EMTN, 0.50%, 5/6/2028 | EUR | 300,000 | 379,845 | ||
| Pfizer, Inc.: | |||||
0.25%, 3/6/2022 | EUR | 100,000 | 123,144 | ||
Series REGS, 2.74%, 6/15/2043 | GBP | 300,000 | 514,140 | ||
Philip Morris International, Inc. Series EMTN, 2.88%, 3/3/2026 | EUR | 200,000 | 279,171 | ||
| Procter & Gamble Co.: | |||||
1.13%, 11/2/2023 | EUR | 400,000 | 509,144 | ||
2.00%, 8/16/2022 | EUR | 100,000 | 126,933 | ||
4.88%, 5/11/2027 | EUR | 100,000 | 161,581 | ||
4.88%, 5/11/2027 | EUR | 100,000 | 161,581 | ||
Schlumberger Finance B.V. 2.00%, 5/6/2032 | EUR | 100,000 | 142,855 | ||
| Thermo Fisher Scientific, Inc.: | |||||
0.75%, 9/12/2024 | EUR | 148,000 | 186,373 | ||
Series EMTN, 1.88%, 10/1/2049 | EUR | 200,000 | 282,567 | ||
| Toyota Motor Credit Corp.: | |||||
Series EMTN, 0.25%, 7/16/2026 | EUR | 200,000 | 248,753 | ||
Series EMTN, 0.75%, 7/21/2022 | EUR | 300,000 | 372,881 | ||
Upjohn Finance B.V. 1.91%, 6/23/2032 | EUR | 200,000 | 270,274 |
| Security Description | Principal Amount | Value | |||
US Bancorp Series EMTN, 0.85%, 6/7/2024 | EUR | 200,000 | $ 252,880 | ||
Utah Acquisition Sub, Inc. Series ., 2.25%, 11/22/2024 | EUR | 200,000 | 263,538 | ||
| Verizon Communications, Inc.: | |||||
0.88%, 4/2/2025 | EUR | 300,000 | 382,405 | ||
0.88%, 4/8/2027 | EUR | 100,000 | 128,495 | ||
1.25%, 4/8/2030 | EUR | 400,000 | 531,810 | ||
1.30%, 5/18/2033 | EUR | 400,000 | 532,064 | ||
1.38%, 10/27/2026 | EUR | 100,000 | 132,052 | ||
1.38%, 11/2/2028 | EUR | 100,000 | 133,851 | ||
2.63%, 12/1/2031 | EUR | 200,000 | 302,720 | ||
Series 20Y, 2.88%, 1/15/2038 | EUR | 300,000 | 481,825 | ||
Series EMTN, 3.25%, 2/17/2026 | EUR | 250,000 | 357,428 | ||
3.38%, 10/27/2036 | GBP | 100,000 | 174,656 | ||
3.38%, 10/27/2036 | GBP | 100,000 | 174,656 | ||
| Walmart, Inc.: | |||||
4.88%, 9/21/2029 | EUR | 121,000 | 211,215 | ||
5.25%, 9/28/2035 | GBP | 168,000 | 365,222 | ||
5.63%, 3/27/2034 | GBP | 150,000 | 326,169 | ||
| Wells Fargo & Co.: | |||||
Series EMTN, 0.50%, 4/26/2024 | EUR | 100,000 | 124,108 | ||
Series EMTN, 0.63%, 3/25/2030 | EUR | 100,000 | 124,516 | ||
0.63%, 8/14/2030 | EUR | 200,000 | 248,408 | ||
Series EMTN, 1.00%, 2/2/2027 | EUR | 300,000 | 383,234 | ||
Series EMTN, 1.38%, 10/26/2026 | EUR | 300,000 | 390,190 | ||
Series EMTN, 1.50%, 9/12/2022 | EUR | 100,000 | 125,931 | ||
Series EMTN, 1.50%, 5/24/2027 | EUR | 800,000 | 1,052,008 | ||
Series EMTN, 1.63%, 6/2/2025 | EUR | 400,000 | 521,183 | ||
Series EMTN, 2.00%, 7/28/2025 | GBP | 200,000 | 288,409 | ||
Series EMTN, 2.00%, 4/27/2026 | EUR | 400,000 | 534,425 | ||
Series EMTN, 2.13%, 6/4/2024 | EUR | 100,000 | 130,944 | ||
Series EMTN, 2.25%, 5/2/2023 | EUR | 100,000 | 129,183 | ||
Series EMTN, 2.63%, 8/16/2022 | EUR | 550,000 | 703,504 | ||
4.63%, 11/2/2035 | GBP | 150,000 | 290,035 |
| Security Description | Principal Amount | Value | |||
Series EMTN, 3 Month USD LIBOR + 1.67%, 1.34%, 5/4/2025 (a) | EUR | 400,000 | $ 509,481 | ||
| 68,400,530 | |||||
TOTAL CORPORATE BONDS & NOTES (Cost $236,039,348) | 255,588,371 |
| Shares | |||
| SHORT-TERM INVESTMENTS — 0.2% | |||
State Street Institutional U.S. Government Money Market Fund, Class G Shares 0.05% (c) (d) | 42,458 | 42,458 | |
State Street Navigator Securities Lending Portfolio II (e) (f) | 597,922 | 597,922 | |
TOTAL SHORT-TERM INVESTMENTS (Cost $640,380) | 640,380 | ||
TOTAL INVESTMENTS — 98.3% (Cost $236,679,728) | 256,228,751 | ||
OTHER ASSETS IN EXCESS OF LIABILITIES — 1.7% | 4,317,364 | ||
NET ASSETS — 100.0% | $ 260,546,115 | ||
| (a) | Variable Rate Security - Interest rate shown is rate in effect at December 31, 2020. For securities based on a published reference rate and spread, the reference rate and spread are indicated in the description above. |
| (b) | All or a portion of the shares of the security are on loan at December 31, 2020. |
| (c) | The Fund invested in certain money market funds managed by SSGA Funds Management, Inc. Amounts related to these transactions during the period ended December 31, 2020 are shown in the Affiliate Table below. |
| (d) | The rate shown is the annualized seven-day yield at December 31, 2020. |
| (e) | The Fund invested in an affiliated entity. Amounts related to these transactions during the period ended December 31, 2020 are shown in the Affiliate Table below. |
| (f) | Investment of cash collateral for securities loaned. |
| EMTN | Euro Medium Term Note |
| GMTN | Global Medium Term Note |
| LIBOR | London Interbank Offered Rate |
| MTN | Medium Term Note |
| AUD | Australian Dollar |
| CHF | Swiss Franc |
| EUR | Euro |
| GBP | British Pound |
| JPY | Japanese Yen |
| Description | Level 1 – Quoted Prices | Level 2 – Other Significant Observable Inputs | Level 3 – Significant Unobservable Inputs | Total | ||||
| ASSETS: | ||||||||
| INVESTMENTS: | ||||||||
Corporate Bonds & Notes | $ — | $255,588,371 | $— | $255,588,371 | ||||
Short-Term Investments | 640,380 | — | — | 640,380 | ||||
TOTAL INVESTMENTS | $640,380 | $255,588,371 | $— | $256,228,751 |
| % of Total Investments | ||
| Financial | 46.5% | |
| Consumer, Non-cyclical | 15.6 | |
| Communications | 10.6 | |
| Consumer, Cyclical | 7.9 | |
| Energy | 5.7 | |
| Utilities | 4.5 | |
| Industrial | 3.9 | |
| Technology | 3.9 | |
| Basic Materials | 1.0 | |
| Diversified | 0.2 | |
| Short-Term Investments | 0.2 | |
| TOTAL | 100.0% |
| Number of Shares Held at 12/31/19 | Value at 12/31/19 | Cost of Purchases | Proceeds from Shares Sold | Realized Gain (Loss) | Change in Unrealized Appreciation/ Depreciation | Number of Shares Held at 12/31/20 | Value at 12/31/20 | Dividend Income | |||||||||
State Street Institutional U.S. Government Money Market Fund, Class G Shares | 45,509 | $45,509 | $71,983,454 | $71,986,505 | $— | $— | 42,458 | $ 42,458 | $ 376 | ||||||||
State Street Navigator Securities Lending Portfolio II | — | — | 13,611,366 | 13,013,444 | — | — | 597,922 | 597,922 | 6,135 | ||||||||
Total | $45,509 | $85,594,820 | $84,999,949 | $— | $— | $640,380 | $ 6,511 |
| Security Description | Principal Amount | Value | ||||
| FOREIGN GOVERNMENT OBLIGATIONS — 98.2% | ||||||
| AUSTRALIA — 4.6% | ||||||
| Australia Government Bond: | ||||||
Series 159, 0.25%, 11/21/2024 | AUD | 2,050,000 | $ 1,585,974 | |||
Series 161, 0.25%, 11/21/2025 | AUD | 2,380,000 | 1,829,427 | |||
Series 164, 0.50%, 9/21/2026 | AUD | 1,469,000 | 1,136,486 | |||
Series 160, 1.00%, 12/21/2030 | AUD | 2,070,000 | 1,601,096 | |||
Series 163, 1.00%, 11/21/2031 | AUD | 2,000,000 | 1,535,070 | |||
Series 158, 1.25%, 5/21/2032 | AUD | 1,137,000 | 892,722 | |||
Series 157, 1.50%, 6/21/2031 | AUD | 1,852,000 | 1,498,576 | |||
Series 162, 1.75%, 6/21/2051 | AUD | 1,250,000 | 917,843 | |||
Series 153, 2.25%, 11/21/2022 | AUD | 2,145,000 | 1,722,790 | |||
Series 149, 2.25%, 5/21/2028 | AUD | 2,330,000 | 2,001,004 | |||
Series 155, 2.50%, 5/21/2030 | AUD | 2,730,000 | 2,406,955 | |||
Series 137, 2.75%, 4/21/2024 | AUD | 2,640,000 | 2,214,493 | |||
Series 148, 2.75%, 11/21/2027 | AUD | 1,350,000 | 1,192,214 | |||
Series 148, 2.75%, 11/21/2027 | AUD | 970,000 | 856,628 | |||
Series 152, 2.75%, 11/21/2028 | AUD | 2,635,000 | 2,345,907 | |||
Series 154, 2.75%, 11/21/2029 | AUD | 2,615,000 | 2,343,547 | |||
Series 145, 2.75%, 6/21/2035 | AUD | 674,000 | 617,769 | |||
Series 156, 2.75%, 5/21/2041 | AUD | 925,000 | 840,221 | |||
Series 150, 3.00%, 3/21/2047 | AUD | 1,205,000 | 1,145,194 | |||
Series 139, 3.25%, 4/21/2025 | AUD | 2,632,000 | 2,291,345 | |||
Series 138, 3.25%, 4/21/2029 | AUD | 3,128,000 | 2,890,614 | |||
Series 147, 3.25%, 6/21/2039 | AUD | 925,000 | 901,728 | |||
Series 144, 3.75%, 4/21/2037 | AUD | 1,114,000 | 1,146,009 | |||
Series 142, 4.25%, 4/21/2026 | AUD | 2,574,000 | 2,388,266 | |||
Series 140, 4.50%, 4/21/2033 | AUD | 1,410,000 | 1,510,097 | |||
Series 136, 4.75%, 4/21/2027 | AUD | 2,515,000 | 2,447,999 | |||
| Security Description | Principal Amount | Value | |||
Series 133, 5.50%, 4/21/2023 | AUD | 2,755,000 | $ 2,388,684 | ||
Series 128, 5.75%, 7/15/2022 | AUD | 2,005,000 | 1,681,731 | ||
| 46,330,389 | |||||
| AUSTRIA — 2.9% | |||||
| Austria Government Bond: | |||||
Zero Coupon, 9/20/2022 (a) | EUR | 590,000 | 730,350 | ||
Zero Coupon, 4/20/2023 (a) | EUR | 500,000 | 621,375 | ||
Zero Coupon, 7/15/2023 (a) | EUR | 815,000 | 1,014,614 | ||
Zero Coupon, 7/15/2024 (a) | EUR | 550,000 | 689,325 | ||
Zero Coupon, 2/20/2030 (a) | EUR | 467,000 | 593,921 | ||
0.50%, 4/20/2027 (a) | EUR | 740,000 | 970,669 | ||
0.50%, 2/20/2029 (a) | EUR | 1,046,000 | 1,386,786 | ||
0.75%, 10/20/2026 (a) | EUR | 1,641,000 | 2,172,127 | ||
0.75%, 2/20/2028 (a) | EUR | 1,158,000 | 1,552,321 | ||
0.75%, 3/20/2051 (a) | EUR | 250,000 | 365,435 | ||
0.85%, 6/30/2120 (a) | EUR | 200,000 | 321,195 | ||
1.20%, 10/20/2025 (a) | EUR | 864,000 | 1,154,496 | ||
1.50%, 2/20/2047 (a) | EUR | 789,000 | 1,333,635 | ||
1.50%, 11/2/2086 (a) | EUR | 210,000 | 432,442 | ||
Series 1, 1.65%, 10/21/2024 (a) | EUR | 850,000 | 1,134,046 | ||
1.75%, 10/20/2023 (a) | EUR | 1,226,000 | 1,603,604 | ||
2.10%, 9/20/2117 (a) | EUR | 540,000 | 1,473,071 | ||
2.40%, 5/23/2034 (a) | EUR | 685,000 | 1,142,298 | ||
3.15%, 6/20/2044 (a) | EUR | 709,000 | 1,518,526 | ||
3.40%, 11/22/2022 (a) | EUR | 1,002,000 | 1,321,211 | ||
3.65%, 4/20/2022 (a) | EUR | 704,000 | 909,358 | ||
3.80%, 1/26/2062 (a) | EUR | 472,000 | 1,403,634 | ||
4.15%, 3/15/2037 (a) | EUR | 1,285,000 | 2,689,115 | ||
4.85%, 3/15/2026 (a) | EUR | 880,000 | 1,393,117 | ||
6.25%, 7/15/2027 | EUR | 825,000 | 1,472,504 | ||
| 29,399,175 | |||||
| BELGIUM — 4.6% | |||||
| Belgium Government Bond: | |||||
Series 91, Zero Coupon, 10/22/2027 (a) | EUR | 750,000 | 953,402 | ||
Series 89, 0.10%, 6/22/2030 | EUR | 950,000 | 1,216,994 | ||
Series 79, 0.20%, 10/22/2023 (a) | EUR | 1,155,000 | 1,449,262 |
| Security Description | Principal Amount | Value | |||
Series 90, 0.40%, 6/22/2040 (a) | EUR | 500,000 | $ 645,595 | ||
Series 82, 0.50%, 10/22/2024 (a) | EUR | 1,120,000 | 1,433,550 | ||
Series 74, 0.80%, 6/22/2025 (a) | EUR | 1,301,000 | 1,698,823 | ||
Series 81, 0.80%, 6/22/2027 (a) | EUR | 1,300,000 | 1,736,948 | ||
Series 85, 0.80%, 6/22/2028 (a) | EUR | 1,766,000 | 2,380,200 | ||
Series 87, 0.90%, 6/22/2029 (a) | EUR | 1,467,000 | 2,003,641 | ||
Series 77, 1.00%, 6/22/2026 (a) | EUR | 1,090,000 | 1,454,302 | ||
Series 75, 1.00%, 6/22/2031 (a) | EUR | 1,180,000 | 1,647,736 | ||
Series 86, 1.25%, 4/22/2033 | EUR | 580,000 | 841,570 | ||
Series 84, 1.45%, 6/22/2037 (a) | EUR | 420,000 | 637,963 | ||
Series 78, 1.60%, 6/22/2047 (a) | EUR | 1,035,000 | 1,687,983 | ||
Series 88, 1.70%, 6/22/2050 (a) | EUR | 600,000 | 1,016,169 | ||
Series 76, 1.90%, 6/22/2038 (a) | EUR | 695,000 | 1,129,835 | ||
Series 80, 2.15%, 6/22/2066 (a) | EUR | 555,000 | 1,146,386 | ||
Series 68, 2.25%, 6/22/2023 | EUR | 1,206,000 | 1,584,430 | ||
Series 83, 2.25%, 6/22/2057 (a) | EUR | 594,000 | 1,183,988 | ||
Series 72, 2.60%, 6/22/2024 (a) | EUR | 1,146,000 | 1,564,733 | ||
Series 73, 3.00%, 6/22/2034 (a) | EUR | 835,000 | 1,462,445 | ||
Series 71, 3.75%, 6/22/2045 | EUR | 695,000 | 1,562,038 | ||
Series 48, 4.00%, 3/28/2022 | EUR | 1,150,000 | 1,488,690 | ||
Series 66, 4.00%, 3/28/2032 | EUR | 859,000 | 1,567,686 | ||
Series 65, 4.25%, 9/28/2022 (a) | EUR | 1,240,000 | 1,648,592 | ||
Series 60, 4.25%, 3/28/2041 (a) | EUR | 1,580,000 | 3,521,758 | ||
Series 64, 4.50%, 3/28/2026 (a) | EUR | 911,000 | 1,419,873 | ||
Series 44, 5.00%, 3/28/2035 (a) | EUR | 1,402,000 | 2,991,976 | ||
Series 31, 5.50%, 3/28/2028 | EUR | 1,715,000 | 3,037,014 | ||
| 46,113,582 | |||||
| CANADA — 4.6% | |||||
| Canadian Government Bond: | |||||
0.25%, 8/1/2022 | CAD | 1,660,000 | 1,304,533 |
| Security Description | Principal Amount | Value | |||
0.25%, 11/1/2022 | CAD | 1,650,000 | $ 1,296,545 | ||
0.50%, 3/1/2022 | CAD | 2,670,000 | 2,104,291 | ||
0.50%, 9/1/2025 | CAD | 3,160,000 | 2,490,621 | ||
1.00%, 9/1/2022 | CAD | 2,230,000 | 1,774,233 | ||
1.00%, 6/1/2027 | CAD | 1,249,000 | 1,013,013 | ||
1.25%, 3/1/2025 | CAD | 1,470,000 | 1,196,735 | ||
1.25%, 6/1/2030 | CAD | 3,339,000 | 2,758,842 | ||
1.50%, 2/1/2022 | CAD | 1,510,000 | 1,202,690 | ||
1.50%, 5/1/2022 | CAD | 1,758,000 | 1,404,496 | ||
1.50%, 6/1/2023 | CAD | 1,585,000 | 1,282,195 | ||
1.50%, 9/1/2024 | CAD | 2,189,000 | 1,792,626 | ||
1.50%, 6/1/2026 | CAD | 1,453,000 | 1,204,245 | ||
1.75%, 3/1/2023 | CAD | 2,362,000 | 1,915,556 | ||
2.00%, 9/1/2023 | CAD | 2,395,000 | 1,967,378 | ||
2.00%, 6/1/2028 | CAD | 1,350,000 | 1,173,991 | ||
2.00%, 12/1/2051 | CAD | 1,680,000 | 1,590,488 | ||
2.25%, 3/1/2024 | CAD | 1,523,000 | 1,269,541 | ||
2.25%, 6/1/2025 | CAD | 810,000 | 687,769 | ||
2.25%, 6/1/2029 | CAD | 1,435,000 | 1,280,169 | ||
2.50%, 6/1/2024 | CAD | 2,180,000 | 1,839,140 | ||
2.75%, 6/1/2022 | CAD | 1,520,000 | 1,236,640 | ||
2.75%, 12/1/2048 | CAD | 1,417,000 | 1,528,180 | ||
2.75%, 12/1/2064 | CAD | 535,000 | 640,916 | ||
3.50%, 12/1/2045 | CAD | 1,646,000 | 1,953,094 | ||
4.00%, 6/1/2041 | CAD | 1,408,000 | 1,700,630 | ||
5.00%, 6/1/2037 | CAD | 1,020,000 | 1,293,583 | ||
Series WL43, 5.75%, 6/1/2029 | CAD | 1,220,000 | 1,362,388 | ||
5.75%, 6/1/2033 | CAD | 1,620,000 | 2,009,665 | ||
Series A55, 8.00%, 6/1/2023 | CAD | 390,000 | 363,248 | ||
Series VW17, 8.00%, 6/1/2027 | CAD | 1,070,000 | 1,237,639 | ||
Series A-76, 9.00%, 6/1/2025 | CAD | 330,000 | 356,441 | ||
| 46,231,521 | |||||
| CHILE — 0.3% | |||||
| Bonos de la Tesoreria de la Republica en pesos: | |||||
2.50%, 3/1/2025 | CLP | 145,000,000 | 213,628 | ||
4.00%, 3/1/2023 (a) | CLP | 225,000,000 | 339,453 | ||
4.50%, 3/1/2026 | CLP | 310,000,000 | 499,633 | ||
4.70%, 9/1/2030 (a) | CLP | 280,000,000 | 461,367 | ||
5.00%, 3/1/2035 | CLP | 475,000,000 | 803,729 | ||
5.10%, 7/15/2050 | CLP | 95,000,000 | 161,352 | ||
Series 10YR, 6.00%, 1/1/2022 | CLP | 20,000,000 | 29,723 | ||
Series 30YR, 6.00%, 1/1/2043 | CLP | 280,000,000 | 533,148 | ||
| 3,042,033 |
| Security Description | Principal Amount | Value | |||
| CHINA — 4.5% | |||||
| China Government Bond: | |||||
Series 1904, 3.19%, 4/11/2024 | CNY | 7,300,000 | $ 1,125,284 | ||
Series 1907, 3.25%, 6/6/2026 | CNY | 29,500,000 | 4,560,057 | ||
Series 1827, 3.25%, 11/22/2028 | CNY | 78,000,000 | 11,951,420 | ||
Series 1823, 3.29%, 10/18/2023 | CNY | 111,800,000 | 17,305,700 | ||
Series 1824, 4.08%, 10/22/2048 | CNY | 67,430,000 | 10,816,777 | ||
| 45,759,238 | |||||
| COLOMBIA — 0.6% | |||||
| Colombian TES: | |||||
Series B, 6.00%, 4/28/2028 | COP | 3,000,000,000 | 938,669 | ||
Series B, 7.00%, 5/4/2022 | COP | 4,180,000,000 | 1,297,990 | ||
Series B, 7.00%, 6/30/2032 | COP | 6,700,000,000 | 2,160,391 | ||
Series B, 7.50%, 8/26/2026 | COP | 6,125,000,000 | 2,067,090 | ||
| 6,464,140 | |||||
| CYPRUS — 0.1% | |||||
| Cyprus Government International Bond: | |||||
Series EMTN, 1.25%, 1/21/2040 | EUR | 100,000 | 131,928 | ||
Series EMTN, 2.38%, 9/25/2028 | EUR | 250,000 | 358,500 | ||
Series EMTN, 2.75%, 6/27/2024 | EUR | 50,000 | 67,197 | ||
Series EMTN, 2.75%, 2/26/2034 | EUR | 100,000 | 156,816 | ||
Series EMTN, 2.75%, 5/3/2049 | EUR | 100,000 | 175,516 | ||
Series EMTN, 3.75%, 7/26/2023 | EUR | 110,000 | 148,301 | ||
Series EMTN, 3.88%, 5/6/2022 | EUR | 130,000 | 167,872 | ||
Series EMTN, 4.25%, 11/4/2025 | EUR | 100,000 | 147,891 | ||
Series EMTN, 4.25%, 11/4/2025 | EUR | 70,000 | 103,524 | ||
| 1,457,545 | |||||
| CZECH REPUBLIC — 0.6% | |||||
| Czech Republic Government Bond: | |||||
Series 126, 0.10%, 4/17/2022 | CZK | 650,000 | 30,203 | ||
Series 100, 0.25%, 2/10/2027 | CZK | 11,360,000 | 505,150 |
| Security Description | Principal Amount | Value | |||
Series 97, 0.45%, 10/25/2023 | CZK | 9,450,000 | $ 440,840 | ||
Series 94, 0.95%, 5/15/2030 | CZK | 10,730,000 | 485,235 | ||
Series 95, 1.00%, 6/26/2026 | CZK | 10,420,000 | 486,939 | ||
Series 121, 1.20%, 3/13/2031 | CZK | 8,130,000 | 373,940 | ||
Series 120, 1.25%, 2/14/2025 | CZK | 10,100,000 | 479,834 | ||
Series 125, 1.50%, 4/24/2040 | CZK | 2,300,000 | 104,157 | ||
Series 103, 2.00%, 10/13/2033 | CZK | 9,500,000 | 472,438 | ||
Series 89, 2.40%, 9/17/2025 | CZK | 10,440,000 | 522,152 | ||
Series 78, 2.50%, 8/25/2028 | CZK | 12,510,000 | 643,086 | ||
Series 105, 2.75%, 7/23/2029 | CZK | 10,330,000 | 543,213 | ||
Series 49, 4.20%, 12/4/2036 | CZK | 4,530,000 | 293,837 | ||
Series 52, 4.70%, 9/12/2022 | CZK | 8,460,000 | 423,990 | ||
Series 53, 4.85%, 11/26/2057 | CZK | 1,750,000 | 136,201 | ||
Series 58, 5.70%, 5/25/2024 | CZK | 9,490,000 | 520,488 | ||
| 6,461,703 | |||||
| DENMARK — 1.0% | |||||
| Denmark Government Bond: | |||||
Series 3Y, 0.25%, 11/15/2022 (a) | DKK | 3,070,000 | 512,825 | ||
Series 30Y, 0.25%, 11/15/2052 (a) | DKK | 1,000,000 | 180,526 | ||
Series 10Y, 0.50%, 11/15/2027 | DKK | 7,268,000 | 1,279,459 | ||
Series 10YR, 0.50%, 11/15/2029 (a) | DKK | 6,613,000 | 1,179,513 | ||
1.50%, 11/15/2023 | DKK | 5,955,000 | 1,038,833 | ||
1.75%, 11/15/2025 | DKK | 5,883,000 | 1,078,225 | ||
4.50%, 11/15/2039 | DKK | 13,786,000 | 4,337,692 | ||
7.00%, 11/10/2024 | DKK | 895,000 | 190,762 | ||
| 9,797,835 | |||||
| ESTONIA — 0.0% (b) | |||||
Estonia Government International Bond 0.13%, 6/10/2030 | EUR | 100,000 | 126,026 | ||
| FINLAND — 1.2% | |||||
| Finland Government Bond: | |||||
Series 5Y, Zero Coupon, 4/15/2022 (a) | EUR | 335,000 | 413,455 |
| Security Description | Principal Amount | Value | |||
Zero Coupon, 9/15/2023 (a) | EUR | 595,000 | $ 742,439 | ||
Zero Coupon, 9/15/2024 (a) | EUR | 455,000 | 571,802 | ||
0.13%, 4/15/2036 (a) | EUR | 400,000 | 511,230 | ||
0.25%, 9/15/2040 (a) | EUR | 250,000 | 324,814 | ||
0.50%, 4/15/2026 (a) | EUR | 531,000 | 691,332 | ||
0.50%, 9/15/2027 (a) | EUR | 590,000 | 777,164 | ||
0.50%, 9/15/2028 (a) | EUR | 512,000 | 678,090 | ||
0.50%, 9/15/2029 (a) | EUR | 450,000 | 598,830 | ||
0.75%, 4/15/2031 (a) | EUR | 410,000 | 563,138 | ||
0.88%, 9/15/2025 (a) | EUR | 393,000 | 517,418 | ||
1.13%, 4/15/2034 (a) | EUR | 443,000 | 642,135 | ||
Series 30Y, 1.38%, 4/15/2047 (a) | EUR | 289,000 | 484,403 | ||
1.50%, 4/15/2023 (a) | EUR | 430,000 | 552,947 | ||
1.63%, 9/15/2022 (a) | EUR | 440,000 | 559,904 | ||
2.00%, 4/15/2024 (a) | EUR | 497,000 | 663,298 | ||
2.63%, 7/4/2042 (a) | EUR | 534,000 | 1,038,995 | ||
2.75%, 7/4/2028 (a) | EUR | 565,000 | 868,091 | ||
4.00%, 7/4/2025 (a) | EUR | 561,000 | 835,014 | ||
| 12,034,499 | |||||
| FRANCE — 4.9% | |||||
| France Government Bond OAT: | |||||
Zero Coupon, 2/25/2022 | EUR | 435,000 | 536,514 | ||
Zero Coupon, 5/25/2022 | EUR | 677,000 | 836,436 | ||
Zero Coupon, 2/25/2023 | EUR | 530,000 | 658,523 | ||
Zero Coupon, 3/25/2023 | EUR | 1,006,000 | 1,250,473 | ||
Zero Coupon, 3/25/2024 | EUR | 900,000 | 1,126,578 | ||
Zero Coupon, 3/25/2025 | EUR | 1,005,000 | 1,264,861 | ||
Zero Coupon, 2/25/2026 | EUR | 500,000 | 631,229 | ||
Zero Coupon, 11/25/2029 | EUR | 931,000 | 1,181,380 | ||
Zero Coupon, 11/25/2030 | EUR | 400,000 | 506,234 | ||
0.25%, 11/25/2026 | EUR | 847,000 | 1,089,345 | ||
0.50%, 5/25/2025 | EUR | 870,000 | 1,119,501 | ||
0.50%, 5/25/2026 | EUR | 768,000 | 997,864 | ||
0.50%, 5/25/2029 | EUR | 713,000 | 943,855 | ||
0.50%, 5/25/2040 (a) | EUR | 150,000 | 197,960 | ||
0.75%, 5/25/2028 | EUR | 958,000 | 1,284,512 | ||
0.75%, 11/25/2028 | EUR | 821,000 | 1,105,155 | ||
0.75%, 5/25/2052 (a) | EUR | 400,000 | 545,214 | ||
1.00%, 11/25/2025 | EUR | 720,000 | 953,608 | ||
1.00%, 5/25/2027 | EUR | 670,000 | 904,194 | ||
1.25%, 5/25/2034 | EUR | 835,000 | 1,216,720 | ||
1.25%, 5/25/2036 (a) | EUR | 660,000 | 971,369 | ||
1.50%, 5/25/2031 | EUR | 1,095,000 | 1,599,116 |
| Security Description | Principal Amount | Value | |||
1.50%, 5/25/2050 (a) | EUR | 530,000 | $ 863,775 | ||
1.75%, 5/25/2023 | EUR | 905,000 | 1,173,021 | ||
1.75%, 11/25/2024 | EUR | 1,000,000 | 1,341,992 | ||
1.75%, 6/25/2039 (a) | EUR | 550,000 | 889,078 | ||
1.75%, 5/25/2066 (a) | EUR | 285,000 | 530,317 | ||
2.00%, 5/25/2048 (a) | EUR | 599,000 | 1,067,915 | ||
2.25%, 10/25/2022 | EUR | 990,000 | 1,277,178 | ||
2.25%, 5/25/2024 | EUR | 740,000 | 997,592 | ||
2.50%, 5/25/2030 | EUR | 1,374,000 | 2,147,416 | ||
2.75%, 10/25/2027 | EUR | 1,115,000 | 1,678,797 | ||
3.00%, 4/25/2022 | EUR | 990,000 | 1,270,148 | ||
3.25%, 5/25/2045 | EUR | 685,000 | 1,447,946 | ||
3.50%, 4/25/2026 | EUR | 810,000 | 1,213,427 | ||
4.00%, 10/25/2038 | EUR | 570,000 | 1,200,476 | ||
4.00%, 4/25/2055 (a) | EUR | 424,000 | 1,124,737 | ||
4.00%, 4/25/2060 | EUR | 382,000 | 1,073,660 | ||
4.25%, 10/25/2023 | EUR | 1,050,000 | 1,466,339 | ||
4.50%, 4/25/2041 | EUR | 810,000 | 1,877,696 | ||
4.75%, 4/25/2035 | EUR | 615,000 | 1,290,006 | ||
5.50%, 4/25/2029 | EUR | 755,000 | 1,395,222 | ||
5.75%, 10/25/2032 | EUR | 745,000 | 1,572,703 | ||
6.00%, 10/25/2025 | EUR | 700,000 | 1,136,470 | ||
8.50%, 4/25/2023 | EUR | 110,000 | 163,394 | ||
| 49,119,946 | |||||
| GERMANY — 4.5% | |||||
| Bundesrepublik Deutschland: | |||||
Zero Coupon, 3/11/2022 | EUR | 200,000 | 246,753 | ||
Zero Coupon, 6/10/2022 | EUR | 250,000 | 308,954 | ||
Zero Coupon, 8/15/2026 | EUR | 887,000 | 1,131,175 | ||
Zero Coupon, 8/15/2029 | EUR | 800,000 | 1,033,264 | ||
Zero Coupon, 8/15/2030 | EUR | 800,000 | 1,034,068 | ||
Zero Coupon, 8/15/2050 | EUR | 500,000 | 641,869 | ||
0.25%, 2/15/2027 | EUR | 1,082,000 | 1,404,950 | ||
0.25%, 8/15/2028 | EUR | 630,000 | 826,741 | ||
0.50%, 8/15/2027 | EUR | 1,020,000 | 1,350,713 | ||
0.50%, 2/15/2028 | EUR | 595,000 | 791,619 | ||
1.25%, 8/15/2048 | EUR | 699,000 | 1,204,637 | ||
Series 98, 4.75%, 7/4/2028 | EUR | 419,000 | 729,376 | ||
Series 08, 4.75%, 7/4/2040 | EUR | 100,000 | 249,177 | ||
Series 94, 6.25%, 1/4/2024 | EUR | 465,000 | 691,016 | ||
| Federal Republic of Germany: | |||||
Series 175, Zero Coupon, 4/8/2022 | EUR | 545,000 | 672,903 |
| Security Description | Principal Amount | Value | |||
Series 176, Zero Coupon, 10/7/2022 | EUR | 510,000 | $ 631,748 | ||
Series 177, Zero Coupon, 4/14/2023 | EUR | 965,000 | 1,201,117 | ||
Series 178, Zero Coupon, 10/13/2023 | EUR | 605,000 | 756,081 | ||
Series 179, Zero Coupon, 4/5/2024 | EUR | 550,000 | 690,005 | ||
Series 180, Zero Coupon, 10/18/2024 | EUR | 800,000 | 1,007,070 | ||
Series 181, Zero Coupon, 4/11/2025 | EUR | 750,000 | 947,371 | ||
Series 182, Zero Coupon, 10/10/2025 | EUR | 300,000 | 380,199 | ||
Zero Coupon, 2/15/2030 | EUR | 831,000 | 1,073,978 | ||
Zero Coupon, 5/15/2035 | EUR | 500,000 | 646,568 | ||
0.25%, 2/15/2029 | EUR | 866,000 | 1,139,592 | ||
0.50%, 2/15/2025 | EUR | 798,000 | 1,027,819 | ||
0.50%, 2/15/2026 | EUR | 1,173,000 | 1,528,557 | ||
1.00%, 8/15/2024 | EUR | 765,000 | 996,538 | ||
1.00%, 8/15/2025 | EUR | 868,000 | 1,149,469 | ||
1.50%, 9/4/2022 | EUR | 520,000 | 660,357 | ||
1.50%, 2/15/2023 | EUR | 560,000 | 718,066 | ||
1.50%, 5/15/2023 | EUR | 695,000 | 896,195 | ||
1.50%, 5/15/2024 | EUR | 774,000 | 1,020,115 | ||
1.75%, 7/4/2022 | EUR | 650,000 | 824,807 | ||
1.75%, 2/15/2024 | EUR | 650,000 | 858,348 | ||
2.00%, 1/4/2022 | EUR | 650,000 | 817,363 | ||
2.00%, 8/15/2023 | EUR | 550,000 | 722,075 | ||
2.50%, 7/4/2044 | EUR | 782,000 | 1,606,889 | ||
2.50%, 8/15/2046 | EUR | 829,000 | 1,748,512 | ||
3.25%, 7/4/2042 | EUR | 614,000 | 1,351,742 | ||
Series 05, 4.00%, 1/4/2037 | EUR | 742,000 | 1,572,619 | ||
Series 2007, 4.25%, 7/4/2039 | EUR | 450,000 | 1,039,379 | ||
Series 03, 4.75%, 7/4/2034 | EUR | 655,000 | 1,390,713 | ||
Series 08, 4.75%, 7/4/2040 | EUR | 493,000 | 1,228,443 | ||
Series 00, 5.50%, 1/4/2031 | EUR | 590,000 | 1,176,977 | ||
Series 98, 5.63%, 1/4/2028 | EUR | 425,000 | 758,121 | ||
Series 00, 6.25%, 1/4/2030 | EUR | 683,000 | 1,372,771 | ||
Series 97, 6.50%, 7/4/2027 | EUR | 350,000 | 635,186 | ||
| 45,892,005 |
| Security Description | Principal Amount | Value | |||
| HONG KONG — 0.1% | |||||
| Hong Kong Government Bond Programme: | |||||
1.10%, 1/17/2023 | HKD | 1,700,000 | $ 223,339 | ||
1.16%, 5/18/2022 | HKD | 750,000 | 98,094 | ||
1.25%, 6/29/2027 | HKD | 450,000 | 60,783 | ||
1.68%, 1/21/2026 | HKD | 450,000 | 61,780 | ||
1.89%, 3/2/2032 | HKD | 300,000 | 42,814 | ||
1.97%, 1/17/2029 | HKD | 600,000 | 85,556 | ||
2.02%, 3/7/2034 | HKD | 300,000 | 43,603 | ||
2.13%, 7/16/2030 | HKD | 400,000 | 58,027 | ||
2.22%, 8/7/2024 | HKD | 850,000 | 117,215 | ||
| 791,211 | |||||
| HUNGARY — 0.5% | |||||
| Hungary Government Bond: | |||||
Series 25/C, 1.00%, 11/26/2025 | HUF | 7,000,000 | 23,405 | ||
Series 22/C, 1.50%, 8/24/2022 | HUF | 42,500,000 | 145,678 | ||
Series 23/C, 1.50%, 8/23/2023 | HUF | 46,000,000 | 158,197 | ||
Series 22/B, 1.75%, 10/26/2022 | HUF | 89,020,000 | 306,826 | ||
Series 29/A, 2.00%, 5/23/2029 | HUF | 17,000,000 | 57,607 | ||
Series 21/B, 2.50%, 10/27/2021 | HUF | 48,950,000 | 167,928 | ||
Series 24/C, 2.50%, 10/24/2024 | HUF | 105,000,000 | 374,519 | ||
Series 26/D, 2.75%, 12/22/2026 | HUF | 84,930,000 | 307,941 | ||
Series 24/B, 3.00%, 6/26/2024 | HUF | 118,130,000 | 426,140 | ||
Series 27/A, 3.00%, 10/27/2027 | HUF | 156,260,000 | 576,984 | ||
Series 30/A, 3.00%, 8/21/2030 | HUF | 136,000,000 | 496,790 | ||
Series 38/A, 3.00%, 10/27/2038 | HUF | 25,500,000 | 94,810 | ||
Series 31/A, 3.25%, 10/22/2031 | HUF | 27,000,000 | 100,815 | ||
Series 25/B, 5.50%, 6/24/2025 | HUF | 113,650,000 | 456,141 | ||
Series 23/A, 6.00%, 11/24/2023 | HUF | 99,460,000 | 385,801 | ||
Series 28/A, 6.75%, 10/22/2028 | HUF | 92,270,000 | 424,587 | ||
Series 22/A, 7.00%, 6/24/2022 | HUF | 54,000,000 | 199,389 | ||
| 4,703,558 | |||||
| INDONESIA — 2.0% | |||||
| Indonesia Treasury Bond: | |||||
Series FR63, 5.63%, 5/15/2023 | IDR | 33,921,000,000 | 2,492,420 |
| Security Description | Principal Amount | Value | |||
Series FR64, 6.13%, 5/15/2028 | IDR | 61,260,000,000 | $ 4,418,132 | ||
Series FR65, 6.63%, 5/15/2033 | IDR | 60,700,000,000 | 4,430,020 | ||
Series FR59, 7.00%, 5/15/2027 | IDR | 29,050,000,000 | 2,225,408 | ||
Series FR75, 7.50%, 5/15/2038 | IDR | 51,250,000,000 | 3,976,373 | ||
Series FR70, 8.38%, 3/15/2024 | IDR | 40,120,000,000 | 3,140,238 | ||
| 20,682,591 | |||||
| IRELAND — 1.6% | |||||
| Ireland Government Bond: | |||||
Zero Coupon, 10/18/2022 | EUR | 425,000 | 526,429 | ||
0.20%, 5/15/2027 | EUR | 600,000 | 767,283 | ||
0.20%, 10/18/2030 | EUR | 200,000 | 256,918 | ||
0.40%, 5/15/2035 | EUR | 500,000 | 655,773 | ||
0.80%, 3/15/2022 | EUR | 595,000 | 740,680 | ||
0.90%, 5/15/2028 | EUR | 768,000 | 1,036,360 | ||
1.00%, 5/15/2026 | EUR | 1,000,000 | 1,329,062 | ||
1.10%, 5/15/2029 | EUR | 900,000 | 1,242,958 | ||
1.30%, 5/15/2033 | EUR | 357,000 | 518,534 | ||
1.35%, 3/18/2031 | EUR | 807,000 | 1,156,571 | ||
1.50%, 5/15/2050 | EUR | 500,000 | 819,411 | ||
1.70%, 5/15/2037 | EUR | 755,000 | 1,185,395 | ||
2.00%, 2/18/2045 | EUR | 665,000 | 1,168,999 | ||
2.40%, 5/15/2030 | EUR | 750,000 | 1,158,503 | ||
3.40%, 3/18/2024 | EUR | 764,000 | 1,057,536 | ||
3.90%, 3/20/2023 | EUR | 615,000 | 829,152 | ||
5.40%, 3/13/2025 | EUR | 969,000 | 1,488,779 | ||
| 15,938,343 | |||||
| ISRAEL — 0.8% | |||||
| Israel Government Bond: | |||||
Series 0722, 0.75%, 7/31/2022 | ILS | 1,270,000 | 399,707 | ||
Series 0330, 1.00%, 3/31/2030 | ILS | 1,575,000 | 500,141 | ||
Series 1122, 1.25%, 11/30/2022 | ILS | 930,000 | 296,166 | ||
Series 1123, 1.50%, 11/30/2023 | ILS | 1,690,000 | 546,447 | ||
Series 0537, 1.50%, 5/31/2037 | ILS | 900,000 | 282,943 | ||
Series 0825, 1.75%, 8/31/2025 | ILS | 1,904,000 | 632,642 | ||
Series 0327, 2.00%, 3/31/2027 | ILS | 1,490,000 | 509,340 | ||
Series 0928, 2.25%, 9/28/2028 | ILS | 2,300,000 | 806,674 | ||
Series 0324, 3.75%, 3/31/2024 | ILS | 1,517,000 | 526,634 |
| Security Description | Principal Amount | Value | |||
Series 0347, 3.75%, 3/31/2047 | ILS | 1,735,000 | $ 754,128 | ||
Series 0323, 4.25%, 3/31/2023 | ILS | 1,469,000 | 499,730 | ||
Series 0122, 5.50%, 1/31/2022 | ILS | 2,227,500 | 734,247 | ||
Series 0142, 5.50%, 1/31/2042 | ILS | 1,955,000 | 1,042,115 | ||
Series 1026, 6.25%, 10/30/2026 | ILS | 2,090,000 | 871,503 | ||
| 8,402,417 | |||||
| ITALY — 4.6% | |||||
| Italy Buoni Poliennali Del Tesoro: | |||||
0.35%, 2/1/2025 | EUR | 475,000 | 593,908 | ||
0.65%, 10/15/2023 | EUR | 370,000 | 465,337 | ||
0.90%, 8/1/2022 | EUR | 370,000 | 462,343 | ||
0.95%, 3/1/2023 | EUR | 435,000 | 547,839 | ||
0.95%, 3/15/2023 | EUR | 365,000 | 459,944 | ||
1.00%, 7/15/2022 | EUR | 400,000 | 500,334 | ||
1.20%, 4/1/2022 | EUR | 585,000 | 730,734 | ||
1.25%, 12/1/2026 | EUR | 688,000 | 900,641 | ||
1.35%, 4/1/2030 | EUR | 500,000 | 662,012 | ||
1.45%, 11/15/2024 | EUR | 334,000 | 435,033 | ||
1.45%, 5/15/2025 | EUR | 350,000 | 457,750 | ||
1.45%, 3/1/2036 (a) | EUR | 400,000 | 525,493 | ||
1.60%, 6/1/2026 | EUR | 393,000 | 522,257 | ||
1.65%, 12/1/2030 (a) | EUR | 600,000 | 814,392 | ||
1.75%, 7/1/2024 | EUR | 400,000 | 523,239 | ||
1.85%, 5/15/2024 | EUR | 355,000 | 465,287 | ||
2.00%, 2/1/2028 | EUR | 570,000 | 784,109 | ||
2.05%, 8/1/2027 | EUR | 290,000 | 398,493 | ||
2.20%, 6/1/2027 | EUR | 485,000 | 671,314 | ||
2.25%, 9/1/2036 (a) | EUR | 295,000 | 429,607 | ||
Series 5Y, 2.45%, 10/1/2023 | EUR | 385,000 | 507,490 | ||
2.45%, 9/1/2033 (a) | EUR | 470,000 | 692,431 | ||
2.50%, 11/15/2025 | EUR | 978,000 | 1,346,833 | ||
2.80%, 12/1/2028 | EUR | 558,000 | 815,328 | ||
2.80%, 3/1/2067 (a) | EUR | 245,000 | 401,665 | ||
2.95%, 9/1/2038 (a) | EUR | 327,000 | 521,931 | ||
3.00%, 8/1/2029 | EUR | 602,000 | 899,084 | ||
3.10%, 3/1/2040 (a) | EUR | 300,000 | 490,178 | ||
3.45%, 3/1/2048 (a) | EUR | 446,000 | 803,053 | ||
3.85%, 9/1/2049 (a) | EUR | 280,000 | 541,086 | ||
7.25%, 11/1/2026 | EUR | 316,000 | 548,485 | ||
9.00%, 11/1/2023 | EUR | 250,000 | 387,292 | ||
| Republic of Italy: | |||||
0.05%, 1/15/2023 (a) | EUR | 300,000 | 370,522 | ||
0.30%, 8/15/2023 (a) | EUR | 650,000 | 808,907 | ||
0.60%, 6/15/2023 | EUR | 350,000 | 438,948 | ||
1.35%, 4/15/2022 | EUR | 550,000 | 688,516 | ||
1.45%, 9/15/2022 | EUR | 360,000 | 454,755 | ||
1.50%, 6/1/2025 | EUR | 354,000 | 464,193 | ||
1.65%, 3/1/2032 (a) | EUR | 627,000 | 851,368 |
| Security Description | Principal Amount | Value | |||
1.85%, 7/1/2025 (a) | EUR | 250,000 | $ 332,862 | ||
2.00%, 12/1/2025 | EUR | 407,000 | 548,675 | ||
2.10%, 7/15/2026 | EUR | 150,000 | 204,446 | ||
Series CAC, 2.45%, 9/1/2050 (a) | EUR | 350,000 | 534,190 | ||
2.50%, 12/1/2024 | EUR | 420,000 | 567,751 | ||
2.70%, 3/1/2047 (a) | EUR | 335,000 | 531,500 | ||
3.25%, 9/1/2046 (a) | EUR | 481,000 | 833,531 | ||
3.35%, 3/1/2035 (a) | EUR | 300,000 | 488,820 | ||
3.50%, 3/1/2030 (a) | EUR | 770,000 | 1,201,115 | ||
3.75%, 9/1/2024 | EUR | 430,000 | 602,467 | ||
4.00%, 2/1/2037 (a) | EUR | 640,000 | 1,131,617 | ||
4.50%, 5/1/2023 | EUR | 430,000 | 586,473 | ||
4.50%, 3/1/2024 | EUR | 505,000 | 711,565 | ||
4.50%, 3/1/2026 (a) | EUR | 494,000 | 745,313 | ||
4.75%, 8/1/2023 (a) | EUR | 530,000 | 735,248 | ||
4.75%, 9/1/2028 (a) | EUR | 931,000 | 1,521,996 | ||
4.75%, 9/1/2044 (a) | EUR | 607,000 | 1,268,597 | ||
5.00%, 3/1/2022 | EUR | 585,000 | 761,396 | ||
5.00%, 3/1/2025 (a) | EUR | 550,000 | 818,243 | ||
5.00%, 8/1/2034 (a) | EUR | 452,000 | 850,857 | ||
5.00%, 8/1/2039 (a) | EUR | 510,000 | 1,035,995 | ||
5.00%, 9/1/2040 (a) | EUR | 470,000 | 964,254 | ||
5.25%, 11/1/2029 | EUR | 757,000 | 1,316,739 | ||
5.50%, 9/1/2022 | EUR | 400,000 | 537,585 | ||
5.50%, 11/1/2022 | EUR | 650,000 | 881,267 | ||
5.75%, 2/1/2033 | EUR | 739,000 | 1,432,168 | ||
6.00%, 5/1/2031 | EUR | 550,000 | 1,039,423 | ||
6.50%, 11/1/2027 | EUR | 430,000 | 750,004 | ||
| 46,316,228 | |||||
| JAPAN — 22.1% | |||||
| Government of Japan 5 Year Bond: | |||||
Series 131, 0.10%, 3/20/2022 | JPY | 164,800,000 | 1,600,226 | ||
Series 132, 0.10%, 6/20/2022 | JPY | 187,000,000 | 1,816,949 | ||
Series 133, 0.10%, 9/20/2022 | JPY | 146,150,000 | 1,421,043 | ||
Series 134, 0.10%, 12/20/2022 | JPY | 172,150,000 | 1,674,946 | ||
Series 135, 0.10%, 3/20/2023 | JPY | 187,300,000 | 1,823,384 | ||
Series 136, 0.10%, 6/20/2023 | JPY | 315,000,000 | 3,068,355 | ||
Series 137, 0.10%, 9/20/2023 | JPY | 188,200,000 | 1,834,533 | ||
Series 138, 0.10%, 12/20/2023 | JPY | 286,000,000 | 2,789,168 | ||
Series 139, 0.10%, 3/20/2024 | JPY | 275,000,000 | 2,683,358 | ||
Series 140, 0.10%, 6/20/2024 | JPY | 153,000,000 | 1,493,530 | ||
Series 141, 0.10%, 9/20/2024 | JPY | 171,550,000 | 1,675,506 |
| Security Description | Principal Amount | Value | |||
Series 142, 0.10%, 12/20/2024 | JPY | 150,000,000 | $ 1,465,553 | ||
Series 143, 0.10%, 3/20/2025 | JPY | 413,000,000 | 4,037,516 | ||
Series 144, 0.10%, 6/20/2025 | JPY | 283,100,000 | 2,768,537 | ||
| Government of Japan 10 Year Bond: | |||||
Series 342, 0.10%, 3/20/2026 | JPY | 180,500,000 | 1,766,643 | ||
Series 343, 0.10%, 6/20/2026 | JPY | 190,000,000 | 1,860,563 | ||
Series 344, 0.10%, 9/20/2026 | JPY | 205,550,000 | 2,013,273 | ||
Series 345, 0.10%, 12/20/2026 | JPY | 192,250,000 | 1,883,825 | ||
Series 346, 0.10%, 3/20/2027 | JPY | 297,250,000 | 2,914,084 | ||
Series 347, 0.10%, 6/20/2027 | JPY | 157,000,000 | 1,539,815 | ||
Series 348, 0.10%, 9/20/2027 | JPY | 189,000,000 | 1,854,065 | ||
Series 349, 0.10%, 12/20/2027 | JPY | 220,200,000 | 2,161,157 | ||
Series 350, 0.10%, 3/20/2028 | JPY | 277,550,000 | 2,723,079 | ||
Series 351, 0.10%, 6/20/2028 | JPY | 197,500,000 | 1,937,985 | ||
Series 352, 0.10%, 9/20/2028 | JPY | 136,150,000 | 1,336,049 | ||
Series 353, 0.10%, 12/20/2028 | JPY | 165,000,000 | 1,618,676 | ||
Series 354, 0.10%, 3/20/2029 | JPY | 160,000,000 | 1,568,944 | ||
Series 355, 0.10%, 6/20/2029 | JPY | 210,000,000 | 2,057,937 | ||
Series 356, 0.10%, 9/20/2029 | JPY | 325,000,000 | 3,183,203 | ||
Series 357, 0.10%, 12/20/2029 | JPY | 265,000,000 | 2,593,122 | ||
Series 358, 0.10%, 3/20/2030 | JPY | 152,500,000 | 1,491,175 | ||
Series 359, 0.10%, 6/20/2030 | JPY | 415,000,000 | 4,053,611 | ||
Series 337, 0.30%, 12/20/2024 | JPY | 116,750,000 | 1,149,554 | ||
Series 341, 0.30%, 12/20/2025 | JPY | 354,150,000 | 3,499,583 | ||
Series 338, 0.40%, 3/20/2025 | JPY | 214,450,000 | 2,122,379 | ||
Series 339, 0.40%, 6/20/2025 | JPY | 217,500,000 | 2,155,324 | ||
Series 340, 0.40%, 9/20/2025 | JPY | 347,150,000 | 3,444,668 | ||
Series 335, 0.50%, 9/20/2024 | JPY | 219,250,000 | 2,172,475 |
| Security Description | Principal Amount | Value | |||
Series 336, 0.50%, 12/20/2024 | JPY | 98,700,000 | $ 979,429 | ||
Series 328, 0.60%, 3/20/2023 | JPY | 226,550,000 | 2,229,272 | ||
Series 331, 0.60%, 9/20/2023 | JPY | 77,000,000 | 760,513 | ||
Series 332, 0.60%, 12/20/2023 | JPY | 245,000,000 | 2,423,850 | ||
Series 333, 0.60%, 3/20/2024 | JPY | 238,250,000 | 2,361,085 | ||
Series 334, 0.60%, 6/20/2024 | JPY | 252,950,000 | 2,511,125 | ||
Series 326, 0.70%, 12/20/2022 | JPY | 85,000,000 | 836,473 | ||
Series 324, 0.80%, 6/20/2022 | JPY | 89,950,000 | 882,790 | ||
Series 325, 0.80%, 9/20/2022 | JPY | 226,500,000 | 2,228,232 | ||
Series 327, 0.80%, 12/20/2022 | JPY | 120,600,000 | 1,189,098 | ||
Series 329, 0.80%, 6/20/2023 | JPY | 254,400,000 | 2,520,271 | ||
Series 330, 0.80%, 9/20/2023 | JPY | 195,750,000 | 1,943,432 | ||
Series 322, 0.90%, 3/20/2022 | JPY | 137,550,000 | 1,348,495 | ||
Series 323, 0.90%, 6/20/2022 | JPY | 95,500,000 | 938,609 | ||
Series 321, 1.00%, 3/20/2022 | JPY | 248,950,000 | 2,443,517 | ||
| Government of Japan 2 Year Bond: | |||||
Series 408, 0.10%, 1/1/2022 | JPY | 172,000,000 | 1,669,505 | ||
Series 409, 0.10%, 2/1/2022 | JPY | 40,000,000 | 388,335 | ||
Series 410, 0.10%, 3/1/2022 | JPY | 50,000,000 | 485,525 | ||
Series 411, 0.10%, 4/1/2022 | JPY | 47,000,000 | 456,462 | ||
Series 412, 0.10%, 5/1/2022 | JPY | 50,000,000 | 485,723 | ||
Series 413, 0.10%, 6/1/2022 | JPY | 50,000,000 | 485,815 | ||
Series 416, 0.10%, 9/1/2022 | JPY | 141,000,000 | 1,371,078 | ||
| Government of Japan 20 Year Bond: | |||||
Series 157, 0.20%, 6/20/2036 | JPY | 124,650,000 | 1,196,891 | ||
Series 169, 0.30%, 6/20/2039 | JPY | 60,000,000 | 573,605 | ||
Series 170, 0.30%, 9/20/2039 | JPY | 140,000,000 | 1,335,617 | ||
Series 171, 0.30%, 12/20/2039 | JPY | 90,400,000 | 861,350 |
| Security Description | Principal Amount | Value | |||
Series 156, 0.40%, 3/20/2036 | JPY | 93,900,000 | $ 929,587 | ||
Series 168, 0.40%, 3/20/2039 | JPY | 100,000,000 | 974,168 | ||
Series 172, 0.40%, 3/20/2040 | JPY | 115,000,000 | 1,115,626 | ||
Series 173, 0.40%, 6/20/2040 | JPY | 60,000,000 | 581,549 | ||
Series 158, 0.50%, 9/20/2036 | JPY | 90,300,000 | 905,877 | ||
Series 164, 0.50%, 3/20/2038 | JPY | 139,800,000 | 1,393,559 | ||
Series 165, 0.50%, 6/20/2038 | JPY | 90,000,000 | 896,156 | ||
Series 167, 0.50%, 12/20/2038 | JPY | 65,000,000 | 645,404 | ||
Series 159, 0.60%, 12/20/2036 | JPY | 90,050,000 | 916,217 | ||
Series 161, 0.60%, 6/20/2037 | JPY | 97,150,000 | 986,762 | ||
Series 162, 0.60%, 9/20/2037 | JPY | 80,000,000 | 811,832 | ||
Series 163, 0.60%, 12/20/2037 | JPY | 96,000,000 | 973,250 | ||
Series 160, 0.70%, 3/20/2037 | JPY | 101,450,000 | 1,046,405 | ||
Series 166, 0.70%, 9/20/2038 | JPY | 95,000,000 | 976,104 | ||
Series 62, 0.80%, 6/20/2023 | JPY | 60,000,000 | 594,404 | ||
Series 61, 1.00%, 3/20/2023 | JPY | 47,500,000 | 471,471 | ||
Series 155, 1.00%, 12/20/2035 | JPY | 117,500,000 | 1,264,953 | ||
Series 151, 1.20%, 12/20/2034 | JPY | 130,000,000 | 1,432,248 | ||
Series 152, 1.20%, 3/20/2035 | JPY | 95,000,000 | 1,047,369 | ||
Series 154, 1.20%, 9/20/2035 | JPY | 104,950,000 | 1,159,263 | ||
Series 153, 1.30%, 6/20/2035 | JPY | 110,000,000 | 1,229,045 | ||
Series 60, 1.40%, 12/20/2022 | JPY | 50,000,000 | 498,775 | ||
Series 150, 1.40%, 9/20/2034 | JPY | 292,350,000 | 3,294,215 | ||
Series 144, 1.50%, 3/20/2033 | JPY | 66,200,000 | 747,535 | ||
Series 148, 1.50%, 3/20/2034 | JPY | 110,000,000 | 1,250,204 | ||
Series 149, 1.50%, 6/20/2034 | JPY | 100,000,000 | 1,138,031 | ||
Series 136, 1.60%, 3/20/2032 | JPY | 100,600,000 | 1,138,720 | ||
Series 143, 1.60%, 3/20/2033 | JPY | 60,000,000 | 684,510 |
| Security Description | Principal Amount | Value | |||
Series 147, 1.60%, 12/20/2033 | JPY | 150,000,000 | $ 1,720,834 | ||
Series 140, 1.70%, 9/20/2032 | JPY | 100,000,000 | 1,147,784 | ||
Series 141, 1.70%, 12/20/2032 | JPY | 130,000,000 | 1,495,431 | ||
Series 145, 1.70%, 6/20/2033 | JPY | 156,150,000 | 1,803,261 | ||
Series 146, 1.70%, 9/20/2033 | JPY | 175,000,000 | 2,024,912 | ||
Series 122, 1.80%, 9/20/2030 | JPY | 95,050,000 | 1,079,314 | ||
Series 130, 1.80%, 9/20/2031 | JPY | 134,100,000 | 1,538,997 | ||
Series 133, 1.80%, 12/20/2031 | JPY | 150,000,000 | 1,725,992 | ||
Series 142, 1.80%, 12/20/2032 | JPY | 166,650,000 | 1,936,074 | ||
Series 58, 1.90%, 9/20/2022 | JPY | 46,500,000 | 465,977 | ||
Series 65, 1.90%, 12/20/2023 | JPY | 55,000,000 | 564,698 | ||
Series 108, 1.90%, 12/20/2028 | JPY | 51,350,000 | 575,128 | ||
Series 109, 1.90%, 3/20/2029 | JPY | 54,300,000 | 610,477 | ||
Series 121, 1.90%, 9/20/2030 | JPY | 48,600,000 | 556,425 | ||
Series 127, 1.90%, 3/20/2031 | JPY | 55,000,000 | 633,418 | ||
Series 73, 2.00%, 12/20/2024 | JPY | 35,000,000 | 367,540 | ||
Series 77, 2.00%, 3/20/2025 | JPY | 30,000,000 | 316,551 | ||
Series 93, 2.00%, 3/20/2027 | JPY | 30,000,000 | 328,464 | ||
Series 124, 2.00%, 12/20/2030 | JPY | 50,000,000 | 579,006 | ||
Series 72, 2.10%, 9/20/2024 | JPY | 70,000,000 | 734,022 | ||
Series 82, 2.10%, 9/20/2025 | JPY | 45,000,000 | 481,473 | ||
Series 92, 2.10%, 12/20/2026 | JPY | 63,800,000 | 699,022 | ||
Series 94, 2.10%, 3/20/2027 | JPY | 81,000,000 | 891,749 | ||
Series 96, 2.10%, 6/20/2027 | JPY | 43,000,000 | 475,818 | ||
Series 99, 2.10%, 12/20/2027 | JPY | 90,000,000 | 1,005,251 | ||
Series 105, 2.10%, 9/20/2028 | JPY | 54,000,000 | 610,760 | ||
Series 107, 2.10%, 12/20/2028 | JPY | 50,000,000 | 567,751 | ||
Series 113, 2.10%, 9/20/2029 | JPY | 96,250,000 | 1,105,637 |
| Security Description | Principal Amount | Value | |||
Series 117, 2.10%, 3/20/2030 | JPY | 99,600,000 | $ 1,151,702 | ||
Series 90, 2.20%, 9/20/2026 | JPY | 45,300,000 | 496,591 | ||
Series 97, 2.20%, 9/20/2027 | JPY | 84,700,000 | 947,185 | ||
Series 100, 2.20%, 3/20/2028 | JPY | 83,000,000 | 936,406 | ||
Series 106, 2.20%, 9/20/2028 | JPY | 50,000,000 | 569,272 | ||
Series 115, 2.20%, 12/20/2029 | JPY | 75,000,000 | 870,761 | ||
Series 125, 2.20%, 3/20/2031 | JPY | 48,650,000 | 574,710 | ||
Series 95, 2.30%, 6/20/2027 | JPY | 50,000,000 | 559,567 | ||
Series 102, 2.40%, 6/20/2028 | JPY | 58,600,000 | 672,727 | ||
| Government of Japan 30 Year Bond: | |||||
Series 51, 0.30%, 6/20/2046 | JPY | 60,000,000 | 548,685 | ||
Series 63, 0.40%, 6/20/2049 | JPY | 80,000,000 | 731,123 | ||
Series 64, 0.40%, 9/20/2049 | JPY | 60,000,000 | 546,767 | ||
Series 65, 0.40%, 12/20/2049 | JPY | 102,350,000 | 931,128 | ||
Series 66, 0.40%, 3/20/2050 | JPY | 105,000,000 | 954,097 | ||
Series 52, 0.50%, 9/20/2046 | JPY | 62,500,000 | 599,200 | ||
Series 62, 0.50%, 3/20/2049 | JPY | 100,000,000 | 940,636 | ||
Series 53, 0.60%, 12/20/2046 | JPY | 59,650,000 | 584,962 | ||
Series 59, 0.70%, 6/20/2048 | JPY | 57,000,000 | 567,626 | ||
Series 61, 0.70%, 12/20/2048 | JPY | 65,000,000 | 644,623 | ||
Series 50, 0.80%, 3/20/2046 | JPY | 59,650,000 | 614,468 | ||
Series 54, 0.80%, 3/20/2047 | JPY | 48,150,000 | 494,078 | ||
Series 55, 0.80%, 6/20/2047 | JPY | 44,650,000 | 457,848 | ||
Series 56, 0.80%, 9/20/2047 | JPY | 48,750,000 | 499,654 | ||
Series 57, 0.80%, 12/20/2047 | JPY | 68,250,000 | 698,187 | ||
Series 58, 0.80%, 3/20/2048 | JPY | 77,150,000 | 788,082 | ||
Series 60, 0.90%, 9/20/2048 | JPY | 51,650,000 | 538,727 | ||
Series 48, 1.40%, 9/20/2045 | JPY | 84,350,000 | 983,867 |
| Security Description | Principal Amount | Value | |||
Series 49, 1.40%, 12/20/2045 | JPY | 59,650,000 | $ 696,047 | ||
Series 45, 1.50%, 12/20/2044 | JPY | 50,000,000 | 593,729 | ||
Series 46, 1.50%, 3/20/2045 | JPY | 69,650,000 | 827,577 | ||
Series 47, 1.60%, 6/20/2045 | JPY | 162,850,000 | 1,972,134 | ||
Series 11, 1.70%, 6/20/2033 | JPY | 42,150,000 | 486,878 | ||
Series 41, 1.70%, 12/20/2043 | JPY | 113,000,000 | 1,386,065 | ||
Series 42, 1.70%, 3/20/2044 | JPY | 49,650,000 | 609,616 | ||
Series 43, 1.70%, 6/20/2044 | JPY | 100,550,000 | 1,235,573 | ||
Series 44, 1.70%, 9/20/2044 | JPY | 67,000,000 | 824,117 | ||
Series 38, 1.80%, 3/20/2043 | JPY | 50,000,000 | 621,275 | ||
Series 40, 1.80%, 9/20/2043 | JPY | 70,000,000 | 871,954 | ||
Series 37, 1.90%, 9/20/2042 | JPY | 85,000,000 | 1,069,932 | ||
Series 39, 1.90%, 6/20/2043 | JPY | 53,500,000 | 676,247 | ||
Series 13, 2.00%, 12/20/2033 | JPY | 50,000,000 | 598,392 | ||
Series 33, 2.00%, 9/20/2040 | JPY | 91,200,000 | 1,150,766 | ||
Series 35, 2.00%, 9/20/2041 | JPY | 82,500,000 | 1,047,573 | ||
Series 36, 2.00%, 3/20/2042 | JPY | 105,000,000 | 1,337,658 | ||
Series 34, 2.20%, 3/20/2041 | JPY | 65,550,000 | 854,109 | ||
Series 21, 2.30%, 12/20/2035 | JPY | 30,000,000 | 378,312 | ||
Series 25, 2.30%, 12/20/2036 | JPY | 18,400,000 | 234,460 | ||
Series 30, 2.30%, 3/20/2039 | JPY | 97,950,000 | 1,268,573 | ||
Series 32, 2.30%, 3/20/2040 | JPY | 63,650,000 | 834,167 | ||
Series 26, 2.40%, 3/20/2037 | JPY | 40,000,000 | 516,906 | ||
Series 29, 2.40%, 9/20/2038 | JPY | 50,000,000 | 655,073 | ||
Series 16, 2.50%, 9/20/2034 | JPY | 20,000,000 | 254,112 | ||
Series 20, 2.50%, 9/20/2035 | JPY | 30,000,000 | 385,785 | ||
Series 22, 2.50%, 3/20/2036 | JPY | 40,000,000 | 517,309 | ||
Series 24, 2.50%, 9/20/2036 | JPY | 30,000,000 | 390,275 |
| Security Description | Principal Amount | Value | |||
Series 27, 2.50%, 9/20/2037 | JPY | 47,950,000 | $ 630,305 | ||
| Government of Japan 40 Year Bond: | |||||
Series 9, 0.40%, 3/20/2056 | JPY | 123,600,000 | 1,095,670 | ||
Series 12, 0.50%, 3/20/2059 | JPY | 75,000,000 | 682,609 | ||
Series 13, 0.50%, 3/20/2060 | JPY | 30,000,000 | 273,102 | ||
Series 11, 0.80%, 3/20/2058 | JPY | 73,000,000 | 735,720 | ||
Series 10, 0.90%, 3/20/2057 | JPY | 76,750,000 | 797,584 | ||
Series 8, 1.40%, 3/20/2055 | JPY | 58,750,000 | 696,231 | ||
Series 7, 1.70%, 3/20/2054 | JPY | 75,000,000 | 950,015 | ||
Series 6, 1.90%, 3/20/2053 | JPY | 44,000,000 | 579,123 | ||
Series 5, 2.00%, 3/20/2052 | JPY | 40,000,000 | 533,624 | ||
Series 2, 2.20%, 3/20/2049 | JPY | 41,650,000 | 569,259 | ||
Series 3, 2.20%, 3/20/2050 | JPY | 29,650,000 | 407,329 | ||
Series 4, 2.20%, 3/20/2051 | JPY | 38,050,000 | 524,135 | ||
Series 1, 2.40%, 3/20/2048 | JPY | 42,000,000 | 592,731 | ||
| 223,569,625 | |||||
| LATVIA — 0.1% | |||||
| Republic of Latvia: | |||||
0.38%, 10/7/2026 | EUR | 300,000 | 382,670 | ||
Series GMTN, 1.38%, 9/23/2025 | EUR | 100,000 | 132,827 | ||
1.38%, 5/16/2036 | EUR | 150,000 | 218,812 | ||
Series 7, 2.25%, 2/15/2047 | EUR | 100,000 | 178,329 | ||
Series EMTN, 2.88%, 4/30/2024 | EUR | 100,000 | 136,548 | ||
| 1,049,186 | |||||
| LITHUANIA — 0.1% | |||||
| Lithuania Government International Bond: | |||||
Series EMTN, 0.75%, 5/6/2030 | EUR | 150,000 | 199,500 | ||
Series EMTN, 0.95%, 5/26/2027 | EUR | 170,000 | 225,003 | ||
Series EMTN, 1.25%, 10/22/2025 | EUR | 150,000 | 198,493 | ||
Series EMTN, 2.10%, 5/26/2047 | EUR | 55,000 | 95,167 | ||
Series EMTN, 2.13%, 10/29/2026 | EUR | 100,000 | 141,211 |
| Security Description | Principal Amount | Value | |||
Series EMTN, 2.13%, 10/22/2035 | EUR | 190,000 | $ 302,263 | ||
Series EMTN, 3.38%, 1/22/2024 | EUR | 100,000 | 137,068 | ||
| 1,298,705 | |||||
| LUXEMBOURG — 0.1% | |||||
| Luxembourg Government Bond: | |||||
Zero Coupon, 11/13/2026 | EUR | 150,000 | 189,668 | ||
0.63%, 2/1/2027 | EUR | 300,000 | 393,129 | ||
2.13%, 7/10/2023 | EUR | 290,000 | 380,175 | ||
2.25%, 3/21/2022 | EUR | 100,000 | 126,696 | ||
2.25%, 3/19/2028 | EUR | 80,000 | 117,500 | ||
| 1,207,168 | |||||
| MALAYSIA — 1.7% | |||||
| Malaysia Government Bond: | |||||
Series 0313, 3.48%, 3/15/2023 | MYR | 3,200,000 | 822,565 | ||
Series 0513, 3.73%, 6/15/2028 | MYR | 2,300,000 | 622,628 | ||
Series 0215, 3.80%, 9/30/2022 | MYR | 1,730,000 | 444,801 | ||
Series 0116, 3.80%, 8/17/2023 | MYR | 1,500,000 | 390,510 | ||
Series 0413, 3.84%, 4/15/2033 | MYR | 1,700,000 | 451,407 | ||
Series 0117, 3.88%, 3/10/2022 | MYR | 800,000 | 203,701 | ||
Series 0219, 3.89%, 8/15/2029 | MYR | 2,850,000 | 779,219 | ||
Series 0316, 3.90%, 11/30/2026 | MYR | 1,000,000 | 270,143 | ||
Series 0417, 3.90%, 11/16/2027 | MYR | 2,070,000 | 564,504 | ||
Series 0115, 3.96%, 9/15/2025 | MYR | 3,650,000 | 980,967 | ||
Series 0217, 4.06%, 9/30/2024 | MYR | 2,500,000 | 665,666 | ||
Series 0412, 4.13%, 4/15/2032 | MYR | 1,500,000 | 413,169 | ||
Series 0114, 4.18%, 7/15/2024 | MYR | 1,295,000 | 345,426 | ||
Series 0411, 4.23%, 6/30/2031 | MYR | 1,720,000 | 480,833 | ||
Series 0415, 4.25%, 5/31/2035 | MYR | 1,350,000 | 373,705 | ||
Series 0311, 4.39%, 4/15/2026 | MYR | 2,300,000 | 631,824 | ||
Series 0216, 4.74%, 3/15/2046 | MYR | 1,970,000 | 559,297 | ||
Series 0317, 4.76%, 4/7/2037 | MYR | 1,920,000 | 554,810 |
| Security Description | Principal Amount | Value | |||
Series 0713, 4.94%, 9/30/2043 | MYR | 1,610,000 | $ 472,864 | ||
| Malaysia Government Investment Issue: | |||||
Series 0113, 3.87%, 8/8/2028 | MYR | 1,250,000 | 337,123 | ||
Series 0317, 3.95%, 4/14/2022 | MYR | 1,762,000 | 449,657 | ||
Series 0415, 3.99%, 10/15/2025 | MYR | 1,250,000 | 335,287 | ||
Series 0217, 4.05%, 8/15/2024 | MYR | 1,850,000 | 490,684 | ||
Series 0316, 4.07%, 9/30/2026 | MYR | 3,300,000 | 893,799 | ||
Series 0115, 4.19%, 7/15/2022 | MYR | 565,000 | 145,373 | ||
Series 0315, 4.25%, 9/30/2030 | MYR | 1,000,000 | 276,998 | ||
Series 0117, 4.26%, 7/26/2027 | MYR | 2,920,000 | 802,809 | ||
Series 0116, 4.39%, 7/7/2023 | MYR | 125,000 | 32,920 | ||
Series 0813, 4.44%, 5/22/2024 | MYR | 1,830,000 | 489,844 | ||
Series 0219, 4.47%, 9/15/2039 | MYR | 1,600,000 | 447,851 | ||
Series 0513, 4.58%, 8/30/2033 | MYR | 1,385,000 | 389,273 | ||
Series 0617, 4.72%, 6/15/2033 | MYR | 1,600,000 | 456,414 | ||
Series 0517, 4.76%, 8/4/2037 | MYR | 2,100,000 | 591,950 | ||
Series 0615, 4.79%, 10/31/2035 | MYR | 920,000 | 262,236 | ||
Series 0417, 4.90%, 5/8/2047 | MYR | 3,080,000 | 875,254 | ||
Series 0913, 4.94%, 12/6/2028 | MYR | 725,000 | 209,351 | ||
| 17,514,862 | |||||
| MEXICO — 1.5% | |||||
| Mexican Bonos: | |||||
Series M, 5.75%, 3/5/2026 | MXN | 22,595,000 | 1,185,037 | ||
Series M, 6.50%, 6/9/2022 | MXN | 27,950,000 | 1,444,134 | ||
Series M, 6.75%, 3/9/2023 | MXN | 22,650,000 | 1,192,321 | ||
Series M 20, 7.50%, 6/3/2027 | MXN | 28,185,000 | 1,609,496 | ||
Series M, 7.75%, 5/29/2031 | MXN | 13,130,000 | 774,212 | ||
Series M, 7.75%, 11/23/2034 | MXN | 9,290,000 | 549,106 | ||
Series M, 7.75%, 11/13/2042 | MXN | 17,010,000 | 983,209 | ||
Series M, 8.00%, 12/7/2023 | MXN | 20,940,000 | 1,153,148 |
| Security Description | Principal Amount | Value | |||
Series M, 8.00%, 9/5/2024 | MXN | 24,400,000 | $ 1,368,802 | ||
Series M, 8.00%, 11/7/2047 | MXN | 14,540,000 | 861,191 | ||
Series M 20, 8.50%, 5/31/2029 | MXN | 20,610,000 | 1,260,773 | ||
Series M 30, 8.50%, 11/18/2038 | MXN | 17,605,000 | 1,095,397 | ||
Series M 20, 10.00%, 12/5/2024 | MXN | 23,860,000 | 1,432,259 | ||
Series M 30, 10.00%, 11/20/2036 | MXN | 9,600,000 | 675,100 | ||
| 15,584,185 | |||||
| NETHERLANDS — 3.6% | |||||
| Kingdom of Netherlands: | |||||
Zero Coupon, 1/15/2022 (a) | EUR | 1,302,000 | 1,604,599 | ||
Zero Coupon, 1/15/2024 (a) | EUR | 1,619,000 | 2,024,508 | ||
Zero Coupon, 1/15/2027 (a) | EUR | 550,000 | 699,266 | ||
Zero Coupon, 7/15/2030 (a) | EUR | 1,399,000 | 1,793,547 | ||
Zero Coupon, 1/15/2052 (a) | EUR | 500,000 | 628,802 | ||
0.25%, 7/15/2025 (a) | EUR | 1,355,000 | 1,730,732 | ||
0.25%, 7/15/2029 (a) | EUR | 1,088,000 | 1,424,677 | ||
0.50%, 7/15/2026 (a) | EUR | 1,402,000 | 1,828,559 | ||
0.50%, 1/15/2040 (a) | EUR | 961,000 | 1,350,325 | ||
0.75%, 7/15/2027 (a) | EUR | 1,380,000 | 1,844,800 | ||
0.75%, 7/15/2028 (a) | EUR | 1,350,000 | 1,823,067 | ||
1.75%, 7/15/2023 (a) | EUR | 1,659,000 | 2,158,379 | ||
2.00%, 7/15/2024 (a) | EUR | 1,245,000 | 1,671,710 | ||
2.25%, 7/15/2022 (a) | EUR | 1,335,000 | 1,707,870 | ||
2.50%, 1/15/2033 (a) | EUR | 1,170,000 | 1,948,774 | ||
2.75%, 1/15/2047 (a) | EUR | 1,450,000 | 3,171,398 | ||
3.75%, 1/15/2023 (a) | EUR | 1,006,000 | 1,343,528 | ||
3.75%, 1/15/2042 (a) | EUR | 1,385,000 | 3,167,069 | ||
4.00%, 1/15/2037 (a) | EUR | 1,374,000 | 2,884,866 | ||
5.50%, 1/15/2028 | EUR | 1,112,000 | 1,959,461 | ||
| 36,765,937 | |||||
| NEW ZEALAND — 0.7% | |||||
| New Zealand Government Bond: | |||||
0.50%, 5/15/2024 | NZD | 980,000 | 709,156 | ||
1.50%, 5/15/2031 | NZD | 640,000 | 483,379 | ||
1.75%, 5/15/2041 | NZD | 600,000 | 425,421 | ||
Series 0425, 2.75%, 4/15/2025 | NZD | 1,075,000 | 851,098 | ||
Series 0437, 2.75%, 4/15/2037 | NZD | 780,000 | 660,340 |
| Security Description | Principal Amount | Value | |||
Series 0429, 3.00%, 4/20/2029 | NZD | 1,360,000 | $ 1,150,217 | ||
Series 0433, 3.50%, 4/14/2033 | NZD | 530,000 | 481,988 | ||
Series 0427, 4.50%, 4/15/2027 | NZD | 1,160,000 | 1,036,909 | ||
Series 0423, 5.50%, 4/15/2023 | NZD | 1,250,000 | 1,006,749 | ||
| 6,805,257 | |||||
| NORWAY — 0.4% | |||||
| Norway Government Bond: | |||||
Series 482, 1.38%, 8/19/2030 (a) | NOK | 3,450,000 | 418,471 | ||
Series 478, 1.50%, 2/19/2026 (a) | NOK | 3,162,000 | 384,510 | ||
Series 477, 1.75%, 3/13/2025 (a) | NOK | 3,690,000 | 451,663 | ||
Series 479, 1.75%, 2/17/2027 (a) | NOK | 3,605,000 | 445,891 | ||
Series 481, 1.75%, 9/6/2029 (a) | NOK | 3,990,000 | 498,534 | ||
Series 475, 2.00%, 5/24/2023 (a) | NOK | 7,530,000 | 913,605 | ||
Series 480, 2.00%, 4/26/2028 (a) | NOK | 3,200,000 | 404,161 | ||
Series 476, 3.00%, 3/14/2024 (a) | NOK | 5,087,000 | 642,064 | ||
| 4,158,899 | |||||
| PERU — 0.4% | |||||
| Peru Government Bond: | |||||
5.94%, 2/12/2029 | PEN | 2,200,000 | 759,251 | ||
6.15%, 8/12/2032 | PEN | 2,000,000 | 672,130 | ||
6.35%, 8/12/2028 | PEN | 2,000,000 | 702,509 | ||
6.90%, 8/12/2037 | PEN | 2,000,000 | 681,812 | ||
8.20%, 8/12/2026 | PEN | 2,000,000 | 750,530 | ||
| 3,566,232 | |||||
| POLAND — 1.1% | |||||
| Poland Government Bond: | |||||
Series 0722, Zero Coupon, 7/25/2022 | PLN | 2,800,000 | 751,035 | ||
Series 0425, 0.75%, 4/25/2025 | PLN | 500,000 | 136,171 | ||
Series 0422, 2.25%, 4/25/2022 | PLN | 3,425,000 | 946,155 | ||
Series 1024, 2.25%, 10/25/2024 | PLN | 1,650,000 | 475,277 | ||
Series 0123, 2.50%, 1/25/2023 | PLN | 3,570,000 | 1,006,203 | ||
Series 0424, 2.50%, 4/25/2024 | PLN | 2,950,000 | 850,960 | ||
Series 0726, 2.50%, 7/25/2026 | PLN | 3,405,000 | 1,009,912 |
| Security Description | Principal Amount | Value | |||
Series 0727, 2.50%, 7/25/2027 | PLN | 3,225,000 | $ 962,550 | ||
Series 0428, 2.75%, 4/25/2028 | PLN | 3,020,000 | 918,545 | ||
Series 1029, 2.75%, 10/25/2029 | PLN | 3,450,000 | 1,056,951 | ||
Series 0725, 3.25%, 7/25/2025 | PLN | 2,840,000 | 859,933 | ||
Series 1023, 4.00%, 10/25/2023 | PLN | 2,430,000 | 722,635 | ||
Series 0447, 4.00%, 4/25/2047 | PLN | 440,000 | 174,075 | ||
Series 0922, 5.75%, 9/23/2022 | PLN | 1,984,000 | 584,817 | ||
Series 0429, 5.75%, 4/25/2029 | PLN | 885,000 | 330,648 | ||
| 10,785,867 | |||||
| PORTUGAL — 1.8% | |||||
| Portugal Obrigacoes do Tesouro OT: | |||||
0.48%, 10/18/2030 (a) | EUR | 660,000 | 842,243 | ||
0.70%, 10/15/2027 (a) | EUR | 650,000 | 846,530 | ||
1.95%, 6/15/2029 (a) | EUR | 1,079,000 | 1,548,072 | ||
2.13%, 10/17/2028 (a) | EUR | 921,000 | 1,327,498 | ||
2.20%, 10/17/2022 (a) | EUR | 975,000 | 1,255,396 | ||
Series 15Y, 2.25%, 4/18/2034 (a) | EUR | 763,000 | 1,174,896 | ||
2.88%, 10/15/2025 (a) | EUR | 1,185,000 | 1,681,950 | ||
2.88%, 7/21/2026 (a) | EUR | 970,000 | 1,401,958 | ||
3.88%, 2/15/2030 (a) | EUR | 779,000 | 1,291,676 | ||
4.10%, 4/15/2037 (a) | EUR | 905,000 | 1,749,576 | ||
4.10%, 2/15/2045 (a) | EUR | 380,000 | 808,082 | ||
4.13%, 4/14/2027 (a) | EUR | 830,000 | 1,299,822 | ||
4.95%, 10/25/2023 (a) | EUR | 1,074,000 | 1,520,668 | ||
5.65%, 2/15/2024 (a) | EUR | 1,100,000 | 1,608,168 | ||
| 18,356,535 | |||||
| ROMANIA — 0.4% | |||||
| Romania Government Bond: | |||||
Series 7Y, 3.25%, 4/29/2024 | RON | 2,000,000 | 513,028 | ||
Series 3Y, 4.00%, 8/8/2022 | RON | 4,700,000 | 1,208,674 | ||
Series 4.3Y, 4.40%, 9/25/2023 | RON | 2,000,000 | 526,546 | ||
Series 7Y, 4.85%, 4/22/2026 | RON | 3,000,000 | 831,243 |
| Security Description | Principal Amount | Value | |||
Series 10Y, 5.00%, 2/12/2029 | RON | 3,000,000 | $ 864,364 | ||
| 3,943,855 | |||||
| RUSSIA — 0.9% | |||||
| Russian Federal Bond - OFZ: | |||||
Series 5084, 5.30%, 10/4/2023 | RUB | 6,400,000 | 87,771 | ||
Series 6232, 6.00%, 10/6/2027 | RUB | 21,500,000 | 296,249 | ||
Series 6223, 6.50%, 2/28/2024 | RUB | 35,600,000 | 503,862 | ||
Series 6224, 6.90%, 5/23/2029 | RUB | 38,776,000 | 563,047 | ||
Series 6211, 7.00%, 1/25/2023 | RUB | 12,330,000 | 175,122 | ||
Series 6215, 7.00%, 8/16/2023 | RUB | 30,120,000 | 429,417 | ||
Series 6212, 7.05%, 1/19/2028 | RUB | 28,910,000 | 422,211 | ||
Series 6222, 7.10%, 10/16/2024 | RUB | 37,190,000 | 539,072 | ||
Series 6229, 7.15%, 11/12/2025 | RUB | 17,900,000 | 261,760 | ||
Series 6225, 7.25%, 5/10/2034 | RUB | 47,930,000 | 705,040 | ||
Series 6220, 7.40%, 12/7/2022 | RUB | 35,630,000 | 509,162 | ||
Series 6227, 7.40%, 7/17/2024 | RUB | 43,400,000 | 633,715 | ||
Series 6209, 7.60%, 7/20/2022 | RUB | 29,160,000 | 413,759 | ||
Series 6228, 7.65%, 4/10/2030 | RUB | 13,450,000 | 205,311 | ||
Series 6221, 7.70%, 3/23/2033 | RUB | 40,451,000 | 616,108 | ||
Series 6230, 7.70%, 3/16/2039 | RUB | 25,000,000 | 386,037 | ||
Series 6219, 7.75%, 9/16/2026 | RUB | 40,480,000 | 608,067 | ||
Series 6226, 7.95%, 10/7/2026 | RUB | 42,000,000 | 637,596 | ||
Series 6207, 8.15%, 2/3/2027 | RUB | 40,165,000 | 617,387 | ||
Series 6218, 8.50%, 9/17/2031 | RUB | 30,040,000 | 487,365 | ||
| 9,098,058 | |||||
| SINGAPORE — 0.9% | |||||
| Singapore Government Bond: | |||||
1.75%, 4/1/2022 | SGD | 465,000 | 358,397 | ||
1.75%, 2/1/2023 | SGD | 610,000 | 474,937 | ||
1.88%, 3/1/2050 | SGD | 350,000 | 311,903 | ||
2.00%, 2/1/2024 | SGD | 130,000 | 103,327 | ||
2.13%, 6/1/2026 | SGD | 545,000 | 446,186 | ||
2.25%, 8/1/2036 | SGD | 795,000 | 698,426 |
| Security Description | Principal Amount | Value | |||
2.38%, 6/1/2025 | SGD | 590,000 | $ 484,898 | ||
2.38%, 7/1/2039 | SGD | 250,000 | 225,572 | ||
2.63%, 5/1/2028 | SGD | 490,000 | 419,506 | ||
2.75%, 7/1/2023 | SGD | 1,015,000 | 813,665 | ||
2.75%, 4/1/2042 | SGD | 460,000 | 445,940 | ||
2.75%, 3/1/2046 | SGD | 660,000 | 665,168 | ||
2.88%, 7/1/2029 | SGD | 640,000 | 566,260 | ||
2.88%, 9/1/2030 | SGD | 670,000 | 601,897 | ||
3.00%, 9/1/2024 | SGD | 750,000 | 622,160 | ||
3.13%, 9/1/2022 | SGD | 820,000 | 649,504 | ||
3.38%, 9/1/2033 | SGD | 550,000 | 530,991 | ||
3.50%, 3/1/2027 | SGD | 730,000 | 645,653 | ||
| 9,064,390 | |||||
| SLOVAKIA — 0.5% | |||||
| Slovakia Government Bond: | �� | ||||
Series 230, Zero Coupon, 11/13/2023 | EUR | 110,000 | 136,620 | ||
Series 231, 0.63%, 5/22/2026 | EUR | 220,000 | 286,705 | ||
Series 234, 1.00%, 6/12/2028 | EUR | 284,000 | 388,353 | ||
Series 228, 1.38%, 1/21/2027 | EUR | 450,000 | 614,690 | ||
Series 229, 1.63%, 1/21/2031 | EUR | 360,000 | 536,529 | ||
Series 232, 1.88%, 3/9/2037 | EUR | 265,000 | 426,772 | ||
Series 233, 2.00%, 10/17/2047 | EUR | 290,000 | 516,649 | ||
Series 235, 2.25%, 6/12/2068 | EUR | 70,000 | 151,368 | ||
Series 225, 3.00%, 2/28/2023 | EUR | 302,000 | 398,069 | ||
Series 223, 3.38%, 11/15/2024 | EUR | 345,000 | 487,571 | ||
Series 227, 3.63%, 1/16/2029 | EUR | 630,000 | 1,034,389 | ||
Series 216, 4.35%, 10/14/2025 | EUR | 282,000 | 427,392 | ||
| 5,405,107 | |||||
| SLOVENIA — 0.3% | |||||
| Slovenia Government Bond: | |||||
Series RS80, 1.00%, 3/6/2028 | EUR | 297,000 | 397,637 | ||
Series RS81, 1.19%, 3/14/2029 | EUR | 300,000 | 410,012 | ||
Series RS79, 1.25%, 3/22/2027 | EUR | 312,000 | 420,605 | ||
Series RS74, 1.50%, 3/25/2035 | EUR | 225,000 | 332,038 | ||
Series RS78, 1.75%, 11/3/2040 | EUR | 280,000 | 444,587 |
| Security Description | Principal Amount | Value | |||
Series RS75, 2.13%, 7/28/2025 | EUR | 180,000 | $ 246,535 | ||
Series RS73, 2.25%, 3/25/2022 | EUR | 155,000 | 196,035 | ||
Series RS77, 2.25%, 3/3/2032 | EUR | 190,000 | 294,020 | ||
Series RS76, 3.13%, 8/7/2045 | EUR | 145,000 | 297,006 | ||
Series RS66, 4.63%, 9/9/2024 | EUR | 210,000 | 305,895 | ||
Series RS70, 5.13%, 3/30/2026 | EUR | 135,000 | 213,944 | ||
| 3,558,314 | |||||
| SOUTH KOREA — 4.5% | |||||
| Korea Treasury Bond: | |||||
Series 2612, 1.50%, 12/10/2026 | KRW | 1,139,150,000 | 1,050,399 | ||
Series 3609, 1.50%, 9/10/2036 | KRW | 685,690,000 | 604,183 | ||
Series 2606, 1.88%, 6/10/2026 | KRW | 866,000,000 | 815,583 | ||
Series 2209, 2.00%, 9/10/2022 | KRW | 2,818,690,000 | 2,642,905 | ||
Series 4603, 2.00%, 3/10/2046 | KRW | 1,625,000,000 | 1,543,587 | ||
Series 4903, 2.00%, 3/10/2049 | KRW | 4,884,000,000 | 4,652,084 | ||
Series 2706, 2.13%, 6/10/2027 | KRW | 3,349,870,000 | 3,198,034 | ||
Series 4703, 2.13%, 3/10/2047 | KRW | 4,220,330,000 | 4,113,161 | ||
Series 2506, 2.25%, 6/10/2025 | KRW | 1,049,940,000 | 1,004,770 | ||
Series 2512, 2.25%, 12/10/2025 | KRW | 921,000,000 | 882,967 | ||
Series 3709, 2.25%, 9/10/2037 | KRW | 500,000,000 | 488,373 | ||
Series 3509, 2.63%, 9/10/2035 | KRW | 939,210,000 | 955,519 | ||
Series 4412, 2.75%, 12/10/2044 | KRW | 1,248,000,000 | 1,350,147 | ||
Series 2409, 3.00%, 9/10/2024 | KRW | 1,644,000,000 | 1,611,648 | ||
Series 4212, 3.00%, 12/10/2042 | KRW | 1,421,780,000 | 1,581,462 | ||
Series 2309, 3.38%, 9/10/2023 | KRW | 1,609,090,000 | 1,573,239 | ||
Series 2403, 3.50%, 3/10/2024 | KRW | 1,340,830,000 | 1,326,710 | ||
Series 2206, 3.75%, 6/10/2022 | KRW | 4,253,000,000 | 4,077,086 | ||
Series 3312, 3.75%, 12/10/2033 | KRW | 1,336,250,000 | 1,508,125 | ||
Series 3112, 4.00%, 12/10/2031 | KRW | 1,622,640,000 | 1,825,165 |
| Security Description | Principal Amount | Value | |||
Series 3012, 4.75%, 12/10/2030 | KRW | 3,095,050,000 | $ 3,626,030 | ||
Series 2803, 5.50%, 3/10/2028 | KRW | 4,337,000,000 | 5,060,323 | ||
| 45,491,500 | |||||
| SPAIN — 4.6% | |||||
| Kingdom of Spain: | |||||
Zero Coupon, 4/30/2023 | EUR | 975,000 | 1,208,629 | ||
Zero Coupon, 1/31/2025 | EUR | 500,000 | 623,807 | ||
Series 5YR, 0.25%, 7/30/2024 (a) | EUR | 868,000 | 1,091,842 | ||
0.35%, 7/30/2023 | EUR | 670,000 | 838,745 | ||
0.40%, 4/30/2022 | EUR | 650,000 | 805,978 | ||
0.45%, 10/31/2022 | EUR | 705,000 | 878,837 | ||
0.60%, 10/31/2029 (a) | EUR | 1,850,000 | 2,396,375 | ||
0.80%, 7/30/2027 (a) | EUR | 550,000 | 720,293 | ||
1.00%, 10/31/2050 (a) | EUR | 450,000 | 569,208 | ||
1.20%, 10/31/2040 (a) | EUR | 750,000 | 1,016,042 | ||
1.25%, 10/31/2030 (a) | EUR | 500,000 | 683,534 | ||
1.30%, 10/31/2026 (a) | EUR | 901,000 | 1,210,844 | ||
1.40%, 4/30/2028 (a) | EUR | 520,000 | 711,179 | ||
1.40%, 7/30/2028 (a) | EUR | 997,000 | 1,366,357 | ||
1.45%, 10/31/2027 (a) | EUR | 812,000 | 1,109,069 | ||
1.45%, 4/30/2029 (a) | EUR | 710,000 | 981,294 | ||
1.50%, 4/30/2027 (a) | EUR | 570,000 | 778,304 | ||
1.60%, 4/30/2025 (a) | EUR | 642,000 | 856,839 | ||
1.85%, 7/30/2035 (a) | EUR | 648,000 | 959,796 | ||
1.95%, 4/30/2026 (a) | EUR | 750,000 | 1,033,927 | ||
1.95%, 7/30/2030 (a) | EUR | 965,000 | 1,399,822 | ||
2.15%, 10/31/2025 (a) | EUR | 900,000 | 1,239,974 | ||
2.35%, 7/30/2033 (a) | EUR | 670,000 | 1,033,956 | ||
Series 30Y, 2.70%, 10/31/2048 (a) | EUR | 488,000 | 877,093 | ||
2.75%, 10/31/2024 (a) | EUR | 735,000 | 1,012,352 | ||
2.90%, 10/31/2046 (a) | EUR | 700,000 | 1,282,586 | ||
3.45%, 7/30/2066 (a) | EUR | 530,000 | 1,171,547 | ||
3.80%, 4/30/2024 (a) | EUR | 835,000 | 1,170,439 | ||
4.20%, 1/31/2037 (a) | EUR | 615,000 | 1,196,828 | ||
4.40%, 10/31/2023 (a) | EUR | 998,000 | 1,393,664 | ||
4.65%, 7/30/2025 (a) | EUR | 870,000 | 1,315,857 | ||
4.70%, 7/30/2041 (a) | EUR | 890,000 | 1,949,830 | ||
4.80%, 1/31/2024 (a) | EUR | 579,000 | 825,857 | ||
4.90%, 7/30/2040 (a) | EUR | 585,000 | 1,293,194 |
| Security Description | Principal Amount | Value | |||
5.15%, 10/31/2028 (a) | EUR | 675,000 | $ 1,170,302 | ||
5.15%, 10/31/2044 (a) | EUR | 415,000 | 1,002,778 | ||
5.40%, 1/31/2023 (a) | EUR | 830,000 | 1,142,276 | ||
5.75%, 7/30/2032 | EUR | 825,000 | 1,658,550 | ||
5.85%, 1/31/2022 (a) | EUR | 948,000 | 1,240,540 | ||
5.90%, 7/30/2026 (a) | EUR | 793,000 | 1,313,364 | ||
6.00%, 1/31/2029 | EUR | 942,000 | 1,726,082 | ||
| 46,257,790 | |||||
| SWEDEN — 0.7% | |||||
| Kingdom of Sweden: | |||||
Series 1062, 0.13%, 5/12/2031 (a) | SEK | 2,800,000 | 343,864 | ||
Series 1060, 0.75%, 5/12/2028 | SEK | 4,435,000 | 575,366 | ||
Series 1061, 0.75%, 11/12/2029 (a) | SEK | 5,465,000 | 714,881 | ||
Series 1059, 1.00%, 11/12/2026 | SEK | 6,120,000 | 798,736 | ||
Series 1057, 1.50%, 11/13/2023 (a) | SEK | 8,505,000 | 1,091,507 | ||
Series 1056, 2.25%, 6/1/2032 | SEK | 1,950,000 | 295,515 | ||
Series 1058, 2.50%, 5/12/2025 | SEK | 5,870,000 | 802,675 | ||
Series 1054, 3.50%, 6/1/2022 | SEK | 9,565,000 | 1,228,222 | ||
Series 1053, 3.50%, 3/30/2039 | SEK | 4,655,000 | 885,349 | ||
Sweden Government International Bond Series REGS, 0.13%, 9/9/2030 | SEK | 2,000,000 | 246,479 | ||
| 6,982,594 | |||||
| SWITZERLAND — 0.8% | |||||
| Switzerland Government Bond: | |||||
Zero Coupon, 6/22/2029 | CHF | 270,000 | 320,842 | ||
Zero Coupon, 7/24/2039 | CHF | 20,000 | 23,979 | ||
0.50%, 5/27/2030 | CHF | 195,000 | 242,970 | ||
0.50%, 6/27/2032 | CHF | 130,000 | 163,776 | ||
0.50%, 6/28/2045 | CHF | 120,000 | 164,792 | ||
0.50%, 5/24/2055 | CHF | 130,000 | 194,438 | ||
0.50%, 5/30/2058 | CHF | 105,000 | 162,557 | ||
1.25%, 6/11/2024 | CHF | 285,000 | 345,018 | ||
1.25%, 5/28/2026 | CHF | 260,000 | 325,901 | ||
1.25%, 6/27/2037 | CHF | 440,000 | 630,321 | ||
1.50%, 7/24/2025 | CHF | 210,000 | 262,163 | ||
1.50%, 4/30/2042 | CHF | 295,000 | 466,453 | ||
2.00%, 5/25/2022 | CHF | 350,000 | 411,511 | ||
2.00%, 6/25/2064 | CHF | 240,000 | 586,795 |
| Security Description | Principal Amount | Value | |||
2.25%, 6/22/2031 | CHF | 220,000 | $ 322,154 | ||
2.50%, 3/8/2036 | CHF | 245,000 | 399,644 | ||
3.25%, 6/27/2027 | CHF | 270,000 | 384,558 | ||
3.50%, 4/8/2033 | CHF | 300,000 | 508,128 | ||
4.00%, 2/11/2023 | CHF | 410,000 | 510,989 | ||
4.00%, 4/8/2028 | CHF | 576,000 | 876,307 | ||
4.00%, 1/6/2049 | CHF | 275,000 | 705,023 | ||
| 8,008,319 | |||||
| THAILAND — 1.7% | |||||
| Thailand Government Bond: | |||||
1.45%, 12/17/2024 | THB | 3,000,000 | 103,636 | ||
1.88%, 6/17/2022 | THB | 27,900,000 | 951,477 | ||
2.00%, 12/17/2022 | THB | 23,065,000 | 794,167 | ||
2.13%, 12/17/2026 | THB | 60,250,000 | 2,172,618 | ||
2.40%, 12/17/2023 | THB | 8,000,000 | 282,218 | ||
2.88%, 6/17/2046 | THB | 22,850,000 | 909,449 | ||
3.40%, 6/17/2036 | THB | 17,710,000 | 736,735 | ||
3.58%, 12/17/2027 | THB | 16,000,000 | 630,216 | ||
3.63%, 6/16/2023 | THB | 20,640,000 | 742,727 | ||
3.78%, 6/25/2032 | THB | 36,500,000 | 1,537,748 | ||
3.85%, 12/12/2025 | THB | 15,850,000 | 612,222 | ||
4.00%, 6/17/2066 | THB | 25,530,000 | 1,241,804 | ||
4.26%, 12/12/2037 | THB | 56,550,000 | 2,588,831 | ||
4.68%, 6/29/2044 | THB | 18,340,000 | 942,541 | ||
4.75%, 12/20/2024 | THB | 5,000,000 | 194,271 | ||
4.85%, 6/17/2061 | THB | 19,010,000 | 1,045,858 | ||
4.88%, 6/22/2029 | THB | 28,455,000 | 1,230,358 | ||
| 16,716,876 | |||||
| UNITED KINGDOM — 5.3% | |||||
| United Kingdom Treasury Bond: | |||||
0.13%, 1/31/2023 | GBP | 770,000 | 1,056,757 | ||
0.13%, 1/30/2026 | GBP | 340,000 | 468,463 | ||
0.13%, 1/31/2028 | GBP | 150,000 | 205,900 | ||
0.38%, 10/22/2030 | GBP | 700,000 | 971,858 | ||
0.50%, 7/22/2022 | GBP | 555,000 | 766,367 | ||
0.50%, 10/22/2061 | GBP | 200,000 | 257,273 | ||
0.63%, 6/7/2025 | GBP | 911,000 | 1,284,556 | ||
0.63%, 10/22/2050 | GBP | 550,000 | 728,011 | ||
0.75%, 7/22/2023 | GBP | 760,000 | 1,061,954 | ||
0.88%, 10/22/2029 | GBP | 750,000 | 1,090,497 | ||
1.00%, 4/22/2024 | GBP | 775,000 | 1,098,184 | ||
1.25%, 7/22/2027 | GBP | 570,000 | 841,876 | ||
1.25%, 10/22/2041 | GBP | 250,000 | 379,267 | ||
1.50%, 7/22/2026 | GBP | 680,000 | 1,010,019 | ||
1.50%, 7/22/2047 | GBP | 475,000 | 768,214 | ||
1.63%, 10/22/2028 | GBP | 1,506,000 | 2,309,761 | ||
1.63%, 10/22/2054 | GBP | 420,000 | 730,024 | ||
1.63%, 10/22/2071 | GBP | 290,000 | 582,551 | ||
1.75%, 9/7/2022 | GBP | 828,000 | 1,168,136 | ||
1.75%, 9/7/2037 | GBP | 590,000 | 956,814 | ||
1.75%, 1/22/2049 | GBP | 748,000 | 1,286,461 |
| Security Description | Principal Amount | Value | |||
1.75%, 7/22/2057 | GBP | 631,000 | $ 1,160,551 | ||
2.00%, 9/7/2025 | GBP | 775,000 | 1,164,206 | ||
2.25%, 9/7/2023 | GBP | 760,000 | 1,104,658 | ||
2.50%, 7/22/2065 | GBP | 445,000 | 1,043,055 | ||
2.75%, 9/7/2024 | GBP | 780,000 | 1,177,929 | ||
3.25%, 1/22/2044 | GBP | 540,000 | 1,135,939 | ||
3.50%, 1/22/2045 | GBP | 540,000 | 1,190,342 | ||
3.50%, 7/22/2068 | GBP | 460,000 | 1,366,954 | ||
3.75%, 7/22/2052 | GBP | 584,000 | 1,482,092 | ||
4.00%, 3/7/2022 | GBP | 805,000 | 1,153,975 | ||
4.00%, 1/22/2060 | GBP | 560,000 | 1,642,622 | ||
4.25%, 12/7/2027 | GBP | 720,000 | 1,272,972 | ||
4.25%, 6/7/2032 | GBP | 830,000 | 1,637,904 | ||
4.25%, 3/7/2036 | GBP | 615,000 | 1,303,010 | ||
4.25%, 9/7/2039 | GBP | 449,000 | 1,009,817 | ||
4.25%, 12/7/2040 | GBP | 997,000 | 2,283,802 | ||
4.25%, 12/7/2046 | GBP | 438,000 | 1,095,910 | ||
4.25%, 12/7/2049 | GBP | 556,000 | 1,459,106 | ||
4.25%, 12/7/2055 | GBP | 515,000 | 1,478,945 | ||
4.50%, 9/7/2034 | GBP | 760,000 | 1,605,512 | ||
4.50%, 12/7/2042 | GBP | 550,000 | 1,337,261 | ||
4.75%, 12/7/2030 | GBP | 1,120,000 | 2,215,999 | ||
4.75%, 12/7/2038 | GBP | 590,000 | 1,383,799 | ||
5.00%, 3/7/2025 | GBP | 978,000 | 1,622,719 | ||
6.00%, 12/7/2028 | GBP | 445,000 | 891,553 | ||
| 53,243,575 | |||||
TOTAL FOREIGN GOVERNMENT OBLIGATIONS (Cost $922,837,652) | 993,496,821 |
| Shares | |||
| SHORT-TERM INVESTMENT — 0.0% (b) | |||
State Street Institutional U.S. Government Money Market Fund, Class G Shares 0.05% (c) (d) (Cost $3,640) | 3,640 | 3,640 | |
TOTAL INVESTMENTS — 98.2% (Cost $922,841,292) | 993,500,461 | ||
OTHER ASSETS IN EXCESS OF LIABILITIES — 1.8% | 18,046,220 | ||
NET ASSETS — 100.0% | $ 1,011,546,681 | ||
| (a) | Securities purchased pursuant to Rule 144A of the Securities Act of 1933, as amended. These securities, which represent 20.0% of net assets as of December 31, 2020, are considered liquid and may be resold in transactions exempt from registration, normally to qualified institutional buyers. |
| (b) | Amount is less than 0.05% of net assets. |
| (c) | The Fund invested in certain money market funds managed by SSGA Funds Management, Inc. Amounts related to these transactions during the period ended December 31, 2020 are shown in the Affiliate Table below. |
| (d) | The rate shown is the annualized seven-day yield at December 31, 2020. |
| EMTN | Euro Medium Term Note |
| GMTN | Global Medium Term Note |
| AUD | Australian Dollar |
| CAD | Canadian Dollar |
| CHF | Swiss Franc |
| CLP | Chilean Peso |
| CNY | China Yuan Renminbi |
| COP | Colombian Peso |
| CZK | Czech Koruna |
| DKK | Danish Krone |
| EUR | Euro |
| GBP | British Pound |
| HKD | Hong Kong Dollar |
| HUF | Hungary Forint |
| IDR | Indonesia Rupiah |
| ILS | Israeli New Shekel |
| JPY | Japanese Yen |
| KRW | South Korean Won |
| MXN | Mexican Peso |
| MYR | Malaysian Ringgit |
| NOK | Norwegian Krone |
| NZD | New Zealand Dollar |
| PEN | Peru Nuevo Sol |
| PLN | Polish Zloty |
| RON | Romania New Leu |
| RUB | Russian Ruble |
| SEK | Swedish Krona |
| SGD | Singapore Dollar |
| THB | Thai Baht |
| Description | Level 1 – Quoted Prices | Level 2 – Other Significant Observable Inputs | Level 3 – Significant Unobservable Inputs | Total | ||||
| ASSETS: | ||||||||
| INVESTMENTS: | ||||||||
Foreign Government Obligations | $ — | $993,496,821 | $— | $993,496,821 | ||||
Short-Term Investment | 3,640 | — | — | 3,640 | ||||
TOTAL INVESTMENTS | $3,640 | $993,496,821 | $— | $993,500,461 |
| Number of Shares Held at 12/31/19 | Value at 12/31/19 | Cost of Purchases | Proceeds from Shares Sold | Realized Gain (Loss) | Change in Unrealized Appreciation/ Depreciation | Number of Shares Held at 12/31/20 | Value at 12/31/20 | Dividend Income | |||||||||
State Street Institutional U.S. Government Money Market Fund, Class G Shares | 516,327 | $ 516,327 | $39,138,984 | $39,651,671 | $— | $— | 3,640 | $3,640 | $2,315 | ||||||||
State Street Navigator Securities Lending Portfolio II | 660,550 | 660,550 | 199,365 | 859,915 | — | — | — | — | — | ||||||||
Total | $1,176,877 | $39,338,349 | $ 40,511,586 | $— | $— | $3,640 | $2,315 |
| Security Description | Principal Amount | Value | ||||
| FOREIGN GOVERNMENT OBLIGATIONS — 95.3% | ||||||
| AUSTRALIA — 3.7% | ||||||
| Australia Government Bond: | ||||||
Series 153, 2.25%, 11/21/2022 | AUD | 2,970,000 | $ 2,385,402 | |||
Series 133, 5.50%, 4/21/2023 | AUD | 3,690,000 | 3,199,363 | |||
Series 128, 5.75%, 7/15/2022 | AUD | 2,645,000 | 2,218,543 | |||
| 7,803,308 | ||||||
| AUSTRIA — 3.0% | ||||||
| Austria Government Bond: | ||||||
Zero Coupon, 9/20/2022 (a) | EUR | 800,000 | 990,305 | |||
Zero Coupon, 4/20/2023 (a) | EUR | 800,000 | 994,200 | |||
Zero Coupon, 7/15/2023 (a) | EUR | 700,000 | 871,448 | |||
1.75%, 10/20/2023 (a) | EUR | 1,000,000 | 1,307,997 | |||
3.40%, 11/22/2022 (a) | EUR | 1,155,000 | 1,522,953 | |||
3.65%, 4/20/2022 (a) | EUR | 551,000 | 711,727 | |||
| 6,398,630 | ||||||
| BELGIUM — 3.0% | ||||||
| Belgium Government Bond: | ||||||
Series 79, 0.20%, 10/22/2023 (a) | EUR | 750,000 | 941,079 | |||
Series 68, 2.25%, 6/22/2023 | EUR | 1,550,000 | 2,036,373 | |||
Series 48, 4.00%, 3/28/2022 | EUR | 1,170,000 | 1,514,581 | |||
Series 65, 4.25%, 9/28/2022 (a) | EUR | 1,420,000 | 1,887,903 | |||
| 6,379,936 | ||||||
| CANADA — 4.6% | ||||||
| Canadian Government Bond: | ||||||
0.25%, 8/1/2022 | CAD | 140,000 | 110,021 | |||
0.25%, 11/1/2022 | CAD | 1,970,000 | 1,547,996 | |||
0.50%, 3/1/2022 | CAD | 510,000 | 401,943 | |||
1.00%, 9/1/2022 | CAD | 940,000 | 747,883 | |||
1.50%, 2/1/2022 | CAD | 710,000 | 565,503 | |||
1.50%, 5/1/2022 | CAD | 1,145,000 | 914,760 | |||
1.50%, 6/1/2023 | CAD | 1,400,000 | 1,132,539 | |||
1.75%, 3/1/2023 | CAD | 1,880,000 | 1,524,659 | |||
2.00%, 9/1/2023 | CAD | 1,900,000 | 1,560,759 | |||
2.75%, 6/1/2022 | CAD | 1,310,000 | 1,065,789 | |||
Series A55, 8.00%, 6/1/2023 | CAD | 180,000 | 167,653 | |||
| 9,739,505 | ||||||
| Security Description | Principal Amount | Value | |||
| CHILE — 0.2% | |||||
| Bonos de la Tesoreria de la Republica en pesos: | |||||
4.00%, 3/1/2023 (a) | CLP | 220,000,000 | $ 331,910 | ||
Series 10YR, 6.00%, 1/1/2022 | CLP | 25,000,000 | 37,154 | ||
| 369,064 | |||||
| CHINA — 4.5% | |||||
| China Government Bond: | |||||
Series INBK, 2.24%, 3/5/2023 | CNY | 850,000 | 128,266 | ||
Series INBK, 2.36%, 7/2/2023 | CNY | 63,000,000 | 9,518,300 | ||
| 9,646,566 | |||||
| COLOMBIA — 0.4% | |||||
Colombian TES Series B, 7.00%, 5/4/2022 | COP | 2,665,000,000 | 827,547 | ||
| CYPRUS — 0.1% | |||||
| Cyprus Government International Bond: | |||||
Series EMTN, 3.75%, 7/26/2023 | EUR | 100,000 | 134,819 | ||
Series EMTN, 3.88%, 5/6/2022 | EUR | 150,000 | 193,699 | ||
| 328,518 | |||||
| CZECH REPUBLIC — 0.5% | |||||
| Czech Republic Government Bond: | |||||
Series 126, 0.10%, 4/17/2022 | CZK | 3,500,000 | 162,631 | ||
Series 97, 0.45%, 10/25/2023 | CZK | 10,500,000 | 489,822 | ||
Series 52, 4.70%, 9/12/2022 | CZK | 7,650,000 | 383,395 | ||
| 1,035,848 | |||||
| DENMARK — 0.9% | |||||
| Denmark Government Bond: | |||||
Series 3Y, 0.25%, 11/15/2022 (a) | DKK | 6,380,000 | 1,065,740 | ||
1.50%, 11/15/2023 | DKK | 5,200,000 | 907,126 | ||
| 1,972,866 | |||||
| FINLAND — 1.2% | |||||
| Finland Government Bond: | |||||
Series 5Y, Zero Coupon, 4/15/2022 (a) | EUR | 420,000 | 518,362 | ||
Zero Coupon, 9/15/2023 (a) | EUR | 450,000 | 561,508 | ||
1.50%, 4/15/2023 (a) | EUR | 600,000 | 771,554 |
| Security Description | Principal Amount | Value | |||
1.63%, 9/15/2022 (a) | EUR | 520,000 | $ 661,705 | ||
| 2,513,129 | |||||
| FRANCE — 6.3% | |||||
| France Government Bond OAT: | |||||
Zero Coupon, 2/25/2022 | EUR | 1,230,000 | 1,517,039 | ||
Zero Coupon, 5/25/2022 | EUR | 1,250,000 | 1,544,380 | ||
Zero Coupon, 2/25/2023 | EUR | 450,000 | 559,123 | ||
Zero Coupon, 3/25/2023 | EUR | 1,585,000 | 1,970,179 | ||
1.75%, 5/25/2023 | EUR | 1,727,000 | 2,238,460 | ||
2.25%, 10/25/2022 | EUR | 1,000,000 | 1,290,079 | ||
3.00%, 4/25/2022 | EUR | 1,261,000 | 1,617,835 | ||
8.25%, 4/25/2022 | EUR | 80,000 | 109,405 | ||
8.50%, 4/25/2023 | EUR | 400,000 | 594,161 | ||
French Republic Government Bond OAT 4.25%, 10/25/2023 | EUR | 1,450,000 | 2,024,945 | ||
| 13,465,606 | |||||
| GERMANY — 5.3% | |||||
| Bundesrepublik Deutschland: | |||||
Zero Coupon, 3/11/2022 | EUR | 550,000 | 678,572 | ||
Zero Coupon, 6/10/2022 | EUR | 500,000 | 617,907 | ||
| Federal Republic of Germany: | |||||
Series 175, Zero Coupon, 4/8/2022 | EUR | 970,000 | 1,197,644 | ||
Series 176, Zero Coupon, 10/7/2022 | EUR | 800,000 | 990,977 | ||
Series 177, Zero Coupon, 4/14/2023 | EUR | 737,000 | 917,330 | ||
Series 178, Zero Coupon, 10/13/2023 | EUR | 850,000 | 1,062,262 | ||
1.50%, 9/4/2022 | EUR | 620,000 | 787,349 | ||
1.50%, 2/15/2023 | EUR | 900,000 | 1,154,035 | ||
1.50%, 5/15/2023 | EUR | 960,000 | 1,237,910 | ||
1.75%, 7/4/2022 | EUR | 520,000 | 659,846 | ||
2.00%, 1/4/2022 | EUR | 920,000 | 1,156,883 | ||
2.00%, 8/15/2023 | EUR | 600,000 | 787,718 | ||
| 11,248,433 | |||||
| HONG KONG — 0.2% | |||||
| Hong Kong Government Bond Programme: | |||||
0.51%, 10/23/2023 | HKD | 250,000 | 32,537 | ||
1.10%, 1/17/2023 | HKD | 1,550,000 | 203,633 | ||
1.16%, 5/18/2022 | HKD | 1,050,000 | 137,332 | ||
| 373,502 |
| Security Description | Principal Amount | Value | |||
| HUNGARY — 0.6% | |||||
| Hungary Government Bond: | |||||
Series 22/C, 1.50%, 8/24/2022 | HUF | 27,000,000 | $ 92,549 | ||
Series 23/C, 1.50%, 8/23/2023 | HUF | 67,000,000 | 230,417 | ||
Series 22/B, 1.75%, 10/26/2022 | HUF | 81,200,000 | 279,873 | ||
Series 23/A, 6.00%, 11/24/2023 | HUF | 95,200,000 | 369,276 | ||
Series 22/A, 7.00%, 6/24/2022 | HUF | 59,100,000 | 218,220 | ||
| 1,190,335 | |||||
| INDONESIA — 1.2% | |||||
Indonesia Treasury Bond Series FR61, 7.00%, 5/15/2022 | IDR | 34,717,000,000 | 2,572,517 | ||
Perusahaan Penerbit SBSN Indonesia Series PBS, 6.50%, 5/15/2021 | IDR | 445,000,000 | 32,042 | ||
| 2,604,559 | |||||
| IRELAND — 1.1% | |||||
| Ireland Government Bond: | |||||
Zero Coupon, 10/18/2022 | EUR | 600,000 | 743,194 | ||
0.80%, 3/15/2022 | EUR | 790,000 | 983,423 | ||
3.90%, 3/20/2023 | EUR | 419,000 | 564,902 | ||
| 2,291,519 | |||||
| ISRAEL — 1.3% | |||||
| Israel Government Bond: | |||||
Series 0722, 0.75%, 7/31/2022 | ILS | 1,940,000 | 610,576 | ||
Series 1122, 1.25%, 11/30/2022 | ILS | 1,380,000 | 439,472 | ||
Series 1123, 1.50%, 11/30/2023 | ILS | 1,800,000 | 582,015 | ||
Series 0323, 4.25%, 3/31/2023 | ILS | 1,770,000 | 602,126 | ||
Series 0122, 5.50%, 1/31/2022 | ILS | 1,610,000 | 530,701 | ||
| 2,764,890 | |||||
| ITALY — 7.3% | |||||
| Italy Buoni Poliennali Del Tesoro: | |||||
0.65%, 10/15/2023 | EUR | 800,000 | 1,006,134 | ||
0.90%, 8/1/2022 | EUR | 666,000 | 832,217 | ||
0.95%, 3/1/2023 | EUR | 700,000 | 881,580 | ||
0.95%, 3/15/2023 | EUR | 700,000 | 882,085 | ||
1.00%, 7/15/2022 | EUR | 490,000 | 612,909 | ||
1.20%, 4/1/2022 | EUR | 699,000 | 873,133 |
| Security Description | Principal Amount | Value | |||
Series 5Y, 2.45%, 10/1/2023 | EUR | 850,000 | $ 1,120,432 | ||
Italy Certificati di Credito del Tesoro Zero Coupon Zero Coupon, 5/30/2022 | EUR | 500,000 | 615,493 | ||
| Republic of Italy: | |||||
0.05%, 1/15/2023 (a) | EUR | 658,000 | 812,678 | ||
0.30%, 8/15/2023 (a) | EUR | 300,000 | 373,342 | ||
0.60%, 6/15/2023 | EUR | 600,000 | 752,483 | ||
1.35%, 4/15/2022 | EUR | 750,000 | 938,886 | ||
1.45%, 9/15/2022 | EUR | 650,000 | 821,085 | ||
4.50%, 5/1/2023 | EUR | 850,000 | 1,159,307 | ||
4.75%, 8/1/2023 (a) | EUR | 900,000 | 1,248,535 | ||
5.00%, 3/1/2022 | EUR | 850,000 | 1,106,302 | ||
5.50%, 9/1/2022 | EUR | 850,000 | 1,142,368 | ||
5.50%, 11/1/2022 | EUR | 350,000 | 474,528 | ||
| 15,653,497 | |||||
| JAPAN — 20.5% | |||||
| Government of Japan 5 Year Bond: | |||||
Series 131, 0.10%, 3/20/2022 | JPY | 635,000,000 | 6,165,918 | ||
Series 132, 0.10%, 6/20/2022 | JPY | 392,500,000 | 3,813,650 | ||
Series 133, 0.10%, 9/20/2022 | JPY | 425,000,000 | 4,132,353 | ||
Series 134, 0.10%, 12/20/2022 | JPY | 372,000,000 | 3,619,402 | ||
Series 135, 0.10%, 3/20/2023 | JPY | 432,000,000 | 4,205,561 | ||
Series 136, 0.10%, 6/20/2023 | JPY | 541,000,000 | 5,269,779 | ||
Series 137, 0.10%, 9/20/2023 | JPY | 449,500,000 | 4,381,629 | ||
| Government of Japan 10 Year Bond: | |||||
Series 328, 0.60%, 3/20/2023 | JPY | 164,500,000 | 1,618,695 | ||
Series 324, 0.80%, 6/20/2022 | JPY | 354,000,000 | 3,474,237 | ||
Series 325, 0.80%, 9/20/2022 | JPY | 315,000,000 | 3,098,865 | ||
Series 321, 1.00%, 3/20/2022 | JPY | 400,000,000 | 3,926,117 | ||
| 43,706,206 | |||||
| MALAYSIA — 1.6% | |||||
| Malaysia Government Bond: | |||||
Series 0112, 3.42%, 8/15/2022 | MYR | 2,550,000 | 649,737 | ||
Series 0313, 3.48%, 3/15/2023 | MYR | 9,700,000 | 2,493,400 |
| Security Description | Principal Amount | Value | |||
Malaysia Government Investment Issue Series 0116, 4.39%, 7/7/2023 | MYR | 1,000,000 | $ 263,364 | ||
| 3,406,501 | |||||
| MEXICO — 1.1% | |||||
| Mexican Bonos: | |||||
Series M, 6.50%, 6/9/2022 | MXN | 34,860,000 | 1,801,163 | ||
Series M, 6.75%, 3/9/2023 | MXN | 9,500,000 | 500,090 | ||
| 2,301,253 | |||||
| NETHERLANDS — 3.5% | |||||
| Kingdom of Netherlands: | |||||
Zero Coupon, 1/15/2022 (a) | EUR | 1,600,000 | 1,971,857 | ||
1.75%, 7/15/2023 (a) | EUR | 1,650,000 | 2,146,671 | ||
2.25%, 7/15/2022 (a) | EUR | 1,275,000 | 1,631,112 | ||
3.75%, 1/15/2023 (a) | EUR | 1,225,000 | 1,636,005 | ||
| 7,385,645 | |||||
| NEW ZEALAND — 0.5% | |||||
New Zealand Government Bond Series 0423, 5.50%, 4/15/2023 | NZD | 1,470,000 | 1,183,937 | ||
| NORWAY — 0.4% | |||||
Norway Government Bond Series 475, 2.00%, 5/24/2023 (a) | NOK | 7,595,000 | 921,491 | ||
| PERU — 0.0% (b) | |||||
Bonos de la Tesoreria de la Republica en pesos 5.20%, 9/12/2023 | PEN | 200,000 | 61,867 | ||
| POLAND — 1.9% | |||||
| Poland Government Bond: | |||||
Series 0722, Zero Coupon, 7/25/2022 | PLN | 3,150,000 | 844,914 | ||
Series 0422, 2.25%, 4/25/2022 | PLN | 3,330,000 | 919,911 | ||
Series 0123, 2.50%, 1/25/2023 | PLN | 2,880,000 | 811,727 | ||
Series 1023, 4.00%, 10/25/2023 | PLN | 2,300,000 | 683,975 | ||
Series 0922, 5.75%, 9/23/2022 | PLN | 2,630,000 | 775,236 | ||
| 4,035,763 | |||||
| PORTUGAL — 1.4% | |||||
| Portugal Obrigacoes do Tesouro OT: | |||||
2.20%, 10/17/2022 (a) | EUR | 1,270,000 | 1,635,234 | ||
4.95%, 10/25/2023 (a) | EUR | 925,000 | 1,309,700 | ||
| 2,944,934 |
| Security Description | Principal Amount | Value | |||
| ROMANIA — 0.8% | |||||
| Romania Government Bond: | |||||
Series 3Y, 4.00%, 8/8/2022 | RON | 1,200,000 | $ 308,598 | ||
Series 4.3Y, 4.40%, 9/25/2023 | RON | 5,350,000 | 1,408,510 | ||
| 1,717,108 | |||||
| RUSSIA — 0.8% | |||||
| Russian Federal Bond - OFZ: | |||||
Series 5084, 5.30%, 10/4/2023 | RUB | 6,000,000 | 82,286 | ||
Series 6211, 7.00%, 1/25/2023 | RUB | 19,700,000 | 279,797 | ||
Series 6215, 7.00%, 8/16/2023 | RUB | 27,000,000 | 384,935 | ||
Series 6220, 7.40%, 12/7/2022 | RUB | 28,800,000 | 411,560 | ||
Series 6209, 7.60%, 7/20/2022 | RUB | 33,050,000 | 468,955 | ||
| 1,627,533 | |||||
| SINGAPORE — 1.0% | |||||
| Singapore Government Bond: | |||||
1.75%, 4/1/2022 | SGD | 600,000 | 462,448 | ||
1.75%, 2/1/2023 | SGD | 850,000 | 661,798 | ||
2.75%, 7/1/2023 | SGD | 980,000 | 785,607 | ||
3.13%, 9/1/2022 | SGD | 420,000 | 332,673 | ||
| 2,242,526 | |||||
| SLOVAKIA — 0.2% | |||||
Slovakia Government Bond Series 225, 3.00%, 2/28/2023 | EUR | 400,000 | 527,244 | ||
| SLOVENIA — 0.1% | |||||
Slovenia Government Bond Series RS73, 2.25%, 3/25/2022 | EUR | 250,000 | 316,186 | ||
| SOUTH KOREA — 4.6% | |||||
Korea Treasury Bond Series 2212, 1.25%, 12/10/2022 | KRW | 10,513,000,000 | 9,739,911 | ||
| SPAIN — 4.5% | |||||
| Kingdom of Spain: | |||||
Zero Coupon, 4/30/2023 | EUR | 450,000 | 557,829 | ||
0.35%, 7/30/2023 | EUR | 650,000 | 813,707 | ||
0.40%, 4/30/2022 | EUR | 1,300,000 | 1,611,956 | ||
0.45%, 10/31/2022 | EUR | 906,000 | 1,129,399 | ||
4.40%, 10/31/2023 (a) | EUR | 1,350,000 | 1,885,217 | ||
5.40%, 1/31/2023 (a) | EUR | 1,356,000 | 1,866,177 | ||
5.85%, 1/31/2022 (a) | EUR | 1,370,000 | 1,792,764 | ||
| 9,657,049 |
| Security Description | Principal Amount | Value | |||
| SWEDEN — 1.1% | |||||
| Kingdom of Sweden: | |||||
Series 1057, 1.50%, 11/13/2023 (a) | SEK | 9,300,000 | $ 1,193,535 | ||
Series 1054, 3.50%, 6/1/2022 | SEK | 8,975,000 | 1,152,461 | ||
| 2,345,996 | |||||
| SWITZERLAND — 0.4% | |||||
| Switzerland Government Bond: | |||||
2.00%, 5/25/2022 | CHF | 260,000 | 305,694 | ||
4.00%, 2/11/2023 | CHF | 505,000 | 629,389 | ||
| 935,083 | |||||
| THAILAND — 0.9% | |||||
| Thailand Government Bond: | |||||
1.88%, 6/17/2022 | THB | 16,480,000 | 562,019 | ||
2.00%, 12/17/2022 | THB | 29,100,000 | 1,001,962 | ||
3.63%, 6/16/2023 | THB | 10,050,000 | 361,648 | ||
| 1,925,629 | |||||
| UNITED KINGDOM — 4.6% | |||||
| United Kingdom Treasury Bond: | |||||
0.13%, 1/31/2023 | GBP | 1,010,000 | 1,386,136 | ||
0.50%, 7/22/2022 | GBP | 1,800,000 | 2,485,516 | ||
0.75%, 7/22/2023 | GBP | 1,000,000 | 1,397,308 | ||
1.75%, 9/7/2022 | GBP | 890,000 | 1,255,605 | ||
2.25%, 9/7/2023 | GBP | 930,000 | 1,351,753 | ||
4.00%, 3/7/2022 | GBP | 1,355,000 | 1,942,405 | ||
| 9,818,723 | |||||
TOTAL FOREIGN GOVERNMENT OBLIGATIONS (Cost $189,837,427) | 203,407,843 |
| Shares | |||
| SHORT-TERM INVESTMENT — 0.0% (b) | |||
State Street Institutional U.S. Government Money Market Fund, Class G Shares 0.05% (c) (d) (Cost $69,640) | 69,640 | 69,640 | |
TOTAL INVESTMENTS — 95.3% (Cost $189,907,067) | 203,477,483 | ||
OTHER ASSETS IN EXCESS OF LIABILITIES — 4.7% | 9,951,818 | ||
NET ASSETS — 100.0% | $ 213,429,301 | ||
| (a) | Securities purchased pursuant to Rule 144A of the Securities Act of 1933, as amended. These securities, which represent 15.7% of net assets as of December 31, 2020, are considered liquid and may be resold in transactions exempt from registration, normally to qualified institutional buyers. |
| (b) | Amount is less than 0.05% of net assets. |
| (c) | The Fund invested in certain money market funds managed by SSGA Funds Management, Inc. Amounts related to these transactions during the period ended December 31, 2020 are shown in the Affiliate Table below. |
| (d) | The rate shown is the annualized seven-day yield at December 31, 2020. |
| EMTN | Euro Medium Term Note |
| AUD | Australian Dollar |
| CAD | Canadian Dollar |
| CHF | Swiss Franc |
| CLP | Chilean Peso |
| CNY | China Yuan Renminbi |
| COP | Colombian Peso |
| CZK | Czech Koruna |
| DKK | Danish Krone |
| EUR | Euro |
| GBP | British Pound |
| HKD | Hong Kong Dollar |
| HUF | Hungary Forint |
| IDR | Indonesia Rupiah |
| ILS | Israeli New Shekel |
| JPY | Japanese Yen |
| KRW | South Korean Won |
| MXN | Mexican Peso |
| MYR | Malaysian Ringgit |
| NOK | Norwegian Krone |
| NZD | New Zealand Dollar |
| PEN | Peru Nuevo Sol |
| PLN | Polish Zloty |
| RON | Romania New Leu |
| RUB | Russian Ruble |
| SEK | Swedish Krona |
| SGD | Singapore Dollar |
| THB | Thai Baht |
| Description | Level 1 – Quoted Prices | Level 2 – Other Significant Observable Inputs | Level 3 – Significant Unobservable Inputs | Total | ||||
| ASSETS: | ||||||||
| INVESTMENTS: | ||||||||
Foreign Government Obligations | $ — | $203,407,843 | $— | $203,407,843 | ||||
Short-Term Investment | 69,640 | — | — | 69,640 | ||||
TOTAL INVESTMENTS | $69,640 | $203,407,843 | $— | $203,477,483 |
| Number of Shares Held at 12/31/19 | Value at 12/31/19 | Cost of Purchases | Proceeds from Shares Sold | Realized Gain (Loss) | Change in Unrealized Appreciation/ Depreciation | Number of Shares Held at 12/31/20 | Value at 12/31/20 | Dividend Income | |||||||||
State Street Institutional U.S. Government Money Market Fund, Class G Shares | 15,997 | $15,997 | $27,509,782 | $27,456,139 | $— | $— | 69,640 | $69,640 | $1,020 |
| Security Description | Principal Amount | Value | ||||
| FOREIGN GOVERNMENT OBLIGATIONS — 99.5% | ||||||
| AUSTRALIA — 4.6% | ||||||
| Australia Government Bond: | ||||||
Series 27CI, 0.75%, 11/21/2027 | AUD | 2,573,406 | $ 2,245,399 | |||
Series 50CI, 1.00%, 2/21/2050 | AUD | 1,796,025 | 1,830,794 | |||
Series 22CI, 1.25%, 2/21/2022 | AUD | 3,223,503 | 2,561,445 | |||
Series 40CI, 1.25%, 8/21/2040 | AUD | 1,461,645 | 1,472,438 | |||
Series 35CI, 2.00%, 8/21/2035 | AUD | 2,030,940 | 2,172,494 | |||
Series 30CI, 2.50%, 9/20/2030 | AUD | 3,457,132 | 3,559,888 | |||
Series 25CI, 3.00%, 9/20/2025 | AUD | 4,018,238 | 3,742,241 | |||
| 17,584,699 | ||||||
| BRAZIL — 5.8% | ||||||
| Brazil Notas do Tesouro Nacional Serie B: | ||||||
Series NTNB, 6.00%, 8/15/2022 | BRL | 14,549,976 | 3,067,375 | |||
Series NTNB, 6.00%, 5/15/2023 | BRL | 11,096,280 | 2,394,038 | |||
Series NTNB, 6.00%, 8/15/2024 | BRL | 8,890,702 | 1,968,131 | |||
Series NTNB, 6.00%, 5/15/2025 | BRL | 5,471,202 | 1,198,442 | |||
Series NTNB, 6.00%, 8/15/2026 | BRL | 4,103,401 | 941,570 | |||
Series NTNB, 6.00%, 8/15/2028 | BRL | 6,086,712 | 1,440,366 | |||
Series NTNB, 6.00%, 8/15/2030 | BRL | 3,556,281 | 863,685 | |||
Series NTNB, 6.00%, 5/15/2035 | BRL | 8,377,775 | 2,116,484 | |||
Series NTNB, 6.00%, 8/15/2040 | BRL | 4,958,212 | 1,272,792 | |||
Series NTNB, 6.00%, 5/15/2045 | BRL | 8,001,632 | 2,062,119 | |||
Series NTNB, 6.00%, 8/15/2050 | BRL | 13,848,979 | 3,671,567 | |||
Series NTNB, 6.00%, 5/15/2055 | BRL | 4,582,131 | 1,243,616 | |||
| 22,240,185 | ||||||
| CANADA — 4.5% | ||||||
| Canadian Government Real Return Bond: | ||||||
Series CPI, 0.50%, 12/1/2050 | CAD | 1,666,051 | 1,638,981 | |||
Series CPI, 1.25%, 12/1/2047 | CAD | 1,784,160 | 2,008,160 | |||
| Security Description | Principal Amount | Value | |||
Series CPI, 1.50%, 12/1/2044 | CAD | 2,467,756 | $ 2,783,005 | ||
Series CPI, 2.00%, 12/1/2041 | CAD | 1,922,183 | 2,273,502 | ||
Series CPI, 3.00%, 12/1/2036 | CAD | 1,922,213 | 2,380,210 | ||
Series CPI, 4.00%, 12/1/2031 | CAD | 1,978,354 | 2,382,472 | ||
Series CPI, 4.25%, 12/1/2021 | CAD | 2,060,302 | 1,696,224 | ||
Series CPI, 4.25%, 12/1/2026 | CAD | 1,761,052 | 1,829,642 | ||
| 16,992,196 | |||||
| CHILE — 4.8% | |||||
| Bonos de la Tesoreria de la Republica: | |||||
Zero Coupon, 3/1/2025 | CLP | 726,758,250 | 1,066,137 | ||
1.30%, 3/1/2023 | CLP | 639,547,260 | 966,092 | ||
1.50%, 3/1/2026 | CLP | 2,529,118,710 | 4,016,964 | ||
1.90%, 9/1/2030 | CLP | 639,547,260 | 1,081,076 | ||
2.00%, 3/1/2035 | CLP | 1,829,711,720 | 3,222,890 | ||
2.10%, 7/15/2050 | CLP | 610,476,930 | 1,115,958 | ||
Series 30YR, 3.00%, 1/1/2044 | CLP | 2,427,372,555 | 5,066,220 | ||
| Bonos del Banco Central de Chile en UF: | |||||
Series 10YR, 3.00%, 3/1/2022 | CLP | 29,070,330 | 43,204 | ||
Series 10YR, 3.00%, 3/1/2023 | CLP | 26,880 | 42 | ||
Series 20YR, 3.00%, 5/1/2028 | CLP | 116,281,320 | 207,581 | ||
Series 20YR, 3.00%, 2/1/2031 | CLP | 406,984,620 | 751,320 | ||
Series 30YR, 3.00%, 2/1/2041 | CLP | 406,984,620 | 837,953 | ||
| 18,375,437 | |||||
| COLOMBIA — 4.6% | |||||
| Colombian TES: | |||||
Series UVR, 2.25%, 4/18/2029 | COP | 1,375,313,000 | 411,552 | ||
Series UVR, 3.00%, 3/25/2033 | COP | 6,601,502,400 | 2,049,373 | ||
Series UVR, 3.30%, 3/17/2027 | COP | 9,407,140,920 | 3,085,185 | ||
Series UVR, 3.50%, 5/7/2025 | COP | 4,978,633,060 | 1,626,267 | ||
Series UVR, 3.75%, 2/25/2037 | COP | 4,263,470,300 | 1,422,987 | ||
Series UVR, 3.75%, 6/16/2049 | COP | 3,108,207,380 | 1,008,288 | ||
Series UVR, 4.75%, 2/23/2023 | COP | 14,468,292,760 | 4,615,569 |
| Security Description | Principal Amount | Value | |||
Series UVR, 4.75%, 4/4/2035 | COP | 8,320,635,256 | $ 3,072,228 | ||
| 17,291,449 | |||||
| FRANCE — 8.1% | |||||
| French Republic Government Bond OAT: | |||||
Series OATI, 0.10%, 3/1/2025 | EUR | 1,182,863 | 1,523,160 | ||
Series OATE, 0.10%, 3/1/2026 (a) | EUR | 1,070,850 | 1,415,366 | ||
Series OATI, 0.10%, 3/1/2028 | EUR | 1,306,746 | 1,748,557 | ||
Series OATE, 0.10%, 3/1/2029 | EUR | 905,391 | 1,251,951 | ||
Series OATI, 0.10%, 3/1/2036 (a) | EUR | 596,328 | 874,269 | ||
Series OATE, 0.10%, 7/25/2036 (a) | EUR | 514,020 | 772,028 | ||
Series OATE, 0.10%, 7/25/2047 (a) | EUR | 1,199,657 | 2,021,393 | ||
Series OATE, 0.25%, 7/25/2024 | EUR | 2,150,104 | 2,802,364 | ||
Series OATE, 0.70%, 7/25/2030 (a) | EUR | 1,388,772 | 2,064,959 | ||
Series OATE, 1.10%, 7/25/2022 | EUR | 1,678,054 | 2,146,283 | ||
Series OATE, 1.80%, 7/25/2040 (a) | EUR | 1,376,619 | 2,792,004 | ||
Series OATE, 1.85%, 7/25/2027 | EUR | 2,480,495 | 3,728,005 | ||
Series OATI, 2.10%, 7/25/2023 (a) | EUR | 2,336,385 | 3,096,580 | ||
Series OATE, 3.15%, 7/25/2032 | EUR | 1,544,263 | 2,966,327 | ||
Series OATI, 3.40%, 7/25/2029 | EUR | 1,013,423 | 1,773,685 | ||
| 30,976,931 | |||||
| GERMANY — 4.5% | |||||
| Deutsche Bundesrepublik Inflation Linked Bond: | |||||
Series I/L, 0.10%, 4/15/2023 | EUR | 3,149,401 | 3,962,090 | ||
Series I/L, 0.10%, 4/15/2026 | EUR | 3,518,224 | 4,676,987 | ||
Series I/L, 0.10%, 4/15/2046 | EUR | 1,782,933 | 3,250,373 | ||
Series I/L, 0.50%, 4/15/2030 | EUR | 3,511,784 | 5,163,093 | ||
| 17,052,543 | |||||
| ISRAEL — 4.5% | |||||
| Israel Government Bond - CPI Linked: | |||||
Series 0529, 0.50%, 5/31/2029 | ILS | 3,553,546 | 1,226,342 |
| Security Description | Principal Amount | Value | |||
0.75%, 10/31/2025 | ILS | 8,458,069 | $ 2,857,107 | ||
Series 0527, 0.75%, 5/31/2027 | ILS | 4,001,457 | 1,379,804 | ||
1.00%, 5/31/2045 | ILS | 4,144,989 | 1,543,171 | ||
1.75%, 9/29/2023 | ILS | 3,926,550 | 1,309,255 | ||
Series 0922, 2.75%, 9/30/2022 | ILS | 4,985,957 | 1,647,753 | ||
Series 0841, 2.75%, 8/30/2041 | ILS | 5,902,090 | 2,914,536 | ||
Series 0536, 4.00%, 5/30/2036 | ILS | 5,304,280 | 2,765,208 | ||
Israel Government Bond - Galil Series 5904, 4.00%, 7/31/2024 | ILS | 4,333,636 | 1,591,055 | ||
| 17,234,231 | |||||
| ITALY — 5.6% | |||||
| Italy Buoni Poliennali Del Tesoro: | |||||
Series CPI, 0.10%, 5/15/2022 (a) | EUR | 1,274,941 | 1,581,075 | ||
Series CPI, 0.10%, 5/15/2023 | EUR | 1,183,499 | 1,478,989 | ||
Series CPI, 0.40%, 5/15/2030 (a) | EUR | 981,233 | 1,274,561 | ||
Series CPI, 1.25%, 9/15/2032 (a) | EUR | 1,461,726 | 2,084,559 | ||
Series CPI, 1.30%, 5/15/2028 (a) | EUR | 1,722,319 | 2,364,040 | ||
Series CPI, 2.35%, 9/15/2024 (a) | EUR | 1,470,560 | 2,011,690 | ||
Series CPI, 2.35%, 9/15/2035 (a) | EUR | 1,468,163 | 2,469,236 | ||
Series CPI, 2.55%, 9/15/2041 (a) | EUR | 1,631,886 | 3,001,759 | ||
Series CPI, 2.60%, 9/15/2023 (a) | EUR | 2,028,627 | 2,729,295 | ||
Series CPI, 3.10%, 9/15/2026 (a) | EUR | 1,413,287 | 2,105,913 | ||
| 21,101,117 | |||||
| JAPAN — 4.4% | |||||
| Japanese Government CPI Linked Bond: | |||||
Series 17, 0.10%, 9/10/2023 | JPY | 63,745,000 | 619,347 | ||
Series 18, 0.10%, 3/10/2024 | JPY | 126,030,700 | 1,223,711 | ||
Series 19, 0.10%, 9/10/2024 | JPY | 170,859,000 | 1,658,827 | ||
Series 20, 0.10%, 3/10/2025 | JPY | 323,147,000 | 3,139,075 | ||
Series 21, 0.10%, 3/10/2026 | JPY | 208,488,480 | 2,029,433 | ||
Series 22, 0.10%, 3/10/2027 | JPY | 156,315,597 | 1,522,989 | ||
Series 23, 0.10%, 3/10/2028 | JPY | 249,478,080 | 2,427,799 |
| Security Description | Principal Amount | Value | |||
Series 24, 0.10%, 3/10/2029 | JPY | 355,647,560 | $ 3,467,396 | ||
Series 25, 0.20%, 3/10/2030 | JPY | 82,268,770 | 815,158 | ||
| 16,903,735 | |||||
| MEXICO — 4.4% | |||||
| Mexican Udibonos: | |||||
Series S, 2.00%, 6/9/2022 | MXN | 51,391,545 | 2,608,923 | ||
Series S, 3.50%, 11/16/2023 | MXN | 11,890,075 | 636,635 | ||
Series S, 4.00%, 11/30/2028 | MXN | 49,211,698 | 2,857,072 | ||
Series S, 4.00%, 11/15/2040 | MXN | 50,863,106 | 2,948,556 | ||
Series S, 4.00%, 11/8/2046 | MXN | 44,918,059 | 2,688,208 | ||
Series S, 4.00%, 11/3/2050 | MXN | 13,871,754 | 842,428 | ||
Series S, 4.50%, 12/4/2025 | MXN | 45,182,283 | 2,597,196 | ||
Series S, 4.50%, 11/22/2035 | MXN | 26,686,612 | 1,660,368 | ||
| 16,839,386 | |||||
| NEW ZEALAND — 2.7% | |||||
| New Zealand Government Bond: | |||||
Series 0925, 2.00%, 9/20/2025 | NZD | 2,520,018 | 2,033,871 | ||
Series 0935, 2.50%, 9/20/2035 | NZD | 2,913,834 | 2,908,926 | ||
Series 0940, 2.50%, 9/20/2040 | NZD | 2,006,250 | 2,109,156 | ||
Series 0930, 3.00%, 9/20/2030 | NZD | 3,211,942 | 3,083,318 | ||
| 10,135,271 | |||||
| SOUTH AFRICA — 4.7% | |||||
| South Africa Government Bond - CPI Linked: | |||||
Series 2029, 1.88%, 3/31/2029 | ZAR | 12,032,643 | 695,298 | ||
Series 2033, 1.88%, 2/28/2033 | ZAR | 20,522,798 | 1,063,759 | ||
Series 2025, 2.00%, 1/31/2025 | ZAR | 34,604,128 | 2,289,602 | ||
Series 2038, 2.25%, 1/31/2038 | ZAR | 36,108,658 | 1,796,334 | ||
Series 2046, 2.50%, 3/31/2046 | ZAR | 36,868,965 | 1,742,256 | ||
Series 2050, 2.50%, 12/31/2050 | ZAR | 46,597,451 | 2,113,673 | ||
Series R210, 2.60%, 3/31/2028 | ZAR | 24,390,128 | 1,530,265 | ||
Series R212, 2.75%, 1/31/2022 | ZAR | 20,840,244 | 1,443,039 |
| Security Description | Principal Amount | Value | |||
Series R202, 3.45%, 12/7/2033 | ZAR | 38,432,003 | $ 2,361,177 | ||
Series R197, 5.50%, 12/7/2023 | ZAR | 36,307,630 | 2,750,792 | ||
| 17,786,195 | |||||
| SOUTH KOREA — 0.7% | |||||
| Inflation Linked Korea Treasury Bond: | |||||
Series 2606, 1.00%, 6/10/2026 | KRW | 908,745,760 | 857,780 | ||
Series 2806, 1.75%, 6/10/2028 | KRW | 1,688,126,850 | 1,670,141 | ||
| 2,527,921 | |||||
| SPAIN — 4.4% | |||||
| Spain Government Inflation Linked Bond: | |||||
0.15%, 11/30/2023 | EUR | 708,250 | 904,008 | ||
0.30%, 11/30/2021 | EUR | 1,489,781 | 1,853,511 | ||
0.65%, 11/30/2027 (a) | EUR | 2,396,074 | 3,306,675 | ||
0.70%, 11/30/2033 (a) | EUR | 1,555,072 | 2,288,509 | ||
1.00%, 11/30/2030 (a) | EUR | 2,818,152 | 4,142,535 | ||
1.80%, 11/30/2024 (a) | EUR | 3,145,123 | 4,337,367 | ||
| 16,832,605 | |||||
| SWEDEN — 3.8% | |||||
| Sweden Inflation Linked Bond: | |||||
Series 3112, 0.13%, 6/1/2026 | SEK | 14,338,432 | 1,913,742 | ||
Series 3113, 0.13%, 12/1/2027 | SEK | 15,334,126 | 2,093,787 | ||
Series 3111, 0.13%, 6/1/2032 (a) | SEK | 14,151,533 | 2,076,990 | ||
Series 3108, 0.25%, 6/1/2022 (a) | SEK | 19,377,866 | 2,406,516 | ||
Series 3109, 1.00%, 6/1/2025 (a) | SEK | 19,803,742 | 2,694,171 | ||
Series 3104, 3.50%, 12/1/2028 (a) | SEK | 19,006,093 | 3,290,939 | ||
| 14,476,145 | |||||
| TURKEY — 5.4% | |||||
| Turkey Government Bond: | |||||
Series CPI, 1.00%, 5/3/2023 | TRY | 8,354,300 | 1,106,017 | ||
1.50%, 6/18/2025 | TRY | 5,369,547 | 709,175 | ||
Series CPI, 2.00%, 10/26/2022 | TRY | 10,824,481 | 1,466,790 | ||
Series CPI, 2.00%, 9/18/2024 | TRY | 7,561,052 | 1,023,489 | ||
Series CPI, 2.00%, 4/16/2025 | TRY | 10,721,605 | 1,453,219 | ||
Series CPI, 2.40%, 5/8/2024 | TRY | 7,215,791 | 989,438 |
| Security Description | Principal Amount | Value | |||
Series CPI, 2.70%, 1/14/2026 | TRY | 9,915,312 | $ 1,380,026 | ||
Series CPI, 2.80%, 11/8/2023 | TRY | 5,126,021 | 709,063 | ||
Series CPI, 2.90%, 7/7/2027 | TRY | 8,640,372 | 1,209,632 | ||
Series CPI, 2.90%, 1/12/2028 | TRY | 1,503,495 | 209,880 | ||
Series CPI, 3.00%, 7/21/2021 | TRY | 31,169,873 | 4,252,355 | ||
Series CPI, 3.00%, 2/23/2022 | TRY | 9,204,801 | 1,265,284 | ||
Series CPI, 3.00%, 8/2/2023 | TRY | 11,140,834 | 1,547,382 | ||
3.20%, 11/6/2024 | TRY | 3,441,901 | 488,411 | ||
Series CPI, 3.30%, 6/28/2028 | TRY | 14,134,920 | 2,022,884 | ||
4.10%, 6/5/2024 | TRY | 480,670 | 69,768 | ||
Series CPI, 4.20%, 1/10/2024 | TRY | 5,500,395 | 793,359 | ||
| 20,696,172 | |||||
| UNITED KINGDOM — 22.0% | |||||
| United Kingdom Gilt Inflation Linked: | |||||
Series 3MO, 0.13%, 3/22/2024 | GBP | 1,466,524 | 2,205,021 | ||
Series 3MO, 0.13%, 3/22/2026 | GBP | 1,435,944 | 2,298,132 | ||
Series 3MO, 0.13%, 8/10/2028 | GBP | 1,496,623 | 2,583,628 | ||
Series 3MO, 0.13%, 3/22/2029 | GBP | 1,487,496 | 2,608,890 | ||
Series 3MO, 0.13%, 11/22/2036 | GBP | 1,075,258 | 2,293,174 | ||
Series 3MO, 0.13%, 8/10/2041 | GBP | 945,783 | 2,210,256 | ||
Series 3MO, 0.13%, 3/22/2044 | GBP | 1,365,750 | 3,335,161 | ||
Series 3MO, 0.13%, 3/22/2046 | GBP | 1,084,549 | 2,751,159 | ||
Series 3MO, 0.13%, 8/10/2048 | GBP | 926,406 | 2,473,384 | ||
Series 3MO, 0.13%, 11/22/2056 | GBP | 516,643 | 1,597,126 | ||
Series 3MO, 0.13%, 3/22/2058 | GBP | 856,839 | 2,710,376 | ||
Series 3MO, 0.13%, 11/22/2065 | GBP | 621,525 | 2,315,017 | ||
Series 3MO, 0.13%, 3/22/2068 | GBP | 1,119,680 | 4,482,193 | ||
Series 3MO, 0.25%, 3/22/2052 | GBP | 1,155,067 | 3,386,316 | ||
Series 3MO, 0.38%, 3/22/2062 | GBP | 1,528,727 | 5,560,178 | ||
Series 3MO, 0.50%, 3/22/2050 | GBP | 1,034,325 | 3,067,790 |
| Security Description | Principal Amount | Value | |||
Series 3MO, 0.63%, 3/22/2040 | GBP | 1,495,131 | $ 3,658,898 | ||
Series 3MO, 0.63%, 11/22/2042 | GBP | 1,357,478 | 3,528,462 | ||
Series 3MO, 0.75%, 3/22/2034 | GBP | 1,222,926 | 2,615,908 | ||
Series 3MO, 0.75%, 11/22/2047 | GBP | 1,012,813 | 3,001,925 | ||
Series 3MO, 1.13%, 11/22/2037 | GBP | 2,502,932 | 6,227,729 | ||
Series 3MO, 1.25%, 11/22/2027 | GBP | 1,592,310 | 2,883,410 | ||
Series 3MO, 1.25%, 11/22/2032 | GBP | 1,423,007 | 3,086,031 | ||
Series 3MO, 1.25%, 11/22/2055 | GBP | 1,194,353 | 4,608,029 | ||
Series 3MO, 1.88%, 11/22/2022 | GBP | 1,545,502 | 2,312,108 | ||
Series 8MO, 2.00%, 1/26/2035 | GBP | 967,828 | 2,385,849 | ||
Series 8MO, 2.50%, 7/17/2024 | GBP | 1,271,502 | 2,069,561 | ||
Series 8MO, 4.13%, 7/22/2030 | GBP | 648,853 | 1,558,240 | ||
| 83,813,951 | |||||
TOTAL FOREIGN GOVERNMENT OBLIGATIONS (Cost $332,404,511) | 378,860,169 |
| Shares | |||
| SHORT-TERM INVESTMENT — 0.0% (b) | |||
State Street Institutional U.S. Government Money Market Fund, Class G Shares 0.05% (c) (d) (Cost $99,158) | 99,158 | 99,158 | |
TOTAL INVESTMENTS — 99.5% (Cost $332,503,669) | 378,959,327 | ||
OTHER ASSETS IN EXCESS OF LIABILITIES — 0.5% | 1,758,032 | ||
NET ASSETS — 100.0% | $ 380,717,359 | ||
| (a) | Securities purchased pursuant to Rule 144A of the Securities Act of 1933, as amended. These securities, which represent 15.0% of net assets as of December 31, 2020, are considered liquid and may be resold in transactions exempt from registration, normally to qualified institutional buyers. |
| (b) | Amount is less than 0.05% of net assets. |
| (c) | The Fund invested in certain money market funds managed by SSGA Funds Management, Inc. Amounts related to these transactions during the period ended December 31, 2020 are shown in the Affiliate Table below. |
| (d) | The rate shown is the annualized seven-day yield at December 31, 2020. |
| AUD | Australian Dollar |
| BRL | Brazilian Real |
| CAD | Canadian Dollar |
| CLP | Chilean Peso |
| COP | Colombian Peso |
| EUR | Euro |
| GBP | British Pound |
| ILS | Israeli New Shekel |
| JPY | Japanese Yen |
| KRW | South Korean Won |
| MXN | Mexican Peso |
| NZD | New Zealand Dollar |
| SEK | Swedish Krona |
| TRY | Turkish New Lira |
| ZAR | South African Rand |
| Description | Level 1 – Quoted Prices | Level 2 – Other Significant Observable Inputs | Level 3 – Significant Unobservable Inputs | Total | ||||
| ASSETS: | ||||||||
| INVESTMENTS: | ||||||||
Foreign Government Obligations | $ — | $378,860,169 | $— | $378,860,169 | ||||
Short-Term Investment | 99,158 | — | — | 99,158 | ||||
TOTAL INVESTMENTS | $99,158 | $378,860,169 | $— | $378,959,327 |
| Number of Shares Held at 12/31/19 | Value at 12/31/19 | Cost of Purchases | Proceeds from Shares Sold | Realized Gain (Loss) | Change in Unrealized Appreciation/ Depreciation | Number of Shares Held at 12/31/20 | Value at 12/31/20 | Dividend Income | |||||||||
State Street Institutional U.S. Government Money Market Fund, Class G Shares | 69,368 | $69,368 | $12,391,025 | $12,361,235 | $— | $— | 99,158 | $99,158 | $1,033 |
| SPDR Bloomberg Barclays Emerging Markets Local Bond ETF | SPDR Bloomberg Barclays International Corporate Bond ETF | ||
| ASSETS | |||
Investments in unaffiliated issuers, at value* | $ 988,524,749 | $255,588,371 | |
Investments in affiliated issuers, at value | 10,227,948 | 640,380 | |
Total Investments | 998,752,697 | 256,228,751 | |
Foreign currency, at value | 6,410,481 | 1,535,401 | |
Cash | — | — | |
Receivable for investments sold | 12,385,854 | 1,267,523 | |
Receivable for fund shares sold | 5,599,440 | — | |
Unrealized appreciation on forward foreign currency exchange contracts | 83,265 | — | |
Dividends receivable — affiliated issuers | 184 | 11 | |
Interest receivable - unaffiliated issuers | 12,823,264 | 2,216,315 | |
Securities lending income receivable — affiliated issuers | — | 143 | |
Receivable for foreign taxes recoverable | 112,038 | 6,666 | |
TOTAL ASSETS | 1,036,167,223 | 261,254,810 | |
| LIABILITIES | |||
Payable upon return of securities loaned | — | 597,922 | |
Payable for investments purchased | 21,795,193 | — | |
Unrealized depreciation on forward foreign currency exchange contracts | 87,259 | — | |
Deferred foreign taxes payable | 567,431 | — | |
Advisory fee payable | 272,450 | 108,173 | |
Trustees’ fees and expenses payable | 1,539 | 2,600 | |
TOTAL LIABILITIES | 22,723,872 | 708,695 | |
NET ASSETS | $1,013,443,351 | $ 260,546,115 | |
| NET ASSETS CONSIST OF: | |||
Paid-in Capital | $ 987,737,710 | $241,372,018 | |
Total distributable earnings (loss)** | 25,705,641 | 19,174,097 | |
NET ASSETS | $1,013,443,351 | $ 260,546,115 | |
| NET ASSET VALUE PER SHARE | |||
Net asset value per share | $ 28.00 | $ 37.76 | |
Shares outstanding (unlimited amount authorized, $0.01 par value) | 36,200,000 | 6,900,000 | |
| COST OF INVESTMENTS: | |||
Investments in unaffiliated issuers | $ 945,983,194 | $236,039,348 | |
Investments in affiliated issuers | 10,227,948 | 640,380 | |
Total cost of investments | $ 956,211,142 | $236,679,728 | |
Foreign currency, at cost | $ 6,370,603 | $ 1,525,356 | |
* Includes investments in securities on loan, at value | $ — | $ 587,761 | |
** Includes deferred foreign taxes | $ 567,431 | $ — |
| SPDR Bloomberg Barclays International Treasury Bond ETF | SPDR Bloomberg Barclays Short Term International Treasury Bond ETF | SPDR FTSE International Government Inflation-Protected Bond ETF | ||
| $ 993,496,821 | $203,407,843 | $378,860,169 | ||
| 3,640 | 69,640 | 99,158 | ||
| 993,500,461 | 203,477,483 | 378,959,327 | ||
| 1,737,611 | 431,249 | 186,614 | ||
| 12,963 | 2,839 | — | ||
| 9,524,902 | 7,997,319 | — | ||
| — | — | — | ||
| — | — | — | ||
| — | — | — | ||
| 6,592,840 | 1,421,757 | 1,782,526 | ||
| — | — | — | ||
| 660,661 | 177,997 | — | ||
| 1,012,029,438 | 213,508,644 | 380,928,467 | ||
| — | — | — | ||
| — | — | — | ||
| — | — | — | ||
| 183,984 | 5,431 | 50,320 | ||
| 297,077 | 70,686 | 158,485 | ||
| 1,696 | 3,226 | 2,303 | ||
| 482,757 | 79,343 | 211,108 | ||
| $ 1,011,546,681 | $213,429,301 | $380,717,359 | ||
| $ 942,922,874 | $200,206,453 | $341,654,767 | ||
| 68,623,807 | 13,222,848 | 39,062,592 | ||
| $ 1,011,546,681 | $213,429,301 | $380,717,359 | ||
| $ 31.22 | $ 32.84 | $ 58.57 | ||
| 32,400,038 | 6,500,000 | 6,500,483 | ||
| $ 922,837,652 | $189,837,427 | $ 332,404,511 | ||
| 3,640 | 69,640 | 99,158 | ||
| $ 922,841,292 | $189,907,067 | $332,503,669 | ||
| $ 1,727,454 | $ 429,721 | $ 183,785 | ||
| $ — | $ — | $ — | ||
| $ 183,984 | $ 5,431 | $ 48,394 |
| SPDR Bloomberg Barclays Emerging Markets Local Bond ETF | SPDR Bloomberg Barclays International Corporate Bond ETF | ||
| INVESTMENT INCOME | |||
Interest income — unaffiliated issuers | $ 42,492,140 | $ 1,959,189 | |
Dividend income — affiliated issuers | 29,435 | 376 | |
Unaffiliated securities lending income | — | — | |
Affiliated securities lending income | 3,588 | 6,135 | |
Foreign taxes withheld | (1,255,576) | (2,108) | |
TOTAL INVESTMENT INCOME (LOSS) | 41,269,587 | 1,963,592 | |
| EXPENSES | |||
Advisory fee | 2,712,383 | 948,280 | |
Trustees’ fees and expenses | 18,991 | 565 | |
TOTAL EXPENSES | 2,731,374 | 948,845 | |
NET INVESTMENT INCOME (LOSS) | $ 38,538,213 | $ 1,014,747 | |
| REALIZED AND UNREALIZED GAIN (LOSS) | |||
| Net realized gain (loss) on: | |||
Investments—unaffiliated issuers* | (34,298,625) | (2,446,060) | |
In-kind redemptions — unaffiliated issuers | 3,107,563 | (209,028) | |
Forward foreign currency exchange contracts | 42,996 | — | |
Foreign currency transactions | (5,639,370) | (31,713) | |
Net realized gain (loss) | (36,787,436) | (2,686,801) | |
| Net change in unrealized appreciation/depreciation on: | |||
Investments — unaffiliated issuers** | 20,119,672 | 23,004,869 | |
Forward foreign currency exchange contracts | (110,578) | — | |
Foreign currency translations | 228,373 | 64,919 | |
Net change in unrealized appreciation/depreciation | 20,237,467 | 23,069,788 | |
NET REALIZED AND UNREALIZED GAIN (LOSS) | (16,549,969) | 20,382,987 | |
NET INCREASE (DECREASE) IN NET ASSETS FROM OPERATIONS | $ 21,988,244 | $21,397,734 | |
* Includes foreign capital gain taxes | $ (123,007) | $ — | |
** Includes foreign deferred taxes | $ (293,327) | $ — |
| SPDR Bloomberg Barclays International Treasury Bond ETF | SPDR Bloomberg Barclays Short Term International Treasury Bond ETF | SPDR FTSE International Government Inflation-Protected Bond ETF | ||
| $ 14,401,494 | $ 1,325,102 | $ 8,323,130 | ||
| 2,315 | 1,020 | 1,033 | ||
| 2,199 | — | — | ||
| — | — | — | ||
| (338,596) | (58,861) | (42,293) | ||
| 14,067,412 | 1,267,261 | 8,281,870 | ||
| 3,195,109 | 872,023 | 1,727,088 | ||
| 6,818 | 684 | 782 | ||
| 3,201,927 | 872,707 | 1,727,870 | ||
| $ 10,865,485 | $ 394,554 | $ 6,554,000 | ||
| (6,780,558) | (2,008,990) | (12,877,047) | ||
| (3,533,611) | 2,238,057 | 4,368,984 | ||
| — | — | — | ||
| (1,546,600) | 76,542 | (1,007,097) | ||
| (11,860,769) | 305,609 | (9,515,160) | ||
| 75,776,556 | 12,866,594 | 24,806,713 | ||
| — | — | — | ||
| 201,012 | 21,596 | 66,589 | ||
| 75,977,568 | 12,888,190 | 24,873,302 | ||
| 64,116,799 | 13,193,799 | 15,358,142 | ||
| $ 74,982,284 | $13,588,353 | $ 21,912,142 | ||
| $ (26,335) | $ (20,896) | $ (6,266) | ||
| $ (102,489) | $ 5,290 | $ (5,894) |
| SPDR Bloomberg Barclays Emerging Markets Local Bond ETF | |||||
| Year Ended 12/31/20 | Six-month Period Ended 12/31/19(a) | Year Ended 6/30/19 | |||
| INCREASE (DECREASE) IN NET ASSETS FROM OPERATIONS: | |||||
Net investment income (loss) | $ 38,538,213 | $ 20,770,689 | $ 36,200,827 | ||
Net realized gain (loss) | (36,787,436) | (21,114,549) | (23,459,125) | ||
Net change in unrealized appreciation/depreciation | 20,237,467 | 27,339,901 | 40,737,222 | ||
Net increase (decrease) in net assets resulting from operations | 21,988,244 | 26,996,041 | 53,478,924 | ||
Distributions to shareholders | (7,233,667) | (1,987,352) | (18,596,461) | ||
Return of capital | (27,530,700) | (21,574,785) | (12,351,842) | ||
Total Distributions to shareholders | (34,764,367) | (23,562,137) | (30,948,303) | ||
| FROM BENEFICIAL INTEREST TRANSACTIONS: | |||||
Proceeds from shares sold | 363,726,320 | 222,765,636 | 283,813,595 | ||
Cost of shares redeemed | (353,921,776) | (21,644,038) | (16,273,520) | ||
Other Capital | 785,892 | 335,816 | 591,371 | ||
Net increase (decrease) from share transactions | 10,590,436 | 201,457,414 | 268,131,446 | ||
Net increase (decrease) in net assets from beneficial interest transactions | 10,590,436 | 201,457,414 | 268,131,446 | ||
Contribution from Affiliate (Note 4) | — | — | 142,298 | ||
Net increase (decrease) in net assets during the period | (2,185,687) | 204,891,318 | 290,804,365 | ||
Net assets at beginning of period | 1,015,629,038 | 810,737,720 | 519,933,355 | ||
NET ASSETS AT END OF PERIOD | $1,013,443,351 | $1,015,629,038 | $810,737,720 | ||
| SHARES OF BENEFICIAL INTEREST: | |||||
Shares sold | 13,400,000 | 8,100,000 | 10,600,000 | ||
Shares redeemed | (13,700,000) | (800,000) | (600,000) | ||
Net increase (decrease) from share transactions | (300,000) | 7,300,000 | 10,000,000 | ||
| (a) | Effective November 12, 2019, the Board of Trustees approved a change in fiscal year end for the Fund from June 30 to December 31. |
| SPDR Bloomberg Barclays International Corporate Bond ETF | SPDR Bloomberg Barclays International Treasury Bond ETF | |||||||||
| Year Ended 12/31/20 | Six-month Period Ended 12/31/19(a) | Year Ended 6/30/19 | Year Ended 12/31/20 | Six-month Period Ended 12/31/19(a) | Year Ended 6/30/19 | |||||
| $ 1,014,747 | $ 721,641 | $ 1,628,186 | $ 10,865,485 | $ 7,133,359 | $ 15,953,339 | |||||
| (2,686,801) | (1,475,355) | (6,055,393) | (11,860,769) | (2,204,516) | (17,770,790) | |||||
| 23,069,788 | 814,963 | 5,954,873 | 75,977,568 | (3,085,816) | 51,709,951 | |||||
| 21,397,734 | 61,249 | 1,527,666 | 74,982,284 | 1,843,027 | 49,892,500 | |||||
| (240,207) | (499,181) | — | (9,187,648) | (7,025,941) | (13,509,746) | |||||
| (677,526) | (159,224) | (1,352,194) | — | — | — | |||||
| (917,733) | (658,405) | (1,352,194) | (9,187,648) | (7,025,941) | (13,509,746) | |||||
| 109,839,151 | 46,924,212 | 9,941,724 | 216,578,417 | 89,142,321 | 296,314,744 | |||||
| (60,177,217) | (23,493,520) | (73,064,672) | (300,066,124) | (178,026,850) | (729,733,193) | |||||
| 131,234 | 81,587 | 19,650 | 371,816 | 56,593 | 270,459 | |||||
| 49,793,168 | 23,512,279 | (63,103,298) | (83,115,891) | (88,827,936) | (433,147,990) | |||||
| 49,793,168 | 23,512,279 | (63,103,298) | (83,115,891) | (88,827,936) | (433,147,990) | |||||
| — | — | — | 12,963 | — | — | |||||
| 70,273,169 | 22,915,123 | (62,927,826) | (17,308,292) | (94,010,850) | (396,765,236) | |||||
| 190,272,946 | 167,357,823 | 230,285,649 | 1,028,854,973 | 1,122,865,823 | 1,519,631,059 | |||||
| $ 260,546,115 | $190,272,946 | $167,357,823 | $ 1,011,546,681 | $1,028,854,973 | $1,122,865,823 | |||||
| 3,100,000 | 1,400,000 | 300,000 | 7,300,000 | 3,100,000 | 10,700,000 | |||||
| (1,800,000) | (700,000) | (2,200,000) | (10,700,000) | (6,200,000) | (26,300,000) | |||||
| 1,300,000 | 700,000 | (1,900,000) | (3,400,000) | (3,100,000) | (15,600,000) | |||||
| (a) | Effective November 12, 2019, the Board of Trustees approved a change in fiscal year end for the Fund from June 30 to December 31. |
| SPDR Bloomberg Barclays Short Term International Treasury Bond ETF | |||||
| Year Ended 12/31/20 | Six-month Period Ended 12/31/19(a) | Year Ended 6/30/19 | |||
| INCREASE (DECREASE) IN NET ASSETS FROM OPERATIONS: | |||||
Net investment income (loss) | $ 394,554 | $ 650,533 | $ 1,439,783 | ||
Net realized gain (loss) | 305,609 | (3,250,719) | (2,158,472) | ||
Net change in unrealized appreciation/depreciation | 12,888,190 | 1,721,876 | 1,978,189 | ||
Net increase (decrease) in net assets resulting from operations | 13,588,353 | (878,310) | 1,259,500 | ||
Distributions to shareholders | (360,995) | — | (3,097,036) | ||
Return of capital | — | (667,017) | (606,203) | ||
Total Distributions to shareholders | (360,995) | (667,017) | (3,703,239) | ||
| FROM BENEFICIAL INTEREST TRANSACTIONS: | |||||
Proceeds from shares sold | 24,375,784 | 33,490,820 | 64,766,646 | ||
Cost of shares redeemed | (123,724,120) | (30,583,886) | (96,823,406) | ||
Other Capital | 51,143 | 16,994 | 35,702 | ||
Net increase (decrease) from share transactions | (99,297,193) | 2,923,928 | (32,021,058) | ||
Net increase (decrease) in net assets from beneficial interest transactions | (99,297,193) | 2,923,928 | (32,021,058) | ||
Contribution from Affiliate (Note 4) | 2,839 | — | — | ||
Net increase (decrease) in net assets during the period | (86,066,996) | 1,378,601 | (34,464,797) | ||
Net assets at beginning of period | 299,496,297 | 298,117,696 | 332,582,493 | ||
NET ASSETS AT END OF PERIOD | $ 213,429,301 | $299,496,297 | $ 298,117,696 | ||
| SHARES OF BENEFICIAL INTEREST: | |||||
Shares sold | 800,000 | 1,100,000 | 2,100,000 | ||
Shares redeemed | (4,000,000) | (1,000,000) | (3,100,000) | ||
Net increase (decrease) from share transactions | (3,200,000) | 100,000 | (1,000,000) | ||
| (a) | Effective November 12, 2019, the Board of Trustees approved a change in fiscal year end for the Fund from June 30 to December 31. |
| SPDR FTSE International Government Inflation-Protected Bond ETF | ||||
| Year Ended 12/31/20 | Six-month Period Ended 12/31/19(a) | Year Ended 6/30/19 | ||
| $ 6,554,000 | $ 5,438,873 | $ 16,759,415 | ||
| (9,515,160) | 1,352,754 | (27,735,476) | ||
| 24,873,302 | (46,949) | 28,930,152 | ||
| 21,912,142 | 6,744,678 | 17,954,091 | ||
| (6,033,523) | (7,249,343) | — | ||
| — | (138,032) | (16,623,886) | ||
| (6,033,523) | (7,387,375) | (16,623,886) | ||
| 27,546,758 | 11,029,696 | 21,554,235 | ||
| (94,086,672) | (54,943,938) | (115,583,422) | ||
| 162,162 | 59,664 | 254,750 | ||
| (66,377,752) | (43,854,578) | (93,774,437) | ||
| (66,377,752) | (43,854,578) | (93,774,437) | ||
| — | — | — | ||
| (50,499,133) | (44,497,275) | (92,444,232) | ||
| 431,216,492 | 475,713,767 | 568,157,999 | ||
| $380,717,359 | $431,216,492 | $ 475,713,767 | ||
| 500,000 | 200,000 | 400,000 | ||
| (1,800,000) | (1,000,000) | (2,200,000) | ||
| (1,300,000) | (800,000) | (1,800,000) | ||
| (a) | Effective November 12, 2019, the Board of Trustees approved a change in fiscal year end for the Fund from June 30 to December 31. |
| SPDR Bloomberg Barclays Emerging Markets Local Bond ETF | |||||||||||
| Year Ended 12/31/20 | Six-month Period Ended 12/31/19(a) | Year Ended 6/30/19 | Year Ended 6/30/18 | Year Ended 6/30/17 | Year Ended 6/30/16 | ||||||
Net asset value, beginning of period | $ 27.83 | $ 27.76 | $ 27.08 | $ 28.99 | $ 27.74 | $ 27.08 | |||||
| Income (loss) from investment operations: | |||||||||||
Net investment income (loss) (b) | 1.13 | 0.65 | 1.51 | 1.41 | 1.38 | 1.47 | |||||
Net realized and unrealized gain (loss) (c) | 0.05 | 0.15 | 0.45 | (2.28) | (0.18) | (0.90) | |||||
Total from investment operations | 1.18 | 0.80 | 1.96 | (0.87) | 1.20 | 0.57 | |||||
Contribution from Affiliate (Note 4) | — | — | 0.01 | — | — | — | |||||
Other capital (b) | 0.02 | 0.01 | 0.02 | 0.06 | 0.05 | 0.09 | |||||
| Distributions to shareholders from: | |||||||||||
Net investment income | (0.22) | (0.07) | (0.79) | (0.67) | — | — | |||||
Return of Capital | (0.81) | (0.67) | (0.52) | (0.43) | — | — | |||||
Total distributions | (1.03) | (0.74) | (1.31) | (1.10) | — | — | |||||
Net asset value, end of period | $ 28.00 | $ 27.83 | $ 27.76 | $ 27.08 | $ 28.99 | $ 27.74 | |||||
Total return (d) | 4.59% | 2.94% | 7.70%(e) | (3.03)% | 4.49% | 2.44% | |||||
| Ratios and Supplemental Data: | |||||||||||
Net assets, end of period (in 000s) | $1,013,443 | $1,015,629 | $810,738 | $519,933 | $130,438 | $205,272 | |||||
| Ratios to average net assets: | |||||||||||
Total expenses | 0.30% | 0.30%(f) | 0.39% | 0.41% | 0.47% | 0.50% | |||||
Net expenses | 0.30% | 0.30%(f) | 0.38% | 0.41% | 0.46% | 0.50% | |||||
Net investment income (loss) | 4.26% | 4.69%(f) | 5.68% | 4.81% | 4.95% | 5.67% | |||||
Portfolio turnover rate (g) | 50% | 18%(h) | 43% | 83% | 42% | 44% | |||||
| (a) | Effective November 12, 2019, the Board of Trustees approved a change in fiscal year end for the Fund from June 30 to December 31. |
| (b) | Per share numbers have been calculated using average shares outstanding, which more appropriately presents the per share data for the year. |
| (c) | Amounts shown in this caption for a share outstanding may not accord with the change in aggregate gains and losses in securities for the fiscal period because of the timing of sales and repurchases of Fund shares in relation to fluctuating market values for the Fund. |
| (d) | Total return is calculated assuming a purchase of shares at net asset value on the first day and a sale at net asset value on the last day of each period reported. Distributions are assumed, for the purpose of this calculation, to be reinvested at net asset value per share on the respective payment dates of each distribution. Total returns for periods of less than one year are not annualized. Broker commission charges are not included in this calculation. |
| (e) | If an Affiliate had not made a contribution during the year ended June 30, 2019, the total return would have been 7.66%. |
| (f) | Annualized. |
| (g) | Portfolio turnover rate excludes securities received or delivered from in-kind processing of creations or redemptions. |
| (h) | Not annualized. |
| SPDR Bloomberg Barclays International Corporate Bond ETF | |||||||||||
| Year Ended 12/31/20 | Six-month Period Ended 12/31/19(a) | Year Ended 6/30/19 | Year Ended 6/30/18 | Year Ended 6/30/17 | Year Ended 6/30/16 | ||||||
Net asset value, beginning of period | $ 33.98 | $ 34.15 | $ 33.87 | $ 33.17 | $ 32.44 | $ 31.34 | |||||
| Income (loss) from investment operations: | |||||||||||
Net investment income (loss) (b) | 0.18 | 0.14 | 0.29 | 0.25 | 0.42 | 0.57 | |||||
Net realized and unrealized gain (loss) (c) | 3.74 | (0.20) | 0.23 | 0.63 | 0.30 | 0.53 | |||||
Total from investment operations | 3.92 | (0.06) | 0.52 | 0.88 | 0.72 | 1.10 | |||||
Other capital (b) | 0.02 | 0.02 | 0.00(d) | 0.04 | 0.01 | (0.00)(d) | |||||
| Distributions to shareholders from: | |||||||||||
Net investment income | (0.04) | (0.10) | — | (0.22) | — | (0.00)(d) | |||||
Net realized gains | — | — | — | — | (0.00)(d) | — | |||||
Return of Capital | (0.12) | (0.03) | (0.24) | — | — | — | |||||
Total distributions | (0.16) | (0.13) | (0.24) | (0.22) | (0.00)(d) | (0.00)(d) | |||||
Net asset value, end of period | $ 37.76 | $ 33.98 | $ 34.15 | $ 33.87 | $ 33.17 | $ 32.44 | |||||
Total return (e) | 11.69% | (0.15)% | 1.59% | 2.71% | 2.26% | 3.54% | |||||
| Ratios and Supplemental Data: | |||||||||||
Net assets, end of period (in 000s) | $260,546 | $190,273 | $167,358 | $230,286 | $149,286 | $139,508 | |||||
| Ratios to average net assets: | |||||||||||
Total expenses | 0.50% | 0.50%(f) | 0.51% | 0.50% | 0.50% | 0.50% | |||||
Net investment income (loss) | 0.54% | 0.81%(f) | 0.88% | 0.72% | 1.30% | 1.80% | |||||
Portfolio turnover rate (g) | 23% | 5%(h) | 16% | 23% | 14% | 19% | |||||
| (a) | Effective November 12, 2019, the Board of Trustees approved a change in fiscal year end for the Fund from June 30 to December 31. |
| (b) | Per share numbers have been calculated using average shares outstanding, which more appropriately presents the per share data for the year. |
| (c) | Amounts shown in this caption for a share outstanding may not accord with the change in aggregate gains and losses in securities for the fiscal period because of the timing of sales and repurchases of Fund shares in relation to fluctuating market values for the Fund. |
| (d) | Amount is less than $0.005 per share. |
| (e) | Total return is calculated assuming a purchase of shares at net asset value on the first day and a sale at net asset value on the last day of each period reported. Distributions are assumed, for the purpose of this calculation, to be reinvested at net asset value per share on the respective payment dates of each distribution. Total returns for periods of less than one year are not annualized. Broker commission charges are not included in this calculation. |
| (f) | Annualized. |
| (g) | Portfolio turnover rate excludes securities received or delivered from in-kind processing of creations or redemptions. |
| (h) | Not annualized. |
| SPDR Bloomberg Barclays International Treasury Bond ETF | |||||||||||
| Year Ended 12/31/20 | Six-month Period Ended 12/31/19(a) | Year Ended 6/30/19 | Year Ended 6/30/18 | Year Ended 6/30/17 | Year Ended 6/30/16 | ||||||
Net asset value, beginning of period | $ 28.74 | $ 28.87 | $ 27.88 | $ 27.56 | $ 28.60 | $ 26.08 | |||||
| Income (loss) from investment operations: | |||||||||||
Net investment income (loss) (b) | 0.35 | 0.19 | 0.39 | 0.31 | 0.46 | 0.50 | |||||
Net realized and unrealized gain (loss) (c) | 2.42 | (0.13) | 0.92 | 0.24 | (1.51) | 2.01 | |||||
Total from investment operations | 2.77 | 0.06 | 1.31 | 0.55 | (1.05) | 2.51 | |||||
Contribution from Affiliate (Note 4) | 0.00(d) | — | — | — | — | — | |||||
Other capital (b) | 0.01 | 0.00(d) | 0.01 | 0.01 | 0.01 | 0.01 | |||||
| Distributions to shareholders from: | |||||||||||
Net investment income | (0.30) | (0.19) | (0.33) | (0.24) | — | — | |||||
Total distributions | (0.30) | (0.19) | (0.33) | (0.24) | — | — | |||||
Net asset value, end of period | $ 31.22 | $ 28.74 | $ 28.87 | $ 27.88 | $ 27.56 | $ 28.60 | |||||
Total return (e) | 9.73%(f) | 0.20% | 4.78% | 2.02% | (3.61)% | 9.67% | |||||
| Ratios and Supplemental Data: | |||||||||||
Net assets, end of period (in 000s) | $1,011,547 | $1,028,855 | $1,122,866 | $1,519,631 | $1,568,418 | $1,675,762 | |||||
| Ratios to average net assets: | |||||||||||
Total expenses | 0.35% | 0.35%(g) | 0.38% | 0.50% | 0.50% | 0.50% | |||||
Net investment income (loss) | 1.19% | 1.31%(g) | 1.42% | 1.09% | 1.46% | 1.86% | |||||
Portfolio turnover rate (h) | 16% | 7%(i) | 18% | 29% | 25% | 24% | |||||
| (a) | Effective November 12, 2019, the Board of Trustees approved a change in fiscal year end for the Fund from June 30 to December 31. |
| (b) | Per share numbers have been calculated using average shares outstanding, which more appropriately presents the per share data for the year. |
| (c) | Amounts shown in this caption for a share outstanding may not accord with the change in aggregate gains and losses in securities for the fiscal period because of the timing of sales and repurchases of Fund shares in relation to fluctuating market values for the Fund. |
| (d) | Amount is less than $0.005 per share. |
| (e) | Total return is calculated assuming a purchase of shares at net asset value on the first day and a sale at net asset value on the last day of each period reported. Distributions are assumed, for the purpose of this calculation, to be reinvested at net asset value per share on the respective payment dates of each distribution. Total returns for periods of less than one year are not annualized. Broker commission charges are not included in this calculation. |
| (f) | If an affiliate had not made a contribution during theyear ended December 31, 2020, the total return would have remained 9.73%. |
| (g) | Annualized. |
| (h) | Portfolio turnover rate excludes securities received or delivered from in-kind processing of creations or redemptions. |
| (i) | Not annualized. |
| SPDR Bloomberg Barclays Short Term International Treasury Bond ETF | |||||||||||
| Year Ended 12/31/20 | Six-month Period Ended 12/31/19(a) | Year Ended 6/30/19 | Year Ended 6/30/18 | Year Ended 6/30/17 | Year Ended 6/30/16 | ||||||
Net asset value, beginning of period | $ 30.88 | $ 31.05 | $ 31.38 | $ 31.23 | $ 31.48 | $ 30.71 | |||||
| Income (loss) from investment operations: | |||||||||||
Net investment income (loss) (b) | 0.05 | 0.07 | 0.16 | 0.00(c) | 0.03 | 0.17 | |||||
Net realized and unrealized gain (loss) (d) | 1.94 | (0.17) | (0.10) | 0.28 | (0.42) | 0.59 | |||||
Total from investment operations | 1.99 | (0.10) | 0.06 | 0.28 | (0.39) | 0.76 | |||||
Contribution from Affiliate (Note 4) | 0.00(c) | — | — | — | 0.18 | — | |||||
Other capital (b) | 0.01 | 0.00(c) | 0.00(c) | 0.01 | 0.00(c) | 0.03 | |||||
| Distributions to shareholders from: | |||||||||||
Net investment income | (0.04) | — | (0.33) | (0.14) | — | — | |||||
Net realized gains | — | — | — | — | (0.04) | (0.02) | |||||
Return of Capital | — | (0.07) | (0.06) | — | — | — | |||||
Total distributions | (0.04) | (0.07) | (0.39) | (0.14) | (0.04) | (0.02) | |||||
Net asset value, end of period | $ 32.84 | $ 30.88 | $ 31.05 | $ 31.38 | $ 31.23 | $ 31.48 | |||||
Total return (e) | 6.49%(f) | (0.36)% | 0.21% | 0.90% | (0.66)%(g) | 2.56% | |||||
| Ratios and Supplemental Data: | |||||||||||
Net assets, end of period (in 000s) | $213,429 | $299,496 | $298,118 | $332,582 | $196,749 | $182,560 | |||||
| Ratios to average net assets: | |||||||||||
Total expenses | 0.35% | 0.35%(h) | 0.36% | 0.35% | 0.35% | 0.35% | |||||
Net investment income (loss) | 0.16% | 0.43%(h) | 0.51% | 0.01% | 0.11% | 0.55% | |||||
Portfolio turnover rate (i) | 67% | 31%(j) | 66% | 63% | 74% | 85% | |||||
| (a) | Effective November 12, 2019, the Board of Trustees approved a change in fiscal year end for the Fund from June 30 to December 31. |
| (b) | Per share numbers have been calculated using average shares outstanding, which more appropriately presents the per share data for the year. |
| (c) | Amount is less than $0.005 per share. |
| (d) | Amounts shown in this caption for a share outstanding may not accord with the change in aggregate gains and losses in securities for the fiscal period because of the timing of sales and repurchases of Fund shares in relation to fluctuating market values for the Fund. |
| (e) | Total return is calculated assuming a purchase of shares at net asset value on the first day and a sale at net asset value on the last day of each period reported. Distributions are assumed, for the purpose of this calculation, to be reinvested at net asset value per share on the respective payment dates of each distribution. Total returns for periods of less than one year are not annualized. Broker commission charges are not included in this calculation. |
| (f) | If an affiliate had not made a contribution during the year ended ended December 31, 2020, the total return would have remained 6.49%. |
| (g) | If the Adviser had not made a one-time voluntary contribution during the period ended June 30, 2017, the total return would have been (1.24)%. |
| (h) | Annualized. |
| (i) | Portfolio turnover rate excludes securities received or delivered from in-kind processing of creations or redemptions. |
| (j) | Not annualized. |
| SPDR FTSE International Government Inflation-Protected Bond ETF | |||||||||||
| Year Ended 12/31/20 | Six-month Period Ended 12/31/19(a) | Year Ended 6/30/19 | Year Ended 6/30/18 | Year Ended 6/30/17 | Year Ended 6/30/16 | ||||||
Net asset value, beginning of period | $ 55.28 | $ 55.31 | $ 54.63 | $ 55.75 | $ 55.13 | $ 54.61 | |||||
| Income (loss) from investment operations: | |||||||||||
Net investment income (loss) (b) | 1.02 | 0.66 | 1.92 | 1.73 | 1.86 | 1.39 | |||||
Net realized and unrealized gain (loss) (c) | 3.17 | 0.19 | 0.57 | (1.11) | (0.65) | (0.37) | |||||
Total from investment operations | 4.19 | 0.85 | 2.49 | 0.62 | 1.21 | 1.02 | |||||
Contribution from Affiliate (Note 4) | — | — | — | 0.00(d) | — | — | |||||
Other capital (b) | 0.03 | 0.01 | 0.03 | 0.11 | 0.07 | 0.08 | |||||
| Distributions to shareholders from: | |||||||||||
Net investment income | (0.93) | (0.87) | — | (1.18) | — | (0.05) | |||||
Net realized gains | — | — | — | (0.47) | (0.66) | (0.53) | |||||
Return of Capital | — | (0.02) | (1.84) | (0.20) | — | — | |||||
Total distributions | (0.93) | (0.89) | (1.84) | (1.85) | (0.66) | (0.58) | |||||
Net asset value, end of period | $ 58.57 | $ 55.28 | $ 55.31 | $ 54.63 | $ 55.75 | $ 55.13 | |||||
Total return (e) | 7.76% | 1.58% | 4.78% | 1.21% | 2.39% | 2.12% | |||||
| Ratios and Supplemental Data: | |||||||||||
Net assets, end of period (in 000s) | $380,717 | $431,216 | $475,714 | $568,158 | $496,236 | $617,443 | |||||
| Ratios to average net assets: | |||||||||||
Total expenses | 0.50% | 0.50%(f) | 0.50% | 0.50% | 0.50% | 0.50% | |||||
Net investment income (loss) | 1.90% | 2.39%(f) | 3.60% | 3.02% | 3.39% | 2.63% | |||||
Portfolio turnover rate (g) | 28% | 8%(h) | 37% | 32% | 42% | 52% | |||||
| (a) | Effective November 12, 2019, the Board of Trustees approved a change in fiscal year end for the Fund from June 30 to December 31. |
| (b) | Per share numbers have been calculated using average shares outstanding, which more appropriately presents the per share data for the year. |
| (c) | Amounts shown in this caption for a share outstanding may not accord with the change in aggregate gains and losses in securities for the fiscal period because of the timing of sales and repurchases of Fund shares in relation to fluctuating market values for the Fund. |
| (d) | Amount is less than $0.005 per share. |
| (e) | Total return is calculated assuming a purchase of shares at net asset value on the first day and a sale at net asset value on the last day of each period reported. Distributions are assumed, for the purpose of this calculation, to be reinvested at net asset value per share on the respective payment dates of each distribution. Total returns for periods of less than one year are not annualized. Broker commission charges are not included in this calculation. |
| (f) | Annualized. |
| (g) | Portfolio turnover rate excludes securities received or delivered from in-kind processing of creations or redemptions. |
| (h) | Not annualized. |
| SPDR Bloomberg Barclays Emerging Markets Local Bond ETF |
| SPDR Bloomberg Barclays International Corporate Bond ETF |
| SPDR Bloomberg Barclays International Treasury Bond ETF |
| SPDR Bloomberg Barclays Short Term International Treasury Bond ETF |
| SPDR FTSE International Government Inflation-Protected Bond ETF |
| Funds | Strategies |
| SPDR Bloomberg Barclays Emerging Markets Local Bond ETF | Efficient portfolio management to reduce the currency deviation of the fund versus the Index |
| Asset Derivatives | |||||||||||
| Interest Rate Contracts Risk | Foreign Exchange Contracts Risk | Credit Contracts Risk | Equity Contracts Risk | Commodity Contracts Risk | Total | ||||||
| SPDR Bloomberg Barclays Emerging Markets Local Bond ETF | |||||||||||
Forward Foreign Currency Exchange Contracts | $— | $83,265 | $— | $— | $— | $83,265 | |||||
| Liability Derivatives | |||||||||||
| Interest Rate Contracts Risk | Foreign Exchange Contracts Risk | Credit Contracts Risk | Equity Contracts Risk | Commodity Contracts Risk | Total | ||||||
| SPDR Bloomberg Barclays Emerging Markets Local Bond ETF | |||||||||||
Forward Foreign Currency Exchange Contracts | $— | $87,259 | $— | $— | $— | $87,259 | |||||
| Net Realized Gain (Loss) | |||||||||||
| Interest Rate Contracts Risk | Foreign Exchange Contracts Risk | Credit Contracts Risk | Equity Contracts Risk | Commodity Contracts Risk | Total | ||||||
| SPDR Bloomberg Barclays Emerging Markets Local Bond ETF | |||||||||||
Forward Foreign Currency Exchange Contracts | $— | $42,996 | $— | $— | $— | $42,996 | |||||
| Net Change in Unrealized Appreciation (Depreciation) | |||||||||||
| Interest Rate Contracts Risk | Foreign Exchange Contracts Risk | Credit Contracts Risk | Equity Contracts Risk | Commodity Contracts Risk | Total | ||||||
| SPDR Bloomberg Barclays Emerging Markets Local Bond ETF | |||||||||||
Forward Foreign Currency Exchange Contracts | $— | $(110,578) | $— | $— | $— | $(110,578) | |||||
| Offsetting of Financial Assets and Derivative Assets | ||||||||
| Forward Foreign Currency Exchange Contracts | ||||||||
| Counterparty | Gross Amounts of Assets | Amount Eligible to Offset | Collateral (Received) Pledged | Net Amount | ||||
Societe Generale | $ 32,110 | $ (6,985) | $— | $25,125 | ||||
Standard Chartered Bank | 51,155 | (51,155) | — | — | ||||
| $83,265 | $(58,140) | $— | $25,125 | |||||
| Offsetting of Financial Liabilities and Derivative Liabilities | ||||||||
| Forward Foreign Currency Exchange Contracts | ||||||||
| Counterparty | Gross Amounts of Liabilities | Amount Eligible to Offset | Collateral (Received) Pledged | Net Amount | ||||
Citibank N.A. | $ (6,434) | $ — | $— | $ (6,434) | ||||
HSBC Bank USA | (3,200) | — | — | (3,200) | ||||
Societe Generale | (6,985) | 6,985 | — | — | ||||
Standard Chartered Bank | (69,173) | 51,155 | — | (18,018) | ||||
Westpac Banking Corp. | (1,467) | — | — | (1,467) | ||||
| $(87,259) | $58,140 | $— | $ (29,119) | |||||
| Annual Rate | |
SPDR Bloomberg Barclays Emerging Markets Local Bond ETF | 0.30% |
SPDR Bloomberg Barclays International Corporate Bond ETF | 0.50 |
SPDR Bloomberg Barclays International Treasury Bond ETF | 0.35 |
SPDR Bloomberg Barclays Short Term International Treasury Bond ETF | 0.35 |
SPDR FTSE International Government Inflation-Protected Bond ETF | 0.50 |
| Purchases | Sales | ||
SPDR Bloomberg Barclays Emerging Markets Local Bond ETF | $522,678,319 | $441,069,156 | |
SPDR Bloomberg Barclays International Corporate Bond ETF | 70,622,431 | 44,241,354 | |
SPDR Bloomberg Barclays International Treasury Bond ETF | 149,427,791 | 166,452,867 | |
SPDR Bloomberg Barclays Short Term International Treasury Bond ETF | 163,739,902 | 175,188,017 | |
SPDR FTSE International Government Inflation-Protected Bond ETF | 98,165,844 | 130,790,627 |
| In-kind Contributions | In-kind Redemptions | In-kind Net Realized Gains/(Losses) | |||
SPDR Bloomberg Barclays Emerging Markets Local Bond ETF | $ 50,670,843 | $ 118,522,627 | $ 3,107,563 | ||
SPDR Bloomberg Barclays International Corporate Bond ETF | 65,603,760 | 42,794,727 | (209,028) | ||
SPDR Bloomberg Barclays International Treasury Bond ETF | 183,696,739 | 243,787,051 | (3,533,611) | ||
SPDR Bloomberg Barclays Short Term International Treasury Bond ETF | 18,933,124 | 100,627,125 | 2,238,057 | ||
SPDR FTSE International Government Inflation-Protected Bond ETF | 18,749,108 | 61,526,570 | 4,368,984 |
| Ordinary Income | Long-Term Capital Gains | Tax Return of Capital | Total | ||||
SPDR Bloomberg Barclays Emerging Markets Local Bond ETF | $7,233,667 | $ — | $27,530,700 | $34,764,367 | |||
SPDR Bloomberg Barclays International Corporate Bond ETF | 240,207 | — | 677,526 | 917,733 | |||
SPDR Bloomberg Barclays International Treasury Bond ETF | 9,187,648 | — | — | 9,187,648 | |||
SPDR Bloomberg Barclays Short Term International Treasury Bond ETF | 217,049 | 143,946 | — | 360,995 | |||
SPDR FTSE International Government Inflation-Protected Bond ETF | 4,046,100 | 1,987,423 | — | 6,033,523 |
| Ordinary Income | Long-Term Capital Gains | Tax Return of Capital | Total | ||||
SPDR Bloomberg Barclays Emerging Markets Local Bond ETF | $ 1,987,352 | $ — | $ 21,574,785 | $ 23,562,137 | |||
SPDR Bloomberg Barclays International Corporate Bond ETF | 499,181 | — | 159,224 | 658,405 | |||
SPDR Bloomberg Barclays International Treasury Bond ETF | 7,025,941 | — | — | 7,025,941 | |||
SPDR Bloomberg Barclays Short Term International Treasury Bond ETF | — | — | 667,017 | 667,017 | |||
SPDR FTSE International Government Inflation-Protected Bond ETF | 6,804,640 | 444,703 | 138,032 | 7,387,375 |
| Undistributed Ordinary Income | Capital Loss Carryforwards | Undistributed Long-Term Capital Gains | Net Unrealized Gains (Losses) | Total | |||||
SPDR Bloomberg Barclays Emerging Markets Local Bond ETF | $— | $(15,353,241) | $ — | $41,087,042 | $25,733,801 | ||||
SPDR Bloomberg Barclays International Corporate Bond ETF | — | (340,889) | — | 19,526,541 | 19,185,652 | ||||
SPDR Bloomberg Barclays International Treasury Bond ETF | — | (790,828) | — | 70,034,063 | 69,243,235 | ||||
SPDR Bloomberg Barclays Short Term International Treasury Bond ETF | — | — | — | 13,617,936 | 13,617,936 | ||||
SPDR FTSE International Government Inflation-Protected Bond ETF | — | — | 1,231,484 | 37,831,108 | 39,062,592 |
| Non-Expiring Short Term | Non-Expiring Long Term | ||
SPDR Bloomberg Barclays Emerging Markets Local Bond ETF | $9,233,266 | $6,119,975 | |
SPDR Bloomberg Barclays International Corporate Bond ETF | 262,343 | 78,546 | |
SPDR Bloomberg Barclays International Treasury Bond ETF | 790,828 | — |
| Tax Cost | Gross Unrealized Appreciation | Gross Unrealized Depreciation | Net Unrealized Appreciation (Depreciation) | ||||
SPDR Bloomberg Barclays Emerging Markets Local Bond ETF | $957,612,174 | $61,395,813 | $20,822,721 | $40,573,092 | |||
SPDR Bloomberg Barclays International Corporate Bond ETF | 236,806,057 | 19,654,067 | 231,373 | 19,422,694 | |||
SPDR Bloomberg Barclays International Treasury Bond ETF | 923,593,344 | 79,847,206 | 10,124,073 | 69,723,133 | |||
SPDR Bloomberg Barclays Short Term International Treasury Bond ETF | 189,930,868 | 13,705,935 | 164,751 | 13,541,184 | |||
SPDR FTSE International Government Inflation-Protected Bond ETF | 341,176,906 | 47,393,285 | 9,659,258 | 37,734,027 |
| Fund | Market Value of Securities on Loan | Cash Collateral Received | Non-Cash Collateral Received | Total Collateral Received | ||||
SPDR Bloomberg Barclays International Corporate Bond ETF | $ 587,761 | $ 597,922 | $ — | $ 597,922 |
| Remaining Contractual Maturity of the Agreements As of December 31, 2020 | ||||||||||||||
| Fund | Securities Lending Transactions | Overnight and Continuous | <30 Days | Between 30 & 90 Days | >90 Days | Total Borrowings | Gross Amount of Recognized Liabilities for Securities Lending Transactions | |||||||
SPDR Bloomberg Barclays International Corporate Bond ETF | Corporate Bonds & Notes | $597,922 | $— | $— | $— | $597,922 | $597,922 | |||||||
| Individual series constituting SPDR Series Trust | Statement of operations | Statements of changes in net assets | Financial highlights |
| SPDR Bloomberg Barclays Emerging Markets Local Bond ETF SPDR Bloomberg Barclays International Corporate Bond ETF SPDR Bloomberg Barclays International Treasury Bond ETF SPDR Bloomberg Barclays Short Term International Treasury Bond ETF SPDR FTSE International Government Inflation-Protected Bond | For the year ended December 31, 2020 | For the year ended December 31, 2020, the period from July 1, 2019 to December 31, 2019 and the year ended June 30, 2019 | For the year ended December 31, 2020, the period from July 1, 2019 to December 31, 2019 and each of the four years in the period ended June 30, 2019 |

February 26, 2021
| Actual | Hypothetical (assuming a 5% return before expenses) | ||||||||
| Annualized Expense Ratio | Ending Account Value | Expenses Paid During Period(a) | Ending Account Value | Expenses Paid During Period(a) | |||||
SPDR Bloomberg Barclays Emerging Markets Local Bond ETF | 0.30% | $1,089.90 | $1.58 | $1,023.60 | $1.53 | ||||
| SPDR Bloomberg Barclays International Corporate Bond ETF | 0.50 | 1,128.50 | 2.68 | 1,022.60 | 2.54 | ||||
| SPDR Bloomberg Barclays International Treasury Bond ETF | 0.35 | 1,090.30 | 1.84 | 1,023.40 | 1.78 | ||||
| SPDR Bloomberg Barclays Short Term International Treasury Bond ETF | 0.35 | 1,079.40 | 1.83 | 1,023.40 | 1.78 | ||||
| SPDR FTSE International Government Inflation-Protected Bond ETF | 0.50 | 1,128.00 | 2.67 | 1,022.60 | 2.54 | ||||
| (a) | Expenses are equal to the Fund's annualized net expense ratio multiplied by the average account value of the period, multiplied by 184, then divided by 366. |
| Amount | |
SPDR Bloomberg Barclays Short Term International Treasury Bond ETF | $ 143,946 |
SPDR FTSE International Government Inflation-Protected Bond ETF | 1,987,423 |
| Amount | |
SPDR Bloomberg Barclays Emerging Markets Local Bond ETF | $1,378,668 |
SPDR Bloomberg Barclays International Corporate Bond ETF | 2,108 |
SPDR Bloomberg Barclays International Treasury Bond ETF | 343,552 |
SPDR Bloomberg Barclays Short Term International Treasury Bond ETF | 79,702 |
SPDR FTSE International Government Inflation-Protected Bond ETF | 48,556 |
| Amount | |
SPDR Bloomberg Barclays Emerging Markets Local Bond ETF | $38,738,192 |
SPDR Bloomberg Barclays International Corporate Bond ETF | 1,847,876 |
SPDR Bloomberg Barclays International Treasury Bond ETF | 12,765,794 |
SPDR Bloomberg Barclays Short Term International Treasury Bond ETF | 1,295,464 |
SPDR FTSE International Government Inflation-Protected Bond ETF | 7,422,901 |
| • | the Program supported each Fund’s ability to honor redemption requests timely; |
| • | the Program supported SSGA FM’s management of each Fund’s liquidity profile, including during periods of market volatility and net redemptions; |
| • | no material liquidity issues were identified during the period; |
| • | there were no material changes to the Program during the period; |
| • | the implementation of the Program was effective to manage each Fund’s liquidity risk; and |
| • | the Program operated adequately during the period. |
| Name, Address and Year of Birth | Position(s) with Funds | Term of Office and Length of Time Served | Principal Occupation(s) During Past 5 Years | Number of Portfolios in Fund Complex Overseen by Trustee† | Other Directorships Held by Trustee During the Past 5 Years | |||||
| Trustees | ||||||||||
| Independent Trustees | ||||||||||
| CARL G. VERBONCOEUR c/o SPDR Series Trust One Iron Street Boston, MA 02210 1952 | Independent Trustee, Chairman, Trustee Committee Chair | Term: Unlimited Served: since April 2010 | Self-employed consultant since 2009. | 126 | The Motley Fool Funds Trust (Trustee). | |||||
| BONNY EUGENIA BOATMAN c/o SPDR Series Trust One Iron Street Boston, MA 02210 1950 | Independent Trustee | Term: Unlimited Served: since April 2010 | Retired. | 126 | None. | |||||
| DWIGHT D. CHURCHILL c/o SPDR Series Trust One Iron Street Boston, MA 02210 1953 | Independent Trustee, Audit Committee Chair | Term: Unlimited Served: since April 2010 | Self-employed consultant since 2010; CEO and President, CFA Institute (June 2014-January 2015). | 126 | Affiliated Managers Group, Inc. (Chairman, Director and Audit Committee Chair). | |||||
| FRANK NESVET c/o SPDR Series Trust One Iron Street Boston, MA 02210 1943 | Independent Trustee | Term: Unlimited Served: since September 2000 | Retired. | 126 | None. | |||||
| CLARE S. RICHER c/o SPDR Series Trust One Iron Street Boston, MA 02210 1958 | Independent Trustee | Term: Unlimited Served: since July 2018 | Retired. Chief Financial Officer, Putnam Investments LLC (December 2008- May 2017). | 126 | Principal Financial Group (Director); Bain Capital Specialty Finance (Director); Putnam Acquisition Financing Inc. (Director); Putnam Acquisition Financing LLC (Director); Putnam GP Inc. (Director); Putnam Investor Services, Inc. (Director); Putnam Investments Limited (Director); University of Notre Dame (Trustee). |
| Name, Address and Year of Birth | Position(s) with Funds | Term of Office and Length of Time Served | Principal Occupation(s) During Past 5 Years | Number of Portfolios in Fund Complex Overseen by Trustee† | Other Directorships Held by Trustee During the Past 5 Years | |||||
| SANDRA G. SPONEM c/o SPDR Series Trust One Iron Street Boston, MA 02210 1958 | Independent Trustee | Term: Unlimited Served: since July 2018 | Retired. Chief Financial Officer, M.A. Mortenson Companies, Inc. (February 2007- April 2017). | 126 | Rydex Series Funds, Rydex Dynamic Funds, Rydex Variable Trust, Guggenheim Funds Trust, Guggenheim Variable Funds Trust, Guggenheim Strategy Funds Trust, Transparent Value Trust, Fiduciary/ Claymore Energy Infrastructure Fund, Guggenheim Taxable Municipal Managed Duration Trust, Guggenheim Strategic Opportunities Fund, Guggenheim Enhanced Equity Income Fund Guggenheim Credit Allocation Fund, Guggenheim Energy & Income Fund (Trustee and Audit Committee Chair). | |||||
| Interested Trustee | ||||||||||
| JAMES E. ROSS* c/o SPDR Series Trust One Iron Street Boston, MA 02210 1965 | Interested Trustee | Term: Unlimited Served as Trustee: since April 2010 | Non-Executive Chairman, Fusion Acquisition Corp. (June 2020 - Present); Retired Chairman and Director, SSGA Funds Management, Inc. (2005 - March 2020); Retired Executive Vice President, State Street Global Advisors (2012 - March 2020); Retired Chief Executive Officer and Director, State Street Global Advisors Funds Distributors, LLC (May 2017 - March 2020); Director, State Street Global Markets, LLC (2013 - April 2017); President, SSGA Funds Management, Inc. (2005 - 2012). | 137 | SSGA SPDR ETFs Europe I plc (Director) (November 2016- present); SSGA SPDR ETFs Europe II plc (Director) (November 2016- March 2020); State Street Navigator Securities Lending Trust (July 2016 - March 2020); SSGA Funds (January 2014 - March 2020); State Street Institutional Investment Trust (February 2007 - March 2020); State Street Master Funds (February 2007 - March 2020); Elfun Funds (July 2016 - December 2018). | |||||
| † For the purpose of determining the number of portfolios overseen by the Trustees, “Fund Complex” comprises registered investment companies for which SSGA Funds Management, Inc. serves as investment adviser. | ||||||||||
| * Mr. Ross is an Interested Trustee because of his former position with the Adviser and ownership interest in an affiliate of the Adviser. | ||||||||||
| Name, Address and Year of Birth | Position(s) with Funds | Term of Office and Length of Time Served | Principal Occupation(s) During the Past 5 Years | |||
| Officers | ||||||
| ELLEN M. NEEDHAM SSGA Funds Management, Inc. One Iron Street Boston, MA 02210 1967 | President | Term: Unlimited Served: since October 2012 | Chairman, SSGA Funds Management Inc. (March 2020 - present); President and Director, SSGA Funds Management, Inc. (2001 - present); Senior Managing Director, State Street Global Advisors (1992 - present)*; Manager, State Street Global Advisors Funds Distributors, LLC (May 2017 - present). | |||
| BRUCE S. ROSENBERG SSGA Funds Management, Inc. One Iron Street Boston, MA 02210 1961 | Treasurer | Term: Unlimited Served: since February 2016 | Managing Director, State Street Global Advisors and SSGA Funds Management, Inc. (July 2015 - present); Director, Credit Suisse (April 2008 - July 2015). | |||
| ANN M. CARPENTER SSGA Funds Management, Inc. One Iron Street Boston, MA 02210 1966 | Vice President; Deputy Treasurer | Term: Unlimited Served: since August 2012 (with respect to Vice President); since February 2016 (with respect to Deputy Treasurer) | Chief Operating Officer, SSGA Funds Management, Inc. (2005 - Present)*; Managing Director, State Street Global Advisors (2005 - present).* | |||
| MICHAEL P. RILEY SSGA Funds Management, Inc. One Iron Street Boston, MA 02210 1969 | Vice President | Term: Unlimited Served: since February 2005 | Managing Director, State Street Global Advisors (2005 - present).* | |||
| CHAD C. HALLETT SSGA Funds Management, Inc. One Iron Street Boston, MA 02210 1969 | Deputy Treasurer | Term: Unlimited Served: since February 2016 | Vice President, State Street Global Advisors and SSGA Funds Management, Inc. (November 2014 - present); Vice President, State Street Bank and Trust Company (2001 - November 2014).* | |||
| DARLENE ANDERSON-VASQUEZ SSGA Funds Management, Inc. One Iron Street Boston, MA 02210 1968 | Deputy Treasurer | Term: Unlimited Served: since November 2016 | Managing Director, State Street Global Advisors and SSGA Funds Management, Inc. (May 2016 - present); Senior Vice President, John Hancock Investments (September 2007 - May 2016). | |||
| ARTHUR A. JENSEN SSGA Funds Management, Inc. 1600 Summer Street Stamford, CT 06905 1966 | Deputy Treasurer | Term: Unlimited Served: Since August 2017 | Vice President at State Street Global Advisors (July 2016 – present); Mutual Funds Controller at GE Asset Management Incorporated (April 2011 - July 2016). | |||
| DAVID LANCASTER SSGA Funds Management, Inc. One Iron Street Boston, MA 02210 1971 | Assistant Treasurer | Term: Unlimited Served: since November 2020 | Vice President, State Street Global Advisors and SSGA Funds Management, Inc. (July 2017 - present); Assistant Vice President, State Street Bank and Trust Company (November 2011 - July 2017). | |||
| SUJATA UPRETI SSGA Funds Management, Inc. One Iron Street Boston, MA 02210 1974 | Assistant Treasurer | Term: Unlimited Served: since February 2016 | Vice President, State Street Global Advisors and SSGA Funds Management, Inc. (May 2015 - present). |
| Name, Address and Year of Birth | Position(s) with Funds | Term of Office and Length of Time Served | Principal Occupation(s) During the Past 5 Years | |||
| BRIAN HARRIS SSGA Funds Management, Inc. One Iron Street Boston, MA 02210 1973 | Chief Compliance Officer; Anti-Money Laundering Officer; Code of Ethics Compliance Officer | Term: Unlimited Served: since November 2013 | Managing Director, State Street Global Advisors and SSGA Funds Management, Inc. (June 2013 - present).* | |||
| SEAN O'MALLEY SSGA Funds Management, Inc. One Iron Street Boston, MA 02210 1969 | Chief Legal Officer | Term: Unlimited Served:since August 2019 | Senior Vice President and Deputy General Counsel, State Street Global Advisors (November 2013 - present). | |||
| DAVID BARR SSGA Funds Management, Inc One Iron Street Boston, MA 02210 1974 | Assistant Secretary | Term:Unlimited Served:since November 2020 | Vice President and Senior Counsel, State Street Global Advisors (October 2019 - present); Vice President at Eaton Vance Corp (October 2010 - October 2019). | |||
| DAVID URMAN SSGA Funds Management, Inc One Iron Street Boston, MA 02210 1985 | Assistant Secretary | Term:Unlimited Served:since August 2019 | Vice President and Senior Counsel, State Street Global Advisors (April 2019-Present); Vice President and Counsel, State Street Global Advisors (August 2015-April 2019); Associate, Ropes & Gray LLP (November 2012-August 2015). | |||
| * Served in various capacities and/or with various affiliated entities during noted time period. | ||||||
| The Statement of Additional Information (SAI) includes additional information about the Funds' trustees and is available, without charge, upon request and by calling 1-866-787-2257. | ||||||
One Iron Street
Boston, MA 02210
One Iron Street
Boston, MA 02210
and Transfer Agent
One Lincoln Street
Boston, MA 02111
1111 Pennsylvania Avenue, NW
Washington, DC 20004
200 Clarendon Street
Boston, MA 02116
One Iron Street
Boston, MA 02210
Item 2. Code of Ethics.
As of the end of the period covered by this report, the registrant has adopted a code of ethics that applies to the registrant’s principal executive officer, principal financial officer, principal accounting officer or controller, or persons performing similar functions, regardless of whether these individuals are employed by the registrant or a third party (the “Code of Ethics”). During the period covered by this report, no substantive amendments were made to the Code of Ethics. During the period covered by this report, the registrant did not grant any waivers, including any implicit waivers, from any provision of the Code of Ethics.
The Code of Ethics is attached hereto as Exhibit 13(a)(1).
Item 3. Audit Committee Financial Expert.
(a)(1) The Board of Trustees of the registrant has determined that the registrant has six Board members serving on the Audit Committee that possess the attributes identified in Instructions 2(b) of Item 3 to Form N-CSR to qualify as an “audit committee financial expert.”
(2) Bonny Boatman, Dwight Churchill, Frank Nesvet, Clare Richer, Sandra Sponem and Carl Verboncoeur are the registrant’s audit committee financial experts. The Board also determined that each of the foregoing persons are not “interested person(s)” of the registrant as that term is defined in Section 2(a)(19) of the Investment Company Act of 1940, as amended (the “1940 Act”).
Item 4. Principal Accountant Fees and Services.
(a) Audit Fees.
For the fiscal year ending December 31, 2020, reporting period ending December 31, 2019 and fiscal year ending June 30, 2019, the aggregate audit fees billed for professional services rendered by the principal accountant were $89,700, $65,780 and $1,108,872, respectively. Audit fees include the performance of the annual audits, security counts performed during the course of the period for each series of the registrant and routine regulatory filings (one for each SEC registrant).
(b) Audit-Related Fees.
For the fiscal year ending December 31, 2020, reporting period ending December 31, 2019 and fiscal year ending June 30, 2019, the principal accountant did not bill the registrant any fees for assurances and related services that are reasonably related to the performance of the audit of the registrant’s financial statements and are not reported under paragraph (a) of this Item.
(c) Tax Fees.
For the fiscal year ending December 31, 2020, reporting period ending December 31, 2019 and fiscal year ending June 30, 2019, the aggregate tax fees billed for professional services rendered by the principal accountant were $49,605, $29,750 and $803,601, respectively. Tax fees represent services related to the review of year-end distribution requirements, as well as the review and signing as preparer of all federal, state and excise income tax returns for the series of the registrant.
(d) All Other Fees.
There were no other fees billed by the principal accountant for the fiscal year ending December 31, 2020, reporting period ending December 31, 2019 and fiscal year ending June 30, 2019.
For the fiscal year ended December 31, 2020 and calendar year ended December 31, 2019, the aggregate fees for professional services rendered by E&Y for products and services provided by E&Y to the Adviser and any entity controlling, controlled by, or under common control with the Adviser that provides ongoing services to the Trust that (i) relate directly to the operations and financial reporting of the Trust and (ii) were pre-approved by the Audit Committee were approximately $7,019,005 and $6,939,666, respectively.
(e)(1) Audit Committee Pre-Approval Policies and Procedures.
The registrant’s Audit Committee Charter states the following with respect to pre-approval procedures:
Before the independent auditors are engaged by the Trust to render audit or non-audit services, either:
| a. | The Audit Committee shall pre-approve all audit, audit-related and permissible non-audit services provided to the Trust. The Audit Committee may delegate to one or more of its members the authority to grant pre-approvals. Any decision of any member to whom authority is delegated under this section shall be presented to the full Audit Committee at its next regularly scheduled meeting; |
or
| b. | The engagement to render the audit, audit-related or permissible non-audit service is entered into pursuant to pre-approval policies and procedures established by the Audit Committee. Any such policies and procedures must (1) be detailed as to the particular service and (2) not involve any delegation of the Audit Committee’s responsibilities to the investment adviser. The Audit Committee must be informed of each service entered into pursuant to the policies and procedures. A copy of any such policies and procedures shall be attached as an exhibit to the Audit Committee Charter. |
| c. | Pre-Approval for a service provided to the Trust other than audit or audit-related services is not required if: (1) the aggregate amount of all such permissible non-audit services provided to the Trust constitutes not more than five percent (5%) of the total amount of revenues paid by the Trust to the independent auditors during the fiscal year in which the permissible non-audit services are provided; (2) such services were not recognized by the Trust at the time of the engagement to be permissible non-audit services; and (3) such services are promptly brought to the attention of the Audit Committee and are approved by the Audit Committee or by one or more members of the Audit Committee to whom authority to grant such approvals has been delegated by the Audit Committee prior to the completion of the audit. |
| d. | The Audit Committee shall pre-approve any permissible non-audit services proposed to be provided by the independent auditors to (a) the investment adviser and (b) any entity controlling, controlled by, or under common control with the investment adviser that provides ongoing services to the Trust, if the independent auditors’ engagement with the investment adviser or any such control persons relates directly to the operations and financial reporting of the Trust. It shall be the responsibility of the independent auditors to notify the Audit Committee of any permissible non-audit services that need to be pre-approved. |
Notwithstanding the above, Pre-Approval for any permissible non-audit services under this Sub-section is not required if: (1) the aggregate amount of all such permissible non-audit services constitutes not more than five percent (5%) of the
total amount of revenues paid to the independent auditors by the Trust and any other entity that has its services approved under this Section (i.e., the investment adviser or any control person) during the fiscal year in which the permissible non-audit services are provided; (2) such services were not recognized by the Trust at the time of the engagement to be permissible non-audit services; and (3) such services are promptly brought to the attention of the Audit Committee and are approved by the Audit Committee or by one or more members of the Audit Committee to whom authority to grant such approvals has been delegated by the Audit Committee prior to the completion of the audit.
(e)(2) Percentage of Services.
One hundred percent of the services described in each of paragraphs (b) through (d) of this Item were approved by the registrant’s Audit Committee pursuant to paragraph (c)(7)(i)(C) of Rule 2-01 of Regulation S-X.
(f) Not applicable.
(g) The aggregate non-audit fees billed for by the registrant’s accountant for services rendered to the registrant, and rendered to the registrant’s investment adviser (not including any sub-adviser whose role is primarily portfolio management and is subcontracted with or overseen by another investment adviser), and any entity controlling, controlled by, or under common control with the adviser were as follows:
| FY 2020 (in millions) | FY 2019 (in millions) | |||||||
| Non audit services billed to: | ||||||||
Registrant: | See Item 4(c) | See Item 4(c) | ||||||
Investment Adviser: | — | — | ||||||
| Other entities in the Investment Company Complex(1): | ||||||||
Audit Related Fees | $ | 17.6 | $ | 15.2 | ||||
Tax Fees | $ | 4.9 | $ | 5.8 | ||||
All Other Fees | $ | 14.1 | $ | 14.2 | ||||
| (1) | Services under the caption Audit-Related Fees consisted principally of reports on the processing of transactions by servicing organizations, audits of employee benefit plan, non-statutory audits and due diligence procedures. Services under the caption Tax Fees consisted principally of expatriate, compliance and corporate tax advisory services. Services under the caption All Other Fees primarily related to statutory and financial statement audits and the requirement to opine on the design and operating effectiveness of internal control over financial reporting. |
(h) The registrant’s principal accountant notified the registrant’s Audit Committee of all non-audit services that were rendered by the principal accountant to the Adviser and any entity controlling, controlled by, or under common control with the Adviser that provides services to the registrant, which services were not required to be pre-approved pursuant to paragraph (c)(7)(ii) of Rule 2-01 of Regulation S-X, allowing the registrant’s Audit Committee to consider whether such services were compatible with maintaining the principal accountant’s independence.
Item 5. Audit Committees of Listed Registrants.
The registrant has an audit committee which was established by the Board of Trustees of the registrant in accordance with Section 3(a)(58)(A) of the Securities Exchange Act of 1934, as amended. The members of the registrant’s Audit committee are Bonny Boatman, Dwight Churchill, Frank Nesvet, Clare Richer, Sandra Sponem and Carl Verboncoeur.
Item 6. Investments.
| (a) | A Schedule of Investments for each applicable series of the registrant is included as a part of the report to shareholders filed under Item 1 of this Form N-CSR. |
| (b) | Not applicable to the registrant. |
Item 7. Disclosure of Proxy Voting Policies and Procedures for Closed-End Management Investment Companies.
Not applicable to the registrant.
Item 8. Portfolio Managers of Closed-End Management Investment Companies.
Not applicable to the registrant.
Item 9. Purchases of Equity Securities by Closed-End Management Investment Company and Affiliated Purchasers.
Not applicable to the registrant.
Item 10. Submission of Matters to a Vote of Security Holders.
The registrant has not adopted any material changes to the procedures by which shareholders may recommend nominees to the registrant’s Board.
Item 11. Controls and Procedures.
(a) Within 90 days of the filing date of this Form N-CSR, Ellen M. Needham, the registrant’s President and Principal Executive Officer, and Bruce S. Rosenberg, the registrant’s Treasurer and Principal Financial Officer, reviewed the registrant’s disclosure controls and procedures (as defined in Rule 30a-3(c) under the Investment Company Act of 1940, as amended ( the “1940 Act”) and evaluated their effectiveness. Based on their review, Ms. Needham and Mr. Rosenberg determined that the disclosure controls and procedures adequately ensure that information required to be disclosed by the registrant in its periodic reports is recorded, processed, summarized and reported within the time periods required by the U.S. Securities and Exchange Commission.
(b) There were no changes in the registrant’s internal control over financial reporting (as defined in Rule 30a-3(d) under the 1940 Act) that occurred during the period covered by this report that have materially affected, or are reasonably likely to materially affect, the registrant’s internal control over financial reporting.
Item 12. Disclosure of Securities Lending Activities for Closed-End Management Investment Companies.
(a) Not applicable to the registrant.
(b) Not applicable to the registrant.
Item 13. Exhibits.
SIGNATURES
Pursuant to the requirements of the Securities Exchange Act of 1934, as amended, and the Investment Company Act of 1940, as amended, the registrant has duly caused this report to be signed on its behalf by the undersigned, thereunto duly authorized.
SPDR® Series Trust
| By: | /s/ Ellen M. Needham | |
| Ellen M. Needham | ||
| President and Principal Executive Officer | ||
| Date: | March 5, 2021 | |
Pursuant to the requirements of the Securities Exchange Act of 1934, as amended, and the Investment Company Act of 1940, as amended, this report has been signed below by the following persons on behalf of the registrant and in the capacities and on the dates indicated.
| By: | /s/ Ellen M. Needham | |
| Ellen M. Needham | ||
| President and Principal Executive Officer | ||
| Date: | March 5, 2021 | |
| By: | /s/ Bruce S. Rosenberg | |
| Bruce S. Rosenberg | ||
| Treasurer and Principal Financial Officer | ||
| Date: | March 5, 2021 | |