0001064642ssga:SPDRETFsIndexSP500Index12068BroadBasedIndexMember2018-04-300001064642ssga:C000123372Member2019-02-280001064642ssga:C000231370Member2022-09-300001064642ssga:SPDRETFsIndexSPSmallCap600Index11995AdditionalIndexMember2024-03-310001064642ssga:SPDRETFsIndexSP500Index4446BroadBasedIndexMember2024-04-300001064642ssga:SPDRETFsIndexSP500Index12063BroadBasedIndexMember2014-08-310001064642ssga:SPDRETFsIndexSPBiotechnologySelectIndustryIndex12050AdditionalIndexMember2015-02-28
SECURITIES AND EXCHANGE COMMISSION
Washington, D.C. 20549
FORM N-CSR
CERTIFIED SHAREHOLDER REPORT OF REGISTERED
MANAGEMENT INVESTMENT COMPANIES
Investment Company Act file number: 811-08839
SPDR® SERIES TRUST
(Exact name of registrant as specified in charter)
One Iron Street, Boston, Massachusetts 02210
(Address of principal executive offices) (zip code)
Sean O’Malley, Esq.
Senior Vice President and General Counsel
c/o SSGA Funds Management, Inc.
One Iron Street
Boston, Massachusetts 02210
(Name and address of agent for service)
Copy to:
W. John McGuire, Esq.
Morgan, Lewis & Bockius LLP
1111 Pennsylvania Avenue, NW
Washington, DC 20004
Registrant’s telephone number, including area code: (617) 664-1465
Date of fiscal year end: June 30
Date of reporting period: June 30, 2024
Item 1. Report to Shareholders.
(a) The Report to Shareholders is attached herewith.
SPDR Russell 1000 Yield Focus ETF
Principal Listing Exchange: NYSEArca
Annual Shareholder Report
June 30, 2024
This annual shareholder report contains important information about the SPDR Russell 1000 Yield Focus ETF (the "Fund") for the year ended June 30, 2024. You can find additional information about the Fund, including the Prospectus, Statement of Additional Information, financial statements and other information at www.ssga.com/us/en/institutional/fund-finder?tab=documents&type=etfs. You can also request this information about the Fund by contacting us at 1-866-787-2257.
What were the Fund costs for the last year?
| Fund Name | Cost of a $10,000 investment | Costs paid as a percentage of a $10,000 investment |
|---|
| SPDR Russell 1000 Yield Focus ETF | $21 | 0.20% |
How did the Fund perform last year and what affected its performance?
The reporting period’s market environment was largely driven by news about inflation, economic growth and the impact either would have on the U.S. Federal Reserve (the "Fed") and other central banks with regard to interest rate decisions. Alongside this macro story was the prospect of a burgeoning artificial intelligence boom, driving up the values of AI-related tech and semiconductor companies. And markets continued to be dominated by the so-called "Magnificent Seven", consisting of Alphabet Inc, Amazon.com Inc, Apple Inc, Meta Platforms Inc, Microsoft Corp, NVIDIA Corp and Tesla Inc. Compared to the Russell 1000 Index, which returned 23.88% during the reporting period, the Fund significantly underperformed. The Fund's focus on higher yielding dividend stocks had significant overlap with value stocks, which underperformed growth securities which in turn captured the outperformance of AI-related tech and semiconductor companies, as well as the Magnificent Seven. Because of this, value stocks significantly underperformed. The Fund also tilts towards stocks characterized by the quality and size factors, but while the quality factor slightly outperformed, the size factor underperformed, and the net impact to the Fund was negative.
The Fund's benchmarks are unmanaged indices used as a general measure of market performance. Calculations assume dividends and capital gains.
Comparison of Change in Value of a $10,000 Investment
(Based on Net Asset Value)
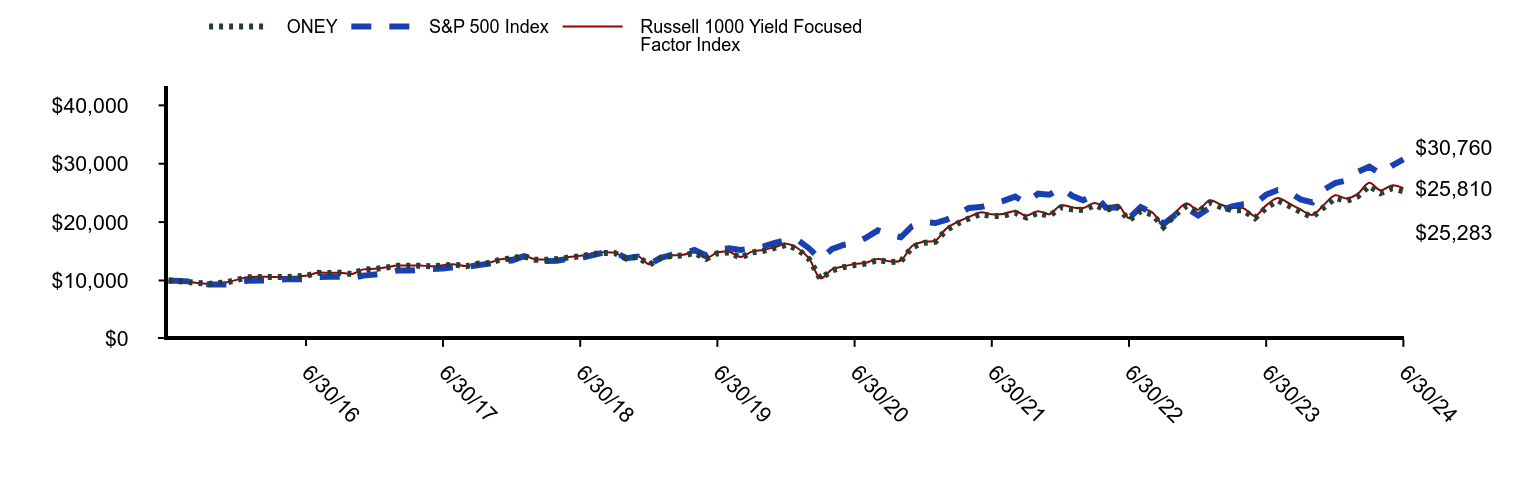
| ONEY | S&P 500 Index | Russell 1000 Yield Focused Factor Index |
|---|
| 11/30/15 | $10,000 | $10,000 | $10,000 |
| 12/31/15 | $9,726 | $9,843 | $9,725 |
| 1/31/16 | $9,407 | $9,313 | $9,410 |
| 2/29/16 | $9,691 | $9,311 | $9,697 |
| 3/31/16 | $10,531 | $9,960 | $10,539 |
| 4/30/16 | $10,601 | $10,013 | $10,615 |
| 5/31/16 | $10,589 | $10,189 | $10,602 |
| 6/30/16 | $10,792 | $10,212 | $10,804 |
| 7/31/16 | $11,300 | $10,601 | $11,312 |
| 8/31/16 | $11,293 | $10,615 | $11,308 |
| 9/30/16 | $11,314 | $10,623 | $11,331 |
| 10/31/16 | $11,102 | $10,416 | $11,120 |
| 11/30/16 | $11,877 | $10,827 | $11,896 |
| 12/31/16 | $11,974 | $11,030 | $11,997 |
| 1/31/17 | $12,216 | $11,252 | $12,244 |
| 2/28/17 | $12,521 | $11,687 | $12,548 |
| 3/31/17 | $12,531 | $11,694 | $12,546 |
| 4/30/17 | $12,532 | $11,818 | $12,564 |
| 5/31/17 | $12,400 | $11,970 | $12,431 |
| 6/30/17 | $12,588 | $12,053 | $12,622 |
| 7/31/17 | $12,718 | $12,292 | $12,755 |
| 8/31/17 | $12,436 | $12,330 | $12,475 |
| 9/30/17 | $12,870 | $12,593 | $12,929 |
| 10/31/17 | $12,995 | $12,881 | $13,049 |
| 11/30/17 | $13,574 | $13,280 | $13,635 |
| 12/31/17 | $13,790 | $13,427 | $13,872 |
| 1/31/18 | $14,179 | $14,152 | $14,263 |
| 2/28/18 | $13,568 | $13,641 | $13,650 |
| 3/31/18 | $13,543 | $13,328 | $13,587 |
| 4/30/18 | $13,658 | $13,396 | $13,690 |
| 5/31/18 | $13,947 | $13,738 | $14,021 |
| 6/30/18 | $14,132 | $13,808 | $14,224 |
| 7/31/18 | $14,496 | $14,285 | $14,610 |
| 8/31/18 | $14,716 | $14,779 | $14,833 |
| 9/30/18 | $14,706 | $14,845 | $14,735 |
| 10/31/18 | $13,733 | $13,803 | $13,819 |
| 11/30/18 | $14,059 | $14,078 | $14,171 |
| 12/31/18 | $12,686 | $12,792 | $12,787 |
| 1/31/19 | $13,917 | $13,888 | $14,018 |
| 2/28/19 | $14,193 | $14,372 | $14,299 |
| 3/31/19 | $14,269 | $14,625 | $14,390 |
| 4/30/19 | $14,718 | $15,229 | $14,843 |
| 5/31/19 | $13,712 | $14,266 | $13,824 |
| 6/30/19 | $14,661 | $15,279 | $14,791 |
| 7/31/19 | $14,787 | $15,512 | $14,925 |
| 8/31/19 | $13,904 | $15,227 | $14,035 |
| 9/30/19 | $14,795 | $15,492 | $14,933 |
| 10/31/19 | $15,079 | $15,829 | $15,223 |
| 11/30/19 | $15,571 | $16,432 | $15,717 |
| 12/31/19 | $16,109 | $16,904 | $16,273 |
| 1/31/20 | $15,317 | $16,922 | $15,475 |
| 2/29/20 | $13,707 | $15,529 | $13,845 |
| 3/31/20 | $10,279 | $13,611 | $10,384 |
| 4/30/20 | $11,710 | $15,356 | $11,841 |
| 5/31/20 | $12,265 | $16,087 | $12,405 |
| 6/30/20 | $12,645 | $16,407 | $12,798 |
| 7/31/20 | $12,894 | $17,332 | $13,044 |
| 8/31/20 | $13,522 | $18,578 | $13,685 |
| 9/30/20 | $13,134 | $17,872 | $13,281 |
| 10/31/20 | $13,263 | $17,397 | $13,419 |
| 11/30/20 | $15,711 | $19,301 | $15,900 |
| 12/31/20 | $16,445 | $20,043 | $16,646 |
| 1/31/21 | $16,633 | $19,841 | $16,841 |
| 2/28/21 | $18,593 | $20,388 | $18,838 |
| 3/31/21 | $19,766 | $21,281 | $20,018 |
| 4/30/21 | $20,608 | $22,416 | $20,860 |
| 5/31/21 | $21,379 | $22,573 | $21,663 |
| 6/30/21 | $21,032 | $23,100 | $21,327 |
| 7/31/21 | $21,085 | $23,649 | $21,380 |
| 8/31/21 | $21,609 | $24,368 | $21,916 |
| 9/30/21 | $20,795 | $23,234 | $21,086 |
| 10/31/21 | $21,572 | $24,862 | $21,877 |
| 11/30/21 | $21,051 | $24,690 | $21,355 |
| 12/31/21 | $22,532 | $25,796 | $22,862 |
| 1/31/22 | $22,182 | $24,462 | $22,522 |
| 2/28/22 | $22,058 | $23,729 | $22,403 |
| 3/31/22 | $22,927 | $24,610 | $23,283 |
| 4/30/22 | $22,112 | $22,464 | $22,457 |
| 5/31/22 | $22,579 | $22,505 | $22,942 |
| 6/30/22 | $20,315 | $20,648 | $20,649 |
| 7/31/22 | $21,862 | $22,552 | $22,230 |
| 8/31/22 | $21,313 | $21,632 | $21,669 |
| 9/30/22 | $19,157 | $19,640 | $19,469 |
| 10/31/22 | $21,261 | $21,230 | $21,620 |
| 11/30/22 | $22,785 | $22,416 | $23,173 |
| 12/31/22 | $21,733 | $21,125 | $22,116 |
| 1/31/23 | $23,335 | $22,452 | $23,740 |
| 2/28/23 | $22,620 | $21,904 | $23,029 |
| 3/31/23 | $22,050 | $22,708 | $22,443 |
| 4/30/23 | $22,000 | $23,063 | $22,391 |
| 5/31/23 | $20,686 | $23,163 | $21,048 |
| 6/30/23 | $22,457 | $24,693 | $22,858 |
| 7/31/23 | $23,710 | $25,487 | $24,138 |
| 8/31/23 | $22,757 | $25,081 | $23,168 |
| 9/30/23 | $21,752 | $23,885 | $22,143 |
| 10/31/23 | $20,851 | $23,383 | $21,230 |
| 11/30/23 | $22,481 | $25,518 | $22,894 |
| 12/31/23 | $24,143 | $26,678 | $24,590 |
| 1/31/24 | $23,615 | $27,126 | $24,058 |
| 2/29/24 | $24,378 | $28,574 | $24,848 |
| 3/31/24 | $26,222 | $29,494 | $26,737 |
| 4/30/24 | $24,949 | $28,290 | $25,436 |
| 5/31/24 | $25,791 | $29,694 | $26,290 |
| 6/30/24 | $25,283 | $30,760 | $25,810 |
Average Annual Total Returns (%)
| Name | 1 Year | 5 Years | Since Inception 12/2/15 |
|---|
| ONEY | 12.72% | 11.54% | 11.43% |
| S&P 500 Index | 24.56% | 15.05% | 13.96% |
| Russell 1000 Yield Focused Factor Index | 12.91% | 11.78% | 11.69% |
The Fund’s past performance is not necessarily an indication of how the Fund will perform in the future. The returns do not reflect the deduction of taxes that a shareholder would pay on Fund distributions or on the redemption or sale of Fund shares. Updated performance information is available by calling 1-866-787-2257 or visiting our website at www.ssga.com/us/en/institutional/fund-finder?tab=documents&type=etfs.
| Statistic | Value |
|---|
| Total Net Assets | $785,303,531 |
| # of Portfolio Holdings | 296 |
| Portfolio Turnover Rate | 35% |
| Total Advisory Fees Paid | $1,530,619 |
What did the Fund invest in?
| Industry | % Value of Total Net Assets |
| Oil, Gas & Consumable Fuels | 8.2% |
| Food Products | 6.3% |
| Electric Utilities | 5.1% |
| Machinery | 5.0% |
| Chemicals | 4.8% |
| Multi-Utilities | 4.0% |
| Consumer Staples Distribution & Retail | 3.9% |
| Specialized REITs | 3.7% |
| Banks | 3.5% |
| Pharmaceuticals | 3.3% |
| Holdings | % Value of Total Net Assets |
| Bristol-Myers Squibb Co. | 2.0% |
| Ford Motor Co. | 1.5% |
| Diamondback Energy, Inc. | 1.4% |
| Altria Group, Inc. | 1.4% |
| PACCAR, Inc. | 1.2% |
| Gilead Sciences, Inc. | 1.2% |
| Devon Energy Corp. | 1.2% |
| Archer-Daniels-Midland Co. | 1.2% |
| EOG Resources, Inc. | 1.1% |
| Sysco Corp. | 1.1% |
SPDR Russell 1000 Momentum Focus ETF
Principal Listing Exchange: NYSEArca
Annual Shareholder Report
June 30, 2024
This annual shareholder report contains important information about the SPDR Russell 1000 Momentum Focus ETF (the "Fund") for the year ended June 30, 2024. You can find additional information about the Fund, including the Prospectus, Statement of Additional Information, financial statements and other information at www.ssga.com/us/en/institutional/fund-finder?tab=documents&type=etfs. You can also request this information about the Fund by contacting us at 1-866-787-2257.
What were the Fund costs for the last year?
| Fund Name | Cost of a $10,000 investment | Costs paid as a percentage of a $10,000 investment |
|---|
| SPDR Russell 1000 Momentum Focus ETF | $21 | 0.20% |
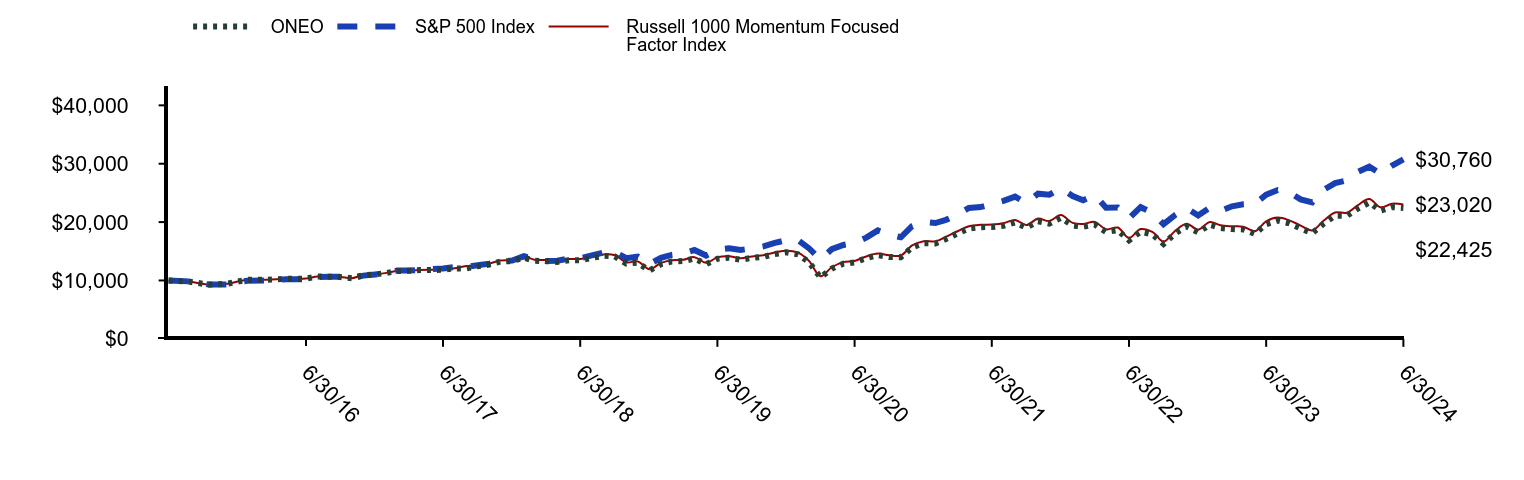
How did the Fund perform last year and what affected its performance?
During the reporting period, Energy was the best performing sector within the portfolio, followed by Financials and Information Technology. At the same time, Consumer Staples was the worst performing sector, followed by Communication Services and Health Care. From a single stock perspective, NVDIA was the best performing security in the portfolio, followed by Williams-Sonoma Inc and Constellation Energy. The worst performing security was Hertz Global, followed by New York Community Bancorp and ViaSat.
When we analyze the performance of the Russell 1000 Momentum Focus Index relative to the market capitalization weighted index, such as the Russell 1000 Index, we can see that the Factor Index underperformed the Russell 1000 over the reporting period. Most of the underperformance can be attributed to under-weight to Information Technology stocks, followed by Communication Services and Industrials. Under-weights to NVDIA Corp, Meta Platforms and Amazon Inc were the main relative detractors. On the positive side, over-weights to Apple Inc and NRG Energy Inc added relative value, while under-weight to Tesla also contributed positively.
The Fund's benchmarks are unmanaged indices used as a general measure of market performance. Calculations assume dividends and capital gains.
Comparison of Change in Value of a $10,000 Investment
(Based on Net Asset Value)
| ONEO | S&P 500 Index | Russell 1000 Momentum Focused Factor Index |
|---|
| 11/30/15 | $10,000 | $10,000 | $10,000 |
| 12/31/15 | $9,809 | $9,843 | $9,809 |
| 1/31/16 | $9,289 | $9,313 | $9,294 |
| 2/29/16 | $9,445 | $9,311 | $9,446 |
| 3/31/16 | $10,117 | $9,960 | $10,125 |
| 4/30/16 | $10,130 | $10,013 | $10,140 |
| 5/31/16 | $10,269 | $10,189 | $10,282 |
| 6/30/16 | $10,310 | $10,212 | $10,321 |
| 7/31/16 | $10,682 | $10,601 | $10,695 |
| 8/31/16 | $10,627 | $10,615 | $10,640 |
| 9/30/16 | $10,583 | $10,623 | $10,602 |
| 10/31/16 | $10,385 | $10,416 | $10,398 |
| 11/30/16 | $10,897 | $10,827 | $10,917 |
| 12/31/16 | $11,038 | $11,030 | $11,057 |
| 1/31/17 | $11,283 | $11,252 | $11,299 |
| 2/28/17 | $11,629 | $11,687 | $11,655 |
| 3/31/17 | $11,656 | $11,694 | $11,665 |
| 4/30/17 | $11,779 | $11,818 | $11,791 |
| 5/31/17 | $11,801 | $11,970 | $11,834 |
| 6/30/17 | $11,823 | $12,053 | $11,862 |
| 7/31/17 | $12,066 | $12,292 | $12,090 |
| 8/31/17 | $12,061 | $12,330 | $12,482 |
| 9/30/17 | $12,439 | $12,593 | $12,479 |
| 10/31/17 | $12,726 | $12,881 | $12,883 |
| 11/30/17 | $13,234 | $13,280 | $13,413 |
| 12/31/17 | $13,319 | $13,427 | $13,518 |
| 1/31/18 | $13,908 | $14,152 | $14,104 |
| 2/28/18 | $13,370 | $13,641 | $13,561 |
| 3/31/18 | $13,310 | $13,328 | $13,506 |
| 4/30/18 | $13,180 | $13,396 | $13,376 |
| 5/31/18 | $13,473 | $13,738 | $13,676 |
| 6/30/18 | $13,478 | $13,808 | $13,689 |
| 7/31/18 | $13,863 | $14,285 | $14,083 |
| 8/31/18 | $14,224 | $14,779 | $14,455 |
| 9/30/18 | $14,103 | $14,845 | $14,330 |
| 10/31/18 | $12,890 | $13,803 | $13,101 |
| 11/30/18 | $13,039 | $14,078 | $13,269 |
| 12/31/18 | $11,701 | $12,792 | $11,915 |
| 1/31/19 | $12,784 | $13,888 | $13,003 |
| 2/28/19 | $13,244 | $14,372 | $13,472 |
| 3/31/19 | $13,319 | $14,625 | $13,548 |
| 4/30/19 | $13,747 | $15,229 | $13,993 |
| 5/31/19 | $12,795 | $14,266 | $13,020 |
| 6/30/19 | $13,710 | $15,279 | $13,956 |
| 7/31/19 | $13,882 | $15,512 | $14,137 |
| 8/31/19 | $13,550 | $15,227 | $13,802 |
| 9/30/19 | $13,872 | $15,492 | $14,124 |
| 10/31/19 | $14,048 | $15,829 | $14,311 |
| 11/30/19 | $14,522 | $16,432 | $14,789 |
| 12/31/19 | $14,820 | $16,904 | $15,100 |
| 1/31/20 | $14,482 | $16,922 | $14,758 |
| 2/29/20 | $13,146 | $15,529 | $13,386 |
| 3/31/20 | $10,499 | $13,611 | $10,706 |
| 4/30/20 | $12,026 | $15,356 | $12,265 |
| 5/31/20 | $12,881 | $16,087 | $13,143 |
| 6/30/20 | $13,092 | $16,407 | $13,347 |
| 7/31/20 | $13,836 | $17,332 | $14,117 |
| 8/31/20 | $14,320 | $18,578 | $14,616 |
| 9/30/20 | $14,012 | $17,872 | $14,303 |
| 10/31/20 | $13,992 | $17,397 | $14,276 |
| 11/30/20 | $15,677 | $19,301 | $16,000 |
| 12/31/20 | $16,381 | $20,043 | $16,727 |
| 1/31/21 | $16,346 | $19,841 | $16,699 |
| 2/28/21 | $17,102 | $20,388 | $17,468 |
| 3/31/21 | $18,062 | $21,281 | $18,435 |
| 4/30/21 | $18,878 | $22,416 | $19,288 |
| 5/31/21 | $19,130 | $22,573 | $19,534 |
| 6/30/21 | $19,151 | $23,100 | $19,570 |
| 7/31/21 | $19,361 | $23,649 | $19,790 |
| 8/31/21 | $19,929 | $24,368 | $20,372 |
| 9/30/21 | $19,059 | $23,234 | $19,486 |
| 10/31/21 | $20,147 | $24,862 | $20,598 |
| 11/30/21 | $19,738 | $24,690 | $20,180 |
| 12/31/21 | $20,731 | $25,796 | $21,201 |
| 1/31/22 | $19,407 | $24,462 | $19,856 |
| 2/28/22 | $19,233 | $23,729 | $19,682 |
| 3/31/22 | $19,584 | $24,610 | $20,037 |
| 4/30/22 | $18,328 | $22,464 | $18,756 |
| 5/31/22 | $18,620 | $22,505 | $19,061 |
| 6/30/22 | $16,883 | $20,648 | $17,285 |
| 7/31/22 | $18,356 | $22,552 | $18,802 |
| 8/31/22 | $17,893 | $21,632 | $18,332 |
| 9/30/22 | $16,261 | $19,640 | $16,651 |
| 10/31/22 | $18,075 | $21,230 | $18,512 |
| 11/30/22 | $19,243 | $22,416 | $19,735 |
| 12/31/22 | $18,250 | $21,125 | $18,703 |
| 1/31/23 | $19,541 | $22,452 | $20,026 |
| 2/28/23 | $18,992 | $21,904 | $19,472 |
| 3/31/23 | $18,806 | $22,708 | $19,284 |
| 4/30/23 | $18,739 | $23,063 | $19,210 |
| 5/31/23 | $17,997 | $23,163 | $18,447 |
| 6/30/23 | $19,640 | $24,693 | $20,143 |
| 7/31/23 | $20,263 | $25,487 | $20,775 |
| 8/31/23 | $19,782 | $25,081 | $20,290 |
| 9/30/23 | $18,926 | $23,885 | $19,406 |
| 10/31/23 | $18,108 | $23,383 | $18,570 |
| 11/30/23 | $19,718 | $25,518 | $20,224 |
| 12/31/23 | $21,107 | $26,678 | $21,652 |
| 1/31/24 | $21,066 | $27,126 | $21,608 |
| 2/29/24 | $22,290 | $28,574 | $22,878 |
| 3/31/24 | $23,350 | $29,494 | $23,966 |
| 4/30/24 | $21,958 | $28,290 | $22,533 |
| 5/31/24 | $22,562 | $29,694 | $23,151 |
| 6/30/24 | $22,425 | $30,760 | $23,020 |
Average Annual Total Returns (%)
| Name | 1 Year | 5 Years | Since Inception 12/2/15 |
|---|
| ONEO | 14.17% | 10.34% | 9.87% |
| S&P 500 Index | 24.56% | 15.05% | 13.96% |
| Russell 1000 Momentum Focused Factor Index | 14.29% | 10.53% | 10.09% |
The Fund’s past performance is not necessarily an indication of how the Fund will perform in the future. The returns do not reflect the deduction of taxes that a shareholder would pay on Fund distributions or on the redemption or sale of Fund shares. Updated performance information is available by calling 1-866-787-2257 or visiting our website at www.ssga.com/us/en/institutional/fund-finder?tab=documents&type=etfs.
| Statistic | Value |
|---|
| Total Net Assets | $145,751,747 |
| # of Portfolio Holdings | 914 |
| Portfolio Turnover Rate | 50% |
| Total Advisory Fees Paid | $301,520 |
What did the Fund invest in?
| Industry | % Value of Total Net Assets |
| Insurance | 5.4% |
| Software | 5.1% |
| Health Care Providers & Services | 4.9% |
| Oil, Gas & Consumable Fuels | 4.8% |
| Semiconductors & Semiconductor Equipment | 4.3% |
| Hotels, Restaurants & Leisure | 4.1% |
| Specialty Retail | 4.0% |
| Machinery | 3.7% |
| Household Durables | 3.6% |
| Consumer Staples Distribution & Retail | 3.0% |
| Holdings | % Value of Total Net Assets |
| PulteGroup, Inc. | 0.8% |
| McKesson Corp. | 0.8% |
| Arch Capital Group Ltd. | 0.7% |
| Lennar Corp., A | 0.7% |
| Expedia Group, Inc. | 0.6% |
| Diamondback Energy, Inc. | 0.6% |
| Casey's General Stores, Inc. | 0.6% |
| GoDaddy, Inc., A | 0.6% |
| DR Horton, Inc. | 0.6% |
| Vistra Corp. | 0.6% |
SPDR Russell 1000 Low Volatility Focus ETF
Principal Listing Exchange: NYSEArca
Annual Shareholder Report
June 30, 2024
This annual shareholder report contains important information about the SPDR Russell 1000 Low Volatility Focus ETF (the "Fund") for the year ended June 30, 2024. You can find additional information about the Fund, including the Prospectus, Statement of Additional Information, financial statements and other information at www.ssga.com/us/en/institutional/fund-finder?tab=documents&type=etfs. You can also request this information about the Fund by contacting us at 1-866-787-2257.
What were the Fund costs for the last year?
| Fund Name | Cost of a $10,000 investment | Costs paid as a percentage of a $10,000 investment |
|---|
| SPDR Russell 1000 Low Volatility Focus ETF | $21 | 0.20% |
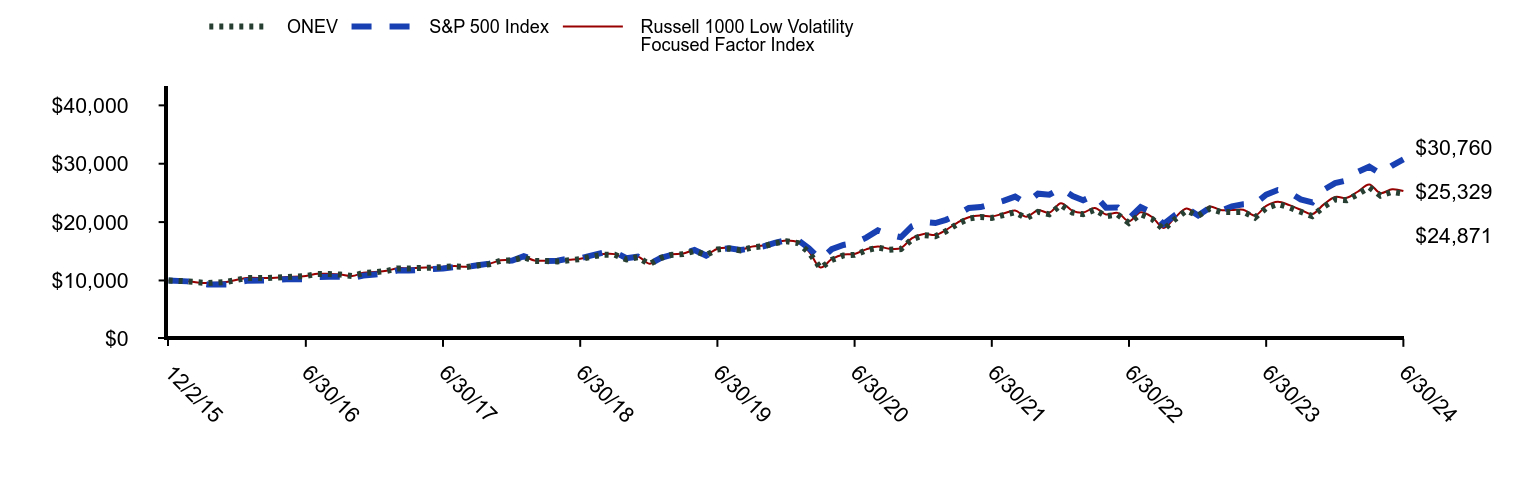
How did the Fund perform last year and what affected its performance?
Management fees, cash drag, and cumulative effects of security mis-weights contributed to the difference between the Fund’s performance and that of the Index and were primary drivers of Fund performance during the period.
During the reporting period, the Energy sector was the best performing sector for this strategy, followed by Financials and Industrials. At the same time, Consumer Staples was the worst performing sector, followed by Communication Services and Utilities. From a single stock perspective, Williams-Sonoma was the best performing security in the Index, followed by NRG Energy Inc and SL Green Realty Corp. Hertz Global was the worst performing security in the Index, followed by New York Community Bancorp, Inc. and Leggett & Platt Inc. When we analyze the performance for this Strategy relative to a market capitalization weighted index, such as the Russell 1000 Index, we can see that during the reporting period, the Russell 1000 Low Volatility Focus Index trailed the Russell 1000 Index. Most of this underperformance can be explained by the Factor index’s underweight to Information Security stocks, followed by Communication Services and overweight to the Consumer Staples sector. From a single security perspective, the Factor Index did not hold NVDIA Corp., Meta Platforms and Amazon Inc, which are the top 3 detractors from relative performance. Simultaneously, not including Apple Inc, Tesla Inc and Johnson & Johnson contributed positively.
The Fund's benchmarks are unmanaged indices used as a general measure of market performance. Calculations assume dividends and capital gains.
Comparison of Change in Value of a $10,000 Investment
(Based on Net Asset Value)
| ONEV | S&P 500 Index | Russell 1000 Low Volatility Focused Factor Index |
|---|
| 12/2/15 | $10,000 | $10,000 | $10,000 |
| 12/31/15 | $9,850 | $9,843 | $9,848 |
| 1/31/16 | $9,546 | $9,313 | $9,549 |
| 2/29/16 | $9,745 | $9,311 | $9,748 |
| 3/31/16 | $10,429 | $9,960 | $10,437 |
| 4/30/16 | $10,397 | $10,013 | $10,408 |
| 5/31/16 | $10,580 | $10,189 | $10,593 |
| 6/30/16 | $10,760 | $10,212 | $10,773 |
| 7/31/16 | $11,128 | $10,601 | $11,142 |
| 8/31/16 | $11,108 | $10,615 | $11,123 |
| 9/30/16 | $11,011 | $10,623 | $11,031 |
| 10/31/16 | $10,743 | $10,416 | $10,764 |
| 11/30/16 | $11,289 | $10,827 | $11,312 |
| 12/31/16 | $11,420 | $11,030 | $11,446 |
| 1/31/17 | $11,618 | $11,252 | $11,649 |
| 2/28/17 | $12,062 | $11,687 | $12,088 |
| 3/31/17 | $12,054 | $11,694 | $12,087 |
| 4/30/17 | $12,143 | $11,818 | $12,175 |
| 5/31/17 | $12,202 | $11,970 | $12,239 |
| 6/30/17 | $12,298 | $12,053 | $12,337 |
| 7/31/17 | $12,415 | $12,292 | $12,458 |
| 8/31/17 | $12,305 | $12,330 | $12,354 |
| 9/30/17 | $12,581 | $12,593 | $12,646 |
| 10/31/17 | $12,788 | $12,881 | $12,853 |
| 11/30/17 | $13,384 | $13,280 | $13,451 |
| 12/31/17 | $13,439 | $13,427 | $13,532 |
| 1/31/18 | $13,952 | $14,152 | $14,031 |
| 2/28/18 | $13,346 | $13,641 | $13,431 |
| 3/31/18 | $13,313 | $13,328 | $13,396 |
| 4/30/18 | $13,266 | $13,396 | $13,350 |
| 5/31/18 | $13,456 | $13,738 | $13,553 |
| 6/30/18 | $13,661 | $13,808 | $13,736 |
| 7/31/18 | $14,081 | $14,285 | $14,199 |
| 8/31/18 | $14,426 | $14,779 | $14,535 |
| 9/30/18 | $14,393 | $14,845 | $14,511 |
| 10/31/18 | $13,594 | $13,803 | $13,670 |
| 11/30/18 | $13,994 | $14,078 | $14,119 |
| 12/31/18 | $12,780 | $12,792 | $12,876 |
| 1/31/19 | $13,870 | $13,888 | $13,967 |
| 2/28/19 | $14,386 | $14,372 | $14,489 |
| 3/31/19 | $14,508 | $14,625 | $14,614 |
| 4/30/19 | $15,058 | $15,229 | $15,172 |
| 5/31/19 | $14,348 | $14,266 | $14,459 |
| 6/30/19 | $15,321 | $15,279 | $15,447 |
| 7/31/19 | $15,482 | $15,512 | $15,610 |
| 8/31/19 | $15,140 | $15,227 | $15,275 |
| 9/30/19 | $15,664 | $15,492 | $15,796 |
| 10/31/19 | $15,858 | $15,829 | $15,991 |
| 11/30/19 | $16,381 | $16,432 | $16,526 |
| 12/31/19 | $16,706 | $16,904 | $16,860 |
| 1/31/20 | $16,407 | $16,922 | $16,564 |
| 2/29/20 | $14,831 | $15,529 | $14,966 |
| 3/31/20 | $12,120 | $13,611 | $12,225 |
| 4/30/20 | $13,509 | $15,356 | $13,643 |
| 5/31/20 | $14,286 | $16,087 | $14,442 |
| 6/30/20 | $14,382 | $16,407 | $14,542 |
| 7/31/20 | $15,158 | $17,332 | $15,327 |
| 8/31/20 | $15,627 | $18,578 | $15,814 |
| 9/30/20 | $15,268 | $17,872 | $15,444 |
| 10/31/20 | $15,371 | $17,397 | $15,537 |
| 11/30/20 | $17,068 | $19,301 | $17,253 |
| 12/31/20 | $17,775 | $20,043 | $17,974 |
| 1/31/21 | $17,574 | $19,841 | $17,791 |
| 2/28/21 | $18,430 | $20,388 | $18,643 |
| 3/31/21 | $19,705 | $21,281 | $19,928 |
| 4/30/21 | $20,596 | $22,416 | $20,842 |
| 5/31/21 | $20,886 | $22,573 | $21,133 |
| 6/30/21 | $20,723 | $23,100 | $20,979 |
| 7/31/21 | $21,204 | $23,649 | $21,466 |
| 8/31/21 | $21,694 | $24,368 | $21,970 |
| 9/30/21 | $20,661 | $23,234 | $20,920 |
| 10/31/21 | $21,747 | $24,862 | $22,021 |
| 11/30/21 | $21,333 | $24,690 | $21,613 |
| 12/31/21 | $22,941 | $25,796 | $23,246 |
| 1/31/22 | $21,630 | $24,462 | $21,925 |
| 2/28/22 | $21,338 | $23,729 | $21,634 |
| 3/31/22 | $22,115 | $24,610 | $22,422 |
| 4/30/22 | $21,016 | $22,464 | $21,309 |
| 5/31/22 | $21,280 | $22,505 | $21,581 |
| 6/30/22 | $19,853 | $20,648 | $20,141 |
| 7/31/22 | $21,357 | $22,552 | $21,674 |
| 8/31/22 | $20,526 | $21,632 | $20,836 |
| 9/30/22 | $18,722 | $19,640 | $18,994 |
| 10/31/22 | $20,514 | $21,230 | $20,815 |
| 11/30/22 | $21,984 | $22,416 | $22,331 |
| 12/31/22 | $21,077 | $21,125 | $21,404 |
| 1/31/23 | $22,329 | $22,452 | $22,683 |
| 2/28/23 | $21,732 | $21,904 | $22,089 |
| 3/31/23 | $21,708 | $22,708 | $22,060 |
| 4/30/23 | $21,762 | $23,063 | $22,119 |
| 5/31/23 | $20,773 | $23,163 | $21,113 |
| 6/30/23 | $22,402 | $24,693 | $22,771 |
| 7/31/23 | $23,094 | $25,487 | $23,482 |
| 8/31/23 | $22,517 | $25,081 | $22,901 |
| 9/30/23 | $21,760 | $23,885 | $22,117 |
| 10/31/23 | $21,013 | $23,383 | $21,373 |
| 11/30/23 | $22,600 | $25,518 | $22,990 |
| 12/31/23 | $23,884 | $26,678 | $24,291 |
| 1/31/24 | $23,748 | $27,126 | $24,160 |
| 2/29/24 | $24,754 | $28,574 | $25,199 |
| 3/31/24 | $25,979 | $29,494 | $26,446 |
| 4/30/24 | $24,529 | $28,290 | $24,962 |
| 5/31/24 | $25,171 | $29,694 | $25,622 |
| 6/30/24 | $24,871 | $30,760 | $25,329 |
Average Annual Total Returns (%)
| Name | 1 Year | 5 Years | Since Inception 12/2/15 |
|---|
| ONEV | 11.07% | 10.18% | 11.21% |
| S&P 500 Index | 24.56% | 15.05% | 13.96% |
| Russell 1000 Low Volatility Focused Factor Index | 11.23% | 10.40% | 11.45% |
The Fund’s past performance is not necessarily an indication of how the Fund will perform in the future. The returns do not reflect the deduction of taxes that a shareholder would pay on Fund distributions or on the redemption or sale of Fund shares. Updated performance information is available by calling 1-866-787-2257 or visiting our website at www.ssga.com/us/en/institutional/fund-finder?tab=documents&type=etfs.
| Statistic | Value |
|---|
| Total Net Assets | $631,531,455 |
| # of Portfolio Holdings | 434 |
| Portfolio Turnover Rate | 34% |
| Total Advisory Fees Paid | $1,184,449 |
What did the Fund invest in?
| Industry | % Value of Total Net Assets |
| Health Care Providers & Services | 7.0% |
| Insurance | 6.9% |
| Machinery | 5.1% |
| Food Products | 3.9% |
| Capital Markets | 3.8% |
| Professional Services | 3.8% |
| Electric Utilities | 3.6% |
| Consumer Staples Distribution & Retail | 3.6% |
| Specialty Retail | 3.3% |
| Multi-Utilities | 3.0% |
| Holdings | % Value of Total Net Assets |
| Cognizant Technology Solutions Corp., A | 1.4% |
| Bristol-Myers Squibb Co. | 1.1% |
| Humana, Inc. | 1.1% |
| Arch Capital Group Ltd. | 1.0% |
| Cardinal Health, Inc. | 1.0% |
| Centene Corp. | 0.8% |
| Electronic Arts, Inc. | 0.7% |
| McKesson Corp. | 0.7% |
| Best Buy Co., Inc. | 0.7% |
| AutoZone, Inc. | 0.7% |
SPDR S&P 400 Mid Cap Growth ETF
Principal Listing Exchange: NYSEArca
Annual Shareholder Report
June 30, 2024
This annual shareholder report contains important information about the SPDR S&P 400 Mid Cap Growth ETF (the "Fund") for the year ended June 30, 2024. You can find additional information about the Fund, including the Prospectus, Statement of Additional Information, financial statements and other information at www.ssga.com/us/en/institutional/fund-finder?tab=documents&type=etfs. You can also request this information about the Fund by contacting us at 1-866-787-2257.
What were the Fund costs for the last year?
| Fund Name | Cost of a $10,000 investment | Costs paid as a percentage of a $10,000 investment |
|---|
| SPDR S&P 400 Mid Cap Growth ETF | $16 | 0.15% |
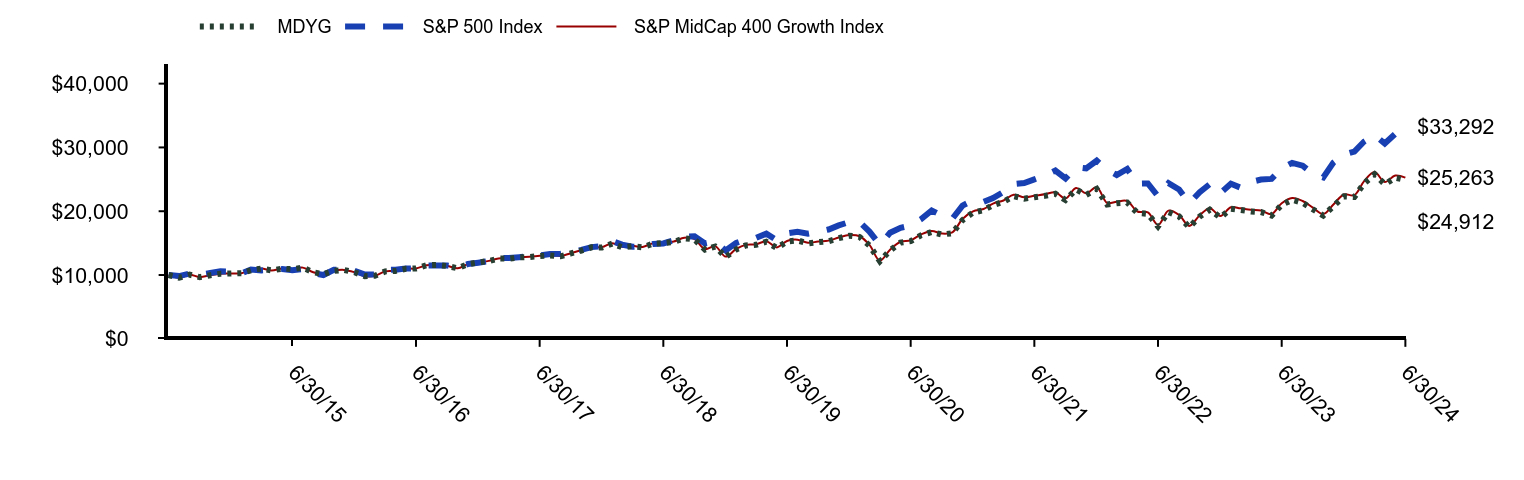
How did the Fund perform last year and what affected its performance?
The Fund’s performance was largely driven by news about inflation, economic growth and the impact either would have on the U.S. Federal Reserve (the “Fed”) and other central banks with regard to interest rate decisions. Alongside this macro story was the prospect of a burgeoning artificial intelligence boom, driving up the values of AI-related tech and semiconductor companies.
The Fund's benchmarks are unmanaged indices used as a general measure of market performance. Calculations assume dividends and capital gains.
Comparison of Change in Value of a $10,000 Investment
(Based on Net Asset Value)
| MDYG | S&P 500 Index | S&P MidCap 400 Growth Index |
|---|
| 6/30/14 | $10,000 | $10,000 | $10,000 |
| 7/31/14 | $9,585 | $9,838 | $9,579 |
| 8/31/14 | $10,051 | $10,245 | $10,048 |
| 9/30/14 | $9,675 | $10,065 | $9,671 |
| 10/31/14 | $9,971 | $10,311 | $9,968 |
| 11/30/14 | $10,211 | $10,581 | $10,211 |
| 12/31/14 | $10,236 | $10,557 | $10,235 |
| 1/31/15 | $10,289 | $10,267 | $10,293 |
| 2/28/15 | $10,750 | $10,860 | $10,753 |
| 3/31/15 | $11,011 | $10,725 | $11,009 |
| 4/30/15 | $10,717 | $10,801 | $10,726 |
| 5/31/15 | $11,004 | $10,942 | $11,005 |
| 6/30/15 | $10,910 | $10,737 | $10,904 |
| 7/31/15 | $11,164 | $10,944 | $11,160 |
| 8/31/15 | $10,428 | $10,285 | $10,429 |
| 9/30/15 | $10,144 | $10,003 | $10,146 |
| 10/31/15 | $10,665 | $10,813 | $10,671 |
| 11/30/15 | $10,798 | $10,849 | $10,806 |
| 12/31/15 | $10,433 | $10,653 | $10,442 |
| 1/31/16 | $9,828 | $10,080 | $9,833 |
| 2/29/16 | $9,888 | $10,077 | $9,891 |
| 3/31/16 | $10,566 | $10,780 | $10,572 |
| 4/30/16 | $10,637 | $10,838 | $10,644 |
| 5/31/16 | $10,979 | $11,027 | $10,994 |
| 6/30/16 | $11,027 | $11,053 | $11,032 |
| 7/31/16 | $11,520 | $11,474 | $11,531 |
| 8/31/16 | $11,590 | $11,489 | $11,603 |
| 9/30/16 | $11,416 | $11,498 | $11,445 |
| 10/31/16 | $11,051 | $11,274 | $11,065 |
| 11/30/16 | $11,690 | $11,718 | $11,706 |
| 12/31/16 | $11,967 | $11,938 | $11,986 |
| 1/31/17 | $12,197 | $12,178 | $12,220 |
| 2/28/17 | $12,583 | $12,650 | $12,609 |
| 3/31/17 | $12,565 | $12,657 | $12,596 |
| 4/30/17 | $12,769 | $12,791 | $12,803 |
| 5/31/17 | $12,832 | $12,955 | $12,862 |
| 6/30/17 | $12,970 | $13,046 | $13,010 |
| 7/31/17 | $13,071 | $13,304 | $13,115 |
| 8/31/17 | $12,936 | $13,345 | $12,980 |
| 9/30/17 | $13,380 | $13,630 | $13,425 |
| 10/31/17 | $13,836 | $13,942 | $13,888 |
| 11/30/17 | $14,345 | $14,374 | $14,395 |
| 12/31/17 | $14,319 | $14,532 | $14,375 |
| 1/31/18 | $14,937 | $15,317 | $15,000 |
| 2/28/18 | $14,362 | $14,764 | $14,423 |
| 3/31/18 | $14,520 | $14,426 | $14,570 |
| 4/30/18 | $14,339 | $14,499 | $14,408 |
| 5/31/18 | $14,922 | $14,869 | $14,987 |
| 6/30/18 | $14,985 | $14,945 | $15,052 |
| 7/31/18 | $15,189 | $15,461 | $15,260 |
| 8/31/18 | $15,772 | $15,995 | $15,841 |
| 9/30/18 | $15,579 | $16,067 | $15,647 |
| 10/31/18 | $13,983 | $14,939 | $14,055 |
| 11/30/18 | $14,459 | $15,237 | $14,528 |
| 12/31/18 | $12,826 | $13,845 | $12,889 |
| 1/31/19 | $14,007 | $15,032 | $14,088 |
| 2/28/19 | $14,645 | $15,555 | $14,726 |
| 3/31/19 | $14,738 | $15,829 | $14,816 |
| 4/30/19 | $15,217 | $16,483 | $15,307 |
| 5/31/19 | $14,244 | $15,441 | $14,334 |
| 6/30/19 | $15,258 | $16,537 | $15,344 |
| 7/31/19 | $15,431 | $16,789 | $15,536 |
| 8/31/19 | $14,956 | $16,480 | $15,058 |
| 9/30/19 | $15,150 | $16,767 | $15,251 |
| 10/31/19 | $15,291 | $17,132 | $15,393 |
| 11/30/19 | $15,771 | $17,785 | $15,879 |
| 12/31/19 | $16,165 | $18,296 | $16,277 |
| 1/31/20 | $15,960 | $18,315 | $16,081 |
| 2/29/20 | $14,623 | $16,807 | $14,721 |
| 3/31/20 | $12,159 | $14,731 | $12,253 |
| 4/30/20 | $13,861 | $16,620 | $13,974 |
| 5/31/20 | $15,089 | $17,411 | $15,220 |
| 6/30/20 | $15,299 | $17,758 | $15,429 |
| 7/31/20 | $16,236 | $18,759 | $16,372 |
| 8/31/20 | $16,756 | $20,107 | $16,910 |
| 9/30/20 | $16,352 | $19,343 | $16,508 |
| 10/31/20 | $16,552 | $18,829 | $16,700 |
| 11/30/20 | $18,611 | $20,890 | $18,782 |
| 12/31/20 | $19,798 | $21,693 | $19,982 |
| 1/31/21 | $20,150 | $21,474 | $20,351 |
| 2/28/21 | $20,975 | $22,066 | $21,185 |
| 3/31/21 | $21,481 | $23,033 | $21,689 |
| 4/30/21 | $22,367 | $24,262 | $22,590 |
| 5/31/21 | $21,974 | $24,431 | $22,193 |
| 6/30/21 | $22,203 | $25,002 | $22,431 |
| 7/31/21 | $22,411 | $25,596 | $22,645 |
| 8/31/21 | $22,739 | $26,374 | $22,972 |
| 9/30/21 | $21,761 | $25,147 | $21,992 |
| 10/31/21 | $23,408 | $26,909 | $23,657 |
| 11/30/21 | $22,573 | $26,723 | $22,814 |
| 12/31/21 | $23,500 | $27,920 | $23,753 |
| 1/31/22 | $21,052 | $26,475 | $21,286 |
| 2/28/22 | $21,256 | $25,683 | $21,492 |
| 3/31/22 | $21,365 | $26,636 | $21,605 |
| 4/30/22 | $19,738 | $24,314 | $19,958 |
| 5/31/22 | $19,588 | $24,358 | $19,809 |
| 6/30/22 | $17,634 | $22,348 | $17,832 |
| 7/31/22 | $19,869 | $24,408 | $20,096 |
| 8/31/22 | $19,191 | $23,413 | $19,418 |
| 9/30/22 | $17,501 | $21,256 | $17,700 |
| 10/31/22 | $19,155 | $22,977 | $19,370 |
| 11/30/22 | $20,246 | $24,261 | $20,482 |
| 12/31/22 | $19,020 | $22,864 | $19,249 |
| 1/31/23 | $20,377 | $24,300 | $20,620 |
| 2/28/23 | $20,201 | $23,707 | $20,450 |
| 3/31/23 | $19,970 | $24,578 | $20,219 |
| 4/30/23 | $19,870 | $24,961 | $20,116 |
| 5/31/23 | $19,315 | $25,070 | $19,556 |
| 6/30/23 | $20,994 | $26,726 | $21,259 |
| 7/31/23 | $21,789 | $27,585 | $22,066 |
| 8/31/23 | $21,329 | $27,146 | $21,607 |
| 9/30/23 | $20,307 | $25,852 | $20,570 |
| 10/31/23 | $19,321 | $25,308 | $19,570 |
| 11/30/23 | $20,786 | $27,619 | $21,057 |
| 12/31/23 | $22,324 | $28,874 | $22,616 |
| 1/31/24 | $22,232 | $29,359 | $22,534 |
| 2/29/24 | $24,363 | $30,927 | $24,721 |
| 3/31/24 | $25,773 | $31,922 | $26,144 |
| 4/30/24 | $24,235 | $30,619 | $24,576 |
| 5/31/24 | $25,253 | $32,138 | $25,589 |
| 6/30/24 | $24,912 | $33,292 | $25,263 |
Average Annual Total Returns (%)
| Name | 1 Year | 5 Years | 10 Years |
|---|
| MDYG | 18.65% | 10.31% | 9.55% |
| S&P 500 Index | 24.56% | 15.05% | 12.86% |
| S&P MidCap 400 Growth Index | 18.82% | 10.49% | 9.71% |
The Fund’s past performance is not necessarily an indication of how the Fund will perform in the future. The returns do not reflect the deduction of taxes that a shareholder would pay on Fund distributions or on the redemption or sale of Fund shares. Updated performance information is available by calling 1-866-787-2257 or visiting our website at www.ssga.com/us/en/institutional/fund-finder?tab=documents&type=etfs.
| Statistic | Value |
|---|
| Total Net Assets | $2,451,856,985 |
| # of Portfolio Holdings | 253 |
| Portfolio Turnover Rate | 51% |
| Total Advisory Fees Paid | $3,446,071 |
What did the Fund invest in?
| Industry | % Value of Total Net Assets |
| Building Products | 6.7% |
| Machinery | 6.2% |
| Oil, Gas & Consumable Fuels | 6.0% |
| Hotels, Restaurants & Leisure | 5.4% |
| Specialty Retail | 4.8% |
| Biotechnology | 4.5% |
| Software | 4.4% |
| Semiconductors & Semiconductor Equipment | 3.9% |
| Commercial Services & Supplies | 3.4% |
| Insurance | 2.9% |
| Holdings | % Value of Total Net Assets |
| Pure Storage, Inc., A | 1.4% |
| Carlisle Cos., Inc. | 1.4% |
| Williams-Sonoma, Inc. | 1.3% |
| Lennox International, Inc. | 1.2% |
| EMCOR Group, Inc. | 1.2% |
| Reliance, Inc. | 1.2% |
| Manhattan Associates, Inc. | 1.1% |
| Owens Corning | 1.1% |
| Watsco, Inc. | 1.1% |
| Casey's General Stores, Inc. | 1.0% |
SPDR S&P 400 Mid Cap Value ETF
Principal Listing Exchange: NYSEArca
Annual Shareholder Report
June 30, 2024
This annual shareholder report contains important information about the SPDR S&P 400 Mid Cap Value ETF (the "Fund") for the year ended June 30, 2024. You can find additional information about the Fund, including the Prospectus, Statement of Additional Information, financial statements and other information at www.ssga.com/us/en/institutional/fund-finder?tab=documents&type=etfs. You can also request this information about the Fund by contacting us at 1-866-787-2257.
What were the Fund costs for the last year?
| Fund Name | Cost of a $10,000 investment | Costs paid as a percentage of a $10,000 investment |
|---|
| SPDR S&P 400 Mid Cap Value ETF | $16 | 0.15% |
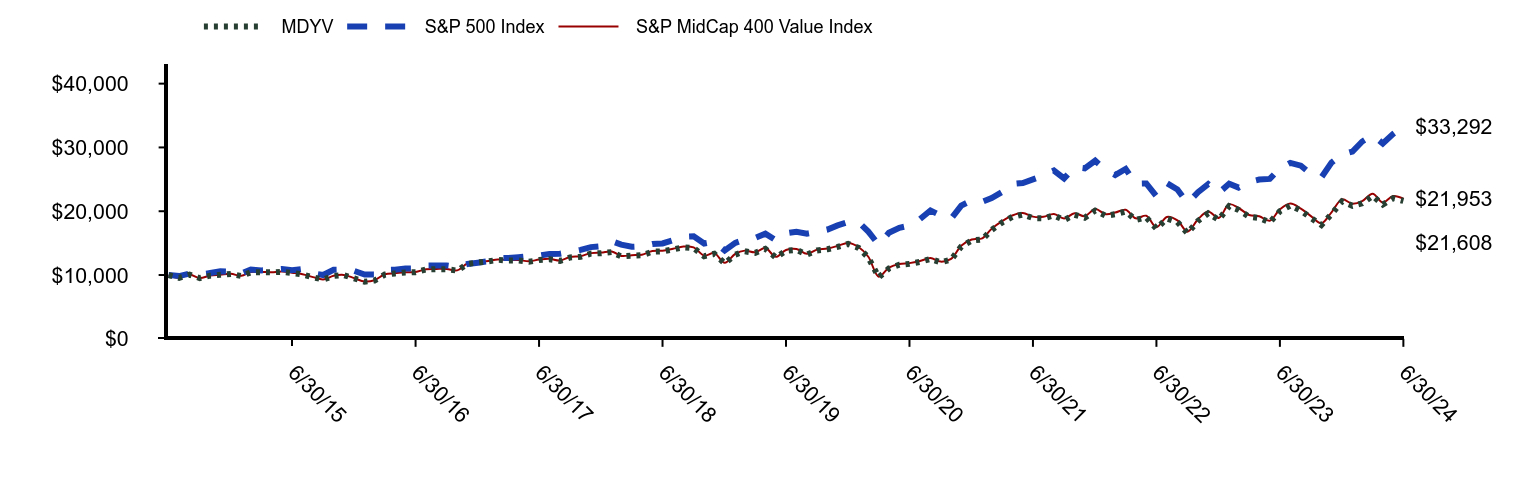
How did the Fund perform last year and what affected its performance?
The Fund’s performance was largely driven by news about inflation, economic growth and the impact either would have on the U.S. Federal Reserve (the “Fed”) and other central banks with regard to interest rate decisions. Alongside this macro story was the prospect of a burgeoning Artificial Intelligence boom, driving up the values of A.I.-related tech and semiconductor companies.
The Fund's benchmarks are unmanaged indices used as a general measure of market performance. Calculations assume dividends and capital gains.
Comparison of Change in Value of a $10,000 Investment
(Based on Net Asset Value)
| MDYV | S&P 500 Index | S&P MidCap 400 Value Index |
|---|
| 6/30/14 | $10,000 | $10,000 | $10,000 |
| 7/31/14 | $9,555 | $9,838 | $9,566 |
| 8/31/14 | $10,058 | $10,245 | $10,070 |
| 9/30/14 | $9,521 | $10,065 | $9,531 |
| 10/31/14 | $9,904 | $10,311 | $9,918 |
| 11/30/14 | $10,026 | $10,581 | $10,043 |
| 12/31/14 | $10,172 | $10,557 | $10,187 |
| 1/31/15 | $9,852 | $10,267 | $9,881 |
| 2/28/15 | $10,432 | $10,860 | $10,462 |
| 3/31/15 | $10,451 | $10,725 | $10,475 |
| 4/30/15 | $10,413 | $10,801 | $10,440 |
| 5/31/15 | $10,511 | $10,942 | $10,536 |
| 6/30/15 | $10,327 | $10,737 | $10,353 |
| 7/31/15 | $10,089 | $10,944 | $10,124 |
| 8/31/15 | $9,642 | $10,285 | $9,669 |
| 9/30/15 | $9,289 | $10,003 | $9,304 |
| 10/31/15 | $9,854 | $10,813 | $9,877 |
| 11/30/15 | $9,995 | $10,849 | $10,021 |
| 12/31/15 | $9,480 | $10,653 | $9,510 |
| 1/31/16 | $8,950 | $10,080 | $8,982 |
| 2/29/16 | $9,141 | $10,077 | $9,184 |
| 3/31/16 | $10,078 | $10,780 | $10,114 |
| 4/30/16 | $10,251 | $10,838 | $10,288 |
| 5/31/16 | $10,402 | $11,027 | $10,434 |
| 6/30/16 | $10,449 | $11,053 | $10,484 |
| 7/31/16 | $10,875 | $11,474 | $10,913 |
| 8/31/16 | $10,916 | $11,489 | $10,956 |
| 9/30/16 | $10,915 | $11,498 | $10,958 |
| 10/31/16 | $10,691 | $11,274 | $10,729 |
| 11/30/16 | $11,740 | $11,718 | $11,799 |
| 12/31/16 | $11,972 | $11,938 | $12,031 |
| 1/31/17 | $12,141 | $12,178 | $12,197 |
| 2/28/17 | $12,387 | $12,650 | $12,440 |
| 3/31/17 | $12,276 | $12,657 | $12,351 |
| 4/30/17 | $12,270 | $12,791 | $12,348 |
| 5/31/17 | $12,083 | $12,955 | $12,160 |
| 6/30/17 | $12,347 | $13,046 | $12,420 |
| 7/31/17 | $12,470 | $13,304 | $12,539 |
| 8/31/17 | $12,209 | $13,345 | $12,280 |
| 9/30/17 | $12,749 | $13,630 | $12,825 |
| 10/31/17 | $12,876 | $13,942 | $12,953 |
| 11/30/17 | $13,354 | $14,374 | $13,434 |
| 12/31/17 | $13,428 | $14,532 | $13,513 |
| 1/31/18 | $13,598 | $15,317 | $13,692 |
| 2/28/18 | $12,912 | $14,764 | $12,999 |
| 3/31/18 | $13,020 | $14,426 | $13,108 |
| 4/30/18 | $13,096 | $14,499 | $13,193 |
| 5/31/18 | $13,656 | $14,869 | $13,751 |
| 6/30/18 | $13,712 | $14,945 | $13,809 |
| 7/31/18 | $14,004 | $15,461 | $14,108 |
| 8/31/18 | $14,357 | $15,995 | $14,468 |
| 9/30/18 | $14,228 | $16,067 | $14,330 |
| 10/31/18 | $12,955 | $14,939 | $13,058 |
| 11/30/18 | $13,332 | $15,237 | $13,435 |
| 12/31/18 | $11,822 | $13,845 | $11,909 |
| 1/31/19 | $13,198 | $15,032 | $13,303 |
| 2/28/19 | $13,717 | $15,555 | $13,826 |
| 3/31/19 | $13,471 | $15,829 | $13,579 |
| 4/30/19 | $14,107 | $16,483 | $14,226 |
| 5/31/19 | $12,745 | $15,441 | $12,852 |
| 6/30/19 | $13,804 | $16,537 | $13,918 |
| 7/31/19 | $13,937 | $16,789 | $14,074 |
| 8/31/19 | $13,194 | $16,480 | $13,317 |
| 9/30/19 | $13,857 | $16,767 | $13,980 |
| 10/31/19 | $14,039 | $17,132 | $14,166 |
| 11/30/19 | $14,424 | $17,785 | $14,561 |
| 12/31/19 | $14,872 | $18,296 | $15,015 |
| 1/31/20 | $14,253 | $18,315 | $14,395 |
| 2/29/20 | $12,753 | $16,807 | $12,862 |
| 3/31/20 | $9,650 | $14,731 | $9,746 |
| 4/30/20 | $11,031 | $16,620 | $11,144 |
| 5/31/20 | $11,615 | $17,411 | $11,733 |
| 6/30/20 | $11,746 | $17,758 | $11,865 |
| 7/31/20 | $12,070 | $18,759 | $12,189 |
| 8/31/20 | $12,527 | $20,107 | $12,654 |
| 9/30/20 | $11,984 | $19,343 | $12,103 |
| 10/31/20 | $12,403 | $18,829 | $12,526 |
| 11/30/20 | $14,459 | $20,890 | $14,603 |
| 12/31/20 | $15,412 | $21,693 | $15,576 |
| 1/31/21 | $15,579 | $21,474 | $15,755 |
| 2/28/21 | $17,071 | $22,066 | $17,258 |
| 3/31/21 | $18,243 | $23,033 | $18,446 |
| 4/30/21 | $19,109 | $24,262 | $19,333 |
| 5/31/21 | $19,484 | $24,431 | $19,707 |
| 6/30/21 | $18,928 | $25,002 | $19,154 |
| 7/31/21 | $18,887 | $25,596 | $19,119 |
| 8/31/21 | $19,343 | $26,374 | $19,578 |
| 9/30/21 | $18,619 | $25,147 | $18,849 |
| 10/31/21 | $19,446 | $26,909 | $19,684 |
| 11/30/21 | $18,979 | $26,723 | $19,215 |
| 12/31/21 | $20,096 | $27,920 | $20,351 |
| 1/31/22 | $19,292 | $26,475 | $19,544 |
| 2/28/22 | $19,533 | $25,683 | $19,790 |
| 3/31/22 | $19,960 | $26,636 | $20,228 |
| 4/30/22 | $18,640 | $24,314 | $18,888 |
| 5/31/22 | $19,038 | $24,358 | $19,293 |
| 6/30/22 | $17,273 | $22,348 | $17,500 |
| 7/31/22 | $18,854 | $24,408 | $19,109 |
| 8/31/22 | $18,309 | $23,413 | $18,564 |
| 9/30/22 | $16,574 | $21,256 | $16,798 |
| 10/31/22 | $18,484 | $22,977 | $18,735 |
| 11/30/22 | $19,665 | $24,261 | $19,946 |
| 12/31/22 | $18,666 | $22,864 | $18,940 |
| 1/31/23 | $20,801 | $24,300 | $21,098 |
| 2/28/23 | $20,210 | $23,707 | $20,508 |
| 3/31/23 | $19,138 | $24,578 | $19,416 |
| 4/30/23 | $18,933 | $24,961 | $19,208 |
| 5/31/23 | $18,245 | $25,070 | $18,512 |
| 6/30/23 | $20,004 | $26,726 | $20,295 |
| 7/31/23 | $20,897 | $27,585 | $21,203 |
| 8/31/23 | $20,104 | $27,146 | $20,408 |
| 9/30/23 | $18,953 | $25,852 | $19,234 |
| 10/31/23 | $17,843 | $25,308 | $18,104 |
| 11/30/23 | $19,546 | $27,619 | $19,834 |
| 12/31/23 | $21,530 | $28,874 | $21,855 |
| 1/31/24 | $20,855 | $29,359 | $21,179 |
| 2/29/24 | $21,238 | $30,927 | $21,589 |
| 3/31/24 | $22,392 | $31,922 | $22,754 |
| 4/30/24 | $21,046 | $30,619 | $21,378 |
| 5/31/24 | $22,036 | $32,138 | $22,378 |
| 6/30/24 | $21,608 | $33,292 | $21,953 |
Average Annual Total Returns (%)
| Name | 1 Year | 5 Years | 10 Years |
|---|
| MDYV | 8.02% | 9.38% | 8.02% |
| S&P 500 Index | 24.56% | 15.05% | 12.86% |
| S&P MidCap 400 Value Index | 8.17% | 9.54% | 8.18% |
The Fund’s past performance is not necessarily an indication of how the Fund will perform in the future. The returns do not reflect the deduction of taxes that a shareholder would pay on Fund distributions or on the redemption or sale of Fund shares. Updated performance information is available by calling 1-866-787-2257 or visiting our website at www.ssga.com/us/en/institutional/fund-finder?tab=documents&type=etfs.
| Statistic | Value |
|---|
| Total Net Assets | $2,418,933,978 |
| # of Portfolio Holdings | 294 |
| Portfolio Turnover Rate | 41% |
| Total Advisory Fees Paid | $3,592,109 |
What did the Fund invest in?
| Industry | % Value of Total Net Assets |
| Banks | 9.3% |
| Insurance | 6.7% |
| Electronic Equipment, Instruments & Components | 3.9% |
| Oil, Gas & Consumable Fuels | 3.7% |
| Capital Markets | 3.5% |
| Consumer Staples Distribution & Retail | 3.1% |
| Specialty Retail | 3.1% |
| Professional Services | 3.0% |
| Metals & Mining | 2.7% |
| Machinery | 2.6% |
| Holdings | % Value of Total Net Assets |
| Illumina, Inc. | 1.3% |
| Reinsurance Group of America, Inc. | 1.1% |
| Tenet Healthcare Corp. | 1.0% |
| Fidelity National Financial, Inc. | 1.0% |
| WP Carey, Inc. | 1.0% |
| U.S. Foods Holding Corp. | 0.9% |
| BJ's Wholesale Club Holdings, Inc. | 0.9% |
| Ally Financial, Inc. | 0.9% |
| Performance Food Group Co. | 0.8% |
| Jones Lang LaSalle, Inc. | 0.8% |
SPDR S&P 600 Small Cap Growth ETF
Principal Listing Exchange: NYSEArca
Annual Shareholder Report
June 30, 2024
This annual shareholder report contains important information about the SPDR S&P 600 Small Cap Growth ETF (the "Fund") for the year ended June 30, 2024. You can find additional information about the Fund, including the Prospectus, Statement of Additional Information, financial statements and other information at www.ssga.com/us/en/institutional/fund-finder?tab=documents&type=etfs. You can also request this information about the Fund by contacting us at 1-866-787-2257.
What were the Fund costs for the last year?
| Fund Name | Cost of a $10,000 investment | Costs paid as a percentage of a $10,000 investment |
|---|
| SPDR S&P 600 Small Cap Growth ETF | $16 | 0.15% |
How did the Fund perform last year and what affected its performance?
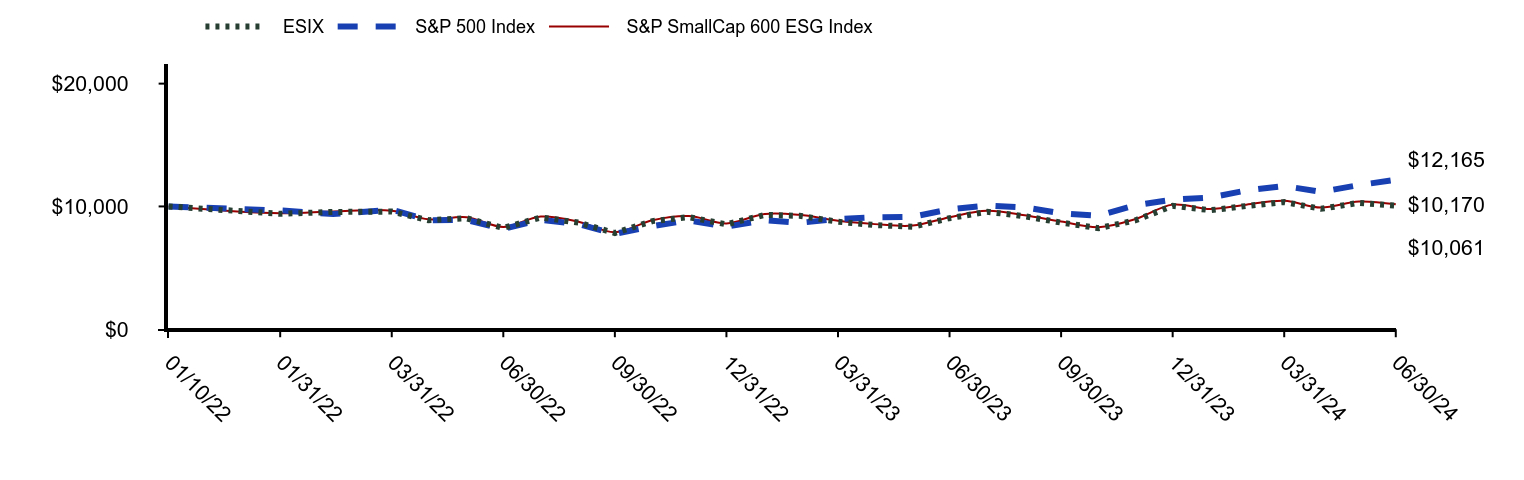
Performance of the Fund for the reporting period was driven by positive earnings growth, Artificial Intelligence and other Technology-centered tailwinds and a resilient economy despite sticky core inflation. During the reporting period, the Fund’s use of their current investment strategies did not cause the Fund’s performance to materially deviate from the manager’s expectations considering the uncertainty of the markets.
The Fund's benchmarks are unmanaged indices used as a general measure of market performance. Calculations assume dividends and capital gains.
Comparison of Change in Value of a $10,000 Investment
(Based on Net Asset Value)
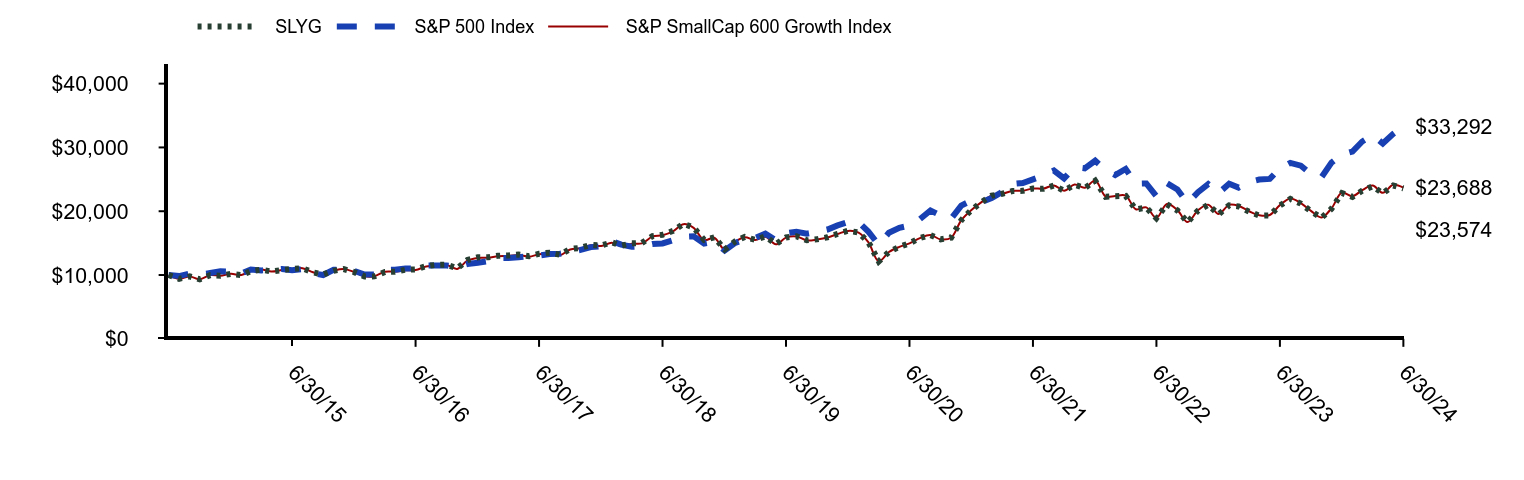
| SLYG | S&P 500 Index | S&P SmallCap 600 Growth Index |
|---|
| 6/30/14 | $10,000 | $10,000 | $10,000 |
| 7/31/14 | $9,405 | $9,838 | $9,401 |
| 8/31/14 | $9,780 | $10,245 | $9,785 |
| 9/30/14 | $9,337 | $10,065 | $9,335 |
| 10/31/14 | $9,985 | $10,311 | $9,987 |
| 11/30/14 | $9,895 | $10,581 | $9,894 |
| 12/31/14 | $10,184 | $10,557 | $10,193 |
| 1/31/15 | $9,998 | $10,267 | $10,011 |
| 2/28/15 | $10,614 | $10,860 | $10,627 |
| 3/31/15 | $10,849 | $10,725 | $10,866 |
| 4/30/15 | $10,541 | $10,801 | $10,555 |
| 5/31/15 | $10,763 | $10,942 | $10,788 |
| 6/30/15 | $10,945 | $10,737 | $10,959 |
| 7/31/15 | $11,053 | $10,944 | $11,073 |
| 8/31/15 | $10,411 | $10,285 | $10,426 |
| 9/30/15 | $10,085 | $10,003 | $10,094 |
| 10/31/15 | $10,656 | $10,813 | $10,671 |
| 11/30/15 | $10,942 | $10,849 | $10,960 |
| 12/31/15 | $10,454 | $10,653 | $10,476 |
| 1/31/16 | $9,785 | $10,080 | $9,802 |
| 2/29/16 | $9,790 | $10,077 | $9,821 |
| 3/31/16 | $10,493 | $10,780 | $10,516 |
| 4/30/16 | $10,520 | $10,838 | $10,547 |
| 5/31/16 | $10,820 | $11,027 | $10,746 |
| 6/30/16 | $10,873 | $11,053 | $10,792 |
| 7/31/16 | $11,407 | $11,474 | $11,334 |
| 8/31/16 | $11,592 | $11,489 | $11,512 |
| 9/30/16 | $11,631 | $11,498 | $11,565 |
| 10/31/16 | $11,037 | $11,274 | $10,962 |
| 11/30/16 | $12,348 | $11,718 | $12,252 |
| 12/31/16 | $12,769 | $11,938 | $12,682 |
| 1/31/17 | $12,789 | $12,178 | $12,713 |
| 2/28/17 | $13,010 | $12,650 | $12,933 |
| 3/31/17 | $13,062 | $12,657 | $12,990 |
| 4/30/17 | $13,212 | $12,791 | $13,146 |
| 5/31/17 | $12,948 | $12,955 | $12,881 |
| 6/30/17 | $13,328 | $13,046 | $13,261 |
| 7/31/17 | $13,506 | $13,304 | $13,427 |
| 8/31/17 | $13,173 | $13,345 | $13,106 |
| 9/30/17 | $14,084 | $13,630 | $14,011 |
| 10/31/17 | $14,260 | $13,942 | $14,187 |
| 11/30/17 | $14,738 | $14,374 | $14,655 |
| 12/31/17 | $14,621 | $14,532 | $14,557 |
| 1/31/18 | $15,138 | $15,317 | $15,078 |
| 2/28/18 | $14,597 | $14,764 | $14,537 |
| 3/31/18 | $14,973 | $14,426 | $14,909 |
| 4/30/18 | $15,035 | $14,499 | $14,966 |
| 5/31/18 | $16,093 | $14,869 | $16,025 |
| 6/30/18 | $16,313 | $14,945 | $16,246 |
| 7/31/18 | $16,919 | $15,461 | $16,856 |
| 8/31/18 | $18,039 | $15,995 | $17,976 |
| 9/30/18 | $17,445 | $16,067 | $17,381 |
| 10/31/18 | $15,508 | $14,939 | $15,456 |
| 11/30/18 | $15,910 | $15,237 | $15,842 |
| 12/31/18 | $14,002 | $13,845 | $13,967 |
| 1/31/19 | $15,286 | $15,032 | $15,236 |
| 2/28/19 | $15,968 | $15,555 | $15,921 |
| 3/31/19 | $15,523 | $15,829 | $15,481 |
| 4/30/19 | $16,051 | $16,483 | $16,013 |
| 5/31/19 | $14,849 | $15,441 | $14,814 |
| 6/30/19 | $15,895 | $16,537 | $15,867 |
| 7/31/19 | $16,073 | $16,789 | $16,045 |
| 8/31/19 | $15,445 | $16,480 | $15,421 |
| 9/30/19 | $15,596 | $16,767 | $15,573 |
| 10/31/19 | $15,914 | $17,132 | $15,883 |
| 11/30/19 | $16,454 | $17,785 | $16,428 |
| 12/31/19 | $16,934 | $18,296 | $16,918 |
| 1/31/20 | $16,668 | $18,315 | $16,646 |
| 2/29/20 | $15,178 | $16,807 | $15,142 |
| 3/31/20 | $12,144 | $14,731 | $12,162 |
| 4/30/20 | $13,616 | $16,620 | $13,610 |
| 5/31/20 | $14,424 | $17,411 | $14,418 |
| 6/30/20 | $14,971 | $17,758 | $14,966 |
| 7/31/20 | $15,809 | $18,759 | $15,792 |
| 8/31/20 | $16,263 | $20,107 | $16,266 |
| 9/30/20 | $15,594 | $19,343 | $15,585 |
| 10/31/20 | $15,856 | $18,829 | $15,843 |
| 11/30/20 | $18,589 | $20,890 | $18,573 |
| 12/31/20 | $20,239 | $21,693 | $20,234 |
| 1/31/21 | $21,501 | $21,474 | $21,506 |
| 2/28/21 | $22,438 | $22,066 | $22,472 |
| 3/31/21 | $22,737 | $23,033 | $22,716 |
| 4/30/21 | $23,162 | $24,262 | $23,185 |
| 5/31/21 | $23,197 | $24,431 | $23,209 |
| 6/30/21 | $23,556 | $25,002 | $23,571 |
| 7/31/21 | $23,519 | $25,596 | $23,547 |
| 8/31/21 | $24,019 | $26,374 | $24,048 |
| 9/30/21 | $23,197 | $25,147 | $23,219 |
| 10/31/21 | $24,147 | $26,909 | $24,173 |
| 11/30/21 | $23,642 | $26,723 | $23,681 |
| 12/31/21 | $24,772 | $27,920 | $24,812 |
| 1/31/22 | $22,258 | $26,475 | $22,301 |
| 2/28/22 | $22,347 | $25,683 | $22,390 |
| 3/31/22 | $22,403 | $26,636 | $22,451 |
| 4/30/22 | $20,284 | $24,314 | $20,318 |
| 5/31/22 | $20,554 | $24,358 | $20,600 |
| 6/30/22 | $18,907 | $22,348 | $18,945 |
| 7/31/22 | $21,091 | $24,408 | $21,147 |
| 8/31/22 | $20,122 | $23,413 | $20,172 |
| 9/30/22 | $18,271 | $21,256 | $18,305 |
| 10/31/22 | $20,105 | $22,977 | $20,143 |
| 11/30/22 | $20,981 | $24,261 | $21,033 |
| 12/31/22 | $19,521 | $22,864 | $19,582 |
| 1/31/23 | $20,929 | $24,300 | $20,997 |
| 2/28/23 | $20,756 | $23,707 | $20,828 |
| 3/31/23 | $19,931 | $24,578 | $20,001 |
| 4/30/23 | $19,312 | $24,961 | $19,374 |
| 5/31/23 | $19,353 | $25,070 | $19,413 |
| 6/30/23 | $20,890 | $26,726 | $20,957 |
| 7/31/23 | $21,944 | $27,585 | $22,009 |
| 8/31/23 | $21,191 | $27,146 | $21,268 |
| 9/30/23 | $20,006 | $25,852 | $20,065 |
| 10/31/23 | $18,967 | $25,308 | $19,029 |
| 11/30/23 | $20,399 | $27,619 | $20,456 |
| 12/31/23 | $22,850 | $28,874 | $22,931 |
| 1/31/24 | $22,251 | $29,359 | $22,347 |
| 2/29/24 | $23,207 | $30,927 | $23,303 |
| 3/31/24 | $23,917 | $31,922 | $24,025 |
| 4/30/24 | $22,789 | $30,619 | $22,885 |
| 5/31/24 | $24,033 | $32,138 | $24,136 |
| 6/30/24 | $23,574 | $33,292 | $23,688 |
Average Annual Total Returns (%)
| Name | 1 Year | 5 Years | 10 Years |
|---|
| SLYG | 12.88% | 8.20% | 8.96% |
| S&P 500 Index | 24.56% | 15.05% | 12.86% |
| S&P SmallCap 600 Growth Index | 13.03% | 8.34% | 9.11% |
The Fund’s past performance is not necessarily an indication of how the Fund will perform in the future. The returns do not reflect the deduction of taxes that a shareholder would pay on Fund distributions or on the redemption or sale of Fund shares. Updated performance information is available by calling 1-866-787-2257 or visiting our website at www.ssga.com/us/en/institutional/fund-finder?tab=documents&type=etfs.
| Statistic | Value |
|---|
| Total Net Assets | $3,226,943,974 |
| # of Portfolio Holdings | 351 |
| Portfolio Turnover Rate | 53% |
| Total Advisory Fees Paid | $4,337,627 |
What did the Fund invest in?
| Industry | % Value of Total Net Assets |
| Machinery | 6.4% |
| Software | 6.2% |
| Specialty Retail | 5.2% |
| Electronic Equipment, Instruments & Components | 5.2% |
| Banks | 4.2% |
| Oil, Gas & Consumable Fuels | 4.1% |
| Household Durables | 4.1% |
| Metals & Mining | 4.1% |
| Semiconductors & Semiconductor Equipment | 3.8% |
| Health Care Equipment & Supplies | 3.8% |
| Holdings | % Value of Total Net Assets |
| Abercrombie & Fitch Co., A | 1.5% |
| Fabrinet | 1.5% |
| Ensign Group, Inc. | 1.2% |
| SPS Commerce, Inc. | 1.2% |
| ATI, Inc. | 1.1% |
| SPX Technologies, Inc. | 1.1% |
| Mueller Industries, Inc. | 1.1% |
| Glaukos Corp. | 1.0% |
| Meritage Homes Corp. | 1.0% |
| Badger Meter, Inc. | 0.9% |
SPDR S&P 600 Small Cap Value ETF
Principal Listing Exchange: NYSEArca
Annual Shareholder Report
June 30, 2024
This annual shareholder report contains important information about the SPDR S&P 600 Small Cap Value ETF (the "Fund") for the year ended June 30, 2024. You can find additional information about the Fund, including the Prospectus, Statement of Additional Information, financial statements and other information at www.ssga.com/us/en/institutional/fund-finder?tab=documents&type=etfs. You can also request this information about the Fund by contacting us at 1-866-787-2257.
What were the Fund costs for the last year?
| Fund Name | Cost of a $10,000 investment | Costs paid as a percentage of a $10,000 investment |
|---|
| SPDR S&P 600 Small Cap Value ETF | $15 | 0.15% |
How did the Fund perform last year and what affected its performance?
Performance of the Fund for the reporting period was driven by positive earnings growth, robust employment and consumer spending data and a resilient economy despite sticky core inflation. During the reporting period, the Fund’s use of their current investment strategies did not cause the Fund’s performance to materially deviate from the manager’s expectations considering the uncertainty of the markets.
The Fund's benchmarks are unmanaged indices used as a general measure of market performance. Calculations assume dividends and capital gains.
Comparison of Change in Value of a $10,000 Investment
(Based on Net Asset Value)
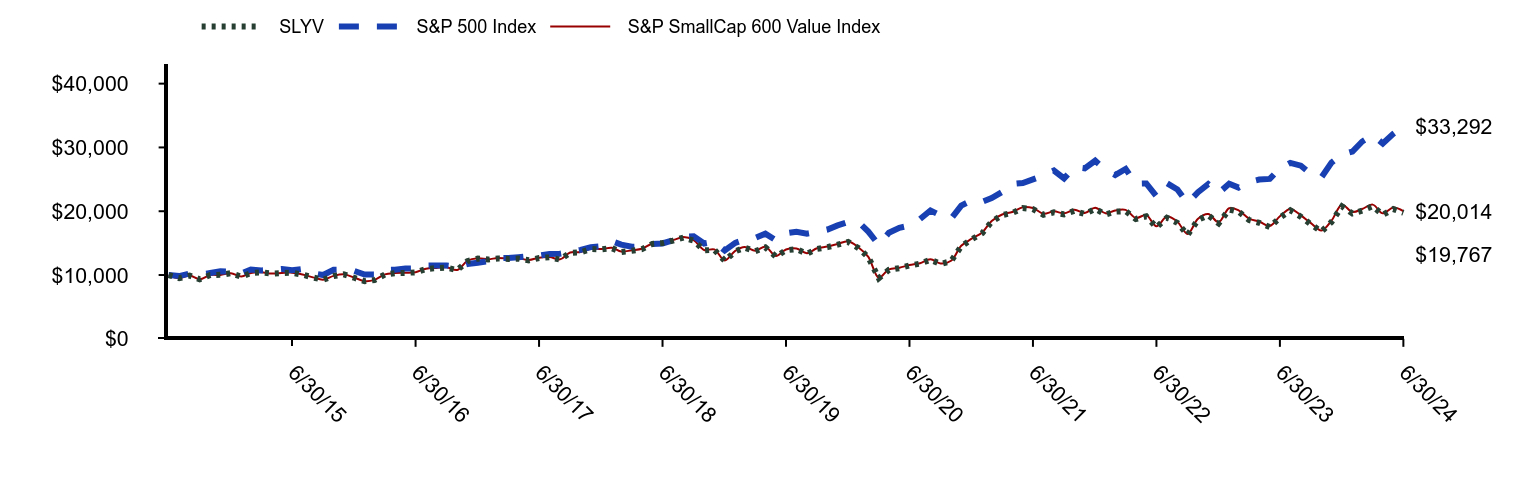
| SLYV | S&P 500 Index | S&P SmallCap 600 Value Index |
|---|
| 6/30/14 | $10,000 | $10,000 | $10,000 |
| 7/31/14 | $9,497 | $9,838 | $9,495 |
| 8/31/14 | $9,918 | $10,245 | $9,921 |
| 9/30/14 | $9,328 | $10,065 | $9,322 |
| 10/31/14 | $9,995 | $10,311 | $9,991 |
| 11/30/14 | $10,025 | $10,581 | $10,022 |
| 12/31/14 | $10,283 | $10,557 | $10,295 |
| 1/31/15 | $9,734 | $10,267 | $9,756 |
| 2/28/15 | $10,310 | $10,860 | $10,331 |
| 3/31/15 | $10,412 | $10,725 | $10,427 |
| 4/30/15 | $10,227 | $10,801 | $10,243 |
| 5/31/15 | $10,304 | $10,942 | $10,329 |
| 6/30/15 | $10,356 | $10,737 | $10,375 |
| 7/31/15 | $10,064 | $10,944 | $10,087 |
| 8/31/15 | $9,613 | $10,285 | $9,633 |
| 9/30/15 | $9,252 | $10,003 | $9,265 |
| 10/31/15 | $9,843 | $10,813 | $9,863 |
| 11/30/15 | $10,101 | $10,849 | $10,124 |
| 12/31/15 | $9,576 | $10,653 | $9,608 |
| 1/31/16 | $9,027 | $10,080 | $9,043 |
| 2/29/16 | $9,212 | $10,077 | $9,237 |
| 3/31/16 | $10,079 | $10,780 | $10,106 |
| 4/30/16 | $10,289 | $10,838 | $10,316 |
| 5/31/16 | $10,330 | $11,027 | $10,368 |
| 6/30/16 | $10,422 | $11,053 | $10,449 |
| 7/31/16 | $10,957 | $11,474 | $10,989 |
| 8/31/16 | $11,076 | $11,489 | $11,113 |
| 9/30/16 | $11,162 | $11,498 | $11,205 |
| 10/31/16 | $10,749 | $11,274 | $10,789 |
| 11/30/16 | $12,177 | $11,718 | $12,227 |
| 12/31/16 | $12,578 | $11,938 | $12,618 |
| 1/31/17 | $12,422 | $12,178 | $12,479 |
| 2/28/17 | $12,605 | $12,650 | $12,659 |
| 3/31/17 | $12,521 | $12,657 | $12,564 |
| 4/30/17 | $12,582 | $12,791 | $12,637 |
| 5/31/17 | $12,306 | $12,955 | $12,351 |
| 6/30/17 | $12,673 | $13,046 | $12,725 |
| 7/31/17 | $12,770 | $13,304 | $12,812 |
| 8/31/17 | $12,414 | $13,345 | $12,461 |
| 9/30/17 | $13,489 | $13,630 | $13,524 |
| 10/31/17 | $13,566 | $13,942 | $13,609 |
| 11/30/17 | $14,079 | $14,374 | $14,118 |
| 12/31/17 | $14,011 | $14,532 | $14,069 |
| 1/31/18 | $14,210 | $15,317 | $14,273 |
| 2/28/18 | $13,619 | $14,764 | $13,679 |
| 3/31/18 | $13,808 | $14,426 | $13,883 |
| 4/30/18 | $14,050 | $14,499 | $14,112 |
| 5/31/18 | $14,878 | $14,869 | $14,940 |
| 6/30/18 | $14,999 | $14,945 | $15,073 |
| 7/31/18 | $15,389 | $15,461 | $15,466 |
| 8/31/18 | $15,871 | $15,995 | $15,952 |
| 9/30/18 | $15,391 | $16,067 | $15,466 |
| 10/31/18 | $13,858 | $14,939 | $13,933 |
| 11/30/18 | $13,951 | $15,237 | $14,017 |
| 12/31/18 | $12,223 | $13,845 | $12,289 |
| 1/31/19 | $13,716 | $15,032 | $13,801 |
| 2/28/19 | $14,293 | $15,555 | $14,382 |
| 3/31/19 | $13,737 | $15,829 | $13,820 |
| 4/30/19 | $14,330 | $16,483 | $14,416 |
| 5/31/19 | $12,896 | $15,441 | $12,982 |
| 6/30/19 | $13,889 | $16,537 | $13,993 |
| 7/31/19 | $14,055 | $16,789 | $14,155 |
| 8/31/19 | $13,328 | $16,480 | $13,428 |
| 9/30/19 | $14,096 | $16,767 | $14,196 |
| 10/31/19 | $14,373 | $17,132 | $14,466 |
| 11/30/19 | $14,755 | $17,785 | $14,859 |
| 12/31/19 | $15,187 | $18,296 | $15,305 |
| 1/31/20 | $14,221 | $18,315 | $14,322 |
| 2/29/20 | $12,780 | $16,807 | $12,856 |
| 3/31/20 | $9,505 | $14,731 | $9,585 |
| 4/30/20 | $10,809 | $16,620 | $10,893 |
| 5/31/20 | $11,079 | $17,411 | $11,153 |
| 6/30/20 | $11,488 | $17,758 | $11,561 |
| 7/31/20 | $11,785 | $18,759 | $11,846 |
| 8/31/20 | $12,387 | $20,107 | $12,460 |
| 9/30/20 | $11,739 | $19,343 | $11,803 |
| 10/31/20 | $12,174 | $18,829 | $12,231 |
| 11/30/20 | $14,499 | $20,890 | $14,578 |
| 12/31/20 | $15,597 | $21,693 | $15,693 |
| 1/31/21 | $16,559 | $21,474 | $16,679 |
| 2/28/21 | $18,360 | $22,066 | $18,483 |
| 3/31/21 | $19,386 | $23,033 | $19,487 |
| 4/30/21 | $19,729 | $24,262 | $19,881 |
| 5/31/21 | $20,487 | $24,431 | $20,640 |
| 6/30/21 | $20,333 | $25,002 | $20,498 |
| 7/31/21 | $19,449 | $25,596 | $19,606 |
| 8/31/21 | $19,819 | $26,374 | $19,982 |
| 9/30/21 | $19,515 | $25,147 | $19,674 |
| 10/31/21 | $20,063 | $26,909 | $20,231 |
| 11/30/21 | $19,558 | $26,723 | $19,723 |
| 12/31/21 | $20,364 | $27,920 | $20,554 |
| 1/31/22 | $19,481 | $26,475 | $19,666 |
| 2/28/22 | $19,930 | $25,683 | $20,126 |
| 3/31/22 | $20,013 | $26,636 | $20,218 |
| 4/30/22 | $18,779 | $24,314 | $18,951 |
| 5/31/22 | $19,196 | $24,358 | $19,385 |
| 6/30/22 | $17,474 | $22,348 | $17,643 |
| 7/31/22 | $18,964 | $24,408 | $19,163 |
| 8/31/22 | $18,181 | $23,413 | $18,361 |
| 9/30/22 | $16,291 | $21,256 | $16,446 |
| 10/31/22 | $18,639 | $22,977 | $18,816 |
| 11/30/22 | $19,354 | $24,261 | $19,560 |
| 12/31/22 | $18,096 | $22,864 | $18,284 |
| 1/31/23 | $20,257 | $24,300 | $20,470 |
| 2/28/23 | $19,918 | $23,707 | $20,130 |
| 3/31/23 | $18,619 | $24,578 | $18,842 |
| 4/30/23 | $18,185 | $24,961 | $18,387 |
| 5/31/23 | $17,512 | $25,070 | $17,700 |
| 6/30/23 | $18,995 | $26,726 | $19,209 |
| 7/31/23 | $20,143 | $27,585 | $20,363 |
| 8/31/23 | $19,148 | $27,146 | $19,361 |
| 9/30/23 | $17,937 | $25,852 | $18,133 |
| 10/31/23 | $16,809 | $25,308 | $16,994 |
| 11/30/23 | $18,317 | $27,619 | $18,524 |
| 12/31/23 | $20,765 | $28,874 | $21,006 |
| 1/31/24 | $19,640 | $29,359 | $19,880 |
| 2/29/24 | $20,094 | $30,927 | $20,346 |
| 3/31/24 | $20,772 | $31,922 | $21,035 |
| 4/30/24 | $19,433 | $30,619 | $19,667 |
| 5/31/24 | $20,330 | $32,138 | $20,573 |
| 6/30/24 | $19,767 | $33,292 | $20,014 |
Average Annual Total Returns (%)
| Name | 1 Year | 5 Years | 10 Years |
|---|
| SLYV | 4.06% | 7.31% | 7.05% |
| S&P 500 Index | 24.56% | 15.05% | 12.86% |
| S&P SmallCap 600 Value Index | 4.20% | 7.42% | 7.18% |
The Fund’s past performance is not necessarily an indication of how the Fund will perform in the future. The returns do not reflect the deduction of taxes that a shareholder would pay on Fund distributions or on the redemption or sale of Fund shares. Updated performance information is available by calling 1-866-787-2257 or visiting our website at www.ssga.com/us/en/institutional/fund-finder?tab=documents&type=etfs.
| Statistic | Value |
|---|
| Total Net Assets | $3,646,673,500 |
| # of Portfolio Holdings | 464 |
| Portfolio Turnover Rate | 58% |
| Total Advisory Fees Paid | $5,688,497 |
What did the Fund invest in?
| Industry | % Value of Total Net Assets |
| Banks | 14.1% |
| Specialty Retail | 4.1% |
| Electronic Equipment, Instruments & Components | 3.3% |
| Commercial Services & Supplies | 3.2% |
| Insurance | 3.1% |
| Financial Services | 3.0% |
| Machinery | 3.0% |
| Capital Markets | 2.6% |
| Chemicals | 2.5% |
| Health Care Providers & Services | 2.5% |
| Holdings | % Value of Total Net Assets |
| Comerica, Inc. | 1.1% |
| Robert Half, Inc. | 1.1% |
| Organon & Co. | 0.9% |
| Lincoln National Corp. | 0.9% |
| Mr Cooper Group, Inc. | 0.9% |
| Alaska Air Group, Inc. | 0.9% |
| Jackson Financial, Inc., A | 0.9% |
| Dycom Industries, Inc. | 0.8% |
| VF Corp. | 0.8% |
| Academy Sports & Outdoors, Inc. | 0.7% |
SPDR S&P 1500 Value Tilt ETF
Principal Listing Exchange: NYSEArca
Annual Shareholder Report
June 30, 2024
This annual shareholder report contains important information about the SPDR S&P 1500 Value Tilt ETF (the "Fund") for the year ended June 30, 2024. You can find additional information about the Fund, including the Prospectus, Statement of Additional Information, financial statements and other information at www.ssga.com/us/en/institutional/fund-finder?tab=documents&type=etfs. You can also request this information about the Fund by contacting us at 1-866-787-2257.
What were the Fund costs for the last year?
| Fund Name | Cost of a $10,000 investment | Costs paid as a percentage of a $10,000 investment |
|---|
| SPDR S&P 1500 Value Tilt ETF | $13 | 0.12% |
How did the Fund perform last year and what affected its performance?
The reporting period’s market environment was largely driven by news about inflation, economic growth and the impact either would have on the Fed and other central banks with regard to interest rate decisions. Alongside this macro story was the prospect of a burgeoning artificial intelligence boom, driving up the values of AI-related tech and semiconductor companies. And markets continued to be dominated by the so-called "Magnificent Seven", consisting of Alphabet Inc, Amazon.com Inc, Apple Inc, Meta Platforms Inc, Microsoft Corp, NVIDIA Corp and Tesla Inc. Compared to the performance of the S&P 500, which returned 24.56% for the reporting period, the Fund significantly underperformed. The Fund's tilt towards value stocks substantially underperformed growth stocks whose returns were characterized by the high returns of the Magnificent Seven and AI-related tech and semiconductor stocks. As a result, the Fund's value tilt strategy was unable to generate competitive returns for the reporting period.
The Fund's benchmarks are unmanaged indices used as a general measure of market performance. Calculations assume dividends and capital gains.
Comparison of Change in Value of a $10,000 Investment
(Based on Net Asset Value)
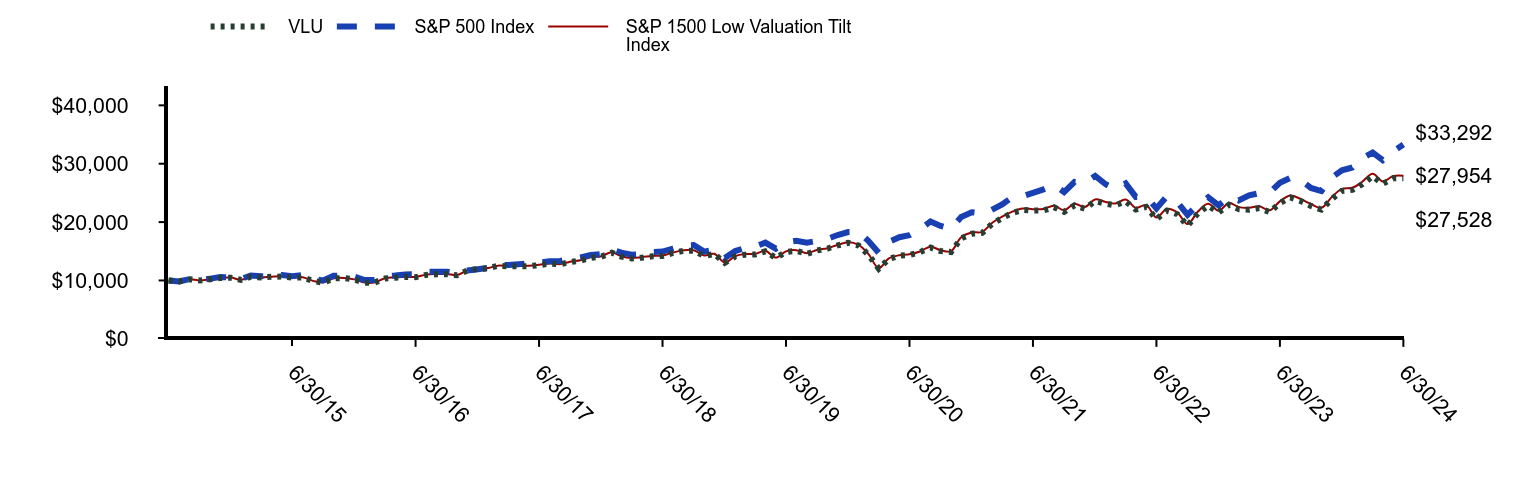
| VLU | S&P 500 Index | S&P 1500 Low Valuation Tilt Index |
|---|
| 6/30/14 | $10,000 | $10,000 | $10,000 |
| 7/31/14 | $9,828 | $9,838 | $9,831 |
| 8/31/14 | $10,214 | $10,245 | $10,222 |
| 9/30/14 | $9,991 | $10,065 | $9,992 |
| 10/31/14 | $10,207 | $10,311 | $10,219 |
| 11/30/14 | $10,431 | $10,581 | $10,443 |
| 12/31/14 | $10,464 | $10,557 | $10,489 |
| 1/31/15 | $10,099 | $10,267 | $10,103 |
| 2/28/15 | $10,648 | $10,860 | $10,662 |
| 3/31/15 | $10,504 | $10,725 | $10,528 |
| 4/30/15 | $10,625 | $10,801 | $10,633 |
| 5/31/15 | $10,678 | $10,942 | $10,706 |
| 6/30/15 | $10,476 | $10,737 | $10,502 |
| 7/31/15 | $10,533 | $10,944 | $10,551 |
| 8/31/15 | $9,907 | $10,285 | $9,928 |
| 9/30/15 | $9,631 | $10,003 | $9,648 |
| 10/31/15 | $10,359 | $10,813 | $10,380 |
| 11/30/15 | $10,425 | $10,849 | $10,439 |
| 12/31/15 | $10,162 | $10,653 | $10,187 |
| 1/31/16 | $9,622 | $10,080 | $9,651 |
| 2/29/16 | $9,630 | $10,077 | $9,656 |
| 3/31/16 | $10,339 | $10,780 | $10,370 |
| 4/30/16 | $10,478 | $10,838 | $10,516 |
| 5/31/16 | $10,604 | $11,027 | $10,638 |
| 6/30/16 | $10,567 | $11,053 | $10,596 |
| 7/31/16 | $10,950 | $11,474 | $10,983 |
| 8/31/16 | $11,064 | $11,489 | $11,093 |
| 9/30/16 | $11,059 | $11,498 | $11,097 |
| 10/31/16 | $10,905 | $11,274 | $10,941 |
| 11/30/16 | $11,707 | $11,718 | $11,738 |
| 12/31/16 | $11,972 | $11,938 | $12,016 |
| 1/31/17 | $12,077 | $12,178 | $12,127 |
| 2/28/17 | $12,499 | $12,650 | $12,539 |
| 3/31/17 | $12,417 | $12,657 | $12,466 |
| 4/30/17 | $12,431 | $12,791 | $12,479 |
| 5/31/17 | $12,440 | $12,955 | $12,501 |
| 6/30/17 | $12,631 | $13,046 | $12,679 |
| 7/31/17 | $12,868 | $13,304 | $12,915 |
| 8/31/17 | $12,766 | $13,345 | $12,801 |
| 9/30/17 | $13,171 | $13,630 | $13,222 |
| 10/31/17 | $13,410 | $13,942 | $13,457 |
| 11/30/17 | $13,884 | $14,374 | $13,953 |
| 12/31/17 | $14,082 | $14,532 | $14,162 |
| 1/31/18 | $14,766 | $15,317 | $14,843 |
| 2/28/18 | $14,079 | $14,764 | $14,157 |
| 3/31/18 | $13,783 | $14,426 | $13,864 |
| 4/30/18 | $13,902 | $14,499 | $13,996 |
| 5/31/18 | $14,130 | $14,869 | $14,200 |
| 6/30/18 | $14,197 | $14,945 | $14,268 |
| 7/31/18 | $14,708 | $15,461 | $14,786 |
| 8/31/18 | $15,088 | $15,995 | $15,171 |
| 9/30/18 | $15,101 | $16,067 | $15,187 |
| 10/31/18 | $14,209 | $14,939 | $14,289 |
| 11/30/18 | $14,547 | $15,237 | $14,565 |
| 12/31/18 | $13,012 | $13,845 | $13,082 |
| 1/31/19 | $14,128 | $15,032 | $14,164 |
| 2/28/19 | $14,417 | $15,555 | $14,519 |
| 3/31/19 | $14,458 | $15,829 | $14,560 |
| 4/30/19 | $14,998 | $16,483 | $15,079 |
| 5/31/19 | $13,859 | $15,441 | $13,916 |
| 6/30/19 | $14,886 | $16,537 | $14,987 |
| 7/31/19 | $15,066 | $16,789 | $15,180 |
| 8/31/19 | $14,566 | $16,480 | $14,683 |
| 9/30/19 | $15,140 | $16,767 | $15,229 |
| 10/31/19 | $15,472 | $17,132 | $15,528 |
| 11/30/19 | $16,000 | $17,785 | $16,088 |
| 12/31/19 | $16,443 | $18,296 | $16,541 |
| 1/31/20 | $15,993 | $18,315 | $16,105 |
| 2/29/20 | $14,439 | $16,807 | $14,542 |
| 3/31/20 | $12,023 | $14,731 | $12,113 |
| 4/30/20 | $13,691 | $16,620 | $13,784 |
| 5/31/20 | $14,240 | $17,411 | $14,328 |
| 6/30/20 | $14,364 | $17,758 | $14,491 |
| 7/31/20 | $14,858 | $18,759 | $14,972 |
| 8/31/20 | $15,642 | $20,107 | $15,791 |
| 9/30/20 | $15,025 | $19,343 | $15,185 |
| 10/31/20 | $14,872 | $18,829 | $15,022 |
| 11/30/20 | $17,221 | $20,890 | $17,401 |
| 12/31/20 | $18,000 | $21,693 | $18,204 |
| 1/31/21 | $18,154 | $21,474 | $18,333 |
| 2/28/21 | $19,626 | $22,066 | $19,802 |
| 3/31/21 | $20,700 | $23,033 | $20,925 |
| 4/30/21 | $21,563 | $24,262 | $21,789 |
| 5/31/21 | $22,082 | $24,431 | $22,327 |
| 6/30/21 | $21,959 | $25,002 | $22,210 |
| 7/31/21 | $22,003 | $25,596 | $22,262 |
| 8/31/21 | $22,538 | $26,374 | $22,812 |
| 9/30/21 | $21,761 | $25,147 | $22,033 |
| 10/31/21 | $22,868 | $26,909 | $23,156 |
| 11/30/21 | $22,302 | $26,723 | $22,564 |
| 12/31/21 | $23,589 | $27,920 | $23,879 |
| 1/31/22 | $23,165 | $26,475 | $23,457 |
| 2/28/22 | $22,872 | $25,683 | $23,172 |
| 3/31/22 | $23,544 | $26,636 | $23,858 |
| 4/30/22 | $22,141 | $24,314 | $22,434 |
| 5/31/22 | $22,592 | $24,358 | $22,911 |
| 6/30/22 | $20,507 | $22,348 | $20,780 |
| 7/31/22 | $21,965 | $24,408 | $22,263 |
| 8/31/22 | $21,342 | $23,413 | $21,630 |
| 9/30/22 | $19,391 | $21,256 | $19,658 |
| 10/31/22 | $21,525 | $22,977 | $21,826 |
| 11/30/22 | $22,806 | $24,261 | $23,122 |
| 12/31/22 | $21,659 | $22,864 | $21,956 |
| 1/31/23 | $22,968 | $24,300 | $23,285 |
| 2/28/23 | $22,220 | $23,707 | $22,567 |
| 3/31/23 | $22,118 | $24,578 | $22,444 |
| 4/30/23 | $22,387 | $24,961 | $22,704 |
| 5/31/23 | $21,719 | $25,070 | $22,024 |
| 6/30/23 | $23,250 | $26,726 | $23,554 |
| 7/31/23 | $24,227 | $27,585 | $24,570 |
| 8/31/23 | $23,601 | $27,146 | $23,939 |
| 9/30/23 | $22,772 | $25,852 | $23,096 |
| 10/31/23 | $22,134 | $25,308 | $22,448 |
| 11/30/23 | $23,902 | $27,619 | $24,233 |
| 12/31/23 | $25,353 | $28,874 | $25,679 |
| 1/31/24 | $25,511 | $29,359 | $25,877 |
| 2/29/24 | $26,489 | $30,927 | $26,906 |
| 3/31/24 | $27,842 | $31,922 | $28,274 |
| 4/30/24 | $26,558 | $30,619 | $26,956 |
| 5/31/24 | $27,499 | $32,138 | $27,892 |
| 6/30/24 | $27,528 | $33,292 | $27,954 |
Average Annual Total Returns (%)
| Name | 1 Year | 5 Years | 10 Years |
|---|
| VLU | 18.54% | 13.08% | 10.66% |
| S&P 500 Index | 24.56% | 15.05% | 12.86% |
| S&P 1500 Low Valuation Tilt Index | 18.69% | 13.28% | 10.83% |
The Fund’s past performance is not necessarily an indication of how the Fund will perform in the future. The returns do not reflect the deduction of taxes that a shareholder would pay on Fund distributions or on the redemption or sale of Fund shares. Updated performance information is available by calling 1-866-787-2257 or visiting our website at www.ssga.com/us/en/institutional/fund-finder?tab=documents&type=etfs.
| Statistic | Value |
|---|
| Total Net Assets | $352,913,967 |
| # of Portfolio Holdings | 1,472 |
| Portfolio Turnover Rate | 13% |
| Total Advisory Fees Paid | $349,303 |
What did the Fund invest in?
| Industry | % Value of Total Net Assets |
| Banks | 9.9% |
| Oil, Gas & Consumable Fuels | 8.6% |
| Health Care Providers & Services | 4.9% |
| Insurance | 4.0% |
| Interactive Media & Services | 3.9% |
| Financial Services | 3.7% |
| Semiconductors & Semiconductor Equipment | 3.2% |
| Technology Hardware, Storage & Peripherals | 3.1% |
| Software | 3.1% |
| Consumer Staples Distribution & Retail | 3.1% |
| Holdings | % Value of Total Net Assets |
| Apple, Inc. | 2.3% |
| Berkshire Hathaway, Inc., B | 2.3% |
| Alphabet, Inc. | 2.2% |
| Exxon Mobil Corp. | 2.1% |
| Amazon.com, Inc. | 2.1% |
| Meta Platforms, Inc. | 1.7% |
| Microsoft Corp. | 1.7% |
| Verizon Communications, Inc. | 1.6% |
| Walmart, Inc. | 1.6% |
| Bank of America Corp. | 1.5% |
SPDR S&P 1500 Momentum Tilt ETF
Principal Listing Exchange: NYSEArca
Annual Shareholder Report
June 30, 2024
This annual shareholder report contains important information about the SPDR S&P 1500 Momentum Tilt ETF (the "Fund") for the year ended June 30, 2024. You can find additional information about the Fund, including the Prospectus, Statement of Additional Information, financial statements and other information at www.ssga.com/us/en/institutional/fund-finder?tab=documents&type=etfs. You can also request this information about the Fund by contacting us at 1-866-787-2257.
What were the Fund costs for the last year?
| Fund Name | Cost of a $10,000 investment | Costs paid as a percentage of a $10,000 investment |
|---|
| SPDR S&P 1500 Momentum Tilt ETF | $14 | 0.12% |
How did the Fund perform last year and what affected its performance?
The reporting period’s market environment was largely driven by news about inflation, economic growth and the impact either would have on the Fed and other central banks with regard to interest rate decisions. Alongside this macro story was the prospect of a burgeoning artificial intelligence boom, driving up the values of AI-related tech and semiconductor companies. And markets continued to be dominated by the so-called "Magnificent Seven", consisting of Alphabet Inc, Amazon.com Inc, Apple Inc, Meta Platforms Inc, Microsoft Corp, NVIDIA Corp and Tesla Inc. Compared to the performance of the S&P 500, which returned 24.56% for the reporting period, the Fund significantly outperformed. The Fund's tilt towards high momentum securities captured the returns of the many high-performing AI-related tech and semiconductor stocks. As a result, the Fund's momentum tilt strategy successfully produced strong relative returns for the reporting period.
The Fund's benchmarks are unmanaged indices used as a general measure of market performance. Calculations assume dividends and capital gains.
Comparison of Change in Value of a $10,000 Investment
(Based on Net Asset Value)
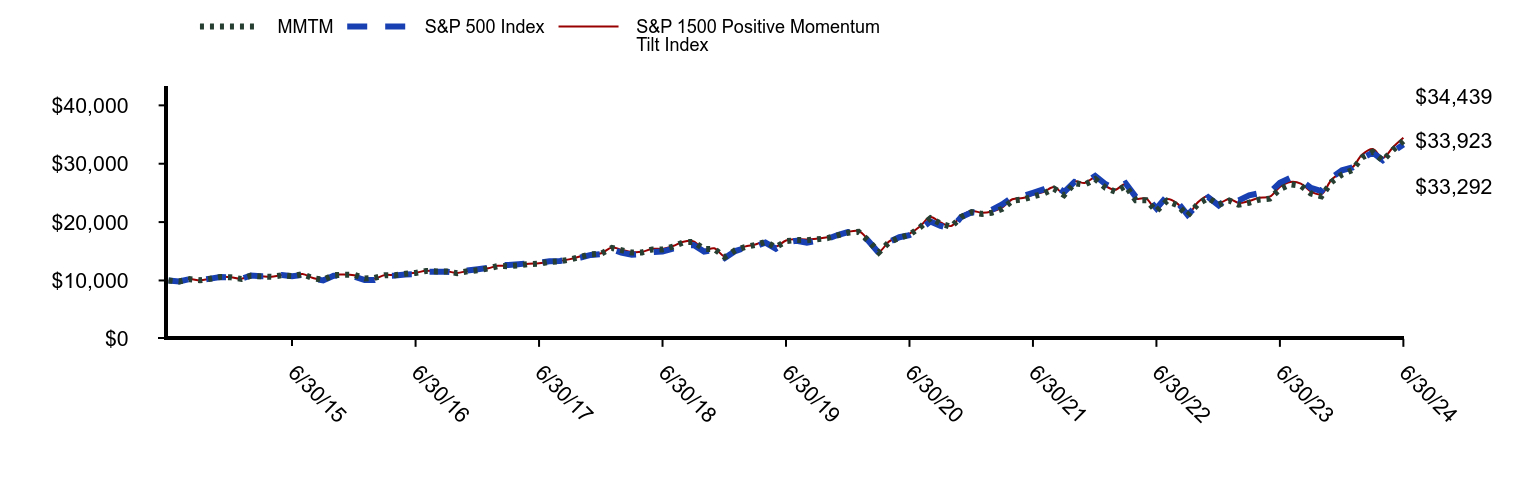
| MMTM | S&P 500 Index | S&P 1500 Positive Momentum Tilt Index |
|---|
| 6/30/14 | $10,000 | $10,000 | $10,000 |
| 7/31/14 | $9,815 | $9,838 | $9,816 |
| 8/31/14 | $10,224 | $10,245 | $10,231 |
| 9/30/14 | $10,035 | $10,065 | $10,040 |
| 10/31/14 | $10,284 | $10,311 | $10,295 |
| 11/30/14 | $10,594 | $10,581 | $10,602 |
| 12/31/14 | $10,547 | $10,557 | $10,566 |
| 1/31/15 | $10,259 | $10,267 | $10,282 |
| 2/28/15 | $10,809 | $10,860 | $10,832 |
| 3/31/15 | $10,699 | $10,725 | $10,717 |
| 4/30/15 | $10,624 | $10,801 | $10,642 |
| 5/31/15 | $10,895 | $10,942 | $10,917 |
| 6/30/15 | $10,747 | $10,737 | $10,772 |
| 7/31/15 | $11,069 | $10,944 | $11,095 |
| 8/31/15 | $10,377 | $10,285 | $10,406 |
| 9/30/15 | $10,129 | $10,003 | $10,161 |
| 10/31/15 | $10,909 | $10,813 | $10,940 |
| 11/30/15 | $10,986 | $10,849 | $11,016 |
| 12/31/15 | $10,972 | $10,653 | $10,901 |
| 1/31/16 | $10,355 | $10,080 | $10,403 |
| 2/29/16 | $10,452 | $10,077 | $10,296 |
| 3/31/16 | $10,907 | $10,780 | $10,949 |
| 4/30/16 | $10,895 | $10,838 | $10,926 |
| 5/31/16 | $11,134 | $11,027 | $11,158 |
| 6/30/16 | $11,288 | $11,053 | $11,315 |
| 7/31/16 | $11,625 | $11,474 | $11,647 |
| 8/31/16 | $11,539 | $11,489 | $11,559 |
| 9/30/16 | $11,539 | $11,498 | $11,567 |
| 10/31/16 | $11,250 | $11,274 | $11,285 |
| 11/30/16 | $11,579 | $11,718 | $11,614 |
| 12/31/16 | $11,747 | $11,938 | $11,828 |
| 1/31/17 | $12,050 | $12,178 | $12,093 |
| 2/28/17 | $12,467 | $12,650 | $12,511 |
| 3/31/17 | $12,452 | $12,657 | $12,499 |
| 4/30/17 | $12,581 | $12,791 | $12,629 |
| 5/31/17 | $12,811 | $12,955 | $12,864 |
| 6/30/17 | $12,878 | $13,046 | $12,932 |
| 7/31/17 | $13,190 | $13,304 | $13,246 |
| 8/31/17 | $13,283 | $13,345 | $13,348 |
| 9/30/17 | $13,594 | $13,630 | $13,652 |
| 10/31/17 | $14,074 | $13,942 | $14,147 |
| 11/30/17 | $14,487 | $14,374 | $14,565 |
| 12/31/17 | $14,605 | $14,532 | $14,663 |
| 1/31/18 | $15,577 | $15,317 | $15,657 |
| 2/28/18 | $15,188 | $14,764 | $15,272 |
| 3/31/18 | $14,771 | $14,426 | $14,863 |
| 4/30/18 | $14,801 | $14,499 | $14,907 |
| 5/31/18 | $15,321 | $14,869 | $15,424 |
| 6/30/18 | $15,317 | $14,945 | $15,404 |
| 7/31/18 | $15,804 | $15,461 | $15,902 |
| 8/31/18 | $16,557 | $15,995 | $16,643 |
| 9/30/18 | $16,586 | $16,067 | $16,703 |
| 10/31/18 | $15,401 | $14,939 | $15,278 |
| 11/30/18 | $15,414 | $15,237 | $15,516 |
| 12/31/18 | $14,000 | $13,845 | $14,120 |
| 1/31/19 | $15,170 | $15,032 | $15,241 |
| 2/28/19 | $15,706 | $15,555 | $15,796 |
| 3/31/19 | $16,075 | $15,829 | $16,157 |
| 4/30/19 | $16,608 | $16,483 | $16,676 |
| 5/31/19 | $15,703 | $15,441 | $15,819 |
| 6/30/19 | $16,725 | $16,537 | $16,858 |
| 7/31/19 | $16,924 | $16,789 | $17,063 |
| 8/31/19 | $16,901 | $16,480 | $17,038 |
| 9/30/19 | $17,046 | $16,767 | $17,171 |
| 10/31/19 | $17,255 | $17,132 | $17,385 |
| 11/30/19 | $17,736 | $17,785 | $17,865 |
| 12/31/19 | $18,179 | $18,296 | $18,327 |
| 1/31/20 | $18,316 | $18,315 | $18,466 |
| 2/29/20 | $16,842 | $16,807 | $16,959 |
| 3/31/20 | $14,815 | $14,731 | $14,938 |
| 4/30/20 | $16,526 | $16,620 | $16,647 |
| 5/31/20 | $17,308 | $17,411 | $17,501 |
| 6/30/20 | $17,835 | $17,758 | $17,998 |
| 7/31/20 | $19,090 | $18,759 | $19,249 |
| 8/31/20 | $20,660 | $20,107 | $20,855 |
| 9/30/20 | $19,745 | $19,343 | $19,940 |
| 10/31/20 | $19,177 | $18,829 | $19,324 |
| 11/30/20 | $20,891 | $20,890 | $21,055 |
| 12/31/20 | $21,702 | $21,693 | $21,904 |
| 1/31/21 | $21,386 | $21,474 | $21,596 |
| 2/28/21 | $21,603 | $22,066 | $21,811 |
| 3/31/21 | $22,274 | $23,033 | $22,478 |
| 4/30/21 | $23,666 | $24,262 | $23,907 |
| 5/31/21 | $23,881 | $24,431 | $24,124 |
| 6/30/21 | $24,383 | $25,002 | $24,660 |
| 7/31/21 | $24,876 | $25,596 | $25,131 |
| 8/31/21 | $25,738 | $26,374 | $26,007 |
| 9/30/21 | $24,627 | $25,147 | $24,891 |
| 10/31/21 | $26,668 | $26,909 | $26,963 |
| 11/30/21 | $26,421 | $26,723 | $26,700 |
| 12/31/21 | $27,371 | $27,920 | $27,651 |
| 1/31/22 | $25,872 | $26,475 | $26,171 |
| 2/28/22 | $25,221 | $25,683 | $25,530 |
| 3/31/22 | $26,175 | $26,636 | $26,500 |
| 4/30/22 | $23,741 | $24,314 | $24,037 |
| 5/31/22 | $23,734 | $24,358 | $24,029 |
| 6/30/22 | $21,851 | $22,348 | $22,113 |
| 7/31/22 | $23,654 | $24,408 | $23,940 |
| 8/31/22 | $22,901 | $23,413 | $23,175 |
| 9/30/22 | $21,100 | $21,256 | $21,336 |
| 10/31/22 | $23,124 | $22,977 | $23,419 |
| 11/30/22 | $24,143 | $24,261 | $24,477 |
| 12/31/22 | $22,975 | $22,864 | $23,263 |
| 1/31/23 | $23,688 | $24,300 | $23,973 |
| 2/28/23 | $22,971 | $23,707 | $23,268 |
| 3/31/23 | $23,310 | $24,578 | $23,625 |
| 4/30/23 | $23,847 | $24,961 | $24,163 |
| 5/31/23 | $24,010 | $25,070 | $24,348 |
| 6/30/23 | $25,662 | $26,726 | $26,028 |
| 7/31/23 | $26,479 | $27,585 | $26,860 |
| 8/31/23 | $26,219 | $27,146 | $26,601 |
| 9/30/23 | $24,901 | $25,852 | $25,239 |
| 10/31/23 | $24,423 | $25,308 | $24,776 |
| 11/30/23 | $26,882 | $27,619 | $27,262 |
| 12/31/23 | $28,144 | $28,874 | $28,558 |
| 1/31/24 | $28,946 | $29,359 | $29,383 |
| 2/29/24 | $31,090 | $30,927 | $31,578 |
| 3/31/24 | $32,029 | $31,922 | $32,517 |
| 4/30/24 | $30,552 | $30,619 | $30,999 |
| 5/31/24 | $32,393 | $32,138 | $32,873 |
| 6/30/24 | $33,923 | $33,292 | $34,439 |
Average Annual Total Returns (%)
| Name | 1 Year | 5 Years | 10 Years |
|---|
| MMTM | 32.16% | 15.18% | 12.99% |
| S&P 500 Index | 24.56% | 15.05% | 12.86% |
| S&P 1500 Positive Momentum Tilt Index | 32.31% | 15.36% | 13.16% |
The Fund’s past performance is not necessarily an indication of how the Fund will perform in the future. The returns do not reflect the deduction of taxes that a shareholder would pay on Fund distributions or on the redemption or sale of Fund shares. Updated performance information is available by calling 1-866-787-2257 or visiting our website at www.ssga.com/us/en/institutional/fund-finder?tab=documents&type=etfs.
| Statistic | Value |
|---|
| Total Net Assets | $106,800,422 |
| # of Portfolio Holdings | 1,451 |
| Portfolio Turnover Rate | 56% |
| Total Advisory Fees Paid | $108,290 |
What did the Fund invest in?
| Industry | % Value of Total Net Assets |
| Semiconductors & Semiconductor Equipment | 19.4% |
| Software | 12.0% |
| Interactive Media & Services | 9.3% |
| Broadline Retail | 5.9% |
| Banks | 4.7% |
| Pharmaceuticals | 3.2% |
| Financial Services | 3.2% |
| Technology Hardware, Storage & Peripherals | 2.7% |
| Oil, Gas & Consumable Fuels | 2.3% |
| Insurance | 2.2% |
| Holdings | % Value of Total Net Assets |
| NVIDIA Corp. | 11.7% |
| Microsoft Corp. | 7.6% |
| Amazon.com, Inc. | 5.8% |
| Alphabet, Inc. | 5.3% |
| Meta Platforms, Inc. | 4.0% |
| Broadcom, Inc. | 2.6% |
| Eli Lilly & Co. | 2.5% |
| Apple, Inc. | 2.1% |
| JPMorgan Chase & Co. | 1.7% |
| Berkshire Hathaway, Inc., B | 1.4% |
SPDR SSGA US Large Cap Low Volatility Index ETF
Principal Listing Exchange: NYSEArca
Annual Shareholder Report
June 30, 2024
This annual shareholder report contains important information about the SPDR SSGA US Large Cap Low Volatility Index ETF (the "Fund") for the year ended June 30, 2024. You can find additional information about the Fund, including the Prospectus, Statement of Additional Information, financial statements and other information at www.ssga.com/us/en/institutional/fund-finder?tab=documents&type=etfs. You can also request this information about the Fund by contacting us at 1-866-787-2257.
What were the Fund costs for the last year?
| Fund Name | Cost of a $10,000 investment | Costs paid as a percentage of a $10,000 investment |
|---|
| SPDR SSGA US Large Cap Low Volatility Index ETF | $13 | 0.12% |
How did the Fund perform last year and what affected its performance?
As 4Q23 began, markets seemed to teeter on each economic release, and the heightened sensitivity combined with the geopolitical uncertainty introduced by the attacks of October 7th in Israel caused bond market yields to spike and markets to sell-off in October. Concern about rate hikes turned into speculation about rate cuts and the possibility that the Fed might actually orchestrate an economic soft landing. This, combined with continued enthusiasm for semiconductor companies that investors believed would drive the impending A.I. revolution, induced markets to resume their gains in the last two months of the calendar year. As markets wrestled with the Fed’s slight bias towards hawkishness, A.I.-related semiconductor stocks continued to surge, revealing the investor belief that A.I. represented an enormous secular growth opportunity that transcended concerns about the macroeconomy. These and the Magnificent Seven once again pulled the market up with them into the end of the Reporting Period, ultimately producing strong net gains for the year.
The Fund's benchmarks are unmanaged indices used as a general measure of market performance. Calculations assume dividends and capital gains.
Comparison of Change in Value of a $10,000 Investment
(Based on Net Asset Value)
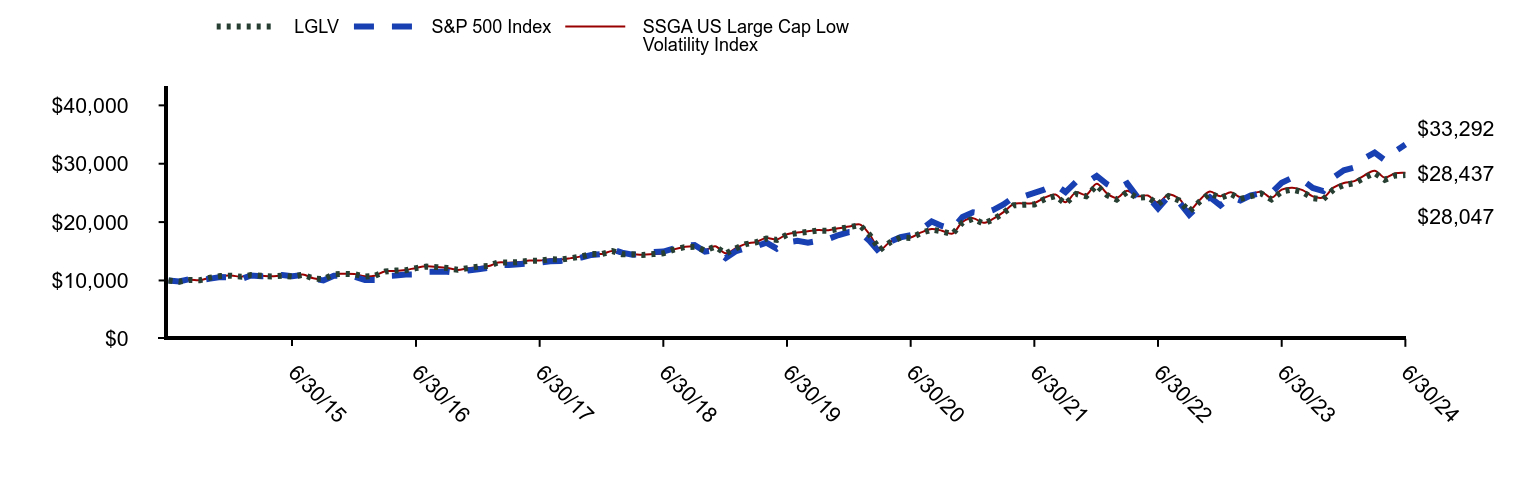
| LGLV | S&P 500 Index | SSGA US Large Cap Low Volatility Index |
|---|
| 6/30/14 | $10,000 | $10,000 | $10,000 |
| 7/31/14 | $9,788 | $9,838 | $9,787 |
| 8/31/14 | $10,097 | $10,245 | $10,101 |
| 9/30/14 | $10,036 | $10,065 | $10,039 |
| 10/31/14 | $10,482 | $10,311 | $10,490 |
| 11/30/14 | $10,760 | $10,581 | $10,765 |
| 12/31/14 | $10,816 | $10,557 | $10,833 |
| 1/31/15 | $10,639 | $10,267 | $10,656 |
| 2/28/15 | $10,922 | $10,860 | $10,941 |
| 3/31/15 | $10,806 | $10,725 | $10,819 |
| 4/30/15 | $10,699 | $10,801 | $10,720 |
| 5/31/15 | $10,822 | $10,942 | $10,844 |
| 6/30/15 | $10,652 | $10,737 | $10,671 |
| 7/31/15 | $10,986 | $10,944 | $11,004 |
| 8/31/15 | $10,355 | $10,285 | $10,375 |
| 9/30/15 | $10,231 | $10,003 | $10,252 |
| 10/31/15 | $11,048 | $10,813 | $11,076 |
| 11/30/15 | $11,140 | $10,849 | $11,155 |
| 12/31/15 | $11,065 | $10,653 | $11,101 |
| 1/31/16 | $10,671 | $10,080 | $10,705 |
| 2/29/16 | $10,791 | $10,077 | $10,823 |
| 3/31/16 | $11,550 | $10,780 | $11,588 |
| 4/30/16 | $11,686 | $10,838 | $11,615 |
| 5/31/16 | $11,756 | $11,027 | $11,786 |
| 6/30/16 | $12,113 | $11,053 | $12,153 |
| 7/31/16 | $12,386 | $11,474 | $12,417 |
| 8/31/16 | $12,284 | $11,489 | $12,314 |
| 9/30/16 | $12,123 | $11,498 | $12,141 |
| 10/31/16 | $11,821 | $11,274 | $11,810 |
| 11/30/16 | $12,112 | $11,718 | $12,106 |
| 12/31/16 | $12,370 | $11,938 | $12,318 |
| 1/31/17 | $12,503 | $12,178 | $12,479 |
| 2/28/17 | $13,103 | $12,650 | $13,071 |
| 3/31/17 | $13,074 | $12,657 | $13,045 |
| 4/30/17 | $13,146 | $12,791 | $13,157 |
| 5/31/17 | $13,384 | $12,955 | $13,402 |
| 6/30/17 | $13,394 | $13,046 | $13,411 |
| 7/31/17 | $13,637 | $13,304 | $13,651 |
| 8/31/17 | $13,587 | $13,345 | $13,594 |
| 9/30/17 | $13,811 | $13,630 | $13,825 |
| 10/31/17 | $14,103 | $13,942 | $14,126 |
| 11/30/17 | $14,534 | $14,374 | $14,567 |
| 12/31/17 | $14,532 | $14,532 | $14,550 |
| 1/31/18 | $15,029 | $15,317 | $15,053 |
| 2/28/18 | $14,485 | $14,764 | $14,481 |
| 3/31/18 | $14,504 | $14,426 | $14,474 |
| 4/30/18 | $14,365 | $14,499 | $14,391 |
| 5/31/18 | $14,514 | $14,869 | $14,519 |
| 6/30/18 | $14,651 | $14,945 | $14,672 |
| 7/31/18 | $15,288 | $15,461 | $15,325 |
| 8/31/18 | $15,702 | $15,995 | $15,746 |
| 9/30/18 | $15,765 | $16,067 | $15,849 |
| 10/31/18 | $15,143 | $14,939 | $15,200 |
| 11/30/18 | $15,797 | $15,237 | $15,867 |
| 12/31/18 | $14,601 | $13,845 | $14,650 |
| 1/31/19 | $15,515 | $15,032 | $15,567 |
| 2/28/19 | $16,223 | $15,555 | $16,275 |
| 3/31/19 | $16,534 | $15,829 | $16,604 |
| 4/30/19 | $17,188 | $16,483 | $17,272 |
| 5/31/19 | $16,931 | $15,441 | $17,015 |
| 6/30/19 | $17,823 | $16,537 | $17,918 |
| 7/31/19 | $18,125 | $16,789 | $18,221 |
| 8/31/19 | $18,319 | $16,480 | $18,427 |
| 9/30/19 | $18,546 | $16,767 | $18,645 |
| 10/31/19 | $18,502 | $17,132 | $18,603 |
| 11/30/19 | $18,849 | $17,785 | $18,954 |
| 12/31/19 | $19,119 | $18,296 | $19,235 |
| 1/31/20 | $19,486 | $18,315 | $19,606 |
| 2/29/20 | $17,855 | $16,807 | $17,948 |
| 3/31/20 | $15,249 | $14,731 | $15,319 |
| 4/30/20 | $16,540 | $16,620 | $16,632 |
| 5/31/20 | $17,362 | $17,411 | $17,458 |
| 6/30/20 | $17,274 | $17,758 | $17,369 |
| 7/31/20 | $18,138 | $18,759 | $18,230 |
| 8/31/20 | $18,704 | $20,107 | $18,818 |
| 9/30/20 | $18,418 | $19,343 | $18,529 |
| 10/31/20 | $17,945 | $18,829 | $18,029 |
| 11/30/20 | $19,918 | $20,890 | $20,027 |
| 12/31/20 | $20,556 | $21,693 | $20,679 |
| 1/31/21 | $19,767 | $21,474 | $19,886 |
| 2/28/21 | $20,425 | $22,066 | $20,548 |
| 3/31/21 | $21,578 | $23,033 | $21,697 |
| 4/30/21 | $22,875 | $24,262 | $23,102 |
| 5/31/21 | $22,973 | $24,431 | $23,205 |
| 6/30/21 | $23,031 | $25,002 | $23,272 |
| 7/31/21 | $23,958 | $25,596 | $24,209 |
| 8/31/21 | $24,451 | $26,374 | $24,712 |
| 9/30/21 | $23,168 | $25,147 | $23,413 |
| 10/31/21 | $24,822 | $26,909 | $25,090 |
| 11/30/21 | $24,420 | $26,723 | $24,689 |
| 12/31/21 | $26,275 | $27,920 | $26,563 |
| 1/31/22 | $24,603 | $26,475 | $24,887 |
| 2/28/22 | $23,875 | $25,683 | $24,138 |
| 3/31/22 | $25,132 | $26,636 | $25,390 |
| 4/30/22 | $24,165 | $24,314 | $24,431 |
| 5/31/22 | $24,271 | $24,358 | $24,545 |
| 6/30/22 | $23,059 | $22,348 | $23,307 |
| 7/31/22 | $24,430 | $24,408 | $24,712 |
| 8/31/22 | $23,723 | $23,413 | $23,997 |
| 9/30/22 | $21,818 | $21,256 | $22,052 |
| 10/31/22 | $23,517 | $22,977 | $23,788 |
| 11/30/22 | $24,934 | $24,261 | $25,239 |
| 12/31/22 | $24,143 | $22,864 | $24,431 |
| 1/31/23 | $24,812 | $24,300 | $25,111 |
| 2/28/23 | $23,975 | $23,707 | $24,274 |
| 3/31/23 | $24,448 | $24,578 | $24,755 |
| 4/30/23 | $24,902 | $24,961 | $25,210 |
| 5/31/23 | $23,879 | $25,070 | $24,172 |
| 6/30/23 | $25,224 | $26,726 | $25,547 |
| 7/31/23 | $25,562 | $27,585 | $25,885 |
| 8/31/23 | $25,156 | $27,146 | $25,478 |
| 9/30/23 | $24,102 | $25,852 | $24,404 |
| 10/31/23 | $23,911 | $25,308 | $24,217 |
| 11/30/23 | $25,562 | $27,619 | $25,897 |
| 12/31/23 | $26,362 | $28,874 | $26,704 |
| 1/31/24 | $26,651 | $29,359 | $27,009 |
| 2/29/24 | $27,584 | $30,927 | $27,970 |
| 3/31/24 | $28,414 | $31,922 | $28,812 |
| 4/30/24 | $27,246 | $30,619 | $27,619 |
| 5/31/24 | $27,983 | $32,138 | $28,354 |
| 6/30/24 | $28,047 | $33,292 | $28,437 |
Average Annual Total Returns (%)
| Name | 1 Year | 5 Years | 10 Years |
|---|
| LGLV | 11.16% | 9.48% | 10.86% |
| S&P 500 Index | 24.56% | 15.05% | 12.86% |
| SSGA US Large Cap Low Volatility Index | 11.30% | 9.59% | 11.02% |
(1) The SSGA US Large Cap Low Volatility Index reflects linked performance returns of both the SSGA US Large Cap Low Volatility Index and the Russell 1000 Low Volatility Index. The index returns are reflective of the Russell 1000 Low Volatility Index from fund inception until 12/13/2016 and of the SSGA US Large Cap Low Volatility Index effective 12/13/2016.
The Fund’s past performance is not necessarily an indication of how the Fund will perform in the future. The returns do not reflect the deduction of taxes that a shareholder would pay on Fund distributions or on the redemption or sale of Fund shares. Updated performance information is available by calling 1-866-787-2257 or visiting our website at www.ssga.com/us/en/institutional/fund-finder?tab=documents&type=etfs.
| Statistic | Value |
|---|
| Total Net Assets | $695,377,212 |
| # of Portfolio Holdings | 164 |
| Portfolio Turnover Rate | 22% |
| Total Advisory Fees Paid | $900,789 |
What did the Fund invest in?
| Industry | % Value of Total Net Assets |
| Insurance | 12.0% |
| Residential REITs | 6.3% |
| Multi-Utilities | 5.8% |
| Professional Services | 4.8% |
| Machinery | 4.6% |
| Software | 3.6% |
| Capital Markets | 3.5% |
| Specialty Retail | 3.1% |
| Electric Utilities | 3.1% |
| Commercial Services & Supplies | 3.0% |
| Holdings | % Value of Total Net Assets |
| Colgate-Palmolive Co. | 1.5% |
| PepsiCo, Inc. | 1.4% |
| Linde PLC | 1.2% |
| Walmart, Inc. | 1.2% |
| General Mills, Inc. | 1.2% |
| Procter & Gamble Co. | 1.1% |
| AvalonBay Communities, Inc. | 1.1% |
| Duke Energy Corp. | 1.1% |
| Republic Services, Inc. | 1.1% |
| Equity Residential | 1.1% |
SPDR SSGA US Small Cap Low Volatility Index ETF
Principal Listing Exchange: NYSEArca
Annual Shareholder Report
June 30, 2024
This annual shareholder report contains important information about the SPDR SSGA US Small Cap Low Volatility Index ETF (the "Fund") for the year ended June 30, 2024. You can find additional information about the Fund, including the Prospectus, Statement of Additional Information, financial statements and other information at www.ssga.com/us/en/institutional/fund-finder?tab=documents&type=etfs. You can also request this information about the Fund by contacting us at 1-866-787-2257.
What were the Fund costs for the last year?
| Fund Name | Cost of a $10,000 investment | Costs paid as a percentage of a $10,000 investment |
|---|
| SPDR SSGA US Small Cap Low Volatility Index ETF | $13 | 0.12% |
How did the Fund perform last year and what affected its performance?
The reporting period’s market environment was largely driven by news about inflation, economic growth and the impact either would have on the Fed and other central banks with regard to interest rate decisions. Alongside this macro story was the prospect of a burgeoning artificial intelligence boom, driving up the values of A.I.-related tech and semiconductor companies. And markets continued to be dominated by the so-called "Magnificent Seven", consisting of Alphabet Inc, Amazon.com Inc, Apple Inc, Meta Platforms Inc, Microsoft Corp, NVIDIA Corp and Tesla Inc. Compared to the Russell 2000 Index, which gained 10.06% in the reporting period, the Fund slightly underperformed. Small cap securities that exhibited low volatility characteristics slightly underperformed the broader small cap market. Because the Fund's strategy targeted these securities, relative performance was negatively impacted.
The Fund's benchmarks are unmanaged indices used as a general measure of market performance. Calculations assume dividends and capital gains.
Comparison of Change in Value of a $10,000 Investment
(Based on Net Asset Value)
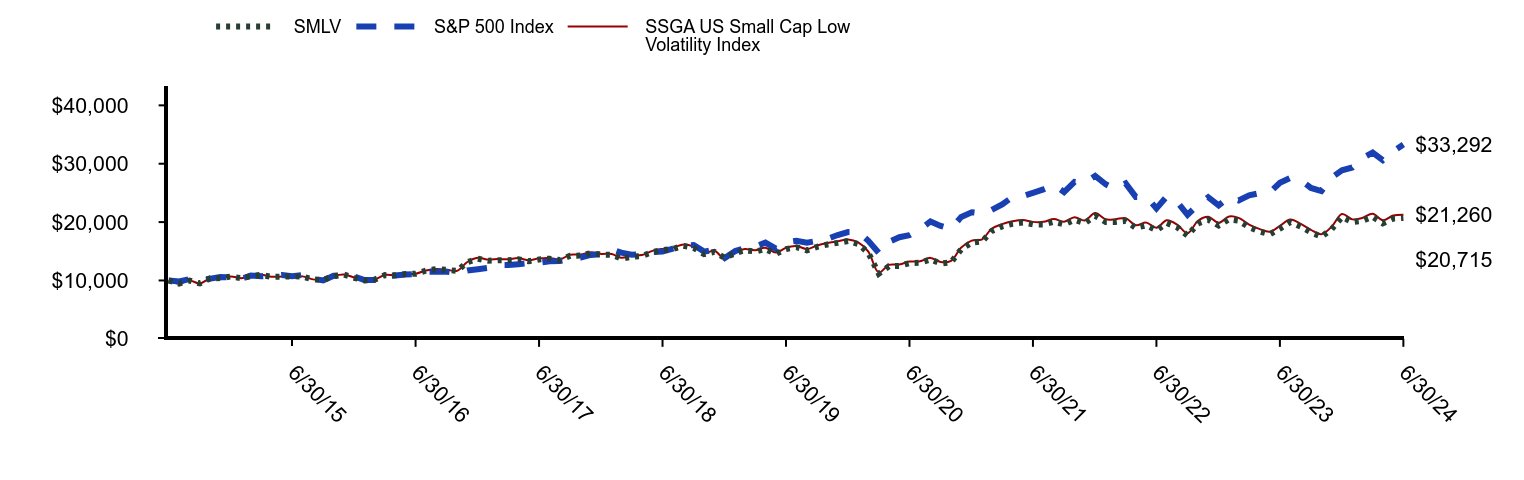
| SMLV | S&P 500 Index | SSGA US Small Cap Low Volatility Index |
|---|
| 6/30/14 | $10,000 | $10,000 | $10,000 |
| 7/31/14 | $9,475 | $9,838 | $9,476 |
| 8/31/14 | $9,972 | $10,245 | $9,979 |
| 9/30/14 | $9,492 | $10,065 | $9,488 |
| 10/31/14 | $10,364 | $10,311 | $10,374 |
| 11/30/14 | $10,401 | $10,581 | $10,409 |
| 12/31/14 | $10,683 | $10,557 | $10,690 |
| 1/31/15 | $10,378 | $10,267 | $10,397 |
| 2/28/15 | $10,749 | $10,860 | $10,758 |
| 3/31/15 | $10,950 | $10,725 | $10,970 |
| 4/30/15 | $10,619 | $10,801 | $10,640 |
| 5/31/15 | $10,652 | $10,942 | $10,684 |
| 6/30/15 | $10,705 | $10,737 | $10,725 |
| 7/31/15 | $10,689 | $10,944 | $10,699 |
| 8/31/15 | $10,161 | $10,285 | $10,187 |
| 9/30/15 | $10,091 | $10,003 | $10,102 |
| 10/31/15 | $10,736 | $10,813 | $10,759 |
| 11/30/15 | $11,008 | $10,849 | $11,034 |
| 12/31/15 | $10,454 | $10,653 | $10,499 |
| 1/31/16 | $10,004 | $10,080 | $10,017 |
| 2/29/16 | $10,123 | $10,077 | $10,144 |
| 3/31/16 | $10,913 | $10,780 | $10,931 |
| 4/30/16 | $10,872 | $10,838 | $10,889 |
| 5/31/16 | $11,107 | $11,027 | $11,120 |
| 6/30/16 | $11,147 | $11,053 | $11,159 |
| 7/31/16 | $11,696 | $11,474 | $11,715 |
| 8/31/16 | $11,948 | $11,489 | $11,973 |
| 9/30/16 | $11,812 | $11,498 | $11,844 |
| 10/31/16 | $11,636 | $11,274 | $11,655 |
| 11/30/16 | $13,151 | $11,718 | $13,166 |
| 12/31/16 | $13,714 | $11,938 | $13,893 |
| 1/31/17 | $13,370 | $12,178 | $13,574 |
| 2/28/17 | $13,462 | $12,650 | $13,661 |
| 3/31/17 | $13,457 | $12,657 | $13,642 |
| 4/30/17 | $13,635 | $12,791 | $13,830 |
| 5/31/17 | $13,292 | $12,955 | $13,465 |
| 6/30/17 | $13,583 | $13,046 | $13,783 |
| 7/31/17 | $13,733 | $13,304 | $13,859 |
| 8/31/17 | $13,493 | $13,345 | $13,630 |
| 9/30/17 | $14,228 | $13,630 | $14,399 |
| 10/31/17 | $14,260 | $13,942 | $14,431 |
| 11/30/17 | $14,686 | $14,374 | $14,839 |
| 12/31/17 | $14,411 | $14,532 | $14,554 |
| 1/31/18 | $14,395 | $15,317 | $14,548 |
| 2/28/18 | $13,746 | $14,764 | $13,896 |
| 3/31/18 | $14,059 | $14,426 | $14,237 |
| 4/30/18 | $14,184 | $14,499 | $14,355 |
| 5/31/18 | $14,861 | $14,869 | $15,067 |
| 6/30/18 | $15,195 | $14,945 | $15,409 |
| 7/31/18 | $15,410 | $15,461 | $15,626 |
| 8/31/18 | $15,934 | $15,995 | $16,169 |
| 9/30/18 | $15,581 | $16,067 | $15,808 |
| 10/31/18 | $14,502 | $14,939 | $14,695 |
| 11/30/18 | $14,897 | $15,237 | $15,090 |
| 12/31/18 | $13,877 | $13,845 | $13,716 |
| 1/31/19 | $14,664 | $15,032 | $14,873 |
| 2/28/19 | $15,182 | $15,555 | $15,402 |
| 3/31/19 | $14,961 | $15,829 | $15,177 |
| 4/30/19 | $15,368 | $16,483 | $15,601 |
| 5/31/19 | $14,557 | $15,441 | $14,770 |
| 6/30/19 | $15,374 | $16,537 | $15,615 |
| 7/31/19 | $15,694 | $16,789 | $15,915 |
| 8/31/19 | $15,152 | $16,480 | $15,381 |
| 9/30/19 | $15,764 | $16,767 | $16,000 |
| 10/31/19 | $16,169 | $17,132 | $16,414 |
| 11/30/19 | $16,444 | $17,785 | $16,696 |
| 12/31/19 | $16,756 | $18,296 | $17,019 |
| 1/31/20 | $16,217 | $18,315 | $16,468 |
| 2/29/20 | $14,730 | $16,807 | $14,943 |
| 3/31/20 | $11,155 | $14,731 | $11,360 |
| 4/30/20 | $12,427 | $16,620 | $12,678 |
| 5/31/20 | $12,486 | $17,411 | $12,737 |
| 6/30/20 | $12,970 | $17,758 | $13,233 |
| 7/31/20 | $13,023 | $18,759 | $13,282 |
| 8/31/20 | $13,593 | $20,107 | $13,869 |
| 9/30/20 | $12,899 | $19,343 | $13,157 |
| 10/31/20 | $13,115 | $18,829 | $13,367 |
| 11/30/20 | $15,351 | $20,890 | $15,660 |
| 12/31/20 | $16,481 | $21,693 | $16,821 |
| 1/31/21 | $16,698 | $21,474 | $17,058 |
| 2/28/21 | $18,478 | $22,066 | $18,868 |
| 3/31/21 | $19,260 | $23,033 | $19,655 |
| 4/30/21 | $19,698 | $24,262 | $20,136 |
| 5/31/21 | $19,928 | $24,431 | $20,369 |
| 6/30/21 | $19,609 | $25,002 | $20,037 |
| 7/31/21 | $19,600 | $25,596 | $20,044 |
| 8/31/21 | $20,064 | $26,374 | $20,520 |
| 9/30/21 | $19,616 | $25,147 | $20,056 |
| 10/31/21 | $20,385 | $26,909 | $20,847 |
| 11/30/21 | $19,830 | $26,723 | $20,290 |
| 12/31/21 | $21,062 | $27,920 | $21,548 |
| 1/31/22 | $20,024 | $26,475 | $20,487 |
| 2/28/22 | $20,018 | $25,683 | $20,481 |
| 3/31/22 | $20,208 | $26,636 | $20,685 |
| 4/30/22 | $19,016 | $24,314 | $19,447 |
| 5/31/22 | $19,454 | $24,358 | $19,908 |
| 6/30/22 | $18,607 | $22,348 | $19,041 |
| 7/31/22 | $19,831 | $24,408 | $20,299 |
| 8/31/22 | $19,083 | $23,413 | $19,526 |
| 9/30/22 | $17,693 | $21,256 | $18,096 |
| 10/31/22 | $19,772 | $22,977 | $20,226 |
| 11/30/22 | $20,420 | $24,261 | $20,909 |
| 12/31/22 | $19,422 | $22,864 | $19,882 |
| 1/31/23 | $20,470 | $24,300 | $20,957 |
| 2/28/23 | $20,241 | $23,707 | $20,726 |
| 3/31/23 | $19,123 | $24,578 | $19,581 |
| 4/30/23 | $18,407 | $24,961 | $18,838 |
| 5/31/23 | $17,920 | $25,070 | $18,341 |
| 6/30/23 | $18,894 | $26,726 | $19,347 |
| 7/31/23 | $19,983 | $27,585 | $20,454 |
| 8/31/23 | $19,234 | $27,146 | $19,694 |
| 9/30/23 | $18,240 | $25,852 | $18,672 |
| 10/31/23 | $17,505 | $25,308 | $17,919 |
| 11/30/23 | $18,749 | $27,619 | $19,185 |
| 12/31/23 | $20,885 | $28,874 | $21,379 |
| 1/31/24 | $19,996 | $29,359 | $20,464 |
| 2/29/24 | $20,202 | $30,927 | $20,706 |
| 3/31/24 | $20,906 | $31,922 | $21,431 |
| 4/30/24 | $19,796 | $30,619 | $20,301 |
| 5/31/24 | $20,599 | $32,138 | $21,118 |
| 6/30/24 | $20,715 | $33,292 | $21,260 |
Average Annual Total Returns (%)
| Name | 1 Year | 5 Years | 10 Years |
|---|
| SMLV | 9.65% | 6.14% | 7.56% |
| S&P 500 Index | 24.56% | 15.05% | 12.86% |
| SSGA US Small Cap Low Volatility Index | 9.89% | 6.37% | 7.69% |
(1) The SSGA US Small Cap Low Volatility Index reflects linked performance returns of both the SSGA US Small Cap Low Volatility Index and the Russell 2000 Low Volatility Index. The index returns are reflective of the Russell 2000 Low Volatility Index from fund inception until 12/13/2016 and of the SSGA US Small Cap Low Volatility Index effective 12/13/2016.
The Fund’s past performance is not necessarily an indication of how the Fund will perform in the future. The returns do not reflect the deduction of taxes that a shareholder would pay on Fund distributions or on the redemption or sale of Fund shares. Updated performance information is available by calling 1-866-787-2257 or visiting our website at www.ssga.com/us/en/institutional/fund-finder?tab=documents&type=etfs.
| Statistic | Value |
|---|
| Total Net Assets | $171,727,429 |
| # of Portfolio Holdings | 420 |
| Portfolio Turnover Rate | 56% |
| Total Advisory Fees Paid | $217,757 |
What did the Fund invest in?
| Industry | % Value of Total Net Assets |
| Banks | 47.0% |
| Insurance | 7.5% |
| Capital Markets | 5.5% |
| Financial Services | 5.0% |
| Machinery | 1.8% |
| Consumer Finance | 1.7% |
| Office REITs | 1.5% |
| Electronic Equipment, Instruments & Components | 1.5% |
| Oil, Gas & Consumable Fuels | 1.5% |
| Health Care Equipment & Supplies | 1.5% |
| Holdings | % Value of Total Net Assets |
| Nelnet, Inc., A | 1.7% |
| PJT Partners, Inc., A | 1.6% |
| Hanover Insurance Group, Inc. | 1.5% |
| Community Financial System, Inc. | 1.4% |
| Old National Bancorp | 1.4% |
| Enstar Group Ltd. | 1.3% |
| NBT Bancorp, Inc. | 1.3% |
| Park National Corp. | 1.3% |
| City Holding Co. | 1.2% |
| Virtu Financial, Inc., A | 1.2% |
SPDR S&P Kensho Intelligent Structures ETF
Principal Listing Exchange: NYSEArca
Annual Shareholder Report
June 30, 2024
This annual shareholder report contains important information about the SPDR S&P Kensho Intelligent Structures ETF (the "Fund") for the year ended June 30, 2024. You can find additional information about the Fund, including the Prospectus, Statement of Additional Information, financial statements and other information at www.ssga.com/us/en/institutional/fund-finder?tab=documents&type=etfs. You can also request this information about the Fund by contacting us at 1-866-787-2257.
What were the Fund costs for the last year?
| Fund Name | Cost of a $10,000 investment | Costs paid as a percentage of a $10,000 investment |
|---|
| SPDR S&P Kensho Intelligent Structures ETF | $44 | 0.45% |
How did the Fund perform last year and what affected its performance?
U.S. Economic indicators from the U.S. remained relatively strong over the Q3 2023. While investors began the quarter with hopes that the rate hikes would soon end and cuts would begin, that probability ended by the end of the quarter. U.S. stocks rallied in the Q4 2023, supported by prospects of rate cuts in 2024. October’s economic data had spooked investors. However, things took a turn by November – inflation softened and the U.S. Federal Reserve (“the Fed”) Chair’s supportive comments shored up investor sentiment. U.S. equities rallied for a second straight quarter in the Q1 2024. At 10.4%, the S&P 500 Index posted its biggest first-quarter gain since 2019 and its fifth gain in the last six quarters. The AI theme was a key tailwinds in the Q1 2024. The biggest area of concern during the quarter revolved around sticky core services inflation even as the U.S. economy remained resilient. U.S. equity indices were mixed in the Q2 2024, with a tough start to the quarter in April. The momentum changed in the middle of the month due to a strong jobs report, ending up positive in May and June. The Fed held the interest rates steady and struck a hawkish tone in June, maintaining the current policy rate and projecting only one rate cut in 2024.
The Fund's benchmarks are unmanaged indices used as a general measure of market performance. Calculations assume dividends and capital gains.
Comparison of Change in Value of a $10,000 Investment
(Based on Net Asset Value)
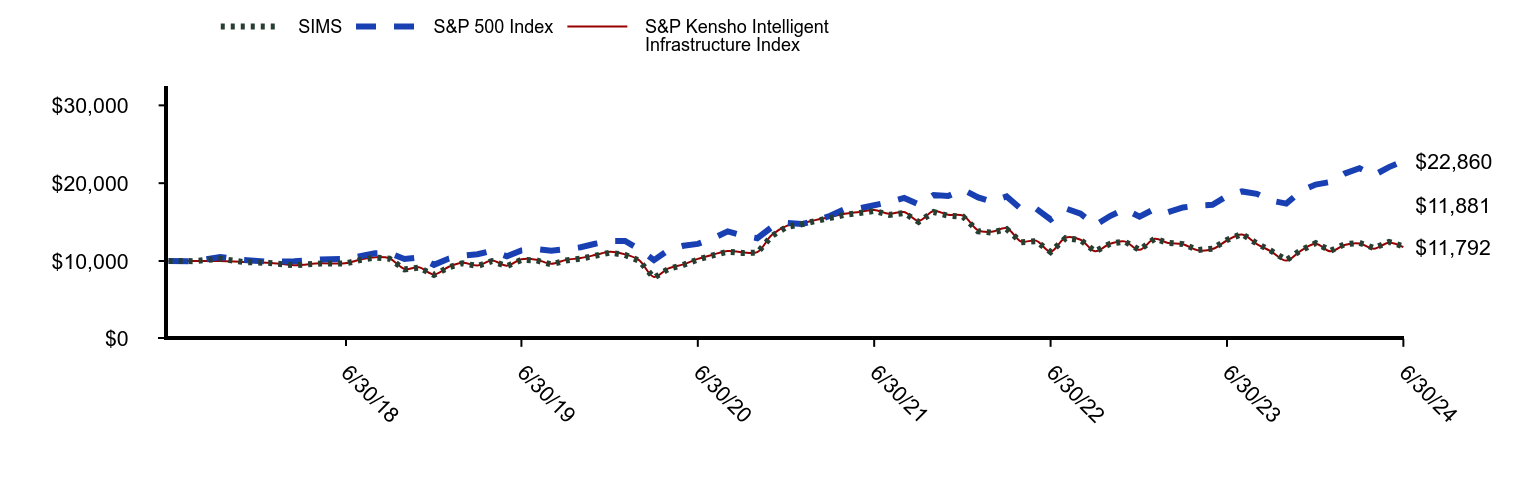
| SIMS | S&P 500 Index | S&P Kensho Intelligent Infrastructure Index |
|---|
| 11/30/17 | $10,000 | $10,000 | $10,000 |
| 12/31/17 | $9,982 | $9,978 | $10,005 |
| 1/31/18 | $10,301 | $10,517 | $10,005 |
| 2/28/18 | $9,869 | $10,137 | $9,884 |
| 3/31/18 | $9,757 | $9,905 | $9,779 |
| 4/30/18 | $9,447 | $9,956 | $9,470 |
| 5/31/18 | $9,674 | $10,209 | $9,704 |
| 6/30/18 | $9,666 | $10,261 | $9,701 |
| 7/31/18 | $10,126 | $10,616 | $10,164 |
| 8/31/18 | $10,441 | $10,983 | $10,486 |
| 9/30/18 | $10,293 | $11,032 | $10,339 |
| 10/31/18 | $8,928 | $10,258 | $8,973 |
| 11/30/18 | $9,138 | $10,462 | $9,194 |
| 12/31/18 | $8,218 | $9,506 | $8,272 |
| 1/31/19 | $9,198 | $10,321 | $9,258 |
| 2/28/19 | $9,716 | $10,681 | $9,777 |
| 3/31/19 | $9,357 | $10,869 | $9,420 |
| 4/30/19 | $9,985 | $11,318 | $10,050 |
| 5/31/19 | $9,347 | $10,602 | $9,405 |
| 6/30/19 | $10,145 | $11,355 | $10,222 |
| 7/31/19 | $10,081 | $11,528 | $10,172 |
| 8/31/19 | $9,559 | $11,316 | $9,646 |
| 9/30/19 | $10,055 | $11,513 | $10,137 |
| 10/31/19 | $10,296 | $11,763 | $10,381 |
| 11/30/19 | $10,678 | $12,212 | $10,765 |
| 12/31/19 | $11,082 | $12,563 | $11,192 |
| 1/31/20 | $10,774 | $12,575 | $10,856 |
| 2/29/20 | $10,052 | $11,540 | $10,121 |
| 3/31/20 | $7,845 | $10,115 | $7,959 |
| 4/30/20 | $8,987 | $11,412 | $9,050 |
| 5/31/20 | $9,508 | $11,955 | $9,573 |
| 6/30/20 | $10,185 | $12,193 | $10,270 |
| 7/31/20 | $10,727 | $12,880 | $10,807 |
| 8/31/20 | $11,199 | $13,806 | $11,288 |
| 9/30/20 | $11,033 | $13,282 | $11,126 |
| 10/31/20 | $11,057 | $12,928 | $11,137 |
| 11/30/20 | $13,215 | $14,344 | $13,330 |
| 12/31/20 | $14,389 | $14,895 | $14,516 |
| 1/31/21 | $14,717 | $14,745 | $14,839 |
| 2/28/21 | $15,137 | $15,151 | $15,253 |
| 3/31/21 | $15,537 | $15,815 | $15,659 |
| 4/30/21 | $15,929 | $16,659 | $16,065 |
| 5/31/21 | $16,179 | $16,775 | $16,308 |
| 6/30/21 | $16,426 | $17,167 | $16,559 |
| 7/31/21 | $15,931 | $17,575 | $16,060 |
| 8/31/21 | $16,158 | $18,109 | $16,291 |
| 9/30/21 | $15,033 | $17,267 | $15,154 |
| 10/31/21 | $16,290 | $18,476 | $16,424 |
| 11/30/21 | $15,815 | $18,348 | $15,940 |
| 12/31/21 | $15,684 | $19,171 | $15,824 |
| 1/31/22 | $13,822 | $18,179 | $13,941 |
| 2/28/22 | $13,645 | $17,634 | $13,761 |
| 3/31/22 | $14,104 | $18,289 | $14,217 |
| 4/30/22 | $12,422 | $16,694 | $12,502 |
| 5/31/22 | $12,544 | $16,725 | $12,615 |
| 6/30/22 | $11,157 | $15,344 | $11,212 |
| 7/31/22 | $12,943 | $16,759 | $12,996 |
| 8/31/22 | $12,696 | $16,076 | $12,736 |
| 9/30/22 | $11,232 | $14,595 | $11,248 |
| 10/31/22 | $12,208 | $15,777 | $12,224 |
| 11/30/22 | $12,508 | $16,659 | $12,523 |
| 12/31/22 | $11,425 | $15,699 | $11,431 |
| 1/31/23 | $12,851 | $16,685 | $12,847 |
| 2/28/23 | $12,330 | $16,278 | $12,312 |
| 3/31/23 | $12,171 | $16,876 | $12,143 |
| 4/30/23 | $11,414 | $17,139 | $11,377 |
| 5/31/23 | $11,579 | $17,214 | $11,535 |
| 6/30/23 | $12,696 | $18,351 | $12,633 |
| 7/31/23 | $13,480 | $18,941 | $13,406 |
| 8/31/23 | $12,247 | $18,639 | $12,181 |
| 9/30/23 | $11,291 | $17,750 | $11,218 |
| 10/31/23 | $10,112 | $17,377 | $10,055 |
| 11/30/23 | $11,360 | $18,964 | $11,302 |
| 12/31/23 | $12,293 | $19,826 | $12,209 |
| 1/31/24 | $11,317 | $20,159 | $11,238 |
| 2/29/24 | $12,151 | $21,235 | $12,067 |
| 3/31/24 | $12,333 | $21,918 | $12,246 |
| 4/30/24 | $11,671 | $21,024 | $11,576 |
| 5/31/24 | $12,446 | $22,068 | $12,349 |
| 6/30/24 | $11,881 | $22,860 | $11,792 |
Average Annual Total Returns (%)
| Name | 1 Year | 5 Years | Since Inception 12/26/17 |
|---|
| SIMS | (6.39%) | 3.22% | 2.75% |
| S&P 500 Index | 24.56% | 15.05% | 13.49% |
| S&P Kensho Intelligent Infrastructure Index | (6.66%) | 2.90% | 2.56% |
The Fund’s past performance is not necessarily an indication of how the Fund will perform in the future. The returns do not reflect the deduction of taxes that a shareholder would pay on Fund distributions or on the redemption or sale of Fund shares. Updated performance information is available by calling 1-866-787-2257 or visiting our website at www.ssga.com/us/en/institutional/fund-finder?tab=documents&type=etfs.
| Statistic | Value |
|---|
| Total Net Assets | $13,312,348 |
| # of Portfolio Holdings | 51 |
| Portfolio Turnover Rate | 31% |
| Total Advisory Fees Paid | $85,757 |
What did the Fund invest in?
| Industry | % Value of Total Net Assets |
| Electrical Equipment | 17.3% |
| Electronic Equipment, Instruments & Components | 12.0% |
| Machinery | 11.4% |
| Building Products | 8.1% |
| Software | 7.0% |
| Semiconductors & Semiconductor Equipment | 5.6% |
| Commercial Services & Supplies | 5.3% |
| Oil, Gas & Consumable Fuels | 5.3% |
| Professional Services | 3.6% |
| Diversified Consumer Services | 2.8% |
| Holdings | % Value of Total Net Assets |
| ADT, Inc. | 2.9% |
| Alarm.com Holdings, Inc. | 2.8% |
| Mueller Water Products, Inc., A | 2.8% |
| Select Water Solutions, Inc. | 2.8% |
| Badger Meter, Inc. | 2.8% |
| Carrier Global Corp. | 2.8% |
| Xylem, Inc. | 2.7% |
| Resideo Technologies, Inc. | 2.7% |
| Tetra Tech, Inc. | 2.7% |
| Pentair PLC | 2.7% |
SPDR S&P Kensho Smart Mobility ETF
Principal Listing Exchange: NYSEArca
Annual Shareholder Report
June 30, 2024
This annual shareholder report contains important information about the SPDR S&P Kensho Smart Mobility ETF (the "Fund") for the year ended June 30, 2024. You can find additional information about the Fund, including the Prospectus, Statement of Additional Information, financial statements and other information at www.ssga.com/us/en/institutional/fund-finder?tab=documents&type=etfs. You can also request this information about the Fund by contacting us at 1-866-787-2257.
What were the Fund costs for the last year?
| Fund Name | Cost of a $10,000 investment | Costs paid as a percentage of a $10,000 investment |
|---|
| SPDR S&P Kensho Smart Mobility ETF | $42 | 0.45% |
How did the Fund perform last year and what affected its performance?
The reporting period’s market environment was largely driven by news about inflation, economic growth and the impact either would have on the U.S. Federal Reserve (the “Fed”) and other central banks with regard to interest rate decisions. Alongside this macro story was the prospect of a burgeoning artificial intelligence boom, driving up the values of AI-related tech and semiconductor companies. AI-related semiconductor stocks continued to surge, revealing the investor belief that AI represented an enormous secular growth opportunity that transcended concerns about the macroeconomy. While AI stocks and the Magnificent Seven drove broader market returns higher, many companies outside of this space fell behind, including those specializing in smart mobility.
The Fund did not invest in derivatives during the reporting period
The Fund's benchmarks are unmanaged indices used as a general measure of market performance. Calculations assume dividends and capital gains.
Comparison of Change in Value of a $10,000 Investment
(Based on Net Asset Value)
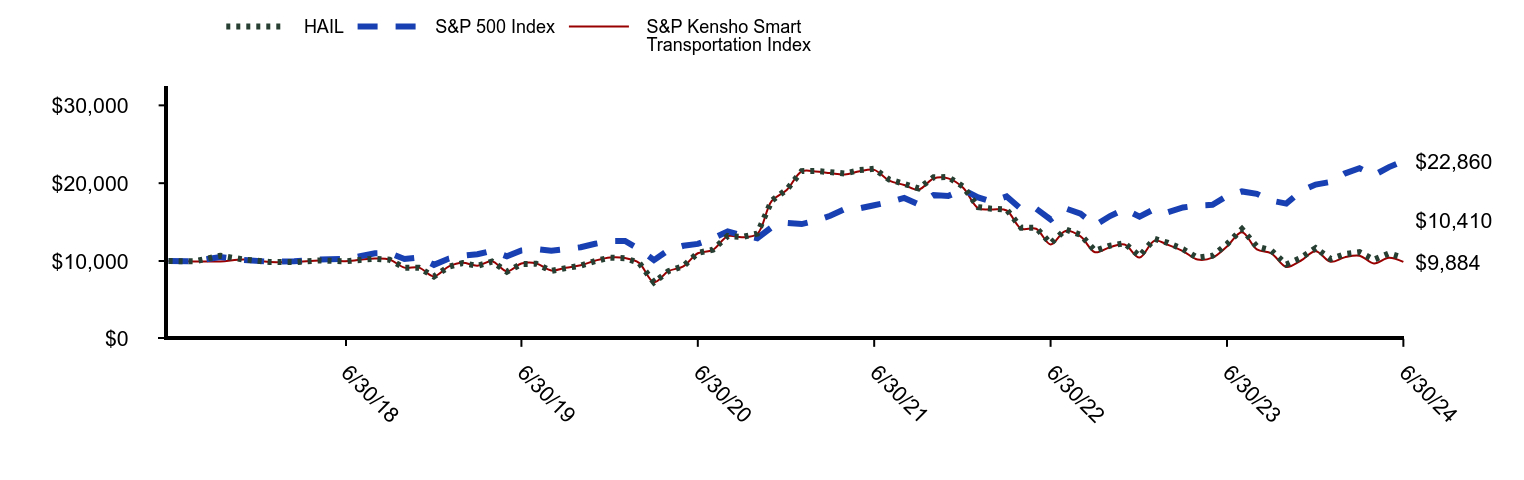
| HAIL | S&P 500 Index | S&P Kensho Smart Transportation Index |
|---|
| 11/30/17 | $10,000 | $10,000 | $10,000 |
| 12/31/17 | $9,953 | $9,978 | $9,944 |
| 1/31/18 | $10,674 | $10,517 | $9,944 |
| 2/28/18 | $10,197 | $10,137 | $10,196 |
| 3/31/18 | $9,882 | $9,905 | $9,882 |
| 4/30/18 | $9,855 | $9,956 | $9,851 |
| 5/31/18 | $10,072 | $10,209 | $10,080 |
| 6/30/18 | $9,953 | $10,261 | $9,962 |
| 7/31/18 | $10,143 | $10,616 | $10,160 |
| 8/31/18 | $10,291 | $10,983 | $10,312 |
| 9/30/18 | $10,169 | $11,032 | $10,193 |
| 10/31/18 | $9,124 | $10,258 | $9,148 |
| 11/30/18 | $9,127 | $10,462 | $9,153 |
| 12/31/18 | $8,006 | $9,506 | $8,034 |
| 1/31/19 | $9,268 | $10,321 | $9,300 |
| 2/28/19 | $9,736 | $10,681 | $9,770 |
| 3/31/19 | $9,369 | $10,869 | $9,406 |
| 4/30/19 | $9,929 | $11,318 | $9,972 |
| 5/31/19 | $8,630 | $10,602 | $8,673 |
| 6/30/19 | $9,617 | $11,355 | $9,670 |
| 7/31/19 | $9,639 | $11,528 | $9,687 |
| 8/31/19 | $8,736 | $11,316 | $8,781 |
| 9/30/19 | $9,085 | $11,513 | $9,128 |
| 10/31/19 | $9,408 | $11,763 | $9,449 |
| 11/30/19 | $10,001 | $12,212 | $10,043 |
| 12/31/19 | $10,432 | $12,563 | $10,460 |
| 1/31/20 | $10,346 | $12,575 | $10,377 |
| 2/29/20 | $9,768 | $11,540 | $9,767 |
| 3/31/20 | $7,260 | $10,115 | $7,259 |
| 4/30/20 | $8,706 | $11,412 | $8,698 |
| 5/31/20 | $9,333 | $11,955 | $9,310 |
| 6/30/20 | $11,041 | $12,193 | $10,997 |
| 7/31/20 | $11,446 | $12,880 | $11,413 |
| 8/31/20 | $13,219 | $13,806 | $13,195 |
| 9/30/20 | $13,089 | $13,282 | $13,049 |
| 10/31/20 | $13,523 | $12,928 | $13,463 |
| 11/30/20 | $17,758 | $14,344 | $17,714 |
| 12/31/20 | $19,175 | $14,895 | $19,126 |
| 1/31/21 | $21,549 | $14,745 | $21,505 |
| 2/28/21 | $21,577 | $15,151 | $21,510 |
| 3/31/21 | $21,420 | $15,815 | $21,301 |
| 4/30/21 | $21,238 | $16,659 | $21,125 |
| 5/31/21 | $21,679 | $16,775 | $21,537 |
| 6/30/21 | $21,846 | $17,167 | $21,712 |
| 7/31/21 | $20,469 | $17,575 | $20,330 |
| 8/31/21 | $19,916 | $18,109 | $19,769 |
| 9/30/21 | $19,324 | $17,267 | $19,174 |
| 10/31/21 | $20,761 | $18,476 | $20,606 |
| 11/30/21 | $20,788 | $18,348 | $20,621 |
| 12/31/21 | $19,570 | $19,171 | $19,424 |
| 1/31/22 | $16,925 | $18,179 | $16,805 |
| 2/28/22 | $16,725 | $17,634 | $16,629 |
| 3/31/22 | $16,606 | $18,289 | $16,490 |
| 4/30/22 | $14,279 | $16,694 | $14,163 |
| 5/31/22 | $14,284 | $16,725 | $14,145 |
| 6/30/22 | $12,245 | $15,344 | $12,130 |
| 7/31/22 | $14,062 | $16,759 | $13,854 |
| 8/31/22 | $13,361 | $16,076 | $13,155 |
| 9/30/22 | $11,309 | $14,595 | $11,128 |
| 10/31/22 | $11,972 | $15,777 | $11,777 |
| 11/30/22 | $12,290 | $16,659 | $12,110 |
| 12/31/22 | $10,637 | $15,699 | $10,445 |
| 1/31/23 | $12,853 | $16,685 | $12,608 |
| 2/28/23 | $12,321 | $16,278 | $12,076 |
| 3/31/23 | $11,519 | $16,876 | $11,277 |
| 4/30/23 | $10,416 | $17,139 | $10,187 |
| 5/31/23 | $10,677 | $17,214 | $10,427 |
| 6/30/23 | $12,164 | $18,351 | $11,865 |
| 7/31/23 | $14,102 | $18,941 | $13,705 |
| 8/31/23 | $11,851 | $18,639 | $11,490 |
| 9/30/23 | $11,346 | $17,750 | $10,980 |
| 10/31/23 | $9,559 | $17,377 | $9,241 |
| 11/30/23 | $10,396 | $18,964 | $10,033 |
| 12/31/23 | $11,662 | $19,826 | $11,262 |
| 1/31/24 | $10,262 | $20,159 | $9,905 |
| 2/29/24 | $10,877 | $21,235 | $10,466 |
| 3/31/24 | $11,133 | $21,918 | $10,683 |
| 4/30/24 | $10,171 | $21,024 | $9,682 |
| 5/31/24 | $10,966 | $22,068 | $10,426 |
| 6/30/24 | $10,410 | $22,860 | $9,884 |
Average Annual Total Returns (%)
| Name | 1 Year | 5 Years | Since Inception 12/26/17 |
|---|
| HAIL | (14.40%) | 1.58% | 0.62% |
| S&P 500 Index | 24.56% | 15.05% | 13.49% |
| S&P Kensho Smart Transportation Index | (16.69%) | 0.44% | (0.18%) |
The Fund’s past performance is not necessarily an indication of how the Fund will perform in the future. The returns do not reflect the deduction of taxes that a shareholder would pay on Fund distributions or on the redemption or sale of Fund shares. Updated performance information is available by calling 1-866-787-2257 or visiting our website at www.ssga.com/us/en/institutional/fund-finder?tab=documents&type=etfs.
| Statistic | Value |
|---|
| Total Net Assets | $44,215,492 |
| # of Portfolio Holdings | 74 |
| Portfolio Turnover Rate | 44% |
| Total Advisory Fees Paid | $210,520 |
What did the Fund invest in?
| Industry | % Value of Total Net Assets |
| Automobiles | 21.3% |
| Auto Components | 18.6% |
| Semiconductors & Semiconductor Equipment | 15.3% |
| Machinery | 8.1% |
| Electronic Equipment, Instruments & Components | 8.1% |
| Ground Transportation | 6.2% |
| Electrical Equipment | 5.4% |
| Aerospace & Defense | 5.2% |
| Software | 4.5% |
| Chemicals | 1.4% |
| Holdings | % Value of Total Net Assets |
| Rivian Automotive, Inc., A | 2.0% |
| Tesla, Inc. | 2.0% |
| Aurora Innovation, Inc. | 2.0% |
| Canoo, Inc. | 1.9% |
| Luminar Technologies, Inc. | 1.8% |
| Allison Transmission Holdings, Inc. | 1.8% |
| Cummins, Inc. | 1.8% |
| Uber Technologies, Inc. | 1.8% |
| Garrett Motion, Inc. | 1.8% |
| Visteon Corp. | 1.8% |
SPDR S&P Kensho Future Security ETF
Principal Listing Exchange: NYSEArca
Annual Shareholder Report
June 30, 2024
This annual shareholder report contains important information about the SPDR S&P Kensho Future Security ETF (the "Fund") for the year ended June 30, 2024. You can find additional information about the Fund, including the Prospectus, Statement of Additional Information, financial statements and other information at www.ssga.com/us/en/institutional/fund-finder?tab=documents&type=etfs. You can also request this information about the Fund by contacting us at 1-866-787-2257.
What were the Fund costs for the last year?
| Fund Name | Cost of a $10,000 investment | Costs paid as a percentage of a $10,000 investment |
|---|
| SPDR S&P Kensho Future Security ETF | $49 | 0.45% |
How did the Fund perform last year and what affected its performance?
U.S. Economic indicators from the U.S. remained relatively strong over the Q3 2023. U.S. stocks rallied in the Q4 2023, supported by prospects of rate cuts in 2024. U.S. equities rallied for a second straight quarter in the Q1 2024. U.S. equity indices were mixed in the Q2 2024, with a tough start to the quarter in April. The momentum changed in the middle of the month due to a strong jobs report, ending up positive in May and June. The U.S. Federal Reserve (“the Fed”), held the interest rates steady in June, maintaining the current policy rate and projecting only one rate cut in 2024. In terms of Future Security Index, the period started out very eventful on the cybersecurity front as ransomware attacks were carried out in September on Caesars Entertainment and MGM Resorts, among other well-known corporations. The continuous adoption of cloud, hybrid workforce, rapid emergence and use of AI has made security risk management a top priority.
The Fund did not invest in derivatives during the reporting period.
The Fund's benchmarks are unmanaged indices used as a general measure of market performance. Calculations assume dividends and capital gains.
Comparison of Change in Value of a $10,000 Investment
(Based on Net Asset Value)
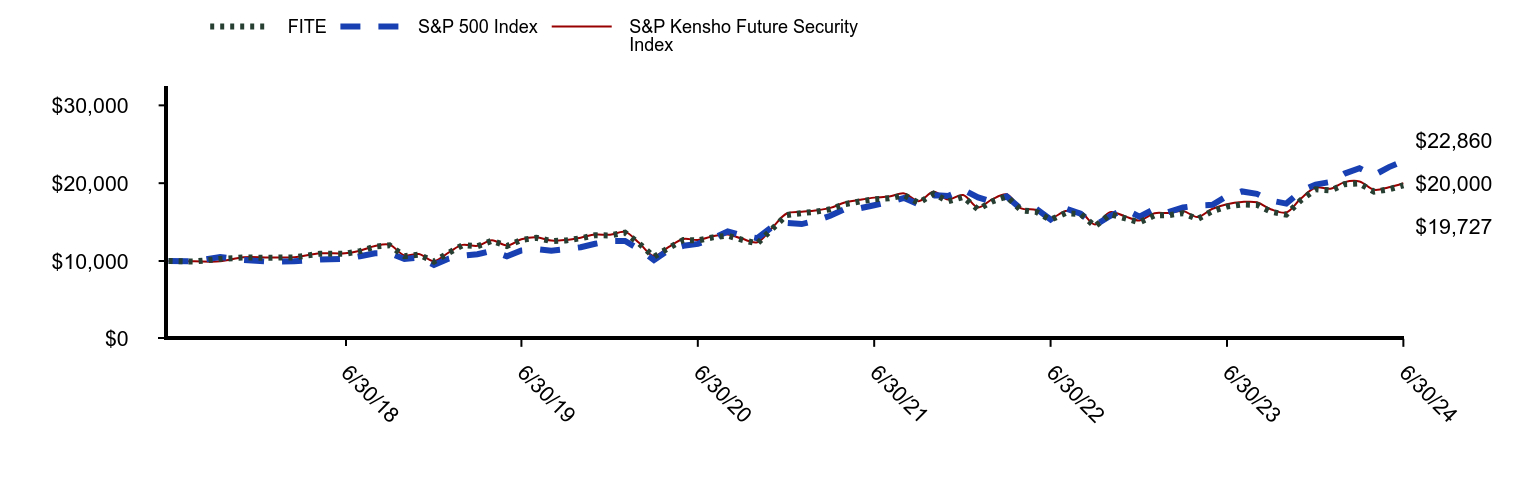
| FITE | S&P 500 Index | S&P Kensho Future Security Index |
|---|
| 11/30/17 | $10,000 | $10,000 | $10,000 |
| 12/31/17 | $9,938 | $9,978 | $9,956 |
| 1/31/18 | $10,273 | $10,517 | $9,956 |
| 2/28/18 | $10,449 | $10,137 | $10,477 |
| 3/31/18 | $10,422 | $9,905 | $10,465 |
| 4/30/18 | $10,461 | $9,956 | $10,497 |
| 5/31/18 | $10,945 | $10,209 | $10,987 |
| 6/30/18 | $10,935 | $10,261 | $10,987 |
| 7/31/18 | $11,273 | $10,616 | $11,330 |
| 8/31/18 | $11,855 | $10,983 | $11,923 |
| 9/30/18 | $12,012 | $11,032 | $12,089 |
| 10/31/18 | $10,624 | $10,258 | $10,713 |
| 11/30/18 | $10,813 | $10,462 | $10,890 |
| 12/31/18 | $9,929 | $9,506 | $9,989 |
| 1/31/19 | $11,073 | $10,321 | $11,116 |
| 2/28/19 | $12,028 | $10,681 | $12,074 |
| 3/31/19 | $11,899 | $10,869 | $11,952 |
| 4/30/19 | $12,602 | $11,318 | $12,658 |
| 5/31/19 | $11,929 | $10,602 | $11,987 |
| 6/30/19 | $12,706 | $11,355 | $12,786 |
| 7/31/19 | $12,985 | $11,528 | $13,052 |
| 8/31/19 | $12,558 | $11,316 | $12,631 |
| 9/30/19 | $12,636 | $11,513 | $12,709 |
| 10/31/19 | $12,923 | $11,763 | $12,999 |
| 11/30/19 | $13,317 | $12,212 | $13,396 |
| 12/31/19 | $13,288 | $12,563 | $13,373 |
| 1/31/20 | $13,652 | $12,575 | $13,746 |
| 2/29/20 | $12,259 | $11,540 | $12,338 |
| 3/31/20 | $10,535 | $10,115 | $10,626 |
| 4/30/20 | $11,665 | $11,412 | $11,776 |
| 5/31/20 | $12,709 | $11,955 | $12,832 |
| 6/30/20 | $12,636 | $12,193 | $12,697 |
| 7/31/20 | $13,040 | $12,880 | $13,173 |
| 8/31/20 | $13,260 | $13,806 | $13,396 |
| 9/30/20 | $12,714 | $13,282 | $12,849 |
| 10/31/20 | $12,247 | $12,928 | $12,400 |
| 11/30/20 | $14,061 | $14,344 | $14,209 |
| 12/31/20 | $15,918 | $14,895 | $16,101 |
| 1/31/21 | $16,161 | $14,745 | $16,319 |
| 2/28/21 | $16,323 | $15,151 | $16,484 |
| 3/31/21 | $16,643 | $15,815 | $16,829 |
| 4/30/21 | $17,305 | $16,659 | $17,510 |
| 5/31/21 | $17,648 | $16,775 | $17,861 |
| 6/30/21 | $17,930 | $17,167 | $18,144 |
| 7/31/21 | $18,051 | $17,575 | $18,280 |
| 8/31/21 | $18,446 | $18,109 | $18,687 |
| 9/30/21 | $17,466 | $17,267 | $17,691 |
| 10/31/21 | $18,646 | $18,476 | $18,890 |
| 11/30/21 | $17,667 | $18,348 | $17,901 |
| 12/31/21 | $18,232 | $19,171 | $18,482 |
| 1/31/22 | $16,629 | $18,179 | $16,879 |
| 2/28/22 | $17,630 | $17,634 | $17,886 |
| 3/31/22 | $18,292 | $18,289 | $18,566 |
| 4/30/22 | $16,525 | $16,694 | $16,767 |
| 5/31/22 | $16,313 | $16,725 | $16,561 |
| 6/30/22 | $15,294 | $15,344 | $15,528 |
| 7/31/22 | $16,160 | $16,759 | $16,414 |
| 8/31/22 | $16,042 | $16,076 | $16,296 |
| 9/30/22 | $14,465 | $14,595 | $14,693 |
| 10/31/22 | $16,014 | $15,777 | $16,279 |
| 11/30/22 | $15,512 | $16,659 | $15,771 |
| 12/31/22 | $14,965 | $15,699 | $15,218 |
| 1/31/23 | $15,863 | $16,685 | $16,140 |
| 2/28/23 | $15,889 | $16,278 | $16,164 |
| 3/31/23 | $16,141 | $16,876 | $16,425 |
| 4/30/23 | $15,388 | $17,139 | $15,659 |
| 5/31/23 | $16,419 | $17,214 | $16,716 |
| 6/30/23 | $16,993 | $18,351 | $17,305 |
| 7/31/23 | $17,266 | $18,941 | $17,582 |
| 8/31/23 | $17,224 | $18,639 | $17,544 |
| 9/30/23 | $16,311 | $17,750 | $16,614 |
| 10/31/23 | $15,965 | $17,377 | $16,237 |
| 11/30/23 | $17,797 | $18,964 | $18,015 |
| 12/31/23 | $19,211 | $19,826 | $19,451 |
| 1/31/24 | $19,056 | $20,159 | $19,287 |
| 2/29/24 | $19,877 | $21,235 | $20,137 |
| 3/31/24 | $19,959 | $21,918 | $20,226 |
| 4/30/24 | $18,904 | $21,024 | $19,152 |
| 5/31/24 | $19,215 | $22,068 | $19,469 |
| 6/30/24 | $19,727 | $22,860 | $20,000 |
Average Annual Total Returns (%)
| Name | 1 Year | 5 Years | Since Inception 12/26/17 |
|---|
| FITE | 16.07% | 9.17% | 11.04% |
| S&P 500 Index | 24.56% | 15.05% | 13.49% |
| S&P Kensho Future Security Index | 15.58% | 9.36% | 11.24% |
The Fund’s past performance is not necessarily an indication of how the Fund will perform in the future. The returns do not reflect the deduction of taxes that a shareholder would pay on Fund distributions or on the redemption or sale of Fund shares. Updated performance information is available by calling 1-866-787-2257 or visiting our website at www.ssga.com/us/en/institutional/fund-finder?tab=documents&type=etfs.
| Statistic | Value |
|---|
| Total Net Assets | $57,710,372 |
| # of Portfolio Holdings | 66 |
| Portfolio Turnover Rate | 32% |
| Total Advisory Fees Paid | $188,413 |
What did the Fund invest in?
| Industry | % Value of Total Net Assets |
| Software | 29.6% |
| Aerospace & Defense | 29.5% |
| Electronic Equipment, Instruments & Components | 10.2% |
| Communications Equipment | 8.5% |
| Professional Services | 6.8% |
| IT Services | 5.4% |
| Energy Equipment & Services | 1.8% |
| Semiconductors & Semiconductor Equipment | 1.8% |
| Diversified Telecommunication Services | 1.7% |
| Interactive Media & Services | 1.7% |
| Holdings | % Value of Total Net Assets |
| SentinelOne, Inc., A | 2.0% |
| Varonis Systems, Inc. | 1.9% |
| Rapid7, Inc. | 1.9% |
| Cloudflare, Inc., A | 1.9% |
| CyberArk Software Ltd. | 1.9% |
| Datadog, Inc., A | 1.9% |
| Broadcom, Inc. | 1.8% |
| Oceaneering International, Inc. | 1.8% |
| Parsons Corp. | 1.8% |
| Palo Alto Networks, Inc. | 1.8% |
SPDR S&P Kensho New Economies Composite ETF
Principal Listing Exchange: NYSEArca
Annual Shareholder Report
June 30, 2024
This annual shareholder report contains important information about the SPDR S&P Kensho New Economies Composite ETF (the "Fund") for the year ended June 30, 2024. You can find additional information about the Fund, including the Prospectus, Statement of Additional Information, financial statements and other information at www.ssga.com/us/en/institutional/fund-finder?tab=documents&type=etfs. You can also request this information about the Fund by contacting us at 1-866-787-2257.
What were the Fund costs for the last year?
| Fund Name | Cost of a $10,000 investment | Costs paid as a percentage of a $10,000 investment |
|---|
| SPDR S&P Kensho New Economies Composite ETF | $20 | 0.20% |
How did the Fund perform last year and what affected its performance?
U.S. Economic indicators from the U.S. remained relatively strong over the Q3 2023. While investors began the quarter with hopes that the rate hikes would soon end and cuts would begin, that probability ended by the end of the quarter. U.S. stocks rallied in the Q4 2023, supported by prospects of rate cuts in 2024. October’s economic data had spooked investors. However, things took a turn by November – inflation softened and the U.S. Federal Reserve (the “Fed”) Chair’s supportive comments shored up investor sentiment. U.S. equities rallied for a second straight quarter in the Q1 2024. At 10.4%, the S&P 500 Index posted its biggest first-quarter gain since 2019 and its fifth gain in the last six quarters. The AI theme was a key tailwinds in the Q1 2024. The biggest area of concern during the quarter revolved around sticky core services inflation even as the U.S. economy remained resilient. U.S. equity indices were mixed in the Q2 2024, with a tough start to the quarter in April. The momentum changed in the middle of the month due to a strong jobs report, ending up positive in May and June. The Fed held the interest rates steady and struck a hawkish tone in June, maintaining the current policy rate and projecting only one rate cut in 2024.
The Fund's benchmarks are unmanaged indices used as a general measure of market performance. Calculations assume dividends and capital gains.
Comparison of Change in Value of a $10,000 Investment
(Based on Net Asset Value)
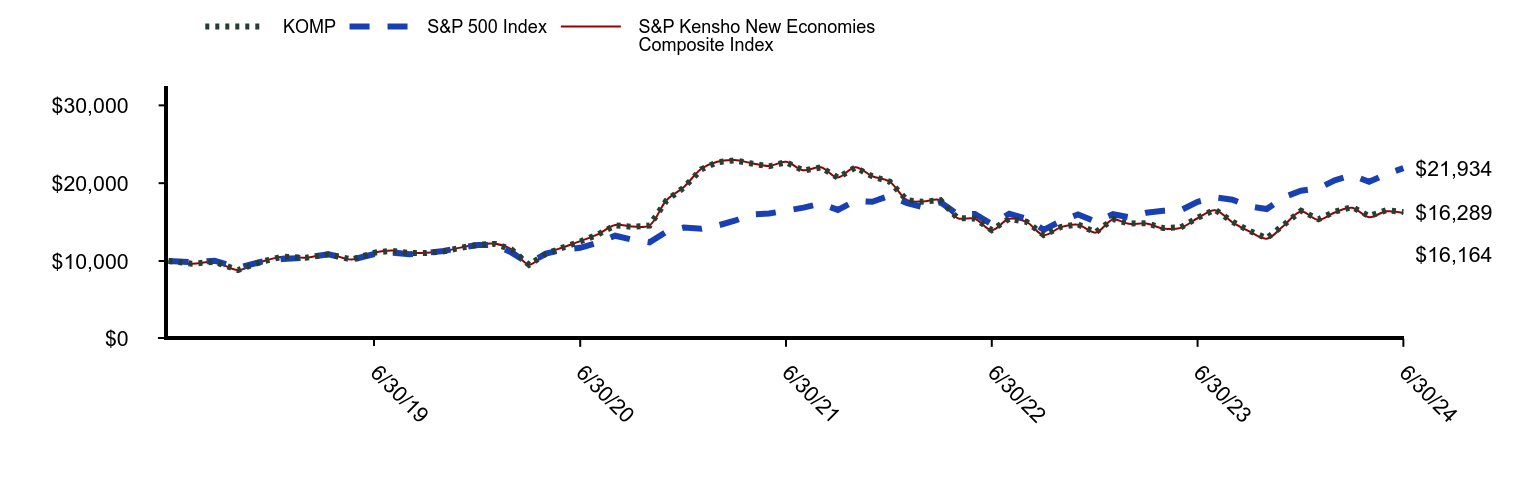
| KOMP | S&P 500 Index | S&P Kensho New Economies Composite Index |
|---|
| 9/30/18 | $10,000 | $10,000 | $10,000 |
| 10/31/18 | $9,658 | $9,842 | $9,653 |
| 11/30/18 | $9,886 | $10,038 | $9,879 |
| 12/31/18 | $8,839 | $9,121 | $8,831 |
| 1/31/19 | $9,906 | $9,903 | $9,903 |
| 2/28/19 | $10,553 | $10,248 | $10,553 |
| 3/31/19 | $10,427 | $10,428 | $10,431 |
| 4/30/19 | $10,860 | $10,859 | $10,867 |
| 5/31/19 | $10,188 | $10,172 | $10,196 |
| 6/30/19 | $11,073 | $10,895 | $11,093 |
| 7/31/19 | $11,324 | $11,060 | $11,342 |
| 8/31/19 | $11,032 | $10,857 | $11,055 |
| 9/30/19 | $11,033 | $11,046 | $11,057 |
| 10/31/19 | $11,238 | $11,287 | $11,256 |
| 11/30/19 | $11,691 | $11,717 | $11,720 |
| 12/31/19 | $12,091 | $12,053 | $12,124 |
| 1/31/20 | $12,197 | $12,066 | $12,227 |
| 2/29/20 | $11,471 | $11,073 | $11,497 |
| 3/31/20 | $9,523 | $9,705 | $9,531 |
| 4/30/20 | $10,921 | $10,949 | $10,945 |
| 5/31/20 | $11,746 | $11,471 | $11,773 |
| 6/30/20 | $12,503 | $11,699 | $12,553 |
| 7/31/20 | $13,396 | $12,358 | $13,428 |
| 8/31/20 | $14,578 | $13,247 | $14,621 |
| 9/30/20 | $14,399 | $12,743 | $14,438 |
| 10/31/20 | $14,559 | $12,404 | $14,590 |
| 11/30/20 | $17,778 | $13,762 | $17,814 |
| 12/31/20 | $19,458 | $14,291 | $19,524 |
| 1/31/21 | $21,794 | $14,147 | $21,848 |
| 2/28/21 | $22,692 | $14,537 | $22,764 |
| 3/31/21 | $22,940 | $15,174 | $22,978 |
| 4/30/21 | $22,524 | $15,984 | $22,574 |
| 5/31/21 | $22,169 | $16,095 | $22,199 |
| 6/30/21 | $22,695 | $16,471 | $22,740 |
| 7/31/21 | $21,621 | $16,862 | $21,658 |
| 8/31/21 | $22,029 | $17,375 | $22,057 |
| 9/30/21 | $20,707 | $16,567 | $20,724 |
| 10/31/21 | $22,014 | $17,728 | $22,059 |
| 11/30/21 | $20,886 | $17,605 | $20,892 |
| 12/31/21 | $20,186 | $18,394 | $20,185 |
| 1/31/22 | $17,788 | $17,442 | $17,805 |
| 2/28/22 | $17,623 | $16,920 | $17,652 |
| 3/31/22 | $17,813 | $17,548 | $17,822 |
| 4/30/22 | $15,526 | $16,018 | $15,520 |
| 5/31/22 | $15,442 | $16,047 | $15,435 |
| 6/30/22 | $13,970 | $14,722 | $13,961 |
| 7/31/22 | $15,435 | $16,080 | $15,423 |
| 8/31/22 | $15,019 | $15,424 | $14,993 |
| 9/30/22 | $13,353 | $14,004 | $13,317 |
| 10/31/22 | $14,390 | $15,137 | $14,358 |
| 11/30/22 | $14,696 | $15,983 | $14,666 |
| 12/31/22 | $13,679 | $15,062 | $13,649 |
| 1/31/23 | $15,378 | $16,009 | $15,329 |
| 2/28/23 | $14,823 | $15,618 | $14,779 |
| 3/31/23 | $14,857 | $16,192 | $14,813 |
| 4/30/23 | $14,234 | $16,444 | $14,177 |
| 5/31/23 | $14,318 | $16,516 | $14,256 |
| 6/30/23 | $15,560 | $17,607 | $15,493 |
| 7/31/23 | $16,605 | $18,173 | $16,526 |
| 8/31/23 | $15,045 | $17,883 | $14,970 |
| 9/30/23 | $13,877 | $17,031 | $13,795 |
| 10/31/23 | $12,939 | $16,673 | $12,868 |
| 11/30/23 | $14,628 | $18,195 | $14,537 |
| 12/31/23 | $16,453 | $19,022 | $16,351 |
| 1/31/24 | $15,368 | $19,342 | $15,281 |
| 2/29/24 | $16,333 | $20,374 | $16,236 |
| 3/31/24 | $16,936 | $21,030 | $16,831 |
| 4/30/24 | $15,765 | $20,172 | $15,630 |
| 5/31/24 | $16,527 | $21,173 | $16,386 |
| 6/30/24 | $16,289 | $21,934 | $16,164 |
Average Annual Total Returns (%)
| Name | 1 Year | 5 Years | Since Inception 10/22/18 |
|---|
| KOMP | 4.69% | 8.03% | 8.96% |
| S&P 500 Index | 24.56% | 15.05% | 14.71% |
| S&P Kensho New Economies Composite Index | 4.33% | 7.82% | 8.81% |
The Fund’s past performance is not necessarily an indication of how the Fund will perform in the future. The returns do not reflect the deduction of taxes that a shareholder would pay on Fund distributions or on the redemption or sale of Fund shares. Updated performance information is available by calling 1-866-787-2257 or visiting our website at www.ssga.com/us/en/institutional/fund-finder?tab=documents&type=etfs.
| Statistic | Value |
|---|
| Total Net Assets | $1,883,743,580 |
| # of Portfolio Holdings | 443 |
| Portfolio Turnover Rate | 59% |
| Total Advisory Fees Paid | $3,618,591 |
What did the Fund invest in?
| Industry | % Value of Total Net Assets |
| Software | 12.4% |
| Aerospace & Defense | 8.8% |
| Health Care Equipment & Supplies | 7.5% |
| Electronic Equipment, Instruments & Components | 6.8% |
| Financial Services | 5.0% |
| Semiconductors & Semiconductor Equipment | 4.9% |
| Biotechnology | 4.5% |
| Machinery | 3.6% |
| Electrical Equipment | 3.0% |
| Life Sciences Tools & Services | 2.8% |
| Holdings | % Value of Total Net Assets |
| Teledyne Technologies, Inc. | 1.1% |
| Oceaneering International, Inc. | 1.1% |
| Parsons Corp. | 1.0% |
| Coinbase Global, Inc., A | 1.0% |
| Bruker Corp. | 1.0% |
| Leidos Holdings, Inc. | 1.0% |
| AeroVironment, Inc. | 0.9% |
| Kratos Defense & Security Solutions, Inc. | 0.9% |
| PTC, Inc. | 0.9% |
| Lockheed Martin Corp. | 0.8% |
SPDR S&P Kensho Clean Power ETF
Principal Listing Exchange: NYSEArca
Annual Shareholder Report
June 30, 2024
This annual shareholder report contains important information about the SPDR S&P Kensho Clean Power ETF (the "Fund") for the year ended June 30, 2024. You can find additional information about the Fund, including the Prospectus, Statement of Additional Information, financial statements and other information at www.ssga.com/us/en/institutional/fund-finder?tab=documents&type=etfs. You can also request this information about the Fund by contacting us at 1-866-787-2257.
What were the Fund costs for the last year?
| Fund Name | Cost of a $10,000 investment | Costs paid as a percentage of a $10,000 investment |
|---|
| SPDR S&P Kensho Clean Power ETF | $39 | 0.45% |
How did the Fund perform last year and what affected its performance?
The reporting period’s market environment was largely driven by news about inflation, economic growth and the impact either would have on the U.S. Federal Reserve (the “Fed”) and other central banks with regard to interest rate decisions. Alongside this macro story was the prospect of a burgeoning artificial intelligence boom, driving up the values of AI-related tech and semiconductor companies. AI-related semiconductor stocks continued to surge, revealing the investor belief that AI represented an enormous secular growth opportunity that transcended concerns about the macroeconomy. While AI stocks and the Magnificent Seven drove broader market returns higher, many companies outside of this space fell behind, including those specializing in clean power.
The Fund's benchmarks are unmanaged indices used as a general measure of market performance. Calculations assume dividends and capital gains.
Comparison of Change in Value of a $10,000 Investment
(Based on Net Asset Value)
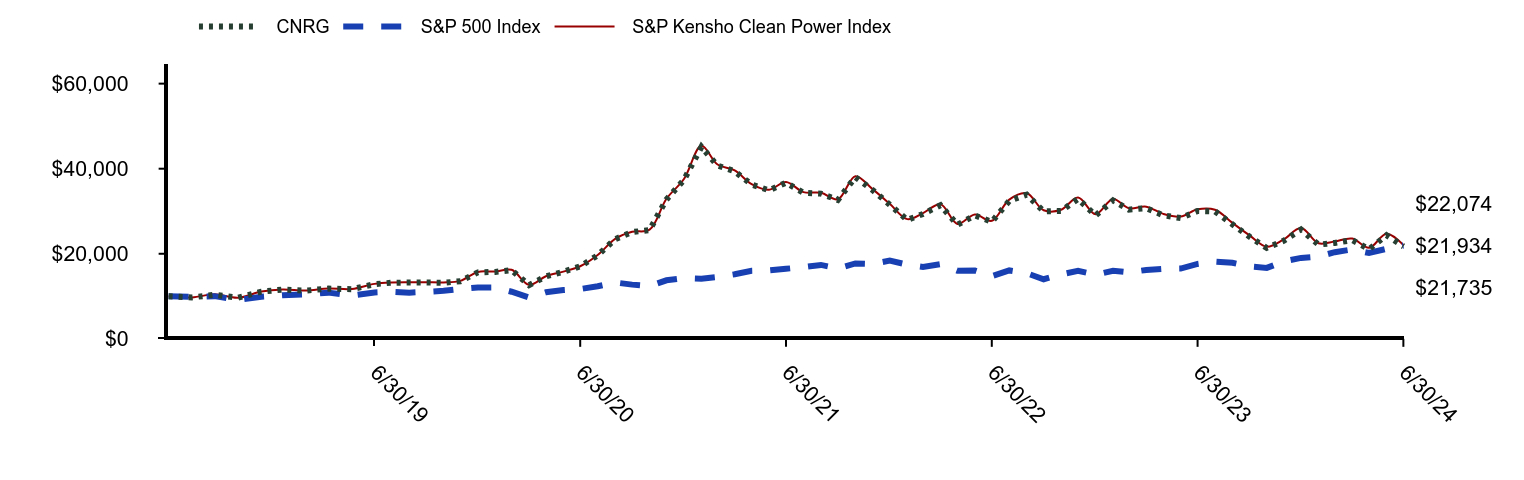
| CNRG | S&P 500 Index | S&P Kensho Clean Power Index |
|---|
| 9/30/18 | $10,000 | $10,000 | $10,000 |
| 10/31/18 | $9,739 | $9,842 | $9,742 |
| 11/30/18 | $10,363 | $10,038 | $10,464 |
| 12/31/18 | $9,657 | $9,121 | $9,656 |
| 1/31/19 | $11,089 | $9,903 | $11,109 |
| 2/28/19 | $11,579 | $10,248 | $11,606 |
| 3/31/19 | $11,336 | $10,428 | $11,366 |
| 4/30/19 | $11,809 | $10,859 | $11,847 |
| 5/31/19 | $11,675 | $10,172 | $11,718 |
| 6/30/19 | $12,855 | $10,895 | $12,921 |
| 7/31/19 | $13,200 | $11,060 | $13,259 |
| 8/31/19 | $13,227 | $10,857 | $13,311 |
| 9/30/19 | $13,243 | $11,046 | $13,310 |
| 10/31/19 | $13,177 | $11,287 | $13,254 |
| 11/30/19 | $13,547 | $11,717 | $13,629 |
| 12/31/19 | $15,621 | $12,053 | $15,734 |
| 1/31/20 | $15,740 | $12,066 | $15,826 |
| 2/29/20 | $16,146 | $11,073 | $16,227 |
| 3/31/20 | $12,640 | $9,705 | $12,684 |
| 4/30/20 | $14,688 | $10,949 | $14,721 |
| 5/31/20 | $15,758 | $11,471 | $15,807 |
| 6/30/20 | $17,028 | $11,699 | $17,066 |
| 7/31/20 | $19,635 | $12,358 | $19,711 |
| 8/31/20 | $23,439 | $13,247 | $23,506 |
| 9/30/20 | $25,091 | $12,743 | $25,173 |
| 10/31/20 | $25,584 | $12,404 | $25,679 |
| 11/30/20 | $32,786 | $13,762 | $32,936 |
| 12/31/20 | $37,371 | $14,291 | $37,569 |
| 1/31/21 | $45,140 | $14,147 | $45,392 |
| 2/28/21 | $40,771 | $14,537 | $41,041 |
| 3/31/21 | $39,392 | $15,174 | $39,606 |
| 4/30/21 | $36,267 | $15,984 | $36,390 |
| 5/31/21 | $34,918 | $16,095 | $35,071 |
| 6/30/21 | $36,698 | $16,471 | $36,878 |
| 7/31/21 | $34,329 | $16,862 | $34,501 |
| 8/31/21 | $34,142 | $17,375 | $34,327 |
| 9/30/21 | $32,646 | $16,567 | $32,821 |
| 10/31/21 | $38,023 | $17,728 | $38,245 |
| 11/30/21 | $35,042 | $17,605 | $35,253 |
| 12/31/21 | $31,545 | $18,394 | $31,747 |
| 1/31/22 | $27,952 | $17,442 | $28,147 |
| 2/28/22 | $29,364 | $16,920 | $29,567 |
| 3/31/22 | $31,417 | $17,548 | $31,641 |
| 4/30/22 | $26,819 | $16,018 | $27,019 |
| 5/31/22 | $29,005 | $16,047 | $29,236 |
| 6/30/22 | $27,513 | $14,722 | $27,745 |
| 7/31/22 | $32,446 | $16,080 | $32,738 |
| 8/31/22 | $33,904 | $15,424 | $34,224 |
| 9/30/22 | $29,962 | $14,004 | $30,219 |
| 10/31/22 | $30,077 | $15,137 | $30,347 |
| 11/30/22 | $32,914 | $15,983 | $33,230 |
| 12/31/22 | $28,998 | $15,062 | $29,302 |
| 1/31/23 | $32,518 | $16,009 | $32,855 |
| 2/28/23 | $30,379 | $15,618 | $30,704 |
| 3/31/23 | $30,727 | $16,192 | $31,069 |
| 4/30/23 | $29,042 | $16,444 | $29,384 |
| 5/31/23 | $28,395 | $16,516 | $28,751 |
| 6/30/23 | $30,062 | $17,607 | $30,458 |
| 7/31/23 | $29,968 | $18,173 | $30,354 |
| 8/31/23 | $26,902 | $17,883 | $27,265 |
| 9/30/23 | $24,046 | $17,031 | $24,369 |
| 10/31/23 | $21,376 | $16,673 | $21,664 |
| 11/30/23 | $23,049 | $18,195 | $23,369 |
| 12/31/23 | $25,690 | $19,022 | $26,065 |
| 1/31/24 | $22,146 | $19,342 | $22,476 |
| 2/29/24 | $22,552 | $20,374 | $22,891 |
| 3/31/24 | $23,202 | $21,030 | $23,563 |
| 4/30/24 | $21,071 | $20,172 | $21,390 |
| 5/31/24 | $24,353 | $21,173 | $24,715 |
| 6/30/24 | $21,735 | $21,934 | $22,074 |
Average Annual Total Returns (%)
| Name | 1 Year | 5 Years | Since Inception 10/22/18 |
|---|
| CNRG | (27.69%) | 11.08% | 14.64% |
| S&P 500 Index | 24.56% | 15.05% | 14.71% |
| S&P Kensho Clean Power Index | (27.53%) | 11.31% | 14.94% |
The Fund’s past performance is not necessarily an indication of how the Fund will perform in the future. The returns do not reflect the deduction of taxes that a shareholder would pay on Fund distributions or on the redemption or sale of Fund shares. Updated performance information is available by calling 1-866-787-2257 or visiting our website at www.ssga.com/us/en/institutional/fund-finder?tab=documents&type=etfs.
| Statistic | Value |
|---|
| Total Net Assets | $178,946,257 |
| # of Portfolio Holdings | 46 |
| Portfolio Turnover Rate | 38% |
| Total Advisory Fees Paid | $1,090,028 |
What did the Fund invest in?
| Industry | % Value of Total Net Assets |
| Electrical Equipment | 30.2% |
| Independent Power and Renewable Electricity Producers | 17.3% |
| Semiconductors & Semiconductor Equipment | 15.9% |
| Electric Utilities | 15.4% |
| Construction & Engineering | 7.8% |
| Machinery | 4.0% |
| Automobiles | 2.5% |
| Electronic Equipment, Instruments & Components | 2.3% |
| Diversified Consumer Services | 2.3% |
| Building Products | 2.1% |
| Holdings | % Value of Total Net Assets |
| Sunnova Energy International, Inc. | 3.2% |
| Avangrid, Inc. | 3.1% |
| Atlantica Sustainable Infrastructure PLC | 3.1% |
| ALLETE, Inc. | 3.1% |
| Arcosa, Inc. | 3.1% |
| NextEra Energy, Inc. | 3.1% |
| GE Vernova, Inc. | 3.0% |
| Ormat Technologies, Inc. | 3.0% |
| Generac Holdings, Inc. | 2.9% |
| Constellation Energy Corp. | 2.9% |
SPDR S&P Kensho Final Frontiers ETF
Principal Listing Exchange: NYSEArca
Annual Shareholder Report
June 30, 2024
This annual shareholder report contains important information about the SPDR S&P Kensho Final Frontiers ETF (the "Fund") for the year ended June 30, 2024. You can find additional information about the Fund, including the Prospectus, Statement of Additional Information, financial statements and other information at www.ssga.com/us/en/institutional/fund-finder?tab=documents&type=etfs. You can also request this information about the Fund by contacting us at 1-866-787-2257.
What were the Fund costs for the last year?
| Fund Name | Cost of a $10,000 investment | Costs paid as a percentage of a $10,000 investment |
|---|
| SPDR S&P Kensho Final Frontiers ETF | $46 | 0.45% |
How did the Fund perform last year and what affected its performance?
U.S. Economic indicators from the U.S. remained relatively strong over the Q3 2023. While investors began the quarter with hopes that the rate hikes would soon end and cuts would begin, that probability ended by the end of the quarter. U.S. stocks rallied in Q4 2023, supported by prospects of rate cuts in 2024. U.S. equities rallied for a second straight quarter in Q1 2024. The AI theme was a key tailwinds in Q1 2024. The biggest area of concern during the quarter revolved around sticky core services inflation even as the U.S. economy remained resilient. U.S. equity indices were mixed in Q2 2024, with a tough start to the quarter in April. The momentum changed in the middle of the month due to a strong jobs report, ending up positive in May and June. Despite the strength in AI and increased focus on robotics, Final Frontiers Index overall performance was muted for the reporting period due to concerns over aerospace struggles and manufacturing delays.
The Fund's benchmarks are unmanaged indices used as a general measure of market performance. Calculations assume dividends and capital gains.
Comparison of Change in Value of a $10,000 Investment
(Based on Net Asset Value)
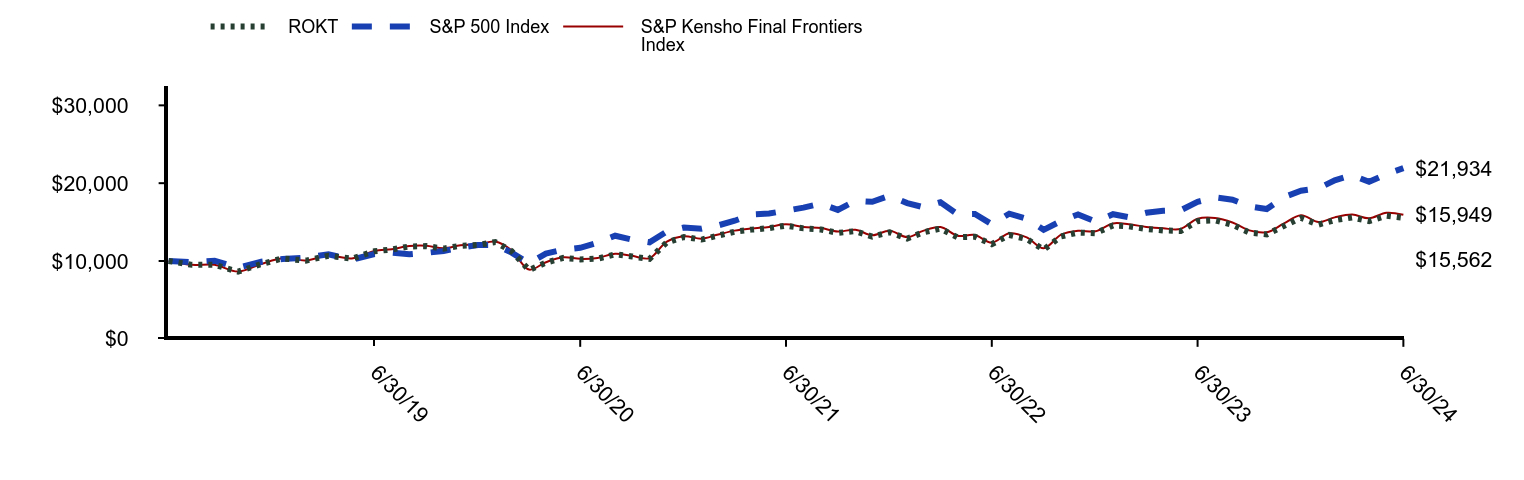
| ROKT | S&P 500 Index | S&P Kensho Final Frontiers Index |
|---|
| 9/30/18 | $10,000 | $10,000 | $10,000 |
| 10/31/18 | $9,505 | $9,842 | $9,505 |
| 11/30/18 | $9,517 | $10,038 | $9,521 |
| 12/31/18 | $8,634 | $9,121 | $8,640 |
| 1/31/19 | $9,607 | $9,903 | $9,616 |
| 2/28/19 | $10,330 | $10,248 | $10,345 |
| 3/31/19 | $10,049 | $10,428 | $10,065 |
| 4/30/19 | $10,670 | $10,859 | $10,696 |
| 5/31/19 | $10,303 | $10,172 | $10,329 |
| 6/30/19 | $11,250 | $10,895 | $11,287 |
| 7/31/19 | $11,479 | $11,060 | $11,518 |
| 8/31/19 | $11,866 | $10,857 | $11,919 |
| 9/30/19 | $11,912 | $11,046 | $11,965 |
| 10/31/19 | $11,595 | $11,287 | $11,651 |
| 11/30/19 | $11,956 | $11,717 | $12,017 |
| 12/31/19 | $12,056 | $12,053 | $12,129 |
| 1/31/20 | $12,435 | $12,066 | $12,500 |
| 2/29/20 | $11,262 | $11,073 | $11,366 |
| 3/31/20 | $8,844 | $9,705 | $8,899 |
| 4/30/20 | $9,784 | $10,949 | $9,845 |
| 5/31/20 | $10,405 | $11,471 | $10,476 |
| 6/30/20 | $10,207 | $11,699 | $10,277 |
| 7/31/20 | $10,298 | $12,358 | $10,396 |
| 8/31/20 | $10,856 | $13,247 | $10,937 |
| 9/30/20 | $10,580 | $12,743 | $10,664 |
| 10/31/20 | $10,276 | $12,404 | $10,358 |
| 11/30/20 | $12,365 | $13,762 | $12,465 |
| 12/31/20 | $13,087 | $14,291 | $13,191 |
| 1/31/21 | $12,754 | $14,147 | $12,873 |
| 2/28/21 | $13,237 | $14,537 | $13,370 |
| 3/31/21 | $13,768 | $15,174 | $13,903 |
| 4/30/21 | $14,033 | $15,984 | $14,183 |
| 5/31/21 | $14,228 | $16,095 | $14,383 |
| 6/30/21 | $14,543 | $16,471 | $14,709 |
| 7/31/21 | $14,192 | $16,862 | $14,365 |
| 8/31/21 | $14,052 | $17,375 | $14,226 |
| 9/30/21 | $13,611 | $16,567 | $13,783 |
| 10/31/21 | $13,835 | $17,728 | $14,016 |
| 11/30/21 | $13,136 | $17,605 | $13,311 |
| 12/31/21 | $13,687 | $18,394 | $13,878 |
| 1/31/22 | $12,885 | $17,442 | $13,069 |
| 2/28/22 | $13,675 | $16,920 | $13,874 |
| 3/31/22 | $14,157 | $17,548 | $14,370 |
| 4/30/22 | $13,050 | $16,018 | $13,248 |
| 5/31/22 | $13,126 | $16,047 | $13,334 |
| 6/30/22 | $12,158 | $14,722 | $12,347 |
| 7/31/22 | $13,338 | $16,080 | $13,557 |
| 8/31/22 | $12,826 | $15,424 | $13,033 |
| 9/30/22 | $11,460 | $14,004 | $11,640 |
| 10/31/22 | $13,166 | $15,137 | $13,386 |
| 11/30/22 | $13,659 | $15,983 | $13,890 |
| 12/31/22 | $13,573 | $15,062 | $13,813 |
| 1/31/23 | $14,560 | $16,009 | $14,829 |
| 2/28/23 | $14,453 | $15,618 | $14,723 |
| 3/31/23 | $14,114 | $16,192 | $14,384 |
| 4/30/23 | $13,929 | $16,444 | $14,196 |
| 5/31/23 | $13,855 | $16,516 | $14,128 |
| 6/30/23 | $15,126 | $17,607 | $15,424 |
| 7/31/23 | $15,218 | $18,173 | $15,526 |
| 8/31/23 | $14,649 | $17,883 | $14,951 |
| 9/30/23 | $13,652 | $17,031 | $13,934 |
| 10/31/23 | $13,413 | $16,673 | $13,697 |
| 11/30/23 | $14,484 | $18,195 | $14,799 |
| 12/31/23 | $15,535 | $19,022 | $15,880 |
| 1/31/24 | $14,675 | $19,342 | $15,005 |
| 2/29/24 | $15,248 | $20,374 | $15,606 |
| 3/31/24 | $15,587 | $21,030 | $15,960 |
| 4/30/24 | $15,135 | $20,172 | $15,494 |
| 5/31/24 | $15,819 | $21,173 | $16,198 |
| 6/30/24 | $15,562 | $21,934 | $15,949 |
Average Annual Total Returns (%)
| Name | 1 Year | 5 Years | Since Inception 10/22/18 |
|---|
| ROKT | 2.93% | 6.71% | 8.09% |
| S&P 500 Index | 24.56% | 15.05% | 14.71% |
| S&P Kensho Final Frontiers Index | 3.40% | 7.16% | 8.55% |
The Fund’s past performance is not necessarily an indication of how the Fund will perform in the future. The returns do not reflect the deduction of taxes that a shareholder would pay on Fund distributions or on the redemption or sale of Fund shares. Updated performance information is available by calling 1-866-787-2257 or visiting our website at www.ssga.com/us/en/institutional/fund-finder?tab=documents&type=etfs.
| Statistic | Value |
|---|
| Total Net Assets | $15,190,432 |
| # of Portfolio Holdings | 32 |
| Portfolio Turnover Rate | 21% |
| Total Advisory Fees Paid | $74,383 |
What did the Fund invest in?
| Industry | % Value of Total Net Assets |
| Aerospace & Defense | 51.9% |
| Electronic Equipment, Instruments & Components | 12.3% |
| Energy Equipment & Services | 7.4% |
| Machinery | 6.2% |
| Professional Services | 6.0% |
| Industrial Conglomerates | 4.4% |
| Diversified Telecommunication Services | 4.2% |
| Semiconductors & Semiconductor Equipment | 2.6% |
| Containers & Packaging | 2.4% |
| Communications Equipment | 2.4% |
| Holdings | % Value of Total Net Assets |
| Oceaneering International, Inc. | 4.6% |
| Rocket Lab USA, Inc. | 4.4% |
| L3Harris Technologies, Inc. | 4.4% |
| Honeywell International, Inc. | 4.4% |
| Northrop Grumman Corp. | 4.4% |
| Lockheed Martin Corp. | 4.4% |
| Boeing Co. | 4.3% |
| Moog, Inc., A | 4.3% |
| HEICO Corp. | 4.3% |
| Teledyne Technologies, Inc. | 4.2% |
Principal Listing Exchange: NYSEArca
Annual Shareholder Report
June 30, 2024
This annual shareholder report contains important information about the SPDR S&P 500 ESG ETF (the "Fund") for the year ended June 30, 2024. You can find additional information about the Fund, including the Prospectus, Statement of Additional Information, financial statements and other information at www.ssga.com/us/en/institutional/fund-finder?tab=documents&type=etfs. You can also request this information about the Fund by contacting us at 1-866-787-2257.
What were the Fund costs for the last year?
| Fund Name | Cost of a $10,000 investment | Costs paid as a percentage of a $10,000 investment |
|---|
| SPDR S&P 500 ESG ETF | $11 | 0.10% |
How did the Fund perform last year and what affected its performance?
The reporting period’s market environment was largely driven by news about inflation, economic growth and the impact either would have on the U.S. Federal Reserve (the “Fed”) and other central banks with regard to interest rate decisions. Alongside this macro story was the prospect of a burgeoning artificial intelligence boom, driving up the values of AI-related tech and semiconductor companies. The reporting period began just after the so-called “Magnificent Seven” stocks began dominating U.S. market returns, thereby earning their catchy moniker. But these seven tech mega-caps—Alphabet Inc, Amazon.com Inc, Apple Inc, Meta Platforms Inc, Microsoft Corp, NVIDIA Corp. and Tesla Inc.—lost some of their shine when in aggregate, they alongside the rest of the market pulled back in the third quarter of 2023. Uncertainty surrounding economic growth, inflation and the Fed’s stance on the direction of rates rattled some investors who feared that the Fed would keep rates higher for longer, cutting into economic growth more than was necessary to curtail inflation. U.S. markets continued to be strong in 2024 as Meta, NVIDIA and Amazon.com had near-record gains in February after strong earnings numbers.
The Fund's benchmarks are unmanaged indices used as a general measure of market performance. Calculations assume dividends and capital gains.
Comparison of Change in Value of a $10,000 Investment
(Based on Net Asset Value)
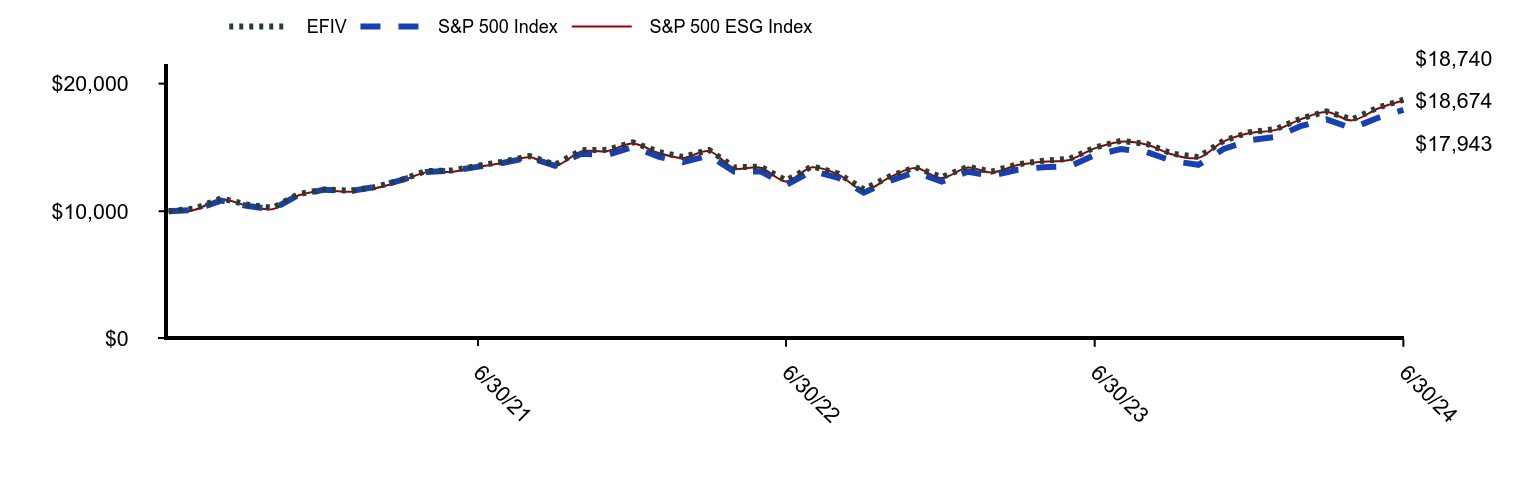
| EFIV | S&P 500 Index | S&P 500 ESG Index |
|---|
| 6/30/20 | $10,000 | $10,000 | $10,000 |
| 7/31/20 | $10,205 | $10,110 | $10,120 |
| 8/31/20 | $11,005 | $10,837 | $10,920 |
| 9/30/20 | $10,530 | $10,425 | $10,451 |
| 10/31/20 | $10,256 | $10,148 | $10,165 |
| 11/30/20 | $11,329 | $11,259 | $11,233 |
| 12/31/20 | $11,704 | $11,692 | $11,614 |
| 1/31/21 | $11,612 | $11,573 | $11,527 |
| 2/28/21 | $11,877 | $11,893 | $11,787 |
| 3/31/21 | $12,426 | $12,413 | $12,328 |
| 4/30/21 | $13,147 | $13,076 | $13,045 |
| 5/31/21 | $13,201 | $13,167 | $13,098 |
| 6/30/21 | $13,557 | $13,475 | $13,465 |
| 7/31/21 | $13,891 | $13,795 | $13,794 |
| 8/31/21 | $14,322 | $14,214 | $14,225 |
| 9/30/21 | $13,644 | $13,553 | $13,558 |
| 10/31/21 | $14,784 | $14,503 | $14,688 |
| 11/30/21 | $14,810 | $14,402 | $14,709 |
| 12/31/21 | $15,402 | $15,048 | $15,306 |
| 1/31/22 | $14,643 | $14,269 | $14,556 |
| 2/28/22 | $14,256 | $13,842 | $14,173 |
| 3/31/22 | $14,803 | $14,356 | $14,710 |
| 4/30/22 | $13,447 | $13,104 | $13,363 |
| 5/31/22 | $13,501 | $13,128 | $13,414 |
| 6/30/22 | $12,419 | $12,044 | $12,338 |
| 7/31/22 | $13,526 | $13,155 | $13,446 |
| 8/31/22 | $12,940 | $12,618 | $12,873 |
| 9/30/22 | $11,710 | $11,456 | $11,638 |
| 10/31/22 | $12,737 | $12,384 | $12,670 |
| 11/30/22 | $13,449 | $13,076 | $13,387 |
| 12/31/22 | $12,667 | $12,322 | $12,601 |
| 1/31/23 | $13,489 | $13,097 | $13,421 |
| 2/28/23 | $13,106 | $12,777 | $13,044 |
| 3/31/23 | $13,680 | $13,246 | $13,620 |
| 4/30/23 | $13,956 | $13,453 | $13,887 |
| 5/31/23 | $14,096 | $13,511 | $14,022 |
| 6/30/23 | $14,990 | $14,404 | $14,928 |
| 7/31/23 | $15,521 | $14,867 | $15,451 |
| 8/31/23 | $15,274 | $14,630 | $15,206 |
| 9/30/23 | $14,508 | $13,933 | $14,442 |
| 10/31/23 | $14,242 | $13,640 | $14,181 |
| 11/30/23 | $15,536 | $14,885 | $15,469 |
| 12/31/23 | $16,199 | $15,562 | $16,128 |
| 1/31/24 | $16,440 | $15,823 | $16,375 |
| 2/29/24 | $17,255 | $16,668 | $17,198 |
| 3/31/24 | $17,829 | $17,204 | $17,771 |
| 4/30/24 | $17,187 | $16,503 | $17,121 |
| 5/31/24 | $18,123 | $17,322 | $18,051 |
| 6/30/24 | $18,740 | $17,943 | $18,674 |
Average Annual Total Returns (%)
| Name | 1 Year | Since Inception 7/27/20 |
|---|
| EFIV | 24.95% | 17.10% |
| S&P 500 Index | 24.56% | 16.03% |
| S&P 500 ESG Index | 25.09% | 17.24% |
The Fund’s past performance is not necessarily an indication of how the Fund will perform in the future. The returns do not reflect the deduction of taxes that a shareholder would pay on Fund distributions or on the redemption or sale of Fund shares. Updated performance information is available by calling 1-866-787-2257 or visiting our website at www.ssga.com/us/en/institutional/fund-finder?tab=documents&type=etfs.
| Statistic | Value |
|---|
| Total Net Assets | $1,284,451,056 |
| # of Portfolio Holdings | 322 |
| Portfolio Turnover Rate | 12% |
| Total Advisory Fees Paid | $1,069,556 |
What did the Fund invest in?
| Industry | % Value of Total Net Assets |
| Semiconductors & Semiconductor Equipment | 12.8% |
| Software | 11.6% |
| Technology Hardware, Storage & Peripherals | 9.4% |
| Interactive Media & Services | 5.9% |
| Banks | 4.9% |
| Pharmaceuticals | 4.1% |
| Oil, Gas & Consumable Fuels | 3.9% |
| Financial Services | 3.1% |
| Health Care Providers & Services | 2.8% |
| Consumer Staples Distribution & Retail | 2.4% |
| Holdings | % Value of Total Net Assets |
| Microsoft Corp. | 10.0% |
| NVIDIA Corp. | 9.1% |
| Apple, Inc. | 9.1% |
| Alphabet, Inc. | 5.9% |
| Eli Lilly & Co. | 2.2% |
| JPMorgan Chase & Co. | 1.8% |
| Tesla, Inc. | 1.7% |
| Exxon Mobil Corp. | 1.6% |
| UnitedHealth Group, Inc. | 1.4% |
| Visa, Inc., A | 1.2% |
SPDR S&P SmallCap 600 ESG ETF
Principal Listing Exchange: NYSEArca
Annual Shareholder Report
June 30, 2024
This annual shareholder report contains important information about the SPDR S&P SmallCap 600 ESG ETF (the "Fund") for the year ended June 30, 2024. You can find additional information about the Fund, including the Prospectus, Statement of Additional Information, financial statements and other information at www.ssga.com/us/en/institutional/fund-finder?tab=documents&type=etfs. You can also request this information about the Fund by contacting us at 1-866-787-2257.
What were the Fund costs for the last year?
| Fund Name | Cost of a $10,000 investment | Costs paid as a percentage of a $10,000 investment |
|---|
| SPDR S&P SmallCap 600 ESG ETF | $13 | 0.12% |
How did the Fund perform last year and what affected its performance?
Management fees, cash drag, and cumulative effects of security mis-weights contributed to the difference between the Fund’s performance and that of the Index and were primary drivers of Fund performance during the period.
Over the past year, the S&P 600 ESG Index has outperformed the S&P 600 Index by 2.81%. Most of this outperformance was explained by overweights to Information Technology securities and Industrials.
During the Reported Period Financials, Industrials and Materials were the best performing sectors in the fund, while Utilities, Communication Services and Health Care were the bottom performers. From a single security level contribution, Abercrombie and Fitch was the best performing stock in the portfolio, followed by Powell Industries and Hibbett Inc. Forward Air Corporation was the worst performing security, followed by TTEC Holdings and iRobot Corp.
The fund did not invest in any derivative during the reported period.
The Fund's benchmarks are unmanaged indices used as a general measure of market performance. Calculations assume dividends and capital gains.
Comparison of Change in Value of a $10,000 Investment
(Based on Net Asset Value)
| ESIX | S&P 500 Index | S&P SmallCap 600 ESG Index |
|---|
| 01/10/22 | $10,000 | $10,000 | $10,000 |
| 01/31/22 | $9,403 | $9,673 | $9,448 |
| 02/28/22 | $9,552 | $9,383 | $9,594 |
| 03/31/22 | $9,581 | $9,732 | $9,655 |
| 04/30/22 | $8,875 | $8,883 | $8,950 |
| 05/31/22 | $9,035 | $8,899 | $9,118 |
| 06/30/22 | $8,246 | $8,165 | $8,330 |
| 07/31/22 | $9,105 | $8,918 | $9,182 |
| 08/31/22 | $8,682 | $8,554 | $8,750 |
| 09/30/22 | $7,833 | $7,766 | $7,896 |
| 10/31/22 | $8,807 | $8,395 | $8,878 |
| 11/30/22 | $9,130 | $8,864 | $9,215 |
| 12/31/22 | $8,543 | $8,353 | $8,619 |
| 01/31/23 | $9,311 | $8,878 | $9,392 |
| 02/28/23 | $9,235 | $8,662 | $9,314 |
| 03/31/23 | $8,754 | $8,980 | $8,827 |
| 04/30/23 | $8,484 | $9,120 | $8,559 |
| 05/31/23 | $8,348 | $9,159 | $8,440 |
| 06/30/23 | $9,044 | $9,765 | $9,124 |
| 07/31/23 | $9,564 | $10,078 | $9,648 |
| 08/31/23 | $9,199 | $9,918 | $9,283 |
| 09/30/23 | $8,685 | $9,445 | $8,764 |
| 10/31/23 | $8,232 | $9,246 | $8,306 |
| 11/30/23 | $8,859 | $10,091 | $8,957 |
| 12/31/23 | $10,050 | $10,549 | $10,147 |
| 01/31/24 | $9,693 | $10,727 | $9,788 |
| 02/29/24 | $10,033 | $11,299 | $10,146 |
| 03/31/24 | $10,355 | $11,663 | $10,456 |
| 04/30/24 | $9,809 | $11,188 | $9,912 |
| 05/31/24 | $10,294 | $11,743 | $10,403 |
| 06/30/24 | $10,061 | $12,165 | $10,170 |
Average Annual Total Returns (%)
| Name | 1 Year | Since Inception 1/10/22 |
|---|
| ESIX | 11.29% | 0.51% |
| S&P 500 Index | 24.56% | 8.25% |
| S&P SmallCap 600 ESG Index | 11.47% | 0.69% |
The Fund’s past performance is not necessarily an indication of how the Fund will perform in the future. The returns do not reflect the deduction of taxes that a shareholder would pay on Fund distributions or on the redemption or sale of Fund shares. Updated performance information is available by calling 1-866-787-2257 or visiting our website at www.ssga.com/us/en/institutional/fund-finder?tab=documents&type=etfs.
| Statistic | Value |
|---|
| Total Net Assets | $5,073,139 |
| # of Portfolio Holdings | 399 |
| Portfolio Turnover Rate | 47% |
| Total Advisory Fees Paid | $5,581 |
What did the Fund invest in?
| Industry | % Value of Total Net Assets |
| Banks | 9.1% |
| Machinery | 5.7% |
| Specialty Retail | 4.8% |
| Electronic Equipment, Instruments & Components | 4.7% |
| Software | 3.8% |
| Household Durables | 3.7% |
| Health Care Equipment & Supplies | 3.7% |
| Semiconductors & Semiconductor Equipment | 3.2% |
| Financial Services | 3.0% |
| Chemicals | 3.0% |
| Holdings | % Value of Total Net Assets |
| Abercrombie & Fitch Co., A | 1.1% |
| Fabrinet | 1.1% |
| Ensign Group, Inc. | 0.9% |
| SPS Commerce, Inc. | 0.8% |
| ATI, Inc. | 0.8% |
| SPX Technologies, Inc. | 0.8% |
| Mueller Industries, Inc. | 0.8% |
| Glaukos Corp. | 0.7% |
| Meritage Homes Corp. | 0.7% |
| Insight Enterprises, Inc. | 0.7% |
SPDR MSCI USA Climate Paris Aligned ETF
Principal Listing Exchange: NYSEArca
Annual Shareholder Report
June 30, 2024
This annual shareholder report contains important information about the SPDR MSCI USA Climate Paris Aligned ETF (the "Fund") for the year ended June 30, 2024. You can find additional information about the Fund, including the Prospectus, Statement of Additional Information, financial statements and other information at www.ssga.com/us/en/institutional/fund-finder?tab=documents&type=etfs. You can also request this information about the Fund by contacting us at 1-866-787-2257.
What were the Fund costs for the last year?
| Fund Name | Cost of a $10,000 investment | Costs paid as a percentage of a $10,000 investment |
|---|
| SPDR MSCI USA Climate Paris Aligned ETF | $11 | 0.10% |
How did the Fund perform last year and what affected its performance?
U.S. markets closed the calendar year of 2023 with a rally, supported by prospects of rate cuts in 2024 and encouraging Q3 2023 earnings. This rally continued in to the first calendar quarter of 2024. Communications services fared the best with strong returns by Meta, Walt Disney and Netflix. Information Technology was also a stand out with a strong rally in Nvidia Corp. The AI theme was one of the key tailwinds in Q1 and Q2 of 2024, helping to drive select big tech outperformance. US.. equity markets moved higher in May and June of 2024, posting strong returns as corporate earnings results outweighed fears that the U.S. Federal Reserve (the “Fed”) might delay rate cuts until later in 2024.
The Fund's benchmarks are unmanaged indices used as a general measure of market performance. Calculations assume dividends and capital gains.
Comparison of Change in Value of a $10,000 Investment
(Based on Net Asset Value)
| NZUS | S&P 500 Index | MSCI USA Climate Paris Aligned Index |
|---|
| 04/21/22 | $10,000 | $10,000 | $10,000 |
| 04/30/22 | $9,266 | $9,674 | $9,413 |
| 05/31/22 | $9,188 | $9,692 | $9,335 |
| 06/30/22 | $8,501 | $8,892 | $8,633 |
| 07/31/22 | $9,406 | $9,712 | $9,557 |
| 08/31/22 | $8,938 | $9,316 | $9,083 |
| 09/30/22 | $8,098 | $8,458 | $8,226 |
| 10/31/22 | $8,668 | $9,142 | $8,805 |
| 11/30/22 | $9,132 | $9,653 | $9,282 |
| 12/31/22 | $8,561 | $9,097 | $8,700 |
| 01/31/23 | $9,184 | $9,669 | $9,336 |
| 02/28/23 | $8,990 | $9,433 | $9,140 |
| 03/31/23 | $9,344 | $9,779 | $9,503 |
| 04/30/23 | $9,439 | $9,932 | $9,598 |
| 05/31/23 | $9,567 | $9,975 | $9,727 |
| 06/30/23 | $10,213 | $10,634 | $10,393 |
| 07/31/23 | $10,528 | $10,976 | $10,709 |
| 08/31/23 | $10,374 | $10,801 | $10,552 |
| 09/30/23 | $9,786 | $10,286 | $9,954 |
| 10/31/23 | $9,507 | $10,070 | $9,673 |
| 11/30/23 | $10,519 | $10,989 | $10,688 |
| 12/31/23 | $11,064 | $11,488 | $11,242 |
| 01/31/24 | $11,175 | $11,682 | $11,359 |
| 02/29/24 | $11,748 | $12,305 | $11,956 |
| 03/31/24 | $11,984 | $12,701 | $12,194 |
| 04/30/24 | $11,385 | $12,183 | $11,584 |
| 05/31/24 | $12,033 | $12,789 | $12,236 |
| 06/30/24 | $12,528 | $13,247 | $12,742 |
Average Annual Total Returns (%)
| Name | 1 Year | Since Inception 4/21/22 |
|---|
| NZUS | 22.61% | 11.64% |
| S&P 500 Index | 24.56% | 13.69% |
| MSCI USA Climate Paris Aligned Index | 22.60% | 11.69% |
The Fund’s past performance is not necessarily an indication of how the Fund will perform in the future. The returns do not reflect the deduction of taxes that a shareholder would pay on Fund distributions or on the redemption or sale of Fund shares. Updated performance information is available by calling 1-866-787-2257 or visiting our website at www.ssga.com/us/en/institutional/fund-finder?tab=documents&type=etfs.
| Statistic | Value |
|---|
| Total Net Assets | $2,438,973 |
| # of Portfolio Holdings | 254 |
| Portfolio Turnover Rate | 9% |
| Total Advisory Fees Paid | $68,723 |
What did the Fund invest in?
| Asset | % Value of Total Net Assets |
| Common Stocks | 99.8% |
| Holdings | % Value of Total Net Assets |
| Microsoft Corp. | 7.8% |
| NVIDIA Corp. | 7.2% |
| Apple, Inc. | 6.9% |
| Alphabet, Inc. | 3.9% |
| Amazon.com, Inc. | 3.7% |
| Meta Platforms, Inc. | 2.4% |
| Eli Lilly & Co. | 2.1% |
| Tesla, Inc. | 1.9% |
| Broadcom, Inc. | 1.7% |
| Visa, Inc., A | 1.6% |
SPDR Portfolio S&P 1500 Composite Stock Market ETF
Principal Listing Exchange: NYSEArca
Annual Shareholder Report
June 30, 2024
This annual shareholder report contains important information about the SPDR Portfolio S&P 1500 Composite Stock Market ETF (the "Portfolio") for the year ended June 30, 2024. You can find additional information about the Portfolio, including the Prospectus, Statement of Additional Information, financial statements and other information at www.ssga.com/us/en/institutional/fund-finder?tab=documents&type=etfs. You can also request this information about the Portfolio by contacting us at 1-866-787-2257.
What were the Portfolio costs for the last year?
| Portfolio Name | Cost of a $10,000 investment | Costs paid as a percentage of a $10,000 investment |
|---|
| SPDR Portfolio S&P 1500 Composite Stock Market ETF | $3 | 0.03% |
How did the Fund perform last year and what affected its performance?
The reporting period’s market environment was largely driven by news about inflation, economic growth and the impact either would have on the Fed and other central banks with regard to interest rate decisions. Alongside this macro story was the prospect of a burgeoning artificial intelligence boom, driving up the values of A.I.-related tech and semiconductor companies. A.I.-related semiconductor stocks continued to surge, revealing the investor belief that A.I. represented an enormous secular growth opportunity that transcended concerns about the macroeconomy. These and the Magnificent Seven once again pulled the market up with them into the end of the reporting period, ultimately producing strong net gains for the year. The Fund used equity index futures in order to equitize cash and accruals during the reporting period. The Fund’s use of futures helped the Fund track the Index.
The Fund's benchmarks are unmanaged indices used as a general measure of market performance. Calculations assume dividends and capital gains.
Comparison of Change in Value of a $10,000 Investment
(Based on Net Asset Value)
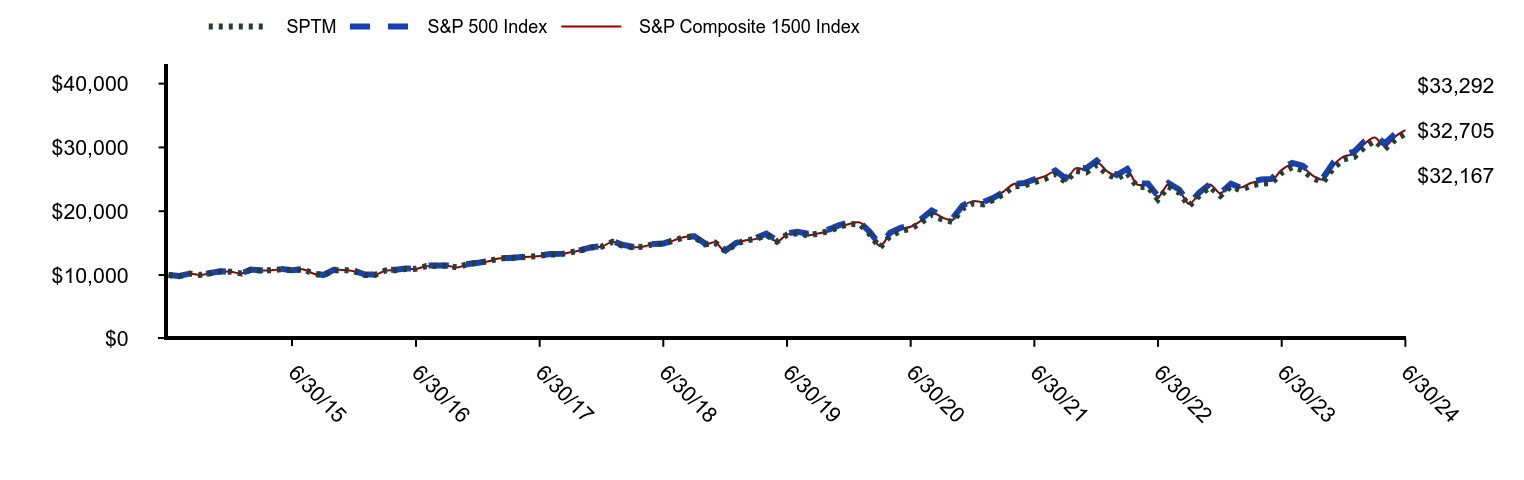
| SPTM | S&P 500 Index | S&P Composite 1500 Index |
|---|
| 6/30/14 | $10,000 | $10,000 | $10,000 |
| 7/31/14 | $9,810 | $9,838 | $9,803 |
| 8/31/14 | $10,217 | $10,245 | $10,214 |
| 9/30/14 | $10,012 | $10,065 | $10,001 |
| 10/31/14 | $10,275 | $10,311 | $10,276 |
| 11/30/14 | $10,541 | $10,581 | $10,525 |
| 12/31/14 | $10,529 | $10,557 | $10,525 |
| 1/31/15 | $10,239 | $10,267 | $10,232 |
| 2/28/15 | $10,834 | $10,860 | $10,825 |
| 3/31/15 | $10,715 | $10,725 | $10,715 |
| 4/30/15 | $10,767 | $10,801 | $10,763 |
| 5/31/15 | $10,907 | $10,942 | $10,912 |
| 6/30/15 | $10,721 | $10,737 | $10,729 |
| 7/31/15 | $10,904 | $10,944 | $10,909 |
| 8/31/15 | $10,254 | $10,285 | $10,250 |
| 9/30/15 | $9,946 | $10,003 | $9,952 |
| 10/31/15 | $10,740 | $10,813 | $10,738 |
| 11/30/15 | $10,793 | $10,849 | $10,797 |
| 12/31/15 | $10,585 | $10,653 | $10,576 |
| 1/31/16 | $9,990 | $10,080 | $9,979 |
| 2/29/16 | $10,005 | $10,077 | $9,976 |
| 3/31/16 | $10,705 | $10,780 | $10,678 |
| 4/30/16 | $10,756 | $10,838 | $10,744 |
| 5/31/16 | $10,950 | $11,027 | $10,937 |
| 6/30/16 | $10,966 | $11,053 | $10,960 |
| 7/31/16 | $11,417 | $11,474 | $11,395 |
| 8/31/16 | $11,437 | $11,489 | $11,424 |
| 9/30/16 | $11,441 | $11,498 | $11,443 |
| 10/31/16 | $11,201 | $11,274 | $11,196 |
| 11/30/16 | $11,723 | $11,718 | $11,697 |
| 12/31/16 | $11,950 | $11,938 | $11,925 |
| 1/31/17 | $12,167 | $12,178 | $12,149 |
| 2/28/17 | $12,608 | $12,650 | $12,601 |
| 3/31/17 | $12,625 | $12,657 | $12,610 |
| 4/30/17 | $12,760 | $12,791 | $12,744 |
| 5/31/17 | $12,895 | $12,955 | $12,874 |
| 6/30/17 | $13,011 | $13,046 | $12,990 |
| 7/31/17 | $13,217 | $13,304 | $13,235 |
| 8/31/17 | $13,249 | $13,345 | $13,260 |
| 9/30/17 | $13,570 | $13,630 | $13,584 |
| 10/31/17 | $13,875 | $13,942 | $13,880 |
| 11/30/17 | $14,296 | $14,374 | $14,314 |
| 12/31/17 | $14,468 | $14,532 | $14,460 |
| 1/31/18 | $15,200 | $15,317 | $15,202 |
| 2/28/18 | $14,633 | $14,764 | $14,646 |
| 3/31/18 | $14,354 | $14,426 | $14,357 |
| 4/30/18 | $14,428 | $14,499 | $14,436 |
| 5/31/18 | $14,839 | $14,869 | $14,855 |
| 6/30/18 | $14,921 | $14,945 | $14,941 |
| 7/31/18 | $15,402 | $15,461 | $15,425 |
| 8/31/18 | $15,937 | $15,995 | $15,973 |
| 9/30/18 | $15,975 | $16,067 | $16,002 |
| 10/31/18 | $14,801 | $14,939 | $14,825 |
| 11/30/18 | $15,070 | $15,237 | $15,113 |
| 12/31/18 | $13,701 | $13,845 | $13,691 |
| 1/31/19 | $14,901 | $15,032 | $14,908 |
| 2/28/19 | $15,442 | $15,555 | $15,445 |
| 3/31/19 | $15,663 | $15,829 | $15,664 |
| 4/30/19 | $16,291 | $16,483 | $16,300 |
| 5/31/19 | $15,238 | $15,441 | $15,243 |
| 6/30/19 | $16,318 | $16,537 | $16,327 |
| 7/31/19 | $16,564 | $16,789 | $16,566 |
| 8/31/19 | $16,206 | $16,480 | $16,218 |
| 9/30/19 | $16,505 | $16,767 | $16,503 |
| 10/31/19 | $16,864 | $17,132 | $16,864 |
| 11/30/19 | $17,509 | $17,785 | $17,508 |
| 12/31/19 | $18,002 | $18,296 | $18,014 |
| 1/31/20 | $17,962 | $18,315 | $18,250 |
| 2/29/20 | $16,483 | $16,807 | $16,727 |
| 3/31/20 | $14,284 | $14,731 | $14,539 |
| 4/30/20 | $16,127 | $16,620 | $16,413 |
| 5/31/20 | $16,911 | $17,411 | $17,217 |
| 6/30/20 | $17,246 | $17,758 | $17,559 |
| 7/31/20 | $18,226 | $18,759 | $18,532 |
| 8/31/20 | $19,465 | $20,107 | $19,813 |
| 9/30/20 | $18,736 | $19,343 | $19,062 |
| 10/31/20 | $18,332 | $18,829 | $18,627 |
| 11/30/20 | $20,401 | $20,890 | $20,733 |
| 12/31/20 | $21,220 | $21,693 | $21,586 |
| 1/31/21 | $21,075 | $21,474 | $21,440 |
| 2/28/21 | $21,740 | $22,066 | $22,111 |
| 3/31/21 | $22,703 | $23,033 | $23,077 |
| 4/30/21 | $23,873 | $24,262 | $24,276 |
| 5/31/21 | $24,049 | $24,431 | $24,447 |
| 6/30/21 | $24,533 | $25,002 | $24,955 |
| 7/31/21 | $25,068 | $25,596 | $25,486 |
| 8/31/21 | $25,803 | $26,374 | $26,239 |
| 9/30/21 | $24,620 | $25,147 | $25,043 |
| 10/31/21 | $26,307 | $26,909 | $26,759 |
| 11/30/21 | $26,084 | $26,723 | $26,528 |
| 12/31/21 | $27,270 | $27,920 | $27,726 |
| 1/31/22 | $25,800 | $26,475 | $26,245 |
| 2/28/22 | $25,122 | $25,683 | $25,547 |
| 3/31/22 | $26,001 | $26,636 | $26,440 |
| 4/30/22 | $23,775 | $24,314 | $24,164 |
| 5/31/22 | $23,832 | $24,358 | $24,226 |
| 6/30/22 | $21,853 | $22,348 | $22,206 |
| 7/31/22 | $23,872 | $24,408 | $24,277 |
| 8/31/22 | $22,908 | $23,413 | $23,299 |
| 9/30/22 | $20,807 | $21,256 | $21,150 |
| 10/31/22 | $22,544 | $22,977 | $22,913 |
| 11/30/22 | $23,786 | $24,261 | $24,193 |
| 12/31/22 | $22,425 | $22,864 | $22,796 |
| 1/31/23 | $23,890 | $24,300 | $24,286 |
| 2/28/23 | $23,314 | $23,707 | $23,710 |
| 3/31/23 | $24,017 | $24,578 | $24,428 |
| 4/30/23 | $24,340 | $24,961 | $24,751 |
| 5/31/23 | $24,395 | $25,070 | $24,796 |
| 6/30/23 | $26,035 | $26,726 | $26,478 |
| 7/31/23 | $26,909 | $27,585 | $27,357 |
| 8/31/23 | $26,443 | $27,146 | $26,884 |
| 9/30/23 | $25,179 | $25,852 | $25,587 |
| 10/31/23 | $24,572 | $25,308 | $24,978 |
| 11/30/23 | $26,803 | $27,619 | $27,246 |
| 12/31/23 | $28,148 | $28,874 | $28,601 |
| 1/31/24 | $28,514 | $29,359 | $28,984 |
| 2/29/24 | $30,000 | $30,927 | $30,527 |
| 3/31/24 | $31,023 | $31,922 | $31,550 |
| 4/30/24 | $29,727 | $30,619 | $30,214 |
| 5/31/24 | $31,197 | $32,138 | $31,704 |
| 6/30/24 | $32,167 | $33,292 | $32,705 |
Average Annual Total Returns (%)
| Name | 1 Year | 5 Years | 10 Years |
|---|
| SPTM | 23.52% | 14.53% | 12.39% |
| S&P 500 Index | 24.56% | 15.05% | 12.86% |
| S&P Composite 1500 Index | 23.52% | 14.56% | 12.41% |
(1) Effective January 24, 2020, the Fund changed it's benchmark index from the SSGA Total Stock Market Index to the S&P Composite 1500 Index. Effective November 16, 2017, the Fund changed its benchmark index from the Russell 3000 Index to the SSGA Total Stock Market Index. Effective July 9, 2013, the Fund changed its benchmark index from the Dow Jones U.S. Total Stock Market Index to the Russell 3000 Index. The Fund’s performance is based on the Fund’s prior investment strategy to track different benchmark indices for periods prior to January 24, 2020. (2) Index returns represent the Fund’s prior benchmark indices from June 30, 2014 through January 23, 2020 and the S&P Composite 1500 Index from January 24, 2020 through June 30, 2024.
The Fund’s past performance is not necessarily an indication of how the Fund will perform in the future. The returns do not reflect the deduction of taxes that a shareholder would pay on Fund distributions or on the redemption or sale of Fund shares. Updated performance information is available by calling 1-866-787-2257 or visiting our website at www.ssga.com/us/en/institutional/fund-finder?tab=documents&type=etfs.
| Statistic | Value |
|---|
| Total Net Assets | $8,578,278,357 |
| # of Portfolio Holdings | 1,515 |
| Portfolio Turnover Rate | 3% |
| Total Advisory Fees Paid | $2,222,943 |
What did the Portfolio invest in?
| Industry | % Value of Total Net Assets |
| Semiconductors & Semiconductor Equipment | 11.3% |
| Software | 10.3% |
| Technology Hardware, Storage & Peripherals | 6.5% |
| Interactive Media & Services | 6.2% |
| Banks | 4.2% |
| Broadline Retail | 3.7% |
| Financial Services | 3.7% |
| Pharmaceuticals | 3.5% |
| Oil, Gas & Consumable Fuels | 3.4% |
| Health Care Providers & Services | 2.5% |
| Holdings | % Value of Total Net Assets |
| Microsoft Corp. | 6.7% |
| NVIDIA Corp. | 6.1% |
| Apple, Inc. | 6.1% |
| Alphabet, Inc. | 3.9% |
| Amazon.com, Inc. | 3.6% |
| Meta Platforms, Inc. | 2.2% |
| Berkshire Hathaway, Inc., B | 1.5% |
| Eli Lilly & Co. | 1.4% |
| Broadcom, Inc. | 1.4% |
| JPMorgan Chase & Co. | 1.2% |
SPDR Portfolio S&P 500 ETF
Principal Listing Exchange: NYSEArca
Annual Shareholder Report
June 30, 2024
This annual shareholder report contains important information about the SPDR Portfolio S&P 500 ETF (the "Portfolio") for the year ended June 30, 2024. You can find additional information about the Portfolio, including the Prospectus, Statement of Additional Information, financial statements and other information at www.ssga.com/us/en/institutional/fund-finder?tab=documents&type=etfs. You can also request this information about the Portfolio by contacting us at 1-866-787-2257. This report describes changes to the Fund that occurred during the reporting period.
What were the Portfolio costs for the last year?
| Portfolio Name | Cost of a $10,000 investment | Costs paid as a percentage of a $10,000 investment |
|---|
| SPDR Portfolio S&P 500 ETF | $2 | 0.02% |
Effective August 1, 2023 the management fee was reduced from 0.03% to 0.02%.
How did the Fund perform last year and what affected its performance?
Performance was weak during the 1st quarter of the fiscal year as challenging inflation prints contributed to reduced optimism regarding the timing and magnitude of Federal Reserve rate cuts. These rate concerns combined with signs that growth was slowing led to the market’s decline during the 1st quarter. Conversely, the 2nd quarter of the fiscal year was marked by a dramatic change in returns as the S&P 500 gained over 11% during this period. This was driven by better growth, incremental progress on the inflation front and AI related optimism. The second half of the fiscal year continued the strong market returns from the second quarter. Though there were concerns regarding the stickiness of inflation during the early part of the period by the end of the period the market was convinced that real inflation progress was occurring especially in regard to the last mile of inflation. There were other signs most notably in the labor market that perhaps the Federal Reserve was going to pull of the challenging act of a soft landing. This combined with continued earnings growth and even increasing levels of AI related optimism led to the market appreciating by over 15% over the final 2 quarters of the fiscal year.
The Fund's benchmarks are unmanaged indices used as a general measure of market performance. Calculations assume dividends and capital gains.
Comparison of Change in Value of a $10,000 Investment
(Based on Net Asset Value)
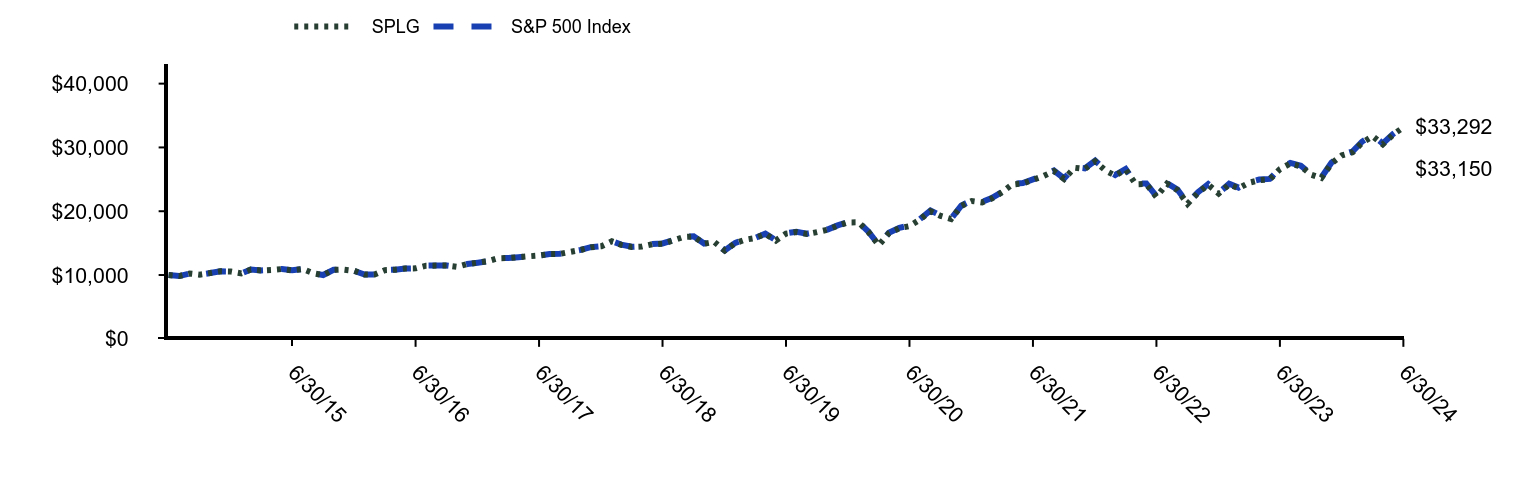
| SPLG | S&P 500 Index |
|---|
| 6/30/14 | $10,000 | $10,000 |
| 7/31/14 | $9,840 | $9,838 |
| 8/31/14 | $10,244 | $10,245 |
| 9/30/14 | $10,066 | $10,065 |
| 10/31/14 | $10,310 | $10,311 |
| 11/30/14 | $10,586 | $10,581 |
| 12/31/14 | $10,553 | $10,557 |
| 1/31/15 | $10,260 | $10,267 |
| 2/28/15 | $10,860 | $10,860 |
| 3/31/15 | $10,723 | $10,725 |
| 4/30/15 | $10,794 | $10,801 |
| 5/31/15 | $10,940 | $10,942 |
| 6/30/15 | $10,726 | $10,737 |
| 7/31/15 | $10,946 | $10,944 |
| 8/31/15 | $10,286 | $10,285 |
| 9/30/15 | $9,992 | $10,003 |
| 10/31/15 | $10,807 | $10,813 |
| 11/30/15 | $10,853 | $10,849 |
| 12/31/15 | $10,654 | $10,653 |
| 1/31/16 | $10,074 | $10,080 |
| 2/29/16 | $10,069 | $10,077 |
| 3/31/16 | $10,768 | $10,780 |
| 4/30/16 | $10,835 | $10,838 |
| 5/31/16 | $11,031 | $11,027 |
| 6/30/16 | $11,044 | $11,053 |
| 7/31/16 | $11,460 | $11,474 |
| 8/31/16 | $11,478 | $11,489 |
| 9/30/16 | $11,493 | $11,498 |
| 10/31/16 | $11,277 | $11,274 |
| 11/30/16 | $11,721 | $11,718 |
| 12/31/16 | $11,946 | $11,938 |
| 1/31/17 | $12,178 | $12,178 |
| 2/28/17 | $12,626 | $12,650 |
| 3/31/17 | $12,664 | $12,657 |
| 4/30/17 | $12,790 | $12,791 |
| 5/31/17 | $12,938 | $12,955 |
| 6/30/17 | $13,046 | $13,046 |
| 7/31/17 | $13,299 | $13,304 |
| 8/31/17 | $13,324 | $13,345 |
| 9/30/17 | $13,620 | $13,630 |
| 10/31/17 | $13,921 | $13,942 |
| 11/30/17 | $14,337 | $14,374 |
| 12/31/17 | $14,510 | $14,532 |
| 1/31/18 | $15,289 | $15,317 |
| 2/28/18 | $14,728 | $14,764 |
| 3/31/18 | $14,406 | $14,426 |
| 4/30/18 | $14,471 | $14,499 |
| 5/31/18 | $14,834 | $14,869 |
| 6/30/18 | $14,913 | $14,945 |
| 7/31/18 | $15,423 | $15,461 |
| 8/31/18 | $15,957 | $15,995 |
| 9/30/18 | $16,026 | $16,067 |
| 10/31/18 | $14,902 | $14,939 |
| 11/30/18 | $15,194 | $15,237 |
| 12/31/18 | $13,831 | $13,845 |
| 1/31/19 | $15,004 | $15,032 |
| 2/28/19 | $15,523 | $15,555 |
| 3/31/19 | $15,794 | $15,829 |
| 4/30/19 | $16,441 | $16,483 |
| 5/31/19 | $15,402 | $15,441 |
| 6/30/19 | $16,495 | $16,537 |
| 7/31/19 | $16,746 | $16,789 |
| 8/31/19 | $16,430 | $16,480 |
| 9/30/19 | $16,726 | $16,767 |
| 10/31/19 | $17,094 | $17,132 |
| 11/30/19 | $17,744 | $17,785 |
| 12/31/19 | $18,245 | $18,296 |
| 1/31/20 | $18,259 | $18,315 |
| 2/29/20 | $16,773 | $16,807 |
| 3/31/20 | $14,684 | $14,731 |
| 4/30/20 | $16,547 | $16,620 |
| 5/31/20 | $17,338 | $17,411 |
| 6/30/20 | $17,670 | $17,758 |
| 7/31/20 | $18,699 | $18,759 |
| 8/31/20 | $20,010 | $20,107 |
| 9/30/20 | $19,259 | $19,343 |
| 10/31/20 | $18,782 | $18,829 |
| 11/30/20 | $20,823 | $20,890 |
| 12/31/20 | $21,603 | $21,693 |
| 1/31/21 | $21,389 | $21,474 |
| 2/28/21 | $21,984 | $22,066 |
| 3/31/21 | $22,982 | $23,033 |
| 4/30/21 | $24,198 | $24,262 |
| 5/31/21 | $24,364 | $24,431 |
| 6/30/21 | $24,911 | $25,002 |
| 7/31/21 | $25,514 | $25,596 |
| 8/31/21 | $26,287 | $26,374 |
| 9/30/21 | $25,054 | $25,147 |
| 10/31/21 | $26,814 | $26,909 |
| 11/30/21 | $26,618 | $26,723 |
| 12/31/21 | $27,821 | $27,920 |
| 1/31/22 | $26,357 | $26,475 |
| 2/28/22 | $25,592 | $25,683 |
| 3/31/22 | $26,547 | $26,636 |
| 4/30/22 | $24,225 | $24,314 |
| 5/31/22 | $24,275 | $24,358 |
| 6/30/22 | $22,262 | $22,348 |
| 7/31/22 | $24,315 | $24,408 |
| 8/31/22 | $23,316 | $23,413 |
| 9/30/22 | $21,168 | $21,256 |
| 10/31/22 | $22,892 | $22,977 |
| 11/30/22 | $24,158 | $24,261 |
| 12/31/22 | $22,775 | $22,864 |
| 1/31/23 | $24,204 | $24,300 |
| 2/28/23 | $23,601 | $23,707 |
| 3/31/23 | $24,475 | $24,578 |
| 4/30/23 | $24,864 | $24,961 |
| 5/31/23 | $24,983 | $25,070 |
| 6/30/23 | $26,606 | $26,726 |
| 7/31/23 | $27,479 | $27,585 |
| 8/31/23 | $27,038 | $27,146 |
| 9/30/23 | $25,755 | $25,852 |
| 10/31/23 | $25,204 | $25,308 |
| 11/30/23 | $27,500 | $27,619 |
| 12/31/23 | $28,767 | $28,874 |
| 1/31/24 | $29,230 | $29,359 |
| 2/29/24 | $30,748 | $30,927 |
| 3/31/24 | $31,763 | $31,922 |
| 4/30/24 | $30,485 | $30,619 |
| 5/31/24 | $32,024 | $32,138 |
| 6/30/24 | $33,150 | $33,292 |
Average Annual Total Returns (%)
| Name | 1 Year | 5 Years | 10 Years |
|---|
| SPLG | 24.51% | 14.97% | 12.73% |
| S&P 500 Index | 24.56% | 15.05% | 12.86% |
(1) Effective January 24, 2020, the Fund changed its benchmark index from the SSGA Large Cap Index to the S&P 500 Index. Effective November 16, 2017, the Fund changed its benchmark index from the Russell 1000 Index to the SSGA Large Cap Index. The Fund’s performance in the tables above and graph below is based on the Fund’s prior investment strategy to track a different benchmark indices for periods prior to January 24, 2020.
(2) Index returns represent the Fund’s prior benchmark indices from June 30, 2014 through January 23, 2020 and the S&P 500 Index from January 24, 2020 through June 30, 2024.
The Fund’s past performance is not necessarily an indication of how the Fund will perform in the future. The returns do not reflect the deduction of taxes that a shareholder would pay on Fund distributions or on the redemption or sale of Fund shares. Updated performance information is available by calling 1-866-787-2257 or visiting our website at www.ssga.com/us/en/institutional/fund-finder?tab=documents&type=etfs.
| Statistic | Value |
|---|
| Total Net Assets | $39,710,522,838 |
| # of Portfolio Holdings | 506 |
| Portfolio Turnover Rate | 3% |
| Total Advisory Fees Paid | $5,525,776 |
What did the Portfolio invest in?
| Industry | % Value of Total Net Assets |
| Semiconductors & Semiconductor Equipment | 12.0% |
| Software | 11.0% |
| Technology Hardware, Storage & Peripherals | 7.0% |
| Interactive Media & Services | 6.7% |
| Banks | 4.0% |
| Broadline Retail | 3.9% |
| Financial Services | 3.8% |
| Pharmaceuticals | 3.8% |
| Oil, Gas & Consumable Fuels | 3.3% |
| Health Care Providers & Services | 2.4% |
| Holdings | % Value of Total Net Assets |
| Microsoft Corp. | 7.2% |
| NVIDIA Corp. | 6.6% |
| Apple, Inc. | 6.6% |
| Alphabet, Inc. | 4.3% |
| Amazon.com, Inc. | 3.8% |
| Meta Platforms, Inc. | 2.4% |
| Berkshire Hathaway, Inc., B | 1.6% |
| Eli Lilly & Co. | 1.6% |
| Broadcom, Inc. | 1.5% |
| JPMorgan Chase & Co. | 1.3% |
Effective August 1, 2023 the management fee was reduced from 0.03% to 0.02%.
SPDR Portfolio S&P 600 Small Cap ETF
Principal Listing Exchange: NYSEArca
Annual Shareholder Report
June 30, 2024
This annual shareholder report contains important information about the SPDR Portfolio S&P 600 Small Cap ETF (the "Portfolio") for the year ended June 30, 2024. You can find additional information about the Portfolio, including the Prospectus, Statement of Additional Information, financial statements and other information at www.ssga.com/us/en/institutional/fund-finder?tab=documents&type=etfs. You can also request this information about the Portfolio by contacting us at 1-866-787-2257. This report describes changes to the Fund that occurred during the reporting period.
What were the Portfolio costs for the last year?
| Portfolio Name | Cost of a $10,000 investment | Costs paid as a percentage of a $10,000 investment |
|---|
| SPDR Portfolio S&P 600 Small Cap ETF | $3 | 0.03% |
Effective August 1, 2023 the management fee was reduced from 0.05% to 0.03%.
How did the Fund perform last year and what affected its performance?
The reporting period’s market environment was largely driven by news about inflation, economic growth and the impact on the Fed regarding interest rate decisions. The first quarter of the reporting period started with Investors hope of Fed rate cuts based on positive economic indicators, but those hopes waned quickly as the S&P 600 Index ending up losing 5% in the quarter. In the fourth quarter of 2023, small cap Index gained 15% on the back of growing anticipation of potential policy easing and prospects of rate cuts in 2024. The small cap Index picked up another 2.5% in the following quarter based on macroeconomic data that continued to highlight a strong US economy. In the second quarter of 2024, the Fed held the interest rates steady and struck a hawkish tone in June that resulted in a decline of 3.1% of the S&P 600 Index for the second quarter of 2024. On an individual security level, the top positive contributors to the Fund’s performance on an absolute basis during the reporting period were PHINIA Inc., e.l.f. Beauty, and Onto Innovation Inc. The top negative contributors to the Fund’s performance on an absolute basis during the reporting period were V.F. Corporation, Worthington Steel Inc., and Organon & Co.
The Fund's benchmarks are unmanaged indices used as a general measure of market performance. Calculations assume dividends and capital gains.
Comparison of Change in Value of a $10,000 Investment
(Based on Net Asset Value)
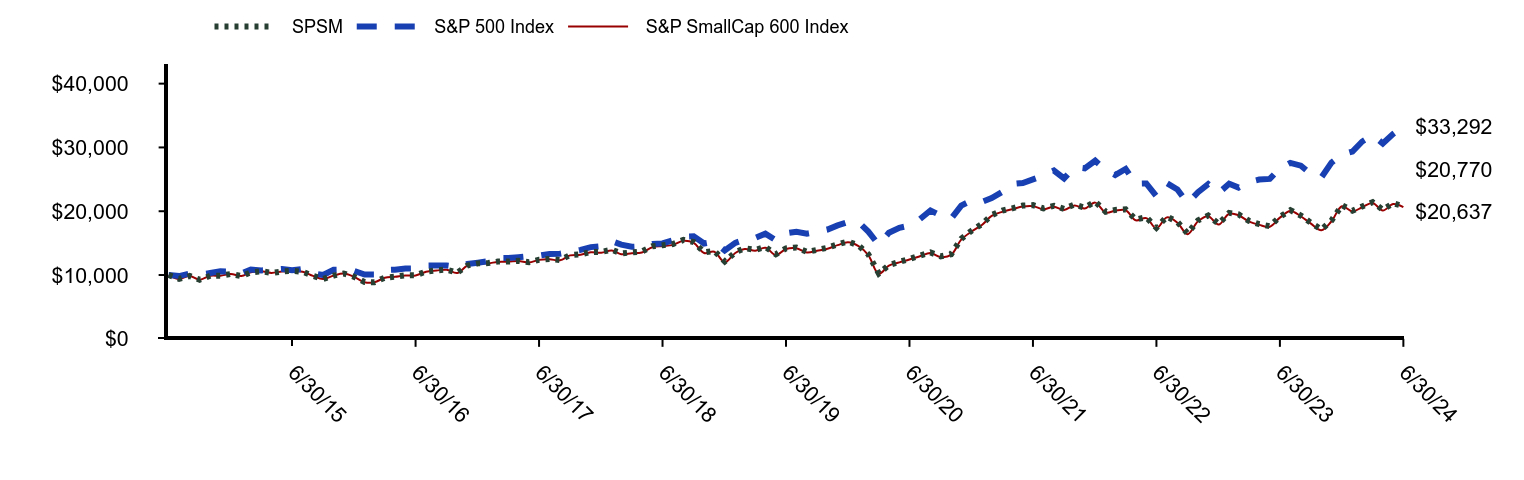
| SPSM | S&P 500 Index | S&P SmallCap 600 Index |
|---|
| 6/30/14 | $10,000 | $10,000 | $10,000 |
| 7/31/14 | $9,391 | $9,838 | $9,395 |
| 8/31/14 | $9,851 | $10,245 | $9,861 |
| 9/30/14 | $9,271 | $10,065 | $9,264 |
| 10/31/14 | $9,881 | $10,311 | $9,875 |
| 11/30/14 | $9,890 | $10,581 | $9,884 |
| 12/31/14 | $10,164 | $10,557 | $10,165 |
| 1/31/15 | $9,830 | $10,267 | $9,838 |
| 2/28/15 | $10,416 | $10,860 | $10,422 |
| 3/31/15 | $10,598 | $10,725 | $10,604 |
| 4/30/15 | $10,333 | $10,801 | $10,333 |
| 5/31/15 | $10,554 | $10,942 | $10,569 |
| 6/30/15 | $10,652 | $10,737 | $10,649 |
| 7/31/15 | $10,520 | $10,944 | $10,525 |
| 8/31/15 | $9,873 | $10,285 | $9,863 |
| 9/30/15 | $9,371 | $10,003 | $9,379 |
| 10/31/15 | $9,910 | $10,813 | $9,908 |
| 11/30/15 | $10,239 | $10,849 | $10,230 |
| 12/31/15 | $9,720 | $10,653 | $9,717 |
| 1/31/16 | $8,894 | $10,080 | $8,862 |
| 2/29/16 | $8,877 | $10,077 | $8,862 |
| 3/31/16 | $9,588 | $10,780 | $9,569 |
| 4/30/16 | $9,739 | $10,838 | $9,719 |
| 5/31/16 | $9,960 | $11,027 | $9,938 |
| 6/30/16 | $9,964 | $11,053 | $9,932 |
| 7/31/16 | $10,555 | $11,474 | $10,525 |
| 8/31/16 | $10,734 | $11,489 | $10,711 |
| 9/30/16 | $10,858 | $11,498 | $10,830 |
| 10/31/16 | $10,355 | $11,274 | $10,316 |
| 11/30/16 | $11,503 | $11,718 | $11,466 |
| 12/31/16 | $11,828 | $11,938 | $11,787 |
| 1/31/17 | $11,874 | $12,178 | $11,833 |
| 2/28/17 | $12,105 | $12,650 | $12,061 |
| 3/31/17 | $12,108 | $12,657 | $12,077 |
| 4/30/17 | $12,240 | $12,791 | $12,210 |
| 5/31/17 | $12,001 | $12,955 | $11,962 |
| 6/30/17 | $12,399 | $13,046 | $12,376 |
| 7/31/17 | $12,511 | $13,304 | $12,467 |
| 8/31/17 | $12,353 | $13,345 | $12,309 |
| 9/30/17 | $13,124 | $13,630 | $13,077 |
| 10/31/17 | $13,238 | $13,942 | $13,188 |
| 11/30/17 | $13,614 | $14,374 | $13,575 |
| 12/31/17 | $13,632 | $14,532 | $13,503 |
| 1/31/18 | $13,969 | $15,317 | $13,835 |
| 2/28/18 | $13,383 | $14,764 | $13,259 |
| 3/31/18 | $13,545 | $14,426 | $13,417 |
| 4/30/18 | $13,685 | $14,499 | $13,534 |
| 5/31/18 | $14,512 | $14,869 | $14,366 |
| 6/30/18 | $14,671 | $14,945 | $14,537 |
| 7/31/18 | $14,860 | $15,461 | $14,727 |
| 8/31/18 | $15,510 | $15,995 | $15,375 |
| 9/30/18 | $15,166 | $16,067 | $15,033 |
| 10/31/18 | $13,566 | $14,939 | $13,454 |
| 11/30/18 | $13,787 | $15,237 | $13,642 |
| 12/31/18 | $12,121 | $13,845 | $12,005 |
| 1/31/19 | $13,570 | $15,032 | $13,449 |
| 2/28/19 | $14,211 | $15,555 | $14,086 |
| 3/31/19 | $13,940 | $15,829 | $13,820 |
| 4/30/19 | $14,408 | $16,483 | $14,283 |
| 5/31/19 | $13,249 | $15,441 | $13,142 |
| 6/30/19 | $14,184 | $16,537 | $14,077 |
| 7/31/19 | $14,314 | $16,789 | $14,200 |
| 8/31/19 | $13,636 | $16,480 | $13,519 |
| 9/30/19 | $13,943 | $16,767 | $13,809 |
| 10/31/19 | $14,273 | $17,132 | $14,133 |
| 11/30/19 | $14,817 | $17,785 | $14,684 |
| 12/31/19 | $15,247 | $18,296 | $15,130 |
| 1/31/20 | $14,633 | $18,315 | $14,526 |
| 2/29/20 | $13,248 | $16,807 | $13,131 |
| 3/31/20 | $10,244 | $14,731 | $10,190 |
| 4/30/20 | $11,558 | $16,620 | $11,484 |
| 5/31/20 | $12,060 | $17,411 | $11,979 |
| 6/30/20 | $12,512 | $17,758 | $12,426 |
| 7/31/20 | $13,042 | $18,759 | $12,937 |
| 8/31/20 | $13,544 | $20,107 | $13,453 |
| 9/30/20 | $12,922 | $19,343 | $12,820 |
| 10/31/20 | $13,266 | $18,829 | $13,151 |
| 11/30/20 | $15,673 | $20,890 | $15,541 |
| 12/31/20 | $16,968 | $21,693 | $16,834 |
| 1/31/21 | $18,014 | $21,474 | $17,893 |
| 2/28/21 | $19,396 | $22,066 | $19,262 |
| 3/31/21 | $20,092 | $23,033 | $19,904 |
| 4/30/21 | $20,456 | $24,262 | $20,310 |
| 5/31/21 | $20,896 | $24,431 | $20,732 |
| 6/30/21 | $20,958 | $25,002 | $20,801 |
| 7/31/21 | $20,453 | $25,596 | $20,305 |
| 8/31/21 | $20,860 | $26,374 | $20,714 |
| 9/30/21 | $20,361 | $25,147 | $20,210 |
| 10/31/21 | $21,057 | $26,909 | $20,902 |
| 11/30/21 | $20,564 | $26,723 | $20,424 |
| 12/31/21 | $21,496 | $27,920 | $21,349 |
| 1/31/22 | $19,927 | $26,475 | $19,798 |
| 2/28/22 | $20,204 | $25,683 | $20,075 |
| 3/31/22 | $20,287 | $26,636 | $20,149 |
| 4/30/22 | $18,709 | $24,314 | $18,575 |
| 5/31/22 | $19,048 | $24,358 | $18,922 |
| 6/30/22 | $17,425 | $22,348 | $17,305 |
| 7/31/22 | $19,160 | $24,408 | $19,038 |
| 8/31/22 | $18,325 | $23,413 | $18,203 |
| 9/30/22 | $16,519 | $21,256 | $16,404 |
| 10/31/22 | $18,574 | $22,977 | $18,433 |
| 11/30/22 | $19,323 | $24,261 | $19,201 |
| 12/31/22 | $18,030 | $22,864 | $17,912 |
| 1/31/23 | $19,745 | $24,300 | $19,613 |
| 2/28/23 | $19,496 | $23,707 | $19,372 |
| 3/31/23 | $18,482 | $24,578 | $18,372 |
| 4/30/23 | $17,978 | $24,961 | $17,862 |
| 5/31/23 | $17,662 | $25,070 | $17,549 |
| 6/30/23 | $19,119 | $26,726 | $18,993 |
| 7/31/23 | $20,172 | $27,585 | $20,039 |
| 8/31/23 | $19,330 | $27,146 | $19,210 |
| 9/30/23 | $18,181 | $25,852 | $18,057 |
| 10/31/23 | $17,133 | $25,308 | $17,022 |
| 11/30/23 | $18,555 | $27,619 | $18,430 |
| 12/31/23 | $20,926 | $28,874 | $20,788 |
| 1/31/24 | $20,092 | $29,359 | $19,967 |
| 2/29/24 | $20,757 | $30,927 | $20,631 |
| 3/31/24 | $21,425 | $31,922 | $21,299 |
| 4/30/24 | $20,242 | $30,619 | $20,104 |
| 5/31/24 | $21,263 | $32,138 | $21,118 |
| 6/30/24 | $20,770 | $33,292 | $20,637 |
Average Annual Total Returns (%)
| Name | 1 Year | 5 Years | 10 Years |
|---|
| SPSM | 8.64% | 7.91% | 7.59% |
| S&P 500 Index | 24.56% | 15.05% | 12.86% |
| S&P SmallCap 600 Index | 8.66% | 7.95% | 7.59% |
(1) Effective January 24, 2020, the Fund changed its benchmark index from the SSGA Small Cap Index to the S&P SmallCap 600 Index. Effective November 16, 2017, the Fund changed its benchmark index from the Russell 2000 Index to the SSGA Small Cap Index. The Fund’s performance is based on the Fund’s prior investment strategy to track different indices for periods prior to January 24, 2020. (2) Index returns represent the Fund’s prior benchmark indices from June 30, 2014 through January 23, 2020 and the S&P SmallCap 600 Index from January 24, 2020 through June 30, 2024.
The Fund’s past performance is not necessarily an indication of how the Fund will perform in the future. The returns do not reflect the deduction of taxes that a shareholder would pay on Fund distributions or on the redemption or sale of Fund shares. Updated performance information is available by calling 1-866-787-2257 or visiting our website at www.ssga.com/us/en/institutional/fund-finder?tab=documents&type=etfs.
| Statistic | Value |
|---|
| Total Net Assets | $10,221,763,681 |
| # of Portfolio Holdings | 609 |
| Portfolio Turnover Rate | 24% |
| Total Advisory Fees Paid | $2,878,149 |
What did the Portfolio invest in?
| Industry | % Value of Total Net Assets |
| Banks | 9.1% |
| Machinery | 4.7% |
| Specialty Retail | 4.6% |
| Electronic Equipment, Instruments & Components | 4.2% |
| Software | 4.0% |
| Health Care Equipment & Supplies | 3.1% |
| Health Care Providers & Services | 3.1% |
| Household Durables | 3.0% |
| Semiconductors & Semiconductor Equipment | 2.9% |
| Oil, Gas & Consumable Fuels | 2.7% |
| Holdings | % Value of Total Net Assets |
| Abercrombie & Fitch Co., A | 0.8% |
| Fabrinet | 0.7% |
| Ensign Group, Inc. | 0.6% |
| SPS Commerce, Inc. | 0.6% |
| ATI, Inc. | 0.6% |
| Comerica, Inc. | 0.6% |
| Robert Half, Inc. | 0.6% |
| SPX Technologies, Inc. | 0.6% |
| Mueller Industries, Inc. | 0.5% |
| Glaukos Corp. | 0.5% |
Effective August 1, 2023 the management fee was reduced from 0.05% to 0.03%.
SPDR Portfolio S&P 500 Growth ETF
Principal Listing Exchange: NYSEArca
Annual Shareholder Report
June 30, 2024
This annual shareholder report contains important information about the SPDR Portfolio S&P 500 Growth ETF (the "Portfolio") for the year ended June 30, 2024. You can find additional information about the Portfolio, including the Prospectus, Statement of Additional Information, financial statements and other information at www.ssga.com/us/en/institutional/fund-finder?tab=documents&type=etfs. You can also request this information about the Portfolio by contacting us at 1-866-787-2257.
What were the Portfolio costs for the last year?
| Portfolio Name | Cost of a $10,000 investment | Costs paid as a percentage of a $10,000 investment |
|---|
| SPDR Portfolio S&P 500 Growth ETF | $5 | 0.04% |
How did the Fund perform last year and what affected its performance?
U.S. Economic indicators from the U.S. remained relatively strong over the Q3 2023. While investors began the quarter with hopes that the rate hikes would soon end and cuts would begin, that probability ended by the end of the quarter. U.S. stocks rallied in Q4 2023, supported by prospects of rate cuts in 2024. October’s economic data had spooked investors. However, things took a turn by November – inflation softened and the U.S. Federal Reserve (the “Fed”) Chair’s supportive comments shored up investor sentiment. U.S. equities rallied for a second straight quarter in Q1 2024. At 10.4%, the S&P 500 index posted its biggest first-quarter gain since 2019 and its fifth gain in the last six quarters. The AI theme was a key tailwind in Q1 2024. The biggest area of concern during the quarter revolved around sticky core services inflation even as the U.S. economy remained resilient. U.S. equity indices were mixed in Q2 2024, with a tough start to the quarter in April. The momentum changed in the middle of the month due to a strong jobs report, ending up positive in May and June. The Fed held the interest rates steady and struck a hawkish tone in June, maintaining the current policy rate and projecting only one rate cut in 2024.
The Fund's benchmarks are unmanaged indices used as a general measure of market performance. Calculations assume dividends and capital gains.
Comparison of Change in Value of a $10,000 Investment
(Based on Net Asset Value)
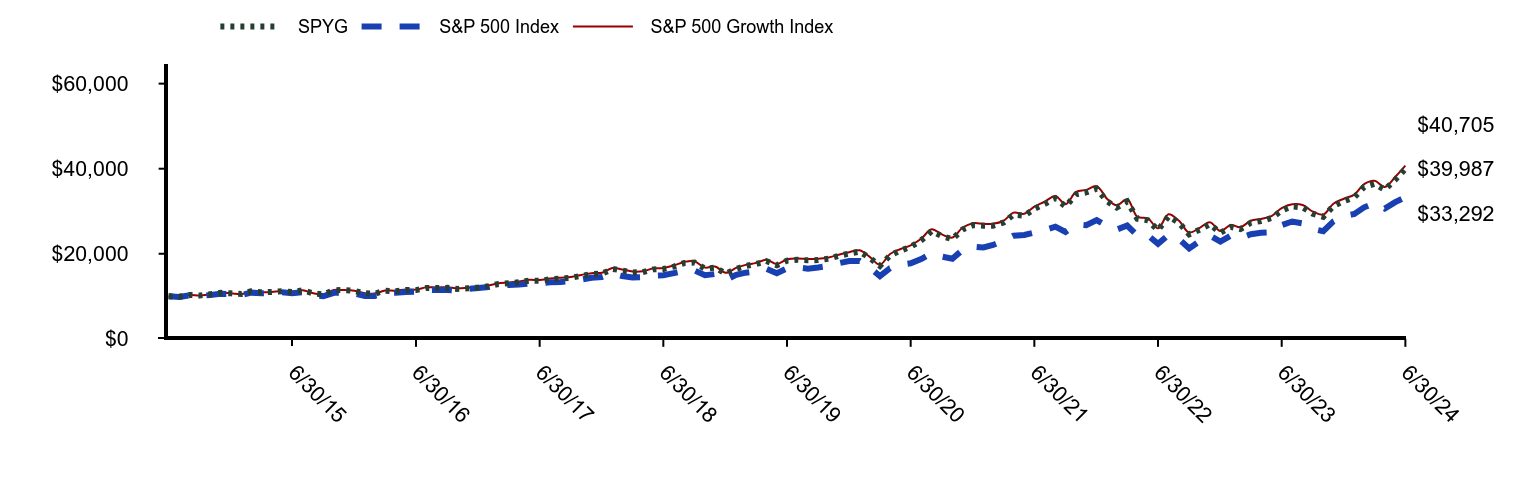
| SPYG | S&P 500 Index | S&P 500 Growth Index |
|---|
| 6/30/14 | $10,000 | $10,000 | $10,000 |
| 7/31/14 | $9,878 | $9,838 | $9,876 |
| 8/31/14 | $10,308 | $10,245 | $10,305 |
| 9/30/14 | $10,200 | $10,065 | $10,192 |
| 10/31/14 | $10,487 | $10,311 | $10,492 |
| 11/30/14 | $10,812 | $10,581 | $10,811 |
| 12/31/14 | $10,703 | $10,557 | $10,708 |
| 1/31/15 | $10,521 | $10,267 | $10,529 |
| 2/28/15 | $11,152 | $10,860 | $11,159 |
| 3/31/15 | $10,965 | $10,725 | $10,973 |
| 4/30/15 | $11,014 | $10,801 | $11,025 |
| 5/31/15 | $11,210 | $10,942 | $11,222 |
| 6/30/15 | $10,995 | $10,737 | $11,007 |
| 7/31/15 | $11,398 | $10,944 | $11,406 |
| 8/31/15 | $10,696 | $10,285 | $10,712 |
| 9/30/15 | $10,450 | $10,003 | $10,476 |
| 10/31/15 | $11,447 | $10,813 | $11,460 |
| 11/30/15 | $11,458 | $10,849 | $11,474 |
| 12/31/15 | $11,272 | $10,653 | $11,300 |
| 1/31/16 | $10,700 | $10,080 | $10,730 |
| 2/29/16 | $10,620 | $10,077 | $10,645 |
| 3/31/16 | $11,333 | $10,780 | $11,360 |
| 4/30/16 | $11,185 | $10,838 | $11,318 |
| 5/31/16 | $11,481 | $11,027 | $11,621 |
| 6/30/16 | $11,452 | $11,053 | $11,579 |
| 7/31/16 | $11,971 | $11,474 | $12,117 |
| 8/31/16 | $11,936 | $11,489 | $12,082 |
| 9/30/16 | $11,986 | $11,498 | $12,130 |
| 10/31/16 | $11,732 | $11,274 | $11,873 |
| 11/30/16 | $11,879 | $11,718 | $12,018 |
| 12/31/16 | $12,047 | $11,938 | $12,189 |
| 1/31/17 | $12,396 | $12,178 | $12,553 |
| 2/28/17 | $12,898 | $12,650 | $13,064 |
| 3/31/17 | $13,057 | $12,657 | $13,227 |
| 4/30/17 | $13,312 | $12,791 | $13,485 |
| 5/31/17 | $13,690 | $12,955 | $13,867 |
| 6/30/17 | $13,625 | $13,046 | $13,813 |
| 7/31/17 | $13,991 | $13,304 | $14,173 |
| 8/31/17 | $14,185 | $13,345 | $14,383 |
| 9/30/17 | $14,340 | $13,630 | $14,543 |
| 10/31/17 | $14,811 | $13,942 | $15,020 |
| 11/30/17 | $15,222 | $14,374 | $15,443 |
| 12/31/17 | $15,327 | $14,532 | $15,533 |
| 1/31/18 | $16,428 | $15,317 | $16,656 |
| 2/28/18 | $16,084 | $14,764 | $16,319 |
| 3/31/18 | $15,620 | $14,426 | $15,833 |
| 4/30/18 | $15,652 | $14,499 | $15,877 |
| 5/31/18 | $16,333 | $14,869 | $16,565 |
| 6/30/18 | $16,420 | $14,945 | $16,664 |
| 7/31/18 | $16,990 | $15,461 | $17,237 |
| 8/31/18 | $17,813 | $15,995 | $18,080 |
| 9/30/18 | $17,947 | $16,067 | $18,211 |
| 10/31/18 | $16,495 | $14,939 | $16,740 |
| 11/30/18 | $16,736 | $15,237 | $16,997 |
| 12/31/18 | $15,318 | $13,845 | $15,532 |
| 1/31/19 | $16,456 | $15,032 | $16,698 |
| 2/28/19 | $17,127 | $15,555 | $17,381 |
| 3/31/19 | $17,590 | $15,829 | $17,854 |
| 4/30/19 | $18,283 | $16,483 | $18,566 |
| 5/31/19 | $17,321 | $15,441 | $17,584 |
| 6/30/19 | $18,374 | $16,537 | $18,668 |
| 7/31/19 | $18,598 | $16,789 | $18,884 |
| 8/31/19 | $18,455 | $16,480 | $18,749 |
| 9/30/19 | $18,518 | $16,767 | $18,803 |
| 10/31/19 | $18,844 | $17,132 | $19,131 |
| 11/30/19 | $19,492 | $17,785 | $19,787 |
| 12/31/19 | $20,047 | $18,296 | $20,367 |
| 1/31/20 | $20,498 | $18,315 | $20,830 |
| 2/29/20 | $19,100 | $16,807 | $19,340 |
| 3/31/20 | $17,144 | $14,731 | $17,413 |
| 4/30/20 | $19,606 | $16,620 | $19,930 |
| 5/31/20 | $20,770 | $17,411 | $21,115 |
| 6/30/20 | $21,617 | $17,758 | $21,982 |
| 7/31/20 | $23,154 | $18,759 | $23,519 |
| 8/31/20 | $25,334 | $20,107 | $25,770 |
| 9/30/20 | $24,155 | $19,343 | $24,565 |
| 10/31/20 | $23,451 | $18,829 | $23,808 |
| 11/30/20 | $25,715 | $20,890 | $26,118 |
| 12/31/20 | $26,729 | $21,693 | $27,184 |
| 1/31/21 | $26,592 | $21,474 | $27,046 |
| 2/28/21 | $26,594 | $22,066 | $27,046 |
| 3/31/21 | $27,328 | $23,033 | $27,761 |
| 4/30/21 | $29,208 | $24,262 | $29,668 |
| 5/31/21 | $28,936 | $24,431 | $29,403 |
| 6/30/21 | $30,558 | $25,002 | $31,074 |
| 7/31/21 | $31,732 | $25,596 | $32,252 |
| 8/31/21 | $33,047 | $26,374 | $33,600 |
| 9/30/21 | $31,116 | $25,147 | $31,654 |
| 10/31/21 | $33,955 | $26,909 | $34,529 |
| 11/30/21 | $34,431 | $26,723 | $35,019 |
| 12/31/21 | $35,296 | $27,920 | $35,886 |
| 1/31/22 | $32,313 | $26,475 | $32,882 |
| 2/28/22 | $30,867 | $25,683 | $31,404 |
| 3/31/22 | $32,274 | $26,636 | $32,803 |
| 4/30/22 | $28,219 | $24,314 | $28,709 |
| 5/31/22 | $27,848 | $24,358 | $28,320 |
| 6/30/22 | $25,563 | $22,348 | $25,975 |
| 7/31/22 | $28,817 | $24,408 | $29,307 |
| 8/31/22 | $27,269 | $23,413 | $27,742 |
| 9/30/22 | $24,562 | $21,256 | $24,973 |
| 10/31/22 | $25,663 | $22,977 | $26,095 |
| 11/30/22 | $26,952 | $24,261 | $27,424 |
| 12/31/22 | $24,910 | $22,864 | $25,334 |
| 1/31/23 | $26,311 | $24,300 | $26,759 |
| 2/28/23 | $25,787 | $23,707 | $26,240 |
| 3/31/23 | $27,296 | $24,578 | $27,775 |
| 4/30/23 | $27,696 | $24,961 | $28,171 |
| 5/31/23 | $28,394 | $25,070 | $28,874 |
| 6/30/23 | $30,176 | $26,726 | $30,716 |
| 7/31/23 | $31,114 | $27,585 | $31,652 |
| 8/31/23 | $30,914 | $27,146 | $31,455 |
| 9/30/23 | $29,416 | $25,852 | $29,922 |
| 10/31/23 | $28,699 | $25,308 | $29,201 |
| 11/30/23 | $31,208 | $27,619 | $31,762 |
| 12/31/23 | $32,379 | $28,874 | $32,943 |
| 1/31/24 | $33,295 | $29,359 | $33,895 |
| 2/29/24 | $35,706 | $30,927 | $36,368 |
| 3/31/24 | $36,468 | $31,922 | $37,143 |
| 4/30/24 | $35,057 | $30,619 | $35,692 |
| 5/31/24 | $37,403 | $32,138 | $38,049 |
| 6/30/24 | $39,987 | $33,292 | $40,705 |
Average Annual Total Returns (%)
| Name | 1 Year | 5 Years | 10 Years |
|---|
| SPYG | 32.45% | 16.81% | 14.86% |
| S&P 500 Index | 24.56% | 15.05% | 12.86% |
| S&P 500 Growth Index | 32.52% | 16.87% | 14.97% |
The Fund’s past performance is not necessarily an indication of how the Fund will perform in the future. The returns do not reflect the deduction of taxes that a shareholder would pay on Fund distributions or on the redemption or sale of Fund shares. Updated performance information is available by calling 1-866-787-2257 or visiting our website at www.ssga.com/us/en/institutional/fund-finder?tab=documents&type=etfs.
| Statistic | Value |
|---|
| Total Net Assets | $28,915,787,995 |
| # of Portfolio Holdings | 233 |
| Portfolio Turnover Rate | 32% |
| Total Advisory Fees Paid | $8,754,713 |
What did the Portfolio invest in?
| Industry | % Value of Total Net Assets |
| Software | 19.0% |
| Semiconductors & Semiconductor Equipment | 18.6% |
| Interactive Media & Services | 11.8% |
| Technology Hardware, Storage & Peripherals | 11.7% |
| Broadline Retail | 4.5% |
| Pharmaceuticals | 3.5% |
| Hotels, Restaurants & Leisure | 2.5% |
| Financial Services | 2.4% |
| Automobiles | 2.2% |
| Specialty Retail | 1.4% |
| Holdings | % Value of Total Net Assets |
| Microsoft Corp. | 12.6% |
| NVIDIA Corp. | 11.5% |
| Apple, Inc. | 11.5% |
| Alphabet, Inc. | 7.4% |
| Amazon.com, Inc. | 4.5% |
| Meta Platforms, Inc. | 4.4% |
| Eli Lilly & Co. | 2.9% |
| Broadcom, Inc. | 2.8% |
| Tesla, Inc. | 2.2% |
| Netflix, Inc. | 1.1% |
SPDR Portfolio S&P 500 Value ETF
Principal Listing Exchange: NYSEArca
Annual Shareholder Report
June 30, 2024
This annual shareholder report contains important information about the SPDR Portfolio S&P 500 Value ETF (the "Portfolio") for the year ended June 30, 2024. You can find additional information about the Portfolio, including the Prospectus, Statement of Additional Information, financial statements and other information at www.ssga.com/us/en/institutional/fund-finder?tab=documents&type=etfs. You can also request this information about the Portfolio by contacting us at 1-866-787-2257.
What were the Portfolio costs for the last year?
| Portfolio Name | Cost of a $10,000 investment | Costs paid as a percentage of a $10,000 investment |
|---|
| SPDR Portfolio S&P 500 Value ETF | $4 | 0.04% |
How did the Fund perform last year and what affected its performance?
U.S. Economic indicators from the U.S. remained relatively strong over the Q3 2023. While investors began the quarter with hopes that the rate hikes would soon end and cuts would begin, that probability ended by the end of the quarter. U.S. stocks rallied in Q4 2023, supported by prospects of rate cuts in 2024. October’s economic data had spooked investors. However, things took a turn by November – inflation softened and the U.S. Federal Reserve (the “Fed”) Chair’s supportive comments shored up investor sentiment. U.S. equities rallied for a second straight quarter in Q1 2024. At 10.4%, the S&P 500 index posted its biggest first-quarter gain since 2019 and its fifth gain in the last six quarters. The AI theme was a key tailwind in Q1 2024. The biggest area of concern during the quarter revolved around sticky core services inflation even as the U.S. economy remained resilient. U.S. equity indices were mixed in Q2 2024, with a tough start to the quarter in April. The momentum changed in the middle of the month due to a strong jobs report, ending up positive in May and June. The Fed held the interest rates steady and struck a hawkish tone in June, maintaining the current policy rate and projecting only one rate cut in 2024.
The Fund's benchmarks are unmanaged indices used as a general measure of market performance. Calculations assume dividends and capital gains.
Comparison of Change in Value of a $10,000 Investment
(Based on Net Asset Value)
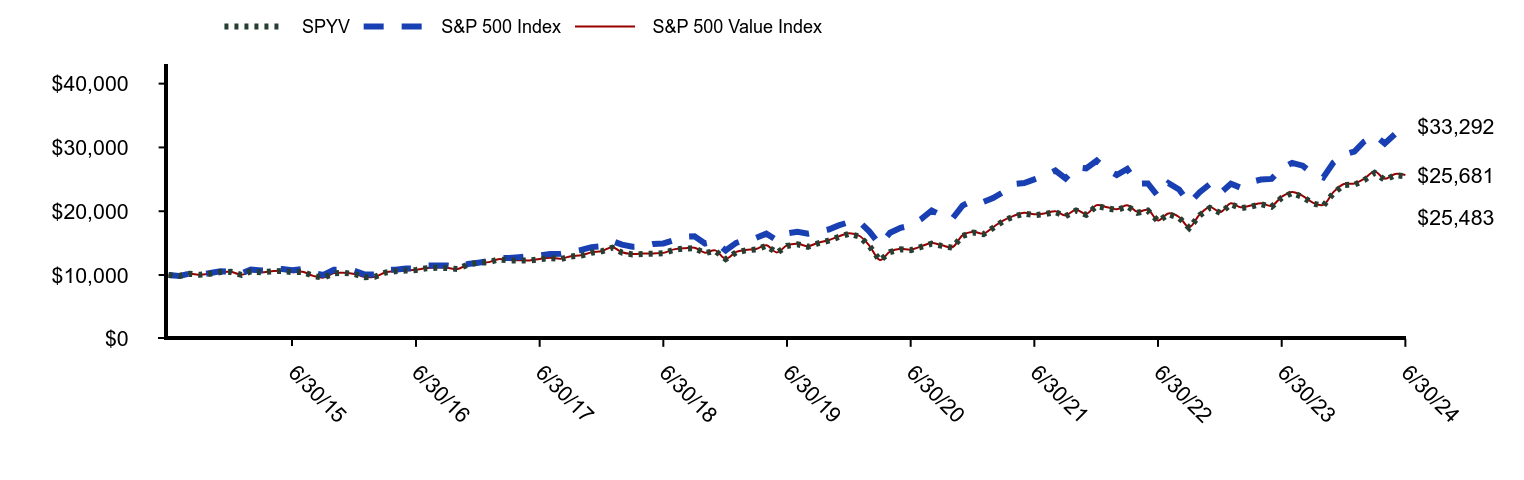
| SPYV | S&P 500 Index | S&P 500 Value Index |
|---|
| 6/30/14 | $10,000 | $10,000 | $10,000 |
| 7/31/14 | $9,857 | $9,838 | $9,847 |
| 8/31/14 | $10,200 | $10,245 | $10,203 |
| 9/30/14 | $10,033 | $10,065 | $10,025 |
| 10/31/14 | $10,213 | $10,311 | $10,214 |
| 11/30/14 | $10,461 | $10,581 | $10,447 |
| 12/31/14 | $10,504 | $10,557 | $10,504 |
| 1/31/15 | $10,021 | $10,267 | $10,038 |
| 2/28/15 | $10,581 | $10,860 | $10,589 |
| 3/31/15 | $10,427 | $10,725 | $10,432 |
| 4/30/15 | $10,569 | $10,801 | $10,588 |
| 5/31/15 | $10,655 | $10,942 | $10,666 |
| 6/30/15 | $10,444 | $10,737 | $10,457 |
| 7/31/15 | $10,488 | $10,944 | $10,497 |
| 8/31/15 | $9,859 | $10,285 | $9,869 |
| 9/30/15 | $9,580 | $10,003 | $9,594 |
| 10/31/15 | $10,285 | $10,813 | $10,296 |
| 11/30/15 | $10,346 | $10,849 | $10,349 |
| 12/31/15 | $10,161 | $10,653 | $10,175 |
| 1/31/16 | $9,656 | $10,080 | $9,678 |
| 2/29/16 | $9,713 | $10,077 | $9,732 |
| 3/31/16 | $10,380 | $10,780 | $10,398 |
| 4/30/16 | $10,597 | $10,838 | $10,618 |
| 5/31/16 | $10,693 | $11,027 | $10,714 |
| 6/30/16 | $10,790 | $11,053 | $10,810 |
| 7/31/16 | $11,075 | $11,474 | $11,104 |
| 8/31/16 | $11,141 | $11,489 | $11,169 |
| 9/30/16 | $11,102 | $11,498 | $11,128 |
| 10/31/16 | $10,937 | $11,274 | $10,960 |
| 11/30/16 | $11,636 | $11,718 | $11,650 |
| 12/31/16 | $11,922 | $11,938 | $11,946 |
| 1/31/17 | $11,998 | $12,178 | $12,025 |
| 2/28/17 | $12,444 | $12,650 | $12,488 |
| 3/31/17 | $12,295 | $12,657 | $12,340 |
| 4/30/17 | $12,290 | $12,791 | $12,331 |
| 5/31/17 | $12,257 | $12,955 | $12,291 |
| 6/30/17 | $12,478 | $13,046 | $12,525 |
| 7/31/17 | $12,661 | $13,304 | $12,697 |
| 8/31/17 | $12,493 | $13,345 | $12,549 |
| 9/30/17 | $12,906 | $13,630 | $12,961 |
| 10/31/17 | $13,056 | $13,942 | $13,110 |
| 11/30/17 | $13,499 | $14,374 | $13,554 |
| 12/31/17 | $13,734 | $14,532 | $13,781 |
| 1/31/18 | $14,291 | $15,317 | $14,353 |
| 2/28/18 | $13,505 | $14,764 | $13,566 |
| 3/31/18 | $13,235 | $14,426 | $13,289 |
| 4/30/18 | $13,298 | $14,499 | $13,356 |
| 5/31/18 | $13,334 | $14,869 | $13,391 |
| 6/30/18 | $13,419 | $14,945 | $13,475 |
| 7/31/18 | $13,958 | $15,461 | $14,021 |
| 8/31/18 | $14,144 | $15,995 | $14,211 |
| 9/30/18 | $14,200 | $16,067 | $14,265 |
| 10/31/18 | $13,438 | $14,939 | $13,505 |
| 11/30/18 | $13,789 | $15,237 | $13,861 |
| 12/31/18 | $12,498 | $13,845 | $12,547 |
| 1/31/19 | $13,561 | $15,032 | $13,623 |
| 2/28/19 | $13,860 | $15,555 | $13,929 |
| 3/31/19 | $14,004 | $15,829 | $14,077 |
| 4/30/19 | $14,578 | $16,483 | $14,658 |
| 5/31/19 | $13,479 | $15,441 | $13,548 |
| 6/30/19 | $14,564 | $16,537 | $14,643 |
| 7/31/19 | $14,820 | $16,789 | $14,901 |
| 8/31/19 | $14,429 | $16,480 | $14,515 |
| 9/30/19 | $14,978 | $16,767 | $15,058 |
| 10/31/19 | $15,377 | $17,132 | $15,457 |
| 11/30/19 | $15,967 | $17,785 | $16,053 |
| 12/31/19 | $16,455 | $18,296 | $16,553 |
| 1/31/20 | $16,021 | $18,315 | $16,117 |
| 2/29/20 | $14,532 | $16,807 | $14,584 |
| 3/31/20 | $12,294 | $14,731 | $12,359 |
| 4/30/20 | $13,596 | $16,620 | $13,682 |
| 5/31/20 | $14,022 | $17,411 | $14,119 |
| 6/30/20 | $13,895 | $17,758 | $13,984 |
| 7/31/20 | $14,414 | $18,759 | $14,496 |
| 8/31/20 | $14,922 | $20,107 | $15,015 |
| 9/30/20 | $14,564 | $19,343 | $14,655 |
| 10/31/20 | $14,292 | $18,829 | $14,362 |
| 11/30/20 | $16,126 | $20,890 | $16,211 |
| 12/31/20 | $16,669 | $21,693 | $16,778 |
| 1/31/21 | $16,407 | $21,474 | $16,513 |
| 2/28/21 | $17,386 | $22,066 | $17,490 |
| 3/31/21 | $18,489 | $23,033 | $18,585 |
| 4/30/21 | $19,167 | $24,262 | $19,279 |
| 5/31/21 | $19,628 | $24,431 | $19,744 |
| 6/30/21 | $19,388 | $25,002 | $19,513 |
| 7/31/21 | $19,545 | $25,596 | $19,667 |
| 8/31/21 | $19,878 | $26,374 | $20,006 |
| 9/30/21 | $19,216 | $25,147 | $19,348 |
| 10/31/21 | $20,103 | $26,909 | $20,236 |
| 11/30/21 | $19,443 | $26,723 | $19,577 |
| 12/31/21 | $20,817 | $27,920 | $20,956 |
| 1/31/22 | $20,465 | $26,475 | $20,616 |
| 2/28/22 | $20,177 | $25,683 | $20,320 |
| 3/31/22 | $20,777 | $26,636 | $20,922 |
| 4/30/22 | $19,769 | $24,314 | $19,904 |
| 5/31/22 | $20,095 | $24,358 | $20,229 |
| 6/30/22 | $18,446 | $22,348 | $18,562 |
| 7/31/22 | $19,527 | $24,408 | $19,659 |
| 8/31/22 | $18,969 | $23,413 | $19,100 |
| 9/30/22 | $17,377 | $21,256 | $17,482 |
| 10/31/22 | $19,365 | $22,977 | $19,493 |
| 11/30/22 | $20,519 | $24,261 | $20,667 |
| 12/31/22 | $19,725 | $22,864 | $19,859 |
| 1/31/23 | $21,099 | $24,300 | $21,249 |
| 2/28/23 | $20,461 | $23,707 | $20,616 |
| 3/31/23 | $20,732 | $24,578 | $20,886 |
| 4/30/23 | $21,096 | $24,961 | $21,244 |
| 5/31/23 | $20,699 | $25,070 | $20,839 |
| 6/30/23 | $22,107 | $26,726 | $22,272 |
| 7/31/23 | $22,870 | $27,585 | $23,032 |
| 8/31/23 | $22,235 | $27,146 | $22,401 |
| 9/30/23 | $21,216 | $25,852 | $21,361 |
| 10/31/23 | $20,846 | $25,308 | $20,992 |
| 11/30/23 | $22,831 | $27,619 | $23,001 |
| 12/31/23 | $24,103 | $28,874 | $24,273 |
| 1/31/24 | $24,160 | $29,359 | $24,346 |
| 2/29/24 | $24,873 | $30,927 | $25,087 |
| 3/31/24 | $26,012 | $31,922 | $26,228 |
| 4/30/24 | $24,908 | $30,619 | $25,101 |
| 5/31/24 | $25,666 | $32,138 | $25,849 |
| 6/30/24 | $25,483 | $33,292 | $25,681 |
Average Annual Total Returns (%)
| Name | 1 Year | 5 Years | 10 Years |
|---|
| SPYV | 15.23% | 11.83% | 9.80% |
| S&P 500 Index | 24.56% | 15.05% | 12.86% |
| S&P 500 Value Index | 15.29% | 11.89% | 9.89% |
The Fund’s past performance is not necessarily an indication of how the Fund will perform in the future. The returns do not reflect the deduction of taxes that a shareholder would pay on Fund distributions or on the redemption or sale of Fund shares. Updated performance information is available by calling 1-866-787-2257 or visiting our website at www.ssga.com/us/en/institutional/fund-finder?tab=documents&type=etfs.
| Statistic | Value |
|---|
| Total Net Assets | $21,456,649,059 |
| # of Portfolio Holdings | 440 |
| Portfolio Turnover Rate | 33% |
| Total Advisory Fees Paid | $7,540,099 |
What did the Portfolio invest in?
| Industry | % Value of Total Net Assets |
| Banks | 9.4% |
| Oil, Gas & Consumable Fuels | 6.1% |
| Financial Services | 6.0% |
| Health Care Providers & Services | 4.6% |
| Pharmaceuticals | 4.3% |
| Health Care Equipment & Supplies | 3.8% |
| Insurance | 3.6% |
| Consumer Staples Distribution & Retail | 3.6% |
| Semiconductors & Semiconductor Equipment | 3.5% |
| Electric Utilities | 3.3% |
| Holdings | % Value of Total Net Assets |
| Berkshire Hathaway, Inc., B | 3.8% |
| JPMorgan Chase & Co. | 3.0% |
| Exxon Mobil Corp. | 2.7% |
| Johnson & Johnson | 1.8% |
| UnitedHealth Group, Inc. | 1.5% |
| Walmart, Inc. | 1.5% |
| Bank of America Corp. | 1.4% |
| Chevron Corp. | 1.4% |
| Procter & Gamble Co. | 1.2% |
| Costco Wholesale Corp. | 1.1% |
SPDR Portfolio S&P 500 High Dividend ETF
Principal Listing Exchange: NYSEArca
Annual Shareholder Report
June 30, 2024
This annual shareholder report contains important information about the SPDR Portfolio S&P 500 High Dividend ETF (the "Portfolio") for the year ended June 30, 2024. You can find additional information about the Portfolio, including the Prospectus, Statement of Additional Information, financial statements and other information at www.ssga.com/us/en/institutional/fund-finder?tab=documents&type=etfs. You can also request this information about the Portfolio by contacting us at 1-866-787-2257.
What were the Portfolio costs for the last year?
| Portfolio Name | Cost of a $10,000 investment | Costs paid as a percentage of a $10,000 investment |
|---|
| SPDR Portfolio S&P 500 High Dividend ETF | $7 | 0.07% |
How did the Fund perform last year and what affected its performance?
The reporting period’s market environment was largely driven by news about inflation, economic growth and the impact either would have on the Fed and other central banks with regard to interest rate decisions. Alongside this macro story was the prospect of a burgeoning artificial intelligence boom, driving up the values of A.I.-related tech and semiconductor companies. And markets continued to be dominated by the so-called “Magnificent Seven”, consisting of Alphabet Inc, Amazon.com Inc, Apple Inc, Meta Platforms Inc, Microsoft Corp, NVIDIA Corp and Tesla Inc.
Compared with the S&P 500, which returned 24.56% during the reporting period, the Fund underperformed. Stocks with high dividend yields usually have substantial overlap with value stocks, and because these value stocks were significantly outperformed by growth stocks which comprised securities such as the A.I.-related tech and semiconductor companies, as well as the Magnificent Seven, their relative performance suffered. As a result, the Fund’s strategy underperformed the broader market during the reporting period.
The Fund's benchmarks are unmanaged indices used as a general measure of market performance. Calculations assume dividends and capital gains.
Comparison of Change in Value of a $10,000 Investment
(Based on Net Asset Value)
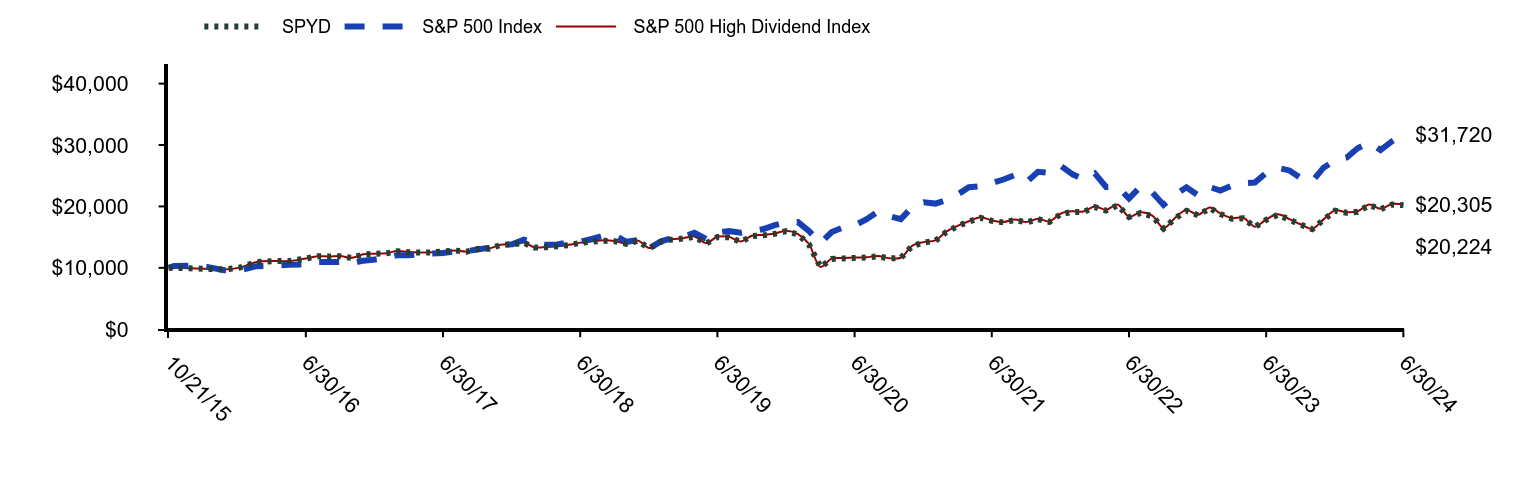
| SPYD | S&P 500 Index | S&P 500 High Dividend Index |
|---|
| 10/21/15 | $10,000 | $10,000 | $10,000 |
| 10/31/15 | $10,007 | $10,302 | $10,007 |
| 11/30/15 | $9,917 | $10,336 | $9,913 |
| 12/31/15 | $9,839 | $10,150 | $9,843 |
| 1/31/16 | $9,728 | $9,604 | $9,735 |
| 2/29/16 | $10,031 | $9,601 | $10,030 |
| 3/31/16 | $10,957 | $10,270 | $10,957 |
| 4/30/16 | $11,090 | $10,326 | $11,103 |
| 5/31/16 | $11,104 | $10,506 | $11,109 |
| 6/30/16 | $11,523 | $10,531 | $11,534 |
| 7/31/16 | $11,887 | $10,932 | $11,893 |
| 8/31/16 | $11,839 | $10,946 | $11,846 |
| 9/30/16 | $11,904 | $10,955 | $11,922 |
| 10/31/16 | $11,612 | $10,741 | $11,632 |
| 11/30/16 | $12,195 | $11,164 | $12,207 |
| 12/31/16 | $12,281 | $11,374 | $12,301 |
| 1/31/17 | $12,365 | $11,603 | $12,388 |
| 2/28/17 | $12,711 | $12,052 | $12,738 |
| 3/31/17 | $12,541 | $12,059 | $12,568 |
| 4/30/17 | $12,480 | $12,187 | $12,509 |
| 5/31/17 | $12,496 | $12,343 | $12,526 |
| 6/30/17 | $12,668 | $12,429 | $12,697 |
| 7/31/17 | $12,823 | $12,676 | $12,837 |
| 8/31/17 | $12,640 | $12,715 | $12,674 |
| 9/30/17 | $13,051 | $12,986 | $13,086 |
| 10/31/17 | $13,119 | $13,283 | $13,155 |
| 11/30/17 | $13,706 | $13,695 | $13,746 |
| 12/31/17 | $13,827 | $13,845 | $13,869 |
| 1/31/18 | $14,078 | $14,593 | $14,120 |
| 2/28/18 | $13,309 | $14,066 | $13,358 |
| 3/31/18 | $13,344 | $13,744 | $13,390 |
| 4/30/18 | $13,512 | $13,814 | $13,560 |
| 5/31/18 | $13,710 | $14,167 | $13,758 |
| 6/30/18 | $14,056 | $14,239 | $14,107 |
| 7/31/18 | $14,266 | $14,730 | $14,320 |
| 8/31/18 | $14,415 | $15,240 | $14,472 |
| 9/30/18 | $14,317 | $15,308 | $14,368 |
| 10/31/18 | $13,904 | $14,234 | $13,956 |
| 11/30/18 | $14,381 | $14,517 | $14,444 |
| 12/31/18 | $13,168 | $13,191 | $13,211 |
| 1/31/19 | $14,247 | $14,321 | $14,298 |
| 2/28/19 | $14,593 | $14,820 | $14,648 |
| 3/31/19 | $14,769 | $15,082 | $14,827 |
| 4/30/19 | $15,052 | $15,704 | $15,113 |
| 5/31/19 | $13,983 | $14,711 | $14,036 |
| 6/30/19 | $15,007 | $15,756 | $15,069 |
| 7/31/19 | $14,984 | $15,996 | $15,044 |
| 8/31/19 | $14,233 | $15,702 | $14,296 |
| 9/30/19 | $15,171 | $15,975 | $15,235 |
| 10/31/19 | $15,291 | $16,323 | $15,355 |
| 11/30/19 | $15,535 | $16,945 | $15,601 |
| 12/31/19 | $15,970 | $17,432 | $16,049 |
| 1/31/20 | $15,431 | $17,450 | $15,505 |
| 2/29/20 | $13,837 | $16,013 | $13,884 |
| 3/31/20 | $10,119 | $14,035 | $10,155 |
| 4/30/20 | $11,441 | $15,835 | $11,497 |
| 5/31/20 | $11,538 | $16,589 | $11,596 |
| 6/30/20 | $11,617 | $16,919 | $11,669 |
| 7/31/20 | $11,684 | $17,873 | $11,730 |
| 8/31/20 | $11,867 | $19,157 | $11,924 |
| 9/30/20 | $11,526 | $18,429 | $11,572 |
| 10/31/20 | $11,610 | $17,939 | $11,645 |
| 11/30/20 | $13,540 | $19,903 | $13,586 |
| 12/31/20 | $14,129 | $20,668 | $14,190 |
| 1/31/21 | $14,410 | $20,460 | $14,472 |
| 2/28/21 | $15,778 | $21,024 | $15,852 |
| 3/31/21 | $16,788 | $21,945 | $16,846 |
| 4/30/21 | $17,521 | $23,116 | $17,595 |
| 5/31/21 | $18,151 | $23,277 | $18,229 |
| 6/30/21 | $17,651 | $23,821 | $17,732 |
| 7/31/21 | $17,396 | $24,386 | $17,473 |
| 8/31/21 | $17,792 | $25,128 | $17,876 |
| 9/30/21 | $17,393 | $23,959 | $17,471 |
| 10/31/21 | $17,922 | $25,638 | $18,006 |
| 11/30/21 | $17,473 | $25,460 | $17,561 |
| 12/31/21 | $18,763 | $26,601 | $18,853 |
| 1/31/22 | $19,100 | $25,225 | $19,200 |
| 2/28/22 | $19,064 | $24,469 | $19,164 |
| 3/31/22 | $19,889 | $25,378 | $19,997 |
| 4/30/22 | $19,332 | $23,165 | $19,437 |
| 5/31/22 | $20,184 | $23,207 | $20,290 |
| 6/30/22 | $18,264 | $21,292 | $18,349 |
| 7/31/22 | $18,939 | $23,255 | $19,035 |
| 8/31/22 | $18,394 | $22,307 | $18,498 |
| 9/30/22 | $16,399 | $20,252 | $16,476 |
| 10/31/22 | $18,061 | $21,892 | $18,154 |
| 11/30/22 | $19,296 | $23,115 | $19,410 |
| 12/31/22 | $18,540 | $21,784 | $18,645 |
| 1/31/23 | $19,734 | $23,152 | $19,840 |
| 2/28/23 | $18,760 | $22,587 | $18,872 |
| 3/31/23 | $17,989 | $23,417 | $18,086 |
| 4/30/23 | $18,079 | $23,782 | $18,169 |
| 5/31/23 | $16,642 | $23,886 | $16,710 |
| 6/30/23 | $17,794 | $25,464 | $17,872 |
| 7/31/23 | $18,636 | $26,282 | $18,708 |
| 8/31/23 | $17,861 | $25,863 | $17,939 |
| 9/30/23 | $17,022 | $24,630 | $17,091 |
| 10/31/23 | $16,301 | $24,112 | $16,369 |
| 11/30/23 | $17,818 | $26,314 | $17,893 |
| 12/31/23 | $19,294 | $27,510 | $19,371 |
| 1/31/24 | $18,967 | $27,972 | $19,045 |
| 2/29/24 | $19,129 | $29,466 | $19,216 |
| 3/31/24 | $20,222 | $30,414 | $20,317 |
| 4/30/24 | $19,539 | $29,173 | $19,623 |
| 5/31/24 | $20,307 | $30,620 | $20,388 |
| 6/30/24 | $20,224 | $31,720 | $20,305 |
Average Annual Total Returns (%)
| Name | 1 Year | 5 Years | Since Inception 10/21/15 |
|---|
| SPYD | 13.61% | 6.14% | 8.43% |
| S&P 500 Index | 24.56% | 15.05% | 14.19% |
| S&P 500 High Dividend Index | 13.62% | 6.14% | 8.49% |
The Fund’s past performance is not necessarily an indication of how the Fund will perform in the future. The returns do not reflect the deduction of taxes that a shareholder would pay on Fund distributions or on the redemption or sale of Fund shares. Updated performance information is available by calling 1-866-787-2257 or visiting our website at www.ssga.com/us/en/institutional/fund-finder?tab=documents&type=etfs.
| Statistic | Value |
|---|
| Total Net Assets | $5,921,861,119 |
| # of Portfolio Holdings | 76 |
| Portfolio Turnover Rate | 43% |
| Total Advisory Fees Paid | $4,585,376 |
What did the Portfolio invest in?
| Industry | % Value of Total Net Assets |
| Banks | 14.6% |
| Electric Utilities | 13.8% |
| Specialized REITs | 8.0% |
| Residential REITs | 7.1% |
| Retail REITs | 6.3% |
| Oil, Gas & Consumable Fuels | 5.9% |
| Multi-Utilities | 4.3% |
| Food Products | 3.7% |
| Capital Markets | 3.6% |
| Pharmaceuticals | 3.4% |
| Holdings | % Value of Total Net Assets |
| Iron Mountain, Inc. | 1.7% |
| Public Service Enterprise Group, Inc. | 1.6% |
| Williams Cos., Inc. | 1.6% |
| Hasbro, Inc. | 1.5% |
| International Paper Co. | 1.5% |
| Citigroup, Inc. | 1.5% |
| ONEOK, Inc. | 1.5% |
| Equity Residential | 1.5% |
| Kinder Morgan, Inc. | 1.5% |
| Essex Property Trust, Inc. | 1.5% |
SPDR Portfolio S&P Sector Neutral Dividend ETF
Principal Listing Exchange: NYSEArca
Annual Shareholder Report
June 30, 2024
This annual shareholder report contains important information about the SPDR Portfolio S&P Sector Neutral Dividend ETF (the "Portfolio") for the period ended June 30, 2024. You can find additional information about the Portfolio, including the Prospectus, Statement of Additional Information, financial statements and other information at www.ssga.com/us/en/institutional/fund-finder?tab=documents&type=etfs. You can also request this information about the Portfolio by contacting us at 1-866-787-2257.
What were the Portfolio costs for the last year?
| Portfolio Name | Cost of a $10,000 investment | Costs paid as a percentage of a $10,000 investment |
|---|
| SPDR Portfolio S&P Sector Neutral Dividend ETF | $6 | 0.09% |
The dollar amounts above reflect expenses paid since the commencement of operations on September 12, 2023. Expenses for the full reporting period would be higher.
How did the Fund perform last year and what affected its performance?
As 4Q23 began, markets seemed to teeter on each economic release, and the heightened sensitivity combined with the geopolitical uncertainty introduced by the attacks of October 7th in Israel caused bond market yields to spike and markets to sell-off in October. Concern about rate hikes turned into speculation about rate cuts and the possibility that the Fed might actually orchestrate an economic soft landing. This, combined with continued enthusiasm for semiconductor companies that investors believed would drive the impending A.I. revolution, induced markets to resume their gains in the last two months of the calendar year.
As markets wrestled with the Fed’s slight bias towards hawkishness, A.I.-related semiconductor stocks continued to surge, revealing the investor belief that A.I. represented an enormous secular growth opportunity that transcended concerns about the macroeconomy. These and the Magnificent Seven once again pulled the market up with them into the end of the reporting period, ultimately producing strong net gains for the year.
The Fund's benchmarks are unmanaged indices used as a general measure of market performance. Calculations assume dividends and capital gains.
Comparison of Change in Value of a $10,000 Investment
(Based on Net Asset Value)
| SPDG | S&P 500 Index | S&P Sector-Neutral High Yield Dividend Aristocrats Index |
|---|
| 09/11/23 | $10,000 | $10,000 | $10,000 |
| 09/30/23 | $9,664 | $9,563 | $9,658 |
| 10/31/23 | $9,381 | $9,362 | $9,375 |
| 11/30/23 | $10,113 | $10,217 | $10,110 |
| 12/31/23 | $10,809 | $10,681 | $10,801 |
| 01/31/24 | $10,959 | $10,861 | $10,944 |
| 02/29/24 | $11,158 | $11,440 | $11,176 |
| 03/31/24 | $11,648 | $11,809 | $11,661 |
| 04/30/24 | $11,132 | $11,327 | $11,138 |
| 05/31/24 | $11,456 | $11,890 | $11,454 |
| 06/30/24 | $11,716 | $12,317 | $11,724 |
Average Annual Total Returns (%)
| Name | Since Inception 9/11/23 |
|---|
| SPDG | 17.10% |
| S&P 500 Index | 23.14% |
| S&P Sector-Neutral High Yield Dividend Aristocrats Index | 17.22% |
The Fund’s past performance is not necessarily an indication of how the Fund will perform in the future. The returns do not reflect the deduction of taxes that a shareholder would pay on Fund distributions or on the redemption or sale of Fund shares. Updated performance information is available by calling 1-866-787-2257 or visiting our website at www.ssga.com/us/en/institutional/fund-finder?tab=documents&type=etfs.
| Statistic | Value |
|---|
| Total Net Assets | $5,852,423 |
| # of Portfolio Holdings | 273 |
| Portfolio Turnover Rate | 23% |
| Total Advisory Fees Paid | $1,711 |
What did the Portfolio invest in?
| Industry | % Value of Total Net Assets |
| Semiconductors & Semiconductor Equipment | 17.6% |
| Banks | 10.2% |
| Diversified Telecommunication Services | 7.6% |
| Specialty Retail | 6.2% |
| IT Services | 4.8% |
| Pharmaceuticals | 4.2% |
| Oil, Gas & Consumable Fuels | 3.7% |
| Software | 3.3% |
| Health Care Providers & Services | 3.1% |
| Hotels, Restaurants & Leisure | 3.0% |
SPDR Portfolio S&P 400 Mid Cap ETF
Principal Listing Exchange: NYSEArca
Annual Shareholder Report
June 30, 2024
This annual shareholder report contains important information about the SPDR Portfolio S&P 400 Mid Cap ETF (the "Portfolio") for the year ended June 30, 2024. You can find additional information about the Portfolio, including the Prospectus, Statement of Additional Information, financial statements and other information at www.ssga.com/us/en/institutional/fund-finder?tab=documents&type=etfs. You can also request this information about the Portfolio by contacting us at 1-866-787-2257. This report describes changes to the Fund that occurred during the reporting period.
What were the Portfolio costs for the last year?
| Portfolio Name | Cost of a $10,000 investment | Costs paid as a percentage of a $10,000 investment |
|---|
| SPDR Portfolio S&P 400 Mid Cap ETF | $3 | 0.03% |
Effective August 1, 2023 the management fee was reduced from 0.05% to 0.03%.
How did the Fund perform last year and what affected its performance?
U.S. Economic indicators from the U.S. remained relatively strong over the Q3 2023. While investors began the quarter with hopes that the rate hikes would soon end and cuts would begin, that probability ended by the end of the quarter. U.S. stocks rallied in Q4 2023, supported by prospects of rate cuts in 2024. October’s economic data had spooked investors. However, things took a turn by November – inflation softened and the U.S. Federal Reserve (the “Fed”) Chair’s supportive comments shored up investor sentiment. U.S. equities rallied for a second straight quarter in Q1 2024. At 10.4%, the S&P 500 index posted its biggest first-quarter gain since 2019 and its fifth gain in the last six quarters. The AI theme was a key tailwind in Q1 2024. The biggest area of concern during the quarter revolved around sticky core services inflation even as the U.S. economy remained resilient. U.S. equity indices were mixed in Q2 2024, with a tough start to the quarter in April. The momentum changed in the middle of the month due to a strong jobs report, ending up positive in May and June. The Fed held the interest rates steady and struck a hawkish tone in June, maintaining the current policy rate and projecting only one rate cut in 2024.
The Fund's benchmarks are unmanaged indices used as a general measure of market performance. Calculations assume dividends and capital gains.
Comparison of Change in Value of a $10,000 Investment
(Based on Net Asset Value)
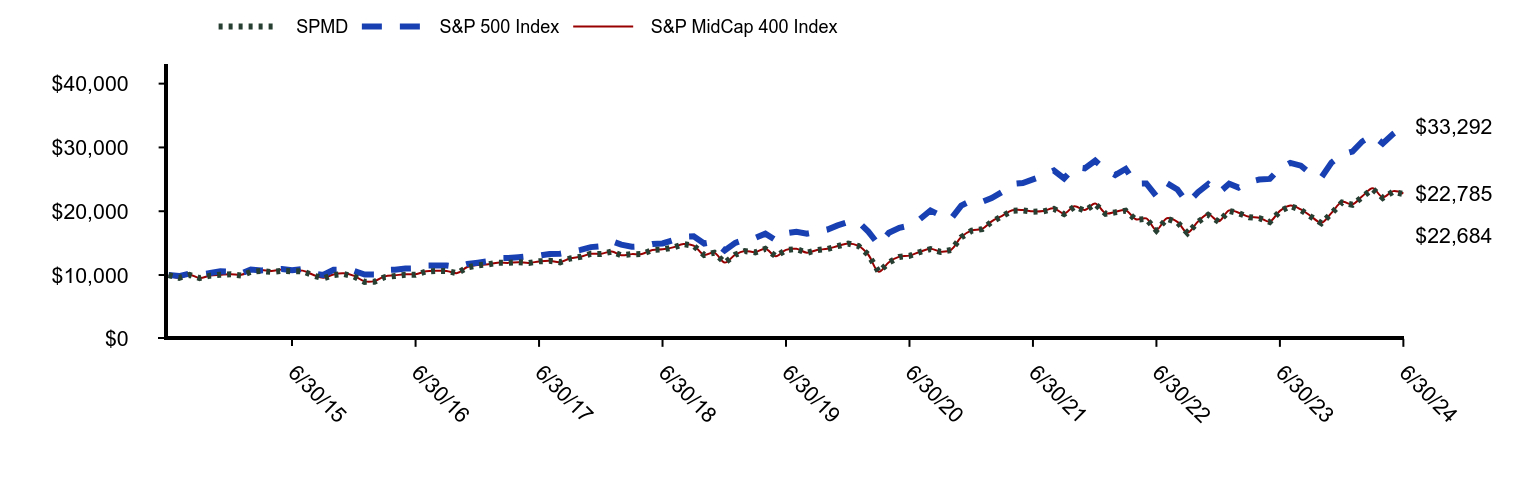
| SPMD | S&P 500 Index | S&P MidCap 400 Index |
|---|
| 6/30/14 | $10,000 | $10,000 | $10,000 |
| 7/31/14 | $9,563 | $9,838 | $9,562 |
| 8/31/14 | $10,020 | $10,245 | $10,036 |
| 9/30/14 | $9,524 | $10,065 | $9,520 |
| 10/31/14 | $9,903 | $10,311 | $9,913 |
| 11/30/14 | $10,030 | $10,581 | $10,031 |
| 12/31/14 | $10,121 | $10,557 | $10,128 |
| 1/31/15 | $9,930 | $10,267 | $10,039 |
| 2/28/15 | $10,499 | $10,860 | $10,660 |
| 3/31/15 | $10,642 | $10,725 | $10,784 |
| 4/30/15 | $10,474 | $10,801 | $10,651 |
| 5/31/15 | $10,645 | $10,942 | $10,868 |
| 6/30/15 | $10,600 | $10,737 | $10,691 |
| 7/31/15 | $10,595 | $10,944 | $10,688 |
| 8/31/15 | $9,946 | $10,285 | $10,048 |
| 9/30/15 | $9,468 | $10,003 | $9,572 |
| 10/31/15 | $10,001 | $10,813 | $10,099 |
| 11/30/15 | $10,159 | $10,849 | $10,272 |
| 12/31/15 | $9,769 | $10,653 | $9,859 |
| 1/31/16 | $8,924 | $10,080 | $9,009 |
| 2/29/16 | $8,952 | $10,077 | $9,041 |
| 3/31/16 | $9,680 | $10,780 | $9,790 |
| 4/30/16 | $9,845 | $10,838 | $9,956 |
| 5/31/16 | $10,025 | $11,027 | $10,137 |
| 6/30/16 | $10,028 | $11,053 | $10,133 |
| 7/31/16 | $10,561 | $11,474 | $10,592 |
| 8/31/16 | $10,654 | $11,489 | $10,672 |
| 9/30/16 | $10,632 | $11,498 | $10,645 |
| 10/31/16 | $10,289 | $11,274 | $10,302 |
| 11/30/16 | $11,210 | $11,718 | $11,266 |
| 12/31/16 | $11,521 | $11,938 | $11,554 |
| 1/31/17 | $11,673 | $12,178 | $11,674 |
| 2/28/17 | $11,938 | $12,650 | $11,943 |
| 3/31/17 | $11,911 | $12,657 | $11,906 |
| 4/30/17 | $12,000 | $12,791 | $12,009 |
| 5/31/17 | $11,876 | $12,955 | $11,891 |
| 6/30/17 | $12,144 | $13,046 | $12,133 |
| 7/31/17 | $12,239 | $13,304 | $12,243 |
| 8/31/17 | $11,995 | $13,345 | $12,016 |
| 9/30/17 | $12,601 | $13,630 | $12,626 |
| 10/31/17 | $12,853 | $13,942 | $12,859 |
| 11/30/17 | $13,319 | $14,374 | $13,326 |
| 12/31/17 | $13,313 | $14,532 | $13,325 |
| 1/31/18 | $13,676 | $15,317 | $13,694 |
| 2/28/18 | $13,097 | $14,764 | $13,110 |
| 3/31/18 | $13,264 | $14,426 | $13,277 |
| 4/30/18 | $13,282 | $14,499 | $13,294 |
| 5/31/18 | $13,922 | $14,869 | $13,938 |
| 6/30/18 | $14,008 | $14,945 | $14,027 |
| 7/31/18 | $14,313 | $15,461 | $14,336 |
| 8/31/18 | $14,846 | $15,995 | $14,868 |
| 9/30/18 | $14,588 | $16,067 | $14,606 |
| 10/31/18 | $13,148 | $14,939 | $13,169 |
| 11/30/18 | $13,495 | $15,237 | $13,513 |
| 12/31/18 | $11,940 | $13,845 | $11,952 |
| 1/31/19 | $13,193 | $15,032 | $13,209 |
| 2/28/19 | $13,753 | $15,555 | $13,774 |
| 3/31/19 | $13,560 | $15,829 | $13,577 |
| 4/30/19 | $14,095 | $16,483 | $14,117 |
| 5/31/19 | $12,939 | $15,441 | $12,959 |
| 6/30/19 | $13,922 | $16,537 | $13,942 |
| 7/31/19 | $14,070 | $16,789 | $14,106 |
| 8/31/19 | $13,475 | $16,480 | $13,501 |
| 9/30/19 | $13,904 | $16,767 | $13,926 |
| 10/31/19 | $14,101 | $17,132 | $14,117 |
| 11/30/19 | $14,517 | $17,785 | $14,541 |
| 12/31/19 | $14,934 | $18,296 | $14,957 |
| 1/31/20 | $14,534 | $18,315 | $14,561 |
| 2/29/20 | $13,167 | $16,807 | $13,179 |
| 3/31/20 | $10,487 | $14,731 | $10,510 |
| 4/30/20 | $11,969 | $16,620 | $12,001 |
| 5/31/20 | $12,839 | $17,411 | $12,879 |
| 6/30/20 | $13,006 | $17,758 | $13,041 |
| 7/31/20 | $13,607 | $18,759 | $13,642 |
| 8/31/20 | $14,080 | $20,107 | $14,121 |
| 9/30/20 | $13,620 | $19,343 | $13,663 |
| 10/31/20 | $13,925 | $18,829 | $13,960 |
| 11/30/20 | $15,912 | $20,890 | $15,953 |
| 12/31/20 | $16,944 | $21,693 | $16,993 |
| 1/31/21 | $17,187 | $21,474 | $17,249 |
| 2/28/21 | $18,355 | $22,066 | $18,422 |
| 3/31/21 | $19,228 | $23,033 | $19,282 |
| 4/30/21 | $20,082 | $24,262 | $20,150 |
| 5/31/21 | $20,128 | $24,431 | $20,190 |
| 6/30/21 | $19,912 | $25,002 | $19,983 |
| 7/31/21 | $19,979 | $25,596 | $20,052 |
| 8/31/21 | $20,376 | $26,374 | $20,443 |
| 9/30/21 | $19,560 | $25,147 | $19,631 |
| 10/31/21 | $20,715 | $26,909 | $20,787 |
| 11/30/21 | $20,094 | $26,723 | $20,176 |
| 12/31/21 | $21,125 | $27,920 | $21,201 |
| 1/31/22 | $19,595 | $26,475 | $19,672 |
| 2/28/22 | $19,823 | $25,683 | $19,891 |
| 3/31/22 | $20,086 | $26,636 | $20,167 |
| 4/30/22 | $18,665 | $24,314 | $18,734 |
| 5/31/22 | $18,799 | $24,358 | $18,874 |
| 6/30/22 | $16,993 | $22,348 | $17,058 |
| 7/31/22 | $18,840 | $24,408 | $18,909 |
| 8/31/22 | $18,249 | $23,413 | $18,322 |
| 9/30/22 | $16,578 | $21,256 | $16,638 |
| 10/31/22 | $18,326 | $22,977 | $18,388 |
| 11/30/22 | $19,438 | $24,261 | $19,513 |
| 12/31/22 | $18,359 | $22,864 | $18,432 |
| 1/31/23 | $20,058 | $24,300 | $20,133 |
| 2/28/23 | $19,687 | $23,707 | $19,768 |
| 3/31/23 | $19,060 | $24,578 | $19,133 |
| 4/30/23 | $18,913 | $24,961 | $18,984 |
| 5/31/23 | $18,308 | $25,070 | $18,378 |
| 6/30/23 | $19,986 | $26,726 | $20,062 |
| 7/31/23 | $20,809 | $27,585 | $20,889 |
| 8/31/23 | $20,204 | $27,146 | $20,285 |
| 9/30/23 | $19,146 | $25,852 | $19,219 |
| 10/31/23 | $18,125 | $25,308 | $18,193 |
| 11/30/23 | $19,666 | $27,619 | $19,741 |
| 12/31/23 | $21,380 | $28,874 | $21,462 |
| 1/31/24 | $21,009 | $29,359 | $21,094 |
| 2/29/24 | $22,231 | $30,927 | $22,347 |
| 3/31/24 | $23,484 | $31,922 | $23,598 |
| 4/30/24 | $22,084 | $30,619 | $22,177 |
| 5/31/24 | $23,070 | $32,138 | $23,151 |
| 6/30/24 | $22,684 | $33,292 | $22,785 |
Average Annual Total Returns (%)
| Name | 1 Year | 5 Years | 10 Years |
|---|
| SPMD | 13.52% | 10.26% | 8.54% |
| S&P 500 Index | 24.56% | 15.05% | 12.86% |
| S&P MidCap 400 Index | 13.57% | 10.32% | 8.60% |
(1) Effective January 24, 2020, the Fund changed its benchmark index from the S&P 1000 Index to the S&P MidCap 400 Index. Effective August 31, 2016, the Fund changed its benchmark index from the Russell Small Cap Completeness Index to the S&P 1000 Index. The Fund’s performance is based on the Fund’s prior investment strategy to track different benchmark indices for periods prior to January 24, 2020.
(2) Index returns represent the Fund’s prior benchmark indices from June 30, 2014 through January 24, 2020 and the S&P MidCap 400 Index from January 24, 2020 through June 30, 2024.
The Fund’s past performance is not necessarily an indication of how the Fund will perform in the future. The returns do not reflect the deduction of taxes that a shareholder would pay on Fund distributions or on the redemption or sale of Fund shares. Updated performance information is available by calling 1-866-787-2257 or visiting our website at www.ssga.com/us/en/institutional/fund-finder?tab=documents&type=etfs.
| Statistic | Value |
|---|
| Total Net Assets | $10,047,259,139 |
| # of Portfolio Holdings | 402 |
| Portfolio Turnover Rate | 20% |
| Total Advisory Fees Paid | $2,568,517 |
What did the Portfolio invest in?
| Industry | % Value of Total Net Assets |
| Banks | 5.2% |
| Oil, Gas & Consumable Fuels | 4.9% |
| Insurance | 4.7% |
| Machinery | 4.5% |
| Specialty Retail | 4.0% |
| Building Products | 3.7% |
| Hotels, Restaurants & Leisure | 3.6% |
| Biotechnology | 3.2% |
| Capital Markets | 3.0% |
| Semiconductors & Semiconductor Equipment | 2.8% |
| Holdings | % Value of Total Net Assets |
| Pure Storage, Inc., A | 0.7% |
| Carlisle Cos., Inc. | 0.7% |
| Williams-Sonoma, Inc. | 0.7% |
| EMCOR Group, Inc. | 0.6% |
| Lennox International, Inc. | 0.6% |
| Illumina, Inc. | 0.6% |
| Reliance, Inc. | 0.6% |
| BioMarin Pharmaceutical, Inc. | 0.6% |
| Burlington Stores, Inc. | 0.6% |
| Manhattan Associates, Inc. | 0.6% |
Effective August 1, 2023 the management fee was reduced from 0.05% to 0.03%.
Principal Listing Exchange: NYSEArca
Annual Shareholder Report
June 30, 2024
This annual shareholder report contains important information about the SPDR Dow Jones REIT ETF (the "Fund") for the year ended June 30, 2024. You can find additional information about the Fund, including the Prospectus, Statement of Additional Information, financial statements and other information at www.ssga.com/us/en/institutional/fund-finder?tab=documents&type=etfs. You can also request this information about the Fund by contacting us at 1-866-787-2257.
What were the Fund costs for the last year?
| Fund Name | Cost of a $10,000 investment | Costs paid as a percentage of a $10,000 investment |
|---|
| SPDR Dow Jones REIT ETF | $26 | 0.25% |
How did the Fund perform last year and what affected its performance?
Real Estate Investment trusts continued to underperform broader markets as interest rates rose over the second half of 2023. Markets continued to pare back rate cut expectations in the first quarter of 2024, as macroeconomic data continued to highlight an exceptionally strong U.S. economy. REITs, an interest rate sensitive asset class, suffered on the back of higher interest rates.
The Fund's benchmarks are unmanaged indices used as a general measure of market performance. Calculations assume dividends and capital gains.
Comparison of Change in Value of a $10,000 Investment
(Based on Net Asset Value)
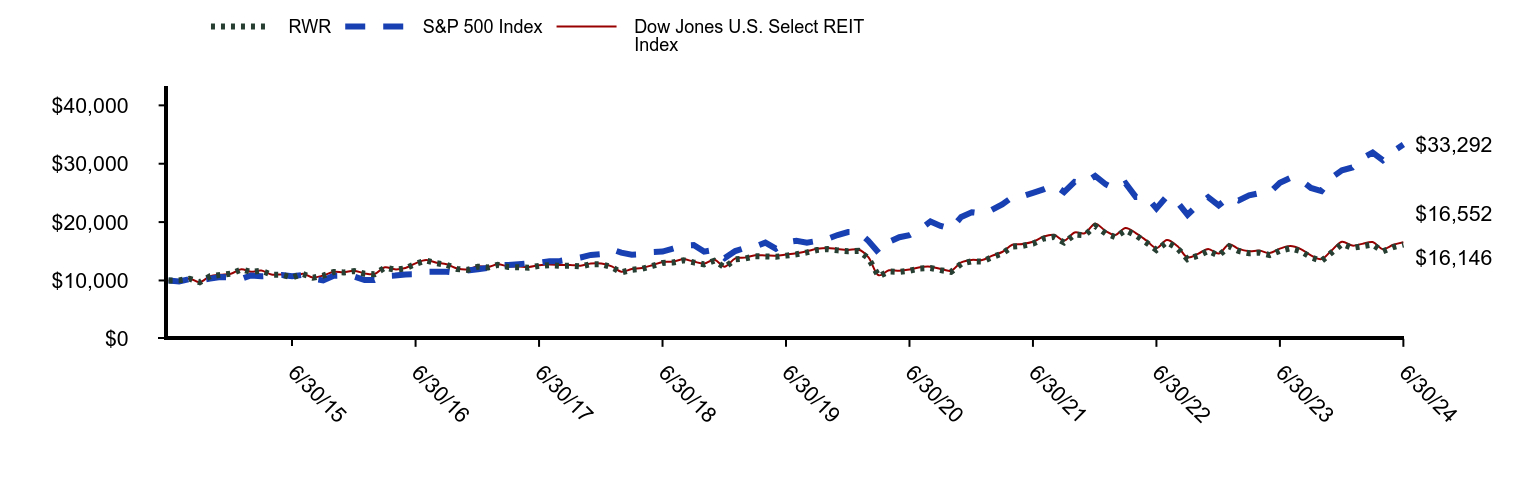
| RWR | S&P 500 Index | Dow Jones U.S. Select REIT Index |
|---|
| 6/30/14 | $10,000 | $10,000 | $10,000 |
| 7/31/14 | $10,020 | $9,838 | $10,021 |
| 8/31/14 | $10,296 | $10,245 | $10,300 |
| 9/30/14 | $9,697 | $10,065 | $9,700 |
| 10/31/14 | $10,726 | $10,311 | $10,740 |
| 11/30/14 | $10,956 | $10,581 | $10,967 |
| 12/31/14 | $11,156 | $10,557 | $11,164 |
| 1/31/15 | $11,896 | $10,267 | $11,911 |
| 2/28/15 | $11,459 | $10,860 | $11,484 |
| 3/31/15 | $11,666 | $10,725 | $11,690 |
| 4/30/15 | $10,984 | $10,801 | $11,013 |
| 5/31/15 | $10,975 | $10,942 | $11,009 |
| 6/30/15 | $10,496 | $10,737 | $10,521 |
| 7/31/15 | $11,118 | $10,944 | $11,146 |
| 8/31/15 | $10,465 | $10,285 | $10,493 |
| 9/30/15 | $10,818 | $10,003 | $10,847 |
| 10/31/15 | $11,442 | $10,813 | $11,478 |
| 11/30/15 | $11,376 | $10,849 | $11,415 |
| 12/31/15 | $11,621 | $10,653 | $11,664 |
| 1/31/16 | $11,158 | $10,080 | $11,204 |
| 2/29/16 | $11,056 | $10,077 | $11,103 |
| 3/31/16 | $12,201 | $10,780 | $12,262 |
| 4/30/16 | $11,842 | $10,838 | $11,902 |
| 5/31/16 | $12,076 | $11,027 | $12,142 |
| 6/30/16 | $12,853 | $11,053 | $12,927 |
| 7/31/16 | $13,413 | $11,474 | $13,492 |
| 8/31/16 | $12,954 | $11,489 | $13,036 |
| 9/30/16 | $12,679 | $11,498 | $12,767 |
| 10/31/16 | $11,969 | $11,274 | $12,049 |
| 11/30/16 | $11,805 | $11,718 | $11,886 |
| 12/31/16 | $12,360 | $11,938 | $12,443 |
| 1/31/17 | $12,241 | $12,178 | $12,336 |
| 2/28/17 | $12,666 | $12,650 | $12,768 |
| 3/31/17 | $12,304 | $12,657 | $12,409 |
| 4/30/17 | $12,274 | $12,791 | $12,380 |
| 5/31/17 | $12,197 | $12,955 | $12,312 |
| 6/30/17 | $12,503 | $13,046 | $12,613 |
| 7/31/17 | $12,616 | $13,304 | $12,729 |
| 8/31/17 | $12,505 | $13,345 | $12,629 |
| 9/30/17 | $12,541 | $13,630 | $12,663 |
| 10/31/17 | $12,401 | $13,942 | $12,525 |
| 11/30/17 | $12,784 | $14,374 | $12,909 |
| 12/31/17 | $12,791 | $14,532 | $12,913 |
| 1/31/18 | $12,271 | $15,317 | $12,402 |
| 2/28/18 | $11,384 | $14,764 | $11,509 |
| 3/31/18 | $11,833 | $14,426 | $11,955 |
| 4/30/18 | $12,001 | $14,499 | $12,132 |
| 5/31/18 | $12,482 | $14,869 | $12,615 |
| 6/30/18 | $13,010 | $14,945 | $13,150 |
| 7/31/18 | $13,070 | $15,461 | $13,222 |
| 8/31/18 | $13,458 | $15,995 | $13,616 |
| 9/30/18 | $13,091 | $16,067 | $13,245 |
| 10/31/18 | $12,762 | $14,939 | $12,907 |
| 11/30/18 | $13,378 | $15,237 | $13,533 |
| 12/31/18 | $12,230 | $13,845 | $12,370 |
| 1/31/19 | $13,618 | $15,032 | $13,781 |
| 2/28/19 | $13,754 | $15,555 | $13,914 |
| 3/31/19 | $14,143 | $15,829 | $14,315 |
| 4/30/19 | $14,111 | $16,483 | $14,288 |
| 5/31/19 | $14,059 | $15,441 | $14,239 |
| 6/30/19 | $14,253 | $16,537 | $14,432 |
| 7/31/19 | $14,480 | $16,789 | $14,663 |
| 8/31/19 | $14,807 | $16,480 | $15,011 |
| 9/30/19 | $15,211 | $16,767 | $15,418 |
| 10/31/19 | $15,372 | $17,132 | $15,582 |
| 11/30/19 | $15,158 | $17,785 | $15,372 |
| 12/31/19 | $15,007 | $18,296 | $15,228 |
| 1/31/20 | $15,066 | $18,315 | $15,291 |
| 2/29/20 | $13,820 | $16,807 | $14,006 |
| 3/31/20 | $10,705 | $14,731 | $10,885 |
| 4/30/20 | $11,538 | $16,620 | $11,737 |
| 5/31/20 | $11,469 | $17,411 | $11,663 |
| 6/30/20 | $11,671 | $17,758 | $11,877 |
| 7/31/20 | $12,066 | $18,759 | $12,273 |
| 8/31/20 | $12,139 | $20,107 | $12,358 |
| 9/30/20 | $11,771 | $19,343 | $11,975 |
| 10/31/20 | $11,475 | $18,829 | $11,665 |
| 11/30/20 | $12,868 | $20,890 | $13,098 |
| 12/31/20 | $13,288 | $21,693 | $13,523 |
| 1/31/21 | $13,247 | $21,474 | $13,496 |
| 2/28/21 | $13,960 | $22,066 | $14,216 |
| 3/31/21 | $14,606 | $23,033 | $14,875 |
| 4/30/21 | $15,807 | $24,262 | $16,107 |
| 5/31/21 | $15,947 | $24,431 | $16,252 |
| 6/30/21 | $16,303 | $25,002 | $16,625 |
| 7/31/21 | $17,166 | $25,596 | $17,510 |
| 8/31/21 | $17,465 | $26,374 | $17,817 |
| 9/30/21 | $16,495 | $25,147 | $16,833 |
| 10/31/21 | $17,846 | $26,909 | $18,209 |
| 11/30/21 | $17,732 | $26,723 | $18,100 |
| 12/31/21 | $19,324 | $27,920 | $19,731 |
| 1/31/22 | $18,060 | $26,475 | $18,456 |
| 2/28/22 | $17,424 | $25,683 | $17,803 |
| 3/31/22 | $18,594 | $26,636 | $18,996 |
| 4/30/22 | $17,732 | $24,314 | $18,113 |
| 5/31/22 | $16,508 | $24,358 | $16,863 |
| 6/30/22 | $15,222 | $22,348 | $15,555 |
| 7/31/22 | $16,565 | $24,408 | $16,939 |
| 8/31/22 | $15,535 | $23,413 | $15,887 |
| 9/30/22 | $13,641 | $21,256 | $13,941 |
| 10/31/22 | $14,243 | $22,977 | $14,567 |
| 11/30/22 | $15,065 | $24,261 | $15,411 |
| 12/31/22 | $14,277 | $22,864 | $14,604 |
| 1/31/23 | $15,837 | $24,300 | $16,207 |
| 2/28/23 | $15,048 | $23,707 | $15,409 |
| 3/31/23 | $14,659 | $24,578 | $15,009 |
| 4/30/23 | $14,764 | $24,961 | $15,113 |
| 5/31/23 | $14,353 | $25,070 | $14,696 |
| 6/30/23 | $15,086 | $26,726 | $15,447 |
| 7/31/23 | $15,521 | $27,585 | $15,890 |
| 8/31/23 | $15,017 | $27,146 | $15,383 |
| 9/30/23 | $13,973 | $25,852 | $14,304 |
| 10/31/23 | $13,330 | $25,308 | $13,657 |
| 11/30/23 | $14,770 | $27,619 | $15,127 |
| 12/31/23 | $16,252 | $28,874 | $16,643 |
| 1/31/24 | $15,580 | $29,359 | $15,971 |
| 2/29/24 | $15,860 | $30,927 | $16,269 |
| 3/31/24 | $16,166 | $31,922 | $16,578 |
| 4/30/24 | $14,993 | $30,619 | $15,364 |
| 5/31/24 | $15,717 | $32,138 | $16,109 |
| 6/30/24 | $16,146 | $33,292 | $16,552 |
Average Annual Total Returns (%)
| Name | 1 Year | 5 Years | 10 Years |
|---|
| RWR | 6.97% | 2.53% | 4.91% |
| S&P 500 Index | 24.56% | 15.05% | 12.86% |
| Dow Jones U.S. Select REIT Index | 7.15% | 2.78% | 5.17% |
The Fund’s past performance is not necessarily an indication of how the Fund will perform in the future. The returns do not reflect the deduction of taxes that a shareholder would pay on Fund distributions or on the redemption or sale of Fund shares. Updated performance information is available by calling 1-866-787-2257 or visiting our website at www.ssga.com/us/en/institutional/fund-finder?tab=documents&type=etfs.
| Statistic | Value |
|---|
| Total Net Assets | $1,414,154,478 |
| # of Portfolio Holdings | 105 |
| Portfolio Turnover Rate | 4% |
| Total Advisory Fees Paid | $3,405,605 |
What did the Fund invest in?
| Industry | % Value of Total Net Assets |
| Specialized REITs | 22.0% |
| Residential REITs | 18.8% |
| Retail REITs | 17.4% |
| Industrial REITs | 15.6% |
| Health Care REITs | 12.4% |
| Office REITs | 6.0% |
| Hotel & Resort REITs | 3.7% |
| Diversified REITs | 2.4% |
| Holdings | % Value of Total Net Assets |
| Prologis, Inc. | 10.4% |
| Equinix, Inc. | 7.1% |
| Welltower, Inc. | 6.1% |
| Digital Realty Trust, Inc. | 4.9% |
| Simon Property Group, Inc. | 4.7% |
| Public Storage | 4.6% |
| Realty Income Corp. | 4.5% |
| Extra Space Storage, Inc. | 3.4% |
| AvalonBay Communities, Inc. | 3.0% |
| Equity Residential | 2.4% |
Principal Listing Exchange: NYSEArca
Annual Shareholder Report
June 30, 2024
This annual shareholder report contains important information about the SPDR S&P Bank ETF (the "Fund") for the year ended June 30, 2024. You can find additional information about the Fund, including the Prospectus, Statement of Additional Information, financial statements and other information at www.ssga.com/us/en/institutional/fund-finder?tab=documents&type=etfs. You can also request this information about the Fund by contacting us at 1-866-787-2257.
What were the Fund costs for the last year?
| Fund Name | Cost of a $10,000 investment | Costs paid as a percentage of a $10,000 investment |
|---|
| SPDR S&P Bank ETF | $41 | 0.35% |
How did the Fund perform last year and what affected its performance?
In Q3 2023, the S&P Bank Select Industry Index returned 3.4% for the quarter. Global economic growth remained lackluster in the third quarter, with manufacturing activities contracting for the fourth month running and services sector growth also slowing down. Business activity in the United States rose at a weaker pace, signaling broad stagnation in output amid muted demand conditions. Core inflation numbers showed a disinflationary trend, while the labor market continued to be relatively robust across key developed economies. Performance of the Fund during the reporting period was driven by strong labor markets, strong consumer spending, slowing inflation, a pause in interest rate hikes, and concerns over a recession weighted on the minds of many investors. Bank stocks rose for the fiscal year. During the reporting period, the Fund’s use of their current investment strategies did not cause the Fund’s performance to materially deviate from the manager’s expectations considering the uncertainty of the markets.
The Fund's benchmarks are unmanaged indices used as a general measure of market performance. Calculations assume dividends and capital gains.
Comparison of Change in Value of a $10,000 Investment
(Based on Net Asset Value)
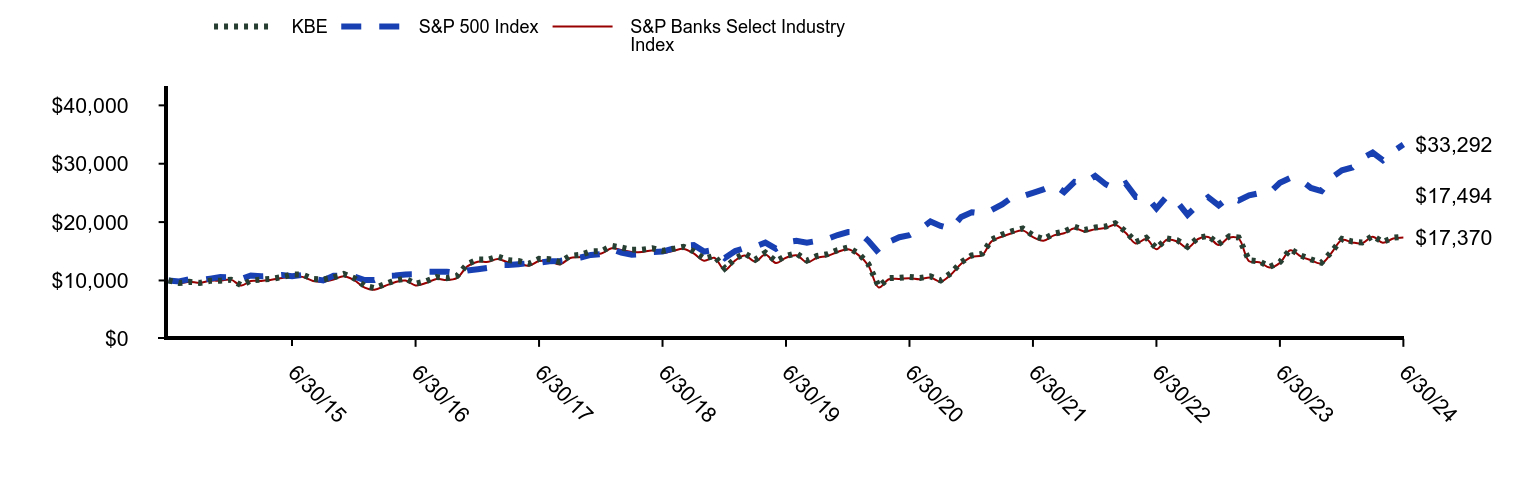
| KBE | S&P 500 Index | S&P Banks Select Industry Index |
|---|
| 6/30/14 | $10,000 | $10,000 | $10,000 |
| 7/31/14 | $9,560 | $9,838 | $9,564 |
| 8/31/14 | $9,764 | $10,245 | $9,770 |
| 9/30/14 | $9,582 | $10,065 | $9,588 |
| 10/31/14 | $9,930 | $10,311 | $9,943 |
| 11/30/14 | $9,963 | $10,581 | $9,980 |
| 12/31/14 | $10,124 | $10,557 | $10,145 |
| 1/31/15 | $9,161 | $10,267 | $9,128 |
| 2/28/15 | $9,991 | $10,860 | $9,909 |
| 3/31/15 | $10,147 | $10,725 | $9,907 |
| 4/30/15 | $10,277 | $10,801 | $10,129 |
| 5/31/15 | $10,571 | $10,942 | $10,403 |
| 6/30/15 | $11,038 | $10,737 | $10,655 |
| 7/31/15 | $10,992 | $10,944 | $10,617 |
| 8/31/15 | $10,281 | $10,285 | $9,924 |
| 9/30/15 | $10,157 | $10,003 | $9,804 |
| 10/31/15 | $10,533 | $10,813 | $10,172 |
| 11/30/15 | $11,107 | $10,849 | $10,733 |
| 12/31/15 | $10,390 | $10,653 | $10,051 |
| 1/31/16 | $9,070 | $10,080 | $8,770 |
| 2/29/16 | $8,692 | $10,077 | $8,405 |
| 3/31/16 | $9,364 | $10,780 | $9,061 |
| 4/30/16 | $10,014 | $10,838 | $9,697 |
| 5/31/16 | $10,307 | $11,027 | $9,983 |
| 6/30/16 | $9,456 | $11,053 | $9,154 |
| 7/31/16 | $9,868 | $11,474 | $9,555 |
| 8/31/16 | $10,590 | $11,489 | $10,262 |
| 9/30/16 | $10,395 | $11,498 | $10,076 |
| 10/31/16 | $10,790 | $11,274 | $10,462 |
| 11/30/16 | $12,807 | $11,718 | $12,420 |
| 12/31/16 | $13,592 | $11,938 | $13,198 |
| 1/31/17 | $13,589 | $12,178 | $13,190 |
| 2/28/17 | $14,102 | $12,650 | $13,692 |
| 3/31/17 | $13,479 | $12,657 | $13,090 |
| 4/30/17 | $13,332 | $12,791 | $12,945 |
| 5/31/17 | $12,883 | $12,955 | $12,514 |
| 6/30/17 | $13,701 | $13,046 | $13,321 |
| 7/31/17 | $13,641 | $13,304 | $13,265 |
| 8/31/17 | $13,122 | $13,345 | $12,757 |
| 9/30/17 | $14,230 | $13,630 | $13,844 |
| 10/31/17 | $14,403 | $13,942 | $14,021 |
| 11/30/17 | $14,984 | $14,374 | $14,591 |
| 12/31/17 | $15,012 | $14,532 | $14,612 |
| 1/31/18 | $15,917 | $15,317 | $15,508 |
| 2/28/18 | $15,638 | $14,764 | $15,242 |
| 3/31/18 | $15,239 | $14,426 | $14,860 |
| 4/30/18 | $15,268 | $14,499 | $14,890 |
| 5/31/18 | $15,525 | $14,869 | $15,146 |
| 6/30/18 | $15,071 | $14,945 | $14,702 |
| 7/31/18 | $15,412 | $15,461 | $15,045 |
| 8/31/18 | $15,773 | $15,995 | $15,407 |
| 9/30/18 | $14,988 | $16,067 | $14,640 |
| 10/31/18 | $13,712 | $14,939 | $13,394 |
| 11/30/18 | $14,219 | $15,237 | $13,892 |
| 12/31/18 | $12,065 | $13,845 | $11,780 |
| 1/31/19 | $13,762 | $15,032 | $13,449 |
| 2/28/19 | $14,620 | $15,555 | $14,294 |
| 3/31/19 | $13,557 | $15,829 | $13,248 |
| 4/30/19 | $14,761 | $16,483 | $14,434 |
| 5/31/19 | $13,294 | $15,441 | $13,002 |
| 6/30/19 | $14,201 | $16,537 | $13,892 |
| 7/31/19 | $14,641 | $16,789 | $14,323 |
| 8/31/19 | $13,392 | $16,480 | $13,106 |
| 9/30/19 | $14,189 | $16,767 | $13,888 |
| 10/31/19 | $14,506 | $17,132 | $14,203 |
| 11/30/19 | $15,202 | $17,785 | $14,887 |
| 12/31/19 | $15,655 | $18,296 | $15,336 |
| 1/31/20 | $14,631 | $18,315 | $14,339 |
| 2/29/20 | $12,823 | $16,807 | $12,560 |
| 3/31/20 | $8,973 | $14,731 | $8,800 |
| 4/30/20 | $10,414 | $16,620 | $10,209 |
| 5/31/20 | $10,465 | $17,411 | $10,260 |
| 6/30/20 | $10,603 | $17,758 | $10,398 |
| 7/31/20 | $10,433 | $18,759 | $10,226 |
| 8/31/20 | $10,702 | $20,107 | $10,496 |
| 9/30/20 | $9,999 | $19,343 | $9,804 |
| 10/31/20 | $11,265 | $18,829 | $11,040 |
| 11/30/20 | $13,120 | $20,890 | $12,863 |
| 12/31/20 | $14,284 | $21,693 | $14,026 |
| 1/31/21 | $14,597 | $21,474 | $14,347 |
| 2/28/21 | $17,007 | $22,066 | $16,705 |
| 3/31/21 | $17,852 | $23,033 | $17,530 |
| 4/30/21 | $18,457 | $24,262 | $18,139 |
| 5/31/21 | $18,896 | $24,431 | $18,579 |
| 6/30/21 | $17,726 | $25,002 | $17,439 |
| 7/31/21 | $17,092 | $25,596 | $16,819 |
| 8/31/21 | $18,006 | $26,374 | $17,724 |
| 9/30/21 | $18,368 | $25,147 | $18,084 |
| 10/31/21 | $19,209 | $26,909 | $18,927 |
| 11/30/21 | $18,648 | $26,723 | $18,372 |
| 12/31/21 | $19,064 | $27,920 | $18,797 |
| 1/31/22 | $19,244 | $26,475 | $18,981 |
| 2/28/22 | $19,801 | $25,683 | $19,536 |
| 3/31/22 | $18,398 | $26,636 | $18,163 |
| 4/30/22 | $16,565 | $24,314 | $16,344 |
| 5/31/22 | $17,315 | $24,358 | $17,093 |
| 6/30/22 | $15,545 | $22,348 | $15,344 |
| 7/31/22 | $17,191 | $24,408 | $16,986 |
| 8/31/22 | $16,880 | $23,413 | $16,674 |
| 9/30/22 | $15,780 | $21,256 | $15,583 |
| 10/31/22 | $17,303 | $22,977 | $17,103 |
| 11/30/22 | $17,649 | $24,261 | $17,459 |
| 12/31/22 | $16,244 | $22,864 | $16,072 |
| 1/31/23 | $17,538 | $24,300 | $17,357 |
| 2/28/23 | $17,350 | $23,707 | $17,180 |
| 3/31/23 | $13,440 | $24,578 | $13,298 |
| 4/30/23 | $13,279 | $24,961 | $13,134 |
| 5/31/23 | $12,338 | $25,070 | $12,207 |
| 6/30/23 | $13,154 | $26,726 | $13,017 |
| 7/31/23 | $15,340 | $27,585 | $15,185 |
| 8/31/23 | $14,280 | $27,146 | $14,143 |
| 9/30/23 | $13,609 | $25,852 | $13,463 |
| 10/31/23 | $13,044 | $25,308 | $12,906 |
| 11/30/23 | $14,895 | $27,619 | $14,739 |
| 12/31/23 | $17,124 | $28,874 | $16,959 |
| 1/31/24 | $16,659 | $29,359 | $16,509 |
| 2/29/24 | $16,510 | $30,927 | $16,383 |
| 3/31/24 | $17,630 | $31,922 | $17,497 |
| 4/30/24 | $16,606 | $30,619 | $16,475 |
| 5/31/24 | $17,321 | $32,138 | $17,188 |
| 6/30/24 | $17,494 | $33,292 | $17,370 |
Average Annual Total Returns (%)
| Name | 1 Year | 5 Years | 10 Years |
|---|
| KBE | 32.98% | 4.25% | 5.75% |
| S&P 500 Index | 24.56% | 15.05% | 12.86% |
| S&P Banks Select Industry Index | 33.44% | 4.57% | 6.08% |
The Fund’s past performance is not necessarily an indication of how the Fund will perform in the future. The returns do not reflect the deduction of taxes that a shareholder would pay on Fund distributions or on the redemption or sale of Fund shares. Updated performance information is available by calling 1-866-787-2257 or visiting our website at www.ssga.com/us/en/institutional/fund-finder?tab=documents&type=etfs.
| Statistic | Value |
|---|
| Total Net Assets | $1,444,705,964 |
| # of Portfolio Holdings | 94 |
| Portfolio Turnover Rate | 42% |
| Total Advisory Fees Paid | $5,114,191 |
What did the Fund invest in?
| Industry | % Value of Total Net Assets |
| Banks | 86.4% |
| Financial Services | 13.5% |
| Holdings | % Value of Total Net Assets |
| Bancorp, Inc. | 1.3% |
| First Horizon Corp. | 1.2% |
| First Interstate BancSystem, Inc., A | 1.2% |
| Webster Financial Corp. | 1.2% |
| Synovus Financial Corp. | 1.2% |
| Truist Financial Corp. | 1.2% |
| Axos Financial, Inc. | 1.2% |
| Comerica, Inc. | 1.2% |
| Old National Bancorp | 1.2% |
Hancock Whitney Corp. | 1.2% |
SPDR S&P Regional Banking ETF
Principal Listing Exchange: NYSEArca
Annual Shareholder Report
June 30, 2024
This annual shareholder report contains important information about the SPDR S&P Regional Banking ETF (the "Fund") for the year ended June 30, 2024. You can find additional information about the Fund, including the Prospectus, Statement of Additional Information, financial statements and other information at www.ssga.com/us/en/institutional/fund-finder?tab=documents&type=etfs. You can also request this information about the Fund by contacting us at 1-866-787-2257.
What were the Fund costs for the last year?
| Fund Name | Cost of a $10,000 investment | Costs paid as a percentage of a $10,000 investment |
|---|
| SPDR S&P Regional Banking ETF | $39 | 0.35% |
How did the Fund perform last year and what affected its performance?
U.S. Economic indicators from the U.S. remained relatively strong over the Q3 2023. While investors began the quarter with hopes that the rate hikes would soon end and cuts would begin, that probability ended by the end of the quarter. While larger banks posted higher returns due to rapidly rising interest rates, those higher rates had the opposite effect on regional banks. After the collapses of Silicon Valley Bank, First Republic Bank, and Signature Bank earlier in 2023, customers of local banks were still feeling uneasy about depositing their money for fear of further collapses. U.S. stocks rallied in Q4 2023, supported by prospects of rate cuts in 2024. U.S. equities rallied for a second straight quarter in Q1 2024. The Fed held the interest rates steady and struck a hawkish tone in June, maintaining the current policy rate and projecting only one rate cut in 2024. Luckily, even the hope of possible future rate cuts helped the Regional Banking Industry to finish the reporting period with strong positive returns.
The Fund's benchmarks are unmanaged indices used as a general measure of market performance. Calculations assume dividends and capital gains.
Comparison of Change in Value of a $10,000 Investment
(Based on Net Asset Value)
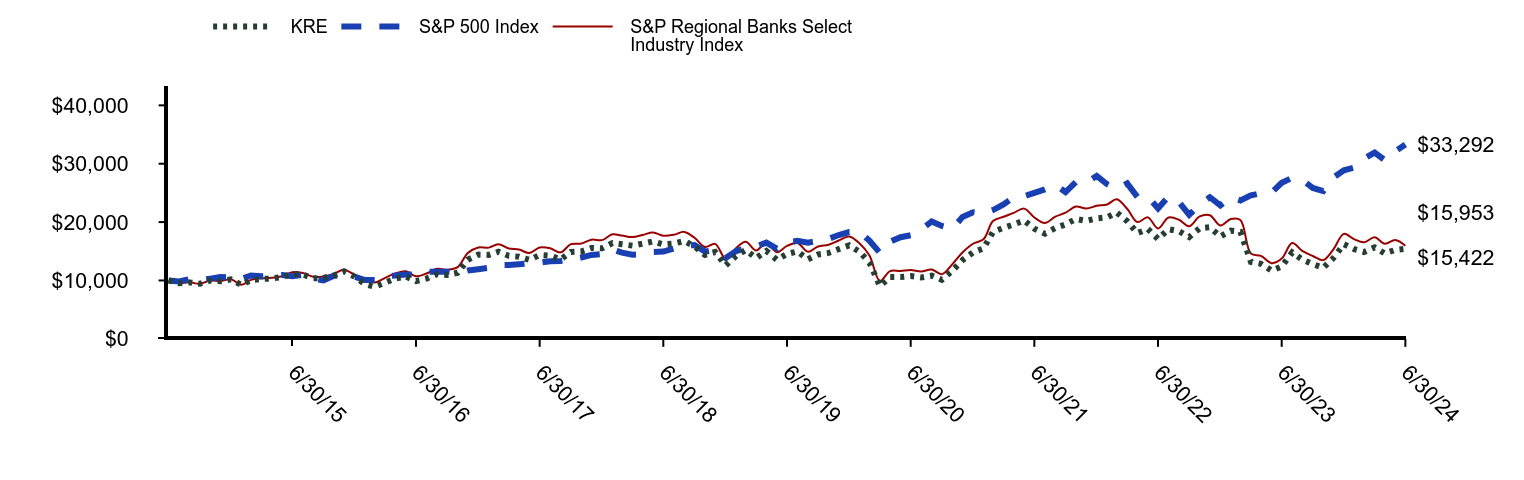
| KRE | S&P 500 Index | S&P Regional Banks Select Industry Index |
|---|
| 6/30/14 | $10,000 | $10,000 | $10,000 |
| 7/31/14 | $9,531 | $9,838 | $9,526 |
| 8/31/14 | $9,668 | $10,245 | $9,672 |
| 9/30/14 | $9,428 | $10,065 | $9,426 |
| 10/31/14 | $9,986 | $10,311 | $9,987 |
| 11/30/14 | $9,882 | $10,581 | $9,886 |
| 12/31/14 | $10,195 | $10,557 | $10,206 |
| 1/31/15 | $9,221 | $10,267 | $9,261 |
| 2/28/15 | $10,065 | $10,860 | $10,103 |
| 3/31/15 | $10,264 | $10,725 | $10,355 |
| 4/30/15 | $10,329 | $10,801 | $10,451 |
| 5/31/15 | $10,590 | $10,942 | $10,718 |
| 6/30/15 | $11,146 | $10,737 | $11,402 |
| 7/31/15 | $11,008 | $10,944 | $11,267 |
| 8/31/15 | $10,369 | $10,285 | $10,623 |
| 9/30/15 | $10,441 | $10,003 | $10,683 |
| 10/31/15 | $10,857 | $10,813 | $11,126 |
| 11/30/15 | $11,574 | $10,849 | $11,854 |
| 12/31/15 | $10,684 | $10,653 | $10,969 |
| 1/31/16 | $9,338 | $10,080 | $9,933 |
| 2/29/16 | $8,933 | $10,077 | $9,670 |
| 3/31/16 | $9,645 | $10,780 | $10,449 |
| 4/30/16 | $10,344 | $10,838 | $11,213 |
| 5/31/16 | $10,674 | $11,027 | $11,575 |
| 6/30/16 | $9,897 | $11,053 | $10,725 |
| 7/31/16 | $10,322 | $11,474 | $11,194 |
| 8/31/16 | $11,074 | $11,489 | $12,004 |
| 9/30/16 | $10,924 | $11,498 | $11,845 |
| 10/31/16 | $11,317 | $11,274 | $12,278 |
| 11/30/16 | $13,547 | $11,718 | $14,706 |
| 12/31/16 | $14,426 | $11,938 | $15,663 |
| 1/31/17 | $14,379 | $12,178 | $15,624 |
| 2/28/17 | $14,911 | $12,650 | $16,210 |
| 3/31/17 | $14,219 | $12,657 | $15,461 |
| 4/30/17 | $14,074 | $12,791 | $15,297 |
| 5/31/17 | $13,519 | $12,955 | $14,700 |
| 6/30/17 | $14,367 | $13,046 | $15,640 |
| 7/31/17 | $14,249 | $13,304 | $15,510 |
| 8/31/17 | $13,608 | $13,345 | $14,815 |
| 9/30/17 | $14,891 | $13,630 | $16,218 |
| 10/31/17 | $14,977 | $13,942 | $16,315 |
| 11/30/17 | $15,574 | $14,374 | $16,983 |
| 12/31/17 | $15,509 | $14,532 | $16,910 |
| 1/31/18 | $16,418 | $15,317 | $17,907 |
| 2/28/18 | $16,210 | $14,764 | $17,683 |
| 3/31/18 | $15,963 | $14,426 | $17,432 |
| 4/30/18 | $16,304 | $14,499 | $17,804 |
| 5/31/18 | $16,695 | $14,869 | $18,229 |
| 6/30/18 | $16,177 | $14,945 | $17,675 |
| 7/31/18 | $16,320 | $15,461 | $17,834 |
| 8/31/18 | $16,756 | $15,995 | $18,318 |
| 9/30/18 | $15,833 | $16,067 | $17,307 |
| 10/31/18 | $14,388 | $14,939 | $15,729 |
| 11/30/18 | $14,870 | $15,237 | $16,266 |
| 12/31/18 | $12,562 | $13,845 | $13,734 |
| 1/31/19 | $14,220 | $15,032 | $15,559 |
| 2/28/19 | $15,204 | $15,555 | $16,640 |
| 3/31/19 | $13,852 | $15,829 | $15,148 |
| 4/30/19 | $15,054 | $16,483 | $16,476 |
| 5/31/19 | $13,548 | $15,441 | $14,829 |
| 6/30/19 | $14,532 | $16,537 | $15,918 |
| 7/31/19 | $14,981 | $16,789 | $16,412 |
| 8/31/19 | $13,617 | $16,480 | $14,909 |
| 9/30/19 | $14,453 | $16,767 | $15,830 |
| 10/31/19 | $14,715 | $17,132 | $16,118 |
| 11/30/19 | $15,367 | $17,785 | $16,837 |
| 12/31/19 | $16,011 | $18,296 | $17,530 |
| 1/31/20 | $14,900 | $18,315 | $16,322 |
| 2/29/20 | $13,051 | $16,807 | $14,280 |
| 3/31/20 | $9,038 | $14,731 | $9,922 |
| 4/30/20 | $10,579 | $16,620 | $11,600 |
| 5/31/20 | $10,584 | $17,411 | $11,613 |
| 6/30/20 | $10,752 | $17,758 | $11,804 |
| 7/31/20 | $10,518 | $18,759 | $11,541 |
| 8/31/20 | $10,825 | $20,107 | $11,876 |
| 9/30/20 | $10,101 | $19,343 | $11,087 |
| 10/31/20 | $11,658 | $18,829 | $12,787 |
| 11/30/20 | $13,486 | $20,890 | $14,801 |
| 12/31/20 | $14,817 | $21,693 | $16,286 |
| 1/31/21 | $15,496 | $21,474 | $17,045 |
| 2/28/21 | $18,332 | $22,066 | $20,175 |
| 3/31/21 | $19,016 | $23,033 | $20,909 |
| 4/30/21 | $19,606 | $24,262 | $21,581 |
| 5/31/21 | $20,260 | $24,431 | $22,305 |
| 6/30/21 | $18,867 | $25,002 | $20,791 |
| 7/31/21 | $18,011 | $25,596 | $19,849 |
| 8/31/21 | $18,985 | $26,374 | $20,929 |
| 9/30/21 | $19,607 | $25,147 | $21,620 |
| 10/31/21 | $20,543 | $26,909 | $22,668 |
| 11/30/21 | $20,220 | $26,723 | $22,318 |
| 12/31/21 | $20,634 | $27,920 | $22,785 |
| 1/31/22 | $20,825 | $26,475 | $23,019 |
| 2/28/22 | $21,642 | $25,683 | $23,906 |
| 3/31/22 | $20,158 | $26,636 | $22,281 |
| 4/30/22 | $18,109 | $24,314 | $20,012 |
| 5/31/22 | $18,817 | $24,358 | $20,809 |
| 6/30/22 | $17,111 | $22,348 | $18,918 |
| 7/31/22 | $18,773 | $24,408 | $20,781 |
| 8/31/22 | $18,424 | $23,413 | $20,395 |
| 9/30/22 | $17,444 | $21,256 | $19,294 |
| 10/31/22 | $18,937 | $22,977 | $20,976 |
| 11/30/22 | $19,111 | $24,261 | $21,179 |
| 12/31/22 | $17,527 | $22,864 | $19,423 |
| 1/31/23 | $18,529 | $24,300 | $20,529 |
| 2/28/23 | $18,350 | $23,707 | $20,348 |
| 3/31/23 | $13,190 | $24,578 | $14,619 |
| 4/30/23 | $12,838 | $24,961 | $14,220 |
| 5/31/23 | $11,701 | $25,070 | $12,962 |
| 6/30/23 | $12,401 | $26,726 | $13,745 |
| 7/31/23 | $14,799 | $27,585 | $16,408 |
| 8/31/23 | $13,531 | $27,146 | $15,011 |
| 9/30/23 | $12,803 | $25,852 | $14,190 |
| 10/31/23 | $12,164 | $25,308 | $13,483 |
| 11/30/23 | $13,827 | $27,619 | $15,324 |
| 12/31/23 | $16,207 | $28,874 | $17,979 |
| 1/31/24 | $15,356 | $29,359 | $17,049 |
| 2/29/24 | $14,883 | $30,927 | $16,546 |
| 3/31/24 | $15,658 | $31,922 | $17,410 |
| 4/30/24 | $14,642 | $30,619 | $16,274 |
| 5/31/24 | $15,228 | $32,138 | $16,915 |
| 6/30/24 | $15,422 | $33,292 | $15,953 |
Average Annual Total Returns (%)
| Name | 1 Year | 5 Years | 10 Years |
|---|
| KRE | 24.30% | 1.19% | 4.42% |
| S&P 500 Index | 24.56% | 15.05% | 12.86% |
| S&P Regional Banks Select Industry Index | 24.77% | 1.50% | 4.78% |
The Fund’s past performance is not necessarily an indication of how the Fund will perform in the future. The returns do not reflect the deduction of taxes that a shareholder would pay on Fund distributions or on the redemption or sale of Fund shares. Updated performance information is available by calling 1-866-787-2257 or visiting our website at www.ssga.com/us/en/institutional/fund-finder?tab=documents&type=etfs.
| Statistic | Value |
|---|
| Total Net Assets | $2,712,298,027 |
| # of Portfolio Holdings | 143 |
| Portfolio Turnover Rate | 51% |
| Total Advisory Fees Paid | $10,212,729 |
What did the Fund invest in?
| Industry | % Value of Total Net Assets |
| Banks | 99.6% |
| Holdings | % Value of Total Net Assets |
| First Horizon Corp. | 2.3% |
| Webster Financial Corp. | 2.3% |
| Synovus Financial Corp. | 2.3% |
| Truist Financial Corp. | 2.3% |
| Bank OZK | 2.3% |
| Columbia Banking System, Inc. | 2.2% |
| Regions Financial Corp. | 2.2% |
| Western Alliance Bancorp | 2.2% |
| Valley National Bancorp | 2.2% |
| Huntington Bancshares, Inc. | 2.2% |
Principal Listing Exchange: NYSEArca
Annual Shareholder Report
June 30, 2024
This annual shareholder report contains important information about the SPDR S&P Dividend ETF (the "Fund") for the year ended June 30, 2024. You can find additional information about the Fund, including the Prospectus, Statement of Additional Information, financial statements and other information at www.ssga.com/us/en/institutional/fund-finder?tab=documents&type=etfs. You can also request this information about the Fund by contacting us at 1-866-787-2257.
What were the Fund costs for the last year?
| Fund Name | Cost of a $10,000 investment | Costs paid as a percentage of a $10,000 investment |
|---|
| SPDR S&P Dividend ETF | $36 | 0.35% |
How did the Fund perform last year and what affected its performance?
The reporting period began with uncertainty around economic growth, inflation and the Fed’s stance on the direction of rates rattled some investors who feared that the Fed would keep rates higher for longer. Despite the geopolitical uncertainty introduced by the attacks of October 7th in Israel, the ongoing trickle of indicators revealed that the economy was gradually beginning to slow, and the Fed managed to soothe investors by tempering its hawkish language. Concern about rate hikes turned into speculation about rate cuts. This, combined with continued enthusiasm for semiconductor companies that investors believed would drive the impending A.I. revolution, induced markets to resume their gains.
The Fund's benchmarks are unmanaged indices used as a general measure of market performance. Calculations assume dividends and capital gains.
Comparison of Change in Value of a $10,000 Investment
(Based on Net Asset Value)
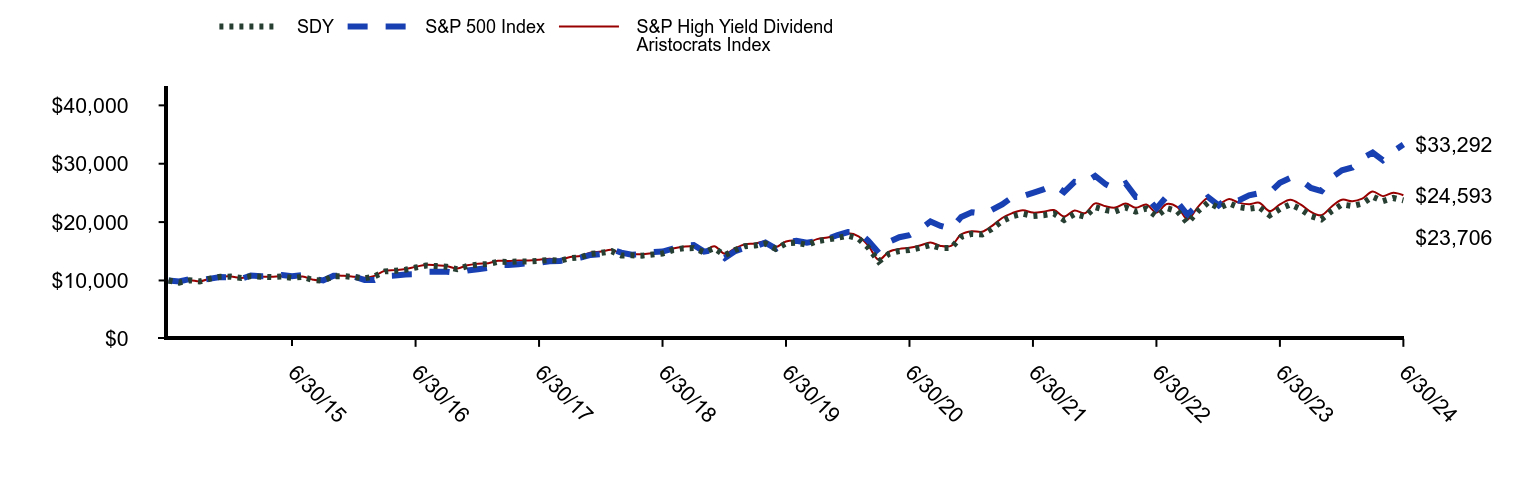
| SDY | S&P 500 Index | S&P High Yield Dividend Aristocrats Index |
|---|
| 6/30/14 | $10,000 | $10,000 | $10,000 |
| 7/31/14 | $9,633 | $9,838 | $9,639 |
| 8/31/14 | $10,043 | $10,245 | $10,054 |
| 9/30/14 | $9,844 | $10,065 | $9,854 |
| 10/31/14 | $10,318 | $10,311 | $10,336 |
| 11/30/14 | $10,623 | $10,581 | $10,640 |
| 12/31/14 | $10,666 | $10,557 | $10,692 |
| 1/31/15 | $10,410 | $10,267 | $10,434 |
| 2/28/15 | $10,734 | $10,860 | $10,771 |
| 3/31/15 | $10,638 | $10,725 | $10,676 |
| 4/30/15 | $10,576 | $10,801 | $10,617 |
| 5/31/15 | $10,678 | $10,942 | $10,723 |
| 6/30/15 | $10,440 | $10,737 | $10,485 |
| 7/31/15 | $10,624 | $10,944 | $10,670 |
| 8/31/15 | $10,089 | $10,285 | $10,138 |
| 9/30/15 | $9,954 | $10,003 | $10,001 |
| 10/31/15 | $10,724 | $10,813 | $10,777 |
| 11/30/15 | $10,750 | $10,849 | $10,806 |
| 12/31/15 | $10,576 | $10,653 | $10,651 |
| 1/31/16 | $10,378 | $10,080 | $10,458 |
| 2/29/16 | $10,698 | $10,077 | $10,787 |
| 3/31/16 | $11,558 | $10,780 | $11,657 |
| 4/30/16 | $11,668 | $10,838 | $11,771 |
| 5/31/16 | $11,833 | $11,027 | $11,945 |
| 6/30/16 | $12,213 | $11,053 | $12,328 |
| 7/31/16 | $12,559 | $11,474 | $12,685 |
| 8/31/16 | $12,463 | $11,489 | $12,593 |
| 9/30/16 | $12,348 | $11,498 | $12,480 |
| 10/31/16 | $11,919 | $11,274 | $12,043 |
| 11/30/16 | $12,469 | $11,718 | $12,608 |
| 12/31/16 | $12,714 | $11,938 | $12,855 |
| 1/31/17 | $12,813 | $12,178 | $12,964 |
| 2/28/17 | $13,197 | $12,650 | $13,359 |
| 3/31/17 | $13,174 | $12,657 | $13,342 |
| 4/30/17 | $13,248 | $12,791 | $13,423 |
| 5/31/17 | $13,260 | $12,955 | $13,437 |
| 6/30/17 | $13,364 | $13,046 | $13,547 |
| 7/31/17 | $13,515 | $13,304 | $13,704 |
| 8/31/17 | $13,391 | $13,345 | $13,583 |
| 9/30/17 | $13,801 | $13,630 | $14,005 |
| 10/31/17 | $13,983 | $13,942 | $14,192 |
| 11/30/17 | $14,559 | $14,374 | $14,779 |
| 12/31/17 | $14,730 | $14,532 | $14,949 |
| 1/31/18 | $15,015 | $15,317 | $15,255 |
| 2/28/18 | $14,283 | $14,764 | $14,514 |
| 3/31/18 | $14,303 | $14,426 | $14,534 |
| 4/30/18 | $14,251 | $14,499 | $14,491 |
| 5/31/18 | $14,432 | $14,869 | $14,676 |
| 6/30/18 | $14,631 | $14,945 | $14,880 |
| 7/31/18 | $15,212 | $15,461 | $15,484 |
| 8/31/18 | $15,513 | $15,995 | $15,795 |
| 9/30/18 | $15,555 | $16,067 | $15,840 |
| 10/31/18 | $14,812 | $14,939 | $15,090 |
| 11/30/18 | $15,543 | $15,237 | $15,850 |
| 12/31/18 | $14,324 | $13,845 | $14,586 |
| 1/31/19 | $15,224 | $15,032 | $15,514 |
| 2/28/19 | $15,872 | $15,555 | $16,185 |
| 3/31/19 | $16,000 | $15,829 | $16,317 |
| 4/30/19 | $16,334 | $16,483 | $16,668 |
| 5/31/19 | $15,422 | $15,441 | $15,734 |
| 6/30/19 | $16,347 | $16,537 | $16,687 |
| 7/31/19 | $16,484 | $16,789 | $16,837 |
| 8/31/19 | $16,090 | $16,480 | $16,440 |
| 9/30/19 | $16,722 | $16,767 | $17,083 |
| 10/31/19 | $16,999 | $17,132 | $17,375 |
| 11/30/19 | $17,319 | $17,785 | $17,700 |
| 12/31/19 | $17,664 | $18,296 | $18,070 |
| 1/31/20 | $17,167 | $18,315 | $17,565 |
| 2/29/20 | $15,621 | $16,807 | $15,972 |
| 3/31/20 | $13,237 | $14,731 | $13,541 |
| 4/30/20 | $14,557 | $16,620 | $14,910 |
| 5/31/20 | $15,050 | $17,411 | $15,414 |
| 6/30/20 | $15,221 | $17,758 | $15,590 |
| 7/31/20 | $15,607 | $18,759 | $15,982 |
| 8/31/20 | $16,090 | $20,107 | $16,490 |
| 9/30/20 | $15,539 | $19,343 | $15,919 |
| 10/31/20 | $15,562 | $18,829 | $15,925 |
| 11/30/20 | $17,464 | $20,890 | $17,896 |
| 12/31/20 | $17,983 | $21,693 | $18,442 |
| 1/31/21 | $17,886 | $21,474 | $18,355 |
| 2/28/21 | $18,806 | $22,066 | $19,302 |
| 3/31/21 | $20,177 | $23,033 | $20,697 |
| 4/30/21 | $20,979 | $24,262 | $21,546 |
| 5/31/21 | $21,440 | $24,431 | $22,020 |
| 6/30/21 | $21,043 | $25,002 | $21,625 |
| 7/31/21 | $21,187 | $25,596 | $21,774 |
| 8/31/21 | $21,461 | $26,374 | $22,068 |
| 9/30/21 | $20,368 | $25,147 | $20,942 |
| 10/31/21 | $21,378 | $26,909 | $21,993 |
| 11/30/21 | $20,910 | $26,723 | $21,508 |
| 12/31/21 | $22,552 | $27,920 | $23,211 |
| 1/31/22 | $22,041 | $26,475 | $22,698 |
| 2/28/22 | $21,822 | $25,683 | $22,482 |
| 3/31/22 | $22,499 | $26,636 | $23,179 |
| 4/30/22 | $21,797 | $24,314 | $22,462 |
| 5/31/22 | $22,326 | $24,358 | $23,015 |
| 6/30/22 | $20,998 | $22,348 | $21,652 |
| 7/31/22 | $22,388 | $24,408 | $23,099 |
| 8/31/22 | $21,868 | $23,413 | $22,573 |
| 9/30/22 | $19,849 | $21,256 | $20,476 |
| 10/31/22 | $21,888 | $22,977 | $22,599 |
| 11/30/22 | $23,365 | $24,261 | $24,142 |
| 12/31/22 | $22,432 | $22,864 | $23,177 |
| 1/31/23 | $23,204 | $24,300 | $23,973 |
| 2/28/23 | $22,567 | $23,707 | $23,332 |
| 3/31/23 | $22,302 | $24,578 | $23,064 |
| 4/30/23 | $22,542 | $24,961 | $23,310 |
| 5/31/23 | $21,165 | $25,070 | $21,881 |
| 6/30/23 | $22,252 | $26,726 | $23,024 |
| 7/31/23 | $23,026 | $27,585 | $23,828 |
| 8/31/23 | $22,207 | $27,146 | $22,982 |
| 9/30/23 | $21,021 | $25,852 | $21,754 |
| 10/31/23 | $20,467 | $25,308 | $21,186 |
| 11/30/23 | $21,863 | $27,619 | $22,641 |
| 12/31/23 | $23,015 | $28,874 | $23,832 |
| 1/31/24 | $22,752 | $29,359 | $23,573 |
| 2/29/24 | $23,160 | $30,927 | $24,017 |
| 3/31/24 | $24,347 | $31,922 | $25,253 |
| 4/30/24 | $23,575 | $30,619 | $24,449 |
| 5/31/24 | $24,131 | $32,138 | $25,021 |
| 6/30/24 | $23,706 | $33,292 | $24,593 |
Average Annual Total Returns (%)
| Name | 1 Year | 5 Years | 10 Years |
|---|
| SDY | 6.52% | 7.72% | 9.02% |
| S&P 500 Index | 24.56% | 15.05% | 12.86% |
| S&P High Yield Dividend Aristocrats Index | 6.81% | 8.06% | 9.42% |
The Fund’s past performance is not necessarily an indication of how the Fund will perform in the future. The returns do not reflect the deduction of taxes that a shareholder would pay on Fund distributions or on the redemption or sale of Fund shares. Updated performance information is available by calling 1-866-787-2257 or visiting our website at www.ssga.com/us/en/institutional/fund-finder?tab=documents&type=etfs.
| Statistic | Value |
|---|
| Total Net Assets | $19,708,801,684 |
| # of Portfolio Holdings | 136 |
| Portfolio Turnover Rate | 55% |
| Total Advisory Fees Paid | $72,006,698 |
What did the Fund invest in?
| Industry | % Value of Total Net Assets |
| Electric Utilities | 10.0% |
| Machinery | 6.2% |
| Household Products | 5.6% |
| Chemicals | 5.3% |
| Insurance | 5.2% |
| Semiconductors & Semiconductor Equipment | 4.7% |
| Food Products | 4.3% |
| Aerospace & Defense | 4.0% |
| Multi-Utilities | 3.6% |
| Capital Markets | 3.6% |
| Holdings | % Value of Total Net Assets |
| Realty Income Corp. | 2.6% |
| Southern Co. | 1.9% |
| Chevron Corp. | 1.8% |
| Xcel Energy, Inc. | 1.8% |
| T Rowe Price Group, Inc. | 1.8% |
| Edison International | 1.8% |
| Kimberly-Clark Corp. | 1.8% |
| Consolidated Edison, Inc. | 1.6% |
| Texas Instruments, Inc. | 1.6% |
| Kenvue, Inc. | 1.6% |
SPDR S&P Aerospace & Defense ETF
Principal Listing Exchange: NYSEArca
Annual Shareholder Report
June 30, 2024
This annual shareholder report contains important information about the SPDR S&P Aerospace & Defense ETF (the "Fund") for the year ended June 30, 2024. You can find additional information about the Fund, including the Prospectus, Statement of Additional Information, financial statements and other information at www.ssga.com/us/en/institutional/fund-finder?tab=documents&type=etfs. You can also request this information about the Fund by contacting us at 1-866-787-2257.
What were the Fund costs for the last year?
| Fund Name | Cost of a $10,000 investment | Costs paid as a percentage of a $10,000 investment |
|---|
| SPDR S&P Aerospace & Defense ETF | $38 | 0.35% |
How did the Fund perform last year and what affected its performance?
After gaining close to 22% during the prior fiscal year, the Aerospace & Defense Industry continued that trajectory during this most recent fiscal year by adding another 16.21%. Unlike the prior period, however, the Industry lagged the S&P 500 Index (+24.56%) this time around. The more than 8% deficit is even more noteworthy given that the Industry actually beat the broader index by close to 10% during the second fiscal quarter – the only quarter of outperformance throughout the fiscal period. The quarterly outperformance stemmed from business aviation usage hitting 20% above pre-COVID levels (according to data tracker WingX Advance) and the passing of the National Defense Authorization Act (NDAA) that will allocate $886 billion to national security in 2024. Overall, defense stocks paralleled the S&P 500 for the most part while Aerospace stocks played the role of laggard. This was led by Virgin Galactic (-89.14%) who announced the discontinuance of their Unity spacecraft venture. Boeing (-12.63%) also had an unfortunate year that not only saw manufacturing problems interrupting production of both their 737 Max and 787 Dreamliner, but also in-flight malfunctions, whistleblowing, and regulatory scrutiny.
The Fund's benchmarks are unmanaged indices used as a general measure of market performance. Calculations assume dividends and capital gains.
Comparison of Change in Value of a $10,000 Investment
(Based on Net Asset Value)
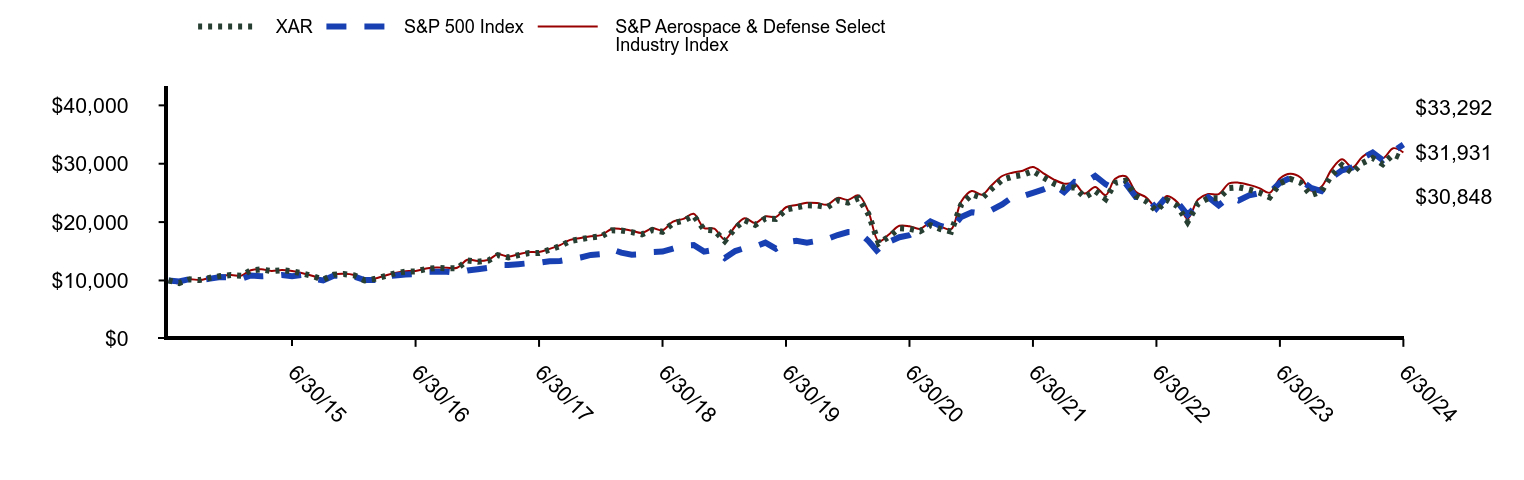
| XAR | S&P 500 Index | S&P Aerospace & Defense Select Industry Index |
|---|
| 6/30/14 | $10,000 | $10,000 | $10,000 |
| 7/31/14 | $9,536 | $9,838 | $9,533 |
| 8/31/14 | $10,207 | $10,245 | $10,212 |
| 9/30/14 | $10,064 | $10,065 | $10,065 |
| 10/31/14 | $10,468 | $10,311 | $10,479 |
| 11/30/14 | $10,750 | $10,581 | $10,765 |
| 12/31/14 | $10,927 | $10,557 | $10,942 |
| 1/31/15 | $10,814 | $10,267 | $10,831 |
| 2/28/15 | $11,743 | $10,860 | $11,760 |
| 3/31/15 | $11,892 | $10,725 | $11,915 |
| 4/30/15 | $11,603 | $10,801 | $11,632 |
| 5/31/15 | $11,760 | $10,942 | $11,789 |
| 6/30/15 | $11,569 | $10,737 | $11,604 |
| 7/31/15 | $11,201 | $10,944 | $11,239 |
| 8/31/15 | $10,731 | $10,285 | $10,775 |
| 9/30/15 | $10,130 | $10,003 | $10,171 |
| 10/31/15 | $10,968 | $10,813 | $11,008 |
| 11/30/15 | $11,104 | $10,849 | $11,151 |
| 12/31/15 | $10,882 | $10,653 | $10,941 |
| 1/31/16 | $10,002 | $10,080 | $10,062 |
| 2/29/16 | $10,243 | $10,077 | $10,302 |
| 3/31/16 | $10,749 | $10,780 | $10,817 |
| 4/30/16 | $11,232 | $10,838 | $11,301 |
| 5/31/16 | $11,514 | $11,027 | $11,591 |
| 6/30/16 | $11,555 | $11,053 | $11,633 |
| 7/31/16 | $11,956 | $11,474 | $12,045 |
| 8/31/16 | $12,134 | $11,489 | $12,221 |
| 9/30/16 | $12,083 | $11,498 | $12,173 |
| 10/31/16 | $12,089 | $11,274 | $12,176 |
| 11/30/16 | $13,436 | $11,718 | $13,540 |
| 12/31/16 | $13,215 | $11,938 | $13,327 |
| 1/31/17 | $13,411 | $12,178 | $13,532 |
| 2/28/17 | $14,343 | $12,650 | $14,476 |
| 3/31/17 | $13,949 | $12,657 | $14,085 |
| 4/30/17 | $14,334 | $12,791 | $14,478 |
| 5/31/17 | $14,704 | $12,955 | $14,855 |
| 6/30/17 | $14,717 | $13,046 | $14,876 |
| 7/31/17 | $15,246 | $13,304 | $15,411 |
| 8/31/17 | $15,878 | $13,345 | $16,058 |
| 9/30/17 | $16,750 | $13,630 | $16,946 |
| 10/31/17 | $17,077 | $13,942 | $17,279 |
| 11/30/17 | $17,364 | $14,374 | $17,583 |
| 12/31/17 | $17,556 | $14,532 | $17,773 |
| 1/31/18 | $18,587 | $15,317 | $18,826 |
| 2/28/18 | $18,559 | $14,764 | $18,804 |
| 3/31/18 | $18,275 | $14,426 | $18,531 |
| 4/30/18 | $17,894 | $14,499 | $18,151 |
| 5/31/18 | $18,655 | $14,869 | $18,925 |
| 6/30/18 | $18,350 | $14,945 | $18,616 |
| 7/31/18 | $19,791 | $15,461 | $20,083 |
| 8/31/18 | $20,233 | $15,995 | $20,545 |
| 9/30/18 | $21,097 | $16,067 | $21,417 |
| 10/31/18 | $18,688 | $14,939 | $18,976 |
| 11/30/18 | $18,572 | $15,237 | $18,873 |
| 12/31/18 | $16,757 | $13,845 | $17,024 |
| 1/31/19 | $19,004 | $15,032 | $19,299 |
| 2/28/19 | $20,308 | $15,555 | $20,647 |
| 3/31/19 | $19,526 | $15,829 | $19,854 |
| 4/30/19 | $20,613 | $16,483 | $20,976 |
| 5/31/19 | $20,523 | $15,441 | $20,881 |
| 6/30/19 | $22,148 | $16,537 | $22,543 |
| 7/31/19 | $22,525 | $16,789 | $22,935 |
| 8/31/19 | $22,872 | $16,480 | $23,304 |
| 9/30/19 | $22,843 | $16,767 | $23,275 |
| 10/31/19 | $22,564 | $17,132 | $22,997 |
| 11/30/19 | $23,700 | $17,785 | $24,150 |
| 12/31/19 | $23,331 | $18,296 | $23,798 |
| 1/31/20 | $24,095 | $18,315 | $24,579 |
| 2/29/20 | $21,413 | $16,807 | $21,845 |
| 3/31/20 | $16,355 | $14,731 | $16,699 |
| 4/30/20 | $17,498 | $16,620 | $17,871 |
| 5/31/20 | $18,955 | $17,411 | $19,367 |
| 6/30/20 | $18,859 | $17,758 | $19,282 |
| 7/31/20 | $18,440 | $18,759 | $18,842 |
| 8/31/20 | $19,465 | $20,107 | $19,900 |
| 9/30/20 | $18,803 | $19,343 | $19,231 |
| 10/31/20 | $18,369 | $18,829 | $18,779 |
| 11/30/20 | $23,003 | $20,890 | $23,533 |
| 12/31/20 | $24,745 | $21,693 | $25,334 |
| 1/31/21 | $24,133 | $21,474 | $24,693 |
| 2/28/21 | $25,700 | $22,066 | $26,321 |
| 3/31/21 | $27,244 | $23,033 | $27,897 |
| 4/30/21 | $27,786 | $24,262 | $28,468 |
| 5/31/21 | $28,100 | $24,431 | $28,802 |
| 6/30/21 | $28,716 | $25,002 | $29,444 |
| 7/31/21 | $27,652 | $25,596 | $28,361 |
| 8/31/21 | $26,604 | $26,374 | $27,290 |
| 9/30/21 | $25,902 | $25,147 | $26,592 |
| 10/31/21 | $25,920 | $26,909 | $26,609 |
| 11/30/21 | $24,260 | $26,723 | $24,908 |
| 12/31/21 | $25,337 | $27,920 | $26,023 |
| 1/31/22 | $23,964 | $26,475 | $24,621 |
| 2/28/22 | $26,710 | $25,683 | $27,437 |
| 3/31/22 | $27,106 | $26,636 | $27,863 |
| 4/30/22 | $24,502 | $24,314 | $25,191 |
| 5/31/22 | $23,549 | $24,358 | $24,221 |
| 6/30/22 | $21,933 | $22,348 | $22,546 |
| 7/31/22 | $23,783 | $24,408 | $24,465 |
| 8/31/22 | $22,744 | $23,413 | $23,395 |
| 9/30/22 | $20,036 | $21,256 | $20,591 |
| 10/31/22 | $23,190 | $22,977 | $23,864 |
| 11/30/22 | $24,093 | $24,261 | $24,807 |
| 12/31/22 | $24,076 | $22,864 | $24,789 |
| 1/31/23 | $25,833 | $24,300 | $26,621 |
| 2/28/23 | $25,961 | $23,707 | $26,754 |
| 3/31/23 | $25,573 | $24,578 | $26,371 |
| 4/30/23 | $25,050 | $24,961 | $25,829 |
| 5/31/23 | $24,259 | $25,070 | $25,019 |
| 6/30/23 | $26,633 | $26,726 | $27,478 |
| 7/31/23 | $27,401 | $27,585 | $28,276 |
| 8/31/23 | $26,743 | $27,146 | $27,600 |
| 9/30/23 | $24,596 | $25,852 | $25,387 |
| 10/31/23 | $25,242 | $25,308 | $26,063 |
| 11/30/23 | $28,050 | $27,619 | $28,972 |
| 12/31/23 | $29,769 | $28,874 | $30,759 |
| 1/31/24 | $28,421 | $29,359 | $29,366 |
| 2/29/24 | $30,097 | $30,927 | $31,148 |
| 3/31/24 | $30,974 | $31,922 | $32,045 |
| 4/30/24 | $29,917 | $30,619 | $30,937 |
| 5/31/24 | $31,591 | $32,138 | $32,661 |
| 6/30/24 | $30,848 | $33,292 | $31,931 |
Average Annual Total Returns (%)
| Name | 1 Year | 5 Years | 10 Years |
|---|
| XAR | 15.85% | 6.86% | 11.93% |
| S&P 500 Index | 24.56% | 15.05% | 12.86% |
| S&P Aerospace & Defense Select Industry Index | 16.21% | 7.21% | 12.31% |
The Fund’s past performance is not necessarily an indication of how the Fund will perform in the future. The returns do not reflect the deduction of taxes that a shareholder would pay on Fund distributions or on the redemption or sale of Fund shares. Updated performance information is available by calling 1-866-787-2257 or visiting our website at www.ssga.com/us/en/institutional/fund-finder?tab=documents&type=etfs.
| Statistic | Value |
|---|
| Total Net Assets | $2,114,115,858 |
| # of Portfolio Holdings | 34 |
| Portfolio Turnover Rate | 36% |
| Total Advisory Fees Paid | $6,460,002 |
What did the Fund invest in?
| Industry | % Value of Total Net Assets |
| Aerospace & Defense | 99.8% |
| Holdings | % Value of Total Net Assets |
| Spirit AeroSystems Holdings, Inc., A | 5.2% |
| BWX Technologies, Inc. | 4.9% |
| Huntington Ingalls Industries, Inc. | 4.8% |
| L3Harris Technologies, Inc. | 4.8% |
| Northrop Grumman Corp. | 4.8% |
| Boeing Co. | 4.8% |
| Lockheed Martin Corp. | 4.7% |
| Curtiss-Wright Corp. | 4.7% |
| Textron, Inc. | 4.7% |
| Axon Enterprise, Inc. | 4.7% |
Principal Listing Exchange: NYSEArca
Annual Shareholder Report
June 30, 2024
This annual shareholder report contains important information about the SPDR S&P Biotech ETF (the "Fund") for the year ended June 30, 2024. You can find additional information about the Fund, including the Prospectus, Statement of Additional Information, financial statements and other information at www.ssga.com/us/en/institutional/fund-finder?tab=documents&type=etfs. You can also request this information about the Fund by contacting us at 1-866-787-2257.
What were the Fund costs for the last year?
| Fund Name | Cost of a $10,000 investment | Costs paid as a percentage of a $10,000 investment |
|---|
| SPDR S&P Biotech ETF | $37 | 0.35% |
How did the Fund perform last year and what affected its performance?
Performance of the fund during the reporting period was driven by positive results of drug trials by multiple companies within the investment universe.
The Fund's benchmarks are unmanaged indices used as a general measure of market performance. Calculations assume dividends and capital gains.
Comparison of Change in Value of a $10,000 Investment
(Based on Net Asset Value)
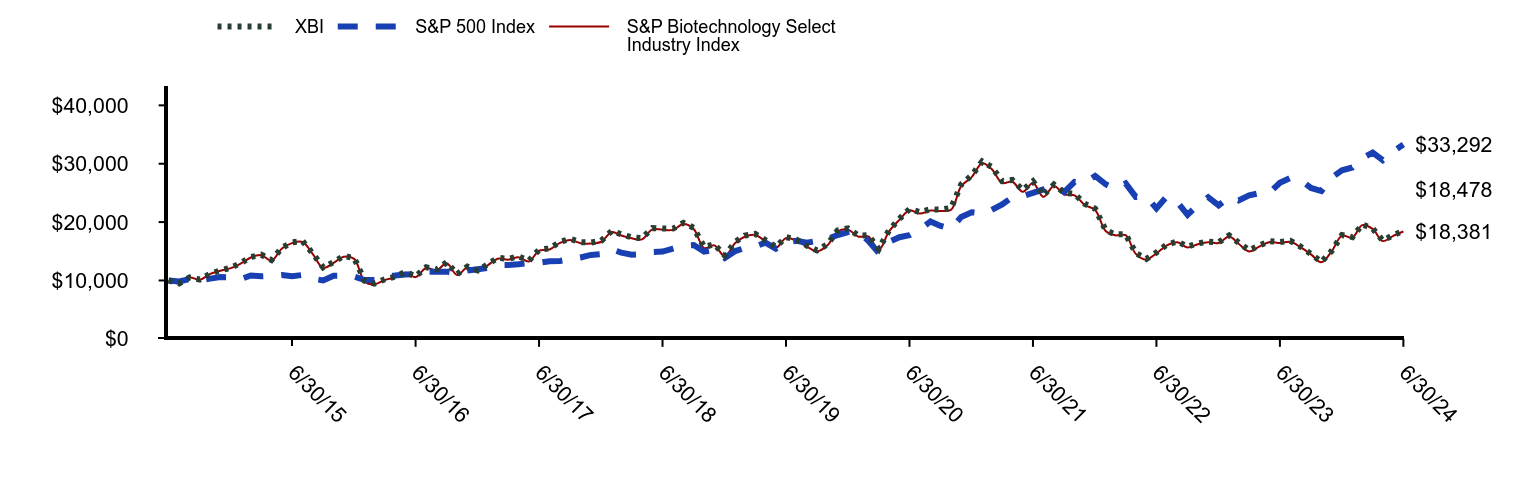
| XBI | S&P 500 Index | S&P Biotechnology Select Industry Index |
|---|
| 6/30/14 | $10,000 | $10,000 | $10,000 |
| 7/31/14 | $9,486 | $9,838 | $9,474 |
| 8/31/14 | $10,512 | $10,245 | $10,503 |
| 9/30/14 | $10,160 | $10,065 | $10,121 |
| 10/31/14 | $11,165 | $10,311 | $11,125 |
| 11/30/14 | $11,718 | $10,581 | $11,654 |
| 12/31/14 | $12,171 | $10,557 | $12,114 |
| 1/31/15 | $13,041 | $10,267 | $12,971 |
| 2/28/15 | $14,017 | $10,860 | $13,931 |
| 3/31/15 | $14,405 | $10,725 | $14,330 |
| 4/30/15 | $13,500 | $10,801 | $13,405 |
| 5/31/15 | $15,596 | $10,942 | $15,479 |
| 6/30/15 | $16,536 | $10,737 | $16,403 |
| 7/31/15 | $16,736 | $10,944 | $16,587 |
| 8/31/15 | $14,568 | $10,285 | $14,451 |
| 9/30/15 | $12,224 | $10,003 | $12,136 |
| 10/31/15 | $13,136 | $10,813 | $13,022 |
| 11/30/15 | $14,212 | $10,849 | $14,079 |
| 12/31/15 | $13,834 | $10,653 | $13,699 |
| 1/31/16 | $9,954 | $10,080 | $9,844 |
| 2/29/16 | $9,464 | $10,077 | $9,348 |
| 3/31/16 | $10,201 | $10,780 | $10,088 |
| 4/30/16 | $10,647 | $10,838 | $10,514 |
| 5/31/16 | $11,454 | $11,027 | $11,325 |
| 6/30/16 | $10,690 | $11,053 | $10,570 |
| 7/31/16 | $12,258 | $11,474 | $12,121 |
| 8/31/16 | $11,875 | $11,489 | $11,732 |
| 9/30/16 | $13,098 | $11,498 | $12,939 |
| 10/31/16 | $11,084 | $11,274 | $10,936 |
| 11/30/16 | $12,383 | $11,718 | $12,232 |
| 12/31/16 | $11,702 | $11,938 | $11,562 |
| 1/31/17 | $12,829 | $12,178 | $12,679 |
| 2/28/17 | $13,887 | $12,650 | $13,731 |
| 3/31/17 | $13,716 | $12,657 | $13,568 |
| 4/30/17 | $14,127 | $12,791 | $13,971 |
| 5/31/17 | $13,393 | $12,955 | $13,250 |
| 6/30/17 | $15,277 | $13,046 | $15,114 |
| 7/31/17 | $15,477 | $13,304 | $15,303 |
| 8/31/17 | $16,609 | $13,345 | $16,434 |
| 9/30/17 | $17,140 | $13,630 | $16,945 |
| 10/31/17 | $16,573 | $13,942 | $16,383 |
| 11/30/17 | $16,496 | $14,374 | $16,317 |
| 12/31/17 | $16,820 | $14,532 | $16,634 |
| 1/31/18 | $18,498 | $15,317 | $18,302 |
| 2/28/18 | $17,905 | $14,764 | $17,703 |
| 3/31/18 | $17,396 | $14,426 | $17,218 |
| 4/30/18 | $17,235 | $14,499 | $17,039 |
| 5/31/18 | $18,960 | $14,869 | $18,760 |
| 6/30/18 | $18,884 | $14,945 | $18,683 |
| 7/31/18 | $18,883 | $15,461 | $18,667 |
| 8/31/18 | $19,876 | $15,995 | $19,662 |
| 9/30/18 | $19,035 | $16,067 | $18,823 |
| 10/31/18 | $15,722 | $14,939 | $15,547 |
| 11/30/18 | $16,198 | $15,237 | $16,005 |
| 12/31/18 | $14,290 | $13,845 | $14,139 |
| 1/31/19 | $16,604 | $15,032 | $16,427 |
| 2/28/19 | $17,704 | $15,555 | $17,493 |
| 3/31/19 | $17,982 | $15,829 | $17,780 |
| 4/30/19 | $16,918 | $16,483 | $16,721 |
| 5/31/19 | $15,764 | $15,441 | $15,583 |
| 6/30/19 | $17,430 | $16,537 | $17,250 |
| 7/31/19 | $17,006 | $16,789 | $16,831 |
| 8/31/19 | $15,959 | $16,480 | $15,789 |
| 9/30/19 | $15,146 | $16,767 | $14,982 |
| 10/31/19 | $16,201 | $17,132 | $16,020 |
| 11/30/19 | $18,574 | $17,785 | $18,377 |
| 12/31/19 | $18,912 | $18,296 | $18,710 |
| 1/31/20 | $17,696 | $18,315 | $17,502 |
| 2/29/20 | $17,739 | $16,807 | $17,544 |
| 3/31/20 | $15,374 | $14,731 | $15,245 |
| 4/30/20 | $18,556 | $16,620 | $18,364 |
| 5/31/20 | $20,561 | $17,411 | $20,379 |
| 6/30/20 | $22,250 | $17,758 | $22,029 |
| 7/31/20 | $21,702 | $18,759 | $21,454 |
| 8/31/20 | $22,206 | $20,107 | $21,968 |
| 9/30/20 | $22,131 | $19,343 | $21,907 |
| 10/31/20 | $22,419 | $18,829 | $22,120 |
| 11/30/20 | $26,455 | $20,890 | $26,159 |
| 12/31/20 | $28,006 | $21,693 | $27,710 |
| 1/31/21 | $30,397 | $21,474 | $30,073 |
| 2/28/21 | $29,456 | $22,066 | $29,100 |
| 3/31/21 | $27,026 | $23,033 | $26,710 |
| 4/30/21 | $27,211 | $24,262 | $26,917 |
| 5/31/21 | $25,491 | $24,431 | $25,187 |
| 6/30/21 | $26,984 | $25,002 | $26,697 |
| 7/31/21 | $24,597 | $25,596 | $24,322 |
| 8/31/21 | $26,440 | $26,374 | $26,198 |
| 9/30/21 | $25,027 | $25,147 | $24,775 |
| 10/31/21 | $24,842 | $26,909 | $24,588 |
| 11/30/21 | $23,147 | $26,723 | $22,920 |
| 12/31/21 | $22,282 | $27,920 | $22,063 |
| 1/31/22 | $18,612 | $26,475 | $18,473 |
| 2/28/22 | $17,893 | $25,683 | $17,739 |
| 3/31/22 | $17,911 | $26,636 | $17,751 |
| 4/30/22 | $14,692 | $24,314 | $14,562 |
| 5/31/22 | $13,694 | $24,358 | $13,580 |
| 6/30/22 | $14,793 | $22,348 | $14,646 |
| 7/31/22 | $16,148 | $24,408 | $16,001 |
| 8/31/22 | $16,671 | $23,413 | $16,526 |
| 9/30/22 | $15,797 | $21,256 | $15,667 |
| 10/31/22 | $16,358 | $22,977 | $16,220 |
| 11/30/22 | $16,651 | $24,261 | $16,542 |
| 12/31/22 | $16,536 | $22,864 | $16,410 |
| 1/31/23 | $17,709 | $24,300 | $17,516 |
| 2/28/23 | $16,490 | $23,707 | $16,295 |
| 3/31/23 | $15,181 | $24,578 | $14,982 |
| 4/30/23 | $15,971 | $24,961 | $15,796 |
| 5/31/23 | $16,743 | $25,070 | $16,588 |
| 6/30/23 | $16,567 | $26,726 | $16,423 |
| 7/31/23 | $16,793 | $27,585 | $16,630 |
| 8/31/23 | $15,759 | $27,146 | $15,659 |
| 9/30/23 | $14,540 | $25,852 | $14,474 |
| 10/31/23 | $13,184 | $25,308 | $13,111 |
| 11/30/23 | $15,030 | $27,619 | $14,955 |
| 12/31/23 | $17,774 | $28,874 | $17,683 |
| 1/31/24 | $17,430 | $29,359 | $17,331 |
| 2/29/24 | $19,597 | $30,927 | $19,486 |
| 3/31/24 | $18,898 | $31,922 | $18,828 |
| 4/30/24 | $16,835 | $30,619 | $16,749 |
| 5/31/24 | $17,763 | $32,138 | $17,631 |
| 6/30/24 | $18,478 | $33,292 | $18,381 |
Average Annual Total Returns (%)
| Name | 1 Year | 5 Years | 10 Years |
|---|
| XBI | 11.53% | 1.17% | 6.34% |
| S&P 500 Index | 24.56% | 15.05% | 12.86% |
| S&P Biotechnology Select Industry Index | 11.93% | 1.28% | 6.28% |
The Fund’s past performance is not necessarily an indication of how the Fund will perform in the future. The returns do not reflect the deduction of taxes that a shareholder would pay on Fund distributions or on the redemption or sale of Fund shares. Updated performance information is available by calling 1-866-787-2257 or visiting our website at www.ssga.com/us/en/institutional/fund-finder?tab=documents&type=etfs.
| Statistic | Value |
|---|
| Total Net Assets | $6,916,986,175 |
| # of Portfolio Holdings | 143 |
| Portfolio Turnover Rate | 90% |
| Total Advisory Fees Paid | $22,791,014 |
What did the Fund invest in?
| Industry | % Value of Total Net Assets |
| Biotechnology | 99.8% |
| Pharmaceuticals | 0.2% |
| Holdings | % Value of Total Net Assets |
| Sarepta Therapeutics, Inc. | 3.3% |
| United Therapeutics Corp. | 3.0% |
| Alnylam Pharmaceuticals, Inc. | 2.9% |
| Gilead Sciences, Inc. | 2.8% |
| Amgen, Inc. | 2.8% |
| AbbVie, Inc. | 2.7% |
| Regeneron Pharmaceuticals, Inc. | 2.7% |
| Exact Sciences Corp. | 2.7% |
| Biogen, Inc. | 2.7% |
| BioMarin Pharmaceutical, Inc. | 2.7% |
SPDR S&P Homebuilders ETF
Principal Listing Exchange: NYSEArca
Annual Shareholder Report
June 30, 2024
This annual shareholder report contains important information about the SPDR S&P Homebuilders ETF (the "Fund") for the year ended June 30, 2024. You can find additional information about the Fund, including the Prospectus, Statement of Additional Information, financial statements and other information at www.ssga.com/us/en/institutional/fund-finder?tab=documents&type=etfs. You can also request this information about the Fund by contacting us at 1-866-787-2257.
What were the Fund costs for the last year?
| Fund Name | Cost of a $10,000 investment | Costs paid as a percentage of a $10,000 investment |
|---|
| SPDR S&P Homebuilders ETF | $40 | 0.35% |
How did the Fund perform last year and what affected its performance?
The market environment over the reporting period was largely driven by news about inflation, economic growth and the impact either would have on the Fed and other central banks with regard to interest rate decisions. Elevated mortgage rates, low existing home inventory and robust housing demand were favorable conditions for the homebuilder industry. The overall housing market still faces significant under-supply which has increased the demand for new construction.
The Fund's benchmarks are unmanaged indices used as a general measure of market performance. Calculations assume dividends and capital gains.
Comparison of Change in Value of a $10,000 Investment
(Based on Net Asset Value)
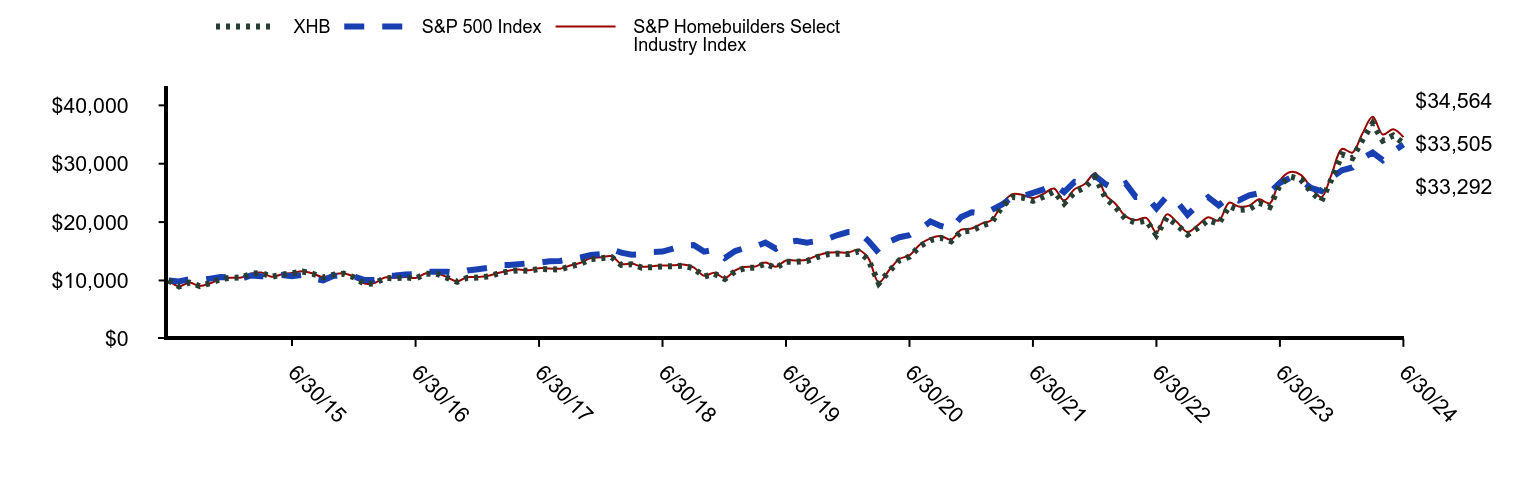
| XHB | S&P 500 Index | S&P Homebuilders Select Industry Index |
|---|
| 6/30/14 | $10,000 | $10,000 | $10,000 |
| 7/31/14 | $8,987 | $9,838 | $8,991 |
| 8/31/14 | $9,637 | $10,245 | $9,639 |
| 9/30/14 | $9,049 | $10,065 | $9,054 |
| 10/31/14 | $9,520 | $10,311 | $9,530 |
| 11/30/14 | $10,236 | $10,581 | $10,243 |
| 12/31/14 | $10,455 | $10,557 | $10,468 |
| 1/31/15 | $10,504 | $10,267 | $10,523 |
| 2/28/15 | $11,126 | $10,860 | $11,152 |
| 3/31/15 | $11,319 | $10,725 | $11,354 |
| 4/30/15 | $10,611 | $10,801 | $10,641 |
| 5/31/15 | $11,016 | $10,942 | $11,047 |
| 6/30/15 | $11,238 | $10,737 | $11,271 |
| 7/31/15 | $11,535 | $10,944 | $11,575 |
| 8/31/15 | $11,118 | $10,285 | $11,164 |
| 9/30/15 | $10,515 | $10,003 | $10,559 |
| 10/31/15 | $10,985 | $10,813 | $11,036 |
| 11/30/15 | $11,163 | $10,849 | $11,217 |
| 12/31/15 | $10,512 | $10,653 | $10,571 |
| 1/31/16 | $9,404 | $10,080 | $9,456 |
| 2/29/16 | $9,499 | $10,077 | $9,557 |
| 3/31/16 | $10,426 | $10,780 | $10,495 |
| 4/30/16 | $10,377 | $10,838 | $10,448 |
| 5/31/16 | $10,531 | $11,027 | $10,599 |
| 6/30/16 | $10,360 | $11,053 | $10,434 |
| 7/31/16 | $11,141 | $11,474 | $11,224 |
| 8/31/16 | $11,162 | $11,489 | $11,249 |
| 9/30/16 | $10,493 | $11,498 | $10,578 |
| 10/31/16 | $9,778 | $11,274 | $9,860 |
| 11/30/16 | $10,462 | $11,718 | $10,552 |
| 12/31/16 | $10,490 | $11,938 | $10,584 |
| 1/31/17 | $10,698 | $12,178 | $10,796 |
| 2/28/17 | $11,159 | $12,650 | $11,265 |
| 3/31/17 | $11,554 | $12,657 | $11,669 |
| 4/30/17 | $11,737 | $12,791 | $11,858 |
| 5/31/17 | $11,634 | $12,955 | $11,755 |
| 6/30/17 | $11,977 | $13,046 | $12,111 |
| 7/31/17 | $11,924 | $13,304 | $12,058 |
| 8/31/17 | $11,878 | $13,345 | $12,015 |
| 9/30/17 | $12,410 | $13,630 | $12,555 |
| 10/31/17 | $12,884 | $13,942 | $13,041 |
| 11/30/17 | $13,656 | $14,374 | $13,824 |
| 12/31/17 | $13,814 | $14,532 | $13,987 |
| 1/31/18 | $13,976 | $15,317 | $14,159 |
| 2/28/18 | $12,658 | $14,764 | $12,825 |
| 3/31/18 | $12,765 | $14,426 | $12,891 |
| 4/30/18 | $12,192 | $14,499 | $12,360 |
| 5/31/18 | $12,286 | $14,869 | $12,451 |
| 6/30/18 | $12,412 | $14,945 | $12,564 |
| 7/31/18 | $12,427 | $15,461 | $12,591 |
| 8/31/18 | $12,553 | $15,995 | $12,721 |
| 9/30/18 | $12,076 | $16,067 | $12,236 |
| 10/31/18 | $10,674 | $14,939 | $10,817 |
| 11/30/18 | $11,164 | $15,237 | $11,320 |
| 12/31/18 | $10,270 | $13,845 | $10,410 |
| 1/31/19 | $11,575 | $15,032 | $11,740 |
| 2/28/19 | $12,115 | $15,555 | $12,296 |
| 3/31/19 | $12,202 | $15,829 | $12,390 |
| 4/30/19 | $12,880 | $16,483 | $13,077 |
| 5/31/19 | $12,142 | $15,441 | $12,336 |
| 6/30/19 | $13,223 | $16,537 | $13,434 |
| 7/31/19 | $13,204 | $16,789 | $13,418 |
| 8/31/19 | $13,333 | $16,480 | $13,560 |
| 9/30/19 | $14,015 | $16,767 | $14,251 |
| 10/31/19 | $14,491 | $17,132 | $14,738 |
| 11/30/19 | $14,601 | $17,785 | $14,847 |
| 12/31/19 | $14,518 | $18,296 | $14,779 |
| 1/31/20 | $14,969 | $18,315 | $15,239 |
| 2/29/20 | $13,578 | $16,807 | $13,824 |
| 3/31/20 | $9,520 | $14,731 | $9,657 |
| 4/30/20 | $11,526 | $16,620 | $11,708 |
| 5/31/20 | $13,461 | $17,411 | $13,681 |
| 6/30/20 | $14,081 | $17,758 | $14,309 |
| 7/31/20 | $15,906 | $18,759 | $16,171 |
| 8/31/20 | $16,903 | $20,107 | $17,199 |
| 9/30/20 | $17,310 | $19,343 | $17,605 |
| 10/31/20 | $16,709 | $18,829 | $16,992 |
| 11/30/20 | $18,368 | $20,890 | $18,704 |
| 12/31/20 | $18,546 | $21,693 | $18,889 |
| 1/31/21 | $19,423 | $21,474 | $19,777 |
| 2/28/21 | $19,978 | $22,066 | $20,349 |
| 3/31/21 | $22,669 | $23,033 | $23,116 |
| 4/30/21 | $24,310 | $24,262 | $24,786 |
| 5/31/21 | $24,173 | $24,431 | $24,653 |
| 6/30/21 | $23,634 | $25,002 | $24,123 |
| 7/31/21 | $24,342 | $25,596 | $24,846 |
| 8/31/21 | $25,217 | $26,374 | $25,750 |
| 9/30/21 | $23,200 | $25,147 | $23,692 |
| 10/31/21 | $25,092 | $26,909 | $25,631 |
| 11/30/21 | $25,957 | $26,723 | $26,526 |
| 12/31/21 | $27,757 | $27,920 | $28,376 |
| 1/31/22 | $24,086 | $26,475 | $24,635 |
| 2/28/22 | $22,667 | $25,683 | $23,191 |
| 3/31/22 | $20,535 | $26,636 | $20,987 |
| 4/30/22 | $19,901 | $24,314 | $20,353 |
| 5/31/22 | $20,248 | $24,358 | $20,728 |
| 6/30/22 | $17,806 | $22,348 | $18,217 |
| 7/31/22 | $20,826 | $24,408 | $21,323 |
| 8/31/22 | $19,447 | $23,413 | $19,919 |
| 9/30/22 | $17,867 | $21,256 | $18,288 |
| 10/31/22 | $19,018 | $22,977 | $19,493 |
| 11/30/22 | $20,324 | $24,261 | $20,834 |
| 12/31/22 | $19,737 | $22,864 | $20,241 |
| 1/31/23 | $22,729 | $24,300 | $23,321 |
| 2/28/23 | $22,078 | $23,707 | $22,673 |
| 3/31/23 | $22,225 | $24,578 | $22,821 |
| 4/30/23 | $23,266 | $24,961 | $23,894 |
| 5/31/23 | $22,599 | $25,070 | $23,219 |
| 6/30/23 | $26,397 | $26,726 | $27,136 |
| 7/31/23 | $27,803 | $27,585 | $28,578 |
| 8/31/23 | $27,308 | $27,146 | $28,089 |
| 9/30/23 | $25,238 | $25,852 | $25,951 |
| 10/31/23 | $23,606 | $25,308 | $24,280 |
| 11/30/23 | $27,343 | $27,619 | $28,148 |
| 12/31/23 | $31,592 | $28,874 | $32,523 |
| 1/31/24 | $30,976 | $29,359 | $31,908 |
| 2/29/24 | $34,042 | $30,927 | $35,099 |
| 3/31/24 | $36,907 | $31,922 | $38,054 |
| 4/30/24 | $33,951 | $30,619 | $35,002 |
| 5/31/24 | $34,841 | $32,138 | $35,912 |
| 6/30/24 | $33,505 | $33,292 | $34,564 |
Average Annual Total Returns (%)
| Name | 1 Year | 5 Years | 10 Years |
|---|
| XHB | 26.90% | 20.44% | 12.86% |
| S&P 500 Index | 24.56% | 15.05% | 12.86% |
| S&P Homebuilders Select Industry Index | 27.37% | 20.80% | 13.20% |
The Fund’s past performance is not necessarily an indication of how the Fund will perform in the future. The returns do not reflect the deduction of taxes that a shareholder would pay on Fund distributions or on the redemption or sale of Fund shares. Updated performance information is available by calling 1-866-787-2257 or visiting our website at www.ssga.com/us/en/institutional/fund-finder?tab=documents&type=etfs.
| Statistic | Value |
|---|
| Total Net Assets | $1,744,452,269 |
| # of Portfolio Holdings | 37 |
| Portfolio Turnover Rate | 45% |
| Total Advisory Fees Paid | $5,515,363 |
What did the Fund invest in?
| Industry | % Value of Total Net Assets |
| Homebuilding | 51.6% |
| Building Products | 35.7% |
| Home Improvement Retail | 9.4% |
| Homefurnishing Retail | 3.1% |
| Holdings | % Value of Total Net Assets |
| KB Home | 3.4% |
| Allegion PLC | 3.4% |
| Lennox International, Inc. | 3.3% |
| Carlisle Cos., Inc. | 3.3% |
| Taylor Morrison Home Corp. | 3.3% |
| NVR, Inc. | 3.3% |
| Trane Technologies PLC | 3.3% |
| Tri Pointe Homes, Inc. | 3.3% |
| Home Depot, Inc. | 3.3% |
| A O Smith Corp. | 3.3% |
SPDR S&P Oil & Gas Exploration & Production ETF
Principal Listing Exchange: NYSEArca
Annual Shareholder Report
June 30, 2024
This annual shareholder report contains important information about the SPDR S&P Oil & Gas Exploration & Production ETF (the "Fund") for the year ended June 30, 2024. You can find additional information about the Fund, including the Prospectus, Statement of Additional Information, financial statements and other information at www.ssga.com/us/en/institutional/fund-finder?tab=documents&type=etfs. You can also request this information about the Fund by contacting us at 1-866-787-2257.
What were the Fund costs for the last year?
| Fund Name | Cost of a $10,000 investment | Costs paid as a percentage of a $10,000 investment |
|---|
| SPDR S&P Oil & Gas Exploration & Production ETF | $38 | 0.35% |
How did the Fund perform last year and what affected its performance?
The reporting period’s market environment was largely driven by news about inflation, economic growth and the impact either would have on the Federal Reserve and other central banks with regard to interest rate decisions. Alongside this macro story was the prospect of a burgeoning artificial intelligence boom, driving up the values of A.I.-related tech and semiconductor companies. A spike in the price of oil driven by higher demand also contributed to a complex economic situation. The higher prices were supported by increased demand for power generation, reduced production in the U.S., and supply disruptions in Norway. Robust liquified natural gas demand from Asia also boosted prices.
The Fund's benchmarks are unmanaged indices used as a general measure of market performance. Calculations assume dividends and capital gains.
Comparison of Change in Value of a $10,000 Investment
(Based on Net Asset Value)
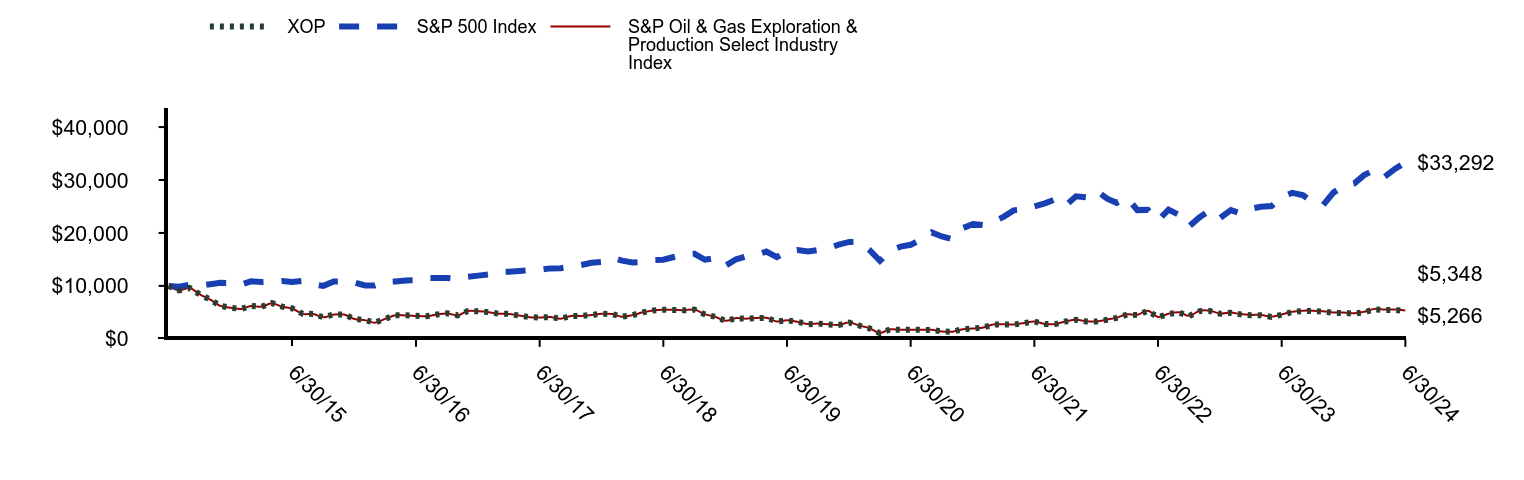
| XOP | S&P 500 Index | S&P Oil & Gas Exploration & Production Select Industry Index |
|---|
| 6/30/14 | $10,000 | $10,000 | $10,000 |
| 7/31/14 | $9,146 | $9,838 | $9,143 |
| 8/31/14 | $9,609 | $10,245 | $9,614 |
| 9/30/14 | $8,382 | $10,065 | $8,388 |
| 10/31/14 | $7,412 | $10,311 | $7,409 |
| 11/30/14 | $6,214 | $10,581 | $6,212 |
| 12/31/14 | $5,857 | $10,557 | $5,850 |
| 1/31/15 | $5,651 | $10,267 | $5,644 |
| 2/28/15 | $6,219 | $10,860 | $6,212 |
| 3/31/15 | $6,062 | $10,725 | $6,048 |
| 4/30/15 | $6,760 | $10,801 | $6,741 |
| 5/31/15 | $6,078 | $10,942 | $6,064 |
| 6/30/15 | $5,755 | $10,737 | $5,738 |
| 7/31/15 | $4,727 | $10,944 | $4,711 |
| 8/31/15 | $4,710 | $10,285 | $4,695 |
| 9/30/15 | $4,070 | $10,003 | $4,054 |
| 10/31/15 | $4,596 | $10,813 | $4,579 |
| 11/30/15 | $4,602 | $10,849 | $4,584 |
| 12/31/15 | $3,764 | $10,653 | $3,741 |
| 1/31/16 | $3,550 | $10,080 | $3,530 |
| 2/29/16 | $3,064 | $10,077 | $3,048 |
| 3/31/16 | $3,789 | $10,780 | $3,772 |
| 4/30/16 | $4,462 | $10,838 | $4,439 |
| 5/31/16 | $4,434 | $11,027 | $4,413 |
| 6/30/16 | $4,353 | $11,053 | $4,335 |
| 7/31/16 | $4,284 | $11,474 | $4,268 |
| 8/31/16 | $4,602 | $11,489 | $4,585 |
| 9/30/16 | $4,823 | $11,498 | $4,806 |
| 10/31/16 | $4,438 | $11,274 | $4,424 |
| 11/30/16 | $5,258 | $11,718 | $5,239 |
| 12/31/16 | $5,205 | $11,938 | $5,194 |
| 1/31/17 | $5,036 | $12,178 | $5,023 |
| 2/28/17 | $4,757 | $12,650 | $4,747 |
| 3/31/17 | $4,713 | $12,657 | $4,705 |
| 4/30/17 | $4,404 | $12,791 | $4,398 |
| 5/31/17 | $4,103 | $12,955 | $4,097 |
| 6/30/17 | $4,027 | $13,046 | $4,020 |
| 7/31/17 | $4,107 | $13,304 | $4,100 |
| 8/31/17 | $3,808 | $13,345 | $3,804 |
| 9/30/17 | $4,313 | $13,630 | $4,310 |
| 10/31/17 | $4,335 | $13,942 | $4,333 |
| 11/30/17 | $4,518 | $14,374 | $4,517 |
| 12/31/17 | $4,719 | $14,532 | $4,722 |
| 1/31/18 | $4,675 | $15,317 | $4,675 |
| 2/28/18 | $4,188 | $14,764 | $4,191 |
| 3/31/18 | $4,471 | $14,426 | $4,477 |
| 4/30/18 | $4,998 | $14,499 | $5,002 |
| 5/31/18 | $5,360 | $14,869 | $5,367 |
| 6/30/18 | $5,473 | $14,945 | $5,482 |
| 7/31/18 | $5,466 | $15,461 | $5,476 |
| 8/31/18 | $5,383 | $15,995 | $5,395 |
| 9/30/18 | $5,514 | $16,067 | $5,526 |
| 10/31/18 | $4,596 | $14,939 | $4,611 |
| 11/30/18 | $4,175 | $15,237 | $4,185 |
| 12/31/18 | $3,387 | $13,845 | $3,398 |
| 1/31/19 | $3,896 | $15,032 | $3,912 |
| 2/28/19 | $3,801 | $15,555 | $3,814 |
| 3/31/19 | $3,931 | $15,829 | $3,946 |
| 4/30/19 | $3,957 | $16,483 | $3,972 |
| 5/31/19 | $3,278 | $15,441 | $3,291 |
| 6/30/19 | $3,496 | $16,537 | $3,511 |
| 7/31/19 | $3,216 | $16,789 | $3,231 |
| 8/31/19 | $2,767 | $16,480 | $2,781 |
| 9/30/19 | $2,879 | $16,767 | $2,890 |
| 10/31/19 | $2,721 | $17,132 | $2,733 |
| 11/30/19 | $2,621 | $17,785 | $2,632 |
| 12/31/19 | $3,068 | $18,296 | $3,088 |
| 1/31/20 | $2,478 | $18,315 | $2,490 |
| 2/29/20 | $1,993 | $16,807 | $2,003 |
| 3/31/20 | $1,075 | $14,731 | $1,079 |
| 4/30/20 | $1,780 | $16,620 | $1,788 |
| 5/31/20 | $1,695 | $17,411 | $1,699 |
| 6/30/20 | $1,718 | $17,758 | $1,724 |
| 7/31/20 | $1,690 | $18,759 | $1,694 |
| 8/31/20 | $1,691 | $20,107 | $1,696 |
| 9/30/20 | $1,396 | $19,343 | $1,400 |
| 10/31/20 | $1,348 | $18,829 | $1,352 |
| 11/30/20 | $1,792 | $20,890 | $1,799 |
| 12/31/20 | $1,950 | $21,693 | $1,958 |
| 1/31/21 | $2,144 | $21,474 | $2,153 |
| 2/28/21 | $2,685 | $22,066 | $2,697 |
| 3/31/21 | $2,725 | $23,033 | $2,736 |
| 4/30/21 | $2,690 | $24,262 | $2,704 |
| 5/31/21 | $2,985 | $24,431 | $3,001 |
| 6/30/21 | $3,251 | $25,002 | $3,274 |
| 7/31/21 | $2,781 | $25,596 | $2,801 |
| 8/31/21 | $2,779 | $26,374 | $2,800 |
| 9/30/21 | $3,263 | $25,147 | $3,290 |
| 10/31/21 | $3,588 | $26,909 | $3,617 |
| 11/30/21 | $3,284 | $26,723 | $3,315 |
| 12/31/21 | $3,252 | $27,920 | $3,282 |
| 1/31/22 | $3,613 | $26,475 | $3,648 |
| 2/28/22 | $3,967 | $25,683 | $4,006 |
| 3/31/22 | $4,578 | $26,636 | $4,628 |
| 4/30/22 | $4,484 | $24,314 | $4,533 |
| 5/31/22 | $5,262 | $24,358 | $5,322 |
| 6/30/22 | $4,090 | $22,348 | $4,134 |
| 7/31/22 | $4,694 | $24,408 | $4,746 |
| 8/31/22 | $4,960 | $23,413 | $5,016 |
| 9/30/22 | $4,312 | $21,256 | $4,357 |
| 10/31/22 | $5,230 | $22,977 | $5,285 |
| 11/30/22 | $5,260 | $24,261 | $5,316 |
| 12/31/22 | $4,731 | $22,864 | $4,782 |
| 1/31/23 | $4,909 | $24,300 | $4,963 |
| 2/28/23 | $4,627 | $23,707 | $4,680 |
| 3/31/23 | $4,476 | $24,578 | $4,529 |
| 4/30/23 | $4,462 | $24,961 | $4,514 |
| 5/31/23 | $4,145 | $25,070 | $4,194 |
| 6/30/23 | $4,550 | $26,726 | $4,605 |
| 7/31/23 | $5,056 | $27,585 | $5,117 |
| 8/31/23 | $5,252 | $27,146 | $5,321 |
| 9/30/23 | $5,253 | $25,852 | $5,318 |
| 10/31/23 | $5,157 | $25,308 | $5,225 |
| 11/30/23 | $4,902 | $27,619 | $4,966 |
| 12/31/23 | $4,898 | $28,874 | $4,966 |
| 1/31/24 | $4,757 | $29,359 | $4,824 |
| 2/29/24 | $5,022 | $30,927 | $5,096 |
| 3/31/24 | $5,573 | $31,922 | $5,658 |
| 4/30/24 | $5,444 | $30,619 | $5,525 |
| 5/31/24 | $5,474 | $32,138 | $5,556 |
| 6/30/24 | $5,266 | $33,292 | $5,348 |
Average Annual Total Returns (%)
| Name | 1 Year | 5 Years | 10 Years |
|---|
| XOP | 15.74% | 8.54% | (6.21%) |
| S&P 500 Index | 24.56% | 15.05% | 12.86% |
| S&P Oil & Gas Exploration & Production Select Industry Index | 16.11% | 8.78% | (6.07%) |
The Fund’s past performance is not necessarily an indication of how the Fund will perform in the future. The returns do not reflect the deduction of taxes that a shareholder would pay on Fund distributions or on the redemption or sale of Fund shares. Updated performance information is available by calling 1-866-787-2257 or visiting our website at www.ssga.com/us/en/institutional/fund-finder?tab=documents&type=etfs.
| Statistic | Value |
|---|
| Total Net Assets | $3,488,401,418 |
| # of Portfolio Holdings | 57 |
| Portfolio Turnover Rate | 36% |
| Total Advisory Fees Paid | $12,842,652 |
What did the Fund invest in?
| Industry | % Value of Total Net Assets |
| Oil, Gas & Consumable Fuels | 99.8% |
| Holdings | % Value of Total Net Assets |
| Diamondback Energy, Inc. | 3.0% |
| Permian Resources Corp. | 3.0% |
| Matador Resources Co. | 3.0% |
| Civitas Resources, Inc. | 3.0% |
| EOG Resources, Inc. | 3.0% |
| APA Corp. | 2.9% |
| Exxon Mobil Corp. | 2.9% |
| Occidental Petroleum Corp. | 2.9% |
| Marathon Oil Corp. | 2.9% |
| ConocoPhillips | 2.9% |
(b) Not applicable.
Item 2. Code of Ethics.
As of the end of the period covered by this report, the registrant has adopted a code of ethics that applies to the registrant’s principal executive officer, principal financial officer, principal accounting officer or controller, or persons performing similar functions, regardless of whether these individuals are employed by the registrant or a third party (the “Code of Ethics”). During the period covered by this report, no substantive amendments were made to the Code of Ethics. During the period covered by this report, the registrant did not grant any waivers, including any implicit waivers, from any provision of the Code of Ethics. The Code of Ethics is attached hereto as Exhibit 19(a)(1).
Item 3. Audit Committee Financial Expert.
(a)(1) The Board of Trustees of the registrant has determined that the registrant has four Board members serving on the Audit Committee that possess the attributes identified in Instructions 2(b) of Item 3 to Form N-CSR to qualify as an “audit committee financial expert.”
(2) Dwight Churchill, Clare Richer, Kristi Rowsell, Sandra Sponem and Carl Verboncoeur are the registrant’s audit committee financial experts. The Board also determined that each of the foregoing persons are not “interested person(s)” of the registrant as that term is defined in Section 2(a)(19) of the Investment Company Act of 1940, as amended (the “1940 Act”).
Item 4. Principal Accountant Fees and Services.
(a) Audit Fees.
For the fiscal years ending June 30, 2024 and June 30, 2023, the aggregate audit fees billed for professional services rendered by the principal accountant were $1,485,013 and $1,425,788, respectively. Audit fees include the performance of the annual audits, security counts performed during the course of the period for each series of the registrant and routine regulatory filings (one for each SEC registrant).
(b) Audit-Related Fees.
For the fiscal years ending June 30, 2024 and June 30, 2023, the principal accountant did not bill the registrant any fees for assurances and related services that are reasonably related to the performance of the audit of the registrant’s financial statements and are not reported under paragraph (a) of this Item.
(c) Tax Fees.
For the fiscal years ending June 30, 2024 and June 30, 2023, the aggregate tax fees billed for professional services rendered by the principal accountant were $216,969 and $214,191, respectively. Tax fees represent services related to the review of year-end distribution requirements.
(d) All Other Fees.
For the fiscal years ended June 30, 2024 and June 30, 2023, there were no fees billed for professional services rendered by E&Y for products and services provided by E&Y to the Trust, other than the services reported in paragraphs (a) through (c).
For the fiscal years ended June 30, 2024 and June 30, 2023, the aggregate fees for professional services rendered by E&Y for products and services provided by E&Y to the Adviser and any entity controlling, controlled by, or under common control with the Adviser that provides ongoing services to the Trust that (i) relate directly to the operations and financial reporting of the Trust and (ii) were pre-approved by the Audit Committee were approximately $9,387,702 and $9,540,002, respectively.
(e)(1) Audit Committee Pre-Approval Policies and Procedures.
The registrant’s Audit Committee Charter states the following with respect to pre-approval procedures:
Before the independent auditors are engaged by the Trust to render audit, audit-related or permissible non-audit services, either:
| | (a) | The Audit Committee shall pre-approve all audit, audit-related and permissible non-audit services provided to the Trust. The Audit Committee may delegate to one or more of its members the authority to grant pre-approvals. Any decision of any member to whom authority is delegated under this section shall be presented to the full Audit Committee at its next regularly scheduled meeting; |
or
| | (b) | The engagement to render the audit, audit-related or permissible non-audit service is entered into pursuant to pre-approval policies and procedures established by the Audit Committee. Any such policies and procedures must (1) be detailed as to the particular service and (2) not involve any delegation of the Audit Committee’s responsibilities to the investment adviser. The Audit Committee must be informed of each service entered into pursuant to the policies and procedures. A copy of any such policies and procedures shall be attached as an exhibit to the Audit Committee Charter. |
| | (c) | Pre-Approval for a service provided to the Trust other than audit or audit-related services is not required if: (1) the aggregate amount of all such permissible non-audit services provided to the Trust constitutes not more than five percent (5%) of the total amount of revenues paid by the Trust to the independent auditors during the fiscal year in which the permissible non-audit services are provided; (2) such services were not recognized by the Trust at the time of the engagement to be permissible non-audit services; and (3) such services are promptly brought to the attention of the Audit Committee and are approved by the Audit Committee or by one or more members of the Audit Committee to whom authority to grant such approvals has been delegated by the Audit Committee prior to the completion of the audit. |
| | (d) | The Audit Committee shall pre-approve any permissible non-audit services proposed to be provided by the independent auditors to (a) the investment adviser and (b) any entity controlling, controlled by, or under common control with the investment adviser that provides ongoing services to the Trust, if the independent auditors’ engagement with the investment adviser or any such control persons relates directly to the operations and financial reporting of the Trust. It shall be the responsibility of the independent auditors to notify the Audit Committee of any permissible non-audit services that need to be pre-approved. |
Notwithstanding the above, Pre-Approval for any permissible non-audit services under this Sub-section is not required if: (1) the aggregate amount of all such permissible non-audit services constitutes not more than five percent (5%) of the total amount of revenues paid to the independent auditors by the Trust and any other entity that has its services approved under this Section (i.e., the investment adviser or any control person) during
the fiscal year in which the permissible non-audit services are provided; (2) such services were not recognized by the Trust at the time of the engagement to be permissible non-audit services; and (3) such services are promptly brought to the attention of the Audit Committee and are approved by the Audit Committee or by one or more members of the Audit Committee to whom authority to grant such approvals has been delegated by the Audit Committee prior to the completion of the audit.
(e)(2) Percentage of Services.
One hundred percent of the services described in each of paragraphs (b) through (d) of this Item were approved by the registrant’s Audit Committee pursuant to paragraph (c)(7)(i)(C) of Rule 2-01 of Regulation S-X.
(f) Not applicable.
(g) The aggregate non-audit fees billed for by the registrant’s accountant for services rendered to the registrant, and rendered to the registrant’s investment adviser (not including any sub-adviser whose role is primarily portfolio management and is subcontracted with or overseen by another investment adviser), and any entity controlling, controlled by, or under common control with the adviser were as follows:
| | | | | | | | |
| | | FY 2024
(in millions) | | | FY 2023
(in millions) | |
Non audit services billed to: | | | | | | | | |
Registrant: | | | See Item 4(c) | | | | See Item 4(c) | |
Investment Adviser: | | | — | | | | — | |
Other entities in the Investment Company Complex (1)(2): | | | | | | | | |
Audit Related Fees | | $ | 18.3 | | | $ | 17.9 | |
Tax Fees | | $ | 3.1 | | | $ | 5.6 | |
All Other Fees | | $ | 15 | | | $ | 15.5 | |
| (1) | Information is for the calendar years 2024 and 2023, respectively. |
| (2) | Services under the caption Audit-Related Fees consisted principally of reports on the processing of transactions by servicing organizations, audits of employee benefit plan, non-statutory audits and due diligence procedures. Services under the caption Tax Fees consisted principally of expatriate, compliance and corporate tax advisory services. Services under the caption All Other Fees primarily related to statutory and financial statement audits and the requirement to opine on the design and operating effectiveness of internal control over financial reporting. |
(h) The registrant’s principal accountant notified the registrant’s Audit Committee of all non-audit services that were rendered by the principal accountant to the Adviser and any entity controlling, controlled by, or under common control with the Adviser that provides services to the registrant, which services were not required to be pre-approved pursuant to paragraph (c)(7)(ii) of Rule 2-01 of Regulation S-X, allowing the registrant’s Audit Committee to consider whether such services were compatible with maintaining the principal accountant’s independence.
(i) Not applicable.
(j) Not applicable.
Item 5. Audit Committees of Listed Registrants.
The registrant has an audit committee which was established by the Board of Trustees of the Trust in accordance with Section 3(a)(58)(A) of the Securities Exchange Act of 1934, as amended (the “1934 Act”). The members of the registrant’s Audit Committee are Dwight Churchill, Carolyn Clancy, Clare Richer, Kristi Rowsell, James Ross, Sandra Sponem and Carl Verboncoeur.
Item 6. Investments.
(a) A Schedule of Investments for each applicable series of the registrant is included as a part of the report to shareholders filed under Item 7(a) of this Form N-CSR.
(b) Not applicable to the registrant.
Item 7. Financial Statements and Financial Highlights for Open-End Management Investment Companies
(a) The registrant’s Financial Statements are attached herewith.
(b) The registrant’s Financial Highlights are included as part of the Financial Statements filed under Item 7(a) of this Form.
Annual Financial Statements and Other Information
June 30, 2024
SPDR® Series Trust - Equity Funds
| SPDR MSCI USA Climate Paris Aligned ETF |
| SPDR Russell 1000 Low Volatility Focus ETF |
| SPDR Russell 1000 Momentum Focus ETF |
| SPDR Russell 1000 Yield Focus ETF |
| SPDR S&P 400 Mid Cap Growth ETF |
| SPDR S&P 400 Mid Cap Value ETF |
| SPDR S&P 500 ESG ETF |
| SPDR S&P 600 Small Cap Growth ETF |
| SPDR S&P 600 Small Cap Value ETF |
| SPDR S&P 1500 Momentum Tilt ETF |
| SPDR S&P 1500 Value Tilt ETF |
| SPDR S&P Kensho Clean Power ETF |
| SPDR S&P Kensho Final Frontiers ETF |
| SPDR S&P Kensho Future Security ETF |
| SPDR S&P Kensho Intelligent Structures ETF |
| SPDR S&P Kensho New Economies Composite ETF |
| SPDR S&P Kensho Smart Mobility ETF |
| SPDR S&P SmallCap 600 ESG ETF |
| SPDR SSGA US Large Cap Low Volatility Index ETF |
| SPDR SSGA US Small Cap Low Volatility Index ETF |
The information contained in this report is intended for the general information of shareholders of the Trust. This report is not authorized for distribution to prospective investors unless preceded or accompanied by a current Trust prospectus which contains important information concerning the Trust. You may obtain a current prospectus and SAI from the Distributor by calling 1-866-787-2257 or visiting https://www.ssga.com/spdrs. Please read the prospectus carefully before you invest.
TABLE OF CONTENTS
Changes in and Disagreements with Accountants for Open-End Management Investment Companies (N-CSR Item 8) - Not Applicable
Proxy Disclosures for Open-End Management Investment Companies (N-CSR Item 9) - Not applicable
Remuneration Paid to Directors, Officers, and Others of Open-End Management Investment Companies (N-CSR Item 10) - Please see Statement of Operations in the Financial Statements under Item 7 above
SPDR SERIES TRUST
SPDR MSCI USA CLIMATE PARIS ALIGNED ETF
SCHEDULE OF INVESTMENTS
June 30, 2024
| Security Description | | | Shares | | Value |
| COMMON STOCKS — 99.8% | |
| AEROSPACE & DEFENSE — 0.1% | |
Axon Enterprise, Inc. (a)
| | 7 | | $2,060 |
| AUTOMOBILES — 2.3% | |
Rivian Automotive, Inc. Class A (a)
| | 737 | | 9,890 |
Tesla, Inc. (a)
| | 236 | | 46,700 |
| | | | | | 56,590 |
| BANKS — 1.9% | |
Bank of America Corp.
| | 8 | | 318 |
Bank of New York Mellon Corp.
| | 73 | | 4,372 |
JPMorgan Chase & Co.
| | 141 | | 28,519 |
M&T Bank Corp.
| | 10 | | 1,514 |
Northern Trust Corp.
| | 23 | | 1,931 |
U.S. Bancorp
| | 67 | | 2,660 |
Wells Fargo & Co.
| | 102 | | 6,058 |
| | | | | | 45,372 |
| BEVERAGES — 0.4% | |
Brown-Forman Corp. Class B
| | 63 | | 2,721 |
Constellation Brands, Inc. Class A
| | 4 | | 1,029 |
Keurig Dr Pepper, Inc.
| | 63 | | 2,104 |
Monster Beverage Corp. (a)
| | 70 | | 3,497 |
| | | | | | 9,351 |
| BIOTECHNOLOGY — 2.0% | |
AbbVie, Inc.
| | 90 | | 15,437 |
Alnylam Pharmaceuticals, Inc. (a)
| | 12 | | 2,916 |
Amgen, Inc.
| | 25 | | 7,811 |
Biogen, Inc. (a)
| | 9 | | 2,086 |
BioMarin Pharmaceutical, Inc. (a)
| | 20 | | 1,647 |
Exact Sciences Corp. (a)
| | 7 | | 296 |
Gilead Sciences, Inc.
| | 9 | | 617 |
GRAIL, Inc. (a)
| | 1 | | 10 |
Incyte Corp. (a)
| | 14 | | 849 |
Moderna, Inc. (a)
| | 4 | | 475 |
Neurocrine Biosciences, Inc. (a)
| | 8 | | 1,101 |
Regeneron Pharmaceuticals, Inc. (a)
| | 7 | | 7,357 |
Vertex Pharmaceuticals, Inc. (a)
| | 16 | | 7,500 |
| | | | | | 48,102 |
| BROADLINE RETAIL — 4.2% | |
Amazon.com, Inc. (a)
| | 472 | | 91,214 |
eBay, Inc.
| | 77 | | 4,136 |
Etsy, Inc. (a)
| | 26 | | 1,534 |
MercadoLibre, Inc. (a)
| | 3 | | 4,930 |
| | | | | | 101,814 |
| BUILDING PRODUCTS — 0.3% | |
A O Smith Corp.
| | 18 | | 1,472 |
Allegion PLC
| | 46 | | 5,435 |
| | | | | | 6,907 |
| CAPITAL MARKETS — 3.3% | |
Ameriprise Financial, Inc.
| | 2 | | 854 |
BlackRock, Inc.
| | 3 | | 2,362 |
Blackstone, Inc.
| | 35 | | 4,333 |
Cboe Global Markets, Inc.
| | 13 | | 2,211 |
| Security Description | | | Shares | | Value |
Charles Schwab Corp.
| | 138 | | $10,169 |
CME Group, Inc.
| | 35 | | 6,881 |
Coinbase Global, Inc. Class A (a)
| | 1 | | 222 |
FactSet Research Systems, Inc.
| | 6 | | 2,449 |
Intercontinental Exchange, Inc.
| | 47 | | 6,434 |
KKR & Co., Inc.
| | 32 | | 3,368 |
MarketAxess Holdings, Inc.
| | 7 | | 1,404 |
Moody's Corp.
| | 32 | | 13,470 |
Nasdaq, Inc.
| | 42 | | 2,531 |
S&P Global, Inc.
| | 40 | | 17,840 |
SEI Investments Co.
| | 36 | | 2,329 |
T Rowe Price Group, Inc.
| | 24 | | 2,767 |
Tradeweb Markets, Inc. Class A
| | 5 | | 530 |
| | | | | | 80,154 |
| CHEMICALS — 1.5% | |
Ecolab, Inc.
| | 16 | | 3,808 |
Sherwin-Williams Co.
| | 107 | | 31,932 |
| | | | | | 35,740 |
| COMMERCIAL SERVICES & SUPPLIES — 0.7% | |
Cintas Corp.
| | 6 | | 4,202 |
Copart, Inc. (a)
| | 78 | | 4,224 |
Rollins, Inc.
| | 62 | | 3,025 |
Veralto Corp.
| | 38 | | 3,628 |
Waste Management, Inc.
| | 5 | | 1,067 |
| | | | | | 16,146 |
| COMMUNICATIONS EQUIPMENT — 1.7% | |
Arista Networks, Inc. (a)
| | 5 | | 1,753 |
Cisco Systems, Inc.
| | 385 | | 18,291 |
F5, Inc. (a)
| | 19 | | 3,273 |
Juniper Networks, Inc.
| | 216 | | 7,875 |
Motorola Solutions, Inc.
| | 27 | | 10,423 |
| | | | | | 41,615 |
| CONSTRUCTION & ENGINEERING — 0.5% | |
AECOM
| | 138 | | 12,163 |
| CONSTRUCTION MATERIALS — 0.1% | |
Vulcan Materials Co.
| | 5 | | 1,243 |
| CONSUMER FINANCE — 0.4% | |
American Express Co.
| | 36 | | 8,336 |
Discover Financial Services
| | 12 | | 1,570 |
| | | | | | 9,906 |
| DIVERSIFIED REITs — 0.0% (b) | |
WP Carey, Inc. REIT
| | 5 | | 275 |
| DIVERSIFIED TELECOMMUNICATION SERVICES — 0.1% | |
Verizon Communications, Inc.
| | 72 | | 2,969 |
| ELECTRIC UTILITIES — 1.1% | |
Edison International
| | 389 | | 27,934 |
| ELECTRICAL EQUIPMENT — 1.1% | |
AMETEK, Inc.
| | 74 | | 12,337 |
Eaton Corp. PLC
| | 8 | | 2,508 |
Rockwell Automation, Inc.
| | 43 | | 11,837 |
| | | | | | 26,682 |
See accompanying notes to financial statements.
1
SPDR SERIES TRUST
SPDR MSCI USA CLIMATE PARIS ALIGNED ETF
SCHEDULE OF INVESTMENTS (continued)
June 30, 2024
| Security Description | | | Shares | | Value |
| ELECTRONIC EQUIPMENT, INSTRUMENTS & COMPONENTS — 0.4% | |
Amphenol Corp. Class A
| | 72 | | $4,850 |
Keysight Technologies, Inc. (a)
| | 21 | | 2,872 |
Trimble, Inc. (a)
| | 50 | | 2,796 |
| | | | | | 10,518 |
| ENTERTAINMENT — 1.2% | |
Liberty Media Corp.-Liberty Formula One Class C (a)
| | 26 | | 1,868 |
Netflix, Inc. (a)
| | 26 | | 17,547 |
Take-Two Interactive Software, Inc. (a)
| | 4 | | 622 |
Walt Disney Co.
| | 104 | | 10,326 |
| | | | | | 30,363 |
| FINANCIAL SERVICES — 3.2% | |
Apollo Global Management, Inc.
| | 36 | | 4,251 |
Block, Inc. (a)
| | 9 | | 580 |
Fiserv, Inc. (a)
| | 13 | | 1,938 |
Mastercard, Inc. Class A
| | 64 | | 28,234 |
PayPal Holdings, Inc. (a)
| | 61 | | 3,540 |
Visa, Inc. Class A
| | 151 | | 39,633 |
| | | | | | 78,176 |
| FOOD PRODUCTS — 0.3% | |
Hershey Co.
| | 43 | | 7,904 |
McCormick & Co., Inc.
| | 4 | | 284 |
| | | | | | 8,188 |
| GROUND TRANSPORTATION — 0.6% | |
CSX Corp.
| | 10 | | 334 |
Old Dominion Freight Line, Inc.
| | 23 | | 4,062 |
Uber Technologies, Inc. (a)
| | 75 | | 5,451 |
Union Pacific Corp.
| | 22 | | 4,978 |
| | | | | | 14,825 |
| HEALTH CARE EQUIPMENT & SUPPLIES — 2.4% | |
Align Technology, Inc. (a)
| | 4 | | 966 |
Baxter International, Inc.
| | 5 | | 167 |
Becton Dickinson & Co.
| | 11 | | 2,571 |
Boston Scientific Corp. (a)
| | 85 | | 6,546 |
Cooper Cos., Inc.
| | 27 | | 2,357 |
Dexcom, Inc. (a)
| | 28 | | 3,175 |
Edwards Lifesciences Corp. (a)
| | 70 | | 6,466 |
Hologic, Inc. (a)
| | 28 | | 2,079 |
IDEXX Laboratories, Inc. (a)
| | 8 | | 3,897 |
Insulet Corp. (a)
| | 5 | | 1,009 |
Intuitive Surgical, Inc. (a)
| | 19 | | 8,452 |
Medtronic PLC
| | 92 | | 7,241 |
ResMed, Inc.
| | 14 | | 2,680 |
Stryker Corp.
| | 24 | | 8,166 |
Teleflex, Inc.
| | 5 | | 1,052 |
Zimmer Biomet Holdings, Inc.
| | 17 | | 1,845 |
| | | | | | 58,669 |
| HEALTH CARE PROVIDERS & SERVICES — 1.6% | |
Elevance Health, Inc.
| | 14 | | 7,586 |
Humana, Inc.
| | 8 | | 2,989 |
| Security Description | | | Shares | | Value |
Labcorp Holdings, Inc.
| | 2 | | $407 |
Quest Diagnostics, Inc.
| | 5 | | 684 |
UnitedHealth Group, Inc.
| | 53 | | 26,991 |
| | | | | | 38,657 |
| HEALTH CARE REITs — 0.7% | |
Healthpeak Properties, Inc. REIT
| | 556 | | 10,898 |
Ventas, Inc. REIT
| | 31 | | 1,589 |
Welltower, Inc. REIT
| | 40 | | 4,170 |
| | | | | | 16,657 |
| HEALTH CARE TECHNOLOGY — 0.1% | |
Veeva Systems, Inc. Class A (a)
| | 9 | | 1,647 |
| HOTELS, RESTAURANTS & LEISURE — 1.8% | |
Airbnb, Inc. Class A (a)
| | 38 | | 5,762 |
Chipotle Mexican Grill, Inc. (a)
| | 76 | | 4,761 |
Hilton Worldwide Holdings, Inc.
| | 5 | | 1,091 |
McDonald's Corp.
| | 85 | | 21,661 |
Starbucks Corp.
| | 74 | | 5,761 |
Yum! Brands, Inc.
| | 30 | | 3,974 |
| | | | | | 43,010 |
| HOUSEHOLD DURABLES — 0.2% | |
Garmin Ltd.
| | 33 | | 5,376 |
| HOUSEHOLD PRODUCTS — 0.2% | |
Church & Dwight Co., Inc.
| | 51 | | 5,288 |
| INDUSTRIAL REITs — 0.8% | |
Prologis, Inc. REIT
| | 171 | | 19,205 |
| INSURANCE — 3.4% | |
Aflac, Inc.
| | 134 | | 11,967 |
Allstate Corp.
| | 20 | | 3,193 |
American Financial Group, Inc.
| | 32 | | 3,937 |
Aon PLC Class A
| | 13 | | 3,817 |
Arch Capital Group Ltd. (a)
| | 65 | | 6,558 |
Arthur J Gallagher & Co.
| | 9 | | 2,334 |
Brown & Brown, Inc.
| | 51 | | 4,560 |
Chubb Ltd.
| | 36 | | 9,183 |
Cincinnati Financial Corp.
| | 25 | | 2,952 |
Erie Indemnity Co. Class A
| | 6 | | 2,174 |
Hartford Financial Services Group, Inc.
| | 40 | | 4,022 |
Markel Group, Inc. (a)
| | 2 | | 3,151 |
Marsh & McLennan Cos., Inc.
| | 38 | | 8,007 |
MetLife, Inc.
| | 40 | | 2,808 |
Progressive Corp.
| | 37 | | 7,685 |
Travelers Cos., Inc.
| | 8 | | 1,627 |
W R Berkley Corp.
| | 26 | | 2,043 |
Willis Towers Watson PLC
| | 11 | | 2,884 |
| | | | | | 82,902 |
| INTERACTIVE MEDIA & SERVICES — 6.4% | |
Alphabet, Inc. Class A
| | 178 | | 32,423 |
Alphabet, Inc. Class C
| | 348 | | 63,830 |
Match Group, Inc. (a)
| | 15 | | 456 |
Meta Platforms, Inc. Class A
| | 117 | | 58,994 |
Pinterest, Inc. Class A (a)
| | 20 | | 881 |
See accompanying notes to financial statements.
2
SPDR SERIES TRUST
SPDR MSCI USA CLIMATE PARIS ALIGNED ETF
SCHEDULE OF INVESTMENTS (continued)
June 30, 2024
| Security Description | | | Shares | | Value |
Snap, Inc. Class A (a)
| | 39 | | $648 |
| | | | | | 157,232 |
| IT SERVICES — 1.9% | |
Accenture PLC Class A
| | 46 | | 13,957 |
EPAM Systems, Inc. (a)
| | 1 | | 188 |
International Business Machines Corp.
| | 159 | | 27,499 |
MongoDB, Inc. (a)
| | 1 | | 250 |
Okta, Inc. (a)
| | 8 | | 749 |
Snowflake, Inc. Class A (a)
| | 6 | | 810 |
VeriSign, Inc. (a)
| | 22 | | 3,912 |
| | | | | | 47,365 |
| LIFE SCIENCES TOOLS & SERVICES — 2.4% | |
Agilent Technologies, Inc.
| | 19 | | 2,463 |
Avantor, Inc. (a)
| | 33 | | 700 |
Bio-Rad Laboratories, Inc. Class A (a)
| | 3 | | 820 |
Bio-Techne Corp.
| | 11 | | 788 |
Danaher Corp.
| | 58 | | 14,491 |
Illumina, Inc. (a)
| | 11 | | 1,148 |
IQVIA Holdings, Inc. (a)
| | 3 | | 634 |
Mettler-Toledo International, Inc. (a)
| | 7 | | 9,783 |
Revvity, Inc.
| | 27 | | 2,831 |
Thermo Fisher Scientific, Inc.
| | 26 | | 14,378 |
Waters Corp. (a)
| | 14 | | 4,062 |
West Pharmaceutical Services, Inc.
| | 20 | | 6,588 |
| | | | | | 58,686 |
| MACHINERY — 2.9% | |
Fortive Corp.
| | 128 | | 9,485 |
Graco, Inc.
| | 32 | | 2,537 |
IDEX Corp.
| | 30 | | 6,036 |
Illinois Tool Works, Inc.
| | 34 | | 8,057 |
Ingersoll Rand, Inc.
| | 10 | | 908 |
Pentair PLC
| | 121 | | 9,277 |
Xylem, Inc.
| | 245 | | 33,229 |
| | | | | | 69,529 |
| MEDIA — 0.4% | |
Charter Communications, Inc. Class A (a)
| | 9 | | 2,691 |
Comcast Corp. Class A
| | 144 | | 5,639 |
Fox Corp. Class A
| | 25 | | 859 |
Fox Corp. Class B
| | 18 | | 576 |
Trade Desk, Inc. Class A (a)
| | 11 | | 1,075 |
| | | | | | 10,840 |
| METALS & MINING — 0.1% | |
Newmont Corp.
| | 60 | | 2,512 |
| OFFICE REITs — 0.9% | |
Alexandria Real Estate Equities, Inc. REIT
| | 110 | | 12,867 |
Boston Properties, Inc. REIT
| | 151 | | 9,295 |
| | | | | | 22,162 |
| PERSONAL CARE PRODUCTS — 0.1% | |
Estee Lauder Cos., Inc. Class A
| | 13 | | 1,383 |
| PHARMACEUTICALS — 5.3% | |
Bristol-Myers Squibb Co.
| | 167 | | 6,936 |
Catalent, Inc. (a)
| | 16 | | 900 |
| Security Description | | | Shares | | Value |
Eli Lilly & Co.
| | 57 | | $51,607 |
Johnson & Johnson
| | 159 | | 23,239 |
Merck & Co., Inc.
| | 179 | | 22,160 |
Pfizer, Inc.
| | 257 | | 7,191 |
Royalty Pharma PLC Class A
| | 118 | | 3,112 |
Zoetis, Inc.
| | 79 | | 13,695 |
| | | | | | 128,840 |
| PROFESSIONAL SERVICES — 0.5% | |
Automatic Data Processing, Inc.
| | 8 | | 1,910 |
Booz Allen Hamilton Holding Corp.
| | 6 | | 923 |
Equifax, Inc.
| | 10 | | 2,425 |
Paychex, Inc.
| | 28 | | 3,320 |
Paycom Software, Inc.
| | 1 | | 143 |
TransUnion
| | 3 | | 222 |
Verisk Analytics, Inc.
| | 15 | | 4,043 |
| | | | | | 12,986 |
| REAL ESTATE MANAGEMENT & DEVELOPMENT — 0.1% | |
CoStar Group, Inc. (a)
| | 34 | | 2,521 |
| RESIDENTIAL REITs — 1.0% | |
AvalonBay Communities, Inc. REIT
| | 54 | | 11,172 |
Equity Residential REIT
| | 36 | | 2,496 |
Essex Property Trust, Inc. REIT
| | 39 | | 10,616 |
| | | | | | 24,284 |
| RETAIL REITs — 0.4% | |
Kimco Realty Corp. REIT
| | 95 | | 1,849 |
Realty Income Corp. REIT
| | 86 | | 4,543 |
Simon Property Group, Inc. REIT
| | 23 | | 3,491 |
| | | | | | 9,883 |
| SEMICONDUCTORS & SEMICONDUCTOR EQUIPMENT — 13.9% | |
Advanced Micro Devices, Inc. (a)
| | 106 | | 17,194 |
Analog Devices, Inc.
| | 77 | | 17,576 |
Broadcom, Inc.
| | 26 | | 41,744 |
Enphase Energy, Inc. (a)
| | 93 | | 9,273 |
First Solar, Inc. (a)
| | 86 | | 19,389 |
Intel Corp.
| | 312 | | 9,663 |
KLA Corp.
| | 9 | | 7,421 |
Marvell Technology, Inc.
| | 91 | | 6,361 |
Monolithic Power Systems, Inc.
| | 4 | | 3,287 |
NVIDIA Corp.
| | 1,425 | | 176,044 |
QUALCOMM, Inc.
| | 71 | | 14,142 |
Texas Instruments, Inc.
| | 84 | | 16,340 |
| | | | | | 338,434 |
| SOFTWARE — 12.4% | |
Adobe, Inc. (a)
| | 30 | | 16,666 |
ANSYS, Inc. (a)
| | 5 | | 1,608 |
Autodesk, Inc. (a)
| | 24 | | 5,939 |
DocuSign, Inc. (a)
| | 7 | | 375 |
Fortinet, Inc. (a)
| | 35 | | 2,109 |
HubSpot, Inc. (a)
| | 1 | | 590 |
Intuit, Inc.
| | 25 | | 16,430 |
Microsoft Corp.
| | 423 | | 189,060 |
Oracle Corp.
| | 116 | | 16,379 |
See accompanying notes to financial statements.
3
SPDR SERIES TRUST
SPDR MSCI USA CLIMATE PARIS ALIGNED ETF
SCHEDULE OF INVESTMENTS (continued)
June 30, 2024
| Security Description | | | Shares | | Value |
Palo Alto Networks, Inc. (a)
| | 4 | | $1,356 |
Roper Technologies, Inc.
| | 8 | | 4,509 |
Salesforce, Inc.
| | 69 | | 17,740 |
ServiceNow, Inc. (a)
| | 24 | | 18,880 |
Synopsys, Inc. (a)
| | 11 | | 6,546 |
Tyler Technologies, Inc. (a)
| | 2 | | 1,006 |
Workday, Inc. Class A (a)
| | 8 | | 1,788 |
Zoom Video Communications, Inc. Class A (a)
| | 7 | | 414 |
| | | | | | 301,395 |
| SPECIALIZED REITs — 3.1% | |
American Tower Corp. REIT
| | 33 | | 6,414 |
Digital Realty Trust, Inc. REIT
| | 253 | | 38,469 |
Equinix, Inc. REIT
| | 26 | | 19,672 |
Extra Space Storage, Inc. REIT
| | 9 | | 1,399 |
Public Storage REIT
| | 17 | | 4,890 |
VICI Properties, Inc. REIT
| | 207 | | 5,928 |
| | | | | | 76,772 |
| SPECIALTY RETAIL — 1.5% | |
Home Depot, Inc.
| | 60 | | 20,655 |
Lowe's Cos., Inc.
| | 5 | | 1,102 |
Ross Stores, Inc.
| | 27 | | 3,924 |
TJX Cos., Inc.
| | 89 | | 9,799 |
Ulta Beauty, Inc. (a)
| | 5 | | 1,929 |
| | | | | | 37,409 |
| TECHNOLOGY HARDWARE, STORAGE & PERIPHERALS — 6.9% | |
Apple, Inc.
| | 802 | | 168,917 |
| TEXTILES, APPAREL & LUXURY GOODS — 0.2% | |
Lululemon Athletica, Inc. (a)
| | 8 | | 2,390 |
NIKE, Inc. Class B
| | 27 | | 2,035 |
| | | | | | 4,425 |
| Security Description | | | Shares | | Value |
| TRADING COMPANIES & DISTRIBUTORS — 0.2% | |
Fastenal Co.
| | 76 | | $4,776 |
WW Grainger, Inc.
| | 1 | | 902 |
| | | | | | 5,678 |
| WATER UTILITIES — 0.6% | |
American Water Works Co., Inc.
| | 107 | | 13,820 |
| WIRELESS TELECOMMUNICATION SERVICES — 0.0% (b) | |
T-Mobile U.S., Inc.
| | 6 | | 1,057 |
TOTAL COMMON STOCKS
(Cost $2,373,871)
| | | | | 2,434,634 |
| SHORT-TERM INVESTMENT — 0.3% | | | |
State Street Institutional Liquid Reserves Fund, Premier Class 5.36% (c) (d)
(Cost $7,747)
| | 7,745 | | 7,747 |
TOTAL INVESTMENTS — 100.1%
(Cost $2,381,618)
| | 2,442,381 | |
LIABILITIES IN EXCESS OF OTHER ASSETS — (0.1)%
| | (3,408) | |
NET ASSETS — 100.0%
| | $2,438,973 | |
| (a) | Non-income producing security. |
| (b) | Amount is less than 0.05% of net assets. |
| (c) | The Fund invested in certain money market funds managed by SSGA Funds Management, Inc. Amounts related to these investments during the year ended June 30, 2024 are shown in the Affiliate Table below. |
| (d) | The rate shown is the annualized seven-day yield at June 30, 2024. |
| REIT | Real Estate Investment Trust |
During the year ended June 30, 2024, the average notional value related to futures contracts was $10,772. There were no futures held at June 30, 2024.
The following table summarizes the value of the Fund's investments according to the fair value hierarchy as of June 30, 2024.
| Description | | Level 1 –
Quoted Prices | | Level 2 –
Other Significant
Observable Inputs | | Level 3 –
Significant
Unobservable Inputs | | Total |
| ASSETS: | | | | | | | | |
| INVESTMENTS: | | | | | | | | |
Common Stocks
| | $2,434,634 | | $— | | $— | | $2,434,634 |
Short-Term Investment
| | 7,747 | | — | | — | | 7,747 |
TOTAL INVESTMENTS
| | $2,442,381 | | $— | | $— | | $2,442,381 |
See accompanying notes to financial statements.
4
SPDR SERIES TRUST
SPDR MSCI USA CLIMATE PARIS ALIGNED ETF
SCHEDULE OF INVESTMENTS (continued)
June 30, 2024
Affiliate Table
| | Number of
Shares Held
at 6/30/23 | | Value at
6/30/23 | | Cost of
Purchases | | Proceeds
from
Shares Sold | | Realized
Gain (Loss) | | Change in
Unrealized
Appreciation/
Depreciation | | Number of
Shares Held
at 6/30/24 | | Value at
6/30/24 | | Dividend
Income |
State Street Institutional Liquid Reserves Fund, Premier Class
| 153,356 | | $153,387 | | $1,668,506 | | $1,814,192 | | $48 | | $(2) | | 7,745 | | $7,747 | | $6,270 |
See accompanying notes to financial statements.
5
SPDR SERIES TRUST
SPDR RUSSELL 1000 LOW VOLATILITY FOCUS ETF
SCHEDULE OF INVESTMENTS
June 30, 2024
| Security Description | | | Shares | | Value |
| COMMON STOCKS — 99.7% | |
| AEROSPACE & DEFENSE — 1.1% | |
BWX Technologies, Inc.
| | 9,101 | | $864,595 |
Curtiss-Wright Corp.
| | 2,807 | | 760,641 |
Huntington Ingalls Industries, Inc.
| | 8,629 | | 2,125,581 |
Northrop Grumman Corp.
| | 3,828 | | 1,668,817 |
Textron, Inc.
| | 15,229 | | 1,307,562 |
Woodward, Inc.
| | 1,721 | | 300,108 |
| | | | | | 7,027,304 |
| AIR FREIGHT & LOGISTICS — 0.9% | |
CH Robinson Worldwide, Inc.
| | 7,075 | | 623,449 |
Expeditors International of Washington, Inc.
| | 22,081 | | 2,755,488 |
FedEx Corp.
| | 6,439 | | 1,930,670 |
GXO Logistics, Inc. (a)
| | 10,298 | | 520,049 |
| | | | | | 5,829,656 |
| AIRLINES — 0.4% | |
Alaska Air Group, Inc. (a)
| | 10,025 | | 405,010 |
Southwest Airlines Co.
| | 78,908 | | 2,257,558 |
| | | | | | 2,662,568 |
| AUTO COMPONENTS — 0.8% | |
BorgWarner, Inc.
| | 58,477 | | 1,885,298 |
Gentex Corp.
| | 58,812 | | 1,982,553 |
Lear Corp.
| | 9,888 | | 1,129,308 |
| | | | | | 4,997,159 |
| AUTOMOBILES — 0.0% (b) | |
Harley-Davidson, Inc.
| | 7,280 | | 244,171 |
| BANKS — 0.3% | |
Bank OZK
| | 7,246 | | 297,086 |
Commerce Bancshares, Inc.
| | 6,770 | | 377,631 |
First Citizens BancShares, Inc. Class A
| | 519 | | 873,793 |
First Hawaiian, Inc.
| | 5,557 | | 115,363 |
Prosperity Bancshares, Inc.
| | 5,027 | | 307,351 |
| | | | | | 1,971,224 |
| BEVERAGES — 0.7% | |
Boston Beer Co., Inc. Class A (a)
| | 808 | | 246,481 |
Brown-Forman Corp. Class A
| | 2,172 | | 95,850 |
Brown-Forman Corp. Class B
| | 9,744 | | 420,843 |
Coca-Cola Consolidated, Inc.
| | 707 | | 767,095 |
Molson Coors Beverage Co. Class B
| | 28,566 | | 1,452,010 |
Monster Beverage Corp. (a)
| | 22,324 | | 1,115,084 |
| | | | | | 4,097,363 |
| BIOTECHNOLOGY — 1.9% | |
Exelixis, Inc. (a)
| | 37,645 | | 845,883 |
Gilead Sciences, Inc.
| | 66,631 | | 4,571,553 |
Incyte Corp. (a)
| | 36,572 | | 2,216,995 |
Neurocrine Biosciences, Inc. (a)
| | 6,329 | | 871,313 |
United Therapeutics Corp. (a)
| | 11,104 | | 3,537,179 |
| | | | | | 12,042,923 |
| Security Description | | | Shares | | Value |
| BROADLINE RETAIL — 0.7% | |
eBay, Inc.
| | 72,200 | | $3,878,584 |
Ollie's Bargain Outlet Holdings, Inc. (a)
| | 2,648 | | 259,954 |
| | | | | | 4,138,538 |
| BUILDING PRODUCTS — 1.8% | |
A O Smith Corp.
| | 23,967 | | 1,960,021 |
AAON, Inc.
| | 6,099 | | 532,076 |
Allegion PLC
| | 11,280 | | 1,332,732 |
Armstrong World Industries, Inc.
| | 5,086 | | 575,939 |
Carlisle Cos., Inc.
| | 3,017 | | 1,222,519 |
Fortune Brands Innovations, Inc.
| | 7,764 | | 504,194 |
Lennox International, Inc.
| | 1,877 | | 1,004,157 |
Masco Corp.
| | 28,824 | | 1,921,696 |
Owens Corning
| | 7,401 | | 1,285,702 |
Simpson Manufacturing Co., Inc.
| | 6,004 | | 1,011,854 |
| | | | | | 11,350,890 |
| CAPITAL MARKETS — 3.8% | |
Affiliated Managers Group, Inc.
| | 8,123 | | 1,269,056 |
Cboe Global Markets, Inc.
| | 22,823 | | 3,881,279 |
Evercore, Inc. Class A
| | 3,272 | | 681,983 |
FactSet Research Systems, Inc.
| | 6,873 | | 2,806,040 |
Franklin Resources, Inc.
| | 20,421 | | 456,409 |
Houlihan Lokey, Inc.
| | 11,498 | | 1,550,620 |
Interactive Brokers Group, Inc. Class A
| | 4,511 | | 553,049 |
Janus Henderson Group PLC
| | 24,775 | | 835,165 |
LPL Financial Holdings, Inc.
| | 3,746 | | 1,046,258 |
MarketAxess Holdings, Inc.
| | 4,854 | | 973,373 |
Morningstar, Inc.
| | 1,232 | | 364,487 |
MSCI, Inc.
| | 3,643 | | 1,755,015 |
Nasdaq, Inc.
| | 16,041 | | 966,631 |
SEI Investments Co.
| | 25,699 | | 1,662,468 |
T Rowe Price Group, Inc.
| | 35,415 | | 4,083,704 |
Tradeweb Markets, Inc. Class A
| | 8,762 | | 928,772 |
Virtu Financial, Inc. Class A
| | 6,459 | | 145,005 |
| | | | | | 23,959,314 |
| CHEMICALS — 1.8% | |
Ashland, Inc.
| | 5,950 | | 562,216 |
Axalta Coating Systems Ltd. (a)
| | 14,319 | | 489,280 |
Celanese Corp.
| | 12,397 | | 1,672,231 |
CF Industries Holdings, Inc.
| | 15,906 | | 1,178,953 |
Corteva, Inc.
| | 18,598 | | 1,003,176 |
Eastman Chemical Co.
| | 14,537 | | 1,424,190 |
Element Solutions, Inc.
| | 13,901 | | 376,995 |
FMC Corp.
| | 5,277 | | 303,691 |
Huntsman Corp.
| | 16,137 | | 367,439 |
NewMarket Corp.
| | 1,710 | | 881,625 |
PPG Industries, Inc.
| | 12,149 | | 1,529,438 |
RPM International, Inc.
| | 12,358 | | 1,330,709 |
Westlake Corp.
| | 1,412 | | 204,486 |
| | | | | | 11,324,429 |
| COMMERCIAL SERVICES & SUPPLIES — 0.7% | |
MSA Safety, Inc.
| | 2,038 | | 382,512 |
See accompanying notes to financial statements.
6
SPDR SERIES TRUST
SPDR RUSSELL 1000 LOW VOLATILITY FOCUS ETF
SCHEDULE OF INVESTMENTS (continued)
June 30, 2024
| Security Description | | | Shares | | Value |
Republic Services, Inc.
| | 6,101 | | $1,185,668 |
Rollins, Inc.
| | 29,092 | | 1,419,399 |
Stericycle, Inc. (a)
| | 5,002 | | 290,766 |
Tetra Tech, Inc.
| | 2,270 | | 464,170 |
Vestis Corp.
| | 32,136 | | 393,023 |
| | | | | | 4,135,538 |
| COMMUNICATIONS EQUIPMENT — 0.9% | |
Ciena Corp. (a)
| | 13,655 | | 657,898 |
F5, Inc. (a)
| | 14,852 | | 2,557,960 |
Juniper Networks, Inc.
| | 75,414 | | 2,749,594 |
| | | | | | 5,965,452 |
| CONSTRUCTION & ENGINEERING — 0.8% | |
AECOM
| | 12,737 | | 1,122,639 |
Comfort Systems USA, Inc.
| | 1,928 | | 586,343 |
EMCOR Group, Inc.
| | 4,421 | | 1,614,019 |
MDU Resources Group, Inc.
| | 26,407 | | 662,816 |
Valmont Industries, Inc.
| | 2,733 | | 750,072 |
WillScot Mobile Mini Holdings Corp. (a)
| | 7,450 | | 280,418 |
| | | | | | 5,016,307 |
| CONSTRUCTION MATERIALS — 0.5% | |
CRH PLC
| | 20,741 | | 1,555,160 |
Eagle Materials, Inc.
| | 3,827 | | 832,220 |
Vulcan Materials Co.
| | 3,553 | | 883,560 |
| | | | | | 3,270,940 |
| CONSUMER FINANCE — 0.2% | |
Credit Acceptance Corp. (a)
| | 363 | | 186,829 |
Synchrony Financial
| | 16,046 | | 757,211 |
| | | | | | 944,040 |
| CONSUMER STAPLES DISTRIBUTION & RETAIL — 3.6% | |
Albertsons Cos., Inc. Class A
| | 70,407 | | 1,390,538 |
BJ's Wholesale Club Holdings, Inc. (a)
| | 26,853 | | 2,358,768 |
Casey's General Stores, Inc.
| | 9,325 | | 3,558,047 |
Dollar General Corp.
| | 29,570 | | 3,910,041 |
Dollar Tree, Inc. (a)
| | 20,724 | | 2,212,701 |
Grocery Outlet Holding Corp. (a)
| | 24,637 | | 544,970 |
Kroger Co.
| | 67,719 | | 3,381,210 |
Sysco Corp.
| | 21,077 | | 1,504,687 |
Target Corp.
| | 21,546 | | 3,189,670 |
Walgreens Boots Alliance, Inc. (c)
| | 42,714 | | 516,626 |
| | | | | | 22,567,258 |
| CONTAINERS & PACKAGING — 2.3% | |
Amcor PLC
| | 239,528 | | 2,342,584 |
AptarGroup, Inc.
| | 9,176 | | 1,292,073 |
Ardagh Group SA (a) (c)
| | 1,132 | | 9,622 |
Avery Dennison Corp.
| | 5,921 | | 1,294,627 |
Ball Corp.
| | 14,975 | | 898,799 |
Berry Global Group, Inc.
| | 13,454 | | 791,768 |
Crown Holdings, Inc.
| | 11,511 | | 856,303 |
Graphic Packaging Holding Co.
| | 40,506 | | 1,061,662 |
International Paper Co.
| | 57,442 | | 2,478,622 |
| Security Description | | | Shares | | Value |
Packaging Corp. of America
| | 9,392 | | $1,714,604 |
Sealed Air Corp.
| | 4,242 | | 147,579 |
Silgan Holdings, Inc.
| | 13,145 | | 556,428 |
Sonoco Products Co.
| | 18,989 | | 963,122 |
| | | | | | 14,407,793 |
| DISTRIBUTORS — 1.2% | |
Genuine Parts Co.
| | 30,823 | | 4,263,437 |
LKQ Corp.
| | 24,393 | | 1,014,505 |
Pool Corp.
| | 7,357 | | 2,261,027 |
| | | | | | 7,538,969 |
| DIVERSIFIED CONSUMER SERVICES — 0.8% | |
Bright Horizons Family Solutions, Inc. (a)
| | 2,545 | | 280,154 |
Grand Canyon Education, Inc. (a)
| | 7,432 | | 1,039,811 |
H&R Block, Inc.
| | 35,284 | | 1,913,451 |
Service Corp. International
| | 24,788 | | 1,763,170 |
| | | | | | 4,996,586 |
| DIVERSIFIED REITs — 0.2% | |
WP Carey, Inc. REIT
| | 26,186 | | 1,441,539 |
| DIVERSIFIED TELECOMMUNICATION SERVICES — 0.3% | |
Frontier Communications Parent, Inc. (a)
| | 21,270 | | 556,849 |
GCI Liberty, Inc. (a) (d)
| | 10,520 | | — |
Iridium Communications, Inc.
| | 9,086 | | 241,869 |
Liberty Global Ltd. Class A (a)
| | 32,798 | | 571,669 |
Liberty Global Ltd. Class C (a)
| | 43,711 | | 780,241 |
| | | | | | 2,150,628 |
| ELECTRIC UTILITIES — 3.6% | |
Alliant Energy Corp.
| | 23,886 | | 1,215,797 |
American Electric Power Co., Inc.
| | 20,731 | | 1,818,938 |
Avangrid, Inc.
| | 7,271 | | 258,338 |
Edison International
| | 20,937 | | 1,503,486 |
Entergy Corp.
| | 24,955 | | 2,670,185 |
Evergy, Inc.
| | 35,412 | | 1,875,774 |
Eversource Energy
| | 14,856 | | 842,484 |
Exelon Corp.
| | 64,175 | | 2,221,097 |
FirstEnergy Corp.
| | 32,189 | | 1,231,873 |
IDACORP, Inc.
| | 8,192 | | 763,085 |
NRG Energy, Inc.
| | 9,702 | | 755,398 |
OGE Energy Corp.
| | 44,016 | | 1,571,371 |
Pinnacle West Capital Corp. (c)
| | 18,436 | | 1,408,142 |
PPL Corp.
| | 52,316 | | 1,446,537 |
Xcel Energy, Inc.
| | 53,566 | | 2,860,960 |
| | | | | | 22,443,465 |
| ELECTRICAL EQUIPMENT — 0.6% | |
Acuity Brands, Inc.
| | 3,534 | | 853,249 |
AMETEK, Inc.
| | 7,226 | | 1,204,646 |
Rockwell Automation, Inc.
| | 6,156 | | 1,694,624 |
Sensata Technologies Holding PLC
| | 4,110 | | 153,673 |
| | | | | | 3,906,192 |
See accompanying notes to financial statements.
7
SPDR SERIES TRUST
SPDR RUSSELL 1000 LOW VOLATILITY FOCUS ETF
SCHEDULE OF INVESTMENTS (continued)
June 30, 2024
| Security Description | | | Shares | | Value |
| ELECTRONIC EQUIPMENT, INSTRUMENTS & COMPONENTS — 1.6% | |
Arrow Electronics, Inc. (a)
| | 4,967 | | $599,815 |
Cognex Corp.
| | 6,261 | | 292,764 |
Crane NXT Co.
| | 7,091 | | 435,529 |
Hubbell, Inc.
| | 1,958 | | 715,610 |
IPG Photonics Corp. (a)
| | 6,105 | | 515,201 |
Jabil, Inc.
| | 24,382 | | 2,652,518 |
Keysight Technologies, Inc. (a)
| | 15,843 | | 2,166,530 |
Littelfuse, Inc.
| | 1,736 | | 443,704 |
TD SYNNEX Corp.
| | 7,030 | | 811,262 |
Teledyne Technologies, Inc. (a)
| | 1,266 | | 491,183 |
Vontier Corp.
| | 18,718 | | 715,028 |
| | | | | | 9,839,144 |
| ENTERTAINMENT — 0.9% | |
Electronic Arts, Inc.
| | 33,857 | | 4,717,296 |
Liberty Media Corp.-Liberty Formula One Class C (a)
| | 8,575 | | 616,028 |
Madison Square Garden Sports Corp. (a)
| | 3,334 | | 627,225 |
| | | | | | 5,960,549 |
| FINANCIAL SERVICES — 0.9% | |
Corpay, Inc. (a)
| | 4,627 | | 1,232,679 |
Euronet Worldwide, Inc. (a)
| | 2,958 | | 306,153 |
Jack Henry & Associates, Inc.
| | 8,719 | | 1,447,528 |
MGIC Investment Corp.
| | 51,989 | | 1,120,363 |
Voya Financial, Inc.
| | 6,270 | | 446,111 |
Western Union Co.
| | 85,965 | | 1,050,492 |
| | | | | | 5,603,326 |
| FOOD PRODUCTS — 3.9% | |
Archer-Daniels-Midland Co.
| | 73,936 | | 4,469,431 |
Bunge Global SA
| | 13,285 | | 1,418,439 |
Campbell Soup Co.
| | 31,061 | | 1,403,646 |
Conagra Brands, Inc.
| | 51,997 | | 1,477,755 |
Flowers Foods, Inc.
| | 38,953 | | 864,757 |
General Mills, Inc.
| | 37,880 | | 2,396,289 |
Hershey Co.
| | 10,678 | | 1,962,937 |
Hormel Foods Corp.
| | 27,037 | | 824,358 |
Ingredion, Inc.
| | 16,660 | | 1,910,902 |
J M Smucker Co.
| | 14,522 | | 1,583,479 |
Kellanova
| | 33,828 | | 1,951,199 |
Kraft Heinz Co.
| | 35,917 | | 1,157,246 |
McCormick & Co., Inc.
| | 17,316 | | 1,228,397 |
Pilgrim's Pride Corp. (a)
| | 3,015 | | 116,047 |
Post Holdings, Inc. (a)
| | 8,175 | | 851,508 |
Seaboard Corp.
| | 65 | | 205,448 |
Tyson Foods, Inc. Class A
| | 16,763 | | 957,838 |
| | | | | | 24,779,676 |
| GAS UTILITIES — 0.9% | |
Atmos Energy Corp.
| | 30,907 | | 3,605,301 |
National Fuel Gas Co.
| | 23,162 | | 1,255,149 |
UGI Corp.
| | 28,369 | | 649,650 |
| | | | | | 5,510,100 |
| Security Description | | | Shares | | Value |
| GROUND TRANSPORTATION — 1.3% | |
CSX Corp.
| | 52,474 | | $1,755,255 |
JB Hunt Transport Services, Inc.
| | 9,782 | | 1,565,120 |
Knight-Swift Transportation Holdings, Inc.
| | 20,896 | | 1,043,128 |
Landstar System, Inc.
| | 9,043 | | 1,668,253 |
Old Dominion Freight Line, Inc.
| | 5,738 | | 1,013,331 |
Ryder System, Inc.
| | 3,533 | | 437,668 |
Schneider National, Inc. Class B
| | 11,931 | | 288,253 |
U-Haul Holding Co. (a) (c) (e)
| | 1,903 | | 117,472 |
U-Haul Holding Co. (e)
| | 8,141 | | 488,623 |
| | | | | | 8,377,103 |
| HEALTH CARE EQUIPMENT & SUPPLIES — 2.1% | |
Baxter International, Inc.
| | 33,981 | | 1,136,664 |
Cooper Cos., Inc.
| | 10,237 | | 893,690 |
Dentsply Sirona, Inc.
| | 22,611 | | 563,240 |
Envista Holdings Corp. (a)
| | 12,224 | | 203,285 |
GE HealthCare Technologies, Inc.
| | 41,144 | | 3,205,941 |
Hologic, Inc. (a)
| | 18,911 | | 1,404,142 |
Solventum Corp. (a)
| | 35,248 | | 1,863,914 |
STERIS PLC
| | 6,176 | | 1,355,879 |
Teleflex, Inc.
| | 4,050 | | 851,837 |
Zimmer Biomet Holdings, Inc.
| | 14,843 | | 1,610,911 |
| | | | | | 13,089,503 |
| HEALTH CARE PROVIDERS & SERVICES — 7.0% | |
Amedisys, Inc. (a)
| | 2,971 | | 272,738 |
Cardinal Health, Inc.
| | 61,941 | | 6,090,039 |
Cencora, Inc.
| | 19,182 | | 4,321,705 |
Centene Corp. (a)
| | 75,788 | | 5,024,744 |
Chemed Corp.
| | 3,774 | | 2,047,697 |
CVS Health Corp.
| | 37,237 | | 2,199,217 |
DaVita, Inc. (a)
| | 9,187 | | 1,273,043 |
Encompass Health Corp.
| | 18,269 | | 1,567,297 |
Henry Schein, Inc. (a)
| | 7,008 | | 449,213 |
Humana, Inc.
| | 18,542 | | 6,928,218 |
Labcorp Holdings, Inc.
| | 16,080 | | 3,272,441 |
McKesson Corp.
| | 8,073 | | 4,714,955 |
Molina Healthcare, Inc. (a)
| | 7,326 | | 2,178,020 |
Premier, Inc. Class A
| | 30,264 | | 565,029 |
Quest Diagnostics, Inc.
| | 17,258 | | 2,362,275 |
Universal Health Services, Inc. Class B
| | 6,350 | | 1,174,305 |
| | | | | | 44,440,936 |
| HOTEL & RESORT REITs — 0.2% | |
Host Hotels & Resorts, Inc. REIT
| | 66,194 | | 1,190,168 |
| HOTELS, RESTAURANTS & LEISURE — 1.0% | |
Choice Hotels International, Inc.
| | 3,520 | | 418,880 |
Domino's Pizza, Inc.
| | 2,856 | | 1,474,639 |
Texas Roadhouse, Inc.
| | 4,280 | | 734,919 |
Travel & Leisure Co.
| | 3,058 | | 137,549 |
Vail Resorts, Inc.
| | 6,788 | | 1,222,722 |
Wyndham Hotels & Resorts, Inc.
| | 3,309 | | 244,866 |
Yum! Brands, Inc.
| | 16,885 | | 2,236,587 |
| | | | | | 6,470,162 |
See accompanying notes to financial statements.
8
SPDR SERIES TRUST
SPDR RUSSELL 1000 LOW VOLATILITY FOCUS ETF
SCHEDULE OF INVESTMENTS (continued)
June 30, 2024
| Security Description | | | Shares | | Value |
| HOUSEHOLD DURABLES — 1.7% | |
DR Horton, Inc.
| | 13,796 | | $1,944,270 |
Garmin Ltd.
| | 16,796 | | 2,736,404 |
Leggett & Platt, Inc.
| | 24,914 | | 285,514 |
Newell Brands, Inc.
| | 59,367 | | 380,543 |
NVR, Inc. (a)
| | 322 | | 2,443,516 |
PulteGroup, Inc.
| | 14,997 | | 1,651,170 |
SharkNinja, Inc.
| | 4,279 | | 321,567 |
Whirlpool Corp.
| | 9,509 | | 971,820 |
| | | | | | 10,734,804 |
| HOUSEHOLD PRODUCTS — 1.3% | |
Church & Dwight Co., Inc.
| | 13,702 | | 1,420,623 |
Clorox Co.
| | 12,752 | | 1,740,265 |
Colgate-Palmolive Co.
| | 19,140 | | 1,857,346 |
Kimberly-Clark Corp.
| | 22,308 | | 3,082,966 |
Reynolds Consumer Products, Inc.
| | 13,518 | | 378,234 |
| | | | | | 8,479,434 |
| INDEPENDENT POWER AND RENEWABLE ELECTRICITY PRODUCERS — 0.3% | |
AES Corp.
| | 20,852 | | 366,370 |
Brookfield Renewable Corp. Class A (c)
| | 6,073 | | 172,352 |
Clearway Energy, Inc. Class A
| | 4,123 | | 93,427 |
Clearway Energy, Inc. Class C
| | 9,054 | | 223,543 |
Vistra Corp.
| | 12,376 | | 1,064,088 |
| | | | | | 1,919,780 |
| INDUSTRIAL REITs — 0.4% | |
EastGroup Properties, Inc. REIT
| | 4,973 | | 845,907 |
First Industrial Realty Trust, Inc. REIT
| | 23,120 | | 1,098,431 |
STAG Industrial, Inc. REIT
| | 15,557 | | 560,986 |
| | | | | | 2,505,324 |
| INSURANCE — 6.9% | |
American Financial Group, Inc.
| | 4,013 | | 493,679 |
Aon PLC Class A
| | 10,398 | | 3,052,645 |
Arch Capital Group Ltd. (a)
| | 65,283 | | 6,586,402 |
Assurant, Inc.
| | 5,820 | | 967,575 |
Assured Guaranty Ltd.
| | 6,535 | | 504,175 |
Axis Capital Holdings Ltd.
| | 8,067 | | 569,934 |
Brown & Brown, Inc.
| | 20,920 | | 1,870,457 |
Cincinnati Financial Corp.
| | 32,528 | | 3,841,557 |
CNA Financial Corp.
| | 2,850 | | 131,300 |
Everest Group Ltd.
| | 10,942 | | 4,169,121 |
First American Financial Corp.
| | 4,424 | | 238,675 |
Globe Life, Inc.
| | 17,223 | | 1,417,108 |
Hanover Insurance Group, Inc.
| | 1,767 | | 221,652 |
Hartford Financial Services Group, Inc.
| | 16,130 | | 1,621,710 |
Kinsale Capital Group, Inc.
| | 2,460 | | 947,789 |
Loews Corp.
| | 18,262 | | 1,364,902 |
Markel Group, Inc. (a)
| | 1,913 | | 3,014,238 |
Old Republic International Corp.
| | 32,932 | | 1,017,599 |
Primerica, Inc.
| | 5,086 | | 1,203,246 |
RenaissanceRe Holdings Ltd.
| | 13,183 | | 2,946,532 |
| Security Description | | | Shares | | Value |
RLI Corp.
| | 10,532 | | $1,481,747 |
Travelers Cos., Inc.
| | 9,841 | | 2,001,069 |
W R Berkley Corp.
| | 29,824 | | 2,343,570 |
Willis Towers Watson PLC
| | 5,931 | | 1,554,752 |
| | | | | | 43,561,434 |
| IT SERVICES — 2.9% | |
Akamai Technologies, Inc. (a)
| | 23,234 | | 2,092,919 |
Amdocs Ltd.
| | 29,123 | | 2,298,387 |
Cognizant Technology Solutions Corp. Class A
| | 126,585 | | 8,607,780 |
GoDaddy, Inc. Class A (a)
| | 11,942 | | 1,668,417 |
VeriSign, Inc. (a)
| | 22,057 | | 3,921,734 |
| | | | | | 18,589,237 |
| LEISURE EQUIPMENT & PRODUCTS — 0.4% | |
Brunswick Corp.
| | 5,058 | | 368,071 |
Mattel, Inc. (a)
| | 70,383 | | 1,144,427 |
Polaris, Inc.
| | 12,838 | | 1,005,344 |
| | | | | | 2,517,842 |
| LIFE SCIENCES TOOLS & SERVICES — 1.5% | |
Agilent Technologies, Inc.
| | 22,474 | | 2,913,305 |
Bio-Techne Corp.
| | 9,290 | | 665,629 |
Bruker Corp.
| | 9,990 | | 637,462 |
Charles River Laboratories International, Inc. (a)
| | 2,488 | | 513,971 |
Fortrea Holdings, Inc. (a)
| | 17,013 | | 397,083 |
Mettler-Toledo International, Inc. (a)
| | 899 | | 1,256,433 |
Qiagen NV (a)
| | 24,801 | | 1,019,073 |
West Pharmaceutical Services, Inc.
| | 5,940 | | 1,956,577 |
| | | | | | 9,359,533 |
| MACHINERY — 5.1% | |
AGCO Corp.
| | 10,445 | | 1,022,357 |
Allison Transmission Holdings, Inc.
| | 22,223 | | 1,686,726 |
CNH Industrial NV
| | 38,971 | | 394,776 |
Crane Co.
| | 5,041 | | 730,844 |
Cummins, Inc.
| | 13,768 | | 3,812,772 |
Donaldson Co., Inc.
| | 23,365 | | 1,671,999 |
Dover Corp.
| | 6,379 | | 1,151,091 |
Esab Corp.
| | 3,126 | | 295,188 |
Flowserve Corp.
| | 7,356 | | 353,824 |
Fortive Corp.
| | 16,912 | | 1,253,179 |
Gates Industrial Corp. PLC (a)
| | 11,629 | | 183,854 |
Graco, Inc.
| | 22,551 | | 1,787,843 |
IDEX Corp.
| | 7,021 | | 1,412,625 |
Illinois Tool Works, Inc.
| | 8,904 | | 2,109,892 |
ITT, Inc.
| | 7,771 | | 1,003,858 |
Lincoln Electric Holdings, Inc.
| | 9,536 | | 1,798,871 |
Middleby Corp. (a)
| | 2,154 | | 264,102 |
Nordson Corp.
| | 2,217 | | 514,211 |
Oshkosh Corp.
| | 10,563 | | 1,142,917 |
Otis Worldwide Corp.
| | 19,514 | | 1,878,418 |
PACCAR, Inc.
| | 29,371 | | 3,023,451 |
Pentair PLC
| | 9,247 | | 708,968 |
Snap-on, Inc.
| | 10,760 | | 2,812,556 |
Timken Co.
| | 4,316 | | 345,841 |
See accompanying notes to financial statements.
9
SPDR SERIES TRUST
SPDR RUSSELL 1000 LOW VOLATILITY FOCUS ETF
SCHEDULE OF INVESTMENTS (continued)
June 30, 2024
| Security Description | | | Shares | | Value |
Toro Co.
| | 11,310 | | $1,057,598 |
| | | | | | 32,417,761 |
| MARINE — 0.1% | |
Kirby Corp. (a)
| | 3,679 | | 440,487 |
| MEDIA — 2.4% | |
Charter Communications, Inc. Class A (a)
| | 9,642 | | 2,882,572 |
Fox Corp. Class A
| | 53,028 | | 1,822,572 |
Fox Corp. Class B
| | 30,093 | | 963,578 |
Interpublic Group of Cos., Inc.
| | 60,099 | | 1,748,280 |
Liberty Broadband Corp. Class A (a)
| | 1,481 | | 80,863 |
Liberty Broadband Corp. Class C (a)
| | 8,927 | | 489,378 |
Liberty Media Corp.-Liberty SiriusXM Class A (a)
| | 11,903 | | 263,652 |
Liberty Media Corp.-Liberty SiriusXM Class C (a)
| | 27,863 | | 617,444 |
New York Times Co. Class A
| | 25,100 | | 1,285,371 |
News Corp. Class A
| | 29,623 | | 816,706 |
News Corp. Class B
| | 8,516 | | 241,769 |
Nexstar Media Group, Inc.
| | 2,919 | | 484,583 |
Omnicom Group, Inc.
| | 33,348 | | 2,991,316 |
Sirius XM Holdings, Inc. (c)
| | 124,772 | | 353,105 |
| | | | | | 15,041,189 |
| METALS & MINING — 1.5% | |
Nucor Corp.
| | 16,316 | | 2,579,233 |
Reliance, Inc.
| | 14,520 | | 4,146,912 |
Royal Gold, Inc.
| | 8,005 | | 1,001,906 |
Steel Dynamics, Inc.
| | 11,528 | | 1,492,876 |
| | | | | | 9,220,927 |
| MORTGAGE REAL ESTATE INVESTMENT TRUST (REITs) — 0.0% (b) | |
Rithm Capital Corp. REIT
| | 20,999 | | 229,099 |
| MULTI-UTILITIES — 3.0% | |
Ameren Corp.
| | 30,318 | | 2,155,913 |
CenterPoint Energy, Inc.
| | 57,864 | | 1,792,627 |
CMS Energy Corp.
| | 29,842 | | 1,776,494 |
Consolidated Edison, Inc.
| | 22,798 | | 2,038,597 |
Dominion Energy, Inc.
| | 39,060 | | 1,913,940 |
DTE Energy Co.
| | 11,428 | | 1,268,622 |
NiSource, Inc.
| | 54,386 | | 1,566,861 |
Public Service Enterprise Group, Inc.
| | 30,881 | | 2,275,930 |
Sempra
| | 28,210 | | 2,145,652 |
WEC Energy Group, Inc.
| | 25,517 | | 2,002,064 |
| | | | | | 18,936,700 |
| OFFICE REITs — 0.1% | |
Highwoods Properties, Inc. REIT
| | 9,267 | | 243,444 |
Kilroy Realty Corp. REIT
| | 9,674 | | 301,539 |
| | | | | | 544,983 |
| OIL, GAS & CONSUMABLE FUELS — 1.0% | |
Chesapeake Energy Corp.
| | 28,499 | | 2,342,333 |
Coterra Energy, Inc.
| | 86,116 | | 2,296,714 |
DT Midstream, Inc.
| | 14,804 | | 1,051,528 |
| Security Description | | | Shares | | Value |
HF Sinclair Corp.
| | 8,354 | | $445,602 |
| | | | | | 6,136,177 |
| PERSONAL CARE PRODUCTS — 0.6% | |
BellRing Brands, Inc. (a)
| | 8,155 | | 465,977 |
Kenvue, Inc.
| | 170,212 | | 3,094,454 |
| | | | | | 3,560,431 |
| PHARMACEUTICALS — 2.3% | |
Bristol-Myers Squibb Co.
| | 172,842 | | 7,178,128 |
Jazz Pharmaceuticals PLC (a)
| | 15,473 | | 1,651,433 |
Organon & Co.
| | 33,918 | | 702,103 |
Perrigo Co. PLC
| | 24,193 | | 621,276 |
Royalty Pharma PLC Class A
| | 99,513 | | 2,624,158 |
Viatris, Inc.
| | 163,098 | | 1,733,732 |
| | | | | | 14,510,830 |
| PROFESSIONAL SERVICES — 3.8% | |
Booz Allen Hamilton Holding Corp.
| | 9,991 | | 1,537,615 |
Broadridge Financial Solutions, Inc.
| | 13,973 | | 2,752,681 |
CACI International, Inc. Class A (a)
| | 4,554 | | 1,958,812 |
Dun & Bradstreet Holdings, Inc.
| | 31,468 | | 291,394 |
FTI Consulting, Inc. (a)
| | 5,373 | | 1,158,043 |
Genpact Ltd.
| | 40,155 | | 1,292,589 |
Jacobs Solutions, Inc.
| | 17,118 | | 2,391,556 |
Leidos Holdings, Inc.
| | 22,659 | | 3,305,495 |
ManpowerGroup, Inc.
| | 10,694 | | 746,441 |
Parsons Corp. (a)
| | 10,154 | | 830,699 |
Paychex, Inc.
| | 15,895 | | 1,884,511 |
Robert Half, Inc.
| | 25,983 | | 1,662,392 |
Science Applications International Corp.
| | 12,992 | | 1,527,210 |
SS&C Technologies Holdings, Inc.
| | 16,157 | | 1,012,559 |
Verisk Analytics, Inc.
| | 6,366 | | 1,715,955 |
| | | | | | 24,067,952 |
| REAL ESTATE MANAGEMENT & DEVELOPMENT — 0.2% | |
CBRE Group, Inc. Class A (a)
| | 15,939 | | 1,420,324 |
| RESIDENTIAL REITs — 1.7% | |
American Homes 4 Rent Class A REIT
| | 21,958 | | 815,959 |
AvalonBay Communities, Inc. REIT
| | 8,248 | | 1,706,429 |
Camden Property Trust REIT
| | 12,842 | | 1,401,191 |
Equity LifeStyle Properties, Inc. REIT
| | 21,092 | | 1,373,722 |
Equity Residential REIT
| | 22,934 | | 1,590,243 |
Essex Property Trust, Inc. REIT
| | 3,094 | | 842,187 |
Mid-America Apartment Communities, Inc. REIT
| | 13,923 | | 1,985,559 |
UDR, Inc. REIT
| | 29,095 | | 1,197,259 |
| | | | | | 10,912,549 |
| RETAIL REITs — 0.2% | |
Agree Realty Corp. REIT
| | 5,964 | | 369,410 |
NNN REIT, Inc.
| | 18,736 | | 798,154 |
| | | | | | 1,167,564 |
See accompanying notes to financial statements.
10
SPDR SERIES TRUST
SPDR RUSSELL 1000 LOW VOLATILITY FOCUS ETF
SCHEDULE OF INVESTMENTS (continued)
June 30, 2024
| Security Description | | | Shares | | Value |
| SEMICONDUCTORS & SEMICONDUCTOR EQUIPMENT — 1.1% | |
Cirrus Logic, Inc. (a)
| | 10,928 | | $1,395,068 |
Qorvo, Inc. (a)
| | 9,297 | | 1,078,824 |
Skyworks Solutions, Inc.
| | 40,839 | | 4,352,621 |
| | | | | | 6,826,513 |
| SOFTWARE — 1.0% | |
ANSYS, Inc. (a)
| | 5,910 | | 1,900,065 |
Dolby Laboratories, Inc. Class A
| | 14,861 | | 1,177,437 |
Dropbox, Inc. Class A (a)
| | 63,221 | | 1,420,576 |
Gen Digital, Inc.
| | 63,248 | | 1,579,935 |
| | | | | | 6,078,013 |
| SPECIALIZED REITs — 2.0% | |
CubeSmart REIT
| | 44,115 | | 1,992,674 |
Lamar Advertising Co. Class A REIT
| | 9,592 | | 1,146,532 |
National Storage Affiliates Trust REIT
| | 10,026 | | 413,272 |
Public Storage REIT
| | 13,578 | | 3,905,712 |
Rayonier, Inc. REIT
| | 23,610 | | 686,815 |
SBA Communications Corp. REIT
| | 7,739 | | 1,519,166 |
VICI Properties, Inc. REIT
| | 60,060 | | 1,720,118 |
Weyerhaeuser Co. REIT
| | 46,461 | | 1,319,028 |
| | | | | | 12,703,317 |
| SPECIALTY RETAIL — 3.3% | |
Advance Auto Parts, Inc.
| | 9,911 | | 627,664 |
AutoZone, Inc. (a)
| | 1,553 | | 4,603,247 |
Best Buy Co., Inc.
| | 54,813 | | 4,620,188 |
Five Below, Inc. (a)
| | 2,956 | | 322,115 |
Murphy USA, Inc.
| | 3,585 | | 1,683,014 |
O'Reilly Automotive, Inc. (a)
| | 4,196 | | 4,431,228 |
Penske Automotive Group, Inc.
| | 1,094 | | 163,028 |
Tractor Supply Co.
| | 12,496 | | 3,373,920 |
Valvoline, Inc. (a)
| | 30,024 | | 1,297,037 |
| | | | | | 21,121,441 |
| TECHNOLOGY HARDWARE, STORAGE & PERIPHERALS — 1.3% | |
Hewlett Packard Enterprise Co.
| | 194,677 | | 4,121,312 |
NetApp, Inc.
| | 32,079 | | 4,131,775 |
| | | | | | 8,253,087 |
| TEXTILES, APPAREL & LUXURY GOODS — 0.8% | |
Carter's, Inc.
| | 9,116 | | 564,919 |
Columbia Sportswear Co.
| | 8,456 | | 668,700 |
Ralph Lauren Corp.
| | 7,966 | | 1,394,528 |
Skechers USA, Inc. Class A (a)
| | 24,401 | | 1,686,597 |
Under Armour, Inc. Class A (a)
| | 9,035 | | 60,263 |
Under Armour, Inc. Class C (a)
| | 9,232 | | 60,285 |
VF Corp.
| | 57,527 | | 776,615 |
| | | | | | 5,211,907 |
| TOBACCO — 0.5% | |
Altria Group, Inc.
| | 74,989 | | 3,415,749 |
| TRADING COMPANIES & DISTRIBUTORS — 2.3% | |
Core & Main, Inc. Class A (a)
| | 29,493 | | 1,443,387 |
| Security Description | | | Shares | | Value |
Fastenal Co.
| | 53,589 | | $3,367,533 |
Ferguson PLC
| | 23,606 | | 4,571,302 |
MSC Industrial Direct Co., Inc. Class A
| | 11,674 | | 925,865 |
SiteOne Landscape Supply, Inc. (a)
| | 3,038 | | 368,844 |
Watsco, Inc.
| | 3,174 | | 1,470,324 |
WW Grainger, Inc.
| | 2,477 | | 2,234,848 |
| | | | | | 14,382,103 |
| WATER UTILITIES — 0.3% | |
American Water Works Co., Inc.
| | 8,278 | | 1,069,186 |
Essential Utilities, Inc.
| | 24,293 | | 906,858 |
| | | | | | 1,976,044 |
TOTAL COMMON STOCKS
(Cost $580,603,864)
| | | | | 629,933,448 |
| SHORT-TERM INVESTMENTS — 0.7% | | | |
State Street Institutional Liquid Reserves Fund, Premier Class 5.36% (f) (g)
| | 1,216,601 | | 1,216,966 |
State Street Navigator Securities Lending Portfolio II (h) (i)
| | 2,916,007 | | 2,916,007 |
TOTAL SHORT-TERM INVESTMENTS
(Cost $4,132,948)
| | 4,132,973 | |
TOTAL INVESTMENTS — 100.4%
(Cost $584,736,812)
| | 634,066,421 | |
LIABILITIES IN EXCESS OF OTHER ASSETS — (0.4)%
| | (2,534,966) | |
NET ASSETS — 100.0%
| | $631,531,455 | |
| (a) | Non-income producing security. |
| (b) | Amount is less than 0.05% of net assets. |
| (c) | All or a portion of the shares of the security are on loan at June 30, 2024. |
| (d) | Fair valued as determined in good faith by the Trust's Oversight Committee in accordance with policy and procedures approved by the Board of Trustees. Security value is determined based on Level 3 inputs. As of June 30, 2024, total aggregate fair value of the security is $0, representing 0.00% of the Fund's net assets. |
| (e) | Reflects separate holdings of the issuer's common stock traded on different securities exchanges. |
| (f) | The Fund invested in certain money market funds managed by SSGA Funds Management, Inc. Amounts related to these investments during the year ended June 30, 2024 are shown in the Affiliate Table below. |
| (g) | The rate shown is the annualized seven-day yield at June 30, 2024. |
| (h) | The Fund invested in an affiliated entity. Amounts related to these investments during the year ended June 30, 2024 are shown in the Affiliate Table below. |
| (i) | Investment of cash collateral for securities loaned. |
| REIT | Real Estate Investment Trust |
See accompanying notes to financial statements.
11
SPDR SERIES TRUST
SPDR RUSSELL 1000 LOW VOLATILITY FOCUS ETF
SCHEDULE OF INVESTMENTS (continued)
June 30, 2024
At June 30, 2024, open futures contracts were as follows:
| Description | | Number of
Contracts | | Expiration
Date | | Notional
Amount | | Value | | Unrealized
Appreciation
(Depreciation) |
| E-mini Russell 1000 Index (long) | | 7 | | 09/20/2024 | | $1,046,671 | | $1,051,680 | | $5,009 |
During the year ended June 30, 2024, the average notional value related to futures contracts was $951,894.
The following table summarizes the value of the Fund's investments according to the fair value hierarchy as of June 30, 2024.
| Description | | Level 1 –
Quoted Prices | | Level 2 –
Other Significant
Observable Inputs | | Level 3 –
Significant
Unobservable Inputs | | Total |
| ASSETS: | | | | | | | | |
| INVESTMENTS: | | | | | | | | |
Common Stocks
| | $629,933,448 | | $— | | $0(a) | | $629,933,448 |
Short-Term Investments
| | 4,132,973 | | — | | — | | 4,132,973 |
TOTAL INVESTMENTS
| | $634,066,421 | | $— | | $0 | | $634,066,421 |
| OTHER FINANCIAL INSTRUMENTS: | | | | | | | | |
Futures Contracts - Unrealized Appreciation
| | $5,009 | | $— | | $— | | $5,009 |
TOTAL OTHER FINANCIAL INSTRUMENTS:
| | $5,009 | | $— | | $— | | $5,009 |
| (a) | The Fund held a Level 3 security that was valued at $0 at June 30, 2024. |
Affiliate Table
| | Number of
Shares Held
at
6/30/23 | | Value at
6/30/23 | | Cost of
Purchases | | Proceeds
from
Shares Sold | | Realized
Gain (Loss) | | Change in
Unrealized
Appreciation/
Depreciation | | Number of
Shares Held
at
6/30/24 | | Value at
6/30/24 | | Dividend
Income |
State Street Institutional Liquid Reserves Fund, Premier Class
| 516,604 | | $516,708 | | $19,974,305 | | $19,273,877 | | $(195) | | $25 | | 1,216,601 | | $1,216,966 | | $41,350 |
State Street Navigator Securities Lending Portfolio II
| 2,291,301 | | 2,291,301 | | 74,603,228 | | 73,978,522 | | — | | — | | 2,916,007 | | 2,916,007 | | 132,511 |
Total
| | | $2,808,009 | | $94,577,533 | | $93,252,399 | | $(195) | | $25 | | | | $4,132,973 | | $173,861 |
See accompanying notes to financial statements.
12
SPDR SERIES TRUST
SPDR RUSSELL 1000 MOMENTUM FOCUS ETF
SCHEDULE OF INVESTMENTS
June 30, 2024
| Security Description | | | Shares | | Value |
| COMMON STOCKS — 99.7% | |
| AEROSPACE & DEFENSE — 1.4% | |
Axon Enterprise, Inc. (a)
| | 170 | | $50,021 |
Boeing Co. (a)
| | 66 | | 12,013 |
BWX Technologies, Inc.
| | 1,220 | | 115,900 |
Curtiss-Wright Corp.
| | 749 | | 202,964 |
General Dynamics Corp.
| | 829 | | 240,526 |
HEICO Corp.
| | 50 | | 11,180 |
HEICO Corp. Class A
| | 99 | | 17,574 |
Hexcel Corp.
| | 1,271 | | 79,374 |
Howmet Aerospace, Inc.
| | 2,133 | | 165,585 |
Huntington Ingalls Industries, Inc.
| | 1,093 | | 269,239 |
L3Harris Technologies, Inc.
| | 307 | | 68,946 |
Lockheed Martin Corp.
| | 231 | | 107,900 |
Northrop Grumman Corp.
| | 174 | | 75,855 |
RTX Corp.
| | 822 | | 82,520 |
Spirit AeroSystems Holdings, Inc. Class A (a)
| | 270 | | 8,875 |
Textron, Inc.
| | 3,474 | | 298,278 |
TransDigm Group, Inc.
| | 49 | | 62,603 |
Woodward, Inc.
| | 855 | | 149,095 |
| | | | | | 2,018,448 |
| AIR FREIGHT & LOGISTICS — 0.4% | |
CH Robinson Worldwide, Inc.
| | 278 | | 24,497 |
Expeditors International of Washington, Inc.
| | 1,106 | | 138,018 |
FedEx Corp.
| | 1,193 | | 357,709 |
GXO Logistics, Inc. (a)
| | 586 | | 29,593 |
United Parcel Service, Inc. Class B
| | 550 | | 75,268 |
| | | | | | 625,085 |
| AIRLINES — 0.9% | |
Alaska Air Group, Inc. (a)
| | 2,994 | | 120,957 |
American Airlines Group, Inc. (a) (b)
| | 4,881 | | 55,302 |
Delta Air Lines, Inc.
| | 14,673 | | 696,087 |
Southwest Airlines Co.
| | 9,152 | | 261,839 |
United Airlines Holdings, Inc. (a)
| | 2,924 | | 142,282 |
| | | | | | 1,276,467 |
| AUTO COMPONENTS — 0.4% | |
Aptiv PLC (a)
| | 955 | | 67,251 |
BorgWarner, Inc.
| | 5,554 | | 179,061 |
Gentex Corp.
| | 7,998 | | 269,613 |
Lear Corp.
| | 1,186 | | 135,453 |
| | | | | | 651,378 |
| AUTOMOBILES — 0.6% | |
Ford Motor Co.
| | 12,836 | | 160,964 |
General Motors Co.
| | 9,559 | | 444,111 |
Harley-Davidson, Inc.
| | 4,610 | | 154,619 |
Thor Industries, Inc.
| | 1,584 | | 148,025 |
| | | | | | 907,719 |
| BANKS — 2.2% | |
Bank of America Corp.
| | 640 | | 25,453 |
Bank of New York Mellon Corp.
| | 2,009 | | 120,319 |
Bank OZK
| | 2,445 | | 100,245 |
| Security Description | | | Shares | | Value |
BOK Financial Corp.
| | 90 | | $8,248 |
Citigroup, Inc.
| | 364 | | 23,099 |
Citizens Financial Group, Inc.
| | 3,416 | | 123,079 |
Columbia Banking System, Inc.
| | 1,820 | | 36,200 |
Comerica, Inc.
| | 1,836 | | 93,709 |
Commerce Bancshares, Inc.
| | 683 | | 38,098 |
Cullen/Frost Bankers, Inc.
| | 132 | | 13,415 |
East West Bancorp, Inc.
| | 2,073 | | 151,806 |
Fifth Third Bancorp
| | 4,613 | | 168,328 |
First Citizens BancShares, Inc. Class A
| | 358 | | 602,732 |
First Hawaiian, Inc.
| | 796 | | 16,525 |
First Horizon Corp.
| | 5,769 | | 90,977 |
FNB Corp.
| | 3,085 | | 42,203 |
Goldman Sachs Group, Inc.
| | 38 | | 17,188 |
Huntington Bancshares, Inc.
| | 8,873 | | 116,946 |
JPMorgan Chase & Co.
| | 55 | | 11,124 |
KeyCorp
| | 7,813 | | 111,023 |
M&T Bank Corp.
| | 925 | | 140,008 |
Northern Trust Corp.
| | 726 | | 60,969 |
NU Holdings Ltd. Class A (a)
| | 6,370 | | 82,109 |
Pinnacle Financial Partners, Inc.
| | 840 | | 67,234 |
PNC Financial Services Group, Inc.
| | 676 | | 105,105 |
Popular, Inc.
| | 709 | | 62,697 |
Prosperity Bancshares, Inc.
| | 395 | | 24,150 |
Regions Financial Corp.
| | 6,528 | | 130,821 |
State Street Corp. (c)
| | 668 | | 49,432 |
Synovus Financial Corp.
| | 1,811 | | 72,784 |
Truist Financial Corp.
| | 1,063 | | 41,298 |
U.S. Bancorp
| | 2,183 | | 86,665 |
Webster Financial Corp.
| | 1,766 | | 76,980 |
Wells Fargo & Co.
| | 1,066 | | 63,310 |
Western Alliance Bancorp
| | 796 | | 50,005 |
Wintrust Financial Corp.
| | 829 | | 81,706 |
Zions Bancorp NA
| | 1,862 | | 80,755 |
| | | | | | 3,186,745 |
| BEVERAGES — 0.5% | |
Boston Beer Co., Inc. Class A (a)
| | 117 | | 35,691 |
Brown-Forman Corp. Class B
| | 311 | | 13,432 |
Celsius Holdings, Inc. (a) (b)
| | 2,148 | | 122,629 |
Coca-Cola Co.
| | 388 | | 24,696 |
Coca-Cola Consolidated, Inc.
| | 272 | | 295,120 |
Constellation Brands, Inc. Class A
| | 282 | | 72,553 |
Keurig Dr Pepper, Inc.
| | 1,705 | | 56,947 |
Molson Coors Beverage Co. Class B
| | 1,927 | | 97,950 |
Monster Beverage Corp. (a)
| | 738 | | 36,863 |
PepsiCo, Inc.
| | 234 | | 38,594 |
| | | | | | 794,475 |
| BIOTECHNOLOGY — 1.0% | |
AbbVie, Inc.
| | 453 | | 77,699 |
Amgen, Inc.
| | 276 | | 86,236 |
BioMarin Pharmaceutical, Inc. (a)
| | 116 | | 9,550 |
Exelixis, Inc. (a)
| | 8,408 | | 188,928 |
Gilead Sciences, Inc.
| | 1,681 | | 115,333 |
See accompanying notes to financial statements.
13
SPDR SERIES TRUST
SPDR RUSSELL 1000 MOMENTUM FOCUS ETF
SCHEDULE OF INVESTMENTS (continued)
June 30, 2024
| Security Description | | | Shares | | Value |
Incyte Corp. (a)
| | 480 | | $29,098 |
Neurocrine Biosciences, Inc. (a)
| | 1,199 | | 165,066 |
Regeneron Pharmaceuticals, Inc. (a)
| | 217 | | 228,074 |
Roivant Sciences Ltd. (a)
| | 1,891 | | 19,988 |
United Therapeutics Corp. (a)
| | 1,266 | | 403,284 |
Vertex Pharmaceuticals, Inc. (a)
| | 312 | | 146,241 |
Viking Therapeutics, Inc. (a)
| | 222 | | 11,768 |
| | | | | | 1,481,265 |
| BROADLINE RETAIL — 1.1% | |
Amazon.com, Inc. (a)
| | 362 | | 69,957 |
Coupang, Inc. (a)
| | 19,044 | | 398,972 |
Dillard's, Inc. Class A
| | 181 | | 79,711 |
eBay, Inc.
| | 6,835 | | 367,176 |
Etsy, Inc. (a)
| | 341 | | 20,112 |
Kohl's Corp.
| | 2,800 | | 64,372 |
Macy's, Inc.
| | 12,477 | | 239,558 |
Nordstrom, Inc.
| | 4,701 | | 99,755 |
Ollie's Bargain Outlet Holdings, Inc. (a)
| | 2,271 | | 222,944 |
| | | | | | 1,562,557 |
| BUILDING PRODUCTS — 2.8% | |
A O Smith Corp.
| | 3,384 | | 276,744 |
AAON, Inc.
| | 1,731 | | 151,012 |
Advanced Drainage Systems, Inc.
| | 1,181 | | 189,421 |
Allegion PLC
| | 922 | | 108,934 |
Armstrong World Industries, Inc.
| | 1,268 | | 143,588 |
AZEK Co., Inc. (a)
| | 3,191 | | 134,437 |
Builders FirstSource, Inc. (a)
| | 3,952 | | 546,996 |
Carlisle Cos., Inc.
| | 697 | | 282,431 |
Carrier Global Corp.
| | 3,098 | | 195,422 |
Fortune Brands Innovations, Inc.
| | 1,314 | | 85,331 |
Hayward Holdings, Inc. (a)
| | 1,166 | | 14,342 |
Johnson Controls International PLC
| | 2,117 | | 140,717 |
Lennox International, Inc.
| | 466 | | 249,301 |
Masco Corp.
| | 4,321 | | 288,081 |
Owens Corning
| | 3,707 | | 643,980 |
Simpson Manufacturing Co., Inc.
| | 1,548 | | 260,885 |
Trane Technologies PLC
| | 746 | | 245,382 |
Trex Co., Inc. (a)
| | 1,994 | | 147,795 |
| | | | | | 4,104,799 |
| CAPITAL MARKETS — 2.7% | |
Affiliated Managers Group, Inc.
| | 1,878 | | 293,400 |
Ameriprise Financial, Inc.
| | 278 | | 118,759 |
ARES Management Corp. Class A
| | 319 | | 42,516 |
BlackRock, Inc.
| | 113 | | 88,967 |
Blackstone, Inc.
| | 805 | | 99,659 |
Blue Owl Capital, Inc.
| | 2,007 | | 35,624 |
Cboe Global Markets, Inc.
| | 2,470 | | 420,048 |
Charles Schwab Corp.
| | 627 | | 46,204 |
CME Group, Inc.
| | 249 | | 48,953 |
Coinbase Global, Inc. Class A (a)
| | 71 | | 15,778 |
Evercore, Inc. Class A
| | 1,431 | | 298,263 |
FactSet Research Systems, Inc.
| | 450 | | 183,722 |
| Security Description | | | Shares | | Value |
Franklin Resources, Inc.
| | 1,233 | | $27,558 |
Houlihan Lokey, Inc.
| | 1,662 | | 224,137 |
Interactive Brokers Group, Inc. Class A
| | 893 | | 109,482 |
Intercontinental Exchange, Inc.
| | 279 | | 38,192 |
Invesco Ltd.
| | 704 | | 10,532 |
Janus Henderson Group PLC
| | 5,132 | | 173,000 |
Jefferies Financial Group, Inc.
| | 187 | | 9,305 |
KKR & Co., Inc.
| | 264 | | 27,783 |
LPL Financial Holdings, Inc.
| | 1,734 | | 484,306 |
MarketAxess Holdings, Inc.
| | 170 | | 34,090 |
Moody's Corp.
| | 419 | | 176,370 |
Morningstar, Inc.
| | 156 | | 46,153 |
MSCI, Inc.
| | 278 | | 133,927 |
Nasdaq, Inc.
| | 1,263 | | 76,108 |
Raymond James Financial, Inc.
| | 265 | | 32,757 |
S&P Global, Inc.
| | 110 | | 49,060 |
SEI Investments Co.
| | 2,388 | | 154,480 |
Stifel Financial Corp.
| | 876 | | 73,715 |
T Rowe Price Group, Inc.
| | 1,607 | | 185,303 |
TPG, Inc.
| | 906 | | 37,554 |
Tradeweb Markets, Inc. Class A
| | 1,427 | | 151,262 |
Virtu Financial, Inc. Class A
| | 1,568 | | 35,202 |
XP, Inc. Class A
| | 1,239 | | 21,794 |
| | | | | | 4,003,963 |
| CHEMICALS — 2.1% | |
Air Products & Chemicals, Inc.
| | 369 | | 95,221 |
Albemarle Corp. (b)
| | 163 | | 15,570 |
Ashland, Inc.
| | 308 | | 29,103 |
Axalta Coating Systems Ltd. (a)
| | 1,596 | | 54,535 |
Celanese Corp.
| | 3,627 | | 489,246 |
CF Industries Holdings, Inc.
| | 3,269 | | 242,298 |
Chemours Co.
| | 3,545 | | 80,011 |
Corteva, Inc.
| | 1,198 | | 64,620 |
Dow, Inc.
| | 2,587 | | 137,240 |
DuPont de Nemours, Inc.
| | 1,989 | | 160,095 |
Eastman Chemical Co.
| | 2,411 | | 236,206 |
Ecolab, Inc.
| | 487 | | 115,906 |
Element Solutions, Inc.
| | 2,619 | | 71,027 |
FMC Corp.
| | 171 | | 9,841 |
Huntsman Corp.
| | 1,018 | | 23,180 |
International Flavors & Fragrances, Inc.
| | 566 | | 53,889 |
Linde PLC
| | 163 | | 71,526 |
LyondellBasell Industries NV Class A
| | 2,048 | | 195,912 |
Mosaic Co.
| | 2,149 | | 62,106 |
NewMarket Corp.
| | 395 | | 203,650 |
Olin Corp.
| | 3,012 | | 142,016 |
PPG Industries, Inc.
| | 591 | | 74,401 |
RPM International, Inc.
| | 1,515 | | 163,135 |
Scotts Miracle-Gro Co.
| | 756 | | 49,185 |
Sherwin-Williams Co.
| | 538 | | 160,555 |
Westlake Corp.
| | 612 | | 88,630 |
| | | | | | 3,089,104 |
See accompanying notes to financial statements.
14
SPDR SERIES TRUST
SPDR RUSSELL 1000 MOMENTUM FOCUS ETF
SCHEDULE OF INVESTMENTS (continued)
June 30, 2024
| Security Description | | | Shares | | Value |
| COMMERCIAL SERVICES & SUPPLIES — 1.0% | |
Cintas Corp.
| | 235 | | $164,561 |
Clean Harbors, Inc. (a)
| | 1,078 | | 243,790 |
Copart, Inc. (a)
| | 2,686 | | 145,474 |
MSA Safety, Inc.
| | 173 | | 32,470 |
Republic Services, Inc.
| | 906 | | 176,072 |
Rollins, Inc.
| | 3,007 | | 146,711 |
Stericycle, Inc. (a)
| | 460 | | 26,740 |
Tetra Tech, Inc.
| | 485 | | 99,173 |
Veralto Corp.
| | 1,337 | | 127,643 |
Vestis Corp.
| | 7,726 | | 94,489 |
Waste Management, Inc.
| | 900 | | 192,006 |
| | | | | | 1,449,129 |
| COMMUNICATIONS EQUIPMENT — 0.8% | |
Arista Networks, Inc. (a)
| | 698 | | 244,635 |
Ciena Corp. (a)
| | 2,079 | | 100,166 |
Cisco Systems, Inc.
| | 2,326 | | 110,508 |
F5, Inc. (a)
| | 2,448 | | 421,619 |
Juniper Networks, Inc.
| | 1,973 | | 71,936 |
Lumentum Holdings, Inc. (a)
| | 123 | | 6,263 |
Motorola Solutions, Inc.
| | 661 | | 255,179 |
| | | | | | 1,210,306 |
| CONSTRUCTION & ENGINEERING — 1.2% | |
AECOM
| | 1,392 | | 122,691 |
API Group Corp. (a)
| | 3,294 | | 123,953 |
Comfort Systems USA, Inc.
| | 1,123 | | 341,527 |
EMCOR Group, Inc.
| | 1,428 | | 521,334 |
MasTec, Inc. (a)
| | 1,966 | | 210,342 |
MDU Resources Group, Inc.
| | 4,716 | | 118,372 |
Quanta Services, Inc.
| | 835 | | 212,165 |
Valmont Industries, Inc.
| | 83 | | 22,779 |
WillScot Mobile Mini Holdings Corp. (a)
| | 1,082 | | 40,727 |
| | | | | | 1,713,890 |
| CONSTRUCTION MATERIALS — 0.9% | |
CRH PLC
| | 7,311 | | 548,179 |
Eagle Materials, Inc.
| | 1,429 | | 310,750 |
Martin Marietta Materials, Inc.
| | 387 | | 209,677 |
Vulcan Materials Co.
| | 692 | | 172,086 |
| | | | | | 1,240,692 |
| CONSUMER FINANCE — 1.2% | |
Ally Financial, Inc.
| | 2,043 | | 81,046 |
American Express Co.
| | 536 | | 124,111 |
Capital One Financial Corp.
| | 2,802 | | 387,937 |
Credit Acceptance Corp. (a)
| | 85 | | 43,748 |
Discover Financial Services
| | 1,859 | | 243,176 |
OneMain Holdings, Inc.
| | 3,189 | | 154,634 |
SLM Corp.
| | 2,429 | | 50,499 |
Synchrony Financial
| | 13,654 | | 644,332 |
| | | | | | 1,729,483 |
| CONSUMER STAPLES DISTRIBUTION & RETAIL — 3.0% | |
Albertsons Cos., Inc. Class A
| | 5,987 | | 118,243 |
| Security Description | | | Shares | | Value |
BJ's Wholesale Club Holdings, Inc. (a)
| | 7,524 | | $660,908 |
Casey's General Stores, Inc.
| | 2,175 | | 829,893 |
Costco Wholesale Corp.
| | 145 | | 123,249 |
Dollar General Corp.
| | 980 | | 129,585 |
Dollar Tree, Inc. (a)
| | 2,895 | | 309,099 |
Grocery Outlet Holding Corp. (a)
| | 4,277 | | 94,607 |
Kroger Co.
| | 9,764 | | 487,517 |
Performance Food Group Co. (a)
| | 8,628 | | 570,397 |
Sysco Corp.
| | 4,936 | | 352,381 |
Target Corp.
| | 1,367 | | 202,371 |
U.S. Foods Holding Corp. (a)
| | 7,552 | | 400,105 |
Walmart, Inc.
| | 599 | | 40,558 |
| | | | | | 4,318,913 |
| CONTAINERS & PACKAGING — 1.0% | |
Amcor PLC
| | 10,728 | | 104,920 |
AptarGroup, Inc.
| | 990 | | 139,402 |
Ardagh Group SA (a) (b)
| | 1,422 | | 12,087 |
Avery Dennison Corp.
| | 704 | | 153,930 |
Ball Corp.
| | 1,722 | | 103,354 |
Berry Global Group, Inc.
| | 902 | | 53,083 |
Crown Holdings, Inc.
| | 1,104 | | 82,126 |
Graphic Packaging Holding Co.
| | 3,442 | | 90,215 |
International Paper Co.
| | 6,289 | | 271,370 |
Packaging Corp. of America
| | 1,395 | | 254,671 |
Sealed Air Corp.
| | 437 | | 15,203 |
Silgan Holdings, Inc.
| | 905 | | 38,309 |
Sonoco Products Co.
| | 1,025 | | 51,988 |
Westrock Co.
| | 2,999 | | 150,730 |
| | | | | | 1,521,388 |
| DISTRIBUTORS — 0.3% | |
Genuine Parts Co.
| | 1,478 | | 204,437 |
LKQ Corp.
| | 2,045 | | 85,052 |
Pool Corp.
| | 416 | | 127,849 |
| | | | | | 417,338 |
| DIVERSIFIED CONSUMER SERVICES — 0.6% | |
ADT, Inc.
| | 2,908 | | 22,101 |
Bright Horizons Family Solutions, Inc. (a)
| | 468 | | 51,517 |
Duolingo, Inc. (a)
| | 295 | | 61,558 |
Grand Canyon Education, Inc. (a)
| | 1,496 | | 209,305 |
H&R Block, Inc.
| | 8,155 | | 442,246 |
Service Corp. International
| | 1,106 | | 78,670 |
| | | | | | 865,397 |
| DIVERSIFIED REITs — 0.0% (d) | |
WP Carey, Inc. REIT
| | 964 | | 53,068 |
| DIVERSIFIED TELECOMMUNICATION SERVICES — 0.5% | |
AT&T, Inc.
| | 11,705 | | 223,683 |
Frontier Communications Parent, Inc. (a)
| | 9,250 | | 242,165 |
GCI Liberty, Inc. (a) (e)
| | 6,909 | | — |
Liberty Global Ltd. Class A (a)
| | 1,923 | | 33,518 |
Liberty Global Ltd. Class C (a)
| | 3,131 | | 55,888 |
See accompanying notes to financial statements.
15
SPDR SERIES TRUST
SPDR RUSSELL 1000 MOMENTUM FOCUS ETF
SCHEDULE OF INVESTMENTS (continued)
June 30, 2024
| Security Description | | | Shares | | Value |
Verizon Communications, Inc.
| | 4,826 | | $199,024 |
| | | | | | 754,278 |
| ELECTRIC UTILITIES — 1.7% | |
Alliant Energy Corp.
| | 1,251 | | 63,676 |
American Electric Power Co., Inc.
| | 2,034 | | 178,463 |
Avangrid, Inc.
| | 281 | | 9,984 |
Constellation Energy Corp.
| | 76 | | 15,220 |
Duke Energy Corp.
| | 1,589 | | 159,265 |
Edison International
| | 2,423 | | 173,996 |
Entergy Corp.
| | 2,915 | | 311,905 |
Evergy, Inc.
| | 1,821 | | 96,458 |
Eversource Energy
| | 614 | | 34,820 |
Exelon Corp.
| | 3,506 | | 121,343 |
FirstEnergy Corp.
| | 2,919 | | 111,710 |
IDACORP, Inc.
| | 327 | | 30,460 |
NextEra Energy, Inc.
| | 879 | | 62,242 |
NRG Energy, Inc.
| | 4,738 | | 368,901 |
OGE Energy Corp.
| | 3,120 | | 111,384 |
PG&E Corp.
| | 9,720 | | 169,711 |
Pinnacle West Capital Corp. (b)
| | 1,082 | | 82,643 |
PPL Corp.
| | 5,232 | | 144,665 |
Southern Co.
| | 1,565 | | 121,397 |
Xcel Energy, Inc.
| | 2,346 | | 125,300 |
| | | | | | 2,493,543 |
| ELECTRICAL EQUIPMENT — 1.1% | |
Acuity Brands, Inc.
| | 1,374 | | 331,739 |
AMETEK, Inc.
| | 539 | | 89,857 |
Eaton Corp. PLC
| | 367 | | 115,073 |
Emerson Electric Co.
| | 154 | | 16,965 |
GE Vernova, Inc. (a)
| | 952 | | 163,277 |
Generac Holdings, Inc. (a)
| | 887 | | 117,279 |
nVent Electric PLC
| | 1,836 | | 140,656 |
Regal Rexnord Corp.
| | 234 | | 31,641 |
Rockwell Automation, Inc.
| | 719 | | 197,926 |
Sensata Technologies Holding PLC
| | 636 | | 23,780 |
Vertiv Holdings Co. Class A
| | 3,526 | | 305,246 |
| | | | | | 1,533,439 |
| ELECTRONIC EQUIPMENT, INSTRUMENTS & COMPONENTS — 1.7% | |
Amphenol Corp. Class A
| | 4,985 | | 335,840 |
Arrow Electronics, Inc. (a)
| | 366 | | 44,198 |
CDW Corp.
| | 1,005 | | 224,959 |
Cognex Corp.
| | 270 | | 12,625 |
Corning, Inc.
| | 1,645 | | 63,908 |
Crane NXT Co.
| | 809 | | 49,689 |
Hubbell, Inc.
| | 311 | | 113,664 |
IPG Photonics Corp. (a)
| | 450 | | 37,976 |
Jabil, Inc.
| | 6,903 | | 750,977 |
Keysight Technologies, Inc. (a)
| | 1,568 | | 214,424 |
Littelfuse, Inc.
| | 178 | | 45,495 |
TD SYNNEX Corp.
| | 2,636 | | 304,195 |
Teledyne Technologies, Inc. (a)
| | 223 | | 86,520 |
Trimble, Inc. (a)
| | 670 | | 37,466 |
Vontier Corp.
| | 2,377 | | 90,801 |
| Security Description | | | Shares | | Value |
Zebra Technologies Corp. Class A (a)
| | 59 | | $18,227 |
| | | | | | 2,430,964 |
| ENERGY EQUIPMENT & SERVICES — 1.1% | |
Baker Hughes Co.
| | 8,998 | | 316,460 |
Halliburton Co.
| | 7,766 | | 262,335 |
NOV, Inc.
| | 6,082 | | 115,619 |
Schlumberger NV
| | 4,345 | | 204,997 |
TechnipFMC PLC
| | 12,614 | | 329,856 |
Weatherford International PLC (a)
| | 2,796 | | 342,370 |
| | | | | | 1,571,637 |
| ENTERTAINMENT — 0.5% | |
Electronic Arts, Inc.
| | 1,162 | | 161,901 |
Liberty Media Corp.-Liberty Formula One Class C (a)
| | 233 | | 16,739 |
Live Nation Entertainment, Inc. (a)
| | 1,896 | | 177,731 |
Madison Square Garden Sports Corp. (a)
| | 150 | | 28,219 |
Netflix, Inc. (a)
| | 103 | | 69,513 |
Spotify Technology SA (a)
| | 352 | | 110,454 |
Walt Disney Co.
| | 363 | | 36,042 |
Warner Bros Discovery, Inc. (a)
| | 20,765 | | 154,492 |
| | | | | | 755,091 |
| FINANCIAL SERVICES — 1.5% | |
Apollo Global Management, Inc.
| | 1,177 | | 138,968 |
Berkshire Hathaway, Inc. Class B (a)
| | 214 | | 87,055 |
Block, Inc. (a)
| | 636 | | 41,016 |
Corebridge Financial, Inc.
| | 1,743 | | 50,756 |
Corpay, Inc. (a)
| | 940 | | 250,425 |
Equitable Holdings, Inc.
| | 1,697 | | 69,339 |
Euronet Worldwide, Inc. (a)
| | 1,203 | | 124,510 |
Fidelity National Information Services, Inc.
| | 455 | | 34,289 |
Fiserv, Inc. (a)
| | 891 | | 132,795 |
Global Payments, Inc.
| | 751 | | 72,622 |
Jack Henry & Associates, Inc.
| | 501 | | 83,176 |
Mastercard, Inc. Class A
| | 65 | | 28,675 |
MGIC Investment Corp.
| | 15,672 | | 337,732 |
PayPal Holdings, Inc. (a)
| | 3,385 | | 196,432 |
Rocket Cos., Inc. Class A (a)
| | 1,035 | | 14,179 |
Toast, Inc. Class A (a)
| | 7,405 | | 190,827 |
Visa, Inc. Class A
| | 128 | | 33,596 |
Voya Financial, Inc.
| | 365 | | 25,970 |
Western Union Co.
| | 19,099 | | 233,390 |
WEX, Inc. (a)
| | 583 | | 103,273 |
| | | | | | 2,249,025 |
| FOOD PRODUCTS — 1.7% | |
Archer-Daniels-Midland Co.
| | 8,802 | | 532,081 |
Bunge Global SA
| | 2,373 | | 253,365 |
Campbell Soup Co.
| | 1,995 | | 90,154 |
Conagra Brands, Inc.
| | 1,609 | | 45,728 |
Flowers Foods, Inc.
| | 3,635 | | 80,697 |
Freshpet, Inc. (a)
| | 437 | | 56,543 |
See accompanying notes to financial statements.
16
SPDR SERIES TRUST
SPDR RUSSELL 1000 MOMENTUM FOCUS ETF
SCHEDULE OF INVESTMENTS (continued)
June 30, 2024
| Security Description | | | Shares | | Value |
General Mills, Inc.
| | 1,475 | | $93,308 |
Hershey Co.
| | 190 | | 34,928 |
Hormel Foods Corp.
| | 826 | | 25,185 |
Ingredion, Inc.
| | 2,802 | | 321,389 |
J M Smucker Co.
| | 222 | | 24,207 |
Kellanova
| | 1,989 | | 114,726 |
Kraft Heinz Co.
| | 3,239 | | 104,361 |
Lamb Weston Holdings, Inc.
| | 298 | | 25,056 |
McCormick & Co., Inc.
| | 239 | | 16,955 |
Mondelez International, Inc. Class A
| | 1,240 | | 81,146 |
Pilgrim's Pride Corp. (a)
| | 1,276 | | 49,113 |
Post Holdings, Inc. (a)
| | 1,018 | | 106,035 |
Seaboard Corp.
| | 2 | | 6,321 |
Tyson Foods, Inc. Class A
| | 6,331 | | 361,753 |
| | | | | | 2,423,051 |
| GAS UTILITIES — 0.3% | |
Atmos Energy Corp.
| | 1,899 | | 221,519 |
National Fuel Gas Co.
| | 2,822 | | 152,924 |
UGI Corp.
| | 628 | | 14,381 |
| | | | | | 388,824 |
| GROUND TRANSPORTATION — 1.0% | |
CSX Corp.
| | 2,970 | | 99,346 |
JB Hunt Transport Services, Inc.
| | 542 | | 86,720 |
Knight-Swift Transportation Holdings, Inc.
| | 375 | | 18,720 |
Landstar System, Inc.
| | 381 | | 70,287 |
Norfolk Southern Corp.
| | 277 | | 59,469 |
Old Dominion Freight Line, Inc.
| | 1,310 | | 231,346 |
Ryder System, Inc.
| | 1,885 | | 233,514 |
Saia, Inc. (a)
| | 653 | | 309,711 |
Schneider National, Inc. Class B
| | 391 | | 9,447 |
Uber Technologies, Inc. (a)
| | 1,262 | | 91,722 |
U-Haul Holding Co. (a) (b) (f)
| | 334 | | 20,618 |
U-Haul Holding Co. (f)
| | 1,443 | | 86,609 |
Union Pacific Corp.
| | 278 | | 62,900 |
XPO, Inc. (a)
| | 524 | | 55,623 |
| | | | | | 1,436,032 |
| HEALTH CARE EQUIPMENT & SUPPLIES — 1.2% | |
Abbott Laboratories
| | 341 | | 35,433 |
Align Technology, Inc. (a)
| | 503 | | 121,439 |
Baxter International, Inc.
| | 914 | | 30,573 |
Becton Dickinson & Co.
| | 155 | | 36,225 |
Boston Scientific Corp. (a)
| | 900 | | 69,309 |
Cooper Cos., Inc.
| | 389 | | 33,960 |
Dexcom, Inc. (a)
| | 454 | | 51,475 |
Edwards Lifesciences Corp. (a)
| | 695 | | 64,197 |
Enovis Corp. (a)
| | 192 | | 8,679 |
GE HealthCare Technologies, Inc.
| | 3,228 | | 251,526 |
Hologic, Inc. (a)
| | 481 | | 35,714 |
IDEXX Laboratories, Inc. (a)
| | 191 | | 93,055 |
Inspire Medical Systems, Inc. (a)
| | 129 | | 17,264 |
Intuitive Surgical, Inc. (a)
| | 166 | | 73,845 |
Masimo Corp. (a)
| | 224 | | 28,211 |
Medtronic PLC
| | 754 | | 59,347 |
| Security Description | | | Shares | | Value |
ResMed, Inc.
| | 350 | | $66,997 |
Solventum Corp. (a)
| | 8,146 | | 430,761 |
STERIS PLC
| | 352 | | 77,278 |
Stryker Corp.
| | 177 | | 60,224 |
Teleflex, Inc.
| | 102 | | 21,454 |
Zimmer Biomet Holdings, Inc.
| | 293 | | 31,799 |
| | | | | | 1,698,765 |
| HEALTH CARE PROVIDERS & SERVICES — 4.9% | |
Acadia Healthcare Co., Inc. (a)
| | 371 | | 25,058 |
Amedisys, Inc. (a)
| | 281 | | 25,796 |
Cardinal Health, Inc.
| | 8,076 | | 794,032 |
Cencora, Inc.
| | 2,459 | | 554,013 |
Centene Corp. (a)
| | 10,054 | | 666,580 |
Chemed Corp.
| | 154 | | 83,557 |
Cigna Group
| | 1,225 | | 404,948 |
CVS Health Corp.
| | 4,387 | | 259,096 |
DaVita, Inc. (a)
| | 2,191 | | 303,607 |
Elevance Health, Inc.
| | 634 | | 343,539 |
Encompass Health Corp.
| | 2,251 | | 193,113 |
HCA Healthcare, Inc.
| | 502 | | 161,283 |
Henry Schein, Inc. (a)
| | 176 | | 11,282 |
Humana, Inc.
| | 1,706 | | 637,447 |
Labcorp Holdings, Inc.
| | 948 | | 192,928 |
McKesson Corp.
| | 1,883 | | 1,099,747 |
Molina Healthcare, Inc. (a)
| | 1,361 | | 404,625 |
Premier, Inc. Class A
| | 996 | | 18,595 |
Quest Diagnostics, Inc.
| | 961 | | 131,542 |
Tenet Healthcare Corp. (a)
| | 3,676 | | 489,018 |
UnitedHealth Group, Inc.
| | 100 | | 50,926 |
Universal Health Services, Inc. Class B
| | 1,734 | | 320,669 |
| | | | | | 7,171,401 |
| HEALTH CARE REITs — 0.1% | |
Healthpeak Properties, Inc. REIT
| | 1,169 | | 22,912 |
Omega Healthcare Investors, Inc. REIT
| | 981 | | 33,599 |
Ventas, Inc. REIT
| | 187 | | 9,586 |
Welltower, Inc. REIT
| | 165 | | 17,201 |
| | | | | | 83,298 |
| HEALTH CARE TECHNOLOGY — 0.1% | |
Doximity, Inc. Class A (a)
| | 546 | | 15,271 |
Veeva Systems, Inc. Class A (a)
| | 468 | | 85,649 |
| | | | | | 100,920 |
| HOTEL & RESORT REITs — 0.2% | |
Host Hotels & Resorts, Inc. REIT
| | 15,104 | | 271,570 |
Park Hotels & Resorts, Inc. REIT
| | 2,301 | | 34,469 |
| | | | | | 306,039 |
| HOTELS, RESTAURANTS & LEISURE — 4.1% | |
Airbnb, Inc. Class A (a)
| | 1,215 | | 184,230 |
Aramark
| | 9,520 | | 323,870 |
Booking Holdings, Inc.
| | 82 | | 324,843 |
Boyd Gaming Corp.
| | 1,654 | | 91,135 |
Caesars Entertainment, Inc. (a)
| | 325 | | 12,916 |
See accompanying notes to financial statements.
17
SPDR SERIES TRUST
SPDR RUSSELL 1000 MOMENTUM FOCUS ETF
SCHEDULE OF INVESTMENTS (continued)
June 30, 2024
| Security Description | | | Shares | | Value |
Carnival Corp. (a)
| | 4,030 | | $75,442 |
Cava Group, Inc. (a)
| | 321 | | 29,773 |
Chipotle Mexican Grill, Inc. (a)
| | 3,733 | | 233,872 |
Choice Hotels International, Inc.
| | 369 | | 43,911 |
Churchill Downs, Inc.
| | 401 | | 55,980 |
Darden Restaurants, Inc.
| | 1,337 | | 202,315 |
Domino's Pizza, Inc.
| | 423 | | 218,408 |
DoorDash, Inc. Class A (a)
| | 4,416 | | 480,372 |
DraftKings, Inc. Class A (a)
| | 1,499 | | 57,217 |
Expedia Group, Inc. (a)
| | 7,432 | | 936,358 |
Hilton Worldwide Holdings, Inc.
| | 1,215 | | 265,113 |
Hyatt Hotels Corp. Class A
| | 538 | | 81,733 |
Las Vegas Sands Corp.
| | 847 | | 37,480 |
Light & Wonder, Inc. (a)
| | 1,875 | | 196,650 |
Marriott International, Inc. Class A
| | 1,104 | | 266,914 |
Marriott Vacations Worldwide Corp.
| | 101 | | 8,819 |
McDonald's Corp.
| | 136 | | 34,658 |
MGM Resorts International (a)
| | 3,324 | | 147,719 |
Norwegian Cruise Line Holdings Ltd. (a)
| | 9,315 | | 175,029 |
Planet Fitness, Inc. Class A (a)
| | 377 | | 27,743 |
Royal Caribbean Cruises Ltd. (a)
| | 2,599 | | 414,359 |
Starbucks Corp.
| | 907 | | 70,610 |
Texas Roadhouse, Inc.
| | 2,244 | | 385,317 |
Travel & Leisure Co.
| | 1,735 | | 78,040 |
Vail Resorts, Inc.
| | 211 | | 38,007 |
Wendy's Co.
| | 1,032 | | 17,503 |
Wingstop, Inc.
| | 479 | | 202,454 |
Wyndham Hotels & Resorts, Inc.
| | 634 | | 46,916 |
Wynn Resorts Ltd.
| | 1,256 | | 112,412 |
Yum! Brands, Inc.
| | 714 | | 94,576 |
| | | | | | 5,972,694 |
| HOUSEHOLD DURABLES — 3.6% | |
DR Horton, Inc.
| | 5,801 | | 817,535 |
Garmin Ltd.
| | 2,097 | | 341,643 |
Lennar Corp. Class A
| | 6,399 | | 959,018 |
Mohawk Industries, Inc. (a)
| | 1,302 | | 147,894 |
Newell Brands, Inc.
| | 7,286 | | 46,703 |
NVR, Inc. (a)
| | 67 | | 508,434 |
PulteGroup, Inc.
| | 10,064 | | 1,108,046 |
SharkNinja, Inc.
| | 908 | | 68,236 |
Tempur Sealy International, Inc.
| | 3,274 | | 154,991 |
Toll Brothers, Inc.
| | 5,803 | | 668,390 |
TopBuild Corp. (a)
| | 983 | | 378,721 |
Whirlpool Corp.
| | 236 | | 24,119 |
| | | | | | 5,223,730 |
| HOUSEHOLD PRODUCTS — 0.5% | |
Church & Dwight Co., Inc.
| | 1,613 | | 167,236 |
Clorox Co.
| | 354 | | 48,310 |
Colgate-Palmolive Co.
| | 2,627 | | 254,924 |
Kimberly-Clark Corp.
| | 1,302 | | 179,936 |
Procter & Gamble Co.
| | 242 | | 39,911 |
Reynolds Consumer Products, Inc.
| | 983 | | 27,504 |
Spectrum Brands Holdings, Inc.
| | 906 | | 77,853 |
| | | | | | 795,674 |
| Security Description | | | Shares | | Value |
| INDEPENDENT POWER AND RENEWABLE ELECTRICITY PRODUCERS — 0.7% | |
AES Corp.
| | 6,996 | | $122,920 |
Brookfield Renewable Corp. Class A
| | 621 | | 17,624 |
Clearway Energy, Inc. Class C
| | 324 | | 7,999 |
Vistra Corp.
| | 9,468 | | 814,059 |
| | | | | | 962,602 |
| INDUSTRIAL CONGLOMERATES — 0.2% | |
3M Co.
| | 652 | | 66,628 |
General Electric Co.
| | 958 | | 152,293 |
Honeywell International, Inc.
| | 266 | | 56,802 |
| | | | | | 275,723 |
| INDUSTRIAL REITs — 0.1% | |
EastGroup Properties, Inc. REIT
| | 169 | | 28,747 |
First Industrial Realty Trust, Inc. REIT
| | 567 | | 26,938 |
Prologis, Inc. REIT
| | 195 | | 21,900 |
Rexford Industrial Realty, Inc. REIT
| | 124 | | 5,529 |
STAG Industrial, Inc. REIT
| | 645 | | 23,259 |
| | | | | | 106,373 |
| INSURANCE — 5.4% | |
Aflac, Inc.
| | 3,078 | | 274,896 |
Allstate Corp.
| | 345 | | 55,083 |
American Financial Group, Inc.
| | 1,306 | | 160,664 |
American International Group, Inc.
| | 1,439 | | 106,831 |
Aon PLC Class A
| | 289 | | 84,845 |
Arch Capital Group Ltd. (a)
| | 10,033 | | 1,012,229 |
Arthur J Gallagher & Co.
| | 177 | | 45,898 |
Assurant, Inc.
| | 694 | | 115,378 |
Assured Guaranty Ltd.
| | 3,113 | | 240,168 |
Axis Capital Holdings Ltd.
| | 1,077 | | 76,090 |
Brown & Brown, Inc.
| | 2,194 | | 196,166 |
Chubb Ltd.
| | 1,067 | | 272,170 |
Cincinnati Financial Corp.
| | 3,909 | | 461,653 |
CNA Financial Corp.
| | 279 | | 12,854 |
Everest Group Ltd.
| | 1,302 | | 496,088 |
Fidelity National Financial, Inc.
| | 2,605 | | 128,739 |
First American Financial Corp.
| | 397 | | 21,418 |
Globe Life, Inc.
| | 2,571 | | 211,542 |
Hanover Insurance Group, Inc.
| | 176 | | 22,077 |
Hartford Financial Services Group, Inc.
| | 4,259 | | 428,200 |
Kinsale Capital Group, Inc.
| | 1,077 | | 414,947 |
Loews Corp.
| | 2,125 | | 158,822 |
Markel Group, Inc. (a)
| | 258 | | 406,520 |
Marsh & McLennan Cos., Inc.
| | 917 | | 193,230 |
MetLife, Inc.
| | 1,252 | | 87,878 |
Old Republic International Corp.
| | 4,543 | | 140,379 |
Primerica, Inc.
| | 651 | | 154,014 |
Principal Financial Group, Inc.
| | 609 | | 47,776 |
Progressive Corp.
| | 1,248 | | 259,222 |
Prudential Financial, Inc.
| | 914 | | 107,112 |
Reinsurance Group of America, Inc.
| | 745 | | 152,926 |
RenaissanceRe Holdings Ltd.
| | 2,273 | | 508,038 |
See accompanying notes to financial statements.
18
SPDR SERIES TRUST
SPDR RUSSELL 1000 MOMENTUM FOCUS ETF
SCHEDULE OF INVESTMENTS (continued)
June 30, 2024
| Security Description | | | Shares | | Value |
RLI Corp.
| | 745 | | $104,814 |
Ryan Specialty Holdings, Inc. (b)
| | 289 | | 16,736 |
Travelers Cos., Inc.
| | 1,025 | | 208,423 |
Unum Group
| | 3,175 | | 162,274 |
W R Berkley Corp.
| | 3,398 | | 267,015 |
White Mountains Insurance Group Ltd.
| | 6 | | 10,905 |
Willis Towers Watson PLC
| | 288 | | 75,496 |
| | | | | | 7,899,516 |
| INTERACTIVE MEDIA & SERVICES — 0.6% | |
Alphabet, Inc. Class A
| | 651 | | 118,580 |
Alphabet, Inc. Class C
| | 578 | | 106,017 |
IAC, Inc. (a)
| | 436 | | 20,426 |
Match Group, Inc. (a)
| | 2,756 | | 83,727 |
Meta Platforms, Inc. Class A
| | 303 | | 152,779 |
Pinterest, Inc. Class A (a)
| | 7,023 | | 309,504 |
TripAdvisor, Inc. (a)
| | 3,643 | | 64,882 |
ZoomInfo Technologies, Inc. (a)
| | 4,998 | | 63,824 |
| | | | | | 919,739 |
| IT SERVICES — 2.4% | |
Accenture PLC Class A
| | 253 | | 76,763 |
Akamai Technologies, Inc. (a)
| | 2,360 | | 212,589 |
Amdocs Ltd.
| | 1,973 | | 155,709 |
Cloudflare, Inc. Class A (a)
| | 121 | | 10,022 |
Cognizant Technology Solutions Corp. Class A
| | 8,013 | | 544,884 |
DXC Technology Co. (a)
| | 10,662 | | 203,538 |
EPAM Systems, Inc. (a)
| | 1,903 | | 357,973 |
Gartner, Inc. (a)
| | 870 | | 390,682 |
Globant SA (a)
| | 421 | | 75,048 |
GoDaddy, Inc. Class A (a)
| | 5,915 | | 826,385 |
International Business Machines Corp.
| | 1,572 | | 271,877 |
Kyndryl Holdings, Inc. (a)
| | 4,433 | | 116,632 |
MongoDB, Inc. (a)
| | 38 | | 9,499 |
Okta, Inc. (a)
| | 663 | | 62,063 |
Snowflake, Inc. Class A (a)
| | 474 | | 64,033 |
Twilio, Inc. Class A (a)
| | 461 | | 26,189 |
VeriSign, Inc. (a)
| | 249 | | 44,272 |
| | | | | | 3,448,158 |
| LEISURE EQUIPMENT & PRODUCTS — 0.2% | |
Brunswick Corp.
| | 867 | | 63,092 |
Hasbro, Inc.
| | 221 | | 12,928 |
Mattel, Inc. (a)
| | 7,094 | | 115,348 |
Polaris, Inc.
| | 176 | | 13,783 |
YETI Holdings, Inc. (a)
| | 2,889 | | 110,215 |
| | | | | | 315,366 |
| LIFE SCIENCES TOOLS & SERVICES — 0.9% | |
Agilent Technologies, Inc.
| | 1,938 | | 251,223 |
Avantor, Inc. (a)
| | 4,720 | | 100,064 |
Azenta, Inc. (a)
| | 420 | | 22,100 |
Bio-Techne Corp.
| | 571 | | 40,912 |
Bruker Corp.
| | 725 | | 46,262 |
| Security Description | | | Shares | | Value |
Charles River Laboratories International, Inc. (a)
| | 281 | | $58,049 |
Danaher Corp.
| | 148 | | 36,978 |
Fortrea Holdings, Inc. (a)
| | 2,938 | | 68,573 |
IQVIA Holdings, Inc. (a)
| | 336 | | 71,044 |
Medpace Holdings, Inc. (a)
| | 623 | | 256,583 |
Mettler-Toledo International, Inc. (a)
| | 67 | | 93,639 |
Qiagen NV (a)
| | 694 | | 28,516 |
Repligen Corp. (a)
| | 85 | | 10,715 |
Revvity, Inc.
| | 194 | | 20,343 |
Thermo Fisher Scientific, Inc.
| | 54 | | 29,862 |
Waters Corp. (a)
| | 74 | | 21,469 |
West Pharmaceutical Services, Inc.
| | 454 | | 149,543 |
| | | | | | 1,305,875 |
| MACHINERY — 3.7% | |
AGCO Corp.
| | 614 | | 60,098 |
Allison Transmission Holdings, Inc.
| | 5,134 | | 389,671 |
Caterpillar, Inc.
| | 750 | | 249,825 |
CNH Industrial NV
| | 3,345 | | 33,885 |
Crane Co.
| | 1,130 | | 163,827 |
Cummins, Inc.
| | 1,768 | | 489,612 |
Deere & Co.
| | 348 | | 130,023 |
Donaldson Co., Inc.
| | 2,417 | | 172,961 |
Dover Corp.
| | 925 | | 166,916 |
Esab Corp.
| | 1,214 | | 114,638 |
Flowserve Corp.
| | 3,519 | | 169,264 |
Fortive Corp.
| | 1,516 | | 112,336 |
Gates Industrial Corp. PLC (a)
| | 6,905 | | 109,168 |
Graco, Inc.
| | 1,064 | | 84,354 |
IDEX Corp.
| | 429 | | 86,315 |
Illinois Tool Works, Inc.
| | 462 | | 109,476 |
Ingersoll Rand, Inc.
| | 2,373 | | 215,563 |
ITT, Inc.
| | 2,633 | | 340,131 |
Lincoln Electric Holdings, Inc.
| | 988 | | 186,376 |
Middleby Corp. (a)
| | 230 | | 28,200 |
Nordson Corp.
| | 225 | | 52,187 |
Oshkosh Corp.
| | 2,820 | | 305,124 |
Otis Worldwide Corp.
| | 1,478 | | 142,272 |
PACCAR, Inc.
| | 4,798 | | 493,906 |
Parker-Hannifin Corp.
| | 78 | | 39,453 |
Pentair PLC
| | 2,288 | | 175,421 |
RBC Bearings, Inc. (a)
| | 303 | | 81,743 |
Snap-on, Inc.
| | 1,239 | | 323,862 |
Stanley Black & Decker, Inc.
| | 631 | | 50,411 |
Timken Co.
| | 1,019 | | 81,652 |
Toro Co.
| | 490 | | 45,820 |
Westinghouse Air Brake Technologies Corp.
| | 1,416 | | 223,799 |
| | | | | | 5,428,289 |
| MARINE — 0.1% | |
Kirby Corp. (a)
| | 1,731 | | 207,253 |
| MEDIA — 1.2% | |
Charter Communications, Inc. Class A (a)
| | 613 | | 183,262 |
Comcast Corp. Class A
| | 3,409 | | 133,496 |
See accompanying notes to financial statements.
19
SPDR SERIES TRUST
SPDR RUSSELL 1000 MOMENTUM FOCUS ETF
SCHEDULE OF INVESTMENTS (continued)
June 30, 2024
| Security Description | | | Shares | | Value |
Fox Corp. Class A
| | 3,360 | | $115,483 |
Fox Corp. Class B
| | 1,665 | | 53,313 |
Interpublic Group of Cos., Inc.
| | 2,899 | | 84,332 |
Liberty Broadband Corp. Class C (a)
| | 279 | | 15,295 |
Liberty Media Corp.-Liberty SiriusXM Class A (a)
| | 1,117 | | 24,742 |
Liberty Media Corp.-Liberty SiriusXM Class C (a)
| | 2,694 | | 59,699 |
New York Times Co. Class A
| | 3,795 | | 194,342 |
News Corp. Class A
| | 5,337 | | 147,141 |
News Corp. Class B
| | 1,763 | | 50,052 |
Nexstar Media Group, Inc.
| | 1,207 | | 200,374 |
Omnicom Group, Inc.
| | 2,678 | | 240,217 |
Trade Desk, Inc. Class A (a)
| | 2,000 | | 195,340 |
| | | | | | 1,697,088 |
| METALS & MINING — 1.6% | |
Alcoa Corp.
| | 233 | | 9,269 |
ATI, Inc. (a)
| | 1,537 | | 85,227 |
Cleveland-Cliffs, Inc. (a)
| | 10,185 | | 156,747 |
Freeport-McMoRan, Inc.
| | 3,679 | | 178,799 |
Nucor Corp.
| | 4,132 | | 653,187 |
Reliance, Inc.
| | 1,260 | | 359,856 |
Royal Gold, Inc.
| | 913 | | 114,271 |
Southern Copper Corp.
| | 257 | | 27,689 |
Steel Dynamics, Inc.
| | 5,054 | | 654,493 |
U.S. Steel Corp.
| | 3,850 | | 145,530 |
| | | | | | 2,385,068 |
| MORTGAGE REAL ESTATE INVESTMENT TRUST (REITs) — 0.1% | |
Rithm Capital Corp. REIT
| | 9,080 | | 99,063 |
Starwood Property Trust, Inc. REIT (b)
| | 1,036 | | 19,622 |
| | | | | | 118,685 |
| MULTI-UTILITIES — 1.1% | |
Ameren Corp.
| | 876 | | 62,292 |
CenterPoint Energy, Inc.
| | 6,567 | | 203,446 |
CMS Energy Corp.
| | 2,210 | | 131,561 |
Consolidated Edison, Inc.
| | 1,771 | | 158,363 |
Dominion Energy, Inc.
| | 2,771 | | 135,779 |
DTE Energy Co.
| | 889 | | 98,688 |
NiSource, Inc.
| | 5,105 | | 147,075 |
Public Service Enterprise Group, Inc.
| | 4,335 | | 319,490 |
Sempra
| | 2,508 | | 190,758 |
WEC Energy Group, Inc.
| | 1,264 | | 99,173 |
| | | | | | 1,546,625 |
| OFFICE REITs — 0.1% | |
Alexandria Real Estate Equities, Inc. REIT
| | 133 | | 15,557 |
Boston Properties, Inc. REIT
| | 459 | | 28,256 |
Cousins Properties, Inc. REIT
| | 503 | | 11,645 |
Highwoods Properties, Inc. REIT
| | 1,407 | | 36,962 |
Kilroy Realty Corp. REIT
| | 965 | | 30,079 |
| Security Description | | | Shares | | Value |
Vornado Realty Trust REIT
| | 925 | | $24,318 |
| | | | | | 146,817 |
| OIL, GAS & CONSUMABLE FUELS — 4.8% | |
Antero Midstream Corp.
| | 7,704 | | 113,557 |
Antero Resources Corp. (a)
| | 1,953 | | 63,726 |
APA Corp.
| | 2,115 | | 62,266 |
Cheniere Energy, Inc.
| | 339 | | 59,267 |
Chesapeake Energy Corp.
| | 2,662 | | 218,790 |
Chevron Corp.
| | 436 | | 68,199 |
Chord Energy Corp.
| | 2,988 | | 501,028 |
Civitas Resources, Inc.
| | 1,358 | | 93,702 |
ConocoPhillips
| | 2,149 | | 245,803 |
Coterra Energy, Inc.
| | 11,223 | | 299,317 |
Devon Energy Corp.
| | 7,265 | | 344,361 |
Diamondback Energy, Inc.
| | 4,671 | | 935,087 |
DT Midstream, Inc.
| | 1,878 | | 133,394 |
EOG Resources, Inc.
| | 3,936 | | 495,424 |
EQT Corp.
| | 222 | | 8,210 |
Exxon Mobil Corp.
| | 399 | | 45,933 |
Hess Corp.
| | 511 | | 75,383 |
HF Sinclair Corp.
| | 4,872 | | 259,872 |
Kinder Morgan, Inc.
| | 6,267 | | 124,525 |
Marathon Oil Corp.
| | 15,056 | | 431,656 |
Marathon Petroleum Corp.
| | 2,891 | | 501,531 |
Matador Resources Co.
| | 3,055 | | 182,078 |
Occidental Petroleum Corp.
| | 2,825 | | 178,060 |
Ovintiv, Inc.
| | 2,167 | | 101,567 |
Permian Resources Corp.
| | 4,860 | | 78,489 |
Phillips 66
| | 1,765 | | 249,165 |
Range Resources Corp.
| | 1,530 | | 51,301 |
Southwestern Energy Co. (a)
| | 9,162 | | 61,660 |
Targa Resources Corp.
| | 428 | | 55,118 |
Texas Pacific Land Corp.
| | 277 | | 203,393 |
Valero Energy Corp.
| | 3,077 | | 482,351 |
Viper Energy, Inc.
| | 2,029 | | 76,148 |
Williams Cos., Inc.
| | 6,292 | | 267,410 |
| | | | | | 7,067,771 |
| PERSONAL CARE PRODUCTS — 0.2% | |
BellRing Brands, Inc. (a)
| | 3,875 | | 221,417 |
Coty, Inc. Class A (a)
| | 858 | | 8,597 |
elf Beauty, Inc. (a)
| | 166 | | 34,980 |
Estee Lauder Cos., Inc. Class A
| | 130 | | 13,832 |
Kenvue, Inc.
| | 2,549 | | 46,341 |
| | | | | | 325,167 |
| PAPER & FOREST PRODUCTS — 0.0% (d) | |
Louisiana-Pacific Corp.
| | 517 | | 42,565 |
| PHARMACEUTICALS — 0.4% | |
Bristol-Myers Squibb Co.
| | 924 | | 38,374 |
Catalent, Inc. (a)
| | 394 | | 22,155 |
Eli Lilly & Co.
| | 13 | | 11,770 |
Jazz Pharmaceuticals PLC (a)
| | 631 | | 67,347 |
Johnson & Johnson
| | 269 | | 39,317 |
Merck & Co., Inc.
| | 237 | | 29,340 |
Organon & Co.
| | 3,663 | | 75,824 |
See accompanying notes to financial statements.
20
SPDR SERIES TRUST
SPDR RUSSELL 1000 MOMENTUM FOCUS ETF
SCHEDULE OF INVESTMENTS (continued)
June 30, 2024
| Security Description | | | Shares | | Value |
Perrigo Co. PLC
| | 1,808 | | $46,429 |
Royalty Pharma PLC Class A
| | 1,727 | | 45,541 |
Viatris, Inc.
| | 21,400 | | 227,482 |
Zoetis, Inc.
| | 312 | | 54,088 |
| | | | | | 657,667 |
| PROFESSIONAL SERVICES — 2.5% | |
Automatic Data Processing, Inc.
| | 414 | | 98,818 |
Booz Allen Hamilton Holding Corp.
| | 1,218 | | 187,450 |
Broadridge Financial Solutions, Inc.
| | 1,222 | | 240,734 |
CACI International, Inc. Class A (a)
| | 685 | | 294,639 |
Clarivate PLC (a) (b)
| | 2,937 | | 16,712 |
Dayforce, Inc. (a) (b)
| | 574 | | 28,470 |
Dun & Bradstreet Holdings, Inc.
| | 1,139 | | 10,547 |
Equifax, Inc.
| | 263 | | 63,767 |
FTI Consulting, Inc. (a)
| | 272 | | 58,624 |
Genpact Ltd.
| | 1,267 | | 40,785 |
Jacobs Solutions, Inc.
| | 1,958 | | 273,552 |
KBR, Inc.
| | 955 | | 61,254 |
Leidos Holdings, Inc.
| | 4,433 | | 646,686 |
ManpowerGroup, Inc.
| | 873 | | 60,935 |
Parsons Corp. (a)
| | 2,643 | | 216,224 |
Paychex, Inc.
| | 1,633 | | 193,608 |
Paycom Software, Inc.
| | 2,792 | | 399,368 |
Paylocity Holding Corp. (a)
| | 292 | | 38,500 |
Robert Half, Inc.
| | 1,825 | | 116,764 |
Science Applications International Corp.
| | 2,340 | | 275,067 |
SS&C Technologies Holdings, Inc.
| | 1,675 | | 104,972 |
TransUnion
| | 637 | | 47,240 |
Verisk Analytics, Inc.
| | 454 | | 122,376 |
| | | | | | 3,597,092 |
| REAL ESTATE MANAGEMENT & DEVELOPMENT — 0.3% | |
CBRE Group, Inc. Class A (a)
| | 2,580 | | 229,904 |
CoStar Group, Inc. (a)
| | 363 | | 26,913 |
Jones Lang LaSalle, Inc. (a)
| | 566 | | 116,188 |
Lennar Corp. Class B
| | 368 | | 51,310 |
| | | | | | 424,315 |
| RESIDENTIAL REITs — 0.3% | |
American Homes 4 Rent Class A REIT
| | 956 | | 35,525 |
AvalonBay Communities, Inc. REIT
| | 415 | | 85,859 |
Camden Property Trust REIT
| | 383 | | 41,789 |
Equity LifeStyle Properties, Inc. REIT
| | 633 | | 41,227 |
Equity Residential REIT
| | 1,083 | | 75,095 |
Essex Property Trust, Inc. REIT
| | 259 | | 70,500 |
Invitation Homes, Inc. REIT
| | 1,064 | | 38,187 |
Mid-America Apartment Communities, Inc. REIT
| | 277 | | 39,503 |
UDR, Inc. REIT
| | 898 | | 36,953 |
| | | | | | 464,638 |
| RETAIL REITs — 0.5% | |
Agree Realty Corp. REIT
| | 154 | | 9,539 |
Brixmor Property Group, Inc. REIT
| | 2,295 | | 52,991 |
| Security Description | | | Shares | | Value |
Federal Realty Investment Trust REIT
| | 362 | | $36,551 |
Kimco Realty Corp. REIT
| | 2,814 | | 54,760 |
NNN REIT, Inc.
| | 1,531 | | 65,221 |
Realty Income Corp. REIT
| | 291 | | 15,371 |
Regency Centers Corp. REIT
| | 535 | | 33,277 |
Simon Property Group, Inc. REIT
| | 2,656 | | 403,181 |
| | | | | | 670,891 |
| SEMICONDUCTORS & SEMICONDUCTOR EQUIPMENT — 4.3% | |
Advanced Micro Devices, Inc. (a)
| | 282 | | 45,743 |
Amkor Technology, Inc.
| | 6,627 | | 265,213 |
Analog Devices, Inc.
| | 884 | | 201,782 |
Applied Materials, Inc.
| | 2,062 | | 486,611 |
Astera Labs, Inc. (a)
| | 188 | | 11,376 |
Broadcom, Inc.
| | 36 | | 57,799 |
Cirrus Logic, Inc. (a)
| | 2,792 | | 356,427 |
Entegris, Inc.
| | 712 | | 96,405 |
First Solar, Inc. (a)
| | 325 | | 73,275 |
GLOBALFOUNDRIES, Inc. (a)
| | 375 | | 18,960 |
Intel Corp.
| | 1,025 | | 31,744 |
KLA Corp.
| | 745 | | 614,260 |
Lam Research Corp.
| | 656 | | 698,542 |
Lattice Semiconductor Corp. (a)
| | 3,603 | | 208,938 |
MACOM Technology Solutions Holdings, Inc. (a)
| | 884 | | 98,539 |
Marvell Technology, Inc.
| | 1,235 | | 86,326 |
Microchip Technology, Inc.
| | 2,849 | | 260,683 |
MKS Instruments, Inc.
| | 91 | | 11,883 |
Monolithic Power Systems, Inc.
| | 454 | | 373,043 |
NVIDIA Corp.
| | 1,760 | | 217,430 |
ON Semiconductor Corp. (a)
| | 1,916 | | 131,342 |
Onto Innovation, Inc. (a)
| | 1,286 | | 282,354 |
Qorvo, Inc. (a)
| | 2,093 | | 242,872 |
QUALCOMM, Inc.
| | 1,375 | | 273,872 |
Skyworks Solutions, Inc.
| | 5,401 | | 575,639 |
Teradyne, Inc.
| | 2,124 | | 314,968 |
Texas Instruments, Inc.
| | 478 | | 92,985 |
Universal Display Corp.
| | 763 | | 160,421 |
| | | | | | 6,289,432 |
| SOFTWARE — 5.1% | |
Adobe, Inc. (a)
| | 409 | | 227,216 |
ANSYS, Inc. (a)
| | 188 | | 60,442 |
Appfolio, Inc. Class A (a)
| | 75 | | 18,343 |
AppLovin Corp. Class A (a)
| | 5,471 | | 455,297 |
Aspen Technology, Inc. (a)
| | 349 | | 69,322 |
Atlassian Corp. Class A (a)
| | 797 | | 140,973 |
Autodesk, Inc. (a)
| | 920 | | 227,654 |
Bentley Systems, Inc. Class B
| | 707 | | 34,898 |
Cadence Design Systems, Inc. (a)
| | 915 | | 281,591 |
CCC Intelligent Solutions Holdings, Inc. (a)
| | 1,608 | | 17,865 |
Crowdstrike Holdings, Inc. Class A (a)
| | 1,079 | | 413,462 |
Datadog, Inc. Class A (a)
| | 1,150 | | 149,144 |
See accompanying notes to financial statements.
21
SPDR SERIES TRUST
SPDR RUSSELL 1000 MOMENTUM FOCUS ETF
SCHEDULE OF INVESTMENTS (continued)
June 30, 2024
| Security Description | | | Shares | | Value |
DocuSign, Inc. (a)
| | 2,068 | | $110,638 |
Dolby Laboratories, Inc. Class A
| | 1,488 | | 117,894 |
DoubleVerify Holdings, Inc. (a)
| | 4,155 | | 80,898 |
Dropbox, Inc. Class A (a)
| | 14,614 | | 328,377 |
Dynatrace, Inc. (a)
| | 2,676 | | 119,724 |
Elastic NV (a)
| | 87 | | 9,910 |
Fair Isaac Corp. (a)
| | 153 | | 227,765 |
Fortinet, Inc. (a)
| | 9,764 | | 588,476 |
Gen Digital, Inc.
| | 12,098 | | 302,208 |
Gitlab, Inc. Class A (a)
| | 1,083 | | 53,847 |
Guidewire Software, Inc. (a)
| | 494 | | 68,118 |
HubSpot, Inc. (a)
| | 147 | | 86,699 |
Informatica, Inc. Class A (a)
| | 383 | | 11,827 |
Intuit, Inc.
| | 452 | | 297,059 |
Manhattan Associates, Inc. (a)
| | 1,577 | | 389,014 |
Microsoft Corp.
| | 453 | | 202,468 |
MicroStrategy, Inc. Class A (a)
| | 5 | | 6,887 |
nCino, Inc. (a)
| | 394 | | 12,391 |
Nutanix, Inc. Class A (a)
| | 1,111 | | 63,160 |
Palantir Technologies, Inc. Class A (a)
| | 2,242 | | 56,790 |
Palo Alto Networks, Inc. (a)
| | 707 | | 239,680 |
Pegasystems, Inc.
| | 97 | | 5,872 |
Procore Technologies, Inc. (a)
| | 1,058 | | 70,156 |
PTC, Inc. (a)
| | 425 | | 77,210 |
RingCentral, Inc. Class A (a)
| | 1,475 | | 41,595 |
Roper Technologies, Inc.
| | 205 | | 115,550 |
Salesforce, Inc.
| | 830 | | 213,393 |
SentinelOne, Inc. Class A (a)
| | 1,605 | | 33,785 |
ServiceNow, Inc. (a)
| | 320 | | 251,734 |
Smartsheet, Inc. Class A (a)
| | 903 | | 39,804 |
Synopsys, Inc. (a)
| | 590 | | 351,086 |
Teradata Corp. (a)
| | 5,702 | | 197,061 |
Tyler Technologies, Inc. (a)
| | 244 | | 122,678 |
UiPath, Inc. Class A (a)
| | 1,528 | | 19,375 |
Workday, Inc. Class A (a)
| | 858 | | 191,815 |
Zoom Video Communications, Inc. Class A (a)
| | 1,248 | | 73,869 |
Zscaler, Inc. (a)
| | 463 | | 88,984 |
| | | | | | 7,364,004 |
| SPECIALIZED REITs — 0.8% | |
American Tower Corp. REIT
| | 103 | | 20,021 |
Crown Castle, Inc. REIT
| | 355 | | 34,684 |
CubeSmart REIT
| | 2,171 | | 98,064 |
Digital Realty Trust, Inc. REIT
| | 488 | | 74,200 |
EPR Properties REIT
| | 487 | | 20,444 |
Equinix, Inc. REIT
| | 27 | | 20,428 |
Extra Space Storage, Inc. REIT
| | 430 | | 66,826 |
Gaming & Leisure Properties, Inc. REIT
| | 1,783 | | 80,610 |
Iron Mountain, Inc. REIT
| | 563 | | 50,456 |
Lamar Advertising Co. Class A REIT
| | 1,886 | | 225,434 |
National Storage Affiliates Trust REIT
| | 962 | | 39,654 |
Public Storage REIT
| | 545 | | 156,769 |
Rayonier, Inc. REIT
| | 849 | | 24,697 |
| Security Description | | | Shares | | Value |
SBA Communications Corp. REIT
| | 204 | | $40,045 |
VICI Properties, Inc. REIT
| | 4,584 | | 131,286 |
Weyerhaeuser Co. REIT
| | 2,745 | | 77,931 |
| | | | | | 1,161,549 |
| SPECIALTY RETAIL — 4.0% | |
Advance Auto Parts, Inc.
| | 1,958 | | 124,000 |
AutoNation, Inc. (a)
| | 303 | | 48,292 |
AutoZone, Inc. (a)
| | 105 | | 311,230 |
Bath & Body Works, Inc.
| | 6,612 | | 258,199 |
Best Buy Co., Inc.
| | 3,396 | | 286,249 |
Burlington Stores, Inc. (a)
| | 857 | | 205,680 |
CarMax, Inc. (a)
| | 776 | | 56,912 |
Carvana Co. (a)
| | 1,006 | | 129,492 |
Dick's Sporting Goods, Inc.
| | 3,345 | | 718,673 |
Five Below, Inc. (a)
| | 385 | | 41,953 |
Floor & Decor Holdings, Inc. Class A (a) (b)
| | 2,262 | | 224,865 |
Gap, Inc.
| | 11,795 | | 281,783 |
Home Depot, Inc.
| | 235 | | 80,896 |
Lithia Motors, Inc.
| | 40 | | 10,098 |
Lowe's Cos., Inc.
| | 608 | | 134,040 |
Murphy USA, Inc.
| | 558 | | 261,959 |
O'Reilly Automotive, Inc. (a)
| | 227 | | 239,726 |
Penske Automotive Group, Inc.
| | 188 | | 28,016 |
RH (a)
| | 108 | | 26,400 |
Ross Stores, Inc.
| | 2,435 | | 353,854 |
TJX Cos., Inc.
| | 2,696 | | 296,830 |
Tractor Supply Co.
| | 1,472 | | 397,440 |
Ulta Beauty, Inc. (a)
| | 786 | | 303,294 |
Valvoline, Inc. (a)
| | 5,571 | | 240,667 |
Wayfair, Inc. Class A (a) (b)
| | 249 | | 13,130 |
Williams-Sonoma, Inc.
| | 2,744 | | 774,823 |
| | | | | | 5,848,501 |
| TECHNOLOGY HARDWARE, STORAGE & PERIPHERALS — 1.9% | |
Apple, Inc.
| | 522 | | 109,943 |
Dell Technologies, Inc. Class C
| | 3,103 | | 427,935 |
Hewlett Packard Enterprise Co.
| | 17,346 | | 367,215 |
HP, Inc.
| | 6,839 | | 239,502 |
NetApp, Inc.
| | 5,574 | | 717,931 |
Pure Storage, Inc. Class A (a)
| | 5,534 | | 355,338 |
Super Micro Computer, Inc. (a)
| | 737 | | 603,861 |
| | | | | | 2,821,725 |
| TEXTILES, APPAREL & LUXURY GOODS — 1.8% | |
Amer Sports, Inc. (a)
| | 591 | | 7,429 |
Carter's, Inc.
| | 1,389 | | 86,076 |
Columbia Sportswear Co.
| | 1,457 | | 115,219 |
Crocs, Inc. (a)
| | 1,553 | | 226,645 |
Deckers Outdoor Corp. (a)
| | 339 | | 328,135 |
Lululemon Athletica, Inc. (a)
| | 391 | | 116,792 |
NIKE, Inc. Class B
| | 684 | | 51,553 |
PVH Corp.
| | 3,365 | | 356,252 |
Ralph Lauren Corp.
| | 2,249 | | 393,710 |
Skechers USA, Inc. Class A (a)
| | 6,574 | | 454,395 |
See accompanying notes to financial statements.
22
SPDR SERIES TRUST
SPDR RUSSELL 1000 MOMENTUM FOCUS ETF
SCHEDULE OF INVESTMENTS (continued)
June 30, 2024
| Security Description | | | Shares | | Value |
Tapestry, Inc.
| | 9,702 | | $415,149 |
Under Armour, Inc. Class A (a)
| | 6,307 | | 42,068 |
Under Armour, Inc. Class C (a)
| | 5,475 | | 35,752 |
VF Corp.
| | 1,447 | | 19,534 |
| | | | | | 2,648,709 |
| TOBACCO — 0.4% | |
Altria Group, Inc.
| | 8,925 | | 406,534 |
Philip Morris International, Inc.
| | 1,051 | | 106,498 |
| | | | | | 513,032 |
| TRADING COMPANIES & DISTRIBUTORS — 2.0% | |
Air Lease Corp.
| | 2,515 | | 119,538 |
Core & Main, Inc. Class A (a)
| | 9,715 | | 475,452 |
Fastenal Co.
| | 3,635 | | 228,423 |
Ferguson PLC
| | 3,309 | | 640,788 |
MSC Industrial Direct Co., Inc. Class A
| | 848 | | 67,255 |
SiteOne Landscape Supply, Inc. (a)
| | 628 | | 76,246 |
United Rentals, Inc.
| | 862 | | 557,481 |
Watsco, Inc.
| | 448 | | 207,532 |
WESCO International, Inc.
| | 1,685 | | 267,106 |
WW Grainger, Inc.
| | 351 | | 316,686 |
| | | | | | 2,956,507 |
| WATER UTILITIES — 0.1% | |
American Water Works Co., Inc.
| | 274 | | 35,390 |
Essential Utilities, Inc.
| | 1,349 | | 50,358 |
| | | | | | 85,748 |
| WIRELESS TELECOMMUNICATION SERVICES — 0.0% (d) | |
T-Mobile U.S., Inc.
| | 320 | | 56,378 |
TOTAL COMMON STOCKS
(Cost $123,084,570)
| | | | | 145,368,882 |
| SHORT-TERM INVESTMENTS — 0.4% | | | |
State Street Institutional Liquid Reserves Fund, Premier Class 5.36% (g) (h)
| | 137,550 | | 137,591 |
| Security Description | | | Shares | | Value |
State Street Navigator Securities Lending Portfolio II (c) (i)
| | 370,318 | | $370,318 |
TOTAL SHORT-TERM INVESTMENTS
(Cost $507,903)
| | 507,909 | |
TOTAL INVESTMENTS — 100.1%
(Cost $123,592,473)
| | 145,876,791 | |
LIABILITIES IN EXCESS OF OTHER ASSETS — (0.1)%
| | (125,044) | |
NET ASSETS — 100.0%
| | $145,751,747 | |
| (a) | Non-income producing security. |
| (b) | All or a portion of the shares of the security are on loan at June 30, 2024. |
| (c) | The Fund invested in an affiliated entity. Amounts related to these investments during the year ended June 30, 2024 are shown in the Affiliate Table below. |
| (d) | Amount is less than 0.05% of net assets. |
| (e) | Fair valued as determined in good faith by the Trust's Oversight Committee in accordance with policy and procedures approved by the Board of Trustees. Security value is determined based on Level 3 inputs. As of June 30, 2024, total aggregate fair value of the security is $0, representing 0.00% of the Fund's net assets. |
| (f) | Reflects separate holdings of the issuer's common stock traded on different securities exchanges. |
| (g) | The Fund invested in certain money market funds managed by SSGA Funds Management, Inc. Amounts related to these investments during the year ended June 30, 2024 are shown in the Affiliate Table below. |
| (h) | The rate shown is the annualized seven-day yield at June 30, 2024. |
| (i) | Investment of cash collateral for securities loaned. |
| REIT | Real Estate Investment Trust |
At June 30, 2024, open futures contracts were as follows:
| Description | | Number of
Contracts | | Expiration
Date | | Notional
Amount | | Value | | Unrealized
Appreciation
(Depreciation) |
| E-mini Russell 1000 Index (long) | | 1 | | 09/20/2024 | | $148,973 | | $150,240 | | $1,267 |
During the year ended June 30, 2024, the average notional value related to futures contracts was $188,461.
See accompanying notes to financial statements.
23
SPDR SERIES TRUST
SPDR RUSSELL 1000 MOMENTUM FOCUS ETF
SCHEDULE OF INVESTMENTS (continued)
June 30, 2024
The following table summarizes the value of the Fund's investments according to the fair value hierarchy as of June 30, 2024.
| Description | | Level 1 –
Quoted Prices | | Level 2 –
Other Significant
Observable Inputs | | Level 3 –
Significant
Unobservable Inputs | | Total |
| ASSETS: | | | | | | | | |
| INVESTMENTS: | | | | | | | | |
Common Stocks
| | $145,368,882 | | $— | | $0(a) | | $145,368,882 |
Short-Term Investments
| | 507,909 | | — | | — | | 507,909 |
TOTAL INVESTMENTS
| | $145,876,791 | | $— | | $0 | | $145,876,791 |
| OTHER FINANCIAL INSTRUMENTS: | | | | | | | | |
Futures Contracts - Unrealized Appreciation
| | $1,267 | | $— | | $— | | $1,267 |
TOTAL OTHER FINANCIAL INSTRUMENTS:
| | $1,267 | | $— | | $— | | $1,267 |
| (a) | The Fund held a Level 3 security that was valued at $0 at June 30, 2024. |
Affiliate Table
| | Number of
Shares Held
at
6/30/23 | | Value at
6/30/23 | | Cost of
Purchases | | Proceeds
from
Shares Sold | | Realized
Gain (Loss) | | Change in
Unrealized
Appreciation/
Depreciation | | Number of
Shares Held
at
6/30/24 | | Value at
6/30/24 | | Dividend
Income |
State Street Corp.
| 1,863 | | $136,334 | | $15,006 | | $102,674 | | $2,642 | | $(1,876) | | 668 | | $49,432 | | $3,800 |
State Street Institutional Liquid Reserves Fund, Premier Class
| 180,310 | | 180,346 | | 4,081,069 | | 4,123,820 | | (8) | | 4 | | 137,550 | | 137,591 | | 10,543 |
State Street Navigator Securities Lending Portfolio II
| 903,428 | | 903,428 | | 21,054,010 | | 21,587,120 | | — | | — | | 370,318 | | 370,318 | | 4,464 |
Total
| | | $1,220,108 | | $25,150,085 | | $25,813,614 | | $2,634 | | $(1,872) | | | | $557,341 | | $18,807 |
See accompanying notes to financial statements.
24
SPDR SERIES TRUST
SPDR RUSSELL 1000 YIELD FOCUS ETF
SCHEDULE OF INVESTMENTS
June 30, 2024
| Security Description | | | Shares | | Value |
| COMMON STOCKS — 99.5% | |
| AEROSPACE & DEFENSE — 0.4% | |
Huntington Ingalls Industries, Inc.
| | 12,470 | | $3,071,735 |
| AIR FREIGHT & LOGISTICS — 0.2% | |
CH Robinson Worldwide, Inc.
| | 18,711 | | 1,648,813 |
| AIRLINES — 0.7% | |
Southwest Airlines Co.
| | 188,289 | | 5,386,948 |
| AUTO COMPONENTS — 0.8% | |
BorgWarner, Inc.
| | 72,473 | | 2,336,530 |
Gentex Corp.
| | 46,692 | | 1,573,987 |
Lear Corp.
| | 17,772 | | 2,029,740 |
| | | | | | 5,940,257 |
| AUTOMOBILES — 1.8% | |
Ford Motor Co.
| | 933,066 | | 11,700,648 |
Harley-Davidson, Inc.
| | 38,064 | | 1,276,666 |
Thor Industries, Inc.
| | 15,066 | | 1,407,918 |
| | | | | | 14,385,232 |
| BANKS — 3.5% | |
Bank OZK
| | 33,407 | | 1,369,687 |
Citizens Financial Group, Inc.
| | 63,261 | | 2,279,294 |
Columbia Banking System, Inc.
| | 63,421 | | 1,261,444 |
Comerica, Inc.
| | 36,742 | | 1,875,312 |
Cullen/Frost Bankers, Inc.
| | 8,676 | | 881,742 |
East West Bancorp, Inc.
| | 23,264 | | 1,703,623 |
First Hawaiian, Inc.
| | 28,348 | | 588,504 |
First Horizon Corp.
| | 102,064 | | 1,609,549 |
FNB Corp.
| | 59,256 | | 810,622 |
Huntington Bancshares, Inc.
| | 169,779 | | 2,237,687 |
KeyCorp
| | 136,901 | | 1,945,363 |
M&T Bank Corp.
| | 17,027 | | 2,577,207 |
Popular, Inc.
| | 7,831 | | 692,495 |
Prosperity Bancshares, Inc.
| | 12,796 | | 782,347 |
Regions Financial Corp.
| | 151,117 | | 3,028,385 |
Synovus Financial Corp.
| | 31,080 | | 1,249,105 |
Webster Financial Corp.
| | 33,122 | | 1,443,788 |
Zions Bancorp NA
| | 25,915 | | 1,123,934 |
| | | | | | 27,460,088 |
| BEVERAGES — 0.4% | |
Molson Coors Beverage Co. Class B
| | 55,158 | | 2,803,681 |
| BIOTECHNOLOGY — 1.2% | |
Gilead Sciences, Inc.
| | 137,437 | | 9,429,553 |
| BROADLINE RETAIL — 1.0% | |
eBay, Inc.
| | 84,486 | | 4,538,588 |
Kohl's Corp.
| | 34,730 | | 798,443 |
Macy's, Inc.
| | 86,146 | | 1,654,003 |
Nordstrom, Inc.
| | 31,483 | | 668,069 |
| | | | | | 7,659,103 |
| BUILDING PRODUCTS — 1.2% | |
A O Smith Corp.
| | 28,674 | | 2,344,960 |
Allegion PLC
| | 12,500 | | 1,476,875 |
Fortune Brands Innovations, Inc.
| | 13,084 | | 849,675 |
| Security Description | | | Shares | | Value |
Masco Corp.
| | 37,740 | | $2,516,126 |
Owens Corning
| | 12,870 | | 2,235,776 |
| | | | | | 9,423,412 |
| CAPITAL MARKETS — 2.4% | |
Evercore, Inc. Class A
| | 5,905 | | 1,230,779 |
Franklin Resources, Inc.
| | 89,666 | | 2,004,035 |
Houlihan Lokey, Inc.
| | 8,923 | | 1,203,356 |
Janus Henderson Group PLC
| | 40,704 | | 1,372,132 |
MarketAxess Holdings, Inc.
| | 5,722 | | 1,147,433 |
SEI Investments Co.
| | 16,188 | | 1,047,202 |
T Rowe Price Group, Inc.
| | 69,131 | | 7,971,495 |
TPG, Inc.
| | 11,118 | | 460,841 |
Virtu Financial, Inc. Class A
| | 25,920 | | 581,904 |
XP, Inc. Class A
| | 122,953 | | 2,162,743 |
| | | | | | 19,181,920 |
| CHEMICALS — 4.8% | |
Albemarle Corp.
| | 14,574 | | 1,392,108 |
Celanese Corp.
| | 25,240 | | 3,404,624 |
CF Industries Holdings, Inc.
| | 58,997 | | 4,372,858 |
Chemours Co.
| | 46,918 | | 1,058,939 |
Dow, Inc.
| | 104,506 | | 5,544,043 |
Eastman Chemical Co.
| | 36,853 | | 3,610,488 |
FMC Corp.
| | 18,200 | | 1,047,410 |
Huntsman Corp.
| | 51,457 | | 1,171,676 |
LyondellBasell Industries NV Class A
| | 76,969 | | 7,362,855 |
Mosaic Co.
| | 100,817 | | 2,913,611 |
NewMarket Corp.
| | 2,117 | | 1,091,462 |
Olin Corp.
| | 19,303 | | 910,136 |
PPG Industries, Inc.
| | 24,849 | | 3,128,241 |
Scotts Miracle-Gro Co.
| | 13,383 | | 870,698 |
| | | | | | 37,879,149 |
| COMMUNICATIONS EQUIPMENT — 0.5% | |
Juniper Networks, Inc.
| | 101,301 | | 3,693,434 |
| CONSTRUCTION & ENGINEERING — 0.2% | |
MDU Resources Group, Inc.
| | 63,946 | | 1,605,045 |
| CONSUMER FINANCE — 1.2% | |
Ally Financial, Inc.
| | 33,032 | | 1,310,379 |
OneMain Holdings, Inc.
| | 35,565 | | 1,724,547 |
SLM Corp.
| | 24,528 | | 509,937 |
Synchrony Financial
| | 126,377 | | 5,963,731 |
| | | | | | 9,508,594 |
| CONSUMER STAPLES DISTRIBUTION & RETAIL — 4.0% | |
Albertsons Cos., Inc. Class A
| | 131,687 | | 2,600,818 |
Dollar General Corp.
| | 25,549 | | 3,378,344 |
Kroger Co.
| | 104,430 | | 5,214,190 |
Sysco Corp.
| | 123,979 | | 8,850,861 |
Target Corp.
| | 55,853 | | 8,268,478 |
Walgreens Boots Alliance, Inc.
| | 225,627 | | 2,728,959 |
| | | | | | 31,041,650 |
| CONTAINERS & PACKAGING — 2.3% | |
Amcor PLC
| | 453,271 | | 4,432,990 |
See accompanying notes to financial statements.
25
SPDR SERIES TRUST
SPDR RUSSELL 1000 YIELD FOCUS ETF
SCHEDULE OF INVESTMENTS (continued)
June 30, 2024
| Security Description | | | Shares | | Value |
Ardagh Group SA (a) (b)
| | 6,370 | | $54,145 |
Berry Global Group, Inc.
| | 26,430 | | 1,555,406 |
Graphic Packaging Holding Co.
| | 39,205 | | 1,027,563 |
International Paper Co.
| | 109,175 | | 4,710,901 |
Packaging Corp. of America
| | 21,723 | | 3,965,751 |
Sealed Air Corp.
| | 17,124 | | 595,744 |
Silgan Holdings, Inc.
| | 12,311 | | 521,125 |
Sonoco Products Co.
| | 30,814 | | 1,562,886 |
| | | | | | 18,426,511 |
| DISTRIBUTORS — 1.4% | |
Genuine Parts Co.
| | 43,831 | | 6,062,704 |
LKQ Corp.
| | 83,858 | | 3,487,654 |
Pool Corp.
| | 3,900 | | 1,198,587 |
| | | | | | 10,748,945 |
| DIVERSIFIED CONSUMER SERVICES — 0.5% | |
ADT, Inc.
| | 61,486 | | 467,293 |
H&R Block, Inc.
| | 43,690 | | 2,369,309 |
Service Corp. International
| | 18,194 | | 1,294,139 |
| | | | | | 4,130,741 |
| DIVERSIFIED REITs — 0.4% | |
WP Carey, Inc. REIT
| | 59,451 | | 3,272,777 |
| DIVERSIFIED TELECOMMUNICATION SERVICES — 0.1% | |
Iridium Communications, Inc.
| | 23,600 | | 628,232 |
| ELECTRIC UTILITIES — 5.1% | |
Alliant Energy Corp.
| | 37,428 | | 1,905,085 |
American Electric Power Co., Inc.
| | 34,801 | | 3,053,440 |
Avangrid, Inc.
| | 15,509 | | 551,035 |
Edison International
| | 42,999 | | 3,087,758 |
Entergy Corp.
| | 47,118 | | 5,041,626 |
Evergy, Inc.
| | 70,179 | | 3,717,382 |
Eversource Energy
| | 31,040 | | 1,760,278 |
Exelon Corp.
| | 122,481 | | 4,239,067 |
FirstEnergy Corp.
| | 69,131 | | 2,645,643 |
IDACORP, Inc.
| | 11,860 | | 1,104,759 |
NRG Energy, Inc.
| | 15,955 | | 1,242,256 |
OGE Energy Corp.
| | 62,915 | | 2,246,066 |
Pinnacle West Capital Corp.
| | 35,777 | | 2,732,647 |
PPL Corp.
| | 83,661 | | 2,313,227 |
Xcel Energy, Inc.
| | 90,077 | | 4,811,013 |
| | | | | | 40,451,282 |
| ELECTRICAL EQUIPMENT — 0.5% | |
Rockwell Automation, Inc.
| | 13,800 | | 3,798,864 |
| ENERGY EQUIPMENT & SERVICES — 1.3% | |
Baker Hughes Co.
| | 176,342 | | 6,201,948 |
Halliburton Co.
| | 110,798 | | 3,742,757 |
| | | | | | 9,944,705 |
| FINANCIAL SERVICES — 0.4% | |
MGIC Investment Corp.
| | 83,985 | | 1,809,877 |
UWM Holdings Corp. (b)
| | 18,107 | | 125,481 |
Western Union Co.
| | 106,377 | | 1,299,927 |
| | | | | | 3,235,285 |
| Security Description | | | Shares | | Value |
| FOOD PRODUCTS — 6.3% | |
Archer-Daniels-Midland Co.
| | 155,415 | | $9,394,837 |
Bunge Global SA
| | 31,561 | | 3,369,768 |
Campbell Soup Co.
| | 60,506 | | 2,734,266 |
Conagra Brands, Inc.
| | 136,703 | | 3,885,099 |
Flowers Foods, Inc.
| | 59,011 | | 1,310,044 |
General Mills, Inc.
| | 75,114 | | 4,751,712 |
Hershey Co.
| | 14,786 | | 2,718,110 |
Hormel Foods Corp.
| | 59,427 | | 1,811,929 |
Ingredion, Inc.
| | 20,648 | | 2,368,326 |
J M Smucker Co.
| | 32,444 | | 3,537,694 |
Kellanova
| | 73,496 | | 4,239,249 |
Kraft Heinz Co.
| | 105,053 | | 3,384,808 |
McCormick & Co., Inc.
| | 22,700 | | 1,610,338 |
Tyson Foods, Inc. Class A
| | 73,522 | | 4,201,047 |
| | | | | | 49,317,227 |
| GAS UTILITIES — 0.9% | |
Atmos Energy Corp.
| | 36,214 | | 4,224,363 |
National Fuel Gas Co.
| | 28,706 | | 1,555,578 |
UGI Corp.
| | 66,034 | | 1,512,179 |
| | | | | | 7,292,120 |
| GROUND TRANSPORTATION — 0.4% | |
Knight-Swift Transportation Holdings, Inc.
| | 16,100 | | 803,712 |
Ryder System, Inc.
| | 13,576 | | 1,681,795 |
Schneider National, Inc. Class B
| | 14,781 | | 357,109 |
| | | | | | 2,842,616 |
| HEALTH CARE EQUIPMENT & SUPPLIES — 0.4% | |
Baxter International, Inc.
| | 69,068 | | 2,310,325 |
Dentsply Sirona, Inc.
| | 34,643 | | 862,957 |
| | | | | | 3,173,282 |
| HEALTH CARE PROVIDERS & SERVICES — 2.4% | |
Cardinal Health, Inc.
| | 76,767 | | 7,547,732 |
CVS Health Corp.
| | 100,990 | | 5,964,469 |
Labcorp Holdings, Inc.
| | 12,100 | | 2,462,471 |
Premier, Inc. Class A
| | 37,471 | | 699,584 |
Quest Diagnostics, Inc.
| | 17,730 | | 2,426,882 |
| | | | | | 19,101,138 |
| HEALTH CARE REITs — 0.3% | |
Healthpeak Properties, Inc. REIT
| | 53,418 | | 1,046,993 |
Omega Healthcare Investors, Inc. REIT
| | 39,938 | | 1,367,876 |
| | | | | | 2,414,869 |
| HOTEL & RESORT REITs — 0.6% | |
Host Hotels & Resorts, Inc. REIT
| | 219,640 | | 3,949,127 |
Park Hotels & Resorts, Inc. REIT
| | 42,828 | | 641,564 |
| | | | | | 4,590,691 |
| HOTELS, RESTAURANTS & LEISURE — 2.3% | |
Aramark
| | 58,809 | | 2,000,682 |
Boyd Gaming Corp.
| | 18,604 | | 1,025,080 |
Darden Restaurants, Inc.
| | 37,516 | | 5,676,921 |
Marriott Vacations Worldwide Corp.
| | 10,987 | | 959,385 |
See accompanying notes to financial statements.
26
SPDR SERIES TRUST
SPDR RUSSELL 1000 YIELD FOCUS ETF
SCHEDULE OF INVESTMENTS (continued)
June 30, 2024
| Security Description | | | Shares | | Value |
Texas Roadhouse, Inc.
| | 8,182 | | $1,404,931 |
Travel & Leisure Co.
| | 21,576 | | 970,489 |
Vail Resorts, Inc.
| | 11,966 | | 2,155,436 |
Wendy's Co.
| | 54,189 | | 919,045 |
Wyndham Hotels & Resorts, Inc.
| | 20,463 | | 1,514,262 |
Wynn Resorts Ltd.
| | 13,569 | | 1,214,426 |
| | | | | | 17,840,657 |
| HOUSEHOLD DURABLES — 0.4% | |
Leggett & Platt, Inc.
| | 41,791 | | 478,925 |
Newell Brands, Inc.
| | 130,467 | | 836,293 |
Whirlpool Corp.
| | 16,693 | | 1,706,025 |
| | | | | | 3,021,243 |
| HOUSEHOLD PRODUCTS — 1.4% | |
Clorox Co.
| | 30,960 | | 4,225,111 |
Kimberly-Clark Corp.
| | 43,905 | | 6,067,671 |
Reynolds Consumer Products, Inc.
| | 17,072 | | 477,675 |
Spectrum Brands Holdings, Inc.
| | 5,445 | | 467,889 |
| | | | | | 11,238,346 |
| INDEPENDENT POWER AND RENEWABLE ELECTRICITY PRODUCERS — 0.4% | |
AES Corp.
| | 107,303 | | 1,885,314 |
Brookfield Renewable Corp. Class A
| | 26,293 | | 746,195 |
Clearway Energy, Inc. Class A
| | 10,887 | | 246,699 |
Clearway Energy, Inc. Class C
| | 25,766 | | 636,163 |
| | | | | | 3,514,371 |
| INDUSTRIAL REITs — 0.4% | |
EastGroup Properties, Inc. REIT
| | 6,290 | | 1,069,929 |
First Industrial Realty Trust, Inc. REIT
| | 27,265 | | 1,295,360 |
STAG Industrial, Inc. REIT
| | 25,358 | | 914,410 |
| | | | | | 3,279,699 |
| INSURANCE — 2.8% | |
American Financial Group, Inc.
| | 14,532 | | 1,787,727 |
Assured Guaranty Ltd.
| | 16,700 | | 1,288,405 |
Axis Capital Holdings Ltd.
| | 11,978 | | 846,246 |
Cincinnati Financial Corp.
| | 48,250 | | 5,698,325 |
CNA Financial Corp.
| | 5,764 | | 265,547 |
Everest Group Ltd.
| | 13,185 | | 5,023,749 |
Fidelity National Financial, Inc.
| | 35,265 | | 1,742,796 |
First American Financial Corp.
| | 17,907 | | 966,083 |
Old Republic International Corp.
| | 61,607 | | 1,903,656 |
Unum Group
| | 42,077 | | 2,150,555 |
| | | | | | 21,673,089 |
| IT SERVICES — 1.4% | |
Amdocs Ltd.
| | 36,093 | | 2,848,460 |
Cognizant Technology Solutions Corp. Class A
| | 115,177 | | 7,832,036 |
| | | | | | 10,680,496 |
| LEISURE EQUIPMENT & PRODUCTS — 0.5% | |
Brunswick Corp.
| | 21,228 | | 1,544,761 |
Hasbro, Inc.
| | 20,098 | | 1,175,733 |
| Security Description | | | Shares | | Value |
Polaris, Inc.
| | 16,474 | | $1,290,079 |
| | | | | | 4,010,573 |
| MACHINERY — 5.0% | |
AGCO Corp.
| | 13,200 | | 1,292,016 |
Allison Transmission Holdings, Inc.
| | 19,788 | | 1,501,909 |
CNH Industrial NV
| | 275,101 | | 2,786,773 |
Cummins, Inc.
| | 27,561 | | 7,632,468 |
Donaldson Co., Inc.
| | 19,712 | | 1,410,591 |
Flowserve Corp.
| | 25,106 | | 1,207,598 |
Lincoln Electric Holdings, Inc.
| | 9,234 | | 1,741,902 |
Oshkosh Corp.
| | 18,475 | | 1,998,995 |
PACCAR, Inc.
| | 93,533 | | 9,628,287 |
Snap-on, Inc.
| | 16,297 | | 4,259,873 |
Stanley Black & Decker, Inc.
| | 40,244 | | 3,215,093 |
Timken Co.
| | 10,386 | | 832,230 |
Toro Co.
| | 15,145 | | 1,416,209 |
| | | | | | 38,923,944 |
| MEDIA — 1.8% | |
Fox Corp. Class A
| | 50,889 | | 1,749,055 |
Fox Corp. Class B
| | 31,937 | | 1,022,623 |
Interpublic Group of Cos., Inc.
| | 118,723 | | 3,453,652 |
Nexstar Media Group, Inc.
| | 9,817 | | 1,629,720 |
Omnicom Group, Inc.
| | 61,009 | | 5,472,507 |
Sirius XM Holdings, Inc. (b)
| | 192,303 | | 544,218 |
| | | | | | 13,871,775 |
| METALS & MINING — 0.8% | |
Reliance, Inc.
| | 10,235 | | 2,923,116 |
Steel Dynamics, Inc.
| | 25,212 | | 3,264,954 |
| | | | | | 6,188,070 |
| MORTGAGE REAL ESTATE INVESTMENT TRUST (REITs) — 0.3% | |
Rithm Capital Corp. REIT
| | 151,867 | | 1,656,869 |
Starwood Property Trust, Inc. REIT
| | 41,003 | | 776,597 |
| | | | | | 2,433,466 |
| MULTI-UTILITIES — 4.0% | |
Ameren Corp.
| | 46,320 | | 3,293,815 |
CenterPoint Energy, Inc.
| | 107,091 | | 3,317,679 |
CMS Energy Corp.
| | 41,237 | | 2,454,839 |
Consolidated Edison, Inc.
| | 36,186 | | 3,235,752 |
Dominion Energy, Inc.
| | 81,453 | | 3,991,197 |
DTE Energy Co.
| | 20,156 | | 2,237,518 |
NiSource, Inc.
| | 87,355 | | 2,516,697 |
Public Service Enterprise Group, Inc.
| | 46,111 | | 3,398,381 |
Sempra
| | 43,852 | | 3,335,383 |
WEC Energy Group, Inc.
| | 46,633 | | 3,658,825 |
| | | | | | 31,440,086 |
| OFFICE REITs — 0.4% | |
Boston Properties, Inc. REIT
| | 14,081 | | 866,826 |
Cousins Properties, Inc. REIT
| | 15,674 | | 362,853 |
Highwoods Properties, Inc. REIT
| | 32,830 | | 862,444 |
See accompanying notes to financial statements.
27
SPDR SERIES TRUST
SPDR RUSSELL 1000 YIELD FOCUS ETF
SCHEDULE OF INVESTMENTS (continued)
June 30, 2024
| Security Description | | | Shares | | Value |
Kilroy Realty Corp. REIT
| | 29,938 | | $933,168 |
| | | | | | 3,025,291 |
| OIL, GAS & CONSUMABLE FUELS — 8.2% | |
Antero Midstream Corp.
| | 106,810 | | 1,574,379 |
APA Corp.
| | 114,031 | | 3,357,073 |
Chesapeake Energy Corp.
| | 41,362 | | 3,399,543 |
Chord Energy Corp.
| | 19,471 | | 3,264,897 |
Civitas Resources, Inc.
| | 31,491 | | 2,172,879 |
Coterra Energy, Inc.
| | 233,812 | | 6,235,766 |
Devon Energy Corp.
| | 198,339 | | 9,401,268 |
Diamondback Energy, Inc.
| | 56,046 | | 11,219,849 |
DT Midstream, Inc.
| | 30,600 | | 2,173,518 |
EOG Resources, Inc.
| | 70,668 | | 8,894,981 |
HF Sinclair Corp.
| | 51,052 | | 2,723,114 |
Marathon Oil Corp.
| | 132,294 | | 3,792,869 |
Valero Energy Corp.
| | 34,337 | | 5,382,668 |
Viper Energy, Inc.
| | 28,700 | | 1,077,111 |
| | | | | | 64,669,915 |
| PERSONAL CARE PRODUCTS — 0.7% | |
Kenvue, Inc.
| | 324,993 | | 5,908,373 |
| PHARMACEUTICALS — 3.3% | |
Bristol-Myers Squibb Co.
| | 383,638 | | 15,932,486 |
Organon & Co.
| | 80,954 | | 1,675,748 |
Perrigo Co. PLC
| | 42,600 | | 1,093,968 |
Royalty Pharma PLC Class A
| | 123,330 | | 3,252,212 |
Viatris, Inc.
| | 374,030 | | 3,975,939 |
| | | | | | 25,930,353 |
| PROFESSIONAL SERVICES — 1.2% | |
Genpact Ltd.
| | 55,353 | | 1,781,813 |
ManpowerGroup, Inc.
| | 15,075 | | 1,052,235 |
Paychex, Inc.
| | 39,146 | | 4,641,150 |
Robert Half, Inc.
| | 32,202 | | 2,060,284 |
| | | | | | 9,535,482 |
| RESIDENTIAL REITs — 2.0% | |
AvalonBay Communities, Inc. REIT
| | 11,712 | | 2,423,096 |
Camden Property Trust REIT
| | 19,814 | | 2,161,905 |
Equity LifeStyle Properties, Inc. REIT
| | 27,314 | | 1,778,961 |
Equity Residential REIT
| | 37,543 | | 2,603,232 |
Essex Property Trust, Inc. REIT
| | 5,156 | | 1,403,463 |
Mid-America Apartment Communities, Inc. REIT
| | 21,818 | | 3,111,465 |
UDR, Inc. REIT
| | 53,168 | | 2,187,863 |
| | | | | | 15,669,985 |
| RETAIL REITs — 2.0% | |
Agree Realty Corp. REIT
| | 10,884 | | 674,155 |
Brixmor Property Group, Inc. REIT
| | 75,890 | | 1,752,300 |
Federal Realty Investment Trust REIT
| | 9,946 | | 1,004,248 |
Kimco Realty Corp. REIT
| | 123,158 | | 2,396,655 |
NNN REIT, Inc.
| | 57,113 | | 2,433,014 |
Regency Centers Corp. REIT
| | 21,853 | | 1,359,256 |
| Security Description | | | Shares | | Value |
Simon Property Group, Inc. REIT
| | 40,057 | | $6,080,652 |
| | | | | | 15,700,280 |
| SEMICONDUCTORS & SEMICONDUCTOR EQUIPMENT — 0.8% | |
Amkor Technology, Inc.
| | 18,800 | | 752,376 |
Skyworks Solutions, Inc.
| | 50,618 | | 5,394,866 |
| | | | | | 6,147,242 |
| SOFTWARE — 0.4% | |
Dolby Laboratories, Inc. Class A
| | 12,200 | | 966,606 |
Gen Digital, Inc.
| | 97,112 | | 2,425,858 |
| | | | | | 3,392,464 |
| SPECIALIZED REITs — 3.7% | |
CubeSmart REIT
| | 70,506 | | 3,184,756 |
EPR Properties REIT
| | 23,510 | | 986,950 |
Gaming & Leisure Properties, Inc. REIT
| | 82,080 | | 3,710,837 |
Lamar Advertising Co. Class A REIT
| | 27,433 | | 3,279,066 |
National Storage Affiliates Trust REIT
| | 22,501 | | 927,491 |
Public Storage REIT
| | 21,299 | | 6,126,657 |
Rayonier, Inc. REIT
| | 42,659 | | 1,240,950 |
VICI Properties, Inc. REIT
| | 262,139 | | 7,507,661 |
Weyerhaeuser Co. REIT
| | 80,050 | | 2,272,620 |
| | | | | | 29,236,988 |
| SPECIALTY RETAIL — 2.1% | |
Advance Auto Parts, Inc.
| | 13,216 | | 836,969 |
Bath & Body Works, Inc.
| | 36,492 | | 1,425,013 |
Best Buy Co., Inc.
| | 67,933 | | 5,726,073 |
Dick's Sporting Goods, Inc.
| | 17,934 | | 3,853,120 |
Gap, Inc.
| | 63,174 | | 1,509,227 |
Penske Automotive Group, Inc.
| | 5,326 | | 793,680 |
Williams-Sonoma, Inc.
| | 8,512 | | 2,403,533 |
| | | | | | 16,547,615 |
| TECHNOLOGY HARDWARE, STORAGE & PERIPHERALS — 2.4% | |
Hewlett Packard Enterprise Co.
| | 408,953 | | 8,657,535 |
HP, Inc.
| | 166,167 | | 5,819,168 |
NetApp, Inc.
| | 34,566 | | 4,452,101 |
| | | | | | 18,928,804 |
| TEXTILES, APPAREL & LUXURY GOODS — 1.0% | |
Carter's, Inc.
| | 11,262 | | 697,906 |
Columbia Sportswear Co.
| | 10,477 | | 828,521 |
Ralph Lauren Corp.
| | 12,134 | | 2,124,178 |
Tapestry, Inc.
| | 72,161 | | 3,087,769 |
VF Corp. (b)
| | 110,257 | | 1,488,470 |
| | | | | | 8,226,844 |
| TOBACCO — 1.4% | |
Altria Group, Inc.
| | 234,154 | | 10,665,715 |
| TRADING COMPANIES & DISTRIBUTORS — 0.6% | |
Air Lease Corp.
| | 24,280 | | 1,154,029 |
MSC Industrial Direct Co., Inc. Class A
| | 14,478 | | 1,148,250 |
See accompanying notes to financial statements.
28
SPDR SERIES TRUST
SPDR RUSSELL 1000 YIELD FOCUS ETF
SCHEDULE OF INVESTMENTS (continued)
June 30, 2024
| Security Description | | | Shares | | Value |
Watsco, Inc.
| | 5,709 | | $2,644,637 |
| | | | | | 4,946,916 |
| WATER UTILITIES — 0.2% | |
Essential Utilities, Inc.
| | 38,320 | | 1,430,486 |
TOTAL COMMON STOCKS
(Cost $758,517,728)
| | | | | 781,566,467 |
| SHORT-TERM INVESTMENT — 0.1% | | | |
State Street Navigator Securities Lending Portfolio II (c) (d)
(Cost $652,751)
| | 652,751 | | 652,751 |
TOTAL INVESTMENTS — 99.6%
(Cost $759,170,479)
| | 782,219,218 | |
OTHER ASSETS IN EXCESS OF LIABILITIES — 0.4%
| | 3,084,313 | |
NET ASSETS — 100.0%
| | $785,303,531 | |
| (a) | Non-income producing security. |
| (b) | All or a portion of the shares of the security are on loan at June 30, 2024. |
| (c) | The Fund invested in an affiliated entity. Amounts related to these investments during the year ended June 30, 2024 are shown in the Affiliate Table below. |
| (d) | Investment of cash collateral for securities loaned. |
| REIT | Real Estate Investment Trust |
At June 30, 2024, open futures contracts were as follows:
| Description | | Number of
Contracts | | Expiration
Date | | Notional
Amount | | Value | | Unrealized
Appreciation
(Depreciation) |
| E-mini S&P 500 Index (long) | | 8 | | 09/20/2024 | | $2,198,104 | | $2,208,600 | | $10,496 |
During the year ended June 30, 2024, the average notional value related to futures contracts was $2,728,354.
The following table summarizes the value of the Fund's investments according to the fair value hierarchy as of June 30, 2024.
| Description | | Level 1 –
Quoted Prices | | Level 2 –
Other Significant
Observable Inputs | | Level 3 –
Significant
Unobservable Inputs | | Total |
| ASSETS: | | | | | | | | |
| INVESTMENTS: | | | | | | | | |
Common Stocks
| | $781,566,467 | | $— | | $— | | $781,566,467 |
Short-Term Investment
| | 652,751 | | — | | — | | 652,751 |
TOTAL INVESTMENTS
| | $782,219,218 | | $— | | $— | | $782,219,218 |
| OTHER FINANCIAL INSTRUMENTS: | | | | | | | | |
Futures Contracts - Unrealized Appreciation
| | $10,496 | | $— | | $— | | $10,496 |
TOTAL OTHER FINANCIAL INSTRUMENTS:
| | $10,496 | | $— | | $— | | $10,496 |
See accompanying notes to financial statements.
29
SPDR SERIES TRUST
SPDR RUSSELL 1000 YIELD FOCUS ETF
SCHEDULE OF INVESTMENTS (continued)
June 30, 2024
Affiliate Table
| | Number of
Shares Held
at
6/30/23 | | Value at
6/30/23 | | Cost of
Purchases | | Proceeds
from
Shares Sold | | Realized
Gain (Loss) | | Change in
Unrealized
Appreciation/
Depreciation | | Number of
Shares Held
at
6/30/24 | | Value at
6/30/24 | | Dividend
Income |
State Street Corp.
| 37,464 | | $2,741,616 | | $1,034,593 | | $3,813,994 | | $116,556 | | $(78,771) | | — | | $— | | $75,652 |
State Street Institutional Liquid Reserves Fund, Premier Class
| 1,573,702 | | 1,574,017 | | 44,297,951 | | 45,872,002 | | 57 | | (23) | | — | | — | | 124,458 |
State Street Navigator Securities Lending Portfolio II
| 4,689,669 | | 4,689,669 | | 125,572,146 | | 129,609,064 | | — | | — | | 652,751 | | 652,751 | | 130,916 |
Total
| | | $9,005,302 | | $170,904,690 | | $179,295,060 | | $116,613 | | $(78,794) | | | | $652,751 | | $331,026 |
See accompanying notes to financial statements.
30
SPDR SERIES TRUST
SPDR S&P 400 MID CAP GROWTH ETF
SCHEDULE OF INVESTMENTS
June 30, 2024
| Security Description | | | Shares | | Value |
| COMMON STOCKS — 99.9% | |
| AEROSPACE & DEFENSE — 2.0% | |
BWX Technologies, Inc.
| | 160,025 | | $15,202,375 |
Curtiss-Wright Corp.
| | 43,583 | | 11,810,121 |
Hexcel Corp.
| | 71,624 | | 4,472,919 |
Woodward, Inc.
| | 106,648 | | 18,597,278 |
| | | | | | 50,082,693 |
| AIR FREIGHT & LOGISTICS — 0.3% | |
GXO Logistics, Inc. (a)
| | 132,363 | | 6,684,331 |
| AUTO COMPONENTS — 0.8% | |
Autoliv, Inc.
| | 76,404 | | 8,174,464 |
Gentex Corp.
| | 260,244 | | 8,772,825 |
Visteon Corp. (a)
| | 21,809 | | 2,327,020 |
| | | | | | 19,274,309 |
| BANKS — 1.5% | |
Bank OZK
| | 96,484 | | 3,955,844 |
Commerce Bancshares, Inc.
| | 85,029 | | 4,742,918 |
Cullen/Frost Bankers, Inc.
| | 47,421 | | 4,819,396 |
East West Bancorp, Inc.
| | 132,148 | | 9,677,198 |
First Financial Bankshares, Inc.
| | 90,408 | | 2,669,748 |
Hancock Whitney Corp.
| | 79,192 | | 3,787,753 |
International Bancshares Corp.
| | 40,388 | | 2,310,598 |
Pinnacle Financial Partners, Inc.
| | 55,169 | | 4,415,727 |
| | | | | | 36,379,182 |
| BEVERAGES — 1.1% | |
Boston Beer Co., Inc. Class A (a)
| | 7,409 | | 2,260,115 |
Celsius Holdings, Inc. (a) (b)
| | 261,065 | | 14,904,201 |
Coca-Cola Consolidated, Inc.
| | 8,178 | | 8,873,130 |
| | | | | | 26,037,446 |
| BIOTECHNOLOGY — 4.5% | |
Arrowhead Pharmaceuticals, Inc. (a) (b)
| | 218,435 | | 5,677,126 |
BioMarin Pharmaceutical, Inc. (a)
| | 186,106 | | 15,322,107 |
Cytokinetics, Inc. (a)
| | 90,762 | | 4,917,485 |
Exelixis, Inc. (a)
| | 509,612 | | 11,450,981 |
Halozyme Therapeutics, Inc. (a)
| | 222,694 | | 11,660,258 |
Neurocrine Biosciences, Inc. (a)
| | 176,270 | | 24,267,091 |
Roivant Sciences Ltd. (a) (b)
| | 369,065 | | 3,901,017 |
Sarepta Therapeutics, Inc. (a)
| | 132,381 | | 20,916,198 |
United Therapeutics Corp. (a)
| | 34,933 | | 11,127,907 |
| | | | | | 109,240,170 |
| BROADLINE RETAIL — 0.4% | |
Ollie's Bargain Outlet Holdings, Inc. (a)
| | 107,231 | | 10,526,867 |
| BUILDING PRODUCTS — 6.7% | |
AAON, Inc.
| | 119,321 | | 10,409,564 |
Advanced Drainage Systems, Inc.
| | 119,322 | | 19,138,055 |
Carlisle Cos., Inc.
| | 83,197 | | 33,712,256 |
Fortune Brands Innovations, Inc.
| | 87,953 | | 5,711,668 |
Lennox International, Inc.
| | 56,207 | | 30,069,621 |
| Security Description | | | Shares | | Value |
Owens Corning
| | 151,836 | | $26,376,950 |
Simpson Manufacturing Co., Inc. (b)
| | 73,762 | | 12,431,110 |
Trex Co., Inc. (a)
| | 190,240 | | 14,100,589 |
UFP Industries, Inc.
| | 108,032 | | 12,099,584 |
| | | | | | 164,049,397 |
| CAPITAL MARKETS — 2.5% | |
Carlyle Group, Inc.
| | 182,245 | | 7,317,137 |
Evercore, Inc. Class A
| | 42,732 | | 8,906,631 |
Houlihan Lokey, Inc.
| | 91,634 | | 12,357,761 |
Interactive Brokers Group, Inc. Class A
| | 110,578 | | 13,556,863 |
Morningstar, Inc.
| | 45,629 | | 13,499,339 |
SEI Investments Co.
| | 87,774 | | 5,678,100 |
| | | | | | 61,315,831 |
| CHEMICALS — 2.3% | |
Arcadium Lithium PLC (a) (b)
| | 1,107,270 | | 3,720,427 |
Axalta Coating Systems Ltd. (a)
| | 386,145 | | 13,194,575 |
Cabot Corp.
| | 65,126 | | 5,984,428 |
NewMarket Corp.
| | 12,148 | | 6,263,144 |
Olin Corp.
| | 86,112 | | 4,060,181 |
RPM International, Inc.
| | 121,721 | | 13,106,917 |
Scotts Miracle-Gro Co. (b)
| | 28,134 | | 1,830,398 |
Westlake Corp.
| | 56,480 | | 8,179,434 |
| | | | | | 56,339,504 |
| COMMERCIAL SERVICES & SUPPLIES — 3.4% | |
Brink's Co.
| | 78,162 | | 8,003,789 |
Clean Harbors, Inc. (a)
| | 87,821 | | 19,860,719 |
MSA Safety, Inc.
| | 64,809 | | 12,164,001 |
RB Global, Inc. (b)
| | 321,777 | | 24,570,892 |
Tetra Tech, Inc.
| | 93,719 | | 19,163,661 |
| | | | | | 83,763,062 |
| COMMUNICATIONS EQUIPMENT — 0.2% | |
Ciena Corp. (a)
| | 104,237 | | 5,022,139 |
| CONSTRUCTION & ENGINEERING — 2.4% | |
AECOM
| | 110,108 | | 9,704,919 |
Comfort Systems USA, Inc.
| | 62,315 | | 18,951,238 |
EMCOR Group, Inc.
| | 82,293 | | 30,043,528 |
| | | | | | 58,699,685 |
| CONSTRUCTION MATERIALS — 0.7% | |
Eagle Materials, Inc.
| | 60,317 | | 13,116,535 |
Knife River Corp. (a)
| | 70,660 | | 4,956,092 |
| | | | | | 18,072,627 |
| CONSUMER FINANCE — 0.4% | |
FirstCash Holdings, Inc.
| | 65,616 | | 6,881,806 |
SLM Corp.
| | 154,576 | | 3,213,635 |
| | | | | | 10,095,441 |
| CONSUMER STAPLES DISTRIBUTION & RETAIL — 1.3% | |
Casey's General Stores, Inc.
| | 64,839 | | 24,739,969 |
Sprouts Farmers Market, Inc. (a)
| | 72,433 | | 6,059,745 |
| | | | | | 30,799,714 |
See accompanying notes to financial statements.
31
SPDR SERIES TRUST
SPDR S&P 400 MID CAP GROWTH ETF
SCHEDULE OF INVESTMENTS (continued)
June 30, 2024
| Security Description | | | Shares | | Value |
| CONTAINERS & PACKAGING — 0.7% | |
AptarGroup, Inc.
| | 68,382 | | $9,628,870 |
Crown Holdings, Inc.
| | 98,567 | | 7,332,399 |
| | | | | | 16,961,269 |
| DIVERSIFIED CONSUMER SERVICES — 1.8% | |
Duolingo, Inc. (a) (b)
| | 64,759 | | 13,513,260 |
Grand Canyon Education, Inc. (a)
| | 51,533 | | 7,209,982 |
H&R Block, Inc.
| | 244,185 | | 13,242,153 |
Service Corp. International
| | 130,590 | | 9,288,867 |
| | | | | | 43,254,262 |
| DIVERSIFIED TELECOMMUNICATION SERVICES — 0.1% | |
Iridium Communications, Inc.
| | 106,773 | | 2,842,297 |
| ELECTRIC UTILITIES — 0.1% | |
IDACORP, Inc.
| | 34,777 | | 3,239,478 |
| ELECTRICAL EQUIPMENT — 1.7% | |
Acuity Brands, Inc.
| | 27,353 | | 6,604,108 |
EnerSys
| | 30,559 | | 3,163,468 |
NEXTracker, Inc. Class A (a)
| | 214,956 | | 10,077,137 |
nVent Electric PLC
| | 290,796 | | 22,277,882 |
| | | | | | 42,122,595 |
| ELECTRONIC EQUIPMENT, INSTRUMENTS & COMPONENTS — 1.3% | |
Cognex Corp.
| | 132,866 | | 6,212,814 |
IPG Photonics Corp. (a)
| | 22,744 | | 1,919,366 |
Littelfuse, Inc.
| | 30,489 | | 7,792,683 |
Novanta, Inc. (a)
| | 36,588 | | 5,967,869 |
Vontier Corp.
| | 270,098 | | 10,317,744 |
| | | | | | 32,210,476 |
| ENERGY EQUIPMENT & SERVICES — 1.3% | |
ChampionX Corp.
| | 224,312 | | 7,449,401 |
Valaris Ltd. (a) (b)
| | 109,562 | | 8,162,369 |
Weatherford International PLC (a)
| | 128,102 | | 15,686,090 |
| | | | | | 31,297,860 |
| ENTERTAINMENT — 0.4% | |
TKO Group Holdings, Inc.
| | 44,583 | | 4,814,518 |
Warner Music Group Corp. Class A (b)
| | 191,746 | | 5,877,015 |
| | | | | | 10,691,533 |
| FINANCIAL SERVICES — 1.5% | |
Equitable Holdings, Inc.
| | 283,502 | | 11,583,892 |
Euronet Worldwide, Inc. (a)
| | 41,414 | | 4,286,349 |
MGIC Investment Corp.
| | 178,157 | | 3,839,283 |
Voya Financial, Inc.
| | 70,861 | | 5,041,760 |
WEX, Inc. (a)
| | 73,346 | | 12,992,511 |
| | | | | | 37,743,795 |
| FOOD PRODUCTS — 0.3% | |
Ingredion, Inc.
| | 41,554 | | 4,766,244 |
Lancaster Colony Corp.
| | 17,180 | | 3,246,504 |
| | | | | | 8,012,748 |
| Security Description | | | Shares | | Value |
| GROUND TRANSPORTATION — 1.8% | |
Avis Budget Group, Inc. (b)
| | 31,998 | | $3,344,431 |
Landstar System, Inc.
| | 42,792 | | 7,894,268 |
Saia, Inc. (a) (b)
| | 46,599 | | 22,101,440 |
XPO, Inc. (a)
| | 95,582 | | 10,146,029 |
| | | | | | 43,486,168 |
| HEALTH CARE EQUIPMENT & SUPPLIES — 1.4% | |
Haemonetics Corp. (a)
| | 53,620 | | 4,435,982 |
Lantheus Holdings, Inc. (a)
| | 121,861 | | 9,784,220 |
LivaNova PLC (a)
| | 35,256 | | 1,932,734 |
Masimo Corp. (a)
| | 48,615 | | 6,122,573 |
Penumbra, Inc. (a) (b)
| | 67,837 | | 12,208,625 |
| | | | | | 34,484,134 |
| HEALTH CARE PROVIDERS & SERVICES — 1.8% | |
Acadia Healthcare Co., Inc. (a)
| | 162,275 | | 10,960,054 |
Amedisys, Inc. (a)
| | 24,072 | | 2,209,810 |
Chemed Corp.
| | 15,937 | | 8,647,097 |
Encompass Health Corp.
| | 79,699 | | 6,837,377 |
HealthEquity, Inc. (a)
| | 78,029 | | 6,726,100 |
Option Care Health, Inc. (a)
| | 168,136 | | 4,657,367 |
Progyny, Inc. (a)
| | 145,684 | | 4,168,019 |
| | | | | | 44,205,824 |
| HEALTH CARE REITs — 0.3% | |
Omega Healthcare Investors, Inc. REIT
| | 178,130 | | 6,100,953 |
| HEALTH CARE TECHNOLOGY — 0.1% | |
Doximity, Inc. Class A (a) (b)
| | 107,412 | | 3,004,314 |
| HOTEL & RESORT REITs — 0.2% | |
Park Hotels & Resorts, Inc. REIT
| | 370,371 | | 5,548,158 |
| HOTELS, RESTAURANTS & LEISURE — 5.4% | |
Boyd Gaming Corp. (b)
| | 118,478 | | 6,528,138 |
Choice Hotels International, Inc.
| | 20,544 | | 2,444,736 |
Churchill Downs, Inc.
| | 117,126 | | 16,350,790 |
Hilton Grand Vacations, Inc. (a)
| | 74,616 | | 3,016,725 |
Hyatt Hotels Corp. Class A
| | 79,028 | | 12,005,934 |
Light & Wonder, Inc. (a) (b)
| | 157,846 | | 16,554,888 |
Planet Fitness, Inc. Class A (a)
| | 153,127 | | 11,268,616 |
Texas Roadhouse, Inc.
| | 116,962 | | 20,083,545 |
Travel & Leisure Co.
| | 87,751 | | 3,947,040 |
Vail Resorts, Inc.
| | 44,037 | | 7,932,385 |
Wendy's Co.
| | 157,815 | | 2,676,542 |
Wingstop, Inc.
| | 51,456 | | 21,748,393 |
Wyndham Hotels & Resorts, Inc.
| | 93,525 | | 6,920,850 |
| | | | | | 131,478,582 |
| HOUSEHOLD DURABLES — 2.5% | |
KB Home
| | 64,691 | | 4,540,015 |
Tempur Sealy International, Inc.
| | 303,912 | | 14,387,194 |
Toll Brothers, Inc.
| | 182,440 | | 21,013,439 |
TopBuild Corp. (a)
| | 55,393 | | 21,341,261 |
| | | | | | 61,281,909 |
| INDUSTRIAL REITs — 1.1% | |
EastGroup Properties, Inc. REIT
| | 52,133 | | 8,867,823 |
See accompanying notes to financial statements.
32
SPDR SERIES TRUST
SPDR S&P 400 MID CAP GROWTH ETF
SCHEDULE OF INVESTMENTS (continued)
June 30, 2024
| Security Description | | | Shares | | Value |
First Industrial Realty Trust, Inc. REIT
| | 111,664 | | $5,305,157 |
Rexford Industrial Realty, Inc. REIT (b)
| | 149,063 | | 6,646,719 |
STAG Industrial, Inc. REIT
| | 160,088 | | 5,772,773 |
| | | | | | 26,592,472 |
| INSURANCE — 2.9% | |
Erie Indemnity Co. Class A
| | 25,409 | | 9,208,222 |
Kinsale Capital Group, Inc.
| | 38,677 | | 14,901,475 |
Primerica, Inc.
| | 60,216 | | 14,245,901 |
RenaissanceRe Holdings Ltd.
| | 51,123 | | 11,426,502 |
RLI Corp.
| | 45,979 | | 6,468,785 |
Ryan Specialty Holdings, Inc. (b)
| | 178,692 | | 10,348,054 |
Selective Insurance Group, Inc.
| | 58,804 | | 5,517,579 |
| | | | | | 72,116,518 |
| INTERACTIVE MEDIA & SERVICES — 0.1% | |
ZoomInfo Technologies, Inc. (a)
| | 164,875 | | 2,105,454 |
| LEISURE EQUIPMENT & PRODUCTS — 0.5% | |
Brunswick Corp.
| | 72,450 | | 5,272,186 |
Mattel, Inc. (a)
| | 266,225 | | 4,328,819 |
YETI Holdings, Inc. (a)
| | 95,945 | | 3,660,302 |
| | | | | | 13,261,307 |
| LIFE SCIENCES TOOLS & SERVICES — 1.7% | |
Azenta, Inc. (a)
| | 60,704 | | 3,194,244 |
Bruker Corp.
| | 102,701 | | 6,553,351 |
Medpace Holdings, Inc. (a)
| | 41,266 | | 16,995,402 |
Repligen Corp. (a)
| | 90,900 | | 11,458,854 |
Sotera Health Co. (a) (b)
| | 219,008 | | 2,599,625 |
| | | | | | 40,801,476 |
| MACHINERY — 6.2% | |
Chart Industries, Inc. (a) (b)
| | 73,557 | | 10,617,217 |
Crane Co.
| | 86,034 | | 12,473,209 |
Donaldson Co., Inc.
| | 120,631 | | 8,632,354 |
Esab Corp.
| | 99,846 | | 9,428,458 |
Flowserve Corp.
| | 104,141 | | 5,009,182 |
Graco, Inc.
| | 296,212 | | 23,483,687 |
ITT, Inc.
| | 144,098 | | 18,614,580 |
Lincoln Electric Holdings, Inc.
| | 99,656 | | 18,799,108 |
Middleby Corp. (a)
| | 47,289 | | 5,798,104 |
RBC Bearings, Inc. (a)
| | 51,019 | | 13,763,906 |
Terex Corp. (b)
| | 66,252 | | 3,633,260 |
Timken Co.
| | 44,477 | | 3,563,942 |
Toro Co.
| | 88,105 | | 8,238,699 |
Watts Water Technologies, Inc. Class A
| | 48,188 | | 8,836,234 |
| | | | | | 150,891,940 |
| MARINE — 0.2% | |
Kirby Corp. (a)
| | 43,066 | | 5,156,292 |
| MEDIA — 0.6% | |
New York Times Co. Class A
| | 286,243 | | 14,658,504 |
| METALS & MINING — 1.5% | |
MP Materials Corp. (a) (b)
| | 94,188 | | 1,199,013 |
| Security Description | | | Shares | | Value |
Reliance, Inc.
| | 100,609 | | $28,733,931 |
Royal Gold, Inc.
| | 60,131 | | 7,525,996 |
| | | | | | 37,458,940 |
| OFFICE REITs — 0.1% | |
COPT Defense Properties REIT
| | 77,056 | | 1,928,712 |
| OIL, GAS & CONSUMABLE FUELS — 6.0% | |
Antero Midstream Corp.
| | 348,494 | | 5,136,802 |
Chord Energy Corp.
| | 108,896 | | 18,259,681 |
Civitas Resources, Inc.
| | 161,136 | | 11,118,384 |
CNX Resources Corp. (a)
| | 269,525 | | 6,549,457 |
DT Midstream, Inc.
| | 107,605 | | 7,643,183 |
Equitrans Midstream Corp.
| | 312,660 | | 4,058,327 |
Matador Resources Co.
| | 203,003 | | 12,098,979 |
Murphy Oil Corp.
| | 109,570 | | 4,518,667 |
Ovintiv, Inc.
| | 435,876 | | 20,429,508 |
Permian Resources Corp.
| | 898,902 | | 14,517,267 |
Range Resources Corp.
| | 424,700 | | 14,240,191 |
Southwestern Energy Co. (a)
| | 1,929,846 | | 12,987,864 |
Texas Pacific Land Corp. (b)
| | 21,890 | | 16,073,170 |
| | | | | | 147,631,480 |
| PAPER & FOREST PRODUCTS — 0.2% | |
Louisiana-Pacific Corp.
| | 72,898 | | 6,001,692 |
| PERSONAL CARE PRODUCTS — 1.4% | |
BellRing Brands, Inc. (a)
| | 121,555 | | 6,945,653 |
Coty, Inc. Class A (a)
| | 640,990 | | 6,422,720 |
elf Beauty, Inc. (a)
| | 97,234 | | 20,489,148 |
| | | | | | 33,857,521 |
| PHARMACEUTICALS — 0.2% | |
Jazz Pharmaceuticals PLC (a)
| | 46,534 | | 4,966,574 |
| PROFESSIONAL SERVICES — 2.4% | |
CACI International, Inc. Class A (a)
| | 14,481 | | 6,228,712 |
ExlService Holdings, Inc. (a)
| | 162,871 | | 5,107,635 |
Exponent, Inc.
| | 45,453 | | 4,323,489 |
FTI Consulting, Inc. (a)
| | 61,346 | | 13,221,903 |
Insperity, Inc.
| | 31,475 | | 2,870,835 |
KBR, Inc.
| | 108,640 | | 6,968,170 |
Maximus, Inc.
| | 78,061 | | 6,689,828 |
Paylocity Holding Corp. (a)
| | 76,383 | | 10,071,098 |
Science Applications International Corp.
| | 31,543 | | 3,707,880 |
| | | | | | 59,189,550 |
| RESIDENTIAL REITs — 1.1% | |
American Homes 4 Rent Class A REIT
| | 337,810 | | 12,553,020 |
Equity LifeStyle Properties, Inc. REIT
| | 208,848 | | 13,602,270 |
| | | | | | 26,155,290 |
| RETAIL REITs — 0.4% | |
Brixmor Property Group, Inc. REIT
| | 233,159 | | 5,383,641 |
See accompanying notes to financial statements.
33
SPDR SERIES TRUST
SPDR S&P 400 MID CAP GROWTH ETF
SCHEDULE OF INVESTMENTS (continued)
June 30, 2024
| Security Description | | | Shares | | Value |
NNN REIT, Inc.
| | 119,280 | | $5,081,328 |
| | | | | | 10,464,969 |
| SEMICONDUCTORS & SEMICONDUCTOR EQUIPMENT — 3.9% | |
Allegro MicroSystems, Inc. (a) (b)
| | 43,937 | | 1,240,781 |
Cirrus Logic, Inc. (a)
| | 54,111 | | 6,907,810 |
Lattice Semiconductor Corp. (a)
| | 240,735 | | 13,960,223 |
MACOM Technology Solutions Holdings, Inc. (a)
| | 60,690 | | 6,765,114 |
MKS Instruments, Inc.
| | 54,414 | | 7,105,380 |
Onto Innovation, Inc. (a)
| | 86,236 | | 18,933,976 |
Power Integrations, Inc. (b)
| | 49,960 | | 3,506,693 |
Rambus, Inc. (a)
| | 188,545 | | 11,078,904 |
Silicon Laboratories, Inc. (a)
| | 56,141 | | 6,210,879 |
Synaptics, Inc. (a)
| | 28,452 | | 2,509,466 |
Universal Display Corp.
| | 76,429 | | 16,069,197 |
Wolfspeed, Inc. (a) (b)
| | 104,002 | | 2,367,086 |
| | | | | | 96,655,509 |
| SOFTWARE — 4.4% | |
Altair Engineering, Inc. Class A (a) (b)
| | 99,561 | | 9,764,943 |
Appfolio, Inc. Class A (a)
| | 36,733 | | 8,983,790 |
Aspen Technology, Inc. (a)
| | 24,499 | | 4,866,236 |
Blackbaud, Inc. (a)
| | 44,049 | | 3,355,212 |
CommVault Systems, Inc. (a)
| | 45,819 | | 5,570,216 |
Dolby Laboratories, Inc. Class A
| | 59,938 | | 4,748,888 |
Dropbox, Inc. Class A (a)
| | 424,976 | | 9,549,211 |
Dynatrace, Inc. (a)
| | 421,196 | | 18,844,309 |
Manhattan Associates, Inc. (a)
| | 107,839 | | 26,601,724 |
Qualys, Inc. (a)
| | 64,604 | | 9,212,530 |
Teradata Corp. (a)
| | 170,044 | | 5,876,721 |
| | | | | | 107,373,780 |
| SPECIALIZED REITs — 1.6% | |
CubeSmart REIT
| | 217,556 | | 9,827,004 |
EPR Properties REIT
| | 82,474 | | 3,462,259 |
Gaming & Leisure Properties, Inc. REIT
| | 205,327 | | 9,282,834 |
Lamar Advertising Co. Class A REIT
| | 89,069 | | 10,646,418 |
National Storage Affiliates Trust REIT
| | 60,043 | | 2,474,972 |
Rayonier, Inc. REIT
| | 91,488 | | 2,661,386 |
| | | | | | 38,354,873 |
| SPECIALTY RETAIL — 4.8% | |
Burlington Stores, Inc. (a)
| | 67,061 | | 16,094,640 |
Dick's Sporting Goods, Inc.
| | 54,228 | | 11,650,886 |
Five Below, Inc. (a)
| | 96,566 | | 10,522,797 |
Floor & Decor Holdings, Inc. Class A (a) (b)
| | 187,343 | | 18,623,768 |
Murphy USA, Inc.
| | 32,998 | | 15,491,241 |
RH (a) (b)
| | 12,237 | | 2,991,212 |
Valvoline, Inc. (a)
| | 225,335 | | 9,734,472 |
| Security Description | | | Shares | | Value |
Williams-Sonoma, Inc. (b)
| | 112,609 | | $31,797,403 |
| | | | | | 116,906,419 |
| TECHNOLOGY HARDWARE, STORAGE & PERIPHERALS — 1.4% | |
Pure Storage, Inc. Class A (a)
| | 535,419 | | 34,379,254 |
| TEXTILES, APPAREL & LUXURY GOODS — 1.5% | |
Capri Holdings Ltd. (a)
| | 98,366 | | 3,253,947 |
Columbia Sportswear Co. (b)
| | 28,489 | | 2,252,910 |
Crocs, Inc. (a)
| | 106,314 | | 15,515,465 |
Skechers USA, Inc. Class A (a)
| | 231,771 | | 16,020,012 |
| | | | | | 37,042,334 |
| TRADING COMPANIES & DISTRIBUTORS — 2.2% | |
Applied Industrial Technologies, Inc.
| | 67,592 | | 13,112,848 |
Core & Main, Inc. Class A (a)
| | 171,451 | | 8,390,812 |
GATX Corp.
| | 23,127 | | 3,061,089 |
MSC Industrial Direct Co., Inc. Class A
| | 43,303 | | 3,434,361 |
Watsco, Inc. (b)
| | 56,062 | | 25,970,161 |
| | | | | | 53,969,271 |
| WATER UTILITIES — 0.3% | |
Essential Utilities, Inc.
| | 212,447 | | 7,930,647 |
TOTAL COMMON STOCKS
(Cost $2,277,689,661)
| | | | | 2,450,199,531 |
| SHORT-TERM INVESTMENTS — 2.5% | | | |
State Street Institutional Liquid Reserves Fund, Premier Class 5.36% (c) (d)
| | 858,551 | | 858,809 |
State Street Navigator Securities Lending Portfolio II (e) (f)
| | 59,754,443 | | 59,754,443 |
TOTAL SHORT-TERM INVESTMENTS
(Cost $60,613,166)
| | 60,613,252 | |
TOTAL INVESTMENTS — 102.4%
(Cost $2,338,302,827)
| | 2,510,812,783 | |
LIABILITIES IN EXCESS OF OTHER ASSETS — (2.4)%
| | (58,955,798) | |
NET ASSETS — 100.0%
| | $2,451,856,985 | |
| (a) | Non-income producing security. |
| (b) | All or a portion of the shares of the security are on loan at June 30, 2024. |
| (c) | The Fund invested in certain money market funds managed by SSGA Funds Management, Inc. Amounts related to these investments during the year ended June 30, 2024 are shown in the Affiliate Table below. |
| (d) | The rate shown is the annualized seven-day yield at June 30, 2024. |
| (e) | The Fund invested in an affiliated entity. Amounts related to these investments during the year ended June 30, 2024 are shown in the Affiliate Table below. |
| (f) | Investment of cash collateral for securities loaned. |
| REIT | Real Estate Investment Trust |
See accompanying notes to financial statements.
34
SPDR SERIES TRUST
SPDR S&P 400 MID CAP GROWTH ETF
SCHEDULE OF INVESTMENTS (continued)
June 30, 2024
The following table summarizes the value of the Fund's investments according to the fair value hierarchy as of June 30, 2024.
| Description | | Level 1 –
Quoted Prices | | Level 2 –
Other Significant
Observable Inputs | | Level 3 –
Significant
Unobservable Inputs | | Total |
| ASSETS: | | | | | | | | |
| INVESTMENTS: | | | | | | | | |
Common Stocks
| | $2,450,199,531 | | $— | | $— | | $2,450,199,531 |
Short-Term Investments
| | 60,613,252 | | — | | — | | 60,613,252 |
TOTAL INVESTMENTS
| | $2,510,812,783 | | $— | | $— | | $2,510,812,783 |
Affiliate Table
| | Number of
Shares Held
at
6/30/23 | | Value at
6/30/23 | | Cost of
Purchases | | Proceeds
from
Shares Sold | | Realized
Gain (Loss) | | Change in
Unrealized
Appreciation/
Depreciation | | Number of
Shares Held
at
6/30/24 | | Value at
6/30/24 | | Dividend
Income |
State Street Institutional Liquid Reserves Fund, Premier Class
| 2,235,101 | | $2,235,548 | | $60,174,342 | | $61,551,239 | | $73 | | $85 | | 858,551 | | $858,809 | | $80,542 |
State Street Navigator Securities Lending Portfolio II
| 123,785,640 | | 123,785,640 | | 1,187,159,067 | | 1,251,190,264 | | — | | — | | 59,754,443 | | 59,754,443 | | 210,015 |
Total
| | | $126,021,188 | | $1,247,333,409 | | $1,312,741,503 | | $73 | | $85 | | | | $60,613,252 | | $290,557 |
See accompanying notes to financial statements.
35
SPDR SERIES TRUST
SPDR S&P 400 MID CAP VALUE ETF
SCHEDULE OF INVESTMENTS
June 30, 2024
| Security Description | | | Shares | | Value |
| COMMON STOCKS — 99.7% | |
| AEROSPACE & DEFENSE — 0.5% | |
Curtiss-Wright Corp.
| | 25,506 | | $6,911,616 |
Hexcel Corp.
| | 80,491 | | 5,026,663 |
| | | | | | 11,938,279 |
| AIR FREIGHT & LOGISTICS — 0.2% | |
GXO Logistics, Inc. (a)
| | 83,988 | | 4,241,394 |
| AUTO COMPONENTS — 1.5% | |
Adient PLC (a)
| | 170,667 | | 4,217,181 |
Autoliv, Inc.
| | 55,050 | | 5,889,799 |
Gentex Corp.
| | 158,170 | | 5,331,911 |
Goodyear Tire & Rubber Co. (a)
| | 540,876 | | 6,138,943 |
Lear Corp.
| | 108,823 | | 12,428,675 |
Visteon Corp. (a)
| | 28,879 | | 3,081,389 |
| | | | | | 37,087,898 |
| AUTOMOBILES — 0.7% | |
Harley-Davidson, Inc.
| | 232,535 | | 7,799,224 |
Thor Industries, Inc. (b)
| | 101,330 | | 9,469,288 |
| | | | | | 17,268,512 |
| BANKS — 9.3% | |
Associated Banc-Corp.
| | 281,703 | | 5,958,018 |
Bank OZK
| | 96,243 | | 3,945,963 |
Cadence Bank
| | 350,561 | | 9,913,865 |
Columbia Banking System, Inc.
| | 397,793 | | 7,912,103 |
Commerce Bancshares, Inc.
| | 132,105 | | 7,368,817 |
Cullen/Frost Bankers, Inc.
| | 70,772 | | 7,192,558 |
East West Bancorp, Inc.
| | 122,883 | | 8,998,722 |
First Financial Bankshares, Inc.
| | 146,583 | | 4,328,596 |
First Horizon Corp.
| | 1,047,466 | | 16,518,539 |
FNB Corp.
| | 690,572 | | 9,447,025 |
Glacier Bancorp, Inc.
| | 215,394 | | 8,038,504 |
Hancock Whitney Corp.
| | 79,018 | | 3,779,431 |
Home BancShares, Inc.
| | 353,898 | | 8,479,396 |
International Bancshares Corp.
| | 57,911 | | 3,313,088 |
New York Community Bancorp, Inc. (b)
| | 1,481,316 | | 4,769,838 |
Old National Bancorp
| | 605,835 | | 10,414,304 |
Pinnacle Financial Partners, Inc.
| | 85,765 | | 6,864,631 |
Prosperity Bancshares, Inc.
| | 184,020 | | 11,250,983 |
SouthState Corp.
| | 146,101 | | 11,165,038 |
Synovus Financial Corp.
| | 280,911 | | 11,289,813 |
Texas Capital Bancshares, Inc. (a)
| | 88,620 | | 5,418,227 |
UMB Financial Corp.
| | 83,304 | | 6,949,220 |
United Bankshares, Inc.
| | 256,245 | | 8,312,588 |
Valley National Bancorp
| | 812,597 | | 5,671,927 |
Webster Financial Corp.
| | 328,554 | | 14,321,669 |
Wintrust Financial Corp.
| | 118,424 | | 11,671,869 |
Zions Bancorp NA
| | 283,079 | | 12,277,136 |
| | | | | | 225,571,868 |
| BEVERAGES — 0.1% | |
Boston Beer Co., Inc. Class A (a)
| | 9,361 | | 2,855,573 |
| Security Description | | | Shares | | Value |
| BIOTECHNOLOGY — 1.8% | |
BioMarin Pharmaceutical, Inc. (a)
| | 160,100 | | $13,181,033 |
Cytokinetics, Inc. (a)
| | 119,827 | | 6,492,227 |
Roivant Sciences Ltd. (a) (b)
| | 244,342 | | 2,582,695 |
Sarepta Therapeutics, Inc. (a)
| | 35,870 | | 5,667,460 |
United Therapeutics Corp. (a)
| | 46,776 | | 14,900,495 |
| | | | | | 42,823,910 |
| BROADLINE RETAIL — 0.6% | |
Macy's, Inc.
| | 527,937 | | 10,136,391 |
Nordstrom, Inc. (b)
| | 186,074 | | 3,948,490 |
| | | | | | 14,084,881 |
| BUILDING PRODUCTS — 0.4% | |
Fortune Brands Innovations, Inc.
| | 144,010 | | 9,352,009 |
| CAPITAL MARKETS — 3.5% | |
Affiliated Managers Group, Inc.
| | 60,584 | | 9,465,038 |
Carlyle Group, Inc. (b)
| | 213,308 | | 8,564,316 |
Evercore, Inc. Class A
| | 20,861 | | 4,348,058 |
Federated Hermes, Inc.
| | 152,481 | | 5,013,575 |
Interactive Brokers Group, Inc. Class A
| | 84,194 | | 10,322,185 |
Janus Henderson Group PLC
| | 243,856 | | 8,220,386 |
Jefferies Financial Group, Inc.
| | 324,987 | | 16,171,353 |
SEI Investments Co.
| | 94,897 | | 6,138,887 |
Stifel Financial Corp.
| | 196,207 | | 16,510,819 |
| | | | | | 84,754,617 |
| CHEMICALS — 2.1% | |
Arcadium Lithium PLC (a) (b)
| | 764,779 | | 2,569,658 |
Ashland, Inc.
| | 96,226 | | 9,092,395 |
Avient Corp.
| | 173,382 | | 7,568,124 |
Cabot Corp.
| | 34,662 | | 3,185,091 |
Chemours Co.
| | 282,845 | | 6,383,812 |
Olin Corp.
| | 133,875 | | 6,312,206 |
RPM International, Inc.
| | 113,527 | | 12,224,587 |
Scotts Miracle-Gro Co. (b)
| | 49,514 | | 3,221,381 |
| | | | | | 50,557,254 |
| COMMERCIAL SERVICES & SUPPLIES — 0.4% | |
Stericycle, Inc. (a)
| | 178,049 | | 10,349,988 |
| COMMUNICATIONS EQUIPMENT — 0.6% | |
Ciena Corp. (a)
| | 162,107 | | 7,810,315 |
Lumentum Holdings, Inc. (a)
| | 128,441 | | 6,540,216 |
| | | | | | 14,350,531 |
| CONSTRUCTION & ENGINEERING — 2.5% | |
AECOM
| | 140,934 | | 12,421,923 |
Fluor Corp. (a)
| | 327,998 | | 14,284,313 |
MasTec, Inc. (a)
| | 116,436 | | 12,457,488 |
MDU Resources Group, Inc.
| | 391,214 | | 9,819,471 |
Valmont Industries, Inc.
| | 38,754 | | 10,636,035 |
| | | | | | 59,619,230 |
| CONSTRUCTION MATERIALS — 0.1% | |
Knife River Corp. (a)
| | 31,179 | | 2,186,895 |
See accompanying notes to financial statements.
36
SPDR SERIES TRUST
SPDR S&P 400 MID CAP VALUE ETF
SCHEDULE OF INVESTMENTS (continued)
June 30, 2024
| Security Description | | | Shares | | Value |
| CONSUMER FINANCE — 1.1% | |
Ally Financial, Inc.
| | 523,596 | | $20,771,053 |
SLM Corp.
| | 250,478 | | 5,207,438 |
| | | | | | 25,978,491 |
| CONSUMER STAPLES DISTRIBUTION & RETAIL — 3.1% | |
BJ's Wholesale Club Holdings, Inc. (a)
| | 254,462 | | 22,351,942 |
Performance Food Group Co. (a)
| | 297,820 | | 19,688,880 |
Sprouts Farmers Market, Inc. (a)
| | 112,667 | | 9,425,721 |
U.S. Foods Holding Corp. (a)
| | 432,836 | | 22,931,652 |
| | | | | | 74,398,195 |
| CONTAINERS & PACKAGING — 2.6% | |
AptarGroup, Inc.
| | 51,652 | | 7,273,118 |
Berry Global Group, Inc.
| | 219,210 | | 12,900,509 |
Crown Holdings, Inc.
| | 121,335 | | 9,026,111 |
Graphic Packaging Holding Co. (b)
| | 588,545 | | 15,425,764 |
Greif, Inc. Class A
| | 49,011 | | 2,816,662 |
Silgan Holdings, Inc.
| | 154,159 | | 6,525,551 |
Sonoco Products Co.
| | 188,578 | | 9,564,676 |
| | | | | | 63,532,391 |
| DIVERSIFIED CONSUMER SERVICES — 0.6% | |
Graham Holdings Co. Class B
| | 6,590 | | 4,610,034 |
Service Corp. International
| | 136,922 | | 9,739,262 |
| | | | | | 14,349,296 |
| DIVERSIFIED REITs — 1.0% | |
WP Carey, Inc. REIT
| | 418,751 | | 23,052,243 |
| DIVERSIFIED TELECOMMUNICATION SERVICES — 0.6% | |
Frontier Communications Parent, Inc. (a) (b)
| | 429,006 | | 11,231,377 |
Iridium Communications, Inc.
| | 115,323 | | 3,069,898 |
| | | | | | 14,301,275 |
| ELECTRIC UTILITIES — 1.7% | |
ALLETE, Inc.
| | 109,627 | | 6,835,243 |
IDACORP, Inc.
| | 58,738 | | 5,471,445 |
OGE Energy Corp.
| | 384,249 | | 13,717,689 |
PNM Resources, Inc.
| | 171,331 | | 6,332,394 |
Portland General Electric Co.
| | 195,783 | | 8,465,657 |
| | | | | | 40,822,428 |
| ELECTRICAL EQUIPMENT — 1.6% | |
Acuity Brands, Inc.
| | 28,424 | | 6,862,690 |
EnerSys
| | 43,796 | | 4,533,762 |
Regal Rexnord Corp.
| | 127,408 | | 17,228,110 |
Sensata Technologies Holding PLC
| | 289,083 | | 10,808,813 |
| | | | | | 39,433,375 |
| ELECTRONIC EQUIPMENT, INSTRUMENTS & COMPONENTS — 3.9% | |
Arrow Electronics, Inc. (a)
| | 101,985 | | 12,315,709 |
Avnet, Inc.
| | 173,493 | | 8,933,155 |
Belden, Inc.
| | 77,249 | | 7,245,956 |
Cognex Corp.
| | 182,642 | | 8,540,340 |
| Security Description | | | Shares | | Value |
Coherent Corp. (a)
| | 253,936 | | $18,400,203 |
Crane NXT Co. (b)
| | 92,239 | | 5,665,319 |
IPG Photonics Corp. (a)
| | 29,979 | | 2,529,928 |
Littelfuse, Inc.
| | 14,151 | | 3,616,854 |
Novanta, Inc. (a)
| | 28,667 | | 4,675,874 |
TD SYNNEX Corp.
| | 148,763 | | 17,167,250 |
Vishay Intertechnology, Inc. (b)
| | 237,724 | | 5,301,245 |
| | | | | | 94,391,833 |
| ENERGY EQUIPMENT & SERVICES — 0.8% | |
ChampionX Corp.
| | 119,371 | | 3,964,311 |
NOV, Inc.
| | 757,832 | | 14,406,386 |
| | | | | | 18,370,697 |
| ENTERTAINMENT — 0.4% | |
TKO Group Holdings, Inc.
| | 63,764 | | 6,885,874 |
Warner Music Group Corp. Class A (b)
| | 61,870 | | 1,896,316 |
| | | | | | 8,782,190 |
| FINANCIAL SERVICES — 2.0% | |
Equitable Holdings, Inc.
| | 275,558 | | 11,259,300 |
Essent Group Ltd.
| | 204,557 | | 11,494,058 |
Euronet Worldwide, Inc. (a)
| | 38,088 | | 3,942,108 |
MGIC Investment Corp.
| | 313,986 | | 6,766,398 |
Voya Financial, Inc.
| | 114,802 | | 8,168,162 |
Western Union Co.
| | 642,811 | | 7,855,151 |
| | | | | | 49,485,177 |
| FOOD PRODUCTS — 1.9% | |
Darling Ingredients, Inc. (a)
| | 306,456 | | 11,262,258 |
Flowers Foods, Inc.
| | 365,063 | | 8,104,399 |
Ingredion, Inc.
| | 80,594 | | 9,244,132 |
Lancaster Colony Corp.
| | 20,122 | | 3,802,454 |
Pilgrim's Pride Corp. (a)
| | 76,569 | | 2,947,141 |
Post Holdings, Inc. (a)
| | 96,470 | | 10,048,315 |
| | | | | | 45,408,699 |
| GAS UTILITIES — 2.0% | |
National Fuel Gas Co.
| | 176,417 | | 9,560,037 |
New Jersey Resources Corp.
| | 187,718 | | 8,023,067 |
ONE Gas, Inc.
| | 107,494 | | 6,863,492 |
Southwest Gas Holdings, Inc. (b)
| | 115,641 | | 8,138,814 |
Spire, Inc.
| | 109,711 | | 6,662,749 |
UGI Corp.
| | 402,386 | | 9,214,639 |
| | | | | | 48,462,798 |
| GROUND TRANSPORTATION — 1.8% | |
Knight-Swift Transportation Holdings, Inc.
| | 309,598 | | 15,455,132 |
Landstar System, Inc.
| | 21,732 | | 4,009,119 |
Ryder System, Inc.
| | 84,067 | | 10,414,220 |
XPO, Inc. (a)
| | 118,172 | | 12,543,958 |
| | | | | | 42,422,429 |
| HEALTH CARE EQUIPMENT & SUPPLIES — 2.2% | |
Dentsply Sirona, Inc. (b)
| | 398,335 | | 9,922,525 |
Enovis Corp. (a)
| | 94,873 | | 4,288,260 |
Envista Holdings Corp. (a)
| | 326,464 | | 5,429,096 |
See accompanying notes to financial statements.
37
SPDR SERIES TRUST
SPDR S&P 400 MID CAP VALUE ETF
SCHEDULE OF INVESTMENTS (continued)
June 30, 2024
| Security Description | | | Shares | | Value |
Globus Medical, Inc. Class A (a)
| | 215,800 | | $14,780,142 |
Haemonetics Corp. (a)
| | 38,550 | | 3,189,242 |
LivaNova PLC (a)
| | 64,850 | | 3,555,077 |
Masimo Corp. (a)
| | 32,193 | | 4,054,386 |
Neogen Corp. (a) (b)
| | 374,521 | | 5,853,763 |
QuidelOrtho Corp. (a) (b)
| | 94,122 | | 3,126,733 |
| | | | | | 54,199,224 |
| HEALTH CARE PROVIDERS & SERVICES — 2.5% | |
Amedisys, Inc. (a)
| | 35,995 | | 3,304,341 |
Chemed Corp.
| | 11,661 | | 6,327,025 |
Encompass Health Corp.
| | 106,298 | | 9,119,305 |
HealthEquity, Inc. (a)
| | 80,978 | | 6,980,304 |
Option Care Health, Inc. (a)
| | 148,598 | | 4,116,165 |
R1 RCM, Inc. (a)
| | 376,125 | | 4,724,130 |
Tenet Healthcare Corp. (a)
| | 186,863 | | 24,858,385 |
| | | | | | 59,429,655 |
| HEALTH CARE REITs — 1.2% | |
Healthcare Realty Trust, Inc. REIT
| | 725,727 | | 11,959,981 |
Omega Healthcare Investors, Inc. REIT
| | 279,843 | | 9,584,623 |
Sabra Health Care REIT, Inc.
| | 439,815 | | 6,773,151 |
| | | | | | 28,317,755 |
| HEALTH CARE TECHNOLOGY — 0.1% | |
Doximity, Inc. Class A (a) (b)
| | 116,009 | | 3,244,772 |
| HOTELS, RESTAURANTS & LEISURE — 1.6% | |
Aramark
| | 503,620 | | 17,133,152 |
Choice Hotels International, Inc.
| | 23,186 | | 2,759,134 |
Hilton Grand Vacations, Inc. (a)
| | 49,451 | | 1,999,304 |
Marriott Vacations Worldwide Corp.
| | 62,115 | | 5,423,882 |
Travel & Leisure Co.
| | 40,577 | | 1,825,154 |
Vail Resorts, Inc.
| | 24,556 | | 4,423,272 |
Wendy's Co.
| | 145,202 | | 2,462,626 |
Wyndham Hotels & Resorts, Inc.
| | 52,072 | | 3,853,328 |
| | | | | | 39,879,852 |
| HOUSEHOLD DURABLES — 1.3% | |
Helen of Troy Ltd. (a) (b)
| | 45,215 | | 4,193,239 |
KB Home
| | 69,858 | | 4,902,635 |
Taylor Morrison Home Corp. (a)
| | 202,796 | | 11,243,010 |
Whirlpool Corp. (b)
| | 104,776 | | 10,708,107 |
| | | | | | 31,046,991 |
| INDEPENDENT POWER & RENEWABLE ELECTRICITY PRODUCERS — 0.3% | |
Ormat Technologies, Inc.
| | 102,206 | | 7,328,170 |
| INDUSTRIAL REITs — 1.2% | |
EastGroup Properties, Inc. REIT
| | 34,659 | | 5,895,496 |
First Industrial Realty Trust, Inc. REIT
| | 130,792 | | 6,213,928 |
Rexford Industrial Realty, Inc. REIT
| | 254,244 | | 11,336,740 |
| Security Description | | | Shares | | Value |
STAG Industrial, Inc. REIT
| | 173,004 | | $6,238,524 |
| | | | | | 29,684,688 |
| INSURANCE — 6.7% | |
American Financial Group, Inc.
| | 125,272 | | 15,410,961 |
Brighthouse Financial, Inc. (a)
| | 117,988 | | 5,113,600 |
CNO Financial Group, Inc.
| | 205,642 | | 5,700,396 |
Erie Indemnity Co. Class A
| | 19,893 | | 7,209,223 |
Fidelity National Financial, Inc.
| | 496,672 | | 24,545,530 |
First American Financial Corp.
| | 198,950 | | 10,733,353 |
Hanover Insurance Group, Inc.
| | 69,059 | | 8,662,761 |
Kemper Corp.
| | 114,954 | | 6,820,221 |
Old Republic International Corp.
| | 484,291 | | 14,964,592 |
Reinsurance Group of America, Inc.
| | 125,837 | | 25,830,561 |
RenaissanceRe Holdings Ltd.
| | 45,683 | | 10,210,607 |
RLI Corp.
| | 26,728 | | 3,760,362 |
Selective Insurance Group, Inc.
| | 51,930 | | 4,872,592 |
Unum Group
| | 340,868 | | 17,421,764 |
| | | | | | 161,256,523 |
| INTERACTIVE MEDIA & SERVICES — 0.4% | |
Ziff Davis, Inc. (a)
| | 87,664 | | 4,825,903 |
ZoomInfo Technologies, Inc. (a)
| | 361,697 | | 4,618,871 |
| | | | | | 9,444,774 |
| IT SERVICES — 0.5% | |
Kyndryl Holdings, Inc. (a)
| | 441,264 | | 11,609,656 |
| LEISURE EQUIPMENT & PRODUCTS — 0.8% | |
Brunswick Corp. (b)
| | 50,036 | | 3,641,120 |
Mattel, Inc. (a)
| | 366,087 | | 5,952,574 |
Polaris, Inc.
| | 100,916 | | 7,902,732 |
YETI Holdings, Inc. (a)
| | 58,291 | | 2,223,802 |
| | | | | | 19,720,228 |
| LIFE SCIENCES TOOLS & SERVICES — 1.6% | |
Azenta, Inc. (a) (b)
| | 36,896 | | 1,941,468 |
Bruker Corp.
| | 73,962 | | 4,719,515 |
Illumina, Inc. (a)
| | 304,589 | | 31,793,000 |
| | | | | | 38,453,983 |
| MACHINERY — 2.6% | |
AGCO Corp.
| | 118,779 | | 11,626,089 |
Donaldson Co., Inc.
| | 98,306 | | 7,034,777 |
Flowserve Corp.
| | 137,620 | | 6,619,522 |
Middleby Corp. (a)
| | 51,087 | | 6,263,777 |
Oshkosh Corp.
| | 125,358 | | 13,563,736 |
Terex Corp.
| | 56,247 | | 3,084,585 |
Timken Co.
| | 75,117 | | 6,019,125 |
Toro Co.
| | 104,222 | | 9,745,799 |
| | | | | | 63,957,410 |
| MARINE — 0.3% | |
Kirby Corp. (a)
| | 64,214 | | 7,688,342 |
| MEDIA — 0.6% | |
Nexstar Media Group, Inc.
| | 59,290 | | 9,842,733 |
See accompanying notes to financial statements.
38
SPDR SERIES TRUST
SPDR S&P 400 MID CAP VALUE ETF
SCHEDULE OF INVESTMENTS (continued)
June 30, 2024
| Security Description | | | Shares | | Value |
TEGNA, Inc.
| | 322,251 | | $4,492,179 |
| | | | | | 14,334,912 |
| METALS & MINING — 2.7% | |
Alcoa Corp.
| | 344,054 | | 13,686,468 |
Cleveland-Cliffs, Inc. (a)
| | 911,138 | | 14,022,414 |
Commercial Metals Co.
| | 221,876 | | 12,200,961 |
MP Materials Corp. (a) (b)
| | 152,645 | | 1,943,171 |
Royal Gold, Inc.
| | 59,967 | | 7,505,470 |
U.S. Steel Corp.
| | 428,490 | | 16,196,922 |
| | | | | | 65,555,406 |
| MORTGAGE REAL ESTATE INVESTMENT TRUST (REITs) — 1.2% | |
Annaly Capital Management, Inc. REIT
| | 957,952 | | 18,258,565 |
Starwood Property Trust, Inc. REIT (b)
| | 575,665 | | 10,903,095 |
| | | | | | 29,161,660 |
| MULTI-UTILITIES — 0.5% | |
Black Hills Corp.
| | 130,989 | | 7,123,182 |
Northwestern Energy Group, Inc.
| | 116,445 | | 5,831,565 |
| | | | | | 12,954,747 |
| OFFICE REITs — 1.0% | |
COPT Defense Properties REIT
| | 130,250 | | 3,260,158 |
Cousins Properties, Inc. REIT
| | 288,879 | | 6,687,549 |
Kilroy Realty Corp. REIT
| | 202,897 | | 6,324,299 |
Vornado Realty Trust REIT
| | 303,952 | | 7,990,898 |
| | | | | | 24,262,904 |
| OIL, GAS & CONSUMABLE FUELS — 3.7% | |
Antero Midstream Corp.
| | 272,689 | | 4,019,436 |
Antero Resources Corp. (a)
| | 559,296 | | 18,249,828 |
Chesapeake Energy Corp. (b)
| | 213,260 | | 17,527,839 |
DT Midstream, Inc.
| | 68,226 | | 4,846,093 |
Equitrans Midstream Corp.
| | 486,141 | | 6,310,110 |
HF Sinclair Corp.
| | 287,041 | | 15,310,767 |
Murphy Oil Corp.
| | 157,008 | | 6,475,010 |
PBF Energy, Inc. Class A
| | 202,578 | | 9,322,640 |
Texas Pacific Land Corp. (b)
| | 11,690 | | 8,583,616 |
| | | | | | 90,645,339 |
| PAPER & FOREST PRODUCTS — 0.1% | |
Louisiana-Pacific Corp.
| | 42,459 | | 3,495,649 |
| PERSONAL CARE PRODUCTS — 0.3% | |
BellRing Brands, Inc. (a)
| | 116,482 | | 6,655,781 |
| PHARMACEUTICALS — 0.6% | |
Jazz Pharmaceuticals PLC (a)
| | 69,469 | | 7,414,426 |
Perrigo Co. PLC
| | 258,970 | | 6,650,350 |
| | | | | | 14,064,776 |
| PROFESSIONAL SERVICES — 3.0% | |
ASGN, Inc. (a)
| | 87,221 | | 7,690,276 |
CACI International, Inc. Class A (a)
| | 26,913 | | 11,576,089 |
Concentrix Corp. (b)
| | 89,023 | | 5,633,375 |
| Security Description | | | Shares | | Value |
ExlService Holdings, Inc. (a)
| | 132,658 | | $4,160,155 |
Exponent, Inc.
| | 47,147 | | 4,484,623 |
Genpact Ltd.
| | 317,684 | | 10,226,248 |
Insperity, Inc.
| | 33,971 | | 3,098,495 |
KBR, Inc.
| | 137,754 | | 8,835,541 |
ManpowerGroup, Inc.
| | 90,609 | | 6,324,508 |
Maximus, Inc.
| | 31,196 | | 2,673,497 |
Science Applications International Corp.
| | 63,296 | | 7,440,445 |
| | | | | | 72,143,252 |
| REAL ESTATE MANAGEMENT & DEVELOPMENT — 0.8% | |
Jones Lang LaSalle, Inc. (a)
| | 91,028 | | 18,686,228 |
| RESIDENTIAL REITs — 1.0% | |
American Homes 4 Rent Class A REIT
| | 244,602 | | 9,089,410 |
Equity LifeStyle Properties, Inc. REIT
| | 127,567 | | 8,308,439 |
Independence Realty Trust, Inc. REIT
| | 426,815 | | 7,998,513 |
| | | | | | 25,396,362 |
| RETAIL REITs — 1.6% | |
Agree Realty Corp. REIT (b)
| | 192,473 | | 11,921,778 |
Brixmor Property Group, Inc. REIT
| | 320,554 | | 7,401,592 |
Kite Realty Group Trust REIT
| | 421,506 | | 9,433,304 |
NNN REIT, Inc.
| | 219,502 | | 9,350,785 |
| | | | | | 38,107,459 |
| SEMICONDUCTORS & SEMICONDUCTOR EQUIPMENT — 1.6% | |
Allegro MicroSystems, Inc. (a) (b)
| | 88,246 | | 2,492,067 |
Amkor Technology, Inc.
| | 196,482 | | 7,863,210 |
Cirrus Logic, Inc. (a)
| | 44,074 | | 5,626,487 |
MACOM Technology Solutions Holdings, Inc. (a)
| | 38,562 | | 4,298,506 |
MKS Instruments, Inc.
| | 61,866 | | 8,078,462 |
Power Integrations, Inc. (b)
| | 53,949 | | 3,786,681 |
Synaptics, Inc. (a)
| | 44,291 | | 3,906,466 |
Wolfspeed, Inc. (a) (b)
| | 126,687 | | 2,883,396 |
| | | | | | 38,935,275 |
| SOFTWARE — 0.6% | |
Aspen Technology, Inc. (a)
| | 26,502 | | 5,264,093 |
Blackbaud, Inc. (a) (b)
| | 29,195 | | 2,223,783 |
CommVault Systems, Inc. (a)
| | 32,953 | | 4,006,096 |
Dolby Laboratories, Inc. Class A
| | 48,783 | | 3,865,077 |
| | | | | | 15,359,049 |
| SPECIALIZED REITs — 1.9% | |
CubeSmart REIT
| | 192,380 | | 8,689,805 |
EPR Properties REIT
| | 54,674 | | 2,295,215 |
Gaming & Leisure Properties, Inc. REIT
| | 296,581 | | 13,408,427 |
Lamar Advertising Co. Class A REIT
| | 70,093 | | 8,378,216 |
See accompanying notes to financial statements.
39
SPDR SERIES TRUST
SPDR S&P 400 MID CAP VALUE ETF
SCHEDULE OF INVESTMENTS (continued)
June 30, 2024
| Security Description | | | Shares | | Value |
National Storage Affiliates Trust REIT
| | 67,578 | | $2,785,565 |
PotlatchDeltic Corp. REIT
| | 151,005 | | 5,948,087 |
Rayonier, Inc. REIT
| | 161,322 | | 4,692,857 |
| | | | | | 46,198,172 |
| SPECIALTY RETAIL — 3.1% | |
AutoNation, Inc. (a)
| | 46,694 | | 7,442,090 |
Burlington Stores, Inc. (a)
| | 48,989 | | 11,757,360 |
Dick's Sporting Goods, Inc.
| | 52,490 | | 11,277,477 |
GameStop Corp. Class A (a) (b)
| | 516,431 | | 12,750,681 |
Gap, Inc. (b)
| | 415,596 | | 9,928,588 |
Lithia Motors, Inc. (b)
| | 52,524 | | 13,259,684 |
Penske Automotive Group, Inc.
| | 36,846 | | 5,490,791 |
RH (a) (b)
| | 16,092 | | 3,933,528 |
| | | | | | 75,840,199 |
| TEXTILES, APPAREL & LUXURY GOODS — 1.1% | |
Capri Holdings Ltd. (a)
| | 115,162 | | 3,809,559 |
Carter's, Inc. (b)
| | 69,388 | | 4,299,974 |
Columbia Sportswear Co. (b)
| | 33,248 | | 2,629,252 |
PVH Corp.
| | 108,519 | | 11,488,907 |
Under Armour, Inc. Class A (a)
| | 358,746 | | 2,392,836 |
Under Armour, Inc. Class C (a) (b)
| | 362,557 | | 2,367,497 |
| | | | | | 26,988,025 |
| TRADING COMPANIES & DISTRIBUTORS — 1.2% | |
Core & Main, Inc. Class A (a)
| | 139,735 | | 6,838,631 |
GATX Corp.
| | 42,612 | | 5,640,124 |
| Security Description | | | Shares | | Value |
MSC Industrial Direct Co., Inc. Class A
| | 39,834 | | $3,159,234 |
WESCO International, Inc.
| | 83,780 | | 13,280,806 |
| | | | | | 28,918,795 |
| WATER UTILITIES — 0.4% | |
Essential Utilities, Inc.
| | 251,118 | | 9,374,235 |
TOTAL COMMON STOCKS
(Cost $2,384,502,490)
| | | | | 2,412,574,604 |
| SHORT-TERM INVESTMENT — 1.7% | | | |
State Street Navigator Securities Lending Portfolio II (c) (d)
(Cost $39,656,620)
| | 39,656,620 | | 39,656,620 |
TOTAL INVESTMENTS — 101.4%
(Cost $2,424,159,110)
| | 2,452,231,224 | |
LIABILITIES IN EXCESS OF OTHER ASSETS — (1.4)%
| | (33,297,246) | |
NET ASSETS — 100.0%
| | $2,418,933,978 | |
| (a) | Non-income producing security. |
| (b) | All or a portion of the shares of the security are on loan at June 30, 2024. |
| (c) | The Fund invested in an affiliated entity. Amounts related to these investments during the year ended June 30, 2024 are shown in the Affiliate Table below. |
| (d) | Investment of cash collateral for securities loaned. |
| REIT | Real Estate Investment Trust |
The following table summarizes the value of the Fund's investments according to the fair value hierarchy as of June 30, 2024.
| Description | | Level 1 –
Quoted Prices | | Level 2 –
Other Significant
Observable Inputs | | Level 3 –
Significant
Unobservable Inputs | | Total |
| ASSETS: | | | | | | | | |
| INVESTMENTS: | | | | | | | | |
Common Stocks
| | $2,412,574,604 | | $— | | $— | | $2,412,574,604 |
Short-Term Investment
| | 39,656,620 | | — | | — | | 39,656,620 |
TOTAL INVESTMENTS
| | $2,452,231,224 | | $— | | $— | | $2,452,231,224 |
Affiliate Table
| | Number of
Shares Held
at
6/30/23 | | Value at
6/30/23 | | Cost of
Purchases | | Proceeds
from
Shares Sold | | Realized
Gain (Loss) | | Change in
Unrealized
Appreciation/
Depreciation | | Number of
Shares Held
at
6/30/24 | | Value at
6/30/24 | | Dividend
Income |
State Street Institutional Liquid Reserves Fund, Premier Class
| 2,887,605 | | $2,888,182 | | $111,639,035 | | $114,527,241 | | $36 | | $(12) | | — | | $— | | $129,901 |
State Street Navigator Securities Lending Portfolio II
| 146,709,166 | | 146,709,166 | | 1,199,499,859 | | 1,306,552,405 | | — | | — | | 39,656,620 | | 39,656,620 | | 312,723 |
Total
| | | $149,597,348 | | $1,311,138,894 | | $1,421,079,646 | | $36 | | $(12) | | | | $39,656,620 | | $442,624 |
See accompanying notes to financial statements.
40
SPDR SERIES TRUST
SPDR S&P 500 ESG ETF
SCHEDULE OF INVESTMENTS
June 30, 2024
| Security Description | | | Shares | | Value |
| COMMON STOCKS — 99.9% | |
| AEROSPACE & DEFENSE — 0.1% | |
Axon Enterprise, Inc. (a)
| | 2,708 | | $796,802 |
| AIR FREIGHT & LOGISTICS — 0.3% | |
CH Robinson Worldwide, Inc.
| | 4,536 | | 399,712 |
United Parcel Service, Inc. Class B
| | 27,861 | | 3,812,778 |
| | | | | | 4,212,490 |
| AIRLINES — 0.1% | |
American Airlines Group, Inc. (a)
| | 25,215 | | 285,686 |
Delta Air Lines, Inc.
| | 24,721 | | 1,172,764 |
| | | | | | 1,458,450 |
| AUTO COMPONENTS — 0.1% | |
Aptiv PLC (a)
| | 10,736 | | 756,029 |
BorgWarner, Inc.
| | 8,846 | | 285,195 |
| | | | | | 1,041,224 |
| AUTOMOBILES — 1.8% | |
General Motors Co.
| | 44,482 | | 2,066,634 |
Tesla, Inc. (a)
| | 107,173 | | 21,207,393 |
| | | | | | 23,274,027 |
| BANKS — 4.9% | |
Bank of America Corp.
| | 262,821 | | 10,452,391 |
Bank of New York Mellon Corp.
| | 29,243 | | 1,751,363 |
Citigroup, Inc.
| | 73,356 | | 4,655,172 |
Citizens Financial Group, Inc.
| | 17,963 | | 647,207 |
Fifth Third Bancorp
| | 26,230 | | 957,133 |
Goldman Sachs Group, Inc.
| | 12,586 | | 5,692,900 |
Huntington Bancshares, Inc.
| | 55,888 | | 736,604 |
JPMorgan Chase & Co.
| | 111,336 | | 22,518,819 |
KeyCorp
| | 36,153 | | 513,734 |
M&T Bank Corp.
| | 6,430 | | 973,245 |
Morgan Stanley
| | 48,271 | | 4,691,459 |
Northern Trust Corp.
| | 7,936 | | 666,465 |
PNC Financial Services Group, Inc.
| | 15,338 | | 2,384,752 |
Regions Financial Corp.
| | 35,634 | | 714,105 |
State Street Corp. (b)
| | 11,598 | | 858,252 |
Truist Financial Corp.
| | 51,394 | | 1,996,657 |
U.S. Bancorp
| | 60,032 | | 2,383,270 |
| | | | | | 62,593,528 |
| BEVERAGES — 1.6% | |
Coca-Cola Co.
| | 149,902 | | 9,541,262 |
Keurig Dr Pepper, Inc.
| | 40,083 | | 1,338,772 |
Molson Coors Beverage Co. Class B
| | 7,169 | | 364,400 |
PepsiCo, Inc.
| | 52,978 | | 8,737,662 |
| | | | | | 19,982,096 |
| BIOTECHNOLOGY — 2.3% | |
AbbVie, Inc.
| | 68,082 | | 11,677,425 |
Amgen, Inc.
| | 20,591 | | 6,433,658 |
Biogen, Inc. (a)
| | 5,561 | | 1,289,151 |
Gilead Sciences, Inc.
| | 47,998 | | 3,293,143 |
| Security Description | | | Shares | | Value |
Incyte Corp. (a)
| | 7,152 | | $433,554 |
Moderna, Inc. (a)
| | 12,763 | | 1,515,606 |
Regeneron Pharmaceuticals, Inc. (a)
| | 4,095 | | 4,303,968 |
| | | | | | 28,946,505 |
| BROADLINE RETAIL — 0.1% | |
eBay, Inc.
| | 19,959 | | 1,072,197 |
Etsy, Inc. (a)
| | 4,600 | | 271,308 |
| | | | | | 1,343,505 |
| BUILDING PRODUCTS — 0.6% | |
Allegion PLC
| | 3,408 | | 402,655 |
Carrier Global Corp.
| | 32,205 | | 2,031,491 |
Johnson Controls International PLC
| | 26,232 | | 1,743,641 |
Masco Corp.
| | 8,524 | | 568,295 |
Trane Technologies PLC
| | 8,803 | | 2,895,571 |
| | | | | | 7,641,653 |
| CAPITAL MARKETS — 2.4% | |
Ameriprise Financial, Inc.
| | 3,817 | | 1,630,584 |
BlackRock, Inc.
| | 5,416 | | 4,264,125 |
Cboe Global Markets, Inc.
| | 4,068 | | 691,804 |
Charles Schwab Corp.
| | 57,347 | | 4,225,900 |
CME Group, Inc.
| | 13,905 | | 2,733,723 |
FactSet Research Systems, Inc.
| | 1,463 | | 597,299 |
Franklin Resources, Inc.
| | 11,550 | | 258,143 |
Intercontinental Exchange, Inc.
| | 22,046 | | 3,017,877 |
Invesco Ltd.
| | 17,373 | | 259,900 |
MarketAxess Holdings, Inc.
| | 1,486 | | 297,988 |
Moody's Corp.
| | 6,062 | | 2,551,678 |
MSCI, Inc.
| | 3,039 | | 1,464,038 |
Nasdaq, Inc.
| | 14,659 | | 883,351 |
Raymond James Financial, Inc.
| | 7,244 | | 895,431 |
S&P Global, Inc.
| | 12,409 | | 5,534,414 |
T Rowe Price Group, Inc.
| | 8,608 | | 992,589 |
| | | | | | 30,298,844 |
| CHEMICALS — 1.8% | |
Air Products & Chemicals, Inc.
| | 8,548 | | 2,205,811 |
Albemarle Corp.
| | 4,520 | | 431,750 |
CF Industries Holdings, Inc.
| | 7,340 | | 544,041 |
Corteva, Inc.
| | 27,056 | | 1,459,401 |
Dow, Inc.
| | 27,029 | | 1,433,888 |
Ecolab, Inc.
| | 9,786 | | 2,329,068 |
FMC Corp.
| | 4,835 | | 278,254 |
International Flavors & Fragrances, Inc.
| | 9,804 | | 933,439 |
Linde PLC
| | 18,707 | | 8,208,819 |
LyondellBasell Industries NV Class A
| | 9,882 | | 945,312 |
Mosaic Co.
| | 12,545 | | 362,551 |
PPG Industries, Inc.
| | 9,103 | | 1,145,977 |
Sherwin-Williams Co.
| | 9,024 | | 2,693,032 |
| | | | | | 22,971,343 |
See accompanying notes to financial statements.
41
SPDR SERIES TRUST
SPDR S&P 500 ESG ETF
SCHEDULE OF INVESTMENTS (continued)
June 30, 2024
| Security Description | | | Shares | | Value |
| COMMERCIAL SERVICES & SUPPLIES — 0.5% | |
Cintas Corp.
| | 3,336 | | $2,336,068 |
Republic Services, Inc.
| | 7,836 | | 1,522,848 |
Waste Management, Inc.
| | 14,168 | | 3,022,601 |
| | | | | | 6,881,517 |
| COMMUNICATIONS EQUIPMENT — 0.6% | |
Cisco Systems, Inc.
| | 156,554 | | 7,437,881 |
| CONSTRUCTION & ENGINEERING — 0.1% | |
Quanta Services, Inc.
| | 5,556 | | 1,411,724 |
| CONSUMER FINANCE — 0.7% | |
American Express Co.
| | 22,009 | | 5,096,184 |
Capital One Financial Corp.
| | 14,654 | | 2,028,846 |
Discover Financial Services
| | 9,640 | | 1,261,009 |
Synchrony Financial
| | 15,623 | | 737,249 |
| | | | | | 9,123,288 |
| CONSUMER STAPLES DISTRIBUTION & RETAIL — 2.4% | |
Costco Wholesale Corp.
| | 17,148 | | 14,575,628 |
Kroger Co.
| | 25,506 | | 1,273,515 |
Sysco Corp.
| | 19,225 | | 1,372,473 |
Target Corp.
| | 17,785 | | 2,632,891 |
Walgreens Boots Alliance, Inc.
| | 27,651 | | 334,439 |
Walmart, Inc.
| | 164,968 | | 11,169,983 |
| | | | | | 31,358,929 |
| CONTAINERS & PACKAGING — 0.2% | |
Amcor PLC
| | 55,771 | | 545,441 |
Avery Dennison Corp.
| | 3,108 | | 679,564 |
Ball Corp.
| | 12,104 | | 726,482 |
Westrock Co.
| | 9,870 | | 496,066 |
| | | | | | 2,447,553 |
| DISTRIBUTORS — 0.1% | |
Genuine Parts Co.
| | 5,416 | | 749,141 |
LKQ Corp.
| | 10,296 | | 428,210 |
Pool Corp.
| | 1,472 | | 452,390 |
| | | | | | 1,629,741 |
| DIVERSIFIED TELECOMMUNICATION SERVICES — 0.4% | |
AT&T, Inc.
| | 275,504 | | 5,264,881 |
| ELECTRIC UTILITIES — 0.8% | |
Edison International
| | 14,818 | | 1,064,081 |
Entergy Corp.
| | 8,188 | | 876,116 |
Eversource Energy
| | 13,422 | | 761,162 |
Exelon Corp.
| | 38,378 | | 1,328,262 |
NextEra Energy, Inc.
| | 79,069 | | 5,598,876 |
| | | | | | 9,628,497 |
| ELECTRICAL EQUIPMENT — 0.8% | |
AMETEK, Inc.
| | 8,924 | | 1,487,720 |
Eaton Corp. PLC
| | 15,438 | | 4,840,585 |
Emerson Electric Co.
| | 22,059 | | 2,430,019 |
Rockwell Automation, Inc.
| | 4,475 | | 1,231,878 |
| | | | | | 9,990,202 |
| Security Description | | | Shares | | Value |
| ELECTRONIC EQUIPMENT, INSTRUMENTS & COMPONENTS — 0.2% | |
Hubbell, Inc.
| | 2,072 | | $757,274 |
TE Connectivity Ltd.
| | 11,858 | | 1,783,799 |
| | | | | | 2,541,073 |
| ENERGY EQUIPMENT & SERVICES — 0.4% | |
Baker Hughes Co.
| | 38,520 | | 1,354,749 |
Halliburton Co.
| | 34,258 | | 1,157,235 |
Schlumberger NV
| | 54,994 | | 2,594,617 |
| | | | | | 5,106,601 |
| ENTERTAINMENT — 0.7% | |
Electronic Arts, Inc.
| | 9,426 | | 1,313,325 |
Take-Two Interactive Software, Inc. (a)
| | 6,116 | | 950,977 |
Walt Disney Co.
| | 70,691 | | 7,018,909 |
| | | | | | 9,283,211 |
| FINANCIAL SERVICES — 3.1% | |
Corpay, Inc. (a)
| | 2,808 | | 748,079 |
Fidelity National Information Services, Inc.
| | 21,521 | | 1,621,823 |
Fiserv, Inc. (a)
| | 23,143 | | 3,449,233 |
Global Payments, Inc.
| | 10,060 | | 972,802 |
Jack Henry & Associates, Inc.
| | 2,808 | | 466,184 |
Mastercard, Inc. Class A
| | 31,816 | | 14,035,947 |
PayPal Holdings, Inc. (a)
| | 41,242 | | 2,393,273 |
Visa, Inc. Class A
| | 60,930 | | 15,992,297 |
| | | | | | 39,679,638 |
| FOOD PRODUCTS — 0.9% | |
Archer-Daniels-Midland Co.
| | 20,485 | | 1,238,318 |
Campbell Soup Co.
| | 7,621 | | 344,393 |
Conagra Brands, Inc.
| | 18,448 | | 524,292 |
General Mills, Inc.
| | 21,855 | | 1,382,547 |
Hershey Co.
| | 5,769 | | 1,060,515 |
Hormel Foods Corp.
| | 11,224 | | 342,220 |
J M Smucker Co.
| | 4,068 | | 443,575 |
Kellanova
| | 10,132 | | 584,414 |
Kraft Heinz Co.
| | 30,719 | | 989,766 |
Lamb Weston Holdings, Inc.
| | 5,616 | | 472,193 |
McCormick & Co., Inc.
| | 9,653 | | 684,784 |
Mondelez International, Inc. Class A
| | 51,892 | | 3,395,813 |
Tyson Foods, Inc. Class A
| | 11,048 | | 631,283 |
| | | | | | 12,094,113 |
| GROUND TRANSPORTATION — 1.3% | |
CSX Corp.
| | 76,138 | | 2,546,816 |
JB Hunt Transport Services, Inc.
| | 3,138 | | 502,080 |
Norfolk Southern Corp.
| | 8,741 | | 1,876,605 |
Uber Technologies, Inc. (a)
| | 80,673 | | 5,863,314 |
Union Pacific Corp.
| | 23,500 | | 5,317,110 |
| | | | | | 16,105,925 |
| HEALTH CARE EQUIPMENT & SUPPLIES — 2.3% | |
Abbott Laboratories
| | 66,917 | | 6,953,345 |
Baxter International, Inc.
| | 19,585 | | 655,118 |
See accompanying notes to financial statements.
42
SPDR SERIES TRUST
SPDR S&P 500 ESG ETF
SCHEDULE OF INVESTMENTS (continued)
June 30, 2024
| Security Description | | | Shares | | Value |
Becton Dickinson & Co.
| | 11,085 | | $2,590,675 |
Boston Scientific Corp. (a)
| | 56,432 | | 4,345,828 |
Edwards Lifesciences Corp. (a)
| | 23,313 | | 2,153,422 |
Hologic, Inc. (a)
| | 9,074 | | 673,745 |
IDEXX Laboratories, Inc. (a)
| | 3,173 | | 1,545,886 |
Medtronic PLC
| | 51,193 | | 4,029,401 |
ResMed, Inc.
| | 5,716 | | 1,094,157 |
Stryker Corp.
| | 12,989 | | 4,419,507 |
Teleflex, Inc.
| | 1,798 | | 378,173 |
Zimmer Biomet Holdings, Inc.
| | 7,992 | | 867,372 |
| | | | | | 29,706,629 |
| HEALTH CARE PROVIDERS & SERVICES — 2.8% | |
Cardinal Health, Inc.
| | 9,400 | | 924,208 |
Cencora, Inc.
| | 6,353 | | 1,431,331 |
Centene Corp. (a)
| | 20,549 | | 1,362,399 |
Cigna Group
| | 10,987 | | 3,631,973 |
CVS Health Corp.
| | 48,450 | | 2,861,457 |
DaVita, Inc. (a)
| | 2,085 | | 288,918 |
Elevance Health, Inc.
| | 9,000 | | 4,876,740 |
Humana, Inc.
| | 4,675 | | 1,746,814 |
Quest Diagnostics, Inc.
| | 4,249 | | 581,603 |
UnitedHealth Group, Inc.
| | 35,679 | | 18,169,887 |
| | | | | | 35,875,330 |
| HEALTH CARE REITs — 0.3% | |
Healthpeak Properties, Inc. REIT
| | 27,264 | | 534,374 |
Ventas, Inc. REIT
| | 15,492 | | 794,120 |
Welltower, Inc. REIT
| | 23,114 | | 2,409,635 |
| | | | | | 3,738,129 |
| HOTEL & RESORT REITs — 0.0% (c) | |
Host Hotels & Resorts, Inc. REIT
| | 27,173 | | 488,571 |
| HOTELS, RESTAURANTS & LEISURE — 1.9% | |
Caesars Entertainment, Inc. (a)
| | 8,285 | | 329,246 |
Carnival Corp. (a)
| | 38,840 | | 727,085 |
Chipotle Mexican Grill, Inc. (a)
| | 51,905 | | 3,251,848 |
Expedia Group, Inc. (a)
| | 5,080 | | 640,029 |
Hilton Worldwide Holdings, Inc.
| | 9,740 | | 2,125,268 |
Las Vegas Sands Corp.
| | 14,269 | | 631,403 |
Marriott International, Inc. Class A
| | 9,529 | | 2,303,826 |
McDonald's Corp.
| | 27,908 | | 7,112,075 |
MGM Resorts International (a)
| | 10,551 | | 468,887 |
Norwegian Cruise Line Holdings Ltd. (a)
| | 16,420 | | 308,532 |
Royal Caribbean Cruises Ltd. (a)
| | 9,058 | | 1,444,117 |
Starbucks Corp.
| | 43,665 | | 3,399,320 |
Wynn Resorts Ltd.
| | 3,644 | | 326,138 |
Yum! Brands, Inc.
| | 10,779 | | 1,427,786 |
| | | | | | 24,495,560 |
| HOUSEHOLD DURABLES — 0.2% | |
DR Horton, Inc.
| | 11,532 | | 1,625,205 |
Mohawk Industries, Inc. (a)
| | 1,992 | | 226,271 |
PulteGroup, Inc.
| | 8,118 | | 893,792 |
| | | | | | 2,745,268 |
| Security Description | | | Shares | | Value |
| HOUSEHOLD PRODUCTS — 1.4% | |
Colgate-Palmolive Co.
| | 31,770 | | $3,082,961 |
Procter & Gamble Co.
| | 91,120 | | 15,027,510 |
| | | | | | 18,110,471 |
| INDUSTRIAL CONGLOMERATES — 0.5% | |
General Electric Co.
| | 41,948 | | 6,668,474 |
| INDUSTRIAL REITs — 0.3% | |
Prologis, Inc. REIT
| | 35,631 | | 4,001,718 |
| INSURANCE — 2.2% | |
Aflac, Inc.
| | 20,323 | | 1,815,047 |
Allstate Corp.
| | 10,128 | | 1,617,036 |
American International Group, Inc.
| | 25,688 | | 1,907,077 |
Aon PLC Class A
| | 8,409 | | 2,468,714 |
Arch Capital Group Ltd. (a)
| | 14,322 | | 1,444,947 |
Arthur J Gallagher & Co.
| | 8,328 | | 2,159,534 |
Assurant, Inc.
| | 2,034 | | 338,153 |
Chubb Ltd.
| | 15,571 | | 3,971,851 |
Everest Group Ltd.
| | 1,698 | | 646,972 |
Globe Life, Inc.
| | 3,319 | | 273,087 |
Hartford Financial Services Group, Inc.
| | 11,463 | | 1,152,490 |
Marsh & McLennan Cos., Inc.
| | 19,020 | | 4,007,894 |
MetLife, Inc.
| | 23,620 | | 1,657,888 |
Principal Financial Group, Inc.
| | 8,491 | | 666,119 |
Prudential Financial, Inc.
| | 13,864 | | 1,624,722 |
Travelers Cos., Inc.
| | 8,789 | | 1,787,155 |
Willis Towers Watson PLC
| | 3,990 | | 1,045,939 |
| | | | | | 28,584,625 |
| INTERACTIVE MEDIA & SERVICES — 5.9% | |
Alphabet, Inc. Class A
| | 227,064 | | 41,359,708 |
Alphabet, Inc. Class C
| | 188,781 | | 34,626,211 |
| | | | | | 75,985,919 |
| IT SERVICES — 1.1% | |
Accenture PLC Class A
| | 24,200 | | 7,342,522 |
Akamai Technologies, Inc. (a)
| | 5,816 | | 523,905 |
International Business Machines Corp.
| | 35,217 | | 6,090,780 |
| | | | | | 13,957,207 |
| LEISURE EQUIPMENT & PRODUCTS — 0.0% (c) | |
Hasbro, Inc.
| | 5,035 | | 294,547 |
| LIFE SCIENCES TOOLS & SERVICES — 0.8% | |
Agilent Technologies, Inc.
| | 11,267 | | 1,460,541 |
Bio-Rad Laboratories, Inc. Class A (a)
| | 808 | | 220,673 |
Charles River Laboratories International, Inc. (a)
| | 1,972 | | 407,376 |
Danaher Corp.
| | 25,336 | | 6,330,200 |
Mettler-Toledo International, Inc. (a)
| | 870 | | 1,215,903 |
Revvity, Inc.
| | 4,780 | | 501,231 |
Waters Corp. (a)
| | 2,300 | | 667,276 |
| | | | | | 10,803,200 |
See accompanying notes to financial statements.
43
SPDR SERIES TRUST
SPDR S&P 500 ESG ETF
SCHEDULE OF INVESTMENTS (continued)
June 30, 2024
| Security Description | | | Shares | | Value |
| MACHINERY — 2.1% | |
Caterpillar, Inc.
| | 18,902 | | $6,296,256 |
Cummins, Inc.
| | 5,239 | | 1,450,836 |
Deere & Co.
| | 10,021 | | 3,744,146 |
Dover Corp.
| | 5,392 | | 972,986 |
Fortive Corp.
| | 13,467 | | 997,905 |
IDEX Corp.
| | 2,901 | | 583,681 |
Illinois Tool Works, Inc.
| | 10,480 | | 2,483,341 |
Ingersoll Rand, Inc.
| | 15,615 | | 1,418,467 |
Otis Worldwide Corp.
| | 15,633 | | 1,504,833 |
PACCAR, Inc.
| | 20,112 | | 2,070,329 |
Parker-Hannifin Corp.
| | 4,902 | | 2,479,481 |
Pentair PLC
| | 6,419 | | 492,145 |
Stanley Black & Decker, Inc.
| | 5,908 | | 471,990 |
Westinghouse Air Brake Technologies Corp.
| | 6,920 | | 1,093,706 |
Xylem, Inc.
| | 9,261 | | 1,256,069 |
| | | | | | 27,316,171 |
| MEDIA — 0.6% | |
Comcast Corp. Class A
| | 152,629 | | 5,976,951 |
Interpublic Group of Cos., Inc.
| | 14,788 | | 430,183 |
News Corp. Class A
| | 14,635 | | 403,487 |
News Corp. Class B
| | 4,412 | | 125,257 |
Omnicom Group, Inc.
| | 7,624 | | 683,873 |
Paramount Global Class B
| | 18,652 | | 193,794 |
| | | | | | 7,813,545 |
| METALS & MINING — 0.4% | |
Freeport-McMoRan, Inc.
| | 55,279 | | 2,686,559 |
Newmont Corp.
| | 44,371 | | 1,857,814 |
| | | | | | 4,544,373 |
| MULTI-UTILITIES — 0.3% | |
Consolidated Edison, Inc.
| | 13,304 | | 1,189,644 |
Public Service Enterprise Group, Inc.
| | 19,208 | | 1,415,629 |
Sempra
| | 24,278 | | 1,846,585 |
| | | | | | 4,451,858 |
| OFFICE REITs — 0.1% | |
Alexandria Real Estate Equities, Inc. REIT
| | 6,076 | | 710,710 |
Boston Properties, Inc. REIT
| | 5,601 | | 344,797 |
| | | | | | 1,055,507 |
| OIL, GAS & CONSUMABLE FUELS — 3.9% | |
Chevron Corp.
| | 66,168 | | 10,349,999 |
Devon Energy Corp.
| | 24,658 | | 1,168,789 |
Diamondback Energy, Inc.
| | 6,852 | | 1,371,702 |
EQT Corp.
| | 15,832 | | 585,467 |
Exxon Mobil Corp.
| | 173,904 | | 20,019,828 |
Hess Corp.
| | 10,616 | | 1,566,072 |
Kinder Morgan, Inc.
| | 74,506 | | 1,480,434 |
Marathon Petroleum Corp.
| | 13,649 | | 2,367,829 |
Occidental Petroleum Corp.
| | 25,357 | | 1,598,252 |
ONEOK, Inc.
| | 22,456 | | 1,831,287 |
Phillips 66
| | 16,591 | | 2,342,151 |
| Security Description | | | Shares | | Value |
Targa Resources Corp.
| | 8,624 | | $1,110,599 |
Valero Energy Corp.
| | 13,108 | | 2,054,810 |
Williams Cos., Inc.
| | 46,847 | | 1,990,998 |
| | | | | | 49,838,217 |
| PERSONAL CARE PRODUCTS — 0.1% | |
Estee Lauder Cos., Inc. Class A
| | 9,014 | | 959,090 |
| PHARMACEUTICALS — 4.1% | |
Bristol-Myers Squibb Co.
| | 78,437 | | 3,257,489 |
Eli Lilly & Co.
| | 30,809 | | 27,893,853 |
Merck & Co., Inc.
| | 97,668 | | 12,091,298 |
Pfizer, Inc.
| | 217,545 | | 6,086,909 |
Zoetis, Inc.
| | 17,701 | | 3,068,645 |
| | | | | | 52,398,194 |
| PROFESSIONAL SERVICES — 0.6% | |
Automatic Data Processing, Inc.
| | 15,784 | | 3,767,483 |
Broadridge Financial Solutions, Inc.
| | 4,545 | | 895,365 |
Dayforce, Inc. (a)
| | 6,016 | | 298,394 |
Paychex, Inc.
| | 12,324 | | 1,461,133 |
Verisk Analytics, Inc.
| | 5,552 | | 1,496,542 |
| | | | | | 7,918,917 |
| REAL ESTATE MANAGEMENT & DEVELOPMENT — 0.2% | |
CBRE Group, Inc. Class A (a)
| | 11,479 | | 1,022,894 |
CoStar Group, Inc. (a)
| | 15,676 | | 1,162,218 |
| | | | | | 2,185,112 |
| RESIDENTIAL REITs — 0.2% | |
AvalonBay Communities, Inc. REIT
| | 5,436 | | 1,124,654 |
Equity Residential REIT
| | 13,307 | | 922,707 |
UDR, Inc. REIT
| | 11,652 | | 479,480 |
| | | | | | 2,526,841 |
| RETAIL REITs — 0.1% | |
Federal Realty Investment Trust REIT
| | 2,838 | | 286,553 |
Kimco Realty Corp. REIT
| | 25,698 | | 500,083 |
Regency Centers Corp. REIT
| | 6,389 | | 397,396 |
| | | | | | 1,184,032 |
| SEMICONDUCTORS & SEMICONDUCTOR EQUIPMENT — 12.8% | |
Advanced Micro Devices, Inc. (a)
| | 62,298 | | 10,105,359 |
Applied Materials, Inc.
| | 32,085 | | 7,571,739 |
Intel Corp.
| | 162,909 | | 5,045,292 |
KLA Corp.
| | 5,245 | | 4,324,555 |
Lam Research Corp.
| | 5,006 | | 5,330,639 |
Micron Technology, Inc.
| | 42,497 | | 5,589,630 |
NVIDIA Corp.
| | 950,214 | | 117,389,437 |
ON Semiconductor Corp. (a)
| | 16,433 | | 1,126,482 |
QUALCOMM, Inc.
| | 42,959 | | 8,556,574 |
| | | | | | 165,039,707 |
| SOFTWARE — 11.6% | |
Adobe, Inc. (a)
| | 17,411 | | 9,672,507 |
Autodesk, Inc. (a)
| | 8,241 | | 2,039,235 |
See accompanying notes to financial statements.
44
SPDR SERIES TRUST
SPDR S&P 500 ESG ETF
SCHEDULE OF INVESTMENTS (continued)
June 30, 2024
| Security Description | | | Shares | | Value |
Microsoft Corp.
| | 287,098 | | $128,318,451 |
Salesforce, Inc.
| | 37,336 | | 9,599,086 |
| | | | | | 149,629,279 |
| SPECIALIZED REITs — 1.1% | |
American Tower Corp. REIT
| | 18,002 | | 3,499,229 |
Digital Realty Trust, Inc. REIT
| | 12,094 | | 1,838,893 |
Equinix, Inc. REIT
| | 3,604 | | 2,726,786 |
Extra Space Storage, Inc. REIT
| | 8,085 | | 1,256,490 |
Iron Mountain, Inc. REIT
| | 11,254 | | 1,008,584 |
Public Storage REIT
| | 6,116 | | 1,759,267 |
SBA Communications Corp. REIT
| | 4,196 | | 823,675 |
Weyerhaeuser Co. REIT
| | 28,098 | | 797,702 |
| | | | | | 13,710,626 |
| SPECIALTY RETAIL — 2.2% | |
Bath & Body Works, Inc.
| | 8,724 | | 340,672 |
Best Buy Co., Inc.
| | 7,431 | | 626,359 |
CarMax, Inc. (a)
| | 6,116 | | 448,547 |
Home Depot, Inc.
| | 38,347 | | 13,200,571 |
Lowe's Cos., Inc.
| | 22,187 | | 4,891,346 |
Ross Stores, Inc.
| | 12,968 | | 1,884,510 |
TJX Cos., Inc.
| | 43,917 | | 4,835,262 |
Tractor Supply Co.
| | 4,196 | | 1,132,920 |
Ulta Beauty, Inc. (a)
| | 1,872 | | 722,349 |
| | | | | | 28,082,536 |
| TECHNOLOGY HARDWARE, STORAGE & PERIPHERALS — 9.4% | |
Apple, Inc.
| | 556,811 | | 117,275,533 |
Hewlett Packard Enterprise Co.
| | 50,133 | | 1,061,316 |
HP, Inc.
| | 33,565 | | 1,175,446 |
Western Digital Corp. (a)
| | 12,468 | | 944,700 |
| | | | | | 120,456,995 |
| TEXTILES, APPAREL & LUXURY GOODS — 0.5% | |
Deckers Outdoor Corp. (a)
| | 1,036 | | 1,002,796 |
Lululemon Athletica, Inc. (a)
| | 4,480 | | 1,338,176 |
NIKE, Inc. Class B
| | 46,835 | | 3,529,954 |
Ralph Lauren Corp.
| | 1,542 | | 269,943 |
| Security Description | | | Shares | | Value |
Tapestry, Inc.
| | 8,823 | | $377,536 |
| | | | | | 6,518,405 |
| TRADING COMPANIES & DISTRIBUTORS — 0.2% | |
United Rentals, Inc.
| | 2,575 | | 1,665,330 |
WW Grainger, Inc.
| | 1,672 | | 1,508,545 |
| | | | | | 3,173,875 |
| WATER UTILITIES — 0.1% | |
American Water Works Co., Inc.
| | 7,504 | | 969,217 |
| WIRELESS TELECOMMUNICATION SERVICES — 0.3% | |
T-Mobile U.S., Inc.
| | 20,156 | | 3,551,084 |
TOTAL COMMON STOCKS
(Cost $1,035,874,422)
| | | | | 1,283,324,470 |
| SHORT-TERM INVESTMENT — 0.1% | | | |
State Street Institutional Liquid Reserves Fund, Premier Class 5.36% (d) (e)
(Cost $598,843)
| | 598,678 | | 598,858 |
TOTAL INVESTMENTS — 100.0%
(Cost $1,036,473,265)
| | 1,283,923,328 | |
OTHER ASSETS IN EXCESS OF LIABILITIES — 0.0% (c)
| | 527,728 | |
NET ASSETS — 100.0%
| | $1,284,451,056 | |
| (a) | Non-income producing security. |
| (b) | The Fund invested in an affiliated entity, State Street Corp. Amounts related to these investments during the year ended June 30, 2024 are shown in the Affiliate Table below. |
| (c) | Amount is less than 0.05% of net assets. |
| (d) | The Fund invested in certain money market funds managed by SSGA Funds Management, Inc. Amounts related to these investments during the year ended June 30, 2024 are shown in the Affiliate Table below. |
| (e) | The rate shown is the annualized seven-day yield at June 30, 2024. |
| REIT | Real Estate Investment Trust |
At June 30, 2024, open futures contracts were as follows:
| Description | | Number of
Contracts | | Expiration
Date | | Notional
Amount | | Value | | Unrealized
Appreciation
(Depreciation) |
| E-mini S&P 500 ESG Index (long) | | 4 | | 09/20/2024 | | $983,805 | | $981,910 | | $(1,895) |
During the year ended June 30, 2024, the average notional value related to futures contracts was $1,183,074.
See accompanying notes to financial statements.
45
SPDR SERIES TRUST
SPDR S&P 500 ESG ETF
SCHEDULE OF INVESTMENTS (continued)
June 30, 2024
The following table summarizes the value of the Fund's investments according to the fair value hierarchy as of June 30, 2024.
| Description | | Level 1 –
Quoted Prices | | Level 2 –
Other Significant
Observable Inputs | | Level 3 –
Significant
Unobservable Inputs | | Total |
| ASSETS: | | | | | | | | |
| INVESTMENTS: | | | | | | | | |
Common Stocks
| | $1,283,324,470 | | $— | | $— | | $1,283,324,470 |
Short-Term Investment
| | 598,858 | | — | | — | | 598,858 |
TOTAL INVESTMENTS
| | $1,283,923,328 | | $— | | $— | | $1,283,923,328 |
| OTHER FINANCIAL INSTRUMENTS: | | | | | | | | |
Futures Contracts - Unrealized Depreciation
| | $(1,895) | | $— | | $— | | $(1,895) |
TOTAL OTHER FINANCIAL INSTRUMENTS:
| | $(1,895) | | $— | | $— | | $(1,895) |
Affiliate Table
| | Number of
Shares Held
at
6/30/23 | | Value at
6/30/23 | | Cost of
Purchases | | Proceeds
from
Shares Sold | | Realized
Gain (Loss) | | Change in
Unrealized
Appreciation/
Depreciation | | Number of
Shares Held
at
6/30/24 | | Value at
6/30/24 | | Dividend
Income |
State Street Corp.
| 11,047 | | $808,420 | | $277,050 | | $242,165 | | $(33,380) | | $48,327 | | 11,598 | | $858,252 | | $22,973 |
State Street Institutional Liquid Reserves Fund, Premier Class
| 725,538 | | 725,683 | | 22,522,453 | | 22,649,063 | | (209) | | (6) | | 598,678 | | 598,858 | | 60,789 |
Total
| | | $1,534,103 | | $22,799,503 | | $22,891,228 | | $(33,589) | | $48,321 | | | | $1,457,110 | | $83,762 |
See accompanying notes to financial statements.
46
SPDR SERIES TRUST
SPDR S&P 600 SMALL CAP GROWTH ETF
SCHEDULE OF INVESTMENTS
June 30, 2024
| Security Description | | | Shares | | Value |
| COMMON STOCKS — 99.8% | |
| AEROSPACE & DEFENSE — 2.0% | |
AAR Corp. (a)
| | 127,979 | | $9,304,072 |
AeroVironment, Inc. (a)
| | 148,967 | | 27,135,829 |
Moog, Inc. Class A
| | 153,205 | | 25,631,197 |
National Presto Industries, Inc.
| | 13,116 | | 985,405 |
| | | | | | 63,056,503 |
| AIRLINES — 0.3% | |
SkyWest, Inc. (a)
| | 115,357 | | 9,467,349 |
Sun Country Airlines Holdings, Inc. (a)
| | 98,666 | | 1,239,245 |
| | | | | | 10,706,594 |
| AUTO COMPONENTS — 1.3% | |
Dorman Products, Inc. (a)
| | 102,135 | | 9,343,310 |
Fox Factory Holding Corp. (a) (b)
| | 83,179 | | 4,008,396 |
Gentherm, Inc. (a)
| | 76,478 | | 3,771,895 |
LCI Industries (b)
| | 85,624 | | 8,851,809 |
Patrick Industries, Inc. (b)
| | 111,877 | | 12,144,248 |
XPEL, Inc. (a) (b)
| | 111,895 | | 3,978,986 |
| | | | | | 42,098,644 |
| AUTOMOBILES — 0.1% | |
Winnebago Industries, Inc. (b)
| | 87,221 | | 4,727,378 |
| BANKS — 4.2% | |
Axos Financial, Inc. (a)
| | 170,955 | | 9,770,078 |
BancFirst Corp.
| | 47,350 | | 4,152,595 |
Bancorp, Inc. (a)
| | 274,625 | | 10,369,840 |
Bank of Hawaii Corp. (b)
| | 83,652 | | 4,785,731 |
Berkshire Hills Bancorp, Inc.
| | 117,181 | | 2,671,727 |
Cathay General Bancorp
| | 181,055 | | 6,829,395 |
City Holding Co. (b)
| | 46,706 | | 4,962,512 |
Customers Bancorp, Inc. (a)
| | 154,363 | | 7,406,337 |
First BanCorp
| | 879,673 | | 16,089,219 |
First Commonwealth Financial Corp.
| | 261,294 | | 3,608,470 |
Lakeland Financial Corp. (b)
| | 62,950 | | 3,872,684 |
OFG Bancorp
| | 252,391 | | 9,452,043 |
Park National Corp. (b)
| | 31,005 | | 4,413,252 |
Pathward Financial, Inc.
| | 136,167 | | 7,702,967 |
Preferred Bank (b)
| | 64,959 | | 4,903,755 |
S&T Bancorp, Inc.
| | 112,784 | | 3,765,858 |
ServisFirst Bancshares, Inc. (b)
| | 120,571 | | 7,618,881 |
Southside Bancshares, Inc. (b)
| | 62,753 | | 1,732,610 |
Triumph Financial, Inc. (a)
| | 115,621 | | 9,452,017 |
Westamerica BanCorp
| | 85,567 | | 4,152,567 |
WSFS Financial Corp.
| | 145,393 | | 6,833,471 |
| | | | | | 134,546,009 |
| BEVERAGES — 0.2% | |
MGP Ingredients, Inc. (b)
| | 50,314 | | 3,743,361 |
National Beverage Corp.
| | 71,445 | | 3,660,842 |
| | | | | | 7,404,203 |
| BIOTECHNOLOGY — 2.3% | |
Alkermes PLC (a)
| | 575,869 | | 13,878,443 |
| Security Description | | | Shares | | Value |
Arcus Biosciences, Inc. (a)
| | 123,655 | | $1,883,266 |
Catalyst Pharmaceuticals, Inc. (a)
| | 595,115 | | 9,218,331 |
Dynavax Technologies Corp. (a)
| | 692,661 | | 7,778,583 |
Ironwood Pharmaceuticals, Inc. (a) (b)
| | 434,977 | | 2,836,050 |
Krystal Biotech, Inc. (a)
| | 87,200 | | 16,013,408 |
Myriad Genetics, Inc. (a)
| | 241,303 | | 5,902,271 |
REGENXBIO, Inc. (a)
| | 97,546 | | 1,141,288 |
Vericel Corp. (a)
| | 262,230 | | 12,031,113 |
Xencor, Inc. (a)
| | 176,206 | | 3,335,580 |
| | | | | | 74,018,333 |
| BUILDING PRODUCTS — 2.2% | |
American Woodmark Corp. (a)
| | 47,639 | | 3,744,425 |
Apogee Enterprises, Inc.
| | 55,472 | | 3,485,583 |
Armstrong World Industries, Inc.
| | 233,167 | | 26,403,831 |
AZZ, Inc.
| | 158,248 | | 12,224,658 |
Gibraltar Industries, Inc. (a)
| | 163,732 | | 11,223,829 |
Griffon Corp.
| | 134,008 | | 8,557,751 |
Insteel Industries, Inc.
| | 68,469 | | 2,119,800 |
Quanex Building Products Corp.
| | 126,463 | | 3,496,702 |
| | | | | | 71,256,579 |
| CAPITAL MARKETS — 2.3% | |
Artisan Partners Asset Management, Inc. Class A (b)
| | 206,006 | | 8,501,868 |
BGC Group, Inc. Class A
| | 1,181,384 | | 9,805,487 |
Brightsphere Investment Group, Inc.
| | 91,589 | | 2,030,528 |
Cohen & Steers, Inc. (b)
| | 68,427 | | 4,965,063 |
Donnelley Financial Solutions, Inc. (a)
| | 132,635 | | 7,907,699 |
Moelis & Co. Class A (b)
| | 201,763 | | 11,472,244 |
Piper Sandler Cos.
| | 40,814 | | 9,394,159 |
PJT Partners, Inc. Class A (b)
| | 66,557 | | 7,182,166 |
StepStone Group, Inc. Class A (b)
| | 81,900 | | 3,758,391 |
Virtus Investment Partners, Inc.
| | 22,252 | | 5,025,614 |
WisdomTree, Inc. (b)
| | 589,809 | | 5,845,007 |
| | | | | | 75,888,226 |
| CHEMICALS — 2.1% | |
Balchem Corp.
| | 97,285 | | 14,977,026 |
Hawkins, Inc.
| | 100,898 | | 9,181,718 |
HB Fuller Co.
| | 142,758 | | 10,986,656 |
Innospec, Inc.
| | 84,126 | | 10,397,132 |
Koppers Holdings, Inc.
| | 61,577 | | 2,277,733 |
Minerals Technologies, Inc.
| | 85,380 | | 7,100,201 |
Quaker Chemical Corp.
| | 38,574 | | 6,546,008 |
Sensient Technologies Corp.
| | 97,665 | | 7,245,766 |
| | | | | | 68,712,240 |
| COMMERCIAL SERVICES & SUPPLIES — 1.1% | |
Brady Corp. Class A
| | 157,429 | | 10,393,463 |
HNI Corp.
| | 150,059 | | 6,755,656 |
Liquidity Services, Inc. (a)
| | 125,463 | | 2,506,751 |
See accompanying notes to financial statements.
47
SPDR SERIES TRUST
SPDR S&P 600 SMALL CAP GROWTH ETF
SCHEDULE OF INVESTMENTS (continued)
June 30, 2024
| Security Description | | | Shares | | Value |
Matthews International Corp. Class A
| | 108,504 | | $2,718,025 |
UniFirst Corp.
| | 32,564 | | 5,585,703 |
Vestis Corp. (b)
| | 384,050 | | 4,696,931 |
Viad Corp. (a)
| | 116,325 | | 3,955,050 |
| | | | | | 36,611,579 |
| COMMUNICATIONS EQUIPMENT — 0.5% | |
Calix, Inc. (a)
| | 154,594 | | 5,477,265 |
Extreme Networks, Inc. (a)
| | 411,266 | | 5,531,528 |
Harmonic, Inc. (a)
| | 337,157 | | 3,968,338 |
| | | | | | 14,977,131 |
| CONSTRUCTION & ENGINEERING — 1.0% | |
Arcosa, Inc.
| | 152,275 | | 12,701,258 |
Granite Construction, Inc.
| | 122,254 | | 7,576,080 |
MYR Group, Inc. (a)
| | 89,091 | | 12,090,540 |
| | | | | | 32,367,878 |
| CONSUMER FINANCE — 0.3% | |
PROG Holdings, Inc.
| | 228,759 | | 7,933,362 |
World Acceptance Corp. (a) (b)
| | 19,012 | | 2,349,503 |
| | | | | | 10,282,865 |
| CONSUMER STAPLES DISTRIBUTION & RETAIL — 0.1% | |
Andersons, Inc.
| | 91,034 | | 4,515,286 |
| CONTAINERS & PACKAGING — 0.4% | |
Myers Industries, Inc. (b)
| | 101,085 | | 1,352,517 |
Sealed Air Corp.
| | 310,498 | | 10,802,226 |
| | | | | | 12,154,743 |
| DIVERSIFIED CONSUMER SERVICES — 1.7% | |
Adtalem Global Education, Inc. (a)
| | 199,888 | | 13,634,361 |
Frontdoor, Inc. (a)
| | 413,705 | | 13,979,092 |
Mister Car Wash, Inc. (a) (b)
| | 221,817 | | 1,579,337 |
Perdoceo Education Corp.
| | 193,096 | | 4,136,116 |
Strategic Education, Inc.
| | 47,368 | | 5,241,743 |
Stride, Inc. (a)
| | 212,412 | | 14,975,046 |
| | | | | | 53,545,695 |
| DIVERSIFIED REITs — 0.5% | |
Armada Hoffler Properties, Inc. REIT
| | 162,280 | | 1,799,685 |
Essential Properties Realty Trust, Inc. REIT
| | 484,477 | | 13,424,858 |
| | | | | | 15,224,543 |
| DIVERSIFIED TELECOMMUNICATION SERVICES — 0.5% | |
Cogent Communications Holdings, Inc. (b)
| | 224,167 | | 12,651,986 |
Shenandoah Telecommunications Co.
| | 263,988 | | 4,310,924 |
| | | | | | 16,962,910 |
| ELECTRIC UTILITIES — 0.8% | |
MGE Energy, Inc. (b)
| | 107,058 | | 7,999,374 |
Otter Tail Corp. (b)
| | 222,598 | | 19,497,359 |
| | | | | | 27,496,733 |
| Security Description | | | Shares | | Value |
| ELECTRICAL EQUIPMENT — 1.0% | |
Encore Wire Corp.
| | 84,082 | | $24,369,486 |
Powell Industries, Inc.
| | 48,887 | | 7,010,396 |
Vicor Corp. (a)
| | 66,734 | | 2,212,899 |
| | | | | | 33,592,781 |
| ELECTRONIC EQUIPMENT, INSTRUMENTS & COMPONENTS — 5.2% | |
Advanced Energy Industries, Inc.
| | 124,273 | | 13,515,932 |
Arlo Technologies, Inc. (a)
| | 525,402 | | 6,851,242 |
Badger Meter, Inc.
| | 156,636 | | 29,189,119 |
CTS Corp.
| | 90,205 | | 4,567,079 |
ePlus, Inc. (a)
| | 86,924 | | 6,404,560 |
Fabrinet (a)
| | 192,798 | | 47,195,022 |
Insight Enterprises, Inc. (a) (b)
| | 95,732 | | 18,989,400 |
Itron, Inc. (a)
| | 120,301 | | 11,904,987 |
Knowles Corp. (a)
| | 192,820 | | 3,328,073 |
OSI Systems, Inc. (a)
| | 84,270 | | 11,588,810 |
Plexus Corp. (a)
| | 63,759 | | 6,578,654 |
Rogers Corp. (a)
| | 60,035 | | 7,240,821 |
| | | | | | 167,353,699 |
| ENERGY EQUIPMENT & SERVICES — 3.6% | |
Archrock, Inc.
| | 731,146 | | 14,783,772 |
Cactus, Inc. Class A (b)
| | 216,300 | | 11,407,662 |
Core Laboratories, Inc. (b)
| | 115,042 | | 2,334,202 |
Helix Energy Solutions Group, Inc. (a)
| | 764,950 | | 9,133,503 |
Helmerich & Payne, Inc. (b)
| | 288,692 | | 10,433,329 |
Liberty Energy, Inc.
| | 806,837 | | 16,854,825 |
Oceaneering International, Inc. (a)
| | 545,707 | | 12,911,428 |
Patterson-UTI Energy, Inc.
| | 902,217 | | 9,346,968 |
RPC, Inc. (b)
| | 473,731 | | 2,960,819 |
Tidewater, Inc. (a)
| | 258,600 | | 24,621,306 |
| | | | | | 114,787,814 |
| ENTERTAINMENT — 0.9% | |
Cinemark Holdings, Inc. (a) (b)
| | 569,995 | | 12,323,292 |
Madison Square Garden Sports Corp. (a)
| | 88,807 | | 16,707,261 |
| | | | | | 29,030,553 |
| FINANCIAL SERVICES — 1.4% | |
EVERTEC, Inc.
| | 342,097 | | 11,374,725 |
NMI Holdings, Inc. Class A (a)
| | 282,432 | | 9,613,985 |
Payoneer Global, Inc. (a)
| | 529,512 | | 2,933,496 |
Radian Group, Inc.
| | 440,265 | | 13,692,242 |
Walker & Dunlop, Inc.
| | 78,439 | | 7,702,710 |
| | | | | | 45,317,158 |
| FOOD PRODUCTS — 1.3% | |
Cal-Maine Foods, Inc. (b)
| | 216,231 | | 13,213,876 |
J & J Snack Foods Corp. (b)
| | 82,411 | | 13,381,074 |
John B Sanfilippo & Son, Inc.
| | 26,488 | | 2,573,839 |
Simply Good Foods Co. (a)
| | 309,166 | | 11,170,168 |
Tootsie Roll Industries, Inc. (b)
| | 60,855 | | 1,860,337 |
| | | | | | 42,199,294 |
See accompanying notes to financial statements.
48
SPDR SERIES TRUST
SPDR S&P 600 SMALL CAP GROWTH ETF
SCHEDULE OF INVESTMENTS (continued)
June 30, 2024
| Security Description | | | Shares | | Value |
| GAS UTILITIES — 0.2% | |
Chesapeake Utilities Corp.
| | 54,062 | | $5,741,384 |
| GROUND TRANSPORTATION — 0.8% | |
ArcBest Corp.
| | 124,586 | | 13,340,669 |
Heartland Express, Inc.
| | 141,293 | | 1,742,143 |
Marten Transport Ltd.
| | 151,277 | | 2,791,061 |
RXO, Inc. (a)
| | 285,617 | | 7,468,884 |
| | | | | | 25,342,757 |
| HEALTH CARE EQUIPMENT & SUPPLIES — 3.8% | |
Artivion, Inc. (a)
| | 117,873 | | 3,023,442 |
CONMED Corp. (b)
| | 165,481 | | 11,471,143 |
Glaukos Corp. (a)
| | 268,389 | | 31,763,838 |
Inari Medical, Inc. (a) (b)
| | 159,744 | | 7,691,674 |
Integer Holdings Corp. (a) (b)
| | 178,350 | | 20,651,147 |
LeMaitre Vascular, Inc.
| | 105,953 | | 8,717,813 |
Merit Medical Systems, Inc. (a)
| | 182,344 | | 15,672,467 |
STAAR Surgical Co. (a)
| | 160,236 | | 7,628,836 |
Tandem Diabetes Care, Inc. (a)
| | 157,205 | | 6,333,789 |
UFP Technologies, Inc. (a)
| | 37,401 | | 9,869,002 |
| | | | | | 122,823,151 |
| HEALTH CARE PROVIDERS & SERVICES — 3.6% | |
Addus HomeCare Corp. (a)
| | 39,672 | | 4,606,316 |
AMN Healthcare Services, Inc. (a) (b)
| | 108,347 | | 5,550,617 |
Astrana Health, Inc. (a) (b)
| | 224,449 | | 9,103,652 |
CorVel Corp. (a)
| | 48,086 | | 12,226,827 |
Ensign Group, Inc.
| | 300,987 | | 37,229,082 |
National HealthCare Corp.
| | 35,308 | | 3,827,387 |
NeoGenomics, Inc. (a) (b)
| | 684,490 | | 9,493,876 |
OmniAb, Inc. (a) (b) (c)
| | 65,116 | | — |
Privia Health Group, Inc. (a)
| | 552,122 | | 9,595,880 |
RadNet, Inc. (a)
| | 354,819 | | 20,905,936 |
U.S. Physical Therapy, Inc.
| | 45,788 | | 4,231,727 |
| | | | | | 116,771,300 |
| HEALTH CARE REITs — 0.6% | |
CareTrust REIT, Inc.
| | 475,453 | | 11,933,870 |
Community Healthcare Trust, Inc. REIT
| | 57,124 | | 1,336,130 |
LTC Properties, Inc. REIT
| | 99,135 | | 3,420,158 |
Universal Health Realty Income Trust REIT
| | 34,416 | | 1,347,042 |
| | | | | | 18,037,200 |
| HEALTH CARE TECHNOLOGY — 0.4% | |
Certara, Inc. (a) (b)
| | 329,051 | | 4,557,356 |
HealthStream, Inc.
| | 71,186 | | 1,986,090 |
Schrodinger, Inc. (a) (b)
| | 169,997 | | 3,287,742 |
Simulations Plus, Inc. (b)
| | 52,724 | | 2,563,441 |
| | | | | | 12,394,629 |
| HOTEL & RESORT REITs — 1.4% | |
Apple Hospitality REIT, Inc.
| | 1,199,357 | | 17,438,651 |
DiamondRock Hospitality Co. REIT
| | 1,126,122 | | 9,515,731 |
| Security Description | | | Shares | | Value |
Summit Hotel Properties, Inc. REIT
| | 307,282 | | $1,840,619 |
Sunstone Hotel Investors, Inc. REIT
| | 1,081,450 | | 11,311,967 |
Xenia Hotels & Resorts, Inc. REIT
| | 329,961 | | 4,728,341 |
| | | | | | 44,835,309 |
| HOTELS, RESTAURANTS & LEISURE — 2.3% | |
Bloomin' Brands, Inc. (b)
| | 223,010 | | 4,288,482 |
Brinker International, Inc. (a)
| | 98,909 | | 7,160,023 |
Cheesecake Factory, Inc. (b)
| | 113,617 | | 4,464,012 |
Chuy's Holdings, Inc. (a)
| | 56,288 | | 1,458,985 |
Dave & Buster's Entertainment, Inc. (a) (b)
| | 172,715 | | 6,875,784 |
Dine Brands Global, Inc. (b)
| | 37,481 | | 1,356,812 |
Golden Entertainment, Inc.
| | 70,389 | | 2,189,802 |
Jack in the Box, Inc. (b)
| | 104,754 | | 5,336,169 |
Monarch Casino & Resort, Inc.
| | 69,079 | | 4,706,352 |
Papa John's International, Inc. (b)
| | 84,221 | | 3,956,703 |
Sabre Corp. (a) (b)
| | 1,117,181 | | 2,982,873 |
Shake Shack, Inc. Class A (a)
| | 200,346 | | 18,031,140 |
Six Flags Entertainment Corp. (b)
| | 385,052 | | 12,760,623 |
| | | | | | 75,567,760 |
| HOUSEHOLD DURABLES — 4.1% | |
Cavco Industries, Inc. (a)
| | 41,238 | | 14,275,359 |
Century Communities, Inc.
| | 78,632 | | 6,421,089 |
Ethan Allen Interiors, Inc.
| | 52,688 | | 1,469,468 |
Green Brick Partners, Inc. (a)
| | 135,927 | | 7,780,462 |
Installed Building Products, Inc. (b)
| | 125,049 | | 25,720,078 |
La-Z-Boy, Inc.
| | 121,374 | | 4,524,823 |
LGI Homes, Inc. (a)
| | 65,017 | | 5,818,371 |
M/I Homes, Inc. (a)
| | 147,652 | | 18,034,215 |
Meritage Homes Corp.
| | 193,528 | | 31,322,507 |
Tri Pointe Homes, Inc. (a)
| | 307,421 | | 11,451,432 |
Worthington Enterprises, Inc. (b)
| | 112,475 | | 5,323,442 |
| | | | | | 132,141,246 |
| HOUSEHOLD PRODUCTS — 0.6% | |
Energizer Holdings, Inc.
| | 161,868 | | 4,781,581 |
WD-40 Co. (b)
| | 72,107 | | 15,837,581 |
| | | | | | 20,619,162 |
| INDUSTRIAL REITs — 0.3% | |
Innovative Industrial Properties, Inc. REIT
| | 82,568 | | 9,018,077 |
| INSURANCE — 1.5% | |
Ambac Financial Group, Inc. (a)
| | 251,389 | | 3,222,807 |
AMERISAFE, Inc.
| | 46,132 | | 2,024,733 |
Assured Guaranty Ltd.
| | 164,808 | | 12,714,937 |
Goosehead Insurance, Inc. Class A (a) (b)
| | 131,253 | | 7,539,172 |
HCI Group, Inc. (b)
| | 36,855 | | 3,396,925 |
Palomar Holdings, Inc. (a)
| | 133,850 | | 10,861,928 |
See accompanying notes to financial statements.
49
SPDR SERIES TRUST
SPDR S&P 600 SMALL CAP GROWTH ETF
SCHEDULE OF INVESTMENTS (continued)
June 30, 2024
| Security Description | | | Shares | | Value |
SiriusPoint Ltd. (a)
| | 502,348 | | $6,128,646 |
Trupanion, Inc. (a)
| | 95,545 | | 2,809,023 |
| | | | | | 48,698,171 |
| INTERACTIVE MEDIA & SERVICES — 1.6% | |
Cargurus, Inc. (a)
| | 416,683 | | 10,917,095 |
Cars.com, Inc. (a)
| | 325,123 | | 6,404,923 |
IAC, Inc. (a) (b)
| | 152,024 | | 7,122,325 |
Shutterstock, Inc. (b)
| | 63,807 | | 2,469,331 |
TripAdvisor, Inc. (a)
| | 577,398 | | 10,283,458 |
Yelp, Inc. (a)
| | 358,494 | | 13,246,353 |
| | | | | | 50,443,485 |
| IT SERVICES — 0.4% | |
DigitalOcean Holdings, Inc. (a) (b)
| | 151,836 | | 5,276,301 |
Perficient, Inc. (a)
| | 116,186 | | 8,689,551 |
| | | | | | 13,965,852 |
| LIFE SCIENCES TOOLS & SERVICES — 0.1% | |
BioLife Solutions, Inc. (a) (b)
| | 117,145 | | 2,510,417 |
| MACHINERY — 6.4% | |
Alamo Group, Inc.
| | 55,020 | | 9,518,460 |
Albany International Corp. Class A
| | 80,165 | | 6,769,934 |
Enerpac Tool Group Corp.
| | 195,349 | | 7,458,425 |
Enpro, Inc.
| | 50,343 | | 7,328,430 |
ESCO Technologies, Inc.
| | 136,926 | | 14,382,707 |
Federal Signal Corp.
| | 325,585 | | 27,241,697 |
Franklin Electric Co., Inc.
| | 211,005 | | 20,324,002 |
John Bean Technologies Corp.
| | 102,612 | | 9,745,062 |
Lindsay Corp.
| | 29,943 | | 3,679,396 |
Mueller Industries, Inc.
| | 605,559 | | 34,480,529 |
Proto Labs, Inc. (a)
| | 85,762 | | 2,649,188 |
SPX Technologies, Inc. (a)
| | 246,466 | | 35,032,677 |
Standex International Corp.
| | 63,817 | | 10,284,110 |
Tennant Co.
| | 100,454 | | 9,888,692 |
Trinity Industries, Inc.
| | 216,459 | | 6,476,453 |
| | | | | | 205,259,762 |
| MARINE — 0.7% | |
Matson, Inc.
| | 182,001 | | 23,836,671 |
| MEDIA — 0.1% | |
TechTarget, Inc. (a)
| | 83,595 | | 2,605,656 |
| METALS & MINING — 4.1% | |
Alpha Metallurgical Resources, Inc.
| | 61,586 | | 17,276,721 |
Arch Resources, Inc.
| | 66,308 | | 10,094,067 |
ATI, Inc. (a)
| | 663,416 | | 36,786,417 |
Carpenter Technology Corp.
| | 264,323 | | 28,964,514 |
Haynes International, Inc.
| | 39,894 | | 2,341,778 |
Materion Corp.
| | 110,112 | | 11,906,411 |
Metallus, Inc. (a)
| | 122,220 | | 2,477,399 |
Olympic Steel, Inc.
| | 26,980 | | 1,209,513 |
Warrior Met Coal, Inc.
| | 278,366 | | 17,473,034 |
| Security Description | | | Shares | | Value |
Worthington Steel, Inc.
| | 117,190 | | $3,909,458 |
| | | | | | 132,439,312 |
| MORTGAGE REAL ESTATE INVESTMENT TRUST (REITs) — 0.9% | |
Apollo Commercial Real Estate Finance, Inc. REIT (b)
| | 426,833 | | 4,178,695 |
ARMOUR Residential REIT, Inc. (b)
| | 176,411 | | 3,418,845 |
Ellington Financial, Inc. REIT (b)
| | 448,914 | | 5,422,881 |
New York Mortgage Trust, Inc. REIT (b)
| | 503,835 | | 2,942,397 |
Redwood Trust, Inc. REIT (b)
| | 696,875 | | 4,522,719 |
Two Harbors Investment Corp. REIT
| | 551,833 | | 7,289,714 |
| | | | | | 27,775,251 |
| MULTI-UTILITIES — 0.1% | |
Unitil Corp.
| | 40,541 | | 2,099,618 |
| OIL, GAS & CONSUMABLE FUELS — 4.1% | |
California Resources Corp. (b)
| | 341,385 | | 18,168,510 |
Comstock Resources, Inc. (b)
| | 261,996 | | 2,719,518 |
CONSOL Energy, Inc. (a)
| | 140,648 | | 14,350,315 |
CVR Energy, Inc. (b)
| | 85,867 | | 2,298,660 |
Dorian LPG Ltd.
| | 180,636 | | 7,579,487 |
Magnolia Oil & Gas Corp. Class A (b)
| | 963,749 | | 24,421,400 |
Northern Oil & Gas, Inc. (b)
| | 487,135 | | 18,106,808 |
Par Pacific Holdings, Inc. (a)
| | 282,089 | | 7,122,747 |
Peabody Energy Corp.
| | 251,179 | | 5,556,080 |
REX American Resources Corp. (a)
| | 82,329 | | 3,753,379 |
SM Energy Co.
| | 613,028 | | 26,501,200 |
Vital Energy, Inc. (a)
| | 66,404 | | 2,976,227 |
| | | | | | 133,554,331 |
| PERSONAL CARE PRODUCTS — 0.3% | |
Inter Parfums, Inc.
| | 96,414 | | 11,186,916 |
| PHARMACEUTICALS — 1.4% | |
Amphastar Pharmaceuticals, Inc. (a)
| | 200,352 | | 8,014,080 |
ANI Pharmaceuticals, Inc. (a)
| | 83,823 | | 5,337,849 |
Collegium Pharmaceutical, Inc. (a) (b)
| | 174,238 | | 5,610,464 |
Corcept Therapeutics, Inc. (a) (b)
| | 315,895 | | 10,263,428 |
Harmony Biosciences Holdings, Inc. (a) (b)
| | 70,812 | | 2,136,398 |
Innoviva, Inc. (a) (b)
| | 142,795 | | 2,341,838 |
Prestige Consumer Healthcare, Inc. (a)
| | 127,875 | | 8,804,194 |
Supernus Pharmaceuticals, Inc. (a)
| | 121,747 | | 3,256,732 |
| | | | | | 45,764,983 |
| PROFESSIONAL SERVICES — 1.2% | |
CSG Systems International, Inc.
| | 77,379 | | 3,185,693 |
Korn Ferry
| | 163,720 | | 10,992,161 |
See accompanying notes to financial statements.
50
SPDR SERIES TRUST
SPDR S&P 600 SMALL CAP GROWTH ETF
SCHEDULE OF INVESTMENTS (continued)
June 30, 2024
| Security Description | | | Shares | | Value |
Verra Mobility Corp. (a)
| | 887,021 | | $24,126,971 |
| | | | | | 38,304,825 |
| REAL ESTATE MANAGEMENT & DEVELOPMENT — 0.5% | |
eXp World Holdings, Inc. (b)
| | 426,348 | | 4,811,337 |
Marcus & Millichap, Inc.
| | 54,591 | | 1,720,708 |
St. Joe Co.
| | 191,234 | | 10,460,500 |
| | | | | | 16,992,545 |
| RESIDENTIAL REITs — 0.1% | |
Veris Residential, Inc. REIT
| | 179,072 | | 2,686,080 |
| RETAIL REITs — 1.4% | |
Getty Realty Corp. REIT
| | 114,792 | | 3,060,355 |
Phillips Edison & Co., Inc. REIT
| | 337,369 | | 11,035,340 |
Saul Centers, Inc. REIT
| | 35,688 | | 1,312,248 |
SITE Centers Corp. REIT
| | 447,980 | | 6,495,710 |
Tanger, Inc. REIT
| | 582,350 | | 15,787,508 |
Urban Edge Properties REIT
| | 370,912 | | 6,850,744 |
Whitestone REIT
| | 129,893 | | 1,728,876 |
| | | | | | 46,270,781 |
| SEMICONDUCTORS & SEMICONDUCTOR EQUIPMENT — 3.8% | |
Axcelis Technologies, Inc. (a)
| | 173,272 | | 24,637,546 |
CEVA, Inc. (a)
| | 57,212 | | 1,103,620 |
Cohu, Inc. (a)
| | 101,094 | | 3,346,211 |
Diodes, Inc. (a) (b)
| | 150,454 | | 10,822,156 |
FormFactor, Inc. (a)
| | 411,039 | | 24,880,191 |
Kulicke & Soffa Industries, Inc.
| | 185,305 | | 9,115,153 |
MaxLinear, Inc. (a)
| | 255,338 | | 5,142,507 |
PDF Solutions, Inc. (a)
| | 162,285 | | 5,903,928 |
Photronics, Inc. (a)
| | 234,289 | | 5,779,910 |
Semtech Corp. (a) (b)
| | 152,980 | | 4,571,042 |
SiTime Corp. (a)
| | 54,033 | | 6,720,625 |
SMART Global Holdings, Inc. (a) (b)
| | 119,168 | | 2,725,372 |
SolarEdge Technologies, Inc. (a) (b)
| | 118,653 | | 2,997,175 |
Veeco Instruments, Inc. (a)
| | 302,575 | | 14,133,278 |
| | | | | | 121,878,714 |
| SOFTWARE — 6.2% | |
A10 Networks, Inc.
| | 182,997 | | 2,534,508 |
ACI Worldwide, Inc. (a)
| | 353,067 | | 13,977,922 |
Adeia, Inc.
| | 239,381 | | 2,677,476 |
Agilysys, Inc. (a)
| | 109,268 | | 11,379,169 |
Alarm.com Holdings, Inc. (a)
| | 267,033 | | 16,967,277 |
BlackLine, Inc. (a)
| | 183,393 | | 8,885,391 |
Box, Inc. Class A (a)
| | 473,718 | | 12,525,104 |
DoubleVerify Holdings, Inc. (a)
| | 758,346 | | 14,764,997 |
Envestnet, Inc. (a)
| | 112,327 | | 7,030,547 |
InterDigital, Inc. (b)
| | 134,251 | | 15,648,297 |
LiveRamp Holdings, Inc. (a)
| | 351,348 | | 10,870,707 |
Marathon Digital Holdings, Inc. (a) (b)
| | 1,454,694 | | 28,875,676 |
N-able, Inc. (a)
| | 247,978 | | 3,776,705 |
Progress Software Corp. (b)
| | 229,453 | | 12,450,120 |
| Security Description | | | Shares | | Value |
SPS Commerce, Inc. (a)
| | 197,416 | | $37,145,795 |
| | | | | | 199,509,691 |
| SPECIALIZED REITs — 0.4% | |
Four Corners Property Trust, Inc. REIT
| | 221,130 | | 5,455,277 |
Outfront Media, Inc. REIT
| | 322,745 | | 4,615,254 |
Uniti Group, Inc. REIT (b)
| | 657,351 | | 1,919,465 |
| | | | | | 11,989,996 |
| SPECIALTY RETAIL — 5.2% | |
Abercrombie & Fitch Co. Class A (a)
| | 272,508 | | 48,462,823 |
American Eagle Outfitters, Inc. (b)
| | 984,511 | | 19,650,840 |
Asbury Automotive Group, Inc. (a) (b)
| | 52,508 | | 11,964,998 |
Boot Barn Holdings, Inc. (a)
| | 161,850 | | 20,867,320 |
Buckle, Inc.
| | 95,585 | | 3,530,910 |
Group 1 Automotive, Inc.
| | 70,345 | | 20,912,162 |
Guess?, Inc. (b)
| | 152,161 | | 3,104,084 |
Signet Jewelers Ltd. (b)
| | 237,817 | | 21,303,647 |
Upbound Group, Inc.
| | 138,513 | | 4,252,349 |
Urban Outfitters, Inc. (a)
| | 304,598 | | 12,503,748 |
| | | | | | 166,552,881 |
| TEXTILES, APPAREL & LUXURY GOODS — 1.3% | |
Kontoor Brands, Inc.
| | 264,382 | | 17,488,869 |
Oxford Industries, Inc. (b)
| | 78,697 | | 7,881,505 |
Steven Madden Ltd. (b)
| | 366,932 | | 15,521,224 |
| | | | | | 40,891,598 |
| TOBACCO — 0.1% | |
Vector Group Ltd.
| | 331,834 | | 3,507,485 |
| TRADING COMPANIES & DISTRIBUTORS — 1.7% | |
Air Lease Corp.
| | 116,720 | | 5,547,702 |
Boise Cascade Co.
| | 210,359 | | 25,079,000 |
GMS, Inc. (a)
| | 211,953 | | 17,085,531 |
Rush Enterprises, Inc. Class A
| | 147,322 | | 6,168,372 |
| | | | | | 53,880,605 |
| WATER UTILITIES — 0.6% | |
American States Water Co.
| | 104,933 | | 7,614,988 |
California Water Service Group
| | 122,090 | | 5,920,144 |
Middlesex Water Co.
| | 45,617 | | 2,383,944 |
SJW Group
| | 69,372 | | 3,761,350 |
| | | | | | 19,680,426 |
| WIRELESS TELECOMMUNICATION SERVICES — 0.2% | |
Gogo, Inc. (a) (b)
| | 163,321 | | 1,571,148 |
Telephone & Data Systems, Inc.
| | 259,851 | | 5,386,711 |
| | | | | | 6,957,859 |
TOTAL COMMON STOCKS
(Cost $2,719,109,713)
| | | | | 3,221,371,257 |
See accompanying notes to financial statements.
51
SPDR SERIES TRUST
SPDR S&P 600 SMALL CAP GROWTH ETF
SCHEDULE OF INVESTMENTS (continued)
June 30, 2024
| Security Description | | | Shares | | Value |
| SHORT-TERM INVESTMENTS — 5.8% | | | |
State Street Institutional Liquid Reserves Fund, Premier Class 5.36% (d) (e)
| | 3,987,519 | | $3,988,716 |
State Street Navigator Securities Lending Portfolio II (f) (g)
| | 183,700,828 | | 183,700,828 |
TOTAL SHORT-TERM INVESTMENTS
(Cost $187,689,235)
| | 187,689,544 | |
TOTAL INVESTMENTS — 105.6%
(Cost $2,906,798,948)
| | 3,409,060,801 | |
LIABILITIES IN EXCESS OF OTHER ASSETS — (5.6)%
| | (182,116,827) | |
NET ASSETS — 100.0%
| | $3,226,943,974 | |
| (a) | Non-income producing security. |
| (b) | All or a portion of the shares of the security are on loan at June 30, 2024. |
| (c) | Fair valued as determined in good faith by the Trust's Oversight Committee in accordance with policy and procedures approved by the Board of Trustees. Security value is determined based on Level 3 inputs. As of June 30, 2024, total aggregate fair value of the securities is $0, representing 0.00% of the Fund's net assets. |
| (d) | The Fund invested in certain money market funds managed by SSGA Funds Management, Inc. Amounts related to these investments during the period ended June 30, 2024 are shown in the Affiliate Table below. |
| (e) | The rate shown is the annualized seven-day yield at June 30, 2024. |
| (f) | The Fund invested in an affiliated entity. Amounts related to these investments during the year ended June 30, 2024 are shown in the Affiliate Table below. |
| (g) | Investment of cash collateral for securities loaned. |
| REIT | Real Estate Investment Trust |
The following table summarizes the value of the Fund's investments according to the fair value hierarchy as of June 30, 2024.
| Description | | Level 1 –
Quoted Prices | | Level 2 –
Other Significant
Observable Inputs | | Level 3 –
Significant
Unobservable Inputs | | Total |
| ASSETS: | | | | | | | | |
| INVESTMENTS: | | | | | | | | |
Common Stocks
| | $3,221,371,257 | | $— | | $0(a) | | $3,221,371,257 |
Short-Term Investments
| | 187,689,544 | | — | | — | | 187,689,544 |
TOTAL INVESTMENTS
| | $3,409,060,801 | | $— | | $0 | | $3,409,060,801 |
| (a) | The Fund held a Level 3 security that was valued at $0 at June 30, 2024. |
Affiliate Table
| | Number of
Shares Held
at
6/30/23 | | Value at
6/30/23 | | Cost of
Purchases | | Proceeds
from
Shares Sold | | Realized
Gain (Loss) | | Change in
Unrealized
Appreciation/
Depreciation | | Number of
Shares Held
at
6/30/24 | | Value at
6/30/24 | | Dividend
Income |
State Street Institutional Liquid Reserves Fund, Premier Class
| 4,134,416 | | $4,135,243 | | $101,900,297 | | $102,047,241 | | $108 | | $309 | | 3,987,519 | | $3,988,716 | | $172,276 |
State Street Navigator Securities Lending Portfolio II
| 196,880,455 | | 196,880,455 | | 1,336,691,134 | | 1,349,870,761 | | — | | — | | 183,700,828 | | 183,700,828 | | 401,522 |
Total
| | | $201,015,698 | | $1,438,591,431 | | $1,451,918,002 | | $108 | | $309 | | | | $187,689,544 | | $573,798 |
See accompanying notes to financial statements.
52
SPDR SERIES TRUST
SPDR S&P 600 SMALL CAP VALUE ETF
SCHEDULE OF INVESTMENTS
June 30, 2024
| Security Description | | | Shares | | Value |
| COMMON STOCKS — 99.8% | |
| AEROSPACE & DEFENSE — 0.6% | |
AAR Corp. (a)
| | 57,256 | | $4,162,511 |
Mercury Systems, Inc. (a)
| | 322,551 | | 8,705,652 |
National Presto Industries, Inc.
| | 18,133 | | 1,362,332 |
Triumph Group, Inc. (a)
| | 474,803 | | 7,316,714 |
| | | | | | 21,547,209 |
| AIR FREIGHT & LOGISTICS — 0.6% | |
Forward Air Corp. (b)
| | 195,008 | | 3,712,952 |
Hub Group, Inc. Class A
| | 381,392 | | 16,418,926 |
| | | | | | 20,131,878 |
| AIRLINES — 1.6% | |
Alaska Air Group, Inc. (a)
| | 783,783 | | 31,664,833 |
Allegiant Travel Co. (b)
| | 89,254 | | 4,483,228 |
JetBlue Airways Corp. (a) (b)
| | 2,101,008 | | 12,795,139 |
SkyWest, Inc. (a)
| | 114,439 | | 9,392,009 |
Sun Country Airlines Holdings, Inc. (a)
| | 128,835 | | 1,618,168 |
| | | | | | 59,953,377 |
| AUTO COMPONENTS — 1.5% | |
American Axle & Manufacturing Holdings, Inc. (a)
| | 726,121 | | 5,075,586 |
Dana, Inc.
| | 796,908 | | 9,658,525 |
Dorman Products, Inc. (a)
| | 53,422 | | 4,887,045 |
Fox Factory Holding Corp. (a)
| | 159,329 | | 7,678,065 |
Gentherm, Inc. (a)
| | 105,560 | | 5,206,219 |
LCI Industries (b)
| | 58,172 | | 6,013,821 |
Phinia, Inc.
| | 282,220 | | 11,108,179 |
Standard Motor Products, Inc.
| | 115,933 | | 3,214,822 |
| | | | | | 52,842,262 |
| AUTOMOBILES — 0.1% | |
Winnebago Industries, Inc. (b)
| | 79,559 | | 4,312,098 |
| BANKS — 14.1% | |
Ameris Bancorp
| | 399,800 | | 20,129,930 |
Atlantic Union Bankshares Corp.
| | 554,538 | | 18,216,573 |
Axos Financial, Inc. (a)
| | 115,883 | | 6,622,714 |
Banc of California, Inc.
| | 857,485 | | 10,958,658 |
BancFirst Corp.
| | 34,714 | | 3,044,418 |
Bank of Hawaii Corp. (b)
| | 147,107 | | 8,415,992 |
BankUnited, Inc.
| | 461,760 | | 13,515,715 |
Banner Corp.
| | 212,751 | | 10,560,960 |
Berkshire Hills Bancorp, Inc.
| | 137,305 | | 3,130,554 |
Brookline Bancorp, Inc.
| | 549,072 | | 4,584,751 |
Capitol Federal Financial, Inc.
| | 762,506 | | 4,186,158 |
Cathay General Bancorp
| | 238,360 | | 8,990,939 |
Central Pacific Financial Corp.
| | 171,345 | | 3,632,514 |
City Holding Co.
| | 36,429 | | 3,870,581 |
Comerica, Inc.
| | 818,944 | | 41,798,902 |
Community Financial System, Inc.
| | 325,996 | | 15,390,271 |
CVB Financial Corp.
| | 819,463 | | 14,127,542 |
Dime Community Bancshares, Inc.
| | 216,616 | | 4,418,966 |
| Security Description | | | Shares | | Value |
Eagle Bancorp, Inc.
| | 186,484 | | $3,524,548 |
FB Financial Corp.
| | 217,705 | | 8,497,026 |
First Bancorp/Southern Pines NC
| | 254,259 | | 8,115,947 |
First Commonwealth Financial Corp.
| | 340,200 | | 4,698,162 |
First Financial Bancorp
| | 589,690 | | 13,102,912 |
First Hawaiian, Inc.
| | 789,711 | | 16,394,400 |
Fulton Financial Corp.
| | 1,122,721 | | 19,063,803 |
Hanmi Financial Corp.
| | 190,250 | | 3,180,980 |
Heritage Financial Corp.
| | 214,249 | | 3,862,910 |
Hilltop Holdings, Inc.
| | 286,229 | | 8,953,243 |
Hope Bancorp, Inc.
| | 745,032 | | 8,001,644 |
Independent Bank Corp.
| | 262,313 | | 13,304,515 |
Independent Bank Group, Inc.
| | 222,359 | | 10,121,782 |
Lakeland Financial Corp. (b)
| | 83,510 | | 5,137,535 |
National Bank Holdings Corp. Class A
| | 233,620 | | 9,122,861 |
NBT Bancorp, Inc. (b)
| | 291,222 | | 11,241,169 |
Northwest Bancshares, Inc.
| | 786,091 | | 9,079,351 |
Pacific Premier Bancorp, Inc.
| | 595,674 | | 13,682,632 |
Park National Corp.
| | 52,384 | | 7,456,339 |
Provident Financial Services, Inc.
| | 806,164 | | 11,568,453 |
Renasant Corp.
| | 347,956 | | 10,626,576 |
S&T Bancorp, Inc.
| | 111,037 | | 3,707,526 |
Seacoast Banking Corp. of Florida
| | 519,960 | | 12,291,854 |
ServisFirst Bancshares, Inc. (b)
| | 163,639 | | 10,340,348 |
Simmons First National Corp. Class A
| | 775,142 | | 13,626,996 |
Southside Bancshares, Inc. (b)
| | 110,499 | | 3,050,877 |
Stellar Bancorp, Inc.
| | 291,254 | | 6,687,192 |
Tompkins Financial Corp.
| | 77,399 | | 3,784,811 |
TrustCo Bank Corp.
| | 117,476 | | 3,379,785 |
Trustmark Corp.
| | 378,025 | | 11,355,871 |
United Community Banks, Inc.
| | 735,890 | | 18,735,759 |
Veritex Holdings, Inc.
| | 336,816 | | 7,103,450 |
WaFd, Inc.
| | 417,437 | | 11,930,350 |
Westamerica BanCorp
| | 65,685 | | 3,187,693 |
WSFS Financial Corp.
| | 204,191 | | 9,596,977 |
| | | | | | 513,112,415 |
| BEVERAGES — 0.2% | |
MGP Ingredients, Inc. (b)
| | 40,501 | | 3,013,274 |
National Beverage Corp.
| | 66,206 | | 3,392,396 |
| | | | | | 6,405,670 |
| BIOTECHNOLOGY — 1.1% | |
Alkermes PLC (a)
| | 376,319 | | 9,069,288 |
Arcus Biosciences, Inc. (a)
| | 201,265 | | 3,065,266 |
Ironwood Pharmaceuticals, Inc. (a)
| | 372,950 | | 2,431,634 |
Krystal Biotech, Inc. (a)
| | 52,152 | | 9,577,193 |
Myriad Genetics, Inc. (a)
| | 285,101 | | 6,973,570 |
REGENXBIO, Inc. (a)
| | 156,521 | | 1,831,296 |
Vir Biotechnology, Inc. (a)
| | 537,831 | | 4,786,696 |
See accompanying notes to financial statements.
53
SPDR SERIES TRUST
SPDR S&P 600 SMALL CAP VALUE ETF
SCHEDULE OF INVESTMENTS (continued)
June 30, 2024
| Security Description | | | Shares | | Value |
Xencor, Inc. (a)
| | 182,829 | | $3,460,953 |
| | | | | | 41,195,896 |
| BROADLINE RETAIL — 0.4% | |
Kohl's Corp. (b)
| | 685,106 | | 15,750,587 |
| BUILDING PRODUCTS — 1.5% | |
American Woodmark Corp. (a)
| | 43,072 | | 3,385,459 |
Apogee Enterprises, Inc.
| | 75,211 | | 4,725,883 |
Griffon Corp.
| | 73,449 | | 4,690,453 |
Hayward Holdings, Inc. (a) (b)
| | 783,048 | | 9,631,490 |
Insteel Industries, Inc.
| | 44,555 | | 1,379,423 |
Masterbrand, Inc. (a)
| | 784,476 | | 11,516,108 |
Quanex Building Products Corp.
| | 63,375 | | 1,752,319 |
Resideo Technologies, Inc. (a)
| | 901,898 | | 17,641,125 |
| | | | | | 54,722,260 |
| CAPITAL MARKETS — 2.6% | |
Artisan Partners Asset Management, Inc. Class A
| | 190,046 | | 7,843,198 |
B Riley Financial, Inc. (b)
| | 104,680 | | 1,846,555 |
BGC Group, Inc. Class A
| | 995,967 | | 8,266,526 |
Brightsphere Investment Group, Inc.
| | 72,776 | | 1,613,444 |
Cohen & Steers, Inc. (b)
| | 82,796 | | 6,007,678 |
Moelis & Co. Class A
| | 199,698 | | 11,354,828 |
Piper Sandler Cos.
| | 49,018 | | 11,282,473 |
PJT Partners, Inc. Class A (b)
| | 58,659 | | 6,329,893 |
StepStone Group, Inc. Class A
| | 224,964 | | 10,323,598 |
StoneX Group, Inc. (a)
| | 168,477 | | 12,688,003 |
Virtu Financial, Inc. Class A
| | 546,588 | | 12,270,901 |
Virtus Investment Partners, Inc.
| | 15,317 | | 3,459,344 |
| | | | | | 93,286,441 |
| CHEMICALS — 2.5% | |
AdvanSix, Inc.
| | 165,614 | | 3,795,873 |
Balchem Corp.
| | 88,155 | | 13,571,462 |
HB Fuller Co.
| | 171,611 | | 13,207,183 |
Ingevity Corp. (a)
| | 208,691 | | 9,121,884 |
Innospec, Inc.
| | 57,029 | | 7,048,214 |
Koppers Holdings, Inc.
| | 62,196 | | 2,300,630 |
Mativ Holdings, Inc.
| | 335,563 | | 5,691,148 |
Minerals Technologies, Inc.
| | 99,609 | | 8,283,484 |
Quaker Chemical Corp.
| | 41,071 | | 6,969,749 |
Sensient Technologies Corp.
| | 149,179 | | 11,067,590 |
Stepan Co.
| | 131,843 | | 11,069,538 |
| | | | | | 92,126,755 |
| COMMERCIAL SERVICES & SUPPLIES — 3.2% | |
ABM Industries, Inc.
| | 390,923 | | 19,768,976 |
Brady Corp. Class A
| | 96,842 | | 6,393,509 |
CoreCivic, Inc. (a)
| | 687,259 | | 8,920,622 |
Deluxe Corp.
| | 272,100 | | 6,111,366 |
Enviri Corp. (a)
| | 494,755 | | 4,269,736 |
GEO Group, Inc. (a)
| | 823,339 | | 11,823,148 |
Healthcare Services Group, Inc. (a)
| | 454,913 | | 4,812,979 |
HNI Corp.
| | 116,871 | | 5,261,532 |
| Security Description | | | Shares | | Value |
Interface, Inc.
| | 359,813 | | $5,282,055 |
Matthews International Corp. Class A
| | 68,272 | | 1,710,213 |
MillerKnoll, Inc.
| | 442,483 | | 11,721,375 |
OPENLANE, Inc. (a)
| | 668,988 | | 11,098,511 |
Pitney Bowes, Inc. (b)
| | 961,234 | | 4,883,069 |
UniFirst Corp.
| | 54,955 | | 9,426,431 |
Vestis Corp.
| | 381,677 | | 4,667,910 |
| | | | | | 116,151,432 |
| COMMUNICATIONS EQUIPMENT — 1.2% | |
Calix, Inc. (a)
| | 183,700 | | 6,508,491 |
Digi International, Inc. (a)
| | 224,726 | | 5,152,967 |
Extreme Networks, Inc. (a)
| | 321,084 | | 4,318,580 |
Harmonic, Inc. (a)
| | 338,523 | | 3,984,416 |
NetScout Systems, Inc. (a)
| | 441,185 | | 8,069,273 |
Viasat, Inc. (a) (b)
| | 464,501 | | 5,899,163 |
Viavi Solutions, Inc. (a)
| | 1,378,916 | | 9,473,153 |
| | | | | | 43,406,043 |
| CONSTRUCTION & ENGINEERING — 1.3% | |
Arcosa, Inc.
| | 123,077 | | 10,265,853 |
Dycom Industries, Inc. (a)
| | 179,656 | | 30,318,746 |
Granite Construction, Inc.
| | 133,676 | | 8,283,902 |
| | | | | | 48,868,501 |
| CONSUMER FINANCE — 1.3% | |
Bread Financial Holdings, Inc. (b)
| | 306,310 | | 13,649,174 |
Encore Capital Group, Inc. (a)
| | 146,356 | | 6,107,436 |
Enova International, Inc. (a)
| | 167,534 | | 10,428,991 |
EZCORP, Inc. Class A (a)
| | 321,029 | | 3,361,174 |
Green Dot Corp. Class A (a)
| | 286,939 | | 2,711,573 |
Navient Corp. (b)
| | 497,372 | | 7,241,736 |
PRA Group, Inc. (a)
| | 243,092 | | 4,779,189 |
| | | | | | 48,279,273 |
| CONSUMER STAPLES DISTRIBUTION & RETAIL — 1.3% | |
Andersons, Inc.
| | 92,288 | | 4,577,485 |
Chefs' Warehouse, Inc. (a)
| | 218,617 | | 8,550,111 |
Grocery Outlet Holding Corp. (a)
| | 616,880 | | 13,645,385 |
PriceSmart, Inc.
| | 155,440 | | 12,621,728 |
SpartanNash Co.
| | 212,914 | | 3,994,267 |
United Natural Foods, Inc. (a)
| | 367,162 | | 4,809,822 |
| | | | | | 48,198,798 |
| CONTAINERS & PACKAGING — 0.9% | |
Myers Industries, Inc.
| | 117,171 | | 1,567,748 |
O-I Glass, Inc. (a)
| | 961,891 | | 10,705,847 |
Sealed Air Corp.
| | 539,723 | | 18,776,963 |
| | | | | | 31,050,558 |
| DIVERSIFIED CONSUMER SERVICES — 0.4% | |
Mister Car Wash, Inc. (a) (b)
| | 309,044 | | 2,200,393 |
Perdoceo Education Corp.
| | 178,342 | | 3,820,086 |
Strategic Education, Inc.
| | 79,882 | | 8,839,742 |
| | | | | | 14,860,221 |
See accompanying notes to financial statements.
54
SPDR SERIES TRUST
SPDR S&P 600 SMALL CAP VALUE ETF
SCHEDULE OF INVESTMENTS (continued)
June 30, 2024
| Security Description | | | Shares | | Value |
| DIVERSIFIED REITs — 1.1% | |
Alexander & Baldwin, Inc. REIT
| | 448,421 | | $7,605,220 |
American Assets Trust, Inc. REIT
| | 300,922 | | 6,734,634 |
Armada Hoffler Properties, Inc. REIT
| | 244,330 | | 2,709,620 |
Essential Properties Realty Trust, Inc. REIT
| | 519,725 | | 14,401,580 |
Global Net Lease, Inc. REIT
| | 1,206,901 | | 8,870,722 |
| | | | | | 40,321,776 |
| DIVERSIFIED TELECOMMUNICATION SERVICES — 0.2% | |
Consolidated Communications Holdings, Inc. (a)
| | 468,160 | | 2,059,904 |
Lumen Technologies, Inc. (a) (b)
| | 6,269,842 | | 6,896,826 |
| | | | | | 8,956,730 |
| ELECTRIC UTILITIES — 0.2% | |
MGE Energy, Inc. (b)
| | 100,590 | | 7,516,085 |
| ELECTRICAL EQUIPMENT — 0.6% | |
SunPower Corp. (a) (b)
| | 531,081 | | 1,572,000 |
Sunrun, Inc. (a) (b)
| | 1,369,235 | | 16,239,127 |
Vicor Corp. (a)
| | 65,704 | | 2,178,745 |
| | | | | | 19,989,872 |
| ELECTRONIC EQUIPMENT, INSTRUMENTS & COMPONENTS — 3.3% | |
Advanced Energy Industries, Inc.
| | 87,857 | | 9,555,327 |
Benchmark Electronics, Inc.
| | 222,636 | | 8,785,217 |
CTS Corp.
| | 83,078 | | 4,206,239 |
ePlus, Inc. (a)
| | 64,138 | | 4,725,688 |
Insight Enterprises, Inc. (a) (b)
| | 59,838 | | 11,869,466 |
Itron, Inc. (a)
| | 144,481 | | 14,297,840 |
Knowles Corp. (a) (b)
| | 327,093 | | 5,645,625 |
PC Connection, Inc.
| | 70,015 | | 4,494,963 |
Plexus Corp. (a)
| | 94,692 | | 9,770,320 |
Rogers Corp. (a)
| | 34,195 | | 4,124,259 |
Sanmina Corp. (a)
| | 342,496 | | 22,690,360 |
ScanSource, Inc. (a)
| | 152,607 | | 6,762,016 |
TTM Technologies, Inc. (a)
| | 628,670 | | 12,215,058 |
| | | | | | 119,142,378 |
| ENERGY EQUIPMENT & SERVICES — 1.5% | |
Bristow Group, Inc. (a)
| | 149,061 | | 4,998,015 |
Cactus, Inc. Class A (b)
| | 154,272 | | 8,136,305 |
Core Laboratories, Inc. (b)
| | 166,639 | | 3,381,105 |
Dril-Quip, Inc. (a)
| | 212,628 | | 3,954,881 |
Helmerich & Payne, Inc.
| | 280,557 | | 10,139,330 |
Nabors Industries Ltd. (a) (b)
| | 55,397 | | 3,942,051 |
Patterson-UTI Energy, Inc.
| | 859,744 | | 8,906,948 |
ProPetro Holding Corp. (a)
| | 509,100 | | 4,413,897 |
U.S. Silica Holdings, Inc. (a)
| | 482,630 | | 7,456,634 |
| | | | | | 55,329,166 |
| FINANCIAL SERVICES — 3.0% | |
Jackson Financial, Inc. Class A
| | 419,226 | | 31,131,723 |
Mr Cooper Group, Inc. (a)
| | 399,736 | | 32,470,555 |
NCR Atleos Corp. (a)
| | 423,219 | | 11,435,377 |
NMI Holdings, Inc. Class A (a)
| | 173,525 | | 5,906,791 |
| Security Description | | | Shares | | Value |
Payoneer Global, Inc. (a)
| | 938,820 | | $5,201,063 |
Radian Group, Inc.
| | 418,524 | | 13,016,097 |
Walker & Dunlop, Inc. (b)
| | 118,747 | | 11,660,955 |
| | | | | | 110,822,561 |
| FOOD PRODUCTS — 1.2% | |
B&G Foods, Inc. (b)
| | 488,333 | | 3,945,731 |
Calavo Growers, Inc. (b)
| | 112,330 | | 2,549,891 |
Fresh Del Monte Produce, Inc.
| | 207,092 | | 4,524,960 |
Hain Celestial Group, Inc. (a) (b)
| | 554,948 | | 3,834,691 |
John B Sanfilippo & Son, Inc.
| | 26,126 | | 2,538,663 |
Simply Good Foods Co. (a)
| | 207,909 | | 7,511,752 |
Tootsie Roll Industries, Inc. (b)
| | 42,732 | | 1,306,317 |
TreeHouse Foods, Inc. (a)
| | 295,626 | | 10,831,737 |
WK Kellogg Co. (b)
| | 408,462 | | 6,723,285 |
| | | | | | 43,767,027 |
| GAS UTILITIES — 0.5% | |
Chesapeake Utilities Corp. (b)
| | 75,636 | | 8,032,543 |
Northwest Natural Holding Co.
| | 234,896 | | 8,482,095 |
| | | | | | 16,514,638 |
| GROUND TRANSPORTATION — 0.9% | |
Heartland Express, Inc.
| | 127,430 | | 1,571,212 |
Hertz Global Holdings, Inc. (a)
| | 812,300 | | 2,867,419 |
Marten Transport Ltd.
| | 189,154 | | 3,489,891 |
RXO, Inc. (a) (b)
| | 392,059 | | 10,252,343 |
Werner Enterprises, Inc. (b)
| | 391,724 | | 14,035,471 |
| | | | | | 32,216,336 |
| HEALTH CARE EQUIPMENT & SUPPLIES — 2.3% | |
Artivion, Inc. (a)
| | 113,912 | | 2,921,843 |
Avanos Medical, Inc. (a)
| | 283,544 | | 5,648,196 |
Embecta Corp.
| | 356,214 | | 4,452,675 |
ICU Medical, Inc. (a)
| | 126,474 | | 15,018,788 |
Inari Medical, Inc. (a)
| | 137,472 | | 6,619,277 |
Integra LifeSciences Holdings Corp. (a)
| | 423,452 | | 12,339,391 |
Merit Medical Systems, Inc. (a)
| | 147,123 | | 12,645,222 |
Omnicell, Inc. (a)
| | 283,648 | | 7,678,351 |
STAAR Surgical Co. (a) (b)
| | 118,368 | | 5,635,500 |
Tandem Diabetes Care, Inc. (a)
| | 215,482 | | 8,681,770 |
Varex Imaging Corp. (a)
| | 252,641 | | 3,721,402 |
| | | | | | 85,362,415 |
| HEALTH CARE PROVIDERS & SERVICES — 2.5% | |
AdaptHealth Corp. (a)
| | 482,590 | | 4,825,900 |
Addus HomeCare Corp. (a)
| | 63,324 | | 7,352,550 |
AMN Healthcare Services, Inc. (a) (b)
| | 107,982 | | 5,531,918 |
Cross Country Healthcare, Inc. (a)
| | 201,943 | | 2,794,891 |
Enhabit, Inc. (a)
| | 309,763 | | 2,763,086 |
Fulgent Genetics, Inc. (a) (b)
| | 128,199 | | 2,515,264 |
National HealthCare Corp.
| | 44,377 | | 4,810,467 |
Owens & Minor, Inc. (a)
| | 452,788 | | 6,112,638 |
Patterson Cos., Inc. (b)
| | 492,538 | | 11,880,016 |
Pediatrix Medical Group, Inc. (a)
| | 511,400 | | 3,861,070 |
See accompanying notes to financial statements.
55
SPDR SERIES TRUST
SPDR S&P 600 SMALL CAP VALUE ETF
SCHEDULE OF INVESTMENTS (continued)
June 30, 2024
| Security Description | | | Shares | | Value |
Premier, Inc. Class A
| | 647,455 | | $12,087,985 |
Select Medical Holdings Corp.
| | 658,599 | | 23,090,481 |
U.S. Physical Therapy, Inc. (b)
| | 41,865 | | 3,869,163 |
| | | | | | 91,495,429 |
| HEALTH CARE REITs — 0.9% | |
CareTrust REIT, Inc.
| | 317,404 | | 7,966,840 |
Community Healthcare Trust, Inc. REIT
| | 91,957 | | 2,150,874 |
LTC Properties, Inc. REIT
| | 151,657 | | 5,232,167 |
Medical Properties Trust, Inc. REIT (b)
| | 3,708,059 | | 15,981,734 |
Universal Health Realty Income Trust REIT
| | 40,856 | | 1,599,104 |
| | | | | | 32,930,719 |
| HEALTH CARE TECHNOLOGY — 0.3% | |
Certara, Inc. (a)
| | 279,535 | | 3,871,560 |
HealthStream, Inc.
| | 70,001 | | 1,953,028 |
Schrodinger, Inc. (a) (b)
| | 150,192 | | 2,904,713 |
Simulations Plus, Inc. (b)
| | 42,545 | | 2,068,538 |
| | | | | | 10,797,839 |
| HOTEL & RESORT REITs — 0.6% | |
Pebblebrook Hotel Trust REIT
| | 744,344 | | 10,234,730 |
Service Properties Trust REIT
| | 1,023,890 | | 5,262,795 |
Summit Hotel Properties, Inc. REIT
| | 327,488 | | 1,961,653 |
Xenia Hotels & Resorts, Inc. REIT
| | 258,274 | | 3,701,066 |
| | | | | | 21,160,244 |
| HOTELS, RESTAURANTS & LEISURE — 1.8% | |
BJ's Restaurants, Inc. (a) (b)
| | 144,459 | | 5,012,727 |
Bloomin' Brands, Inc. (b)
| | 272,393 | | 5,238,117 |
Brinker International, Inc. (a)
| | 159,374 | | 11,537,084 |
Cheesecake Factory, Inc. (b)
| | 156,360 | | 6,143,384 |
Chuy's Holdings, Inc. (a)
| | 45,786 | | 1,186,773 |
Cracker Barrel Old Country Store, Inc. (b)
| | 137,134 | | 5,781,570 |
Dine Brands Global, Inc.
| | 55,055 | | 1,992,991 |
Golden Entertainment, Inc.
| | 52,265 | | 1,625,964 |
Papa John's International, Inc. (b)
| | 107,984 | | 5,073,088 |
Penn Entertainment, Inc. (a) (b)
| | 923,140 | | 17,867,375 |
Sabre Corp. (a) (b)
| | 1,128,316 | | 3,012,604 |
| | | | | | 64,471,677 |
| HOUSEHOLD DURABLES — 1.8% | |
Century Communities, Inc.
| | 85,626 | | 6,992,219 |
Ethan Allen Interiors, Inc.
| | 83,310 | | 2,323,516 |
La-Z-Boy, Inc. (b)
| | 121,202 | | 4,518,410 |
Leggett & Platt, Inc. (b)
| | 827,964 | | 9,488,467 |
LGI Homes, Inc. (a)
| | 50,691 | | 4,536,338 |
Newell Brands, Inc.
| | 2,359,483 | | 15,124,286 |
Sonos, Inc. (a)
| | 759,117 | | 11,204,567 |
Tri Pointe Homes, Inc. (a)
| | 228,568 | | 8,514,158 |
| Security Description | | | Shares | | Value |
Worthington Enterprises, Inc. (b)
| | 58,557 | | $2,771,503 |
| | | | | | 65,473,464 |
| HOUSEHOLD PRODUCTS — 0.6% | |
Central Garden & Pet Co. (a) (b)
| | 60,574 | | 2,332,099 |
Central Garden & Pet Co. Class A (a)
| | 334,631 | | 11,052,862 |
Energizer Holdings, Inc.
| | 222,668 | | 6,577,613 |
| | | | | | 19,962,574 |
| INDEPENDENT POWER AND RENEWABLE ELECTRICITY PRODUCERS — 0.5% | |
Clearway Energy, Inc. Class A
| | 213,784 | | 4,844,345 |
Clearway Energy, Inc. Class C
| | 509,284 | | 12,574,222 |
| | | | | | 17,418,567 |
| INDUSTRIAL REITs — 0.7% | |
Innovative Industrial Properties, Inc. REIT
| | 78,696 | | 8,595,177 |
LXP Industrial Trust REIT
| | 1,818,029 | | 16,580,425 |
| | | | | | 25,175,602 |
| INSURANCE — 3.1% | |
AMERISAFE, Inc.
| | 67,353 | | 2,956,123 |
Assured Guaranty Ltd.
| | 127,774 | | 9,857,764 |
Employers Holdings, Inc.
| | 156,591 | | 6,675,474 |
Genworth Financial, Inc. Class A (a)
| | 2,703,811 | | 16,331,018 |
Horace Mann Educators Corp.
| | 253,019 | | 8,253,480 |
Lincoln National Corp.
| | 1,050,208 | | 32,661,469 |
Mercury General Corp.
| | 164,189 | | 8,725,004 |
ProAssurance Corp. (a)
| | 315,071 | | 3,850,168 |
Safety Insurance Group, Inc.
| | 91,615 | | 6,873,873 |
Stewart Information Services Corp. (b)
| | 170,343 | | 10,574,893 |
Trupanion, Inc. (a) (b)
| | 118,614 | | 3,487,252 |
United Fire Group, Inc.
| | 131,216 | | 2,819,832 |
| | | | | | 113,066,350 |
| INTERACTIVE MEDIA & SERVICES — 0.6% | |
IAC, Inc. (a) (b)
| | 258,982 | | 12,133,307 |
QuinStreet, Inc. (a)
| | 324,390 | | 5,381,630 |
Shutterstock, Inc. (b)
| | 74,001 | | 2,863,839 |
| | | | | | 20,378,776 |
| IT SERVICES — 0.9% | |
DigitalOcean Holdings, Inc. (a) (b)
| | 149,253 | | 5,186,542 |
DXC Technology Co. (a) (b)
| | 1,105,188 | | 21,098,039 |
Perficient, Inc. (a)
| | 84,676 | | 6,332,918 |
| | | | | | 32,617,499 |
| LEISURE EQUIPMENT & PRODUCTS — 0.9% | |
Sturm Ruger & Co., Inc. (b)
| | 107,526 | | 4,478,458 |
Topgolf Callaway Brands Corp. (a)
| | 873,148 | | 13,359,164 |
Vista Outdoor, Inc. (a)
| | 359,532 | | 13,536,380 |
| | | | | | 31,374,002 |
See accompanying notes to financial statements.
56
SPDR SERIES TRUST
SPDR S&P 600 SMALL CAP VALUE ETF
SCHEDULE OF INVESTMENTS (continued)
June 30, 2024
| Security Description | | | Shares | | Value |
| LIFE SCIENCES TOOLS & SERVICES — 0.6% | |
BioLife Solutions, Inc. (a) (b)
| | 94,326 | | $2,021,406 |
Cytek Biosciences, Inc. (a) (b)
| | 591,900 | | 3,302,802 |
Fortrea Holdings, Inc. (a) (b)
| | 552,231 | | 12,889,071 |
Mesa Laboratories, Inc. (b)
| | 31,649 | | 2,746,184 |
| | | | | | 20,959,463 |
| MACHINERY — 3.0% | |
3D Systems Corp. (a) (b)
| | 824,212 | | 2,530,331 |
Albany International Corp. Class A
| | 100,235 | | 8,464,846 |
Astec Industries, Inc.
| | 140,634 | | 4,171,204 |
Barnes Group, Inc.
| | 313,226 | | 12,970,689 |
Enerpac Tool Group Corp.
| | 110,550 | | 4,220,799 |
Enpro, Inc.
| | 71,137 | | 10,355,413 |
Greenbrier Cos., Inc.
| | 192,254 | | 9,526,186 |
Hillenbrand, Inc. (b)
| | 433,583 | | 17,351,992 |
John Bean Technologies Corp.
| | 78,602 | | 7,464,832 |
Kennametal, Inc. (b)
| | 485,906 | | 11,438,227 |
Lindsay Corp.
| | 34,791 | | 4,275,118 |
Proto Labs, Inc. (a)
| | 54,718 | | 1,690,239 |
Titan International, Inc. (a)
| | 315,126 | | 2,335,084 |
Trinity Industries, Inc.
| | 252,742 | | 7,562,040 |
Wabash National Corp. (b)
| | 278,060 | | 6,072,830 |
| | | | | | 110,429,830 |
| MEDIA — 1.3% | |
AMC Networks, Inc. Class A (a) (b)
| | 193,918 | | 1,873,248 |
Cable One, Inc. (b)
| | 28,128 | | 9,957,312 |
EchoStar Corp. Class A (a) (b)
| | 744,630 | | 13,261,860 |
John Wiley & Sons, Inc. Class A
| | 259,844 | | 10,575,651 |
Scholastic Corp.
| | 157,278 | | 5,578,651 |
TechTarget, Inc. (a)
| | 67,380 | | 2,100,235 |
Thryv Holdings, Inc. (a)
| | 194,764 | | 3,470,694 |
| | | | | | 46,817,651 |
| METALS & MINING — 0.9% | |
Arch Resources, Inc.
| | 34,702 | | 5,282,685 |
Century Aluminum Co. (a)
| | 320,643 | | 5,370,770 |
Compass Minerals International, Inc. (b)
| | 209,403 | | 2,163,133 |
Haynes International, Inc.
| | 36,228 | | 2,126,584 |
Kaiser Aluminum Corp.
| | 98,300 | | 8,640,570 |
Metallus, Inc. (a)
| | 103,677 | | 2,101,533 |
Olympic Steel, Inc.
| | 30,878 | | 1,384,261 |
SunCoke Energy, Inc.
| | 519,331 | | 5,089,444 |
Worthington Steel, Inc.
| | 58,861 | | 1,963,603 |
| | | | | | 34,122,583 |
| MORTGAGE REAL ESTATE INVESTMENT TRUST (REITs) — 2.4% | |
Apollo Commercial Real Estate Finance, Inc. REIT (b)
| | 316,827 | | 3,101,736 |
Arbor Realty Trust, Inc. REIT (b)
| | 1,164,464 | | 16,710,059 |
ARMOUR Residential REIT, Inc. (b)
| | 93,348 | | 1,809,084 |
| Security Description | | | Shares | | Value |
Blackstone Mortgage Trust, Inc. Class A REIT (b)
| | 1,072,204 | | $18,677,794 |
Franklin BSP Realty Trust, Inc. REIT
| | 505,754 | | 6,372,500 |
Hannon Armstrong Sustainable Infrastructure Capital, Inc. REIT (b)
| | 702,443 | | 20,792,313 |
KKR Real Estate Finance Trust, Inc. REIT
| | 359,661 | | 3,254,932 |
PennyMac Mortgage Investment Trust REIT (b)
| | 536,462 | | 7,376,353 |
Ready Capital Corp. REIT (b)
| | 959,729 | | 7,850,583 |
| | | | | | 85,945,354 |
| MULTI-UTILITIES — 0.5% | |
Avista Corp.
| | 482,956 | | 16,715,107 |
Unitil Corp.
| | 55,713 | | 2,885,376 |
| | | | | | 19,600,483 |
| OFFICE REITs — 2.1% | |
Brandywine Realty Trust REIT
| | 1,064,134 | | 4,767,320 |
Douglas Emmett, Inc. REIT (b)
| | 1,033,919 | | 13,761,462 |
Easterly Government Properties, Inc. REIT (b)
| | 619,795 | | 7,666,864 |
Highwoods Properties, Inc. REIT
| | 654,782 | | 17,201,123 |
Hudson Pacific Properties, Inc. REIT (b)
| | 783,580 | | 3,769,020 |
JBG SMITH Properties REIT
| | 516,577 | | 7,867,468 |
SL Green Realty Corp. REIT (b)
| | 400,273 | | 22,671,463 |
| | | | | | 77,704,720 |
| OIL, GAS & CONSUMABLE FUELS — 1.2% | |
Comstock Resources, Inc. (b)
| | 282,744 | | 2,934,883 |
CVR Energy, Inc. (b)
| | 81,050 | | 2,169,709 |
Green Plains, Inc. (a)
| | 399,148 | | 6,330,487 |
Peabody Energy Corp.
| | 358,976 | | 7,940,549 |
Talos Energy, Inc. (a)
| | 965,654 | | 11,732,696 |
Vital Energy, Inc. (a)
| | 84,417 | | 3,783,570 |
World Kinect Corp.
| | 370,198 | | 9,551,108 |
| | | | | | 44,443,002 |
| PERSONAL CARE PRODUCTS — 0.5% | |
Edgewell Personal Care Co.
| | 306,057 | | 12,300,431 |
Nu Skin Enterprises, Inc. Class A
| | 306,809 | | 3,233,767 |
USANA Health Sciences, Inc. (a)
| | 70,022 | | 3,167,795 |
| | | | | | 18,701,993 |
| PAPER & FOREST PRODUCTS — 0.6% | |
Clearwater Paper Corp. (a)
| | 103,031 | | 4,993,912 |
Mercer International, Inc.
| | 272,322 | | 2,325,630 |
Sylvamo Corp.
| | 215,930 | | 14,812,798 |
| | | | | | 22,132,340 |
| PHARMACEUTICALS — 2.2% | |
Corcept Therapeutics, Inc. (a)
| | 198,092 | | 6,436,009 |
Harmony Biosciences Holdings, Inc. (a) (b)
| | 111,925 | | 3,376,777 |
Innoviva, Inc. (a)
| | 169,705 | | 2,783,162 |
Ligand Pharmaceuticals, Inc. (a)
| | 104,280 | | 8,786,633 |
See accompanying notes to financial statements.
57
SPDR SERIES TRUST
SPDR S&P 600 SMALL CAP VALUE ETF
SCHEDULE OF INVESTMENTS (continued)
June 30, 2024
| Security Description | | | Shares | | Value |
Organon & Co.
| | 1,588,529 | | $32,882,550 |
Pacira BioSciences, Inc. (a) (b)
| | 287,554 | | 8,226,920 |
Phibro Animal Health Corp. Class A
| | 125,650 | | 2,107,151 |
Prestige Consumer Healthcare, Inc. (a)
| | 160,365 | | 11,041,130 |
Supernus Pharmaceuticals, Inc. (a)
| | 203,767 | | 5,450,767 |
| | | | | | 81,091,099 |
| PROFESSIONAL SERVICES — 1.9% | |
CSG Systems International, Inc.
| | 89,611 | | 3,689,285 |
Heidrick & Struggles International, Inc.
| | 125,107 | | 3,950,879 |
Kelly Services, Inc. Class A
| | 198,934 | | 4,259,177 |
Korn Ferry
| | 135,407 | | 9,091,226 |
NV5 Global, Inc. (a) (b)
| | 79,764 | | 7,415,659 |
Robert Half, Inc.
| | 638,496 | | 40,850,974 |
| | | | | | 69,257,200 |
| REAL ESTATE MANAGEMENT & DEVELOPMENT — 0.6% | |
Cushman & Wakefield PLC (a)
| | 1,216,709 | | 12,653,774 |
Kennedy-Wilson Holdings, Inc.
| | 722,116 | | 7,018,967 |
Marcus & Millichap, Inc. (b)
| | 88,286 | | 2,782,775 |
| | | | | | 22,455,516 |
| RESIDENTIAL REITs — 0.7% | |
Centerspace REIT
| | 92,140 | | 6,231,428 |
Elme Communities REIT
| | 543,555 | | 8,658,831 |
NexPoint Residential Trust, Inc. REIT
| | 141,135 | | 5,576,244 |
Veris Residential, Inc. REIT
| | 298,368 | | 4,475,520 |
| | | | | | 24,942,023 |
| RETAIL REITs — 2.1% | |
Acadia Realty Trust REIT
| | 637,375 | | 11,421,760 |
Getty Realty Corp. REIT
| | 172,914 | | 4,609,887 |
Macerich Co. REIT
| | 1,332,675 | | 20,576,502 |
Phillips Edison & Co., Inc. REIT
| | 370,468 | | 12,118,008 |
Retail Opportunity Investments Corp. REIT
| | 787,253 | | 9,785,555 |
Saul Centers, Inc. REIT
| | 40,823 | | 1,501,062 |
SITE Centers Corp. REIT
| | 589,968 | | 8,554,536 |
Urban Edge Properties REIT
| | 300,958 | | 5,558,694 |
Whitestone REIT
| | 149,511 | | 1,989,992 |
| | | | | | 76,115,996 |
| SEMICONDUCTORS & SEMICONDUCTOR EQUIPMENT — 2.1% | |
Alpha & Omega Semiconductor Ltd. (a) (b)
| | 143,561 | | 5,364,875 |
CEVA, Inc. (a)
| | 83,037 | | 1,601,784 |
Cohu, Inc. (a)
| | 171,615 | | 5,680,456 |
Diodes, Inc. (a)
| | 111,065 | | 7,988,905 |
Ichor Holdings Ltd. (a)
| | 206,797 | | 7,972,024 |
Kulicke & Soffa Industries, Inc. (b)
| | 126,754 | | 6,235,029 |
MaxLinear, Inc. (a)
| | 179,526 | | 3,615,654 |
Photronics, Inc. (a)
| | 118,869 | | 2,932,498 |
| Security Description | | | Shares | | Value |
Semtech Corp. (a)
| | 219,329 | | $6,553,551 |
SiTime Corp. (a) (b)
| | 45,647 | | 5,677,574 |
SMART Global Holdings, Inc. (a) (b)
| | 190,585 | | 4,358,679 |
SolarEdge Technologies, Inc. (a) (b)
| | 215,863 | | 5,452,699 |
Ultra Clean Holdings, Inc. (a)
| | 277,408 | | 13,592,992 |
| | | | | | 77,026,720 |
| SOFTWARE — 1.7% | |
A10 Networks, Inc.
| | 234,668 | | 3,250,152 |
ACI Worldwide, Inc. (a)
| | 240,998 | | 9,541,111 |
Adeia, Inc.
| | 402,175 | | 4,498,327 |
BlackLine, Inc. (a)
| | 104,551 | | 5,065,496 |
Box, Inc. Class A (a)
| | 347,761 | | 9,194,801 |
Envestnet, Inc. (a) (b)
| | 179,647 | | 11,244,105 |
N-able, Inc. (a)
| | 156,173 | | 2,378,515 |
NCR Voyix Corp. (a) (b)
| | 850,977 | | 10,509,566 |
Sprinklr, Inc. Class A (a) (b)
| | 740,040 | | 7,119,185 |
| | | | | | 62,801,258 |
| SPECIALIZED REITs — 0.6% | |
Four Corners Property Trust, Inc. REIT
| | 318,149 | | 7,848,736 |
Outfront Media, Inc. REIT
| | 523,009 | | 7,479,028 |
Safehold, Inc. REIT (b)
| | 277,986 | | 5,362,350 |
Uniti Group, Inc. REIT
| | 712,353 | | 2,080,071 |
| | | | | | 22,770,185 |
| SPECIALTY RETAIL — 4.1% | |
Academy Sports & Outdoors, Inc. (b)
| | 455,855 | | 24,274,279 |
Advance Auto Parts, Inc. (b)
| | 368,230 | | 23,320,006 |
Asbury Automotive Group, Inc. (a) (b)
| | 63,591 | | 14,490,481 |
Buckle, Inc.
| | 69,387 | | 2,563,156 |
Caleres, Inc.
| | 204,271 | | 6,863,506 |
Designer Brands, Inc. Class A (b)
| | 272,297 | | 1,859,789 |
Foot Locker, Inc.
| | 507,801 | | 12,654,401 |
Haverty Furniture Cos., Inc. (b)
| | 82,274 | | 2,080,709 |
Hibbett, Inc. (b)
| | 73,842 | | 6,439,761 |
Leslie's, Inc. (a) (b)
| | 1,141,150 | | 4,781,418 |
MarineMax, Inc. (a) (b)
| | 125,390 | | 4,058,874 |
Monro, Inc.
| | 184,659 | | 4,405,964 |
National Vision Holdings, Inc. (a)
| | 485,274 | | 6,352,237 |
ODP Corp. (a)
| | 197,324 | | 7,748,913 |
Sally Beauty Holdings, Inc. (a)
| | 639,419 | | 6,860,966 |
Shoe Carnival, Inc. (b)
| | 110,618 | | 4,080,698 |
Sonic Automotive, Inc. Class A
| | 91,826 | | 5,001,762 |
Upbound Group, Inc.
| | 121,704 | | 3,736,313 |
Victoria's Secret & Co. (a) (b)
| | 483,591 | | 8,545,053 |
| | | | | | 150,118,286 |
| TECHNOLOGY HARDWARE, STORAGE & PERIPHERALS — 0.3% | |
Corsair Gaming, Inc. (a)
| | 272,862 | | 3,012,397 |
See accompanying notes to financial statements.
58
SPDR SERIES TRUST
SPDR S&P 600 SMALL CAP VALUE ETF
SCHEDULE OF INVESTMENTS (continued)
June 30, 2024
| Security Description | | | Shares | | Value |
Xerox Holdings Corp. (b)
| | 705,815 | | $8,201,570 |
| | | | | | 11,213,967 |
| TEXTILES, APPAREL & LUXURY GOODS — 1.5% | |
G-III Apparel Group Ltd. (a)
| | 247,241 | | 6,692,814 |
Hanesbrands, Inc. (a) (b)
| | 2,171,575 | | 10,705,865 |
Movado Group, Inc.
| | 97,615 | | 2,426,709 |
VF Corp. (b)
| | 2,041,469 | | 27,559,831 |
Wolverine World Wide, Inc. (b)
| | 493,675 | | 6,674,486 |
| | | | | | 54,059,705 |
| TOBACCO — 0.3% | |
Universal Corp.
| | 151,825 | | 7,316,447 |
Vector Group Ltd.
| | 454,610 | | 4,805,227 |
| | | | | | 12,121,674 |
| TRADING COMPANIES & DISTRIBUTORS — 1.3% | |
Air Lease Corp.
| | 505,389 | | 24,021,139 |
DNOW, Inc. (a)
| | 659,690 | | 9,057,544 |
DXP Enterprises, Inc. (a)
| | 80,659 | | 3,697,409 |
Rush Enterprises, Inc. Class A
| | 210,336 | | 8,806,768 |
| | | | | | 45,582,860 |
| WATER UTILITIES — 0.7% | |
American States Water Co.
| | 108,074 | | 7,842,930 |
California Water Service Group
| | 214,081 | | 10,380,788 |
Middlesex Water Co.
| | 60,713 | | 3,172,861 |
SJW Group
| | 103,246 | | 5,597,998 |
| | | | | | 26,994,577 |
| WIRELESS TELECOMMUNICATION SERVICES — 0.2% | |
Gogo, Inc. (a) (b)
| | 199,749 | | 1,921,585 |
Telephone & Data Systems, Inc.
| | 304,419 | | 6,310,606 |
| | | | | | 8,232,191 |
TOTAL COMMON STOCKS
(Cost $3,713,012,259)
| | | | | 3,638,104,076 |
| WARRANTS — 0.0% (c) | | | | | |
| ENERGY EQUIPMENT & SERVICES — 0.0% (c) | | | | | |
Nabors Industries Ltd. (expiring 06/11/26) (a) (b)
(Cost $0)
| | | 17,916 | | 118,246 |
| Security Description | | | Shares | | Value |
| SHORT-TERM INVESTMENTS — 7.5% | | | |
State Street Institutional Liquid Reserves Fund, Premier Class 5.36% (d) (e)
| | 3,286,169 | | $3,287,155 |
State Street Navigator Securities Lending Portfolio II (f) (g)
| | 272,620,822 | | 272,620,822 |
TOTAL SHORT-TERM INVESTMENTS
(Cost $275,907,779)
| | 275,907,977 | |
TOTAL INVESTMENTS — 107.3%
(Cost $3,988,920,038)
| | 3,914,130,299 | |
LIABILITIES IN EXCESS OF OTHER ASSETS — (7.3)%
| | (267,456,799) | |
NET ASSETS — 100.0%
| | $3,646,673,500 | |
| (a) | Non-income producing security. |
| (b) | All or a portion of the shares of the security are on loan at June 30, 2024. |
| (c) | Amount is less than 0.05% of net assets. |
| (d) | The Fund invested in certain money market funds managed by SSGA Funds Management, Inc. Amounts related to these investments during the year ended June 30, 2024 are shown in the Affiliate Table below. |
| (e) | The rate shown is the annualized seven-day yield at June 30, 2024. |
| (f) | The Fund invested in an affiliated entity. Amounts related to these investments during the year ended June 30, 2024 are shown in the Affiliate Table below. |
| (g) | Investment of cash collateral for securities loaned. |
| REIT | Real Estate Investment Trust |
The following table summarizes the value of the Fund's investments according to the fair value hierarchy as of June 30, 2024.
| Description | | Level 1 –
Quoted Prices | | Level 2 –
Other Significant
Observable Inputs | | Level 3 –
Significant
Unobservable Inputs | | Total |
| ASSETS: | | | | | | | | |
| INVESTMENTS: | | | | | | | | |
Common Stocks
| | $3,638,104,076 | | $— | | $— | | $3,638,104,076 |
Warrants
| | 118,246 | | — | | — | | 118,246 |
Short-Term Investments
| | 275,907,977 | | — | | — | | 275,907,977 |
TOTAL INVESTMENTS
| | $3,914,130,299 | | $— | | $— | | $3,914,130,299 |
See accompanying notes to financial statements.
59
SPDR SERIES TRUST
SPDR S&P 600 SMALL CAP VALUE ETF
SCHEDULE OF INVESTMENTS (continued)
June 30, 2024
Affiliate Table
| | Number of
Shares Held
at
6/30/23 | | Value at
6/30/23 | | Cost of
Purchases | | Proceeds
from
Shares Sold | | Realized
Gain (Loss) | | Change in
Unrealized
Appreciation/
Depreciation | | Number of
Shares Held
at
6/30/24 | | Value at
6/30/24 | | Dividend
Income |
State Street Institutional Liquid Reserves Fund, Premier Class
| 3,477,999 | | $3,478,695 | | $248,539,035 | | $248,729,737 | | $(1,036) | | $198 | | 3,286,169 | | $3,287,155 | | $283,485 |
State Street Navigator Securities Lending Portfolio II
| 362,515,235 | | 362,515,235 | | 1,715,084,811 | | 1,804,979,224 | | — | | — | | 272,620,822 | | 272,620,822 | | 1,912,643 |
Total
| | | $365,993,930 | | $1,963,623,846 | | $2,053,708,961 | | $(1,036) | | $198 | | | | $275,907,977 | | $2,196,128 |
See accompanying notes to financial statements.
60
SPDR SERIES TRUST
SPDR S&P 1500 MOMENTUM TILT ETF
SCHEDULE OF INVESTMENTS
June 30, 2024
| Security Description | | | Shares | | Value |
| COMMON STOCKS — 99.9% | |
| AEROSPACE & DEFENSE — 1.0% | |
AAR Corp. (a)
| | 72 | | $5,234 |
AeroVironment, Inc. (a)
| | 82 | | 14,937 |
Axon Enterprise, Inc. (a)
| | 216 | | 63,556 |
Boeing Co. (a)
| | 182 | | 33,126 |
BWX Technologies, Inc.
| | 300 | | 28,500 |
Curtiss-Wright Corp.
| | 125 | | 33,873 |
General Dynamics Corp.
| | 503 | | 145,940 |
Hexcel Corp.
| | 111 | | 6,932 |
Howmet Aerospace, Inc.
| | 1,280 | | 99,366 |
Huntington Ingalls Industries, Inc.
| | 121 | | 29,806 |
L3Harris Technologies, Inc.
| | 220 | | 49,408 |
Lockheed Martin Corp.
| | 114 | | 53,249 |
Mercury Systems, Inc. (a)
| | 56 | | 1,512 |
Moog, Inc. Class A
| | 91 | | 15,224 |
Northrop Grumman Corp.
| | 134 | | 58,417 |
RTX Corp.
| | 701 | | 70,373 |
Textron, Inc.
| | 559 | | 47,996 |
TransDigm Group, Inc.
| | 193 | | 246,579 |
Triumph Group, Inc. (a)
| | 7 | | 108 |
Woodward, Inc.
| | 197 | | 34,353 |
| | | | | | 1,038,489 |
| AIR FREIGHT & LOGISTICS — 0.2% | |
CH Robinson Worldwide, Inc.
| | 39 | | 3,437 |
Expeditors International of Washington, Inc.
| | 169 | | 21,090 |
FedEx Corp.
| | 510 | | 152,918 |
Forward Air Corp.
| | 38 | | 724 |
GXO Logistics, Inc. (a)
| | 62 | | 3,131 |
Hub Group, Inc. Class A
| | 108 | | 4,649 |
United Parcel Service, Inc. Class B
| | 77 | | 10,537 |
| | | | | | 196,486 |
| AIRLINES — 0.1% | |
Alaska Air Group, Inc. (a)
| | 42 | | 1,697 |
Allegiant Travel Co.
| | 5 | | 251 |
American Airlines Group, Inc. (a) (b)
| | 898 | | 10,174 |
Delta Air Lines, Inc.
| | 1,690 | | 80,174 |
JetBlue Airways Corp. (a)
| | 106 | | 646 |
SkyWest, Inc. (a)
| | 181 | | 14,855 |
Southwest Airlines Co.
| | 315 | | 9,012 |
United Airlines Holdings, Inc. (a)
| | 381 | | 18,539 |
| | | | | | 135,348 |
| AUTO COMPONENTS — 0.1% | |
Adient PLC (a)
| | 10 | | 247 |
American Axle & Manufacturing Holdings, Inc. (a)
| | 63 | | 440 |
Aptiv PLC (a)
| | 29 | | 2,042 |
Autoliv, Inc.
| | 209 | | 22,361 |
BorgWarner, Inc.
| | 72 | | 2,321 |
Dana, Inc.
| | 15 | | 182 |
Dorman Products, Inc. (a)
| | 3 | | 275 |
Fox Factory Holding Corp. (a)
| | 4 | | 193 |
Gentex Corp.
| | 470 | | 15,844 |
| Security Description | | | Shares | | Value |
Gentherm, Inc. (a)
| | 48 | | $2,367 |
Goodyear Tire & Rubber Co. (a)
| | 667 | | 7,571 |
LCI Industries
| | 49 | | 5,066 |
Lear Corp.
| | 54 | | 6,167 |
Patrick Industries, Inc.
| | 82 | | 8,901 |
Phinia, Inc.
| | 5 | | 197 |
Standard Motor Products, Inc.
| | 36 | | 998 |
Visteon Corp. (a)
| | 3 | | 320 |
XPEL, Inc. (a)
| | 2 | | 71 |
| | | | | | 75,563 |
| AUTOMOBILES — 0.8% | |
Ford Motor Co.
| | 6,181 | | 77,510 |
General Motors Co.
| | 3,047 | | 141,564 |
Harley-Davidson, Inc.
| | 201 | | 6,741 |
Tesla, Inc. (a)
| | 3,218 | | 636,778 |
Thor Industries, Inc.
| | 175 | | 16,354 |
Winnebago Industries, Inc.
| | 41 | | 2,222 |
| | | | | | 881,169 |
| BANKS — 4.7% | |
Ameris Bancorp
| | 197 | | 9,919 |
Associated Banc-Corp.
| | 299 | | 6,324 |
Atlantic Union Bankshares Corp.
| | 176 | | 5,782 |
Axos Financial, Inc. (a)
| | 78 | | 4,458 |
Banc of California, Inc.
| | 360 | | 4,601 |
BancFirst Corp.
| | 5 | | 438 |
Bancorp, Inc. (a)
| | 93 | | 3,512 |
Bank of America Corp.
| | 15,115 | | 601,124 |
Bank of Hawaii Corp. (b)
| | 96 | | 5,492 |
Bank of New York Mellon Corp.
| | 2,005 | | 120,079 |
Bank OZK
| | 233 | | 9,553 |
BankUnited, Inc.
| | 146 | | 4,273 |
Banner Corp.
| | 3 | | 149 |
Berkshire Hills Bancorp, Inc.
| | 5 | | 114 |
Brookline Bancorp, Inc.
| | 224 | | 1,870 |
Cadence Bank
| | 556 | | 15,724 |
Capitol Federal Financial, Inc.
| | 48 | | 264 |
Cathay General Bancorp
| | 55 | | 2,075 |
Central Pacific Financial Corp.
| | 97 | | 2,056 |
Citigroup, Inc.
| | 5,023 | | 318,760 |
Citizens Financial Group, Inc.
| | 837 | | 30,157 |
City Holding Co.
| | 21 | | 2,231 |
Columbia Banking System, Inc.
| | 65 | | 1,293 |
Comerica, Inc.
| | 320 | | 16,333 |
Commerce Bancshares, Inc.
| | 113 | | 6,303 |
Community Financial System, Inc.
| | 31 | | 1,463 |
Cullen/Frost Bankers, Inc.
| | 60 | | 6,098 |
Customers Bancorp, Inc. (a)
| | 107 | | 5,134 |
CVB Financial Corp.
| | 232 | | 4,000 |
Dime Community Bancshares, Inc.
| | 90 | | 1,836 |
Eagle Bancorp, Inc.
| | 51 | | 964 |
East West Bancorp, Inc.
| | 461 | | 33,759 |
FB Financial Corp.
| | 65 | | 2,537 |
Fifth Third Bancorp
| | 2,085 | | 76,082 |
First BanCorp
| | 406 | | 7,426 |
First Bancorp/Southern Pines NC
| | 4 | | 128 |
See accompanying notes to financial statements.
61
SPDR SERIES TRUST
SPDR S&P 1500 MOMENTUM TILT ETF
SCHEDULE OF INVESTMENTS (continued)
June 30, 2024
| Security Description | | | Shares | | Value |
First Commonwealth Financial Corp.
| | 56 | | $773 |
First Financial Bancorp
| | 94 | | 2,089 |
First Financial Bankshares, Inc.
| | 172 | | 5,079 |
First Hawaiian, Inc.
| | 127 | | 2,636 |
First Horizon Corp.
| | 177 | | 2,791 |
FNB Corp.
| | 719 | | 9,836 |
Fulton Financial Corp.
| | 433 | | 7,352 |
Glacier Bancorp, Inc.
| | 199 | | 7,427 |
Goldman Sachs Group, Inc.
| | 585 | | 264,607 |
Hancock Whitney Corp.
| | 191 | | 9,136 |
Hanmi Financial Corp.
| | 131 | | 2,190 |
Heritage Financial Corp.
| | 3 | | 54 |
Hilltop Holdings, Inc.
| | 56 | | 1,752 |
Home BancShares, Inc.
| | 288 | | 6,900 |
Hope Bancorp, Inc.
| | 12 | | 129 |
Huntington Bancshares, Inc.
| | 3,211 | | 42,321 |
Independent Bank Corp.
| | 27 | | 1,369 |
Independent Bank Group, Inc.
| | 102 | | 4,643 |
International Bancshares Corp.
| | 130 | | 7,437 |
JPMorgan Chase & Co.
| | 8,810 | | 1,781,911 |
KeyCorp
| | 3,066 | | 43,568 |
Lakeland Financial Corp.
| | 12 | | 738 |
M&T Bank Corp.
| | 263 | | 39,808 |
Morgan Stanley
| | 1,455 | | 141,411 |
National Bank Holdings Corp. Class A
| | 77 | | 3,007 |
NBT Bancorp, Inc.
| | 68 | | 2,625 |
New York Community Bancorp, Inc. (b)
| | 1,109 | | 3,571 |
Northern Trust Corp.
| | 324 | | 27,209 |
Northwest Bancshares, Inc.
| | 13 | | 150 |
OFG Bancorp
| | 57 | | 2,135 |
Old National Bancorp
| | 761 | | 13,082 |
Pacific Premier Bancorp, Inc.
| | 10 | | 230 |
Park National Corp.
| | 31 | | 4,413 |
Pathward Financial, Inc.
| | 49 | | 2,772 |
Pinnacle Financial Partners, Inc.
| | 249 | | 19,930 |
PNC Financial Services Group, Inc.
| | 798 | | 124,073 |
Preferred Bank
| | 33 | | 2,491 |
Prosperity Bancshares, Inc.
| | 108 | | 6,603 |
Provident Financial Services, Inc.
| | 7 | | 100 |
Regions Financial Corp.
| | 1,463 | | 29,318 |
Renasant Corp.
| | 6 | | 183 |
S&T Bancorp, Inc.
| | 90 | | 3,005 |
Seacoast Banking Corp. of Florida
| | 8 | | 189 |
ServisFirst Bancshares, Inc.
| | 119 | | 7,520 |
Simmons First National Corp. Class A
| | 220 | | 3,868 |
Southside Bancshares, Inc.
| | 3 | | 83 |
SouthState Corp.
| | 117 | | 8,941 |
State Street Corp. (c)
| | 351 | | 25,974 |
Stellar Bancorp, Inc.
| | 5 | | 115 |
Synovus Financial Corp.
| | 355 | | 14,267 |
Texas Capital Bancshares, Inc. (a)
| | 84 | | 5,136 |
Tompkins Financial Corp.
| | 19 | | 929 |
Triumph Financial, Inc. (a)
| | 40 | | 3,270 |
| Security Description | | | Shares | | Value |
Truist Financial Corp.
| | 2,676 | | $103,963 |
TrustCo Bank Corp.
| | 37 | | 1,064 |
Trustmark Corp.
| | 58 | | 1,742 |
U.S. Bancorp
| | 3,781 | | 150,106 |
UMB Financial Corp.
| | 116 | | 9,677 |
United Bankshares, Inc.
| | 185 | | 6,001 |
United Community Banks, Inc.
| | 12 | | 306 |
Valley National Bancorp
| | 138 | | 963 |
Veritex Holdings, Inc.
| | 101 | | 2,130 |
WaFd, Inc.
| | 49 | | 1,400 |
Webster Financial Corp.
| | 490 | | 21,359 |
Wells Fargo & Co.
| | 10,695 | | 635,176 |
Westamerica BanCorp
| | 8 | | 388 |
Wintrust Financial Corp.
| | 201 | | 19,811 |
WSFS Financial Corp.
| | 134 | | 6,298 |
Zions Bancorp NA
| | 485 | | 21,034 |
| | | | | | 4,994,875 |
| BEVERAGES — 0.4% | |
Boston Beer Co., Inc. Class A (a)
| | 5 | | 1,525 |
Brown-Forman Corp. Class B
| | 60 | | 2,591 |
Celsius Holdings, Inc. (a) (b)
| | 609 | | 34,768 |
Coca-Cola Co.
| | 2,054 | | 130,737 |
Coca-Cola Consolidated, Inc.
| | 16 | | 17,360 |
Constellation Brands, Inc. Class A
| | 255 | | 65,606 |
Keurig Dr Pepper, Inc.
| | 330 | | 11,022 |
MGP Ingredients, Inc. (b)
| | 21 | | 1,562 |
Molson Coors Beverage Co. Class B
| | 254 | | 12,911 |
Monster Beverage Corp. (a)
| | 702 | | 35,065 |
National Beverage Corp.
| | 12 | | 615 |
PepsiCo, Inc.
| | 435 | | 71,745 |
| | | | | | 385,507 |
| BIOTECHNOLOGY — 1.3% | |
AbbVie, Inc.
| | 3,169 | | 543,547 |
Alkermes PLC (a)
| | 188 | | 4,531 |
Amgen, Inc.
| | 960 | | 299,952 |
Arcus Biosciences, Inc. (a)
| | 5 | | 76 |
Arrowhead Pharmaceuticals, Inc. (a)
| | 11 | | 286 |
Biogen, Inc. (a)
| | 16 | | 3,709 |
Catalyst Pharmaceuticals, Inc. (a)
| | 34 | | 527 |
Cytokinetics, Inc. (a)
| | 399 | | 21,618 |
Dynavax Technologies Corp. (a)
| | 411 | | 4,616 |
Exelixis, Inc. (a)
| | 647 | | 14,538 |
Gilead Sciences, Inc.
| | 395 | | 27,101 |
Halozyme Therapeutics, Inc. (a)
| | 237 | | 12,409 |
Incyte Corp. (a)
| | 19 | | 1,152 |
Ironwood Pharmaceuticals, Inc. (a)
| | 77 | | 502 |
Moderna, Inc. (a)
| | 37 | | 4,394 |
Myriad Genetics, Inc. (a)
| | 45 | | 1,101 |
Neurocrine Biosciences, Inc. (a)
| | 241 | | 33,178 |
Regeneron Pharmaceuticals, Inc. (a)
| | 168 | | 176,573 |
REGENXBIO, Inc. (a)
| | 4 | | 47 |
Roivant Sciences Ltd. (a) (b)
| | 606 | | 6,405 |
United Therapeutics Corp. (a)
| | 24 | | 7,645 |
See accompanying notes to financial statements.
62
SPDR SERIES TRUST
SPDR S&P 1500 MOMENTUM TILT ETF
SCHEDULE OF INVESTMENTS (continued)
June 30, 2024
| Security Description | | | Shares | | Value |
Vericel Corp. (a)
| | 150 | | $6,882 |
Vertex Pharmaceuticals, Inc. (a)
| | 463 | | 217,017 |
Vir Biotechnology, Inc. (a)
| | 9 | | 80 |
Xencor, Inc. (a)
| | 18 | | 341 |
| | | | | | 1,388,227 |
| BROADLINE RETAIL — 5.9% | |
Amazon.com, Inc. (a)
| | 31,970 | | 6,178,202 |
eBay, Inc.
| | 712 | | 38,249 |
Etsy, Inc. (a)
| | 41 | | 2,418 |
Kohl's Corp.
| | 315 | | 7,242 |
Macy's, Inc.
| | 550 | | 10,560 |
Nordstrom, Inc.
| | 231 | | 4,902 |
Ollie's Bargain Outlet Holdings, Inc. (a)
| | 112 | | 10,995 |
| | | | | | 6,252,568 |
| BUILDING PRODUCTS — 1.0% | |
A O Smith Corp.
| | 264 | | 21,590 |
AAON, Inc.
| | 166 | | 14,482 |
Advanced Drainage Systems, Inc.
| | 267 | | 42,824 |
Allegion PLC
| | 158 | | 18,668 |
American Woodmark Corp. (a)
| | 65 | | 5,109 |
Apogee Enterprises, Inc.
| | 76 | | 4,775 |
Armstrong World Industries, Inc.
| | 164 | | 18,571 |
AZZ, Inc.
| | 98 | | 7,571 |
Builders FirstSource, Inc. (a)
| | 492 | | 68,098 |
Carlisle Cos., Inc.
| | 179 | | 72,533 |
Carrier Global Corp.
| | 2,381 | | 150,194 |
Fortune Brands Innovations, Inc.
| | 271 | | 17,599 |
Gibraltar Industries, Inc. (a)
| | 115 | | 7,883 |
Griffon Corp.
| | 140 | | 8,940 |
Hayward Holdings, Inc. (a)
| | 116 | | 1,427 |
Insteel Industries, Inc.
| | 30 | | 929 |
Johnson Controls International PLC
| | 935 | | 62,149 |
Lennox International, Inc.
| | 126 | | 67,407 |
Masco Corp.
| | 673 | | 44,869 |
Masterbrand, Inc. (a)
| | 340 | | 4,991 |
Owens Corning
| | 291 | | 50,553 |
Quanex Building Products Corp.
| | 53 | | 1,465 |
Resideo Technologies, Inc. (a)
| | 257 | | 5,027 |
Simpson Manufacturing Co., Inc.
| | 163 | | 27,470 |
Trane Technologies PLC
| | 745 | | 245,053 |
Trex Co., Inc. (a)
| | 401 | | 29,722 |
UFP Industries, Inc.
| | 202 | | 22,624 |
| | | | | | 1,022,523 |
| CAPITAL MARKETS — 2.0% | |
Affiliated Managers Group, Inc.
| | 46 | | 7,187 |
Ameriprise Financial, Inc.
| | 307 | | 131,147 |
Artisan Partners Asset Management, Inc. Class A
| | 161 | | 6,644 |
B Riley Financial, Inc. (b)
| | 68 | | 1,200 |
BGC Group, Inc. Class A
| | 1,430 | | 11,869 |
BlackRock, Inc.
| | 280 | | 220,450 |
Blackstone, Inc.
| | 2,355 | | 291,549 |
Brightsphere Investment Group, Inc.
| | 3 | | 67 |
| Security Description | | | Shares | | Value |
Carlyle Group, Inc.
| | 708 | | $28,426 |
Cboe Global Markets, Inc.
| | 234 | | 39,794 |
Charles Schwab Corp.
| | 4,243 | | 312,667 |
CME Group, Inc.
| | 646 | | 127,004 |
Donnelley Financial Solutions, Inc. (a)
| | 68 | | 4,054 |
Evercore, Inc. Class A
| | 128 | | 26,679 |
FactSet Research Systems, Inc.
| | 44 | | 17,964 |
Federated Hermes, Inc.
| | 38 | | 1,249 |
Franklin Resources, Inc.
| | 260 | | 5,811 |
Houlihan Lokey, Inc.
| | 148 | | 19,959 |
Interactive Brokers Group, Inc. Class A
| | 305 | | 37,393 |
Intercontinental Exchange, Inc.
| | 1,149 | | 157,287 |
Invesco Ltd.
| | 542 | | 8,108 |
Janus Henderson Group PLC
| | 316 | | 10,652 |
Jefferies Financial Group, Inc.
| | 483 | | 24,034 |
MarketAxess Holdings, Inc.
| | 4 | | 802 |
Moelis & Co. Class A
| | 218 | | 12,395 |
Moody's Corp.
| | 282 | | 118,702 |
Morningstar, Inc.
| | 96 | | 28,402 |
MSCI, Inc.
| | 125 | | 60,219 |
Nasdaq, Inc.
| | 522 | | 31,456 |
Piper Sandler Cos.
| | 45 | | 10,358 |
PJT Partners, Inc. Class A
| | 52 | | 5,611 |
Raymond James Financial, Inc.
| | 536 | | 66,255 |
S&P Global, Inc.
| | 509 | | 227,014 |
SEI Investments Co.
| | 194 | | 12,550 |
Stifel Financial Corp.
| | 226 | | 19,018 |
StoneX Group, Inc. (a)
| | 27 | | 2,033 |
T Rowe Price Group, Inc.
| | 307 | | 35,400 |
Virtus Investment Partners, Inc.
| | 4 | | 903 |
WisdomTree, Inc. (b)
| | 43 | | 426 |
| | | | | | 2,122,738 |
| CHEMICALS — 1.1% | |
AdvanSix, Inc.
| | 28 | | 642 |
Air Products & Chemicals, Inc.
| | 24 | | 6,193 |
Albemarle Corp.
| | 12 | | 1,146 |
Arcadium Lithium PLC (a)
| | 48 | | 161 |
Ashland, Inc.
| | 28 | | 2,646 |
Avient Corp.
| | 109 | | 4,758 |
Axalta Coating Systems Ltd. (a)
| | 260 | | 8,884 |
Balchem Corp.
| | 56 | | 8,621 |
Cabot Corp.
| | 123 | | 11,303 |
Celanese Corp.
| | 327 | | 44,109 |
CF Industries Holdings, Inc.
| | 303 | | 22,458 |
Chemours Co.
| | 46 | | 1,038 |
Corteva, Inc.
| | 222 | | 11,975 |
Dow, Inc.
| | 964 | | 51,140 |
DuPont de Nemours, Inc.
| | 572 | | 46,040 |
Eastman Chemical Co.
| | 211 | | 20,672 |
Ecolab, Inc.
| | 670 | | 159,460 |
FMC Corp.
| | 13 | | 748 |
Hawkins, Inc.
| | 78 | | 7,098 |
HB Fuller Co.
| | 64 | | 4,926 |
Ingevity Corp. (a)
| | 11 | | 481 |
See accompanying notes to financial statements.
63
SPDR SERIES TRUST
SPDR S&P 1500 MOMENTUM TILT ETF
SCHEDULE OF INVESTMENTS (continued)
June 30, 2024
| Security Description | | | Shares | | Value |
Innospec, Inc.
| | 36 | | $4,449 |
International Flavors & Fragrances, Inc.
| | 80 | | 7,617 |
Koppers Holdings, Inc.
| | 107 | | 3,958 |
Linde PLC
| | 973 | | 426,962 |
LyondellBasell Industries NV Class A
| | 351 | | 33,577 |
Mativ Holdings, Inc.
| | 28 | | 475 |
Minerals Technologies, Inc.
| | 64 | | 5,322 |
Mosaic Co.
| | 38 | | 1,098 |
NewMarket Corp.
| | 28 | | 14,436 |
Olin Corp.
| | 139 | | 6,554 |
PPG Industries, Inc.
| | 224 | | 28,199 |
Quaker Chemical Corp.
| | 16 | | 2,715 |
RPM International, Inc.
| | 395 | | 42,534 |
Scotts Miracle-Gro Co. (b)
| | 29 | | 1,887 |
Sensient Technologies Corp.
| | 42 | | 3,116 |
Sherwin-Williams Co.
| | 721 | | 215,168 |
Stepan Co.
| | 7 | | 588 |
Westlake Corp.
| | 70 | | 10,137 |
| | | | | | 1,223,291 |
| COMMERCIAL SERVICES & SUPPLIES — 0.7% | |
ABM Industries, Inc.
| | 81 | | 4,096 |
Brady Corp. Class A
| | 81 | | 5,348 |
Brink's Co.
| | 124 | | 12,698 |
Cintas Corp.
| | 282 | | 197,473 |
Clean Harbors, Inc. (a)
| | 129 | | 29,173 |
Copart, Inc. (a)
| | 2,678 | | 145,041 |
CoreCivic, Inc. (a)
| | 420 | | 5,452 |
Deluxe Corp.
| | 13 | | 292 |
Enviri Corp. (a)
| | 28 | | 242 |
GEO Group, Inc. (a)
| | 451 | | 6,476 |
Healthcare Services Group, Inc. (a)
| | 94 | | 995 |
HNI Corp.
| | 148 | | 6,663 |
Interface, Inc.
| | 62 | | 910 |
Liquidity Services, Inc. (a)
| | 29 | | 579 |
Matthews International Corp. Class A
| | 28 | | 701 |
MillerKnoll, Inc.
| | 207 | | 5,483 |
MSA Safety, Inc.
| | 121 | | 22,711 |
OPENLANE, Inc. (a)
| | 59 | | 979 |
Pitney Bowes, Inc.
| | 17 | | 86 |
Republic Services, Inc.
| | 453 | | 88,036 |
Rollins, Inc.
| | 326 | | 15,906 |
Stericycle, Inc. (a)
| | 125 | | 7,266 |
Tetra Tech, Inc.
| | 130 | | 26,582 |
UniFirst Corp.
| | 2 | | 343 |
Veralto Corp.
| | 247 | | 23,581 |
Vestis Corp.
| | 157 | | 1,920 |
Viad Corp. (a)
| | 31 | | 1,054 |
Waste Management, Inc.
| | 813 | | 173,445 |
| | | | | | 783,531 |
| COMMUNICATIONS EQUIPMENT — 0.7% | |
Arista Networks, Inc. (a)
| | 932 | | 326,647 |
Calix, Inc. (a)
| | 33 | | 1,169 |
| Security Description | | | Shares | | Value |
Ciena Corp. (a)
| | 169 | | $8,142 |
Cisco Systems, Inc.
| | 4,719 | | 224,200 |
Digi International, Inc. (a)
| | 4 | | 92 |
Extreme Networks, Inc. (a)
| | 216 | | 2,905 |
F5, Inc. (a)
| | 168 | | 28,935 |
Harmonic, Inc. (a)
| | 12 | | 141 |
Juniper Networks, Inc.
| | 578 | | 21,074 |
Lumentum Holdings, Inc. (a)
| | 8 | | 407 |
Motorola Solutions, Inc.
| | 298 | | 115,043 |
NetScout Systems, Inc. (a)
| | 82 | | 1,500 |
Viasat, Inc. (a) (b)
| | 8 | | 102 |
Viavi Solutions, Inc. (a)
| | 98 | | 673 |
| | | | | | 731,030 |
| CONSTRUCTION & ENGINEERING — 0.3% | |
AECOM
| | 205 | | 18,069 |
Arcosa, Inc.
| | 102 | | 8,508 |
Comfort Systems USA, Inc.
| | 138 | | 41,969 |
Dycom Industries, Inc. (a)
| | 95 | | 16,032 |
EMCOR Group, Inc.
| | 184 | | 67,175 |
Fluor Corp. (a)
| | 486 | | 21,165 |
Granite Construction, Inc.
| | 98 | | 6,073 |
MasTec, Inc. (a)
| | 56 | | 5,991 |
MDU Resources Group, Inc.
| | 408 | | 10,241 |
MYR Group, Inc. (a)
| | 47 | | 6,378 |
Quanta Services, Inc.
| | 476 | | 120,947 |
Valmont Industries, Inc.
| | 2 | | 549 |
| | | | | | 323,097 |
| CONSTRUCTION MATERIALS — 0.3% | |
Eagle Materials, Inc.
| | 127 | | 27,617 |
Knife River Corp. (a)
| | 220 | | 15,431 |
Martin Marietta Materials, Inc.
| | 215 | | 116,487 |
Vulcan Materials Co.
| | 435 | | 108,176 |
| | | | | | 267,711 |
| CONSUMER FINANCE — 0.7% | |
Ally Financial, Inc.
| | 888 | | 35,227 |
American Express Co.
| | 1,630 | | 377,427 |
Bread Financial Holdings, Inc.
| | 127 | | 5,659 |
Capital One Financial Corp.
| | 1,245 | | 172,370 |
Discover Financial Services
| | 555 | | 72,600 |
Encore Capital Group, Inc. (a)
| | 11 | | 459 |
Enova International, Inc. (a)
| | 76 | | 4,731 |
FirstCash Holdings, Inc.
| | 53 | | 5,559 |
Green Dot Corp. Class A (a)
| | 6 | | 57 |
Navient Corp.
| | 95 | | 1,383 |
PRA Group, Inc. (a)
| | 34 | | 668 |
PROG Holdings, Inc.
| | 59 | | 2,046 |
SLM Corp.
| | 674 | | 14,012 |
Synchrony Financial
| | 1,331 | | 62,810 |
| | | | | | 755,008 |
| CONSUMER STAPLES DISTRIBUTION & RETAIL — 1.8% | |
Andersons, Inc.
| | 67 | | 3,323 |
BJ's Wholesale Club Holdings, Inc. (a)
| | 68 | | 5,973 |
Casey's General Stores, Inc.
| | 98 | | 37,393 |
See accompanying notes to financial statements.
64
SPDR SERIES TRUST
SPDR S&P 1500 MOMENTUM TILT ETF
SCHEDULE OF INVESTMENTS (continued)
June 30, 2024
| Security Description | | | Shares | | Value |
Chefs' Warehouse, Inc. (a)
| | 4 | | $157 |
Costco Wholesale Corp.
| | 1,359 | | 1,155,136 |
Dollar General Corp.
| | 21 | | 2,777 |
Dollar Tree, Inc. (a)
| | 21 | | 2,242 |
Grocery Outlet Holding Corp. (a)
| | 48 | | 1,062 |
Kroger Co.
| | 1,048 | | 52,327 |
Performance Food Group Co. (a)
| | 271 | | 17,916 |
PriceSmart, Inc.
| | 28 | | 2,274 |
SpartanNash Co.
| | 4 | | 75 |
Sprouts Farmers Market, Inc. (a)
| | 343 | | 28,695 |
Sysco Corp.
| | 578 | | 41,263 |
Target Corp.
| | 633 | | 93,709 |
U.S. Foods Holding Corp. (a)
| | 597 | | 31,629 |
United Natural Foods, Inc. (a)
| | 109 | | 1,428 |
Walgreens Boots Alliance, Inc. (b)
| | 80 | | 968 |
Walmart, Inc.
| | 6,779 | | 459,006 |
| | | | | | 1,937,353 |
| CONTAINERS & PACKAGING — 0.2% | |
Amcor PLC
| | 161 | | 1,574 |
AptarGroup, Inc.
| | 117 | | 16,475 |
Avery Dennison Corp.
| | 178 | | 38,920 |
Ball Corp.
| | 632 | | 37,933 |
Berry Global Group, Inc.
| | 109 | | 6,415 |
Crown Holdings, Inc.
| | 38 | | 2,827 |
Graphic Packaging Holding Co.
| | 485 | | 12,712 |
Greif, Inc. Class A
| | 13 | | 747 |
International Paper Co.
| | 621 | | 26,796 |
Myers Industries, Inc.
| | 11 | | 147 |
O-I Glass, Inc. (a)
| | 48 | | 534 |
Packaging Corp. of America
| | 254 | | 46,370 |
Sealed Air Corp.
| | 14 | | 487 |
Silgan Holdings, Inc.
| | 64 | | 2,709 |
Sonoco Products Co.
| | 50 | | 2,536 |
Westrock Co.
| | 895 | | 44,983 |
| | | | | | 242,165 |
| DISTRIBUTORS — 0.0% (d) | |
Genuine Parts Co.
| | 43 | | 5,948 |
LKQ Corp.
| | 60 | | 2,495 |
Pool Corp.
| | 44 | | 13,523 |
| | | | | | 21,966 |
| DIVERSIFIED CONSUMER SERVICES — 0.1% | |
Adtalem Global Education, Inc. (a)
| | 143 | | 9,754 |
Frontdoor, Inc. (a)
| | 225 | | 7,603 |
Graham Holdings Co. Class B
| | 10 | | 6,996 |
Grand Canyon Education, Inc. (a)
| | 57 | | 7,975 |
H&R Block, Inc.
| | 427 | | 23,156 |
Perdoceo Education Corp.
| | 91 | | 1,949 |
Service Corp. International
| | 172 | | 12,234 |
Strategic Education, Inc.
| | 29 | | 3,209 |
Stride, Inc. (a)
| | 138 | | 9,729 |
| | | | | | 82,605 |
| DIVERSIFIED REITs — 0.0% (d) | |
Alexander & Baldwin, Inc. REIT
| | 90 | | 1,526 |
American Assets Trust, Inc. REIT
| | 5 | | 112 |
| Security Description | | | Shares | | Value |
Armada Hoffler Properties, Inc. REIT
| | 57 | | $632 |
Essential Properties Realty Trust, Inc. REIT
| | 211 | | 5,847 |
Global Net Lease, Inc. REIT
| | 126 | | 926 |
| | | | | | 9,043 |
| DIVERSIFIED TELECOMMUNICATION SERVICES — 0.4% | |
AT&T, Inc.
| | 6,795 | | 129,852 |
Cogent Communications Holdings, Inc.
| | 24 | | 1,354 |
Consolidated Communications Holdings, Inc. (a)
| | 93 | | 409 |
Frontier Communications Parent, Inc. (a)
| | 254 | | 6,650 |
Iridium Communications, Inc.
| | 68 | | 1,810 |
Lumen Technologies, Inc. (a) (b)
| | 748 | | 823 |
Shenandoah Telecommunications Co.
| | 93 | | 1,519 |
Verizon Communications, Inc.
| | 5,770 | | 237,955 |
| | | | | | 380,372 |
| ELECTRIC UTILITIES — 0.6% | |
ALLETE, Inc.
| | 68 | | 4,240 |
Alliant Energy Corp.
| | 138 | | 7,024 |
American Electric Power Co., Inc.
| | 167 | | 14,653 |
Constellation Energy Corp.
| | 1,247 | | 249,737 |
Duke Energy Corp.
| | 710 | | 71,163 |
Edison International
| | 203 | | 14,577 |
Entergy Corp.
| | 201 | | 21,507 |
Evergy, Inc.
| | 70 | | 3,708 |
Eversource Energy
| | 36 | | 2,042 |
Exelon Corp.
| | 305 | | 10,556 |
FirstEnergy Corp.
| | 296 | | 11,328 |
IDACORP, Inc.
| | 39 | | 3,633 |
NextEra Energy, Inc.
| | 223 | | 15,791 |
NRG Energy, Inc.
| | 816 | | 63,534 |
OGE Energy Corp.
| | 153 | | 5,462 |
Otter Tail Corp.
| | 105 | | 9,197 |
PG&E Corp.
| | 675 | | 11,785 |
Pinnacle West Capital Corp.
| | 62 | | 4,735 |
PNM Resources, Inc.
| | 86 | | 3,178 |
Portland General Electric Co.
| | 76 | | 3,286 |
PPL Corp.
| | 404 | | 11,171 |
Southern Co.
| | 576 | | 44,680 |
Xcel Energy, Inc.
| | 58 | | 3,098 |
| | | | | | 590,085 |
| ELECTRICAL EQUIPMENT — 0.8% | |
Acuity Brands, Inc.
| | 106 | | 25,593 |
AMETEK, Inc.
| | 512 | | 85,356 |
Eaton Corp. PLC
| | 1,476 | | 462,800 |
Emerson Electric Co.
| | 1,509 | | 166,231 |
Encore Wire Corp.
| | 55 | | 15,941 |
EnerSys
| | 56 | | 5,797 |
Generac Holdings, Inc. (a)
| | 111 | | 14,676 |
nVent Electric PLC
| | 612 | | 46,885 |
Powell Industries, Inc.
| | 49 | | 7,027 |
See accompanying notes to financial statements.
65
SPDR SERIES TRUST
SPDR S&P 1500 MOMENTUM TILT ETF
SCHEDULE OF INVESTMENTS (continued)
June 30, 2024
| Security Description | | | Shares | | Value |
Regal Rexnord Corp.
| | 175 | | $23,663 |
Rockwell Automation, Inc.
| | 108 | | 29,730 |
Sensata Technologies Holding PLC
| | 15 | | 561 |
SunPower Corp. (a) (b)
| | 47 | | 139 |
Sunrun, Inc. (a) (b)
| | 27 | | 320 |
Vicor Corp. (a)
| | 7 | | 232 |
| | | | | | 884,951 |
| ELECTRONIC EQUIPMENT, INSTRUMENTS & COMPONENTS — 0.9% | |
Advanced Energy Industries, Inc.
| | 85 | | 9,245 |
Amphenol Corp. Class A
| | 3,928 | | 264,629 |
Arlo Technologies, Inc. (a)
| | 480 | | 6,259 |
Arrow Electronics, Inc. (a)
| | 73 | | 8,815 |
Avnet, Inc.
| | 181 | | 9,320 |
Badger Meter, Inc.
| | 75 | | 13,976 |
Belden, Inc.
| | 64 | | 6,003 |
Benchmark Electronics, Inc.
| | 53 | | 2,091 |
CDW Corp.
| | 438 | | 98,042 |
Cognex Corp.
| | 18 | | 842 |
Coherent Corp. (a)
| | 488 | | 35,361 |
Corning, Inc.
| | 730 | | 28,361 |
Crane NXT Co. (b)
| | 143 | | 8,783 |
CTS Corp.
| | 21 | | 1,063 |
ePlus, Inc. (a)
| | 86 | | 6,336 |
Fabrinet (a)
| | 134 | | 32,802 |
Hubbell, Inc.
| | 170 | | 62,132 |
Insight Enterprises, Inc. (a)
| | 99 | | 19,638 |
IPG Photonics Corp. (a)
| | 21 | | 1,772 |
Itron, Inc. (a)
| | 168 | | 16,625 |
Jabil, Inc.
| | 447 | | 48,629 |
Keysight Technologies, Inc. (a)
| | 203 | | 27,760 |
Knowles Corp. (a)
| | 88 | | 1,519 |
Littelfuse, Inc.
| | 28 | | 7,157 |
Novanta, Inc. (a)
| | 43 | | 7,014 |
OSI Systems, Inc. (a)
| | 59 | | 8,114 |
PC Connection, Inc.
| | 32 | | 2,054 |
Plexus Corp. (a)
| | 46 | | 4,746 |
Rogers Corp. (a)
| | 2 | | 241 |
Sanmina Corp. (a)
| | 88 | | 5,830 |
ScanSource, Inc. (a)
| | 17 | | 753 |
TD SYNNEX Corp.
| | 156 | | 18,002 |
TE Connectivity Ltd.
| | 490 | | 73,711 |
Teledyne Technologies, Inc. (a)
| | 45 | | 17,459 |
Trimble, Inc. (a)
| | 604 | | 33,776 |
TTM Technologies, Inc. (a)
| | 82 | | 1,593 |
Vishay Intertechnology, Inc.
| | 204 | | 4,549 |
Vontier Corp.
| | 521 | | 19,902 |
Zebra Technologies Corp. Class A (a)
| | 49 | | 15,138 |
| | | | | | 930,042 |
| ENERGY EQUIPMENT & SERVICES — 0.3% | |
Archrock, Inc.
| | 535 | | 10,818 |
Baker Hughes Co.
| | 1,544 | | 54,302 |
Bristow Group, Inc. (a)
| | 7 | | 235 |
ChampionX Corp.
| | 424 | | 14,081 |
| Security Description | | | Shares | | Value |
Core Laboratories, Inc.
| | 5 | | $101 |
Dril-Quip, Inc. (a)
| | 4 | | 74 |
Halliburton Co.
| | 1,597 | | 53,947 |
Helix Energy Solutions Group, Inc. (a)
| | 386 | | 4,609 |
Helmerich & Payne, Inc.
| | 219 | | 7,915 |
Liberty Energy, Inc.
| | 492 | | 10,278 |
Nabors Industries Ltd. (a)
| | 3 | | 213 |
NOV, Inc.
| | 624 | | 11,862 |
Oceaneering International, Inc. (a)
| | 93 | | 2,200 |
Patterson-UTI Energy, Inc.
| | 365 | | 3,781 |
ProPetro Holding Corp. (a)
| | 10 | | 87 |
RPC, Inc.
| | 8 | | 50 |
Schlumberger NV
| | 1,960 | | 92,473 |
U.S. Silica Holdings, Inc. (a)
| | 7 | | 108 |
Valaris Ltd. (a)
| | 111 | | 8,270 |
Weatherford International PLC (a)
| | 273 | | 33,429 |
| | | | | | 308,833 |
| ENTERTAINMENT — 1.4% | |
Cinemark Holdings, Inc. (a) (b)
| | 206 | | 4,454 |
Electronic Arts, Inc.
| | 231 | | 32,185 |
Live Nation Entertainment, Inc. (a)
| | 465 | | 43,589 |
Madison Square Garden Sports Corp. (a)
| | 15 | | 2,822 |
Netflix, Inc. (a)
| | 1,599 | | 1,079,133 |
Take-Two Interactive Software, Inc. (a)
| | 251 | | 39,028 |
TKO Group Holdings, Inc.
| | 7 | | 756 |
Walt Disney Co.
| | 2,905 | | 288,437 |
Warner Bros Discovery, Inc. (a)
| | 227 | | 1,689 |
| | | | | | 1,492,093 |
| FINANCIAL SERVICES — 3.2% | |
Berkshire Hathaway, Inc. Class B (a)
| | 3,639 | | 1,480,345 |
Corpay, Inc. (a)
| | 199 | | 53,016 |
Equitable Holdings, Inc.
| | 1,027 | | 41,963 |
Essent Group Ltd.
| | 302 | | 16,969 |
Euronet Worldwide, Inc. (a)
| | 37 | | 3,830 |
EVERTEC, Inc.
| | 87 | | 2,893 |
Fidelity National Information Services, Inc.
| | 1,236 | | 93,145 |
Fiserv, Inc. (a)
| | 1,300 | | 193,752 |
Global Payments, Inc.
| | 413 | | 39,937 |
Jack Henry & Associates, Inc.
| | 85 | | 14,112 |
Jackson Financial, Inc. Class A
| | 262 | | 19,456 |
Mastercard, Inc. Class A
| | 1,655 | | 730,120 |
MGIC Investment Corp.
| | 888 | | 19,136 |
Mr Cooper Group, Inc. (a)
| | 231 | | 18,764 |
NCR Atleos Corp. (a)
| | 75 | | 2,027 |
NMI Holdings, Inc. Class A (a)
| | 229 | | 7,795 |
Payoneer Global, Inc. (a)
| | 199 | | 1,102 |
PayPal Holdings, Inc. (a)
| | 124 | | 7,196 |
Radian Group, Inc.
| | 463 | | 14,399 |
Visa, Inc. Class A
| | 2,505 | | 657,487 |
Voya Financial, Inc.
| | 104 | | 7,400 |
See accompanying notes to financial statements.
66
SPDR SERIES TRUST
SPDR S&P 1500 MOMENTUM TILT ETF
SCHEDULE OF INVESTMENTS (continued)
June 30, 2024
| Security Description | | | Shares | | Value |
Walker & Dunlop, Inc.
| | 109 | | $10,704 |
Western Union Co.
| | 851 | | 10,399 |
WEX, Inc. (a)
| | 95 | | 16,828 |
| | | | | | 3,462,775 |
| FOOD PRODUCTS — 0.1% | |
Archer-Daniels-Midland Co.
| | 56 | | 3,385 |
B&G Foods, Inc. (b)
| | 162 | | 1,309 |
Bunge Global SA
| | 199 | | 21,247 |
Calavo Growers, Inc.
| | 6 | | 136 |
Cal-Maine Foods, Inc.
| | 38 | | 2,322 |
Campbell Soup Co.
| | 64 | | 2,892 |
Conagra Brands, Inc.
| | 49 | | 1,393 |
Darling Ingredients, Inc. (a)
| | 17 | | 625 |
Flowers Foods, Inc.
| | 20 | | 444 |
Fresh Del Monte Produce, Inc.
| | 34 | | 743 |
General Mills, Inc.
| | 60 | | 3,796 |
Hain Celestial Group, Inc. (a)
| | 32 | | 221 |
Hershey Co.
| | 15 | | 2,757 |
Hormel Foods Corp.
| | 95 | | 2,897 |
Ingredion, Inc.
| | 112 | | 12,846 |
J & J Snack Foods Corp.
| | 6 | | 974 |
J M Smucker Co.
| | 46 | | 5,016 |
John B Sanfilippo & Son, Inc.
| | 10 | | 972 |
Kellanova
| | 87 | | 5,018 |
Kraft Heinz Co.
| | 438 | | 14,112 |
Lamb Weston Holdings, Inc.
| | 46 | | 3,868 |
Lancaster Colony Corp.
| | 15 | | 2,835 |
McCormick & Co., Inc.
| | 27 | | 1,915 |
Mondelez International, Inc. Class A
| | 427 | | 27,943 |
Pilgrim's Pride Corp. (a)
| | 120 | | 4,619 |
Post Holdings, Inc. (a)
| | 79 | | 8,229 |
Simply Good Foods Co. (a)
| | 50 | | 1,806 |
Tootsie Roll Industries, Inc.
| | 2 | | 61 |
TreeHouse Foods, Inc. (a)
| | 29 | | 1,063 |
Tyson Foods, Inc. Class A
| | 109 | | 6,228 |
WK Kellogg Co.
| | 49 | | 806 |
| | | | | | 142,478 |
| GAS UTILITIES — 0.0% (d) | |
Atmos Energy Corp.
| | 174 | | 20,297 |
Chesapeake Utilities Corp.
| | 9 | | 956 |
National Fuel Gas Co.
| | 50 | | 2,710 |
New Jersey Resources Corp.
| | 76 | | 3,248 |
Northwest Natural Holding Co.
| | 11 | | 397 |
ONE Gas, Inc.
| | 43 | | 2,746 |
Southwest Gas Holdings, Inc.
| | 171 | | 12,035 |
Spire, Inc.
| | 30 | | 1,822 |
UGI Corp.
| | 27 | | 618 |
| | | | | | 44,829 |
| GROUND TRANSPORTATION — 1.2% | |
ArcBest Corp.
| | 52 | | 5,568 |
Avis Budget Group, Inc. (b)
| | 2 | | 209 |
CSX Corp.
| | 3,544 | | 118,547 |
Heartland Express, Inc.
| | 30 | | 370 |
JB Hunt Transport Services, Inc.
| | 108 | | 17,280 |
| Security Description | | | Shares | | Value |
Knight-Swift Transportation Holdings, Inc.
| | 136 | | $6,789 |
Landstar System, Inc.
| | 43 | | 7,933 |
Marten Transport Ltd.
| | 83 | | 1,531 |
Norfolk Southern Corp.
| | 453 | | 97,255 |
Old Dominion Freight Line, Inc.
| | 435 | | 76,821 |
RXO, Inc. (a)
| | 86 | | 2,249 |
Ryder System, Inc.
| | 145 | | 17,963 |
Saia, Inc. (a)
| | 95 | | 45,057 |
Uber Technologies, Inc. (a)
| | 8,179 | | 594,450 |
Union Pacific Corp.
| | 1,223 | | 276,716 |
Werner Enterprises, Inc.
| | 85 | | 3,045 |
XPO, Inc. (a)
| | 472 | | 50,103 |
| | | | | | 1,321,886 |
| HEALTH CARE EQUIPMENT & SUPPLIES — 1.3% | |
Abbott Laboratories
| | 1,650 | | 171,451 |
Align Technology, Inc. (a)
| | 38 | | 9,174 |
Artivion, Inc. (a)
| | 4 | | 103 |
Avanos Medical, Inc. (a)
| | 5 | | 100 |
Baxter International, Inc.
| | 158 | | 5,285 |
Becton Dickinson & Co.
| | 91 | | 21,268 |
Boston Scientific Corp. (a)
| | 3,248 | | 250,128 |
CONMED Corp.
| | 60 | | 4,159 |
Cooper Cos., Inc.
| | 189 | | 16,500 |
Dentsply Sirona, Inc.
| | 152 | | 3,786 |
Dexcom, Inc. (a)
| | 529 | | 59,978 |
Edwards Lifesciences Corp. (a)
| | 704 | | 65,028 |
Embecta Corp.
| | 18 | | 225 |
Enovis Corp. (a)
| | 15 | | 678 |
Envista Holdings Corp. (a)
| | 54 | | 898 |
GE HealthCare Technologies, Inc.
| | 583 | | 45,427 |
Glaukos Corp. (a)
| | 176 | | 20,830 |
Globus Medical, Inc. Class A (a)
| | 12 | | 822 |
Haemonetics Corp. (a)
| | 70 | | 5,791 |
Hologic, Inc. (a)
| | 75 | | 5,569 |
ICU Medical, Inc. (a)
| | 6 | | 712 |
IDEXX Laboratories, Inc. (a)
| | 96 | | 46,771 |
Inari Medical, Inc. (a)
| | 89 | | 4,285 |
Insulet Corp. (a)
| | 7 | | 1,413 |
Integer Holdings Corp. (a)
| | 117 | | 13,547 |
Integra LifeSciences Holdings Corp. (a)
| | 7 | | 204 |
Intuitive Surgical, Inc. (a)
| | 781 | | 347,428 |
Lantheus Holdings, Inc. (a)
| | 52 | | 4,175 |
LeMaitre Vascular, Inc.
| | 68 | | 5,595 |
LivaNova PLC (a)
| | 36 | | 1,974 |
Masimo Corp. (a)
| | 5 | | 630 |
Medtronic PLC
| | 702 | | 55,254 |
Merit Medical Systems, Inc. (a)
| | 69 | | 5,931 |
Neogen Corp. (a)
| | 101 | | 1,579 |
Omnicell, Inc. (a)
| | 19 | | 514 |
Penumbra, Inc. (a)
| | 5 | | 900 |
QuidelOrtho Corp. (a)
| | 5 | | 166 |
ResMed, Inc.
| | 15 | | 2,871 |
Solventum Corp. (a)
| | 17 | | 899 |
STAAR Surgical Co. (a)
| | 5 | | 238 |
See accompanying notes to financial statements.
67
SPDR SERIES TRUST
SPDR S&P 1500 MOMENTUM TILT ETF
SCHEDULE OF INVESTMENTS (continued)
June 30, 2024
| Security Description | | | Shares | | Value |
STERIS PLC
| | 157 | | $34,468 |
Stryker Corp.
| | 535 | | 182,034 |
Tandem Diabetes Care, Inc. (a)
| | 6 | | 242 |
Teleflex, Inc.
| | 5 | | 1,052 |
UFP Technologies, Inc. (a)
| | 31 | | 8,180 |
Varex Imaging Corp. (a)
| | 28 | | 412 |
Zimmer Biomet Holdings, Inc.
| | 67 | | 7,272 |
| | | | | | 1,415,946 |
| HEALTH CARE PROVIDERS & SERVICES — 1.7% | |
Acadia Healthcare Co., Inc. (a)
| | 106 | | 7,159 |
AdaptHealth Corp. (a)
| | 8 | | 80 |
Addus HomeCare Corp. (a)
| | 21 | | 2,438 |
Amedisys, Inc. (a)
| | 44 | | 4,039 |
AMN Healthcare Services, Inc. (a)
| | 21 | | 1,076 |
Astrana Health, Inc. (a)
| | 4 | | 162 |
Cardinal Health, Inc.
| | 643 | | 63,220 |
Cencora, Inc.
| | 507 | | 114,227 |
Centene Corp. (a)
| | 734 | | 48,664 |
Chemed Corp.
| | 21 | | 11,394 |
Cigna Group
| | 811 | | 268,092 |
CorVel Corp. (a)
| | 25 | | 6,357 |
Cross Country Healthcare, Inc. (a)
| | 4 | | 55 |
CVS Health Corp.
| | 1,461 | | 86,287 |
DaVita, Inc. (a)
| | 176 | | 24,388 |
Elevance Health, Inc.
| | 322 | | 174,479 |
Encompass Health Corp.
| | 222 | | 19,045 |
Enhabit, Inc. (a)
| | 5 | | 45 |
Ensign Group, Inc.
| | 121 | | 14,967 |
Fulgent Genetics, Inc. (a)
| | 2 | | 39 |
HCA Healthcare, Inc.
| | 263 | | 84,497 |
HealthEquity, Inc. (a)
| | 280 | | 24,136 |
Henry Schein, Inc. (a)
| | 40 | | 2,564 |
Humana, Inc.
| | 13 | | 4,858 |
Labcorp Holdings, Inc.
| | 113 | | 22,997 |
McKesson Corp.
| | 402 | | 234,784 |
Molina Healthcare, Inc. (a)
| | 141 | | 41,919 |
National HealthCare Corp.
| | 48 | | 5,203 |
NeoGenomics, Inc. (a)
| | 352 | | 4,882 |
Option Care Health, Inc. (a)
| | 172 | | 4,764 |
Owens & Minor, Inc. (a)
| | 282 | | 3,807 |
Patterson Cos., Inc.
| | 61 | | 1,471 |
Pediatrix Medical Group, Inc. (a)
| | 30 | | 227 |
Progyny, Inc. (a)
| | 9 | | 258 |
Quest Diagnostics, Inc.
| | 37 | | 5,065 |
R1 RCM, Inc. (a)
| | 13 | | 163 |
RadNet, Inc. (a)
| | 248 | | 14,612 |
Select Medical Holdings Corp.
| | 11 | | 386 |
Tenet Healthcare Corp. (a)
| | 280 | | 37,249 |
U.S. Physical Therapy, Inc.
| | 8 | | 739 |
UnitedHealth Group, Inc.
| | 879 | | 447,640 |
Universal Health Services, Inc. Class B
| | 109 | | 20,157 |
| | | | | | 1,808,591 |
| HEALTH CARE REITs — 0.1% | |
CareTrust REIT, Inc.
| | 286 | | 7,179 |
| Security Description | | | Shares | | Value |
Community Healthcare Trust, Inc. REIT
| | 8 | | $187 |
Healthcare Realty Trust, Inc. REIT
| | 126 | | 2,076 |
Healthpeak Properties, Inc. REIT
| | 151 | | 2,960 |
LTC Properties, Inc. REIT
| | 13 | | 449 |
Medical Properties Trust, Inc. REIT
| | 201 | | 866 |
Omega Healthcare Investors, Inc. REIT
| | 437 | | 14,967 |
Sabra Health Care REIT, Inc.
| | 533 | | 8,208 |
Universal Health Realty Income Trust REIT
| | 29 | | 1,135 |
Ventas, Inc. REIT
| | 128 | | 6,561 |
Welltower, Inc. REIT
| | 1,075 | | 112,069 |
| | | | | | 156,657 |
| HEALTH CARE TECHNOLOGY — 0.0% (d) | |
Certara, Inc. (a)
| | 87 | | 1,205 |
Schrodinger, Inc. (a)
| | 22 | | 426 |
Simulations Plus, Inc.
| | 2 | | 97 |
| | | | | | 1,728 |
| HOTEL & RESORT REITs — 0.1% | |
Apple Hospitality REIT, Inc.
| | 196 | | 2,850 |
DiamondRock Hospitality Co. REIT
| | 65 | | 549 |
Host Hotels & Resorts, Inc. REIT
| | 1,713 | | 30,800 |
Park Hotels & Resorts, Inc. REIT
| | 732 | | 10,965 |
Pebblebrook Hotel Trust REIT
| | 12 | | 165 |
Service Properties Trust REIT
| | 200 | | 1,028 |
Summit Hotel Properties, Inc. REIT
| | 197 | | 1,180 |
Sunstone Hotel Investors, Inc. REIT
| | 67 | | 701 |
Xenia Hotels & Resorts, Inc. REIT
| | 172 | | 2,465 |
| | | | | | 50,703 |
| HOTELS, RESTAURANTS & LEISURE — 1.7% | |
Airbnb, Inc. Class A (a)
| | 1,058 | | 160,425 |
Aramark
| | 582 | | 19,800 |
BJ's Restaurants, Inc. (a)
| | 3 | | 104 |
Bloomin' Brands, Inc.
| | 231 | | 4,442 |
Booking Holdings, Inc.
| | 83 | | 328,804 |
Boyd Gaming Corp.
| | 64 | | 3,526 |
Brinker International, Inc. (a)
| | 35 | | 2,534 |
Caesars Entertainment, Inc. (a)
| | 109 | | 4,332 |
Carnival Corp. (a)
| | 3,813 | | 71,379 |
Cheesecake Factory, Inc.
| | 27 | | 1,061 |
Chipotle Mexican Grill, Inc. (a)
| | 3,650 | | 228,672 |
Choice Hotels International, Inc.
| | 13 | | 1,547 |
Churchill Downs, Inc.
| | 7 | | 977 |
Chuy's Holdings, Inc. (a)
| | 2 | | 52 |
Cracker Barrel Old Country Store, Inc. (b)
| | 2 | | 84 |
Darden Restaurants, Inc.
| | 165 | | 24,968 |
Dave & Buster's Entertainment, Inc. (a)
| | 119 | | 4,737 |
Dine Brands Global, Inc.
| | 12 | | 434 |
Domino's Pizza, Inc.
| | 115 | | 59,378 |
Expedia Group, Inc. (a)
| | 400 | | 50,396 |
Golden Entertainment, Inc.
| | 7 | | 218 |
Hilton Grand Vacations, Inc. (a)
| | 21 | | 849 |
See accompanying notes to financial statements.
68
SPDR SERIES TRUST
SPDR S&P 1500 MOMENTUM TILT ETF
SCHEDULE OF INVESTMENTS (continued)
June 30, 2024
| Security Description | | | Shares | | Value |
Hilton Worldwide Holdings, Inc.
| | 773 | | $168,669 |
Hyatt Hotels Corp. Class A
| | 95 | | 14,432 |
Jack in the Box, Inc.
| | 6 | | 306 |
Las Vegas Sands Corp.
| | 38 | | 1,682 |
Light & Wonder, Inc. (a)
| | 314 | | 32,932 |
Marriott International, Inc. Class A
| | 787 | | 190,273 |
Marriott Vacations Worldwide Corp.
| | 4 | | 349 |
McDonald's Corp.
| | 230 | | 58,613 |
MGM Resorts International (a)
| | 263 | | 11,688 |
Monarch Casino & Resort, Inc.
| | 37 | | 2,521 |
Norwegian Cruise Line Holdings Ltd. (a)
| | 1,393 | | 26,174 |
Papa John's International, Inc.
| | 10 | | 470 |
Penn Entertainment, Inc. (a)
| | 17 | | 329 |
Royal Caribbean Cruises Ltd. (a)
| | 923 | | 147,154 |
Sabre Corp. (a)
| | 37 | | 99 |
Shake Shack, Inc. Class A (a)
| | 138 | | 12,420 |
Six Flags Entertainment Corp.
| | 112 | | 3,712 |
Starbucks Corp.
| | 120 | | 9,342 |
Texas Roadhouse, Inc.
| | 190 | | 32,625 |
Travel & Leisure Co.
| | 158 | | 7,107 |
Vail Resorts, Inc.
| | 8 | | 1,441 |
Wendy's Co.
| | 85 | | 1,442 |
Wingstop, Inc.
| | 111 | | 46,915 |
Wyndham Hotels & Resorts, Inc.
| | 112 | | 8,288 |
Wynn Resorts Ltd.
| | 29 | | 2,595 |
Yum! Brands, Inc.
| | 148 | | 19,604 |
| | | | | | 1,769,901 |
| HOUSEHOLD DURABLES — 0.7% | |
Cavco Industries, Inc. (a)
| | 19 | | 6,577 |
Century Communities, Inc.
| | 106 | | 8,656 |
DR Horton, Inc.
| | 977 | | 137,689 |
Ethan Allen Interiors, Inc.
| | 80 | | 2,231 |
Garmin Ltd.
| | 501 | | 81,623 |
Green Brick Partners, Inc. (a)
| | 113 | | 6,468 |
Helen of Troy Ltd. (a)
| | 40 | | 3,710 |
Installed Building Products, Inc.
| | 99 | | 20,362 |
KB Home
| | 241 | | 16,913 |
La-Z-Boy, Inc.
| | 69 | | 2,572 |
Leggett & Platt, Inc.
| | 14 | | 160 |
Lennar Corp. Class A
| | 793 | | 118,847 |
LGI Homes, Inc. (a)
| | 35 | | 3,132 |
M/I Homes, Inc. (a)
| | 123 | | 15,023 |
Meritage Homes Corp.
| | 96 | | 15,538 |
Mohawk Industries, Inc. (a)
| | 95 | | 10,791 |
Newell Brands, Inc.
| | 42 | | 269 |
NVR, Inc. (a)
| | 8 | | 60,709 |
PulteGroup, Inc.
| | 816 | | 89,842 |
Taylor Morrison Home Corp. (a)
| | 363 | | 20,125 |
Tempur Sealy International, Inc.
| | 564 | | 26,700 |
Toll Brothers, Inc.
| | 415 | | 47,800 |
TopBuild Corp. (a)
| | 120 | | 46,232 |
Tri Pointe Homes, Inc. (a)
| | 239 | | 8,903 |
Whirlpool Corp.
| | 6 | | 613 |
| Security Description | | | Shares | | Value |
Worthington Enterprises, Inc.
| | 124 | | $5,869 |
| | | | | | 757,354 |
| HOUSEHOLD PRODUCTS — 0.5% | |
Central Garden & Pet Co. Class A (a)
| | 72 | | 2,378 |
Church & Dwight Co., Inc.
| | 287 | | 29,756 |
Clorox Co.
| | 39 | | 5,322 |
Colgate-Palmolive Co.
| | 1,130 | | 109,655 |
Energizer Holdings, Inc.
| | 20 | | 591 |
Kimberly-Clark Corp.
| | 106 | | 14,649 |
Procter & Gamble Co.
| | 2,236 | | 368,761 |
WD-40 Co.
| | 29 | | 6,370 |
| | | | | | 537,482 |
| INDEPENDENT POWER AND RENEWABLE ELECTRICITY PRODUCERS — 0.1% | |
AES Corp.
| | 75 | | 1,318 |
Ormat Technologies, Inc.
| | 5 | | 359 |
Vistra Corp.
| | 1,384 | | 118,996 |
| | | | | | 120,673 |
| INDUSTRIAL CONGLOMERATES — 0.8% | |
3M Co.
| | 509 | | 52,015 |
General Electric Co.
| | 4,053 | | 644,305 |
Honeywell International, Inc.
| | 626 | | 133,676 |
| | | | | | 829,996 |
| INDUSTRIAL REITs — 0.2% | |
EastGroup Properties, Inc. REIT
| | 75 | | 12,758 |
First Industrial Realty Trust, Inc. REIT
| | 159 | | 7,554 |
Innovative Industrial Properties, Inc. REIT
| | 101 | | 11,031 |
LXP Industrial Trust REIT
| | 150 | | 1,368 |
Prologis, Inc. REIT
| | 1,073 | | 120,509 |
Rexford Industrial Realty, Inc. REIT
| | 60 | | 2,675 |
STAG Industrial, Inc. REIT
| | 353 | | 12,729 |
| | | | | | 168,624 |
| INSURANCE — 2.2% | |
Aflac, Inc.
| | 947 | | 84,577 |
Allstate Corp.
| | 860 | | 137,308 |
American Financial Group, Inc.
| | 90 | | 11,072 |
American International Group, Inc.
| | 2,176 | | 161,546 |
AMERISAFE, Inc.
| | 12 | | 527 |
Aon PLC Class A
| | 207 | | 60,771 |
Arch Capital Group Ltd. (a)
| | 668 | | 67,395 |
Arthur J Gallagher & Co.
| | 390 | | 101,131 |
Assurant, Inc.
| | 170 | | 28,263 |
Assured Guaranty Ltd.
| | 189 | | 14,581 |
Brighthouse Financial, Inc. (a)
| | 21 | | 910 |
Brown & Brown, Inc.
| | 574 | | 51,321 |
Chubb Ltd.
| | 898 | | 229,062 |
Cincinnati Financial Corp.
| | 249 | | 29,407 |
CNO Financial Group, Inc.
| | 210 | | 5,821 |
Employers Holdings, Inc.
| | 43 | | 1,833 |
Erie Indemnity Co. Class A
| | 92 | | 33,341 |
See accompanying notes to financial statements.
69
SPDR SERIES TRUST
SPDR S&P 1500 MOMENTUM TILT ETF
SCHEDULE OF INVESTMENTS (continued)
June 30, 2024
| Security Description | | | Shares | | Value |
Everest Group Ltd.
| | 49 | | $18,670 |
Fidelity National Financial, Inc.
| | 846 | | 41,809 |
First American Financial Corp.
| | 157 | | 8,470 |
Genworth Financial, Inc. Class A (a)
| | 1,171 | | 7,073 |
Globe Life, Inc.
| | 65 | | 5,348 |
Goosehead Insurance, Inc. Class A (a)
| | 97 | | 5,572 |
Hanover Insurance Group, Inc.
| | 29 | | 3,638 |
Hartford Financial Services Group, Inc.
| | 914 | | 91,894 |
HCI Group, Inc.
| | 7 | | 645 |
Horace Mann Educators Corp.
| | 20 | | 652 |
Kemper Corp.
| | 134 | | 7,950 |
Kinsale Capital Group, Inc.
| | 72 | | 27,740 |
Lincoln National Corp.
| | 556 | | 17,292 |
Loews Corp.
| | 442 | | 33,035 |
Marsh & McLennan Cos., Inc.
| | 675 | | 142,236 |
Mercury General Corp.
| | 96 | | 5,101 |
MetLife, Inc.
| | 1,102 | | 77,349 |
Old Republic International Corp.
| | 563 | | 17,397 |
Palomar Holdings, Inc. (a)
| | 86 | | 6,979 |
Primerica, Inc.
| | 82 | | 19,400 |
Principal Financial Group, Inc.
| | 347 | | 27,222 |
ProAssurance Corp. (a)
| | 101 | | 1,234 |
Progressive Corp.
| | 1,916 | | 397,972 |
Prudential Financial, Inc.
| | 1,029 | | 120,589 |
Reinsurance Group of America, Inc.
| | 174 | | 35,717 |
RenaissanceRe Holdings Ltd.
| | 48 | | 10,728 |
RLI Corp.
| | 45 | | 6,331 |
Safety Insurance Group, Inc.
| | 10 | | 750 |
Selective Insurance Group, Inc.
| | 100 | | 9,383 |
SiriusPoint Ltd. (a)
| | 486 | | 5,929 |
Stewart Information Services Corp.
| | 106 | | 6,580 |
Travelers Cos., Inc.
| | 506 | | 102,890 |
Trupanion, Inc. (a)
| | 28 | | 823 |
United Fire Group, Inc.
| | 37 | | 795 |
Unum Group
| | 403 | | 20,597 |
W R Berkley Corp.
| | 663 | | 52,099 |
Willis Towers Watson PLC
| | 163 | | 42,729 |
| | | | | | 2,399,484 |
| INTERACTIVE MEDIA & SERVICES — 9.3% | |
Alphabet, Inc. Class A
| | 16,799 | | 3,059,938 |
Alphabet, Inc. Class C
| | 13,958 | | 2,560,176 |
Cargurus, Inc. (a)
| | 243 | | 6,367 |
Cars.com, Inc. (a)
| | 95 | | 1,871 |
Match Group, Inc. (a)
| | 40 | | 1,215 |
Meta Platforms, Inc. Class A
| | 8,578 | | 4,325,199 |
QuinStreet, Inc. (a)
| | 6 | | 100 |
Shutterstock, Inc. (b)
| | 44 | | 1,703 |
TripAdvisor, Inc. (a)
| | 354 | | 6,305 |
Yelp, Inc. (a)
| | 231 | | 8,535 |
Ziff Davis, Inc. (a)
| | 38 | | 2,092 |
| | | | | | 9,973,501 |
| IT SERVICES — 1.1% | |
Accenture PLC Class A
| | 1,126 | | 341,640 |
| Security Description | | | Shares | | Value |
Akamai Technologies, Inc. (a)
| | 336 | | $30,267 |
Cognizant Technology Solutions Corp. Class A
| | 944 | | 64,192 |
DXC Technology Co. (a)
| | 21 | | 401 |
EPAM Systems, Inc. (a)
| | 6 | | 1,129 |
Gartner, Inc. (a)
| | 255 | | 114,510 |
GoDaddy, Inc. Class A (a)
| | 460 | | 64,266 |
International Business Machines Corp.
| | 2,995 | | 517,985 |
Kyndryl Holdings, Inc. (a)
| | 777 | | 20,443 |
Perficient, Inc. (a)
| | 11 | | 823 |
VeriSign, Inc. (a)
| | 10 | | 1,778 |
| | | | | | 1,157,434 |
| LEISURE EQUIPMENT & PRODUCTS — 0.0% (d) | |
Brunswick Corp.
| | 95 | | 6,913 |
Hasbro, Inc.
| | 40 | | 2,340 |
Mattel, Inc. (a)
| | 405 | | 6,585 |
Polaris, Inc.
| | 5 | | 392 |
Sturm Ruger & Co., Inc.
| | 28 | | 1,166 |
Topgolf Callaway Brands Corp. (a)
| | 46 | | 704 |
Vista Outdoor, Inc. (a)
| | 105 | | 3,953 |
YETI Holdings, Inc. (a)
| | 31 | | 1,183 |
| | | | | | 23,236 |
| LIFE SCIENCES TOOLS & SERVICES — 0.7% | |
Agilent Technologies, Inc.
| | 341 | | 44,204 |
Azenta, Inc. (a)
| | 139 | | 7,314 |
BioLife Solutions, Inc. (a)
| | 9 | | 193 |
Bio-Rad Laboratories, Inc. Class A (a)
| | 6 | | 1,639 |
Bio-Techne Corp.
| | 19 | | 1,361 |
Bruker Corp.
| | 118 | | 7,530 |
Charles River Laboratories International, Inc. (a)
| | 146 | | 30,161 |
Danaher Corp.
| | 1,042 | | 260,344 |
Fortrea Holdings, Inc. (a)
| | 127 | | 2,964 |
Illumina, Inc. (a)
| | 17 | | 1,774 |
IQVIA Holdings, Inc. (a)
| | 443 | | 93,668 |
Medpace Holdings, Inc. (a)
| | 91 | | 37,478 |
Mettler-Toledo International, Inc. (a)
| | 2 | | 2,795 |
Repligen Corp. (a)
| | 82 | | 10,337 |
Revvity, Inc.
| | 13 | | 1,363 |
Sotera Health Co. (a)
| | 71 | | 843 |
Thermo Fisher Scientific, Inc.
| | 367 | | 202,951 |
Waters Corp. (a)
| | 81 | | 23,500 |
West Pharmaceutical Services, Inc.
| | 86 | | 28,327 |
| | | | | | 758,746 |
| MACHINERY — 2.1% | |
3D Systems Corp. (a)
| | 13 | | 40 |
AGCO Corp.
| | 32 | | 3,132 |
Alamo Group, Inc.
| | 32 | | 5,536 |
Albany International Corp. Class A
| | 10 | | 844 |
Astec Industries, Inc.
| | 7 | | 208 |
Barnes Group, Inc.
| | 50 | | 2,070 |
Caterpillar, Inc.
| | 1,707 | | 568,602 |
See accompanying notes to financial statements.
70
SPDR SERIES TRUST
SPDR S&P 1500 MOMENTUM TILT ETF
SCHEDULE OF INVESTMENTS (continued)
June 30, 2024
| Security Description | | | Shares | | Value |
Chart Industries, Inc. (a)
| | 76 | | $10,970 |
Crane Co.
| | 185 | | 26,821 |
Cummins, Inc.
| | 273 | | 75,602 |
Deere & Co.
| | 303 | | 113,210 |
Donaldson Co., Inc.
| | 174 | | 12,451 |
Dover Corp.
| | 251 | | 45,293 |
Enerpac Tool Group Corp.
| | 81 | | 3,093 |
Enpro, Inc.
| | 76 | | 11,063 |
Esab Corp.
| | 191 | | 18,036 |
ESCO Technologies, Inc.
| | 55 | | 5,777 |
Federal Signal Corp.
| | 194 | | 16,232 |
Flowserve Corp.
| | 326 | | 15,681 |
Fortive Corp.
| | 851 | | 63,059 |
Franklin Electric Co., Inc.
| | 53 | | 5,105 |
Graco, Inc.
| | 267 | | 21,168 |
Greenbrier Cos., Inc.
| | 80 | | 3,964 |
Hillenbrand, Inc.
| | 68 | | 2,721 |
IDEX Corp.
| | 120 | | 24,144 |
Illinois Tool Works, Inc.
| | 373 | | 88,386 |
Ingersoll Rand, Inc.
| | 1,410 | | 128,084 |
ITT, Inc.
| | 269 | | 34,749 |
John Bean Technologies Corp.
| | 10 | | 950 |
Kennametal, Inc.
| | 61 | | 1,436 |
Lincoln Electric Holdings, Inc.
| | 187 | | 35,276 |
Lindsay Corp.
| | 1 | | 123 |
Middleby Corp. (a)
| | 74 | | 9,073 |
Mueller Industries, Inc.
| | 333 | | 18,961 |
Nordson Corp.
| | 108 | | 25,049 |
Oshkosh Corp.
| | 228 | | 24,670 |
Otis Worldwide Corp.
| | 628 | | 60,451 |
PACCAR, Inc.
| | 1,933 | | 198,983 |
Parker-Hannifin Corp.
| | 475 | | 240,260 |
Pentair PLC
| | 507 | | 38,872 |
Proto Labs, Inc. (a)
| | 28 | | 865 |
RBC Bearings, Inc. (a)
| | 57 | | 15,377 |
Snap-on, Inc.
| | 73 | | 19,081 |
SPX Technologies, Inc. (a)
| | 168 | | 23,879 |
Standex International Corp.
| | 32 | | 5,157 |
Stanley Black & Decker, Inc.
| | 285 | | 22,769 |
Tennant Co.
| | 48 | | 4,725 |
Terex Corp.
| | 203 | | 11,133 |
Timken Co.
| | 60 | | 4,808 |
Titan International, Inc. (a)
| | 16 | | 119 |
Toro Co.
| | 35 | | 3,273 |
Trinity Industries, Inc.
| | 81 | | 2,424 |
Wabash National Corp.
| | 47 | | 1,026 |
Watts Water Technologies, Inc. Class A
| | 64 | | 11,736 |
Westinghouse Air Brake Technologies Corp.
| | 548 | | 86,611 |
Xylem, Inc.
| | 433 | | 58,728 |
| | | | | | 2,231,856 |
| MARINE — 0.0% (d) | |
Kirby Corp. (a)
| | 107 | | 12,811 |
| Security Description | | | Shares | | Value |
Matson, Inc.
| | 104 | | $13,621 |
| | | | | | 26,432 |
| MEDIA — 0.2% | |
AMC Networks, Inc. Class A (a)
| | 3 | | 29 |
Cable One, Inc.
| | 1 | | 354 |
Charter Communications, Inc. Class A (a)
| | 10 | | 2,990 |
Comcast Corp. Class A
| | 3,766 | | 147,477 |
Fox Corp. Class A
| | 76 | | 2,612 |
Fox Corp. Class B
| | 40 | | 1,281 |
Interpublic Group of Cos., Inc.
| | 236 | | 6,865 |
John Wiley & Sons, Inc. Class A
| | 67 | | 2,727 |
New York Times Co. Class A
| | 190 | | 9,730 |
News Corp. Class A
| | 1,163 | | 32,064 |
News Corp. Class B
| | 333 | | 9,454 |
Nexstar Media Group, Inc.
| | 30 | | 4,980 |
Omnicom Group, Inc.
| | 223 | | 20,003 |
Paramount Global Class B
| | 195 | | 2,026 |
Scholastic Corp.
| | 12 | | 426 |
TechTarget, Inc. (a)
| | 61 | | 1,901 |
TEGNA, Inc.
| | 75 | | 1,045 |
| | | | | | 245,964 |
| METALS & MINING — 0.5% | |
Alcoa Corp.
| | 17 | | 676 |
Alpha Metallurgical Resources, Inc.
| | 47 | | 13,185 |
Arch Resources, Inc.
| | 52 | | 7,916 |
ATI, Inc. (a)
| | 340 | | 18,853 |
Carpenter Technology Corp.
| | 121 | | 13,259 |
Century Aluminum Co. (a)
| | 200 | | 3,350 |
Cleveland-Cliffs, Inc. (a)
| | 1,526 | | 23,485 |
Commercial Metals Co.
| | 233 | | 12,813 |
Compass Minerals International, Inc.
| | 32 | | 331 |
Freeport-McMoRan, Inc.
| | 2,574 | | 125,096 |
Kaiser Aluminum Corp.
| | 11 | | 967 |
Materion Corp.
| | 57 | | 6,163 |
Metallus, Inc. (a)
| | 111 | | 2,250 |
MP Materials Corp. (a)
| | 9 | | 115 |
Newmont Corp.
| | 118 | | 4,941 |
Nucor Corp.
| | 597 | | 94,374 |
Olympic Steel, Inc.
| | 33 | | 1,479 |
Reliance, Inc.
| | 135 | | 38,556 |
Royal Gold, Inc.
| | 47 | | 5,882 |
Steel Dynamics, Inc.
| | 434 | | 56,203 |
SunCoke Energy, Inc.
| | 31 | | 304 |
U.S. Steel Corp.
| | 844 | | 31,903 |
Warrior Met Coal, Inc.
| | 222 | | 13,935 |
Worthington Steel, Inc.
| | 124 | | 4,137 |
| | | | | | 480,173 |
| MORTGAGE REAL ESTATE INVESTMENT TRUST (REITs) — 0.0% (d) | |
Annaly Capital Management, Inc. REIT
| | 687 | | 13,094 |
Apollo Commercial Real Estate Finance, Inc. REIT
| | 222 | | 2,173 |
See accompanying notes to financial statements.
71
SPDR SERIES TRUST
SPDR S&P 1500 MOMENTUM TILT ETF
SCHEDULE OF INVESTMENTS (continued)
June 30, 2024
| Security Description | | | Shares | | Value |
Arbor Realty Trust, Inc. REIT (b)
| | 329 | | $4,721 |
ARMOUR Residential REIT, Inc.
| | 14 | | 271 |
Blackstone Mortgage Trust, Inc. Class A REIT
| | 176 | | 3,066 |
Ellington Financial, Inc. REIT (b)
| | 81 | | 979 |
Hannon Armstrong Sustainable Infrastructure Capital, Inc. REIT (b)
| | 137 | | 4,055 |
New York Mortgage Trust, Inc. REIT
| | 77 | | 450 |
PennyMac Mortgage Investment Trust REIT
| | 126 | | 1,733 |
Ready Capital Corp. REIT (b)
| | 49 | | 401 |
Redwood Trust, Inc. REIT
| | 163 | | 1,058 |
Two Harbors Investment Corp. REIT
| | 48 | | 634 |
Starwood Property Trust, Inc. REIT (b)
| | 534 | | 10,114 |
| | | | | | 42,749 |
| MULTI-UTILITIES — 0.1% | |
Ameren Corp.
| | 81 | | 5,760 |
Avista Corp.
| | 92 | | 3,184 |
Black Hills Corp.
| | 49 | | 2,664 |
CenterPoint Energy, Inc.
| | 200 | | 6,196 |
CMS Energy Corp.
| | 159 | | 9,465 |
Consolidated Edison, Inc.
| | 109 | | 9,747 |
Dominion Energy, Inc.
| | 265 | | 12,985 |
DTE Energy Co.
| | 196 | | 21,758 |
NiSource, Inc.
| | 319 | | 9,190 |
Northwestern Energy Group, Inc.
| | 46 | | 2,304 |
Public Service Enterprise Group, Inc.
| | 561 | | 41,346 |
Sempra
| | 200 | | 15,212 |
Unitil Corp.
| | 15 | | 777 |
WEC Energy Group, Inc.
| | 34 | | 2,668 |
| | | | | | 143,256 |
| OFFICE REITs — 0.1% | |
Alexandria Real Estate Equities, Inc. REIT
| | 183 | | 21,406 |
Boston Properties, Inc. REIT
| | 320 | | 19,699 |
Brandywine Realty Trust REIT
| | 220 | | 986 |
COPT Defense Properties REIT
| | 61 | | 1,527 |
Cousins Properties, Inc. REIT
| | 85 | | 1,968 |
Douglas Emmett, Inc. REIT (b)
| | 16 | | 213 |
Easterly Government Properties, Inc. REIT
| | 9 | | 111 |
Highwoods Properties, Inc. REIT
| | 185 | | 4,860 |
Hudson Pacific Properties, Inc. REIT
| | 114 | | 548 |
JBG SMITH Properties REIT
| | 39 | | 594 |
Kilroy Realty Corp. REIT
| | 236 | | 7,356 |
SL Green Realty Corp. REIT
| | 266 | | 15,066 |
Vornado Realty Trust REIT
| | 590 | | 15,511 |
| | | | | | 89,845 |
| OIL, GAS & CONSUMABLE FUELS — 2.3% | |
Antero Midstream Corp.
| | 732 | | 10,790 |
Antero Resources Corp. (a)
| | 508 | | 16,576 |
| Security Description | | | Shares | | Value |
APA Corp.
| | 52 | | $1,531 |
California Resources Corp.
| | 152 | | 8,089 |
Chesapeake Energy Corp.
| | 129 | | 10,603 |
Chevron Corp.
| | 539 | | 84,310 |
Chord Energy Corp.
| | 137 | | 22,972 |
Civitas Resources, Inc.
| | 172 | | 11,868 |
CNX Resources Corp. (a)
| | 494 | | 12,004 |
ConocoPhillips
| | 2,364 | | 270,394 |
CONSOL Energy, Inc. (a)
| | 88 | | 8,979 |
Coterra Energy, Inc.
| | 1,000 | | 26,670 |
Devon Energy Corp.
| | 339 | | 16,069 |
Diamondback Energy, Inc.
| | 548 | | 109,704 |
Dorian LPG Ltd.
| | 137 | | 5,749 |
DT Midstream, Inc.
| | 215 | | 15,272 |
EOG Resources, Inc.
| | 677 | | 85,214 |
EQT Corp.
| | 478 | | 17,676 |
Equitrans Midstream Corp.
| | 1,784 | | 23,156 |
Exxon Mobil Corp.
| | 3,327 | | 383,004 |
Green Plains, Inc. (a)
| | 89 | | 1,412 |
Hess Corp.
| | 262 | | 38,650 |
HF Sinclair Corp.
| | 445 | | 23,736 |
Kinder Morgan, Inc.
| | 2,654 | | 52,735 |
Magnolia Oil & Gas Corp. Class A
| | 333 | | 8,438 |
Marathon Oil Corp.
| | 927 | | 26,577 |
Marathon Petroleum Corp.
| | 1,230 | | 213,380 |
Matador Resources Co.
| | 269 | | 16,032 |
Murphy Oil Corp.
| | 291 | | 12,001 |
Northern Oil & Gas, Inc.
| | 178 | | 6,616 |
Occidental Petroleum Corp.
| | 764 | | 48,155 |
ONEOK, Inc.
| | 1,169 | | 95,332 |
Ovintiv, Inc.
| | 774 | | 36,277 |
Par Pacific Holdings, Inc. (a)
| | 153 | | 3,863 |
PBF Energy, Inc. Class A
| | 379 | | 17,442 |
Permian Resources Corp.
| | 1,889 | | 30,507 |
Phillips 66
| | 1,498 | | 211,473 |
Range Resources Corp.
| | 518 | | 17,369 |
REX American Resources Corp. (a)
| | 48 | | 2,188 |
SM Energy Co.
| | 428 | | 18,502 |
Southwestern Energy Co. (a)
| | 3,372 | | 22,694 |
Talos Energy, Inc. (a)
| | 10 | | 122 |
Targa Resources Corp.
| | 730 | | 94,009 |
Valero Energy Corp.
| | 1,072 | | 168,047 |
Vital Energy, Inc. (a)
| | 2 | | 90 |
Williams Cos., Inc.
| | 2,954 | | 125,545 |
World Kinect Corp.
| | 6 | | 155 |
| | | | | | 2,431,977 |
| PERSONAL CARE PRODUCTS — 0.1% | |
BellRing Brands, Inc. (a)
| | 498 | | 28,456 |
Coty, Inc. Class A (a)
| | 199 | | 1,994 |
Edgewell Personal Care Co.
| | 16 | | 643 |
elf Beauty, Inc. (a)
| | 229 | | 48,255 |
Estee Lauder Cos., Inc. Class A
| | 27 | | 2,873 |
Inter Parfums, Inc.
| | 38 | | 4,409 |
Kenvue, Inc.
| | 190 | | 3,454 |
Nu Skin Enterprises, Inc. Class A
| | 102 | | 1,075 |
See accompanying notes to financial statements.
72
SPDR SERIES TRUST
SPDR S&P 1500 MOMENTUM TILT ETF
SCHEDULE OF INVESTMENTS (continued)
June 30, 2024
| Security Description | | | Shares | | Value |
USANA Health Sciences, Inc. (a)
| | 8 | | $362 |
| | | | | | 91,521 |
| PAPER & FOREST PRODUCTS — 0.0% (d) | |
Clearwater Paper Corp. (a)
| | 5 | | 242 |
Louisiana-Pacific Corp.
| | 183 | | 15,067 |
Mercer International, Inc.
| | 208 | | 1,776 |
Sylvamo Corp.
| | 52 | | 3,567 |
| | | | | | 20,652 |
| PHARMACEUTICALS — 3.2% | |
Amphastar Pharmaceuticals, Inc. (a)
| | 158 | | 6,320 |
ANI Pharmaceuticals, Inc. (a)
| | 65 | | 4,139 |
Bristol-Myers Squibb Co.
| | 208 | | 8,638 |
Catalent, Inc. (a)
| | 248 | | 13,945 |
Collegium Pharmaceutical, Inc. (a)
| | 28 | | 902 |
Corcept Therapeutics, Inc. (a)
| | 107 | | 3,476 |
Eli Lilly & Co.
| | 2,956 | | 2,676,303 |
Harmony Biosciences Holdings, Inc. (a)
| | 3 | | 91 |
Innoviva, Inc. (a)
| | 153 | | 2,509 |
Jazz Pharmaceuticals PLC (a)
| | 6 | | 640 |
Johnson & Johnson
| | 1,271 | | 185,769 |
Ligand Pharmaceuticals, Inc. (a)
| | 18 | | 1,517 |
Merck & Co., Inc.
| | 3,478 | | 430,576 |
Organon & Co.
| | 30 | | 621 |
Pacira BioSciences, Inc. (a)
| | 4 | | 114 |
Perrigo Co. PLC
| | 45 | | 1,156 |
Pfizer, Inc.
| | 621 | | 17,376 |
Phibro Animal Health Corp. Class A
| | 2 | | 34 |
Prestige Consumer Healthcare, Inc. (a)
| | 59 | | 4,062 |
Supernus Pharmaceuticals, Inc. (a)
| | 42 | | 1,124 |
Viatris, Inc.
| | 2,660 | | 28,276 |
Zoetis, Inc.
| | 145 | | 25,137 |
| | | | | | 3,412,725 |
| PROFESSIONAL SERVICES — 0.6% | |
ASGN, Inc. (a)
| | 144 | | 12,697 |
Automatic Data Processing, Inc.
| | 564 | | 134,621 |
Broadridge Financial Solutions, Inc.
| | 325 | | 64,025 |
CACI International, Inc. Class A (a)
| | 35 | | 15,055 |
Concentrix Corp.
| | 5 | | 316 |
CSG Systems International, Inc.
| | 20 | | 823 |
Dayforce, Inc. (a) (b)
| | 147 | | 7,291 |
Equifax, Inc.
| | 248 | | 60,130 |
ExlService Holdings, Inc. (a)
| | 91 | | 2,854 |
Exponent, Inc.
| | 40 | | 3,805 |
FTI Consulting, Inc. (a)
| | 48 | | 10,345 |
Genpact Ltd.
| | 17 | | 547 |
Heidrick & Struggles International, Inc.
| | 58 | | 1,832 |
Insperity, Inc.
| | 11 | | 1,003 |
Jacobs Solutions, Inc.
| | 305 | | 42,612 |
KBR, Inc.
| | 239 | | 15,330 |
Kelly Services, Inc. Class A
| | 29 | | 621 |
Korn Ferry
| | 92 | | 6,177 |
| Security Description | | | Shares | | Value |
Leidos Holdings, Inc.
| | 392 | | $57,185 |
ManpowerGroup, Inc.
| | 49 | | 3,420 |
Maximus, Inc.
| | 47 | | 4,028 |
NV5 Global, Inc. (a)
| | 6 | | 558 |
Paychex, Inc.
| | 440 | | 52,166 |
Paycom Software, Inc.
| | 5 | | 715 |
Paylocity Holding Corp. (a)
| | 4 | | 527 |
Robert Half, Inc.
| | 131 | | 8,381 |
Science Applications International Corp.
| | 114 | | 13,401 |
Verisk Analytics, Inc.
| | 260 | | 70,083 |
Verra Mobility Corp. (a)
| | 561 | | 15,259 |
| | | | | | 605,807 |
| REAL ESTATE MANAGEMENT & DEVELOPMENT — 0.1% | |
CBRE Group, Inc. Class A (a)
| | 597 | | 53,199 |
CoStar Group, Inc. (a)
| | 710 | | 52,640 |
Cushman & Wakefield PLC (a)
| | 186 | | 1,934 |
eXp World Holdings, Inc. (b)
| | 71 | | 801 |
Jones Lang LaSalle, Inc. (a)
| | 126 | | 25,865 |
Marcus & Millichap, Inc.
| | 2 | | 63 |
St. Joe Co.
| | 84 | | 4,595 |
| | | | | | 139,097 |
| RESIDENTIAL REITs — 0.1% | |
American Homes 4 Rent Class A REIT
| | 437 | | 16,239 |
AvalonBay Communities, Inc. REIT
| | 135 | | 27,930 |
Camden Property Trust REIT
| | 11 | | 1,200 |
Centerspace REIT
| | 2 | | 135 |
Elme Communities REIT
| | 163 | | 2,597 |
Equity LifeStyle Properties, Inc. REIT
| | 62 | | 4,038 |
Equity Residential REIT
| | 341 | | 23,645 |
Essex Property Trust, Inc. REIT
| | 89 | | 24,226 |
Independence Realty Trust, Inc. REIT
| | 27 | | 506 |
Invitation Homes, Inc. REIT
| | 672 | | 24,118 |
Mid-America Apartment Communities, Inc. REIT
| | 12 | | 1,711 |
UDR, Inc. REIT
| | 176 | | 7,243 |
Veris Residential, Inc. REIT
| | 49 | | 735 |
| | | | | | 134,323 |
| RETAIL REITs — 0.2% | |
Acadia Realty Trust REIT
| | 146 | | 2,616 |
Agree Realty Corp. REIT
| | 32 | | 1,982 |
Brixmor Property Group, Inc. REIT
| | 408 | | 9,421 |
Federal Realty Investment Trust REIT
| | 55 | | 5,553 |
Getty Realty Corp. REIT
| | 36 | | 960 |
Kimco Realty Corp. REIT
| | 612 | | 11,910 |
Kite Realty Group Trust REIT
| | 385 | | 8,616 |
Macerich Co. REIT
| | 798 | | 12,321 |
NNN REIT, Inc.
| | 140 | | 5,964 |
Phillips Edison & Co., Inc. REIT
| | 193 | | 6,313 |
Realty Income Corp. REIT
| | 88 | | 4,648 |
Regency Centers Corp. REIT
| | 202 | | 12,564 |
See accompanying notes to financial statements.
73
SPDR SERIES TRUST
SPDR S&P 1500 MOMENTUM TILT ETF
SCHEDULE OF INVESTMENTS (continued)
June 30, 2024
| Security Description | | | Shares | | Value |
Retail Opportunity Investments Corp. REIT
| | 41 | | $510 |
Saul Centers, Inc. REIT
| | 1 | | 37 |
Simon Property Group, Inc. REIT
| | 998 | | 151,496 |
SITE Centers Corp. REIT
| | 317 | | 4,597 |
Tanger, Inc. REIT
| | 336 | | 9,109 |
Urban Edge Properties REIT
| | 183 | | 3,380 |
| | | | | | 251,997 |
| SEMICONDUCTORS & SEMICONDUCTOR EQUIPMENT — 19.4% | |
Advanced Micro Devices, Inc. (a)
| | 6,312 | | 1,023,870 |
Allegro MicroSystems, Inc. (a)
| | 7 | | 198 |
Alpha & Omega Semiconductor Ltd. (a)
| | 2 | | 75 |
Amkor Technology, Inc.
| | 326 | | 13,047 |
Analog Devices, Inc.
| | 681 | | 155,445 |
Applied Materials, Inc.
| | 3,075 | | 725,669 |
Axcelis Technologies, Inc. (a)
| | 12 | | 1,706 |
Broadcom, Inc.
| | 1,705 | | 2,737,429 |
CEVA, Inc. (a)
| | 7 | | 135 |
Cirrus Logic, Inc. (a)
| | 36 | | 4,596 |
Cohu, Inc. (a)
| | 34 | | 1,125 |
Diodes, Inc. (a)
| | 23 | | 1,654 |
Enphase Energy, Inc. (a)
| | 14 | | 1,396 |
First Solar, Inc. (a)
| | 34 | | 7,666 |
FormFactor, Inc. (a)
| | 317 | | 19,188 |
Ichor Holdings Ltd. (a)
| | 48 | | 1,850 |
Intel Corp.
| | 12,052 | | 373,250 |
KLA Corp.
| | 499 | | 411,430 |
Kulicke & Soffa Industries, Inc.
| | 103 | | 5,067 |
Lam Research Corp.
| | 484 | | 515,387 |
Lattice Semiconductor Corp. (a)
| | 71 | | 4,117 |
MACOM Technology Solutions Holdings, Inc. (a)
| | 149 | | 16,609 |
MaxLinear, Inc. (a)
| | 39 | | 785 |
Microchip Technology, Inc.
| | 972 | | 88,938 |
Micron Technology, Inc.
| | 4,079 | | 536,511 |
MKS Instruments, Inc.
| | 206 | | 26,899 |
Monolithic Power Systems, Inc.
| | 147 | | 120,787 |
NVIDIA Corp.
| | 101,486 | | 12,537,580 |
NXP Semiconductors NV
| | 843 | | 226,843 |
ON Semiconductor Corp. (a)
| | 406 | | 27,831 |
Onto Innovation, Inc. (a)
| | 189 | | 41,497 |
PDF Solutions, Inc. (a)
| | 28 | | 1,019 |
Photronics, Inc. (a)
| | 115 | | 2,837 |
Power Integrations, Inc.
| | 41 | | 2,878 |
Qorvo, Inc. (a)
| | 173 | | 20,075 |
QUALCOMM, Inc.
| | 3,417 | | 680,598 |
Rambus, Inc. (a)
| | 286 | | 16,805 |
Semtech Corp. (a)
| | 107 | | 3,197 |
Silicon Laboratories, Inc. (a)
| | 39 | | 4,315 |
SiTime Corp. (a)
| | 23 | | 2,861 |
Skyworks Solutions, Inc.
| | 179 | | 19,078 |
SMART Global Holdings, Inc. (a)
| | 80 | | 1,830 |
SolarEdge Technologies, Inc. (a)
| | 6 | | 152 |
Synaptics, Inc. (a)
| | 20 | | 1,764 |
| Security Description | | | Shares | | Value |
Teradyne, Inc.
| | 274 | | $40,631 |
Texas Instruments, Inc.
| | 1,056 | | 205,424 |
Ultra Clean Holdings, Inc. (a)
| | 144 | | 7,056 |
Universal Display Corp.
| | 87 | | 18,292 |
Veeco Instruments, Inc. (a)
| | 160 | | 7,474 |
Wolfspeed, Inc. (a) (b)
| | 12 | | 273 |
| | | | | | 20,665,139 |
| SOFTWARE — 12.0% | |
A10 Networks, Inc.
| | 86 | | 1,191 |
ACI Worldwide, Inc. (a)
| | 241 | | 9,541 |
Adeia, Inc.
| | 106 | | 1,186 |
Adobe, Inc. (a)
| | 1,002 | | 556,651 |
Agilysys, Inc. (a)
| | 19 | | 1,979 |
Alarm.com Holdings, Inc. (a)
| | 162 | | 10,293 |
ANSYS, Inc. (a)
| | 101 | | 32,471 |
Appfolio, Inc. Class A (a)
| | 76 | | 18,587 |
Aspen Technology, Inc. (a)
| | 43 | | 8,541 |
Autodesk, Inc. (a)
| | 475 | | 117,539 |
Blackbaud, Inc. (a)
| | 42 | | 3,199 |
BlackLine, Inc. (a)
| | 68 | | 3,295 |
Box, Inc. Class A (a)
| | 163 | | 4,310 |
Cadence Design Systems, Inc. (a)
| | 833 | | 256,356 |
CommVault Systems, Inc. (a)
| | 162 | | 19,694 |
Dolby Laboratories, Inc. Class A
| | 33 | | 2,615 |
DoubleVerify Holdings, Inc. (a)
| | 225 | | 4,381 |
Dropbox, Inc. Class A (a)
| | 410 | | 9,213 |
Dynatrace, Inc. (a)
| | 278 | | 12,438 |
Envestnet, Inc. (a)
| | 5 | | 313 |
Fair Isaac Corp. (a)
| | 94 | | 139,934 |
Fortinet, Inc. (a)
| | 740 | | 44,600 |
Gen Digital, Inc.
| | 1,242 | | 31,025 |
InterDigital, Inc. (b)
| | 107 | | 12,472 |
Intuit, Inc.
| | 858 | | 563,886 |
LiveRamp Holdings, Inc. (a)
| | 194 | | 6,002 |
Manhattan Associates, Inc. (a)
| | 202 | | 49,829 |
Microsoft Corp.
| | 18,084 | | 8,082,644 |
N-able, Inc. (a)
| | 271 | | 4,127 |
NCR Voyix Corp. (a)
| | 123 | | 1,519 |
Oracle Corp.
| | 3,535 | | 499,142 |
Palo Alto Networks, Inc. (a)
| | 1,060 | | 359,351 |
Progress Software Corp.
| | 61 | | 3,310 |
PTC, Inc. (a)
| | 366 | | 66,491 |
Qualys, Inc. (a)
| | 113 | | 16,114 |
Roper Technologies, Inc.
| | 191 | | 107,659 |
Salesforce, Inc.
| | 3,168 | | 814,493 |
ServiceNow, Inc. (a)
| | 714 | | 561,682 |
SPS Commerce, Inc. (a)
| | 66 | | 12,418 |
Synopsys, Inc. (a)
| | 499 | | 296,935 |
Teradata Corp. (a)
| | 51 | | 1,763 |
Tyler Technologies, Inc. (a)
| | 58 | | 29,161 |
| | | | | | 12,778,350 |
| SPECIALIZED REITs — 0.5% | |
American Tower Corp. REIT
| | 246 | | 47,817 |
Crown Castle, Inc. REIT
| | 137 | | 13,385 |
CubeSmart REIT
| | 174 | | 7,860 |
See accompanying notes to financial statements.
74
SPDR SERIES TRUST
SPDR S&P 1500 MOMENTUM TILT ETF
SCHEDULE OF INVESTMENTS (continued)
June 30, 2024
| Security Description | | | Shares | | Value |
Digital Realty Trust, Inc. REIT
| | 1,056 | | $160,565 |
EPR Properties REIT
| | 190 | | 7,976 |
Equinix, Inc. REIT
| | 129 | | 97,601 |
Extra Space Storage, Inc. REIT
| | 112 | | 17,406 |
Four Corners Property Trust, Inc. REIT
| | 65 | | 1,604 |
Gaming & Leisure Properties, Inc. REIT
| | 87 | | 3,933 |
Iron Mountain, Inc. REIT
| | 956 | | 85,677 |
Lamar Advertising Co. Class A REIT
| | 139 | | 16,615 |
National Storage Affiliates Trust REIT
| | 8 | | 330 |
PotlatchDeltic Corp. REIT
| | 89 | | 3,506 |
Public Storage REIT
| | 150 | | 43,147 |
Rayonier, Inc. REIT
| | 48 | | 1,396 |
Safehold, Inc. REIT
| | 86 | | 1,659 |
SBA Communications Corp. REIT
| | 33 | | 6,478 |
Uniti Group, Inc. REIT
| | 864 | | 2,523 |
VICI Properties, Inc. REIT
| | 327 | | 9,365 |
Weyerhaeuser Co. REIT
| | 1,310 | | 37,191 |
| | | | | | 566,034 |
| SPECIALTY RETAIL — 2.0% | |
Abercrombie & Fitch Co. Class A (a)
| | 213 | | 37,880 |
Academy Sports & Outdoors, Inc.
| | 127 | | 6,763 |
Advance Auto Parts, Inc.
| | 33 | | 2,090 |
American Eagle Outfitters, Inc.
| | 682 | | 13,613 |
Asbury Automotive Group, Inc. (a)
| | 31 | | 7,064 |
AutoNation, Inc. (a)
| | 58 | | 9,244 |
AutoZone, Inc. (a)
| | 28 | | 82,995 |
Bath & Body Works, Inc.
| | 644 | | 25,148 |
Best Buy Co., Inc.
| | 263 | | 22,168 |
Boot Barn Holdings, Inc. (a)
| | 68 | | 8,767 |
Buckle, Inc.
| | 49 | | 1,810 |
Burlington Stores, Inc. (a)
| | 101 | | 24,240 |
Caleres, Inc.
| | 44 | | 1,478 |
CarMax, Inc. (a)
| | 272 | | 19,948 |
Designer Brands, Inc. Class A (b)
| | 5 | | 34 |
Dick's Sporting Goods, Inc.
| | 190 | | 40,822 |
Five Below, Inc. (a)
| | 17 | | 1,852 |
Floor & Decor Holdings, Inc. Class A (a) (b)
| | 229 | | 22,765 |
Foot Locker, Inc.
| | 8 | | 199 |
GameStop Corp. Class A (a)
| | 86 | | 2,123 |
Gap, Inc.
| | 812 | | 19,399 |
Group 1 Automotive, Inc.
| | 30 | | 8,918 |
Guess?, Inc.
| | 28 | | 571 |
Haverty Furniture Cos., Inc.
| | 51 | | 1,290 |
Hibbett, Inc.
| | 20 | | 1,744 |
Home Depot, Inc.
| | 2,206 | | 759,393 |
Leslie's, Inc. (a) (b)
| | 268 | | 1,123 |
Lithia Motors, Inc.
| | 65 | | 16,409 |
Lowe's Cos., Inc.
| | 1,033 | | 227,735 |
MarineMax, Inc. (a)
| | 2 | | 65 |
Monro, Inc.
| | 10 | | 239 |
Murphy USA, Inc.
| | 62 | | 29,107 |
National Vision Holdings, Inc. (a)
| | 8 | | 105 |
| Security Description | | | Shares | | Value |
ODP Corp. (a)
| | 51 | | $2,003 |
O'Reilly Automotive, Inc. (a)
| | 106 | | 111,942 |
Penske Automotive Group, Inc.
| | 54 | | 8,047 |
RH (a)
| | 37 | | 9,044 |
Ross Stores, Inc.
| | 888 | | 129,044 |
Sally Beauty Holdings, Inc. (a)
| | 163 | | 1,749 |
Shoe Carnival, Inc.
| | 77 | | 2,841 |
Signet Jewelers Ltd.
| | 85 | | 7,614 |
Sonic Automotive, Inc. Class A
| | 28 | | 1,525 |
TJX Cos., Inc.
| | 2,527 | | 278,223 |
Tractor Supply Co.
| | 148 | | 39,960 |
Ulta Beauty, Inc. (a)
| | 16 | | 6,174 |
Upbound Group, Inc.
| | 105 | | 3,224 |
Urban Outfitters, Inc. (a)
| | 133 | | 5,460 |
Valvoline, Inc. (a)
| | 258 | | 11,146 |
Victoria's Secret & Co. (a)
| | 29 | | 512 |
Williams-Sonoma, Inc.
| | 264 | | 74,546 |
| | | | | | 2,090,155 |
| TECHNOLOGY HARDWARE, STORAGE & PERIPHERALS — 2.7% | |
Apple, Inc.
| | 10,674 | | 2,248,158 |
Hewlett Packard Enterprise Co.
| | 2,608 | | 55,211 |
HP, Inc.
| | 829 | | 29,032 |
NetApp, Inc.
| | 718 | | 92,478 |
Pure Storage, Inc. Class A (a)
| | 1,160 | | 74,484 |
Seagate Technology Holdings PLC
| | 638 | | 65,886 |
Super Micro Computer, Inc. (a)
| | 208 | | 170,425 |
Western Digital Corp. (a)
| | 1,198 | | 90,772 |
Xerox Holdings Corp.
| | 96 | | 1,116 |
| | | | | | 2,827,562 |
| TEXTILES, APPAREL & LUXURY GOODS — 0.2% | |
Capri Holdings Ltd. (a)
| | 132 | | 4,367 |
Carter's, Inc.
| | 31 | | 1,921 |
Columbia Sportswear Co.
| | 4 | | 316 |
Crocs, Inc. (a)
| | 83 | | 12,113 |
Deckers Outdoor Corp. (a)
| | 92 | | 89,052 |
G-III Apparel Group Ltd. (a)
| | 162 | | 4,385 |
Hanesbrands, Inc. (a) (b)
| | 222 | | 1,095 |
Kontoor Brands, Inc.
| | 138 | | 9,129 |
Lululemon Athletica, Inc. (a)
| | 109 | | 32,558 |
Movado Group, Inc.
| | 77 | | 1,914 |
NIKE, Inc. Class B
| | 129 | | 9,723 |
Oxford Industries, Inc. (b)
| | 27 | | 2,704 |
PVH Corp.
| | 167 | | 17,680 |
Ralph Lauren Corp.
| | 136 | | 23,808 |
Skechers USA, Inc. Class A (a)
| | 183 | | 12,649 |
Steven Madden Ltd.
| | 93 | | 3,934 |
Tapestry, Inc.
| | 363 | | 15,533 |
Under Armour, Inc. Class A (a)
| | 20 | | 133 |
Under Armour, Inc. Class C (a)
| | 42 | | 274 |
VF Corp. (b)
| | 36 | | 486 |
Wolverine World Wide, Inc. (b)
| | 77 | | 1,041 |
| | | | | | 244,815 |
See accompanying notes to financial statements.
75
SPDR SERIES TRUST
SPDR S&P 1500 MOMENTUM TILT ETF
SCHEDULE OF INVESTMENTS (continued)
June 30, 2024
| Security Description | | | Shares | | Value |
| TOBACCO — 0.1% | |
Altria Group, Inc.
| | 931 | | $42,407 |
Philip Morris International, Inc.
| | 492 | | 49,854 |
Universal Corp.
| | 36 | | 1,735 |
Vector Group Ltd.
| | 68 | | 719 |
| | | | | | 94,715 |
| TRADING COMPANIES & DISTRIBUTORS — 0.5% | |
Air Lease Corp.
| | 229 | | 10,884 |
Applied Industrial Technologies, Inc.
| | 118 | | 22,892 |
Boise Cascade Co.
| | 152 | | 18,122 |
Core & Main, Inc. Class A (a)
| | 632 | | 30,930 |
DNOW, Inc. (a)
| | 83 | | 1,140 |
Fastenal Co.
| | 1,752 | | 110,096 |
GATX Corp.
| | 58 | | 7,677 |
GMS, Inc. (a)
| | 112 | | 9,028 |
MSC Industrial Direct Co., Inc. Class A
| | 55 | | 4,362 |
Rush Enterprises, Inc. Class A
| | 183 | | 7,662 |
United Rentals, Inc.
| | 263 | | 170,090 |
Watsco, Inc.
| | 62 | | 28,721 |
WESCO International, Inc.
| | 63 | | 9,987 |
WW Grainger, Inc.
| | 135 | | 121,802 |
| | | | | | 553,393 |
| WATER UTILITIES — 0.0% (d) | |
American States Water Co.
| | 19 | | 1,379 |
American Water Works Co., Inc.
| | 21 | | 2,713 |
California Water Service Group
| | 17 | | 824 |
Essential Utilities, Inc.
| | 28 | | 1,045 |
Middlesex Water Co.
| | 20 | | 1,045 |
SJW Group
| | 9 | | 488 |
| | | | | | 7,494 |
| WIRELESS TELECOMMUNICATION SERVICES — 0.1% | |
Gogo, Inc. (a)
| | 19 | | 183 |
| Security Description | | | Shares | | Value |
Telephone & Data Systems, Inc.
| | 313 | | $6,488 |
T-Mobile U.S., Inc.
| | 716 | | 126,145 |
| | | | | | 132,816 |
TOTAL COMMON STOCKS
(Cost $73,529,233)
| | | | | 106,667,540 |
| SHORT-TERM INVESTMENTS — 0.2% | | | |
State Street Institutional Liquid Reserves Fund, Premier Class 5.36% (e) (f)
| | 110,094 | | 110,127 |
State Street Navigator Securities Lending Portfolio II (c) (g)
| | 86,288 | | 86,288 |
TOTAL SHORT-TERM INVESTMENTS
(Cost $196,407)
| | 196,415 | |
TOTAL INVESTMENTS — 100.1%
(Cost $73,725,640)
| | 106,863,955 | |
LIABILITIES IN EXCESS OF OTHER ASSETS — (0.1)%
| | (63,533) | |
NET ASSETS — 100.0%
| | $106,800,422 | |
| (a) | Non-income producing security. |
| (b) | All or a portion of the shares of the security are on loan at June 30, 2024. |
| (c) | The Fund invested in an affiliated entity. Amounts related to these investments during the year ended June 30, 2024 are shown in the Affiliate Table below. |
| (d) | Amount is less than 0.05% of net assets. |
| (e) | The Fund invested in certain money market funds managed by SSGA Funds Management, Inc. Amounts related to these investments during the period ended June 30, 2024 are shown in the Affiliate Table below. |
| (f) | The rate shown is the annualized seven-day yield at June 30, 2024. |
| (g) | Investment of cash collateral for securities loaned. |
| REIT | Real Estate Investment Trust |
The following table summarizes the value of the Fund's investments according to the fair value hierarchy as of June 30, 2024.
| Description | | Level 1 –
Quoted Prices | | Level 2 –
Other Significant
Observable Inputs | | Level 3 –
Significant
Unobservable Inputs | | Total |
| ASSETS: | | | | | | | | |
| INVESTMENTS: | | | | | | | | |
Common Stocks
| | $106,667,540 | | $— | | $— | | $106,667,540 |
Short-Term Investments
| | 196,415 | | — | | — | | 196,415 |
TOTAL INVESTMENTS
| | $106,863,955 | | $— | | $— | | $106,863,955 |
See accompanying notes to financial statements.
76
SPDR SERIES TRUST
SPDR S&P 1500 MOMENTUM TILT ETF
SCHEDULE OF INVESTMENTS (continued)
June 30, 2024
Affiliate Table
| | Number of
Shares Held
at
6/30/23 | | Value at
6/30/23 | | Cost of
Purchases | | Proceeds
from
Shares Sold | | Realized
Gain (Loss) | | Change in
Unrealized
Appreciation/
Depreciation | | Number of
Shares Held
at
6/30/24 | | Value at
6/30/24 | | Dividend
Income |
State Street Corp.
| 1,116 | | $81,669 | | $22,165 | | $74,024 | | $(9,126) | | $5,290 | | 351 | | $25,974 | | $649 |
State Street Institutional Liquid Reserves Fund, Premier Class
| 79,645 | | 79,661 | | 10,047,442 | | 10,016,955 | | (27) | | 6 | | 110,094 | | 110,127 | | 5,371 |
State Street Navigator Securities Lending Portfolio II
| 149,489 | | 149,489 | | 1,995,084 | | 2,058,285 | | — | | — | | 86,288 | | 86,288 | | 847 |
Total
| | | $310,819 | | $12,064,691 | | $12,149,264 | | $(9,153) | | $5,296 | | | | $222,389 | | $6,867 |
See accompanying notes to financial statements.
77
SPDR SERIES TRUST
SPDR S&P 1500 VALUE TILT ETF
SCHEDULE OF INVESTMENTS
June 30, 2024
| Security Description | | | Shares | | Value |
| COMMON STOCKS — 99.9% | |
| AEROSPACE & DEFENSE — 1.6% | |
AAR Corp. (a)
| | 240 | | $17,448 |
AeroVironment, Inc. (a)
| | 153 | | 27,871 |
Axon Enterprise, Inc. (a)
| | 114 | | 33,543 |
Boeing Co. (a)
| | 3,355 | | 610,644 |
BWX Technologies, Inc.
| | 308 | | 29,260 |
Curtiss-Wright Corp.
| | 225 | | 60,971 |
General Dynamics Corp.
| | 2,465 | | 715,195 |
Hexcel Corp.
| | 413 | | 25,792 |
Howmet Aerospace, Inc.
| | 1,370 | | 106,353 |
Huntington Ingalls Industries, Inc.
| | 429 | | 105,676 |
L3Harris Technologies, Inc.
| | 1,542 | | 346,302 |
Lockheed Martin Corp.
| | 2,334 | | 1,090,211 |
Mercury Systems, Inc. (a)
| | 255 | | 6,882 |
Moog, Inc. Class A
| | 300 | | 50,190 |
National Presto Industries, Inc.
| | 8 | | 601 |
Northrop Grumman Corp.
| | 1,148 | | 500,471 |
RTX Corp.
| | 14,534 | | 1,459,068 |
Textron, Inc.
| | 1,654 | | 142,012 |
TransDigm Group, Inc.
| | 63 | | 80,489 |
Triumph Group, Inc. (a)
| | 383 | | 5,902 |
Woodward, Inc.
| | 389 | | 67,834 |
| | | | | | 5,482,715 |
| AIR FREIGHT & LOGISTICS — 0.8% | |
CH Robinson Worldwide, Inc.
| | 2,233 | | 196,772 |
Expeditors International of Washington, Inc.
| | 1,182 | | 147,502 |
FedEx Corp.
| | 3,326 | | 997,268 |
Forward Air Corp.
| | 1,020 | | 19,421 |
GXO Logistics, Inc. (a)
| | 1,293 | | 65,296 |
Hub Group, Inc. Class A
| | 1,200 | | 51,660 |
United Parcel Service, Inc. Class B
| | 10,603 | | 1,451,020 |
| | | | | | 2,928,939 |
| AIRLINES — 0.8% | |
Alaska Air Group, Inc. (a)
| | 4,178 | | 168,791 |
Allegiant Travel Co.
| | 378 | | 18,987 |
American Airlines Group, Inc. (a) (b)
| | 21,667 | | 245,487 |
Delta Air Lines, Inc.
| | 21,458 | | 1,017,968 |
JetBlue Airways Corp. (a)
| | 11,627 | | 70,808 |
SkyWest, Inc. (a)
| | 785 | | 64,425 |
Southwest Airlines Co.
| | 19,755 | | 565,191 |
Sun Country Airlines Holdings, Inc. (a)
| | 413 | | 5,187 |
United Airlines Holdings, Inc. (a)
| | 10,859 | | 528,399 |
| | | | | | 2,685,243 |
| AUTO COMPONENTS — 0.4% | |
Adient PLC (a)
| | 3,022 | | 74,674 |
American Axle & Manufacturing Holdings, Inc. (a)
| | 4,802 | | 33,566 |
Aptiv PLC (a)
| | 3,372 | | 237,456 |
Autoliv, Inc.
| | 910 | | 97,361 |
BorgWarner, Inc.
| | 7,606 | | 245,217 |
Dana, Inc.
| | 4,282 | | 51,898 |
| Security Description | | | Shares | | Value |
Dorman Products, Inc. (a)
| | 256 | | $23,419 |
Fox Factory Holding Corp. (a)
| | 454 | | 21,878 |
Gentex Corp.
| | 1,654 | | 55,756 |
Gentherm, Inc. (a)
| | 233 | | 11,492 |
Goodyear Tire & Rubber Co. (a)
| | 10,204 | | 115,815 |
LCI Industries
| | 368 | | 38,044 |
Lear Corp.
| | 1,887 | | 215,514 |
Patrick Industries, Inc.
| | 299 | | 32,457 |
Phinia, Inc.
| | 708 | | 27,867 |
Standard Motor Products, Inc.
| | 423 | | 11,730 |
Visteon Corp. (a)
| | 302 | | 32,223 |
XPEL, Inc. (a)
| | 43 | | 1,529 |
| | | | | | 1,327,896 |
| AUTOMOBILES — 1.5% | |
Ford Motor Co.
| | 130,401 | | 1,635,229 |
General Motors Co.
| | 38,226 | | 1,775,980 |
Harley-Davidson, Inc.
| | 2,692 | | 90,290 |
Tesla, Inc. (a)
| | 7,548 | | 1,493,598 |
Thor Industries, Inc.
| | 1,021 | | 95,412 |
Winnebago Industries, Inc.
| | 567 | | 30,731 |
| | | | | | 5,121,240 |
| BANKS — 9.9% | |
Ameris Bancorp
| | 939 | | 47,279 |
Associated Banc-Corp.
| | 4,940 | | 104,481 |
Atlantic Union Bankshares Corp.
| | 1,730 | | 56,830 |
Axos Financial, Inc. (a)
| | 759 | | 43,377 |
Banc of California, Inc.
| | 4,592 | | 58,686 |
BancFirst Corp.
| | 478 | | 41,921 |
Bancorp, Inc. (a)
| | 530 | | 20,013 |
Bank of America Corp.
| | 131,098 | | 5,213,767 |
Bank of Hawaii Corp. (b)
| | 576 | | 32,953 |
Bank of New York Mellon Corp.
| | 14,536 | | 870,561 |
Bank OZK
| | 3,483 | | 142,803 |
BankUnited, Inc.
| | 2,725 | | 79,761 |
Banner Corp.
| | 1,139 | | 56,540 |
Berkshire Hills Bancorp, Inc.
| | 995 | | 22,686 |
Brookline Bancorp, Inc.
| | 1,969 | | 16,441 |
Cadence Bank
| | 2,655 | | 75,083 |
Capitol Federal Financial, Inc.
| | 4,105 | | 22,536 |
Cathay General Bancorp
| | 2,406 | | 90,754 |
Central Pacific Financial Corp.
| | 965 | | 20,458 |
Citigroup, Inc.
| | 63,428 | | 4,025,141 |
Citizens Financial Group, Inc.
| | 15,438 | | 556,231 |
City Holding Co.
| | 174 | | 18,488 |
Columbia Banking System, Inc.
| | 6,907 | | 137,380 |
Comerica, Inc.
| | 4,366 | | 222,841 |
Commerce Bancshares, Inc.
| | 1,185 | | 66,099 |
Community Financial System, Inc.
| | 769 | | 36,304 |
Cullen/Frost Bankers, Inc.
| | 701 | | 71,243 |
Customers Bancorp, Inc. (a)
| | 415 | | 19,912 |
CVB Financial Corp.
| | 2,889 | | 49,806 |
Dime Community Bancshares, Inc.
| | 1,174 | | 23,950 |
Eagle Bancorp, Inc.
| | 1,132 | | 21,395 |
East West Bancorp, Inc.
| | 2,045 | | 149,755 |
FB Financial Corp.
| | 671 | | 26,189 |
See accompanying notes to financial statements.
78
SPDR SERIES TRUST
SPDR S&P 1500 VALUE TILT ETF
SCHEDULE OF INVESTMENTS (continued)
June 30, 2024
| Security Description | | | Shares | | Value |
Fifth Third Bancorp
| | 9,859 | | $359,755 |
First BanCorp
| | 2,438 | | 44,591 |
First Bancorp/Southern Pines NC
| | 441 | | 14,077 |
First Commonwealth Financial Corp.
| | 1,965 | | 27,137 |
First Financial Bancorp
| | 3,150 | | 69,993 |
First Financial Bankshares, Inc.
| | 1,085 | | 32,040 |
First Hawaiian, Inc.
| | 2,970 | | 61,657 |
First Horizon Corp.
| | 10,700 | | 168,739 |
FNB Corp.
| | 6,870 | | 93,982 |
Fulton Financial Corp.
| | 3,149 | | 53,470 |
Glacier Bancorp, Inc.
| | 1,141 | | 42,582 |
Goldman Sachs Group, Inc.
| | 3,935 | | 1,779,879 |
Hancock Whitney Corp.
| | 1,860 | | 88,964 |
Hanmi Financial Corp.
| | 909 | | 15,198 |
Heritage Financial Corp.
| | 758 | | 13,667 |
Hilltop Holdings, Inc.
| | 1,674 | | 52,363 |
Home BancShares, Inc.
| | 2,714 | | 65,027 |
Hope Bancorp, Inc.
| | 4,301 | | 46,193 |
Huntington Bancshares, Inc.
| | 27,725 | | 365,415 |
Independent Bank Corp.
| | 814 | | 41,286 |
Independent Bank Group, Inc.
| | 1,296 | | 58,994 |
International Bancshares Corp.
| | 1,211 | | 69,281 |
JPMorgan Chase & Co.
| | 24,408 | | 4,936,762 |
KeyCorp
| | 31,010 | | 440,652 |
Lakeland Financial Corp.
| | 235 | | 14,457 |
M&T Bank Corp.
| | 3,183 | | 481,779 |
Morgan Stanley
| | 18,232 | | 1,771,968 |
National Bank Holdings Corp. Class A
| | 465 | | 18,158 |
NBT Bancorp, Inc.
| | 854 | | 32,964 |
New York Community Bancorp, Inc. (b)
| | 23,912 | | 76,997 |
Northern Trust Corp.
| | 2,971 | | 249,505 |
Northwest Bancshares, Inc.
| | 4,210 | | 48,626 |
OFG Bancorp
| | 753 | | 28,200 |
Old National Bancorp
| | 6,001 | | 103,157 |
Pacific Premier Bancorp, Inc.
| | 2,064 | | 47,410 |
Park National Corp.
| | 221 | | 31,457 |
Pathward Financial, Inc.
| | 376 | | 21,270 |
Pinnacle Financial Partners, Inc.
| | 921 | | 73,717 |
PNC Financial Services Group, Inc.
| | 7,619 | | 1,184,602 |
Preferred Bank
| | 222 | | 16,759 |
Prosperity Bancshares, Inc.
| | 1,434 | | 87,675 |
Provident Financial Services, Inc.
| | 4,259 | | 61,117 |
Regions Financial Corp.
| | 17,689 | | 354,488 |
Renasant Corp.
| | 1,858 | | 56,743 |
S&T Bancorp, Inc.
| | 921 | | 30,752 |
Seacoast Banking Corp. of Florida
| | 895 | | 21,158 |
ServisFirst Bancshares, Inc.
| | 404 | | 25,529 |
Simmons First National Corp. Class A
| | 4,143 | | 72,834 |
Southside Bancshares, Inc.
| | 651 | | 17,974 |
SouthState Corp.
| | 920 | | 70,306 |
State Street Corp. (c)
| | 5,778 | | 427,572 |
Stellar Bancorp, Inc.
| | 402 | | 9,230 |
Synovus Financial Corp.
| | 2,801 | | 112,572 |
| Security Description | | | Shares | | Value |
Texas Capital Bancshares, Inc. (a)
| | 1,074 | | $65,664 |
Tompkins Financial Corp.
| | 221 | | 10,807 |
Triumph Financial, Inc. (a)
| | 203 | | 16,595 |
Truist Financial Corp.
| | 44,509 | | 1,729,175 |
TrustCo Bank Corp.
| | 534 | | 15,363 |
Trustmark Corp.
| | 1,350 | | 40,554 |
U.S. Bancorp
| | 30,068 | | 1,193,700 |
UMB Financial Corp.
| | 632 | | 52,721 |
United Bankshares, Inc.
| | 2,212 | | 71,757 |
United Community Banks, Inc.
| | 1,658 | | 42,213 |
Valley National Bancorp
| | 15,115 | | 105,503 |
Veritex Holdings, Inc.
| | 1,972 | | 41,589 |
WaFd, Inc.
| | 2,249 | | 64,276 |
Webster Financial Corp.
| | 2,696 | | 117,519 |
Wells Fargo & Co.
| | 67,027 | | 3,980,734 |
Westamerica BanCorp
| | 251 | | 12,181 |
Wintrust Financial Corp.
| | 741 | | 73,033 |
WSFS Financial Corp.
| | 753 | | 35,391 |
Zions Bancorp NA
| | 4,905 | | 212,730 |
| | | | | | 34,813,849 |
| BEVERAGES — 1.2% | |
Boston Beer Co., Inc. Class A (a)
| | 59 | | 17,998 |
Brown-Forman Corp. Class B
| | 1,971 | | 85,128 |
Celsius Holdings, Inc. (a) (b)
| | 166 | | 9,477 |
Coca-Cola Co.
| | 22,767 | | 1,449,120 |
Coca-Cola Consolidated, Inc.
| | 66 | | 71,610 |
Constellation Brands, Inc. Class A
| | 794 | | 204,280 |
Keurig Dr Pepper, Inc.
| | 12,573 | | 419,938 |
MGP Ingredients, Inc. (b)
| | 166 | | 12,350 |
Molson Coors Beverage Co. Class B
| | 6,130 | | 311,588 |
Monster Beverage Corp. (a)
| | 3,943 | | 196,953 |
National Beverage Corp.
| | 480 | | 24,595 |
PepsiCo, Inc.
| | 8,045 | | 1,326,862 |
| | | | | | 4,129,899 |
| BIOTECHNOLOGY — 1.6% | |
AbbVie, Inc.
| | 8,765 | | 1,503,373 |
Alkermes PLC (a)
| | 977 | | 23,546 |
Amgen, Inc.
| | 3,159 | | 987,030 |
Arcus Biosciences, Inc. (a)
| | 853 | | 12,991 |
Arrowhead Pharmaceuticals, Inc. (a)
| | 259 | | 6,731 |
Biogen, Inc. (a)
| | 1,751 | | 405,917 |
Catalyst Pharmaceuticals, Inc. (a)
| | 450 | | 6,970 |
Cytokinetics, Inc. (a)
| | 161 | | 8,723 |
Dynavax Technologies Corp. (a)
| | 1,312 | | 14,734 |
Exelixis, Inc. (a)
| | 2,241 | | 50,355 |
Gilead Sciences, Inc.
| | 15,041 | | 1,031,963 |
Halozyme Therapeutics, Inc. (a)
| | 496 | | 25,971 |
Incyte Corp. (a)
| | 1,298 | | 78,685 |
Ironwood Pharmaceuticals, Inc. (a)
| | 2,056 | | 13,405 |
Moderna, Inc. (a)
| | 1,636 | | 194,275 |
Myriad Genetics, Inc. (a)
| | 752 | | 18,394 |
Neurocrine Biosciences, Inc. (a)
| | 279 | | 38,410 |
Regeneron Pharmaceuticals, Inc. (a)
| | 494 | | 519,209 |
See accompanying notes to financial statements.
79
SPDR SERIES TRUST
SPDR S&P 1500 VALUE TILT ETF
SCHEDULE OF INVESTMENTS (continued)
June 30, 2024
| Security Description | | | Shares | | Value |
REGENXBIO, Inc. (a)
| | 469 | | $5,487 |
Roivant Sciences Ltd. (a) (b)
| | 11,180 | | 118,173 |
United Therapeutics Corp. (a)
| | 385 | | 122,642 |
Vericel Corp. (a)
| | 63 | | 2,890 |
Vertex Pharmaceuticals, Inc. (a)
| | 859 | | 402,630 |
Vir Biotechnology, Inc. (a)
| | 2,726 | | 24,261 |
Xencor, Inc. (a)
| | 462 | | 8,746 |
| | | | | | 5,625,511 |
| BROADLINE RETAIL — 2.3% | |
Amazon.com, Inc. (a)
| | 38,211 | | 7,384,276 |
eBay, Inc.
| | 5,638 | | 302,873 |
Etsy, Inc. (a)
| | 629 | | 37,098 |
Kohl's Corp.
| | 3,666 | | 84,281 |
Macy's, Inc.
| | 9,078 | | 174,298 |
Nordstrom, Inc.
| | 3,559 | | 75,522 |
Ollie's Bargain Outlet Holdings, Inc. (a)
| | 440 | | 43,195 |
| | | | | | 8,101,543 |
| BUILDING PRODUCTS — 0.6% | |
A O Smith Corp.
| | 753 | | 61,580 |
AAON, Inc.
| | 60 | | 5,234 |
Advanced Drainage Systems, Inc.
| | 243 | | 38,975 |
Allegion PLC
| | 418 | | 49,387 |
American Woodmark Corp. (a)
| | 231 | | 18,157 |
Apogee Enterprises, Inc.
| | 284 | | 17,845 |
Armstrong World Industries, Inc.
| | 184 | | 20,836 |
AZZ, Inc.
| | 260 | | 20,085 |
Builders FirstSource, Inc. (a)
| | 1,041 | | 144,085 |
Carlisle Cos., Inc.
| | 227 | | 91,983 |
Carrier Global Corp.
| | 4,119 | | 259,826 |
Fortune Brands Innovations, Inc.
| | 1,024 | | 66,499 |
Gibraltar Industries, Inc. (a)
| | 265 | | 18,166 |
Griffon Corp.
| | 325 | | 20,754 |
Insteel Industries, Inc.
| | 277 | | 8,576 |
Johnson Controls International PLC
| | 7,400 | | 491,878 |
Lennox International, Inc.
| | 109 | | 58,313 |
Masco Corp.
| | 1,284 | | 85,604 |
Masterbrand, Inc. (a)
| | 4,594 | | 67,440 |
Owens Corning
| | 967 | | 167,987 |
Quanex Building Products Corp.
| | 367 | | 10,148 |
Resideo Technologies, Inc. (a)
| | 2,816 | | 55,081 |
Simpson Manufacturing Co., Inc.
| | 178 | | 29,998 |
Trane Technologies PLC
| | 761 | | 250,316 |
Trex Co., Inc. (a)
| | 403 | | 29,870 |
UFP Industries, Inc.
| | 670 | | 75,040 |
| | | | | | 2,163,663 |
| CAPITAL MARKETS — 1.7% | |
Affiliated Managers Group, Inc.
| | 495 | | 77,334 |
Ameriprise Financial, Inc.
| | 845 | | 360,976 |
Artisan Partners Asset Management, Inc. Class A
| | 828 | | 34,172 |
B Riley Financial, Inc. (b)
| | 607 | | 10,707 |
BGC Group, Inc. Class A
| | 4,203 | | 34,885 |
BlackRock, Inc.
| | 818 | | 644,028 |
| Security Description | | | Shares | | Value |
Blackstone, Inc.
| | 2,984 | | $369,419 |
Brightsphere Investment Group, Inc.
| | 485 | | 10,752 |
Carlyle Group, Inc.
| | 1,828 | | 73,394 |
Cboe Global Markets, Inc.
| | 565 | | 96,084 |
Charles Schwab Corp.
| | 12,566 | | 925,989 |
CME Group, Inc.
| | 1,777 | | 349,358 |
Donnelley Financial Solutions, Inc. (a)
| | 209 | | 12,461 |
Evercore, Inc. Class A
| | 280 | | 58,360 |
FactSet Research Systems, Inc.
| | 105 | | 42,868 |
Federated Hermes, Inc.
| | 1,168 | | 38,404 |
Franklin Resources, Inc.
| | 9,939 | | 222,137 |
Houlihan Lokey, Inc.
| | 307 | | 41,402 |
Interactive Brokers Group, Inc. Class A
| | 1,290 | | 158,154 |
Intercontinental Exchange, Inc.
| | 2,689 | | 368,097 |
Invesco Ltd.
| | 14,882 | | 222,635 |
Janus Henderson Group PLC
| | 4,395 | | 148,155 |
Jefferies Financial Group, Inc.
| | 3,246 | | 161,521 |
MarketAxess Holdings, Inc.
| | 158 | | 31,684 |
Moelis & Co. Class A
| | 390 | | 22,175 |
Moody's Corp.
| | 333 | | 140,170 |
Morningstar, Inc.
| | 85 | | 25,147 |
MSCI, Inc.
| | 92 | | 44,321 |
Nasdaq, Inc.
| | 3,106 | | 187,168 |
Piper Sandler Cos.
| | 125 | | 28,771 |
PJT Partners, Inc. Class A
| | 211 | | 22,769 |
Raymond James Financial, Inc.
| | 1,532 | | 189,370 |
S&P Global, Inc.
| | 922 | | 411,212 |
SEI Investments Co.
| | 810 | | 52,399 |
Stifel Financial Corp.
| | 1,231 | | 103,589 |
StoneX Group, Inc. (a)
| | 945 | | 71,168 |
T Rowe Price Group, Inc.
| | 2,432 | | 280,434 |
Virtus Investment Partners, Inc.
| | 90 | | 20,326 |
WisdomTree, Inc.
| | 744 | | 7,373 |
| | | | | | 6,099,368 |
| CHEMICALS — 1.9% | |
AdvanSix, Inc.
| | 485 | | 11,116 |
Air Products & Chemicals, Inc.
| | 1,807 | | 466,296 |
Albemarle Corp. (b)
| | 1,697 | | 162,098 |
Arcadium Lithium PLC (a) (b)
| | 8,376 | | 28,143 |
Ashland, Inc.
| | 657 | | 62,080 |
Avient Corp.
| | 1,522 | | 66,435 |
Axalta Coating Systems Ltd. (a)
| | 1,612 | | 55,082 |
Balchem Corp.
| | 173 | | 26,633 |
Cabot Corp.
| | 602 | | 55,318 |
Celanese Corp.
| | 1,209 | | 163,082 |
CF Industries Holdings, Inc.
| | 2,768 | | 205,164 |
Chemours Co.
| | 2,842 | | 64,144 |
Corteva, Inc.
| | 5,702 | | 307,566 |
Dow, Inc.
| | 13,444 | | 713,204 |
DuPont de Nemours, Inc.
| | 8,233 | | 662,674 |
Eastman Chemical Co.
| | 1,696 | | 166,157 |
Ecolab, Inc.
| | 695 | | 165,410 |
FMC Corp.
| | 1,806 | | 103,935 |
Hawkins, Inc.
| | 186 | | 16,926 |
See accompanying notes to financial statements.
80
SPDR SERIES TRUST
SPDR S&P 1500 VALUE TILT ETF
SCHEDULE OF INVESTMENTS (continued)
June 30, 2024
| Security Description | | | Shares | | Value |
HB Fuller Co.
| | 526 | | $40,481 |
Ingevity Corp. (a)
| | 514 | | 22,467 |
Innospec, Inc.
| | 253 | | 31,268 |
International Flavors & Fragrances, Inc.
| | 2,157 | | 205,368 |
Koppers Holdings, Inc.
| | 310 | | 11,467 |
Linde PLC
| | 1,619 | | 710,433 |
LyondellBasell Industries NV Class A
| | 8,478 | | 811,006 |
Mativ Holdings, Inc.
| | 1,810 | | 30,698 |
Minerals Technologies, Inc.
| | 449 | | 37,339 |
Mosaic Co.
| | 10,821 | | 312,727 |
NewMarket Corp.
| | 73 | | 37,637 |
Olin Corp.
| | 1,742 | | 82,135 |
PPG Industries, Inc.
| | 1,914 | | 240,954 |
Quaker Chemical Corp.
| | 153 | | 25,964 |
RPM International, Inc.
| | 635 | | 68,377 |
Scotts Miracle-Gro Co. (b)
| | 607 | | 39,491 |
Sensient Technologies Corp.
| | 438 | | 32,495 |
Sherwin-Williams Co.
| | 636 | | 189,802 |
Stepan Co.
| | 259 | | 21,746 |
Westlake Corp.
| | 1,060 | | 153,509 |
| | | | | | 6,606,827 |
| COMMERCIAL SERVICES & SUPPLIES — 0.5% | |
ABM Industries, Inc.
| | 2,080 | | 105,186 |
Brady Corp. Class A
| | 516 | | 34,066 |
Brink's Co.
| | 455 | | 46,592 |
Cintas Corp.
| | 182 | | 127,447 |
Clean Harbors, Inc. (a)
| | 393 | | 88,877 |
Copart, Inc. (a)
| | 2,364 | | 128,034 |
CoreCivic, Inc. (a)
| | 4,126 | | 53,555 |
Deluxe Corp.
| | 1,574 | | 35,352 |
Enviri Corp. (a)
| | 2,195 | | 18,943 |
GEO Group, Inc. (a)
| | 4,486 | | 64,419 |
Healthcare Services Group, Inc. (a)
| | 1,912 | | 20,229 |
HNI Corp.
| | 920 | | 41,418 |
Interface, Inc.
| | 722 | | 10,599 |
Liquidity Services, Inc. (a)
| | 255 | | 5,095 |
Matthews International Corp. Class A
| | 526 | | 13,176 |
MillerKnoll, Inc.
| | 2,409 | | 63,814 |
MSA Safety, Inc.
| | 108 | | 20,271 |
OPENLANE, Inc. (a)
| | 3,579 | | 59,376 |
Pitney Bowes, Inc.
| | 6,111 | | 31,044 |
Republic Services, Inc.
| | 1,661 | | 322,799 |
Rollins, Inc.
| | 773 | | 37,715 |
Stericycle, Inc. (a)
| | 782 | | 45,458 |
Tetra Tech, Inc.
| | 261 | | 53,369 |
UniFirst Corp.
| | 176 | | 30,189 |
Veralto Corp.
| | 593 | | 56,614 |
Vestis Corp.
| | 4,350 | | 53,200 |
Viad Corp. (a)
| | 255 | | 8,670 |
Waste Management, Inc.
| | 1,720 | | 366,945 |
| | | | | | 1,942,452 |
| Security Description | | | Shares | | Value |
| COMMUNICATIONS EQUIPMENT — 0.7% | |
Arista Networks, Inc. (a)
| | 723 | | $253,397 |
Calix, Inc. (a)
| | 406 | | 14,385 |
Ciena Corp. (a)
| | 1,162 | | 55,985 |
Cisco Systems, Inc.
| | 34,308 | | 1,629,973 |
Digi International, Inc. (a)
| | 265 | | 6,076 |
Extreme Networks, Inc. (a)
| | 745 | | 10,020 |
F5, Inc. (a)
| | 381 | | 65,620 |
Harmonic, Inc. (a)
| | 1,177 | | 13,853 |
Juniper Networks, Inc.
| | 2,762 | | 100,703 |
Lumentum Holdings, Inc. (a)
| | 768 | | 39,107 |
Motorola Solutions, Inc.
| | 351 | | 135,504 |
NetScout Systems, Inc. (a)
| | 750 | | 13,717 |
Viasat, Inc. (a) (b)
| | 2,488 | | 31,598 |
Viavi Solutions, Inc. (a)
| | 1,436 | | 9,865 |
| | | | | | 2,379,803 |
| CONSTRUCTION & ENGINEERING — 0.2% | |
AECOM
| | 1,113 | | 98,100 |
Arcosa, Inc.
| | 516 | | 43,040 |
Comfort Systems USA, Inc.
| | 133 | | 40,448 |
Dycom Industries, Inc. (a)
| | 296 | | 49,953 |
EMCOR Group, Inc.
| | 231 | | 84,333 |
Fluor Corp. (a)
| | 2,056 | | 89,539 |
Granite Construction, Inc.
| | 475 | | 29,436 |
MasTec, Inc. (a)
| | 884 | | 94,579 |
MDU Resources Group, Inc.
| | 3,898 | | 97,840 |
MYR Group, Inc. (a)
| | 192 | | 26,056 |
Quanta Services, Inc.
| | 483 | | 122,725 |
Valmont Industries, Inc.
| | 177 | | 48,578 |
| | | | | | 824,627 |
| CONSTRUCTION MATERIALS — 0.1% | |
Eagle Materials, Inc.
| | 92 | | 20,006 |
Knife River Corp. (a)
| | 264 | | 18,517 |
Martin Marietta Materials, Inc.
| | 206 | | 111,611 |
Vulcan Materials Co.
| | 443 | | 110,165 |
| | | | | | 260,299 |
| CONSUMER FINANCE — 1.4% | |
Ally Financial, Inc.
| | 8,988 | | 356,554 |
American Express Co.
| | 4,829 | | 1,118,155 |
Bread Financial Holdings, Inc.
| | 1,645 | | 73,301 |
Capital One Financial Corp.
| | 12,706 | | 1,759,146 |
Discover Financial Services
| | 3,621 | | 473,663 |
Encore Capital Group, Inc. (a)
| | 910 | | 37,974 |
Enova International, Inc. (a)
| | 1,129 | | 70,280 |
EZCORP, Inc. Class A (a)
| | 1,760 | | 18,427 |
FirstCash Holdings, Inc.
| | 315 | | 33,037 |
Green Dot Corp. Class A (a)
| | 1,748 | | 16,519 |
Navient Corp.
| | 3,191 | | 46,461 |
PRA Group, Inc. (a)
| | 754 | | 14,824 |
PROG Holdings, Inc.
| | 1,806 | | 62,632 |
SLM Corp.
| | 2,659 | | 55,281 |
Synchrony Financial
| | 13,470 | | 635,649 |
World Acceptance Corp. (a)
| | 191 | | 23,604 |
| | | | | | 4,795,507 |
See accompanying notes to financial statements.
81
SPDR SERIES TRUST
SPDR S&P 1500 VALUE TILT ETF
SCHEDULE OF INVESTMENTS (continued)
June 30, 2024
| Security Description | | | Shares | | Value |
| CONSUMER STAPLES DISTRIBUTION & RETAIL — 3.1% | |
Andersons, Inc.
| | 1,171 | | $58,082 |
BJ's Wholesale Club Holdings, Inc. (a)
| | 1,433 | | 125,875 |
Casey's General Stores, Inc.
| | 316 | | 120,573 |
Chefs' Warehouse, Inc. (a)
| | 517 | | 20,220 |
Costco Wholesale Corp.
| | 1,220 | | 1,036,988 |
Dollar General Corp.
| | 2,385 | | 315,368 |
Dollar Tree, Inc. (a)
| | 2,217 | | 236,709 |
Grocery Outlet Holding Corp. (a)
| | 1,135 | | 25,106 |
Kroger Co.
| | 22,259 | | 1,111,392 |
Performance Food Group Co. (a)
| | 5,150 | | 340,466 |
PriceSmart, Inc.
| | 504 | | 40,925 |
SpartanNash Co.
| | 1,427 | | 26,770 |
Sprouts Farmers Market, Inc. (a)
| | 856 | | 71,613 |
Sysco Corp.
| | 6,013 | | 429,268 |
Target Corp.
| | 5,621 | | 832,133 |
U.S. Foods Holding Corp. (a)
| | 4,329 | | 229,350 |
United Natural Foods, Inc. (a)
| | 2,108 | | 27,615 |
Walgreens Boots Alliance, Inc. (b)
| | 23,703 | | 286,688 |
Walmart, Inc.
| | 82,310 | | 5,573,210 |
| | | | | | 10,908,351 |
| CONTAINERS & PACKAGING — 0.6% | |
Amcor PLC
| | 20,923 | | 204,627 |
AptarGroup, Inc.
| | 327 | | 46,045 |
Avery Dennison Corp.
| | 397 | | 86,804 |
Ball Corp.
| | 2,559 | | 153,591 |
Berry Global Group, Inc.
| | 2,219 | | 130,588 |
Crown Holdings, Inc.
| | 1,444 | | 107,419 |
Graphic Packaging Holding Co.
| | 3,694 | | 96,820 |
Greif, Inc. Class A
| | 952 | | 54,712 |
International Paper Co.
| | 11,455 | | 494,283 |
Myers Industries, Inc.
| | 516 | | 6,904 |
O-I Glass, Inc. (a)
| | 5,122 | | 57,008 |
Packaging Corp. of America
| | 753 | | 137,468 |
Sealed Air Corp.
| | 1,547 | | 53,820 |
Silgan Holdings, Inc.
| | 1,551 | | 65,654 |
Sonoco Products Co.
| | 1,874 | | 95,049 |
Westrock Co.
| | 8,509 | | 427,662 |
| | | | | | 2,218,454 |
| DISTRIBUTORS — 0.1% | |
Genuine Parts Co.
| | 1,520 | | 210,247 |
LKQ Corp.
| | 3,231 | | 134,377 |
Pool Corp.
| | 109 | | 33,499 |
| | | | | | 378,123 |
| DIVERSIFIED CONSUMER SERVICES — 0.1% | |
Adtalem Global Education, Inc. (a)
| | 657 | | 44,814 |
Frontdoor, Inc. (a)
| | 621 | | 20,984 |
Graham Holdings Co. Class B
| | 121 | | 84,646 |
Grand Canyon Education, Inc. (a)
| | 262 | | 36,656 |
H&R Block, Inc.
| | 1,604 | | 86,985 |
Mister Car Wash, Inc. (a) (b)
| | 1,796 | | 12,788 |
Perdoceo Education Corp.
| | 1,432 | | 30,673 |
Service Corp. International
| | 1,109 | | 78,883 |
| Security Description | | | Shares | | Value |
Strategic Education, Inc.
| | 251 | | $27,776 |
Stride, Inc. (a)
| | 473 | | 33,346 |
| | | | | | 457,551 |
| DIVERSIFIED REITs — 0.1% | |
Alexander & Baldwin, Inc. REIT
| | 983 | | 16,672 |
American Assets Trust, Inc. REIT
| | 768 | | 17,188 |
Armada Hoffler Properties, Inc. REIT
| | 755 | | 8,373 |
Essential Properties Realty Trust, Inc. REIT
| | 1,487 | | 41,205 |
Global Net Lease, Inc. REIT
| | 7,071 | | 51,972 |
WP Carey, Inc. REIT
| | 3,168 | | 174,398 |
| | | | | | 309,808 |
| DIVERSIFIED TELECOMMUNICATION SERVICES — 3.0% | |
AT&T, Inc.
| | 238,961 | | 4,566,545 |
Cogent Communications Holdings, Inc.
| | 608 | | 34,316 |
Consolidated Communications Holdings, Inc. (a)
| | 3,408 | | 14,995 |
Frontier Communications Parent, Inc. (a)
| | 4,236 | | 110,898 |
Iridium Communications, Inc.
| | 406 | | 10,808 |
Lumen Technologies, Inc. (a) (b)
| | 35,723 | | 39,295 |
Shenandoah Telecommunications Co.
| | 607 | | 9,912 |
Verizon Communications, Inc.
| | 140,282 | | 5,785,230 |
| | | | | | 10,571,999 |
| ELECTRIC UTILITIES — 2.3% | |
ALLETE, Inc.
| | 1,098 | | 68,460 |
Alliant Energy Corp.
| | 2,671 | | 135,954 |
American Electric Power Co., Inc.
| | 6,367 | | 558,641 |
Constellation Energy Corp.
| | 671 | | 134,381 |
Duke Energy Corp.
| | 11,161 | | 1,118,667 |
Edison International
| | 4,648 | | 333,773 |
Entergy Corp.
| | 4,049 | | 433,243 |
Evergy, Inc.
| | 4,400 | | 233,068 |
Eversource Energy
| | 5,057 | | 286,782 |
Exelon Corp.
| | 19,059 | | 659,632 |
FirstEnergy Corp.
| | 6,158 | | 235,667 |
IDACORP, Inc.
| | 615 | | 57,287 |
MGE Energy, Inc.
| | 292 | | 21,818 |
NextEra Energy, Inc.
| | 17,458 | | 1,236,201 |
NRG Energy, Inc.
| | 2,452 | | 190,913 |
OGE Energy Corp.
| | 2,736 | | 97,675 |
Otter Tail Corp.
| | 443 | | 38,802 |
PG&E Corp.
| | 23,173 | | 404,601 |
Pinnacle West Capital Corp.
| | 2,172 | | 165,897 |
PNM Resources, Inc.
| | 1,643 | | 60,725 |
Portland General Electric Co.
| | 1,369 | | 59,196 |
PPL Corp.
| | 10,669 | | 294,998 |
Southern Co.
| | 13,168 | | 1,021,442 |
Xcel Energy, Inc.
| | 7,986 | | 426,532 |
| | | | | | 8,274,355 |
See accompanying notes to financial statements.
82
SPDR SERIES TRUST
SPDR S&P 1500 VALUE TILT ETF
SCHEDULE OF INVESTMENTS (continued)
June 30, 2024
| Security Description | | | Shares | | Value |
| ELECTRICAL EQUIPMENT — 0.5% | |
Acuity Brands, Inc.
| | 179 | | $43,218 |
AMETEK, Inc.
| | 737 | | 122,865 |
Eaton Corp. PLC
| | 1,335 | | 418,589 |
Emerson Electric Co.
| | 4,828 | | 531,853 |
Encore Wire Corp.
| | 202 | | 58,546 |
EnerSys
| | 518 | | 53,623 |
Generac Holdings, Inc. (a)
| | 469 | | 62,011 |
nVent Electric PLC
| | 909 | | 69,639 |
Powell Industries, Inc.
| | 161 | | 23,087 |
Regal Rexnord Corp.
| | 388 | | 52,465 |
Rockwell Automation, Inc.
| | 540 | | 148,651 |
Sensata Technologies Holding PLC
| | 1,827 | | 68,312 |
SunPower Corp. (a) (b)
| | 972 | | 2,877 |
Sunrun, Inc. (a) (b)
| | 3,229 | | 38,296 |
Vicor Corp. (a)
| | 6 | | 199 |
| | | | | | 1,694,231 |
| ELECTRONIC EQUIPMENT, INSTRUMENTS & COMPONENTS — 0.9% | |
Advanced Energy Industries, Inc.
| | 184 | | 20,012 |
Amphenol Corp. Class A
| | 3,427 | | 230,877 |
Arrow Electronics, Inc. (a)
| | 1,783 | | 215,315 |
Avnet, Inc.
| | 2,998 | | 154,367 |
Badger Meter, Inc.
| | 29 | | 5,404 |
Belden, Inc.
| | 252 | | 23,638 |
Benchmark Electronics, Inc.
| | 1,436 | | 56,665 |
CDW Corp.
| | 629 | | 140,795 |
Cognex Corp.
| | 632 | | 29,552 |
Coherent Corp. (a)
| | 1,072 | | 77,677 |
Corning, Inc.
| | 8,383 | | 325,680 |
Crane NXT Co. (b)
| | 261 | | 16,031 |
CTS Corp.
| | 169 | | 8,557 |
ePlus, Inc. (a)
| | 302 | | 22,251 |
Fabrinet (a)
| | 180 | | 44,062 |
Hubbell, Inc.
| | 249 | | 91,005 |
Insight Enterprises, Inc. (a)
| | 401 | | 79,542 |
IPG Photonics Corp. (a)
| | 418 | | 35,275 |
Itron, Inc. (a)
| | 376 | | 37,209 |
Jabil, Inc.
| | 1,542 | | 167,754 |
Keysight Technologies, Inc. (a)
| | 841 | | 115,007 |
Knowles Corp. (a)
| | 1,426 | | 24,613 |
Littelfuse, Inc.
| | 194 | | 49,584 |
Novanta, Inc. (a)
| | 149 | | 24,303 |
OSI Systems, Inc. (a)
| | 182 | | 25,029 |
PC Connection, Inc.
| | 516 | | 33,127 |
Plexus Corp. (a)
| | 397 | | 40,962 |
Rogers Corp. (a)
| | 153 | | 18,453 |
Sanmina Corp. (a)
| | 1,846 | | 122,298 |
ScanSource, Inc. (a)
| | 833 | | 36,910 |
TD SYNNEX Corp.
| | 2,654 | | 306,272 |
TE Connectivity Ltd.
| | 2,507 | | 377,128 |
Teledyne Technologies, Inc. (a)
| | 273 | | 105,919 |
Trimble, Inc. (a)
| | 1,232 | | 68,893 |
TTM Technologies, Inc. (a)
| | 1,959 | | 38,063 |
Vishay Intertechnology, Inc.
| | 2,699 | | 60,188 |
Vontier Corp.
| | 824 | | 31,477 |
| Security Description | | | Shares | | Value |
Zebra Technologies Corp. Class A (a)
| | 240 | | $74,143 |
| | | | | | 3,334,037 |
| ENERGY EQUIPMENT & SERVICES — 0.6% | |
Archrock, Inc.
| | 1,490 | | 30,128 |
Baker Hughes Co.
| | 10,857 | | 381,841 |
Bristow Group, Inc. (a)
| | 476 | | 15,960 |
ChampionX Corp.
| | 1,160 | | 38,523 |
Core Laboratories, Inc.
| | 233 | | 4,727 |
Dril-Quip, Inc. (a)
| | 518 | | 9,635 |
Halliburton Co.
| | 9,671 | | 326,686 |
Helix Energy Solutions Group, Inc. (a)
| | 2,223 | | 26,543 |
Helmerich & Payne, Inc.
| | 3,272 | | 118,250 |
Liberty Energy, Inc.
| | 2,902 | | 60,623 |
Nabors Industries Ltd. (a)
| | 384 | | 27,325 |
NOV, Inc.
| | 5,702 | | 108,395 |
Oceaneering International, Inc. (a)
| | 1,095 | | 25,908 |
Patterson-UTI Energy, Inc.
| | 6,150 | | 63,714 |
ProPetro Holding Corp. (a)
| | 3,851 | | 33,388 |
RPC, Inc.
| | 3,427 | | 21,419 |
Schlumberger NV
| | 12,049 | | 568,472 |
U.S. Silica Holdings, Inc. (a)
| | 2,733 | | 42,225 |
Valaris Ltd. (a)
| | 758 | | 56,471 |
Weatherford International PLC (a)
| | 786 | | 96,246 |
| | | | | | 2,056,479 |
| ENTERTAINMENT — 0.8% | |
Cinemark Holdings, Inc. (a) (b)
| | 3,511 | | 75,908 |
Electronic Arts, Inc.
| | 1,157 | | 161,205 |
Live Nation Entertainment, Inc. (a)
| | 1,198 | | 112,300 |
Madison Square Garden Sports Corp. (a)
| | 95 | | 17,872 |
Netflix, Inc. (a)
| | 909 | | 613,466 |
Take-Two Interactive Software, Inc. (a)
| | 435 | | 67,638 |
TKO Group Holdings, Inc.
| | 1,149 | | 124,080 |
Walt Disney Co.
| | 10,733 | | 1,065,680 |
Warner Bros Discovery, Inc. (a)
| | 73,479 | | 546,684 |
| | | | | | 2,784,833 |
| FINANCIAL SERVICES — 3.7% | |
Berkshire Hathaway, Inc. Class B (a)
| | 19,791 | | 8,050,979 |
Corpay, Inc. (a)
| | 451 | | 120,151 |
Equitable Holdings, Inc.
| | 6,010 | | 245,569 |
Essent Group Ltd.
| | 1,285 | | 72,204 |
Euronet Worldwide, Inc. (a)
| | 528 | | 54,648 |
EVERTEC, Inc.
| | 471 | | 15,661 |
Fidelity National Information Services, Inc.
| | 4,716 | | 355,398 |
Fiserv, Inc. (a)
| | 2,963 | | 441,605 |
Global Payments, Inc.
| | 2,114 | | 204,424 |
Jack Henry & Associates, Inc.
| | 296 | | 49,142 |
Jackson Financial, Inc. Class A
| | 2,346 | | 174,214 |
Mastercard, Inc. Class A
| | 999 | | 440,719 |
MGIC Investment Corp.
| | 3,942 | | 84,950 |
See accompanying notes to financial statements.
83
SPDR SERIES TRUST
SPDR S&P 1500 VALUE TILT ETF
SCHEDULE OF INVESTMENTS (continued)
June 30, 2024
| Security Description | | | Shares | | Value |
Mr Cooper Group, Inc. (a)
| | 2,142 | | $173,995 |
NCR Atleos Corp. (a)
| | 2,214 | | 59,822 |
NMI Holdings, Inc. Class A (a)
| | 1,306 | | 44,456 |
Payoneer Global, Inc. (a)
| | 920 | | 5,097 |
PayPal Holdings, Inc. (a)
| | 8,709 | | 505,383 |
Radian Group, Inc.
| | 2,930 | | 91,123 |
Visa, Inc. Class A
| | 5,279 | | 1,385,579 |
Voya Financial, Inc.
| | 1,973 | | 140,379 |
Walker & Dunlop, Inc.
| | 280 | | 27,496 |
Western Union Co.
| | 11,605 | | 141,813 |
WEX, Inc. (a)
| | 253 | | 44,816 |
| | | | | | 12,929,623 |
| FOOD PRODUCTS — 1.8% | |
Archer-Daniels-Midland Co.
| | 16,442 | | 993,919 |
B&G Foods, Inc. (b)
| | 2,339 | | 18,899 |
Bunge Global SA
| | 4,812 | | 513,777 |
Calavo Growers, Inc.
| | 454 | | 10,306 |
Cal-Maine Foods, Inc.
| | 1,348 | | 82,376 |
Campbell Soup Co.
| | 3,770 | | 170,366 |
Conagra Brands, Inc.
| | 9,151 | | 260,071 |
Darling Ingredients, Inc. (a)
| | 2,307 | | 84,782 |
Flowers Foods, Inc.
| | 2,783 | | 61,783 |
Fresh Del Monte Produce, Inc.
| | 1,427 | | 31,180 |
General Mills, Inc.
| | 6,166 | | 390,061 |
Hain Celestial Group, Inc. (a)
| | 2,972 | | 20,537 |
Hershey Co.
| | 1,218 | | 223,905 |
Hormel Foods Corp.
| | 9,595 | | 292,552 |
Ingredion, Inc.
| | 946 | | 108,506 |
J & J Snack Foods Corp.
| | 146 | | 23,706 |
J M Smucker Co.
| | 1,539 | | 167,813 |
John B Sanfilippo & Son, Inc.
| | 75 | | 7,288 |
Kellanova
| | 3,835 | | 221,203 |
Kraft Heinz Co.
| | 26,400 | | 850,608 |
Lamb Weston Holdings, Inc.
| | 677 | | 56,922 |
Lancaster Colony Corp.
| | 150 | | 28,345 |
McCormick & Co., Inc.
| | 2,043 | | 144,930 |
Mondelez International, Inc. Class A
| | 10,941 | | 715,979 |
Pilgrim's Pride Corp. (a)
| | 1,443 | | 55,541 |
Post Holdings, Inc. (a)
| | 965 | | 100,514 |
Simply Good Foods Co. (a)
| | 660 | | 23,846 |
Tootsie Roll Industries, Inc.
| | 543 | | 16,600 |
TreeHouse Foods, Inc. (a)
| | 674 | | 24,695 |
Tyson Foods, Inc. Class A
| | 9,484 | | 541,916 |
WK Kellogg Co.
| | 2,185 | | 35,965 |
| | | | | | 6,278,891 |
| GAS UTILITIES — 0.2% | |
Atmos Energy Corp.
| | 1,821 | | 212,420 |
Chesapeake Utilities Corp.
| | 194 | | 20,603 |
National Fuel Gas Co.
| | 1,765 | | 95,645 |
New Jersey Resources Corp.
| | 1,188 | | 50,775 |
Northwest Natural Holding Co.
| | 1,218 | | 43,982 |
ONE Gas, Inc.
| | 1,836 | | 117,229 |
Southwest Gas Holdings, Inc.
| | 974 | | 68,550 |
Spire, Inc.
| | 1,052 | | 63,888 |
| Security Description | | | Shares | | Value |
UGI Corp.
| | 6,938 | | $158,880 |
| | | | | | 831,972 |
| GROUND TRANSPORTATION — 0.8% | |
ArcBest Corp.
| | 284 | | 30,411 |
Avis Budget Group, Inc. (b)
| | 708 | | 74,000 |
CSX Corp.
| | 11,563 | | 386,782 |
Heartland Express, Inc.
| | 982 | | 12,108 |
Hertz Global Holdings, Inc. (a)
| | 4,875 | | 17,209 |
JB Hunt Transport Services, Inc.
| | 686 | | 109,760 |
Knight-Swift Transportation Holdings, Inc.
| | 2,350 | | 117,312 |
Landstar System, Inc.
| | 257 | | 47,411 |
Marten Transport Ltd.
| | 906 | | 16,716 |
Norfolk Southern Corp.
| | 1,835 | | 393,956 |
Old Dominion Freight Line, Inc.
| | 535 | | 94,481 |
RXO, Inc. (a)
| | 1,371 | | 35,852 |
Ryder System, Inc.
| | 1,466 | | 181,608 |
Saia, Inc. (a)
| | 86 | | 40,789 |
Uber Technologies, Inc. (a)
| | 4,332 | | 314,850 |
Union Pacific Corp.
| | 3,571 | | 807,974 |
Werner Enterprises, Inc.
| | 1,222 | | 43,784 |
XPO, Inc. (a)
| | 945 | | 100,312 |
| | | | | | 2,825,315 |
| HEALTH CARE EQUIPMENT & SUPPLIES — 1.5% | |
Abbott Laboratories
| | 8,156 | | 847,490 |
Align Technology, Inc. (a)
| | 381 | | 91,985 |
Artivion, Inc. (a)
| | 8 | | 205 |
Avanos Medical, Inc. (a)
| | 505 | | 10,060 |
Baxter International, Inc.
| | 6,130 | | 205,049 |
Becton Dickinson & Co.
| | 1,425 | | 333,037 |
Boston Scientific Corp. (a)
| | 4,889 | | 376,502 |
CONMED Corp.
| | 44 | | 3,050 |
Cooper Cos., Inc.
| | 662 | | 57,793 |
Dentsply Sirona, Inc.
| | 1,650 | | 41,102 |
Dexcom, Inc. (a)
| | 498 | | 56,463 |
Edwards Lifesciences Corp. (a)
| | 2,074 | | 191,575 |
Embecta Corp.
| | 277 | | 3,463 |
Enovis Corp. (a)
| | 721 | | 32,589 |
Envista Holdings Corp. (a)
| | 2,481 | | 41,259 |
GE HealthCare Technologies, Inc.
| | 1,212 | | 94,439 |
Glaukos Corp. (a)
| | 58 | | 6,864 |
Globus Medical, Inc. Class A (a)
| | 724 | | 49,587 |
Haemonetics Corp. (a)
| | 256 | | 21,179 |
Hologic, Inc. (a)
| | 1,159 | | 86,056 |
ICU Medical, Inc. (a)
| | 194 | | 23,038 |
IDEXX Laboratories, Inc. (a)
| | 176 | | 85,747 |
Inari Medical, Inc. (a)
| | 46 | | 2,215 |
Insulet Corp. (a)
| | 148 | | 29,866 |
Integer Holdings Corp. (a)
| | 275 | | 31,842 |
Integra LifeSciences Holdings Corp. (a)
| | 833 | | 24,274 |
Intuitive Surgical, Inc. (a)
| | 744 | | 330,968 |
Lantheus Holdings, Inc. (a)
| | 343 | | 27,539 |
LivaNova PLC (a)
| | 255 | | 13,979 |
Masimo Corp. (a)
| | 213 | | 26,825 |
See accompanying notes to financial statements.
84
SPDR SERIES TRUST
SPDR S&P 1500 VALUE TILT ETF
SCHEDULE OF INVESTMENTS (continued)
June 30, 2024
| Security Description | | | Shares | | Value |
Medtronic PLC
| | 14,516 | | $1,142,554 |
Merit Medical Systems, Inc. (a)
| | 257 | | 22,089 |
Neogen Corp. (a)
| | 1,100 | | 17,193 |
Omnicell, Inc. (a)
| | 668 | | 18,083 |
Penumbra, Inc. (a)
| | 44 | | 7,919 |
QuidelOrtho Corp. (a)
| | 1,637 | | 54,381 |
ResMed, Inc.
| | 398 | | 76,185 |
Solventum Corp. (a)
| | 289 | | 15,282 |
STAAR Surgical Co. (a)
| | 152 | | 7,237 |
STERIS PLC
| | 377 | | 82,767 |
Stryker Corp.
| | 912 | | 310,308 |
Tandem Diabetes Care, Inc. (a)
| | 153 | | 6,164 |
Teleflex, Inc.
| | 277 | | 58,261 |
Varex Imaging Corp. (a)
| | 262 | | 3,859 |
Zimmer Biomet Holdings, Inc.
| | 1,696 | | 184,067 |
| | | | | | 5,152,389 |
| HEALTH CARE PROVIDERS & SERVICES — 4.9% | |
Acadia Healthcare Co., Inc. (a)
| | 670 | | 45,252 |
AdaptHealth Corp. (a)
| | 2,755 | | 27,550 |
Addus HomeCare Corp. (a)
| | 144 | | 16,720 |
Amedisys, Inc. (a)
| | 280 | | 25,704 |
AMN Healthcare Services, Inc. (a)
| | 730 | | 37,398 |
Astrana Health, Inc. (a)
| | 301 | | 12,209 |
Cardinal Health, Inc.
| | 8,057 | | 792,164 |
Cencora, Inc.
| | 5,482 | | 1,235,095 |
Centene Corp. (a)
| | 17,697 | | 1,173,311 |
Chemed Corp.
| | 37 | | 20,075 |
Cigna Group
| | 4,130 | | 1,365,254 |
CorVel Corp. (a)
| | 51 | | 12,968 |
Cross Country Healthcare, Inc. (a)
| | 670 | | 9,273 |
CVS Health Corp.
| | 41,838 | | 2,470,952 |
DaVita, Inc. (a)
| | 1,785 | | 247,347 |
Elevance Health, Inc.
| | 2,829 | | 1,532,922 |
Encompass Health Corp.
| | 814 | | 69,833 |
Enhabit, Inc. (a)
| | 481 | | 4,291 |
Ensign Group, Inc.
| | 259 | | 32,036 |
Fulgent Genetics, Inc. (a)
| | 707 | | 13,871 |
HCA Healthcare, Inc.
| | 2,153 | | 691,716 |
HealthEquity, Inc. (a)
| | 290 | | 24,998 |
Henry Schein, Inc. (a)
| | 1,525 | | 97,753 |
Humana, Inc.
| | 2,343 | | 875,462 |
Labcorp Holdings, Inc.
| | 924 | | 188,043 |
McKesson Corp.
| | 2,514 | | 1,468,277 |
Molina Healthcare, Inc. (a)
| | 488 | | 145,082 |
National HealthCare Corp.
| | 195 | | 21,138 |
NeoGenomics, Inc. (a)
| | 1,061 | | 14,716 |
OmniAb, Inc. (a) (d)
| | 38 | | — |
Option Care Health, Inc. (a)
| | 1,327 | | 36,758 |
Owens & Minor, Inc. (a)
| | 2,735 | | 36,923 |
Patterson Cos., Inc.
| | 2,728 | | 65,799 |
Pediatrix Medical Group, Inc. (a)
| | 1,761 | | 13,296 |
Premier, Inc. Class A
| | 1,738 | | 32,448 |
Progyny, Inc. (a)
| | 246 | | 7,038 |
Quest Diagnostics, Inc.
| | 1,327 | | 181,640 |
R1 RCM, Inc. (a)
| | 1,656 | | 20,799 |
| Security Description | | | Shares | | Value |
RadNet, Inc. (a)
| | 309 | | $18,206 |
Select Medical Holdings Corp.
| | 2,270 | | 79,586 |
Tenet Healthcare Corp. (a)
| | 1,469 | | 195,421 |
U.S. Physical Therapy, Inc.
| | 151 | | 13,955 |
UnitedHealth Group, Inc.
| | 7,515 | | 3,827,089 |
Universal Health Services, Inc. Class B
| | 881 | | 162,923 |
| | | | | | 17,363,291 |
| HEALTH CARE REITs — 0.3% | |
CareTrust REIT, Inc.
| | 1,350 | | 33,885 |
Community Healthcare Trust, Inc. REIT
| | 295 | | 6,900 |
Healthcare Realty Trust, Inc. REIT
| | 5,513 | | 90,854 |
Healthpeak Properties, Inc. REIT
| | 8,601 | | 168,580 |
LTC Properties, Inc. REIT
| | 838 | | 28,911 |
Medical Properties Trust, Inc. REIT
| | 21,544 | | 92,855 |
Omega Healthcare Investors, Inc. REIT
| | 3,548 | | 121,519 |
Sabra Health Care REIT, Inc.
| | 4,428 | | 68,191 |
Universal Health Realty Income Trust REIT
| | 8 | | 313 |
Ventas, Inc. REIT
| | 4,858 | | 249,021 |
Welltower, Inc. REIT
| | 3,514 | | 366,334 |
| | | | | | 1,227,363 |
| HEALTH CARE TECHNOLOGY — 0.0% (e) | |
Certara, Inc. (a)
| | 474 | | 6,565 |
Doximity, Inc. Class A (a)
| | 770 | | 21,537 |
| | | | | | 28,102 |
| HOTEL & RESORT REITs — 0.1% | |
Apple Hospitality REIT, Inc.
| | 7,048 | | 102,478 |
DiamondRock Hospitality Co. REIT
| | 2,577 | | 21,776 |
Host Hotels & Resorts, Inc. REIT
| | 8,516 | | 153,118 |
Park Hotels & Resorts, Inc. REIT
| | 6,952 | | 104,141 |
Pebblebrook Hotel Trust REIT
| | 4,184 | | 57,530 |
Service Properties Trust REIT
| | 3,617 | | 18,591 |
Summit Hotel Properties, Inc. REIT
| | 3,606 | | 21,600 |
Sunstone Hotel Investors, Inc. REIT
| | 2,485 | | 25,993 |
Xenia Hotels & Resorts, Inc. REIT
| | 1,416 | | 20,291 |
| | | | | | 525,518 |
| HOTELS, RESTAURANTS & LEISURE — 1.5% | |
Airbnb, Inc. Class A (a)
| | 1,806 | | 273,844 |
Aramark
| | 5,026 | | 170,984 |
BJ's Restaurants, Inc. (a)
| | 204 | | 7,079 |
Bloomin' Brands, Inc.
| | 1,164 | | 22,384 |
Booking Holdings, Inc.
| | 94 | | 372,381 |
Boyd Gaming Corp.
| | 980 | | 53,998 |
Brinker International, Inc. (a)
| | 860 | | 62,255 |
Caesars Entertainment, Inc. (a)
| | 2,605 | | 103,523 |
Carnival Corp. (a)
| | 33,360 | | 624,499 |
Cheesecake Factory, Inc.
| | 902 | | 35,440 |
Chipotle Mexican Grill, Inc. (a)
| | 2,800 | | 175,420 |
Choice Hotels International, Inc.
| | 158 | | 18,802 |
Churchill Downs, Inc.
| | 364 | | 50,814 |
Chuy's Holdings, Inc. (a)
| | 51 | | 1,322 |
See accompanying notes to financial statements.
85
SPDR SERIES TRUST
SPDR S&P 1500 VALUE TILT ETF
SCHEDULE OF INVESTMENTS (continued)
June 30, 2024
| Security Description | | | Shares | | Value |
Cracker Barrel Old Country Store, Inc. (b)
| | 737 | | $31,072 |
Darden Restaurants, Inc.
| | 1,029 | | 155,708 |
Dave & Buster's Entertainment, Inc. (a)
| | 468 | | 18,631 |
Dine Brands Global, Inc.
| | 513 | | 18,571 |
Domino's Pizza, Inc.
| | 97 | | 50,084 |
Expedia Group, Inc. (a)
| | 1,042 | | 131,282 |
Golden Entertainment, Inc.
| | 381 | | 11,853 |
Hilton Grand Vacations, Inc. (a)
| | 931 | | 37,640 |
Hilton Worldwide Holdings, Inc.
| | 308 | | 67,206 |
Hyatt Hotels Corp. Class A
| | 536 | | 81,429 |
Jack in the Box, Inc.
| | 211 | | 10,748 |
Las Vegas Sands Corp.
| | 5,344 | | 236,472 |
Light & Wonder, Inc. (a)
| | 762 | | 79,919 |
Marriott International, Inc. Class A
| | 1,315 | | 317,927 |
Marriott Vacations Worldwide Corp.
| | 632 | | 55,186 |
McDonald's Corp.
| | 1,995 | | 508,406 |
MGM Resorts International (a)
| | 5,233 | | 232,554 |
Monarch Casino & Resort, Inc.
| | 251 | | 17,101 |
Norwegian Cruise Line Holdings Ltd. (a)
| | 5,134 | | 96,468 |
Papa John's International, Inc. (b)
| | 203 | | 9,537 |
Penn Entertainment, Inc. (a) (b)
| | 4,932 | | 95,459 |
Planet Fitness, Inc. Class A (a)
| | 185 | | 13,614 |
Royal Caribbean Cruises Ltd. (a)
| | 1,421 | | 226,550 |
Sabre Corp. (a)
| | 12,567 | | 33,554 |
Shake Shack, Inc. Class A (a)
| | 179 | | 16,110 |
Six Flags Entertainment Corp.
| | 1,054 | | 34,930 |
Starbucks Corp.
| | 5,582 | | 434,559 |
Texas Roadhouse, Inc.
| | 316 | | 54,260 |
Travel & Leisure Co.
| | 1,214 | | 54,606 |
Vail Resorts, Inc.
| | 323 | | 58,182 |
Wendy's Co.
| | 1,658 | | 28,120 |
Wingstop, Inc.
| | 28 | | 11,834 |
Wyndham Hotels & Resorts, Inc.
| | 498 | | 36,852 |
Wynn Resorts Ltd.
| | 805 | | 72,047 |
Yum! Brands, Inc.
| | 920 | | 121,863 |
| | | | | | 5,433,079 |
| HOUSEHOLD DURABLES — 0.8% | |
Cavco Industries, Inc. (a)
| | 67 | | 23,193 |
Century Communities, Inc.
| | 409 | | 33,399 |
DR Horton, Inc.
| | 2,519 | | 355,003 |
Ethan Allen Interiors, Inc.
| | 522 | | 14,559 |
Garmin Ltd.
| | 1,243 | | 202,510 |
Green Brick Partners, Inc. (a)
| | 617 | | 35,317 |
Helen of Troy Ltd. (a)
| | 290 | | 26,895 |
Installed Building Products, Inc.
| | 127 | | 26,121 |
KB Home
| | 1,068 | | 74,952 |
La-Z-Boy, Inc.
| | 934 | | 34,820 |
Leggett & Platt, Inc.
| | 4,418 | | 50,630 |
Lennar Corp. Class A
| | 2,985 | | 447,362 |
LGI Homes, Inc. (a)
| | 285 | | 25,505 |
M/I Homes, Inc. (a)
| | 403 | | 49,222 |
Meritage Homes Corp.
| | 439 | | 71,052 |
Mohawk Industries, Inc. (a)
| | 1,752 | | 199,010 |
| Security Description | | | Shares | | Value |
Newell Brands, Inc.
| | 13,886 | | $89,009 |
NVR, Inc. (a)
| | 25 | | 189,714 |
PulteGroup, Inc.
| | 1,792 | | 197,299 |
Sonos, Inc. (a)
| | 849 | | 12,531 |
Taylor Morrison Home Corp. (a)
| | 2,056 | | 113,985 |
Tempur Sealy International, Inc.
| | 472 | | 22,345 |
Toll Brothers, Inc.
| | 1,258 | | 144,896 |
TopBuild Corp. (a)
| | 157 | | 60,487 |
Tri Pointe Homes, Inc. (a)
| | 1,857 | | 69,173 |
Whirlpool Corp.
| | 1,821 | | 186,106 |
Worthington Enterprises, Inc.
| | 1,136 | | 53,767 |
| | | | | | 2,808,862 |
| HOUSEHOLD PRODUCTS — 0.8% | |
Central Garden & Pet Co. (a) (b)
| | 253 | | 9,740 |
Central Garden & Pet Co. Class A (a)
| | 1,095 | | 36,168 |
Church & Dwight Co., Inc.
| | 1,073 | | 111,248 |
Clorox Co.
| | 725 | | 98,941 |
Colgate-Palmolive Co.
| | 3,820 | | 370,693 |
Energizer Holdings, Inc.
| | 818 | | 24,164 |
Kimberly-Clark Corp.
| | 2,844 | | 393,041 |
Procter & Gamble Co.
| | 11,136 | | 1,836,549 |
WD-40 Co.
| | 47 | | 10,323 |
| | | | | | 2,890,867 |
| INDEPENDENT POWER AND RENEWABLE ELECTRICITY PRODUCERS — 0.2% | |
AES Corp.
| | 10,330 | | 181,498 |
Clearway Energy, Inc. Class A
| | 1,148 | | 26,014 |
Clearway Energy, Inc. Class C
| | 2,726 | | 67,305 |
Ormat Technologies, Inc.
| | 436 | | 31,261 |
Vistra Corp.
| | 2,838 | | 244,011 |
| | | | | | 550,089 |
| INDUSTRIAL CONGLOMERATES — 0.7% | |
3M Co.
| | 7,999 | | 817,418 |
General Electric Co.
| | 5,884 | | 935,379 |
Honeywell International, Inc.
| | 3,857 | | 823,624 |
| | | | | | 2,576,421 |
| INDUSTRIAL REITs — 0.2% | |
EastGroup Properties, Inc. REIT
| | 221 | | 37,592 |
First Industrial Realty Trust, Inc. REIT
| | 1,082 | | 51,406 |
Innovative Industrial Properties, Inc. REIT
| | 437 | | 47,729 |
LXP Industrial Trust REIT
| | 3,148 | | 28,710 |
Prologis, Inc. REIT
| | 4,554 | | 511,460 |
Rexford Industrial Realty, Inc. REIT
| | 1,298 | | 57,878 |
STAG Industrial, Inc. REIT
| | 1,474 | | 53,152 |
| | | | | | 787,927 |
| INSURANCE — 4.0% | |
Aflac, Inc.
| | 7,619 | | 680,453 |
Allstate Corp.
| | 3,171 | | 506,282 |
Ambac Financial Group, Inc. (a)
| | 1,416 | | 18,153 |
American Financial Group, Inc.
| | 2,162 | | 265,969 |
See accompanying notes to financial statements.
86
SPDR SERIES TRUST
SPDR S&P 1500 VALUE TILT ETF
SCHEDULE OF INVESTMENTS (continued)
June 30, 2024
| Security Description | | | Shares | | Value |
American International Group, Inc.
| | 12,760 | | $947,302 |
AMERISAFE, Inc.
| | 255 | | 11,192 |
Aon PLC Class A
| | 728 | | 213,726 |
Arch Capital Group Ltd. (a)
| | 4,507 | | 454,711 |
Arthur J Gallagher & Co.
| | 726 | | 188,259 |
Assurant, Inc.
| | 753 | | 125,186 |
Assured Guaranty Ltd.
| | 787 | | 60,717 |
Brighthouse Financial, Inc. (a)
| | 2,124 | | 92,054 |
Brown & Brown, Inc.
| | 1,260 | | 112,657 |
Chubb Ltd.
| | 4,934 | | 1,258,565 |
Cincinnati Financial Corp.
| | 1,843 | | 217,658 |
CNO Financial Group, Inc.
| | 3,623 | | 100,430 |
Employers Holdings, Inc.
| | 513 | | 21,869 |
Erie Indemnity Co. Class A
| | 147 | | 53,273 |
Everest Group Ltd.
| | 830 | | 316,247 |
Fidelity National Financial, Inc.
| | 4,948 | | 244,530 |
First American Financial Corp.
| | 1,977 | | 106,659 |
Genworth Financial, Inc. Class A (a)
| | 16,536 | | 99,877 |
Globe Life, Inc.
| | 1,223 | | 100,628 |
Hanover Insurance Group, Inc.
| | 520 | | 65,229 |
Hartford Financial Services Group, Inc.
| | 4,319 | | 434,232 |
HCI Group, Inc.
| | 55 | | 5,069 |
Horace Mann Educators Corp.
| | 895 | | 29,195 |
Kemper Corp.
| | 874 | | 51,854 |
Kinsale Capital Group, Inc.
| | 26 | | 10,017 |
Lincoln National Corp.
| | 5,621 | | 174,813 |
Loews Corp.
| | 6,035 | | 451,056 |
Marsh & McLennan Cos., Inc.
| | 2,039 | | 429,658 |
Mercury General Corp.
| | 878 | | 46,657 |
MetLife, Inc.
| | 19,864 | | 1,394,254 |
Old Republic International Corp.
| | 4,995 | | 154,346 |
Palomar Holdings, Inc. (a)
| | 151 | | 12,254 |
Primerica, Inc.
| | 262 | | 61,984 |
Principal Financial Group, Inc.
| | 7,264 | | 569,861 |
ProAssurance Corp. (a)
| | 1,170 | | 14,297 |
Progressive Corp.
| | 2,753 | | 571,826 |
Prudential Financial, Inc.
| | 11,955 | | 1,401,006 |
Reinsurance Group of America, Inc.
| | 2,184 | | 448,310 |
RenaissanceRe Holdings Ltd.
| | 764 | | 170,762 |
RLI Corp.
| | 249 | | 35,032 |
Safety Insurance Group, Inc.
| | 252 | | 18,908 |
Selective Insurance Group, Inc.
| | 648 | | 60,802 |
SiriusPoint Ltd. (a)
| | 3,894 | | 47,507 |
Stewart Information Services Corp.
| | 396 | | 24,584 |
Travelers Cos., Inc.
| | 2,758 | | 560,812 |
Trupanion, Inc. (a)
| | 182 | | 5,351 |
United Fire Group, Inc.
| | 865 | | 18,589 |
Unum Group
| | 6,022 | | 307,784 |
W R Berkley Corp.
| | 2,202 | | 173,033 |
Willis Towers Watson PLC
| | 833 | | 218,363 |
| | | | | | 14,163,842 |
| INTERACTIVE MEDIA & SERVICES — 3.9% | |
Alphabet, Inc. Class A
| | 16,200 | | 2,950,830 |
Alphabet, Inc. Class C
| | 26,267 | | 4,817,893 |
Cargurus, Inc. (a)
| | 849 | | 22,244 |
| Security Description | | | Shares | | Value |
Cars.com, Inc. (a)
| | 462 | | $9,102 |
Match Group, Inc. (a)
| | 1,627 | | 49,428 |
Meta Platforms, Inc. Class A
| | 11,779 | | 5,939,207 |
QuinStreet, Inc. (a)
| | 909 | | 15,080 |
Shutterstock, Inc. (b)
| | 189 | | 7,314 |
TripAdvisor, Inc. (a)
| | 1,146 | | 20,410 |
Yelp, Inc. (a)
| | 705 | | 26,050 |
Ziff Davis, Inc. (a)
| | 454 | | 24,993 |
ZoomInfo Technologies, Inc. (a)
| | 1,583 | | 20,215 |
| | | | | | 13,902,766 |
| IT SERVICES — 1.0% | |
Accenture PLC Class A
| | 3,380 | | 1,025,526 |
Akamai Technologies, Inc. (a)
| | 1,172 | | 105,574 |
Cognizant Technology Solutions Corp. Class A
| | 5,400 | | 367,200 |
DXC Technology Co. (a)
| | 6,056 | | 115,609 |
EPAM Systems, Inc. (a)
| | 254 | | 47,780 |
Gartner, Inc. (a)
| | 223 | | 100,140 |
GoDaddy, Inc. Class A (a)
| | 660 | | 92,209 |
International Business Machines Corp.
| | 7,806 | | 1,350,048 |
Kyndryl Holdings, Inc. (a)
| | 4,407 | | 115,948 |
Perficient, Inc. (a)
| | 195 | | 14,584 |
VeriSign, Inc. (a)
| | 469 | | 83,388 |
| | | | | | 3,418,006 |
| LEISURE EQUIPMENT & PRODUCTS — 0.1% | |
Brunswick Corp.
| | 851 | | 61,927 |
Hasbro, Inc.
| | 1,576 | | 92,196 |
Mattel, Inc. (a)
| | 2,066 | | 33,593 |
Polaris, Inc.
| | 1,016 | | 79,563 |
Sturm Ruger & Co., Inc.
| | 246 | | 10,246 |
Topgolf Callaway Brands Corp. (a)
| | 2,250 | | 34,425 |
Vista Outdoor, Inc. (a)
| | 853 | | 32,116 |
YETI Holdings, Inc. (a)
| | 281 | | 10,720 |
| | | | | | 354,786 |
| LIFE SCIENCES TOOLS & SERVICES — 0.6% | |
Agilent Technologies, Inc.
| | 984 | | 127,556 |
Azenta, Inc. (a)
| | 328 | | 17,259 |
Bio-Rad Laboratories, Inc. Class A (a)
| | 300 | | 81,933 |
Bio-Techne Corp.
| | 242 | | 17,339 |
Bruker Corp.
| | 299 | | 19,079 |
Charles River Laboratories International, Inc. (a)
| | 252 | | 52,058 |
Danaher Corp.
| | 1,808 | | 451,729 |
Fortrea Holdings, Inc. (a)
| | 730 | | 17,038 |
Illumina, Inc. (a)
| | 748 | | 78,076 |
IQVIA Holdings, Inc. (a)
| | 856 | | 180,993 |
Medpace Holdings, Inc. (a)
| | 76 | | 31,301 |
Mettler-Toledo International, Inc. (a)
| | 59 | | 82,458 |
Repligen Corp. (a)
| | 170 | | 21,430 |
Revvity, Inc.
| | 728 | | 76,338 |
Sotera Health Co. (a)
| | 2,400 | | 28,488 |
Thermo Fisher Scientific, Inc.
| | 1,103 | | 609,959 |
See accompanying notes to financial statements.
87
SPDR SERIES TRUST
SPDR S&P 1500 VALUE TILT ETF
SCHEDULE OF INVESTMENTS (continued)
June 30, 2024
| Security Description | | | Shares | | Value |
Waters Corp. (a)
| | 204 | | $59,185 |
West Pharmaceutical Services, Inc.
| | 79 | | 26,022 |
| | | | | | 1,978,241 |
| MACHINERY — 1.6% | |
3D Systems Corp. (a)
| | 274 | | 841 |
AGCO Corp.
| | 1,191 | | 116,575 |
Alamo Group, Inc.
| | 65 | | 11,245 |
Albany International Corp. Class A
| | 251 | | 21,197 |
Astec Industries, Inc.
| | 252 | | 7,474 |
Barnes Group, Inc.
| | 686 | | 28,407 |
Caterpillar, Inc.
| | 2,422 | | 806,768 |
Chart Industries, Inc. (a)
| | 213 | | 30,744 |
Crane Co.
| | 605 | | 87,713 |
Cummins, Inc.
| | 1,479 | | 409,579 |
Deere & Co.
| | 2,114 | | 789,854 |
Donaldson Co., Inc.
| | 703 | | 50,307 |
Dover Corp.
| | 688 | | 124,150 |
Enerpac Tool Group Corp.
| | 191 | | 7,292 |
Enpro, Inc.
| | 225 | | 32,753 |
Esab Corp.
| | 189 | | 17,847 |
ESCO Technologies, Inc.
| | 172 | | 18,067 |
Federal Signal Corp.
| | 261 | | 21,838 |
Flowserve Corp.
| | 1,105 | | 53,151 |
Fortive Corp.
| | 1,647 | | 122,043 |
Franklin Electric Co., Inc.
| | 265 | | 25,525 |
Graco, Inc.
| | 529 | | 41,939 |
Greenbrier Cos., Inc.
| | 1,179 | | 58,419 |
Hillenbrand, Inc.
| | 968 | | 38,739 |
IDEX Corp.
| | 241 | | 48,489 |
Illinois Tool Works, Inc.
| | 1,344 | | 318,474 |
Ingersoll Rand, Inc.
| | 851 | | 77,305 |
ITT, Inc.
| | 386 | | 49,864 |
John Bean Technologies Corp.
| | 212 | | 20,134 |
Kennametal, Inc.
| | 1,327 | | 31,238 |
Lincoln Electric Holdings, Inc.
| | 236 | | 44,519 |
Lindsay Corp.
| | 90 | | 11,059 |
Middleby Corp. (a)
| | 428 | | 52,477 |
Mueller Industries, Inc.
| | 1,419 | | 80,798 |
Nordson Corp.
| | 256 | | 59,377 |
Oshkosh Corp.
| | 790 | | 85,478 |
Otis Worldwide Corp.
| | 1,366 | | 131,491 |
PACCAR, Inc.
| | 4,251 | | 437,598 |
Parker-Hannifin Corp.
| | 534 | | 270,103 |
Pentair PLC
| | 815 | | 62,486 |
Proto Labs, Inc. (a)
| | 283 | | 8,742 |
RBC Bearings, Inc. (a)
| | 138 | | 37,230 |
Snap-on, Inc.
| | 415 | | 108,477 |
SPX Technologies, Inc. (a)
| | 127 | | 18,052 |
Standex International Corp.
| | 53 | | 8,541 |
Stanley Black & Decker, Inc.
| | 2,220 | | 177,356 |
Tennant Co.
| | 112 | | 11,025 |
Terex Corp.
| | 768 | | 42,117 |
Timken Co.
| | 755 | | 60,498 |
Titan International, Inc. (a)
| | 2,217 | | 16,428 |
Toro Co.
| | 517 | | 48,345 |
| Security Description | | | Shares | | Value |
Trinity Industries, Inc.
| | 2,709 | | $81,053 |
Wabash National Corp.
| | 648 | | 14,152 |
Watts Water Technologies, Inc. Class A
| | 182 | | 33,373 |
Westinghouse Air Brake Technologies Corp.
| | 882 | | 139,400 |
Xylem, Inc.
| | 759 | | 102,943 |
| | | | | | 5,611,089 |
| MARINE — 0.0% (e) | |
Kirby Corp. (a)
| | 648 | | 77,585 |
Matson, Inc.
| | 503 | | 65,878 |
| | | | | | 143,463 |
| MEDIA — 1.4% | |
AMC Networks, Inc. Class A (a)
| | 1,417 | | 13,688 |
Cable One, Inc. (b)
| | 152 | | 53,808 |
Charter Communications, Inc. Class A (a)
| | 3,269 | | 977,300 |
Comcast Corp. Class A
| | 57,357 | | 2,246,100 |
EchoStar Corp. Class A (a)
| | 3,990 | | 71,062 |
Fox Corp. Class A
| | 7,923 | | 272,314 |
Fox Corp. Class B
| | 4,367 | | 139,831 |
Interpublic Group of Cos., Inc.
| | 4,712 | | 137,072 |
John Wiley & Sons, Inc. Class A
| | 1,397 | | 56,858 |
New York Times Co. Class A
| | 729 | | 37,332 |
News Corp. Class A
| | 4,126 | | 113,754 |
News Corp. Class B
| | 1,245 | | 35,346 |
Nexstar Media Group, Inc.
| | 617 | | 102,428 |
Omnicom Group, Inc.
| | 2,391 | | 214,473 |
Paramount Global Class B
| | 15,978 | | 166,011 |
Scholastic Corp.
| | 849 | | 30,114 |
TechTarget, Inc. (a)
| | 184 | | 5,735 |
TEGNA, Inc.
| | 6,521 | | 90,903 |
Thryv Holdings, Inc. (a)
| | 611 | | 10,888 |
| | | | | | 4,775,017 |
| METALS & MINING — 0.9% | |
Alcoa Corp.
| | 2,616 | | 104,064 |
Alpha Metallurgical Resources, Inc.
| | 226 | | 63,400 |
Arch Resources, Inc.
| | 608 | | 92,556 |
ATI, Inc. (a)
| | 1,086 | | 60,219 |
Carpenter Technology Corp.
| | 500 | | 54,790 |
Century Aluminum Co. (a)
| | 991 | | 16,599 |
Cleveland-Cliffs, Inc. (a)
| | 7,211 | | 110,977 |
Commercial Metals Co.
| | 2,228 | | 122,518 |
Compass Minerals International, Inc.
| | 514 | | 5,310 |
Freeport-McMoRan, Inc.
| | 7,072 | | 343,699 |
Haynes International, Inc.
| | 254 | | 14,910 |
Kaiser Aluminum Corp.
| | 343 | | 30,150 |
Materion Corp.
| | 153 | | 16,544 |
Metallus, Inc. (a)
| | 737 | | 14,939 |
MP Materials Corp. (a) (b)
| | 1,227 | | 15,620 |
Newmont Corp.
| | 12,520 | | 524,212 |
Nucor Corp.
| | 2,970 | | 469,498 |
Olympic Steel, Inc.
| | 332 | | 14,884 |
Reliance, Inc.
| | 624 | | 178,214 |
See accompanying notes to financial statements.
88
SPDR SERIES TRUST
SPDR S&P 1500 VALUE TILT ETF
SCHEDULE OF INVESTMENTS (continued)
June 30, 2024
| Security Description | | | Shares | | Value |
Royal Gold, Inc.
| | 395 | | $49,438 |
Steel Dynamics, Inc.
| | 2,203 | | 285,289 |
SunCoke Energy, Inc.
| | 3,013 | | 29,527 |
U.S. Steel Corp.
| | 7,406 | | 279,947 |
Warrior Met Coal, Inc.
| | 1,846 | | 115,873 |
Worthington Steel, Inc.
| | 1,118 | | 37,296 |
| | | | | | 3,050,473 |
| MORTGAGE REAL ESTATE INVESTMENT TRUST (REITs) — 0.2% | |
Annaly Capital Management, Inc. REIT
| | 7,242 | | 138,032 |
Apollo Commercial Real Estate Finance, Inc. REIT
| | 5,176 | | 50,673 |
Arbor Realty Trust, Inc. REIT (b)
| | 6,243 | | 89,587 |
ARMOUR Residential REIT, Inc.
| | 1,991 | | 38,586 |
Blackstone Mortgage Trust, Inc. Class A REIT
| | 5,705 | | 99,381 |
Ellington Financial, Inc. REIT (b)
| | 1,754 | | 21,188 |
Franklin BSP Realty Trust, Inc. REIT
| | 1,212 | | 15,271 |
Hannon Armstrong Sustainable Infrastructure Capital, Inc. REIT (b)
| | 940 | | 27,824 |
KKR Real Estate Finance Trust, Inc. REIT
| | 1,651 | | 14,942 |
New York Mortgage Trust, Inc. REIT
| | 3,470 | | 20,265 |
PennyMac Mortgage Investment Trust REIT
| | 3,453 | | 47,479 |
Ready Capital Corp. REIT (b)
| | 5,881 | | 48,107 |
Redwood Trust, Inc. REIT
| | 4,497 | | 29,185 |
Two Harbors Investment Corp. REIT
| | 3,655 | | 48,283 |
Starwood Property Trust, Inc. REIT (b)
| | 9,851 | | 186,578 |
| | | | | | 875,381 |
| MULTI-UTILITIES — 1.2% | |
Ameren Corp.
| | 3,807 | | 270,716 |
Avista Corp.
| | 1,480 | | 51,223 |
Black Hills Corp.
| | 2,251 | | 122,409 |
CenterPoint Energy, Inc.
| | 9,137 | | 283,064 |
CMS Energy Corp.
| | 3,199 | | 190,437 |
Consolidated Edison, Inc.
| | 5,000 | | 447,100 |
Dominion Energy, Inc.
| | 16,022 | | 785,078 |
DTE Energy Co.
| | 2,990 | | 331,920 |
NiSource, Inc.
| | 6,517 | | 187,755 |
Northwestern Energy Group, Inc.
| | 1,178 | | 58,994 |
Public Service Enterprise Group, Inc.
| | 6,019 | | 443,600 |
Sempra
| | 7,595 | | 577,676 |
Unitil Corp.
| | 298 | | 15,433 |
WEC Energy Group, Inc.
| | 3,809 | | 298,854 |
| | | | | | 4,064,259 |
| OFFICE REITs — 0.3% | |
Alexandria Real Estate Equities, Inc. REIT
| | 1,643 | | 192,182 |
Boston Properties, Inc. REIT
| | 2,766 | | 170,275 |
Brandywine Realty Trust REIT
| | 6,976 | | 31,252 |
| Security Description | | | Shares | | Value |
COPT Defense Properties REIT
| | 1,419 | | $35,517 |
Cousins Properties, Inc. REIT
| | 3,331 | | 77,113 |
Douglas Emmett, Inc. REIT (b)
| | 6,331 | | 84,265 |
Easterly Government Properties, Inc. REIT
| | 3,425 | | 42,367 |
Highwoods Properties, Inc. REIT
| | 3,806 | | 99,984 |
Hudson Pacific Properties, Inc. REIT
| | 4,722 | | 22,713 |
JBG SMITH Properties REIT
| | 3,582 | | 54,554 |
Kilroy Realty Corp. REIT
| | 3,810 | | 118,758 |
SL Green Realty Corp. REIT
| | 939 | | 53,185 |
Vornado Realty Trust REIT
| | 5,293 | | 139,153 |
| | | | | | 1,121,318 |
| OIL, GAS & CONSUMABLE FUELS — 8.6% | |
Antero Midstream Corp.
| | 4,929 | | 72,653 |
Antero Resources Corp. (a)
| | 5,411 | | 176,561 |
APA Corp.
| | 6,914 | | 203,548 |
California Resources Corp.
| | 1,234 | | 65,673 |
Chesapeake Energy Corp.
| | 3,681 | | 302,541 |
Chevron Corp.
| | 33,026 | | 5,165,927 |
Chord Energy Corp.
| | 2,043 | | 342,570 |
Civitas Resources, Inc.
| | 3,072 | | 211,968 |
CNX Resources Corp. (a)
| | 5,027 | | 122,156 |
Comstock Resources, Inc. (b)
| | 3,323 | | 34,493 |
ConocoPhillips
| | 14,222 | | 1,626,712 |
CONSOL Energy, Inc. (a)
| | 880 | | 89,786 |
Coterra Energy, Inc.
| | 9,083 | | 242,244 |
CVR Energy, Inc. (b)
| | 1,071 | | 28,671 |
Devon Energy Corp.
| | 12,264 | | 581,314 |
Diamondback Energy, Inc.
| | 2,163 | | 433,011 |
Dorian LPG Ltd.
| | 1,159 | | 48,632 |
DT Midstream, Inc.
| | 1,052 | | 74,724 |
EOG Resources, Inc.
| | 7,038 | | 885,873 |
EQT Corp.
| | 8,489 | | 313,923 |
Equitrans Midstream Corp.
| | 6,272 | | 81,411 |
Exxon Mobil Corp.
| | 65,289 | | 7,516,070 |
Green Plains, Inc. (a)
| | 730 | | 11,578 |
Hess Corp.
| | 1,611 | | 237,655 |
HF Sinclair Corp.
| | 5,163 | | 275,394 |
Kinder Morgan, Inc.
| | 64,033 | | 1,272,336 |
Magnolia Oil & Gas Corp. Class A
| | 2,236 | | 56,660 |
Marathon Oil Corp.
| | 11,203 | | 321,190 |
Marathon Petroleum Corp.
| | 11,716 | | 2,032,492 |
Matador Resources Co.
| | 1,758 | | 104,777 |
Murphy Oil Corp.
| | 4,805 | | 198,158 |
Northern Oil & Gas, Inc.
| | 3,023 | | 112,365 |
Occidental Petroleum Corp.
| | 12,788 | | 806,028 |
ONEOK, Inc.
| | 4,917 | | 400,981 |
Ovintiv, Inc.
| | 8,366 | | 392,114 |
Par Pacific Holdings, Inc. (a)
| | 1,976 | | 49,894 |
PBF Energy, Inc. Class A
| | 3,603 | | 165,810 |
Peabody Energy Corp.
| | 3,647 | | 80,672 |
Permian Resources Corp.
| | 6,172 | | 99,678 |
Phillips 66
| | 14,098 | | 1,990,215 |
Range Resources Corp.
| | 3,492 | | 117,087 |
REX American Resources Corp. (a)
| | 302 | | 13,768 |
See accompanying notes to financial statements.
89
SPDR SERIES TRUST
SPDR S&P 1500 VALUE TILT ETF
SCHEDULE OF INVESTMENTS (continued)
June 30, 2024
| Security Description | | | Shares | | Value |
SM Energy Co.
| | 2,215 | | $95,754 |
Southwestern Energy Co. (a)
| | 36,465 | | 245,409 |
Talos Energy, Inc. (a)
| | 4,768 | | 57,931 |
Targa Resources Corp.
| | 1,812 | | 233,349 |
Valero Energy Corp.
| | 10,874 | | 1,704,608 |
Vital Energy, Inc. (a)
| | 944 | | 42,310 |
Williams Cos., Inc.
| | 13,213 | | 561,553 |
World Kinect Corp.
| | 1,994 | | 51,445 |
| | | | | | 30,351,672 |
| PERSONAL CARE PRODUCTS — 0.3% | |
BellRing Brands, Inc. (a)
| | 420 | | 23,999 |
Coty, Inc. Class A (a)
| | 7,154 | | 71,683 |
Edgewell Personal Care Co.
| | 627 | | 25,199 |
elf Beauty, Inc. (a)
| | 48 | | 10,115 |
Estee Lauder Cos., Inc. Class A
| | 1,891 | | 201,202 |
Inter Parfums, Inc.
| | 75 | | 8,702 |
Kenvue, Inc.
| | 36,577 | | 664,970 |
Nu Skin Enterprises, Inc. Class A
| | 948 | | 9,992 |
USANA Health Sciences, Inc. (a)
| | 253 | | 11,446 |
| | | | | | 1,027,308 |
| PAPER & FOREST PRODUCTS — 0.0% (e) | |
Clearwater Paper Corp. (a)
| | 527 | | 25,544 |
Louisiana-Pacific Corp.
| | 544 | | 44,787 |
Mercer International, Inc.
| | 1,981 | | 16,918 |
Sylvamo Corp.
| | 675 | | 46,305 |
| | | | | | 133,554 |
| PHARMACEUTICALS — 3.0% | |
Amphastar Pharmaceuticals, Inc. (a)
| | 267 | | 10,680 |
Bristol-Myers Squibb Co.
| | 24,565 | | 1,020,184 |
Catalent, Inc. (a)
| | 889 | | 49,988 |
Collegium Pharmaceutical, Inc. (a)
| | 273 | | 8,791 |
Corcept Therapeutics, Inc. (a)
| | 527 | | 17,122 |
Eli Lilly & Co.
| | 966 | | 874,597 |
Harmony Biosciences Holdings, Inc. (a)
| | 292 | | 8,810 |
Innoviva, Inc. (a)
| | 2,538 | | 41,623 |
Jazz Pharmaceuticals PLC (a)
| | 761 | | 81,222 |
Johnson & Johnson
| | 19,644 | | 2,871,167 |
Ligand Pharmaceuticals, Inc. (a)
| | 216 | | 18,200 |
Merck & Co., Inc.
| | 11,909 | | 1,474,334 |
Organon & Co.
| | 8,466 | | 175,246 |
Pacira BioSciences, Inc. (a)
| | 251 | | 7,181 |
Perrigo Co. PLC
| | 2,676 | | 68,720 |
Pfizer, Inc.
| | 108,944 | | 3,048,253 |
Phibro Animal Health Corp. Class A
| | 750 | | 12,578 |
Prestige Consumer Healthcare, Inc. (a)
| | 527 | | 36,284 |
Supernus Pharmaceuticals, Inc. (a)
| | 521 | | 13,937 |
Viatris, Inc.
| | 39,724 | | 422,266 |
Zoetis, Inc.
| | 968 | | 167,813 |
| | | | | | 10,428,996 |
| PROFESSIONAL SERVICES — 0.5% | |
ASGN, Inc. (a)
| | 534 | | 47,083 |
Automatic Data Processing, Inc.
| | 1,131 | | 269,958 |
| Security Description | | | Shares | | Value |
Broadridge Financial Solutions, Inc.
| | 393 | | $77,421 |
CACI International, Inc. Class A (a)
| | 258 | | 110,974 |
Concentrix Corp.
| | 1,559 | | 98,653 |
CSG Systems International, Inc.
| | 258 | | 10,622 |
Dayforce, Inc. (a) (b)
| | 465 | | 23,064 |
Equifax, Inc.
| | 258 | | 62,555 |
ExlService Holdings, Inc. (a)
| | 733 | | 22,987 |
Exponent, Inc.
| | 146 | | 13,888 |
FTI Consulting, Inc. (a)
| | 211 | | 45,477 |
Genpact Ltd.
| | 1,994 | | 64,187 |
Heidrick & Struggles International, Inc.
| | 258 | | 8,148 |
Insperity, Inc.
| | 390 | | 35,572 |
Jacobs Solutions, Inc.
| | 977 | | 136,497 |
KBR, Inc.
| | 844 | | 54,134 |
Kelly Services, Inc. Class A
| | 1,423 | | 30,466 |
Korn Ferry
| | 752 | | 50,489 |
Leidos Holdings, Inc.
| | 1,116 | | 162,802 |
ManpowerGroup, Inc.
| | 1,616 | | 112,797 |
Maximus, Inc.
| | 677 | | 58,019 |
NV5 Global, Inc. (a)
| | 152 | | 14,131 |
Paychex, Inc.
| | 1,530 | | 181,397 |
Paycom Software, Inc.
| | 138 | | 19,739 |
Paylocity Holding Corp. (a)
| | 145 | | 19,118 |
Robert Half, Inc.
| | 1,139 | | 72,873 |
Science Applications International Corp.
| | 566 | | 66,533 |
Verisk Analytics, Inc.
| | 176 | | 47,441 |
Verra Mobility Corp. (a)
| | 662 | | 18,006 |
| | | | | | 1,935,031 |
| REAL ESTATE MANAGEMENT & DEVELOPMENT — 0.2% | |
CBRE Group, Inc. Class A (a)
| | 2,509 | | 223,577 |
CoStar Group, Inc. (a)
| | 1,282 | | 95,047 |
Cushman & Wakefield PLC (a)
| | 6,463 | | 67,215 |
eXp World Holdings, Inc. (b)
| | 2,550 | | 28,777 |
Jones Lang LaSalle, Inc. (a)
| | 687 | | 141,027 |
Kennedy-Wilson Holdings, Inc.
| | 3,922 | | 38,122 |
Marcus & Millichap, Inc.
| | 516 | | 16,264 |
St. Joe Co.
| | 265 | | 14,496 |
| | | | | | 624,525 |
| RESIDENTIAL REITs — 0.4% | |
American Homes 4 Rent Class A REIT
| | 2,586 | | 96,096 |
AvalonBay Communities, Inc. REIT
| | 1,198 | | 247,854 |
Camden Property Trust REIT
| | 1,161 | | 126,677 |
Centerspace REIT
| | 251 | | 16,975 |
Elme Communities REIT
| | 1,422 | | 22,652 |
Equity LifeStyle Properties, Inc. REIT
| | 874 | | 56,924 |
Equity Residential REIT
| | 4,166 | | 288,870 |
Essex Property Trust, Inc. REIT
| | 544 | | 148,077 |
Independence Realty Trust, Inc. REIT
| | 1,745 | | 32,701 |
Invitation Homes, Inc. REIT
| | 4,698 | | 168,611 |
See accompanying notes to financial statements.
90
SPDR SERIES TRUST
SPDR S&P 1500 VALUE TILT ETF
SCHEDULE OF INVESTMENTS (continued)
June 30, 2024
| Security Description | | | Shares | | Value |
Mid-America Apartment Communities, Inc. REIT
| | 986 | | $140,614 |
NexPoint Residential Trust, Inc. REIT
| | 155 | | 6,124 |
UDR, Inc. REIT
| | 2,557 | | 105,221 |
Veris Residential, Inc. REIT
| | 1,420 | | 21,300 |
| | | | | | 1,478,696 |
| RETAIL REITs — 0.4% | |
Acadia Realty Trust REIT
| | 1,504 | | 26,952 |
Agree Realty Corp. REIT
| | 1,088 | | 67,391 |
Brixmor Property Group, Inc. REIT
| | 3,661 | | 84,532 |
Federal Realty Investment Trust REIT
| | 499 | | 50,384 |
Getty Realty Corp. REIT
| | 752 | | 20,048 |
Kimco Realty Corp. REIT
| | 5,626 | | 109,482 |
Kite Realty Group Trust REIT
| | 2,384 | | 53,354 |
Macerich Co. REIT
| | 3,124 | | 48,235 |
NNN REIT, Inc.
| | 2,191 | | 93,337 |
Phillips Edison & Co., Inc. REIT
| | 992 | | 32,448 |
Realty Income Corp. REIT
| | 7,383 | | 389,970 |
Regency Centers Corp. REIT
| | 1,986 | | 123,529 |
Retail Opportunity Investments Corp. REIT
| | 1,857 | | 23,082 |
Saul Centers, Inc. REIT
| | 464 | | 17,061 |
Simon Property Group, Inc. REIT
| | 1,352 | | 205,234 |
SITE Centers Corp. REIT
| | 2,324 | | 33,698 |
Tanger, Inc. REIT
| | 758 | | 20,549 |
Urban Edge Properties REIT
| | 1,427 | | 26,357 |
Whitestone REIT
| | 639 | | 8,505 |
| | | | | | 1,434,148 |
| SEMICONDUCTORS & SEMICONDUCTOR EQUIPMENT — 3.2% | |
Advanced Micro Devices, Inc. (a)
| | 3,404 | | 552,163 |
Allegro MicroSystems, Inc. (a)
| | 781 | | 22,055 |
Alpha & Omega Semiconductor Ltd. (a)
| | 833 | | 31,129 |
Amkor Technology, Inc.
| | 3,796 | | 151,916 |
Analog Devices, Inc.
| | 2,340 | | 534,128 |
Applied Materials, Inc.
| | 2,382 | | 562,128 |
Axcelis Technologies, Inc. (a)
| | 169 | | 24,030 |
Broadcom, Inc.
| | 929 | | 1,491,537 |
CEVA, Inc. (a)
| | 254 | | 4,900 |
Cirrus Logic, Inc. (a)
| | 438 | | 55,915 |
Cohu, Inc. (a)
| | 208 | | 6,885 |
Diodes, Inc. (a)
| | 556 | | 39,993 |
Enphase Energy, Inc. (a)
| | 452 | | 45,069 |
First Solar, Inc. (a)
| | 529 | | 119,268 |
FormFactor, Inc. (a)
| | 503 | | 30,447 |
Ichor Holdings Ltd. (a)
| | 219 | | 8,442 |
Intel Corp.
| | 51,609 | | 1,598,331 |
KLA Corp.
| | 283 | | 233,336 |
Kulicke & Soffa Industries, Inc.
| | 619 | | 30,449 |
Lam Research Corp.
| | 376 | | 400,384 |
Lattice Semiconductor Corp. (a)
| | 279 | | 16,179 |
| Security Description | | | Shares | | Value |
MACOM Technology Solutions Holdings, Inc. (a)
| | 280 | | $31,212 |
MaxLinear, Inc. (a)
| | 520 | | 10,473 |
Microchip Technology, Inc.
| | 2,459 | | 224,999 |
Micron Technology, Inc.
| | 5,188 | | 682,378 |
MKS Instruments, Inc.
| | 312 | | 40,741 |
Monolithic Power Systems, Inc.
| | 58 | | 47,657 |
NVIDIA Corp.
| | 9,872 | | 1,219,587 |
NXP Semiconductors NV
| | 1,211 | | 325,868 |
ON Semiconductor Corp. (a)
| | 2,499 | | 171,306 |
Onto Innovation, Inc. (a)
| | 134 | | 29,421 |
Photronics, Inc. (a)
| | 971 | | 23,955 |
Power Integrations, Inc.
| | 181 | | 12,704 |
Qorvo, Inc. (a)
| | 785 | | 91,091 |
QUALCOMM, Inc.
| | 5,244 | | 1,044,500 |
Rambus, Inc. (a)
| | 318 | | 18,686 |
Semtech Corp. (a)
| | 377 | | 11,265 |
Silicon Laboratories, Inc. (a)
| | 86 | | 9,514 |
SiTime Corp. (a)
| | 37 | | 4,602 |
Skyworks Solutions, Inc.
| | 1,742 | | 185,662 |
SMART Global Holdings, Inc. (a)
| | 1,105 | | 25,271 |
SolarEdge Technologies, Inc. (a)
| | 478 | | 12,074 |
Synaptics, Inc. (a)
| | 310 | | 27,342 |
Teradyne, Inc.
| | 526 | | 78,001 |
Texas Instruments, Inc.
| | 4,484 | | 872,273 |
Ultra Clean Holdings, Inc. (a)
| | 619 | | 30,331 |
Universal Display Corp.
| | 126 | | 26,492 |
Veeco Instruments, Inc. (a)
| | 337 | | 15,741 |
Wolfspeed, Inc. (a) (b)
| | 248 | | 5,644 |
| | | | | | 11,237,474 |
| SOFTWARE — 3.1% | |
ACI Worldwide, Inc. (a)
| | 909 | | 35,987 |
Adeia, Inc.
| | 2,196 | | 24,562 |
Adobe, Inc. (a)
| | 1,292 | | 717,758 |
Agilysys, Inc. (a)
| | 27 | | 2,812 |
Alarm.com Holdings, Inc. (a)
| | 214 | | 13,597 |
ANSYS, Inc. (a)
| | 293 | | 94,200 |
Aspen Technology, Inc. (a)
| | 405 | | 80,445 |
Autodesk, Inc. (a)
| | 449 | | 111,105 |
Blackbaud, Inc. (a)
| | 154 | | 11,730 |
Box, Inc. Class A (a)
| | 484 | | 12,797 |
Cadence Design Systems, Inc. (a)
| | 331 | | 101,865 |
CommVault Systems, Inc. (a)
| | 127 | | 15,439 |
Dolby Laboratories, Inc. Class A
| | 500 | | 39,615 |
DoubleVerify Holdings, Inc. (a)
| | 453 | | 8,820 |
Dropbox, Inc. Class A (a)
| | 2,080 | | 46,738 |
Dynatrace, Inc. (a)
| | 670 | | 29,976 |
Envestnet, Inc. (a)
| | 257 | | 16,086 |
Fair Isaac Corp. (a)
| | 29 | | 43,171 |
Fortinet, Inc. (a)
| | 1,824 | | 109,932 |
Gen Digital, Inc.
| | 6,761 | | 168,890 |
InterDigital, Inc. (b)
| | 263 | | 30,655 |
Intuit, Inc.
| | 340 | | 223,451 |
LiveRamp Holdings, Inc. (a)
| | 520 | | 16,089 |
Manhattan Associates, Inc. (a)
| | 59 | | 14,554 |
Microsoft Corp.
| | 13,178 | | 5,889,907 |
See accompanying notes to financial statements.
91
SPDR SERIES TRUST
SPDR S&P 1500 VALUE TILT ETF
SCHEDULE OF INVESTMENTS (continued)
June 30, 2024
| Security Description | | | Shares | | Value |
N-able, Inc. (a)
| | 489 | | $7,447 |
NCR Voyix Corp. (a)
| | 4,442 | | 54,859 |
Oracle Corp.
| | 9,329 | | 1,317,255 |
Palo Alto Networks, Inc. (a)
| | 663 | | 224,764 |
Progress Software Corp.
| | 251 | | 13,619 |
PTC, Inc. (a)
| | 380 | | 69,035 |
Qualys, Inc. (a)
| | 97 | | 13,832 |
Roper Technologies, Inc.
| | 358 | | 201,790 |
Salesforce, Inc.
| | 3,231 | | 830,690 |
ServiceNow, Inc. (a)
| | 247 | | 194,308 |
SPS Commerce, Inc. (a)
| | 61 | | 11,478 |
Synopsys, Inc. (a)
| | 323 | | 192,204 |
Teradata Corp. (a)
| | 753 | | 26,024 |
Tyler Technologies, Inc. (a)
| | 123 | | 61,842 |
| | | | | | 11,079,328 |
| SPECIALIZED REITs — 0.8% | |
American Tower Corp. REIT
| | 2,488 | | 483,617 |
Crown Castle, Inc. REIT
| | 3,661 | | 357,680 |
CubeSmart REIT
| | 1,827 | | 82,526 |
Digital Realty Trust, Inc. REIT
| | 887 | | 134,868 |
EPR Properties REIT
| | 932 | | 39,125 |
Equinix, Inc. REIT
| | 316 | | 239,086 |
Extra Space Storage, Inc. REIT
| | 1,041 | | 161,782 |
Four Corners Property Trust, Inc. REIT
| | 931 | | 22,968 |
Gaming & Leisure Properties, Inc. REIT
| | 3,224 | | 145,757 |
Iron Mountain, Inc. REIT
| | 1,439 | | 128,963 |
Lamar Advertising Co. Class A REIT
| | 674 | | 80,563 |
National Storage Affiliates Trust REIT
| | 905 | | 37,304 |
Outfront Media, Inc. REIT
| | 1,558 | | 22,279 |
PotlatchDeltic Corp. REIT
| | 861 | | 33,915 |
Public Storage REIT
| | 781 | | 224,655 |
Rayonier, Inc. REIT
| | 841 | | 24,465 |
Safehold, Inc. REIT
| | 1,481 | | 28,569 |
SBA Communications Corp. REIT
| | 311 | | 61,049 |
Uniti Group, Inc. REIT
| | 3,455 | | 10,089 |
VICI Properties, Inc. REIT
| | 11,235 | | 321,770 |
Weyerhaeuser Co. REIT
| | 7,926 | | 225,019 |
| | | | | | 2,866,049 |
| SPECIALTY RETAIL — 2.1% | |
Abercrombie & Fitch Co. Class A (a)
| | 247 | | 43,926 |
Academy Sports & Outdoors, Inc.
| | 1,067 | | 56,818 |
Advance Auto Parts, Inc.
| | 1,959 | | 124,063 |
American Eagle Outfitters, Inc.
| | 2,241 | | 44,730 |
Asbury Automotive Group, Inc. (a)
| | 734 | | 167,257 |
AutoNation, Inc. (a)
| | 858 | | 136,748 |
AutoZone, Inc. (a)
| | 79 | | 234,164 |
Bath & Body Works, Inc.
| | 2,454 | | 95,829 |
Best Buy Co., Inc.
| | 6,346 | | 534,904 |
Boot Barn Holdings, Inc. (a)
| | 211 | | 27,204 |
Buckle, Inc.
| | 560 | | 20,686 |
Burlington Stores, Inc. (a)
| | 375 | | 90,000 |
Caleres, Inc.
| | 638 | | 21,437 |
| Security Description | | | Shares | | Value |
CarMax, Inc. (a)
| | 2,285 | | $167,582 |
Designer Brands, Inc. Class A (b)
| | 2,090 | | 14,275 |
Dick's Sporting Goods, Inc.
| | 631 | | 135,570 |
Five Below, Inc. (a)
| | 195 | | 21,249 |
Floor & Decor Holdings, Inc. Class A (a)
| | 291 | | 28,928 |
Foot Locker, Inc.
| | 2,879 | | 71,745 |
GameStop Corp. Class A (a)
| | 3,243 | | 80,070 |
Gap, Inc.
| | 7,122 | | 170,145 |
Group 1 Automotive, Inc.
| | 439 | | 130,506 |
Guess?, Inc.
| | 974 | | 19,870 |
Haverty Furniture Cos., Inc.
| | 261 | | 6,601 |
Hibbett, Inc.
| | 265 | | 23,111 |
Home Depot, Inc.
| | 4,907 | | 1,689,186 |
Leslie's, Inc. (a) (b)
| | 902 | | 3,779 |
Lithia Motors, Inc.
| | 909 | | 229,477 |
Lowe's Cos., Inc.
| | 3,368 | | 742,509 |
MarineMax, Inc. (a)
| | 508 | | 16,444 |
Monro, Inc.
| | 991 | | 23,645 |
Murphy USA, Inc.
| | 273 | | 128,163 |
National Vision Holdings, Inc. (a)
| | 1,196 | | 15,656 |
ODP Corp. (a)
| | 1,209 | | 47,477 |
O'Reilly Automotive, Inc. (a)
| | 244 | | 257,679 |
Penske Automotive Group, Inc.
| | 645 | | 96,118 |
RH (a)
| | 126 | | 30,799 |
Ross Stores, Inc.
| | 1,575 | | 228,879 |
Sally Beauty Holdings, Inc. (a)
| | 3,443 | | 36,943 |
Shoe Carnival, Inc.
| | 765 | | 28,221 |
Signet Jewelers Ltd.
| | 848 | | 75,964 |
Sonic Automotive, Inc. Class A
| | 622 | | 33,880 |
TJX Cos., Inc.
| | 5,355 | | 589,585 |
Tractor Supply Co.
| | 488 | | 131,760 |
Ulta Beauty, Inc. (a)
| | 282 | | 108,815 |
Upbound Group, Inc.
| | 1,651 | | 50,686 |
Urban Outfitters, Inc. (a)
| | 2,067 | | 84,850 |
Valvoline, Inc. (a)
| | 1,408 | | 60,826 |
Victoria's Secret & Co. (a)
| | 2,562 | | 45,271 |
Williams-Sonoma, Inc.
| | 319 | | 90,076 |
| | | | | | 7,314,106 |
| TECHNOLOGY HARDWARE, STORAGE & PERIPHERALS — 3.1% | |
Apple, Inc.
| | 39,213 | | 8,259,042 |
Corsair Gaming, Inc. (a)
| | 852 | | 9,406 |
Hewlett Packard Enterprise Co.
| | 43,047 | | 911,305 |
HP, Inc.
| | 28,874 | | 1,011,167 |
NetApp, Inc.
| | 1,206 | | 155,333 |
Pure Storage, Inc. Class A (a)
| | 849 | | 54,514 |
Seagate Technology Holdings PLC
| | 1,584 | | 163,580 |
Super Micro Computer, Inc. (a)
| | 108 | | 88,490 |
Western Digital Corp. (a)
| | 2,635 | | 199,654 |
Xerox Holdings Corp.
| | 3,766 | | 43,761 |
| | | | | | 10,896,252 |
| TEXTILES, APPAREL & LUXURY GOODS — 0.5% | |
Capri Holdings Ltd. (a)
| | 1,584 | | 52,399 |
Carter's, Inc.
| | 502 | | 31,109 |
See accompanying notes to financial statements.
92
SPDR SERIES TRUST
SPDR S&P 1500 VALUE TILT ETF
SCHEDULE OF INVESTMENTS (continued)
June 30, 2024
| Security Description | | | Shares | | Value |
Columbia Sportswear Co.
| | 693 | | $54,802 |
Crocs, Inc. (a)
| | 492 | | 71,802 |
Deckers Outdoor Corp. (a)
| | 84 | | 81,308 |
G-III Apparel Group Ltd. (a)
| | 1,506 | | 40,767 |
Hanesbrands, Inc. (a) (b)
| | 12,553 | | 61,886 |
Kontoor Brands, Inc.
| | 664 | | 43,924 |
Lululemon Athletica, Inc. (a)
| | 384 | | 114,701 |
Movado Group, Inc.
| | 665 | | 16,532 |
NIKE, Inc. Class B
| | 6,006 | | 452,672 |
Oxford Industries, Inc. (b)
| | 167 | | 16,725 |
PVH Corp.
| | 722 | | 76,438 |
Ralph Lauren Corp.
| | 566 | | 99,084 |
Skechers USA, Inc. Class A (a)
| | 1,586 | | 109,624 |
Steven Madden Ltd.
| | 742 | | 31,387 |
Tapestry, Inc.
| | 2,785 | | 119,170 |
Under Armour, Inc. Class A (a)
| | 6,253 | | 41,708 |
Under Armour, Inc. Class C (a)
| | 6,318 | | 41,257 |
VF Corp. (b)
| | 10,964 | | 148,014 |
Wolverine World Wide, Inc. (b)
| | 2,634 | | 35,612 |
| | | | | | 1,740,921 |
| TOBACCO — 0.8% | |
Altria Group, Inc.
| | 24,969 | | 1,137,338 |
Philip Morris International, Inc.
| | 16,994 | | 1,722,002 |
Universal Corp.
| | 974 | | 46,937 |
Vector Group Ltd.
| | 4,656 | | 49,214 |
| | | | | | 2,955,491 |
| TRADING COMPANIES & DISTRIBUTORS — 0.4% | |
Air Lease Corp.
| | 3,420 | | 162,553 |
Applied Industrial Technologies, Inc.
| | 229 | | 44,426 |
Boise Cascade Co.
| | 476 | | 56,749 |
Core & Main, Inc. Class A (a)
| | 909 | | 44,486 |
DNOW, Inc. (a)
| | 1,775 | | 24,371 |
DXP Enterprises, Inc. (a)
| | 253 | | 11,597 |
Fastenal Co.
| | 1,908 | | 119,899 |
GATX Corp.
| | 398 | | 52,679 |
GMS, Inc. (a)
| | 479 | | 38,612 |
MSC Industrial Direct Co., Inc. Class A
| | 760 | | 60,276 |
Rush Enterprises, Inc. Class A
| | 1,180 | | 49,407 |
United Rentals, Inc.
| | 333 | | 215,361 |
Watsco, Inc.
| | 256 | | 118,589 |
WESCO International, Inc.
| | 840 | | 133,157 |
WW Grainger, Inc.
| | 184 | | 166,012 |
| | | | | | 1,298,174 |
| WATER UTILITIES — 0.1% | |
American States Water Co.
| | 251 | | 18,215 |
American Water Works Co., Inc.
| | 1,583 | | 204,460 |
California Water Service Group
| | 434 | | 21,045 |
Essential Utilities, Inc.
| | 2,729 | | 101,874 |
Middlesex Water Co.
| | 56 | | 2,926 |
| Security Description | | | Shares | | Value |
SJW Group
| | 213 | | $11,549 |
| | | | | | 360,069 |
| WIRELESS TELECOMMUNICATION SERVICES — 0.4% | |
Gogo, Inc. (a)
| | 479 | | 4,608 |
Telephone & Data Systems, Inc.
| | 3,288 | | 68,160 |
T-Mobile U.S., Inc.
| | 7,558 | | 1,331,569 |
| | | | | | 1,404,337 |
TOTAL COMMON STOCKS
(Cost $323,360,306)
| | | | | 352,512,083 |
| WARRANTS — 0.0% (e) | | | | | |
| ENERGY EQUIPMENT & SERVICES — 0.0% (e) | | | | | |
Nabors Industries Ltd. (expiring 06/11/26) (a)
(Cost $0)
| | | 62 | | 409 |
| SHORT-TERM INVESTMENTS — 0.5% | | | |
State Street Institutional Liquid Reserves Fund, Premier Class 5.36% (f) (g)
| | 674,640 | | 674,843 |
State Street Navigator Securities Lending Portfolio II (c) (h)
| | 1,228,745 | | 1,228,745 |
TOTAL SHORT-TERM INVESTMENTS
(Cost $1,903,529)
| | 1,903,588 | |
TOTAL INVESTMENTS — 100.4%
(Cost $325,263,835)
| | 354,416,080 | |
LIABILITIES IN EXCESS OF OTHER ASSETS — (0.4)%
| | (1,502,113) | |
NET ASSETS — 100.0%
| | $352,913,967 | |
| (a) | Non-income producing security. |
| (b) | All or a portion of the shares of the security are on loan at June 30, 2024. |
| (c) | The Fund invested in an affiliated entity. Amounts related to these investments during the year ended June 30, 2024 are shown in the Affiliate Table below. |
| (d) | Fair valued as determined in good faith by the Trust's Oversight Committee in accordance with policy and procedures approved by the Board of Trustees. Security value is determined based on Level 3 inputs. As of June 30, 2024, total aggregate fair value of the securities is $0, representing 0.00% of the Fund's net assets. |
| (e) | Amount is less than 0.05% of net assets. |
| (f) | The Fund invested in certain money market funds managed by SSGA Funds Management, Inc. Amounts related to these investments during the year ended June 30, 2024 are shown in the Affiliate Table below. |
| (g) | The rate shown is the annualized seven-day yield at June 30, 2024. |
| (h) | Investment of cash collateral for securities loaned. |
| REIT | Real Estate Investment Trust |
See accompanying notes to financial statements.
93
SPDR SERIES TRUST
SPDR S&P 1500 VALUE TILT ETF
SCHEDULE OF INVESTMENTS (continued)
June 30, 2024
The following table summarizes the value of the Fund's investments according to the fair value hierarchy as of June 30, 2024.
| Description | | Level 1 –
Quoted Prices | | Level 2 –
Other Significant
Observable Inputs | | Level 3 –
Significant
Unobservable Inputs | | Total |
| ASSETS: | | | | | | | | |
| INVESTMENTS: | | | | | | | | |
Common Stocks
| | $352,512,083 | | $— | | $0(a) | | $352,512,083 |
Warrants
| | 409 | | — | | — | | 409 |
Short-Term Investments
| | 1,903,588 | | — | | — | | 1,903,588 |
TOTAL INVESTMENTS
| | $354,416,080 | | $— | | $0 | | $354,416,080 |
| (a) | The Fund held a Level 3 security that was valued at $0 at June 30, 2024. |
Affiliate Table
| | Number of
Shares Held
at
6/30/23 | | Value at
6/30/23 | | Cost of
Purchases | | Proceeds
from
Shares Sold | | Realized
Gain (Loss) | | Change in
Unrealized
Appreciation/
Depreciation | | Number of
Shares Held
at
6/30/24 | | Value at
6/30/24 | | Dividend
Income |
State Street Corp.
| 5,211 | | $381,341 | | $172,755 | | $133,805 | | $(25,843) | | $33,124 | | 5,778 | | $427,572 | | $11,397 |
State Street Institutional Liquid Reserves Fund, Premier Class
| 317,946 | | 318,010 | | 11,766,574 | | 11,409,771 | | (26) | | 56 | | 674,640 | | 674,843 | | 20,094 |
State Street Navigator Securities Lending Portfolio II
| 868,772 | | 868,772 | | 13,582,664 | | 13,222,691 | | — | | — | | 1,228,745 | | 1,228,745 | | 7,077 |
Total
| | | $1,568,123 | | $25,521,993 | | $24,766,267 | | $(25,869) | | $33,180 | | | | $2,331,160 | | $38,568 |
See accompanying notes to financial statements.
94
SPDR SERIES TRUST
SPDR S&P KENSHO CLEAN POWER ETF
SCHEDULE OF INVESTMENTS
June 30, 2024
| Security Description | | | Shares | | Value |
| COMMON STOCKS — 99.8% | |
| AUTOMOBILES — 2.5% | |
Tesla, Inc. (a)
| | 22,452 | | $4,442,802 |
| BUILDING PRODUCTS — 2.1% | |
Gibraltar Industries, Inc. (a)
| | 55,483 | | 3,803,359 |
| CONSTRUCTION & ENGINEERING — 7.8% | |
Ameresco, Inc. Class A (a)
| | 156,861 | | 4,519,166 |
Arcosa, Inc.
| | 65,657 | | 5,476,450 |
Valmont Industries, Inc.
| | 14,762 | | 4,051,431 |
| | | | | | 14,047,047 |
| DIVERSIFIED CONSUMER SERVICES — 2.3% | |
ADT, Inc.
| | 533,455 | | 4,054,258 |
| ELECTRIC UTILITIES — 15.4% | |
ALLETE, Inc.
| | 88,387 | | 5,510,929 |
Avangrid, Inc.
| | 158,228 | | 5,621,841 |
Centrais Eletricas Brasileiras SA ADR (b)
| | 639,882 | | 4,114,441 |
Constellation Energy Corp.
| | 25,604 | | 5,127,713 |
Enel Chile SA ADR
| | 217,676 | | 609,493 |
Genie Energy Ltd. Class B
| | 78,475 | | 1,147,305 |
NextEra Energy, Inc.
| | 77,174 | | 5,464,691 |
| | | | | | 27,596,413 |
| ELECTRICAL EQUIPMENT — 30.2% | |
American Superconductor Corp. (a)
| | 155,198 | | 3,630,081 |
Array Technologies, Inc. (a)
| | 424,824 | | 4,358,694 |
Ballard Power Systems, Inc. (a) (b)
| | 1,579,219 | | 3,553,243 |
Bloom Energy Corp. Class A (a) (b)
| | 364,261 | | 4,458,555 |
Fluence Energy, Inc. (a) (b)
| | 174,225 | | 3,021,062 |
GE Vernova, Inc. (a)
| | 31,376 | | 5,381,298 |
Generac Holdings, Inc. (a)
| | 39,038 | | 5,161,604 |
NEXTracker, Inc. Class A (a)
| | 92,546 | | 4,338,556 |
Plug Power, Inc. (a) (b)
| | 1,910,050 | | 4,450,417 |
Shoals Technologies Group, Inc. Class A (a)
| | 788,820 | | 4,922,237 |
SunPower Corp. (a) (b)
| | 1,654,938 | | 4,898,616 |
Sunrun, Inc. (a) (b)
| | 380,673 | | 4,514,782 |
TPI Composites, Inc. (a) (b)
| | 367,053 | | 1,464,541 |
| | | | | | 54,153,686 |
| ELECTRONIC EQUIPMENT, INSTRUMENTS & COMPONENTS — 2.3% | |
Corning, Inc.
| | 104,800 | | 4,071,480 |
| INDEPENDENT POWER AND RENEWABLE ELECTRICITY PRODUCERS — 17.3% | |
AES Corp.
| | 283,646 | | 4,983,660 |
Altus Power, Inc. (a)
| | 662,039 | | 2,595,193 |
Atlantica Sustainable Infrastructure PLC
| | 253,241 | | 5,558,640 |
Montauk Renewables, Inc. (a)
| | 166,504 | | 949,073 |
Ormat Technologies, Inc.
| | 73,961 | | 5,303,004 |
| Security Description | | | Shares | | Value |
ReNew Energy Global PLC Class A (a) (b)
| | 474,271 | | $2,959,451 |
Sunnova Energy International, Inc. (a) (b)
| | 1,023,336 | | 5,710,215 |
TransAlta Corp. (b)
| | 400,308 | | 2,834,180 |
| | | | | | 30,893,416 |
| MACHINERY — 4.0% | |
Cummins, Inc.
| | 14,618 | | 4,048,163 |
Hyster-Yale, Inc.
| | 44,074 | | 3,073,280 |
| | | | | | 7,121,443 |
| SEMICONDUCTORS & SEMICONDUCTOR EQUIPMENT — 15.9% | |
Applied Materials, Inc.
| | 16,735 | | 3,949,293 |
Canadian Solar, Inc. (a) (b)
| | 303,639 | | 4,478,675 |
Daqo New Energy Corp. ADR (a) (b)
| | 273,415 | | 3,991,859 |
Enphase Energy, Inc. (a)
| | 41,483 | | 4,136,270 |
First Solar, Inc. (a)
| | 18,581 | | 4,189,272 |
JinkoSolar Holding Co. Ltd. ADR (b)
| | 218,853 | | 4,534,634 |
SolarEdge Technologies, Inc. (a) (b)
| | 124,889 | | 3,154,696 |
| | | | | | 28,434,699 |
TOTAL COMMON STOCKS
(Cost $269,652,525)
| | | | | 178,618,603 |
| SHORT-TERM INVESTMENTS — 8.9% | | | |
State Street Institutional Liquid Reserves Fund, Premier Class 5.36% (c) (d)
| | 108,981 | | 109,013 |
State Street Navigator Securities Lending Portfolio II (e) (f)
| | 15,807,447 | | 15,807,447 |
TOTAL SHORT-TERM INVESTMENTS
(Cost $15,916,453)
| | 15,916,460 | |
TOTAL INVESTMENTS — 108.7%
(Cost $285,568,978)
| | 194,535,063 | |
LIABILITIES IN EXCESS OF OTHER ASSETS — (8.7)%
| | (15,588,806) | |
NET ASSETS — 100.0%
| | $178,946,257 | |
| (a) | Non-income producing security. |
| (b) | All or a portion of the shares of the security are on loan at June 30, 2024. |
| (c) | The Fund invested in certain money market funds managed by SSGA Funds Management, Inc. Amounts related to these investments during the year ended June 30, 2024 are shown in the Affiliate Table below. |
| (d) | The rate shown is the annualized seven-day yield at June 30, 2024. |
| (e) | The Fund invested in an affiliated entity. Amounts related to these investments during the year ended June 30, 2024 are shown in the Affiliate Table below. |
| (f) | Investment of cash collateral for securities loaned. |
| ADR | American Depositary Receipt |
See accompanying notes to financial statements.
95
SPDR SERIES TRUST
SPDR S&P KENSHO CLEAN POWER ETF
SCHEDULE OF INVESTMENTS (continued)
June 30, 2024
The following table summarizes the value of the Fund's investments according to the fair value hierarchy as of June 30, 2024.
| Description | | Level 1 –
Quoted Prices | | Level 2 –
Other Significant
Observable Inputs | | Level 3 –
Significant
Unobservable Inputs | | Total |
| ASSETS: | | | | | | | | |
| INVESTMENTS: | | | | | | | | |
Common Stocks
| | $178,618,603 | | $— | | $— | | $178,618,603 |
Short-Term Investments
| | 15,916,460 | | — | | — | | 15,916,460 |
TOTAL INVESTMENTS
| | $194,535,063 | | $— | | $— | | $194,535,063 |
Affiliate Table
| | Number of
Shares Held
at
6/30/23 | | Value at
6/30/23 | | Cost of
Purchases | | Proceeds
from
Shares Sold | | Realized
Gain (Loss) | | Change in
Unrealized
Appreciation/
Depreciation | | Number of
Shares Held
at
6/30/24 | | Value at
6/30/24 | | Dividend
Income |
State Street Institutional Liquid Reserves Fund, Premier Class
| 2 | | $2 | | $6,684,912 | | $6,576,004 | | $96 | | $7 | | 108,981 | | $109,013 | | $18,809 |
State Street Navigator Securities Lending Portfolio II
| 33,532,944 | | 33,532,944 | | 139,478,223 | | 157,203,720 | | — | | — | | 15,807,447 | | 15,807,447 | | 369,960 |
Total
| | | $33,532,946 | | $146,163,135 | | $163,779,724 | | $96 | | $7 | | | | $15,916,460 | | $388,769 |
See accompanying notes to financial statements.
96
SPDR SERIES TRUST
SPDR S&P KENSHO FINAL FRONTIERS ETF
SCHEDULE OF INVESTMENTS
June 30, 2024
| Security Description | | | Shares | | Value |
| COMMON STOCKS — 99.8% | |
| AEROSPACE & DEFENSE — 51.9% | |
Boeing Co. (a)
| | 3,576 | | $650,868 |
BWX Technologies, Inc.
| | 4,596 | | 436,620 |
Ducommun, Inc. (a)
| | 3,281 | | 190,495 |
Elbit Systems Ltd.
| | 923 | | 163,029 |
General Dynamics Corp.
| | 1,398 | | 405,616 |
HEICO Corp.
| | 2,897 | | 647,798 |
Hexcel Corp.
| | 10,105 | | 631,057 |
Huntington Ingalls Industries, Inc.
| | 1,691 | | 416,544 |
L3Harris Technologies, Inc.
| | 2,983 | | 669,922 |
Lockheed Martin Corp.
| | 1,423 | | 664,683 |
Moog, Inc. Class A
| | 3,886 | | 650,128 |
Northrop Grumman Corp.
| | 1,529 | | 666,567 |
Rocket Lab USA, Inc. (a)
| | 140,772 | | 675,706 |
RTX Corp.
| | 6,118 | | 614,186 |
TransDigm Group, Inc.
| | 311 | | 397,337 |
| | | | | | 7,880,556 |
| COMMUNICATIONS EQUIPMENT — 2.4% | |
Viasat, Inc. (a)
| | 28,847 | | 366,357 |
| CONTAINERS & PACKAGING — 2.4% | |
Ball Corp.
| | 6,127 | | 367,742 |
| DIVERSIFIED TELECOMMUNICATION SERVICES — 4.2% | |
Iridium Communications, Inc.
| | 23,735 | | 631,826 |
| ELECTRONIC EQUIPMENT, INSTRUMENTS & COMPONENTS — 12.3% | |
Amphenol Corp. Class A
| | 5,989 | | 403,479 |
Coherent Corp. (a)
| | 5,841 | | 423,239 |
Teledyne Technologies, Inc. (a)
| | 1,645 | | 638,227 |
TTM Technologies, Inc. (a)
| | 20,442 | | 397,188 |
| | | | | | 1,862,133 |
| ENERGY EQUIPMENT & SERVICES — 7.4% | |
Oceaneering International, Inc. (a)
| | 29,609 | | 700,549 |
TechnipFMC PLC
| | 16,507 | | 431,658 |
| | | | | | 1,132,207 |
| INDUSTRIAL CONGLOMERATES — 4.4% | |
Honeywell International, Inc.
| | 3,133 | | 669,021 |
| Security Description | | | Shares | | Value |
| MACHINERY — 6.2% | |
ESCO Technologies, Inc.
| | 5,173 | | $543,372 |
Standex International Corp.
| | 2,460 | | 396,429 |
| | | | | | 939,801 |
| PROFESSIONAL SERVICES — 6.0% | |
KBR, Inc.
| | 6,388 | | 409,726 |
Leidos Holdings, Inc.
| | 2,845 | | 415,029 |
Planet Labs PBC (a) (b)
| | 50,673 | | 94,252 |
| | | | | | 919,007 |
| SEMICONDUCTORS & SEMICONDUCTOR EQUIPMENT — 2.6% | |
Analog Devices, Inc.
| | 1,725 | | 393,748 |
TOTAL COMMON STOCKS
(Cost $12,780,329)
| | | | | 15,162,398 |
| SHORT-TERM INVESTMENT — 0.2% | | | |
State Street Institutional Liquid Reserves Fund, Premier Class 5.36% (c) (d)
(Cost $31,288)
| | 31,281 | | 31,290 |
TOTAL INVESTMENTS — 100.0%
(Cost $12,811,617)
| | 15,193,688 | |
LIABILITIES IN EXCESS OF OTHER ASSETS — (0.0)% (e)
| | (3,256) | |
NET ASSETS — 100.0%
| | $15,190,432 | |
| (a) | Non-income producing security. |
| (b) | All or a portion of the shares of the security are on loan at June 30, 2024. |
| (c) | The Fund invested in certain money market funds managed by SSGA Funds Management, Inc. Amounts related to these investments during the year ended June 30, 2024 are shown in the Affiliate Table below. |
| (d) | The rate shown is the annualized seven-day yield at June 30, 2024. |
| (e) | Amount is less than 0.05% of net assets. |
The following table summarizes the value of the Fund's investments according to the fair value hierarchy as of June 30, 2024.
| Description | | Level 1 –
Quoted Prices | | Level 2 –
Other Significant
Observable Inputs | | Level 3 –
Significant
Unobservable Inputs | | Total |
| ASSETS: | | | | | | | | |
| INVESTMENTS: | | | | | | | | |
Common Stocks
| | $15,162,398 | | $— | | $— | | $15,162,398 |
Short-Term Investment
| | 31,290 | | — | | — | | 31,290 |
TOTAL INVESTMENTS
| | $15,193,688 | | $— | | $— | | $15,193,688 |
See accompanying notes to financial statements.
97
SPDR SERIES TRUST
SPDR S&P KENSHO FINAL FRONTIERS ETF
SCHEDULE OF INVESTMENTS (continued)
June 30, 2024
Affiliate Table
| | Number of
Shares Held
at
6/30/23 | | Value at
6/30/23 | | Cost of
Purchases | | Proceeds
from
Shares Sold | | Realized
Gain (Loss) | | Change in
Unrealized
Appreciation/
Depreciation | | Number of
Shares Held
at
6/30/24 | | Value at
6/30/24 | | Dividend
Income |
State Street Institutional Liquid Reserves Fund, Premier Class
| 22,788 | | $22,793 | | $229,596 | | $221,108 | | $7 | | $2 | | 31,281 | | $31,290 | | $1,160 |
State Street Navigator Securities Lending Portfolio II
| 1,289,659 | | 1,289,659 | | 4,814,642 | | 6,104,301 | | — | | — | | — | | — | | 1,872 |
Total
| | | $1,312,452 | | $5,044,238 | | $6,325,409 | | $7 | | $2 | | | | $31,290 | | $3,032 |
See accompanying notes to financial statements.
98
SPDR SERIES TRUST
SPDR S&P KENSHO FUTURE SECURITY ETF
SCHEDULE OF INVESTMENTS
June 30, 2024
| Security Description | | | Shares | | Value |
| COMMON STOCKS — 99.9% | |
| AEROSPACE & DEFENSE — 29.5% | |
AeroVironment, Inc. (a)
| | 4,543 | | $827,553 |
Boeing Co. (a)
| | 5,411 | | 984,856 |
Ducommun, Inc. (a)
| | 12,356 | | 717,389 |
Elbit Systems Ltd.
| | 3,475 | | 613,789 |
Embraer SA ADR (a)
| | 26,150 | | 674,670 |
General Dynamics Corp.
| | 2,629 | | 762,778 |
HEICO Corp.
| | 4,360 | | 974,940 |
Hexcel Corp.
| | 15,210 | | 949,865 |
Huntington Ingalls Industries, Inc.
| | 3,181 | | 783,576 |
Kratos Defense & Security Solutions, Inc. (a)
| | 48,053 | | 961,541 |
L3Harris Technologies, Inc.
| | 4,490 | | 1,008,364 |
Leonardo DRS, Inc. (a)
| | 31,063 | | 792,417 |
Lockheed Martin Corp.
| | 2,142 | | 1,000,528 |
Mercury Systems, Inc. (a)
| | 25,622 | | 691,538 |
Moog, Inc. Class A
| | 5,849 | | 978,538 |
Northrop Grumman Corp.
| | 2,302 | | 1,003,557 |
Rocket Lab USA, Inc. (a) (b)
| | 211,928 | | 1,017,254 |
RTX Corp.
| | 9,257 | | 929,310 |
Textron, Inc.
| | 8,947 | | 768,189 |
V2X, Inc. (a)
| | 12,509 | | 599,932 |
| | | | | | 17,040,584 |
| COMMUNICATIONS EQUIPMENT — 8.5% | |
Cisco Systems, Inc.
| | 21,553 | | 1,023,983 |
F5, Inc. (a)
| | 5,850 | | 1,007,546 |
Juniper Networks, Inc.
| | 27,663 | | 1,008,593 |
NetScout Systems, Inc. (a)
| | 52,860 | | 966,809 |
Viasat, Inc. (a)
| | 69,312 | | 880,262 |
| | | | | | 4,887,193 |
| DIVERSIFIED TELECOMMUNICATION SERVICES — 1.7% | |
Iridium Communications, Inc.
| | 35,916 | | 956,084 |
| ELECTRONIC EQUIPMENT, INSTRUMENTS & COMPONENTS — 10.2% | |
908 Devices, Inc. (a)
| | 34,430 | | 177,315 |
Amphenol Corp. Class A
| | 11,265 | | 758,923 |
Coherent Corp. (a)
| | 10,987 | | 796,118 |
MicroVision, Inc. (a) (b)
| | 610,619 | | 647,256 |
Mirion Technologies, Inc. (a)
| | 75,936 | | 815,553 |
OSI Systems, Inc. (a)
| | 7,087 | | 974,604 |
Sanmina Corp. (a)
| | 11,438 | | 757,767 |
Teledyne Technologies, Inc. (a)
| | 2,488 | | 965,294 |
| | | | | | 5,892,830 |
| ENERGY EQUIPMENT & SERVICES — 1.8% | |
Oceaneering International, Inc. (a)
| | 44,566 | | 1,054,431 |
| HEALTH CARE EQUIPMENT & SUPPLIES — 1.3% | |
Varex Imaging Corp. (a)
| | 49,857 | | 734,394 |
| INTERACTIVE MEDIA & SERVICES — 1.7% | |
Ziff Davis, Inc. (a)
| | 17,748 | | 977,027 |
| IT SERVICES — 5.4% | |
Akamai Technologies, Inc. (a)
| | 11,122 | | 1,001,870 |
Cloudflare, Inc. Class A (a)
| | 13,037 | | 1,079,855 |
| Security Description | | | Shares | | Value |
Okta, Inc. (a)
| | 11,070 | | $1,036,262 |
| | | | | | 3,117,987 |
| LIFE SCIENCES TOOLS & SERVICES — 1.6% | |
Bruker Corp.
| | 14,928 | | 952,556 |
| PROFESSIONAL SERVICES — 6.8% | |
CACI International, Inc. Class A (a)
| | 1,811 | | 778,966 |
KBR, Inc.
| | 12,017 | | 770,770 |
Leidos Holdings, Inc.
| | 6,800 | | 991,984 |
Parsons Corp. (a)
| | 12,779 | | 1,045,450 |
Planet Labs PBC (a) (b)
| | 190,806 | | 354,899 |
| | | | | | 3,942,069 |
| SEMICONDUCTORS & SEMICONDUCTOR EQUIPMENT — 1.8% | |
Broadcom, Inc.
| | 658 | | 1,056,439 |
| SOFTWARE — 29.6% | |
A10 Networks, Inc.
| | 70,099 | | 970,871 |
BlackBerry Ltd. (a) (b)
| | 356,822 | | 884,919 |
Check Point Software Technologies Ltd. (a)
| | 6,222 | | 1,026,630 |
Crowdstrike Holdings, Inc. Class A (a)
| | 2,538 | | 972,536 |
CyberArk Software Ltd. (a)
| | 3,941 | | 1,077,548 |
Datadog, Inc. Class A (a)
| | 8,298 | | 1,076,168 |
Fortinet, Inc. (a)
| | 16,305 | | 982,702 |
N-able, Inc. (a)
| | 67,947 | | 1,034,833 |
OneSpan, Inc. (a)
| | 61,615 | | 789,904 |
Palo Alto Networks, Inc. (a)
| | 3,074 | | 1,042,117 |
Qualys, Inc. (a)
| | 6,998 | | 997,915 |
Radware Ltd. (a)
| | 44,869 | | 818,411 |
Rapid7, Inc. (a)
| | 25,575 | | 1,105,607 |
SentinelOne, Inc. Class A (a)
| | 54,319 | | 1,143,415 |
Tenable Holdings, Inc. (a)
| | 23,539 | | 1,025,830 |
Varonis Systems, Inc. (a)
| | 23,124 | | 1,109,258 |
Zscaler, Inc. (a)
| | 5,234 | | 1,005,922 |
| | | | | | 17,064,586 |
TOTAL COMMON STOCKS
(Cost $54,316,040)
| | | | | 57,676,180 |
| SHORT-TERM INVESTMENTS — 2.3% | | | |
State Street Institutional Liquid Reserves Fund, Premier Class 5.36% (c) (d)
| | 47,060 | | 47,074 |
State Street Navigator Securities Lending Portfolio II (e) (f)
| | 1,256,763 | | 1,256,763 |
TOTAL SHORT-TERM INVESTMENTS
(Cost $1,303,834)
| | 1,303,837 | |
TOTAL INVESTMENTS — 102.2%
(Cost $55,619,874)
| | 58,980,017 | |
LIABILITIES IN EXCESS OF OTHER ASSETS — (2.2)%
| | (1,269,645) | |
NET ASSETS — 100.0%
| | $57,710,372 | |
See accompanying notes to financial statements.
99
SPDR SERIES TRUST
SPDR S&P KENSHO FUTURE SECURITY ETF
SCHEDULE OF INVESTMENTS (continued)
June 30, 2024
| (a) | Non-income producing security. |
| (b) | All or a portion of the shares of the security are on loan at June 30, 2024. |
| (c) | The Fund invested in certain money market funds managed by SSGA Funds Management, Inc. Amounts related to these investments during the year ended June 30, 2024 are shown in the Affiliate Table below. |
| (d) | The rate shown is the annualized seven-day yield at June 30, 2024. |
| (e) | The Fund invested in an affiliated entity. Amounts related to these investments during the year ended June 30, 2024 are shown in the Affiliate Table below. |
| (f) | Investment of cash collateral for securities loaned. |
| ADR | American Depositary Receipt |
The following table summarizes the value of the Fund's investments according to the fair value hierarchy as of June 30, 2024.
| Description | | Level 1 –
Quoted Prices | | Level 2 –
Other Significant
Observable Inputs | | Level 3 –
Significant
Unobservable Inputs | | Total |
| ASSETS: | | | | | | | | |
| INVESTMENTS: | | | | | | | | |
Common Stocks
| | $57,676,180 | | $— | | $— | | $57,676,180 |
Short-Term Investments
| | 1,303,837 | | — | | — | | 1,303,837 |
TOTAL INVESTMENTS
| | $58,980,017 | | $— | | $— | | $58,980,017 |
Affiliate Table
| | Number of
Shares Held
at
6/30/23 | | Value at
6/30/23 | | Cost of
Purchases | | Proceeds
from
Shares Sold | | Realized
Gain (Loss) | | Change in
Unrealized
Appreciation/
Depreciation | | Number of
Shares Held
at
6/30/24 | | Value at
6/30/24 | | Dividend
Income |
State Street Institutional Liquid Reserves Fund, Premier Class
| 58,231 | | $58,242 | | $2,239,364 | | $2,250,628 | | $94 | | $2 | | 47,060 | | $47,074 | | $3,533 |
State Street Navigator Securities Lending Portfolio II
| 2,266,047 | | 2,266,047 | | 14,277,831 | | 15,287,115 | | — | | — | | 1,256,763 | | 1,256,763 | | 28,206 |
Total
| | | $2,324,289 | | $16,517,195 | | $17,537,743 | | $94 | | $2 | | | | $1,303,837 | | $31,739 |
See accompanying notes to financial statements.
100
SPDR SERIES TRUST
SPDR S&P KENSHO INTELLIGENT STRUCTURES ETF
SCHEDULE OF INVESTMENTS
June 30, 2024
| Security Description | | | Shares | | Value |
| COMMON STOCKS — 99.8% | |
| AUTO COMPONENTS — 1.7% | |
Gentex Corp.
| | 6,624 | | $223,295 |
| BUILDING PRODUCTS — 8.1% | |
Carrier Global Corp.
| | 5,817 | | 366,936 |
Johnson Controls International PLC
| | 5,261 | | 349,699 |
Resideo Technologies, Inc. (a)
| | 18,400 | | 359,904 |
| | | | | | 1,076,539 |
| COMMERCIAL SERVICES & SUPPLIES — 5.3% | |
Tetra Tech, Inc.
| | 1,758 | | 359,476 |
Veralto Corp.
| | 3,703 | | 353,525 |
| | | | | | 713,001 |
| DIVERSIFIED CONSUMER SERVICES — 2.8% | |
ADT, Inc.
| | 50,139 | | 381,056 |
| DIVERSIFIED TELECOMMUNICATION SERVICES — 1.6% | |
BCE, Inc. (b)
| | 6,729 | | 217,818 |
| ELECTRIC UTILITIES — 1.6% | |
NRG Energy, Inc.
| | 2,846 | | 221,590 |
| ELECTRICAL EQUIPMENT — 17.3% | |
Acuity Brands, Inc.
| | 898 | | 216,813 |
AMETEK, Inc.
| | 1,328 | | 221,391 |
Blink Charging Co. (a) (b)
| | 109,734 | | 300,671 |
Bloom Energy Corp. Class A (a) (b)
| | 24,448 | | 299,244 |
ChargePoint Holdings, Inc. (a) (b)
| | 208,463 | | 314,779 |
Generac Holdings, Inc. (a)
| | 2,624 | | 346,945 |
Shoals Technologies Group, Inc. Class A (a)
| | 52,953 | | 330,427 |
Stem, Inc. (a)
| | 248,446 | | 275,775 |
| | | | | | 2,306,045 |
| ELECTRONIC EQUIPMENT, INSTRUMENTS & COMPONENTS — 12.0% | |
Arlo Technologies, Inc. (a)
| | 27,508 | | 358,704 |
Badger Meter, Inc.
| | 1,980 | | 368,973 |
Itron, Inc. (a)
| | 3,459 | | 342,303 |
MicroVision, Inc. (a) (b)
| | 148,162 | | 157,052 |
SmartRent, Inc. (a)
| | 58,504 | | 139,825 |
TE Connectivity Ltd.
| | 1,531 | | 230,308 |
| | | | | | 1,597,165 |
| ENERGY EQUIPMENT & SERVICES — 2.8% | |
Select Water Solutions, Inc.
| | 34,737 | | 371,686 |
| ENTERTAINMENT — 1.8% | |
Roku, Inc. (a)
| | 4,094 | | 245,353 |
| INDEPENDENT POWER & RENEWABLE ELECTRICITY PRODUCERS — 1.7% | |
Atlantica Sustainable Infrastructure PLC
| | 10,478 | | 229,992 |
| INDUSTRIAL CONGLOMERATES — 1.8% | |
Honeywell International, Inc.
| | 1,107 | | 236,389 |
| INTERACTIVE MEDIA & SERVICES — 1.6% | |
Baidu, Inc. ADR (a) (b)
| | 2,445 | | 211,444 |
| Security Description | | | Shares | | Value |
| MACHINERY — 11.4% | |
Chart Industries, Inc. (a)
| | 1,576 | | $227,480 |
Energy Recovery, Inc. (a)
| | 14,484 | | 192,492 |
Mueller Water Products, Inc. Class A
| | 20,885 | | 374,259 |
Pentair PLC
| | 4,682 | | 358,969 |
Xylem, Inc.
| | 2,662 | | 361,047 |
| | | | | | 1,514,247 |
| OIL, GAS & CONSUMABLE FUELS — 5.3% | |
BP PLC ADR
| | 6,489 | | 234,253 |
Shell PLC ADR
| | 3,277 | | 236,534 |
Suncor Energy, Inc.
| | 6,063 | | 231,000 |
| | | | | | 701,787 |
| PROFESSIONAL SERVICES — 3.6% | |
NV5 Global, Inc. (a)
| | 2,481 | | 230,659 |
Parsons Corp. (a)
| | 2,999 | | 245,348 |
| | | | | | 476,007 |
| SEMICONDUCTORS & SEMICONDUCTOR EQUIPMENT — 5.6% | |
ON Semiconductor Corp. (a)
| | 3,027 | | 207,501 |
Silicon Laboratories, Inc. (a)
| | 3,073 | | 339,966 |
STMicroelectronics NV (b)
| | 5,101 | | 200,367 |
| | | | | | 747,834 |
| SOFTWARE — 7.0% | |
Alarm.com Holdings, Inc. (a)
| | 5,915 | | 375,839 |
Aspen Technology, Inc. (a)
| | 1,128 | | 224,055 |
Rekor Systems, Inc. (a)
| | 61,801 | | 95,791 |
Roper Technologies, Inc.
| | 413 | | 232,792 |
| | | | | | 928,477 |
| SPECIALTY RETAIL — 2.2% | |
EVgo, Inc. (a) (b)
| | 117,635 | | 288,206 |
| TRADING COMPANIES & DISTRIBUTORS — 1.7% | |
Core & Main, Inc. Class A (a)
| | 4,558 | | 223,068 |
| WATER UTILITIES — 1.2% | |
Consolidated Water Co. Ltd.
| | 5,918 | | 157,064 |
| WIRELESS TELECOMMUNICATION SERVICES — 1.7% | |
Rogers Communications, Inc. Class B
| | 5,995 | | 221,695 |
TOTAL COMMON STOCKS
(Cost $18,685,070)
| | | | | 13,289,758 |
| SHORT-TERM INVESTMENTS — 6.3% | | | |
State Street Institutional Liquid Reserves Fund, Premier Class 5.36% (c) (d)
| | 6,236 | | 6,238 |
See accompanying notes to financial statements.
101
SPDR SERIES TRUST
SPDR S&P KENSHO INTELLIGENT STRUCTURES ETF
SCHEDULE OF INVESTMENTS (continued)
June 30, 2024
| Security Description | | | Shares | | Value |
State Street Navigator Securities Lending Portfolio II (e) (f)
| | 833,420 | | $833,420 |
TOTAL SHORT-TERM INVESTMENTS
(Cost $839,658)
| | 839,658 | |
TOTAL INVESTMENTS — 106.1%
(Cost $19,524,728)
| | 14,129,416 | |
LIABILITIES IN EXCESS OF OTHER ASSETS — (6.1)%
| | (817,068) | |
NET ASSETS — 100.0%
| | $13,312,348 | |
| (a) | Non-income producing security. |
| (b) | All or a portion of the shares of the security are on loan at June 30, 2024. |
| (c) | The Fund invested in certain money market funds managed by SSGA Funds Management, Inc. Amounts related to these investments during the year ended June 30, 2024 are shown in the Affiliate Table below. |
| (d) | The rate shown is the annualized seven-day yield at June 30, 2024. |
| (e) | The Fund invested in an affiliated entity. Amounts related to these investments during the year ended June 30, 2024 are shown in the Affiliate Table below. |
| (f) | Investment of cash collateral for securities loaned. |
| ADR | American Depositary Receipt |
The following table summarizes the value of the Fund's investments according to the fair value hierarchy as of June 30, 2024.
| Description | | Level 1 –
Quoted Prices | | Level 2 –
Other Significant
Observable Inputs | | Level 3 –
Significant
Unobservable Inputs | | Total |
| ASSETS: | | | | | | | | |
| INVESTMENTS: | | | | | | | | |
Common Stocks
| | $13,289,758 | | $— | | $— | | $13,289,758 |
Short-Term Investments
| | 839,658 | | — | | — | | 839,658 |
TOTAL INVESTMENTS
| | $14,129,416 | | $— | | $— | | $14,129,416 |
Affiliate Table
| | Number of
Shares Held
at
6/30/23 | | Value at
6/30/23 | | Cost of
Purchases | | Proceeds
from
Shares Sold | | Realized
Gain (Loss) | | Change in
Unrealized
Appreciation/
Depreciation | | Number of
Shares Held
at
6/30/24 | | Value at
6/30/24 | | Dividend
Income |
State Street Institutional Liquid Reserves Fund, Premier Class
| 42,700 | | $42,709 | | $755,967 | | $792,444 | | $6 | | $— | | 6,236 | | $6,238 | | $1,679 |
State Street Navigator Securities Lending Portfolio II
| 2,190,208 | | 2,190,208 | | 15,186,851 | | 16,543,639 | | — | | — | | 833,420 | | 833,420 | | 68,734 |
Total
| | | $2,232,917 | | $15,942,818 | | $17,336,083 | | $6 | | $— | | | | $839,658 | | $70,413 |
See accompanying notes to financial statements.
102
SPDR SERIES TRUST
SPDR S&P KENSHO NEW ECONOMIES COMPOSITE ETF
SCHEDULE OF INVESTMENTS
June 30, 2024
| Security Description | | | Shares | | Value |
| COMMON STOCKS — 99.8% | |
| AEROSPACE & DEFENSE — 8.8% | |
AeroVironment, Inc. (a)
| | 94,662 | | $17,243,630 |
Boeing Co. (a)
| | 50,191 | | 9,135,264 |
BWX Technologies, Inc.
| | 30,279 | | 2,876,505 |
Ducommun, Inc. (a)
| | 69,751 | | 4,049,743 |
EHang Holdings Ltd. ADR (a) (b)
| | 1,158,519 | | 15,732,688 |
Embraer SA ADR (a)
| | 278,179 | | 7,177,018 |
General Dynamics Corp.
| | 27,786 | | 8,061,830 |
HEICO Corp.
| | 43,547 | | 9,737,545 |
Hexcel Corp.
| | 58,174 | | 3,632,966 |
Huntington Ingalls Industries, Inc.
| | 22,440 | | 5,527,645 |
Kratos Defense & Security Solutions, Inc. (a)
| | 827,655 | | 16,561,376 |
L3Harris Technologies, Inc.
| | 18,860 | | 4,235,579 |
Leonardo DRS, Inc. (a)
| | 335,755 | | 8,565,110 |
Lockheed Martin Corp.
| | 34,147 | | 15,950,064 |
Mercury Systems, Inc. (a)
| | 176,397 | | 4,760,955 |
Moog, Inc. Class A
| | 23,320 | | 3,901,436 |
Northrop Grumman Corp.
| | 27,010 | | 11,775,009 |
Rocket Lab USA, Inc. (a) (b)
| | 911,200 | | 4,373,760 |
RTX Corp.
| | 38,898 | | 3,904,970 |
Textron, Inc.
| | 74,045 | | 6,357,504 |
TransDigm Group, Inc.
| | 1,996 | | 2,550,110 |
| | | | | | 166,110,707 |
| AUTO COMPONENTS — 1.1% | |
American Axle & Manufacturing Holdings, Inc. (a)
| | 182,489 | | 1,275,598 |
Aptiv PLC (a)
| | 11,998 | | 844,899 |
BorgWarner, Inc.
| | 38,702 | | 1,247,752 |
Dana, Inc.
| | 107,274 | | 1,300,161 |
Garrett Motion, Inc. (a)
| | 155,592 | | 1,336,535 |
Gentex Corp.
| | 138,552 | | 4,670,588 |
Gentherm, Inc. (a)
| | 27,500 | | 1,356,300 |
Lear Corp.
| | 7,955 | | 908,541 |
Luminar Technologies, Inc. (a) (b)
| | 520,707 | | 775,853 |
Mobileye Global, Inc. Class A (a) (b)
| | 27,516 | | 772,787 |
Modine Manufacturing Co. (a)
| | 9,952 | | 997,091 |
Visteon Corp. (a)
| | 44,724 | | 4,772,051 |
| | | | | | 20,258,156 |
| AUTOMOBILES — 1.4% | |
Canoo, Inc. (a)
| | 608,147 | | 1,295,353 |
Ford Motor Co.
| | 82,143 | | 1,030,073 |
General Motors Co.
| | 28,464 | | 1,322,437 |
Honda Motor Co. Ltd. ADR (b)
| | 42,632 | | 1,374,456 |
Li Auto, Inc. ADR (a) (b)
| | 80,974 | | 1,447,815 |
Lucid Group, Inc. (a) (b)
| | 829,570 | | 2,165,178 |
NIO, Inc. ADR (a) (b)
| | 532,763 | | 2,216,294 |
Polestar Automotive Holding U.K. PLC Class A ADR (a) (b)
| | 1,065,370 | | 838,020 |
Rivian Automotive, Inc. Class A (a) (b)
| | 183,327 | | 2,460,248 |
| Security Description | | | Shares | | Value |
Stellantis NV
| | 210,269 | | $4,173,840 |
Tesla, Inc. (a)
| | 18,111 | | 3,583,805 |
Toyota Motor Corp. ADR (b)
| | 7,512 | | 1,539,735 |
XPeng, Inc. ADR (a)
| | 323,314 | | 2,369,891 |
| | | | | | 25,817,145 |
| BANKS — 1.9% | |
Banco Santander SA ADR
| | 2,012,621 | | 9,318,435 |
Bank of Nova Scotia (b)
| | 122,340 | | 5,593,385 |
Grupo Financiero Galicia SA ADR (a) (b)
| | 83,118 | | 2,540,086 |
ING Groep NV ADR (b)
| | 339,597 | | 5,820,693 |
Inter & Co., Inc. Class A
| | 943,393 | | 5,801,867 |
Itau Unibanco Holding SA ADR
| | 244,830 | | 1,429,807 |
Toronto-Dominion Bank (b)
| | 105,875 | | 5,818,890 |
| | | | | | 36,323,163 |
| BIOTECHNOLOGY — 4.5% | |
4D Molecular Therapeutics, Inc. (a)
| | 83,360 | | 1,749,726 |
Allogene Therapeutics, Inc. (a) (b)
| | 761,456 | | 1,774,193 |
Alnylam Pharmaceuticals, Inc. (a)
| | 13,115 | | 3,186,945 |
Arcturus Therapeutics Holdings, Inc. (a)
| | 88,141 | | 2,146,233 |
Arrowhead Pharmaceuticals, Inc. (a)
| | 74,960 | | 1,948,210 |
Autolus Therapeutics PLC ADR (a) (b)
| | 525,287 | | 1,827,999 |
Avidity Biosciences, Inc. (a)
| | 49,947 | | 2,040,335 |
Beam Therapeutics, Inc. (a) (b)
| | 77,590 | | 1,817,934 |
Biogen, Inc. (a)
| | 9,030 | | 2,093,335 |
BioMarin Pharmaceutical, Inc. (a)
| | 17,805 | | 1,465,886 |
BioNTech SE ADR (a)
| | 23,489 | | 1,887,576 |
CareDx, Inc. (a)
| | 109,131 | | 1,694,804 |
CRISPR Therapeutics AG (a) (b)
| | 31,892 | | 1,722,487 |
Editas Medicine, Inc. (a) (b)
| | 329,036 | | 1,536,598 |
Fate Therapeutics, Inc. (a)
| | 555,508 | | 1,822,066 |
Grifols SA ADR (a)
| | 465,830 | | 2,937,058 |
Ideaya Biosciences, Inc. (a)
| | 35,076 | | 1,231,518 |
Immatics NV (a)
| | 122,640 | | 1,425,077 |
Intellia Therapeutics, Inc. (a)
| | 67,762 | | 1,516,514 |
Ionis Pharmaceuticals, Inc. (a)
| | 37,551 | | 1,789,681 |
Iovance Biotherapeutics, Inc. (a)
| | 212,419 | | 1,703,600 |
Krystal Biotech, Inc. (a) (b)
| | 11,092 | | 2,036,935 |
Legend Biotech Corp. ADR (a) (b)
| | 42,846 | | 1,897,649 |
Merus NV (a) (b)
| | 45,243 | | 2,677,028 |
Moderna, Inc. (a)
| | 14,127 | | 1,677,581 |
Natera, Inc. (a)
| | 16,949 | | 1,835,407 |
Neurogene, Inc. (a)
| | 48,236 | | 1,755,308 |
Novavax, Inc. (a) (b)
| | 133,828 | | 1,694,263 |
Ocugen, Inc. (a) (b)
| | 1,278,639 | | 1,981,890 |
Recursion Pharmaceuticals, Inc. Class A (a) (b)
| | 145,155 | | 1,088,663 |
See accompanying notes to financial statements.
103
SPDR SERIES TRUST
SPDR S&P KENSHO NEW ECONOMIES COMPOSITE ETF
SCHEDULE OF INVESTMENTS (continued)
June 30, 2024
| Security Description | | | Shares | | Value |
Regeneron Pharmaceuticals, Inc. (a)
| | 1,485 | | $1,560,780 |
REGENXBIO, Inc. (a)
| | 149,884 | | 1,753,643 |
Rocket Pharmaceuticals, Inc. (a)
| | 88,461 | | 1,904,565 |
Roivant Sciences Ltd. (a) (b)
| | 132,077 | | 1,396,054 |
Sarepta Therapeutics, Inc. (a)
| | 17,650 | | 2,788,700 |
Twist Bioscience Corp. (a)
| | 220,789 | | 10,880,482 |
Ultragenyx Pharmaceutical, Inc. (a)
| | 46,635 | | 1,916,699 |
Vertex Pharmaceuticals, Inc. (a)
| | 3,333 | | 1,562,244 |
Verve Therapeutics, Inc. (a) (b)
| | 352,872 | | 1,722,015 |
Vir Biotechnology, Inc. (a)
| | 202,090 | | 1,798,601 |
Xencor, Inc. (a)
| | 95,581 | | 1,809,348 |
| | | | | | 85,055,630 |
| BROADLINE RETAIL — 0.9% | |
Alibaba Group Holding Ltd. ADR
| | 44,907 | | 3,233,304 |
Jumia Technologies AG ADR (a)
| | 475,398 | | 3,337,294 |
MercadoLibre, Inc. (a)
| | 6,031 | | 9,911,345 |
| | | | | | 16,481,943 |
| BUILDING PRODUCTS — 1.3% | |
Carrier Global Corp.
| | 116,951 | | 7,377,269 |
Gibraltar Industries, Inc. (a)
| | 13,209 | | 905,477 |
Johnson Controls International PLC
| | 119,177 | | 7,921,695 |
Resideo Technologies, Inc. (a)
| | 385,459 | | 7,539,578 |
| | | | | | 23,744,019 |
| CAPITAL MARKETS — 1.6% | |
Charles Schwab Corp.
| | 74,993 | | 5,526,234 |
Coinbase Global, Inc. Class A (a)
| | 86,507 | | 19,224,451 |
Robinhood Markets, Inc. Class A (a)
| | 249,868 | | 5,674,502 |
| | | | | | 30,425,187 |
| CHEMICALS — 1.5% | |
Aspen Aerogels, Inc. (a)
| | 51,459 | | 1,227,297 |
Cabot Corp.
| | 101,103 | | 9,290,355 |
Corteva, Inc.
| | 40,017 | | 2,158,517 |
FMC Corp.
| | 51,807 | | 2,981,493 |
Huntsman Corp.
| | 216,859 | | 4,937,880 |
Mosaic Co.
| | 78,938 | | 2,281,308 |
Nutrien Ltd. (b)
| | 58,511 | | 2,978,795 |
Scotts Miracle-Gro Co. (b)
| | 33,473 | | 2,177,753 |
| | | | | | 28,033,398 |
| COMMERCIAL SERVICES & SUPPLIES — 0.5% | |
MSA Safety, Inc.
| | 27,992 | | 5,253,819 |
Tetra Tech, Inc.
| | 9,625 | | 1,968,120 |
Veralto Corp.
| | 20,915 | | 1,996,755 |
| | | | | | 9,218,694 |
| COMMUNICATIONS EQUIPMENT — 0.9% | |
Cisco Systems, Inc.
| | 92,716 | | 4,404,937 |
F5, Inc. (a)
| | 15,444 | | 2,659,920 |
Juniper Networks, Inc.
| | 76,475 | | 2,788,279 |
NetScout Systems, Inc. (a)
| | 144,712 | | 2,646,783 |
| Security Description | | | Shares | | Value |
Viasat, Inc. (a) (b)
| | 351,979 | | $4,470,133 |
| | | | | | 16,970,052 |
| CONSTRUCTION & ENGINEERING — 0.6% | |
Ameresco, Inc. Class A (a) (b)
| | 223,871 | | 6,449,724 |
Arcosa, Inc.
| | 15,018 | | 1,252,651 |
Valmont Industries, Inc.
| | 14,630 | | 4,015,203 |
| | | | | | 11,717,578 |
| CONSTRUCTION MATERIALS — 0.2% | |
Cemex SAB de CV ADR
| | 589,506 | | 3,766,943 |
| CONSUMER FINANCE — 2.7% | |
Ally Financial, Inc.
| | 147,210 | | 5,839,821 |
Green Dot Corp. Class A (a)
| | 393,225 | | 3,715,976 |
Kaspi.KZ JSC ADR
| | 24,068 | | 3,105,013 |
LendingClub Corp. (a)
| | 1,348,898 | | 11,411,677 |
Lufax Holding Ltd. ADR (b)
| | 2,859,753 | | 6,777,614 |
SoFi Technologies, Inc. (a) (b)
| | 1,211,130 | | 8,005,569 |
Upstart Holdings, Inc. (a) (b)
| | 488,452 | | 11,522,583 |
| | | | | | 50,378,253 |
| CONSUMER STAPLES DISTRIBUTION & RETAIL — 0.1% | |
Andersons, Inc.
| | 45,190 | | 2,241,424 |
| CONTAINERS & PACKAGING — 0.2% | |
AptarGroup, Inc.
| | 13,205 | | 1,859,396 |
Ball Corp.
| | 38,354 | | 2,302,007 |
| | | | | | 4,161,403 |
| DIVERSIFIED CONSUMER SERVICES — 0.5% | |
ADT, Inc.
| | 1,162,713 | | 8,836,619 |
| DIVERSIFIED TELECOMMUNICATION SERVICES — 0.8% | |
Bandwidth, Inc. Class A (a)
| | 84,463 | | 1,425,735 |
BCE, Inc. (b)
| | 141,263 | | 4,572,683 |
Iridium Communications, Inc.
| | 336,962 | | 8,969,929 |
| | | | | | 14,968,347 |
| ELECTRIC UTILITIES — 1.9% | |
ALLETE, Inc.
| | 102,002 | | 6,359,825 |
Avangrid, Inc.
| | 183,738 | | 6,528,211 |
Centrais Eletricas Brasileiras SA ADR (b)
| | 843,748 | | 5,425,300 |
Constellation Energy Corp.
| | 28,976 | | 5,803,023 |
NextEra Energy, Inc.
| | 93,138 | | 6,595,102 |
NRG Energy, Inc.
| | 63,348 | | 4,932,275 |
| | | | | | 35,643,736 |
| ELECTRICAL EQUIPMENT — 3.0% | |
Acuity Brands, Inc.
| | 18,354 | | 4,431,390 |
American Superconductor Corp. (a)
| | 48,586 | | 1,136,427 |
AMETEK, Inc.
| | 8,012 | | 1,335,680 |
Array Technologies, Inc. (a)
| | 121,731 | | 1,248,960 |
Ballard Power Systems, Inc. (a) (b)
| | 1,010,658 | | 2,273,980 |
Blink Charging Co. (a) (b)
| | 1,584,693 | | 4,342,059 |
Bloom Energy Corp. Class A (a) (b)
| | 275,794 | | 3,375,719 |
See accompanying notes to financial statements.
104
SPDR SERIES TRUST
SPDR S&P KENSHO NEW ECONOMIES COMPOSITE ETF
SCHEDULE OF INVESTMENTS (continued)
June 30, 2024
| Security Description | | | Shares | | Value |
ChargePoint Holdings, Inc. (a) (b)
| | 1,107,511 | | $1,672,342 |
Emerson Electric Co.
| | 50,676 | | 5,582,468 |
Fluence Energy, Inc. (a) (b)
| | 53,639 | | 930,100 |
GE Vernova, Inc. (a)
| | 7,563 | | 1,297,130 |
Generac Holdings, Inc. (a)
| | 65,996 | | 8,725,991 |
NEXTracker, Inc. Class A (a)
| | 24,338 | | 1,140,965 |
Plug Power, Inc. (a) (b)
| | 1,094,374 | | 2,549,891 |
Rockwell Automation, Inc.
| | 19,813 | | 5,454,123 |
Sensata Technologies Holding PLC
| | 24,353 | | 910,559 |
Shoals Technologies Group, Inc. Class A (a)
| | 512,746 | | 3,199,535 |
Sociedad Quimica y Minera de Chile SA ADR (b)
| | 49,175 | | 2,003,881 |
Stem, Inc. (a)
| | 1,637,417 | | 1,817,533 |
SunPower Corp. (a) (b)
| | 452,945 | | 1,340,717 |
Sunrun, Inc. (a) (b)
| | 103,246 | | 1,224,498 |
| | | | | | 55,993,948 |
| ELECTRONIC EQUIPMENT, INSTRUMENTS & COMPONENTS — 6.8% | |
Amphenol Corp. Class A
| | 39,425 | | 2,656,062 |
Arlo Technologies, Inc. (a)
| | 562,164 | | 7,330,619 |
Badger Meter, Inc.
| | 10,901 | | 2,031,401 |
Cognex Corp.
| | 122,636 | | 5,734,459 |
Coherent Corp. (a)
| | 87,766 | | 6,359,524 |
Corning, Inc.
| | 24,438 | | 949,416 |
Hollysys Automation Technologies Ltd. (a) (b)
| | 226,697 | | 4,905,723 |
IPG Photonics Corp. (a)
| | 39,677 | | 3,348,342 |
Itron, Inc. (a)
| | 18,897 | | 1,870,047 |
Mirion Technologies, Inc. (a)
| | 824,112 | | 8,850,963 |
Novanta, Inc. (a)
| | 20,817 | | 3,395,461 |
OSI Systems, Inc. (a)
| | 107,304 | | 14,756,446 |
Ouster, Inc. (a)
| | 707,269 | | 6,952,454 |
PAR Technology Corp. (a) (b)
| | 115,284 | | 5,428,724 |
Sanmina Corp. (a)
| | 181,342 | | 12,013,908 |
TE Connectivity Ltd.
| | 32,664 | | 4,913,646 |
Teledyne Technologies, Inc. (a)
| | 54,582 | | 21,176,724 |
Trimble, Inc. (a)
| | 65,861 | | 3,682,947 |
TTM Technologies, Inc. (a)
| | 145,662 | | 2,830,213 |
Vontier Corp.
| | 39,782 | | 1,519,673 |
Zebra Technologies Corp. Class A (a)
| | 23,243 | | 7,180,460 |
| | | | | | 127,887,212 |
| ENERGY EQUIPMENT & SERVICES — 1.7% | |
Helix Energy Solutions Group, Inc. (a)
| | 312,178 | | 3,727,405 |
Oceaneering International, Inc. (a)
| | 886,159 | | 20,966,522 |
Select Water Solutions, Inc.
| | 227,068 | | 2,429,628 |
TechnipFMC PLC
| | 216,461 | | 5,660,455 |
| | | | | | 32,784,010 |
| ENTERTAINMENT — 1.4% | |
Bilibili, Inc. ADR (a)
| | 222,349 | | 3,433,068 |
| Security Description | | | Shares | | Value |
Electronic Arts, Inc.
| | 23,530 | | $3,278,435 |
iQIYI, Inc. ADR (a)
| | 522,684 | | 1,918,250 |
NetEase, Inc. ADR
| | 29,865 | | 2,854,497 |
ROBLOX Corp. Class A (a)
| | 71,973 | | 2,678,115 |
Roku, Inc. (a)
| | 81,420 | | 4,879,501 |
Sea Ltd. ADR (a)
| | 35,530 | | 2,537,553 |
Take-Two Interactive Software, Inc. (a)
| | 15,727 | | 2,445,391 |
Tencent Music Entertainment Group ADR
| | 228,941 | | 3,216,621 |
| | | | | | 27,241,431 |
| FINANCIAL SERVICES — 5.0% | |
Block, Inc. (a)
| | 55,267 | | 3,564,169 |
Dlocal Ltd. (a) (b)
| | 504,260 | | 4,079,463 |
Euronet Worldwide, Inc. (a)
| | 36,777 | | 3,806,420 |
Fidelity National Information Services, Inc.
| | 50,330 | | 3,792,869 |
Fiserv, Inc. (a)
| | 26,406 | | 3,935,550 |
Flywire Corp. (a)
| | 240,967 | | 3,949,449 |
Global Payments, Inc.
| | 39,622 | | 3,831,447 |
Marqeta, Inc. Class A (a)
| | 711,515 | | 3,899,102 |
Mastercard, Inc. Class A
| | 19,291 | | 8,510,418 |
Nuvei Corp. (b)
| | 124,102 | | 4,018,423 |
Pagseguro Digital Ltd. Class A (a)
| | 320,884 | | 3,751,134 |
Paymentus Holdings, Inc. Class A (a)
| | 206,653 | | 3,926,407 |
Payoneer Global, Inc. (a)
| | 502,116 | | 2,781,723 |
PayPal Holdings, Inc. (a)
| | 61,767 | | 3,584,339 |
Paysafe Ltd. (a)
| | 813,636 | | 14,385,085 |
Repay Holdings Corp. (a)
| | 350,208 | | 3,698,196 |
Rocket Cos., Inc. Class A (a)
| | 782,772 | | 10,723,976 |
Shift4 Payments, Inc. Class A (a) (b)
| | 54,351 | | 3,986,646 |
Visa, Inc. Class A
| | 14,555 | | 3,820,251 |
| | | | | | 94,045,067 |
| FOOD PRODUCTS — 0.3% | |
Beyond Meat, Inc. (a) (b)
| | 459,894 | | 3,085,889 |
Darling Ingredients, Inc. (a)
| | 56,877 | | 2,090,230 |
| | | | | | 5,176,119 |
| GROUND TRANSPORTATION — 0.6% | |
Avis Budget Group, Inc. (b)
| | 24,194 | | 2,528,757 |
Grab Holdings Ltd. Class A (a)
| | 1,220,486 | | 4,332,725 |
Lyft, Inc. Class A (a)
| | 161,573 | | 2,278,179 |
Uber Technologies, Inc. (a)
| | 37,992 | | 2,761,259 |
| | | | | | 11,900,920 |
| HEALTH CARE EQUIPMENT & SUPPLIES — 7.5% | |
Abbott Laboratories
| | 48,138 | | 5,002,020 |
Alphatec Holdings, Inc. (a)
| | 295,866 | | 3,091,800 |
Boston Scientific Corp. (a)
| | 69,247 | | 5,332,711 |
CONMED Corp.
| | 48,927 | | 3,391,620 |
Dentsply Sirona, Inc.
| | 147,499 | | 3,674,200 |
Dexcom, Inc. (a)
| | 81,708 | | 9,264,053 |
Globus Medical, Inc. Class A (a)
| | 90,696 | | 6,211,769 |
See accompanying notes to financial statements.
105
SPDR SERIES TRUST
SPDR S&P KENSHO NEW ECONOMIES COMPOSITE ETF
SCHEDULE OF INVESTMENTS (continued)
June 30, 2024
| Security Description | | | Shares | | Value |
Inspire Medical Systems, Inc. (a)
| | 59,599 | | $7,976,134 |
Intuitive Surgical, Inc. (a)
| | 26,684 | | 11,870,377 |
iRhythm Technologies, Inc. (a)
| | 136,837 | | 14,729,135 |
Koninklijke Philips NV (a) (b)
| | 73,381 | | 1,849,201 |
Masimo Corp. (a)
| | 107,580 | | 13,548,625 |
Medtronic PLC
| | 125,882 | | 9,908,172 |
Omnicell, Inc. (a)
| | 336,220 | | 9,101,475 |
Paragon 28, Inc. (a) (b)
| | 627,562 | | 4,292,524 |
Penumbra, Inc. (a)
| | 17,377 | | 3,127,339 |
PROCEPT BioRobotics Corp. (a)
| | 87,553 | | 5,348,613 |
ResMed, Inc.
| | 16,172 | | 3,095,644 |
Smith & Nephew PLC ADR (b)
| | 132,706 | | 3,288,455 |
Stryker Corp.
| | 17,726 | | 6,031,272 |
Varex Imaging Corp. (a)
| | 485,209 | | 7,147,129 |
Zimmer Biomet Holdings, Inc.
| | 31,582 | | 3,427,594 |
| | | | | | 140,709,862 |
| HEALTH CARE PROVIDERS & SERVICES — 1.8% | |
Accolade, Inc. (a)
| | 289,913 | | 1,037,889 |
Cigna Group
| | 5,913 | | 1,954,660 |
CorVel Corp. (a)
| | 6,984 | | 1,775,822 |
CVS Health Corp.
| | 33,624 | | 1,985,833 |
HealthEquity, Inc. (a)
| | 73,631 | | 6,346,992 |
Hims & Hers Health, Inc. (a)
| | 168,492 | | 3,401,854 |
McKesson Corp.
| | 6,175 | | 3,606,447 |
ModivCare, Inc. (a)
| | 70,118 | | 1,839,896 |
OmniAb, Inc. (a) (c)
| | 4,014 | | — |
Pediatrix Medical Group, Inc. (a)
| | 271,875 | | 2,052,656 |
Premier, Inc. Class A
| | 101,965 | | 1,903,687 |
Privia Health Group, Inc. (a)
| | 221,733 | | 3,853,720 |
Quest Diagnostics, Inc.
| | 13,848 | | 1,895,514 |
UnitedHealth Group, Inc.
| | 3,731 | | 1,900,049 |
| | | | | | 33,555,019 |
| HEALTH CARE TECHNOLOGY — 0.7% | |
Doximity, Inc. Class A (a)
| | 64,468 | | 1,803,170 |
Evolent Health, Inc. Class A (a)
| | 77,179 | | 1,475,662 |
GoodRx Holdings, Inc. Class A (a) (b)
| | 448,111 | | 3,495,266 |
LifeMD, Inc. (a)
| | 485,957 | | 3,333,665 |
Teladoc Health, Inc. (a)
| | 336,109 | | 3,287,146 |
| | | | | | 13,394,909 |
| HOUSEHOLD DURABLES — 0.9% | |
Garmin Ltd.
| | 60,337 | | 9,830,104 |
iRobot Corp. (a)
| | 567,308 | | 5,168,176 |
Sony Group Corp. ADR
| | 28,675 | | 2,435,941 |
| | | | | | 17,434,221 |
| INDEPENDENT POWER AND RENEWABLE ELECTRICITY PRODUCERS — 2.0% | |
AES Corp.
| | 337,871 | | 5,936,393 |
Altus Power, Inc. (a) (b)
| | 1,342,886 | | 5,264,113 |
Atlantica Sustainable Infrastructure PLC (b)
| | 348,083 | | 7,640,422 |
Ormat Technologies, Inc.
| | 106,917 | | 7,665,949 |
ReNew Energy Global PLC Class A (a)
| | 714,725 | | 4,459,884 |
| Security Description | | | Shares | | Value |
Sunnova Energy International, Inc. (a) (b)
| | 296,167 | | $1,652,612 |
TransAlta Corp.
| | 607,997 | | 4,304,619 |
| | | | | | 36,923,992 |
| INDUSTRIAL CONGLOMERATES — 0.6% | |
Honeywell International, Inc.
| | 49,521 | | 10,574,714 |
| INSURANCE — 0.7% | |
Allstate Corp.
| | 36,834 | | 5,880,916 |
Progressive Corp.
| | 29,571 | | 6,142,192 |
Sun Life Financial, Inc. (b)
| | 39,148 | | 1,917,861 |
| | | | | | 13,940,969 |
| INTERACTIVE MEDIA & SERVICES — 2.7% | |
Alphabet, Inc. Class C
| | 19,873 | | 3,645,106 |
Baidu, Inc. ADR (a) (b)
| | 52,982 | | 4,581,883 |
Bumble, Inc. Class A (a)
| | 314,003 | | 3,300,172 |
Hello Group, Inc. ADR
| | 499,429 | | 3,056,505 |
JOYY, Inc. ADR
| | 95,150 | | 2,863,063 |
Match Group, Inc. (a)
| | 99,567 | | 3,024,845 |
Meta Platforms, Inc. Class A
| | 19,116 | | 9,638,670 |
Rumble, Inc. (a) (b)
| | 484,984 | | 2,691,661 |
Snap, Inc. Class A (a)
| | 577,926 | | 9,599,351 |
Vimeo, Inc. (a)
| | 739,193 | | 2,757,190 |
Weibo Corp. ADR
| | 341,214 | | 2,620,524 |
Yandex NV Class A (a) (c)
| | 72,702 | | — |
Ziff Davis, Inc. (a)
| | 50,048 | | 2,755,142 |
| | | | | | 50,534,112 |
| IT SERVICES — 0.7% | |
Akamai Technologies, Inc. (a)
| | 26,949 | | 2,427,566 |
Cloudflare, Inc. Class A (a)
| | 32,636 | | 2,703,240 |
Okta, Inc. (a)
| | 26,821 | | 2,510,714 |
Shopify, Inc. Class A (a)
| | 63,165 | | 4,172,048 |
Twilio, Inc. Class A (a)
| | 29,801 | | 1,692,995 |
| | | | | | 13,506,563 |
| LIFE SCIENCES TOOLS & SERVICES — 2.8% | |
Agilent Technologies, Inc.
| | 22,371 | | 2,899,953 |
Azenta, Inc. (a)
| | 27,014 | | 1,421,477 |
Bio-Techne Corp.
| | 25,381 | | 1,818,549 |
Bruker Corp.
| | 293,806 | | 18,747,761 |
Charles River Laboratories International, Inc. (a)
| | 22,244 | | 4,595,165 |
Danaher Corp.
| | 25,286 | | 6,317,707 |
Maravai LifeSciences Holdings, Inc. Class A (a)
| | 211,578 | | 1,514,898 |
Mettler-Toledo International, Inc. (a)
| | 2,240 | | 3,130,602 |
Revvity, Inc.
| | 30,075 | | 3,153,664 |
Stevanato Group SpA (b)
| | 211,241 | | 3,874,160 |
Thermo Fisher Scientific, Inc.
| | 9,005 | | 4,979,765 |
| | | | | | 52,453,701 |
| MACHINERY — 3.6% | |
3D Systems Corp. (a)
| | 2,677,453 | | 8,219,781 |
AGCO Corp.
| | 29,830 | | 2,919,760 |
See accompanying notes to financial statements.
106
SPDR SERIES TRUST
SPDR S&P KENSHO NEW ECONOMIES COMPOSITE ETF
SCHEDULE OF INVESTMENTS (continued)
June 30, 2024
| Security Description | | | Shares | | Value |
Allison Transmission Holdings, Inc.
| | 18,749 | | $1,423,049 |
Barnes Group, Inc.
| | 85,618 | | 3,545,441 |
Blue Bird Corp. (a)
| | 26,195 | | 1,410,601 |
Chart Industries, Inc. (a) (b)
| | 9,820 | | 1,417,419 |
CNH Industrial NV
| | 206,675 | | 2,093,618 |
Cummins, Inc.
| | 8,273 | | 2,291,042 |
Deere & Co.
| | 17,326 | | 6,473,513 |
Dover Corp.
| | 20,683 | | 3,732,247 |
Energy Recovery, Inc. (a)
| | 149,824 | | 1,991,161 |
ESCO Technologies, Inc.
| | 36,649 | | 3,849,611 |
Hyster-Yale, Inc.
| | 24,868 | | 1,734,046 |
John Bean Technologies Corp.
| | 62,096 | | 5,897,257 |
Lincoln Electric Holdings, Inc.
| | 16,152 | | 3,046,913 |
Lindsay Corp.
| | 26,530 | | 3,260,007 |
Mueller Water Products, Inc. Class A
| | 113,578 | | 2,035,318 |
PACCAR, Inc.
| | 9,329 | | 960,327 |
Pentair PLC
| | 25,330 | | 1,942,051 |
REV Group, Inc.
| | 41,230 | | 1,026,215 |
Standex International Corp.
| | 15,049 | | 2,425,146 |
Symbotic, Inc. (a) (b)
| | 142,886 | | 5,023,872 |
Xylem, Inc.
| | 14,746 | | 2,000,000 |
| | | | | | 68,718,395 |
| METALS & MINING — 1.0% | |
ArcelorMittal SA (b)
| | 42,813 | | 981,702 |
ATI, Inc. (a)
| | 69,779 | | 3,869,246 |
Carpenter Technology Corp.
| | 56,245 | | 6,163,327 |
Kaiser Aluminum Corp.
| | 42,200 | | 3,709,380 |
POSCO Holdings, Inc. ADR (b)
| | 50,353 | | 3,310,206 |
| | | | | | 18,033,861 |
| OIL, GAS & CONSUMABLE FUELS — 0.2% | |
BP PLC ADR
| | 39,170 | | 1,414,037 |
Shell PLC ADR
| | 19,770 | | 1,426,999 |
Suncor Energy, Inc.
| | 37,920 | | 1,444,752 |
| | | | | | 4,285,788 |
| PHARMACEUTICALS — 1.2% | |
Bristol-Myers Squibb Co.
| | 35,554 | | 1,476,558 |
Catalent, Inc. (a)
| | 36,840 | | 2,071,513 |
Dr Reddy's Laboratories Ltd. ADR
| | 26,971 | | 2,054,921 |
Liquidia Corp. (a) (b)
| | 733,940 | | 8,807,280 |
Novartis AG ADR (b)
| | 14,753 | | 1,570,604 |
Sanofi SA ADR
| | 32,054 | | 1,555,260 |
WaVe Life Sciences Ltd. (a)
| | 322,237 | | 1,607,963 |
Zoetis, Inc.
| | 17,420 | | 3,019,931 |
| | | | | | 22,164,030 |
| PROFESSIONAL SERVICES — 2.8% | |
CACI International, Inc. Class A (a)
| | 18,362 | | 7,898,047 |
ExlService Holdings, Inc. (a)
| | 63,458 | | 1,990,043 |
KBR, Inc.
| | 39,732 | | 2,548,410 |
Leidos Holdings, Inc.
| | 128,207 | | 18,702,837 |
NV5 Global, Inc. (a)
| | 14,970 | | 1,391,761 |
| Security Description | | | Shares | | Value |
Parsons Corp. (a)
| | 239,685 | | $19,608,630 |
| | | | | | 52,139,728 |
| SEMICONDUCTORS & SEMICONDUCTOR EQUIPMENT — 4.8% | |
Advanced Micro Devices, Inc. (a)
| | 22,307 | | 3,618,418 |
Allegro MicroSystems, Inc. (a)
| | 31,283 | | 883,432 |
Ambarella, Inc. (a)
| | 286,809 | | 15,473,346 |
Analog Devices, Inc.
| | 12,434 | | 2,838,185 |
Applied Materials, Inc.
| | 20,229 | | 4,773,842 |
Broadcom, Inc.
| | 1,745 | | 2,801,650 |
Canadian Solar, Inc. (a) (b)
| | 84,579 | | 1,247,540 |
Daqo New Energy Corp. ADR (a) (b)
| | 72,327 | | 1,055,974 |
Enphase Energy, Inc. (a)
| | 19,100 | | 1,904,461 |
First Solar, Inc. (a)
| | 5,350 | | 1,206,211 |
indie Semiconductor, Inc. Class A (a) (b)
| | 138,460 | | 854,298 |
Intel Corp.
| | 21,970 | | 680,411 |
JinkoSolar Holding Co. Ltd. ADR (b)
| | 59,917 | | 1,241,480 |
KLA Corp.
| | 6,459 | | 5,325,510 |
Micron Technology, Inc.
| | 24,552 | | 3,229,325 |
NVIDIA Corp.
| | 41,088 | | 5,076,011 |
NXP Semiconductors NV
| | 12,424 | | 3,343,174 |
ON Semiconductor Corp. (a)
| | 97,663 | | 6,694,799 |
QUALCOMM, Inc.
| | 4,748 | | 945,707 |
Silicon Laboratories, Inc. (a)
| | 62,554 | | 6,920,349 |
SolarEdge Technologies, Inc. (a) (b)
| | 47,292 | | 1,194,596 |
STMicroelectronics NV (b)
| | 52,695 | | 2,069,860 |
Synaptics, Inc. (a)
| | 37,599 | | 3,316,232 |
Teradyne, Inc.
| | 40,167 | | 5,956,364 |
Tower Semiconductor Ltd. (a)
| | 105,846 | | 4,160,806 |
Ultra Clean Holdings, Inc. (a)
| | 71,663 | | 3,511,487 |
| | | | | | 90,323,468 |
| SOFTWARE — 12.4% | |
A10 Networks, Inc.
| | 183,831 | | 2,546,059 |
ACI Worldwide, Inc. (a)
| | 110,834 | | 4,387,918 |
Adobe, Inc. (a)
| | 2,403 | | 1,334,963 |
Agilysys, Inc. (a)
| | 28,680 | | 2,986,735 |
Alarm.com Holdings, Inc. (a)
| | 115,387 | | 7,331,690 |
ANSYS, Inc. (a)
| | 14,628 | | 4,702,902 |
Asana, Inc. Class A (a) (b)
| | 113,477 | | 1,587,543 |
Aspen Technology, Inc. (a)
| | 36,005 | | 7,151,673 |
Atlassian Corp. Class A (a)
| | 9,319 | | 1,648,345 |
Aurora Innovation, Inc. (a) (b)
| | 253,696 | | 702,738 |
Autodesk, Inc. (a)
| | 23,334 | | 5,773,998 |
Bill Holdings, Inc. (a)
| | 51,213 | | 2,694,828 |
Bit Digital, Inc. (a) (b)
| | 3,276,564 | | 10,419,474 |
Bitfarms Ltd. (a) (b)
| | 4,853,813 | | 12,474,299 |
Blackbaud, Inc. (a)
| | 75,511 | | 5,751,673 |
BlackBerry Ltd. (a) (b)
| | 928,475 | | 2,302,618 |
Box, Inc. Class A (a)
| | 66,755 | | 1,765,002 |
Check Point Software Technologies Ltd. (a)
| | 16,193 | | 2,671,845 |
See accompanying notes to financial statements.
107
SPDR SERIES TRUST
SPDR S&P KENSHO NEW ECONOMIES COMPOSITE ETF
SCHEDULE OF INVESTMENTS (continued)
June 30, 2024
| Security Description | | | Shares | | Value |
Cipher Mining, Inc. (a) (b)
| | 1,988,440 | | $8,252,026 |
Cleanspark, Inc. (a)
| | 497,973 | | 7,942,669 |
Crowdstrike Holdings, Inc. Class A (a)
| | 6,821 | | 2,613,739 |
CyberArk Software Ltd. (a)
| | 10,252 | | 2,803,102 |
Datadog, Inc. Class A (a)
| | 20,799 | | 2,697,422 |
Dropbox, Inc. Class A (a)
| | 77,080 | | 1,731,988 |
Fortinet, Inc. (a)
| | 43,281 | | 2,608,546 |
Hive Digital Technologies Ltd. (a) (b)
| | 3,123,045 | | 9,618,979 |
Hut 8 Corp. (a)
| | 807,088 | | 12,098,249 |
Lightspeed Commerce, Inc. (a) (b)
| | 186,063 | | 2,547,202 |
Marathon Digital Holdings, Inc. (a)
| | 443,277 | | 8,799,048 |
Microsoft Corp.
| | 13,970 | | 6,243,892 |
Monday.com Ltd. (a)
| | 9,042 | | 2,176,952 |
N-able, Inc. (a)
| | 191,977 | | 2,923,810 |
OneSpan, Inc. (a)
| | 663,689 | | 8,508,493 |
Palo Alto Networks, Inc. (a)
| | 8,021 | | 2,719,199 |
PTC, Inc. (a)
| | 90,561 | | 16,452,217 |
Q2 Holdings, Inc. (a)
| | 238,787 | | 14,406,020 |
Qualys, Inc. (a)
| | 17,603 | | 2,510,188 |
Radware Ltd. (a)
| | 148,908 | | 2,716,082 |
Rapid7, Inc. (a)
| | 65,217 | | 2,819,331 |
RingCentral, Inc. Class A (a)
| | 55,075 | | 1,553,115 |
Riot Platforms, Inc. (a) (b)
| | 849,535 | | 7,764,750 |
Roper Technologies, Inc.
| | 2,541 | | 1,432,260 |
SentinelOne, Inc. Class A (a)
| | 116,943 | | 2,461,650 |
Smartsheet, Inc. Class A (a)
| | 37,927 | | 1,671,822 |
Tenable Holdings, Inc. (a)
| | 59,086 | | 2,574,968 |
Unity Software, Inc. (a)
| | 334,098 | | 5,432,434 |
Varonis Systems, Inc. (a)
| | 58,368 | | 2,799,913 |
Workiva, Inc. (a)
| | 21,894 | | 1,598,043 |
Zoom Video Communications, Inc. Class A (a)
| | 28,638 | | 1,695,083 |
Zscaler, Inc. (a)
| | 13,855 | | 2,662,792 |
| | | | | | 233,070,287 |
| SPECIALTY RETAIL — 0.1% | |
EVgo, Inc. (a) (b)
| | 1,120,176 | | 2,744,431 |
| TECHNOLOGY HARDWARE, STORAGE & PERIPHERALS — 2.0% | |
Apple, Inc.
| | 64,083 | | 13,497,162 |
Canaan, Inc. ADR (a) (b)
| | 8,810,627 | | 8,808,865 |
Eastman Kodak Co. (a)
| | 733,940 | | 3,948,597 |
HP, Inc.
| | 185,323 | | 6,490,011 |
Xerox Holdings Corp.
| | 473,914 | | 5,506,881 |
| | | | | | 38,251,516 |
| Security Description | | | Shares | | Value |
| TRADING COMPANIES & DISTRIBUTORS — 0.6% | |
Applied Industrial Technologies, Inc.
| | 49,638 | | $9,629,772 |
Core & Main, Inc. Class A (a)
| | 26,536 | | 1,298,672 |
Titan Machinery, Inc. (a)
| | 87,772 | | 1,395,575 |
| | | | | | 12,324,019 |
| WIRELESS TELECOMMUNICATION SERVICES — 0.5% | |
Rogers Communications, Inc. Class B (b)
| | 128,391 | | 4,747,899 |
SK Telecom Co. Ltd. ADR (b)
| | 206,602 | | 4,324,180 |
| | | | | | 9,072,079 |
TOTAL COMMON STOCKS
(Cost $1,771,928,685)
| | | | | 1,879,336,768 |
| SHORT-TERM INVESTMENTS — 6.4% | | | |
State Street Institutional Liquid Reserves Fund, Premier Class 5.36% (d) (e)
| | 3,052,375 | | 3,053,291 |
State Street Navigator Securities Lending Portfolio II (f) (g)
| | 118,034,139 | | 118,034,139 |
TOTAL SHORT-TERM INVESTMENTS
(Cost $121,087,199)
| | 121,087,430 | |
TOTAL INVESTMENTS — 106.2%
(Cost $1,893,015,884)
| | 2,000,424,198 | |
LIABILITIES IN EXCESS OF OTHER ASSETS — (6.2)%
| | (116,680,618) | |
NET ASSETS — 100.0%
| | $1,883,743,580 | |
| (a) | Non-income producing security. |
| (b) | All or a portion of the shares of the security are on loan at June 30, 2024. |
| (c) | Fair valued as determined in good faith by the Trust's Oversight Committee in accordance with policy and procedures approved by the Board of Trustees. Security value is determined based on Level 3 inputs. As of June 30, 2024, total aggregate fair value of the securities is $0, representing 0.00% of the Fund's net assets. |
| (d) | The Fund invested in certain money market funds managed by SSGA Funds Management, Inc. Amounts related to these investments during the year ended June 30, 2024 are shown in the Affiliate Table below. |
| (e) | The rate shown is the annualized seven-day yield at June 30, 2024. |
| (f) | The Fund invested in an affiliated entity. Amounts related to these investments during the year ended June 30, 2024 are shown in the Affiliate Table below. |
| (g) | Investment of cash collateral for securities loaned. |
| ADR | American Depositary Receipt |
See accompanying notes to financial statements.
108
SPDR SERIES TRUST
SPDR S&P KENSHO NEW ECONOMIES COMPOSITE ETF
SCHEDULE OF INVESTMENTS (continued)
June 30, 2024
The following table summarizes the value of the Fund's investments according to the fair value hierarchy as of June 30, 2024.
| Description | | Level 1 –
Quoted Prices | | Level 2 –
Other Significant
Observable Inputs | | Level 3 –
Significant
Unobservable Inputs | | Total |
| ASSETS: | | | | | | | | |
| INVESTMENTS: | | | | | | | | |
Common Stocks
| | $1,879,336,768 | | $— | | $0(a) | | $1,879,336,768 |
Short-Term Investments
| | 121,087,430 | | — | | — | | 121,087,430 |
TOTAL INVESTMENTS
| | $2,000,424,198 | | $— | | $0 | | $2,000,424,198 |
| (a) | The Fund held Level 3 securities that were valued at $0 at June 30, 2024. |
Affiliate Table
| | Number of
Shares Held
at
6/30/23 | | Value at
6/30/23 | | Cost of
Purchases | | Proceeds
from
Shares Sold | | Realized
Gain (Loss) | | Change in
Unrealized
Appreciation/
Depreciation | | Number of
Shares Held
at
6/30/24 | | Value at
6/30/24 | | Dividend
Income |
State Street Institutional Liquid Reserves Fund, Premier Class
| 485,531 | | $485,628 | | $68,185,179 | | $65,617,843 | | $96 | | $231 | | 3,052,375 | | $3,053,291 | | $125,133 |
State Street Navigator Securities Lending Portfolio II
| 174,179,345 | | 174,179,345 | | 754,322,874 | | 810,468,080 | | — | | — | | 118,034,139 | | 118,034,139 | | 6,933,781 |
Total
| | | $174,664,973 | | $822,508,053 | | $876,085,923 | | $96 | | $231 | | | | $121,087,430 | | $7,058,914 |
See accompanying notes to financial statements.
109
SPDR SERIES TRUST
SPDR S&P KENSHO SMART MOBILITY ETF
SCHEDULE OF INVESTMENTS
June 30, 2024
| Security Description | | | Shares | | Value |
| COMMON STOCKS — 99.9% | |
| AEROSPACE & DEFENSE — 5.2% | |
EHang Holdings Ltd. ADR (a)
| | 52,844 | | $717,621 |
HEICO Corp.
| | 2,316 | | 517,881 |
Huntington Ingalls Industries, Inc.
| | 2,144 | | 528,132 |
Textron, Inc.
| | 6,064 | | 520,655 |
| | | | | | 2,284,289 |
| AIRLINES — 0.9% | |
Blade Air Mobility, Inc. (a)
| | 115,406 | | 401,613 |
| AUTO COMPONENTS — 18.6% | |
American Axle & Manufacturing Holdings, Inc. (a)
| | 105,237 | | 735,607 |
Aptiv PLC (a)
| | 10,460 | | 736,593 |
BorgWarner, Inc.
| | 22,994 | | 741,327 |
Dana, Inc.
| | 58,660 | | 710,959 |
Garrett Motion, Inc. (a)
| | 90,799 | | 779,964 |
Gentherm, Inc. (a)
| | 14,854 | | 732,599 |
Hesai Group ADR (a) (b)
| | 100,049 | | 419,205 |
Lear Corp.
| | 4,317 | | 493,045 |
Luminar Technologies, Inc. (a) (b)
| | 542,955 | | 809,003 |
Mobileye Global, Inc. Class A (a) (b)
| | 27,002 | | 758,351 |
Modine Manufacturing Co. (a)
| | 5,463 | | 547,338 |
Visteon Corp. (a)
| | 7,302 | | 779,123 |
| | | | | | 8,243,114 |
| AUTOMOBILES — 21.3% | |
Canoo, Inc. (a)
| | 387,761 | | 825,931 |
Ford Motor Co.
| | 43,417 | | 544,449 |
General Motors Co.
| | 16,105 | | 748,238 |
Honda Motor Co. Ltd. ADR (b)
| | 24,064 | | 775,823 |
Li Auto, Inc. ADR (a) (b)
| | 41,493 | | 741,895 |
Lucid Group, Inc. (a) (b)
| | 297,615 | | 776,775 |
NIO, Inc. ADR (a)
| | 176,915 | | 735,966 |
Polestar Automotive Holding U.K. PLC Class A ADR (a) (b)
| | 888,175 | | 698,639 |
Rivian Automotive, Inc. Class A (a) (b)
| | 67,120 | | 900,750 |
Stellantis NV
| | 24,141 | | 479,199 |
Tesla, Inc. (a)
| | 4,442 | | 878,983 |
Toyota Motor Corp. ADR
| | 2,550 | | 522,674 |
XPeng, Inc. ADR (a)
| | 105,267 | | 771,607 |
| | | | | | 9,400,929 |
| BANKS — 1.2% | |
Itau Unibanco Holding SA ADR
| | 89,342 | | 521,757 |
| CHEMICALS — 1.4% | |
Aspen Aerogels, Inc. (a)
| | 26,023 | | 620,649 |
| COMMUNICATIONS EQUIPMENT — 0.3% | |
Ituran Location & Control Ltd.
| | 5,820 | | 143,405 |
| DIVERSIFIED TELECOMMUNICATION SERVICES — 1.2% | |
Iridium Communications, Inc.
| | 19,067 | | 507,563 |
| ELECTRICAL EQUIPMENT — 5.4% | |
Ballard Power Systems, Inc. (a) (b)
| | 285,219 | | 641,743 |
Blink Charging Co. (a) (b)
| | 232,273 | | 636,428 |
Plug Power, Inc. (a) (b)
| | 271,244 | | 631,998 |
| Security Description | | | Shares | | Value |
Sensata Technologies Holding PLC
| | 13,228 | | $494,595 |
| | | | | | 2,404,764 |
| ELECTRONIC EQUIPMENT, INSTRUMENTS & COMPONENTS — 8.1% | |
Innoviz Technologies Ltd. (a) (b)
| | 290,747 | | 269,668 |
MicroVision, Inc. (a) (b)
| | 494,546 | | 524,219 |
Ouster, Inc. (a)
| | 73,020 | | 717,786 |
PAR Technology Corp. (a)
| | 11,567 | | 544,690 |
Powerfleet, Inc. NJ (a)
| | 110,222 | | 503,714 |
Trimble, Inc. (a)
| | 9,341 | | 522,349 |
Vontier Corp.
| | 13,478 | | 514,860 |
| | | | | | 3,597,286 |
| GROUND TRANSPORTATION — 6.2% | |
Avis Budget Group, Inc. (b)
| | 7,044 | | 736,239 |
Grab Holdings Ltd. Class A (a)
| | 143,673 | | 510,039 |
Lyft, Inc. Class A (a)
| | 50,959 | | 718,522 |
Uber Technologies, Inc. (a)
| | 10,760 | | 782,037 |
| | | | | | 2,746,837 |
| INTERACTIVE MEDIA & SERVICES — 1.1% | |
Baidu, Inc. ADR (a) (b)
| | 5,553 | | 480,223 |
Yandex NV Class A (a) (c)
| | 12,595 | | — |
| | | | | | 480,223 |
| MACHINERY — 8.1% | |
Allison Transmission Holdings, Inc.
| | 10,601 | | 804,616 |
Blue Bird Corp. (a)
| | 9,106 | | 490,358 |
Cummins, Inc.
| | 2,898 | | 802,543 |
Hyster-Yale, Inc.
| | 6,943 | | 484,135 |
PACCAR, Inc.
| | 4,910 | | 505,436 |
REV Group, Inc.
| | 19,845 | | 493,942 |
| | | | | | 3,581,030 |
| METALS & MINING — 1.1% | |
ArcelorMittal SA (b)
| | 21,647 | | 496,366 |
| SEMICONDUCTORS & SEMICONDUCTOR EQUIPMENT — 15.3% | |
Allegro MicroSystems, Inc. (a) (b)
| | 26,600 | | 751,184 |
Ambarella, Inc. (a)
| | 13,719 | | 740,140 |
Enphase Energy, Inc. (a)
| | 3,909 | | 389,766 |
indie Semiconductor, Inc. Class A (a) (b)
| | 106,026 | | 654,181 |
Intel Corp.
| | 17,046 | | 527,915 |
NVIDIA Corp.
| | 6,281 | | 775,955 |
NXP Semiconductors NV
| | 1,844 | | 496,202 |
ON Semiconductor Corp. (a)
| | 10,395 | | 712,577 |
QUALCOMM, Inc.
| | 3,657 | | 728,401 |
SolarEdge Technologies, Inc. (a) (b)
| | 11,731 | | 296,325 |
STMicroelectronics NV (b)
| | 17,503 | | 687,518 |
| | | | | | 6,760,164 |
| SOFTWARE — 4.5% | |
ANSYS, Inc. (a)
| | 2,417 | | 777,066 |
Aurora Innovation, Inc. (a) (b)
| | 313,061 | | 867,179 |
See accompanying notes to financial statements.
110
SPDR SERIES TRUST
SPDR S&P KENSHO SMART MOBILITY ETF
SCHEDULE OF INVESTMENTS (continued)
June 30, 2024
| Security Description | | | Shares | | Value |
Rekor Systems, Inc. (a)
| | 207,317 | | $321,341 |
| | | | | | 1,965,586 |
TOTAL COMMON STOCKS
(Cost $65,378,796)
| | | | | 44,155,575 |
| SHORT-TERM INVESTMENTS — 9.8% | | | |
State Street Institutional Liquid Reserves Fund, Premier Class 5.36% (d) (e)
| | 29,310 | | 29,319 |
State Street Navigator Securities Lending Portfolio II (f) (g)
| | 4,321,780 | | 4,321,780 |
TOTAL SHORT-TERM INVESTMENTS
(Cost $4,351,099)
| | 4,351,099 | |
TOTAL INVESTMENTS — 109.7%
(Cost $69,729,895)
| | 48,506,674 | |
LIABILITIES IN EXCESS OF OTHER ASSETS — (9.7)%
| | (4,291,182) | |
NET ASSETS — 100.0%
| | $44,215,492 | |
| (a) | Non-income producing security. |
| (b) | All or a portion of the shares of the security are on loan at June 30, 2024. |
| (c) | Fair valued as determined in good faith by the Trust's Oversight Committee in accordance with policy and procedures approved by the Board of Trustees. Security value is determined based on Level 3 inputs. As of June 30, 2024, total aggregate fair value of the security is $0, representing 0.00% of the Fund's net assets. |
| (d) | The Fund invested in certain money market funds managed by SSGA Funds Management, Inc. Amounts related to these investments during the year ended June 30, 2024 are shown in the Affiliate Table below. |
| (e) | The rate shown is the annualized seven-day yield at June 30, 2024. |
| (f) | The Fund invested in an affiliated entity. Amounts related to these investments during the year ended June 30, 2024 are shown in the Affiliate Table below. |
| (g) | Investment of cash collateral for securities loaned. |
| ADR | American Depositary Receipt |
The following table summarizes the value of the Fund's investments according to the fair value hierarchy as of June 30, 2024.
| Description | | Level 1 –
Quoted Prices | | Level 2 –
Other Significant
Observable Inputs | | Level 3 –
Significant
Unobservable Inputs | | Total |
| ASSETS: | | | | | | | | |
| INVESTMENTS: | | | | | | | | |
Common Stocks
| | $44,155,575 | | $— | | $0(a) | | $44,155,575 |
Short-Term Investments
| | 4,351,099 | | — | | — | | 4,351,099 |
TOTAL INVESTMENTS
| | $48,506,674 | | $— | | $0 | | $48,506,674 |
| (a) | The Fund held a Level 3 security that was valued at $0 at June 30, 2024. |
Affiliate Table
| | Number of
Shares Held
at
6/30/23 | | Value at
6/30/23 | | Cost of
Purchases | | Proceeds
from
Shares Sold | | Realized
Gain (Loss) | | Change in
Unrealized
Appreciation/
Depreciation | | Number of
Shares Held
at
6/30/24 | | Value at
6/30/24 | | Dividend
Income |
State Street Institutional Liquid Reserves Fund, Premier Class
| 22,410 | | $22,414 | | $3,440,273 | | $3,433,380 | | $15 | | $(3) | | 29,310 | | $29,319 | | $4,781 |
State Street Navigator Securities Lending Portfolio II
| 4,841,313 | | 4,841,313 | | 24,296,239 | | 24,815,772 | | — | | — | | 4,321,780 | | 4,321,780 | | 434,761 |
Total
| | | $4,863,727 | | $27,736,512 | | $28,249,152 | | $15 | | $(3) | | | | $4,351,099 | | $439,542 |
See accompanying notes to financial statements.
111
SPDR SERIES TRUST
SPDR S&P SMALLCAP 600 ESG ETF
SCHEDULE OF INVESTMENTS
June 30, 2024
| Security Description | | | Shares | | Value |
| COMMON STOCKS — 99.8% | |
| AEROSPACE & DEFENSE — 0.2% | |
Triumph Group, Inc. (a)
| | 472 | | $7,273 |
| AIR FREIGHT & LOGISTICS — 0.4% | |
Forward Air Corp.
| | 189 | | 3,599 |
Hub Group, Inc. Class A
| | 383 | | 16,488 |
| | | | | | 20,087 |
| AIRLINES — 1.0% | |
Alaska Air Group, Inc. (a)
| | 782 | | 31,593 |
Allegiant Travel Co.
| | 88 | | 4,420 |
JetBlue Airways Corp. (a)
| | 2,044 | | 12,448 |
| | | | | | 48,461 |
| AUTO COMPONENTS — 1.2% | |
American Axle & Manufacturing Holdings, Inc. (a)
| | 718 | | 5,019 |
Dana, Inc.
| | 788 | | 9,551 |
Dorman Products, Inc. (a)
| | 174 | | 15,917 |
Gentherm, Inc. (a)
| | 201 | | 9,913 |
LCI Industries
| | 155 | | 16,024 |
Standard Motor Products, Inc.
| | 114 | | 3,161 |
| | | | | | 59,585 |
| AUTOMOBILES — 0.2% | |
Winnebago Industries, Inc.
| | 180 | | 9,756 |
| BANKS — 9.1% | |
Ameris Bancorp
| | 397 | | 19,989 |
Atlantic Union Bankshares Corp.
| | 558 | | 18,330 |
Banc of California, Inc.
| | 850 | | 10,863 |
BancFirst Corp.
| | 89 | | 7,805 |
Bancorp, Inc. (a)
| | 329 | | 12,423 |
Bank of Hawaii Corp.
| | 244 | | 13,959 |
BankUnited, Inc.
| | 457 | | 13,376 |
Banner Corp.
| | 210 | | 10,424 |
Berkshire Hills Bancorp, Inc.
| | 262 | | 5,974 |
Cathay General Bancorp
| | 445 | | 16,785 |
Central Pacific Financial Corp.
| | 166 | | 3,519 |
City Holding Co.
| | 91 | | 9,669 |
Community Financial System, Inc.
| | 327 | | 15,438 |
Customers Bancorp, Inc. (a)
| | 174 | | 8,349 |
Dime Community Bancshares, Inc.
| | 214 | | 4,366 |
Eagle Bancorp, Inc.
| | 183 | | 3,459 |
FB Financial Corp.
| | 215 | | 8,391 |
First BanCorp
| | 1,032 | | 18,875 |
First Commonwealth Financial Corp.
| | 625 | | 8,631 |
First Financial Bancorp
| | 584 | | 12,977 |
First Hawaiian, Inc.
| | 783 | | 16,255 |
Fulton Financial Corp.
| | 1,107 | | 18,797 |
Hanmi Financial Corp.
| | 186 | | 3,110 |
Heritage Financial Corp.
| | 214 | | 3,858 |
Hilltop Holdings, Inc.
| | 284 | | 8,884 |
Hope Bancorp, Inc.
| | 737 | | 7,915 |
Independent Bank Corp.
| | 263 | | 13,339 |
Independent Bank Group, Inc.
| | 221 | | 10,060 |
Lakeland Financial Corp.
| | 156 | | 9,597 |
| Security Description | | | Shares | | Value |
National Bank Holdings Corp. Class A
| | 231 | | $9,021 |
OFG Bancorp
| | 288 | | 10,786 |
Pacific Premier Bancorp, Inc.
| | 589 | | 13,529 |
Pathward Financial, Inc.
| | 156 | | 8,825 |
Preferred Bank
| | 77 | | 5,813 |
Provident Financial Services, Inc.
| | 798 | | 11,451 |
Renasant Corp.
| | 344 | | 10,506 |
S&T Bancorp, Inc.
| | 235 | | 7,847 |
Seacoast Banking Corp. of Florida
| | 517 | | 12,222 |
Simmons First National Corp. Class A
| | 767 | | 13,484 |
Southside Bancshares, Inc.
| | 176 | | 4,859 |
Tompkins Financial Corp.
| | 77 | | 3,765 |
Triumph Financial, Inc. (a)
| | 132 | | 10,791 |
TrustCo Bank Corp.
| | 117 | | 3,366 |
United Community Banks, Inc.
| | 730 | | 18,586 |
| | | | | | 460,268 |
| BEVERAGES — 0.1% | |
MGP Ingredients, Inc.
| | 96 | | 7,142 |
| BIOTECHNOLOGY — 1.9% | |
Alkermes PLC (a)
| | 1,037 | | 24,992 |
Arcus Biosciences, Inc. (a)
| | 332 | | 5,056 |
Catalyst Pharmaceuticals, Inc. (a)
| | 684 | | 10,595 |
Dynavax Technologies Corp. (a)
| | 793 | | 8,905 |
Ironwood Pharmaceuticals, Inc. (a)
| | 842 | | 5,490 |
Myriad Genetics, Inc. (a)
| | 558 | | 13,649 |
REGENXBIO, Inc. (a)
| | 279 | | 3,264 |
Vericel Corp. (a)
| | 293 | | 13,443 |
Vir Biotechnology, Inc. (a)
| | 528 | | 4,699 |
Xencor, Inc. (a)
| | 374 | | 7,080 |
| | | | | | 97,173 |
| BROADLINE RETAIL — 0.3% | |
Kohl's Corp.
| | 679 | | 15,610 |
| BUILDING PRODUCTS — 2.4% | |
American Woodmark Corp. (a)
| | 98 | | 7,703 |
Apogee Enterprises, Inc.
| | 135 | | 8,482 |
Armstrong World Industries, Inc.
| | 274 | | 31,028 |
AZZ, Inc.
| | 179 | | 13,828 |
Gibraltar Industries, Inc. (a)
| | 187 | | 12,819 |
Griffon Corp.
| | 235 | | 15,007 |
Hayward Holdings, Inc. (a)
| | 773 | | 9,508 |
Quanex Building Products Corp.
| | 203 | | 5,613 |
Resideo Technologies, Inc. (a)
| | 896 | | 17,526 |
| | | | | | 121,514 |
| CAPITAL MARKETS — 1.8% | |
Artisan Partners Asset Management, Inc. Class A
| | 431 | | 17,787 |
Donnelley Financial Solutions, Inc. (a)
| | 152 | | 9,062 |
Piper Sandler Cos.
| | 96 | | 22,096 |
PJT Partners, Inc. Class A
| | 137 | | 14,784 |
StoneX Group, Inc. (a)
| | 166 | | 12,502 |
Virtus Investment Partners, Inc.
| | 43 | | 9,712 |
WisdomTree, Inc.
| | 677 | | 6,709 |
| | | | | | 92,652 |
See accompanying notes to financial statements.
112
SPDR SERIES TRUST
SPDR S&P SMALLCAP 600 ESG ETF
SCHEDULE OF INVESTMENTS (continued)
June 30, 2024
| Security Description | | | Shares | | Value |
| CHEMICALS — 3.0% | |
AdvanSix, Inc.
| | 166 | | $3,805 |
Balchem Corp.
| | 200 | | 30,790 |
HB Fuller Co.
| | 333 | | 25,628 |
Ingevity Corp. (a)
| | 207 | | 9,048 |
Innospec, Inc.
| | 153 | | 18,909 |
Koppers Holdings, Inc.
| | 127 | | 4,698 |
Minerals Technologies, Inc.
| | 200 | | 16,632 |
Quaker Chemical Corp.
| | 85 | | 14,424 |
Sensient Technologies Corp.
| | 259 | | 19,215 |
Stepan Co.
| | 131 | | 10,999 |
| | | | | | 154,148 |
| COMMERCIAL SERVICES & SUPPLIES — 1.9% | |
ABM Industries, Inc.
| | 385 | | 19,469 |
Brady Corp. Class A
| | 274 | | 18,090 |
Enviri Corp. (a)
| | 489 | | 4,220 |
GEO Group, Inc. (a)
| | 821 | | 11,790 |
HNI Corp.
| | 286 | | 12,876 |
Interface, Inc.
| | 356 | | 5,226 |
Matthews International Corp. Class A
| | 188 | | 4,709 |
MillerKnoll, Inc.
| | 446 | | 11,815 |
Pitney Bowes, Inc.
| | 941 | | 4,780 |
Viad Corp. (a)
| | 128 | | 4,352 |
| | | | | | 97,327 |
| COMMUNICATIONS EQUIPMENT — 0.7% | |
Extreme Networks, Inc. (a)
| | 789 | | 10,612 |
Harmonic, Inc. (a)
| | 689 | | 8,110 |
NetScout Systems, Inc. (a)
| | 436 | | 7,974 |
Viavi Solutions, Inc. (a)
| | 1,365 | | 9,378 |
| | | | | | 36,074 |
| CONSTRUCTION & ENGINEERING — 1.7% | |
Arcosa, Inc.
| | 303 | | 25,273 |
Dycom Industries, Inc. (a)
| | 182 | | 30,715 |
Granite Construction, Inc.
| | 270 | | 16,732 |
MYR Group, Inc. (a)
| | 103 | | 13,978 |
| | | | | | 86,698 |
| CONSUMER FINANCE — 0.9% | |
Bread Financial Holdings, Inc.
| | 302 | | 13,457 |
Encore Capital Group, Inc. (a)
| | 145 | | 6,051 |
Green Dot Corp. Class A (a)
| | 277 | | 2,618 |
Navient Corp.
| | 503 | | 7,324 |
PRA Group, Inc. (a)
| | 241 | | 4,738 |
PROG Holdings, Inc.
| | 274 | | 9,502 |
World Acceptance Corp. (a)
| | 21 | | 2,595 |
| | | | | | 46,285 |
| CONSUMER STAPLES DISTRIBUTION & RETAIL — 0.6% | |
Andersons, Inc.
| | 193 | | 9,573 |
PriceSmart, Inc.
| | 154 | | 12,505 |
SpartanNash Co.
| | 213 | | 3,996 |
United Natural Foods, Inc. (a)
| | 364 | | 4,768 |
| | | | | | 30,842 |
| Security Description | | | Shares | | Value |
| CONTAINERS & PACKAGING — 0.8% | |
O-I Glass, Inc. (a)
| | 948 | | $10,551 |
Sealed Air Corp.
| | 896 | | 31,172 |
| | | | | | 41,723 |
| DIVERSIFIED CONSUMER SERVICES — 1.3% | |
Adtalem Global Education, Inc. (a)
| | 241 | | 16,439 |
Frontdoor, Inc. (a)
| | 488 | | 16,489 |
Strategic Education, Inc.
| | 136 | | 15,050 |
Stride, Inc. (a)
| | 244 | | 17,202 |
| | | | | | 65,180 |
| DIVERSIFIED REITs — 0.3% | |
Alexander & Baldwin, Inc. REIT
| | 445 | | 7,547 |
American Assets Trust, Inc. REIT
| | 299 | | 6,692 |
| | | | | | 14,239 |
| DIVERSIFIED TELECOMMUNICATION SERVICES — 0.3% | |
Consolidated Communications Holdings, Inc. (a)
| | 456 | | 2,006 |
Lumen Technologies, Inc. (a)
| | 6,188 | | 6,807 |
Shenandoah Telecommunications Co.
| | 308 | | 5,030 |
| | | | | | 13,843 |
| ELECTRICAL EQUIPMENT — 0.6% | |
Encore Wire Corp.
| | 97 | | 28,113 |
SunPower Corp. (a)
| | 527 | | 1,560 |
| | | | | | 29,673 |
| ELECTRONIC EQUIPMENT, INSTRUMENTS & COMPONENTS — 4.7% | |
Advanced Energy Industries, Inc.
| | 229 | | 24,906 |
Arlo Technologies, Inc. (a)
| | 580 | | 7,563 |
Badger Meter, Inc.
| | 182 | | 33,916 |
Benchmark Electronics, Inc.
| | 218 | | 8,602 |
Fabrinet (a)
| | 225 | | 55,078 |
Insight Enterprises, Inc. (a)
| | 171 | | 33,919 |
Itron, Inc. (a)
| | 282 | | 27,907 |
Knowles Corp. (a)
| | 547 | | 9,441 |
Plexus Corp. (a)
| | 169 | | 17,437 |
Rogers Corp. (a)
| | 103 | | 12,423 |
ScanSource, Inc. (a)
| | 154 | | 6,824 |
| | | | | | 238,016 |
| ENERGY EQUIPMENT & SERVICES — 1.9% | |
Archrock, Inc.
| | 842 | | 17,025 |
Bristow Group, Inc. (a)
| | 147 | | 4,929 |
Core Laboratories, Inc.
| | 286 | | 5,803 |
Dril-Quip, Inc. (a)
| | 209 | | 3,887 |
Helix Energy Solutions Group, Inc. (a)
| | 869 | | 10,376 |
Helmerich & Payne, Inc.
| | 615 | | 22,226 |
Nabors Industries Ltd. (a)
| | 55 | | 3,914 |
Patterson-UTI Energy, Inc.
| | 1,905 | | 19,736 |
U.S. Silica Holdings, Inc. (a)
| | 473 | | 7,308 |
| | | | | | 95,204 |
| FINANCIAL SERVICES — 3.0% | |
EVERTEC, Inc.
| | 396 | | 13,167 |
Jackson Financial, Inc. Class A
| | 418 | | 31,040 |
See accompanying notes to financial statements.
113
SPDR SERIES TRUST
SPDR S&P SMALLCAP 600 ESG ETF
SCHEDULE OF INVESTMENTS (continued)
June 30, 2024
| Security Description | | | Shares | | Value |
Mr Cooper Group, Inc. (a)
| | 401 | | $32,573 |
NMI Holdings, Inc. Class A (a)
| | 497 | | 16,918 |
Payoneer Global, Inc. (a)
| | 1,598 | | 8,853 |
Radian Group, Inc.
| | 928 | | 28,861 |
Walker & Dunlop, Inc.
| | 205 | | 20,131 |
| | | | | | 151,543 |
| FOOD PRODUCTS — 1.3% | |
B&G Foods, Inc.
| | 482 | | 3,895 |
Calavo Growers, Inc.
| | 109 | | 2,474 |
Cal-Maine Foods, Inc.
| | 249 | | 15,216 |
Fresh Del Monte Produce, Inc.
| | 207 | | 4,523 |
Hain Celestial Group, Inc. (a)
| | 551 | | 3,808 |
John B Sanfilippo & Son, Inc.
| | 55 | | 5,344 |
Simply Good Foods Co. (a)
| | 566 | | 20,450 |
TreeHouse Foods, Inc. (a)
| | 308 | | 11,285 |
| | | | | | 66,995 |
| GAS UTILITIES — 0.2% | |
Northwest Natural Holding Co.
| | 234 | | 8,450 |
| GROUND TRANSPORTATION — 0.3% | |
ArcBest Corp.
| | 148 | | 15,848 |
| HEALTH CARE EQUIPMENT & SUPPLIES — 3.7% | |
Artivion, Inc. (a)
| | 239 | | 6,130 |
Avanos Medical, Inc. (a)
| | 285 | | 5,677 |
CONMED Corp.
| | 192 | | 13,309 |
Embecta Corp.
| | 353 | | 4,413 |
Glaukos Corp. (a)
| | 310 | | 36,689 |
ICU Medical, Inc. (a)
| | 127 | | 15,081 |
Integer Holdings Corp. (a)
| | 207 | | 23,969 |
Merit Medical Systems, Inc. (a)
| | 359 | | 30,856 |
Omnicell, Inc. (a)
| | 279 | | 7,553 |
STAAR Surgical Co. (a)
| | 299 | | 14,235 |
Tandem Diabetes Care, Inc. (a)
| | 406 | | 16,358 |
UFP Technologies, Inc. (a)
| | 43 | | 11,346 |
Varex Imaging Corp. (a)
| | 249 | | 3,668 |
| | | | | | 189,284 |
| HEALTH CARE PROVIDERS & SERVICES — 2.8% | |
Addus HomeCare Corp. (a)
| | 109 | | 12,656 |
AMN Healthcare Services, Inc. (a)
| | 231 | | 11,834 |
Cross Country Healthcare, Inc. (a)
| | 202 | | 2,796 |
Enhabit, Inc. (a)
| | 307 | | 2,738 |
Ensign Group, Inc.
| | 349 | | 43,168 |
Fulgent Genetics, Inc. (a)
| | 124 | | 2,433 |
OmniAb, Inc. (a) (b)
| | 52 | | — |
Owens & Minor, Inc. (a)
| | 469 | | 6,331 |
Patterson Cos., Inc.
| | 506 | | 12,205 |
Pediatrix Medical Group, Inc. (a)
| | 508 | | 3,835 |
Premier, Inc. Class A
| | 646 | | 12,061 |
Select Medical Holdings Corp.
| | 655 | | 22,964 |
U.S. Physical Therapy, Inc.
| | 92 | | 8,503 |
| | | | | | 141,524 |
| HEALTH CARE REITs — 0.6% | |
CareTrust REIT, Inc.
| | 875 | | 21,962 |
| Security Description | | | Shares | | Value |
LTC Properties, Inc. REIT
| | 268 | | $9,246 |
| | | | | | 31,208 |
| HEALTH CARE TECHNOLOGY — 0.3% | |
Certara, Inc. (a)
| | 656 | | 9,085 |
Schrodinger, Inc. (a)
| | 335 | | 6,479 |
| | | | | | 15,564 |
| HOTEL & RESORT REITs — 1.3% | |
Apple Hospitality REIT, Inc.
| | 1,388 | | 20,181 |
DiamondRock Hospitality Co. REIT
| | 1,286 | | 10,867 |
Pebblebrook Hotel Trust REIT
| | 739 | | 10,161 |
Summit Hotel Properties, Inc. REIT
| | 660 | | 3,953 |
Sunstone Hotel Investors, Inc. REIT
| | 1,260 | | 13,180 |
Xenia Hotels & Resorts, Inc. REIT
| | 645 | | 9,243 |
| | | | | | 67,585 |
| HOTELS, RESTAURANTS & LEISURE — 1.9% | |
BJ's Restaurants, Inc. (a)
| | 142 | | 4,927 |
Brinker International, Inc. (a)
| | 271 | | 19,618 |
Cheesecake Factory, Inc.
| | 286 | | 11,237 |
Cracker Barrel Old Country Store, Inc.
| | 136 | | 5,734 |
Dine Brands Global, Inc.
| | 95 | | 3,439 |
Jack in the Box, Inc.
| | 120 | | 6,113 |
Papa John's International, Inc.
| | 201 | | 9,443 |
Shake Shack, Inc. Class A (a)
| | 233 | | 20,970 |
Six Flags Entertainment Corp.
| | 444 | | 14,714 |
| | | | | | 96,195 |
| HOUSEHOLD DURABLES — 3.7% | |
Cavco Industries, Inc. (a)
| | 48 | | 16,616 |
Century Communities, Inc.
| | 177 | | 14,454 |
Installed Building Products, Inc.
| | 146 | | 30,029 |
La-Z-Boy, Inc.
| | 263 | | 9,805 |
M/I Homes, Inc. (a)
| | 174 | | 21,252 |
Meritage Homes Corp.
| | 226 | | 36,578 |
Newell Brands, Inc.
| | 2,337 | | 14,980 |
Sonos, Inc. (a)
| | 759 | | 11,203 |
Tri Pointe Homes, Inc. (a)
| | 596 | | 22,201 |
Worthington Enterprises, Inc.
| | 187 | | 8,851 |
| | | | | | 185,969 |
| HOUSEHOLD PRODUCTS — 0.9% | |
Central Garden & Pet Co. (a)
| | 58 | | 2,233 |
Central Garden & Pet Co. Class A (a)
| | 332 | | 10,966 |
Energizer Holdings, Inc.
| | 410 | | 12,111 |
WD-40 Co.
| | 85 | | 18,670 |
| | | | | | 43,980 |
| INDEPENDENT POWER AND RENEWABLE ELECTRICITY PRODUCERS — 0.3% | |
Clearway Energy, Inc. Class A
| | 213 | | 4,827 |
Clearway Energy, Inc. Class C
| | 506 | | 12,493 |
| | | | | | 17,320 |
| INDUSTRIAL REITs — 0.3% | |
LXP Industrial Trust REIT
| | 1,795 | | 16,370 |
See accompanying notes to financial statements.
114
SPDR SERIES TRUST
SPDR S&P SMALLCAP 600 ESG ETF
SCHEDULE OF INVESTMENTS (continued)
June 30, 2024
| Security Description | | | Shares | | Value |
| INSURANCE — 2.8% | |
Ambac Financial Group, Inc. (a)
| | 277 | | $3,551 |
AMERISAFE, Inc.
| | 118 | | 5,179 |
Assured Guaranty Ltd.
| | 318 | | 24,534 |
Employers Holdings, Inc.
| | 158 | | 6,735 |
Genworth Financial, Inc. Class A (a)
| | 2,766 | | 16,707 |
Horace Mann Educators Corp.
| | 250 | | 8,155 |
Lincoln National Corp.
| | 1,054 | | 32,779 |
Palomar Holdings, Inc. (a)
| | 152 | | 12,335 |
ProAssurance Corp. (a)
| | 313 | | 3,825 |
Safety Insurance Group, Inc.
| | 91 | | 6,828 |
Stewart Information Services Corp.
| | 168 | | 10,429 |
Trupanion, Inc. (a)
| | 220 | | 6,468 |
United Fire Group, Inc.
| | 130 | | 2,794 |
| | | | | | 140,319 |
| INTERACTIVE MEDIA & SERVICES — 1.0% | |
Cargurus, Inc. (a)
| | 483 | | 12,654 |
Cars.com, Inc. (a)
| | 377 | | 7,427 |
QuinStreet, Inc. (a)
| | 320 | | 5,309 |
TripAdvisor, Inc. (a)
| | 663 | | 11,808 |
Yelp, Inc. (a)
| | 420 | | 15,519 |
| | | | | | 52,717 |
| IT SERVICES — 0.7% | |
DXC Technology Co. (a)
| | 1,102 | | 21,037 |
Perficient, Inc. (a)
| | 214 | | 16,005 |
| | | | | | 37,042 |
| MACHINERY — 5.7% | |
Alamo Group, Inc.
| | 65 | | 11,245 |
Barnes Group, Inc.
| | 311 | | 12,878 |
Enerpac Tool Group Corp.
| | 332 | | 12,676 |
Enpro, Inc.
| | 128 | | 18,633 |
Federal Signal Corp.
| | 378 | | 31,627 |
Franklin Electric Co., Inc.
| | 247 | | 23,791 |
Greenbrier Cos., Inc.
| | 190 | | 9,414 |
Hillenbrand, Inc.
| | 438 | | 17,529 |
John Bean Technologies Corp.
| | 199 | | 18,899 |
Kennametal, Inc.
| | 486 | | 11,440 |
Lindsay Corp.
| | 68 | | 8,356 |
Mueller Industries, Inc.
| | 703 | | 40,029 |
SPX Technologies, Inc. (a)
| | 283 | | 40,226 |
Tennant Co.
| | 114 | | 11,222 |
Trinity Industries, Inc.
| | 502 | | 15,020 |
Wabash National Corp.
| | 278 | | 6,072 |
| | | | | | 289,057 |
| MARINE — 0.6% | |
Matson, Inc.
| | 210 | | 27,504 |
| MEDIA — 0.3% | |
John Wiley & Sons, Inc. Class A
| | 258 | | 10,501 |
Thryv Holdings, Inc. (a)
| | 189 | | 3,368 |
| | | | | | 13,869 |
| METALS & MINING — 1.4% | |
ATI, Inc. (a)
| | 767 | | 42,530 |
Century Aluminum Co. (a)
| | 318 | | 5,326 |
| Security Description | | | Shares | | Value |
Compass Minerals International, Inc.
| | 208 | | $2,149 |
Haynes International, Inc.
| | 77 | | 4,520 |
Kaiser Aluminum Corp.
| | 97 | | 8,526 |
Metallus, Inc. (a)
| | 236 | | 4,784 |
SunCoke Energy, Inc.
| | 514 | | 5,037 |
| | | | | | 72,872 |
| MORTGAGE REAL ESTATE INVESTMENT TRUST (REITs) — 1.3% | |
Blackstone Mortgage Trust, Inc. Class A REIT
| | 1,057 | | 18,413 |
Franklin BSP Realty Trust, Inc. REIT
| | 503 | | 6,338 |
Hannon Armstrong Sustainable Infrastructure Capital, Inc. REIT
| | 701 | | 20,749 |
PennyMac Mortgage Investment Trust REIT
| | 531 | | 7,301 |
Redwood Trust, Inc. REIT
| | 806 | | 5,231 |
Two Harbors Investment Corp. REIT
| | 633 | | 8,362 |
| | | | | | 66,394 |
| MULTI-UTILITIES — 0.4% | |
Avista Corp.
| | 474 | | 16,405 |
Unitil Corp.
| | 99 | | 5,127 |
| | | | | | 21,532 |
| OFFICE REITs — 1.5% | |
Brandywine Realty Trust REIT
| | 1,056 | | 4,731 |
Douglas Emmett, Inc. REIT
| | 1,023 | | 13,616 |
Easterly Government Properties, Inc. REIT
| | 634 | | 7,843 |
Highwoods Properties, Inc. REIT
| | 648 | | 17,023 |
Hudson Pacific Properties, Inc. REIT
| | 777 | | 3,737 |
JBG SMITH Properties REIT
| | 534 | | 8,133 |
SL Green Realty Corp. REIT
| | 397 | | 22,486 |
| | | | | | 77,569 |
| OIL, GAS & CONSUMABLE FUELS — 2.7% | |
California Resources Corp.
| | 396 | | 21,075 |
Comstock Resources, Inc.
| | 594 | | 6,166 |
Dorian LPG Ltd.
| | 209 | | 8,770 |
Green Plains, Inc. (a)
| | 394 | | 6,249 |
Magnolia Oil & Gas Corp. Class A
| | 1,114 | | 28,229 |
Par Pacific Holdings, Inc. (a)
| | 341 | | 8,610 |
SM Energy Co.
| | 717 | | 30,996 |
Talos Energy, Inc. (a)
| | 963 | | 11,700 |
Vital Energy, Inc. (a)
| | 152 | | 6,813 |
World Kinect Corp.
| | 369 | | 9,520 |
| | | | | | 138,128 |
| PERSONAL CARE PRODUCTS — 0.4% | |
Edgewell Personal Care Co.
| | 306 | | 12,298 |
Nu Skin Enterprises, Inc. Class A
| | 303 | | 3,194 |
USANA Health Sciences, Inc. (a)
| | 68 | | 3,076 |
| | | | | | 18,568 |
| PAPER & FOREST PRODUCTS — 0.5% | |
Clearwater Paper Corp. (a)
| | 102 | | 4,944 |
Mercer International, Inc.
| | 269 | | 2,297 |
See accompanying notes to financial statements.
115
SPDR SERIES TRUST
SPDR S&P SMALLCAP 600 ESG ETF
SCHEDULE OF INVESTMENTS (continued)
June 30, 2024
| Security Description | | | Shares | | Value |
Sylvamo Corp.
| | 221 | | $15,161 |
| | | | | | 22,402 |
| PHARMACEUTICALS — 1.9% | |
Amphastar Pharmaceuticals, Inc. (a)
| | 229 | | 9,160 |
Collegium Pharmaceutical, Inc. (a)
| | 200 | | 6,440 |
Harmony Biosciences Holdings, Inc. (a)
| | 201 | | 6,064 |
Ligand Pharmaceuticals, Inc. (a)
| | 104 | | 8,763 |
Organon & Co.
| | 1,586 | | 32,830 |
Pacira BioSciences, Inc. (a)
| | 285 | | 8,154 |
Phibro Animal Health Corp. Class A
| | 125 | | 2,096 |
Prestige Consumer Healthcare, Inc. (a)
| | 305 | | 21,000 |
| | | | | | 94,507 |
| PROFESSIONAL SERVICES — 1.4% | |
CSG Systems International, Inc.
| | 173 | | 7,122 |
Heidrick & Struggles International, Inc.
| | 124 | | 3,916 |
Kelly Services, Inc. Class A
| | 196 | | 4,196 |
Korn Ferry
| | 322 | | 21,619 |
NV5 Global, Inc. (a)
| | 78 | | 7,252 |
Verra Mobility Corp. (a)
| | 1,034 | | 28,125 |
| | | | | | 72,230 |
| REAL ESTATE MANAGEMENT & DEVELOPMENT — 0.5% | |
Cushman & Wakefield PLC (a)
| | 1,204 | | 12,521 |
Kennedy-Wilson Holdings, Inc.
| | 726 | | 7,057 |
Marcus & Millichap, Inc.
| | 146 | | 4,602 |
| | | | | | 24,180 |
| RESIDENTIAL REITs — 0.4% | |
Centerspace REIT
| | 92 | | 6,222 |
Elme Communities REIT
| | 538 | | 8,570 |
Veris Residential, Inc. REIT
| | 492 | | 7,380 |
| | | | | | 22,172 |
| RETAIL REITs — 2.3% | |
Acadia Realty Trust REIT
| | 627 | | 11,236 |
Macerich Co. REIT
| | 1,324 | | 20,443 |
Phillips Edison & Co., Inc. REIT
| | 759 | | 24,827 |
Retail Opportunity Investments Corp. REIT
| | 773 | | 9,608 |
SITE Centers Corp. REIT
| | 1,104 | | 16,008 |
Tanger, Inc. REIT
| | 672 | | 18,218 |
Urban Edge Properties REIT
| | 722 | | 13,335 |
Whitestone REIT
| | 289 | | 3,847 |
| | | | | | 117,522 |
| SEMICONDUCTORS & SEMICONDUCTOR EQUIPMENT — 3.2% | |
Axcelis Technologies, Inc. (a)
| | 201 | | 28,580 |
Cohu, Inc. (a)
| | 291 | | 9,632 |
Diodes, Inc. (a)
| | 287 | | 20,644 |
FormFactor, Inc. (a)
| | 484 | | 29,296 |
Kulicke & Soffa Industries, Inc.
| | 346 | | 17,020 |
Semtech Corp. (a)
| | 395 | | 11,802 |
SiTime Corp. (a)
| | 107 | | 13,309 |
SMART Global Holdings, Inc. (a)
| | 318 | | 7,273 |
SolarEdge Technologies, Inc. (a)
| | 354 | | 8,942 |
| Security Description | | | Shares | | Value |
Veeco Instruments, Inc. (a)
| | 346 | | $16,162 |
| | | | | | 162,660 |
| SOFTWARE — 3.8% | |
ACI Worldwide, Inc. (a)
| | 649 | | 25,694 |
Agilysys, Inc. (a)
| | 124 | | 12,913 |
BlackLine, Inc. (a)
| | 312 | | 15,117 |
Box, Inc. Class A (a)
| | 894 | | 23,637 |
DoubleVerify Holdings, Inc. (a)
| | 866 | | 16,861 |
InterDigital, Inc.
| | 158 | | 18,417 |
LiveRamp Holdings, Inc. (a)
| | 406 | | 12,562 |
NCR Voyix Corp. (a)
| | 849 | | 10,485 |
Progress Software Corp.
| | 269 | | 14,596 |
SPS Commerce, Inc. (a)
| | 227 | | 42,712 |
| | | | | | 192,994 |
| SPECIALIZED REITs — 0.2% | |
Safehold, Inc. REIT
| | 274 | | 5,285 |
Uniti Group, Inc. REIT
| | 1,463 | | 4,272 |
| | | | | | 9,557 |
| SPECIALTY RETAIL — 4.8% | |
Abercrombie & Fitch Co. Class A (a)
| | 315 | | 56,020 |
Academy Sports & Outdoors, Inc.
| | 460 | | 24,495 |
Advance Auto Parts, Inc.
| | 367 | | 23,242 |
American Eagle Outfitters, Inc.
| | 1,154 | | 23,034 |
Caleres, Inc.
| | 204 | | 6,855 |
Foot Locker, Inc.
| | 502 | | 12,510 |
Group 1 Automotive, Inc.
| | 82 | | 24,377 |
Guess?, Inc.
| | 168 | | 3,427 |
Haverty Furniture Cos., Inc.
| | 82 | | 2,074 |
Hibbett, Inc.
| | 72 | | 6,279 |
Leslie's, Inc. (a)
| | 1,132 | | 4,743 |
Monro, Inc.
| | 183 | | 4,366 |
National Vision Holdings, Inc. (a)
| | 480 | | 6,283 |
ODP Corp. (a)
| | 204 | | 8,011 |
Sally Beauty Holdings, Inc. (a)
| | 643 | | 6,899 |
Signet Jewelers Ltd.
| | 272 | | 24,366 |
Upbound Group, Inc.
| | 273 | | 8,381 |
| | | | | | 245,362 |
| TECHNOLOGY HARDWARE, STORAGE & PERIPHERALS — 0.2% | |
Corsair Gaming, Inc. (a)
| | 265 | | 2,926 |
Xerox Holdings Corp.
| | 694 | | 8,064 |
| | | | | | 10,990 |
| TEXTILES, APPAREL & LUXURY GOODS — 0.9% | |
Hanesbrands, Inc. (a)
| | 2,147 | | 10,585 |
Movado Group, Inc.
| | 96 | | 2,387 |
Oxford Industries, Inc.
| | 90 | | 9,013 |
Steven Madden Ltd.
| | 430 | | 18,189 |
Wolverine World Wide, Inc.
| | 488 | | 6,598 |
| | | | | | 46,772 |
| TRADING COMPANIES & DISTRIBUTORS — 1.7% | |
Air Lease Corp.
| | 641 | | 30,467 |
Boise Cascade Co.
| | 246 | | 29,328 |
See accompanying notes to financial statements.
116
SPDR SERIES TRUST
SPDR S&P SMALLCAP 600 ESG ETF
SCHEDULE OF INVESTMENTS (continued)
June 30, 2024
| Security Description | | | Shares | | Value |
DNOW, Inc. (a)
| | 652 | | $8,952 |
Rush Enterprises, Inc. Class A
| | 384 | | 16,078 |
| | | | | | 84,825 |
| WATER UTILITIES — 1.0% | |
American States Water Co.
| | 227 | | 16,473 |
California Water Service Group
| | 354 | | 17,166 |
Middlesex Water Co.
| | 110 | | 5,749 |
SJW Group
| | 179 | | 9,705 |
| | | | | | 49,093 |
| WIRELESS TELECOMMUNICATION SERVICES — 0.3% | |
Gogo, Inc. (a)
| | 380 | | 3,655 |
Telephone & Data Systems, Inc.
| | 605 | | 12,542 |
| | | | | | 16,197 |
TOTAL COMMON STOCKS
(Cost $4,983,960)
| | | | | 5,063,642 |
| SHORT-TERM INVESTMENT — 0.1% | | | |
State Street Institutional Liquid Reserves Fund, Premier Class 5.36% (c) (d)
(Cost $6,620)
| | 6,618 | | 6,620 |
TOTAL INVESTMENTS — 99.9%
(Cost $4,990,580)
| | 5,070,262 | |
OTHER ASSETS IN EXCESS OF LIABILITIES — 0.1%
| | 2,877 | |
NET ASSETS — 100.0%
| | $5,073,139 | |
| (a) | Non-income producing security. |
| (b) | Fair valued as determined in good faith by the Trust's Oversight Committee in accordance with policy and procedures approved by the Board of Trustees. Security value is determined based on Level 3 inputs. As of June 30, 2024, total aggregate fair value of the security is $0, representing 0.00% of the Fund's net assets. |
| (c) | The Fund invested in certain money market funds managed by SSGA Funds Management, Inc. Amounts related to these investments during the year ended June 30, 2024 are shown in the Affiliate Table below. |
| (d) | The rate shown is the annualized seven-day yield at June 30, 2024. |
| REIT | Real Estate Investment Trust |
The following table summarizes the value of the Fund's investments according to the fair value hierarchy as of June 30, 2024.
| Description | | Level 1 –
Quoted Prices | | Level 2 –
Other Significant
Observable Inputs | | Level 3 –
Significant
Unobservable Inputs | | Total |
| ASSETS: | | | | | | | | |
| INVESTMENTS: | | | | | | | | |
Common Stocks
| | $5,063,642 | | $— | | $0(a) | | $5,063,642 |
Short-Term Investment
| | 6,620 | | — | | — | | 6,620 |
TOTAL INVESTMENTS
| | $5,070,262 | | $— | | $0 | | $5,070,262 |
| (a) | The Fund held a Level 3 security that was valued at $0 at June 30, 2024. |
Affiliate Table
| | Number of
Shares Held
at
6/30/23 | | Value at
6/30/23 | | Cost of
Purchases | | Proceeds
from
Shares Sold | | Realized
Gain (Loss) | | Change in
Unrealized
Appreciation/
Depreciation | | Number of
Shares Held
at
6/30/24 | | Value at
6/30/24 | | Dividend
Income |
State Street Institutional Liquid Reserves Fund, Premier Class
| 7,801 | | $7,803 | | $311,700 | | $312,880 | | $(3) | | $— | | 6,618 | | $6,620 | | $422 |
See accompanying notes to financial statements.
117
SPDR SERIES TRUST
SPDR SSGA US LARGE CAP LOW VOLATILITY INDEX ETF
SCHEDULE OF INVESTMENTS
June 30, 2024
| Security Description | | | Shares | | Value |
| COMMON STOCKS — 99.6% | |
| AEROSPACE & DEFENSE — 2.2% | |
General Dynamics Corp.
| | 19,015 | | $5,517,012 |
Lockheed Martin Corp.
| | 11,240 | | 5,250,204 |
Northrop Grumman Corp.
| | 10,781 | | 4,699,977 |
| | | | | | 15,467,193 |
| AIR FREIGHT & LOGISTICS — 0.4% | |
CH Robinson Worldwide, Inc.
| | 32,299 | | 2,846,188 |
| AUTO COMPONENTS — 0.3% | |
Gentex Corp.
| | 64,657 | | 2,179,587 |
| BANKS — 0.3% | |
Commerce Bancshares, Inc.
| | 35,256 | | 1,966,580 |
| BEVERAGES — 1.4% | |
PepsiCo, Inc.
| | 58,197 | | 9,598,431 |
| CAPITAL MARKETS — 3.5% | |
CME Group, Inc.
| | 28,598 | | 5,622,367 |
FactSet Research Systems, Inc.
| | 10,668 | | 4,355,424 |
Houlihan Lokey, Inc.
| | 19,327 | | 2,606,439 |
Intercontinental Exchange, Inc.
| | 34,105 | | 4,668,633 |
Nasdaq, Inc.
| | 85,215 | | 5,135,056 |
SEI Investments Co.
| | 30,172 | | 1,951,827 |
| | | | | | 24,339,746 |
| CHEMICALS — 2.4% | |
Air Products & Chemicals, Inc.
| | 28,395 | | 7,327,330 |
Linde PLC
| | 19,621 | | 8,609,891 |
NewMarket Corp.
| | 1,956 | | 1,008,455 |
| | | | | | 16,945,676 |
| COMMERCIAL SERVICES & SUPPLIES — 3.0% | |
Casella Waste Systems, Inc. Class A (a)
| | 16,104 | | 1,597,839 |
MSA Safety, Inc.
| | 10,270 | | 1,927,576 |
Republic Services, Inc.
| | 38,558 | | 7,493,362 |
Rollins, Inc.
| | 73,699 | | 3,595,774 |
Waste Management, Inc.
| | 30,610 | | 6,530,338 |
| | | | | | 21,144,889 |
| COMMUNICATIONS EQUIPMENT — 1.2% | |
Cisco Systems, Inc.
| | 71,051 | | 3,375,633 |
Motorola Solutions, Inc.
| | 12,924 | | 4,989,310 |
| | | | | | 8,364,943 |
| CONSTRUCTION MATERIALS — 1.0% | |
Vulcan Materials Co.
| | 27,995 | | 6,961,797 |
| CONSUMER STAPLES DISTRIBUTION & RETAIL — 2.9% | |
Casey's General Stores, Inc.
| | 10,392 | | 3,965,172 |
Costco Wholesale Corp.
| | 5,998 | | 5,098,240 |
Dollar General Corp.
| | 20,692 | | 2,736,103 |
Walmart, Inc.
| | 120,611 | | 8,166,571 |
| | | | | | 19,966,086 |
| CONTAINERS & PACKAGING — 2.8% | |
Amcor PLC
| | 403,356 | | 3,944,822 |
AptarGroup, Inc.
| | 18,391 | | 2,589,637 |
| Security Description | | | Shares | | Value |
Avery Dennison Corp.
| | 22,361 | | $4,889,232 |
Graphic Packaging Holding Co.
| | 84,534 | | 2,215,636 |
Packaging Corp. of America
| | 24,598 | | 4,490,611 |
Sonoco Products Co.
| | 27,221 | | 1,380,649 |
| | | | | | 19,510,587 |
| DIVERSIFIED CONSUMER SERVICES — 0.4% | |
Service Corp. International
| | 39,627 | | 2,818,669 |
| DIVERSIFIED TELECOMMUNICATION SERVICES — 1.6% | |
AT&T, Inc.
| | 242,675 | | 4,637,519 |
Verizon Communications, Inc.
| | 166,250 | | 6,856,150 |
| | | | | | 11,493,669 |
| ELECTRIC UTILITIES — 3.1% | |
Duke Energy Corp.
| | 75,096 | | 7,526,872 |
Southern Co.
| | 90,891 | | 7,050,415 |
Xcel Energy, Inc.
| | 136,302 | | 7,279,890 |
| | | | | | 21,857,177 |
| ELECTRICAL EQUIPMENT — 1.1% | |
AMETEK, Inc.
| | 21,991 | | 3,666,120 |
Eaton Corp. PLC
| | 13,753 | | 4,312,253 |
| | | | | | 7,978,373 |
| ENTERTAINMENT — 0.7% | |
Electronic Arts, Inc.
| | 33,197 | | 4,625,338 |
| FINANCIAL SERVICES — 2.6% | |
Berkshire Hathaway, Inc. Class B (a)
| | 15,896 | | 6,466,493 |
Fiserv, Inc. (a)
| | 26,703 | | 3,979,815 |
Jack Henry & Associates, Inc.
| | 20,286 | | 3,367,882 |
Visa, Inc. Class A
| | 16,279 | | 4,272,749 |
| | | | | | 18,086,939 |
| FOOD PRODUCTS — 1.8% | |
General Mills, Inc.
| | 128,965 | | 8,158,326 |
Kellanova
| | 79,853 | | 4,605,921 |
| | | | | | 12,764,247 |
| GROUND TRANSPORTATION — 0.8% | |
Landstar System, Inc.
| | 9,932 | | 1,832,255 |
Union Pacific Corp.
| | 15,815 | | 3,578,302 |
| | | | | | 5,410,557 |
| HEALTH CARE EQUIPMENT & SUPPLIES — 2.2% | |
Abbott Laboratories
| | 42,924 | | 4,460,233 |
Becton Dickinson & Co.
| | 24,738 | | 5,781,518 |
Medtronic PLC
| | 54,387 | | 4,280,801 |
Solventum Corp. (a)
| | 10,930 | | 577,978 |
| | | | | | 15,100,530 |
| HEALTH CARE PROVIDERS & SERVICES — 2.7% | |
Cencora, Inc.
| | 23,217 | | 5,230,790 |
Chemed Corp.
| | 4,171 | | 2,263,101 |
McKesson Corp.
| | 9,858 | | 5,757,467 |
UnitedHealth Group, Inc.
| | 10,247 | | 5,218,387 |
| | | | | | 18,469,745 |
See accompanying notes to financial statements.
118
SPDR SERIES TRUST
SPDR SSGA US LARGE CAP LOW VOLATILITY INDEX ETF
SCHEDULE OF INVESTMENTS (continued)
June 30, 2024
| Security Description | | | Shares | | Value |
| HOTELS, RESTAURANTS & LEISURE — 1.6% | |
McDonald's Corp.
| | 22,066 | | $5,623,299 |
Starbucks Corp.
| | 34,968 | | 2,722,259 |
Yum! Brands, Inc.
| | 23,570 | | 3,122,082 |
| | | | | | 11,467,640 |
| HOUSEHOLD DURABLES — 1.0% | |
Garmin Ltd.
| | 26,740 | | 4,356,481 |
NVR, Inc. (a)
| | 369 | | 2,800,178 |
| | | | | | 7,156,659 |
| HOUSEHOLD PRODUCTS — 2.6% | |
Colgate-Palmolive Co.
| | 105,040 | | 10,193,082 |
Procter & Gamble Co.
| | 46,607 | | 7,686,426 |
| | | | | | 17,879,508 |
| INDUSTRIAL CONGLOMERATES — 1.3% | |
3M Co.
| | 44,016 | | 4,497,995 |
Honeywell International, Inc.
| | 20,570 | | 4,392,518 |
| | | | | | 8,890,513 |
| INDUSTRIAL REITs — 0.6% | |
EastGroup Properties, Inc. REIT
| | 13,281 | | 2,259,098 |
First Industrial Realty Trust, Inc. REIT
| | 37,873 | | 1,799,346 |
| | | | | | 4,058,444 |
| INSURANCE — 12.0% | |
Aflac, Inc.
| | 49,781 | | 4,445,941 |
Allstate Corp.
| | 32,236 | | 5,146,800 |
Aon PLC Class A
| | 14,503 | | 4,257,791 |
Arthur J Gallagher & Co.
| | 22,143 | | 5,741,901 |
Assurant, Inc.
| | 14,411 | | 2,395,829 |
Brown & Brown, Inc.
| | 59,420 | | 5,312,742 |
Chubb Ltd.
| | 19,767 | | 5,042,166 |
CNA Financial Corp.
| | 75,455 | | 3,476,212 |
Globe Life, Inc.
| | 25,676 | | 2,112,621 |
Loews Corp.
| | 51,392 | | 3,841,038 |
Markel Group, Inc. (a)
| | 3,509 | | 5,528,991 |
Marsh & McLennan Cos., Inc.
| | 30,738 | | 6,477,111 |
Old Republic International Corp.
| | 71,891 | | 2,221,432 |
Progressive Corp.
| | 30,045 | | 6,240,647 |
RLI Corp.
| | 11,381 | | 1,601,193 |
Ryan Specialty Holdings, Inc. (b)
| | 59,162 | | 3,426,071 |
Selective Insurance Group, Inc.
| | 16,679 | | 1,564,991 |
Travelers Cos., Inc.
| | 25,824 | | 5,251,052 |
W R Berkley Corp.
| | 56,095 | | 4,407,945 |
Willis Towers Watson PLC
| | 17,696 | | 4,638,830 |
| | | | | | 83,131,304 |
| INTERACTIVE MEDIA & SERVICES — 0.6% | |
Alphabet, Inc. Class A
| | 23,665 | | 4,310,580 |
| IT SERVICES — 2.3% | |
Accenture PLC Class A
| | 9,458 | | 2,869,652 |
Akamai Technologies, Inc. (a)
| | 31,777 | | 2,862,472 |
Amdocs Ltd.
| | 32,574 | | 2,570,740 |
International Business Machines Corp.
| | 22,893 | | 3,959,344 |
| Security Description | | | Shares | | Value |
VeriSign, Inc. (a)
| | 21,171 | | $3,764,204 |
| | | | | | 16,026,412 |
| MACHINERY — 4.6% | |
Donaldson Co., Inc.
| | 33,489 | | 2,396,473 |
Fortive Corp.
| | 41,601 | | 3,082,634 |
Graco, Inc.
| | 46,656 | | 3,698,888 |
IDEX Corp.
| | 21,009 | | 4,227,011 |
Illinois Tool Works, Inc.
| | 14,918 | | 3,534,969 |
Nordson Corp.
| | 14,339 | | 3,325,787 |
Otis Worldwide Corp.
| | 52,418 | | 5,045,757 |
PACCAR, Inc.
| | 38,590 | | 3,972,454 |
Toro Co.
| | 28,925 | | 2,704,777 |
| | | | | | 31,988,750 |
| MEDIA — 1.0% | |
Comcast Corp. Class A
| | 81,498 | | 3,191,462 |
Fox Corp. Class A
| | 99,947 | | 3,435,178 |
| | | | | | 6,626,640 |
| MULTI-UTILITIES — 5.8% | |
Ameren Corp.
| | 74,185 | | 5,275,295 |
CMS Energy Corp.
| | 81,952 | | 4,878,603 |
Consolidated Edison, Inc.
| | 74,628 | | 6,673,236 |
DTE Energy Co.
| | 57,915 | | 6,429,144 |
NiSource, Inc.
| | 124,558 | | 3,588,516 |
Public Service Enterprise Group, Inc.
| | 98,582 | | 7,265,494 |
WEC Energy Group, Inc.
| | 79,453 | | 6,233,882 |
| | | | | | 40,344,170 |
| OFFICE REITs — 0.2% | |
COPT Defense Properties REIT
| | 62,774 | | 1,571,233 |
| OIL, GAS & CONSUMABLE FUELS — 2.9% | |
Cheniere Energy, Inc.
| | 15,568 | | 2,721,754 |
Chesapeake Energy Corp.
| | 30,357 | | 2,495,042 |
Chevron Corp.
| | 16,108 | | 2,519,613 |
DT Midstream, Inc.
| | 27,140 | | 1,927,754 |
Exxon Mobil Corp.
| | 20,844 | | 2,399,561 |
Kinder Morgan, Inc.
| | 229,939 | | 4,568,888 |
Williams Cos., Inc.
| | 77,714 | | 3,302,845 |
| | | | | | 19,935,457 |
| PHARMACEUTICALS — 2.4% | |
Bristol-Myers Squibb Co.
| | 105,298 | | 4,373,026 |
Johnson & Johnson
| | 50,226 | | 7,341,032 |
Merck & Co., Inc.
| | 41,620 | | 5,152,556 |
| | | | | | 16,866,614 |
| PROFESSIONAL SERVICES — 4.8% | |
Automatic Data Processing, Inc.
| | 19,393 | | 4,628,915 |
Booz Allen Hamilton Holding Corp.
| | 35,969 | | 5,535,629 |
Broadridge Financial Solutions, Inc.
| | 19,025 | | 3,747,925 |
CACI International, Inc. Class A (a)
| | 6,146 | | 2,643,579 |
Jacobs Solutions, Inc.
| | 35,037 | | 4,895,019 |
Maximus, Inc.
| | 16,852 | | 1,444,217 |
Paychex, Inc.
| | 36,532 | | 4,331,234 |
See accompanying notes to financial statements.
119
SPDR SERIES TRUST
SPDR SSGA US LARGE CAP LOW VOLATILITY INDEX ETF
SCHEDULE OF INVESTMENTS (continued)
June 30, 2024
| Security Description | | | Shares | | Value |
Science Applications International Corp.
| | 14,376 | | $1,689,899 |
Verisk Analytics, Inc.
| | 16,029 | | 4,320,617 |
| | | | | | 33,237,034 |
| REAL ESTATE MANAGEMENT & DEVELOPMENT — 0.4% | |
CoStar Group, Inc. (a)
| | 37,281 | | 2,764,013 |
| RESIDENTIAL REITs — 6.3% | |
American Homes 4 Rent Class A REIT
| | 94,538 | | 3,513,032 |
AvalonBay Communities, Inc. REIT
| | 36,479 | | 7,547,140 |
Camden Property Trust REIT
| | 29,384 | | 3,206,088 |
Equity LifeStyle Properties, Inc. REIT
| | 52,288 | | 3,405,518 |
Equity Residential REIT
| | 107,481 | | 7,452,733 |
Invitation Homes, Inc. REIT
| | 171,627 | | 6,159,693 |
Mid-America Apartment Communities, Inc. REIT
| | 33,594 | | 4,790,840 |
Sun Communities, Inc. REIT
| | 34,601 | | 4,163,884 |
UDR, Inc. REIT
| | 91,724 | | 3,774,443 |
| | | | | | 44,013,371 |
| RETAIL REITs — 0.3% | |
Agree Realty Corp. REIT
| | 28,501 | | 1,765,352 |
| SEMICONDUCTORS & SEMICONDUCTOR EQUIPMENT — 0.6% | |
Texas Instruments, Inc.
| | 21,710 | | 4,223,246 |
| SOFTWARE — 3.6% | |
Check Point Software Technologies Ltd. (a)
| | 26,858 | | 4,431,570 |
Dolby Laboratories, Inc. Class A
| | 26,331 | | 2,086,205 |
Microsoft Corp.
| | 12,317 | | 5,505,083 |
Oracle Corp.
| | 28,742 | | 4,058,370 |
Roper Technologies, Inc.
| | 8,004 | | 4,511,535 |
Tyler Technologies, Inc. (a)
| | 8,202 | | 4,123,802 |
| | | | | | 24,716,565 |
| SPECIALIZED REITs — 2.7% | |
American Tower Corp. REIT
| | 30,372 | | 5,903,709 |
Equinix, Inc. REIT
| | 7,817 | | 5,914,342 |
Public Storage REIT
| | 23,712 | | 6,820,757 |
| | | | | | 18,638,808 |
| Security Description | | | Shares | | Value |
| SPECIALTY RETAIL — 3.1% | |
AutoZone, Inc. (a)
| | 1,228 | | $3,639,915 |
Home Depot, Inc.
| | 10,086 | | 3,472,005 |
Lowe's Cos., Inc.
| | 11,325 | | 2,496,709 |
O'Reilly Automotive, Inc. (a)
| | 3,416 | | 3,607,501 |
TJX Cos., Inc.
| | 42,153 | | 4,641,045 |
Tractor Supply Co.
| | 14,642 | | 3,953,340 |
| | | | | | 21,810,515 |
| TRADING COMPANIES & DISTRIBUTORS — 0.5% | |
Fastenal Co.
| | 55,738 | | 3,502,576 |
TOTAL COMMON STOCKS
(Cost $647,177,961)
| | | | | 692,822,351 |
| SHORT-TERM INVESTMENTS — 0.5% | | | |
State Street Institutional Liquid Reserves Fund, Premier Class 5.36% (c) (d)
| | 1,857,526 | | 1,858,084 |
State Street Navigator Securities Lending Portfolio II (e) (f)
| | 1,657,465 | | 1,657,465 |
TOTAL SHORT-TERM INVESTMENTS
(Cost $3,515,537)
| | 3,515,549 | |
TOTAL INVESTMENTS — 100.1%
(Cost $650,693,498)
| | 696,337,900 | |
LIABILITIES IN EXCESS OF OTHER ASSETS — (0.1)%
| | (960,688) | |
NET ASSETS — 100.0%
| | $695,377,212 | |
| (a) | Non-income producing security. |
| (b) | All or a portion of the shares of the security are on loan at June 30, 2024. |
| (c) | The Fund invested in certain money market funds managed by SSGA Funds Management, Inc. Amounts related to these investments during the year ended June 30, 2024 are shown in the Affiliate Table below. |
| (d) | The rate shown is the annualized seven-day yield at June 30, 2024. |
| (e) | The Fund invested in an affiliated entity. Amounts related to these investments during the year ended June 30, 2024 are shown in the Affiliate Table below. |
| (f) | Investment of cash collateral for securities loaned. |
| REIT | Real Estate Investment Trust |
The following table summarizes the value of the Fund's investments according to the fair value hierarchy as of June 30, 2024.
| Description | | Level 1 –
Quoted Prices | | Level 2 –
Other Significant
Observable Inputs | | Level 3 –
Significant
Unobservable Inputs | | Total |
| ASSETS: | | | | | | | | |
| INVESTMENTS: | | | | | | | | |
Common Stocks
| | $692,822,351 | | $— | | $— | | $692,822,351 |
Short-Term Investments
| | 3,515,549 | | — | | — | | 3,515,549 |
TOTAL INVESTMENTS
| | $696,337,900 | | $— | | $— | | $696,337,900 |
See accompanying notes to financial statements.
120
SPDR SERIES TRUST
SPDR SSGA US LARGE CAP LOW VOLATILITY INDEX ETF
SCHEDULE OF INVESTMENTS (continued)
June 30, 2024
Affiliate Table
| | Number of
Shares Held
at
6/30/23 | | Value at
6/30/23 | | Cost of
Purchases | | Proceeds
from
Shares Sold | | Realized
Gain (Loss) | | Change in
Unrealized
Appreciation/
Depreciation | | Number of
Shares Held
at
6/30/24 | | Value at
6/30/24 | | Dividend
Income |
State Street Institutional Liquid Reserves Fund, Premier Class
| 1,487,182 | | $1,487,479 | | $30,942,908 | | $30,571,810 | | $(451) | | $(42) | | 1,857,526 | | $1,858,084 | | $94,666 |
State Street Navigator Securities Lending Portfolio II
| — | | — | | 45,933,767 | | 44,276,302 | | — | | — | | 1,657,465 | | 1,657,465 | | 3,061 |
Total
| | | $1,487,479 | | $76,876,675 | | $74,848,112 | | $(451) | | $(42) | | | | $3,515,549 | | $97,727 |
See accompanying notes to financial statements.
121
SPDR SERIES TRUST
SPDR SSGA US SMALL CAP LOW VOLATILITY INDEX ETF
SCHEDULE OF INVESTMENTS
June 30, 2024
| Security Description | | | Shares | | Value |
| COMMON STOCKS — 99.7% | |
| AEROSPACE & DEFENSE — 0.5% | |
Mercury Systems, Inc. (a)
| | 3,753 | | $101,293 |
Moog, Inc. Class A
| | 942 | | 157,597 |
National Presto Industries, Inc.
| | 4,598 | | 345,448 |
Park Aerospace Corp.
| | 16,993 | | 232,464 |
| | | | | | 836,802 |
| AIR FREIGHT & LOGISTICS — 0.2% | |
Hub Group, Inc. Class A
| | 4,359 | | 187,655 |
Radiant Logistics, Inc. (a)
| | 24,692 | | 140,497 |
| | | | | | 328,152 |
| AUTO COMPONENTS — 0.3% | |
Dorman Products, Inc. (a)
| | 1,739 | | 159,083 |
Gentherm, Inc. (a)
| | 1,768 | | 87,198 |
Standard Motor Products, Inc.
| | 7,156 | | 198,436 |
| | | | | | 444,717 |
| AUTOMOBILES — 0.0% (b) | |
NWTN, Inc. Class B (a)
| | 32,684 | | 41,836 |
| BANKS — 47.0% | |
1st Source Corp.
| | 23,904 | | 1,281,732 |
ACNB Corp.
| | 11,132 | | 403,758 |
Arrow Financial Corp.
| | 22,688 | | 591,022 |
Bank First Corp.
| | 12,299 | | 1,015,774 |
Bar Harbor Bankshares
| | 20,152 | | 541,686 |
Bridgewater Bancshares, Inc. (a)
| | 28,630 | | 332,394 |
Brookline Bancorp, Inc.
| | 118,270 | | 987,554 |
Burke & Herbert Financial Services Corp.
| | 16,948 | | 864,009 |
Cambridge Bancorp
| | 10,105 | | 697,245 |
Camden National Corp.
| | 19,072 | | 629,376 |
Capital Bancorp, Inc.
| | 12,145 | | 248,972 |
Capital City Bank Group, Inc.
| | 17,771 | | 505,407 |
Capitol Federal Financial, Inc.
| | 170,038 | | 933,509 |
Citizens & Northern Corp.
| | 19,964 | | 357,156 |
City Holding Co.
| | 19,808 | | 2,104,600 |
CNB Financial Corp.
| | 27,759 | | 566,561 |
Community Financial System, Inc.
| | 50,486 | | 2,383,444 |
Community Trust Bancorp, Inc.
| | 23,901 | | 1,043,518 |
Enterprise Bancorp, Inc.
| | 12,837 | | 319,385 |
Enterprise Financial Services Corp.
| | 37,657 | | 1,540,548 |
Esquire Financial Holdings, Inc.
| | 9,368 | | 445,917 |
Farmers & Merchants Bancorp, Inc.
| | 17,170 | | 398,687 |
Farmers National Banc Corp.
| | 48,558 | | 606,489 |
First Bancorp, Inc.
| | 12,979 | | 322,528 |
First Bancshares, Inc.
| | 38,755 | | 1,006,855 |
First Busey Corp.
| | 74,635 | | 1,806,913 |
First Business Financial Services, Inc.
| | 10,573 | | 391,095 |
First Commonwealth Financial Corp.
| | 113,240 | | 1,563,844 |
First Community Bankshares, Inc.
| | 21,333 | | 785,908 |
First Financial Bankshares, Inc.
| | 59,615 | | 1,760,431 |
First Financial Corp.
| | 15,275 | | 563,342 |
First Mid Bancshares, Inc.
| | 28,561 | | 939,086 |
First of Long Island Corp.
| | 28,693 | | 287,504 |
| Security Description | | | Shares | | Value |
Five Star Bancorp
| | 15,355 | | $363,146 |
FS Bancorp, Inc.
| | 8,954 | | 326,373 |
Fulton Financial Corp.
| | 97,466 | | 1,654,973 |
German American Bancorp, Inc.
| | 38,233 | | 1,351,537 |
Glacier Bancorp, Inc.
| | 37,281 | | 1,391,327 |
Great Southern Bancorp, Inc.
| | 12,041 | | 669,600 |
Guaranty Bancshares, Inc.
| | 11,196 | | 353,122 |
HarborOne Bancorp, Inc.
| | 53,758 | | 598,326 |
Heritage Financial Corp.
| | 46,728 | | 842,506 |
Hingham Institution For Savings The
| | 2,129 | | 380,835 |
Home Bancorp, Inc.
| | 9,536 | | 381,535 |
Home BancShares, Inc.
| | 62,984 | | 1,509,097 |
HomeTrust Bancshares, Inc.
| | 19,669 | | 590,660 |
International Bancshares Corp.
| | 31,570 | | 1,806,120 |
Kearny Financial Corp.
| | 77,301 | | 475,401 |
Lakeland Financial Corp.
| | 22,865 | | 1,406,655 |
Macatawa Bank Corp.
| | 35,528 | | 518,709 |
Metrocity Bankshares, Inc.
| | 24,462 | | 645,797 |
Mid Penn Bancorp, Inc.
| | 19,652 | | 431,361 |
National Bank Holdings Corp. Class A
| | 49,389 | | 1,928,640 |
NBT Bancorp, Inc.
| | 56,903 | | 2,196,456 |
Nicolet Bankshares, Inc.
| | 17,808 | | 1,478,776 |
Northfield Bancorp, Inc.
| | 53,168 | | 504,033 |
Northwest Bancshares, Inc.
| | 165,472 | | 1,911,202 |
Old National Bancorp
| | 135,709 | | 2,332,838 |
Origin Bancorp, Inc.
| | 38,596 | | 1,224,265 |
Orrstown Financial Services, Inc.
| | 13,624 | | 372,753 |
Park National Corp.
| | 15,304 | | 2,178,371 |
Peoples Bancorp, Inc.
| | 45,654 | | 1,369,620 |
Peoples Financial Services Corp.
| | 9,249 | | 421,199 |
Primis Financial Corp.
| | 28,497 | | 298,649 |
QCR Holdings, Inc.
| | 22,158 | | 1,329,480 |
S&T Bancorp, Inc.
| | 44,358 | | 1,481,114 |
Sandy Spring Bancorp, Inc.
| | 59,274 | | 1,443,915 |
Sierra Bancorp
| | 18,057 | | 404,116 |
Simmons First National Corp. Class A
| | 71,505 | | 1,257,058 |
SmartFinancial, Inc.
| | 19,246 | | 455,553 |
South Plains Financial, Inc.
| | 15,964 | | 431,028 |
Southern California Bancorp (a) (c)
| | 15,634 | | 210,590 |
Southside Bancshares, Inc.
| | 39,203 | | 1,082,395 |
Stock Yards Bancorp, Inc.
| | 31,494 | | 1,564,307 |
Tompkins Financial Corp.
| | 17,703 | | 865,677 |
Towne Bank
| | 63,370 | | 1,728,100 |
TrustCo Bank Corp.
| | 25,077 | | 721,465 |
Trustmark Corp.
| | 54,128 | | 1,626,005 |
Univest Financial Corp.
| | 39,495 | | 901,671 |
WaFd, Inc.
| | 52,238 | | 1,492,962 |
WesBanco, Inc.
| | 51,629 | | 1,440,965 |
West BanCorp, Inc.
| | 20,081 | | 359,450 |
Westamerica BanCorp
| | 34,825 | | 1,690,057 |
| | | | | | 80,626,039 |
| BIOTECHNOLOGY — 0.6% | |
ACADIA Pharmaceuticals, Inc. (a)
| | 2,630 | | 42,738 |
ADMA Biologics, Inc. (a)
| | 12,582 | | 140,667 |
See accompanying notes to financial statements.
122
SPDR SERIES TRUST
SPDR SSGA US SMALL CAP LOW VOLATILITY INDEX ETF
SCHEDULE OF INVESTMENTS (continued)
June 30, 2024
| Security Description | | | Shares | | Value |
Agios Pharmaceuticals, Inc. (a)
| | 2,262 | | $97,537 |
Alkermes PLC (a)
| | 3,509 | | 84,567 |
Anika Therapeutics, Inc. (a)
| | 3,274 | | 82,930 |
Immatics NV (a)
| | 5,779 | | 67,152 |
Insmed, Inc. (a)
| | 2,350 | | 157,450 |
Ironwood Pharmaceuticals, Inc. (a)
| | 12,914 | | 84,199 |
PTC Therapeutics, Inc. (a)
| | 2,187 | | 66,878 |
Ultragenyx Pharmaceutical, Inc. (a)
| | 1,220 | | 50,142 |
Xencor, Inc. (a)
| | 4,191 | | 79,336 |
| | | | | | 953,596 |
| BUILDING PRODUCTS — 0.4% | |
Apogee Enterprises, Inc.
| | 2,167 | | 136,163 |
AZZ, Inc.
| | 1,824 | | 140,904 |
CSW Industrials, Inc.
| | 962 | | 255,228 |
Janus International Group, Inc. (a) (c)
| | 8,555 | | 108,050 |
| | | | | | 640,345 |
| CAPITAL MARKETS — 5.5% | |
Diamond Hill Investment Group, Inc.
| | 3,734 | | 525,560 |
GCM Grosvenor, Inc. Class A (c)
| | 181,861 | | 1,774,963 |
Patria Investments Ltd. Class A
| | 103,693 | | 1,250,537 |
PJT Partners, Inc. Class A (c)
| | 24,881 | | 2,684,909 |
Trinity Capital, Inc. (c)
| | 59,234 | | 837,569 |
Virtu Financial, Inc. Class A
| | 89,326 | | 2,005,369 |
WisdomTree, Inc.
| | 28,426 | | 281,702 |
| | | | | | 9,360,609 |
| CHEMICALS — 1.0% | |
Ashland, Inc.
| | 2,300 | | 217,327 |
Ecovyst, Inc. (a)
| | 14,337 | | 128,603 |
Hawkins, Inc.
| | 1,952 | | 177,632 |
HB Fuller Co.
| | 1,583 | | 121,828 |
Huntsman Corp.
| | 5,254 | | 119,634 |
Innospec, Inc.
| | 1,368 | | 169,071 |
Minerals Technologies, Inc.
| | 2,094 | | 174,137 |
Sensient Technologies Corp.
| | 4,196 | | 311,301 |
Stepan Co.
| | 3,021 | | 253,643 |
| | | | | | 1,673,176 |
| COMMERCIAL SERVICES & SUPPLIES — 0.9% | |
ABM Industries, Inc.
| | 2,917 | | 147,513 |
Brady Corp. Class A
| | 3,816 | | 251,932 |
Ennis, Inc.
| | 23,913 | | 523,456 |
HNI Corp.
| | 4,118 | | 185,392 |
Matthews International Corp. Class A
| | 4,215 | | 105,586 |
Stericycle, Inc. (a)
| | 3,032 | | 176,250 |
UniFirst Corp.
| | 1,391 | | 238,598 |
| | | | | | 1,628,727 |
| COMMUNICATIONS EQUIPMENT — 0.2% | |
Ituran Location & Control Ltd.
| | 4,622 | | 113,886 |
NetScout Systems, Inc. (a)
| | 9,342 | | 170,865 |
Viavi Solutions, Inc. (a)
| | 13,500 | | 92,745 |
| | | | | | 377,496 |
| Security Description | | | Shares | | Value |
| CONSTRUCTION & ENGINEERING — 0.8% | |
Arcosa, Inc.
| | 2,550 | | $212,696 |
Argan, Inc.
| | 5,216 | | 381,603 |
Construction Partners, Inc. Class A (a)
| | 3,145 | | 173,635 |
Great Lakes Dredge & Dock Corp. (a)
| | 14,748 | | 129,487 |
MYR Group, Inc. (a)
| | 854 | | 115,896 |
Primoris Services Corp.
| | 2,826 | | 140,989 |
Valmont Industries, Inc.
| | 786 | | 215,718 |
| | | | | | 1,370,024 |
| CONSUMER FINANCE — 1.7% | |
Nelnet, Inc. Class A
| | 29,522 | | 2,977,589 |
| CONSUMER STAPLES DISTRIBUTION & RETAIL — 0.2% | |
PriceSmart, Inc.
| | 1,789 | | 145,267 |
Village Super Market, Inc. Class A
| | 10,689 | | 282,296 |
| | | | | | 427,563 |
| CONTAINERS & PACKAGING — 0.5% | |
Greif, Inc. Class A
| | 3,643 | | 209,363 |
Silgan Holdings, Inc.
| | 7,626 | | 322,809 |
TriMas Corp.
| | 10,846 | | 277,224 |
| | | | | | 809,396 |
| DISTRIBUTORS — 0.1% | |
Weyco Group, Inc.
| | 4,130 | | 125,222 |
| DIVERSIFIED CONSUMER SERVICES — 0.5% | |
Carriage Services, Inc.
| | 3,385 | | 90,853 |
Frontdoor, Inc. (a)
| | 4,224 | | 142,729 |
Graham Holdings Co. Class B
| | 244 | | 170,690 |
Grand Canyon Education, Inc. (a)
| | 1,053 | | 147,325 |
Laureate Education, Inc.
| | 8,450 | | 126,243 |
Perdoceo Education Corp.
| | 6,113 | | 130,941 |
Strategic Education, Inc.
| | 1,136 | | 125,710 |
| | | | | | 934,491 |
| DIVERSIFIED REITs — 0.5% | |
Armada Hoffler Properties, Inc. REIT
| | 15,005 | | 166,405 |
Broadstone Net Lease, Inc. REIT
| | 15,007 | | 238,161 |
CTO Realty Growth, Inc. REIT (c)
| | 15,767 | | 275,292 |
Gladstone Commercial Corp. REIT
| | 15,454 | | 220,529 |
| | | | | | 900,387 |
| DIVERSIFIED TELECOMMUNICATION SERVICES — 0.4% | |
Anterix, Inc. (a)
| | 2,824 | | 111,802 |
ATN International, Inc.
| | 5,306 | | 120,977 |
Cogent Communications Holdings, Inc.
| | 2,440 | | 137,714 |
Iridium Communications, Inc.
| | 3,563 | | 94,847 |
Liberty Latin America Ltd. Class C (a)
| | 16,831 | | 161,914 |
Shenandoah Telecommunications Co.
| | 5,850 | | 95,530 |
| | | | | | 722,784 |
See accompanying notes to financial statements.
123
SPDR SERIES TRUST
SPDR SSGA US SMALL CAP LOW VOLATILITY INDEX ETF
SCHEDULE OF INVESTMENTS (continued)
June 30, 2024
| Security Description | | | Shares | | Value |
| ELECTRIC UTILITIES — 0.7% | |
IDACORP, Inc.
| | 4,563 | | $425,043 |
MGE Energy, Inc.
| | 4,500 | | 336,240 |
PNM Resources, Inc.
| | 10,558 | | 390,224 |
| | | | | | 1,151,507 |
| ELECTRICAL EQUIPMENT — 0.1% | |
EnerSys
| | 1,438 | | 148,862 |
| ELECTRONIC EQUIPMENT, INSTRUMENTS & COMPONENTS — 1.5% | |
Advanced Energy Industries, Inc.
| | 966 | | 105,062 |
Avnet, Inc.
| | 3,043 | | 156,684 |
Badger Meter, Inc.
| | 1,243 | | 231,633 |
Benchmark Electronics, Inc.
| | 4,843 | | 191,105 |
Crane NXT Co. (c)
| | 2,253 | | 138,379 |
CTS Corp.
| | 2,776 | | 140,549 |
ePlus, Inc. (a)
| | 1,561 | | 115,015 |
Hollysys Automation Technologies Ltd. (a) (c)
| | 5,380 | | 116,423 |
IPG Photonics Corp. (a)
| | 1,099 | | 92,745 |
Knowles Corp. (a)
| | 7,589 | | 130,986 |
Methode Electronics, Inc.
| | 10,538 | | 109,068 |
OSI Systems, Inc. (a)
| | 1,469 | | 202,017 |
Plexus Corp. (a)
| | 1,907 | | 196,764 |
Sanmina Corp. (a)
| | 1,971 | | 130,579 |
ScanSource, Inc. (a)
| | 2,319 | | 102,755 |
TTM Technologies, Inc. (a)
| | 7,154 | | 139,002 |
Vishay Intertechnology, Inc.
| | 5,953 | | 132,752 |
Vishay Precision Group, Inc. (a)
| | 4,234 | | 128,883 |
| | | | | | 2,560,401 |
| ENERGY EQUIPMENT & SERVICES — 0.4% | |
Archrock, Inc.
| | 9,659 | | 195,305 |
Dril-Quip, Inc. (a)
| | 8,439 | | 156,965 |
Ranger Energy Services, Inc.
| | 14,173 | | 149,100 |
Valaris Ltd. (a)
| | 2,726 | | 203,087 |
| | | | | | 704,457 |
| ENTERTAINMENT — 0.1% | |
Madison Square Garden Sports Corp. (a)
| | 940 | | 176,842 |
| FINANCIAL SERVICES — 5.0% | |
Alerus Financial Corp.
| | 25,136 | | 492,917 |
Banco Latinoamericano de Comercio Exterior SA
| | 50,236 | | 1,490,502 |
Cannae Holdings, Inc. (c)
| | 6,719 | | 121,883 |
Cass Information Systems, Inc.
| | 4,468 | | 179,033 |
EVERTEC, Inc.
| | 38,703 | | 1,286,875 |
Federal Agricultural Mortgage Corp. Class C
| | 8,284 | | 1,497,913 |
Radian Group, Inc.
| | 49,974 | | 1,554,191 |
Waterstone Financial, Inc.
| | 22,619 | | 289,297 |
Western Union Co.
| | 139,418 | | 1,703,688 |
| | | | | | 8,616,299 |
| FOOD PRODUCTS — 0.8% | |
Cal-Maine Foods, Inc.
| | 3,550 | | 216,940 |
| Security Description | | | Shares | | Value |
Flowers Foods, Inc.
| | 24,959 | | $554,090 |
J & J Snack Foods Corp.
| | 1,758 | | 285,446 |
John B Sanfilippo & Son, Inc.
| | 2,298 | | 223,297 |
Nomad Foods Ltd.
| | 10,750 | | 177,160 |
| | | | | | 1,456,933 |
| GAS UTILITIES — 1.1% | |
Chesapeake Utilities Corp.
| | 3,348 | | 355,558 |
National Fuel Gas Co.
| | 16,381 | | 887,686 |
Northwest Natural Holding Co.
| | 9,529 | | 344,092 |
Spire, Inc.
| | 5,965 | | 362,255 |
| | | | | | 1,949,591 |
| GROUND TRANSPORTATION — 0.6% | |
Heartland Express, Inc.
| | 23,617 | | 291,198 |
Marten Transport Ltd.
| | 12,643 | | 233,263 |
Schneider National, Inc. Class B
| | 8,450 | | 204,152 |
Werner Enterprises, Inc.
| | 7,100 | | 254,393 |
| | | | | | 983,006 |
| HEALTH CARE EQUIPMENT & SUPPLIES — 1.5% | |
Artivion, Inc. (a)
| | 3,443 | | 88,313 |
AtriCure, Inc. (a)
| | 2,354 | | 53,601 |
Avanos Medical, Inc. (a)
| | 5,545 | | 110,456 |
CONMED Corp.
| | 1,247 | | 86,442 |
Envista Holdings Corp. (a)
| | 5,070 | | 84,314 |
Glaukos Corp. (a)
| | 750 | | 88,762 |
Haemonetics Corp. (a)
| | 1,287 | | 106,474 |
ICU Medical, Inc. (a)
| | 1,135 | | 134,781 |
Inari Medical, Inc. (a)
| | 1,871 | | 90,089 |
Integer Holdings Corp. (a)
| | 1,097 | | 127,022 |
Integra LifeSciences Holdings Corp. (a)
| | 3,919 | | 114,200 |
iRadimed Corp.
| | 2,136 | | 93,856 |
LeMaitre Vascular, Inc.
| | 2,152 | | 177,067 |
LivaNova PLC (a)
| | 1,920 | | 105,254 |
Merit Medical Systems, Inc. (a)
| | 1,255 | | 107,867 |
Neogen Corp. (a)
| | 4,972 | | 77,712 |
Omnicell, Inc. (a)
| | 3,581 | | 96,938 |
Orthofix Medical, Inc. (a)
| | 6,450 | | 85,527 |
OrthoPediatrics Corp. (a)
| | 3,095 | | 89,012 |
Surmodics, Inc. (a)
| | 2,250 | | 94,590 |
UFP Technologies, Inc. (a)
| | 738 | | 194,736 |
Utah Medical Products, Inc.
| | 3,741 | | 249,936 |
Varex Imaging Corp. (a)
| | 5,315 | | 78,290 |
| | | | | | 2,535,239 |
| HEALTH CARE PROVIDERS & SERVICES — 0.8% | |
Addus HomeCare Corp. (a)
| | 1,560 | | 181,132 |
Amedisys, Inc. (a)
| | 1,053 | | 96,665 |
AMN Healthcare Services, Inc. (a)
| | 2,125 | | 108,864 |
National HealthCare Corp.
| | 3,412 | | 369,861 |
National Research Corp.
| | 3,291 | | 75,528 |
Patterson Cos., Inc.
| | 4,503 | | 108,612 |
Premier, Inc. Class A
| | 10,273 | | 191,797 |
RadNet, Inc. (a)
| | 1,500 | | 88,380 |
Select Medical Holdings Corp.
| | 3,112 | | 109,107 |
See accompanying notes to financial statements.
124
SPDR SERIES TRUST
SPDR SSGA US SMALL CAP LOW VOLATILITY INDEX ETF
SCHEDULE OF INVESTMENTS (continued)
June 30, 2024
| Security Description | | | Shares | | Value |
U.S. Physical Therapy, Inc.
| | 903 | | $83,455 |
| | | | | | 1,413,401 |
| HEALTH CARE REITs — 0.7% | |
CareTrust REIT, Inc.
| | 7,700 | | 193,270 |
Community Healthcare Trust, Inc. REIT
| | 9,730 | | 227,585 |
Global Medical REIT, Inc.
| | 18,725 | | 170,023 |
LTC Properties, Inc. REIT
| | 6,978 | | 240,741 |
National Health Investors, Inc. REIT
| | 3,152 | | 213,485 |
Universal Health Realty Income Trust REIT
| | 5,429 | | 212,491 |
| | | | | | 1,257,595 |
| HEALTH CARE TECHNOLOGY — 0.1% | |
HealthStream, Inc.
| | 8,737 | | 243,762 |
| HOTEL & RESORT REITs — 0.1% | |
Apple Hospitality REIT, Inc.
| | 9,990 | | 145,255 |
| HOTELS, RESTAURANTS & LEISURE — 0.4% | |
Arcos Dorados Holdings, Inc. Class A
| | 7,852 | | 70,668 |
Bowlero Corp. Class A
| | 7,230 | | 104,763 |
Cracker Barrel Old Country Store, Inc. (c)
| | 1,399 | | 58,982 |
Global Business Travel Group I (a)
| | 18,584 | | 122,654 |
Papa John's International, Inc. (c)
| | 1,710 | | 80,336 |
Wendy's Co.
| | 10,671 | | 180,980 |
| | | | | | 618,383 |
| HOUSEHOLD DURABLES — 0.3% | |
Cavco Industries, Inc. (a)
| | 274 | | 94,850 |
Ethan Allen Interiors, Inc.
| | 3,400 | | 94,826 |
Helen of Troy Ltd. (a)
| | 1,005 | | 93,204 |
La-Z-Boy, Inc.
| | 3,833 | | 142,894 |
Leggett & Platt, Inc.
| | 5,673 | | 65,013 |
Tri Pointe Homes, Inc. (a)
| | 2,633 | | 98,079 |
| | | | | | 588,866 |
| HOUSEHOLD PRODUCTS — 0.2% | |
Central Garden & Pet Co. (a) (c)
| | 3,374 | | 129,899 |
Spectrum Brands Holdings, Inc.
| | 1,130 | | 97,101 |
WD-40 Co.
| | 727 | | 159,678 |
| | | | | | 386,678 |
| INDUSTRIAL REITs — 0.1% | |
LXP Industrial Trust REIT
| | 27,802 | | 253,554 |
| INSURANCE — 7.5% | |
AMERISAFE, Inc.
| | 25,844 | | 1,134,293 |
CNO Financial Group, Inc.
| | 60,651 | | 1,681,246 |
Employers Holdings, Inc.
| | 33,820 | | 1,441,747 |
Enstar Group Ltd. (a)
| | 7,240 | | 2,213,268 |
Greenlight Capital Re Ltd. Class A (a)
| | 35,304 | | 462,482 |
Hanover Insurance Group, Inc.
| | 20,991 | | 2,633,111 |
Horace Mann Educators Corp.
| | 55,487 | | 1,809,986 |
Safety Insurance Group, Inc.
| | 19,394 | | 1,455,132 |
| | | | | | 12,831,265 |
| Security Description | | | Shares | | Value |
| INTERACTIVE MEDIA & SERVICES — 0.1% | |
Ziff Davis, Inc. (a)
| | 1,973 | | $108,614 |
ZipRecruiter, Inc. Class A (a)
| | 6,943 | | 63,112 |
| | | | | | 171,726 |
| IT SERVICES — 0.2% | |
Hackett Group, Inc.
| | 7,880 | | 171,154 |
Squarespace, Inc. Class A (a)
| | 3,193 | | 139,310 |
| | | | | | 310,464 |
| LEISURE EQUIPMENT & PRODUCTS — 0.1% | |
Johnson Outdoors, Inc. Class A
| | 2,885 | | 100,917 |
Sturm Ruger & Co., Inc.
| | 3,334 | | 138,861 |
| | | | | | 239,778 |
| LIFE SCIENCES TOOLS & SERVICES — 0.1% | |
Azenta, Inc. (a)
| | 940 | | 49,463 |
Mesa Laboratories, Inc.
| | 1,014 | | 87,985 |
| | | | | | 137,448 |
| MACHINERY — 1.8% | |
Alamo Group, Inc.
| | 914 | | 158,122 |
Albany International Corp. Class A
| | 1,306 | | 110,292 |
Columbus McKinnon Corp.
| | 3,268 | | 112,877 |
Douglas Dynamics, Inc.
| | 6,041 | | 141,359 |
Enerpac Tool Group Corp.
| | 3,480 | | 132,866 |
ESCO Technologies, Inc.
| | 1,739 | | 182,665 |
Federal Signal Corp.
| | 2,427 | | 203,067 |
Franklin Electric Co., Inc.
| | 2,614 | | 251,781 |
Gencor Industries, Inc. (a)
| | 12,484 | | 241,441 |
Gorman-Rupp Co.
| | 5,538 | | 203,300 |
Hillenbrand, Inc.
| | 2,290 | | 91,646 |
John Bean Technologies Corp.
| | 1,280 | | 121,562 |
Kadant, Inc.
| | 484 | | 142,190 |
L B Foster Co. Class A (a)
| | 5,069 | | 109,085 |
Lindsay Corp.
| | 1,639 | | 201,400 |
Miller Industries, Inc.
| | 3,365 | | 185,142 |
Mueller Water Products, Inc. Class A
| | 10,444 | | 187,156 |
Standex International Corp.
| | 876 | | 141,167 |
Tennant Co.
| | 1,669 | | 164,296 |
| | | | | | 3,081,414 |
| MEDIA — 0.5% | |
Cable One, Inc. (c)
| | 326 | | 115,404 |
EchoStar Corp. Class A (a)
| | 6,120 | | 108,997 |
John Wiley & Sons, Inc. Class A
| | 3,854 | | 156,858 |
Scholastic Corp.
| | 2,790 | | 98,961 |
TechTarget, Inc. (a)
| | 3,068 | | 95,630 |
TEGNA, Inc.
| | 14,365 | | 200,248 |
| | | | | | 776,098 |
| METALS & MINING — 0.3% | |
Arch Resources, Inc.
| | 790 | | 120,262 |
Materion Corp.
| | 815 | | 88,126 |
SunCoke Energy, Inc.
| | 17,656 | | 173,029 |
Warrior Met Coal, Inc.
| | 3,346 | | 210,028 |
| | | | | | 591,445 |
See accompanying notes to financial statements.
125
SPDR SERIES TRUST
SPDR SSGA US SMALL CAP LOW VOLATILITY INDEX ETF
SCHEDULE OF INVESTMENTS (continued)
June 30, 2024
| Security Description | | | Shares | | Value |
| MORTGAGE REAL ESTATE INVESTMENT TRUST (REITs) — 0.3% | |
AFC Gamma, Inc. REIT (c)
| | 21,393 | | $260,995 |
KKR Real Estate Finance Trust, Inc. REIT
| | 19,567 | | 177,081 |
| | | | | | 438,076 |
| MULTI-UTILITIES — 0.5% | |
Black Hills Corp.
| | 6,879 | | 374,080 |
Northwestern Energy Group, Inc.
| | 8,353 | | 418,318 |
| | | | | | 792,398 |
| OFFICE REITs — 1.5% | |
Cousins Properties, Inc. REIT
| | 6,991 | | 161,842 |
Douglas Emmett, Inc. REIT (c)
| | 11,327 | | 150,762 |
Easterly Government Properties, Inc. REIT
| | 25,310 | | 313,085 |
Equity Commonwealth REIT (a)
| | 67,083 | | 1,301,410 |
Highwoods Properties, Inc. REIT
| | 6,755 | | 177,454 |
JBG SMITH Properties REIT
| | 10,243 | | 156,001 |
Postal Realty Trust, Inc. Class A REIT
| | 22,838 | | 304,430 |
| | | | | | 2,564,984 |
| OIL, GAS & CONSUMABLE FUELS — 1.5% | |
California Resources Corp.
| | 3,204 | | 170,517 |
Delek U.S. Holdings, Inc.
| | 5,419 | | 134,174 |
Geopark Ltd. (c)
| | 15,106 | | 165,411 |
Gulfport Energy Corp. (a)
| | 1,936 | | 292,336 |
Permian Basin Royalty Trust (c)
| | 13,894 | | 156,446 |
Sabine Royalty Trust (c)
| | 6,266 | | 405,348 |
Sable Offshore Corp. (a) (c)
| | 68,697 | | 1,035,264 |
SFL Corp. Ltd.
| | 11,546 | | 160,259 |
Sitio Royalties Corp. Class A
| | 5,268 | | 124,377 |
| | | | | | 2,644,132 |
| PERSONAL CARE PRODUCTS — 0.2% | |
Herbalife Ltd. (a)
| | 8,500 | | 88,315 |
Nature's Sunshine Products, Inc. (a)
| | 6,289 | | 94,775 |
USANA Health Sciences, Inc. (a)
| | 2,087 | | 94,416 |
| | | | | | 277,506 |
| PHARMACEUTICALS — 0.9% | |
Amphastar Pharmaceuticals, Inc. (a)
| | 2,003 | | 80,120 |
ANI Pharmaceuticals, Inc. (a)
| | 1,296 | | 82,529 |
Corcept Therapeutics, Inc. (a)
| | 2,953 | | 95,943 |
Harmony Biosciences Holdings, Inc. (a)
| | 2,319 | | 69,964 |
Innoviva, Inc. (a)
| | 10,250 | | 168,100 |
Oculis Holding AG (a) (c)
| | 8,634 | | 103,176 |
Organon & Co.
| | 3,940 | | 81,558 |
Pacira BioSciences, Inc. (a)
| | 4,085 | | 116,872 |
Perrigo Co. PLC
| | 4,790 | | 123,007 |
Phibro Animal Health Corp. Class A
| | 8,561 | | 143,568 |
Prestige Consumer Healthcare, Inc. (a)
| | 3,666 | | 252,404 |
Supernus Pharmaceuticals, Inc. (a)
| | 4,018 | | 107,482 |
| Security Description | | | Shares | | Value |
Theravance Biopharma, Inc. (a) (c)
| | 7,373 | | $62,523 |
| | | | | | 1,487,246 |
| PROFESSIONAL SERVICES — 1.3% | |
ASGN, Inc. (a)
| | 1,042 | | 91,873 |
Barrett Business Services, Inc.
| | 4,248 | | 139,207 |
CBIZ, Inc. (a)
| | 3,175 | | 235,268 |
Concentrix Corp.
| | 1,790 | | 113,271 |
CSG Systems International, Inc.
| | 4,619 | | 190,164 |
Dun & Bradstreet Holdings, Inc.
| | 14,931 | | 138,261 |
Exponent, Inc.
| | 2,512 | | 238,941 |
Forrester Research, Inc. (a)
| | 7,228 | | 123,454 |
Heidrick & Struggles International, Inc.
| | 4,510 | | 142,426 |
Huron Consulting Group, Inc. (a)
| | 1,372 | | 135,142 |
IBEX Holdings Ltd. (a)
| | 6,254 | | 101,190 |
ICF International, Inc.
| | 1,765 | | 262,032 |
Kforce, Inc.
| | 2,429 | | 150,914 |
Resources Connection, Inc.
| | 19,517 | | 215,468 |
| | | | | | 2,277,611 |
| REAL ESTATE MANAGEMENT & DEVELOPMENT — 0.3% | |
Kennedy-Wilson Holdings, Inc.
| | 19,178 | | 186,410 |
Tejon Ranch Co. (a)
| | 18,696 | | 318,954 |
| | | | | | 505,364 |
| RESIDENTIAL REITs — 0.4% | |
Centerspace REIT
| | 3,659 | | 247,458 |
Elme Communities REIT
| | 16,152 | | 257,301 |
Independence Realty Trust, Inc. REIT
| | 10,004 | | 187,475 |
| | | | | | 692,234 |
| RETAIL REITs — 0.6% | |
Getty Realty Corp. REIT
| | 11,078 | | 295,339 |
NETSTREIT Corp. (c)
| | 14,986 | | 241,275 |
Phillips Edison & Co., Inc. REIT
| | 10,968 | | 358,763 |
Saul Centers, Inc. REIT
| | 4,739 | | 174,253 |
| | | | | | 1,069,630 |
| SEMICONDUCTORS & SEMICONDUCTOR EQUIPMENT — 0.4% | |
CEVA, Inc. (a)
| | 4,024 | | 77,623 |
FormFactor, Inc. (a)
| | 1,970 | | 119,244 |
NVE Corp.
| | 1,390 | | 103,819 |
Power Integrations, Inc.
| | 1,561 | | 109,567 |
Tower Semiconductor Ltd. (a)
| | 3,290 | | 129,330 |
Veeco Instruments, Inc. (a)
| | 2,630 | | 122,847 |
| | | | | | 662,430 |
| SOFTWARE — 1.2% | |
A10 Networks, Inc.
| | 7,314 | | 101,299 |
ACI Worldwide, Inc. (a)
| | 3,878 | | 153,530 |
Alarm.com Holdings, Inc. (a)
| | 1,220 | | 77,519 |
American Software, Inc. Class A
| | 11,429 | | 104,347 |
Blackbaud, Inc. (a)
| | 2,111 | | 160,795 |
BlackLine, Inc. (a)
| | 1,800 | | 87,210 |
Box, Inc. Class A (a)
| | 3,995 | | 105,628 |
See accompanying notes to financial statements.
126
SPDR SERIES TRUST
SPDR SSGA US SMALL CAP LOW VOLATILITY INDEX ETF
SCHEDULE OF INVESTMENTS (continued)
June 30, 2024
| Security Description | | | Shares | | Value |
CommVault Systems, Inc. (a)
| | 1,702 | | $206,912 |
Envestnet, Inc. (a)
| | 1,960 | | 122,676 |
Magic Software Enterprises Ltd.
| | 13,044 | | 125,614 |
nCino, Inc. (a)
| | 5,086 | | 159,955 |
Progress Software Corp.
| | 3,541 | | 192,134 |
Radware Ltd. (a)
| | 7,862 | | 143,403 |
Sapiens International Corp. NV
| | 3,863 | | 131,071 |
Verint Systems, Inc. (a)
| | 3,139 | | 101,076 |
Workiva, Inc. (a)
| | 1,220 | | 89,048 |
| | | | | | 2,062,217 |
| SPECIALIZED REITs — 0.3% | |
Farmland Partners, Inc. REIT (c)
| | 14,173 | | 163,415 |
Four Corners Property Trust, Inc. REIT
| | 8,830 | | 217,836 |
PotlatchDeltic Corp. REIT
| | 3,882 | | 152,912 |
| | | | | | 534,163 |
| SPECIALTY RETAIL — 0.4% | |
Advance Auto Parts, Inc.
| | 1,283 | | 81,253 |
Arko Corp.
| | 41,042 | | 257,333 |
Group 1 Automotive, Inc.
| | 325 | | 96,616 |
Monro, Inc.
| | 4,036 | | 96,299 |
Winmark Corp.
| | 454 | | 160,094 |
| | | | | | 691,595 |
| TECHNOLOGY HARDWARE, STORAGE & PERIPHERALS — 0.1% | |
CompoSecure, Inc. Class A (c)
| | 22,622 | | 153,830 |
| TEXTILES, APPAREL & LUXURY GOODS — 0.3% | |
Carter's, Inc.
| | 1,879 | | 116,442 |
Columbia Sportswear Co.
| | 2,876 | | 227,434 |
Oxford Industries, Inc. (c)
| | 896 | | 89,734 |
Steven Madden Ltd.
| | 2,878 | | 121,740 |
| | | | | | 555,350 |
| TRADING COMPANIES & DISTRIBUTORS — 1.4% | |
GATX Corp.
| | 1,709 | | 226,203 |
McGrath RentCorp
| | 17,812 | | 1,897,868 |
| Security Description | | | Shares | | Value |
Rush Enterprises, Inc. Class A
| | 3,570 | | $149,476 |
Transcat, Inc. (a)
| | 1,398 | | 167,313 |
| | | | | | 2,440,860 |
| WATER UTILITIES — 0.2% | |
Artesian Resources Corp. Class A
| | 11,554 | | 406,239 |
| WIRELESS TELECOMMUNICATION SERVICES — 0.1% | |
Spok Holdings, Inc.
| | 8,543 | | 126,522 |
| DIVERSIFIED FINANCIAL SERVICES — 1.4% | |
Churchill Capital Corp. VII Class A (a) (c)
| | 121,965 | | 1,313,563 |
Oklo, Inc. (a)
| | 55,228 | | 467,781 |
Slam Corp. Class A (a)
| | 53,246 | | 592,628 |
| | | | | | 2,373,972 |
TOTAL COMMON STOCKS
(Cost $178,657,945)
| | | | | 171,265,579 |
| SHORT-TERM INVESTMENT — 1.2% | | | |
State Street Navigator Securities Lending Portfolio II (d) (e)
(Cost $1,985,283)
| | 1,985,283 | | 1,985,283 |
TOTAL INVESTMENTS — 100.9%
(Cost $180,643,228)
| | 173,250,862 | |
LIABILITIES IN EXCESS OF OTHER ASSETS — (0.9)%
| | (1,523,433) | |
NET ASSETS — 100.0%
| | $171,727,429 | |
| (a) | Non-income producing security. |
| (b) | Amount is less than 0.05% of net assets. |
| (c) | All or a portion of the shares of the security are on loan at June 30, 2024. |
| (d) | The Fund invested in an affiliated entity. Amounts related to these investments during the year ended June 30, 2024 are shown in the Affiliate Table below. |
| (e) | Investment of cash collateral for securities loaned. |
| REIT | Real Estate Investment Trust |
The following table summarizes the value of the Fund's investments according to the fair value hierarchy as of June 30, 2024.
| Description | | Level 1 –
Quoted Prices | | Level 2 –
Other Significant
Observable Inputs | | Level 3 –
Significant
Unobservable Inputs | | Total |
| ASSETS: | | | | | | | | |
| INVESTMENTS: | | | | | | | | |
Common Stocks
| | $171,265,579 | | $— | | $— | | $171,265,579 |
Short-Term Investment
| | 1,985,283 | | — | | — | | 1,985,283 |
TOTAL INVESTMENTS
| | $173,250,862 | | $— | | $— | | $173,250,862 |
See accompanying notes to financial statements.
127
SPDR SERIES TRUST
SPDR SSGA US SMALL CAP LOW VOLATILITY INDEX ETF
SCHEDULE OF INVESTMENTS (continued)
June 30, 2024
Affiliate Table
| | Number of
Shares Held
at
6/30/23 | | Value at
6/30/23 | | Cost of
Purchases | | Proceeds
from
Shares Sold | | Realized
Gain (Loss) | | Change in
Unrealized
Appreciation/
Depreciation | | Number of
Shares Held
at
6/30/24 | | Value at
6/30/24 | | Dividend
Income |
State Street Institutional Liquid Reserves Fund, Premier Class
| 350,625 | | $350,695 | | $10,091,562 | | $10,442,165 | | $(92) | | $— | | — | | $— | | $15,693 |
State Street Navigator Securities Lending Portfolio II
| 4,129,146 | | 4,129,146 | | 39,525,936 | | 41,669,799 | | — | | — | | 1,985,283 | | 1,985,283 | | 48,807 |
Total
| | | $4,479,841 | | $49,617,498 | | $52,111,964 | | $(92) | | $— | | | | $1,985,283 | | $64,500 |
See accompanying notes to financial statements.
128
SPDR SERIES TRUST
STATEMENTS OF ASSETS AND LIABILITIES
June 30, 2024
| | SPDR MSCI USA Climate Paris Aligned ETF | | SPDR Russell 1000 Low Volatility Focus ETF | | SPDR Russell 1000 Momentum Focus ETF | | SPDR Russell 1000 Yield Focus ETF |
| ASSETS | | | | | | | |
Investments in unaffiliated issuers, at value*
| $2,434,634 | | $629,933,448 | | $145,319,450 | | $781,566,467 |
Investments in affiliated issuers, at value
| 7,747 | | 4,132,973 | | 557,341 | | 652,751 |
Total Investments
| 2,442,381 | | 634,066,421 | | 145,876,791 | | 782,219,218 |
Net cash at broker
| — | | 40,633 | | 5,234 | | 74,079 |
Cash
| — | | — | | — | | — |
Receivable from broker — accumulated variation margin on futures contracts
| — | | 5,030 | | 1,270 | | 10,518 |
Receivable for investments sold
| — | | 188,184,769 | | 41,943,566 | | 245,994,337 |
Receivable for fund shares sold
| — | | 727,579 | | — | | 599,064 |
Dividends receivable — unaffiliated issuers
| 1,181 | | 771,326 | | 94,724 | | 1,759,847 |
Dividends receivable — affiliated issuers
| 27 | | 4,893 | | 852 | | 8,033 |
Securities lending income receivable — unaffiliated issuers
| — | | — | | 12 | | 72 |
Securities lending income receivable — affiliated issuers
| — | | 2,880 | | 172 | | 3,979 |
Receivable for foreign taxes recoverable
| 711 | | — | | 82 | | — |
Other receivable
| — | | — | | — | | — |
TOTAL ASSETS
| 2,444,300 | | 823,803,531 | | 187,922,703 | | 1,030,669,147 |
| LIABILITIES | | | | | | | |
Due to custodian
| — | | 2,209,569 | | 467 | | 1,048,760 |
Payable upon return of securities loaned
| — | | 2,916,007 | | 370,318 | | 652,751 |
Payable for investments purchased
| 5,051 | | 187,037,934 | | 41,776,136 | | 243,529,425 |
Payable for fund shares repurchased
| — | | — | | — | | — |
Payable to broker – accumulated variation margin on open futures contracts
| — | | — | | — | | — |
Advisory fee payable
| 218 | | 108,558 | | 24,009 | | 134,628 |
Trustees’ fees and expenses payable
| 58 | | 8 | | 26 | | 52 |
TOTAL LIABILITIES
| 5,327 | | 192,272,076 | | 42,170,956 | | 245,365,616 |
NET ASSETS
| $2,438,973 | | $631,531,455 | | $145,751,747 | | $785,303,531 |
| NET ASSETS CONSIST OF: | | | | | | | |
Paid-in capital
| $3,925,879 | | $685,112,313 | | $236,298,451 | | $867,546,954 |
Total distributable earnings (loss)
| (1,486,906) | | (53,580,858) | | (90,546,704) | | (82,243,423) |
NET ASSETS
| $2,438,973 | | $631,531,455 | | $145,751,747 | | $785,303,531 |
| NET ASSET VALUE PER SHARE | | | | | | | |
Net asset value per share
| $30.49 | | $118.26 | | $110.42 | | $103.88 |
Shares outstanding (unlimited amount authorized, $0.01 par value)
| 80,000 | | 5,340,000 | | 1,320,000 | | 7,560,000 |
| COST OF INVESTMENTS: | | | | | | | |
Investments in unaffiliated issuers
| $2,373,871 | | $580,603,864 | | $123,037,094 | | $758,517,728 |
Investments in affiliated issuers
| 7,747 | | 4,132,948 | | 555,379 | | 652,751 |
Total cost of investments
| $2,381,618 | | $584,736,812 | | $123,592,473 | | $759,170,479 |
* Includes investments in securities on loan, at value
| $— | | $3,227,613 | | $485,432 | | $2,059,868 |
See accompanying notes to financial statements.
129
| SPDR S&P 400 Mid Cap Growth ETF | | SPDR S&P 400 Mid Cap Value ETF | | SPDR S&P 500 ESG ETF | | SPDR S&P 600 Small Cap Growth ETF | | SPDR S&P 600 Small Cap Value ETF |
| | | | | | | | | |
| $2,450,199,531 | | $2,412,574,604 | | $1,282,466,218 | | $3,221,371,257 | | $3,638,222,322 |
| 60,613,252 | | 39,656,620 | | 1,457,110 | | 187,689,544 | | 275,907,977 |
| 2,510,812,783 | | 2,452,231,224 | | 1,283,923,328 | | 3,409,060,801 | | 3,914,130,299 |
| — | | — | | 31,787 | | — | | — |
| 17,553 | | — | | — | | 40,738 | | 92,267 |
| — | | — | | — | | — | | — |
| — | | 10,783,858 | | — | | — | | — |
| — | | — | | — | | — | | — |
| 1,053,591 | | 3,705,580 | | 591,350 | | 2,216,191 | | 5,949,201 |
| 8,337 | | 14,872 | | 6,265 | | 26,926 | | 28,095 |
| 10,505 | | 7,104 | | — | | 18,006 | | 27,382 |
| 10,335 | | 16,567 | | — | | 26,531 | | 173,868 |
| — | | — | | — | | — | | — |
| — | | — | | 1,862 | | — | | — |
| 2,511,913,104 | | 2,466,759,205 | | 1,284,554,592 | | 3,411,389,193 | | 3,920,401,112 |
| | | | | | | | | |
| — | | 7,871,727 | | — | | — | | — |
| 59,754,443 | | 39,656,620 | | — | | 183,700,828 | | 272,620,822 |
| — | | — | | — | | 348,338 | | 627,007 |
| 1,187 | | — | | — | | — | | 23,200 |
| — | | — | | 1,885 | | — | | — |
| 300,489 | | 296,880 | | 101,651 | | 396,053 | | 456,278 |
| — | | — | | — | | — | | 305 |
| 60,056,119 | | 47,825,227 | | 103,536 | | 184,445,219 | | 273,727,612 |
| $2,451,856,985 | | $2,418,933,978 | | $1,284,451,056 | | $3,226,943,974 | | $3,646,673,500 |
| | | | | | | | | |
| $2,875,004,998 | | $3,034,678,643 | | $1,052,291,878 | | $3,483,949,290 | | $5,116,961,045 |
| (423,148,013) | | (615,744,665) | | 232,159,178 | | (257,005,316) | | (1,470,287,545) |
| $2,451,856,985 | | $2,418,933,978 | | $1,284,451,056 | | $3,226,943,974 | | $3,646,673,500 |
| | | | | | | | | |
| $84.11 | | $72.97 | | $53.08 | | $85.82 | | $78.42 |
| 29,150,000 | | 33,150,000 | | 24,200,000 | | 37,600,028 | | 46,502,102 |
| | | | | | | | | |
| $2,277,689,661 | | $2,384,502,490 | | $1,034,999,985 | | $2,719,109,713 | | $3,713,012,259 |
| 60,613,166 | | 39,656,620 | | 1,473,280 | | 187,689,235 | | 275,907,779 |
| $2,338,302,827 | | $2,424,159,110 | | $1,036,473,265 | | $2,906,798,948 | | $3,988,920,038 |
| $164,961,637 | | $99,754,101 | | $— | | $318,263,612 | | $480,880,861 |
SPDR SERIES TRUST
STATEMENTS OF ASSETS AND LIABILITIES (continued)
June 30, 2024
| | SPDR S&P 1500 Momentum Tilt ETF | | SPDR S&P 1500 Value Tilt ETF | | SPDR S&P Kensho Clean Power ETF | | SPDR S&P Kensho Final Frontiers ETF |
| ASSETS | | | | | | | |
Investments in unaffiliated issuers, at value*
| $106,641,566 | | $352,084,920 | | $178,618,603 | | $15,162,398 |
Investments in affiliated issuers, at value
| 222,389 | | 2,331,160 | | 15,916,460 | | 31,290 |
Total Investments
| 106,863,955 | | 354,416,080 | | 194,535,063 | | 15,193,688 |
Foreign currency, at value
| — | | — | | — | | — |
Cash
| — | | — | | — | | — |
Receivable for investments sold
| 581 | | 97,239 | | 924,893 | | — |
Receivable for fund shares sold
| — | | — | | 152 | | — |
Dividends receivable — unaffiliated issuers
| 32,408 | | 318,583 | | 223,374 | | 2,368 |
Dividends receivable — affiliated issuers
| 437 | | 2,698 | | 1,668 | | 144 |
Securities lending income receivable — unaffiliated issuers
| 6 | | 99 | | 13,634 | | 14 |
Securities lending income receivable — affiliated issuers
| 41 | | 625 | | 54,032 | | 11 |
Receivable for foreign taxes recoverable
| — | | 427 | | — | | — |
TOTAL ASSETS
| 106,897,428 | | 354,835,751 | | 195,752,816 | | 15,196,225 |
| LIABILITIES | | | | | | | |
Due to custodian
| 331 | | 1,013 | | 924,894 | | — |
Payable upon return of securities loaned
| 86,288 | | 1,228,745 | | 15,807,447 | | — |
Payable for investments purchased
| — | | 657,351 | | — | | — |
Advisory fee payable
| 10,387 | | 34,675 | | 74,150 | | 5,793 |
Trustees’ fees and expenses payable
| — | | — | | 68 | | — |
TOTAL LIABILITIES
| 97,006 | | 1,921,784 | | 16,806,559 | | 5,793 |
NET ASSETS
| $106,800,422 | | $352,913,967 | | $178,946,257 | | $15,190,432 |
| NET ASSETS CONSIST OF: | | | | | | | |
Paid-in capital
| $89,104,237 | | $336,307,931 | | $404,000,293 | | $16,113,249 |
Total distributable earnings (loss)
| 17,696,185 | | 16,606,036 | | (225,054,036) | | (922,817) |
NET ASSETS
| $106,800,422 | | $352,913,967 | | $178,946,257 | | $15,190,432 |
| NET ASSET VALUE PER SHARE | | | | | | | |
Net asset value per share
| $242.73 | | $172.15 | | $60.35 | | $44.68 |
Shares outstanding (unlimited amount authorized, $0.01 par value)
| 440,000 | | 2,050,000 | | 2,965,000 | | 340,000 |
| COST OF INVESTMENTS: | | | | | | | |
Investments in unaffiliated issuers
| $73,503,399 | | $322,908,951 | | $269,652,525 | | $12,780,329 |
Investments in affiliated issuers
| 222,241 | | 2,354,884 | | 15,916,453 | | 31,288 |
Total cost of investments
| $73,725,640 | | $325,263,835 | | $285,568,978 | | $12,811,617 |
Foreign currency, at cost
| $— | | $— | | $— | | $— |
* Includes investments in securities on loan, at value
| $114,565 | | $1,983,855 | | $31,926,309 | | $84,825 |
See accompanying notes to financial statements.
131
| SPDR S&P Kensho Future Security ETF | | SPDR S&P Kensho Intelligent Structures ETF | | SPDR S&P Kensho New Economies Composite ETF | | SPDR S&P Kensho Smart Mobility ETF | | SPDR S&P SmallCap 600 ESG ETF | | SPDR SSGA US Large Cap Low Volatility Index ETF |
| | | | | | | | | | | |
| $57,676,180 | | $13,289,758 | | $1,879,336,768 | | $44,155,575 | | $5,063,642 | | $692,822,351 |
| 1,303,837 | | 839,658 | | 121,087,430 | | 4,351,099 | | 6,620 | | 3,515,549 |
| 58,980,017 | | 14,129,416 | | 2,000,424,198 | | 48,506,674 | | 5,070,262 | | 696,337,900 |
| — | | — | | 14,541 | | — | | — | | — |
| — | | 2,707 | | 4,095,929 | | — | | — | | — |
| — | | — | | 269,119 | | 96,492 | | — | | — |
| — | | — | | 3,835 | | — | | — | | — |
| 5,703 | | 12,132 | | 1,104,058 | | — | | 4,615 | | 783,889 |
| 142 | | 107 | | 15,014 | | 669 | | 30 | | 8,460 |
| 318 | | 504 | | 22,748 | | 13,581 | | — | | — |
| 2,237 | | 4,582 | | 341,445 | | 23,747 | | — | | 177 |
| — | | 1,510 | | 99,393 | | — | | — | | — |
| 58,988,417 | | 14,150,958 | | 2,006,390,280 | | 48,641,163 | | 5,074,907 | | 697,130,426 |
| | | | | | | | | | | |
| — | | — | | — | | 84,993 | | — | | 27,671 |
| 1,256,763 | | 833,420 | | 118,034,139 | | 4,321,780 | | — | | 1,657,465 |
| — | | — | | 4,300,609 | | — | | 1,277 | | — |
| 21,282 | | 5,184 | | 311,895 | | 18,887 | | 491 | | 67,961 |
| — | | 6 | | 57 | | 11 | | — | | 117 |
| 1,278,045 | | 838,610 | | 122,646,700 | | 4,425,671 | | 1,768 | | 1,753,214 |
| $57,710,372 | | $13,312,348 | | $1,883,743,580 | | $44,215,492 | | $5,073,139 | | $695,377,212 |
| | | | | | | | | | | |
| $59,949,944 | | $30,471,451 | | $2,741,362,456 | | $157,551,346 | | $5,364,903 | | $720,568,987 |
| (2,239,572) | | (17,159,103) | | (857,618,876) | | (113,335,854) | | (291,764) | | (25,191,775) |
| $57,710,372 | | $13,312,348 | | $1,883,743,580 | | $44,215,492 | | $5,073,139 | | $695,377,212 |
| | | | | | | | | | | |
| $56.58 | | $33.28 | | $46.06 | | $27.81 | | $28.99 | | $152.83 |
| 1,020,000 | | 400,000 | | 40,895,000 | | 1,590,000 | | 175,000 | | 4,550,000 |
| | | | | | | | | | | |
| $54,316,040 | | $18,685,070 | | $1,771,928,685 | | $65,378,796 | | $4,983,960 | | $647,177,961 |
| 1,303,834 | | 839,658 | | 121,087,199 | | 4,351,099 | | 6,620 | | 3,515,537 |
| $55,619,874 | | $19,524,728 | | $1,893,015,884 | | $69,729,895 | | $4,990,580 | | $650,693,498 |
| $— | | $— | | $16,031 | | $— | | $— | | $— |
| $1,617,960 | | $1,323,694 | | $173,174,033 | | $8,111,113 | | $— | | $3,083,418 |
SPDR SERIES TRUST
STATEMENTS OF ASSETS AND LIABILITIES (continued)
June 30, 2024
| | SPDR SSGA US Small Cap Low Volatility Index ETF |
| ASSETS | |
Investments in unaffiliated issuers, at value*
| $171,265,579 |
Investments in affiliated issuers, at value
| 1,985,283 |
Total Investments
| 173,250,862 |
Receivable for investments sold
| 385,136 |
Dividends receivable — unaffiliated issuers
| 248,764 |
Dividends receivable — affiliated issuers
| 1,686 |
Securities lending income receivable — unaffiliated issuers
| 5,598 |
Securities lending income receivable — affiliated issuers
| 8,270 |
TOTAL ASSETS
| 173,900,316 |
| LIABILITIES | |
Due to custodian
| 166,063 |
Payable upon return of securities loaned
| 1,985,283 |
Payable for investments purchased
| 4,725 |
Advisory fee payable
| 16,794 |
Trustees’ fees and expenses payable
| 22 |
TOTAL LIABILITIES
| 2,172,887 |
NET ASSETS
| $171,727,429 |
| NET ASSETS CONSIST OF: | |
Paid-in capital
| $229,765,664 |
Total distributable earnings (loss)
| (58,038,235) |
NET ASSETS
| $171,727,429 |
| NET ASSET VALUE PER SHARE | |
Net asset value per share
| $110.08 |
Shares outstanding (unlimited amount authorized, $0.01 par value)
| 1,560,000 |
| COST OF INVESTMENTS: | |
Investments in unaffiliated issuers
| $178,657,945 |
Investments in affiliated issuers
| 1,985,283 |
Total cost of investments
| $180,643,228 |
* Includes investments in securities on loan, at value
| $5,543,503 |
See accompanying notes to financial statements.
133
[This Page Intentionally Left Blank]
SPDR SERIES TRUST
STATEMENTS OF OPERATIONS
For the Year Ended June 30, 2024
| | SPDR MSCI USA Climate Paris Aligned ETF | | SPDR Russell 1000 Low Volatility Focus ETF | | SPDR Russell 1000 Momentum Focus ETF | | SPDR Russell 1000 Yield Focus ETF |
| INVESTMENT INCOME | | | | | | | |
Interest income — unaffiliated issuers
| $28 | | $2,488 | | $539 | | $— |
Dividend income — unaffiliated issuers
| 817,383 | | 11,686,030 | | 2,165,695 | | 27,564,950 |
Dividend income — affiliated issuers
| 6,270 | | 41,350 | | 14,343 | | 200,110 |
Unaffiliated securities lending income
| — | | 3,046 | | 595 | | 43,258 |
Affiliated securities lending income
| — | | 132,511 | | 4,464 | | 130,916 |
Foreign taxes withheld
| — | | (6,311) | | (932) | | (23,341) |
TOTAL INVESTMENT INCOME (LOSS)
| 823,681 | | 11,859,114 | | 2,184,704 | | 27,915,893 |
| EXPENSES | | | | | | | |
Advisory fee
| 68,723 | | 1,184,449 | | 301,520 | | 1,530,619 |
Trustees’ fees and expenses
| 972 | | 5,838 | | 1,532 | | 7,709 |
Miscellaneous expenses
| 94 | | 622 | | 165 | | 816 |
TOTAL EXPENSES
| 69,789 | | 1,190,909 | | 303,217 | | 1,539,144 |
NET INVESTMENT INCOME (LOSS)
| $753,892 | | $10,668,205 | | $1,881,487 | | $26,376,749 |
| REALIZED AND UNREALIZED GAIN (LOSS) | | | | | | | |
| Net realized gain (loss) on: | | | | | | | |
Investments — unaffiliated issuers
| 254,208 | | (15,596,881) | | 6,498,450 | | (35,342,832) |
Investments — affiliated issuers
| 48 | | (195) | | 1,611 | | 11,326 |
In-kind redemptions — unaffiliated issuers
| 15,800,702 | | 63,474,263 | | 8,436,372 | | 78,441,740 |
In-kind redemptions — affiliated issuers
| — | | — | | 1,023 | | 105,287 |
Futures contracts
| 3,411 | | 180,101 | | 39,923 | | 511,085 |
Net realized gain (loss)
| 16,058,369 | | 48,057,288 | | 14,977,379 | | 43,726,606 |
| Net change in unrealized appreciation/depreciation on: | | | | | | | |
Investments — unaffiliated issuers
| (3,927,589) | | 3,736,105 | | 3,221,093 | | 22,950,475 |
Investments — affiliated issuers
| (2) | | 25 | | (1,872) | | (78,794) |
Futures contracts
| — | | (24,907) | | (5,756) | | (78,108) |
Net change in unrealized appreciation/depreciation
| (3,927,591) | | 3,711,223 | | 3,213,465 | | 22,793,573 |
NET REALIZED AND UNREALIZED GAIN (LOSS)
| 12,130,778 | | 51,768,511 | | 18,190,844 | | 66,520,179 |
NET INCREASE (DECREASE) IN NET ASSETS FROM OPERATIONS
| $12,884,670 | | $62,436,716 | | $20,072,331 | | $92,896,928 |
See accompanying notes to financial statements.
135
| SPDR S&P 400 Mid Cap Growth ETF | | SPDR S&P 400 Mid Cap Value ETF | | SPDR S&P 500 ESG ETF | | SPDR S&P 600 Small Cap Growth ETF | | SPDR S&P 600 Small Cap Value ETF |
| | | | | | | | | |
| $— | | $— | | $2,142 | | $— | | $— |
| 26,576,045 | | 47,537,541 | | 15,797,309 | | 38,611,590 | | 83,648,521 |
| 80,542 | | 129,901 | | 83,762 | | 172,276 | | 283,485 |
| 64,729 | | 105,168 | | — | | 187,321 | | 339,059 |
| 210,015 | | 312,723 | | — | | 401,522 | | 1,912,643 |
| — | | — | | (4,210) | | (80,309) | | — |
| 26,931,331 | | 48,085,333 | | 15,879,003 | | 39,292,400 | | 86,183,708 |
| | | | | | | | | |
| 3,446,071 | | 3,592,109 | | 1,069,556 | | 4,337,627 | | 5,688,497 |
| 21,144 | | 23,606 | | 10,310 | | 27,702 | | 38,665 |
| 2,331 | | 4,975 | | 1,109 | | 3,002 | | 4,097 |
| 3,469,546 | | 3,620,690 | | 1,080,975 | | 4,368,331 | | 5,731,259 |
| $23,461,785 | | $44,464,643 | | $14,798,028 | | $34,924,069 | | $80,452,449 |
| | | | | | | | | |
| | | | | | | | | |
| (32,780,170) | | (169,108,163) | | 361,758 | | 2,900,115 | | (329,244,107) |
| 73 | | 36 | | (40,773) | | 108 | | (1,036) |
| 312,723,557 | | 214,177,187 | | 52,389,482 | | 112,825,979 | | 415,874,146 |
| — | | — | | 7,184 | | — | | — |
| — | | — | | 272,582 | | — | | — |
| 279,943,460 | | 45,069,060 | | 52,990,233 | | 115,726,202 | | 86,629,003 |
| | | | | | | | | |
| 103,737,181 | | 83,984,866 | | 183,585,377 | | 221,653,576 | | (5,240,491) |
| 85 | | (12) | | 48,321 | | 309 | | 198 |
| — | | — | | (13,680) | | — | | — |
| 103,737,266 | | 83,984,854 | | 183,620,018 | | 221,653,885 | | (5,240,293) |
| 383,680,726 | | 129,053,914 | | 236,610,251 | | 337,380,087 | | 81,388,710 |
| $407,142,511 | | $173,518,557 | | $251,408,279 | | $372,304,156 | | $161,841,159 |
SPDR SERIES TRUST
STATEMENTS OF OPERATIONS (continued)
For the Year Ended June 30, 2024
| | SPDR S&P 1500 Momentum Tilt ETF | | SPDR S&P 1500 Value Tilt ETF | | SPDR S&P Kensho Clean Power ETF | | SPDR S&P Kensho Final Frontiers ETF |
| INVESTMENT INCOME | | | | | | | |
Dividend income — unaffiliated issuers
| $985,002 | | $6,594,115 | | $3,532,643 | | $178,542 |
Dividend income — affiliated issuers
| 6,020 | | 31,491 | | 18,809 | | 1,160 |
Unaffiliated securities lending income
| 46 | | 537 | | 218,347 | | 2,781 |
Affiliated securities lending income
| 847 | | 7,077 | | 369,960 | | 1,872 |
Foreign taxes withheld
| (462) | | (981) | | (122,814) | | (327) |
TOTAL INVESTMENT INCOME (LOSS)
| 991,453 | | 6,632,239 | | 4,016,945 | | 184,028 |
| EXPENSES | | | | | | | |
Advisory fee
| 108,290 | | 349,303 | | 1,090,028 | | 74,383 |
Trustees’ fees and expenses
| 867 | | 2,717 | | 2,804 | | 173 |
Miscellaneous expenses
| 94 | | 295 | | 278 | | 18 |
TOTAL EXPENSES
| 109,251 | | 352,315 | | 1,093,110 | | 74,574 |
NET INVESTMENT INCOME (LOSS)
| $882,202 | | $6,279,924 | | $2,923,835 | | $109,454 |
| REALIZED AND UNREALIZED GAIN (LOSS) | | | | | | | |
| Net realized gain (loss) on: | | | | | | | |
Investments — unaffiliated issuers
| (1,572,353) | | (5,976,075) | | (37,110,784) | | (1,202,793) |
Investments — affiliated issuers
| (9,864) | | (28,291) | | 96 | | 7 |
In-kind redemptions — unaffiliated issuers
| 6,895,253 | | 16,458,115 | | (1,509,647) | | 615,036 |
In-kind redemptions — affiliated issuers
| 711 | | 2,422 | | — | | — |
Foreign currency transactions
| — | | — | | (14,082) | | — |
Net realized gain (loss)
| 5,313,747 | | 10,456,171 | | (38,634,417) | | (587,750) |
| Net change in unrealized appreciation/depreciation on: | | | | | | | |
Investments — unaffiliated issuers
| 20,111,960 | | 33,948,837 | | (53,715,957) | | 877,622 |
Investments — affiliated issuers
| 5,296 | | 33,180 | | 7 | | 2 |
Foreign currency translations
| — | | — | | (365) | | — |
Net change in unrealized appreciation/depreciation
| 20,117,256 | | 33,982,017 | | (53,716,315) | | 877,624 |
NET REALIZED AND UNREALIZED GAIN (LOSS)
| 25,431,003 | | 44,438,188 | | (92,350,732) | | 289,874 |
NET INCREASE (DECREASE) IN NET ASSETS FROM OPERATIONS
| $26,313,205 | | $50,718,112 | | $(89,426,897) | | $399,328 |
See accompanying notes to financial statements.
137
| SPDR S&P Kensho Future Security ETF | | SPDR S&P Kensho Intelligent Structures ETF | | SPDR S&P Kensho New Economies Composite ETF | | SPDR S&P Kensho Smart Mobility ETF | | SPDR S&P SmallCap 600 ESG ETF | | SPDR SSGA US Large Cap Low Volatility Index ETF |
| | | | | | | | | | | |
| $223,384 | | $201,164 | | $14,902,745 | | $485,835 | | $74,951 | | $15,948,525 |
| 3,533 | | 1,679 | | 125,133 | | 4,781 | | 422 | | 94,666 |
| 4,782 | | 27,279 | | 1,041,163 | | 455,853 | | — | | 5,646 |
| 28,206 | | 68,734 | | 6,933,781 | | 434,761 | | — | | 3,061 |
| (993) | | (8,799) | | (474,006) | | (13,231) | | (88) | | — |
| 258,912 | | 290,057 | | 22,528,816 | | 1,367,999 | | 75,285 | | 16,051,898 |
| | | | | | | | | | | |
| 188,413 | | 85,757 | | 3,618,591 | | 210,520 | | 5,581 | | 900,789 |
| 370 | | 216 | | 17,928 | | 480 | | 47 | | 7,967 |
| 41 | | 22 | | 1,921 | | 51 | | 5 | | 833 |
| 188,824 | | 85,995 | | 3,638,440 | | 211,051 | | 5,633 | | 909,589 |
| $70,088 | | $204,062 | | $18,890,376 | | $1,156,948 | | $69,652 | | $15,142,309 |
| | | | | | | | | | | |
| | | | | | | | | | | |
| (104,880) | | (673,599) | | (94,579,138) | | (21,813,484) | | (116,486) | | 4,799,971 |
| 94 | | 6 | | 96 | | 15 | | (3) | | (451) |
| 4,523,710 | | 331,801 | | 46,119,201 | | 6,290,236 | | 827,511 | | 41,013,299 |
| — | | — | | — | | — | | — | | — |
| — | | 86 | | (1,299) | | 3 | | — | | — |
| 4,418,924 | | (341,706) | | (48,461,140) | | (15,523,230) | | 711,022 | | 45,812,819 |
| | | | | | | | | | | |
| 1,377,891 | | (1,475,243) | | 117,700,297 | | 8,239,124 | | 83,481 | | 15,815,930 |
| 2 | | — | | 231 | | (3) | | — | | (42) |
| — | | (14) | | 17 | | (4) | | — | | — |
| 1,377,893 | | (1,475,257) | | 117,700,545 | | 8,239,117 | | 83,481 | | 15,815,888 |
| 5,796,817 | | (1,816,963) | | 69,239,405 | | (7,284,113) | | 794,503 | | 61,628,707 |
| $5,866,905 | | $(1,612,901) | | $88,129,781 | | $(6,127,165) | | $864,155 | | $76,771,016 |
SPDR SERIES TRUST
STATEMENTS OF OPERATIONS (continued)
For the Year Ended June 30, 2024
| | SPDR SSGA US Small Cap Low Volatility Index ETF |
| INVESTMENT INCOME | |
Dividend income — unaffiliated issuers
| $4,375,456 |
Dividend income — affiliated issuers
| 15,693 |
Unaffiliated securities lending income
| 15,758 |
Affiliated securities lending income
| 48,807 |
Foreign taxes withheld
| (11,007) |
TOTAL INVESTMENT INCOME (LOSS)
| 4,444,707 |
| EXPENSES | |
Advisory fee
| 217,757 |
Trustees’ fees and expenses
| 1,896 |
Miscellaneous expenses
| 199 |
TOTAL EXPENSES
| 219,852 |
NET INVESTMENT INCOME (LOSS)
| $4,224,855 |
| REALIZED AND UNREALIZED GAIN (LOSS) | |
| Net realized gain (loss) on: | |
Investments — unaffiliated issuers
| (554,366) |
Investments — affiliated issuers
| (92) |
In-kind redemptions — unaffiliated issuers
| 2,392,906 |
Net realized gain (loss)
| 1,838,448 |
| Net change in unrealized appreciation/depreciation on: | |
Investments — unaffiliated issuers
| 9,745,301 |
NET REALIZED AND UNREALIZED GAIN (LOSS)
| 11,583,749 |
NET INCREASE (DECREASE) IN NET ASSETS FROM OPERATIONS
| $15,808,604 |
See accompanying notes to financial statements.
139
[This Page Intentionally Left Blank]
SPDR SERIES TRUST
STATEMENTS OF CHANGES IN NET ASSETS
| | SPDR MSCI USA Climate Paris Aligned ETF | | SPDR Russell 1000 Low Volatility Focus ETF |
| | Year Ended
6/30/24 | | Year Ended
6/30/23 | | Year Ended
6/30/24 | | Year Ended
6/30/23 |
| INCREASE (DECREASE) IN NET ASSETS FROM OPERATIONS: | | | | | | | |
Net investment income (loss)
| $753,892 | | $1,274,252 | | $10,668,205 | | $10,109,008 |
Net realized gain (loss)
| 16,058,369 | | (1,768,261) | | 48,057,288 | | 39,732,071 |
Net change in unrealized appreciation/depreciation
| (3,927,591) | | 24,929,983 | | 3,711,223 | | 17,195,874 |
Net increase (decrease) in net assets resulting from operations
| 12,884,670 | | 24,435,974 | | 62,436,716 | | 67,036,953 |
Net equalization credits and charges
| (27,074) | | (128,705) | | (149,892) | | 27,344 |
Distributions to shareholders
| (818,255) | | (1,272,662) | | (11,077,139) | | (10,690,380) |
| FROM BENEFICIAL INTEREST TRANSACTIONS: | | | | | | | |
Proceeds from shares sold
| 2,188,587 | | — | | 258,776,143 | | 195,948,970 |
Cost of shares redeemed
| (114,400,899) | | (52,032,491) | | (225,274,044) | | (246,578,317) |
Net income equalization
| 27,074 | | 128,705 | | 149,892 | | (27,344) |
Net increase (decrease) in net assets from beneficial interest transactions
| (112,185,238) | | (51,903,786) | | 33,651,991 | | (50,656,691) |
Contribution from affiliate (Note 4)
| — | | 16,574 | | — | | — |
Net increase (decrease) in net assets during the period
| (100,145,897) | | (28,852,605) | | 84,861,676 | | 5,717,226 |
Net assets at beginning of period
| 102,584,870 | | 131,437,475 | | 546,669,779 | | 540,952,553 |
NET ASSETS AT END OF PERIOD
| $2,438,973 | | $102,584,870 | | $631,531,455 | | $546,669,779 |
| SHARES OF BENEFICIAL INTEREST: | | | | | | | |
Shares sold
| 80,000 | | — | | 2,210,000 | | 1,870,000 |
Shares redeemed
| (4,080,000) | | (2,120,000) | | (1,910,000) | | (2,350,000) |
Net increase (decrease) from share transactions
| (4,000,000) | | (2,120,000) | | 300,000 | | (480,000) |
See accompanying notes to financial statements.
141
| SPDR Russell 1000 Momentum Focus ETF | | SPDR Russell 1000 Yield Focus ETF | | SPDR S&P 400 Mid Cap Growth ETF |
Year Ended
6/30/24 | | Year Ended
6/30/23 | | Year Ended
6/30/24 | | Year Ended
6/30/23 | | Year Ended
6/30/24 | | Year Ended
6/30/23 |
| | | | | | | | | | | |
| $1,881,487 | | $4,414,823 | | $26,376,749 | | $26,928,148 | | $23,461,785 | | $19,501,026 |
| 14,977,379 | | 27,614,428 | | 43,726,606 | | 41,950,521 | | 279,943,460 | | (140,216,097) |
| 3,213,465 | | 8,807,550 | | 22,793,573 | | 10,812,115 | | 103,737,266 | | 353,142,546 |
| 20,072,331 | | 40,836,801 | | 92,896,928 | | 79,690,784 | | 407,142,511 | | 232,427,475 |
| 61,885 | | (111,661) | | 38,420 | | (6,682) | | (799,830) | | (369,296) |
| (2,028,167) | | (4,578,436) | | (25,771,600) | | (27,371,410) | | (25,105,656) | | (21,188,775) |
| | | | | | | | | | | |
| 2,128,448 | | 10,888,984 | | 292,391,638 | | 229,200,723 | | 1,299,912,993 | | 1,899,514,586 |
| (31,226,184) | | (158,267,565) | | (333,386,795) | | (302,178,618) | | (1,079,325,774) | | (1,551,069,205) |
| (61,885) | | 111,661 | | (38,420) | | 6,682 | | 799,830 | | 369,296 |
| (29,159,621) | | (147,266,920) | | (41,033,577) | | (72,971,213) | | 221,387,049 | | 348,814,677 |
| — | | — | | — | | — | | — | | — |
| (11,053,572) | | (111,120,216) | | 26,130,171 | | (20,658,521) | | 602,624,074 | | 559,684,081 |
| 156,805,319 | | 267,925,535 | | 759,173,360 | | 779,831,881 | | 1,849,232,911 | | 1,289,548,830 |
| $145,751,747 | | $156,805,319 | | $785,303,531 | | $759,173,360 | | $2,451,856,985 | | $1,849,232,911 |
| | | | | | | | | | | |
| 20,000 | | 120,000 | | 2,860,000 | | 2,420,000 | | 16,350,000 | | 28,350,000 |
| (300,000) | | (1,640,000) | | (3,270,000) | | (3,200,000) | | (13,000,000) | | (23,700,000) |
| (280,000) | | (1,520,000) | | (410,000) | | (780,000) | | 3,350,000 | | 4,650,000 |
SPDR SERIES TRUST
STATEMENTS OF CHANGES IN NET ASSETS (continued)
| | SPDR S&P 400 Mid Cap Value ETF | | SPDR S&P 500 ESG ETF |
| | Year Ended
6/30/24 | | Year Ended
6/30/23 | | Year Ended
6/30/24 | | Year Ended
6/30/23 |
| INCREASE (DECREASE) IN NET ASSETS FROM OPERATIONS: | | | | | | | |
Net investment income (loss)
| $44,464,643 | | $42,034,839 | | $14,798,028 | | $10,542,839 |
Net realized gain (loss)
| 45,069,060 | | (79,661,934) | | 52,990,233 | | 21,034,633 |
Net change in unrealized appreciation/depreciation
| 83,984,854 | | 213,488,157 | | 183,620,018 | | 107,896,309 |
Net increase (decrease) in net assets resulting from operations
| 173,518,557 | | 175,861,062 | | 251,408,279 | | 139,473,781 |
Net equalization credits and charges
| (1,333,445) | | (643,073) | | 218,063 | | 661,129 |
Distributions to shareholders
| (42,103,288) | | (41,180,242) | | (15,041,149) | | (11,215,118) |
| FROM BENEFICIAL INTEREST TRANSACTIONS: | | | | | | | |
Proceeds from shares sold
| 1,379,215,237 | | 2,825,889,322 | | 397,159,867 | | 481,646,638 |
Cost of shares redeemed
| (1,316,190,156) | | (2,167,202,015) | | (235,967,462) | | (157,590,836) |
Net income equalization
| 1,333,445 | | 643,073 | | (218,063) | | (661,129) |
Net increase (decrease) in net assets from beneficial interest transactions
| 64,358,526 | | 659,330,380 | | 160,974,342 | | 323,394,673 |
Contribution from affiliate (Note 4)
| — | | — | | — | | — |
Net increase (decrease) in net assets during the period
| 194,440,350 | | 793,368,127 | | 397,559,535 | | 452,314,465 |
Net assets at beginning of period
| 2,224,493,628 | | 1,431,125,501 | | 886,891,521 | | 434,577,056 |
NET ASSETS AT END OF PERIOD
| $2,418,933,978 | | $2,224,493,628 | | $1,284,451,056 | | $886,891,521 |
| SHARES OF BENEFICIAL INTEREST: | | | | | | | |
Shares sold
| 19,300,000 | | 42,850,000 | | 8,475,000 | | 12,550,000 |
Shares redeemed
| (18,500,000) | | (34,150,000) | | (4,875,000) | | (3,950,000) |
Net increase (decrease) from share transactions
| 800,000 | | 8,700,000 | | 3,600,000 | | 8,600,000 |
See accompanying notes to financial statements.
143
| SPDR S&P 600 Small Cap Growth ETF | | SPDR S&P 600 Small Cap Value ETF | | SPDR S&P 1500 Momentum Tilt ETF |
Year Ended
6/30/24 | | Year Ended
6/30/23 | | Year Ended
6/30/24 | | Year Ended
6/30/23 | | Year Ended
6/30/24 | | Year Ended
6/30/23 |
| | | | | | | | | | | |
| $34,924,069 | | $29,406,339 | | $80,452,449 | | $74,872,547 | | $882,202 | | $1,315,861 |
| 115,726,202 | | (193,996,545) | | 86,629,003 | | (104,384,976) | | 5,313,747 | | (222,599) |
| 221,653,885 | | 377,652,643 | | (5,240,293) | | 301,833,103 | | 20,117,256 | | 10,957,651 |
| 372,304,156 | | 213,062,437 | | 161,841,159 | | 272,320,674 | | 26,313,205 | | 12,050,913 |
| 233,317 | | 266,198 | | (318,879) | | (368,324) | | (4,922) | | (18,884) |
| (34,338,059) | | (30,198,647) | | (90,691,924) | | (72,577,342) | | (858,890) | | (1,308,052) |
| | | | | | | | | | | |
| 664,751,347 | | 521,554,835 | | 1,423,021,889 | | 1,436,056,622 | | 20,164,268 | | 22,286,242 |
| (306,216,196) | | (212,263,544) | | (1,671,940,023) | | (1,646,581,413) | | (22,242,283) | | (21,989,657) |
| (233,317) | | (266,198) | | 318,879 | | 368,324 | | 4,922 | | 18,884 |
| 358,301,834 | | 309,025,093 | | (248,599,255) | | (210,156,467) | | (2,073,093) | | 315,469 |
| — | | — | | — | | — | | — | | 99,073 |
| 696,501,248 | | 492,155,081 | | (177,768,899) | | (10,781,459) | | 23,376,300 | | 11,138,519 |
| 2,530,442,726 | | 2,038,287,645 | | 3,824,442,399 | | 3,835,223,858 | | 83,424,122 | | 72,285,603 |
| $3,226,943,974 | | $2,530,442,726 | | $3,646,673,500 | | $3,824,442,399 | | $106,800,422 | | $83,424,122 |
| | | | | | | | | | | |
| 8,450,000 | | 6,950,000 | | 17,700,000 | | 18,700,000 | | 100,000 | | 130,000 |
| (3,750,000) | | (2,950,000) | | (20,750,000) | | (22,150,000) | | (110,000) | | (130,000) |
| 4,700,000 | | 4,000,000 | | (3,050,000) | | (3,450,000) | | (10,000) | | — |
SPDR SERIES TRUST
STATEMENTS OF CHANGES IN NET ASSETS (continued)
| | SPDR S&P 1500 Value Tilt ETF | | SPDR S&P Kensho Clean Power ETF |
| | Year Ended
6/30/24 | | Year Ended
6/30/23 | | Year Ended
6/30/24 | | Year Ended
6/30/23 |
| INCREASE (DECREASE) IN NET ASSETS FROM OPERATIONS: | | | | | | | |
Net investment income (loss)
| $6,279,924 | | $4,867,747 | | $2,923,835 | | $2,697,484 |
Net realized gain (loss)
| 10,456,171 | | 881,052 | | (38,634,417) | | (13,544,835) |
Net change in unrealized appreciation/depreciation
| 33,982,017 | | 21,367,943 | | (53,716,315) | | 31,917,632 |
Net increase (decrease) in net assets resulting from operations
| 50,718,112 | | 27,116,742 | | (89,426,897) | | 21,070,281 |
Net equalization credits and charges
| 140,927 | | (9,974) | | (191,391) | | 159,400 |
Distributions to shareholders
| (6,381,059) | | (4,870,940) | | (3,354,549) | | (3,050,067) |
| FROM BENEFICIAL INTEREST TRANSACTIONS: | | | | | | | |
Proceeds from shares sold
| 127,827,618 | | 34,707,187 | | 14,539,698 | | 67,574,102 |
Cost of shares redeemed
| (50,607,212) | | (29,129,613) | | (82,026,092) | | (13,349,970) |
Net income equalization
| (140,927) | | 9,974 | | 191,391 | | (159,400) |
Net increase (decrease) in net assets from beneficial interest transactions
| 77,079,479 | | 5,587,548 | | (67,295,003) | | 54,064,732 |
Net increase (decrease) in net assets during the period
| 121,557,459 | | 27,823,376 | | (160,267,840) | | 72,244,346 |
Net assets at beginning of period
| 231,356,508 | | 203,533,132 | | 339,214,097 | | 266,969,751 |
NET ASSETS AT END OF PERIOD
| $352,913,967 | | $231,356,508 | | $178,946,257 | | $339,214,097 |
| SHARES OF BENEFICIAL INTEREST: | | | | | | | |
Shares sold
| 800,000 | | 250,000 | | 210,000 | | 750,000 |
Shares redeemed
| (310,000) | | (210,000) | | (1,250,000) | | (160,000) |
Net increase (decrease) from share transactions
| 490,000 | | 40,000 | | (1,040,000) | | 590,000 |
See accompanying notes to financial statements.
145
| SPDR S&P Kensho Final Frontiers ETF | | SPDR S&P Kensho Future Security ETF | | SPDR S&P Kensho Intelligent Structures ETF |
Year Ended
6/30/24 | | Year Ended
6/30/23 | | Year Ended
6/30/24 | | Year Ended
6/30/23 | | Year Ended
6/30/24 | | Year Ended
6/30/23 |
| | | | | | | | | | | |
| $109,454 | | $89,772 | | $70,088 | | $30,704 | | $204,062 | | $449,685 |
| (587,750) | | 30,971 | | 4,418,924 | | (1,522,317) | | (341,706) | | (5,535,197) |
| 877,624 | | 3,730,587 | | 1,377,893 | | 4,553,130 | | (1,475,257) | | 8,537,888 |
| 399,328 | | 3,851,330 | | 5,866,905 | | 3,061,517 | | (1,612,901) | | 3,452,376 |
| (4,743) | | (3,764) | | (4,094) | | (1,267) | | (6,370) | | (10,210) |
| (116,041) | | (91,719) | | (75,999) | | (25,158) | | (199,997) | | (416,542) |
| | | | | | | | | | | |
| — | | — | | 30,988,694 | | 8,158,517 | | 1,713,932 | | 374,606 |
| (3,016,301) | | (3,144,844) | | (11,787,807) | | (7,055,801) | | (9,954,715) | | (11,201,839) |
| 4,743 | | 3,764 | | 4,094 | | 1,267 | | 6,370 | | 10,210 |
| (3,011,558) | | (3,141,080) | | 19,204,981 | | 1,103,983 | | (8,234,413) | | (10,817,023) |
| (2,733,014) | | 614,767 | | 24,991,793 | | 4,139,075 | | (10,053,681) | | (7,791,399) |
| 17,923,446 | | 17,308,679 | | 32,718,579 | | 28,579,504 | | 23,366,029 | | 31,157,428 |
| $15,190,432 | | $17,923,446 | | $57,710,372 | | $32,718,579 | | $13,312,348 | | $23,366,029 |
| | | | | | | | | | | |
| — | | — | | 570,000 | | 180,000 | | 50,000 | | 10,000 |
| (70,000) | | (80,000) | | (220,000) | | (160,000) | | (300,000) | | (330,000) |
| (70,000) | | (80,000) | | 350,000 | | 20,000 | | (250,000) | | (320,000) |
SPDR SERIES TRUST
STATEMENTS OF CHANGES IN NET ASSETS (continued)
| | SPDR S&P Kensho New Economies Composite ETF | | SPDR S&P Kensho Smart Mobility ETF |
| | Year Ended
6/30/24 | | Year Ended
6/30/23 | | Year Ended
6/30/24 | | Year Ended
6/30/23 |
| INCREASE (DECREASE) IN NET ASSETS FROM OPERATIONS: | | | | | | | |
Net investment income (loss)
| $18,890,376 | | $22,189,756 | | $1,156,948 | | $1,365,106 |
Net realized gain (loss)
| (48,461,140) | | (176,364,459) | | (15,523,230) | | (25,966,932) |
Net change in unrealized appreciation/depreciation
| 117,700,545 | | 330,937,419 | | 8,239,117 | | 23,290,874 |
Net increase (decrease) in net assets resulting from operations
| 88,129,781 | | 176,762,716 | | (6,127,165) | | (1,310,952) |
Net equalization credits and charges
| (86,855) | | (439,004) | | (28,650) | | 244,150 |
Distributions to shareholders
| (24,011,717) | | (22,478,195) | | (1,314,818) | | (1,376,377) |
Return of capital
| — | | — | | — | | — |
Total Distributions to shareholders
| (24,011,717) | | (22,478,195) | | (1,314,818) | | (1,376,377) |
| FROM BENEFICIAL INTEREST TRANSACTIONS: | | | | | | | |
Proceeds from shares sold
| 171,758,851 | | 225,934,058 | | 55,041,465 | | 1,590,905 |
Cost of shares redeemed
| (162,184,038) | | (107,263,615) | | (57,220,608) | | (22,204,560) |
Net income equalization
| 86,855 | | 439,004 | | 28,650 | | (244,150) |
Net increase (decrease) in net assets from beneficial interest transactions
| 9,661,668 | | 119,109,447 | | (2,150,493) | | (20,857,805) |
Net increase (decrease) in net assets during the period
| 73,692,877 | | 272,954,964 | | (9,621,126) | | (23,300,984) |
Net assets at beginning of period
| 1,810,050,703 | | 1,537,095,739 | | 53,836,618 | | 77,137,602 |
NET ASSETS AT END OF PERIOD
| $1,883,743,580 | | $1,810,050,703 | | $44,215,492 | | $53,836,618 |
| SHARES OF BENEFICIAL INTEREST: | | | | | | | |
Shares sold
| 3,900,000 | | 5,360,000 | | 1,960,000 | | 50,000 |
Shares redeemed
| (3,610,000) | | (2,640,000) | | (1,980,000) | | (680,000) |
Net increase (decrease) from share transactions
| 290,000 | | 2,720,000 | | (20,000) | | (630,000) |
See accompanying notes to financial statements.
147
| SPDR S&P SmallCap 600 ESG ETF | | SPDR SSGA US Large Cap Low Volatility Index ETF | | SPDR SSGA US Small Cap Low Volatility Index ETF |
Year Ended
6/30/24 | | Year Ended
6/30/23 | | Year Ended
6/30/24 | | Year Ended
6/30/23 | | Year Ended
6/30/24 | | Year Ended
6/30/23 |
| | | | | | | | | | | |
| $69,652 | | $48,393 | | $15,142,309 | | $12,780,355 | | $4,224,855 | | $5,201,788 |
| 711,022 | | (199,486) | | 45,812,819 | | 794,173 | | 1,838,448 | | 4,544,945 |
| 83,481 | | 448,008 | | 15,815,888 | | 45,126,192 | | 9,745,301 | | (7,620,238) |
| 864,155 | | 296,915 | | 76,771,016 | | 58,700,720 | | 15,808,604 | | 2,126,495 |
| (10,266) | | 1,007 | | 1,119,921 | | (1,213,314) | | 296,452 | | 10,883 |
| (74,260) | | (50,033) | | (16,227,652) | | (13,326,785) | | (5,000,516) | | (5,499,034) |
| — | | (2,510) | | — | | — | | — | | — |
| (74,260) | | (52,543) | | (16,227,652) | | (13,326,785) | | (5,000,516) | | (5,499,034) |
| | | | | | | | | | | |
| 15,214,115 | | 1,264,444 | | 88,966,271 | | 284,150,030 | | 10,837,886 | | 24,236,473 |
| (14,904,895) | | — | | (271,853,982) | | (69,545,218) | | (40,883,052) | | (15,984,066) |
| 10,266 | | (1,007) | | (1,119,921) | | 1,213,314 | | (296,452) | | (10,883) |
| 319,486 | | 1,263,437 | | (184,007,632) | | 215,818,126 | | (30,341,618) | | 8,241,524 |
| 1,099,115 | | 1,508,816 | | (122,344,347) | | 259,978,747 | | (19,237,078) | | 4,879,868 |
| 3,974,024 | | 2,465,208 | | 817,721,559 | | 557,742,812 | | 190,964,507 | | 186,084,639 |
| $5,073,139 | | $3,974,024 | | $695,377,212 | | $817,721,559 | | $171,727,429 | | $190,964,507 |
| | | | | | | | | | | |
| 600,000 | | 50,000 | | 610,000 | | 2,080,000 | | 100,000 | | 220,000 |
| (575,000) | | — | | (1,880,000) | | (520,000) | | (390,000) | | (150,000) |
| 25,000 | | 50,000 | | (1,270,000) | | 1,560,000 | | (290,000) | | 70,000 |
SPDR SERIES TRUST
FINANCIAL HIGHLIGHTS
Selected data for a share outstanding throughout each period
| | SPDR MSCI USA Climate Paris Aligned ETF |
| | Year
Ended
6/30/24 | | Year
Ended
6/30/23 | | For the
Period
4/22/22*-
6/30/22 |
Net asset value, beginning of period
| $25.14 | | $21.20 | | $25.00 |
| Income (loss) from investment operations: | | | | | |
Net investment income (loss) (a)
| 0.28 | | 0.29 | | 0.07 |
Net realized and unrealized gain (loss) (b)
| 5.38 | | 3.99 | | (3.83) |
Total from investment operations
| 5.66 | | 4.28 | | (3.76) |
Net equalization credits and charges (a)
| (0.01) | | (0.03) | | (0.00)(c) |
Contribution from affiliate (Note 4)
| — | | 0.00(c) | | — |
| Distributions to shareholders from: | | | | | |
Net investment income
| (0.30) | | (0.31) | | (0.04) |
Net asset value, end of period
| $30.49 | | $25.14 | | $21.20 |
Total return (d)
| 22.61% | | 20.25% | | (13.67)% |
| Ratios and Supplemental Data: | | | | | |
Net assets, end of period (in 000s)
| $2,439 | | $102,585 | | $131,437 |
| Ratios to average net assets: | | | | | |
Total expenses
| 0.10% | | 0.11% | | 0.10%(e) |
Net investment income (loss)
| 1.10% | | 1.31% | | 1.62%(e) |
Portfolio turnover rate (f)
| 9% | | 14% | | 6%(g) |
| * | Commencement of operations. |
| (a) | Per share numbers have been calculated using average shares outstanding, which more appropriately presents the per share data for the year. |
| (b) | Amounts shown in this caption for a share outstanding may not accord with the change in aggregate gains and losses in securities for the fiscal period because of the timing of sales and repurchases of Fund shares in relation to fluctuating market values for the Fund. |
| (c) | Amount is less than $0.005 per share. |
| (d) | Total return is calculated assuming a purchase of shares at net asset value on the first day and a sale at net asset value on the last day of each period reported. Distributions are assumed, for the purpose of this calculation, to be reinvested at net asset value per share on the respective payment dates of each distribution. Total returns for periods of less than one year are not annualized. Broker commission charges are not included in this calculation. |
| (e) | Annualized. |
| (f) | Portfolio turnover rate excludes securities received or delivered from in-kind processing of creations or redemptions. |
| (g) | Not annualized. |
See accompanying notes to financial statements.
149
SPDR SERIES TRUST
FINANCIAL HIGHLIGHTS (continued)
Selected data for a share outstanding throughout each period
| | SPDR Russell 1000 Low Volatility Focus ETF |
| | Year
Ended
6/30/24 | | Year
Ended
6/30/23 | | Year
Ended
6/30/22 | | Year
Ended
6/30/21 | | Year
Ended
6/30/20 |
Net asset value, beginning of period
| $108.47 | | $98.00 | | $103.93 | | $73.50 | | $80.17 |
| Income (loss) from investment operations: | | | | | | | | | |
Net investment income (loss) (a)
| 2.04 | | 1.84 | | 1.60 | | 1.49 | | 1.58 |
Net realized and unrealized gain (loss) (b)
| 9.89 | | 10.61 | | (5.82) | | 30.62 | | (6.42) |
Total from investment operations
| 11.93 | | 12.45 | | (4.22) | | 32.11 | | (4.84) |
Net equalization credits and charges (a)
| (0.03) | | 0.00(c) | | (0.02) | | (0.02) | | 0.01 |
| Distributions to shareholders from: | | | | | | | | | |
Net investment income
| (2.11) | | (1.98) | | (1.69) | | (1.66) | | (1.84) |
Net asset value, end of period
| $118.26 | | $108.47 | | $98.00 | | $103.93 | | $73.50 |
Total return (d)
| 11.07% | | 12.87% | | (4.20)% | | 44.00% | | (6.10)% |
| Ratios and Supplemental Data: | | | | | | | | | |
Net assets, end of period (in 000s)
| $631,531 | | $546,670 | | $540,953 | | $544,605 | | $474,842 |
| Ratios to average net assets: | | | | | | | | | |
Total expenses
| 0.20% | | 0.21% | | 0.20% | | 0.20% | | 0.20% |
Net investment income (loss)
| 1.80% | | 1.78% | | 1.49% | | 1.67% | | 2.02% |
Portfolio turnover rate (e)
| 34% | | 30% | | 27% | | 31% | | 28% |
| (a) | Per share numbers have been calculated using average shares outstanding, which more appropriately presents the per share data for the year. |
| (b) | Amounts shown in this caption for a share outstanding may not accord with the change in aggregate gains and losses in securities for the fiscal period because of the timing of sales and repurchases of Fund shares in relation to fluctuating market values for the Fund. |
| (c) | Amount is less than $0.005 per share. |
| (d) | Total return is calculated assuming a purchase of shares at net asset value on the first day and a sale at net asset value on the last day of each period reported. Distributions are assumed, for the purpose of this calculation, to be reinvested at net asset value per share on the respective payment dates of each distribution. Total returns for periods of less than one year are not annualized. Broker commission charges are not included in this calculation. |
| (e) | Portfolio turnover rate excludes securities received or delivered from in-kind processing of creations or redemptions. |
See accompanying notes to financial statements.
150
SPDR SERIES TRUST
FINANCIAL HIGHLIGHTS (continued)
Selected data for a share outstanding throughout each period
| | SPDR Russell 1000 Momentum Focus ETF |
| | Year
Ended
6/30/24 | | Year
Ended
6/30/23 | | Year
Ended
6/30/22 | | Year
Ended
6/30/21 | | Year
Ended
6/30/20 |
Net asset value, beginning of period
| $98.00 | | $85.87 | | $98.81 | | $68.38 | | $73.00 |
| Income (loss) from investment operations: | | | | | | | | | |
Net investment income (loss) (a)
| 1.28 | | 1.63 | | 1.45 | | 1.06 | | 1.20 |
Net realized and unrealized gain (loss) (b)
| 12.50 | | 12.32 | | (13.03) | | 30.58 | | (4.46) |
Total from investment operations
| 13.78 | | 13.95 | | (11.58) | | 31.64 | | (3.26) |
Net equalization credits and charges (a)
| 0.04 | | (0.04) | | (0.00)(c) | | (0.08) | | (0.08) |
| Distributions to shareholders from: | | | | | | | | | |
Net investment income
| (1.40) | | (1.78) | | (1.36) | | (1.13) | | (1.28) |
Net asset value, end of period
| $110.42 | | $98.00 | | $85.87 | | $98.81 | | $68.38 |
Total return (d)
| 14.17% | | 16.40% | | (11.87)% | | 46.38% | | (4.59)% |
| Ratios and Supplemental Data: | | | | | | | | | |
Net assets, end of period (in 000s)
| $145,752 | | $156,805 | | $267,926 | | $312,235 | | $311,807 |
| Ratios to average net assets: | | | | | | | | | |
Total expenses
| 0.20% | | 0.21% | | 0.20% | | 0.20% | | 0.20% |
Net investment income (loss)
| 1.25% | | 1.76% | | 1.46% | | 1.27% | | 1.68% |
Portfolio turnover rate (e)
| 50% | | 37% | | 44% | | 42% | | 42% |
| (a) | Per share numbers have been calculated using average shares outstanding, which more appropriately presents the per share data for the year. |
| (b) | Amounts shown in this caption for a share outstanding may not accord with the change in aggregate gains and losses in securities for the fiscal period because of the timing of sales and repurchases of Fund shares in relation to fluctuating market values for the Fund. |
| (c) | Amount is less than $0.005 per share. |
| (d) | Total return is calculated assuming a purchase of shares at net asset value on the first day and a sale at net asset value on the last day of each period reported. Distributions are assumed, for the purpose of this calculation, to be reinvested at net asset value per share on the respective payment dates of each distribution. Total returns for periods of less than one year are not annualized. Broker commission charges are not included in this calculation. |
| (e) | Portfolio turnover rate excludes securities received or delivered from in-kind processing of creations or redemptions. |
See accompanying notes to financial statements.
151
SPDR SERIES TRUST
FINANCIAL HIGHLIGHTS (continued)
Selected data for a share outstanding throughout each period
| | SPDR Russell 1000 Yield Focus ETF |
| | Year
Ended
6/30/24 | | Year
Ended
6/30/23 | | Year
Ended
6/30/22 | | Year
Ended
6/30/21 | | Year
Ended
6/30/20 |
Net asset value, beginning of period
| $95.25 | | $89.12 | | $94.82 | | $58.69 | | $70.62 |
| Income (loss) from investment operations: | | | | | | | | | |
Net investment income (loss) (a)
| 3.41 | | 3.05 | | 2.76 | | 2.09 | | 2.16 |
Net realized and unrealized gain (loss) (b)
| 8.55 | | 6.18 | | (5.91) | | 36.29 | | (11.73) |
Total from investment operations
| 11.96 | | 9.23 | | (3.15) | | 38.38 | | (9.57) |
Net equalization credits and charges (a)
| 0.00(c) | | (0.00)(c) | | 0.02 | | 0.06 | | 0.01 |
| Distributions to shareholders from: | | | | | | | | | |
Net investment income
| (3.33) | | (3.10) | | (2.57) | | (2.31) | | (2.37) |
Net asset value, end of period
| $103.88 | | $95.25 | | $89.12 | | $94.82 | | $58.69 |
Total return (d)
| 12.72% | | 10.59% | | (3.45)% | | 66.30% | | (13.74)% |
| Ratios and Supplemental Data: | | | | | | | | | |
Net assets, end of period (in 000s)
| $785,304 | | $759,173 | | $779,832 | | $655,207 | | $356,828 |
| Ratios to average net assets: | | | | | | | | | |
Total expenses
| 0.20% | | 0.21% | | 0.20% | | 0.20% | | 0.20% |
Net investment income (loss)
| 3.45% | | 3.26% | | 2.83% | | 2.69% | | 3.27% |
Portfolio turnover rate (e)
| 35% | | 33% | | 40% | | 58% | | 34% |
| (a) | Per share numbers have been calculated using average shares outstanding, which more appropriately presents the per share data for the year. |
| (b) | Amounts shown in this caption for a share outstanding may not accord with the change in aggregate gains and losses in securities for the fiscal period because of the timing of sales and repurchases of Fund shares in relation to fluctuating market values for the Fund. |
| (c) | Amount is less than $0.005 per share. |
| (d) | Total return is calculated assuming a purchase of shares at net asset value on the first day and a sale at net asset value on the last day of each period reported. Distributions are assumed, for the purpose of this calculation, to be reinvested at net asset value per share on the respective payment dates of each distribution. Total returns for periods of less than one year are not annualized. Broker commission charges are not included in this calculation. |
| (e) | Portfolio turnover rate excludes securities received or delivered from in-kind processing of creations or redemptions. |
See accompanying notes to financial statements.
152
SPDR SERIES TRUST
FINANCIAL HIGHLIGHTS (continued)
Selected data for a share outstanding throughout each period
| | SPDR S&P 400 Mid Cap Growth ETF |
| | Year
Ended
6/30/24 | | Year
Ended
6/30/23 | | Year
Ended
6/30/22 | | Year
Ended
6/30/21 | | Year
Ended
6/30/20 |
Net asset value, beginning of period
| $71.68 | | $60.97 | | $77.52 | | $53.77 | | $54.22 |
| Income (loss) from investment operations: | | | | | | | | | |
Net investment income (loss) (a)
| 0.79 | | 0.77 | | 0.55 | | 0.43 | | 0.55 |
Net realized and unrealized gain (loss) (b)
| 12.52 | | 10.79 | | (16.50) | | 23.79 | | (0.38) |
Total from investment operations
| 13.31 | | 11.56 | | (15.95) | | 24.22 | | 0.17 |
Net equalization credits and charges (a)
| (0.03) | | (0.01) | | 0.08 | | (0.01) | | (0.00)(c) |
| Distributions to shareholders from: | | | | | | | | | |
Net investment income
| (0.85) | | (0.84) | | (0.68) | | (0.46) | | (0.62) |
Net asset value, end of period
| $84.11 | | $71.68 | | $60.97 | | $77.52 | | $53.77 |
Total return (d)
| 18.65% | | 19.07% | | (20.61)% | | 45.10% | | 0.35% |
| Ratios and Supplemental Data: | | | | | | | | | |
Net assets, end of period (in 000s)
| $2,451,857 | | $1,849,233 | | $1,289,549 | | $1,682,086 | | $1,941,214 |
| Ratios to average net assets: | | | | | | | | | |
Total expenses
| 0.15% | | 0.16% | | 0.15% | | 0.15% | | 0.15% |
Net investment income (loss)
| 1.02% | | 1.15% | | 0.73% | | 0.65% | | 1.04% |
Portfolio turnover rate (e)
| 51% | | 52% | | 43% | | 37% | | 45% |
| (a) | Per share numbers have been calculated using average shares outstanding, which more appropriately presents the per share data for the year. |
| (b) | Amounts shown in this caption for a share outstanding may not accord with the change in aggregate gains and losses in securities for the fiscal period because of the timing of sales and repurchases of Fund shares in relation to fluctuating market values for the Fund. |
| (c) | Amount is less than $0.005 per share. |
| (d) | Total return is calculated assuming a purchase of shares at net asset value on the first day and a sale at net asset value on the last day of each period reported. Distributions are assumed, for the purpose of this calculation, to be reinvested at net asset value per share on the respective payment dates of each distribution. Total returns for periods of less than one year are not annualized. Broker commission charges are not included in this calculation. |
| (e) | Portfolio turnover rate excludes securities received or delivered from in-kind processing of creations or redemptions. |
See accompanying notes to financial statements.
153
SPDR SERIES TRUST
FINANCIAL HIGHLIGHTS (continued)
Selected data for a share outstanding throughout each period
| | SPDR S&P 400 Mid Cap Value ETF |
| | Year
Ended
6/30/24 | | Year
Ended
6/30/23 | | Year
Ended
6/30/22 | | Year
Ended
6/30/21 | | Year
Ended
6/30/20 |
Net asset value, beginning of period
| $68.76 | | $60.51 | | $67.55 | | $42.66 | | $51.34 |
| Income (loss) from investment operations: | | | | | | | | | |
Net investment income (loss) (a)
| 1.30 | | 1.28 | | 1.16 | | 1.04 | | 1.02 |
Net realized and unrealized gain (loss) (b)
| 4.22 | | 8.21 | | (7.00) | | 24.71 | | (8.59) |
Total from investment operations
| 5.52 | | 9.49 | | (5.84) | | 25.75 | | (7.57) |
Net equalization credits and charges (a)
| (0.04) | | (0.02) | | 0.01 | | 0.15 | | 0.00(c) |
| Distributions to shareholders from: | | | | | | | | | |
Net investment income
| (1.27) | | (1.22) | | (1.21) | | (1.01) | | (1.11) |
Net asset value, end of period
| $72.97 | | $68.76 | | $60.51 | | $67.55 | | $42.66 |
Total return (d)
| 8.02% | | 15.84% | | (8.78)% | | 61.10% | | (14.85)% |
| Ratios and Supplemental Data: | | | | | | | | | |
Net assets, end of period (in 000s)
| $2,418,934 | | $2,224,494 | | $1,431,126 | | $1,526,568 | | $893,653 |
| Ratios to average net assets: | | | | | | | | | |
Total expenses
| 0.15% | | 0.15% | | 0.15% | | 0.15% | | 0.15% |
Net investment income (loss)
| 1.86% | | 1.94% | | 1.71% | | 1.82% | | 2.13% |
Portfolio turnover rate (e)
| 41% | | 46% | | 32% | | 38% | | 45% |
| (a) | Per share numbers have been calculated using average shares outstanding, which more appropriately presents the per share data for the year. |
| (b) | Amounts shown in this caption for a share outstanding may not accord with the change in aggregate gains and losses in securities for the fiscal period because of the timing of sales and repurchases of Fund shares in relation to fluctuating market values for the Fund. |
| (c) | Amount is less than $0.005 per share. |
| (d) | Total return is calculated assuming a purchase of shares at net asset value on the first day and a sale at net asset value on the last day of each period reported. Distributions are assumed, for the purpose of this calculation, to be reinvested at net asset value per share on the respective payment dates of each distribution. Total returns for periods of less than one year are not annualized. Broker commission charges are not included in this calculation. |
| (e) | Portfolio turnover rate excludes securities received or delivered from in-kind processing of creations or redemptions. |
See accompanying notes to financial statements.
154
SPDR SERIES TRUST
FINANCIAL HIGHLIGHTS (continued)
Selected data for a share outstanding throughout each period
| | SPDR S&P 500 ESG ETF |
| | Year
Ended
6/30/24 | | Year
Ended
6/30/23 | | Year
Ended
6/30/22 | | For the
Period
7/28/20*-
6/30/21 |
Net asset value, beginning of period
| $43.05 | | $36.21 | | $40.12 | | $30.25 |
| Income (loss) from investment operations: | | | | | | | |
Net investment income (loss) (a)
| 0.64 | | 0.63 | | 0.57 | | 0.47 |
Net realized and unrealized gain (loss) (b)
| 10.02 | | 6.80 | | (3.97) | | 9.76 |
Total from investment operations
| 10.66 | | 7.43 | | (3.40) | | 10.23 |
Net equalization credits and charges (a)
| 0.01 | | 0.04 | | 0.05 | | 0.12 |
| Distributions to shareholders from: | | | | | | | |
Net investment income
| (0.64) | | (0.63) | | (0.56) | | (0.48) |
Net asset value, end of period
| $53.08 | | $43.05 | | $36.21 | | $40.12 |
Total return (c)
| 24.95% | | 20.86% | | (8.48)% | | 34.47% |
| Ratios and Supplemental Data: | | | | | | | |
Net assets, end of period (in 000s)
| $1,284,451 | | $886,892 | | $434,577 | | $235,700 |
| Ratios to average net assets: | | | | | | | |
Total expenses
| 0.10% | | 0.10% | | 0.10% | | 0.10%(d) |
Net investment income (loss)
| 1.38% | | 1.63% | | 1.36% | | 1.39%(d) |
Portfolio turnover rate (e)
| 12% | | 12% | | 6% | | 16%(f) |
| * | Commencement of operations. |
| (a) | Per share numbers have been calculated using average shares outstanding, which more appropriately presents the per share data for the year. |
| (b) | Amounts shown in this caption for a share outstanding may not accord with the change in aggregate gains and losses in securities for the fiscal period because of the timing of sales and repurchases of Fund shares in relation to fluctuating market values for the Fund. |
| (c) | Total return is calculated assuming a purchase of shares at net asset value on the first day and a sale at net asset value on the last day of each period reported. Distributions are assumed, for the purpose of this calculation, to be reinvested at net asset value per share on the respective payment dates of each distribution. Total returns for periods of less than one year are not annualized. Broker commission charges are not included in this calculation. |
| (d) | Annualized. |
| (e) | Portfolio turnover rate excludes securities received or delivered from in-kind processing of creations or redemptions. |
| (f) | Not annualized. |
See accompanying notes to financial statements.
155
SPDR SERIES TRUST
FINANCIAL HIGHLIGHTS (continued)
Selected data for a share outstanding throughout each period
| | SPDR S&P 600 Small Cap Growth ETF |
| | Year
Ended
6/30/24 | | Year
Ended
6/30/23 | | Year
Ended
6/30/22 | | Year
Ended
6/30/21 | | Year
Ended
6/30/20 |
Net asset value, beginning of period
| $76.91 | | $70.53 | | $88.70 | | $56.77 | | $60.96 |
| Income (loss) from investment operations: | | | | | | | | | |
Net investment income (loss) (a)
| 0.97 | | 0.96 | | 0.80 | | 0.52 | | 0.59 |
Net realized and unrealized gain (loss) (b)
| 8.87 | | 6.38 | | (18.19) | | 31.91 | | (4.10) |
Total from investment operations
| 9.84 | | 7.34 | | (17.39) | | 32.43 | | (3.51) |
Net equalization credits and charges (a)
| 0.01 | | 0.01 | | (0.00)(c) | | (0.00)(c) | | (0.02) |
| Distributions to shareholders from: | | | | | | | | | |
Net investment income
| (0.94) | | (0.97) | | (0.78) | | (0.50) | | (0.66) |
Net asset value, end of period
| $85.82 | | $76.91 | | $70.53 | | $88.70 | | $56.77 |
Total return (d)
| 12.88% | | 10.53% | | (19.74)% | | 57.23% | | (5.80)% |
| Ratios and Supplemental Data: | | | | | | | | | |
Net assets, end of period (in 000s)
| $3,226,944 | | $2,530,443 | | $2,038,288 | | $2,306,075 | | $1,541,359 |
| Ratios to average net assets: | | | | | | | | | |
Total expenses
| 0.15% | | 0.16% | | 0.15% | | 0.15% | | 0.15% |
Net investment income (loss)
| 1.21% | | 1.30% | | 0.95% | | 0.69% | | 1.01% |
Portfolio turnover rate (e)
| 53% | | 48% | | 44% | | 38% | | 50% |
| (a) | Per share numbers have been calculated using average shares outstanding, which more appropriately presents the per share data for the year. |
| (b) | Amounts shown in this caption for a share outstanding may not accord with the change in aggregate gains and losses in securities for the fiscal period because of the timing of sales and repurchases of Fund shares in relation to fluctuating market values for the Fund. |
| (c) | Amount is less than $0.005 per share. |
| (d) | Total return is calculated assuming a purchase of shares at net asset value on the first day and a sale at net asset value on the last day of each period reported. Distributions are assumed, for the purpose of this calculation, to be reinvested at net asset value per share on the respective payment dates of each distribution. Total returns for periods of less than one year are not annualized. Broker commission charges are not included in this calculation. |
| (e) | Portfolio turnover rate excludes securities received or delivered from in-kind processing of creations or redemptions. |
See accompanying notes to financial statements.
156
SPDR SERIES TRUST
FINANCIAL HIGHLIGHTS (continued)
Selected data for a share outstanding throughout each period
| | SPDR S&P 600 Small Cap Value ETF |
| | Year
Ended
6/30/24 | | Year
Ended
6/30/23 | | Year
Ended
6/30/22 | | Year
Ended
6/30/21 | | Year
Ended
6/30/20 |
Net asset value, beginning of period
| $77.18 | | $72.36 | | $85.72 | | $49.15 | | $60.70 |
| Income (loss) from investment operations: | | | | | | | | | |
Net investment income (loss) (a)
| 1.65 | | 1.45 | | 1.41 | | 1.07 | | 1.13 |
Net realized and unrealized gain (loss) (b)
| 1.48 | | 4.79 | | (13.35) | | 36.50 | | (11.53) |
Total from investment operations
| 3.13 | | 6.24 | | (11.94) | | 37.57 | | (10.40) |
Net equalization credits and charges (a)
| (0.01) | | (0.01) | | (0.00)(c) | | 0.04 | | (0.01) |
| Distributions to shareholders from: | | | | | | | | | |
Net investment income
| (1.88) | | (1.41) | | (1.42) | | (1.04) | | (1.14) |
Net asset value, end of period
| $78.42 | | $77.18 | | $72.36 | | $85.72 | | $49.15 |
Total return (d)
| 4.06% | | 8.76% | | (14.09)% | | 76.93% | | (17.29)% |
| Ratios and Supplemental Data: | | | | | | | | | |
Net assets, end of period (in 000s)
| $3,646,674 | | $3,824,442 | | $3,835,224 | | $4,127,553 | | $1,916,806 |
| Ratios to average net assets: | | | | | | | | | |
Total expenses
| 0.15% | | 0.16% | | 0.15% | | 0.15% | | 0.15% |
Net investment income (loss)
| 2.12% | | 1.90% | | 1.72% | | 1.55% | | 2.02% |
Portfolio turnover rate (e)
| 58% | | 46% | | 38% | | 36% | | 51% |
| (a) | Per share numbers have been calculated using average shares outstanding, which more appropriately presents the per share data for the year. |
| (b) | Amounts shown in this caption for a share outstanding may not accord with the change in aggregate gains and losses in securities for the fiscal period because of the timing of sales and repurchases of Fund shares in relation to fluctuating market values for the Fund. |
| (c) | Amount is less than $0.005 per share. |
| (d) | Total return is calculated assuming a purchase of shares at net asset value on the first day and a sale at net asset value on the last day of each period reported. Distributions are assumed, for the purpose of this calculation, to be reinvested at net asset value per share on the respective payment dates of each distribution. Total returns for periods of less than one year are not annualized. Broker commission charges are not included in this calculation. |
| (e) | Portfolio turnover rate excludes securities received or delivered from in-kind processing of creations or redemptions. |
See accompanying notes to financial statements.
157
SPDR SERIES TRUST
FINANCIAL HIGHLIGHTS (continued)
Selected data for a share outstanding throughout each period
| | SPDR S&P 1500 Momentum Tilt ETF |
| | Year
Ended
6/30/24 | | Year
Ended
6/30/23 | | Year
Ended
6/30/22 | | Year
Ended
6/30/21 | | Year
Ended
6/30/20 |
Net asset value, beginning of period
| $185.39 | | $160.63 | | $181.66 | | $134.17 | | $127.95 |
| Income (loss) from investment operations: | | | | | | | | | |
Net investment income (loss) (a)
| 2.01 | | 2.93 | | 2.33 | | 1.61 | | 2.11 |
Net realized and unrealized gain (loss) (b)
| 57.30 | | 24.60 | | (21.01) | | 47.49 | | 6.32 |
Total from investment operations
| 59.31 | | 27.53 | | (18.68) | | 49.10 | | 8.43 |
Net equalization credits and charges (a)
| (0.01) | | (0.04) | | (0.01) | | (0.02) | | (0.05) |
Contribution from affiliate (Note 4)
| — | | 0.22 | | — | | — | | — |
| Distributions to shareholders from: | | | | | | | | | |
Net investment income
| (1.96) | | (2.95) | | (2.34) | | (1.59) | | (2.16) |
Net asset value, end of period
| $242.73 | | $185.39 | | $160.63 | | $181.66 | | $134.17 |
Total return (c)
| 32.16% | | 17.46%(d) | | (10.45)% | | 36.74% | | 6.64% |
| Ratios and Supplemental Data: | | | | | | | | | |
Net assets, end of period (in 000s)
| $106,800 | | $83,424 | | $72,286 | | $86,289 | | $67,085 |
| Ratios to average net assets: | | | | | | | | | |
Total expenses
| 0.12% | | 0.13% | | 0.12% | | 0.12% | | 0.12% |
Net investment income (loss)
| 0.98% | | 1.73% | | 1.24% | | 1.01% | | 1.62% |
Portfolio turnover rate (e)
| 56% | | 104% | | 60% | | 53% | | 65% |
| (a) | Per share numbers have been calculated using average shares outstanding, which more appropriately presents the per share data for the year. |
| (b) | Amounts shown in this caption for a share outstanding may not accord with the change in aggregate gains and losses in securities for the fiscal period because of the timing of sales and repurchases of Fund shares in relation to fluctuating market values for the Fund. |
| (c) | Total return is calculated assuming a purchase of shares at net asset value on the first day and a sale at net asset value on the last day of each period reported. Distributions are assumed, for the purpose of this calculation, to be reinvested at net asset value per share on the respective payment dates of each distribution. Total returns for periods of less than one year are not annualized. Broker commission charges are not included in this calculation. |
| (d) | If an affiliate had not made a contribution during the period ended June 30, 2023, the total return would have been 17.32%. |
| (e) | Portfolio turnover rate excludes securities received or delivered from in-kind processing of creations or redemptions. |
See accompanying notes to financial statements.
158
SPDR SERIES TRUST
FINANCIAL HIGHLIGHTS (continued)
Selected data for a share outstanding throughout each period
| | SPDR S&P 1500 Value Tilt ETF |
| | Year
Ended
6/30/24 | | Year
Ended
6/30/23 | | Year
Ended
6/30/22 | | Year
Ended
6/30/21 | | Year
Ended
6/30/20 |
Net asset value, beginning of period
| $148.31 | | $133.90 | | $146.31 | | $97.54 | | $103.92 |
| Income (loss) from investment operations: | | | | | | | | | |
Net investment income (loss) (a)
| 3.44 | | 3.12 | | 2.99 | | 2.56 | | 2.53 |
Net realized and unrealized gain (loss) (b)
| 23.73 | | 14.42 | | (12.36) | | 48.10 | | (6.33) |
Total from investment operations
| 27.17 | | 17.54 | | (9.37) | | 50.66 | | (3.80) |
Net equalization credits and charges (a)
| 0.08 | | (0.01) | | (0.02) | | 0.58 | | (0.01) |
| Distributions to shareholders from: | | | | | | | | | |
Net investment income
| (3.41) | | (3.12) | | (3.02) | | (2.47) | | (2.57) |
Net asset value, end of period
| $172.15 | | $148.31 | | $133.90 | | $146.31 | | $97.54 |
Total return (c)
| 18.54% | | 13.29% | | (6.60)% | | 53.02% | | (3.68)% |
| Ratios and Supplemental Data: | | | | | | | | | |
Net assets, end of period (in 000s)
| $352,914 | | $231,357 | | $203,533 | | $215,082 | | $20,483 |
| Ratios to average net assets: | | | | | | | | | |
Total expenses
| 0.12% | | 0.13% | | 0.12% | | 0.12% | | 0.12% |
Net investment income (loss)
| 2.16% | | 2.21% | | 2.00% | | 1.90% | | 2.46% |
Portfolio turnover rate (d)
| 13% | | 14% | | 11% | | 24% | | 16% |
| (a) | Per share numbers have been calculated using average shares outstanding, which more appropriately presents the per share data for the year. |
| (b) | Amounts shown in this caption for a share outstanding may not accord with the change in aggregate gains and losses in securities for the fiscal period because of the timing of sales and repurchases of Fund shares in relation to fluctuating market values for the Fund. |
| (c) | Total return is calculated assuming a purchase of shares at net asset value on the first day and a sale at net asset value on the last day of each period reported. Distributions are assumed, for the purpose of this calculation, to be reinvested at net asset value per share on the respective payment dates of each distribution. Total returns for periods of less than one year are not annualized. Broker commission charges are not included in this calculation. |
| (d) | Portfolio turnover rate excludes securities received or delivered from in-kind processing of creations or redemptions. |
See accompanying notes to financial statements.
159
SPDR SERIES TRUST
FINANCIAL HIGHLIGHTS (continued)
Selected data for a share outstanding throughout each period
| | SPDR S&P Kensho Clean Power ETF |
| | Year
Ended
6/30/24 | | Year
Ended
6/30/23 | | Year
Ended
6/30/22 | | Year
Ended
6/30/21 | | Year
Ended
6/30/20 |
Net asset value, beginning of period
| $84.70 | | $78.18 | | $105.73 | | $49.44 | | $38.06 |
| Income (loss) from investment operations: | | | | | | | | | |
Net investment income (loss) (a)
| 0.82 | | 0.70 | | 1.05 | | 1.20 | | 1.04 |
Net realized and unrealized gain (loss) (b)
| (24.14) | | 6.55 | | (27.37) | | 55.34 | | 10.88 |
Total from investment operations
| (23.32) | | 7.25 | | (26.32) | | 56.54 | | 11.92 |
Net equalization credits and charges (a)
| (0.05) | | 0.04 | | (0.00)(c) | | 0.50 | | 0.26 |
| Distributions to shareholders from: | | | | | | | | | |
Net investment income
| (0.98) | | (0.77) | | (1.23) | | (0.75) | | (0.80) |
Net asset value, end of period
| $60.35 | | $84.70 | | $78.18 | | $105.73 | | $49.44 |
Total return (d)
| (27.69)% | | 9.35% | | (25.03)% | | 115.51% | | 32.40% |
| Ratios and Supplemental Data: | | | | | | | | | |
Net assets, end of period (in 000s)
| $178,946 | | $339,214 | | $266,970 | | $402,315 | | $29,418 |
| Ratios to average net assets: | | | | | | | | | |
Total expenses
| 0.45% | | 0.46% | | 0.45% | | 0.45% | | 0.45% |
Net investment income (loss)
| 1.21% | | 0.80% | | 1.15% | | 1.15% | | 2.42% |
Portfolio turnover rate (e)
| 38% | | 32% | | 27% | | 43% | | 37% |
| (a) | Per share numbers have been calculated using average shares outstanding, which more appropriately presents the per share data for the year. |
| (b) | Amounts shown in this caption for a share outstanding may not accord with the change in aggregate gains and losses in securities for the fiscal period because of the timing of sales and repurchases of Fund shares in relation to fluctuating market values for the Fund. |
| (c) | Amount is less than $0.005 per share. |
| (d) | Total return is calculated assuming a purchase of shares at net asset value on the first day and a sale at net asset value on the last day of each period reported. Distributions are assumed, for the purpose of this calculation, to be reinvested at net asset value per share on the respective payment dates of each distribution. Total returns for periods of less than one year are not annualized. Broker commission charges are not included in this calculation. |
| (e) | Portfolio turnover rate excludes securities received or delivered from in-kind processing of creations or redemptions. |
See accompanying notes to financial statements.
160
SPDR SERIES TRUST
FINANCIAL HIGHLIGHTS (continued)
Selected data for a share outstanding throughout each period
| | SPDR S&P Kensho Final Frontiers ETF |
| | Year
Ended
6/30/24 | | Year
Ended
6/30/23 | | Year
Ended
6/30/22 | | Year
Ended
6/30/21 | | Year
Ended
6/30/20 |
Net asset value, beginning of period
| $43.72 | | $35.32 | | $42.47 | | $30.36 | | $33.70 |
| Income (loss) from investment operations: | | | | | | | | | |
Net investment income (loss) (a)
| 0.28 | | 0.20 | | 0.18 | | 0.48 | | 0.29 |
Net realized and unrealized gain (loss) (b)
| 1.00 | | 8.42 | | (7.14) | | 12.32 | | (3.63) |
Total from investment operations
| 1.28 | | 8.62 | | (6.96) | | 12.80 | | (3.34) |
Net equalization credits and charges (a)
| (0.01) | | (0.01) | | (0.00)(c) | | 0.04 | | 0.21 |
| Distributions to shareholders from: | | | | | | | | | |
Net investment income
| (0.31) | | (0.21) | | (0.19) | | (0.73) | | (0.21) |
Net asset value, end of period
| $44.68 | | $43.72 | | $35.32 | | $42.47 | | $30.36 |
Total return (d)
| 2.93% | | 24.43% | | (16.42)% | | 42.54% | | (9.34)% |
| Ratios and Supplemental Data: | | | | | | | | | |
Net assets, end of period (in 000s)
| $15,190 | | $17,923 | | $17,309 | | $22,509 | | $8,804 |
| Ratios to average net assets: | | | | | | | | | |
Total expenses
| 0.45% | | 0.46% | | 0.45% | | 0.45% | | 0.45% |
Net investment income (loss)
| 0.66% | | 0.51% | | 0.45% | | 1.26% | | 0.87% |
Portfolio turnover rate (e)
| 21% | | 28% | | 22% | | 43% | | 39% |
| (a) | Per share numbers have been calculated using average shares outstanding, which more appropriately presents the per share data for the year. |
| (b) | Amounts shown in this caption for a share outstanding may not accord with the change in aggregate gains and losses in securities for the fiscal period because of the timing of sales and repurchases of Fund shares in relation to fluctuating market values for the Fund. |
| (c) | Amount is less than $0.005 per share. |
| (d) | Total return is calculated assuming a purchase of shares at net asset value on the first day and a sale at net asset value on the last day of each period reported. Distributions are assumed, for the purpose of this calculation, to be reinvested at net asset value per share on the respective payment dates of each distribution. Total returns for periods of less than one year are not annualized. Broker commission charges are not included in this calculation. |
| (e) | Portfolio turnover rate excludes securities received or delivered from in-kind processing of creations or redemptions. |
See accompanying notes to financial statements.
161
SPDR SERIES TRUST
FINANCIAL HIGHLIGHTS (continued)
Selected data for a share outstanding throughout each period
| | SPDR S&P Kensho Future Security ETF |
| | Year
Ended
6/30/24 | | Year
Ended
6/30/23 | | Year
Ended
6/30/22 | | Year
Ended
6/30/21 | | Year
Ended
6/30/20 |
Net asset value, beginning of period
| $48.83 | | $43.97 | | $51.75 | | $36.60 | | $37.52 |
| Income (loss) from investment operations: | | | | | | | | | |
Net investment income (loss) (a)
| 0.09 | | 0.05 | | 0.23 | | 0.19 | | 0.46 |
Net realized and unrealized gain (loss) (b)
| 7.77 | | 4.85 | | (7.76) | | 15.15 | | (0.96) |
Total from investment operations
| 7.86 | | 4.90 | | (7.53) | | 15.34 | | (0.50) |
Net equalization credits and charges (a)
| (0.01) | | (0.00)(c) | | (0.02) | | 0.17 | | 0.02 |
| Distributions to shareholders from: | | | | | | | | | |
Net investment income
| (0.10) | | (0.04) | | (0.23) | | (0.36) | | (0.44) |
Net asset value, end of period
| $56.58 | | $48.83 | | $43.97 | | $51.75 | | $36.60 |
Total return (d)
| 16.07% | | 11.16% | | (14.66)% | | 42.50% | | (1.16)% |
| Ratios and Supplemental Data: | | | | | | | | | |
Net assets, end of period (in 000s)
| $57,710 | | $32,719 | | $28,580 | | $27,429 | | $19,397 |
| Ratios to average net assets: | | | | | | | | | |
Total expenses
| 0.45% | | 0.46% | | 0.45% | | 0.45% | | 0.45% |
Net investment income (loss)
| 0.17% | | 0.10% | | 0.46% | | 0.42% | | 1.25% |
Portfolio turnover rate (e)
| 32% | | 33% | | 32% | | 39% | | 25% |
| (a) | Per share numbers have been calculated using average shares outstanding, which more appropriately presents the per share data for the year. |
| (b) | Amounts shown in this caption for a share outstanding may not accord with the change in aggregate gains and losses in securities for the fiscal period because of the timing of sales and repurchases of Fund shares in relation to fluctuating market values for the Fund. |
| (c) | Amount is less than $0.005 per share. |
| (d) | Total return is calculated assuming a purchase of shares at net asset value on the first day and a sale at net asset value on the last day of each period reported. Distributions are assumed, for the purpose of this calculation, to be reinvested at net asset value per share on the respective payment dates of each distribution. Total returns for periods of less than one year are not annualized. Broker commission charges are not included in this calculation. |
| (e) | Portfolio turnover rate excludes securities received or delivered from in-kind processing of creations or redemptions. |
See accompanying notes to financial statements.
162
SPDR SERIES TRUST
FINANCIAL HIGHLIGHTS (continued)
Selected data for a share outstanding throughout each period
| | SPDR S&P Kensho Intelligent Structures ETF |
| | Year
Ended
6/30/24 | | Year
Ended
6/30/23 | | Year
Ended
6/30/22 | | Year
Ended
6/30/21 | | Year
Ended
6/30/20 |
Net asset value, beginning of period
| $35.95 | | $32.12 | | $47.76 | | $29.91 | | $30.22 |
| Income (loss) from investment operations: | | | | | | | | | |
Net investment income (loss) (a)
| 0.36 | | 0.56 | | 0.37 | | 0.56 | | 0.42 |
Net realized and unrealized gain (loss) (b)
| (2.65) | | 3.83 | | (15.59) | | 17.65 | | (0.27) |
Total from investment operations
| (2.29) | | 4.39 | | (15.22) | | 18.21 | | 0.15 |
Net equalization credits and charges (a)
| (0.01) | | (0.01) | | (0.00)(c) | | 0.04 | | (0.01) |
| Distributions to shareholders from: | | | | | | | | | |
Net investment income
| (0.37) | | (0.55) | | (0.42) | | (0.40) | | (0.45) |
Net asset value, end of period
| $33.28 | | $35.95 | | $32.12 | | $47.76 | | $29.91 |
Total return (d)
| (6.39)% | | 13.75% | | (32.02)% | | 61.22% | | 0.45% |
| Ratios and Supplemental Data: | | | | | | | | | |
Net assets, end of period (in 000s)
| $13,312 | | $23,366 | | $31,157 | | $53,013 | | $6,281 |
| Ratios to average net assets: | | | | | | | | | |
Total expenses
| 0.45% | | 0.46% | | 0.45% | | 0.45% | | 0.45% |
Net investment income (loss)
| 1.07% | | 1.61% | | 0.88% | | 1.27% | | 1.43% |
Portfolio turnover rate (e)
| 31% | | 31% | | 32% | | 58% | | 26% |
| (a) | Per share numbers have been calculated using average shares outstanding, which more appropriately presents the per share data for the year. |
| (b) | Amounts shown in this caption for a share outstanding may not accord with the change in aggregate gains and losses in securities for the fiscal period because of the timing of sales and repurchases of Fund shares in relation to fluctuating market values for the Fund. |
| (c) | Amount is less than $0.005 per share. |
| (d) | Total return is calculated assuming a purchase of shares at net asset value on the first day and a sale at net asset value on the last day of each period reported. Distributions are assumed, for the purpose of this calculation, to be reinvested at net asset value per share on the respective payment dates of each distribution. Total returns for periods of less than one year are not annualized. Broker commission charges are not included in this calculation. |
| (e) | Portfolio turnover rate excludes securities received or delivered from in-kind processing of creations or redemptions. |
See accompanying notes to financial statements.
163
SPDR SERIES TRUST
FINANCIAL HIGHLIGHTS (continued)
Selected data for a share outstanding throughout each period
| | SPDR S&P Kensho New Economies Composite ETF |
| | Year
Ended
6/30/24 | | Year
Ended
6/30/23 | | Year
Ended
6/30/22 | | Year
Ended
6/30/21 | | Year
Ended
6/30/20 |
Net asset value, beginning of period
| $44.58 | | $40.57 | | $66.83 | | $37.27 | | $33.27 |
| Income (loss) from investment operations: | | | | | | | | | |
Net investment income (loss) (a)
| 0.46 | | 0.56 | | 0.62 | | 0.57 | | 0.43 |
Net realized and unrealized gain (loss) (b)
| 1.61 | | 4.03 | | (26.12) | | 29.61 | | 3.43 |
Total from investment operations
| 2.07 | | 4.59 | | (25.50) | | 30.18 | | 3.86 |
Net equalization credits and charges (a)
| (0.00)(c) | | (0.01) | | (0.01) | | 0.01 | | 0.48 |
| Distributions to shareholders from: | | | | | | | | | |
Net investment income
| (0.59) | | (0.57) | | (0.75) | | (0.63) | | (0.34) |
Net asset value, end of period
| $46.06 | | $44.58 | | $40.57 | | $66.83 | | $37.27 |
Total return (d)
| 4.69% | | 11.41% | | (38.45)% | | 81.27% | | 13.09% |
| Ratios and Supplemental Data: | | | | | | | | | |
Net assets, end of period (in 000s)
| $1,883,744 | | $1,810,051 | | $1,537,096 | | $2,131,029 | | $1,011,260 |
| Ratios to average net assets: | | | | | | | | | |
Total expenses
| 0.20% | | 0.21% | | 0.20% | | 0.20% | | 0.20% |
Net investment income (loss)
| 1.04% | | 1.34% | | 1.12% | | 1.01% | | 1.27% |
Portfolio turnover rate (e)
| 59% | | 62% | | 61% | | 67% | | 91% |
| (a) | Per share numbers have been calculated using average shares outstanding, which more appropriately presents the per share data for the year. |
| (b) | Amounts shown in this caption for a share outstanding may not accord with the change in aggregate gains and losses in securities for the fiscal period because of the timing of sales and repurchases of Fund shares in relation to fluctuating market values for the Fund. |
| (c) | Amount is less than $0.005 per share. |
| (d) | Total return is calculated assuming a purchase of shares at net asset value on the first day and a sale at net asset value on the last day of each period reported. Distributions are assumed, for the purpose of this calculation, to be reinvested at net asset value per share on the respective payment dates of each distribution. Total returns for periods of less than one year are not annualized. Broker commission charges are not included in this calculation. |
| (e) | Portfolio turnover rate excludes securities received or delivered from in-kind processing of creations or redemptions. |
See accompanying notes to financial statements.
164
SPDR SERIES TRUST
FINANCIAL HIGHLIGHTS (continued)
Selected data for a share outstanding throughout each period
| | SPDR S&P Kensho Smart Mobility ETF |
| | Year
Ended
6/30/24 | | Year
Ended
6/30/23 | | Year
Ended
6/30/22 | | Year
Ended
6/30/21 | | Year
Ended
6/30/20 |
Net asset value, beginning of period
| $33.44 | | $34.44 | | $62.05 | | $31.57 | | $28.05 |
| Income (loss) from investment operations: | | | | | | | | | |
Net investment income (loss) (a)
| 0.74 | | 0.71 | | 0.39 | | 0.88 | | 0.40 |
Net realized and unrealized gain (loss) (b)
| (5.49) | | (1.13) | | (27.65) | | 30.70 | | 3.41 |
Total from investment operations
| (4.75) | | (0.42) | | (27.26) | | 31.58 | | 3.81 |
Net equalization credits and charges (a)
| (0.02) | | 0.13 | | 0.18 | | (0.64) | | 0.16 |
| Distributions to shareholders from: | | | | | | | | | |
Net investment income
| (0.86) | | (0.71) | | (0.53) | | (0.46) | | (0.45) |
Net asset value, end of period
| $27.81 | | $33.44 | | $34.44 | | $62.05 | | $31.57 |
Total return (c)
| (14.40)% | | (0.71)% | | (43.90)% | | 98.17% | | 14.48% |
| Ratios and Supplemental Data: | | | | | | | | | |
Net assets, end of period (in 000s)
| $44,215 | | $53,837 | | $77,138 | | $233,305 | | $5,367 |
| Ratios to average net assets: | | | | | | | | | |
Total expenses
| 0.45% | | 0.46% | | 0.45% | | 0.45% | | 0.45% |
Net investment income (loss)
| 2.47% | | 2.11% | | 0.75% | | 1.49% | | 1.47% |
Portfolio turnover rate (d)
| 44% | | 33% | | 38% | | 70% | | 29% |
| (a) | Per share numbers have been calculated using average shares outstanding, which more appropriately presents the per share data for the year. |
| (b) | Amounts shown in this caption for a share outstanding may not accord with the change in aggregate gains and losses in securities for the fiscal period because of the timing of sales and repurchases of Fund shares in relation to fluctuating market values for the Fund. |
| (c) | Total return is calculated assuming a purchase of shares at net asset value on the first day and a sale at net asset value on the last day of each period reported. Distributions are assumed, for the purpose of this calculation, to be reinvested at net asset value per share on the respective payment dates of each distribution. Total returns for periods of less than one year are not annualized. Broker commission charges are not included in this calculation. |
| (d) | Portfolio turnover rate excludes securities received or delivered from in-kind processing of creations or redemptions. |
See accompanying notes to financial statements.
165
SPDR SERIES TRUST
FINANCIAL HIGHLIGHTS (continued)
Selected data for a share outstanding throughout each period
| | SPDR S&P SmallCap 600 ESG ETF |
| | Year
Ended
6/30/24 | | Year
Ended
6/30/23 | | For the
Period
1/11/22*-
6/30/22 |
Net asset value, beginning of period
| $26.49 | | $24.65 | | $30.00 |
| Income (loss) from investment operations: | | | | | |
Net investment income (loss) (a)
| 0.41 | | 0.41 | | 0.17 |
Net realized and unrealized gain (loss) (b)
| 2.63 | | 1.86 | | (5.37) |
Total from investment operations
| 3.04 | | 2.27 | | (5.20) |
Net equalization credits and charges (a)
| (0.06) | | 0.01 | | — |
| Distributions to shareholders from: | | | | | |
Net investment income
| (0.48) | | (0.42) | | (0.15) |
Return of capital
| — | | (0.02) | | — |
Total distributions
| (0.48) | | (0.44) | | — |
Net asset value, end of period
| $28.99 | | $26.49 | | $24.65 |
Total return (c)
| 11.29% | | 9.39% | | (16.81)% |
| Ratios and Supplemental Data: | | | | | |
Net assets, end of period (in 000s)
| $5,073 | | $3,974 | | $2,465 |
| Ratios to average net assets: | | | | | |
Total expenses
| 0.12% | | 0.12% | | 0.12%(d) |
Net investment income (loss)
| 1.50% | | 1.59% | | 1.32%(d) |
Portfolio turnover rate (e)
| 47% | | 39% | | 31%(f) |
| * | Commencement of operations. |
| (a) | Per share numbers have been calculated using average shares outstanding, which more appropriately presents the per share data for the year. |
| (b) | Amounts shown in this caption for a share outstanding may not accord with the change in aggregate gains and losses in securities for the fiscal period because of the timing of sales and repurchases of Fund shares in relation to fluctuating market values for the Fund. |
| (c) | Total return is calculated assuming a purchase of shares at net asset value on the first day and a sale at net asset value on the last day of each period reported. Distributions are assumed, for the purpose of this calculation, to be reinvested at net asset value per share on the respective payment dates of each distribution. Total returns for periods of less than one year are not annualized. Broker commission charges are not included in this calculation. |
| (d) | Annualized. |
| (e) | Portfolio turnover rate excludes securities received or delivered from in-kind processing of creations or redemptions. |
| (f) | Not annualized. |
See accompanying notes to financial statements.
166
SPDR SERIES TRUST
FINANCIAL HIGHLIGHTS (continued)
Selected data for a share outstanding throughout each period
| | SPDR SSGA US Large Cap Low Volatility Index ETF |
| | Year
Ended
6/30/24 | | Year
Ended
6/30/23 | | Year
Ended
6/30/22 | | Year
Ended
6/30/21 | | Year
Ended
6/30/20 |
Net asset value, beginning of period
| $140.50 | | $130.93 | | $133.08 | | $102.17 | | $107.69 |
| Income (loss) from investment operations: | | | | | | | | | |
Net investment income (loss) (a)
| 2.91 | | 2.66 | | 2.09 | | 1.99 | | 2.20 |
Net realized and unrealized gain (loss) (b)
| 12.39 | | 9.83 | | (1.87) | | 31.82 | | (5.49) |
Total from investment operations
| 15.30 | | 12.49 | | 0.22 | | 33.81 | | (3.29) |
Net equalization credits and charges (a)
| 0.22 | | (0.25) | | (0.05) | | (0.15) | | 0.01 |
| Distributions to shareholders from: | | | | | | | | | |
Net investment income
| (3.19) | | (2.67) | | (2.32) | | (2.75) | | (2.24) |
Net asset value, end of period
| $152.83 | | $140.50 | | $130.93 | | $133.08 | | $102.17 |
Total return (c)
| 11.16% | | 9.48% | | 0.05% | | 33.27% | | (3.05)% |
| Ratios and Supplemental Data: | | | | | | | | | |
Net assets, end of period (in 000s)
| $695,377 | | $817,722 | | $557,743 | | $573,565 | | $658,964 |
| Ratios to average net assets: | | | | | | | | | |
Total expenses
| 0.12% | | 0.13% | | 0.12% | | 0.12% | | 0.12% |
Net investment income (loss)
| 2.02% | | 1.96% | | 1.50% | | 1.69% | | 2.04% |
Portfolio turnover rate (d)
| 22% | | 27% | | 22% | | 34% | | 25% |
| (a) | Per share numbers have been calculated using average shares outstanding, which more appropriately presents the per share data for the year. |
| (b) | Amounts shown in this caption for a share outstanding may not accord with the change in aggregate gains and losses in securities for the fiscal period because of the timing of sales and repurchases of Fund shares in relation to fluctuating market values for the Fund. |
| (c) | Total return is calculated assuming a purchase of shares at net asset value on the first day and a sale at net asset value on the last day of each period reported. Distributions are assumed, for the purpose of this calculation, to be reinvested at net asset value per share on the respective payment dates of each distribution. Total returns for periods of less than one year are not annualized. Broker commission charges are not included in this calculation. |
| (d) | Portfolio turnover rate excludes securities received or delivered from in-kind processing of creations or redemptions. |
See accompanying notes to financial statements.
167
SPDR SERIES TRUST
FINANCIAL HIGHLIGHTS (continued)
Selected data for a share outstanding throughout each period
| | SPDR SSGA US Small Cap Low Volatility Index ETF |
| | Year
Ended
6/30/24 | | Year
Ended
6/30/23 | | Year
Ended
6/30/22 | | Year
Ended
6/30/21 | | Year
Ended
6/30/20 |
Net asset value, beginning of period
| $103.22 | | $104.54 | | $112.64 | | $76.41 | | $93.35 |
| Income (loss) from investment operations: | | | | | | | | | |
Net investment income (loss) (a)
| 2.46 | | 2.84 | | 2.11 | | 2.06 | | 2.24 |
Net realized and unrealized gain (loss) (b)
| 7.21 | | (1.22) | | (7.72) | | 36.73 | | (16.77) |
Total from investment operations
| 9.67 | | 1.62 | | (5.61) | | 38.79 | | (14.53) |
Net equalization credits and charges (a)
| 0.17 | | 0.01 | | 0.03 | | (0.10) | | 0.07 |
| Distributions to shareholders from: | | | | | | | | | |
Net investment income
| (2.98) | | (2.95) | | (2.52) | | (2.46) | | (2.48) |
Net asset value, end of period
| $110.08 | | $103.22 | | $104.54 | | $112.64 | | $76.41 |
Total return (c)
| 9.65% | | 1.56% | | (5.07)% | | 51.11% | | (15.68)% |
| Ratios and Supplemental Data: | | | | | | | | | |
Net assets, end of period (in 000s)
| $171,727 | | $190,965 | | $186,085 | | $220,778 | | $247,577 |
| Ratios to average net assets: | | | | | | | | | |
Total expenses
| 0.12% | | 0.13% | | 0.12% | | 0.12% | | 0.12% |
Net investment income (loss)
| 2.33% | | 2.65% | | 1.86% | | 2.19% | | 2.56% |
Portfolio turnover rate (d)
| 56% | | 31% | | 23% | | 52% | | 32% |
| (a) | Per share numbers have been calculated using average shares outstanding, which more appropriately presents the per share data for the year. |
| (b) | Amounts shown in this caption for a share outstanding may not accord with the change in aggregate gains and losses in securities for the fiscal period because of the timing of sales and repurchases of Fund shares in relation to fluctuating market values for the Fund. |
| (c) | Total return is calculated assuming a purchase of shares at net asset value on the first day and a sale at net asset value on the last day of each period reported. Distributions are assumed, for the purpose of this calculation, to be reinvested at net asset value per share on the respective payment dates of each distribution. Total returns for periods of less than one year are not annualized. Broker commission charges are not included in this calculation. |
| (d) | Portfolio turnover rate excludes securities received or delivered from in-kind processing of creations or redemptions. |
See accompanying notes to financial statements.
168
SPDR SERIES TRUST
NOTES TO FINANCIAL STATEMENTS
June 30, 2024
1. Organization
SPDR Series Trust (the “Trust”), a Massachusetts business trust, registered under the Investment Company Act of 1940, as amended (“1940 Act”), is an open-end management investment company.
As of June 30, 2024, the Trust consists of eighty-four (84) series, each of which represents a separate series of beneficial interest in the Trust. The Declaration of Trust permits the Board of Trustees of the Trust (the “Board”) to authorize the issuance of an unlimited number of shares of beneficial interest at $0.01 par value. The financial statements herein relate to the following series (each a “Fund”, and collectively, the “Funds”):
| SPDR MSCI USA Climate Paris Aligned ETF |
| SPDR Russell 1000 Low Volatility Focus ETF |
| SPDR Russell 1000 Momentum Focus ETF |
| SPDR Russell 1000 Yield Focus ETF |
| SPDR S&P 400 Mid Cap Growth ETF |
| SPDR S&P 400 Mid Cap Value ETF |
| SPDR S&P 500 ESG ETF |
| SPDR S&P 600 Small Cap Growth ETF |
| SPDR S&P 600 Small Cap Value ETF |
| SPDR S&P 1500 Momentum Tilt ETF |
| SPDR S&P 1500 Value Tilt ETF |
| SPDR S&P Kensho Clean Power ETF |
| SPDR S&P Kensho Final Frontiers ETF |
| SPDR S&P Kensho Future Security ETF |
| SPDR S&P Kensho Intelligent Structures ETF |
| SPDR S&P Kensho New Economies Composite ETF |
| SPDR S&P Kensho Smart Mobility ETF |
| SPDR S&P SmallCap 600 ESG ETF |
| SPDR SSGA US Large Cap Low Volatility Index ETF |
| SPDR SSGA US Small Cap Low Volatility Index ETF |
Each Fund is classified as a diversified investment company under the 1940 Act, except the SPDR S&P Kensho Clean Power ETF, SPDR S&P Kensho Final Frontiers ETF, SPDR S&P 1500 Momentum Tilt ETF and SPDR MSCI USA Climate Paris Aligned ETF are classified as a non-diversified investment company.
Under the Trust’s organizational documents, its officers and trustees are indemnified against certain liabilities arising out of the performance of their duties to the Trust. Additionally, in the normal course of business, the Trust enters into contracts with service providers that contain general indemnification clauses. The Trust’s maximum exposure under these arrangements is unknown as this would involve future claims that may be made against the Trust that have not yet occurred.
2. Summary of Significant Accounting Policies
The following is a summary of significant accounting policies followed by the Trust in the preparation of its financial statements:
The preparation of financial statements in accordance with U.S. generally accepted accounting principles (“U.S. GAAP”) requires management to make estimates and assumptions that affect the reported amounts and disclosures in the financial statements. Actual results could differ from those estimates. Each Fund is an investment company under U.S. GAAP and follows the accounting and reporting guidance applicable to investment companies.
Security Valuation
Each Fund's investments are valued at fair value each day that the New York Stock Exchange (“NYSE”) is open and, for financial reporting purposes, as of the report date should the reporting period end on a day that the NYSE is not open. Fair value is generally defined as the price a fund would receive to sell an asset or pay to transfer a liability in an orderly transaction between market participants at the measurement date. By its nature, a fair value price is a good faith estimate of the valuation in a current sale and may not reflect an actual market price. The investments of each Fund are valued pursuant to the policy and procedures developed by the Oversight Committee (the “Committee”) and approved by the Board. The Committee provides oversight of the valuation of investments for the Funds. The Board has responsibility for overseeing the determination of the fair value of investments.
Valuation techniques used to value each Fund’s investments by major category are as follows:
• Equity investments (including preferred stocks and registered investment companies that are exchange-traded funds) traded on a recognized securities exchange for which market quotations are readily available are valued at the last sale price or official closing price, as applicable, on the primary market or exchange on which they trade. Equity investments traded on a recognized exchange for which there were no sales on that day are valued
SPDR SERIES TRUST
NOTES TO FINANCIAL STATEMENTS (continued)
June 30, 2024
at the last published sale price or at fair value.
• Rights and warrants are valued at the last reported sale price obtained from independent pricing services or brokers on the valuation date. If no price is obtained from pricing services or brokers, valuation will be based upon the intrinsic value, pursuant to the valuation policy and procedures approved by the Board.
• Investments in registered investment companies (including money market funds) or other unitized pooled investment vehicles that are not traded on an exchange are valued at that day’s published net asset value (“NAV”) per share or unit.
• Exchange-traded futures contracts are valued at the closing settlement price on the primary market on which they are traded most extensively. Exchange-traded futures contracts traded on a recognized exchange for which there were no sales on that day are valued at the last reported sale price obtained from independent pricing services or brokers or at fair value.
In the event prices or quotations are not readily available or that the application of these valuation methods results in a price for an investment that is deemed to be not representative of the fair value of such investment, fair value will be determined in good faith by the Committee, in accordance with the valuation policy and procedures approved by the Board.
Fair value pricing could result in a difference between the prices used to calculate a Fund's NAV and the prices used by the Funds' underlying benchmarks. Various inputs are used in determining the value of the Funds' investments.
The Funds value their assets and liabilities at fair value using a fair value hierarchy consisting of three broad levels that prioritize the inputs to valuation techniques giving the highest priority to readily available unadjusted quoted prices in active markets for identical assets or liabilities (Level 1 measurements) and the lowest priority to unobservable inputs (Level 3 measurements) when market prices are not readily available or reliable. The categorization of a value determined for an investment within the hierarchy is based upon the pricing transparency of the investment and is not necessarily an indication of the risk associated with investing in it.
The three levels of the fair value hierarchy are as follows:
• Level 1 – Unadjusted quoted prices in active markets for an identical asset or liability;
• Level 2 – Inputs other than quoted prices included within Level 1 that are observable for the asset or liability either directly or indirectly, including quoted prices for similar assets or liabilities in active markets, quoted prices for identical or similar assets or liabilities in markets that are not considered to be active, inputs other than quoted prices that are observable for the asset or liability (such as exchange rates, financing terms, interest rates, yield curves, volatilities, prepayment speeds, loss severities, credit risks and default rates) or other market-corroborated inputs; and
• Level 3 – Unobservable inputs for the asset or liability, including the Committee’s assumptions used in determining the fair value of investments.
The value of each Fund’s investments, according to the fair value hierarchy as of June 30, 2024, is disclosed in each Fund’s respective Schedule of Investments.
Investment Transactions and Income Recognition
Investment transactions are accounted for on trade date for financial reporting purposes. Realized gains and losses from the sale or disposition of investments and foreign exchange transactions, if any, are determined using the identified cost method.
Dividend income and capital gain distributions, if any, are recognized on the ex-dividend date, or when the information becomes available, net of any foreign taxes withheld at source, if any. Interest income is recorded daily on an accrual basis. All premiums and discounts are amortized/accreted for financial reporting purposes. Non-cash dividends received in the form of stock, if any, are recorded as dividend income at fair value. Distributions received by the Fund's may include a return of capital that is estimated by management. Such amounts are recorded as a reduction of the cost of investments or reclassified to capital gains.
SPDR SERIES TRUST
NOTES TO FINANCIAL STATEMENTS (continued)
June 30, 2024
Certain Funds invest in real estate investment trusts (“REITs”). REITs determine the tax character of their distributions annually and may characterize a portion of their distributions as a return of capital or capital gain. The Funds' policy is to record all REIT distributions initially as dividend income and re-designate a portion to return of capital or capital gain distributions at year end based on information provided by the REIT and/or SSGA Funds Management, Inc.’s (the “Adviser” or “SSGA FM”) estimates of such re-designations for which actual information has not yet been reported.
Expenses
Certain expenses, which are directly identifiable to a specific Fund, are applied to that Fund within the Trust. Other expenses which cannot be attributed to a specific Fund are allocated in such a manner as deemed equitable, taking into consideration the nature and type of expense and the relative net assets of the Funds within the Trust.
Foreign Currency Translation
The accounting records of the Funds are maintained in U.S. dollars. Foreign currencies as well as investment securities and other assets and liabilities denominated in a foreign currency are translated to U.S. dollars using exchange rates at period end. Purchases and sales of securities, income receipts and expense payments denominated in foreign currencies are translated into U.S. dollars at the prevailing exchange rate on the respective dates of the transactions.
The effects of exchange rate fluctuations on investments are included with the net realized and unrealized gain (loss) on investment securities. Other foreign currency transactions resulting in realized and unrealized gain (loss) are disclosed separately.
Foreign Taxes
The Funds may be subject to foreign taxes (a portion of which may be reclaimable) on income, stock dividends, realized and unrealized capital gains on investments or certain foreign currency transactions. Foreign taxes are recorded in accordance with SSGA FM understanding of the applicable foreign tax regulations and rates that exist in the foreign jurisdictions in which the Funds invest. These foreign taxes, if any, are paid by the Funds and are reflected in the Statements of Operations, if applicable. Foreign taxes payable or deferred as of June 30, 2024, if any, are disclosed in the Funds' Statements of Assets and Liabilities.
Equalization
The Funds follow the accounting practice known as “Equalization” by which a portion of the proceeds from sales and costs of reacquiring Fund shares, equivalent on a per share basis to the amount of distributable net investment income on the date of the transaction, is credited or charged to undistributed net investment income. As a result, undistributed net investment income per share is unaffected by sales or reacquisition of Fund shares. Amounts related to Equalization can be found on the Statements of Changes in Net Assets.
Distributions
Distributions from net investment income, if any, are declared and paid quarterly. Net realized capital gains, if any, are distributed annually. Dividends may be declared and paid more frequently or at any other times to improve Index tracking or to comply with the distribution requirements of the Internal Revenue Code of 1986 (the “Internal Revenue Code”), as amended. The amount and character of income and capital gains to be distributed are determined in accordance with applicable tax regulations which may differ from net investment income and realized gains recognized for U.S. GAAP purposes.
3. Derivative Financial Instruments
Futures Contracts
The Funds may enter into futures contracts to meet the Funds’ objectives. A futures contract is a standardized, exchange-traded agreement to buy or sell a financial instrument at a set price on a future date. Upon entering into a futures contract, a Fund is required to deposit with the broker, cash or securities in an amount equal to the minimum initial margin requirements of the clearing house. Securities deposited, if any, are designated on the Schedules of Investments and cash deposited, if any, is included in Net cash at broker on the Statements of Assets and Liabilities. Subsequent payments are made or received by the Funds equal to the daily change in the contract value, accumulated, exchange rates, and or other transactional fees. The accumulation of those payments are recorded as variation margin receivable or payable with a corresponding offset to unrealized gains
SPDR SERIES TRUST
NOTES TO FINANCIAL STATEMENTS (continued)
June 30, 2024
or losses. The Funds recognize a realized gain or loss when the contract is closed.
Losses may arise if the value of a futures contract decreases due to unfavorable changes in the market rates or values of the underlying instrument during the term of the contract or if the counterparty does not perform under the contract. The use of futures contracts also involves the risk that the movements in the price of the futures contracts do not correlate with the movement of the assets underlying such contracts.
For the year ended June 30, 2024, the following Funds entered into futures contracts for the strategies listed below:
| Fund | Strategies |
| SPDR MSCI USA Climate Paris Aligned ETF | Cash equitization, reduce tracking error and to facilitate daily liquidity |
| SPDR Russell 1000 Low Volatility Focus ETF | Cash equitization, reduce tracking error and to facilitate daily liquidity |
| SPDR Russell 1000 Momentum Focus ETF | Cash equitization, reduce tracking error and to facilitate daily liquidity |
| SPDR Russell 1000 Yield Focus ETF | Cash equitization, reduce tracking error and to facilitate daily liquidity |
| SPDR S&P 500 ESG ETF | Cash equitization, reduce tracking error and to facilitate daily liquidity |
The following tables summarize the value of the Fund's derivative instruments as of June 30, 2024, and the related location in the accompanying Statement of Assets and Liabilities and Statement of Operations, presented by primary underlying risk exposure:
| | Asset Derivatives |
| | Interest
Rate
Risk | | Foreign
Exchange
Risk | | Credit
Risk | | Equity
Risk | | Commodity
Risk | | Total |
| SPDR Russell 1000 Low Volatility Focus ETF | | | | | | | | | | | |
Futures Contracts
| $— | | $— | | $— | | $5,030 | | $— | | $5,030 |
| SPDR Russell 1000 Momentum Focus ETF | | | | | | | | | | | |
Futures Contracts
| — | | — | | — | | 1,270 | | — | | 1,270 |
| SPDR Russell 1000 Yield Focus ETF | | | | | | | | | | | |
Futures Contracts
| — | | — | | — | | 10,518 | | — | | 10,518 |
| | Liability Derivatives |
| | Interest
Rate
Risk | | Foreign
Exchange
Risk | | Credit
Risk | | Equity
Risk | | Commodity
Risk | | Total |
| SPDR S&P 500 ESG ETF | | | | | | | | | | | |
Futures Contracts
| $— | | $— | | $— | | $1,885 | | $— | | $1,885 |
SPDR SERIES TRUST
NOTES TO FINANCIAL STATEMENTS (continued)
June 30, 2024
| | Net Realized Gain (Loss) |
| | Interest
Rate
Risk | | Foreign
Exchange
Risk | | Credit
Risk | | Equity
Risk | | Commodity
Risk | | Total |
| SPDR MSCI USA Climate Paris Aligned ETF | | | | | | | | | | | |
Futures Contracts
| $— | | $— | | $— | | $3,411 | | $— | | $3,411 |
| SPDR Russell 1000 Low Volatility Focus ETF | | | | | | | | | | | |
Futures Contracts
| — | | — | | — | | 180,101 | | — | | 180,101 |
| SPDR Russell 1000 Momentum Focus ETF | | | | | | | | | | | |
Futures Contracts
| — | | — | | — | | 39,923 | | — | | 39,923 |
| SPDR Russell 1000 Yield Focus ETF | | | | | | | | | | | |
Futures Contracts
| — | | — | | — | | 511,085 | | — | | 511,085 |
| SPDR S&P 500 ESG ETF | | | | | | | | | | | |
Futures Contracts
| — | | — | | — | | 272,582 | | — | | 272,582 |
| | Net Change in Unrealized Appreciation/Depreciation |
| | Interest
Rate
Risk | | Foreign
Exchange
Risk | | Credit
Risk | | Equity
Risk | | Commodity
Risk | | Total |
| SPDR Russell 1000 Low Volatility Focus ETF | | | | | | | | | | | |
Futures Contracts
| $— | | $— | | $— | | $(24,907) | | $— | | $(24,907) |
| SPDR Russell 1000 Momentum Focus ETF | | | | | | | | | | | |
Futures Contracts
| — | | — | | — | | (5,756) | | — | | (5,756) |
| SPDR Russell 1000 Yield Focus ETF | | | | | | | | | | | |
Futures Contracts
| — | | — | | — | | (78,108) | | — | | (78,108) |
| SPDR S&P 500 ESG ETF | | | | | | | | | | | |
Futures Contracts
| — | | — | | — | | (13,680) | | — | | (13,680) |
4. Fees and Transactions with Affiliates
Advisory Fee
The Trust, on behalf of each Fund, has entered into an Investment Advisory Agreement with SSGA FM. For its advisory services to the Funds, facilities furnished and expenses borne by the Adviser, each Fund pays the Adviser a fee (“Management/Advisory fee”) accrued daily and paid monthly, based on a percentage of each Fund’s average daily net assets as shown in the following table:
| | Annual Rate |
SPDR MSCI USA Climate Paris Aligned ETF
| 0.10% |
SPDR Russell 1000 Low Volatility Focus ETF
| 0.20 |
SPDR Russell 1000 Momentum Focus ETF
| 0.20 |
SPDR Russell 1000 Yield Focus ETF
| 0.20 |
SPDR S&P 400 Mid Cap Growth ETF
| 0.15 |
SPDR S&P 400 Mid Cap Value ETF
| 0.15 |
SPDR S&P 500 ESG ETF
| 0.10 |
SPDR S&P 600 Small Cap Growth ETF
| 0.15 |
SPDR S&P 600 Small Cap Value ETF
| 0.15 |
SPDR S&P 1500 Momentum Tilt ETF
| 0.12 |
SPDR S&P 1500 Value Tilt ETF
| 0.12 |
SPDR S&P Kensho Clean Power ETF
| 0.45 |
SPDR S&P Kensho Final Frontiers ETF
| 0.45 |
SPDR SERIES TRUST
NOTES TO FINANCIAL STATEMENTS (continued)
June 30, 2024
| | Annual Rate |
SPDR S&P Kensho Future Security ETF
| 0.45% |
SPDR S&P Kensho Intelligent Structures ETF
| 0.45 |
SPDR S&P Kensho New Economies Composite ETF
| 0.20 |
SPDR S&P Kensho Smart Mobility ETF
| 0.45 |
SPDR S&P SmallCap 600 ESG ETF
| 0.12 |
SPDR SSGA US Large Cap Low Volatility Index ETF
| 0.12 |
SPDR SSGA US Small Cap Low Volatility Index ETF
| 0.12 |
From time to time, the Adviser may waive all or a portion of its Management fee. The Adviser has contractually agreed to waive a portion of its Management fee and/or reimburse expenses in an amount equal to any acquired fund fees and expenses (excluding holdings in acquired funds for cash management purposes, if any) for each Fund until October 31, 2024. This waiver and/or reimbursement does not provide for the recoupment by the Adviser of any amounts waived or reimbursed. This waiver and/or reimbursement may not be terminated prior to October 31, 2024 except with the approval of the Board.
The Adviser pays all the expenses of each Fund other than the Management fee, brokerage expenses, taxes, interest, fees and expenses of the Trust’s Trustees, who are not “interested persons” of the Trust, as defined in the 1940 Act (“Independent Trustees”) (including any Trustees’ counsel fees), acquired fund fees and expenses, litigation expenses and other extraordinary expenses.
Administrator, Custodian, Sub-Administrator and Transfer Agent Fees
SSGA FM serves as administrator and State Street Bank and Trust Company (“State Street”), an affiliate of the Adviser, serves as custodian, sub-administrator and transfer agent. State Street receives fees for its services as custodian, sub-administrator and transfer agent from the Adviser.
Distributor
State Street Global Advisors Funds Distributors, LLC (“SSGA FD” or the “Distributor”), an affiliate of the Adviser, serves as the Distributor of the Trust.
Other Transactions with Affiliates - Securities Lending
State Street, an affiliate of the Funds, acts as the securities lending agent for the Funds, pursuant to an amended and restated securities lending authorization agreement dated January 6, 2017, as amended.
Net proceeds collected by State Street on investment of cash collateral or any fee income less rebates payable to borrowers, are paid as follows: If the calendar year to date net proceeds are below a specified threshold across SPDR ETFs, each Fund retains eighty five percent (85%) of the net proceeds and fifteen percent (15%) of such net proceeds is payable to State Street. Starting the business day following the date that calendar year to date net proceeds exceeds a specified threshold, each Fund retains ninety percent (90%) of the net proceeds and ten percent (10%) of such net proceeds is payable to State Street.
In addition, cash collateral from lending activities is invested in the State Street Navigator Securities Lending Portfolio II, an affiliated fund, for which SSGA FM serves as investment adviser. See Note 9 for additional information regarding securities lending.
Other Transactions with Affiliates
The Funds may invest in affiliated entities, including securities issued by State Street Corporation, affiliated funds, or entities deemed to be affiliates as a result of the Funds owning more than five percent of the entity’s voting securities or outstanding shares. Amounts relating to these transactions during the year ended June 30, 2024, are disclosed in the Schedules of Investments.
During the year ended June 30, 2023, the Adviser made a contribution of $16,574 to the SPDR MSCI USA Climate Paris Aligned ETF related to a trading matter.
SPDR SERIES TRUST
NOTES TO FINANCIAL STATEMENTS (continued)
June 30, 2024
During the year ended June 30, 2023, the Adviser made a contribution of $99,073 to the SPDR S&P 1500 Momentum Tilt ETF related to a trading matter.
Due to Custodian
In certain circumstances, the Funds may have cash overdrafts with the Custodian due to expense payments, capital transactions, trading of securities, investment operations or derivative transactions. The Due to Custodian amount, if any, reflects cash overdrawn with State Street, as custodian, who is an affiliate of the Funds.
5. Trustees' Fees
The fees and expenses of the Independent Trustees are paid directly by the Funds. The Independent Trustees are reimbursed for travel and other out-of-pocket expenses in connection with meeting attendance and industry seminars.
6. Investment Transactions
Purchases and sales of investments (excluding in-kind transactions and short term investments) for the year ended June 30, 2024, were as follows:
| | Purchases | | Sales |
SPDR MSCI USA Climate Paris Aligned ETF
| $6,303,111 | | $6,002,775 |
SPDR Russell 1000 Low Volatility Focus ETF
| 201,398,931 | | 198,916,902 |
SPDR Russell 1000 Momentum Focus ETF
| 74,575,617 | | 74,394,929 |
SPDR Russell 1000 Yield Focus ETF
| 283,645,815 | | 267,674,091 |
SPDR S&P 400 Mid Cap Growth ETF
| 1,145,842,796 | | 1,148,318,066 |
SPDR S&P 400 Mid Cap Value ETF
| 985,810,981 | | 980,292,004 |
SPDR S&P 500 ESG ETF
| 125,181,316 | | 125,564,615 |
SPDR S&P 600 Small Cap Growth ETF
| 1,555,451,402 | | 1,525,069,939 |
SPDR S&P 600 Small Cap Value ETF
| 2,182,374,327 | | 2,175,125,001 |
SPDR S&P 1500 Momentum Tilt ETF
| 50,296,344 | | 50,232,998 |
SPDR S&P 1500 Value Tilt ETF
| 39,176,562 | | 37,667,727 |
SPDR S&P Kensho Clean Power ETF
| 93,241,558 | | 93,201,301 |
SPDR S&P Kensho Final Frontiers ETF
| 3,560,060 | | 3,566,035 |
SPDR S&P Kensho Future Security ETF
| 13,806,442 | | 13,710,742 |
SPDR S&P Kensho Intelligent Structures ETF
| 5,876,014 | | 5,785,075 |
SPDR S&P Kensho New Economies Composite ETF
| 1,060,592,088 | | 1,064,961,045 |
SPDR S&P Kensho Smart Mobility ETF
| 20,728,626 | | 20,673,244 |
SPDR S&P SmallCap 600 ESG ETF
| 2,108,017 | | 1,981,726 |
SPDR SSGA US Large Cap Low Volatility Index ETF
| 176,268,234 | | 162,935,846 |
SPDR SSGA US Small Cap Low Volatility Index ETF
| 106,434,877 | | 101,386,094 |
For the year ended June 30, 2024, the following Funds had in-kind contributions, redemptions and net realized gains/losses in the amounts as follows:
| | In-kind
Contributions | | In-kind
Redemptions | | In-kind Net
Realized
Gains/(Losses) |
SPDR MSCI USA Climate Paris Aligned ETF
| $2,182,139 | | $114,290,510 | | $15,800,702 |
SPDR Russell 1000 Low Volatility Focus ETF
| 255,552,317 | | 222,912,410 | | 63,474,263 |
SPDR Russell 1000 Momentum Focus ETF
| 2,129,887 | | 31,226,316 | | 8,437,395 |
SPDR Russell 1000 Yield Focus ETF
| 274,987,412 | | 329,858,284 | | 78,547,027 |
SPDR S&P 400 Mid Cap Growth ETF
| 1,270,326,535 | | 1,044,749,705 | | 312,723,557 |
SPDR S&P 400 Mid Cap Value ETF
| 1,372,159,014 | | 1,308,970,802 | | 214,177,187 |
SPDR SERIES TRUST
NOTES TO FINANCIAL STATEMENTS (continued)
June 30, 2024
| | In-kind
Contributions | | In-kind
Redemptions | | In-kind Net
Realized
Gains/(Losses) |
SPDR S&P 500 ESG ETF
| $371,169,539 | | $209,330,595 | | $52,396,666 |
SPDR S&P 600 Small Cap Growth ETF
| 663,382,929 | | 303,244,579 | | 112,825,979 |
SPDR S&P 600 Small Cap Value ETF
| 1,285,685,598 | | 1,536,952,660 | | 415,874,146 |
SPDR S&P 1500 Momentum Tilt ETF
| 20,132,235 | | 22,228,680 | | 6,895,964 |
SPDR S&P 1500 Value Tilt ETF
| 125,734,490 | | 49,749,086 | | 16,460,537 |
SPDR S&P Kensho Clean Power ETF
| 14,528,920 | | 82,024,097 | | (1,509,647) |
SPDR S&P Kensho Final Frontiers ETF
| — | | 3,018,148 | | 615,036 |
SPDR S&P Kensho Future Security ETF
| 31,008,002 | | 11,545,438 | | 4,523,710 |
SPDR S&P Kensho Intelligent Structures ETF
| 678,990 | | 8,922,036 | | 331,801 |
SPDR S&P Kensho New Economies Composite ETF
| 170,128,936 | | 160,679,594 | | 46,119,201 |
SPDR S&P Kensho Smart Mobility ETF
| 54,970,864 | | 57,176,697 | | 6,290,236 |
SPDR S&P SmallCap 600 ESG ETF
| 15,108,248 | | 14,897,818 | | 827,511 |
SPDR SSGA US Large Cap Low Volatility Index ETF
| 79,894,109 | | 271,617,662 | | 41,013,299 |
SPDR SSGA US Small Cap Low Volatility Index ETF
| 6,532,593 | | 40,897,829 | | 2,392,906 |
7. Shareholder Transactions
Each Fund issues and redeems its shares, at NAV, by each Fund only in aggregations of a specified number of shares or multiples thereof (“Creation Units”). Except when aggregated in Creation Units, shares of each Fund are not redeemable. Transactions in capital shares for each Fund are disclosed in detail in the Statements of Changes in Net Assets.
The consideration for the purchase of Creation Units of a Fund may consist of the in-kind deposit of a designated portfolio of securities and a specified amount of cash. Investors purchasing and redeeming Creation Units may pay a purchase transaction fee and a redemption transaction fee directly to the Trust and/or custodian, to offset transfer and other transaction costs associated with the issuance and redemption of Creation Units, including Creation Units for cash. An additional variable fee may be charged for certain transactions. Such variable charges, if any, are included in “Other Capital” on the Statements of Changes in Net Assets.
8. Income Tax Information
The Funds have qualified and intend to continue to qualify as regulated investment companies under Subchapter M of the Internal Revenue Code. The Funds will not be subject to federal income taxes to the extent it distributes its taxable income, including any net realized capital gains, for each fiscal year. Therefore, no provision for federal income tax is required.
The Funds file federal and various state and local tax returns as required. No income tax returns are currently under examination. Generally, the federal returns are subject to examination by the Internal Revenue Service for a period of three years from date of filing, while the state returns may remain open for an additional year depending upon jurisdiction. SSGA FM has analyzed each Fund's tax positions taken on tax returns for all open years and does not believe there are any uncertain tax positions that would require recognition of a tax liability.
Distributions to shareholders are recorded on ex-dividend date. Income dividends and gain distributions are determined in accordance with income tax rules and regulations, which may differ from generally accepted accounting principles.
Certain capital accounts in the financial statements have been adjusted for permanent book-tax differences. These adjustments have no impact on NAV or results of operations. Temporary book-tax differences will reverse in the future. These book-tax differences are primarily due to differing treatments for character of distributions, in-kind transactions, foreign currency gains and losses, passive foreign investment companies, partnerships, corporate actions, forward contracts mark to market, futures contracts mark to market, return of capital basis adjustments, wash sale loss deferrals and distributions in excess of current earnings.
SPDR SERIES TRUST
NOTES TO FINANCIAL STATEMENTS (continued)
June 30, 2024
The tax character of distributions paid during the year ended June 30, 2024, was as follows:
| | Ordinary
Income | | Long-Term
Capital Gains | | Total |
SPDR MSCI USA Climate Paris Aligned ETF
| $818,255 | | $— | | $818,255 |
SPDR Russell 1000 Low Volatility Focus ETF
| 11,077,139 | | — | | 11,077,139 |
SPDR Russell 1000 Momentum Focus ETF
| 2,028,167 | | — | | 2,028,167 |
SPDR Russell 1000 Yield Focus ETF
| 25,771,600 | | — | | 25,771,600 |
SPDR S&P 400 Mid Cap Growth ETF
| 25,105,656 | | — | | 25,105,656 |
SPDR S&P 400 Mid Cap Value ETF
| 42,103,288 | | — | | 42,103,288 |
SPDR S&P 500 ESG ETF
| 15,041,149 | | — | | 15,041,149 |
SPDR S&P 600 Small Cap Growth ETF
| 34,338,059 | | — | | 34,338,059 |
SPDR S&P 600 Small Cap Value ETF
| 90,691,924 | | — | | 90,691,924 |
SPDR S&P 1500 Momentum Tilt ETF
| 858,890 | | — | | 858,890 |
SPDR S&P 1500 Value Tilt ETF
| 6,381,059 | | — | | 6,381,059 |
SPDR S&P Kensho Clean Power ETF
| 3,354,549 | | — | | 3,354,549 |
SPDR S&P Kensho Final Frontiers ETF
| 116,041 | | — | | 116,041 |
SPDR S&P Kensho Future Security ETF
| 75,999 | | — | | 75,999 |
SPDR S&P Kensho Intelligent Structures ETF
| 199,997 | | — | | 199,997 |
SPDR S&P Kensho New Economies Composite ETF
| 24,011,717 | | — | | 24,011,717 |
SPDR S&P Kensho Smart Mobility ETF
| 1,314,818 | | — | | 1,314,818 |
SPDR S&P SmallCap 600 ESG ETF
| 74,260 | | — | | 74,260 |
SPDR SSGA US Large Cap Low Volatility Index ETF
| 16,227,652 | | — | | 16,227,652 |
SPDR SSGA US Small Cap Low Volatility Index ETF
| 5,000,516 | | — | | 5,000,516 |
The tax character of distributions paid during the year ended June 30, 2023, was as follows:
| | Ordinary
Income | | Long-Term
Capital Gains | | Tax Return
of Capital | | Total |
SPDR MSCI USA Climate Paris Aligned ETF
| $ 1,272,662 | | $ — | | $ — | | $ 1,272,662 |
SPDR Russell 1000 Low Volatility Focus ETF
| 10,690,380 | | — | | — | | 10,690,380 |
SPDR Russell 1000 Momentum Focus ETF
| 4,578,436 | | — | | — | | 4,578,436 |
SPDR Russell 1000 Yield Focus ETF
| 27,371,410 | | — | | — | | 27,371,410 |
SPDR S&P 400 Mid Cap Growth ETF
| 21,188,775 | | — | | — | | 21,188,775 |
SPDR S&P 400 Mid Cap Value ETF
| 41,180,242 | | — | | — | | 41,180,242 |
SPDR S&P 500 ESG ETF
| 11,215,118 | | — | | — | | 11,215,118 |
SPDR S&P 600 Small Cap Growth ETF
| 30,198,647 | | — | | — | | 30,198,647 |
SPDR S&P 600 Small Cap Value ETF
| 72,577,342 | | — | | — | | 72,577,342 |
SPDR S&P 1500 Momentum Tilt ETF
| 1,308,052 | | — | | — | | 1,308,052 |
SPDR S&P 1500 Value Tilt ETF
| 4,870,940 | | — | | — | | 4,870,940 |
SPDR S&P Kensho Clean Power ETF
| 3,050,067 | | — | | — | | 3,050,067 |
SPDR S&P Kensho Final Frontiers ETF
| 91,719 | | — | | — | | 91,719 |
SPDR S&P Kensho Future Security ETF
| 25,158 | | — | | — | | 25,158 |
SPDR S&P Kensho Intelligent Structures ETF
| 416,542 | | — | | — | | 416,542 |
SPDR S&P Kensho New Economies Composite ETF
| 22,478,195 | | — | | — | | 22,478,195 |
SPDR S&P Kensho Smart Mobility ETF
| 1,376,377 | | — | | — | | 1,376,377 |
SPDR S&P SmallCap 600 ESG ETF
| 50,033 | | — | | 2,510 | | 52,543 |
SPDR SSGA US Large Cap Low Volatility Index ETF
| 13,326,785 | | — | | — | | 13,326,785 |
SPDR SSGA US Small Cap Low Volatility Index ETF
| 5,499,034 | | — | | — | | 5,499,034 |
SPDR SERIES TRUST
NOTES TO FINANCIAL STATEMENTS (continued)
June 30, 2024
At June 30, 2024, the components of distributable earnings on a tax basis were as follows:
| | Undistributed
Ordinary Income | | Capital Loss
Carryforwards | | Undistributed
Long-Term
Capital Gains | | Net Unrealized
Gains (Losses) | | Total |
| SPDR MSCI USA Climate Paris Aligned ETF | $117,318 | | $(1,664,307) | | $— | | $60,083 | | $(1,486,906) |
SPDR Russell 1000 Low Volatility Focus ETF
| — | | (102,632,287) | | — | | 49,051,429 | | (53,580,858) |
SPDR Russell 1000 Momentum Focus ETF
| 334,391 | | (113,109,340) | | — | | 22,228,245 | | (90,546,704) |
SPDR Russell 1000 Yield Focus ETF
| 1,109,044 | | (105,941,076) | | — | | 22,588,609 | | (82,243,423) |
SPDR S&P 400 Mid Cap Growth ETF
| — | | (592,623,012) | | — | | 169,474,999 | | (423,148,013) |
SPDR S&P 400 Mid Cap Value ETF
| 3,215,952 | | (643,707,707) | | — | | 24,747,090 | | (615,744,665) |
SPDR S&P 500 ESG ETF
| — | | (15,114,706) | | — | | 247,273,884 | | 232,159,178 |
SPDR S&P 600 Small Cap Growth ETF
| 1,039,154 | | (755,000,953) | | — | | 496,956,483 | | (257,005,316) |
SPDR S&P 600 Small Cap Value ETF
| — | | (1,392,801,135) | | — | | (77,486,410) | | (1,470,287,545) |
SPDR S&P 1500 Momentum Tilt ETF
| 68,438 | | (15,502,195) | | — | | 33,129,942 | | 17,696,185 |
SPDR S&P 1500 Value Tilt ETF
| — | | (12,479,461) | | — | | 29,085,497 | | 16,606,036 |
SPDR S&P Kensho Clean Power ETF
| — | | (133,515,151) | | — | | (91,538,885) | | (225,054,036) |
SPDR S&P Kensho Final Frontiers ETF
| — | | (3,292,361) | | — | | 2,369,544 | | (922,817) |
SPDR S&P Kensho Future Security ETF
| 11,725 | | (5,568,476) | | — | | 3,317,179 | | (2,239,572) |
SPDR S&P Kensho Intelligent Structures ETF
| 37,254 | | (11,699,417) | | — | | (5,496,940) | | (17,159,103) |
SPDR S&P Kensho New Economies Composite ETF
| 1,029,972 | | (961,312,577) | | — | | 102,663,729 | | (857,618,876) |
SPDR S&P Kensho Smart Mobility ETF
| 217,151 | | (92,156,073) | | — | | (21,396,932) | | (113,335,854) |
SPDR S&P SmallCap 600 ESG ETF
| — | | (354,201) | | — | | 62,437 | | (291,764) |
SPDR SSGA US Large Cap Low Volatility Index ETF
| — | | (70,801,575) | | — | | 45,609,800 | | (25,191,775) |
SPDR SSGA US Small Cap Low Volatility Index ETF
| — | | (50,704,265) | | — | | (7,333,970) | | (58,038,235) |
As of June 30, 2024, the following Funds had capital loss carryforwards available to offset future realized capital gains as follows:
| | Non-Expiring
Short Term | | Non-Expiring
Long Term |
SPDR MSCI USA Climate Paris Aligned ETF
| $165,070 | | $1,499,237 |
SPDR Russell 1000 Low Volatility Focus ETF
| 40,372,466 | | 62,259,821 |
SPDR Russell 1000 Momentum Focus ETF
| 76,955,890 | | 36,153,450 |
SPDR Russell 1000 Yield Focus ETF
| 15,910,943 | | 90,030,133 |
SPDR S&P 400 Mid Cap Growth ETF
| 316,906,493 | | 275,716,519 |
SPDR S&P 400 Mid Cap Value ETF
| 250,496,075 | | 393,211,632 |
SPDR S&P 500 ESG ETF
| 5,057,555 | | 10,057,151 |
SPDR S&P 600 Small Cap Growth ETF
| 514,980,732 | | 240,020,221 |
SPDR S&P 600 Small Cap Value ETF
| 489,897,273 | | 902,903,862 |
SPDR S&P 1500 Momentum Tilt ETF
| 15,038,818 | | 463,377 |
SPDR S&P 1500 Value Tilt ETF
| 2,496,111 | | 9,983,350 |
SPDR S&P Kensho Clean Power ETF
| 68,561,341 | | 64,953,810 |
SPDR S&P Kensho Final Frontiers ETF
| 1,918,466 | | 1,373,895 |
SPDR S&P Kensho Future Security ETF
| 2,863,088 | | 2,705,388 |
SPDR SERIES TRUST
NOTES TO FINANCIAL STATEMENTS (continued)
June 30, 2024
| | Non-Expiring
Short Term | | Non-Expiring
Long Term |
SPDR S&P Kensho Intelligent Structures ETF
| $7,017,447 | | $4,681,970 |
SPDR S&P Kensho New Economies Composite ETF
| 612,829,921 | | 348,482,656 |
SPDR S&P Kensho Smart Mobility ETF
| 47,551,642 | | 44,604,431 |
SPDR S&P SmallCap 600 ESG ETF
| — | | 354,201 |
SPDR SSGA US Large Cap Low Volatility Index ETF
| 47,487,648 | | 23,313,927 |
SPDR SSGA US Small Cap Low Volatility Index ETF
| 18,373,454 | | 32,330,811 |
As of June 30, 2024, gross unrealized appreciation and gross unrealized depreciation of investments and other financial instruments based on cost for federal income tax purposes were as follows:
| | Tax
Cost | | Gross
Unrealized
Appreciation | | Gross
Unrealized
Depreciation | | Net Unrealized
Appreciation
(Depreciation) |
SPDR MSCI USA Climate Paris Aligned ETF
| $2,382,298 | | $203,033 | | $142,950 | | $60,083 |
SPDR Russell 1000 Low Volatility Focus ETF
| 585,020,002 | | 61,169,166 | | 12,117,738 | | 49,051,428 |
SPDR Russell 1000 Momentum Focus ETF
| 123,649,813 | | 25,484,126 | | 3,255,881 | | 22,228,245 |
SPDR Russell 1000 Yield Focus ETF
| 759,641,105 | | 52,593,389 | | 30,004,780 | | 22,588,609 |
SPDR S&P 400 Mid Cap Growth ETF
| 2,341,337,784 | | 285,207,530 | | 115,732,531 | | 169,474,999 |
SPDR S&P 400 Mid Cap Value ETF
| 2,427,484,134 | | 213,134,404 | | 188,387,314 | | 24,747,090 |
SPDR S&P 500 ESG ETF
| 1,036,647,549 | | 280,124,345 | | 32,850,461 | | 247,273,884 |
SPDR S&P 600 Small Cap Growth ETF
| 2,912,104,318 | | 640,265,474 | | 143,308,991 | | 496,956,483 |
SPDR S&P 600 Small Cap Value ETF
| 3,991,616,709 | | 369,120,367 | | 446,606,777 | | (77,486,410) |
SPDR S&P 1500 Momentum Tilt ETF
| 73,734,033 | | 33,858,482 | | 728,560 | | 33,129,922 |
SPDR S&P 1500 Value Tilt ETF
| 325,330,583 | | 48,297,722 | | 19,212,225 | | 29,085,497 |
SPDR S&P Kensho Clean Power ETF
| 286,073,909 | | 18,225,887 | | 109,764,733 | | (91,538,846) |
SPDR S&P Kensho Final Frontiers ETF
| 12,824,144 | | 3,249,560 | | 880,016 | | 2,369,544 |
SPDR S&P Kensho Future Security ETF
| 55,662,838 | | 7,159,342 | | 3,842,163 | | 3,317,179 |
SPDR S&P Kensho Intelligent Structures ETF
| 19,623,126 | | 1,367,066 | | 6,860,776 | | (5,493,710) |
SPDR S&P Kensho New Economies Composite ETF
| 1,897,759,714 | | 281,073,157 | | 178,408,673 | | 102,664,484 |
SPDR S&P Kensho Smart Mobility ETF
| 69,903,653 | | 1,783,967 | | 23,180,946 | | (21,396,979) |
SPDR S&P SmallCap 600 ESG ETF
| 5,007,825 | | 454,070 | | 391,633 | | 62,437 |
SPDR SSGA US Large Cap Low Volatility Index ETF
| 650,728,100 | | 76,705,381 | | 31,095,581 | | 45,609,800 |
SPDR SSGA US Small Cap Low Volatility Index ETF
| 180,584,832 | | 10,458,089 | | 17,792,059 | | (7,333,970) |
9. Securities Lending
Each Fund may lend securities to qualified broker-dealers or institutional investors. The loans are secured at all times by cash, cash equivalents or U.S. government securities in an amount at least equal to the market value of the securities loaned, plus accrued interest and dividends, determined on a daily basis and adjusted accordingly. The value of the collateral with respect to a loaned security may be temporarily more or less than the value of a security due to market fluctuations of securities values. With respect to each loan, if on any U.S. business day the aggregate market value of securities collateral plus cash collateral is less than the aggregate market value of the securities which are subject to the loan, the borrower will be notified to provide additional collateral on the next business day.
The Funds will regain record ownership of loaned securities to exercise certain beneficial rights; however, the Funds may bear the risk of delay in recovery of, or even loss of rights in the securities loaned should the borrower fail financially. In addition, a Fund will bear the risk of loss of any cash collateral that it may invest. Each Fund receives compensation for lending its securities from interest or dividends earned on the cash, cash equivalents or U.S. government securities held as collateral, net of fee rebates paid to the borrower and net of fees paid to State Street as the lending agent. Additionally, a Fund will receive a fee from the borrower for non-cash collateral equal to a percentage of the market value of the loaned securities.
The market value of securities on loan as of June 30, 2024, and the value of the invested cash collateral are disclosed in the Funds' Statements of Assets and Liabilities. Non-cash collateral is not disclosed in the Funds Statements of Assets and Liabilities as it is held by the lending agent on behalf of the Funds, and the Funds do not
SPDR SERIES TRUST
NOTES TO FINANCIAL STATEMENTS (continued)
June 30, 2024
have the ability to re-hypothecate those securities. Securities lending income, as disclosed in the Funds Statements of Operations, represents the income earned from the non-cash collateral and the investment of cash collateral, net of fee rebates paid to the borrower and net of fees paid to State Street as lending agent.
The following is a summary of each Fund's securities lending agreements and related cash and non-cash collateral received as of June 30, 2024:
| Fund | | Market Value of
Securities on Loan | | Cash
Collateral
Received | | Non-Cash
Collateral
Received* | | Total
Collateral
Received |
SPDR Russell 1000 Low Volatility Focus ETF
| | $ 3,227,613 | | $ 2,916,007 | | $ 399,629 | | $ 3,315,636 |
SPDR Russell 1000 Momentum Focus ETF
| | 485,432 | | 370,318 | | 127,412 | | 497,730 |
SPDR Russell 1000 Yield Focus ETF
| | 2,059,868 | | 652,751 | | 1,474,192 | | 2,126,943 |
SPDR S&P 400 Mid Cap Growth ETF
| | 164,961,637 | | 59,754,443 | | 108,693,869 | | 168,448,312 |
SPDR S&P 400 Mid Cap Value ETF
| | 99,754,101 | | 39,656,620 | | 62,549,263 | | 102,205,883 |
SPDR S&P 600 Small Cap Growth ETF
| | 318,263,612 | | 183,700,828 | | 138,751,778 | | 322,452,606 |
SPDR S&P 600 Small Cap Value ETF
| | 480,880,861 | | 272,620,822 | | 222,054,314 | | 494,675,136 |
SPDR S&P 1500 Momentum Tilt ETF
| | 114,565 | | 86,288 | | 31,450 | | 117,738 |
SPDR S&P 1500 Value Tilt ETF
| | 1,983,855 | | 1,228,745 | | 826,816 | | 2,055,561 |
SPDR S&P Kensho Clean Power ETF
| | 31,926,309 | | 15,807,447 | | 20,039,852 | | 35,847,299 |
SPDR S&P Kensho Final Frontiers ETF
| | 84,825 | | — | | 91,210 | | 91,210 |
SPDR S&P Kensho Future Security ETF
| | 1,617,960 | | 1,256,763 | | 459,761 | | 1,716,524 |
SPDR S&P Kensho Intelligent Structures ETF
| | 1,323,694 | | 833,420 | | 623,783 | | 1,457,203 |
SPDR S&P Kensho New Economies Composite ETF
| | 173,174,033 | | 118,034,139 | | 64,832,497 | | 182,866,636 |
SPDR S&P Kensho Smart Mobility ETF
| | 8,111,113 | | 4,321,780 | | 4,595,931 | | 8,917,711 |
SPDR SSGA US Large Cap Low Volatility Index ETF
| | 3,083,418 | | 1,657,465 | | 1,523,924 | | 3,181,389 |
SPDR SSGA US Small Cap Low Volatility Index ETF
| | 5,543,503 | | 1,985,283 | | 3,681,676 | | 5,666,959 |
| * | The non-cash collateral includes U.S. Treasuries and U.S. Government Agency securities. |
The following table reflects a breakdown of transactions accounted for as secured borrowings, the gross obligation by the type of collateral pledged or securities loaned, and the remaining contractual maturity of those transactions as of June 30, 2024:
| | | | | Remaining Contractual Maturity of the Agreements
as of June 30, 2024 |
| Fund | | Securities
Lending
Transactions | | Overnight
and
Continuous | | <30 Days | | Between
30 & 90
Days | | >90 Days | | Total
Borrowings | | Gross Amount
of Recognized
Liabilities for
Securities Lending Transactions |
SPDR Russell 1000 Low Volatility Focus ETF
| | Common Stocks | | $2,916,007 | | $— | | $— | | $— | | $2,916,007 | | $2,916,007 |
SPDR Russell 1000 Momentum Focus ETF
| | Common Stocks | | 370,318 | | — | | — | | — | | 370,318 | | 370,318 |
SPDR Russell 1000 Yield Focus ETF
| | Common Stocks | | 652,751 | | — | | — | | — | | 652,751 | | 652,751 |
SPDR S&P 400 Mid Cap Growth ETF
| | Common Stocks | | 59,754,443 | | — | | — | | — | | 59,754,443 | | 59,754,443 |
SPDR S&P 400 Mid Cap Value ETF
| | Common Stocks | | 39,656,620 | | — | | — | | — | | 39,656,620 | | 39,656,620 |
SPDR S&P 600 Small Cap Growth ETF
| | Common Stocks | | 183,700,828 | | — | | — | | — | | 183,700,828 | | 183,700,828 |
SPDR S&P 600 Small Cap Value ETF
| | Common Stocks | | 272,597,697 | | — | | — | | — | | 272,597,697 | | 272,597,697 |
SPDR S&P 600 Small Cap Value ETF
| | Warrants | | 23,125 | | — | | — | | — | | 23,125 | | 23,125 |
SPDR SERIES TRUST
NOTES TO FINANCIAL STATEMENTS (continued)
June 30, 2024
| | | | | Remaining Contractual Maturity of the Agreements
as of June 30, 2024 |
| Fund | | Securities
Lending
Transactions | | Overnight
and
Continuous | | <30 Days | | Between
30 & 90
Days | | >90 Days | | Total
Borrowings | | Gross Amount
of Recognized
Liabilities for
Securities Lending Transactions |
SPDR S&P 1500 Momentum Tilt ETF
| | Common Stocks | | $86,288 | | $— | | $— | | $— | | $86,288 | | $86,288 |
SPDR S&P 1500 Value Tilt ETF
| | Common Stocks | | 1,228,745 | | — | | — | | — | | 1,228,745 | | 1,228,745 |
SPDR S&P Kensho Clean Power ETF
| | Common Stocks | | 15,807,447 | | — | | — | | — | | 15,807,447 | | 15,807,447 |
SPDR S&P Kensho Future Security ETF
| | Common Stocks | | 1,256,763 | | — | | — | | — | | 1,256,763 | | 1,256,763 |
SPDR S&P Kensho Intelligent Structures ETF
| | Common Stocks | | 833,420 | | — | | — | | — | | 833,420 | | 833,420 |
SPDR S&P Kensho New Economies Composite ETF
| | Common Stocks | | 118,034,139 | | — | | — | | — | | 118,034,139 | | 118,034,139 |
SPDR S&P Kensho Smart Mobility ETF
| | Common Stocks | | 4,321,780 | | — | | — | | — | | 4,321,780 | | 4,321,780 |
SPDR SSGA US Large Cap Low Volatility Index ETF
| | Common Stocks | | 1,657,465 | | — | | — | | — | | 1,657,465 | | 1,657,465 |
SPDR SSGA US Small Cap Low Volatility Index ETF
| | Common Stocks | | 1,985,283 | | — | | — | | — | | 1,985,283 | | 1,985,283 |
10. Risks
Concentration Risk
As a result of the Funds' ability to invest a large percentage of their assets in obligations of issuers within the same country, state, region, currency or economic sector, an adverse economic, business or political development may affect the value of the Funds' investments more than if the Funds were more broadly diversified.
Credit Risk
A Fund may be exposed to credit risk in the event that an issuer or guarantor fails to perform or that an institution or entity with which the Fund has unsettled or open transactions default.
Market Risk
Each Fund's investments are subject to changes in general economic conditions, and general market fluctuations and the risks inherent in investment in securities markets. Investment markets can be volatile and prices of investments can change substantially due to various factors including, but not limited to, economic growth or recession, changes in interest rates, changes in the actual or perceived creditworthiness of issuers, and general market liquidity. Each Fund is subject to the risk that geopolitical events will disrupt securities markets and adversely affect global economies and markets. Local, regional or global events such as war, acts of terrorism, the spread of infectious illness, such as COVID-19, or other public health issues, or other events could have a significant impact on the Fund and its investments.
Russian Sanctions Risk
Sanctions threatened or imposed by a number of jurisdictions, including the United States, the European Union and the United Kingdom, and other intergovernmental actions that have been or may be undertaken in the future, against Russia, Russian entities or Russian individuals, may result in the devaluation of Russian currency, a downgrade in the country’s credit rating, an immediate freeze of Russian assets, a decline in the value and liquidity of Russian securities, property or interests, and/or other adverse consequences to the Russian economy or a Fund. The scope and scale of sanctions in place at a particular time may be expanded or otherwise modified in a way that have negative effects on a Fund. Sanctions, or the threat of new or modified sanctions, could impair the ability of a Fund to buy, sell, hold, receive, deliver or otherwise transact in certain affected securities or other investment instruments. Sanctions could also result in Russia taking counter measures or other actions in
SPDR SERIES TRUST
NOTES TO FINANCIAL STATEMENTS (continued)
June 30, 2024
response, which may further impair the value and liquidity of Russian securities. These sanctions, and the resulting disruption of the Russian economy, may cause volatility in other regional and global markets and may negatively impact the performance of various sectors and industries, as well as companies in other countries, which could have a negative effect on the performance of a Fund, even if a Fund does not have direct exposure to securities of Russian issuers. As a collective result of the imposition of sanctions, Russian government countermeasures and the impact that they have had on the trading markets for Russian securities, certain Funds have used, and may in the future use, fair valuation procedures approved by the Fund’s Board to value certain Russian securities, which could result in such securities being deemed to have a zero value.
11. Subsequent Events
Management has evaluated the impact of all subsequent events on the Funds through the date the financial statements were issued and has determined that there were no subsequent events requiring adjustment or disclosure in the financial statements.
SPDR SERIES TRUST
REPORT OF INDEPENDENT REGISTERED PUBLIC ACCOUNTING FIRM
To the Shareholders of SPDR MSCI USA Climate Paris Aligned ETF, SPDR Russell 1000 Low Volatility Focus ETF, SPDR Russell 1000 Momentum Focus ETF, SPDR Russell 1000 Yield Focus ETF, SPDR S&P 400 Mid Cap Growth ETF, SPDR S&P 400 Mid Cap Value ETF, SPDR S&P 500 ESG ETF, SPDR S&P 600 Small Cap Growth ETF, SPDR S&P 600 Small Cap Value ETF, SPDR S&P 1500 Momentum Tilt ETF, SPDR S&P 1500 Value Tilt ETF, SPDR S&P Kensho Clean Power ETF, SPDR S&P Kensho Final Frontiers ETF, SPDR S&P Kensho Future Security ETF, SPDR S&P Kensho Intelligent Structures ETF, SPDR S&P Kensho New Economies Composite ETF, SPDR S&P Kensho Smart Mobility ETF, SPDR S&P SmallCap 600 ESG ETF, SPDR SSGA US Large Cap Low Volatility Index ETF and SPDR SSGA US Small Cap Low Volatility Index ETF and the Board of Trustees of SPDR® Series Trust
Opinion on the Financial Statements
We have audited the accompanying statements of assets and liabilities of SPDR MSCI USA Climate Paris Aligned ETF, SPDR Russell 1000 Low Volatility Focus ETF, SPDR Russell 1000 Momentum Focus ETF, SPDR Russell 1000 Yield Focus ETF, SPDR S&P 400 Mid Cap Growth ETF, SPDR S&P 400 Mid Cap Value ETF, SPDR S&P 500 ESG ETF, SPDR S&P 600 Small Cap Growth ETF, SPDR S&P 600 Small Cap Value ETF, SPDR S&P 1500 Momentum Tilt ETF, SPDR S&P 1500 Value Tilt ETF, SPDR S&P Kensho Clean Power ETF, SPDR S&P Kensho Final Frontiers ETF, SPDR S&P Kensho Future Security ETF, SPDR S&P Kensho Intelligent Structures ETF, SPDR S&P Kensho New Economies Composite ETF, SPDR S&P Kensho Smart Mobility ETF, SPDR S&P SmallCap 600 ESG ETF, SPDR SSGA US Large Cap Low Volatility Index ETF and SPDR SSGA US Small Cap Low Volatility Index ETF (collectively, the “Funds”) (twenty of the funds constituting SPDR® Series Trust (the “Trust”)), including the schedules of investments, as of June 30, 2024, and the related statements of operations and changes in net assets, and the financial highlights for each of the periods indicated in the table below and the related notes (collectively referred to as the “financial statements”). In our opinion, the financial statements present fairly, in all material respects, the financial position of each of the Funds (twenty of the funds constituting SPDR® Series Trust) at June 30, 2024, and the results of their operations, changes in net assets and financial highlights for each of the periods indicated in the table below, in conformity with U.S. generally accepted accounting principles.
SPDR SERIES TRUST
REPORT OF INDEPENDENT REGISTERED PUBLIC ACCOUNTING FIRM (continued)
| Individual fund constituting the SPDR Series Trust | Statement of operations | Statement of changes in net assets | Financial highlights |
SPDR Russell 1000 Low Volatility Focus ETF
SPDR Russell 1000 Momentum Focus ETF
SPDR Russell 1000 Yield Focus ETF
SPDR S&P 400 Mid Cap Growth ETF
SPDR S&P 400 Mid Cap Value ETF
SPDR S&P 600 Small Cap Growth ETF
SPDR S&P 600 Small Cap Value ETF
SPDR S&P 1500 Momentum Tilt ETF
SPDR S&P 1500 Value Tilt ETF
SPDR S&P Kensho Future Security ETF
SPDR S&P Kensho Intelligent Structures ETF
SPDR S&P Kensho Smart Mobility ETF
SPDR SSGA US Large Cap Low Volatility Index ETF
SPDR SSGA US Small Cap Low Volatility Index ETF
SPDR S&P Kensho Clean Power ETF
SPDR S&P Kensho Final Frontiers ETF
SPDR S&P Kensho New Economies Composite ETF
| For the year ended June 30, 2024 | For each of the two years in the period ended June 30, 2024 | For each of the five years in the period ended June 30, 2024 |
| SPDR MSCI USA Climate Paris Aligned ETF | For the year ended June 30, 2024 | For each of the two years in the period ended June 30, 2024 | SPDR MSCI USA Climate Paris Aligned ETF For the year ended June 30, 2024 For each of the two years in the period ended June 30, 2024 For each of the two years in the period ended June 30, 2024 and the period from April 22, 2022 (commencement of operations) through June 30, 2022 |
SPDR SERIES TRUST
REPORT OF INDEPENDENT REGISTERED PUBLIC ACCOUNTING FIRM (continued)
| Individual fund constituting the SPDR Series Trust | Statement of operations | Statement of changes in net assets | Financial highlights |
| SPDR S&P 500 ESG ETF | For the year ended June 30, 2024 | For each of the two years in the period ended June 30, 2024 | For each of the three years in the period ended June 30, 2024 and the period from July 28, 2020 (commencement of operations) through June 30, 2021 |
| SPDR S&P SmallCap 600 ESG ETF | For the year ended June 30, 2024 | For each of the two years in the period ended June 30, 2024 | For each of the two years in the period ended June 30, 2024 and the period from January 11, 2022 (commencement of operations) through June 30, 2022 |
Basis for Opinion
These financial statements are the responsibility of the Trust’s management. Our responsibility is to express an opinion on the Funds’ financial statements based on our audits. We are a public accounting firm registered with the Public Company Accounting Oversight Board (United States) (“PCAOB”) and are required to be independent with respect to the Trust in accordance with the U.S. federal securities laws and the applicable rules and regulations of the Securities and Exchange Commission and the PCAOB.
We conducted our audits in accordance with the standards of the PCAOB. Those standards require that we plan and perform the audit to obtain reasonable assurance about whether the financial statements are free of material misstatement, whether due to error or fraud. The Trust is not required to have, nor were we engaged to perform, an audit of the Trust’s internal control over financial reporting. As part of our audits we are required to obtain an understanding of internal control over financial reporting, but not for the purpose of expressing an opinion on the effectiveness of the Trust’s internal control over financial reporting. Accordingly, we express no such opinion.
Our audits included performing procedures to assess the risks of material misstatement of the financial statements, whether due to error or fraud, and performing procedures that respond to those risks. Such procedures included examining, on a test basis, evidence regarding the amounts and disclosures in the financial statements. Our procedures included confirmation of securities owned as of June 30, 2024, by correspondence with the custodian, brokers and others; when replies were not received from brokers and others, we performed other auditing procedures. Our audits also included evaluating the accounting principles used and significant estimates made by management, as well as evaluating the overall presentation of the financial statements. We believe that our audits provide a reasonable basis for our opinion.
We have served as the auditor of one or more State Street Global Advisors investment companies since 2000.
Boston, Massachusetts
August 27, 2024
SPDR SERIES TRUST
OTHER INFORMATION
June 30, 2024 (Unaudited)
Tax Information
For federal income tax purposes, the following information is furnished with respect to the distributions of the Trust for its fiscal year ended June 30, 2024.
Dividends Received Deduction
Each Fund reports the maximum amount allowable of its net taxable income as eligible for the corporate dividends received deduction.
Qualified Business Income Deduction
Each Fund reports the maximum amount allowable of qualified REIT dividends eligible for the qualified business income deduction under Section 199A.
Qualified Dividend Income
A portion of dividends distributed by the Funds during the fiscal year ended June 30, 2024 are considered qualified dividend income and are eligible for reduced tax rates. Each Fund reports the maximum amount allowable of its net taxable income as qualified dividend income as provided in the Jobs and Growth Tax Relief Reconciliation Act of 2003.
SPDR SERIES TRUST
STATEMENT REGARDING BASIS FOR APPROVAL OF INVESTMENT ADVISORY CONTRACT
June 30, 2024 (Unaudited)
Approval of Advisory Agreement
At a meeting held on May 15-16, 2024, the Board of Trustees of the Trust (the “Board”) evaluated a proposal to approve for an additional one year period the Investment Advisory Agreement (the “Advisory Agreement” or “Agreement”) between the SPDR Series Trust (the “Trust” or “SST”) and SSGA Funds Management, Inc. (the “Adviser” or “SSGA FM”) with respect to the equity series of SST (collectively, the “SPDR ETFs”). The Trustees who are not “interested persons” of the Trust within the meaning of the Investment Company Act of 1940, as amended (the “Independent Trustees”), also met separately to consider the Agreement. The Independent Trustees were advised by their independent legal counsel throughout the process.
To evaluate the Advisory Agreement, the Board requested and SSGA FM, the Trust’s adviser and administrator, and State Street Bank and Trust Company, the Trust’s sub-administrator, transfer agent and custodian (“State Street”) provided, such materials as the Board, with the advice of counsel, deemed reasonably necessary. In deciding whether to approve the Advisory Agreement, the Board considered various factors, including the nature, extent and quality of services provided by the Adviser with respect to the SPDR ETFs under the Agreement, the proposed cost of those services in relation to the services provided and in relation to fees charged to comparable funds, other benefits to the Adviser of its relationship with the SPDR ETFs, and extent to which economies of scale would be shared as the SPDR ETFs grow.
Nature, Extent and Quality of Services
The Board considered the nature, extent and quality of services provided by the Adviser. In doing so, the Trustees relied on their prior experience in overseeing the management of the Trusts and the materials provided prior to and at the meeting. The Board reviewed the Advisory Agreement and the Adviser’s responsibilities for managing investment operations of each of the SPDR ETFs in accordance with each SPDR ETF’s investment objectives and policies, and applicable legal and regulatory requirements. The Board appreciated the nature of the SPDR ETFs as exchange-traded funds and the experience and expertise of the Adviser in managing exchange-traded funds. The Board considered the background and experience of the Adviser’s senior management, including those individuals responsible for portfolio management, oversight of sub-advisers and regulatory compliance of the SPDR ETFs. The Board also considered the portfolio management resources, structures and practices of the Adviser, including those associated with monitoring and ensuring each SPDR ETF’s compliance with its investment objectives and policies, and applicable laws and regulations. The Board further considered information about the Adviser’s best execution procedures and overall investment management business, noting that the Adviser serves a wide range of clients across a broad spectrum of asset classes. The Board looked at the Adviser’s general knowledge of the investment management business and that of its affiliates which make up State Street Global Advisors, through which the Adviser shares all of its senior personnel. The Board considered that the Adviser and its affiliates constitute one of the world’s largest investment management enterprises for indexed products generally and exchange-traded funds in particular. The Board specifically considered the Adviser’s experience in managing equity exchange-traded funds with index-based investment objectives.
Investment Performance
The Board then reviewed the SPDR ETFs’ performance, noting that the analysis of investment performance, in absolute terms, was more complex for the actively-managed funds. The Board focused on the extent to which each index-based SPDR ETF achieved its objective as a passively-managed index fund and reviewed information regarding such SPDR ETF’s index tracking. To the extent such tracking was not consistent with management’s expectations, the Trustees sought additional information about steps being taken to address the positive or negative tracking differences.
Profits Realized by Adviser
The Board considered the profitability of the advisory arrangement with the SPDR ETFs to the Adviser and its affiliates, including data on each SPDR ETF’s historical profitability to these entities. The Board, including the Independent Trustees, with their independent legal counsel, had the opportunity to discuss, with representatives of the Adviser and State Street Global Advisors, methodologies used in computing costs that formed the bases of profitability calculations.
Fees Charged to Comparable Funds
The Board evaluated each SPDR ETF’s unitary fee through review of comparative information with respect to fees paid by similar funds – i.e., exchange-traded funds tracking similar equity indexes with respect to each series of SST. The Board reviewed the universe of similar exchange-traded funds for each SPDR ETF based upon data independently obtained from Broadridge Financial Solutions, Inc. (Broadridge) nd related comparative information for similar exchange-traded funds. In doing so, the Board used a fund by fund analysis of the data. In certain
SPDR SERIES TRUST
STATEMENT REGARDING BASIS FOR APPROVAL OF INVESTMENT ADVISORY CONTRACT (continued)
June 30, 2024 (Unaudited)
instances as considered appropriate by the Board, the Board explored with management the reasons for the differences between a SPDR ETF’s fee and fees paid by similar funds.
Other Benefits
The Board also considered whether the Adviser or its affiliates benefited in other ways from its relationship with the Trust, noting that the Adviser does not maintain soft-dollar arrangements in connection with the Trust’s brokerage transactions.
Economies of Scale
The Board reviewed information regarding economies of scale or other efficiencies that may result as each SPDR ETF’s assets grow in size. The Board noted that the advisory fee rate for each SPDR ETF does not provide for breakpoints as assets of the SPDR ETF increase. However, the Board further noted the Adviser’s assertion that future economies of scale (among several factors) had been taken into consideration for the SPDR ETFs by fixing relatively low advisory fees, effectively sharing the benefits of lower fees with the SPDR ETFs from inception. The Adviser also asserted that one of the benefits of the unitary fee was to provide an unvarying expense structure, which could be lost or diluted with the addition of breakpoints. The Board noted that it intends to continue to monitor fees as the SPDR ETFs grow in size and assess whether fee breakpoints may be warranted.
Conclusion
After weighing the foregoing factors, none of which was dispositive in itself and may have been weighed differently by each Trustee, the Board, including the Independent Trustees voting separately, approved the continuation of the Advisory Agreement for each SPDR ETF. In approving the continuance of each Advisory Agreement, the Board, including the Independent Trustees voting separately, found that the terms of each Advisory Agreement are fair and reasonable and that the continuance of the Advisory Agreement is in the best interests of the applicable SPDR ETF and its shareholders. The Board’s conclusions with respect to the factors were as follows: (a) the nature, extent and quality of the services provided by the Adviser with respect to the SPDR ETFs were appropriate; (b) the performance and, more importantly for those SPDR ETFs measured against an index, the index tracking, of each SPDR ETF had been satisfactory or the Adviser had demonstrated due attention to the remediation of underperformance, where appropriate; (c) the Adviser’s unitary fee for each SPDR ETF considered in relation to the services provided, and in relation to the fees charged to comparable funds, was reasonable; (d) the profitability of the Trust’s relationships with the Adviser and its affiliates was not excessive in view of the nature, extent and quality of the services provided; (e) any additional potential benefits to the Adviser or its affiliates were not of a magnitude to materially affect the Board’s conclusions; and (f) the fees paid to the Adviser adequately shared the economies of scale with respect to the SPDR ETFs by way of the relatively low fee structure of the Trust. The Independent Trustees were advised by their independent counsel throughout the process.
Annual Financial Statements and Other Information
June 30, 2024
SPDR® Series Trust - Equity Funds
| SPDR Dow Jones REIT ETF |
| SPDR Portfolio S&P 400 Mid Cap ETF |
| SPDR Portfolio S&P 500 ETF |
| SPDR Portfolio S&P 500 Growth ETF |
| SPDR Portfolio S&P 500 High Dividend ETF |
| SPDR Portfolio S&P 500 Value ETF |
| SPDR Portfolio S&P 600 Small Cap ETF |
| SPDR Portfolio S&P 1500 Composite Stock Market ETF |
| SPDR Portfolio S&P Sector Neutral Dividend ETF |
| SPDR S&P Aerospace & Defense ETF |
| SPDR S&P Bank ETF |
| SPDR S&P Biotech ETF |
| SPDR S&P Dividend ETF |
| SPDR S&P Homebuilders ETF |
| SPDR S&P Oil & Gas Exploration & Production ETF |
| SPDR S&P Regional Banking ETF |
The information contained in this report is intended for the general information of shareholders of the Trust. This report is not authorized for distribution to prospective investors unless preceded or accompanied by a current Trust prospectus which contains important information concerning the Trust. You may obtain a current prospectus and SAI from the Distributor by calling 1-866-787-2257 or visiting https://www.ssga.com/spdrs. Please read the prospectus carefully before you invest.
TABLE OF CONTENTS
Changes in and Disagreements with Accountants for Open-End Management Investment Companies (N-CSR Item 8) - Not Applicable
Proxy Disclosures for Open-End Management Investment Companies (N-CSR Item 9) - Not applicable
Remuneration Paid to Directors, Officers, and Others of Open-End Management Investment Companies (N-CSR Item 10) - Please see Statement of Operations in the Financial Statements under Item 7 above
SPDR DOW JONES REIT ETF
SCHEDULE OF INVESTMENTS
June 30, 2024
| Security Description | | | Shares | | Value |
| COMMON STOCKS — 98.3% | |
| DIVERSIFIED REITs — 2.4% | |
American Assets Trust, Inc. REIT
| | 69,784 | | $1,561,766 |
Broadstone Net Lease, Inc. REIT
| | 278,874 | | 4,425,730 |
Empire State Realty Trust, Inc. Class A REIT
| | 199,885 | | 1,874,921 |
Essential Properties Realty Trust, Inc. REIT
| | 240,546 | | 6,665,530 |
Global Net Lease, Inc. REIT
| | 256,243 | | 1,883,386 |
WP Carey, Inc. REIT
| | 320,660 | | 17,652,333 |
| | | | | | 34,063,666 |
| HEALTH CARE REITs — 12.4% | |
CareTrust REIT, Inc.
| | 197,534 | | 4,958,103 |
Community Healthcare Trust, Inc. REIT
| | 29,633 | | 693,116 |
Diversified Healthcare Trust REIT
| | 324,522 | | 989,792 |
Global Medical REIT, Inc.
| | 88,405 | | 802,717 |
Healthcare Realty Trust, Inc. REIT
| | 547,325 | | 9,019,916 |
Healthpeak Properties, Inc. REIT
| | 1,034,765 | | 20,281,394 |
Medical Properties Trust, Inc. REIT
| | 873,218 | | 3,763,570 |
National Health Investors, Inc. REIT
| | 65,156 | | 4,413,016 |
Omega Healthcare Investors, Inc. REIT
| | 363,570 | | 12,452,273 |
Universal Health Realty Income Trust REIT
| | 16,722 | | 654,499 |
Ventas, Inc. REIT
| | 598,894 | | 30,699,306 |
Welltower, Inc. REIT
| | 833,575 | | 86,900,194 |
| | | | | | 175,627,896 |
| HOTEL & RESORT REITs — 3.7% | |
Apple Hospitality REIT, Inc.
| | 318,245 | | 4,627,282 |
Chatham Lodging Trust REIT
| | 70,364 | | 599,501 |
DiamondRock Hospitality Co. REIT
| | 317,164 | | 2,680,036 |
Host Hotels & Resorts, Inc. REIT
| | 1,048,067 | | 18,844,245 |
Park Hotels & Resorts, Inc. REIT
| | 305,634 | | 4,578,397 |
Pebblebrook Hotel Trust REIT
| | 180,647 | | 2,483,896 |
RLJ Lodging Trust REIT
| | 231,124 | | 2,225,724 |
Ryman Hospitality Properties, Inc. REIT
| | 89,750 | | 8,962,435 |
Service Properties Trust REIT
| | 215,675 | | 1,108,569 |
Summit Hotel Properties, Inc. REIT
| | 154,921 | | 927,977 |
Sunstone Hotel Investors, Inc. REIT
| | 308,141 | | 3,223,155 |
Xenia Hotels & Resorts, Inc. REIT
| | 157,917 | | 2,262,951 |
| | | | | | 52,524,168 |
| INDUSTRIAL REITs — 15.6% | |
Americold Realty Trust, Inc. REIT
| | 392,280 | | 10,018,831 |
EastGroup Properties, Inc. REIT
| | 71,646 | | 12,186,985 |
| Security Description | | | Shares | | Value |
First Industrial Realty Trust, Inc. REIT
| | 198,284 | | $9,420,473 |
Innovative Industrial Properties, Inc. REIT
| | 41,628 | | 4,546,610 |
LXP Industrial Trust REIT
| | 430,656 | | 3,927,583 |
Plymouth Industrial REIT, Inc.
| | 57,031 | | 1,219,323 |
Prologis, Inc. REIT
| | 1,308,349 | | 146,940,676 |
Rexford Industrial Realty, Inc. REIT
| | 311,584 | | 13,893,530 |
STAG Industrial, Inc. REIT
| | 275,967 | | 9,951,370 |
Terreno Realty Corp. REIT
| | 130,523 | | 7,724,351 |
| | | | | | 219,829,732 |
| OFFICE REITs — 6.0% | |
Alexandria Real Estate Equities, Inc. REIT
| | 232,222 | | 27,163,007 |
Boston Properties, Inc. REIT
| | 213,461 | | 13,140,659 |
Brandywine Realty Trust REIT
| | 200,724 | | 899,244 |
COPT Defense Properties REIT
| | 168,359 | | 4,214,026 |
Cousins Properties, Inc. REIT
| | 225,071 | | 5,210,394 |
Douglas Emmett, Inc. REIT
| | 245,827 | | 3,271,957 |
Easterly Government Properties, Inc. REIT (a)
| | 120,429 | | 1,489,707 |
Equity Commonwealth REIT (b)
| | 162,095 | | 3,144,643 |
Highwoods Properties, Inc. REIT
| | 151,797 | | 3,987,707 |
Hudson Pacific Properties, Inc. REIT (a)
| | 182,459 | | 877,628 |
JBG SMITH Properties REIT
| | 126,027 | | 1,919,391 |
Kilroy Realty Corp. REIT
| | 157,901 | | 4,921,774 |
NET Lease Office Properties REIT
| | 21,389 | | 526,597 |
Office Properties Income Trust REIT
| | 60,756 | | 123,942 |
Orion Office REIT, Inc.
| | 69,841 | | 250,729 |
Paramount Group, Inc. REIT
| | 238,340 | | 1,103,514 |
Piedmont Office Realty Trust, Inc. Class A REIT
| | 165,854 | | 1,202,442 |
SL Green Realty Corp. REIT
| | 95,255 | | 5,395,243 |
Vornado Realty Trust REIT
| | 237,302 | | 6,238,670 |
| | | | | | 85,081,274 |
| RESIDENTIAL REITs — 18.8% | |
American Homes 4 Rent Class A REIT
| | 476,648 | | 17,712,240 |
Apartment Investment & Management Co. Class A REIT (b)
| | 200,976 | | 1,666,091 |
AvalonBay Communities, Inc. REIT
| | 204,664 | | 42,342,935 |
Camden Property Trust REIT
| | 157,379 | | 17,171,623 |
Centerspace REIT
| | 21,265 | | 1,438,152 |
Elme Communities REIT
| | 124,275 | | 1,979,701 |
Equity LifeStyle Properties, Inc. REIT
| | 279,678 | | 18,215,428 |
Equity Residential REIT
| | 497,488 | | 34,495,818 |
Essex Property Trust, Inc. REIT
| | 92,728 | | 25,240,562 |
Independence Realty Trust, Inc. REIT
| | 335,632 | | 6,289,744 |
See accompanying notes to financial statements.
1
SPDR DOW JONES REIT ETF
SCHEDULE OF INVESTMENTS (continued)
June 30, 2024
| Security Description | | | Shares | | Value |
Invitation Homes, Inc. REIT
| | 831,022 | | $29,825,379 |
Mid-America Apartment Communities, Inc. REIT
| | 172,565 | | 24,609,495 |
NexPoint Residential Trust, Inc. REIT
| | 28,177 | | 1,113,273 |
Sun Communities, Inc. REIT
| | 185,077 | | 22,272,166 |
UDR, Inc. REIT
| | 448,409 | | 18,452,030 |
UMH Properties, Inc. REIT
| | 90,089 | | 1,440,523 |
Veris Residential, Inc. REIT
| | 118,781 | | 1,781,715 |
| | | | | | 266,046,875 |
| RETAIL REITs — 17.4% | |
Acadia Realty Trust REIT
| | 149,948 | | 2,687,068 |
Agree Realty Corp. REIT
| | 147,656 | | 9,145,813 |
Brixmor Property Group, Inc. REIT
| | 449,602 | | 10,381,310 |
Federal Realty Investment Trust REIT
| | 110,557 | | 11,162,940 |
Getty Realty Corp. REIT
| | 70,250 | | 1,872,865 |
Kimco Realty Corp. REIT
| | 992,104 | | 19,306,344 |
Kite Realty Group Trust REIT
| | 327,884 | | 7,338,044 |
Macerich Co. REIT
| | 320,817 | | 4,953,415 |
NETSTREIT Corp. (a)
| | 95,244 | | 1,533,428 |
NNN REIT, Inc.
| | 273,641 | | 11,657,107 |
Phillips Edison & Co., Inc. REIT
| | 181,174 | | 5,926,202 |
Realty Income Corp. REIT
| | 1,214,593 | | 64,154,802 |
Regency Centers Corp. REIT
| | 250,388 | | 15,574,134 |
Retail Opportunity Investments Corp. REIT
| | 185,291 | | 2,303,167 |
Simon Property Group, Inc. REIT
| | 438,378 | | 66,545,780 |
SITE Centers Corp. REIT
| | 270,490 | | 3,922,105 |
Tanger, Inc. REIT
| | 159,828 | | 4,332,937 |
Urban Edge Properties REIT
| | 177,820 | | 3,284,335 |
| | | | | | 246,081,796 |
| SPECIALIZED REITs — 22.0% | |
CubeSmart REIT
| | 333,138 | | 15,047,843 |
Digital Realty Trust, Inc. REIT
| | 454,452 | | 69,099,427 |
EPR Properties REIT
| | 112,743 | | 4,732,951 |
Equinix, Inc. REIT
| | 133,361 | | 100,900,933 |
| Security Description | | | Shares | | Value |
Extra Space Storage, Inc. REIT
| | 305,027 | | $47,404,246 |
Four Corners Property Trust, Inc. REIT
| | 135,473 | | 3,342,119 |
National Storage Affiliates Trust REIT
| | 111,176 | | 4,582,675 |
Public Storage REIT
| | 227,694 | | 65,496,179 |
| | | | | | 310,606,373 |
TOTAL COMMON STOCKS
(Cost $1,725,777,399)
| | | | | 1,389,861,780 |
| SHORT-TERM INVESTMENTS — 1.0% | | | |
State Street Institutional Liquid Reserves Fund, Premier Class 5.36% (c) (d)
| | 10,547,402 | | 10,550,566 |
State Street Navigator Securities Lending Portfolio II (e) (f)
| | 3,521,807 | | 3,521,807 |
TOTAL SHORT-TERM INVESTMENTS
(Cost $14,072,041)
| | 14,072,373 | |
TOTAL INVESTMENTS — 99.3%
(Cost $1,739,849,440)
| | 1,403,934,153 | |
OTHER ASSETS IN EXCESS OF LIABILITIES — 0.7%
| | 10,220,325 | |
NET ASSETS — 100.0%
| | $1,414,154,478 | |
| (a) | All or a portion of the shares of the security are on loan at June 30, 2024. |
| (b) | Non-income producing security. |
| (c) | The Fund invested in certain money market funds managed by SSGA Funds Management, Inc. Amounts related to these investments during the year ended June 30, 2024 are shown in the Affiliate Table below. |
| (d) | The rate shown is the annualized seven-day yield at June 30, 2024. |
| (e) | The Fund invested in an affiliated entity. Amounts related to these investments during the year ended June 30, 2024 are shown in the Affiliate Table below. |
| (f) | Investment of cash collateral for securities loaned. |
| REIT | Real Estate Investment Trust |
At June 30, 2024, open futures contracts were as follows:
| Description | | Number of
Contracts | | Expiration
Date | | Notional
Amount | | Value | | Unrealized
Appreciation
(Depreciation) |
| Dow Jones US Real Estate Index (long) | | 550 | | 09/20/2024 | | $18,549,281 | | $18,670,420 | | $121,139 |
During the year ended June 30, 2024, the average notional value related to futures contracts was $15,774,951.
See accompanying notes to financial statements.
2
SPDR DOW JONES REIT ETF
SCHEDULE OF INVESTMENTS (continued)
June 30, 2024
The following table summarizes the value of the Fund's investments according to the fair value hierarchy as of June 30, 2024.
| Description | | Level 1 –
Quoted Prices | | Level 2 –
Other Significant
Observable Inputs | | Level 3 –
Significant
Unobservable Inputs | | Total |
| ASSETS: | | | | | | | | |
| INVESTMENTS: | | | | | | | | |
Common Stocks
| | $1,389,861,780 | | $— | | $— | | $1,389,861,780 |
Short-Term Investments
| | 14,072,373 | | — | | — | | 14,072,373 |
TOTAL INVESTMENTS
| | $1,403,934,153 | | $— | | $— | | $1,403,934,153 |
| OTHER FINANCIAL INSTRUMENTS: | | | | | | | | |
Futures Contracts - Unrealized Appreciation
| | $121,139 | | $— | | $— | | $121,139 |
TOTAL OTHER FINANCIAL INSTRUMENTS:
| | $121,139 | | $— | | $— | | $121,139 |
Affiliate Table
| | Number of
Shares Held
at
6/30/23 | | Value at
6/30/23 | | Cost of
Purchases | | Proceeds
from
Shares Sold | | Realized
Gain (Loss) | | Change in
Unrealized
Appreciation/
Depreciation | | Number of
Shares Held
at
6/30/24 | | Value at
6/30/24 | | Dividend
Income |
State Street Institutional Liquid Reserves Fund, Premier Class
| 7,247,438 | | $7,248,887 | | $79,897,475 | | $76,595,656 | | $(328) | | $188 | | 10,547,402 | | $10,550,566 | | $725,802 |
State Street Navigator Securities Lending Portfolio II
| 19,734,758 | | 19,734,758 | | 300,593,905 | | 316,806,856 | | — | | — | | 3,521,807 | | 3,521,807 | | 78,684 |
Total
| | | $26,983,645 | | $380,491,380 | | $393,402,512 | | $(328) | | $188 | | | | $14,072,373 | | $804,486 |
See accompanying notes to financial statements.
3
SPDR PORTFOLIO S&P 400 MID CAP ETF
SCHEDULE OF INVESTMENTS
June 30, 2024
| Security Description | | | Shares | | Value |
| COMMON STOCKS — 99.8% | |
| AEROSPACE & DEFENSE — 1.3% | |
BWX Technologies, Inc.
| | 344,379 | | $32,716,005 |
Curtiss-Wright Corp.
| | 144,238 | | 39,085,613 |
Hexcel Corp.
| | 313,084 | | 19,552,096 |
Woodward, Inc.
| | 229,473 | | 40,015,502 |
| | | | | | 131,369,216 |
| AIR FREIGHT & LOGISTICS — 0.2% | |
GXO Logistics, Inc. (a)
| | 449,905 | | 22,720,202 |
| AUTO COMPONENTS — 1.1% | |
Adient PLC (a)
| | 338,427 | | 8,362,531 |
Autoliv, Inc.
| | 272,792 | | 29,186,016 |
Gentex Corp.
| | 870,930 | | 29,359,050 |
Goodyear Tire & Rubber Co. (a)
| | 1,072,489 | | 12,172,750 |
Lear Corp.
| | 213,900 | | 24,429,519 |
Visteon Corp. (a)
| | 103,965 | | 11,093,066 |
| | | | | | 114,602,932 |
| AUTOMOBILES — 0.3% | |
Harley-Davidson, Inc. (b)
| | 461,109 | | 15,465,596 |
Thor Industries, Inc. (b)
| | 200,914 | | 18,775,413 |
| | | | | | 34,241,009 |
| BANKS — 5.2% | |
Associated Banc-Corp. (b)
| | 558,479 | | 11,811,831 |
Bank OZK
| | 397,389 | | 16,292,949 |
Cadence Bank
| | 688,218 | | 19,462,805 |
Columbia Banking System, Inc.
| | 788,760 | | 15,688,436 |
Commerce Bancshares, Inc. (b)
| | 444,051 | | 24,769,162 |
Cullen/Frost Bankers, Inc.
| | 242,094 | | 24,604,013 |
East West Bancorp, Inc.
| | 524,212 | | 38,388,045 |
First Financial Bankshares, Inc. (b)
| | 484,306 | | 14,301,556 |
First Horizon Corp.
| | 2,060,162 | | 32,488,755 |
FNB Corp.
| | 1,355,243 | | 18,539,724 |
Glacier Bancorp, Inc. (b)
| | 426,920 | | 15,932,654 |
Hancock Whitney Corp.
| | 326,358 | | 15,609,703 |
Home BancShares, Inc.
| | 701,829 | | 16,815,823 |
International Bancshares Corp.
| | 201,475 | | 11,526,385 |
New York Community Bancorp, Inc. (b)
| | 2,937,257 | | 9,457,968 |
Old National Bancorp
| | 1,189,664 | | 20,450,324 |
Pinnacle Financial Partners, Inc.
| | 288,182 | | 23,066,087 |
Prosperity Bancshares, Inc.
| | 360,693 | | 22,052,770 |
SouthState Corp.
| | 286,956 | | 21,929,178 |
Synovus Financial Corp.
| | 551,722 | | 22,173,707 |
Texas Capital Bancshares, Inc. (a)
| | 175,797 | | 10,748,229 |
UMB Financial Corp.
| | 165,285 | | 13,788,075 |
United Bankshares, Inc.
| | 508,135 | | 16,483,899 |
Valley National Bancorp (b)
| | 1,611,331 | | 11,247,090 |
Webster Financial Corp.
| | 646,008 | | 28,159,489 |
Wintrust Financial Corp.
| | 232,653 | | 22,930,280 |
Zions Bancorp NA
| | 556,225 | | 24,123,478 |
| | | | | | 522,842,415 |
| Security Description | | | Shares | | Value |
| BEVERAGES — 0.6% | |
Boston Beer Co., Inc. Class A (a)
| | 34,398 | | $10,493,110 |
Celsius Holdings, Inc. (a) (b)
| | 561,987 | | 32,083,838 |
Coca-Cola Consolidated, Inc.
| | 17,687 | | 19,190,395 |
| | | | | | 61,767,343 |
| BIOTECHNOLOGY — 3.2% | |
Arrowhead Pharmaceuticals, Inc. (a)
| | 467,905 | | 12,160,851 |
BioMarin Pharmaceutical, Inc. (a)
| | 715,369 | | 58,896,330 |
Cytokinetics, Inc. (a) (b)
| | 431,926 | | 23,401,751 |
Exelixis, Inc. (a)
| | 1,097,336 | | 24,657,140 |
Halozyme Therapeutics, Inc. (a)
| | 479,430 | | 25,102,955 |
Neurocrine Biosciences, Inc. (a)
| | 379,111 | | 52,192,211 |
Roivant Sciences Ltd. (a) (b)
| | 1,275,090 | | 13,477,701 |
Sarepta Therapeutics, Inc. (a)
| | 356,102 | | 56,264,116 |
United Therapeutics Corp. (a)
| | 167,051 | | 53,214,096 |
| | | | | | 319,367,151 |
| BROADLINE RETAIL — 0.5% | |
Macy's, Inc.
| | 1,036,592 | | 19,902,567 |
Nordstrom, Inc. (b)
| | 369,014 | | 7,830,477 |
Ollie's Bargain Outlet Holdings, Inc. (a)
| | 230,861 | | 22,663,624 |
| | | | | | 50,396,668 |
| BUILDING PRODUCTS — 3.7% | |
AAON, Inc. (b)
| | 257,016 | | 22,422,076 |
Advanced Drainage Systems, Inc.
| | 256,694 | | 41,171,151 |
Carlisle Cos., Inc.
| | 178,825 | | 72,461,678 |
Fortune Brands Innovations, Inc.
| | 471,161 | | 30,597,195 |
Lennox International, Inc. (b)
| | 120,833 | | 64,643,238 |
Owens Corning
| | 326,438 | | 56,708,810 |
Simpson Manufacturing Co., Inc. (b)
| | 158,827 | | 26,767,114 |
Trex Co., Inc. (a)
| | 409,436 | | 30,347,396 |
UFP Industries, Inc.
| | 232,686 | | 26,060,832 |
| | | | | | 371,179,490 |
| CAPITAL MARKETS — 3.0% | |
Affiliated Managers Group, Inc.
| | 120,001 | | 18,747,756 |
Carlyle Group, Inc. (b)
| | 813,416 | | 32,658,652 |
Evercore, Inc. Class A
| | 133,357 | | 27,795,600 |
Federated Hermes, Inc.
| | 302,420 | | 9,943,570 |
Houlihan Lokey, Inc.
| | 197,252 | | 26,601,405 |
Interactive Brokers Group, Inc. Class A
| | 403,489 | | 49,467,751 |
Janus Henderson Group PLC
| | 483,561 | | 16,300,841 |
Jefferies Financial Group, Inc.
| | 639,039 | | 31,798,581 |
Morningstar, Inc.
| | 98,250 | | 29,067,262 |
SEI Investments Co.
| | 376,146 | | 24,332,885 |
Stifel Financial Corp.
| | 385,939 | | 32,476,767 |
| | | | | | 299,191,070 |
| CHEMICALS — 2.2% | |
Arcadium Lithium PLC (a) (b)
| | 3,888,550 | | 13,065,528 |
See accompanying notes to financial statements.
4
SPDR PORTFOLIO S&P 400 MID CAP ETF
SCHEDULE OF INVESTMENTS (continued)
June 30, 2024
| Security Description | | | Shares | | Value |
Ashland, Inc.
| | 188,821 | | $17,841,696 |
Avient Corp.
| | 343,821 | | 15,007,787 |
Axalta Coating Systems Ltd. (a)
| | 831,232 | | 28,403,197 |
Cabot Corp.
| | 208,129 | | 19,124,974 |
Chemours Co.
| | 560,964 | | 12,660,958 |
NewMarket Corp.
| | 26,003 | | 13,406,367 |
Olin Corp.
| | 449,914 | | 21,213,445 |
RPM International, Inc.
| | 485,090 | | 52,234,491 |
Scotts Miracle-Gro Co. (b)
| | 158,305 | | 10,299,323 |
Westlake Corp. (b)
| | 121,096 | | 17,537,123 |
| | | | | | 220,794,889 |
| COMMERCIAL SERVICES & SUPPLIES — 2.0% | |
Brink's Co.
| | 167,470 | | 17,148,928 |
Clean Harbors, Inc. (a)
| | 188,957 | | 42,732,626 |
MSA Safety, Inc.
| | 139,449 | | 26,173,183 |
RB Global, Inc. (b)
| | 692,157 | | 52,853,108 |
Stericycle, Inc. (a)
| | 349,499 | | 20,316,377 |
Tetra Tech, Inc.
| | 201,581 | | 41,219,283 |
| | | | | | 200,443,505 |
| COMMUNICATIONS EQUIPMENT — 0.4% | |
Ciena Corp. (a)
| | 544,754 | | 26,246,248 |
Lumentum Holdings, Inc. (a)
| | 254,675 | | 12,968,051 |
| | | | | | 39,214,299 |
| CONSTRUCTION & ENGINEERING — 2.4% | |
AECOM
| | 512,868 | | 45,204,186 |
Comfort Systems USA, Inc.
| | 134,162 | | 40,801,347 |
EMCOR Group, Inc.
| | 177,066 | | 64,643,255 |
Fluor Corp. (a)
| | 644,880 | | 28,084,524 |
MasTec, Inc. (a)
| | 228,930 | | 24,493,221 |
MDU Resources Group, Inc.
| | 768,140 | | 19,280,314 |
Valmont Industries, Inc.
| | 76,077 | | 20,879,333 |
| | | | | | 243,386,180 |
| CONSTRUCTION MATERIALS — 0.4% | |
Eagle Materials, Inc.
| | 129,780 | | 28,221,959 |
Knife River Corp. (a)
| | 213,277 | | 14,959,249 |
| | | | | | 43,181,208 |
| CONSUMER FINANCE — 0.7% | |
Ally Financial, Inc.
| | 1,030,648 | | 40,885,806 |
FirstCash Holdings, Inc.
| | 140,493 | | 14,734,906 |
SLM Corp.
| | 827,733 | | 17,208,569 |
| | | | | | 72,829,281 |
| CONSUMER STAPLES DISTRIBUTION & RETAIL — 2.1% | |
BJ's Wholesale Club Holdings, Inc. (a) (b)
| | 500,891 | | 43,998,266 |
Casey's General Stores, Inc.
| | 139,453 | | 53,209,687 |
Performance Food Group Co. (a)
| | 586,247 | | 38,756,789 |
Sprouts Farmers Market, Inc. (a) (b)
| | 378,544 | | 31,668,991 |
U.S. Foods Holding Corp. (a)
| | 852,131 | | 45,145,900 |
| | | | | | 212,779,633 |
| CONTAINERS & PACKAGING — 1.6% | |
AptarGroup, Inc.
| | 249,609 | | 35,147,443 |
| Security Description | | | Shares | | Value |
Berry Global Group, Inc.
| | 430,957 | | $25,361,819 |
Crown Holdings, Inc.
| | 449,441 | | 33,433,916 |
Graphic Packaging Holding Co.
| | 1,157,681 | | 30,342,819 |
Greif, Inc. Class A
| | 96,057 | | 5,520,396 |
Silgan Holdings, Inc.
| | 305,663 | | 12,938,715 |
Sonoco Products Co.
| | 370,128 | | 18,772,892 |
| | | | | | 161,518,000 |
| DIVERSIFIED CONSUMER SERVICES — 1.2% | |
Duolingo, Inc. (a) (b)
| | 139,397 | | 29,087,972 |
Graham Holdings Co. Class B
| | 13,095 | | 9,160,607 |
Grand Canyon Education, Inc. (a)
| | 110,429 | | 15,450,122 |
H&R Block, Inc. (b)
| | 525,679 | | 28,507,572 |
Service Corp. International
| | 548,600 | | 39,021,918 |
| | | | | | 121,228,191 |
| DIVERSIFIED REITs — 0.5% | |
WP Carey, Inc. REIT
| | 824,324 | | 45,379,036 |
| DIVERSIFIED TELECOMMUNICATION SERVICES — 0.3% | |
Frontier Communications Parent, Inc. (a) (b)
| | 842,742 | | 22,062,986 |
Iridium Communications, Inc.
| | 457,465 | | 12,177,718 |
| | | | | | 34,240,704 |
| ELECTRIC UTILITIES — 0.9% | |
ALLETE, Inc.
| | 217,371 | | 13,553,082 |
IDACORP, Inc. (b)
| | 190,972 | | 17,789,042 |
OGE Energy Corp.
| | 755,545 | | 26,972,956 |
PNM Resources, Inc.
| | 339,766 | | 12,557,751 |
Portland General Electric Co.
| | 388,166 | | 16,784,298 |
| | | | | | 87,657,129 |
| ELECTRICAL EQUIPMENT — 1.7% | |
Acuity Brands, Inc.
| | 114,868 | | 27,733,730 |
EnerSys
| | 152,288 | | 15,764,854 |
NEXTracker, Inc. Class A (a)
| | 462,939 | | 21,702,580 |
nVent Electric PLC (b)
| | 625,467 | | 47,917,027 |
Regal Rexnord Corp.
| | 250,585 | | 33,884,103 |
Sensata Technologies Holding PLC
| | 567,887 | | 21,233,295 |
| | | | | | 168,235,589 |
| ELECTRONIC EQUIPMENT, INSTRUMENTS & COMPONENTS — 2.5% | |
Arrow Electronics, Inc. (a)
| | 200,510 | | 24,213,587 |
Avnet, Inc.
| | 340,532 | | 17,533,993 |
Belden, Inc.
| | 153,245 | | 14,374,381 |
Cognex Corp.
| | 646,669 | | 30,238,242 |
Coherent Corp. (a)
| | 499,734 | | 36,210,726 |
Crane NXT Co. (b)
| | 182,965 | | 11,237,710 |
IPG Photonics Corp. (a)
| | 108,162 | | 9,127,791 |
Littelfuse, Inc.
| | 93,325 | | 23,852,937 |
Novanta, Inc. (a)
| | 135,190 | | 22,050,841 |
TD SYNNEX Corp.
| | 292,751 | | 33,783,465 |
Vishay Intertechnology, Inc.
| | 471,402 | | 10,512,265 |
Vontier Corp.
| | 581,668 | | 22,219,718 |
| | | | | | 255,355,656 |
See accompanying notes to financial statements.
5
SPDR PORTFOLIO S&P 400 MID CAP ETF
SCHEDULE OF INVESTMENTS (continued)
June 30, 2024
| Security Description | | | Shares | | Value |
| ENERGY EQUIPMENT & SERVICES — 1.0% | |
ChampionX Corp.
| | 717,268 | | $23,820,470 |
NOV, Inc.
| | 1,490,099 | | 28,326,782 |
Valaris Ltd. (a) (b)
| | 234,605 | | 17,478,073 |
Weatherford International PLC (a)
| | 275,611 | | 33,748,567 |
| | | | | | 103,373,892 |
| ENTERTAINMENT — 0.4% | |
TKO Group Holdings, Inc.
| | 221,856 | | 23,958,229 |
Warner Music Group Corp. Class A (b)
| | 533,500 | | 16,351,775 |
| | | | | | 40,310,004 |
| FINANCIAL SERVICES — 1.8% | |
Equitable Holdings, Inc.
| | 1,151,766 | | 47,061,159 |
Essent Group Ltd.
| | 401,881 | | 22,581,693 |
Euronet Worldwide, Inc. (a)
| | 164,127 | | 16,987,144 |
MGIC Investment Corp.
| | 1,004,316 | | 21,643,010 |
Voya Financial, Inc.
| | 379,393 | | 26,993,812 |
Western Union Co.
| | 1,274,577 | | 15,575,331 |
WEX, Inc. (a)
| | 157,890 | | 27,968,635 |
| | | | | | 178,810,784 |
| FOOD PRODUCTS — 1.1% | |
Darling Ingredients, Inc. (a)
| | 601,925 | | 22,120,744 |
Flowers Foods, Inc.
| | 723,870 | | 16,069,914 |
Ingredion, Inc. (b)
| | 247,353 | | 28,371,389 |
Lancaster Colony Corp.
| | 76,722 | | 14,498,156 |
Pilgrim's Pride Corp. (a)
| | 151,718 | | 5,839,626 |
Post Holdings, Inc. (a)
| | 189,468 | | 19,734,987 |
| | | | | | 106,634,816 |
| GAS UTILITIES — 1.0% | |
National Fuel Gas Co. (b)
| | 346,248 | | 18,763,179 |
New Jersey Resources Corp.
| | 372,315 | | 15,912,743 |
ONE Gas, Inc. (b)
| | 213,530 | | 13,633,890 |
Southwest Gas Holdings, Inc. (b)
| | 226,815 | | 15,963,240 |
Spire, Inc.
| | 217,516 | | 13,209,747 |
UGI Corp.
| | 789,726 | | 18,084,725 |
| | | | | | 95,567,524 |
| GROUND TRANSPORTATION — 1.8% | |
Avis Budget Group, Inc. (b)
| | 68,456 | | 7,155,021 |
Knight-Swift Transportation Holdings, Inc.
| | 608,834 | | 30,392,993 |
Landstar System, Inc.
| | 134,756 | | 24,859,787 |
Ryder System, Inc.
| | 165,148 | | 20,458,534 |
Saia, Inc. (a) (b)
| | 100,212 | | 47,529,549 |
XPO, Inc. (a)
| | 438,290 | | 46,524,484 |
| | | | | | 176,920,368 |
| HEALTH CARE EQUIPMENT & SUPPLIES — 1.8% | |
Dentsply Sirona, Inc. (b)
| | 782,172 | | 19,483,905 |
Enovis Corp. (a)
| | 188,574 | | 8,523,545 |
Envista Holdings Corp. (a)
| | 647,410 | | 10,766,428 |
Globus Medical, Inc. Class A (a)
| | 424,341 | | 29,063,115 |
Haemonetics Corp. (a) (b)
| | 191,300 | | 15,826,249 |
| Security Description | | | Shares | | Value |
Lantheus Holdings, Inc. (a)
| | 261,127 | | $20,965,887 |
LivaNova PLC (a)
| | 204,035 | | 11,185,199 |
Masimo Corp. (a)
| | 168,001 | | 21,158,046 |
Neogen Corp. (a) (b)
| | 742,561 | | 11,606,228 |
Penumbra, Inc. (a) (b)
| | 146,015 | | 26,278,320 |
QuidelOrtho Corp. (a) (b)
| | 186,734 | | 6,203,303 |
| | | | | | 181,060,225 |
| HEALTH CARE PROVIDERS & SERVICES — 2.1% | |
Acadia Healthcare Co., Inc. (a)
| | 349,522 | | 23,606,716 |
Amedisys, Inc. (a)
| | 122,954 | | 11,287,177 |
Chemed Corp.
| | 57,080 | | 30,970,467 |
Encompass Health Corp.
| | 379,276 | | 32,538,088 |
HealthEquity, Inc. (a)
| | 327,742 | | 28,251,360 |
Option Care Health, Inc. (a)
| | 654,773 | | 18,137,212 |
Progyny, Inc. (a) (b)
| | 312,041 | | 8,927,493 |
R1 RCM, Inc. (a)
| | 745,903 | | 9,368,542 |
Tenet Healthcare Corp. (a)
| | 368,037 | | 48,959,962 |
| | | | | | 212,047,017 |
| HEALTH CARE REITs — 0.7% | |
Healthcare Realty Trust, Inc. REIT
| | 1,426,106 | | 23,502,227 |
Omega Healthcare Investors, Inc. REIT
| | 930,917 | | 31,883,907 |
Sabra Health Care REIT, Inc.
| | 872,058 | | 13,429,693 |
| | | | | | 68,815,827 |
| HEALTH CARE TECHNOLOGY — 0.1% | |
Doximity, Inc. Class A (a) (b)
| | 460,173 | | 12,871,039 |
| HOTEL & RESORT REITs — 0.1% | |
Park Hotels & Resorts, Inc. REIT
| | 793,415 | | 11,885,357 |
| HOTELS, RESTAURANTS & LEISURE — 3.6% | |
Aramark
| | 990,779 | | 33,706,301 |
Boyd Gaming Corp.
| | 253,785 | | 13,983,553 |
Choice Hotels International, Inc.
| | 90,008 | | 10,710,952 |
Churchill Downs, Inc.
| | 251,950 | | 35,172,220 |
Hilton Grand Vacations, Inc. (a) (b)
| | 257,867 | | 10,425,563 |
Hyatt Hotels Corp. Class A
| | 170,141 | | 25,847,821 |
Light & Wonder, Inc. (a) (b)
| | 339,609 | | 35,618,192 |
Marriott Vacations Worldwide Corp. (b)
| | 123,165 | | 10,754,768 |
Planet Fitness, Inc. Class A (a)
| | 328,842 | | 24,199,483 |
Texas Roadhouse, Inc.
| | 251,641 | | 43,209,276 |
Travel & Leisure Co.
| | 268,430 | | 12,073,981 |
Vail Resorts, Inc.
| | 143,059 | | 25,769,218 |
Wendy's Co. (b)
| | 625,955 | | 10,616,197 |
Wingstop, Inc.
| | 110,633 | | 46,760,144 |
Wyndham Hotels & Resorts, Inc.
| | 303,572 | | 22,464,328 |
| | | | | | 361,311,997 |
| HOUSEHOLD DURABLES — 1.9% | |
Helen of Troy Ltd. (a) (b)
| | 89,676 | | 8,316,552 |
KB Home
| | 277,057 | | 19,443,860 |
Taylor Morrison Home Corp. (a)
| | 398,488 | | 22,092,175 |
Tempur Sealy International, Inc.
| | 654,127 | | 30,966,372 |
See accompanying notes to financial statements.
6
SPDR PORTFOLIO S&P 400 MID CAP ETF
SCHEDULE OF INVESTMENTS (continued)
June 30, 2024
| Security Description | | | Shares | | Value |
Toll Brothers, Inc.
| | 392,480 | | $45,205,847 |
TopBuild Corp. (a)
| | 119,165 | | 45,910,700 |
Whirlpool Corp. (b)
| | 205,852 | | 21,038,074 |
| | | | | | 192,973,580 |
| INDEPENDENT POWER & RENEWABLE ELECTRICITY PRODUCERS — 0.1% | |
Ormat Technologies, Inc. (b)
| | 202,569 | | 14,524,197 |
| INDUSTRIAL REITs — 1.2% | |
EastGroup Properties, Inc. REIT
| | 181,041 | | 30,795,074 |
First Industrial Realty Trust, Inc. REIT
| | 498,602 | | 23,688,581 |
Rexford Industrial Realty, Inc. REIT
| | 818,906 | | 36,515,019 |
STAG Industrial, Inc. REIT
| | 685,940 | | 24,734,996 |
| | | | | | 115,733,670 |
| INSURANCE — 4.7% | |
American Financial Group, Inc.
| | 246,483 | | 30,322,339 |
Brighthouse Financial, Inc. (a)
| | 233,951 | | 10,139,436 |
CNO Financial Group, Inc.
| | 407,846 | | 11,305,491 |
Erie Indemnity Co. Class A
| | 93,982 | | 34,059,077 |
Fidelity National Financial, Inc.
| | 977,858 | | 48,325,742 |
First American Financial Corp.
| | 390,733 | | 21,080,045 |
Hanover Insurance Group, Inc.
| | 135,442 | | 16,989,845 |
Kemper Corp.
| | 227,941 | | 13,523,740 |
Kinsale Capital Group, Inc.
| | 83,337 | | 32,108,079 |
Old Republic International Corp.
| | 952,384 | | 29,428,666 |
Primerica, Inc.
| | 129,632 | | 30,668,339 |
Reinsurance Group of America, Inc.
| | 247,873 | | 50,880,891 |
RenaissanceRe Holdings Ltd.
| | 199,234 | | 44,530,791 |
RLI Corp.
| | 151,581 | | 21,325,931 |
Ryan Specialty Holdings, Inc. (b)
| | 384,507 | | 22,266,800 |
Selective Insurance Group, Inc.
| | 229,040 | | 21,490,823 |
Unum Group
| | 670,631 | | 34,275,950 |
| | | | | | 472,721,985 |
| INTERACTIVE MEDIA & SERVICES — 0.2% | |
Ziff Davis, Inc. (a)
| | 174,591 | | 9,611,235 |
ZoomInfo Technologies, Inc. (a)
| | 1,070,573 | | 13,671,217 |
| | | | | | 23,282,452 |
| IT SERVICES — 0.2% | |
Kyndryl Holdings, Inc. (a)
| | 866,857 | | 22,807,008 |
| LEISURE EQUIPMENT & PRODUCTS — 0.7% | |
Brunswick Corp. (b)
| | 254,503 | | 18,520,183 |
Mattel, Inc. (a)
| | 1,296,283 | | 21,077,562 |
Polaris, Inc.
| | 200,120 | | 15,671,397 |
YETI Holdings, Inc. (a) (b)
| | 321,107 | | 12,250,232 |
| | | | | | 67,519,374 |
| LIFE SCIENCES TOOLS & SERVICES — 1.6% | |
Azenta, Inc. (a)
| | 203,160 | | 10,690,279 |
Bruker Corp.
| | 366,864 | | 23,409,592 |
Illumina, Inc. (a)
| | 600,108 | | 62,639,273 |
Medpace Holdings, Inc. (a)
| | 88,695 | | 36,529,036 |
Repligen Corp. (a)
| | 195,751 | | 24,676,371 |
| Security Description | | | Shares | | Value |
Sotera Health Co. (a) (b)
| | 469,230 | | $5,569,760 |
| | | | | | 163,514,311 |
| MACHINERY — 4.5% | |
AGCO Corp.
| | 233,370 | | 22,842,256 |
Chart Industries, Inc. (a) (b)
| | 158,375 | | 22,859,848 |
Crane Co.
| | 185,156 | | 26,843,917 |
Donaldson Co., Inc.
| | 453,497 | | 32,452,245 |
Esab Corp.
| | 213,949 | | 20,203,204 |
Flowserve Corp.
| | 495,964 | | 23,855,868 |
Graco, Inc.
| | 637,144 | | 50,512,776 |
ITT, Inc.
| | 310,077 | | 40,055,747 |
Lincoln Electric Holdings, Inc.
| | 214,373 | | 40,439,323 |
Middleby Corp. (a)
| | 202,586 | | 24,839,069 |
Oshkosh Corp.
| | 246,348 | | 26,654,854 |
RBC Bearings, Inc. (a)
| | 109,425 | | 29,520,677 |
Terex Corp. (b)
| | 253,585 | | 13,906,601 |
Timken Co.
| | 243,998 | | 19,551,560 |
Toro Co.
| | 393,288 | | 36,776,361 |
Watts Water Technologies, Inc. Class A
| | 103,274 | | 18,937,353 |
| | | | | | 450,251,659 |
| MARINE — 0.3% | |
Kirby Corp. (a)
| | 219,630 | | 26,296,300 |
| MEDIA — 0.6% | |
New York Times Co. Class A
| | 616,029 | | 31,546,845 |
Nexstar Media Group, Inc. (b)
| | 117,483 | | 19,503,353 |
TEGNA, Inc.
| | 639,005 | | 8,907,730 |
| | | | | | 59,957,928 |
| METALS & MINING — 2.1% | |
Alcoa Corp.
| | 676,486 | | 26,910,613 |
Cleveland-Cliffs, Inc. (a) (b)
| | 1,791,246 | | 27,567,276 |
Commercial Metals Co.
| | 435,902 | | 23,970,251 |
MP Materials Corp. (a) (b)
| | 504,425 | | 6,421,330 |
Reliance, Inc.
| | 216,332 | | 61,784,419 |
Royal Gold, Inc.
| | 247,646 | | 30,995,374 |
U.S. Steel Corp. (b)
| | 842,890 | | 31,861,242 |
| | | | | | 209,510,505 |
| MORTGAGE REAL ESTATE INVESTMENT TRUST (REITs) — 0.6% | |
Annaly Capital Management, Inc. REIT
| | 1,885,317 | | 35,934,142 |
Starwood Property Trust, Inc. REIT (b)
| | 1,130,769 | | 21,416,765 |
| | | | | | 57,350,907 |
| MULTI-UTILITIES — 0.3% | |
Black Hills Corp.
| | 259,710 | | 14,123,030 |
Northwestern Energy Group, Inc.
| | 230,908 | | 11,563,872 |
| | | | | | 25,686,902 |
| OFFICE REITs — 0.5% | |
COPT Defense Properties REIT
| | 423,433 | | 10,598,528 |
Cousins Properties, Inc. REIT
| | 572,920 | | 13,263,098 |
Kilroy Realty Corp. REIT
| | 402,362 | | 12,541,624 |
See accompanying notes to financial statements.
7
SPDR PORTFOLIO S&P 400 MID CAP ETF
SCHEDULE OF INVESTMENTS (continued)
June 30, 2024
| Security Description | | | Shares | | Value |
Vornado Realty Trust REIT
| | 602,818 | | $15,848,085 |
| | | | | | 52,251,335 |
| OIL, GAS & CONSUMABLE FUELS — 4.9% | |
Antero Midstream Corp.
| | 1,287,206 | | 18,973,416 |
Antero Resources Corp. (a) (b)
| | 1,100,604 | | 35,912,708 |
Chesapeake Energy Corp. (b)
| | 419,654 | | 34,491,362 |
Chord Energy Corp.
| | 234,212 | | 39,272,668 |
Civitas Resources, Inc.
| | 346,914 | | 23,937,066 |
CNX Resources Corp. (a)
| | 577,359 | | 14,029,824 |
DT Midstream, Inc.
| | 365,827 | | 25,984,692 |
Equitrans Midstream Corp.
| | 1,633,698 | | 21,205,400 |
HF Sinclair Corp.
| | 564,630 | | 30,117,364 |
Matador Resources Co. (b)
| | 437,193 | | 26,056,703 |
Murphy Oil Corp.
| | 546,096 | | 22,520,999 |
Ovintiv, Inc.
| | 937,762 | | 43,952,905 |
PBF Energy, Inc. Class A
| | 397,532 | | 18,294,423 |
Permian Resources Corp. (b)
| | 1,934,847 | | 31,247,779 |
Range Resources Corp.
| | 914,047 | | 30,647,996 |
Southwestern Energy Co. (a)
| | 4,154,319 | | 27,958,567 |
Texas Pacific Land Corp.
| | 70,136 | | 51,498,761 |
| | | | | | 496,102,633 |
| PAPER & FOREST PRODUCTS — 0.2% | |
Louisiana-Pacific Corp.
| | 240,343 | | 19,787,439 |
| PERSONAL CARE PRODUCTS — 0.9% | |
BellRing Brands, Inc. (a)
| | 491,416 | | 28,079,510 |
Coty, Inc. Class A (a)
| | 1,373,153 | | 13,758,993 |
elf Beauty, Inc. (a) (b)
| | 209,098 | | 44,061,131 |
| | | | | | 85,899,634 |
| PHARMACEUTICALS — 0.4% | |
Jazz Pharmaceuticals PLC (a)
| | 237,444 | | 25,342,398 |
Perrigo Co. PLC
| | 513,587 | | 13,188,914 |
| | | | | | 38,531,312 |
| PROFESSIONAL SERVICES — 2.7% | |
ASGN, Inc. (a)
| | 172,956 | | 15,249,531 |
CACI International, Inc. Class A (a)
| | 83,988 | | 36,125,758 |
Concentrix Corp. (b)
| | 176,466 | | 11,166,768 |
ExlService Holdings, Inc. (a)
| | 611,927 | | 19,190,031 |
Exponent, Inc.
| | 190,843 | | 18,152,986 |
FTI Consulting, Inc. (a)
| | 132,129 | | 28,477,763 |
Genpact Ltd.
| | 623,748 | | 20,078,448 |
Insperity, Inc.
| | 134,781 | | 12,293,375 |
KBR, Inc.
| | 505,841 | | 32,444,642 |
ManpowerGroup, Inc.
| | 179,734 | | 12,545,433 |
Maximus, Inc.
| | 228,985 | | 19,624,015 |
Paylocity Holding Corp. (a)
| | 163,686 | | 21,581,999 |
Science Applications International Corp.
| | 193,124 | | 22,701,726 |
| | | | | | 269,632,475 |
| REAL ESTATE MANAGEMENT & DEVELOPMENT — 0.4% | |
Jones Lang LaSalle, Inc. (a)
| | 179,209 | | 36,788,023 |
| Security Description | | | Shares | | Value |
| RESIDENTIAL REITs — 1.1% | |
American Homes 4 Rent Class A REIT
| | 1,212,306 | | $45,049,291 |
Equity LifeStyle Properties, Inc. REIT
| | 702,622 | | 45,761,771 |
Independence Realty Trust, Inc. REIT
| | 846,367 | | 15,860,917 |
| | | | | | 106,671,979 |
| RETAIL REITs — 1.0% | |
Agree Realty Corp. REIT
| | 378,258 | | 23,429,301 |
Brixmor Property Group, Inc. REIT
| | 1,135,104 | | 26,209,551 |
Kite Realty Group Trust REIT
| | 827,322 | | 18,515,466 |
NNN REIT, Inc.
| | 690,769 | | 29,426,760 |
| | | | | | 97,581,078 |
| SEMICONDUCTORS & SEMICONDUCTOR EQUIPMENT — 2.8% | |
Allegro MicroSystems, Inc. (a) (b)
| | 269,148 | | 7,600,739 |
Amkor Technology, Inc.
| | 389,551 | | 15,589,831 |
Cirrus Logic, Inc. (a)
| | 203,236 | | 25,945,108 |
Lattice Semiconductor Corp. (a)
| | 518,193 | | 30,050,012 |
MACOM Technology Solutions Holdings, Inc. (a)
| | 206,482 | | 23,016,548 |
MKS Instruments, Inc. (b)
| | 237,960 | | 31,072,817 |
Onto Innovation, Inc. (a) (b)
| | 185,705 | | 40,773,390 |
Power Integrations, Inc. (b)
| | 213,869 | | 15,011,465 |
Rambus, Inc. (a) (b)
| | 406,043 | | 23,859,087 |
Silicon Laboratories, Inc. (a)
| | 120,221 | | 13,300,049 |
Synaptics, Inc. (a)
| | 148,819 | | 13,125,836 |
Universal Display Corp.
| | 164,448 | | 34,575,192 |
Wolfspeed, Inc. (a) (b)
| | 474,121 | | 10,790,994 |
| | | | | | 284,711,068 |
| SOFTWARE — 2.6% | |
Altair Engineering, Inc. Class A (a) (b)
| | 214,510 | | 21,039,141 |
Appfolio, Inc. Class A (a)
| | 79,100 | | 19,345,487 |
Aspen Technology, Inc. (a) (b)
| | 104,955 | | 20,847,212 |
Blackbaud, Inc. (a) (b)
| | 152,273 | | 11,598,634 |
CommVault Systems, Inc. (a)
| | 163,552 | | 19,883,017 |
Dolby Laboratories, Inc. Class A
| | 225,085 | | 17,833,485 |
Dropbox, Inc. Class A (a)
| | 910,306 | | 20,454,576 |
Dynatrace, Inc. (a)
| | 906,184 | | 40,542,672 |
Manhattan Associates, Inc. (a)
| | 231,993 | | 57,228,033 |
Qualys, Inc. (a)
| | 139,149 | | 19,842,647 |
Teradata Corp. (a)
| | 364,299 | | 12,590,173 |
| | | | | | 261,205,077 |
| SPECIALIZED REITs — 1.7% | |
CubeSmart REIT
| | 847,525 | | 38,282,704 |
EPR Properties REIT
| | 285,077 | | 11,967,532 |
Gaming & Leisure Properties, Inc. REIT
| | 1,022,806 | | 46,241,059 |
Lamar Advertising Co. Class A REIT
| | 330,859 | | 39,547,576 |
See accompanying notes to financial statements.
8
SPDR PORTFOLIO S&P 400 MID CAP ETF
SCHEDULE OF INVESTMENTS (continued)
June 30, 2024
| Security Description | | | Shares | | Value |
National Storage Affiliates Trust REIT
| | 262,607 | | $10,824,661 |
PotlatchDeltic Corp. REIT
| | 299,535 | | 11,798,684 |
Rayonier, Inc. REIT
| | 515,932 | | 15,008,462 |
| | | | | | 173,670,678 |
| SPECIALTY RETAIL — 4.0% | |
AutoNation, Inc. (a)
| | 92,558 | | 14,751,894 |
Burlington Stores, Inc. (a)
| | 240,597 | | 57,743,280 |
Dick's Sporting Goods, Inc.
| | 219,362 | | 47,129,926 |
Five Below, Inc. (a)
| | 207,883 | | 22,653,010 |
Floor & Decor Holdings, Inc. Class A (a) (b)
| | 403,121 | | 40,074,259 |
GameStop Corp. Class A (a) (b)
| | 1,015,071 | | 25,062,103 |
Gap, Inc.
| | 816,145 | | 19,497,704 |
Lithia Motors, Inc. (b)
| | 103,226 | | 26,059,404 |
Murphy USA, Inc.
| | 71,055 | | 33,357,480 |
Penske Automotive Group, Inc.
| | 73,045 | | 10,885,166 |
RH (a) (b)
| | 58,092 | | 14,200,008 |
Valvoline, Inc. (a)
| | 485,464 | | 20,972,045 |
Williams-Sonoma, Inc. (b)
| | 242,022 | | 68,339,752 |
| | | | | | 400,726,031 |
| TECHNOLOGY HARDWARE, STORAGE & PERIPHERALS — 0.7% | |
Pure Storage, Inc. Class A (a)
| | 1,151,247 | | 73,921,570 |
| TEXTILES, APPAREL & LUXURY GOODS — 1.3% | |
Capri Holdings Ltd. (a)
| | 439,178 | | 14,528,008 |
Carter's, Inc. (b)
| | 137,513 | | 8,521,681 |
Columbia Sportswear Co. (b)
| | 127,000 | | 10,043,160 |
Crocs, Inc. (a)
| | 228,728 | | 33,380,564 |
PVH Corp.
| | 213,257 | | 22,577,519 |
Skechers USA, Inc. Class A (a)
| | 498,774 | | 34,475,259 |
Under Armour, Inc. Class A (a) (b)
| | 709,540 | | 4,732,632 |
Under Armour, Inc. Class C (a) (b)
| | 718,850 | | 4,694,090 |
| | | | | | 132,952,913 |
| Security Description | | | Shares | | Value |
| TRADING COMPANIES & DISTRIBUTORS — 1.7% | |
Applied Industrial Technologies, Inc.
| | 145,436 | | $28,214,584 |
Core & Main, Inc. Class A (a)
| | 644,224 | | 31,528,323 |
GATX Corp.
| | 134,143 | | 17,755,168 |
MSC Industrial Direct Co., Inc. Class A (b)
| | 171,839 | | 13,628,551 |
Watsco, Inc. (b)
| | 120,605 | | 55,869,060 |
WESCO International, Inc.
| | 164,693 | | 26,107,134 |
| | | | | | 173,102,820 |
| WATER UTILITIES — 0.4% | |
Essential Utilities, Inc.
| | 948,039 | | 35,390,296 |
TOTAL COMMON STOCKS
(Cost $8,814,384,705)
| | | | | 10,024,586,785 |
| SHORT-TERM INVESTMENT — 3.8% | | | |
State Street Navigator Securities Lending Portfolio II (c) (d)
(Cost $380,676,390)
| | 380,676,390 | | 380,676,390 |
TOTAL INVESTMENTS — 103.6%
(Cost $9,195,061,095)
| | 10,405,263,175 | |
LIABILITIES IN EXCESS OF OTHER ASSETS — (3.6)%
| | (358,004,036) | |
NET ASSETS — 100.0%
| | $10,047,259,139 | |
| (a) | Non-income producing security. |
| (b) | All or a portion of the shares of the security are on loan at June 30, 2024. |
| (c) | The Fund invested in an affiliated entity. Amounts related to these investments during the year ended June 30, 2024 are shown in the Affiliate Table below. |
| (d) | Investment of cash collateral for securities loaned. |
| REIT | Real Estate Investment Trust |
The following table summarizes the value of the Fund's investments according to the fair value hierarchy as of June 30, 2024.
| Description | | Level 1 –
Quoted Prices | | Level 2 –
Other Significant
Observable Inputs | | Level 3 –
Significant
Unobservable Inputs | | Total |
| ASSETS: | | | | | | | | |
| INVESTMENTS: | | | | | | | | |
Common Stocks
| | $10,024,586,785 | | $— | | $— | | $10,024,586,785 |
Short-Term Investment
| | 380,676,390 | | — | | — | | 380,676,390 |
TOTAL INVESTMENTS
| | $10,405,263,175 | | $— | | $— | | $10,405,263,175 |
See accompanying notes to financial statements.
9
SPDR PORTFOLIO S&P 400 MID CAP ETF
SCHEDULE OF INVESTMENTS (continued)
June 30, 2024
Affiliate Table
| | Number of
Shares Held
at
6/30/23 | | Value at
6/30/23 | | Cost of
Purchases | | Proceeds
from
Shares Sold | | Realized
Gain (Loss) | | Change in
Unrealized
Appreciation/
Depreciation | | Number of
Shares Held
at
6/30/24 | | Value at
6/30/24 | | Dividend
Income |
State Street Institutional Liquid Reserves Fund, Premier Class
| 5,772,295 | | $5,773,449 | | $278,145,577 | | $283,920,519 | | $1,518 | | $(25) | | — | | $— | | $296,834 |
State Street Navigator Securities Lending Portfolio II
| 353,598,518 | | 353,598,518 | | 3,610,658,840 | | 3,583,580,968 | | — | | — | | 380,676,390 | | 380,676,390 | | 893,877 |
Total
| | | $359,371,967 | | $3,888,804,417 | | $3,867,501,487 | | $1,518 | | $(25) | | | | $380,676,390 | | $1,190,711 |
See accompanying notes to financial statements.
10
SPDR PORTFOLIO S&P 500 ETF
SCHEDULE OF INVESTMENTS
June 30, 2024
| Security Description | | | Shares | | Value |
| COMMON STOCKS — 99.7% | |
| AEROSPACE & DEFENSE — 1.4% | |
Axon Enterprise, Inc. (a)
| | 61,000 | | $17,948,640 |
Boeing Co. (a)
| | 495,444 | | 90,175,763 |
General Dynamics Corp.
| | 196,603 | | 57,042,394 |
Howmet Aerospace, Inc.
| | 337,523 | | 26,201,911 |
Huntington Ingalls Industries, Inc.
| | 34,546 | | 8,509,716 |
L3Harris Technologies, Inc.
| | 163,711 | | 36,766,216 |
Lockheed Martin Corp.
| | 184,405 | | 86,135,576 |
Northrop Grumman Corp.
| | 120,178 | | 52,391,599 |
RTX Corp.
| | 1,147,069 | | 115,154,257 |
Textron, Inc.
| | 164,612 | | 14,133,586 |
TransDigm Group, Inc.
| | 48,181 | | 61,556,527 |
| | | | | | 566,016,185 |
| AIR FREIGHT & LOGISTICS — 0.4% | |
CH Robinson Worldwide, Inc.
| | 100,814 | | 8,883,730 |
Expeditors International of Washington, Inc.
| | 121,941 | | 15,217,017 |
FedEx Corp.
| | 195,554 | | 58,634,911 |
United Parcel Service, Inc. Class B
| | 625,726 | | 85,630,603 |
| | | | | | 168,366,261 |
| AIRLINES — 0.2% | |
American Airlines Group, Inc. (a) (b)
| | 560,563 | | 6,351,179 |
Delta Air Lines, Inc.
| | 553,886 | | 26,276,352 |
Southwest Airlines Co. (b)
| | 517,170 | | 14,796,233 |
United Airlines Holdings, Inc. (a)
| | 283,935 | | 13,816,277 |
| | | | | | 61,240,041 |
| AUTO COMPONENTS — 0.1% | |
Aptiv PLC (a)
| | 234,875 | | 16,539,898 |
BorgWarner, Inc.
| | 202,896 | | 6,541,367 |
| | | | | | 23,081,265 |
| AUTOMOBILES — 1.4% | |
Ford Motor Co.
| | 3,373,342 | | 42,301,709 |
General Motors Co.
| | 985,204 | | 45,772,578 |
Tesla, Inc. (a)
| | 2,395,864 | | 474,093,568 |
| | | | | | 562,167,855 |
| BANKS — 4.0% | |
Bank of America Corp.
| | 5,874,893 | | 233,644,495 |
Bank of New York Mellon Corp.
| | 645,713 | | 38,671,752 |
Citigroup, Inc.
| | 1,644,638 | | 104,368,728 |
Citizens Financial Group, Inc.
| | 392,933 | | 14,157,376 |
Fifth Third Bancorp
| | 594,594 | | 21,696,735 |
Goldman Sachs Group, Inc.
| | 278,387 | | 125,920,008 |
Huntington Bancshares, Inc.
| | 1,247,489 | | 16,441,905 |
JPMorgan Chase & Co.
| | 2,479,605 | | 501,524,907 |
KeyCorp
| | 805,273 | | 11,442,929 |
M&T Bank Corp.
| | 144,807 | | 21,917,988 |
Morgan Stanley
| | 1,083,143 | | 105,270,668 |
Northern Trust Corp.
| | 178,584 | | 14,997,484 |
| Security Description | | | Shares | | Value |
PNC Financial Services Group, Inc.
| | 345,525 | | $53,722,227 |
Regions Financial Corp.
| | 799,005 | | 16,012,060 |
State Street Corp. (c)
| | 260,821 | | 19,300,754 |
Truist Financial Corp.
| | 1,152,892 | | 44,789,854 |
U.S. Bancorp
| | 1,348,666 | | 53,542,040 |
Wells Fargo & Co.
| | 3,010,282 | | 178,780,648 |
| | | | | | 1,576,202,558 |
| BEVERAGES — 1.3% | |
Brown-Forman Corp. Class B (b)
| | 159,349 | | 6,882,283 |
Coca-Cola Co.
| | 3,347,745 | | 213,083,969 |
Constellation Brands, Inc. Class A
| | 139,157 | | 35,802,313 |
Keurig Dr Pepper, Inc.
| | 900,342 | | 30,071,423 |
Molson Coors Beverage Co. Class B
| | 161,452 | | 8,206,605 |
Monster Beverage Corp. (a)
| | 612,344 | | 30,586,583 |
PepsiCo, Inc.
| | 1,188,381 | | 195,999,679 |
| | | | | | 520,632,855 |
| BIOTECHNOLOGY — 1.9% | |
AbbVie, Inc.
| | 1,524,806 | | 261,534,725 |
Amgen, Inc.
| | 462,886 | | 144,628,731 |
Biogen, Inc. (a)
| | 124,652 | | 28,896,827 |
Gilead Sciences, Inc.
| | 1,076,933 | | 73,888,373 |
Incyte Corp. (a)
| | 161,283 | | 9,776,975 |
Moderna, Inc. (a)
| | 286,203 | | 33,986,606 |
Regeneron Pharmaceuticals, Inc. (a)
| | 91,302 | | 95,961,141 |
Vertex Pharmaceuticals, Inc. (a)
| | 223,084 | | 104,563,933 |
| | | | | | 753,237,311 |
| BROADLINE RETAIL — 3.9% | |
Amazon.com, Inc. (a)
| | 7,907,595 | | 1,528,142,734 |
eBay, Inc.
| | 436,859 | | 23,468,065 |
Etsy, Inc. (a)
| | 102,321 | | 6,034,893 |
| | | | | | 1,557,645,692 |
| BUILDING PRODUCTS — 0.5% | |
A O Smith Corp.
| | 106,664 | | 8,722,982 |
Allegion PLC
| | 75,237 | | 8,889,252 |
Builders FirstSource, Inc. (a)
| | 105,428 | | 14,592,289 |
Carrier Global Corp.
| | 721,340 | | 45,502,127 |
Johnson Controls International PLC
| | 581,699 | | 38,665,532 |
Masco Corp.
| | 189,413 | | 12,628,165 |
Trane Technologies PLC
| | 195,488 | | 64,301,868 |
| | | | | | 193,302,215 |
| CAPITAL MARKETS — 2.1% | |
Ameriprise Financial, Inc.
| | 85,741 | | 36,627,698 |
BlackRock, Inc.
| | 120,637 | | 94,979,923 |
Blackstone, Inc.
| | 617,150 | | 76,403,170 |
Cboe Global Markets, Inc.
| | 90,913 | | 15,460,665 |
Charles Schwab Corp.
| | 1,288,826 | | 94,973,588 |
CME Group, Inc.
| | 310,361 | | 61,016,973 |
See accompanying notes to financial statements.
11
SPDR PORTFOLIO S&P 500 ETF
SCHEDULE OF INVESTMENTS (continued)
June 30, 2024
| Security Description | | | Shares | | Value |
FactSet Research Systems, Inc. (b)
| | 33,008 | | $13,476,176 |
Franklin Resources, Inc. (b)
| | 259,332 | | 5,796,070 |
Intercontinental Exchange, Inc.
| | 496,550 | | 67,972,729 |
Invesco Ltd.
| | 390,554 | | 5,842,688 |
KKR & Co., Inc.
| | 574,661 | | 60,477,324 |
MarketAxess Holdings, Inc.
| | 33,321 | | 6,681,860 |
Moody's Corp.
| | 135,603 | | 57,079,371 |
MSCI, Inc.
| | 69,076 | | 33,277,363 |
Nasdaq, Inc.
| | 328,633 | | 19,803,424 |
Raymond James Financial, Inc.
| | 162,011 | | 20,026,180 |
S&P Global, Inc.
| | 276,389 | | 123,269,494 |
T Rowe Price Group, Inc.
| | 192,869 | | 22,239,724 |
| | | | | | 815,404,420 |
| CHEMICALS — 1.4% | |
Air Products & Chemicals, Inc.
| | 192,797 | | 49,751,266 |
Albemarle Corp. (b)
| | 100,312 | | 9,581,802 |
Celanese Corp.
| | 86,589 | | 11,679,990 |
CF Industries Holdings, Inc.
| | 157,832 | | 11,698,508 |
Corteva, Inc.
| | 601,921 | | 32,467,619 |
Dow, Inc.
| | 610,450 | | 32,384,372 |
DuPont de Nemours, Inc.
| | 361,047 | | 29,060,673 |
Eastman Chemical Co.
| | 101,910 | | 9,984,123 |
Ecolab, Inc.
| | 219,455 | | 52,230,290 |
FMC Corp. (b)
| | 110,464 | | 6,357,203 |
International Flavors & Fragrances, Inc.
| | 221,358 | | 21,075,495 |
Linde PLC
| | 415,104 | | 182,151,786 |
LyondellBasell Industries NV Class A
| | 221,956 | | 21,232,311 |
Mosaic Co.
| | 282,960 | | 8,177,544 |
PPG Industries, Inc.
| | 204,186 | | 25,704,976 |
Sherwin-Williams Co.
| | 201,413 | | 60,107,682 |
| | | | | | 563,645,640 |
| COMMERCIAL SERVICES & SUPPLIES — 0.6% | |
Cintas Corp.
| | 74,402 | | 52,100,745 |
Copart, Inc. (a)
| | 754,909 | | 40,885,871 |
Republic Services, Inc.
| | 176,390 | | 34,279,633 |
Rollins, Inc.
| | 244,036 | | 11,906,516 |
Veralto Corp.
| | 188,168 | | 17,964,399 |
Waste Management, Inc.
| | 315,103 | | 67,224,074 |
| | | | | | 224,361,238 |
| COMMUNICATIONS EQUIPMENT — 0.8% | |
Arista Networks, Inc. (a)
| | 218,230 | | 76,485,250 |
Cisco Systems, Inc.
| | 3,496,274 | | 166,107,978 |
F5, Inc. (a)
| | 50,628 | | 8,719,661 |
Juniper Networks, Inc.
| | 278,663 | | 10,160,053 |
Motorola Solutions, Inc.
| | 144,820 | | 55,907,761 |
| | | | | | 317,380,703 |
| CONSTRUCTION & ENGINEERING — 0.1% | |
Quanta Services, Inc.
| | 125,440 | | 31,873,050 |
| CONSTRUCTION MATERIALS — 0.1% | |
Martin Marietta Materials, Inc.
| | 52,929 | | 28,676,932 |
| Security Description | | | Shares | | Value |
Vulcan Materials Co.
| | 114,587 | | $28,495,495 |
| | | | | | 57,172,427 |
| CONSUMER FINANCE — 0.5% | |
American Express Co.
| | 490,759 | | 113,635,246 |
Capital One Financial Corp.
| | 330,573 | | 45,767,832 |
Discover Financial Services
| | 214,899 | | 28,110,938 |
Synchrony Financial
| | 350,926 | | 16,560,198 |
| | | | | | 204,074,214 |
| CONSUMER STAPLES DISTRIBUTION & RETAIL — 1.9% | |
Costco Wholesale Corp.
| | 382,936 | | 325,491,771 |
Dollar General Corp.
| | 190,692 | | 25,215,203 |
Dollar Tree, Inc. (a)
| | 178,189 | | 19,025,240 |
Kroger Co.
| | 568,438 | | 28,382,109 |
Sysco Corp.
| | 430,583 | | 30,739,320 |
Target Corp.
| | 398,500 | | 58,993,940 |
Walgreens Boots Alliance, Inc. (b)
| | 618,949 | | 7,486,188 |
Walmart, Inc.
| | 3,688,460 | | 249,745,627 |
| | | | | | 745,079,398 |
| CONTAINERS & PACKAGING — 0.2% | |
Amcor PLC
| | 1,249,523 | | 12,220,335 |
Avery Dennison Corp.
| | 70,176 | | 15,343,983 |
Ball Corp.
| | 272,813 | | 16,374,236 |
International Paper Co. (b)
| | 304,267 | | 13,129,121 |
Packaging Corp. of America
| | 77,732 | | 14,190,754 |
Westrock Co.
| | 221,874 | | 11,151,387 |
| | | | | | 82,409,816 |
| DISTRIBUTORS — 0.1% | |
Genuine Parts Co.
| | 121,423 | | 16,795,229 |
LKQ Corp.
| | 226,654 | | 9,426,540 |
Pool Corp. (b)
| | 33,184 | | 10,198,439 |
| | | | | | 36,420,208 |
| DIVERSIFIED TELECOMMUNICATION SERVICES — 0.7% | |
AT&T, Inc.
| | 6,185,070 | | 118,196,688 |
Verizon Communications, Inc.
| | 3,633,616 | | 149,850,324 |
| | | | | | 268,047,012 |
| ELECTRIC UTILITIES — 1.5% | |
Alliant Energy Corp.
| | 218,594 | | 11,126,435 |
American Electric Power Co., Inc.
| | 454,543 | | 39,881,603 |
Constellation Energy Corp.
| | 272,247 | | 54,522,907 |
Duke Energy Corp.
| | 667,470 | | 66,900,518 |
Edison International
| | 332,394 | | 23,869,213 |
Entergy Corp.
| | 184,497 | | 19,741,179 |
Evergy, Inc.
| | 197,849 | | 10,480,061 |
Eversource Energy
| | 298,859 | | 16,948,294 |
Exelon Corp.
| | 861,907 | | 29,830,601 |
FirstEnergy Corp. (b)
| | 446,384 | | 17,083,116 |
NextEra Energy, Inc.
| | 1,772,839 | | 125,534,730 |
NRG Energy, Inc.
| | 180,099 | | 14,022,508 |
PG&E Corp.
| | 1,843,204 | | 32,182,342 |
Pinnacle West Capital Corp. (b)
| | 98,301 | | 7,508,230 |
See accompanying notes to financial statements.
12
SPDR PORTFOLIO S&P 500 ETF
SCHEDULE OF INVESTMENTS (continued)
June 30, 2024
| Security Description | | | Shares | | Value |
PPL Corp.
| | 642,168 | | $17,755,945 |
Southern Co.
| | 944,883 | | 73,294,574 |
Xcel Energy, Inc.
| | 477,447 | | 25,500,444 |
| | | | | | 586,182,700 |
| ELECTRICAL EQUIPMENT — 0.7% | |
AMETEK, Inc.
| | 198,640 | | 33,115,274 |
Eaton Corp. PLC
| | 345,887 | | 108,452,869 |
Emerson Electric Co.
| | 495,586 | | 54,593,754 |
GE Vernova, Inc. (a)
| | 235,462 | | 40,384,087 |
Generac Holdings, Inc. (a)
| | 52,612 | | 6,956,359 |
Rockwell Automation, Inc.
| | 99,364 | | 27,352,922 |
| | | | | | 270,855,265 |
| ELECTRONIC EQUIPMENT, INSTRUMENTS & COMPONENTS — 0.6% | |
Amphenol Corp. Class A
| | 1,038,422 | | 69,958,490 |
CDW Corp.
| | 114,721 | | 25,679,149 |
Corning, Inc.
| | 662,655 | | 25,744,147 |
Hubbell, Inc.
| | 46,712 | | 17,072,302 |
Jabil, Inc.
| | 104,094 | | 11,324,386 |
Keysight Technologies, Inc. (a)
| | 150,583 | | 20,592,225 |
TE Connectivity Ltd.
| | 264,371 | | 39,769,329 |
Teledyne Technologies, Inc. (a)
| | 40,534 | | 15,726,381 |
Trimble, Inc. (a)
| | 213,143 | | 11,918,957 |
Zebra Technologies Corp. Class A (a)
| | 44,462 | | 13,735,646 |
| | | | | | 251,521,012 |
| ENERGY EQUIPMENT & SERVICES — 0.3% | |
Baker Hughes Co.
| | 861,767 | | 30,308,345 |
Halliburton Co.
| | 773,173 | | 26,117,784 |
Schlumberger NV
| | 1,230,989 | | 58,078,061 |
| | | | | | 114,504,190 |
| ENTERTAINMENT — 1.2% | |
Electronic Arts, Inc.
| | 210,207 | | 29,288,141 |
Live Nation Entertainment, Inc. (a) (b)
| | 123,425 | | 11,569,860 |
Netflix, Inc. (a)
| | 372,065 | | 251,099,227 |
Take-Two Interactive Software, Inc. (a)
| | 136,277 | | 21,189,711 |
Walt Disney Co.
| | 1,574,110 | | 156,293,382 |
Warner Bros Discovery, Inc. (a)
| | 1,917,685 | | 14,267,576 |
| | | | | | 483,707,897 |
| FINANCIAL SERVICES — 3.8% | |
Berkshire Hathaway, Inc. Class B (a)
| | 1,563,165 | | 635,895,522 |
Corpay, Inc. (a)
| | 60,702 | | 16,171,620 |
Fidelity National Information Services, Inc.
| | 480,328 | | 36,197,518 |
Fiserv, Inc. (a)
| | 505,209 | | 75,296,349 |
Global Payments, Inc.
| | 220,457 | | 21,318,192 |
Jack Henry & Associates, Inc.
| | 62,545 | | 10,383,721 |
Mastercard, Inc. Class A
| | 708,900 | | 312,738,324 |
PayPal Holdings, Inc. (a)
| | 903,212 | | 52,413,392 |
| Security Description | | | Shares | | Value |
Visa, Inc. Class A
| | 1,359,296 | | $356,774,421 |
| | | | | | 1,517,189,059 |
| FOOD PRODUCTS — 0.7% | |
Archer-Daniels-Midland Co.
| | 426,891 | | 25,805,561 |
Bunge Global SA
| | 125,132 | | 13,360,344 |
Campbell Soup Co. (b)
| | 173,698 | | 7,849,413 |
Conagra Brands, Inc.
| | 410,426 | | 11,664,307 |
General Mills, Inc.
| | 491,111 | | 31,067,682 |
Hershey Co. (b)
| | 128,795 | | 23,676,385 |
Hormel Foods Corp.
| | 249,135 | | 7,596,126 |
J M Smucker Co.
| | 89,887 | | 9,801,278 |
Kellanova
| | 227,555 | | 13,125,372 |
Kraft Heinz Co.
| | 681,515 | | 21,958,413 |
Lamb Weston Holdings, Inc. (b)
| | 124,578 | | 10,474,518 |
McCormick & Co., Inc.
| | 219,718 | | 15,586,795 |
Mondelez International, Inc. Class A
| | 1,158,250 | | 75,795,880 |
Tyson Foods, Inc. Class A
| | 249,844 | | 14,276,086 |
| | | | | | 282,038,160 |
| GAS UTILITIES — 0.0% (d) | |
Atmos Energy Corp.
| | 131,043 | | 15,286,166 |
| GROUND TRANSPORTATION — 1.0% | |
CSX Corp.
| | 1,687,989 | | 56,463,232 |
JB Hunt Transport Services, Inc.
| | 71,434 | | 11,429,440 |
Norfolk Southern Corp.
| | 196,132 | | 42,107,579 |
Old Dominion Freight Line, Inc.
| | 154,693 | | 27,318,784 |
Uber Technologies, Inc. (a)
| | 1,780,016 | | 129,371,563 |
Union Pacific Corp.
| | 527,596 | | 119,373,871 |
| | | | | | 386,064,469 |
| HEALTH CARE EQUIPMENT & SUPPLIES — 2.4% | |
Abbott Laboratories
| | 1,501,575 | | 156,028,658 |
Align Technology, Inc. (a)
| | 60,503 | | 14,607,239 |
Baxter International, Inc.
| | 435,983 | | 14,583,631 |
Becton Dickinson & Co.
| | 249,431 | | 58,294,519 |
Boston Scientific Corp. (a)
| | 1,266,809 | | 97,556,961 |
Cooper Cos., Inc.
| | 171,908 | | 15,007,568 |
Dexcom, Inc. (a)
| | 335,398 | | 38,027,425 |
Edwards Lifesciences Corp. (a)
| | 520,317 | | 48,061,681 |
GE HealthCare Technologies, Inc.
| | 366,219 | | 28,535,785 |
Hologic, Inc. (a)
| | 202,187 | | 15,012,385 |
IDEXX Laboratories, Inc. (a)
| | 71,389 | | 34,780,721 |
Insulet Corp. (a)
| | 61,020 | | 12,313,836 |
Intuitive Surgical, Inc. (a)
| | 305,731 | | 136,004,435 |
Medtronic PLC
| | 1,146,587 | | 90,247,863 |
ResMed, Inc.
| | 126,870 | | 24,285,455 |
Solventum Corp. (a)
| | 119,925 | | 6,341,634 |
STERIS PLC
| | 86,322 | | 18,951,132 |
Stryker Corp.
| | 292,814 | | 99,629,964 |
Teleflex, Inc.
| | 40,423 | | 8,502,170 |
Zimmer Biomet Holdings, Inc.
| | 177,571 | | 19,271,781 |
| | | | | | 936,044,843 |
See accompanying notes to financial statements.
13
SPDR PORTFOLIO S&P 500 ETF
SCHEDULE OF INVESTMENTS (continued)
June 30, 2024
| Security Description | | | Shares | | Value |
| HEALTH CARE PROVIDERS & SERVICES — 2.4% | |
Cardinal Health, Inc.
| | 212,348 | | $20,878,055 |
Cencora, Inc.
| | 143,203 | | 32,263,636 |
Centene Corp. (a)
| | 460,755 | | 30,548,057 |
Cigna Group
| | 245,307 | | 81,091,135 |
CVS Health Corp.
| | 1,087,653 | | 64,236,786 |
DaVita, Inc. (a)
| | 44,721 | | 6,196,989 |
Elevance Health, Inc.
| | 200,664 | | 108,731,795 |
HCA Healthcare, Inc.
| | 167,390 | | 53,779,059 |
Henry Schein, Inc. (a)
| | 112,211 | | 7,192,725 |
Humana, Inc.
| | 103,947 | | 38,839,797 |
Labcorp Holdings, Inc.
| | 73,605 | | 14,979,354 |
McKesson Corp.
| | 112,262 | | 65,565,498 |
Molina Healthcare, Inc. (a)
| | 49,792 | | 14,803,162 |
Quest Diagnostics, Inc.
| | 96,327 | | 13,185,240 |
UnitedHealth Group, Inc.
| | 794,713 | | 404,715,542 |
Universal Health Services, Inc. Class B
| | 53,037 | | 9,808,132 |
| | | | | | 966,814,962 |
| HEALTH CARE REITs — 0.2% | |
Healthpeak Properties, Inc. REIT
| | 611,577 | | 11,986,909 |
Ventas, Inc. REIT
| | 345,456 | | 17,708,075 |
Welltower, Inc. REIT
| | 516,356 | | 53,830,113 |
| | | | | | 83,525,097 |
| HOTEL & RESORT REITs — 0.0% (d) | |
Host Hotels & Resorts, Inc. REIT
| | 613,453 | | 11,029,885 |
| HOTELS, RESTAURANTS & LEISURE — 1.9% | |
Airbnb, Inc. Class A (a)
| | 375,784 | | 56,980,128 |
Booking Holdings, Inc.
| | 29,282 | | 116,000,643 |
Caesars Entertainment, Inc. (a)
| | 184,974 | | 7,350,867 |
Carnival Corp. (a)
| | 872,129 | | 16,326,255 |
Chipotle Mexican Grill, Inc. (a)
| | 1,186,018 | | 74,304,028 |
Darden Restaurants, Inc.
| | 103,715 | | 15,694,154 |
Domino's Pizza, Inc.
| | 30,034 | | 15,507,455 |
Expedia Group, Inc. (a)
| | 109,643 | | 13,813,922 |
Hilton Worldwide Holdings, Inc.
| | 215,872 | | 47,103,270 |
Las Vegas Sands Corp.
| | 319,669 | | 14,145,353 |
Marriott International, Inc. Class A
| | 207,190 | | 50,092,326 |
McDonald's Corp.
| | 622,232 | | 158,569,603 |
MGM Resorts International (a)
| | 216,727 | | 9,631,348 |
Norwegian Cruise Line Holdings Ltd. (a) (b)
| | 366,684 | | 6,889,992 |
Royal Caribbean Cruises Ltd. (a) (b)
| | 202,796 | | 32,331,766 |
Starbucks Corp.
| | 978,292 | | 76,160,032 |
Wynn Resorts Ltd.
| | 83,957 | | 7,514,152 |
Yum! Brands, Inc.
| | 243,724 | | 32,283,681 |
| | | | | | 750,698,975 |
| HOUSEHOLD DURABLES — 0.3% | |
DR Horton, Inc.
| | 256,009 | | 36,079,348 |
Garmin Ltd.
| | 134,091 | | 21,846,106 |
Lennar Corp. Class A
| | 211,377 | | 31,679,071 |
Mohawk Industries, Inc. (a)
| | 47,275 | | 5,369,967 |
| Security Description | | | Shares | | Value |
NVR, Inc. (a)
| | 2,691 | | $20,420,815 |
PulteGroup, Inc.
| | 183,612 | | 20,215,681 |
| | | | | | 135,610,988 |
| HOUSEHOLD PRODUCTS — 1.2% | |
Church & Dwight Co., Inc.
| | 212,655 | | 22,048,070 |
Clorox Co.
| | 109,086 | | 14,886,967 |
Colgate-Palmolive Co.
| | 708,417 | | 68,744,786 |
Kimberly-Clark Corp.
| | 291,711 | | 40,314,460 |
Procter & Gamble Co.
| | 2,036,876 | | 335,921,590 |
| | | | | | 481,915,873 |
| INDEPENDENT POWER AND RENEWABLE ELECTRICITY PRODUCERS — 0.1% | |
AES Corp.
| | 577,614 | | 10,148,678 |
Vistra Corp.
| | 282,060 | | 24,251,519 |
| | | | | | 34,400,197 |
| INDUSTRIAL CONGLOMERATES — 0.8% | |
3M Co.
| | 478,179 | | 48,865,112 |
General Electric Co.
| | 941,846 | | 149,725,259 |
Honeywell International, Inc.
| | 562,193 | | 120,050,693 |
| | | | | | 318,641,064 |
| INDUSTRIAL REITs — 0.2% | |
Prologis, Inc. REIT
| | 799,138 | | 89,751,189 |
| INSURANCE — 2.0% | |
Aflac, Inc.
| | 446,484 | | 39,875,486 |
Allstate Corp.
| | 227,131 | | 36,263,735 |
American International Group, Inc.
| | 573,036 | | 42,542,193 |
Aon PLC Class A
| | 187,687 | | 55,101,149 |
Arch Capital Group Ltd. (a)
| | 320,058 | | 32,290,652 |
Arthur J Gallagher & Co.
| | 187,226 | | 48,549,574 |
Assurant, Inc.
| | 45,467 | | 7,558,889 |
Brown & Brown, Inc.
| | 202,333 | | 18,090,593 |
Chubb Ltd.
| | 350,689 | | 89,453,750 |
Cincinnati Financial Corp.
| | 137,015 | | 16,181,471 |
Everest Group Ltd.
| | 37,235 | | 14,187,280 |
Globe Life, Inc.
| | 74,058 | | 6,093,492 |
Hartford Financial Services Group, Inc.
| | 258,150 | | 25,954,401 |
Loews Corp.
| | 160,494 | | 11,995,321 |
Marsh & McLennan Cos., Inc.
| | 424,740 | | 89,501,213 |
MetLife, Inc.
| | 515,850 | | 36,207,511 |
Principal Financial Group, Inc.
| | 188,473 | | 14,785,707 |
Progressive Corp.
| | 506,904 | | 105,289,030 |
Prudential Financial, Inc.
| | 311,303 | | 36,481,599 |
Travelers Cos., Inc.
| | 197,614 | | 40,182,831 |
W R Berkley Corp.
| | 175,765 | | 13,811,614 |
Willis Towers Watson PLC
| | 88,497 | | 23,198,604 |
| | | | | | 803,596,095 |
| INTERACTIVE MEDIA & SERVICES — 6.7% | |
Alphabet, Inc. Class A
| | 5,072,141 | | 923,890,483 |
Alphabet, Inc. Class C
| | 4,219,672 | | 773,972,238 |
Match Group, Inc. (a)
| | 229,469 | | 6,971,268 |
See accompanying notes to financial statements.
14
SPDR PORTFOLIO S&P 500 ETF
SCHEDULE OF INVESTMENTS (continued)
June 30, 2024
| Security Description | | | Shares | | Value |
Meta Platforms, Inc. Class A
| | 1,892,288 | | $954,129,456 |
| | | | | | 2,658,963,445 |
| IT SERVICES — 1.0% | |
Accenture PLC Class A
| | 542,133 | | 164,488,574 |
Akamai Technologies, Inc. (a)
| | 131,926 | | 11,883,894 |
Cognizant Technology Solutions Corp. Class A
| | 433,396 | | 29,470,928 |
EPAM Systems, Inc. (a)
| | 49,648 | | 9,339,285 |
Gartner, Inc. (a)
| | 67,040 | | 30,104,982 |
GoDaddy, Inc. Class A (a)
| | 121,740 | | 17,008,295 |
International Business Machines Corp.
| | 791,990 | | 136,974,671 |
VeriSign, Inc. (a)
| | 75,926 | | 13,499,643 |
| | | | | | 412,770,272 |
| LEISURE EQUIPMENT & PRODUCTS — 0.0% (d) | |
Hasbro, Inc.
| | 111,541 | | 6,525,148 |
| LIFE SCIENCES TOOLS & SERVICES — 1.2% | |
Agilent Technologies, Inc.
| | 253,655 | | 32,881,297 |
Bio-Rad Laboratories, Inc. Class A (a)
| | 17,782 | | 4,856,442 |
Bio-Techne Corp.
| | 137,676 | | 9,864,485 |
Charles River Laboratories International, Inc. (a)
| | 44,953 | | 9,286,391 |
Danaher Corp.
| | 569,181 | | 142,209,873 |
IQVIA Holdings, Inc. (a)
| | 157,395 | | 33,279,599 |
Mettler-Toledo International, Inc. (a)
| | 18,337 | | 25,627,608 |
Revvity, Inc.
| | 107,231 | | 11,244,243 |
Thermo Fisher Scientific, Inc.
| | 329,676 | | 182,310,828 |
Waters Corp. (a)
| | 50,743 | | 14,721,559 |
West Pharmaceutical Services, Inc.
| | 62,860 | | 20,705,455 |
| | | | | | 486,987,780 |
| MACHINERY — 1.6% | |
Caterpillar, Inc.
| | 422,266 | | 140,656,805 |
Cummins, Inc.
| | 118,116 | | 32,709,864 |
Deere & Co.
| | 223,507 | | 83,508,920 |
Dover Corp.
| | 118,698 | | 21,419,054 |
Fortive Corp.
| | 303,659 | | 22,501,132 |
IDEX Corp.
| | 65,116 | | 13,101,339 |
Illinois Tool Works, Inc.
| | 234,989 | | 55,682,993 |
Ingersoll Rand, Inc.
| | 348,417 | | 31,650,200 |
Nordson Corp.
| | 47,252 | | 10,959,629 |
Otis Worldwide Corp.
| | 349,853 | | 33,676,850 |
PACCAR, Inc.
| | 454,803 | | 46,817,421 |
Parker-Hannifin Corp.
| | 111,290 | | 56,291,595 |
Pentair PLC
| | 144,571 | | 11,084,259 |
Snap-on, Inc.
| | 46,641 | | 12,191,491 |
Stanley Black & Decker, Inc.
| | 132,308 | | 10,570,086 |
Westinghouse Air Brake Technologies Corp.
| | 152,312 | | 24,072,912 |
Xylem, Inc.
| | 208,645 | | 28,298,521 |
| | | | | | 635,193,071 |
| Security Description | | | Shares | | Value |
| MEDIA — 0.5% | |
Charter Communications, Inc. Class A (a) (b)
| | 85,519 | | $25,566,760 |
Comcast Corp. Class A
| | 3,379,761 | | 132,351,441 |
Fox Corp. Class A
| | 207,129 | | 7,119,024 |
Fox Corp. Class B
| | 120,153 | | 3,847,299 |
Interpublic Group of Cos., Inc. (b)
| | 336,087 | | 9,776,771 |
News Corp. Class A
| | 337,533 | | 9,305,785 |
News Corp. Class B (b)
| | 102,077 | | 2,897,966 |
Omnicom Group, Inc.
| | 171,727 | | 15,403,912 |
Paramount Global Class B
| | 431,322 | | 4,481,435 |
| | | | | | 210,750,393 |
| METALS & MINING — 0.4% | |
Freeport-McMoRan, Inc.
| | 1,239,644 | | 60,246,698 |
Newmont Corp.
| | 998,538 | | 41,808,786 |
Nucor Corp.
| | 207,050 | | 32,730,464 |
Steel Dynamics, Inc.
| | 127,498 | | 16,510,991 |
| | | | | | 151,296,939 |
| MULTI-UTILITIES — 0.6% | |
Ameren Corp.
| | 227,566 | | 16,182,218 |
CenterPoint Energy, Inc.
| | 543,737 | | 16,844,972 |
CMS Energy Corp.
| | 254,693 | | 15,161,874 |
Consolidated Edison, Inc.
| | 298,115 | | 26,657,443 |
Dominion Energy, Inc.
| | 722,902 | | 35,422,198 |
DTE Energy Co.
| | 176,872 | | 19,634,561 |
NiSource, Inc.
| | 354,864 | | 10,223,632 |
Public Service Enterprise Group, Inc.
| | 430,118 | | 31,699,697 |
Sempra
| | 544,432 | | 41,409,498 |
WEC Energy Group, Inc.
| | 272,075 | | 21,347,005 |
| | | | | | 234,583,098 |
| OFFICE REITs — 0.1% | |
Alexandria Real Estate Equities, Inc. REIT
| | 136,569 | | 15,974,476 |
Boston Properties, Inc. REIT
| | 123,246 | | 7,587,024 |
| | | | | | 23,561,500 |
| OIL, GAS & CONSUMABLE FUELS — 3.3% | |
APA Corp.
| | 311,855 | | 9,181,011 |
Chevron Corp.
| | 1,480,016 | | 231,504,103 |
ConocoPhillips
| | 1,009,941 | | 115,517,052 |
Coterra Energy, Inc.
| | 642,678 | | 17,140,222 |
Devon Energy Corp.
| | 545,755 | | 25,868,787 |
Diamondback Energy, Inc.
| | 153,920 | | 30,813,245 |
EOG Resources, Inc.
| | 496,256 | | 62,463,743 |
EQT Corp.
| | 356,780 | | 13,193,724 |
Exxon Mobil Corp.
| | 3,873,466 | | 445,913,406 |
Hess Corp.
| | 238,306 | | 35,154,901 |
Kinder Morgan, Inc.
| | 1,678,035 | | 33,342,555 |
Marathon Oil Corp.
| | 487,013 | | 13,962,663 |
Marathon Petroleum Corp.
| | 304,238 | | 52,779,208 |
Occidental Petroleum Corp.
| | 572,596 | | 36,090,726 |
ONEOK, Inc.
| | 506,044 | | 41,267,888 |
Phillips 66
| | 366,152 | | 51,689,678 |
See accompanying notes to financial statements.
15
SPDR PORTFOLIO S&P 500 ETF
SCHEDULE OF INVESTMENTS (continued)
June 30, 2024
| Security Description | | | Shares | | Value |
Targa Resources Corp.
| | 193,239 | | $24,885,318 |
Valero Energy Corp.
| | 282,414 | | 44,271,219 |
Williams Cos., Inc.
| | 1,054,126 | | 44,800,355 |
| | | | | | 1,329,839,804 |
| PERSONAL CARE PRODUCTS — 0.1% | |
Estee Lauder Cos., Inc. Class A
| | 199,580 | | 21,235,312 |
Kenvue, Inc.
| | 1,654,294 | | 30,075,065 |
| | | | | | 51,310,377 |
| PHARMACEUTICALS — 3.8% | |
Bristol-Myers Squibb Co.
| | 1,750,276 | | 72,688,962 |
Catalent, Inc. (a)
| | 157,503 | | 8,856,394 |
Eli Lilly & Co.
| | 689,439 | | 624,204,282 |
Johnson & Johnson
| | 2,078,101 | | 303,735,242 |
Merck & Co., Inc.
| | 2,187,019 | | 270,752,952 |
Pfizer, Inc.
| | 4,881,101 | | 136,573,206 |
Viatris, Inc.
| | 1,040,983 | | 11,065,650 |
Zoetis, Inc.
| | 394,023 | | 68,307,827 |
| | | | | | 1,496,184,515 |
| PROFESSIONAL SERVICES — 0.6% | |
Automatic Data Processing, Inc.
| | 353,487 | | 84,373,812 |
Broadridge Financial Solutions, Inc.
| | 101,842 | | 20,062,874 |
Dayforce, Inc. (a) (b)
| | 134,319 | | 6,662,222 |
Equifax, Inc.
| | 107,174 | | 25,985,408 |
Jacobs Solutions, Inc.
| | 108,949 | | 15,221,265 |
Leidos Holdings, Inc.
| | 116,701 | | 17,024,342 |
Paychex, Inc.
| | 276,016 | | 32,724,457 |
Paycom Software, Inc.
| | 41,196 | | 5,892,676 |
Verisk Analytics, Inc.
| | 123,176 | | 33,202,091 |
| | | | | | 241,149,147 |
| REAL ESTATE MANAGEMENT & DEVELOPMENT — 0.1% | |
CBRE Group, Inc. Class A (a)
| | 257,298 | | 22,927,825 |
CoStar Group, Inc. (a)
| | 356,227 | | 26,410,670 |
| | | | | | 49,338,495 |
| RESIDENTIAL REITs — 0.3% | |
AvalonBay Communities, Inc. REIT
| | 122,388 | | 25,320,853 |
Camden Property Trust REIT
| | 90,040 | | 9,824,264 |
Equity Residential REIT
| | 295,855 | | 20,514,586 |
Essex Property Trust, Inc. REIT
| | 55,412 | | 15,083,146 |
Invitation Homes, Inc. REIT
| | 500,084 | | 17,948,015 |
Mid-America Apartment Communities, Inc. REIT
| | 99,139 | | 14,138,213 |
UDR, Inc. REIT
| | 263,392 | | 10,838,581 |
| | | | | | 113,667,658 |
| RETAIL REITs — 0.3% | |
Federal Realty Investment Trust REIT
| | 62,510 | | 6,311,635 |
Kimco Realty Corp. REIT
| | 576,325 | | 11,215,284 |
Realty Income Corp. REIT
| | 718,801 | | 37,967,069 |
Regency Centers Corp. REIT
| | 141,277 | | 8,787,429 |
| Security Description | | | Shares | | Value |
Simon Property Group, Inc. REIT
| | 281,982 | | $42,804,868 |
| | | | | | 107,086,285 |
| SEMICONDUCTORS & SEMICONDUCTOR EQUIPMENT — 12.0% | |
Advanced Micro Devices, Inc. (a)
| | 1,397,111 | | 226,625,375 |
Analog Devices, Inc.
| | 429,011 | | 97,926,051 |
Applied Materials, Inc.
| | 717,462 | | 169,313,857 |
Broadcom, Inc.
| | 376,102 | | 603,843,044 |
Enphase Energy, Inc. (a)
| | 118,932 | | 11,858,710 |
First Solar, Inc. (a)
| | 91,584 | | 20,648,529 |
Intel Corp.
| | 3,654,431 | | 113,177,728 |
KLA Corp.
| | 116,209 | | 95,815,483 |
Lam Research Corp.
| | 112,925 | | 120,248,186 |
Microchip Technology, Inc.
| | 468,384 | | 42,857,136 |
Micron Technology, Inc.
| | 953,586 | | 125,425,167 |
Monolithic Power Systems, Inc.
| | 41,455 | | 34,062,744 |
NVIDIA Corp.
| | 21,240,082 | | 2,623,999,730 |
NXP Semiconductors NV
| | 220,803 | | 59,415,879 |
ON Semiconductor Corp. (a)
| | 369,460 | | 25,326,483 |
Qorvo, Inc. (a)
| | 84,778 | | 9,837,639 |
QUALCOMM, Inc.
| | 965,985 | | 192,404,892 |
Skyworks Solutions, Inc.
| | 138,537 | | 14,765,274 |
Teradyne, Inc.
| | 132,605 | | 19,663,995 |
Texas Instruments, Inc.
| | 787,224 | | 153,138,685 |
| | | | | | 4,760,354,587 |
| SOFTWARE — 11.0% | |
Adobe, Inc. (a)
| | 386,768 | | 214,865,095 |
ANSYS, Inc. (a)
| | 74,645 | | 23,998,368 |
Autodesk, Inc. (a)
| | 185,336 | | 45,861,393 |
Cadence Design Systems, Inc. (a)
| | 235,183 | | 72,377,568 |
Crowdstrike Holdings, Inc. Class A (a)
| | 199,144 | | 76,309,989 |
Fair Isaac Corp. (a)
| | 21,344 | | 31,773,959 |
Fortinet, Inc. (a)
| | 552,094 | | 33,274,705 |
Gen Digital, Inc.
| | 475,761 | | 11,884,510 |
Intuit, Inc.
| | 241,796 | | 158,910,749 |
Microsoft Corp.
| | 6,417,587 | | 2,868,340,510 |
Oracle Corp.
| | 1,376,456 | | 194,355,587 |
Palo Alto Networks, Inc. (a)
| | 279,086 | | 94,612,945 |
PTC, Inc. (a)
| | 103,067 | | 18,724,182 |
Roper Technologies, Inc.
| | 92,305 | | 52,028,636 |
Salesforce, Inc.
| | 837,076 | | 215,212,240 |
ServiceNow, Inc. (a)
| | 177,376 | | 139,536,378 |
Synopsys, Inc. (a)
| | 131,770 | | 78,411,056 |
Tyler Technologies, Inc. (a)
| | 36,393 | | 18,297,673 |
| | | | | | 4,348,775,543 |
| SPECIALIZED REITs — 0.9% | |
American Tower Corp. REIT
| | 403,497 | | 78,431,747 |
Crown Castle, Inc. REIT
| | 373,549 | | 36,495,737 |
Digital Realty Trust, Inc. REIT
| | 279,314 | | 42,469,694 |
Equinix, Inc. REIT
| | 81,812 | | 61,898,959 |
Extra Space Storage, Inc. REIT
| | 184,299 | | 28,641,908 |
Iron Mountain, Inc. REIT
| | 251,944 | | 22,579,221 |
See accompanying notes to financial statements.
16
SPDR PORTFOLIO S&P 500 ETF
SCHEDULE OF INVESTMENTS (continued)
June 30, 2024
| Security Description | | | Shares | | Value |
Public Storage REIT
| | 136,608 | | $39,295,291 |
SBA Communications Corp. REIT
| | 92,698 | | 18,196,617 |
VICI Properties, Inc. REIT
| | 893,696 | | 25,595,454 |
Weyerhaeuser Co. REIT
| | 636,274 | | 18,063,819 |
| | | | | | 371,668,447 |
| SPECIALTY RETAIL — 1.8% | |
AutoZone, Inc. (a)
| | 14,858 | | 44,040,598 |
Bath & Body Works, Inc.
| | 198,450 | | 7,749,473 |
Best Buy Co., Inc.
| | 167,494 | | 14,118,069 |
CarMax, Inc. (a)
| | 137,677 | | 10,097,231 |
Home Depot, Inc.
| | 855,741 | | 294,580,282 |
Lowe's Cos., Inc.
| | 494,044 | | 108,916,940 |
O'Reilly Automotive, Inc. (a)
| | 50,837 | | 53,686,922 |
Ross Stores, Inc.
| | 291,563 | | 42,369,935 |
TJX Cos., Inc.
| | 977,850 | | 107,661,285 |
Tractor Supply Co. (b)
| | 93,178 | | 25,158,060 |
Ulta Beauty, Inc. (a)
| | 41,651 | | 16,071,872 |
| | | | | | 724,450,667 |
| TECHNOLOGY HARDWARE, STORAGE & PERIPHERALS — 7.0% | |
Apple, Inc.
| | 12,446,278 | | 2,621,435,072 |
Hewlett Packard Enterprise Co.
| | 1,122,048 | | 23,753,756 |
HP, Inc.
| | 752,387 | | 26,348,593 |
NetApp, Inc.
| | 177,398 | | 22,848,862 |
Seagate Technology Holdings PLC
| | 168,941 | | 17,446,537 |
Super Micro Computer, Inc. (a) (b)
| | 43,819 | | 35,903,098 |
Western Digital Corp. (a)
| | 280,361 | | 21,242,953 |
| | | | | | 2,768,978,871 |
| TEXTILES, APPAREL & LUXURY GOODS — 0.4% | |
Deckers Outdoor Corp. (a)
| | 22,484 | | 21,763,388 |
Lululemon Athletica, Inc. (a)
| | 99,524 | | 29,727,819 |
NIKE, Inc. Class B
| | 1,046,146 | | 78,848,024 |
Ralph Lauren Corp. (b)
| | 34,143 | | 5,977,073 |
Tapestry, Inc.
| | 198,134 | | 8,478,154 |
| | | | | | 144,794,458 |
| TOBACCO — 0.5% | |
Altria Group, Inc.
| | 1,483,170 | | 67,558,394 |
Philip Morris International, Inc.
| | 1,344,586 | | 136,246,899 |
| | | | | | 203,805,293 |
| Security Description | | | Shares | | Value |
| TRADING COMPANIES & DISTRIBUTORS — 0.3% | |
Fastenal Co.
| | 495,844 | | $31,158,837 |
United Rentals, Inc.
| | 57,533 | | 37,208,317 |
WW Grainger, Inc.
| | 37,781 | | 34,087,529 |
| | | | | | 102,454,683 |
| WATER UTILITIES — 0.1% | |
American Water Works Co., Inc.
| | 170,276 | | 21,992,848 |
| WIRELESS TELECOMMUNICATION SERVICES — 0.2% | |
T-Mobile U.S., Inc.
| | 445,211 | | 78,437,274 |
TOTAL COMMON STOCKS
(Cost $32,532,625,936)
| | | | | 39,582,059,048 |
| SHORT-TERM INVESTMENTS — 0.6% | | | |
State Street Institutional Liquid Reserves Fund, Premier Class 5.36% (e) (f)
| | 104,217,233 | | 104,248,498 |
State Street Navigator Securities Lending Portfolio II (c) (g)
| | 150,685,702 | | 150,685,702 |
TOTAL SHORT-TERM INVESTMENTS
(Cost $254,925,379)
| | 254,934,200 | |
TOTAL INVESTMENTS — 100.3%
(Cost $32,787,551,315)
| | 39,836,993,248 | |
LIABILITIES IN EXCESS OF OTHER ASSETS — (0.3)%
| | (126,470,410) | |
NET ASSETS — 100.0%
| | $39,710,522,838 | |
| (a) | Non-income producing security. |
| (b) | All or a portion of the shares of the security are on loan at June 30, 2024. |
| (c) | The Fund invested in an affiliated entity. Amounts related to these investments during the year ended June 30, 2024 are shown in the Affiliate Table below. |
| (d) | Amount is less than 0.05% of net assets. |
| (e) | The Fund invested in certain money market funds managed by SSGA Funds Management, Inc. Amounts related to these investments during the year ended June 30, 2024 are shown in the Affiliate Table below. |
| (f) | The rate shown is the annualized seven-day yield at June 30, 2024. |
| (g) | Investment of cash collateral for securities loaned. |
| REIT | Real Estate Investment Trust |
At June 30, 2024, open futures contracts were as follows:
| Description | | Number of
Contracts | | Expiration
Date | | Notional
Amount | | Value | | Unrealized
Appreciation
(Depreciation) |
| E-mini S&P 500 Index (long) | | 405 | | 09/20/2024 | | $111,294,002 | | $111,810,375 | | $516,373 |
During the year ended June 30, 2024, the average notional value related to futures contracts was $82,987,490
See accompanying notes to financial statements.
17
SPDR PORTFOLIO S&P 500 ETF
SCHEDULE OF INVESTMENTS (continued)
June 30, 2024
The following table summarizes the value of the Fund's investments according to the fair value hierarchy as of June 30, 2024.
| Description | | Level 1 –
Quoted Prices | | Level 2 –
Other Significant
Observable Inputs | | Level 3 –
Significant
Unobservable Inputs | | Total |
| ASSETS: | | | | | | | | |
| INVESTMENTS: | | | | | | | | |
Common Stocks
| | $39,582,059,048 | | $— | | $— | | $39,582,059,048 |
Short-Term Investments
| | 254,934,200 | | — | | — | | 254,934,200 |
TOTAL INVESTMENTS
| | $39,836,993,248 | | $— | | $— | | $39,836,993,248 |
| OTHER FINANCIAL INSTRUMENTS: | | | | | | | | |
Futures Contracts - Unrealized Appreciation
| | $516,373 | | $— | | $— | | $516,373 |
TOTAL OTHER FINANCIAL INSTRUMENTS:
| | $516,373 | | $— | | $— | | $516,373 |
Affiliate Table
| | Number of
Shares Held
at
6/30/23 | | Value at
6/30/23 | | Cost of
Purchases | | Proceeds
from
Shares Sold | | Realized
Gain (Loss) | | Change in
Unrealized
Appreciation/
Depreciation | | Number of
Shares Held
at
6/30/24 | | Value at
6/30/24 | | Dividend
Income |
State Street Corp.
| 175,314 | | $12,829,479 | | $9,195,398 | | $3,014,700 | | $(473,267) | | $763,844 | | 260,821 | | $19,300,754 | | $412,515 |
State Street Institutional Liquid Reserves Fund, Premier Class
| 60,252,596 | | 60,264,646 | | 740,914,839 | | 696,919,741 | | (18,850) | | 7,604 | | 104,217,233 | | 104,248,498 | | 4,974,120 |
State Street Navigator Securities Lending Portfolio II
| 7,796,325 | | 7,796,325 | | 1,798,951,593 | | 1,656,062,216 | | — | | — | | 150,685,702 | | 150,685,702 | | 282,788 |
Total
| | | $80,890,450 | | $2,549,061,830 | | $2,355,996,657 | | $(492,117) | | $771,448 | | | | $274,234,954 | | $5,669,423 |
See accompanying notes to financial statements.
18
SPDR PORTFOLIO S&P 500 GROWTH ETF
SCHEDULE OF INVESTMENTS
June 30, 2024
| Security Description | | | Shares | | Value |
| COMMON STOCKS — 100.0% | |
| AEROSPACE & DEFENSE — 0.6% | |
Axon Enterprise, Inc. (a)
| | 81,036 | | $23,844,033 |
Boeing Co. (a)
| | 290,163 | | 52,812,567 |
Howmet Aerospace, Inc.
| | 257,046 | | 19,954,481 |
TransDigm Group, Inc.
| | 63,902 | | 81,641,834 |
| | | | | | 178,252,915 |
| AIR FREIGHT & LOGISTICS — 0.0% (b) | |
Expeditors International of Washington, Inc.
| | 59,697 | | 7,449,589 |
| AIRLINES — 0.1% | |
Delta Air Lines, Inc.
| | 412,885 | | 19,587,264 |
| AUTOMOBILES — 2.2% | |
Tesla, Inc. (a)
| | 3,170,392 | | 627,357,169 |
| BEVERAGES — 0.8% | |
Coca-Cola Co.
| | 1,727,819 | | 109,975,679 |
Monster Beverage Corp. (a)
| | 486,254 | | 24,288,387 |
PepsiCo, Inc.
| | 565,505 | | 93,268,740 |
| | | | | | 227,532,806 |
| BIOTECHNOLOGY — 1.0% | |
AbbVie, Inc.
| | 746,635 | | 128,062,835 |
Regeneron Pharmaceuticals, Inc. (a)
| | 72,673 | | 76,381,503 |
Vertex Pharmaceuticals, Inc. (a)
| | 188,709 | | 88,451,683 |
| | | | | | 292,896,021 |
| BROADLINE RETAIL — 4.5% | |
Amazon.com, Inc. (a)
| | 6,753,874 | | 1,305,186,150 |
Etsy, Inc. (a)
| | 58,774 | | 3,466,491 |
| | | | | | 1,308,652,641 |
| BUILDING PRODUCTS — 0.4% | |
A O Smith Corp.
| | 86,984 | | 7,113,552 |
Allegion PLC
| | 37,935 | | 4,482,020 |
Builders FirstSource, Inc. (a)
| | 139,433 | | 19,298,922 |
Carrier Global Corp.
| | 459,629 | | 28,993,397 |
Masco Corp.
| | 135,934 | | 9,062,720 |
Trane Technologies PLC
| | 178,468 | | 58,703,479 |
| | | | | | 127,654,090 |
| CAPITAL MARKETS — 1.3% | |
Ameriprise Financial, Inc.
| | 60,134 | | 25,688,644 |
Blackstone, Inc.
| | 587,963 | | 72,789,819 |
Cboe Global Markets, Inc.
| | 76,934 | | 13,083,396 |
CME Group, Inc.
| | 148,140 | | 29,124,324 |
FactSet Research Systems, Inc.
| | 20,516 | | 8,376,067 |
KKR & Co., Inc.
| | 760,499 | | 80,034,915 |
Moody's Corp.
| | 84,310 | | 35,488,608 |
MSCI, Inc.
| | 51,581 | | 24,849,147 |
S&P Global, Inc.
| | 160,955 | | 71,785,930 |
| | | | | | 361,220,850 |
| CHEMICALS — 0.8% | |
Celanese Corp.
| | 114,805 | | 15,486,046 |
CF Industries Holdings, Inc.
| | 112,804 | | 8,361,033 |
| Security Description | | | Shares | | Value |
Ecolab, Inc.
| | 148,140 | | $35,257,320 |
Linde PLC
| | 285,634 | | 125,339,056 |
Sherwin-Williams Co.
| | 133,226 | | 39,758,635 |
| | | | | | 224,202,090 |
| COMMERCIAL SERVICES & SUPPLIES — 0.6% | |
Cintas Corp.
| | 54,246 | | 37,986,304 |
Copart, Inc. (a)
| | 999,774 | | 54,147,760 |
Republic Services, Inc.
| | 133,296 | | 25,904,745 |
Rollins, Inc.
| | 138,040 | | 6,734,971 |
Waste Management, Inc.
| | 195,991 | | 41,812,720 |
| | | | | | 166,586,500 |
| COMMUNICATIONS EQUIPMENT — 0.5% | |
Arista Networks, Inc. (a)
| | 290,041 | | 101,653,570 |
Motorola Solutions, Inc.
| | 110,489 | | 42,654,278 |
| | | | | | 144,307,848 |
| CONSTRUCTION & ENGINEERING — 0.1% | |
Quanta Services, Inc.
| | 115,410 | | 29,324,527 |
| CONSTRUCTION MATERIALS — 0.2% | |
Martin Marietta Materials, Inc.
| | 46,442 | | 25,162,276 |
Vulcan Materials Co.
| | 96,747 | | 24,059,044 |
| | | | | | 49,221,320 |
| CONSUMER FINANCE — 0.4% | |
American Express Co.
| | 454,498 | | 105,239,012 |
Discover Financial Services
| | 154,583 | | 20,221,002 |
| | | | | | 125,460,014 |
| CONSUMER STAPLES DISTRIBUTION & RETAIL — 0.6% | |
Costco Wholesale Corp.
| | 212,840 | | 180,911,872 |
| DISTRIBUTORS — 0.0% (b) | |
Pool Corp.
| | 24,966 | | 7,672,801 |
| ELECTRIC UTILITIES — 0.1% | |
Constellation Energy Corp.
| | 162,054 | | 32,454,555 |
| ELECTRICAL EQUIPMENT — 0.5% | |
AMETEK, Inc.
| | 126,908 | | 21,156,833 |
Eaton Corp. PLC
| | 283,266 | | 88,818,054 |
GE Vernova, Inc. (a)
| | 134,676 | | 23,098,281 |
Generac Holdings, Inc. (a)
| | 42,242 | | 5,585,237 |
Rockwell Automation, Inc.
| | 62,556 | | 17,220,416 |
| | | | | | 155,878,821 |
| ELECTRONIC EQUIPMENT, INSTRUMENTS & COMPONENTS — 0.4% | |
Amphenol Corp. Class A
| | 768,672 | | 51,785,433 |
CDW Corp.
| | 64,511 | | 14,440,142 |
Hubbell, Inc.
| | 28,236 | | 10,319,693 |
Jabil, Inc.
| | 74,398 | | 8,093,759 |
TE Connectivity Ltd.
| | 136,428 | | 20,522,864 |
| | | | | | 105,161,891 |
| ENTERTAINMENT — 1.3% | |
Electronic Arts, Inc.
| | 122,347 | | 17,046,608 |
Live Nation Entertainment, Inc. (a)
| | 162,754 | | 15,256,560 |
See accompanying notes to financial statements.
19
SPDR PORTFOLIO S&P 500 GROWTH ETF
SCHEDULE OF INVESTMENTS (continued)
June 30, 2024
| Security Description | | | Shares | | Value |
Netflix, Inc. (a)
| | 492,391 | | $332,304,838 |
Take-Two Interactive Software, Inc. (a)
| | 90,684 | | 14,100,455 |
| | | | | | 378,708,461 |
| FINANCIAL SERVICES — 2.4% | |
Corpay, Inc. (a)
| | 80,247 | | 21,378,603 |
Fiserv, Inc. (a)
| | 347,671 | | 51,816,886 |
Mastercard, Inc. Class A
| | 675,428 | | 297,971,817 |
Visa, Inc. Class A
| | 1,187,183 | | 311,599,922 |
| | | | | | 682,767,228 |
| FOOD PRODUCTS — 0.2% | |
Hershey Co.
| | 64,089 | | 11,781,481 |
Lamb Weston Holdings, Inc.
| | 108,896 | | 9,155,976 |
Mondelez International, Inc. Class A
| | 643,735 | | 42,126,018 |
| | | | | | 63,063,475 |
| GROUND TRANSPORTATION — 1.1% | |
CSX Corp.
| | 1,116,955 | | 37,362,145 |
Old Dominion Freight Line, Inc.
| | 203,589 | | 35,953,817 |
Uber Technologies, Inc. (a)
| | 2,387,614 | | 173,531,785 |
Union Pacific Corp.
| | 313,729 | | 70,984,324 |
| | | | | | 317,832,071 |
| HEALTH CARE EQUIPMENT & SUPPLIES — 1.4% | |
Align Technology, Inc. (a)
| | 44,042 | | 10,633,060 |
Boston Scientific Corp. (a)
| | 923,955 | | 71,153,774 |
Cooper Cos., Inc.
| | 95,389 | | 8,327,460 |
Dexcom, Inc. (a)
| | 277,162 | | 31,424,628 |
Edwards Lifesciences Corp. (a)
| | 254,738 | | 23,530,149 |
IDEXX Laboratories, Inc. (a)
| | 52,806 | | 25,727,083 |
Insulet Corp. (a)
| | 30,414 | | 6,137,545 |
Intuitive Surgical, Inc. (a)
| | 267,536 | | 119,013,390 |
STERIS PLC
| | 63,256 | | 13,887,222 |
Stryker Corp.
| | 247,931 | | 84,358,523 |
| | | | | | 394,192,834 |
| HEALTH CARE PROVIDERS & SERVICES — 0.9% | |
DaVita, Inc. (a)
| | 32,536 | | 4,508,514 |
HCA Healthcare, Inc.
| | 106,341 | | 34,165,236 |
Molina Healthcare, Inc. (a)
| | 39,485 | | 11,738,891 |
UnitedHealth Group, Inc.
| | 399,682 | | 203,542,055 |
| | | | | | 253,954,696 |
| HOTEL & RESORT REITs — 0.0% (b) | |
Host Hotels & Resorts, Inc. REIT
| | 483,372 | | 8,691,029 |
| HOTELS, RESTAURANTS & LEISURE — 2.5% | |
Airbnb, Inc. Class A (a)
| | 252,294 | | 38,255,339 |
Booking Holdings, Inc.
| | 38,735 | | 153,448,703 |
Caesars Entertainment, Inc. (a)
| | 143,433 | | 5,700,027 |
Carnival Corp. (a)
| | 819,465 | | 15,340,385 |
Chipotle Mexican Grill, Inc. (a)
| | 1,569,238 | | 98,312,761 |
Darden Restaurants, Inc.
| | 70,891 | | 10,727,226 |
Domino's Pizza, Inc.
| | 15,963 | | 8,242,176 |
Expedia Group, Inc. (a)
| | 145,041 | | 18,273,716 |
Hilton Worldwide Holdings, Inc.
| | 285,758 | | 62,352,396 |
| Security Description | | | Shares | | Value |
Las Vegas Sands Corp.
| | 254,440 | | $11,258,970 |
Marriott International, Inc. Class A
| | 274,173 | | 66,286,806 |
McDonald's Corp.
| | 362,316 | | 92,332,609 |
MGM Resorts International (a)
| | 194,998 | | 8,665,711 |
Norwegian Cruise Line Holdings Ltd. (a)
| | 490,255 | | 9,211,892 |
Royal Caribbean Cruises Ltd. (a)
| | 270,552 | | 43,134,105 |
Starbucks Corp.
| | 763,671 | | 59,451,787 |
Wynn Resorts Ltd.
| | 107,906 | | 9,657,587 |
Yum! Brands, Inc.
| | 148,037 | | 19,608,981 |
| | | | | | 730,261,177 |
| HOUSEHOLD DURABLES — 0.5% | |
DR Horton, Inc.
| | 338,677 | | 47,729,749 |
Garmin Ltd.
| | 94,791 | | 15,443,350 |
Lennar Corp. Class A
| | 156,647 | | 23,476,686 |
NVR, Inc. (a)
| | 3,580 | | 27,167,045 |
PulteGroup, Inc.
| | 240,352 | | 26,462,755 |
| | | | | | 140,279,585 |
| HOUSEHOLD PRODUCTS — 0.8% | |
Church & Dwight Co., Inc.
| | 128,519 | | 13,324,850 |
Colgate-Palmolive Co.
| | 365,653 | | 35,482,967 |
Procter & Gamble Co.
| | 1,051,722 | | 173,449,992 |
| | | | | | 222,257,809 |
| INDEPENDENT POWER & RENEWABLE ELECTRICITY PRODUCERS — 0.1% | |
Vistra Corp.
| | 373,175 | | 32,085,586 |
| INDUSTRIAL CONGLOMERATES — 0.3% | |
General Electric Co.
| | 537,799 | | 85,493,907 |
| INSURANCE — 0.9% | |
Aon PLC Class A
| | 126,704 | | 37,197,760 |
Arch Capital Group Ltd. (a)
| | 427,358 | | 43,116,149 |
Arthur J Gallagher & Co.
| | 127,362 | | 33,026,240 |
Brown & Brown, Inc.
| | 210,979 | | 18,863,633 |
Marsh & McLennan Cos., Inc.
| | 292,731 | | 61,684,276 |
Progressive Corp.
| | 334,630 | | 69,505,997 |
| | | | | | 263,394,055 |
| INTERACTIVE MEDIA & SERVICES — 11.8% | |
Alphabet, Inc. Class A
| | 6,431,037 | | 1,171,413,389 |
Alphabet, Inc. Class C
| | 5,350,266 | | 981,345,790 |
Meta Platforms, Inc. Class A
| | 2,504,045 | | 1,262,589,570 |
| | | | | | 3,415,348,749 |
| IT SERVICES — 0.7% | |
Accenture PLC Class A
| | 387,945 | | 117,706,393 |
Akamai Technologies, Inc. (a)
| | 81,777 | | 7,366,472 |
EPAM Systems, Inc. (a)
| | 26,473 | | 4,979,836 |
Gartner, Inc. (a)
| | 88,734 | | 39,846,890 |
GoDaddy, Inc. Class A (a)
| | 161,079 | | 22,504,347 |
VeriSign, Inc. (a)
| | 47,540 | | 8,452,612 |
| | | | | | 200,856,550 |
| LIFE SCIENCES TOOLS & SERVICES — 0.5% | |
IQVIA Holdings, Inc. (a)
| | 79,095 | | 16,723,847 |
See accompanying notes to financial statements.
20
SPDR PORTFOLIO S&P 500 GROWTH ETF
SCHEDULE OF INVESTMENTS (continued)
June 30, 2024
| Security Description | | | Shares | | Value |
Mettler-Toledo International, Inc. (a)
| | 9,234 | | $12,905,346 |
Thermo Fisher Scientific, Inc.
| | 165,697 | | 91,630,441 |
Waters Corp. (a)
| | 25,065 | | 7,271,858 |
West Pharmaceutical Services, Inc.
| | 83,277 | | 27,430,611 |
| | | | | | 155,962,103 |
| MACHINERY — 1.4% | |
Caterpillar, Inc.
| | 324,141 | | 107,971,367 |
Deere & Co.
| | 168,596 | | 62,992,523 |
Fortive Corp.
| | 402,299 | | 29,810,356 |
Illinois Tool Works, Inc.
| | 142,735 | | 33,822,486 |
Ingersoll Rand, Inc.
| | 354,941 | | 32,242,840 |
Otis Worldwide Corp.
| | 180,168 | | 17,342,972 |
PACCAR, Inc.
| | 437,208 | | 45,006,192 |
Parker-Hannifin Corp.
| | 114,605 | | 57,968,355 |
Pentair PLC
| | 132,826 | | 10,183,769 |
Snap-on, Inc.
| | 27,153 | | 7,097,523 |
| | | | | | 404,438,383 |
| MEDIA — 0.1% | |
Charter Communications, Inc. Class A (a) (c)
| | 51,449 | | 15,381,193 |
| METALS & MINING — 0.3% | |
Freeport-McMoRan, Inc.
| | 820,757 | | 39,888,790 |
Nucor Corp.
| | 172,629 | | 27,289,193 |
Steel Dynamics, Inc.
| | 106,366 | | 13,774,397 |
| | | | | | 80,952,380 |
| OIL, GAS & CONSUMABLE FUELS — 1.4% | |
APA Corp.
| | 411,408 | | 12,111,852 |
ConocoPhillips
| | 922,066 | | 105,465,909 |
Coterra Energy, Inc.
| | 561,318 | | 14,970,351 |
Diamondback Energy, Inc.
| | 203,812 | | 40,801,124 |
EOG Resources, Inc.
| | 433,468 | | 54,560,617 |
Hess Corp.
| | 315,789 | | 46,585,193 |
Marathon Oil Corp.
| | 341,582 | | 9,793,156 |
Marathon Petroleum Corp.
| | 221,461 | | 38,419,054 |
ONEOK, Inc.
| | 413,439 | | 33,715,950 |
Targa Resources Corp.
| | 253,323 | | 32,622,936 |
Williams Cos., Inc.
| | 543,145 | | 23,083,663 |
| | | | | | 412,129,805 |
| PHARMACEUTICALS — 3.5% | |
Eli Lilly & Co.
| | 912,274 | | 825,954,634 |
Merck & Co., Inc.
| | 1,157,694 | | 143,322,517 |
Zoetis, Inc.
| | 286,786 | | 49,717,221 |
| | | | | | 1,018,994,372 |
| PROFESSIONAL SERVICES — 0.4% | |
Automatic Data Processing, Inc.
| | 182,357 | | 43,526,792 |
Broadridge Financial Solutions, Inc.
| | 76,956 | | 15,160,332 |
Dayforce, Inc. (a) (c)
| | 99,191 | | 4,919,874 |
Equifax, Inc.
| | 55,110 | | 13,361,971 |
Paychex, Inc.
| | 146,428 | | 17,360,504 |
Paycom Software, Inc.
| | 23,661 | | 3,384,469 |
| Security Description | | | Shares | | Value |
Verisk Analytics, Inc.
| | 89,651 | | $24,165,427 |
| | | | | | 121,879,369 |
| REAL ESTATE MANAGEMENT & DEVELOPMENT — 0.1% | |
CoStar Group, Inc. (a)
| | 200,591 | | 14,871,817 |
| RETAIL REITs — 0.1% | |
Simon Property Group, Inc. REIT
| | 137,828 | | 20,922,290 |
| SEMICONDUCTORS & SEMICONDUCTOR EQUIPMENT — 18.6% | |
Advanced Micro Devices, Inc. (a)
| | 1,846,952 | | 299,594,084 |
Analog Devices, Inc.
| | 334,313 | | 76,310,285 |
Applied Materials, Inc.
| | 949,427 | | 224,055,278 |
Broadcom, Inc.
| | 497,808 | | 799,245,678 |
Enphase Energy, Inc. (a)
| | 57,500 | | 5,733,325 |
KLA Corp.
| | 153,808 | | 126,816,234 |
Lam Research Corp.
| | 149,383 | | 159,070,488 |
Microchip Technology, Inc.
| | 364,298 | | 33,333,267 |
Monolithic Power Systems, Inc.
| | 55,665 | | 45,738,817 |
NVIDIA Corp.
| | 26,931,255 | | 3,327,087,243 |
NXP Semiconductors NV
| | 219,075 | | 58,950,892 |
ON Semiconductor Corp. (a)
| | 216,289 | | 14,826,611 |
QUALCOMM, Inc.
| | 664,269 | | 132,309,099 |
Texas Instruments, Inc.
| | 384,976 | | 74,889,381 |
| | | | | | 5,377,960,682 |
| SOFTWARE — 19.0% | |
Adobe, Inc. (a)
| | 511,891 | | 284,375,926 |
ANSYS, Inc. (a)
| | 56,856 | | 18,279,204 |
Autodesk, Inc. (a)
| | 127,139 | | 31,460,546 |
Cadence Design Systems, Inc. (a)
| | 310,927 | | 95,687,784 |
Crowdstrike Holdings, Inc. Class A (a)
| | 263,565 | | 100,995,472 |
Fair Isaac Corp. (a)
| | 28,272 | | 42,087,395 |
Fortinet, Inc. (a)
| | 724,484 | | 43,664,651 |
Intuit, Inc.
| | 319,956 | | 210,278,283 |
Microsoft Corp.
| | 8,137,166 | | 3,636,906,344 |
Oracle Corp.
| | 1,821,523 | | 257,199,048 |
Palo Alto Networks, Inc. (a)
| | 369,163 | | 125,149,949 |
PTC, Inc. (a)
| | 82,106 | | 14,916,197 |
Roper Technologies, Inc.
| | 52,549 | | 29,619,769 |
Salesforce, Inc.
| | 1,109,835 | | 285,338,578 |
ServiceNow, Inc. (a)
| | 234,209 | | 184,245,194 |
Synopsys, Inc. (a)
| | 174,309 | | 103,724,314 |
Tyler Technologies, Inc. (a)
| | 48,484 | | 24,376,785 |
| | | | | | 5,488,305,439 |
| SPECIALIZED REITs — 0.5% | |
American Tower Corp. REIT
| | 218,766 | | 42,523,735 |
Digital Realty Trust, Inc. REIT
| | 152,025 | | 23,115,401 |
Equinix, Inc. REIT
| | 50,949 | | 38,548,013 |
Iron Mountain, Inc. REIT
| | 170,821 | | 15,308,978 |
Public Storage REIT
| | 75,872 | | 21,824,581 |
SBA Communications Corp. REIT
| | 49,126 | | 9,643,434 |
| | | | | | 150,964,142 |
See accompanying notes to financial statements.
21
SPDR PORTFOLIO S&P 500 GROWTH ETF
SCHEDULE OF INVESTMENTS (continued)
June 30, 2024
| Security Description | | | Shares | | Value |
| SPECIALTY RETAIL — 1.4% | |
AutoZone, Inc. (a)
| | 13,654 | | $40,471,822 |
Home Depot, Inc.
| | 419,005 | | 144,238,281 |
O'Reilly Automotive, Inc. (a)
| | 49,103 | | 51,855,714 |
Ross Stores, Inc.
| | 383,185 | | 55,684,444 |
TJX Cos., Inc.
| | 841,152 | | 92,610,835 |
Tractor Supply Co. (c)
| | 51,749 | | 13,972,230 |
Ulta Beauty, Inc. (a)
| | 36,175 | | 13,958,847 |
| | | | | | 412,792,173 |
| TECHNOLOGY HARDWARE, STORAGE & PERIPHERALS — 11.7% | |
Apple, Inc.
| | 15,781,000 | | 3,323,794,220 |
NetApp, Inc.
| | 87,284 | | 11,242,179 |
Seagate Technology Holdings PLC
| | 91,484 | | 9,447,553 |
Super Micro Computer, Inc. (a)
| | 57,590 | | 47,186,366 |
| | | | | | 3,391,670,318 |
| TEXTILES, APPAREL & LUXURY GOODS — 0.4% | |
Deckers Outdoor Corp. (a)
| | 29,316 | | 28,376,422 |
Lululemon Athletica, Inc. (a)
| | 130,972 | | 39,121,337 |
NIKE, Inc. Class B
| | 595,263 | | 44,864,972 |
Ralph Lauren Corp.
| | 24,521 | | 4,292,646 |
| | | | | | 116,655,377 |
| TOBACCO — 0.2% | |
Philip Morris International, Inc.
| | 657,256 | | 66,599,750 |
| TRADING COMPANIES & DISTRIBUTORS — 0.4% | |
Fastenal Co.
| | 327,149 | | 20,558,043 |
United Rentals, Inc.
| | 76,070 | | 49,196,751 |
WW Grainger, Inc.
| | 37,450 | | 33,788,888 |
| | | | | | 103,543,682 |
TOTAL COMMON STOCKS
(Cost $20,758,171,079)
| | | | | 28,914,996,071 |
| Security Description | | | Shares | | Value |
| SHORT-TERM INVESTMENTS — 0.1% | | | |
State Street Institutional Liquid Reserves Fund, Premier Class 5.36% (d) (e)
| | 9,740,165 | | $9,743,087 |
State Street Navigator Securities Lending Portfolio II (f) (g)
| | 15,106,095 | | 15,106,095 |
TOTAL SHORT-TERM INVESTMENTS
(Cost $24,848,780)
| | 24,849,182 | |
TOTAL INVESTMENTS — 100.1%
(Cost $20,783,019,859)
| | 28,939,845,253 | |
LIABILITIES IN EXCESS OF OTHER ASSETS — (0.1)%
| | (24,057,258) | |
NET ASSETS — 100.0%
| | $28,915,787,995 | |
| (a) | Non-income producing security. |
| (b) | Amount is less than 0.05% of net assets. |
| (c) | All or a portion of the shares of the security are on loan at June 30, 2024. |
| (d) | The Fund invested in certain money market funds managed by SSGA Funds Management, Inc. Amounts related to these investments during the year ended June 30, 2024 are shown in the Affiliate Table below. |
| (e) | The rate shown is the annualized seven-day yield at June 30, 2024. |
| (f) | The Fund invested in an affiliated entity. Amounts related to these investments during the year ended June 30, 2024 are shown in the Affiliate Table below. |
| (g) | Investment of cash collateral for securities loaned. |
| REIT | Real Estate Investment Trust |
The following table summarizes the value of the Fund's investments according to the fair value hierarchy as of June 30, 2024.
| Description | | Level 1 –
Quoted Prices | | Level 2 –
Other Significant
Observable Inputs | | Level 3 –
Significant
Unobservable Inputs | | Total |
| ASSETS: | | | | | | | | |
| INVESTMENTS: | | | | | | | | |
Common Stocks
| | $28,914,996,071 | | $— | | $— | | $28,914,996,071 |
Short-Term Investments
| | 24,849,182 | | — | | — | | 24,849,182 |
TOTAL INVESTMENTS
| | $28,939,845,253 | | $— | | $— | | $28,939,845,253 |
See accompanying notes to financial statements.
22
SPDR PORTFOLIO S&P 500 GROWTH ETF
SCHEDULE OF INVESTMENTS (continued)
June 30, 2024
Affiliate Table
| | Number of
Shares Held
at
6/30/23 | | Value at
6/30/23 | | Cost of
Purchases | | Proceeds
from
Shares Sold | | Realized
Gain (Loss) | | Change in
Unrealized
Appreciation/
Depreciation | | Number of
Shares Held
at
6/30/24 | | Value at
6/30/24 | | Dividend
Income |
State Street Institutional Liquid Reserves Fund, Premier Class
| 8,291,050 | | $8,292,708 | | $378,695,666 | | $377,243,411 | | $(1,996) | | $120 | | 9,740,165 | | $9,743,087 | | $723,579 |
State Street Navigator Securities Lending Portfolio II
| — | | — | | 1,301,909,956 | | 1,286,803,861 | | — | | — | | 15,106,095 | | 15,106,095 | | 247,755 |
Total
| | | $8,292,708 | | $1,680,605,622 | | $1,664,047,272 | | $(1,996) | | $120 | | | | $24,849,182 | | $971,334 |
See accompanying notes to financial statements.
23
SPDR PORTFOLIO S&P 500 HIGH DIVIDEND ETF
SCHEDULE OF INVESTMENTS
June 30, 2024
| Security Description | | | Shares | | Value |
| COMMON STOCKS — 99.1% | | | | | |
| AIR FREIGHT & LOGISTICS — 1.1% | | | | | |
United Parcel Service, Inc. Class B
| | | 476,963 | | $65,272,387 |
| AUTOMOBILES — 1.4% | | | | | |
Ford Motor Co.
| | | 6,788,821 | | 85,131,815 |
| BANKS — 14.6% | | | | | |
Citigroup, Inc.
| | | 1,405,916 | | 89,219,429 |
Citizens Financial Group, Inc.
| | | 2,223,383 | | 80,108,489 |
Fifth Third Bancorp
| | | 2,157,998 | | 78,745,347 |
Huntington Bancshares, Inc.
| | | 5,725,087 | | 75,456,647 |
KeyCorp
| | | 5,186,000 | | 73,693,060 |
M&T Bank Corp.
| | | 524,881 | | 79,445,988 |
Morgan Stanley
| | | 855,145 | | 83,111,543 |
PNC Financial Services Group, Inc.
| | | 498,419 | | 77,494,186 |
Regions Financial Corp.
| | | 3,890,048 | | 77,956,562 |
Truist Financial Corp.
| | | 1,994,214 | | 77,475,214 |
U.S. Bancorp
| | | 1,758,170 | | 69,799,349 |
| | | | | | 862,505,814 |
| BIOTECHNOLOGY — 2.4% | | | | | |
AbbVie, Inc.
| | | 456,022 | | 78,216,893 |
Gilead Sciences, Inc.
| | | 939,106 | | 64,432,063 |
| | | | | | 142,648,956 |
| CAPITAL MARKETS — 3.6% | | | | | |
Franklin Resources, Inc.
| | | 2,778,593 | | 62,101,553 |
Invesco Ltd.
| | | 4,721,102 | | 70,627,686 |
T Rowe Price Group, Inc.
| | | 682,271 | | 78,672,669 |
| | | | | | 211,401,908 |
| CHEMICALS — 2.6% | | | | | |
Dow, Inc.
| | | 1,410,516 | | 74,827,874 |
LyondellBasell Industries NV Class A
| | | 801,618 | | 76,682,778 |
| | | | | | 151,510,652 |
| CONSUMER STAPLES DISTRIBUTION & RETAIL — 0.7% | | | | | |
Walgreens Boots Alliance, Inc.
| | | 3,338,720 | | 40,381,818 |
| CONTAINERS & PACKAGING — 2.8% | | | | | |
Amcor PLC
| | | 8,043,258 | | 78,663,063 |
International Paper Co.
| | | 2,069,596 | | 89,303,068 |
| | | | | | 167,966,131 |
| DIVERSIFIED TELECOMMUNICATION SERVICES — 2.7% | | | | | |
AT&T, Inc.
| | | 4,489,223 | | 85,789,052 |
Verizon Communications, Inc.
| | | 1,814,009 | | 74,809,731 |
| | | | | | 160,598,783 |
| Security Description | | | Shares | | Value |
| ELECTRIC UTILITIES — 13.8% | | | | | |
American Electric Power Co., Inc.
| | | 972,623 | | $85,337,942 |
Duke Energy Corp.
| | | 792,055 | | 79,387,673 |
Edison International
| | | 1,148,803 | | 82,495,543 |
Entergy Corp.
| | | 770,391 | | 82,431,837 |
Evergy, Inc.
| | | 1,517,335 | | 80,373,235 |
Eversource Energy
| | | 1,408,646 | | 79,884,315 |
Exelon Corp.
| | | 2,197,301 | | 76,048,587 |
FirstEnergy Corp.
| | | 2,082,415 | | 79,694,022 |
Pinnacle West Capital Corp.
| | | 1,097,931 | | 83,859,970 |
Southern Co.
| | | 1,097,931 | | 85,166,508 |
| | | | | | 814,679,632 |
| FOOD PRODUCTS — 3.7% | | | | | |
Conagra Brands, Inc.
| | | 2,546,278 | | 72,365,221 |
Kellanova
| | | 1,400,421 | | 80,776,283 |
Kraft Heinz Co.
| | | 2,028,461 | | 65,357,013 |
| | | | | | 218,498,517 |
| HEALTH CARE REITs — 2.7% | | | | | |
Healthpeak Properties, Inc. REIT
| | | 3,914,423 | | 76,722,691 |
Ventas, Inc. REIT
| | | 1,574,816 | | 80,725,068 |
| | | | | | 157,447,759 |
| HOTEL & RESORT REITs — 1.2% | | | | | |
Host Hotels & Resorts, Inc. REIT
| | | 3,838,039 | | 69,007,941 |
| INSURANCE — 1.4% | | | | | |
Prudential Financial, Inc.
| | | 714,629 | | 83,747,372 |
| IT SERVICES — 1.3% | | | | | |
International Business Machines Corp.
| | | 430,585 | | 74,469,676 |
| LEISURE EQUIPMENT & PRODUCTS — 1.5% | | | | | |
Hasbro, Inc.
| | | 1,556,062 | | 91,029,627 |
| MULTI-UTILITIES — 4.3% | | | | | |
Dominion Energy, Inc.
| | | 1,696,085 | | 83,108,165 |
Public Service Enterprise Group, Inc.
| | | 1,314,140 | | 96,852,118 |
WEC Energy Group, Inc.
| | | 947,176 | | 74,315,429 |
| | | | | | 254,275,712 |
| OFFICE REITs — 2.3% | | | | | |
Alexandria Real Estate Equities, Inc. REIT
| | | 618,472 | | 72,342,670 |
Boston Properties, Inc. REIT
| | | 1,060,001 | | 65,253,661 |
| | | | | | 137,596,331 |
| OIL, GAS & CONSUMABLE FUELS — 5.9% | | | | | |
Chevron Corp.
| | | 516,680 | | 80,819,086 |
Kinder Morgan, Inc.
| | | 4,433,342 | | 88,090,506 |
ONEOK, Inc.
| | | 1,087,371 | | 88,675,105 |
See accompanying notes to financial statements.
24
SPDR PORTFOLIO S&P 500 HIGH DIVIDEND ETF
SCHEDULE OF INVESTMENTS (continued)
June 30, 2024
| Security Description | | | Shares | | Value |
Williams Cos., Inc.
| | | 2,200,383 | | $93,516,277 |
| | | | | | 351,100,974 |
| PHARMACEUTICALS — 3.4% | | | | | |
Bristol-Myers Squibb Co.
| | | 1,486,564 | | 61,737,003 |
Pfizer, Inc.
| | | 2,643,331 | | 73,960,401 |
Viatris, Inc.
| | | 6,372,661 | | 67,741,387 |
| | | | | | 203,438,791 |
| RESIDENTIAL REITs — 7.1% | | | | | |
Camden Property Trust REIT
| | | 767,403 | | 83,731,341 |
Equity Residential REIT
| | | 1,274,382 | | 88,365,648 |
Essex Property Trust, Inc. REIT
| | | 319,140 | | 86,869,908 |
Mid-America Apartment Communities, Inc. REIT
| | | 558,568 | | 79,657,383 |
UDR, Inc. REIT
| | | 2,039,836 | | 83,939,251 |
| | | | | | 422,563,531 |
| RETAIL REITs — 6.3% | | | | | |
Federal Realty Investment Trust REIT
| | | 739,738 | | 74,691,346 |
Kimco Realty Corp. REIT
| | | 3,705,358 | | 72,106,267 |
Realty Income Corp. REIT
| | | 1,361,770 | | 71,928,691 |
Regency Centers Corp. REIT
| | | 1,203,707 | | 74,870,575 |
Simon Property Group, Inc. REIT
| | | 529,262 | | 80,341,972 |
| | | | | | 373,938,851 |
| SPECIALIZED REITs — 8.0% | | | | | |
Crown Castle, Inc. REIT
| | | 707,514 | | 69,124,118 |
Digital Realty Trust, Inc. REIT
| | | 542,852 | | 82,540,647 |
Extra Space Storage, Inc. REIT
| | | 509,730 | | 79,217,139 |
Iron Mountain, Inc. REIT
| | | 1,117,372 | | 100,138,879 |
| Security Description | | | Shares | | Value |
Public Storage REIT
| | | 259,342 | | $74,599,726 |
VICI Properties, Inc. REIT
| | | 2,468,178 | | 70,688,618 |
| | | | | | 476,309,127 |
| SPECIALTY RETAIL — 1.5% | | | | | |
Best Buy Co., Inc.
| | | 1,021,178 | | 86,075,094 |
| TOBACCO — 2.8% | | | | | |
Altria Group, Inc.
| | | 1,875,274 | | 85,418,731 |
Philip Morris International, Inc.
| | | 823,914 | | 83,487,205 |
| | | | | | 168,905,936 |
TOTAL COMMON STOCKS
(Cost $6,186,112,711)
| | | | | 5,870,503,135 |
| | | | |
| SHORT-TERM INVESTMENT — 0.8% | |
State Street Institutional Liquid Reserves Fund, Premier Class 5.36% (a) (b)
(Cost $45,242,266)
| | 45,229,163 | 45,242,732 |
TOTAL INVESTMENTS — 99.9%
(Cost $6,231,354,977)
| 5,915,745,867 |
OTHER ASSETS IN EXCESS OF LIABILITIES — 0.1%
| 6,115,252 |
NET ASSETS — 100.0%
| $5,921,861,119 |
| (a) | The Fund invested in certain money market funds managed by SSGA Funds Management, Inc. Amounts related to these investments during the year ended June 30, 2024 are shown in the Affiliate Table below. |
| (b) | The rate shown is the annualized seven-day yield at June 30, 2024. |
| REIT | Real Estate Investment Trust |
At June 30, 2024, open futures contracts were as follows:
| Description | | Number of
Contracts | | Expiration
Date | | Notional
Amount | | Value | | Unrealized
Appreciation
(Depreciation) |
| E-mini S&P 500 Index (long) | | 183 | | 09/20/2024 | | $50,288,287 | | $50,521,725 | | $233,438 |
During the year ended June 30, 2024, the average notional value related to futures contracts was $44,145,231.
See accompanying notes to financial statements.
25
SPDR PORTFOLIO S&P 500 HIGH DIVIDEND ETF
SCHEDULE OF INVESTMENTS (continued)
June 30, 2024
The following table summarizes the value of the Fund's investments according to the fair value hierarchy as of June 30, 2024.
| Description | | Level 1 –
Quoted Prices | | Level 2 –
Other Significant
Observable Inputs | | Level 3 –
Significant
Unobservable Inputs | | Total |
| ASSETS: | | | | | | | | |
| INVESTMENTS: | | | | | | | | |
Common Stocks
| | $5,870,503,135 | | $— | | $— | | $5,870,503,135 |
Short-Term Investment
| | 45,242,732 | | — | | — | | 45,242,732 |
TOTAL INVESTMENTS
| | $5,915,745,867 | | $— | | $— | | $5,915,745,867 |
| OTHER FINANCIAL INSTRUMENTS: | | | | | | | | |
Futures Contracts - Unrealized Appreciation
| | $233,438 | | $— | | $— | | $233,438 |
TOTAL OTHER FINANCIAL INSTRUMENTS:
| | $233,438 | | $— | | $— | | $233,438 |
Affiliate Table
| | Number of
Shares Held
at
6/30/23 | | Value at
6/30/23 | | Cost of
Purchases | | Proceeds
from
Shares Sold | | Realized
Gain (Loss) | | Change in
Unrealized
Appreciation/
Depreciation | | Number of
Shares Held
at
6/30/24 | | Value at
6/30/24 | | Dividend
Income |
State Street Institutional Liquid Reserves Fund, Premier Class
| 24,740,296 | | $24,745,244 | | $626,331,878 | | $605,830,855 | | $(3,364) | | $(171) | | 45,229,163 | | $45,242,732 | | $1,840,788 |
State Street Navigator Securities Lending Portfolio II
| 57,337,305 | | 57,337,305 | | 1,052,241,485 | | 1,109,578,790 | | — | | — | | — | | — | | 70,550 |
Total
| | | $82,082,549 | | $1,678,573,363 | | $1,715,409,645 | | $(3,364) | | $(171) | | | | $45,242,732 | | $1,911,338 |
See accompanying notes to financial statements.
26
SPDR PORTFOLIO S&P 500 VALUE ETF
SCHEDULE OF INVESTMENTS
June 30, 2024
| Security Description | | | Shares | | Value |
| COMMON STOCKS — 99.8% | |
| AEROSPACE & DEFENSE — 2.6% | |
Boeing Co. (a)
| | 356,094 | | $64,812,669 |
General Dynamics Corp.
| | 249,983 | | 72,530,068 |
Howmet Aerospace, Inc.
| | 181,095 | | 14,058,405 |
Huntington Ingalls Industries, Inc.
| | 43,728 | | 10,771,518 |
L3Harris Technologies, Inc.
| | 208,860 | | 46,905,779 |
Lockheed Martin Corp.
| | 235,318 | | 109,917,038 |
Northrop Grumman Corp.
| | 153,291 | | 66,827,211 |
RTX Corp.
| | 1,465,039 | | 147,075,265 |
Textron, Inc.
| | 210,189 | | 18,046,827 |
| | | | | | 550,944,780 |
| AIR FREIGHT & LOGISTICS — 1.0% | |
CH Robinson Worldwide, Inc.
| | 129,068 | | 11,373,472 |
Expeditors International of Washington, Inc.
| | 98,087 | | 12,240,277 |
FedEx Corp.
| | 249,424 | | 74,787,292 |
United Parcel Service, Inc. Class B
| | 803,787 | | 109,998,251 |
| | | | | | 208,399,292 |
| AIRLINES — 0.3% | |
American Airlines Group, Inc. (a) (b)
| | 720,032 | | 8,157,962 |
Delta Air Lines, Inc.
| | 309,247 | | 14,670,678 |
Southwest Airlines Co.
| | 655,110 | | 18,742,697 |
United Airlines Holdings, Inc. (a)
| | 360,463 | | 17,540,130 |
| | | | | | 59,111,467 |
| AUTO COMPONENTS — 0.1% | |
Aptiv PLC (a)
| | 299,754 | | 21,108,677 |
BorgWarner, Inc.
| | 251,695 | | 8,114,647 |
| | | | | | 29,223,324 |
| AUTOMOBILES — 0.5% | |
Ford Motor Co.
| | 4,321,308 | | 54,189,202 |
General Motors Co.
| | 1,257,273 | | 58,412,904 |
| | | | | | 112,602,106 |
| BANKS — 9.4% | |
Bank of America Corp.
| | 7,497,391 | | 298,171,240 |
Bank of New York Mellon Corp.
| | 824,084 | | 49,354,391 |
Citigroup, Inc.
| | 2,101,934 | | 133,388,732 |
Citizens Financial Group, Inc.
| | 501,454 | | 18,067,388 |
Fifth Third Bancorp
| | 750,564 | | 27,388,080 |
Goldman Sachs Group, Inc.
| | 355,307 | | 160,712,462 |
Huntington Bancshares, Inc.
| | 1,590,865 | | 20,967,601 |
JPMorgan Chase & Co.
| | 3,164,457 | | 640,043,073 |
KeyCorp
| | 1,029,331 | | 14,626,793 |
M&T Bank Corp.
| | 183,166 | | 27,724,006 |
Morgan Stanley
| | 1,378,844 | | 134,009,848 |
Northern Trust Corp.
| | 225,304 | | 18,921,030 |
PNC Financial Services Group, Inc.
| | 437,733 | | 68,058,727 |
Regions Financial Corp.
| | 1,014,507 | | 20,330,720 |
State Street Corp. (c)
| | 331,581 | | 24,536,994 |
| Security Description | | | Shares | | Value |
Truist Financial Corp.
| | 1,474,527 | | $57,285,374 |
U.S. Bancorp
| | 1,719,546 | | 68,265,976 |
Wells Fargo & Co.
| | 3,841,787 | | 228,163,730 |
| | | | | | 2,010,016,165 |
| BEVERAGES — 2.1% | |
Brown-Forman Corp. Class B (b)
| | 198,634 | | 8,579,002 |
Coca-Cola Co.
| | 2,606,163 | | 165,882,275 |
Constellation Brands, Inc. Class A
| | 177,142 | | 45,575,094 |
Keurig Dr Pepper, Inc.
| | 1,144,734 | | 38,234,116 |
Molson Coors Beverage Co. Class B
| | 203,638 | | 10,350,920 |
Monster Beverage Corp. (a)
| | 312,632 | | 15,615,968 |
PepsiCo, Inc.
| | 969,523 | | 159,903,428 |
| | | | | | 444,140,803 |
| BIOTECHNOLOGY — 3.2% | |
AbbVie, Inc.
| | 1,225,885 | | 210,263,795 |
Amgen, Inc.
| | 591,152 | | 184,705,442 |
Biogen, Inc. (a)
| | 160,470 | | 37,200,155 |
Gilead Sciences, Inc.
| | 1,371,449 | | 94,095,116 |
Incyte Corp. (a)
| | 204,524 | | 12,398,245 |
Moderna, Inc. (a)
| | 367,398 | | 43,628,513 |
Regeneron Pharmaceuticals, Inc. (a)
| | 46,710 | | 49,093,611 |
Vertex Pharmaceuticals, Inc. (a)
| | 102,044 | | 47,830,064 |
| | | | | | 679,214,941 |
| BROADLINE RETAIL — 0.2% | |
eBay, Inc.
| | 557,619 | | 29,955,293 |
Etsy, Inc. (a)
| | 73,017 | | 4,306,542 |
| | | | | | 34,261,835 |
| BUILDING PRODUCTS — 0.6% | |
A O Smith Corp.
| | 49,671 | | 4,062,094 |
Allegion PLC
| | 59,468 | | 7,026,144 |
Carrier Global Corp.
| | 478,432 | | 30,179,491 |
Johnson Controls International PLC
| | 742,369 | | 49,345,267 |
Masco Corp.
| | 110,665 | | 7,378,036 |
Trane Technologies PLC
| | 77,778 | | 25,583,518 |
| | | | | | 123,574,550 |
| CAPITAL MARKETS — 3.2% | |
Ameriprise Financial, Inc.
| | 51,772 | | 22,116,481 |
BlackRock, Inc.
| | 153,991 | | 121,240,194 |
Blackstone, Inc.
| | 221,550 | | 27,427,890 |
Cboe Global Markets, Inc.
| | 42,075 | | 7,155,274 |
Charles Schwab Corp.
| | 1,645,072 | | 121,225,356 |
CME Group, Inc.
| | 253,673 | | 49,872,112 |
FactSet Research Systems, Inc.
| | 22,373 | | 9,134,225 |
Franklin Resources, Inc.
| | 329,707 | | 7,368,951 |
Intercontinental Exchange, Inc.
| | 632,039 | | 86,519,819 |
Invesco Ltd.
| | 497,486 | | 7,442,391 |
MarketAxess Holdings, Inc.
| | 41,833 | | 8,388,771 |
Moody's Corp.
| | 91,743 | | 38,617,381 |
MSCI, Inc.
| | 37,307 | | 17,972,647 |
See accompanying notes to financial statements.
27
SPDR PORTFOLIO S&P 500 VALUE ETF
SCHEDULE OF INVESTMENTS (continued)
June 30, 2024
| Security Description | | | Shares | | Value |
Nasdaq, Inc.
| | 417,451 | | $25,155,597 |
Raymond James Financial, Inc.
| | 207,398 | | 25,636,467 |
S&P Global, Inc.
| | 198,103 | | 88,353,938 |
T Rowe Price Group, Inc.
| | 246,377 | | 28,409,732 |
| | | | | | 692,037,226 |
| CHEMICALS — 2.3% | |
Air Products & Chemicals, Inc.
| | 244,836 | | 63,179,930 |
Albemarle Corp. (b)
| | 129,030 | | 12,324,945 |
CF Industries Holdings, Inc.
| | 92,682 | | 6,869,590 |
Corteva, Inc.
| | 772,536 | | 41,670,592 |
Dow, Inc.
| | 773,445 | | 41,031,257 |
DuPont de Nemours, Inc.
| | 460,736 | | 37,084,641 |
Eastman Chemical Co.
| | 128,853 | | 12,623,728 |
Ecolab, Inc.
| | 136,649 | | 32,522,462 |
FMC Corp.
| | 138,092 | | 7,947,195 |
International Flavors & Fragrances, Inc.
| | 280,435 | | 26,700,216 |
Linde PLC
| | 254,275 | | 111,578,413 |
LyondellBasell Industries NV Class A
| | 282,189 | | 26,994,200 |
Mosaic Co.
| | 360,012 | | 10,404,347 |
PPG Industries, Inc.
| | 259,797 | | 32,705,844 |
Sherwin-Williams Co.
| | 128,580 | | 38,372,129 |
| | | | | | 502,009,489 |
| COMMERCIAL SERVICES & SUPPLIES — 0.6% | |
Cintas Corp.
| | 42,723 | | 29,917,208 |
Republic Services, Inc.
| | 96,667 | | 18,786,265 |
Rollins, Inc.
| | 177,140 | | 8,642,661 |
Veralto Corp.
| | 240,841 | | 22,993,090 |
Waste Management, Inc.
| | 213,984 | | 45,651,346 |
| | | | | | 125,990,570 |
| COMMUNICATIONS EQUIPMENT — 1.2% | |
Cisco Systems, Inc.
| | 4,461,974 | | 211,988,385 |
F5, Inc. (a)
| | 64,417 | | 11,094,540 |
Juniper Networks, Inc.
| | 354,818 | | 12,936,664 |
Motorola Solutions, Inc.
| | 76,869 | | 29,675,277 |
| | | | | | 265,694,866 |
| CONSTRUCTION & ENGINEERING — 0.1% | |
Quanta Services, Inc.
| | 49,772 | | 12,646,567 |
| CONSTRUCTION MATERIALS — 0.1% | |
Martin Marietta Materials, Inc.
| | 23,105 | | 12,518,289 |
Vulcan Materials Co.
| | 52,645 | | 13,091,759 |
| | | | | | 25,610,048 |
| CONSUMER FINANCE — 0.6% | |
American Express Co.
| | 188,834 | | 43,724,513 |
Capital One Financial Corp.
| | 421,015 | | 58,289,527 |
Discover Financial Services
| | 126,375 | | 16,531,114 |
Synchrony Financial
| | 446,723 | | 21,080,858 |
| | | | | | 139,626,012 |
| CONSUMER STAPLES DISTRIBUTION & RETAIL — 3.6% | |
Costco Wholesale Corp.
| | 283,297 | | 240,799,617 |
Dollar General Corp.
| | 241,809 | | 31,974,404 |
| Security Description | | | Shares | | Value |
Dollar Tree, Inc. (a)
| | 227,312 | | $24,270,102 |
Kroger Co.
| | 737,630 | | 36,829,866 |
Sysco Corp.
| | 548,138 | | 39,131,572 |
Target Corp.
| | 509,800 | | 75,470,792 |
Walgreens Boots Alliance, Inc.
| | 788,037 | | 9,531,308 |
Walmart, Inc.
| | 4,707,224 | | 318,726,137 |
| | | | | | 776,733,798 |
| CONTAINERS & PACKAGING — 0.5% | |
Amcor PLC
| | 1,589,022 | | 15,540,635 |
Avery Dennison Corp.
| | 88,482 | | 19,346,589 |
Ball Corp.
| | 346,440 | | 20,793,329 |
International Paper Co.
| | 380,417 | | 16,414,994 |
Packaging Corp. of America
| | 97,590 | | 17,816,030 |
Westrock Co.
| | 282,399 | | 14,193,374 |
| | | | | | 104,104,951 |
| DISTRIBUTORS — 0.2% | |
Genuine Parts Co.
| | 153,995 | | 21,300,588 |
LKQ Corp.
| | 294,426 | | 12,245,177 |
Pool Corp. (b)
| | 18,144 | | 5,576,196 |
| | | | | | 39,121,961 |
| DIVERSIFIED TELECOMMUNICATION SERVICES — 1.6% | |
AT&T, Inc.
| | 7,901,211 | | 150,992,142 |
Verizon Communications, Inc.
| | 4,638,363 | | 191,286,090 |
| | | | | | 342,278,232 |
| ELECTRIC UTILITIES — 3.3% | |
Alliant Energy Corp.
| | 280,547 | | 14,279,842 |
American Electric Power Co., Inc.
| | 580,828 | | 50,961,849 |
Constellation Energy Corp.
| | 191,103 | | 38,272,198 |
Duke Energy Corp.
| | 849,048 | | 85,100,081 |
Edison International
| | 422,602 | | 30,347,050 |
Entergy Corp.
| | 235,317 | | 25,178,919 |
Evergy, Inc.
| | 253,012 | | 13,402,046 |
Eversource Energy
| | 385,284 | | 21,849,456 |
Exelon Corp.
| | 1,101,940 | | 38,138,143 |
FirstEnergy Corp.
| | 569,502 | | 21,794,841 |
NextEra Energy, Inc.
| | 2,264,045 | | 160,317,026 |
NRG Energy, Inc.
| | 229,770 | | 17,889,892 |
PG&E Corp.
| | 2,346,690 | | 40,973,207 |
Pinnacle West Capital Corp.
| | 125,344 | | 9,573,775 |
PPL Corp.
| | 813,043 | | 22,480,639 |
Southern Co.
| | 1,204,861 | | 93,461,068 |
Xcel Energy, Inc.
| | 612,293 | | 32,702,569 |
| | | | | | 716,722,601 |
| ELECTRICAL EQUIPMENT — 0.9% | |
AMETEK, Inc.
| | 131,850 | | 21,980,713 |
Eaton Corp. PLC
| | 167,117 | | 52,399,535 |
Emerson Electric Co.
| | 629,576 | | 69,354,092 |
GE Vernova, Inc. (a)
| | 172,201 | | 29,534,194 |
Generac Holdings, Inc. (a)
| | 26,139 | | 3,456,099 |
Rockwell Automation, Inc.
| | 65,446 | | 18,015,975 |
| | | | | | 194,740,608 |
See accompanying notes to financial statements.
28
SPDR PORTFOLIO S&P 500 VALUE ETF
SCHEDULE OF INVESTMENTS (continued)
June 30, 2024
| Security Description | | | Shares | | Value |
| ELECTRONIC EQUIPMENT, INSTRUMENTS & COMPONENTS — 1.0% | |
Amphenol Corp. Class A
| | 581,490 | | $39,174,981 |
CDW Corp.
| | 85,425 | | 19,121,532 |
Corning, Inc.
| | 849,590 | | 33,006,572 |
Hubbell, Inc.
| | 32,048 | | 11,712,903 |
Jabil, Inc.
| | 61,134 | | 6,650,768 |
Keysight Technologies, Inc. (a)
| | 191,864 | | 26,237,402 |
TE Connectivity Ltd.
| | 207,673 | | 31,240,249 |
Teledyne Technologies, Inc. (a)
| | 52,050 | | 20,194,359 |
Trimble, Inc. (a)
| | 273,500 | | 15,294,120 |
Zebra Technologies Corp. Class A (a)
| | 56,370 | | 17,414,384 |
| | | | | | 220,047,270 |
| ENERGY EQUIPMENT & SERVICES — 0.7% | |
Baker Hughes Co.
| | 1,102,783 | | 38,784,878 |
Halliburton Co.
| | 978,213 | | 33,044,035 |
Schlumberger NV
| | 1,571,287 | | 74,133,321 |
| | | | | | 145,962,234 |
| ENTERTAINMENT — 1.2% | |
Electronic Arts, Inc.
| | 149,539 | | 20,835,269 |
Take-Two Interactive Software, Inc. (a)
| | 86,994 | | 13,526,697 |
Walt Disney Co.
| | 2,008,945 | | 199,468,149 |
Warner Bros Discovery, Inc. (a)
| | 2,448,397 | | 18,216,074 |
| | | | | | 252,046,189 |
| FINANCIAL SERVICES — 6.0% | |
Berkshire Hathaway, Inc. Class B (a)
| | 1,994,940 | | 811,541,592 |
Fidelity National Information Services, Inc.
| | 612,983 | | 46,194,399 |
Fiserv, Inc. (a)
| | 309,436 | | 46,118,341 |
Global Payments, Inc.
| | 281,302 | | 27,201,903 |
Jack Henry & Associates, Inc.
| | 80,158 | | 13,307,831 |
Mastercard, Inc. Class A
| | 253,298 | | 111,744,946 |
PayPal Holdings, Inc. (a)
| | 1,152,698 | | 66,891,065 |
Visa, Inc. Class A
| | 589,755 | | 154,792,995 |
| | | | | | 1,277,793,072 |
| FOOD PRODUCTS — 1.4% | |
Archer-Daniels-Midland Co.
| | 544,813 | | 32,933,946 |
Bunge Global SA
| | 156,013 | | 16,657,508 |
Campbell Soup Co.
| | 216,622 | | 9,789,148 |
Conagra Brands, Inc.
| | 525,416 | | 14,932,323 |
General Mills, Inc.
| | 625,380 | | 39,561,539 |
Hershey Co.
| | 102,114 | | 18,771,617 |
Hormel Foods Corp.
| | 319,576 | | 9,743,872 |
J M Smucker Co.
| | 116,650 | | 12,719,516 |
Kellanova
| | 289,907 | | 16,721,836 |
Kraft Heinz Co.
| | 878,278 | | 28,298,117 |
Lamb Weston Holdings, Inc. (b)
| | 53,672 | | 4,512,742 |
McCormick & Co., Inc.
| | 276,251 | | 19,597,246 |
Mondelez International, Inc. Class A
| | 859,878 | | 56,270,416 |
| Security Description | | | Shares | | Value |
Tyson Foods, Inc. Class A
| | 315,797 | | $18,044,640 |
| | | | | | 298,554,466 |
| GAS UTILITIES — 0.1% | |
Atmos Energy Corp.
| | 166,143 | | 19,380,581 |
| GROUND TRANSPORTATION — 0.9% | |
CSX Corp.
| | 1,077,101 | | 36,029,028 |
JB Hunt Transport Services, Inc.
| | 89,520 | | 14,323,200 |
Norfolk Southern Corp.
| | 248,769 | | 53,408,217 |
Union Pacific Corp.
| | 369,769 | | 83,663,934 |
| | | | | | 187,424,379 |
| HEALTH CARE EQUIPMENT & SUPPLIES — 3.8% | |
Abbott Laboratories
| | 1,916,948 | | 199,190,067 |
Align Technology, Inc. (a)
| | 35,357 | | 8,536,240 |
Baxter International, Inc.
| | 559,815 | | 18,725,812 |
Becton Dickinson & Co.
| | 318,002 | | 74,320,247 |
Boston Scientific Corp. (a)
| | 728,999 | | 56,140,213 |
Cooper Cos., Inc.
| | 126,658 | | 11,057,243 |
Dexcom, Inc. (a)
| | 170,876 | | 19,373,921 |
Edwards Lifesciences Corp. (a)
| | 420,906 | | 38,879,087 |
GE HealthCare Technologies, Inc.
| | 465,787 | | 36,294,123 |
Hologic, Inc. (a)
| | 257,612 | | 19,127,691 |
IDEXX Laboratories, Inc. (a)
| | 40,190 | | 19,580,568 |
Insulet Corp. (a)
| | 47,810 | | 9,648,058 |
Intuitive Surgical, Inc. (a)
| | 132,892 | | 59,117,006 |
Medtronic PLC
| | 1,463,443 | | 115,187,599 |
ResMed, Inc.
| | 161,996 | | 31,009,274 |
Solventum Corp. (a)
| | 151,562 | | 8,014,599 |
STERIS PLC
| | 47,768 | | 10,486,987 |
Stryker Corp.
| | 134,063 | | 45,614,936 |
Teleflex, Inc.
| | 51,784 | | 10,891,729 |
Zimmer Biomet Holdings, Inc.
| | 226,680 | | 24,601,580 |
| | | | | | 815,796,980 |
| HEALTH CARE PROVIDERS & SERVICES — 4.6% | |
Cardinal Health, Inc.
| | 268,150 | | 26,364,508 |
Cencora, Inc.
| | 181,999 | | 41,004,375 |
Centene Corp. (a)
| | 587,548 | | 38,954,432 |
Cigna Group
| | 312,997 | | 103,467,418 |
CVS Health Corp.
| | 1,385,276 | | 81,814,401 |
DaVita, Inc. (a)
| | 26,414 | | 3,660,188 |
Elevance Health, Inc.
| | 256,103 | | 138,771,972 |
HCA Healthcare, Inc.
| | 111,043 | | 35,675,895 |
Henry Schein, Inc. (a)
| | 142,311 | | 9,122,135 |
Humana, Inc.
| | 132,752 | | 49,602,785 |
Labcorp Holdings, Inc.
| | 93,348 | | 18,997,251 |
McKesson Corp.
| | 143,202 | | 83,635,696 |
Molina Healthcare, Inc. (a)
| | 26,086 | | 7,755,368 |
Quest Diagnostics, Inc.
| | 121,939 | | 16,691,010 |
UnitedHealth Group, Inc.
| | 628,781 | | 320,213,012 |
Universal Health Services, Inc. Class B
| | 67,316 | | 12,448,748 |
| | | | | | 988,179,194 |
See accompanying notes to financial statements.
29
SPDR PORTFOLIO S&P 500 VALUE ETF
SCHEDULE OF INVESTMENTS (continued)
June 30, 2024
| Security Description | | | Shares | | Value |
| HEALTH CARE REITs — 0.5% | |
Healthpeak Properties, Inc. REIT
| | 780,200 | | $15,291,920 |
Ventas, Inc. REIT
| | 446,059 | | 22,864,984 |
Welltower, Inc. REIT
| | 658,828 | | 68,682,819 |
| | | | | | 106,839,723 |
| HOTEL & RESORT REITs — 0.0% (d) | |
Host Hotels & Resorts, Inc. REIT
| | 307,687 | | 5,532,212 |
| HOTELS, RESTAURANTS & LEISURE — 1.2% | |
Airbnb, Inc. Class A (a)
| | 243,260 | | 36,885,514 |
Caesars Entertainment, Inc. (a) (b)
| | 98,771 | | 3,925,159 |
Carnival Corp. (a)
| | 318,913 | | 5,970,051 |
Darden Restaurants, Inc.
| | 62,727 | | 9,491,850 |
Domino's Pizza, Inc.
| | 23,032 | | 11,892,113 |
Las Vegas Sands Corp.
| | 159,496 | | 7,057,698 |
McDonald's Corp.
| | 444,711 | | 113,330,151 |
MGM Resorts International (a)
| | 95,371 | | 4,238,287 |
Starbucks Corp.
| | 511,131 | | 39,791,548 |
Yum! Brands, Inc.
| | 167,273 | | 22,156,982 |
| | | | | | 254,739,353 |
| HOUSEHOLD DURABLES — 0.2% | |
Garmin Ltd.
| | 77,719 | | 12,661,979 |
Lennar Corp. Class A
| | 119,548 | | 17,916,659 |
Mohawk Industries, Inc. (a)
| | 57,801 | | 6,565,616 |
| | | | | | 37,144,254 |
| HOUSEHOLD PRODUCTS — 1.9% | |
Church & Dwight Co., Inc.
| | 146,334 | | 15,171,909 |
Clorox Co.
| | 136,461 | | 18,622,832 |
Colgate-Palmolive Co.
| | 552,201 | | 53,585,585 |
Kimberly-Clark Corp.
| | 370,884 | | 51,256,169 |
Procter & Gamble Co.
| | 1,586,490 | | 261,643,931 |
| | | | | | 400,280,426 |
| INDEPENDENT POWER & RENEWABLE ELECTRICITY PRODUCERS — 0.1% | |
AES Corp.
| | 783,162 | | 13,760,156 |
| INDUSTRIAL CONGLOMERATES — 1.5% | |
3M Co.
| | 608,493 | | 62,181,900 |
General Electric Co.
| | 687,479 | | 109,288,537 |
Honeywell International, Inc.
| | 717,588 | | 153,233,741 |
| | | | | | 324,704,178 |
| INDUSTRIAL REITs — 0.5% | |
Prologis, Inc. REIT
| | 1,020,219 | | 114,580,796 |
| INSURANCE — 3.6% | |
Aflac, Inc.
| | 569,755 | | 50,884,819 |
Allstate Corp.
| | 290,824 | | 46,432,960 |
American International Group, Inc.
| | 731,300 | | 54,291,712 |
Aon PLC Class A
| | 117,412 | | 34,469,815 |
Arthur J Gallagher & Co.
| | 117,952 | | 30,586,133 |
Assurant, Inc.
| | 57,147 | | 9,500,689 |
Brown & Brown, Inc.
| | 56,846 | | 5,082,601 |
Chubb Ltd.
| | 447,449 | | 114,135,291 |
| Security Description | | | Shares | | Value |
Cincinnati Financial Corp.
| | 172,453 | | $20,366,699 |
Everest Group Ltd.
| | 47,670 | | 18,163,223 |
Globe Life, Inc.
| | 94,412 | | 7,768,219 |
Hartford Financial Services Group, Inc.
| | 327,976 | | 32,974,707 |
Loews Corp.
| | 199,932 | | 14,942,918 |
Marsh & McLennan Cos., Inc.
| | 260,142 | | 54,817,122 |
MetLife, Inc.
| | 658,230 | | 46,201,164 |
Principal Financial Group, Inc.
| | 240,919 | | 18,900,096 |
Progressive Corp.
| | 322,299 | | 66,944,725 |
Prudential Financial, Inc.
| | 397,664 | | 46,602,244 |
Travelers Cos., Inc.
| | 252,358 | | 51,314,476 |
W R Berkley Corp.
| | 222,450 | | 17,480,121 |
Willis Towers Watson PLC
| | 112,678 | | 29,537,411 |
| | | | | | 771,397,145 |
| INTERACTIVE MEDIA & SERVICES — 0.0% (d) | |
Match Group, Inc. (a)
| | 299,292 | | 9,092,491 |
| IT SERVICES — 1.5% | |
Accenture PLC Class A
| | 318,717 | | 96,701,925 |
Akamai Technologies, Inc. (a)
| | 88,446 | | 7,967,216 |
Cognizant Technology Solutions Corp. Class A
| | 547,255 | | 37,213,340 |
EPAM Systems, Inc. (a)
| | 38,104 | | 7,167,743 |
International Business Machines Corp.
| | 1,012,267 | | 175,071,578 |
VeriSign, Inc. (a)
| | 50,214 | | 8,928,049 |
| | | | | | 333,049,851 |
| LEISURE EQUIPMENT & PRODUCTS — 0.0% (d) | |
Hasbro, Inc.
| | 144,234 | | 8,437,689 |
| LIFE SCIENCES TOOLS & SERVICES — 2.2% | |
Agilent Technologies, Inc.
| | 322,802 | | 41,844,824 |
Bio-Rad Laboratories, Inc. Class A (a)
| | 22,979 | | 6,275,795 |
Bio-Techne Corp.
| | 172,437 | | 12,355,111 |
Charles River Laboratories International, Inc. (a)
| | 56,378 | | 11,646,567 |
Danaher Corp.
| | 726,448 | | 181,503,033 |
IQVIA Holdings, Inc. (a)
| | 124,482 | | 26,320,474 |
Mettler-Toledo International, Inc. (a)
| | 14,695 | | 20,537,585 |
Revvity, Inc.
| | 135,606 | | 14,219,645 |
Thermo Fisher Scientific, Inc.
| | 260,760 | | 144,200,280 |
Waters Corp. (a)
| | 41,110 | | 11,926,833 |
| | | | | | 470,830,147 |
| MACHINERY — 2.0% | |
Caterpillar, Inc.
| | 226,322 | | 75,387,858 |
Cummins, Inc.
| | 150,729 | | 41,741,382 |
Deere & Co.
| | 123,268 | | 46,056,623 |
Dover Corp.
| | 151,473 | | 27,333,303 |
IDEX Corp.
| | 83,028 | | 16,705,234 |
Illinois Tool Works, Inc.
| | 161,727 | | 38,322,830 |
Ingersoll Rand, Inc.
| | 102,987 | | 9,355,339 |
Nordson Corp.
| | 59,615 | | 13,827,103 |
Otis Worldwide Corp.
| | 272,646 | | 26,244,904 |
See accompanying notes to financial statements.
30
SPDR PORTFOLIO S&P 500 VALUE ETF
SCHEDULE OF INVESTMENTS (continued)
June 30, 2024
| Security Description | | | Shares | | Value |
PACCAR, Inc.
| | 155,271 | | $15,983,597 |
Parker-Hannifin Corp.
| | 31,099 | | 15,730,185 |
Pentair PLC
| | 54,082 | | 4,146,467 |
Snap-on, Inc.
| | 32,126 | | 8,397,415 |
Stanley Black & Decker, Inc.
| | 168,473 | | 13,459,308 |
Westinghouse Air Brake Technologies Corp.
| | 194,332 | | 30,714,172 |
Xylem, Inc.
| | 267,200 | | 36,240,336 |
| | | | | | 419,646,056 |
| MEDIA — 1.2% | |
Charter Communications, Inc. Class A (a) (b)
| | 58,611 | | 17,522,344 |
Comcast Corp. Class A
| | 4,313,248 | | 168,906,792 |
Fox Corp. Class A (b)
| | 262,764 | | 9,031,199 |
Fox Corp. Class B
| | 144,015 | | 4,611,360 |
Interpublic Group of Cos., Inc. (b)
| | 421,124 | | 12,250,497 |
News Corp. Class A
| | 419,543 | | 11,566,800 |
News Corp. Class B (b)
| | 125,163 | | 3,553,378 |
Omnicom Group, Inc.
| | 217,530 | | 19,512,441 |
Paramount Global Class B
| | 526,258 | | 5,467,821 |
| | | | | | 252,422,632 |
| METALS & MINING — 0.5% | |
Freeport-McMoRan, Inc.
| | 789,786 | | 38,383,600 |
Newmont Corp.
| | 1,267,070 | | 53,052,221 |
Nucor Corp.
| | 97,782 | | 15,457,378 |
Steel Dynamics, Inc.
| | 62,234 | | 8,059,303 |
| | | | | | 114,952,502 |
| MULTI-UTILITIES — 1.4% | |
Ameren Corp.
| | 293,884 | | 20,898,091 |
CenterPoint Energy, Inc.
| | 704,957 | | 21,839,568 |
CMS Energy Corp.
| | 329,071 | | 19,589,597 |
Consolidated Edison, Inc.
| | 380,204 | | 33,997,842 |
Dominion Energy, Inc.
| | 919,926 | | 45,076,374 |
DTE Energy Co.
| | 227,556 | | 25,260,991 |
NiSource, Inc.
| | 494,044 | | 14,233,408 |
Public Service Enterprise Group, Inc.
| | 548,870 | | 40,451,719 |
Sempra
| | 697,373 | | 53,042,190 |
WEC Energy Group, Inc.
| | 347,632 | | 27,275,207 |
| | | | | | 301,664,987 |
| OFFICE REITs — 0.1% | |
Alexandria Real Estate Equities, Inc. REIT
| | 173,385 | | 20,280,844 |
Boston Properties, Inc. REIT
| | 159,624 | | 9,826,453 |
| | | | | | 30,107,297 |
| OIL, GAS & CONSUMABLE FUELS — 6.1% | |
Chevron Corp.
| | 1,888,721 | | 295,433,739 |
ConocoPhillips
| | 402,222 | | 46,006,152 |
Coterra Energy, Inc.
| | 283,084 | | 7,549,850 |
Devon Energy Corp.
| | 696,430 | | 33,010,782 |
EOG Resources, Inc.
| | 215,350 | | 27,106,105 |
EQT Corp.
| | 486,579 | | 17,993,691 |
| Security Description | | | Shares | | Value |
Exxon Mobil Corp.
| | 4,943,322 | | $569,075,229 |
Kinder Morgan, Inc.
| | 2,129,882 | | 42,320,755 |
Marathon Oil Corp.
| | 292,119 | | 8,375,052 |
Marathon Petroleum Corp.
| | 174,674 | | 30,302,446 |
Occidental Petroleum Corp.
| | 732,768 | | 46,186,367 |
ONEOK, Inc.
| | 243,336 | | 19,844,051 |
Phillips 66
| | 467,155 | | 65,948,271 |
Valero Energy Corp.
| | 360,303 | | 56,481,098 |
Williams Cos., Inc.
| | 817,484 | | 34,743,070 |
| | | | | | 1,300,376,658 |
| PERSONAL CARE PRODUCTS — 0.3% | |
Estee Lauder Cos., Inc. Class A
| | 256,194 | | 27,259,042 |
Kenvue, Inc.
| | 2,106,217 | | 38,291,025 |
| | | | | | 65,550,067 |
| PHARMACEUTICALS — 4.3% | |
Bristol-Myers Squibb Co.
| | 2,239,508 | | 93,006,767 |
Catalent, Inc. (a)
| | 198,809 | | 11,179,030 |
Johnson & Johnson
| | 2,652,075 | | 387,627,282 |
Merck & Co., Inc.
| | 1,673,699 | | 207,203,936 |
Pfizer, Inc.
| | 6,244,314 | | 174,715,906 |
Viatris, Inc.
| | 1,318,564 | | 14,016,335 |
Zoetis, Inc.
| | 227,068 | | 39,364,509 |
| | | | | | 927,113,765 |
| PROFESSIONAL SERVICES — 0.9% | |
Automatic Data Processing, Inc.
| | 275,822 | | 65,835,953 |
Broadridge Financial Solutions, Inc.
| | 55,735 | | 10,979,795 |
Dayforce, Inc. (a) (b)
| | 76,609 | | 3,799,806 |
Equifax, Inc.
| | 82,947 | | 20,111,330 |
Jacobs Solutions, Inc.
| | 138,405 | | 19,336,563 |
Leidos Holdings, Inc.
| | 151,074 | | 22,038,675 |
Paychex, Inc.
| | 211,556 | | 25,082,079 |
Paycom Software, Inc.
| | 30,386 | | 4,346,414 |
Verisk Analytics, Inc.
| | 71,660 | | 19,315,953 |
| | | | | | 190,846,568 |
| REAL ESTATE MANAGEMENT & DEVELOPMENT — 0.2% | |
CBRE Group, Inc. Class A (a)
| | 332,399 | | 29,620,075 |
CoStar Group, Inc. (a)
| | 256,698 | | 19,031,590 |
| | | | | | 48,651,665 |
| RESIDENTIAL REITs — 0.7% | |
AvalonBay Communities, Inc. REIT
| | 155,857 | | 32,245,255 |
Camden Property Trust REIT
| | 117,588 | | 12,830,027 |
Equity Residential REIT
| | 379,036 | | 26,282,356 |
Essex Property Trust, Inc. REIT
| | 70,525 | | 19,196,905 |
Invitation Homes, Inc. REIT
| | 634,568 | | 22,774,645 |
Mid-America Apartment Communities, Inc. REIT
| | 128,277 | | 18,293,583 |
UDR, Inc. REIT
| | 333,184 | | 13,710,522 |
| | | | | | 145,333,293 |
| RETAIL REITs — 0.6% | |
Federal Realty Investment Trust REIT
| | 81,273 | | 8,206,135 |
See accompanying notes to financial statements.
31
SPDR PORTFOLIO S&P 500 VALUE ETF
SCHEDULE OF INVESTMENTS (continued)
June 30, 2024
| Security Description | | | Shares | | Value |
Kimco Realty Corp. REIT
| | 731,099 | | $14,227,186 |
Realty Income Corp. REIT
| | 959,505 | | 50,681,054 |
Regency Centers Corp. REIT
| | 181,069 | | 11,262,492 |
Simon Property Group, Inc. REIT
| | 226,312 | | 34,354,162 |
| | | | | | 118,731,029 |
| SEMICONDUCTORS & SEMICONDUCTOR EQUIPMENT — 3.5% | |
Analog Devices, Inc.
| | 223,839 | | 51,093,490 |
Enphase Energy, Inc. (a)
| | 93,782 | | 9,351,003 |
First Solar, Inc. (a)
| | 117,704 | | 26,537,544 |
Intel Corp.
| | 4,691,049 | | 145,281,788 |
Microchip Technology, Inc.
| | 243,376 | | 22,268,904 |
Micron Technology, Inc.
| | 1,220,237 | | 160,497,773 |
NXP Semiconductors NV
| | 70,832 | | 19,060,183 |
ON Semiconductor Corp. (a)
| | 262,660 | | 18,005,343 |
Qorvo, Inc. (a)
| | 105,770 | | 12,273,551 |
QUALCOMM, Inc.
| | 591,352 | | 117,785,491 |
Skyworks Solutions, Inc.
| | 176,417 | | 18,802,524 |
Teradyne, Inc.
| | 172,081 | | 25,517,891 |
Texas Instruments, Inc.
| | 632,094 | | 122,961,246 |
| | | | | | 749,436,731 |
| SOFTWARE — 0.5% | |
ANSYS, Inc. (a)
| | 41,203 | | 13,246,764 |
Autodesk, Inc. (a)
| | 113,155 | | 28,000,205 |
Gen Digital, Inc.
| | 614,498 | | 15,350,160 |
PTC, Inc. (a)
| | 52,772 | | 9,587,089 |
Roper Technologies, Inc.
| | 67,068 | | 37,803,549 |
| | | | | | 103,987,767 |
| SPECIALIZED REITs — 1.5% | |
American Tower Corp. REIT
| | 302,808 | | 58,859,819 |
Crown Castle, Inc. REIT
| | 476,725 | | 46,576,032 |
Digital Realty Trust, Inc. REIT
| | 210,027 | | 31,934,605 |
Equinix, Inc. REIT
| | 55,446 | | 41,950,444 |
Extra Space Storage, Inc. REIT
| | 232,710 | | 36,165,461 |
Iron Mountain, Inc. REIT
| | 157,585 | | 14,122,768 |
Public Storage REIT
| | 100,902 | | 29,024,460 |
SBA Communications Corp. REIT
| | 71,089 | | 13,954,771 |
VICI Properties, Inc. REIT
| | 1,149,555 | | 32,923,255 |
Weyerhaeuser Co. REIT
| | 804,717 | | 22,845,916 |
| | | | | | 328,357,531 |
| SPECIALTY RETAIL — 2.4% | |
AutoZone, Inc. (a)
| | 5,962 | | 17,671,964 |
Bath & Body Works, Inc.
| | 247,623 | | 9,669,678 |
Best Buy Co., Inc.
| | 210,499 | | 17,742,961 |
CarMax, Inc. (a)
| | 173,159 | | 12,699,481 |
Home Depot, Inc.
| | 688,007 | | 236,839,530 |
Lowe's Cos., Inc.
| | 630,577 | | 139,017,005 |
O'Reilly Automotive, Inc. (a)
| | 17,524 | | 18,506,396 |
TJX Cos., Inc.
| | 439,274 | | 48,364,067 |
Tractor Supply Co.
| | 68,996 | | 18,628,920 |
Ulta Beauty, Inc. (a)
| | 18,124 | | 6,993,508 |
| | | | | | 526,133,510 |
| Security Description | | | Shares | | Value |
| TECHNOLOGY HARDWARE, STORAGE & PERIPHERALS — 0.6% | |
Hewlett Packard Enterprise Co.
| | 1,430,728 | | $30,288,512 |
HP, Inc.
| | 959,406 | | 33,598,398 |
NetApp, Inc.
| | 142,436 | | 18,345,757 |
Seagate Technology Holdings PLC
| | 126,412 | | 13,054,567 |
Western Digital Corp. (a)
| | 359,809 | | 27,262,728 |
| | | | | | 122,549,962 |
| TEXTILES, APPAREL & LUXURY GOODS — 0.3% | |
NIKE, Inc. Class B
| | 763,806 | | 57,568,058 |
Ralph Lauren Corp.
| | 19,493 | | 3,412,445 |
Tapestry, Inc.
| | 252,608 | | 10,809,096 |
| | | | | | 71,789,599 |
| TOBACCO — 0.9% | |
Altria Group, Inc.
| | 1,892,726 | | 86,213,669 |
Philip Morris International, Inc.
| | 1,079,259 | | 109,361,315 |
| | | | | | 195,574,984 |
| TRADING COMPANIES & DISTRIBUTORS — 0.1% | |
Fastenal Co.
| | 315,659 | | 19,836,011 |
WW Grainger, Inc.
| | 12,062 | | 10,882,819 |
| | | | | | 30,718,830 |
| WATER UTILITIES — 0.1% | |
American Water Works Co., Inc.
| | 214,482 | | 27,702,495 |
| WIRELESS TELECOMMUNICATION SERVICES — 0.5% | |
T-Mobile U.S., Inc.
| | 568,144 | | 100,095,610 |
TOTAL COMMON STOCKS
(Cost $19,950,240,510)
| | | | | 21,416,122,516 |
| SHORT-TERM INVESTMENTS — 0.4% | | | |
State Street Institutional Liquid Reserves Fund, Premier Class 5.36% (e) (f)
| | 20,686,220 | | 20,692,426 |
State Street Navigator Securities Lending Portfolio II (c) (g)
| | 57,581,983 | | 57,581,983 |
TOTAL SHORT-TERM INVESTMENTS
(Cost $78,273,753)
| | 78,274,409 | |
TOTAL INVESTMENTS — 100.2%
(Cost $20,028,514,263)
| | 21,494,396,925 | |
LIABILITIES IN EXCESS OF OTHER ASSETS — (0.2)%
| | (37,747,866) | |
NET ASSETS — 100.0%
| | $21,456,649,059 | |
| (a) | Non-income producing security. |
| (b) | All or a portion of the shares of the security are on loan at June 30, 2024. |
| (c) | The Fund invested in an affiliated entity. Amounts related to these investments during the year ended June 30, 2024 are shown in the Affiliate Table below. |
| (d) | Amount is less than 0.05% of net assets. |
See accompanying notes to financial statements.
32
SPDR PORTFOLIO S&P 500 VALUE ETF
SCHEDULE OF INVESTMENTS (continued)
June 30, 2024
| (e) | The Fund invested in certain money market funds managed by SSGA Funds Management, Inc. Amounts related to these investments during the period ended June 30, 2024 are shown in the Affiliate Table below. |
| (f) | The rate shown is the annualized seven-day yield at June 30, 2024. |
| (g) | Investment of cash collateral for securities loaned. |
| REIT | Real Estate Investment Trust |
The following table summarizes the value of the Fund's investments according to the fair value hierarchy as of June 30, 2024.
| Description | | Level 1 –
Quoted Prices | | Level 2 –
Other Significant
Observable Inputs | | Level 3 –
Significant
Unobservable Inputs | | Total |
| ASSETS: | | | | | | | | |
| INVESTMENTS: | | | | | | | | |
Common Stocks
| | $21,416,122,516 | | $— | | $— | | $21,416,122,516 |
Short-Term Investments
| | 78,274,409 | | — | | — | | 78,274,409 |
TOTAL INVESTMENTS
| | $21,494,396,925 | | $— | | $— | | $21,494,396,925 |
Affiliate Table
| | Number of
Shares Held
at
6/30/23 | | Value at
6/30/23 | | Cost of
Purchases | | Proceeds
from
Shares Sold | | Realized
Gain (Loss) | | Change in
Unrealized
Appreciation/
Depreciation | | Number of
Shares Held
at
6/30/24 | | Value at
6/30/24 | | Dividend
Income |
State Street Corp.
| 314,813 | | $23,038,015 | | $11,734,117 | | $10,742,693 | | $(589,489) | | $1,097,044 | | 331,581 | | $24,536,994 | | $664,731 |
State Street Institutional Liquid Reserves Fund, Premier Class
| 13,554,935 | | 13,557,646 | | 788,547,307 | | 781,412,350 | | (638) | | 461 | | 20,686,220 | | 20,692,426 | | 1,062,611 |
State Street Navigator Securities Lending Portfolio II
| 38,455,337 | | 38,455,337 | | 955,970,749 | | 936,844,103 | | — | | — | | 57,581,983 | | 57,581,983 | | 155,758 |
Total
| | | $75,050,998 | | $1,756,252,173 | | $1,728,999,146 | | $(590,127) | | $1,097,505 | | | | $102,811,403 | | $1,883,100 |
See accompanying notes to financial statements.
33
SPDR PORTFOLIO S&P 600 SMALL CAP ETF
SCHEDULE OF INVESTMENTS
June 30, 2024
| Security Description | | | Shares | | Value |
| COMMON STOCKS — 99.8% | | | | | |
| AEROSPACE & DEFENSE — 1.3% | | | | | |
AAR Corp. (a) (b)
| | | 283,655 | | $20,621,718 |
AeroVironment, Inc. (a)
| | | 239,459 | | 43,619,852 |
Mercury Systems, Inc. (a) (b)
| | | 447,379 | | 12,074,759 |
Moog, Inc. Class A
| | | 246,344 | | 41,213,351 |
National Presto Industries, Inc.
| | | 43,631 | | 3,277,997 |
Triumph Group, Inc. (a)
| | | 658,401 | | 10,145,959 |
| | | | | | 130,953,636 |
| AIR FREIGHT & LOGISTICS — 0.3% | | | | | |
Forward Air Corp. (b)
| | | 273,029 | | 5,198,472 |
Hub Group, Inc. Class A
| | | 528,852 | | 22,767,079 |
| | | | | | 27,965,551 |
| AIRLINES — 1.0% | | | | | |
Alaska Air Group, Inc. (a)
| | | 1,086,904 | | 43,910,922 |
Allegiant Travel Co. (b)
| | | 121,870 | | 6,121,530 |
JetBlue Airways Corp. (a) (b)
| | | 2,913,486 | | 17,743,130 |
SkyWest, Inc. (a)
| | | 344,889 | | 28,305,040 |
Sun Country Airlines Holdings, Inc. (a)
| | | 324,761 | | 4,078,998 |
| | | | | | 100,159,620 |
| AUTO COMPONENTS — 1.4% | | | | | |
American Axle & Manufacturing Holdings, Inc. (a)
| | | 991,513 | | 6,930,676 |
Dana, Inc.
| | | 1,105,162 | | 13,394,563 |
Dorman Products, Inc. (a)
| | | 239,075 | | 21,870,581 |
Fox Factory Holding Corp. (a)
| | | 356,499 | | 17,179,687 |
Gentherm, Inc. (a)
| | | 271,063 | | 13,368,827 |
LCI Industries (b)
| | | 218,012 | | 22,538,081 |
Patrick Industries, Inc.
| | | 180,364 | | 19,578,512 |
Phinia, Inc.
| | | 391,352 | | 15,403,615 |
Standard Motor Products, Inc.
| | | 163,374 | | 4,530,361 |
XPEL, Inc. (a) (b)
| | | 182,288 | | 6,482,161 |
| | | | | | 141,277,064 |
| AUTOMOBILES — 0.1% | | | | | |
Winnebago Industries, Inc. (b)
| | | 250,687 | | 13,587,235 |
| BANKS — 9.1% | | | | | |
Ameris Bancorp
| | | 554,365 | | 27,912,278 |
Atlantic Union Bankshares Corp.
| | | 768,952 | | 25,260,073 |
Axos Financial, Inc. (a)
| | | 434,245 | | 24,817,102 |
Banc of California, Inc.
| | | 1,189,097 | | 15,196,660 |
BancFirst Corp.
| | | 124,331 | | 10,903,829 |
Bancorp, Inc. (a)
| | | 443,371 | | 16,741,689 |
Bank of Hawaii Corp. (b)
| | | 339,981 | | 19,450,313 |
BankUnited, Inc.
| | | 640,387 | | 18,744,128 |
Banner Corp.
| | | 295,055 | | 14,646,530 |
Berkshire Hills Bancorp, Inc.
| | | 364,068 | | 8,300,750 |
Brookline Bancorp, Inc.
| | | 761,407 | | 6,357,748 |
Capitol Federal Financial, Inc.
| | | 1,057,333 | | 5,804,758 |
| Security Description | | | Shares | | Value |
Cathay General Bancorp
| | | 623,740 | | $23,527,473 |
Central Pacific Financial Corp.
| | | 226,541 | | 4,802,669 |
City Holding Co. (b)
| | | 126,473 | | 13,437,756 |
Comerica, Inc.
| | | 1,135,680 | | 57,965,107 |
Community Financial System, Inc.
| | | 452,030 | | 21,340,336 |
Customers Bancorp, Inc. (a)
| | | 244,017 | | 11,707,936 |
CVB Financial Corp.
| | | 1,136,255 | | 19,589,036 |
Dime Community Bancshares, Inc.
| | | 300,475 | | 6,129,690 |
Eagle Bancorp, Inc.
| | | 252,541 | | 4,773,025 |
FB Financial Corp.
| | | 301,839 | | 11,780,776 |
First BanCorp
| | | 1,416,684 | | 25,911,150 |
First Bancorp/Southern Pines NC
| | | 352,646 | | 11,256,460 |
First Commonwealth Financial Corp.
| | | 873,575 | | 12,064,071 |
First Financial Bancorp
| | | 817,640 | | 18,167,961 |
First Hawaiian, Inc.
| | | 1,095,073 | | 22,733,716 |
Fulton Financial Corp.
| | | 1,556,920 | | 26,436,502 |
Hanmi Financial Corp.
| | | 251,932 | | 4,212,303 |
Heritage Financial Corp.
| | | 297,188 | | 5,358,300 |
Hilltop Holdings, Inc.
| | | 396,958 | | 12,416,846 |
Hope Bancorp, Inc.
| | | 1,033,118 | | 11,095,687 |
Independent Bank Corp.
| | | 363,801 | | 18,451,987 |
Independent Bank Group, Inc.
| | | 308,333 | | 14,035,318 |
Lakeland Financial Corp.
| | | 218,444 | | 13,438,675 |
National Bank Holdings Corp. Class A
| | | 323,990 | | 12,651,810 |
NBT Bancorp, Inc. (b)
| | | 403,829 | | 15,587,799 |
Northwest Bancshares, Inc.
| | | 1,090,086 | | 12,590,493 |
OFG Bancorp
| | | 402,593 | | 15,077,108 |
Pacific Premier Bancorp, Inc.
| | | 826,024 | | 18,973,771 |
Park National Corp.
| | | 123,098 | | 17,521,769 |
Pathward Financial, Inc.
| | | 216,501 | | 12,247,462 |
Preferred Bank
| | | 105,562 | | 7,968,875 |
Provident Financial Services, Inc.
| | | 1,117,914 | | 16,042,066 |
Renasant Corp.
| | | 482,562 | | 14,737,443 |
S&T Bancorp, Inc.
| | | 327,473 | | 10,934,323 |
Seacoast Banking Corp. of Florida
| | | 720,953 | | 17,043,329 |
ServisFirst Bancshares, Inc. (b)
| | | 420,228 | | 26,554,207 |
Simmons First National Corp. Class A
| | | 1,074,891 | | 18,896,584 |
Southside Bancshares, Inc. (b)
| | | 246,433 | | 6,804,015 |
Stellar Bancorp, Inc.
| | | 403,807 | | 9,271,409 |
Tompkins Financial Corp.
| | | 105,014 | | 5,135,185 |
Triumph Financial, Inc. (a) (b)
| | | 184,936 | | 15,118,518 |
TrustCo Bank Corp.
| | | 159,123 | | 4,577,969 |
Trustmark Corp.
| | | 524,218 | | 15,747,509 |
United Community Banks, Inc. (b)
| | | 1,020,547 | | 25,983,127 |
Veritex Holdings, Inc.
| | | 467,005 | | 9,849,135 |
WaFd, Inc.
| | | 578,802 | | 16,542,161 |
Westamerica BanCorp
| | | 228,470 | | 11,087,649 |
See accompanying notes to financial statements.
34
SPDR PORTFOLIO S&P 600 SMALL CAP ETF
SCHEDULE OF INVESTMENTS (continued)
June 30, 2024
| Security Description | | | Shares | | Value |
WSFS Financial Corp.
| | | 514,755 | | $24,193,485 |
| | | | | | 925,905,839 |
| BEVERAGES — 0.2% | | | | | |
MGP Ingredients, Inc. (b)
| | | 133,843 | | 9,957,919 |
National Beverage Corp.
| | | 200,355 | | 10,266,190 |
| | | | | | 20,224,109 |
| BIOTECHNOLOGY — 1.7% | | | | | |
Alkermes PLC (a)
| | | 1,449,485 | | 34,932,589 |
Arcus Biosciences, Inc. (a) (b)
| | | 467,439 | | 7,119,096 |
Catalyst Pharmaceuticals, Inc. (a)
| | | 961,191 | | 14,888,849 |
Dynavax Technologies Corp. (a) (b)
| | | 1,121,173 | | 12,590,773 |
Ironwood Pharmaceuticals, Inc. (a)
| | | 1,213,645 | | 7,912,965 |
Krystal Biotech, Inc. (a)
| | | 212,870 | | 39,091,447 |
Myriad Genetics, Inc. (a)
| | | 775,281 | | 18,963,373 |
REGENXBIO, Inc. (a)
| | | 358,809 | | 4,198,065 |
Tobira Therapeutics, Inc. CVR (a)
| | | 740 | | 3,352 |
Vericel Corp. (a) (b)
| | | 416,298 | | 19,099,752 |
Vir Biotechnology, Inc. (a) (b)
| | | 745,923 | | 6,638,715 |
Xencor, Inc. (a)
| | | 528,146 | | 9,997,804 |
| | | | | | 175,436,780 |
| BROADLINE RETAIL — 0.2% | | | | | |
Kohl's Corp. (b)
| | | 949,950 | | 21,839,351 |
| BUILDING PRODUCTS — 1.9% | | | | | |
American Woodmark Corp. (a)
| | | 135,699 | | 10,665,941 |
Apogee Enterprises, Inc.
| | | 189,514 | | 11,908,112 |
Armstrong World Industries, Inc.
| | | 374,822 | | 42,444,843 |
AZZ, Inc.
| | | 254,467 | | 19,657,576 |
Gibraltar Industries, Inc. (a)
| | | 260,988 | | 17,890,727 |
Griffon Corp.
| | | 318,357 | | 20,330,278 |
Hayward Holdings, Inc. (a) (b)
| | | 1,085,856 | | 13,356,029 |
Insteel Industries, Inc. (b)
| | | 163,555 | | 5,063,663 |
Masterbrand, Inc. (a)
| | | 1,087,905 | | 15,970,445 |
Quanex Building Products Corp.
| | | 283,595 | | 7,841,402 |
Resideo Technologies, Inc. (a)
| | | 1,250,728 | | 24,464,240 |
| | | | | | 189,593,256 |
| CAPITAL MARKETS — 2.5% | | | | | |
Artisan Partners Asset Management, Inc. Class A (b)
| | | 598,828 | | 24,713,632 |
B Riley Financial, Inc. (b)
| | | 140,166 | | 2,472,528 |
BGC Group, Inc. Class A
| | | 3,288,356 | | 27,293,355 |
Brightsphere Investment Group, Inc.
| | | 252,279 | | 5,593,025 |
Cohen & Steers, Inc. (b)
| | | 223,544 | | 16,220,353 |
Donnelley Financial Solutions, Inc. (a)
| | | 213,449 | | 12,725,829 |
Moelis & Co. Class A (b)
| | | 602,684 | | 34,268,612 |
| Security Description | | | Shares | | Value |
Piper Sandler Cos.
| | | 133,249 | | $30,669,922 |
PJT Partners, Inc. Class A (b)
| | | 188,967 | | 20,391,429 |
StepStone Group, Inc. Class A (b)
| | | 445,590 | | 20,448,125 |
StoneX Group, Inc. (a)
| | | 233,631 | | 17,594,751 |
Virtu Financial, Inc. Class A
| | | 758,050 | | 17,018,223 |
Virtus Investment Partners, Inc.
| | | 57,344 | | 12,951,142 |
WisdomTree, Inc. (b)
| | | 956,213 | | 9,476,071 |
| | | | | | 251,836,997 |
| CHEMICALS — 2.3% | | | | | |
AdvanSix, Inc.
| | | 229,748 | | 5,265,824 |
Balchem Corp.
| | | 277,758 | | 42,760,844 |
Hawkins, Inc.
| | | 162,959 | | 14,829,269 |
HB Fuller Co.
| | | 466,764 | | 35,922,158 |
Ingevity Corp. (a)
| | | 289,355 | | 12,647,707 |
Innospec, Inc.
| | | 213,556 | | 26,393,386 |
Koppers Holdings, Inc.
| | | 183,718 | | 6,795,729 |
Mativ Holdings, Inc.
| | | 465,346 | | 7,892,268 |
Minerals Technologies, Inc.
| | | 276,187 | | 22,967,711 |
Quaker Chemical Corp.
| | | 118,632 | | 20,131,850 |
Sensient Technologies Corp.
| | | 362,879 | | 26,921,993 |
Stepan Co.
| | | 182,847 | | 15,351,834 |
| | | | | | 237,880,573 |
| COMMERCIAL SERVICES & SUPPLIES — 2.1% | | | | | |
ABM Industries, Inc.
| | | 542,149 | | 27,416,475 |
Brady Corp. Class A
| | | 383,664 | | 25,329,497 |
CoreCivic, Inc. (a)
| | | 952,986 | | 12,369,758 |
Deluxe Corp.
| | | 377,293 | | 8,474,001 |
Enviri Corp. (a)
| | | 673,685 | | 5,813,902 |
GEO Group, Inc. (a)
| | | 1,141,725 | | 16,395,171 |
Healthcare Services Group, Inc. (a)
| | | 630,784 | | 6,673,695 |
HNI Corp.
| | | 405,157 | | 18,240,168 |
Interface, Inc.
| | | 498,868 | | 7,323,382 |
Liquidity Services, Inc. (a)
| | | 185,251 | | 3,701,315 |
Matthews International Corp. Class A
| | | 263,026 | | 6,588,801 |
MillerKnoll, Inc.
| | | 613,687 | | 16,256,569 |
OPENLANE, Inc. (a)
| | | 927,648 | | 15,389,680 |
Pitney Bowes, Inc. (b)
| | | 1,311,220 | | 6,660,998 |
UniFirst Corp.
| | | 129,095 | | 22,143,665 |
Vestis Corp.
| | | 1,126,000 | | 13,770,980 |
Viad Corp. (a)
| | | 180,943 | | 6,152,062 |
| | | | | | 218,700,119 |
| COMMUNICATIONS EQUIPMENT — 0.8% | | | | | |
Calix, Inc. (a)
| | | 499,492 | | 17,697,001 |
Digi International, Inc. (a)
| | | 311,622 | | 7,145,492 |
Extreme Networks, Inc. (a)
| | | 1,113,048 | | 14,970,496 |
Harmonic, Inc. (a) (b)
| | | 993,371 | | 11,691,977 |
NetScout Systems, Inc. (a)
| | | 611,682 | | 11,187,664 |
Viasat, Inc. (a) (b)
| | | 644,071 | | 8,179,702 |
See accompanying notes to financial statements.
35
SPDR PORTFOLIO S&P 600 SMALL CAP ETF
SCHEDULE OF INVESTMENTS (continued)
June 30, 2024
| Security Description | | | Shares | | Value |
Viavi Solutions, Inc. (a)
| | | 1,912,199 | | $13,136,807 |
| | | | | | 84,009,139 |
| CONSTRUCTION & ENGINEERING — 1.2% | | | | | |
Arcosa, Inc.
| | | 416,148 | | 34,710,905 |
Dycom Industries, Inc. (a)
| | | 249,208 | | 42,056,342 |
Granite Construction, Inc.
| | | 378,162 | | 23,434,699 |
MYR Group, Inc. (a)
| | | 143,637 | | 19,492,977 |
| | | | | | 119,694,923 |
| CONSUMER FINANCE — 0.8% | | | | | |
Bread Financial Holdings, Inc.
| | | 424,708 | | 18,924,988 |
Encore Capital Group, Inc. (a) (b)
| | | 202,912 | | 8,467,518 |
Enova International, Inc. (a)
| | | 232,340 | | 14,463,165 |
EZCORP, Inc. Class A (a)
| | | 434,969 | | 4,554,125 |
Green Dot Corp. Class A (a)
| | | 392,470 | | 3,708,842 |
Navient Corp.
| | | 689,702 | | 10,042,061 |
PRA Group, Inc. (a)
| | | 337,054 | | 6,626,482 |
PROG Holdings, Inc.
| | | 369,794 | | 12,824,456 |
World Acceptance Corp. (a) (b)
| | | 29,271 | | 3,617,310 |
| | | | | | 83,228,947 |
| CONSUMER STAPLES DISTRIBUTION & RETAIL — 0.7% | | | | | |
Andersons, Inc.
| | | 272,164 | | 13,499,334 |
Chefs' Warehouse, Inc. (a)
| | | 303,208 | | 11,858,465 |
Grocery Outlet Holding Corp. (a) (b)
| | | 855,350 | | 18,920,342 |
PriceSmart, Inc.
| | | 215,457 | | 17,495,109 |
SpartanNash Co.
| | | 295,192 | | 5,537,802 |
United Natural Foods, Inc. (a)
| | | 501,370 | | 6,567,947 |
| | | | | | 73,878,999 |
| CONTAINERS & PACKAGING — 0.6% | | | | | |
Myers Industries, Inc.
| | | 311,335 | | 4,165,662 |
O-I Glass, Inc. (a)
| | | 1,333,831 | | 14,845,539 |
Sealed Air Corp.
| | | 1,247,283 | | 43,392,976 |
| | | | | | 62,404,177 |
| DIVERSIFIED CONSUMER SERVICES — 1.0% | | | | | |
Adtalem Global Education, Inc. (a)
| | | 322,145 | | 21,973,510 |
Frontdoor, Inc. (a)
| | | 666,295 | | 22,514,108 |
Mister Car Wash, Inc. (a) (b)
| | | 805,779 | | 5,737,146 |
Perdoceo Education Corp.
| | | 561,899 | | 12,035,877 |
Strategic Education, Inc.
| | | 187,802 | | 20,782,169 |
Stride, Inc. (a)
| | | 342,213 | | 24,126,017 |
| | | | | | 107,168,827 |
| Diversified REITs — 0.8% | | | | | |
Alexander & Baldwin, Inc. REIT
| | | 621,833 | | 10,546,288 |
| Security Description | | | Shares | | Value |
American Assets Trust, Inc. REIT
| | | 417,287 | | $9,338,883 |
Armada Hoffler Properties, Inc. REIT
| | | 574,557 | | 6,371,837 |
Essential Properties Realty Trust, Inc. REIT
| | | 1,501,573 | | 41,608,588 |
Global Net Lease, Inc. REIT
| | | 1,673,596 | | 12,300,930 |
| | | | | | 80,166,526 |
| DIVERSIFIED TELECOMMUNICATION SERVICES — 0.4% | | | | | |
Cogent Communications Holdings, Inc. (b)
| | | 361,520 | | 20,404,189 |
Consolidated Communications Holdings, Inc. (a)
| | | 653,640 | | 2,876,016 |
Lumen Technologies, Inc. (a) (b)
| | | 8,694,443 | | 9,563,887 |
Shenandoah Telecommunications Co. (b)
| | | 429,877 | | 7,019,892 |
| | | | | | 39,863,984 |
| ELECTRIC UTILITIES — 0.5% | | | | | |
MGE Energy, Inc. (b)
| | | 309,853 | | 23,152,216 |
Otter Tail Corp. (b)
| | | 358,170 | | 31,372,110 |
| | | | | | 54,524,326 |
| ELECTRICAL EQUIPMENT — 0.8% | | | | | |
Encore Wire Corp. (b)
| | | 135,247 | | 39,198,638 |
Powell Industries, Inc.
| | | 79,099 | | 11,342,797 |
SunPower Corp. (a) (b)
| | | 737,119 | | 2,181,872 |
Sunrun, Inc. (a) (b)
| | | 1,898,731 | | 22,518,950 |
Vicor Corp. (a)
| | | 193,859 | | 6,428,364 |
| | | | | | 81,670,621 |
| ELECTRONIC EQUIPMENT, INSTRUMENTS & COMPONENTS — 4.2% | | | | | |
Advanced Energy Industries, Inc. (b)
| | | 320,690 | | 34,878,244 |
Arlo Technologies, Inc. (a)
| | | 840,305 | | 10,957,577 |
Badger Meter, Inc.
| | | 251,746 | | 46,912,867 |
Benchmark Electronics, Inc.
| | | 308,738 | | 12,182,802 |
CTS Corp.
| | | 261,845 | | 13,257,212 |
ePlus, Inc. (a) (b)
| | | 228,268 | | 16,818,786 |
Fabrinet (a)
| | | 309,644 | | 75,797,755 |
Insight Enterprises, Inc. (a) (b)
| | | 237,014 | | 47,014,097 |
Itron, Inc. (a)
| | | 392,862 | | 38,877,624 |
Knowles Corp. (a)
| | | 768,729 | | 13,268,263 |
OSI Systems, Inc. (a)
| | | 134,353 | | 18,476,225 |
PC Connection, Inc.
| | | 97,142 | | 6,236,516 |
Plexus Corp. (a)
| | | 234,572 | | 24,203,139 |
Rogers Corp. (a)
| | | 143,878 | | 17,353,126 |
Sanmina Corp. (a)
| | | 474,989 | | 31,468,021 |
ScanSource, Inc. (a) (b)
| | | 211,669 | | 9,379,053 |
TTM Technologies, Inc. (a)
| | | 871,761 | | 16,938,316 |
| | | | | | 434,019,623 |
See accompanying notes to financial statements.
36
SPDR PORTFOLIO S&P 600 SMALL CAP ETF
SCHEDULE OF INVESTMENTS (continued)
June 30, 2024
| Security Description | | | Shares | | Value |
| ENERGY EQUIPMENT & SERVICES — 2.5% | | | | | |
Archrock, Inc.
| | | 1,178,004 | | $23,819,241 |
Bristow Group, Inc. (a)
| | | 206,721 | | 6,931,355 |
Cactus, Inc. Class A (b)
| | | 562,850 | | 29,684,709 |
Core Laboratories, Inc. (b)
| | | 401,694 | | 8,150,371 |
Dril-Quip, Inc. (a)
| | | 294,787 | | 5,483,038 |
Helix Energy Solutions Group, Inc. (a)
| | | 1,227,527 | | 14,656,672 |
Helmerich & Payne, Inc. (b)
| | | 845,619 | | 30,560,671 |
Liberty Energy, Inc. (b)
| | | 1,299,053 | | 27,137,217 |
Nabors Industries Ltd. (a) (b)
| | | 76,843 | | 5,468,148 |
Oceaneering International, Inc. (a)
| | | 868,493 | | 20,548,544 |
Patterson-UTI Energy, Inc.
| | | 2,649,459 | | 27,448,395 |
ProPetro Holding Corp. (a) (b)
| | | 706,010 | | 6,121,107 |
RPC, Inc. (b)
| | | 706,554 | | 4,415,963 |
Tidewater, Inc. (a)
| | | 415,750 | | 39,583,558 |
U.S. Silica Holdings, Inc. (a)
| | | 669,236 | | 10,339,696 |
| | | | | | 260,348,685 |
| ENTERTAINMENT — 0.5% | | | | | |
Cinemark Holdings, Inc. (a) (b)
| | | 913,980 | | 19,760,248 |
Madison Square Garden Sports Corp. (a)
| | | 142,981 | | 26,899,015 |
| | | | | | 46,659,263 |
| FINANCIAL SERVICES — 2.2% | | | | | |
EVERTEC, Inc.
| | | 551,697 | | 18,343,925 |
Jackson Financial, Inc. Class A
| | | 581,404 | | 43,175,061 |
Mr Cooper Group, Inc. (a)
| | | 554,388 | | 45,032,937 |
NCR Atleos Corp. (a)
| | | 586,815 | | 15,855,742 |
NMI Holdings, Inc. Class A (a)
| | | 687,652 | | 23,407,674 |
Payoneer Global, Inc. (a)
| | | 2,169,867 | | 12,021,063 |
Radian Group, Inc.
| | | 1,289,817 | | 40,113,309 |
Walker & Dunlop, Inc. (b)
| | | 288,836 | | 28,363,695 |
| | | | | | 226,313,406 |
| FOOD PRODUCTS — 1.2% | | | | | |
B&G Foods, Inc. (b)
| | | 664,341 | | 5,367,875 |
Calavo Growers, Inc. (b)
| | | 148,122 | | 3,362,369 |
Cal-Maine Foods, Inc.
| | | 348,585 | | 21,302,029 |
Fresh Del Monte Produce, Inc.
| | | 287,225 | | 6,275,866 |
Hain Celestial Group, Inc. (a)
| | | 754,505 | | 5,213,630 |
J & J Snack Foods Corp.
| | | 132,820 | | 21,565,983 |
John B Sanfilippo & Son, Inc.
| | | 77,121 | | 7,493,848 |
Simply Good Foods Co. (a)
| | | 779,430 | | 28,160,806 |
Tootsie Roll Industries, Inc. (b)
| | | 148,194 | | 4,530,291 |
TreeHouse Foods, Inc. (a)
| | | 410,004 | | 15,022,547 |
WK Kellogg Co. (b)
| | | 566,437 | | 9,323,553 |
| | | | | | 127,618,797 |
| GAS UTILITIES — 0.3% | | | | | |
Chesapeake Utilities Corp.
| | | 190,732 | | 20,255,738 |
| Security Description | | | Shares | | Value |
Northwest Natural Holding Co. (b)
| | | 326,828 | | $11,801,759 |
| | | | | | 32,057,497 |
| GROUND TRANSPORTATION — 0.8% | | | | | |
ArcBest Corp.
| | | 200,737 | | 21,494,918 |
Heartland Express, Inc. (b)
| | | 383,896 | | 4,733,438 |
Hertz Global Holdings, Inc. (a)
| | | 1,126,400 | | 3,976,192 |
Marten Transport Ltd.
| | | 494,780 | | 9,128,691 |
RXO, Inc. (a) (b)
| | | 1,006,851 | | 26,329,153 |
Werner Enterprises, Inc. (b)
| | | 543,190 | | 19,462,498 |
| | | | | | 85,124,890 |
| HEALTH CARE EQUIPMENT & SUPPLIES — 3.1% | | | | | |
Artivion, Inc. (a)
| | | 339,574 | | 8,710,073 |
Avanos Medical, Inc. (a)
| | | 393,164 | | 7,831,827 |
CONMED Corp. (b)
| | | 263,801 | | 18,286,685 |
Embecta Corp. (b)
| | | 493,945 | | 6,174,313 |
Glaukos Corp. (a)
| | | 431,434 | | 51,060,214 |
ICU Medical, Inc. (a)
| | | 175,299 | | 20,816,756 |
Inari Medical, Inc. (a) (b)
| | | 443,226 | | 21,341,332 |
Integer Holdings Corp. (a) (b)
| | | 286,994 | | 33,231,035 |
Integra LifeSciences Holdings Corp. (a)
| | | 587,200 | | 17,111,008 |
LeMaitre Vascular, Inc.
| | | 171,091 | | 14,077,368 |
Merit Medical Systems, Inc. (a) (b)
| | | 497,715 | | 42,778,604 |
Omnicell, Inc. (a)
| | | 393,359 | | 10,648,228 |
STAAR Surgical Co. (a)
| | | 420,704 | | 20,029,717 |
Tandem Diabetes Care, Inc. (a)
| | | 553,274 | | 22,291,410 |
UFP Technologies, Inc. (a)
| | | 60,458 | | 15,953,052 |
Varex Imaging Corp. (a)
| | | 343,278 | | 5,056,485 |
| | | | | | 315,398,107 |
| HEALTH CARE PROVIDERS & SERVICES — 3.1% | | | | | |
AdaptHealth Corp. (a)
| | | 669,114 | | 6,691,140 |
Addus HomeCare Corp. (a)
| | | 151,299 | | 17,567,327 |
AMN Healthcare Services, Inc. (a) (b)
| | | 325,478 | | 16,674,238 |
Astrana Health, Inc. (a) (b)
| | | 362,515 | | 14,703,608 |
CorVel Corp. (a)
| | | 77,616 | | 19,735,420 |
Cross Country Healthcare, Inc. (a)
| | | 280,020 | | 3,875,477 |
Enhabit, Inc. (a) (b)
| | | 417,892 | | 3,727,597 |
Ensign Group, Inc.
| | | 483,676 | | 59,825,884 |
Fulgent Genetics, Inc. (a)
| | | 169,177 | | 3,319,253 |
National HealthCare Corp.
| | | 116,126 | | 12,588,058 |
NeoGenomics, Inc. (a)
| | | 1,093,896 | | 15,172,337 |
OmniAb, Inc. (a) (c)
| | | 84,362 | | — |
Owens & Minor, Inc. (a)
| | | 627,802 | | 8,475,327 |
Patterson Cos., Inc.
| | | 682,997 | | 16,473,888 |
Pediatrix Medical Group, Inc. (a)
| | | 709,183 | | 5,354,332 |
Premier, Inc. Class A
| | | 897,898 | | 16,763,756 |
See accompanying notes to financial statements.
37
SPDR PORTFOLIO S&P 600 SMALL CAP ETF
SCHEDULE OF INVESTMENTS (continued)
June 30, 2024
| Security Description | | | Shares | | Value |
Privia Health Group, Inc. (a)
| | | 889,170 | | $15,453,775 |
RadNet, Inc. (a)
| | | 569,581 | | 33,559,712 |
Select Medical Holdings Corp.
| | | 913,338 | | 32,021,630 |
U.S. Physical Therapy, Inc.
| | | 129,062 | | 11,927,910 |
| | | | | | 313,910,669 |
| HEALTH CARE REITs — 0.7% | | | | | |
CareTrust REIT, Inc.
| | | 1,216,899 | | 30,544,165 |
Community Healthcare Trust, Inc. REIT
| | | 205,186 | | 4,799,301 |
LTC Properties, Inc. REIT (b)
| | | 367,951 | | 12,694,309 |
Medical Properties Trust, Inc. REIT (b)
| | | 5,142,031 | | 22,162,154 |
Universal Health Realty Income Trust REIT
| | | 108,988 | | 4,265,790 |
| | | | | | 74,465,719 |
| HEALTH CARE TECHNOLOGY — 0.3% | | | | | |
Certara, Inc. (a) (b)
| | | 923,055 | | 12,784,312 |
HealthStream, Inc.
| | | 201,912 | | 5,633,345 |
Schrodinger, Inc. (a) (b)
| | | 473,339 | | 9,154,376 |
Simulations Plus, Inc. (b)
| | | 136,935 | | 6,657,780 |
| | | | | | 34,229,813 |
| HOTEL & RESORT REITs — 1.0% | | | | | |
Apple Hospitality REIT, Inc.
| | | 1,930,571 | | 28,070,502 |
DiamondRock Hospitality Co. REIT
| | | 1,799,295 | | 15,204,043 |
Pebblebrook Hotel Trust REIT (b)
| | | 1,032,200 | | 14,192,750 |
Service Properties Trust REIT
| | | 1,419,860 | | 7,298,081 |
Summit Hotel Properties, Inc. REIT
| | | 909,212 | | 5,446,180 |
Sunstone Hotel Investors, Inc. REIT (b)
| | | 1,744,603 | | 18,248,547 |
Xenia Hotels & Resorts, Inc. REIT
| | | 873,364 | | 12,515,306 |
| | | | | | 100,975,409 |
| HOTELS, RESTAURANTS & LEISURE — 2.1% | | | | | |
BJ's Restaurants, Inc. (a) (b)
| | | 200,297 | | 6,950,306 |
Bloomin' Brands, Inc.
| | | 740,709 | | 14,243,834 |
Brinker International, Inc. (a) (b)
| | | 381,063 | | 27,585,151 |
Cheesecake Factory, Inc. (b)
| | | 401,591 | | 15,778,510 |
Chuy's Holdings, Inc. (a)
| | | 147,616 | | 3,826,207 |
Cracker Barrel Old Country Store, Inc. (b)
| | | 190,141 | | 8,016,344 |
Dave & Buster's Entertainment, Inc. (a)
| | | 276,267 | | 10,998,189 |
Dine Brands Global, Inc. (b)
| | | 131,948 | | 4,776,518 |
Golden Entertainment, Inc.
| | | 182,508 | | 5,677,824 |
Jack in the Box, Inc. (b)
| | | 166,064 | | 8,459,300 |
Monarch Casino & Resort, Inc.
| | | 112,324 | | 7,652,634 |
Papa John's International, Inc. (b)
| | | 282,382 | | 13,266,306 |
| Security Description | | | Shares | | Value |
Penn Entertainment, Inc. (a)
| | | 1,280,090 | | $24,776,142 |
Sabre Corp. (a) (b)
| | | 3,271,516 | | 8,734,948 |
Shake Shack, Inc. Class A (a)
| | | 322,483 | | 29,023,470 |
Six Flags Entertainment Corp. (b)
| | | 620,733 | | 20,571,092 |
| | | | | | 210,336,775 |
| HOUSEHOLD DURABLES — 3.0% | | | | | |
Cavco Industries, Inc. (a)
| | | 66,532 | | 23,031,382 |
Century Communities, Inc.
| | | 242,341 | | 19,789,566 |
Ethan Allen Interiors, Inc.
| | | 195,863 | | 5,462,619 |
Green Brick Partners, Inc. (a)
| | | 215,498 | | 12,335,106 |
Installed Building Products, Inc. (b)
| | | 201,071 | | 41,356,283 |
La-Z-Boy, Inc.
| | | 365,234 | | 13,615,924 |
Leggett & Platt, Inc. (b)
| | | 1,148,160 | | 13,157,914 |
LGI Homes, Inc. (a)
| | | 175,656 | | 15,719,455 |
M/I Homes, Inc. (a)
| | | 237,671 | | 29,029,136 |
Meritage Homes Corp.
| | | 311,083 | | 50,348,784 |
Newell Brands, Inc.
| | | 3,271,930 | | 20,973,071 |
Sonos, Inc. (a)
| | | 1,052,749 | | 15,538,575 |
Tri Pointe Homes, Inc. (a)
| | | 812,654 | | 30,271,362 |
Worthington Enterprises, Inc.
| | | 262,046 | | 12,402,637 |
| | | | | | 303,031,814 |
| HOUSEHOLD PRODUCTS — 0.6% | | | | | |
Central Garden & Pet Co. Class A (a)
| | | 464,011 | | 15,326,283 |
Central Garden & Pet Co. (a) (b)
| | | 81,651 | | 3,143,564 |
Energizer Holdings, Inc.
| | | 571,902 | | 16,893,985 |
WD-40 Co. (b)
| | | 116,106 | | 25,501,522 |
| | | | | | 60,865,354 |
| INDEPENDENT POWER AND RENEWABLE ELECTRICITY PRODUCERS — 0.2% | | | | | |
Clearway Energy, Inc. Class A
| | | 296,524 | | 6,719,234 |
Clearway Energy, Inc. Class C
| | | 706,273 | | 17,437,880 |
| | | | | | 24,157,114 |
| INDUSTRIAL REITs — 0.5% | | | | | |
Innovative Industrial Properties, Inc. REIT
| | | 242,690 | | 26,506,602 |
LXP Industrial Trust REIT
| | | 2,521,016 | | 22,991,666 |
| | | | | | 49,498,268 |
| INSURANCE — 2.3% | | | | | |
Ambac Financial Group, Inc. (a)
| | | 379,051 | | 4,859,434 |
AMERISAFE, Inc.
| | | 163,859 | | 7,191,772 |
Assured Guaranty Ltd.
| | | 442,799 | | 34,161,943 |
Employers Holdings, Inc.
| | | 217,088 | | 9,254,461 |
Genworth Financial, Inc. Class A (a)
| | | 3,749,397 | | 22,646,358 |
See accompanying notes to financial statements.
38
SPDR PORTFOLIO S&P 600 SMALL CAP ETF
SCHEDULE OF INVESTMENTS (continued)
June 30, 2024
| Security Description | | | Shares | | Value |
Goosehead Insurance, Inc. Class A (a) (b)
| | | 217,528 | | $12,494,808 |
HCI Group, Inc.
| | | 60,396 | | 5,566,699 |
Horace Mann Educators Corp.
| | | 350,924 | | 11,447,141 |
Lincoln National Corp. (b)
| | | 1,456,375 | | 45,293,262 |
Mercury General Corp.
| | | 227,703 | | 12,100,137 |
Palomar Holdings, Inc. (a)
| | | 213,510 | | 17,326,337 |
ProAssurance Corp. (a)
| | | 436,912 | | 5,339,065 |
Safety Insurance Group, Inc.
| | | 127,092 | | 9,535,713 |
SiriusPoint Ltd. (a) (b)
| | | 780,055 | | 9,516,671 |
Stewart Information Services Corp. (b)
| | | 236,236 | | 14,665,531 |
Trupanion, Inc. (a)
| | | 309,533 | | 9,100,270 |
United Fire Group, Inc.
| | | 177,191 | | 3,807,835 |
| | | | | | 234,307,437 |
| INTERACTIVE MEDIA & SERVICES — 1.1% | | | | | |
Cargurus, Inc. (a)
| | | 672,368 | | 17,616,042 |
Cars.com, Inc. (a)
| | | 526,651 | | 10,375,025 |
IAC, Inc. (a) (b)
| | | 598,482 | | 28,038,882 |
QuinStreet, Inc. (a)
| | | 449,789 | | 7,461,999 |
Shutterstock, Inc. (b)
| | | 205,687 | | 7,960,087 |
TripAdvisor, Inc. (a)
| | | 931,752 | | 16,594,503 |
Yelp, Inc. (a)
| | | 577,870 | | 21,352,296 |
| | | | | | 109,398,834 |
| IT SERVICES — 0.7% | | | | | |
DigitalOcean Holdings, Inc. (a) (b)
| | | 451,588 | | 15,692,683 |
DXC Technology Co. (a) (b)
| | | 1,532,522 | | 29,255,845 |
Perficient, Inc. (a)
| | | 301,142 | | 22,522,410 |
| | | | | | 67,470,938 |
| LEISURE EQUIPMENT & PRODUCTS — 0.4% | | | | | |
Sturm Ruger & Co., Inc. (b)
| | | 149,089 | | 6,209,557 |
Topgolf Callaway Brands Corp. (a)
| | | 1,210,729 | | 18,524,154 |
Vista Outdoor, Inc. (a) (b)
| | | 498,496 | | 18,768,374 |
| | | | | | 43,502,085 |
| LIFE SCIENCES TOOLS & SERVICES — 0.3% | | | | | |
BioLife Solutions, Inc. (a) (b)
| | | 315,444 | | 6,759,965 |
Cytek Biosciences, Inc. (a) (b)
| | | 820,863 | | 4,580,416 |
Fortrea Holdings, Inc. (a) (b)
| | | 765,758 | | 17,872,792 |
Mesa Laboratories, Inc.
| | | 42,742 | | 3,708,723 |
| | | | | | 32,921,896 |
| MACHINERY — 4.7% | | | | | |
3D Systems Corp. (a) (b)
| | | 1,142,962 | | 3,508,893 |
Alamo Group, Inc.
| | | 88,814 | | 15,364,822 |
Albany International Corp. Class A
| | | 267,205 | | 22,565,462 |
Astec Industries, Inc.
| | | 194,993 | | 5,783,492 |
Barnes Group, Inc.
| | | 434,333 | | 17,985,730 |
Enerpac Tool Group Corp.
| | | 464,679 | | 17,741,444 |
Enpro, Inc.
| | | 179,460 | | 26,123,992 |
| Security Description | | | Shares | | Value |
ESCO Technologies, Inc.
| | | 220,592 | | $23,170,984 |
Federal Signal Corp.
| | | 523,418 | | 43,794,384 |
Franklin Electric Co., Inc.
| | | 339,406 | | 32,691,586 |
Greenbrier Cos., Inc. (b)
| | | 266,671 | | 13,213,548 |
Hillenbrand, Inc. (b)
| | | 601,269 | | 24,062,785 |
John Bean Technologies Corp. (b)
| | | 272,620 | | 25,890,721 |
Kennametal, Inc.
| | | 673,801 | | 15,861,276 |
Lindsay Corp. (b)
| | | 94,502 | | 11,612,406 |
Mueller Industries, Inc. (b)
| | | 973,057 | | 55,405,866 |
Proto Labs, Inc. (a)
| | | 216,812 | | 6,697,323 |
SPX Technologies, Inc. (a)
| | | 396,036 | | 56,292,557 |
Standex International Corp.
| | | 101,548 | | 16,364,460 |
Tennant Co.
| | | 162,842 | | 16,030,166 |
Titan International, Inc. (a)
| | | 423,041 | | 3,134,734 |
Trinity Industries, Inc.
| | | 700,993 | | 20,973,711 |
Wabash National Corp.
| | | 385,600 | | 8,421,504 |
| | | | | | 482,691,846 |
| MARINE — 0.4% | | | | | |
Matson, Inc.
| | | 292,698 | | 38,334,657 |
| MEDIA — 0.7% | | | | | |
AMC Networks, Inc. Class A (a) (b)
| | | 255,042 | | 2,463,706 |
Cable One, Inc. (b)
| | | 39,012 | | 13,810,248 |
EchoStar Corp. Class A (a)
| | | 1,032,544 | | 18,389,609 |
John Wiley & Sons, Inc. Class A
| | | 360,309 | | 14,664,576 |
Scholastic Corp.
| | | 218,042 | | 7,733,950 |
TechTarget, Inc. (a) (b)
| | | 219,136 | | 6,830,469 |
Thryv Holdings, Inc. (a)
| | | 272,339 | | 4,853,081 |
| | | | | | 68,745,639 |
| METALS & MINING — 2.5% | | | | | |
Alpha Metallurgical Resources, Inc.
| | | 99,194 | | 27,826,893 |
Arch Resources, Inc.
| | | 155,129 | | 23,615,288 |
ATI, Inc. (a) (b)
| | | 1,065,883 | | 59,103,212 |
Carpenter Technology Corp.
| | | 424,891 | | 46,559,556 |
Century Aluminum Co. (a)
| | | 444,665 | | 7,448,139 |
Compass Minerals International, Inc. (b)
| | | 281,262 | | 2,905,436 |
Ferroglobe PLC (a) (c)
| | | 5,429 | | — |
Haynes International, Inc.
| | | 108,804 | | 6,386,795 |
Kaiser Aluminum Corp.
| | | 136,353 | | 11,985,429 |
Materion Corp.
| | | 177,587 | | 19,202,482 |
Metallus, Inc. (a)
| | | 334,407 | | 6,778,430 |
Olympic Steel, Inc. (b)
| | | 81,632 | | 3,659,562 |
SunCoke Energy, Inc.
| | | 720,184 | | 7,057,803 |
Warrior Met Coal, Inc.
| | | 447,957 | | 28,118,261 |
Worthington Steel, Inc.
| | | 263,242 | | 8,781,753 |
| | | | | | 259,429,039 |
See accompanying notes to financial statements.
39
SPDR PORTFOLIO S&P 600 SMALL CAP ETF
SCHEDULE OF INVESTMENTS (continued)
June 30, 2024
| Security Description | | | Shares | | Value |
| MORTGAGE REAL ESTATE INVESTMENT TRUST (REITs) — 1.6% | | | | | |
Apollo Commercial Real Estate Finance, Inc. REIT (b)
| | | 1,120,314 | | $10,967,874 |
Arbor Realty Trust, Inc. REIT (b)
| | | 1,614,781 | | 23,172,107 |
ARMOUR Residential REIT, Inc. (b)
| | | 417,574 | | 8,092,584 |
Blackstone Mortgage Trust, Inc. Class A REIT (b)
| | | 1,486,816 | | 25,900,335 |
Ellington Financial, Inc. REIT (b)
| | | 703,013 | | 8,492,397 |
Franklin BSP Realty Trust, Inc. REIT
| | | 701,230 | | 8,835,498 |
Hannon Armstrong Sustainable Infrastructure Capital, Inc. REIT (b)
| | | 974,078 | | 28,832,709 |
KKR Real Estate Finance Trust, Inc. REIT
| | | 487,676 | | 4,413,468 |
New York Mortgage Trust, Inc. REIT (b)
| | | 781,431 | | 4,563,557 |
PennyMac Mortgage Investment Trust REIT (b)
| | | 743,865 | | 10,228,144 |
Ready Capital Corp. REIT (b)
| | | 1,330,812 | | 10,886,042 |
Redwood Trust, Inc. REIT (b)
| | | 1,131,980 | | 7,346,550 |
Two Harbors Investment Corp. REIT
| | | 886,456 | | 11,710,084 |
| | | | | | 163,441,349 |
| MULTI-UTILITIES — 0.3% | | | | | |
Avista Corp.
| | | 669,727 | | 23,179,252 |
Unitil Corp.
| | | 138,541 | | 7,175,038 |
| | | | | | 30,354,290 |
| OFFICE REITs — 1.1% | | | | | |
Brandywine Realty Trust REIT
| | | 1,475,623 | | 6,610,791 |
Douglas Emmett, Inc. REIT (b)
| | | 1,433,702 | | 19,082,574 |
Easterly Government Properties, Inc. REIT (b)
| | | 882,220 | | 10,913,061 |
Highwoods Properties, Inc. REIT
| | | 907,907 | | 23,850,717 |
Hudson Pacific Properties, Inc. REIT (b)
| | | 1,086,678 | | 5,226,921 |
JBG SMITH Properties REIT
| | | 716,382 | | 10,910,498 |
SL Green Realty Corp. REIT (b)
| | | 555,083 | | 31,439,901 |
| | | | | | 108,034,463 |
| OIL, GAS & CONSUMABLE FUELS — 2.7% | | | | | |
California Resources Corp.
| | | 549,629 | | 29,251,255 |
Comstock Resources, Inc. (b)
| | | 820,147 | | 8,513,126 |
CONSOL Energy, Inc. (a)
| | | 226,508 | | 23,110,611 |
CVR Energy, Inc. (b)
| | | 249,676 | | 6,683,826 |
Dorian LPG Ltd.
| | | 292,083 | | 12,255,803 |
Green Plains, Inc. (a)
| | | 553,529 | | 8,778,970 |
Magnolia Oil & Gas Corp. Class A (b)
| | | 1,549,828 | | 39,272,641 |
| Security Description | | | Shares | | Value |
Northern Oil & Gas, Inc. (b)
| | | 784,008 | | $29,141,577 |
Par Pacific Holdings, Inc. (a)
| | | 456,623 | | 11,529,731 |
Peabody Energy Corp. (b)
| | | 905,131 | | 20,021,498 |
REX American Resources Corp. (a)
| | | 130,448 | | 5,947,124 |
SM Energy Co.
| | | 985,397 | | 42,598,712 |
Talos Energy, Inc. (a)
| | | 1,339,091 | | 16,269,956 |
Vital Energy, Inc. (a)
| | | 218,919 | | 9,811,950 |
World Kinect Corp. (b)
| | | 513,407 | | 13,245,901 |
| | | | | | 276,432,681 |
| PERSONAL CARE PRODUCTS — 0.4% | | | | | |
Edgewell Personal Care Co.
| | | 424,479 | | 17,059,811 |
Inter Parfums, Inc.
| | | 153,579 | | 17,819,771 |
Nu Skin Enterprises, Inc. Class A
| | | 425,466 | | 4,484,412 |
USANA Health Sciences, Inc. (a)
| | | 92,377 | | 4,179,136 |
| | | | | | 43,543,130 |
| PAPER & FOREST PRODUCTS — 0.3% | | | | | |
Clearwater Paper Corp. (a)
| | | 142,907 | | 6,926,702 |
Mercer International, Inc.
| | | 383,452 | | 3,274,680 |
Sylvamo Corp. (b)
| | | 299,451 | | 20,542,339 |
| | | | | | 30,743,721 |
| PHARMACEUTICALS — 1.8% | | | | | |
Amphastar Pharmaceuticals, Inc. (a) (b)
| | | 326,762 | | 13,070,480 |
ANI Pharmaceuticals, Inc. (a)
| | | 131,296 | | 8,360,929 |
Collegium Pharmaceutical, Inc. (a) (b)
| | | 280,245 | | 9,023,889 |
Corcept Therapeutics, Inc. (a)
| | | 784,738 | | 25,496,138 |
Harmony Biosciences Holdings, Inc. (a) (b)
| | | 272,424 | | 8,219,032 |
Innoviva, Inc. (a)
| | | 470,708 | | 7,719,611 |
Ligand Pharmaceuticals, Inc. (a)
| | | 145,021 | | 12,219,469 |
Organon & Co.
| | | 2,202,839 | | 45,598,767 |
Pacira BioSciences, Inc. (a) (b)
| | | 398,695 | | 11,406,664 |
Phibro Animal Health Corp. Class A
| | | 168,439 | | 2,824,722 |
Prestige Consumer Healthcare, Inc. (a)
| | | 427,553 | | 29,437,024 |
Supernus Pharmaceuticals, Inc. (a)
| | | 470,938 | | 12,597,592 |
| | | | | | 185,974,317 |
| PROFESSIONAL SERVICES — 1.5% | | | | | |
CSG Systems International, Inc.
| | | 243,564 | | 10,027,530 |
Heidrick & Struggles International, Inc.
| | | 170,306 | | 5,378,264 |
Kelly Services, Inc. Class A
| | | 270,974 | | 5,801,553 |
Korn Ferry
| | | 446,960 | | 30,008,894 |
See accompanying notes to financial statements.
40
SPDR PORTFOLIO S&P 600 SMALL CAP ETF
SCHEDULE OF INVESTMENTS (continued)
June 30, 2024
| Security Description | | | Shares | | Value |
NV5 Global, Inc. (a)
| | | 110,599 | | $10,282,389 |
Robert Half, Inc.
| | | 885,490 | | 56,653,650 |
Verra Mobility Corp. (a)
| | | 1,426,427 | | 38,798,815 |
| | | | | | 156,951,095 |
| REAL ESTATE MANAGEMENT & DEVELOPMENT — 0.6% | | | | | |
Cushman & Wakefield PLC (a)
| | | 1,687,261 | | 17,547,515 |
eXp World Holdings, Inc. (b)
| | | 663,190 | | 7,484,099 |
Kennedy-Wilson Holdings, Inc.
| | | 1,001,342 | | 9,733,044 |
Marcus & Millichap, Inc.
| | | 201,998 | | 6,366,977 |
St. Joe Co.
| | | 305,102 | | 16,689,079 |
| | | | | | 57,820,714 |
| RESIDENTIAL REITs — 0.4% | | | | | |
Centerspace REIT
| | | 127,768 | | 8,640,950 |
Elme Communities REIT
| | | 753,858 | | 12,008,958 |
NexPoint Residential Trust, Inc. REIT
| | | 195,695 | | 7,731,909 |
Veris Residential, Inc. REIT
| | | 689,528 | | 10,342,920 |
| | | | | | 38,724,737 |
| RETAIL REITs — 1.8% | | | | | |
Acadia Realty Trust REIT
| | | 883,823 | | 15,838,108 |
Getty Realty Corp. REIT
| | | 420,620 | | 11,213,729 |
Macerich Co. REIT
| | | 1,848,029 | | 28,533,568 |
Phillips Edison & Co., Inc. REIT
| | | 1,048,414 | | 34,293,622 |
Retail Opportunity Investments Corp. REIT
| | | 1,091,722 | | 13,570,104 |
Saul Centers, Inc. REIT
| | | 108,084 | | 3,974,249 |
SITE Centers Corp. REIT
| | | 1,543,572 | | 22,381,794 |
Tanger, Inc. REIT
| | | 936,707 | | 25,394,127 |
Urban Edge Properties REIT
| | | 1,017,761 | | 18,798,046 |
Whitestone REIT
| | | 406,556 | | 5,411,260 |
| | | | | | 179,408,607 |
| SEMICONDUCTORS & SEMICONDUCTOR EQUIPMENT — 3.0% | | | | | |
Alpha & Omega Semiconductor Ltd. (a)
| | | 199,109 | | 7,440,703 |
Axcelis Technologies, Inc. (a)
| | | 278,609 | | 39,615,414 |
CEVA, Inc. (a)
| | | 196,529 | | 3,791,045 |
Cohu, Inc. (a)
| | | 403,292 | | 13,348,965 |
Diodes, Inc. (a)
| | | 395,112 | | 28,420,406 |
FormFactor, Inc. (a)
| | | 661,056 | | 40,013,720 |
Ichor Holdings Ltd. (a) (b)
| | | 286,726 | | 11,053,287 |
Kulicke & Soffa Industries, Inc.
| | | 475,126 | | 23,371,448 |
MaxLinear, Inc. (a)
| | | 647,457 | | 13,039,784 |
PDF Solutions, Inc. (a)
| | | 263,211 | | 9,575,616 |
Photronics, Inc. (a)
| | | 542,712 | | 13,388,705 |
Semtech Corp. (a) (b)
| | | 552,991 | | 16,523,371 |
SiTime Corp. (a)
| | | 150,886 | | 18,767,201 |
SMART Global Holdings, Inc. (a) (b)
| | | 447,928 | | 10,244,113 |
| Security Description | | | Shares | | Value |
SolarEdge Technologies, Inc. (a) (b)
| | | 490,831 | | $12,398,391 |
Ultra Clean Holdings, Inc. (a)
| | | 384,678 | | 18,849,222 |
Veeco Instruments, Inc. (a)
| | | 485,161 | | 22,661,870 |
| | | | | | 302,503,261 |
| SOFTWARE — 4.0% | | | | | |
A10 Networks, Inc.
| | | 599,467 | | 8,302,618 |
ACI Worldwide, Inc. (a)
| | | 903,140 | | 35,755,313 |
Adeia, Inc.
| | | 929,460 | | 10,396,010 |
Agilysys, Inc. (a)
| | | 172,941 | | 18,010,076 |
Alarm.com Holdings, Inc. (a)
| | | 429,872 | | 27,314,067 |
BlackLine, Inc. (a) (b)
| | | 439,470 | | 21,292,322 |
Box, Inc. Class A (a)
| | | 1,236,487 | | 32,692,716 |
DoubleVerify Holdings, Inc. (a)
| | | 1,206,706 | | 23,494,566 |
Envestnet, Inc. (a)
| | | 429,546 | | 26,885,284 |
InterDigital, Inc. (b)
| | | 216,156 | | 25,195,143 |
LiveRamp Holdings, Inc. (a)
| | | 566,895 | | 17,539,731 |
Marathon Digital Holdings, Inc. (a) (b)
| | | 2,338,090 | | 46,411,086 |
N-able, Inc. (a)
| | | 601,374 | | 9,158,926 |
NCR Voyix Corp. (a)
| | | 1,171,140 | | 14,463,579 |
Progress Software Corp. (b)
| | | 370,200 | | 20,087,052 |
Sprinklr, Inc. Class A (a) (b)
| | | 1,026,278 | | 9,872,794 |
SPS Commerce, Inc. (a)
| | | 317,186 | | 59,681,718 |
| | | | | | 406,553,001 |
| SPECIALIZED REITs — 0.5% | | | | | |
Four Corners Property Trust, Inc. REIT
| | | 787,910 | | 19,437,740 |
Outfront Media, Inc. REIT
| | | 1,250,436 | | 17,881,235 |
Safehold, Inc. REIT (b)
| | | 385,528 | | 7,436,835 |
Uniti Group, Inc. REIT (b)
| | | 2,021,045 | | 5,901,451 |
| | | | | | 50,657,261 |
| SPECIALTY RETAIL — 4.6% | | | | | |
Abercrombie & Fitch Co. Class A (a)
| | | 437,689 | | 77,838,612 |
Academy Sports & Outdoors, Inc. (b)
| | | 632,080 | | 33,658,260 |
Advance Auto Parts, Inc. (b)
| | | 510,639 | | 32,338,768 |
American Eagle Outfitters, Inc. (b)
| | | 1,584,159 | | 31,619,814 |
Asbury Automotive Group, Inc. (a) (b)
| | | 172,785 | | 39,372,518 |
Boot Barn Holdings, Inc. (a) (b)
| | | 260,357 | | 33,567,828 |
Buckle, Inc. (b)
| | | 253,329 | | 9,357,973 |
Caleres, Inc. (b)
| | | 283,254 | | 9,517,334 |
Designer Brands, Inc. Class A (b)
| | | 377,449 | | 2,577,977 |
Foot Locker, Inc.
| | | 704,185 | | 17,548,290 |
Group 1 Automotive, Inc. (b)
| | | 113,186 | | 33,647,934 |
Guess?, Inc.
| | | 233,530 | | 4,764,012 |
Haverty Furniture Cos., Inc.
| | | 114,025 | | 2,883,692 |
Hibbett, Inc. (b)
| | | 101,152 | | 8,821,466 |
Leslie's, Inc. (a) (b)
| | | 1,582,489 | | 6,630,629 |
MarineMax, Inc. (a) (b)
| | | 173,792 | | 5,625,647 |
See accompanying notes to financial statements.
41
SPDR PORTFOLIO S&P 600 SMALL CAP ETF
SCHEDULE OF INVESTMENTS (continued)
June 30, 2024
| Security Description | | | Shares | | Value |
Monro, Inc.
| | | 256,178 | | $6,112,407 |
National Vision Holdings, Inc. (a)
| | | 672,959 | | 8,809,033 |
ODP Corp. (a)
| | | 273,691 | | 10,747,846 |
Sally Beauty Holdings, Inc. (a)
| | | 886,690 | | 9,514,184 |
Shoe Carnival, Inc. (b)
| | | 150,633 | | 5,556,851 |
Signet Jewelers Ltd. (b)
| | | 382,542 | | 34,268,112 |
Sonic Automotive, Inc. Class A (b)
| | | 127,323 | | 6,935,284 |
Upbound Group, Inc.
| | | 383,685 | | 11,779,130 |
Urban Outfitters, Inc. (a)
| | | 485,782 | | 19,941,351 |
Victoria's Secret & Co. (a) (b)
| | | 670,637 | | 11,850,156 |
| | | | | | 475,285,108 |
| TECHNOLOGY HARDWARE, STORAGE & PERIPHERALS — 0.1% | | | | | |
Corsair Gaming, Inc. (a)
| | | 377,953 | | 4,172,601 |
Xerox Holdings Corp. (b)
| | | 978,771 | | 11,373,319 |
| | | | | | 15,545,920 |
| TEXTILES, APPAREL & LUXURY GOODS — 1.4% | | | | | |
G-III Apparel Group Ltd. (a)
| | | 342,775 | | 9,278,919 |
Hanesbrands, Inc. (a) (b)
| | | 3,011,353 | | 14,845,970 |
Kontoor Brands, Inc. (b)
| | | 425,605 | | 28,153,771 |
Movado Group, Inc. (b)
| | | 136,268 | | 3,387,623 |
Oxford Industries, Inc. (b)
| | | 125,907 | | 12,609,586 |
Steven Madden Ltd. (b)
| | | 590,850 | | 24,992,955 |
VF Corp. (b)
| | | 2,830,852 | | 38,216,502 |
Wolverine World Wide, Inc. (b)
| | | 684,631 | | 9,256,211 |
| | | | | | 140,741,537 |
| TOBACCO — 0.2% | | | | | |
Universal Corp.
| | | 210,501 | | 10,144,043 |
Vector Group Ltd.
| | | 1,146,113 | | 12,114,415 |
| | | | | | 22,258,458 |
| TRADING COMPANIES & DISTRIBUTORS — 1.5% | | | | | |
Air Lease Corp.
| | | 887,199 | | 42,168,569 |
Boise Cascade Co.
| | | 338,118 | | 40,310,428 |
DNOW, Inc. (a)
| | | 914,860 | | 12,561,028 |
DXP Enterprises, Inc. (a)
| | | 111,842 | | 5,126,837 |
GMS, Inc. (a)
| | | 341,185 | | 27,502,923 |
Rush Enterprises, Inc. Class A
| | | 530,214 | | 22,200,060 |
| | | | | | 149,869,845 |
| WATER UTILITIES — 0.7% | | | | | |
American States Water Co.
| | | 318,877 | | 23,140,904 |
California Water Service Group
| | | 494,690 | | 23,987,518 |
Middlesex Water Co.
| | | 152,721 | | 7,981,199 |
| Security Description | | | Shares | | Value |
SJW Group
| | | 251,286 | | $13,624,727 |
| | | | | | 68,734,348 |
| WIRELESS TELECOMMUNICATION SERVICES — 0.2% | | | | | |
Gogo, Inc. (a) (b)
| | | 522,599 | | 5,027,402 |
Telephone & Data Systems, Inc.
| | | 844,387 | | 17,504,143 |
| | | | | | 22,531,545 |
TOTAL COMMON STOCKS
(Cost $9,449,877,140)
| | | | | 10,203,893,561 |
| | | | |
| SHORT-TERM INVESTMENTS — 7.4% | |
State Street Institutional Liquid Reserves Fund, Premier Class 5.36% (d) (e)
| 6,698,607 | 6,700,617 |
State Street Navigator Securities Lending Portfolio II (f) (g)
| 751,498,526 | 751,498,526 |
TOTAL SHORT-TERM INVESTMENTS
(Cost $758,198,806)
| | | 758,199,143 |
TOTAL INVESTMENTS — 107.2%
(Cost $10,208,075,946)
| 10,962,092,704 |
LIABILITIES IN EXCESS OF OTHER ASSETS — (7.2)%
| (740,329,023) |
NET ASSETS — 100.0%
| $10,221,763,681 |
| (a) | Non-income producing security. |
| (b) | All or a portion of the shares of the security are on loan at June 30, 2024. |
| (c) | Fair valued as determined in good faith by the Trust's Oversight Committee in accordance with policy and procedures approved by the Board of Trustees. Security value is determined based on Level 3 inputs. As of June 30, 2024, total aggregate fair value of the securities is $0, representing 0.00% of the Fund's net assets. |
| (d) | The Fund invested in certain money market funds managed by SSGA Funds Management, Inc. Amounts related to these investments during the year ended June 30, 2024 are shown in the Affiliate Table below. |
| (e) | The rate shown is the annualized seven-day yield at June 30, 2024. |
| (f) | The Fund invested in an affiliated entity. Amounts related to these investments during the year ended June 30, 2024 are shown in the Affiliate Table below. |
| (g) | Investment of cash collateral for securities loaned. |
| REIT | Real Estate Investment Trust |
See accompanying notes to financial statements.
42
SPDR PORTFOLIO S&P 600 SMALL CAP ETF
SCHEDULE OF INVESTMENTS (continued)
June 30, 2024
At June 30, 2024, open futures contracts were as follows:
| Description | | Number of
Contracts | | Expiration
Date | | Notional
Amount | | Value | | Unrealized
Appreciation
(Depreciation) |
| E-mini Russell 2000 Index (long) | | 83 | | 09/20/2024 | | $8,581,554 | | $8,569,750 | | $(11,804) |
During the year ended June 30, 2024, the average notional value related to futures contracts was $8,986,851.
The following table summarizes the value of the Fund's investments according to the fair value hierarchy as of June 30, 2024.
| Description | | Level 1 –
Quoted Prices | | Level 2 –
Other Significant
Observable Inputs | | Level 3 –
Significant
Unobservable Inputs | | Total |
| ASSETS: | | | | | | | | |
| INVESTMENTS: | | | | | | | | |
Common Stocks
| | $10,203,890,209 | | $3,352 | | $0(a) | | $10,203,893,561 |
Short-Term Investments
| | 758,199,143 | | — | | — | | 758,199,143 |
TOTAL INVESTMENTS
| | $10,962,089,352 | | $3,352 | | $0 | | $10,962,092,704 |
| OTHER FINANCIAL INSTRUMENTS: | | | | | | | | |
Futures Contracts - Unrealized Depreciation
| | $(11,804) | | $— | | $— | | $(11,804) |
TOTAL OTHER FINANCIAL INSTRUMENTS:
| | $(11,804) | | $— | | $— | | $(11,804) |
| (a) | The Fund held Level 3 securities that were valued at $0 at June 30, 2024. |
Affiliate Table
| | Number of
Shares Held
at
6/30/23 | | Value at
6/30/23 | | Cost of
Purchases | | Proceeds
from
Shares Sold | | Realized
Gain (Loss) | | Change in
Unrealized
Appreciation/
Depreciation | | Number of
Shares Held
at
6/30/24 | | Value at
6/30/24 | | Dividend
Income |
State Street Institutional Liquid Reserves Fund, Premier Class
| 4,663,221 | | $4,664,154 | | $436,536,581 | | $434,498,483 | | $(1,972) | | $337 | | 6,698,607 | | $6,700,617 | | $562,540 |
State Street Navigator Securities Lending Portfolio II
| 658,928,677 | | 658,928,677 | | 3,516,775,855 | | 3,424,206,006 | | — | | — | | 751,498,526 | | 751,498,526 | | 3,193,213 |
Total
| | | $663,592,831 | | $3,953,312,436 | | $3,858,704,489 | | $(1,972) | | $337 | | | | $758,199,143 | | $3,755,753 |
See accompanying notes to financial statements.
43
SPDR PORTFOLIO S&P 1500 COMPOSITE STOCK MARKET ETF
SCHEDULE OF INVESTMENTS
June 30, 2024
| Security Description | | | Shares | | Value |
| COMMON STOCKS — 99.8% | |
| AEROSPACE & DEFENSE — 1.4% | |
AAR Corp. (a)
| | 5,922 | | $430,529 |
AeroVironment, Inc. (a)
| | 3,628 | | 660,876 |
Axon Enterprise, Inc. (a)
| | 12,153 | | 3,575,899 |
Boeing Co. (a)
| | 98,382 | | 17,906,508 |
BWX Technologies, Inc.
| | 15,836 | | 1,504,420 |
Curtiss-Wright Corp.
| | 6,623 | | 1,794,701 |
General Dynamics Corp.
| | 39,001 | | 11,315,750 |
Hexcel Corp.
| | 14,892 | | 930,005 |
Howmet Aerospace, Inc.
| | 67,651 | | 5,251,747 |
Huntington Ingalls Industries, Inc.
| | 7,306 | | 1,799,687 |
L3Harris Technologies, Inc.
| | 32,678 | | 7,338,825 |
Lockheed Martin Corp.
| | 38,006 | | 17,752,603 |
Mercury Systems, Inc. (a)
| | 9,295 | | 250,872 |
Moog, Inc. Class A
| | 5,094 | | 852,226 |
National Presto Industries, Inc.
| | 108 | | 8,114 |
Northrop Grumman Corp.
| | 24,540 | | 10,698,213 |
RTX Corp.
| | 228,964 | | 22,985,696 |
Textron, Inc.
| | 34,174 | | 2,934,180 |
TransDigm Group, Inc.
| | 9,591 | | 12,253,557 |
Triumph Group, Inc. (a)
| | 11,531 | | 177,693 |
Woodward, Inc.
| | 10,020 | | 1,747,288 |
| | | | | | 122,169,389 |
| AIR FREIGHT & LOGISTICS — 0.4% | |
CH Robinson Worldwide, Inc.
| | 20,142 | | 1,774,913 |
Expeditors International of Washington, Inc.
| | 25,572 | | 3,191,130 |
FedEx Corp.
| | 39,958 | | 11,981,007 |
Forward Air Corp. (b)
| | 4,972 | | 94,667 |
GXO Logistics, Inc. (a)
| | 20,479 | | 1,034,189 |
Hub Group, Inc. Class A
| | 11,444 | | 492,664 |
United Parcel Service, Inc. Class B
| | 124,752 | | 17,072,311 |
| | | | | | 35,640,881 |
| AIRLINES — 0.2% | |
Alaska Air Group, Inc. (a)
| | 21,684 | | 876,034 |
Allegiant Travel Co. (b)
| | 2,361 | | 118,593 |
American Airlines Group, Inc. (a) (b)
| | 106,992 | | 1,212,219 |
Delta Air Lines, Inc.
| | 109,754 | | 5,206,730 |
JetBlue Airways Corp. (a) (b)
| | 52,462 | | 319,494 |
SkyWest, Inc. (a)
| | 8,650 | | 709,905 |
Southwest Airlines Co. (b)
| | 100,066 | | 2,862,888 |
Sun Country Airlines Holdings, Inc. (a)
| | 903 | | 11,342 |
United Airlines Holdings, Inc. (a)
| | 52,513 | | 2,555,282 |
| | | | | | 13,872,487 |
| AUTO COMPONENTS — 0.2% | |
Adient PLC (a)
| | 15,414 | | 380,880 |
American Axle & Manufacturing Holdings, Inc. (a)
| | 16,427 | | 114,825 |
Aptiv PLC (a)
| | 48,828 | | 3,438,468 |
| Security Description | | | Shares | | Value |
Autoliv, Inc.
| | 13,425 | | $1,436,341 |
BorgWarner, Inc.
| | 41,672 | | 1,343,505 |
Dana, Inc. (b)
| | 26,175 | | 317,241 |
Dorman Products, Inc. (a)
| | 5,120 | | 468,378 |
Fox Factory Holding Corp. (a) (b)
| | 6,434 | | 310,054 |
Gentex Corp.
| | 42,389 | | 1,428,933 |
Gentherm, Inc. (a)
| | 5,553 | | 273,874 |
Goodyear Tire & Rubber Co. (a)
| | 48,448 | | 549,885 |
LCI Industries (b)
| | 4,664 | | 482,164 |
Lear Corp.
| | 9,738 | | 1,112,177 |
Patrick Industries, Inc. (b)
| | 3,289 | | 357,021 |
Phinia, Inc.
| | 8,301 | | 326,727 |
Standard Motor Products, Inc.
| | 2,729 | | 75,675 |
Visteon Corp. (a)
| | 4,955 | | 528,699 |
XPEL, Inc. (a) (b)
| | 2,400 | | 85,344 |
| | | | | | 13,030,191 |
| AUTOMOBILES — 1.3% | |
Ford Motor Co.
| | 671,953 | | 8,426,291 |
General Motors Co.
| | 199,141 | | 9,252,091 |
Harley-Davidson, Inc. (b)
| | 21,793 | | 730,937 |
Tesla, Inc. (a)
| | 476,673 | | 94,324,053 |
Thor Industries, Inc. (b)
| | 9,335 | | 872,356 |
Winnebago Industries, Inc. (b)
| | 5,697 | | 308,777 |
| | | | | | 113,914,505 |
| BANKS — 4.2% | |
Ameris Bancorp
| | 9,693 | | 488,043 |
Associated Banc-Corp.
| | 27,354 | | 578,537 |
Atlantic Union Bankshares Corp. (b)
| | 13,052 | | 428,758 |
Axos Financial, Inc. (a)
| | 9,514 | | 543,725 |
Banc of California, Inc.
| | 22,939 | | 293,160 |
BancFirst Corp.
| | 3,019 | | 264,766 |
Bancorp, Inc. (a)
| | 9,099 | | 343,578 |
Bank of America Corp.
| | 1,185,727 | | 47,156,363 |
Bank of Hawaii Corp. (b)
| | 7,207 | | 412,312 |
Bank of New York Mellon Corp.
| | 132,390 | | 7,928,837 |
Bank OZK
| | 20,717 | | 849,397 |
BankUnited, Inc.
| | 15,540 | | 454,856 |
Banner Corp.
| | 5,470 | | 271,531 |
Berkshire Hills Bancorp, Inc.
| | 7,768 | | 177,110 |
Brookline Bancorp, Inc.
| | 14,697 | | 122,720 |
Cadence Bank (b)
| | 30,051 | | 849,842 |
Capitol Federal Financial, Inc.
| | 22,613 | | 124,145 |
Cathay General Bancorp
| | 12,900 | | 486,588 |
Central Pacific Financial Corp.
| | 5,764 | | 122,197 |
Citigroup, Inc.
| | 331,723 | | 21,051,142 |
Citizens Financial Group, Inc.
| | 80,287 | | 2,892,741 |
City Holding Co. (b)
| | 2,908 | | 308,975 |
Columbia Banking System, Inc.
| | 33,432 | | 664,962 |
Comerica, Inc.
| | 23,987 | | 1,224,297 |
Commerce Bancshares, Inc.
| | 21,172 | | 1,180,974 |
Community Financial System, Inc.
| | 9,320 | | 439,997 |
Cullen/Frost Bankers, Inc.
| | 10,058 | | 1,022,195 |
Customers Bancorp, Inc. (a)
| | 5,825 | | 279,484 |
See accompanying notes to financial statements.
44
SPDR PORTFOLIO S&P 1500 COMPOSITE STOCK MARKET ETF
SCHEDULE OF INVESTMENTS (continued)
June 30, 2024
| Security Description | | | Shares | | Value |
CVB Financial Corp.
| | 21,447 | | $369,746 |
Dime Community Bancshares, Inc.
| | 5,717 | | 116,627 |
Eagle Bancorp, Inc.
| | 5,926 | | 112,001 |
East West Bancorp, Inc.
| | 24,647 | | 1,804,900 |
FB Financial Corp.
| | 3,567 | | 139,220 |
Fifth Third Bancorp
| | 117,343 | | 4,281,846 |
First BanCorp (c)
| | 37,067 | | 677,955 |
First Bancorp/Southern Pines NC (c)
| | 1,899 | | 60,616 |
First Commonwealth Financial Corp.
| | 17,524 | | 242,006 |
First Financial Bancorp
| | 15,390 | | 341,966 |
First Financial Bankshares, Inc. (b)
| | 24,067 | | 710,699 |
First Hawaiian, Inc.
| | 22,908 | | 475,570 |
First Horizon Corp.
| | 84,428 | | 1,331,430 |
FNB Corp.
| | 57,405 | | 785,300 |
Fulton Financial Corp.
| | 28,908 | | 490,858 |
Glacier Bancorp, Inc. (b)
| | 15,811 | | 590,067 |
Goldman Sachs Group, Inc.
| | 56,217 | | 25,428,073 |
Hancock Whitney Corp.
| | 15,812 | | 756,288 |
Hanmi Financial Corp.
| | 5,824 | | 97,377 |
Heritage Financial Corp.
| | 5,718 | | 103,096 |
Hilltop Holdings, Inc.
| | 10,258 | | 320,870 |
Home BancShares, Inc.
| | 27,854 | | 667,382 |
Hope Bancorp, Inc.
| | 23,082 | | 247,901 |
Huntington Bancshares, Inc.
| | 251,791 | | 3,318,605 |
Independent Bank Corp.
| | 6,533 | | 331,354 |
Independent Bank Group, Inc.
| | 6,060 | | 275,851 |
International Bancshares Corp.
| | 9,563 | | 547,099 |
JPMorgan Chase & Co.
| | 494,009 | | 99,918,260 |
KeyCorp
| | 166,116 | | 2,360,508 |
Lakeland Financial Corp. (b)
| | 4,468 | | 274,871 |
M&T Bank Corp.
| | 28,589 | | 4,327,231 |
Morgan Stanley
| | 217,579 | | 21,146,503 |
National Bank Holdings Corp. Class A
| | 6,130 | | 239,377 |
NBT Bancorp, Inc.
| | 8,547 | | 329,914 |
New York Community Bancorp, Inc. (b)
| | 118,136 | | 380,398 |
Northern Trust Corp.
| | 35,834 | | 3,009,339 |
Northwest Bancshares, Inc.
| | 19,469 | | 224,867 |
OFG Bancorp
| | 8,182 | | 306,416 |
Old National Bancorp
| | 49,619 | | 852,951 |
Pacific Premier Bancorp, Inc.
| | 16,882 | | 387,780 |
Park National Corp.
| | 2,519 | | 358,554 |
Pathward Financial, Inc.
| | 5,878 | | 332,518 |
Pinnacle Financial Partners, Inc.
| | 12,760 | | 1,021,310 |
PNC Financial Services Group, Inc.
| | 68,758 | | 10,690,494 |
Preferred Bank (b)
| | 2,469 | | 186,385 |
Prosperity Bancshares, Inc.
| | 15,761 | | 963,628 |
Provident Financial Services, Inc.
| | 12,382 | | 177,682 |
Regions Financial Corp.
| | 166,515 | | 3,336,961 |
Renasant Corp.
| | 9,920 | | 302,957 |
| Security Description | | | Shares | | Value |
S&T Bancorp, Inc.
| | 6,619 | | $221,008 |
Seacoast Banking Corp. of Florida (b)
| | 7,713 | | 182,335 |
ServisFirst Bancshares, Inc. (b)
| | 8,129 | | 513,672 |
Simmons First National Corp. Class A
| | 19,987 | | 351,371 |
Southside Bancshares, Inc.
| | 5,694 | | 157,211 |
SouthState Corp.
| | 13,125 | | 1,003,013 |
State Street Corp. (d)
| | 54,943 | | 4,065,782 |
Stellar Bancorp, Inc.
| | 4,348 | | 99,830 |
Synovus Financial Corp. (b)
| | 25,850 | | 1,038,912 |
Texas Capital Bancshares, Inc. (a)
| | 8,639 | | 528,188 |
Tompkins Financial Corp.
| | 2,191 | | 107,140 |
Triumph Financial, Inc. (a)
| | 3,419 | | 279,503 |
Truist Financial Corp.
| | 231,405 | | 8,990,084 |
TrustCo Bank Corp.
| | 3,295 | | 94,797 |
Trustmark Corp.
| | 11,397 | | 342,366 |
U.S. Bancorp
| | 268,707 | | 10,667,668 |
UMB Financial Corp. (b)
| | 6,316 | | 526,881 |
United Bankshares, Inc.
| | 19,727 | | 639,944 |
United Community Banks, Inc.
| | 14,037 | | 357,382 |
Valley National Bancorp
| | 68,409 | | 477,495 |
Veritex Holdings, Inc.
| | 6,581 | | 138,793 |
WaFd, Inc.
| | 13,213 | | 377,628 |
Webster Financial Corp.
| | 31,645 | | 1,379,406 |
Wells Fargo & Co.
| | 599,947 | | 35,630,852 |
Westamerica BanCorp
| | 3,826 | | 185,676 |
Wintrust Financial Corp.
| | 9,572 | | 943,416 |
WSFS Financial Corp.
| | 8,894 | | 418,018 |
Zions Bancorp NA
| | 27,623 | | 1,198,010 |
| | | | | | 357,631,220 |
| BEVERAGES — 1.3% | |
Boston Beer Co., Inc. Class A (a)
| | 1,795 | | 547,565 |
Brown-Forman Corp. Class B
| | 31,645 | | 1,366,748 |
Celsius Holdings, Inc. (a) (b)
| | 25,603 | | 1,461,675 |
Coca-Cola Co.
| | 671,796 | | 42,759,815 |
Coca-Cola Consolidated, Inc.
| | 786 | | 852,810 |
Constellation Brands, Inc. Class A
| | 27,863 | | 7,168,593 |
Keurig Dr Pepper, Inc.
| | 173,656 | | 5,800,110 |
MGP Ingredients, Inc. (b)
| | 2,800 | | 208,320 |
Molson Coors Beverage Co. Class B
| | 32,981 | | 1,676,424 |
Monster Beverage Corp. (a)
| | 127,461 | | 6,366,677 |
National Beverage Corp.
| | 4,806 | | 246,260 |
PepsiCo, Inc.
| | 237,254 | | 39,130,302 |
| | | | | | 107,585,299 |
| BIOTECHNOLOGY — 2.0% | |
AbbVie, Inc.
| | 304,687 | | 52,259,914 |
Alkermes PLC (a)
| | 28,706 | | 691,815 |
Amgen, Inc.
| | 92,421 | | 28,876,941 |
Arcus Biosciences, Inc. (a)
| | 8,133 | | 123,866 |
Arrowhead Pharmaceuticals, Inc. (a) (b)
| | 16,864 | | 438,295 |
See accompanying notes to financial statements.
45
SPDR PORTFOLIO S&P 1500 COMPOSITE STOCK MARKET ETF
SCHEDULE OF INVESTMENTS (continued)
June 30, 2024
| Security Description | | | Shares | | Value |
Biogen, Inc. (a)
| | 25,063 | | $5,810,105 |
BioMarin Pharmaceutical, Inc. (a)
| | 32,639 | | 2,687,169 |
Catalyst Pharmaceuticals, Inc. (a)
| | 16,604 | | 257,196 |
Cytokinetics, Inc. (a) (b)
| | 18,999 | | 1,029,366 |
Dynavax Technologies Corp. (a) (b)
| | 19,573 | | 219,805 |
Exelixis, Inc. (a)
| | 54,137 | | 1,216,458 |
Gilead Sciences, Inc.
| | 215,661 | | 14,796,501 |
Halozyme Therapeutics, Inc. (a)
| | 22,425 | | 1,174,173 |
Incyte Corp. (a)
| | 31,950 | | 1,936,809 |
Ironwood Pharmaceuticals, Inc. (a) (b)
| | 23,617 | | 153,983 |
Krystal Biotech, Inc. (a)
| | 4,306 | | 790,754 |
Moderna, Inc. (a)
| | 57,127 | | 6,783,831 |
Myriad Genetics, Inc. (a)
| | 14,035 | | 343,296 |
Neurocrine Biosciences, Inc. (a)
| | 16,136 | | 2,221,443 |
Regeneron Pharmaceuticals, Inc. (a)
| | 18,464 | | 19,406,218 |
REGENXBIO, Inc. (a)
| | 6,118 | | 71,581 |
Roivant Sciences Ltd. (a) (b)
| | 58,275 | | 615,967 |
Sarepta Therapeutics, Inc. (a)
| | 16,148 | | 2,551,384 |
United Therapeutics Corp. (a)
| | 7,711 | | 2,456,339 |
Vericel Corp. (a)
| | 8,182 | | 375,390 |
Vertex Pharmaceuticals, Inc. (a)
| | 44,463 | | 20,840,697 |
Vir Biotechnology, Inc. (a)
| | 12,835 | | 114,232 |
Xencor, Inc. (a)
| | 9,897 | | 187,350 |
| | | | | | 168,430,878 |
| BROADLINE RETAIL — 3.7% | |
Amazon.com, Inc. (a)
| | 1,577,095 | | 304,773,609 |
eBay, Inc.
| | 91,019 | | 4,889,541 |
Etsy, Inc. (a)
| | 21,068 | | 1,242,591 |
Kohl's Corp. (b)
| | 19,092 | | 438,925 |
Macy's, Inc.
| | 53,126 | | 1,020,019 |
Nordstrom, Inc. (b)
| | 18,754 | | 397,960 |
Ollie's Bargain Outlet Holdings, Inc. (a)
| | 9,432 | | 925,939 |
| | | | | | 313,688,584 |
| BUILDING PRODUCTS — 0.7% | |
A O Smith Corp.
| | 21,107 | | 1,726,130 |
AAON, Inc. (b)
| | 9,979 | | 870,568 |
Advanced Drainage Systems, Inc.
| | 11,015 | | 1,766,696 |
Allegion PLC
| | 15,660 | | 1,850,229 |
American Woodmark Corp. (a)
| | 2,848 | | 223,853 |
Apogee Enterprises, Inc.
| | 5,441 | | 341,885 |
Armstrong World Industries, Inc.
| | 7,638 | | 864,927 |
AZZ, Inc.
| | 5,414 | | 418,232 |
Builders FirstSource, Inc. (a)
| | 21,182 | | 2,931,801 |
Carlisle Cos., Inc.
| | 8,419 | | 3,411,463 |
Carrier Global Corp.
| | 144,604 | | 9,121,620 |
Fortune Brands Innovations, Inc.
| | 21,675 | | 1,407,575 |
Gibraltar Industries, Inc. (a)
| | 5,538 | | 379,630 |
Griffon Corp.
| | 8,459 | | 540,192 |
| Security Description | | | Shares | | Value |
Hayward Holdings, Inc. (a) (b)
| | 21,624 | | $265,975 |
Insteel Industries, Inc.
| | 2,941 | | 91,053 |
Johnson Controls International PLC
| | 117,419 | | 7,804,841 |
Lennox International, Inc.
| | 5,787 | | 3,095,929 |
Masco Corp.
| | 38,801 | | 2,586,863 |
Masterbrand, Inc. (a)
| | 23,900 | | 350,852 |
Owens Corning
| | 15,474 | | 2,688,143 |
Quanex Building Products Corp.
| | 5,707 | | 157,799 |
Resideo Technologies, Inc. (a)
| | 25,474 | | 498,271 |
Simpson Manufacturing Co., Inc. (b)
| | 7,263 | | 1,224,033 |
Trane Technologies PLC
| | 39,359 | | 12,946,356 |
Trex Co., Inc. (a) (b)
| | 20,101 | | 1,489,886 |
UFP Industries, Inc.
| | 10,652 | | 1,193,024 |
| | | | | | 60,247,826 |
| CAPITAL MARKETS — 2.1% | |
Affiliated Managers Group, Inc.
| | 5,794 | | 905,197 |
Ameriprise Financial, Inc.
| | 17,774 | | 7,592,875 |
Artisan Partners Asset Management, Inc. Class A (b)
| | 11,830 | | 488,224 |
B Riley Financial, Inc. (b)
| | 2,947 | | 51,985 |
BGC Group, Inc. Class A
| | 66,620 | | 552,946 |
BlackRock, Inc.
| | 24,185 | | 19,041,334 |
Blackstone, Inc.
| | 122,490 | | 15,164,262 |
Brightsphere Investment Group, Inc. (b)
| | 4,852 | | 107,569 |
Carlyle Group, Inc. (b)
| | 37,224 | | 1,494,544 |
Cboe Global Markets, Inc.
| | 18,807 | | 3,198,318 |
Charles Schwab Corp.
| | 256,654 | | 18,912,833 |
CME Group, Inc.
| | 61,783 | | 12,146,538 |
Cohen & Steers, Inc. (b)
| | 4,454 | | 323,182 |
Donnelley Financial Solutions, Inc. (a)
| | 5,479 | | 326,658 |
Evercore, Inc. Class A
| | 6,396 | | 1,333,118 |
FactSet Research Systems, Inc.
| | 6,529 | | 2,665,595 |
Federated Hermes, Inc.
| | 16,289 | | 535,582 |
Franklin Resources, Inc.
| | 48,082 | | 1,074,633 |
Houlihan Lokey, Inc.
| | 8,838 | | 1,191,893 |
Interactive Brokers Group, Inc. Class A
| | 18,483 | | 2,266,016 |
Intercontinental Exchange, Inc.
| | 98,732 | | 13,515,423 |
Invesco Ltd.
| | 66,415 | | 993,568 |
Janus Henderson Group PLC
| | 26,083 | | 879,258 |
Jefferies Financial Group, Inc. (b)
| | 29,012 | | 1,443,637 |
KKR & Co., Inc.
| | 114,532 | | 12,053,348 |
MarketAxess Holdings, Inc.
| | 6,835 | | 1,370,623 |
Moelis & Co. Class A (b)
| | 11,430 | | 649,910 |
Moody's Corp.
| | 27,156 | | 11,430,775 |
Morningstar, Inc.
| | 4,570 | | 1,352,034 |
MSCI, Inc.
| | 13,618 | | 6,560,471 |
Nasdaq, Inc.
| | 60,396 | | 3,639,463 |
Piper Sandler Cos.
| | 2,504 | | 576,346 |
PJT Partners, Inc. Class A (b)
| | 3,846 | | 415,022 |
Raymond James Financial, Inc.
| | 32,097 | | 3,967,510 |
See accompanying notes to financial statements.
46
SPDR PORTFOLIO S&P 1500 COMPOSITE STOCK MARKET ETF
SCHEDULE OF INVESTMENTS (continued)
June 30, 2024
| Security Description | | | Shares | | Value |
S&P Global, Inc.
| | 55,791 | | $24,882,786 |
SEI Investments Co.
| | 17,227 | | 1,114,415 |
StepStone Group, Inc. Class A (b)
| | 8,909 | | 408,834 |
Stifel Financial Corp.
| | 17,984 | | 1,513,354 |
StoneX Group, Inc. (a)
| | 4,318 | | 325,189 |
T Rowe Price Group, Inc.
| | 38,784 | | 4,472,183 |
Virtu Financial, Inc. Class A
| | 6,018 | | 135,104 |
Virtus Investment Partners, Inc.
| | 850 | | 191,972 |
WisdomTree, Inc. (b)
| | 20,412 | | 202,283 |
| | | | | | 181,466,810 |
| CHEMICALS — 1.5% | |
AdvanSix, Inc.
| | 5,677 | | 130,117 |
Air Products & Chemicals, Inc.
| | 38,159 | | 9,846,930 |
Albemarle Corp. (b)
| | 20,533 | | 1,961,312 |
Arcadium Lithium PLC (a) (b)
| | 176,877 | | 594,307 |
Ashland, Inc.
| | 9,476 | | 895,387 |
Avient Corp.
| | 13,934 | | 608,219 |
Axalta Coating Systems Ltd. (a)
| | 38,375 | | 1,311,274 |
Balchem Corp.
| | 5,514 | | 848,880 |
Cabot Corp. (b)
| | 9,903 | | 909,987 |
Celanese Corp.
| | 17,361 | | 2,341,825 |
CF Industries Holdings, Inc.
| | 33,322 | | 2,469,827 |
Chemours Co.
| | 27,831 | | 628,146 |
Corteva, Inc.
| | 121,346 | | 6,545,403 |
Dow, Inc.
| | 121,354 | | 6,437,830 |
DuPont de Nemours, Inc.
| | 74,027 | | 5,958,433 |
Eastman Chemical Co.
| | 20,474 | | 2,005,838 |
Ecolab, Inc.
| | 42,991 | | 10,231,858 |
FMC Corp. (b)
| | 22,092 | | 1,271,394 |
Hawkins, Inc.
| | 3,807 | | 346,437 |
HB Fuller Co.
| | 9,224 | | 709,879 |
Ingevity Corp. (a)
| | 6,989 | | 305,489 |
Innospec, Inc.
| | 4,480 | | 553,683 |
International Flavors & Fragrances, Inc.
| | 42,495 | | 4,045,949 |
Koppers Holdings, Inc.
| | 3,019 | | 111,673 |
Linde PLC
| | 83,493 | | 36,637,563 |
LyondellBasell Industries NV Class A
| | 44,117 | | 4,220,232 |
Mativ Holdings, Inc.
| | 9,822 | | 166,581 |
Minerals Technologies, Inc.
| | 5,744 | | 477,671 |
Mosaic Co.
| | 59,493 | | 1,719,348 |
NewMarket Corp.
| | 1,137 | | 586,203 |
Olin Corp. (b)
| | 21,061 | | 993,026 |
PPG Industries, Inc.
| | 40,655 | | 5,118,058 |
Quaker Chemical Corp.
| | 2,361 | | 400,662 |
RPM International, Inc.
| | 22,823 | | 2,457,581 |
Scotts Miracle-Gro Co. (b)
| | 7,167 | | 466,285 |
Sensient Technologies Corp.
| | 7,516 | | 557,612 |
Sherwin-Williams Co.
| | 40,522 | | 12,092,980 |
Stepan Co.
| | 3,023 | | 253,811 |
Westlake Corp.
| | 5,880 | | 851,542 |
| | | | | | 128,069,232 |
| Security Description | | | Shares | | Value |
| COMMERCIAL SERVICES & SUPPLIES — 0.7% | |
ABM Industries, Inc.
| | 11,248 | | $568,811 |
Brady Corp. Class A
| | 8,502 | | 561,302 |
Brink's Co.
| | 8,596 | | 880,230 |
Cintas Corp.
| | 14,968 | | 10,481,492 |
Clean Harbors, Inc. (a)
| | 8,524 | | 1,927,703 |
Copart, Inc. (a)
| | 149,947 | | 8,121,129 |
CoreCivic, Inc. (a)
| | 23,887 | | 310,053 |
Deluxe Corp.
| | 8,760 | | 196,750 |
Enviri Corp. (a)
| | 14,497 | | 125,109 |
GEO Group, Inc. (a)
| | 23,988 | | 344,468 |
Healthcare Services Group, Inc. (a)
| | 12,790 | | 135,318 |
HNI Corp.
| | 7,583 | | 341,387 |
Interface, Inc.
| | 11,521 | | 169,128 |
Liquidity Services, Inc. (a)
| | 4,670 | | 93,307 |
Matthews International Corp. Class A
| | 5,792 | | 145,090 |
MillerKnoll, Inc.
| | 11,192 | | 296,476 |
MSA Safety, Inc.
| | 5,878 | | 1,103,242 |
OPENLANE, Inc. (a)
| | 21,905 | | 363,404 |
Pitney Bowes, Inc. (b)
| | 29,696 | | 150,856 |
RB Global, Inc. (b)
| | 31,636 | | 2,415,725 |
Republic Services, Inc.
| | 36,095 | | 7,014,702 |
Rollins, Inc.
| | 48,518 | | 2,367,193 |
Stericycle, Inc. (a)
| | 15,595 | | 906,537 |
Tetra Tech, Inc.
| | 9,629 | | 1,968,938 |
UniFirst Corp.
| | 2,623 | | 449,923 |
Veralto Corp.
| | 37,866 | | 3,615,067 |
Vestis Corp. (b)
| | 22,703 | | 277,658 |
Viad Corp. (a)
| | 3,029 | | 102,986 |
Waste Management, Inc.
| | 63,547 | | 13,557,117 |
| | | | | | 58,991,101 |
| COMMUNICATIONS EQUIPMENT — 0.8% | |
Arista Networks, Inc. (a)
| | 43,182 | | 15,134,427 |
Calix, Inc. (a)
| | 9,576 | | 339,278 |
Ciena Corp. (a)
| | 26,603 | | 1,281,732 |
Cisco Systems, Inc.
| | 697,688 | | 33,147,157 |
Digi International, Inc. (a)
| | 5,329 | | 122,194 |
Extreme Networks, Inc. (a)
| | 22,101 | | 297,258 |
F5, Inc. (a)
| | 10,674 | | 1,838,383 |
Harmonic, Inc. (a)
| | 22,219 | | 261,518 |
Juniper Networks, Inc.
| | 56,597 | | 2,063,526 |
Lumentum Holdings, Inc. (a) (b)
| | 13,067 | | 665,372 |
Motorola Solutions, Inc.
| | 28,895 | | 11,154,915 |
NetScout Systems, Inc. (a)
| | 12,314 | | 225,223 |
Viasat, Inc. (a) (b)
| | 10,207 | | 129,629 |
Viavi Solutions, Inc. (a)
| | 39,795 | | 273,392 |
| | | | | | 66,934,004 |
| CONSTRUCTION & ENGINEERING — 0.2% | |
AECOM
| | 23,897 | | 2,106,282 |
Arcosa, Inc.
| | 8,185 | | 682,711 |
Comfort Systems USA, Inc.
| | 5,846 | | 1,777,886 |
Dycom Industries, Inc. (a)
| | 5,490 | | 926,492 |
EMCOR Group, Inc.
| | 8,136 | | 2,970,291 |
See accompanying notes to financial statements.
47
SPDR PORTFOLIO S&P 1500 COMPOSITE STOCK MARKET ETF
SCHEDULE OF INVESTMENTS (continued)
June 30, 2024
| Security Description | | | Shares | | Value |
Fluor Corp. (a)
| | 29,317 | | $1,276,755 |
Granite Construction, Inc. (b)
| | 8,851 | | 548,497 |
MasTec, Inc. (a)
| | 9,982 | | 1,067,974 |
MDU Resources Group, Inc.
| | 35,390 | | 888,289 |
MYR Group, Inc. (a)
| | 2,803 | | 380,395 |
Quanta Services, Inc.
| | 24,416 | | 6,203,861 |
Valmont Industries, Inc.
| | 2,751 | | 755,012 |
| | | | | | 19,584,445 |
| CONSTRUCTION MATERIALS — 0.2% | |
Eagle Materials, Inc.
| | 5,973 | | 1,298,889 |
Knife River Corp. (a)
| | 8,832 | | 619,476 |
Martin Marietta Materials, Inc.
| | 10,683 | | 5,788,049 |
Vulcan Materials Co.
| | 22,126 | | 5,502,294 |
| | | | | | 13,208,708 |
| CONSUMER FINANCE — 0.5% | |
Ally Financial, Inc.
| | 46,830 | | 1,857,746 |
American Express Co.
| | 99,045 | | 22,933,870 |
Bread Financial Holdings, Inc. (b)
| | 7,351 | | 327,561 |
Capital One Financial Corp.
| | 65,806 | | 9,110,841 |
Discover Financial Services
| | 43,099 | | 5,637,780 |
Encore Capital Group, Inc. (a)
| | 5,572 | | 232,520 |
Enova International, Inc. (a)
| | 4,744 | | 295,314 |
EZCORP, Inc. Class A (a)
| | 9,315 | | 97,528 |
FirstCash Holdings, Inc.
| | 7,208 | | 755,975 |
Green Dot Corp. Class A (a)
| | 9,089 | | 85,891 |
Navient Corp. (b)
| | 10,411 | | 151,584 |
PRA Group, Inc. (a)
| | 7,979 | | 156,867 |
PROG Holdings, Inc.
| | 3,959 | | 137,298 |
SLM Corp.
| | 38,965 | | 810,082 |
Synchrony Financial
| | 72,165 | | 3,405,466 |
World Acceptance Corp. (a)
| | 478 | | 59,071 |
| | | | | | 46,055,394 |
| CONSUMER STAPLES DISTRIBUTION & RETAIL — 1.9% | |
Andersons, Inc.
| | 5,602 | | 277,859 |
BJ's Wholesale Club Holdings, Inc. (a)
| | 22,367 | | 1,964,717 |
Casey's General Stores, Inc.
| | 5,944 | | 2,267,993 |
Chefs' Warehouse, Inc. (a)
| | 3,703 | | 144,824 |
Costco Wholesale Corp.
| | 76,285 | | 64,841,487 |
Dollar General Corp.
| | 37,768 | | 4,994,063 |
Dollar Tree, Inc. (a)
| | 37,052 | | 3,956,042 |
Grocery Outlet Holding Corp. (a) (b)
| | 12,817 | | 283,512 |
Kroger Co.
| | 113,416 | | 5,662,861 |
Performance Food Group Co. (a)
| | 26,786 | | 1,770,822 |
PriceSmart, Inc.
| | 3,512 | | 285,174 |
SpartanNash Co.
| | 5,932 | | 111,284 |
Sprouts Farmers Market, Inc. (a)
| | 20,419 | | 1,708,254 |
Sysco Corp.
| | 87,566 | | 6,251,337 |
Target Corp.
| | 79,052 | | 11,702,858 |
U.S. Foods Holding Corp. (a)
| | 35,858 | | 1,899,757 |
United Natural Foods, Inc. (a)
| | 9,552 | | 125,131 |
| Security Description | | | Shares | | Value |
Walgreens Boots Alliance, Inc. (b)
| | 123,611 | | $1,495,075 |
Walmart, Inc.
| | 739,167 | | 50,048,998 |
| | | | | | 159,792,048 |
| CONTAINERS & PACKAGING — 0.3% | |
Amcor PLC
| | 248,956 | | 2,434,790 |
AptarGroup, Inc.
| | 11,035 | | 1,553,838 |
Avery Dennison Corp.
| | 14,172 | | 3,098,708 |
Ball Corp.
| | 55,851 | | 3,352,177 |
Berry Global Group, Inc.
| | 20,748 | | 1,221,020 |
Crown Holdings, Inc.
| | 20,848 | | 1,550,883 |
Graphic Packaging Holding Co.
| | 53,487 | | 1,401,894 |
Greif, Inc. Class A
| | 2,900 | | 166,663 |
International Paper Co.
| | 59,582 | | 2,570,963 |
Myers Industries, Inc.
| | 5,699 | | 76,253 |
O-I Glass, Inc. (a)
| | 26,665 | | 296,781 |
Packaging Corp. of America
| | 16,248 | | 2,966,235 |
Sealed Air Corp.
| | 26,724 | | 929,728 |
Silgan Holdings, Inc.
| | 13,964 | | 591,096 |
Sonoco Products Co.
| | 17,694 | | 897,440 |
Westrock Co.
| | 45,460 | | 2,284,819 |
| | | | | | 25,393,288 |
| DISTRIBUTORS — 0.1% | |
Genuine Parts Co.
| | 24,597 | | 3,402,257 |
LKQ Corp.
| | 48,096 | | 2,000,313 |
Pool Corp.
| | 6,649 | | 2,043,437 |
| | | | | | 7,446,007 |
| DIVERSIFIED CONSUMER SERVICES — 0.1% | |
Adtalem Global Education, Inc. (a)
| | 8,583 | | 585,446 |
Duolingo, Inc. (a) (b)
| | 6,154 | | 1,284,155 |
Frontdoor, Inc. (a)
| | 14,223 | | 480,595 |
Graham Holdings Co. Class B
| | 586 | | 409,936 |
Grand Canyon Education, Inc. (a)
| | 5,168 | | 723,055 |
H&R Block, Inc.
| | 24,751 | | 1,342,247 |
Mister Car Wash, Inc. (a) (b)
| | 13,760 | | 97,971 |
Perdoceo Education Corp.
| | 12,294 | | 263,338 |
Service Corp. International
| | 25,484 | | 1,812,677 |
Strategic Education, Inc.
| | 4,315 | | 477,498 |
Stride, Inc. (a)
| | 7,052 | | 497,166 |
| | | | | | 7,974,084 |
| DIVERSIFIED REITs — 0.0% (e) | |
Alexander & Baldwin, Inc. REIT
| | 11,630 | | 197,245 |
American Assets Trust, Inc. REIT
| | 8,707 | | 194,863 |
Armada Hoffler Properties, Inc. REIT
| | 9,507 | | 105,433 |
Essential Properties Realty Trust, Inc. REIT
| | 19,316 | | 535,246 |
Global Net Lease, Inc. REIT
| | 16,489 | | 121,194 |
WP Carey, Inc. REIT
| | 36,966 | | 2,034,978 |
| | | | | | 3,188,959 |
See accompanying notes to financial statements.
48
SPDR PORTFOLIO S&P 1500 COMPOSITE STOCK MARKET ETF
SCHEDULE OF INVESTMENTS (continued)
June 30, 2024
| Security Description | | | Shares | | Value |
| DIVERSIFIED TELECOMMUNICATION SERVICES — 0.6% | |
AT&T, Inc.
| | 1,224,491 | | $23,400,023 |
Cogent Communications Holdings, Inc. (b)
| | 7,468 | | 421,494 |
Consolidated Communications Holdings, Inc. (a)
| | 12,601 | | 55,444 |
Frontier Communications Parent, Inc. (a) (b)
| | 38,575 | | 1,009,893 |
Iridium Communications, Inc.
| | 22,490 | | 598,684 |
Lumen Technologies, Inc. (a) (b)
| | 170,815 | | 187,897 |
Shenandoah Telecommunications Co.
| | 8,518 | | 139,099 |
Verizon Communications, Inc.
| | 723,486 | | 29,836,563 |
| | | | | | 55,649,097 |
| ELECTRIC UTILITIES — 1.4% | |
ALLETE, Inc.
| | 9,176 | | 572,124 |
Alliant Energy Corp.
| | 43,223 | | 2,200,051 |
American Electric Power Co., Inc.
| | 89,097 | | 7,817,371 |
Constellation Energy Corp.
| | 55,974 | | 11,209,913 |
Duke Energy Corp.
| | 132,977 | | 13,328,285 |
Edison International
| | 64,621 | | 4,640,434 |
Entergy Corp.
| | 34,882 | | 3,732,374 |
Evergy, Inc.
| | 39,481 | | 2,091,309 |
Eversource Energy
| | 58,261 | | 3,303,981 |
Exelon Corp.
| | 168,315 | | 5,825,382 |
FirstEnergy Corp.
| | 88,927 | | 3,403,236 |
IDACORP, Inc. (b)
| | 8,466 | | 788,608 |
MGE Energy, Inc. (b)
| | 6,248 | | 466,851 |
NextEra Energy, Inc.
| | 353,398 | | 25,024,112 |
NRG Energy, Inc.
| | 41,644 | | 3,242,402 |
OGE Energy Corp.
| | 35,061 | | 1,251,678 |
Otter Tail Corp. (b)
| | 7,265 | | 636,341 |
PG&E Corp.
| | 361,112 | | 6,305,015 |
Pinnacle West Capital Corp. (b)
| | 20,064 | | 1,532,488 |
PNM Resources, Inc.
| | 14,348 | | 530,302 |
Portland General Electric Co.
| | 15,622 | | 675,495 |
PPL Corp.
| | 130,875 | | 3,618,694 |
Southern Co.
| | 188,294 | | 14,605,966 |
Xcel Energy, Inc.
| | 95,354 | | 5,092,857 |
| | | | | | 121,895,269 |
| ELECTRICAL EQUIPMENT — 0.7% | |
Acuity Brands, Inc.
| | 5,338 | | 1,288,807 |
AMETEK, Inc.
| | 39,360 | | 6,561,706 |
Eaton Corp. PLC
| | 68,779 | | 21,565,655 |
Emerson Electric Co.
| | 98,646 | | 10,866,843 |
Encore Wire Corp.
| | 3,029 | | 877,895 |
EnerSys
| | 7,501 | | 776,504 |
GE Vernova, Inc. (a)
| | 46,673 | | 8,004,886 |
Generac Holdings, Inc. (a)
| | 10,776 | | 1,424,803 |
NEXTracker, Inc. Class A (a)
| | 21,124 | | 990,293 |
nVent Electric PLC (b)
| | 27,886 | | 2,136,346 |
Powell Industries, Inc.
| | 1,833 | | 262,852 |
Regal Rexnord Corp.
| | 12,062 | | 1,631,024 |
Rockwell Automation, Inc.
| | 20,116 | | 5,537,532 |
| Security Description | | | Shares | | Value |
Sensata Technologies Holding PLC
| | 26,250 | | $981,488 |
SunPower Corp. (a) (b)
| | 14,448 | | 42,766 |
Sunrun, Inc. (a) (b)
| | 36,852 | | 437,065 |
Vicor Corp. (a)
| | 3,236 | | 107,306 |
| | | | | | 63,493,771 |
| ELECTRONIC EQUIPMENT, INSTRUMENTS & COMPONENTS — 0.8% | |
Advanced Energy Industries, Inc.
| | 6,511 | | 708,136 |
Amphenol Corp. Class A
| | 205,848 | | 13,867,980 |
Arlo Technologies, Inc. (a)
| | 13,100 | | 170,824 |
Arrow Electronics, Inc. (a)
| | 9,635 | | 1,163,523 |
Avnet, Inc.
| | 16,923 | | 871,365 |
Badger Meter, Inc.
| | 5,159 | | 961,380 |
Belden, Inc.
| | 6,987 | | 655,381 |
Benchmark Electronics, Inc.
| | 6,005 | | 236,957 |
CDW Corp.
| | 23,119 | | 5,174,957 |
Cognex Corp.
| | 30,649 | | 1,433,147 |
Coherent Corp. (a)
| | 20,721 | | 1,501,444 |
Corning, Inc.
| | 131,263 | | 5,099,568 |
Crane NXT Co. (b)
| | 8,446 | | 518,753 |
CTS Corp. (b)
| | 5,618 | | 284,439 |
ePlus, Inc. (a)
| | 5,350 | | 394,188 |
Fabrinet (a)
| | 5,972 | | 1,461,886 |
Hubbell, Inc.
| | 9,418 | | 3,442,091 |
Insight Enterprises, Inc. (a) (b)
| | 4,817 | | 955,500 |
IPG Photonics Corp. (a)
| | 5,854 | | 494,019 |
Itron, Inc. (a)
| | 7,039 | | 696,579 |
Jabil, Inc.
| | 22,012 | | 2,394,686 |
Keysight Technologies, Inc. (a)
| | 30,640 | | 4,190,020 |
Knowles Corp. (a) (b)
| | 16,236 | | 280,233 |
Littelfuse, Inc.
| | 4,475 | | 1,143,765 |
Novanta, Inc. (a)
| | 5,986 | | 976,376 |
OSI Systems, Inc. (a)
| | 2,831 | | 389,319 |
PC Connection, Inc.
| | 2,214 | | 142,139 |
Plexus Corp. (a)
| | 5,142 | | 530,552 |
Rogers Corp. (a)
| | 2,933 | | 353,749 |
Sanmina Corp. (a)
| | 11,623 | | 770,024 |
ScanSource, Inc. (a)
| | 5,678 | | 251,592 |
TD SYNNEX Corp.
| | 7,364 | | 849,806 |
TE Connectivity Ltd.
| | 54,222 | | 8,156,615 |
Teledyne Technologies, Inc. (a)
| | 7,921 | | 3,073,190 |
Trimble, Inc. (a)
| | 43,715 | | 2,444,543 |
TTM Technologies, Inc. (a)
| | 17,749 | | 344,863 |
Vishay Intertechnology, Inc. (b)
| | 23,351 | | 520,727 |
Vontier Corp.
| | 24,820 | | 948,124 |
Zebra Technologies Corp. Class A (a)
| | 9,242 | | 2,855,131 |
| | | | | | 70,707,571 |
| ENERGY EQUIPMENT & SERVICES — 0.4% | |
Archrock, Inc.
| | 17,211 | | 348,006 |
Baker Hughes Co.
| | 174,330 | | 6,131,186 |
Bristow Group, Inc. (a) (b)
| | 4,669 | | 156,552 |
Cactus, Inc. Class A (b)
| | 11,312 | | 596,595 |
ChampionX Corp.
| | 33,875 | | 1,124,989 |
See accompanying notes to financial statements.
49
SPDR PORTFOLIO S&P 1500 COMPOSITE STOCK MARKET ETF
SCHEDULE OF INVESTMENTS (continued)
June 30, 2024
| Security Description | | | Shares | | Value |
Core Laboratories, Inc. (b)
| | 7,807 | | $158,404 |
Dril-Quip, Inc. (a)
| | 5,723 | | 106,448 |
Halliburton Co.
| | 152,401 | | 5,148,106 |
Helix Energy Solutions Group, Inc. (a)
| | 24,599 | | 293,712 |
Helmerich & Payne, Inc. (b)
| | 19,493 | | 704,477 |
Liberty Energy, Inc. (b)
| | 26,750 | | 558,808 |
Nabors Industries Ltd. (a) (b)
| | 1,365 | | 97,133 |
NOV, Inc.
| | 67,999 | | 1,292,661 |
Oceaneering International, Inc. (a)
| | 17,804 | | 421,243 |
Patterson-UTI Energy, Inc.
| | 54,658 | | 566,257 |
ProPetro Holding Corp. (a)
| | 14,748 | | 127,865 |
RPC, Inc. (b)
| | 12,541 | | 78,381 |
Schlumberger NV
| | 245,324 | | 11,574,386 |
Tidewater, Inc. (a)
| | 8,309 | | 791,100 |
U.S. Silica Holdings, Inc. (a)
| | 16,374 | | 252,978 |
Valaris Ltd. (a) (b)
| | 10,480 | | 780,760 |
Weatherford International PLC (a)
| | 12,475 | | 1,527,564 |
| | | | | | 32,837,611 |
| ENTERTAINMENT — 1.2% | |
Cinemark Holdings, Inc. (a) (b)
| | 19,765 | | 427,319 |
Electronic Arts, Inc.
| | 42,598 | | 5,935,180 |
Live Nation Entertainment, Inc. (a)
| | 24,776 | | 2,322,502 |
Madison Square Garden Sports Corp. (a)
| | 3,068 | | 577,183 |
Netflix, Inc. (a)
| | 73,990 | | 49,934,371 |
Take-Two Interactive Software, Inc. (a)
| | 27,551 | | 4,283,905 |
TKO Group Holdings, Inc.
| | 8,199 | | 885,410 |
Walt Disney Co.
| | 314,825 | | 31,258,974 |
Warner Bros Discovery, Inc. (a)
| | 376,339 | | 2,799,962 |
Warner Music Group Corp. Class A (b)
| | 24,327 | | 745,623 |
| | | | | | 99,170,429 |
| FINANCIAL SERVICES — 3.7% | |
Berkshire Hathaway, Inc. Class B (a)
| | 313,346 | | 127,469,153 |
BM Technologies, Inc. (a)
| | 11 | | 25 |
Corpay, Inc. (a)
| | 12,775 | | 3,403,388 |
Equitable Holdings, Inc.
| | 54,763 | | 2,237,616 |
Essent Group Ltd.
| | 17,875 | | 1,004,396 |
Euronet Worldwide, Inc. (a)
| | 8,854 | | 916,389 |
EVERTEC, Inc.
| | 10,434 | | 346,930 |
Fidelity National Information Services, Inc.
| | 102,049 | | 7,690,413 |
Fiserv, Inc. (a)
| | 103,376 | | 15,407,159 |
Global Payments, Inc.
| | 44,778 | | 4,330,033 |
Jack Henry & Associates, Inc.
| | 13,234 | | 2,197,109 |
Jackson Financial, Inc. Class A
| | 10,311 | | 765,695 |
Mastercard, Inc. Class A
| | 142,598 | | 62,908,534 |
MGIC Investment Corp.
| | 47,743 | | 1,028,862 |
Mr Cooper Group, Inc. (a)
| | 12,528 | | 1,017,649 |
NCR Atleos Corp. (a)
| | 11,355 | | 306,812 |
| Security Description | | | Shares | | Value |
NMI Holdings, Inc. Class A (a)
| | 10,683 | | $363,649 |
Payoneer Global, Inc. (a)
| | 34,738 | | 192,448 |
PayPal Holdings, Inc. (a)
| | 185,658 | | 10,773,734 |
Radian Group, Inc.
| | 27,349 | | 850,554 |
Visa, Inc. Class A
| | 270,869 | | 71,094,986 |
Voya Financial, Inc.
| | 18,835 | | 1,340,110 |
Walker & Dunlop, Inc.
| | 5,096 | | 500,427 |
Western Union Co.
| | 70,465 | | 861,082 |
WEX, Inc. (a)
| | 7,661 | | 1,357,070 |
| | | | | | 318,364,223 |
| FOOD PRODUCTS — 0.8% | |
Archer-Daniels-Midland Co.
| | 91,876 | | 5,553,904 |
B&G Foods, Inc. (b)
| | 7,603 | | 61,432 |
Bunge Global SA
| | 25,967 | | 2,772,497 |
Calavo Growers, Inc.
| | 2,963 | | 67,260 |
Cal-Maine Foods, Inc. (b)
| | 6,275 | | 383,465 |
Campbell Soup Co.
| | 36,757 | | 1,661,049 |
Conagra Brands, Inc.
| | 83,470 | | 2,372,217 |
Darling Ingredients, Inc. (a)
| | 28,327 | | 1,041,017 |
Flowers Foods, Inc.
| | 31,165 | | 691,863 |
Fresh Del Monte Produce, Inc.
| | 5,790 | | 126,511 |
General Mills, Inc.
| | 100,070 | | 6,330,428 |
Hain Celestial Group, Inc. (a)
| | 14,578 | | 100,734 |
Hershey Co.
| | 25,452 | | 4,678,841 |
Hormel Foods Corp.
| | 49,193 | | 1,499,895 |
Ingredion, Inc.
| | 11,494 | | 1,318,362 |
J & J Snack Foods Corp.
| | 2,622 | | 425,734 |
J M Smucker Co.
| | 18,249 | | 1,989,871 |
John B Sanfilippo & Son, Inc.
| | 875 | | 85,024 |
Kellanova
| | 44,217 | | 2,550,437 |
Kraft Heinz Co.
| | 138,591 | | 4,465,402 |
Lamb Weston Holdings, Inc.
| | 25,673 | | 2,158,586 |
Lancaster Colony Corp.
| | 2,767 | | 522,880 |
McCormick & Co., Inc.
| | 42,963 | | 3,047,795 |
Mondelez International, Inc. Class A
| | 234,787 | | 15,364,461 |
Pilgrim's Pride Corp. (a)
| | 8,635 | | 332,361 |
Post Holdings, Inc. (a)
| | 8,781 | | 914,629 |
Simply Good Foods Co. (a)
| | 14,714 | | 531,617 |
Tootsie Roll Industries, Inc. (b)
| | 3,293 | | 100,667 |
TreeHouse Foods, Inc. (a)
| | 9,768 | | 357,900 |
Tyson Foods, Inc. Class A
| | 50,411 | | 2,880,485 |
WK Kellogg Co. (b)
| | 590 | | 9,711 |
| | | | | | 64,397,035 |
| GAS UTILITIES — 0.1% | |
Atmos Energy Corp.
| | 25,669 | | 2,994,289 |
Chesapeake Utilities Corp. (b)
| | 2,817 | | 299,165 |
National Fuel Gas Co.
| | 15,241 | | 825,910 |
New Jersey Resources Corp.
| | 15,398 | | 658,111 |
Northwest Natural Holding Co.
| | 5,627 | | 203,191 |
ONE Gas, Inc.
| | 9,278 | | 592,400 |
Southwest Gas Holdings, Inc.
| | 9,042 | | 636,376 |
Spire, Inc.
| | 8,966 | | 544,505 |
UGI Corp.
| | 35,810 | | 820,049 |
| | | | | | 7,573,996 |
See accompanying notes to financial statements.
50
SPDR PORTFOLIO S&P 1500 COMPOSITE STOCK MARKET ETF
SCHEDULE OF INVESTMENTS (continued)
June 30, 2024
| Security Description | | | Shares | | Value |
| GROUND TRANSPORTATION — 1.0% | |
ArcBest Corp.
| | 4,922 | | $527,048 |
Avis Budget Group, Inc. (b)
| | 3,328 | | 347,843 |
CSX Corp.
| | 340,336 | | 11,384,239 |
Heartland Express, Inc.
| | 8,761 | | 108,023 |
Hertz Global Holdings, Inc. (a) (b)
| | 27,825 | | 98,222 |
JB Hunt Transport Services, Inc.
| | 14,692 | | 2,350,720 |
Knight-Swift Transportation Holdings, Inc.
| | 29,899 | | 1,492,558 |
Landstar System, Inc.
| | 6,582 | | 1,214,247 |
Marten Transport Ltd.
| | 9,606 | | 177,231 |
Norfolk Southern Corp.
| | 39,145 | | 8,404,040 |
Old Dominion Freight Line, Inc.
| | 31,014 | | 5,477,072 |
RXO, Inc. (a) (b)
| | 16,779 | | 438,771 |
Ryder System, Inc.
| | 7,662 | | 949,169 |
Saia, Inc. (a) (b)
| | 4,680 | | 2,219,677 |
Uber Technologies, Inc. (a)
| | 354,372 | | 25,755,757 |
Union Pacific Corp.
| | 105,198 | | 23,802,100 |
Werner Enterprises, Inc. (b)
| | 9,516 | | 340,958 |
XPO, Inc. (a)
| | 20,079 | | 2,131,386 |
| | | | | | 87,219,061 |
| HEALTH CARE EQUIPMENT & SUPPLIES — 2.3% | |
Abbott Laboratories
| | 299,576 | | 31,128,942 |
Align Technology, Inc. (a)
| | 12,479 | | 3,012,805 |
Artivion, Inc. (a)
| | 6,279 | | 161,056 |
Avanos Medical, Inc. (a)
| | 8,368 | | 166,691 |
Baxter International, Inc.
| | 87,628 | | 2,931,157 |
Becton Dickinson & Co.
| | 49,608 | | 11,593,886 |
Boston Scientific Corp. (a)
| | 252,782 | | 19,466,742 |
CONMED Corp.
| | 5,038 | | 349,234 |
Cooper Cos., Inc.
| | 33,088 | | 2,888,582 |
Dentsply Sirona, Inc. (b)
| | 37,894 | | 943,939 |
Dexcom, Inc. (a)
| | 66,571 | | 7,547,820 |
Edwards Lifesciences Corp. (a)
| | 104,442 | | 9,647,307 |
Embecta Corp.
| | 9,880 | | 123,500 |
Enovis Corp. (a)
| | 6,247 | | 282,364 |
Envista Holdings Corp. (a)
| | 27,650 | | 459,819 |
GE HealthCare Technologies, Inc.
| | 67,453 | | 5,255,938 |
Glaukos Corp. (a)
| | 7,211 | | 853,422 |
Globus Medical, Inc. Class A (a)
| | 18,893 | | 1,293,982 |
Haemonetics Corp. (a) (b)
| | 8,498 | | 703,039 |
Hologic, Inc. (a)
| | 43,819 | | 3,253,561 |
ICU Medical, Inc. (a) (b)
| | 2,901 | | 344,494 |
IDEXX Laboratories, Inc. (a)
| | 14,343 | | 6,987,910 |
Inari Medical, Inc. (a)
| | 9,487 | | 456,799 |
Insulet Corp. (a)
| | 12,135 | | 2,448,843 |
Integer Holdings Corp. (a) (b)
| | 5,552 | | 642,866 |
Integra LifeSciences Holdings Corp. (a)
| | 12,434 | | 362,327 |
Intuitive Surgical, Inc. (a)
| | 60,900 | | 27,091,365 |
Lantheus Holdings, Inc. (a)
| | 11,449 | | 919,240 |
LeMaitre Vascular, Inc.
| | 2,860 | | 235,321 |
LivaNova PLC (a)
| | 8,973 | | 491,900 |
Masimo Corp. (a)
| | 8,036 | | 1,012,054 |
| Security Description | | | Shares | | Value |
Medtronic PLC
| | 230,828 | | $18,168,472 |
Merit Medical Systems, Inc. (a) (b)
| | 8,605 | | 739,600 |
Neogen Corp. (a) (b)
| | 30,518 | | 476,996 |
Omnicell, Inc. (a)
| | 6,471 | | 175,170 |
Penumbra, Inc. (a) (b)
| | 6,014 | | 1,082,340 |
QuidelOrtho Corp. (a) (b)
| | 10,438 | | 346,750 |
ResMed, Inc.
| | 25,061 | | 4,797,177 |
Solventum Corp. (a)
| | 24,084 | | 1,273,562 |
Spectrum Pharmaceuticals, Inc. (a)
| | 22 | | 2 |
STAAR Surgical Co. (a)
| | 7,857 | | 374,072 |
STERIS PLC
| | 17,108 | | 3,755,890 |
Stryker Corp.
| | 58,243 | | 19,817,181 |
Tandem Diabetes Care, Inc. (a)
| | 10,680 | | 430,297 |
Teleflex, Inc.
| | 7,952 | | 1,672,544 |
UFP Technologies, Inc. (a)
| | 1,100 | | 290,257 |
Varex Imaging Corp. (a)
| | 6,650 | | 97,954 |
Zimmer Biomet Holdings, Inc.
| | 35,701 | | 3,874,629 |
| | | | | | 200,429,798 |
| HEALTH CARE PROVIDERS & SERVICES — 2.5% | |
Acadia Healthcare Co., Inc. (a)
| | 15,523 | | 1,048,423 |
AdaptHealth Corp. (a)
| | 16,532 | | 165,320 |
Addus HomeCare Corp. (a)
| | 2,606 | | 302,583 |
Amedisys, Inc. (a)
| | 5,168 | | 474,422 |
AMN Healthcare Services, Inc. (a) (b)
| | 7,321 | | 375,055 |
Astrana Health, Inc. (a) (b)
| | 3,446 | | 139,770 |
Cardinal Health, Inc.
| | 42,450 | | 4,173,684 |
Cencora, Inc.
| | 28,774 | | 6,482,782 |
Centene Corp. (a)
| | 93,405 | | 6,192,752 |
Chemed Corp.
| | 2,623 | | 1,423,187 |
Cigna Group
| | 50,433 | | 16,671,637 |
CorVel Corp. (a)
| | 1,134 | | 288,342 |
Cross Country Healthcare, Inc. (a)
| | 5,579 | | 77,213 |
CVS Health Corp.
| | 222,905 | | 13,164,769 |
DaVita, Inc. (a)
| | 9,394 | | 1,301,727 |
Elevance Health, Inc.
| | 40,667 | | 22,035,821 |
Encompass Health Corp.
| | 17,534 | | 1,504,242 |
Enhabit, Inc. (a)
| | 8,575 | | 76,489 |
Ensign Group, Inc. (b)
| | 9,015 | | 1,115,065 |
Fulgent Genetics, Inc. (a)
| | 2,242 | | 43,988 |
HCA Healthcare, Inc.
| | 34,119 | | 10,961,752 |
HealthEquity, Inc. (a)
| | 12,955 | | 1,116,721 |
Henry Schein, Inc. (a)
| | 24,017 | | 1,539,490 |
Humana, Inc.
| | 21,235 | | 7,934,458 |
Labcorp Holdings, Inc.
| | 14,685 | | 2,988,544 |
McKesson Corp.
| | 22,901 | | 13,375,100 |
Molina Healthcare, Inc. (a)
| | 10,290 | | 3,059,217 |
National HealthCare Corp.
| | 2,346 | | 254,306 |
NeoGenomics, Inc. (a)
| | 21,287 | | 295,251 |
OmniAb, Inc. (a) (b) (f)
| | 1,881 | | — |
Option Care Health, Inc. (a)
| | 31,081 | | 860,944 |
Owens & Minor, Inc. (a)
| | 12,873 | | 173,786 |
Patterson Cos., Inc. (b)
| | 15,287 | | 368,722 |
See accompanying notes to financial statements.
51
SPDR PORTFOLIO S&P 1500 COMPOSITE STOCK MARKET ETF
SCHEDULE OF INVESTMENTS (continued)
June 30, 2024
| Security Description | | | Shares | | Value |
Pediatrix Medical Group, Inc. (a)
| | 15,060 | | $113,703 |
Premier, Inc. Class A
| | 20,577 | | 384,173 |
Privia Health Group, Inc. (a)
| | 16,165 | | 280,948 |
Progyny, Inc. (a) (b)
| | 14,343 | | 410,353 |
Quest Diagnostics, Inc.
| | 19,443 | | 2,661,358 |
R1 RCM, Inc. (a)
| | 21,594 | | 271,221 |
RadNet, Inc. (a)
| | 6,846 | | 403,366 |
Select Medical Holdings Corp.
| | 18,618 | | 652,747 |
Tenet Healthcare Corp. (a)
| | 18,368 | | 2,443,495 |
U.S. Physical Therapy, Inc.
| | 2,450 | | 226,429 |
UnitedHealth Group, Inc.
| | 159,297 | | 81,123,590 |
Universal Health Services, Inc. Class B
| | 9,424 | | 1,742,780 |
| | | | | | 210,699,725 |
| HEALTH CARE REITs — 0.2% | |
CareTrust REIT, Inc.
| | 16,865 | | 423,311 |
Community Healthcare Trust, Inc. REIT
| | 3,609 | | 84,414 |
Healthcare Realty Trust, Inc. REIT
| | 57,408 | | 946,084 |
Healthpeak Properties, Inc. REIT
| | 114,071 | | 2,235,792 |
LTC Properties, Inc. REIT (b)
| | 7,046 | | 243,087 |
Medical Properties Trust, Inc. REIT (b)
| | 95,047 | | 409,653 |
Omega Healthcare Investors, Inc. REIT
| | 40,031 | | 1,371,062 |
Sabra Health Care REIT, Inc.
| | 37,122 | | 571,679 |
Universal Health Realty Income Trust REIT
| | 1,740 | | 68,104 |
Ventas, Inc. REIT
| | 65,844 | | 3,375,163 |
Welltower, Inc. REIT
| | 95,374 | | 9,942,739 |
| | | | | | 19,671,088 |
| HEALTH CARE TECHNOLOGY — 0.0% (e) | |
Certara, Inc. (a) (b)
| | 18,315 | | 253,663 |
Doximity, Inc. Class A (a) (b)
| | 20,648 | | 577,524 |
HealthStream, Inc.
| | 5,684 | | 158,584 |
Schrodinger, Inc. (a) (b)
| | 9,424 | | 182,260 |
Simulations Plus, Inc. (b)
| | 2,259 | | 109,833 |
| | | | | | 1,281,864 |
| HOTEL & RESORT REITs — 0.1% | |
Apple Hospitality REIT, Inc.
| | 36,693 | | 533,516 |
DiamondRock Hospitality Co. REIT
| | 38,481 | | 325,164 |
Host Hotels & Resorts, Inc. REIT
| | 121,431 | | 2,183,329 |
Park Hotels & Resorts, Inc. REIT
| | 41,153 | | 616,472 |
Pebblebrook Hotel Trust REIT (b)
| | 22,414 | | 308,193 |
Service Properties Trust REIT (b)
| | 28,845 | | 148,263 |
Summit Hotel Properties, Inc. REIT
| | 18,511 | | 110,881 |
Sunstone Hotel Investors, Inc. REIT
| | 36,986 | | 386,874 |
Xenia Hotels & Resorts, Inc. REIT
| | 20,237 | | 289,996 |
| | | | | | 4,902,688 |
| Security Description | | | Shares | | Value |
| HOTELS, RESTAURANTS & LEISURE — 2.0% | |
Airbnb, Inc. Class A (a)
| | 73,615 | | $11,162,242 |
Aramark
| | 45,347 | | 1,542,705 |
BJ's Restaurants, Inc. (a) (b)
| | 5,090 | | 176,623 |
Bloomin' Brands, Inc. (b)
| | 14,784 | | 284,296 |
Booking Holdings, Inc.
| | 5,956 | | 23,594,694 |
Boyd Gaming Corp.
| | 13,732 | | 756,633 |
Brinker International, Inc. (a)
| | 6,856 | | 496,306 |
Caesars Entertainment, Inc. (a)
| | 35,615 | | 1,415,340 |
Carnival Corp. (a)
| | 174,747 | | 3,271,264 |
Cheesecake Factory, Inc. (b)
| | 7,292 | | 286,503 |
Chipotle Mexican Grill, Inc. (a)
| | 236,160 | | 14,795,424 |
Choice Hotels International, Inc.
| | 5,100 | | 606,900 |
Churchill Downs, Inc.
| | 11,904 | | 1,661,798 |
Chuy's Holdings, Inc. (a)
| | 3,221 | | 83,488 |
Cracker Barrel Old Country Store, Inc. (b)
| | 4,214 | | 177,662 |
Darden Restaurants, Inc.
| | 20,675 | | 3,128,541 |
Dave & Buster's Entertainment, Inc. (a) (b)
| | 6,143 | | 244,553 |
Dine Brands Global, Inc. (b)
| | 2,463 | | 89,161 |
Domino's Pizza, Inc.
| | 6,305 | | 3,255,461 |
Expedia Group, Inc. (a)
| | 22,316 | | 2,811,593 |
Golden Entertainment, Inc.
| | 3,315 | | 103,130 |
Hilton Grand Vacations, Inc. (a)
| | 13,725 | | 554,902 |
Hilton Worldwide Holdings, Inc.
| | 44,201 | | 9,644,658 |
Hyatt Hotels Corp. Class A
| | 7,921 | | 1,203,358 |
Jack in the Box, Inc. (b)
| | 3,704 | | 188,682 |
Las Vegas Sands Corp.
| | 63,582 | | 2,813,503 |
Light & Wonder, Inc. (a) (b)
| | 15,673 | | 1,643,784 |
Marriott International, Inc. Class A
| | 42,439 | | 10,260,477 |
Marriott Vacations Worldwide Corp.
| | 6,276 | | 548,020 |
McDonald's Corp.
| | 124,858 | | 31,818,813 |
MGM Resorts International (a)
| | 47,099 | | 2,093,080 |
Monarch Casino & Resort, Inc.
| | 2,575 | | 175,435 |
Norwegian Cruise Line Holdings Ltd. (a) (b)
| | 73,475 | | 1,380,595 |
Papa John's International, Inc. (b)
| | 6,351 | | 298,370 |
Penn Entertainment, Inc. (a) (b)
| | 25,779 | | 498,953 |
Planet Fitness, Inc. Class A (a)
| | 14,836 | | 1,091,781 |
Royal Caribbean Cruises Ltd. (a) (b)
| | 39,230 | | 6,254,439 |
Sabre Corp. (a) (b)
| | 50,899 | | 135,900 |
Shake Shack, Inc. Class A (a)
| | 5,965 | | 536,850 |
Six Flags Entertainment Corp. (b)
| | 12,894 | | 427,307 |
Starbucks Corp.
| | 197,662 | | 15,387,987 |
Texas Roadhouse, Inc.
| | 11,454 | | 1,966,766 |
Travel & Leisure Co.
| | 15,198 | | 683,606 |
Vail Resorts, Inc.
| | 6,705 | | 1,207,772 |
Wendy's Co.
| | 30,859 | | 523,369 |
Wingstop, Inc.
| | 5,220 | | 2,206,285 |
Wyndham Hotels & Resorts, Inc.
| | 14,335 | | 1,060,790 |
Wynn Resorts Ltd.
| | 17,208 | | 1,540,116 |
See accompanying notes to financial statements.
52
SPDR PORTFOLIO S&P 1500 COMPOSITE STOCK MARKET ETF
SCHEDULE OF INVESTMENTS (continued)
June 30, 2024
| Security Description | | | Shares | | Value |
Yum! Brands, Inc.
| | 47,967 | | $6,353,709 |
| | | | | | 172,443,624 |
| HOUSEHOLD DURABLES — 0.5% | |
Cavco Industries, Inc. (a)
| | 1,719 | | 595,066 |
Century Communities, Inc.
| | 3,645 | | 297,651 |
DR Horton, Inc.
| | 52,782 | | 7,438,567 |
Ethan Allen Interiors, Inc.
| | 5,133 | | 143,159 |
Garmin Ltd.
| | 25,690 | | 4,185,415 |
Green Brick Partners, Inc. (a)
| | 4,370 | | 250,139 |
Helen of Troy Ltd. (a) (b)
| | 4,638 | | 430,128 |
Installed Building Products, Inc. (b)
| | 3,868 | | 795,570 |
KB Home
| | 15,381 | | 1,079,439 |
La-Z-Boy, Inc. (b)
| | 8,055 | | 300,290 |
Leggett & Platt, Inc. (b)
| | 22,856 | | 261,930 |
Lennar Corp. Class A
| | 43,090 | | 6,457,898 |
LGI Homes, Inc. (a)
| | 2,810 | | 251,467 |
M/I Homes, Inc. (a)
| | 3,766 | | 459,979 |
Meritage Homes Corp.
| | 6,159 | | 996,834 |
Mohawk Industries, Inc. (a)
| | 10,288 | | 1,168,614 |
Newell Brands, Inc. (b)
| | 65,906 | | 422,457 |
NVR, Inc. (a)
| | 529 | | 4,014,348 |
PulteGroup, Inc.
| | 37,084 | | 4,082,948 |
Sonos, Inc. (a)
| | 22,135 | | 326,713 |
Taylor Morrison Home Corp. (a)
| | 18,521 | | 1,026,804 |
Tempur Sealy International, Inc.
| | 32,335 | | 1,530,739 |
Toll Brothers, Inc.
| | 19,753 | | 2,275,151 |
TopBuild Corp. (a)
| | 5,606 | | 2,159,824 |
Tri Pointe Homes, Inc. (a)
| | 16,652 | | 620,287 |
Whirlpool Corp. (b)
| | 9,464 | | 967,221 |
Worthington Enterprises, Inc. (b)
| | 6,090 | | 288,240 |
| | | | | | 42,826,878 |
| HOUSEHOLD PRODUCTS — 1.1% | |
Central Garden & Pet Co. (a) (b)
| | 2,382 | | 91,707 |
Central Garden & Pet Co. Class A (a)
| | 9,478 | | 313,058 |
Church & Dwight Co., Inc.
| | 42,261 | | 4,381,621 |
Clorox Co.
| | 21,328 | | 2,910,632 |
Colgate-Palmolive Co.
| | 143,587 | | 13,933,683 |
Energizer Holdings, Inc.
| | 10,077 | | 297,675 |
Kimberly-Clark Corp.
| | 58,540 | | 8,090,228 |
Procter & Gamble Co.
| | 405,857 | | 66,933,936 |
WD-40 Co. (b)
| | 2,461 | | 540,534 |
| | | | | | 97,493,074 |
| INDEPENDENT POWER AND RENEWABLE ELECTRICITY PRODUCERS — 0.1% | |
AES Corp.
| | 115,483 | | 2,029,036 |
Clearway Energy, Inc. Class A
| | 5,960 | | 135,054 |
Clearway Energy, Inc. Class C (b)
| | 14,280 | | 352,573 |
Ormat Technologies, Inc.
| | 7,968 | | 571,306 |
Vistra Corp.
| | 59,554 | | 5,120,453 |
| | | | | | 8,208,422 |
| Security Description | | | Shares | | Value |
| INDUSTRIAL CONGLOMERATES — 0.7% | |
3M Co.
| | 96,361 | | $9,847,131 |
General Electric Co.
| | 186,718 | | 29,682,560 |
Honeywell International, Inc.
| | 113,523 | | 24,241,701 |
| | | | | | 63,771,392 |
| INDUSTRIAL REITs — 0.3% | |
EastGroup Properties, Inc. REIT
| | 7,139 | | 1,214,344 |
First Industrial Realty Trust, Inc. REIT
| | 22,773 | | 1,081,945 |
Innovative Industrial Properties, Inc. REIT
| | 4,169 | | 455,338 |
LXP Industrial Trust REIT
| | 45,697 | | 416,757 |
Prologis, Inc. REIT
| | 158,127 | | 17,759,243 |
Rexford Industrial Realty, Inc. REIT (b)
| | 35,671 | | 1,590,570 |
STAG Industrial, Inc. REIT
| | 31,116 | | 1,122,043 |
| | | | | | 23,640,240 |
| INSURANCE — 2.2% | |
Aflac, Inc.
| | 93,291 | | 8,331,819 |
Allstate Corp.
| | 45,179 | | 7,213,279 |
Ambac Financial Group, Inc. (a)
| | 8,037 | | 103,034 |
American Financial Group, Inc.
| | 11,892 | | 1,462,954 |
American International Group, Inc.
| | 120,879 | | 8,974,057 |
AMERISAFE, Inc.
| | 2,963 | | 130,046 |
Aon PLC Class A
| | 37,439 | | 10,991,342 |
Arch Capital Group Ltd. (a)
| | 63,925 | | 6,449,393 |
Arthur J Gallagher & Co.
| | 37,178 | | 9,640,627 |
Assurant, Inc.
| | 9,079 | | 1,509,384 |
Assured Guaranty Ltd.
| | 9,403 | | 725,442 |
Brighthouse Financial, Inc. (a)
| | 9,192 | | 398,381 |
Brown & Brown, Inc.
| | 39,623 | | 3,542,692 |
Chubb Ltd.
| | 70,895 | | 18,083,897 |
Cincinnati Financial Corp.
| | 26,283 | | 3,104,022 |
CNO Financial Group, Inc.
| | 23,349 | | 647,234 |
Employers Holdings, Inc.
| | 5,814 | | 247,851 |
Erie Indemnity Co. Class A
| | 4,436 | | 1,607,606 |
Everest Group Ltd.
| | 7,250 | | 2,762,395 |
Fidelity National Financial, Inc.
| | 44,595 | | 2,203,885 |
First American Financial Corp.
| | 18,295 | | 987,015 |
Genworth Financial, Inc. Class A (a)
| | 81,310 | | 491,112 |
Globe Life, Inc.
| | 14,741 | | 1,212,890 |
Goosehead Insurance, Inc. Class A (a) (b)
| | 4,188 | | 240,559 |
Hanover Insurance Group, Inc.
| | 6,212 | | 779,233 |
Hartford Financial Services Group, Inc.
| | 52,826 | | 5,311,126 |
HCI Group, Inc. (b)
| | 1,056 | | 97,332 |
Horace Mann Educators Corp.
| | 6,637 | | 216,499 |
Kemper Corp.
| | 9,801 | | 581,493 |
Kinsale Capital Group, Inc.
| | 3,730 | | 1,437,094 |
Lincoln National Corp.
| | 30,507 | | 948,768 |
Loews Corp.
| | 31,856 | | 2,380,917 |
Marsh & McLennan Cos., Inc.
| | 85,212 | | 17,955,873 |
See accompanying notes to financial statements.
53
SPDR PORTFOLIO S&P 1500 COMPOSITE STOCK MARKET ETF
SCHEDULE OF INVESTMENTS (continued)
June 30, 2024
| Security Description | | | Shares | | Value |
Mercury General Corp.
| | 4,730 | | $251,352 |
MetLife, Inc.
| | 109,010 | | 7,651,412 |
Old Republic International Corp.
| | 49,338 | | 1,524,544 |
Palomar Holdings, Inc. (a)
| | 3,529 | | 286,378 |
Primerica, Inc.
| | 5,979 | | 1,414,512 |
Principal Financial Group, Inc.
| | 38,420 | | 3,014,049 |
ProAssurance Corp. (a)
| | 10,976 | | 134,127 |
Progressive Corp.
| | 100,689 | | 20,914,112 |
Prudential Financial, Inc.
| | 62,584 | | 7,334,219 |
Reinsurance Group of America, Inc.
| | 11,422 | | 2,344,594 |
RenaissanceRe Holdings Ltd.
| | 8,853 | | 1,978,734 |
RLI Corp.
| | 7,177 | | 1,009,732 |
Ryan Specialty Holdings, Inc. (b)
| | 17,600 | | 1,019,216 |
Safety Insurance Group, Inc. (b)
| | 2,851 | | 213,911 |
Selective Insurance Group, Inc.
| | 9,579 | | 898,798 |
SiriusPoint Ltd. (a)
| | 14,719 | | 179,572 |
Stewart Information Services Corp. (b)
| | 3,769 | | 233,980 |
Travelers Cos., Inc.
| | 39,477 | | 8,027,253 |
Trupanion, Inc. (a)
| | 5,250 | | 154,350 |
United Fire Group, Inc.
| | 3,019 | | 64,878 |
Unum Group
| | 31,552 | | 1,612,623 |
W R Berkley Corp.
| | 36,558 | | 2,872,728 |
Willis Towers Watson PLC
| | 17,799 | | 4,665,830 |
| | | | | | 188,570,155 |
| INTERACTIVE MEDIA & SERVICES — 6.2% | |
Alphabet, Inc. Class A
| | 1,010,896 | | 184,134,706 |
Alphabet, Inc. Class C
| | 840,930 | | 154,243,381 |
Cargurus, Inc. (a)
| | 15,033 | | 393,865 |
Cars.com, Inc. (a)
| | 10,968 | | 216,070 |
IAC, Inc. (a)
| | 12,060 | | 565,011 |
Match Group, Inc. (a) (b)
| | 47,626 | | 1,446,878 |
Meta Platforms, Inc. Class A
| | 377,115 | | 190,148,925 |
QuinStreet, Inc. (a)
| | 8,116 | | 134,644 |
Shutterstock, Inc. (b)
| | 3,897 | | 150,814 |
TripAdvisor, Inc. (a)
| | 17,132 | | 305,121 |
Yelp, Inc. (a)
| | 10,059 | | 371,680 |
Ziff Davis, Inc. (a)
| | 7,111 | | 391,460 |
ZoomInfo Technologies, Inc. (a)
| | 47,178 | | 602,463 |
| | | | | | 533,105,018 |
| IT SERVICES — 1.0% | |
Accenture PLC Class A
| | 108,143 | | 32,811,668 |
Akamai Technologies, Inc. (a)
| | 25,983 | | 2,340,549 |
Cognizant Technology Solutions Corp. Class A
| | 87,210 | | 5,930,280 |
DigitalOcean Holdings, Inc. (a) (b)
| | 8,739 | | 303,680 |
DXC Technology Co. (a) (b)
| | 33,381 | | 637,243 |
EPAM Systems, Inc. (a)
| | 9,768 | | 1,837,458 |
Gartner, Inc. (a)
| | 13,534 | | 6,077,578 |
GoDaddy, Inc. Class A (a)
| | 25,304 | | 3,535,222 |
International Business Machines Corp.
| | 157,328 | | 27,209,878 |
Kyndryl Holdings, Inc. (a)
| | 31,170 | | 820,083 |
| Security Description | | | Shares | | Value |
Perficient, Inc. (a)
| | 5,583 | | $417,552 |
VeriSign, Inc. (a)
| | 15,460 | | 2,748,788 |
| | | | | | 84,669,979 |
| LEISURE EQUIPMENT & PRODUCTS — 0.1% | |
Brunswick Corp.
| | 11,889 | | 865,163 |
Hasbro, Inc.
| | 22,564 | | 1,319,994 |
Mattel, Inc. (a) (b)
| | 60,842 | | 989,291 |
Polaris, Inc.
| | 10,139 | | 793,985 |
Sturm Ruger & Co., Inc. (b)
| | 2,933 | | 122,159 |
Topgolf Callaway Brands Corp. (a)
| | 17,806 | | 272,432 |
Vista Outdoor, Inc. (a)
| | 10,264 | | 386,440 |
YETI Holdings, Inc. (a) (b)
| | 13,434 | | 512,507 |
| | | | | | 5,261,971 |
| LIFE SCIENCES TOOLS & SERVICES — 1.2% | |
Agilent Technologies, Inc.
| | 50,403 | | 6,533,741 |
Azenta, Inc. (a)
| | 10,334 | | 543,775 |
BioLife Solutions, Inc. (a) (b)
| | 5,336 | | 114,351 |
Bio-Rad Laboratories, Inc. Class A (a)
| | 3,284 | | 896,893 |
Bio-Techne Corp.
| | 27,375 | | 1,961,419 |
Bruker Corp.
| | 17,448 | | 1,113,357 |
Charles River Laboratories International, Inc. (a)
| | 8,623 | | 1,781,339 |
Cytek Biosciences, Inc. (a) (b)
| | 13,982 | | 78,020 |
Danaher Corp.
| | 113,471 | | 28,350,729 |
Fortrea Holdings, Inc. (a) (b)
| | 16,485 | | 384,760 |
Illumina, Inc. (a)
| | 27,385 | | 2,858,446 |
IQVIA Holdings, Inc. (a)
| | 31,514 | | 6,663,320 |
Medpace Holdings, Inc. (a)
| | 4,075 | | 1,678,289 |
Mesa Laboratories, Inc.
| | 570 | | 49,459 |
Mettler-Toledo International, Inc. (a)
| | 3,665 | | 5,122,167 |
Repligen Corp. (a)
| | 8,172 | | 1,030,162 |
Revvity, Inc.
| | 22,089 | | 2,316,253 |
Sotera Health Co. (a) (b)
| | 17,079 | | 202,728 |
Thermo Fisher Scientific, Inc.
| | 66,618 | | 36,839,754 |
Waters Corp. (a)
| | 10,165 | | 2,949,070 |
West Pharmaceutical Services, Inc.
| | 12,734 | | 4,194,452 |
| | | | | | 105,662,484 |
| MACHINERY — 1.8% | |
3D Systems Corp. (a) (b)
| | 23,504 | | 72,157 |
AGCO Corp.
| | 10,590 | | 1,036,549 |
Alamo Group, Inc.
| | 1,892 | | 327,316 |
Albany International Corp. Class A
| | 5,396 | | 455,692 |
Astec Industries, Inc.
| | 3,565 | | 105,738 |
Barnes Group, Inc.
| | 8,514 | | 352,565 |
Caterpillar, Inc.
| | 84,192 | | 28,044,355 |
Chart Industries, Inc. (a) (b)
| | 6,168 | | 890,289 |
Crane Co.
| | 8,446 | | 1,224,501 |
Cummins, Inc.
| | 22,840 | | 6,325,081 |
Deere & Co.
| | 44,032 | | 16,451,676 |
Donaldson Co., Inc.
| | 21,697 | | 1,552,637 |
See accompanying notes to financial statements.
54
SPDR PORTFOLIO S&P 1500 COMPOSITE STOCK MARKET ETF
SCHEDULE OF INVESTMENTS (continued)
June 30, 2024
| Security Description | | | Shares | | Value |
Dover Corp.
| | 24,760 | | $4,467,942 |
Enerpac Tool Group Corp.
| | 11,024 | | 420,896 |
Enpro, Inc.
| | 3,373 | | 491,008 |
Esab Corp.
| | 9,785 | | 923,998 |
ESCO Technologies, Inc.
| | 4,680 | | 491,587 |
Federal Signal Corp.
| | 10,541 | | 881,965 |
Flowserve Corp.
| | 23,358 | | 1,123,520 |
Fortive Corp.
| | 58,687 | | 4,348,707 |
Franklin Electric Co., Inc.
| | 7,001 | | 674,336 |
Graco, Inc.
| | 28,975 | | 2,297,138 |
Greenbrier Cos., Inc. (b)
| | 5,626 | | 278,768 |
Hillenbrand, Inc. (b)
| | 13,029 | | 521,421 |
IDEX Corp.
| | 13,150 | | 2,645,780 |
Illinois Tool Works, Inc.
| | 47,449 | | 11,243,515 |
Ingersoll Rand, Inc.
| | 69,840 | | 6,344,266 |
ITT, Inc.
| | 15,180 | | 1,960,952 |
John Bean Technologies Corp.
| | 5,456 | | 518,156 |
Kennametal, Inc.
| | 14,500 | | 341,330 |
Lincoln Electric Holdings, Inc.
| | 10,330 | | 1,948,651 |
Lindsay Corp.
| | 2,051 | | 252,027 |
Middleby Corp. (a)
| | 9,920 | | 1,216,291 |
Mueller Industries, Inc.
| | 19,608 | | 1,116,480 |
Nordson Corp.
| | 8,837 | | 2,049,654 |
Oshkosh Corp.
| | 11,782 | | 1,274,812 |
Otis Worldwide Corp.
| | 70,249 | | 6,762,169 |
PACCAR, Inc.
| | 89,132 | | 9,175,248 |
Parker-Hannifin Corp.
| | 22,423 | | 11,341,778 |
Pentair PLC
| | 28,859 | | 2,212,620 |
Proto Labs, Inc. (a)
| | 4,768 | | 147,284 |
RBC Bearings, Inc. (a)
| | 5,070 | | 1,367,785 |
Snap-on, Inc.
| | 9,570 | | 2,501,502 |
SPX Technologies, Inc. (a)
| | 7,869 | | 1,118,500 |
Standex International Corp.
| | 2,632 | | 424,147 |
Stanley Black & Decker, Inc.
| | 27,131 | | 2,167,496 |
Tennant Co.
| | 2,923 | | 287,740 |
Terex Corp. (b)
| | 12,694 | | 696,139 |
Timken Co.
| | 11,819 | | 947,056 |
Titan International, Inc. (a)
| | 10,812 | | 80,117 |
Toro Co.
| | 18,532 | | 1,732,927 |
Trinity Industries, Inc.
| | 14,437 | | 431,955 |
Wabash National Corp. (b)
| | 9,642 | | 210,581 |
Watts Water Technologies, Inc. Class A
| | 4,946 | | 906,948 |
Westinghouse Air Brake Technologies Corp.
| | 30,825 | | 4,871,891 |
Xylem, Inc.
| | 41,571 | | 5,638,275 |
| | | | | | 157,693,914 |
| MARINE — 0.0% (e) | |
Kirby Corp. (a)
| | 9,560 | | 1,144,619 |
Matson, Inc.
| | 6,023 | | 788,832 |
| | | | | | 1,933,451 |
| MEDIA — 0.5% | |
AMC Networks, Inc. Class A (a) (b)
| | 4,767 | | 46,049 |
Cable One, Inc. (b)
| | 776 | | 274,704 |
| Security Description | | | Shares | | Value |
Charter Communications, Inc. Class A (a) (b)
| | 17,322 | | $5,178,585 |
Comcast Corp. Class A
| | 669,096 | | 26,201,799 |
EchoStar Corp. Class A (a) (b)
| | 15,331 | | 273,045 |
Fox Corp. Class A
| | 43,766 | | 1,504,237 |
Fox Corp. Class B
| | 26,048 | | 834,057 |
Interpublic Group of Cos., Inc. (b)
| | 67,776 | | 1,971,604 |
John Wiley & Sons, Inc. Class A
| | 7,651 | | 311,396 |
New York Times Co. Class A
| | 25,160 | | 1,288,444 |
News Corp. Class A
| | 67,893 | | 1,871,810 |
News Corp. Class B
| | 21,065 | | 598,035 |
Nexstar Media Group, Inc.
| | 5,556 | | 922,352 |
Omnicom Group, Inc.
| | 34,050 | | 3,054,285 |
Paramount Global Class B
| | 83,122 | | 863,638 |
Scholastic Corp.
| | 5,770 | | 204,662 |
TechTarget, Inc. (a)
| | 4,417 | | 137,678 |
TEGNA, Inc. (b)
| | 38,159 | | 531,936 |
Thryv Holdings, Inc. (a)
| | 3,126 | | 55,705 |
| | | | | | 46,124,021 |
| METALS & MINING — 0.5% | |
Alcoa Corp.
| | 29,444 | | 1,171,282 |
Alpha Metallurgical Resources, Inc.
| | 2,100 | | 589,113 |
Arch Resources, Inc.
| | 3,124 | | 475,567 |
ATI, Inc. (a)
| | 22,580 | | 1,252,061 |
Carpenter Technology Corp.
| | 8,649 | | 947,757 |
Century Aluminum Co. (a)
| | 8,734 | | 146,294 |
Cleveland-Cliffs, Inc. (a)
| | 85,521 | | 1,316,168 |
Commercial Metals Co.
| | 20,863 | | 1,147,256 |
Compass Minerals International, Inc. (b)
| | 5,840 | | 60,327 |
Ferroglobe PLC (a) (f)
| | 929 | | — |
Freeport-McMoRan, Inc.
| | 249,917 | | 12,145,966 |
Haynes International, Inc.
| | 2,808 | | 164,830 |
Kaiser Aluminum Corp.
| | 2,933 | | 257,811 |
Materion Corp.
| | 2,987 | | 322,984 |
Metallus, Inc. (a)
| | 3,950 | | 80,067 |
MP Materials Corp. (a) (b)
| | 13,720 | | 174,656 |
Newmont Corp.
| | 199,119 | | 8,337,113 |
Nucor Corp.
| | 42,944 | | 6,788,588 |
Olympic Steel, Inc.
| | 2,760 | | 123,731 |
Reliance, Inc.
| | 9,896 | | 2,826,298 |
Royal Gold, Inc.
| | 11,090 | | 1,388,024 |
Steel Dynamics, Inc.
| | 26,676 | | 3,454,542 |
SunCoke Energy, Inc.
| | 6,520 | | 63,896 |
U.S. Steel Corp.
| | 37,353 | | 1,411,943 |
Warrior Met Coal, Inc.
| | 6,646 | | 417,169 |
Worthington Steel, Inc.
| | 6,094 | | 203,296 |
| | | | | | 45,266,739 |
| MORTGAGE REAL ESTATE INVESTMENT TRUST (REITs) — 0.1% | |
Annaly Capital Management, Inc. REIT
| | 81,700 | | 1,557,202 |
See accompanying notes to financial statements.
55
SPDR PORTFOLIO S&P 1500 COMPOSITE STOCK MARKET ETF
SCHEDULE OF INVESTMENTS (continued)
June 30, 2024
| Security Description | | | Shares | | Value |
Apollo Commercial Real Estate Finance, Inc. REIT (b)
| | 21,308 | | $208,605 |
Arbor Realty Trust, Inc. REIT (b)
| | 31,496 | | 451,968 |
ARMOUR Residential REIT, Inc. (b)
| | 2,588 | | 50,155 |
Blackstone Mortgage Trust, Inc. Class A REIT (b)
| | 29,820 | | 519,464 |
Ellington Financial, Inc. REIT (b)
| | 8,149 | | 98,440 |
Franklin BSP Realty Trust, Inc. REIT
| | 7,193 | | 90,632 |
Hannon Armstrong Sustainable Infrastructure Capital, Inc. REIT (b)
| | 18,448 | | 546,061 |
KKR Real Estate Finance Trust, Inc. REIT (b)
| | 7,039 | | 63,703 |
New York Mortgage Trust, Inc. REIT (b)
| | 14,578 | | 85,136 |
PennyMac Mortgage Investment Trust REIT (b)
| | 17,331 | | 238,301 |
Ready Capital Corp. REIT (b)
| | 12,437 | | 101,735 |
Redwood Trust, Inc. REIT
| | 20,022 | | 129,943 |
Two Harbors Investment Corp. REIT
| | 12,612 | | 166,604 |
Starwood Property Trust, Inc. REIT (b)
| | 53,810 | | 1,019,161 |
| | | | | | 5,327,110 |
| MULTI-UTILITIES — 0.6% | |
Ameren Corp.
| | 43,008 | | 3,058,299 |
Avista Corp.
| | 12,221 | | 422,969 |
Black Hills Corp.
| | 10,698 | | 581,757 |
CenterPoint Energy, Inc.
| | 112,388 | | 3,481,780 |
CMS Energy Corp.
| | 49,197 | | 2,928,698 |
Consolidated Edison, Inc.
| | 59,528 | | 5,322,994 |
Dominion Energy, Inc.
| | 140,766 | | 6,897,534 |
DTE Energy Co.
| | 35,639 | | 3,956,285 |
NiSource, Inc.
| | 67,397 | | 1,941,708 |
Northwestern Energy Group, Inc.
| | 9,262 | | 463,841 |
Public Service Enterprise Group, Inc.
| | 86,733 | | 6,392,222 |
Sempra
| | 109,488 | | 8,327,657 |
Unitil Corp.
| | 2,540 | | 131,547 |
WEC Energy Group, Inc.
| | 54,040 | | 4,239,978 |
| | | | | | 48,147,269 |
| OFFICE REITs — 0.1% | |
Alexandria Real Estate Equities, Inc. REIT
| | 26,900 | | 3,146,493 |
Boston Properties, Inc. REIT
| | 24,421 | | 1,503,357 |
Brandywine Realty Trust REIT
| | 30,147 | | 135,059 |
COPT Defense Properties REIT
| | 20,512 | | 513,415 |
Cousins Properties, Inc. REIT
| | 25,955 | | 600,858 |
Douglas Emmett, Inc. REIT (b)
| | 28,611 | | 380,812 |
Easterly Government Properties, Inc. REIT (b)
| | 10,871 | | 134,474 |
Highwoods Properties, Inc. REIT
| | 18,283 | | 480,294 |
Hudson Pacific Properties, Inc. REIT
| | 25,978 | | 124,954 |
| Security Description | | | Shares | | Value |
JBG SMITH Properties REIT
| | 18,807 | | $286,431 |
Kilroy Realty Corp. REIT
| | 17,480 | | 544,852 |
SL Green Realty Corp. REIT (b)
| | 12,014 | | 680,473 |
Vornado Realty Trust REIT
| | 27,916 | | 733,912 |
| | | | | | 9,265,384 |
| OIL, GAS & CONSUMABLE FUELS — 3.4% | |
Antero Midstream Corp.
| | 51,769 | | 763,075 |
Antero Resources Corp. (a)
| | 48,822 | | 1,593,062 |
APA Corp.
| | 60,797 | | 1,789,864 |
California Resources Corp.
| | 11,095 | | 590,476 |
Chesapeake Energy Corp. (b)
| | 18,702 | | 1,537,117 |
Chevron Corp.
| | 294,910 | | 46,129,822 |
Chord Energy Corp.
| | 10,643 | | 1,784,618 |
Civitas Resources, Inc.
| | 14,551 | | 1,004,019 |
CNX Resources Corp. (a)
| | 27,342 | | 664,411 |
Comstock Resources, Inc. (b)
| | 15,786 | | 163,859 |
ConocoPhillips
| | 204,529 | | 23,394,027 |
CONSOL Energy, Inc. (a)
| | 5,801 | | 591,876 |
Coterra Energy, Inc.
| | 130,719 | | 3,486,276 |
CVR Energy, Inc. (b)
| | 5,090 | | 136,259 |
Devon Energy Corp.
| | 110,666 | | 5,245,568 |
Diamondback Energy, Inc.
| | 29,904 | | 5,986,482 |
Dorian LPG Ltd.
| | 5,861 | | 245,928 |
DT Midstream, Inc.
| | 16,386 | | 1,163,898 |
EOG Resources, Inc.
| | 100,187 | | 12,610,538 |
EQT Corp.
| | 70,779 | | 2,617,407 |
Equitrans Midstream Corp.
| | 70,188 | | 911,040 |
Exxon Mobil Corp.
| | 772,032 | | 88,876,324 |
Green Plains, Inc. (a)
| | 9,061 | | 143,707 |
Hess Corp.
| | 46,416 | | 6,847,288 |
HF Sinclair Corp.
| | 26,002 | | 1,386,947 |
Kinder Morgan, Inc.
| | 334,688 | | 6,650,251 |
Magnolia Oil & Gas Corp. Class A
| | 31,940 | | 809,360 |
Marathon Oil Corp.
| | 100,754 | | 2,888,617 |
Marathon Petroleum Corp.
| | 59,493 | | 10,320,846 |
Matador Resources Co.
| | 18,678 | | 1,113,209 |
Murphy Oil Corp.
| | 25,657 | | 1,058,095 |
Northern Oil & Gas, Inc. (b)
| | 12,030 | | 447,155 |
Occidental Petroleum Corp.
| | 114,465 | | 7,214,729 |
ONEOK, Inc.
| | 100,572 | | 8,201,647 |
Ovintiv, Inc.
| | 43,756 | | 2,050,844 |
Par Pacific Holdings, Inc. (a)
| | 8,960 | | 226,240 |
PBF Energy, Inc. Class A
| | 19,803 | | 911,334 |
Peabody Energy Corp.
| | 18,934 | | 418,820 |
Permian Resources Corp.
| | 65,108 | | 1,051,494 |
Phillips 66
| | 76,832 | | 10,846,373 |
Range Resources Corp.
| | 45,810 | | 1,536,009 |
REX American Resources Corp. (a)
| | 739 | | 33,691 |
SM Energy Co.
| | 20,580 | | 889,673 |
Southwestern Energy Co. (a)
| | 171,210 | | 1,152,243 |
Talos Energy, Inc. (a)
| | 5,259 | | 63,897 |
Targa Resources Corp.
| | 38,950 | | 5,015,981 |
Texas Pacific Land Corp. (b)
| | 3,203 | | 2,351,867 |
Valero Energy Corp.
| | 58,652 | | 9,194,287 |
See accompanying notes to financial statements.
56
SPDR PORTFOLIO S&P 1500 COMPOSITE STOCK MARKET ETF
SCHEDULE OF INVESTMENTS (continued)
June 30, 2024
| Security Description | | | Shares | | Value |
Vital Energy, Inc. (a)
| | 2,127 | | $95,332 |
Williams Cos., Inc.
| | 208,544 | | 8,863,120 |
World Kinect Corp.
| | 10,804 | | 278,743 |
| | | | | | 293,347,745 |
| PERSONAL CARE PRODUCTS — 0.2% | |
BellRing Brands, Inc. (a)
| | 22,751 | | 1,299,992 |
Coty, Inc. Class A (a)
| | 51,274 | | 513,765 |
Edgewell Personal Care Co.
| | 9,510 | | 382,207 |
elf Beauty, Inc. (a)
| | 9,486 | | 1,998,890 |
Estee Lauder Cos., Inc. Class A
| | 39,274 | | 4,178,754 |
Inter Parfums, Inc.
| | 2,911 | | 337,763 |
Kenvue, Inc.
| | 297,637 | | 5,411,041 |
Nu Skin Enterprises, Inc. Class A
| | 8,672 | | 91,403 |
USANA Health Sciences, Inc. (a)
| | 2,227 | | 100,749 |
| | | | | | 14,314,564 |
| PAPER & FOREST PRODUCTS — 0.0% (e) | |
Clearwater Paper Corp. (a)
| | 2,842 | | 137,752 |
Louisiana-Pacific Corp.
| | 11,286 | | 929,176 |
Mercer International, Inc.
| | 6,555 | | 55,980 |
Sylvamo Corp.
| | 5,909 | | 405,357 |
| | | | | | 1,528,265 |
| PHARMACEUTICALS — 3.5% | |
Amphastar Pharmaceuticals, Inc. (a)
| | 6,166 | | 246,640 |
ANI Pharmaceuticals, Inc. (a)
| | 875 | | 55,720 |
Bristol-Myers Squibb Co.
| | 350,408 | | 14,552,444 |
Catalent, Inc. (a)
| | 29,056 | | 1,633,819 |
Collegium Pharmaceutical, Inc. (a) (b)
| | 1,428 | | 45,982 |
Corcept Therapeutics, Inc. (a) (b)
| | 17,702 | | 575,138 |
Eli Lilly & Co.
| | 137,340 | | 124,344,889 |
Harmony Biosciences Holdings, Inc. (a)
| | 4,053 | | 122,279 |
Innoviva, Inc. (a) (b)
| | 10,601 | | 173,856 |
Jazz Pharmaceuticals PLC (a)
| | 9,864 | | 1,052,785 |
Johnson & Johnson
| | 414,604 | | 60,598,521 |
Ligand Pharmaceuticals, Inc. (a) (b)
| | 2,707 | | 228,092 |
Merck & Co., Inc.
| | 436,357 | | 54,020,997 |
Organon & Co.
| | 43,480 | | 900,036 |
Pacira BioSciences, Inc. (a)
| | 7,686 | | 219,896 |
Perrigo Co. PLC
| | 23,921 | | 614,291 |
Pfizer, Inc.
| | 975,507 | | 27,294,686 |
Phibro Animal Health Corp. Class A
| | 3,001 | | 50,327 |
Prestige Consumer Healthcare, Inc. (a)
| | 8,870 | | 610,699 |
Supernus Pharmaceuticals, Inc. (a)
| | 9,226 | | 246,795 |
Viatris, Inc.
| | 207,152 | | 2,202,026 |
Zoetis, Inc.
| | 79,499 | | 13,781,947 |
| | | | | | 303,571,865 |
| PROFESSIONAL SERVICES — 0.7% | |
ASGN, Inc. (a)
| | 8,648 | | 762,494 |
| Security Description | | | Shares | | Value |
Automatic Data Processing, Inc.
| | 71,021 | | $16,952,002 |
Broadridge Financial Solutions, Inc.
| | 20,011 | | 3,942,167 |
CACI International, Inc. Class A (a)
| | 3,773 | | 1,622,880 |
Concentrix Corp. (b)
| | 7,384 | | 467,260 |
CSG Systems International, Inc.
| | 5,834 | | 240,186 |
Dayforce, Inc. (a) (b)
| | 26,792 | | 1,328,883 |
Equifax, Inc.
| | 20,774 | | 5,036,864 |
ExlService Holdings, Inc. (a)
| | 28,788 | | 902,792 |
Exponent, Inc.
| | 8,696 | | 827,163 |
FTI Consulting, Inc. (a)
| | 5,570 | | 1,200,502 |
Genpact Ltd.
| | 29,710 | | 956,365 |
Heidrick & Struggles International, Inc.
| | 3,145 | | 99,319 |
Insperity, Inc.
| | 5,912 | | 539,234 |
Jacobs Solutions, Inc.
| | 22,652 | | 3,164,711 |
KBR, Inc.
| | 24,465 | | 1,569,185 |
Kelly Services, Inc. Class A
| | 5,738 | | 122,851 |
Korn Ferry
| | 9,479 | | 636,420 |
Leidos Holdings, Inc.
| | 23,308 | | 3,400,171 |
ManpowerGroup, Inc.
| | 9,905 | | 691,369 |
Maximus, Inc.
| | 10,799 | | 925,474 |
NV5 Global, Inc. (a) (b)
| | 2,142 | | 199,142 |
Paychex, Inc.
| | 54,906 | | 6,509,655 |
Paycom Software, Inc.
| | 8,207 | | 1,173,929 |
Paylocity Holding Corp. (a)
| | 6,680 | | 880,758 |
Robert Half, Inc.
| | 19,595 | | 1,253,688 |
Science Applications International Corp.
| | 9,774 | | 1,148,934 |
Verisk Analytics, Inc.
| | 24,716 | | 6,662,198 |
Verra Mobility Corp. (a)
| | 24,374 | | 662,973 |
| | | | | | 63,879,569 |
| REAL ESTATE MANAGEMENT & DEVELOPMENT — 0.1% | |
CBRE Group, Inc. Class A (a)
| | 53,449 | | 4,762,840 |
CoStar Group, Inc. (a)
| | 70,747 | | 5,245,182 |
Cushman & Wakefield PLC (a)
| | 28,262 | | 293,925 |
eXp World Holdings, Inc. (b)
| | 12,725 | | 143,602 |
Jones Lang LaSalle, Inc. (a)
| | 8,689 | | 1,783,678 |
Kennedy-Wilson Holdings, Inc. (b)
| | 20,360 | | 197,899 |
Marcus & Millichap, Inc. (b)
| | 4,321 | | 136,198 |
St. Joe Co.
| | 5,371 | | 293,794 |
| | | | | | 12,857,118 |
| RESIDENTIAL REITs — 0.3% | |
American Homes 4 Rent Class A REIT
| | 54,989 | | 2,043,391 |
AvalonBay Communities, Inc. REIT
| | 23,834 | | 4,931,016 |
Camden Property Trust REIT
| | 17,641 | | 1,924,810 |
Centerspace REIT
| | 1,245 | | 84,199 |
Elme Communities REIT
| | 15,340 | | 244,366 |
Equity LifeStyle Properties, Inc. REIT
| | 30,467 | | 1,984,316 |
Equity Residential REIT
| | 59,038 | | 4,093,695 |
See accompanying notes to financial statements.
57
SPDR PORTFOLIO S&P 1500 COMPOSITE STOCK MARKET ETF
SCHEDULE OF INVESTMENTS (continued)
June 30, 2024
| Security Description | | | Shares | | Value |
Essex Property Trust, Inc. REIT
| | 10,940 | | $2,977,868 |
Independence Realty Trust, Inc. REIT
| | 41,592 | | 779,434 |
Invitation Homes, Inc. REIT
| | 99,050 | | 3,554,905 |
Mid-America Apartment Communities, Inc. REIT
| | 19,909 | | 2,839,222 |
NexPoint Residential Trust, Inc. REIT
| | 3,288 | | 129,909 |
UDR, Inc. REIT
| | 51,580 | | 2,122,517 |
Veris Residential, Inc. REIT
| | 16,794 | | 251,910 |
| | | | | | 27,961,558 |
| RETAIL REITs — 0.3% | |
Acadia Realty Trust REIT
| | 15,359 | | 275,233 |
Agree Realty Corp. REIT (b)
| | 17,406 | | 1,078,128 |
Brixmor Property Group, Inc. REIT
| | 51,785 | | 1,195,716 |
Federal Realty Investment Trust REIT
| | 12,525 | | 1,264,649 |
Getty Realty Corp. REIT
| | 6,484 | | 172,863 |
Kimco Realty Corp. REIT
| | 116,009 | | 2,257,535 |
Kite Realty Group Trust REIT
| | 38,184 | | 854,558 |
Macerich Co. REIT
| | 37,077 | | 572,469 |
NNN REIT, Inc.
| | 30,587 | | 1,303,006 |
Phillips Edison & Co., Inc. REIT
| | 20,448 | | 668,854 |
Realty Income Corp. REIT
| | 140,853 | | 7,439,856 |
Regency Centers Corp. REIT
| | 28,801 | | 1,791,422 |
Retail Opportunity Investments Corp. REIT
| | 21,192 | | 263,417 |
Saul Centers, Inc. REIT
| | 2,998 | | 110,236 |
Simon Property Group, Inc. REIT
| | 55,151 | | 8,371,922 |
SITE Centers Corp. REIT
| | 27,430 | | 397,735 |
Tanger, Inc. REIT
| | 17,918 | | 485,757 |
Urban Edge Properties REIT
| | 20,200 | | 373,094 |
Whitestone REIT
| | 7,336 | | 97,642 |
| | | | | | 28,974,092 |
| SEMICONDUCTORS & SEMICONDUCTOR EQUIPMENT — 11.3% | |
Advanced Micro Devices, Inc. (a)
| | 279,016 | | 45,259,185 |
Allegro MicroSystems, Inc. (a) (b)
| | 11,379 | | 321,343 |
Alpha & Omega Semiconductor Ltd. (a) (b)
| | 3,723 | | 139,129 |
Amkor Technology, Inc.
| | 18,191 | | 728,004 |
Analog Devices, Inc.
| | 85,806 | | 19,586,078 |
Applied Materials, Inc.
| | 144,927 | | 34,201,323 |
Axcelis Technologies, Inc. (a)
| | 5,668 | | 805,933 |
Broadcom, Inc.
| | 74,953 | | 120,339,290 |
CEVA, Inc. (a)
| | 3,803 | | 73,360 |
Cirrus Logic, Inc. (a)
| | 10,145 | | 1,295,111 |
Cohu, Inc. (a)
| | 7,054 | | 233,487 |
Diodes, Inc. (a)
| | 6,461 | | 464,740 |
Enphase Energy, Inc. (a)
| | 22,978 | | 2,291,136 |
First Solar, Inc. (a)
| | 18,466 | | 4,163,344 |
FormFactor, Inc. (a)
| | 13,304 | | 805,291 |
Ichor Holdings Ltd. (a)
| | 3,379 | | 130,260 |
Intel Corp.
| | 725,877 | | 22,480,411 |
| Security Description | | | Shares | | Value |
KLA Corp.
| | 23,605 | | $19,462,559 |
Kulicke & Soffa Industries, Inc. (b)
| | 10,794 | | 530,957 |
Lam Research Corp.
| | 22,730 | | 24,204,040 |
Lattice Semiconductor Corp. (a)
| | 23,341 | | 1,353,545 |
MACOM Technology Solutions Holdings, Inc. (a)
| | 8,520 | | 949,724 |
MaxLinear, Inc. (a)
| | 12,209 | | 245,889 |
Microchip Technology, Inc.
| | 91,711 | | 8,391,556 |
Micron Technology, Inc.
| | 189,114 | | 24,874,164 |
MKS Instruments, Inc.
| | 9,322 | | 1,217,267 |
Monolithic Power Systems, Inc.
| | 8,241 | | 6,771,465 |
NVIDIA Corp.
| | 4,233,217 | | 522,971,628 |
NXP Semiconductors NV
| | 44,411 | | 11,950,556 |
ON Semiconductor Corp. (a)
| | 75,090 | | 5,147,420 |
Onto Innovation, Inc. (a)
| | 7,862 | | 1,726,181 |
PDF Solutions, Inc. (a)
| | 5,391 | | 196,125 |
Photronics, Inc. (a)
| | 11,291 | | 278,549 |
Power Integrations, Inc.
| | 8,896 | | 624,410 |
Qorvo, Inc. (a)
| | 16,747 | | 1,943,322 |
QUALCOMM, Inc.
| | 191,634 | | 38,169,660 |
Rambus, Inc. (a)
| | 20,331 | | 1,194,650 |
Semtech Corp. (a) (b)
| | 11,096 | | 331,548 |
Silicon Laboratories, Inc. (a)
| | 5,512 | | 609,793 |
SiTime Corp. (a) (b)
| | 2,543 | | 316,298 |
Skyworks Solutions, Inc.
| | 28,452 | | 3,032,414 |
SMART Global Holdings, Inc. (a) (b)
| | 5,489 | | 125,533 |
SolarEdge Technologies, Inc. (a) (b)
| | 8,924 | | 225,420 |
Synaptics, Inc. (a) (b)
| | 6,299 | | 555,572 |
Teradyne, Inc.
| | 26,370 | | 3,910,407 |
Texas Instruments, Inc.
| | 156,476 | | 30,439,276 |
Ultra Clean Holdings, Inc. (a)
| | 6,595 | | 323,155 |
Universal Display Corp.
| | 7,552 | | 1,587,808 |
Veeco Instruments, Inc. (a) (b)
| | 8,542 | | 398,997 |
Wolfspeed, Inc. (a) (b)
| | 18,830 | | 428,571 |
| | | | | | 967,805,884 |
| SOFTWARE — 10.3% | |
A10 Networks, Inc.
| | 10,467 | | 144,968 |
ACI Worldwide, Inc. (a)
| | 20,276 | | 802,727 |
Adeia, Inc.
| | 16,710 | | 186,901 |
Adobe, Inc. (a)
| | 76,869 | | 42,703,804 |
Agilysys, Inc. (a)
| | 3,040 | | 316,586 |
Alarm.com Holdings, Inc. (a)
| | 7,298 | | 463,715 |
Altair Engineering, Inc. Class A (a) (b)
| | 9,812 | | 962,361 |
ANSYS, Inc. (a)
| | 14,911 | | 4,793,887 |
Appfolio, Inc. Class A (a)
| | 3,525 | | 862,109 |
Aspen Technology, Inc. (a) (b)
| | 4,897 | | 972,691 |
Autodesk, Inc. (a)
| | 36,831 | | 9,113,831 |
Blackbaud, Inc. (a)
| | 8,601 | | 655,138 |
BlackLine, Inc. (a)
| | 8,772 | | 425,003 |
Box, Inc. Class A (a)
| | 24,740 | | 654,126 |
Cadence Design Systems, Inc. (a)
| | 46,800 | | 14,402,700 |
See accompanying notes to financial statements.
58
SPDR PORTFOLIO S&P 1500 COMPOSITE STOCK MARKET ETF
SCHEDULE OF INVESTMENTS (continued)
June 30, 2024
| Security Description | | | Shares | | Value |
CommVault Systems, Inc. (a)
| | 8,434 | | $1,025,321 |
Crowdstrike Holdings, Inc. Class A (a)
| | 39,745 | | 15,229,887 |
Dolby Laboratories, Inc. Class A
| | 10,336 | | 818,921 |
DoubleVerify Holdings, Inc. (a)
| | 21,739 | | 423,258 |
Dropbox, Inc. Class A (a)
| | 47,170 | | 1,059,910 |
Dynatrace, Inc. (a)
| | 41,025 | | 1,835,459 |
Envestnet, Inc. (a)
| | 9,385 | | 587,407 |
Fair Isaac Corp. (a)
| | 4,346 | | 6,469,716 |
Fortinet, Inc. (a)
| | 109,823 | | 6,619,032 |
Gen Digital, Inc.
| | 101,416 | | 2,533,372 |
InterDigital, Inc. (b)
| | 5,242 | | 611,008 |
Intuit, Inc.
| | 48,238 | | 31,702,496 |
LiveRamp Holdings, Inc. (a)
| | 11,514 | | 356,243 |
Manhattan Associates, Inc. (a)
| | 10,823 | | 2,669,818 |
Marathon Digital Holdings, Inc. (a) (b)
| | 38,389 | | 762,022 |
Microsoft Corp.
| | 1,279,045 | | 571,669,163 |
N-able, Inc. (a)
| | 11,775 | | 179,333 |
NCR Voyix Corp. (a) (b)
| | 22,806 | | 281,654 |
Oracle Corp.
| | 271,728 | | 38,367,994 |
Palo Alto Networks, Inc. (a)
| | 53,527 | | 18,146,188 |
Progress Software Corp. (b)
| | 8,113 | | 440,211 |
PTC, Inc. (a)
| | 20,524 | | 3,728,595 |
Qualys, Inc. (a)
| | 5,683 | | 810,396 |
Roper Technologies, Inc.
| | 18,051 | | 10,174,627 |
Salesforce, Inc.
| | 168,054 | | 43,206,683 |
ServiceNow, Inc. (a)
| | 35,308 | | 27,775,744 |
Sprinklr, Inc. Class A (a) (b)
| | 18,383 | | 176,844 |
SPS Commerce, Inc. (a)
| | 5,838 | | 1,098,478 |
Synopsys, Inc. (a)
| | 26,080 | | 15,519,165 |
Teradata Corp. (a)
| | 18,555 | | 641,261 |
Tyler Technologies, Inc. (a)
| | 7,015 | | 3,527,002 |
| | | | | | 885,907,755 |
| SPECIALIZED REITs — 1.0% | |
American Tower Corp. REIT
| | 79,847 | | 15,520,660 |
Crown Castle, Inc. REIT
| | 74,258 | | 7,255,007 |
CubeSmart REIT
| | 38,990 | | 1,761,178 |
Digital Realty Trust, Inc. REIT
| | 52,336 | | 7,957,689 |
EPR Properties REIT
| | 12,866 | | 540,115 |
Equinix, Inc. REIT
| | 16,189 | | 12,248,597 |
Extra Space Storage, Inc. REIT
| | 35,431 | | 5,506,332 |
Four Corners Property Trust, Inc. REIT
| | 12,617 | | 311,261 |
Gaming & Leisure Properties, Inc. REIT
| | 45,430 | | 2,053,890 |
Iron Mountain, Inc. REIT
| | 49,856 | | 4,468,095 |
Lamar Advertising Co. Class A REIT
| | 15,254 | | 1,823,311 |
National Storage Affiliates Trust REIT
| | 13,251 | | 546,206 |
Outfront Media, Inc. REIT
| | 18,930 | | 270,699 |
PotlatchDeltic Corp. REIT (b)
| | 11,725 | | 461,848 |
Public Storage REIT
| | 27,300 | | 7,852,845 |
Rayonier, Inc. REIT
| | 24,316 | | 707,352 |
Safehold, Inc. REIT (b)
| | 5,637 | | 108,738 |
| Security Description | | | Shares | | Value |
SBA Communications Corp. REIT
| | 18,734 | | $3,677,484 |
Uniti Group, Inc. REIT (b)
| | 33,734 | | 98,503 |
VICI Properties, Inc. REIT
| | 172,288 | | 4,934,328 |
Weyerhaeuser Co. REIT
| | 127,985 | | 3,633,494 |
| | | | | | 81,737,632 |
| SPECIALTY RETAIL — 2.0% | |
Abercrombie & Fitch Co. Class A (a)
| | 8,824 | | 1,569,260 |
Academy Sports & Outdoors, Inc. (b)
| | 14,934 | | 795,235 |
Advance Auto Parts, Inc. (b)
| | 11,463 | | 725,952 |
American Eagle Outfitters, Inc.
| | 27,421 | | 547,323 |
Asbury Automotive Group, Inc. (a) (b)
| | 3,294 | | 750,604 |
AutoNation, Inc. (a)
| | 4,708 | | 750,361 |
AutoZone, Inc. (a)
| | 3,005 | | 8,907,120 |
Bath & Body Works, Inc.
| | 41,048 | | 1,602,924 |
Best Buy Co., Inc.
| | 34,797 | | 2,933,039 |
Boot Barn Holdings, Inc. (a) (b)
| | 3,535 | | 455,768 |
Buckle, Inc. (b)
| | 5,033 | | 185,919 |
Burlington Stores, Inc. (a)
| | 11,200 | | 2,688,000 |
Caleres, Inc.
| | 8,304 | | 279,014 |
CarMax, Inc. (a) (b)
| | 28,564 | | 2,094,884 |
Designer Brands, Inc. Class A (b)
| | 13,456 | | 91,904 |
Dick's Sporting Goods, Inc.
| | 11,096 | | 2,383,976 |
Five Below, Inc. (a)
| | 9,549 | | 1,040,554 |
Floor & Decor Holdings, Inc. Class A (a) (b)
| | 18,393 | | 1,828,448 |
Foot Locker, Inc.
| | 17,100 | | 426,132 |
GameStop Corp. Class A (a) (b)
| | 40,336 | | 995,896 |
Gap, Inc. (b)
| | 36,157 | | 863,791 |
Group 1 Automotive, Inc.
| | 2,431 | | 722,688 |
Guess?, Inc.
| | 6,329 | | 129,112 |
Haverty Furniture Cos., Inc.
| | 2,938 | | 74,302 |
Hibbett, Inc. (b)
| | 2,837 | | 247,415 |
Home Depot, Inc.
| | 172,222 | | 59,285,701 |
Leslie's, Inc. (a) (b)
| | 25,960 | | 108,772 |
Lithia Motors, Inc. (b)
| | 4,943 | | 1,247,860 |
Lowe's Cos., Inc.
| | 99,394 | | 21,912,401 |
MarineMax, Inc. (a) (b)
| | 3,071 | | 99,408 |
Monro, Inc.
| | 5,944 | | 141,824 |
Murphy USA, Inc.
| | 2,945 | | 1,382,560 |
National Vision Holdings, Inc. (a)
| | 14,126 | | 184,909 |
ODP Corp. (a) (b)
| | 7,561 | | 296,920 |
O'Reilly Automotive, Inc. (a)
| | 10,236 | | 10,809,830 |
Penske Automotive Group, Inc.
| | 4,101 | | 611,131 |
RH (a) (b)
| | 2,704 | | 660,966 |
Ross Stores, Inc.
| | 57,558 | | 8,364,329 |
Sally Beauty Holdings, Inc. (a) (b)
| | 22,442 | | 240,803 |
Shoe Carnival, Inc. (b)
| | 4,237 | | 156,303 |
Signet Jewelers Ltd. (b)
| | 8,897 | | 796,993 |
Sonic Automotive, Inc. Class A
| | 3,944 | | 214,830 |
TJX Cos., Inc.
| | 196,918 | | 21,680,672 |
See accompanying notes to financial statements.
59
SPDR PORTFOLIO S&P 1500 COMPOSITE STOCK MARKET ETF
SCHEDULE OF INVESTMENTS (continued)
June 30, 2024
| Security Description | | | Shares | | Value |
Tractor Supply Co.
| | 18,742 | | $5,060,340 |
Ulta Beauty, Inc. (a)
| | 8,458 | | 3,263,688 |
Upbound Group, Inc.
| | 6,988 | | 214,532 |
Urban Outfitters, Inc. (a)
| | 11,435 | | 469,407 |
Valvoline, Inc. (a)
| | 23,873 | | 1,031,314 |
Victoria's Secret & Co. (a) (b)
| | 13,477 | | 238,139 |
Williams-Sonoma, Inc. (b)
| | 11,065 | | 3,124,424 |
| | | | | | 174,687,677 |
| TECHNOLOGY HARDWARE, STORAGE & PERIPHERALS — 6.5% | |
Apple, Inc.
| | 2,480,538 | | 522,450,914 |
Corsair Gaming, Inc. (a)
| | 5,811 | | 64,153 |
Hewlett Packard Enterprise Co.
| | 221,499 | | 4,689,134 |
HP, Inc.
| | 149,730 | | 5,243,545 |
NetApp, Inc.
| | 35,921 | | 4,626,625 |
Pure Storage, Inc. Class A (a)
| | 50,540 | | 3,245,173 |
Seagate Technology Holdings PLC
| | 34,355 | | 3,547,841 |
Super Micro Computer, Inc. (a) (b)
| | 7,955 | | 6,517,929 |
Western Digital Corp. (a)
| | 53,381 | | 4,044,678 |
Xerox Holdings Corp. (b)
| | 26,961 | | 313,287 |
| | | | | | 554,743,279 |
| TEXTILES, APPAREL & LUXURY GOODS — 0.4% | |
Capri Holdings Ltd. (a)
| | 20,051 | | 663,287 |
Carter's, Inc. (b)
| | 7,671 | | 475,372 |
Columbia Sportswear Co. (b)
| | 5,460 | | 431,777 |
Crocs, Inc. (a)
| | 11,465 | | 1,673,202 |
Deckers Outdoor Corp. (a)
| | 4,256 | | 4,119,595 |
G-III Apparel Group Ltd. (a)
| | 8,606 | | 232,964 |
Hanesbrands, Inc. (a) (b)
| | 59,691 | | 294,277 |
Kontoor Brands, Inc.
| | 8,099 | | 535,749 |
Lululemon Athletica, Inc. (a)
| | 19,908 | | 5,946,520 |
Movado Group, Inc. (b)
| | 2,911 | | 72,367 |
NIKE, Inc. Class B
| | 210,787 | | 15,887,016 |
Oxford Industries, Inc. (b)
| | 2,911 | | 291,537 |
PVH Corp.
| | 10,418 | | 1,102,954 |
Ralph Lauren Corp.
| | 6,871 | | 1,202,837 |
Skechers USA, Inc. Class A (a)
| | 22,188 | | 1,533,635 |
Steven Madden Ltd. (b)
| | 13,420 | | 567,666 |
Tapestry, Inc.
| | 37,427 | | 1,601,501 |
Under Armour, Inc. Class A (a) (b)
| | 34,370 | | 229,248 |
Under Armour, Inc. Class C (a) (b)
| | 34,220 | | 223,457 |
VF Corp. (b)
| | 55,195 | | 745,132 |
Wolverine World Wide, Inc. (b)
| | 13,883 | | 187,698 |
| | | | | | 38,017,791 |
| TOBACCO — 0.5% | |
Altria Group, Inc.
| | 306,270 | | 13,950,599 |
Philip Morris International, Inc.
| | 267,398 | | 27,095,439 |
Universal Corp.
| | 3,080 | | 148,425 |
Vector Group Ltd.
| | 21,249 | | 224,602 |
| | | | | | 41,419,065 |
| Security Description | | | Shares | | Value |
| TRADING COMPANIES & DISTRIBUTORS — 0.4% | |
Air Lease Corp.
| | 17,840 | | $847,935 |
Applied Industrial Technologies, Inc.
| | 7,017 | | 1,361,298 |
Boise Cascade Co.
| | 6,644 | | 792,098 |
Core & Main, Inc. Class A (a)
| | 20,965 | | 1,026,027 |
DNOW, Inc. (a)
| | 12,331 | | 169,305 |
DXP Enterprises, Inc. (a)
| | 2,724 | | 124,868 |
Fastenal Co.
| | 98,537 | | 6,192,065 |
GATX Corp.
| | 5,820 | | 770,335 |
GMS, Inc. (a)
| | 6,425 | | 517,919 |
MSC Industrial Direct Co., Inc. Class A (b)
| | 7,988 | | 633,528 |
Rush Enterprises, Inc. Class A
| | 10,560 | | 442,147 |
United Rentals, Inc.
| | 11,829 | | 7,650,169 |
Watsco, Inc. (b)
| | 5,590 | | 2,589,512 |
WESCO International, Inc.
| | 7,820 | | 1,239,626 |
WW Grainger, Inc.
| | 7,710 | | 6,956,271 |
| | | | | | 31,313,103 |
| WATER UTILITIES — 0.1% | |
American States Water Co.
| | 6,077 | | 441,008 |
American Water Works Co., Inc.
| | 33,597 | | 4,339,389 |
California Water Service Group
| | 9,016 | | 437,186 |
Essential Utilities, Inc.
| | 38,677 | | 1,443,812 |
Middlesex Water Co.
| | 2,901 | | 151,606 |
SJW Group
| | 4,672 | | 253,316 |
| | | | | | 7,066,317 |
| WIRELESS TELECOMMUNICATION SERVICES — 0.2% | |
Gogo, Inc. (a) (b)
| | 11,523 | | 110,852 |
NII Holdings, Inc. (a) (b)
| | 11,225 | | 1,459 |
Telephone & Data Systems, Inc.
| | 18,285 | | 379,048 |
T-Mobile U.S., Inc.
| | 87,694 | | 15,449,929 |
| | | | | | 15,941,288 |
TOTAL COMMON STOCKS
(Cost $5,970,971,317)
| | | | | 8,567,094,258 |
| SHORT-TERM INVESTMENTS — 0.7% | | | |
State Street Institutional Liquid Reserves Fund, Premier Class 5.36% (g) (h)
| | 5,175,258 | | 5,176,810 |
State Street Navigator Securities Lending Portfolio II (d) (i)
| | 52,623,778 | | 52,623,778 |
TOTAL SHORT-TERM INVESTMENTS
(Cost $57,800,322)
| | 57,800,588 | |
TOTAL INVESTMENTS — 100.5%
(Cost $6,028,771,639)
| | 8,624,894,846 | |
LIABILITIES IN EXCESS OF OTHER ASSETS — (0.5)%
| | (46,616,489) | |
NET ASSETS — 100.0%
| | $8,578,278,357 | |
See accompanying notes to financial statements.
60
SPDR PORTFOLIO S&P 1500 COMPOSITE STOCK MARKET ETF
SCHEDULE OF INVESTMENTS (continued)
June 30, 2024
| (a) | Non-income producing security. |
| (b) | All or a portion of the shares of the security are on loan at June 30, 2024. |
| (c) | Reflects separate holdings of the issuer's common stock traded on different securities exchanges. |
| (d) | The Fund invested in an affiliated entity. Amounts related to these investments during the year ended June 30, 2024 are shown in the Affiliate Table below. |
| (e) | Amount is less than 0.05% of net assets. |
| (f) | Fair valued as determined in good faith by the Trust's Oversight Committee in accordance with policy and procedures approved by the Board of Trustees. Security value is determined based on Level 3 inputs. As of June 30, 2024, total aggregate fair value of the securities is $0, representing 0.00% of the Fund's net assets. |
| (g) | The Fund invested in certain money market funds managed by SSGA Funds Management, Inc. Amounts related to these investments during the year ended June 30, 2024 are shown in the Affiliate Table below. |
| (h) | The rate shown is the annualized seven-day yield at June 30, 2024. |
| (i) | Investment of cash collateral for securities loaned. |
| REIT | Real Estate Investment Trust |
At June 30, 2024, open futures contracts were as follows:
| Description | | Number of
Contracts | | Expiration
Date | | Notional
Amount | | Value | | Unrealized
Appreciation
(Depreciation) |
| E-mini S&P 500 Index (long) | | 33 | | 09/20/2024 | | $9,079,171 | | $9,110,475 | | $31,304 |
During the year ended June 30, 2024, the average notional value related to futures contracts was $22,302,298.
The following table summarizes the value of the Fund's investments according to the fair value hierarchy as of June 30, 2024.
| Description | | Level 1 –
Quoted Prices | | Level 2 –
Other Significant
Observable Inputs | | Level 3 –
Significant
Unobservable Inputs | | Total |
| ASSETS: | | | | | | | | |
| INVESTMENTS: | | | | | | | | |
Common Stocks
| | $8,567,092,797 | | $1,461 | | $0(a) | | $8,567,094,258 |
Short-Term Investments
| | 57,800,588 | | — | | — | | 57,800,588 |
TOTAL INVESTMENTS
| | $8,624,893,385 | | $1,461 | | $0 | | $8,624,894,846 |
| OTHER FINANCIAL INSTRUMENTS: | | | | | | | | |
Futures Contracts - Unrealized Appreciation
| | $31,304 | | $— | | $— | | $31,304 |
TOTAL OTHER FINANCIAL INSTRUMENTS:
| | $31,304 | | $— | | $— | | $31,304 |
| (a) | The Fund held Level 3 securities that were valued at $0 at June 30, 2024. |
Affiliate Table
| | Number of
Shares Held
at
6/30/23 | | Value at
6/30/23 | | Cost of
Purchases | | Proceeds
from
Shares Sold | | Realized
Gain (Loss) | | Change in
Unrealized
Appreciation/
Depreciation | | Number of
Shares Held
at
6/30/24 | | Value at
6/30/24 | | Dividend
Income |
State Street Corp.
| 56,455 | | $4,131,377 | | $495,453 | | $600,283 | | $(116,157) | | $155,392 | | 54,943 | | $4,065,782 | | $110,980 |
State Street Institutional Liquid Reserves Fund, Premier Class
| 9,420,116 | | 9,422,000 | | 199,609,014 | | 203,847,745 | | (5,062) | | (1,397) | | 5,175,258 | | 5,176,810 | | 1,260,973 |
State Street Navigator Securities Lending Portfolio II
| 28,869,269 | | 28,869,269 | | 534,095,756 | | 510,341,247 | | — | | — | | 52,623,778 | | 52,623,778 | | 189,499 |
Total
| | | $42,422,646 | | $734,200,223 | | $714,789,275 | | $(121,219) | | $153,995 | | | | $61,866,370 | | $1,561,452 |
See accompanying notes to financial statements.
61
SPDR PORTFOLIO S&P SECTOR NEUTRAL DIVIDEND ETF
SCHEDULE OF INVESTMENTS
June 30, 2024
| Security Description | | | Shares | | Value |
| COMMON STOCKS — 99.7% | | | | | |
| AEROSPACE & DEFENSE — 1.2% | | | | | |
General Dynamics Corp.
| | | 55 | | $15,958 |
Huntington Ingalls Industries, Inc.
| | | 11 | | 2,710 |
L3Harris Technologies, Inc.
| | | 49 | | 11,004 |
Lockheed Martin Corp.
| | | 53 | | 24,756 |
Northrop Grumman Corp.
| | | 36 | | 15,694 |
| | | | | | 70,122 |
| AIR FREIGHT & LOGISTICS — 0.8% | | | | | |
CH Robinson Worldwide, Inc.
| | | 32 | | 2,820 |
FedEx Corp.
| | | 62 | | 18,590 |
United Parcel Service, Inc. Class B
| | | 182 | | 24,907 |
| | | | | | 46,317 |
| AUTO COMPONENTS — 0.0% (a) | | | | | |
LCI Industries
| | | 17 | | 1,757 |
| BANKS — 10.2% | | | | | |
Associated Banc-Corp.
| | | 99 | | 2,094 |
Atlantic Union Bankshares Corp.
| | | 53 | | 1,741 |
Bank of Hawaii Corp.
| | | 29 | | 1,659 |
Bank of New York Mellon Corp.
| | | 501 | | 30,005 |
Bank OZK
| | | 68 | | 2,788 |
BankUnited, Inc.
| | | 50 | | 1,463 |
Banner Corp.
| | | 23 | | 1,142 |
Cadence Bank
| | | 121 | | 3,422 |
Cathay General Bancorp
| | | 52 | | 1,961 |
Citigroup, Inc.
| | | 1,262 | | 80,086 |
Citizens Financial Group, Inc.
| | | 318 | | 11,457 |
Columbia Banking System, Inc.
| | | 139 | | 2,765 |
Comerica, Inc.
| | | 91 | | 4,645 |
Community Financial System, Inc.
| | | 38 | | 1,794 |
Cullen/Frost Bankers, Inc.
| | | 41 | | 4,167 |
CVB Financial Corp.
| | | 90 | | 1,552 |
Fifth Third Bancorp
| | | 450 | | 16,420 |
First Financial Bancorp
| | | 62 | | 1,378 |
First Hawaiian, Inc.
| | | 84 | | 1,744 |
First Horizon Corp.
| | | 380 | | 5,993 |
FNB Corp.
| | | 244 | | 3,338 |
Fulton Financial Corp.
| | | 112 | | 1,902 |
Glacier Bancorp, Inc.
| | | 77 | | 2,874 |
Goldman Sachs Group, Inc.
| | | 211 | | 95,439 |
Huntington Bancshares, Inc.
| | | 979 | | 12,903 |
Independent Bank Corp.
| | | 29 | | 1,471 |
KeyCorp
| | | 665 | | 9,450 |
M&T Bank Corp.
| | | 108 | | 16,347 |
Morgan Stanley
| | | 827 | | 80,376 |
Northern Trust Corp.
| | | 142 | | 11,925 |
Old National Bancorp
| | | 203 | | 3,489 |
PNC Financial Services Group, Inc.
| | | 268 | | 41,669 |
Prosperity Bancshares, Inc.
| | | 65 | | 3,974 |
Regions Financial Corp.
| | | 664 | | 13,306 |
Simmons First National Corp. Class A
| | | 85 | | 1,494 |
State Street Corp. (b)
| | | 206 | | 15,244 |
Synovus Financial Corp.
| | | 105 | | 4,220 |
Truist Financial Corp.
| | | 880 | | 34,188 |
| Security Description | | | Shares | | Value |
Trustmark Corp.
| | | 41 | | $1,232 |
U.S. Bancorp
| | | 1,117 | | 44,345 |
United Bankshares, Inc.
| | | 91 | | 2,952 |
United Community Banks, Inc.
| | | 79 | | 2,011 |
Valley National Bancorp
| | | 283 | | 1,975 |
WaFd, Inc.
| | | 46 | | 1,315 |
Webster Financial Corp.
| | | 129 | | 5,623 |
Zions Bancorp NA
| | | 102 | | 4,424 |
| | | | | | 595,762 |
| BEVERAGES — 2.6% | | | | | |
Coca-Cola Co.
| | | 1,224 | | 77,908 |
PepsiCo, Inc.
| | | 438 | | 72,239 |
| | | | | | 150,147 |
| BIOTECHNOLOGY — 2.6% | | | | | |
AbbVie, Inc.
| | | 482 | | 82,673 |
Amgen, Inc.
| | | 141 | | 44,055 |
Gilead Sciences, Inc.
| | | 347 | | 23,808 |
| | | | | | 150,536 |
| BUILDING PRODUCTS — 0.2% | | | | | |
A O Smith Corp.
| | | 32 | | 2,617 |
Allegion PLC
| | | 23 | | 2,717 |
Masco Corp.
| | | 61 | | 4,067 |
Owens Corning
| | | 22 | | 3,822 |
| | | | | | 13,223 |
| CAPITAL MARKETS — 0.6% | | | | | |
Federated Hermes, Inc.
| | | 55 | | 1,808 |
Franklin Resources, Inc.
| | | 219 | | 4,895 |
Janus Henderson Group PLC
| | | 90 | | 3,034 |
Jefferies Financial Group, Inc.
| | | 111 | | 5,523 |
T Rowe Price Group, Inc.
| | | 160 | | 18,450 |
| | | | | | 33,710 |
| CHEMICALS — 1.9% | | | | | |
Air Products & Chemicals, Inc.
| | | 124 | | 31,998 |
Ashland, Inc.
| | | 28 | | 2,646 |
Avient Corp.
| | | 50 | | 2,183 |
Cabot Corp.
| | | 30 | | 2,757 |
Celanese Corp.
| | | 60 | | 8,093 |
CF Industries Holdings, Inc.
| | | 109 | | 8,079 |
Chemours Co.
| | | 79 | | 1,783 |
Eastman Chemical Co.
| | | 66 | | 6,466 |
FMC Corp.
| | | 73 | | 4,201 |
LyondellBasell Industries NV Class A
| | | 141 | | 13,488 |
NewMarket Corp.
| | | 4 | | 2,062 |
PPG Industries, Inc.
| | | 142 | | 17,876 |
RPM International, Inc.
| | | 77 | | 8,291 |
Scotts Miracle-Gro Co.
| | | 24 | | 1,562 |
Sensient Technologies Corp.
| | | 22 | | 1,632 |
| | | | | | 113,117 |
| COMMERCIAL SERVICES & SUPPLIES — 0.6% | | | | | |
ABM Industries, Inc.
| | | 16 | | 809 |
Brady Corp. Class A
| | | 12 | | 792 |
See accompanying notes to financial statements.
62
SPDR PORTFOLIO S&P SECTOR NEUTRAL DIVIDEND ETF
SCHEDULE OF INVESTMENTS (continued)
June 30, 2024
| Security Description | | | Shares | | Value |
Republic Services, Inc.
| | | 52 | | $10,106 |
Waste Management, Inc.
| | | 95 | | 20,267 |
| | | | | | 31,974 |
| COMMUNICATIONS EQUIPMENT — 2.7% | | | | | |
Cisco Systems, Inc.
| | | 3,182 | | 151,177 |
Juniper Networks, Inc.
| | | 253 | | 9,224 |
| | | | | | 160,401 |
| CONSUMER FINANCE — 0.1% | | | | | |
Ally Financial, Inc.
| | | 183 | | 7,260 |
Navient Corp.
| | | 56 | | 815 |
| | | | | | 8,075 |
| CONSUMER STAPLES DISTRIBUTION & RETAIL — 0.6% | | | | | |
Sysco Corp.
| | | 164 | | 11,708 |
Target Corp.
| | | 153 | | 22,650 |
| | | | | | 34,358 |
| CONTAINERS & PACKAGING — 0.7% | | | | | |
Amcor PLC
| | | 833 | | 8,147 |
Avery Dennison Corp.
| | | 46 | | 10,058 |
Graphic Packaging Holding Co.
| | | 179 | | 4,691 |
Packaging Corp. of America
| | | 53 | | 9,676 |
Sealed Air Corp.
| | | 92 | | 3,201 |
Silgan Holdings, Inc.
| | | 46 | | 1,947 |
Sonoco Products Co.
| | | 55 | | 2,789 |
| | | | | | 40,509 |
| DISTRIBUTORS — 0.2% | | | | | |
Genuine Parts Co.
| | | 83 | | 11,481 |
| DIVERSIFIED CONSUMER SERVICES — 0.1% | | | | | |
H&R Block, Inc.
| | | 90 | | 4,881 |
| DIVERSIFIED TELECOMMUNICATION SERVICES — 7.6% | | | | | |
Cogent Communications Holdings, Inc.
| | | 102 | | 5,757 |
Verizon Communications, Inc.
| | | 10,602 | | 437,226 |
| | | | | | 442,983 |
| ELECTRIC UTILITIES — 1.9% | | | | | |
ALLETE, Inc.
| | | 18 | | 1,122 |
American Electric Power Co., Inc.
| | | 162 | | 14,214 |
Duke Energy Corp.
| | | 232 | | 23,254 |
Edison International
| | | 117 | | 8,402 |
Entergy Corp.
| | | 64 | | 6,848 |
Evergy, Inc.
| | | 72 | | 3,814 |
Eversource Energy
| | | 106 | | 6,011 |
Exelon Corp.
| | | 303 | | 10,487 |
FirstEnergy Corp.
| | | 160 | | 6,123 |
OGE Energy Corp.
| | | 62 | | 2,214 |
Pinnacle West Capital Corp.
| | | 35 | | 2,673 |
Portland General Electric Co.
| | | 30 | | 1,297 |
Southern Co.
| | | 325 | | 25,210 |
| | | | | | 111,669 |
| Security Description | | | Shares | | Value |
| ELECTRICAL EQUIPMENT — 1.0% | | | | | |
Eaton Corp. PLC
| | | 101 | | $31,668 |
Emerson Electric Co.
| | | 149 | | 16,414 |
nVent Electric PLC
| | | 44 | | 3,371 |
Rockwell Automation, Inc.
| | | 31 | | 8,534 |
| | | | | | 59,987 |
| ELECTRONIC EQUIPMENT, INSTRUMENTS & COMPONENTS — 1.2% | | | | | |
Avnet, Inc.
| | | 70 | | 3,604 |
Corning, Inc.
| | | 609 | | 23,660 |
Hubbell, Inc.
| | | 14 | | 5,117 |
TE Connectivity Ltd.
| | | 237 | | 35,652 |
Vishay Intertechnology, Inc.
| | | 101 | | 2,252 |
| | | | | | 70,285 |
| FINANCIAL SERVICES — 0.1% | | | | | |
Radian Group, Inc.
| | | 110 | | 3,421 |
Western Union Co.
| | | 240 | | 2,933 |
| | | | | | 6,354 |
| FOOD PRODUCTS — 0.6% | | | | | |
Campbell Soup Co.
| | | 61 | | 2,756 |
Conagra Brands, Inc.
| | | 141 | | 4,007 |
Flowers Foods, Inc.
| | | 57 | | 1,265 |
General Mills, Inc.
| | | 176 | | 11,134 |
Hormel Foods Corp.
| | | 89 | | 2,714 |
Ingredion, Inc.
| | | 21 | | 2,409 |
J M Smucker Co.
| | | 35 | | 3,816 |
Kellanova
| | | 82 | | 4,730 |
Tyson Foods, Inc. Class A
| | | 86 | | 4,914 |
| | | | | | 37,745 |
| GAS UTILITIES — 0.1% | | | | | |
National Fuel Gas Co.
| | | 29 | | 1,572 |
ONE Gas, Inc.
| | | 17 | | 1,085 |
Southwest Gas Holdings, Inc.
| | | 19 | | 1,337 |
Spire, Inc.
| | | 17 | | 1,032 |
UGI Corp.
| | | 62 | | 1,420 |
| | | | | | 6,446 |
| GROUND TRANSPORTATION — 0.9% | | | | | |
Norfolk Southern Corp.
| | | 59 | | 12,667 |
Ryder System, Inc.
| | | 11 | | 1,363 |
Union Pacific Corp.
| | | 160 | | 36,201 |
Werner Enterprises, Inc.
| | | 18 | | 645 |
| | | | | | 50,876 |
| HEALTH CARE EQUIPMENT & SUPPLIES — 1.7% | | | | | |
Abbott Laboratories
| | | 466 | | 48,422 |
Baxter International, Inc.
| | | 135 | | 4,516 |
Becton Dickinson & Co.
| | | 78 | | 18,229 |
Dentsply Sirona, Inc.
| | | 57 | | 1,420 |
Medtronic PLC
| | | 362 | | 28,493 |
| | | | | | 101,080 |
See accompanying notes to financial statements.
63
SPDR PORTFOLIO S&P SECTOR NEUTRAL DIVIDEND ETF
SCHEDULE OF INVESTMENTS (continued)
June 30, 2024
| Security Description | | | Shares | | Value |
| HEALTH CARE PROVIDERS & SERVICES — 3.1% | | | | | |
Cardinal Health, Inc.
| | | 67 | | $6,587 |
Cigna Group
| | | 77 | | 25,454 |
CVS Health Corp.
| | | 374 | | 22,088 |
Patterson Cos., Inc.
| | | 22 | | 531 |
Quest Diagnostics, Inc.
| | | 28 | | 3,833 |
UnitedHealth Group, Inc.
| | | 239 | | 121,713 |
| | | | | | 180,206 |
| HEALTH CARE REITs — 0.2% | | | | | |
CareTrust REIT, Inc.
| | | 98 | | 2,460 |
Omega Healthcare Investors, Inc. REIT
| | | 186 | | 6,370 |
| | | | | | 8,830 |
| HOTELS, RESTAURANTS & LEISURE — 3.0% | | | | | |
McDonald's Corp.
| | | 459 | | 116,971 |
Papa John's International, Inc.
| | | 21 | | 987 |
Starbucks Corp.
| | | 732 | | 56,986 |
| | | | | | 174,944 |
| HOUSEHOLD DURABLES — 0.4% | | | | | |
Garmin Ltd.
| | | 100 | | 16,292 |
Whirlpool Corp.
| | | 39 | | 3,986 |
| | | | | | 20,278 |
| HOUSEHOLD PRODUCTS — 0.3% | | | | | |
Clorox Co.
| | | 40 | | 5,459 |
Energizer Holdings, Inc.
| | | 21 | | 620 |
Kimberly-Clark Corp.
| | | 100 | | 13,820 |
| | | | | | 19,899 |
| INDUSTRIAL CONGLOMERATES — 0.6% | | | | | |
Honeywell International, Inc.
| | | 174 | | 37,156 |
| INSURANCE — 1.9% | | | | | |
Cincinnati Financial Corp.
| | | 106 | | 12,518 |
Fidelity National Financial, Inc.
| | | 178 | | 8,797 |
First American Financial Corp.
| | | 71 | | 3,830 |
Lincoln National Corp.
| | | 124 | | 3,856 |
MetLife, Inc.
| | | 414 | | 29,059 |
Old Republic International Corp.
| | | 174 | | 5,377 |
Principal Financial Group, Inc.
| | | 153 | | 12,003 |
Prudential Financial, Inc.
| | | 249 | | 29,180 |
Unum Group
| | | 124 | | 6,338 |
| | | | | | 110,958 |
| IT SERVICES — 4.8% | | | | | |
Accenture PLC Class A
| | | 520 | | 157,773 |
International Business Machines Corp.
| | | 727 | | 125,735 |
| | | | | | 283,508 |
| LEISURE EQUIPMENT & PRODUCTS — 0.1% | | | | | |
Hasbro, Inc.
| | | 80 | | 4,680 |
Polaris, Inc.
| | | 38 | | 2,976 |
| | | | | | 7,656 |
| Security Description | | | Shares | | Value |
| MACHINERY — 2.4% | | | | | |
Barnes Group, Inc.
| | | 13 | | $538 |
Caterpillar, Inc.
| | | 130 | | 43,303 |
Cummins, Inc.
| | | 35 | | 9,693 |
Deere & Co.
| | | 68 | | 25,407 |
Donaldson Co., Inc.
| | | 31 | | 2,218 |
Dover Corp.
| | | 36 | | 6,496 |
Flowserve Corp.
| | | 32 | | 1,539 |
Hillenbrand, Inc.
| | | 18 | | 720 |
Illinois Tool Works, Inc.
| | | 73 | | 17,298 |
Kennametal, Inc.
| | | 20 | | 471 |
Lincoln Electric Holdings, Inc.
| | | 15 | | 2,830 |
Oshkosh Corp.
| | | 17 | | 1,840 |
Parker-Hannifin Corp.
| | | 33 | | 16,692 |
Snap-on, Inc.
| | | 15 | | 3,921 |
Stanley Black & Decker, Inc.
| | | 41 | | 3,276 |
Timken Co.
| | | 17 | | 1,362 |
Toro Co.
| | | 28 | | 2,618 |
Trinity Industries, Inc.
| | | 21 | | 628 |
| | | | | | 140,850 |
| MEDIA — 0.7% | | | | | |
Interpublic Group of Cos., Inc.
| | | 962 | | 27,984 |
Nexstar Media Group, Inc.
| | | 81 | | 13,447 |
| | | | | | 41,431 |
| MORTGAGE REAL ESTATE INVESTMENT TRUST (REITs) — 0.2% | | | | | |
Arbor Realty Trust, Inc. REIT
| | | 124 | | 1,779 |
Blackstone Mortgage Trust, Inc. Class A REIT
| | | 118 | | 2,055 |
Hannon Armstrong Sustainable Infrastructure Capital, Inc. REIT
| | | 81 | | 2,398 |
Starwood Property Trust, Inc. REIT
| | | 202 | | 3,826 |
| | | | | | 10,058 |
| MULTI-UTILITIES — 0.2% | | | | | |
Avista Corp.
| | | 23 | | 796 |
Black Hills Corp.
| | | 21 | | 1,142 |
Northwestern Energy Group, Inc.
| | | 19 | | 951 |
WEC Energy Group, Inc.
| | | 97 | | 7,611 |
| | | | | | 10,500 |
| OFFICE REITs — 0.2% | | | | | |
Boston Properties, Inc. REIT
| | | 110 | | 6,772 |
COPT Defense Properties REIT
| | | 86 | | 2,152 |
Highwoods Properties, Inc. REIT
| | | 80 | | 2,102 |
Kilroy Realty Corp. REIT
| | | 85 | | 2,649 |
| | | | | | 13,675 |
| OIL, GAS & CONSUMABLE FUELS — 3.7% | | | | | |
Chevron Corp.
| | | 403 | | 63,037 |
DT Midstream, Inc.
| | | 22 | | 1,563 |
Exxon Mobil Corp.
| | | 915 | | 105,335 |
Kinder Morgan, Inc.
| | | 456 | | 9,061 |
ONEOK, Inc.
| | | 139 | | 11,335 |
See accompanying notes to financial statements.
64
SPDR PORTFOLIO S&P SECTOR NEUTRAL DIVIDEND ETF
SCHEDULE OF INVESTMENTS (continued)
June 30, 2024
| Security Description | | | Shares | | Value |
Phillips 66
| | | 106 | | $14,964 |
Valero Energy Corp.
| | | 83 | | 13,011 |
| | | | | | 218,306 |
| PERSONAL CARE PRODUCTS — 0.2% | | | | | |
Kenvue, Inc.
| | | 598 | | 10,872 |
| PHARMACEUTICALS — 4.2% | | | | | |
Bristol-Myers Squibb Co.
| | | 573 | | 23,797 |
Johnson & Johnson
| | | 647 | | 94,566 |
Merck & Co., Inc.
| | | 670 | | 82,946 |
Organon & Co.
| | | 66 | | 1,366 |
Perrigo Co. PLC
| | | 36 | | 924 |
Pfizer, Inc.
| | | 1,513 | | 42,334 |
| | | | | | 245,933 |
| PROFESSIONAL SERVICES — 0.9% | | | | | |
Automatic Data Processing, Inc.
| | | 105 | | 25,063 |
Broadridge Financial Solutions, Inc.
| | | 31 | | 6,107 |
Insperity, Inc.
| | | 9 | | 821 |
Korn Ferry
| | | 14 | | 940 |
Leidos Holdings, Inc.
| | | 35 | | 5,106 |
ManpowerGroup, Inc.
| | | 13 | | 907 |
Maximus, Inc.
| | | 16 | | 1,371 |
Paychex, Inc.
| | | 82 | | 9,722 |
Robert Half, Inc.
| | | 30 | | 1,919 |
| | | | | | 51,956 |
| RESIDENTIAL REITs — 0.7% | | | | | |
Equity Residential REIT
| | | 253 | | 17,543 |
Mid-America Apartment Communities, Inc. REIT
| | | 88 | | 12,550 |
UDR, Inc. REIT
| | | 224 | | 9,217 |
| | | | | | 39,310 |
| RETAIL REITs — 0.8% | | | | | |
Agree Realty Corp. REIT
| | | 73 | | 4,522 |
Federal Realty Investment Trust REIT
| | | 53 | | 5,351 |
NNN REIT, Inc.
| | | 140 | | 5,964 |
Realty Income Corp. REIT
| | | 618 | | 32,643 |
| | | | | | 48,480 |
| SEMICONDUCTORS & SEMICONDUCTOR EQUIPMENT — 17.6% | | | | | |
Analog Devices, Inc.
| | | 391 | | 89,250 |
Broadcom, Inc.
| | | 354 | | 568,357 |
Microchip Technology, Inc.
| | | 426 | | 38,979 |
QUALCOMM, Inc.
| | | 887 | | 176,673 |
Skyworks Solutions, Inc.
| | | 133 | | 14,175 |
Texas Instruments, Inc.
| | | 726 | | 141,229 |
| | | | | | 1,028,663 |
| SOFTWARE — 3.3% | | | | | |
Dolby Laboratories, Inc. Class A
| | | 48 | | 3,803 |
InterDigital, Inc.
| | | 21 | | 2,448 |
Oracle Corp.
| | | 1,319 | | 186,243 |
| | | | | | 192,494 |
| Security Description | | | Shares | | Value |
| SPECIALIZED REITs — 0.8% | | | | | |
Crown Castle, Inc. REIT
| | | 353 | | $34,488 |
CubeSmart REIT
| | | 180 | | 8,131 |
Four Corners Property Trust, Inc. REIT
| | | 69 | | 1,702 |
National Storage Affiliates Trust REIT
| | | 63 | | 2,597 |
| | | | | | 46,918 |
| SPECIALTY RETAIL — 6.2% | | | | | |
Best Buy Co., Inc.
| | | 131 | | 11,042 |
Dick's Sporting Goods, Inc.
| | | 39 | | 8,379 |
Home Depot, Inc.
| | | 700 | | 240,968 |
Lowe's Cos., Inc.
| | | 390 | | 85,980 |
Tractor Supply Co.
| | | 69 | | 18,630 |
| | | | | | 364,999 |
| TECHNOLOGY HARDWARE, STORAGE & PERIPHERALS — 1.5% | | | | | |
Hewlett Packard Enterprise Co.
| | | 1,038 | | 21,975 |
HP, Inc.
| | | 722 | | 25,284 |
NetApp, Inc.
| | | 165 | | 21,252 |
Seagate Technology Holdings PLC
| | | 158 | | 16,317 |
| | | | | | 84,828 |
| TOBACCO — 1.2% | | | | | |
Altria Group, Inc.
| | | 560 | | 25,508 |
Philip Morris International, Inc.
| | | 454 | | 46,004 |
| | | | | | 71,512 |
| TRADING COMPANIES & DISTRIBUTORS — 0.3% | | | | | |
Fastenal Co.
| | | 166 | | 10,431 |
GATX Corp.
| | | 10 | | 1,324 |
MSC Industrial Direct Co., Inc. Class A
| | | 12 | | 952 |
Watsco, Inc.
| | | 8 | | 3,706 |
| | | | | | 16,413 |
TOTAL COMMON STOCKS
(Cost $5,345,892)
| | | | | 5,834,428 |
| | | | |
| SHORT-TERM INVESTMENT — 0.2% | |
State Street Institutional Liquid Reserves Fund, Premier Class 5.36% (c) (d)
(Cost $10,655)
| | 10,652 | 10,656 |
TOTAL INVESTMENTS — 99.9%
(Cost $5,356,547)
| 5,845,084 |
OTHER ASSETS IN EXCESS OF LIABILITIES — 0.1%
| 7,339 |
NET ASSETS — 100.0%
| $5,852,423 |
See accompanying notes to financial statements.
65
SPDR PORTFOLIO S&P SECTOR NEUTRAL DIVIDEND ETF
SCHEDULE OF INVESTMENTS (continued)
June 30, 2024
| (a) | Amount is less than 0.05% of net assets. |
| (b) | The Fund invested in an affiliated entity, State Street Corp. Amounts related to these investments during the year ended June 30, 2024 are shown in the Affiliate Table below. |
| (c) | The Fund invested in certain money market funds managed by SSGA Funds Management, Inc. Amounts related to these investments during the year ended June 30, 2024 are shown in the Affiliate Table below. |
| (d) | The rate shown is the annualized seven-day yield at June 30, 2024. |
| REIT | Real Estate Investment Trust |
The following table summarizes the value of the Fund's investments according to the fair value hierarchy as of June 30, 2024.
| Description | | Level 1 –
Quoted Prices | | Level 2 –
Other Significant
Observable Inputs | | Level 3 –
Significant
Unobservable Inputs | | Total |
| ASSETS: | | | | | | | | |
| INVESTMENTS: | | | | | | | | |
Common Stocks
| | $5,834,428 | | $— | | $— | | $5,834,428 |
Short-Term Investment
| | 10,656 | | — | | — | | 10,656 |
TOTAL INVESTMENTS
| | $5,845,084 | | $— | | $— | | $5,845,084 |
Affiliate Table
| | Number of
Shares Held
at
9/12/23* | | Value at
9/12/23* | | Cost of
Purchases | | Proceeds
from
Shares Sold | | Realized
Gain (Loss) | | Change in
Unrealized
Appreciation/
Depreciation | | Number of
Shares Held
at
6/30/24 | | Value at
6/30/24 | | Dividend
Income |
State Street Corp.
| — | | $— | | $15,936 | | $911 | | $(69) | | $288 | | 206 | | $15,244 | | $253 |
State Street Institutional Liquid Reserves Fund, Premier Class
| — | | — | | 193,115 | | 182,460 | | — | | 1 | | 10,652 | | 10,656 | | 441 |
Total
| | | $— | | $209,051 | | $183,371 | | $(69) | | $289 | | | | $25,900 | | $694 |
| * | Commencement of operations. |
See accompanying notes to financial statements.
66
SPDR S&P AEROSPACE & DEFENSE ETF
SCHEDULE OF INVESTMENTS
June 30, 2024
| Security Description | | | Shares | | Value |
| COMMON STOCKS — 99.9% | | | | | |
| AEROSPACE & DEFENSE — 99.9% | | | |
AAR Corp. (a)
| | | 654,785 | | $47,602,870 |
AeroVironment, Inc. (a) (b)
| | | 455,952 | | 83,056,216 |
Archer Aviation, Inc. Class A (a) (b)
| | | 7,112,685 | | 25,036,651 |
Astronics Corp. (a)
| | | 238,258 | | 4,772,308 |
Axon Enterprise, Inc. (a)
| | | 335,713 | | 98,780,193 |
Boeing Co. (a)
| | | 553,614 | | 100,763,284 |
BWX Technologies, Inc.
| | | 1,097,508 | | 104,263,260 |
Cadre Holdings, Inc. (b)
| | | 656,159 | | 22,020,696 |
Curtiss-Wright Corp.
| | | 368,639 | | 99,893,796 |
Ducommun, Inc. (a)
| | | 158,317 | | 9,191,885 |
General Dynamics Corp.
| | | 336,346 | | 97,587,428 |
HEICO Corp. (b)
| | | 435,845 | | 97,459,300 |
Hexcel Corp.
| | | 1,576,532 | | 98,454,423 |
Howmet Aerospace, Inc.
| | | 1,243,212 | | 96,510,548 |
Huntington Ingalls Industries, Inc.
| | | 411,554 | | 101,378,097 |
Kratos Defense & Security Solutions, Inc. (a)
| | | 2,380,222 | | 47,628,242 |
L3Harris Technologies, Inc.
| | | 451,277 | | 101,347,789 |
Leonardo DRS, Inc. (a) (b)
| | | 1,089,412 | | 27,790,900 |
Lockheed Martin Corp.
| | | 214,119 | | 100,014,985 |
Mercury Systems, Inc. (a) (b)
| | | 983,822 | | 26,553,356 |
Moog, Inc. Class A
| | | 238,587 | | 39,915,605 |
National Presto Industries, Inc.
| | | 84,556 | | 6,352,692 |
Northrop Grumman Corp.
| | | 231,411 | | 100,883,625 |
Rocket Lab USA, Inc. (a) (b)
| | | 8,906,607 | | 42,751,714 |
RTX Corp.
| | | 941,563 | | 94,523,510 |
Spirit AeroSystems Holdings, Inc. Class A (a) (b)
| | | 3,343,752 | | 109,909,128 |
Textron, Inc.
| | | 1,151,192 | | 98,841,345 |
TransDigm Group, Inc.
| | | 75,797 | | 96,839,005 |
Triumph Group, Inc. (a) (b)
| | | 1,387,015 | | 21,373,901 |
V2X, Inc. (a)
| | | 179,786 | | 8,622,537 |
| Security Description | | | Shares | | Value |
Virgin Galactic Holdings, Inc. (a) (b)
| | | 777,086 | | $6,550,835 |
Woodward, Inc.
| | | 544,915 | | 95,022,278 |
TOTAL COMMON STOCKS
(Cost $1,758,495,007)
| | | | | 2,111,692,402 |
| SHORT-TERM INVESTMENTS — 7.7% | | | | | |
State Street Institutional Liquid Reserves Fund, Premier Class 5.36% (c) (d)
| | 2,708,743 | | 2,709,555 |
State Street Navigator Securities Lending Portfolio II (e) (f)
| | 160,660,356 | | 160,660,356 |
TOTAL SHORT-TERM INVESTMENTS
(Cost $163,369,699)
| | | | | 163,369,911 |
TOTAL INVESTMENTS — 107.6%
(Cost $1,921,864,706)
| | | | 2,275,062,313 |
LIABILITIES IN EXCESS OF OTHER ASSETS — (7.6)%
| | | | | (160,946,455) |
NET ASSETS — 100.0%
| | | | | $2,114,115,858 |
| | |
| (a) | Non-income producing security. |
| (b) | All or a portion of the shares of the security are on loan at June 30, 2024. |
| (c) | The Fund invested in certain money market funds managed by SSGA Funds Management, Inc. Amounts related to these investments during the year ended June 30, 2024 are shown in the Affiliate Table below. |
| (d) | The rate shown is the annualized seven-day yield at June 30, 2024. |
| (e) | The Fund invested in an affiliated entity. Amounts related to these investments during the year ended June 30, 2024 are shown in the Affiliate Table below. |
| (f) | Investment of cash collateral for securities loaned. |
The following table summarizes the value of the Fund's investments according to the fair value hierarchy as of June 30, 2024.
| Description | | Level 1 –
Quoted Prices | | Level 2 –
Other Significant
Observable Inputs | | Level 3 –
Significant
Unobservable Inputs | | Total |
| ASSETS: | | | | | | | | |
| INVESTMENTS: | | | | | | | | |
Common Stocks
| | $2,111,692,402 | | $— | | $— | | $2,111,692,402 |
Short-Term Investments
| | 163,369,911 | | — | | — | | 163,369,911 |
TOTAL INVESTMENTS
| | $2,275,062,313 | | $— | | $— | | $2,275,062,313 |
See accompanying notes to financial statements.
67
SPDR S&P AEROSPACE & DEFENSE ETF
SCHEDULE OF INVESTMENTS (continued)
June 30, 2024
Affiliate Table
| | Number of
Shares Held
at
6/30/23 | | Value at
6/30/23 | | Cost of
Purchases | | Proceeds
from
Shares Sold | | Realized
Gain (Loss) | | Change in
Unrealized
Appreciation/
Depreciation(a) | | Number of
Shares Held
at
6/30/24 | | Value at
6/30/24 | | Dividend
Income |
State Street Institutional Liquid Reserves Fund, Premier Class
| 1,402,370 | | $1,402,650 | | $62,461,655 | | $61,154,756 | | $(85) | | $91 | | 2,708,743 | | $2,709,555 | | $166,747 |
State Street Navigator Securities Lending Portfolio II
| 76,645,226 | | 76,645,226 | | 1,016,622,056 | | 932,606,926 | | — | | — | | 160,660,356 | | 160,660,356 | | 1,459,511 |
Virgin Galactic Holdings, Inc.
| 15,261,096 | | 59,213,052 | | 58,446,128 | | 3,637,682 | | (10,290,184) | | —* | | — | | —* | | — |
Total
| | | $137,260,928 | | $1,137,529,839 | | $997,399,364 | | $(10,290,269) | | $91 | | | | $163,369,911 | | $1,626,258 |
| (a) | Does not include change in unrealized appreciation and depreciation from investments that are no longer affiliates at year ended June 30, 2024. |
| * | As of June 30, 2024, no longer an affiliate. |
See accompanying notes to financial statements.
68
SPDR S&P BANK ETF
SCHEDULE OF INVESTMENTS
June 30, 2024
| Security Description | | | Shares | | Value |
| COMMON STOCKS — 99.8% | |
| BANKS — 86.3% | |
Ameris Bancorp
| | 335,490 | | $16,891,922 |
Associated Banc-Corp.
| | 784,877 | | 16,600,149 |
Atlantic Union Bankshares Corp. (a)
| | 456,124 | | 14,983,673 |
Axos Financial, Inc. (b)
| | 300,372 | | 17,166,260 |
Banc of California, Inc. (a)
| | 1,222,549 | | 15,624,176 |
Bancorp, Inc. (b)
| | 479,168 | | 18,093,384 |
Bank of America Corp.
| | 400,041 | | 15,909,631 |
Bank of Hawaii Corp. (a)
| | 280,611 | | 16,053,755 |
Bank of New York Mellon Corp.
| | 270,552 | | 16,203,359 |
Bank OZK
| | 414,729 | | 17,003,889 |
BankUnited, Inc.
| | 580,317 | | 16,985,879 |
Banner Corp.
| | 222,749 | | 11,057,260 |
BOK Financial Corp.
| | 179,851 | | 16,481,546 |
Cadence Bank (a)
| | 582,902 | | 16,484,469 |
Cathay General Bancorp (a)
| | 435,092 | | 16,411,670 |
Citigroup, Inc.
| | 264,582 | | 16,790,374 |
Citizens Financial Group, Inc.
| | 460,742 | | 16,600,534 |
Columbia Banking System, Inc.
| | 853,129 | | 16,968,736 |
Comerica, Inc.
| | 335,272 | | 17,112,283 |
Commerce Bancshares, Inc.
| | 296,460 | | 16,536,539 |
Community Financial System, Inc.
| | 339,700 | | 16,037,237 |
Cullen/Frost Bankers, Inc.
| | 165,186 | | 16,787,853 |
CVB Financial Corp.
| | 954,131 | | 16,449,218 |
East West Bancorp, Inc. (a)
| | 226,157 | | 16,561,477 |
Eastern Bankshares, Inc.
| | 1,019,645 | | 14,254,637 |
Fifth Third Bancorp
| | 445,699 | | 16,263,557 |
First BanCorp
| | 916,911 | | 16,770,302 |
First Citizens BancShares, Inc. Class A
| | 9,617 | | 16,191,277 |
First Financial Bancorp
| | 427,323 | | 9,495,117 |
First Financial Bankshares, Inc. (a)
| | 564,254 | | 16,662,421 |
First Hawaiian, Inc. (a)
| | 798,452 | | 16,575,864 |
First Horizon Corp.
| | 1,100,038 | | 17,347,599 |
First Interstate BancSystem, Inc. Class A
| | 622,177 | | 17,277,855 |
First Merchants Corp.
| | 324,946 | | 10,817,452 |
FNB Corp. (a)
| | 1,234,079 | | 16,882,201 |
Fulton Financial Corp.
| | 990,378 | | 16,816,618 |
Glacier Bancorp, Inc. (a)
| | 444,942 | | 16,605,235 |
Hancock Whitney Corp.
| | 357,089 | | 17,079,567 |
Hilltop Holdings, Inc.
| | 319,717 | | 10,000,748 |
Home BancShares, Inc.
| | 687,886 | | 16,481,749 |
Huntington Bancshares, Inc.
| | 1,269,001 | | 16,725,433 |
Independent Bank Corp.
| | 333,203 | | 16,900,056 |
Independent Bank Group, Inc.
| | 306,766 | | 13,963,988 |
International Bancshares Corp.
| | 276,946 | | 15,844,081 |
JPMorgan Chase & Co.
| | 81,005 | | 16,384,071 |
KeyCorp
| | 1,174,963 | | 16,696,224 |
Lakeland Financial Corp. (a)
| | 126,478 | | 7,780,927 |
M&T Bank Corp.
| | 110,408 | | 16,711,355 |
| Security Description | | | Shares | | Value |
New York Community Bancorp, Inc. (a)
| | 5,146,727 | | $16,572,461 |
Northern Trust Corp.
| | 192,252 | | 16,145,323 |
Old National Bancorp (a)
| | 994,770 | | 17,100,096 |
Pacific Premier Bancorp, Inc.
| | 692,792 | | 15,913,432 |
Pinnacle Financial Partners, Inc. (a)
| | 209,329 | | 16,754,693 |
PNC Financial Services Group, Inc.
| | 103,894 | | 16,153,439 |
Popular, Inc.
| | 186,696 | | 16,509,527 |
Prosperity Bancshares, Inc.
| | 272,999 | | 16,691,159 |
Regions Financial Corp.
| | 841,690 | | 16,867,468 |
Renasant Corp.
| | 270,148 | | 8,250,320 |
Seacoast Banking Corp. of Florida (a)
| | 512,594 | | 12,117,722 |
ServisFirst Bancshares, Inc. (a)
| | 207,378 | | 13,104,216 |
Simmons First National Corp. Class A
| | 592,270 | | 10,412,107 |
SouthState Corp.
| | 220,161 | | 16,824,704 |
Synovus Financial Corp. (a)
| | 429,127 | | 17,246,614 |
Texas Capital Bancshares, Inc. (b)
| | 275,203 | | 16,825,911 |
Triumph Financial, Inc. (a) (b)
| | 187,931 | | 15,363,359 |
Truist Financial Corp.
| | 443,307 | | 17,222,477 |
Trustmark Corp.
| | 322,292 | | 9,681,652 |
U.S. Bancorp
| | 404,261 | | 16,049,162 |
UMB Financial Corp. (a)
| | 196,294 | | 16,374,845 |
United Bankshares, Inc.
| | 504,582 | | 16,368,640 |
United Community Banks, Inc.
| | 648,124 | | 16,501,237 |
Valley National Bancorp (a)
| | 2,407,598 | | 16,805,034 |
WaFd, Inc.
| | 526,818 | | 15,056,458 |
Webster Financial Corp.
| | 396,002 | | 17,261,727 |
Wells Fargo & Co.
| | 273,476 | | 16,241,740 |
WesBanco, Inc.
| | 244,369 | | 6,820,339 |
Western Alliance Bancorp
| | 268,012 | | 16,836,514 |
Wintrust Financial Corp.
| | 170,720 | | 16,826,163 |
WSFS Financial Corp.
| | 302,575 | | 14,221,025 |
Zions Bancorp NA
| | 385,217 | | 16,706,861 |
| | | | | | 1,246,150,032 |
| FINANCIAL SERVICES — 13.5% | |
Apollo Global Management, Inc.
| | 135,476 | | 15,995,651 |
Corebridge Financial, Inc.
| | 553,705 | | 16,123,890 |
Equitable Holdings, Inc.
| | 395,601 | | 16,164,257 |
Essent Group Ltd. (a)
| | 286,136 | | 16,077,982 |
Jackson Financial, Inc. Class A
| | 226,843 | | 16,845,361 |
MGIC Investment Corp.
| | 767,605 | | 16,541,888 |
Mr Cooper Group, Inc. (a) (b)
| | 191,926 | | 15,590,149 |
NMI Holdings, Inc. Class A (b)
| | 494,099 | | 16,819,130 |
PennyMac Financial Services, Inc.
| | 171,669 | | 16,239,887 |
Radian Group, Inc.
| | 523,950 | | 16,294,845 |
Voya Financial, Inc.
| | 221,967 | | 15,792,952 |
See accompanying notes to financial statements.
69
SPDR S&P BANK ETF
SCHEDULE OF INVESTMENTS (continued)
June 30, 2024
| Security Description | | | Shares | | Value |
Walker & Dunlop, Inc.
| | 166,395 | | $16,339,989 |
| | | | | | 194,825,981 |
TOTAL COMMON STOCKS
(Cost $1,528,835,573)
| | | | | 1,440,976,013 |
| SHORT-TERM INVESTMENTS — 2.1% | | | |
State Street Institutional Liquid Reserves Fund, Premier Class 5.36% (c) (d)
| | 982,274 | | 982,568 |
State Street Navigator Securities Lending Portfolio II (e) (f)
| | 29,664,528 | | 29,664,528 |
TOTAL SHORT-TERM INVESTMENTS
(Cost $30,647,055)
| | 30,647,096 | |
TOTAL INVESTMENTS — 101.9%
(Cost $1,559,482,628)
| | 1,471,623,109 | |
LIABILITIES IN EXCESS OF OTHER ASSETS — (1.9)%
| | (26,917,145) | |
NET ASSETS — 100.0%
| | $1,444,705,964 | |
| (a) | All or a portion of the shares of the security are on loan at June 30, 2024. |
| (b) | Non-income producing security. |
| (c) | The Fund invested in certain money market funds managed by SSGA Funds Management, Inc. Amounts related to these investments during the year ended June 30, 2024 are shown in the Affiliate Table below. |
| (d) | The rate shown is the annualized seven-day yield at June 30, 2024. |
| (e) | The Fund invested in an affiliated entity. Amounts related to these investments during the year ended June 30, 2024 are shown in the Affiliate Table below. |
| (f) | Investment of cash collateral for securities loaned. |
The following table summarizes the value of the Fund's investments according to the fair value hierarchy as of June 30, 2024.
| Description | | Level 1 –
Quoted Prices | | Level 2 –
Other Significant
Observable Inputs | | Level 3 –
Significant
Unobservable Inputs | | Total |
| ASSETS: | | | | | | | | |
| INVESTMENTS: | | | | | | | | |
Common Stocks
| | $1,440,976,013 | | $— | | $— | | $1,440,976,013 |
Short-Term Investments
| | 30,647,096 | | — | | — | | 30,647,096 |
TOTAL INVESTMENTS
| | $1,471,623,109 | | $— | | $— | | $1,471,623,109 |
Affiliate Table
| | Number of
Shares Held
at
6/30/23 | | Value at
6/30/23 | | Cost of
Purchases | | Proceeds
from
Shares Sold | | Realized
Gain (Loss) | | Change in
Unrealized
Appreciation/
Depreciation | | Number of
Shares Held
at
6/30/24 | | Value at
6/30/24 | | Dividend
Income |
State Street Institutional Liquid Reserves Fund, Premier Class
| 416,292 | | $416,375 | | $85,643,482 | | $85,077,288 | | $(42) | | $41 | | 982,274 | | $982,568 | | $76,637 |
State Street Navigator Securities Lending Portfolio II
| 61,218,060 | | 61,218,060 | | 691,730,294 | | 723,283,826 | | — | | — | | 29,664,528 | | 29,664,528 | | 141,015 |
Total
| | | $61,634,435 | | $777,373,776 | | $808,361,114 | | $(42) | | $41 | | | | $30,647,096 | | $217,652 |
See accompanying notes to financial statements.
70
SPDR S&P BIOTECH ETF
SCHEDULE OF INVESTMENTS
June 30, 2024
| Security Description | | | Shares | | Value |
| COMMON STOCKS — 100.0% | | | | | |
| BIOTECHNOLOGY — 99.8% | | | |
4D Molecular Therapeutics, Inc. (a)
| | | 959,765 | | $20,145,467 |
89bio, Inc. (a) (b)
| | | 1,441,600 | | 11,547,216 |
AbbVie, Inc.
| | | 1,104,365 | | 189,420,685 |
ACADIA Pharmaceuticals, Inc. (a)
| | | 3,064,200 | | 49,793,250 |
ADMA Biologics, Inc. (a)
| | | 2,811,122 | | 31,428,344 |
Agios Pharmaceuticals, Inc. (a)
| | | 771,858 | | 33,282,517 |
Akero Therapeutics, Inc. (a)
| | | 1,215,466 | | 28,514,832 |
Alector, Inc. (a) (b)
| | | 1,005,433 | | 4,564,666 |
Alkermes PLC (a) (b)
| | | 2,897,436 | | 69,828,208 |
Allogene Therapeutics, Inc. (a) (b)
| | | 4,189,650 | | 9,761,885 |
Alnylam Pharmaceuticals, Inc. (a)
| | | 814,744 | | 197,982,792 |
Altimmune, Inc. (a) (b)
| | | 2,225,729 | | 14,801,098 |
Amgen, Inc.
| | | 623,375 | | 194,773,519 |
Amicus Therapeutics, Inc. (a)
| | | 4,586,953 | | 45,502,574 |
AnaptysBio, Inc. (a)
| | | 498,989 | | 12,504,664 |
Anavex Life Sciences Corp. (a) (b)
| | | 2,253,063 | | 9,507,926 |
Apellis Pharmaceuticals, Inc. (a)
| | | 2,430,484 | | 93,233,366 |
Apogee Therapeutics, Inc. (a) (b)
| | | 751,645 | | 29,577,231 |
Arcellx, Inc. (a) (b)
| | | 861,784 | | 47,561,859 |
Arcturus Therapeutics Holdings, Inc. (a) (b)
| | | 783,578 | | 19,080,124 |
Arcus Biosciences, Inc. (a) (b)
| | | 962,144 | | 14,653,453 |
Arcutis Biotherapeutics, Inc. (a) (b)
| | | 2,606,243 | | 24,238,060 |
Ardelyx, Inc. (a) (b)
| | | 6,455,508 | | 47,835,314 |
Arrowhead Pharmaceuticals, Inc. (a) (b)
| | | 1,471,818 | | 38,252,550 |
ARS Pharmaceuticals, Inc. (a) (b)
| | | 899,796 | | 7,657,264 |
Astria Therapeutics, Inc. (a) (b)
| | | 1,103,287 | | 10,039,912 |
Avid Bioservices, Inc. (a) (b)
| | | 1,851,230 | | 13,217,782 |
Avidity Biosciences, Inc. (a)
| | | 1,098,102 | | 44,857,467 |
Beam Therapeutics, Inc. (a) (b)
| | | 1,660,024 | | 38,894,362 |
BioCryst Pharmaceuticals, Inc. (a) (b)
| | | 4,677,931 | | 28,909,614 |
Biogen, Inc. (a)
| | | 803,619 | | 186,294,957 |
Biohaven Ltd. (a)
| | | 1,965,204 | | 68,212,231 |
BioMarin Pharmaceutical, Inc. (a)
| | | 2,229,427 | | 183,548,725 |
Blueprint Medicines Corp. (a) (b)
| | | 953,817 | | 102,802,396 |
Bridgebio Pharma, Inc. (a)
| | | 2,728,067 | | 69,101,937 |
C4 Therapeutics, Inc. (a) (b)
| | | 1,855,857 | | 8,574,059 |
Cabaletta Bio, Inc. (a) (b)
| | | 1,040,333 | | 7,781,691 |
| Security Description | | | Shares | | Value |
CareDx, Inc. (a)
| | | 898,309 | | $13,950,739 |
Cargo Therapeutics, Inc. (a)
| | | 399,654 | | 6,562,319 |
Catalyst Pharmaceuticals, Inc. (a)
| | | 1,863,178 | | 28,860,627 |
Celldex Therapeutics, Inc. (a) (b)
| | | 1,200,220 | | 44,420,142 |
Cerevel Therapeutics Holdings, Inc. (a)
| | | 1,841,026 | | 75,279,553 |
CG oncology, Inc. (a)
| | | 511,985 | | 16,163,366 |
Cogent Biosciences, Inc. (a) (b)
| | | 1,847,862 | | 15,577,477 |
Corbus Pharmaceuticals Holdings, Inc. (a)
| | | 233,136 | | 10,549,404 |
Crinetics Pharmaceuticals, Inc. (a)
| | | 1,126,548 | | 50,458,085 |
CRISPR Therapeutics AG (a) (b)
| | | 1,833,667 | | 99,036,355 |
Cullinan Therapeutics, Inc. (a) (b)
| | | 1,051,151 | | 18,332,073 |
Cytokinetics, Inc. (a) (b)
| | | 2,634,007 | | 142,710,499 |
Day One Biopharmaceuticals, Inc. (a) (b)
| | | 1,503,180 | | 20,713,820 |
Denali Therapeutics, Inc. (a)
| | | 1,521,552 | | 35,330,437 |
Disc Medicine, Inc. (a) (b)
| | | 240,927 | | 10,858,580 |
Dynavax Technologies Corp. (a)
| | | 3,130,770 | | 35,158,547 |
Dyne Therapeutics, Inc. (a)
| | | 1,460,159 | | 51,529,011 |
Editas Medicine, Inc. (a) (b)
| | | 2,158,457 | | 10,079,994 |
Exact Sciences Corp. (a) (b)
| | | 4,445,402 | | 187,818,234 |
Exelixis, Inc. (a)
| | | 3,509,028 | | 78,847,859 |
Fate Therapeutics, Inc. (a)
| | | 2,519,029 | | 8,262,415 |
Geron Corp. (a) (b)
| | | 9,717,225 | | 41,201,034 |
Gilead Sciences, Inc.
| | | 2,861,615 | | 196,335,405 |
Halozyme Therapeutics, Inc. (a)
| | | 1,315,480 | | 68,878,533 |
Heron Therapeutics, Inc. (a) (b)
| | | 2,586,991 | | 9,054,469 |
Humacyte, Inc. (a) (b)
| | | 1,042,045 | | 5,001,816 |
Ideaya Biosciences, Inc. (a)
| | | 1,206,800 | | 42,370,748 |
ImmunityBio, Inc. (a) (b)
| | | 4,375,822 | | 27,655,195 |
Immunome, Inc. (a)
| | | 1,165,513 | | 14,102,707 |
Immunovant, Inc. (a) (b)
| | | 1,413,306 | | 37,311,278 |
Incyte Corp. (a) (b)
| | | 2,840,599 | | 172,197,111 |
Insmed, Inc. (a) (b)
| | | 1,127,200 | | 75,522,400 |
Intellia Therapeutics, Inc. (a) (b)
| | | 2,094,751 | | 46,880,527 |
Ionis Pharmaceuticals, Inc. (a)
| | | 1,696,059 | | 80,834,172 |
Iovance Biotherapeutics, Inc. (a) (b)
| | | 6,766,302 | | 54,265,742 |
Ironwood Pharmaceuticals, Inc. (a)
| | | 3,860,503 | | 25,170,480 |
iTeos Therapeutics, Inc. (a)
| | | 359,452 | | 5,334,268 |
Janux Therapeutics, Inc. (a)
| | | 775,957 | | 32,504,839 |
Keros Therapeutics, Inc. (a)
| | | 578,076 | | 26,418,073 |
Kiniksa Pharmaceuticals International PLC (a)
| | | 608,734 | | 11,365,064 |
Krystal Biotech, Inc. (a) (b)
| | | 419,887 | | 77,108,049 |
See accompanying notes to financial statements.
71
SPDR S&P BIOTECH ETF
SCHEDULE OF INVESTMENTS (continued)
June 30, 2024
| Security Description | | | Shares | | Value |
Kura Oncology, Inc. (a)
| | | 1,251,337 | | $25,765,029 |
Kymera Therapeutics, Inc. (a) (b)
| | | 912,181 | | 27,228,603 |
Madrigal Pharmaceuticals, Inc. (a) (b)
| | | 365,812 | | 102,485,890 |
MannKind Corp. (a) (b)
| | | 3,519,145 | | 18,369,937 |
MiMedx Group, Inc. (a)
| | | 1,387,693 | | 9,616,712 |
Mirum Pharmaceuticals, Inc. (a) (b)
| | | 691,625 | | 23,646,659 |
Moderna, Inc. (a) (b)
| | | 1,329,624 | | 157,892,850 |
Morphic Holding, Inc. (a) (b)
| | | 748,919 | | 25,515,670 |
Myriad Genetics, Inc. (a)
| | | 938,665 | | 22,959,746 |
Natera, Inc. (a) (b)
| | | 1,650,254 | | 178,706,006 |
Neurocrine Biosciences, Inc. (a)
| | | 1,210,526 | | 166,653,114 |
Novavax, Inc. (a) (b)
| | | 2,630,262 | | 33,299,117 |
Nurix Therapeutics, Inc. (a)
| | | 1,379,221 | | 28,784,342 |
Nuvalent, Inc. Class A (a) (b)
| | | 649,760 | | 49,290,794 |
Ocugen, Inc. (a) (b)
| | | 8,006,661 | | 12,410,325 |
Olema Pharmaceuticals, Inc. (a) (b)
| | | 1,024,551 | | 11,085,642 |
ORIC Pharmaceuticals, Inc. (a) (b)
| | | 1,167,178 | | 8,251,948 |
Praxis Precision Medicines, Inc. (a)
| | | 415,505 | | 17,185,287 |
Protagonist Therapeutics, Inc. (a)
| | | 756,052 | | 26,197,202 |
Prothena Corp. PLC (a) (b)
| | | 974,477 | | 20,113,205 |
PTC Therapeutics, Inc. (a)
| | | 1,009,082 | | 30,857,728 |
Recursion Pharmaceuticals, Inc. Class A (a) (b)
| | | 3,996,545 | | 29,974,088 |
Regeneron Pharmaceuticals, Inc. (a)
| | | 179,598 | | 188,762,886 |
REGENXBIO, Inc. (a)
| | | 1,036,388 | | 12,125,740 |
Relay Therapeutics, Inc. (a)
| | | 1,947,859 | | 12,700,041 |
REVOLUTION Medicines, Inc. (a) (b)
| | | 1,864,500 | | 72,361,245 |
Rhythm Pharmaceuticals, Inc. (a)
| | | 728,846 | | 29,926,417 |
Rocket Pharmaceuticals, Inc. (a) (b)
| | | 1,181,723 | | 25,442,496 |
Roivant Sciences Ltd. (a) (b)
| | | 8,332,440 | | 88,073,891 |
Sage Therapeutics, Inc. (a) (b)
| | | 1,238,041 | | 13,445,125 |
Sana Biotechnology, Inc. (a) (b)
| | | 3,419,219 | | 18,668,936 |
Sarepta Therapeutics, Inc. (a) (b)
| | | 1,448,910 | | 228,927,780 |
Savara, Inc. (a)
| | | 1,355,342 | | 5,462,028 |
Scholar Rock Holding Corp. (a) (b)
| | | 1,335,852 | | 11,127,647 |
Soleno Therapeutics, Inc. (a)
| | | 541,794 | | 22,105,195 |
SpringWorks Therapeutics, Inc. (a) (b)
| | | 1,565,757 | | 58,982,066 |
Spyre Therapeutics, Inc. (a)
| | | 674,012 | | 15,846,022 |
Stoke Therapeutics, Inc. (a)
| | | 802,565 | | 10,842,653 |
Summit Therapeutics, Inc. (a)
| | | 1,666,329 | | 12,997,366 |
Syndax Pharmaceuticals, Inc. (a)
| | | 1,787,038 | | 36,687,890 |
| Security Description | | | Shares | | Value |
Tango Therapeutics, Inc. (a) (b)
| | | 728,281 | | $6,248,651 |
TG Therapeutics, Inc. (a) (b)
| | | 3,384,566 | | 60,211,429 |
Travere Therapeutics, Inc. (a) (b)
| | | 1,830,945 | | 15,050,368 |
Twist Bioscience Corp. (a) (b)
| | | 1,035,367 | | 51,022,886 |
Ultragenyx Pharmaceutical, Inc. (a)
| | | 1,267,215 | | 52,082,537 |
United Therapeutics Corp. (a)
| | | 646,256 | | 205,864,849 |
Vaxcyte, Inc. (a)
| | | 950,960 | | 71,806,990 |
Vera Therapeutics, Inc. (a)
| | | 1,222,972 | | 44,247,127 |
Veracyte, Inc. (a)
| | | 1,105,869 | | 23,964,181 |
Vericel Corp. (a) (b)
| | | 664,072 | | 30,467,623 |
Vertex Pharmaceuticals, Inc. (a)
| | | 387,244 | | 181,509,008 |
Verve Therapeutics, Inc. (a)
| | | 1,491,097 | | 7,276,553 |
Viking Therapeutics, Inc. (a) (b)
| | | 3,370,530 | | 178,671,795 |
Vir Biotechnology, Inc. (a) (b)
| | | 1,464,930 | | 13,037,877 |
Viridian Therapeutics, Inc. (a)
| | | 1,456,140 | | 18,944,381 |
Voyager Therapeutics, Inc. (a)
| | | 891,676 | | 7,053,157 |
Xencor, Inc. (a)
| | | 959,361 | | 18,160,704 |
Zentalis Pharmaceuticals, Inc. (a) (b)
| | | 1,674,270 | | 6,847,764 |
| | | | | | 6,900,938,641 |
| HEALTH CARE EQUIPMENT — 0.0% | | | |
OmniAb, Inc. (a) (b) (c) (d)
| | | 161,959 | | — |
OmniAb, Inc. (a) (b) (c) (d)
| | | 161,959 | | — |
| | | | | | — |
| PHARMACEUTICALS — 0.2% | | | |
Scilex Holding Co. (a)
| | | 5,938,524 | | 11,461,351 |
TOTAL COMMON STOCKS
(Cost $7,294,519,812)
| | | | | 6,912,399,992 |
| RIGHTS — 0.0% (e) | | | | | |
| BIOTECHNOLOGY — 0.0% (e) | | | | | |
Inhibrx, Inc. (expiring 12/31/49) (a) (b)
| | | 1,645,973 | | 1,069,883 |
Mirati Therapeutics, Inc. (expiring 12/31/49) (a) (b)
| | | 1,369,552 | | 958,686 |
TOTAL RIGHTS
(Cost $2,028,569)
| | | | | 2,028,569 |
| SHORT-TERM INVESTMENTS — 7.7% | | | | | |
State Street Institutional Liquid Reserves Fund, Premier Class 5.36% (f) (g)
| | 3,275,805 | | 3,276,788 |
See accompanying notes to financial statements.
72
SPDR S&P BIOTECH ETF
SCHEDULE OF INVESTMENTS (continued)
June 30, 2024
| Security Description | | | Shares | | Value |
State Street Navigator Securities Lending Portfolio II (h) (i)
| | 531,386,578 | | $531,386,578 |
TOTAL SHORT-TERM INVESTMENTS
(Cost $534,663,198)
| | | | | 534,663,366 |
TOTAL INVESTMENTS — 107.7%
(Cost $7,831,211,579)
| | | | 7,449,091,927 |
LIABILITIES IN EXCESS OF OTHER ASSETS — (7.7)%
| | | | | (532,105,752) |
NET ASSETS — 100.0%
| | | | | $6,916,986,175 |
| | |
| (a) | Non-income producing security. |
| (b) | All or a portion of the shares of the security are on loan at June 30, 2024. |
| (c) | Fair valued as determined in good faith by the Trust's Oversight Committee in accordance with policy and procedures approved by the Board of Trustees. Security value is determined based on Level 3 inputs. As of June 30, 2024, total aggregate fair value of the securities is $0, representing 0.00% of the Fund's net assets. |
| (d) | Reflects separate holdings of the issuer's common stock traded on different securities exchanges. |
| (e) | Amount is less than 0.05% of net assets. |
| (f) | The Fund invested in certain money market funds managed by SSGA Funds Management, Inc. Amounts related to these investments during the year ended June 30, 2024 are shown in the Affiliate Table below. |
| (g) | The rate shown is the annualized seven-day yield at June 30, 2024. |
| (h) | The Fund invested in an affiliated entity. Amounts related to these investments during the year ended June 30, 2024 are shown in the Affiliate Table below. |
| (i) | Investment of cash collateral for securities loaned. |
The following table summarizes the value of the Fund's investments according to the fair value hierarchy as of June 30, 2024.
| Description | | Level 1 –
Quoted Prices | | Level 2 –
Other Significant
Observable Inputs | | Level 3 –
Significant
Unobservable Inputs | | Total |
| ASSETS: | | | | | | | | |
| INVESTMENTS: | | | | | | | | |
Common Stocks
| | $6,912,399,992 | | $— | | $0(a) | | $6,912,399,992 |
Rights
| | — | | 2,028,569 | | — | | 2,028,569 |
Short-Term Investments
| | 534,663,366 | | — | | — | | 534,663,366 |
TOTAL INVESTMENTS
| | $7,447,063,358 | | $2,028,569 | | $0 | | $7,449,091,927 |
| (a) | The Fund held Level 3 securities that were valued at $0 at June 30, 2024. |
Affiliate Table
| | Number of
Shares Held
at
6/30/23 | | Value at
6/30/23 | | Cost of
Purchases | | Proceeds
from
Shares Sold | | Realized
Gain (Loss) | | Change in
Unrealized
Appreciation/
Depreciation(a) | | Number of
Shares Held
at
6/30/24 | | Value at
6/30/24 | | Dividend
Income |
Akero Therapeutics, Inc.
| 1,353,167 | | $63,179,367 | | $192,990,969 | | $203,074,075 | | $(26,551,188) | | $—* | | — | | $—* | | $— |
Altimmune, Inc.
| — | | — | | 105,350,592 | | 65,577,764 | | (18,190,574) | | —* | | — | | —* | | — |
Anavex Life Sciences Corp.
| 2,997,852 | | 24,372,537 | | 56,105,429 | | 59,324,503 | | (22,190,400) | | —* | | — | | —* | | — |
Arcturus Therapeutics Holdings, Inc.
| 1,355,141 | | 38,865,444 | | 84,068,598 | | 97,859,487 | | 3,988,144 | | —* | | — | | —* | | — |
Arcutis Biotherapeutics, Inc.
| 4,273,971 | | 40,730,944 | | 129,659,756 | | 106,696,719 | | (63,645,853) | | —* | | — | | —* | | — |
Ardelyx, Inc.
| 17,845,281 | | 60,495,503 | | 163,297,458 | | 226,487,752 | | 35,364,619 | | —* | | — | | —* | | — |
Avid Bioservices, Inc.
| 1,747,640 | | 24,414,531 | | 63,369,947 | | 65,862,144 | | (17,255,756) | | —* | | — | | —* | | — |
Avidity Biosciences, Inc.
| 4,685,206 | | 51,958,935 | | 67,558,476 | | 114,349,317 | | (11,892,999) | | —* | | — | | —* | | — |
BioCryst Pharmaceuticals, Inc.
| 8,336,123 | | 58,686,306 | | 146,246,844 | | 175,015,178 | | (48,143,283) | | —* | | — | | —* | | — |
Biomea Fusion, Inc.
| 1,170,948 | | 25,702,309 | | 121,470,209 | | 91,691,747 | | (70,584,612) | | —* | | — | | —* | | — |
Bioxcel Therapeutics, Inc.
| 1,689,894 | | 11,254,694 | | 4,045,254 | | 9,448,684 | | (28,872,337) | | —* | | — | | —* | | — |
Bluebird Bio, Inc.
| 14,087,477 | | 46,347,799 | | 49,571,728 | | 73,135,025 | | (59,321,223) | | —* | | — | | —* | | — |
C4 Therapeutics, Inc.
| — | | — | | 87,931,476 | | 47,861,082 | | (23,994,246) | | —* | | — | | —* | | — |
Cabaletta Bio, Inc.
| — | | — | | 108,781,892 | | 71,101,993 | | (18,737,788) | | —* | | — | | —* | | — |
CareDx, Inc.
| 2,931,817 | | 24,920,444 | | 64,454,540 | | 91,917,331 | | (43,877,143) | | —* | | — | | —* | | — |
Caribou Biosciences, Inc.
| — | | — | | 64,168,866 | | 46,750,822 | | (17,418,044) | | —* | | — | | —* | | — |
Catalyst Pharmaceuticals, Inc.
| 6,112,156 | | 82,147,377 | | 140,727,339 | | 199,757,230 | | (5,976,109) | | —* | | — | | —* | | — |
Cogent Biosciences, Inc.
| 1,763,107 | | 20,875,187 | | 76,701,674 | | 84,821,243 | | (5,785,310) | | —* | | — | | —* | | — |
Coherus Biosciences, Inc.
| — | | — | | 49,366,787 | | 29,613,406 | | (19,753,381) | | —* | | — | | —* | | — |
Editas Medicine, Inc.
| 4,917,317 | | 40,469,519 | | 102,984,709 | | 115,150,108 | | (47,530,253) | | —* | | — | | —* | | — |
Emergent BioSolutions, Inc
| 4,973,044 | | 36,551,873 | | 9,883,262 | | 29,221,032 | | (134,709,741) | | —* | | — | | —* | | — |
See accompanying notes to financial statements.
73
SPDR S&P BIOTECH ETF
SCHEDULE OF INVESTMENTS (continued)
June 30, 2024
| | Number of
Shares Held
at
6/30/23 | | Value at
6/30/23 | | Cost of
Purchases | | Proceeds
from
Shares Sold | | Realized
Gain (Loss) | | Change in
Unrealized
Appreciation/
Depreciation(a) | | Number of
Shares Held
at
6/30/24 | | Value at
6/30/24 | | Dividend
Income |
Fate Therapeutics, Inc.
| 8,165,594 | | $38,868,227 | | $72,809,254 | | $58,437,374 | | $(42,188,027) | | $—* | | — | | $—* | | $— |
Intercept Pharmaceuticals, Inc.
| 3,524,818 | | 38,984,487 | | 29,555,939 | | 88,870,439 | | 1,962,232 | | —* | | — | | —* | | — |
Ironwood Pharmaceuticals, Inc.
| 6,200,001 | | 65,968,011 | | 174,393,581 | | 182,886,019 | | (25,023,264) | | —* | | — | | —* | | — |
Novavax, Inc
| 9,507,925 | | 70,643,883 | | 202,270,323 | | 330,161,253 | | (84,793,048) | | —* | | — | | —* | | — |
Replimune Group, Inc.
| 1,237,635 | | 28,737,885 | | 95,580,432 | | 103,812,554 | | (16,594,854) | | —* | | — | | —* | | — |
Sage Therapeutics, Inc.
| 1,185,757 | | 55,754,294 | | 173,925,041 | | 153,935,155 | | (48,345,194) | | —* | | — | | —* | | — |
Seres Therapeutics, Inc.
| 6,612,059 | | 31,671,763 | | 19,160,900 | | 23,289,236 | | (34,555,205) | | —* | | — | | —* | | — |
State Street Institutional Liquid Reserves Fund, Premier Class
| 2,170,348 | | 2,170,782 | | 535,668,017 | | 534,568,351 | | 6,172 | | 168 | | 3,275,805 | | 3,276,788 | | 373,007 |
State Street Navigator Securities Lending Portfolio II
| 633,689,418 | | 633,689,418 | | 3,132,769,993 | | 3,235,072,833 | | — | | — | | 531,386,578 | | 531,386,578 | | 14,286,900 |
Travere Therapeutics, Inc.
| 4,260,550 | | 65,442,048 | | 87,680,469 | | 112,038,993 | | (58,517,691) | | —* | | — | | —* | | — |
Twist Bioscience Corp.
| 3,537,498 | | 72,377,209 | | 154,141,596 | | 247,101,239 | | 15,524,907 | | —* | | — | | —* | | — |
uniQure NV
| 1,693,939 | | 19,412,541 | | 41,776,877 | | 45,996,930 | | (31,833,856) | | —* | | — | | —* | | — |
Viridian Therapeutics, Inc.
| 2,086,518 | | 49,638,263 | | 110,720,705 | | 114,153,652 | | (32,094,786) | | —* | | — | | —* | | — |
Total
| | | $1,824,331,580 | | $6,719,188,932 | | $7,235,040,670 | | $(1,001,530,091) | | $168 | | | | $534,663,366 | | $14,659,907 |
| (a) | Does not include change in unrealized appreciation and depreciation from investments that are no longer affiliates at year ended June 30, 2024. |
| * | As of June 30, 2024, no longer an affiliate. |
See accompanying notes to financial statements.
74
SPDR S&P DIVIDEND ETF
SCHEDULE OF INVESTMENTS
June 30, 2024
| Security Description | | | Shares | | Value |
| COMMON STOCKS — 99.7% | |
| AEROSPACE & DEFENSE — 4.0% | |
General Dynamics Corp.
| | 625,832 | | $181,578,897 |
L3Harris Technologies, Inc.
| | 955,257 | | 214,531,617 |
Lockheed Martin Corp.
| | 548,603 | | 256,252,461 |
Northrop Grumman Corp.
| | 299,937 | | 130,757,535 |
| | | | | | 783,120,510 |
| AIR FREIGHT & LOGISTICS — 1.3% | |
CH Robinson Worldwide, Inc.
| | 1,604,707 | | 141,406,781 |
Expeditors International of Washington, Inc.
| | 914,736 | | 114,149,905 |
| | | | | | 255,556,686 |
| BANKS — 2.2% | |
Bank OZK (a)
| | 1,319,347 | | 54,093,227 |
Commerce Bancshares, Inc. (a)
| | 1,453,713 | | 81,088,111 |
Community Financial System, Inc. (a)
| | 730,392 | | 34,481,806 |
Cullen/Frost Bankers, Inc. (a)
| | 802,646 | | 81,572,913 |
Prosperity Bancshares, Inc.
| | 1,249,700 | | 76,406,658 |
UMB Financial Corp. (a)
| | 576,697 | | 48,108,064 |
United Bankshares, Inc.
| | 1,770,782 | | 57,444,168 |
| | | | | | 433,194,947 |
| BEVERAGES — 3.3% | |
Brown-Forman Corp. Class B (a)
| | 2,402,006 | | 103,742,639 |
Coca-Cola Co.
| | 4,764,417 | | 303,255,142 |
PepsiCo, Inc.
| | 1,538,507 | | 253,745,960 |
| | | | | | 660,743,741 |
| BIOTECHNOLOGY — 1.6% | |
AbbVie, Inc.
| | 1,829,690 | | 313,828,429 |
| BUILDING PRODUCTS — 1.0% | |
A O Smith Corp.
| | 1,482,732 | | 121,257,823 |
Carlisle Cos., Inc.
| | 208,406 | | 84,448,195 |
| | | | | | 205,706,018 |
| CAPITAL MARKETS — 3.6% | |
FactSet Research Systems, Inc.
| | 187,134 | | 76,401,198 |
Franklin Resources, Inc.
| | 4,233,516 | | 94,619,082 |
S&P Global, Inc.
| | 188,584 | | 84,108,464 |
SEI Investments Co.
| | 1,359,855 | | 87,969,020 |
T Rowe Price Group, Inc.
| | 3,099,531 | | 357,406,920 |
| | | | | | 700,504,684 |
| CHEMICALS — 5.3% | |
Air Products & Chemicals, Inc.
| | 1,139,238 | | 293,980,366 |
Albemarle Corp. (a)
| | 968,891 | | 92,548,468 |
Ecolab, Inc.
| | 409,605 | | 97,485,990 |
HB Fuller Co.
| | 721,882 | | 55,556,039 |
Linde PLC
| | 245,182 | | 107,588,314 |
PPG Industries, Inc.
| | 1,253,444 | | 157,796,065 |
RPM International, Inc.
| | 1,306,603 | | 140,695,011 |
Sherwin-Williams Co.
| | 248,127 | | 74,048,541 |
Stepan Co.
| | 285,291 | | 23,953,032 |
| | | | | | 1,043,651,826 |
| Security Description | | | Shares | | Value |
| COMMERCIAL SERVICES & SUPPLIES — 2.4% | |
ABM Industries, Inc. (a)
| | 798,444 | | $40,377,313 |
Brady Corp. Class A
| | 571,775 | | 37,748,586 |
Cintas Corp.
| | 107,492 | | 75,272,348 |
MSA Safety, Inc.
| | 465,544 | | 87,377,953 |
Republic Services, Inc.
| | 534,284 | | 103,832,753 |
Waste Management, Inc.
| | 614,215 | | 131,036,628 |
| | | | | | 475,645,581 |
| CONSUMER STAPLES DISTRIBUTION & RETAIL — 3.1% | |
Casey's General Stores, Inc.
| | 157,108 | | 59,946,128 |
Sysco Corp.
| | 2,916,743 | | 208,226,283 |
Target Corp.
| | 1,358,654 | | 201,135,138 |
Walmart, Inc.
| | 2,126,994 | | 144,018,764 |
| | | | | | 613,326,313 |
| CONTAINERS & PACKAGING — 1.8% | |
Amcor PLC
| | 19,454,820 | | 190,268,140 |
AptarGroup, Inc.
| | 740,924 | | 104,329,508 |
Sonoco Products Co.
| | 1,282,957 | | 65,071,579 |
| | | | | | 359,669,227 |
| DISTRIBUTORS — 1.0% | |
Genuine Parts Co.
| | 1,439,768 | | 199,148,710 |
| ELECTRIC UTILITIES — 10.0% | |
Alliant Energy Corp.
| | 3,271,298 | | 166,509,068 |
Edison International
| | 4,866,941 | | 349,495,033 |
Evergy, Inc.
| | 2,982,974 | | 158,008,133 |
Eversource Energy
| | 4,397,295 | | 249,370,600 |
NextEra Energy, Inc.
| | 4,436,291 | | 314,133,766 |
Southern Co.
| | 4,854,779 | | 376,585,207 |
Xcel Energy, Inc.
| | 6,716,684 | | 358,738,092 |
| | | | | | 1,972,839,899 |
| ELECTRICAL EQUIPMENT — 0.9% | |
Emerson Electric Co.
| | 1,536,815 | | 169,295,540 |
| ELECTRONIC EQUIPMENT, INSTRUMENTS & COMPONENTS — 0.3% | |
Badger Meter, Inc.
| | 323,843 | | 60,348,143 |
| FINANCIAL SERVICES — 0.6% | |
Jack Henry & Associates, Inc.
| | 693,083 | | 115,065,640 |
| FOOD PRODUCTS — 4.3% | |
Archer-Daniels-Midland Co.
| | 4,695,229 | | 283,826,593 |
Flowers Foods, Inc.
| | 2,348,946 | | 52,146,601 |
Hormel Foods Corp.
| | 3,657,474 | | 111,516,382 |
J M Smucker Co.
| | 1,442,777 | | 157,320,404 |
Lancaster Colony Corp.
| | 287,547 | | 54,337,757 |
McCormick & Co., Inc.
| | 2,656,399 | | 188,444,945 |
| | | | | | 847,592,682 |
| GAS UTILITIES — 2.6% | |
Atmos Energy Corp.
| | 1,936,778 | | 225,925,154 |
Chesapeake Utilities Corp. (a)
| | 286,957 | | 30,474,833 |
National Fuel Gas Co.
| | 1,170,326 | | 63,419,966 |
New Jersey Resources Corp.
| | 1,234,176 | | 52,748,682 |
ONE Gas, Inc. (a)
| | 705,077 | | 45,019,166 |
Spire, Inc.
| | 701,098 | | 42,577,682 |
See accompanying notes to financial statements.
75
SPDR S&P DIVIDEND ETF
SCHEDULE OF INVESTMENTS (continued)
June 30, 2024
| Security Description | | | Shares | | Value |
UGI Corp.
| | 2,560,105 | | $58,626,405 |
| | | | | | 518,791,888 |
| HEALTH CARE EQUIPMENT & SUPPLIES — 3.0% | |
Abbott Laboratories
| | 1,639,174 | | 170,326,571 |
Becton Dickinson & Co.
| | 597,062 | | 139,539,360 |
Medtronic PLC
| | 3,549,672 | | 279,394,683 |
| | | | | | 589,260,614 |
| HEALTH CARE PROVIDERS & SERVICES — 0.8% | |
Cardinal Health, Inc.
| | 1,577,264 | | 155,076,596 |
| HOTELS, RESTAURANTS & LEISURE — 1.0% | |
McDonald's Corp.
| | 779,682 | | 198,694,161 |
| HOUSEHOLD PRODUCTS — 5.6% | |
Church & Dwight Co., Inc.
| | 929,075 | | 96,326,496 |
Clorox Co.
| | 1,654,603 | | 225,803,671 |
Colgate-Palmolive Co.
| | 2,284,449 | | 221,682,931 |
Kimberly-Clark Corp.
| | 2,526,761 | | 349,198,370 |
Procter & Gamble Co.
| | 1,308,407 | | 215,782,483 |
| | | | | | 1,108,793,951 |
| INSURANCE — 5.2% | |
Aflac, Inc.
| | 2,534,105 | | 226,320,918 |
Brown & Brown, Inc.
| | 652,585 | | 58,347,625 |
Chubb Ltd.
| | 484,013 | | 123,462,036 |
Cincinnati Financial Corp.
| | 1,967,614 | | 232,375,213 |
Erie Indemnity Co. Class A (a)
| | 299,968 | | 108,708,403 |
Old Republic International Corp.
| | 3,358,981 | | 103,792,513 |
RenaissanceRe Holdings Ltd.
| | 274,626 | | 61,381,657 |
RLI Corp.
| | 454,687 | | 63,969,914 |
W R Berkley Corp.
| | 573,239 | | 45,045,121 |
| | | | | | 1,023,403,400 |
| IT SERVICES — 1.5% | |
International Business Machines Corp.
| | 1,738,913 | | 300,745,003 |
| LEISURE EQUIPMENT & PRODUCTS — 0.3% | |
Polaris, Inc. (a)
| | 780,896 | | 61,151,966 |
| LIFE SCIENCES TOOLS & SERVICES — 0.1% | |
West Pharmaceutical Services, Inc.
| | 47,241 | | 15,560,713 |
| MACHINERY — 6.2% | |
Caterpillar, Inc.
| | 355,920 | | 118,556,952 |
Donaldson Co., Inc.
| | 1,574,218 | | 112,651,040 |
Dover Corp.
| | 608,893 | | 109,874,742 |
Franklin Electric Co., Inc.
| | 519,709 | | 50,058,371 |
Graco, Inc.
| | 1,110,848 | | 88,068,029 |
Illinois Tool Works, Inc.
| | 758,699 | | 179,781,315 |
Lincoln Electric Holdings, Inc.
| | 422,444 | | 79,689,836 |
Nordson Corp.
| | 344,467 | | 79,895,676 |
Pentair PLC
| | 1,250,268 | | 95,858,048 |
Stanley Black & Decker, Inc.
| | 2,103,034 | | 168,011,386 |
Toro Co.
| | 1,403,058 | | 131,199,954 |
| | | | | | 1,213,645,349 |
| Security Description | | | Shares | | Value |
| METALS & MINING — 1.0% | |
Nucor Corp.
| | 569,457 | | $90,019,762 |
Royal Gold, Inc.
| | 844,654 | | 105,716,895 |
| | | | | | 195,736,657 |
| MULTI-UTILITIES — 3.6% | |
Avista Corp.
| | 967,875 | | 33,498,154 |
Black Hills Corp.
| | 867,855 | | 47,193,955 |
Consolidated Edison, Inc.
| | 3,587,912 | | 320,831,091 |
WEC Energy Group, Inc.
| | 4,017,092 | | 315,181,038 |
| | | | | | 716,704,238 |
| OIL, GAS & CONSUMABLE FUELS — 3.3% | |
Chevron Corp.
| | 2,312,564 | | 361,731,261 |
Exxon Mobil Corp.
| | 2,461,036 | | 283,314,464 |
| | | | | | 645,045,725 |
| PERSONAL CARE PRODUCTS — 1.6% | |
Kenvue, Inc.
| | 17,535,135 | | 318,788,754 |
| PHARMACEUTICALS — 1.7% | |
Johnson & Johnson
| | 1,910,158 | | 279,188,693 |
Perrigo Co. PLC (a)
| | 1,818,287 | | 46,693,610 |
| | | | | | 325,882,303 |
| PROFESSIONAL SERVICES — 1.0% | |
Automatic Data Processing, Inc.
| | 827,725 | | 197,569,680 |
| RESIDENTIAL REITs — 1.1% | |
Essex Property Trust, Inc. REIT
| | 825,016 | | 224,569,355 |
| RETAIL REITs — 3.6% | |
Federal Realty Investment Trust REIT
| | 926,878 | | 93,586,872 |
NNN REIT, Inc.
| | 2,420,055 | | 103,094,343 |
Realty Income Corp. REIT
| | 9,728,281 | | 513,847,802 |
| | | | | | 710,529,017 |
| SEMICONDUCTORS & SEMICONDUCTOR EQUIPMENT — 4.7% | |
Analog Devices, Inc.
| | 892,572 | | 203,738,485 |
Microchip Technology, Inc.
| | 2,121,088 | | 194,079,552 |
QUALCOMM, Inc.
| | 1,067,357 | | 212,596,167 |
Texas Instruments, Inc.
| | 1,643,611 | | 319,731,648 |
| | | | | | 930,145,852 |
| SOFTWARE — 0.3% | |
Roper Technologies, Inc.
| | 90,277 | | 50,885,534 |
| SPECIALTY RETAIL — 1.9% | |
Best Buy Co., Inc. (a)
| | 2,663,520 | | 224,508,101 |
Lowe's Cos., Inc.
| | 673,827 | | 148,551,900 |
| | | | | | 373,060,001 |
| TEXTILES, APPAREL & LUXURY GOODS — 0.6% | |
NIKE, Inc. Class B
| | 1,526,045 | | 115,018,012 |
| TRADING COMPANIES & DISTRIBUTORS — 1.2% | |
Fastenal Co.
| | 2,729,354 | | 171,512,605 |
WW Grainger, Inc.
| | 69,733 | | 62,915,902 |
| | | | | | 234,428,507 |
See accompanying notes to financial statements.
76
SPDR S&P DIVIDEND ETF
SCHEDULE OF INVESTMENTS (continued)
June 30, 2024
| Security Description | | | Shares | | Value |
| WATER UTILITIES — 1.1% | |
American States Water Co.
| | 483,837 | | $35,112,051 |
California Water Service Group
| | 737,498 | | 35,761,278 |
Essential Utilities, Inc. (a)
| | 3,265,451 | | 121,899,286 |
SJW Group
| | 379,481 | | 20,575,460 |
| | | | | | 213,348,075 |
TOTAL COMMON STOCKS
(Cost $18,530,672,049)
| | | | | 19,646,073,927 |
| SHORT-TERM INVESTMENTS — 0.7% | | | |
State Street Institutional Liquid Reserves Fund, Premier Class 5.36% (b) (c)
| | 33,158,892 | | 33,168,840 |
State Street Navigator Securities Lending Portfolio II (d) (e)
| | 104,487,153 | | 104,487,153 |
TOTAL SHORT-TERM INVESTMENTS
(Cost $137,655,972)
| | 137,655,993 | |
TOTAL INVESTMENTS — 100.4%
(Cost $18,668,328,021)
| | 19,783,729,920 | |
LIABILITIES IN EXCESS OF OTHER ASSETS — (0.4)%
| | (74,928,236) | |
NET ASSETS — 100.0%
| | $19,708,801,684 | |
| (a) | All or a portion of the shares of the security are on loan at June 30, 2024. |
| (b) | The Fund invested in certain money market funds managed by SSGA Funds Management, Inc. Amounts related to these investments during the year ended June 30, 2024 are shown in the Affiliate Table below. |
| (c) | The rate shown is the annualized seven-day yield at June 30, 2024. |
| (d) | The Fund invested in an affiliated entity. Amounts related to these investments during the year ended June 30, 2024 are shown in the Affiliate Table below. |
| (e) | Investment of cash collateral for securities loaned. |
| REIT | Real Estate Investment Trust |
At June 30, 2024, open futures contracts were as follows:
| Description | | Number of
Contracts | | Expiration
Date | | Notional
Amount | | Value | | Unrealized
Appreciation
(Depreciation) |
| E-mini S&P 500 Index (long) | | 206 | | 09/20/2024 | | $56,608,962 | | $56,871,450 | | $262,488 |
During the year ended June 30, 2024, the average notional value related to futures contracts was $64,504,055.
During the year ended June 30, 2024, the average notional value related to swap contracts was $86,176,574. There were no swaps held at June 30, 2024.
See accompanying notes to financial statements.
77
SPDR S&P DIVIDEND ETF
SCHEDULE OF INVESTMENTS (continued)
June 30, 2024
The following table summarizes the value of the Fund's investments according to the fair value hierarchy as of June 30, 2024.
| Description | | Level 1 –
Quoted Prices | | Level 2 –
Other Significant
Observable Inputs | | Level 3 –
Significant
Unobservable Inputs | | Total |
| ASSETS: | | | | | | | | |
| INVESTMENTS: | | | | | | | | |
Common Stocks
| | $19,646,073,927 | | $— | | $— | | $19,646,073,927 |
Short-Term Investments
| | 137,655,993 | | — | | — | | 137,655,993 |
TOTAL INVESTMENTS
| | $19,783,729,920 | | $— | | $— | | $19,783,729,920 |
| OTHER FINANCIAL INSTRUMENTS: | | | | | | | | |
Futures Contracts - Unrealized Appreciation
| | $262,488 | | $— | | $— | | $262,488 |
TOTAL OTHER FINANCIAL INSTRUMENTS:
| | $262,488 | | $— | | $— | | $262,488 |
Affiliate Table
| | Number of
Shares Held
at
6/30/23 | | Value at
6/30/23 | | Cost of
Purchases | | Proceeds
from
Shares Sold | | Realized
Gain (Loss) | | Change in
Unrealized
Appreciation/
Depreciation(a) | | Number of
Shares Held
at
6/30/24 | | Value at
6/30/24 | | Dividend
Income |
ABM Industries, Inc.
| 3,541,033 | | $151,025,058 | | $4,712,127 | | $130,353,660 | | $3,584,504 | | $—* | | — | | $—* | | $1,437,168 |
Avista Corp
| 7,424,165 | | 291,546,960 | | 4,177,694 | | 252,424,739 | | (10,938,891) | | —* | | — | | —* | | 2,086,556 |
Black Hills Corp.
| 4,632,663 | | 279,164,272 | | 5,382,116 | | 230,671,034 | | (23,772,742) | | —* | | — | | —* | | 2,531,418 |
Brady Corp.
| 2,497,174 | | 118,790,567 | | 2,890,624 | | 103,111,637 | | 10,543,899 | | —* | | — | | —* | | 1,044,281 |
John Wiley & Sons, Inc.
| 3,018,528 | | 102,720,508 | | 3,472,146 | | 106,763,678 | | (51,282,392) | | —* | | — | | —* | | 1,543,654 |
Leggett & Platt, Inc.
| 10,949,805 | | 324,333,224 | | 3,816,959 | | 289,392,587 | | (138,061,678) | | —* | | — | | —* | | 2,880,453 |
Nu Skin Enterprises, Inc.
| 5,881,950 | | 195,280,740 | | 384,609 | | 163,273,371 | | (89,255,399) | | —* | | — | | —* | | 670,305 |
ONE Gas, Inc
| 3,110,109 | | 238,887,472 | | 3,882,075 | | 191,423,967 | | (10,835,078) | | —* | | — | | —* | | 2,113,025 |
SJW Group
| 1,935,914 | | 135,726,931 | | 3,285,450 | | 112,069,360 | | (11,944,320) | | —* | | — | | —* | | 659,056 |
State Street Institutional Liquid Reserves Fund, Premier Class
| 600,155,172 | | 600,275,203 | | 1,197,091,069 | | 1,764,195,003 | | (898) | | (1,531) | | 33,158,892 | | 33,168,840 | | 5,919,517 |
State Street Navigator Securities Lending Portfolio II
| 381,931,207 | | 381,931,207 | | 3,504,459,169 | | 3,781,903,223 | | — | | — | | 104,487,153 | | 104,487,153 | | 346,542 |
Total
| | | $2,819,682,142 | | $4,733,554,038 | | $7,125,582,259 | | $(321,962,995) | | $(1,531) | | | | $137,655,993 | | $21,231,975 |
| (a) | Does not include change in unrealized appreciation and depreciation from investments that are no longer affiliates at year ended June 30, 2024. |
| * | As of June 30, 2024, no longer an affiliate. |
See accompanying notes to financial statements.
78
SPDR S&P HOMEBUILDERS ETF
SCHEDULE OF INVESTMENTS
June 30, 2024
| Security Description | | | Shares | | Value |
| COMMON STOCKS — 99.8% | | | | | |
| BUILDING PRODUCTS — 35.7% | | | |
A O Smith Corp.
| | | 703,081 | | $57,497,964 |
Advanced Drainage Systems, Inc.
| | | 339,340 | | 54,426,742 |
Allegion PLC
| | | 498,248 | | 58,868,001 |
Builders FirstSource, Inc. (a)
| | | 387,670 | | 53,657,405 |
Carlisle Cos., Inc.
| | | 143,045 | | 57,963,264 |
Carrier Global Corp.
| | | 900,960 | | 56,832,557 |
Johnson Controls International PLC
| | | 835,029 | | 55,504,378 |
Lennox International, Inc. (b)
| | | 108,569 | | 58,082,244 |
Masco Corp.
| | | 838,531 | | 55,904,862 |
Owens Corning
| | | 328,328 | | 57,037,140 |
Trane Technologies PLC
| | | 175,876 | | 57,850,893 |
| | | | | | 623,625,450 |
| HOME IMPROVEMENT RETAIL — 9.4% | | | |
Floor & Decor Holdings, Inc. Class A (a) (b)
| | | 490,491 | | 48,759,710 |
Home Depot, Inc.
| | | 167,154 | | 57,541,093 |
Lowe's Cos., Inc.
| | | 259,574 | | 57,225,684 |
| | | | | | 163,526,487 |
| HOMEBUILDING — 51.6% | | | |
Beazer Homes USA, Inc. (a)
| | | 549,163 | | 15,090,999 |
Cavco Industries, Inc. (a)
| | | 105,810 | | 36,628,248 |
Century Communities, Inc.
| | | 487,685 | | 39,824,357 |
DR Horton, Inc.
| | | 406,051 | | 57,224,767 |
Dream Finders Homes, Inc. Class A (a) (b)
| | | 673,438 | | 17,388,169 |
Green Brick Partners, Inc. (a)
| | | 598,860 | | 34,278,746 |
Hovnanian Enterprises, Inc. Class A (a)
| | | 115,969 | | 16,458,320 |
Installed Building Products, Inc. (b)
| | | 270,072 | | 55,548,409 |
KB Home
| | | 847,605 | | 59,484,919 |
Lennar Corp. Class A
| | | 373,799 | | 56,021,256 |
LGI Homes, Inc. (a)
| | | 384,040 | | 34,367,740 |
M/I Homes, Inc. (a)
| | | 408,769 | | 49,927,046 |
Meritage Homes Corp.
| | | 353,476 | | 57,210,091 |
NVR, Inc. (a)
| | | 7,626 | | 57,870,359 |
PulteGroup, Inc.
| | | 508,162 | | 55,948,636 |
Skyline Champion Corp. (a)
| | | 470,095 | | 31,848,936 |
| Security Description | | | Shares | | Value |
Taylor Morrison Home Corp. (a)
| | | 1,044,803 | | $57,923,878 |
Toll Brothers, Inc.
| | | 485,888 | | 55,964,580 |
TopBuild Corp. (a)
| | | 139,907 | | 53,901,970 |
Tri Pointe Homes, Inc. (a)
| | | 1,544,794 | | 57,543,577 |
| | | | | | 900,455,003 |
| HOMEFURNISHING RETAIL — 3.1% | | | |
Williams-Sonoma, Inc. (b)
| | | 192,216 | | 54,276,032 |
TOTAL COMMON STOCKS
(Cost $1,798,835,155)
| | | | | 1,741,882,972 |
| SHORT-TERM INVESTMENTS — 3.5% | | | | | |
State Street Institutional Liquid Reserves Fund, Premier Class 5.36% (c) (d)
| | 876,149 | | 876,412 |
State Street Navigator Securities Lending Portfolio II (e) (f)
| | 59,676,717 | | 59,676,717 |
TOTAL SHORT-TERM INVESTMENTS
(Cost $60,553,087)
| | | | | 60,553,129 |
TOTAL INVESTMENTS — 103.3%
(Cost $1,859,388,242)
| | | | 1,802,436,101 |
LIABILITIES IN EXCESS OF OTHER ASSETS — (3.3)%
| | | | | (57,983,832) |
NET ASSETS — 100.0%
| | | | | $1,744,452,269 |
| | |
| (a) | Non-income producing security. |
| (b) | All or a portion of the shares of the security are on loan at June 30, 2024. |
| (c) | The Fund invested in certain money market funds managed by SSGA Funds Management, Inc. Amounts related to these investments during the year ended June 30, 2024 are shown in the Affiliate Table below. |
| (d) | The rate shown is the annualized seven-day yield at June 30, 2024. |
| (e) | The Fund invested in an affiliated entity. Amounts related to these investments during the year ended June 30, 2024 are shown in the Affiliate Table below. |
| (f) | Investment of cash collateral for securities loaned. |
The following table summarizes the value of the Fund's investments according to the fair value hierarchy as of June 30, 2024.
| Description | | Level 1 –
Quoted Prices | | Level 2 –
Other Significant
Observable Inputs | | Level 3 –
Significant
Unobservable Inputs | | Total |
| ASSETS: | | | | | | | | |
| INVESTMENTS: | | | | | | | | |
Common Stocks
| | $1,741,882,972 | | $— | | $— | | $1,741,882,972 |
Short-Term Investments
| | 60,553,129 | | — | | — | | 60,553,129 |
TOTAL INVESTMENTS
| | $1,802,436,101 | | $— | | $— | | $1,802,436,101 |
See accompanying notes to financial statements.
79
SPDR S&P HOMEBUILDERS ETF
SCHEDULE OF INVESTMENTS (continued)
June 30, 2024
Affiliate Table
| | Number of
Shares Held
at
6/30/23 | | Value at
6/30/23 | | Cost of
Purchases | | Proceeds
from
Shares Sold | | Realized
Gain (Loss) | | Change in
Unrealized
Appreciation/
Depreciation | | Number of
Shares Held
at
6/30/24 | | Value at
6/30/24 | | Dividend
Income |
State Street Institutional Liquid Reserves Fund, Premier Class
| 429,169 | | $429,255 | | $74,099,812 | | $73,652,725 | | $28 | | $42 | | 876,149 | | $876,412 | | $54,751 |
State Street Navigator Securities Lending Portfolio II
| 61,594,352 | | 61,594,352 | | 970,698,750 | | 972,616,385 | | — | | — | | 59,676,717 | | 59,676,717 | | 157,554 |
Total
| | | $62,023,607 | | $1,044,798,562 | | $1,046,269,110 | | $28 | | $42 | | | | $60,553,129 | | $212,305 |
See accompanying notes to financial statements.
80
SPDR S&P OIL & GAS EXPLORATION & PRODUCTION ETF
SCHEDULE OF INVESTMENTS
June 30, 2024
| Security Description | | | Shares | | Value |
| COMMON STOCKS — 99.8% | |
| OIL, GAS & CONSUMABLE FUELS — 99.8% | |
Antero Resources Corp. (a) (b)
| | 2,925,739 | | $95,466,864 |
APA Corp.
| | 3,487,303 | | 102,666,200 |
Berry Corp.
| | 1,471,139 | | 9,503,558 |
California Resources Corp. (b)
| | 911,951 | | 48,534,032 |
Chesapeake Energy Corp. (b)
| | 1,139,547 | | 93,659,368 |
Chevron Corp.
| | 635,934 | | 99,472,796 |
Chord Energy Corp.
| | 597,355 | | 100,164,486 |
Civitas Resources, Inc.
| | 1,499,020 | | 103,432,380 |
Clean Energy Fuels Corp. (a) (b)
| | 1,849,855 | | 4,939,113 |
CNX Resources Corp. (a) (b)
| | 3,017,042 | | 73,314,121 |
Comstock Resources, Inc. (b)
| | 1,929,135 | | 20,024,421 |
ConocoPhillips
| | 886,875 | | 101,440,763 |
Coterra Energy, Inc.
| | 3,629,555 | | 96,800,232 |
Crescent Energy Co. Class A
| | 1,838,066 | | 21,781,082 |
CVR Energy, Inc. (b)
| | 580,124 | | 15,529,919 |
Delek U.S. Holdings, Inc.
| | 1,201,708 | | 29,754,290 |
Devon Energy Corp.
| | 2,129,429 | | 100,934,935 |
Diamondback Energy, Inc.
| | 521,692 | | 104,437,522 |
EOG Resources, Inc.
| | 820,524 | | 103,279,356 |
EQT Corp.
| | 2,466,142 | | 91,197,931 |
Exxon Mobil Corp.
| | 889,176 | | 102,361,941 |
Green Plains, Inc. (a)
| | 1,397,872 | | 22,170,250 |
Gulfport Energy Corp. (a)
| | 193,001 | | 29,143,151 |
Hess Corp.
| | 676,291 | | 99,766,448 |
HF Sinclair Corp.
| | 1,857,530 | | 99,080,650 |
Kosmos Energy Ltd. (a) (b)
| | 9,562,218 | | 52,974,688 |
Magnolia Oil & Gas Corp. Class A (b)
| | 3,245,431 | | 82,239,222 |
Marathon Oil Corp.
| | 3,553,766 | | 101,886,471 |
Marathon Petroleum Corp.
| | 570,451 | | 98,961,840 |
Matador Resources Co. (b)
| | 1,736,809 | | 103,513,816 |
Murphy Oil Corp.
| | 2,096,985 | | 86,479,661 |
Northern Oil & Gas, Inc. (b)
| | 1,606,588 | | 59,716,876 |
Occidental Petroleum Corp.
| | 1,621,308 | | 102,191,043 |
Ovintiv, Inc.
| | 2,117,805 | | 99,261,520 |
Par Pacific Holdings, Inc. (a)
| | 1,124,287 | | 28,388,247 |
PBF Energy, Inc. Class A
| | 2,118,517 | | 97,494,152 |
Permian Resources Corp. (b)
| | 6,450,697 | | 104,178,757 |
Phillips 66
| | 709,412 | | 100,147,692 |
Range Resources Corp.
| | 2,752,254 | | 92,283,077 |
REX American Resources Corp. (a)
| | 263,282 | | 12,003,026 |
SandRidge Energy, Inc.
| | 400,438 | | 5,177,663 |
| Security Description | | | Shares | | Value |
SilverBow Resources, Inc. (a)
| | 300,321 | | $11,361,143 |
Sitio Royalties Corp. Class A (b)
| | 702,900 | | 16,595,469 |
SM Energy Co. (b)
| | 1,901,868 | | 82,217,754 |
Southwestern Energy Co. (a)
| | 13,959,373 | | 93,946,580 |
Talos Energy, Inc. (a) (b)
| | 2,520,653 | | 30,625,934 |
Tellurian, Inc. (a) (b)
| | 11,674,017 | | 8,085,424 |
Texas Pacific Land Corp. (b)
| | 63,033 | | 46,283,241 |
VAALCO Energy, Inc. (b)
| | 1,434,453 | | 8,994,020 |
Valero Energy Corp.
| | 646,448 | | 101,337,189 |
Viper Energy, Inc.
| | 1,053,747 | | 39,547,125 |
Vital Energy, Inc. (a)
| | 568,261 | | 25,469,458 |
Vitesse Energy, Inc. (b)
| | 234,080 | | 5,547,696 |
World Kinect Corp. (b)
| | 536,150 | | 13,832,670 |
TOTAL COMMON STOCKS
(Cost $3,722,551,289)
| | | | | 3,479,597,263 |
| SHORT-TERM INVESTMENTS — 4.0% | | | |
State Street Institutional Liquid Reserves Fund, Premier Class 5.36% (c) (d)
| | 7,556,518 | | 7,558,785 |
State Street Navigator Securities Lending Portfolio II (e) (f)
| | 132,864,402 | | 132,864,402 |
TOTAL SHORT-TERM INVESTMENTS
(Cost $140,422,756)
| | 140,423,187 | |
TOTAL INVESTMENTS — 103.8%
(Cost $3,862,974,045)
| | 3,620,020,450 | |
LIABILITIES IN EXCESS OF OTHER ASSETS — (3.8)%
| | (131,619,032) | |
NET ASSETS — 100.0%
| | $3,488,401,418 | |
| (a) | Non-income producing security. |
| (b) | All or a portion of the shares of the security are on loan at June 30, 2024. |
| (c) | The Fund invested in certain money market funds managed by SSGA Funds Management, Inc. Amounts related to these investments during the year ended June 30, 2024 are shown in the Affiliate Table below. |
| (d) | The rate shown is the annualized seven-day yield at June 30, 2024. |
| (e) | The Fund invested in an affiliated entity. Amounts related to these investments during the year ended June 30, 2024 are shown in the Affiliate Table below. |
| (f) | Investment of cash collateral for securities loaned. |
At June 30, 2024, open futures contracts were as follows:
| Description | | Number of
Contracts | | Expiration
Date | | Notional
Amount | | Value | | Unrealized
Appreciation
(Depreciation) |
| E-mini S&P 500 Energy Select Sector Index (long) | | 86 | | 09/20/2024 | | $8,032,339 | | $8,304,160 | | $271,821 |
See accompanying notes to financial statements.
81
SPDR S&P OIL & GAS EXPLORATION & PRODUCTION ETF
SCHEDULE OF INVESTMENTS (continued)
June 30, 2024
During the year ended June 30, 2024, the average notional value related to futures contracts was $7,763,800.
The following table summarizes the value of the Fund's investments according to the fair value hierarchy as of June 30, 2024.
| Description | | Level 1 –
Quoted Prices | | Level 2 –
Other Significant
Observable Inputs | | Level 3 –
Significant
Unobservable Inputs | | Total |
| ASSETS: | | | | | | | | |
| INVESTMENTS: | | | | | | | | |
Common Stocks
| | $3,479,597,263 | | $— | | $— | | $3,479,597,263 |
Short-Term Investments
| | 140,423,187 | | — | | — | | 140,423,187 |
TOTAL INVESTMENTS
| | $3,620,020,450 | | $— | | $— | | $3,620,020,450 |
| OTHER FINANCIAL INSTRUMENTS: | | | | | | | | |
Futures Contracts - Unrealized Appreciation
| | $271,821 | | $— | | $— | | $271,821 |
TOTAL OTHER FINANCIAL INSTRUMENTS:
| | $271,821 | | $— | | $— | | $271,821 |
Affiliate Table
| | Number of
Shares Held
at
6/30/23 | | Value at
6/30/23 | | Cost of
Purchases | | Proceeds
from
Shares Sold | | Realized
Gain (Loss) | | Change in
Unrealized
Appreciation/
Depreciation(a) | | Number of
Shares Held
at
6/30/24 | | Value at
6/30/24 | | Dividend
Income |
State Street Institutional Liquid Reserves Fund, Premier Class
| 2,555,672 | | $2,556,183 | | $146,117,248 | | $141,116,537 | | $1,460 | | $431 | | 7,556,518 | | $7,558,785 | | $250,004 |
State Street Navigator Securities Lending Portfolio II
| 272,551,728 | | 272,551,728 | | 2,430,636,385 | | 2,570,323,711 | | — | | — | | 132,864,402 | | 132,864,402 | | 1,227,099 |
Tellurian, Inc.
| 14,834,689 | | 20,916,911 | | 72,072,642 | | 63,760,627 | | (47,097,323) | | —* | | — | | —* | | — |
Vertex Energy, Inc.
| 4,581,258 | | 28,632,863 | | 20,663,154 | | 35,308,506 | | (22,210,867) | | —* | | — | | —* | | — |
Vital Energy, Inc.
| 1,002,506 | | 45,263,146 | | 128,160,292 | | 147,579,369 | | (20,960,204) | | —* | | — | | —* | | — |
Total
| | | $369,920,831 | | $2,797,649,721 | | $2,958,088,750 | | $(90,266,934) | | $431 | | | | $140,423,187 | | $1,477,103 |
| (a) | Does not include change in unrealized appreciation and depreciation from investments that are no longer affiliates at year ended June 30, 2024. |
| * | As of June 30, 2024, no longer an affiliate. |
See accompanying notes to financial statements.
82
SPDR S&P REGIONAL BANKING ETF
SCHEDULE OF INVESTMENTS
June 30, 2024
| Security Description | | | Shares | | Value |
| COMMON STOCKS — 99.7% | |
| BANKS — 99.7% | |
1st Source Corp.
| | 80,326 | | $4,307,080 |
Amalgamated Financial Corp.
| | 162,172 | | 4,443,513 |
Amerant Bancorp, Inc.
| | 113,654 | | 2,579,946 |
Ameris Bancorp
| | 424,532 | | 21,375,186 |
Associated Banc-Corp.
| | 1,707,022 | | 36,103,515 |
Atlantic Union Bankshares Corp. (a)
| | 508,446 | | 16,702,451 |
Axos Financial, Inc. (a) (b)
| | 692,541 | | 39,578,718 |
Banc of California, Inc.
| | 3,226,798 | | 41,238,478 |
BancFirst Corp.
| | 89,448 | | 7,844,590 |
Bancorp, Inc. (b)
| | 942,523 | | 35,589,668 |
Bank of Hawaii Corp. (a)
| | 370,412 | | 21,191,271 |
Bank OZK
| | 1,490,064 | | 61,092,624 |
BankUnited, Inc.
| | 1,031,337 | | 30,187,234 |
Banner Corp.
| | 248,239 | | 12,322,584 |
Berkshire Hills Bancorp, Inc.
| | 327,152 | | 7,459,066 |
BOK Financial Corp.
| | 200,889 | | 18,409,468 |
Brookline Bancorp, Inc.
| | 575,817 | | 4,808,072 |
Byline Bancorp, Inc.
| | 130,343 | | 3,094,343 |
Cadence Bank
| | 1,564,626 | | 44,247,623 |
Camden National Corp.
| | 58,704 | | 1,937,232 |
Capitol Federal Financial, Inc. (a)
| | 1,210,661 | | 6,646,529 |
Cathay General Bancorp
| | 484,856 | | 18,288,768 |
Central Pacific Financial Corp.
| | 229,987 | | 4,875,724 |
Citizens Financial Group, Inc.
| | 1,655,363 | | 59,642,729 |
City Holding Co.
| | 78,327 | | 8,322,244 |
Coastal Financial Corp. (b)
| | 70,004 | | 3,229,985 |
Columbia Banking System, Inc.
| | 3,065,065 | | 60,964,143 |
Columbia Financial, Inc. (a) (b)
| | 124,123 | | 1,858,121 |
Commerce Bancshares, Inc.
| | 607,557 | | 33,889,529 |
Community Financial System, Inc.
| | 378,598 | | 17,873,612 |
Community Trust Bancorp, Inc.
| | 61,872 | | 2,701,332 |
ConnectOne Bancorp, Inc.
| | 214,003 | | 4,042,517 |
CrossFirst Bankshares, Inc. (b)
| | 202,544 | | 2,839,667 |
Cullen/Frost Bankers, Inc.
| | 562,261 | | 57,142,585 |
Customers Bancorp, Inc. (b)
| | 440,947 | | 21,156,637 |
CVB Financial Corp.
| | 1,063,486 | | 18,334,499 |
Dime Community Bancshares, Inc.
| | 276,392 | | 5,638,397 |
Eagle Bancorp, Inc.
| | 517,506 | | 9,780,863 |
East West Bancorp, Inc.
| | 812,556 | | 59,503,476 |
Eastern Bankshares, Inc.
| | 1,136,487 | | 15,888,088 |
Enterprise Financial Services Corp.
| | 164,756 | | 6,740,168 |
FB Financial Corp.
| | 168,592 | | 6,580,146 |
First BanCorp
| | 1,226,533 | | 22,433,289 |
First Bancorp/Southern Pines NC (a)
| | 196,392 | | 6,268,833 |
First Bancshares, Inc.
| | 241,233 | | 6,267,233 |
First Busey Corp.
| | 214,320 | | 5,188,687 |
First Commonwealth Financial Corp.
| | 632,252 | | 8,731,400 |
First Financial Bancorp
| | 476,200 | | 10,581,164 |
| Security Description | | | Shares | | Value |
First Financial Bankshares, Inc. (a)
| | 666,014 | | $19,667,393 |
First Financial Corp.
| | 62,662 | | 2,310,975 |
First Foundation, Inc.
| | 724,683 | | 4,746,674 |
First Hawaiian, Inc.
| | 940,570 | | 19,526,233 |
First Horizon Corp.
| | 3,952,275 | | 62,327,377 |
First Interstate BancSystem, Inc. Class A
| | 1,029,522 | | 28,589,826 |
First Merchants Corp.
| | 362,206 | | 12,057,838 |
Flushing Financial Corp.
| | 242,480 | | 3,188,612 |
FNB Corp.
| | 3,012,875 | | 41,216,130 |
Fulton Financial Corp.
| | 1,744,427 | | 29,620,370 |
Glacier Bancorp, Inc. (a)
| | 795,281 | | 29,679,887 |
Great Southern Bancorp, Inc.
| | 38,951 | | 2,166,065 |
Hancock Whitney Corp.
| | 687,913 | | 32,902,879 |
Hanmi Financial Corp.
| | 277,914 | | 4,646,722 |
HarborOne Bancorp, Inc.
| | 194,276 | | 2,162,292 |
Heartland Financial USA, Inc.
| | 335,062 | | 14,893,506 |
Heritage Commerce Corp.
| | 500,614 | | 4,355,342 |
Heritage Financial Corp.
| | 243,360 | | 4,387,781 |
Hilltop Holdings, Inc.
| | 356,392 | | 11,147,942 |
Home BancShares, Inc.
| | 1,311,739 | | 31,429,266 |
Hope Bancorp, Inc.
| | 854,416 | | 9,176,428 |
Horizon Bancorp, Inc.
| | 199,252 | | 2,464,747 |
Huntington Bancshares, Inc.
| | 4,559,340 | | 60,092,101 |
Independent Bank Corp. (c)
| | 371,344 | | 18,834,568 |
Independent Bank Corp. (c)
| | 92,344 | | 2,493,288 |
Independent Bank Group, Inc.
| | 341,811 | | 15,559,237 |
International Bancshares Corp.
| | 308,608 | | 17,655,464 |
Kearny Financial Corp.
| | 667,605 | | 4,105,771 |
Lakeland Financial Corp. (a)
| | 140,948 | | 8,671,121 |
Live Oak Bancshares, Inc. (a)
| | 213,898 | | 7,499,264 |
M&T Bank Corp.
| | 396,695 | | 60,043,755 |
Mercantile Bank Corp.
| | 95,899 | | 3,890,622 |
Metropolitan Bank Holding Corp. (b)
| | 122,437 | | 5,153,373 |
Midland States Bancorp, Inc.
| | 80,997 | | 1,834,582 |
National Bank Holdings Corp. Class A
| | 214,921 | | 8,392,665 |
NB Bancorp, Inc. (b)
| | 364,105 | | 5,490,703 |
NBT Bancorp, Inc. (a)
| | 237,970 | | 9,185,642 |
New York Community Bancorp, Inc. (a)
| | 18,491,187 | | 59,541,622 |
Nicolet Bankshares, Inc. (a)
| | 44,125 | | 3,664,140 |
Northwest Bancshares, Inc.
| | 1,046,312 | | 12,084,904 |
OceanFirst Financial Corp.
| | 392,435 | | 6,235,792 |
OFG Bancorp
| | 296,110 | | 11,089,320 |
Old National Bancorp
| | 2,479,749 | | 42,626,885 |
Old Second Bancorp, Inc.
| | 249,530 | | 3,695,539 |
Origin Bancorp, Inc.
| | 150,753 | | 4,781,885 |
Pacific Premier Bancorp, Inc.
| | 772,144 | | 17,736,148 |
Park National Corp. (a)
| | 59,692 | | 8,496,559 |
Pathward Financial, Inc.
| | 227,449 | | 12,866,790 |
Peapack-Gladstone Financial Corp. (a)
| | 135,817 | | 3,076,255 |
Peoples Bancorp, Inc.
| | 152,905 | | 4,587,150 |
Pinnacle Financial Partners, Inc.
| | 580,037 | | 46,426,161 |
See accompanying notes to financial statements.
83
SPDR S&P REGIONAL BANKING ETF
SCHEDULE OF INVESTMENTS (continued)
June 30, 2024
| Security Description | | | Shares | | Value |
Popular, Inc.
| | 510,621 | | $45,154,215 |
Preferred Bank
| | 115,241 | | 8,699,543 |
Premier Financial Corp.
| | 196,407 | | 4,018,487 |
Prosperity Bancshares, Inc.
| | 743,167 | | 45,437,230 |
Provident Financial Services, Inc.
| | 1,440,345 | | 20,668,951 |
QCR Holdings, Inc.
| | 70,896 | | 4,253,760 |
Regions Financial Corp.
| | 3,024,066 | | 60,602,283 |
Renasant Corp.
| | 300,992 | | 9,192,296 |
S&T Bancorp, Inc.
| | 205,078 | | 6,847,554 |
Sandy Spring Bancorp, Inc.
| | 424,807 | | 10,348,299 |
Seacoast Banking Corp. of Florida
| | 571,404 | | 13,507,991 |
ServisFirst Bancshares, Inc. (a)
| | 231,143 | | 14,605,926 |
Simmons First National Corp. Class A
| | 660,078 | | 11,604,171 |
Southside Bancshares, Inc. (a)
| | 156,035 | | 4,308,126 |
SouthState Corp.
| | 683,333 | | 52,220,308 |
Stellar Bancorp, Inc.
| | 217,754 | | 4,999,632 |
Stock Yards Bancorp, Inc. (a)
| | 107,851 | | 5,356,959 |
Synovus Financial Corp. (a)
| | 1,541,755 | | 61,963,133 |
Texas Capital Bancshares, Inc. (b)
| | 577,247 | | 35,292,882 |
TFS Financial Corp. (a)
| | 361,420 | | 4,561,120 |
Tompkins Financial Corp.
| | 77,364 | | 3,783,100 |
Towne Bank
| | 368,277 | | 10,042,914 |
TriCo Bancshares
| | 150,669 | | 5,961,972 |
Triumph Financial, Inc. (a) (b)
| | 209,471 | | 17,124,254 |
Truist Financial Corp.
| | 1,592,720 | | 61,877,172 |
TrustCo Bank Corp.
| | 97,743 | | 2,812,066 |
Trustmark Corp.
| | 359,216 | | 10,790,849 |
UMB Financial Corp. (a)
| | 353,958 | | 29,527,176 |
United Bankshares, Inc.
| | 695,176 | | 22,551,509 |
United Community Banks, Inc.
| | 761,825 | | 19,396,065 |
Univest Financial Corp.
| | 117,852 | | 2,690,561 |
Valley National Bancorp
| | 8,650,089 | | 60,377,621 |
Veritex Holdings, Inc.
| | 540,764 | | 11,404,713 |
WaFd, Inc.
| | 587,181 | | 16,781,633 |
Washington Trust Bancorp, Inc.
| | 122,616 | | 3,360,905 |
Webster Financial Corp.
| | 1,422,774 | | 62,018,719 |
| Security Description | | | Shares | | Value |
WesBanco, Inc.
| | 272,313 | | $7,600,256 |
Westamerica BanCorp
| | 177,199 | | 8,599,467 |
Western Alliance Bancorp
| | 962,822 | | 60,484,478 |
Wintrust Financial Corp.
| | 489,606 | | 48,255,567 |
WSFS Financial Corp.
| | 337,238 | | 15,850,186 |
Zions Bancorp NA
| | 1,384,065 | | 60,026,899 |
TOTAL COMMON STOCKS
(Cost $2,898,695,561)
| | | | | 2,703,359,566 |
| SHORT-TERM INVESTMENTS — 0.6% | | | |
State Street Institutional Liquid Reserves Fund, Premier Class 5.36% (d) (e)
| | 3,432,349 | | 3,433,378 |
State Street Navigator Securities Lending Portfolio II (f) (g)
| | 14,117,136 | | 14,117,136 |
TOTAL SHORT-TERM INVESTMENTS
(Cost $17,550,256)
| | 17,550,514 | |
TOTAL INVESTMENTS — 100.3%
(Cost $2,916,245,817)
| | 2,720,910,080 | |
LIABILITIES IN EXCESS OF OTHER ASSETS — (0.3)%
| | (8,612,053) | |
NET ASSETS — 100.0%
| | $2,712,298,027 | |
| (a) | All or a portion of the shares of the security are on loan at June 30, 2024. |
| (b) | Non-income producing security. |
| (c) | Reflects separate holdings of the issuer's common stock traded on different securities exchanges. |
| (d) | The Fund invested in certain money market funds managed by SSGA Funds Management, Inc. Amounts related to these investments during the year ended June 30, 2024 are shown in the Affiliate Table below. |
| (e) | The rate shown is the annualized seven-day yield at June 30, 2024. |
| (f) | The Fund invested in an affiliated entity. Amounts related to these investments during the year ended June 30, 2024 are shown in the Affiliate Table below. |
| (g) | Investment of cash collateral for securities loaned. |
During the year ended June 30, 2024, the average notional value related to swap contracts was $6,464,077. There were no swaps held at June 30, 2024.
The following table summarizes the value of the Fund's investments according to the fair value hierarchy as of June 30, 2024.
| Description | | Level 1 –
Quoted Prices | | Level 2 –
Other Significant
Observable Inputs | | Level 3 –
Significant
Unobservable Inputs | | Total |
| ASSETS: | | | | | | | | |
| INVESTMENTS: | | | | | | | | |
Common Stocks
| | $2,703,359,566 | | $— | | $— | | $2,703,359,566 |
Short-Term Investments
| | 17,550,514 | | — | | — | | 17,550,514 |
TOTAL INVESTMENTS
| | $2,720,910,080 | | $— | | $— | | $2,720,910,080 |
See accompanying notes to financial statements.
84
SPDR S&P REGIONAL BANKING ETF
SCHEDULE OF INVESTMENTS (continued)
June 30, 2024
Affiliate Table
| | Number of
Shares Held
at
6/30/23 | | Value at
6/30/23 | | Cost of
Purchases | | Proceeds
from
Shares Sold | | Realized
Gain (Loss) | | Change in
Unrealized
Appreciation/
Depreciation(a) | | Number of
Shares Held
at
6/30/24 | | Value at
6/30/24 | | Dividend
Income |
PacWest Bancorp
| 7,207,282 | | $58,739,348 | | $93,048,889 | | $148,047,939 | | $(67,915,347) | | $—* | | — | | $—* | | $122,411 |
State Street Institutional Liquid Reserves Fund, Premier Class
| 625,696 | | 625,821 | | 247,992,782 | | 245,188,523 | | 3,040 | | 258 | | 3,432,349 | | 3,433,378 | | 642,619 |
State Street Navigator Securities Lending Portfolio II
| 88,167,898 | | 88,167,898 | | 990,527,318 | | 1,064,578,080 | | — | | — | | 14,117,136 | | 14,117,136 | | 257,007 |
Total
| | | $147,533,067 | | $1,331,568,989 | | $1,457,814,542 | | $(67,912,307) | | $258 | | | | $17,550,514 | | $1,022,037 |
| (a) | Does not include change in unrealized appreciation and depreciation from investments that are no longer affiliates at year ended June 30, 2024. |
| * | As of June 30, 2024, no longer an affiliate. |
See accompanying notes to financial statements.
85
[This Page Intentionally Left Blank]
SPDR SERIES TRUST
STATEMENTS OF ASSETS AND LIABILITIES
June 30, 2024
| | SPDR Dow Jones REIT ETF | | SPDR Portfolio S&P 400 Mid Cap ETF | | SPDR Portfolio S&P 500 ETF |
| ASSETS | | | | | |
Investments in unaffiliated issuers, at value*
| $1,389,861,780 | | $10,024,586,785 | | $39,562,758,294 |
Investments in affiliated issuers, at value
| 14,072,373 | | 380,676,390 | | 274,234,954 |
Total Investments
| 1,403,934,153 | | 10,405,263,175 | | 39,836,993,248 |
Foreign currency, at value
| — | | — | | — |
Net cash at broker
| 932,210 | | — | | 3,816,024 |
Cash
| 13,349 | | — | | — |
Receivable from broker — accumulated variation margin on futures contracts
| 123,219 | | — | | 517,464 |
Receivable for investments sold
| 8,268,207 | | 21,402,082 | | — |
Receivable for fund shares sold
| — | | — | | 24,431 |
Dividends receivable — unaffiliated issuers
| 4,487,763 | | 9,632,396 | | 20,004,369 |
Dividends receivable — affiliated issuers
| 75,672 | | 44,850 | | 574,643 |
Securities lending income receivable — unaffiliated issuers
| 86 | | 31,107 | | 4,368 |
Securities lending income receivable — affiliated issuers
| 392 | | 52,140 | | 12,612 |
Receivable from Adviser
| — | | — | | — |
Receivable for foreign taxes recoverable
| 158,670 | | — | | 32,141 |
Other receivable
| 427 | | — | | — |
TOTAL ASSETS
| 1,417,994,148 | | 10,436,425,750 | | 39,861,979,300 |
| LIABILITIES | | | | | |
Due to custodian
| — | | 8,239,296 | | 136,922 |
Payable upon return of securities loaned
| 3,521,807 | | 380,676,390 | | 150,685,702 |
Payable for investments purchased
| — | | — | | — |
Payable for fund shares repurchased
| 32,234 | | 2,643 | | — |
Payable to broker – accumulated variation margin on open futures contracts
| — | | — | | — |
Advisory fee payable
| 285,516 | | 248,282 | | 633,838 |
Trustees’ fees and expenses payable
| 113 | | — | | — |
TOTAL LIABILITIES
| 3,839,670 | | 389,166,611 | | 151,456,462 |
NET ASSETS
| $1,414,154,478 | | $10,047,259,139 | | $39,710,522,838 |
| NET ASSETS CONSIST OF: | | | | | |
Paid-in capital
| $2,001,835,887 | | $9,293,211,699 | | $33,021,349,728 |
Total distributable earnings (loss)
| (587,681,409) | | 754,047,440 | | 6,689,173,110 |
NET ASSETS
| $1,414,154,478 | | $10,047,259,139 | | $39,710,522,838 |
| NET ASSET VALUE PER SHARE | | | | | |
Net asset value per share
| $93.15 | | $51.33 | | $63.97 |
Shares outstanding (unlimited amount authorized, $0.01 par value)
| 15,181,617 | | 195,750,000 | | 620,750,000 |
| COST OF INVESTMENTS: | | | | | |
Investments in unaffiliated issuers
| $1,725,777,399 | | $8,814,384,705 | | $32,512,584,140 |
Investments in affiliated issuers
| 14,072,041 | | 380,676,390 | | 274,967,175 |
Total cost of investments
| $1,739,849,440 | | $9,195,061,095 | | $32,787,551,315 |
Foreign currency, at cost
| $— | | $— | | $— |
* Includes investments in securities on loan, at value
| $3,510,772 | | $666,220,732 | | $209,882,934 |
See accompanying notes to financial statements.
87
| SPDR Portfolio S&P 500 Growth ETF | | SPDR Portfolio S&P 500 High Dividend ETF | | SPDR Portfolio S&P 500 Value ETF | | SPDR Portfolio S&P 600 Small Cap ETF | | SPDR Portfolio S&P 1500 Composite Stock Market ETF | | SPDR Portfolio S&P Sector Neutral Dividend ETF |
| | | | | | | | | | | |
| $28,914,996,071 | | $5,870,503,135 | | $21,391,585,522 | | $10,203,893,561 | | $8,563,028,476 | | $5,819,184 |
| 24,849,182 | | 45,242,732 | | 102,811,403 | | 758,199,143 | | 61,866,370 | | 25,900 |
| 28,939,845,253 | | 5,915,745,867 | | 21,494,396,925 | | 10,962,092,704 | | 8,624,894,846 | | 5,845,084 |
| — | | — | | — | | 16,098 | | 2,492 | | — |
| — | | 1,917,217 | | — | | 571,403 | | 317,567 | | — |
| 215,239 | | 427 | | 161,342 | | 356,477 | | — | | — |
| — | | 233,932 | | — | | — | | 31,389 | | — |
| 631,553,922 | | — | | — | | — | | 1,005,775 | | — |
| — | | — | | — | | — | | — | | — |
| 5,690,941 | | 16,762,107 | | 20,144,896 | | 11,641,277 | | 4,687,796 | | 6,001 |
| 94,912 | | 200,570 | | 171,483 | | 56,133 | | 149,611 | | 66 |
| 1,152 | | — | | 890 | | 19,461 | | 4,379 | | — |
| 9,336 | | — | | 5,979 | | 262,735 | | 10,792 | | — |
| — | | — | | — | | — | | — | | 1,500 |
| — | | 339,004 | | — | | — | | 7,558 | | — |
| — | | 12,972 | | 54,080 | | — | | 919 | | — |
| 29,577,410,755 | | 5,935,212,096 | | 21,514,935,595 | | 10,975,016,288 | | 8,631,113,124 | | 5,852,651 |
| | | | | | | | | | | |
| — | | — | | — | | — | | 1,927 | | — |
| 15,106,095 | | — | | 57,581,983 | | 751,498,526 | | 52,623,778 | | — |
| 645,558,364 | | 12,990,900 | | — | | 1,486,240 | | — | | — |
| 20,728 | | — | | — | | 4,301 | | — | | — |
| — | | — | | — | | 11,602 | | — | | — |
| 937,573 | | 359,543 | | 704,553 | | 251,938 | | 209,062 | | 228 |
| — | | 534 | | — | | — | | — | | — |
| 661,622,760 | | 13,350,977 | | 58,286,536 | | 753,252,607 | | 52,834,767 | | 228 |
| $28,915,787,995 | | $5,921,861,119 | | $21,456,649,059 | | $10,221,763,681 | | $8,578,278,357 | | $5,852,423 |
| | | | | | | | | | | |
| $23,630,519,009 | | $7,667,540,092 | | $21,474,929,974 | | $10,573,250,801 | | $6,104,980,587 | | $5,372,439 |
| 5,285,268,986 | | (1,745,678,973) | | (18,280,915) | | (351,487,120) | | 2,473,297,770 | | 479,984 |
| $28,915,787,995 | | $5,921,861,119 | | $21,456,649,059 | | $10,221,763,681 | | $8,578,278,357 | | $5,852,423 |
| | | | | | | | | | | |
| $80.09 | | $40.22 | | $48.76 | | $41.50 | | $66.32 | | $34.43 |
| 361,050,108 | | 147,250,000 | | 440,052,864 | | 246,310,217 | | 129,350,216 | | 170,000 |
| | | | | | | | | | | |
| $20,758,171,079 | | $6,186,112,711 | | $19,924,878,056 | | $9,449,877,140 | | $5,966,562,758 | | $5,330,936 |
| 24,848,780 | | 45,242,266 | | 103,636,207 | | 758,198,806 | | 62,208,881 | | 25,611 |
| $20,783,019,859 | | $6,231,354,977 | | $20,028,514,263 | | $10,208,075,946 | | $6,028,771,639 | | $5,356,547 |
| $— | | $— | | $— | | $16,508 | | $2,513 | | $— |
| $28,959,175 | | $— | | $71,287,378 | | $845,010,698 | | $106,697,727 | | $— |
SPDR SERIES TRUST
STATEMENTS OF ASSETS AND LIABILITIES (continued)
June 30, 2024
| | SPDR S&P Aerospace & Defense ETF | | SPDR S&P Bank ETF | | SPDR S&P Biotech ETF |
| ASSETS | | | | | |
Investments in unaffiliated issuers, at value*
| $2,111,692,402 | | $1,440,976,013 | | $6,914,428,561 |
Investments in affiliated issuers, at value
| 163,369,911 | | 30,647,096 | | 534,663,366 |
Total Investments
| 2,275,062,313 | | 1,471,623,109 | | 7,449,091,927 |
Net cash at broker
| — | | — | | — |
Cash
| 31 | | 38,539 | | 65,146 |
Receivable from broker — accumulated variation margin on futures contracts
| — | | — | | — |
Receivable for fund shares sold
| — | | 7,468 | | — |
Dividends receivable — unaffiliated issuers
| 87,574 | | 3,107,069 | | 960 |
Dividends receivable — affiliated issuers
| 14,393 | | 8,825 | | 15,830 |
Securities lending income receivable — unaffiliated issuers
| 50,049 | | 3,970 | | 258,415 |
Securities lending income receivable — affiliated issuers
| 183,972 | | 5,535 | | 1,047,074 |
TOTAL ASSETS
| 2,275,398,332 | | 1,474,794,515 | | 7,450,479,352 |
| LIABILITIES | | | | | |
Due to custodian
| — | | — | | — |
Payable upon return of securities loaned
| 160,660,356 | | 29,664,528 | | 531,386,578 |
Payable for investments purchased
| — | | 38,413 | | 52,626 |
Payable for fund shares repurchased
| — | | — | | 52,725 |
Advisory fee payable
| 622,118 | | 385,610 | | 2,001,235 |
Trustees’ fees and expenses payable
| — | | — | | 13 |
TOTAL LIABILITIES
| 161,282,474 | | 30,088,551 | | 533,493,177 |
NET ASSETS
| $2,114,115,858 | | $1,444,705,964 | | $6,916,986,175 |
| NET ASSETS CONSIST OF: | | | | | |
Paid-in capital
| $2,370,475,249 | | $2,976,739,088 | | $17,985,269,131 |
Total distributable earnings (loss)
| (256,359,391) | | (1,532,033,124) | | (11,068,282,956) |
NET ASSETS
| $2,114,115,858 | | $1,444,705,964 | | $6,916,986,175 |
| NET ASSET VALUE PER SHARE | | | | | |
Net asset value per share
| $140.01 | | $46.38 | | $92.72 |
Shares outstanding (unlimited amount authorized, $0.01 par value)
| 15,100,000 | | 31,152,118 | | 74,600,000 |
| COST OF INVESTMENTS: | | | | | |
Investments in unaffiliated issuers
| $1,758,495,007 | | $1,528,835,573 | | $7,296,548,381 |
Investments in affiliated issuers
| 163,369,699 | | 30,647,055 | | 534,663,198 |
Total cost of investments
| $1,921,864,706 | | $1,559,482,628 | | $7,831,211,579 |
* Includes investments in securities on loan, at value
| $202,088,801 | | $68,963,171 | | $892,979,107 |
See accompanying notes to financial statements.
89
| SPDR S&P Dividend ETF | | SPDR S&P Homebuilders ETF | | SPDR S&P Oil & Gas Exploration & Production ETF | | SPDR S&P Regional Banking ETF |
| | | | | | | |
| $19,646,073,927 | | $1,741,882,972 | | $3,479,597,263 | | $2,703,359,566 |
| 137,655,993 | | 60,553,129 | | 140,423,187 | | 17,550,514 |
| 19,783,729,920 | | 1,802,436,101 | | 3,620,020,450 | | 2,720,910,080 |
| 1,941,138 | | — | | 257,618 | | — |
| — | | 1,774,684 | | 3,123 | | 506 |
| 263,043 | | — | | 272,092 | | — |
| — | | 2,667 | | 744 | | 4,724 |
| 33,126,028 | | 838,875 | | 1,136,742 | | 6,154,693 |
| 256,351 | | 3,986 | | 46,783 | | 25,519 |
| 26,273 | | 944 | | 184,877 | | 9,800 |
| 25,109 | | 8,222 | | 366,186 | | 8,240 |
| 19,819,367,862 | | 1,805,065,479 | | 3,622,288,615 | | 2,727,113,562 |
| | | | | | | |
| 314,202 | | — | | — | | — |
| 104,487,153 | | 59,676,717 | | 132,864,402 | | 14,117,136 |
| — | | 421,782 | | — | | — |
| 4,469 | | — | | — | | — |
| 5,757,945 | | 514,711 | | 1,022,447 | | 698,140 |
| 2,409 | | — | | 348 | | 259 |
| 110,566,178 | | 60,613,210 | | 133,887,197 | | 14,815,535 |
| $19,708,801,684 | | $1,744,452,269 | | $3,488,401,418 | | $2,712,298,027 |
| | | | | | | |
| $21,905,403,325 | | $2,774,278,975 | | $9,067,524,278 | | $5,670,202,888 |
| (2,196,601,641) | | (1,029,826,706) | | (5,579,122,860) | | (2,957,904,861) |
| $19,708,801,684 | | $1,744,452,269 | | $3,488,401,418 | | $2,712,298,027 |
| | | | | | | |
| $127.15 | | $101.13 | | $145.65 | | $49.09 |
| 155,003,658 | | 17,250,016 | | 23,950,000 | | 55,252,585 |
| | | | | | | |
| $18,530,672,049 | | $1,798,835,155 | | $3,722,551,289 | | $2,898,695,561 |
| 137,655,972 | | 60,553,087 | | 140,422,756 | | 17,550,256 |
| $18,668,328,021 | | $1,859,388,242 | | $3,862,974,045 | | $2,916,245,817 |
| $249,753,029 | | $57,769,273 | | $221,960,119 | | $73,362,571 |
SPDR SERIES TRUST
STATEMENTS OF OPERATIONS
For the Year Ended June 30, 2024
| | SPDR Dow Jones REIT ETF | | SPDR Portfolio S&P 400 Mid Cap ETF | | SPDR Portfolio S&P 500 ETF | | SPDR Portfolio S&P 500 Growth ETF |
| INVESTMENT INCOME | | | | | | | |
Interest income — unaffiliated issuers
| $47,377 | | $— | | $187,478 | | $— |
Dividend income — unaffiliated issuers
| 45,202,417 | | 129,968,602 | | 401,268,256 | | 207,339,629 |
Dividend income — affiliated issuers
| 725,802 | | 296,834 | | 5,386,635 | | 723,579 |
Unaffiliated securities lending income
| 9,242 | | 297,216 | | 26,393 | | 9,573 |
Affiliated securities lending income
| 78,684 | | 893,877 | | 282,788 | | 247,755 |
Foreign taxes withheld
| — | | — | | (107,835) | | (107,263) |
TOTAL INVESTMENT INCOME (LOSS)
| 46,063,522 | | 131,456,529 | | 407,043,715 | | 208,213,273 |
| EXPENSES | | | | | | | |
Advisory fee
| 3,405,605 | | 2,568,517 | | 5,525,776 | | 8,754,713 |
Trustees’ fees and expenses
| 13,893 | | 75,543 | | 233,686 | | 205,115 |
Miscellaneous expenses
| 1,461 | | 10,671 | | 28,220 | | 22,148 |
TOTAL EXPENSES
| 3,420,959 | | 2,654,731 | | 5,787,682 | | 8,981,976 |
NET INVESTMENT INCOME (LOSS)
| $42,642,563 | | $128,801,798 | | $401,256,033 | | $199,231,297 |
| REALIZED AND UNREALIZED GAIN (LOSS) | | | | | | | |
| Net realized gain (loss) on: | | | | | | | |
Investments — unaffiliated issuers
| (19,264,781) | | (107,879,726) | | (139,062,378) | | (359,371,006) |
Investments — affiliated issuers
| (328) | | 1,518 | | (573,148) | | (1,996) |
In-kind redemptions — unaffiliated issuers
| 26,240,445 | | 355,590,957 | | 695,383,014 | | 737,368,927 |
In-kind redemptions — affiliated issuers
| — | | — | | 81,031 | | — |
Foreign currency transactions
| — | | — | | — | | — |
Futures contracts
| 717,057 | | — | | 15,837,707 | | — |
Net realized gain (loss)
| 7,692,393 | | 247,712,749 | | 571,666,226 | | 377,995,925 |
| Net change in unrealized appreciation/depreciation on: | | | | | | | |
Investments — unaffiliated issuers
| 41,825,075 | | 683,332,541 | | 5,553,367,072 | | 6,102,256,025 |
Investments — affiliated issuers
| 188 | | (25) | | 771,448 | | 120 |
Foreign currency translations
| — | | — | | — | | — |
Futures contracts
| (99,332) | | — | | (1,899,992) | | — |
Net change in unrealized appreciation/depreciation
| 41,725,931 | | 683,332,516 | | 5,552,238,528 | | 6,102,256,145 |
NET REALIZED AND UNREALIZED GAIN (LOSS)
| 49,418,324 | | 931,045,265 | | 6,123,904,754 | | 6,480,252,070 |
NET INCREASE (DECREASE) IN NET ASSETS FROM OPERATIONS
| $92,060,887 | | $1,059,847,063 | | $6,525,160,787 | | $6,679,483,367 |
See accompanying notes to financial statements.
91
| SPDR Portfolio S&P 500 High Dividend ETF | | SPDR Portfolio S&P 500 Value ETF | | SPDR Portfolio S&P 600 Small Cap ETF | | SPDR Portfolio S&P 1500 Composite Stock Market ETF | | SPDR Portfolio S&P Sector Neutral Dividend ETF(a) |
| | | | | | | | | |
| $100,701 | | $— | | $27,500 | | $55,890 | | $— |
| 299,939,561 | | 409,321,639 | | 164,306,043 | | 111,984,584 | | 106,301 |
| 1,840,788 | | 1,727,342 | | 562,540 | | 1,371,953 | | 694 |
| 14,208 | | 20,845 | | 123,629 | | 49,308 | | — |
| 70,550 | | 155,758 | | 3,193,213 | | 189,499 | | — |
| — | | (54,233) | | (127,976) | | (29,657) | | — |
| 301,965,808 | | 411,171,351 | | 168,084,949 | | 113,621,577 | | 106,995 |
| | | | | | | | | |
| 4,585,376 | | 7,540,099 | | 2,878,149 | | 2,222,943 | | 1,711 |
| 66,599 | | 179,209 | | 83,961 | | 71,256 | | 29 |
| 7,058 | | 21,931 | | 89,215 | | 10,165 | | 4 |
| 4,659,033 | | 7,741,239 | | 3,051,325 | | 2,304,364 | | 1,744 |
| $297,306,775 | | $403,430,112 | | $165,033,624 | | $111,317,213 | | $105,251 |
| | | | | | | | | |
| | | | | | | | | |
| (357,091,673) | | (385,664,856) | | (326,098,754) | | (20,051,315) | | (11,771) |
| (3,364) | | (748,856) | | (1,972) | | (134,557) | | (69) |
| 195,446,700 | | 1,885,155,185 | | 367,077,705 | | 189,533,580 | | 74,252 |
| — | | 158,729 | | — | | 13,338 | | — |
| — | | — | | — | | (8) | | — |
| 8,493,535 | | — | | 658,920 | | 5,119,079 | | — |
| (153,154,802) | | 1,498,900,202 | | 41,635,899 | | 174,480,117 | | 62,412 |
| | | | | | | | | |
| 689,138,597 | | 869,235,908 | | 559,208,868 | | 1,358,937,918 | | 488,248 |
| (171) | | 1,097,505 | | 337 | | 153,995 | | 289 |
| — | | — | | (92) | | (21) | | — |
| (1,133,671) | | — | | (18,163) | | (370,545) | | — |
| 688,004,755 | | 870,333,413 | | 559,190,950 | | 1,358,721,347 | | 488,537 |
| 534,849,953 | | 2,369,233,615 | | 600,826,849 | | 1,533,201,464 | | 550,949 |
| $832,156,728 | | $2,772,663,727 | | $765,860,473 | | $1,644,518,677 | | $656,200 |
| | |
| (a) | For the period September 12, 2023 (commencement of operations) through June 30, 2024. |
SPDR SERIES TRUST
STATEMENTS OF OPERATIONS (continued)
For the Year Ended June 30, 2024
| | SPDR S&P Aerospace & Defense ETF | | SPDR S&P Bank ETF | | SPDR S&P Biotech ETF | | SPDR S&P Dividend ETF |
| INVESTMENT INCOME | | | | | | | |
Interest income — unaffiliated issuers
| $— | | $— | | $— | | $160,568 |
Dividend income — unaffiliated issuers
| 16,518,488 | | 50,820,741 | | 3,099,947 | | 591,225,592 |
Dividend income — affiliated issuers
| 166,747 | | 76,637 | | 373,007 | | 20,885,433 |
Dividend income — non-cash transactions
| — | | — | | 5,699,178 | | — |
Unaffiliated securities lending income
| 422,204 | | 39,903 | | 2,062,756 | | 292,160 |
Affiliated securities lending income
| 1,459,511 | | 141,015 | | 14,286,900 | | 346,542 |
Foreign taxes withheld
| — | | (104,511) | | — | | — |
TOTAL INVESTMENT INCOME (LOSS)
| 18,566,950 | | 50,973,785 | | 25,521,788 | | 612,910,295 |
| EXPENSES | | | | | | | |
Advisory fee
| 6,460,002 | | 5,114,191 | | 22,791,014 | | 72,006,698 |
Trustees’ fees and expenses
| 17,490 | | 14,328 | | 64,861 | | 216,273 |
Miscellaneous expenses
| 1,889 | | 1,555 | | 6,854 | | 22,438 |
TOTAL EXPENSES
| 6,479,381 | | 5,130,074 | | 22,862,729 | | 72,245,409 |
NET INVESTMENT INCOME (LOSS)
| $12,087,569 | | $45,843,711 | | $2,659,059 | | $540,664,886 |
| REALIZED AND UNREALIZED GAIN (LOSS) | | | | | | | |
| Net realized gain (loss) on: | | | | | | | |
Investments — unaffiliated issuers
| (208,935,120) | | (145,836,232) | | (1,024,052,270) | | (500,287,699) |
Investments — affiliated issuers
| (10,290,269) | | (42) | | (1,001,530,091) | | (321,962,995) |
In-kind redemptions — unaffiliated issuers
| 237,554,109 | | 123,208,091 | | 1,706,218,075 | | 554,666,952 |
Futures contracts
| — | | — | | — | | 8,850,245 |
Swap contracts
| — | | — | | — | | 1,992,539 |
Net realized gain (loss)
| 18,328,720 | | (22,628,183) | | (319,364,286) | | (256,740,958) |
| Net change in unrealized appreciation/depreciation on: | | | | | | | |
Investments — unaffiliated issuers
| 194,679,464 | | 343,281,949 | | 442,478,516 | | 701,741,510 |
Investments — affiliated issuers
| 62,019,261 | | 41 | | 613,313,119 | | 267,004,346 |
Futures contracts
| — | | — | | — | | (2,505,632) |
Swap contracts
| — | | — | | — | | (6,659,869) |
Net change in unrealized appreciation/depreciation
| 256,698,725 | | 343,281,990 | | 1,055,791,635 | | 959,580,355 |
NET REALIZED AND UNREALIZED GAIN (LOSS)
| 275,027,445 | | 320,653,807 | | 736,427,349 | | 702,839,397 |
NET INCREASE (DECREASE) IN NET ASSETS FROM OPERATIONS
| $287,115,014 | | $366,497,518 | | $739,086,408 | | $1,243,504,283 |
See accompanying notes to financial statements.
93
| SPDR S&P Homebuilders ETF | | SPDR S&P Oil & Gas Exploration & Production ETF | | SPDR S&P Regional Banking ETF |
| | | | | |
| $— | | $29,836 | | $— |
| 17,230,865 | | 93,503,096 | | 106,021,679 |
| 54,751 | | 250,004 | | 765,030 |
| — | | — | | — |
| 29,875 | | 418,544 | | 69,571 |
| 157,554 | | 1,227,099 | | 257,007 |
| — | | — | | (243,652) |
| 17,473,045 | | 95,428,579 | | 106,869,635 |
| | | | | |
| 5,515,363 | | 12,842,652 | | 10,212,729 |
| 14,290 | | 36,722 | | 30,353 |
| 1,607 | | 4,000 | | 3,221 |
| 5,531,260 | | 12,883,374 | | 10,246,303 |
| $11,941,785 | | $82,545,205 | | $96,623,332 |
| | | | | |
| | | | | |
| (71,514,559) | | (196,680,314) | | (314,018,594) |
| 28 | | (90,266,934) | | (67,912,307) |
| 455,015,052 | | 403,194,050 | | 421,509,906 |
| — | | 647,985 | | — |
| — | | — | | (408,668) |
| 383,500,521 | | 116,894,787 | | 39,170,337 |
| | | | | |
| (44,348,758) | | 279,737,653 | | 478,103,960 |
| 42 | | 33,461,738 | | 64,564,398 |
| — | | 191,760 | | — |
| — | | — | | — |
| (44,348,716) | | 313,391,151 | | 542,668,358 |
| 339,151,805 | | 430,285,938 | | 581,838,695 |
| $351,093,590 | | $512,831,143 | | $678,462,027 |
SPDR SERIES TRUST
STATEMENTS OF CHANGES IN NET ASSETS
| | SPDR Dow Jones REIT ETF | | SPDR Portfolio S&P 400 Mid Cap ETF |
| | Year Ended
6/30/24 | | Year Ended
6/30/23 | | Year Ended
6/30/24 | | Year Ended
6/30/23 |
| INCREASE (DECREASE) IN NET ASSETS FROM OPERATIONS: | | | | | | | |
Net investment income (loss)
| $42,642,563 | | $46,247,946 | | $128,801,798 | | $92,714,859 |
Net realized gain (loss)
| 7,692,393 | | (29,366,074) | | 247,712,749 | | (5,299,563) |
Net change in unrealized appreciation/depreciation
| 41,725,931 | | (43,123,124) | | 683,332,516 | | 770,941,357 |
Net increase (decrease) in net assets resulting from operations
| 92,060,887 | | (26,241,252) | | 1,059,847,063 | | 858,356,653 |
Net equalization credits and charges
| (1,505,327) | | 8,995,562 | | 2,373,899 | | 1,467,193 |
Distributions to shareholders
| (53,054,560) | | (59,848,485) | | (128,490,199) | | (94,878,855) |
| FROM BENEFICIAL INTEREST TRANSACTIONS: | | | | | | | |
Proceeds from shares sold
| 1,558,310,111 | | 1,062,740,742 | | 3,231,322,858 | | 2,030,980,037 |
Cost of shares redeemed
| (1,525,371,625) | | (1,355,504,487) | | (827,822,937) | | (639,918,879) |
Net income equalization
| 1,505,327 | | (8,995,562) | | (2,373,899) | | (1,467,193) |
Net increase (decrease) in net assets from beneficial interest transactions
| 34,443,813 | | (301,759,307) | | 2,401,126,022 | | 1,389,593,965 |
Net increase (decrease) in net assets during the period
| 71,944,813 | | (378,853,482) | | 3,334,856,785 | | 2,154,538,956 |
Net assets at beginning of period
| 1,342,209,665 | | 1,721,063,147 | | 6,712,402,354 | | 4,557,863,398 |
NET ASSETS AT END OF PERIOD
| $1,414,154,478 | | $1,342,209,665 | | $10,047,259,139 | | $6,712,402,354 |
| SHARES OF BENEFICIAL INTEREST: | | | | | | | |
Shares sold
| 17,200,000 | | 11,625,000 | | 65,950,000 | | 46,850,000 |
Shares redeemed
| (16,850,000) | | (14,900,000) | | (16,450,000) | | (15,400,000) |
Net increase (decrease) from share transactions
| 350,000 | | (3,275,000) | | 49,500,000 | | 31,450,000 |
See accompanying notes to financial statements.
95
| SPDR Portfolio S&P 500 ETF | | SPDR Portfolio S&P 500 Growth ETF | | SPDR Portfolio S&P 500 High Dividend ETF |
Year Ended
6/30/24 | | Year Ended
6/30/23 | | Year Ended
6/30/24 | | Year Ended
6/30/23 | | Year Ended
6/30/24 | | Year Ended
6/30/23 |
| | | | | | | | | | | |
| $401,256,033 | | $255,360,202 | | $199,231,297 | | $173,826,081 | | $297,306,775 | | $312,603,229 |
| 571,666,226 | | 651,761,693 | | 377,995,925 | | (955,624,447) | | (153,154,802) | | 339,913,234 |
| 5,552,238,528 | | 1,924,623,430 | | 6,102,256,145 | | 3,323,567,475 | | 688,004,755 | | (750,323,685) |
| 6,525,160,787 | | 2,831,745,325 | | 6,679,483,367 | | 2,541,769,109 | | 832,156,728 | | (97,807,222) |
| 23,051,078 | | 3,786,305 | | 5,155,839 | | 914,072 | | 7,736,715 | | 2,713,475 |
| (422,265,120) | | (259,368,415) | | (203,965,781) | | (173,909,356) | | (310,151,950) | | (331,882,313) |
| | | | | | | | | | | |
| 17,052,404,014 | | 6,440,027,639 | | 6,937,318,998 | | 7,596,373,579 | | 1,243,680,180 | | 5,104,018,295 |
| (2,221,589,030) | | (2,997,644,605) | | (2,230,036,698) | | (4,080,545,648) | | (2,354,970,721) | | (5,931,088,704) |
| (23,051,078) | | (3,786,305) | | (5,155,839) | | (914,072) | | (7,736,715) | | (2,713,475) |
| 14,807,763,906 | | 3,438,596,729 | | 4,702,126,461 | | 3,514,913,859 | | (1,119,027,256) | | (829,783,884) |
| 20,933,710,651 | | 6,014,759,944 | | 11,182,799,886 | | 5,883,687,684 | | (589,285,763) | | (1,256,759,944) |
| 18,776,812,187 | | 12,762,052,243 | | 17,732,988,109 | | 11,849,300,425 | | 6,511,146,882 | | 7,767,906,826 |
| $39,710,522,838 | | $18,776,812,187 | | $28,915,787,995 | | $17,732,988,109 | | $5,921,861,119 | | $6,511,146,882 |
| | | | | | | | | | | |
| 299,100,000 | | 136,550,000 | | 103,000,000 | | 137,050,000 | | 32,300,000 | | 127,050,000 |
| (38,500,000) | | (64,200,000) | | (32,550,000) | | (73,300,000) | | (60,500,000) | | (146,350,000) |
| 260,600,000 | | 72,350,000 | | 70,450,000 | | 63,750,000 | | (28,200,000) | | (19,300,000) |
SPDR SERIES TRUST
STATEMENTS OF CHANGES IN NET ASSETS (continued)
| | SPDR Portfolio S&P 500 Value ETF | | SPDR Portfolio S&P 600 Small Cap ETF |
| | Year Ended
6/30/24 | | Year Ended
6/30/23 | | Year Ended
6/30/24 | | Year Ended
6/30/23 |
| INCREASE (DECREASE) IN NET ASSETS FROM OPERATIONS: | | | | | | | |
Net investment income (loss)
| $403,430,112 | | $304,356,353 | | $165,033,624 | | $84,645,195 |
Net realized gain (loss)
| 1,498,900,202 | | 649,337,396 | | 41,635,899 | | (170,154,142) |
Net change in unrealized appreciation/depreciation
| 870,333,413 | | 1,503,162,843 | | 559,190,950 | | 530,950,733 |
Net increase (decrease) in net assets resulting from operations
| 2,772,663,727 | | 2,456,856,592 | | 765,860,473 | | 445,441,786 |
Net equalization credits and charges
| 6,314,337 | | 4,301,710 | | 4,535,061 | | 1,623,384 |
Distributions to shareholders
| (410,627,405) | | (309,828,409) | | (166,855,202) | | (80,915,674) |
| FROM BENEFICIAL INTEREST TRANSACTIONS: | | | | | | | |
Proceeds from shares sold
| 8,893,542,486 | | 9,079,649,605 | | 3,355,012,479 | | 2,314,081,742 |
Proceeds in connection with Reorganization (Note 11)
| — | | — | | — | | 1,724,236,383 |
Cost of shares redeemed
| (5,854,100,041) | | (7,675,833,545) | | (1,383,823,356) | | (760,162,360) |
Net income equalization
| (6,314,337) | | (4,301,710) | | (4,535,061) | | (1,623,384) |
Net increase (decrease) in net assets from beneficial interest transactions
| 3,033,128,108 | | 1,399,514,350 | | 1,966,654,062 | | 3,276,532,381 |
Net increase (decrease) in net assets during the period
| 5,401,478,767 | | 3,550,844,243 | | 2,570,194,394 | | 3,642,681,877 |
Net assets at beginning of period
| 16,055,170,292 | | 12,504,326,049 | | 7,651,569,287 | | 4,008,887,410 |
NET ASSETS AT END OF PERIOD
| $21,456,649,059 | | $16,055,170,292 | | $10,221,763,681 | | $7,651,569,287 |
| SHARES OF BENEFICIAL INTEREST: | | | | | | | |
Shares sold
| 195,250,000 | | 228,350,000 | | 83,650,000 | | 61,250,000 |
Shares issued in tax-free transfer of assets (Note 11)
| — | | — | | — | | 44,960,263 |
Shares redeemed
| (126,800,000) | | (196,450,000) | | (34,250,000) | | (20,650,046) |
Net increase (decrease) from share transactions
| 68,450,000 | | 31,900,000 | | 49,400,000 | | 85,560,217 |
See accompanying notes to financial statements.
97
| SPDR Portfolio S&P 1500 Composite Stock Market ETF | | SPDR Portfolio S&P Sector Neutral Dividend ETF | | SPDR S&P Aerospace & Defense ETF |
Year Ended
6/30/24 | | Year Ended
6/30/23 | | For the Period
9/12/23*-
6/30/24 | | Year Ended
6/30/24 | | Year Ended
6/30/23 |
| | | | | | | | | |
| $111,317,213 | | $95,540,373 | | $105,251 | | $12,087,569 | | $6,827,167 |
| 174,480,117 | | 173,551,745 | | 62,412 | | 18,328,720 | | (113,851,785) |
| 1,358,721,347 | | 759,340,987 | | 488,537 | | 256,698,725 | | 367,021,257 |
| 1,644,518,677 | | 1,028,433,105 | | 656,200 | | 287,115,014 | | 259,996,639 |
| 413,873 | | 235,733 | | 4,426 | | (315,744) | | (100,082) |
| (111,412,114) | | (95,739,344) | | (102,092) | | (11,499,663) | | (7,062,064) |
| | | | | | | | | |
| 933,464,196 | | 1,079,809,103 | | 5,950,162 | | 978,835,610 | | 237,846,999 |
| — | | — | | — | | — | | — |
| (428,409,184) | | (589,474,568) | | (651,847) | | (678,265,752) | | (182,727,069) |
| (413,873) | | (235,733) | | (4,426) | | 315,744 | | 100,082 |
| 504,641,139 | | 490,098,802 | | 5,293,889 | | 300,885,602 | | 55,220,012 |
| 2,038,161,575 | | 1,423,028,296 | | 5,852,423 | | 576,185,209 | | 308,054,505 |
| 6,540,116,782 | | 5,117,088,486 | | — | | 1,537,930,649 | | 1,229,876,144 |
| $8,578,278,357 | | $6,540,116,782 | | $5,852,423 | | $2,114,115,858 | | $1,537,930,649 |
| | | | | | | | | |
| 16,450,000 | | 22,000,000 | | 190,000 | | 7,600,000 | | 2,125,000 |
| — | | — | | — | | — | | — |
| (7,150,000) | | (12,100,000) | | (20,000) | | (5,150,000) | | (1,700,000) |
| 9,300,000 | | 9,900,000 | | 170,000 | | 2,450,000 | | 425,000 |
| | |
| * | Commencement of operations. |
SPDR SERIES TRUST
STATEMENTS OF CHANGES IN NET ASSETS (continued)
| | SPDR S&P Bank ETF | | SPDR S&P Biotech ETF |
| | Year Ended
6/30/24 | | Year Ended
6/30/23 | | Year Ended
6/30/24 | | Year Ended
6/30/23 |
| INCREASE (DECREASE) IN NET ASSETS FROM OPERATIONS: | | | | | | | |
Net investment income (loss)
| $45,843,711 | | $48,695,174 | | $2,659,059 | | $(7,903,939) |
Net realized gain (loss)
| (22,628,183) | | (367,247,381) | | (319,364,286) | | (352,842,367) |
Net change in unrealized appreciation/depreciation
| 343,281,990 | | 135,458,759 | | 1,055,791,635 | | 1,094,224,932 |
Net increase (decrease) in net assets resulting from operations
| 366,497,518 | | (183,093,448) | | 739,086,408 | | 733,478,626 |
Net equalization credits and charges
| 1,631,546 | | (577,755) | | 554,340 | | 273,717 |
Distributions to shareholders
| (46,636,959) | | (49,427,639) | | (9,319,348) | | (202,133) |
| FROM BENEFICIAL INTEREST TRANSACTIONS: | | | | | | | |
Proceeds from shares sold
| 2,722,895,794 | | 1,898,622,027 | | 18,707,434,234 | | 18,050,690,118 |
Cost of shares redeemed
| (2,949,526,865) | | (2,390,525,806) | | (18,966,091,493) | | (19,182,560,672) |
Net income equalization
| (1,631,546) | | 577,755 | | (554,340) | | (273,717) |
Other capital
| — | | — | | — | | — |
Net increase (decrease) in net assets from beneficial interest transactions
| (228,262,617) | | (491,326,024) | | (259,211,599) | | (1,132,144,271) |
Contribution from affiliate (Note 4)
| — | | — | | — | | — |
Net increase (decrease) in net assets during the period
| 93,229,488 | | (724,424,866) | | 471,109,801 | | (398,594,061) |
Net assets at beginning of period
| 1,351,476,476 | | 2,075,901,342 | | 6,445,876,374 | | 6,844,470,435 |
NET ASSETS AT END OF PERIOD
| $1,444,705,964 | | $1,351,476,476 | | $6,916,986,175 | | $6,445,876,374 |
| SHARES OF BENEFICIAL INTEREST: | | | | | | | |
Shares sold
| 64,250,000 | | 47,050,000 | | 221,725,000 | | 216,375,000 |
Shares redeemed
| (70,650,000) | | (56,800,000) | | (224,550,000) | | (231,150,000) |
Net increase (decrease) from share transactions
| (6,400,000) | | (9,750,000) | | (2,825,000) | | (14,775,000) |
See accompanying notes to financial statements.
99
| SPDR S&P Dividend ETF | | SPDR S&P Homebuilders ETF | | SPDR S&P Oil & Gas Exploration & Production ETF |
Year Ended
6/30/24 | | Year Ended
6/30/23 | | Year Ended
6/30/24 | | Year Ended
6/30/23 | | Year Ended
6/30/24 | | Year Ended
6/30/23 |
| | | | | | | | | | | |
| $540,664,886 | | $612,209,022 | | $11,941,785 | | $10,431,669 | | $82,545,205 | | $117,030,355 |
| (256,740,958) | | 1,068,601,743 | | 383,500,521 | | (59,921,190) | | 116,894,787 | | 228,322,359 |
| 959,580,355 | | (336,516,211) | | (44,348,716) | | 420,349,055 | | 313,391,151 | | 67,875,665 |
| 1,243,504,283 | | 1,344,294,554 | | 351,093,590 | | 370,859,534 | | 512,831,143 | | 413,228,379 |
| (4,514,353) | | 1,894,838 | | 160,854 | | 305,283 | | 390,958 | | (7,872,422) |
| (552,178,299) | | (585,912,064) | | (12,006,378) | | (10,744,968) | | (84,133,859) | | (111,292,039) |
| | | | | | | | | | | |
| 661,038,600 | | 7,840,965,173 | | 6,326,357,540 | | 5,344,243,911 | | 8,756,969,699 | | 12,425,591,414 |
| (3,701,015,376) | | (7,133,626,177) | | (6,251,488,811) | | (5,261,807,543) | | (8,923,418,256) | | (13,573,674,661) |
| 4,514,353 | | (1,894,838) | | (160,854) | | (305,283) | | (390,958) | | 7,872,422 |
| — | | — | | — | | — | | — | | (730) |
| (3,035,462,423) | | 705,444,158 | | 74,707,875 | | 82,131,085 | | (166,839,515) | | (1,140,211,555) |
| — | | — | | 1,774,131 | | — | | — | | — |
| (2,348,650,792) | | 1,465,721,486 | | 415,730,072 | | 442,550,934 | | 262,248,727 | | (846,147,637) |
| 22,057,452,476 | | 20,591,730,990 | | 1,328,722,197 | | 886,171,263 | | 3,226,152,691 | | 4,072,300,328 |
| $19,708,801,684 | | $22,057,452,476 | | $1,744,452,269 | | $1,328,722,197 | | $3,488,401,418 | | $3,226,152,691 |
| | | | | | | | | | | |
| 5,300,000 | | 63,100,000 | | 70,700,000 | | 82,500,000 | | 61,400,000 | | 93,300,000 |
| (30,200,000) | | (56,700,000) | | (70,000,000) | | (82,150,000) | | (62,500,000) | | (102,350,000) |
| (24,900,000) | | 6,400,000 | | 700,000 | | 350,000 | | (1,100,000) | | (9,050,000) |
SPDR SERIES TRUST
STATEMENTS OF CHANGES IN NET ASSETS (continued)
| | SPDR S&P Regional Banking ETF |
| | Year Ended
6/30/24 | | Year Ended
6/30/23 |
| INCREASE (DECREASE) IN NET ASSETS FROM OPERATIONS: | | | |
Net investment income (loss)
| $96,623,332 | | $84,893,008 |
Net realized gain (loss)
| 39,170,337 | | (960,241,860) |
Net change in unrealized appreciation/depreciation
| 542,668,358 | | 65,462,531 |
Net increase (decrease) in net assets resulting from operations
| 678,462,027 | | (809,886,321) |
Net equalization credits and charges
| (2,352,649) | | 10,167,543 |
Distributions to shareholders
| (94,537,699) | | (95,585,698) |
| FROM BENEFICIAL INTEREST TRANSACTIONS: | | | |
Proceeds from shares sold
| 13,186,193,526 | | 13,555,777,173 |
Cost of shares redeemed
| (13,962,477,298) | | (12,810,102,553) |
Net income equalization
| 2,352,649 | | (10,167,543) |
Net increase (decrease) in net assets from beneficial interest transactions
| (773,931,123) | | 735,507,077 |
Net increase (decrease) in net assets during the period
| (192,359,444) | | (159,797,399) |
Net assets at beginning of period
| 2,904,657,471 | | 3,064,454,870 |
NET ASSETS AT END OF PERIOD
| $2,712,298,027 | | $2,904,657,471 |
| SHARES OF BENEFICIAL INTEREST: | | | |
Shares sold
| 282,750,000 | | 276,600,000 |
Shares redeemed
| (298,650,000) | | (258,200,000) |
Net increase (decrease) from share transactions
| (15,900,000) | | 18,400,000 |
See accompanying notes to financial statements.
101
SPDR SERIES TRUST
FINANCIAL HIGHLIGHTS
Selected data for a share outstanding throughout each period
| | SPDR Dow Jones REIT ETF |
| | Year
Ended
6/30/24 | | Year
Ended
6/30/23 | | Year
Ended
6/30/22 | | Year
Ended
6/30/21 | | Year
Ended
6/30/20 |
Net asset value, beginning of period
| $90.50 | | $95.05 | | $104.87 | | $78.07 | | $98.82 |
| Income (loss) from investment operations: | | | | | | | | | |
Net investment income (loss) (a)
| 2.82 | | 2.74 | | 2.18 | | 1.89 | | 2.50 |
Net realized and unrealized gain (loss) (b)
| 3.46 | | (4.28) | | (8.86) | | 28.25 | | (19.84) |
Total from investment operations
| 6.28 | | (1.54) | | (6.68) | | 30.14 | | (17.34) |
Net equalization credits and charges (a)
| (0.10) | | 0.53 | | 0.06 | | 0.08 | | (0.10) |
| Distributions to shareholders from: | | | | | | | | | |
Net investment income
| (3.53) | | (3.54) | | (3.20) | | (3.42) | | (3.31) |
Net asset value, end of period
| $93.15 | | $90.50 | | $95.05 | | $104.87 | | $78.07 |
Total return (c)
| 6.97% | | (0.81)% | | (6.69)% | | 39.59% | | (18.04)% |
| Ratios and Supplemental Data: | | | | | | | | | |
Net assets, end of period (in 000s)
| $1,414,154 | | $1,342,210 | | $1,721,063 | | $1,838,574 | | $1,353,163 |
| Ratios to average net assets: | | | | | | | | | |
Total expenses
| 0.25% | | 0.26% | | 0.25% | | 0.25% | | 0.25% |
Net investment income (loss)
| 3.13% | | 3.00% | | 1.96% | | 2.12% | | 2.61% |
Portfolio turnover rate (d)
| 4% | | 5% | | 10% | | 6% | | 17% |
| (a) | Per share numbers have been calculated using average shares outstanding, which more appropriately presents the per share data for the year. |
| (b) | Amounts shown in this caption for a share outstanding may not accord with the change in aggregate gains and losses in securities for the fiscal period because of the timing of sales and repurchases of Fund shares in relation to fluctuating market values for the Fund. |
| (c) | Total return is calculated assuming a purchase of shares at net asset value on the first day and a sale at net asset value on the last day of each period reported. Distributions are assumed, for the purpose of this calculation, to be reinvested at net asset value per share on the respective payment dates of each distribution. Total returns for periods of less than one year are not annualized. Broker commission charges are not included in this calculation. |
| (d) | Portfolio turnover rate excludes securities received or delivered from in-kind processing of creations or redemptions. |
See accompanying notes to financial statements.
102
SPDR SERIES TRUST
FINANCIAL HIGHLIGHTS (continued)
Selected data for a share outstanding throughout each period
| | SPDR Portfolio S&P 400 Mid Cap ETF |
| | Year
Ended
6/30/24 | | Year
Ended
6/30/23 | | Year
Ended
6/30/22 | | Year
Ended
6/30/21 | | Year
Ended
6/30/20 |
Net asset value, beginning of period
| $45.90 | | $39.70 | | $47.21 | | $31.26 | | $34.06 |
| Income (loss) from investment operations: | | | | | | | | | |
Net investment income (loss) (a)
| 0.76 | | 0.72 | | 0.64 | | 0.54 | | 0.54 |
Net realized and unrealized gain (loss) (b)
| 5.39 | | 6.19 | | (7.50) | | 15.95 | | (2.77) |
Total from investment operations
| 6.15 | | 6.91 | | (6.86) | | 16.49 | | (2.23) |
Net equalization credits and charges (a)
| 0.01 | | 0.01 | | 0.01 | | 0.01 | | 0.01 |
| Distributions to shareholders from: | | | | | | | | | |
Net investment income
| (0.73) | | (0.72) | | (0.66) | | (0.55) | | (0.58) |
Net asset value, end of period
| $51.33 | | $45.90 | | $39.70 | | $47.21 | | $31.26 |
Total return (c)
| 13.52% | | 17.60% | | (14.67)% | | 53.05% | | (6.53)% |
| Ratios and Supplemental Data: | | | | | | | | | |
Net assets, end of period (in 000s)
| $10,047,259 | | $6,712,402 | | $4,557,863 | | $4,718,598 | | $2,341,048 |
| Ratios to average net assets: | | | | | | | | | |
Total expenses
| 0.03% | | 0.06% | | 0.05% | | 0.05% | | 0.05% |
Net investment income (loss)
| 1.58% | | 1.66% | | 1.37% | | 1.34% | | 1.66% |
Portfolio turnover rate (d)
| 20% | | 17% | | 13% | | 14% | | 30% |
| (a) | Per share numbers have been calculated using average shares outstanding, which more appropriately presents the per share data for the year. |
| (b) | Amounts shown in this caption for a share outstanding may not accord with the change in aggregate gains and losses in securities for the fiscal period because of the timing of sales and repurchases of Fund shares in relation to fluctuating market values for the Fund. |
| (c) | Total return is calculated assuming a purchase of shares at net asset value on the first day and a sale at net asset value on the last day of each period reported. Distributions are assumed, for the purpose of this calculation, to be reinvested at net asset value per share on the respective payment dates of each distribution. Total returns for periods of less than one year are not annualized. Broker commission charges are not included in this calculation. |
| (d) | Portfolio turnover rate excludes securities received or delivered from in-kind processing of creations or redemptions. |
See accompanying notes to financial statements.
103
SPDR SERIES TRUST
FINANCIAL HIGHLIGHTS (continued)
Selected data for a share outstanding throughout each period
| | SPDR Portfolio S&P 500 ETF |
| | Year
Ended
6/30/24 | | Year
Ended
6/30/23 | | Year
Ended
6/30/22 | | Year
Ended
6/30/21 | | Year
Ended
6/30/20 |
Net asset value, beginning of period
| $52.14 | | $44.34 | | $50.34 | | $36.30 | | $34.53 |
| Income (loss) from investment operations: | | | | | | | | | |
Net investment income (loss) (a)
| 0.85 | | 0.79 | | 0.73 | | 0.66 | | 0.69 |
Net realized and unrealized gain (loss) (b)
| 11.77 | | 7.79 | | (6.03) | | 14.02 | | 1.72 |
Total from investment operations
| 12.62 | | 8.58 | | (5.30) | | 14.68 | | 2.41 |
Net equalization credits and charges (a)
| 0.05 | | 0.01 | | 0.02 | | 0.03 | | 0.06 |
Contribution from affiliate
| — | | — | | — | | 0.00(c) | | — |
| Distributions to shareholders from: | | | | | | | | | |
Net investment income
| (0.84) | | (0.79) | | (0.72) | | (0.67) | | (0.70) |
Net asset value, end of period
| $63.97 | | $52.14 | | $44.34 | | $50.34 | | $36.30 |
Total return (d)
| 24.51% | | 19.58% | | (10.67)% | | 40.79% | | 7.26% |
| Ratios and Supplemental Data: | | | | | | | | | |
Net assets, end of period (in 000s)
| $39,710,523 | | $18,776,812 | | $12,762,052 | | $10,724,280 | | $5,516,028 |
| Ratios to average net assets: | | | | | | | | | |
Total expenses
| 0.02% | | 0.04% | | 0.03% | | 0.03% | | 0.03% |
Net investment income (loss)
| 1.50% | | 1.67% | | 1.42% | | 1.51% | | 1.97% |
Portfolio turnover rate (e)
| 3% | | 2% | | 2% | | 4% | | 11% |
| (a) | Per share numbers have been calculated using average shares outstanding, which more appropriately presents the per share data for the year. |
| (b) | Amounts shown in this caption for a share outstanding may not accord with the change in aggregate gains and losses in securities for the fiscal period because of the timing of sales and repurchases of Fund shares in relation to fluctuating market values for the Fund. |
| (c) | Amount is less than $0.005 per share. |
| (d) | Total return is calculated assuming a purchase of shares at net asset value on the first day and a sale at net asset value on the last day of each period reported. Distributions are assumed, for the purpose of this calculation, to be reinvested at net asset value per share on the respective payment dates of each distribution. Total returns for periods of less than one year are not annualized. Broker commission charges are not included in this calculation. |
| (e) | Portfolio turnover rate excludes securities received or delivered from in-kind processing of creations or redemptions. |
See accompanying notes to financial statements.
104
SPDR SERIES TRUST
FINANCIAL HIGHLIGHTS (continued)
Selected data for a share outstanding throughout each period
| | SPDR Portfolio S&P 500 Growth ETF |
| | Year
Ended
6/30/24 | | Year
Ended
6/30/23 | | Year
Ended
6/30/22 | | Year
Ended
6/30/21 | | Year
Ended
6/30/20 |
Net asset value, beginning of period
| $61.02 | | $52.23 | | $62.98 | | $44.96 | | $38.74 |
| Income (loss) from investment operations: | | | | | | | | | |
Net investment income (loss) (a)
| 0.61 | | 0.65 | | 0.47 | | 0.46 | | 0.55 |
Net realized and unrealized gain (loss) (b)
| 19.05 | | 8.78 | | (10.76) | | 18.02 | | 6.24 |
Total from investment operations
| 19.66 | | 9.43 | | (10.29) | | 18.48 | | 6.79 |
Net equalization credits and charges (a)
| 0.02 | | 0.00(c) | | 0.01 | | (0.00)(c) | | (0.01) |
| Distributions to shareholders from: | | | | | | | | | |
Net investment income
| (0.61) | | (0.64) | | (0.47) | | (0.46) | | (0.56) |
Net asset value, end of period
| $80.09 | | $61.02 | | $52.23 | | $62.98 | | $44.96 |
Total return (d)
| 32.45% | | 18.21% | | (16.45)% | | 41.27% | | 17.67% |
| Ratios and Supplemental Data: | | | | | | | | | |
Net assets, end of period (in 000s)
| $28,915,788 | | $17,732,988 | | $11,849,300 | | $12,378,498 | | $7,903,192 |
| Ratios to average net assets: | | | | | | | | | |
Total expenses
| 0.04% | | 0.05% | | 0.04% | | 0.04% | | 0.04% |
Net investment income (loss)
| 0.91% | | 1.19% | | 0.73% | | 0.85% | | 1.36% |
Portfolio turnover rate (e)
| 32% | | 33% | | 14% | | 11% | | 23% |
| (a) | Per share numbers have been calculated using average shares outstanding, which more appropriately presents the per share data for the year. |
| (b) | Amounts shown in this caption for a share outstanding may not accord with the change in aggregate gains and losses in securities for the fiscal period because of the timing of sales and repurchases of Fund shares in relation to fluctuating market values for the Fund. |
| (c) | Amount is less than $0.005 per share. |
| (d) | Total return is calculated assuming a purchase of shares at net asset value on the first day and a sale at net asset value on the last day of each period reported. Distributions are assumed, for the purpose of this calculation, to be reinvested at net asset value per share on the respective payment dates of each distribution. Total returns for periods of less than one year are not annualized. Broker commission charges are not included in this calculation. |
| (e) | Portfolio turnover rate excludes securities received or delivered from in-kind processing of creations or redemptions. |
See accompanying notes to financial statements.
105
SPDR SERIES TRUST
FINANCIAL HIGHLIGHTS (continued)
Selected data for a share outstanding throughout each period
| | SPDR Portfolio S&P 500 High Dividend ETF |
| | Year
Ended
6/30/24 | | Year
Ended
6/30/23 | | Year
Ended
6/30/22 | | Year
Ended
6/30/21 | | Year
Ended
6/30/20 |
Net asset value, beginning of period
| $37.11 | | $39.89 | | $40.09 | | $27.89 | | $38.01 |
| Income (loss) from investment operations: | | | | | | | | | |
Net investment income (loss) (a)
| 1.73 | | 1.66 | | 1.60 | | 1.48 | | 1.58 |
Net realized and unrealized gain (loss) (b)
| 3.17 | | (2.67) | | (0.19) | | 12.47 | | (10.08) |
Total from investment operations
| 4.90 | | (1.01) | | 1.41 | | 13.95 | | (8.50) |
Net equalization credits and charges (a)
| 0.04 | | 0.01 | | (0.04) | | 0.16 | | 0.09 |
| Distributions to shareholders from: | | | | | | | | | |
Net investment income
| (1.83) | | (1.78) | | (1.57) | | (1.91) | | (1.71) |
Net asset value, end of period
| $40.22 | | $37.11 | | $39.89 | | $40.09 | | $27.89 |
Total return (c)
| 13.61% | | (2.46)% | | 3.37% | | 51.84% | | (22.55)% |
| Ratios and Supplemental Data: | | | | | | | | | |
Net assets, end of period (in 000s)
| $5,921,861 | | $6,511,147 | | $7,767,907 | | $4,666,565 | | $1,916,307 |
| Ratios to average net assets: | | | | | | | | | |
Total expenses
| 0.07% | | 0.08% | | 0.07% | | 0.07% | | 0.07% |
Net investment income (loss)
| 4.54% | | 4.23% | | 3.83% | | 4.28% | | 4.64% |
Portfolio turnover rate (d)
| 43% | | 46% | | 29% | | 39% | | 45% |
| (a) | Per share numbers have been calculated using average shares outstanding, which more appropriately presents the per share data for the year. |
| (b) | Amounts shown in this caption for a share outstanding may not accord with the change in aggregate gains and losses in securities for the fiscal period because of the timing of sales and repurchases of Fund shares in relation to fluctuating market values for the Fund. |
| (c) | Total return is calculated assuming a purchase of shares at net asset value on the first day and a sale at net asset value on the last day of each period reported. Distributions are assumed, for the purpose of this calculation, to be reinvested at net asset value per share on the respective payment dates of each distribution. Total return for periods less than one year are not annualized. Broker commission charges are not included in this calculation. |
| (d) | Portfolio turnover rate excludes securities received or delivered from in-kind processing of creations or redemptions. |
See accompanying notes to financial statements.
106
SPDR SERIES TRUST
FINANCIAL HIGHLIGHTS (continued)
Selected data for a share outstanding throughout each period
| | SPDR Portfolio S&P 500 Value ETF |
| | Year
Ended
6/30/24 | | Year
Ended
6/30/23 | | Year
Ended
6/30/22 | | Year
Ended
6/30/21 | | Year
Ended
6/30/20 |
Net asset value, beginning of period
| $43.21 | | $36.81 | | $39.54 | | $29.04 | | $31.28 |
| Income (loss) from investment operations: | | | | | | | | | |
Net investment income (loss) (a)
| 0.98 | | 0.84 | | 0.86 | | 0.81 | | 0.84 |
Net realized and unrealized gain (loss) (b)
| 5.53 | | 6.39 | | (2.76) | | 10.45 | | (2.31) |
Total from investment operations
| 6.51 | | 7.23 | | (1.90) | | 11.26 | | (1.47) |
Net equalization credits and charges (a)
| 0.02 | | 0.01 | | 0.02 | | 0.07 | | 0.07 |
| Distributions to shareholders from: | | | | | | | | | |
Net investment income
| (0.98) | | (0.84) | | (0.85) | | (0.83) | | (0.84) |
Net asset value, end of period
| $48.76 | | $43.21 | | $36.81 | | $39.54 | | $29.04 |
Total return (c)
| 15.23% | | 19.94% | | (4.92)% | | 39.44% | | (4.54)% |
| Ratios and Supplemental Data: | | | | | | | | | |
Net assets, end of period (in 000s)
| $21,456,649 | | $16,055,170 | | $12,504,326 | | $12,120,515 | | $4,753,481 |
| Ratios to average net assets: | | | | | | | | | |
Total expenses
| 0.04% | | 0.05% | | 0.04% | | 0.04% | | 0.04% |
Net investment income (loss)
| 2.14% | | 2.12% | | 2.12% | | 2.28% | | 2.67% |
Portfolio turnover rate (d)
| 33% | | 27% | | 16% | | 18% | | 34% |
| (a) | Per share numbers have been calculated using average shares outstanding, which more appropriately presents the per share data for the year. |
| (b) | Amounts shown in this caption for a share outstanding may not accord with the change in aggregate gains and losses in securities for the fiscal period because of the timing of sales and repurchases of Fund shares in relation to fluctuating market values for the Fund. |
| (c) | Total return is calculated assuming a purchase of shares at net asset value on the first day and a sale at net asset value on the last day of each period reported. Distributions are assumed, for the purpose of this calculation, to be reinvested at net asset value per share on the respective payment dates of each distribution. Total returns for periods of less than one year are not annualized. Broker commission charges are not included in this calculation. |
| (d) | Portfolio turnover rate excludes securities received or delivered from in-kind processing of creations or redemptions. |
See accompanying notes to financial statements.
107
SPDR SERIES TRUST
FINANCIAL HIGHLIGHTS (continued)
Selected data for a share outstanding throughout each period
| | SPDR Portfolio S&P 600 Small Cap ETF |
| | Year
Ended
6/30/24 | | Year
Ended
6/30/23 | | Year
Ended
6/30/22 | | Year
Ended
6/30/21 | | Year
Ended
6/30/20 |
Net asset value, beginning of period
| $38.86 | | $36.00 | | $43.95 | | $26.57 | | $30.65 |
| Income (loss) from investment operations: | | | | | | | | | |
Net investment income (loss) (a)
| 0.72 | | 0.66 | | 0.61 | | 0.45 | | 0.44 |
Net realized and unrealized gain (loss) (b)
| 2.61 | | 2.80 | | (7.95) | | 17.37 | | (4.07) |
Total from investment operations
| 3.33 | | 3.46 | | (7.34) | | 17.82 | | (3.63) |
Net equalization credits and charges (a)
| 0.02 | | 0.01 | | 0.01 | | 0.00(c) | | 0.04 |
| Distributions to shareholders from: | | | | | | | | | |
Net investment income
| (0.71) | | (0.61) | | (0.62) | | (0.44) | | (0.49) |
Net asset value, end of period
| $41.50 | | $38.86 | | $36.00 | | $43.95 | | $26.57 |
Total return (d)
| 8.64% | | 9.75% | | (16.87)% | | 67.37% | | (11.78)% |
| Ratios and Supplemental Data: | | | | | | | | | |
Net assets, end of period (in 000s)
| $10,221,764 | | $7,651,569 | | $4,008,887 | | $4,179,916 | | $2,168,502 |
| Ratios to average net assets: | | | | | | | | | |
Total expenses
| 0.03% | | 0.05% | | 0.05% | | 0.05% | | 0.05% |
Net investment income (loss)
| 1.80% | | 1.75% | | 1.45% | | 1.25% | | 1.55% |
Portfolio turnover rate (e)
| 24% | | 22% | | 16% | | 13% | | 80% |
| (a) | Per share numbers have been calculated using average shares outstanding, which more appropriately presents the per share data for the year. |
| (b) | Amounts shown in this caption for a share outstanding may not accord with the change in aggregate gains and losses in securities for the fiscal period because of the timing of sales and repurchases of Fund shares in relation to fluctuating market values for the Fund. |
| (c) | Amount is less than $0.005 per share. |
| (d) | Total return is calculated assuming a purchase of shares at net asset value on the first day and a sale at net asset value on the last day of each period reported. Distributions are assumed, for the purpose of this calculation, to be reinvested at net asset value per share on the respective payment dates of each distribution. Total returns for periods of less than one year are not annualized. Broker commission charges are not included in this calculation. |
| (e) | Portfolio turnover rate excludes securities received or delivered from in-kind processing of creations or redemptions. |
See accompanying notes to financial statements.
108
SPDR SERIES TRUST
FINANCIAL HIGHLIGHTS (continued)
Selected data for a share outstanding throughout each period
| | SPDR Portfolio S&P 1500 Composite Stock Market ETF |
| | Year
Ended
6/30/24 | | Year
Ended
6/30/23 | | Year
Ended
6/30/22 | | Year
Ended
6/30/21 | | Year
Ended
6/30/20 |
Net asset value, beginning of period
| $54.48 | | $46.46 | | $52.97 | | $37.81 | | $36.49 |
| Income (loss) from investment operations: | | | | | | | | | |
Net investment income (loss) (a)
| 0.88 | | 0.82 | | 0.76 | | 0.68 | | 0.72 |
Net realized and unrealized gain (loss) (b)
| 11.84 | | 8.02 | | (6.51) | | 15.15 | | 1.35 |
Total from investment operations
| 12.72 | | 8.84 | | (5.75) | | 15.83 | | 2.07 |
Net equalization credits and charges (a)
| 0.00(c) | | 0.00(c) | | 0.01 | | 0.01 | | (0.02) |
Contribution from affiliate
| — | | — | | — | | 0.00(c) | | — |
Other capital
| — | | — | | 0.00(c) | | — | | — |
| Distributions to shareholders from: | | | | | | | | | |
Net investment income
| (0.88) | | (0.82) | | (0.77) | | (0.68) | | (0.73) |
Net asset value, end of period
| $66.32 | | $54.48 | | $46.46 | | $52.97 | | $37.81 |
Total return (d)
| 23.52% | | 19.26% | | (11.02)% | | 42.13% | | 5.76% |
| Ratios and Supplemental Data: | | | | | | | | | |
Net assets, end of period (in 000s)
| $8,578,278 | | $6,540,117 | | $5,117,088 | | $5,182,681 | | $3,391,957 |
| Ratios to average net assets: | | | | | | | | | |
Total expenses
| 0.03% | | 0.04% | | 0.03% | | 0.03% | | 0.03% |
Net investment income (loss)
| 1.50% | | 1.67% | | 1.41% | | 1.48% | | 1.93% |
Portfolio turnover rate (e)
| 3% | | 2% | | 1% | | 3% | | 12% |
| (a) | Per share numbers have been calculated using average shares outstanding, which more appropriately presents the per share data for the year. |
| (b) | Amounts shown in this caption for a share outstanding may not accord with the change in aggregate gains and losses in securities for the fiscal period because of the timing of sales and repurchases of Fund shares in relation to fluctuating market values for the Fund. |
| (c) | Amount is less than $0.005 per share. |
| (d) | Total return is calculated assuming a purchase of shares at net asset value on the first day and a sale at net asset value on the last day of each period reported. Distributions are assumed, for the purpose of this calculation, to be reinvested at net asset value per share on the respective payment dates of each distribution. Total returns for periods of less than one year are not annualized. Broker commission charges are not included in this calculation. |
| (e) | Portfolio turnover rate excludes securities received or delivered from in-kind processing of creations or redemptions. |
See accompanying notes to financial statements.
109
SPDR SERIES TRUST
FINANCIAL HIGHLIGHTS (continued)
Selected data for a share outstanding throughout each period
| | SPDR Portfolio S&P Sector Neutral Dividend ETF |
| | For the
Period
9/12/23*-
6/30/24 |
Net asset value, beginning of period
| $30.06 |
| Income (loss) from investment operations: | |
Net investment income (loss) (a)
| 0.80 |
Net realized and unrealized gain (loss) (b)
| 4.29 |
Total from investment operations
| 5.09 |
Net equalization credits and charges (a)
| 0.03 |
| Distributions to shareholders from: | |
Net investment income
| (0.75) |
Net asset value, end of period
| $34.43 |
Total return (c)
| 17.10% |
| Ratios and Supplemental Data: | |
Net assets, end of period (in 000s)
| $5,852 |
| Ratios to average net assets: | |
Total expenses
| 0.05%(d) |
Net investment income (loss)
| 3.08%(d) |
Portfolio turnover rate (e)
| 23%(f) |
| * | Commencement of operations. |
| (a) | Per share numbers have been calculated using average shares outstanding, which more appropriately presents the per share data for the year. |
| (b) | Amounts shown in this caption for a share outstanding may not accord with the change in aggregate gains and losses in securities for the fiscal period because of the timing of sales and repurchases of Fund shares in relation to fluctuating market values for the Fund. |
| (c) | Total return is calculated assuming a purchase of shares at net asset value on the first day and a sale at net asset value on the last day of each period reported. Distributions are assumed, for the purpose of this calculation, to be reinvested at net asset value per share on the respective payment dates of each distribution. Total returns for periods of less than one year are not annualized. Broker commission charges are not included in this calculation. |
| (d) | Annualized. |
| (e) | Portfolio turnover rate excludes securities received or delivered from in-kind processing of creations or redemptions. |
| (f) | Not annualized. |
See accompanying notes to financial statements.
110
SPDR SERIES TRUST
FINANCIAL HIGHLIGHTS (continued)
Selected data for a share outstanding throughout each period
| | SPDR S&P Aerospace & Defense ETF |
| | Year
Ended
6/30/24 | | Year
Ended
6/30/23 | | Year
Ended
6/30/22 | | Year
Ended
6/30/21 | | Year
Ended
6/30/20 |
Net asset value, beginning of period
| $121.58 | | $100.60 | | $132.28 | | $87.61 | | $104.01 |
| Income (loss) from investment operations: | | | | | | | | | |
Net investment income (loss) (a)
| 0.85 | | 0.55 | | 0.49 | | 0.77 | | 1.01 |
Net realized and unrealized gain (loss) (b)
| 18.39 | | 21.01 | | (31.72) | | 44.88 | | (16.37) |
Total from investment operations
| 19.24 | | 21.56 | | (31.23) | | 45.65 | | (15.36) |
Net equalization credits and charges (a)
| (0.02) | | (0.01) | | 0.00(c) | | (0.02) | | 0.00(c) |
| Distributions to shareholders from: | | | | | | | | | |
Net investment income
| (0.79) | | (0.57) | | (0.45) | | (0.96) | | (1.04) |
Net asset value, end of period
| $140.01 | | $121.58 | | $100.60 | | $132.28 | | $87.61 |
Total return (d)
| 15.85% | | 21.49% | | (23.65)% | | 52.23% | | (14.83)% |
| Ratios and Supplemental Data: | | | | | | | | | |
Net assets, end of period (in 000s)
| $2,114,116 | | $1,537,931 | | $1,229,876 | | $1,418,716 | | $1,368,843 |
| Ratios to average net assets: | | | | | | | | | |
Total expenses
| 0.35% | | 0.36% | | 0.35% | | 0.35% | | 0.35% |
Net investment income (loss)
| 0.65% | | 0.50% | | 0.42% | | 0.71% | | 1.01% |
Portfolio turnover rate (e)
| 36% | | 26% | | 38% | | 26% | | 28% |
| (a) | Per share numbers have been calculated using average shares outstanding, which more appropriately presents the per share data for the year. |
| (b) | Amounts shown in this caption for a share outstanding may not accord with the change in aggregate gains and losses in securities for the fiscal period because of the timing of sales and repurchases of Fund shares in relation to fluctuating market values for the Fund. |
| (c) | Amount is less than $0.005 per share. |
| (d) | Total return is calculated assuming a purchase of shares at net asset value on the first day and a sale at net asset value on the last day of each period reported. Distributions are assumed, for the purpose of this calculation, to be reinvested at net asset value per share on the respective payment dates of each distribution. Total returns for periods of less than one year are not annualized. Broker commission charges are not included in this calculation. |
| (e) | Portfolio turnover rate excludes securities received or delivered from in-kind processing of creations or redemptions. |
See accompanying notes to financial statements.
111
SPDR SERIES TRUST
FINANCIAL HIGHLIGHTS (continued)
Selected data for a share outstanding throughout each period
| | SPDR S&P Bank ETF |
| | Year
Ended
6/30/24 | | Year
Ended
6/30/23 | | Year
Ended
6/30/22 | | Year
Ended
6/30/21 | | Year
Ended
6/30/20 |
Net asset value, beginning of period
| $35.99 | | $43.89 | | $51.31 | | $31.57 | | $43.45 |
| Income (loss) from investment operations: | | | | | | | | | |
Net investment income (loss) (a)
| 1.33 | | 1.21 | | 1.15 | | 1.16 | | 1.09 |
Net realized and unrealized gain (loss) (b)
| 10.36 | | (7.82) | | (7.26) | | 19.71 | | (11.95) |
Total from investment operations
| 11.69 | | (6.61) | | (6.11) | | 20.87 | | (10.86) |
Net equalization credits and charges (a)
| 0.05 | | (0.01) | | (0.06) | | 0.01 | | 0.02 |
| Distributions to shareholders from: | | | | | | | | | |
Net investment income
| (1.35) | | (1.28) | | (1.25) | | (1.14) | | (1.04) |
Net asset value, end of period
| $46.38 | | $35.99 | | $43.89 | | $51.31 | | $31.57 |
Total return (c)
| 32.98% | | (15.33)% | | (12.36)% | | 67.13% | | (25.32)% |
| Ratios and Supplemental Data: | | | | | | | | | |
Net assets, end of period (in 000s)
| $1,444,706 | | $1,351,476 | | $2,075,901 | | $3,355,683 | | $1,307,007 |
| Ratios to average net assets: | | | | | | | | | |
Total expenses
| 0.35% | | 0.36% | | 0.35% | | 0.35% | | 0.35% |
Net investment income (loss)
| 3.14% | | 2.75% | | 2.19% | | 2.60% | | 2.74% |
Portfolio turnover rate (d)
| 42% | | 34% | | 37% | | 41% | | 30% |
| (a) | Per share numbers have been calculated using average shares outstanding, which more appropriately presents the per share data for the year. |
| (b) | Amounts shown in this caption for a share outstanding may not accord with the change in aggregate gains and losses in securities for the fiscal period because of the timing of sales and repurchases of Fund shares in relation to fluctuating market values for the Fund. |
| (c) | Total return is calculated assuming a purchase of shares at net asset value on the first day and a sale at net asset value on the last day of each period reported. Distributions are assumed, for the purpose of this calculation, to be reinvested at net asset value per share on the respective payment dates of each distribution. Total returns for periods of less than one year are not annualized. Broker commission charges are not included in this calculation. |
| (d) | Portfolio turnover rate excludes securities received or delivered from in-kind processing of creations or redemptions. |
See accompanying notes to financial statements.
112
SPDR SERIES TRUST
FINANCIAL HIGHLIGHTS (continued)
Selected data for a share outstanding throughout each period
| | SPDR S&P Biotech ETF |
| | Year
Ended
6/30/24 | | Year
Ended
6/30/23 | | Year
Ended
6/30/22 | | Year
Ended
6/30/21 | | Year
Ended
6/30/20 |
Net asset value, beginning of period
| $83.25 | | $74.24 | | $135.54 | | $112.03 | | $87.82 |
| Income (loss) from investment operations: | | | | | | | | | |
Net investment income (loss) (a)
| 0.03 | | (0.09) | | (0.17) | | 0.24 | | 0.01 |
Net realized and unrealized gain (loss) (b)
| 9.56 | | 9.10 | | (61.02) | | 23.57 | | 24.22 |
Total from investment operations
| 9.59 | | 9.01 | | (61.19) | | 23.81 | | 24.23 |
Net equalization credits and charges (a)
| 0.01 | | 0.00(c) | | (0.11) | | (0.00)(c) | | 0.00(c) |
Other capital
| — | | — | | 0.00(c) | | — | | — |
| Distributions to shareholders from: | | | | | | | | | |
Net investment income
| (0.13) | | (0.00)(c) | | — | | (0.30) | | (0.02) |
Net asset value, end of period
| $92.72 | | $83.25 | | $74.24 | | $135.54 | | $112.03 |
Total return (d)
| 11.53% | | 12.15% | | (45.23)% | | 21.27% | | 27.59% |
| Ratios and Supplemental Data: | | | | | | | | | |
Net assets, end of period (in 000s)
| $6,916,986 | | $6,445,876 | | $6,844,470 | | $7,254,733 | | $5,402,647 |
| Ratios to average net assets: | | | | | | | | | |
Total expenses
| 0.35% | | 0.36% | | 0.35% | | 0.35% | | 0.35% |
Net investment income (loss)
| 0.04% | | (0.11)% | | (0.17)% | | 0.18% | | 0.01% |
Portfolio turnover rate (e)
| 90% | | 65% | | 64% | | 74% | | 66% |
| (a) | Per share numbers have been calculated using average shares outstanding, which more appropriately presents the per share data for the year. |
| (b) | Amounts shown in this caption for a share outstanding may not accord with the change in aggregate gains and losses in securities for the fiscal period because of the timing of sales and repurchases of Fund shares in relation to fluctuating market values for the Fund. |
| (c) | Amount is less than $0.005 per share. |
| (d) | Total return is calculated assuming a purchase of shares at net asset value on the first day and a sale at net asset value on the last day of each period reported. Distributions are assumed, for the purpose of this calculation, to be reinvested at net asset value per share on the respective payment dates of each distribution. Total returns for periods of less than one year are not annualized. Broker commission charges are not included in this calculation. |
| (e) | Portfolio turnover rate excludes securities received or delivered from in-kind processing of creations or redemptions. |
See accompanying notes to financial statements.
113
SPDR SERIES TRUST
FINANCIAL HIGHLIGHTS (continued)
Selected data for a share outstanding throughout each period
| | SPDR S&P Dividend ETF |
| | Year
Ended
6/30/24 | | Year
Ended
6/30/23 | | Year
Ended
6/30/22 | | Year
Ended
6/30/21 | | Year
Ended
6/30/20 |
Net asset value, beginning of period
| $122.61 | | $118.68 | | $122.33 | | $91.25 | | $100.96 |
| Income (loss) from investment operations: | | | | | | | | | |
Net investment income (loss) (a)
| 3.24 | | 3.35 | | 3.25 | | 3.28 | | 2.84 |
Net realized and unrealized gain (loss) (b)
| 4.67 | | 3.76 | | (3.57) | | 31.05 | | (9.68) |
Total from investment operations
| 7.91 | | 7.11 | | (0.32) | | 34.33 | | (6.84) |
Net equalization credits and charges (a)
| (0.03) | | 0.01 | | 0.02 | | (0.01) | | (0.04) |
| Distributions to shareholders from: | | | | | | | | | |
Net investment income
| (3.34) | | (3.19) | | (3.35) | | (3.24) | | (2.83) |
Net asset value, end of period
| $127.15 | | $122.61 | | $118.68 | | $122.33 | | $91.25 |
Total return (c)
| 6.52% | | 6.06% | | (0.28)% | | 38.17% | | (6.82)% |
| Ratios and Supplemental Data: | | | | | | | | | |
Net assets, end of period (in 000s)
| $19,708,802 | | $22,057,452 | | $20,591,731 | | $19,670,957 | | $15,197,866 |
| Ratios to average net assets: | | | | | | | | | |
Total expenses
| 0.35% | | 0.36% | | 0.35% | | 0.35% | | 0.35% |
Net investment income (loss)
| 2.63% | | 2.71% | | 2.61% | | 3.06% | | 2.89% |
Portfolio turnover rate (d)
| 55% | | 29% | | 24% | | 22% | | 31% |
| (a) | Per share numbers have been calculated using average shares outstanding, which more appropriately presents the per share data for the year. |
| (b) | Amounts shown in this caption for a share outstanding may not accord with the change in aggregate gains and losses in securities for the fiscal period because of the timing of sales and repurchases of Fund shares in relation to fluctuating market values for the Fund. |
| (c) | Total return is calculated assuming a purchase of shares at net asset value on the first day and a sale at net asset value on the last day of each period reported. Distributions are assumed, for the purpose of this calculation, to be reinvested at net asset value per share on the respective payment dates of each distribution. Total returns for periods of less than one year are not annualized. Broker commission charges are not included in this calculation. |
| (d) | Portfolio turnover rate excludes securities received or delivered from in-kind processing of creations or redemptions. |
See accompanying notes to financial statements.
114
SPDR SERIES TRUST
FINANCIAL HIGHLIGHTS (continued)
Selected data for a share outstanding throughout each period
| | SPDR S&P Homebuilders ETF |
| | Year
Ended
6/30/24 | | Year
Ended
6/30/23 | | Year
Ended
6/30/22 | | Year
Ended
6/30/21 | | Year
Ended
6/30/20 |
Net asset value, beginning of period
| $80.29 | | $54.70 | | $73.23 | | $43.92 | | $41.69 |
| Income (loss) from investment operations: | | | | | | | | | |
Net investment income (loss) (a)
| 0.70 | | 0.70 | | 0.51 | | 0.43 | | 0.43 |
Net realized and unrealized gain (loss) (b)
| 20.72 | | 25.57 | | (18.48) | | 29.30 | | 2.20 |
Total from investment operations
| 21.42 | | 26.27 | | (17.97) | | 29.73 | | 2.63 |
Net equalization credits and charges (a)
| 0.01 | | 0.02 | | (0.04) | | (0.00)(c) | | 0.03 |
Contribution from affiliate (Note 4)
| 0.10 | | — | | — | | — | | — |
| Distributions to shareholders from: | | | | | | | | | |
Net investment income
| (0.69) | | (0.70) | | (0.52) | | (0.42) | | (0.43) |
Net asset value, end of period
| $101.13 | | $80.29 | | $54.70 | | $73.23 | | $43.92 |
Total return (d)
| 26.90%(e) | | 48.39% | | (24.73)% | | 67.87% | | 6.49% |
| Ratios and Supplemental Data: | | | | | | | | | |
Net assets, end of period (in 000s)
| $1,744,452 | | $1,328,722 | | $886,171 | | $1,962,481 | | $799,294 |
| Ratios to average net assets: | | | | | | | | | |
Total expenses
| 0.35% | | 0.36% | | 0.35% | | 0.35% | | 0.35% |
Net investment income (loss)
| 0.76% | | 1.08% | | 0.70% | | 0.70% | | 1.01% |
Portfolio turnover rate (f)
| 45% | | 27% | | 21% | | 24% | | 27% |
| (a) | Per share numbers have been calculated using average shares outstanding, which more appropriately presents the per share data for the year. |
| (b) | Amounts shown in this caption for a share outstanding may not accord with the change in aggregate gains and losses in securities for the fiscal period because of the timing of sales and repurchases of Fund shares in relation to fluctuating market values for the Fund. |
| (c) | Amount is less than $0.005 per share. |
| (d) | Total return is calculated assuming a purchase of shares at net asset value on the first day and a sale at net asset value on the last day of each period reported. Distributions are assumed, for the purpose of this calculation, to be reinvested at net asset value per share on the respective payment dates of each distribution. Total returns for periods of less than one year are not annualized. Broker commission charges are not included in this calculation. |
| (e) | If an affiliate had not made a contribution to the fund during the fiscal year ended June 30, 2024, the total return would have been 26.80%. |
| (f) | Portfolio turnover rate excludes securities received or delivered from in-kind processing of creations or redemptions. |
See accompanying notes to financial statements.
115
SPDR SERIES TRUST
FINANCIAL HIGHLIGHTS (continued)
Selected data for a share outstanding throughout each period
| | SPDR S&P Oil & Gas Exploration & Production ETF |
| | Year
Ended
6/30/24 | | Year
Ended
6/30/23 | | Year
Ended
6/30/22 | | Year
Ended
6/30/21 | | Year
Ended
6/30/20(a) |
Net asset value, beginning of period
| $128.79 | | $119.42 | | $96.74 | | $52.22 | | $108.92 |
| Income (loss) from investment operations: | | | | | | | | | |
Net investment income (loss) (b)
| 3.22 | | 3.83 | | 2.07 | | 1.37 | | 1.46 |
Net realized and unrealized gain (loss) (c)
| 16.97 | | 9.69 | | 22.83 | | 44.56 | | (56.76) |
Total from investment operations
| 20.19 | | 13.52 | | 24.90 | | 45.93 | | (55.30) |
Net equalization credits and charges (b)
| 0.02 | | (0.26) | | (0.14) | | (0.02) | | 0.02 |
Other capital
| — | | (0.00)(d) | | — | | — | | — |
| Distributions to shareholders from: | | | | | | | | | |
Net investment income
| (3.35) | | (3.89) | | (2.08) | | (1.39) | | (1.42) |
Net asset value, end of period
| $145.65 | | $128.79 | | $119.42 | | $96.74 | | $52.22 |
Total return (e)
| 15.74% | | 11.22% | | 25.79% | | 89.34% | | (50.86)% |
| Ratios and Supplemental Data: | | | | | | | | | |
Net assets, end of period (in 000s)
| $3,488,401 | | $3,226,153 | | $4,072,300 | | $4,125,993 | | $2,067,927 |
| Ratios to average net assets: | | | | | | | | | |
Total expenses
| 0.35% | | 0.36% | | 0.35% | | 0.35% | | 0.35% |
Net investment income (loss)
| 2.25% | | 2.85% | | 1.88% | | 2.07% | | 2.13% |
Portfolio turnover rate (f)
| 36% | | 29% | | 42% | | 71% | | 41% |
| (a) | After the close of trading on March 30, 2020, the SPDR S&P Oil & Gas Exploration & Production ETF underwent a 1-for-4 reverse share split. The historical per share activity presented here has been retroactively adjusted to reflect this split. |
| (b) | Per share numbers have been calculated using average shares outstanding, which more appropriately presents the per share data for the year. |
| (c) | Amounts shown in this caption for a share outstanding may not accord with the change in aggregate gains and losses in securities for the fiscal period because of the timing of sales and repurchases of Fund shares in relation to fluctuating market values for the Fund. |
| (d) | Amount is less than $0.005 per share. |
| (e) | Total return is calculated assuming a purchase of shares at net asset value on the first day and a sale at net asset value on the last day of each period reported. Distributions are assumed, for the purpose of this calculation, to be reinvested at net asset value per share on the respective payment dates of each distribution. Total returns for periods of less than one year are not annualized. Broker commission charges are not included in this calculation. |
| (f) | Portfolio turnover rate excludes securities received or delivered from in-kind processing of creations or redemptions. |
See accompanying notes to financial statements.
116
SPDR SERIES TRUST
FINANCIAL HIGHLIGHTS (continued)
Selected data for a share outstanding throughout each period
| | SPDR S&P Regional Banking ETF |
| | Year
Ended
6/30/24 | | Year
Ended
6/30/23 | | Year
Ended
6/30/22 | | Year
Ended
6/30/21 | | Year
Ended
6/30/20 |
Net asset value, beginning of period
| $40.82 | | $58.09 | | $65.50 | | $38.41 | | $53.53 |
| Income (loss) from investment operations: | | | | | | | | | |
Net investment income (loss) (a)
| 1.55 | | 1.53 | | 1.42 | | 1.44 | | 1.37 |
Net realized and unrealized gain (loss) (b)
| 8.34 | | (17.44) | | (7.33) | | 26.99 | | (15.21) |
Total from investment operations
| 9.89 | | (15.91) | | (5.91) | | 28.43 | | (13.84) |
Net equalization credits and charges (a)
| (0.04) | | 0.18 | | (0.07) | | 0.08 | | 0.11 |
| Distributions to shareholders from: | | | | | | | | | |
Net investment income
| (1.58) | | (1.54) | | (1.43) | | (1.42) | | (1.39) |
Net asset value, end of period
| $49.09 | | $40.82 | | $58.09 | | $65.50 | | $38.41 |
Total return (c)
| 24.30% | | (27.47)% | | (9.37)% | | 75.38% | | (25.96)% |
| Ratios and Supplemental Data: | | | | | | | | | |
Net assets, end of period (in 000s)
| $2,712,298 | | $2,904,657 | | $3,064,455 | | $5,092,879 | | $1,208,104 |
| Ratios to average net assets: | | | | | | | | | |
Total expenses
| 0.35% | | 0.36% | | 0.35% | | 0.35% | | 0.35% |
Net investment income (loss)
| 3.31% | | 2.84% | | 2.08% | | 2.47% | | 2.79% |
Portfolio turnover rate (d)
| 51% | | 61% | | 44% | | 50% | | 35% |
| (a) | Per share numbers have been calculated using average shares outstanding, which more appropriately presents the per share data for the year. |
| (b) | Amounts shown in this caption for a share outstanding may not accord with the change in aggregate gains and losses in securities for the fiscal period because of the timing of sales and repurchases of Fund shares in relation to fluctuating market values for the Fund. |
| (c) | Total return is calculated assuming a purchase of shares at net asset value on the first day and a sale at net asset value on the last day of each period reported. Distributions are assumed, for the purpose of this calculation, to be reinvested at net asset value per share on the respective payment dates of each distribution. Total returns for periods of less than one year are not annualized. Broker commission charges are not included in this calculation. |
| (d) | Portfolio turnover rate excludes securities received or delivered from in-kind processing of creations or redemptions. |
See accompanying notes to financial statements.
117
SPDR SERIES TRUST
NOTES TO FINANCIAL STATEMENTS
June 30, 2024
1. Organization
SPDR Series Trust (the “Trust”), a Massachusetts business trust, registered under the Investment Company Act of 1940, as amended (“1940 Act”), is an open-end management investment company.
As of June 30, 2024, the Trust consists of eighty-four (84) series, each of which represents a separate series of beneficial interest in the Trust. The Declaration of Trust permits the Board of Trustees of the Trust (the “Board”) to authorize the issuance of an unlimited number of shares of beneficial interest at $0.01 par value. The financial statements herein relate to the following series (each a “Fund”, and collectively, the “Funds”):
| SPDR Dow Jones REIT ETF |
| SPDR Portfolio S&P 400 Mid Cap ETF |
| SPDR Portfolio S&P 500 ETF |
| SPDR Portfolio S&P 500 Growth ETF |
| SPDR Portfolio S&P 500 High Dividend ETF |
| SPDR Portfolio S&P 500 Value ETF |
| SPDR Portfolio S&P 600 Small Cap ETF |
| SPDR Portfolio S&P 1500 Composite Stock Market ETF |
| SPDR Portfolio S&P Sector Neutral Dividend ETF |
| SPDR S&P Aerospace & Defense ETF |
| SPDR S&P Bank ETF |
| SPDR S&P Biotech ETF |
| SPDR S&P Dividend ETF |
| SPDR S&P Homebuilders ETF |
| SPDR S&P Oil & Gas Exploration & Production ETF |
| SPDR S&P Regional Banking ETF |
The SPDR Portfolio S& P Sector Neutral Dividend ETF was formed on September 11, 2023 and commenced operations on September 12, 2023.
Each Fund is classified as a diversified investment company under the 1940 Act, except that the SPDR Portfolio S&P 500 Growth ETF and the SPDR Portfolio S&P Sector Neutral Dividend ETF are each classified as a non-diversified investment company.
Under the Trust’s organizational documents, its officers and trustees are indemnified against certain liabilities arising out of the performance of their duties to the Trust. Additionally, in the normal course of business, the Trust enters into contracts with service providers that contain general indemnification clauses. The Trust’s maximum exposure under these arrangements is unknown as this would involve future claims that may be made against the Trust that have not yet occurred.
2. Summary of Significant Accounting Policies
The following is a summary of significant accounting policies followed by the Trust in the preparation of its financial statements:
The preparation of financial statements in accordance with U.S. generally accepted accounting principles (“U.S. GAAP”) requires management to make estimates and assumptions that affect the reported amounts and disclosures in the financial statements. Actual results could differ from those estimates. Each Fund is an investment company under U.S. GAAP and follows the accounting and reporting guidance applicable to investment companies.
Security Valuation
Each Fund's investments are valued at fair value each day that the New York Stock Exchange (“NYSE”) is open and, for financial reporting purposes, as of the report date should the reporting period end on a day that the NYSE is not open. Fair value is generally defined as the price a fund would receive to sell an asset or pay to transfer a liability in an orderly transaction between market participants at the measurement date. By its nature, a fair value price is a good faith estimate of the valuation in a current sale and may not reflect an actual market price. The investments of each Fund are valued pursuant to the policy and procedures developed by the Oversight Committee (the “Committee”) and approved by the Board. The Committee provides oversight of the valuation of investments for the Funds. The Board has responsibility for overseeing the determination of the fair value of investments.
Valuation techniques used to value each Fund’s investments by major category are as follows:
• Equity investments (including preferred stocks and registered investment companies that are exchange-traded funds) traded on a recognized securities exchange for which market quotations are readily available are valued at the last sale price or official closing price, as applicable, on the primary market or exchange on which they trade. Equity investments traded on a recognized exchange for which there were no sales on that day are valued
SPDR SERIES TRUST
NOTES TO FINANCIAL STATEMENTS (continued)
June 30, 2024
at the last published sale price or at fair value.
• Rights and warrants are valued at the last reported sale price obtained from independent pricing services or brokers on the valuation date. If no price is obtained from pricing services or brokers, valuation will be based upon the intrinsic value, pursuant to the valuation policy and procedures approved by the Board.
• Investments in registered investment companies (including money market funds) or other unitized pooled investment vehicles that are not traded on an exchange are valued at that day’s published net asset value (“NAV”) per share or unit.
• Exchange-traded futures contracts are valued at the closing settlement price on the primary market on which they are traded most extensively. Exchange-traded futures contracts traded on a recognized exchange for which there were no sales on that day are valued at the last reported sale price obtained from independent pricing services or brokers or at fair value.
• Swap agreements are valued daily based upon prices supplied by Board approved pricing vendors or through brokers. Depending on the product and terms of the transaction, the value of agreements is determined using a series of techniques including valuation models that incorporate a number of market data factors, such as discounted cash flows, yields, curves, trades and values of the underlying reference instruments. In the event SSGA Funds Management, Inc. (the “Adviser” or “SSGA FM”) is unable to obtain an independent, third–party valuation the agreements will be fair valued.
In the event prices or quotations are not readily available or that the application of these valuation methods results in a price for an investment that is deemed to be not representative of the fair value of such investment, fair value will be determined in good faith by the Committee, in accordance with the valuation policy and procedures approved by the Board.
Fair value pricing could result in a difference between the prices used to calculate a Fund's NAV and the prices used by the Funds' underlying benchmarks. Various inputs are used in determining the value of the Funds' investments.
The Funds value their assets and liabilities at fair value using a fair value hierarchy consisting of three broad levels that prioritize the inputs to valuation techniques giving the highest priority to readily available unadjusted quoted prices in active markets for identical assets or liabilities (Level 1 measurements) and the lowest priority to unobservable inputs (Level 3 measurements) when market prices are not readily available or reliable. The categorization of a value determined for an investment within the hierarchy is based upon the pricing transparency of the investment and is not necessarily an indication of the risk associated with investing in it.
The three levels of the fair value hierarchy are as follows:
• Level 1 – Unadjusted quoted prices in active markets for an identical asset or liability;
• Level 2 – Inputs other than quoted prices included within Level 1 that are observable for the asset or liability either directly or indirectly, including quoted prices for similar assets or liabilities in active markets, quoted prices for identical or similar assets or liabilities in markets that are not considered to be active, inputs other than quoted prices that are observable for the asset or liability (such as exchange rates, financing terms, interest rates, yield curves, volatilities, prepayment speeds, loss severities, credit risks and default rates) or other market-corroborated inputs; and
• Level 3 – Unobservable inputs for the asset or liability, including the Committee’s assumptions used in determining the fair value of investments.
The value of each Fund’s investments, according to the fair value hierarchy as of June 30, 2024, is disclosed in each Fund’s respective Schedule of Investments.
SPDR SERIES TRUST
NOTES TO FINANCIAL STATEMENTS (continued)
June 30, 2024
Investment Transactions and Income Recognition
Investment transactions are accounted for on trade date for financial reporting purposes. Realized gains and losses from the sale or disposition of investments and foreign exchange transactions, if any, are determined using the identified cost method.
Dividend income and capital gain distributions, if any, are recognized on the ex-dividend date, or when the information becomes available, net of any foreign taxes withheld at source, if any. Interest income is recorded daily on an accrual basis. All premiums and discounts are amortized/accreted for financial reporting purposes. Non-cash dividends received in the form of stock, if any, are recorded as dividend income at fair value. Distributions received by the Fund's may include a return of capital that is estimated by management. Such amounts are recorded as a reduction of the cost of investments or reclassified to capital gains.
Certain Funds invest in real estate investment trusts (“REITs”). REITs determine the tax character of their distributions annually and may characterize a portion of their distributions as a return of capital or capital gain. The Funds' policy is to record all REIT distributions initially as dividend income and re-designate a portion to return of capital or capital gain distributions at year end based on information provided by the REIT and/or SSGA Funds Management, Inc.’s (the “Adviser” or “SSGA FM”) estimates of such re-designations for which actual information has not yet been reported.
Expenses
Certain expenses, which are directly identifiable to a specific Fund, are applied to that Fund within the Trust. Other expenses which cannot be attributed to a specific Fund are allocated in such a manner as deemed equitable, taking into consideration the nature and type of expense and the relative net assets of the Funds within the Trust.
Foreign Currency Translation
The accounting records of the Funds are maintained in U.S. dollars. Foreign currencies as well as investment securities and other assets and liabilities denominated in a foreign currency are translated to U.S. dollars using exchange rates at period end. Purchases and sales of securities, income receipts and expense payments denominated in foreign currencies are translated into U.S. dollars at the prevailing exchange rate on the respective dates of the transactions.
The effects of exchange rate fluctuations on investments are included with the net realized and unrealized gain (loss) on investment securities. Other foreign currency transactions resulting in realized and unrealized gain (loss) are disclosed separately.
Foreign Taxes
The Funds may be subject to foreign taxes (a portion of which may be reclaimable) on income, stock dividends, realized and unrealized capital gains on investments or certain foreign currency transactions. Foreign taxes are recorded in accordance with SSGA FM understanding of the applicable foreign tax regulations and rates that exist in the foreign jurisdictions in which the Funds invest. These foreign taxes, if any, are paid by the Funds and are reflected in the Statements of Operations, if applicable. Foreign taxes payable or deferred as of June 30, 2024, if any, are disclosed in the Funds' Statements of Assets and Liabilities.
Equalization
The Funds follow the accounting practice known as “Equalization” by which a portion of the proceeds from sales and costs of reacquiring Fund shares, equivalent on a per share basis to the amount of distributable net investment income on the date of the transaction, is credited or charged to undistributed net investment income. As a result, undistributed net investment income per share is unaffected by sales or reacquisition of Fund shares. Amounts related to Equalization can be found on the Statements of Changes in Net Assets.
Distributions
Distributions from net investment income, if any, are declared and paid quarterly. Net realized capital gains, if any, are distributed annually. Dividends may be declared and paid more frequently or at any other times to improve Index tracking or to comply with the distribution requirements of the Internal Revenue Code of 1986, as amended (the “Internal Revenue Code”). The amount and character of income and capital gains to be distributed are determined in accordance with applicable tax regulations which may differ from net investment income and realized gains recognized for U.S. GAAP purposes.
SPDR SERIES TRUST
NOTES TO FINANCIAL STATEMENTS (continued)
June 30, 2024
3. Derivative Financial Instruments
Futures Contracts
The Funds may enter into futures contracts to meet the Funds' objectives. A futures contract is a standardized, exchange-traded agreement to buy or sell a financial instrument at a set price on a future date. Upon entering into a futures contract, a Fund is required to deposit with the broker, cash or securities in an amount equal to the minimum initial margin requirements of the clearing house. Securities deposited, if any, are designated on the Schedules of Investments and cash deposited, if any, is included in Net cash at broker on the Statements of Assets and Liabilities. Subsequent payments are made or received by a Fund equal to the daily change in the contract value, accumulated, exchange rates, and or other transactional fees. The accumulation of those payments are recorded as variation margin receivable or payable with a corresponding offset to unrealized gains or losses. A Fund recognizes a realized gain or loss when the contract is closed.
Losses may arise if the value of a futures contract decreases due to unfavorable changes in the market rates or values of the underlying instrument during the term of the contract or if the counterparty does not perform under the contract. The use of futures contracts also involves the risk that the movements in the price of the futures contracts do not correlate with the movement of the assets underlying such contracts.
For the year ended June 30, 2024, the following Funds entered into futures contracts for the strategies listed below:
| Fund | Strategies |
| SPDR Dow Jones REIT ETF | Cash equitization, reduce tracking error and to facilitate daily liquidity |
| SPDR Portfolio S&P 500 ETF | Cash equitization, reduce tracking error and to facilitate daily liquidity |
| SPDR Portfolio S&P 500 High Dividend ETF | Cash equitization, reduce tracking error and to facilitate daily liquidity |
| SPDR Portfolio S&P 600 Small Cap ETF | Cash equitization, reduce tracking error and to facilitate daily liquidity |
| SPDR Portfolio S&P 1500 Composite Stock Market ETF | Cash equitization, reduce tracking error and to facilitate daily liquidity |
| SPDR S&P Dividend ETF | Cash equitization, reduce tracking error and to facilitate daily liquidity |
| SPDR S&P Oil & Gas Exploration & Production ETF | Cash equitization, reduce tracking error and to facilitate daily liquidity |
Swaps
Certain Funds may enter into swap agreements, in which a Fund and counterparty agree either to make periodic net payments on a specified notional amount or a net payment upon termination. Swap agreements are privately negotiated in the OTC market and may be entered into as a bilateral contract (“BL OTC”) or centrally cleared (“centrally cleared swaps”). Swaps are marked-to-market daily and changes in value are recorded as unrealized appreciation (depreciation).
A BL OTC swap is a transaction between a fund and dealer counterparty where cash flows are exchanged between the two parties for the life of the swap. For BL OTC swaps, any upfront premiums paid are recorded as assets and any upfront fees received are recorded as liabilities and are shown as swap contracts premiums paid and swap contracts premiums received, respectively, in the Statements of Assets and Liabilities and amortized to realized gain/loss ratably over the term of the BL OTC swap. Payments received or made by the Fund for BL OTC swaps are recorded in the Statement of Operations as realized gains or losses, respectively. When a BL OTC swap is terminated, a Fund will record a realized gain or loss equal to the difference between the proceeds from (or cost of) the closing transaction and the Fund’s basis in the contract, if any. Generally, the basis of the contracts is the premium received or paid.
A centrally cleared OTC swap is a transaction executed between a fund and a dealer counterparty, then cleared by a futures commission merchant (FCM) through a clearinghouse. Once cleared, the clearinghouse serves as a central counterparty (“CCP”), with whom a fund exchanges cash flows for the life of the transaction, similar to transactions in futures contracts.
SPDR SERIES TRUST
NOTES TO FINANCIAL STATEMENTS (continued)
June 30, 2024
A Fund is required to interface with the CCP through a broker. Upon entering into a centrally cleared swap, the Fund is required to deposit initial margin with the broker in the form of cash or securities in an amount that varies depending on the size and risk profile of the particular swap. Securities deposited as initial margin if any, are designated on the Schedule of Investments and cash deposited is segregated and recorded on the Statement of Assets and Liabilities as Payable for Collateral for the Total Return Swaps. The daily change in valuation of centrally cleared swaps is recorded as a receivable or payable for variation margin in the Statement of Assets and Liabilities. Payments received from (paid to) the counterparty, including at termination, are recorded as realized gain (loss) in the Statement of Operations. For both bi-lateral and centrally cleared OTC swaps, payments are exchanged at specified intervals, accrued daily commencing with the effective date of the contract and recorded as realized gain or (loss). Some swaps may be terminated prior to the effective date and realize a gain or loss upon termination.
Total Return Swaps
The SPDR S&P Dividend ETF Fund has entered into total return swaps to obtain investment exposures that the Adviser expects to correlate closely with the Index or a portion of the Index. Total return swaps are agreements in which there is an exchange of cash flows whereby one party commits to make payments on the total return (coupon plus capital gains/losses) of an underlying instrument in exchange for fixed or floating rate interest payments. To the extent the total return of the instrument or index underlying the transaction exceeds or falls short of the offsetting interest rate obligation, the Fund will receive a payment or make a payment to the counterparty.
For the year ended June 30, 2024, the Fund entered into total return swap contracts for cash equitization, to reduce tracking error and to facilitate daily liquidity.
The following tables summarize the value of the Fund's derivative instruments as of June 30, 2024, and the related location in the accompanying Statement of Assets and Liabilities and Statement of Operations, presented by primary underlying risk exposure:
| | Asset Derivatives |
| | Interest
Rate
Risk | | Foreign
Exchange
Risk | | Credit
Risk | | Equity
Risk | | Commodity
Risk | | Total |
| SPDR Dow Jones REIT ETF | | | | | | | | | | | |
Futures Contracts
| $— | | $— | | $— | | $123,219 | | $— | | $123,219 |
| SPDR Portfolio S&P 500 ETF | | | | | | | | | | | |
Futures Contracts
| — | | — | | — | | 517,464 | | — | | 517,464 |
| SPDR Portfolio S&P 500 High Dividend ETF | | | | | | | | | | | |
Futures Contracts
| — | | — | | — | | 233,932 | | — | | 233,932 |
| SPDR Portfolio S&P 1500 Composite Stock Market ETF | | | | | | | | | | | |
Futures Contracts
| — | | — | | — | | 31,389 | | — | | 31,389 |
| SPDR S&P Dividend ETF | | | | | | | | | | | |
Futures Contracts
| — | | — | | — | | 263,043 | | — | | 263,043 |
| SPDR S&P Oil & Gas Exploration & Production ETF | | | | | | | | | | | |
Futures Contracts
| — | | — | | — | | 272,092 | | — | | 272,092 |
| | Liability Derivatives |
| | Interest
Rate
Risk | | Foreign
Exchange
Risk | | Credit
Risk | | Equity
Risk | | Commodity
Risk | | Total |
| SPDR Portfolio S&P 600 Small Cap ETF | | | | | | | | | | | |
Futures Contracts
| $— | | $— | | $— | | $11,602 | | $— | | $11,602 |
SPDR SERIES TRUST
NOTES TO FINANCIAL STATEMENTS (continued)
June 30, 2024
| | Net Realized Gain (Loss) |
| | Interest
Rate
Risk | | Foreign
Exchange
Risk | | Credit
Risk | | Equity
Risk | | Commodity
Risk | | Total |
| SPDR Dow Jones REIT ETF | | | | | | | | | | | |
Futures Contracts
| $— | | $— | | $— | | $717,057 | | $— | | $717,057 |
| SPDR Portfolio S&P 500 ETF | | | | | | | | | | | |
Futures Contracts
| — | | — | | — | | 15,837,707 | | — | | 15,837,707 |
| SPDR Portfolio S&P 500 High Dividend ETF | | | | | | | | | | | |
Futures Contracts
| — | | — | | — | | 8,493,535 | | — | | 8,493,535 |
| SPDR Portfolio S&P 600 Small Cap ETF | | | | | | | | | | | |
Futures Contracts
| — | | — | | — | | 658,920 | | — | | 658,920 |
| SPDR Portfolio S&P 1500 Composite Stock Market ETF | | | | | | | | | | | |
Futures Contracts
| — | | — | | — | | 5,119,079 | | — | | 5,119,079 |
| SPDR S&P Dividend ETF | | | | | | | | | | | |
Futures Contracts
| — | | — | | — | | 8,850,245 | | — | | 8,850,245 |
Swap Contracts
| — | | — | | — | | 1,992,539 | | — | | 1,992,539 |
| SPDR S&P Oil & Gas Exploration & Production ETF | | | | | | | | | | | |
Futures Contracts
| — | | — | | — | | 647,985 | | — | | 647,985 |
| SPDR S&P Regional Banking ETF | | | | | | | | | | | |
Swap Contracts
| — | | — | | — | | (408,668) | | — | | (408,668) |
| | Net Change in Unrealized Appreciation/Depreciation |
| | Interest
Rate
Risk | | Foreign
Exchange
Risk | | Credit
Risk | | Equity
Risk | | Commodity
Risk | | Total |
| SPDR Dow Jones REIT ETF | | | | | | | | | | | |
Futures Contracts
| $— | | $— | | $— | | $(99,332) | | $— | | $(99,332) |
| SPDR Portfolio S&P 500 ETF | | | | | | | | | | | |
Futures Contracts
| — | | — | | — | | (1,899,992) | | — | | (1,899,992) |
| SPDR Portfolio S&P 500 High Dividend ETF | | | | | | | | | | | |
Futures Contracts
| — | | — | | — | | (1,133,671) | | — | | (1,133,671) |
| SPDR Portfolio S&P 600 Small Cap ETF | | | | | | | | | | | |
Futures Contracts
| — | | — | | — | | (18,163) | | — | | (18,163) |
| SPDR Portfolio S&P 1500 Composite Stock Market ETF | | | | | | | | | | | |
Futures Contracts
| — | | — | | — | | (370,545) | | — | | (370,545) |
| SPDR S&P Dividend ETF | | | | | | | | | | | |
Futures Contracts
| — | | — | | — | | (2,505,632) | | — | | (2,505,632) |
Swap Contracts
| — | | — | | — | | (6,659,869) | | — | | (6,659,869) |
| SPDR S&P Oil & Gas Exploration & Production ETF | | | | | | | | | | | |
Futures Contracts
| — | | — | | — | | 191,760 | | — | | 191,760 |
4. Fees and Transactions with Affiliates
Advisory Fee
The Trust, on behalf of each Fund, has entered into an Investment Advisory Agreement with SSGA FM. For its advisory services to the Funds, facilities furnished and expenses borne by the Adviser, each Fund pays the Adviser a fee (“Management/Advisory fee”) accrued daily and paid monthly, based on a percentage of each Fund’s
SPDR SERIES TRUST
NOTES TO FINANCIAL STATEMENTS (continued)
June 30, 2024
average daily net assets as shown in the following table:
| | Annual Rate |
SPDR Dow Jones REIT ETF
| 0.25% |
SPDR Portfolio S&P 400 Mid Cap ETF
| 0.03(1) |
SPDR Portfolio S&P 500 ETF
| 0.02(1) |
SPDR Portfolio S&P 500 Growth ETF
| 0.04 |
SPDR Portfolio S&P 500 High Dividend ETF
| 0.07 |
SPDR Portfolio S&P 500 Value ETF
| 0.04 |
SPDR Portfolio S&P 600 Small Cap ETF
| 0.03(1) |
SPDR Portfolio S&P 1500 Composite Stock Market ETF
| 0.03 |
SPDR Portfolio S&P Sector Neutral Dividend ETF
| 0.05 |
SPDR S&P Aerospace & Defense ETF
| 0.35 |
SPDR S&P Bank ETF
| 0.35 |
SPDR S&P Biotech ETF
| 0.35 |
SPDR S&P Dividend ETF
| 0.35 |
SPDR S&P Homebuilders ETF
| 0.35 |
SPDR S&P Oil & Gas Exploration & Production ETF
| 0.35 |
SPDR S&P Regional Banking ETF
| 0.35 |
| (1) | Effective August 1, 2023 the Management Fee was reduced for the following Funds as follows: SPDR Portfolio S&P 400 Mid Cap ETF from 0.05% to 0.03%, SPDR Portfolio S&P 500 ETF from 0.03% to 0.02% and SPDR Portfolio S&P 600 Small Cap ETF from 0.05% to 0.03%. |
From time to time, the Adviser may also waive all or a portion of its Management fee. The Adviser has contractually agreed to waive a portion of its Management fee and/or reimburse expenses in an amount equal to any acquired fund fees and expenses (excluding holdings in acquired funds for cash management purposes, if any) for each Fund until October 31, 2024. This waiver and/or reimbursement does not provide for the recoupment by the Adviser of any amounts waived or reimbursed. This waiver and/or reimbursement may not be terminated prior to October 31, 2024 except with the approval of the Board.
The Adviser pays all the expenses of each Fund other than the Management fee, brokerage expenses, taxes, interest, fees and expenses of the Trust’s Trustees, who are not “interested persons” of the Trust, as defined in the 1940 Act (“Independent Trustees”) (including any Trustees’ counsel fees), acquired fund fees and expenses, litigation expenses and other extraordinary expenses.
Administrator, Custodian, Sub-Administrator and Transfer Agent Fees
SSGA FM serves as administrator and State Street Bank and Trust Company (“State Street”), an affiliate of the Adviser, serves as custodian, sub-administrator and transfer agent. State Street receives fees for its services as custodian, sub-administrator and transfer agent from the Adviser.
Distributor
State Street Global Advisors Funds Distributors, LLC (“SSGA FD” or the “Distributor”), an affiliate of the Adviser, serves as the Distributor of the Trust.
Other Transactions with Affiliates - Securities Lending
State Street, an affiliate of the Funds, acts as the securities lending agent for the Funds, pursuant to an amended and restated securities lending authorization agreement dated January 6, 2017, as amended.
Net proceeds collected by State Street on investment of cash collateral or any fee income less rebates payable to borrowers, are paid as follows: If the calendar year to date net proceeds are below a specified threshold across SPDR ETFs, each Fund retains eighty five percent (85%) of the net proceeds and fifteen percent (15%) of such net proceeds is payable to State Street. Starting the business day following the date that calendar year to date net proceeds exceeds a specified threshold, each Fund retains ninety percent (90%) of the net proceeds and ten percent (10%) of such net proceeds is payable to State Street.
SPDR SERIES TRUST
NOTES TO FINANCIAL STATEMENTS (continued)
June 30, 2024
In addition, cash collateral from lending activities is invested in the State Street Navigator Securities Lending Portfolio II, an affiliated fund, for which SSGA FM serves as investment adviser. See Note 9 for additional information regarding securities lending.
Other Transactions with Affiliates
The Funds may invest in affiliated entities, including securities issued by State Street Corporation, affiliated funds, or entities deemed to be affiliates as a result of the Funds owning more than five percent of the entity’s voting securities or outstanding shares. Amounts relating to these transactions during the year ended June 30, 2024, are disclosed in the Schedules of Investments.
During the year ended June 30, 2024, the Adviser made a contribution of $1,774,131 to the SPDR S&P Homebuilders ETF related to a trading matter.
Due to Custodian
In certain circumstances, the Funds may have cash overdrafts with the Custodian due to expense payments, capital transactions, trading of securities, investment operations or derivative transactions. The Due to Custodian amount, if any, reflects cash overdrawn with State Street, as custodian, who is an affiliate of the Funds.
5. Trustees’ Fees
The fees and expenses of the Independent Trustees are paid directly by the Funds. The Independent Trustees are reimbursed for travel and other out-of-pocket expenses in connection with meeting attendance and industry seminars.
6. Investment Transactions
Purchases and sales of investments (excluding in-kind transactions and short term investments) for the year ended June 30, 2024, were as follows:
| | Purchases | | Sales |
SPDR Dow Jones REIT ETF
| $58,314,019 | | $67,543,652 |
SPDR Portfolio S&P 400 Mid Cap ETF
| 1,657,296,906 | | 1,665,917,189 |
SPDR Portfolio S&P 500 ETF
| 679,320,854 | | 724,119,164 |
SPDR Portfolio S&P 500 Growth ETF
| 7,020,622,600 | | 7,001,380,738 |
SPDR Portfolio S&P 500 High Dividend ETF
| 3,101,235,904 | | 2,779,741,098 |
SPDR Portfolio S&P 500 Value ETF
| 6,144,639,927 | | 6,112,217,819 |
SPDR Portfolio S&P 600 Small Cap ETF
| 2,270,598,608 | | 2,211,594,705 |
SPDR Portfolio S&P 1500 Composite Stock Market ETF
| 200,938,899 | | 189,110,788 |
SPDR Portfolio S&P Sector Neutral Dividend ETF
| 995,264 | | 980,435 |
SPDR S&P Aerospace & Defense ETF
| 662,949,834 | | 658,055,776 |
SPDR S&P Bank ETF
| 609,819,733 | | 611,451,678 |
SPDR S&P Biotech ETF
| 5,994,286,464 | | 5,858,440,729 |
SPDR S&P Dividend ETF
| 12,248,599,560 | | 11,200,866,034 |
SPDR S&P Homebuilders ETF
| 705,885,589 | | 706,729,657 |
SPDR S&P Oil & Gas Exploration & Production ETF
| 1,316,714,146 | | 1,319,086,602 |
SPDR S&P Regional Banking ETF
| 1,472,344,185 | | 1,470,095,012 |
SPDR SERIES TRUST
NOTES TO FINANCIAL STATEMENTS (continued)
June 30, 2024
For the year ended June 30, 2024, the following Funds had in-kind contributions, redemptions and net realized gains/losses in the amounts as follows:
| | In-kind
Contributions | | In-kind
Redemptions | | In-kind Net
Realized
Gains/(Losses) |
SPDR Dow Jones REIT ETF
| $1,237,065,045 | | $1,204,009,926 | | $26,240,445 |
SPDR Portfolio S&P 400 Mid Cap ETF
| 3,138,678,429 | | 727,076,487 | | 355,590,957 |
SPDR Portfolio S&P 500 ETF
| 16,603,499,429 | | 1,780,274,639 | | 695,464,045 |
SPDR Portfolio S&P 500 Growth ETF
| 6,735,883,171 | | 2,032,646,714 | | 737,368,927 |
SPDR Portfolio S&P 500 High Dividend ETF
| 856,992,186 | | 2,278,405,223 | | 195,446,700 |
SPDR Portfolio S&P 500 Value ETF
| 8,734,004,039 | | 5,741,171,735 | | 1,885,313,914 |
SPDR Portfolio S&P 600 Small Cap ETF
| 3,091,052,886 | | 1,118,745,472 | | 367,077,705 |
SPDR Portfolio S&P 1500 Composite Stock Market ETF
| 906,636,321 | | 402,351,572 | | 189,546,918 |
SPDR Portfolio S&P Sector Neutral Dividend ETF
| 5,943,901 | | 674,747 | | 74,252 |
SPDR S&P Aerospace & Defense ETF
| 972,411,123 | | 677,310,520 | | 237,554,109 |
SPDR S&P Bank ETF
| 2,267,022,863 | | 2,493,566,851 | | 123,208,091 |
SPDR S&P Biotech ETF
| 13,472,275,764 | | 13,733,127,268 | | 1,706,218,075 |
SPDR S&P Dividend ETF
| 234,277,472 | | 3,657,809,936 | | 554,666,952 |
SPDR S&P Homebuilders ETF
| 4,869,537,996 | | 4,793,812,482 | | 455,015,052 |
SPDR S&P Oil & Gas Exploration & Production ETF
| 6,980,126,944 | | 7,147,208,573 | | 403,194,050 |
SPDR S&P Regional Banking ETF
| 8,978,160,796 | | 9,755,716,549 | | 421,509,906 |
7. Shareholder Transactions
Each Fund issues and redeems its shares, at NAV, by each Fund only in aggregations of a specified number of shares or multiples thereof (“Creation Units”). Except when aggregated in Creation Units, shares of each Fund are not redeemable. Transactions in capital shares for each Fund are disclosed in detail in the Statements of Changes in Net Assets.
The consideration for the purchase of Creation Units of a Fund may consist of the in-kind deposit of a designated portfolio of securities and a specified amount of cash. Investors purchasing and redeeming Creation Units may pay a purchase transaction fee and a redemption transaction fee directly to the Trust and/or custodian, to offset transfer and other transaction costs associated with the issuance and redemption of Creation Units, including Creation Units for cash. An additional variable fee may be charged for certain transactions. Such variable charges, if any, are included in “Other Capital” on the Statements of Changes in Net Assets.
8. Income Tax Information
The Funds have qualified and intend to continue to qualify as regulated investment companies under Subchapter M of the Internal Revenue Code. Each Fund will not be subject to federal income taxes to the extent it distributes its taxable income, including any net realized capital gains, for each fiscal year. Therefore, no provision for federal income tax is required.
SPDR Portfolio S&P Sector Neutral Dividend ETF intends to qualify as a regulated investment company under Subchapter M of the Internal Revenue Code.
The Funds file federal and various state and local tax returns as required. No income tax returns are currently under examination. Generally, the federal returns are subject to examination by the Internal Revenue Service for a period of three years from date of filing, while the state returns may remain open for an additional year depending upon jurisdiction. SSGA FM has analyzed each Fund's tax positions taken on tax returns for all open years and does not believe there are any uncertain tax positions that would require recognition of a tax liability.
Distributions to shareholders are recorded on ex-dividend date. Income dividends and gain distributions are determined in accordance with income tax rules and regulations, which may differ from generally accepted accounting principles.
SPDR SERIES TRUST
NOTES TO FINANCIAL STATEMENTS (continued)
June 30, 2024
Certain capital accounts in the financial statements have been adjusted for permanent book-tax differences. These adjustments have no impact on NAV or results of operations. Temporary book-tax differences will reverse in the future. These book-tax differences are primarily due to differing treatments for character of distributions, in-kind transactions, swap contracts, passive foreign investment companies, partnerships, corporate actions, futures contracts mark to market, wash sale loss deferrals and distributions in excess of current earnings.
The tax character of distributions paid during the year ended June 30, 2024, was as follows:
| | Ordinary
Income | | Long-Term
Capital Gains | | Total |
SPDR Dow Jones REIT ETF
| $53,054,560 | | $— | | $53,054,560 |
SPDR Portfolio S&P 400 Mid Cap ETF
| 128,490,199 | | — | | 128,490,199 |
SPDR Portfolio S&P 500 ETF
| 422,265,120 | | — | | 422,265,120 |
SPDR Portfolio S&P 500 Growth ETF
| 203,965,781 | | — | | 203,965,781 |
SPDR Portfolio S&P 500 High Dividend ETF
| 310,151,950 | | — | | 310,151,950 |
SPDR Portfolio S&P 500 Value ETF
| 410,627,405 | | — | | 410,627,405 |
SPDR Portfolio S&P 600 Small Cap ETF
| 166,855,202 | | — | | 166,855,202 |
SPDR Portfolio S&P 1500 Composite Stock Market ETF
| 111,412,114 | | — | | 111,412,114 |
SPDR Portfolio S&P Sector Neutral Dividend ETF
| 102,092 | | — | | 102,092 |
SPDR S&P Aerospace & Defense ETF
| 11,499,663 | | — | | 11,499,663 |
SPDR S&P Bank ETF
| 46,636,959 | | — | | 46,636,959 |
SPDR S&P Biotech ETF
| 9,319,348 | | — | | 9,319,348 |
SPDR S&P Dividend ETF
| 552,178,299 | | — | | 552,178,299 |
SPDR S&P Homebuilders ETF
| 12,006,378 | | — | | 12,006,378 |
SPDR S&P Oil & Gas Exploration & Production ETF
| 84,133,859 | | — | | 84,133,859 |
SPDR S&P Regional Banking ETF
| 94,537,699 | | — | | 94,537,699 |
The tax character of distributions paid during the year ended June 30, 2023, was as follows:
| | Ordinary
Income | | Long-Term
Capital Gains | | Total |
SPDR Dow Jones REIT ETF
| $ 59,848,485 | | $ — | | $ 59,848,485 |
SPDR Portfolio S&P 400 Mid Cap ETF
| 94,878,855 | | — | | 94,878,855 |
SPDR Portfolio S&P 500 ETF
| 259,368,415 | | — | | 259,368,415 |
SPDR Portfolio S&P 500 Growth ETF
| 173,909,356 | | — | | 173,909,356 |
SPDR Portfolio S&P 500 High Dividend ETF
| 331,882,313 | | — | | 331,882,313 |
SPDR Portfolio S&P 500 Value ETF
| 309,828,409 | | — | | 309,828,409 |
SPDR Portfolio S&P 600 Small Cap ETF
| 80,915,674 | | — | | 80,915,674 |
SPDR Portfolio S&P 1500 Composite Stock Market ETF
| 95,739,344 | | — | | 95,739,344 |
SPDR S&P Aerospace & Defense ETF
| 7,062,064 | | — | | 7,062,064 |
SPDR S&P Bank ETF
| 49,427,639 | | — | | 49,427,639 |
SPDR S&P Biotech ETF
| 202,133 | | — | | 202,133 |
SPDR S&P Dividend ETF
| 585,912,064 | | — | | 585,912,064 |
SPDR S&P Homebuilders ETF
| 10,744,968 | | — | | 10,744,968 |
SPDR S&P Oil & Gas Exploration & Production ETF
| 111,292,039 | | — | | 111,292,039 |
SPDR S&P Regional Banking ETF
| 95,585,698 | | — | | 95,585,698 |
SPDR SERIES TRUST
NOTES TO FINANCIAL STATEMENTS (continued)
June 30, 2024
At June 30, 2024, the components of distributable earnings on a tax basis were as follows:
| | Undistributed
Ordinary Income | | Capital Loss
Carryforwards | | Undistributed
Long-Term
Capital Gains | | Net Unrealized
Gains (Losses) | | Total |
SPDR Dow Jones REIT ETF
| $— | | $(250,169,164) | | $— | | $(337,512,245) | | $(587,681,409) |
SPDR Portfolio S&P 400 Mid Cap ETF
| 311,599 | | (440,643,399) | | — | | 1,194,379,240 | | 754,047,440 |
SPDR Portfolio S&P 500 ETF
| — | | (355,683,943) | | — | | 7,044,857,053 | | 6,689,173,110 |
SPDR Portfolio S&P 500 Growth ETF
| — | | (2,858,528,711) | | — | | 8,143,797,697 | | 5,285,268,986 |
SPDR Portfolio S&P 500 High Dividend ETF
| — | | (1,426,413,448) | | — | | (319,265,525) | | (1,745,678,973) |
SPDR Portfolio S&P 500 Value ETF
| — | | (1,474,562,472) | | — | | 1,456,281,557 | | (18,280,915) |
SPDR Portfolio S&P 600 Small Cap ETF
| 1,907,993 | | (1,079,916,739) | | — | | 726,521,626 | | (351,487,120) |
SPDR Portfolio S&P 1500 Composite Stock Market ETF
| — | | (122,170,452) | | — | | 2,595,468,222 | | 2,473,297,770 |
SPDR Portfolio S&P Sector Neutral Dividend ETF
| 3,159 | | (8,407) | | — | | 485,232 | | 479,984 |
SPDR S&P Aerospace & Defense ETF
| 587,906 | | (608,723,842) | | — | | 351,776,545 | | (256,359,391) |
SPDR S&P Bank ETF
| 37,079 | | (1,442,939,080) | | — | | (89,131,123) | | (1,532,033,124) |
SPDR S&P Biotech ETF
| — | | (10,675,112,884) | | — | | (393,170,072) | | (11,068,282,956) |
SPDR S&P Dividend ETF
| 60,187,018 | | (3,364,235,979) | | — | | 1,107,447,320 | | (2,196,601,641) |
SPDR S&P Homebuilders ETF
| 1,773,237 | | (972,408,955) | | — | | (59,190,988) | | (1,029,826,706) |
SPDR S&P Oil & Gas Exploration & Production ETF
| 10,559,733 | | (5,345,399,266) | | — | | (244,283,327) | | (5,579,122,860) |
SPDR S&P Regional Banking ETF
| 1,676,965 | | (2,762,049,033) | | — | | (197,532,793) | | (2,957,904,861) |
As of June 30, 2024, the following Funds had capital loss carryforwards available to offset future realized capital gains as follows:
| | Non-Expiring
Short Term | | Non-Expiring
Long Term |
SPDR Dow Jones REIT ETF
| $50,065,132 | | $200,104,032 |
SPDR Portfolio S&P 400 Mid Cap ETF
| 75,916,694 | | 364,726,705 |
SPDR Portfolio S&P 500 ETF
| 129,373,261 | | 226,310,682 |
SPDR Portfolio S&P 500 Growth ETF
| 1,308,096,969 | | 1,550,431,742 |
SPDR Portfolio S&P 500 High Dividend ETF
| 691,133,106 | | 735,280,342 |
SPDR Portfolio S&P 500 Value ETF
| 472,546,979 | | 1,002,015,493 |
SPDR Portfolio S&P 600 Small Cap ETF
| 274,807,725 | | 805,109,014 |
SPDR Portfolio S&P 1500 Composite Stock Market ETF
| 23,490,670 | | 98,679,782 |
SPDR Portfolio S&P Sector Neutral Dividend ETF
| 8,407 | | — |
SPDR S&P Aerospace & Defense ETF
| 276,393,775 | | 332,330,067 |
SPDR S&P Bank ETF
| 489,636,427 | | 953,302,653 |
SPDR S&P Biotech ETF
| 5,319,967,647 | | 5,355,145,237 |
SPDR S&P Dividend ETF
| 1,174,802,059 | | 2,189,433,920 |
SPDR S&P Homebuilders ETF
| 532,039,334 | | 440,369,621 |
SPDR S&P Oil & Gas Exploration & Production ETF
| 2,356,838,487 | | 2,988,560,779 |
SPDR S&P Regional Banking ETF
| 1,119,755,544 | | 1,642,293,489 |
SPDR SERIES TRUST
NOTES TO FINANCIAL STATEMENTS (continued)
June 30, 2024
As of June 30, 2024, gross unrealized appreciation and gross unrealized depreciation of investments and other financial instruments based on cost for federal income tax purposes were as follows:
| | Tax
Cost | | Gross
Unrealized
Appreciation | | Gross
Unrealized
Depreciation | | Net Unrealized
Appreciation
(Depreciation) |
SPDR Dow Jones REIT ETF
| $1,741,567,537 | | $13,389,882 | | $350,902,127 | | $(337,512,245) |
SPDR Portfolio S&P 400 Mid Cap ETF
| 9,210,883,937 | | 1,700,174,573 | | 505,795,335 | | 1,194,379,238 |
SPDR Portfolio S&P 500 ETF
| 32,792,652,568 | | 8,216,772,096 | | 1,171,915,043 | | 7,044,857,053 |
SPDR Portfolio S&P 500 Growth ETF
| 20,796,047,556 | | 8,463,599,001 | | 319,801,304 | | 8,143,797,697 |
SPDR Portfolio S&P 500 High Dividend ETF
| 6,235,244,830 | | 264,419,947 | | 583,685,472 | | (319,265,525) |
SPDR Portfolio S&P 500 Value ETF
| 20,038,115,368 | | 2,328,930,049 | | 872,648,492 | | 1,456,281,557 |
SPDR Portfolio S&P 600 Small Cap ETF
| 10,235,558,864 | | 1,758,055,929 | | 1,031,533,893 | | 726,522,036 |
SPDR Portfolio S&P 1500 Composite Stock Market ETF
| 6,029,457,900 | | 2,988,185,473 | | 392,717,223 | | 2,595,468,250 |
SPDR Portfolio S&P Sector Neutral Dividend ETF
| 5,359,852 | | 612,025 | | 126,793 | | 485,232 |
SPDR S&P Aerospace & Defense ETF
| 1,923,285,768 | | 386,979,280 | | 35,202,735 | | 351,776,545 |
SPDR S&P Bank ETF
| 1,560,754,232 | | 40,947,470 | | 130,078,593 | | (89,131,123) |
SPDR S&P Biotech ETF
| 7,842,261,999 | | 362,129,391 | | 755,299,463 | | (393,170,072) |
SPDR S&P Dividend ETF
| 18,676,545,088 | | 1,995,111,708 | | 887,664,388 | | 1,107,447,320 |
SPDR S&P Homebuilders ETF
| 1,861,627,089 | | 30,304,670 | | 89,495,658 | | (59,190,988) |
SPDR S&P Oil & Gas Exploration & Production ETF
| 3,864,575,598 | | 38,018,184 | | 282,301,511 | | (244,283,327) |
SPDR S&P Regional Banking ETF
| 2,918,442,873 | | 28,421,570 | | 225,954,363 | | (197,532,793) |
9. Securities Lending
Each Fund may lend securities to qualified broker-dealers or institutional investors. The loans are secured at all times by cash, cash equivalents or U.S. government securities in an amount at least equal to the market value of the securities loaned, plus accrued interest and dividends, determined on a daily basis and adjusted accordingly. The value of the collateral with respect to a loaned security may be temporarily more or less than the value of a security due to market fluctuations of securities values. With respect to each loan, if on any U.S. business day the aggregate market value of securities collateral plus cash collateral is less than the aggregate market value of the securities which are subject to the loan, the borrower will be notified to provide additional collateral on the next business day.
The Funds will regain record ownership of loaned securities to exercise certain beneficial rights; however, the Funds may bear the risk of delay in recovery of, or even loss of rights in the securities loaned should the borrower fail financially. In addition, a Fund will bear the risk of loss of any cash collateral that it may invest. Each Fund receives compensation for lending its securities from interest or dividends earned on the cash, cash equivalents or U.S. government securities held as collateral, net of fee rebates paid to the borrower and net of fees paid to State Street as the lending agent. Additionally, a Fund will receive a fee from the borrower for non-cash collateral equal to a percentage of the market value of the loaned securities.
The market value of securities on loan as of June 30, 2024, and the value of the invested cash collateral are disclosed in the Funds' Statements of Assets and Liabilities. Non-cash collateral is not disclosed in the Funds Statements of Assets and Liabilities as it is held by the lending agent on behalf of the Funds, and the Funds do not have the ability to re-hypothecate those securities. Securities lending income, as disclosed in the Funds Statements of Operations, represents the income earned from the non-cash collateral and the investment of cash collateral, net of fee rebates paid to the borrower and net of fees paid to State Street as lending agent.
SPDR SERIES TRUST
NOTES TO FINANCIAL STATEMENTS (continued)
June 30, 2024
The following is a summary of each Fund's securities lending agreements and related cash and non-cash collateral received as of June 30, 2024:
| Fund | | Market Value of
Securities on Loan | | Cash
Collateral
Received | | Non-Cash
Collateral
Received* | | Total
Collateral
Received |
SPDR Dow Jones REIT ETF
| | $ 3,510,772 | | $ 3,521,807 | | $ 95,625 | | $ 3,617,432 |
SPDR Portfolio S&P 400 Mid Cap ETF
| | 666,220,732 | | 380,676,390 | | 302,265,693 | | 682,942,083 |
SPDR Portfolio S&P 500 ETF
| | 209,882,934 | | 150,685,702 | | 66,460,929 | | 217,146,631 |
SPDR Portfolio S&P 500 Growth ETF
| | 28,959,175 | | 15,106,095 | | 14,124,660 | | 29,230,755 |
SPDR Portfolio S&P 500 Value ETF
| | 71,287,378 | | 57,581,983 | | 15,175,070 | | 72,757,053 |
SPDR Portfolio S&P 600 Small Cap ETF
| | 845,010,698 | | 751,498,526 | | 114,565,201 | | 866,063,727 |
SPDR Portfolio S&P 1500 Composite Stock Market ETF
| | 106,697,727 | | 52,623,778 | | 56,773,456 | | 109,397,234 |
SPDR S&P Aerospace & Defense ETF
| | 202,088,801 | | 160,660,356 | | 47,884,703 | | 208,545,059 |
SPDR S&P Bank ETF
| | 68,963,171 | | 29,664,528 | | 39,411,030 | | 69,075,558 |
SPDR S&P Biotech ETF
| | 892,979,107 | | 531,386,578 | | 392,183,371 | | 923,569,949 |
SPDR S&P Dividend ETF
| | 249,753,029 | | 104,487,153 | | 150,009,002 | | 254,496,155 |
SPDR S&P Homebuilders ETF
| | 57,769,273 | | 59,676,717 | | — | | 59,676,717 |
SPDR S&P Oil & Gas Exploration & Production ETF
| | 221,960,119 | | 132,864,402 | | 95,393,916 | | 228,258,318 |
SPDR S&P Regional Banking ETF
| | 73,362,571 | | 14,117,136 | | 59,365,219 | | 73,482,355 |
| * | The non-cash collateral includes U.S. Treasuries and U.S. Government Agency securities. |
The following table reflects a breakdown of transactions accounted for as secured borrowings, the gross obligation by the type of collateral pledged or securities loaned, and the remaining contractual maturity of those transactions as of June 30, 2024:
| | | | | Remaining Contractual Maturity of the Agreements
as of June 30, 2024 |
| Fund | | Securities
Lending
Transactions | | Overnight
and
Continuous | | <30 Days | | Between
30 & 90
Days | | >90 Days | | Total
Borrowings | | Gross Amount
of Recognized
Liabilities for
Securities Lending Transactions |
SPDR Dow Jones REIT ETF
| | Common Stocks | | $3,521,807 | | $— | | $— | | $— | | $3,521,807 | | $3,521,807 |
SPDR Portfolio S&P 400 Mid Cap ETF
| | Common Stocks | | 380,676,390 | | — | | — | | — | | 380,676,390 | | 380,676,390 |
SPDR Portfolio S&P 500 ETF
| | Common Stocks | | 150,685,702 | | — | | — | | — | | 150,685,702 | | 150,685,702 |
SPDR Portfolio S&P 500 Growth ETF
| | Common Stocks | | 15,106,095 | | — | | — | | — | | 15,106,095 | | 15,106,095 |
SPDR Portfolio S&P 500 Value ETF
| | Common Stocks | | 57,581,983 | | — | | — | | — | | 57,581,983 | | 57,581,983 |
SPDR Portfolio S&P 600 Small Cap ETF
| | Common Stocks | | 751,498,526 | | — | | — | | — | | 751,498,526 | | 751,498,526 |
SPDR Portfolio S&P 1500 Composite Stock Market ETF
| | Common Stocks | | 52,623,778 | | — | | — | | — | | 52,623,778 | | 52,623,778 |
SPDR S&P Aerospace & Defense ETF
| | Common Stocks | | 160,660,356 | | — | | — | | — | | 160,660,356 | | 160,660,356 |
SPDR S&P Bank ETF
| | Common Stocks | | 29,664,528 | | — | | — | | — | | 29,664,528 | | 29,664,528 |
SPDR S&P Biotech ETF
| | Common Stocks | | 531,386,578 | | — | | — | | — | | 531,386,578 | | 531,386,578 |
SPDR S&P Dividend ETF
| | Common Stocks | | 104,487,153 | | — | | — | | — | | 104,487,153 | | 104,487,153 |
SPDR S&P Homebuilders ETF
| | Common Stocks | | 59,676,717 | | — | | — | | — | | 59,676,717 | | 59,676,717 |
SPDR S&P Oil & Gas Exploration & Production ETF
| | Common Stocks | | 132,864,402 | | — | | — | | — | | 132,864,402 | | 132,864,402 |
SPDR S&P Regional Banking ETF
| | Common Stocks | | 14,117,136 | | — | | — | | — | | 14,117,136 | | 14,117,136 |
SPDR SERIES TRUST
NOTES TO FINANCIAL STATEMENTS (continued)
June 30, 2024
10. Risks
Concentration Risk
As a result of the Funds' ability to invest a large percentage of their assets in obligations of issuers within the same country, state, region, currency or economic sector, an adverse economic, business or political development may affect the value of the Funds' investments more than if the Funds were more broadly diversified.
Credit Risk
A Fund may be exposed to credit risk in the event that an issuer or guarantor fails to perform or that an institution or entity with which the Fund has unsettled or open transactions default.
Market Risk
Each Fund's investments are subject to changes in general economic conditions, and general market fluctuations and the risks inherent in investment in securities markets. Investment markets can be volatile and prices of investments can change substantially due to various factors including, but not limited to, economic growth or recession, changes in interest rates, changes in the actual or perceived creditworthiness of issuers, and general market liquidity. Each Fund is subject to the risk that geopolitical events will disrupt securities markets and adversely affect global economies and markets. Local, regional or global events such as war, acts of terrorism, the spread of infectious illness, such as COVID-19, or other public health issues, or other events could have a significant impact on the Fund and its investments.
Russian Sanctions Risk
Sanctions threatened or imposed by a number of jurisdictions, including the United States, the European Union and the United Kingdom, and other intergovernmental actions that have been or may be undertaken in the future, against Russia, Russian entities or Russian individuals, may result in the devaluation of Russian currency, a downgrade in the country’s credit rating, an immediate freeze of Russian assets, a decline in the value and liquidity of Russian securities, property or interests, and/or other adverse consequences to the Russian economy or a Fund. The scope and scale of sanctions in place at a particular time may be expanded or otherwise modified in a way that have negative effects on a Fund. Sanctions, or the threat of new or modified sanctions, could impair the ability of a Fund to buy, sell, hold, receive, deliver or otherwise transact in certain affected securities or other investment instruments. Sanctions could also result in Russia taking counter measures or other actions in response, which may further impair the value and liquidity of Russian securities. These sanctions, and the resulting disruption of the Russian economy, may cause volatility in other regional and global markets and may negatively impact the performance of various sectors and industries, as well as companies in other countries, which could have a negative effect on the performance of a Fund, even if a Fund does not have direct exposure to securities of Russian issuers. As a collective result of the imposition of sanctions, Russian government countermeasures and the impact that they have had on the trading markets for Russian securities, certain Funds have used, and may in the future use, fair valuation procedures approved by the Fund’s Board to value certain Russian securities, which could result in such securities being deemed to have a zero value.
11. Reorganization
On June 9, 2023, SPDR Portfolio S&P 600 Small Cap ETF (“Acquiring Fund”) acquired substantially all of the assets and assumed all of the liabilities of SPDR S&P 600 Small Cap ETF (“Acquired Fund”) in exchange for shares of the Acquiring Fund pursuant to an Agreement and Plan of Reorganization approved by the Board. For financial reporting purposes, assets received and shares issued by the Acquiring Fund were recorded at fair value; however, the cost basis of the investments received from the Acquired Fund was carried forward to align ongoing reporting of the Acquiring Fund’s realized gains and losses with amounts distributable to shareholders for tax purposes. The reorganization qualified as a tax-free reorganization for federal income tax purposes with no gain or loss recognized to the funds or their shareholders.
SPDR SERIES TRUST
NOTES TO FINANCIAL STATEMENTS (continued)
June 30, 2024
The reorganization consisted of the transfer of all assets attributable to each class of the Acquired Fund’s shares in exchange for the corresponding class of shares of the Acquiring Fund resulting in a reorganization as follows:
| | Shares of the Fund Issued | Net Assets Recieved from Acquired Fund | Net Assets of the Fund Immediately Prior to Combination | Net Assets of the Fund Immediately After the Combination |
| SPDR Portfolio S&P 600 Small Cap ETF | 44,960,263 | $1,724,236,383 | $5,689,256,430 | $7,413,492,813 |
Assuming the acquisition had been completed on July 1, 2022, the beginning of the annual reporting period of the Acquiring Fund, the Acquiring Fund’s pro forma results of operations for the period ended June 30, 2023, are as follows:
Net Investment income (loss)
| $112,087,193 |
Total net realized and change in unrealized gain (loss)
| $461,929,420 |
Net increase (decrease) in net assets resulting from operations
| $574,016,613 |
12. Subsequent Events
Management has evaluated the impact of all subsequent events on the Funds through the date the financial statements were issued and has determined that there were no subsequent events requiring adjustment or disclosure in the financial statements.
SPDR SERIES TRUST
REPORT OF INDEPENDENT REGISTERED PUBLIC ACCOUNTING FIRM
To the Shareholders of SPDR Dow Jones REIT ETF, SPDR Portfolio S&P 400 Mid Cap ETF, SPDR Portfolio S&P 500 ETF, SPDR Portfolio S&P 500 Growth ETF, SPDR Portfolio S&P 500 High Dividend ETF, SPDR Portfolio S&P 500 Value ETF, SPDR Portfolio S&P 600 Small Cap ETF, SPDR Portfolio S&P 1500 Composite Stock Market ETF, SPDR Portfolio S&P Sector Neutral Dividend ETF, SPDR S&P Aerospace & Defense ETF, SPDR S&P Bank ETF, SPDR S&P Biotech ETF, SPDR S&P Dividend ETF, SPDR S&P Homebuilders ETF, SPDR S&P Oil & Gas Exploration & Production ETF and SPDR S&P Regional Banking ETF and the Board of Trustees of SPDR® Series Trust
Opinion on the Financial Statements
We have audited the accompanying statements of assets and liabilities of SPDR Dow Jones REIT ETF, SPDR Portfolio S&P 400 Mid Cap ETF, SPDR Portfolio S&P 500 ETF, SPDR Portfolio S&P 500 Growth ETF, SPDR Portfolio S&P 500 High Dividend ETF, SPDR Portfolio S&P 500 Value ETF, SPDR Portfolio S&P 600 Small Cap ETF, SPDR Portfolio S&P 1500 Composite Stock Market ETF, SPDR Portfolio S&P Sector Neutral Dividend ETF, SPDR S&P Aerospace & Defense ETF, SPDR S&P Bank ETF, SPDR S&P Biotech ETF, SPDR S&P Dividend ETF, SPDR S&P Homebuilders ETF, SPDR S&P Oil & Gas Exploration & Production ETF, and SPDR S&P Regional Banking ETF (collectively referred to as the “Funds”) (sixteen of the funds constituting SPDR® Series Trust (the “Trust”)), including the schedules of investments, as of June 30, 2024, and the related statements of operations and changes in net assets, and the financial highlights for each of the periods indicated in the table below and the related notes (collectively referred to as the “financial statements”). In our opinion, the financial statements present fairly, in all material respects, the financial position of each of the Funds (sixteen of the funds constituting SPDR® Series Trust) at June 30, 2024, and the results of their operations, changes in net assets and financial highlights for each of the periods indicated in the table below, in conformity with U.S. generally accepted accounting principles.
| Individual Fund constituting the SSGA Series Trust | Statements of operations | Statements of changes in net assets | Financial highlights |
| SPDR Portfolio S&P Sector Neutral Dividend ETF | For the period from September 12, 2023 (commencement of operations) through June 30, 2024 |
| SPDR Dow Jones REIT ETF | For the year ended June 30, 2024 | For each of the two years in the period ended June 30, 2024 | For each of the five years in the period ended June 30, 2024 |
| SPDR Portfolio S&P 400 Mid Cap ETF |
| SPDR Portfolio S&P 500 ETF |
| SPDR Portfolio S&P 500 Growth ETF |
| SPDR Portfolio S&P 500 High Dividend ETF |
| SPDR Portfolio S&P 500 Value ETF | | | |
| SPDR Portfolio S&P 600 Small Cap ETF | | | |
| SPDR Portfolio S&P 1500 Composite Stock Market ETF | | | |
| SPDR S&P Aerospace & Defense ETF | | | |
| SPDR S&P Bank ETF | | | |
| SPDR S&P Biotech ETF | | | |
| SPDR S&P Dividend ETF | | | |
| SPDR S&P Homebuilders ETF | | | |
| SPDR S&P Oil & Gas Exploration & Production ETF | | | |
SPDR SERIES TRUST
REPORT OF INDEPENDENT REGISTERED PUBLIC ACCOUNTING FIRM (continued)
| Individual Fund constituting the SSGA Series Trust | Statements of operations | Statements of changes in net assets | Financial highlights |
| SPDR S&P Regional Banking ETF | For the year ended
June 30, 2024 | For each of the two years
in the period ended
June 30, 2024 | For each of the five years
in the period ended
June 30, 2024 |
Basis for Opinion
These financial statements are the responsibility of the Trust’s management. Our responsibility is to express an opinion on the Funds’ financial statements based on our audits. We are a public accounting firm registered with the Public Company Accounting Oversight Board (United States) (“PCAOB”) and are required to be independent with respect to the Trust in accordance with the U.S. federal securities laws and the applicable rules and regulations of the Securities and Exchange Commission and the PCAOB.
We conducted our audits in accordance with the standards of the PCAOB. Those standards require that we plan and perform the audit to obtain reasonable assurance about whether the financial statements are free of material misstatement, whether due to error or fraud. The Trust is not required to have, nor were we engaged to perform, an audit of the Trust’s internal control over financial reporting. As part of our audits we are required to obtain an understanding of internal control over financial reporting, but not for the purpose of expressing an opinion on the effectiveness of the Trust’s internal control over financial reporting. Accordingly, we express no such opinion.
Our audits included performing procedures to assess the risks of material misstatement of the financial statements, whether due to error or fraud, and performing procedures that respond to those risks. Such procedures included examining, on a test basis, evidence regarding the amounts and disclosures in the financial statements. Our procedures included confirmation of securities owned as of June 30, 2024, by correspondence with the custodian, brokers and others; when replies were not received from brokers and others, we performed other auditing procedures. Our audits also included evaluating the accounting principles used and significant estimates made by management, as well as evaluating the overall presentation of the financial statements. We believe that our audits provide a reasonable basis for our opinion.
We have served as the auditor of one or more State Street Global Advisors investment companies since 2000.
Boston, Massachusetts
August 27, 2024
SPDR SERIES TRUST
OTHER INFORMATION
June 30, 2024 (Unaudited)
Tax Information
For federal income tax purposes, the following information is furnished with respect to the distributions of the Trust for its fiscal year ended June 30, 2024.
Dividends Received Deduction
Each Fund reports the maximum amount allowable of its net taxable income as eligible for the corporate dividends received deduction.
Qualified Business Income Deduction
Each Fund reports the maximum amount allowable of qualified REIT dividends eligible for the qualified business income deduction under Section 199A.
Qualified Dividend Income
A portion of dividends distributed by the Funds during the fiscal year ended June 30, 2024 are considered qualified dividend income and are eligible for reduced tax rates. Each Fund reports the maximum amount allowable of its net taxable income as qualified dividend income as provided in the Jobs and Growth Tax Relief Reconciliation Act of 2003.
SPDR SERIES TRUST
STATEMENT REGARDING BASIS FOR APPROVAL OF INVESTMENT ADVISORY CONTRACT
June 30, 2024 (Unaudited)
Approval of Advisory Agreement
At a meeting held on May 15-16, 2024, the Board of Trustees of the Trust (the “Board”) evaluated a proposal to approve for an additional one year period the Investment Advisory Agreement (the “Advisory Agreement” or “Agreement”) between the SPDR Series Trust (the “Trust” or “SST”) and SSGA Funds Management, Inc. (the “Adviser” or “SSGA FM”) with respect to the equity series of SST (collectively, the “SPDR ETFs”). The Trustees who are not “interested persons” of the Trust within the meaning of the Investment Company Act of 1940, as amended (the “Independent Trustees”), also met separately to consider the Agreement. The Independent Trustees were advised by their independent legal counsel throughout the process.
To evaluate the Advisory Agreement, the Board requested and SSGA FM, the Trust’s adviser and administrator, and State Street Bank and Trust Company, the Trust’s sub-administrator, transfer agent and custodian (“State Street”) provided, such materials as the Board, with the advice of counsel, deemed reasonably necessary. In deciding whether to approve the Advisory Agreement, the Board considered various factors, including the nature, extent and quality of services provided by the Adviser with respect to the SPDR ETFs under the Agreement, the proposed cost of those services in relation to the services provided and in relation to fees charged to comparable funds, other benefits to the Adviser of its relationship with the SPDR ETFs, and extent to which economies of scale would be shared as the SPDR ETFs grow.
Nature, Extent and Quality of Services
The Board considered the nature, extent and quality of services provided by the Adviser. In doing so, the Trustees relied on their prior experience in overseeing the management of the Trusts and the materials provided prior to and at the meeting. The Board reviewed the Advisory Agreement and the Adviser’s responsibilities for managing investment operations of each of the SPDR ETFs in accordance with each SPDR ETF’s investment objectives and policies, and applicable legal and regulatory requirements. The Board appreciated the nature of the SPDR ETFs as exchange-traded funds and the experience and expertise of the Adviser in managing exchange-traded funds. The Board considered the background and experience of the Adviser’s senior management, including those individuals responsible for portfolio management, oversight of sub-advisers and regulatory compliance of the SPDR ETFs. The Board also considered the portfolio management resources, structures and practices of the Adviser, including those associated with monitoring and ensuring each SPDR ETF’s compliance with its investment objectives and policies, and applicable laws and regulations. The Board further considered information about the Adviser’s best execution procedures and overall investment management business, noting that the Adviser serves a wide range of clients across a broad spectrum of asset classes. The Board looked at the Adviser’s general knowledge of the investment management business and that of its affiliates which make up State Street Global Advisors, through which the Adviser shares all of its senior personnel. The Board considered that the Adviser and its affiliates constitute one of the world’s largest investment management enterprises for indexed products generally and exchange-traded funds in particular. The Board specifically considered the Adviser’s experience in managing equity exchange-traded funds with index-based investment objectives.
Investment Performance
The Board then reviewed the SPDR ETFs’ performance, noting that the analysis of investment performance, in absolute terms, was more complex for the actively-managed funds. The Board focused on the extent to which each index-based SPDR ETF achieved its objective as a passively-managed index fund and reviewed information regarding such SPDR ETF’s index tracking. To the extent such tracking was not consistent with management’s expectations, the Trustees sought additional information about steps being taken to address the positive or negative tracking differences.
Profits Realized by Adviser
The Board considered the profitability of the advisory arrangement with the SPDR ETFs to the Adviser and its affiliates, including data on each SPDR ETF’s historical profitability to these entities. The Board, including the Independent Trustees, with their independent legal counsel, had the opportunity to discuss, with representatives of the Adviser and State Street Global Advisors, methodologies used in computing costs that formed the bases of profitability calculations.
Fees Charged to Comparable Funds
The Board evaluated each SPDR ETF’s unitary fee through review of comparative information with respect to fees paid by similar funds – i.e., exchange-traded funds tracking similar equity indexes with respect to each series of SST. The Board reviewed the universe of similar exchange-traded funds for each SPDR ETF based upon data independently obtained from Broadridge Financial Solutions, Inc. (Broadridge) and related comparative information for similar exchange-traded funds. In doing so, the Board used a fund by fund analysis of the data. In certain
SPDR SERIES TRUST
STATEMENT REGARDING BASIS FOR APPROVAL OF INVESTMENT ADVISORY CONTRACT (continued)
June 30, 2024 (Unaudited)
instances as considered appropriate by the Board, the Board explored with management the reasons for the differences between a SPDR ETF’s fee and fees paid by similar funds.
Other Benefits
The Board also considered whether the Adviser or its affiliates benefited in other ways from its relationship with the Trust, noting that the Adviser does not maintain soft-dollar arrangements in connection with the Trust’s brokerage transactions.
Economies of Scale
The Board reviewed information regarding economies of scale or other efficiencies that may result as each SPDR ETF’s assets grow in size. The Board noted that the advisory fee rate for each SPDR ETF does not provide for breakpoints as assets of the SPDR ETF increase. However, the Board further noted the Adviser’s assertion that future economies of scale (among several factors) had been taken into consideration for the SPDR ETFs by fixing relatively low advisory fees, effectively sharing the benefits of lower fees with the SPDR ETFs from inception. The Adviser also asserted that one of the benefits of the unitary fee was to provide an unvarying expense structure, which could be lost or diluted with the addition of breakpoints. The Board noted that it intends to continue to monitor fees as the SPDR ETFs grow in size and assess whether fee breakpoints may be warranted.
Conclusion
After weighing the foregoing factors, none of which was dispositive in itself and may have been weighed differently by each Trustee, the Board, including the Independent Trustees voting separately, approved the continuation of the Advisory Agreement for each SPDR ETF. In approving the continuance of each Advisory Agreement, the Board, including the Independent Trustees voting separately, found that the terms of each Advisory Agreement are fair and reasonable and that the continuance of the Advisory Agreement is in the best interests of the applicable SPDR ETF and its shareholders. The Board’s conclusions with respect to the factors were as follows: (a) the nature, extent and quality of the services provided by the Adviser with respect to the SPDR ETFs were appropriate; (b) the performance and, more importantly for those SPDR ETFs measured against an index, the index tracking, of each SPDR ETF had been satisfactory or the Adviser had demonstrated due attention to the remediation of underperformance, where appropriate; (c) the Adviser’s unitary fee for each SPDR ETF considered in relation to the services provided, and in relation to the fees charged to comparable funds, was reasonable; (d) the profitability of the Trust’s relationships with the Adviser and its affiliates was not excessive in view of the nature, extent and quality of the services provided; (e) any additional potential benefits to the Adviser or its affiliates were not of a magnitude to materially affect the Board’s conclusions; and (f) the fees paid to the Adviser adequately shared the economies of scale with respect to the SPDR ETFs by way of the relatively low fee structure of the Trust. The Independent Trustees were advised by their independent counsel throughout the process.
Item 8. Changes in and Disagreements with Accountants for Open-End Management Investment Companies
Not applicable.
Item 9. Proxy Disclosures for Open-End Management Investment Companies
Not applicable.
Item 10. Remuneration Paid to Directors, Officers, and Others of Open-End Management Investment Companies
Renumeration Paid to Directors, Officers, and Others of Open-End Investment Companies is included as part of the Financial Statements filed under Item 7(a) of this Form.
Item 11. Statement Regarding Basis for Approval of Investment Advisory Contract
The Registrant’s Statement Regarding Basis for Approval of Investment Advisory Contract is included as part of the Financial Statements filed under Item 7(a) of this Form.
Item 12. Disclosure of Proxy Voting Policies and Procedures for Closed-End Management Investment Companies.
Not applicable to the registrant.
Item 13. Portfolio Managers of Closed-End Management Investment Companies.
Not applicable to the registrant.
Item 14. Purchases of Equity Securities by Closed-End Management Investment Company and Affiliated Purchasers.
Not applicable to the registrant.
Item 15. Submission of Matters to a Vote of Security Holders.
The registrant has not adopted any material changes to the procedures by which shareholders may recommend nominees to the registrant’s Board.
Item 16. Controls and Procedures.
(a) Within 90 days of the filing date of this Form N-CSR, Ann M. Carpenter, the registrant’s President and Principal Executive Officer, and Bruce S. Rosenberg, the registrant’s Treasurer and Principal Financial Officer, reviewed the registrant’s disclosure controls and procedures (as defined in Rule 30a-3(c) under the Investment Company Act of 1940, as amended ( the “1940 Act”) and evaluated their effectiveness. Based on their review, Ms. Carpenter and Mr. Rosenberg determined that the disclosure controls and procedures adequately ensure that information required to be disclosed by the registrant in its periodic reports is recorded, processed, summarized and reported within the time periods required by the U.S. Securities and Exchange Commission.
(b) There were no changes in the registrant’s internal control over financial reporting (as defined in Rule 30a-3(d) under the 1940 Act) that occurred during the period covered by this report that have materially affected, or are reasonably likely to materially affect, the registrant’s internal control over financial reporting.
Item 17. Disclosure of Securities Lending Activities for Closed-End Management Investment Companies.
(a) Not applicable to the registrant.
(b) Not applicable to the registrant.
Item 18. Recovery of Erroneously Awarded Compensation
Not applicable to the registrant.
Item 19. Exhibits.
(a)(1) Code of Ethics referred to in Item 2.
a)(2) Not applicable to the registrant.
(a)(3) Separate certifications required by Rule 30a-2(a) under the 1940 Act for each principal executive officer and principal financial officer of the registrant are attached.
(a)(4) Not applicable to the registrant.
(a)(5) Not applicable.
(b) A single certification required by Rule 30a-2(b) under the 1940 Act, Rule 13a-14(b) or Rule 15d-14(b) under the Securities Exchange Act of 1934, as amended, and Section 1350 of Chapter 63 of Title 18 of the United States Code for the principal executive officer and principal financial officer of the registrant is attached.
(101) Inline Interactive Data File - the instance document does not appear in the Interactive Data File because its XBRL tags are embedded within the inline XBRL document.
SIGNATURES
Pursuant to the requirements of the Securities Exchange Act of 1934, as amended, and the Investment Company Act of 1940, as amended, the registrant has duly caused this report to be signed on its behalf by the undersigned, thereunto duly authorized.
| | |
| SPDR® Series Trust |
| |
| By: | | /s/ Ann M. Carpenter |
| | Ann M. Carpenter |
| | President and Principal Executive Officer |
| |
| Date: | | September 6, 2024 |
Pursuant to the requirements of the Securities Exchange Act of 1934, as amended, and the Investment Company Act of 1940, as amended, this report has been signed below by the following persons on behalf of the registrant and in the capacities and on the dates indicated.
| | |
| By: | | /s/ Ann M. Carpenter |
| | Ann M. Carpenter |
| | President and Principal Executive Officer |
| |
Date: | | September 6, 2024 |
| |
| By: | | /s/ Bruce S. Rosenberg |
| | Bruce S. Rosenberg |
| | Treasurer and Principal Financial Officer |
| |
| Date: | | September 6, 2024 |