UNITED STATES
SECURITIES AND EXCHANGE COMMISSION
Washington, D.C. 20549
_____________________________________________
FORM 10-K
(Mark One)
| | | | | | | | | | | | | | | | | | | | |
| ☑ | ANNUAL REPORT PURSUANT TO SECTION 13 OR 15(d) OF THE
SECURITIES EXCHANGE ACT OF 1934 | | |
| | For the Fiscal Year Ended | December 31, 2024 | | |
or
| | | | | | | | | | | | | | |
| ☐ | TRANSITION REPORT PURSUANT TO SECTION 13 OR 15(d) OF THE
SECURITIES EXCHANGE ACT OF 1934 | | |
Commission File Number 1-16463
____________________________________________
PEABODY ENERGY CORPORATION
(Exact name of registrant as specified in its charter)
| | | | | | | | |
| Delaware | | 13-4004153 |
| (State or other jurisdiction of incorporation or organization) | | (I.R.S. Employer Identification No.) |
| | | | | | | | | | | | | | | | | | | | |
| 701 Market Street, | St. Louis, | Missouri | | | 63101-1826 |
| (Address of principal executive offices) | | (Zip Code) |
(314) 342-3400
(Registrant’s telephone number, including area code)
Securities Registered Pursuant to Section 12(b) of the Act:
| | | | | | | | |
| Title of Each Class | Trading Symbol(s) | Name of Each Exchange on Which Registered |
| Common Stock, par value $0.01 per share | BTU | New York Stock Exchange |
Securities Registered Pursuant to Section 12(g) of the Act:
None
Indicate by check mark if the registrant is a well-known seasoned issuer, as defined in Rule 405 of the Securities Act. Yes ☑ No ☐
Indicate by check mark if the registrant is not required to file reports pursuant to Section 13 or Section 15(d) of the Act. Yes ☐ No ☑
Indicate by check mark whether the registrant (1) has filed all reports required to be filed by Section 13 or 15(d) of the Securities Exchange Act of 1934 during the preceding 12 months (or for such shorter period that the registrant was required to file such reports), and (2) has been subject to such filing requirements for the past 90 days. Yes ☑ No ☐
Indicate by check mark whether the registrant has submitted electronically every Interactive Data File required to be submitted pursuant to Rule 405 of Regulation S-T (§ 232.405 of this chapter) during the preceding 12 months (or for such shorter period that the registrant was required to submit such files). Yes ☑ No ☐
Indicate by check mark whether the registrant is a large accelerated filer, an accelerated filer, a non-accelerated filer, a smaller reporting company, or an emerging growth company. See the definitions of “large accelerated filer,” “accelerated filer,” “smaller reporting company,” and “emerging growth company” in Rule 12b-2 of the Exchange Act.
Large accelerated filer ☑ Accelerated filer ☐
Non-accelerated filer ☐ Smaller reporting company ☐
Emerging growth company ☐
If an emerging growth company, indicate by check mark if the registrant has elected not to use the extended transition period for complying with any new or revised financial accounting standards provided pursuant to Section 13(a) of the Exchange Act. ☐
Indicate by check mark whether the registrant has filed a report on and attestation to its management’s assessment of the effectiveness of its internal control over financial reporting under Section 404(b) of the Sarbanes-Oxley Act (15 U.S.C. 7262(b)) by the registered public accounting firm that prepared or issued its audit report. ☑
If securities are registered pursuant to Section 12(b) of the Act, indicate by check mark whether the financial statements of the registrant included in the filing reflect the correction of an error to previously issued financial statements. ☐
Indicate by check mark whether any of those error corrections are restatements that required a recovery analysis of incentive-based compensation received by any of the registrant’s executive officers during the relevant recovery period pursuant to §240.10D-1(b). ☐
Indicate by check mark whether the registrant is a shell company (as defined in Rule 12b-2 of the Exchange Act). Yes ☐ No ☑
Aggregate market value of the voting and non-voting common equity held by non-affiliates (stockholders who are not directors or executive officers) of the Registrant, calculated using the closing price on June 30, 2024: Common Stock, par value $0.01 per share, $2.1 billion.
Number of shares outstanding of each of the Registrant’s classes of Common Stock, as of February 14, 2025: Common Stock, par value $0.01 per share, 121,567,621 shares outstanding.
DOCUMENTS INCORPORATED BY REFERENCE
Portions of the Company’s Proxy Statement to be filed with the Securities and Exchange Commission in connection with the Company’s 2025 Annual Meeting of Shareholders (the Company’s 2025 Proxy Statement) are incorporated by reference into Part III hereof. Other documents incorporated by reference in this report are listed in the Exhibit Index of this Form 10-K.
CAUTIONARY NOTICE REGARDING FORWARD-LOOKING STATEMENTS
This report includes statements of the Company’s expectations, intentions, plans and beliefs that constitute “forward-looking statements” within the meaning of Section 27A of the Securities Act of 1933, as amended (the Securities Act), and Section 21E of the Securities Exchange Act of 1934, as amended (the Exchange Act), and are intended to come within the safe harbor protection provided by those sections. These statements relate to future events or the Company’s future financial performance. The Company uses words such as “anticipate,” “believe,” “expect,” “intend,” “may,” “forecast,” “project,” “should,” “estimate,” “goal,” “plan,” “outlook,” “target,” “likely,” “could,” “may,” “should,” “will,” “would,” “to be” or other similar words to identify forward-looking statements.
Without limiting the foregoing, all statements relating to the Company’s future operating results, anticipated capital expenditures, future cash flows and borrowings, and sources of funding are forward-looking statements and speak only as of the date of this report. These forward-looking statements are based on numerous assumptions and expectations that the Company believes in good faith to be reasonable, but are subject to a wide range of uncertainties and business risks, and actual results may differ materially from those discussed in these statements. These risks include but are not limited to those described in Part I, Item 1A. “Risk Factors.” Such factors are difficult to accurately predict and may be beyond the Company’s control.
When considering these forward-looking statements, you should keep in mind the cautionary statements in this document and in the Company’s other Securities and Exchange Commission (SEC) filings. These forward-looking statements speak only as of the date on which such statements were made, and the Company undertakes no obligation to update these statements except as required by federal securities laws.
| | | | | | | | |
| Peabody Energy Corporation | 2024 Form 10-K | i |
TABLE OF CONTENTS
| | | | | | | | |
| Peabody Energy Corporation | 2024 Form 10-K | 1 |
| | | | | |
| Note: | The words “Peabody” or “the Company” as used in this report, refer to Peabody Energy Corporation or its applicable subsidiary or subsidiaries. Unless otherwise noted herein, disclosures in this Annual Report on Form 10-K relate only to the Company’s continuing operations. |
| When used in this filing, the term “ton” refers to short or net tons, equal to 2,000 pounds (907.18 kilograms), while “tonne” refers to metric tons, equal to 2,204.62 pounds (1,000 kilograms). |
PART I
Item 1. Business.
Overview
Peabody is a leading producer of metallurgical and thermal coal. At December 31, 2024, the Company owned interests in 17 active coal mining operations located in the United States (U.S.) and Australia, including a 50% equity interest in Middlemount Coal Pty Ltd. (Middlemount).
On November 21, 2024, Peabody entered into a partnership with RWE, a renewable energy company, to advance renewable energy projects by repurposing reclaimed land previously used for mining, including certain reclaimed mining land held by the Company.
On November 25, 2024, Peabody entered into definitive agreements with Anglo American plc, a United Kingdom public limited company (Anglo), to acquire a portion of the assets and businesses associated with Anglo’s metallurgical coal portfolio in Australia. The acquisition is expected to close in the second quarter of 2025, subject to regulatory approvals, completion of preemptive rights processes and satisfaction of other customary closing conditions.
During 2024, Peabody continued to advance the development of the Centurion Mine, an underground longwall metallurgical coal mine in Queensland, Australia, as planned. Development coal was produced and sold during the year, and commencement of longwall production is targeted for the first quarter of 2026.
Segment and Geographic Information
As of December 31, 2024, Peabody reports its results of operations primarily through the following reportable segments: Seaborne Thermal, Seaborne Metallurgical, Powder River Basin, Other U.S. Thermal and Corporate and Other. Refer to Part II, Item 7. “Management’s Discussion and Analysis of Financial Condition and Results of Operations” for additional information regarding the Company’s segments. Note 22. “Segment and Geographic Information” to the accompanying consolidated financial statements is incorporated herein by reference and also contains segment and geographic financial information.
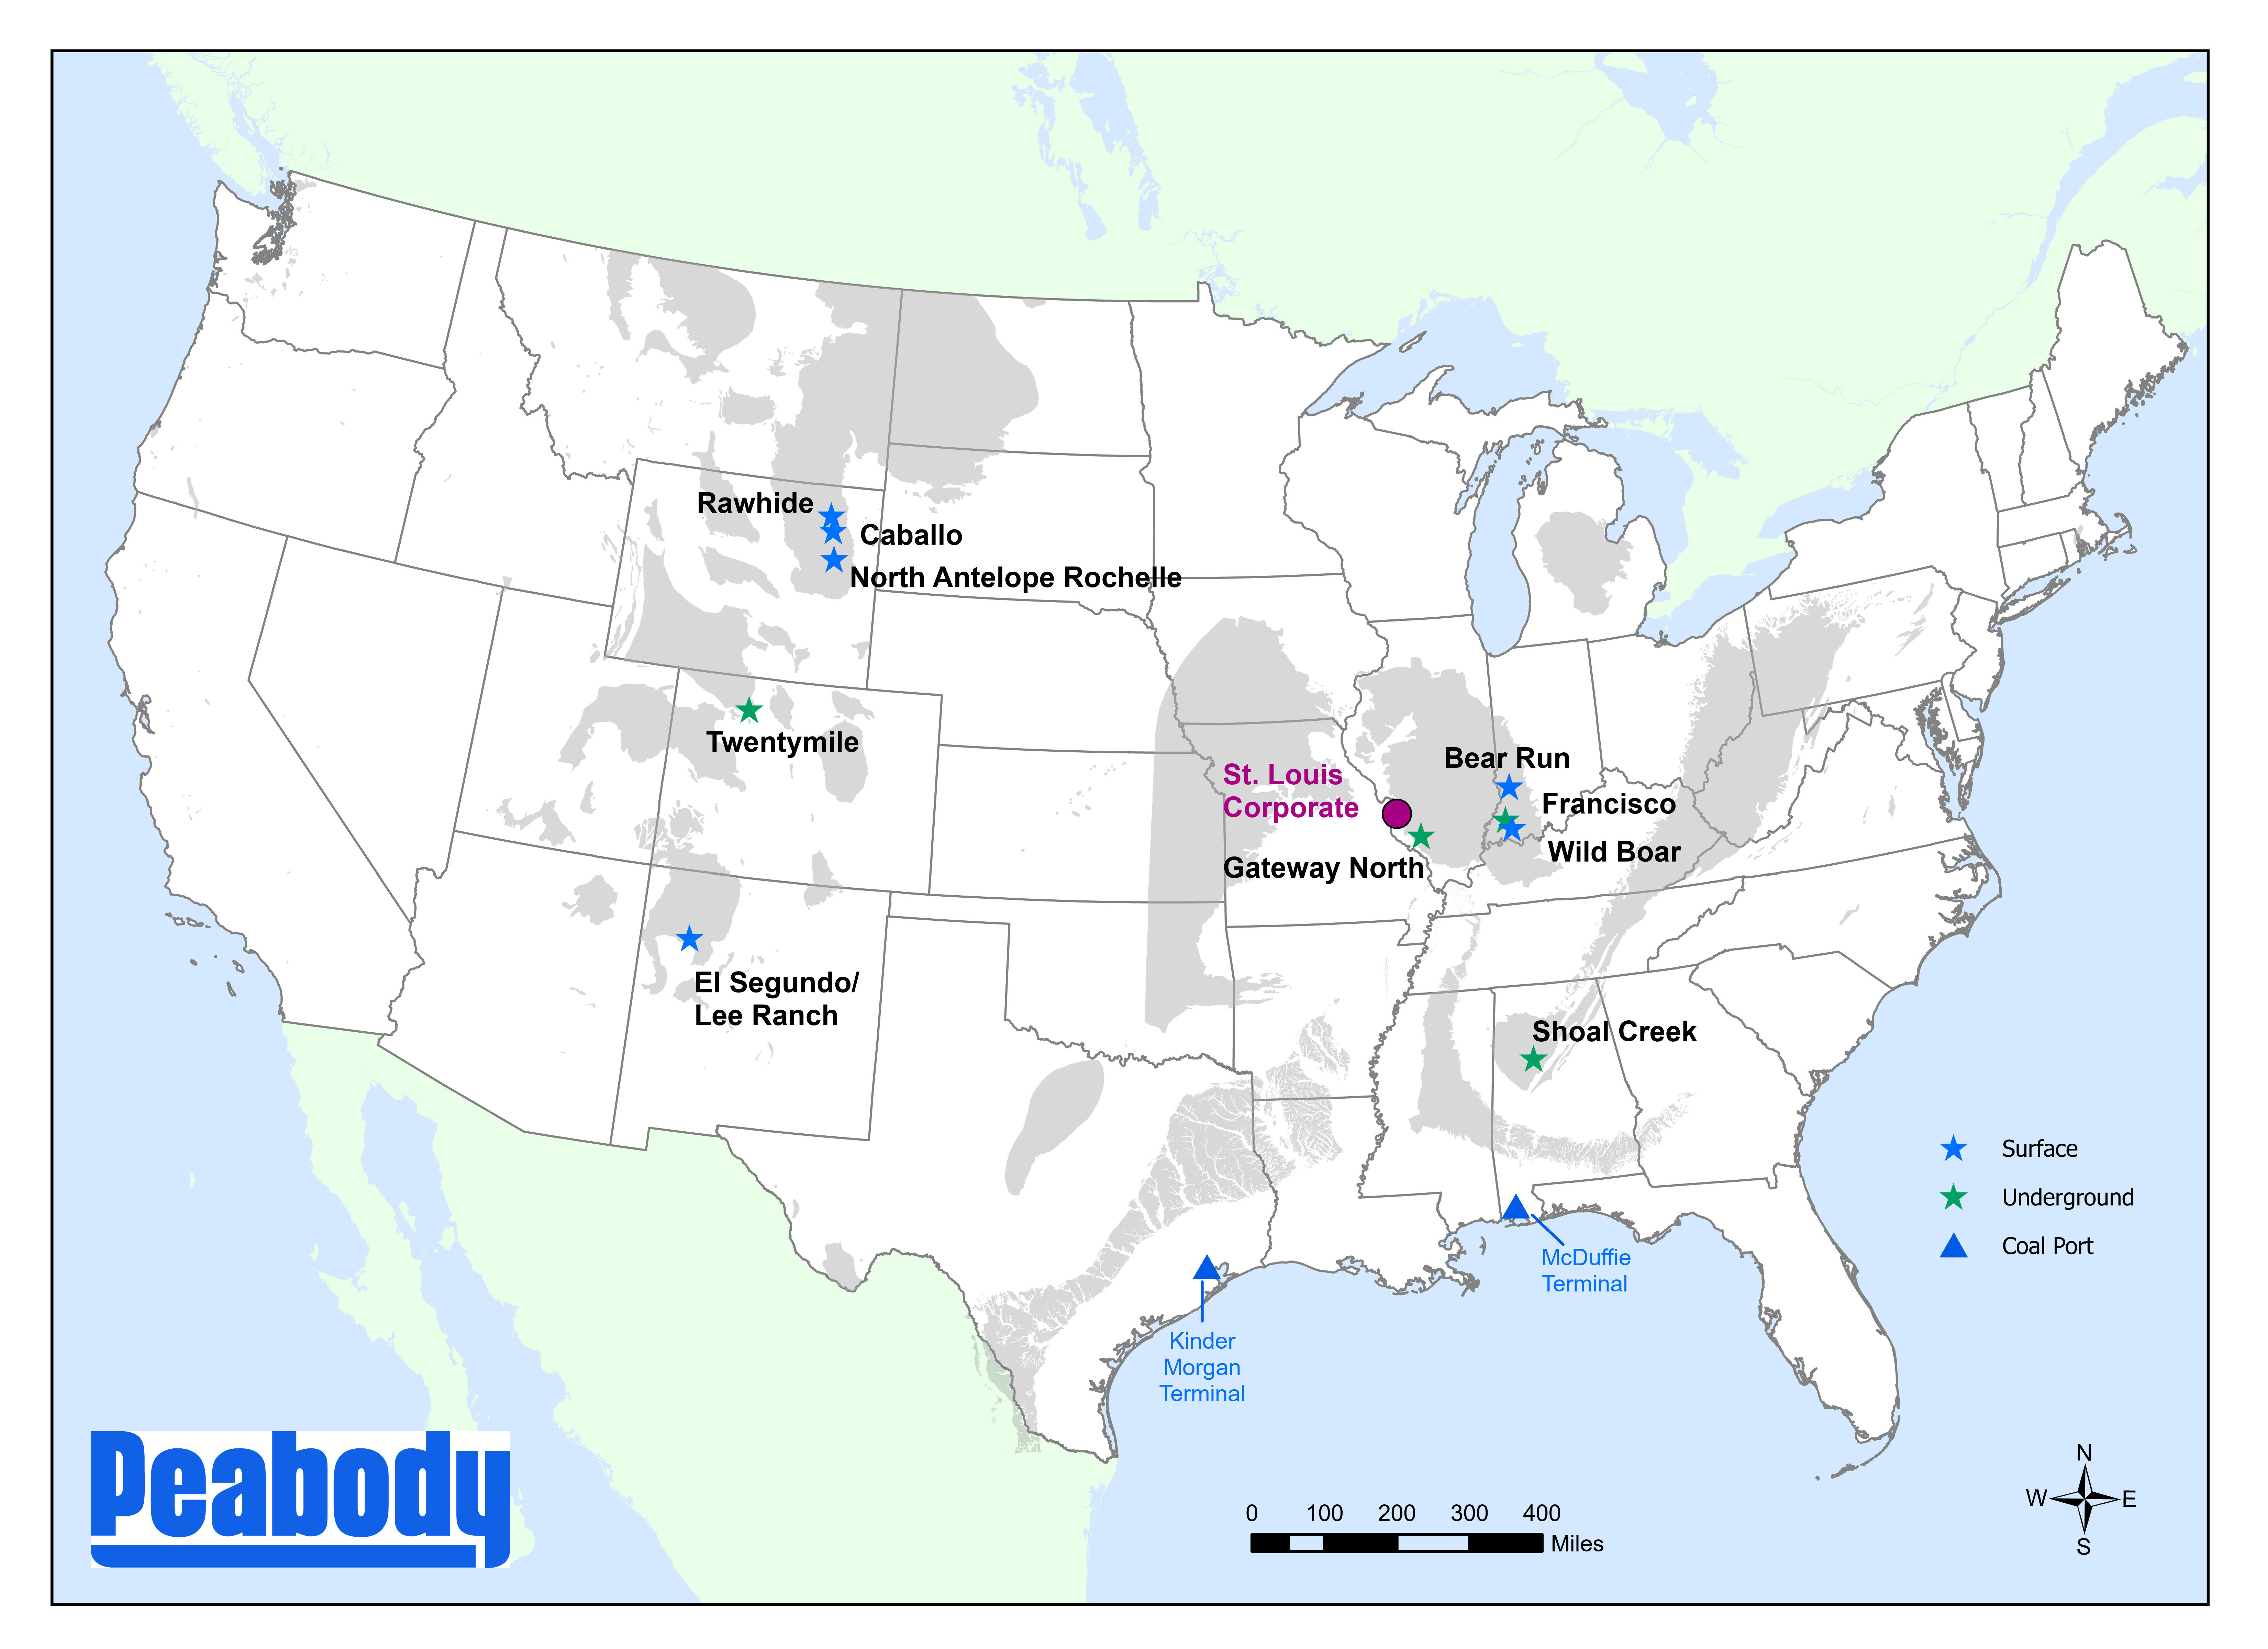
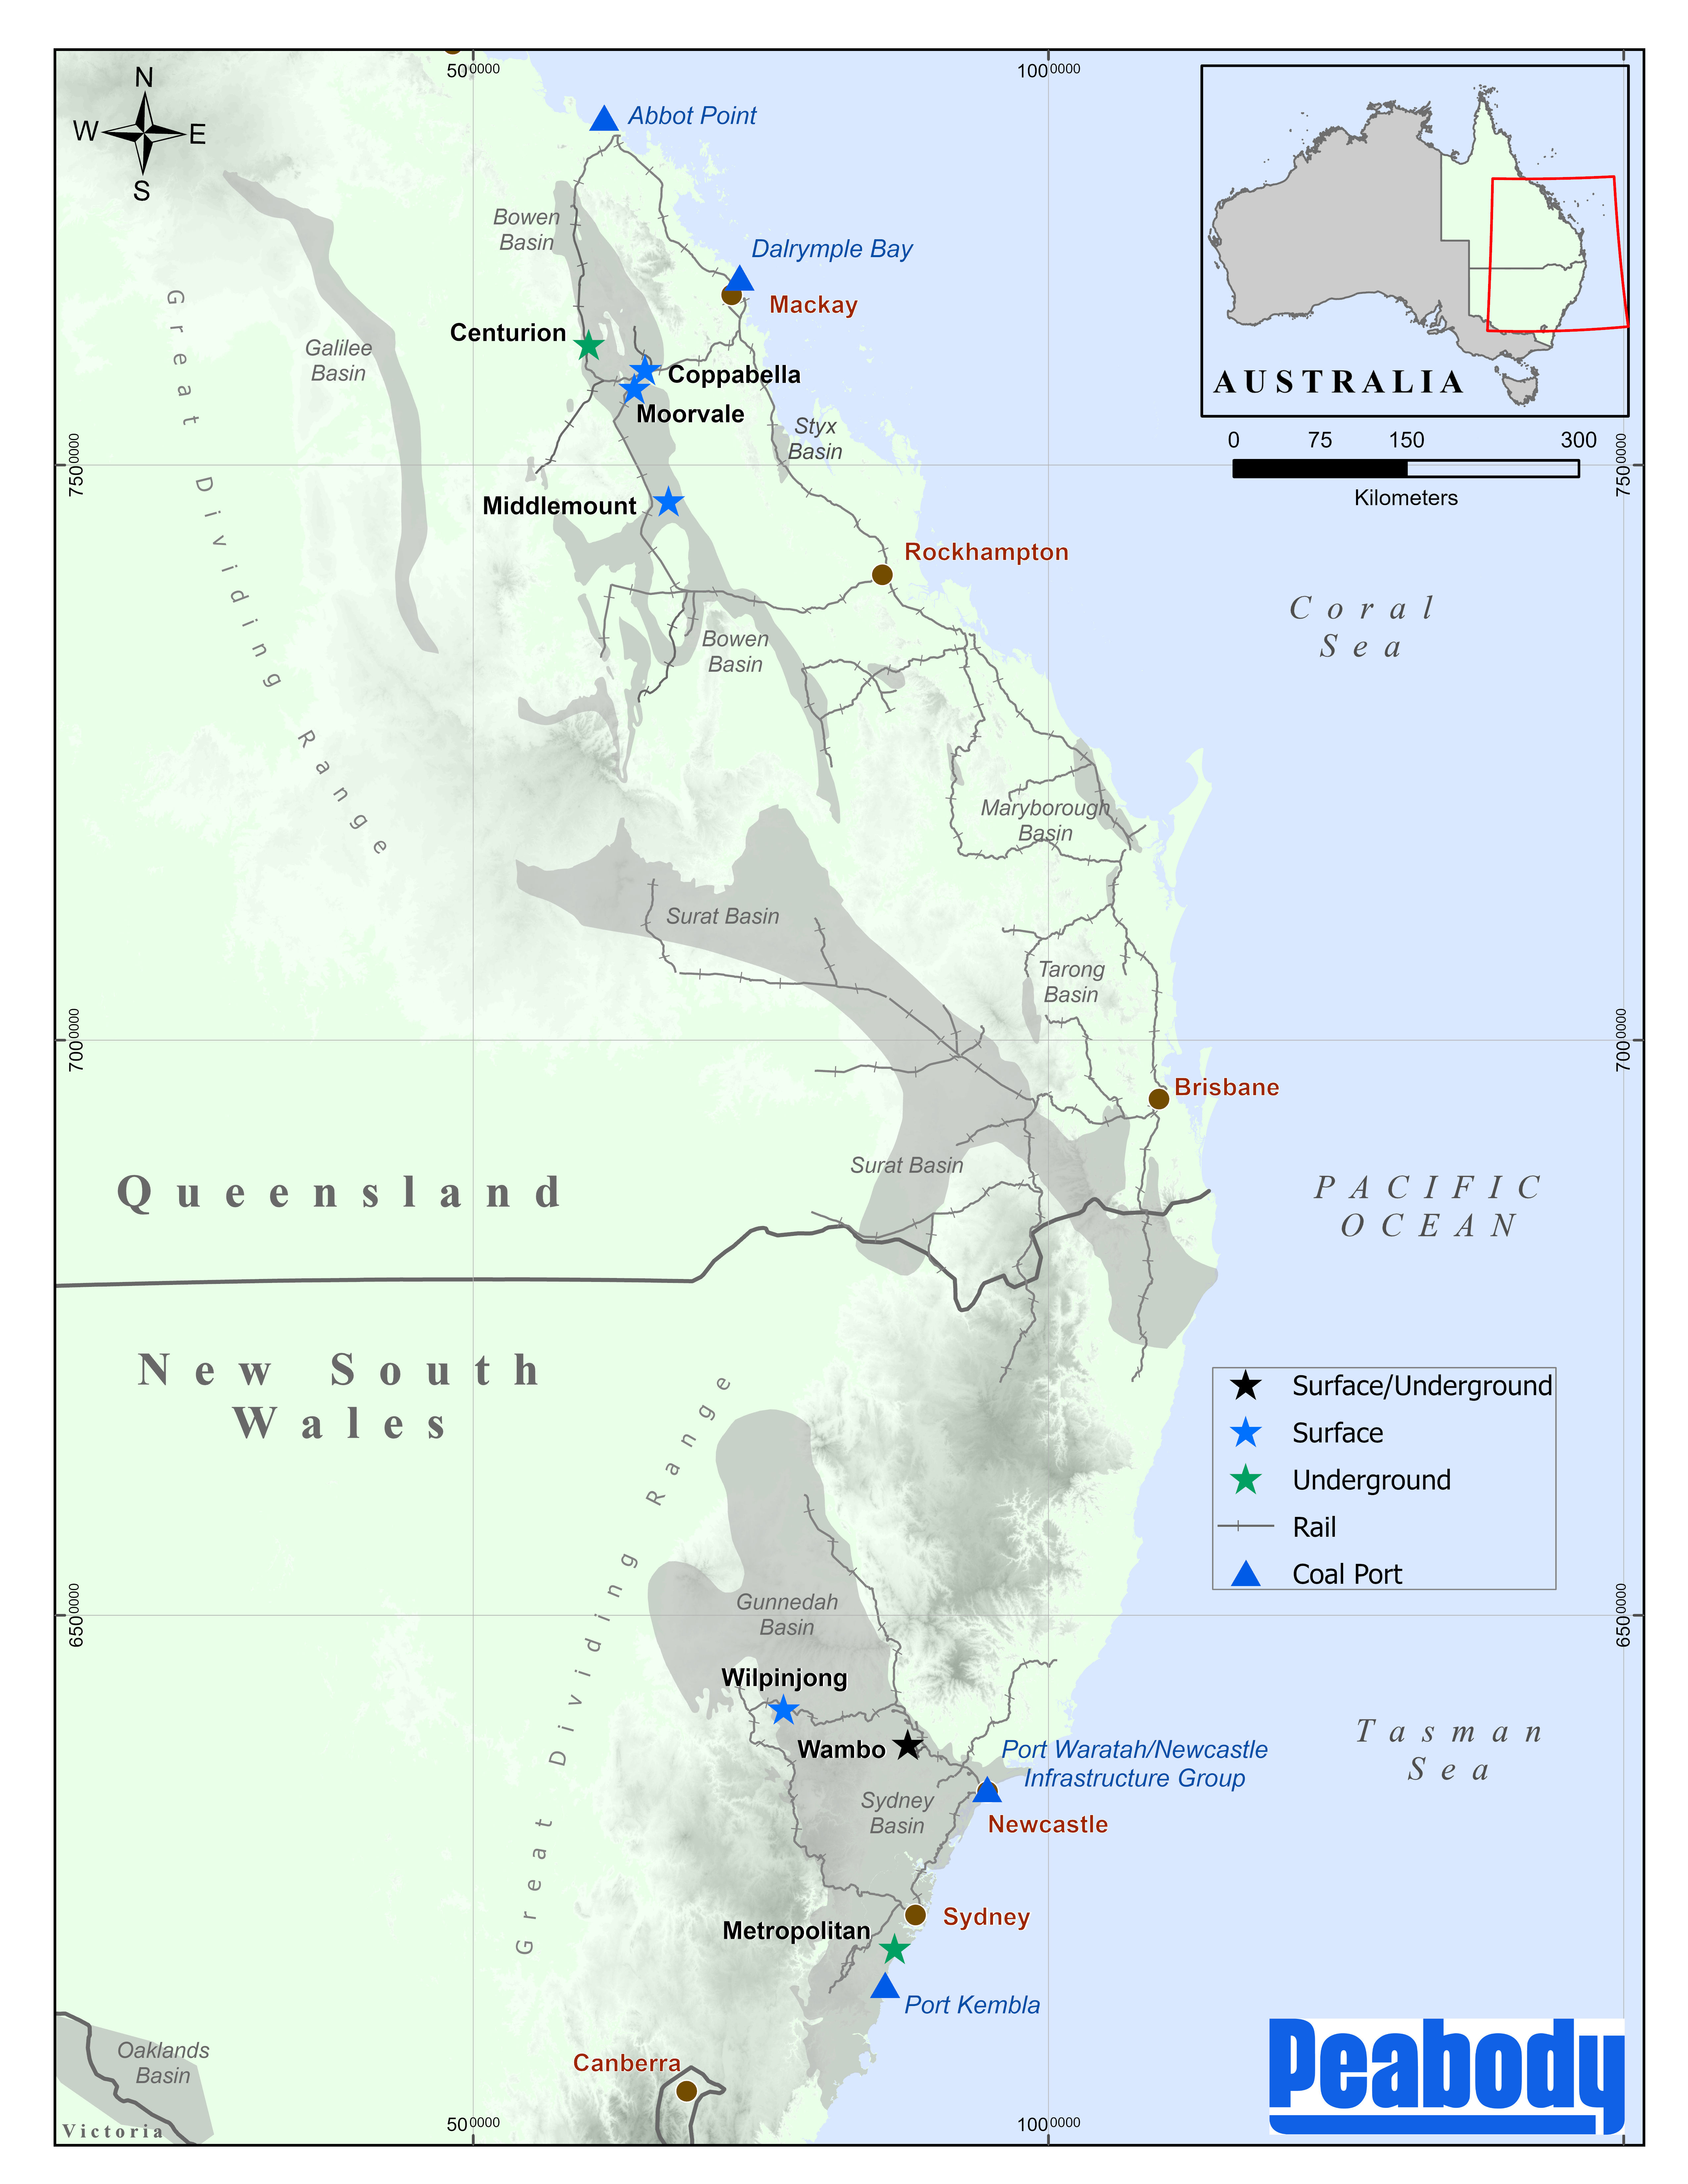
Mining Locations
The maps that follow display Peabody’s active and development mine locations as of December 31, 2024. Also shown are the primary ports that the Company uses for its coal exports and the Company’s corporate headquarters in St. Louis, Missouri.
| | | | | | | | |
| Peabody Energy Corporation | 2024 Form 10-K | 2 |
U.S. Locations
| | | | | | | | |
| Peabody Energy Corporation | 2024 Form 10-K | 3 |
Australian Locations
| | | | | | | | |
| Peabody Energy Corporation | 2024 Form 10-K | 4 |
The table below summarizes information regarding the operating characteristics of each of the Company’s mines in the U.S. and Australia. The mines are listed within their respective reporting segment in descending order, as determined by tons produced in 2024.
| | | | | | | | | | | | | | | | | | | | | | | | | | | | | | | | | | | | | | | | | | | | | | | | | | | | | | | | |
| | | | | | | | | | | | | | Production |
| Segment/Mining Complex | | Location | | Mine Type | | Mining Method | | Coal Type | | Primary Transport Method | | Processing
Plants | | Year Ended December 31, |
| | | | | | | 2024 | | 2023 | | 2022 |
| Seaborne Thermal | | | | | | | | | | | | (Tons in millions) |
| Wilpinjong | | New South Wales | | S | | D, T/S | | T | | R, EV | | Yes | | 12.6 | | | 12.0 | | | 12.1 | |
Wambo Open-Cut (1) | | New South Wales | | S | | T/S | | T, C | | R, EV | | Yes | | 3.3 | | | 2.6 | | | 2.0 | |
Wambo Underground (2) | | New South Wales | | U | | LW | | T, C | | R, EV | | Yes | | 1.4 | | | 1.2 | | | 1.1 | |
| Seaborne Metallurgical | | | | | | | | | | | | | | | | |
Shoal Creek (3) | | Alabama | | U | | LW | | C | | B, EV | | Yes | | 2.1 | | | 0.6 | | | 0.8 | |
| Metropolitan | | New South Wales | | U | | LW | | C, P, T | | R, EV | | Yes | | 1.8 | | | 2.2 | | | 1.8 | |
Coppabella (4) | | Queensland | | S | | DL, D, T/S | | P | | R, EV | | Yes | | 1.7 | | | 2.2 | | | 2.4 | |
Moorvale (4) | | Queensland | | S | | D, T/S | | C, P, T | | R, EV | | Yes | | 1.5 | | | 2.2 | | | 1.5 | |
| | | | | | | | | | | | | | | | | | |
Centurion (5) | | Queensland | | U | | LW | | C | | R, EV | | Yes | | 0.2 | | | — | | | — | |
Middlemount (6) | | Queensland | | S | | D, T/S | | C, P | | R, EV | | Yes | | — | | | — | | | — | |
| Powder River Basin | | | | | | | | | | | | | | | | |
| North Antelope Rochelle | | Wyoming | | S | | DL, D, T/S | | T | | R | | No | | 59.7 | | | 62.0 | | | 60.4 | |
| Caballo | | Wyoming | | S | | D, T/S | | T | | R | | No | | 10.8 | | | 15.3 | | | 12.1 | |
| Rawhide | | Wyoming | | S | | D, T/S | | T | | R | | No | | 9.1 | | | 9.8 | | | 10.3 | |
| Other U.S. Thermal | | | | | | | | | | | | | | | | |
| Bear Run | | Indiana | | S | | DL, D, T/S | | T | | Tr, R, EV | | Yes | | 5.0 | | | 5.5 | | | 6.7 | |
| El Segundo/Lee Ranch | | New Mexico | | S | | DL, D, T/S | | T | | R | | No | | 2.4 | | | 3.4 | | | 3.7 | |
| Gateway North | | Illinois | | U | | CM | | T | | Tr, R, R/B, T/B, EV | | Yes | | 2.1 | | | 2.5 | | | 2.4 | |
| Wild Boar | | Indiana | | S | | HW, DL, D, T/S | | T | | Tr, R, R/B, T/B | | Yes | | 1.8 | | | 1.9 | | | 2.3 | |
| Francisco Underground | | Indiana | | U | | CM | | T | | R | | Yes | | 1.6 | | | 2.0 | | | 1.8 | |
| Twentymile | | Colorado | | U | | LW | | T | | R, Tr, EV | | Yes | | 1.0 | | | 1.3 | | | 1.5 | |
| | | | | | | | | | | | | | | | | | |
| | | | | | | | | | | | | | | | | | |
| | | | | | | | | | | | | | | | | | |
| | | | | | | | | | | | | | | | | | |
| | | | | | | | | | | | | | |
| Legend: | | | |
| S | Surface Mine | | B | Barge |
| U | Underground Mine | | Tr | Truck |
| HW | Highwall Miner | | R/B | Rail to Barge |
| DL | Dragline | | T/B | Truck to Barge |
| D | Dozer/Casting | | T/R | Truck to Rail |
| T/S | Truck and Shovel | | EV | Export Vessel |
| LW | Longwall | | T | Thermal/Steam |
| CM | Continuous Miner | | C | Coking |
| R | Rail | | P | Pulverized Coal Injection |
(1)Peabody owns a 50% undivided interest in an unincorporated joint venture that owns the Wambo Open-Cut Mine. The tons shown reflect its share. The Company’s 50% joint venture interest is subject to an outside non-controlling ownership interest.
(2)Majority-owned mine in which there is an outside non-controlling ownership interest.
(3)The mine experienced a fire in March 2023 and restarted production in June 2023.
(4)Peabody owns a 73.3% undivided interest in an unincorporated joint venture that owns the Coppabella and Moorvale mines. The tons shown reflect its share.
(5)The mine has been undergoing development since 2023. The first development coal was produced in June 2024. Longwall mining is expected to commence in the first quarter of 2026.
(6)Peabody owns a 50% equity interest in Middlemount, which owns the Middlemount Mine. Because Middlemount is accounted for as an unconsolidated equity affiliate, the table above excludes tons produced from that mine, which totaled 1.3 million, 1.2 million and 1.4 million tons, respectively (on a 50% basis).
Refer to the Reserves and Resources tables within Item 2. “Properties,” which is incorporated by reference herein, for additional information regarding coal reserves and resources, and product characteristics associated with each mine.
| | | | | | | | |
| Peabody Energy Corporation | 2024 Form 10-K | 5 |
Coal Supply Agreements
Customers. Peabody’s coal supply agreements are primarily with electricity generators, industrial facilities and steel manufacturers. Most of the Company’s sales from its mining operations are made under long-term coal supply agreements (those with initial terms of one year or longer and which often include price reopener and/or extension provisions). A smaller portion of the Company’s sales from its mining operations are made under contracts with terms of less than one year, including sales made on a spot basis. Sales under long-term coal supply agreements comprised approximately 90%, 92% and 85% of the Company’s worldwide sales from its mining operations (by volume) for the years ended December 31, 2024, 2023 and 2022, respectively.
For the year ended December 31, 2024, Peabody derived 27% of its revenue from coal supply agreements from its five largest customers. Those five customers were supplied primarily from 16 coal supply agreements (excluding trading and brokerage transactions) expiring at various times from 2024 to 2028. Peabody’s largest customer in 2024 contributed revenue of approximately $340 million, or approximately 8% of Peabody’s total revenue from coal supply agreements, and has contracts expiring in 2025.
Backlog. Peabody’s sales backlog, which includes coal supply agreements subject to price reopener and/or extension provisions, was approximately 153 million and 221 million tons of coal as of January 1, 2025 and 2024, respectively. Contracts in backlog have remaining terms ranging from one to seven years and represent slightly more than one year of production based on the Company’s 2024 production volume of 118.1 million tons. Approximately 42% of its backlog is expected to be filled beyond 2025.
Seaborne Operations. Revenue from Peabody’s Seaborne Thermal and Seaborne Metallurgical segments represented approximately 55%, 56% and 59% of the Company’s total revenue from coal supply agreements for the years ended December 31, 2024, 2023 and 2022, respectively, during which periods the coal mining activities of those segments contributed approximately 20%, 18% and 18% of the Company’s sales volumes from mining operations, respectively. Production from these segments is primarily sold into the seaborne thermal and metallurgical markets. A majority of the sales in these segments are executed through annual and multi-year international coal supply agreements which primarily contain provisions requiring both parties to renegotiate pricing periodically, with spot, index and quarterly sales arrangements also utilized. Industry commercial practice, and Peabody’s typical practice, is to negotiate pricing for seaborne thermal coal contracts on an annual, spot or index basis and seaborne metallurgical coal contracts on a quarterly, spot or index basis. For its seaborne operations, the portion of sales volume under contracts with a duration of less than one year represented 36% in 2024.
U.S. Thermal Operations. Revenue from Peabody’s Powder River Basin and Other U.S. Thermal segments, in aggregate, represented approximately 45%, 44% and 41% of the Company’s revenue from coal supply agreements for the years ended December 31, 2024, 2023 and 2022, respectively, during which periods the coal mining activities of those segments contributed approximately 80%, 82% and 82% of the Company’s sales volumes from mining operations, respectively. The Company expects to continue selling a significant portion of coal production from its U.S. thermal operating segments under existing long-term supply agreements. Certain customers utilize long-term sales agreements in recognition of the importance of reliability, service and predictable coal prices to their operations. The terms of coal supply agreements result from competitive bidding and extensive negotiations with customers. Consequently, the terms of those agreements may vary significantly in many respects, including price adjustment features, price reopener terms, coal quality requirements, quantity parameters, permitted sources of supply, treatment of environmental constraints, extension options, force majeure and termination and assignment provisions. Peabody’s approach is to selectively renew, or enter into new, long-term supply agreements when it can do so at prices and terms and conditions it believes are favorable.
Transportation
Methods of Distribution. Coal consumed in the U.S. is usually sold at the mine with transportation costs borne by the purchaser. Peabody’s U.S. mine sites are typically adjacent to a rail loop; however, in limited circumstances coal may be trucked to a barge site or directly to customers. Title predominately passes to the purchaser at the rail or barge, as applicable. Peabody’s U.S. and Australian export coal is usually sold at the loading port, with purchasers paying ocean freight. In each case, the Company usually pays transportation costs from the mine to the port, including any demurrage costs (fees paid to third-party shipping companies for loading time that exceeded the stipulated time).
The Company believes it has good relationships with U.S. and Australian rail carriers and port and barge companies due, in part, to its modern coal-loading facilities and the experience of its transportation coordinators. During 2024, lock outages along the Black Warrior River in Alabama, U.S.A. negatively impacted Peabody’s sales volume and transportation costs at the Shoal Creek Mine. The lock outages have largely been resolved during the second half of 2024, and Peabody anticipates improved sales volume and lower transportation costs at the Shoal Creek Mine in 2025. Refer to the table in the foregoing “Mining Locations” section for a summary of transportation methods by mine.
| | | | | | | | |
| Peabody Energy Corporation | 2024 Form 10-K | 6 |
Export Facilities. Peabody has generally secured its ability to transport coal in Australia through rail and port contracts and access to five east coast coal export terminals that are primarily funded through take-or-pay arrangements (refer to the “Liquidity and Capital Resources” section in Part II, Item 7. “Management’s Discussion and Analysis of Financial Condition and Results of Operations” for additional information on its take-or-pay obligations). In Queensland, seaborne thermal and metallurgical coal from the Company’s mines is exported through the Dalrymple Bay Coal Terminal, in addition to the Abbot Point Coal Terminal used by its joint venture Middlemount Mine. In New South Wales, the Company’s primary ports for exporting thermal and metallurgical coal are at Port Kembla and Newcastle, which includes both the Port Waratah Coal Services terminal and the terminal operated by Newcastle Coal Infrastructure Group. Peabody has secured its ability to transport coal from its Shoal Creek Mine under barge and port contracts; the primary port is the McDuffie Terminal in Mobile, Alabama, which the Company utilizes without a take-or-pay arrangement.
Peabody’s U.S. thermal operations exported less than 1% of their annual tons sold during the year ended December 31, 2022. No tons were exported during the years ended December 31, 2024 and 2023. The primary port used for U.S. thermal exports is the Kinder Morgan Terminal near Houston, Texas.
Suppliers
Mining Supplies and Equipment. Peabody relies on various goods to support its mining operations, including mining equipment and replacement parts, diesel fuel, ammonium-nitrate and emulsion-based explosives, off-the-road tires, steel-related products (such as roof control materials), lubricants and electricity. The Company has established strong, strategic relationships with key suppliers and does not consider itself overly dependent on any single supplier.
When Peabody has chosen to concentrate a significant portion of its purchases with one supplier, it has been to leverage cost savings from bulk purchases, secure long-term pricing for parts and ensure a reliable supply chain. This approach also enables fleet standardization for mining equipment, improving asset utilization, streamlining maintenance practices across global operations and optimizing inventory management, which reduces working capital.
In 2024, lead times for parts and components required for surface and underground mining equipment showed notable improvement. Peabody continues to leverage its global purchasing power and comprehensive planning strategies to maintain a reliable supply chain that effectively supports the needs of its active mines.
Services. In addition to goods, Peabody also contracts services for its mine sites, such as maintenance for mining equipment, construction, temporary labor, explosives use and other requirements. The Company does not perceive any undue operational or financial risk from reliance on individual service providers.
In 2024, inflationary pressures stabilized, returning to more normal levels, and supply chain constraints eased. This resulted in improved access to materials and supplies necessary to support mining operations.
Competition
Demand for coal and the prices that the Company will be able to obtain for its coal are highly competitive and influenced by factors beyond the Company’s control, including but not limited to global economic conditions; the demand for electricity and steel; the cost of alternative sources; the impact of weather on heating and cooling demand; the capacity and cost of transportation; geopolitical risks; and taxes and environmental regulations imposed by the U.S. and foreign governments.
Thermal Coal. Demand for Peabody’s thermal coal products is impacted by economic conditions; demand for electricity, which is impacted by energy efficient products; and the cost of electricity generation from coal and alternative forms of generation. Regulatory policies and environmental, social and governance considerations can also have an impact on generation choices and coal consumption. The Company’s products compete with producers of other forms of electricity generation, including natural gas, oil, nuclear, hydro, wind, solar and biomass, that provide an alternative to coal use. The use and price of thermal coal is heavily influenced by the availability and relative cost of alternative fuel sources and the generation of electricity utilizing alternative fuels, with customers focused on securing the lowest cost fuel supply in order to coordinate the most efficient utilization of generating resources in the economic dispatch of the power grid at the most competitive price.
| | | | | | | | |
| Peabody Energy Corporation | 2024 Form 10-K | 7 |
In the U.S., natural gas is highly competitive (along with other alternative fuel sources) with thermal coal for electricity generation. The competitiveness of natural gas has been strengthened by continued growth in domestic natural gas production and new natural gas combined cycle generation capacity. The Henry Hub Natural Gas Prompt Price averaged $2.41 per mmBtu in 2024, versus $2.66 and $6.54 per mmBtu in 2023 and 2022, respectively. In addition, the competitiveness of other alternative fuel sources for electricity generation has been strengthened by the growth of renewable energy generation. These pressures, coupled with regulatory burdens, contributed to a significant number of coal plant retirements. During 2024, approximately 6 gigawatts of U.S. coal power capacity was retired, and since 2010, U.S. coal power capacity has fallen by approximately forty-two percent. Conversely, emerging technologies, including data centers, artificial intelligence and cryptocurrency, are expected to drive U.S. electricity demand in coming years. As a result, U.S. coal consumption is expected to increase in 2025 which has led to deferrals of planned coal plant retirements.
Internationally, thermal coal also competes with alternative forms of electricity generation. The competitiveness and availability of natural gas, liquefied natural gas, oil, nuclear, hydro, wind, solar and biomass varies by country and region. Seaborne thermal coal consumption is also impacted by the competitiveness of delivered seaborne thermal coal supply from key exporting countries such as Indonesia, Australia, Colombia, the U.S., Russia and South Africa, among others. In addition, seaborne thermal coal import demand can be significantly impacted by the availability of domestic coal production, particularly in the two leading coal import countries, China and India, among others. Global thermal coal markets were turbulent during 2022 and 2023, due in part to the Russian-Ukrainian conflict and the subsequent ban of Russian coal by European countries. Economic sanctions have continued to influence trade flows of thermal coal in 2024.
In addition to its alternative fuel source competitors, Peabody’s principal U.S. direct coal supply competitors (listed alphabetically) are other large coal producers, including Alliance Resource Partners; American Consolidated Natural Resources, Inc.; Core Natural Resources, Inc.; Eagle Specialty Materials LLC; Foresight Energy; Hallador Energy; Kiewit; and Navajo Transitional Energy Company LLC, among others. Major international direct coal supply competitors (listed alphabetically) include Adaro Energy; BHP; Bumi Resources; China Shenhua Energy; Coal India Limited; Drummond Company; Glencore; SUEK; Whitehaven Coal Limited; and Yancoal Australia Ltd, among others.
Metallurgical Coal. Demand for Peabody’s metallurgical coal products is impacted by economic conditions; government policies; demand for steel; and competing technologies used to make steel, some of which do not use coal as a manufacturing input, such as electric arc furnaces. The Company competes on the basis of coal quality and characteristics, delivered energy cost (including transportation costs), customer service and support and reliability of supply.
Seaborne metallurgical coal import demand can be significantly impacted by the availability of domestic coal production, particularly in leading metallurgical coal import countries such as China, among others, and the competitiveness of seaborne metallurgical coal supply from leading metallurgical coal exporting countries of Australia, the U.S., Russia, Canada, Mongolia and Mozambique, among others. Trade flow disruptions occurred during 2022 and 2023 related to sanctions imposed on Russian coal imports.
Major international direct competitors (listed alphabetically) include Anglo American; BHP; Core Natural Resources, Inc.; Foxleigh; Glencore; Jellinbah; KRU; Oak Grove Mine; Stanmore; Warrior Met Coal; Whitehaven Coal Limited; and Yancoal Australia Ltd, among others.
Human Capital
Peabody had approximately 5,600 employees as of December 31, 2024, including approximately 4,300 hourly employees. Additional information on its employees and related labor relations matters is contained in Note 19. “Management — Labor Relations” to the accompanying consolidated financial statements, which information is incorporated herein by reference. Peabody endeavors to engage with its organized workforce and foster strong relationships with those organizations built on trust and communication.
As of December 31, 2024, approximately 3,500 of Peabody’s employees are located in the U.S., with the remainder primarily located in Australia. About 94% of its team members work for mine operations in the U.S. and Australia, while the remaining are based out of its global headquarters in St. Louis or its business offices in Brisbane and Beijing.
Peabody strives to create a strong, united workforce with a commitment to safety as a way of life. In 2024, the Company achieved a global safety incidence rate of 0.81 incidents per 200,000 hours worked, which was 73% better than the 2023 U.S. industry average incidence rate of 2.98 incidents per 200,000 hours worked per the Mine Safety and Health Administration (MSHA).
| | | | | | | | |
| Peabody Energy Corporation | 2024 Form 10-K | 8 |
Peabody strives to offer a work environment that recognizes and develops employees. Peabody seeks a workforce that is comprised of diverse backgrounds, thoughts and experiences as a means to drive innovation and excellence within its business. Such diversity may also serve to mitigate risks to the business in the current tight labor market. The Company strives to attract and retain the best people, develop their potential and align their skills to important initiatives and activities. Peabody believes in fostering a work environment built on mutual trust, respect and engagement. Peabody invests in its employees through health and wellness programs, competitive total rewards and development opportunities. Peabody actively seeks employees' feedback, including through surveys and focus groups on its employee value proposition.
The typical Peabody employee has approximately seven and a half years of experience with the Company, and approximately 46% of all Peabody employees remain employed with the company for more than five years. The Company offers a variety of learning events, including mentoring and development programs to aid its employees in their career growth. During the past five years, approximately 28% of open positions and 63% of director and above positions have been filled by internal candidates through promotions or lateral career development opportunities.
Information About Our Executive Officers
Set forth below are the names, ages and positions of Peabody’s executive officers. Executive officers are appointed by, and hold office at the discretion of, Peabody’s Board of Directors (the Board), subject to the terms of any employment agreements.
| | | | | | | | | | | | | | |
| Name | | Age (1) | | Position (1) |
| James C. Grech | | 63 | | President and Chief Executive Officer |
| Mark A. Spurbeck | | 51 | | Executive Vice President and Chief Financial Officer |
| Darren R. Yeates | | 64 | | Executive Vice President and Chief Operating Officer |
| Scott T. Jarboe | | 51 | | Chief Administrative Officer and Corporate Secretary |
| Patrick J. Forkin III | | 66 | | Chief Development Officer |
| Malcolm Roberts | | 51 | | Chief Marketing Officer |
(1) As of February 14, 2025.
James C. Grech was named Peabody’s President and Chief Executive Officer in June 2021. He has over 30 years of experience in the coal and natural resources industry. Mr. Grech served as Chief Executive Officer and a member of the Board of Directors of Wolverine Fuels, LLC, a thermal coal producer and marketer based in Sandy, Utah, from July 2018 until May 2021. Prior to joining Wolverine Fuels, LLC, Mr. Grech served as President of Nexus Gas Transmission from October 2016 to July 2018, and previously held the position of Chief Commercial Officer and Executive Vice President of Consol Energy. Mr. Grech brings a strong operational, commercial and financial background in both mining and other energy business operations and has extensive utilities and capital markets experience. He serves as a director of Blue Danube. Mr. Grech holds a Bachelor of Science in Electrical Engineering from Lawrence Technological University and an MBA from the University of Michigan.
Mark A. Spurbeck was named Peabody’s Executive Vice President and Chief Financial Officer in June 2020, after serving in an interim capacity from January 2020 through June 2020. He oversees finance, treasury, tax, internal audit, financial reporting, financial planning, risk and mine finance, corporate accounting functions, investor relations and corporate communications, information technology and shared services. Mr. Spurbeck has more than 25 years of accounting and financial experience, most recently serving as the Company’s Senior Vice President and Chief Accounting Officer from early 2018 to January 2020. Prior to joining Peabody, Mr. Spurbeck served as Vice President of Finance and Chief Accounting Officer at Coeur Mining, Inc., a diversified precious metals producer, from March 2013 to January 2018. He also previously held multiple financial positions at Newmont Mining Corporation, a leading gold and copper producer, First Data Corporation, a financial services company, and Deloitte LLP, an international accounting, tax and advisory firm. Mr. Spurbeck is a Certified Public Accountant (inactive) and holds a Bachelor’s Degree in Accounting from Hillsdale College.
| | | | | | | | |
| Peabody Energy Corporation | 2024 Form 10-K | 9 |
Darren R. Yeates was named Peabody’s Executive Vice President and Chief Operating Officer in October 2020. He has executive responsibility for global operations including health, safety and environment, mine operations, technical, procurement, and sales and marketing. Mr. Yeates has over 40 years of mining industry experience. From May 2018 to December 2019, Mr. Yeates served as Chief Operating Officer of MACH Energy Australia, a developer and supplier of thermal coal to both the Australian domestic and Asian export markets. From January 2014 until June 2016, Mr. Yeates served as the Chief Executive Officer of GVK Hancock Coal, a joint venture developing the vast potential of the Galilee Basin in Central Queensland. Prior to that, he spent over 22 years with Rio Tinto, a global mining group, including as Acting Managing Director and Chief Operating Officer for Coal Australia, General Manager Ports and Infrastructure for Pilbara Iron and General Manager Tarong Coal. Prior to joining Rio Tinto, Mr. Yeates worked for six years for BHP, a mining, metals and petroleum company, in coal operations and metalliferous exploration. Mr. Yeates holds a Bachelor of Engineering (Mining) from the University of Queensland, a Graduate Diploma in Management from the University of Central Queensland and a Graduate Diploma of Applied Finance and Investment from the Securities Institute of Australia. He holds an Executive MBA from the Monash Mt Eliza Business School and is a Fellow of the Australian Institute of Company Directors.
Scott T. Jarboe was named Peabody’s Chief Administrative Officer and Corporate Secretary in November 2021 after serving as Chief Legal Officer and Corporate Secretary since March 2020. He leads the Company’s global human resources, legal, government affairs, and ethics and compliance functions. Mr. Jarboe joined Peabody in 2010 and has served in a variety of legal roles. Previously, Mr. Jarboe practiced law with Husch Blackwell LLP and Bryan Cave LLP. Mr. Jarboe holds a Bachelor of Arts Degree from the University of Kansas, a Master’s Degree from the University of Missouri – Kansas City and a Juris Doctor degree from Washington University School of Law.
Patrick J. Forkin III was named Chief Development Officer in July 2022 after serving as Senior Vice President - Corporate Development and Strategy since November 2017. He leads global strategy, mergers and acquisitions, portfolio management and renewable energy development. Mr. Forkin joined Peabody in 2010 and has served in a variety of roles. He has an extensive background in corporate finance, the energy industry, mergers and acquisitions and equity market research. Prior to joining Peabody, Mr. Forkin was in senior leadership roles at a U.S. solar development company and investment banking firms specializing in renewable and conventional energy. He spent the first nine years of his career at Deloitte LLP. Mr. Forkin holds a Bachelor of Science degree in Accountancy from the University of Illinois at Urbana-Champaign and is a Certified Public Accountant (inactive).
Malcolm Roberts was named Chief Marketing Officer in May 2023. He has responsibility for all Peabody sales, marketing and logistics. Mr. Roberts joined Peabody in 2021 as Executive General Manager - Sales & Marketing. He has more than 25 years of experience in the resources and commodities industry, focused on the energy and steel sector, with roles encompassing key aspects of the value chain including finance, commercial, trading and sales and marketing. During the period of October 2018 to June 2020, Mr. Roberts was a senior trading lead within the trading division of Heidelberg Cement, a company with global operations in the cement and concrete industry. His responsibilities included leading a team of traders focused on the trading of solid fuel and other cementitious products. Prior to that, Mr. Roberts spent thirteen years in sales and marketing roles with Rio Tinto primarily within their Energy Product Group, including eleven years in leadership roles covering Rio Tinto’s global coal sales, marketing, trading, logistics and analytics functions, encompassing both metallurgical and thermal coal. Prior to this, Mr. Roberts worked within sales and marketing and finance roles in both mining and manufacturing industries. Mr. Roberts holds an undergraduate degree in Commerce and Management from Lincoln University in New Zealand and is a CA member of Chartered Accountants Australia and New Zealand.
Regulatory Matters — U.S.
Federal, state and local authorities regulate the U.S. coal mining industry with respect to matters such as employee health and safety, permitting and licensing requirements, air quality standards, water pollution, plant and wildlife protection, the reclamation and restoration of mining properties after mining has been completed, the discharge of materials into the environment, surface subsidence from underground mining and the effects of mining on groundwater quality and availability. In addition, the industry is affected by significant requirements mandating certain benefits for current and retired coal miners. Numerous federal, state and local governmental permits and approvals are required for mining operations. Peabody believes that it has obtained all permits currently required to conduct its present mining operations.
The Company endeavors to conduct its mining operations in compliance with all applicable federal, state and local laws and regulations. However, because of extensive and comprehensive regulatory requirements, violations during mining operations occur from time to time in the industry. The Company continually monitors the laws and regulations for changes resulting from updated legislation, judicial decisions and changes in governmental administrations.
| | | | | | | | |
| Peabody Energy Corporation | 2024 Form 10-K | 10 |
Mine Safety and Health
Peabody is subject to health and safety standards both at the federal and state level. The regulations are comprehensive and affect numerous aspects of mining operations, including training of mine personnel, mining procedures, blasting, the equipment used in mining operations and other matters.
MSHA is the entity responsible for monitoring compliance with the federal mine health and safety standards. MSHA employs various enforcement measures for noncompliance, including the issuance of monetary penalties and orders of withdrawal from a mine or part of a mine.
In Part I, Item 4. “Mine Safety Disclosures” and in Exhibit 95 to this Annual Report on Form 10-K, the Company provides additional details on MSHA compliance.
Black Lung (Coal Workers’ Pneumoconiosis)
Black Lung Benefits. Under the U.S. Black Lung Benefits Revenue Act of 1977 and the Black Lung Benefits Reform Act of 1977, as amended in 1981, each U.S. coal mine operator who was the last to employ a claimant for a cumulative year of employment, with the last day worked for the operator after July 1, 1973, must pay federal black lung benefits and medical expenses to claimants whose claims for benefits are allowed. Coal mine operators must also make payments to a trust fund for the payment of benefits and medical expenses to claimants who last worked in the coal industry prior to July 1, 1973. The federal black lung program also includes automatic survivor benefits paid upon the death of a miner with an awarded black lung claim and a rebuttable presumption with regard to pneumoconiosis among miners with 15 or more years of coal mine employment that are totally disabled by a respiratory condition.
The trust fund has been funded by an excise tax on U.S. production. From January 1, 2022 through September 30, 2022 the excise tax rates were set at 2% of the gross sales price not to exceed $0.50 per ton of underground coal and $0.25 per ton of surface coal. Effective October 1, 2022, the excise tax rates were set at 4.4% of the gross sales price not to exceed $1.10 per ton of underground coal and $0.55 per ton of surface coal due to the enactment of the Inflation Reduction Act of 2022.
Peabody recognized expense related to the tax of $52.2 million, $57.4 million and $32.4 million for the years ended December 31, 2024, 2023 and 2022, respectively.
Black Lung Benefits Act Self-Insurance Requirements. The Black Lung Benefits Act requires each coal mine operator to secure the payment of its potential benefits liability by either qualifying as a self-insurer or by purchasing and maintaining a commercial insurance contract. The Department of Labor’s (DOL) Office of Workers’ Compensation Programs (OWCP) is responsible for authorizing coal mine operators to self-insure and for setting the security amounts. As part of its ongoing efforts to reform the self-insurance program to ensure that operators are adequately securing their liabilities, the OWCP finalized a rule on December 12, 2024 to update its regulations for authorizing operators to self-insure and for determining appropriate security amounts.
The changed requirements for security posted to self-insure black lung liabilities could result in the Company being required to post additional security for its obligations.
Environmental Laws and Regulations
Peabody is subject to various federal, state, local and tribal environmental laws and regulations. These laws and regulations place substantial requirements on its coal mining operations and require regular inspection and monitoring of its mines and other facilities to ensure compliance. The Company is also affected by various other federal, state, local and tribal environmental laws and regulations that impact its customers.
Surface Mining Control and Reclamation Act. In the U.S., the Surface Mining Control and Reclamation Act of 1977 (SMCRA), which is administered by the Office of Surface Mining Reclamation and Enforcement (OSMRE), established mining, environmental protection and reclamation standards for surface mining and underground mining. Mine operators must obtain SMCRA permits and permit renewals for mining operations from OSMRE or from the respective state regulatory authority. Where state regulatory agencies have adopted federal mining programs under SMCRA, the state becomes the primary regulatory authority, with oversight from OSMRE. States in which Peabody has active mining operations have achieved primacy control of enforcement through federal authorization. In Arizona, where Peabody performs reclamation work on tribal lands, the Company is regulated by OSMRE because the tribes do not have SMCRA authorization.
| | | | | | | | |
| Peabody Energy Corporation | 2024 Form 10-K | 11 |
SMCRA provides for three categories of bonds: surety bonds, collateral bonds and self-bonds. A surety bond is an indemnity agreement in a sum certain payable to the regulatory authority, executed by the permittee as principal and which is supported by the performance guarantee of a surety corporation. A collateral bond can take several forms, including cash, letters of credit, first lien security interest in property or other qualifying investment securities. A self-bond is an indemnity agreement in a sum certain executed by the permittee or by the permittee and any corporate guarantor made payable to the regulatory authority.
The Company’s total reclamation bonding requirements in the U.S. were $893.1 million as of December 31, 2024. The bond requirements for a mine represent the calculated cost to reclaim the current operations of a mine if it ceased to operate in the current period. The cost calculation for each bond must be completed according to the regulatory authority of each state or OSMRE. The Company’s asset retirement obligations calculated in accordance with generally accepted accounting principles for its active and inactive U.S. operations were $473.3 million as of December 31, 2024. The bond requirement amount for the Company’s U.S. operations significantly exceeds the financial liability for final mine reclamation because the asset retirement obligation liability is discounted from the end of the mine’s economic life to the balance sheet date in recognition that the final reclamation cash outlay is projected to be a number of years away. The bond amount, in contrast with the asset retirement obligation, presumes reclamation begins immediately, as well as different assumptions related to the cost of equipment and services utilized in the reclamation process.
After a permit application is prepared and submitted to the regulatory agency, it goes through a completeness and technical review. Public notice of the proposed permit is given for a comment period before a permit can be issued. Regulatory authorities have considerable discretion in the timing of the permit issuance and the public has the right to comment on and otherwise engage in the permitting process, including public hearings and through intervention in the courts. Before a SMCRA permit is issued, a mine operator must submit a bond or other form of financial security to guarantee the performance of reclamation bonding requirements.
In situations where the Company’s coal resources are federally owned, the U.S. Bureau of Land Management oversees a substantive exploration and leasing process. If surface land is managed by the U.S. Forest Service, that agency serves as the cooperating agency during the federal coal leasing process. Federal coal leases also require an approved federal mining permit under the signature of the Assistant Secretary of the Department of the Interior.
The SMCRA Abandoned Mine Land Fund requires a fee on all coal produced in the U.S. The proceeds are used to rehabilitate lands mined and left unreclaimed prior to August 3, 1977 and to pay health care benefit costs of orphan beneficiaries of the Combined Fund created by the Coal Industry Retiree Health Benefit Act of 1992. The fee amount can change periodically based on changes in federal legislation. Pursuant to the Abandoned Mine Land Reclamation Amendments of 2021, which Congress enacted on November 15, 2021 as part of the Infrastructure Investment and Jobs Act, from October 1, 2021 through September 30, 2034, the fee is $0.224 and $0.096 per ton of surface-mined and underground-mine coal, respectively. The Company recognized expense related to the fees of $20.4 million, $22.2 million and $21.7 million for the years ended December 31, 2024, 2023 and 2022, respectively.
Clean Air Act (CAA). The CAA, enacted in 1970, and comparable state and tribal laws that regulate air emissions affect the Company’s U.S. coal mining operations both directly and indirectly.
National Ambient Air Quality Standards (NAAQS). The CAA requires the United States Environmental Protection Agency (EPA) to review national ambient air quality standards every five years to determine whether revisions to current standards are appropriate. On March 6, 2024, the EPA revised the level of the primary standard for fine particulate matter (PM 2.5), lowering the annual standard from 12.0 µg/m3 to 9.0 µg/m3. States are now required to take several actions to implement the standards which could require fossil fuel electric generating units (EGUs) and non-EGUs to install additional emission control technologies or operate in a different manner. Such actions could potentially increase the cost of utilizing fossil fuels for electric generation and industrial uses. The revised PM 2.5 standard has been challenged in the U.S. Court of Appeals for the District of Columbia Circuit (D.C. Circuit) in Kentucky v. EPA, (D.C. Cir., No. 24-1050).
The EPA is also in the process of reviewing the current ozone NAAQS. The level of the ozone NAAQS can also affect requirements to install new or improved emission control technologies at fossil fuel-fired EGUs and non-EGU industrial sources.
Final 2015 New Source Performance Standards (NSPS) for Fossil Fuel-Fired EGUs. The EPA promulgated a final rule to limit carbon dioxide (CO2) from new, modified and reconstructed fossil fuel-fired EGUs under Section 111(b) of the CAA on August 3, 2015, and published it in the Federal Register on October 23, 2015.
| | | | | | | | |
| Peabody Energy Corporation | 2024 Form 10-K | 12 |
The rule requires that newly-constructed fossil fuel-fired steam generating units achieve an emission standard for CO2 (known as the Best System of Emission Reduction (BSER)) which is based on the performance of a supercritical pulverized coal boiler implementing partial carbon capture, utilization and storage (CCUS). Modified and reconstructed fossil fuel-fired steam generating units must implement the most efficient generation achievable through a combination of best operating practices and equipment upgrades, to meet an emission standard consistent with best historical performance. Reconstructed EGUs must implement the most efficient generating technology based on the size of the unit.
Numerous legal challenges to the final rule were filed in the D.C. Circuit. Sixteen separate petitions for review were filed, and the challengers include 25 states, utilities, mining companies (including Peabody), labor unions, trade organizations and other groups. The cases were consolidated under the case filed by North Dakota (D.C. Cir. No. 15-1381). Four additional cases were filed seeking review of the EPA’s denial of reconsideration petitions in a final action published in the May 6, 2016 Federal Register entitled “Reconsideration of Standards of Performance for Greenhouse Gas Emissions From New, Modified, and Reconstructed Stationary Sources: Electric Generating Units; Notice of final action denying petitions for reconsideration.” Pursuant to an order of the court, these cases remain in abeyance, subject to requirements for the EPA to file 90-day status reports.
EPA Regulation of Greenhouse Gas Emissions from New and Existing Fossil Fuel-Fired EGUs. On May 9, 2024, the EPA published a final rule for new, modified and reconstructed fossil fuel-fired EGUs in the Federal Register. The final rule consists of four elements: (1) revised NSPS for controlling CO2 emissions from new and reconstructed stationary combustion turbines; (2) revised NSPS for fossil fuel-fired steam EGUs that undertake a large modification; (3) emission guidelines for existing fossil fuel-fired steam EGUs; and (4) repeal of the Affordable Clean Energy rule promulgated in 2019.
With respect to existing fossil fuel-fired steam EGUs (primarily coal-fired) the EPA determined that the BSER that is adequately demonstrated is carbon capture and sequestration (CCS) with 90% capture of CO2 emissions. Pursuant to the final rule, existing fossil fuel-fired steam EGUs that intend to operate in the long-term will be required to comply with a CO2 emission rate based on CCS with 90% capture by January 1, 2032. Existing fossil fuel-fired steam EGUs that will permanently cease operations by January 1, 2039 are not subject to emission standards based on 90% CO2 capture, but will need to meet an emission rate based on co-firing with 40% natural gas by January 1, 2030. (This translates into a 16% reduction in CO2 emissions determined from a unit-specific baseline). Existing fossil fuel-fired steam EGUs that permanently cease operations by January 1, 2032 are exempt from these requirements.
All requirements related to existing affected units in the final rule – whether fired by coal or natural gas – will be imposed through state plans that are permitted to take into account the remaining useful life of a generating unit when determining appropriate controls. Under the final rule, such plans must provide for the implementation and enforcement of the NSPS, but states may apply less stringent standards of performance in certain conditions, as specified in EPA regulations. States are also permitted to impose more stringent standards. In addition, the final rule includes several “reliability” mechanisms to allow states to provide alternative emission limitations or compliance date extensions in order to maintain adequate electric generation resources and grid reliability.
Finally, as part of the final rule, any newly constructed stationary combustion turbine (SCT), where construction or reconstruction of the unit was commenced after May 23, 2023, will be subject to CO2 emission limits based on whether it is considered to be a low load, intermediate load or base load EGU. In addition, for affected base load SCTs, a second phase emission standard applies based on 90% CCS as of January 1, 2032. Any new fossil-fuel steam EGU (where construction or reconstruction was commenced after June 18, 2014) will need to comply with standards promulgated in 2015.
The final rule is subject to numerous legal challenges that have been consolidated in the D.C. Circuit in West Virginia v. EPA (D.C. Cir., No. 24-1120). Petitioners filed an emergency application for a stay of the rule with the U.S. Supreme Court which was denied in an order issued by the U.S. Supreme Court on October 16, 2024. If the rule is ultimately affirmed and implemented by the EPA and states, it could have a substantial impact on the use of coal and natural gas for the generation of electricity. A companion rule that addresses how states may implement CO2 emission limits for existing power plants has also been challenged in West Virginia v. EPA (D.C. Cir., No. 24-1009).
EPA’s Permitting Regulations for Major Emission Sources. Coal-fired and other fossil-fuel fired power plants (as well as industrial facilities) may also be subject to emission limits contained in required CAA permits. These limits may be imposed through the Prevention of Significant Deterioration (PSD) program for newly constructed facilities that are considered to be major sources, as well as for existing facilities that undergo major modifications. The CAA also requires such facilities to obtain a title V operating permit. In general, most permits are issued by state environmental agencies that either implement EPA permitting programs or have an EPA-approved state program.
| | | | | | | | |
| Peabody Energy Corporation | 2024 Form 10-K | 13 |
Cross State Air Pollution Rule (CSAPR) and CSAPR Update Rule. The CSAPR and related updates require numerous U.S. states and the District of Columbia to reduce power plant emissions that cross state lines and significantly contribute to ozone and/or fine PM pollution in other states.
On March 15, 2023, the EPA issued a final rule to address regional ozone transport by imposing new federal ozone season emission budgets for nitrogen oxide (NOx) in 23 states, including California, Nevada, Oklahoma and Texas, as well as some Indian reservations. The rule includes state emission budgets for NOx affecting fossil fuel-fired power plants and a “backstop daily emissions rate” for large coal-fired power plants if they exceed specified limits. The rule also sets first-time limits on certain industrial sources that will apply starting with the 2026 ozone season in 20 states. The EPA estimates that annual compliance costs (for 2023 through 2042) will be $770 million to $910 million. These emission limitations would apply in addition to requirements contained in state implementation plans to control ozone precursors in affected states, although states have the option to replace these limits with equally strict or more stringent limitations. When implemented, this rule could influence the closure of some coal generating units that have not installed selective catalytic reduction technologies.
Implementation of the rule for existing sources (accomplished through state implementation plans) was challenged in several U.S. Courts of Appeal, resulting in different court opinions and in requirements being implemented in some states, but stayed in others. On June 27, 2024, the U.S. Supreme Court issued a stay of the rule in 11 states pending the disposition of a petition for review of the rule in the D.C. Circuit and any subsequent timely petition for certiorari filed with and granted by the U.S. Supreme Court. The EPA subsequently issued a policy memorandum on August 5, 2024, that provides an administrative stay of the rule; the D.C. Circuit thereafter issued a partial remand of the rule to allow the EPA to respond to comments regarding the severability of the rule’s provisions, which the EPA subsequently did on December 10, 2024.
Mercury and Air Toxic Standards (MATS). In 2012, the EPA published the final MATS rule, which revised the NSPS for NOx, sulfur dioxide and PM for new and modified coal-fueled electricity generating plants, and imposed maximum achievable control technology (MACT) emission limits on hazardous air pollutants (HAPs) from new and existing coal-fueled and oil-fueled electric generating plants. MACT standards limit emissions of mercury, acid gas HAPs, non-mercury HAP metals and organic HAPs.
On March 6, 2023, the EPA issued a final rule which reaffirmed its determination to regulate coal- and oil-fired EGUs under CAA section 112, including the regulation of HAPs from EGUs after considering cost. On April 24, 2023, the EPA proposed to amend the 2012 MATS rule and require an additional two-thirds reduction in the filterable PM emission of non-mercury HAP metals from existing coal-fired power plants and to reduce the mercury standard for lignite plants by 70%. On May 7, 2024, the EPA finalized a MATS rule which significantly tightens the filterable particulate matter (fPM) emissions limit for existing coal-fired EGU’s, lowering the standard from 0.030 lb/MMBtu to 0.010 lb/MMBtu for all coal-fired power plants. This rule was challenged in the D.C. Circuit in North Dakota v. EPA (D.C. Cir., No. 24-1119).
Regional Haze. The CAA contains a national visibility goal for the “prevention of any future, and the remedying of any existing, impairment of visibility in Class I areas which impairment results from man-made air pollution.” The EPA promulgated comprehensive regulations in 1999 requiring all states to submit plans to address regional haze that could affect 156 national parks and wilderness areas, including requirements for certain sources to install the best available retrofit technology and for states to demonstrate “reasonable progress” towards meeting the national visibility goal.
States are required to revise plans every 10 years, but these statutory deadlines have not been met. On March 29, 2024, the EPA published a proposed consent decree under which deadlines (for the second 10-year regional haze implementation period) would be established for the EPA to take final action to approve, disapprove or conditionally approve, in whole or in part, state regional haze implementation plans for 34 states (at various dates from June 28, 2024 to December 31, 2026). The EPA subsequently filed a motion to approve the consent judgment in the U.S. District Court for the District of Columbia which was granted. On December 31, 2024, EPA proposed to revise the due date for plans (for the third regional haze implementation period) from July 31, 2028 to July 31, 2031.
New Source Review (NSR). The CAA imposes permitting requirements when a new source undergoes construction or when an existing source is reconstructed or undergoes a major modification. These requirements are contained in the CAA’s PSD and Nonattainment New Source Review programs, generally referred to as NSR.
The EPA has taken action on a number of different rules and guidance affecting the interpretation and application of NSR. These rules and guidance may affect the construction, reconstruction and modification of sources and the level of pollution control requirements that will be necessary on a case-by-case basis.
| | | | | | | | |
| Peabody Energy Corporation | 2024 Form 10-K | 14 |
Federal Coal Leasing Moratorium. The Executive Order on Promoting Energy Independence and Economic Growth (EI Order), signed on March 28, 2017, lifted the Department of Interior’s federal coal leasing moratorium and rescinded guidance on the inclusion of social cost of carbon in federal rulemaking. Following the EI Order, the Interior Secretary issued Order 3349 ending the federal coal leasing moratorium, but the Department of Interior revoked Order 3349 in April 2021, which mooted litigation related to Order 3349. In November 2024, the Bureau of Land Management issued amended resource management plans for lands in Wyoming and Montana, which state that no federal coal will be available for future leasing in the Powder River Basin. Montana and Wyoming challenged those decisions in a federal district court on December 11, 2024.
Clean Water Act (CWA). The CWA of 1972 directly impacts U.S. coal mining operations by requiring effluent limitations and treatment standards for wastewater discharge from mines through the National Pollutant Discharge Elimination System (NPDES). Regular monitoring, reporting and performance standards are requirements of NPDES permits that govern the discharge of water from mine-related point sources into jurisdictional waters. The U.S. Army Corps of Engineers (Corps) regulates certain activities affecting navigable waters and waters of the U.S., including wetlands. Section 404 of the CWA requires mining companies to obtain permits from the Corps to place dredged or fill material in or mine through jurisdictional waters of the U.S.
States are empowered to develop and apply water quality standards. These standards are subject to change and must be approved by the EPA. Discharges must either meet state water quality standards or be authorized through available regulatory processes such as alternate standards or variances. Standards vary from state to state. Additionally, through the CWA Section 401 certification program, state and tribal regulators have approval authority over federal permits or licenses that might result in a discharge to their waters. State and tribal regulators consider whether the activity will comply with their water quality standards and other applicable requirements in deciding whether or not to certify the activity.
CWA Definition of “Waters of the United States”. On January 18, 2023, the EPA and the Corps finalized a revised definition of “Waters of the United States” to clarify the scope of federal regulatory authority under the CWA. Several courts preliminarily enjoined that rule in 27 states. In addition, on May 25, 2023, the U.S. Supreme Court issued its decision in Sackett v. EPA, No. 21-454, which significantly narrowed the scope of federal regulatory authority over wetlands and non-navigable waters. The agencies finalized a rule on September 8, 2023, to conform key aspects of the regulatory definition to the Sackett decision. Pending litigation over the January 2023 definition has resumed and is ongoing, as the September 2023 final rule did not address many of the claims at issue in those cases.
CWA Water Quality Certification Rule. The EPA issued a final rule in 2020 that would have limited state and tribal regulators’ certification authority under CWA Section 401 by allowing the EPA to certify projects over state or tribal regulator objections in some circumstances. On September 27, 2023, the EPA finalized a superseding rule that would expand state and tribal regulators’ authority to review activities that require federal permits or licenses and to impose conditions they believe are necessary to ensure compliance with water quality requirements. That rule took effect on November 27, 2023. Challenges to the 2023 rule remain pending in the U.S. District Court for the Western District of Louisiana.
Effluent Limitations Guidelines for the Steam Electric Power Generating Industry. In 2015, the EPA published a final rule setting requirements for wastewater discharge from EGUs. In 2020, the EPA finalized revisions to certain requirements in the 2015 rule. On May 9, 2024, the EPA published a final rule that would establish more stringent standards for flue gas desulfurization wastewater, bottom ash transport water, combustion residual leachate and legacy wastewater discharged from certain surface impoundments. The final revised effluent limitations guidelines would significantly increase costs for many coal-fueled steam electric power plants. In addition, the recently finalized final rule allows EGUs that commit to ceasing coal combustion by December 31, 2034, to comply with less stringent wastewater discharge requirements during the interim. The final rule is subject to numerous legal challenges that have been consolidated in the Eighth Circuit. If the Eighth Circuit affirms the final rule, it could influence fuel switching or additional coal generating unit retirements by the end of 2034.
| | | | | | | | |
| Peabody Energy Corporation | 2024 Form 10-K | 15 |
National Environmental Policy Act. NEPA, signed into law in 1970, requires federal agencies to review the environmental impacts of their decisions and issue either an environmental assessment or an environmental impact statement. Peabody must provide information to agencies when it proposes actions that will be under the authority of the federal government. The NEPA process involves public participation and can involve lengthy timeframes. The White House Council on Environmental Quality (CEQ) issued a final rule comprehensively updating and modernizing its longstanding NEPA regulations on July 16, 2020. That final rule sought to reduce unnecessary paperwork, burdens and delays, promote better coordination among agency decision makers, and clarify scope of NEPA reviews, among other things. States and environmental groups have filed several lawsuits challenging the final rule. On April 20, 2022, however, the CEQ published the final Phase 1 rule that partially amended the 2020 rule by restoring key provisions of the pre-2020 NEPA regulations. The CEQ proposed a Phase 2 rule on July 31, 2023 that makes broader changes to the 2020 rule, and it finalized the Phase 2 rule on May 1, 2024. Separately, the CEQ published NEPA Guidance on Consideration of Greenhouse Gas Emissions and Climate Change on January 9, 2023. The interim guidance was effective immediately, though the agency accepted comments on the guidance. CEQ expected to issue final guidance in April 2024, but it withdrew the guidance from the regulatory review process on November 19, 2024. Finally, on November 12, 2024, a divided panel of the D.C. Circuit held that the CEQ lacks authority to issue legally binding regulations implementing NEPA in Marin Audubon Society v. Federal Aviation Administration, No. 23-1067. Although the federal government and environmental groups have sought rehearing of that decision, litigants in other pending NEPA cases are citing it for the holding that CEQ regulations are not binding.
Resource Conservation and Recovery Act (RCRA). RCRA, which was enacted in 1976, affects U.S. coal mining operations by establishing “cradle to grave” requirements for the treatment, storage and disposal of hazardous wastes. Typically, the only hazardous wastes generated at a mine site are those from products used in vehicles and for machinery maintenance. Coal mine wastes, such as overburden and coal cleaning wastes, are not considered hazardous wastes under RCRA. While coal combustion residuals (CCR or coal ash) are exempted from regulation as hazardous waste, there are various EPA-imposed requirements regarding CCR management.
Rules for Disposal of Coal Combustion Residuals (CCR) from Electric Utilities; Federal CCR Permit Program and Revisions to Closure Requirements. On February 20, 2020, as required by the Water Infrastructure Improvements for the Nation Act, the EPA proposed a federal permitting program for the disposal of CCR in surface impoundments and landfills. Under the proposal, the EPA would directly implement the permit program in Indian Country and at CCR units located in states that have not submitted their own CCR permit program for approval. The proposal includes requirements for federal CCR permit applications, content and modification, as well as procedural requirements. The comment period for the EPA’s proposal ended on April 20, 2020. Although the EPA had planned to finalize this rule in 2021, the EPA postponed the expected issuance date for a final rule until December 2024 and it has not yet issued a final rule. Separately, on August 28, 2020 and November 12, 2020, the EPA finalized two sets of amendments to its 2015 CCR rule to partially address the D.C. Circuit’s 2018 decision holding that certain provisions of that rule were not sufficiently protective. On May 8, 2024, the EPA published a final rule containing additional amendments to the 2015 CCR rule that further address aspects of the D.C. Circuit’s 2018 decision. Finally, the EPA is still considering whether to finalize additional revisions to the 2015 CCR Rule related to closure of CCR units.
Comprehensive Environmental Response, Compensation and Liability Act (CERCLA). Although generally not a prominent environmental law in the coal mining sector, CERCLA, which was enacted in 1980, nonetheless may affect U.S. coal mining operations by creating liability for investigation and remediation in response to releases of hazardous substances into the environment and for damages to natural resources. Under CERCLA, joint and several liabilities may be imposed on waste generators, site owners or operators and others, regardless of fault.
Endangered Species Act (ESA). The ESA of 1973 and counterpart state legislation is intended to protect species whose populations allow for categorization as either endangered or threatened. Changes in listings or requirements under these regulations could have a material adverse effect on Peabody’s costs or its ability to mine some of its properties in accordance with its current mining plans. During the first Trump Administration, the Departments of Interior and Commerce finalized five rules aiming to streamline and update the ESA. But in June 2021, the agencies announced their plan to revise, rescind or reinstate the rules that were finalized (or withdrawn) during the first Trump Administration that conflict with the Biden Administration’s objectives. The agencies issued proposed rules on June 22, 2023, and they published three final revised rules on April 5, 2024.
Use of Explosives. Peabody’s surface mining operations are subject to numerous regulations relating to blasting activities. Pursuant to these regulations, it incurs costs to design and implement blast schedules and to conduct pre-blast surveys and blast monitoring. The storage of explosives is subject to strict federal regulatory requirements. The U.S. Bureau of Alcohol, Tobacco and Firearms (ATF) regulates the use of explosive blasting materials. In addition to ATF regulation, the Department of Homeland Security is expected to finalize an ammonium nitrate security program rule.
| | | | | | | | |
| Peabody Energy Corporation | 2024 Form 10-K | 16 |
Federal Report on Climate Change. On November 29, 2023, the U.S. Global Change Research Program, a working group comprised of thirteen U.S. governmental departments and agencies, issued parts of the Fifth National Climate Assessment. The report addresses “projected vulnerabilities, risks and impacts associated with climate change across the United States and provides examples of response actions in many communities.” While there are no explicit regulatory actions that flow from the issuance of the report, both the legislative and executive branches of government may rely on its conclusions to shape and justify policies and actions going forward.
SEC Climate-Related Disclosures. On March 6, 2024, the SEC adopted final rules it expects will enhance and standardize climate-related disclosures by public companies and in public offerings. Specifically, the final rules will require disclosure of, among other things, climate-related risks that have had or are reasonably likely to have a material impact on a public company’s business strategy, results of operations or financial condition; certain greenhouse gas (GHG) emissions associated with a public company along with, in many cases, an attestation report by a GHG emissions attestation provider; and certain climate-related financial metrics to be included in a company’s audited financial statements. The final rules were challenged by multiple parties, and the cases were consolidated into a judicial review by the Eighth Circuit. On April 4, 2024, the SEC voluntarily stayed implementation of the final rules pending such judicial review. The Company is assessing the potential impact of the final rules.
State Climate Change Legislation. On May 30, 2024, Vermont’s S259, referred to as the Climate Superfund Act, became law and on December 26, 2024, the governor of New York signed S02129, known as the Climate Change Superfund Act (collectively, the Climate Change Laws). The Climate Change Laws aim to require payments from entities deemed “responsible parties” to fund infrastructure projects meant to address climate change in New York. The New York law defines a “responsible party” as an entity that “engaged in the trade or business of extracting fossil fuel or refining crude oil” from January 1, 2000 to December 31, 2018 and that is determined to be accountable for more than 1 billion metric tons of certain greenhouse gas emissions. Responsible party does not include any person lacking “sufficient connection with the state to satisfy the nexus” of the U.S. Constitution. The Vermont law contains a similar definition of a responsible party, except that Vermont’s covered period extends from 1995 to 2024. Both states have stated that they will enact future regulations to carry out the provisions of the law.
On December 30, 2024, the U.S. Chamber of Commerce and American Petroleum Institute filed a lawsuit in the District of Vermont challenging the state’s Climate Superfund Act arguing that the law violates constitutional principles, including federal preemption, interstate commerce and due process, while also imposing excessive fines and an unconstitutional taking.
Additionally, on February 6, 2025, a group of 22 states, led by West Virginia, filed a lawsuit against New York State over its Climate Change Superfund Act, arguing that the law’s $75 billion penalty on fossil fuel producers unfairly shifts costs onto out-of-state energy producers and consumers and violates multiple constitutional protections. The plaintiffs also claim that New York is overstepping its jurisdiction by imposing retroactive fines and discriminatory sanctions, potentially threatening U.S. energy independence.
The Company expects the Climate Change Laws will continue to be challenged. The impacts of these laws are currently being assessed.
Regulatory Matters — Australia
The Australian mining industry is regulated by Australian federal, state and local governments with respect to environmental issues such as land reclamation, water quality, air quality, dust control, noise, planning issues (such as approvals to expand existing mines or to develop new mines) and health and safety issues. The Australian federal government retains control over the level of foreign investment and export approvals. Industrial relations are regulated under both federal and state laws. Australian state governments also require coal companies to post deposits or give other security against land which is being used for mining, with those deposits being returned or security released after satisfactory reclamation is completed. The Company continually monitors the laws and regulations for changes resulting from updated legislation, judicial decisions and changes in governmental administrations.
Australian Federal Government
Environmental Laws. The environmental impacts of Australian mining projects are regulated by both state and federal governments. Federal laws apply if a project is likely to significantly impact a Matter of National Environmental Significance (for example, a water resource, an endangered species or particular protected places). Such mining projects are required to obtain approval under the Commonwealth Environment Protection and Biodiversity Conservation Act 1999 (EPBC Act).
Environmental approval processes involve complex issues that, on occasion, require lengthy studies and documentation and are subject to legal challenge.
| | | | | | | | |
| Peabody Energy Corporation | 2024 Form 10-K | 17 |
There are bilateral agreements in place between the Federal Government and the Queensland and New South Wales State Governments that allow the environmental assessment process at the State level to be relied upon for a decision under the EPBC Act.
In Queensland and New South Wales, the development of a mine requires both the grant of a right to extract the resource and an approval which authorizes the environmental impact. These approvals are obtained under separate legislation for separate government authorities. However, the application processes run concurrently and are also concurrent with any native title or cultural heritage process that is required.
Greenhouse and Energy Reporting Act 2007 (NGER Act). The NGER Act imposes requirements for corporations meeting a certain threshold to register and report greenhouse gas emissions and abatement actions, as well as energy production and consumption as part of a single, national reporting system. The Clean Energy Regulator administers the NGER Act. The federal Department of Environment and Energy is responsible for NGER Act-related policy developments and review. In May 2023, the Australian Parliament passed reforms to the National Greenhouse and Energy Reporting (Safeguard Mechanism) Rule 2015. The reforms commenced on July 1, 2023 and prescribed site specific baseline emissions for heavy emitting facilities as benchmarks for year-on-year improvement (proposed to be 4.9% each year to 2030) before transitioning to industry average emissions benchmarks by 2030. Proponents will earn tradeable credits (Safeguard Mechanism Credits) when emissions are below their baselines or can purchase credits to offset emissions. Access to existing Australian Carbon Credit Units will continue unchanged albeit with a price ceiling of $75 Australian dollars per tonne of CO2 in 2023-2024, increasing with the Consumer Price Index plus 2% each year.
In June 2024 amendments to the NGER Act came into effect requiring open-cut mines covered by the Safeguard Mechanism that currently report fugitive methane emissions using a basic method with minimal data inputs (Method 1) to transition over a two-year period to a more complex method requiring site-level sampling and analysis (Methods 2 or 3). This change in reporting methods is expected to increase the Safeguard Mechanism liability position of open-cut mining operations in Queensland. The impacts of this change are currently being assessed.
On March 27, 2023, the Australian federal government announced several additional emission reduction measures in the Safeguard Mechanism (Crediting) Amendments Bill 2023 passed by the federal Parliament on March 30, 2023. The legislation introduced a cap on overall net emissions from facilities covered by the scheme through 2030. The legislation also set a cap of net zero tonnes carbon dioxide equivalent for any financial year beginning after June 30, 2049. In addition, if the Minister for Environment and Water grants an approval under the Environment Protection and Biodiversity Conservation Act 1999 (Cth) (EPBC Act) to a new or expanded facility covered by the scheme, the Minister will be required to give an estimate of the facility's Scope 1 emissions to the Minister for Climate Change, the Climate Change Secretary and the Climate Change Authority for assessment against scheme targets. The legislation became effective on July 1, 2023.
Industrial Relations Laws. A national industrial relations system, the Fair Work Act and National Employment Standards, applies to all employers and employees. The matters regulated under the national system include general employment conditions, unfair dismissal, enterprise bargaining, bullying claims, industrial action and resolution of workplace disputes. Most of the hourly workers employed in the Company’s mines are also covered by the Black Coal Mining Industry Award and company specific enterprise agreements approved under the national system.
In December 2022, the federal government passed The Fair Work Legislation Amendment (Secure Jobs, Better Pay) Act 2022, which amends the Fair Work Act. The legislation introduced several changes to workplace laws in Australia including changes to enterprise agreement making and termination; when industrial action can be taken; and access to multi-employer bargaining or single interest employer authorizations. Following this amendment, the Wambo Underground Mine and four other mines in New South Wales were served with an application for a single interest employer authorization which was granted by the Fair Work Commission against three employers including Peabody. The three employers have appealed the authorization with the hearing currently scheduled for March 2025.
On December 7, 2023, the Fair Work Legislation Amendment (Closing Loopholes) Bill 2023 was passed by the Australian Federal Parliament. The bill allows unions and/or employees to make application to the Fair Work Commission for a ‘regulated labour hire arrangement order’ that, if successful, requires employers to provide similar wages and conditions to regulated workers as those provided to permanent employees, unless the Fair Work Commission is satisfied that it is not fair and reasonable to do so. Various union applications for regulated labor hire arrangements to apply at Australian coal mining operations are currently being considered by Australia’s Fair Work Commission.
| | | | | | | | |
| Peabody Energy Corporation | 2024 Form 10-K | 18 |
Native Title and Cultural Heritage Laws. Since 1992, the Australian courts have recognized that native title to lands and water, as recognized under the laws and customs of the Aboriginal inhabitants of Australia, may have survived the process of European settlement. These developments are supported by the federal Native Title Act which recognizes and protects native title, and under which a national register of native title claims has been established. Native title rights do not extend to minerals; however, native title rights can be affected by mining activities unless those rights have previously been extinguished, thereby requiring negotiation with the traditional owners (and potentially the payment of compensation) prior to the grant of certain mining tenements. There is also federal and state legislation to prevent damage to Aboriginal cultural heritage and archaeological sites.
Aboriginal and Torres Strait Islander Heritage Protection Act 1984. On August 16, 2024, Australia’s Minister for the Environment and Water made a declaration under Section 10 of the Aboriginal and Torres Strait Islander Heritage Protection Act 1984 over a riverine area in NSW that is a proposed tailings dam site for a gold mining project. The declaration prohibits any mining or related development activity in the area despite the project having previously obtained all necessary environmental and planning approvals under state and federal government laws. The project proponent has indicated that the decision renders the mine project unviable and has initiated Federal Court proceedings seeking a judicial review of the decision-making process. The first hearing is scheduled for March 4, 2025.
Australian Mine Rehabilitation (Reclamation) Laws. Mine reclamation in Australia is regulated by state-specific legislation. The Company operates in both Queensland and New South Wales state jurisdictions. As a condition of approval for mining operations, companies are required to progressively reclaim mined land and provide appropriate bonding or, in certain circumstances, make alternative financial contributions to the relevant state government as a safeguard to cover the costs of reclamation in circumstances where mine operators are unable to do so. Self-bonding is not permitted. Peabody’s mines provide financial assurance to the relevant authorities which is calculated in accordance with current regulatory requirements. This financial assurance is in the form of cash, surety bonds or bank guarantees which are supported by a combination of cash collateral, deeds of indemnity and guarantee and letters of credit issued under the Company’s collateralized letter of credit program and accounts receivable securitization program.
Peabody’s reclamation bonding requirements in Australia were $303.7 million as of December 31, 2024. The bond requirements represent the states’ calculated cost to reclaim the current operations of a mine if it ceases to operate in the current period less any discounts agreed with the state. The cost calculation for each bond must be completed according to the regulatory authority of each state. The Company’s asset retirement obligations calculated in accordance with U.S. generally accepted accounting principles for its active and inactive Australian operations were $250.4 million as of December 31, 2024. The total bonding requirements for the Company’s Australian operations differ from the calculated costs associated with the asset retirement obligations because the costs associated with asset retirement obligations are discounted from the end of the mine’s economic life to the balance sheet date in recognition of the economic reality that reclamation is conducted progressively and final reclamation is projected to be a number of years away, whereas the bonding amount represents the states’ calculated cost of reclamation if a mine ceases to operate immediately as well as different costs assumptions.
New South Wales Government
In New South Wales, laws and regulations related to mining include, but are not limited to, the Mining Act 1992, Work Health and Safety (Mines and Petroleum Sites) Act 2013, Coal Mine Subsidence Compensation Act 2017, Environmental Planning and Assessment Act 1979 (EPA Act), Environmental Planning and Assessment Regulation 2021, Protection of the Environment Operations Act 1997, Contaminated Land Management Act 1997, Explosives Act 2003, Water Management Act 2000, Water Act 1912, Biodiversity Conservation Act 2016 (BC Act), Heritage Act 1977, Aboriginal Land Rights Act 1983, Crown Land Management Act 2016, Dangerous Goods (Road and Rail Transport) Act 2008, Fisheries Management Act 1994, Native Title (New South Wales) Act 1994, Biosecurity Act 2015, Roads Act 1993 and National Parks and Wildlife Act 1974.
NSW Environmental Laws. Under the NSW Environmental Planning and Assessment (EPA) Act 1979 applications for new planning consents or modifications to existing consents are evaluated in consideration of the likely impacts of the development, the suitability of the site, the provisions of environmental planning instruments and the public interest, amongst other matters. New applications for mining projects are generally determined by the NSW Independent Planning Commission, whereas modifications to existing consents are determined under delegation by the NSW Department of Planning, Housing and Infrastructure. Any modification to an existing planning consent must be substantially the same as the approved development, otherwise a new consent is required.
| | | | | | | | |
| Peabody Energy Corporation | 2024 Form 10-K | 19 |
In December 2023, the Climate Change (Net Zero Future) Act 2023 commenced, which legislates NSW Government’s target to achieve net zero GHG emissions by 2050 and interim targets of a 50% reduction on 2005 levels by 2030 and a 70% reduction by 2035. In June 2024, the New South Wales Minister for Planning and Public Spaces requested the New South Wales Independent Planning Commission to consider the NSW Government’s emissions reduction targets and the Act’s guiding principles in its assessment of new planning applications. The NSW Environment Protection Authority (EPA) released its final NSW Guide for Large Emitters in January 2025, which applies to new applications or significant modifications for large emitting premises, such as mining operations. The NSW Guide for Large Emitters sets out the assessment requirements including a need to implement reasonable and feasible emissions reduction technologies, set long-term and interim emission goals for the project and describe any greenhouse gas offset strategies.
The Biodiversity Conservation Act 2016 (BC Act) regulates biodiversity assessment and offsetting requirements for mining projects in New South Wales. Biodiversity offsets can be provided through security of land-based offsets, purchase of offset credits through a market system, or payment into a government-administered Biodiversity Conservation Fund. In December 2024, the Biodiversity Conservation Amendment (Biodiversity Offsets Scheme) Bill 2024 passed New South Wales Parliament. This Bill legislates a transition of the biodiversity offset scheme to “net positive biodiversity outcomes”. It also requires proponents of projects to take all reasonable measures to firstly avoid, and then minimize, impacts on biodiversity values. The recent changes to the biodiversity offset laws will affect approval processes and timeframes for future NSW mining projects.
NSW Reclamation Laws. The Mining Act 1992 (Mining Act) is administered by New South Wales Resources within the Department of Primary Industries and Regional Development and the New South Wales Resources Regulator. The Mining Act authorizes the holder of a mining tenement to extract a mineral subject to obtaining consent under the EPA Act and other ancillary approvals and licenses.
Through the Mining Act, environmental protection and reclamation are regulated by standard conditions in all mining leases. These conditions include requirements for the submission of reclamation outcome documents, a reclamation risk assessment and a forward program that includes a schedule of mining activities for the next three years, and a requirement that the reclamation of land disturbed by mining must occur as soon as reasonably practicable after the disturbance occurs. Mines are required to publicly report their reclamation performance on an annual basis and are subject to regular inspections by the NSW Resources Regulator.
Through the forward program process, a reclamation cost estimate is calculated annually to determine the amount of the security deposit (bond) required to cover the cost of reclamation based on the activities proposed over the forward program period.
NSW Strategic Statement on Coal Exploration and Mining. The New South Wales (NSW) Government released a Strategic Statement on Coal Exploration and Mining in June 2020 which provides a high level framework for the government's policy approach to the future of the coal sector. The NSW Government has committed to a review of the Statement this year, however no specific date has been set for commencement of the review.
NSW Coal Royalty Laws. In New South Wales, a coal royalty is charged as a percentage of the value of coal production (total revenue less allowable deductions). This is equal to 6.2% for deep underground mines (coal extracted at depths greater than 400 meters below ground surface), 7.2% for underground mines and 8.2% for open-cut mines. As part of its 2023-2024 state budget the newly elected New South Wales government announced that from July 1, 2024 it would be increasing each of these rates by 2.6% to 8.8% for deep underground mines, 9.8% for underground mines and 10.8% for open-cut mines. The future impacts of this royalty rate rise on Peabody’s NSW mining operations is being assessed.
NSW Coal Directions. The State of New South Wales (NSW) enacted the Energy and Utilities Administration Amendment Act 2022 granting the State Premier and Minister for Energy the ability to issue directions in the event of a coal market price emergency (among other powers). On December 22, 2022, the State Premier declared such an emergency, intended to control coal and electricity pricing. Subsequently, directions were issued to Peabody Energy Australia Pty Ltd and other coal producers with operations in NSW, which were amended at various dates. The most recent directions required Peabody Energy Australia Pty Ltd to reserve a portion of coal produced by Wambo Coal Pty Ltd and Wilpinjong Coal Pty Ltd for sale to NSW power generators at a capped price until June 30, 2024 and imposed additional reporting obligations to demonstrate compliance. The Australian Energy Regulator has confirmed that the directions have ended, and the last report was submitted on July 12, 2024.
| | | | | | | | |
| Peabody Energy Corporation | 2024 Form 10-K | 20 |
NSW Industrial Manslaughter Laws. On June 20, 2024, the Work Health and Safety Amendment (Industrial Manslaughter) Bill 2024 (Bill) passed the NSW Parliament. The Bill amends the Work Health and Safety Act 2011 to include the offense of industrial manslaughter. The offense will apply to a person conducting a business or undertaking (PCBU) or an officer of a PCBU who engages in conduct that constitutes a failure to comply with the person’s health and safety duty and causes the death of a worker or another individual to whom the duty is owed; and the person engages in conduct with gross negligence. The maximum penalty is $20 million Australian dollars for a body corporate or 25 years imprisonment for an individual. The Bill also provides for an alternative finding of guilt. That is, where a person is charged with industrial manslaughter, and on trial the court or jury is not satisfied that the person is guilty but is satisfied that the person is guilty of an offense against section 31 (Gross negligence or reckless conduct— Category 1) of the NSW WHS Act, the person may be found guilty and liable to punishment for that offense.
NSW Workplace Safety Laws. In New South Wales, a respirable crystalline silica workplace exposure standard of 0.05 mg/m3 applies; a respirable coal dust workplace exposure standard of 1.5 mg/m3 applies and mines must report exceedances of these standards to the NSW Resources Regulator. Additionally, the NSW government requires an exposure standard for diesel particulate matter of 0.1 mg/m3. Underground coal mine operators must also develop and implement safety management systems and procedures to minimize worker exposures to carbon dioxide, ensuring no worker is exposed to an 8-hour time-weighted average atmospheric concentration of carbon dioxide that is greater than 30,000 parts per million for short-term exposure or 12.500 parts per million otherwise.
Metropolitan Mine Stormwater Discharge. Significantly high rainfall in New South Wales, including unprecedented rain totals at the Metropolitan Mine site resulted in stormwater being discharged from the mine site on several occasions in 2021 and 2022. On September 6, 2023, the NSW Environment Protection Authority commenced a prosecution for five breaches of the Protection of the Environment Operations Act 1997 relating to the stormwater discharges. On March 15, 2024, the Company pled guilty to two of the charges related to water pollution and two charges related to a failure to adequately maintain plant and equipment were consolidated into one charge to which the Company also pled guilty. The remaining charge was discontinued. A sentencing hearing was held in November 2024 and the judgment has been reserved. The judgment is expected in the second quarter of 2025.
Queensland Government
In Queensland, laws and regulations related to mining include, but are not limited to, the Mineral Resources Act 1989, Environmental Protection Act 1994 (EP Act), Environmental Protection Regulation 2008, Planning Act 2016, Coal Mining Safety and Health Act 1999, Minerals and Energy Resources (Common Provisions) Act 2014, Explosives Act 1999, Aboriginal Cultural Heritage Act 2003, Water Act 2000, State Development and Public Works Organisation Act 1971, Queensland Heritage Act 1992, Transport Infrastructure Act 1994, Nature Conservation Act 1992, Vegetation Management Act 1999, Biosecurity Act 2014, Land Act 1994, Regional Planning Interests Act 2014, Fisheries Act 1994 and Forestry Act 1959.
A guideline has been issued that provides more certainty to the industry on the circumstances in which an EPO may be issued.
Queensland Environmental and Rehabilitation (Reclamation) Laws. The EP Act is administered by the Department of the Environment, Tourism, Science and Innovation which authorizes environmentally relevant activities such as mining activities relating to a mining lease through an Environmental Authority (EA). Environmental protection and reclamation activities are regulated by conditions in the EA. All mining operations must be carried out in a manner so as to ensure compliance with the conditions in the EA. Mines must submit an annual return reporting on their EA compliance.
In November 2016, amendments to the EP Act and the Water Act 2000 provided for regulatory scrutiny of the environmental impacts of underground water extraction during the operational phase of resource projects for all tenements yet to commence mineral extraction.
The ‘chain of responsibility’ provisions of the EP Act, which became effective in April 2016, allow the regulator to issue an environmental protection order (EPO) to a related person of a company in two circumstances: (a) if an EPO has been issued to the company, an EPO can also be issued to a related person of the company (at the same time or later); or (b) if the company is a high risk company (as defined in the EP Act), an EPO can be issued to a related person of the company (whether or not an EPO has also been issued to the company).
In November 2018, the Queensland government passed the Mineral and Energy Resources (Financial Provisioning) Act 2018 which introduced an updated financial assurance (FA) framework and progressive rehabilitation requirements. The new FA framework created a pooled fund covering most mines and most of the total industry liability, plus other options for providing FA if not part of the pooled fund (for example, allowing insurance bonds or cash). The percentage rate of the total rehabilitation cost payable into the pooled fund takes into account the financial strength of the holder of the EA for the mine and the project strength of the mine. The total rehabilitation cost is determined using an updated rehabilitation cost calculator, which does not provide for discounting.
| | | | | | | | |
| Peabody Energy Corporation | 2024 Form 10-K | 21 |
The new progressive rehabilitation requirements, which commenced on November 1, 2019, require each mine to establish a schedule of rehabilitation milestones covering the life of the mine, and any significant changes to the timing of rehabilitation require regulatory approval. If there is to remain an area within the mine that does not have a post-mining land use (referred to as a non-use management area or NUMA) then each such NUMA will need to pass a public interest evaluation test as part of the approval process. An example of a NUMA is the void that remains after open-cut mining activities have been completed. Under the legislation, an existing mine was exempt from the requirement to justify its NUMAs to the extent that its existing approvals provided for such areas.
Queensland Residual Risk Laws. On August 20, 2020, the Environmental Protection and Other Legislation Amendment Act (Queensland) 2020 (EPOLA Act) became law, amending the residual risk framework that aims to ensure that any remaining risks on former resource sites are appropriately identified, costed and managed. On completion of all mining activities, the holder of the EA for the mine can apply to surrender the EA once all conditions, requirements and rehabilitation obligations have been met. When approving the surrender, the government can request a residual risk payment from the holder of the EA for the mine to cover potential rehabilitation or maintenance costs incurred after the surrender has been accepted. It contemplates two approaches for determining residual risk payments. Depending on the level of risk of a particular site, a cost calculator tool might be used or a panel of appropriately qualified experts might undertake a qualitative and quantitative risk assessment.
Queensland Mine Permitting Laws. Queensland planning policies address matters of Queensland state interest and must be adhered to during mining project approvals. The Mineral Resources Act 1989 is the principal legislation that regulates mining exploration, extraction and processing in Queensland, including coal mining. The Act was amended in 2016 to include significant changes to the management of overlapping coal and coal seam gas tenements, and the coordination of activities and access to private and public land.
Queensland Occupational Health and Safety Laws. Queensland legislation requires Peabody to provide and maintain a safe workplace by providing safe systems of work, safety equipment and appropriate information, instruction, training and supervision. In recognition of the specialized nature of mining and mining activities, specific occupational health and safety obligations have been mandated under state legislation specific to the coal mining industry. There are some differences in the application and detail of the laws, and mining operators, directors, officers and certain other employees are all subject to the obligations under this legislation.
In Queensland, workplace exposure standards for respirable crystalline silica require workplaces to observe an eight hour, time-weighted average airborne concentration of 0.05 mg/m3 and 1.5 mg/m3 for respirable coal dust. The workplace exposure standard for CO2 requires coal mine operators to ensure workers are not exposed to greater than 30,000 ppm for short-term exposure or 12.500 ppm otherwise.
Queensland Mine Safety Laws. On July 1, 2020, the Resources Safety and Health Queensland Act 2020 became effective. It establishes Resources Safety and Health Queensland (RSHQ) as a statutory body designed to ensure independence of the mining safety and health regulator. RSHQ includes inspectorates for coal mines, mineral mines and quarries, explosives and petroleum and gas. The new law seeks to enhance the role of advisory committees to identify, quantify and prioritize safety and health issues in the mining and quarrying industries. It also provides for an independent Work Health and Safety Prosecutor to prosecute serious offenses under resources safety legislation.
Queensland Industrial Manslaughter Laws. On May 20, 2020, the Queensland Parliament passed laws that introduced the criminal offense of ‘industrial manslaughter’ for executive officers, individuals who are senior officers and companies in the mining industry. Individuals face a maximum prison sentence of 20 years and companies can be fined up to $13 million Australian dollars. The bill also introduced the requirement for statutory role holders to be employees of the coal mine operator entity.
Queensland Coal Royalties. On and from July 1, 2022, the Queensland government introduced three new royalty tiers for coal produced and sold from the state. The new tier rates are 20% for the portion of prices above $175 Australian dollars per tonne; 30% for the portion of prices above $225 Australian dollars per tonne; and a 40% tier for the portion of prices above $300 Australian dollars per tonne.
Risks Related to Global Climate Change
Peabody recognizes that climate change is occurring and that human activity, including the use of fossil fuels, contributes to GHG emissions. The Company’s largest contribution to GHG emissions occurs indirectly, through the coal used by its customers in the generation of electricity and the production of steel (Scope 3). To a lesser extent, the Company directly and indirectly contributes to GHG emissions from various aspects of its mining operations, including from the use of electrical power and combustible fuels, as well as from the fugitive methane emissions associated with coal mines and stockpiles (Scopes 1 and 2).
| | | | | | | | |
| Peabody Energy Corporation | 2024 Form 10-K | 22 |
Peabody’s Board of Directors and management believe that coal is essential to affordable, reliable energy and will continue to play a significant role in the global energy mix for the foreseeable future. Peabody views technology as vital to advancing global climate change solutions, and the Company supports advanced coal technologies to drive continuous improvement toward the ultimate goal of net-zero emissions from coal.
The Board has ultimate oversight for climate-related risk and opportunity assessments, and has delegated certain aspects of these assessments to subject matter committees of the Board. In addition, the Board and its committees are provided regular updates on major risks and changes, including climate-related matters. The senior management team champions the strategic objectives set forth by the Board of Directors and Peabody’s global workforce turns those objectives into meaningful actions.
Management believes that the Company’s external communications, including environmental regulatory filings and public notices, SEC filings, its annual Sustainability Report, its website and various other stakeholder-focused publications provide a comprehensive picture of the Company’s material risks and progress towards mitigating these risks. All such communications are subject to oversight and review protocols established by Peabody’s Board and executive leadership team.
The Company faces risks from both the global transition to a net-zero emissions economy and the potential physical impacts of climate change. Such risks may involve financial, policy, legal, technological, reputational and other impacts as the Company meets various mitigation and adaptation requirements.
The transition to a net-zero emissions economy is driven by many factors, including, but not limited to, legislative and regulatory rulemaking processes, campaigns undertaken by non-governmental organizations to minimize or eliminate the use of coal as a source of electricity generation, and the policies of financial institutions and other private companies as related to safety, sustainability, human capital and governance practices. The Company has experienced, or may in the future experience, negative effects on its results of operations due to the following specific risks as a result of such factors:
•Reduced utilization or closure of existing coal-fired electricity generating plants;
•Electricity generators switching from coal to alternative fuels, when feasible;
•Increased costs associated with regulatory compliance;
•Unfavorable impact of regulatory compliance on supply and demand fundamentals, such as limitations on financing or construction of new coal-fueled power stations;
•Uncertainty and inconsistency in rulemaking processes related to periodic governmental administrative and policy changes;
•Unfavorable costs of capital and access to financial markets and products due to the policies of financial institutions;
•Disruption to operations or markets due to anti-coal activism and litigation;
•Reputational damage associated with involvement in GHG emissions; and
•Increased cost and reputational damage related to climate litigation.
With respect to the potential or actual physical impacts of climate change, the Company has identified the following specific risks:
•Disruption to water supplies vital to mining operations;
•Disruption to transportation and other supply chain activities;
•Damage to the Company’s, customers’ or suppliers’ plant and equipment, or third-party infrastructure, resulting from weather events or changes in environmental trends and conditions; and
•Electrical grid failures and power outages.
While the Company faces numerous risks associated with the transition to a net-zero emissions economy and the physical impacts of climate change, certain opportunities may also emerge, such as:
•Heightened emphasis among multiple stakeholders to develop high-efficiency, low-emissions (HELE) technologies and CCUS technologies;
•Increased steel demand related to construction and other infrastructure projects related to climate change concerns; and
•The relative expense and reliability of renewable energy sources compared to coal may encourage support for balanced-source energy policies and regulations.
| | | | | | | | |
| Peabody Energy Corporation | 2024 Form 10-K | 23 |
Global climate issues continue to attract public and scientific attention. Numerous reports, such as the Sixth Assessment Report of the Intergovernmental Panel on Climate Change, have also engendered concern about the impacts of human activity, especially fossil fuel combustion, on global climate issues. In turn, increasing government attention has been paid to global climate issues and to GHG emissions, including emissions of carbon dioxide from coal combustion by power plants. There have been significant developments in federal and state legislation and regulation and international accords regarding climate change, and volatility in the regulatory space is likely to continue. Such developments are described below in the section “Regulations Related to Global Climate Change” within this Item 1.
The enactment of future laws or the passage of regulations regarding emissions from the use of coal by the U.S., some of its states or other countries, and ongoing actions to limit such emissions, such as carbon taxes, could result in electricity generators switching from coal to other fuel sources. Further, policies limiting available financing for the development of new coal-fueled power stations could adversely impact the global demand for coal in the future. The potential financial impact on Peabody of such future laws, regulations or other policies will depend upon the degree to which any such laws or regulations force electricity generators to diminish their reliance on coal as a fuel source. That, in turn, will depend on a number of factors, including the specific requirements imposed by any such laws, regulations or other policies, the time periods over which those laws, regulations or other policies would be phased in, the state of development and deployment of CCUS technologies as well as acceptance of CCUS technologies to meet regulations and the alternative uses for coal. Higher-efficiency coal-fired power plants may also be an option for meeting laws or regulations related to emissions from coal use. Several countries, including major coal users such as China, India and Japan, included using higher-efficiency coal-fueled power plants in their plans under the Paris Agreement. The Company believes HELE and CCUS technologies should be part of the solution to achieve substantial reductions in GHG emissions and should be broadly supported and encouraged, including through eligibility for public funding from national and international sources. In addition, CCUS merits targeted deployment incentives, like those provided to other low-emission sources of energy.
From time to time, the Company’s Board of Directors and management attempt to analyze the potential impact on the Company of as-yet-unadopted, potential laws, regulations and policies. Such analyses require significant assumptions as to the specific provisions of such potential laws, regulations and policies which sometimes show that if implemented in the manner assumed by the analyses, the potential laws, regulations and policies could result in material adverse impacts on the Company’s operations, financial condition or cash flows. Such analyses cannot be relied upon to reasonably predict the quantitative impact that future laws, regulations or other policies may have on the Company’s results of operations, financial condition or cash flows.
Regulations Related to Global Climate Change
In the U.S., Congress has considered legislation addressing global climate issues and GHG emissions, but to date, no new comprehensive, regulatory legislation has been signed into law. The U.S. Congress, however, has approved legislation, the Inflation Reduction Act of 2022, that will provide substantial tax incentives, grants and loan guarantees for energy infrastructure, solar panels, wind turbines, nuclear and geothermal energy, hydrogen projects and carbon capture and storage. While it is possible that the U.S. will adopt additional climate legislation in the future, the timing and specific requirements of any such legislation are uncertain.
The EPA has also undertaken several steps to regulate GHG emissions under existing law, primarily the CAA. In response to the 2007 U.S. Supreme Court ruling in Massachusetts v. EPA, the EPA commenced several rulemaking projects as described under “Regulatory Matters - U.S.” The EPA has indicated that it will continue these efforts and proceed with new regulations affecting GHG emissions from fossil fuel-fired electric generation, methane emissions from oil and gas production and carbon emissions from light and heavy-duty vehicles.
At the same time, a number of states in the U.S. have adopted programs to regulate GHG emissions. For example, 10 northeastern states (Connecticut, Delaware, Maine, Maryland, Massachusetts, New Hampshire, New Jersey, New York, Rhode Island and Vermont) entered into the Regional Greenhouse Gas Initiative (RGGI) in 2005, and Pennsylvania joined in 2022. RGGI is a mandatory cap-and-trade program to cap regional carbon dioxide emissions from power plants. California and the Canadian province of Quebec have adopted greenhouse gas cap-and-trade regulations to date and both programs have begun operating.
Several other U.S. states have enacted legislation establishing GHG emissions reduction goals or requirements. In addition, several states have enacted legislation or have in effect regulations requiring electricity suppliers to use renewable energy sources to generate a certain percentage of power or that provide financial incentives to electricity suppliers for using renewable energy sources. Some states have initiated public utility proceedings that may establish values for carbon emissions.
| | | | | | | | |
| Peabody Energy Corporation | 2024 Form 10-K | 24 |
Increasingly, both foreign and domestic banks, insurance companies and large investors are curtailing or ending their financial relationships with fossil fuel-related companies. This has had adverse impacts on the liquidity and operations of coal producers.
Peabody participated in the Department of Energy’s Voluntary Reporting of Greenhouse Gases Program until its suspension in May 2011, and the Company regularly discloses information regarding its production-related emissions in its annual Sustainability Report. The vast majority of the Company’s emissions are generated by the operation of heavy machinery to extract and transport material at its mines and fugitive emissions from the extraction of coal.
The Kyoto Protocol, adopted in December 1997 by the signatories to the 1992 United Nations Framework Convention on Climate Change (UNFCCC), established a binding set of GHG emission targets for developed nations. The U.S. signed the Kyoto Protocol but it has never been ratified by the U.S. Senate. Australia ratified the Kyoto Protocol in December 2007 and became a full member in March 2008. There were discussions to develop a treaty to replace the Kyoto Protocol after the expiration of its commitment period in 2012, including at the UNFCCC conferences in Cancun (2010), Durban (2011), Doha (2012) and Paris (2015). At the Durban conference, an ad hoc working group was established to develop a protocol, another legal instrument or an agreed outcome with legal force under the UNFCCC, applicable to all parties. At the Doha meeting, an amendment to the Kyoto Protocol was adopted, which included new commitments for certain parties in a second commitment period, from 2013 to 2020. In December 2012, Australia signed on to the second commitment period. During the UNFCCC conference in Paris, France in late 2015, an agreement was adopted calling for voluntary emissions reduction contributions after the second commitment period ends in 2020 (the Paris Agreement). The agreement was entered into force on November 4, 2016 after ratification and execution by more than 55 countries, including Australia, that account for at least 55% of global GHG emissions. On January 20, 2021, the U.S. reentered the Paris Agreement by accepting the agreement and all of its articles and clauses, after having announced its withdrawal from the agreement in November 2019.
In June 2022, the new Australian federal government announced plans to legislate for a 43% reduction in Australia’s GHG emissions by 2030 and to introduce changes by mid-2023 that will require heavy emitting companies producing more than 100,000 tonnes of carbon emissions annually to accelerate their emissions reduction activities. On September 13, 2022, the Australian government passed the Climate Change Act 2022 to set the GHG emissions reduction targets into law.
In May 2023, the Australian Parliament passed reforms to the National Greenhouse and Energy Reporting (Safeguard Mechanism) Rule 2015 (legislated through the National Greenhouse and Energy Reporting Act 2007 (Cth)). Refer to the section “Regulatory Matters — Australia” within this Item 1 for discussion of the reforms.
Available Information
Peabody files or furnishes annual, quarterly and current reports (including any exhibits or amendments to those reports), proxy statements and other information with the SEC. These materials are available free of charge through the Company’s website (www.peabodyenergy.com) as soon as reasonably practicable after such material is electronically filed with, or furnished to, the SEC. Information included on the Company’s website does not constitute part of this document. These materials may also be accessed through the SEC’s website (www.sec.gov).
In addition, copies of the Company’s filings will be made available, free of charge, upon request by telephone at (314) 342-7900 or by mail at: Peabody Energy Corporation, Peabody Plaza, 701 Market Street, St. Louis, Missouri 63101-1826, attention: Investor Relations.
Item 1A. Risk Factors.
The Company operates in a rapidly changing environment that involves a number of risks. The following discussion highlights some of these risks and others are discussed elsewhere in this report. These and other risks could materially and adversely affect the Company’s business, financial condition, prospects, operating results or cash flows. The following risk factors are not an exhaustive list of the risks associated with the Company’s business. New factors may emerge or changes to these risks could occur that could materially affect its business.
Risks Associated with Peabody’s Operations
The Company’s profitability depends upon the prices it receives for its coal.
The Company operates in a competitive and highly regulated industry that has at times experienced strong headwinds. Current pricing levels of both seaborne and domestic coal products may not be sustainable in the future. Declines in coal prices could materially and adversely affect the Company’s operating results and profitability and the value of its coal reserves and resources.
| | | | | | | | |
| Peabody Energy Corporation | 2024 Form 10-K | 25 |
Coal prices are dependent upon factors beyond the Company’s control, including:
•the demand for electricity and capacity utilization of electricity generating units (whether coal or non-coal);
•changes in the fuel consumption and dispatch patterns of electric power generators, whether based on economic or non-economic factors;
•the proximity, capacity and cost of transportation and terminal facilities;
•competition with and the availability, quality and price of coal and alternative fuels, including natural gas, fuel oil, nuclear, hydroelectric, wind, biomass and solar power;
•governmental regulations and taxes, including tariffs or other trade restrictions as well as those establishing air emission standards for coal-fueled power plants or mandating or subsidizing increased use of electricity from renewable energy sources;
•the strength of the global economy, including the relative exchange rates of U.S. dollars for foreign currencies;
•the unknown geopolitical consequences of current and future political and military conflicts, including between Russia and Ukraine;
•the global supply and production costs of thermal and metallurgical coal;
•the demand for steel, which may lead to price fluctuations in the monthly and quarterly repricing of the Company’s metallurgical coal contracts;
•weather patterns, severe weather and natural disasters;
•regulatory, administrative and judicial decisions, including those affecting future mining permits and leases;
•competing technologies used to make steel, some of which do not use coal as a manufacturing input, such as electric arc furnaces; and
•technological developments, including those related to alternative energy sources, those intended to convert coal-to-liquids or gas and those aimed at capturing, using and storing carbon dioxide.
Thermal coal accounted for the majority of the Company’s coal sales by volume during 2024 and 2023, with the vast majority of these sales to electric power generators. The demand for coal consumed for electric power generation is affected by many of the factors described above, but primarily by (i) the overall demand for electricity; (ii) the availability, quality and price of competing fuels, such as natural gas, nuclear, fuel oil and alternative energy sources; (iii) utilization of all electricity generating units (whether using coal or not), including the relative cost of producing electricity from multiple fuels, including coal; (iv) stringent environmental and other governmental regulations; (v) other sociopolitical views on coal; and (vi) the coal inventories of utilities. Gas-fueled generation has displaced and could continue to displace coal-fueled generation (particularly from older, less efficient coal-fueled generation units) as current and potentially increasing regulatory costs and other factors, such as declines in the price of natural gas, impact the operating decisions of electric power generators. In addition, some electric power generators have made decisions to close coal-fueled generation units given ongoing pressure to shift away from coal generation. Many of the new power plants in the U.S. are being fueled by natural gas because gas-fired plants have been less expensive to construct and operate, permits to construct these plants are easier to obtain based on emissions profiles and electric power generators may face public and governmental pressure to generate a larger portion of their electricity from natural gas-fueled units and alternative energy sources. Increasingly stringent regulations along with stagnant electricity demand in recent years have also reduced the number of new power plants being built. In recent years, these trends have reduced demand for the Company’s coal and the related prices. Lower demand for coal consumed by electric power generators has reduced and could continue to reduce the volume of thermal coal that the Company sells and the prices that it receives for the thermal coal, thereby reducing its revenue and adversely impacting its earnings and the value of its coal reserves and resources.
The Company produces metallurgical coal that is used in the global steel industry. Metallurgical coal accounted for approximately 25% and 26% of its revenue in 2024 and 2023, respectively. Changes in governmental policies and regulations and changes in the steel industry, including the demand for steel, could reduce the demand for the Company’s metallurgical coal. The demand for foreign-produced steel both in foreign markets and in the U.S. market depends in part on factors such as tariff rates on steel. The Company’s customers may be affected by imposed tariffs to the extent their imports into other countries are curtailed as a result of tariffs.
In addition, the steel industry’s demand for metallurgical coal is affected by a number of factors, including the variable nature of that industry’s business, technological developments in the steel-making process and the availability of substitutes for steel, such as aluminum, composites and plastics. The steel industry increasingly relies on processes to make steel that do not use coal as a manufacturing input, such as electric arc furnaces. Lower demand for metallurgical coal in international markets would reduce the amount of metallurgical coal that Peabody sells and the prices that it receives for it, thereby reducing revenues and adversely impacting earnings and the value of its coal reserves. Foreign government policies related to coal production and consumption could also negatively impact pricing and demand for the Company’s products.
| | | | | | | | |
| Peabody Energy Corporation | 2024 Form 10-K | 26 |
If a substantial number of the Company’s long-term coal supply agreements, including those with its largest customers, terminate, or if the pricing, volumes or other elements of those agreements materially adjust, its revenue and operating profits could suffer if the Company is unable to find alternate buyers willing to purchase its coal on comparable terms to those in its contracts.
Most of the Company’s sales are made under coal supply agreements, which are important to the stability and profitability of its operations. The execution of a satisfactory coal supply agreement is frequently the basis on which the Company undertakes the development of coal reserves and resources required to be supplied under the contract, particularly in the U.S. For the year ended December 31, 2024, the Company derived 27% of its revenue from coal supply agreements from its five largest customers. Those five customers were supplied primarily from 16 coal supply agreements (excluding trading and brokerage transactions) expiring at various times from 2024 to 2028.
Many of the Company’s coal supply agreements contain provisions that permit the parties to adjust the contract price upward or downward at specified times. The Company may adjust these contract prices based on inflation or deflation, price indices and/or changes in the factors affecting the cost of producing coal, such as taxes, fees, royalties and changes in the laws regulating the mining, production, sale or use of coal. In a limited number of contracts, failure of the parties to agree on a price under those provisions may allow either party to terminate the contract. The Company may experience reductions in coal prices in new long-term coal supply agreements replacing some of its expiring contracts. Coal supply agreements also typically contain force majeure provisions allowing temporary suspension of performance by the Company or the customer during the duration of specified events beyond the control of the affected party. Some coal supply agreements allow customers to vary the volumes of coal that they are required to purchase during a particular period, and where coal supply agreements do not explicitly allow such variation, customers sometimes request that the Company amend the agreements to allow for such variation. Most of its coal supply agreements contain provisions requiring the Company to deliver coal meeting quality thresholds for certain characteristics such as Btu, sulfur content, ash content, volatile matter, coking properties, grindability and ash fusion temperature. Failure to meet these specifications could result in economic penalties, including price adjustments, the rejection of deliveries or termination of the contracts. Moreover, some of these agreements allow the Company’s customers to terminate their contracts in the event of changes in regulations affecting the coal industry that restrict the use or type of coal permissible at the customer’s plant or increase the price of coal beyond specified limits.
On an ongoing basis, the Company discusses the extension of existing agreements or entering into new long-term agreements with various customers, but these negotiations may not be successful and these customers may not continue to purchase coal from the Company under long-term supply agreements.
The operating profits the Company realizes from coal sold under supply agreements depend on a variety of factors. In addition, price adjustment and other contract provisions may increase its exposure to short-term coal price volatility. If a substantial portion of the Company’s coal supply agreements were modified or terminated, it could be materially adversely affected to the extent that it is unable to find alternate buyers for its coal at the same level of profitability. Prices for coal vary by mining region and country. As a result, the Company cannot predict the future strength of the coal industry overall or by mining region and cannot provide assurance that it will be able to replace existing long-term coal supply agreements at the same prices or with similar profit margins when they expire. In addition, the Company’s revenue could be adversely affected by a decline in customer purchases (including contractually obligated purchases) due to lack of demand and oversupply, cost of competing fuels and environmental and other governmental regulations.
| | | | | | | | |
| Peabody Energy Corporation | 2024 Form 10-K | 27 |
Risks inherent to mining could increase the cost of operating the Company’s business, and events and conditions that could occur during the course of its mining operations could have a material adverse impact on the Company.
The Company’s mining operations are subject to conditions that can impact the safety of its workforce, delay coal deliveries or increase the cost of mining at particular mines for varying lengths of time. These conditions include:
•elevated gas levels;
•fires and explosions, including from methane gas or coal dust;
•accidental mine water discharges;
•weather, flooding and natural disasters;
•hazardous events such as roof falls and high wall or tailings dam failures;
•seismic activities, ground failures, rock bursts or structural cave-ins or slides;
•key equipment failures;
•supply chain constraints or unavailability of equipment or parts of the type, quantity and/or size needed to meet production expectations;
•variations in coal seam thickness, coal quality, the amount of rock and soil overlying coal deposits and geologic conditions impacting mine sequencing;
•delays in moving its longwall equipment;
•unexpected maintenance problems; and
•unforeseen delays in implementation of mining technologies that are new to its operations.
The Company maintains insurance policies that provide limited coverage for some of the risks referenced above, which may lessen the impact associated with these risks. However, there can be no assurance as to the amount or timing of recovery under its insurance policies in connection with losses associated with these risks.
The Company’s take-or-pay arrangements could unfavorably affect its profitability.
The Company has substantial take-or-pay arrangements with its port access and rail transportation providers, predominately in Australia, totaling $1.0 billion, with terms ranging up to 19 years, that commit the Company to pay a minimum amount for the delivery of coal even if those commitments go unused. The take-or-pay provisions in these contracts sometimes allow the Company to apply amounts paid for subsequent deliveries, but these provisions have limitations and the Company may not be able to apply all such amounts so paid in all cases. Also, the Company may not be able to utilize the amount of capacity for which it has previously paid. Additionally, the Company may continue to deliver coal during times when it might otherwise be optimal to suspend operations because these take-or-pay provisions effectively convert a variable cost of selling coal to a fixed operating cost.
The Company may not recover its investments in its mining, exploration and other assets, which may require the Company to recognize impairment charges related to those assets.
The value of the Company’s assets have from time to time been adversely affected by numerous uncertain factors, some of which are beyond the Company’s control, including unfavorable changes in the economic environments in which it operates; declining coal-fired electricity generation; lower-than-expected coal pricing; technical and geological operating difficulties; an inability to economically extract its coal reserves and resources; and unanticipated increases in operating costs. These factors may trigger the recognition of additional impairment charges in the future, which could have a substantial impact on the Company’s results of operations.
Because of the volatile and cyclical nature of coal markets, it is reasonably possible that the Company’s current estimates of projected future cash flows from its mining assets may change in the near term, which may result in the need for adjustments to the carrying value of its assets.
The Company’s ability to operate effectively could be impaired if it loses key personnel or fails to attract qualified personnel.
Peabody manages its business with a number of key personnel, the loss of whom could have a material adverse effect on the Company, absent the completion of an orderly transition. In addition, the Company believes that its future success will depend greatly on its continued ability to attract and retain highly skilled and qualified personnel in tight labor markets, particularly personnel with mining experience. Peabody cannot provide assurance that key personnel will continue to be employed by the Company or that it will be able to attract and retain qualified personnel in the future. Failure to retain key personnel or attract qualified personnel could have a material adverse effect on the Company.
| | | | | | | | |
| Peabody Energy Corporation | 2024 Form 10-K | 28 |
The Company could be negatively affected if it fails to maintain satisfactory labor relations.
As of December 31, 2024, the Company had approximately 5,600 employees (excluding employees that were employed at operations classified as discontinued), which included approximately 4,300 hourly employees. The Company is party to labor agreements with various labor unions that represent certain of its employees. Such labor agreements are negotiated periodically, and, therefore, the Company is subject to the risk that these agreements may not be able to be renewed on reasonably satisfactory terms. Approximately 40% of its hourly employees were represented by organized labor unions and generated approximately 21% of its coal production for the year ended December 31, 2024. Relations with its employees and, where applicable, organized labor are important to the Company’s success. If some or all of its current non-union operations were to become unionized, the Company could incur an increased risk of work stoppages, reduced productivity and higher labor costs. Also, if the Company fails to maintain good relations or successfully negotiate contracts with its employees who are represented by unions, the Company could potentially experience labor disputes, strikes, work stoppages, slowdowns or other disruptions in production that could negatively impact its profitability.
The Company could be adversely affected if it fails to appropriately provide financial assurances for its obligations.
U.S. federal and state laws and Australian laws require the Company to provide financial assurances related to requirements to reclaim lands used for mining; to pay federal and state workers’ compensation, such as black lung liabilities; to provide financial assurances for coal lease obligations; and to satisfy other miscellaneous obligations. Historically, the primary methods the Company has used to meet those obligations are to provide a third-party surety bond or a letter of credit. In recent years, the Company has also utilized deposits with regulatory authorities or cash-backed bank guarantees. As of December 31, 2024, the Company had $1,017.5 million of outstanding surety bonds; $262.3 million of letters of credit with third parties; $168.5 million of cash-backed bank guarantees; and $127.6 million of deposits with regulatory authorities in order to provide required financial assurances for post-mining reclamation, workers’ compensation and other insurance obligations, coal lease-related and other obligations and performance guarantees, in addition to collateral for sureties. Under the Company’s agreement with the providers of its surety portfolio, the Company has $394.6 million in cash held in trust accounts for the benefit of certain surety providers as of December 31, 2024.
The Company’s financial assurance obligations may increase or become more costly due to a number of factors, and surety bonds and letters of credit may not be available to the Company, particularly in light of some banks and insurance companies’ announced unwillingness to support thermal coal producers and other fossil fuel companies. Alternative forms of financial assurance such as self-bonding have been severely restricted or terminated in most of the regions where its mines reside. The Company’s failure to retain, or inability to obtain, surety bonds, bank guarantees or letters of credit, or to provide a suitable alternative, could have a material adverse effect on it. That failure could result from a variety of factors including:
•lack of availability, higher expense or unfavorable market terms of new surety bonds, bank guarantees or letters of credit;
•inability to provide or fund collateral for current and future third-party issuers of surety bonds, bank guarantees or letters of credit; and
•lack of available fronting banks in certain countries where the Company must provide financial assurances but its primary surety providers are not licensed or admitted.
As further described in “Liquidity and Capital Resources” of Part II, Item 7. “Management’s Discussion and Analysis of Financial Condition and Results of Operations,” the Company has a surety transaction support agreement with the providers of its surety bond portfolio. The Company’s failure to provide adequate collateral, or abide by other terms in the agreement, could invalidate the agreement and materially and adversely affect its business and results of operations.
The Company’s failure to maintain adequate bonding would invalidate its mining permits and prevent mining operations from continuing, which could result in its inability to continue as a going concern.
| | | | | | | | |
| Peabody Energy Corporation | 2024 Form 10-K | 29 |
If the assumptions underlying the Company’s asset retirement obligations for reclamation and mine closures are materially inaccurate, its costs could be significantly greater than anticipated.
The Company’s asset retirement obligations primarily consist of spending estimates for surface land reclamation and support facilities at both surface and underground mines in accordance with federal and state reclamation laws in the U.S. and Australia as defined by each mining permit. These obligations are determined for each mine using various estimates and assumptions including, among other items, estimates of disturbed acreage as determined from engineering data, estimates of future costs to reclaim the disturbed acreage and the timing of these cash flows, which is driven by the estimated economic life of the mine and the applicable reclamation laws. These cash flows are discounted using a credit-adjusted, risk-free rate. The Company’s management and engineers periodically review these estimates. If its assumptions do not materialize as expected, actual cash expenditures and costs that the Company incurs could be materially different than currently estimated. Moreover, regulatory changes could increase the Company’s obligation to perform reclamation, mine closing and post-closure activities. The resulting estimated asset retirement obligation could change significantly if actual amounts change significantly from its assumptions, which could have a material adverse effect on its results of operations and financial condition.
The Company’s mining operations are extensively regulated, which imposes significant costs on it, and future regulations and developments could increase those costs or limit its ability to produce coal.
The coal mining industry is subject to regulation by federal, state and local authorities with respect to matters such as:
•workplace health and safety;
•limitations on land use;
•mine permitting and licensing requirements;
•reclamation and restoration of mining properties after mining is completed;
•the storage, treatment and disposal of wastes;
•remediation of contaminated soil, sediment and groundwater;
•air quality standards;
•water pollution;
•protection of human health, plant-life and wildlife, including endangered or threatened species and habitats;
•protection of wetlands;
•the discharge of materials into the environment; and
•the effects of mining on surface water and groundwater quality and availability.
Regulatory agencies have the authority under certain circumstances following significant health and safety incidents to order a mine to be temporarily or permanently closed. In the event that such agencies ordered the closing of one of the Company’s mines, its production and sale of coal would be disrupted and it may be required to incur cash outlays to re-open the mine. Any of these actions could have a material adverse effect on the Company’s financial condition, results of operations and cash flows.
New legislation, regulations or orders related to the environment or employee health and safety may be adopted and may materially adversely affect the Company’s mining operations, its cost structure or its customers’ ability to use coal. New legislation, such as the “climate superfund” laws recently passed in New York and Vermont, or administrative regulations (or new interpretations by the relevant government of existing laws, regulations and approvals), including proposals related to the protection of the environment or the reduction of GHG emissions that would further regulate and tax the coal industry, may also require the Company or its customers to change operations significantly or incur increased costs. Some of the Company’s coal supply agreements contain provisions that allow a purchaser to terminate its contract if legislation is passed that either restricts the use or type of coal permissible at the purchaser’s plant or results in specified increases in the cost of coal or its use. These factors and legislation, if enacted, could have a material adverse effect on the Company’s financial condition and results of operations. If the Company is determined to be subject to “climate superfund” laws and related regulations, it may be required to make significant payments to the relevant governments. These payments may be material and could adversely affect the Company’s results of operations, financial condition or cash flows.
For additional information about the various regulations affecting the Company, see the sections entitled “Regulatory Matters —U.S.” and “Regulatory Matters — Australia.”
| | | | | | | | |
| Peabody Energy Corporation | 2024 Form 10-K | 30 |
The Company’s operations may impact the environment or cause exposure to hazardous substances, and its properties may have environmental contamination, which could result in material liabilities to the Company.
The Company’s operations currently use hazardous materials and generate limited quantities of hazardous wastes from time to time. A number of laws, including CERCLA and RCRA in the U.S. and similar laws in other countries where the Company operates, impose liability relating to contamination by hazardous substances. Such liability may involve the costs of investigating or remediating contamination and damages to natural resources, as well as claims seeking to recover for property damage or personal injury caused by hazardous substances. Such liability may arise from conditions at formerly, as well as currently, owned or operated properties, and at properties to which hazardous substances have been sent for treatment, disposal or other handling. Liability under RCRA, CERCLA and similar state statutes is without regard to fault, and typically is joint and several, meaning that a person may be held responsible for more than its share, or even all, of the liability involved.
The Company may be unable to obtain, renew or maintain permits necessary for its operations, or the Company may be unable to obtain, renew or maintain such permits without conditions on the manner in which it runs its operations, which would reduce its production, cash flows and profitability.
Numerous governmental permits and approvals are required for mining operations. The permitting rules, and the interpretations of these rules, are complex, change frequently and are often subject to discretionary interpretations by regulators, all of which may make compliance more difficult or impractical. As part of this permitting process, when the Company applies for permits and approvals, it is required to prepare and present to governmental authorities data pertaining to the potential impact or effect that any proposed exploration for or production of coal may have upon the environment. The public, including non-governmental organizations, opposition groups and individuals, have statutory rights to comment upon and submit objections to requested permits and approvals (including modifications and renewals of certain permits and approvals) and otherwise engage in the permitting process, including bringing citizens’ lawsuits to challenge the issuance of permits, the validity of environmental impact statements or the performance of mining activities. In recent years, the permitting required for coal mining has been the subject of increasingly stringent regulatory and administrative requirements and extensive litigation by environmental groups.
Additionally, the Company’s operations may be affected by sites within or near mining areas that have cultural heritage significance to indigenous peoples, and its mining permits may be rescinded or modified, or its mining plans may be voluntarily adjusted, to mitigate against adverse impacts to such sites.
The costs, liabilities and requirements associated with these permitting requirements and any related opposition may be extensive and time-consuming and may delay commencement or continuation of exploration or production which would adversely affect the Company’s coal production, cash flows and profitability. Further, required permits may not be issued or renewed in a timely fashion or at all, or permits issued or renewed may be conditioned in a manner that may restrict the Company’s ability to efficiently and economically conduct its mining activities, any of which would materially reduce its production, cash flows and profitability.
Concerns about the impacts of coal combustion on global climate are increasingly leading to conditions that have affected and could continue to affect demand for the Company’s products or its securities and its ability to produce, including increased governmental regulation of coal combustion and unfavorable investment decisions by electricity generators.
Global climate issues continue to attract public and scientific attention. Numerous reports, such as the Sixth Assessment Report of the Intergovernmental Panel on Climate Change, have also engendered concern about the impacts of human activity, especially fossil fuel combustion, on global climate issues. In turn, increasing government attention has been paid to global climate issues and to emissions of GHGs, including emissions of CO2 from coal combustion by power plants.
The enactment of future laws or the passage of regulations regarding emissions from the use of coal by the U.S., some of its states or other countries, and ongoing actions to limit such emissions, such as carbon taxes, could result in electricity generators switching from coal to other fuel sources. Further, policies limiting available financing for the development of new coal-fueled power stations could adversely impact the global demand for coal in the future. The potential financial impact on Peabody of such future laws, regulations or other policies will depend upon the degree to which any such laws or regulations force electricity generators to diminish their reliance on coal as a fuel source. That, in turn, will depend on a number of factors, including the specific requirements imposed by any such laws, regulations or other policies, the time periods over which those laws, regulations or other policies would be phased in, the state of development and deployment of CCUS technologies as well as acceptance of CCUS technologies to meet regulations and the alternative uses for coal. Higher-efficiency coal-fired power plants may also be an option for meeting laws or regulations related to emissions from coal use. Several countries, including major coal users such as China, India and Japan, included using higher-efficiency coal-fueled power plants in their plans under the Paris Agreement.
| | | | | | | | |
| Peabody Energy Corporation | 2024 Form 10-K | 31 |
From time to time, the Company’s Board of Directors and management attempt to analyze the potential impact on the Company of as-yet-unadopted, potential laws, regulations and policies. Such analyses require significant assumptions as to the specific provisions of such potential laws, regulations and policies which sometimes show that if implemented in the manner assumed by the analyses, the potential laws, regulations and policies could result in material adverse impacts on the Company’s operations, financial condition or cash flows. Such analyses cannot be relied upon to reasonably predict the quantitative impact that future laws, regulations or other policies may have on the Company’s results of operations, financial condition or cash flows.
Numerous activist groups are devoting substantial resources to anti-coal activities to minimize or eliminate the use of coal as a source of electricity generation, domestically and internationally, thereby further reducing the demand and pricing for coal, and potentially materially and adversely impacting the Company’s future financial results, liquidity and growth prospects.
Several non-governmental organizations have undertaken campaigns to minimize or eliminate the use of coal as a source of electricity generation in the U.S. and across the globe. In an effort to stop or delay coal mining activities, activist groups have brought lawsuits challenging the issuance of individual coal leases and challenging the federal coal leasing program more broadly. Other lawsuits challenge historical and pending regulatory approvals, permits and processes that are necessary to conduct coal mining operations or to operate coal-fueled power plants, including so-called “sue and settle” lawsuits where regulatory authorities in the past have reached private agreements with environmental activists that often involve additional regulatory restrictions or processes being implemented without formal rulemaking.
The effect of these and other similar developments has made it more costly and difficult to maintain the Company’s business. These cost increases and/or substantial or extended declines in the prices the Company receives for its coal due to these or other factors could reduce its revenue and profitability, cash flows, liquidity, and value of its coal reserves and resources, and could result in material losses.
The Company’s trading and hedging activities do not cover certain risks and may expose it to earnings volatility and other risks.
The Company is subject to coal price volatility, price volatility on diesel fuel utilized in its mining operations and foreign currency exchange rate risk associated with the Australian dollar. The Company hedges certain of these risks through hedging arrangements and may continue in the future to enter into hedging arrangements, including economic hedging arrangements, to manage these risks or other exposures. Since the Company’s existing hedging arrangements do not receive cash flow hedge accounting treatment, all changes in fair value are reflected in current earnings.
The Company’s future success depends upon its ability to continue acquiring and developing coal reserves and resources that are economically recoverable.
The Company’s recoverable reserves and resources decline as it produces coal. The Company has not yet applied for the permits required or developed the mines necessary to use all of its reserves and resources. Moreover, the amount of coal reserves and resources described in Part I, Item 2. “Properties” involves the use of certain estimates and those estimates could be inaccurate. Actual production, revenue and expenditures with respect to its coal reserves and resources may vary materially from estimates.
The Company’s future success depends upon it conducting successful exploration and development activities or acquiring properties containing economically recoverable reserves and resources. The Company’s current strategy includes increasing its coal reserves and resources through acquisitions of government and other leases and producing properties and continuing to use its existing properties and infrastructure. In certain locations, leases for oil, natural gas and coalbed methane reserves are located on, or adjacent to, some of the Company’s coal reserves and resources, potentially creating conflicting interests between it and lessees of those interests. Other lessees’ rights relating to these mineral interests could prevent, delay or increase the cost of developing the Company’s coal reserves and resources. These lessees may also seek damages from the Company based on claims that its coal mining operations impair their interests. Additionally, the U.S. federal government limits the amount of federal land that may be leased by any company to 75,000 acres in any one state and 150,000 acres nationwide. As of December 31, 2024, the Company leased a total of 44,287 acres from the federal government subject to those limitations.
| | | | | | | | |
| Peabody Energy Corporation | 2024 Form 10-K | 32 |
The Company’s planned mine development projects and acquisition activities may not result in significant additional reserves and resources, and it may not have success developing additional mines. Most of its mining operations are conducted on properties owned or leased by the Company. Its right to mine some of its coal reserves and resources may be materially adversely affected if defects in title or boundaries exist. In order to conduct its mining operations on properties where these defects exist, the Company may incur unanticipated costs. In addition, in order to develop its reserves and resources, the Company must also own the rights to the related surface property and receive various governmental permits. The Company cannot predict whether it will continue to receive the permits or appropriate land access necessary for it to operate profitably in the future. The Company may not be able to negotiate or secure new leases from the government or from private parties, obtain mining contracts for properties containing additional coal reserves and resources or maintain its leasehold interest in properties on which mining operations have not commenced or have not met minimum quantity or product royalty requirements. From time to time, the Company has experienced litigation with lessors of its coal properties and with royalty holders. In addition, from time to time, its permit applications and federal and state coal leases have been challenged, causing production delays.
To the extent that the Company’s existing sources of liquidity are not sufficient to fund its planned mine development projects or coal reserve and resource acquisition activities, it may require access to capital markets, which may not be available to it or, if available, may not be available on satisfactory terms. If the Company is unable to fund these activities, it may not be able to maintain or increase its existing production rates and could be forced to change its business strategy, which could have a material adverse effect on its financial condition, results of operations and cash flows.
The Company faces numerous uncertainties in estimating its coal reserves and resources and inaccuracies in its estimates could result in lower than expected revenue, higher than expected costs and decreased profitability.
Coal is economically recoverable when the price at which the Company’s coal can be sold exceeds the costs and expenses of mining and selling the coal. The costs and expenses of mining and selling the coal are determined on a mine-by-mine basis, and as a result, the price at which its coal is economically recoverable varies based on the mine. Forecasts of the Company’s future performance are based on, among other things, estimates of its recoverable coal reserves and resources. The Company bases its reserve and resource information on engineering, economic and geological data assembled and analyzed by its staff and third parties, which includes various engineers and geologists. The Company's estimates are also subject to SEC regulations regarding classification of reserves and resources, including subpart 1300 of Regulation S-K. The reserve and resource estimates as to both quantity and quality are updated from time to time to reflect production of coal from the reserves and resources and new drilling or other data received. There are numerous uncertainties inherent in estimating quantities and qualities of coal and costs to mine recoverable reserves and resources, including many factors beyond the Company’s control.
Estimates of economically recoverable coal reserves and resources necessarily depend upon a number of variable factors and assumptions, any one of which may, if incorrect, result in an estimate that varies considerably from actual results. These factors and assumptions include:
•geologic and mining conditions, which may not be fully identified by available exploration data and may differ from the Company’s experience in areas it currently mines;
•demand for coal;
•current and future market prices for coal, contractual arrangements, operating costs and capital expenditures;
•severance and excise taxes, royalties and development and reclamation costs;
•future mining technology improvements;
•the effects of regulation by governmental agencies;
•the ability to obtain, maintain and renew all required permits;
•employee health and safety; and
•historical production from the area compared with production from other producing areas.
The conversion of reported mineral resources to mineral reserves should not be assumed, and the reclassification of reported mineral resources from lower to higher levels of geological confidence should not be assumed. As such, actual coal tonnage recovered from identified reserve and resource areas or properties and revenue and expenditures with respect to the Company’s coal reserves and resources may vary materially from estimates. Thus, these estimates may not accurately reflect its actual reserves and resources. Any material inaccuracy in the Company’s estimates related to its coal reserves and resources could result in lower than expected revenue, higher than expected costs or decreased profitability which could materially and adversely affect its business, results of operations, financial position and cash flows.
| | | | | | | | |
| Peabody Energy Corporation | 2024 Form 10-K | 33 |
Joint ventures, partnerships or non-managed operations may not be successful and may not comply with the Company’s operating standards.
The Company participates in several joint venture and partnership arrangements and may enter into others, all of which necessarily involve risk. Whether or not the Company holds majority interests or maintains operational control in its joint ventures, its partners may, among other things, (1) have economic or business interests or goals that are inconsistent with, or opposed to, the Company’s; (2) seek to block actions that the Company believes are in its or the joint venture’s best interests; or (3) be unable or unwilling to fulfill their obligations under the joint venture or other agreements, such as contributing capital, each of which may adversely impact the Company’s results of operations and its liquidity or impair its ability to recover its investments.
Where the Company’s joint ventures are jointly controlled or not managed by it, the Company may provide expertise and advice but have limited control over compliance with its operational standards. The Company also utilizes contractors across its mining platform, and may be similarly limited in its ability to control their operational practices. Failure by non-controlled joint venture partners or contractors to adhere to operational standards that are equivalent to those of the Company could unfavorably affect safety results, operating costs and productivity and adversely impact its results of operations and reputation.
The Company’s expenditures for postretirement benefit obligations could be materially higher than it has predicted if its underlying assumptions prove to be incorrect.
The Company pays postretirement health and life insurance benefits to eligible retirees. Its total accumulated postretirement benefit obligation related to such benefits was a liability of $134.1 million as of December 31, 2024, of which $13.7 million was classified as a current liability.
These liabilities are actuarially determined. The Company uses various actuarial assumptions, including the discount rate, future cost trends, mortality tables, demographic assumptions and expected rates of return on plan assets to estimate the costs and obligations for these items. Its discount rate is determined by utilizing a hypothetical bond portfolio model which approximates the future cash flows necessary to service its liabilities. A decrease in the discount rate used to determine its postretirement benefit obligations could result in an increase in the valuation of these obligations, thereby increasing the cost in subsequent fiscal years. The Company has made assumptions related to future trends for medical care costs in the estimates of retiree health care obligations. Its medical trend assumption is developed by annually examining the historical trend of its cost per claim data. If the Company’s assumptions do not materialize as expected, actual cash expenditures and costs that it incurs could differ materially from its current estimates. Moreover, regulatory changes or changes in healthcare benefits provided by the government could increase its obligation to satisfy these or additional obligations. The Company develops its actuarial determinations of liabilities using actuarial mortality tables it believes best fit its population’s actual results. In deciding which mortality tables to use, the Company periodically reviews its population’s actual mortality experience and evaluates results against its current assumptions as well as consider recent mortality tables published by the Society of Actuaries Retirement Plans Experience Committee in order to select mortality tables for use in its year end valuations. If the Company’s mortality tables do not anticipate its population’s mortality experience as accurately as expected, actual cash expenditures and costs that the Company incurs could differ materially from its current estimates.
High inflation or imposed tariffs could result in higher costs and decreased profitability.
In recent years the Company has been adversely impacted by inflation, which has increased the cost of materials, labor, equipment, freight, fuel and other cost categories. Tariffs could also increase the cost of new equipment purchases as well as parts and components to service the Company’s equipment fleet.
The Company’s efforts to recover inflation-based cost increases from its customers may be hampered as a result of the structure of its contracts and the contract bidding process as well as the competitive industries, economic conditions and countries in which the Company operates. Accordingly, substantial inflation or tariffs may result in a material adverse impact on the Company’s costs, profitability and financial results.
The Company’s business, results of operations, financial condition and prospects could be materially and adversely affected by pandemics or other widespread illnesses and the related effects on public health.
The Company’s operations are susceptible to widespread outbreaks of illness or other public health issues. Pandemic illnesses could have a material adverse effect on the Company’s business, results of operations, financial condition and prospects, including its ability to comply with restrictions and covenants under its debt and surety bonding obligations.
| | | | | | | | |
| Peabody Energy Corporation | 2024 Form 10-K | 34 |
Pandemics or other widespread illnesses could result in governmental mandates requiring shutdowns of facilities for indefinite periods; serious health issues and absenteeism within the workforce; and disruptions to supply chain and distribution channels impacting both vendors and customers. As a result, the Company could face increased costs or decreased sales. Adverse changes in the general domestic and global economic conditions and disrupted domestic and international credit markets, could negatively affect its customers’ ability to pay the Company as well as its ability to access capital that could negatively affect its liquidity. Despite its efforts to manage these potential impacts, their ultimate impact would also depend on factors beyond the Company’s knowledge or control, including the duration and severity of the pandemic as well as third-party actions taken to contain its spread and mitigate its public health effects. These factors could have a material adverse effect on its business, financial condition, results of operations and prospects.
Peabody is exposed to risks associated with political or international conflicts.
Political or international conflicts can result in worldwide geopolitical and macroeconomic uncertainty, as has been the case with the ongoing conflict between Russia and Ukraine, the Israel-Hamas conflict and escalating tensions in the Middle East. The Company is unable to predict the ultimate impacts related to such conflicts. If a conflict continues for a significant time or expands to other countries, it could have adverse effects on macroeconomic conditions, including but not limited to, turbulent coal pricing and trade flow disruptions resulting from sanctions imposed on coal imports; supply chain disruptions; increased costs; and decreased business spending. Furthermore, political or international conflicts could give rise to disruptions to Peabody or its business partners’ global technology infrastructure, including through cybersecurity attack or cyber intrusion; adverse changes in international trade policies and relations; regulatory enforcement; Peabody’s ability to implement and execute its business strategy; terrorist activities; Peabody’s exposure to foreign currency fluctuations; and constraints, volatility, or disruption in the capital markets, any of which could have a material adverse effect on the Company’s business, results of operations, cash flows and financial condition.
Peabody could be exposed to significant liability, reputational harm, loss of revenue, increased costs or other risks if it sustains cybersecurity attacks or other security breaches that disrupt its operations or result in the dissemination of proprietary or confidential information about the Company, its customers or other third-parties.
Peabody has implemented security protocols and systems with the intent of maintaining the physical and cyber security of its operations and protecting the Company’s and its counterparties’ confidential information and information related to identifiable individuals against unauthorized access. Despite such efforts, the Company may be subject to security breaches which could result in unauthorized access to its facilities or the information it is trying to protect.
The Company is in an industry and business involving energy-related assets that is at a relatively greater risk of security breaches by sophisticated adversaries, such as nation state actors, as compared to other targets. The Company’s information systems and those of important third parties are vulnerable to malicious and intentional cyberattacks involving malware (such as ransomware), accidental or inadvertent incidents, the exploitation of security vulnerabilities or “bugs” in software or hardware, social engineering/phishing attacks, and malfeasance by insiders, among other scenarios. Both the frequency and magnitude of cybersecurity attacks is expected to increase, and attackers are increasingly sophisticated. As a result, Peabody may be unable to anticipate, detect or prevent future attacks at its current resource levels, particularly as the methodologies utilized by attackers change frequently or are not recognized until launched, and Peabody may be unable to investigate or remediate incidents because attackers are increasingly using techniques and tools (such as artificial intelligence and machine learning) designed to circumvent controls, avoid detection, and remove or obfuscate forensic evidence.
Unauthorized physical access to one of the Company’s facilities or electronic access to its information systems could result in, among other things, unfavorable publicity, litigation (including class action) by affected parties, regulatory investigations and enforcement, damage to sources of competitive advantage, disruptions to its operations, loss of customers, financial obligations for damages related to the theft or misuse of such information and costs to investigate and remediate such security vulnerabilities, any of which could have a substantial impact on the Company’s results of operations, financial condition or cash flows.
Peabody’s information and operational technology systems may be adversely affected by disruptions, damage, failure and risks associated with implementation and integration, including of new technologies.
Peabody could be adversely affected by system or network disruptions if new or upgraded information or operational technology systems are defective, not installed properly or not properly integrated into its operations. System modification failures could have a material adverse effect on the Company’s business, financial position and results of operations and could, if not successfully implemented, adversely impact the effectiveness of its internal control over financial reporting.
| | | | | | | | |
| Peabody Energy Corporation | 2024 Form 10-K | 35 |
Further, Peabody increasingly depends on its information technology infrastructure for electronic communications among its operations, personnel, customers and suppliers around the world, including as a result of remote working and flexible working arrangements. These information technology systems, some of which are managed by third parties that the Company does not control, have been and may in the future be susceptible to damage, disruptions or shutdowns. As threats to its information technology infrastructure continue to rapidly evolve, the Company’s controls and procedures may become inadequate and the Company may be required to devote additional resources to modifying or enhancing its systems in the future.
The Company is subject to various general operating risks which may be fully or partially outside of its control.
The Company’s results of operations, financial position or cash flows could be adversely impacted by various general operating risks which may be fully or partially outside of its control. Such risks stem from internal and external sources and include:
•global economic recessions and/or credit market disruptions;
•deterioration of the creditworthiness of its customers or counterparties to financial instruments, and their ability to perform under contracts;
•inability of suppliers and other counterparties, including those related to transportation, contract mining, service provision, and coal trading and brokerage, to fulfil the terms of their contracts with the Company;
•decreases in the availability or increases in costs of key supplies, capital equipment or commodities such as diesel fuel, steel, explosives and tires;
•disruption to, or increased costs within, the transportation chain for coal, including rail, barge, trucking, overland conveyor, ports and ocean-going vessels;
•new or increased forms of taxation imposed by federal, state, provincial or local governmental authorities, including production taxes, sales-related taxes, royalties, environmental taxes, mining profits taxes and income taxes; and
•uncertainties associated with the Company’s global operating platform, including country and political risks, international regulatory requirements, and foreign currency rates.
Risks Related to Peabody’s Capital Structure
The Company may be able to incur more debt, including secured debt, which could increase the risks associated with its indebtedness.
As of December 31, 2024, the Company had approximately $329.3 million of unsecured indebtedness outstanding, excluding finance leases and debt issuance costs, and an additional $320.0 million in revolving commitments.
The Company may be able to incur additional indebtedness in the future, including secured debt. Although covenants under agreements governing the Company’s other indebtedness, including its revolving credit facility and finance leases, limit the Company’s ability to incur additional indebtedness, these restrictions are subject to a number of qualifications and exceptions. In addition, the agreements governing the Company’s other indebtedness do not limit the Company from incurring obligations that do not constitute indebtedness as defined therein.
The degree to which the Company is leveraged could have important consequences, including, but not limited to:
•making it more difficult for the Company to pay interest and satisfy its debt obligations;
•increasing the cost of borrowing;
•increasing the Company’s vulnerability to general adverse economic and industry or regulatory conditions;
•requiring the dedication of a substantial portion of the Company’s cash flow from operations to the payment of principal and interest on the Company’s indebtedness, thereby reducing the availability of cash flow to fund working capital, capital expenditures, business development or other general corporate requirements;
•limiting the Company’s ability to obtain additional financing to fund future working capital, capital expenditures, business development or other general corporate requirements;
•making it more difficult to obtain surety bonds, letters of credit, bank guarantees or other financing, particularly during periods in which credit markets are weak;
•limiting the Company’s flexibility in planning for, or reacting to, changes in its business and in the coal industry;
•causing a decline in the Company’s credit ratings; and
•placing the Company at a competitive disadvantage compared to less leveraged competitors.
| | | | | | | | |
| Peabody Energy Corporation | 2024 Form 10-K | 36 |
The terms of the agreements and instruments governing the Company’s debt and surety bonding obligations impose restrictions that may limit its operating and financial flexibility.
The agreements governing the Company’s unsecured debt, revolving credit facility and surety bonding obligations contain certain restrictions and covenants, which are described below and which could adversely affect the Company’s ability to operate its business, as well as significantly affect its liquidity, and therefore could adversely affect its business, financial condition and results of operations.
These restrictions and covenants may limit, among other things, the Company’s ability to:
•incur additional indebtedness;
•pay dividends on or make distributions in respect of stock or make certain other restricted payments, such as share repurchases;
•make capital or other investments;
•enter into agreements that restrict distributions from certain subsidiaries;
•sell or otherwise dispose of assets;
•use for general purposes the cash received from certain allowable asset sales or disposals;
•enter into transactions with affiliates;
•create or incur liens;
•merge, consolidate or sell all or substantially all of its assets; and
•receive dividends or other payments from subsidiaries in certain cases.
The Company’s ability to comply with these restrictions or covenants may be affected by events beyond its control. A breach of any of these restrictions or covenants together with the expiration of any cure period, if applicable, could result in a default. If any such default occurs, subject to applicable grace periods, the holders of the Company’s indebtedness may elect to declare such indebtedness, together with accrued interest and other amounts payable thereunder, to be immediately due and payable. In addition, the lenders under the Company’s revolving credit facility could elect to require the cash collateralization of any outstanding letters of credit. If the Company’s indebtedness is accelerated, the Company may not have sufficient cash flows and capital resources to repay such indebtedness or be able to restructure or refinance such indebtedness. Even if the Company were able to restructure its indebtedness or obtain additional capital or new or replacement financing, it may not be on commercially reasonable terms or on terms that are acceptable to the Company.
In this regard, if the Company experiences a default under the terms of its unsecured debt, revolving credit facility or surety bonding obligations for any reason, its business, financial condition and results of operations could be materially and adversely affected. In addition, complying with such terms may make it more difficult for the Company to successfully execute its business strategy, including by making it more difficult to compete against competitors who are not subject to such financial restrictions.
The number and quantity of viable financing and insurance alternatives available to the Company may be significantly impacted by unfavorable lending and investment policies by financial institutions and insurance companies associated with concerns about environmental impacts of coal combustion, and negative views around its efforts with respect to environmental and social matters and related governance considerations could harm the perception of the Company by a significant number of investors or result in the exclusion of its securities from consideration by those investors.
Certain banks, other financing sources and insurance companies have taken actions to limit available financing and insurance coverage for the development of new coal-fueled power plants and coal producers and utilities that derive a majority of their revenue from coal, and particularly from thermal coal. This may adversely impact the future global demand for coal. Increasingly, the actions of such financial institutions and insurance companies are informed by non-standardized “sustainability” scores, ratings and benchmarking studies provided by various organizations that assess environmental, social and governance matters. Further, there have been efforts in recent years by members of the general financial and investment communities, including investment advisors, sovereign wealth funds, public pension funds, universities and other institutional investors, to divest themselves and to promote the divestment of securities issued by companies involved in the fossil fuel extraction market, or that have low ratings or scores in studies and assessments of the type noted above, including coal producers. These entities also have been pressuring lenders to limit financing available to such companies.
| | | | | | | | |
| Peabody Energy Corporation | 2024 Form 10-K | 37 |
These efforts may have adverse consequences, including, but not limited to:
•restricting the Company’s ability to access capital and financial markets in the future;
•reducing the demand and price for its equity securities;
•increasing the cost of borrowing;
•causing a decline in the Company’s credit ratings;
•reducing the availability, and/or increasing the cost of, third-party insurance;
•increasing the Company’s retention of risk through self-insurance;
•making it more difficult to obtain surety bonds, letters of credit, bank guarantees or other financing; and
•limiting the Company’s flexibility in business development activities such as mergers, acquisitions and divestitures.
Various states have enacted, or are considering enacting, laws to sanction, or require public funds to divest, from financial institutions that restrict investments in fossil fuel companies based off of extra-regulatory environmental or social factors, or to require such institutions to provide “fair access” to financial services to companies regardless of industry. While similar regulations had been developed by the federal government in the past, and could be again in the future, the previously developed federal regulations have either been suspended or repealed. As such, the final status of efforts to divest or promote the divestment from the fossil fuel extraction market is unclear, but any such efforts may adversely affect the demand for and price of the Company’s securities and impact the Company’s access to the capital and financial markets.
Additionally, in March 2022, the SEC proposed new rules relating to the disclosure of a range of climate-related risks and other information. To the extent this rule is finalized as proposed, the Company and/or its customers could incur increased costs related to the assessment and disclosure of climate-related information. Certain states, such as California, are also adopting or considering adopting climate change-related disclosure requirements. Enhanced climate disclosure requirements could also accelerate any trend by certain stakeholders and capital providers to restrict or seek more stringent conditions with respect to their financing of certain carbon intensive sectors.
Risks Related to Ownership of Peabody’s Securities
The price of Peabody’s securities may be volatile.
The price of Peabody’s common stock (Common Stock) may fluctuate due to a variety of market and industry factors that may materially reduce the market price of its Common Stock regardless of its operating performance, including, among others:
•general economic conditions within the U.S. and internationally, including inflationary pressures and changes in interest rates;
•general market conditions;
•actual or anticipated fluctuations in Peabody’s quarterly and annual results and those of other public companies in its industry;
•industry cycles and trends;
•mergers and strategic alliances in the coal industry;
•changes in government regulation;
•potential or actual military conflicts or acts of terrorism;
•the failure of securities analysts to publish research about Peabody or to accurately predict the results it actually achieves;
•changes in accounting principles;
•announcements concerning Peabody or its competitors;
•the purchase and sale of shares of its Common Stock by significant shareholders;
•lack of or excess of trading liquidity;
•operational incidents; and
•investor sentiment with respect to the Company’s policies or efforts on environmental, social or governance matters.
As a result of all of these factors, investors in Peabody’s Common Stock may not be able to resell their stock at or above the price they paid or at all. Further, Peabody could be the subject of securities class action litigation due to any such stock price volatility, which could divert management’s attention and have a material adverse effect on its results of operation.
| | | | | | | | |
| Peabody Energy Corporation | 2024 Form 10-K | 38 |
Peabody’s Common Stock is subject to dilution and may be subject to further dilution in the future.
Peabody’s Common Stock is subject to dilution from its convertible senior debt and its long-term incentive plan. In addition, Peabody may issue equity securities in connection with future investments, acquisitions or capital raising transactions. Such issuances or grants could constitute a significant portion of the then-outstanding Common Stock, which may result in significant dilution in ownership of Common Stock.
There may be circumstances in which the interests of a significant stockholder could be in conflict with other stakeholders’ interests.
Circumstances may arise in which the interests of a significant stockholder may be in conflict with the interests of the Company’s other stakeholders. A significant stockholder may exert substantial influence over the Company to cause the Company to take action that aligns with their interests, for example, to pursue or prevent acquisitions, divestitures or other transactions, including the issuance or repurchase of additional shares or debt, that, in its judgment, could enhance its investment in Peabody or another company in which it invests. Such transactions may advance the interests of the significant stockholder and not necessarily those of other stakeholders, which might adversely affect Peabody or other holders of its Common Stock or debt instruments.
The future payment of dividends on Peabody’s stock or future repurchases of its stock is dependent on a number of factors and cannot be assured.
In 2023, the Company’s Board of Directors approved a shareholder return framework, which includes share repurchases and cash dividends, and a share repurchase program authorizing repurchases of up to $1.0 billion of the Company’s common stock. Under the share repurchase program authorized by the Board, the Company may purchase shares of common stock from time to time at the discretion of management through open market purchases, privately negotiated transactions, block trades, accelerated or other structured share repurchase programs, or other means. The manner, timing and pricing of any share repurchase transactions will be based on a variety of factors, including market conditions, applicable legal requirements and alternative opportunities that the Company may have for the use or investment of capital. The payment of future cash dividends and future repurchases will depend upon Peabody’s earnings, economic conditions, liquidity and capital requirements, and other factors, including its leverage and other financial ratios. Accordingly, the Company cannot make any assurance that future dividends will be paid or future repurchases will be made.
General Risk Factors
Acquisitions and divestitures are a potentially important part of the Company’s long-term strategy, subject to its investment criteria, and involve a number of risks, any of which could cause the Company not to realize the anticipated benefits.
The Company has engaged in, and may continue to engage in acquisition or divestiture activity, such as its recent conditional acquisition of Anglo’s metallurgical coal assets in Queensland’s Bowen Basin and the related divestiture of a portion of the assets to Pt Bukit Makmur Mandiri Utama (BUMA), based on its set of investment criteria to produce outcomes that increase shareholder value or provide potential strategic benefits. If the Company fails to accurately estimate the future results and value of these assets or any other acquired or divested business or assets and the related risk associated with such a transaction, or are unable to successfully integrate the businesses or assets it acquires, its business, financial condition or results of operations could be negatively affected. Moreover, any transactions the Company pursues could materially impact its liquidity and an acquisition could increase capital resource needs and may require it to incur indebtedness, seek equity capital or both. The Company may not be able to satisfy these liquidity and capital resource needs on acceptable terms or at all. In addition, future acquisitions could result in its assuming significant long-term liabilities, including potentially unknown liabilities, relative to the value of the acquisitions.
The Company may not be able to fully utilize its deferred tax assets.
The Company is subject to income and other taxes in the U.S. and numerous foreign jurisdictions, most significantly Australia. As of December 31, 2024, the Company had gross deferred income tax assets, including net operating loss (NOL) carryforwards, and liabilities of $1,520.0 million and $140.0 million, respectively, as described further in Note 8. “Income Taxes” to the accompanying consolidated financial statements. At that date, the Company also had recorded a valuation allowance of $1,420.9 million.
The Company’s ability to use its U.S. NOL carryforwards may be limited if it experiences an “ownership change” as defined in Section 382 of the Internal Revenue Code of 1986, as amended. An ownership change generally occurs if certain stockholders increase their aggregate percentage ownership of a corporation’s stock by more than 50 percentage points over their lowest percentage ownership at any time during the testing period, which is generally the three-year period preceding any potential ownership change.
| | | | | | | | |
| Peabody Energy Corporation | 2024 Form 10-K | 39 |
Although the Company may be able to utilize some or all of those deferred tax assets in the future if it has income of the appropriate character in those jurisdictions (subject to loss carryforward and tax credit expiry, in certain cases), there is no assurance that it will be able to do so. Further, the Company is presently unable to record tax benefits on future losses in the U.S. until such time as sufficient income is generated by its operations in those jurisdictions to support the realization of the related net deferred tax asset positions. The Company’s results of operations, financial condition and cash flows may adversely be affected in future periods by these limitations.
Peabody’s certificate of incorporation and by-laws include provisions that may discourage a takeover attempt.
Provisions contained in Peabody’s certificate of incorporation and by-laws and Delaware law could make it more difficult for a third-party to acquire it, even if doing so might be beneficial to its stockholders. Provisions of Peabody’s by-laws and certificate of incorporation impose various procedural and other requirements that could make it more difficult for stockholders to effect certain corporate actions. These provisions could limit the price that certain investors might be willing to pay in the future for shares of its Common Stock and may have the effect of delaying or preventing a change in control.
Diversity in interpretation and application of accounting literature in the mining industry may impact the Company’s reported financial results.
The mining industry has limited industry-specific accounting literature and, as a result, the Company understands diversity in practice exists in the interpretation and application of accounting literature to mining-specific issues. As diversity in mining industry accounting is addressed, the Company may need to restate its reported results if the resulting interpretations differ from its current accounting practices. Refer to Note 1. “Summary of Significant Accounting Policies” to the accompanying consolidated financial statements for a summary of the Company’s significant accounting policies.
Item 1B. Unresolved Staff Comments.
None.
Item 1C. Cybersecurity.
Risk Management and Strategy
Peabody uses digital technology to conduct its business operations and engage with its customers, vendors and partners. As the Company invests in technologies such as cloud, analytics, automation and artificial intelligence, it strives to provide the necessary controls to protect these digital assets from continuously evolving cybersecurity risks.
Peabody’s cybersecurity strategy emphasizes reduction of cybersecurity risk exposure and continuous improvement of its controls and policies based on industry recognized best practices for cybersecurity and information technology, including the National Institute of Standards and Technology (NIST) Cybersecurity Framework (CSF). This strategy includes: (i) proactive management of cybersecurity risk to ensure compliance with contractual, legal and regulatory requirements; (ii) performing due diligence on third parties to ensure they have sound cybersecurity practices in place; (iii) ensuring essential business services remain available during a business disruption; (iv) annual cybersecurity assessments to include NIST CSF maturity assessments, penetration testing and red team assessments, as well as table top exercises with subsequent remediation of key findings; (v) participation in Information Sharing and Collaboration industry groups; (vi) maintaining an updated cybersecurity policy and incident response plan; (vii) exercising cyber incident response plans and risk mitigation strategies to address potential incidents should they occur; and (viii) annual cybersecurity awareness training for all employees and directors, including formal training and simulated phishing events.
Third-party experts are engaged to conduct NIST CSF maturity assessments, penetration testing assessments, periodic red team assessments and table top exercises. At a minimum, at least one of these assessments is conducted annually by a third-party expert. Peabody also engages a third-party expert to assess the risk of its business and operational vendors.
Peabody’s enterprise risk management (ERM) framework considers cybersecurity risk alongside other company risks as part of the Company’s overall risk assessment process. The ERM team collaborates with the Chief Information Security Officer (CISO), to gather insights for assessing, identifying and managing cybersecurity threat risks, their severity, and potential mitigations.
| | | | | | | | |
| Peabody Energy Corporation | 2024 Form 10-K | 40 |
Governance
Peabody’s Board of Directors maintains direct oversight over cybersecurity risks and oversees an enterprise-wide approach to risk management, designed to support the achievement of organizational objectives to enhance long-term performance and stockholder value. The Board, as a whole, and through its committees, is responsible for the oversight of risk management and Peabody’s management is responsible for the day-to-day management of the risks the Company faces. Senior leadership, including Peabody’s CISO, regularly briefs the Board on cybersecurity matters and the Board is informed of cybersecurity incidents deemed to have a moderate or higher business impact, even if such incidents are determined to be immaterial, on an ongoing basis.
Peabody’s global cybersecurity department is responsible for overall cybersecurity strategy, policy, operations and cybersecurity incident response. Team members who support the Company’s cybersecurity program invest in ongoing skills development including maintaining industry recognized certifications such as the ISC2 CISSP, GIAC GCIH, Comp TIA Security+, as well as platform specific certifications focused on Peabody’s current cybersecurity infrastructure.
Impact of cybersecurity risks on business strategy, results of operations or financial condition
While Peabody has experienced cybersecurity incidents in the past, to date none have materially affected the Company’s business strategy, results of operations or financial condition. Peabody continues to invest in the cybersecurity and resiliency of its networks and to enhance its internal controls and processes, which are designed to help protect its systems and infrastructure, and the information they contain.
For more information regarding the risks the Company faces from cybersecurity threats, refer to Item 1A. “Risk Factors.”
Item 2. Properties.
Coal Reserves and Resources
Information concerning the Company’s mining properties in this Annual Report on Form 10-K has been prepared in accordance with the requirements of subpart 1300 of Regulation S-K. Subpart 1300 of Regulation S-K requires disclosure of mineral resources, in addition to mineral reserves, both in the aggregate and for each of the Company’s individually material mining properties. The Company’s coal reserves and resources are estimated by individuals deemed Qualified Persons (QP) according to the standards set forth in subpart 1300 of Regulation S-K.
Mineral resources and reserves are defined in subpart 1300 of Regulation S-K as follows:
•Mineral resource. A concentration or occurrence of material of economic interest in or on the earth's crust in such form, grade or quality, and quantity that there are reasonable prospects for economic extraction. A mineral resource is a reasonable estimate of mineralization, taking into account relevant factors such as cut-off grade, likely mining dimensions, location or continuity, that, with the assumed and justifiable technical and economic conditions, is likely to, in whole or in part, become economically extractable. It is not merely an inventory of all mineralization drilled or sampled.
•Mineral reserve. An estimate of tonnage and grade or quality of indicated and measured mineral resources that, in the opinion of a QP, can be the basis of an economically viable project. More specifically, it is the economically mineable part of a measured or indicated mineral resource, which includes diluting materials and allowances for losses that may occur when the material is mined or extracted.
Under subpart 1300 of Regulation S-K, mineral resources may not be classified as mineral reserves unless the determination has been made by a QP that such mineral resources can be the basis of an economically viable project. The conversion of reported mineral resources to mineral reserves should not be assumed.
Coal resources are estimated from geological models constructed from an extensive historical database of drill holes and the Company’s ongoing drilling program. Data from individual drill holes is compiled in a computerized drill-hole database, including the depth, thickness and, where core drilling is used, the quality of the coal observed. For coal deposits, the density of a drill pattern is one of the important factors which determine whether the related coal will be classified as measured, indicated, or inferred.
Mineral resource classifications are differentiated under subpart 1300 of Regulation S-K, in part, as follows:
•Measured resource. That part of a mineral resource with the highest level of geological confidence; quantity and grade or quality are estimated on the basis of conclusive geological evidence and sampling. The level of geological certainty associated with a measured mineral resource is sufficient to allow a qualified person to apply modifying factors in sufficient detail to support detailed mine planning and final evaluation of the economic viability of the deposit.
| | | | | | | | |
| Peabody Energy Corporation | 2024 Form 10-K | 41 |
•Indicated resource. That part of a mineral resource with a level of geological confidence between that of measured and inferred resources; quantity and grade or quality are estimated on the basis of adequate geological evidence and sampling. The level of geological certainty associated with an indicated mineral resource is sufficient to allow a qualified person to apply modifying factors in sufficient detail to support mine planning and evaluation of the economic viability of the deposit.
•Inferred resource. That part of a mineral resource with the lowest level of geological confidence; quantity and grade or quality are estimated on the basis of limited geological evidence and sampling. The level of geological uncertainty associated with an inferred mineral resource is too high to apply relevant technical and economic factors likely to influence the prospects of economic extraction in a manner useful for evaluation of economic viability.
The geological confidence surrounding resource classification is first determined by a drill hole spacing analysis performed by a QP using geostatistical techniques. A QP may also use qualitative analysis to determine the geologic confidence based on historical experience with a specific coal deposit. Resources are further evaluated using a set of structure and quality parameters to determine the reasonable prospects for economic extraction. The structure parameters include coal thickness, depth, dipping angle, and strip ratio, among others. The quality parameters include ash and sulfur content, yield, and heat value, among others. Each coal deposit is different with respect to geology, potential mining methods, logistics, and markets. The cut-off criteria of those structure and quality parameters are different for each deposit, and a QP generally forms those criteria based upon experience with the Company’s existing mining operations or adjacent operations with similar geological conditions. Other factors, such as coal control, or surface and underground obstacles are also considered in connection with resource estimates. The reclassification of reported mineral resources from lower to higher levels of geological confidence should not be assumed.
The economically mineable part of a measured coal resource is considered a proven coal reserve and has the highest degree of assurance of economic viability. The economically mineable part of indicated, and sometimes measured, coal resources are considered probable coal reserves and have a moderate degree of assurance of economic viability.
For each mine or future mine, the Company develops Life-of-Mine (LOM) plans which employ a market-driven, risk-adjusted capital allocation process to guide long-term mine planning of active operations and development projects. QPs rely on LOM planning as an integral process for coal reserve and resource estimates. The LOM plans consider dilution and losses during mining and processing as recoverability factors to estimate saleable coal. The LOM plans are developed in consideration of market demands and operational constraints. The LOM plans project, among other things, annual quantities and qualities for each coal product. The saleable product mix for a mine may include multiple thermal and metallurgical products with different targeted qualities and sales prices. The expected volumes for each mine and product, as well as annual pricing forecasts for each product, developed as described below, and related cost forecasts, developed as described below, are then evaluated to determine the economically viable coal in the LOM plans. Other factors impacting the assessment include geological conditions, production expectations for certain areas, the effects of regulation and taxes by governmental agencies, future price and operating cost assumptions and adverse changes in market conditions and mine closure activities.
The Company periodically reviews and updates coal reserve and resource estimates to reflect the production of coal, new drill hole data, the effects of mining activities, analysis of new engineering and geological data, changes in property control, modification of mining methods and other factors.
Mineral Rights
The Company controls coal rights through direct ownership and numerous lease agreements with government or private parties. The majority of the Company’s coal reserves and resources are controlled through lease agreements with the U.S. and Australian governments. In addition, surface rights are required to conduct certain mining-related activities. The Company holds the majority of the required surface rights to meet mid- to long-term production requirements. The additional surface rights to meet long-term production requirements are expected to be acquired as needed.
| | | | | | | | |
| Peabody Energy Corporation | 2024 Form 10-K | 42 |
The Company is party to numerous U.S. federal coal leases that are administered by the U.S. Department of the Interior under the Federal Coal Leasing Amendments Act of 1976. These leases cover Peabody’s principal reserves in the Powder River Basin and other reserves and resources in Alabama, Colorado and New Mexico. Each of these leases continues indefinitely, provided there is diligent development of the property and continued operation of the related mine or mines. The U.S. Bureau of Land Management (BLM) has asserted the right to adjust the terms and conditions of these leases, including rent and royalties, after the first 20 years of their term and at 10-year intervals thereafter. Annual rents on surface land under federal coal leases are now set at $3.00 per acre. Production royalties on federal leases are set by statute at 12.5% of the gross proceeds of coal mined and sold for surface-mined coal and 8% for underground-mined coal. The U.S. federal government limits by statute the amount of federal land that may be leased by any company and its affiliates at any time to 75,000 acres in any one state and 150,000 acres nationwide. As of December 31, 2024, the Company leased 1,610 acres of federal land in Alabama, 3,480 acres in Colorado, 282 acres in New Mexico and 38,915 acres in Wyoming, for a total of 44,287 acres nationwide subject to those limitations. The Company also leases coal-mining properties from various state governments in the U.S.
Private U.S. coal leases normally have terms of between 10 and 20 years and usually give the Company the right to renew the lease for a stated period or to maintain the lease in force until the exhaustion of mineable and merchantable coal contained on the relevant site. These private U.S. leases provide for royalties to be paid to the lessor either as a fixed amount per ton or as a percentage of the sales price. Many private U.S. leases also require payment of a lease bonus or minimum royalty, payable either at the time of execution of the lease or in periodic installments. The terms of private U.S. leases are normally extended by active production at or near the end of the lease term. Private U.S. leases containing undeveloped coal properties may expire or these leases may be renewed periodically.
Mining and exploration in Australia are generally carried out under leases or licenses granted by state governments. Mining leases are typically for an initial term of up to 21 years (but which may be renewed) and contain conditions relating to such matters as minimum annual expenditures, restoration and rehabilitation. Royalties are paid to the state government as a percentage of the sales price. Generally, landowners do not own the mineral rights or have the ability to grant rights to mine those minerals. These rights are retained by state governments. Compensation is payable to landowners for loss of access to the land, and the amount of compensation can be determined by agreement or court process. Surface rights are typically acquired directly from landowners through agreement or court determination, subject to some exceptions.
Pricing
The pricing information used in support of the Company’s coal reserve and resource estimates include internal, proprietary price forecasts and existing contract economics, in each case on a mine-by-mine and product-by-product basis. In general, price forecasts are based on a thorough analytical process utilizing detailed supply and demand models, global economic indicators, projected foreign exchange rates, analyses of price relationships among various commodities, competing fuels analyses, projected supply and demand fundamentals for steel production and electricity generation, analyses of supplier costs and other variables. Price forecasts, supply and demand models and other key assumptions and analyses are stress-tested against independent third-party research (not commissioned by the Company) to confirm the conclusions reached through analytical processes, and that price forecasts fall within the ranges of the projections included in this third-party research. The development of the analyses, price forecasts, supply and demand models and related assumptions are subject to multiple levels of management review.
Below is a description of some of the specific factors that the Company evaluates in developing price forecasts for thermal and metallurgical coal products on a mine-by-mine and product-by-product basis. Differences between the assumptions and analyses included in the price forecasts and realized factors could cause actual pricing to differ from the forecasts.
Thermal. Several factors can influence thermal coal supply and demand and pricing. Demand is sensitive to total electric power generation volumes, which are determined in part by the impact of weather on heating and cooling demand and economic activity, inter-fuel competition in the electric power generation mix (such as from natural gas and renewable sources), changes in capacity (additions and retirements), competition from other producers, coal stockpiles and policy and regulations. Supply considerations impacting pricing include coal reserve and resource positions, mining methods, strip ratios, production costs and capacity and the cost of new supply (greenfield developments or extensions at existing mines).
In the United States, natural gas is the most significant substitute for thermal coal for electricity generation and can be one of the largest drivers of shifts in supply and demand and pricing. The competitiveness of natural gas as a generation fuel source has been strengthened by accelerated growth in domestic natural gas production, new natural gas combined cycle generation capacity and comparatively low natural gas prices versus historic levels. The build out of renewable generation and subsidized power can also be a key driver of power market pricing and hence coal prices.
| | | | | | | | |
| Peabody Energy Corporation | 2024 Form 10-K | 43 |
Internationally, thermal coal-fueled generation also competes with alternative forms of electricity generation. The competitiveness and availability of generation fueled by natural gas, oil, nuclear, hydro, wind, solar and biomass vary by country and region and can have a meaningful impact on coal pricing. Policy and regulations, which vary from country to country, can also influence prices. In addition, seaborne thermal coal import demand can be significantly impacted by the availability of domestic coal production, particularly in the two leading coal import countries, China and India, and the competitiveness of seaborne supply from leading thermal coal exporting countries, including Indonesia, Australia, Russia, Colombia, the U.S. and South Africa, among others.
Metallurgical. Several factors can influence metallurgical coal supply and demand and pricing. Demand is impacted by economic conditions, government policies and demand for steel, and is also impacted by competing technologies used to make steel, some of which do not use coal as a manufacturing input. Competition from other types of coal is also a key price consideration and can be impacted by the coal quality and characteristics, delivered energy cost (including transportation costs), customer service and support, and reliability of supply.
Seaborne metallurgical coal import demand can be significantly impacted by the availability of domestic coal production, particularly in leading metallurgical coal import countries such as China, among others, as well as country-specific policies restricting or promoting domestic supply. The competitiveness of seaborne metallurgical coal supply from leading metallurgical coal exporting countries of Australia, the U.S., Russia, Canada, Mongolia and Mozambique, among others, is also an important price consideration.
In addition to the factors noted above, the prices which may be obtained at each mine or future mine can be impacted by factors such as (i) the mine’s location, which impacts the total delivered energy costs to its customers, (ii) quality characteristics, particularly if they are unique relative to competing mines, (iii) assumed transportation costs and (iv) other mine costs that are contractually passed on to customers in certain commercial relationships.
| | | | | | | | |
| Peabody Energy Corporation | 2024 Form 10-K | 44 |
Costs
The cost estimates used to establish LOM plans are generally made according to internal processes that project future costs based on historical costs and expected trends. The estimated costs normally include mining, processing, transportation, royalty, add-on tax and other mining-related costs. Estimated mining and processing costs reflect projected changes in prices of consumable commodities (mainly diesel fuel, explosives and steel), labor costs, geological and mining conditions, targeted product qualities and other mining-related costs. Estimates for other sales-related costs (mainly transportation, royalty and add-on tax) are based on contractual prices or fixed rates. Specific factors that may impact the Company’s operating costs include:
•Geological settings. The geological characteristics of each mine are among the most important factors that determine the mining cost. Company geologists conduct the exploration program and provide geological models for the LOM process. Coal seam depth, thickness, dipping angle, partings and quality constrain the available mining methods and size of operations. Shallow coal is typically mined by surface mining methods by which the primary cost is overburden removal. Deep coal is typically mined by underground mining methods where the primary costs include coal extraction, conveyance and roof control.
•Scale of operations and the equipment sizes. For surface mines, dragline systems generally have a lower unit cost than truck-and-shovel systems for overburden removal. Longwall operations are generally more cost-effective than room-and-pillar operations for underground mines.
•Commodity prices. For surface mines, the costs of diesel fuel and explosives are major components of the total mining cost. For underground mines, the steel used for roof control represents a significant cost. Forecasted commodity prices are used to project those costs in the financial models used to establish reserve and resource estimates.
•Target product quality. By targeting a premium quality product, mining and processing processes may experience more coal losses. By lowering product quality the coal losses can be minimized and therefore a lower cost per ton can be achieved. In the Company’s LOM plans, product qualities are estimated to correspond to existing contracts and forecasted market demands.
•Transportation costs. Transportation costs vary by region. Most of the Company’s U.S. thermal operations sell coal at mine loadouts. Therefore, no transportation expenses are included in U.S. thermal cost estimates. The Company’s seaborne operations typically sell coal at designated ports. The estimated costs for seaborne operations include rail and barge transportation and related fees at ports.
•Royalty costs. Royalty costs are based upon contractual agreements for the coal leased from governments or private owners. The royalty rates for coal leased from governments differ by country and, in some cases, by mining method. Estimated add-on taxes and other sales-related costs are determined according to government regulations or historical costs.
•Exchange rates. Costs related to the Company’s Australian production are predominantly denominated in Australian dollars, while the Australian coal exported is sold in U.S. dollars. As a result, Australian/U.S. dollar exchange rates impact the U.S. dollar cost of Australian production.
Summary of Coal Reserves and Resources
Peabody controlled an estimated 2.1 billion tons of coal reserves and 3.6 billion tons of coal resources as of December 31, 2024. Approximately 97% of the Company’s coal reserves and 96% of the Company’s coal resources are held under lease, and the remainder is held through fee ownership.
The following tables summarize the Company’s estimated coal reserves and resources as of December 31, 2024. The quantity of the coal resources is estimated on an in situ basis as attributable to Peabody. Coal resources are reported exclusive of coal reserves. The quantity of the coal reserves is estimated on a saleable product basis as attributable to Peabody. The coal reserves and resources are reported on selected key quality parameters and on different moisture bases generally referenced by sales contracts for each mining property.
| | | | | | | | |
| Peabody Energy Corporation | 2024 Form 10-K | 45 |
| | | | | | | | | | | | | | | | | | | | | | | | | | | | | | | | | | | | | | | | | | | | | | | | | | | | | | | | | | | | | | | | | | | | | | | | | | | | | | | | | | | | | | | | | | | | | | | | | | | | | | | | | | | | | | |
SUMMARY COAL RESERVES AT END OF THE FISCAL YEAR ENDED DECEMBER 31, 2024 (1) |
| (Tons in millions) |
| | | | | | | | | | | | | | | | | | | | | | | | | | | | | | | | | | | | Peabody |
| | | | | | | | Mining | | Coal | | Proven Coal Reserves | Probable Coal Reserves | Total Coal Reserves | Interest |
| Segment / Mining Complex | | Country | | State | | Stage | | Method | | Type | | Amount | | Quality | | Amount | | Quality | | Amount | | Quality | | (10) |
| | | | | | | | | | | | | | | | | | | | | | | | | | | | | | | | | | | | |
Seaborne Thermal:(2)(4) | | | | | | | | | | Tons | | %Ash | | %Sulfur | | Kcal/kg(6) | | Tons | | %Ash | | %Sulfur | | Kcal/kg(6) | | Tons | | %Ash | | %Sulfur | | Kcal/kg(6) | | |
| Wilpinjong | | AUS | | NSW | | P | | S | | T | | 43 | | | 24.5 | | | 0.5 | | | 5,927 | | | 3 | | | 32.9 | | | 0.4 | | | 5,208 | | | 46 | | | 25.0 | | | 0.5 | | | 5,880 | | | 100 | % |
Wambo Opencut (9) | | AUS | | NSW | | P | | S | | T/C | | 27 | | | 11.3 | | | 0.3 | | | 6,412 | | | 2 | | | 11.1 | | | 0.3 | | | 6,434 | | | 29 | | | 11.3 | | | 0.3 | | | 6,414 | | | 50 | % |
| Wambo Underground | | AUS | | NSW | | P | | U | | T/C | | 1 | | | 12.2 | | | 0.4 | | | 6,473 | | | — | | | — | | | — | | | — | | | 1 | | | 12.2 | | | 0.4 | | | 6,473 | | | 100 | % |
| South Wambo | | AUS | | NSW | | E | | U | | T/C | | — | | | — | | | — | | | — | | | 74 | | | 9.8 | | | 0.3 | | | 7,034 | | | 74 | | | 9.8 | | | 0.3 | | | 7,034 | | | 100 | % |
| Total | | | | | | | | | | | | 71 | | | | | | | | | 79 | | | | | | | | | 150 | | | | | | | | | |
| | | | | | | | | | | | | | | | | | | | | | | | | | | | | | | | | | | | |
Seaborne Metallurgical:(3)(4) | | | | | | | | | | Tons | | %Ash | | %Sulfur | | VM%(7) | | Tons | | %Ash | | %Sulfur | | VM%(7) | | Tons | | %Ash | | %Sulfur | | VM%(7) | | |
| Shoal Creek | | USA | | AL | | P | | U | | C | | 13 | | | 9.6 | | | 0.7 | | | 30.4 | | | 3 | | | 9.6 | | | 0.7 | | | 30.4 | | | 16 | | | 9.6 | | | 0.7 | | | 30.4 | | | 100 | % |
| Coppabella | | AUS | | QLD | | P | | S | | P | | 6 | | | 9.0 | | | 0.2 | | | 9.9 | | | 32 | | | 9.6 | | | 0.2 | | | 10.4 | | | 38 | | | 9.5 | | | 0.2 | | | 10.3 | | | 73.3 | % |
| Moorvale | | AUS | | QLD | | P | | S | | C/P/T | | 6 | | | 11.1 | | | 0.3 | | | 17.0 | | | — | | | — | | | — | | | — | | | 6 | | | 11.1 | | | 0.3 | | | 17.0 | | | 73.3 | % |
| Metropolitan | | AUS | | NSW | | P | | U | | C/P/T | | 1 | | | 11.5 | | | 0.4 | | | 18.9 | | | 10 | | | 11.8 | | | 0.4 | | | 18.8 | | | 11 | | | 11.8 | | | 0.4 | | | 18.8 | | | 100 | % |
| Centurion | | AUS | | QLD | | D | | U | | C | | 84 | | | 8.0 | | | 0.5 | | | 21.7 | | | 107 | | | 7.8 | | | 0.5 | | | 20.6 | | | 191 | | | 7.9 | | | 0.5 | | | 21.1 | | | 100 | % |
| | | | | | | | | | | | | | | | | | | | | | | | | | | | | | | | | | | | |
Middlemount (9) | | AUS | | QLD | | P | | S | | C/P | | 25 | | | 10.3 | | | 0.4 | | | 18.0 | | | 10 | | | 10.3 | | | 0.4 | | | 18.0 | | | 35 | | | 10.3 | | | 0.4 | | | 18.0 | | | 50.0 | % |
| Total | | | | | | | | | | | | 135 | | | | | | | | | 162 | | | | | | | | | 297 | | | | | | | | | |
| | | | | | | | | | | | | | | | | | | | | | | | | | | | | | | | | | | | |
Powder River Basin:(5) | | | | | | | | | | Tons | | %Ash | | %Sulfur | | Btu(8) | | Tons | | %Ash | | %Sulfur | | Btu(8) | | Tons | | %Ash | | %Sulfur | | Btu(8) | | |
| North Antelope Rochelle | USA | | WY | | P | | S | | T | | 1,212 | | | 4.6 | | | 0.2 | | | 8,900 | | | 88 | | | 4.7 | | | 0.2 | | | 8,910 | | | 1,300 | | | 4.6 | | | 0.2 | | | 8,900 | | | 100 | % |
| Caballo | | USA | | WY | | P | | S | | T | | 136 | | 5.2 | | | 0.3 | | | 8,470 | | | 32 | | 5.7 | | | 0.4 | | | 8,305 | | | 168 | | 5.3 | | | 0.3 | | | 8,440 | | | 100 | % |
| Rawhide | | USA | | WY | | P | | S | | T | | 78 | | 5.7 | | | 0.3 | | | 8,285 | | | 2 | | 5.3 | | | 0.3 | | | 8,360 | | | 80 | | 5.7 | | | 0.3 | | | 8,290 | | | 100 | % |
| Total | | | | | | | | | | | | 1,426 | | | | | | | | | 122 | | | | | | | | | 1,548 | | | | | | | | | |
| | | | | | | | | | | | | | | | | | | | | | | | | | | | | | | | | | | | |
Other U.S. Thermal:(5) | | | | | | | | | | Tons | | %Ash | | %Sulfur | | Btu(8) | | Tons | | %Ash | | %Sulfur | | Btu(8) | | Tons | | %Ash | | %Sulfur | | Btu(8) | | |
| Bear Run | | USA | | IN | | P | | S | | T | | 51 | | | 10.3 | | | 3.1 | | | 11,070 | | | 18 | | | 9.5 | | | 2.5 | | | 11,050 | | | 69 | | | 10.1 | | | 2.9 | | | 11,065 | | | 100 | % |
| Lee Ranch | | USA | | NM | | P | | S | | T | | 7 | | | 17.5 | | | 0.9 | | | 9,271 | | | 1 | | | 16.0 | | | 0.8 | | | 9,477 | | | 8 | | | 17.3 | | | 0.9 | | | 9,297 | | | 100 | % |
| Gateway North | | USA | | IL | | P | | U | | T | | 19 | | | 8.8 | | | 2.9 | | | 10,919 | | | 3 | | | 8.9 | | | 2.9 | | | 10,916 | | | 22 | | | 8.9 | | | 2.9 | | | 10,917 | | | 100 | % |
| Twentymile | | USA | | CO | | P | | U | | T | | 8 | | | 10.8 | | | 0.4 | | | 11,260 | | | 1 | | | 11.0 | | | 0.5 | | | 11,260 | | | 9 | | | 10.8 | | | 0.4 | | | 11,260 | | | 100 | % |
| Wild Boar | | USA | | IN | | P | | S | | T | | 6 | | | 8.8 | | | 2.7 | | | 10,990 | | | 6 | | | 9.0 | | | 3.0 | | | 11,050 | | | 12 | | | 8.9 | | | 2.9 | | | 11,020 | | | 100 | % |
| Francisco Underground | | USA | | IN | | P | | U | | T | | 1 | | | 9.4 | | | 3.2 | | | 11,490 | | | 1 | | | 9.3 | | | 3.3 | | | 11,530 | | | 2 | | | 9.4 | | | 3.3 | | | 11,510 | | | 100 | % |
| Total | | | | | | | | | | | | 92 | | | | | | | | | 30 | | | | | | | | | 122 | | | | | | | | | |
| | | | | | | | | | | | | | | | | | | | | | | | | | | | | | | | | | | | |
| Grand total | | | | | | | | | | | | 1,724 | | | | | | | | | 393 | | | | | | | | | 2,117 | | | | | | | | | |
| | | | | | | | | | | | | | | | | | | | | | | | | | | | | | | | | | | | |
| Stage | | | | | | | | Mining Method | | | | | | | | | | Coal Type | | | | | | | | | | | | |
| P Producing | | | | | | | | S | | Surface Mine | | | | | | | | T | | Thermal | | | | | | | | |
| I Idle | | | | | | | | U | | Underground Mine | | | | | | | | C | | Coking | | | | | | | | |
| D Development | | | | | | | | | | | | | | | | | | | | | | P | | Pulverized Coal Injection | | | | | | | | |
| E Exploration | | | | | | | | | | | | | | | | | | | | | | | | | | | | | | | | | | | | |
| | | | | | | | |
| Peabody Energy Corporation | 2024 Form 10-K | 46 |
| | | | | | | | | | | | | | | | | | | | | | | | | | | | | | | | | | | | | | | | | | | | | | | | | | | | | | | | | | | | | | | | | | | | | | | | | | | | | | | | | | | | | | | | | | | | | | | | | | | | | | | | | | | | | | | | | | | | | | | | | | | | | | | | | | | | | | |
SUMMARY COAL RESOURCES AT END OF THE FISCAL YEAR ENDED DECEMBER 31, 2024 (1) |
| (Tons in millions) |
| | | | | | | | | | | | | | | | | | | | | | | | | | | | | | | | | | | | | | | | | | | | |
| | | | | | | | | | | | | | | | | | | | | | | | | | | | Measured and Indicated | | | | | | | | | | Peabody |
| | | | | | | | Mining | | Coal | | Measured Coal Resources | Indicated Coal Resources | Coal Resources | | Inferred Coal Resources | Interest |
| Deposit | | Country | | State | | Stage | | Method | | Type | Amount | Quality | Amount | Quality | Amount | Quality | Amount | Quality | | (10) |
| | | | | | | | | | | | | | | | | | | | | | | | | | | | | | | | | | | | | | | | | | | | |
Seaborne Thermal:(2)(4) | | | | | | | | Tons | | %Ash | %Sulfur | Kcal/kg(6) | Tons | | %Ash | %Sulfur | Kcal/kg(6) | | Tons | | %Ash | %Sulfur | Kcal/kg(6) | | Tons | | %Ash | %Sulfur | Kcal/kg(6) | | |
| Wilpinjong | AUS | | NSW | | P | | S | | T | | 137 | | | 23.4 | | | 0.5 | | | 6,018 | | | 59 | | | 25.3 | | | 0.5 | | | 5,872 | | | 196 | | | 24.0 | | | 0.5 | | | 5,974 | | | 9 | | | 26.5 | | | 0.5 | | | 5,767 | | | 100 | % |
Wambo Opencut (9) | AUS | | NSW | | P | | S/U | | T/C | | 223 | | | 20.9 | | | 0.4 | | | 5,825 | | | 181 | | | 21.5 | | | 0.4 | | | 5,813 | | | 404 | | | 21.2 | | | 0.4 | | | 5,820 | | | 273 | | | 20.3 | | | 0.4 | | | 5,865 | | | 50 | % |
| South Wambo | AUS | | NSW | | E | | U | | T/C | | 219 | | | 21.5 | | | 0.3 | | | 6,068 | | | 83 | | | 27.2 | | | 0.3 | | | 5,571 | | | 302 | | | 23.1 | | | 0.3 | | | 5,931 | | | 47 | | | 36.3 | | | 0.3 | | | 4,745 | | | 100 | % |
| Total | | | | | | | | | | | | 579 | | | | | | | | | 323 | | | | | | | | | 902 | | | | | | | | | 329 | | | | | | | | | |
| | | | | | | | | | | | | | | | | | | | | | | | | | | | | | | | | | | | | | | | | | | | |
Seaborne Metallurgical:(3)(4) | | | | | | Tons | | %Ash | %Sulfur | VM%(7) | Tons | | %Ash | %Sulfur | VM%(7) | Tons | | %Ash | %Sulfur | VM%(7) | Tons | | %Ash | %Sulfur | VM%(7) | |
| Shoal Creek | USA | | AL | | P | | U | | C | | 37 | | | 9.6 | | | 0.7 | | | 24.8 | | | 34 | | | 9.6 | | | 0.7 | | | 24.8 | | | 71 | | | 9.6 | | | 0.7 | | | 24.8 | | | 6 | | | 9.6 | | | 0.7 | | | 24.8 | | | 100 | % |
| Metropolitan | AUS | | NSW | | P | | U | | C/P/T | | 7 | | | 15.4 | | | 0.4 | | | 18.6 | | | 8 | | | 15.3 | | | 0.3 | | | 18.7 | | | 15 | | | 15.3 | | | 0.4 | | | 18.6 | | | 2 | | | 16.0 | | | 0.3 | | | 19.0 | | | 100 | % |
| Coppabella | AUS | | QLD | | P | | S | | P | | 12 | | | 15.9 | | | 0.3 | | | 13.2 | | | 39 | | | 16.0 | | | 0.3 | | | 12.6 | | | 51 | | | 16.0 | | | 0.3 | | | 12.7 | | | 50 | | | 15.7 | | | 0.3 | | | 12.6 | | | 73.3 | % |
| Moorvale | AUS | | QLD | | P | | S | | C/P/T | | 22 | | | 18.8 | | | 0.3 | | | 17.3 | | | 17 | | | 17.6 | | | 0.3 | | | 18.6 | | | 39 | | | 18.3 | | | 0.3 | | | 17.9 | | | 6 | | | 16.4 | | | 0.3 | | | 17.1 | | | 73.3 | % |
| | | | | | | | | | | | | | | | | | | | | | | | | | | | | | | | | | | | | | | | | | | |
| Centurion | AUS | | QLD | | E | | U | | C | | 96 | | | 20.7 | | | 0.5 | | | 21.9 | | | 485 | | | 17.9 | | | 0.5 | | | 19.6 | | | 581 | | | 18.4 | | | 0.5 | | | 20.0 | | | 286 | | | 21.1 | | | 0.5 | | | 18.9 | | | 100 | % |
| Coppabella North | AUS | | QLD | | E | | U | | P | | 255 | | | 15.8 | | | 0.3 | | | 14.6 | | | 102 | | | 16.8 | | | 0.3 | | | 14.6 | | | 357 | | | 16.1 | | | 0.3 | | | 14.6 | | | 12 | | | 16.5 | | | 0.3 | | | 14.3 | | | 75.5 | % |
| Yeerun | AUS | | QLD | | E | | S | | P | | 16 | | | 16.0 | | | 0.4 | | | 14.3 | | | 57 | | | 16.2 | | | 0.5 | | | 15.0 | | | 73 | | | 16.2 | | | 0.4 | | | 14.8 | | | 46 | | | 17.8 | | | 0.5 | | | 14.7 | | | 83.0 | % |
| Moorvale North | AUS | | QLD | | E | | S | | P | | 21 | | | 26.0 | | | 0.4 | | | 12.9 | | | 25 | | | 24.5 | | | 0.5 | | | 13.2 | | | 46 | | | 25.2 | | | 0.4 | | | 13.1 | | | 25 | | | 23.2 | | | 0.5 | | | 13.4 | | | 73.3 | % |
| Gundyer | AUS | | QLD | | E | | U | | P | | — | | | — | | | — | | | — | | | 54 | | | 16.4 | | | 0.2 | | | 19.7 | | | 54 | | | 16.4 | | | 0.2 | | | 19.7 | | | 70 | | | 18.3 | | | 0.2 | | | 18.3 | | | 90.0 | % |
| Total | | | | | | | | | | | | 466 | | | | | | | | | 821 | | | | | | | | | 1,287 | | | | | | | | | 503 | | | | | | | | | |
| | | | | | | | | | | | | | | | | | | | | | | | | | | | | | | | | | | | | | | | | | | | |
Powder River Basin:(5) | | | | | | | | Tons | | %Ash | %Sulfur | Btu(8) | Tons | | %Ash | %Sulfur | Btu(8) | Tons | | %Ash | %Sulfur | Btu(8) | Tons | | %Ash | %Sulfur | Btu(8) | |
| Caballo | | USA | | WY | | P | | S | | T | | 143 | | | 5.0 | | | 0.3 | | | 8,525 | | | 114 | | | 5.2 | | | 0.4 | | | 8,240 | | | 257 | | | 5.1 | | | 0.3 | | 8,440 | | | 2 | | | 5.5 | | | 0.4 | | 8,370 | | | 100 | % |
| Rawhide | | USA | | WY | | P | | S | | T | | 13 | | | 5.5 | | | 0.4 | | | 8,120 | | | 95 | | | 5.2 | | | 0.3 | | | 8,355 | | | 108 | | | 5.2 | | | 0.3 | | | 8,330 | | | 7 | | | 5.8 | | | 0.4 | | | 8,235 | | | 100 | % |
| Total | | | | | | | | | | | | 156 | | | | | | | | | 209 | | | | | | | | | 365 | | | | | | | | | 9 | | | | | | | | | |
| | | | | | | | | | | | | | | | | | | | | | | | | | | | | | | | | | | | | | | | | | | | |
Other U.S. Thermal:(5) | | | | | | | | Tons | | %Ash | %Sulfur | Btu(8) | Tons | | %Ash | %Sulfur | Btu(8) | Tons | | %Ash | %Sulfur | Btu(8) | Tons | | %Ash | %Sulfur | Btu(8) | |
| Bear Run | USA | | IN | | P | | S | | T | | 75 | | | 14.9 | | | 3.8 | | | 10,800 | | | 81 | | | 16.6 | | | 3.7 | | | 10,485 | | | 156 | | | 15.8 | | | 3.8 | | | 10,635 | | | 25 | | | 15.7 | | | 3.5 | | | 10,645 | | | 100 | % |
| Francisco Underground | USA | | IN | | P | | U | | T | | 6 | | | 14.0 | | | 5.3 | | | 11,245 | | | 5 | | | 13.5 | | | 5.4 | | | 11,310 | | | 11 | | | 13.8 | | | 5.3 | | | 11,270 | | | — | | | — | | | — | | | — | | | 100 | % |
| Gateway North | USA | | IL | | P | | U | | T | | 29 | | | 12.8 | | | 4.0 | | | 10,603 | | | 15 | | | 12.9 | | | 4.0 | | | 10,606 | | | 44 | | | 12.9 | | | 4.0 | | | 10,604 | | | — | | | — | | | — | | | — | | | 100 | % |
| Lee Ranch | | USA | | NM | | P | | S | | T | | 1 | | | 12.4 | | | 1.1 | | | 10,038 | | | 6 | | | 11.8 | | | 1.0 | | | 10,044 | | | 7 | | | 11.9 | | | 1.0 | | | 10,043 | | | 3 | | | 13.4 | | | 1.2 | | | 9,787 | | | 100 | % |
| Wild Boar | USA | | IN | | P | | S | | T | | — | | | — | | | — | | | — | | | 3 | | | 11.7 | | | 5.5 | | | 11,390 | | | 3 | | | 11.7 | | | 5.5 | | | 11,390 | | | 1 | | | 12.1 | | | 5.3 | | | 11,290 | | | 100 | % |
| Total | | | | | | | | | | | 111 | | | | | | | | | 110 | | | | | | | | | 221 | | | | | | | | | 29 | | | | | | | | | |
| Grand total | | | | | | | | | | 1,312 | | | | | | | | | 1,463 | | | | | | | | | 2,775 | | | | | | | | | 870 | | | | | | | | | |
| | | | | | | | |
| Peabody Energy Corporation | 2024 Form 10-K | 47 |
| | | | | |
| (1) | The sales price assumptions supporting economic recoverability vary depending upon factors such as coal quality and existing customer volume commitments. For the five-year period 2025 through 2029, the estimated sales prices for seaborne metallurgical mines are based upon estimated premium hard coking coal benchmark prices ranging from $200 to $215 per tonne. The estimated sales prices for seaborne thermal mines are based upon estimated Newcastle benchmark prices ranging from $100 to $121 per tonne for the same period. For U.S. domestic thermal mines, the estimated sales prices for the same period range from approximately $10.25 to $70.00 per ton. Subsequent to 2029, for all mines, sales price escalation is assumed at 2.0% to 3.0% per annum through the end of each LOM plan. |
| (2) | The moisture condition for Seaborne Thermal segment coal quality is on an air-dry basis, except for the Wambo Opencut Mine, which is estimated on an as-shipped basis for coal reserves and an in situ moisture basis for coal resources. |
| (3) | The moisture condition for the Seaborne Metallurgical segment coal quality is on an air-dry basis, except for the Shoal Creek Mine, which is on a dry basis. |
| (4) | The quantities for Australian coal reserves are estimated on an as-shipped moisture basis; quantities for Australian coal resources are estimated on an in situ moisture basis. |
| (5) | The quality and quantity estimates for U.S. thermal coal reserves are calculated on as-shipped moisture basis; the quality and quantity estimates for U.S. thermal coal resources are calculated on an in situ moisture basis. |
| (6) | Kcal/kg (kilocalories per kilogram) is the net calorific value (net heating value) of coal, except for the Wambo Opencut Mine which is estimated as gross calorific value. |
| (7) | VM (volatile matter) represents the proportion of certain organic and mineral components in coal, for example, water, carbon dioxide or sulfur dioxide. Volatile matter is inversely related to coal rank. |
| (8) | Btu (British thermal unit) is the gross heating value of coal per pound, which includes the weight of moisture in coal on an as-sold basis. The range of variability of the moisture content in coal may affect the actual shipped Btu content. |
| (9) | Reserve and resource data is maintained and provided by joint venture managing partners utilizing the Australasian Code for Reporting of Exploration Results, Mineral Resources and Ore Reserves. |
| (10) | The quantities of coal reserves and resources are disclosed at Peabody’s proportional ownership share. |
Individual Property Disclosure
To determine the Company’s individually material mining operations in accordance with subpart 1300 of Regulation S-K, management considered both quantitative and qualitative factors, assessed in the context of the Company’s overall business and financial condition. Such assessment included the Company’s aggregate mining operations on all of its mining properties, regardless of the stage of production or the type of coal produced. Quantitative factors included, among others, mining operations’ relative contributions to the Company’s aggregate historical and estimated revenue, cash flows, and Adjusted EBITDA (as defined in Part II, Item 7. “Management’s Discussion and Analysis of Financial Condition and Results of Operations.”) Qualitative factors may include, as applicable, strategic priorities, the regulatory environment, capital expansion plans, and the long-term pricing outlook. The Company concluded that as of December 31, 2024, its individually material mines are North Antelope Rochelle Mine (NARM), Wilpinjong Mine and Centurion Mine. The Company will update its assessment of individually material mines on an annual basis.
The information that follows relating to such individually material mines is derived, for the most part, from, and in some instances is an extract from, the technical report summaries (TRSs) relating to such properties prepared in compliance with the Item 601(b)(96) and subpart 1300 of Regulation S-K. Portions of the following information are based on assumptions, qualifications and procedures that are not fully described herein.
The changes for NARM and Wilpinjong from the previous years are not material, thus no updates for the TRSs are included in this filing. Reference should be made to the full text of the TRS, incorporated herein by reference, made a part of Peabody’s Annual Report on Form 10-K for the year ended December 31, 2021 and December 31, 2023 respectively, which was filed with the SEC on February 18, 2022 and February 23, 2024.
Reference should be made to the full text of the TRS for the Centurion Mine, incorporated herein by reference and made a part of Peabody’s filing on Form 8-K filed with the SEC on October 15, 2024.
| | | | | | | | |
| Peabody Energy Corporation | 2024 Form 10-K | 48 |
North Antelope Rochelle Mine
The North Antelope Rochelle Mine (NARM) is a production-stage surface coal mine located sixty-five miles south of Gillette, Wyoming, USA. NARM is situated in the Gillette Coal Field on the east flank of the Powder River Basin. NARM began operations in 1999 after Peabody combined its interests in the formerly separate North Antelope Mine and Rochelle Mine.
NARM extracts coal from the Wyodak-Anderson coal seam, which ranges from 60- to 80-feet thick and lies from 100 to 400 feet below the surface in the mining area. The Company has secured mineral rights through Federal and State lease agreements which cover 30,159 acres. The typical royalty rate for Federal and State coal leases is 12.5% of realized revenue. Generally, the leases continue indefinitely with periodic renewal, provided there is diligent coal production or other development within the lease area. As of December 31, 2024, all required licenses and permits were in place for the operations of NARM.
The mining operation consists of multiple open pits in four main mining areas, which allows for quality blending and other optimization strategies. Overburden is removed by dragline, truck and shovel, dozer and cast blasting methods. Coal is hauled by truck to one of five dump locations, where it is then crushed and conveyed to silos adjacent to rail load-outs for customer delivery. Coals of varying characteristics may be blended at a central blending facility along the loadout rail loop. Coal is sold unwashed, as a run-of-mine (ROM) product. NARM coal is well recognized for domestic thermal power generation.
The key supporting infrastructure for NARM includes rail services provided by the BNSF Railway Company and Union Pacific Corporation, road access via interstate and state highways and roads, electrical power from a dedicated substation with 230kV and 69kV transmission lines, and water supply from a mine dewatering system and deep wells. The mining industry in the Powder River Basin anchors numerous communities from which the mine attracts qualified personnel.
The property, plant, equipment and mine development assets of NARM had a net book value of approximately $362 million at December 31, 2024. The mine’s operating equipment and facilities meet contemporary mining standards and are adequately maintained to execute the LOM plan. Routine maintenance, overhauls, and necessary capital replacements are generally included in the LOM plan to support future production.
| | | | | | | | |
| Peabody Energy Corporation | 2024 Form 10-K | 49 |
The table below presents NARM coal reserve estimates at December 31, 2024, along with comparative quantities at December 31, 2023. NARM did not hold any coal resources as of December 31, 2024. These coal reserve estimates were supported by the analyses of 4,884 total drill holes within the coal lease area. The quantity of the coal reserves is estimated on a saleable product basis and deemed 100% attributable to Peabody. In addition to quantity, the table presents selected key quality parameters on an as-shipped basis.
| | | | | | | | | | | | | | | | | | | | | | | | | | | | | | | | | | | | | | |
NARM - SUMMARY OF COAL RESERVES (1) |
| (Tons in millions) |
| | | | | | | | | | | | |
| | December 31, 2024 | | December 31, 2023 |
Coal Reserves (2)(3)(4) | | Tons | | %Ash | | %Sulfur | | Btu | | % Mine Yield(5) | | Tons |
| Proven | | 1,212 | | | 4.6 | | | 0.2 | | | 8,900 | | | 100 | % | | 1,261 | |
| Probable | | 88 | | | 4.7 | | | 0.2 | | | 8,910 | | | 100 | % | | 103 | |
| Total | | 1,300 | | | | | | | | | | | 1,364 | |
| | | | | | | | | | | | |
| Year-over-year decrease | | (5) | % | | | | | | | | | | |
The year-over-year decrease in the quantity of coal reserves was driven by production depletion.
| | | | | |
| (1) | Economic recoverability is based upon an estimated average sales price per ton of $14.57 for the five-year period ending December 31, 2029 and assumed escalation of 2.0% per annum during the subsequent period through the end of the LOM plan. |
| (2) | The cut-off grade and metallurgical recovery are not limiting factors for coal reserve estimates due to consistent coal thickness and established trends of coal quality in the leased area. The strip ratio increases gradually, but the existing pit length allows an average mineable strip ratio. Besides the results of drill hole analyses, the main limiting factors include surface infrastructure and lease boundaries. |
| (3) | The quality of coal reserves is estimated on an as-shipped basis. |
| (4) | The quantity of coal reserves is estimated on a saleable product basis, which takes into consideration 92% mining recovery. The results of the LOM planning process demonstrate the economic recoverability of the coal reserve estimates. |
| (5) | Mine yield is the ratio of estimated saleable product coal over ROM coal tons, with processing loss considered. |
| | | | | | | | |
| Peabody Energy Corporation | 2024 Form 10-K | 50 |
Wilpinjong Mine
The Wilpinjong Mine is a production-stage surface thermal coal mine situated approximately 25 miles northeast of Mudgee in New South Wales, Australia. Peabody acquired the mine as part of its acquisition of Excel Coal Pty Ltd (Excel) in 2006. Excel began the development of Wilpinjong Mine in 2006 and it commenced production under Peabody ownership in 2007. A third-party contractor managed mining operations until 2013, when the Company converted the mine to owner-operated.
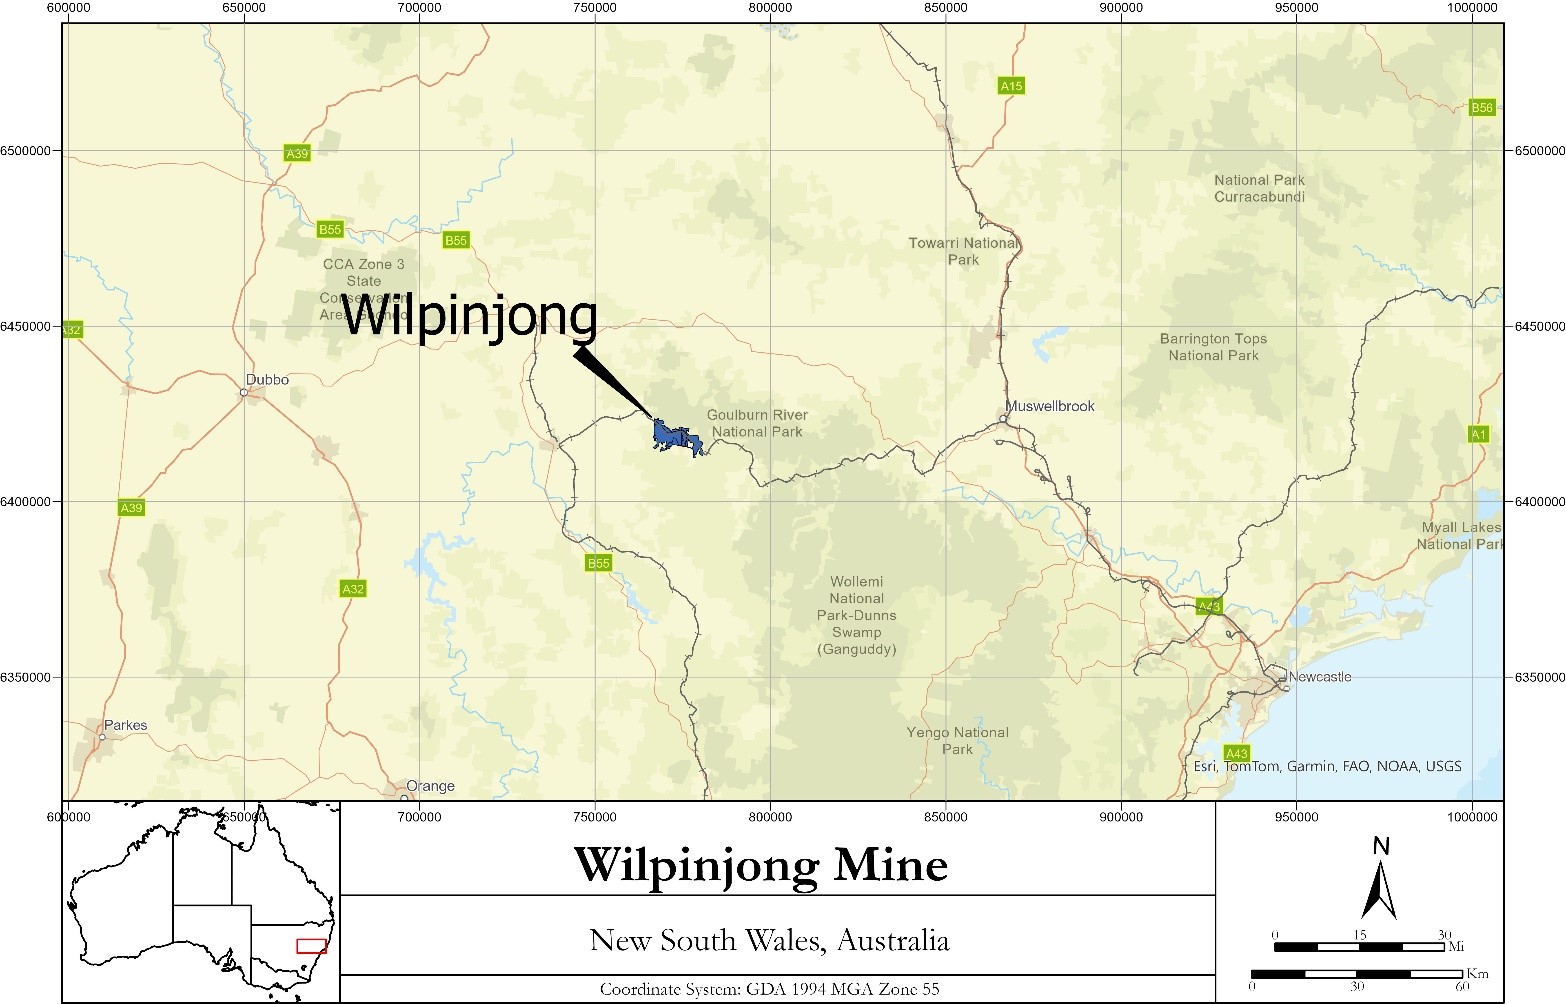
The Wilpinjong Mine extracts coal from the Moolarben and Ulan coal seams which have a combined thickness from 6 to 10 meters and a typical waste depth of less than 80 meters in the Illawarra Coal Measures on the northwest margin of the Sydney Basin. The Company has secured three exploration licenses of 2,958 hectares and four mining leases of 3,790 hectares through the New South Wales Minister of Planning. The typical royalty rate is 10.8% of the value of coal recovered. The mining leases require renewal upon expiration in 2027 for 2,863 hectares and in 2039-2044 for 927 hectares. Renewal applications for two exploration licenses were approved in 2023, with the terms extended to December 2027 and March 2028, and the third was granted in May 2022 for an initial term of 6 years. As of December 31, 2024, all required licenses and permits were in place for the operations of Wilpinjong.
Conventional open cut mining methods are used at the Wilpinjong Coal Mine, with multiple pits at a low strip ratio allowing for relatively rapid pit advance. Overburden is removed by a combination of cast blasting, dozer, and truck and excavator methods. Haul trucks transport coal to various hoppers and pads for blending and temporary storage, as necessary, and then to a coal handling and processing plant to be crushed and washed. Coal is conveyed to a rail loadout and transported by train to either domestic customers or to the Port of Newcastle and seaborne customers for thermal power generation.
The key supporting infrastructure for Wilpinjong Mine includes road access via public roads, port service at two terminals at the Port of Newcastle, above and below rail services, electrical power from a 66kV transmission line, and water supply from captured surface runoff and deep wells. The mine’s proximity to other large coal producers in the region provides access to a significant pool of experienced mining personnel.
The property, plant, equipment and mine development assets of Wilpinjong Mine had a net book value of approximately $266 million at December 31, 2024. The mine’s operating equipment meets contemporary mining standards and is adequately maintained to execute the LOM plan. Routine maintenance, overhauls and necessary capital replacements are generally included in the LOM plan to support future production.
| | | | | | | | |
| Peabody Energy Corporation | 2024 Form 10-K | 51 |
The tables below present Wilpinjong Mine’s estimated coal reserves and resources at December 31, 2024, along with comparative quantities at December 31, 2023. These coal reserve and resource estimates were supported by the analyses of 1,271 total drill holes within the coal lease area. The quantity of the coal resources is estimated on an in situ basis as 100% attributable to Peabody. Coal resources are reported exclusive of coal reserves. The quantity of the coal reserves is estimated on a saleable product basis as 100% attributable to Peabody. Coal reserves and resources are reported on selected key quality parameters on an air-dried basis.
| | | | | | | | | | | | | | | | | | | | | | | | | | | | | | | | | | | | | | |
WILPINJONG MINE - SUMMARY OF COAL RESERVES AND RESOURCES (1) |
| (Tons in millions) |
| | | | | | | | | | | | |
| | December 31, 2024 | | December 31, 2023 |
Coal Reserves (5)(6) | | Tons | | %Ash | | %Sulfur | | Kcal/kg | | % Mine Yield(7) | | Tons |
| Proven | | 43 | | | 24.5 | | | 0.5 | | | 5,927 | | | 84 | % | | 54 | |
| Probable | | 3 | | | 32.9 | | | 0.4 | | | 5,208 | | | 84 | % | | 3 | |
| Total | | 46 | | | | | | | | | | | 57 | |
| | | | | | | | | | | | |
| Year-over-year decrease | | (19) | % | | | | | | | | | | |
| | | | | | | | | | | | |
| | December 31, 2024 | | | | December 31, 2023 |
Coal Resources (2)(3)(4) | | Tons | | %Ash | | %Sulfur | | Kcal/kg | | | | Tons |
| Measured | | 137 | | | 23.4 | | | 0.5 | | | 6,018 | | | | | 103 | |
| Indicated | | 59 | | | 25.3 | | | 0.5 | | | 5,872 | | | | | 25 | |
| Measured and indicated | | 196 | | | 24.0 | | | 0.5 | | | 5,974 | | | | | 128 | |
| Inferred | | 9 | | | 26.5 | | | 0.5 | | | 5,767 | | | | | 6 | |
| Total | | 205 | | | | | | | | | | | 134 | |
| | | | | | | | | | | | |
| | | | | | | | | | | | |
| | | | | | | | | | | | |
The year-over-year decrease in the quantity of coal reserves was driven by production depletion. The year-over-year increase in the quantity of coal resources was driven by inclusion of areas with the lease EL9399.
| | | | | |
| (1) | Economic recoverability is based upon product-specific estimated average sales prices per tonne of $61.36 for the five-year period ending December 31, 2029 and assumed escalation of 2.0% to 3.0% per annum during the subsequent period through the end of the LOM plan. |
| (2) | The quality of coal resources is on an in situ, air-dry basis. |
| (3) | The quantity of coal resource estimates is on an in situ basis, which does not take into consideration coal loss during mining and processing. |
| (4) | Besides the results from drill hole analyses, the raw ash is a key quality parameter that is relevant to both the cut-off grade and metallurgical recovery. The resource is limited by a maximum of 50% raw ash (air-dry basis). Due to the relatively consistent coal thickness and shallow depth, no other geological limiting factors are applied except for known geological anomalies such as paleochannels and igneous intrusion. |
| (5) | The quality of coal reserves is based on an air-dry basis. It is the laboratory results from the core samples with adjustments that reflect the reconciliation results from actual production. |
| (6) | The quantity of coal reserves is estimated on a saleable product basis, which takes into consideration of mining and processing loss. The economic results from the LOM planning process demonstrate the economic viability of the coal reserve estimate. |
| (7) | Mine yield is the ratio of estimated saleable product coal over ROM coal tons with mainly processing loss considered. |
| | | | | | | | |
| Peabody Energy Corporation | 2024 Form 10-K | 52 |
Centurion Mine
The Centurion Mine is an underground longwall metallurgical coal mine located 160 kilometers WSW of Mackay, Queensland, Australia. The Centurion Mine lies on the Collinsville Shelf on the western margin of the Bowen Basin in Central Queensland. White Mining Ltd developed the operation (then known as the North Goonyella Mine), including a rail loop, coal handling preparation plant (CHPP) and nearby accommodation village, following the grant of ML6949 in 1991. Peabody then acquired North Goonyella as part of an acquisition of RAG’s coal assets in April of 2004 and operated it until September of 2018, when a fire in the mine halted operations. The mine has been idled since that time while plans to re-initiate production with regulatory approval were developed.
During the third quarter of 2022, Peabody initiated the development of the mine. In October 2023, Peabody entered into an agreement with Stanmore to purchase the southern area of Wards Well (ML 1790 and ML 70495) with the intent to expand underground operations to the North of the North Goonyella Mine footprint and eventually extend into Dabin (MDL 3010). In December 2023, the mine was renamed the Centurion Mine. Development operations recommenced at the mine in June 2024, with Longwall operations scheduled to commence in early 2026.
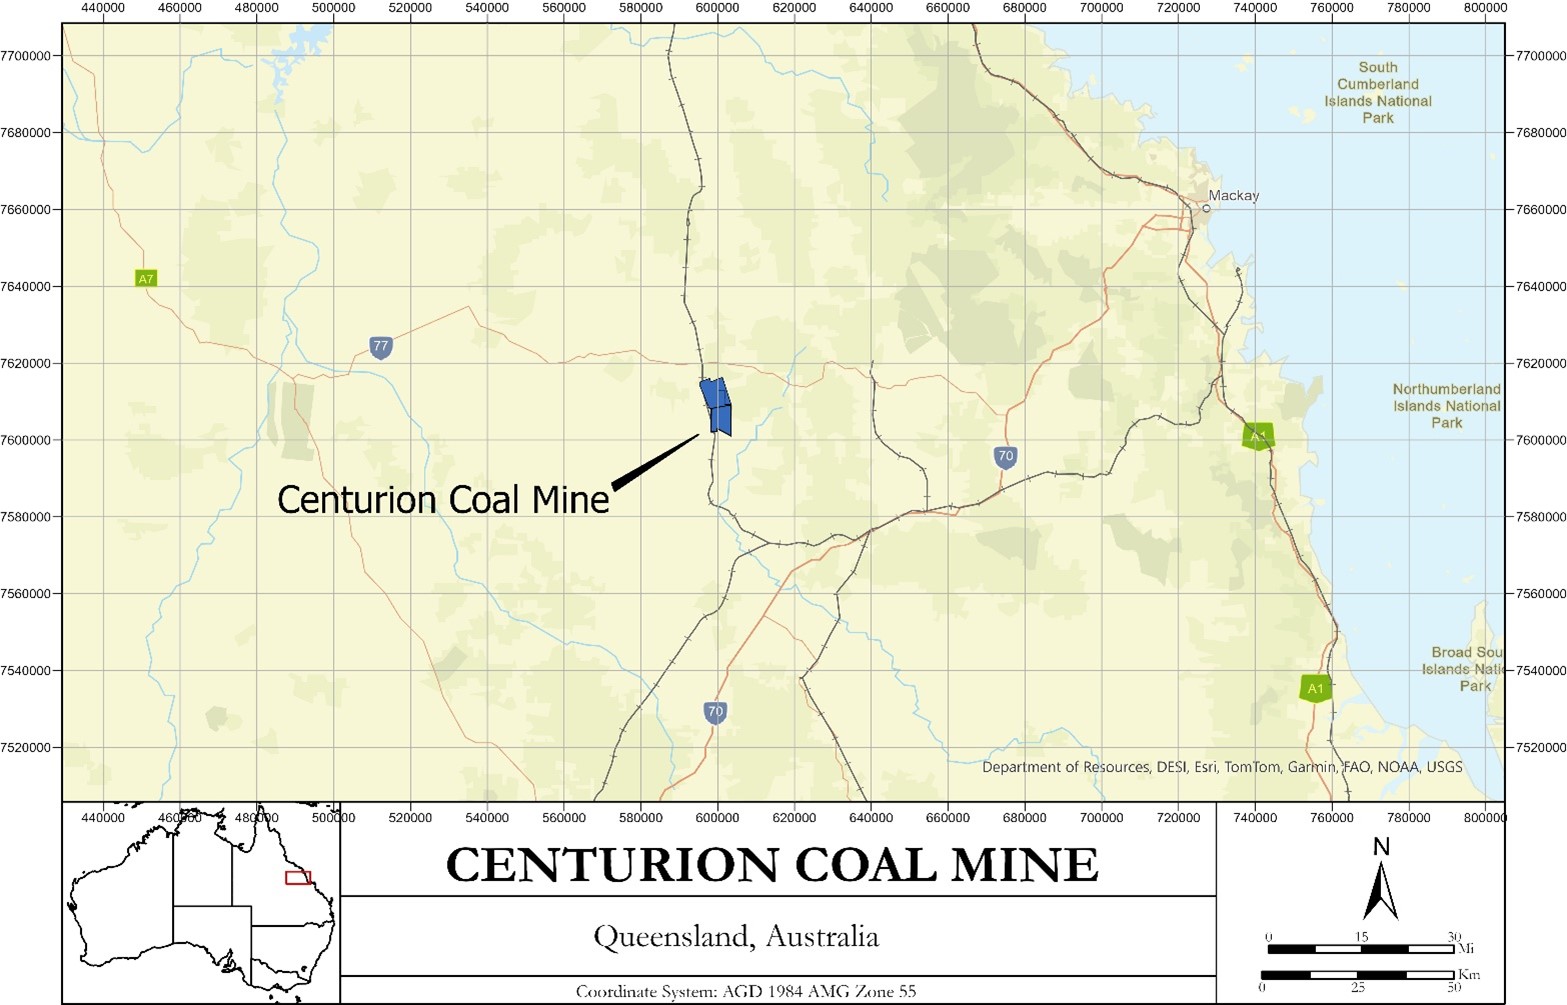
Centurion Mine will extract coal from the Goonyella Middle seam with future plans to extend into the Goonyella Lower B2 (GLB2) seam with mining depths ranging from 210 meters to 540 meters. The Company has secured mineral rights through state mineral leases and has an approved production rate for the operation of 10.2 Mtpa ROM coal that after processing, equates to approximately 7.6 Mtpa product coal. The Centurion Mine operates on a Mining Lease issued by the State Government of Queensland. Tenement holders are bound by the Mineral Resources Act 1989 and the Mineral Resources Regulation 2013 which define the laws pertaining to coal exploration and mining in Queensland. Under the system administered by the Department of Natural Resources, Mines and Energy (DNRME), tenements are held as either EPC (Exploration Permit Coal), MDL (Mineral Development Licence) or ML (Mining Lease).
Production from the Centurion Coal Mine will be subject to the Queensland Government Royalty charged on total revenue. In addition to this standard Government royalty, there is also a special private Royalty agreement established in relation to the sale of the property by a prior owner.
The Centurion Mining Lease, ML6949, encompasses a total of 3,293 hectares. The ML allows mining and sale of coal by both underground and open cut methods. Overlapping this Mining Lease, Centurion also holds a Petroleum Lease, PL504, which enables the company to commercialize any coal seam gas (methane) that may be extracted within the lease area.
| | | | | | | | |
| Peabody Energy Corporation | 2024 Form 10-K | 53 |
Centurion North is comprised of ML1790 and ML70495 (part of the Ward’s Well project which has been subdivided between Peabody and Stanmore) which encompasses surface areas of 2,723 hectares and 748 hectares, respectively. The Centurion North mine also comprises a small portion of MDL3010 (Dabin) which is owned by the West Burton Joint Venture (85% Peabody) and has a land area of 10,827 hectares.
Coal will be produced primarily using longwall systems. The mine will also use continuous miner units for longwall development and limited production. Mined coal will be processed through the on-site wash plant and conveyed to rail loadout facilities. Product coal will be loaded to train via an existing 1,000t Train Loadout Bin. The loaded trains will then travel some 217km to the Port of Hay Point where it will be bottom dumped to conveyor and onto stockpiles at Dalrymple Bay Coal Terminal (DBCT). Shipping of coal to customers will take place on an ocean-going vessel, often shared with other coal suppliers. Centurion Coking coal is a premium Hard Coking Coal (PHCC) with a mature brand name in the seaborne metallurgical marketplace and is well known in both the Atlantic and Pacific seaborne markets.
The key supporting infrastructure for Centurion Mine includes road access via highways and roads, access to both the Goonyella and Newland Rail Systems, coal export terminals at the Port of Hay Point and the Port of Abbot Point, connection to a High Voltage electricity grid that provides electricity to the existing facilities, and water supplied from the 15GL capacity Burton Gorge Dam. Centurion also has a nearby accommodation village with housing and service amenities for a capacity of 440 workers located 19km east of the mine. The mine’s workforce is drawn primarily from the townships of Moranbah, Nebo and Mackay.
The property, plant, equipment and mine development assets of Centurion Mine had a net book value of approximately $758 million at December 31, 2024. The mine’s operating equipment and facilities meet contemporary mining standards and are adequately maintained to execute the LOM plan. Routine maintenance, overhauls and necessary capital replacements are generally included in the LOM plan to support future production. While the mine was idled since 2018, the Company upgraded the mine’s coal transfer and handling facilities, purchased new mining equipment and made other capital investments to improve its prospective cost structure.
| | | | | | | | |
| Peabody Energy Corporation | 2024 Form 10-K | 54 |
The tables below present Centurion Mine’s estimated coal reserves and resources at December 31, 2024, along with comparative quantities at December 31, 2023. These coal reserve and resource estimates were supported by the analyses of 2,065 total drill holes within the coal lease area. The quantity of the coal resources is estimated on an in situ basis as 100% attributable to Peabody. Coal resources are reported exclusive of coal reserves. The quantity of the coal reserves are estimated on a saleable product basis as 100% attributable to Peabody. Coal reserves and resources are reported on selected key quality parameters on an air-dry basis.
| | | | | | | | | | | | | | | | | | | | | | | | | | | | | | | | | | | | | | |
CENTURION MINE - SUMMARY OF COAL RESERVES AND RESOURCES (1) |
| (Tons in millions) |
| | | | | | | | | | | | |
| | December 31, 2024 | | December 31, 2023 |
Coal Reserves (2)(5)(6) | | Tons | | %Ash | | %Sulfur | | %VM | | % Mine Yield(7) | | Tons |
| Proven | | 84 | | | 8.0 | | | 0.5 | | | 21.7 | | | 81 | % | | 46 | |
| Probable | | 107 | | | 7.8 | | | 0.5 | | | 20.6 | | | 82 | % | | 23 | |
| Total | | 191 | | | | | | | | | | | 69 | |
| | | | | | | | | | | | |
| Year-over-year increase | | 177 | % | | | | | | | | | | |
| | | | | | | | | | | | |
| | December 31, 2024 | | | | December 31, 2023 |
Coal Resources (2)(3)(4)(5) | | Tons | | %Ash | | %Sulfur | | VM% | | | | Tons |
| Measured | | 96 | | | 20.7 | | | 0.5 | | | 21.9 | | | | | — | |
| Indicated | | 485 | | | 17.9 | | | 0.5 | | | 19.6 | | | | | 2 | |
| Measured and indicated | | 581 | | | 18.4 | | | 0.5 | | | 20.0 | | | | | 2 | |
| Inferred | | 286 | | | 21.1 | | | 0.5 | | | 18.9 | | | | | 8 | |
| Total | | 867 | | | | | | | | | | | 10 | |
| | | | | | | | | | | | |
The year-over-year increase in the quantity of coal reserves and resources was driven by the Wards Well acquisition in April 2024.
| | | | | |
| (1) | Economic recoverability is based upon an estimated average sales price per tonne of $210 for the LOM plan. |
| (2) | The quality of coal reserves and resources are estimated on an air-dry basis. |
| (3) | The quantity of coal resource estimates are on an in situ basis, which doesn’t take into consideration coal loss during mining and processing. |
| (4) | The coal resource boundary is established by considering various factors, including results from drill hole analyses, mining lease, coal control, geological features, faults and other surface features. |
| (5) | The cut-off grade and metallurgical recovery are not limiting factors for the coal reserve and resource estimates due to relatively consistent coal quality and float recovery from the lab results within the assessed area. The Lease boundary, surface infrastructures, and the base of weathering are the main limiting factors. |
| (6) | The quantity of coal reserves is estimated on a saleable product basis, which takes into consideration of unmined coal (pillars, etc.), coal loss during mining and processing, and additional washing recovery. The results from the LOM planning process demonstrate the economic recoverability of the coal reserve estimate. |
| (7) | Mine yield is the ratio of estimated saleable product coal over ROM coal tons with mainly processing loss considered. |
Internal Controls
The preparation of coal reserve and resource estimates is completed in accordance with the Company’s prescribed internal control procedures, which are designed specifically to ensure the reliability of such estimates presented herein. Annually, QPs and other employees review the estimates of mineral reserves and mineral resources, the supporting documentation, and compliance with applicable internal controls. Such controls employ management systems, standardized procedures, workflow processes, multi-functional supervision and management approval, internal and external reviews, reconciliations, and data security covering record keeping, chain of custody and data storage.
The internal controls for coal reserve and resource estimates also cover exploration activities, sample preparation and analysis, data verification, processing, metallurgical testing, recovery estimation, mine design and sequencing, and coal reserve and resource evaluations, with environmental, social and regulatory considerations. The quality assurance and control protocols over the assaying of drill hole samples are performed by reputable commercial laboratories following certification and accreditation programs established by the American Society for Testing and Materials (ASTM) or Australian National Association of Testing Authorities (NATA).
| | | | | | | | |
| Peabody Energy Corporation | 2024 Form 10-K | 55 |
The coal reserve and resource estimates have inherent risks due to data accuracy, uncertainty from geological interpretation, mine plan assumptions, uncontrolled rights for mineral and surface properties, environmental challenges, uncertainty for future market supply and demand, and changes in laws and regulations. Management and QPs are aware of those risks that might directly impact the assessment of coal reserves and resources. The current coal reserves and resources are estimated based on the best information available and are subject to re-assessment when conditions change. Refer to Item 1A. “Risk Factors” for discussion of risks associated with the estimates of the Company’s coal reserves and resources.
Item 3. Legal Proceedings.
See Note 21. “Commitments and Contingencies” to the accompanying consolidated financial statements for a description of Peabody’s pending legal proceedings, which information is incorporated herein by reference.
Item 4. Mine Safety Disclosures.
Peabody’s “Safety and Sustainability Management System” has been designed to set clear and consistent expectations for safety, health and environmental stewardship across the Company’s business. It aligns to the National Mining Association’s CORESafety® framework and encompasses three fundamental areas: leadership and organization, risk management and assurance. Peabody also partners with other companies and certain governmental agencies to pursue new technologies that have the potential to improve its safety performance and provide better safety protection for employees.
Peabody continually monitors its safety performance and regulatory compliance. The information concerning mine safety violations or other regulatory matters required by SEC regulations is included in Exhibit 95 to this Annual Report on Form 10-K.
PART II
Item 5. Market for Registrant’s Common Equity, Related Stockholder Matters and Issuer Purchases of Equity Securities.
Peabody’s Common Stock is listed on the New York Stock Exchange, under the symbol “BTU.” As of February 14, 2025 there were 170 holders of the Company’s Common Stock, as determined by counting its record holders and the number of participants reflected in a security position listing provided to the Company by the Depository Trust Company (DTC). Because such DTC participants are brokers and other institutions holding shares of Peabody’s Common Stock on behalf of their customers, the Company does not know the actual number of unique shareholders represented by these record holders.
Share Repurchase Program
On April 17, 2023, the Company announced that its Board of Directors authorized a new share repurchase program (2023 Repurchase Program) authorizing repurchases of up to $1.0 billion of its common stock. The 2023 Repurchase Program superseded and replaced the previous repurchase program that had been announced in 2017.
Under the 2023 Repurchase Program, the Company may purchase shares of common stock from time to time at the discretion of management through open market purchases, privately negotiated transactions, block trades, accelerated or other structured share repurchase programs, or other means. The manner, timing and pricing of any share repurchase transactions will be based on a variety of factors, including market conditions, applicable legal requirements, the Company’s capital structure and alternative opportunities that the Company may have for the use or investment of capital. Through December 31, 2024, the Company had repurchased 23.8 million shares of its common stock under the 2023 Repurchase Program for $530.8 million, which included commissions paid of $0.4 million, leaving $469.6 million available for share repurchase.
Dividends
During the year ended December 31, 2024, the Company declared dividends per share of $0.300. On February 6, 2025, the Company declared an additional dividend per share of $0.075 to be paid on March 11, 2025 to shareholders of record as of February 19, 2025.
| | | | | | | | |
| Peabody Energy Corporation | 2024 Form 10-K | 56 |
Share Relinquishments
The Company routinely allows employees to relinquish Common Stock to pay estimated taxes upon the vesting of restricted stock units and the payout of performance units that are settled in Common Stock under its equity incentive plans. The value of Common Stock tendered by employees is determined based on the closing price of the Company’s Common Stock on the dates of the respective relinquishments.
Purchases of Equity Securities
The following table summarizes all share purchases for the three months ended December 31, 2024:
| | | | | | | | | | | | | | | | | | | | | | | | | | |
| Period | | Total Number of Shares Purchased (1) | | Average Price Paid per Share | | Total Number of Shares Purchased as Part of Publicly Announced Program | | Maximum Dollar Value of Shares that May Yet Be Used to Repurchase Shares Under the Publicly Announced Program (In millions) |
| October 1 through October 31, 2024 | | 57 | | | $ | 26.32 | | | — | | | $ | 469.6 | |
| November 1 through November 30, 2024 | | 151 | | | 26.48 | | | — | | | 469.6 | |
| December 1 through December 31, 2024 | | — | | | — | | | — | | | 469.6 | |
| Total | | 208 | | | 26.44 | | | — | | | |
(1) Includes shares withheld to cover the withholding taxes upon the vesting of equity awards, which are not a part of the Repurchase Program Repurchase Program.
Stock Performance Graph
The following performance graph compares the cumulative total return on Peabody’s common stock with the cumulative total return of the S&P MidCap 400 Index and the S&P Metals and Mining Select Industry Index.
The graph assumes that the value of the investment in BTU and each index was $100 at December 31, 2019. The graph also assumes that all dividends were reinvested and that the investments were held through December 31, 2024. These indices are included for comparative purposes only and do not necessarily reflect management's opinion that such indices are an appropriate measure of the relative performance of the stock involved and are not intended to forecast or be indicative of possible future performance of the common stock.
| | | | | | | | |
| Peabody Energy Corporation | 2024 Form 10-K | 57 |
Item 6. Reserved.
Not applicable.
Item 7. Management’s Discussion and Analysis of Financial Condition and Results of Operations.
The Company’s discussion and analysis of the year ended December 31, 2024 compared to the year ended December 31, 2023 is included herein. For discussion and analysis of the year ended December 31, 2023 compared to the year ended December 31, 2022, please refer to Item 7 of Part II, “Management’s Discussion and Analysis of Financial Condition and Results of Operations” in Peabody’s Annual Report on Form 10-K for the year ended December 31, 2023, which was filed with the SEC on February 23, 2024 and is incorporated by reference herein.
Non-GAAP Financial Measures
The following discussion of Peabody’s results of operations includes references to and analysis of Adjusted EBITDA and Total Segment Costs, which are financial measures not recognized in accordance with U.S. generally accepted accounting principles (U.S. GAAP). Adjusted EBITDA is used by the chief operating decision maker, defined as Peabody’s President and Chief Executive Officer, as the primary financial metric to measure each segment’s operating performance against expected results and to allocate resources, including capital investment in mining operations and potential expansions. Total Segment Costs is also used by management as a component of a metric to measure each segment’s operating performance.
| | | | | | | | |
| Peabody Energy Corporation | 2024 Form 10-K | 58 |
Also included in the following discussion of Peabody’s results of operations are references to Revenue per Ton, Costs per Ton and Adjusted EBITDA Margin per Ton for each reporting segment. These metrics are used by management to measure each reporting segment’s operating performance. Management believes Costs per Ton and Adjusted EBITDA Margin per Ton best reflect controllable costs and operating results at the reporting segment level. The Company considers all measures reported on a per ton basis to be operating/statistical measures; however, the Company includes reconciliations of the related non-GAAP financial measures (Adjusted EBITDA and Total Segment Costs) in the “Reconciliation of Non-GAAP Financial Measures” section contained within this Item 7.
Peabody believes non-GAAP measures are used by investors to measure its operating performance. These measures are not intended to serve as alternatives to U.S. GAAP measures of performance and may not be comparable to similarly-titled measures presented by other companies. Refer to the “Reconciliation of Non-GAAP Financial Measures” section contained within this Item 7 for definitions and reconciliations to the most comparable measures under U.S. GAAP.
Overview
In 2024, Peabody produced and sold 118.1 million and 118.0 million tons of coal, respectively, from continuing operations.
As of December 31, 2024, the Company reports its results of operations primarily through the following reportable segments: Seaborne Thermal, Seaborne Metallurgical, Powder River Basin, Other U.S. Thermal and Corporate and Other.
The Company’s seaborne operating platform is primarily export focused with customers spread across several countries, with a portion of its thermal and metallurgical coal sold within Australia. Generally, revenue from individual countries varies year by year based on electricity and steel demand, the strength of the global economy, governmental policies and several other factors, including those specific to each country. The Company classifies its seaborne mines within the Seaborne Thermal or Seaborne Metallurgical segments based on the primary customer base and coal reserve type of each mining operation. A small portion of the coal mined by the Seaborne Thermal segment is of a metallurgical grade. Similarly, a small portion of the coal mined by the Seaborne Metallurgical segment is of a thermal grade. Additionally, the Company may market some of its metallurgical coal products as a thermal coal product from time to time depending on market conditions. Peabody’s Seaborne Thermal and Seaborne Metallurgical segments contributed approximately 70% of the Company’s total Adjusted EBITDA from its mining operations during the year ended December 31, 2024.
The Company’s Seaborne Thermal operations consist of mines in New South Wales, Australia. The mines in that segment utilize both surface and underground extraction processes to mine low-sulfur, high Btu thermal coal.
The Company’s Seaborne Metallurgical operations consist of mines in Queensland, Australia, one in New South Wales, Australia and one in Alabama, USA. The mines in that segment utilize both surface and underground extraction processes to mine various qualities of metallurgical coal. The metallurgical coal qualities include hard coking coal, semi-hard coking coal, semi-soft coking coal and pulverized coal injection coal.
The Company’s thermal operating segments in the U.S. are focused on the mining, preparation and sale of thermal coal, sold primarily to electric utilities in the U.S. under long-term contracts, with a relatively small portion sold as international exports as conditions warrant. The Company’s Powder River Basin operations consist of its mines in Wyoming. The mines in that segment are characterized by surface mining extraction processes, coal with a lower sulfur content and Btu and higher customer transportation costs (due to longer shipping distances). The Company’s Other U.S. Thermal operations reflect the aggregation of its Illinois, Indiana, New Mexico and Colorado mining operations. The mines in that segment are characterized by a mix of surface and underground mining extraction processes, coal with a higher sulfur content and Btu and lower customer transportation costs (due to shorter shipping distances). Geologically, the Company’s Powder River Basin operations mine sub-bituminous coal deposits and its Other U.S. Thermal operations mine both bituminous and sub-bituminous coal deposits. Peabody’s Powder River Basin and Other U.S. Thermal segments contributed approximately 30% of the Company’s total Adjusted EBITDA from its mining operations during the year ended December 31, 2024.
The Company’s Corporate and Other segment includes selling and administrative expenses, results from equity method investments, trading and brokerage activities, minimum charges on certain transportation-related contracts, the closure of inactive mining sites, the impact of foreign currency remeasurement and certain commercial matters.
| | | | | | | | |
| Peabody Energy Corporation | 2024 Form 10-K | 59 |
Resource Management. As of December 31, 2024, Peabody controlled approximately 2.1 billion tons of proven and probable coal reserves, 3.6 billion tons of coal resources and approximately 345,000 acres of surface property through ownership and lease agreements. The Company has an ongoing asset optimization program whereby its property management group regularly reviews these coal reserves, coal resources and surface properties for opportunities to generate earnings and cash flow through the sale or exchange of non-strategic coal reserves, coal resources and surface lands. These surface lands include acres where Peabody has completed post-mining reclamation. In addition, the Company generates revenue through royalties from coal reserves and oil and gas rights leased to third parties, farm income from surface lands under third-party contracts and lease income from surface lands under contracts with renewable energy ventures.
Middlemount Mine. Peabody owns a 50% equity interest in Middlemount, which owns the Middlemount Mine in Queensland, Australia. The mine predominantly produces semi-hard coking coal and low-volatile pulverized coal injection (LV PCI) coal for sale into seaborne coal markets through Abbot Point Coal Terminal, with some capacity also secured at Dalrymple Bay Coal Terminal. Mining operations first commenced at the Middlemount Mine in late 2011. During the years ended December 31, 2024 and 2023, the mine sold 1.3 million and 1.2 million tons of coal, respectively (on a 50% basis).
Summary
Spot pricing for premium low-vol hard coking coal (Premium HCC), premium low-vol pulverized coal injection (Premium PCI) coal, Newcastle index thermal coal and API 5 index thermal coal, and prompt month pricing for PRB 8,800 Btu/Lb coal and Illinois Basin 11,500 Btu/Lb coal during the year ended December 31, 2024 is set forth in the table below.
The seaborne pricing included in the table below is not necessarily indicative of the pricing the Company realized during the year ended December 31, 2024 due to quality differentials and a portion of its seaborne sales being executed through annual and multi-year international coal supply agreements that contain provisions requiring both parties to renegotiate pricing periodically, with spot, index and quarterly sales arrangements also utilized. The Company’s typical practice is to negotiate pricing for seaborne metallurgical coal contracts on a quarterly, spot or index basis and seaborne thermal coal contracts on an annual, spot or index basis.
In the U.S., the pricing included in the table below is also not necessarily indicative of the pricing the Company realized during the year ended December 31, 2024 since the Company generally sells coal under long-term contracts where pricing is determined based on various factors. Such long-term contracts in the U.S. may vary significantly in many respects, including price adjustment features, price reopener terms, coal quality requirements, quantity parameters, permitted sources of supply, treatment of environmental constraints, extension options, force majeure and termination and assignment provisions. Competition from alternative fuels such as natural gas and other fuel sources may also impact the Company’s realized pricing.
| | | | | | | | | | | | | | | | | | | | | | | | | | | | | | | | |
| | High | | Low | | Average | | December 31, 2024 | | February 14, 2025 |
Premium HCC (1) | | $ | 338.10 | | | $ | 180.00 | | | $ | 240.37 | | | $ | 196.50 | | | $ | 190.25 | |
Premium PCI coal (1) | | 200.00 | | | 140.00 | | | 165.04 | | | 150.00 | | | 141.00 | |
Newcastle index thermal coal (1) | | 150.05 | | | 116.08 | | | 135.24 | | | 119.75 | | | 101.80 | |
API 5 index thermal coal (1) | | 96.66 | | | 81.77 | | | 89.23 | | | 84.00 | | | 77.51 | |
PRB 8,800 Btu/Lb coal (2) | | 14.10 | | | 13.40 | | | 13.74 | | | 14.10 | | | 14.20 | |
Illinois Basin 11,500 Btu/Lb coal (2) | | 44.00 | | | 40.00 | | | 41.61 | | | 43.25 | | | 43.50 | |
(1) Prices expressed per metric tonne.
(2) Prices expressed per short ton.
Within the global coal industry, supply and demand for its products and the supplies used for mining continue to be impacted by the ongoing Russian-Ukrainian conflict. As future developments related to the Russian-Ukrainian conflict and geopolitical instability in key energy producing regions are unknown, the global coal industry data for the twelve months ended December 31, 2024 presented herein may not be indicative of their ultimate impacts.
| | | | | | | | |
| Peabody Energy Corporation | 2024 Form 10-K | 60 |
Within the seaborne metallurgical coal market, coking coal prices retreated from a high base during the twelve months ended December 31, 2024. Parts of the global steel market reported tepid demand and thin profit margins during this period, restricting demand growth for metallurgical coal. In China, weakness in the property sector contributed to lower domestic steel demand and steel production in 2024 and supported increased steel exports. The increased availability of competitively priced Chinese imports has placed pressure on steel margins for steel producers in other countries. Despite this, India recorded year-over-year steel production growth supported by increased domestic demand and commissioning of new steelmaking facilities. Meanwhile, the global supply of coking coal has been generally sufficient to meet coking coal demand during the twelve months ended December 31, 2024, despite various supply disruption events such as shipping interruptions at the U.S.’s Baltimore, Maryland port. In the PCI segment, prices traded at a wide discount to coking coal early in the year, caused in part by reduced steel making productivity targets under thin margin conditions. PCI price relativities to coking coal have since improved. Overall, the market for metallurgical coal remains marginally balanced and exposed to volatility, influenced by the rate of exports from Australia and economic performance in China, India and elsewhere.
Within the seaborne thermal coal market, global thermal coal prices have remained relatively stable throughout the twelve months ended December 31, 2024, driven by healthy supply meeting elevated demand in Asian markets. In China, overall total generation demand has been elevated while domestic coal production has only grown slightly, which has driven stronger coal import demand year-over-year through the twelve months ended December 31, 2024. In India, strong growth in coal generation has supported increased import demand, despite elevated domestic coal production. Looking ahead, global thermal coal markets remain turbulent amid winter weather outlooks in the Northern Hemisphere, lower industrial activity, as well as volatile global natural gas markets.
In the U.S., overall electricity demand increased approximately 3% year-over-year. Through the twelve months ended December 31, 2024, electricity generation from thermal coal has decreased year-over-year driven by continued low natural gas prices and stronger renewable generation. Coal’s share of electricity generation has declined to approximately 15% for the twelve months ended December 31, 2024, while wind and solar’s combined generation share is at 17% and the share of natural gas generation has remained level at 43%. U.S. coal inventories have modestly declined through December 31, 2024, with stockpiles less than 10 million tons below levels seen at the end of 2023. During the twelve months ended December 31, 2024, utility consumption of PRB coal has declined compared to the prior year period.
Planned Acquisition
On November 25, 2024, Peabody entered into definitive agreements with Anglo, to acquire a portion of the assets and businesses associated with Anglo’s metallurgical coal portfolio in Australia, including the Moranbah North and Grosvenor mines, the Moranbah South development project, the Capcoal complex, the Roper Creek mine and the Dawson complex (comprising the Dawson Main/Central, Dawson South, Dawson South Exploration and Theodore South exploration mines, collectively, the Dawson Assets). Following the prospective closing of the Anglo acquisition, the Company is contracted to sell the Dawson Assets to BUMA.
Peabody has secured a bridge facility commitment to finance the acquisition. The Company intends to replace the bridge facility with permanent financing, including debt capacity, additional investment by existing joint venture partners and other financing to supplement as warranted.
The acquisition is expected to close in the second quarter of 2025, subject to regulatory approvals, completion of preemptive rights processes and satisfaction of other customary closing conditions. See Note 10. “Long-term Debt” and Note 17. “Other Events” for further information.
Centurion Mine
Peabody’s development of the Centurion Mine, an underground longwall metallurgical coal mine in Queensland, Australia, continues to advance as planned. During the year ended December 31, 2024, four continuous miners units were put into production and the first development coal was produced, washed and sold. The Company is targeting the commencement of longwall production in the first quarter of 2026. Approximately $300 million of the $489 million of capital expenditures to reach longwall production had been completed as of December 31, 2024.
Other
Wards Well Acquisition. On April 16, 2024 the Company acquired the southern part of the Wards Well tenements (Wards Well) which are adjacent to the Company’s Centurion Mine in Queensland, Australia. The acquisition was completed for total consideration of $153.4 million, consisting of cash consideration of $134.4 million, cash transaction costs of $9.4 million and the non-cash settlement of existing receivables with the acquiree of $9.6 million.
| | | | | | | | |
| Peabody Energy Corporation | 2024 Form 10-K | 61 |
The agreement also includes an initial contingent royalty of up to $200 million. The royalty will only be payable once the Company has recovered its investment and development costs of Wards Well and if the average sales price achieved exceeds certain thresholds. No royalty is payable if the Company does not commence mining Wards Well.
Shoal Creek Insurance Recovery. On March 29, 2023, the Company’s Shoal Creek Mine experienced a fire. In October 2023, the Company filed an insurance claim against applicable insurance policies with combined business interruption and property loss limits of $125 million above a $50 million deductible. During June 2024, the Company reached a settlement and recognized a $109.5 million insurance recovery, which the Company included in its results of operations during the year ended December 31, 2024.
Results of Operations
Year Ended December 31, 2024 Compared to Year Ended December 31, 2023
The decrease in income from continuing operations, net of income taxes for the year ended December 31, 2024 compared to the prior year ($408.7 million) was primarily driven by lower revenue ($710.0 million) due to lower seaborne coal pricing, volume decreases in the U.S. thermal segments and no unrealized mark-to-market gains from derivative contracts related to forecasted sales in the current year. This unfavorable variance was partially offset by a lower income tax provision ($200.0 million) and the current year insurance recovery at the Shoal Creek Mine ($109.5 million).
Adjusted EBITDA for the year ended December 31, 2024 reflected a year-over-year decrease of $492.2 million.
Tons Sold
The following table presents tons sold by operating segment:
| | | | | | | | | | | | | | | | | | | | | | | |
| | | Increase (Decrease) |
| | Year Ended December 31, | | to Volumes |
| | 2024 | | 2023 | | Tons | | % |
| | (Tons in millions) | | |
| Seaborne Thermal | 16.4 | | | 15.5 | | | 0.9 | | | 5.8 | % |
| Seaborne Metallurgical | 7.3 | | | 6.9 | | | 0.4 | | | 5.8 | % |
| Powder River Basin | 79.6 | | | 87.2 | | | (7.6) | | | (8.7) | % |
| Other U.S. Thermal | 14.6 | | | 16.2 | | | (1.6) | | | (9.9) | % |
| Total tons sold from operating segments | 117.9 | | | 125.8 | | | (7.9) | | | (6.3) | % |
| Corporate and Other | 0.1 | | | 0.4 | | | (0.3) | | | (75.0) | % |
| Total tons sold | 118.0 | | | 126.2 | | | (8.2) | | | (6.5) | % |
| | | | | | | | |
| Peabody Energy Corporation | 2024 Form 10-K | 62 |
Supplemental Financial Data
The following table presents supplemental financial data by operating segment:
| | | | | | | | | | | | | | | | | | | | | | | |
| Year Ended December 31, | | (Decrease) Increase |
| | 2024 | | 2023 | | $ | | % |
| | | | | | | | |
Revenue per Ton (1) | | | | | | | |
| Seaborne Thermal | $ | 73.88 | | | $ | 85.94 | | | $ | (12.06) | | | (14.0) | % |
| Seaborne Metallurgical | 144.97 | | | 188.66 | | | (43.69) | | | (23.2) | % |
| Powder River Basin | 13.81 | | | 13.74 | | | 0.07 | | | 0.5 | % |
| Other U.S. Thermal | 56.38 | | | 54.77 | | | 1.61 | | | 2.9 | % |
Costs per Ton (1) (2) | | | | | | | |
| Seaborne Thermal | $ | 47.71 | | | $ | 48.66 | | | $ | (0.95) | | | (2.0) | % |
| Seaborne Metallurgical | 122.77 | | | 125.18 | | | (2.41) | | | (1.9) | % |
| Powder River Basin | 12.07 | | | 11.98 | | | 0.09 | | | 0.8 | % |
| Other U.S. Thermal | 46.04 | | | 41.98 | | | 4.06 | | | 9.7 | % |
Adjusted EBITDA Margin per Ton (1) (2) | | | | | | | |
| Seaborne Thermal | $ | 26.17 | | | $ | 37.28 | | | $ | (11.11) | | | (29.8) | % |
| Seaborne Metallurgical | 22.20 | | | 63.48 | | | (41.28) | | | (65.0) | % |
| Powder River Basin | 1.74 | | | 1.76 | | | (0.02) | | | (1.1) | % |
| Other U.S. Thermal | 10.34 | | | 12.79 | | | (2.45) | | | (19.2) | % |
(1)This is an operating/statistical measure not recognized in accordance with U.S. GAAP. Refer to the “Reconciliation of Non-GAAP Financial Measures” section below for definitions and reconciliations to the most comparable measures under U.S. GAAP.
(2)Includes revenue-based production taxes and royalties; excludes depreciation, depletion and amortization; asset retirement obligation expenses; selling and administrative expenses; restructuring charges; asset impairment; amortization of take-or-pay contract-based intangibles; insurance recoveries; and certain other costs related to post-mining activities.
Revenue
The following table presents revenue by reporting segment:
| | | | | | | | | | | | | | | | | | | | | | | |
| | | Decrease |
| Year Ended December 31, | | to Revenue |
| | 2024 | | 2023 | | $ | | % |
| | (Dollars in millions) | | |
| Seaborne Thermal | $ | 1,213.9 | | | $ | 1,329.7 | | | $ | (115.8) | | | (8.7) | % |
| Seaborne Metallurgical | 1,055.6 | | | 1,301.9 | | | (246.3) | | | (18.9) | % |
| Powder River Basin | 1,098.8 | | | 1,198.1 | | | (99.3) | | | (8.3) | % |
| Other U.S. Thermal | 822.6 | | | 888.2 | | | (65.6) | | | (7.4) | % |
| Corporate and Other | 45.8 | | | 228.8 | | | (183.0) | | | (80.0) | % |
| Revenue | $ | 4,236.7 | | | $ | 4,946.7 | | | $ | (710.0) | | | (14.4) | % |
Seaborne Thermal. The decrease in segment revenue during the year ended December 31, 2024 compared to the prior year was due to unfavorable realized prices ($228.0 million), offset by favorable volume ($112.2 million).
Seaborne Metallurgical. Segment revenue decreased during the year ended December 31, 2024 compared to the prior year due to unfavorable realized prices and volume ($356.3 million) from the Australian operations. These decreases were partially offset by favorable results from the Shoal Creek Mine ($110.0 million) due to favorable volume which offset unfavorable realized prices.
Powder River Basin. Segment revenue decreased during the year ended December 31, 2024 compared to the prior year primarily due to unfavorable volume ($100.2 million) resulting from decreased demand driven by low natural gas pricing and mild weather.
| | | | | | | | |
| Peabody Energy Corporation | 2024 Form 10-K | 63 |
Other U.S. Thermal. The decrease in segment revenue during the year ended December 31, 2024 compared to the prior year was due to unfavorable volume ($49.8 million) resulting from decreased demand driven by low natural gas pricing and mild weather and unfavorable realized prices ($34.9 million), partially offset by increased revenue from sales contract cancellation settlements ($19.1 million).
Corporate and Other. Segment revenue decreased during the year ended December 31, 2024 compared to the prior year due to no unrealized mark-to-market gains from derivative contracts related to forecasted sales in the current year ($159.0 million) as all derivative contracts settled in 2023 and prior year revenue related to the Company’s assignment of rights to its excess port and rail capacity ($25.9 million).
Segment Costs
The following table presents costs by reporting segment:
| | | | | | | | | | | | | | | | | | | | | | | |
| | | Increase (Decrease) |
| Year Ended December 31, | | to Total
Segment Costs |
| | 2024 | | 2023 | | $ | | % |
| | (Dollars in millions) | | |
| Seaborne Thermal | $ | 783.9 | | | $ | 752.9 | | | $ | 31.0 | | | 4.1 | % |
| Seaborne Metallurgical | 893.9 | | | 863.8 | | | 30.1 | | | 3.5 | % |
| Powder River Basin | 960.2 | | | 1,044.4 | | | (84.2) | | | (8.1) | % |
| Other U.S. Thermal | 671.8 | | | 680.7 | | | (8.9) | | | (1.3) | % |
| Corporate and Other | 64.5 | | | 11.6 | | | 52.9 | | | 456.0 | % |
Total Segment Costs (1) | $ | 3,374.3 | | | $ | 3,353.4 | | | $ | 20.9 | | | 0.6 | % |
(1)This is a financial measure not recognized in accordance with U.S. GAAP. Refer to the “Reconciliation of Non-GAAP Financial Measures” section below for definitions and reconciliations to the most comparable measures under U.S. GAAP.
Seaborne Thermal. The increase in segment costs during the year ended December 31, 2024 compared to the prior year was primarily driven by favorable volume (0.9 million tons) which resulted in higher sales related costs ($16.9 million) and higher variable costs for labor, repairs and outside services ($12.8 million), slightly offset by favorable commodity pricing ($8.4 million).
Seaborne Metallurgical. Segment costs increased during the year ended December 31, 2024 compared to the prior year due to increased volume from the Shoal Creek Mine ($56.1 million), higher costs at the Australian operations primarily due to production challenges ($21.3 million) and increased taxes and insurance ($11.0 million) driven by Australian carbon taxes. The increases were offset by lower sales related costs ($66.2 million) at the Australian operations due to lower sales volumes and lower pricing.
Powder River Basin. The decrease in segment costs during the year ended December 31, 2024 compared to the prior year was primarily driven by unfavorable volume (7.6 million tons) which resulted in lower sales price sensitive costs ($44.4 million) and lower variable costs for labor, repairs and outside services ($32.3 million) and favorable commodity pricing ($21.7 million). These decreases were partially offset by increased lease spend ($14.3 million).
Other U.S. Thermal. The decrease in segment costs during the year ended December 31, 2024 compared to the prior year was primarily driven by lower costs for labor, repairs and outside services due to lower sales volume (1.6 million tons).
Corporate and Other. Segment costs increased during the year ended December 31, 2024 compared to the prior year primarily due to unfavorable foreign currency rate changes.
| | | | | | | | |
| Peabody Energy Corporation | 2024 Form 10-K | 64 |
Adjusted EBITDA
The following table presents Adjusted EBITDA for each of the Company’s reporting segments:
| | | | | | | | | | | | | | | | | | | | | | | |
| | | Decrease to |
| | Year Ended December 31, | | Adjusted EBITDA |
| | 2024 | | 2023 | | $ | | % |
| | (Dollars in millions) | | |
| Seaborne Thermal | $ | 430.0 | | | $ | 576.8 | | | $ | (146.8) | | | (25.5) | % |
| Seaborne Metallurgical | 242.5 | | | 438.1 | | | (195.6) | | | (44.6) | % |
| Powder River Basin | 138.6 | | | 153.7 | | | (15.1) | | | (9.8) | % |
| Other U.S. Thermal | 150.8 | | | 207.5 | | | (56.7) | | | (27.3) | % |
| Corporate and Other | (90.2) | | | (12.2) | | | (78.0) | | | (639.3) | % |
Adjusted EBITDA (1) | $ | 871.7 | | | $ | 1,363.9 | | | $ | (492.2) | | | (36.1) | % |
(1)This is a financial measure not recognized in accordance with U.S. GAAP. Refer to the “Reconciliation of Non-GAAP Financial Measures” section below for definitions and reconciliations to the most comparable measures under U.S. GAAP.
Seaborne Thermal. Segment Adjusted EBITDA decreased during the year ended December 31, 2024 compared to the same period in the prior year as a result of lower realized prices net of sales price sensitive costs ($225.2 million), partially offset by favorable volume and mix variances ($58.0 million).
Seaborne Metallurgical. Segment Adjusted EBITDA decreased during the year ended December 31, 2024 compared to the same period in the prior year due to lower realized prices net of sales price sensitive costs ($294.5 million) and unfavorable operational costs ($106.3 million). These decreases were offset by favorable volume ($112.0 million), despite the lock outages during 2024, driven by increased production from the Shoal Creek Mine following the fire in the first quarter of 2023, and the Shoal Creek insurance recovery ($80.8 million).
Powder River Basin. Segment Adjusted EBITDA decreased during the year ended December 31, 2024 compared to the same period in the prior year as a result of unfavorable volume ($50.3 million) and increased lease spend ($14.3 million). These decreases were offset by lower costs for labor, repairs and outside services ($32.3 million) and favorable commodity pricing ($21.7 million).
Other U.S. Thermal. Segment Adjusted EBITDA decreased during the year ended December 31, 2024 compared to the same period in the prior year due to unfavorable volume ($63.1 million) and lower realized prices net of sales price sensitive costs ($34.5 million). These decreases were offset by increased sales contract cancellation settlements ($19.1 million) and lower costs for labor, repairs and outside services ($12.0 million).
Corporate and Other Adjusted EBITDA. The following table presents a summary of the components of Corporate and Other Adjusted EBITDA:
| | | | | | | | | | | | | | | | | | | | | | | |
| | | Decrease |
| Year Ended December 31, | | to Income |
| | 2024 | | 2023 | | $ | | % |
| | (Dollars in millions) | | |
Middlemount (1) | $ | 13.1 | | | $ | 13.2 | | | $ | (0.1) | | | (0.8) | % |
Resource management activities (2) | 19.2 | | | 21.0 | | | (1.8) | | | (8.6) | % |
| Selling and administrative expenses | (91.0) | | | (90.7) | | | (0.3) | | | (0.3) | % |
Other items, net (3) | (31.5) | | | 44.3 | | | (75.8) | | | (171.1) | % |
| Corporate and Other Adjusted EBITDA | $ | (90.2) | | | $ | (12.2) | | | $ | (78.0) | | | (639.3) | % |
(1)Middlemount’s results are before the impact of related changes in amortization of basis difference.
(2)Includes gains (losses) on certain surplus coal reserve, coal resource and surface land sales and property management costs and revenue.
(3)Includes trading and brokerage activities, costs associated with post-mining activities, gains (losses) on certain asset disposals, minimum charges on certain transportation-related contracts, results from the Company’s equity method investment in renewable energy joint ventures, costs associated with suspended operations including the Centurion Mine, the impact of foreign currency remeasurement and expenses related to the Company’s other commercial activities.
| | | | | | | | |
| Peabody Energy Corporation | 2024 Form 10-K | 65 |
Corporate and Other Adjusted EBITDA decreased during the year ended December 31, 2024 compared to the same period in the prior year due to the unfavorable net impact of foreign currency rate changes ($28.4 million), prior year revenue related to the Company’s assignment of rights to its excess port and rail capacity ($25.9 million) and unfavorable trading results ($19.0 million).
Income From Continuing Operations, Net of Income Taxes
The following table presents income from continuing operations, net of income taxes:
| | | | | | | | | | | | | | | | | | | | | | | |
| | | | (Decrease) Increase to Income |
| | Year Ended December 31, | |
| | 2024 | | 2023 | | $ | | % |
| | (Dollars in millions) | | |
Adjusted EBITDA (1) | $ | 871.7 | | | $ | 1,363.9 | | | $ | (492.2) | | | (36.1) | % |
| Depreciation, depletion and amortization | (343.0) | | | (321.4) | | | (21.6) | | | (6.7) | % |
| Asset retirement obligation expenses | (48.9) | | | (50.5) | | | 1.6 | | | 3.2 | % |
| Restructuring charges | (4.4) | | | (3.3) | | | (1.1) | | | (33.3) | % |
| Transaction costs related to business combinations | (10.3) | | | — | | | (10.3) | | | n.m. |
| Asset impairment | — | | | (2.0) | | | 2.0 | | | 100.0 | % |
| Provision for NARM and Shoal Creek losses | (3.7) | | | (40.9) | | | 37.2 | | | 91.0 | % |
| Shoal Creek insurance recovery - property damage | 28.7 | | | — | | | 28.7 | | | n.m. |
| Changes in amortization of basis difference related to equity affiliates | 1.8 | | | 1.6 | | | 0.2 | | | 12.5 | % |
| Interest expense, net of capitalized interest | (46.9) | | | (59.8) | | | 12.9 | | | 21.6 | % |
| Net loss on early debt extinguishment | — | | | (8.8) | | | 8.8 | | | 100.0 | % |
| Interest income | 71.0 | | | 76.8 | | | (5.8) | | | (7.6) | % |
| Net mark-to-market adjustment on actuarially determined liabilities | 6.1 | | | 0.3 | | | 5.8 | | | 1,933.3 | % |
| | | | | | | |
| Unrealized gains on derivative contracts related to forecasted sales | — | | | 159.0 | | | (159.0) | | | (100.0) | % |
| Unrealized (losses) gains on foreign currency option contracts | (9.0) | | | 7.4 | | | (16.4) | | | (221.6) | % |
| Take-or-pay contract-based intangible recognition | 3.0 | | | 2.5 | | | 0.5 | | | 20.0 | % |
| Income tax provision | (108.8) | | | (308.8) | | | 200.0 | | | 64.8 | % |
| Income from continuing operations, net of income taxes | $ | 407.3 | | | $ | 816.0 | | | $ | (408.7) | | | (50.1) | % |
(1)This is a financial measure not recognized in accordance with U.S. GAAP. Refer to the “Reconciliation of Non-GAAP Financial Measures” section below for definitions and reconciliations to the most comparable measures under U.S. GAAP.
Depreciation, Depletion and Amortization. The following table presents a summary of depreciation, depletion and amortization expense by reporting segment:
| | | | | | | | | | | | | | | | | | | | | | | |
| | | (Decrease) Increase |
| Year Ended December 31, | | to Income |
| | 2024 | | 2023 | $ | | % |
| | (Dollars in millions) | | |
| Seaborne Thermal | $ | (121.9) | | | $ | (103.7) | | | $ | (18.2) | | | (17.6) | % |
| Seaborne Metallurgical | (93.2) | | | (91.5) | | | (1.7) | | | (1.9) | % |
| Powder River Basin | (55.3) | | | (48.8) | | | (6.5) | | | (13.3) | % |
| Other U.S. Thermal | (64.8) | | | (69.0) | | | 4.2 | | | 6.1 | % |
| Corporate and Other | (7.8) | | | (8.4) | | | 0.6 | | | 7.1 | % |
| Total | $ | (343.0) | | | $ | (321.4) | | | $ | (21.6) | | | (6.7) | % |
| | | | | | | | |
| Peabody Energy Corporation | 2024 Form 10-K | 66 |
Additionally, the following table presents a summary of the Company’s weighted-average depletion rate per ton for active mines in each of its operating segments:
| | | | | | | | | | | |
| Year Ended December 31, |
| 2024 | | 2023 |
| Seaborne Thermal | $ | 2.14 | | | $ | 2.13 | |
| Seaborne Metallurgical | 2.89 | | | 2.16 | |
| Powder River Basin | 0.35 | | | 0.31 | |
| Other U.S. Thermal | 1.63 | | | 1.23 | |
Depreciation, depletion and amortization expense increased during the year ended December 31, 2024 compared to the same period in the prior year primarily due to increased depreciation resulting from asset additions and shortened mine lives. Depletion expense increased primarily as a result of increased volume from the Shoal Creek Mine. The increases in the weighted-average depletion rate per ton for both the Seaborne Metallurgical and the Other U.S. Thermal segments during the year ended December 31, 2024 compared to the same period in the prior year reflect the impact of volume and mix variances across the segments.
Transaction Costs Related to Business Combinations. The charges recorded during the current year period relate to the planned acquisition of multiple metallurgical coal mines from Anglo which was announced during the fourth quarter of 2024. Refer to Note 17. “Other Events” to the accompanying consolidated financial statements for further information regarding the planned acquisition, which information is incorporated herein by reference.
Provision for NARM and Shoal Creek Losses. The provision recorded during the prior year period was for losses related to the events at the NARM and Shoal Creek Mines as discussed in Note 17. “Other Events” to the accompanying consolidated financial statements. Incremental repair costs related to the tornado damage at NARM were recorded during the year ended December 31, 2024.
Shoal Creek Insurance Recovery - Property Damage. During June 2024, the Company reached a settlement related to the Shoal Creek losses and recorded a $109.5 million insurance recovery, as discussed in Note 17. “Other Events” in the accompanying consolidated financial statements. Of this amount, Adjusted EBITDA excludes an allocated amount applicable to losses recognized at the time of the insurance recovery related to longwall development and equipment deemed inoperable within the affected area of the mine, which consisted of $28.7 million recognized during the year ended December 31, 2023. The remaining $80.8 million, applicable to incremental costs and business interruption recoveries, is included in Adjusted EBITDA for the year ended December 31, 2024.
Interest Expense, Net of Capitalized Interest. The decrease in interest expense during the year ended December 31, 2024 compared to the prior year was driven by lower interest and fees for financial assurance instruments and the capitalization of interest related to the development of the Centurion Mine.
Net Loss on Early Debt Extinguishment. The net loss on early debt extinguishment recognized during the prior year was primarily related to the Company’s terminated letter of credit facility, as further discussed in Note 20. “Financial Instruments, Guarantees With Off-Balance-Sheet Risk and Other Guarantees” to the accompanying consolidated financial statements.
Net Mark-to-Market Adjustment on Actuarially Determined Liabilities. The gain recorded during the year ended December 31, 2024 was driven by the favorable impacts of changes for the postretirement benefit plans related to updated claims experience ($12.4 million) and increases to the discount rates for all actuarially determined liabilities ($5.7 million). These increases were offset by negative adjustments to Peabody’s black lung and traumatic workers’ compensation liabilities resulting from increased claims ($8.8 million) and mark-to-market losses on pension plan assets ($5.4 million).
The gain recorded during the year ended December 31, 2023 was driven by the favorable impacts of changes for the postretirement benefit plans related to updated claims experience ($5.4 million) and mark-to-market gains on pension and postretirement benefit plan assets ($3.9 million). These increases were offset by decreases to the discount rates for all actuarially determined liabilities ($6.4 million) and a negative adjustment related to Peabody’s black lung liabilities ($2.6 million).
Unrealized Gains on Derivative Contracts Related to Forecasted Sales. The prior year unrealized gains primarily relate to mark-to-market activity on derivative contracts related to forecasted coal sales. As further discussed in Note 6. “Derivatives and Fair Value Measurements” to the accompanying consolidated financial statements, all derivative contracts related to forecasted coal sales settled in 2023.
| | | | | | | | |
| Peabody Energy Corporation | 2024 Form 10-K | 67 |
Unrealized (Losses) Gains on Foreign Currency Option Contracts. Unrealized (losses) gains primarily relate to mark-to-market activity on foreign currency option contracts. For additional information, refer to Note 6. “Derivatives and Fair Value Measurements” to the accompanying consolidated financial statements.
Income Tax Provision. The decrease in the income tax provision recorded during the year ended December 31, 2024 compared to the prior year period was primarily due to lower pretax income. Refer to Note 8. “Income Taxes” to the accompanying consolidated financial statements for additional information.
Net Income Attributable to Common Stockholders
The following table presents net income attributable to common stockholders:
| | | | | | | | | | | | | | | | | | | | | | | |
| | | Decrease |
| Year Ended December 31, | | to Income |
| 2024 | | 2023 | | $ | | % |
| | (Dollars in millions) | | |
| Income from continuing operations, net of income taxes | $ | 407.3 | | | $ | 816.0 | | | $ | (408.7) | | | (50.1) | % |
| Loss from discontinued operations, net of income taxes | (3.8) | | | (0.4) | | | (3.4) | | | (850.0) | % |
| Net income | 403.5 | | | 815.6 | | | (412.1) | | | (50.5) | % |
| | | | | | | |
| Less: Net income attributable to noncontrolling interests | 32.6 | | | 56.0 | | | (23.4) | | | (41.8) | % |
| Net income attributable to common stockholders | $ | 370.9 | | | $ | 759.6 | | | $ | (388.7) | | | (51.2) | % |
Net Income Attributable to Noncontrolling Interests. The decrease in net income attributable to noncontrolling interests during the year ended December 31, 2024 compared to the prior year period was primarily due to a decline in the financial results of Peabody’s majority-owned Wambo operations in which there is an outside non-controlling interest.
Diluted Earnings per Share (EPS)
The following table presents diluted EPS:
| | | | | | | | | | | | | | | | | | | | | | | |
| | | Decrease to |
| Year Ended December 31, | | EPS |
| | 2024 | | 2023 | | $ | | % |
| Diluted EPS attributable to common stockholders: | | | | | | | |
| Income from continuing operations | $ | 2.73 | | | $ | 5.00 | | | $ | (2.27) | | | (45.4) | % |
| Loss from discontinued operations | (0.03) | | | — | | | (0.03) | | | n.m. |
| Net income attributable to common stockholders | $ | 2.70 | | | $ | 5.00 | | | $ | (2.30) | | | (46.0) | % |
Diluted EPS is commensurate with the changes in results from continuing operations and discontinued operations during that period. Diluted EPS reflects weighted average diluted common shares outstanding of 141.9 million and 154.3 million for the years ended December 31, 2024 and 2023, respectively.
| | | | | | | | |
| Peabody Energy Corporation | 2024 Form 10-K | 68 |
Reconciliation of Non-GAAP Financial Measures
Adjusted EBITDA is defined as income from continuing operations before deducting net interest expense, income taxes, asset retirement obligation expenses and depreciation, depletion and amortization. Adjusted EBITDA is also adjusted for the discrete items that management excluded in analyzing the segments’ operating performance, as displayed in the reconciliations below.
| | | | | | | | | | | | | |
| | Year Ended December 31, |
| | 2024 | | 2023 | | |
| | (Dollars in millions) |
| Income from continuing operations, net of income taxes | $ | 407.3 | | | $ | 816.0 | | | |
| Depreciation, depletion and amortization | 343.0 | | | 321.4 | | | |
| Asset retirement obligation expenses | 48.9 | | | 50.5 | | | |
| Restructuring charges | 4.4 | | | 3.3 | | | |
| Transaction costs related to business combinations | 10.3 | | | — | | | |
| | | | | |
| Asset impairment | — | | | 2.0 | | | |
| Provision for NARM and Shoal Creek losses | 3.7 | | | 40.9 | | | |
| Shoal Creek insurance recovery - property damage | (28.7) | | | — | | | |
| Changes in amortization of basis difference related to equity affiliates | (1.8) | | | (1.6) | | | |
| Interest expense, net of capitalized interest | 46.9 | | | 59.8 | | | |
| Net loss on early debt extinguishment | — | | | 8.8 | | | |
| Interest income | (71.0) | | | (76.8) | | | |
| Net mark-to-market adjustment on actuarially determined liabilities | (6.1) | | | (0.3) | | | |
| | | | | |
| Unrealized gains on derivative contracts related to forecasted sales | — | | | (159.0) | | | |
| Unrealized losses (gains) on foreign currency option contracts | 9.0 | | | (7.4) | | | |
| Take-or-pay contract-based intangible recognition | (3.0) | | | (2.5) | | | |
| Income tax provision | 108.8 | | | 308.8 | | | |
| Total Adjusted EBITDA | $ | 871.7 | | | $ | 1,363.9 | | | |
Total Segment Costs is defined as operating costs and expenses adjusted for the discrete items that management excluded in analyzing each of its segments’ operating performance, as displayed in the reconciliations below:
| | | | | | | | | | | | | | | |
| | Year Ended December 31, | | |
| 2024 | | 2023 | | | |
| | (Dollars in millions) |
| Operating costs and expenses | $ | 3,420.9 | | | $ | 3,385.1 | | | | | |
| Unrealized (losses) gains on foreign currency option contracts | (9.0) | | | 7.4 | | | | | |
| Take-or-pay contract-based intangible recognition | 3.0 | | | 2.5 | | | | | |
| | | | | | | |
| Net periodic benefit credit, excluding service cost | (40.6) | | | (41.6) | | | | | |
| Total Segment Costs | $ | 3,374.3 | | | $ | 3,353.4 | | | | | |
The following table presents Total Segment Costs by reporting segment:
| | | | | | | | | | | | | |
| Year Ended December 31, |
| 2024 | | 2023 | | |
| | (Dollars in millions) |
| Seaborne Thermal | $ | 783.9 | | | $ | 752.9 | | | |
| Seaborne Metallurgical | 893.9 | | | 863.8 | | | |
| Powder River Basin | 960.2 | | | 1,044.4 | | | |
| Other U.S. Thermal | 671.8 | | | 680.7 | | | |
| Corporate and Other | 64.5 | | | 11.6 | | | |
| Total Segment Costs | $ | 3,374.3 | | | $ | 3,353.4 | | | |
| | | | | | | | |
| Peabody Energy Corporation | 2024 Form 10-K | 69 |
Revenue per Ton and Adjusted EBITDA Margin per Ton are equal to revenue by segment and Adjusted EBITDA by segment (excluding insurance recoveries), respectively, divided by segment tons sold. Costs per Ton is equal to Revenue per Ton less Adjusted EBITDA Margin per Ton.
The following tables present tons sold, revenue, Total Segment Costs and Adjusted EBITDA by operating segment:
| | | | | | | | | | | | | | | | | | | | | | | |
| Year Ended December 31, 2024 |
| Seaborne Thermal | | Seaborne Metallurgical | | Powder River Basin | | Other U.S. Thermal |
| | (Amounts in millions, except per ton data) |
| Tons sold | 16.4 | | | 7.3 | | | 79.6 | | | 14.6 | |
| | | | | | | |
| Revenue | $ | 1,213.9 | | | $ | 1,055.6 | | | $ | 1,098.8 | | | $ | 822.6 | |
| Total Segment Costs | 783.9 | | | 893.9 | | | 960.2 | | | 671.8 | |
| Adjusted EBITDA, excluding Shoal Creek insurance recovery | $ | 430.0 | | | $ | 161.7 | | | $ | 138.6 | | | $ | 150.8 | |
| Shoal Creek insurance recovery - business interruption | — | | | 80.8 | | | — | | | — | |
| Adjusted EBITDA | $ | 430.0 | | | $ | 242.5 | | | $ | 138.6 | | | $ | 150.8 | |
| | | | | | | |
| Revenue per Ton | $ | 73.88 | | | $ | 144.97 | | | $ | 13.81 | | | $ | 56.38 | |
| Costs per Ton | 47.71 | | | 122.77 | | | 12.07 | | | 46.04 | |
| Adjusted EBITDA Margin per Ton | $ | 26.17 | | | $ | 22.20 | | | $ | 1.74 | | | $ | 10.34 | |
| | | | | | | | | | | | | | | | | | | | | | | |
| Year Ended December 31, 2023 |
| Seaborne Thermal | | Seaborne Metallurgical | | Powder River Basin | | Other U.S. Thermal |
| | (Amounts in millions, except per ton data) |
| Tons sold | 15.5 | | | 6.9 | | | 87.2 | | | 16.2 | |
| | | | | | | |
| Revenue | $ | 1,329.7 | | | $ | 1,301.9 | | | $ | 1,198.1 | | | $ | 888.2 | |
| Total Segment Costs | 752.9 | | | 863.8 | | | 1,044.4 | | | 680.7 | |
| Adjusted EBITDA | $ | 576.8 | | | $ | 438.1 | | | $ | 153.7 | | | $ | 207.5 | |
| | | | | | | |
| Revenue per Ton | $ | 85.94 | | | $ | 188.66 | | | $ | 13.74 | | | $ | 54.77 | |
| Costs per Ton | 48.66 | | | 125.18 | | | 11.98 | | | 41.98 | |
| Adjusted EBITDA Margin per Ton | $ | 37.28 | | | $ | 63.48 | | | $ | 1.76 | | | $ | 12.79 | |
Liquidity and Capital Resources
Overview
The Company’s primary source of cash is proceeds from the sale of its coal production to customers. The Company has also generated cash from the sale of non-strategic assets, including coal reserves, coal resources and surface lands, and, from time to time, borrowings under its credit facilities and the issuance of securities. The Company’s primary uses of cash include the cash costs of coal production, capital expenditures, coal reserve lease and royalty payments, debt service costs, finance and operating lease payments, postretirement plans, take-or-pay obligations, post-mining reclamation obligations, collateral and margining requirements, dividends, share repurchases and selling and administrative expenses. The Company has also used cash for early debt retirements.
Any future determinations to return capital to stockholders, such as dividends or share repurchases will depend on a variety of factors, including the Company’s net income or other sources of cash, liquidity position and potential alternative uses of cash, such as internal development projects or acquisitions, as well as economic conditions and expected future financial results. The Company’s ability to early retire debt, declare dividends or repurchase shares in the future will depend on its future financial performance, which in turn depends on the successful implementation of its strategy and on financial, competitive, regulatory, technical and other factors, general economic conditions, demand for and selling prices of coal and other factors specific to its industry, many of which are beyond the Company’s control.
| | | | | | | | |
| Peabody Energy Corporation | 2024 Form 10-K | 70 |
Liquidity
As of December 31, 2024, the Company’s cash and cash equivalents balances totaled $700.4 million, including approximately $397 million held by U.S. subsidiaries, approximately $291 million held by Australian subsidiaries and the remainder held by other foreign subsidiaries in accounts predominantly domiciled in the U.S. A significant majority of the cash held by the Company’s foreign subsidiaries is denominated in U.S. dollars. This cash is generally used to support non-U.S. liquidity needs, including capital and operating expenditures in Australia and payment of the foreign subsidiaries’ share of certain U.S. corporate expenditures. From time to time, the Company may repatriate profits from its foreign subsidiaries to the U.S. in the form of intercompany dividends. During the year ended December 31, 2024, no profits from foreign subsidiaries were repatriated. If foreign-held cash is repatriated in the future, the Company does not expect restrictions or potential taxes will have a material effect to its near-term liquidity.
The Company’s available liquidity increased to $1,072.5 million as of December 31, 2024 from $1,059.7 million as of December 31, 2023. Available liquidity was comprised of the following:
| | | | | | | | | | | | | |
| | | December 31, |
| | | 2024 | | 2023 |
| | | (Dollars in millions) |
| Cash and cash equivalents | | | $ | 700.4 | | | $ | 969.3 | |
| Revolving credit facility availability | | | 233.7 | | | — | |
| Accounts receivable securitization program availability | | | 138.4 | | | 90.4 | |
| Total liquidity | | | $ | 1,072.5 | | | $ | 1,059.7 | |
Capital Returns to Shareholders
The Company repurchased approximately 7.7 million shares of its common stock for $180.5 million, including commission fees, and paid dividends of $37.6 million during the year ended December 31, 2024.
Surety Agreement Amendment and Collateral Requirements
In April 2023, the Company amended its existing agreement with the providers of its surety bond portfolio, dated November 6, 2020. Under the April 2023 amendment, the Company and its surety providers agreed to a maximum aggregate collateral amount based upon bonding levels which will vary prospectively as bonding levels increase or decrease. The amendment extended the agreement through December 31, 2026. In order to maintain the maximum collateral agreement, the Company must remain compliant with a minimum liquidity test and a maximum net leverage ratio, as measured each quarter. The minimum liquidity test requires the Company to maintain liquidity at the greater of $400 million or the difference between the penal sum of all surety bonds and the amount of collateral posted in favor of surety providers, which was $495.5 million at December 31, 2024. The Company must also maintain a maximum net leverage ratio of 1.5 to 1.0, where the numerator consists of its funded debt, net of cash, and the denominator consists of its Adjusted EBITDA for the trailing twelve months. For purposes of calculating the ratio, only 50% of the outstanding principal amount of the Company’s 3.250% Convertible Senior Notes due March 2028 (the 2028 Convertible Notes) is deemed to be funded debt. The Company’s ability to pay dividends and make share repurchases is also subject to the quarterly minimum liquidity test. The Company is in compliance with such requirements at December 31, 2024.
At December 31, 2024, the Company’s maximum aggregate collateral amount was $522.0 million, which was comprised of $394.6 million in trust accounts and letters of credit of $127.4 million held for the benefit of certain surety providers. The amendment became effective on April 14, 2023, when the Company terminated a then-existing credit agreement.
Credit Support Facilities
In February 2022, the Company entered into an agreement, which provides up to $250.0 million of capacity for irrevocable standby letters of credit, primarily to support reclamation bonding requirements. The agreement requires the Company to provide cash collateral at a level of 103% of the aggregate amount of letters of credit outstanding under the arrangement (limited to $5.0 million total excess collateralization.) Outstanding letters of credit bear a fixed fee in the amount of 0.75% per annum. The Company receives a variable deposit rate on the amount of cash collateral posted in support of letters of credit. The agreement has an initial expiration date of December 31, 2025. At December 31, 2024, letters of credit of $115.6 million were outstanding under the agreement, which were collateralized by cash of $119.1 million.
| | | | | | | | |
| Peabody Energy Corporation | 2024 Form 10-K | 71 |
In December 2023, the Company established cash-backed bank guarantee facilities, primarily to support Australian reclamation bonding requirements. The Company receives a variable deposit rate on the amount of cash collateral posted in support of the bank guarantee facilities, which mature at various dates between 2026 and 2029. At December 31, 2024, the bank guarantee facilities were backed by cash of $168.5 million.
Revolving Credit Facility
The Company established a new revolving credit facility with a maximum aggregate principal amount of $320.0 million in revolving commitments by entering into a credit agreement, dated as of January 18, 2024 (the 2024 Credit Agreement), by and among the Company, as borrower, certain subsidiaries of the Company party thereto, PNC Bank, National Association, as administrative agent, and the lenders party thereto.
The revolving commitments and any related loans, if applicable (any such loans, the Revolving Loans), established by the 2024 Credit Agreement terminate or mature, as applicable, on January 18, 2028, subject to certain conditions relating to the Company’s outstanding 2028 Convertible Notes. The Revolving Loans bear interest at a secured overnight financing rate (SOFR) plus an applicable margin ranging from 3.50% to 4.25%, depending on the Company’s total net leverage ratio (as defined under the 2024 Credit Agreement) or a base rate plus an applicable margin ranging from 2.50% to 3.25%, at the Company’s option. Letters of credit issued under the 2024 Credit Agreement incur a combined fee equal to an applicable margin ranging from 3.50% to 4.25% plus a fronting fee equal to 0.125% per annum. Unused capacity under the 2024 Credit Agreement bears a commitment fee of 0.50% per annum. On November 25, 2024, the Company amended the 2024 Credit Agreement to, among other things, permit Peabody’s planned acquisition of multiple coal mines from Anglo, the related bridge loan facility and the incurrence of additional indebtedness to finance the acquisition, to the extent applicable.
As of December 31, 2024, the 2024 Credit Agreement had only been utilized for letters of credit, including $86.3 million outstanding as of December 31, 2024. These letters of credit support the Company’s reclamation bonding requirements, lease obligations, insurance policies and various other performance guarantees as further described in Note 20. “Financial Instruments, Guarantees With Off-Balance-Sheet Risk and Other Guarantees.” Availability under the 2024 Credit Agreement was $233.7 million at December 31, 2024.
The 2024 Credit Agreement contains customary covenants that, among other things and subject to certain exceptions (including compliance with financial ratios), may limit the Company and its subsidiaries’ ability to incur additional indebtedness, make certain restricted payments or investments, sell or otherwise dispose of assets, enter into transactions with affiliates, create or incur liens, and merge, consolidate or sell all or substantially all of their assets. The 2024 Credit Agreement is secured by substantially all assets of the Company and its U.S. subsidiaries, as well as a pledge of two Australian subsidiaries.
Capital Expenditures
For 2025, the Company is targeting total capital expenditures of approximately $450 million. Approximately $280 million of such amount is appropriated to major projects and growth capital expenditures, including approximately $250 million for the Company’s Centurion Mine, which includes capital expenditures to reach longwall production and capital expenditures to develop Centurion North.
Indebtedness
The Company’s total indebtedness as of December 31, 2024 and 2023 is presented in the table below.
| | | | | | | | | | | |
| December 31, |
| Debt Instrument (defined below, as applicable) | 2024 | | 2023 |
| (Dollars in millions) |
| | | |
| | | |
| | | |
| | | |
| | | |
| | | |
| 3.250% Convertible Senior Notes due March 2028 (2028 Convertible Notes) | $ | 320.0 | | | $ | 320.0 | |
| | | |
| BUMA Loan Note | 9.3 | | | — | |
| Finance lease obligations | 25.1 | | | 22.3 | |
| Less: Debt issuance costs | (6.3) | | | (8.1) | |
| 348.1 | | | 334.2 | |
| Less: Current portion of long-term debt | 15.8 | | | 13.5 | |
| Long-term debt | $ | 332.3 | | | $ | 320.7 | |
The Company’s indebtedness requires estimated contractual principal and interest payments, assuming interest rates in effect at December 31, 2024, of approximately $27 million in 2025, $18 million in 2026, $13 million in 2027, $326 million in 2028, less than $1 million in 2029 and $9 million thereafter.
| | | | | | | | |
| Peabody Energy Corporation | 2024 Form 10-K | 72 |
Cash paid for interest, net of capitalized interest related to the Company’s indebtedness and financial assurance instruments amounted to $37.6 million, $61.9 million and $118.5 million during the years ended December 31, 2024, 2023, and 2022, respectively.
2028 Convertible Notes
On March 1, 2022, through a private offering, the Company issued the 2028 Convertible Notes in the aggregate principal amount of $320.0 million. The 2028 Convertible Notes are senior unsecured obligations of the Company and are governed under an indenture.
The Company used the proceeds of the offering of the 2028 Convertible Notes and available cash to redeem its then-existing senior secured notes and to pay related premiums, fees and expenses relating to the offering and redemptions.
The 2028 Convertible Notes will mature on March 1, 2028, unless earlier converted, redeemed or repurchased in accordance with their terms. The 2028 Convertible Notes bear interest at a rate of 3.250% per year, payable semi-annually in arrears on March 1 and September 1 of each year.
During the fourth quarter ended December 31, 2024, the Company’s reported common stock prices did not prompt the conversion feature of the 2028 Convertible Notes. As a result, the 2028 Convertible Notes will not be convertible during the first quarter of 2025.
Bridge Loan Facility
Concurrently with its entry into definitive agreements to acquire the Anglo assets, the Company entered into a bridge loan facility commitment letter (the Bridge Commitment Letter, and the senior secured 364-day bridge facility provided for therein, the Bridge Facility), pursuant to which the lenders, agreed to provide the Bridge Facility to the Company in the amount of up to $2.075 billion in order to finance the planned acquisition in part. The Company expects to replace the Bridge Facility with permanent financing prior to the closing date, but there can be no assurance such financing will occur and any such expectation is subject to market conditions.
To the extent borrowings are made under the Bridge Facility, any loans would bear interest at a SOFR plus an applicable margin of 8.00% or a base rate plus an applicable margin of 7.00%, at the Company’s option. Such applicable margin would increase by an additional 0.75% on the date that is 90 days following the closing date of the planned acquisition. Any borrowings under the Bridge Facility would mature 364 days from the initial funding date, which would be on or around the closing date of the planned acquisition.
The availability of borrowings under the Bridge Facility is subject to the satisfaction of certain customary conditions for transactions of this type. Any definitive financing documentation for the Bridge Facility will contain customary representations and warranties, covenants and events of defaults for transactions of this type. Upon execution of any definitive financing documentation for the Bridge Facility, the Bridge Facility will be guaranteed by substantially all U.S. subsidiaries of the Company and secured by substantially all assets of the Company, its U.S. subsidiaries and, subject to certain conditions, certain of the Company’s Australian subsidiaries.
Accounts Receivable Securitization Program
As described in Note 20. “Financial Instruments, Guarantees With Off-Balance-Sheet Risk and Other Guarantees” of the accompanying consolidated financial statements, the Company entered into an accounts receivable securitization program during 2017. The securitization program was amended in February 2023 to increase the available funding capacity from $175.0 million to $225.0 million and adjust the relevant interest rate for borrowings to a SOFR plus an applicable margin. Funding capacity is limited to the availability of eligible receivables and is accounted for as a secured borrowing. Funding capacity under the program may also be utilized for letters of credit in support of other obligations, which has been the Company’s primary utilization. At December 31, 2024, the Company had no outstanding borrowings and $60.4 million of letters of credit outstanding under the program. The Company was not required to post cash collateral under the securitization program at December 31, 2024.
The accounts receivable securitization program was amended in January 2025 to extend its maturity to January 2028.
Other Requirements
The Company will incur significant future cash outflows for certain liabilities related to its prior mining activities and former employees. Such cash flows pertain to postretirement benefit plans, work-related injuries and illnesses, defined benefit pension plans, mine reclamation and end-of-mine closure costs and exploration obligations and are estimated to amount to approximately $100 million in 2025, $100 million in 2026, $150 million in 2027, $90 million in 2028, $140 million in 2029 and $1,275 million thereafter.
| | | | | | | | |
| Peabody Energy Corporation | 2024 Form 10-K | 73 |
The Company has various short- and long-term take-or-pay arrangements in Australia and the U.S. associated with rail and port commitments for the delivery of coal, including amounts relating to export facilities. The estimated future cash flows associated with such arrangements are approximately $86 million in 2025, $90 million in 2026, $90 million in 2027, $90 million in 2028, $70 million in 2029 and $555 million thereafter.
The Company’s operating lease commitments, excluding potential contingent rental amounts, will require cash payments of approximately $38 million in 2025, $34 million in 2026, $29 million in 2027, $23 million in 2028, $6 million in 2029 and $3 million thereafter.
Covenant Compliance
The Company was compliant with all relevant covenants under its debt and other finance agreements at December 31, 2024.
Cash Flows
The following table summarizes the Company’s cash flows for the years ended December 31, 2024 and 2023, as reported in the accompanying consolidated financial statements.
| | | | | | | | | | | | | |
| Year Ended December 31, | | |
| | 2024 | | 2023 | | |
| | (Dollars in millions) |
| Net cash provided by operating activities | $ | 606.5 | | | $ | 1,035.5 | | | |
| Net cash used in investing activities | (598.1) | | | (342.6) | | | |
| Net cash used in financing activities | (276.0) | | | (460.3) | | | |
| Net change in cash, cash equivalents and restricted cash | (267.6) | | | 232.6 | | | |
| Cash, cash equivalents and restricted cash at beginning of period | 1,650.2 | | | 1,417.6 | | | |
| Cash, cash equivalents and restricted cash at end of period | $ | 1,382.6 | | | $ | 1,650.2 | | | |
| | | | | |
| | | | | |
| | | | | |
| | | | | |
| | | | | |
Operating Activities. The decrease in net cash provided by operating activities for the year ended December 31, 2024 compared to the prior year was driven by a year-over-year decrease in operating cash flow from working capital ($359.7 million), primarily attributable to changes in accounts payable and accrued expenses ($305.1 million) driven by income tax payments and accounts receivable ($66.5 million); the prior year receipt of cash related to variation margin requirements associated with derivative financial instruments ($198.0 million); and lower cash generated from mining operations. These unfavorable variances were partially offset by the Shoal Creek insurance recovery excluding proceeds attributable to equipment losses ($98.6 million), decreases in cash used for collateral requirements ($348.7 million) and discontinued operations ($74.5 million) primarily related to the prior year use of cash to settle disputed black lung claims.
Investing Activities. The increase in net cash used in investing activities for the year ended December 31, 2024 compared to the prior year was driven by the acquisition of Wards Well ($143.8 million), the deposit for the planned Anglo acquisition ($75.0 million) and higher capital expenditures driven by the Centurion Mine development ($53.0 million). These variances were partially offset by the Shoal Creek insurance recovery attributable to equipment losses ($10.9 million).
Financing Activities. The decrease in net cash used in financing activities for the year ended December 31, 2024 compared to the prior year was primarily driven by decreases in common stock repurchases ($164.6 million) and distributions to noncontrolling interest ($24.2 million).
Off-Balance-Sheet Arrangements
In the normal course of business, the Company is a party to various guarantees and financial instruments that carry off-balance-sheet risk and are not reflected in the accompanying consolidated balance sheets. Such financial instruments provide support for the Company’s reclamation bonding requirements, lease obligations, insurance policies and various other performance guarantees. The Company periodically evaluates the instruments for on-balance-sheet treatment based on the amount of exposure under the instrument and the likelihood of required performance. The Company does not expect any material losses to result from these guarantees or off-balance-sheet instruments in excess of liabilities provided for in the accompanying consolidated balance sheets.
| | | | | | | | |
| Peabody Energy Corporation | 2024 Form 10-K | 74 |
The following table summarizes the Company’s financial instruments that carry off-balance-sheet risk:
| | | | | | | | | | | | | | | | | | | | | | | |
| December 31, 2024 | | |
| Reclamation Support | | Other Support (1) | | Total | | | | | | |
| (Dollars in millions) |
| Surety bonds | $ | 925.1 | | | $ | 92.4 | | | $ | 1,017.5 | | | | | | | |
Letters of credit (2) | 55.2 | | | 91.5 | | | 146.7 | | | | | | | |
| 980.3 | | | 183.9 | | | 1,164.2 | | | | | | | |
Less: Letters of credit in support of surety bonds (3) | (55.2) | | | (0.1) | | | (55.3) | | | | | | | |
| Obligations supported, net | $ | 925.1 | | | $ | 183.8 | | | $ | 1,108.9 | | | | | | | |
(1) Instruments support obligations related to pension and health care plans, workers’ compensation, property and casualty insurance, customer and vendor contracts and certain restoration ancillary to prior mining activities.
(2) Amounts do not include cash-collateralized letters of credit.
(3) Certain letters of credit serve as collateral for surety bonds at the request of surety bond providers.
Not presented in the above table is $809.8 million of restricted cash and other balances serving as collateral which are included in the accompanying consolidated balance sheets at December 31, 2024, as described in Note 20. “Financial Instruments, Guarantees With Off-Balance-Sheet Risk and Other Guarantees” of the accompanying consolidated financial statements. Such collateral is primarily in support of the financial instruments noted above, including in relation to the Company’s surety bond portfolio, its collateralized letter of credit agreement, its bank guarantee facilities and amounts held directly with beneficiaries which are not supported by surety bonds. The restricted cash and collateral balance decreased $147.8 million during the year ended December 31, 2024 due to collateral releases related to reductions in reclamation bonding requirements, replacement of cash-collateralized letters of credit with letters of credit under the new revolving credit facility and the impact of foreign currency rate changes.
At December 31, 2024, the Company had total asset retirement obligations of $723.7 million. Bonding requirement amounts may differ significantly from the related asset retirement obligation because such requirements are calculated under the assumption that reclamation begins currently, whereas the Company’s accounting liabilities are discounted from the end of a mine’s economic life (when final reclamation work would begin) to the balance sheet date.
As noted above, the Company’s reclamation bonding requirements decreased during the year ended December 31, 2024, primarily due to an approximate $110 million reduction in U.S. reclamation bonding requirements. At December 31, 2024, the Company’s reclamation bonding requirements were supported by approximately $700 million of restricted cash and other balances serving as collateral, which substantially supports the financial liability for final mine reclamation as calculated in accordance with U.S. GAAP.
Guarantees and Other Financial Instruments with Off-Balance Sheet Risk. See Note 20. “Financial Instruments, Guarantees With Off-Balance-Sheet Risk and Other Guarantees” to the accompanying consolidated financial statements for a discussion of the Company’s accounts receivable securitization program and guarantees and other financial instruments with off-balance sheet risk.
Critical Accounting Policies and Estimates
The Company’s discussion and analysis of its financial condition, results of operations, liquidity and capital resources is based upon its consolidated financial statements, which have been prepared in accordance with U.S. GAAP. The Company is also required under U.S. GAAP to make estimates and judgments that affect the reported amounts of assets, liabilities, revenue and expenses, and related disclosure of contingent assets and liabilities. On an ongoing basis, the Company evaluates its estimates. The Company bases its estimates on historical experience and on various other assumptions that it believes are reasonable under the circumstances, the results of which form the basis for making judgments about the carrying values of assets and liabilities that are not readily apparent from other sources. Actual results may differ from these estimates.
| | | | | | | | |
| Peabody Energy Corporation | 2024 Form 10-K | 75 |
Asset Retirement Obligations. The Company’s asset retirement obligations primarily consist of spending estimates for surface land reclamation and support facilities at both surface and underground mines in accordance with applicable reclamation laws and regulations in the U.S. and Australia as defined by each mining permit. Asset retirement obligations are determined for each mine using various estimates and assumptions including, among other items, estimates of disturbed acreage as determined from engineering data, estimates of future costs to reclaim the disturbed acreage and the timing of these cash flows, escalated for inflation and then discounted using a credit-adjusted, risk-free rate. As changes in estimates occur (such as mine plan revisions, changes in estimated costs or changes in timing of the performance of reclamation activities), the revisions to the obligation and asset are recognized at the appropriate credit-adjusted, risk-free rate. If the Company’s assumptions do not materialize as expected, actual cash expenditures and costs that it incurs could be materially different than currently estimated. Moreover, regulatory changes could increase its obligation to perform reclamation and mine closing activities. Amortization associated with the Company’s asset retirement obligation assets of $20.8 million for the year ended December 31, 2024 was included in “Depreciation, depletion and amortization” in the Company’s consolidated statements of operations. Asset retirement obligation expense, consisting of both accretion expense and changes in estimates for the Company’s inactive locations, for the year ended December 31, 2024 was $48.9 million and payments totaled $51.7 million. See Note 12. “Asset Retirement Obligations” to the accompanying consolidated financial statements for additional information regarding the Company’s asset retirement obligations.
Impairment of Long-Lived Assets. The Company evaluates its long-lived assets held and used in operations for impairment as events and changes in circumstances indicate that the carrying amount of such assets might not be recoverable. Factors that would indicate potential impairment to be present include, but are not limited to, a sustained history of operating or cash flow losses, an unfavorable change in earnings and cash flow outlook, prolonged adverse industry or economic trends and a significant adverse change in the extent or manner in which a long-lived asset is being used or in its physical condition. The Company generally does not view short-term declines in thermal and metallurgical coal prices as an indicator of impairment for conducting impairment tests because of historic price volatility. However, the Company generally views a sustained trend of depressed coal pricing (for example, over periods exceeding one year) as a potential indicator of impairment. Because of the volatile and cyclical nature of coal prices and demand, it is reasonably possible that coal prices may decrease and/or fail to improve in the near term, which, absent sufficient mitigation such as an offsetting reduction in the Company’s operating costs, may result in the need for future adjustments to the carrying value of its long-lived mining assets and mining-related investments.
Assets are grouped at the lowest level for which there are identifiable cash flows that are largely independent of the cash flows of other groups of assets. For its active mining operations, the Company generally groups such assets at the mine level, or the mining complex level for mines that share infrastructure. For its development and exploration properties and portfolio of surface land and coal reserve and resource holdings, the Company considers several factors to determine whether to evaluate those assets individually or on a grouped basis for purposes of impairment testing. Such factors include geographic proximity to one another, the expectation of shared infrastructure upon development based on future mining plans and whether it would be most advantageous to bundle such assets in the event of a sale to a third party.
When indicators of impairment are present, the Company evaluates its long-lived assets for recoverability by comparing the estimated undiscounted cash flows in the LOM plan expected to be generated by those assets under various assumptions to their carrying amounts. If such undiscounted cash flows indicate that the carrying value of the asset group is not recoverable, impairment losses are measured by comparing the estimated fair value of the asset group to its carrying amount. As quoted market prices are unavailable for the Company’s individual mining operations, fair value is determined through the use of an expected present value technique based on the income approach, except for non-strategic coal reserves and resources, surface lands and undeveloped coal properties excluded from its long-range mine planning. In those cases, a market approach is utilized based on the most comparable market multiples available. The estimated future cash flows and underlying assumptions used to assess recoverability and, if necessary, measure the fair value of the Company’s long-lived mining assets are derived from those developed in connection with its planning and budgeting process. The Company believes its assumptions to be consistent with those a market participant would use for valuation purposes. The most critical assumptions underlying its projections and fair value estimates include those surrounding future tons sold, coal prices for unpriced coal, production costs (including costs for labor, commodity supplies and contractors), transportation costs, foreign currency exchange rates and a risk-adjusted, cost of capital (all of which generally constitute unobservable Level 3 inputs under the fair value hierarchy), in addition to market multiples for non-strategic coal reserves and resources, surface lands and undeveloped coal properties excluded from the Company’s long-range mine planning (which generally constitute Level 2 inputs under the fair value hierarchy).
No impairment charges related to long-lived assets were recorded for the year ended December 31, 2024. When necessary, the assumptions used are based on the Company’s best knowledge at the time it prepares its analysis but can vary significantly due to the volatile and cyclical nature of coal prices and demand, regulatory issues, unforeseen mining conditions, commodity prices and cost of labor. These factors may cause the Company to be unable to recover all or a portion of the carrying value of its long-lived assets.
| | | | | | | | |
| Peabody Energy Corporation | 2024 Form 10-K | 76 |
The Company identified certain assets with an aggregate carrying value of approximately $208 million at December 31, 2024 in its Other U.S. Thermal segment whose recoverability is most sensitive to customer concentration risk.
See Note 3. “Asset Impairment” to the accompanying consolidated financial statements for additional information regarding impairment charges.
Income Taxes. The Company recognizes deferred tax assets and liabilities for the temporary difference between the consolidated financial carrying amounts of existing assets and liabilities and their respective tax bases and consideration of operating loss and tax credit carryforwards. Deferred income taxes are measured using enacted rates in effect for the year in which temporary differences are expected to be recovered or settled. The impact on deferred tax assets and liabilities of a change in tax rates is recognized in the period that includes the enactment date. Valuation allowances are provided to reduce deferred tax assets to the amount that will be more likely than not realized. The Company makes judgments and estimates regarding the amount and timing of the reversal of taxable temporary differences, the impact of tax planning strategies and expected future taxable income.
Uncertainty exists regarding tax positions taken in previously filed tax returns which remain subject to examination, along with positions expected to be taken in future returns. The Company recognizes the tax benefit from uncertain tax positions when it is more likely than not that the tax position will be sustained upon examination by the taxing authorities based on the technical merits of the position. Adjustments are made to the uncertain tax positions when facts and circumstances change, such as the closing of a tax audit; change in applicable tax laws, including tax case rulings and legislative guidance; or expiration of the applicable statute of limitations.
See Note 8. “Income Taxes” to the accompanying consolidated financial statements for additional information regarding valuation allowances and unrecognized tax benefits.
Contingent liabilities. From time to time, Peabody is subject to legal and environmental matters related to its continuing and discontinued operations and certain historical, non-coal producing operations. In connection with such matters, the Company is required to assess the likelihood of any adverse judgments or outcomes, as well as potential ranges of probable losses.
A determination of the amount of reserves required for these matters is made after considerable analysis of each individual issue. Peabody accrues for legal and environmental matters within “Operating costs and expenses” when it is probable that a liability has been incurred and the amount of the loss can be reasonably estimated. If a range of possible loss exists and no anticipated loss within the range is more likely than any other anticipated loss, the Company records the accrual at the low end of the range, in accordance with Accounting Standards Codification 450, “Contingencies.”
Peabody provides disclosure surrounding loss contingencies when it believes that it is at least reasonably possible that a material loss may be incurred or an exposure to loss in excess of amounts already accrued may exist. Adjustments to contingent liabilities are made when additional information becomes available that affects the amount of estimated loss, which information may include changes in facts and circumstances, changes in interpretations of law in the relevant courts, the results of new or updated environmental remediation cost studies and the ongoing consideration of trends in environmental remediation costs.
Accrued contingent liabilities exclude claims against third parties and are not discounted. The current portion of these accruals is included in “Accounts payables and accrued expenses” and the long-term portion is included in “Other noncurrent liabilities” in the Company’s consolidated balance sheets. In general, legal fees related to environmental remediation and litigation are charged to expense as incurred. The Company includes the interest component of any litigation-related penalties within “Interest expense” in its consolidated statements of operations. See Note 21. “Commitments and Contingencies” to the accompanying consolidated financial statements for further discussion of the Company’s contingent liabilities.
Newly Adopted Accounting Standards and Accounting Standards Not Yet Implemented
See Note 1. “Summary of Significant Accounting Policies” to the accompanying consolidated financial statements for a discussion of newly adopted accounting standards and accounting standards not yet implemented.
Item 7A. Quantitative and Qualitative Disclosures About Market Risk.
The potential for changes in the market value of the Company’s coal and freight-related trading, crude oil, diesel fuel and foreign currency contract portfolios, as applicable, and exposure to interest rate changes is referred to as “market risk.” The Company attempts to manage market price risks through diversification, controlling position sizes and executing hedging strategies. Due to a lack of quoted market prices and the long-term, illiquid nature of the positions, the Company has not quantified market price risk related to its non-trading, long-term coal supply agreement portfolio.
| | | | | | | | |
| Peabody Energy Corporation | 2024 Form 10-K | 77 |
Coal Trading Activities and Related Commodity Price Risk
Peabody engages in direct and brokered trading of physical coal and freight-related commodities in over-the-counter (OTC) markets. These activities give rise to commodity price risk, which represents the potential loss that can be caused by an adverse change in the market value of a particular commitment. Peabody actively measures, monitors, manages and hedges market price risk due to current and anticipated trading activities to remain within risk limits prescribed by management. Peabody also uses its coal trading and brokerage platform to support various coal production-related activities. These transactions may involve coal to be produced from its mines, coal sourcing arrangements with third-party mining companies, joint venture positions with producers or offtake agreements with producers. While the support activities (such as the forward sale of coal to be produced and/or purchased) may ultimately involve instruments sensitive to market price risk, the sourcing of coal in these arrangements does not involve market risk sensitive instruments.
Peabody also monitors other types of risk associated with its coal trading activities, including credit, market liquidity and counterparty nonperformance.
Credit and Nonperformance Risk
The fair values of Peabody’s derivative instruments utilized for corporate hedging and coal trading activities reflect adjustments for credit risk, as necessary. The Company’s exposure is substantially with electric utilities, energy marketers, steel producers and nonfinancial trading houses. Its policy is to independently evaluate each counterparty’s creditworthiness prior to entering into transactions and to regularly monitor exposures. Peabody manages its counterparty risk from its hedging activities related to foreign currency and fuel exposures, as applicable, through established credit standards, diversification of counterparties, utilization of investment grade commercial banks, adherence to established tenor limits based on counterparty creditworthiness and continual monitoring of that creditworthiness. If the Company engages in a transaction with a counterparty that does not meet its credit standards, the Company seeks to protect its position by requiring the counterparty to provide an appropriate credit enhancement. Also, when appropriate (as determined by its credit management function), Peabody has taken steps to reduce its exposure to customers or counterparties whose credit has deteriorated and who may pose a higher risk of failure to perform under their contractual obligations. These steps include obtaining letters of credit or cash collateral (margin), requiring prepayments for shipments or the creation of customer trust accounts held for Peabody’s benefit to serve as collateral in the event of a failure to pay or perform. To reduce its credit exposure related to trading and brokerage activities, Peabody seeks to enter into netting agreements with counterparties that permit it to offset asset and liability positions with such counterparties and, to the extent required, Peabody will post or receive margin amounts associated with exchange-cleared and certain OTC positions. Peabody also continually monitors counterparty and contract nonperformance risk, if present, on a case-by-case basis.
Foreign Currency Risk
The Company utilizes options and collars to hedge currency risk associated with anticipated Australian dollar operating expenditures. The accounting for these derivatives is discussed in Note 6. “Derivatives and Fair Value Measurements” to the accompanying consolidated financial statements. As of December 31, 2024, the Company held average rate options with an aggregate notional amount of $388.0 million Australian dollars to hedge currency risk associated with anticipated Australian dollar operating expenditures over the nine-month period ending September 30, 2025. As of December 31, 2024, the Company also held purchased collars with an aggregate notional amount of $528.0 million Australian dollars related to anticipated Australian dollar operating expenditures during the nine-month period ending September 30, 2025. Assuming the Company had no foreign currency hedging instruments in place, its exposure in operating costs and expenses due to a $0.10 change in the Australian dollar/U.S. dollar exchange rate is approximately $195 to $205 million for the next twelve months. Based upon the Australian dollar/U.S. dollar exchange rate at December 31, 2024, the currency option contracts outstanding at that date would limit the Company’s exposure to approximately $194 million with respect to a $0.10 increase in the exchange rate, while the Company would benefit by approximately $154 million with respect to a $0.10 decrease in the exchange rate for the next twelve months.
Although Peabody believes its Australian dollar monetary asset position acts as a hedge to offset the impact on its results from operations, the Company may continue to use options and collars to hedge its cash flow exposure to currency risk associated with anticipated Australian dollar operating expenditures.
| | | | | | | | |
| Peabody Energy Corporation | 2024 Form 10-K | 78 |
Coal Pricing Risk
The Company predominantly manages its commodity price risk for its non-trading, long-term coal contract portfolio through the use of long-term coal supply agreements (those with terms longer than one year) to the extent possible, rather than through the use of derivative instruments. Sales under such agreements comprised approximately 90%, 92% and 85% of its worldwide sales from its mining operations (by volume) for the years ended December 31, 2024, 2023 and 2022, respectively. As of December 31, 2024, the Company had approximately 85 million tons of U.S. thermal coal priced and committed for 2025. This includes approximately 71 million tons of PRB coal and 14 million tons of other U.S. thermal coal. The Company has the flexibility to increase volumes should demand warrant. Peabody is estimating full year 2025 thermal coal sales volumes from its Seaborne Thermal segment of 14.2 million to 15.2 million tons comprised of thermal export volume of 8.8 million to 9.8 million tons and domestic volume of 5.4 million tons. Peabody is estimating full year 2025 metallurgical coal sales from its Seaborne Metallurgical segment of 8.0 million to 9.0 million tons. Sales commitments in the metallurgical coal market are typically not long-term in nature, and the Company is therefore subject to fluctuations in market pricing. The Company’s sensitivity to market pricing in thermal coal markets is dependent on the duration of contracts.
As of December 31, 2024, the Company had no coal derivative contracts related to its forecasted sales. Historically, such financial contracts have included futures and forwards.
Diesel Fuel Price Risk
The Company expects to consume 85 to 95 million gallons of diesel fuel during the next twelve months. A $10 per barrel change in the price of crude oil (the primary component of a refined diesel fuel product) would increase or decrease its annual diesel fuel costs by approximately $22 million based on its expected usage.
As of December 31, 2024, the Company did not have any diesel fuel derivative instruments in place. The Company partially manages the price risk of diesel fuel through the use of cost pass-through contracts with certain customers.
Interest Rate Risk
Peabody’s objectives in managing exposure to interest rate changes are to limit the impact of interest rate changes on earnings and cash flows and to lower overall borrowing costs. Peabody is primarily exposed to interest rate risk as a result of its interest-earning cash balances.
Peabody’s interest-earning cash and restricted cash balances are primarily held in deposit accounts and investments with maturities of three months or less. Therefore, these balances are subject to interest rate fluctuations and could produce less income if interest rates fall. Based upon its interest-earning cash and restricted cash balances at December 31, 2024, a one percentage point decrease in interest rates would result in a decrease of approximately $14 million to interest income for the next twelve months.
Item 8. Financial Statements and Supplementary Data.
See Part IV, Item 15. “Exhibits and Financial Statement Schedules” of this report for the information required by this Item 8, which information is incorporated by reference herein.
Item 9. Changes in and Disagreements with Accountants on Accounting and Financial Disclosure.
None.
Item 9A. Controls and Procedures.
Evaluation of Disclosure Controls and Procedures
Peabody’s disclosure controls and procedures are designed to, among other things, provide reasonable assurance that material information, both financial and non-financial, and other information required under the securities laws to be disclosed is accumulated and communicated to senior management, including the principal executive officer and principal accounting officer, on a timely basis. As of December 31, 2024, the end of the period covered by this Annual Report on Form 10-K, the Company carried out an evaluation of the effectiveness of the design and operation of its disclosure controls and procedures. Based upon that evaluation, Peabody’s Chief Executive Officer and Chief Financial Officer have concluded that such disclosure controls and procedures, as defined in Rules 13a-15(e) and 15d-15(e) under the Exchange Act as of December 31, 2024 were effective to provide reasonable assurance that the desired control objectives were achieved.
| | | | | | | | |
| Peabody Energy Corporation | 2024 Form 10-K | 79 |
Changes in Internal Control Over Financial Reporting
Peabody periodically reviews its internal control over financial reporting as part of its efforts to ensure compliance with the requirements of Section 404 of the Sarbanes-Oxley Act of 2002. In addition, Peabody routinely reviews its system of internal control over financial reporting to identify potential changes to its processes and systems that may improve controls and increase efficiency, while ensuring that the Company maintains an effective internal control environment. Changes may include such activities as implementing new systems; consolidating the activities of acquired business units; migrating certain processes to its shared services organizations and/or managed third parties; formalizing and refining policies, procedures and control documentation requirements; improving segregation of duties and adding monitoring controls. In addition, when Peabody acquires new businesses, it incorporate its controls and procedures into the acquired business as part of its integration activities.
There have been no changes in Peabody’s internal control over financial reporting that occurred during the three months ended December 31, 2024 that have materially affected, or are reasonably likely to materially affect, its internal control over financial reporting.
Management’s Report on Internal Control Over Financial Reporting
Management is responsible for establishing and maintaining adequate internal control over financial reporting. An evaluation of the effectiveness of the design and operation of the Company’s internal control over financial reporting, as defined in Rules 13a-15(f) and 15d-15(f) under the Exchange Act, as of the end of the period covered by this report was performed under the supervision and with the participation of management, including its Chief Executive Officer and Chief Financial Officer. This evaluation is performed to determine if the Company’s internal controls over financial reporting provide reasonable assurance regarding the reliability of financial reporting and the preparation of financial statements for external purposes in accordance with generally accepted accounting principles.
Because of inherent limitations, any system of internal control over financial reporting may not prevent or detect misstatements. Also, projections of any evaluation of effectiveness to future periods are subject to the risk that controls may become inadequate because of changes in conditions, or that the degree of compliance with the policies or procedures may deteriorate.
Management conducted an assessment of the effectiveness of the Company’s internal control over financial reporting using the criteria set by the Committee of Sponsoring Organizations of the Treadway Commission (COSO) in Internal Control - Integrated Framework (2013). Based on this assessment, management concluded that the Company’s internal control over financial reporting was effective to provide reasonable assurance that the desired control objectives were achieved as of December 31, 2024.
Peabody’s independent registered public accounting firm, Ernst & Young LLP, has audited the consolidated financial statements included in this annual report and issued an attestation report on Peabody’s internal control over financial reporting, as included herein.
| | | | | | | | | | | |
| /s/ James C. Grech | | /s/ Mark A. Spurbeck |
James C. Grech President and Chief Executive Officer | | Mark A. Spurbeck Executive Vice President and Chief Financial Officer |
February 20, 2025
| | | | | | | | |
| Peabody Energy Corporation | 2024 Form 10-K | 80 |
Report of Independent Registered Public Accounting Firm
To the Stockholders and the Board of Directors of Peabody Energy Corporation
Opinion on Internal Control Over Financial Reporting
We have audited Peabody Energy Corporation’s internal control over financial reporting as of December 31, 2024, based on criteria established in Internal Control—Integrated Framework issued by the Committee of Sponsoring Organizations of the Treadway Commission (2013 framework) (the COSO criteria). In our opinion, Peabody Energy Corporation (the Company) maintained, in all material respects, effective internal control over financial reporting as of December 31, 2024, based on the COSO criteria.
We also have audited, in accordance with the standards of the Public Company Accounting Oversight Board (United States) (PCAOB), the consolidated balance sheets of the Company as of December 31, 2024 and 2023, the related consolidated statements of operations, comprehensive income, changes in stockholders’ equity and cash flows for each of the three years in the period ended December 31, 2024, and the related notes and financial statement schedule listed in the Index at Item 15(a) (collectively referred to as the “consolidated financial statements”) and our report dated February 20, 2025 expressed an unqualified opinion thereon.
Basis for Opinion
The Company’s management is responsible for maintaining effective internal control over financial reporting and for its assessment of the effectiveness of internal control over financial reporting included in the accompanying Management’s Report on Internal Control Over Financial Reporting. Our responsibility is to express an opinion on the Company’s internal control over financial reporting based on our audit. We are a public accounting firm registered with the PCAOB and are required to be independent with respect to the Company in accordance with the U.S. federal securities laws and the applicable rules and regulations of the Securities and Exchange Commission and the PCAOB.
We conducted our audit in accordance with the standards of the PCAOB. Those standards require that we plan and perform the audit to obtain reasonable assurance about whether effective internal control over financial reporting was maintained in all material respects.
Our audit included obtaining an understanding of internal control over financial reporting, assessing the risk that a material weakness exists, testing and evaluating the design and operating effectiveness of internal control based on the assessed risk, and performing such other procedures as we considered necessary in the circumstances. We believe that our audit provides a reasonable basis for our opinion.
Definition and Limitations of Internal Control Over Financial Reporting
A company’s internal control over financial reporting is a process designed to provide reasonable assurance regarding the reliability of financial reporting and the preparation of financial statements for external purposes in accordance with generally accepted accounting principles. A company’s internal control over financial reporting includes those policies and procedures that (1) pertain to the maintenance of records that, in reasonable detail, accurately and fairly reflect the transactions and dispositions of the assets of the company; (2) provide reasonable assurance that transactions are recorded as necessary to permit preparation of financial statements in accordance with generally accepted accounting principles, and that receipts and expenditures of the company are being made only in accordance with authorizations of management and directors of the company; and (3) provide reasonable assurance regarding prevention or timely detection of unauthorized acquisition, use, or disposition of the company’s assets that could have a material effect on the financial statements.
Because of its inherent limitations, internal control over financial reporting may not prevent or detect misstatements. Also, projections of any evaluation of effectiveness to future periods are subject to the risk that controls may become inadequate because of changes in conditions, or that the degree of compliance with the policies or procedures may deteriorate.
/s/ Ernst & Young, LLP
St. Louis, Missouri
February 20, 2025
| | | | | | | | |
| Peabody Energy Corporation | 2024 Form 10-K | 81 |
Item 9B. Other Information.
Securities Trading Plans of Directors and Executive Officers
On December 2, 2024, Scott T. Jarboe, Chief Administrative Officer and Corporate Secretary, adopted a Rule 10b5-1 trading arrangement (as such term is defined in Item 408 of Regulation S-K), which is designed to be in effect until January 28, 2026, subject to customary exceptions. Mr. Jarboe’s Rule 10b5-1 trading arrangement calls for potential sales of a percentage of shares that he could receive upon the future vesting of certain outstanding equity awards, net of any shares withheld by Peabody to satisfy applicable taxes. The number of shares to be withheld, and thus the exact maximum number of shares to be sold pursuant to Mr. Jarboe’s Rule 10b5-1 trading arrangement, can only be determined upon the occurrence of the future vesting events. For purposes of this disclosure, without subtracting any shares to be withheld upon future vesting events, the maximum aggregate number of shares to be sold pursuant to Mr. Jarboe’s Rule 10b5-1 trading arrangement is 12,441.
Except as set forth above, during the three months ended December 31, 2024, none of Peabody’s directors or officers adopted or terminated a “Rule 10b5-1 trading arrangement” or “non-Rule 10b5-1 trading arrangement,” as those terms are defined in Item 408 of Regulation S-K.
Item 9C. Disclosure Regarding Foreign Jurisdictions that Prevent Inspections.
Not applicable.
PART III
Item 10.Directors, Executive Officers and Corporate Governance.
The information required by Item 401 of Regulation S-K is included under the caption Proposal 1 - “Election of Directors” in Peabody’s 2025 Proxy Statement and in Part I, Item 1. “Business” of this report under the caption “Information About Our Executive Officers.” The information required by Items 405, 406 and 407(c)(3), (d)(4) and (d)(5) of Regulation S-K is included under the captions “Stock Ownership,” “Additional Information Concerning the Board of Directors - Corporate Governance - Code of Business Conduct and Ethics” and “Additional Information Concerning the Board of Directors - Committee Overview - Audit Committee” in Peabody’s 2025 Proxy Statement. Such information is incorporated herein by reference.
Item 11.Executive Compensation.
The information required by Items 402 and 407(e)(4) and (e)(5) of Regulation S-K is included under the captions “Additional Information Concerning the Board of Directors - Director Compensation,” “Compensation Discussion and Analysis,” “Compensation Committee Interlocks and Insider Participation,” “Compensation Committee Report,” “Risk Assessment in Compensation Programs,” “Executive Compensation Tables,” “Pay Ratio Disclosure” and “Pay Versus Performance Disclosure” in Peabody’s 2025 Proxy Statement and is incorporated herein by reference.
Item 12.Security Ownership of Certain Beneficial Owners and Management and Related Stockholder Matters.
The information required by Item 403 of Regulation S-K is included under the caption “Stock Ownership - Security Ownership of Directors and Management and Certain Beneficial Owners” in Peabody’s 2025 Proxy Statement and is incorporated herein by reference.
| | | | | | | | |
| Peabody Energy Corporation | 2024 Form 10-K | 82 |
Equity Compensation Plan Information
As required by Item 201(d) of Regulation S-K, the following table provides information regarding Peabody’s equity compensation plans as of December 31, 2024:
| | | | | | | | | | | | | | | | | | | | |
| | (a)
Number of Securities
to be Issued
upon Exercise of
Outstanding Options,
Warrants and Rights | | Weighted-Average
Exercise Price of
Outstanding Options,
Warrants and Rights | | Number of Securities
Remaining Available
for Future Issuance
Under Equity
Compensation Plans
(Excluding
Securities
Reflected in Column
(a)) |
| Plan Category | | | |
| Equity compensation plans approved by security holders | | 411,571 | | (1) | $ | — | | (2) | 5,451,805 | |
| Equity compensation plans not approved by security holders | | — | | | — | | | — | |
| Total | | 411,571 | | | $ | — | | | 5,451,805 | |
(1)Shares issuable pursuant to outstanding performance units and vested but not issued deferred stock units. Performance units are shown at target and could change based on actual metrics achieved.
(2)The weighted-average exercise price shown in the table does not take into account outstanding deferred stock units or performance awards.
Refer to Note 16. “Share-Based Compensation” to the accompanying consolidated financial statements for additional information regarding the material features of Peabody’s current equity compensation plans.
Item 13.Certain Relationships and Related Transactions, and Director Independence.
The information required by Items 404 and 407(a) of Regulation S-K is included under the captions “Review of Related Person Transactions” and “Additional Information Concerning the Board of Directors - Board Independence” in Peabody’s 2025 Proxy Statement and is incorporated herein by reference.
Item 14.Principal Accountant Fees and Services.
The information required by Item 9(e) of Schedule 14A is included under the caption “Audit Fees” in Peabody’s 2025 Proxy Statement and is incorporated herein by reference.
PART IV
Item 15.Exhibits and Financial Statement Schedules.
(a) Documents Filed as Part of the Report
(1) Financial Statements.
The following consolidated financial statements of Peabody Energy Corporation and the report thereon of the independent registered public accounting firm are included herein on the pages indicated:
| | | | | | | | |
| Peabody Energy Corporation | 2024 Form 10-K | 83 |
(2) Financial Statement Schedules.
The following financial statement schedule of Peabody Energy Corporation is at the page indicated:
All other schedules for which provision is made in the applicable accounting regulation of the Securities and Exchange Commission are not required under the related instructions or are not applicable and, therefore, have been omitted.
(3) Exhibits.
The exhibits below are numbered in accordance with the Exhibit Table of Item 601 of Regulation S-K.
| | | | | | | | |
| Exhibit No. | | Description of Exhibit |
| 2.1 | | |
| 2.2 | | |
| 2.3 ‡ | | |
| 2.4 ‡ | | Share and Asset Purchase Agreement, dated as of November 25, 2024, by and among Peabody Energy Corporation, Anglo American Netherlands B.V., Moranbah North Coal Pty Ltd., Anglo American Steelmaking Coal Assets Eastern Australia Limited, Anglo American Steelmaking Coal Holdings Limited, Anglo American Services (UK) Ltd. and Peabody MNG Pty Ltd (Incorporated by reference to Exhibit 2.2 of the Registrant’s Current Report on Form 8-K, filed November 29, 2024). |
| 2.5 ‡ | | |
| 2.6 ‡ | | |
| 3.1 | | |
| 3.2 | | |
| 4.1 | | |
| 4.2† | | |
| 4.3 | | |
| 10.1 | | Federal Coal Lease WYW0321779: North Antelope/Rochelle Mine (Incorporated by reference to Exhibit 10.3 of the Registrant’s Form S-4 Registration Statement No. 333-59073, filed July 14, 1998). |
| 10.2 | | Federal Coal Lease WYW119554: North Antelope/Rochelle Mine (Incorporated by reference to Exhibit 10.4 of the Registrant’s Form S-4 Registration Statement No. 333-59073, filed July 14, 1998). |
| 10.3 | | Federal Coal Lease WYW5036: Rawhide Mine (Incorporated by reference to Exhibit 10.5 of the Registrant’s Form S-4 Registration Statement No. 333-59073, filed July 14, 1998). |
| 10.4 | | Federal Coal Lease WYW3397: Caballo Mine (Incorporated by reference to Exhibit 10.6 of the Registrant’s Form S-4 Registration Statement No. 333-59073, filed July 14, 1998). |
| 10.5 | | Federal Coal Lease WYW83394: Caballo Mine (Incorporated by reference to Exhibit 10.7 of the Registrant’s Form S-4 Registration Statement No. 333-59073, filed July 14, 1998). |
| 10.6 | | Federal Coal Lease WYW136142 (Incorporated by reference to Exhibit 10.8 of Amendment No. 1 to the Registrant’s Form S-4 Registration Statement No. 333-59073, filed September 8, 1998). |
| | | | | | | | |
| Peabody Energy Corporation | 2024 Form 10-K | 84 |
| | | | | | | | |
| 10.7 | | Royalty Prepayment Agreement by and among Peabody Natural Resources Company, Gallo Finance Company and Chaco Energy Company, dated September 30, 1998 (incorporated by reference to Exhibit 10.9 of the Registrant’s Quarterly Report on Form 10-Q for the quarter ended September 30, 1998). |
| 10.8 | | |
| 10.9 | | |
| 10.10 | | |
| 10.11 | | |
| 10.12 | | |
| 10.13 | | |
| 10.14 | | |
| 10.15 | | |
| 10.16 | | |
| 10.17 | | |
| 10.18 | | |
| 10.19 | | |
| 10.20 | | |
| 10.21 | | |
| 10.22 | | |
| 10.23* | | |
| 10.24* | | |
| 10.25* | | |
| 10.26 | | |
| 10.27 | | Fifth Amended and Restated Receivables Purchase Agreement, dated as of March 25, 2016, by and among P&L Receivables Company, LLC, Peabody Energy Corporation, the various Sub-Servicers listed on the signature pages thereto, all Conduit Purchasers listed on the signature pages thereto, all Committed Purchasers listed on the signature pages thereto, all Purchaser Agents listed on the signature pages thereto, all LC Participants listed on the signature pages thereto, and PNC Bank, National Association, as Administrator and as LC Bank (Incorporated by reference to Exhibit 10.1 of the Registrant’s Current Report on Form 8-K filed March 31, 2016). |
| | | | | | | | |
| Peabody Energy Corporation | 2024 Form 10-K | 85 |
| | | | | | | | |
| 10.28 | | First Amendment to the Fifth Amended and Restated Receivables Purchase Agreement, dated as of April 12, 2016, by and among P&L Receivables Company, LLC, Peabody Energy Corporation, the various Sub-Servicers listed on the signature pages thereto, and PNC Bank, National Association, as Administrator and as the Sole Purchaser, Committed Purchaser, LC Bank and LC Participant (Incorporated by reference to Exhibit 10.1 of the Registrant’s Current Report on Form 8-K, filed April 13, 2016). |
| 10.29 | | Second Amendment to the Fifth Amended and Restated Receivables Purchase Agreement, dated as of April 18, 2016, by and among Peabody Energy Corporation, P&L Receivables Company, LLC, the various Sub-Servicers listed on the signature pages thereto, and PNC Bank, National Association, as Administrator and as the Sole Purchaser, Committed Purchaser, LC Bank and LC Participant (Incorporated by reference to Exhibit 10.1 of the Registrant’s Current Report on Form 8-K, filed April 22, 2016). |
| 10.30 | | Sixth Amendment to the Sixth Amended and Restated Receivables Purchase Agreement, dated as of June 30, 2020, by and among P&L Receivables Company, LLC, Peabody Energy Corporation, all Committed Purchasers listed on the signature pages thereto, all Purchaser Agents listed on the signature pages thereto, all LC Participants listed on the signature pages thereto, and PNC Bank, National Association, as Administrator and as LC Bank (Incorporated by reference to Exhibit 10.2 of the Registrant’s Quarterly Report on Form 10-Q for the quarter ended June 30, 2020). |
| 10.31 | | |
| 10.32 | | |
| 10.33 | | |
| 10.34 | | Sixth Amended and Restated Receivables Purchase Agreement, dated as of April 3, 2017, by and among P&L Receivables Company, LLC, Peabody Energy Corporation, the various Sub-Servicers listed on the signature pages thereto, all Conduit Purchasers listed on the signature pages thereto, all Committed Purchasers listed on the signature pages thereto, all Purchaser Agents listed on the signature pages thereto, all LC Participants listed on the signature pages thereto, and PNC Bank, National Association, as Administrator and as LC Bank (Incorporated by reference to Exhibit 10.4 of the Registrant’s Current Report on Form 8-K filed April 3, 2017). |
| 10.35 | | First Amendment to the Sixth Amended and Restated Receivables Purchase Agreement, dated as of June 30, 2017, by and among P&L Receivables Company, LLC, Peabody Energy Corporation, the various parties identified on the signature pages thereto as Sub-Servicers, Metropolitan Collieries Pty Ltd, and PNC Bank, National Association, as Administrator and as the sole Purchaser Agent, Committed Purchaser, LC Bank and LC Participant on the date thereof (Incorporated by reference to Exhibit 10.9 of the Registrant’s Quarterly Report on Form 10-Q, filed August 14, 2017). |
| 10.36 | | Second Amendment to the Sixth Amended and Restated Receivables Purchase Agreement, dated as of December 13, 2017, by and among P&L Receivables Company, LLC, Peabody Energy Corporation, Regions Bank, and PNC Bank, National Association, as Administrator and as the sole Purchaser Agent, Committed Purchaser, LC Bank and LC Participant on the date thereof (Incorporated by reference to Exhibit 10.57 of the Registrant’s Annual Report on Form 10-K for the year ended December 31, 2017). |
| 10.37 | | Fifth Amendment to the Sixth Amended and Restated Receivables Purchase Agreement, dated as of April 3, 2019, by and among P&L Receivables Company, LLC, Peabody Energy Corporation, all Committed Purchasers listed on the signature pages thereto, all Purchaser Agents listed on the signature pages thereto, all LC Participants listed on the signature pages thereto, and PNC Bank, National Association, as Administrator and as LC Bank (Incorporated by reference to Exhibit 10.1 of the Registrant’s Current Report on Form 8-K, filed April 4, 2019). |
| 10.38 | | |
| 10.39 | | |
| 10.40 | | |
| 10.41 | | |
| | | | | | | | |
| Peabody Energy Corporation | 2024 Form 10-K | 86 |
| | | | | | | | |
| 10.42 | | |
| 10.43 | | |
| 10.44 | | Amendment No. 6 to Credit Agreement, by and among Peabody Energy Corporation, the subsidiaries of Peabody Energy Corporation party thereto as reaffirming parties, the incremental revolving lenders party thereto, Goldman Sachs Bank USA, as existing administrative agent, and JPMorgan Chase Bank, N.A., as successor administrative agent, dated as of September 17, 2019 (Incorporated by reference to Exhibit 10.1 of the Registrant’s Quarterly Report on Form 10-Q for the quarter ended September 30, 2019). |
| 10.45 | | |
| 10.46 | | |
| 10.47* | | |
| 10.48 | | |
| 10.49 | | |
| 10.50* | | |
| 10.51* | | |
| 10.52* | | |
| 10.53* | | |
| 10.54 | | |
| 10.55* | | |
| 10.56* | | |
| 10.57* | | |
| 10.58* | | |
| 10.59* | | |
| 10.60* | | |
| | | | | | | | |
| Peabody Energy Corporation | 2024 Form 10-K | 87 |
| | | | | | | | |
| 10.61* | | |
| 10.62* | | |
| 10.63* | | |
| 10.64* | | |
| 10.65* | | |
| 10.66* | | |
| 10.67* | | |
| 10.68* | | |
| 10.69* | | |
| 10.70* | | |
| 10.71* † | | |
| 10.72* † | | |
| 10.73* † | | |
| 10.74 | | |
| 10.75 | | |
| 10.76 | | |
| 10.77 | | |
| 10.78 | | |
| 10.79 | | |
| 10.80 | | |
| | | | | | | | |
| Peabody Energy Corporation | 2024 Form 10-K | 88 |
| | | | | | | | |
| 10.81 | | |
| 10.82 | | Eighth Amendment to the Sixth Amended and Restated Receivables Purchase Agreement, dated as of January 28, 2022, by and among P&L Receivables Company, LLC, Peabody Energy Corporation, all Committed Purchasers listed on the signature pages thereto, all Purchaser Agents listed on the signature pages thereto, all LC Participants listed on the signature pages thereto, PNC Bank, National Association, as Administrator and as LC Bank and PNC Capital Markets LLC, as Structuring Agent (Incorporated by reference to Exhibit 10.1 to the Registrant’s Current Report on Form 8-K filed on January 31, 2022). |
| 10.83 | | |
| 10.84 | | Ninth Amendment to the Sixth Amended and Restated Receivables Purchase Agreement, dated as of February 13, 2023, by and among P&L Receivables Company, LLC, Peabody Energy Corporation, all Committed Purchasers listed on the signature pages thereto, all Purchaser Agents listed on the signature pages thereto, all LC Participants listed on the signature pages thereto, PNC Bank, National Association, as Administrator and as LC Bank and PNC Capital Markets LLC, as Structuring Agent (Incorporated by reference to Exhibit 10.1 of the Registrant’s Current Report on Form 8-K, filed February 14, 2023). |
| 10.85 | | |
| 10.86* | | |
| 10.87 | | |
| 10.88 | | |
| 19.1† | | |
| 21† | | |
| 23.1† | | |
| 23.2† | | |
| 23.3† | | |
| 23.4† | | |
| 31.1† | | |
| 31.2† | | |
| 32.1† | | |
| 32.2† | | |
| 95† | | |
| 96.1 | | |
| 96.2 | | |
| 96.3 | | |
| 97 | | |
| 101.INS | | Inline XBRL Instance Document - the instance document does not appear in the interactive data file because XBRL tags are embedded within the Inline XBRL document |
| 101.SCH | | Inline XBRL Taxonomy Extension Schema Document |
| | | | | | | | |
| Peabody Energy Corporation | 2024 Form 10-K | 89 |
| | | | | | | | |
| 101.CAL | | Inline XBRL Taxonomy Extension Calculation Linkbase Document |
| 101.DEF | | Inline XBRL Taxonomy Extension Definition Linkbase Document |
| 101.LAB | | Inline XBRL Taxonomy Extension Label Linkbase Document |
| 101.PRE | | Inline XBRL Taxonomy Extension Presentation Linkbase Document |
| 104 | | Cover Page Interactive Data File (embedded within the Inline XBRL document). |
| | |
| * | These exhibits constitute all management contracts, compensatory plans and arrangements required to be filed as an exhibit to this form pursuant to Item 15(a)(3) and 15(b) of this report. |
| | |
| † | Filed herewith. |
| ‡ | Certain portions of this exhibit have been redacted pursuant to Regulation S-K, Item 601(a)(6) and Item 601(b)(2)(ii). This exhibit excludes certain immaterial schedules and exhibits pursuant to the provisions of Regulation S-K, Item 601(a)(5). A copy of any of the omitted information, schedules and exhibits pursuant to Regulation S-K, Item 601(a)(5), Item 601(a)(6) and Item 601(b)(2)(ii), as applicable, will be furnished to the Securities and Exchange Commission upon request. |
Pursuant to the Instructions to Exhibits, certain instruments defining the rights of holders of long-term debt securities of the Company and its consolidated subsidiaries are not filed because the total amount of securities authorized under any such instrument does not exceed 10% of the total assets of the Company and its subsidiaries on a consolidated basis. A copy of such instrument will be furnished to the Securities and Exchange Commission upon request.
Item 16.Form 10-K Summary.
None.
| | | | | | | | |
| Peabody Energy Corporation | 2024 Form 10-K | 90 |
SIGNATURES
Pursuant to the requirements of Section 13 or 15(d) of the Securities Exchange Act of 1934, the registrant has duly caused this report to be signed on its behalf by the undersigned, thereunto duly authorized.
| | | | | |
| PEABODY ENERGY CORPORATION |
| |
| /s/ JAMES C. GRECH |
| James C. Grech President and Chief Executive Officer |
Date: February 20, 2025
Pursuant to the requirements of the Securities Exchange Act of 1934, this report has been signed below by the following persons, on behalf of the registrant and in the capacities and on the dates indicated.
| | | | | | | | | | | | | | | | | | | | |
| Signature | | Title | | Date |
| | | | | |
| /s/ JAMES C. GRECH | | President and Chief Executive Officer,
Director (principal executive officer) | | February 20, 2025 |
| James C. Grech | | | |
| | | | |
| /s/ MARK A. SPURBECK | | Executive Vice President and Chief Financial Officer (principal financial and accounting officer) | | February 20, 2025 |
| Mark A. Spurbeck | | | |
| | | | |
| /s/ M. KATHERINE BANKS | | Director | | February 20, 2025 |
| M. Katherine Banks | | | | |
| | | | | | |
| /s/ ANDREA BERTONE | | Director | | February 20, 2025 |
| Andrea Bertone | | | |
| | | | |
| /s/ BILL CHAMPION | | Director | | February 20, 2025 |
| Bill Champion | | | |
| | | | | | |
| /s/ NICHOLAS CHIREKOS | | Director | | February 20, 2025 |
| Nicholas Chirekos | | | |
| | | | |
| /s/ STEPHEN GORMAN | | Director | | February 20, 2025 |
| Stephen Gorman | | | |
| | | | |
| /s/ JOE LAYMON | | Director | | February 20, 2025 |
| Joe Laymon | | | |
| | | | |
| /s/ ROBERT MALONE | | Chairman | | February 20, 2025 |
| Robert Malone | | | |
| | | | |
| | | | | | | | |
| Peabody Energy Corporation | 2024 Form 10-K | 91 |
Report of Independent Registered Public Accounting Firm
To the Stockholders and the Board of Directors of Peabody Energy Corporation
Opinion on the Financial Statements
We have audited the accompanying consolidated balance sheets of Peabody Energy Corporation (the Company) as of December 31, 2024 and 2023, the related consolidated statements of operations, comprehensive income, changes in stockholders' equity and cash flows for each of the three years in the period ended December 31, 2024, and the related notes and financial statement schedule listed in the Index at Item 15(a) (collectively referred to as the “consolidated financial statements”). In our opinion, the consolidated financial statements present fairly, in all material respects, the financial position of the Company at December 31, 2024 and 2023, and the results of its operations and its cash flows for each of the three years in the period ended December 31, 2024, in conformity with U.S. generally accepted accounting principles.
We also have audited, in accordance with the standards of the Public Company Accounting Oversight Board (United States) (PCAOB), the Company's internal control over financial reporting as of December 31, 2024, based on criteria established in Internal Control-Integrated Framework issued by the Committee of Sponsoring Organizations of the Treadway Commission (2013 framework) and our report dated February 20, 2025 expressed an unqualified opinion thereon.
Basis for Opinion
These financial statements are the responsibility of the Company's management. Our responsibility is to express an opinion on the Company’s financial statements based on our audits. We are a public accounting firm registered with the PCAOB and are required to be independent with respect to the Company in accordance with the U.S. federal securities laws and the applicable rules and regulations of the Securities and Exchange Commission and the PCAOB.
We conducted our audits in accordance with the standards of the PCAOB. Those standards require that we plan and perform the audit to obtain reasonable assurance about whether the financial statements are free of material misstatement, whether due to error or fraud. Our audits included performing procedures to assess the risks of material misstatement of the financial statements, whether due to error or fraud, and performing procedures that respond to those risks. Such procedures included examining, on a test basis, evidence regarding the amounts and disclosures in the financial statements. Our audits also included evaluating the accounting principles used and significant estimates made by management, as well as evaluating the overall presentation of the financial statements. We believe that our audits provide a reasonable basis for our opinion.
Critical Audit Matter
The critical audit matter communicated below is a matter arising from the current period audit of the financial statements that was communicated or required to be communicated to the audit committee and that: (1) relates to accounts or disclosures that are material to the financial statements and (2) involved our especially challenging, subjective or complex judgments. The communication of the critical audit matter does not alter in any way our opinion on the consolidated financial statements, taken as a whole, and we are not, by communicating the critical audit matter below, providing a separate opinion on the critical audit matter or on the accounts or disclosures to which it relates.
| | | | | | | | |
| Peabody Energy Corporation | 2024 Form 10-K | F-1 |
| | | | | |
| Asset Retirement Obligation Liabilities – Surface Mines |
Description
of the
Matter | At December 31, 2024, the Company’s asset retirement obligation (ARO) liabilities totaled $723.7 million. As discussed in Note 1 and Note 12 to the consolidated financial statements, the Company estimates its ARO liabilities in the U.S. and Australia for final reclamation and mine closure based upon detailed engineering calculations of the amount and timing of the future cash spending for a third party to perform the required work. The Company records an ARO asset associated with the discounted liability for final reclamation and mine closure. The obligation and corresponding asset are recognized in the period in which the liability is incurred. As changes in estimates occur, the revisions to the obligation and asset are recognized at the appropriate credit-adjusted, risk-free rate.
Auditing the Company’s ARO liabilities for surface mines was complex because the calculation involves subjective assumptions related to estimates of disturbed acreage as determined from engineering data, estimates of future costs to reclaim the disturbed acreage and the timing of these cash flows. |
| |
How We
Addressed
the Matter
in Our Audit | We obtained an understanding, evaluated the design, and tested the operating effectiveness of the controls over the Company’s accounting for ARO liabilities for surface mines, including controls over management’s review of the ARO calculation and the significant assumptions and data inputs described above.
Our audit procedures included, among others, evaluating the methodology used, and testing the significant assumptions discussed above and the underlying data used by the Company in its estimate of ARO liabilities for surface mines. To assess the estimates of disturbed acreage, estimates of future costs to reclaim the disturbed acreage, and the timing of these cash flows, we evaluated significant changes from the prior estimate, evaluated consistency between timing of reclamation activities and projected mine life, evaluated the estimated costs for surface mines, compared anticipated costs to recent operating or third-party data, and recalculated management's estimate. Additionally, we involved our specialists to assist in our assessment of the Company’s ARO liabilities for surface mines. As part of this effort, our specialists interviewed members of the Company’s engineering staff, assessed the completeness of the mine reclamation estimate with respect to meeting mine closure and post closure plan regulatory requirements, and tested the accuracy and completeness of the underlying data used in the engineering estimates and assessed the significant assumptions discussed above. |
/s/ Ernst & Young, LLP
We have served as the Company’s auditor since 1991.
St. Louis, Missouri
February 20, 2025
| | | | | | | | |
| Peabody Energy Corporation | 2024 Form 10-K | F-2 |
PEABODY ENERGY CORPORATION
CONSOLIDATED STATEMENTS OF OPERATIONS
| | | | | | | | | | | | | | | | | |
| Year Ended December 31, |
| 2024 | | 2023 | | 2022 |
| | (Dollars in millions, except per share data) |
| Revenue | $ | 4,236.7 | | | $ | 4,946.7 | | | $ | 4,981.9 | |
| Costs and expenses | | | | | |
| Operating costs and expenses (exclusive of items shown separately below) | 3,420.9 | | | 3,385.1 | | | 3,290.8 | |
| Depreciation, depletion and amortization | 343.0 | | | 321.4 | | | 317.6 | |
| Asset retirement obligation expenses | 48.9 | | | 50.5 | | | 49.4 | |
| Selling and administrative expenses | 91.0 | | | 90.7 | | | 88.8 | |
| Restructuring charges | 4.4 | | | 3.3 | | | 2.9 | |
| Transaction costs related to business combinations | 10.3 | | | — | | | — | |
| Other operating (income) loss: | | | | | |
| Net gain on disposals | (9.8) | | | (15.0) | | | (29.2) | |
| | | | | |
| Asset impairment | — | | | 2.0 | | | 11.2 | |
| Provision for NARM and Shoal Creek losses | 3.7 | | | 40.9 | | | — | |
| Shoal Creek insurance recovery | (109.5) | | | — | | | — | |
| Income from equity affiliates | (11.5) | | | (6.9) | | | (131.2) | |
| Operating profit | 445.3 | | | 1,074.7 | | | 1,381.6 | |
| Interest expense, net of capitalized interest | 46.9 | | | 59.8 | | | 140.3 | |
| Net loss on early debt extinguishment | — | | | 8.8 | | | 57.9 | |
| Interest income | (71.0) | | | (76.8) | | | (18.4) | |
| Net periodic benefit credit, excluding service cost | (40.6) | | | (41.6) | | | (49.0) | |
| Net mark-to-market adjustment on actuarially determined liabilities | (6.1) | | | (0.3) | | | (27.8) | |
| | | | | |
| Income from continuing operations before income taxes | 516.1 | | | 1,124.8 | | | 1,278.6 | |
| Income tax provision (benefit) | 108.8 | | | 308.8 | | | (38.8) | |
| Income from continuing operations, net of income taxes | 407.3 | | | 816.0 | | | 1,317.4 | |
| (Loss) income from discontinued operations, net of income taxes | (3.8) | | | (0.4) | | | 1.7 | |
| Net income | 403.5 | | | 815.6 | | | 1,319.1 | |
| | | | | |
| Less: Net income attributable to noncontrolling interests | 32.6 | | | 56.0 | | | 22.0 | |
| Net income attributable to common stockholders | $ | 370.9 | | | $ | 759.6 | | | $ | 1,297.1 | |
| | | | | |
| Income from continuing operations: | | | | | |
| Basic income per share | $ | 2.99 | | | $ | 5.52 | | | $ | 9.12 | |
| Diluted income per share | $ | 2.73 | | | $ | 5.00 | | | $ | 8.29 | |
| Net income attributable to common stockholders: | | | | | |
| Basic income per share | $ | 2.96 | | | $ | 5.52 | | | $ | 9.13 | |
| Diluted income per share | $ | 2.70 | | | $ | 5.00 | | | $ | 8.31 | |
See accompanying notes to consolidated financial statements
| | | | | | | | |
| Peabody Energy Corporation | 2024 Form 10-K | F-3 |
PEABODY ENERGY CORPORATION
CONSOLIDATED STATEMENTS OF COMPREHENSIVE INCOME
| | | | | | | | | | | | | | | | | |
| Year Ended December 31, |
| 2024 | | 2023 | | 2022 |
| (Dollars in millions) |
| Net income | $ | 403.5 | | | $ | 815.6 | | | $ | 1,319.1 | |
| Postretirement plans (net of $0.0 tax provisions in each period) | (46.5) | | | (53.8) | | | (53.8) | |
| | | | | |
| | | | | |
| | | | | |
| | | | | |
| Foreign currency translation adjustment | (4.3) | | | 0.9 | | | (1.6) | |
| Other comprehensive loss, net of income taxes | (50.8) | | | (52.9) | | | (55.4) | |
| Comprehensive income | 352.7 | | | 762.7 | | | 1,263.7 | |
| | | | | |
| Less: Net income attributable to noncontrolling interests | 32.6 | | | 56.0 | | | 22.0 | |
| Comprehensive income attributable to common stockholders | $ | 320.1 | | | $ | 706.7 | | | $ | 1,241.7 | |
See accompanying notes to consolidated financial statements
| | | | | | | | |
| Peabody Energy Corporation | 2024 Form 10-K | F-4 |
PEABODY ENERGY CORPORATION
CONSOLIDATED BALANCE SHEETS
| | | | | | | | | | | |
| | December 31, |
| | 2024 | | 2023 |
| (Amounts in millions, except per share data) |
| ASSETS | | | |
| Current assets | | | |
| Cash and cash equivalents | $ | 700.4 | | | $ | 969.3 | |
| | | |
| Accounts receivable, net of allowance for credit losses of $0.0 at December 31, 2024 and 2023 | 359.3 | | | 389.7 | |
| Inventories, net | 393.4 | | | 351.8 | |
| Other current assets | 327.6 | | | 308.9 | |
| Total current assets | 1,780.7 | | | 2,019.7 | |
| Property, plant, equipment and mine development, net | 3,081.5 | | | 2,844.1 | |
| Operating lease right-of-use assets | 119.3 | | | 61.9 | |
| Restricted cash and collateral | 809.8 | | | 957.6 | |
| Investments and other assets | 162.4 | | | 78.8 | |
| | | |
| Total assets | $ | 5,953.7 | | | $ | 5,962.1 | |
| LIABILITIES AND STOCKHOLDERS’ EQUITY | | | |
| Current liabilities | | | |
| Current portion of long-term debt | $ | 15.8 | | | $ | 13.5 | |
| | | |
| Accounts payable and accrued expenses | 811.7 | | | 965.5 | |
| Total current liabilities | 827.5 | | | 979.0 | |
| Long-term debt, less current portion | 332.3 | | | 320.7 | |
| Deferred income taxes | 40.9 | | | 28.6 | |
| Asset retirement obligations, less current portion | 667.8 | | | 648.6 | |
| Accrued postretirement benefit costs | 120.4 | | | 148.4 | |
| Operating lease liabilities, less current portion | 86.7 | | | 47.7 | |
| Other noncurrent liabilities | 169.3 | | | 181.6 | |
| Total liabilities | 2,244.9 | | | 2,354.6 | |
| Stockholders’ equity | | | |
| Preferred Stock — $0.01 per share par value; 100.0 shares authorized, no shares issued or outstanding as of December 31, 2024 or 2023 | — | | | — | |
| Series Common Stock — $0.01 per share par value; 50.0 shares authorized, no shares issued or outstanding as of December 31, 2024 or 2023 | — | | | — | |
| Common Stock — $0.01 per share par value; 450.0 shares authorized, 189.1 shares issued and 121.4 shares outstanding as of December 31, 2024 and 188.6 shares issued and 128.7 shares outstanding as of December 31, 2023 | 1.9 | | | 1.9 | |
| Additional paid-in capital | 3,990.5 | | | 3,983.0 | |
| Treasury stock, at cost — 67.7 and 59.9 common shares as of December 31, 2024 and 2023 | (1,926.5) | | | (1,740.2) | |
| Retained earnings | 1,445.8 | | | 1,112.7 | |
| Accumulated other comprehensive income | 138.8 | | | 189.6 | |
| Peabody Energy Corporation stockholders’ equity | 3,650.5 | | | 3,547.0 | |
| Noncontrolling interests | 58.3 | | | 60.5 | |
| Total stockholders’ equity | 3,708.8 | | | 3,607.5 | |
| Total liabilities and stockholders’ equity | $ | 5,953.7 | | | $ | 5,962.1 | |
See accompanying notes to consolidated financial statements
| | | | | | | | |
| Peabody Energy Corporation | 2024 Form 10-K | F-5 |
PEABODY ENERGY CORPORATION
CONSOLIDATED STATEMENTS OF CASH FLOWS
| | | | | | | | | | | | | | | | | |
| Year Ended December 31, |
| | 2024 | | 2023 | | 2022 |
| | (Dollars in millions) |
| Cash Flows From Operating Activities | | | | | |
| Net income | $ | 403.5 | | | $ | 815.6 | | | $ | 1,319.1 | |
| Loss (income) from discontinued operations, net of income taxes | 3.8 | | | 0.4 | | | (1.7) | |
| Income from continuing operations, net of income taxes | 407.3 | | | 816.0 | | | 1,317.4 | |
| Adjustments to reconcile income from continuing operations, net of income taxes to net cash provided by operating activities: | | | | | |
| Depreciation, depletion and amortization | 343.0 | | | 321.4 | | | 317.6 | |
| Noncash interest expense, net | 5.4 | | | 4.6 | | | 17.7 | |
| | | | | |
| Deferred income taxes | 12.2 | | | 82.9 | | | (81.6) | |
| Noncash share-based compensation | 7.3 | | | 6.9 | | | 8.4 | |
| Asset impairment | — | | | 2.0 | | | 11.2 | |
| Noncash provision for NARM and Shoal Creek losses | — | | | 33.7 | | | — | |
| Net gain on disposals | (9.8) | | | (15.0) | | | (29.2) | |
| Noncash income from port and rail capacity assignment | (0.3) | | | (9.6) | | | — | |
| Net loss on early debt extinguishment | — | | | 8.8 | | | 57.9 | |
| Income from equity affiliates | (11.5) | | | (6.9) | | | (131.2) | |
| | | | | |
| Shoal Creek insurance recovery attributable to equipment losses | (10.9) | | | — | | | — | |
| Foreign currency option contracts | 9.0 | | | (7.4) | | | 2.3 | |
| | | | | |
| | | | | |
| | | | | |
| Changes in current assets and liabilities: | | | | | |
| Accounts receivable | 21.9 | | | 88.4 | | | (115.0) | |
| | | | | |
| Inventories | (41.6) | | | (59.7) | | | (69.4) | |
| Other current assets | (5.3) | | | 0.9 | | | (29.3) | |
| Accounts payable and accrued expenses | (184.9) | | | 120.2 | | | 68.0 | |
| Collateral arrangements | 149.1 | | | (199.6) | | | (53.3) | |
| Asset retirement obligations | (4.5) | | | (10.3) | | | (22.3) | |
| Workers’ compensation obligations | 2.3 | | | 1.2 | | | (0.9) | |
| Postretirement benefit obligations | (74.5) | | | (61.9) | | | (109.3) | |
| Pension obligations | 3.6 | | | (1.3) | | | 18.6 | |
| | | | | |
| Other, net | (5.0) | | | 1.0 | | | 2.7 | |
| Net cash provided by continuing operations | 612.8 | | | 1,116.3 | | | 1,180.3 | |
| Net cash used in discontinued operations | (6.3) | | | (80.8) | | | (6.7) | |
| Net cash provided by operating activities | 606.5 | | | 1,035.5 | | | 1,173.6 | |
See accompanying notes to consolidated financial statements
| | | | | | | | |
| Peabody Energy Corporation | 2024 Form 10-K | F-6 |
PEABODY ENERGY CORPORATION
CONSOLIDATED STATEMENTS OF CASH FLOWS - (Continued)
| | | | | | | | | | | | | | | | | |
| Year Ended December 31, |
| 2024 | | 2023 | | 2022 |
| (Dollars in millions) |
| Cash Flows From Investing Activities | | | | | |
| Additions to property, plant, equipment and mine development | (401.3) | | | (348.3) | | | (221.5) | |
| Changes in accrued expenses related to capital expenditures | (1.2) | | | 2.9 | | | (2.7) | |
| Wards Well acquisition | (143.8) | | | — | | | — | |
| Deposit associated with planned acquisition | (75.0) | | | — | | | — | |
| Insurance proceeds attributable to Shoal Creek equipment losses | 10.9 | | | — | | | — | |
| Proceeds from disposal of assets, net of receivables | 17.1 | | | 22.8 | | | 40.6 | |
| | | | | |
| Contributions to joint ventures | (728.0) | | | (741.6) | | | (645.9) | |
| Distributions from joint ventures | 717.2 | | | 721.7 | | | 631.6 | |
| Advances to investments | (0.1) | | | (0.5) | | | (1.5) | |
| Cash receipts from Middlemount Coal Pty Ltd and other investments | 0.4 | | | 2.6 | | | 171.8 | |
| | | | | |
| Other, net | 5.7 | | | (2.2) | | | (1.1) | |
| Net cash used in investing activities | (598.1) | | | (342.6) | | | (28.7) | |
| Cash Flows From Financing Activities | | | | | |
| Proceeds from long-term debt | — | | | — | | | 545.0 | |
| Proceeds from loan note related to planned acquisition | 9.3 | | | — | | | — | |
| Repayments of long-term debt | (10.4) | | | (9.0) | | | (1,407.4) | |
| Payment of debt issuance and other deferred financing costs | (12.0) | | | (0.3) | | | (21.1) | |
| Proceeds from common stock issuances, net of costs | — | | | — | | | 222.0 | |
| Common stock repurchases | (183.1) | | | (347.7) | | | — | |
| Excise taxes paid related to common stock repurchases | (3.3) | | | — | | | — | |
| Repurchase of employee common stock relinquished for tax withholding | (4.1) | | | (13.7) | | | (2.6) | |
| Dividends paid | (37.6) | | | (30.6) | | | — | |
| Distributions to noncontrolling interests | (34.8) | | | (59.0) | | | (17.5) | |
| | | | | |
| Net cash used in financing activities | (276.0) | | | (460.3) | | | (681.6) | |
| Net change in cash, cash equivalents and restricted cash | (267.6) | | | 232.6 | | | 463.3 | |
Cash, cash equivalents and restricted cash at beginning of period (1) | 1,650.2 | | | 1,417.6 | | | 954.3 | |
Cash, cash equivalents and restricted cash at end of period (2) | $ | 1,382.6 | | | $ | 1,650.2 | | | $ | 1,417.6 | |
| | | | | |
| | | | | |
|
| | | | | |
| | | | | |
| | | | | |
| | | | | |
| | | | | |
(1) The following table provides a reconciliation of “Cash, cash equivalents and restricted cash at beginning of period”: |
| Cash and cash equivalents | $ | 969.3 | | | | | |
| Restricted cash included in “Restricted cash and collateral” | 680.9 | | | | | |
| Cash, cash equivalents and restricted cash at beginning of period | $ | 1,650.2 | | | | | |
| | | | | |
(2) The following table provides a reconciliation of “Cash, cash equivalents and restricted cash at end of period”: |
| Cash and cash equivalents | $ | 700.4 | | | | | |
| Restricted cash included in “Restricted cash and collateral” | 682.2 | | | | | |
| Cash, cash equivalents and restricted cash at end of period | $ | 1,382.6 | | | | | |
See accompanying notes to consolidated financial statements
| | | | | | | | |
| Peabody Energy Corporation | 2024 Form 10-K | F-7 |
PEABODY ENERGY CORPORATION
CONSOLIDATED STATEMENTS OF CHANGES IN STOCKHOLDERS’ EQUITY
| | | | | | | | | | | | | | | | | | | | | | | | | | | | | | | | | | | | | | | | | | | |
| | | | Peabody Energy Corporation Stockholders’ Equity | | | | |
| | | Common
Stock | | Additional
Paid-in
Capital | | Treasury
Stock | | Retained
Earnings
(Accumulated Deficit) | | Accumulated
Other
Comprehensive Income | | Noncontrolling
Interests | | Total
Stockholders’
Equity |
| | | | (Dollars in millions, except per share data) |
| December 31, 2021 | | | $ | 1.8 | | | $ | 3,745.6 | | | $ | (1,370.3) | | | $ | (913.2) | | | $ | 297.9 | | | $ | 59.0 | | | $ | 1,820.8 | |
| | | | | | | | | | | | | | | |
| Net income | | | — | | | — | | | — | | | 1,297.1 | | | — | | | 22.0 | | | 1,319.1 | |
| | | | | | | | | | | | | | | |
| | | | | | | | | | | | | | | |
| | | | | | | | | | | | | | | |
| Postretirement plans (net of $0.0 tax provision) | | | — | | | — | | | — | | | — | | | (53.8) | | | — | | | (53.8) | |
| Foreign currency translation adjustment | | | — | | | — | | | — | | | — | | | (1.6) | | | — | | | (1.6) | |
| | | | | | | | | | | | | | | |
| | | | | | | | | | | | | | | |
| | | | | | | | | | | | | | | |
| Share-based compensation for equity-classified awards | | | — | | | 8.4 | | | — | | | — | | | — | | | — | | | 8.4 | |
| | | | | | | | | | | | | | | |
| | | | | | | | | | | | | | | |
| | | | | | | | | | | | | | | |
| | | | | | | | | | | | | | | |
| Common stock issuances, net of costs | | | 0.1 | | | 221.9 | | | — | | | — | | | — | | | — | | | 222.0 | |
| | | | | | | | | | | | | | | |
| | | | | | | | | | | | | | | |
| Repurchase of employee common stock relinquished for tax withholding | | | — | | | — | | | (2.6) | | | — | | | — | | | — | | | (2.6) | |
| Distributions to noncontrolling interests | | | — | | | — | | | — | | | — | | | — | | | (17.5) | | | (17.5) | |
| December 31, 2022 | | | $ | 1.9 | | | $ | 3,975.9 | | | $ | (1,372.9) | | | $ | 383.9 | | | $ | 242.5 | | | $ | 63.5 | | | $ | 3,294.8 | |
| | | | | | | | | | | | | | | |
| Net income | | | — | | | — | | | — | | | 759.6 | | | — | | | 56.0 | | | 815.6 | |
| Dividends declared ($0.225 per share) | | | — | | | 0.2 | | | — | | | (30.8) | | | — | | | — | | | (30.6) | |
| | | | | | | | | | | | | | | |
| | | | | | | | | | | | | | | |
| Postretirement plans (net of $0.0 tax provision) | | | — | | | — | | | — | | | — | | | (53.8) | | | — | | | (53.8) | |
| Foreign currency translation adjustment | | | — | | | — | | | — | | | — | | | 0.9 | | | — | | | 0.9 | |
| | | | | | | | | | | | | | | |
| | | | | | | | | | | | | | | |
| | | | | | | | | | | | | | | |
| | | | | | | | | | | | | | | |
| Share-based compensation for equity-classified awards | | | — | | | 6.9 | | | — | | | — | | | — | | | — | | | 6.9 | |
| | | | | | | | | | | | | | | |
| | | | | | | | | | | | | | | |
| | | | | | | | | | | | | | | |
| Common stock repurchases | | | — | | | — | | | (347.7) | | | — | | | — | | | — | | | (347.7) | |
| | | | | | | | | | | | | | | |
| | | | | | | | | | | | | | | |
| Net change in unsettled common stock repurchases | | | — | | | — | | | (2.6) | | | — | | | — | | | — | | | (2.6) | |
| Excise tax accrued on common stock repurchases | | | — | | | — | | | (3.3) | | | — | | | — | | | — | | | (3.3) | |
| Repurchase of employee common stock relinquished for tax withholding | | | — | | | — | | | (13.7) | | | — | | | — | | | — | | | (13.7) | |
| | | | | | | | | | | | | | | |
| | | | | | | | | | | | | | | |
| | | | | | | | | | | | | | | |
| Distributions to noncontrolling interests | | | — | | | — | | | — | | | — | | | — | | | (59.0) | | | (59.0) | |
| December 31, 2023 | | | $ | 1.9 | | | $ | 3,983.0 | | | $ | (1,740.2) | | | $ | 1,112.7 | | | $ | 189.6 | | | $ | 60.5 | | | $ | 3,607.5 | |
| Net income | | | — | | | — | | | — | | | 370.9 | | | — | | | 32.6 | | | 403.5 | |
| Dividends declared ($0.300 per share) | | | — | | | 0.2 | | | — | | | (37.8) | | | — | | | — | | | (37.6) | |
| Postretirement plans (net of $0.0 tax provision) | | | — | | | — | | | — | | | — | | | (46.5) | | | — | | | (46.5) | |
| Foreign currency translation adjustment | | | — | | | — | | | — | | | — | | | (4.3) | | | — | | | (4.3) | |
| | | | | | | | | | | | | | | |
| | | | | | | | | | | | | | | |
| Share-based compensation for equity-classified awards | | | — | | | 7.3 | | | — | | | — | | | — | | | — | | | 7.3 | |
| | | | | | | | | | | | | | | |
| | | | | | | | | | | | | | | |
| | | | | | | | | | | | | | | |
| Common stock repurchases | | | — | | | — | | | (183.1) | | | — | | | — | | | — | | | (183.1) | |
| Net change in unsettled common stock repurchases | | | — | | | — | | | 2.6 | | | — | | | — | | | — | | | 2.6 | |
| Excise tax accrued on common stock repurchases | | | — | | | — | | | (1.7) | | | — | | | — | | | — | | | (1.7) | |
| Repurchase of employee common stock relinquished for tax withholding | | | — | | | — | | | (4.1) | | | — | | | — | | | — | | | (4.1) | |
| | | | | | | | | | | | | | | |
| | | | | | | | | | | | | | | |
| | | | | | | | | | | | | | | |
| Distributions to noncontrolling interests | | | — | | | — | | | — | | | — | | | — | | | (34.8) | | | (34.8) | |
| December 31, 2024 | | | $ | 1.9 | | | $ | 3,990.5 | | | $ | (1,926.5) | | | $ | 1,445.8 | | | $ | 138.8 | | | $ | 58.3 | | | $ | 3,708.8 | |
See accompanying notes to consolidated financial statements
| | | | | | | | |
| Peabody Energy Corporation | 2024 Form 10-K | F-8 |
PEABODY ENERGY CORPORATION
NOTES TO CONSOLIDATED FINANCIAL STATEMENTS
(1) Summary of Significant Accounting Policies
Basis of Presentation
The consolidated financial statements include the accounts of Peabody Energy Corporation (PEC) and its affiliates. The Company, or Peabody, are used interchangeably to refer to Peabody Energy Corporation, to Peabody Energy Corporation and its subsidiaries, or to such subsidiaries, as appropriate to the context. Interests in subsidiaries controlled by the Company are consolidated with any outside stockholder interests reflected as noncontrolling interests, except when the Company has an undivided interest in an unincorporated joint venture. In those cases, the Company includes its proportionate share in the assets, liabilities, revenue and expenses of the jointly controlled entities within each applicable line item of the consolidated financial statements. All intercompany transactions, profits and balances have been eliminated in consolidation.
Description of Business
The Company is engaged in the mining of thermal coal for sale primarily to electric utilities and industrial facilities and metallurgical coal for sale to steel producers. The Company’s mining operations are located in the United States (U.S.) and Australia, including an equity-affiliate mining operation in Australia. The Company’s other commercial activities include trading and brokerage activities, managing its coal reserves and resources and real estate holdings and supporting the development of clean coal technologies. On November 21, 2024, Peabody entered into a partnership with an unrelated renewable energy company, to advance renewable energy projects by repurposing reclaimed land previously used for mining, including certain reclaimed mining land held by the Company.
Newly Adopted Accounting Standards
Segments. In November 2023, Accounting Standards Update (ASU) 2023-07 was issued, which requires public entities to provide in interim periods, following adoption, all disclosures about a reportable segment’s profit or loss that are currently required annually; disclose significant segment expense categories and amounts that are easily computable from the management reports that are regularly provided to the chief operating decision maker (CODM); disclose how the CODM uses each reported measure to assess performance and allocate resources; and disclose the title of the position of the individual identified as the CODM. The Company adopted the amendments effective December 31, 2024, and applied the amendments retrospectively to all prior periods presented in the consolidated financial statements. The adoption of this ASU impacted its disclosures in Note 22. “Segment and Geographic Information,” with no impacts to its consolidated results of operations, cash flows and financial condition.
Accounting Standards Not Yet Implemented
Income Taxes. In December 2023, ASU 2023-09 was issued, which requires public entities to disclose more information primarily related to the income tax rate reconciliation and income taxes paid. The guidance also eliminates certain existing disclosure requirements related to uncertain tax positions and unrecognized deferred tax liabilities. The Company is required to adopt the amendments for fiscal years beginning after December 15, 2024. The amendments should be applied prospectively, with a retrospective option. Early adoption is permitted. The Company expects this ASU to only impact its disclosures with no impacts to its consolidated results of operations, cash flows and financial condition.
Expense Disaggregation. In November 2024, ASU 2024-03 was issued, which requires public entities to disclose additional information about specific expense categories in the notes to financial statements at interim and annual reporting periods. The Company is required to adopt the amendments for fiscal years beginning after December 15, 2026 and interim reporting periods beginning after December 15, 2027. The amendments should be applied prospectively, with a retrospective option. Early adoption is permitted. The Company expects this ASU to only impact its disclosures with no impacts to its consolidated results of operations, cash flows and financial condition.
Induced Conversions of Convertible Debt. In November 2024, ASU 2024-04 was issued, which clarifies the requirements for determining whether certain settlements of convertible debt instruments should be accounted for as an induced conversion. The amendments in this ASU affect entities that settle convertible debt instruments for which the conversion privileges were changed to induce conversion. The Company is required to adopt the amendments for fiscal years beginning after December 15, 2025 and interim reporting periods within those periods. The amendments should be applied prospectively, with a retrospective option. Early adoption is permitted. The Company will apply this guidance upon its adoption, as applicable.
| | | | | | | | |
| Peabody Energy Corporation | 2024 Form 10-K | F-9 |
PEABODY ENERGY CORPORATION
NOTES TO CONSOLIDATED FINANCIAL STATEMENTS — (Continued)
Revenue
The majority of the Company’s revenue is derived from the sale of coal under long-term coal supply agreements (those with initial terms of one year or longer and which often include price reopener and/or extension provisions) and contracts with terms of less than one year, including sales made on a spot basis. The Company’s revenue from coal sales is realized and earned when control passes to the customer. Under the typical terms of the Company’s coal supply agreements, title and risk of loss transfer to the customer at the mine or port, where coal is loaded to the transportation sources that serve the Company’s mines. The Company incurs certain “add-on” taxes and fees on coal sales. Reported coal sales include taxes and fees charged by various federal and state governmental bodies and the freight charged on destination customer contracts.
The Company’s seaborne operating platform is primarily export focused with customers spread across several countries, with a portion of the thermal and metallurgical coal sold within Australia. Generally, revenue from individual countries vary year by year based on electricity and steel demand, the strength of the global economy, governmental policies and several other factors, including those specific to each country. A majority of these sales are executed through annual and multi-year international coal supply agreements that contain provisions requiring both parties to renegotiate pricing periodically. Industry commercial practice, and the Company’s typical practice, is to negotiate pricing for seaborne thermal coal contracts on an annual, spot or index basis and seaborne metallurgical coal contracts on a quarterly, spot or index basis. In the case of periodically negotiated pricing, the Company may deliver coal under provisional pricing until a final agreed-upon price is determined. Variable consideration resulting from provisional pricing arrangements is recognized based on the Company’s best estimate of the amount expected to be received at the time control is transferred to the customer that is not expected to result in a material reversal of revenue.
The Company’s U.S. thermal operating platform primarily sells thermal coal to electric utilities in the U.S. under long-term contracts, with a portion sold into the seaborne markets as conditions warrant. A significant portion of the coal production from the U.S. thermal operating segments is sold under existing long-term supply agreements. Certain customers of those segments utilize long-term sales agreements in recognition of the importance of reliability, service and predictable coal prices to their operations. The terms of coal supply agreements result from competitive bidding and extensive negotiations with customers. Consequently, the terms of those agreements may vary in many respects, including price adjustment features, price reopener terms, coal quality requirements, quantity parameters, permitted sources of supply, treatment of environmental constraints, extension options, force majeure and termination and assignment provisions.
Contract pricing is set forth on a per ton basis, and revenue is generally recorded as the product of price and volume delivered. Many of the Company’s coal supply agreements contain provisions that permit the parties to adjust the contract price upward or downward at specified times. These contract prices may be adjusted based on inflation or deflation and/or changes in the factors affecting the cost of producing coal, such as taxes, fees, royalties and changes in the laws regulating the mining, production, sale or use of coal. In a limited number of contracts, failure of the parties to agree on a price under those provisions may allow either party to terminate the contract. The Company sometimes experiences a reduction in coal prices in new long-term coal supply agreements replacing some of its expiring contracts. Coal supply agreements also typically contain force majeure provisions allowing temporary suspension of performance by the Company or the customer during the duration of specified events beyond the control of the affected party. Most of the coal supply agreements contain provisions requiring the Company to deliver coal meeting quality thresholds for certain characteristics such as Btu, sulfur content, ash content, grindability and ash fusion temperature. Failure to meet these specifications could result in economic penalties, including price adjustments, the rejection of deliveries or termination of the contracts. Moreover, some of these agreements allow the Company’s customers to terminate their contracts in the event of changes in regulations affecting the industry that restrict the use or type of coal permissible at the customer’s plant or increase the price of coal beyond specified limits.
Additional revenue may include gains and losses related to mark-to-market adjustments from economic hedge activities intended to hedge future coal sales, revenue from customer contract-related payments and other insignificant items including royalties related to coal lease agreements, sales agency commissions, farm income and property and facility rentals. Royalty income generally results from the lease or sublease of mineral rights to third parties, with payments based upon a percentage of the selling price or an amount per ton of coal produced.
Discontinued Operations
The Company classifies items within discontinued operations in the consolidated financial statements when the operations and cash flows of a particular component of the Company have been (or will be) eliminated from the ongoing operations of the Company as a result of a disposal (by sale or otherwise) and represents a strategic shift that has (or will have) a major effect on the entity’s operations and financial results.
| | | | | | | | |
| Peabody Energy Corporation | 2024 Form 10-K | F-10 |
PEABODY ENERGY CORPORATION
NOTES TO CONSOLIDATED FINANCIAL STATEMENTS — (Continued)
Discontinued operations include certain former Seaborne Thermal and Other U.S. Thermal segment assets that have ceased production and other previously divested legacy operations, including Patriot Coal Corporation and certain of its wholly-owned subsidiaries (Patriot).
On August 8, 2023, the Company entered into a settlement agreement with the U.S. Department of Labor to resolve a liability dispute regarding the federal black lung claims of Patriot. In accordance with the settlement agreement, the Company paid $72.0 million to settle the Patriot federal black lung claims, with the exception of approximately $4.2 million of certain claims for attorney’s fees and additional compensation due to claimants not paid during appeal. As a result of the settlement, the Company recognized a $3.9 million gain within “(Loss) income from discontinued operations, net of income taxes” during the year ended December 31, 2023.
Assets and Liabilities Held for Sale
The Company classifies assets and liabilities (disposal groups) to be sold as held for sale in the period in which all of the following criteria are met: management, having the authority to approve the action, commits to a plan to sell the disposal group; the disposal group is available for immediate sale in its present condition subject only to terms that are usual and customary for sales of such disposal groups; an active program to locate a buyer and other actions required to complete the plan to sell the disposal group have been initiated; the sale of the disposal group is probable, and transfer of the disposal group is expected to qualify for recognition as a completed sale within one year, except if events or circumstances beyond the Company's control extend the period of time required to sell the disposal group beyond one year; the disposal group is being actively marketed for sale at a price that is reasonable in relation to its current fair value; and actions required to complete the plan indicate that it is unlikely that significant changes to the plan will be made or that the plan will be withdrawn.
The Company initially measures a disposal group that is classified as held for sale at the lower of its carrying value or fair value less any costs to sell. Any loss resulting from this measurement is recognized in the period in which the held for sale criteria are met. Conversely, gains are not recognized on the sale of a disposal group until the date of sale. The Company assesses the fair value of a disposal group, less any costs to sell, each reporting period it remains classified as held for sale and reports any subsequent changes as an adjustment to the carrying value of the disposal group, as long as the new carrying value does not exceed the carrying value of the disposal group at the time it was initially classified as held for sale.
Upon determining that a disposal group meets the criteria to be classified as held for sale, the Company reports the assets and liabilities of the disposal group, if material, in the line items assets held for sale and liabilities held for sale in the consolidated balance sheets.
Cash and Cash Equivalents
Cash and cash equivalents are stated at cost, which approximates fair value. Cash equivalents consist of highly liquid investments with original maturities of three months or less.
Accounts Receivable
The timing of revenue recognition, billings and cash collections results in accounts receivable from customers. Customers are invoiced as coal is shipped or at periodic intervals in accordance with contractual terms. Invoices typically include customary adjustments for the resolution of price variability related to prior shipments, such as coal quality thresholds. Payments are generally received within thirty days of invoicing.
Inventories
Coal is reported as inventory at the point in time the coal is extracted from the mine. Raw coal represents coal stockpiles that may be sold in current condition or may be further processed prior to shipment to a customer. Saleable coal represents coal stockpiles which require no further processing prior to shipment to a customer.
Coal inventory is valued at the lower of average cost or net realizable value. Coal inventory costs include labor, supplies, equipment (including depreciation thereto) and operating overhead and other related costs incurred at or on behalf of the mining location. Net realizable value considers the projected future sales price of the particular coal product, less applicable selling costs and, in the case of raw coal, estimated remaining processing costs. The valuation of coal inventory is subject to several additional estimates, including those related to ground and aerial surveys used to measure quantities and processing recovery rates.
| | | | | | | | |
| Peabody Energy Corporation | 2024 Form 10-K | F-11 |
PEABODY ENERGY CORPORATION
NOTES TO CONSOLIDATED FINANCIAL STATEMENTS — (Continued)
Materials and supplies inventory is valued at the lower of average cost or net realizable value, less a reserve for obsolete or surplus items. This reserve incorporates several factors, such as anticipated usage, inventory turnover and inventory levels.
Property, Plant, Equipment and Mine Development
Property, plant, equipment and mine development are recorded at cost. Interest costs applicable to major asset additions are capitalized during the construction period. Capitalized interest for the year ended December 31, 2024 was $5.8 million. There was no capitalized interest in 2023 or 2022. Expenditures which extend the useful lives of existing plant and equipment assets are capitalized. Maintenance and repairs are charged to operating costs as incurred. Costs incurred to develop coal mines or to expand the capacity of operating mines are capitalized. Maintenance and repair costs incurred to maintain current production capacity at a mine are charged to operating costs as incurred. Costs to acquire computer hardware and the development and/or purchase of software for internal use are capitalized and depreciated over the estimated useful lives.
Coal reserves and resources are recorded at cost, or at fair value in the case of nonmonetary exchanges of coal reserves and resources or business acquisitions.
Depletion of coal reserves and resources and amortization of advance royalties are computed using the units-of-production method utilizing expected recoverable tons (as adjusted for recoverability factors) in the depletion base. Mine development costs are principally amortized over the estimated lives of the mine using the straight-line method. Depreciation of plant and equipment is computed using the straight-line method over the shorter of the asset’s estimated useful life or the life of the mine. At December 31, 2024, the maximum estimated remaining life for any of the Company’s mines was 29 years. As such, the estimated useful lives of the building and improvements and machinery and equipment asset categories range from 1 to 29 years. The estimated life of leasehold improvements is the shorter of useful life or remaining life of the lease.
The Company leases coal reserves under agreements that require royalties to be paid as the coal is sold. Certain agreements also require minimum annual royalties to be paid regardless of the amount of coal mined during the year. Total royalty expense was $370.0 million, $448.3 million and $450.0 million for the years ended December 31, 2024, 2023 and 2022, respectively.
A substantial amount of the coal mined by the Company is produced from mineral reserves leased from the owner. One of the major lessors is the U.S. government, from which the Company leases substantially all of the coal it mines in Wyoming under terms set by Congress and administered by the U.S. Bureau of Land Management. These leases are generally for an initial term of ten years but may be extended by diligent development and mining of the reserves until all economically recoverable reserves are depleted. The Company has met the diligent development requirements for substantially all of these federal leases either directly through production, by including the lease as a part of a logical mining unit with other leases upon which development has occurred or by paying an advance royalty in lieu of continued operations. Annual production on these federal leases must total at least 1.0% of the leased reserve or the original amount of coal in the entire logical mining unit in which the leased reserve resides. In addition, royalties are payable monthly at a rate of 12.5% of the gross realization from the sale of the coal mined using surface mining methods and at a rate of 8.0% of the gross realization for coal produced using underground mining methods.
The remainder of the leased coal is generally leased from state governments, land holding companies and various individuals. The duration of these leases varies greatly. Typically, the lease terms are automatically extended as long as active mining continues. Royalty payments are generally based upon a specified rate per ton or a percentage of the gross realization from the sale of the coal.
Mining and exploration in Australia is generally conducted under leases, licenses or permits granted by the relevant state government. Mining and exploration licenses and their associated environmental protection approvals (granted by the state government, and in some cases also the federal government) contain conditions relating to such matters as minimum annual expenditures, environmental compliance, protection of flora and fauna, restoration and rehabilitation. Royalties are paid to the state government as a percentage of the sales price (less certain allowable deductions in some cases). Generally, landowners do not own the mineral rights or have the ability to grant rights to mine those minerals. These rights are retained by the state government. Compensation is often payable to landowners, occupiers and Aboriginal traditional owners with residual native title rights and interests for the loss of access to the land from the proposed mining activities. The amount and type of compensation and the ability to proceed to grant of a mining tenement may be determined by agreement or court determination, as provided by law.
| | | | | | | | |
| Peabody Energy Corporation | 2024 Form 10-K | F-12 |
PEABODY ENERGY CORPORATION
NOTES TO CONSOLIDATED FINANCIAL STATEMENTS — (Continued)
Leases
The Company determines if an arrangement is a lease at inception. Right-of-use (ROU) assets represent the Company's right to use an underlying asset for the lease term and lease liabilities represent its obligation to make lease payments arising from the lease. Operating lease ROU assets and liabilities are recognized at the lease commencement date based on the present value of lease payments over the lease term. For the purpose of calculating such present values, lease payments include components that vary based upon an index or rate, using the prevailing index or rate at the commencement date, and exclude components that vary based upon other factors. As most of its leases do not contain a readily determinable implicit rate, the Company uses its incremental borrowing rate at commencement to determine the present value of lease payments. The Company does not separate lease components (i.e., fixed payments including rent, real estate taxes and insurance costs) from non-lease components (i.e., common-area maintenance) and recognizes them as a single lease component for the majority of asset classes. Variable lease payments not included within lease contracts are expensed as incurred. The Company's leases may include options to extend or terminate the lease, and such options are reflected in the term when their exercise is reasonably certain. Lease expense is recognized on a straight-line basis over the lease term.
Equity Investments
The Company applies the equity method to investments when it has the ability to exercise significant influence over the operating and financial policies of the joint venture. Investments accounted for under the equity method are initially recorded at cost and any difference between the cost of the Company’s investment and the underlying equity in the net assets of the joint venture at the investment date is amortized over the lives of the related assets that gave rise to the difference. The Company’s pro-rata share of the operating results of joint ventures and basis difference amortization is reported in the consolidated statements of operations in “Income from equity affiliates.” Similarly, the Company’s pro-rata share of the cumulative foreign currency translation adjustment of its equity method investments whose functional currency is not the U.S. dollar is reported in the consolidated balance sheets as a component of “Accumulated other comprehensive income,” with periodic changes thereto reflected in the consolidated statements of comprehensive income. With respect to cash flows attributable to its equity investments, the Company applies the cumulative earnings approach, in which distributions received are considered returns on investment and are classified as cash inflows from operating activities unless the Company’s cumulative distributions received less distributions received in prior periods that were determined to be returns of investment exceed the cumulative equity in earnings recognized by the Company (as adjusted for amortization of basis differences). When such an excess occurs, current-period distributions up to this excess are considered returns of investment and are classified as cash inflows from investing activities.
The Company monitors its equity method investments for circumstances that indicate that the carrying value of the investment may not be recoverable and are determined to be other than temporary. Examples of such indicators include a sustained history of operating losses and adverse changes in earnings and cash flow outlook. In the absence of quoted market prices for an investment, discounted cash flow projections are used to assess fair value, the underlying assumptions to which are generally considered unobservable Level 3 inputs under the fair value hierarchy. If the fair value of an investment is determined to be below its carrying value and that loss in fair value is deemed other than temporary, an impairment loss is recognized. No such impairment losses were recorded in any period presented.
Asset Retirement Obligations
The Company’s asset retirement obligation (ARO) liabilities primarily consist of spending estimates for surface land reclamation and support facilities at both surface and underground mines in accordance with applicable reclamation laws and regulations in the U.S. and Australia as defined by each mining permit. Asset retirement obligations are determined for each mine using various estimates and assumptions including, among other items, estimates of disturbed acreage as determined from engineering data and estimates of future costs to reclaim the disturbed acreage.
The Company estimates its ARO liabilities for final reclamation and mine closure based upon detailed engineering calculations of the amount and timing of the future cash spending for a third party to perform the required work. Spending estimates are escalated for inflation and then discounted at the credit-adjusted, risk-free rate. The Company records an ARO asset associated with the discounted liability for final reclamation and mine closure. The obligation and corresponding asset are recognized in the period in which the liability is incurred. The ARO asset is amortized on the units-of-production method over its expected life and the ARO liability is accreted to the projected spending date. As changes in estimates occur (such as mine plan revisions, changes in estimated costs or changes in timing of the performance of reclamation activities), the revisions to the obligation and asset are recognized at the appropriate credit-adjusted, risk-free rate.
| | | | | | | | |
| Peabody Energy Corporation | 2024 Form 10-K | F-13 |
PEABODY ENERGY CORPORATION
NOTES TO CONSOLIDATED FINANCIAL STATEMENTS — (Continued)
Contingencies
From time to time, the Company is subject to legal and environmental matters related to its continuing and discontinued operations and certain historical, non-coal producing operations. In connection with such matters, the Company is required to assess the likelihood of any adverse judgments or outcomes, as well as potential ranges of probable losses.
A determination of the amount of reserves required for these matters is made after considerable analysis of each individual issue. The Company accrues for legal and environmental matters within “Operating costs and expenses” when it is probable that a liability has been incurred and the amount of the loss can be reasonably estimated. If a range of possible loss exists and no anticipated loss within the range is more likely than any other anticipated loss, the Company records the accrual at the low end of the range, in accordance with Accounting Standards Codification 450, “Contingencies.” The Company provides disclosure surrounding loss contingencies when it believes that it is at least reasonably possible that a material loss may be incurred or an exposure to loss in excess of amounts already accrued may exist. Adjustments to contingent liabilities are made when additional information becomes available that affects the amount of estimated loss, which information may include changes in facts and circumstances, changes in interpretations of law in the relevant courts, the results of new or updated environmental remediation cost studies and the ongoing consideration of trends in environmental remediation costs.
Accrued contingent liabilities exclude claims against third parties and are not discounted. The current portion of these accruals is included in “Accounts payable and accrued expenses” and the long-term portion is included in “Other noncurrent liabilities” in the consolidated balance sheets. In general, legal fees related to environmental remediation and litigation are charged to expense. The Company includes the interest component of any litigation-related penalties within “Interest expense, net of capitalized interest” in the consolidated statements of operations.
The Company applies a loss recovery approach for contingent gains related to contingent consideration. Any consideration is recognized when the contingency is resolved and the consideration is realizable and collection is probable.
Income Taxes
The Company recognizes deferred tax assets and liabilities for the temporary difference between the consolidated financial carrying amounts of existing assets and liabilities and their respective tax bases and consideration of operating loss and tax credit carryforwards. Deferred income taxes are measured using enacted rates in effect for the year in which temporary differences are expected to be recovered or settled. The impact on deferred tax assets and liabilities of a change in tax rates is recognized in the period that includes the enactment date. Valuation allowances are provided to reduce deferred tax assets to the amount that will be more likely than not realized. The Company makes judgments and estimates regarding the amount and timing of the reversal of taxable temporary differences, the impact of tax planning strategies and expected future taxable income.
The Company recognizes the tax benefit from uncertain tax positions when it is more likely than not the tax position will be sustained upon examination by the taxing authorities based on the technical merits of the position. To the extent the Company’s assessment of such tax positions changes, the change in estimate will be recorded in the period in which the determination is made. Tax-related interest and penalties are classified as a component of income tax expense.
Postretirement Health Care and Life Insurance Benefits
The Company accounts for postretirement benefits other than pensions by accruing the costs of benefits to be provided over the employees’ period of active service. These costs are determined on an actuarial basis. The Company’s consolidated balance sheets reflect the accumulated postretirement benefit obligations of its postretirement benefit plans. The Company accounts for changes in its postretirement benefit obligations as a settlement when an irrevocable action has been effected that relieves the Company of its actuarially-determined liability to individual plan participants and removes substantial risk surrounding the nature, amount and timing of the obligation’s funding and the assets used to effect the settlement. The Company records amounts attributable to actuarial valuation changes currently in earnings rather than recording such amounts within accumulated other comprehensive income and amortizing to expense over applicable time periods. See Note 13. “Postretirement Health Care and Life Insurance Benefits” for information related to postretirement benefits.
| | | | | | | | |
| Peabody Energy Corporation | 2024 Form 10-K | F-14 |
PEABODY ENERGY CORPORATION
NOTES TO CONSOLIDATED FINANCIAL STATEMENTS — (Continued)
Pension Plans
The Company sponsors non-contributory defined benefit pension plans accounted for by accruing the cost to provide the benefits over the employees’ period of active service. These costs are determined on an actuarial basis. The Company’s consolidated balance sheets reflect the funded status of the defined benefit pension plans. The Company records amounts attributable to actuarial valuation changes currently in earnings rather than recording such amounts within accumulated other comprehensive income and amortizing to expense over applicable time periods. See Note 14. “Pension and Savings Plans” for information related to pension plans.
Restructuring Activities
From time to time, the Company initiates restructuring activities in connection with its repositioning efforts to appropriately align its cost structure or optimize its coal production relative to prevailing market conditions. Costs associated with restructuring actions can include the impact of early mine closures, voluntary and involuntary workforce reductions, office closures and other related activities. Costs associated with restructuring activities are recognized in the period incurred.
Included as a component of “Restructuring charges” in the Company’s consolidated statements of operations for the years ended December 31, 2024, 2023 and 2022 were aggregate restructuring charges of $4.4 million, $3.3 million and $2.9 million, respectively, primarily associated with voluntary and involuntary workforce reductions. As of December 31, 2024, a $3.4 million accrual for restructuring charges remained in “Accounts payable and accrued expenses,” which is expected to be paid during 2025.
Derivatives
The Company recognizes at fair value all contracts meeting the definition of a derivative as assets or liabilities in the consolidated balance sheets, with the exception of certain sales contracts for which the Company has elected to apply a normal purchases and normal sales exception.
With respect to derivatives used in hedging activities, the Company assesses at hedge inception whether such derivatives are highly effective at offsetting the changes in the anticipated exposure of the hedged item. The change in the fair value of derivatives designated as a cash flow hedge is recorded in “Accumulated other comprehensive income” in the consolidated balance sheets until the hedged transaction impacts reported earnings, at which time any gain or loss is reclassified to earnings. If the hedge ceases to qualify for hedge accounting, the Company prospectively recognizes changes in the fair value of the instrument in earnings in the period of the change. Gains or losses from derivative financial instruments designated as fair value hedges are recognized immediately in earnings, along with the offsetting gain or loss related to the underlying hedged item.
The Company’s asset and liability derivative positions are offset on a counterparty-by-counterparty basis if the contractual agreement provides for the net settlement of contracts with the counterparty in the event of default or termination of any one contract.
Non-derivative contracts and derivative contracts for which the Company has elected to apply the normal purchases and normal sales exception are accounted for on an accrual basis.
Business Combinations
The Company accounts for business combinations using the acquisition method of accounting. The acquisition method requires the Company to determine the fair value of all acquired assets, including identifiable intangible assets and all assumed liabilities. The total cost of acquisitions is allocated to the underlying identifiable net assets, based on their respective estimated fair values. Determining the fair value of assets acquired and liabilities assumed requires management’s judgment and the utilization of independent valuation experts, and often involves the use of significant estimates and assumptions, including assumptions with respect to future cash inflows and outflows, discount rates and asset lives, among other items.
Asset Acquisitions
The Company recognizes the obligation for contingent consideration in asset acquisitions as an adjustment to the cost basis of the assets acquired if and when the contingency is resolved and the consideration is paid or becomes payable.
| | | | | | | | |
| Peabody Energy Corporation | 2024 Form 10-K | F-15 |
PEABODY ENERGY CORPORATION
NOTES TO CONSOLIDATED FINANCIAL STATEMENTS — (Continued)
Impairment of Long-Lived Assets
The Company evaluates its long-lived assets held and used in operations for impairment as events and changes in circumstances indicate that the carrying amount of such assets might not be recoverable. Factors that would indicate potential impairment to be present include, but are not limited to, a sustained history of operating or cash flow losses, an unfavorable change in earnings and cash flow outlook, prolonged adverse industry or economic trends and a significant adverse change in the extent or manner in which a long-lived asset is being used or in its physical condition. The Company generally does not view short-term declines in thermal and metallurgical coal prices as an indicator of impairment for conducting impairment tests because of historic price volatility. However, the Company generally views a sustained trend of depressed coal pricing (for example, over periods exceeding one year) as a potential indicator of impairment. Because of the volatile and cyclical nature of coal prices and demand, it is reasonably possible that coal prices may decrease and/or fail to improve in the near term, which, absent sufficient mitigation such as an offsetting reduction in the Company’s operating costs, may result in the need for future adjustments to the carrying value of its long-lived mining assets and mining-related investments.
Assets are grouped at the lowest level for which there are identifiable cash flows that are largely independent of the cash flows of other groups of assets. For its active mining operations, the Company generally groups such assets at the mine level, or the mining complex level for mines that share infrastructure. For its development and exploration properties and portfolio of surface land and coal reserve and resource holdings, the Company considers several factors to determine whether to evaluate those assets individually or on a grouped basis for purposes of impairment testing. Such factors include geographic proximity to one another, the expectation of shared infrastructure upon development based on future mining plans and whether it would be most advantageous to bundle such assets in the event of sale to a third party.
When indicators of impairment are present, the Company evaluates its long-lived assets for recoverability by comparing the estimated undiscounted cash flows expected to be generated by those assets under various assumptions to their carrying amounts. If such undiscounted cash flows indicate that the carrying value of the asset group is not recoverable, impairment losses are measured by comparing the estimated fair value of the asset group to its carrying amount. As quoted market prices are unavailable for the Company’s individual mining operations, fair value is determined through the use of an expected present value technique based on the income approach, except for non-strategic coal reserves, coal resources, surface lands and undeveloped coal properties excluded from the Company’s long-range mine planning. In those cases, a market approach is utilized based on the most comparable market multiples available. The estimated future cash flows and underlying assumptions used to assess recoverability and, if necessary, measure the fair value of the Company’s long-lived mining assets are derived from those developed in connection with the Company’s planning and budgeting process. The Company believes its assumptions to be consistent with those a market participant would use for valuation purposes. The most critical assumptions underlying the Company’s projections and fair value estimates include those surrounding future tons sold, coal prices for unpriced coal, production costs (including costs for labor, commodity supplies and contractors), transportation costs, foreign currency exchange rates and a risk-adjusted, cost of capital (all of which generally constitute unobservable Level 3 inputs under the fair value hierarchy), in addition to market multiples for non-strategic coal reserves, coal resources, surface lands and undeveloped coal properties excluded from the Company’s long-range mine planning (which generally constitute Level 2 inputs under the fair value hierarchy).
Refer to Note 3. “Asset Impairment” for details regarding impairment charges related to long-lived assets of $9.5 million recognized during the year ended December 31, 2022. There were no impairment charges related to long-lived assets during the years ended December 31, 2024 or 2023.
Fair Value
For assets and liabilities that are recognized or disclosed at fair value in the consolidated financial statements, the Company defines fair value as the price that would be received to sell an asset or paid to transfer a liability in an orderly transaction between market participants at the measurement date.
| | | | | | | | |
| Peabody Energy Corporation | 2024 Form 10-K | F-16 |
PEABODY ENERGY CORPORATION
NOTES TO CONSOLIDATED FINANCIAL STATEMENTS — (Continued)
Foreign Currency
Functional currency is determined by the primary economic environment in which an entity operates, which for the Company’s foreign operations is generally the U.S. dollar because sales prices in international coal markets and the Company’s sources of financing for those operations are denominated in that currency. Accordingly, substantially all of the Company’s consolidated foreign subsidiaries utilize the U.S. dollar as their functional currency. Monetary assets and liabilities are remeasured at year-end exchange rates while non-monetary items are remeasured at historical rates. Income and expense accounts are remeasured at the average rates in effect during the year, except for those expenses related to balance sheet amounts that are remeasured at historical exchange rates. Gains and losses from foreign currency remeasurement related to tax balances are included as a component of “Income tax provision (benefit),” while all other remeasurement gains and losses are included in “Operating costs and expenses” in the consolidated statements of operations. The total impact of foreign currency remeasurement on the consolidated statements of operations was a net loss of $32.3 million for the year ended December 31, 2024 and net gains of $5.3 million and $2.7 million for the years ended December 31, 2023 and 2022, respectively.
The Company owns a 50% equity interest in Middlemount Coal Pty Ltd. (Middlemount), which owns the Middlemount Mine in Queensland, Australia. Middlemount utilizes the Australian dollar as its functional currency. Accordingly, the assets and liabilities of that equity investee are translated to U.S. dollars at the year-end exchange rate and income and expense accounts are translated at the average rate in effect during the year. The Company’s pro-rata share of the translation gains and losses of the equity investee are recorded as a component of “Accumulated other comprehensive income” in the consolidated balance sheets. Australian dollar denominated stockholder loans to the Middlemount Mine, which are long term in nature, are considered part of the Company’s net investment in that operation. Accordingly, foreign currency gains or losses on those loans are recorded as a component of foreign currency translation adjustment. The Company recorded a net loss from foreign currency translation of $4.3 million for year ended December 31, 2024, a net gain of $0.9 million for the year ended December 31, 2023 and a net loss of $1.6 million for the year ended December 31, 2022.
Share-Based Compensation
The Company accounts for share-based compensation at the grant date fair value of awards and recognizes the related expense over the service period of the awards. See Note 16. “Share-Based Compensation” for information related to share-based compensation.
Exploration and Drilling Costs
Exploration expenditures are charged to operating costs as incurred, including costs related to drilling and study costs incurred to convert or upgrade mineral resources to reserves.
Advance Stripping Costs
Pre-production. At existing surface operations, additional pits may be added to increase production capacity in order to meet customer requirements. These expansions may require significant capital to purchase additional equipment, expand the workforce, build or improve existing haul roads and create the initial pre-production box cut to remove overburden (that is, advance stripping costs) for new pits at existing operations. If these pits operate in a separate and distinct area of the mine, the costs associated with initially uncovering coal (that is, advance stripping costs incurred for the initial box cuts) for production are capitalized and amortized over the life of the developed pit consistent with coal industry practices.
Post-production. Advance stripping costs related to post-production are expensed as incurred. Where new pits are routinely developed as part of a contiguous mining sequence, the Company expenses such costs as incurred. The development of a contiguous pit typically reflects the planned progression of an existing pit, thus maintaining production levels from the same mining area utilizing the same employee group and equipment.
| | | | | | | | |
| Peabody Energy Corporation | 2024 Form 10-K | F-17 |
PEABODY ENERGY CORPORATION
NOTES TO CONSOLIDATED FINANCIAL STATEMENTS — (Continued)
Use of Estimates in the Preparation of the Consolidated Financial Statements
These consolidated financial statements have been prepared in conformity with accounting principles generally accepted in the United States (U.S. GAAP). In doing so, estimates and assumptions are made that affect the amounts reported in the consolidated financial statements and accompanying notes. These estimates are based on historical experience and on various other assumptions deemed reasonable under the circumstances, the results of which form the basis for making judgments about the carrying amounts of assets and liabilities that are not readily apparent from other sources. The Company’s actual results may differ materially from these estimates. Significant estimates inherent in the preparation of these consolidated financial statements include, but are not limited to, accounting for sales and cost recognition, postretirement benefit plans, environmental receivables and liabilities, asset retirement obligations, evaluation of long-lived assets for impairment, income taxes including deferred tax assets, fair value measurements and contingencies.
(2) Revenue Recognition
Disaggregation of Revenue
Revenue by product type and market is set forth in the following tables. With respect to its seaborne reportable segments, the Company classifies as “Export” certain revenue from domestically-delivered coal under contracts in which the price is derived on a basis similar to export contracts.
| | | | | | | | | | | | | | | | | | | | | | | | | | | | | | | | | | | |
| Year Ended December 31, 2024 |
| Seaborne Thermal | | Seaborne Metallurgical | | Powder River Basin | | Other U.S. Thermal | | Corporate and Other (1) | | Consolidated |
| (Dollars in millions) |
| Thermal coal | | | | | | | | | | | |
| Domestic | $ | 150.8 | | | $ | — | | | $ | 1,096.4 | | | $ | 785.0 | | | $ | — | | | $ | 2,032.2 | |
| Export | 1,060.6 | | | — | | | — | | | — | | | — | | | 1,060.6 | |
| Total thermal | 1,211.4 | | | — | | | 1,096.4 | | | 785.0 | | | — | | | 3,092.8 | |
| Metallurgical coal | | | | | | | | | | | |
| | | | | | | | | | | |
| Export | — | | | 1,049.5 | | | — | | | — | | | — | | | 1,049.5 | |
| Total metallurgical | — | | | 1,049.5 | | | — | | | — | | | — | | | 1,049.5 | |
Other (2) | 2.5 | | | 6.1 | | | 2.4 | | | 37.6 | | | 45.8 | | | 94.4 | |
| Revenue | $ | 1,213.9 | | | $ | 1,055.6 | | | $ | 1,098.8 | | | $ | 822.6 | | | $ | 45.8 | | | $ | 4,236.7 | |
| | | | | | | | | | | | | | | | | | | | | | | | | | | | | | | | | | | |
| Year Ended December 31, 2023 |
| Seaborne Thermal | | Seaborne Metallurgical | | Powder River Basin | | Other U.S. Thermal | | Corporate and Other (1) | | Consolidated |
| | (Dollars in millions) |
| Thermal coal | | | | | | | | | | | |
| Domestic | $ | 136.4 | | | $ | — | | | $ | 1,193.9 | | | $ | 867.7 | | | $ | — | | | $ | 2,198.0 | |
| Export | 1,192.5 | | | — | | | — | | | — | | | — | | | 1,192.5 | |
| Total thermal | 1,328.9 | | | — | | | 1,193.9 | | | 867.7 | | | — | | | 3,390.5 | |
| Metallurgical coal | | | | | | | | | | | |
| | | | | | | | | | | |
| Export | — | | | 1,299.6 | | | — | | | — | | | — | | | 1,299.6 | |
| Total metallurgical | — | | | 1,299.6 | | | — | | | — | | | — | | | 1,299.6 | |
Other (2) | 0.8 | | | 2.3 | | | 4.2 | | | 20.5 | | | 228.8 | | | 256.6 | |
| Revenue | $ | 1,329.7 | | | $ | 1,301.9 | | | $ | 1,198.1 | | | $ | 888.2 | | | $ | 228.8 | | | $ | 4,946.7 | |
| | | | | | | | |
| Peabody Energy Corporation | 2024 Form 10-K | F-18 |
PEABODY ENERGY CORPORATION
NOTES TO CONSOLIDATED FINANCIAL STATEMENTS — (Continued)
| | | | | | | | | | | | | | | | | | | | | | | | | | | | | | | | | | | |
| Year Ended December 31, 2022 |
| Seaborne Thermal | | Seaborne Metallurgical | | Powder River Basin | | Other U.S. Thermal | | Corporate and Other (1) | | Consolidated |
| | (Dollars in millions) |
| Thermal coal | | | | | | | | | | | |
| Domestic | $ | 167.6 | | | $ | — | | | $ | 1,066.0 | | | $ | 943.9 | | | $ | — | | | $ | 2,177.5 | |
| Export | 1,177.3 | | | — | | | — | | | 3.5 | | | — | | | 1,180.8 | |
| Total thermal | 1,344.9 | | | — | | | 1,066.0 | | | 947.4 | | | — | | | 3,358.3 | |
| Metallurgical coal | | | | | | | | | | | |
| | | | | | | | | | | |
| Export | — | | | 1,610.8 | | | — | | | — | | | — | | | 1,610.8 | |
| Total metallurgical | — | | | 1,610.8 | | | — | | | — | | | — | | | 1,610.8 | |
Other (2) | 0.7 | | | 6.1 | | | (0.5) | | | 4.8 | | | 1.7 | | | 12.8 | |
| Revenue | $ | 1,345.6 | | | $ | 1,616.9 | | | $ | 1,065.5 | | | $ | 952.2 | | | $ | 1.7 | | | $ | 4,981.9 | |
(1) Corporate and Other includes the following:
| | | | | | | | | | | | | | | | | |
| Year Ended December 31, |
| 2024 | | 2023 | | 2022 |
| (Dollars in millions) |
| Unrealized gains (losses) on derivative contracts related to forecasted sales | $ | — | | | $ | 159.0 | | | $ | (35.8) | |
| Realized losses on derivative contracts related to forecasted sales | — | | | (80.9) | | | (455.1) | |
Revenue from physical sale of coal (3) | 27.8 | | | 109.4 | | | 470.7 | |
| Trading revenue | — | | | — | | | 10.7 | |
Other (2) | 18.0 | | | 41.3 | | | 11.2 | |
| Total Corporate and Other | $ | 45.8 | | | $ | 228.8 | | | $ | 1.7 | |
(2) Includes revenue from arrangements such as customer contract-related payments associated with volume shortfalls; royalties related to coal lease agreements; sales agency commissions; farm income; property and facility rentals; and revenue related to the Company’s assignment of rights to its excess port and rail capacity.
(3) Includes revenue recognized upon the physical sale of coal purchased from the Company’s operating segments and sold to customers through the Company’s coal trading business, including as part of settling certain derivative contracts. Primarily represents the difference between the price contracted with the customer and the price allocated to the operating segment.
Committed Revenue from Contracts with Customers
The Company expects to recognize revenue subsequent to December 31, 2024 of approximately $3.6 billion related to contracts with customers in which volumes and prices per ton were fixed or reasonably estimable at December 31, 2024. Approximately 51% of such amount is expected to be recognized over the next twelve months and the remainder thereafter. Actual revenue related to such contracts may differ materially for various reasons, including price adjustment features for coal quality and cost escalations, volume optionality provisions and potential force majeure events. This estimate of future revenue does not include any revenue related to contracts with variable prices per ton that cannot be reasonably estimated, such as the majority of seaborne metallurgical and seaborne thermal coal contracts where pricing is negotiated or settled quarterly or annually.
Accounts Receivable
“Accounts receivable, net” at December 31, 2024 and 2023 consisted of the following:
| | | | | | | | | | | |
| December 31, |
| 2024 | | 2023 |
| | (Dollars in millions) |
| Trade receivables, net | $ | 294.9 | | | $ | 322.3 | |
| Miscellaneous receivables, net | 64.4 | | | 67.4 | |
| Accounts receivable, net | $ | 359.3 | | | $ | 389.7 | |
None of the above receivables included allowances for credit losses at December 31, 2024 or 2023. No charges for credit losses were recognized during the years ended December 31, 2024, 2023 or 2022.
| | | | | | | | |
| Peabody Energy Corporation | 2024 Form 10-K | F-19 |
PEABODY ENERGY CORPORATION
NOTES TO CONSOLIDATED FINANCIAL STATEMENTS — (Continued)
(3) Asset Impairment
No asset impairment charges were recognized during the year ended December 31, 2024. During the year ended December 31, 2023, the Company recognized impairment charges of $2.0 million related to the fair value of an investment in equity securities. During the year ended December 31, 2022, the Company recognized impairment charges of $9.5 million related to the sale of certain land interests in Australia and $1.7 million related to the fair value of an investment in equity securities.
The Company identified certain assets with an aggregate carrying value of approximately $208 million at December 31, 2024 in its Other U.S. Thermal segment whose recoverability is most sensitive to customer concentration risk.
(4) Inventories
“Inventories, net” as of December 31, 2024 and 2023 consisted of the following:
| | | | | | | | | | | |
| December 31, |
| | 2024 | | 2023 |
| | (Dollars in millions) |
| Materials and supplies, net | $ | 157.5 | | | $ | 153.0 | |
| Raw coal | 109.6 | | | 105.6 | |
| Saleable coal | 126.3 | | | 93.2 | |
| Inventories, net | $ | 393.4 | | | $ | 351.8 | |
Materials and supplies inventories, net presented above have been shown net of reserves of $3.5 million and $7.2 million as of December 31, 2024 and 2023, respectively.
(5) Equity Method Investments
The Company’s equity method investments include its interests in Middlemount, R3 Renewables LLC (R3), R3 Renewables II LLC (R3 II) and certain other equity method investments.
The table below summarizes the book value of those investments, which are reported in “Investments and other assets” in the consolidated balance sheets, and the related “Income from equity affiliates”:
| | | | | | | | | | | | | | | | | | | | | | | | | | | | | |
| Book Value at | | (Income) Loss from Equity Affiliates |
| December 31, | | Year Ended December 31, |
| | 2024 | | 2023 | | 2024 | | 2023 | | 2022 |
| | (Dollars in millions) |
| Equity method investment related to Middlemount | $ | 52.7 | | | $ | 42.5 | | | $ | (14.9) | | | $ | (14.8) | | | $ | (135.1) | |
| Equity method investment related to R3 | — | | | 7.1 | | | 3.3 | | | 7.9 | | | 3.9 | |
| Equity method investment related to R3 II | 5.8 | | | — | | | 0.1 | | | — | | | — | |
| Total equity method investments | $ | 58.5 | | | $ | 49.6 | | | $ | (11.5) | | | $ | (6.9) | | | $ | (131.2) | |
Middlemount
The Company received no cash payments from Middlemount during the years ended December 31, 2024 and 2023. The Company received cash payments from Middlemount of $168.4 million during the year ended December 31, 2022.
During the years ended December 31, 2024, 2023 and 2022, respectively, Middlemount generated revenue of approximately $229 million, $219 million and $441 million (on a 50% basis).
Middlemount had current assets, noncurrent assets, current liabilities and noncurrent liabilities of $62.9 million, $224.1 million, $146.2 million and $25.8 million, respectively, as of December 31, 2024 and $48.2 million, $199.5 million, $76.6 million and $58.2 million, respectively, as of December 31, 2023 (on a 50% basis).
| | | | | | | | |
| Peabody Energy Corporation | 2024 Form 10-K | F-20 |
PEABODY ENERGY CORPORATION
NOTES TO CONSOLIDATED FINANCIAL STATEMENTS — (Continued)
R3
In March 2022, the Company entered into a joint venture with unrelated partners to form R3. R3 was formed with the intent of developing various sites, including certain reclaimed mining land held by the Company in the U.S., for utility-scale photovoltaic solar generation and battery storage. The Company contributed $11.3 million, $8.0 million and $10.9 million to R3 during the years ended December 31, 2024, 2023 and 2022, respectively.
In November 2024, R3 sold seven projects to an unrelated party and contributed the remaining three projects to a new entity (R3 II). The unrelated party purchased 75% of the equity in R3 II for cash and contingent consideration for the future obligation to pay seller’s milestone payments. R3 used the proceeds from the sale of R3 II to repurchase shares from the other investors of R3, such that Peabody is the only remaining equity holder of R3, which has a 25% equity interest in R3 II. R3 also distributed $11.4 million of the proceeds to Peabody. As Peabody is the only remaining equity holder of R3, the Company consolidated R3.
(6) Derivatives and Fair Value Measurements
Derivatives
From time to time, the Company may utilize various types of derivative instruments to manage its exposure to risks in the normal course of business, including (1) foreign currency exchange rate risk and the variability of cash flows associated with forecasted Australian dollar expenditures made in its Australian mining platform and (2) price risk of fluctuating coal prices related to forecasted sales or purchases of coal, or changes in the fair value of a fixed price physical sales contract. These risk management activities are actively monitored for compliance with the Company’s risk management policies.
On a limited basis, the Company engages in the direct and brokered trading of coal and freight-related contracts. Except those contracts for which the Company has elected to apply a normal purchases and normal sales exception, all derivative coal trading contracts are accounted for at fair value.
Foreign Currency
The Company utilizes options and collars to hedge currency risk associated with anticipated Australian dollar operating expenditures. As of December 31, 2024, the Company held average rate options with an aggregate notional amount of $388.0 million Australian dollars to hedge currency risk associated with anticipated Australian dollar operating expenditures over the nine-month period ending September 30, 2025. The instruments entitle the Company to receive payment on the notional amount should the quarterly average Australian dollar-to-U.S. dollar exchange rate exceed amounts ranging from $0.70 to $0.74 over the nine-month period ending September 30, 2025. As of December 31, 2024, the Company also held purchased collars with an aggregate notional amount of $528.0 million Australian dollars related to anticipated Australian dollar operating expenditures during the nine-month period ending September 30, 2025. The purchased collars have a floor and ceiling of approximately $0.59 and $0.73, respectively, whereby the Company will incur a loss on the instruments for rates below the floor and a gain for rates above the ceiling.
Derivative Contracts Related to Forecasted Sales
As of December 31, 2024, the Company had no coal derivative contracts related to its forecasted sales. Historically, such financial contracts have included futures and forwards.
During the year ended December 31, 2024, the Company did not have any open positions. During the year ended December 31, 2023, the Company recorded a net unrealized mark-to-market gain of $159.0 million on financial coal derivative contracts and no unrealized mark-to-market gains or losses on physical forward sales contracts. During the year ended December 31, 2022, the Company recorded a net unrealized mark-to-market loss of $35.8 million on coal derivative contracts, which included approximately $65 million of unrealized mark-to-market losses on financial coal derivative contracts and approximately $29 million of unrealized mark-to-market gains on physical forward sales contracts.
Financial Trading Contracts
On a limited basis, the Company may enter coal or freight derivative contracts for trading purposes. Such financial contracts may include futures, forwards and options. The Company held no financial trading contracts as of December 31, 2024.
| | | | | | | | |
| Peabody Energy Corporation | 2024 Form 10-K | F-21 |
PEABODY ENERGY CORPORATION
NOTES TO CONSOLIDATED FINANCIAL STATEMENTS — (Continued)
Tabular Derivatives Disclosures
The Company has master netting agreements with certain of its counterparties which allow for the settlement of contracts in an asset position with contracts in a liability position in the event of default or termination. Such netting arrangements reduce the Company’s credit exposure related to these counterparties. For classification purposes, the Company records the net fair value of all the positions with a given counterparty as a net asset or liability in the consolidated balance sheets. As of December 31, 2024, the Company had a liability derivative comprised of foreign currency option contracts with a fair value of $3.6 million. As of December 31, 2023, the Company had an asset derivative comprised of foreign currency option contracts with a fair value of $6.2 million. The net amount of asset derivatives is included in “Other current assets” and the net amount of liability derivatives is included in “Accounts payable and accrued expenses” in the accompanying consolidated balance sheets.
Currently, the Company does not seek cash flow hedge accounting treatment for its derivative financial instruments and thus changes in fair value are reflected in current earnings. The tables below show the amounts of pretax gains and losses related to the Company’s derivatives and their classification within the accompanying consolidated statements of operations.
| | | | | | | | | | | | | | | | | | | | | | |
| | | Year Ended December 31, 2024 |
| | Total loss recognized in income | | | | Loss realized in income on derivatives | | Unrealized loss recognized in income on derivatives |
| Derivative Instrument | Classification | | | |
| | | (Dollars in millions) |
| Foreign currency option contracts | Operating costs and expenses | $ | (12.7) | | | | | $ | (3.7) | | | $ | (9.0) | |
| | | | | | | | |
| | | | | | | | |
| Total | | $ | (12.7) | | | | | $ | (3.7) | | | $ | (9.0) | |
| | | | | | | | | | | | | | | | | | | | | | |
| | | Year Ended December 31, 2023 |
| | Total (loss) gain recognized in income | | | | (Loss) gain realized in income on derivatives | | Unrealized gain (loss) recognized in income on derivatives |
| Derivative Instrument | Classification | | | |
| | | (Dollars in millions) |
| Foreign currency option contracts | Operating costs and expenses | $ | (1.9) | | | | | $ | (9.3) | | | $ | 7.4 | |
| Derivative contracts related to forecasted sales | Revenue | 78.1 | | | | | (80.9) | | | 159.0 | |
| Financial trading contracts | Revenue | — | | | | | 11.5 | | | (11.5) | |
| Total | | $ | 76.2 | | | | | $ | (78.7) | | | $ | 154.9 | |
| | | | | | | | | | | | | | | | | | | | | | |
| | | Year Ended December 31, 2022 |
| | Total (loss) gain recognized in income | | | | (Loss) gain realized in income on derivatives | | Unrealized (loss) gain recognized in income on derivatives |
| Derivative Instrument | Classification | | | |
| | | (Dollars in millions) |
| Foreign currency option contracts | Operating costs and expenses | $ | (8.4) | | | | | $ | (6.1) | | | $ | (2.3) | |
| Derivative contracts related to forecasted sales | Revenue | (490.9) | | | | | (455.1) | | | (35.8) | |
| Financial trading contracts | Revenue | 10.7 | | | | | 1.1 | | | 9.6 | |
| Total | | $ | (488.6) | | | | | $ | (460.1) | | | $ | (28.5) | |
The Company classifies the cash effects of its derivatives within the “Cash Flows From Operating Activities” section of the consolidated statements of cash flows.
Fair Value Measurements
The Company uses a three-level fair value hierarchy that categorizes assets and liabilities measured at fair value based on the observability of the inputs utilized in the valuation. These levels include: Level 1 - inputs are quoted prices in active markets for the identical assets or liabilities; Level 2 - inputs are other than quoted prices included in Level 1 that are directly or indirectly observable through market-corroborated inputs; and Level 3 - inputs are unobservable, or observable but cannot be market-corroborated, requiring the Company to make assumptions about pricing by market participants.
| | | | | | | | |
| Peabody Energy Corporation | 2024 Form 10-K | F-22 |
PEABODY ENERGY CORPORATION
NOTES TO CONSOLIDATED FINANCIAL STATEMENTS — (Continued)
The following tables set forth the hierarchy of the Company’s net asset (liability) positions for which fair value is measured on a recurring basis.
| | | | | | | | | | | | | | | | | | | | | | | |
| | December 31, 2024 |
| | Level 1 | | Level 2 | | Level 3 | | Total |
| | (Dollars in millions) |
| Foreign currency option contracts | $ | — | | | $ | (3.6) | | | $ | — | | | $ | (3.6) | |
| | | | | | | |
| | | | | | | |
| Equity securities | 1.0 | | | — | | | — | | | 1.0 | |
| Total net assets (liabilities) | $ | 1.0 | | | $ | (3.6) | | | $ | — | | | $ | (2.6) | |
| | | | | | | |
| | December 31, 2023 |
| | Level 1 | | Level 2 | | Level 3 | | Total |
| | (Dollars in millions) |
| Foreign currency option contracts | $ | — | | | $ | 6.2 | | | $ | — | | | $ | 6.2 | |
| | | | | | | |
| | | | | | | |
| Equity securities | 0.4 | | | — | | | — | | | 0.4 | |
| Total net assets | $ | 0.4 | | | $ | 6.2 | | | $ | — | | | $ | 6.6 | |
For Level 1 and 2 financial assets and liabilities, the Company utilizes both direct and indirect observable price quotes, including interest rate yield curves, exchange indices, broker/dealer quotes, published indices, issuer spreads, benchmark securities and other market quotes. In the case of certain debt securities, fair value is provided by a third-party pricing service. Below is a summary of the Company’s valuation techniques for Level 1 and 2 financial assets and liabilities:
•Foreign currency option contracts are valued utilizing inputs obtained in quoted public markets (Level 2) except when credit and non-performance risk is considered to be a significant input, then the Company classifies such contracts as Level 3.
•Derivative contracts related to forecasted sales and financial trading contracts are generally valued based on unadjusted quoted prices in active markets (Level 1) or a valuation that is corroborated by the use of market-based pricing (Level 2) except when credit and non-performance risk is considered to be a significant input (greater than 10% of fair value), then the Company classifies as Level 3.
•Investments in equity securities are based on unadjusted quoted prices in active markets (Level 1).
Other Financial Instruments. The following methods and assumptions were used by the Company in estimating fair values for other financial instruments as of December 31, 2024 and 2023:
•Cash and cash equivalents, restricted cash, accounts receivable, including those within the Company’s accounts receivable securitization program, notes receivable and accounts payable have carrying values which approximate fair value due to the short maturity or the liquid nature of these instruments.
•Long-term debt fair value estimates are based on observed prices for securities when available (Level 2), and otherwise on estimated borrowing rates to discount the cash flows to their present value (Level 3).
Market risk associated with the Company’s fixed-rate long-term debt relates to the potential reduction in the fair value from an increase in interest rates. The fair value of debt, shown below, is principally based on reported market values and estimates based on interest rates, maturities, credit risk, underlying collateral and completed market transactions.
| | | | | | | | | | | |
| | December 31, |
| 2024 | | 2023 |
| | (Dollars in millions) |
| Total debt at par value | $ | 354.4 | | | $ | 342.3 | |
| Less: Unamortized debt issuance costs | (6.3) | | | (8.1) | |
| Net carrying amount | $ | 348.1 | | | $ | 334.2 | |
| | | |
| Estimated fair value | $ | 438.0 | | | $ | 483.9 | |
The Company’s risk management function, which is independent of the Company’s coal trading function, is responsible for valuation policies and procedures, with oversight from executive management. The fair value of the Company’s coal derivative assets and liabilities reflects adjustments for credit risk. The Company’s exposure to credit risk is substantially with electric utilities, energy marketers, steel producers and nonfinancial trading houses.
| | | | | | | | |
| Peabody Energy Corporation | 2024 Form 10-K | F-23 |
PEABODY ENERGY CORPORATION
NOTES TO CONSOLIDATED FINANCIAL STATEMENTS — (Continued)
The following table summarizes the changes in the Company’s recurring Level 3 net financial assets:
| | | | | | | | | | | | | | | | | | | | |
| | Year Ended December 31, |
| | | 2024 | | 2023 | | 2022 |
| | | (Dollars in millions) |
| Beginning of period | | $ | — | | | $ | 2.5 | | | $ | 4.0 | |
| | | | | | |
| | | | | | |
| | | | | | |
| Impairment loss included in earnings | | — | | | (2.0) | | | (1.7) | |
| | | | | | |
| Purchases | | — | | | — | | | 0.2 | |
| | | | | | |
| Exchange | | — | | | (0.5) | | | — | |
| End of period | | $ | — | | | $ | — | | | $ | 2.5 | |
The Company had no transfers between Levels 1, 2 and 3 during any of the periods presented in the table above. The Company’s policy is to value all transfers between levels using the beginning of period valuation.
(7) Property, Plant, Equipment and Mine Development
Property, plant, equipment and mine development, net, as of December 31, 2024 and 2023 consisted of the following:
| | | | | | | | | | | |
| December 31, |
| 2024 | | 2023 |
| (Dollars in millions) |
| Land and coal interests | $ | 2,648.5 | | | $ | 2,475.2 | |
| Buildings and improvements | 726.7 | | | 647.6 | |
| Machinery and equipment | 2,078.8 | | | 1,787.6 | |
| Less: Accumulated depreciation, depletion and amortization | (2,372.5) | | | (2,066.3) | |
| Property, plant, equipment and mine development, net | $ | 3,081.5 | | | $ | 2,844.1 | |
Land and coal interests included coal reserves and resources with a net book value of $1.1 billion and $1.2 billion as of December 31, 2024 and 2023, respectively. Such coal reserves and resources were comprised of mineral rights for leased coal interests and advance royalties that had a net book value of $0.6 billion and $0.7 billion at December 31, 2024 and 2023, respectively, and coal reserves and resources held by fee ownership of $0.5 billion as of both December 31, 2024 and 2023. The amount of coal reserves and resources unassigned to active mining operations, and thus not subject to current depletion, including certain exploratory properties, was $0.1 billion as of both December 31, 2024 and 2023.
(8) Income Taxes
Income from continuing operations before income taxes for the periods presented below consisted of the following:
| | | | | | | | | | | | | | | | | |
| | Year Ended December 31, |
| | 2024 | | 2023 | | 2022 |
| | (Dollars in millions) |
| U.S. | $ | 180.2 | | | $ | 77.8 | | | $ | 59.7 | |
| Non-U.S. | 335.9 | | | 1,047.0 | | | 1,218.9 | |
| Total | $ | 516.1 | | | $ | 1,124.8 | | | $ | 1,278.6 | |
| | | | | | | | |
| Peabody Energy Corporation | 2024 Form 10-K | F-24 |
PEABODY ENERGY CORPORATION
NOTES TO CONSOLIDATED FINANCIAL STATEMENTS — (Continued)
Total income tax provision (benefit) for the periods presented below consisted of the following:
| | | | | | | | | | | | | | | | | |
| | Year Ended December 31, |
| | 2024 | | 2023 | | 2022 |
| | (Dollars in millions) |
| Current: | | | | | |
| U.S. federal | $ | (0.1) | | | $ | (0.1) | | | $ | (0.2) | |
| Non-U.S. | 96.7 | | | 225.9 | | | 42.9 | |
| State | — | | | 0.1 | | | 0.1 | |
| Total current | 96.6 | | | 225.9 | | | 42.8 | |
| Deferred: | | | | | |
| | | | | |
| Non-U.S. | 12.2 | | | 82.9 | | | (81.6) | |
| | | | | |
| Total deferred | 12.2 | | | 82.9 | | | (81.6) | |
| Total income tax provision (benefit) | $ | 108.8 | | | $ | 308.8 | | | $ | (38.8) | |
The following is a reconciliation of the expected statutory federal income tax expense to the Company’s income tax provision (benefit) for the periods presented below:
| | | | | | | | | | | | | | | | | |
| | Year Ended December 31, |
| | 2024 | | 2023 | | 2022 |
| | (Dollars in millions) |
| Expected income tax expense at U.S. federal statutory rate | $ | 108.4 | | | $ | 236.2 | | | $ | 268.5 | |
| Changes in valuation allowance, income tax | (19.6) | | | (11.1) | | | (595.6) | |
| | | | | |
| | | | | |
| Changes in tax reserves | 0.5 | | | (0.8) | | | (1.5) | |
| Excess depletion | (10.2) | | | (15.0) | | | (17.2) | |
| Foreign earnings repatriation | — | | | — | | | 42.3 | |
| Foreign earnings provision differential | 46.0 | | | 91.6 | | | 80.7 | |
| Global intangible low-taxed income | — | | | — | | | 197.2 | |
| | | | | |
| Remeasurement of foreign income tax accounts | (5.7) | | | (0.9) | | | (2.6) | |
| State income taxes, net of federal tax benefit | (12.5) | | | 6.3 | | | 1.1 | |
| Other, net | 1.9 | | | 2.5 | | | (11.7) | |
| Total income tax provision (benefit) | $ | 108.8 | | | $ | 308.8 | | | $ | (38.8) | |
Certain reconciliation items included in the above table exclude the remeasurement of foreign income tax accounts as these foreign currency effects are separately presented. The Company recognizes the tax on global intangible low-taxed income (GILTI) as a period expense. The Company recorded a provision of $197.2 million for the year ended December 31, 2022, which was fully offset within the effective tax rate by the release of valuation allowance associated with the net operating losses (NOLs) that absorbed the GILTI inclusion. No provision for GILTI was recorded for the years ended December 31, 2024 and 2023.
On August 16, 2022, the Inflation Reduction Act of 2022 was signed into law and contained numerous tax provisions including a 15% minimum tax on book income of certain large corporations. This act did not have a material impact on the Company’s tax provision.
| | | | | | | | |
| Peabody Energy Corporation | 2024 Form 10-K | F-25 |
PEABODY ENERGY CORPORATION
NOTES TO CONSOLIDATED FINANCIAL STATEMENTS — (Continued)
The tax effects of temporary differences that gave rise to significant portions of the deferred tax assets and liabilities as of December 31, 2024 and 2023 consisted of the following:
| | | | | | | | | | | |
| December 31, |
| | 2024 | | 2023 |
| | (Dollars in millions) |
| Deferred tax assets: | | | |
| Tax loss carryforwards and credits | $ | 732.5 | | | $ | 745.6 | |
| Property, plant, equipment and mine development, principally due to differences in depreciation, depletion and asset impairments | 523.2 | | | 550.1 | |
| Accrued postretirement benefit obligations | 33.7 | | | 38.6 | |
| Asset retirement obligations | 102.4 | | | 99.1 | |
| | | |
| Employee benefits | 19.7 | | | 20.1 | |
| Take-or-pay obligations | 5.5 | | | 6.7 | |
| | | |
| | | |
| Investments and other assets | 32.6 | | | 40.8 | |
| Workers’ compensation obligations | 8.4 | | | 7.3 | |
| Operating lease liabilities | 29.0 | | | 17.2 | |
| Other | 33.0 | | | 30.6 | |
| Total gross deferred tax assets | 1,520.0 | | | 1,556.1 | |
| Valuation allowance | (1,420.9) | | | (1,473.5) | |
| Total net deferred tax assets | 99.1 | | | 82.6 | |
| Deferred tax liabilities: | | | |
| Property, plant, equipment and mine development, principally due to differences in depreciation, depletion and asset impairments | 95.5 | | | 84.9 | |
| Operating lease right-of-use assets | 29.1 | | | 16.3 | |
| | | |
| Investments and other assets | 15.4 | | | 10.0 | |
| Total deferred tax liabilities | 140.0 | | | 111.2 | |
| Net deferred tax liability | $ | (40.9) | | | $ | (28.6) | |
| Deferred taxes are classified as follows: | | | |
| | | |
| | | |
| Noncurrent deferred income tax liability | $ | (40.9) | | | $ | (28.6) | |
| | | |
As of December 31, 2024, the Company had gross U.S. federal NOLs of $1.7 billion. The Company’s tax loss carryforwards and credits of $732.5 million as of December 31, 2024 were comprised primarily of net federal NOLs of $361.5 million, tax general business credits (GBCs) of $139.1 million, net Australia NOLs and capital tax loss carryforwards of $125.4 million, state NOLs of $87.8 million and other foreign NOLs of $17.8 million. The foreign tax loss carryforwards have no expiration date. The federal NOLs begin to expire in 2037, the state NOLs begin to expire in 2028 and the GBCs begin to expire in 2027.
In assessing the near-term use of NOLs and tax credits and corresponding valuation allowance adjustments, the Company evaluates the expected level of reversals of existing taxable temporary differences, available tax planning strategies and future taxable income. The Company maintained valuation allowances of $1.4 billion against the U.S. net deferred tax asset position of $1.0 billion and against certain foreign deferred tax assets, primarily in Australia, of $0.4 billion. The valuation allowance against the U.S. and certain foreign deferred tax assets continues to be recorded due to unlikely realization.
| | | | | | | | |
| Peabody Energy Corporation | 2024 Form 10-K | F-26 |
PEABODY ENERGY CORPORATION
NOTES TO CONSOLIDATED FINANCIAL STATEMENTS — (Continued)
Unrecognized Tax Benefits
Net unrecognized tax benefits (excluding interest and penalties) were recorded as follows in the consolidated balance sheets as of December 31, 2024 and 2023:
| | | | | | | | | | | |
| December 31, |
| | 2024 | | 2023 |
| (Dollars in millions) |
| Deferred income taxes | $ | 9.2 | | | $ | 7.4 | |
| Other noncurrent liabilities | — | | | 1.3 | |
| Net unrecognized tax benefits | $ | 9.2 | | | $ | 8.7 | |
| Gross unrecognized tax benefits | $ | 9.2 | | | $ | 8.7 | |
The amount of the Company’s gross unrecognized tax benefits increased by $0.5 million since December 31, 2023 primarily due to additions for current and prior year positions, partially offset by reductions due to expiration of statutes. The amount of the net unrecognized tax benefits that, if recognized, would directly affect the effective tax rate was $9.2 million and $8.7 million at December 31, 2024 and 2023, respectively. A reconciliation of the beginning and ending amount of gross unrecognized tax benefits for the periods presented below is as follows:
| | | | | | | | | | | | | | | | | |
| | Year Ended December 31, |
| | 2024 | | 2023 | | 2022 |
| (Dollars in millions) |
| Balance at beginning of period | $ | 8.7 | | | $ | 9.5 | | | $ | 11.0 | |
| Additions for current year tax positions | 1.4 | | | 0.9 | | | 0.8 | |
| Additions (reductions) for prior year tax positions | 0.4 | | | (1.7) | | | (2.3) | |
| Reductions for expirations of statutes limitations | (1.3) | | | — | | | — | |
| Balance at end of period | $ | 9.2 | | | $ | 8.7 | | | $ | 9.5 | |
The Company recognizes interest and penalties related to unrecognized tax benefits in its income tax provision. During the year ended December 31, 2024, the Company’s gross interest and penalties decreased by $6.2 million due to expiration of statutes. The Company recorded $0.2 million of gross interest and penalties in each of the years ended December 31, 2023 and 2022. The Company had no accrued gross interest and penalties related to unrecognized tax benefits at December 31, 2024. The Company had $6.1 million and $5.9 million of accrued gross interest and penalties related to unrecognized tax benefits at December 31, 2023 and 2022, respectively.
The Company expects a decrease in its net unrecognized tax benefits of $0.8 million during the next twelve months due to expiration of statutes.
Tax Returns Subject to Examination
The Company’s federal income tax returns for the tax years 2017 and 2020 through 2023 are subject to potential examinations by the Internal Revenue Service. The Company’s state income tax returns for the tax years 2016 and thereafter remain potentially subject to examination by various state taxing authorities due to NOL carryforwards. Australian income tax returns for tax years 2019 through 2023 continue to be subject to potential examinations by the Australian Taxation Office.
Foreign Earnings
As of December 31, 2024, the Company has unremitted earnings relating to certain wholly owned subsidiaries that are not permanently reinvested, but there are no residual cash taxes on the unremitted earnings. The Company has an earnings deficit for remaining investments outside the U.S. and continues to be permanently reinvested with respect to its historical earnings. However, when appropriate, the Company has the ability to access foreign cash without incurring residual cash taxes due to the existence of NOLs.
| | | | | | | | |
| Peabody Energy Corporation | 2024 Form 10-K | F-27 |
PEABODY ENERGY CORPORATION
NOTES TO CONSOLIDATED FINANCIAL STATEMENTS — (Continued)
Tax Payments and Refunds
The following table summarizes the Company’s income tax payments, net for the periods presented below:
| | | | | | | | | | | | | | | | | |
| | Year Ended December 31, |
| | 2024 | | 2023 | | 2022 |
| | (Dollars in millions) |
| U.S. — federal | $ | (0.1) | | | $ | (0.2) | | | $ | (0.3) | |
| U.S. — state and local | — | | | 0.1 | | | — | |
| Non-U.S. | 222.6 | | | 130.7 | | | 36.9 | |
| Total income tax payments, net | $ | 222.5 | | | $ | 130.6 | | | $ | 36.6 | |
The Organisation for Economic Co-operation and Development (OECD)/G20 Inclusive Framework on Base Erosion and Profit Shifting published the Pillar Two model rules designed to address the tax challenges arising from the digitalization of the global economy. Pillar Two legislation has been enacted or substantially enacted in certain jurisdictions in which the Company operates, effective for the financial year beginning January 1, 2024. Based on an assessment performed, the Pillar Two effective tax rates in all jurisdictions in which the Company operates are above 15% and the Company is not currently aware of any circumstances under which this might change. Therefore, the Company did not incur any Pillar Two top-up taxes in the year ended December 31, 2024.
(9) Accounts Payable and Accrued Expenses
Accounts payable and accrued expenses consisted of the following:
| | | | | | | | | | | |
| December 31, |
| | 2024 | | 2023 |
| | (Dollars in millions) |
| Trade accounts payable | $ | 228.4 | | | $ | 275.8 | |
| Accrued payroll and related benefits | 176.8 | | | 174.3 | |
| Other accrued expenses | 130.1 | | | 140.8 | |
| Accrued taxes other than income | 66.9 | | | 59.3 | |
| Asset retirement obligations | 55.9 | | | 54.2 | |
| Accrued royalties | 50.7 | | | 71.2 | |
| Operating lease liabilities | 32.4 | | | 17.3 | |
| Accrued insurance | 29.8 | | | 32.7 | |
| Workers’ compensation obligations | 11.3 | | | 8.7 | |
| Income taxes payable | 10.7 | | | 120.8 | |
| Accrued litigation reserve | 10.0 | | | 1.6 | |
| Accrued interest | 4.7 | | | 3.6 | |
| Liabilities associated with discontinued operations | 4.0 | | | 5.2 | |
| | | |
| | | |
| | | |
| | | |
| | | |
| | | |
| Accounts payable and accrued expenses | $ | 811.7 | | | $ | 965.5 | |
| | | | | | | | |
| Peabody Energy Corporation | 2024 Form 10-K | F-28 |
PEABODY ENERGY CORPORATION
NOTES TO CONSOLIDATED FINANCIAL STATEMENTS — (Continued)
(10) Long-term Debt
The Company’s total indebtedness as of December 31, 2024 and 2023 consisted of the following:
| | | | | | | | | | | |
| December 31, |
| Debt Instrument (defined below, as applicable) | 2024 | | 2023 |
| (Dollars in millions) |
| | | |
| | | |
| | | |
| | | |
| | | |
| | | |
| 3.250% Convertible Senior Notes due March 2028 (2028 Convertible Notes) | $ | 320.0 | | | $ | 320.0 | |
| | | |
| BUMA Loan Note | 9.3 | | | — | |
| Finance lease obligations | 25.1 | | | 22.3 | |
| Less: Debt issuance costs | (6.3) | | | (8.1) | |
| 348.1 | | | 334.2 | |
| Less: Current portion of long-term debt | 15.8 | | | 13.5 | |
| Long-term debt | $ | 332.3 | | | $ | 320.7 | |
2028 Convertible Notes
On March 1, 2022, through a private offering, the Company issued the 2028 Convertible Notes in the aggregate principal amount of $320.0 million. The 2028 Convertible Notes are senior unsecured obligations of the Company and are governed under an indenture.
The Company used the proceeds of the offering of the 2028 Convertible Notes and available cash to redeem its then-existing senior secured notes and to pay related premiums, fees and expenses relating to the offering and redemptions. The Company capitalized $11.2 million of debt issuance costs related to the offering, which are being amortized over the terms of the notes.
The 2028 Convertible Notes will mature on March 1, 2028, unless earlier converted, redeemed or repurchased in accordance with their terms. The 2028 Convertible Notes bear interest at a rate of 3.250% per year, payable semi-annually in arrears on March 1 and September 1 of each year.
The 2028 Convertible Notes are convertible at the option of the holders only in the following circumstances: (1) during any calendar quarter commencing after the calendar quarter ended June 30, 2022, if the last reported sale price per share of the Company’s common stock exceeds 130% of the conversion price for each of at least 20 trading days during the 30 consecutive trading days ending on, and including, the last trading day of the immediately preceding calendar quarter; (2) during the five consecutive business days immediately after any five consecutive trading day period (such five consecutive trading day period, the Measurement Period) in which the trading price per $1,000 principal amount of 2028 Convertible Notes for each trading day of the Measurement Period was less than 98% of the product of the last reported sale price per share of the Company’s common stock on such trading day and the conversion rate on such trading day; (3) upon the occurrence of certain corporate events or distributions on the Company’s common stock; (4) if the Company calls any 2028 Convertible Notes for redemption; and (5) at any time from, and including, September 1, 2027 until the close of business on the second scheduled trading day immediately before the maturity date.
| | | | | | | | |
| Peabody Energy Corporation | 2024 Form 10-K | F-29 |
PEABODY ENERGY CORPORATION
NOTES TO CONSOLIDATED FINANCIAL STATEMENTS — (Continued)
Upon conversion, the Company may satisfy its conversion obligation by paying or delivering, as applicable, cash, shares of the Company’s common stock or a combination of cash and shares of the Company’s common stock, at the Company’s election, in the manner and subject to the terms and conditions provided in the indenture. The initial conversion rate for the 2028 Convertible Notes was 50.3816 shares of the Company’s common stock per $1,000 principal amount of 2028 Convertible Notes, which represented an initial conversion price of approximately $19.85 per share of the Company’s common stock. The terms of the indenture require conversion rate adjustments upon the payment of dividends to holders of the Company’s common stock once such cumulative dividends impact the conversion rate by at least 1%. Effective February 21, 2024, the conversion rate was increased to 51.0440 shares of the Company’s common stock per $1,000 principal amount of 2028 Convertible Notes, which represented an adjusted conversion price of approximately $19.59 per share. Under the applicable conversion rate formula, the dividends declared and paid during the nine months ended December 31, 2024 and the dividend declared during the three months ending March 31, 2025, yielded a revised conversion rate which met the 1% threshold to impact the existing conversion rate of 51.0440. As such, effective February 18, 2025, the conversion rate was increased to 51.7678 shares of the Company’s common stock per $1,000 principal amount of 2028 Convertible Notes. The conversion rate is subject to further adjustment under certain circumstances in accordance with the terms of the indenture. If certain corporate events described in the indenture occur prior to the maturity date, or the Company delivers a notice of redemption (as described below), the conversion rate will be increased for a holder who elects to convert its 2028 Convertible Notes in connection with such corporate event or notice of redemption, as the case may be, in certain circumstances.
The Company may not redeem the 2028 Convertible Notes prior to March 1, 2025. The Company may redeem for cash all or any portion of the 2028 Convertible Notes, at its option, on or after March 1, 2025 and on or before the 40th scheduled trading day immediately before the maturity date, at a cash redemption price equal to 100% of the principal amount of the 2028 Convertible Notes to be redeemed, plus accrued and unpaid interest, if any, to, but excluding, the redemption date, but only if the last reported sale price per share of the Company’s common stock exceeds 130% of the conversion price on (1) each of at least 20 trading days, whether or not consecutive, during the 30 consecutive trading days ending on, and including, the trading day immediately before the date the Company sends the related redemption notice; and (2) the trading day immediately before the date the Company sends such notice. However, the Company may not redeem less than all of the outstanding 2028 Convertible Notes unless at least $75 million aggregate principal amount of 2028 Convertible Notes are outstanding and not called for redemption as of the time the Company sends the related redemption notice. No sinking fund is provided for the 2028 Convertible Notes.
If the Company undergoes a fundamental change (as defined in the indenture), noteholders may require the Company to repurchase their 2028 Convertible Notes at a cash repurchase price equal to 100% of the principal amount of the 2028 Convertible Notes to be repurchased, plus accrued and unpaid interest, if any, to, but excluding, the fundamental change repurchase date.
During the fourth quarter ended December 31, 2024, the Company’s reported common stock prices did not prompt the conversion feature of the 2028 Convertible Notes. As a result, the 2028 Convertible Notes will not be convertible during the first quarter of 2025.
As of December 31, 2024, the if-converted value of the 2028 Convertible Notes exceeded the principal amount by $25.3 million.
Revolving Credit Facility
The Company established a new revolving credit facility with a maximum aggregate principal amount of $320.0 million in revolving commitments by entering into a credit agreement, dated as of January 18, 2024 (the 2024 Credit Agreement), by and among the Company, as borrower, certain subsidiaries of the Company party thereto, PNC Bank, National Association, as administrative agent, and the lenders party thereto. The Company paid aggregate debt issuance costs of $9.7 million.
| | | | | | | | |
| Peabody Energy Corporation | 2024 Form 10-K | F-30 |
PEABODY ENERGY CORPORATION
NOTES TO CONSOLIDATED FINANCIAL STATEMENTS — (Continued)
The revolving commitments and any related loans, if applicable (any such loans, the Revolving Loans), established by the 2024 Credit Agreement terminate or mature, as applicable, on January 18, 2028, subject to certain conditions relating to the Company’s outstanding 2028 Convertible Notes. The Revolving Loans bear interest at a secured overnight financing rate (SOFR) plus an applicable margin ranging from 3.50% to 4.25%, depending on the Company’s total net leverage ratio (as defined under the 2024 Credit Agreement) or a base rate plus an applicable margin ranging from 2.50% to 3.25%, at the Company’s option. Letters of credit issued under the 2024 Credit Agreement incur a combined fee equal to an applicable margin ranging from 3.50% to 4.25% plus a fronting fee equal to 0.125% per annum. Unused capacity under the 2024 Credit Agreement bears a commitment fee of 0.50% per annum. On November 25, 2024, the Company amended the 2024 Credit Agreement to, among other things, permit Peabody’s planned acquisition of multiple coal mines from Anglo American plc (Anglo) as further discussed in Note 17. “Other Events,” the related bridge loan facility and the incurrence of additional indebtedness to finance the acquisition, to the extent applicable. The Company paid aggregate deferred financing costs of $0.9 million as part of the amendment.
As of December 31, 2024, the 2024 Credit Agreement had only been utilized for letters of credit, including $86.3 million outstanding as of December 31, 2024. These letters of credit support the Company’s reclamation bonding requirements, lease obligations, insurance policies and various other performance guarantees as further described in Note 20. “Financial Instruments, Guarantees With Off-Balance-Sheet Risk and Other Guarantees.” Availability under the 2024 Credit Agreement was $233.7 million at December 31, 2024.
The 2024 Credit Agreement contains customary covenants that, among other things and subject to certain exceptions (including compliance with financial ratios), may limit the Company and its subsidiaries’ ability to incur additional indebtedness, make certain restricted payments or investments, sell or otherwise dispose of assets, enter into transactions with affiliates, create or incur liens, and merge, consolidate or sell all or substantially all of their assets. The 2024 Credit Agreement is secured by substantially all assets of the Company and its U.S. subsidiaries, as well as a pledge of two Australian subsidiaries.
BUMA Loan Note
Following the prospective closing of the Anglo acquisition, the Company is contracted to sell a portion of the assets (the Dawson Assets) to Pt Bukit Makmur Mandiri Utama or one of its subsidiaries (BUMA). Accordingly, on November 25, 2024, concurrent with its entry into the purchase agreements for the Anglo acquisition, the Company entered into a loan note deed with BUMA pursuant to which BUMA will lend to the Company the funds required to purchase the Dawson Assets under the Anglo acquisition purchase agreements and fund certain other obligations in relation to the Dawson Assets (the BUMA Loan Note). The Company received $9.3 million in BUMA Loan Note proceeds during the year ended December 31, 2024 to fund a portion of the deposit to Anglo for the planned acquisition. The BUMA Loan Note bears interest at a coupon rate of 10% per year.
Refer to Note 17. “Other Events” for additional information associated with the Anglo acquisition.
Bridge Loan Facility
Concurrently with its entry into definitive agreements to acquire the Anglo assets, the Company entered into a bridge loan facility commitment letter (the Bridge Commitment Letter, and the senior secured 364-day bridge facility provided for therein, the Bridge Facility), pursuant to which the lenders, agreed to provide the Bridge Facility to the Company in the amount of up to $2.075 billion in order to finance the planned acquisition in part. The Company expects to replace the Bridge Facility with permanent financing prior to the closing date, but there can be no assurance such financing will occur and any such expectation is subject to market conditions.
To the extent borrowings are made under the Bridge Facility, any loans would bear interest at a SOFR plus an applicable margin of 8.00% or a base rate plus an applicable margin of 7.00%, at the Company’s option. Such applicable margin would increase by an additional 0.75% on the date that is 90 days following the closing date of the planned acquisition. Any borrowings under the Bridge Facility would mature 364 days from the initial funding date, which would be on or around the closing date of the planned acquisition.
The availability of borrowings under the Bridge Facility is subject to the satisfaction of certain customary conditions for transactions of this type. Any definitive financing documentation for the Bridge Facility will contain customary representations and warranties, covenants and events of defaults for transactions of this type. Upon execution of any definitive financing documentation for the Bridge Facility, the Bridge Facility will be guaranteed by substantially all U.S. subsidiaries of the Company and secured by substantially all assets of the Company, its U.S. subsidiaries and, subject to certain conditions, certain of the Company’s Australian subsidiaries.
| | | | | | | | |
| Peabody Energy Corporation | 2024 Form 10-K | F-31 |
PEABODY ENERGY CORPORATION
NOTES TO CONSOLIDATED FINANCIAL STATEMENTS — (Continued)
Interest Charges
The following table presents the components of the Company’s interest expense related to its indebtedness and financial assurance instruments such as surety bonds and letters of credit. Additionally, the table sets forth the amount of cash paid for interest, net of capitalized interest and the amount of non-cash interest expense primarily related to the amortization of debt issuance costs.
| | | | | | | | | | | | | | | | | |
| Year Ended December 31, |
| 2024 | | 2023 | | 2022 |
| (Dollars in millions) |
| 2028 Convertible Notes | $ | 10.4 | | | $ | 10.4 | | | $ | 8.7 | |
| Debt retired during 2022 | — | | | — | | | 51.5 | |
| Finance lease obligations | 1.8 | | | 1.8 | | | 2.1 | |
| Financial assurance instruments | 27.3 | | | 38.2 | | | 53.3 | |
| Amortization of debt issuance costs | 5.4 | | | 3.6 | | | 17.3 | |
| Receivables securitization program | 2.6 | | | 3.6 | | | 3.8 | |
| Capitalized interest | (5.8) | | | — | | | — | |
| Other | 5.2 | | | 2.2 | | | 3.6 | |
| Interest expense, net of capitalized interest | $ | 46.9 | | | $ | 59.8 | | | $ | 140.3 | |
| | | | | |
| Cash paid for interest, net of capitalized interest | $ | 37.6 | | | $ | 61.9 | | | $ | 118.5 | |
| Non-cash interest expense | $ | 5.4 | | | $ | 4.6 | | | $ | 17.7 | |
Covenant Compliance
The Company was compliant with all relevant covenants under its debt and other finance agreements at December 31, 2024.
Finance Lease Obligations
Refer to Note 11. “Leases” for additional information associated with the Company’s finance leases, which pertain to the financing of mining equipment used in operations.
(11) Leases
The Company has operating and finance leases for mining and non-mining equipment, office space and certain other facilities under various non-cancellable agreements. Historically, the majority of the Company’s leases have been accounted for as operating leases. Refer to Note 1. “Summary of Significant Accounting Policies” for the Company’s policies regarding “Leases.”
The Company and certain of its subsidiaries have guaranteed other subsidiaries’ performance under various lease obligations. Certain lease agreements are subject to the restrictive covenants of the Company’s credit facilities and include cross-acceleration provisions, under which the lessor could require remedies including, but not limited to, immediate recovery of the present value of any remaining lease payments. The Company typically agrees to indemnify lessors for the value of the property or equipment leased, should the property be damaged or lost during the course of the Company’s operations. The Company expects that losses with respect to leased property, if any, may be covered by insurance (subject to deductibles). Aside from indemnification of the lessor for the value of the property leased, the Company’s maximum potential obligations under its leases are equal to the respective future minimum lease payments, and the Company assumes that no amounts could be recovered from third parties.
| | | | | | | | |
| Peabody Energy Corporation | 2024 Form 10-K | F-32 |
PEABODY ENERGY CORPORATION
NOTES TO CONSOLIDATED FINANCIAL STATEMENTS — (Continued)
The components of lease expense for the periods presented below were as follows:
| | | | | | | | | | | | | | | | | |
| Year Ended December 31, |
| 2024 | | 2023 | | 2022 |
| (Dollars in millions) |
| Operating lease cost: | | | | | |
| Operating leases | $ | 36.9 | | | $ | 22.1 | | | $ | 18.9 | |
| Short-term leases | 32.7 | | | 44.3 | | | 30.6 | |
| Variable leases | 4.7 | | | 8.7 | | | 7.6 | |
| Sublease income | (0.6) | | | (1.4) | | | (1.3) | |
| Total operating lease cost | $ | 73.7 | | | $ | 73.7 | | | $ | 55.8 | |
| | | | | |
| Finance lease cost: | | | | | |
| Amortization of right-of-use assets | $ | 8.8 | | | $ | 7.2 | | | $ | 6.3 | |
| Interest on lease liabilities | 1.8 | | | 1.7 | | | 2.1 | |
| Total finance lease cost | $ | 10.6 | | | $ | 8.9 | | | $ | 8.4 | |
Supplemental balance sheet information related to leases at December 31, 2024 and 2023 was as follows:
| | | | | | | | | | | |
| December 31, |
| 2024 | | 2023 |
| (Dollars in millions) |
| Operating leases: | | | |
| Operating lease right-of-use assets | $ | 119.3 | | | $ | 61.9 | |
| | | |
| Accounts payable and accrued expenses | $ | 32.4 | | | $ | 17.3 | |
| Operating lease liabilities, less current portion | 86.7 | | | 47.7 | |
| Total operating lease liabilities | $ | 119.1 | | | $ | 65.0 | |
| | | |
| Finance leases: | | | |
| Property, plant, equipment and mine development | $ | 46.8 | | | $ | 34.3 | |
| Accumulated depreciation | (22.8) | | | (15.4) | |
| Property, plant, equipment and mine development, net | $ | 24.0 | | | $ | 18.9 | |
| | | |
| Current portion of long-term debt | $ | 15.8 | | | $ | 13.5 | |
| Long-term debt, less current portion | 9.3 | | | 8.8 | |
| Total finance lease liabilities | $ | 25.1 | | | $ | 22.3 | |
| | | |
| Weighted average remaining lease term (years) | | | |
| Operating leases | 4.0 | | 4.6 |
| Finance leases | 5.2 | | 2.3 |
| | | |
| Weighted average discount rate | | | |
| Operating leases | 7.1 | % | | 6.8 | % |
| Finance leases | 6.2 | % | | 6.8 | % |
| | | | | | | | |
| Peabody Energy Corporation | 2024 Form 10-K | F-33 |
PEABODY ENERGY CORPORATION
NOTES TO CONSOLIDATED FINANCIAL STATEMENTS — (Continued)
Supplemental cash flow information related to leases for the periods presented below was as follows:
| | | | | | | | | | | | | | | | | |
| Year Ended December 31, |
| 2024 | | 2023 | | 2022 |
| (Dollars in millions) |
| Cash paid for amounts included in the measurement of lease liabilities: | | | | | |
| Operating cash flows for operating leases | $ | 34.1 | | | $ | 18.8 | | | $ | 20.5 | |
| Operating cash flows for finance leases | 1.8 | | | 1.7 | | | 2.1 | |
| Financing cash flows for finance leases | 10.4 | | | 9.0 | | | 9.3 | |
| | | | | |
| Right-of-use assets obtained in exchange for lease obligations: | | | | | |
| Operating leases | 84.9 | | | 55.6 | | | 13.5 | |
| Finance leases | 14.4 | | | 6.7 | | | 6.4 | |
The Company's leases have remaining lease terms ranging from 1 year to 10 years, and may include options to extend the terms, as applicable. The contractual maturities of lease liabilities were as follows:
| | | | | | | | | | | | | | |
| Period Ending December 31, | | Operating Leases | | Finance Leases |
| | | (Dollars in millions) |
| 2025 | | $ | 38.2 | | | $ | 16.6 | |
| 2026 | | 34.4 | | | 8.0 | |
| 2027 | | 29.0 | | | 2.4 | |
| 2028 | | 22.5 | | | 0.7 | |
| 2029 | | 5.8 | | | 0.1 | |
| 2030 and thereafter | | 3.1 | | | — | |
| Total lease payments | | 133.0 | | | 27.8 | |
| Less imputed interest | | (13.9) | | | (2.7) | |
| Total lease liabilities | | $ | 119.1 | | | $ | 25.1 | |
(12) Asset Retirement Obligations
Reconciliations of the Company’s asset retirement obligations are as follows:
| | | | | | | | | | | |
| | December 31, |
| | 2024 | | 2023 |
| | (Dollars in millions) |
| Balance at beginning of period | $ | 702.8 | | | $ | 750.0 | |
| | | |
| Liabilities settled | (51.7) | | | (60.4) | |
| Accretion expense | 51.4 | | | 61.3 | |
| Revisions to estimates | 21.2 | | | (48.1) | |
| Balance at end of period | $ | 723.7 | | | $ | 702.8 | |
| Less: Current portion (included in “Accounts payable and accrued expenses”) | 55.9 | | | 54.2 | |
| Noncurrent obligation (included in “Asset retirement obligations, less current portion”) | $ | 667.8 | | | $ | 648.6 | |
| Balance at end of period — active locations | $ | 507.9 | | | $ | 541.3 | |
| Balance at end of period — closed or inactive locations | $ | 215.8 | | | $ | 161.5 | |
The Company’s reclamation obligations are secured by surety bonds, which are supported by standby letters of credit and restricted cash, and various other forms of collateral. See Note 20. “Financial Instruments, Guarantees With Off-Balance-Sheet Risk and Other Guarantees” for a discussion of the collateral securing the asset retirement obligations.
| | | | | | | | |
| Peabody Energy Corporation | 2024 Form 10-K | F-34 |
PEABODY ENERGY CORPORATION
NOTES TO CONSOLIDATED FINANCIAL STATEMENTS — (Continued)
(13) Postretirement Health Care and Life Insurance Benefits
The Company currently provides health care and life insurance benefits to qualifying salaried and hourly retirees of its current and certain former subsidiaries and their dependents from benefit plans established by the Company. Plan coverage for health benefits is provided to future hourly and salaried retirees in accordance with the applicable plan document. Life insurance benefits are provided to future represented hourly retirees in accordance with the Company’s benefit plans and any applicable labor agreement.
Net periodic postretirement benefit credit included the following components:
| | | | | | | | | | | | | | | | | |
| | Year Ended December 31, |
| | 2024 | | 2023 | | 2022 |
| | (Dollars in millions) |
| Service cost for benefits earned | $ | 0.5 | | | $ | 0.5 | | | $ | 0.8 | |
| Interest cost on accumulated postretirement benefit obligation | 9.1 | | | 10.2 | | | 7.0 | |
| Expected return on plan assets | (0.4) | | | (0.5) | | | (0.8) | |
| Amortization of prior service credit | (53.0) | | | (53.8) | | | (53.8) | |
| Net actuarial gain | (17.0) | | | (2.6) | | | (51.2) | |
| Net periodic postretirement benefit credit | $ | (60.8) | | | $ | (46.2) | | | $ | (98.0) | |
The actuarial gain for all benefit plans in 2024 was primarily due to the increase in the discount rate used to measure the benefit obligation and favorable impact of claims experience for the year. The actuarial gain for all benefit plans in 2023 was primarily due to favorable impact of claims experience for the year offset by the decrease in the discount rate used to measure the benefit obligation. The actuarial gain for all benefit plans in 2022 was primarily due to the increase in the discount rate used to measure the benefit obligation and favorable impact of claims experience for the year offset by increase in medical trend rate due to inflation as well as the expected impact of the Inflation Reduction Act.
The following includes pretax amounts recorded in “Accumulated other comprehensive income”:
| | | | | | | | | | | | | | | | | |
| | Year Ended December 31, |
| | 2024 | | 2023 | | 2022 |
| | (Dollars in millions) |
| Prior service credit arising during year | $ | (6.5) | | | $ | — | | | $ | — | |
| Amortization: | | | | | |
| Prior service credit | 53.0 | | | 53.8 | | | 53.8 | |
| Total recorded in “Accumulated other comprehensive income” | $ | 46.5 | | | $ | 53.8 | | | $ | 53.8 | |
The Company amortizes prior service credit over an amortization period of the average remaining service period to full eligibility for participating employees at the time of the plan change or the expected lifetime of participants in the plan. A prior service credit established during 2024 is described below. The estimated prior service credit that will be amortized from accumulated other comprehensive income into net periodic postretirement benefit cost during the year ending December 31, 2025 is $40.8 million.
| | | | | | | | |
| Peabody Energy Corporation | 2024 Form 10-K | F-35 |
PEABODY ENERGY CORPORATION
NOTES TO CONSOLIDATED FINANCIAL STATEMENTS — (Continued)
The following table sets forth the plans’ funded status reconciled with the amounts shown in the consolidated balance sheets:
| | | | | | | | | | | |
| | December 31, |
| | 2024 | | 2023 |
| | (Dollars in millions) |
| Change in benefit obligation: | | | |
| Accumulated postretirement benefit obligation at beginning of period | $ | 178.0 | | | $ | 189.9 | |
| Service cost | 0.5 | | | 0.5 | |
| Interest cost | 9.1 | | | 10.2 | |
| | | |
| Plan amendments | (6.5) | | | — | |
| Benefits paid and administrative fees (net of Medicare Part D reimbursements) | (18.8) | | | (20.9) | |
| Actuarial gain | (16.9) | | | (1.7) | |
| Accumulated postretirement benefit obligation at end of period | 145.4 | | | 178.0 | |
| Change in plan assets: | | | |
| Fair value of plan assets at beginning of period | 14.3 | | | 17.4 | |
| Actual return on plan assets | 0.5 | | | 1.5 | |
| Employer contributions | 15.3 | | | 16.3 | |
| | | |
| Benefits paid and administrative fees (net of Medicare Part D reimbursements) | (18.8) | | | (20.9) | |
| Fair value of plan assets at end of period | 11.3 | | | 14.3 | |
| Funded status at end of period | (134.1) | | | (163.7) | |
| Less: Current portion (included in “Accounts payable and accrued expenses”) | 13.7 | | | 15.3 | |
| Noncurrent obligation (included in “Accrued postretirement benefit costs”) | $ | 120.4 | | | $ | 148.4 | |
In December 2024, the Company entered into a new labor agreement covering certain represented employees. Under terms of the new labor agreement, when a represented employee retires or dies the health benefits of the retiree and/or their surviving spouse and any eligible dependents will be provided by the labor union and will no longer be covered by the Company’s health plan. The Company will continue to offer a life insurance benefit to eligible represented retirees. The impact of the changes on future benefits reduced the Company’s accumulated postretirement benefit obligation by $6.5 million. The reduction was attributable to the elimination of health care benefits for certain represented retirees. The reduction in liability was recorded with an offsetting balance in “Accumulated other comprehensive income” and is being amortized to earnings over the average remaining life expectancy of participants benefiting under the plan (12.7 years is the amortization period at December 31, 2024; $6.5 million remaining in “Accumulated other comprehensive income” at December 31, 2024).
A prior service credit established in October 2021 is being amortized to earnings over the average remaining life expectancy of the affected plan participants (11.0 years and 12.0 years were the remaining amortization periods at December 31, 2024 and 2023, respectively; $107.6 million remaining in “Accumulated other comprehensive income” at December 31, 2024). A prior service credit established in December 2020 is being amortized to earnings over the average remaining life expectancy of the affected plan participants 6.5 years and 7.5 years were the remaining amortization periods at December 31, 2024 and 2023, respectively; $6.7 million remaining in “Accumulated other comprehensive income” at December 31, 2024). A prior service credit established in September 2020 is being amortized to earnings over an average remaining service period to full eligibility for participating employees (0.9 years and 1.9 years were the remaining amortization periods at December 31, 2024 and 2023, respectively; $29.4 million remaining in “Accumulated other comprehensive income” at December 31, 2024). A prior service credit established in December 2018 was amortized to earnings over an average remaining service period to full eligibility for participating employees (0.9 years was the remaining amortization period at December 31, 2023).
The weighted-average assumptions used to determine the benefit obligations for the plans as of the end of each year were as follows:
| | | | | | | | | | | |
| December 31, |
| | 2024 | | 2023 |
| Discount rate | 5.70 | % | | 5.44 | % |
| Measurement date | December 31, 2024 | | December 31, 2023 |
| | | | | | | | |
| Peabody Energy Corporation | 2024 Form 10-K | F-36 |
PEABODY ENERGY CORPORATION
NOTES TO CONSOLIDATED FINANCIAL STATEMENTS — (Continued)
The weighted-average assumptions used to determine net periodic postretirement benefit credit for the plans during each period were as follows:
| | | | | | | | | | | | | | | | | |
| Year Ended December 31, |
| | 2024 | | 2023 | | 2022 |
| Discount rate | 5.44 | % | | 5.70 | % | | 2.84 | % |
| Expected long-term return on plan assets (pretax) | 5.75 | % | | 5.75 | % | | 5.75 | % |
| Measurement date | December 31, 2023 | | December 31, 2022 | | December 31, 2021 |
The expected rate of return on plan assets is determined by taking into consideration expected long-term returns associated with each major asset class based on long-term historical ranges, inflation assumptions and the expected net value from active management of the assets based on actual results. Effective January 1, 2025, the Company increased its expected rate of return on plan assets from 5.75% to 5.95% reflecting the impact of its asset allocations and capital market expectations.
The following presents information about the assumed health care cost trend rate:
| | | | | | | | | | | |
| Year Ended December 31, |
| | 2024 | | 2023 |
| Pre-Medicare: | | | |
| Health care cost trend rate assumed for next year | 6.50 | % | | 6.75 | % |
| Rate to which the cost trend is assumed to decline (the ultimate trend rate) | 4.75 | % | | 4.75 | % |
| Year that the rate reaches the ultimate trend rate | 2032 | | 2032 |
| | | |
| Post-Medicare: | | | |
Health care cost trend rate assumed for next year (1) | 6.15 | % | | 9.45 | % |
| Rate to which the cost trend is assumed to decline (the ultimate trend rate) | 4.75 | % | | 4.75 | % |
| Year that the rate reaches the ultimate trend rate | 2032 | | 2032 |
(1) An additional one-time increase of 3% was applied to claims in 2024 to reflect potential reductions in payments from Center for Medicare and Medicaid Services related to the passage of the Inflation Reduction Act in August 2022.
Plan Assets
The Company maintains a Voluntary Employees’ Beneficiary Association (VEBA) trust to pre-fund a portion of benefits for non-represented retirees. Assets of the Peabody Investments Corp. Non-Represented Retiree VEBA Trust (the Non-Represented Trust) are invested in accordance with the investment policy established by the Peabody VEBA Retirement Committee after consultation with outside investment advisors and actuaries. As of December 31, 2024 and 2023, the asset allocation strategy for the Non-Represented Trust is 30% in equity and 70% in fixed income assets. The asset strategy may vary over time based on changes in the status of the Non-Represented Trust, the Company’s risk posture and other factors.
A financial instrument’s level within the valuation hierarchy is based upon the lowest level of input that is significant to the fair value measurement. Following is a description of the valuation techniques and inputs used for investments measured at fair value, including the general classification of such investments pursuant to the valuation hierarchy.
U.S. equity securities. The Non-Represented Trust invests in U.S. equity securities for growth and diversification. Investment vehicles include various domestic large-cap publicly traded common stocks and mutual funds. All common stocks are traded on a national securities exchange and are valued at quoted market prices in active markets and accordingly classified within Level 1 of the valuation hierarchy. The mutual funds are traded on a national securities exchange in an active market, are valued using daily publicly quoted net asset value (NAV) prices and accordingly classified within Level 1 of the valuation hierarchy.
International equity securities. The Non-Represented Trust invests in international equity securities for growth and diversification. Investment vehicles include mutual funds. The mutual funds are traded on a national securities exchange in an active market, are valued using daily publicly quoted net asset value (NAV) prices and accordingly classified within Level 1 of the valuation hierarchy.
| | | | | | | | |
| Peabody Energy Corporation | 2024 Form 10-K | F-37 |
PEABODY ENERGY CORPORATION
NOTES TO CONSOLIDATED FINANCIAL STATEMENTS — (Continued)
Corporate bonds. The Non-Represented Trust invests in corporate bonds for diversification, volatility reduction of equity securities and to provide a hedge to interest rate movements affecting liabilities. Investment types are predominantly investment-grade corporate bonds. Fair value for these securities is provided by a third-party pricing service that utilizes various inputs such as benchmark yields, reported trades, broker/dealer quotes, issuer spreads and benchmark securities as well as other relevant economic measures. Corporate bonds are classified within the Level 2 valuation hierarchy since fair value inputs are derived prices in active markets and the bonds are not traded on a national securities exchange.
U.S. government securities. The Non-Represented Trust invests in U.S. government securities for diversification, volatility reduction of equity securities and to provide a hedge to interest rate movements affecting liabilities. Investment types are predominantly U.S. government bonds, notes, agency securities and municipal bonds. Fair value for these securities is provided by a third-party pricing service that utilizes various inputs such as benchmark yields, reported trades, broker/dealer quotes, issuer spreads and benchmark securities as well as other relevant economic measures. If fair value is based on quoted prices in active markets and traded on a national securities exchange, U.S. government securities are classified within the Level 1 valuation hierarchy; otherwise, U.S. government securities are classified within the Level 2 valuation hierarchy.
Cash funds. The Non-Represented Trust invests in cash funds to manage liquidity resulting from payment of participant benefits and certain administrative fees. The investment consists of non-interest bearing cash funds and U.S. government money market fund which are classified within the Level 1 valuation hierarchy.
The methods described above may produce a fair value calculation that may not be indicative of net realizable value or reflective of future fair values. Furthermore, while the Company believes its valuation methods are appropriate and consistent with other market participants, the use of different methodologies or assumptions to determine the fair value of certain financial instruments could result in a different fair value measurement at the reporting date. The inputs or methodologies used for valuing investments are not necessarily an indication of the risk associated with investing in those investments.
The following tables present the fair value of assets in the Non-Represented Trust by asset category and by fair value hierarchy:
| | | | | | | | | | | | | | | | | | | | | | | |
| December 31, 2024 |
| Level 1 | | Level 2 | | Level 3 | | Total |
| | (Dollars in millions) |
| U.S. equity securities | $ | 2.7 | | | $ | — | | | $ | — | | | $ | 2.7 | |
| International equity securities | 0.7 | | | — | | | — | | | 0.7 | |
| Corporate bonds | — | | | 3.5 | | | — | | | 3.5 | |
| U.S. government securities | 1.1 | | | 2.7 | | | — | | | 3.8 | |
| Cash funds | 0.6 | | | — | | | — | | | 0.6 | |
| Total assets at fair value | $ | 5.1 | | | $ | 6.2 | | | $ | — | | | $ | 11.3 | |
| | | | | | | | | | | | | | | | | | | | | | | |
| December 31, 2023 |
| Level 1 | | Level 2 | | Level 3 | | Total |
| | (Dollars in millions) |
| U.S. equity securities | $ | 3.0 | | | $ | — | | | $ | — | | | $ | 3.0 | |
| International equity securities | 0.9 | | | — | | | — | | | 0.9 | |
| Corporate bonds | — | | | 5.2 | | | — | | | 5.2 | |
| U.S. government securities | 1.8 | | | 2.8 | | | — | | | 4.6 | |
| Cash funds | 0.6 | | | — | | | — | | | 0.6 | |
| Total assets at fair value | $ | 6.3 | | | $ | 8.0 | | | $ | — | | | $ | 14.3 | |
Contributions
Annual contributions to the Non-Represented Trust are discretionary. During the year ended December 31, 2024, the Company made no contributions to the trust.
| | | | | | | | |
| Peabody Energy Corporation | 2024 Form 10-K | F-38 |
PEABODY ENERGY CORPORATION
NOTES TO CONSOLIDATED FINANCIAL STATEMENTS — (Continued)
Estimated Future Benefit Payments
The following benefit payments (net of retiree contributions and Medicare Part D reimbursements), which reflect expected future service, as appropriate, are expected to be paid by the Company or satisfied from Non-Represented Trust assets:
| | | | | |
| | Postretirement
Benefits |
| | (Dollars in millions) |
| 2025 | $ | 18.7 | |
| 2026 | 17.6 | |
| 2027 | 16.6 | |
| 2028 | 15.6 | |
| 2029 | 14.5 | |
| Years 2030-2034 | 58.0 | |
(14) Pension and Savings Plans
One of the Company’s subsidiaries, Peabody Investments Corp. (PIC), sponsored a defined benefit pension plan covering certain U.S. salaried employees and eligible hourly employees at certain PIC subsidiaries (the Peabody Plan). As discussed further below, the Peabody Plan was terminated in 2022 with assets distributed in 2023. A subsidiary of PIC has a defined benefit pension plan covering eligible employees who are represented by the United Mine Workers of America (UMWA) under the Kayenta Reclamation Agreement of 2024 (the Western Plan and together with the Peabody Plan, the Pension Plans).
Effective May 31, 2008, the Peabody Plan was frozen in its entirety for both participation and benefit accrual purposes. In March 2022, PIC entered into a commitment agreement relating to the Peabody Plan with The Prudential Insurance Company of America (Prudential) and Fiduciary Counselors Inc., as independent fiduciary to the Peabody Plan. Under the commitment agreement, the Peabody Plan purchased a buy-in group annuity contract (GAC) from Prudential for approximately $500 million, which was funded directly by the Peabody Plan’s assets. The benefit obligation was not transferred to Prudential and the Peabody Plan continued to administer and pay the retirement benefits of Peabody Plan participants, but was reimbursed by Prudential for the payment of all benefits covered by the GAC. There was no impact on the monthly retirement benefits paid to Peabody Plan participants and no material impact on contributions for the Peabody Plan in 2022 or 2023 as a result of this transaction.
In May 2022, the Board of Directors of PIC approved the termination of the Peabody Plan effective July 31, 2022. In June 2022, the Peabody Plan’s participants were notified of the Peabody Plan termination and PIC filed an application with the Internal Revenue Service to request a determination as to the qualified status under §401(a) of the Internal Revenue Code of 1986 with respect to the amendment and termination of the Peabody Plan. In May 2023, PIC received a favorable determination from the Internal Revenue Service as to the Peabody Plan’s qualified status with respect to its plan termination.
In February 2023, as part of the Peabody Plan termination process, PIC announced a program to offer a voluntary lump-sum pension payout to certain active and deferred participants of the Peabody Plan which would fully settle the Peabody Plan’s obligation to them. The program provided participants with a limited-time opportunity to elect to receive a lump-sum settlement of their pension benefit or begin to receive their benefit in the form of a monthly annuity in May 2023.
On July 31, 2023, as part of the completion of the standard Employee Retirement Income Security Act plan termination process for the Peabody Plan, the GAC with Prudential was converted from a buy-in group annuity contract to a buy-out group annuity contract, irrevocably transferring the remaining benefit obligation and administration to Prudential. Peabody no longer administers or pays the retirement benefits of Peabody Plan participants. No cash contributions were required to complete the termination process for the Peabody Plan.
| | | | | | | | |
| Peabody Energy Corporation | 2024 Form 10-K | F-39 |
PEABODY ENERGY CORPORATION
NOTES TO CONSOLIDATED FINANCIAL STATEMENTS — (Continued)
During the year ended December 31, 2023, the Company settled $443.2 million of its pension obligations for active and deferred participants in the Peabody Plan with an equal amount paid from plan assets. As a result of the termination process, the Company recorded a settlement gain of $2.2 million during the year ended December 31, 2023, which was reflected in “Net periodic benefit credit, excluding service cost” on the consolidated statements of operations. As a result of the Peabody Plan’s over-funded status, $11.1 million was transferred to a Company sponsored employee retirement account (the Qualified Replacement Plan) during December 2023 as part of the distribution of the Peabody Plan assets resulting from the Peabody Plan termination. The Company will use the funds in the Qualified Replacement Plan at least ratably over a seven year period.
Net periodic pension cost included the following components:
| | | | | | | | | | | | | | | | | |
| | Year Ended December 31, |
| | 2024 | | 2023 | | 2022 |
| | (Dollars in millions) |
| Service cost for benefits earned | $ | 0.1 | | | $ | 0.1 | | | $ | 0.1 | |
| Interest cost on projected benefit obligation | 6.5 | | | 20.1 | | | 21.4 | |
| Expected return on plan assets | (4.9) | | | (17.6) | | | (23.8) | |
| | | | | |
| Settlement | — | | | (2.2) | | | — | |
| Net actuarial loss | 1.9 | | | — | | | 20.6 | |
| Net periodic pension cost | $ | 3.6 | | | $ | 0.4 | | | $ | 18.3 | |
The actuarial loss for the Western Plan in 2024 was primarily due to actual returns on plan assets that were lower than expected returns for the year offset by the increase in the discount rate used to measure the benefit obligation. The actuarial loss for all pension plans in 2022 was primarily due to actual returns on plan assets that were lower than expected returns for the year and the premium paid to Prudential to purchase the GAC, offset by the increase in the discount rate used to measure the benefit obligation.
The following summarizes the change in benefit obligation, change in plan assets and funded status of the Pension Plans:
| | | | | | | | | | | |
| | December 31, |
| | 2024 | | 2023 |
| | (Dollars in millions) |
| Change in benefit obligation: | | | |
| Projected benefit obligation at beginning of period | $ | 125.2 | | | $ | 580.9 | |
| Service cost | 0.1 | | | 0.1 | |
| Interest cost | 6.5 | | | 20.1 | |
| Benefits paid | (10.7) | | | (36.1) | |
| Actuarial (gain) loss | (3.5) | | | 3.4 | |
| Settlement | — | | | (443.2) | |
| Projected benefit obligation at end of period | 117.6 | | | 125.2 | |
| Change in plan assets: | | | |
| Fair value of plan assets at beginning of period | 116.0 | | | 583.3 | |
| Actual return on plan assets | (0.5) | | | 23.1 | |
| Employer contributions | — | | | (11.1) | |
| Benefits paid | (10.7) | | | (36.1) | |
| Settlement | — | | | (443.2) | |
| Fair value of plan assets at end of period | 104.8 | | | 116.0 | |
| Funded status at end of period | $ | (12.8) | | | $ | (9.2) | |
| Amounts recognized in the consolidated balance sheets: | | | |
| | | |
| Noncurrent obligation (included in “Other noncurrent liabilities”) | $ | 12.8 | | | $ | 9.2 | |
| | | |
| | | | | | | | |
| Peabody Energy Corporation | 2024 Form 10-K | F-40 |
PEABODY ENERGY CORPORATION
NOTES TO CONSOLIDATED FINANCIAL STATEMENTS — (Continued)
The weighted-average assumptions used to determine the benefit obligations as of the end of each year were as follows:
| | | | | | | | | | | |
| December 31, |
| | 2024 | | 2023 |
| Discount rate | 5.70 | % | | 5.40 | % |
| Measurement date | December 31, 2024 | | December 31, 2023 |
The weighted-average assumptions used to determine net periodic pension cost (credit) during each period were as follows:
| | | | | | | | | | | | | | | | | |
| Year Ended December 31, |
| 2024 | | 2023 | | 2022 |
| Discount rate | 5.40 | % | | 5.44 | % | | 2.95 | % |
| Expected long-term return on plan assets | 4.40 | % | | 4.85 | % | | 3.20 | % |
| Measurement date | December 31, 2023 | | December 31, 2022 | | December 31, 2021 |
The expected rate of return on plan assets is determined by taking into consideration expected long-term returns associated with each major asset class based on long-term historical ranges, inflation assumptions and the expected net value from active management of the assets based on actual results. Effective January 1, 2025, the Company raised its expected rate of return on plan assets from 4.40% to 4.95% for the Western Plan, reflecting the impact of its asset allocations and capital market expectations.
As of December 31, 2024 and 2023, the projected benefit obligation and accumulated benefit obligation for the Western Plan was $117.6 million and $125.2 million, respectively, which exceeded the plan assets of $104.8 million and $116.0 million, respectively, for those periods. As of December 31, 2024 and 2023, there were no plan assets, projected benefit obligation or accumulated benefit obligation for the Peabody Plan.
Assets of the Pension Plans
Prior to December 31, 2023, assets of the PIC Master Trust (the Master Trust) were invested in accordance with investment guidelines established by the Peabody Plan Retirement Committee and the Peabody Western Plan Retirement Committee (collectively, the Retirement Committees) after consultation with outside investment advisors and actuaries. As of January 1, 2024, assets of the Master Trust are invested in accordance with investment guidelines established by the Western Plan Retirement Committee after consultation with outside investment advisors and actuaries.
The asset allocation targets have been set with the expectation that the assets of the Master Trust will be managed with an appropriate level of risk to fund each Pension Plan’s expected liabilities. To determine the appropriate target asset allocations, the Retirement Committees consider the demographics of each Pension Plan’s participants, the funded status of each Pension Plan, the business and financial profile of the Company and other associated risk preferences. These allocation targets are reviewed by the Retirement Committees on a regular basis and revised as necessary. As a result of discretionary contributions made in recent years, the Western Plan has become nearly fully funded and therefore, as of December 31, 2024 and 2023, the Master Trust investment portfolio reflected the Company’s target asset mix of 100% fixed income investments. Prior to December 31, 2023, the assets of the Master Trust also included investments of the Peabody Plan as well as various real estate holdings through limited partnerships. The Peabody Plan assets were distributed and all real estate holdings were liquidated as of December 31, 2023.
Assets of the Master Trust are under management by third-party investment managers, which are selected and monitored by the Retirement Committees. Specific investment guidelines have been established by the Retirement Committees for each major asset class including performance benchmarks, allowable and prohibited investment types and concentration limits. In general, investment guidelines do not permit leveraging the assets held in the Master Trust. However, investment managers may employ various strategies and derivative instruments in establishing overall portfolio characteristics consistent with the guidelines and investment objectives established by the Retirement Committees for their portfolios. Fixed income investment guidelines only allow for exchange-traded derivatives if the investment manager deems the derivative vehicle to be more attractive than a similar direct investment in an underlying cash market or to manage the duration of the fixed income portfolio.
A financial instrument’s level within the valuation hierarchy is based upon the lowest level of input that is significant to the fair value measurement. Following is a description of the valuation techniques and inputs used for investments measured at fair value, including the general classification of such investments pursuant to the valuation hierarchy.
| | | | | | | | |
| Peabody Energy Corporation | 2024 Form 10-K | F-41 |
PEABODY ENERGY CORPORATION
NOTES TO CONSOLIDATED FINANCIAL STATEMENTS — (Continued)
Corporate bonds. The Master Trust invests in corporate bonds for diversification and to provide a hedge to interest rate movements affecting liabilities. Investment types are predominantly investment-grade corporate bonds. Fair value for these securities is provided by a third-party pricing service that utilizes various inputs such as benchmark yields, reported trades, broker/dealer quotes, issuer spreads and benchmark securities as well as other relevant economic measures. Corporate bonds are classified within the Level 2 valuation hierarchy since fair value inputs are derived prices in active markets and the bonds are not traded on a national securities exchange.
U.S. government securities. The Master Trust invests in U.S. government securities for diversification and to provide a hedge to interest rate movements affecting liabilities. Investment types are predominantly U.S. government bonds, agency securities and municipal bonds. Fair value for these securities is provided by a third-party pricing service that utilizes various inputs such as benchmark yields, reported trades, broker/dealer quotes, issuer spreads and benchmark securities as well as other relevant economic measures. If fair value is based on quoted prices in active markets and traded on a national securities exchange, U.S. government securities are classified within the Level 1 valuation hierarchy; otherwise, U.S. government securities are classified within the Level 2 valuation hierarchy.
International government securities. The Master Trust invests in international government securities for diversification and to provide a hedge to interest rate movements affecting liabilities. Investment types are predominantly non-U.S. government bonds. Fair value for these securities is provided by a third-party pricing service that utilizes various inputs such as benchmark yields, reported trades, broker/dealer quotes, issuer spreads and benchmark securities as well as other relevant economic measures. International government securities are classified within the Level 2 valuation hierarchy since fair value inputs are derived prices in active markets and the bonds are not traded on a national securities exchange.
Asset-backed securities. The Master Trust invests in asset-backed securities for diversification and to provide a hedge to interest rate movements affecting liabilities. Investment types are predominately mortgage-backed securities. Asset-backed securities are classified within the Level 2 valuation hierarchy since fair value inputs are derived prices in active markets and the investments are not traded on a national securities exchange.
Cash funds. The Master Trust invests in cash funds to manage liquidity resulting from payment of participant benefits and certain administrative fees. Investment vehicles primarily include a non-interest bearing cash fund with an earnings credit allowance feature, various exchange-traded derivative instruments consisting of futures and interest rate swap agreements used to manage the duration of certain liability-hedging investments. The non-interest bearing cash fund is classified within the Level 1 valuation hierarchy. Exchange traded derivatives, such as options and futures, for which market quotations are readily available, are valued at the last reported sale price or official closing price on the primary market or exchange on which they are traded and are classified within the Level 1 valuation hierarchy.
Group annuity contract. The Master Trust invested in a buy-in GAC to provide a hedge to interest rate movements affecting liabilities. The GAC consisted of a nonparticipating single premium group annuity contract. The initial value of the GAC was equal to the premium paid to secure the contract and was adjusted each reporting period to reflect the estimated fair value of the premium that would be paid for such a contract at that time. Since there were no observable inputs associated with the valuation, the GAC was classified within the Level 3 valuation hierarchy.
Real estate interests. The Master Trust invested in real estate interests for diversification. Investments in real estate represented interests in several limited partnerships, which invest in various real estate properties. Interests in real estate were valued using various methodologies, including independent third party appraisals; fair value measurements were not developed by the Company. For some investments, little market activity may have existed and determination of fair value was then based on the best information available in the circumstances. This involved a significant degree of judgment by taking into consideration a combination of internal and external factors. Accordingly, interests in real estate were classified within the Level 3 valuation hierarchy.
Private mutual funds. The Master Trust invests in mutual funds for growth and diversification. Investment vehicles include an institutional fund that holds a diversified portfolio of long-duration corporate fixed income investments (Corporate Bond Fund). The Corporate Bond Fund is not traded on a national securities exchange and is valued at NAV, the practical expedient to estimate fair value.
The methods described above may produce a fair value calculation that may not be indicative of net realizable value or reflective of future fair values. Furthermore, while the Company believes its valuation methods are appropriate and consistent with other market participants, the use of different methodologies or assumptions to determine the fair value of certain financial instruments could result in a different fair value measurement at the reporting date. The inputs or methodologies used for valuing investments are not necessarily an indication of the risk associated with investing in those investments.
| | | | | | | | |
| Peabody Energy Corporation | 2024 Form 10-K | F-42 |
PEABODY ENERGY CORPORATION
NOTES TO CONSOLIDATED FINANCIAL STATEMENTS — (Continued)
The following tables present the fair value of assets in the Master Trust by asset category and by fair value hierarchy:
| | | | | | | | | | | | | | | | | | | | | | | |
| | December 31, 2024 |
| | Level 1 | | Level 2 | | Level 3 | | Total |
| | (Dollars in millions) |
| | | | | | | |
| Corporate bonds | $ | — | | | $ | 65.3 | | | $ | — | | | $ | 65.3 | |
| U.S. government securities | 13.7 | | | 3.4 | | | — | | | 17.1 | |
| International government securities | — | | | 1.5 | | | — | | | 1.5 | |
| Asset-backed securities | — | | | 0.4 | | | — | | | 0.4 | |
| Cash funds | 4.3 | | | — | | | — | | | 4.3 | |
| | | | | | | |
| | | | | | | |
| Total assets at fair value | $ | 18.0 | | | $ | 70.6 | | | $ | — | | | 88.6 | |
| | | | | | | |
Assets measured at net asset value practical expedient (1) | | | | | | | |
| Private mutual funds | | | | | | | 16.2 | |
| | | | | | | |
| Total plan assets | | | | | | | $ | 104.8 | |
| | | | | | | | | | | | | | | | | | | | | | | |
| | December 31, 2023 |
| | Level 1 | | Level 2 | | Level 3 | | Total |
| | (Dollars in millions) |
| | | | | | | |
| Corporate bonds | $ | — | | | $ | 66.7 | | | $ | — | | | $ | 66.7 | |
| U.S. government securities | 19.3 | | | 4.1 | | | — | | | 23.4 | |
| International government securities | — | | | 1.5 | | | — | | | 1.5 | |
| Asset-backed securities | — | | | 0.5 | | | — | | | 0.5 | |
| Cash funds | 3.8 | | | — | | | — | | | 3.8 | |
| | | | | | | |
| | | | | | | |
| Total assets at fair value | $ | 23.1 | | | $ | 72.8 | | | $ | — | | | 95.9 | |
| | | | | | | |
Assets measured at net asset value practical expedient (1) | | | | | | | |
| Private mutual funds | | | | | | | 20.1 | |
| | | | | | | |
| | | | | | | |
| Total plan assets | | | | | | | $ | 116.0 | |
(1) In accordance with Accounting Standards Update 2015-07, investments that are measured at fair value using the net asset value per share practical expedient have not been classified in the fair value hierarchy. The fair value amounts presented in the tables are intended to permit reconciliation of the fair value hierarchy to the total value of assets of the plans.
The table below sets forth a summary of changes in the fair value of the Master Trust’s Level 3 investments:
| | | | | | | | | | | | | | | | | |
| | Year Ended December 31, |
| 2024 | | 2023 | | 2022 |
| | (Dollars in millions) |
| Balance, beginning of period | $ | — | | | $ | 430.4 | | | $ | 0.3 | |
| Realized (losses) gains | — | | | (10.4) | | | 0.1 | |
| Unrealized losses relating to investments still held at the reporting date | — | | | — | | | (68.8) | |
| Purchases, sales and settlements, net | — | | | (420.0) | | | 498.8 | |
| Balance, end of period | $ | — | | | $ | — | | | $ | 430.4 | |
| | | | | | | | |
| Peabody Energy Corporation | 2024 Form 10-K | F-43 |
PEABODY ENERGY CORPORATION
NOTES TO CONSOLIDATED FINANCIAL STATEMENTS — (Continued)
Contributions
Annual contributions to the qualified plans are made in accordance with minimum funding standards and the Company’s agreement with the Pension Benefit Guaranty Corporation (PBGC). Funding decisions also consider certain funded status thresholds defined by the Pension Protection Act of 2006. As of December 31, 2024, the Company’s remaining qualified plan was expected to be at or above the Pension Protection Act thresholds. The Company was not required to make any cash contributions to its remaining qualified pension plan in 2024 based on minimum funding requirements and did not make any discretionary cash contributions in 2024. In January 2025, the Company made a discretionary cash contribution of $5.0 million to its remaining qualified pension plan which terminated the Company’s agreement with the PBGC and resulted in the release of a $37.0 million letter of credit that had been maintained in favor of the PBGC.
Estimated Future Benefit Payments
The following benefit payments, which reflect expected future service, as appropriate, are expected to be paid in connection with the Company’s benefit obligation:
| | | | | |
| | Pension Benefits |
| | (Dollars in millions) |
| 2025 | $ | 10.9 | |
| 2026 | 10.7 | |
| 2027 | 10.6 | |
| 2028 | 10.4 | |
| 2029 | 10.2 | |
| Years 2030-2034 | 47.1 | |
Defined Contribution Plans
The Company sponsors employee retirement accounts under three 401(k) plans for eligible U.S. employees. The Company matches voluntary contributions to each plan up to specified levels. For one plan, the Company has sole discretion in making any matching contributions. The expense for these plans was $21.7 million, $21.3 million and $20.1 million for the years ended December 31, 2024, 2023 and 2022, respectively. Discretionary contribution features in the plans allow for additional contributions from the Company. The Company granted discretionary contributions of $7.8 million, $7.3 million and $9.2 million during the years ended December 31, 2024, 2023 and 2022, respectively. Discretionary contributions paid during the years ended December 31, 2024, 2023 and 2022 were $7.7 million, $4.6 million and $4.0 million, respectively.
Superannuation
The Company makes superannuation contributions for eligible Australia employees in accordance with the employer contribution rate set by the Government of Australia. The expense related to these contributions was $25.7 million, $21.9 million and $18.8 million for the years ended December 31, 2024, 2023 and 2022, respectively. A performance contribution feature allows for additional discretionary contributions from the Company. The Company granted discretionary performance contributions of $2.2 million during the year ended December 31, 2024, and $1.6 million during both the years ended December 31, 2023 and 2022. Discretionary contributions paid during the years ended December 31, 2024 and 2023 were $1.9 million and $1.3 million, respectively. There were no discretionary performance contributions paid during the year ended December 31, 2022.
| | | | | | | | |
| Peabody Energy Corporation | 2024 Form 10-K | F-44 |
PEABODY ENERGY CORPORATION
NOTES TO CONSOLIDATED FINANCIAL STATEMENTS — (Continued)
(15) Stockholders’ Equity
Common Stock
In accordance with the Company’s Fourth Amended and Restated Certificate of Incorporation, the Company has 450.0 million authorized shares of Common Stock, par value $0.01 per share. Holders of Common Stock are entitled to one vote per share on all matters to be voted upon by the stockholders. The holders of Common Stock do not have cumulative voting rights in the election of directors. Holders of Common Stock are entitled to receive ratably dividends if, as and when dividends are declared from time to time by the Board of Directors (the Board) out of funds legally available for that purpose, after payment of dividends required to be paid on any outstanding preferred stock or series common stock. Upon dissolution, liquidation or winding up of the Company, the holders of Common Stock are entitled to receive ratably the assets available for distribution to the stockholders after payment of liabilities and subject to the right of holders of any outstanding preferred stock or series common stock. The Common Stock has no preemptive or conversion rights and is not subject to further calls or assessment by the Company. There are no redemption or sinking fund provisions applicable to the Common Stock.
The following table summarizes Common Stock activity during the periods presented below:
| | | | | | | | | | | | | | | | | |
| Year Ended December 31, |
| 2024 | | 2023 | | 2022 |
| (In millions) |
| Shares outstanding at the beginning of the period | 128.7 | | | 143.9 | | | 133.3 | |
| | | | | |
| Shares issued for vested restricted stock units | 0.6 | | | 1.5 | | | 0.7 | |
| | | | | |
| Shares issued under at-the-market equity offering program | — | | | — | | | 10.1 | |
| Shares repurchased | (7.9) | | | (16.7) | | | (0.2) | |
| Shares outstanding at the end of the period | 121.4 | | | 128.7 | | | 143.9 | |
Preferred Stock
The Board is authorized to issue up to 100.0 million shares of preferred stock, par value $0.01 per share. The Board can determine the terms and rights of each series, including whether dividends (if any) will be cumulative or non-cumulative and the dividend rate of the series, redemption or sinking fund provisions, conversion terms, prices and rates and amounts payable on shares of the series in the event of any voluntary or involuntary liquidation, dissolution or winding up of the affairs of the Company and whether the shares of the series will be convertible into shares of any other class or series, or any other security, of the Company or any other corporation. The Board may also determine restrictions on the issuance of shares of the same series or of any other class or series, and the voting rights (if any) of the holders of the series. There were no outstanding shares of preferred stock as of December 31, 2024.
Series Common Stock
The Board is authorized to issue up to 50.0 million shares of series common stock, par value $0.01 per share. The Board can determine the terms and rights of each series, whether dividends (if any) will be cumulative or non-cumulative and the dividend rate of the series, redemption or sinking fund provisions, conversion terms, prices and rates and amounts payable on shares of the series in the event of any voluntary or involuntary liquidation, dissolution or winding up of the affairs of the Company and whether the shares of the series will be convertible into shares of any other class or series, or any other security, of the Company or any other corporation. The Board may also determine restrictions on the issuance of shares of the same series or of any other class or series, and the voting rights (if any) of the holders of the series. There were no outstanding shares of series common stock as of December 31, 2024.
Treasury Stock
Shares repurchases. During the fourth quarter of 2020, the Company entered into a transaction support agreement with its surety bond providers which prohibited share repurchases through the earlier of December 31, 2025, or the maturity of the then-existing credit agreement unless otherwise agreed to by the parties to the agreement. Additionally, restrictive covenants in its then-existing credit facility also limited the Company’s ability to repurchase shares. On April 14, 2023, the Company amended the existing transaction support agreement with the surety bond providers to remove the restrictions on shareholder returns, subject to a minimum liquidity threshold, and terminated the then-existing credit facility, which allows share repurchases.
| | | | | | | | |
| Peabody Energy Corporation | 2024 Form 10-K | F-45 |
PEABODY ENERGY CORPORATION
NOTES TO CONSOLIDATED FINANCIAL STATEMENTS — (Continued)
On April 17, 2023, the Board authorized a new share repurchase program (2023 Repurchase Program) authorizing repurchases of up to $1.0 billion of its Common Stock. Under the 2023 Repurchase Program, the Company may purchase shares of common stock at its discretion. The manner, timing, pricing and amount of any share repurchase transactions will be based on a variety of factors, including market conditions, applicable legal requirements and alternative opportunities that the Company may have for the use or investment of capital.
During the year ended December 31, 2024, the Company repurchased 7.7 million shares of its Common Stock for $180.5 million, which included commission fees of $0.2 million. Excluded from this amount repurchased is $2.6 million of repurchases made during the year ended December 31, 2023 that were settled during the year ended December 31, 2024. As of December 31, 2024, the Company had accrued excise taxes of $1.7 million related to the repurchases, which were unpaid at December 31, 2024. The Company includes commission fees and excise taxes, as incurred, with the cost of treasury stock. At December 31, 2024, $469.6 million remained available under the 2023 Repurchase Program.
Shares relinquished. The Company routinely allows employees to relinquish Common Stock to pay estimated taxes upon the vesting of restricted stock units and the payout of performance units that are settled in Common Stock under its equity incentive plans. The number of shares of Common Stock relinquished was 0.1 million, 0.6 million and 0.2 million for the years ended December 31, 2024, 2023 and 2022, respectively. The value of the Common Stock tendered by employees was based upon the closing price on the dates of the respective transactions.
(16) Share-Based Compensation
The Company has established the Peabody Energy Corporation 2017 Incentive Plan (the 2017 Incentive Plan) for employees, non-employee directors and consultants that allows for the issuance of share-based compensation in various forms including options (including non-qualified stock options and incentive stock options), stock appreciation rights, restricted stock, restricted stock units, deferred stock, performance units, dividend equivalents and cash incentive awards. Under the 2017 Incentive Plan, approximately 14 million shares of the Company’s Common Stock were reserved for issuance. As of December 31, 2024, there are approximately 5.5 million shares of the Company’s Common Stock available for grant.
Share-Based Compensation Expense and Cash Flows
The Company’s share-based compensation expense is recorded in “Operating costs and expenses” and “Selling and administrative expenses” in the consolidated statements of operations. Share-based compensation expense and cash flow amounts were as follows:
| | | | | | | | | | | | | | | | | |
| | Year Ended December 31, |
| | 2024 | | 2023 | | 2022 |
| | (Dollars in millions) |
| Share-based compensation expense | $ | 7.3 | | | $ | 6.9 | | | $ | 8.4 | |
| | | | | |
| | | | | |
| Tax benefit | — | | | — | | | — | |
| Share-based compensation expense, net of tax benefit | $ | 7.3 | | | $ | 6.9 | | | $ | 8.4 | |
| | | | | |
| | | | | |
| | | | | |
As of December 31, 2024, the total unrecognized compensation cost related to nonvested awards was $11.0 million, which is expected to be recognized over 3.0 years with a weighted-average period of 0.9 years.
Deferred Stock Units
During the years ended December 31, 2024, 2023 and 2022, the Company granted deferred stock units to each of the non-employee members of the Board. The fair value of these units is equal to the market price of the Company’s Common Stock at the date of grant. These deferred stock units generally vest on a monthly basis over 12 months and are settled in Common Stock three years after the date of grant.
Restricted Stock Units
The Company grants restricted stock units to certain senior management and non-senior management employees. For units granted to both senior and non-senior management employees containing only service conditions, the fair value of the award is equal to the market price of the Company’s Common Stock at the date of grant. Units granted to senior and non-senior management employees vest at various times (none of which exceed three years) in accordance with the underlying award agreement. Compensation cost for both senior and non-senior management employees is recognized on a straight-line basis over the requisite service period. The payouts for active grants awarded during the years ended December 31, 2024, 2023 and 2022 will be settled in the Company’s Common Stock.
| | | | | | | | |
| Peabody Energy Corporation | 2024 Form 10-K | F-46 |
PEABODY ENERGY CORPORATION
NOTES TO CONSOLIDATED FINANCIAL STATEMENTS — (Continued)
Awards granted to certain senior management employees during the year ended December 31, 2022 contain a performance feature in which the award can be increased by up to 100% based on Adjusted EBITDA results over a two-year period. There were 234,973 incremental shares granted during the year ended December 31, 2024 as a result of the performance condition being satisfied which are included in the table below.
A summary of restricted stock unit activity is as follows:
| | | | | | | | | | | |
| Year Ended December 31, 2024 | | Weighted
Average
Grant-Date
Fair Value |
| Nonvested at December 31, 2023 | 430,414 | | | $ | 17.67 | |
| Granted | 541,982 | | | 18.56 | |
| Vested | (523,761) | | | 12.86 | |
| Forfeited | (43,505) | | | 24.62 | |
| Nonvested at December 31, 2024 | 405,130 | | | $ | 24.32 | |
The total fair value at grant date of restricted stock units granted during the years ended December 31, 2024, 2023 and 2022 was $10.1 million, $5.5 million and $3.9 million, respectively.
The restricted stock units receive dividend equivalent units (DEUs) upon payment of cash dividends to holders of Common Stock. DEUs vest subject to the same vesting requirements as the underlying restricted stock unit award. As of December 31, 2024, there were approximately 5,800 nonvested DEUs. The total fair value of restricted stock units and DEUs vested was $13.1 million, $13.8 million and $6.8 million during the years ended December 31, 2024, 2023 and 2022, respectively.
Performance Units
Performance units are typically granted annually in January and vest at the end of a three-year period and are primarily limited to senior management personnel. The performance units are usually subject to the achievement of goals.
The performance units granted during the year ended December 31, 2023 were based on the following conditions: two-year free cash flow and environmental reclamation (performance condition). In addition, the payout of the performance units can be increased by up to 50% of the award granted. The incremental shares, which can be increased by up to 61,902 shares as of December 31, 2024 if the performance condition is satisfied, are not included in the table below.
The performance units granted during the year ended December 31, 2024 were based on the following conditions: two-year free cash flow, sales volume and environmental reclamation (performance condition). In addition, the payout of the performance units can be increased or decreased by up to 25% of the award based on three-year stock price performance compared to a custom peer group (market condition). The performance units can be increased by up to a maximum of 100% of the award granted. The incremental shares, which can be increased by up to 151,106 shares as of December 31, 2024 if the performance condition is satisfied, are not included in the table below.
Awards granted during the year ended December 31, 2024 will be settled in the Company's Common Stock. There were 176,487 and 531,915 performance units granted during the years ended December 31, 2024 and December 31, 2023, respectively. There were no performance units granted during the year ended December 31, 2022.
A summary of performance unit activity is as follows:
| | | | | | | | | | | |
| Year Ended December 31, 2024 | | Weighted
Average
Remaining Contractual Life |
| Nonvested at December 31, 2023 | 144,408 | | | 2.0 | |
| Granted | 176,487 | | | |
| Vested | — | | | |
| Forfeited | (45,984) | | | |
| Nonvested at December 31, 2024 | 274,911 | | | 1.5 | |
| | | | | | | | |
| Peabody Energy Corporation | 2024 Form 10-K | F-47 |
PEABODY ENERGY CORPORATION
NOTES TO CONSOLIDATED FINANCIAL STATEMENTS — (Continued)
As of December 31, 2024, there were no performance units and DEUs that were vested.
The performance units receive DEUs upon payment of cash dividends to holders of Common Stock. DEUs vest subject to the same vesting requirements as the underlying performance unit award. As of December 31, 2024, there were approximately 5,000 nonvested DEUs.
(17) Other Events
Planned Anglo American Acquisition
On November 25, 2024, the Company entered into definitive agreements (the Purchase Agreements), to acquire from Anglo a portion of the assets and businesses associated with Anglo’s metallurgical coal portfolio in Australia, including the Moranbah North and Grosvenor mines, the Moranbah South development project, the Capcoal complex, the Roper Creek mine and the Dawson complex (comprising the Dawson Main/Central, Dawson South, Dawson South Exploration and Theodore South exploration mines, collectively, the Dawson Assets). Following the prospective closing of the Anglo acquisition, the Company is contracted to sell the Dawson Assets to BUMA. The acquisition is expected to close in the second quarter of 2025, subject to regulatory approvals, completion of preemptive rights processes and satisfaction of other customary closing conditions.
The Purchase Agreements contemplate an upfront cash payment of $2.05 billion, including a deposit of $75.0 million paid to Anglo upon execution of the Purchase Agreements, and fixed deferred cash payments totaling $725.0 million that will be payable in annual installments over a four-year period commencing on the first anniversary of the closing date of the acquisition, and additional contingent cash payments capped at $1.0 billion, comprised of (a) royalty payments contingent on the price of coal exceeding agreed-upon thresholds for each of the five years following the closing date of the acquisition and (b) payments contingent on the potential restart of the Grosvenor mine. The total consideration for the acquisition would be up to approximately $3.775 billion if the maximum amounts under the contingencies described above become payable.
Wards Well Acquisition
On April 16, 2024 the Company acquired the southern part of the Wards Well tenements (Wards Well) which are adjacent to the Company’s Centurion Mine in Queensland, Australia. The acquisition was accounted for as an asset acquisition. The acquired asset was measured at the cost of the acquisition based on the total consideration, allocated on the basis of relative fair value. The total consideration of $153.4 million, consisting of cash consideration of $134.4 million, cash transaction costs of $9.4 million and the non-cash settlement of existing receivables with the acquiree of $9.6 million, was recorded in “Property, plant, equipment and mine development, net” in the consolidated balance sheets as of December 31, 2024.
The agreement also includes an initial contingent royalty of up to $200 million. The royalty will only be payable once the Company has recovered its investment and development costs of Wards Well and if the average sales price achieved exceeds certain thresholds. No royalty is payable if the Company does not commence mining Wards Well. The Company will adjust the cost basis of the assets acquired if and when the contingent royalty is paid or becomes payable.
North Antelope Rochelle Mine Tornado
On June 23, 2023, the Company’s North Antelope Rochelle Mine sustained damage from a tornado which led to a temporary suspension of operations. The mine resumed operations on June 25, 2023. During the year ended December 31, 2023, the Company recorded a provision for loss of $12.2 million related to the tornado damage. The combined provision included $4.0 million for materials and supplies inventories, $1.0 million for buildings and equipment and $7.2 million for incremental repair costs. During the year ended December 31, 2024, the Company recorded $3.7 million for incremental repair costs related to the tornado damage.
Shoal Creek
On March 29, 2023, the Company’s Shoal Creek Mine experienced a fire. On June 20, 2023, the Company announced that the Shoal Creek Mine, in coordination with the Mine Safety and Health Administration, had safely completed localized sealing of the affected area of the mine. During the year ended December 31, 2023, the Company recorded a provision for loss of $28.7 million related to the fire, which included $17.8 million related to longwall development and other costs and $10.9 million for equipment deemed inoperable within the affected area of the mine.
| | | | | | | | |
| Peabody Energy Corporation | 2024 Form 10-K | F-48 |
PEABODY ENERGY CORPORATION
NOTES TO CONSOLIDATED FINANCIAL STATEMENTS — (Continued)
In October 2023, the Company filed an insurance claim against applicable insurance policies with combined business interruption and property loss limits of $125 million above a $50 million deductible. During June 2024, the Company reached a settlement and recognized a $109.5 million insurance recovery, which the Company included in its results of operations during the year ended December 31, 2024. The Company collected all of the insurance recovery during the year ended December 31, 2024, and classified $10.9 million of the recovery within the “Cash Flows From Investing Activities” section of the consolidated statements of cash flows since this portion of the recovery related to equipment damage for which the Company previously recognized the provision for loss.
Port and Rail Capacity Assignment
During the year ended December 31, 2023, the Company entered into two agreements to assign the right to its excess port and rail capacity related to its Centurion Mine to unrelated parties. In the first transaction, the Company assigned its right in exchange for $30.0 million Australian dollars. Half of such amount was received by the Company upon entry into the agreement, and half was payable in June 2024, subject to certain conditions. In connection with the transaction, the Company recorded revenue of $19.2 million during the year ended December 31, 2023. In association with the completion of the Wards Well acquisition described above, the remaining receivable was settled as part of the consideration on April 16, 2024.
In the second transaction, the Company assigned its right in exchange for $10.0 million Australian dollars, all of which was received as of December 31, 2023. In connection with the transaction, the Company recorded revenue of $6.7 million during the year ended December 31, 2023.
(18) Earnings per Share (EPS)
Basic EPS is computed based on the weighted average number of shares of common stock outstanding during the period. Diluted EPS is computed based on the weighted average number of shares of common stock plus the effect of dilutive potential common shares outstanding. As such, the Company includes the 2028 Convertible Notes and share-based compensation awards in its potentially dilutive securities. Generally, dilutive securities are not included in the computation of loss per share when a company reports a net loss from continuing operations as the impact would be anti-dilutive.
For all but performance units, the potentially dilutive impact of the Company’s share-based compensation awards is determined using the treasury stock method. Under the treasury stock method, awards are treated as if they had been exercised with any proceeds used to repurchase common stock at the average market price during the period. Any incremental difference between the assumed number of shares issued and purchased is included in the diluted share computation. For performance units, their contingent features result in an assessment for any potentially dilutive common stock by using the end of the reporting period as if it were the end of the contingency period for all units granted. For further discussion of the Company’s share-based compensation awards, see Note 16. “Share-Based Compensation.”
A conversion of the 2028 Convertible Notes may result in payment in the Company’s common stock. For diluted EPS purposes, the potentially dilutive common stock is assumed to have been converted at the beginning of the period (or at the time of issuance, if later). In periods where the potentially dilutive common stock is included in the computation of diluted EPS, the numerator will be adjusted to add back tax adjusted interest expense, which includes the amortization of debt issuance costs, related to the convertible debt.
The computation of diluted EPS excluded aggregate share-based compensation awards of less than 0.1 million for all of the years ended December 31, 2024, 2023 and 2022, because to do so would have been anti-dilutive for those periods. Because the potential dilutive impact of such share-based compensation awards is calculated under the treasury stock method, anti-dilution generally occurs when the exercise prices or unrecognized compensation cost per share of such awards are higher than the Company’s average stock price during the applicable period. Anti-dilution also occurs when a company reports a net loss from continuing operations, and the dilutive impact of all share-based compensation awards are excluded accordingly.
| | | | | | | | |
| Peabody Energy Corporation | 2024 Form 10-K | F-49 |
PEABODY ENERGY CORPORATION
NOTES TO CONSOLIDATED FINANCIAL STATEMENTS — (Continued)
The following illustrates the earnings allocation method utilized in the calculation of basic and diluted EPS:
| | | | | | | | | | | | | | | | | |
| | Year Ended December 31, |
| | 2024 | | 2023 | | 2022 |
| | (In millions, except per share data) |
| Basic EPS numerator: | | | | | |
| Income from continuing operations, net of income taxes | $ | 407.3 | | | $ | 816.0 | | | $ | 1,317.4 | |
| | | | | |
| Less: Net income attributable to noncontrolling interests | 32.6 | | | 56.0 | | | 22.0 | |
| Income from continuing operations attributable to common stockholders | 374.7 | | | 760.0 | | | 1,295.4 | |
| | | | | |
| | | | | |
| (Loss) income from discontinued operations, net of income taxes | (3.8) | | | (0.4) | | | 1.7 | |
| | | | | |
| | | | | |
| Net income attributable to common stockholders | $ | 370.9 | | | $ | 759.6 | | | $ | 1,297.1 | |
| | | | | |
| Diluted EPS numerator: | | | | | |
| Income from continuing operations, net of income taxes | $ | 407.3 | | | $ | 816.0 | | | $ | 1,317.4 | |
| Add: Tax adjusted interest expense related to 2028 Convertible Notes | 12.2 | | | 12.2 | | | 8.7 | |
| | | | | |
| Less: Net income attributable to noncontrolling interests | 32.6 | | | 56.0 | | | 22.0 | |
| Income from continuing operations attributable to common stockholders | 386.9 | | | 772.2 | | | 1,304.1 | |
| | | | | |
| | | | | |
| (Loss) income from discontinued operations, net of income taxes | (3.8) | | | (0.4) | | | 1.7 | |
| | | | | |
| | | | | |
| Net income attributable to common stockholders | $ | 383.1 | | | $ | 771.8 | | | $ | 1,305.8 | |
| | | | | |
| EPS denominator: | | | | | |
| Weighted average shares outstanding — basic | 125.1 | | | 137.6 | | | 142.1 | |
| Dilutive impact of share-based compensation awards | 0.5 | | | 0.6 | | | 1.6 | |
| Dilutive impact of 2028 Convertible Notes | 16.3 | | | 16.1 | | | 13.5 | |
| Weighted average shares outstanding — diluted | 141.9 | | | 154.3 | | | 157.2 | |
| | | | | |
| Basic EPS attributable to common stockholders: | | | | | |
| Income from continuing operations | $ | 2.99 | | | $ | 5.52 | | | $ | 9.12 | |
| (Loss) income from discontinued operations | (0.03) | | | — | | | 0.01 | |
| Net income attributable to common stockholders | $ | 2.96 | | | $ | 5.52 | | | $ | 9.13 | |
| | | | | |
| Diluted EPS attributable to common stockholders: | | | | | |
| Income from continuing operations | $ | 2.73 | | | $ | 5.00 | | | $ | 8.29 | |
| (Loss) income from discontinued operations | (0.03) | | | — | | | 0.02 | |
| Net income attributable to common stockholders | $ | 2.70 | | | $ | 5.00 | | | $ | 8.31 | |
(19) Management — Labor Relations
On December 31, 2024, the Company had approximately 5,600 employees worldwide, including approximately 4,300 hourly employees; the employee amounts exclude employees that were employed at operations classified as discontinued operations. Approximately 40% of those hourly employees were represented by organized labor unions and were employed by mines that generated 21% of the Company’s 2024 coal production from continuing operations. In the U.S., the hourly employees of one active mine and one inactive mine are represented by an organized labor union. In Australia, the coal mining industry is unionized and the majority of hourly workers employed at the Company’s Australian mining operations are members of trade unions. The Mining and Energy Union (MEU) generally represents the Company’s Australian subsidiaries’ hourly production and engineering employees, including those employed through contract mining relationships.
| | | | | | | | |
| Peabody Energy Corporation | 2024 Form 10-K | F-50 |
PEABODY ENERGY CORPORATION
NOTES TO CONSOLIDATED FINANCIAL STATEMENTS — (Continued)
The following table presents the Company’s active and inactive mining operations as of December 31, 2024 in which the employees are represented by organized labor unions:
| | | | | | | | | | | | | | | | | | | | |
| Mine | | Approximate Number of Active Employees Represented | | Union | | Current Agreement Expiration Date or Date Amendable |
| | | | | | |
| U.S. | | | | | | |
Kayenta (1) | | 30 | | UMWA | | November 2029 |
Shoal Creek (2) | | 310 | | UMWA | | December 2024 |
| Australia | | | | | | |
Wilpinjong (3) | | 460 | | MEU | | June 2024 |
| Coppabella | | 330 | | MEU | | February 2026 |
Moorvale (3) | | 165 | | MEU | | June 2023 |
| Centurion | | 130 | | N/A | | January 2028 |
| Metropolitan | | | | | | |
Underground employees (3) | | 165 | | MEU | | May 2025 |
| Handling and preparation plant employees | | 15 | | MEU | | January 2027 |
| Wambo Underground | | | | | | |
| Underground employees | | 90 | | MEU | | November 2025 |
| Handling and preparation plant employees | | 20 | | MEU | | August 2025 |
(1) The Company and Western Surface mine employees agreed to a new five-year term labor agreement in November 2024.
(2) The Company is currently negotiating a new labor agreement with the UMWA and employees.
(3) The Company is currently negotiating a new labor agreement with the MEU and employees.
(20) Financial Instruments, Guarantees With Off-Balance-Sheet Risk and Other Guarantees
In the normal course of business, the Company is a party to various guarantees and financial instruments that carry off-balance-sheet risk and are not reflected in the accompanying consolidated balance sheets. Such financial instruments provide support for the Company’s reclamation bonding requirements, lease obligations, insurance policies and various other performance guarantees. The Company periodically evaluates the instruments for on-balance-sheet treatment based on the amount of exposure under the instrument and the likelihood of required performance. The Company does not expect any material losses to result from these guarantees or off-balance-sheet instruments in excess of liabilities provided for in the accompanying consolidated balance sheets.
The following table summarizes the Company’s financial instruments that carry off-balance-sheet risk.
| | | | | | | | | | | | | | | | | | | | | | | |
| | December 31, 2024 | | |
| | Reclamation Support | | Other Support (1) | | Total | | | | | | |
| | (Dollars in millions) |
| Surety bonds | $ | 925.1 | | | $ | 92.4 | | | $ | 1,017.5 | | | | | | | |
Letters of credit (2) | 55.2 | | | 91.5 | | | 146.7 | | | | | | | |
| 980.3 | | | 183.9 | | | 1,164.2 | | | | | | | |
Less: Letters of credit in support of surety bonds (3) | (55.2) | | | (0.1) | | | (55.3) | | | | | | | |
| Obligations supported, net | $ | 925.1 | | | $ | 183.8 | | | $ | 1,108.9 | | | | | | | |
(1) Instruments support obligations related to pension and health care plans, workers’ compensation, property and casualty insurance, customer and vendor contracts and certain restoration ancillary to prior mining activities.
(2) Amounts do not include cash-collateralized letters of credit.
(3) Certain letters of credit serve as collateral for surety bonds at the request of surety bond providers.
| | | | | | | | |
| Peabody Energy Corporation | 2024 Form 10-K | F-51 |
PEABODY ENERGY CORPORATION
NOTES TO CONSOLIDATED FINANCIAL STATEMENTS — (Continued)
Surety Agreement Amendment and Collateral Requirements
In April 2023, the Company amended its existing agreement with the providers of its surety bond portfolio, dated November 6, 2020. Under the April 2023 amendment, the Company and its surety providers agreed to a maximum aggregate collateral amount based upon bonding levels which will vary prospectively as bonding levels increase or decrease. The amendment also extended the agreement through December 31, 2026. In order to maintain the maximum collateral agreement, the Company must remain compliant with a minimum liquidity test and a maximum net leverage ratio, as measured each quarter. The minimum liquidity test requires the Company to maintain liquidity at the greater of $400 million or the difference between the penal sum of all surety bonds and the amount of collateral posted in favor of surety providers, which was $495.5 million at December 31, 2024. The Company must also maintain a maximum net leverage ratio of 1.5 to 1.0, where the numerator consists of its funded debt, net of cash, and the denominator consists of its Adjusted EBITDA for the trailing twelve months. For purposes of calculating the ratio, only 50% of the outstanding principal amount of the Company’s 2028 Convertible Notes is deemed to be funded debt. The Company’s ability to pay dividends and make share repurchases is also subject to the quarterly minimum liquidity test. The Company is in compliance with such requirements at December 31, 2024.
At December 31, 2024, the Company’s maximum aggregate collateral amount was $522.0 million, which was comprised of $394.6 million in trust accounts and letters of credit of $127.4 million held for the benefit of certain surety providers. The amendment became effective on April 14, 2023, when the Company terminated a then-existing credit agreement which, as amended, provided for $237.2 million of capacity for irrevocable standby letters of credit (LC Facility).
LC Facility
The now-terminated LC Facility had an original capacity of $324.0 million and was subsequently amended at various dates to reduce its capacity and effect certain other changes, including in February 2023 to reduce capacity by $65.0 million, accelerate the expiration date to December 31, 2023 from December 31, 2024, and eliminate the prepayment premium due upon any reduction of commitments thereunder prior to July 29, 2023. The Company recorded early debt extinguishment losses of $8.8 million during the year ended December 31, 2023, primarily as a result of the February 2023 amendment and subsequent termination.
Prior to its termination, undrawn letters of credit under the LC Facility bore interest at 6.00% per annum and unused commitments were subject to a 0.50% per annum commitment fee.
Accounts Receivable Securitization
In 2017, the Company entered into the Sixth Amended and Restated Receivables Purchase Agreement, as amended from time to time (the Receivables Purchase Agreement.) The receivables securitization program authorized under the agreement (Securitization Program) is subject to customary events of default. The Receivables Purchase Agreement was amended in February 2023 to increase the available funding capacity from $175.0 million to $225.0 million and adjust the relevant interest rate for borrowings to a SOFR plus an applicable margin. Such funding is accounted for as a secured borrowing, limited to the availability of eligible receivables, and may be secured by a combination of collateral and the trade receivables underlying the program. Funding capacity under the Securitization Program may also be utilized for letters of credit in support of other obligations, which has been the Company’s primary utilization. The accounts receivable securitization program was amended in January 2025 to extend its maturity to January 2028.
Borrowings under the Securitization Program bear interest at SOFR plus 2.1% per annum and remain outstanding throughout the term of the agreement, subject to the Company maintaining sufficient eligible receivables.
At December 31, 2024, the Company had no outstanding borrowings and $60.4 million of letters of credit outstanding under the Securitization Program. Availability under the Securitization Program, which is adjusted for certain ineligible receivables, was $138.4 million at December 31, 2024. The Company was not required to post cash collateral under the Securitization Program at December 31, 2024.
The Company incurred interest and fees associated with the Securitization Program of $2.6 million, $3.6 million and $3.8 million during the years ended December 31, 2024, 2023 and 2022, respectively, which have been recorded as “Interest expense, net of capitalized interest” in the accompanying statements of operations.
| | | | | | | | |
| Peabody Energy Corporation | 2024 Form 10-K | F-52 |
PEABODY ENERGY CORPORATION
NOTES TO CONSOLIDATED FINANCIAL STATEMENTS — (Continued)
Credit Support Facilities
In February 2022, the Company entered into an agreement, which provides up to $250.0 million of capacity for irrevocable standby letters of credit, primarily to support reclamation bonding requirements. The agreement requires the Company to provide cash collateral at a level of 103% of the aggregate amount of letters of credit outstanding under the arrangement (limited to $5.0 million total excess collateralization.) Outstanding letters of credit bear a fixed fee in the amount of 0.75% per annum. The Company receives a variable deposit rate on the amount of cash collateral posted in support of letters of credit. The agreement has an initial expiration date of December 31, 2025. At December 31, 2024, letters of credit of $115.6 million were outstanding under the agreement, which were collateralized by cash of $119.1 million.
In December 2023, the Company established cash-backed bank guarantee facilities, primarily to support Australian reclamation bonding requirements. During the year ended December 31, 2024, the Company capitalized $1.4 million of debt issuance costs related to these bank guarantee facilities. The Company receives a variable deposit rate on the amount of cash collateral posted in support of the bank guarantee facilities, which mature at various dates between 2026 and 2029. At December 31, 2024, the bank guarantee facilities were backed by cash of $168.5 million.
Restricted Cash and Collateral
The following table summarizes the Company’s “Restricted cash and collateral” in the accompanying consolidated balance sheets. Restricted cash balances are held in controlled accounts with minimum balance requirements; withdrawals are subject to the approval of account beneficiaries, such as the Company’s surety providers, who have perfected security interests in the funds. The Company’s other cash collateral generally includes deposits held by regulatory authorities or financial institutions over which the Company has no control or ability to access. Portions of the restricted cash balances and deposits are held in accounts denominated in Australian dollars.
| | | | | | | | | | | |
| December 31, |
| 2024 | | 2023 |
| | (Dollars in millions) |
Restricted cash (1) | | | |
Surety trust accounts (2) | $ | 394.6 | | | $ | 444.0 | |
Credit support facilities (2) (3) | 287.6 | | | 236.9 | |
| 682.2 | | | 680.9 | |
Other cash collateral (1) | | | |
Deposits with regulatory authorities for reclamation and other obligations (3) | 127.6 | | | 276.7 | |
| Restricted cash and collateral | $ | 809.8 | | | $ | 957.6 | |
(1) Restricted cash balances are combined with unrestricted cash and cash equivalents in the accompanying consolidated statements of cash flows; changes between unrestricted cash and cash equivalents and restricted cash balances are thus not reflected in the operating, investing or financing activities therein. Changes in other cash collateral balances are reflected as operating activities therein.
(2) Surety trust accounts, the funding for collateralized letters of credit and cash supporting the bank guarantee facilities are comprised of highly liquid investments with original maturities of three months or less; interest and other earnings on such funds accrue to the Company.
(3) At December 31, 2024, the Australian dollar denominated balances supporting the bank guarantee facilities and the deposits with regulatory authorities were $271 million and $205 million, respectively. At December 31, 2023, the Australian dollar denominated balances supporting the bank guarantee facilities and the deposits with regulatory authorities were $95 million and $404 million, respectively.
Other
The Company is the lessee under numerous equipment and property leases. It is common in such commercial lease transactions for the Company, as the lessee, to agree to indemnify the lessor for the value of the property or equipment leased, should the property be damaged or lost during the course of the Company’s operations. The Company expects that losses with respect to leased property, if any, may be covered by insurance (subject to deductibles). The Company and certain of its subsidiaries have guaranteed other subsidiaries’ performance under various lease obligations. Aside from indemnification of the lessor for the value of the property leased, the Company’s maximum potential obligations under its leases are equal to the respective future minimum lease payments, and the Company assumes that no amounts could be recovered from third parties.
| | | | | | | | |
| Peabody Energy Corporation | 2024 Form 10-K | F-53 |
PEABODY ENERGY CORPORATION
NOTES TO CONSOLIDATED FINANCIAL STATEMENTS — (Continued)
Substantially all of the Company’s U.S. subsidiaries provide financial guarantees under long-term debt agreements entered into by the Company. The maximum amounts payable under the Company’s debt agreements are equal to the respective principal and interest payments.
(21) Commitments and Contingencies
Commitments
Unconditional Purchase Obligations
As of December 31, 2024, purchase commitments for capital expenditures were $58.7 million, all of which is obligated within the next 12 months.
In Australia, the Company has generally secured the ability to transport coal through rail contracts and ownership interests in five east coast coal export terminals that are primarily funded through take-or-pay arrangements with terms ranging up to 19 years. In the U.S., the Company has entered into certain long-term coal export terminal agreements to secure export capacity through the Gulf Coast. As of December 31, 2024, these Australian and U.S. commitments under take-or-pay arrangements totaled $1.0 billion, of which approximately $86 million is obligated within the next year.
Contingencies
From time to time, the Company or its subsidiaries are involved in legal proceedings arising in the ordinary course of business or related to indemnities or historical operations. The Company believes it has recorded adequate reserves for these liabilities. The Company discusses its significant legal proceedings below, including ongoing proceedings and those that impacted the Company’s consolidated results of operations for the periods presented.
Litigation and Matters Relating to Continuing Operations
Metropolitan Mine Stormwater Discharge. Significantly high rainfall in New South Wales, including unprecedented rain totals at the Metropolitan Mine site resulted in stormwater being discharged from the mine site on several occasions in 2021 and 2022. On September 6, 2023, the New South Wales Environment Protection Authority commenced a prosecution for five breaches of the Protection of the Environment Operations Act 1997 relating to the stormwater discharges. On March 15, 2024, the Company pled guilty to two of the charges related to water pollution and two charges related to a failure to adequately maintain plant and equipment were consolidated into one charge to which the Company also pled guilty. The remaining charge was discontinued. A sentencing hearing was held in November 2024 and the judgment has been reserved. The judgment is expected in the second quarter of 2025. During the year ended December 31, 2024, the Company recorded an immaterial provision to establish a current liability that the Company believes is probable and reasonably estimable.
Other
At times, the Company becomes a party to other disputes, including those related to contract miner performance, claims, lawsuits, arbitration proceedings, regulatory investigations and administrative procedures in the ordinary course of business in the U.S., Australia and other countries where the Company does business. Based on current information, the Company believes that such other pending or threatened proceedings are likely to be resolved without a material adverse effect on its consolidated financial condition, results of operations or cash flows. The Company reassesses the probability and estimability of contingent losses as new information becomes available.
(22) Segment and Geographic Information
The Company reports its results of operations primarily through the following reportable segments: Seaborne Thermal, Seaborne Metallurgical, Powder River Basin, Other U.S. Thermal and Corporate and Other.
The Company’s seaborne operating platform is primarily export focused with customers spread across several countries, with a portion of its thermal and metallurgical coal sold within Australia. Generally, revenue from individual countries varies year by year based on electricity and steel demand, the strength of the global economy, governmental policies and several other factors, including those specific to each country. The Company classifies its seaborne mines within the Seaborne Thermal or Seaborne Metallurgical segments based on the primary customer base and coal reserve type of each mining operation. A small portion of the coal mined by the Seaborne Thermal segment is of a metallurgical grade. Similarly, a small portion of the coal mined by the Seaborne Metallurgical segment is of a thermal grade. Additionally, the Company may market some of its metallurgical coal products as a thermal coal product from time to time depending on market conditions.
| | | | | | | | |
| Peabody Energy Corporation | 2024 Form 10-K | F-54 |
PEABODY ENERGY CORPORATION
NOTES TO CONSOLIDATED FINANCIAL STATEMENTS — (Continued)
The Company’s Seaborne Thermal operations consist of mines in New South Wales, Australia. The mines in that segment utilize both surface and underground extraction processes to mine low-sulfur, high Btu thermal coal.
The Company’s Seaborne Metallurgical operations consist of mines in Queensland, Australia, one in New South Wales, Australia and one in Alabama, USA. The mines in that segment utilize both surface and underground extraction processes to mine various qualities of metallurgical coal. The metallurgical coal qualities include hard coking coal, semi-hard coking coal, semi-soft coking coal and pulverized coal injection coal.
The Company’s thermal operating segments in the U.S. are focused on the mining, preparation and sale of thermal coal, sold primarily to electric utilities in the U.S. under long-term contracts, with a relatively small portion sold as international exports as conditions warrant. The Company’s Powder River Basin operations consist of its mines in Wyoming. The mines in that segment are characterized by surface mining extraction processes, coal with a lower sulfur content and Btu and higher customer transportation costs (due to longer shipping distances). The Company’s Other U.S. Thermal operations reflect the aggregation of its Illinois, Indiana, New Mexico and Colorado mining operations. The mines in that segment are characterized by a mix of surface and underground mining extraction processes, coal with a higher sulfur content and Btu and lower customer transportation costs (due to shorter shipping distances). Geologically, the Company’s Powder River Basin operations mine sub-bituminous coal deposits and its Other U.S. Thermal operations mine both bituminous and sub-bituminous coal deposits.
The Company’s Corporate and Other segment includes selling and administrative expenses, results from equity method investments, trading and brokerage activities, minimum charges on certain transportation-related contracts, the closure of inactive mining sites, the impact of foreign currency remeasurement and certain commercial matters.
The Company’s CODM, defined as the President and Chief Executive Officer, uses Adjusted EBITDA as the primary financial metric to measure each segment’s operating performance against expected results and to allocate resources, including capital investment in mining operations and potential expansions. Adjusted EBITDA is a non-GAAP financial measure defined as income from continuing operations before deducting net interest expense, income taxes, asset retirement obligation expenses and depreciation, depletion and amortization. Adjusted EBITDA is also adjusted for the discrete items that management excluded in analyzing the segments’ operating performance, as displayed in the reconciliations below. Management believes this non-GAAP measure is used by investors to measure the Company’s operating performance. Adjusted EBITDA is not intended to serve as an alternative to U.S. GAAP measures of performance and may not be comparable to similarly-titled measures presented by other companies.
Segment results for the year ended December 31, 2024 were as follows:
| | | | | | | | | | | | | | | | | | | | | | | | | | | | | | | | | | | |
| Seaborne Thermal | | Seaborne Metallurgical | | Powder River Basin | | Other U.S. Thermal | | Corporate
and Other | | Consolidated |
| | (Dollars in millions) |
| Revenue | $ | 1,213.9 | | | $ | 1,055.6 | | | $ | 1,098.8 | | | $ | 822.6 | | | $ | 45.8 | | | $ | 4,236.7 | |
| Less Significant Segment Expenses: | | | | | | | | | | | |
| Labor costs | 157.2 | | | 212.7 | | | 206.8 | | | 218.6 | | | | | |
| Repair costs | 152.8 | | | 190.8 | | | 131.7 | | | 141.0 | | | | | |
| Outside services | 128.7 | | | 258.9 | | | 123.2 | | | 146.8 | | | | | |
| Commodities expense | 88.6 | | | 59.6 | | | 158.5 | | | 77.0 | | | | | |
| Sales related costs | 224.3 | | | 231.6 | | | 297.5 | | | 53.0 | | | | | |
Other expenses (1) | 32.3 | | | (140.5) | | | 42.5 | | | 35.4 | | | | | |
| Adjusted EBITDA | 430.0 | | | 242.5 | | | 138.6 | | | 150.8 | | | (90.2) | | | 871.7 | |
| Additions to property, plant, equipment and mine development | 73.2 | | | 266.6 | | | 35.0 | | | 18.6 | | | 7.9 | | | 401.3 | |
| | | | | | | | | | | |
| Income from equity affiliates | — | | | — | | | — | | | — | | | (11.5) | | | (11.5) | |
| | | | | | | | |
| Peabody Energy Corporation | 2024 Form 10-K | F-55 |
PEABODY ENERGY CORPORATION
NOTES TO CONSOLIDATED FINANCIAL STATEMENTS — (Continued)
Segment results for the year ended December 31, 2023 were as follows:
| | | | | | | | | | | | | | | | | | | | | | | | | | | | | | | | | | | |
| Seaborne Thermal | | Seaborne Metallurgical | | Powder River Basin | | Other U.S. Thermal | | Corporate
and Other | | Consolidated |
| | (Dollars in millions) |
| Revenue | $ | 1,329.7 | | | $ | 1,301.9 | | | $ | 1,198.1 | | | $ | 888.2 | | | $ | 228.8 | | | $ | 4,946.7 | |
| Less Significant Segment Expenses: | | | | | | | | | | | |
| Labor costs | 148.8 | | | 187.2 | | | 201.1 | | | 218.8 | | | | | |
| Repair costs | 154.4 | | | 151.3 | | | 154.9 | | | 153.4 | | | | | |
| Outside services | 122.7 | | | 205.1 | | | 138.0 | | | 176.2 | | | | | |
| Commodities expense | 97.0 | | | 61.5 | | | 180.2 | | | 102.7 | | | | | |
| Sales related costs | 207.4 | | | 259.0 | | | 341.9 | | | 58.7 | | | | | |
Other expenses (1) | 22.6 | | | (0.3) | | | 28.3 | | | (29.1) | | | | | |
| Adjusted EBITDA | 576.8 | | | 438.1 | | | 153.7 | | | 207.5 | | | (12.2) | | | 1,363.9 | |
| Additions to property, plant, equipment and mine development | 62.0 | | | 186.4 | | | 40.9 | | | 47.6 | | | 11.4 | | | 348.3 | |
| | | | | | | | | | | |
| Income from equity affiliates | — | | | — | | | — | | | — | | | (6.9) | | | (6.9) | |
Segment results for the year ended December 31, 2022 were as follows:
| | | | | | | | | | | | | | | | | | | | | | | | | | | | | | | | | | | |
| Seaborne Thermal | | Seaborne Metallurgical | | Powder River Basin | | Other U.S. Thermal | | Corporate
and Other | | Consolidated |
| | (Dollars in millions) |
| Revenue | $ | 1,345.6 | | | $ | 1,616.9 | | | $ | 1,065.5 | | | $ | 952.2 | | | $ | 1.7 | | | $ | 4,981.9 | |
| Less Significant Segment Expenses: | | | | | | | | | | | |
| Labor costs | 143.2 | | | 183.8 | | | 192.1 | | | 200.7 | | | | | |
| Repair costs | 109.3 | | | 134.1 | | | 148.0 | | | 149.0 | | | | | |
| Outside services | 116.5 | | | 167.3 | | | 147.6 | | | 170.8 | | | | | |
| Commodities expense | 97.7 | | | 72.2 | | | 214.1 | | | 137.1 | | | | | |
| Sales related costs | 206.0 | | | 286.0 | | | 286.0 | | | 55.2 | | | | | |
Other expenses (1) | 25.3 | | | (8.2) | | | 9.5 | | | (3.0) | | | | | |
| Adjusted EBITDA | 647.6 | | | 781.7 | | | 68.2 | | | 242.4 | | | 104.8 | | | 1,844.7 | |
| Additions to property, plant, equipment and mine development | 38.8 | | | 84.8 | | | 59.1 | | | 35.3 | | | 3.5 | | | 221.5 | |
| | | | | | | | | | | |
| Income from equity affiliates | — | | | — | | | — | | | — | | | (131.2) | | | (131.2) | |
(1) Other expenses for the mining operations primarily include lease expense; non-sales related taxes; insurance expense; joint facility charges; and credits related to the capitalization of costs to the balance sheet. For the year ended December 31, 2024, the Seaborne Metallurgical segment includes $80.8 million related to the portion of the Shoal Creek insurance recovery that was applicable to incremental costs and business interruption recoveries.
Total assets are reflected at the division level only for the Company’s operating segments and are not allocated between each individual segment as such information is not regularly reviewed by the Company’s CODM. Further, some assets service more than one segment within the division and an allocation of such assets would not be meaningful or representative on a segment by segment basis. Assets related to closed, suspended or otherwise inactive mines are included within the Corporate and Other category. Assets related to the Company’s Centurion Mine, which is in development and targeted to commence longwall production in the first quarter of 2026, are included in the Seaborne division level as of both December 31, 2024 and 2023.
| | | | | | | | |
| Peabody Energy Corporation | 2024 Form 10-K | F-56 |
PEABODY ENERGY CORPORATION
NOTES TO CONSOLIDATED FINANCIAL STATEMENTS — (Continued)
The following table presents total assets at the division level:
| | | | | | | | | | | | | | | | | |
| December 31, |
| 2024 | | 2023 | | 2022 |
| (Dollars in millions) |
| Seaborne | $ | 2,465.3 | | | $ | 2,088.2 | | | $ | 1,632.6 | |
| U.S. Thermal | 1,346.9 | | | 1,373.2 | | | 1,359.4 | |
| Corporate and Other | 2,141.5 | | | 2,500.7 | | | 2,618.8 | |
| Total Assets | $ | 5,953.7 | | | $ | 5,962.1 | | | $ | 5,610.8 | |
The Company defines its long-lived assets as its property, plant, equipment and mine development, net and operating lease right-of-use assets. The following table presents the geographic location of the Company’s long-lived assets:
| | | | | | | | | | | | | | | | | |
| December 31, |
| 2024 | | 2023 | | 2022 |
| (Dollars in millions) |
| U.S. | $ | 1,432.1 | | | $ | 1,523.1 | | | $ | 1,592.2 | |
| Australia | 1,649.4 | | | 1,321.0 | | | 1,272.8 | |
| | | | | |
| Property, plant, equipment and mine development, net | $ | 3,081.5 | | | $ | 2,844.1 | | | $ | 2,865.0 | |
| | | | | |
| U.S. | $ | 85.6 | | | $ | 28.7 | | | $ | 6.4 | |
| Australia | 33.7 | | | 33.1 | | | 20.5 | |
| Other | — | | | 0.1 | | | — | |
| Operating lease right-of-use assets | $ | 119.3 | | | $ | 61.9 | | | $ | 26.9 | |
A reconciliation of consolidated income from continuing operations before income taxes to Adjusted EBITDA follows:
| | | | | | | | | | | | | | | | | |
| | Year Ended December 31, |
| | 2024 | | 2023 | | 2022 |
| | (Dollars in millions) |
| Income from continuing operations before income taxes | $ | 516.1 | | | $ | 1,124.8 | | | $ | 1,278.6 | |
| Depreciation, depletion and amortization | 343.0 | | | 321.4 | | | 317.6 | |
| Asset retirement obligation expenses | 48.9 | | | 50.5 | | | 49.4 | |
| Restructuring charges | 4.4 | | | 3.3 | | | 2.9 | |
| Transaction costs related to business combinations | 10.3 | | | — | | | — | |
| | | | | |
| Asset impairment | — | | | 2.0 | | | 11.2 | |
| Provision for NARM and Shoal Creek losses | 3.7 | | | 40.9 | | | — | |
| Shoal Creek insurance recovery - property damage | (28.7) | | | — | | | — | |
| Changes in amortization of basis difference related to equity affiliates | (1.8) | | | (1.6) | | | (2.3) | |
| Interest expense, net of capitalized interest | 46.9 | | | 59.8 | | | 140.3 | |
| Net loss on early debt extinguishment | — | | | 8.8 | | | 57.9 | |
| Interest income | (71.0) | | | (76.8) | | | (18.4) | |
| Net mark-to-market adjustment on actuarially determined liabilities | (6.1) | | | (0.3) | | | (27.8) | |
| | | | | |
| | | | | |
| | | | | |
| | | | | |
| Unrealized (gains) losses on derivative contracts related to forecasted sales | — | | | (159.0) | | | 35.8 | |
| Unrealized losses (gains) on foreign currency option contracts | 9.0 | | | (7.4) | | | 2.3 | |
| | | | | |
| Take-or-pay contract-based intangible recognition | (3.0) | | | (2.5) | | | (2.8) | |
| | | | | |
| Total Adjusted EBITDA | $ | 871.7 | | | $ | 1,363.9 | | | $ | 1,844.7 | |
| | | | | | | | |
| Peabody Energy Corporation | 2024 Form 10-K | F-57 |
PEABODY ENERGY CORPORATION
NOTES TO CONSOLIDATED FINANCIAL STATEMENTS — (Continued)
The following table presents revenue as a percent of total revenue from external customers by geographic region:
| | | | | | | | | | | | | | | | | |
| | Year Ended December 31, |
| | 2024 | | 2023 | | 2022 |
| U.S. | 45.0 | % | | 42.4 | % | | 36.6 | % |
| Japan | 18.8 | % | | 14.7 | % | | 19.4 | % |
| China | 11.3 | % | | 10.9 | % | | — | % |
| Australia | 8.8 | % | | 8.9 | % | | 8.5 | % |
| Taiwan | 3.3 | % | | 6.6 | % | | 9.3 | % |
| Indonesia | 2.4 | % | | 2.0 | % | | 1.5 | % |
| Brazil | 2.0 | % | | 3.6 | % | | 2.8 | % |
| Malaysia | 1.5 | % | | 0.9 | % | | 0.8 | % |
| Belgium | 1.3 | % | | 0.6 | % | | 1.3 | % |
| India | 1.2 | % | | 1.2 | % | | 2.9 | % |
| France | 1.1 | % | | 1.6 | % | | 1.1 | % |
| Vietnam | 0.9 | % | | 2.4 | % | | 2.8 | % |
| South Korea | 0.6 | % | | — | % | | 2.1 | % |
| Germany | 0.2 | % | | 1.0 | % | | 0.7 | % |
| Chile | — | % | | — | % | | 1.1 | % |
| Other | 1.6 | % | | 3.2 | % | | 9.1 | % |
| Total | 100.0 | % | | 100.0 | % | | 100.0 | % |
The Company attributes revenue to individual countries based on the location of the physical delivery of the coal.
| | | | | | | | |
| Peabody Energy Corporation | 2024 Form 10-K | F-58 |
PEABODY ENERGY CORPORATION
SCHEDULE II — VALUATION AND QUALIFYING ACCOUNTS
| | | | | | | | | | | | | | | | | | | | | | | | | | | | | | | | | | |
| Description | | Balance at
Beginning of Period | | Charged to
Costs and Expenses | | | | Deductions(1) | | Other(2) | | Balance
at End of Period |
| | | (Dollars in millions) |
| Year Ended December 31, 2024 | | | | | | | | | | | | |
| Reserves deducted from asset accounts: | | | | | | | | | | | | |
| | | | | | | | | | | | |
| Reserve for materials and supplies | | $ | 7.2 | | | $ | 1.7 | | | | | $ | (5.4) | | | $ | — | | | $ | 3.5 | |
| | | | | | | | | | | | |
| Tax valuation allowances | | 1,473.5 | | | (9.6) | | | | | — | | | (43.0) | | | 1,420.9 | |
| Year Ended December 31, 2023 | | | | | | | | | | | | |
| Reserves deducted from asset accounts: | | | | | | | | | | | | |
| | | | | | | | | | | | |
| Reserve for materials and supplies | | $ | 9.5 | | | $ | 2.6 | | | | | $ | (4.9) | | | $ | — | | | $ | 7.2 | |
| | | | | | | | | | | | |
| Tax valuation allowances | | 1,451.0 | | | 0.6 | | | | | — | | | 21.9 | | | 1,473.5 | |
| Year Ended December 31, 2022 | | | | | | | | | | | | |
| Reserves deducted from asset accounts: | | | | | | | | | | | | |
| Advance royalty recoupment reserve | | $ | 0.3 | | | $ | (0.3) | | | | | $ | — | | | $ | — | | | $ | — | |
| Reserve for materials and supplies | | 9.0 | | | 1.4 | | | | | (0.9) | | | — | | | 9.5 | |
| | | | | | | | | | | | |
| Tax valuation allowances | | 2,120.8 | | | (583.8) | | | | | — | | | (86.0) | | | 1,451.0 | |
(1)Reserves utilized, unless otherwise indicated.
(2)Includes the impact of changes in the Australian dollar exchange rates.
| | | | | | | | |
| Peabody Energy Corporation | 2024 Form 10-K | F-59 |