Lender Overview March 2016 Exhibit 99.7 |
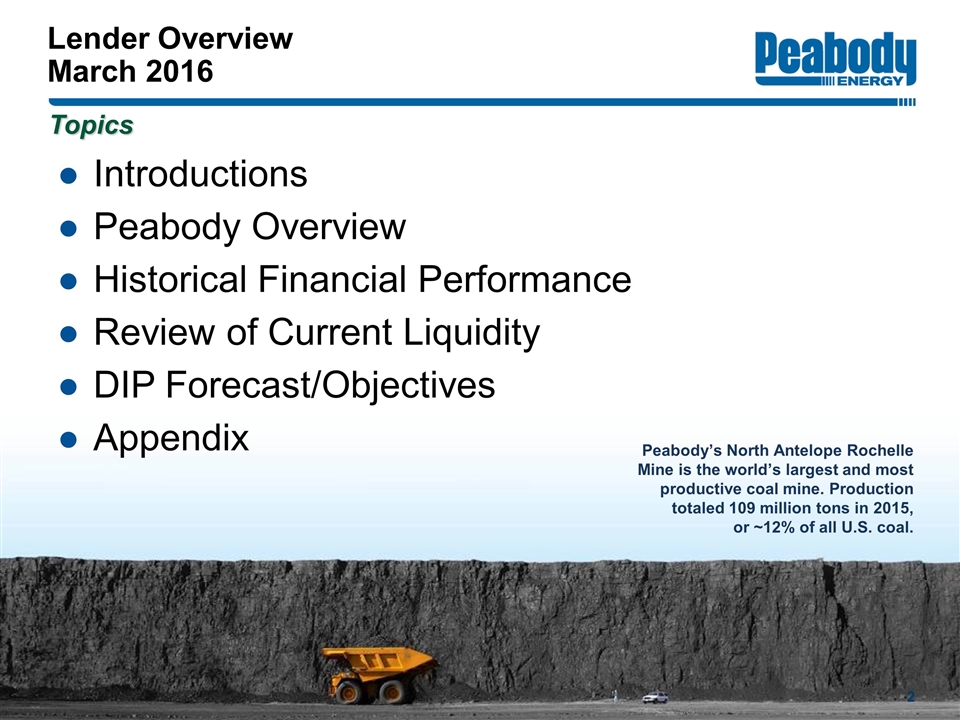
Lender Overview March 2016 Introductions Peabody Overview Historical Financial Performance Review of Current Liquidity DIP Forecast/Objectives Appendix Topics Peabody’s North Antelope Rochelle Mine is the world’s largest and most productive coal mine. Production totaled 109 million tons in 2015, or ~12% of all U.S. coal.

Executive Summary Business segment performance in key markets shows strength despite unprecedented market pressures Prior debt and hedging actions against extreme down-cycle conditions placed unsustainable burden on company despite significant cost, portfolio and overhead improvements Sustainable mining practices in safety and mine reclamation and industry leadership in advocacy of High-Efficiency-Low-Emissions and Carbon Capture, Use and Storage technologies Strengths include unmatched asset base, strong underlying operations, new management team with fresh perspectives
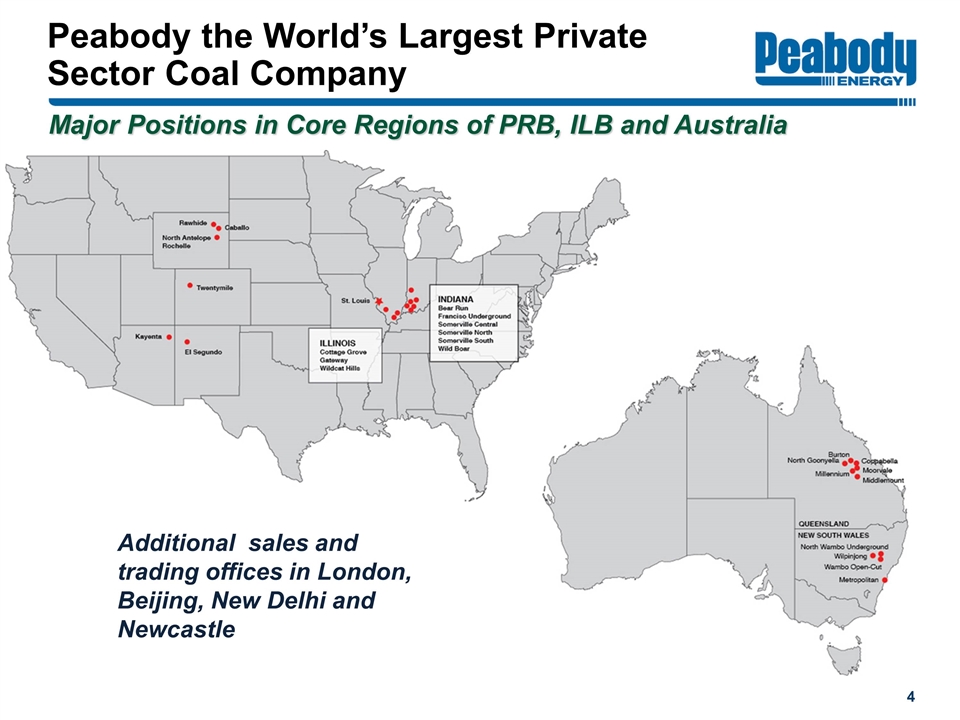
Peabody the World’s Largest Private Sector Coal Company Major Positions in Core Regions of PRB, ILB and Australia Additional sales and trading offices in London, Beijing, New Delhi and Newcastle
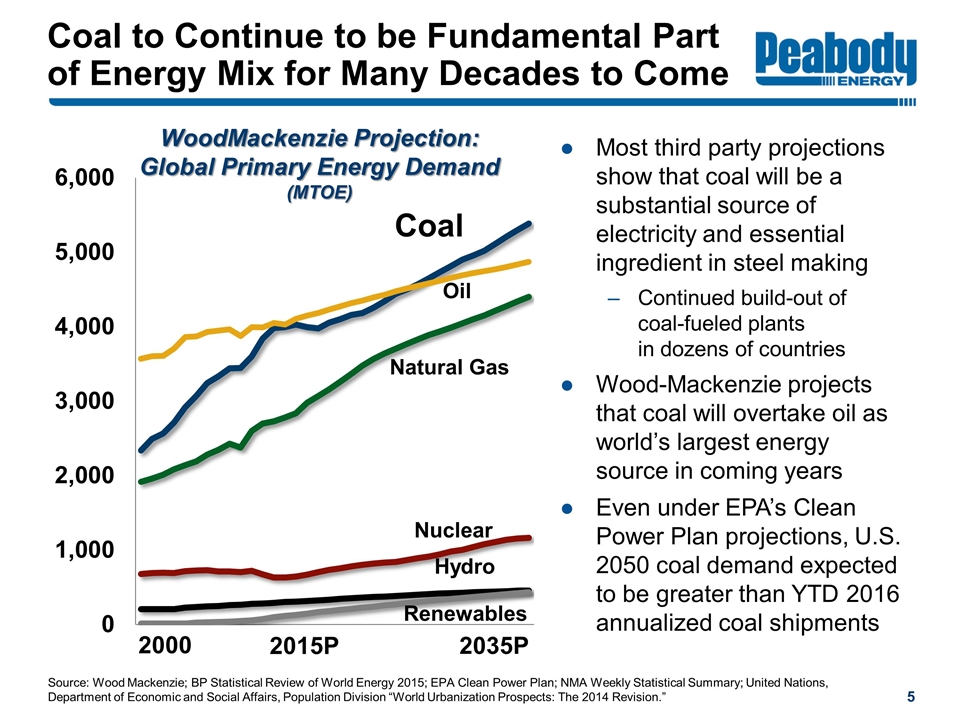
Coal to Continue to be Fundamental Part of Energy Mix for Many Decades to Come Source: Wood Mackenzie. Renewables Natural Gas Oil Nuclear Hydro Coal 2000 2035P 2015P Most third party projections show that coal will be a substantial source of electricity and essential ingredient in steel making Continued build-out of coal-fueled plants in dozens of countries Wood-Mackenzie projects that coal will overtake oil as world’s largest energy source in coming years Even under EPA’s Clean Power Plan projections, U.S. 2050 coal demand expected to be greater than YTD 2016 annualized coal shipments WoodMackenzie Projection: Global Primary Energy Demand (MTOE) Source: Wood Mackenzie; BP Statistical Review of World Energy 2015; EPA Clean Power Plan; NMA Weekly Statistical Summary; United Nations, Department of Economic and Social Affairs, Population Division “World Urbanization Prospects: The 2014 Revision.”
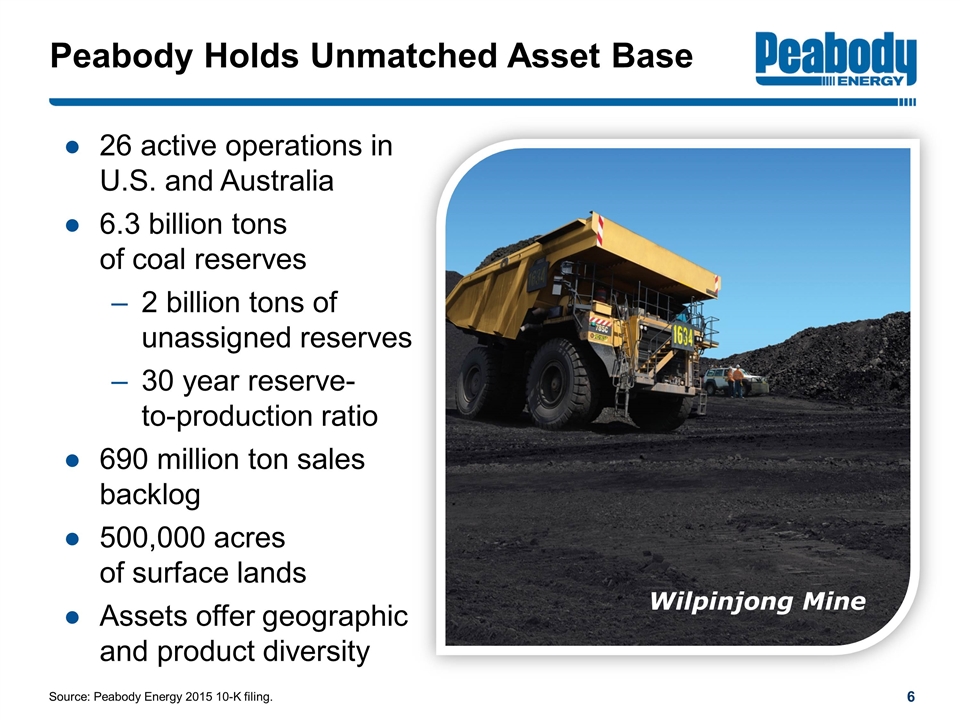
Peabody Holds Unmatched Asset Base 26 active operations in U.S. and Australia 6.3 billion tons of coal reserves 2 billion tons of unassigned reserves 30 year reserve- to-production ratio 690 million ton sales backlog 500,000 acres of surface lands Assets offer geographic and product diversity Source: Peabody Energy 2015 10-K filing. Wilpinjong Mine
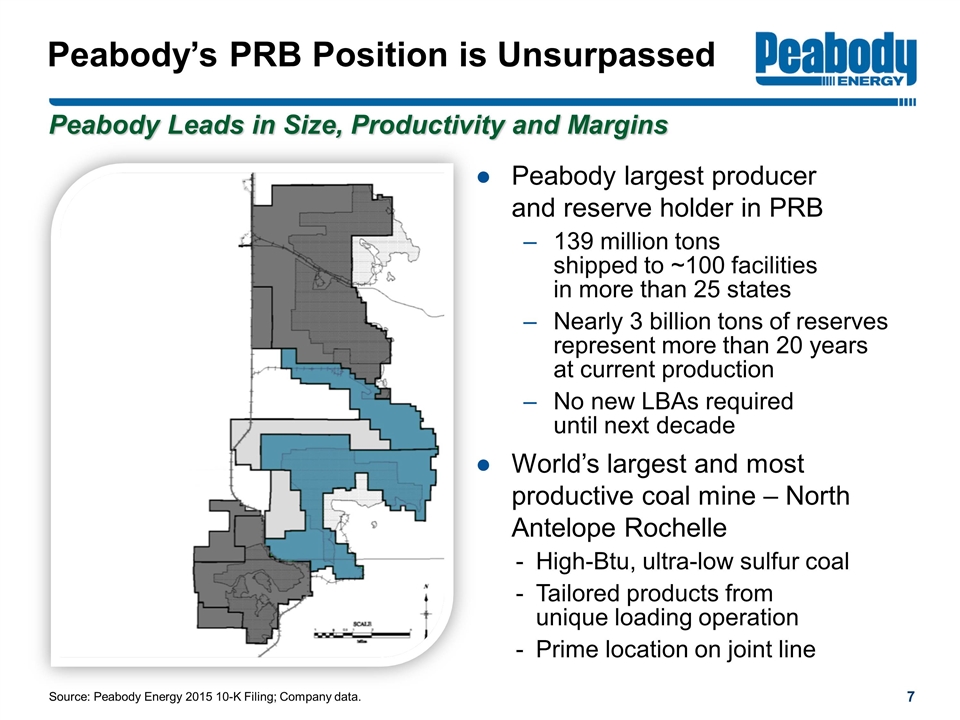
Peabody’s PRB Position is Unsurpassed Peabody Leads in Size, Productivity and Margins Source: Peabody Energy 2015 10-K Filing; Company data. Peabody largest producer and reserve holder in PRB 139 million tons shipped to ~100 facilities in more than 25 states Nearly 3 billion tons of reserves represent more than 20 years at current production No new LBAs required until next decade World’s largest and most productive coal mine – North Antelope Rochelle High-Btu, ultra-low sulfur coal Tailored products from unique loading operation Prime location on joint line
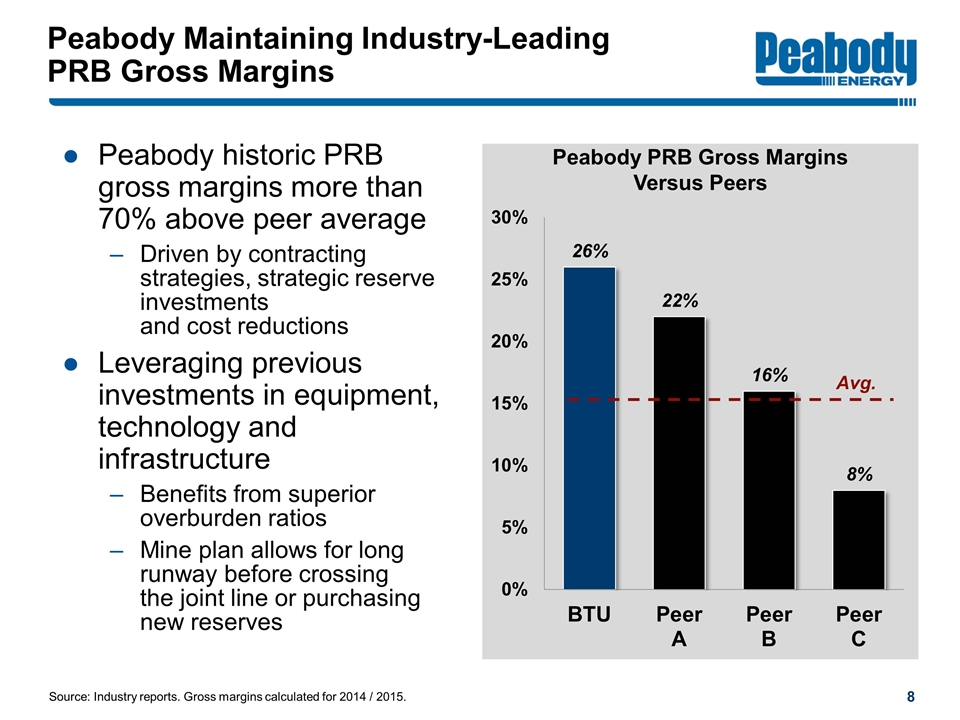
Peabody Maintaining Industry-Leading PRB Gross Margins Source: Industry reports. Gross margins calculated for 2014 / 2015. Peabody historic PRB gross margins more than 70% above peer average Driven by contracting strategies, strategic reserve investments and cost reductions Leveraging previous investments in equipment, technology and infrastructure Benefits from superior overburden ratios Mine plan allows for long runway before crossing the joint line or purchasing new reserves Peabody PRB Gross Margins Versus Peers Avg.
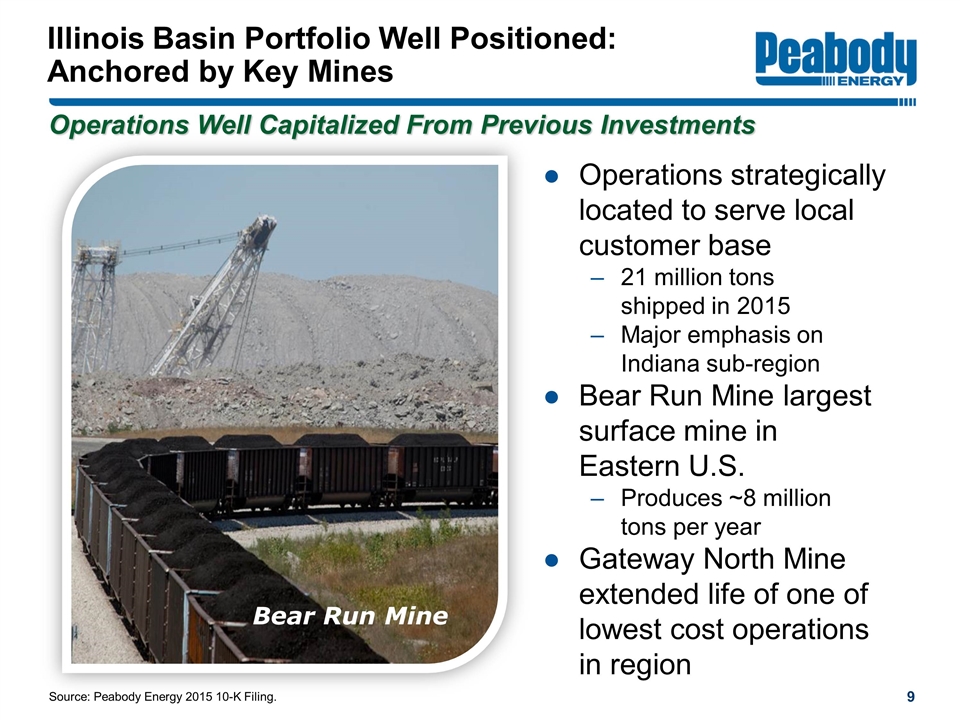
Illinois Basin Portfolio Well Positioned: Anchored by Key Mines Operations Well Capitalized From Previous Investments Source: Peabody Energy 2015 10-K Filing. Operations strategically located to serve local customer base 21 million tons shipped in 2015 Major emphasis on Indiana sub-region Bear Run Mine largest surface mine in Eastern U.S. Produces ~8 million tons per year Gateway North Mine extended life of one of lowest cost operations in region Bear Run Mine
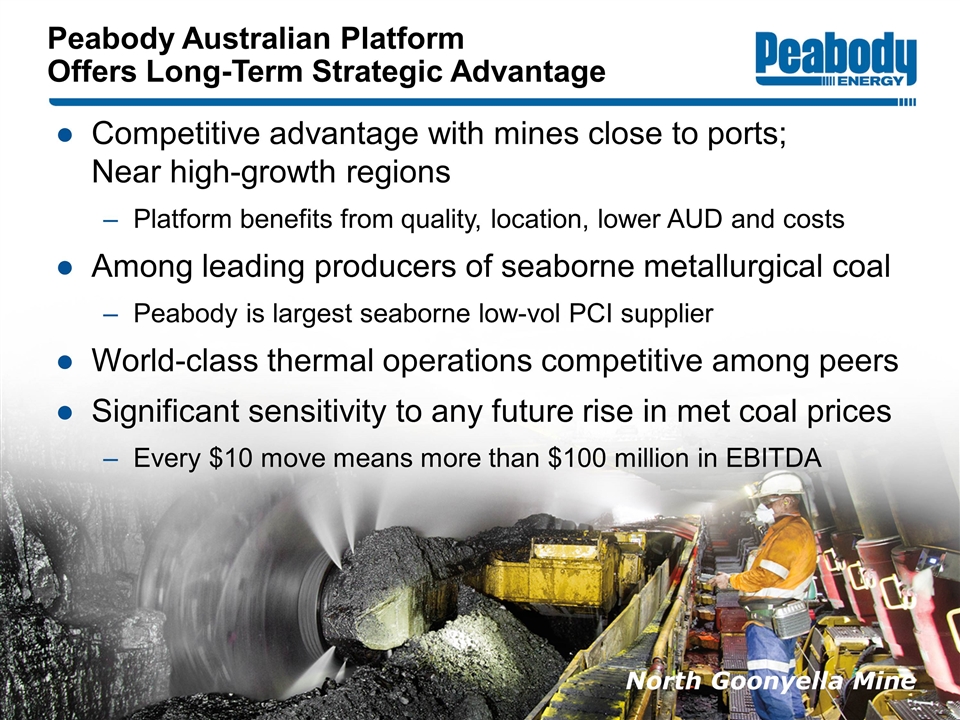
Peabody Australian Platform Offers Long-Term Strategic Advantage Competitive advantage with mines close to ports; Near high-growth regions Platform benefits from quality, location, lower AUD and costs Among leading producers of seaborne metallurgical coal Peabody is largest seaborne low-vol PCI supplier World-class thermal operations competitive among peers Significant sensitivity to any future rise in met coal prices Every $10 move means more than $100 million in EBITDA North Goonyella Mine
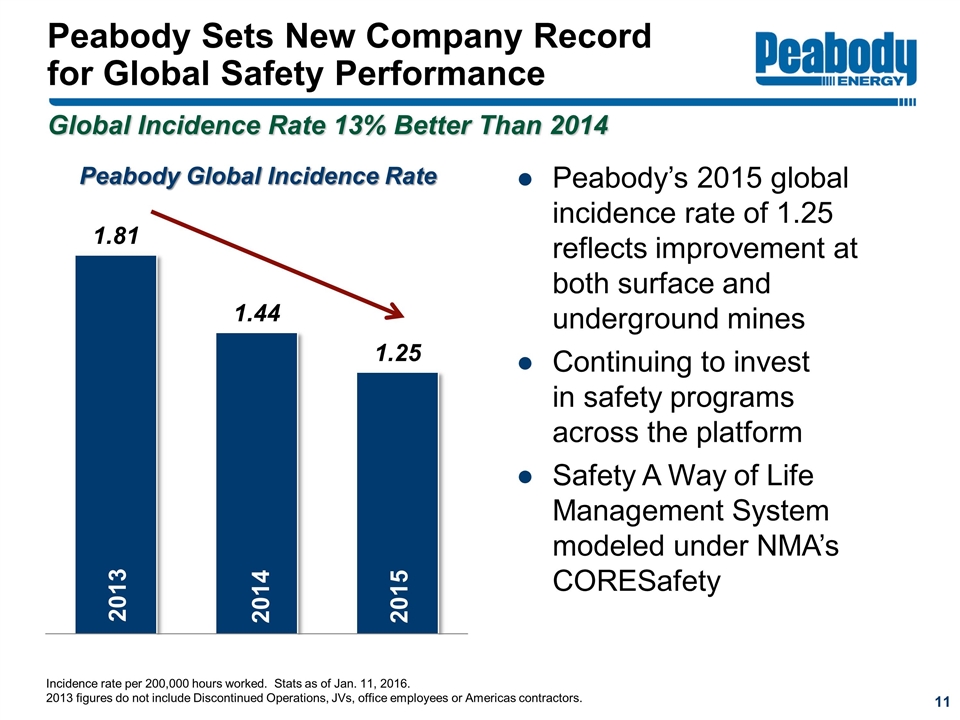
Peabody Sets New Company Record for Global Safety Performance Global Incidence Rate 13% Better Than 2014 Peabody’s 2015 global incidence rate of 1.25 reflects improvement at both surface and underground mines Continuing to invest in safety programs across the platform Safety A Way of Life Management System modeled under NMA’s CORESafety Incidence rate per 200,000 hours worked. Stats as of Jan. 11, 2016. 2013 figures do not include Discontinued Operations, JVs, office employees or Americas contractors. Peabody Global Incidence Rate 2013 2014 2015

Focus on Business Priorities
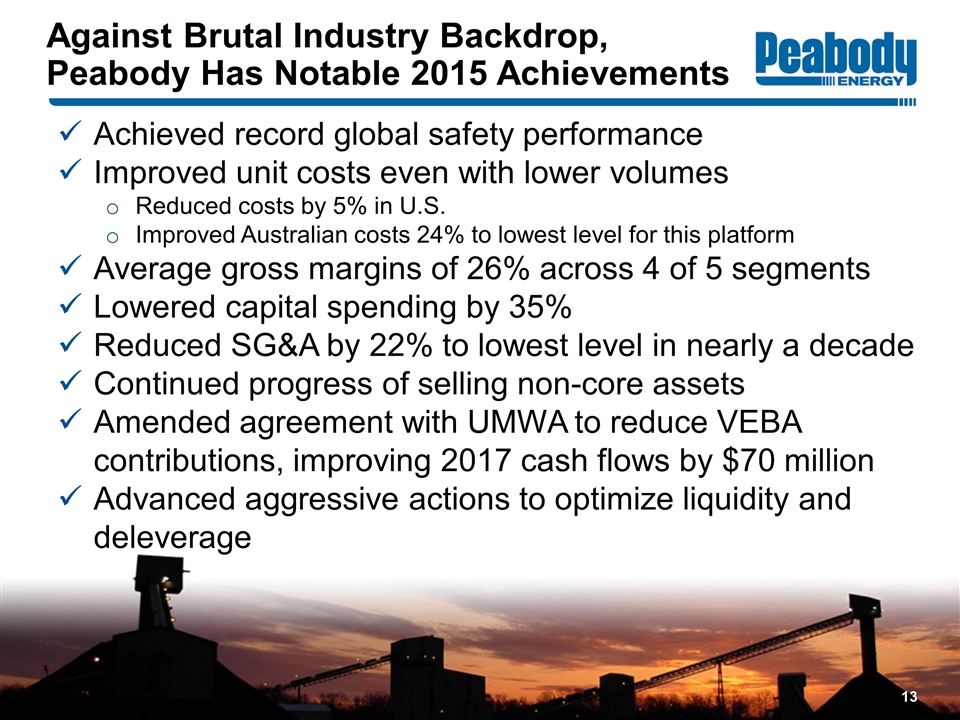
Against Brutal Industry Backdrop, Peabody Has Notable 2015 Achievements Achieved record global safety performance Improved unit costs even with lower volumes Reduced costs by 5% in U.S. Improved Australian costs 24% to lowest level for this platform Average gross margins of 26% across 4 of 5 segments Lowered capital spending by 35% Reduced SG&A by 22% to lowest level in nearly a decade Continued progress of selling non-core assets Amended agreement with UMWA to reduce VEBA contributions, improving 2017 cash flows by $70 million Advanced aggressive actions to optimize liquidity and deleverage
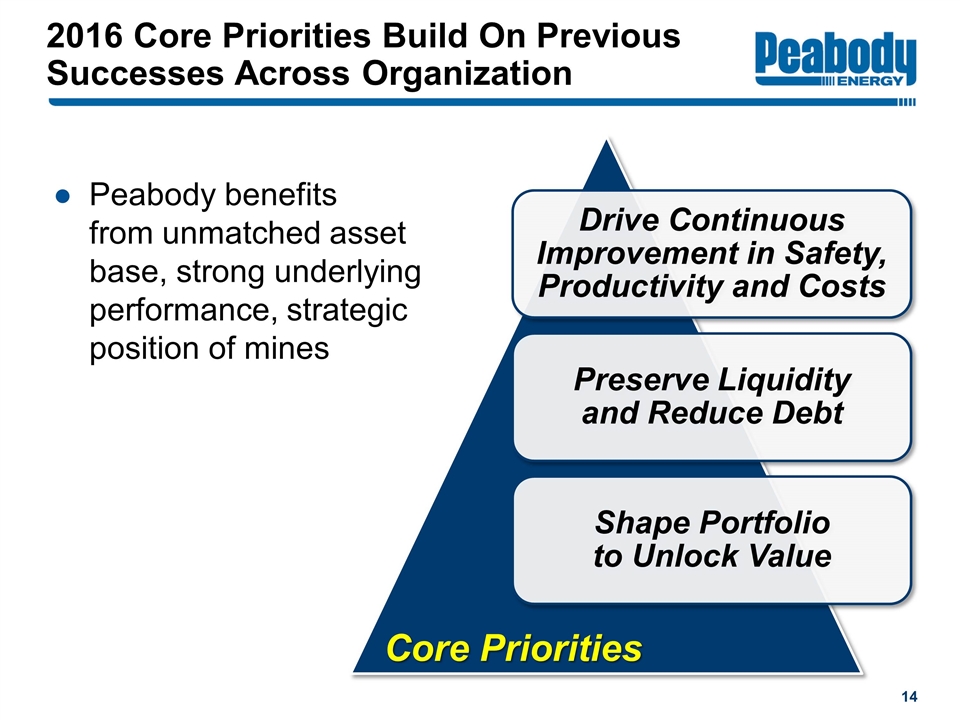
2016 Core Priorities Build On Previous Successes Across Organization Peabody benefits from unmatched asset base, strong underlying performance, strategic position of mines Core Priorities Drive Continuous Improvement in Safety, Productivity and Costs Preserve Liquidity and Reduce Debt Shape Portfolio to Unlock Value
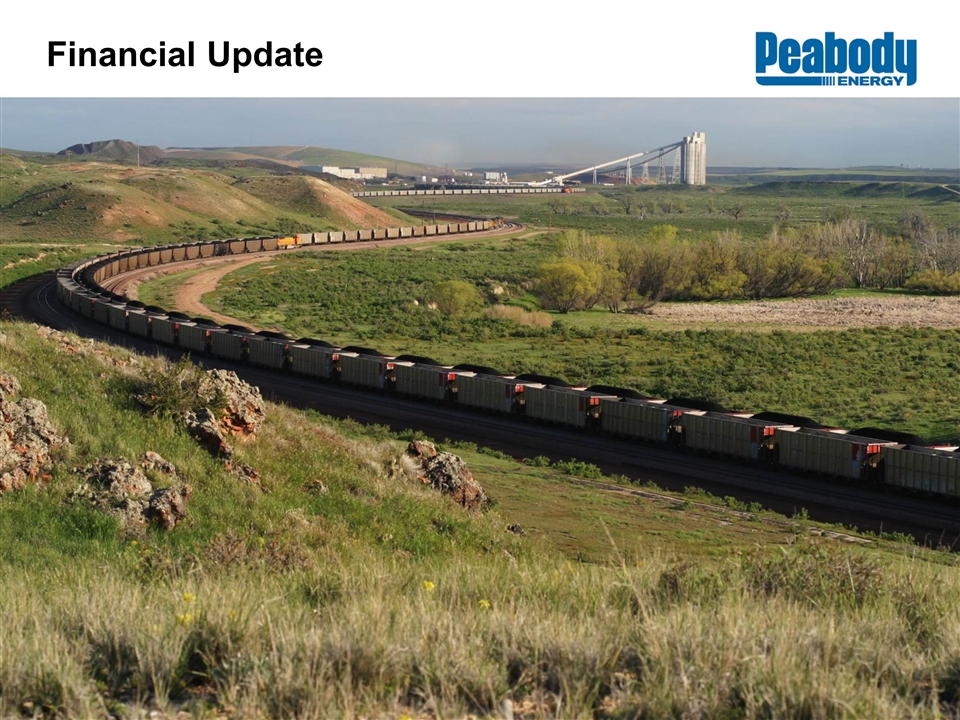
Financial Update North Antelope Rochelle Mine
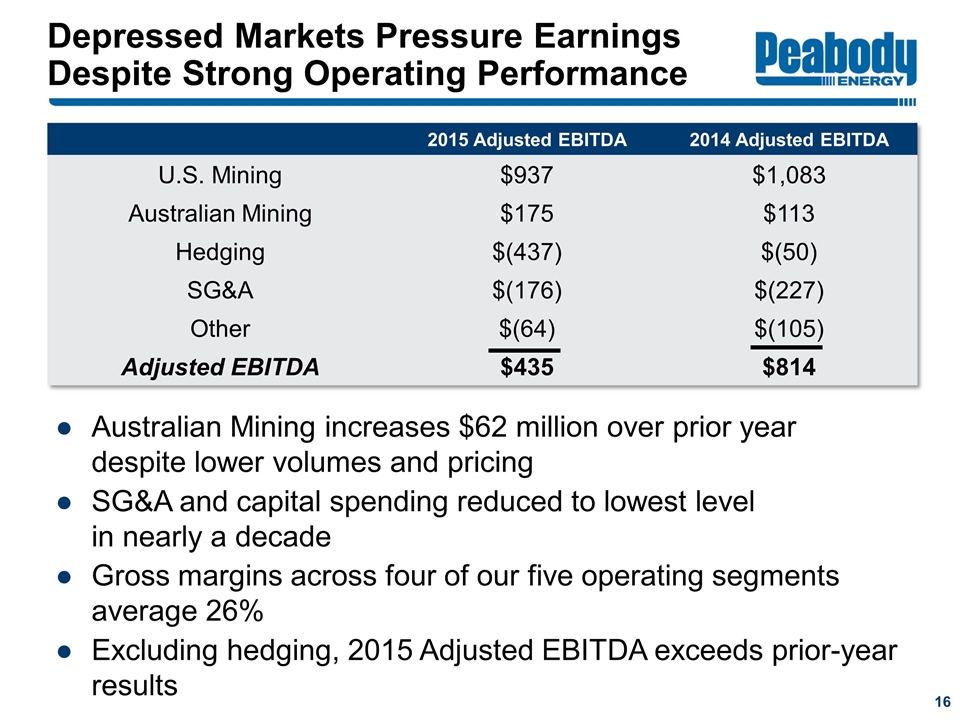
Depressed Markets Pressure Earnings Despite Strong Operating Performance 2015 Adjusted EBITDA 2014 Adjusted EBITDA U.S. Mining $937 $1,083 Australian Mining $175 $113 Hedging $(437) $(50) SG&A $(176) $(227) Other $(64) $(105) Adjusted EBITDA $435 $814 Australian Mining increases $62 million over prior year despite lower volumes and pricing SG&A and capital spending reduced to lowest level in nearly a decade Gross margins across four of our five operating segments average 26% Excluding hedging, 2015 Adjusted EBITDA exceeds prior-year results
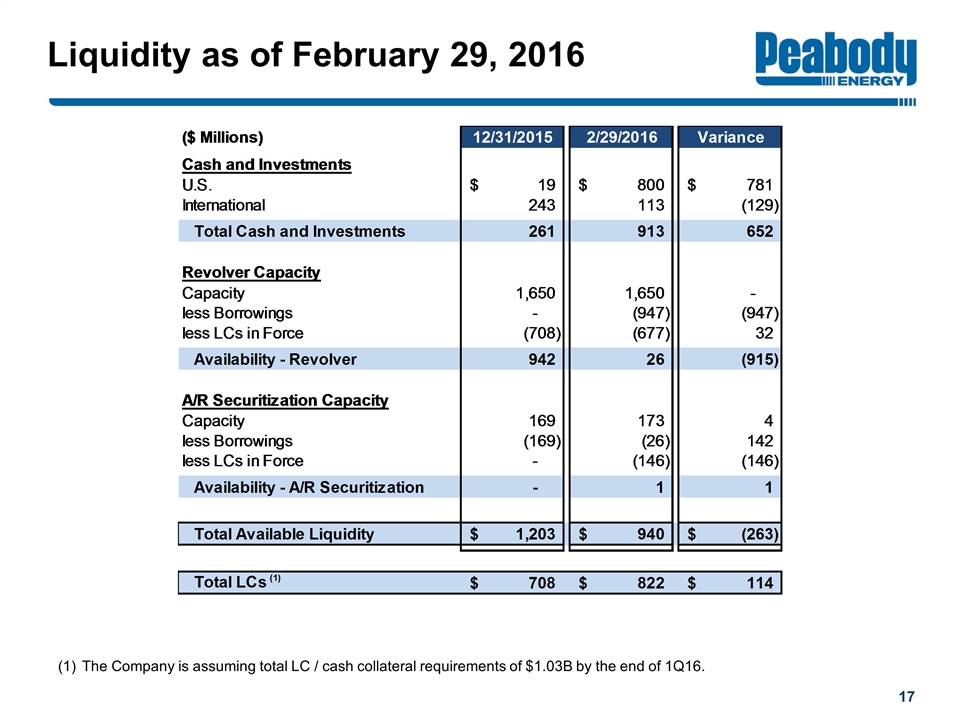
Liquidity as of February 29, 2016 The Company is assuming total LC / cash collateral requirements of $1.03B by the end of 1Q16.
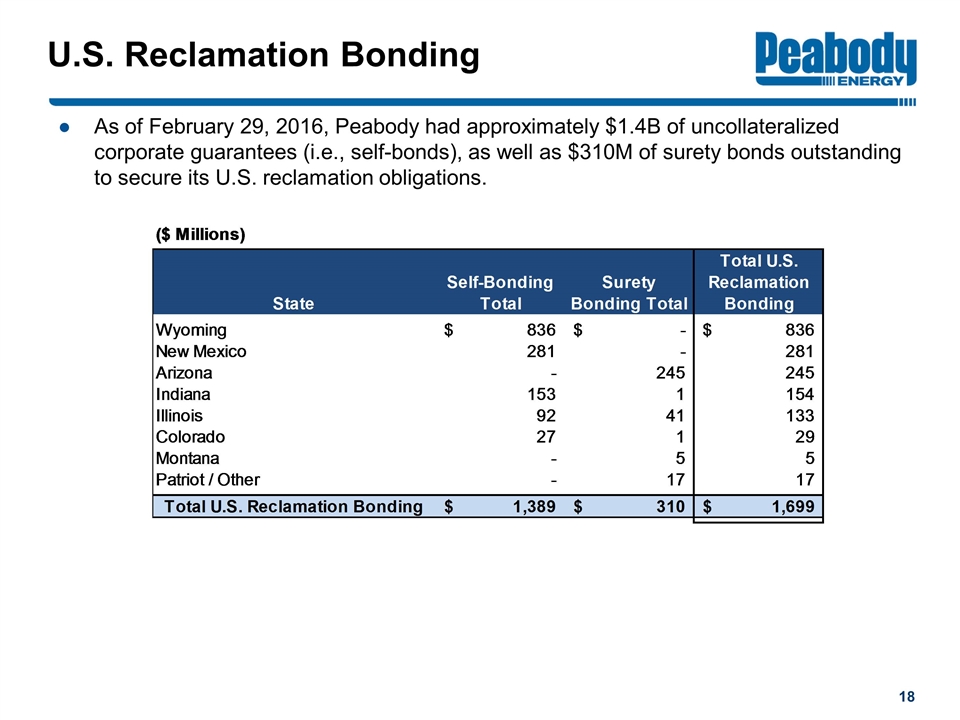
As of February 29, 2016, Peabody had approximately $1.4B of uncollateralized corporate guarantees (i.e., self-bonds), as well as $310M of surety bonds outstanding to secure its U.S. reclamation obligations. U.S. Reclamation Bonding
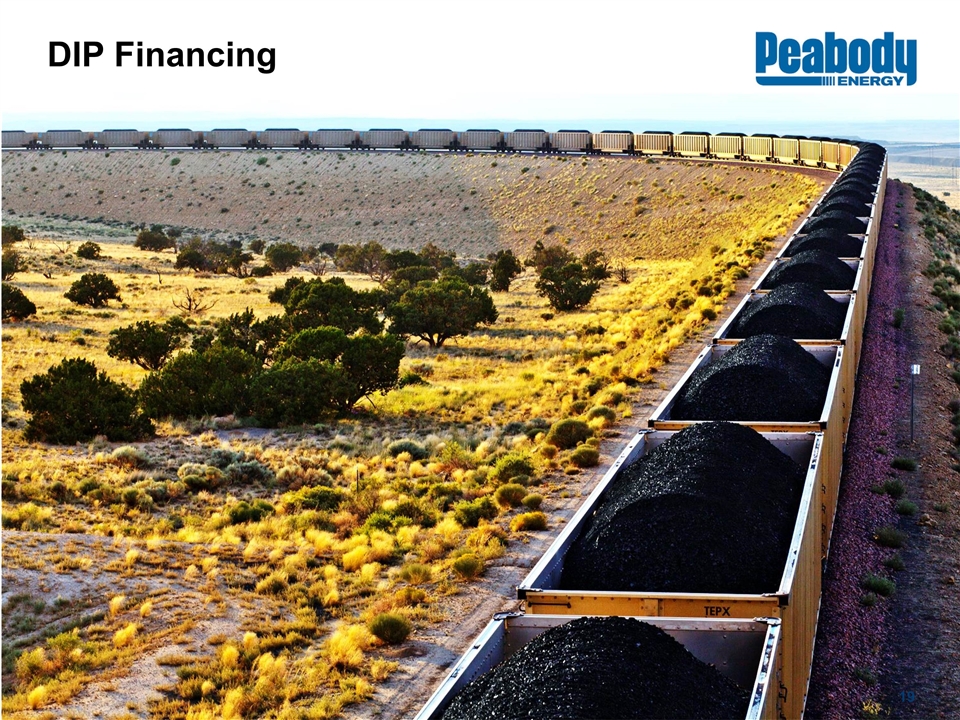
DIP Financing
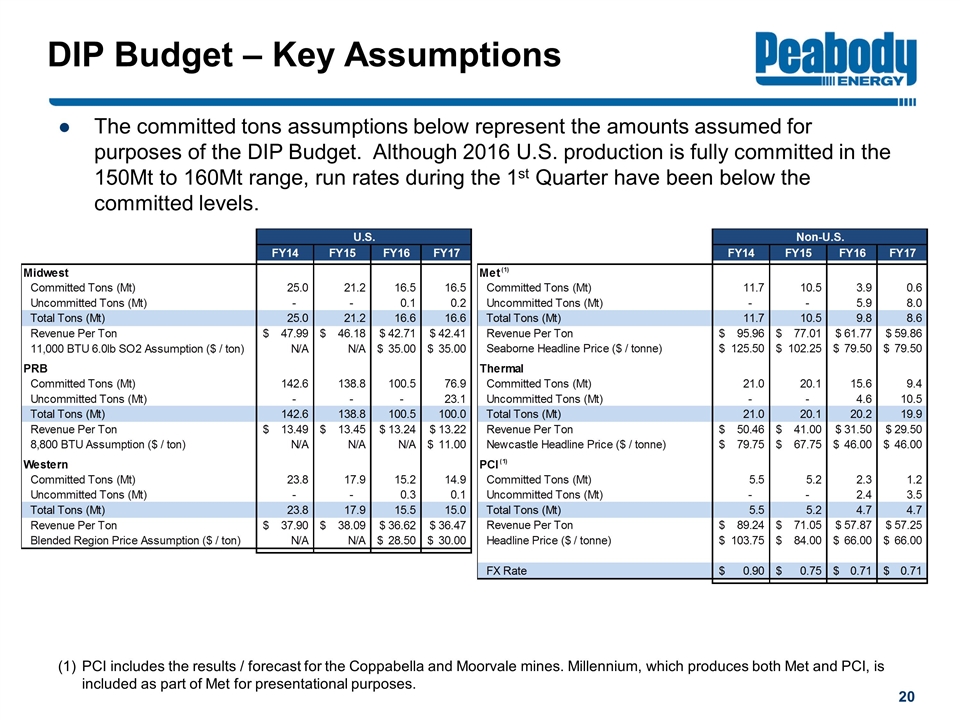
DIP Budget – Key Assumptions The committed tons assumptions below represent the amounts assumed for purposes of the DIP Budget. Although 2016 U.S. production is fully committed in the 150Mt to 160Mt range, run rates during the 1st Quarter have been below the committed levels. PCI includes the results / forecast for the Coppabella and Moorvale mines. Millennium, which produces both Met and PCI, is included as part of Met for presentational purposes.
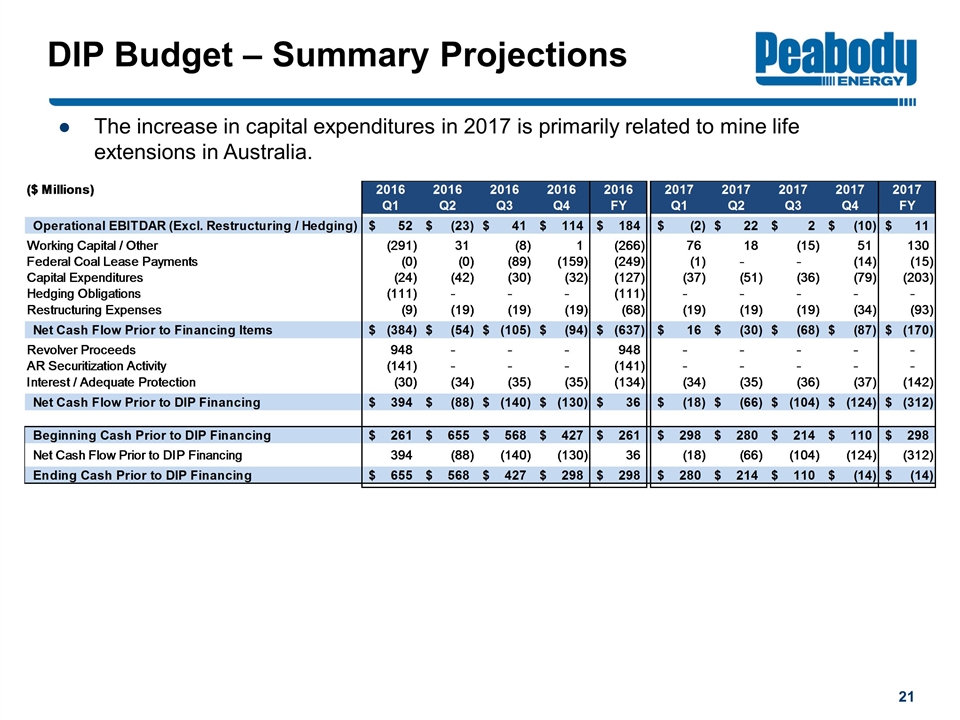
DIP Budget – Summary Projections The increase in capital expenditures in 2017 is primarily related to mine life extensions in Australia.
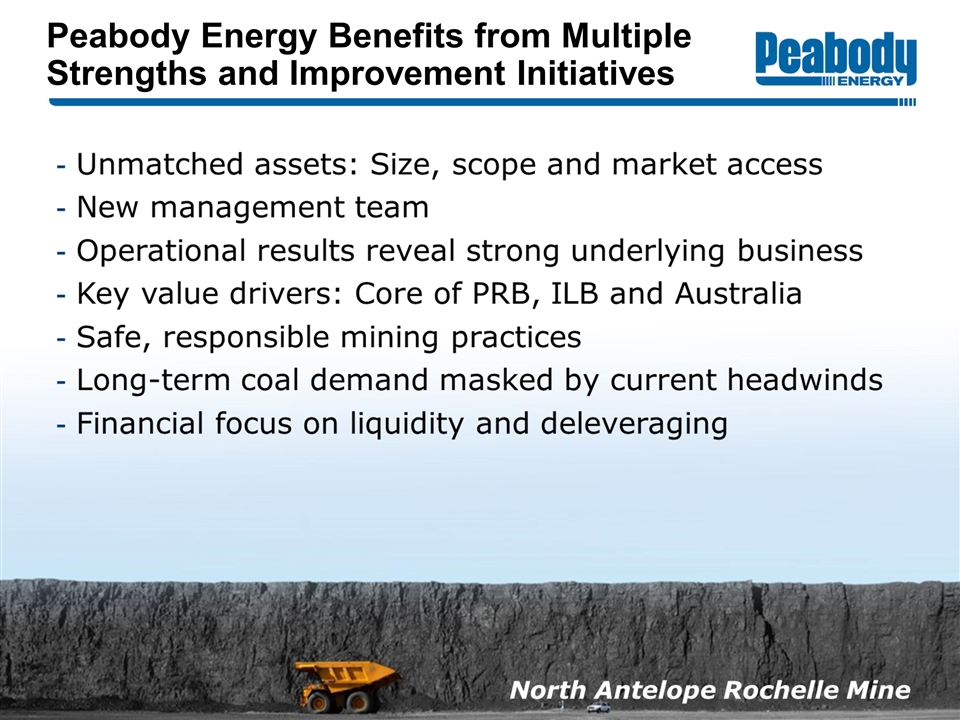
Peabody Energy Benefits from Multiple Strengths and Improvement Initiatives
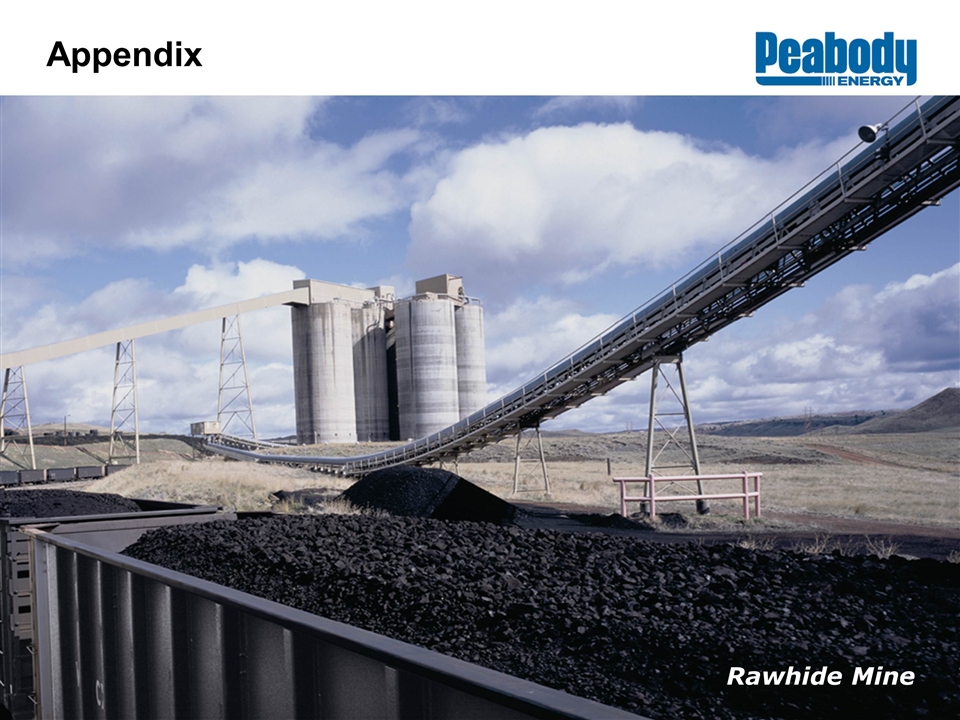
Appendix Rawhide Mine
Disclaimer Peabody or its affiliates and representatives make no representation or warranty, express or implied, as to any matter reflected in or relating to this presentation. Certain statements and information in this presentation are forward-looking in nature and based on numerous assumptions that Peabody believes are reasonable, but they are open to a wide range of uncertainties and business risks that may cause actual results or outcomes to differ materially from expectations. These factors are difficult to accurately predict and may be beyond the control of relevant parties. Actual future results may vary significantly from the projections, estimates, forecasts, and other forward-looking information in this presentation. The recipient must make its own inquiries regarding the assumptions, uncertainties, and contingencies that may affect future value, operations and results, and the impact that a variation in future outcomes may have. Nothing in the presentation is intended to constitute a contract or an offer to enter into a contract, or to be binding or to create legal obligations or rights.
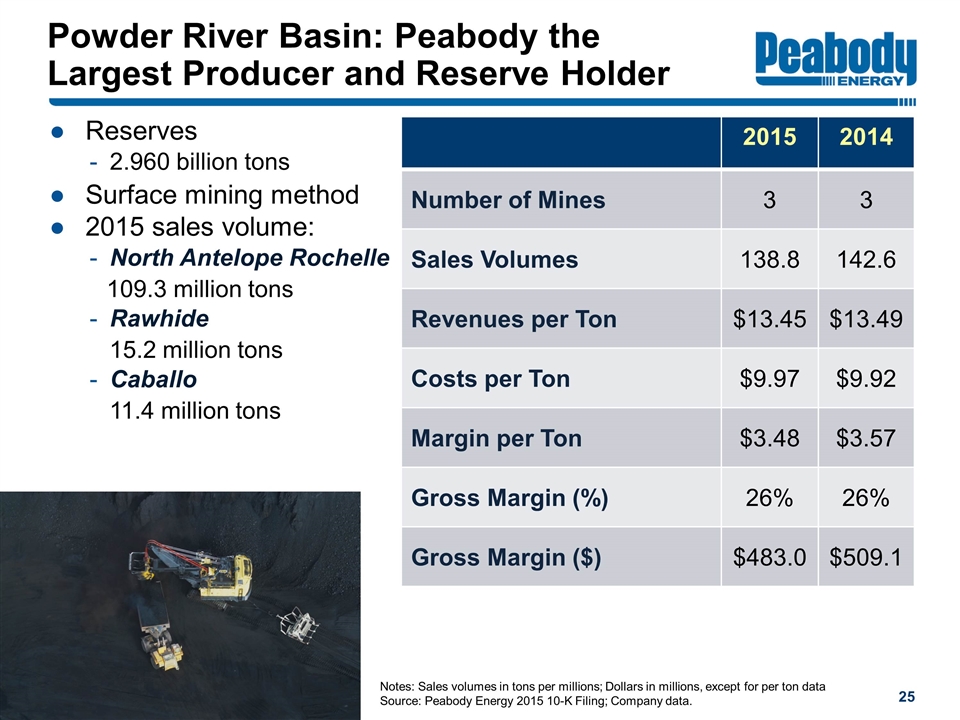
Powder River Basin: Peabody the Largest Producer and Reserve Holder 2015 2014 Number of Mines 3 3 Sales Volumes 138.8 142.6 Revenues per Ton $13.45 $13.49 Costs per Ton $9.97 $9.92 Margin per Ton $3.48 $3.57 Gross Margin (%) 26% 26% Gross Margin ($) $483.0 $509.1 Reserves 2.960 billion tons Surface mining method 2015 sales volume: North Antelope Rochelle 109.3 million tons Rawhide 15.2 million tons Caballo 11.4 million tons Notes: Sales volumes in tons per millions; Dollars in millions, except for per ton data Source: Peabody Energy 2015 10-K Filing; Company data.
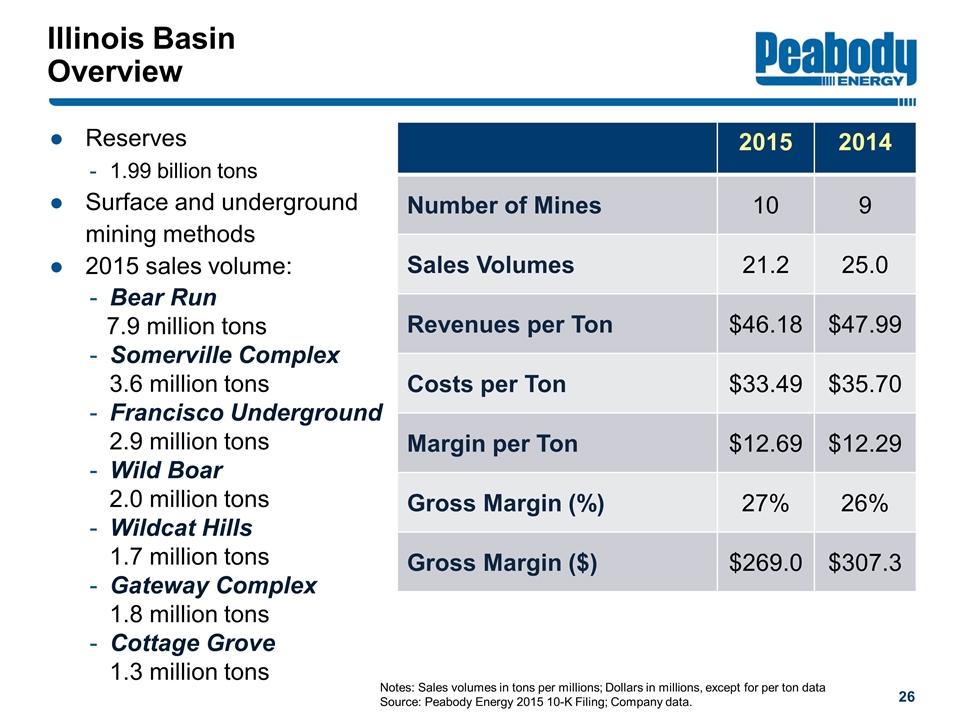
Illinois Basin Overview 2015 2014 Number of Mines 10 9 Sales Volumes 21.2 25.0 Revenues per Ton $46.18 $47.99 Costs per Ton $33.49 $35.70 Margin per Ton $12.69 $12.29 Gross Margin (%) 27% 26% Gross Margin ($) $269.0 $307.3 Reserves 1.99 billion tons Surface and underground mining methods 2015 sales volume: Bear Run 7.9 million tons Somerville Complex 3.6 million tons Francisco Underground 2.9 million tons Wild Boar 2.0 million tons Wildcat Hills 1.7 million tons Gateway Complex 1.8 million tons Cottage Grove 1.3 million tons Notes: Sales volumes in tons per millions; Dollars in millions, except for per ton data Source: Peabody Energy 2015 10-K Filing; Company data.
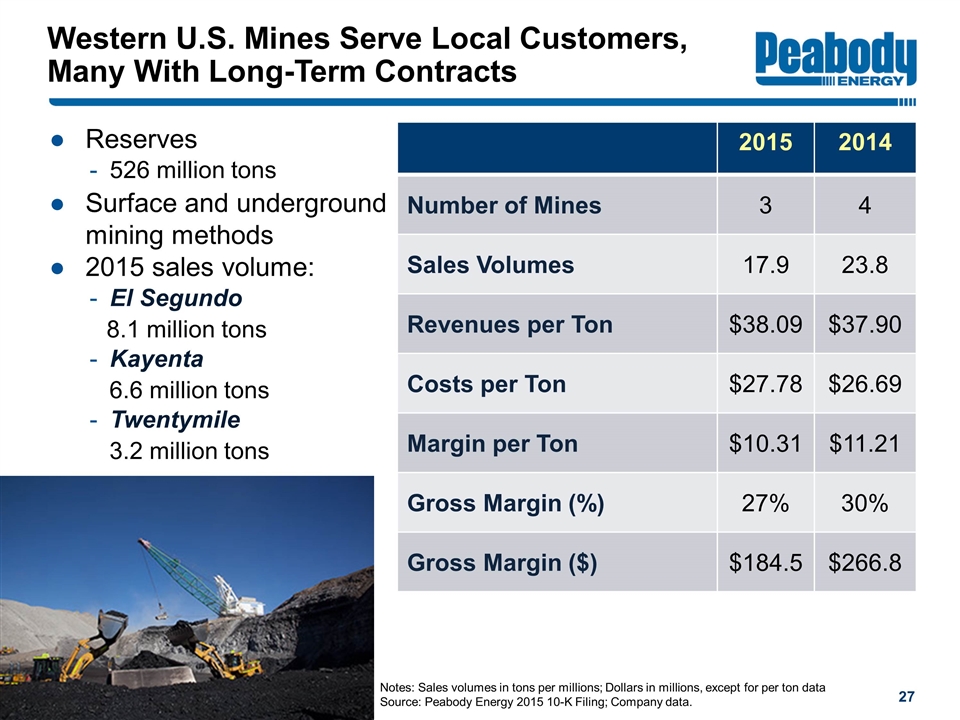
Western U.S. Mines Serve Local Customers, Many With Long-Term Contracts 2015 2014 Number of Mines 3 4 Sales Volumes 17.9 23.8 Revenues per Ton $38.09 $37.90 Costs per Ton $27.78 $26.69 Margin per Ton $10.31 $11.21 Gross Margin (%) 27% 30% Gross Margin ($) $184.5 $266.8 Reserves 526 million tons Surface and underground mining methods 2015 sales volume: El Segundo 8.1 million tons Kayenta 6.6 million tons Twentymile 3.2 million tons Notes: Sales volumes in tons per millions; Dollars in millions, except for per ton data Source: Peabody Energy 2015 10-K Filing; Company data.
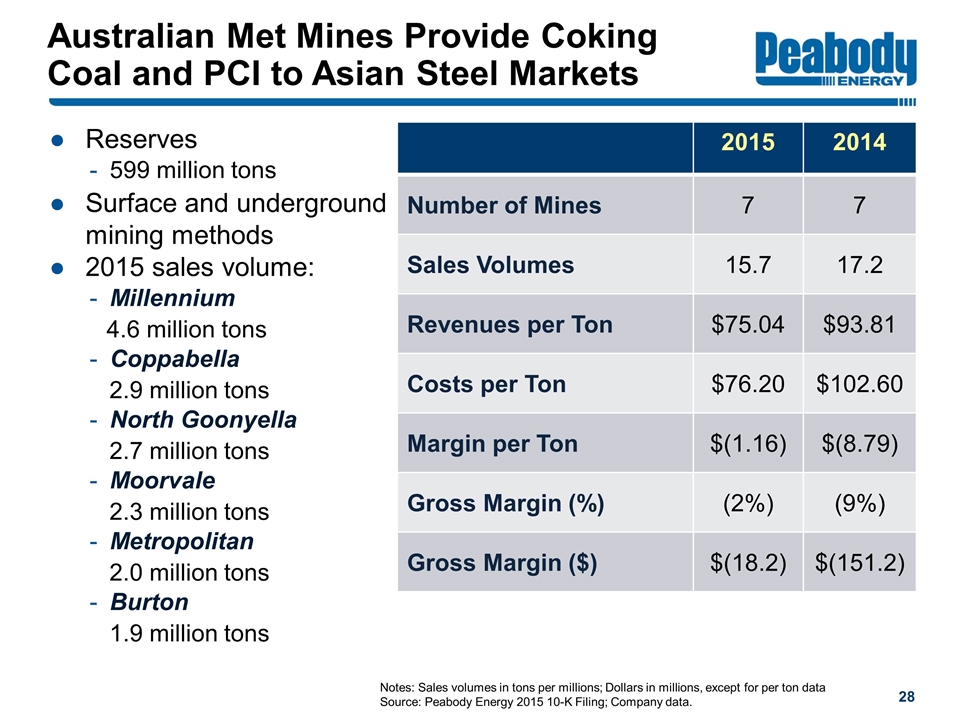
Australian Met Mines Provide Coking Coal and PCI to Asian Steel Markets 2015 2014 Number of Mines 7 7 Sales Volumes 15.7 17.2 Revenues per Ton $75.04 $93.81 Costs per Ton $76.20 $102.60 Margin per Ton $(1.16) $(8.79) Gross Margin (%) (2%) (9%) Gross Margin ($) $(18.2) $(151.2) Reserves 599 million tons Surface and underground mining methods 2015 sales volume: Millennium 4.6 million tons Coppabella 2.9 million tons North Goonyella 2.7 million tons Moorvale 2.3 million tons Metropolitan 2.0 million tons Burton 1.9 million tons Notes: Sales volumes in tons per millions; Dollars in millions, except for per ton data Source: Peabody Energy 2015 10-K Filing; Company data.
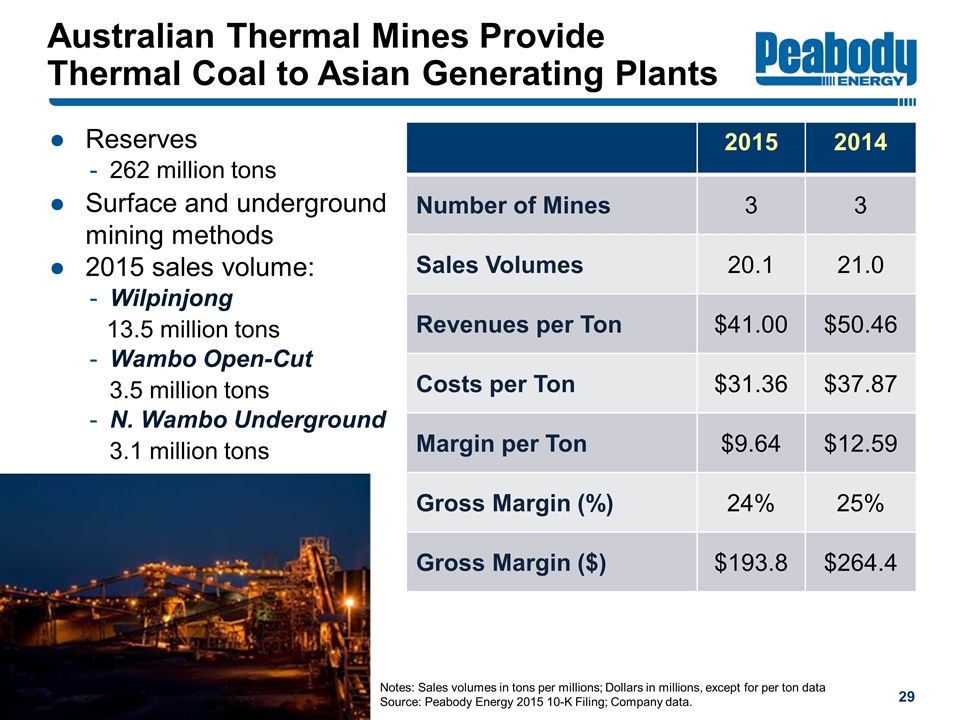
Australian Thermal Mines Provide Thermal Coal to Asian Generating Plants 2015 2014 Number of Mines 3 3 Sales Volumes 20.1 21.0 Revenues per Ton $41.00 $50.46 Costs per Ton $31.36 $37.87 Margin per Ton $9.64 $12.59 Gross Margin (%) 24% 25% Gross Margin ($) $193.8 $264.4 Reserves 262 million tons Surface and underground mining methods 2015 sales volume: Wilpinjong 13.5 million tons Wambo Open-Cut 3.5 million tons N. Wambo Underground 3.1 million tons Notes: Sales volumes in tons per millions; Dollars in millions, except for per ton data Source: Peabody Energy 2015 10-K Filing; Company data.
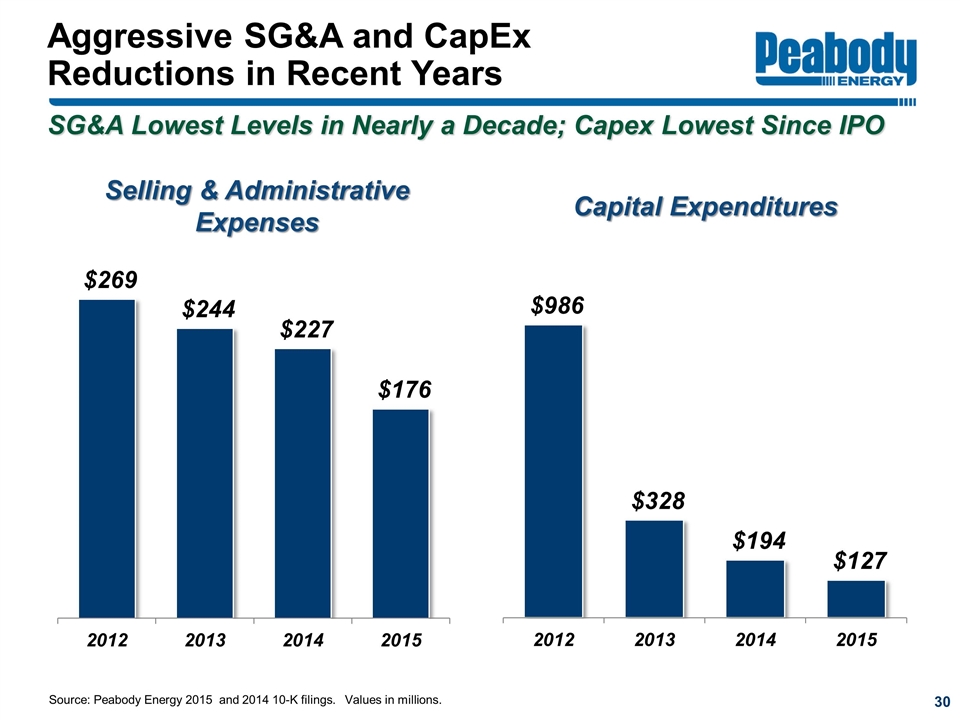
Aggressive SG&A and CapEx Reductions in Recent Years Selling & Administrative Expenses Capital Expenditures Source: Peabody Energy 2015 and 2014 10-K filings. Values in millions. SG&A Lowest Levels in Nearly a Decade; Capex Lowest Since IPO
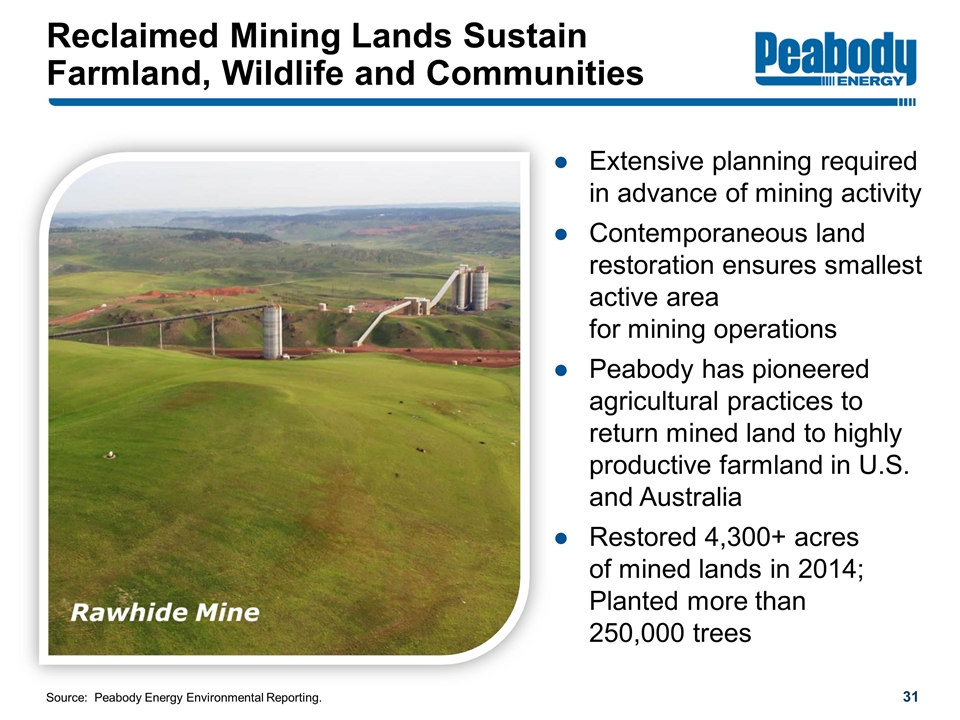
Reclaimed Mining Lands Sustain Farmland, Wildlife and Communities Extensive planning required in advance of mining activity Contemporaneous land restoration ensures smallest active area for mining operations Peabody has pioneered agricultural practices to return mined land to highly productive farmland in U.S. and Australia Restored 4,300+ acres of mined lands in 2014; Planted more than 250,000 trees Source: Peabody Energy Environmental Reporting.
Lender Overview March 2016
Overview of DIP Budget April 12, 2016
Disclaimer Peabody or its affiliates and representatives make no representation or warranty, express or implied, as to any matter reflected in or relating to this presentation. Certain statements and information in this presentation are forward-looking in nature and based on numerous assumptions that Peabody believes are reasonable, but they are open to a wide range of uncertainties and business risks that may cause actual results or outcomes to differ materially from expectations. These factors are difficult to accurately predict and may be beyond the control of relevant parties. Actual future results may vary significantly from the projections, estimates, forecasts, and other forward-looking information in this presentation. The recipient must make its own inquiries regarding the assumptions, uncertainties, and contingencies that may affect future value, operations and results, and the impact that a variation in future outcomes may have. Nothing in the presentation is intended to constitute a contract or an offer to enter into a contract, or to be binding or to create legal obligations or rights. 34
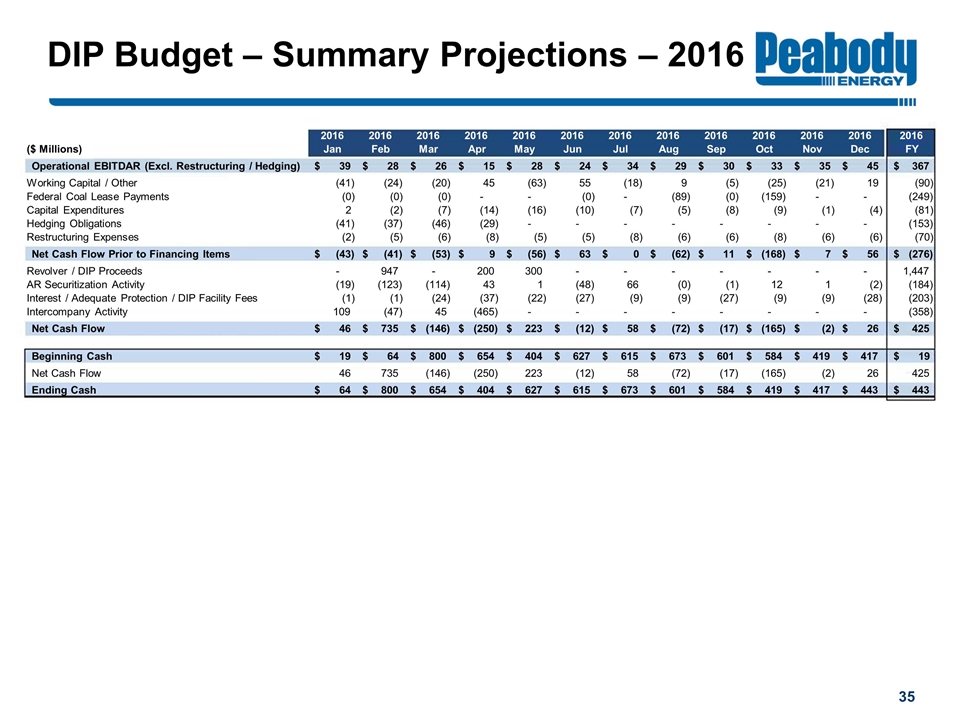
DIP Budget – Summary Projections – 2016 5 2016 2016 2016 2016 2016 2016 2016 2016 2016 2016 2016 2016 2016 ($ Millions) Jan Feb Mar Apr May Jun Jul Aug Sep Oct Nov Dec FY Operational EBITDAR (Excl. Restructuring / Hedging) 39 $ 28 $ 26 $ 15 $ 28 $ 24 $ 34 $ 29 $ 30 $ 33 $ 35 $ 45 $ 367 $ Working Capital / Other (41) (24) (20) 45 (63) 55 (18) 9 (5) (25) (21) 19 (90) Federal Coal Lease Payments (0) (0) (0) - - (0) - (89) (0) (159) - - (249) Capital Expenditures 2 (2) (7) (14) (16) (10) (7) (5) (8) (9) (1) (4) (81) Hedging Obligations (41) (37) (46) (29) - - - - - - - - (153) Restructuring Expenses (2) (5) (6) (8) (5) (5) (8) (6) (6) (8) (6) (6) (70) Net Cash Flow Prior to Financing Items (43) $ (41) $ (53) $ 9 $ (56) $ 63 $ 0 $ (62) $ 11 $ (168) $ 7 $ 56 $ (276) $ Revolver / DIP Proceeds - 947 - 200 300 - - - - - - - 1,447 AR Securitization Activity (19) (123) (114) 43 1 (48) 66 (0) (1) 12 1 (2) (184) Interest / Adequate Protection / DIP Facility Fees (1) (1) (24) (37) (22) (27) (9) (9) (27) (9) (9) (28) (203) Intercompany Activity 109 (47) 45 (465) - - - - - - - - (358) Net Cash Flow 46 $ 735 $ (146) $ (250) $ 223 $ (12) $ 58 $ (72) $ (17) $ (165) $ (2) $ 26 $ 425 $ Beginning Cash 19 $ 64 $ 800 $ 654 $ 404 $ 627 $ 615 $ 673 $ 601 $ 584 $ 419 $ 417 $ 19 $ Net Cash Flow 46 735 (146) (250) 223 (12) 58 (72) (17) (165) (2) 26 425 Ending Cash 64 $ 800 $ 654 $ 404 $ 627 $ 615 $ 673 $ 601 $ 584 $ 419 $ 417 $ 443 $ 443 $
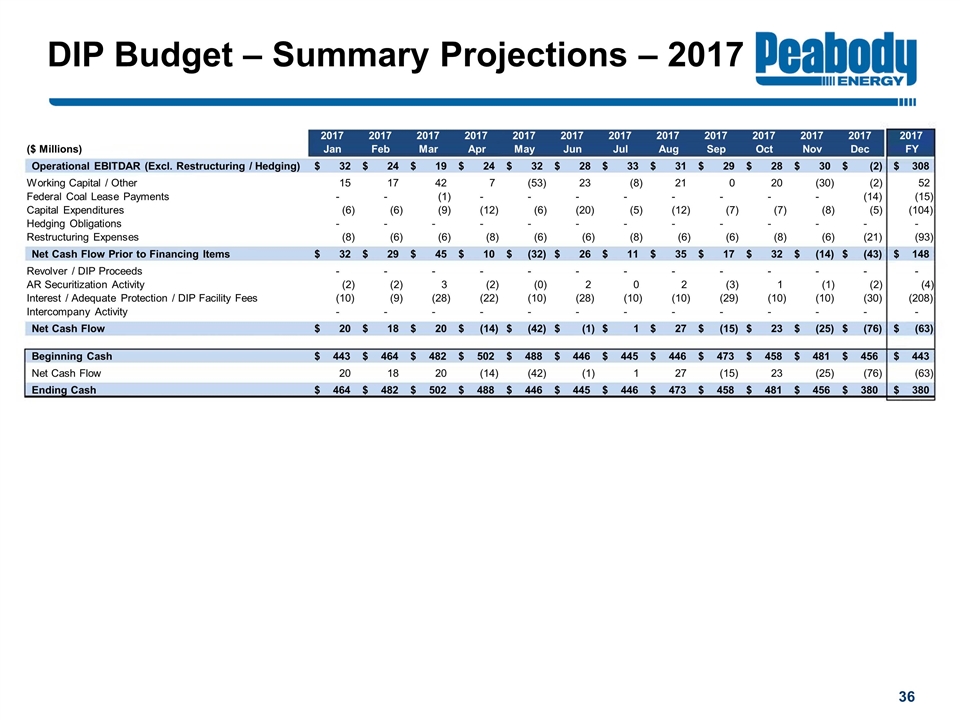
DIP Budget – Summary Projections – 2017 36 2017 2017 2017 2017 2017 2017 2017 2017 2017 2017 2017 2017 2017 ($ Millions) Jan Feb Mar Apr May Jun Jul Aug Sep Oct Nov Dec FY Operational EBITDAR (Excl. Restructuring / Hedging) 32 $ 24 $ 19 $ 24 $ 32 $ 28 $ 33 $ 31 $ 29 $ 28 $ 30 $ (2) $ 308 $ Working Capital / Other 15 17 42 7 (53) 23 (8) 21 0 20 (30) (2) 52 Federal Coal Lease Payments - - (1) - - - - - - - - (14) (15) Capital Expenditures (6) (6) (9) (12) (6) (20) (5) (12) (7) (7) (8) (5) (104) Hedging Obligations - - - - - - - - - - - - - Restructuring Expenses (8) (6) (6) (8) (6) (6) (8) (6) (6) (8) (6) (21) (93) Net Cash Flow Prior to Financing Items 32 $ 29 $ 45 $ 10 $ (32) $ 26 $ 11 $ 35 $ 17 $ 32 $ (14) $ (43) $ 148 $ Revolver / DIP Proceeds - - - - - - - - - - - - - AR Securitization Activity (2) (2) 3 (2) (0) 2 0 2 (3) 1 (1) (2) (4) Interest / Adequate Protection / DIP Facility Fees (10) (9) (28) (22) (10) (28) (10) (10) (29) (10) (10) (30) (208) Intercompany Activity - - - - - - - - - - - - - Net Cash Flow 20 $ 18 $ 20 $ (14) $ (42) $ (1) $ 1 $ 27 $ (15) $ 23 $ (25) $ (76) $ (63) $ Beginning Cash 443 $ 464 $ 482 $ 502 $ 488 $ 446 $ 445 $ 446 $ 473 $ 458 $ 481 $ 456 $ 443 $ Net Cash Flow 20 18 20 (14) (42) (1) 1 27 (15) 23 (25) (76) (63) Ending Cash 464 $ 482 $ 502 $ 488 $ 446 $ 445 $ 446 $ 473 $ 458 $ 481 $ 456 $ 380 $ 380 $
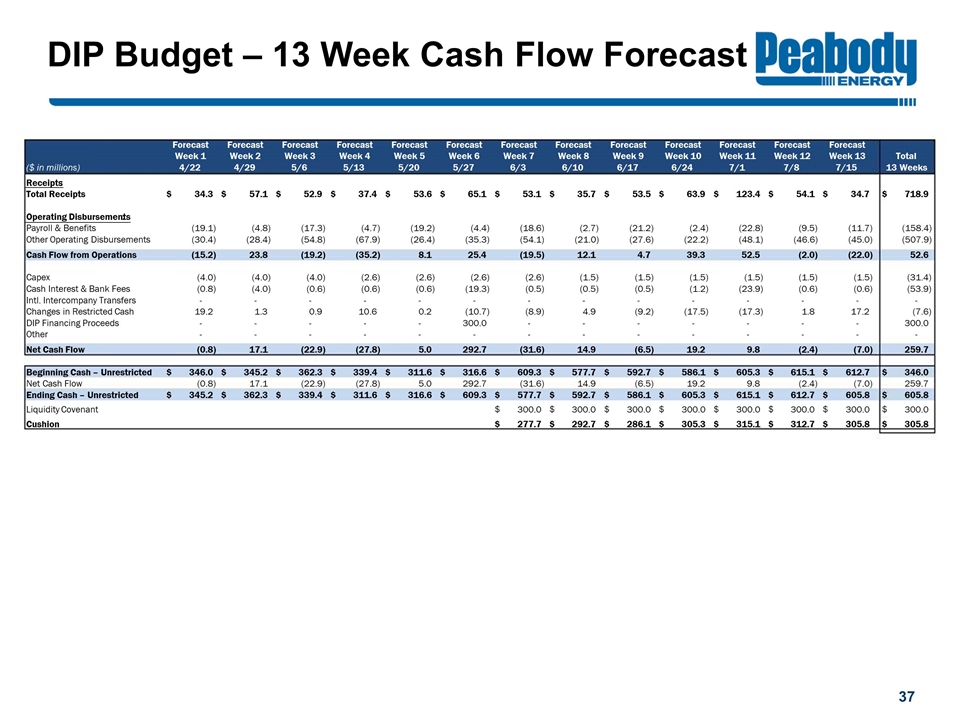
DIP Budget – 13 Week Cash Flow Forecast 37 Forecast Forecast Forecast Forecast Forecast Forecast Forecast Forecast Forecast Forecast Forecast Forecast Forecast Week 1 Week 2 Week 3 Week 4 Week 5 Week 6 Week 7 Week 8 Week 9 Week 10 Week 11 Week 12 Week 13 Total ($ in millions) 4/22 4/29 5/6 5/13 5/20 5/27 6/3 6/10 6/17 6/24 7/1 7/8 7/15 13 Weeks Receipts : Total Receipts 34.3 $ 57.1 $ 52.9 $ 37.4 $ 53.6 $ 65.1 $ 53.1 $ 35.7 $ 53.5 $ 63.9 $ 123.4 $ 54.1 $ 34.7 $ 718.9 $ Operating Disbursements : Payroll & Benefits (19.1) (4.8) (17.3) (4.7) (19.2) (4.4) (18.6) (2.7) (21.2) (2.4) (22.8) (9.5) (11.7) (158.4) Other Operating Disbursements (30.4) (28.4) (54.8) (67.9) (26.4) (35.3) (54.1) (21.0) (27.6) (22.2) (48.1) (46.6) (45.0) (507.9) Cash Flow from Operations (15.2) 23.8 (19.2) (35.2) 8.1 25.4 (19.5) 12.1 4.7 39.3 52.5 (2.0) (22.0) 52.6 Capex (4.0) (4.0) (4.0) (2.6) (2.6) (2.6) (2.6) (1.5) (1.5) (1.5) (1.5) (1.5) (1.5) (31.4) Cash Interest & Bank Fees (0.8) (4.0) (0.6) (0.6) (0.6) (19.3) (0.5) (0.5) (0.5) (1.2) (23.9) (0.6) (0.6) (53.9) Intl. Intercompany Transfers - - - - - - - - - - - - - - Changes in Restricted Cash 19.2 1.3 0.9 10.6 0.2 (10.7) (8.9) 4.9 (9.2) (17.5) (17.3) 1.8 17.2 (7.6) DIP Financing Proceeds - - - - - 300.0 - - - - - - - 300.0 Other - - - - - - - - - - - - - - Net Cash Flow (0.8) 17.1 (22.9) (27.8) 5.0 292.7 (31.6) 14.9 (6.5) 19.2 9.8 (2.4) (7.0) 259.7 Beginning Cash – Unrestricted 346.0 $ 345.2 $ 362.3 $ 339.4 $ 311.6 $ 316.6 $ 609.3 $ 577.7 $ 592.7 $ 586.1 $ 605.3 $ 615.1 $ 612.7 $ 346.0 $ Net Cash Flow (0.8) 17.1 (22.9) (27.8) 5.0 292.7 (31.6) 14.9 (6.5) 19.2 9.8 (2.4) (7.0) 259.7 Ending Cash – Unrestricted 345.2 $ 362.3 $ 339.4 $ 311.6 $ 316.6 $ 609.3 $ 577.7 $ 592.7 $ 586.1 $ 605.3 $ 615.1 $ 612.7 $ 605.8 $ 605.8 $ Liquidity Covenant 300.0 $ 300.0 $ 300.0 $ 300.0 $ 300.0 $ 300.0 $ 300.0 $ 300.0 $ Cushion 277.7 $ 292.7 $ 286.1 $ 305.3 $ 315.1 $ 312.7 $ 305.8 $ 305.8 $
