Exhibit 99.1
PEABODY ENERGY LENDER PRESENTATION
January 2017
Statement on Forward-Looking Information
Certain statements included in this presentation are forward-looking as defined in the Private Securities Litigation Reform Act of 1995. The Company uses words such as “anticipate,” “believe,” “expect,” “may,” “forecast,” “project,” “should,” “estimate,” “plan,” “outlook,” “target,” “likely,” “will,” “to be” or other similar words to identify forward-looking statements. These forward-looking statements are made as of the date of this presentation and are based on numerous assumptions that the Company believes are reasonable, but these assumptions are open to a wide range of uncertainties and business risks that may cause actual results to differ materially from expectations. These factors are difficult to accurately predict and may be beyond the Company’s control. Such factors include, but are not limited to: those described under the “Risk Factors” section and elsewhere in Peabody Energy’s most recently filed Annual Report on Form10-K and subsequent filings with the SEC, including its Quarterly Reports on Form10-Q for the quarters ended March 31, 2016, June 30, 2016 and September 30, 2016, which are available on Peabody Energy’s website at www.peabodyenergy.com and on the SEC’s website at www.sec.gov, such as unfavorable economic, financial and business conditions, as well as risks and uncertainties, including, but not limited to: the Company’s ability to obtain bankruptcy court approval with respect to motions or other requests made to the bankruptcy court in connection with the Company’s voluntary petitions for reorganization under chapter 11 of title 11 of the U.S. Code (the Chapter 11 Cases), including maintaining strategic control asdebtor-in-possession; the Company’s ability to negotiate, develop, confirm and consummate a plan of reorganization; the effects of the Chapter 11 Cases on the operations of the Company, including customer, supplier, banking, insurance and other relationships and agreements; bankruptcy court rulings in the Chapter 11 Cases as well as the outcome of all other pending litigation and the outcome of the Chapter 11 Cases in general; the length of time that the Company will operate under Chapter 11 protection and the continued availability of operating capital during the pendency of the proceedings; risks associated with third-party motions in the Chapter 11 Cases, which may interfere with the Company’s ability to confirm and consummate a plan of reorganization and restructuring generally; increased advisory costs to execute a plan of reorganization; the impact of the New York Stock Exchange’s delisting of the Company’s common stock on the liquidity and market price of the Company’s common stock and on the Company’s ability to access the public capital markets; the likelihood that the Company’s common stock will be cancelled and extinguished upon confirmation of a proposed plan of reorganization with no payments made to the holders of the Company’s common stock; the volatility of the trading price of the Company’s common stock and the absence of correlation between any increases in the trading price and the Company’s expectation that the common stock will be cancelled and extinguished upon confirmation of a proposed plan of reorganization with no payments made to the holders of the Company’s common stock; the Company’s ability to continue as a going concern including the Company’s ability to confirm a plan of reorganization that restructures the Company’s debt obligations to address liquidity issues and allows emergence from the Chapter 11 Cases; the risk that the plan of reorganization may not be accepted or confirmed, in which case there can be no assurance that the Chapter 11 cases will continue rather than be converted to Chapter 7 liquidation cases or that any alternative plan of reorganization would be on terms as favorable to holders of claims and interests as the terms of the plan of reorganization filed by the Company; the Company’s ability to use cash collateral; the effect of the Chapter 11 Cases on the Company’s relationships with third parties, regulatory authorities and employees; the potential adverse effects of the Chapter 11 Cases on the Company’s liquidity, results of operations, or business prospects; the Company’s ability to execute its business and restructuring plan; increased administrative and legal costs related to the Chapter 11 Cases and other litigation and the inherent risks involved in a bankruptcy process; the cost, availability and access to capital and financial markets, including the ability to secure new financing after emerging from the Chapter 11 Cases; the risk that the Chapter 11 Cases will disrupt or impede the Company’s international operations, including the Company’s business operations in Australia; competition in the coal industry and supply and demand for the Company’s coal products, including the impact of alternative energy sources, such as natural gas and renewables, global steel demand and the downstream impact on metallurgical coal prices, and lower demand for the Company’s products by electric power generators; the Company’s ability to successfully consummate planned divestitures, including the planned sale of all of its equity interests in Metropolitan Collieries Pty Ltd; the Company’s ability to appropriately secure its obligations for reclamation, federal and state workers’ compensation, federal coal leases and other obligations related to the Company’s operations, including its ability to utilize self-bonding and/or successfully access the commercial surety bond market; customer procurement practices and contract duration; the impact of weather and natural disasters on demand, production and transportation; reductions and/or deferrals of purchases by major customers and the Company’s ability to renew sales contracts; credit and performance risks associated with customers, suppliers, contract miners,co-shippers, and trading, bank and other financial counterparties; geologic, equipment, permitting, site access, operational risks and new technologies related to mining; transportation availability, performance and costs; availability, timing of delivery and costs of key supplies, capital equipment or commodities such as diesel fuel, steel, explosives and tires; impact oftake-or-pay arrangements for rail and port commitments for the delivery of coal; successful implementation of business strategies, including, without limitation, the actions the Company is implementing to improve its organization and respond to current industry conditions; negotiation of labor contracts, employee relations and workforce availability, including, without limitation, attracting and retaining key personnel; the Company’s ability to comply with financial and other restrictive covenants in various agreements; changes in postretirement benefit and pension obligations and their related funding requirements; replacement and development of coal reserves; effects of changes in interest rates and currency exchange rates (primarily the Australian dollar); effects of acquisitions or divestitures; economic strength and political stability of countries in which the Company has operations or serves customers; legislation, regulations and court decisions or other government actions, including, but not limited to, new environmental and mine safety requirements, changes in income tax regulations, sales-related royalties, or other regulatory taxes and changes in derivative laws and regulations; the Company’s ability to obtain and renew permits necessary for the Company’s operations; litigation or other dispute resolution, including, but not limited to, claims not yet asserted; terrorist attacks or security threats, including, but not limited to, cybersecurity breaches; impacts of pandemic illnesses; and other risks detailed in the Company’s reports filed with the SEC. The Company does not undertake to update its forward-looking statements except as required by law. As outlined in the plan of reorganization, the Company’s equity securities will be cancelled and extinguished upon confirmation of a plan of reorganization by the bankruptcy court, and holders thereof will not be entitled to receive, and will not receive or retain, any property or interest in property on account of such equity interests.
2
Statement on Forward-Looking Information (Continued)
Non-GAAP Financial Measures:
The Company is providing Adjusted EBITDA, Adjusted EBITDAR and margin per ton in this presentation.
Adjusted EBITDA is defined as (loss) income from continuing operations before deducting net interest expense, income taxes, asset retirement obligation expense, depreciation, depletion and amortization and reorganization items, net. Adjusted EBITDA is also adjusted for the discrete items, which are reflected in the reconciliation above included herein, that management excluded in analyzing the segment’s operating performance.
Adjusted EBITDAR is an internal Peabody performance measure that is defined as (loss) income from continuing operations before deducting net interest expense, income taxes, asset retirement obligation expense, depreciation, depletion and amortization and reorganization items, net. EBITDAR is also adjusted for the discrete items, reflected in the reconciliation included herein, that management has excluded in analyzing operating performance and excludes all restructuring costs, including both internal and external restructuring, certain employee compensation programs tied to the Company’s emergence from Chapter 11 and prepetition hedges related to fuel costs and international currency.
Margin per ton is equal to segment Adjusted EBITDA divided by segment tons sold.
Thenon-GAAP measures provided in this presentation are not intended to serve as alternatives to U.S. GAAP measures of performance and may not be comparable to similarly-titled measures presented by other companies. Adjusted EBITDA is used by management as the primary metric to measure our segments’ operating performance. We also believenon-GAAP performance measures are used by investors to measure our operating performance and lenders to measure our ability to incur and service debt.
Refer to the reconciliation ofnon-GAAP measures in the appendix.
Important Notice
This presentation has been prepared by Peabody Energy Corporation and its subsidiaries (“Peabody”) solely for information purposes.
3
Agenda
|
4 Transaction Introduction Greg Berube – Goldman Sachs Executive Summary Walter Hawkins – Senior VP, Finance |
Industry Fundamentals / Outlook Vic Svec – Senior VP, Investor and Corp Relations |
Company Overview / Core Strengths Glenn Kellow – President and CEO |
Financial Information Amy Schwetz – Executive VP and CFO |
Transaction Details David Lischer – Goldman Sachs |
Transaction Summary
5
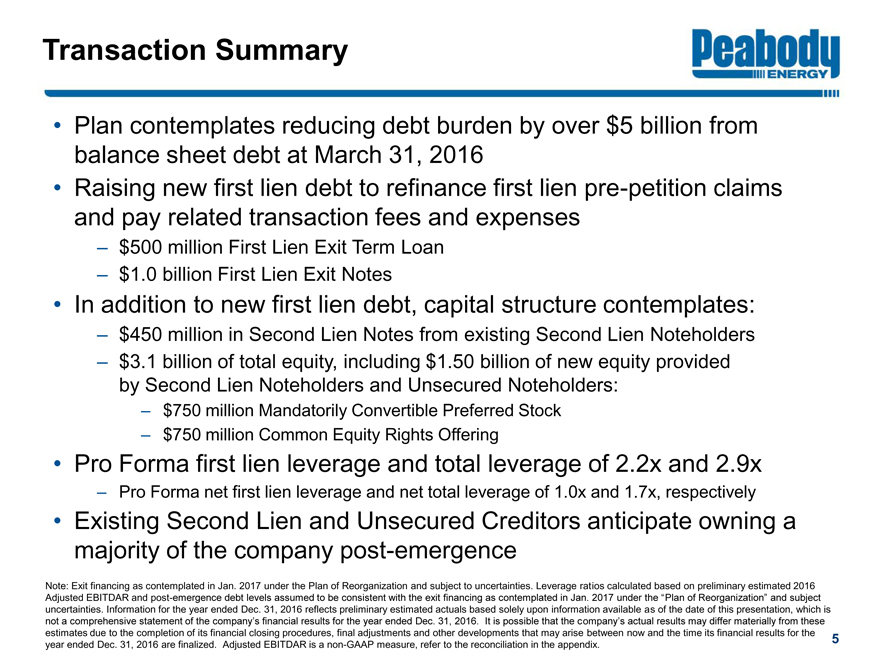
•Plan contemplates reducing debt burden by over $5 billion from balance sheet debt at March 31, 2016
•Raising new first lien debt to refinance first lienpre-petition claims and pay related transaction fees and expenses
–$500 million First Lien Exit Term Loan
–$1.0 billion First Lien Exit Notes
•In addition to new first lien debt, capital structure contemplates:
–$450 million in Second Lien Notes from existing Second Lien Noteholders
–$3.1 billion of total equity, including $1.50 billion of new equity provided by Second Lien Noteholders and Unsecured Noteholders:
–$750 million Mandatorily Convertible Preferred Stock
–$750 million Common Equity Rights Offering
•Pro Forma first lien leverage and total leverage of 2.2x and 2.9x
–Pro Forma net first lien leverage and net total leverage of 1.0x and 1.7x, respectively
•Existing Second Lien and Unsecured Creditors anticipate owning a majority of the company post-emergence
Note: Exit financing as contemplated in Jan. 2017 under the Plan of Reorganization and subject to uncertainties. Leverage ratios calculated based on preliminary estimated 2016 Adjusted EBITDAR and post-emergence debt levels assumed to be consistent with the exit financing as contemplated in Jan. 2017 under the “Plan of Reorganization” and subject uncertainties. Information for the year ended Dec. 31, 2016 reflects preliminary estimated actuals based solely upon information available as of the date of this presentation, which is not a comprehensive statement of the company’s financial results for the year ended Dec. 31, 2016. It is possible that the company’s actual results may differ materially from these estimates due to the completion of its financial closing procedures, final adjustments and other developments that may arise between now and the time its financial results for the year ended Dec. 31, 2016 are finalized. Adjusted EBITDAR is anon-GAAP measure, refer to the reconciliation in the appendix.
|
|
Transaction Rationale
6
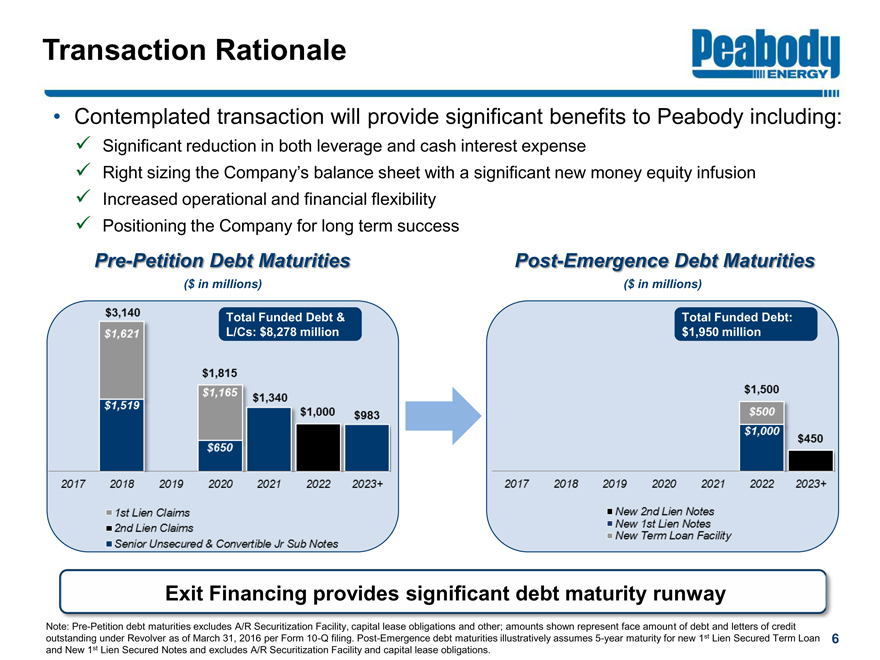
•Contemplated transaction will provide significant benefits to Peabody including:
?Significant reduction in both leverage and cash interest expense
?Right sizing the Company’s balance sheet with a significant new money equity infusion
?Increased operational and financial flexibility
?Positioning the Company for long term success
Pre-Petition Debt Maturities
Post-Emergence Debt Maturities
($ in millions)
($ in millions)
Exit Financing provides significant debt maturity runway
Total Funded Debt: $1,950 million
Note:Pre-Petition debt maturities excludes A/R Securitization Facility, capital lease obligations and other; amounts shown represent face amount of debt and letters of credit outstanding under Revolver as of March 31, 2016 per Form10-Q filing. Post-Emergence debt maturities illustratively assumes5-year maturity for new 1st Lien Secured Term Loan and New 1st Lien Secured Notes and excludes A/R Securitization Facility and capital lease obligations.
Total Funded Debt & L/Cs: $8,278 million
Sources & Uses
Capitalization (As of September 30, 2016)
Sources & Uses | Post-Emergence Capitalization 7
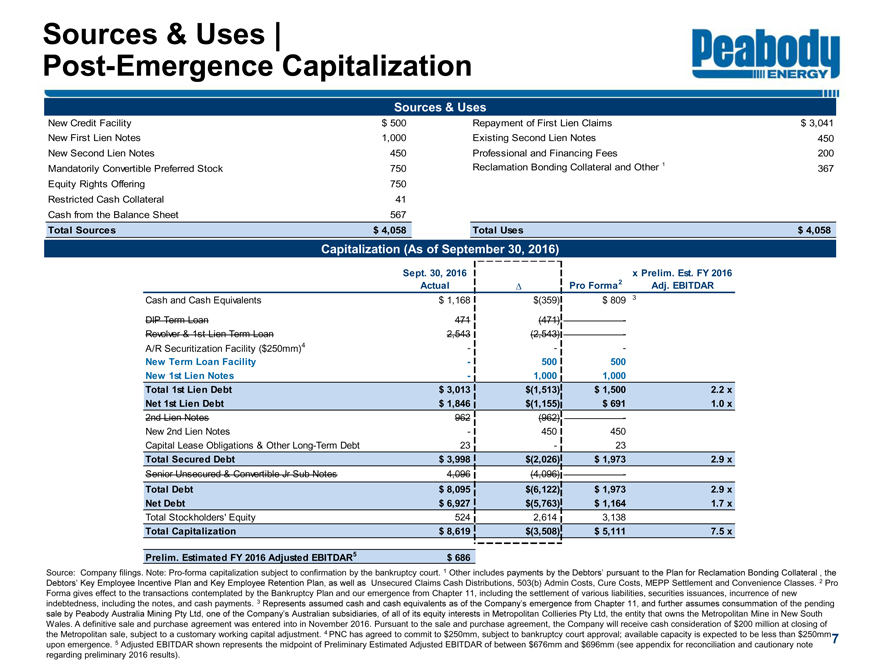
Source: Company filings. Note:Pro-forma capitalization subject to confirmation by the bankruptcy court. 1 Other includes payments by the Debtors’ pursuant to the Plan for Reclamation Bonding Collateral , the Debtors’ Key Employee Incentive Plan and Key Employee Retention Plan, as well as Unsecured Claims Cash Distributions, 503(b) Admin Costs, Cure Costs, MEPP Settlement and Convenience Classes. 2 Pro Forma gives effect to the transactions contemplated by the Bankruptcy Plan and our emergence from Chapter 11, including the settlement of various liabilities, securities issuances, incurrence of new indebtedness, including the notes, and cash payments. 3 Represents assumed cash and cash equivalents as of the Company’s emergence from Chapter 11, and further assumes consummation of the pending sale by Peabody Australia Mining Pty Ltd, one of the Company’s Australian subsidiaries, of all of its equity interests in Metropolitan Collieries Pty Ltd, the entity that owns the Metropolitan Mine in New South Wales. A definitive sale and purchase agreement was entered into in November 2016. Pursuant to the sale and purchase agreement, the Company will receive cash consideration of $200 million at closing of the Metropolitan sale, subject to a customary working capital adjustment. 4 PNC has agreed to commit to $250mm, subject to bankruptcy court approval; available capacity is expected to be less than $250mm upon emergence. 5 Adjusted EBITDAR shown represents the midpoint of Preliminary Estimated Adjusted EBITDAR of between $676mm and $696mm (see appendix for reconciliation and cautionary note regarding preliminary 2016 results). New Credit Facility $ 500 Repayment of First Lien Claims $ 3,041 New First Lien Notes 1,000 Existing Second Lien Notes 450 New Second Lien Notes 450 Professional and Financing Fees 200 Mandatorily Convertible Preferred Stock 750 Reclamation Bonding Collateral and Other 1 367 Equity Rights Offering 750 Restricted Cash Collateral 41 Cash from the Balance Sheet 567 Total Sources $ 4,058 Total Uses $ 4,058 Sept. 30, 2016 Actual ? Pro Forma2 x Prelim. Est. FY 2016 Adj. EBITDAR Cash and Cash Equivalents $ 1,168 $(359) $ 809 3 DIP Term Loan 471 (471)—Revolver & 1st Lien Term Loan 2,543 (2,543)—A/R Securitization Facility ($250mm)4 ——New Term Loan Facility—500 500 New 1st Lien Notes—1,000 1,000 Total 1st Lien Debt $ 3,013 $(1,513) $ 1,500 2.2 x Net 1st Lien Debt $ 1,846 $(1,155) $ 691 1.0 x 2nd Lien Notes 962 (962)—New 2nd Lien Notes—450 450 Capital Lease Obligations & Other Long-Term Debt 23—23 Total Secured Debt $ 3,998 $(2,026) $ 1,973 2.9 x Senior Unsecured & Convertible Jr Sub Notes 4,096 (4,096)—Total Debt $ 8,095 $(6,122) $ 1,973 2.9 x Net Debt $ 6,927 $(5,763) $ 1,164 1.7 x Total Stockholders’ Equity 524 2,614 3,138 Total Capitalization $ 8,619 $(3,508) $ 5,111 7.5 x Prelim. Estimated FY 2016 Adjusted EBITDAR5 $ 686
|
|
•Mix of significant internal and external events results in fundamental repositioning of Peabody
•Major improvements expected across company, industry, capital structure following emergence from Chapter 11
•“New Peabody” builds on:
–Excellent asset and operating base
–Experienced management team with fresh perspectives
–Commitment to lasting values
•Actions designed to strengthen capital structure to sustain performance through all cycles
Peabody: Executive Summary 8
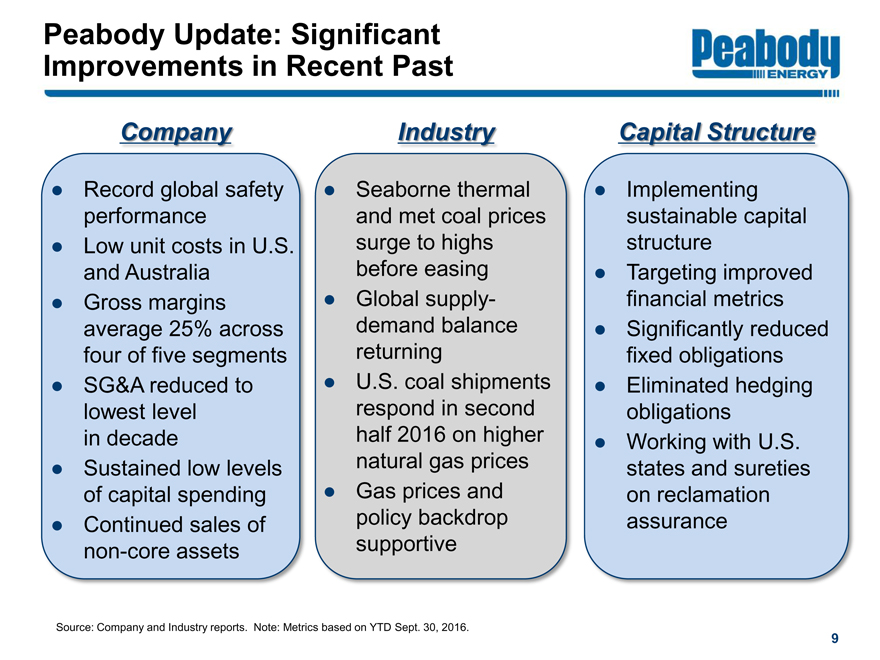
•Record global safety performance
•Low unit costs in U.S. and Australia
•Gross margins average 25% across four of five segments
•SG&A reduced to lowest level in decade
•Sustained low levels of capital spending
•Continued sales ofnon-core assets
Peabody Update: Significant Improvements in Recent Past
Source: Company and Industry reports. Note: Metrics based on YTD Sept. 30, 2016.
9
•Seaborne thermal and met coal prices surge to highs before easing
•Global supply-demand balance returning
•U.S. coal shipments respond in second half 2016 on higher natural gas prices
•Gas prices and policy backdrop supportive
•Implementing sustainable capital structure
•Targeting improved financial metrics
•Significantly reduced fixed obligations
•Eliminated hedging obligations
•Working with U.S. states and sureties on reclamation assurance
Company
Industry
Capital Structure
INDUSTRY FUNDAMENTALS / OUTLOOK
UNITED STATES
•Second half 2016 coal demand rebounds from first half as natural gas prices rise sharply from~15-year-lows
•Long-term utility coal demand expected to remain relatively consistent from 2016 – 2021
•Coal expected to remain a major component of the generation mix
SEABORNE
•Seaborne prices hit multi-year highs towards end of 2016, rising from multi-year lows in first half
•Supply-demand balance in late 2016 driven by China policy restrictions driving increased imports
•Seaborne thermal demand expected to rise modestly from 2016 – 2021 driven by emerging Asia growth
•Seaborne met demand expected to increase by 30 to 35 million tonnes through 2021 driven by India and China
11
Source: Peabody Energy Global Analytics; Industry reports.
Industry Fundamentals
Industry Overview
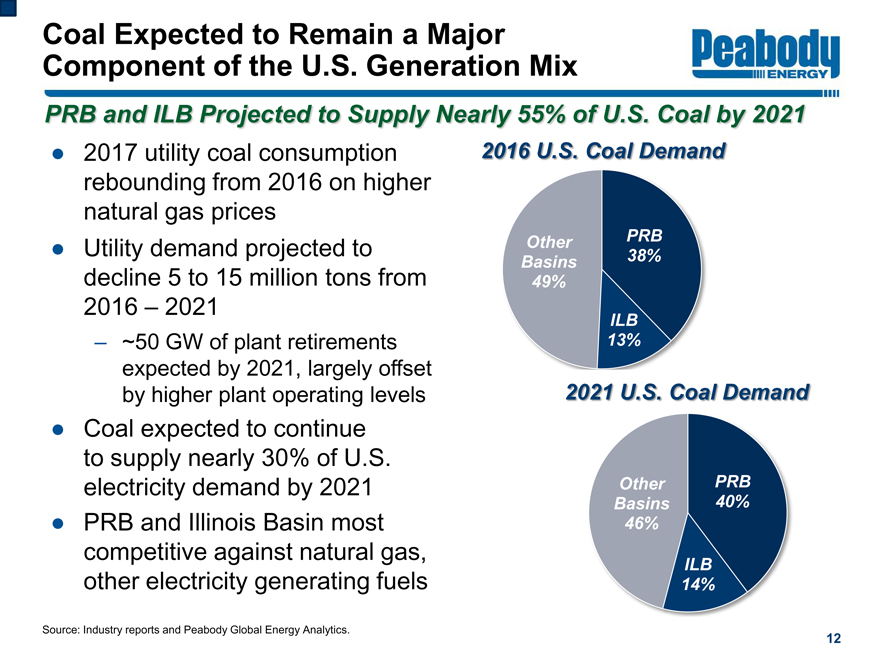
PRB 38%
ILB 13%
Other Basins 49%
2016 U.S. Coal Demand
• 2017 utility coal consumption rebounding from 2016 on higher natural gas prices
• Utility demand projected to decline 5 to 15 million tons from 2016 – 2021
– ~50 GW of plant retirements expected by 2021, largely offset by higher plant operating levels
• Coal expected to continue to supply nearly 30% of U.S. electricity demand by 2021
• PRB and Illinois Basin most competitive against natural gas, other electricity generating fuels
Source: Industry reports and Peabody Global Energy Analytics.
Coal Expected to Remain a Major Component of the U.S. Generation Mix
12
Natural Gas
Nuclear
Other
PRB 40%
ILB 14%
Other Basins 46%
2021 U.S. Coal Demand
PRB and ILB Projected to Supply Nearly 55% of U.S. Coal by 2021
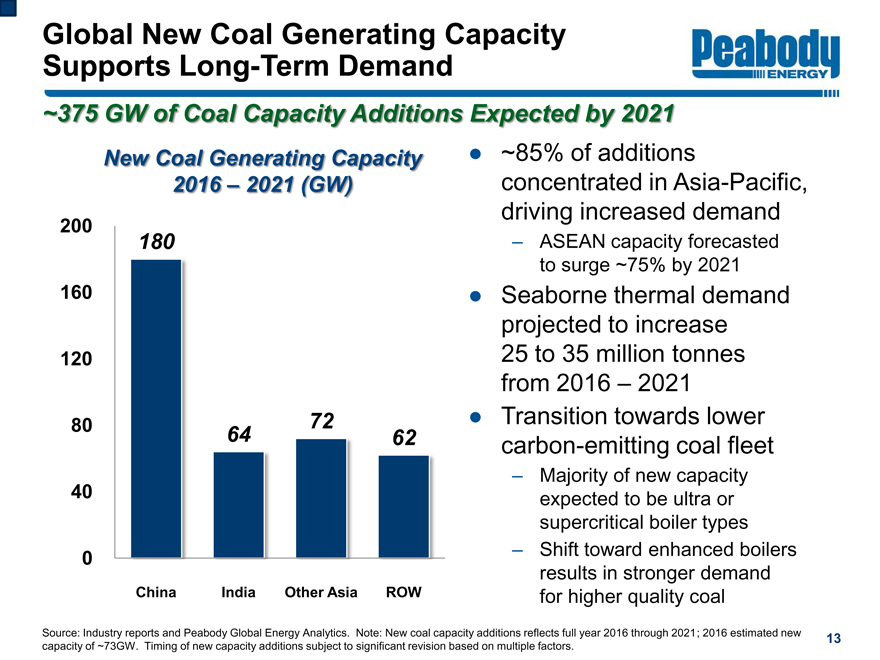
180
64
72
62
0
40
80
120
160
200
China
India
Other Asia
ROW
Source: Industry reports and Peabody Global Energy Analytics. Note: New coal capacity additions reflects full year 2016 through 2021; 2016 estimated new capacity of ~73GW. Timing of new capacity additions subject to significant revision based on multiple factors.
• ~85% of additions concentrated in Asia-Pacific, driving increased demand
– ASEAN capacity forecasted to surge ~75% by 2021
• Seaborne thermal demand projected to increase 25 to 35 million tonnes from 2016 – 2021
• Transition towards lower carbon-emitting coal fleet
– Majority of new capacity expected to be ultra or supercritical boiler types
– Shift toward enhanced boilers results in stronger demand for higher quality coal
~375 GW of Coal Capacity Additions Expected by 2021
New Coal Generating Capacity 2016 – 2021 (GW)
Global New Coal Generating Capacity Supports Long-Term Demand
13
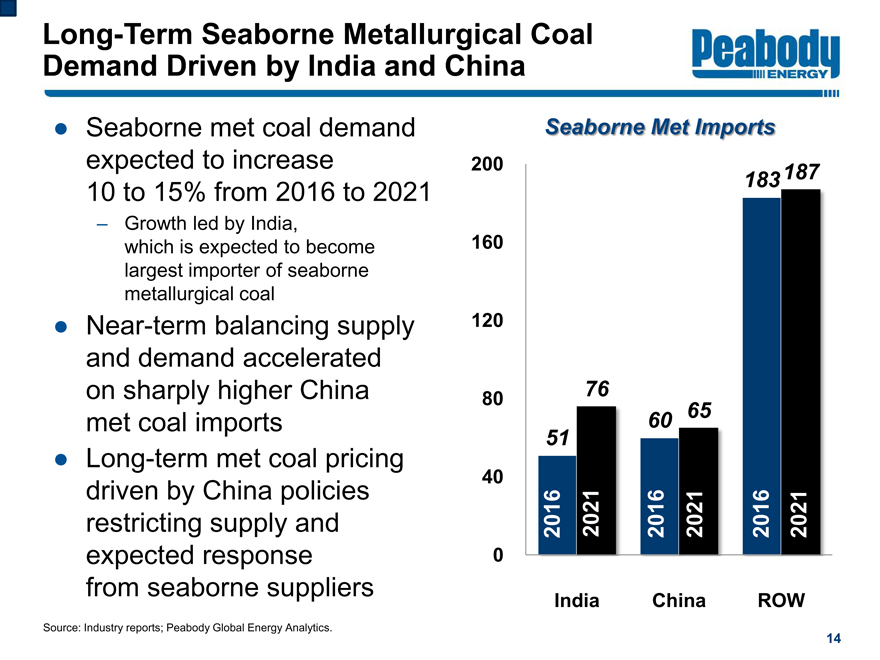
• Seaborne met coal demand expected to increase 10 to 15% from 2016 to 2021
– Growth led by India, which is expected to become largest importer of seaborne metallurgical coal
• Near-term balancing supply and demand accelerated on sharply higher China met coal imports
• Long-term met coal pricing driven by China policies restricting supply and expected response from seaborne suppliers
Source: Industry reports; Peabody Global Energy Analytics.
Long-Term Seaborne Metallurgical Coal Demand Driven by India and China
14
51
60
183
76
65
187
0
40
80 120
160
200
India
China
ROW
Seaborne Met Imports
2016
2021
2021
2021
2016
2016
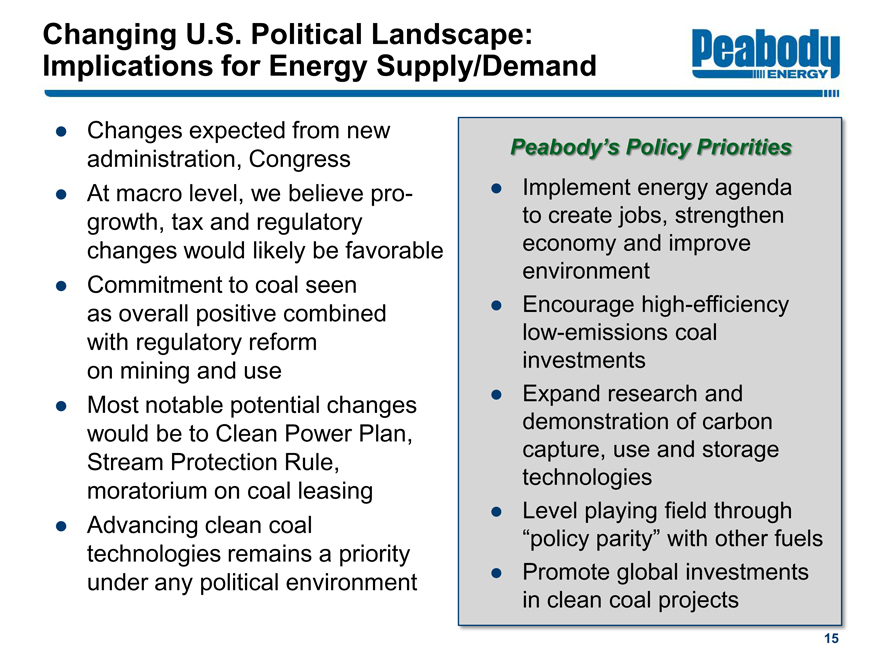
•Changes expected from new administration, Congress
•At macro level, we believepro-growth, tax and regulatory changes would likely be favorable
•Commitment to coal seen as overall positive combined with regulatory reform on mining and use
•Most notable potential changes would be to Clean Power Plan, Stream Protection Rule, moratorium on coal leasing
•Advancing clean coal technologies remains a priority under any political environment
Peabody’s Policy Priorities
•Implement energy agenda to create jobs, strengthen economy and improve environment
•Encourage high-efficiencylow-emissions coal investments
•Expand research and demonstration of carbon capture, use and storage technologies
•Level playing field through “policy parity” with other fuels
•Promote global investments in clean coal projects
Changing U.S. Political Landscape: Implications for Energy Supply/Demand
15
COMPANY OVERVIEW / KEY CREDIT STRENGTHS
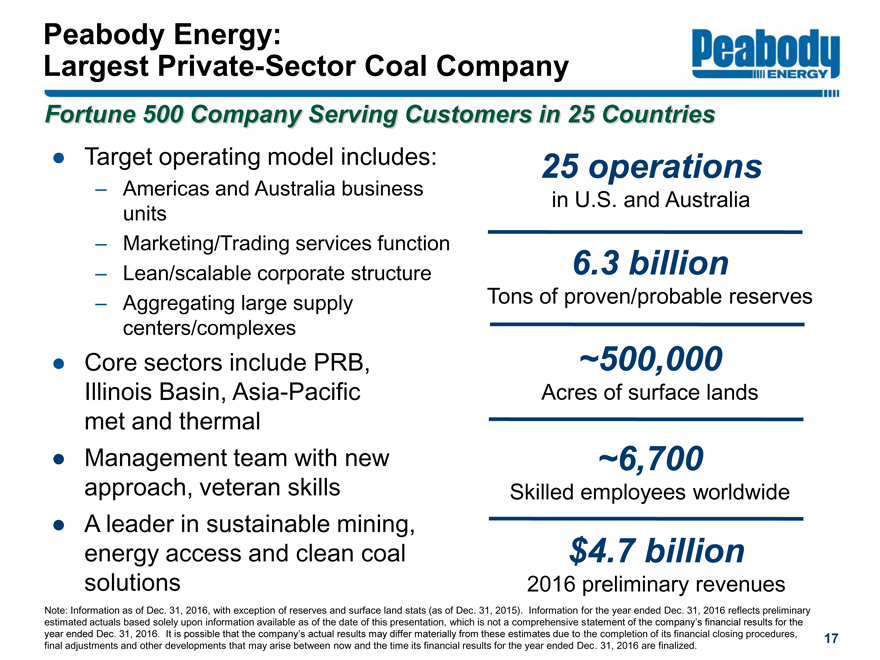
Peabody Energy: Largest Private-Sector Coal Company
Fortune 500 Company Serving Customers in 25 Countries
• Target operating model includes:
– Americas and Australia business units
– Marketing/Trading services function
– Lean/scalable corporate structure
– Aggregating large supply centers/complexes
• Core sectors include PRB, Illinois Basin, Asia-Pacific met and thermal
• Management team with new approach, veteran skills
• A leader in sustainable mining, energy access and clean coal solutions
25 operations in U.S. and Australia
6.3 billion Tons of proven/probable reserves
$4.7 billion
2016 preliminary revenues
~500,000 Acres of surface lands
~6,700 Skilled employees worldwide
Note: Information as of Dec. 31, 2016, with exception of reserves and surface land stats (as of Dec. 31, 2015). Information for the year ended Dec. 31, 2016 reflects preliminary estimated actuals based solely upon information available as of the date of this presentation, which is not a comprehensive statement of the company’s financial results for the year ended Dec. 31, 2016. It is possible that the company’s actual results may differ materially from these estimates due to the completion of its financial closing procedures, final adjustments and other developments that may arise between now and the time its financial results for the year ended Dec. 31, 2016 are finalized.
17
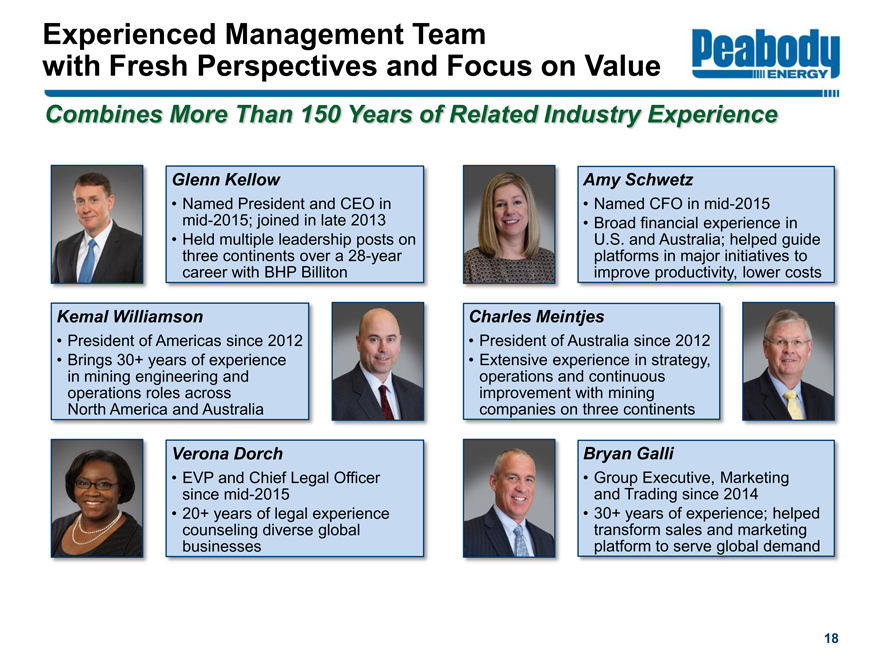
Experienced Management Team with Fresh Perspectives and Focus on Value
18 Glenn Kellow
•Named President and CEO inmid-2015; joined in late 2013
•Held multiple leadership posts on three continents over a28-year career with BHP Billiton
Kemal Williamson
•President of Americas since 2012
•Brings 30+ years of experience in mining engineering and operations roles across North America and Australia
Verona Dorch
•EVP and Chief Legal Officer sincemid-2015
•20+ years of legal experience counseling diverse global businesses
Amy Schwetz
•Named CFO inmid-2015
•Broad financial experience in U.S. and Australia; helped guide platforms in major initiatives to improve productivity, lower costs
Charles Meintjes
•President of Australia since 2012
•Extensive experience in strategy, operations and continuous improvement with mining companies on three continents
Bryan Galli
•Group Executive, Marketing and Trading since 2014
•30+ years of experience; helped transform sales and marketing platform to serve global demand
Combines More Than 150 Years of Related Industry Experience
“New Peabody” Demonstrates Key Credit Strengths
19
Leading Coal Producer, Unmatched Assets
Cost Improvements, Portfolio Optimization
Strong U.S. Platform, Access to Asia-Pacific Demand
Sustainable Capital Structure
1
2
3 4
Leading Coal Producer, Unmatched Assets
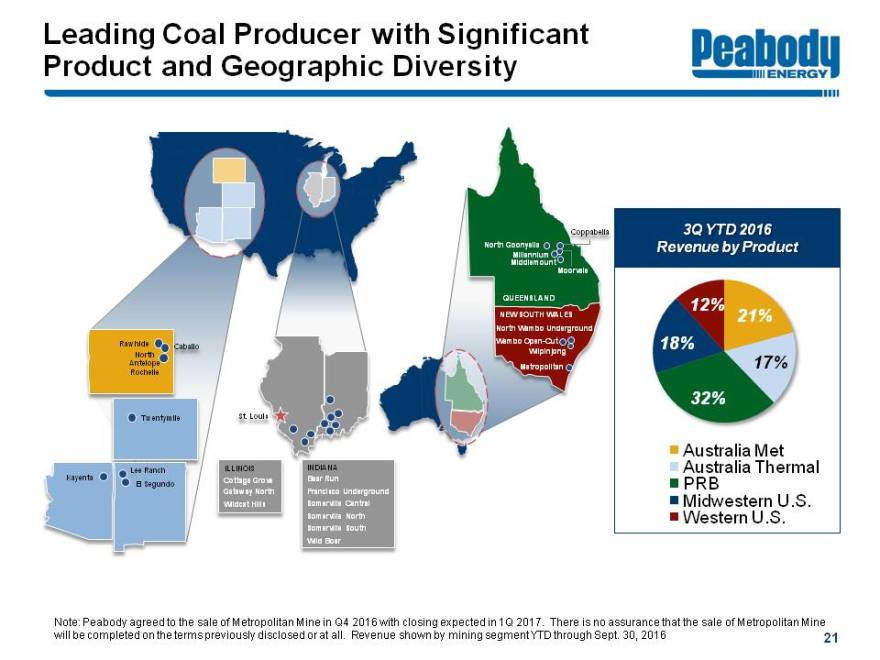
North Antelope Rochelle Caballo Twentymile Kayenta Lee Ranch El Segundo ILLINOIS Cottage Grove Gateway North Wildcat Hills INDIANA Bear Run Francisco Underground Somerville Central Somerville North Somerville South Wild Boar St. Louis Caballo
21%
17%
32%
18%
12%
Australia Met
Australia Thermal
PRB
Midwestern U.S.
Western U.S.
21
ILLINOIS
Cottage Grove
Gateway North
Wildcat Hills
INDIANA
Bear Run
Francisco Underground
Somerville North
Somerville South
Wild Boar
Somerville Central
North Goonyella
Millennium
Coppabella
Moorvale
Middlemount
QUEENSLAND
NEW SOUTH WALES
North Wambo Underground
WamboOpen-Cut
Wilpinjong
Metropolitan
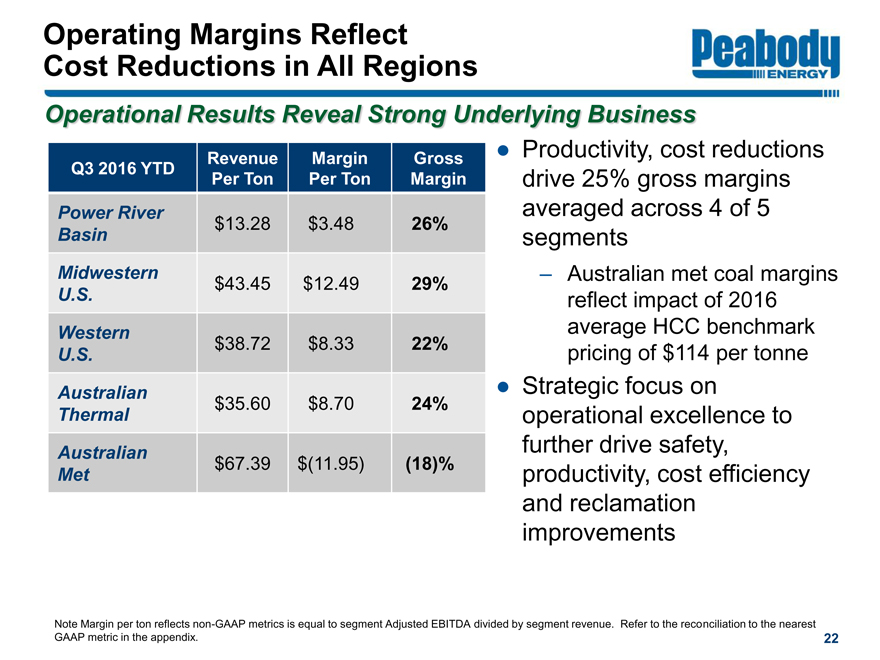
Operating Margins Reflect Cost Reductions in All Regions
22
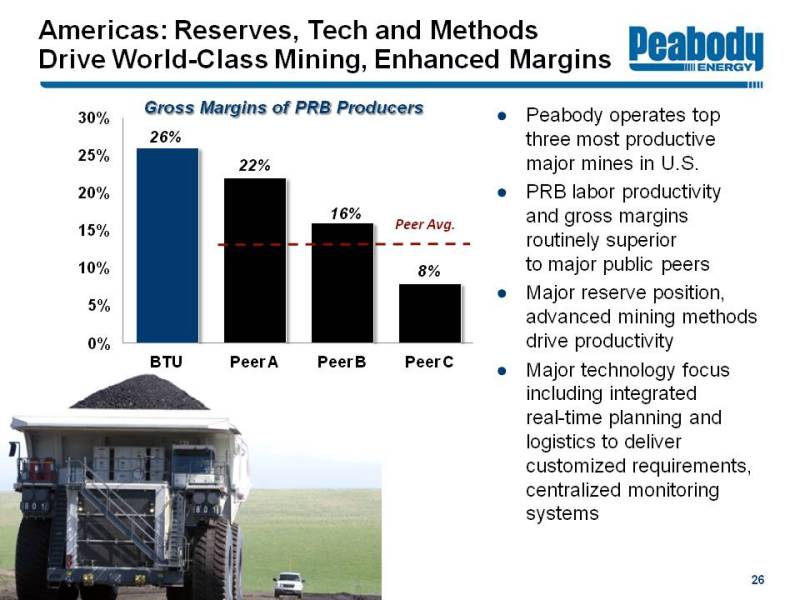
•Productivity, cost reductions drive 25% gross margins averaged across 4 of 5 segments
–Australian met coal margins reflect impact of 2016 average HCC benchmark pricing of $114 per tonne
•Strategic focus on operational excellence to further drive safety, productivity, cost efficiency and reclamation improvements
Note Margin per ton reflectsnon-GAAP metrics is equal to segment Adjusted EBITDA divided by segment revenue. Refer to the reconciliation to the nearest GAAP metric in the appendix.
| | | | | | | | | | | | |
Operational Results Reveal Strong Underlying Business Q3 2016 YTD | |
| Revenue
Per
Ton |
| |
| Margin
Per
Ton |
| |
| Gross
Margin |
|
Power River Basin | | $ | 13.28 | | | $ | 3.48 | | | | 26 | % |
Midwestern U.S. | | $ | 43.45 | | | $ | 12.49 | | | | 29 | % |
Western U.S. | | $ | 38.72 | | | $ | 8.33 | | | | 22 | % |
Australian Thermal | | $ | 35.60 | | | $ | 8.70 | | | | 24 | % |
Australian Met | | $ | 67.39 | | | $ | (11.95 | ) | | | (18 | )% |
Strong U.S. Platform; Access to Asia-Pacific Demand
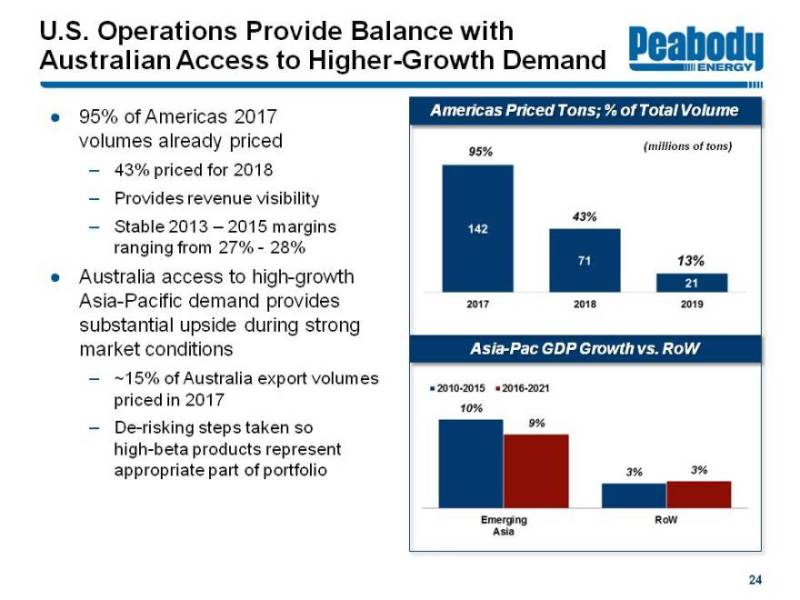
Note: Contracted breakdown shown as of Dec. 31, 2016. Historical margin percentages are equal to total U.S. segment Adjusted EBITDA divided by total U.S. segment revenue. Adjusted EBITDA is a non-GAAP measure; refer to the reconciliation to its nearest GAAP metric inPeabody’s 2015 10K Filing. Source: Peabody Energy and Euromonitor International; Note: Emerging Asia includes China, Taiwan, India, Indonesia, Malaysia, Thailand and Vietnam; RoW includes Canada, USA, Austria, Belgium, France, Germany, Ireland, Italy, Japan, Netherlands, Norway, Portugal, South Korea, Spain, Sweden, UK.
3) Cost Improvements and Portfolio Optimization
Source: Public company reports. 2015 EIA data; ABB Velocity Suite. Note: Gross margin benchmarking reflects average 2014 and 2015. Gross margin percentage calculated as segment Adjusted EBITDA divided by segment revenue. Refer to the reconciliation of segment Adjusted EBITDA inPeabody’s 2015 10K Filing; Peers include Arch Coal, Alpha Natural Resources and Cloud Peak Energy; Note that Alpha Natural Resources was a public peer throughout 2014 – 2015 but no longer is a public company. Productivity defined as total production divided by employee hours; Major mines include mines with 10 million tons or more of annual production in 2015.
27
0
2,000
4,000
6,000
2012
2013
2014
2015
2016
Contractors
Employees
Workforce
~5,900
~3,700
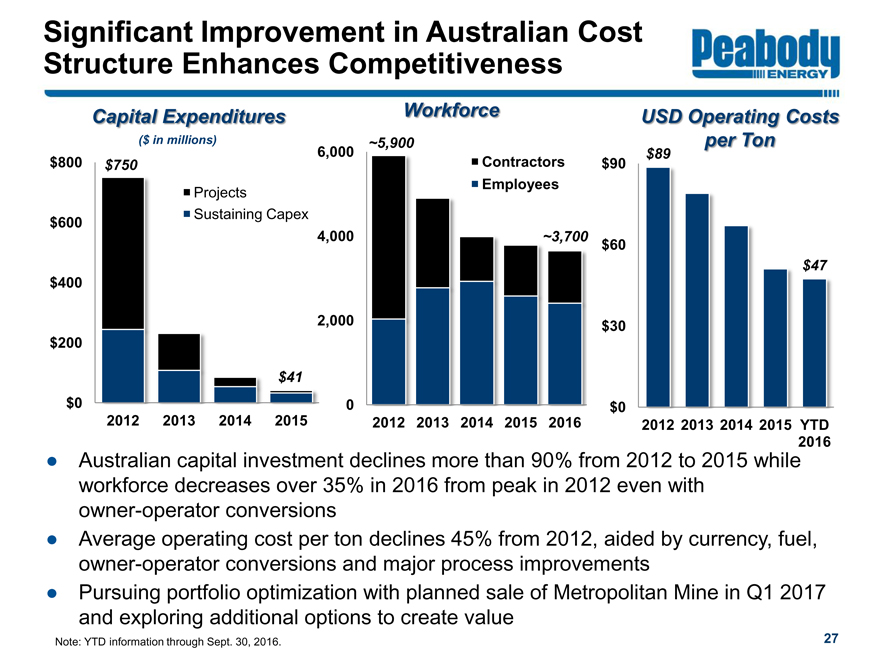
•Australian capital investment declines more than 90% from 2012 to 2015 while workforce decreases over 35% in 2016 from peak in 2012 even with owner-operator conversions
•Average operating cost per ton declines 45% from 2012, aided by currency, fuel, owner-operator conversions and major process improvements
•Pursuing portfolio optimization with planned sale of Metropolitan Mine in Q1 2017 and exploring additional options to create value
Capital Expenditures
Significant Improvement in Australian Cost Structure Enhances Competitiveness
$89
$47
$0
$30
$60
$90 2012
2013
2014
2015
YTD 2016
USD Operating Costs per Ton
$0
$200
$400 $600
$800
2012
2013
2014
2015
Projects
Sustaining Capex
$750
$41
($ in millions)
Note: YTD information through Sept. 30, 2016.
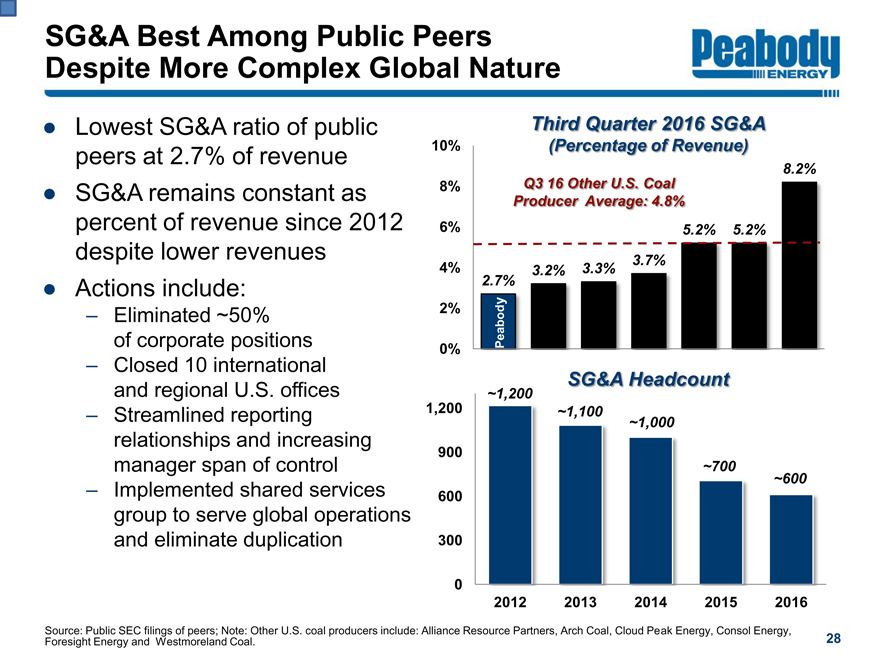
2.7%
3.2%
3.3%
3.7%
5.2%
5.2% 8.2%
0%
2%
4%
6%
8%
10%
28
Peabody
Q3 16 Other U.S. Coal Producer Average: 4.8%
Source: Public SEC filings of peers; Note: Other U.S. coal producers include: Alliance Resource Partners, Arch Coal, Cloud Peak Energy, Consol Energy, Foresight Energy and Westmoreland Coal.
• Lowest SG&A ratio of public peers at 2.7% of revenue
• SG&A remains constant as percent of revenue since 2012 despite lower revenues
• Actions include:
– Eliminated ~50% of corporate positions
– Closed 10 international and regional U.S. offices
– Streamlined reporting relationships and increasing manager span of control
– Implemented shared services group to serve global operations and eliminate duplication
Third Quarter 2016 SG&A (Percentage of Revenue)
0
300
600
900
1,200
2012
2013 2014
2015
2016
SG&A Headcount
~1,200
~1,100
~1,000
~700 ~600
SG&A Best Among Public Peers Despite More Complex Global Nature
4) Sustainable Capital Structure
30
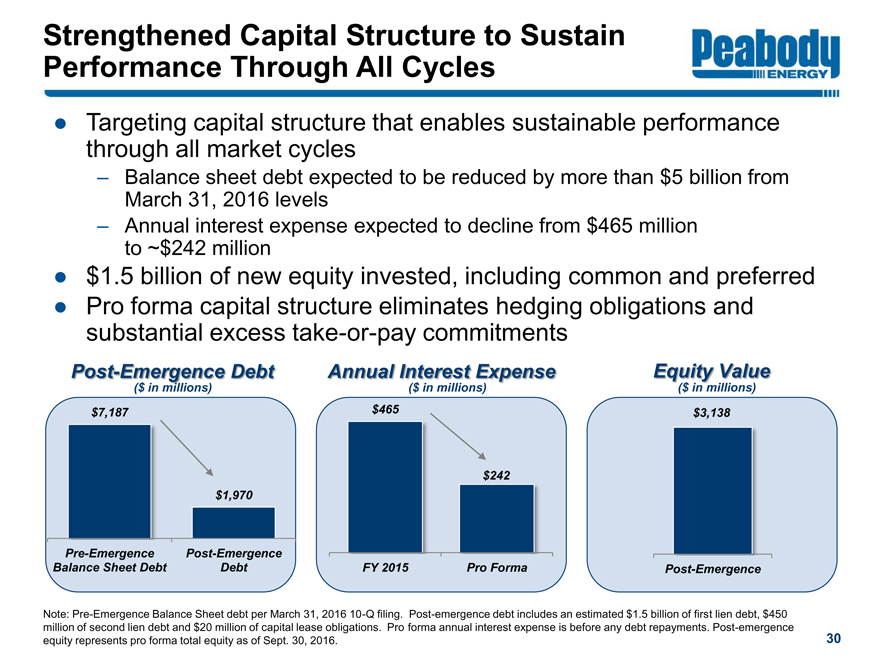
Post-Emergence Debt
Annual Interest Expense
Equity Value
•Targeting capital structure that enables sustainable performance through all market cycles
–Balance sheet debt expected to be reduced by more than $5 billion from March 31, 2016 levels
–Annual interest expense expected to decline from $465 million to ~$242 million
•$1.5 billion of new equity invested, including common and preferred
•Pro forma capital structure eliminates hedging obligations and substantial excesstake-or-pay commitments
$7,187
$1,970
Pre-Emergence Balance Sheet Debt
Post-Emergence Debt
$465
FY 2015
Pro Forma
$242
Post-Emergence
$3,138
Note:Pre-Emergence Balance Sheet debt per March 31, 201610-Q filing. Post-emergence debt includes an estimated $1.5 billion of first lien debt, $450 million of second lien debt and $20 million of capital lease obligations. Pro forma annual interest expense is before any debt repayments. Post-emergence equity represents pro forma total equity as of Sept. 30, 2016.
Strengthened Capital Structure to Sustain Performance Through All Cycles
($ in millions)
($ in millions)
($ in millions)
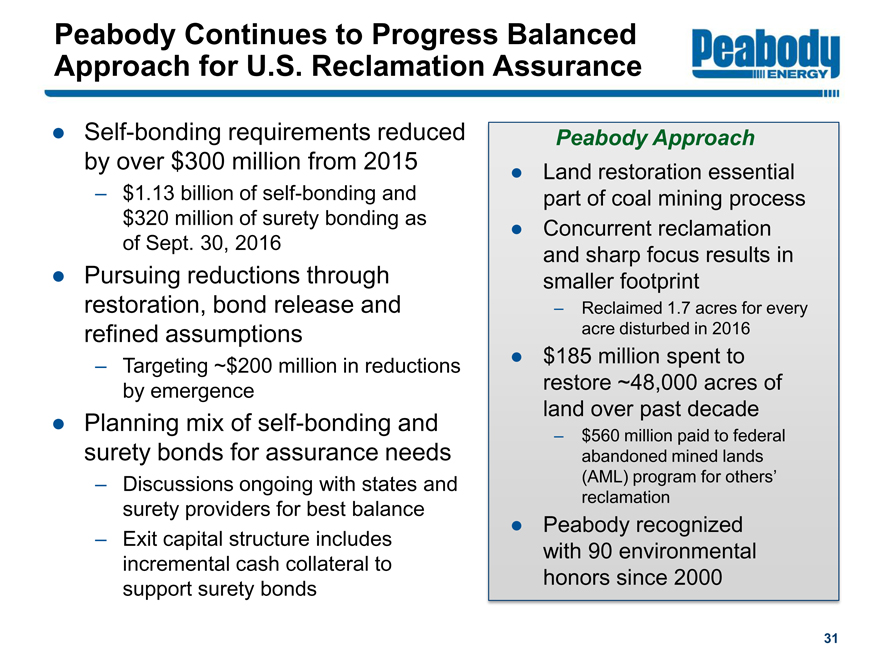
Peabody Continues to Progress Balanced Approach for U.S. Reclamation Assurance
• Self-bonding requirements reduced by over $300 million from 2015
– $1.13 billion of self-bonding and $320 million of surety bonding as of Sept. 30, 2016
• Pursuing reductions through restoration, bond release and refined assumptions
– Targeting ~$200 million in reductions by emergence
• Planning mix of self-bonding and surety bonds for assurance needs
– Discussions ongoing with states and surety providers for best balance
– Exit capital structure includes incremental cash collateral to support surety bonds
31
Peabody Approach
• Land restoration essential part of coal mining process
• Concurrent reclamation and sharp focus results in smaller footprint
– Reclaimed 1.7 acres for every acre disturbed in 2016
• $185 million spent to restore ~48,000 acres of land over past decade
– $560 million paid to federal abandoned mined lands (AML) program for others’ reclamation?
• Peabody recognized with 90 environmental honors since 2000
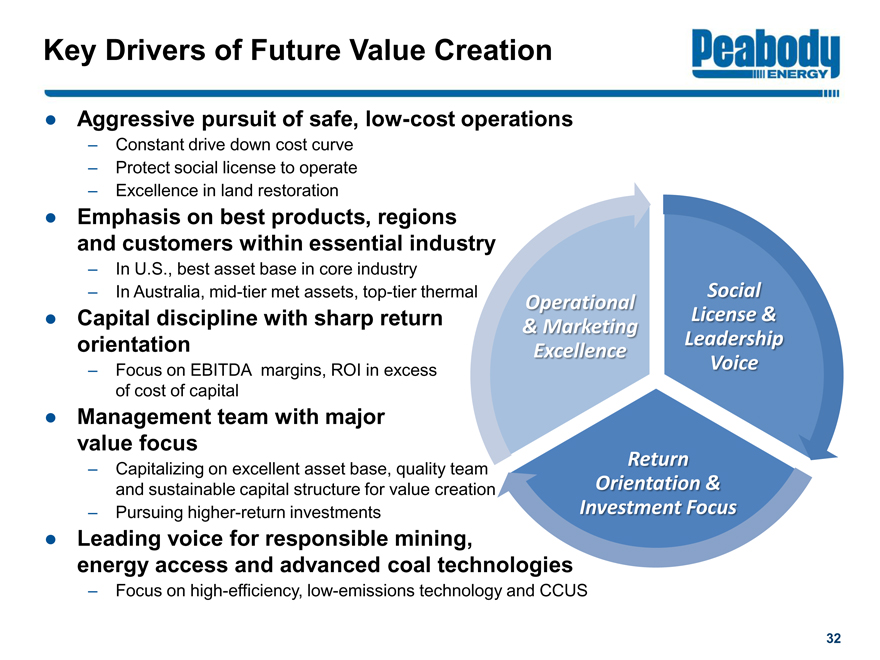
Key Drivers of Future Value Creation
Social License & Leadership Voice
Return Orientation & Investment Focus
Operational & Marketing Excellence
32
•Aggressive pursuit of safe,low-cost operations
–Constant drive down cost curve
–Protect social license to operate
–Excellence in land restoration
•Emphasis on best products, regions and customers within essential industry
–In U.S., best asset base in core industry
–In Australia,mid-tier met assets,top-tier thermal
•Capital discipline with sharp return orientation
–Focus on EBITDA margins, ROI in excess of cost of capital
•Management team with major value focus
–Capitalizing on excellent asset base, quality team and sustainable capital structure for value creation
–Pursuing higher-return investments
•Leading voice for responsible mining, energy access and advanced coal technologies
–Focus on high-efficiency,low-emissions technology and CCUS
FINANCIAL INFORMATION
$7,014
$6,792
$5,609
$4,715 $-
$2,000
$4,000
$6,000 $8,000
2013
2014
2015
2016
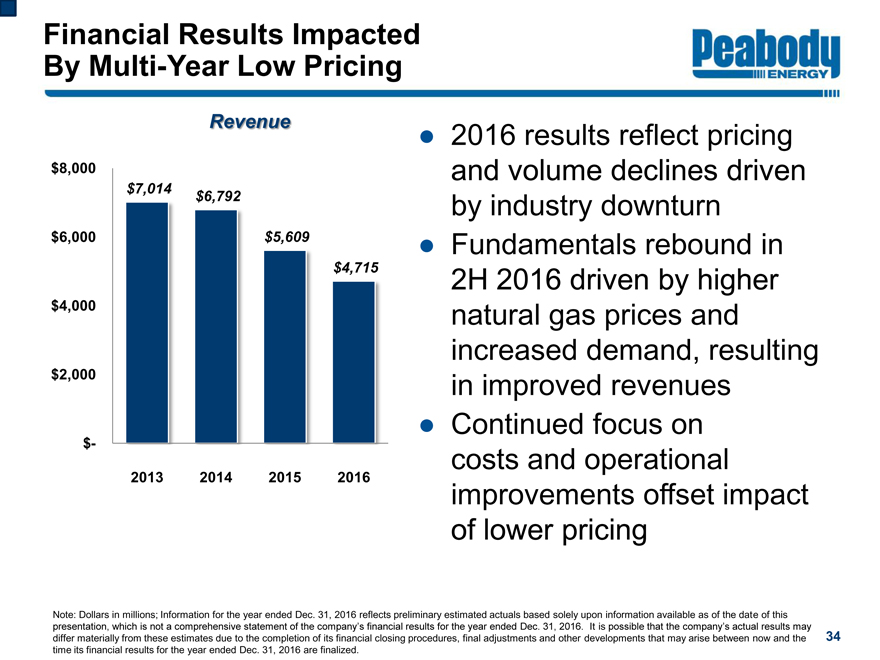
Financial Results Impacted By Multi-Year Low Pricing
34
Revenue
• 2016 results reflect pricing and volume declines driven by industry downturn
• Fundamentals rebound in 2H 2016 driven by higher natural gas prices and increased demand, resulting in improved revenues
• Continued focus on costs and operational improvements offset impact of lower pricing
Note: Dollars in millions; Information for the year ended Dec. 31, 2016 reflects preliminary estimated actuals based solely upon information available as of the date of this presentation, which is not a comprehensive statement of the company’s financial results for the year ended Dec. 31, 2016. It is possible that the company’s actual results may differ materially from these estimates due to the completion of its financial closing procedures, final adjustments and other developments that may arise between now and the time its financial results for the year ended Dec. 31, 2016 are finalized.
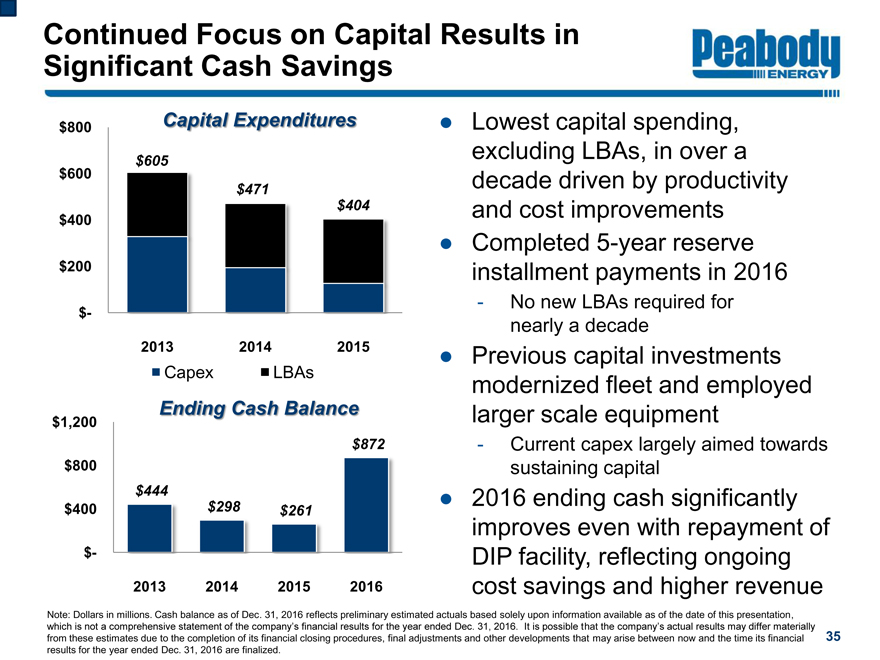
Continued Focus on Capital Results in Significant Cash Savings 35
Capital Expenditures
• Lowest capital spending, excluding LBAs, in over a decade driven by productivity and cost improvements
• Completed5-year reserve installment payments in 2016
- No new LBAs required for nearly a decade
• Previous capital investments modernized fleet and employed larger scale equipment
- Current capex largely aimed towards sustaining capital
• 2016 ending cash significantly improves even with repayment of DIP facility, reflecting ongoing cost savings and higher revenue
Note: Dollars in millions. Cash balance as of Dec. 31, 2016 reflects preliminary estimated actuals based solely upon information available as of the date of this presentation, which is not a comprehensive statement of the company’s financial results for the year ended Dec. 31, 2016. It is possible that the company’s actual results may differ materially from these estimates due to the completion of its financial closing procedures, final adjustments and other developments that may arise between now and the time its financial results for the year ended Dec. 31, 2016 are finalized.
$-
$200 $400
$600
$800
2013 2014
2015 Capex
LBAs
$605
$471
$404 $444
$298 $261
$872
$-
$400
$800 $1,200
2013
2014
2015
2016 Ending Cash Balance
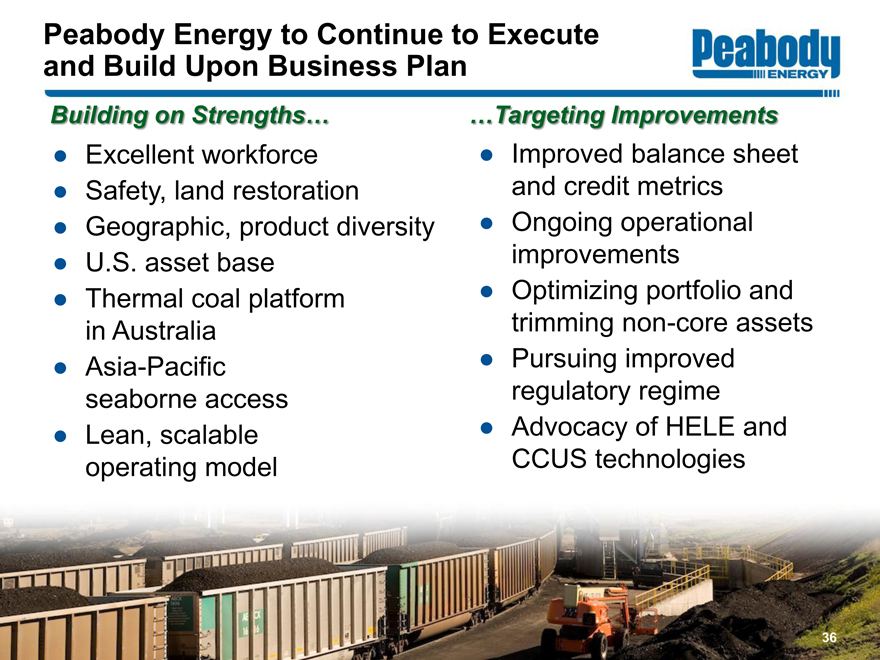
Peabody Energy to Continue to Execute and Build Upon Business Plan
• Excellent workforce
• Safety, land restoration
• Geographic, product diversity
• U.S. asset base
• Thermal coal platform in Australia
• Asia-Pacific seaborne access
• Lean, scalable operating model
Building on Strengths… …Targeting Improvements
• Improved balance sheet and credit metrics
• Ongoing operational improvements
• Optimizing portfolio and trimmingnon-core assets
• Pursuing improved regulatory regime
• Advocacy of HELE and CCUS technologies
36
TRANSACTION SUMMARY
|
|
| | |
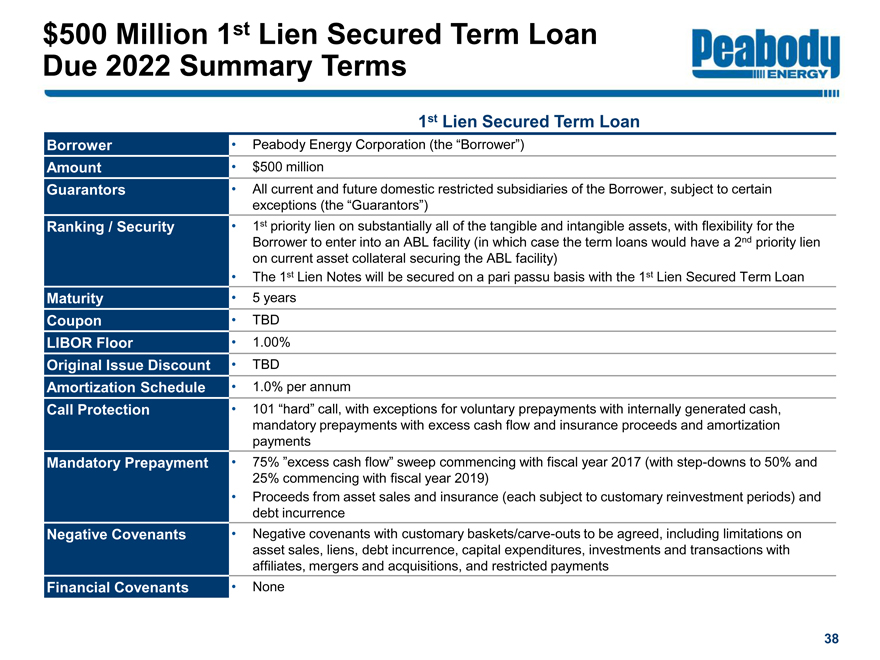
1st Lien Secured Term Loan Borrower •Peabody Energy Corporation (the “Borrower”) Amount •$500 million Guarantors •All current and future domestic restricted subsidiaries of the Borrower, subject to certain exceptions (the “Guarantors”) Ranking / Security •1st priority lien on substantially all of the tangible and intangible assets, with flexibility for the Borrower to enter into an ABL facility (in which case the term loans would have a 2nd priority lien on current asset collateral securing the ABL facility) •The 1st Lien Notes will be secured on a pari passu basis with the 1st Lien Secured Term Loan Maturity •5 years Coupon •TBD LIBOR Floor •1.00% Original Issue Discount •TBD Amortization Schedule •1.0% per annum Call Protection •101 “hard” call, with exceptions for voluntary prepayments with internally generated cash, mandatory prepayments with excess cash flow and insurance proceeds and amortization payments Mandatory Prepayment •75% ”excess cash flow” sweep commencing with fiscal year 2017 (with step-downs to 50% and 25% commencing with fiscal year 2019) •Proceeds from asset sales and insurance (each subject to customary reinvestment periods) and debt incurrence Negative Covenants •Negative covenants with customary baskets/carve-outs to be agreed, including limitations on asset sales, liens, debt incurrence, capital expenditures, investments and transactions with affiliates, mergers and acquisitions, and restricted payments Financial Covenants •None |
|
|
| | |
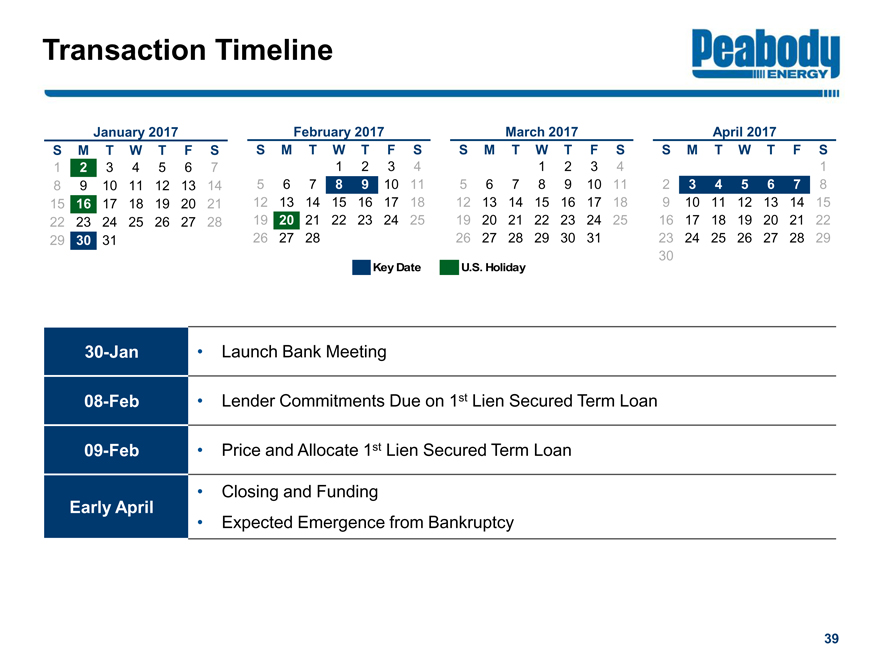
30-Jan | | • Launch Bank Meeting |
08-Feb | | • Lender Commitments Due on 1st Lien Secured Term Loan |
09-Feb | | • Price and Allocate 1st Lien Secured Term Loan |
Early April | | • Closing and Funding • Expected Emergence from Bankruptcy |
APPENDIX
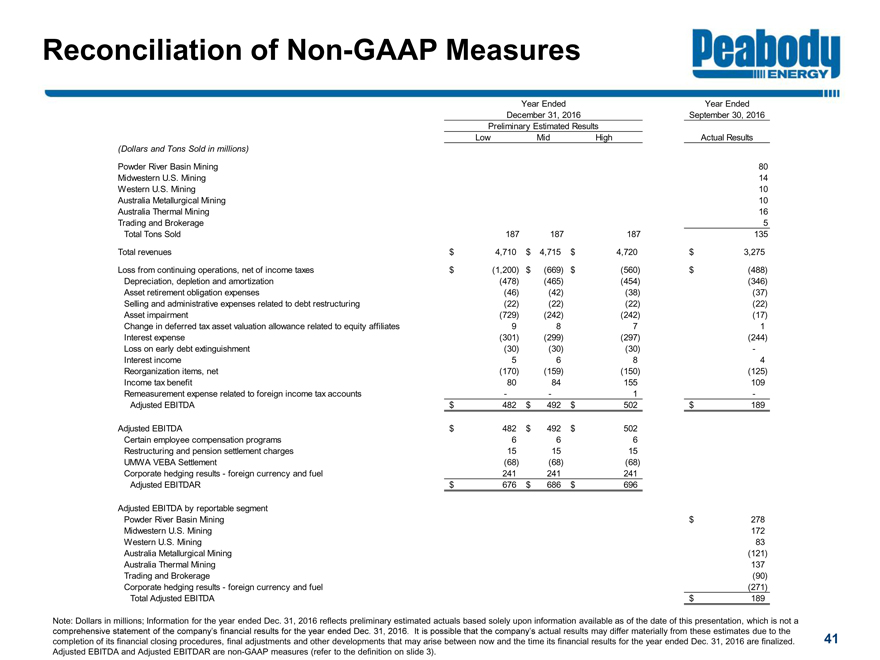
Reconciliation ofNon-GAAP Measures
41
Note: Dollars in millions; Information for the year ended Dec. 31, 2016 reflects preliminary estimated actuals based solely upon information available as of the date of this presentation, which is not a comprehensive statement of the company’s financial results for the year ended Dec. 31, 2016. It is possible that the company’s actual results may differ materially from these estimates due to the completion of its financial closing procedures, final adjustments and other developments that may arise between now and the time its financial results for the year ended Dec. 31, 2016 are finalized. Adjusted EBITDA and Adjusted EBITDAR arenon-GAAP measures (refer to the definition on slide 3). Year EndedSeptember 30, 2016LowMidHighActual Results(Dollars and Tons Sold in millions)Powder River Basin Mining80Midwestern U.S. Mining14Western U.S. Mining10Australia Metallurgical Mining10Australia Thermal Mining16Trading and Brokerage5Total Tons Sold187187187135Total revenues4,710$ 4,715$ 4,720$ 3,275$ Loss from continuing operations, net of income taxes(1,200)$ (669)$ (560)$ (488)$ Depreciation, depletion and amortization(478) (465) (454) (346) Asset retirement obligation expenses(46) (42) (38) (37) Selling and administrative expenses related to debt restructuring(22) (22) (22) (22) Asset impairment(729) (242) (242) (17) Change in deferred tax asset valuation allowance related to equity affiliates9 8 7 1 Interest expense(301) (299) (297) (244) Loss on early debt extinguishment(30) (30) (30)—Interest income5 6 8 4 Reorganization items, net(170) (159) (150) (125) Income tax benefit80 84 155 109 Remeasurement expense related to foreign income tax accounts— 1—Adjusted EBITDA482$ 492$ 502$ 189$ Adjusted EBITDA482$ 492$ 502$ Certain employee compensation programs6 6 6 Restructuring and pension settlement charges15 15 15 UMWA VEBA Settlement(68) (68) (68) Corporate hedging results—foreign currency and fuel241 241 241 Adjusted EBITDAR676$ 686$ 696$ Adjusted EBITDA by reportable segmentPowder River Basin Mining278$ Midwestern U.S. Mining172 Western U.S. Mining83 Australia Metallurgical Mining(121) Australia Thermal Mining137 Trading and Brokerage(90) Corporate hedging results—foreign currency and fuel(271) Total Adjusted EBITDA189$ Year EndedDecember 31, 2016Preliminary Estimated Results
|
|
| | |
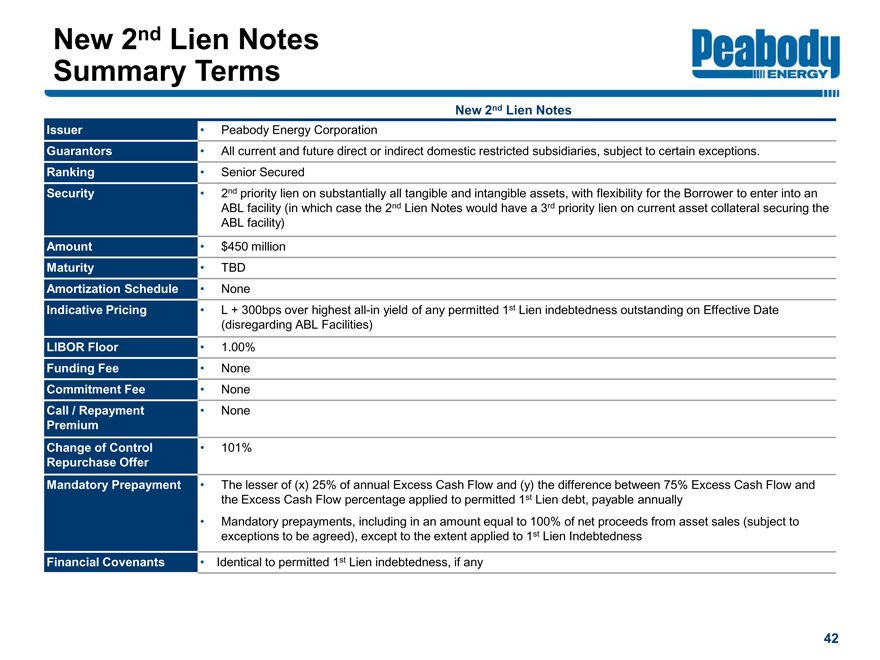
New 2nd Lien Notes Summary Terms New 2nd Lien Notes Issuer •Peabody Energy Corporation Guarantors •All current and future direct or indirect domestic restricted subsidiaries, subject to certain exceptions. Ranking •Senior Secured Security •2nd priority lien on substantially all tangible and intangible assets, with flexibility for the Borrower to enter into an ABL facility (in which case the 2nd Lien Notes would have a 3rd priority lien on current asset collateral securing the ABL facility) Amount •$450 million Maturity •TBD Amortization Schedule •None Indicative Pricing •L + 300bps over highestall-in yield of any permitted 1st Lien indebtedness outstanding on Effective Date (disregarding ABL Facilities) LIBOR Floor •1.00% Funding Fee •None Commitment Fee •None Call / Repayment Premium •None Change of Control Repurchase Offer •101% Mandatory Prepayment •The lesser of (x) 25% of annual Excess Cash Flow and (y) the difference between 75% Excess Cash Flow and the Excess Cash Flow percentage applied to permitted 1st Lien debt, payable annually •Mandatory prepayments, including in an amount equal to 100% of net proceeds from asset sales (subject to exceptions to be agreed), except to the extent applied to 1st Lien Indebtedness Financial Covenants •Identical to permitted 1st Lien indebtedness, if any |
|
|
| | |
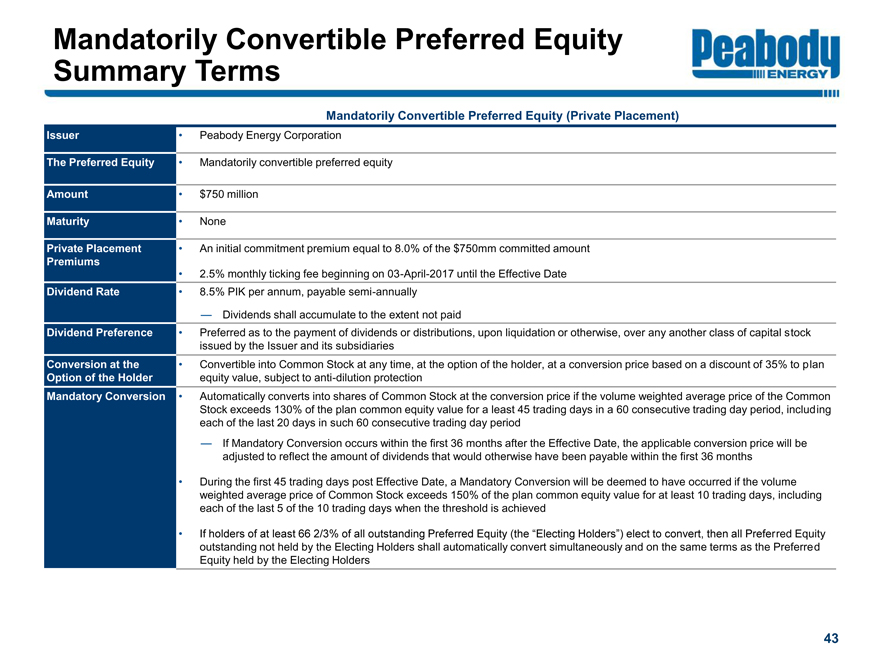
Mandatorily Convertible Preferred Equity Summary Terms Mandatorily Convertible Preferred Equity (Private Placement) |
Issuer | | •Peabody Energy Corporation |
The Preferred Equity | | •Mandatorily convertible preferred equity |
Amount | | •$750 million |
Maturity | | •None |
Private Placement Premiums | | •An initial commitment premium equal to 8.0% of the $750mm committed amount •2.5% monthly ticking fee beginning on03-April-2017 until the Effective Date |
Dividend Rate | | •8.5% PIK per annum, payable semi-annually —Dividends shall accumulate to the extent not paid |
Dividend Preference | | •Preferred as to the payment of dividends or distributions, upon liquidation or otherwise, over any another class of capital stock issued by the Issuer and its subsidiaries |
Conversion at the Option of the Holder | | •Convertible into Common Stock at any time, at the option of the holder, at a conversion price based on a discount of 35% to plan equity value, subject to anti-dilution protection |
Mandatory Conversion | | •Automatically converts into shares of Common Stock at the conversion price if the volume weighted average price of the Common Stock exceeds 130% of the plan common equity value for a least 45 trading days in a 60 consecutive trading day period, including each of the last 20 days in such 60 consecutive trading day period —If Mandatory Conversion occurs within the first 36 months after the Effective Date, the applicable conversion price will be adjusted to reflect the amount of dividends that would otherwise have been payable within the first 36 months •During the first 45 trading days post Effective Date, a Mandatory Conversion will be deemed to have occurred if the volume weighted average price of Common Stock exceeds 150% of the plan common equity value for at least 10 trading days, including each of the last 5 of the 10 trading days when the threshold is achieved •If holders of at least 66 2/3% of all outstanding Preferred Equity (the “Electing Holders”) elect to convert, then all Preferred Equity outstanding not held by the Electing Holders shall automatically convert simultaneously and on the same terms as the Preferred Equity held by the Electing Holders |
|
|
| | |
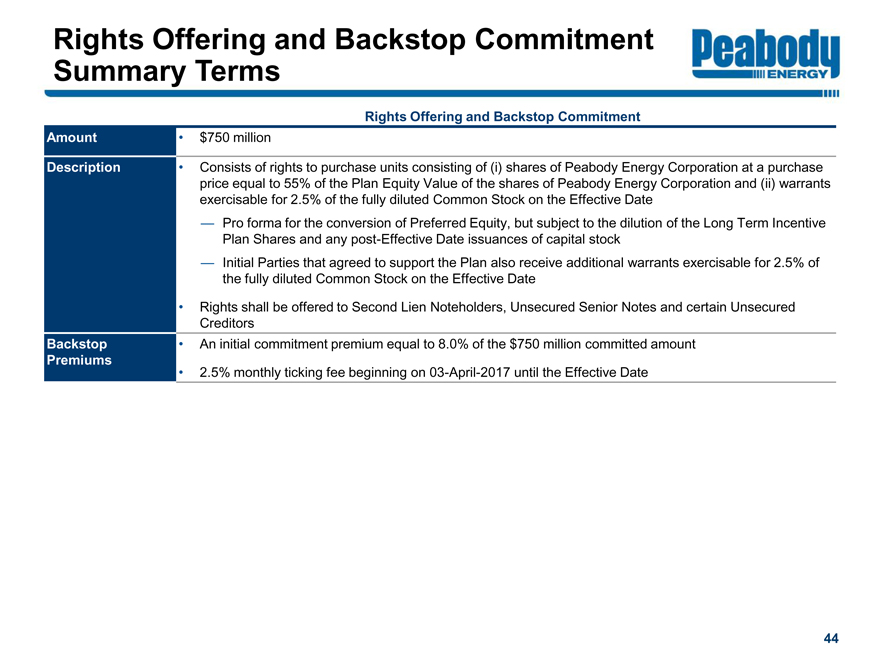
Rights Offering and Backstop Commitment Summary Terms Rights Offering and Backstop Commitment |
Amount | | •$750 million |
Description | | •Consists of rights to purchase units consisting of (i) shares of Peabody Energy Corporation at a purchase price equal to 55% of the Plan Equity Value of the shares of Peabody Energy Corporation and (ii) warrants exercisable for 2.5% of the fully diluted Common Stock on the Effective Date —Pro forma for the conversion of Preferred Equity, but subject to the dilution of the Long Term Incentive Plan Shares and any post-Effective Date issuances of capital stock —Initial Parties that agreed to support the Plan also receive additional warrants exercisable for 2.5% of the fully diluted Common Stock on the Effective Date •Rights shall be offered to Second Lien Noteholders, Unsecured Senior Notes and certain Unsecured Creditors |
Backstop Premiums | | •An initial commitment premium equal to 8.0% of the $750 million committed amount •2.5% monthly ticking fee beginning on03-April-2017 until the Effective Date |