Exhibit 99.1
Investor Presentation
May 2017

Statement on Forward-Looking Information Certain statements included in this presentation are forward-looking as defined in the Private Securities Litigation Reform Act of 1995. The Company uses words such as "anticipate," "believe," "expect," "may," "forecast," "project," "should," "estimate," "plan," "outlook," "target," "likely," "will," "to be" or other similar words to identify forward-looking statements. These forward-looking statements are made as of the date the release was filed and are based on numerous assumptions that the Company believes are reasonable, but these assumptions are open to a wide range of uncertainties and business risks that may cause actual results to differ materially from expectations. These factors are difficult to accurately predict and may be beyond the Company's control. Such factors include, but are not limited to those described in the Company’s most recently filed Annual Report on Form 10-K and Exhibit 99.2 of the Company’s Current Report on Form 8-K filed on April 11, 2017. Factors that could affect the Company’s results or an investment in its securities include but are not limited to: competition in the energy market and supply and demand for the Company's products, including the impact of alternative energy sources, such as natural gas and renewables; global steel demand and the downstream impact on metallurgical coal prices, and lower demand for the Company's products by electric power generators; customer procurement practices and contract duration; the impact of weather and natural disasters on demand, production and transportation; reductions and/or deferrals of purchases by major customers and the Company's ability to renew sales contracts; credit and performance risks associated with customers, suppliers, contract miners, co-shippers, and trading, bank and other financial counterparties; geologic, equipment, permitting, site access, operational risks and new technologies related to mining; transportation availability, performance and costs; availability, timing of delivery and costs of key supplies, capital equipment or commodities such as diesel fuel, steel, explosives and tires; impact of take-or-pay arrangements for rail and port commitments for the delivery of coal; successful implementation of business strategies, including, without limitation, the actions the Company is implementing to improve its organization and respond to current conditions; negotiation of labor contracts, employee relations and workforce availability, including, without limitation, attracting and retaining key personnel; changes in postretirement benefit and pension obligations and their related funding requirements; replacement and development of coal reserves; effects of changes in interest rates and currency exchange rates (primarily the Australian dollar); the Company’s ability to successfully consummate acquisitions or divestitures, and the resulting effects thereof; economic strength and political stability of countries in which the Company has operations or serves customers; legislation, regulations and court decisions or other government actions, including, but not limited to, new environmental and mine safety requirements, changes in income tax regulations, sales-related royalties, or other regulatory taxes and changes in derivative laws and regulations; the Company's ability to obtain and renew permits necessary for the Company's operations; the Company's ability to appropriately secure its requirements for reclamation, federal and state workers' compensation, federal coal leases and other obligations related to the Company's operations, including its ability to utilize self-bonding and/or successfully access the commercial surety bond market; litigation or other dispute resolution, including, but not limited to, claims not yet asserted; terrorist attacks or security threats, including, but not limited to, cybersecurity breaches; impacts of pandemic illnesses; any lack of an established market for certain of the Company’s securities, including the Company’s Series A Convertible Preferred Stock, and potential dilution of its common stock due to future issuances of equity securities; price volatility in the Company’s securities; short-sales in the Company’s common stock; any conflicts of interest between the Company’s significant shareholders and other holders of its capital stock; the Company’s ability to generate sufficient cash to service all of its indebtedness; the limits placed by the Company’s debt instruments and capital structure on its ability to pay dividends and repurchase common stock; the Company’s ability to comply with financial and other restrictive covenants in various agreements, including its debt instruments; and other risks detailed in the Company's reports filed with the SEC. The Company does not undertake to update its forward-looking statements except as required by law. Adjusted EBITDA is a non-GAAP measure defined as income (loss) from continuing operations before deducting net interest expense, income taxes, asset retirement obligation expenses, depreciation, depletion and amortization and reorganization items, net. Adjusted EBITDA is also adjusted for the discrete items that management excluded in analyzing the segments' operating performance as displayed in the reconciliation. A reconciliation of income (loss) from continuing operations, net of income taxes to Adjusted EBITDA is included at the end of this document. Adjusted EBITDA is used by management as one of the primary metrics to measure the Company’s operating performance. Management also believes non-GAAP performance measures are used by investors to measure the Company’s operating performance and lenders to measure the Company’s ability to incur and service debt. Adjusted EBITDA is not intended to serve as an alternative to U.S. GAAP measures of performance and may not be comparable to similarly-titled measures presented by other companies. Adjusted EBITDAR is a non-GAAP measure defined as Adjusted EBITDA further adjusted to exclude the impact of certain employee compensation programs related to the Chapter 11 Cases, restructuring charges, the voluntary employee beneficiary association (VEBA) settlement with the United Mine Workers of America (UMWA) and corporate hedging. A reconciliation of income (loss) from continuing operations, net of income taxes to Adjusted EBITDAR is included at the end of this document. Adjusted EBITDAR is used by management as one of the primary metrics to measure the Company’s operating performance. Management also believes non-GAAP performance measures are used by investors to measure the Company’s operating performance and lenders to measure the Company’s ability to incur and service debt. Adjusted EBITDAR is not intended to serve as an alternative to U.S. GAAP measures of performance and may not be comparable to similarly-titled measures presented by other companies.
|
|
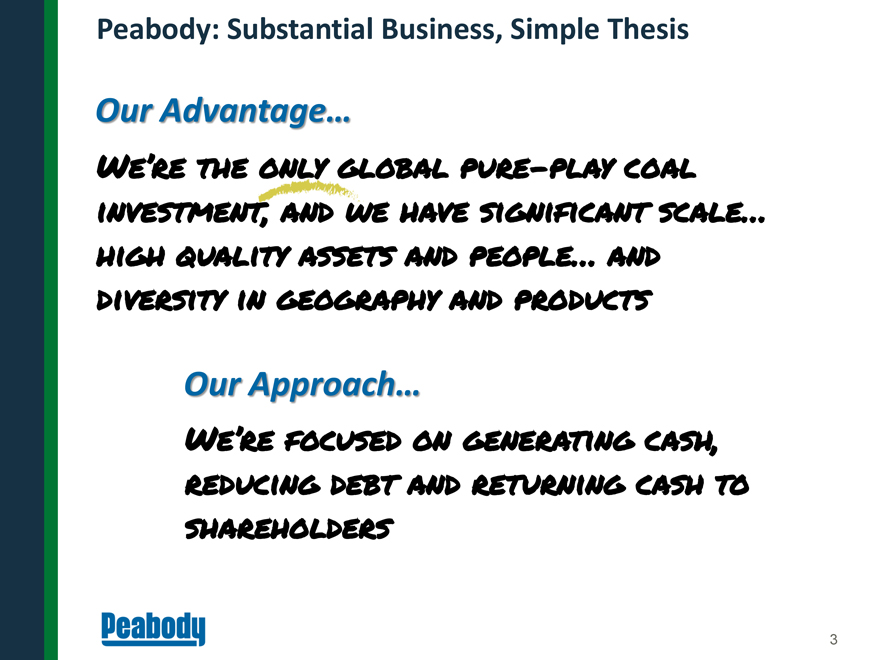
Peabody: Substantial Business, Simple Thesis
Our Advantage…
We’re the only global pure-play coal investment, e have significant scale… high quality assets and people… and diversity in geography and products
Our Approach…
We’re focused on generating cash, reducing debt and returning cash to shareholders
3
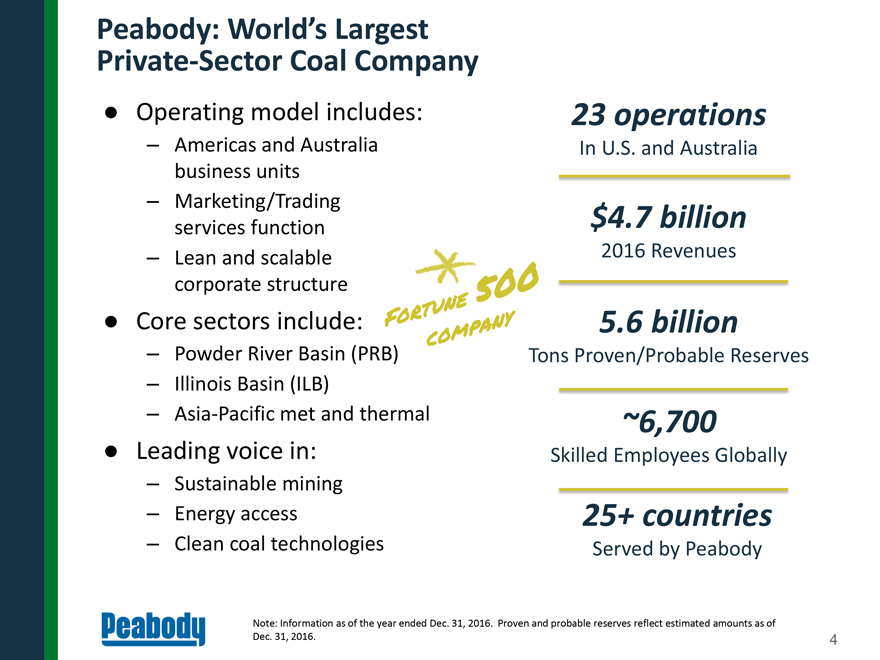
Peabody: World’s Largest Private-Sector Coal Company Operating model includes: 23 operations Americas and AustraliaIn U.S. and Australia business units Marketing/Trading services function$4.7 billion Lean and scalable2016 Revenues corporate structure Core sectors include: 5.6 billion Powder River Basin (PRB)Tons Proven/Probable Reserves Illinois Basin (ILB) Asia-Pacific met and thermal~6,700 Leading voice in: Skilled Employees Globally Sustainable mining Energy access25+ countries Clean coal technologiesServed by Peabody Note: Information as of the year ended Dec. 31, 2016. Proven and probable reserves reflect estimated amounts as of Dec. 31, 2016.4
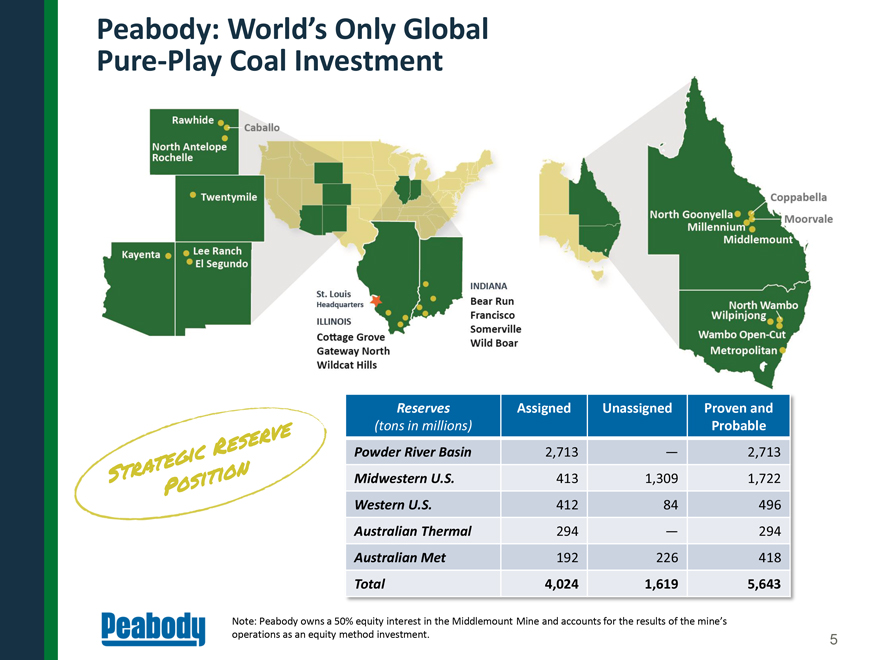
Peabody: World’s Only Global
Pure-Play Coal Investment
Reserves Assigned UnassignedProven and
(tons in millions) Probable
Powder River Basin 2,713 —2,713
Midwestern U.S. 413 1,3091,722
Western U.S. 412 84496
Australian Thermal 294 —294
Australian Met 192 226418
Total 4,024 1,6195,643
Note: Peabody owns a 50% equity interest in the Middlemount Mine and accounts for the results of the mine’s
operations as an equity method investment. 5

Leading Coal Producer with Significant Product and Geographic Diversity Note: Mining tons sold classified by product and production location based on publicly available information.

Largest net income in nearly five years Operating margins average 30% in Q1 Australia two of three largest segments; nearly half of total segment contribution Note: EBITDA margin is equal to segment Adjusted EBITDA divided by segment revenue. Segment average unweighted across five segments. Western U.S. Adjusted EBITDA includes $13 million benefit on customer settlement. Adjusted EBITDA and EBITDA margins are non-GAAP measures and may not be calculated identically by all companies. Please refer to the appendix for information on these non-GAAP measures. First Quarter Operating Margins Reflect Improvements in Australian Segments 1Q 2017 EBITDA Margin Powder River Basin 23% Midwestern U.S. 26% Western U.S. 33% Australian Thermal 34% Australian Met 33%

Americas: Reserves and Enhanced Methods Drive World-Class Mining, Enhanced Margins Peabody operates three of four most productive mines in U.S. PRB labor productivity and gross margins superior to other PRB producers Substantial reserve position, advanced mining methods drive productivity Major technology focus including integrated real-time planning and logistics to deliver customized requirements, centralized monitoring systems No change in Q1 to 2017 targets for volumes, revenue per ton or cost per ton Peer Avg. Source: Public company reports; Ventyx. Other PRB producers include Arch Coal, Cloud Peak Energy and Alpha Natural Resources, which is no longer is a public company and does not have 2016 included in average. EBITDA margin is a non-GAAP measures and may not be calculated identically by all companies. Please refer to the appendix for information on this non-GAAP measures. Productivity defined as total production divided by employee hours.

Australian Units Costs Decline 45% in Four Years, Greatly Improving Competiveness Australian capital investment declines >90% from 2012, while workforce decreases 35% Australian NOLs of A$4.76 billion Competitive strength, asset unique to Peabody’s platform/structure Q1 costs elevated from Cyclone Debbie and temporary geologic issues; Peabody still maintaining cost targets for 2017 2017 met coal volume targets raised based on retaining Metropolitan Targeting Q2 volumes comparable to Q1; ramping up in back half of 2017 Wilpinjong Mine among premier thermal coal assets in Australia Domestic contract allows Peabody access to reserves for export volumes Note: Australian net operating losses as of Dec. 31, 2016. Australia incorporates Peabody’s Australian Thermal and Metallurgical reporting segments. Middlemount results excluded but exposure represents 2.25 million tons per year. Revenues per Ton, Operating Costs per Ton and Gross Margin per Ton are non-GAAP measures. Revenues per Ton and Gross Margin per Ton are approximately equal to Revenues by segment and Adjusted EBITDA by segment, respectively, divided by segment tons sold. Operating costs per Ton is equal to Revenues per Ton less Gross Margin per Ton. Please refer to the appendix for information on non-GAAP measures.

U.S. Operations Provide Balance with Australian Access to Higher-Growth Asia-Pacific Demand Essentially all of Americas 2017 volumes already priced 52% priced for 2018, 67% contracted (on an expected 2017 volume basis) Enhances revenue visibility Australia access to high-growth Asia-Pacific demand provides substantial upside during strong industry conditions North Goonyella and Coppabella mines have ability to set premium HCC and LV PCI benchmarks, respectively Middlemount Mine provides ~2 million tons of met coal exposure not included in volumes Source: Peabody and IMF GDP forecast. Note: Contracted breakdown shown as of March 31, 2017. Emerging Asia includes China, Taiwan, India, Indonesia, Malaysia, Thailand and Vietnam. 100% 52% 20%

Coal consumption rises 3% while natural gas use declines 16% in Q1 Demand still lower than expected on mild winter First quarter gas prices up 55% above prior year Peabody now projects 2017 U.S. coal demand to rise 30 to 40 million tons compared to 2016 levels PRB and Illinois Basin competitive against natural gas above: SPRB: $2.50 to $2.75/mmBtu ILB: $3.00 to $3.50/mmBtu CAPP: $3.75 to $4.25/mmBtu Industry: U.S. Coal Shipments Rise in First Quarter 2017 U.S. Coal and Gas Generation (YoY Change) Gas Price (mmBtu) Source: Industry reports and Peabody Global Energy Analytics. Competitiveness with natural gas is very plant specific and highly dependent on a number of factors, including transportation costs. SPRB and CAPP stand for Southern Powder River Basin and Central Appalachia, respectively.

Pro-growth, tax and regulatory initiatives at macro level Administration steps to review/reverse onerous regulations: Repeal of so-called “Stream Protection Rule” Office of Natural Resources Revenue proposes to rescind Coal Valuation Rule EPA files notice of intent to review, rescind or revise “Waters of the U.S” act Review of Clean Power Plan and favorable D.C. circuit ruling Issuance of Energy Independence executive order DOI issues secretarial order ending coal leasing moratorium DOE orders study on threats to reliable baseload power due to premature retirement of coal plants For Peabody, advancing high-efficiency low emissions (HELE) generation and carbon capture projects remains a priority in any political environment Actions on Policy Front Favorable to Coal Mining and Use

Seaborne Thermal Coal Demand Growth 2016 – 2021 (tonnes in millions) Source: Industry reports and Peabody Global Energy Analytics. Global Thermal: Asia-Pacific Drives Seaborne Demand; Australia Positioned to Serve Growth China Southeast Asia India Atlantic Japan S. Korea Strong demand led by sharp growth in imports in China China imports increase 29% in Q1 over prior year; thermal generation up 7% through March India imports down 22% versus Q1 2016 on increased domestic supply; elevated stockpiles Annual thermal coal contract settles at $85; ~27% higher than prior-year settlement Peabody expects 2017 thermal exports of 13 to 14 million tons ~40% of seaborne thermal sales sold under longer-term contracts Peabody realizes ~90% to 95% of Newcastle index price on average for exports

Solid demand in first quarter on 6% increase in global steel production Supply disruptions due to Cyclone Debbie result in sharp rise in spot prices; Benchmark negotiations for second quarter deferred Peabody expects to export 11 to 12 million tons of met coal in 2017 On weighted-average basis across all met products, Peabody realizes: ~85% to 90% of premium HCC benchmark price ~90% to 95% of premium LV PCI benchmark price Expected Seaborne Met Coal Demand 2016 – 2021 (tonnes in millions) China India Japan Europe S. Korea Other Source: Industry reports; Peabody Global Energy Analytics. Global Metallurgical: Longer-Term Seaborne Met Coal Demand Growth Driven by India

$686 million 2016 Adjusted EBITDAR $1.97 billion Emergence Debt $1.07 billion Unrestricted Cash at March 31 Note: Adjusted EBITDAR is a non-GAAP measure. Please refer to the appendix for information regarding our non-GAAP measures. Peabody calculates gross leverage as total debt divided by Adjusted EBITDA. Under terms of the credit agreement, dividends may commence in 2018, subject to a cap and leverage ratio test. 2.0x Targeted Gross Leverage Managing all aspects of balance sheet, reducing liabilities, maximizing return on investment Lower interest expense Modified hedging strategies Near-term debt reduction Built-in excess cash flow sweep to drive debt reduction Sharp return orientation for future investments emphasizing: Returns in excess of cost of capital Near-term payback period Formalizing creation of dividend and capital allocation policies (including debt reduction targets) in second quarter New Capital Structure, Focused Capital Discipline

Unrestricted Cash Position Builds to $1.068 billion Cash and cash equivalents of $1.068 billion at March 31, 2017 excludes: Current restricted cash: $81 million (plus $1 billion in restricted bond proceeds used at April 3, 2017 emergence) Collateral related to U.S. and Australia reclamation (and other activities) of $594 million in Investments and Other Assets Pursuing steps to free up components of restricted cash Other prominent uses of unrestricted cash outside of Adjusted EBITDAR in 2017 include: Capital expenditures of $165 to $195 million for full year ~$275 to $325 million in Chapter 11-related payments remaining in last three quarters Interest expense of $41 to $43 million per quarter for remainder of 2017

Work with customers and value-chain suppliers to quickly build met coal shipments in Queensland Resume full shipments at the Metropolitan hard coking coal mine in New South Wales following expected completion of an extended longwall move in late May Continue to export thermal coal shipments at strong capacity levels given high Asian demand Peabody’s Australian thermal coal logistics chain unaffected by Cyclone Debbie Company achieves milestone for Wilpinjong Extension Project Complete annual review process to optimize mine plans in more favorable short-term pricing environment Continue to manage company’s cash position and formalize creation of dividend and capital allocation policies, including debt reduction targets Peabody Second Quarter Priorities

Aggressive pursuit of safe, low-cost operations Drive down cost curve Protect social license to operate Excellence in land restoration Emphasis on best products, regions and customers within essential industry In U.S., best asset base in core industry In Australia, mid-tier met assets, top-tier thermal Capital discipline with sharp return orientation Focus on EBITDA margins, ROI in excess of cost of capital; pursuing higher-return investments Management team with value focus Capitalize on excellent asset base, high-quality, aligned workforce and sustainable capital structure Leading voice for responsible mining, energy access and advanced coal technologies Focus on high-efficiency, low-emissions technology and CCUS Key Drivers of Value Creation

“The New BTU” Positioned to Create Substantial Value for Shareholders Over Time Profile Operations Financial Only global pure-play coal investment Scale and diversity of geography and products Serves best demand centers in U.S. and high-growth Asia Superior U.S. assets and operations Restructured balance sheet with significantly reduced debt Experienced international management Strengthened Australia platform Leading PRB operations with low costs and high margins Safety and sustainability Creating a solid capital structure through all cycles New investments filtered on higher returns Technology driven Returning cash generation to shareholders over time
|
|
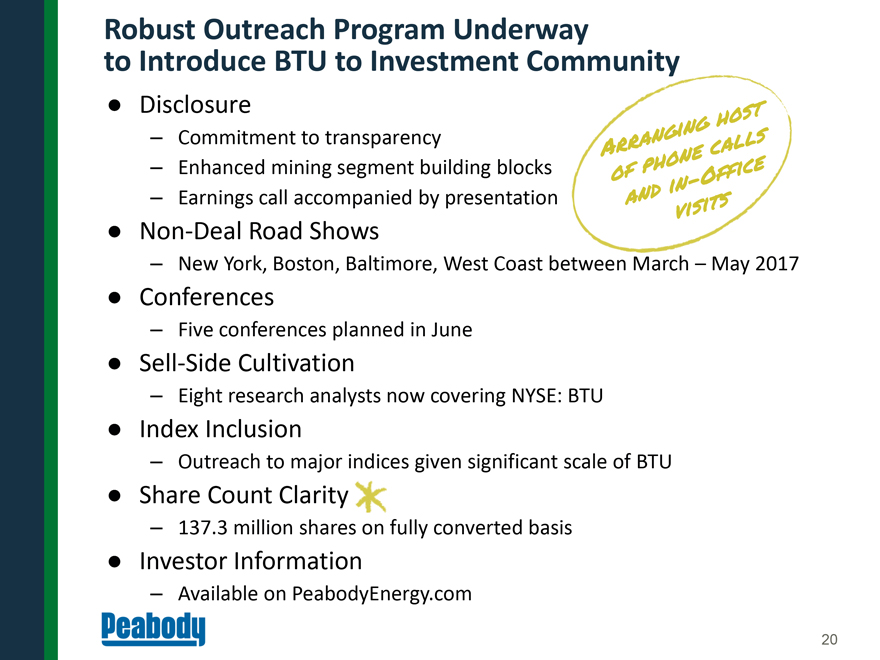
Robust Outreach Program Underway to Introduce BTU to Investment Co Disclosure Commitment to transparency Enhanced mining segment building blocks Earnings call accompanied by presentationNon-Deal Road Shows New York, Boston, Baltimore, West Coast Conferences Five conferences planned in June Sell-Side Cultivation Eight research analysts now covering NYSE: BTU Index Inclusion Outreach to major indices given significant scale of BTU Share Count Clarity 137.3 million shares on fully converted basis Investor Information Available on PeabodyEnergy.com 20
Appendix
Photo: Jimmy Bernhard, KSDK
21

2017 Targets Most Volume/Price/Cost Targets Maintained; Australia Met Coal Volumes Increased Sales Volumes (short tons) Australia Operations – Costs Per Ton (USD)3 PRB 115 – 120 million Metallurgical $85 – $95 ILB 18 – 20 million Thermal $31 – $35 Total U.S. 145 – 155 million Total Australia $51 – $54 Australia Metallurgical1 11 – 12 million Capital Expenditures $165 – $195 million Australia Export Thermal2 13 – 14 million Australia Domestic Thermal ~8 million Q2 - Q4 2017 Cost Sensitivities4 Total Australia 32 – 34 million $0.05 Decrease in A$ FX Rate5 +~$70 – $75 million $0.05 Increase in A$ FX Rate5 - ~$30 – $35 million Trading and Brokerage 3 – 7 million Fuel (+/- $10/barrel) +/- ~$24 million Total Tons Sold 180 – 196 million Priced Position PRB Tons ~115 million tons U.S. Operations – Revenues Per Ton PRB Average Price/Ton $12.67 PRB $12.40 – $12.90 ILB Tons ~19 million tons ILB $41.75 – $43.75 ILB Average Price/Ton $42.39 Total U.S. $18.90 – $19.30 Essentially all of Peabody’s expected 2017 U.S. production is priced as of March 31, 2017; 52% of 2018 volumes are priced and 67% contracted (on a 2017 projected volume basis). U.S. Operations – Costs Per Ton PRB $9.75 – $10.25 ILB $31.25 – $33.25 Total U.S. $14.50 – $15.00

2017 Targets 1 Metallurgical coal sales volumes may range from ~50%-60% PCI and ~40%-50% coking coal (including semi-hard and semi-soft coking coals). Approximately 45%-55% of seaborne metallurgical sales may be executed on a spot basis, with the remainder priced under quarterly contracts. The company also has exposure to approximately 2 million tons of metallurgical coal related to the Middlemount Mine, a 50/50 joint venture accounted for in (Income) Loss from Equity Affiliates. Peabody’s North Goonyella and Coppabella mines have the ability to set the premium HCC benchmark and premium LV PCI benchmark, respectively, with the remainder of products sold at discounts based on coal qualities and properties. On a weighted-average basis across all metallurgical products, Peabody typically realizes approximately 85%-90% of the premium HCC benchmark price for its coking products, and 90%-95% of the premium LV PCI benchmark price for its PCI products. In Q1 2017, the ratio of the premium LV PCI benchmark price to the premium HCC benchmark price was ~63%. 2 Approximately 60% of seaborne thermal sales are executed on a spot basis, with the remainder sold under longer-term contracts. A portion of Peabody’s seaborne thermal coal products sell at or above the Newcastle index, with the remainder sold at discounts relative to the Newcastle index based on coal qualities and properties. On a weighted-average basis across all seaborne thermal products, Peabody realizes approximately 90%-95% of the Newcastle index price. 3 Assumes 2Q – 4Q 2017 average 2017 A$ FX rate of $0.75. 4 Sensitivities reflect approximate impacts of changes in variables on financial performance. When realized, actual impacts may differ significantly. 5 As of May 4, 2017, Peabody had purchased call options in aggregate notional amount of approximately AUD $1.3 billion to manage market price volatility associated with the Australian dollar at an average strike price of ~$0.77 and settlement dates through December 2017. Sensitivities provided are relative to an assumed average A$ rate of $0.75 for remainder of 2017. Note 1: Peabody classifies its Australian Metallurgical or Thermal Mining segments based on the primary customer base and reserve type. A small portion of the coal mined by the Australian Metallurgical Mining segment is of a thermal grade and vice versa. Peabody may market some of its metallurgical coal products as a thermal product from time to time depending on industry conditions. Per ton metrics presented are non-GAAP measures. Due to the volatility and variability of certain items needed to reconcile these measures to their nearest GAAP measure, no reconciliation can be provided without unreasonable cost or effort. Guidance does not reflect the impact of fresh start accounting. Note 2: A sensitivity to changes in seaborne pricing should consider Peabody’s estimated split of PCI and coking coal products, the ratio of premium LV PCI to premium HCC benchmark prices, the weighted average discounts across all products to the applicable premium HCC or premium LV PCI benchmark or Newcastle index prices, in addition to impacts on sales-related costs in Australia, and applicable conversions between short tons and metric tonnes as necessary. Note 3: Peabody would have approximately 137.3 million shares of common stock issued, assuming full conversion of Peabody’s preferred stock (including make-whole shares issuable upon conversion of the preferred stock) and full exercise of all warrants issued in connection with the company’s emergence from Chapter 11. The fully converted shares issued value excludes shares underlying unvested equity awards under Peabody’s long-term incentive plan. As of April 26, holders of approximately 36% of preferred stock issued at emergence had converted their shares into common stock.

Peabody Mission, Values and Strategy Our Mission To create superior value as the leading global supplier of coal, which enables economic prosperity and a better quality of life. Safety: We commit to safety and health as a way of life. People: We offer an inclusive work environment and engage, recognize and develop employees. Customer Focus: We provide customers with quality products and excellent service. Excellence: We are accountable for our own success. We operate cost-competitive mines by applying continuous improvement and technology-driven solutions. Leadership: We have the courage to lead, and do so through inspiration, innovation, collaboration and execution. Sustainability: We take responsibility for the environment, benefit our communities and restore the land for generations that follow. Integrity: We act in an honest and ethical manner. Our Values Leading position in U.S. PRB and ILB basins Australian metallurgical and thermal coal platform to capture higher growth Asian markets Operational Excellence: Drive safety, productivity, cost efficiency and reclamation performance. Financial Strength: Build a capital structure that enables sustainable performance through all market cycles and generates returns to support future growth initiatives. Strategic Portfolio Management: Continually enhance the value of our portfolio; high- quality assets in the right markets. Advance Coal Mining and Use: Protect our license to operate, advocate favorable energy policy and advances in generation technology including HELE and CCUS. People: Employ the best people in the industry and align their talents to maximize their full potential. Our Strategy
|

|
New Board of Directors Represents Independence, Skills and Expertise
Nicholas Chirekos Former North America Head of Mining, J.P. Morgan
Stephen Gorman President and CEO of Borden Dairy Company; Former Chief Operating Officer of Delta Air Lines
Glenn Kellow President and CEO of Peabody; director and executive committee member of the World Coal Association, U.S. National Mining Association and the International Energy Agency Coal Industry Advisory Board
Joe Laymon Vice President of Human Resources and Corporate Services for Chevron Corporation; Former Group VP for Ford Motor Company
Teresa Madden Former EVP and CFO of Xcel Energy, Inc.
Robert Malone Former Chairman of the Board and President of BP America Inc.
Kenneth Moore Former Managing Director of First Reserve Corporation
Michael Sutherlin Former President and CEO of Joy Global Inc.
Shaun Usmar CEO of Triple Flag Mining Finance Ltd.; Former Senior Executive Vice President and CFO of Barrick Gold
25
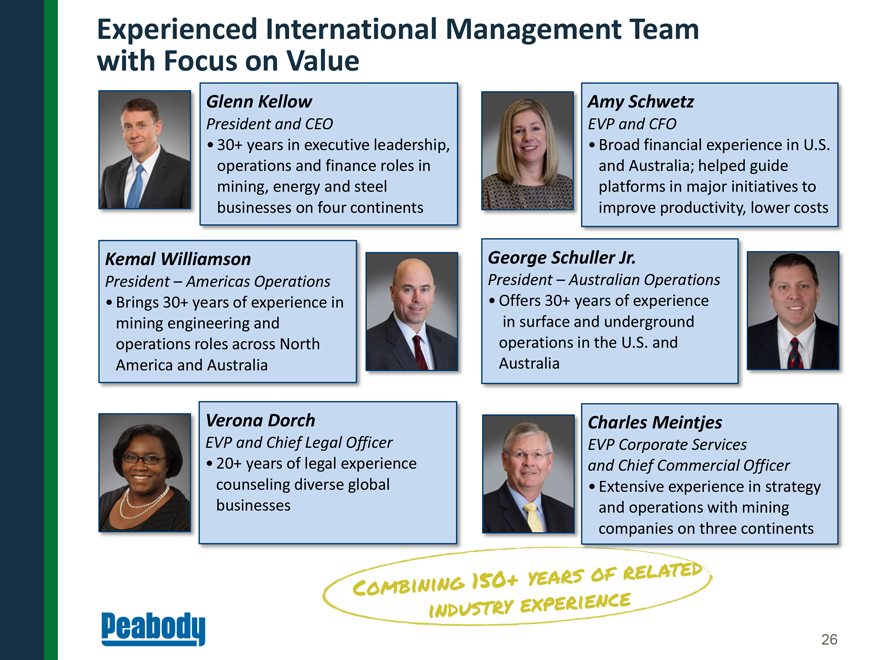
Experienced International Management Team with Focus on Value Glenn Kellow Amy Schwetz President and CEO EVP and CFO 30+ years in executive leadership, Broad financial experience in U.S. operations and finance roles in and Australia; helped guide mining, energy and steel platforms in major initiatives to businesses on four continents improve productivity, lower costs Kemal Williamson George Schuller Jr. President Americas Operations President Australian Operations Brings 30+ years of experience in Offers 30+ years of experience mining engineering and in surface and underground operations roles across North operations in the U.S. and America and Australia Australia Verona Dorch Charles Meintjes EVP and Chief Legal Officer EVP Corporate Services 20+ years of legal experience and Chief Commercial Officer counseling diverse global Extensive experience in strategy businesses and operations with mining companies on three continents 26

Peabody at a Glance: Pre and Post Emergence Challenges Pre-Filing Post-Filing High debt levels Attempted multiple debt exchanges Reducing debt by $5.2 billion to $1.97 billion Uncertainty around coal mine reclamation bonding Self bonding agreements in Wyoming, New Mexico, Indiana and Illinois with compliance discretion by the states Surety bonds supporting coal mine reclamation Reduced U.S. bonding requirements by ~$450 million from 2015 through restoration, bond release and review of bonding calculations 100% third-party bonding facilities at reasonable collateral requirements Fixed charges SG&A reduced to lowest levels in a decade; includes headcount reductions and office closures Completed final LBA payment No new LBAs needed for nearly a decade Australia platform Significant losses from pricing declines Excluded from U.S. Chapter 11 protection Entered into $250 million intercompany facility to protect the business Pursuing additional cost reductions Burton placed on care and maintenance Strengthening Australian met coal platform Legacy currency and fuel hedging Up to ~$100 million in losses per quarter No new currency hedging since 2014 Settled as part of Chapter 11 New options-based approach to mitigate material risks Contracts Renegotiation and restructuring of various supplier contracts and capital leases to achieve more favorable terms Legacy liabilities Amended VEBA agreement with UMWA to improve cash flows by $70 million Patriot MEPP claim totals $642 million Gold Fields/Blue Tee liabilities from Hanson spinoff Kinder Morgan take-or-pay agreement Settled MEPP claim for $75 million Gold Fields liabilities funded with trust Negotiated reduction in port access Modified non-qualified pension and 401(k) plans

Holistic View of Debt and Other Obligations Other Liabilities Million $ 2016 Liability 2016 Expense 2016 Cash Postretirement Health Care $812.1 $56.1 $48.4 Pension $186.3 $23.7 $1.1 Consolidated ARO $758.8 $41.8 $28.7 Sustainable capital structure Focus on leverage and other long-term liabilities balanced with returning cash to shareholders over time Staggered debt maturities at 5 and 8 years B+ and B1 corporate ratings from S&P and Moody’s, respectively Manageable post-retirement benefits Future annual post-retirement health care payments expected to be ~$55 to $60 million Pension plan ~80% funded Final reclamation costs accounted for through ARO liability Majority of reclamation occurs throughout mining process Annual final reclamation payments expected to be ~$25 to $35 million Note: Share amounts presented as of April 3, 2017 emergence date. Debt balances included in plan enterprise value table excludes approximately $20 million in capital leases. Total Debt ~$2.0 B; Net Debt of ~$0.9 B Common shares (plan value) $2.0 billion Preferred shares (plan value) $1.1 billion 6.000% Senior Secured Notes due 2022 $500 million 6.375% Senior Secured Notes due 2025 $500 million Term Loan $950 million Unrestricted Cash (3/31/17) $1,068 million

Summary Exit Financing Terms First Lien Sr. Secured Term Loan First Lien Sr. Secured Notes Size • $950 million • $1,000 million Tenor • 5 Years • 5 Years and 8 years Pricing • L + 4.50% (subject to 1% Libor floor) • 6.000% notes due March 2022 ($500M) • 6.375% notes due March 2025 ($500M) OID • 99.5% • None (issued at par) Amortization • 1.0% per annum • None Mandatory Repayments • 75% Excess Cash Flow (ECF) sweep with step downs to 50% and 25% based on Total Leverage Ratio (net) • Net proceeds from asset sales with FMV above $10 million (if not reinvested within 360 days) • No Excess Cash Flow (ECF) sweep • Net proceeds from asset sales with FMV above $10 million (if not reinvested within 360 days), on a pro rata basis with Term Loan Voluntary Repayments • Fully prepayable with internally generated cash without premium or penalty • Call Protection for first 2-3 years (notes may be redeemed subject to make whole premium) • After non-call period, the notes are callable, in whole or in part (at redemption prices below) Call Protection • 101 “soft” call for repricing and refinancings before 12 month anniversary • 6.000% Notes due 2022 (non-call two years) - 2019: 103.000% - 2020: 101.500% - 2021 and thereafter: 100.000% • 6.375% Notes due 2025 (non-call three years) - 2020: 104.781% - 2021: 103.188% - 2022: 101.594% - 2023 and thereafter: 100.00%

Mandatorily Convertible Preferred Equity Summary Terms Mandatorily Convertible Preferred Equity (Private Placement) Issuer Peabody Energy Corporation The Preferred Equity Mandatorily convertible preferred equity Amount $750 million Maturity None Private Placement Premiums An initial commitment premium equal to 8.0% of the $750mm committed amount 2.5% monthly ticking fee beginning on 03-April-2017 until the Effective Date Dividend Rate 8.5% PIK per annum, payable semi-annually Dividends shall accumulate to the extent not paid Dividend Preference Preferred as to the payment of dividends or distributions, upon liquidation or otherwise, over any junior class of capital stock issued by the Issuer and its subsidiaries Conversion at the Option of the Holder Convertible into Common Stock at any time, at the option of the holder, at a conversion price based on a discount of 35% to plan equity value, subject to anti-dilution protection Mandatory Conversion Automatically converts into shares of Common Stock at the conversion price if the volume weighted average price of the Common Stock exceeds 130% of the plan common equity value for a least 45 trading days in a 60 consecutive trading day period, including each of the last 20 days in such 60 consecutive trading day period If Mandatory Conversion occurs within the first 36 months after the Effective Date, the applicable conversion price will be adjusted to reflect the amount of dividends that would otherwise have been payable within the first 36 months During the first 45 trading days post Effective Date, a Mandatory Conversion will be deemed to have occurred if the volume weighted average price of Common Stock exceeds 150% of the plan common equity value for at least 10 trading days, including each of the last 5 of the 10 trading days when the threshold is achieved If holders of at least 66 2/3% of all outstanding Preferred Equity (the “Electing Holders”) elect to convert, then all Preferred Equity outstanding not held by the Electing Holders shall automatically convert simultaneously and on the same terms as the Preferred Equity held by the Electing Holders

U.S. Bonding Solution Secured to Best Serve Capital Structure Upon Emergence Land restoration essential part of coal mining process Concurrent reclamation and sharp focus results in smaller footprint Reclaimed 1.7 acres for every acre disturbed in 2016 ~$175 million spent to restore more than 48,000 acres of land over past decade $530 million paid to federal abandoned mined lands (AML) program for others’ reclamation Peabody recognized with 90 environmental honors globally since 2000 U.S. reclamation liabilities fully accounted for through ARO liability of ~$470 million Third-party bonding facilities total $1.27 billion on emergence Reduced by ~$450 million from 2015 through restoration, bond release and review of bonding calculations Believe we continue to qualify for self-bonding and may pursue in future should circumstances warrant Peabody Approach Note: ARO liability as of Dec. 31, 2016.

Peabody – Leader in Powder River Basin Operates flagship North Antelope Rochelle Mine – World’s largest coal mine Ability to optimize equipment and resources among Peabody mines Well-positioned on joint line

Reconciliation of Non-GAAP Measures Year Ended December 31, 2016 2015 2014 2013 2012 Powder River Basin Mining Operations 113.1 138.8 142.6 135.2 140.3 Midwestern U.S. Mining Operations 18.3 21.2 25.0 26.3 27.4 Western U.S. Mining Operations 13.7 17.9 23.8 23.6 24.9 Total U.S. Mining Operations 145.1 177.9 191.4 185.1 192.6 Australian Metallurgical Mining Operations 13.4 15.7 17.2 15.0 14.0 Australian Thermal Mining Operations 21.3 20.1 21.0 19.9 19.0 Total Australian Mining Operations 34.7 35.8 38.2 34.9 33.0 Trading and Brokerage Operations 7.0 15.1 20.2 31.7 22.9 Total 186.8 228.8 249.8 251.7 248.5 Powder River Basin Mining Operations $ 1,473.3 $ 1,865.9 $ 1,922.9 $ 1,767.3 $ 1,983.0 Midwestern U.S. Mining Operations 792.5 981.2 1,198.1 1,335.5 1,403.7 Western U.S. Mining Operations 526.0 682.3 902.8 902.3 966.3 Total U.S. Mining Operations 2,791.8 3,529.4 4,023.8 4,005.1 4,353.0 Australian Metallurgical Mining Operations 1,090.4 1,181.9 1,613.8 1,773.4 2,187.5 Australian Thermal Mining Operations 824.9 823.5 1,058.0 1,131.2 1,316.1 Total Australian Mining Operations 1,915.3 2,005.4 2,671.8 2,904.6 3,503.6 Trading and Brokerage Operations (10.9) 42.8 58.4 66.0 199.9 Other 19.1 31.6 38.2 38.0 21.0 Total $ 4,715.3 $ 5,609.2 $ 6,792.2 $ 7,013.7 $ 8,077.5 Loss from continuing operations, net of income taxes $ (674.3) $ (1,813.9) $ (749.1) $ (286.0) $ (470.9) Depreciation, depletion and amortization 465.4 572.2 655.7 740.3 663.4 Asset retirement obligation expenses 41.8 45.5 81.0 66.5 67.0 Asset impairment and mine closure costs 247.9 1,277.8 154.4 528.3 929.0 Selling and administrative expenses related to debt restructuring 21.5 - - - - Settlement charges related to the Patriot bankruptcy reorganization - - - 30.6 - Change in deferred tax asset valuation allowance related to equity affiliates (7.5) (1.0) 52.3 - - Amortization of basis difference related to equity affiliates - 4.9 5.7 6.3 4.6 Interest income (5.7) (7.7) (15.4) (15.7) (24.5) Interest expense 298.6 465.4 426.6 408.3 402.3 Loss on early debt extinguishment 29.5 67.8 1.6 16.9 3.3 Reorganization items, net 159.0 - - - - Income tax (benefit) provision (84.0) (176.4) 201.2 (448.3) 262.3 Adjusted EBITDA (1) $ 492.2 $ 434.6 $ 814.0 $ 1,047.2 $ 1,836.5 Selling and administrative expenses for certain employee compensation programs related to the Chapter 11 Cases 5.7 Restructuring charges 15.5 UMWA VEBA Settlement (68.1) Corporate hedging 241.0 Adjusted EBITDAR (2) $ 686.3 Powder River Basin Mining Operations $ 379.9 $ 482.9 $ 509.0 $ 435.4 $ 542.0 Midwestern U.S. Mining Operations 217.3 269.7 306.9 426.0 405.6 Western U.S. Mining Operations 101.6 184.6 266.9 258.0 279.7 Total U.S. Mining Operations 698.8 937.2 1,082.8 1,119.4 1,227.3 Australian Metallurgical Mining Operations (16.3) (18.2) (151.1) (120.0) 238.4 Australian Thermal Mining Operations 217.6 193.6 264.1 270.0 337.7 Total Australian Mining Operations 201.3 175.4 113.0 150.0 576.1 Trading and Brokerage Operations (72.2) 27.0 14.9 (19.9) 119.7 Other (335.7) (705.0) (396.7) (202.3) (86.6) Adjusted EBITDA (1) $ 492.2 $ 434.6 $ 814.0 $ 1,047.2 $ 1,836.5 (1) Adjusted EBITDA is a non-GAAP measure defined as income (loss) from continuing operations before deducting net interest expense, income taxes, asset retirement obligation expenses, depreciation, depletion and amortization and reorganization items, net. Adjusted EBITDA is also adjusted for the discrete items that management excluded in analyzing the segments' operating performance as displayed in the reconciliation. Adjusted EBITDA is used by management as one of the primary metrics to measure the Company’s operating performance. Management also believes non-GAAP performance measures are used by investors to measure the Company’s operating performance and lenders to measure the Company’s ability to incur and service debt. Adjusted EBITDA is not intended to serve as an alternative to U.S. GAAP measures of performance and may not be comparable to similarly-titled measures presented by other companies. (2) Adjusted EBITDAR is a non-GAAP measure defined as Adjusted EBITDA further adjusted to exclude the impact of certain employee compensation programs related to the Chapter 11 Cases, restructuring charges, the voluntary employee beneficiary association (VEBA) settlement with the United Mine Workers of America (UMWA) and corporate hedging. Adjusted EBITDAR is used by management as one of the primary metrics to measure the Company’s operating performance. Management also believes non-GAAP performance measures are used by investors to measure the Company’s operating performance and lenders to measure the Company’s ability to incur and service debt. Adjusted EBITDAR is not intended to serve as an alternative to U.S. GAAP measures of performance and may not be comparable to similarly-titled measures presented by other companies.

Reconciliation of Non-GAAP Measures Quarter Ended March 31, 2017 2016 Tons Sold (In Millions) Powder River Basin Mining Operations 31.0 24.6 Midwestern U.S. Mining Operations 4.5 4.5 Western U.S. Mining Operations 3.4 2.9 Total U.S. Mining Operations 38.9 32.0 Australian Metallurgical Mining Operations 2.2 3.3 Australian Thermal Mining Operations 4.6 5.2 Total Australian Mining Operations 6.8 8.5 Trading and Brokerage Operations 0.4 2.0 Total 46.1 42.5 Revenues (In Millions) Powder River Basin Mining Operations $ 394.3 $ 336.0 Midwestern U.S. Mining Operations 193.2 199.6 Western U.S. Mining Operations 149.7 112.5 Total U.S. Mining Operations 737.2 648.1 Australian Metallurgical Mining Operations 328.9 205.1 Australian Thermal Mining Operations 224.8 176.7 Total Australian Mining Operations 553.7 381.8 Trading and Brokerage Operations 31.6 (8.8) Other 3.7 6.1 Total $ 1,326.2 $ 1,027.2 Reconciliation of Non-GAAP Financial Measures (In Millions) Income (loss) from continuing operations, net of income taxes $ 131.0 $ (161.7) Depreciation, depletion and amortization 119.9 111.8 Asset retirement obligation expenses 14.6 13.1 Selling and administrative expenses related to debt restructuring - 14.3 Asset impairment 30.5 17.2 Change in deferred tax asset valuation allowance related to equity affiliates (5.2) 1.4 Interest income (2.7) (1.4) Interest expense 32.9 126.2 Reorganization items, net 41.4 - Unrealized gains on non-coal trading derivative contracts - (25.0) Income tax benefit (4.5) (65.8) Adjusted EBITDA (1) 357.9 30.1 Selling and administrative expenses for certain employee compensation programs related to the Chapter 11 Cases 4.5 - Restructuring charges - 12.1 Gain on UMWA VEBA settlement - (68.1) Corporate hedging results 27.6 111.0 Adjusted EBITDAR (2) $ 390.0 $ 85.1 Adjusted EBITDA (1) (In Millions) Powder River Basin Mining Operations $ 91.7 $ 73.8 Midwestern U.S. Mining Operations 50.0 60.6 Western U.S. Mining Operations 50.0 20.1 Total U.S. Mining Operations 191.7 154.5 Australian Metallurgical Mining Operations 109.6 (37.3) Australian Thermal Mining Operations 75.6 42.9 Total Australian Mining Operations 185.2 5.6 Trading and Brokerage Operations 25.4 (18.8) Other (44.4) (111.2) Adjusted EBITDA (1) $ 357.9 $ 30.1 (1) Adjusted EBITDA is a non-GAAP measure defined as income (loss) from continuing operations before deducting net interest expense, income taxes, asset retirement obligation expenses, depreciation, depletion and amortization and reorganization items, net. Adjusted EBITDA is also adjusted for the discrete items that management excluded in analyzing the segments' operating performance as displayed in the reconciliation. Adjusted EBITDA is used by management as one of the primary metrics to measure the Company’s operating performance. Management also believes non-GAAP performance measures are used by investors to measure the Company’s operating performance and lenders to measure the Company’s ability to incur and service debt. Adjusted EBITDA is not intended to serve as an alternative to U.S. GAAP measures of performance and may not be comparable to similarly-titled measures presented by other companies. (2) Adjusted EBITDAR is a non-GAAP measure defined as Adjusted EBITDA further adjusted to exclude the impact of certain employee compensation programs related to the Chapter 11 Cases, restructuring charges, the voluntary employee beneficiary association (VEBA) settlement with the United Mine Workers of America (UMWA) and corporate hedging. Adjusted EBITDAR is used by management as one of the primary metrics to measure the Company’s operating performance. Management also believes non-GAAP performance measures are used by investors to measure the Company’s operating performance and lenders to measure the Company’s ability to incur and service debt. Adjusted EBITDAR is not intended to serve as an alternative to U.S. GAAP measures of performance and may not be comparable to similarly-titled measures presented by other companies.