Exhibit 99.1

Investor Presentation
October 2017
1
Statement on Forward?Looking Information
This presentation contains forward?looking statements within the meaning of the securities laws. Forward?looking statements can be identified by the fact that they do not relate strictly to historical or current facts. They often include words or variations of words such as “expects,” “anticipates,” “intends,” “plans,” “believes,” “seeks,” “estimates,” “projects,” “forecasts,” “targets,” “would,” “will,” “should,” “goal,” “could” or “may” or other similar expressions. Forward?looking statements provide management’s current expectations or predictions of future conditions, events or results. All statements that address operating performance, events or developments that we expect or anticipate will occur in the future are forward?looking statements. They may include estimates of revenues, income, earnings per share, cost savings, capital expenditures, dividends, share repurchases, liquidity, capital structure, market share, industry volume, or other financial items, descriptions of management’s plans or objectives for future operations, or descriptions of assumptions underlying any of the above. All forward?looking statements speak only as of the date they are made and reflect the company’s good faith beliefs, assumptions and expectations, but they are not guarantees of future performance or events. Furthermore, the company disclaims any obligation to publicly update or revise any forward?looking statement, except as required by law. By their nature, forward?looking statements are subject to risks and uncertainties that could cause actual results to differ materially from those suggested by the forward?looking statements. Factors that might cause such differences include, but are not limited to, a variety of economic, competitive and regulatory factors, many of which are beyond the company’s control, that are described in our Annual Report on Form 10?K for the fiscal year ended Dec. 31, 2016, as amended on July 10, 2017 and Aug. 14, 2017, and in Exhibit 99.2 to the Company’s Current Report on Form 8?K filed with the SEC on April 11, 2017, as well as additional factors we may describe from time to time in other filings with the SEC. You may get such filings for free at our website at www.peabodyenergy.com. You should understand that it is not possible to predict or identify all such factors and, consequently, you should not consider any such list to be a complete set of all potential risks or uncertainties.
Adjusted EBITDA is a non?GAAP measure defined as income (loss) from continuing operations before deducting net interest expense, income taxes, asset retirement obligation expenses, depreciation, depletion and amortization and reorganization items, net. Adjusted EBITDA is also adjusted for the discrete items that management excluded in analyzing each of the segment’s operating performance as displayed in the reconciliation. Adjusted EBITDA is used by management as one of the primary metrics to measure the Company’s operating performance. Management also believes non?GAAP performance measures are used by investors to measure the Company’s operating performance and lenders to measure the Company’s ability to incur and service debt. Adjusted EBITDA is not intended to serve as an alternative to U.S. GAAP measures of performance and may not be comparable to similarly?titled measures presented by other companies.
2
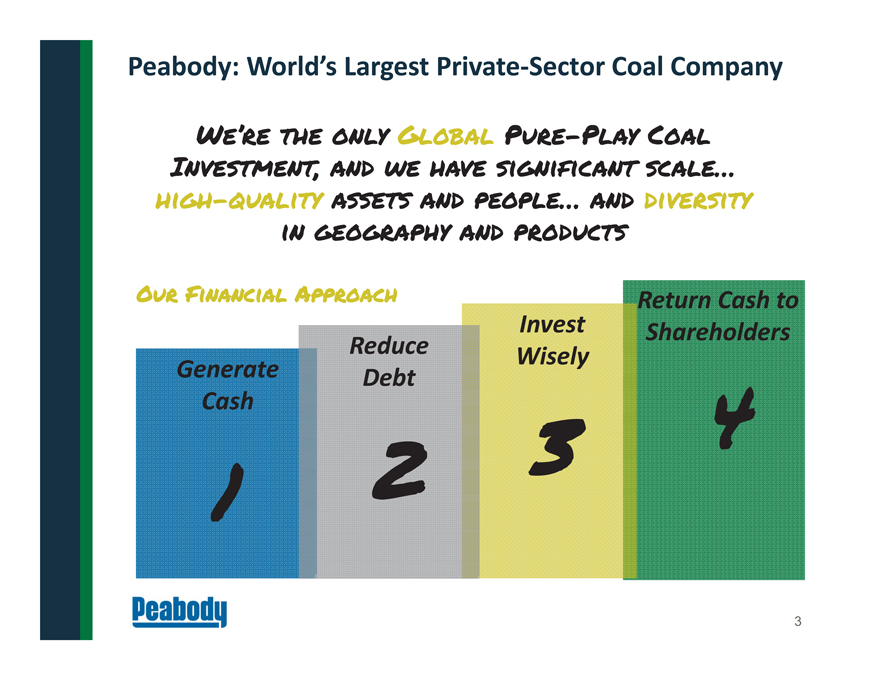
Peabody: World’s Largest Private?Sector Coal Company
We’re the only Global Pure-Play Coal Investment, and we have significant scale… high-quality assets and people… and diversity in geography and products
Our Financial Approach Return Cash to
Invest Shareholders Reduce Wisely Generate Debt Cash
1 2 3 4
3
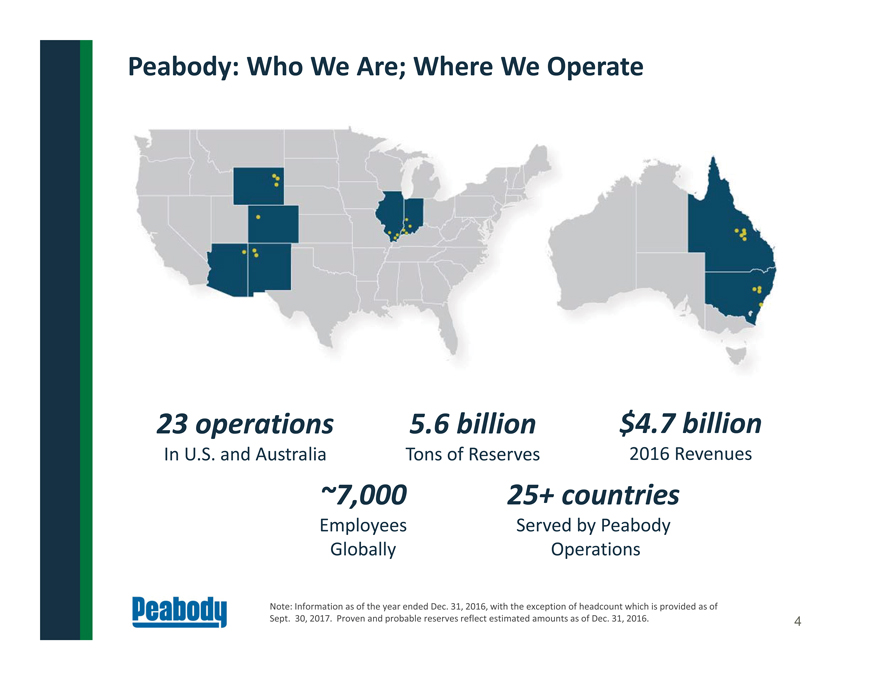
Peabody: Who We Are; Where We Operate
23 operations
In U.S. and Australia
~7,000
Employees Globally
5.6 billion
Tons of Reserves
$4.7 billion
2016 Revenues
25+ countries
Served by Peabody Operations
Note: Information as of the year ended Dec. 31, 2016, with the exception of headcount which is provided as of
Sept. 30, 2017. Proven and probable reserves reflect estimated amounts as of Dec. 31, 2016. 4
4
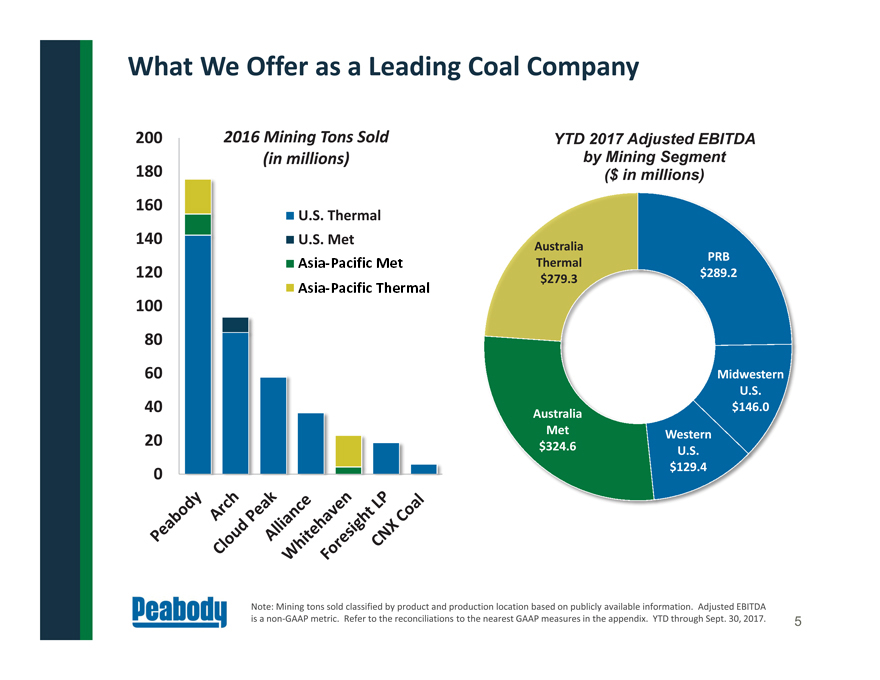
What We Offer as a Leading Coal Company
Note: Mining tons sold classified by product and production location based on publicly available information. Adjusted EBITDA
is a non?GAAP metric. Refer to the reconciliations to the nearest GAAP measures in the appendix. YTD through Sept. 30, 2017.
PRB
$289.2
Midwestern
U.S.
$146.0
Western
U.S.
$129.4
Australia
Met
$324.6
Australia
Thermal
$279.3
YTD 2017 Adjusted EBITDA
by Mining Segment
($ in millions)
0
20
40
60
80
100
120
140
160
180
200 2016 Mining Tons Sold
(in millions)
U.S. Thermal
U.S. Met
Asia-Pacific Met
Asia-Pacific Thermal
5
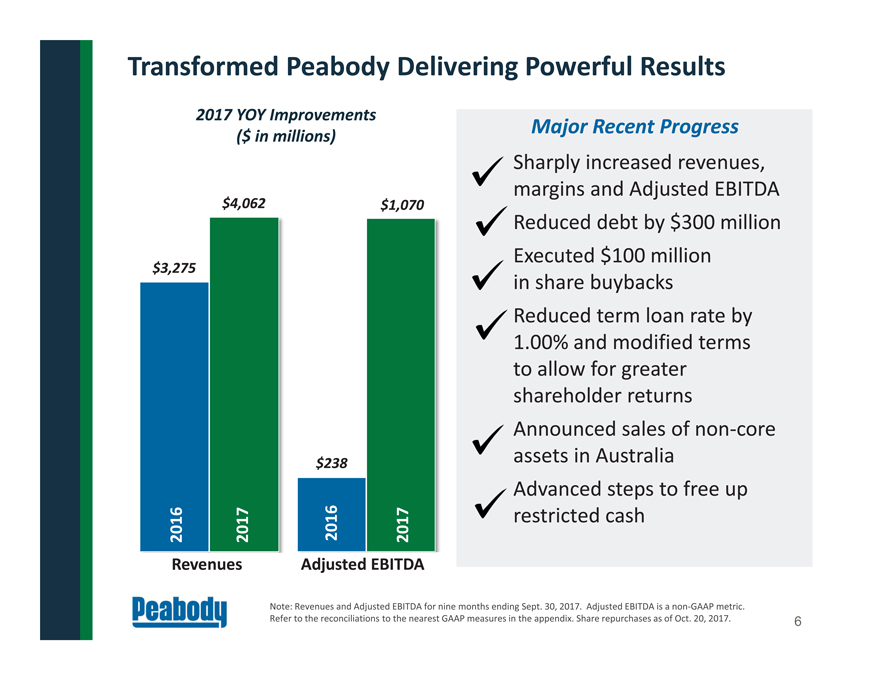
$238
Transformed Peabody Delivering Powerful Results
Note: Revenues and Adjusted EBITDA for nine months ending Sept. 30, 2017. Adjusted EBITDA is a non?GAAP metric.
Refer to the reconciliations to the nearest GAAP measures in the appendix. Share repurchases as of Oct. 20, 2017.
Sharply increased revenues,
margins and Adjusted EBITDA
Reduced debt by $300 million
Executed $100 million
in share buybacks
Reduced term loan rate by
1.00% and modified terms
to allow for greater
shareholder returns
Announced sales of non?core
assets in Australia
Advanced steps to free up
restricted cash
Major Recent Progress
$3,275
$4,062
2016
2017
2017 YOY Improvements
($ in millions)
Revenues Adjusted EBITDA
$1,070
2017
2016
6
Mining Operations
Operations at Peabody’s North Antelope Rochelle Mine in Wyoming
7
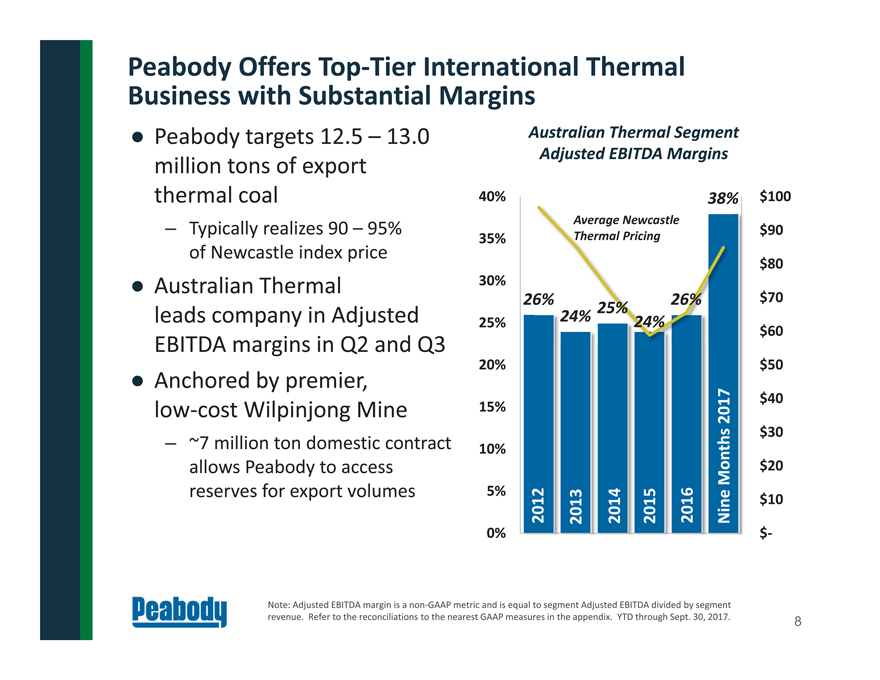
26% 24% 25% 24% 26% 38%
$- $10 $20 $30 $40
$50 $60 $70 $80 $90 $100 0% 5% 10% 15% 20% 25% 30% 35% 40%
Peabody Offers Top?Tier International Thermal
Business with Substantial Margins
| • | | Peabody targets 12.5 – 13.0 million tons of export thermal coal |
– Typically realizes 90 – 95% of Newcastle index price
| • | | Australian Thermal leads company in Adjusted EBITDA margins in Q2 and Q3 |
| • | | Anchored by premier, low-cost Wilpinjong Mine |
– ~7 million ton domestic contract
allows Peabody to access
reserves for export volumes
Australian Thermal Segment
Adjusted EBITDA Margins
2014
Nine Months 2017 Note: Adjusted EBITDA margin is a non?GAAP metric and is equal to segment Adjusted EBITDA divided by segment revenue. Refer to the reconciliations to the nearest GAAP measures in the appendix. YTD through Sept. 30, 2017.
2016 2012 2013 2015 Average Newcastle Thermal Pricing
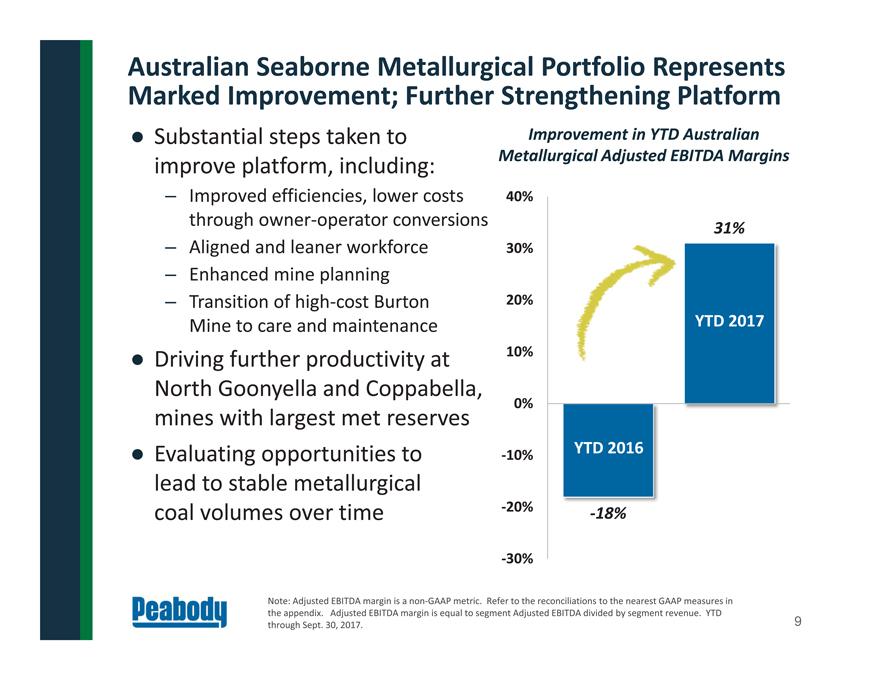
-18%
31%
30%
20%
10%
0%
10%
20%
30%
40%
Australian Seaborne Metallurgical Portfolio Represents
Marked Improvement; Further Strengthening Platform
Substantial steps taken to
improve platform, including:
– Improved efficiencies, lower costs
through owner?operator conversions
– Aligned and leaner workforce
– Enhanced mine planning
– Transition of high?cost Burton
Mine to care and maintenance
Driving further productivity at
North Goonyella and Coppabella,
mines with largest met reserves
Evaluating opportunities to
lead to stable metallurgical
coal volumes over time
Improvement in YTD Australian
Metallurgical Adjusted EBITDA Margins
YTD 2016
YTD 2017
Note: Adjusted EBITDA margin is a non?GAAP metric. Refer to the reconciliations to the nearest GAAP measures in
the appendix. Adjusted EBITDA margin is equal to segment Adjusted EBITDA divided by segment revenue. YTD
through Sept. 30, 2017.
9
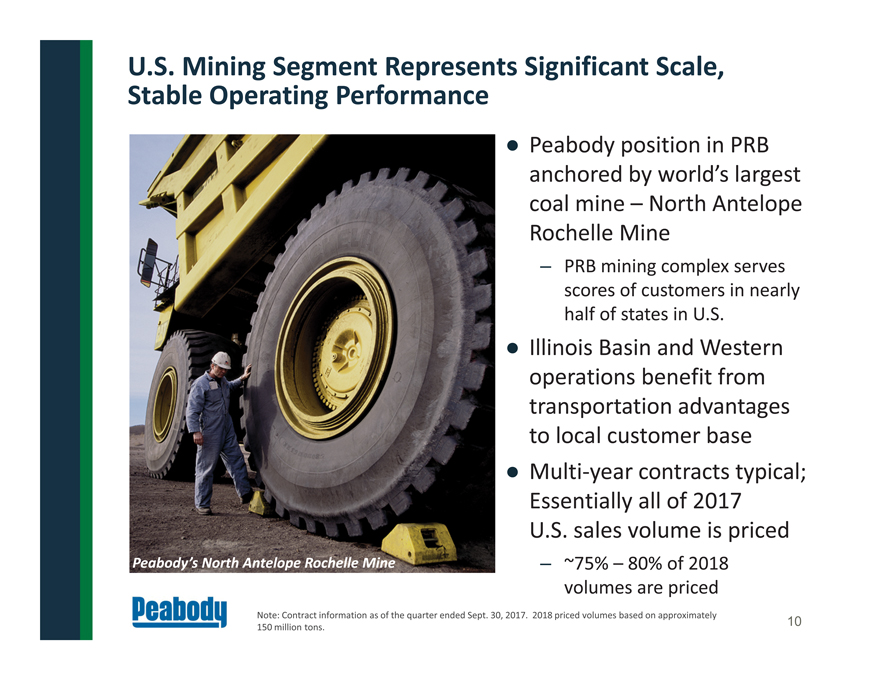
U.S. Mining Segment Represents Significant Scale,
Stable Operating Performance
Note: Contract information as of the quarter ended Sept. 30, 2017. 2018 priced volumes based on approximately
150 million tons.
Peabody position in PRB
anchored by world’s largest
coal mine – North Antelope
Rochelle Mine
– PRB mining complex serves
scores of customers in nearly
half of states in U.S.
Illinois Basin and Western
operations benefit from
transportation advantages
to local customer base
Multi?year contracts typical;
Essentially all of 2017
U.S. sales volume is priced
– ~75% – 80% of 2018
volumes are priced
Peabody’s North Antelope Rochelle Mine
10
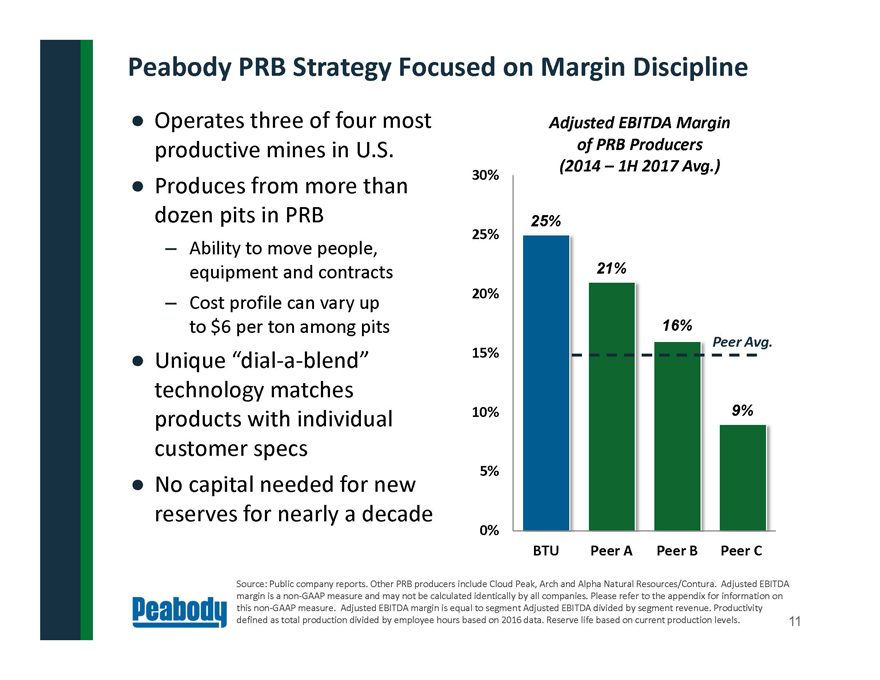
Peabody PRB Strategy Focused on Margin Discipline
25%
21%
16%
9%
0%
5%
10%
15%
20%
25%
30%
BTU Peer A Peer B Peer C
Adjusted EBITDA Margin
of PRB Producers
(2014 – 1H 2017 Avg.)
Operates three of four most
productive mines in U.S.
Produces from more than
dozen pits in PRB
– Ability to move people,
equipment and contracts
– Cost profile can vary up
to $6 per ton among pits
Unique “dial-a-blend”
technology matches
products with individual
customer specs
No capital needed for new
reserves for nearly a decade
Peer Avg.
Source: Public company reports. Other PRB producers include Cloud Peak, Arch and Alpha Natural Resources/Contura. Adjusted EBITDA
margin is a non-GAAP measure and may not be calculated identically by all companies. Please refer to the appendix for information on
this non-GAAP measure. Adjusted EBITDA margin is equal to segment Adjusted EBITDA divided by segment revenue. Productivity
defined as total production divided by employee hours based on 2016 data. Reserve life based on current production levels. 11
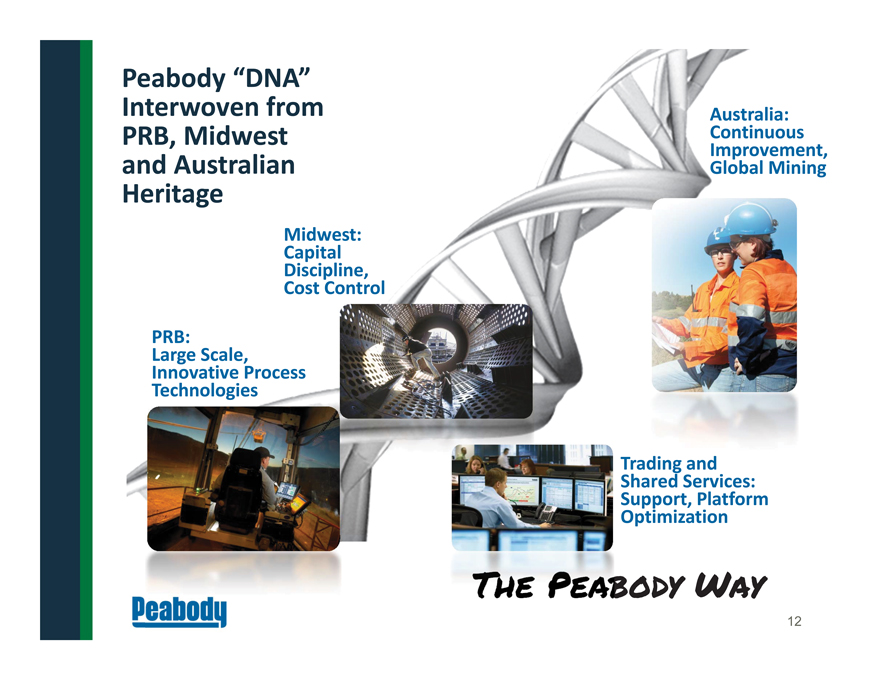
Peabody “DNA”
Interwoven from
PRB, Midwest
and Australian
Heritage
PRB:
Large Scale,
Innovative Process
Technologies
Australia:
Continuous
Improvement,
Global Mining
The Peabody Way
Midwest:
Capital
Discipline,
Cost Control
Trading and
Shared Services:
Support, Platform
Optimization
12
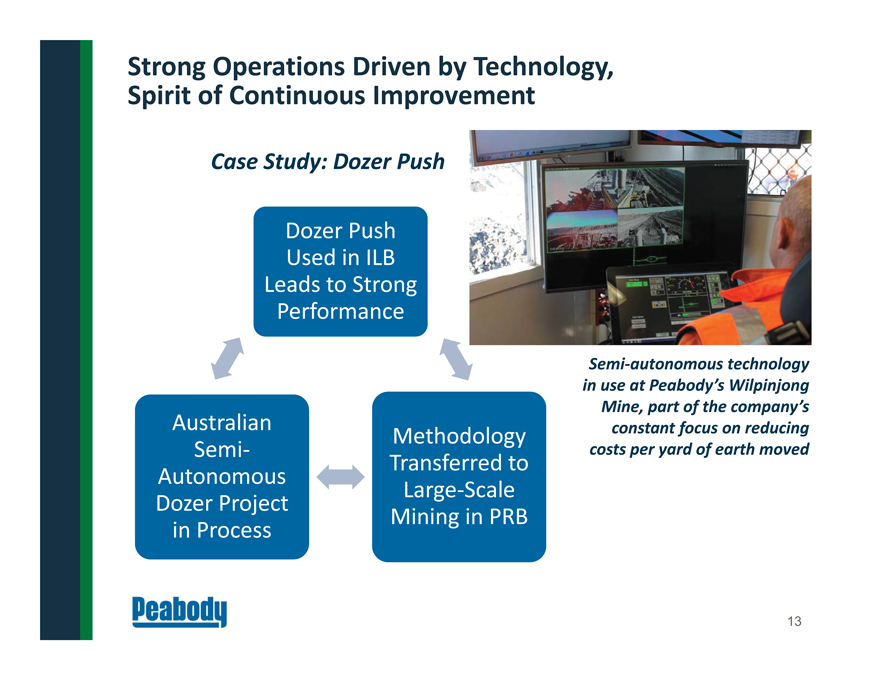
Strong Operations Driven by Technology,
Spirit of Continuous Improvement
Dozer Push
Used in ILB
Leads to Strong
Performance
Methodology
Transferred to
Large?Scale
Mining in PRB
Australian
Semi?
Autonomous
Dozer Project
in Process
Case Study: Dozer Push
Semi?autonomous technology
in use at Peabody’s Wilpinjong
Mine, part of the company’s
constant focus on reducing
costs per yard of earth moved
13
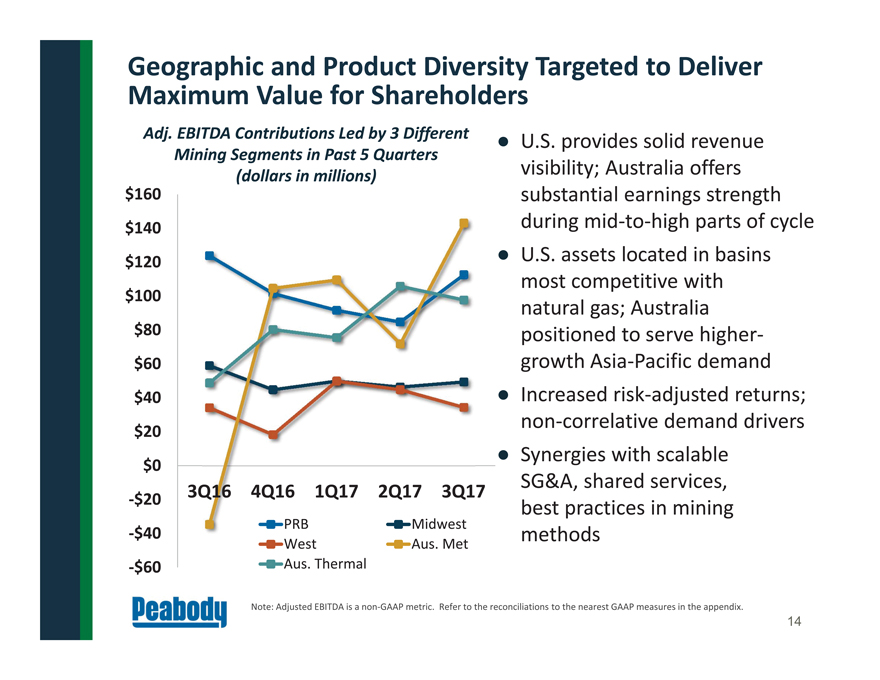
Geographic and Product Diversity Targeted to Deliver
Maximum Value for Shareholders
Note: Adjusted EBITDA is a non?GAAP metric. Refer to the reconciliations to the nearest GAAP measures in the appendix.
| • | | U.S. provides solid revenue |
visibility; Australia offers
substantial earnings strength
during mid-to-high parts of cycle
| • | | U.S. assets located in basins |
most competitive with
natural gas; Australia
positioned to serve highergrowth
Asia-Pacific demand
| • | | Increased risk-adjusted returns; |
non-correlative demand drivers
| • | | Synergies with scalable |
SG&A, shared services,
best practices in mining
methods
Adj. EBITDA Contributions Led by 3 Different
Mining Segments in Past 5 Quarters
(dollars in millions)
$60
$40
$20
$0
$20
$40
$60
$80
$100
$120
$140
$160
3Q16 4Q16 1Q17 2Q17 3Q17
PRB Midwest
West Aus. Met
Aus. Thermal
14
Industry Fundamentals
Coal railed from Peabody’s El Segundo Mine in New Mexico
15
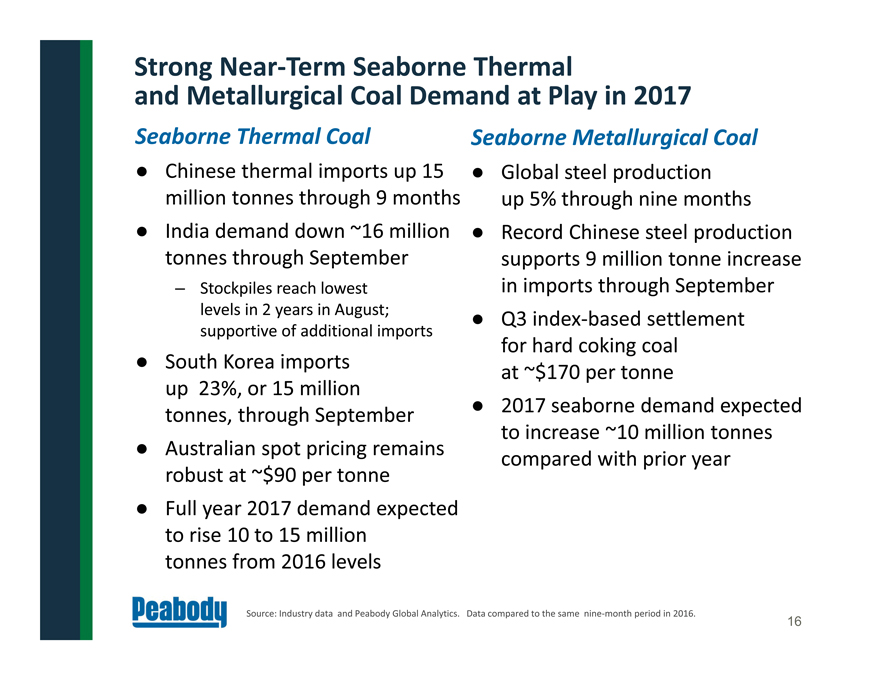
Seaborne Thermal Coal
| • | | Chinese thermal imports up 15 |
million tonnes through 9 months
| • | | India demand down ~16 million |
tonnes through September
– Stockpiles reach lowest
levels in 2 years in August;
supportive of additional imports
up 23%, or 15 million
tonnes, through September
| • | | Australian spot pricing remains |
robust at ~$90 per tonne
| • | | Full year 2017 demand expected |
to rise 10 to 15 million
tonnes from 2016 levels
Strong Near-Term Seaborne Thermal
and Metallurgical Coal Demand at Play in 2017
Source: Industry data and Peabody Global Analytics. Data compared to the same nine-month period in 2016.
Seaborne Metallurgical Coal
| • | | Global steel production |
up 5% through nine months
| • | | Record Chinese steel production |
supports 9 million tonne increase
in imports through September
| • | | Q3 index-based settlement |
for hard coking coal
at ~$170 per tonne
| • | | 2017 seaborne demand expected |
to increase ~10 million tonnes
compared with prior year
16
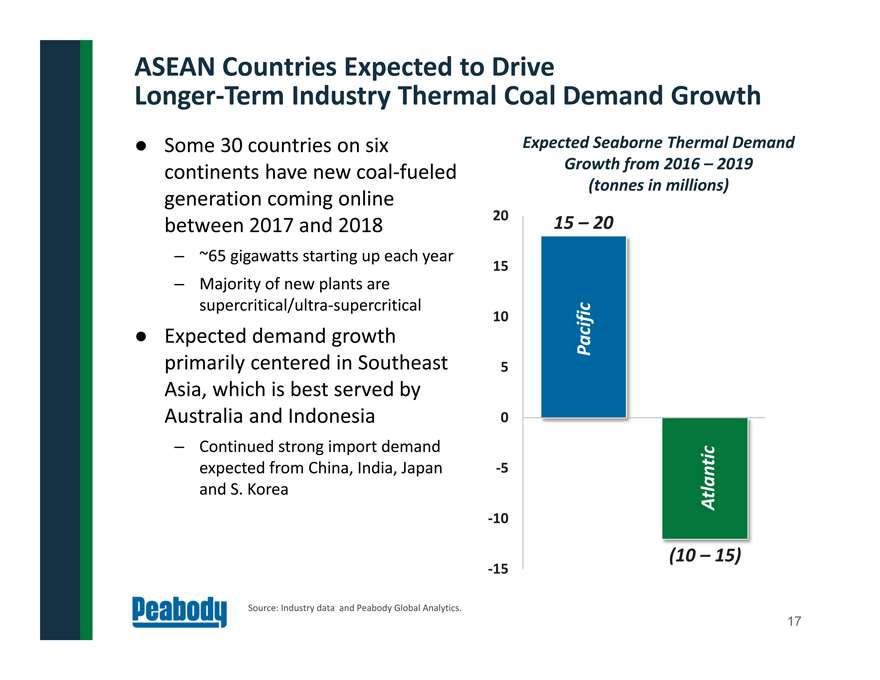
ASEAN Countries Expected to Drive
Longer-Term Industry Thermal Coal Demand Growth
Source: Industry data and Peabody Global Analytics.
| • | | Some 30 countries on six |
continents have new coal?fueled
generation coming online
between 2017 and 2018
– ~65 gigawatts starting up each year
– Majority of new plants are
supercritical/ultra-supercritical
primarily centered in Southeast
Asia, which is best served by
Australia and Indonesia
– Continued strong import demand
expected from China, India, Japan
and S. Korea
15
10
5
0
10
15
20
Atlantic
Pacific
Expected Seaborne Thermal Demand
Growth from 2016 – 2019
(tonnes in millions)
15 – 20
(10 – 15)
17
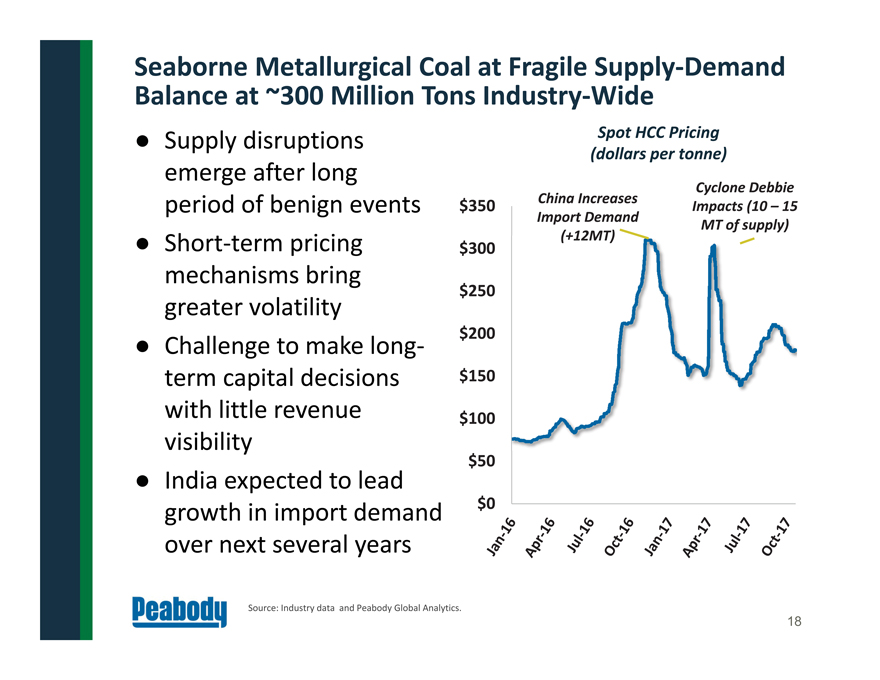
Seaborne Metallurgical Coal at Fragile Supply?Demand
Balance at ~300 Million Tons Industry?Wide
Source: Industry data and Peabody Global Analytics.
emerge after long
period of benign events
mechanisms bring
greater volatility
| • | | Challenge to make longterm |
capital decisions
with little revenue
visibility
growth in import demand
over next several years
$0
$50
$100
$150
$200
$250
$300
$350
Spot HCC Pricing
(dollars per tonne)
China Increases
Import Demand
(+12MT)
Cyclone Debbie
Impacts (10 – 15
MT of supply)
18
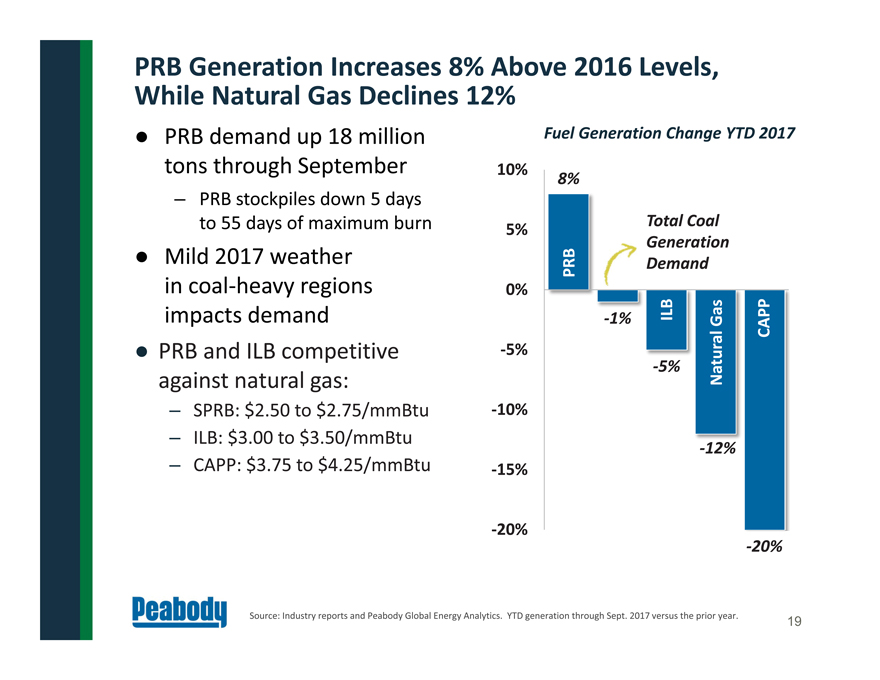
8%
1%
5%
12%
20%
20%
15%
10%
5%
0%
5%
10%
| • | | PRB demand up 18 million |
tons through September
– PRB stockpiles down 5 days
to 55 days of maximum burn
in coal-heavy regions
impacts demand
| • | | PRB and ILB competitive |
against natural gas:
– SPRB: $2.50 to $2.75/mmBtu
– ILB: $3.00 to $3.50/mmBtu
– CAPP: $3.75 to $4.25/mmBtu
PRB Generation Increases 8% Above 2016 Levels,
While Natural Gas Declines 12%
Fuel Generation Change YTD 2017
Source: Industry reports and Peabody Global Energy Analytics. YTD generation through Sept. 2017 versus the prior year.
PRB
ILB
CAPP
Total Coal
Generation
Demand
Natural Gas
19
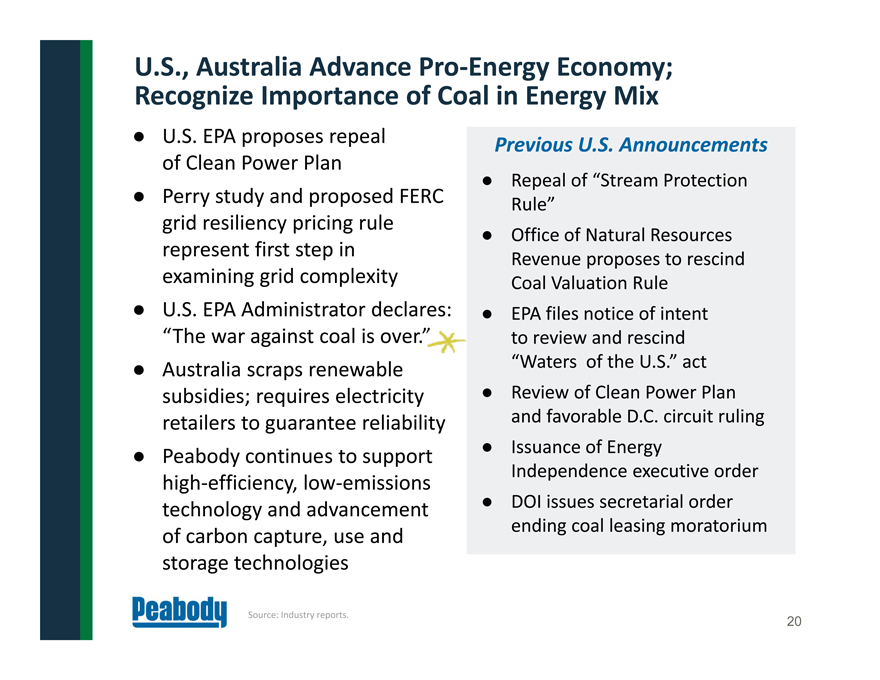
U.S., Australia Advance Pro-Energy Economy; Recognize Importance of Coal in Energy Mix
| • | | U.S. EPA proposes repeal of Clean Power Plan |
| • | | Perry study and proposed FERC grid resiliency pricing rule represent first step in examining grid complexity |
| • | | U.S. EPA Administrator declares: “The war against coal is over.” |
| • | | Australia scraps renewable subsidies; requires electricity retailers to guarantee reliability |
| • | | Peabody continues to support high-efficiency, low-emissions technology and advancement of carbon capture, use and storage technologies Previous U.S. Announcements |
| • | | Repeal of “Stream Protection Rule” Office of Natural Resources Revenue proposes to rescind Coal Valuation Rule |
| • | | EPA files notice of intent to review and rescind “Waters of the U.S.” act |
| • | | Review of Clean Power Plan and favorable D.C. circuit ruling |
| • | | Issuance of Energy Independence executive order |
| • | | DOI issues secretarial order ending coal leasing moratorium |
Source: Industry reports. 20
Financial Approach
21
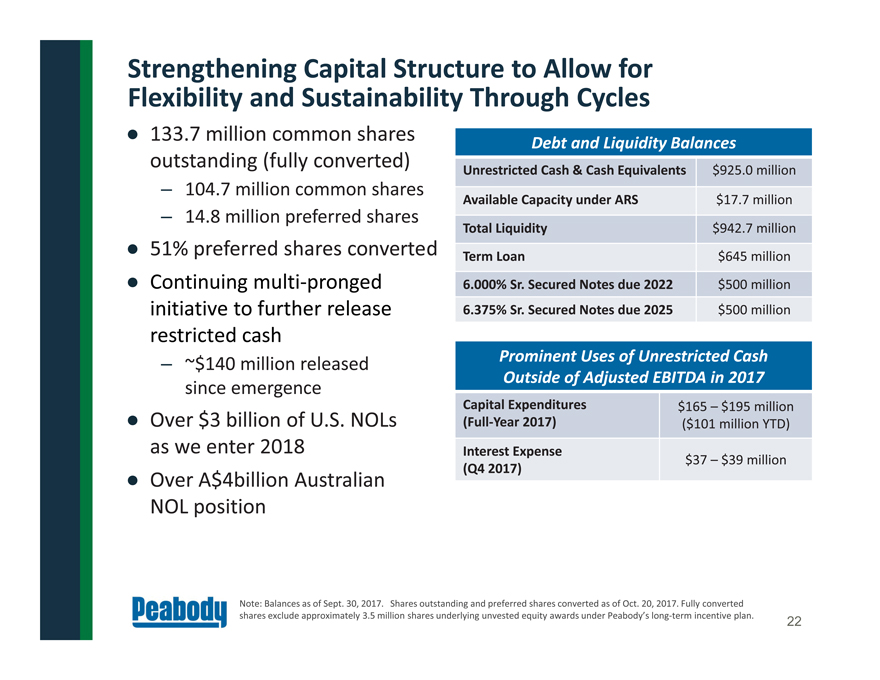
Strengthening Capital Structure to Allow for
Flexibility and Sustainability Through Cycles
| • | | 133.7 million common shares |
outstanding (fully converted)
– 104.7 million common shares
– 14.8 million preferred shares
| • | | 51% preferred shares converted |
| • | | Continuing multi-pronged |
initiative to further release
restricted cash
– ~$140 million released
since emergence
| • | | Over $3 billion of U.S. NOLs |
as we enter 2018
| • | | Over A$4billion Australian |
NOL position
Note: Balances as of Sept. 30, 2017. Shares outstanding and preferred shares converted as of Oct. 20, 2017. Fully converted
shares exclude approximately 3.5 million shares underlying unvested equity awards under Peabody’s long-term incentive plan.
Share Repurchases
Debt Repayment
Debt and Liquidity Balances
Unrestricted Cash & Cash Equivalents $925.0 million
Available Capacity under ARS $17.7 million
Total Liquidity $942.7 million
Term Loan $645 million
6.000% Sr. Secured Notes due 2022 $500 million
6.375% Sr. Secured Notes due 2025 $500 million
Prominent Uses of Unrestricted Cash
Outside of Adjusted EBITDA in 2017
Capital Expenditures
(Full-Year 2017)
$165 – $195 million
($101 million YTD)
Interest Expense
(Q4 2017) $37 – $39 million
22
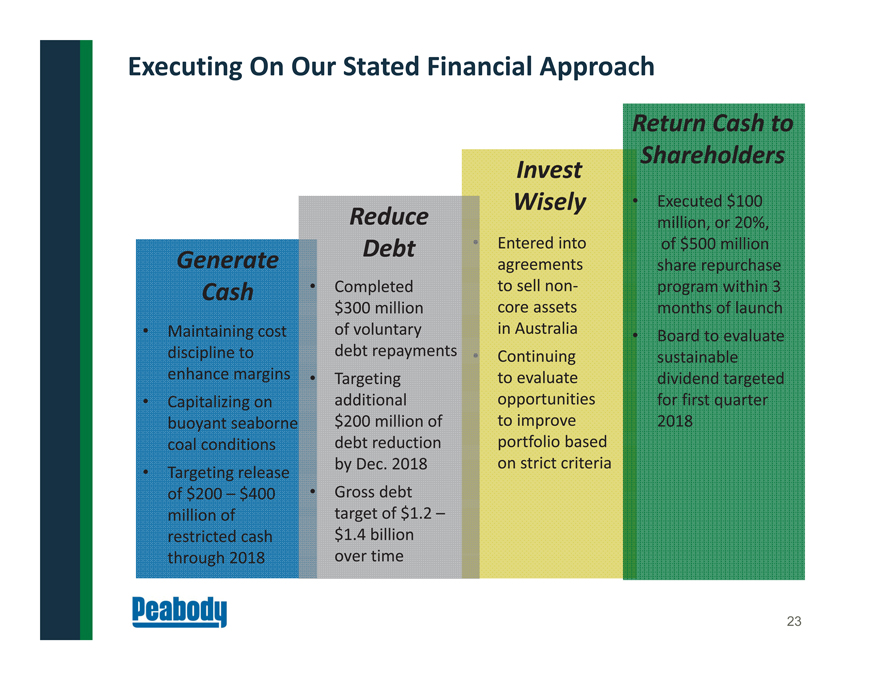
| • | | Entered into agreements to sell noncore assets in Australia |
| • | | Continuing to evaluate opportunities to improve portfolio based on strict criteria Executing On Our Stated Financial Approach Generate Cash Invest Wisely Return Cash to Shareholders Reduce Debt |
| • | | Maintaining cost discipline to enhance margins |
| • | | Capitalizing on buoyant seaborne coal conditions |
| • | | Targeting release of $200 – $400 million of restricted cash through 2018 |
| • | | Completed $300 million of voluntary debt repayments |
| • | | Targeting additional $200 million of debt reduction by Dec. 2018 |
| • | | Gross debt target of $1.2 – $1.4 billion over time |
| • | | Executed $100 million, or 20%, |
of $500 million share repurchase program within 3 months of launch
| • | | Board to evaluate sustainable dividend targeted for first quarter 2018 |
23
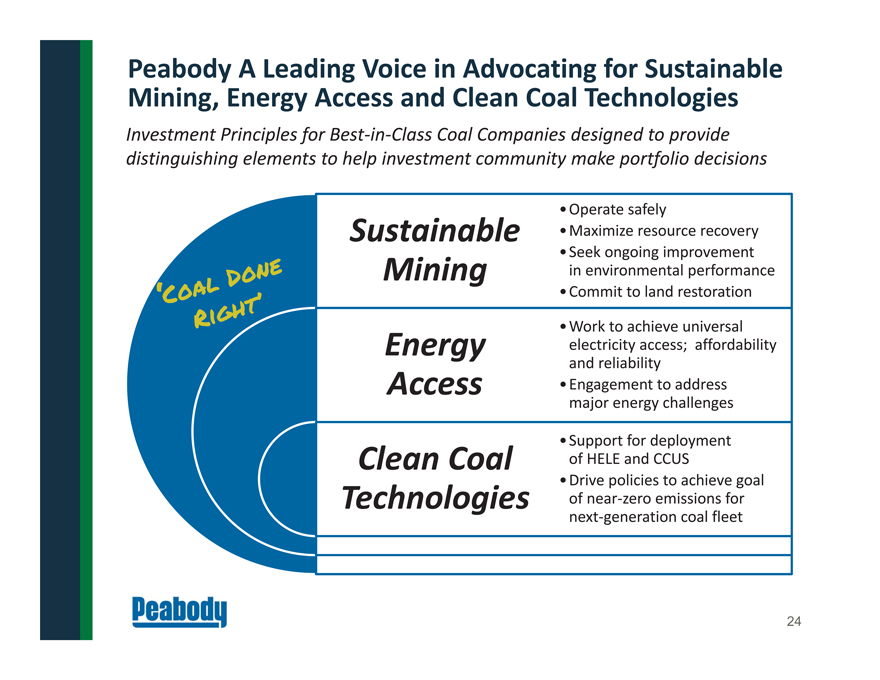
Peabody A Leading Voice in Advocating for Sustainable
Mining, Energy Access and Clean Coal Technologies
Sustainable
Mining
Energy
Access
Clean Coal
Technologies
| • | | Maximize resource recovery |
| • | | Seek ongoing improvement |
in environmental performance
| • | | Commit to land restoration |
| • | | Work to achieve universal |
electricity access; affordability
and reliability
major energy challenges
of HELE and CCUS
| • | | Drive policies to achieve goal |
of near?zero emissions for
next?generation coal fleet
Investment Principles for Best?in?Class Coal Companies designed to provide
distinguishing elements to help investment community make portfolio decisions
24
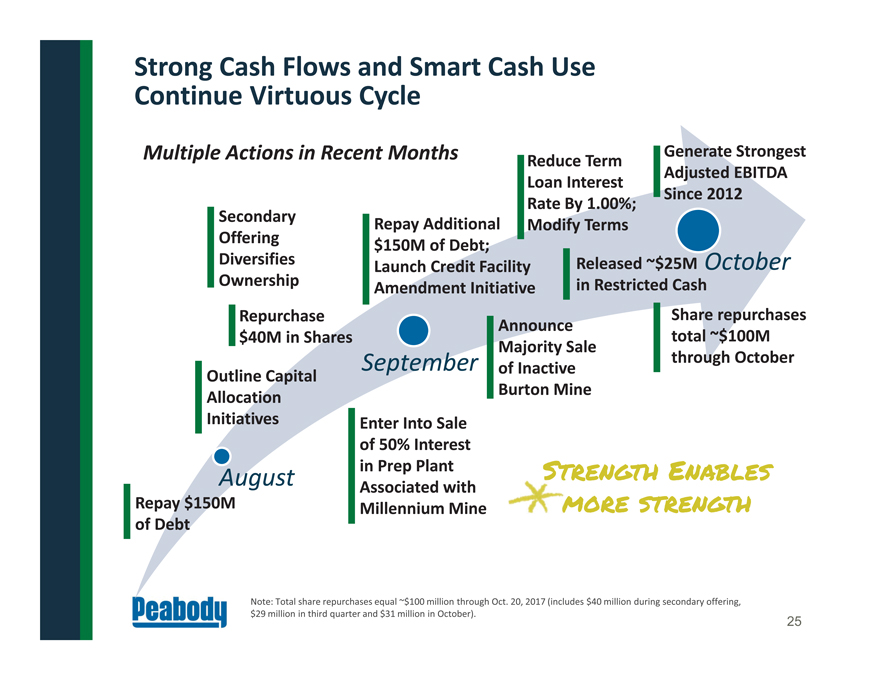
Strong Cash Flows and Smart Cash Use
Continue Virtuous Cycle
August
September
October
Outline Capital
Allocation
Initiatives
Repurchase
$40M in Shares
Repay $150M
of Debt
Repay Additional
$150M of Debt;
Launch Credit Facility
Amendment Initiative
Reduce Term
Loan Interest
Rate By 1.00%;
Modify Terms
Announce
Majority Sale
of Inactive
Burton Mine
Share repurchases
total ~$100M
through October
Enter Into Sale
of 50% Interest
in Prep Plant
Associated with
Millennium Mine
Released ~$25M
in Restricted Cash
Generate Strongest
Adjusted EBITDA
Since 2012
Note: Total share repurchases equal ~$100 million through Oct. 20, 2017 (includes $40 million during secondary offering,
$29 million in third quarter and $31 million in October).
Strength Enables
more strength
Secondary
Offering
Diversifies
Ownership
Multiple Actions in Recent Months
25
APPENDIX
26
Appendix: 2017 Targets
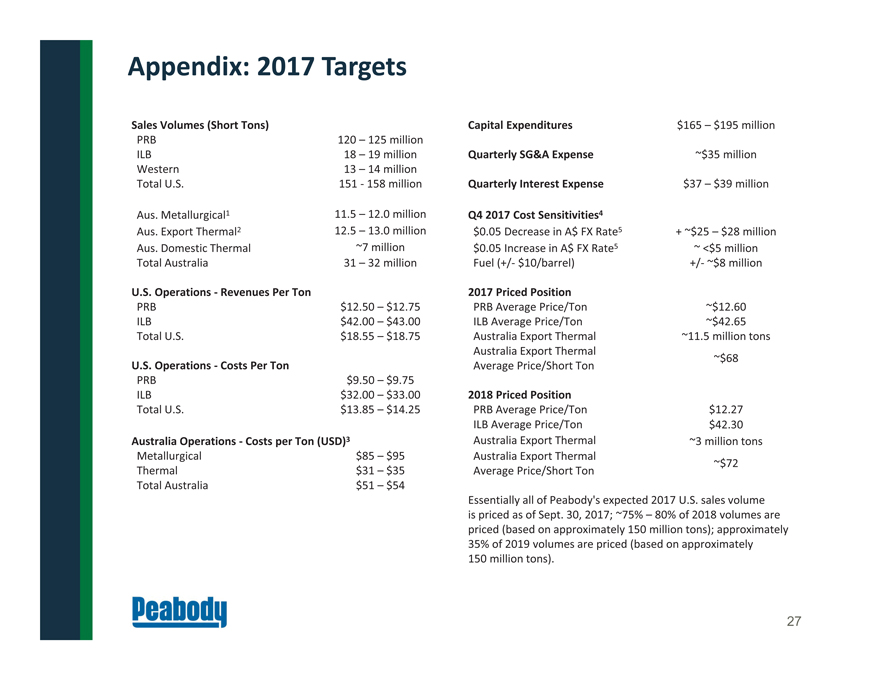
Sales Volumes (Short Tons) Capital Expenditures $165 – $195 million
PRB 120 – 125 million
ILB 18 – 19 million Quarterly SG&A Expense ~$35 million
Western 13 – 14 million
Total U.S. 151 - 158 million Quarterly Interest Expense $37 – $39 million
Aus. Metallurgical1 11.5 – 12.0 million Q4 2017 Cost Sensitivities4
Aus. Export Thermal2 12.5 – 13.0 million $0.05 Decrease in A$ FX Rate5 + ~$25 – $28 million
Aus. Domestic Thermal ~7 million $0.05 Increase in A$ FX Rate5 ~ <$5 million
Total Australia 31 – 32 million Fuel (+/- $10/barrel) +/- ~$8 million
U.S. Operations - Revenues Per Ton 2017 Priced Position
PRB $12.50 – $12.75 PRB Average Price/Ton ~$12.60
ILB $42.00 – $43.00 ILB Average Price/Ton ~$42.65
Total U.S. $18.55 – $18.75 Australia Export Thermal ~11.5 million tons
Australia Export Thermal
U.S. Operations ? Costs Per Ton Average Price/Short Ton ~$68
PRB $9.50 – $9.75
ILB $32.00 – $33.00 2018 Priced Position
Total U.S. $13.85 – $14.25 PRB Average Price/Ton $12.27
ILB Average Price/Ton $42.30
Australia Operations - Costs per Ton (USD)3 Australia Export Thermal ~3 million tons
Metallurgical $85 – $95 Australia Export Thermal
Thermal $31 – $35 Average Price/Short Ton ~$72
Total Australia $51 – $54
Essentially all of Peabody’s expected 2017 U.S. sales volume
is priced as of Sept. 30, 2017; ~75% – 80% of 2018 volumes are
priced (based on approximately 150 million tons); approximately
35% of 2019 volumes are priced (based on approximately
150 million tons).
27
Appendix: 2017 Targets
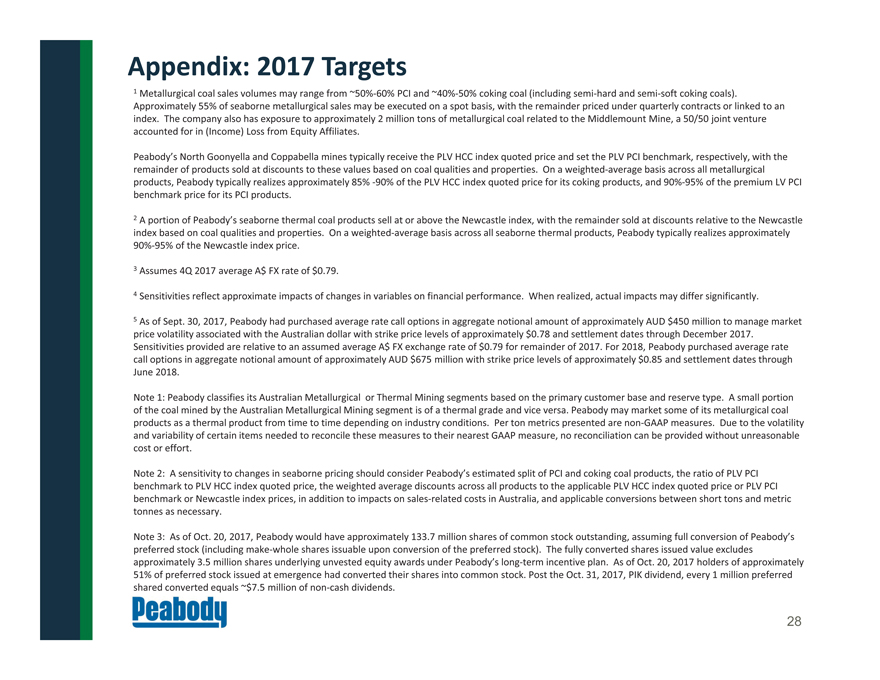
1 Metallurgical coal sales volumes may range from ~50%?60% PCI and ~40%?50% coking coal (including semi?hard and semi?soft coking coals). Approximately 55% of seaborne metallurgical sales may be executed on a spot basis, with the remainder priced under quarterly contracts or linked to an index. The company also has exposure to approximately 2 million tons of metallurgical coal related to the Middlemount Mine, a 50/50 joint venture accounted for in (Income) Loss from Equity Affiliates.
Peabody’s North Goonyella and Coppabella mines typically receive the PLV HCC index quoted price and set the PLV PCI benchmark, respectively, with the remainder of products sold at discounts to these values based on coal qualities and properties. On a weighted-average basis across all metallurgical
products, Peabody typically realizes approximately 85% -90% of the PLV HCC index quoted price for its coking products, and 90%-95% of the premium LV PCI benchmark price for its PCI products.
2 A portion of Peabody’s seaborne thermal coal products sell at or above the Newcastle index, with the remainder sold at discounts relative to the Newcastle index based on coal qualities and properties. On a weighted-average basis across all seaborne thermal products, Peabody typically realizes approximately
90%-95% of the Newcastle index price.
3 Assumes 4Q 2017 average A$ FX rate of $0.79.
4 Sensitivities reflect approximate impacts of changes in variables on financial performance. When realized, actual impacts may differ significantly.
5 As of Sept. 30, 2017, Peabody had purchased average rate call options in aggregate notional amount of approximately AUD $450 million to manage market
price volatility associated with the Australian dollar with strike price levels of approximately $0.78 and settlement dates through December 2017.
Sensitivities provided are relative to an assumed average A$ FX exchange rate of $0.79 for remainder of 2017. For 2018, Peabody purchased average rate call options in aggregate notional amount of approximately AUD $675 million with strike price levels of approximately $0.85 and settlement dates through
June 2018.
Note 1: Peabody classifies its Australian Metallurgical or Thermal Mining segments based on the primary customer base and reserve type. A small portion of the coal mined by the Australian Metallurgical Mining segment is of a thermal grade and vice versa. Peabody may market some of its metallurgical coal products as a thermal product from time to time depending on industry conditions. Per ton metrics presented are non-GAAP measures. Due to the volatility and variability of certain items needed to reconcile these measures to their nearest GAAP measure, no reconciliation can be provided without unreasonable cost or effort.
Note 2: A sensitivity to changes in seaborne pricing should consider Peabody’s estimated split of PCI and coking coal products, the ratio of PLV PCI
benchmark to PLV HCC index quoted price, the weighted average discounts across all products to the applicable PLV HCC index quoted price or PLV PCI benchmark or Newcastle index prices, in addition to impacts on sales-related costs in Australia, and applicable conversions between short tons and metric tonnes as necessary.
Note 3: As of Oct. 20, 2017, Peabody would have approximately 133.7 million shares of common stock outstanding, assuming full conversion of Peabody’s preferred stock (including make?whole shares issuable upon conversion of the preferred stock). The fully converted shares issued value excludes approximately 3.5 million shares underlying unvested equity awards under Peabody’s long-term incentive plan. As of Oct. 20, 2017 holders of approximately 51% of preferred stock issued at emergence had converted their shares into common stock. Post the Oct. 31, 2017, PIK dividend, every 1 million preferred shared converted equals ~$7.5 million of non-cash dividends.
28
Appendix: Reconciliation of Non?GAAP Measures
2017 2016 2016
Successor Predecessor Successor Predecessor Predecessor
April 2 through January 1 through Nine Months Ended
September 30 April 1 September 30
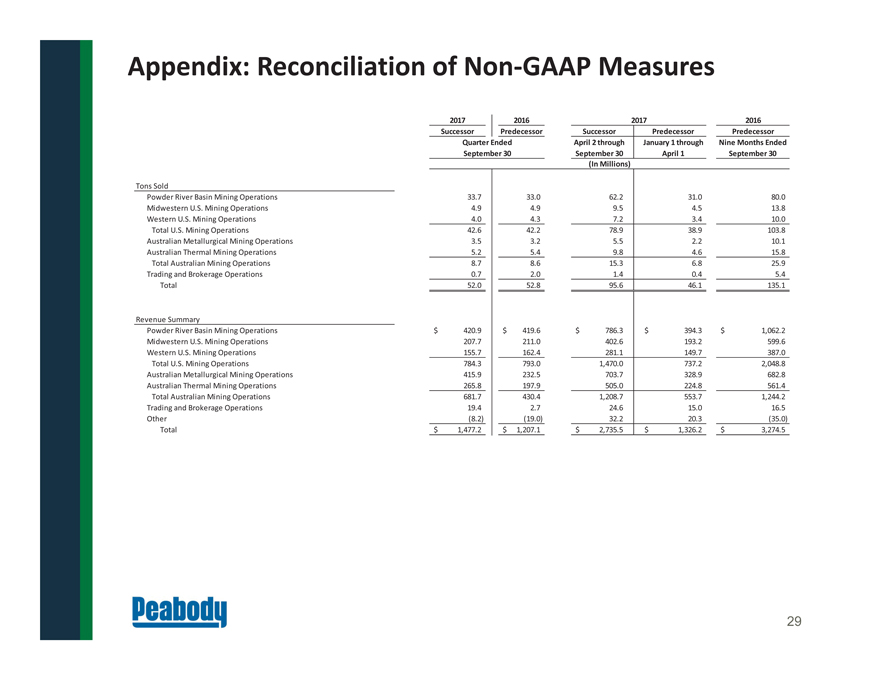
Powder River Basin Mining Operations 33.7 33.0 62.2 31.0 80.0
Midwestern U.S. Mining Operations 4.9 4.9 9.5 4.5 13.8
Western U.S. Mining Operations 4.0 4.3 7.2 3.4 10.0
Total U.S. Mining Operations 42.6 42.2 78.9 38.9 103.8
Australian Metallurgical Mining Operations 3.5 3.2 5.5 2.2 10.1
Australian Thermal Mining Operations 5.2 5.4 9.8 4.6 15.8
Total Australian Mining Operations 8.7 8.6 15.3 6.8 25.9
Trading and Brokerage Operations 0.7 2.0 1.4 0.4 5.4
Total 52.0 52.8 95.6 46.1 135.1
Powder River Basin Mining Operations $ 420.9 $ 419.6 $ 786.3 $ 394.3 $ 1,062.2
Midwestern U.S. Mining Operations 207.7 211.0 402.6 193.2 599.6
Western U.S. Mining Operations 155.7 162.4 281.1 149.7 387.0
Total U.S. Mining Operations 784.3 793.0 1,470.0 737.2 2,048.8
Australian Metallurgical Mining Operations 415.9 232.5 703.7 328.9 682.8
Australian Thermal Mining Operations 265.8 197.9 505.0 224.8 561.4
Total Australian Mining Operations 681.7 430.4 1,208.7 553.7 1,244.2
Trading and Brokerage Operations 19.4 2.7 24.6 15.0 16.5
Other (8.2) (19.0) 32.2 20.3 (35.0)
Total $ 1,477.2 $ 1,207.1 $ 2,735.5 $ 1,326.2 $ 3,274.5
Tons Sold
2017
(In Millions)
Quarter Ended
September 30
Revenue Summary
29
Appendix: Reconciliation of Non-GAAP Measures
2017 2016 2016
Successor Predecessor Successor Predecessor Predecessor
April 2 through January 1 through Nine Months Ended
September 30 April 1 September 30
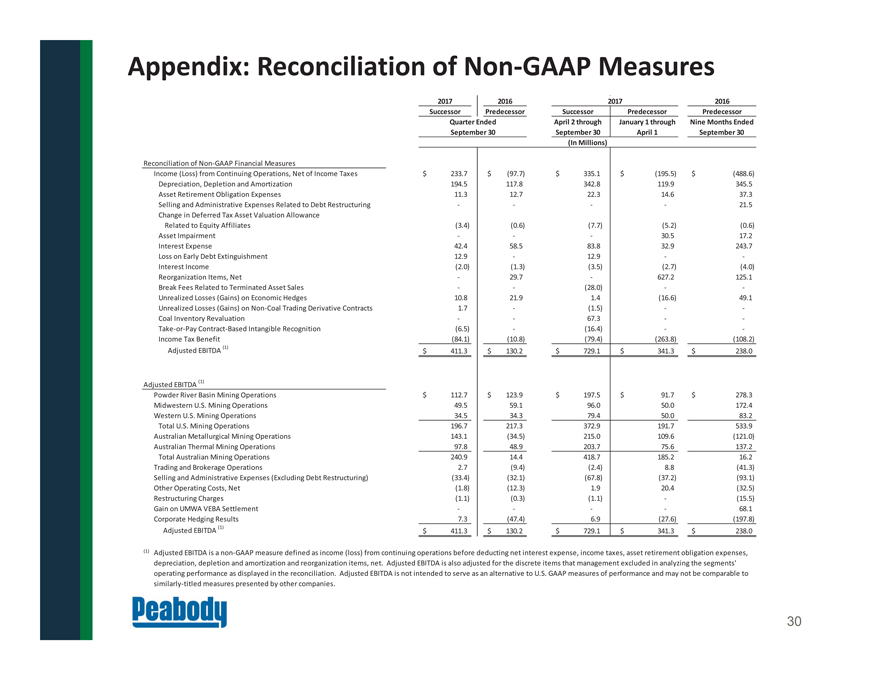
Income (Loss) from Continuing Operations, Net of Income Taxes $ 233.7 $ (97.7) $ 335.1 $ (195.5) $ (488.6)
Depreciation, Depletion and Amortization 1 94.5 117.8 342.8 119.9 345.5
Asset Retirement Obligation Expenses 11.3 12.7 22.3 14.6 37.3
Selling and Administrative Expenses Related to Debt Restructuring - - - - 21.5
Change in Deferred Tax Asset Valuation Allowance
Related to Equity Affiliates ( 3.4) (0.6) (7.7) (5.2) (0.6)
Asset Impairment - - - 30.5 17.2
Interest Expense 42.4 58.5 83.8 32.9 243.7
Loss on Early Debt Extinguishment 12.9 - 12.9 - -
Interest Income (2.0) (1.3) (3.5) (2.7) (4.0)
Reorganization Items, Net - 29.7 - 627.2 125.1
Break Fees Related to Terminated Asset Sales ? ? (28.0) ? ?
Unrealized Losses (Gains) on Economic Hedges 10.8 21.9 1.4 (16.6) 49.1
Unrealized Losses (Gains) on Non-Coal Trading Derivative Contracts 1.7 - (1.5) - -
Coal Inventory Revaluation - - 67.3 - -
Take-or-Pay Contract?Based Intangible Recognition ( 6.5) - (16.4) - -
Income Tax Benefit (84.1) (10.8) (79.4) (263.8) (108.2)
Adjusted EBITDA (1) $ 411.3 $ 130.2 $ 729.1 $ 341.3 $ 238.0
Powder River Basin Mining Operations $ 112.7 $ 123.9 $ 197.5 $ 91.7 $ 278.3
Midwestern U.S. Mining Operations 49.5 59.1 96.0 50.0 172.4
Western U.S. Mining Operations 34.5 34.3 79.4 50.0 83.2
Total U.S. Mining Operations 196.7 217.3 372.9 191.7 533.9
Australian Metallurgical Mining Operations 143.1 (34.5) 215.0 109.6 (121.0)
Australian Thermal Mining Operations 97.8 48.9 203.7 75.6 137.2
Total Australian Mining Operations 240.9 14.4 418.7 185.2 16.2
Trading and Brokerage Operations 2.7 (9.4) (2.4) 8.8 (41.3)
Selling and Administrative Expenses (Excluding Debt Restructuring) (33.4) (32.1) (67.8) (37.2) (93.1)
Other Operating Costs, Net (1.8) (12.3) 1.9 20.4 (32.5)
Restructuring Charges (1.1) (0.3) (1.1) - (15.5)
Gain on UMWA VEBA Settlement - - - - 68.1
Corporate Hedging Results 7.3 (47.4) 6.9 (27.6) (197.8)
Adjusted EBITDA (1) $ 411.3 $ 130.2 $ 729.1 $ 341.3 $ 238.0
(1) Adjusted EBITDA is a non-GAAP measure defined as income (loss) from continuing operations before deducting net interest expense, income taxes, asset retirement obligation expenses,
depreciation, depletion and amortization and reorganization items, net. Adjusted EBITDA is also adjusted for the discrete items that management excluded in analyzing the segments’
operating performance as displayed in the reconciliation. Adjusted EBITDA is not intended to serve as an alternative to U.S. GAAP measures of performance and may not be comparable to
similarly-titled measures presented by other companies.
Adjusted EBITDA (1)
Reconciliation of Non-GAAP Financial Measures
2017
Quarter Ended
September 30
(In Millions)
30
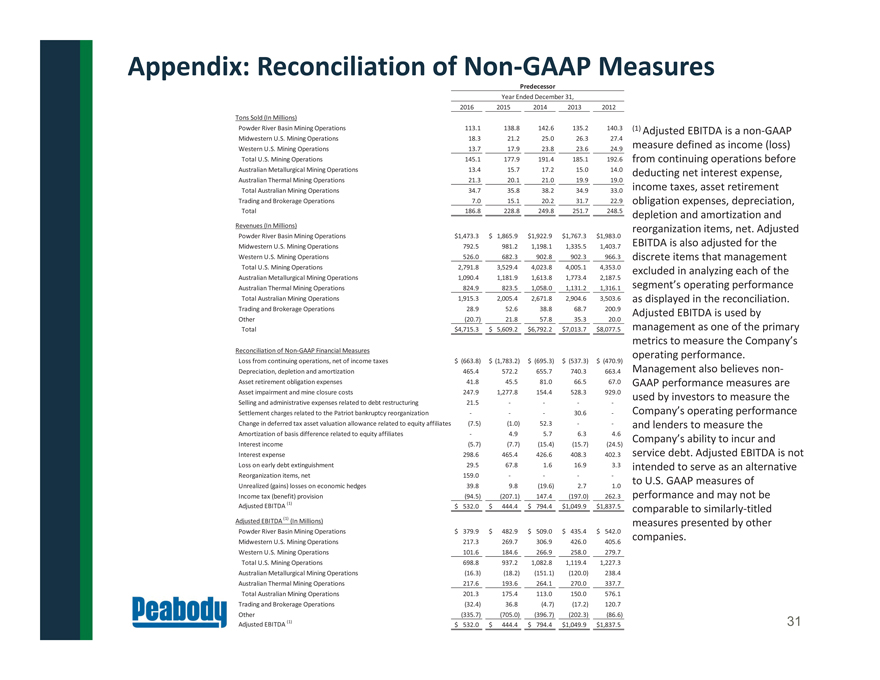
| (1) | Adjusted EBITDA is a non?GAAP measure defined as income (loss) from continuing operations before |
deducting net interest expense, income taxes, asset retirement obligation expenses, depreciation, depletion and amortization and
reorganization items, net. Adjusted EBITDA is also adjusted for the discrete items that management excluded in analyzing each of the segment’s operating performance as displayed in the reconciliation. Adjusted EBITDA is used by management as one of the primary
metrics to measure the Company’s operating performance. Management also believes non? GAAP performance measures are used by investors to measure the Company’s operating performance and lenders to measure the Company’s ability to incur and service debt. Adjusted EBITDA is not intended to serve as an alternative to U.S. GAAP measures of performance and may not be comparable to similarly-titled measures presented by other companies. Appendix: Reconciliation of Non?GAAP Measures 2016 2015 2014 2013 2012 Tons Sold (In Millions) Powder River Basin Mining Operations 113.1 138.8 142.6 135.2 140.3 Midwestern U.S. Mining Operations 18.3 21.2 25.0 26.3 27.4 Western U.S. Mining Operations 13.7 17.9 23.8 23.6 24.9 Total U.S. Mining Operations 145.1 177.9 191.4 185.1 192.6 Australian Metallurgical Mining Operations 13.4 15.7 17.2 15.0 14.0 Australian Thermal Mining Operations 21.3 20.1 21.0 19.9 19.0 Total Australian Mining Operations 34.7 35.8 38.2 34.9 33.0 Trading and Brokerage Operations 7.0 15.1 20.2 31.7 22.9 Total 186.8 228.8 249.8 251.7 248.5 Revenues (In Millions) Powder River Basin Mining Operations $ 1,473.3 $ 1,865.9 $ 1,922.9 $ 1,767.3 $ 1,983.0 Midwestern U.S. Mining Operations 792.5 981.2 1,198.1 1,335.5 1,403.7 Western U.S. Mining Operations 526.0 682.3 902.8 902.3 966.3 Total U.S. Mining Operations 2,791.8 3,529.4 4,023.8 4,005.1 4,353.0 Australian Metallurgical Mining Operations 1,090.4 1,181.9 1,613.8 1,773.4 2,187.5 Australian Thermal Mining Operations 824.9 823.5 1,058.0 1,131.2 1,316.1 Total Australian Mining Operations 1,915.3 2,005.4 2,671.8 2,904.6 3,503.6 Trading and Brokerage Operations 28.9 52.6 38.8 68.7 200.9 Other (20.7) 21.8 57.8 35.3 20.0 Total $4 ,715.3 $ 5,609.2 $ 6,792.2 $ 7,013.7 $ 8,077.5 Reconciliation of Non?GAAP Financial Measures Loss from continuing operations, net of income taxes $ (663.8) $ (1,783.2) $ (695.3) $ (537.3) $ (470.9) Depreciation, depletion and amortization 465.4 572.2 655.7 740.3 663.4 Asset retirement obligation expenses 41.8 45.5 81.0 66.5 67.0 Asset impairment and mine closure costs 247.9 1,277.8 154.4 528.3 929.0 Selling and administrative expenses related to debt restructuring 21.5--- Settlement charges related to the Patriot bankruptcy reorganization --- 30.6 - Change in deferred tax asset valuation allowance related to equity affiliates (7.5) (1.0) 52.3 -- Amortization of basis difference related to equity affiliates ? 4.9 5.7 6.3 4.6 Interest income (5.7) (7.7) (15.4) (15.7) (24.5) Interest expense 298.6 465.4 426.6 408.3 402.3 Loss on early debt extinguishment 29.5 67.8 1.6 16.9 3.3 Reorganization items, net 159.0 ---- Unrealized (gains) losses on economichedges 39.8 9.8 (19.6) 2.7 1.0 Income tax (benefit) provision (94.5) (207.1) 147.4 (197.0) 262.3 Adjusted EBITDA (1) $ 532.0 $ 444.4 $ 794.4 $ 1,049.9 $ 1,837.5 Adjusted EBITDA (1) (In Millions) Powder River Basin Mining Operations $ 379.9 $ 482.9 $ 509.0 $ 435.4 $ 542.0 Midwestern U.S. Mining Operations 217.3 269.7 306.9 426.0 405.6 Western U.S. Mining Operations 101.6 184.6 266.9 258.0 279.7 Total U.S. Mining Operations 698.8 937.2 1,082.8 1,119.4 1,227.3 Australian Metallurgical Mining Operations (16.3) (18.2) (151.1) (120.0) 238.4 Australian Thermal Mining Operations 217.6 193.6 264.1 270.0 337.7 Total Australian Mining Operations 201.3 175.4 113.0 150.0 576.1 Trading and Brokerage Operations (32.4) 36.8 (4.7) (17.2) 120.7 Other (335.7) (705.0) (396.7) (202.3) (86.6) Adjusted EBITDA (1) $ 532.0 $ 444.4 $ 794.4 $ 1,049.9 $ 1,837.5 Predecessor
Year Ended December 31, 31
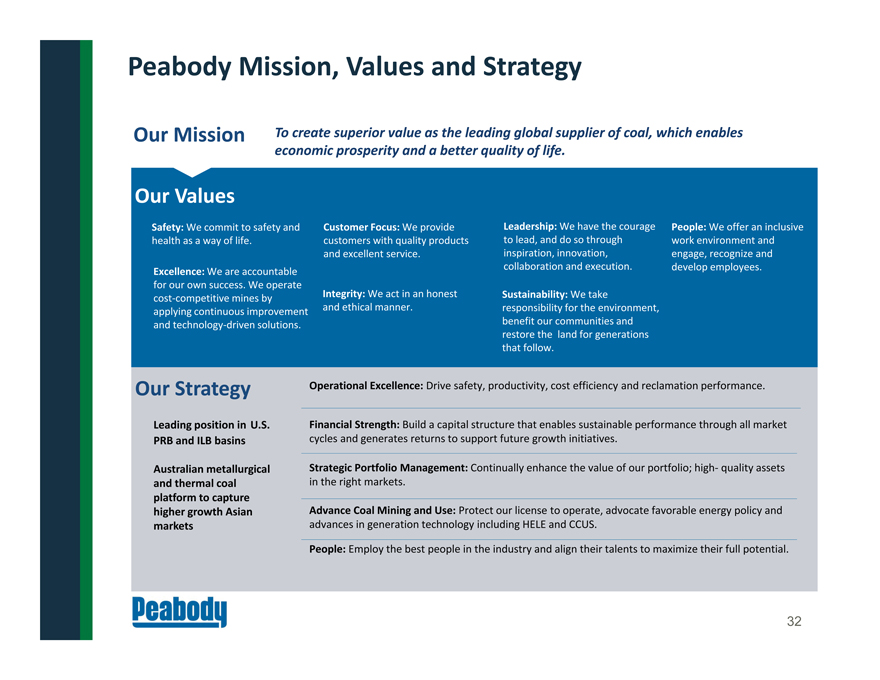
Peabody Mission, Values and Strategy
Our Mission To create superior value as the leading global supplier of coal, which enables
economic prosperity and a better quality of life.
Safety: We commit to safety and
health as a way of life.
People: We offer an inclusive
work environment and
engage, recognize and
develop employees.
Customer Focus: We provide
customers with quality products
and excellent service.
Excellence: We are accountable
for our own success. We operate
cost?competitive mines by
applying continuous improvement
and technology?driven solutions.
Leadership: We have the courage
to lead, and do so through
inspiration, innovation,
collaboration and execution.
Sustainability: We take
responsibility for the environment,
benefit our communities and
restore the land for generations
that follow.
Integrity: We act in an honest
and ethical manner.
Our Values
Leading position in U.S.
PRB and ILB basins
Australian metallurgical
and thermal coal
platform to capture
higher growth Asian
markets
Operational Excellence: Drive safety, productivity, cost efficiency and reclamation performance.
Financial Strength: Build a capital structure that enables sustainable performance through all market
cycles and generates returns to support future growth initiatives.
Strategic Portfolio Management: Continually enhance the value of our portfolio; high? quality assets
in the right markets.
Advance Coal Mining and Use: Protect our license to operate, advocate favorable energy policy and
advances in generation technology including HELE and CCUS.
People: Employ the best people in the industry and align their talents to maximize their full potential.
Our Strategy
32
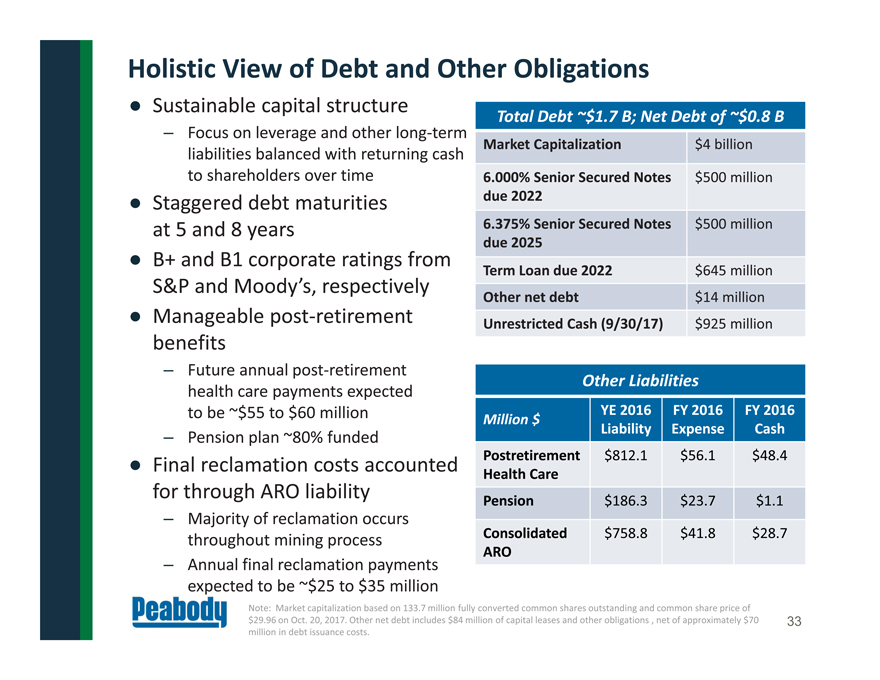
Holistic View of Debt and Other Obligations
Other Liabilities Million $ YE 2016 Liability FY 2016
Expense FY 2016 Cash
Postretirement
Health Care $812.1 $56.1 $48.4 Pension $186.3 $23.7 $1.1
Consolidated ARO
$758.8 $41.8 $28.7 Sustainable capital structure
– Focus on leverage and other long-term liabilities balanced with returning cash
to shareholders over time Staggered debt maturities
at 5 and 8 years B+ and B1 corporate ratings from
S&P and Moody’s, respectively
Manageable post?retirement benefits
– Future annual post?retirement health care payments expected
to be ~$55 to $60 million – Pension plan ~80% funded Final reclamation costs accounted for through ARO liability – Majority of reclamation occurs throughout mining process – Annual final reclamation payments
expected to be ~$25 to $35 million Note: Market capitalization based on 133.7 million fully converted common shares outstanding and common share price of
$29.96 on Oct. 20, 2017. Other net debt includes $84 million of capital leases and other obligations , net of approximately $70 million in debt issuance costs.
Total Debt ~$1.7 B; Net Debt of ~$0.8 B Market Capitalization $4 billion 6.000% Senior Secured Notes due 2022 $500 million 6.375% Senior Secured Notes
due 2025 $500 million Term Loan due 2022 $645 million Other net debt $14 million Unrestricted Cash (9/30/17) $925 million 33
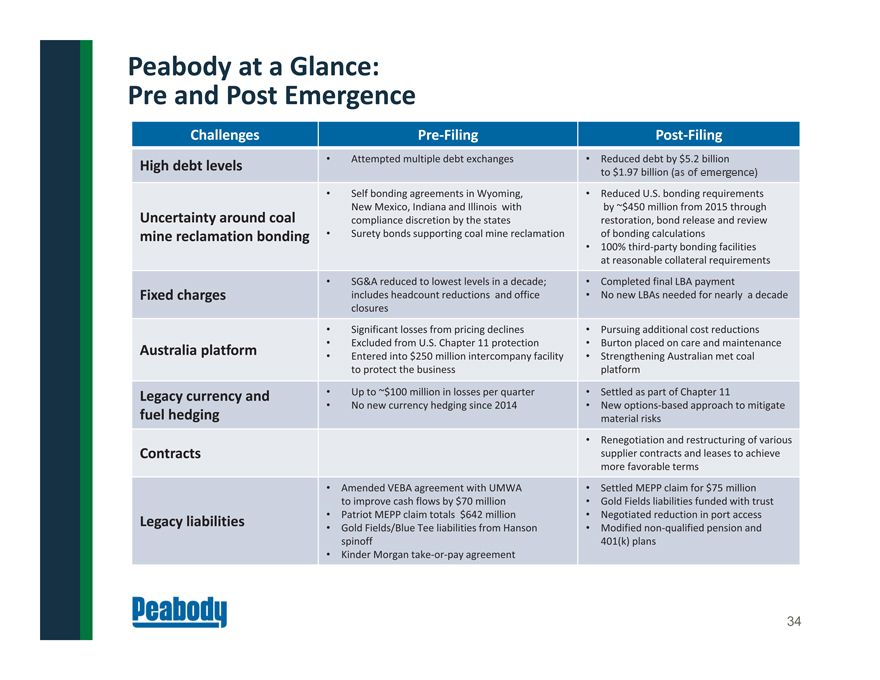
Peabody at a Glance: Pre and Post Emergence Challenges Pre-Filing Post?Filing High debt levels • Attempted multiple debt exchanges • Reduced debt by $5.2 billion to $1.97 billion as of emergence Uncertainty around coal mine reclamation bonding
| • | | Self bonding agreements in Wyoming, New Mexico, Indiana and Illinois with compliance discretion by the states Surety bonds supporting coal mine reclamation |
| • | | Reduced U.S. bonding requirements by ~$450 million from 2015 through restoration, bond release and review of bonding calculations 100% third?party bonding facilities at reasonable collateral requirements Fixed charges |
| • | | SG&A reduced to lowest levels in a decade; includes headcount reductions and office closures Completed final LBA payment No new LBAs needed for nearly a decade Australia platform Significant losses from pricing declines |
| • | | Excluded from U.S. Chapter 11 protection Entered into $250 million intercompany facility to protect the business |
| • | | Pursuing additional cost reductions Burton placed on care and maintenance Strengthening Australian met coal platform Legacy currency and fuel hedging Up to ~$100 million in losses per quarter No new currency hedging since 2014 Settled as part of Chapter 11 New options-based approach to mitigate material risks Contracts Renegotiation and restructuring of various supplier contracts and leases to achieve more favorable terms Legacy liabilities Amended VEBA agreement with UMWA to improve cash flows by $70 million Patriot MEPP claim totals $642 million Gold Fields/Blue Tee liabilities from Hanson spinoff Kinder Morgan take-or-pay agreement Settled MEPP claim for $75 million Gold Fields liabilities funded with trust Negotiated reduction in port access |
| • | | Modified non-qualified pension and 401(k) plans 34 |
Mandatorily Convertible Preferred Equity
Summary Terms
Mandatorily Convertible Preferred Equity (Private Placement)
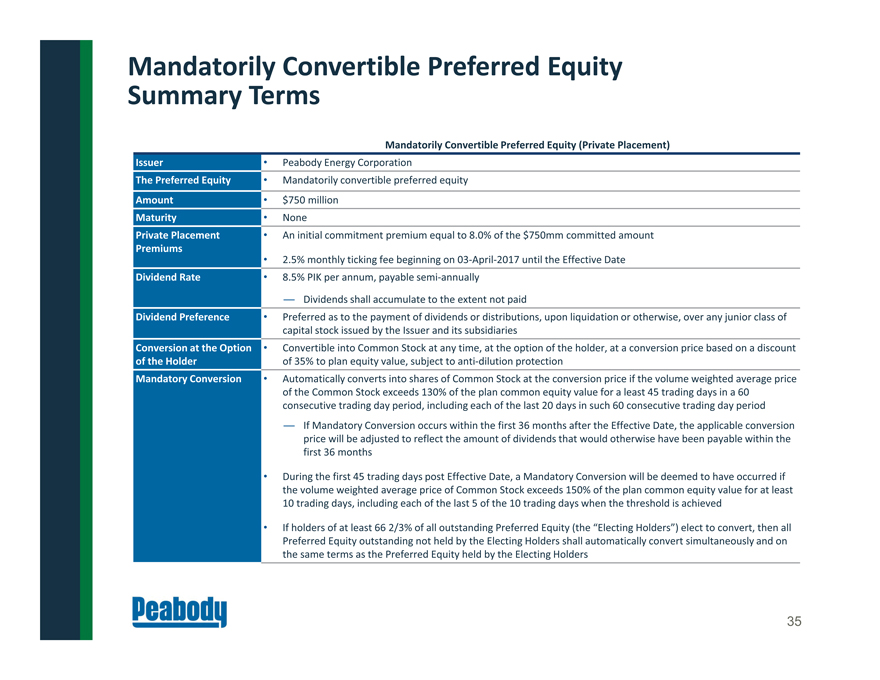
Issuer • Peabody Energy Corporation
The Preferred Equity
• Mandatorily convertible preferred equity
Amount
• $750 million
Maturity
• None
Private Placement
Premiums
| • | | An initial commitment premium equal to 8.0% of the $750mm committed amount |
| • | | 2.5% monthly ticking fee beginning on 03-April-2017 until the Effective Date |
Dividend Rate • 8.5% PIK per annum, payable semi?annually
— Dividends shall accumulate to the extent not paid
Dividend Preference • Preferred as to the payment of dividends or distributions, upon liquidation or otherwise, over any junior class of
capital stock issued by the Issuer and its subsidiaries
Conversion at the Option
of the Holder
| • | | Convertible into Common Stock at any time, at the option of the holder, at a conversion price based on a discount |
of 35% to plan equity value, subject to anti-dilution protection
Mandatory Conversion
• Automatically converts into shares of Common Stock at the conversion price if the volume weighted average price
of the Common Stock exceeds 130% of the plan common equity value for a least 45 trading days in a 60
consecutive trading day period, including each of the last 20 days in such 60 consecutive trading day period
— If Mandatory Conversion occurs within the first 36 months after the Effective Date, the applicable conversion
price will be adjusted to reflect the amount of dividends that would otherwise have been payable within the
first 36 months
| • | | During the first 45 trading days post Effective Date, a Mandatory Conversion will be deemed to have occurred if |
the volume weighted average price of Common Stock exceeds 150% of the plan common equity value for at least
10 trading days, including each of the last 5 of the 10 trading days when the threshold is achieved
| • | | If holders of at least 66 2/3% of all outstanding Preferred Equity (the “Electing Holders”) elect to convert, then all |
Preferred Equity outstanding not held by the Electing Holders shall automatically convert simultaneously and on
the same terms as the Preferred Equity held by the Electing Holders
35