|
Exhibit 99.1 
|
Peabody Analyst and Investor Day February 22, 2018
|
 |
Statement on Forward-Looking Information This presentation contains forward-looking statements within the meaning of the securities laws. Forward-looking statements can be identified by the fact that they do not relate strictly to historical or current facts. They often include words or variation of words such as “expects,” “anticipates,” “intends,” “plans,” “believes,” “seeks,” “estimates,” “projects,” “forecasts,” “targets,” “would,” “will,” “should,” “goal,” “could” or “may” or other similar expressions. Forward-looking statements provide management’s current expectations or predictions of future conditions, events or results. All statements that address operating performance, events or developments that we expect or anticipate will occur in the future are forward-looking statements. They may include estimates of revenues, income, earnings per share, cost savings, capital expenditures, dividends, share repurchases, liquidity, capital structure, market share, industry volume, or other financial items, descriptions of management’s plans or objectives for future operations, or descriptions of assumptions underlying any of the above. All forward-looking statements speak only as of the date they are made and reflect the company’s good faith beliefs, assumptions and expectations, but they are not guarantees of future performance or events. Furthermore, the company disclaims any obligation to publicly update or revise any forward-looking statement, except as required by law. By their nature, forward-looking statements are subject to risks and uncertainties that could cause actual results to differ materially from those suggested by the forward-looking statements. Factors that might cause such differences include, but are not limited to, a variety of economic, competitive and regulatory factors, many of which are beyond the company’s control, that are described in our Annual Report on Form10-K for the fiscal year ended Dec. 31, 2016, as amended on July 10, 2017 and Aug. 14, 2017, and in Exhibit 99.2 to the Company’s Current Report on Form8-K filed with the SEC on April 11, 2017, as well as additional factors we may describe from time to time in other filings with the SEC. You may get such filings for free at our website at www.peabodyenergy.com. You should understand that it is not possible to predict or identify all such factors and, consequently, you should not consider any such list to be a complete set of all potential risks or uncertainties. 2
|
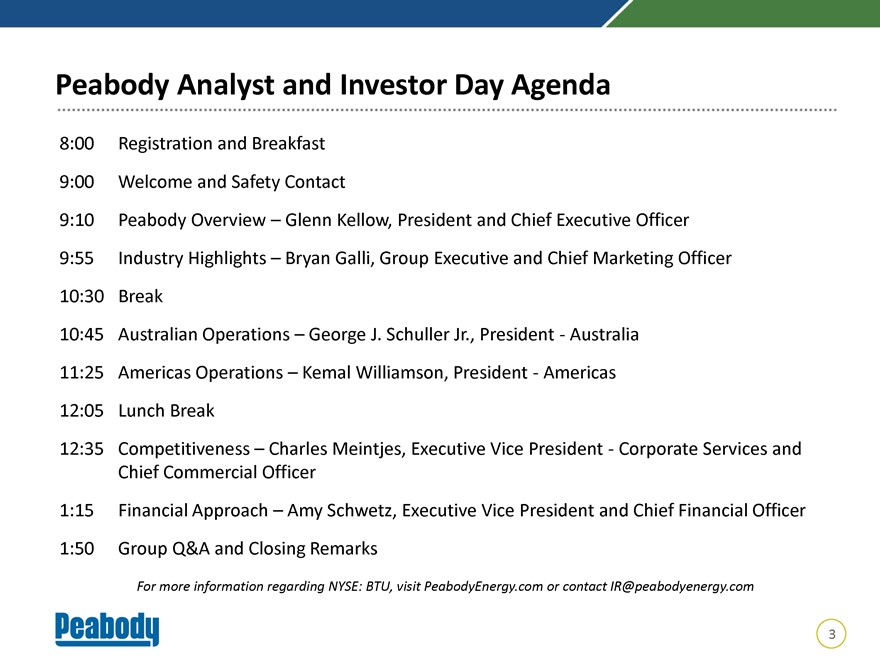 |
Peabody Analyst and Investor Day Agenda 8:00 Registration and Breakfast 9:00 Welcome and Safety Contact 9:10 Peabody Overview – Glenn Kellow, President and Chief Executive Officer 9:55 Industry Highlights – Bryan Galli, Group Executive and Chief Marketing Officer 10:30 Break 10:45 Australian Operations – George J. Schuller Jr., President—Australia 11:25 Americas Operations – Kemal Williamson, President—Americas 12:05 Lunch Break 12:35 Competitiveness – Charles Meintjes, Executive Vice President—Corporate Services and Chief Commercial Officer 1:15 Financial Approach – Amy Schwetz, Executive Vice President and Chief Financial Officer 1:50 Group Q&A and Closing Remarks For more information regarding NYSE: BTU, visit PeabodyEnergy.com or contact IR@peabodyenergy.com 3
BTU Analyst and Investor Day: Delivering Results, Generating Value Glenn Kellow President and Chief Executive Officer February 22, 2018
BTU Analyst and Investor Day: Overview Peabody is the leading global pure-play coal investment, and we have significant scale, high-quality assets and people, and diversity in geography and products We are executing an integrated approach to delivering results and generating value across the cycle Today, we invite you to take a deeper look at Peabody “beneath the surface” My discussion will center on: 1) Our Company Profile; 2) Industry Dynamics; and 3) Our Strategies to Create Value 2
|
 |
Today’s Presenters and Our Executive Leadership Team Industry Fundamentals Bryan Galli Group Executive and Chief Marketing Officer Australian Operations George J. Schuller Jr. President Australia Americas Operations Kemal Williamson President Americas Improving Competitiveness Charles Meintjes EVP Corporate Services and Chief Commercial Officer From Left: Paul Richard 1, Verona Dorch 2, Kemal Williamson, Financial Approach Amy Schwetz, Glenn Kellow, George J. Schuller Jr., Charles Meintjes Amy Schwetz EVP and Chief Financial Officer 1 2 3 Note: SVP and Chief Human Resources Officer; EVP, CLO, Government Affairs and Corporate Secretary
|
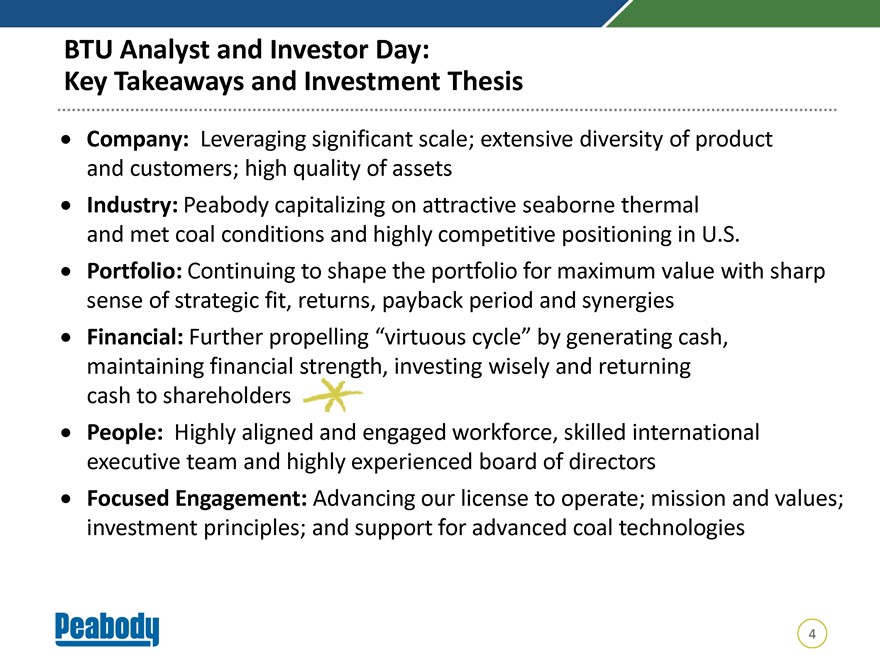 |
BTU Analyst and Investor Day: Key Takeaways and Investment Thesis Company: Leveraging significant scale; extensive diversity of product and customers; high quality of assets Industry: Peabody capitalizing on attractive seaborne thermal and met coal conditions and highly competitive positioning in U.S. Portfolio: Continuing to shape the portfolio for maximum value with sharp sense of strategic fit, returns, payback period and synergies Financial: Further propelling “virtuous cycle” by generating cash, maintaining financial strength, investing wisely and returning cash to shareholders People: Highly aligned and engaged workforce, skilled international executive team and highly experienced board of directors Focused Engagement: Advancing our license to operate; mission and values; investment principles; and support for advanced coal technologies 4
|
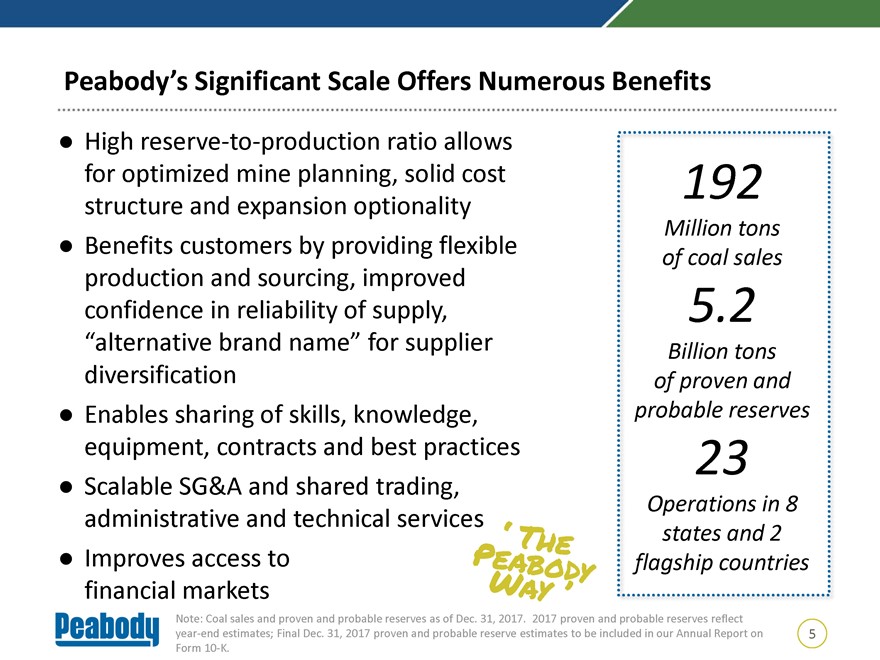 |
Peabody’s Significant Scale Offers Numerous Benefits Highreserve-to-production ratio allows for optimized mine planning, solid cost structure and expansion optionality Benefits customers by providing flexible production and sourcing, improved confidence in reliability of supply, “alternative brand name” for supplier diversification Enables sharing of skills, knowledge, equipment, contracts and best practices Scalable SG&A and shared trading, administrative and technical services Improves access to financial markets Note: Coal sales and proven and probable reserves as of Dec. 31, 2017. 2017 proven and probable reserves reflectyear-end estimates; Final Dec. 31, 2017 proven and probable reserve estimates to be included in our Annual Report on 5 Form10-K.
|
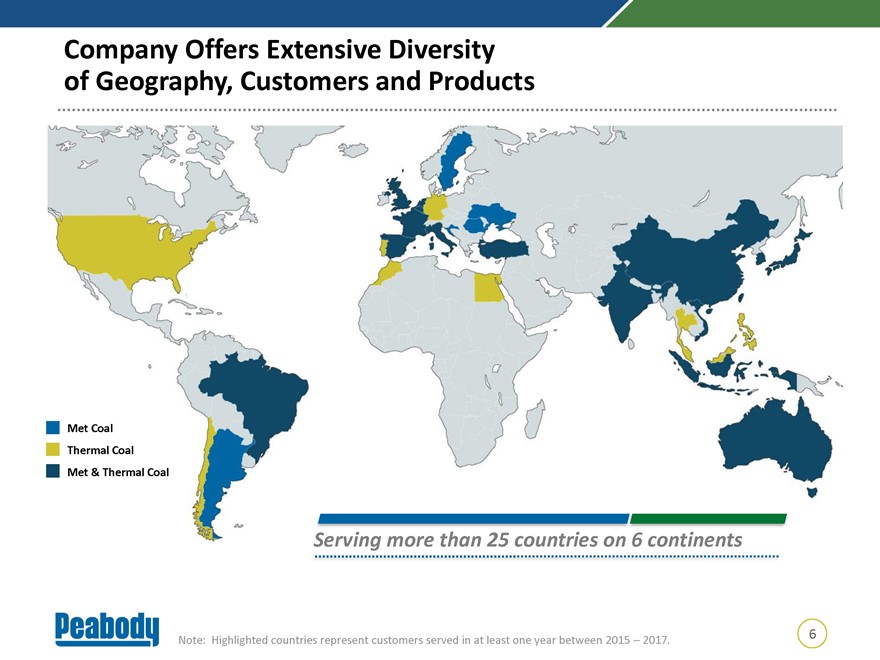 |
Company Offers Extensive Diversity of Geography, Customers and Products Met Coal Thermal Coal Met & Thermal Coal Serving more than 25 countries on 6 continents 6 Note: Highlighted countries represent customers served in at least one year between 2015 – 2017.
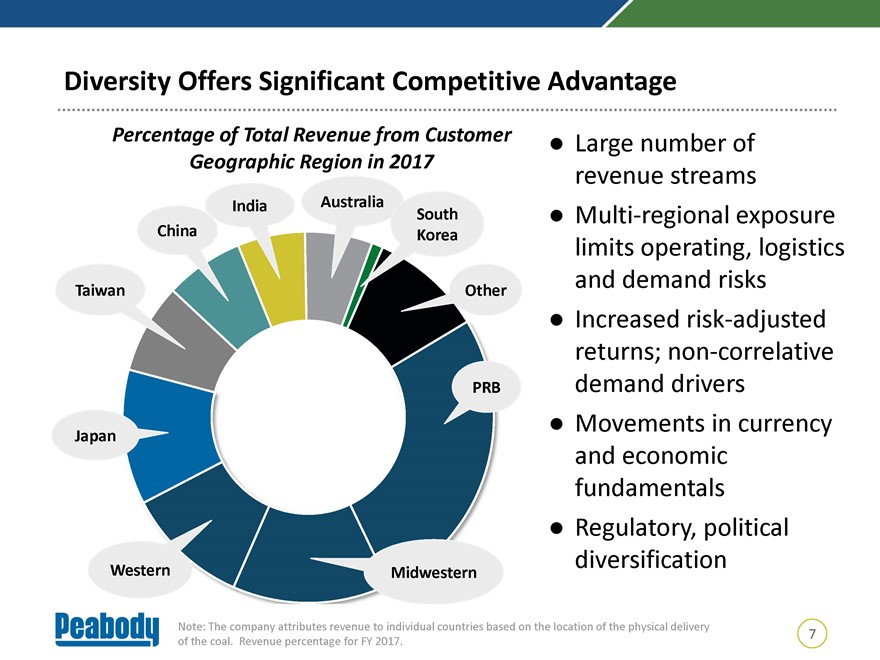
Diversity Offers Significant Competitive Advantage Percentage of Total Revenue from Customer Large number of Geographic Region in 2017 revenue streams India Australia South Multi-regional exposure China Korea limits operating, logistics and demand risks Taiwan Other Increased risk-adjusted returns;non-correlative PRB demand drivers Movements in currency Japan and economic fundamentals Regulatory, political diversification Western Midwestern Note: The company attributes revenue to individual countries based on the location of the physical delivery 7 of the coal. Revenue percentage for FY 2017.
|
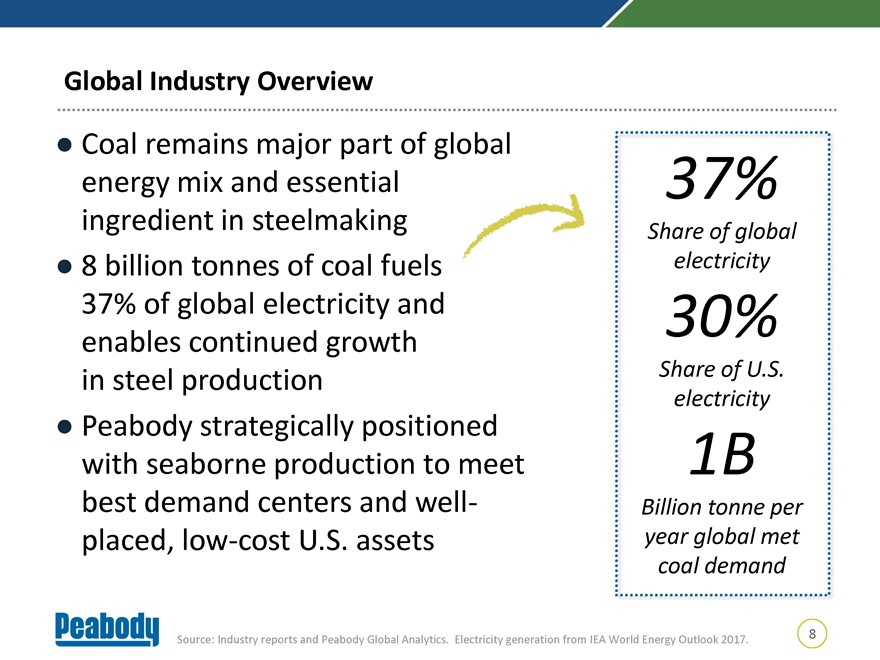 |
Global Industry Overview Coal remains major part of global energy mix and essential ingredient in steelmaking 8 billion tonnes of coal fuels 37% of global electricity and enables continued growth in steel production Peabody strategically positioned with seaborne production to meet best demand centers and well-placed,low-cost U.S. assets 8 Source: Industry reports and Peabody Global Analytics. Electricity generation from IEA World Energy Outlook 2017.
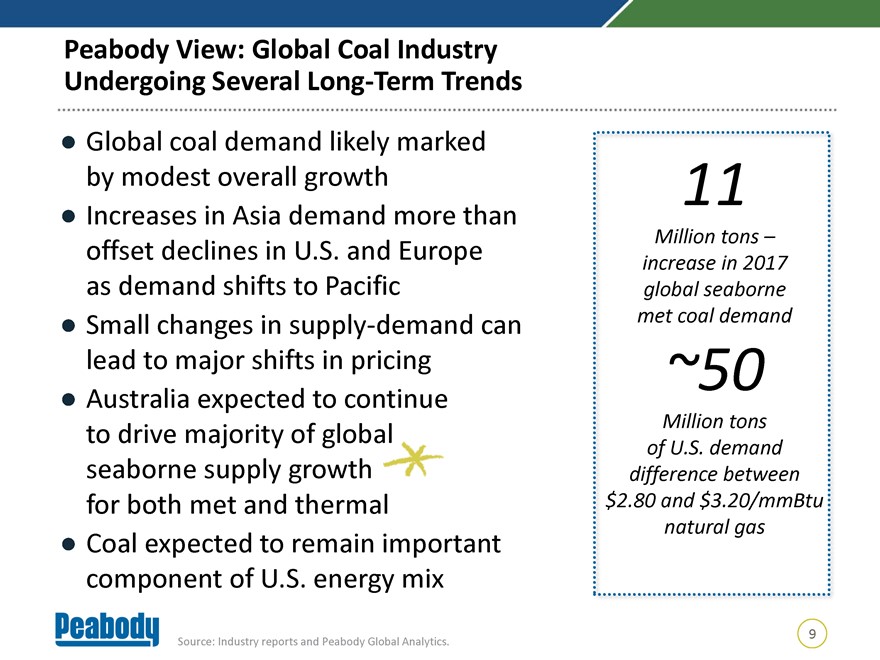
Peabody View: Global Coal Industry Undergoing Several Long-Term Trends Global coal demand likely marked by modest overall growth Increases in Asia demand more than offset declines in U.S. and Europe as demand shifts to Pacific Small changes in supply-demand can lead to major shifts in pricing Australia expected to continue to drive majority of global seaborne supply growth for both met and thermal Coal expected to remain important component of U.S. energy mix 9 Source: Industry reports and Peabody Global Analytics.
|
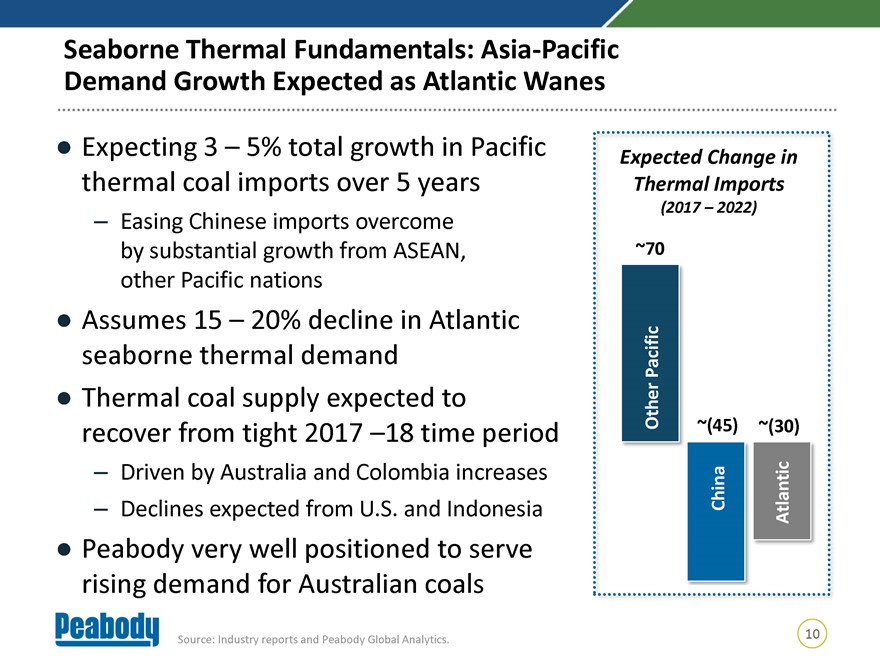 |
Seaborne Thermal Fundamentals: Asia-Pacific Demand Growth Expected as Atlantic Wanes Expecting 3 - 5% total growth in Pacific thermal coal imports over 5 years - Easing Chinese imports overcome by substantial growth from ASEAN, other Pacific nations Assumes 15 - 20% decline in Atlantic seaborne thermal demand Thermal coal supply expected to recover from tight 2017 18 time period Driven by Australia and Colombia increases - Declines expected from U.S. and Indonesia Peabody very well positioned to serve rising demand for Australian coals 10 Source: Industry reports and Peabody Global Analytics.
|
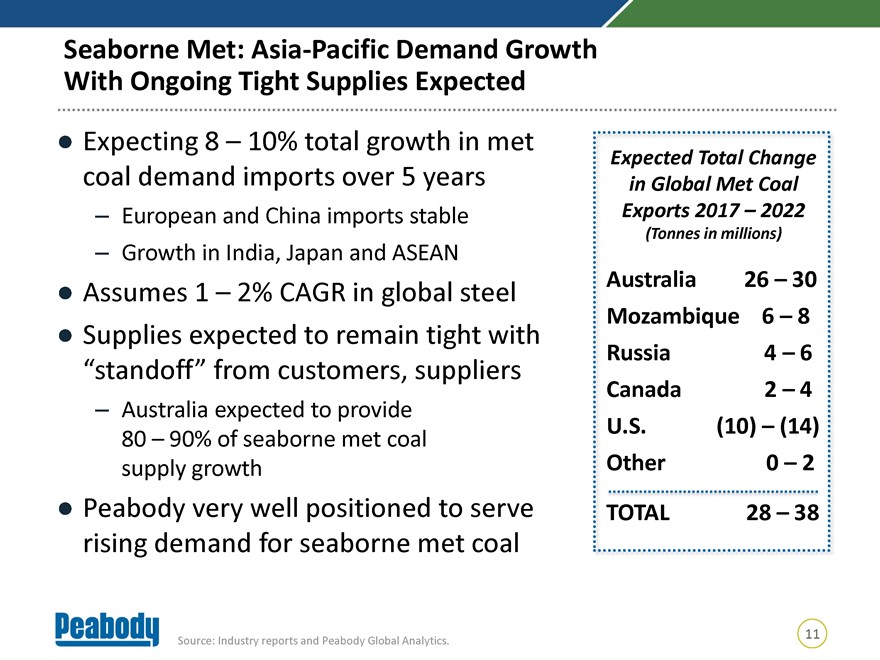 |
Seaborne Met: Asia-Pacific Demand Growth With Ongoing Tight Supplies Expected Expecting 8 - 10% total growth in met coal demand imports over 5 years - European and China imports stable - Growth in India, Japan and ASEAN Assumes 1 - 2% CAGR in global steel Supplies expected to remain tight with “standoff” from customers, suppliers - Australia expected to provide 80 - 90% of seaborne met coal supply growth Peabody very well positioned to serve rising demand for seaborne met coal 11 Source: Industry reports and Peabody Global Analytics.
|
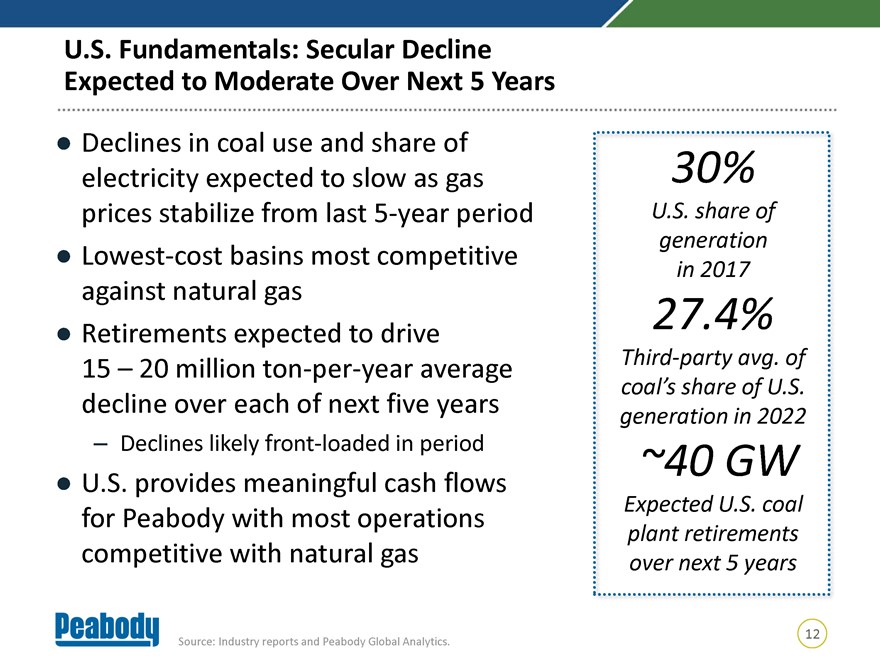 |
U.S. Fundamentals: Secular Decline Expected to Moderate Over Next 5 Years Declines in coal use and share of electricity expected to slow as gas prices stabilize from last 5-year period Lowest-cost basins most competitive against natural gas Retirements expected to drive 15 - 20 million ton-per-year average decline over each of next five years - Declines likely front-loaded in period U.S. provides meaningful cash flows for Peabody with most operations competitive with natural gas 12 Source: Industry reports and Peabody Global Analytics.
|
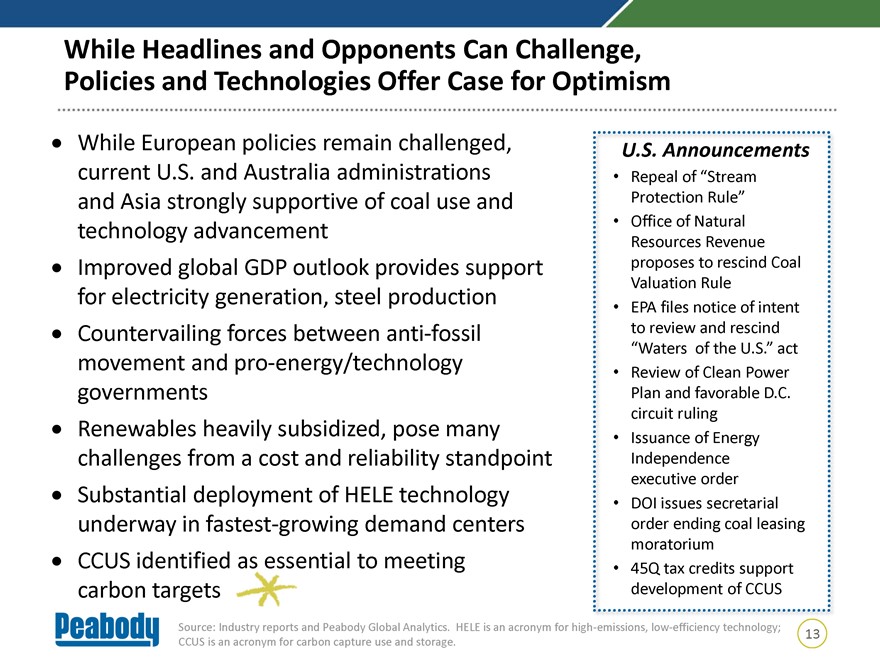 |
While Headlines and Opponents Can Challenge, Policies and Technologies Offer Case for Optimism While European policies remain challenged, current U.S. and Australia administrations and Asia strongly supportive of coal use and technology advancement Improved global GDP outlook provides support for electricity generation, steel production Countervailing forces between anti-fossil movement andpro-energy/technology governments Renewables heavily subsidized, pose many challenges from a cost and reliability standpoint Substantial deployment of HELE technology underway in fastest-growing demand centers CCUS identified as essential to meeting carbon targets Source: Industry reports and Peabody Global Analytics. HELE is an acronym for high-emissions,low-efficiency technology; 13 CCUS is an acronym for carbon capture use and storage.
|
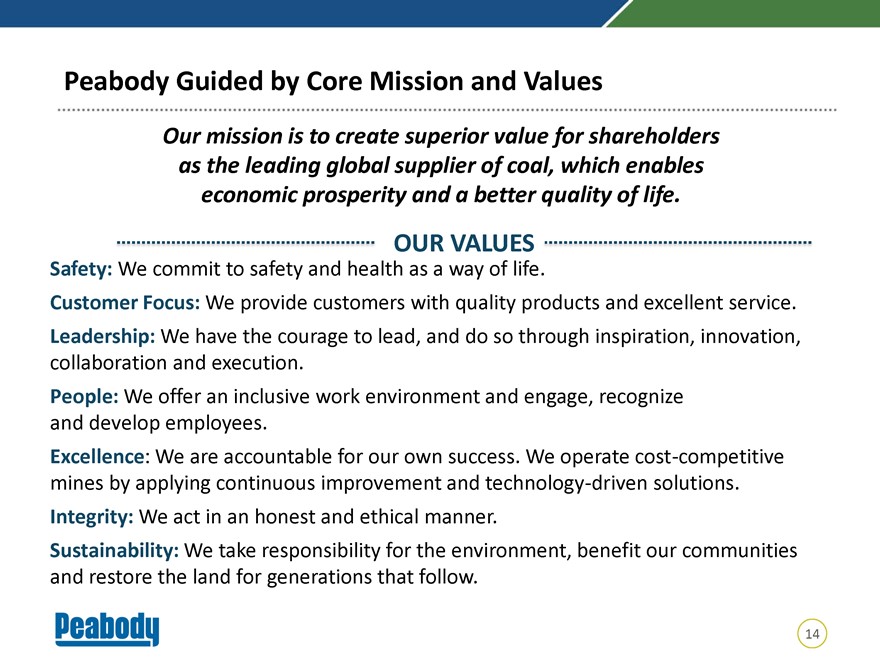 |
Peabody Guided by Core Mission and Values Our mission is to create superior value for shareholders as the leading global supplier of coal, which enables economic prosperity and a better quality of life. OUR VALUES Safety: We commit to safety and health as a way of life. Customer Focus: We provide customers with quality products and excellent service. Leadership: We have the courage to lead, and do so through inspiration, innovation, collaboration and execution. People: We offer an inclusive work environment and engage, recognize and develop employees. Excellence: We are accountable for our own success. We operate cost-competitive mines by applying continuous improvement and technology-driven solutions. Integrity: We act in an honest and ethical manner. Sustainability: We take responsibility for the environment, benefit our communities and restore the land for generations that follow. 14
|
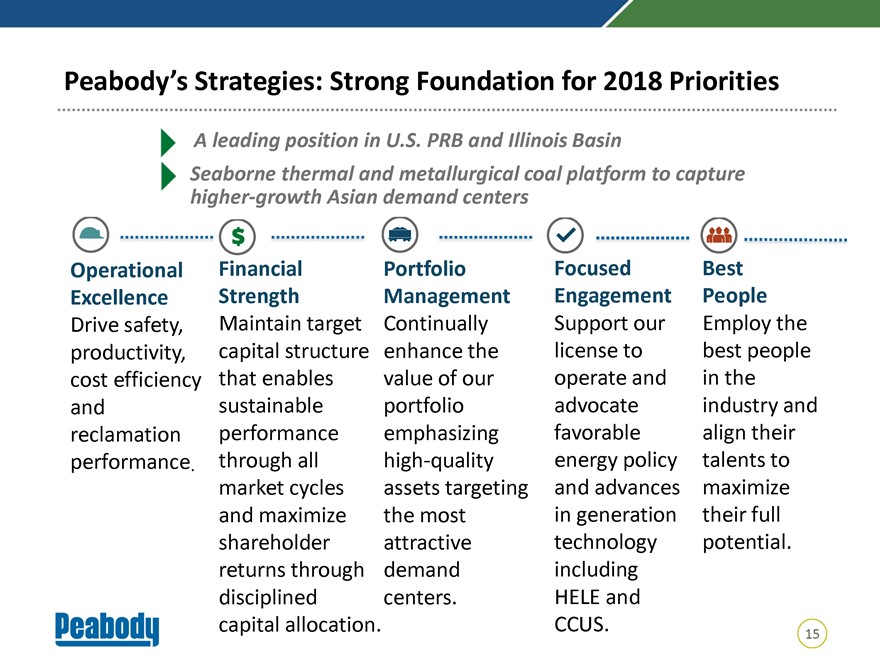 |
Peabody’s Strategies: Strong Foundation for 2018 Priorities A leading position in U.S. PRB and Illinois Basin Seaborne thermal and metallurgical coal platform to capture higher-growth Asian demand centers Operational Financial Portfolio Focused Best Excellence Strength Management Engagement People Drive safety, Maintain target Continually Support our Employ the productivity, capital structure enhance the license to best people cost efficiency that enables value of our operate and in the and sustainable portfolio advocate industry and reclamation performance emphasizing favorable align their performance. through all high-quality energy policy talents to market cycles assets targeting and advances maximize and maximize the most in generation their full shareholder attractive technology potential. returns through demand including disciplined centers. HELE and capital allocation. CCUS. 15
|
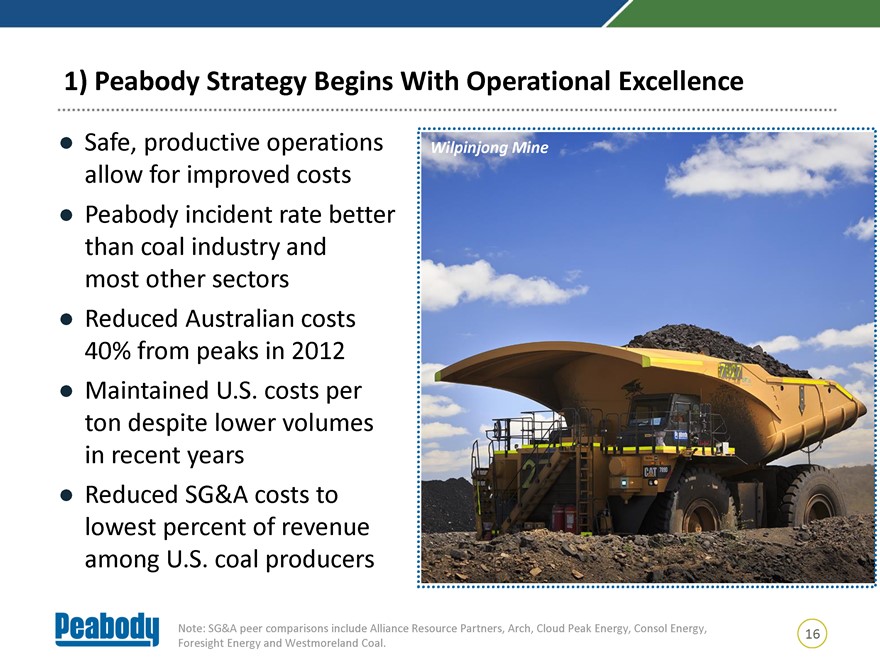 |
1) Peabody Strategy Begins With Operational Excellence Safe, productive operations Wilpinjong Mine allow for improved costs Peabody incident rate better than coal industry and most other sectors Reduced Australian costs 40% from peaks in 2012 Maintained U.S. costs per ton despite lower volumes in recent years Reduced SG&A costs to lowest percent of revenue among U.S. coal producers Note: SG&A peer comparisons include Alliance Resource Partners, Arch, Cloud Peak Energy, Consol Energy, 16 Foresight Energy and Westmoreland Coal.
|
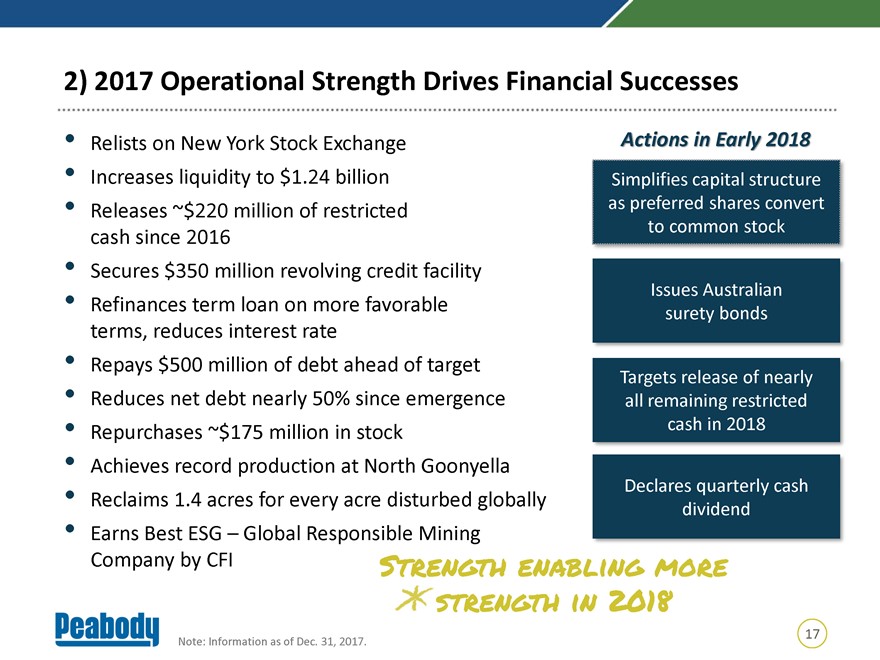 |
2) 2017 Operational Strength Drives Financial Successes Relists on New York Stock Exchange Actions in Early 2018 Increases liquidity to $1.24 billion Simplifies capital structure Releases ~$220 million of restricted as preferred shares convert to common stock cash since 2016 Secures $350 million revolving credit facility Issues Australian Refinances term loan on more favorable surety bonds terms, reduces interest rate Repays $500 million of debt ahead of target Targets release of nearly Reduces net debt nearly 50% since emergence all remaining restricted Repurchases ~$175 million in stock cash in 2018 Achieves record production at North Goonyella Declares quarterly cash Reclaims 1.4 acres for every acre disturbed globally dividend Earns Best ESG - Global Responsible Mining Company by CFI Strength enabling more strength in 2018 17 Note: Information as of Dec. 31, 2017.
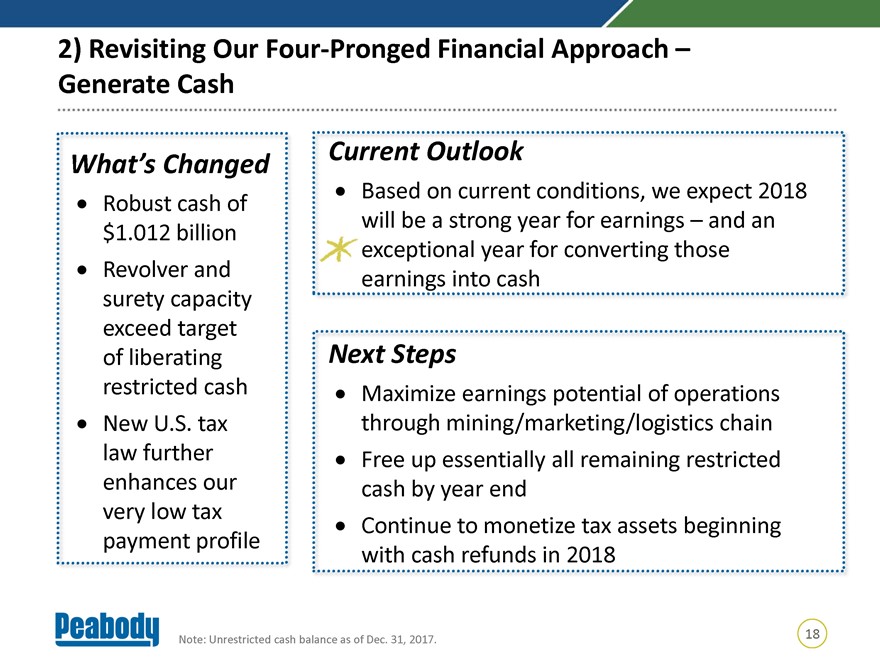
2) Revisiting Our Four-Pronged Financial Approach –Generate Cash 18 Note: Unrestricted cash balance as of Dec. 31, 2017.
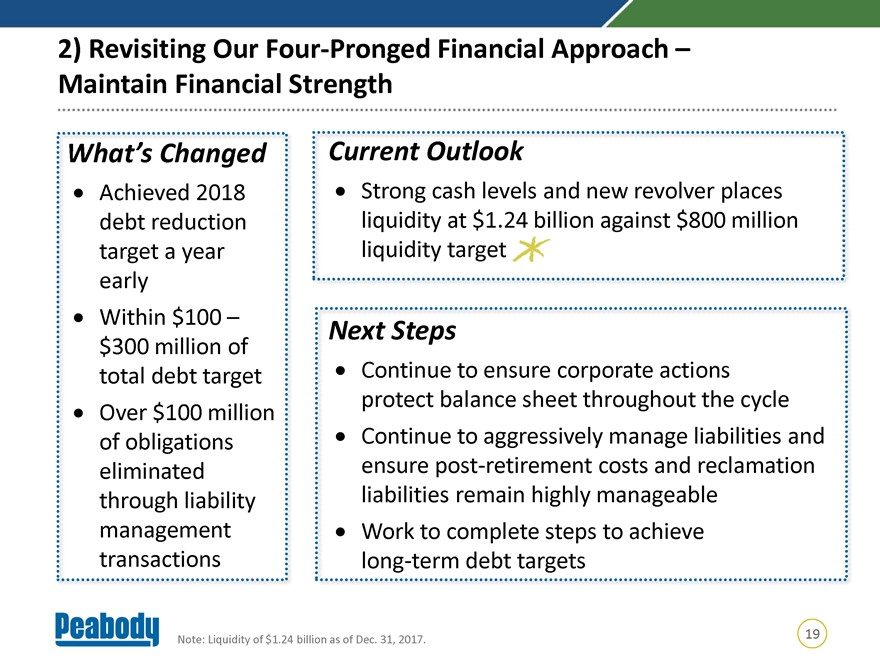
2) Revisiting Our Four-Pronged Financial Approach - Maintain Financial Strength 19 Note: Liquidity of $1.24 billion as of Dec. 31, 2017.
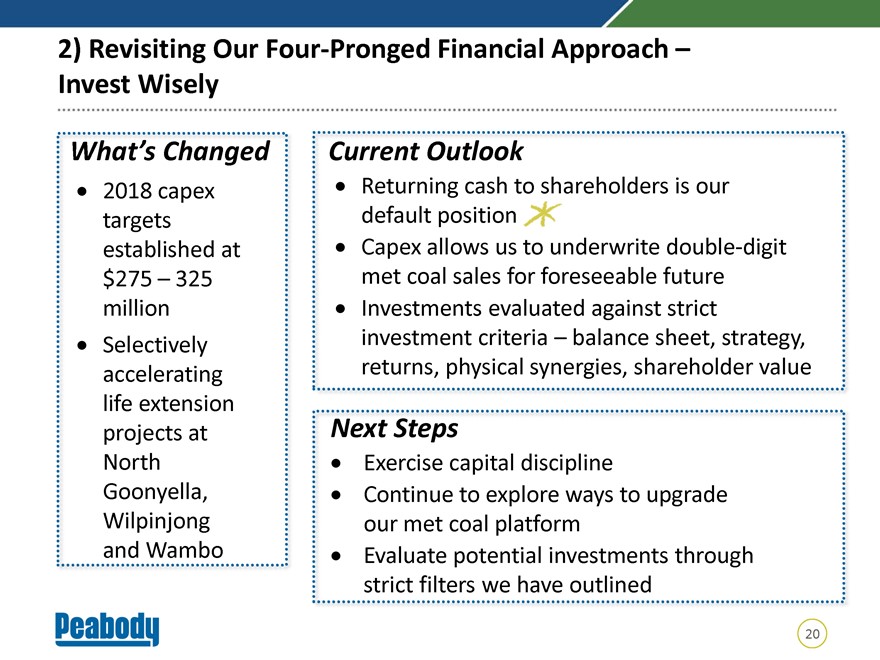
2) Revisiting Our Four-Pronged Financial Approach - Invest Wisely 20
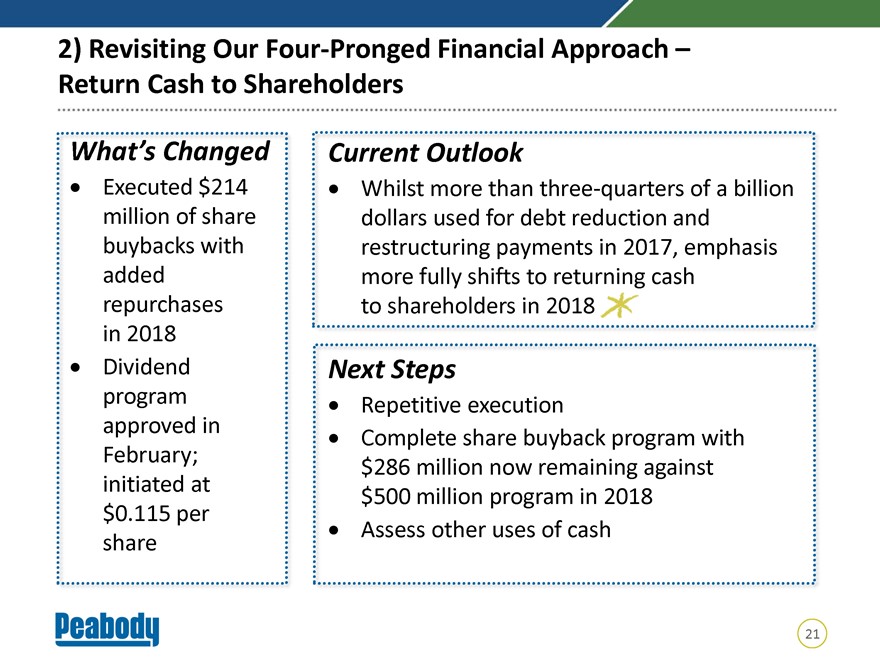
2) Revisiting Our Four-Pronged Financial Approach –Return Cash to Shareholders 21
3) Peabody Continues to Shape the Portfolio to Create Value Within Continues to provide favorable exposure Australia… to growing demand centers Benefits from significant reserve position from prior acquisition Year-over-year continuous improvement Continuing methodical steps to upgrade met coal platform: – Closing of Burton; Sale of reserves – North Goonyella longwall extends life through 2026 – Life extension projects at North Goonyella, Moorvale, Wilpinjong and Wambo Approach: – Manage life extensions, Wambo JV – Continue to use strict investment filters – Optionality forout-of-the-money, organic met volume growth – Offer credible product brand alternatives 22
|
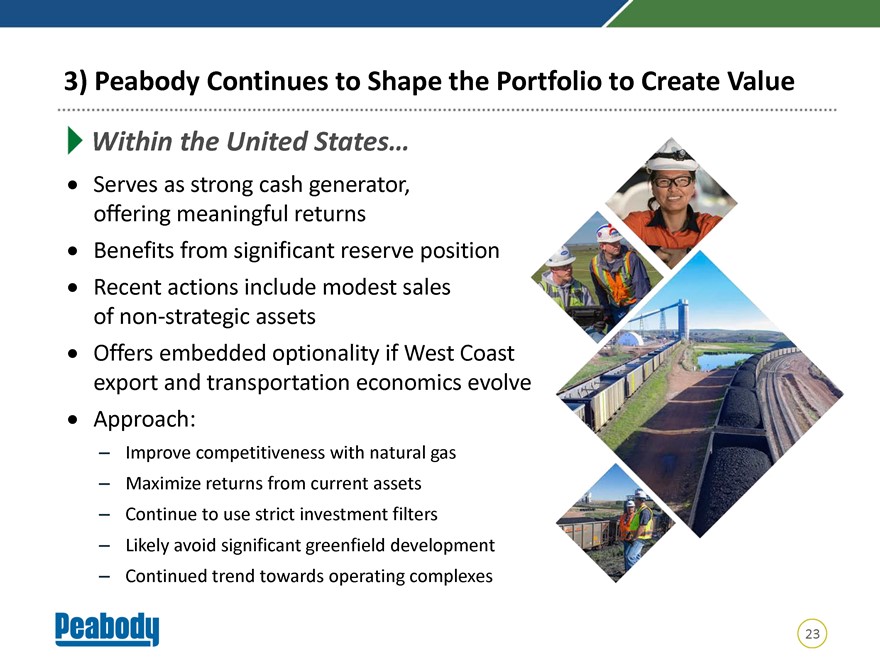 |
3) Peabody Continues to Shape the Portfolio to Create Value Within the United States… Serves as strong cash generator, offering meaningful returns Benefits from significant reserve position Recent actions include modest sales ofnon-strategic assets Offers embedded optionality if West Coast export and transportation economics evolv Approach: – Improve competitiveness with natural gas – Maximize returns from current assets – Continue to use strict investment filters – Likely avoid significant greenfield development – Continued trend towards operating complexes 23
|
 |
4)Focused Engagement: How We Behave as Important as What We Do Fundamental, consistent attention to social responsibility and “Coal Done Right” approach Recognition of ESG and Peabody’s ability to attract best possible capital – “Investment Principles” serve as our own benchmark – Peabody honored through multiple ESG and Social Responsibility awards “Common Ground” approach toward engagement with government and NGOs Alignment with U.N. Sustainable Development Goals Advanced coal technologies essential to meeting society’s goals 24
|
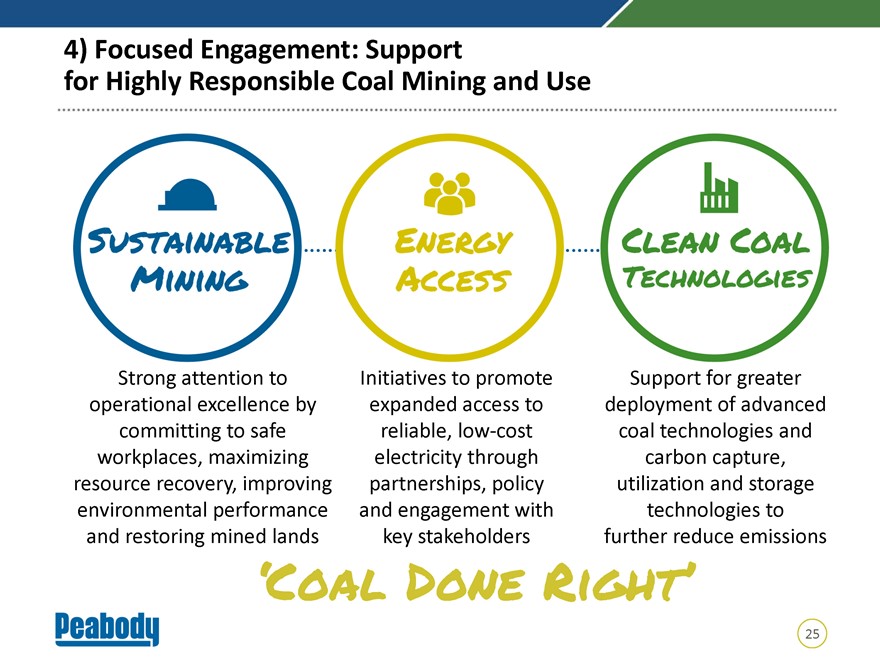 |
4) Focused Engagement: Support for Highly Responsible Coal Mining and Use Strong attention to Initiatives to promote Support for greater operational excellence by expanded access to deployment of advanced committing to safe reliable,low-cost coal technologies and workplaces, maximizing electricity through carbon capture, resource recovery, improving partnerships, policy utilization and storage environmental performance and engagement with technologies to and restoring mined lands key stakeholders further reduce emissions ‘Coal Done Right’ 25
|
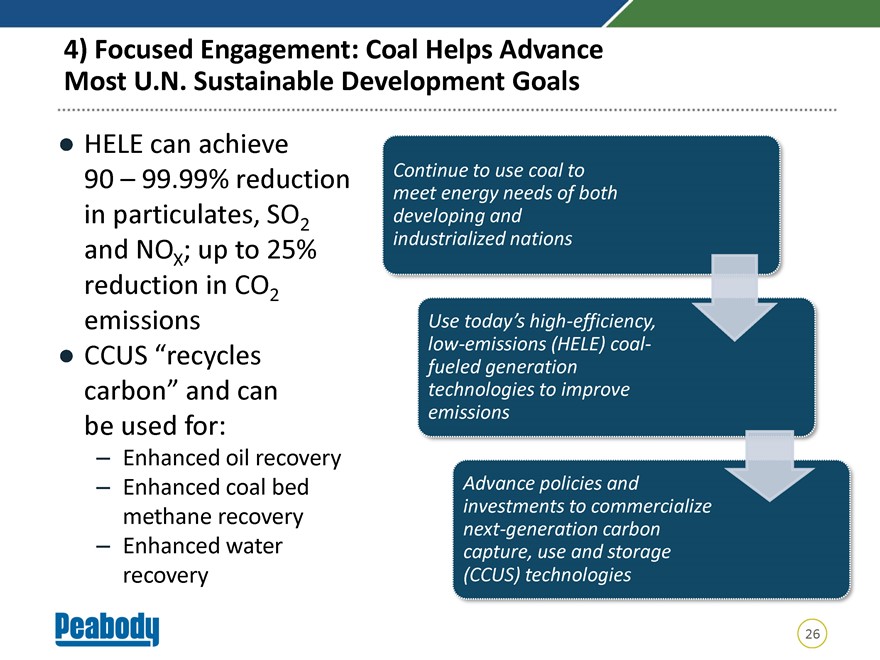 |
4) Focused Engagement: Coal Helps Advance Most U.N. Sustainable Development Goals HELE can achieve 90 – 99.99% reduction Continue to use coal to meet energy needs of both in particulates, SO developing and 2 and NO ; up to 25% industrialized nations X reduction in CO2 emissions Use today’s high-efficiency, CCUS “recycleslow-emissions (HELE) coal-fueled generation carbon” and can technologies to improve emissions be used for: – Enhanced oil recovery – Enhanced coal bed Advance policies and investments to commercialize methane recovery Enhanced water next-generation carbon – capture, use and storage recovery (CCUS) technologies 26
|
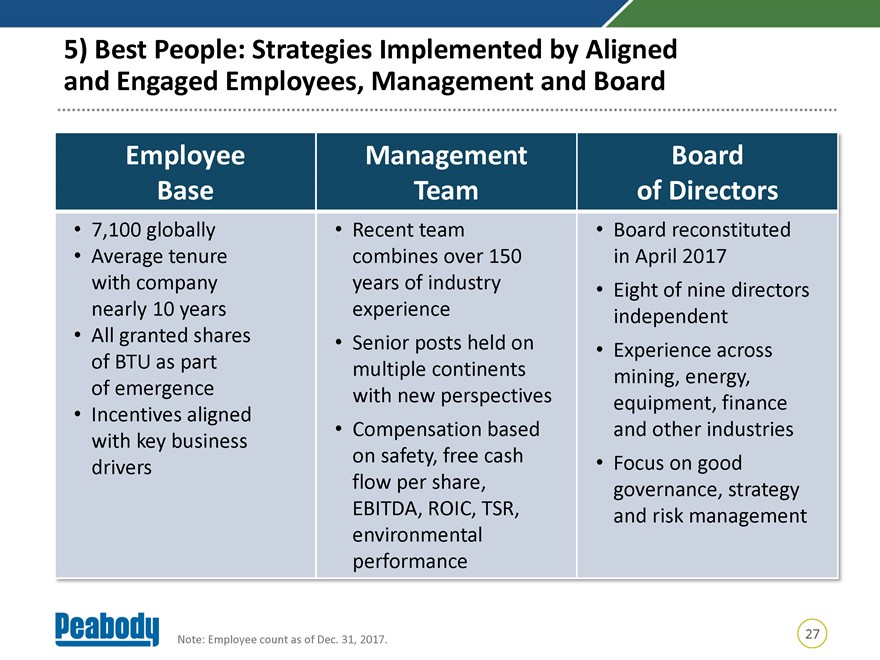 |
5) Best People: Strategies Implemented by Aligned and Engaged Employees, Management and Board Employee Management Board Base Team of Directors 7,100 globally Recent team Board reconstituted Average tenure combines over 150 in April 2017 with company years of industry Eight of nine directors nearly 10 years experience independent All granted shares Senior posts held on Experience across of BTU as part multiple continents mining, energy, of emergence with new perspectives equipment, finance Incentives aligned Compensation based and other industries with key business on safety, free cash Focus on good drivers flow per share, governance, strategy EBITDA, ROIC, TSR, and risk management environmental performance 27 Note: Employee count as of Dec. 31, 2017.
|
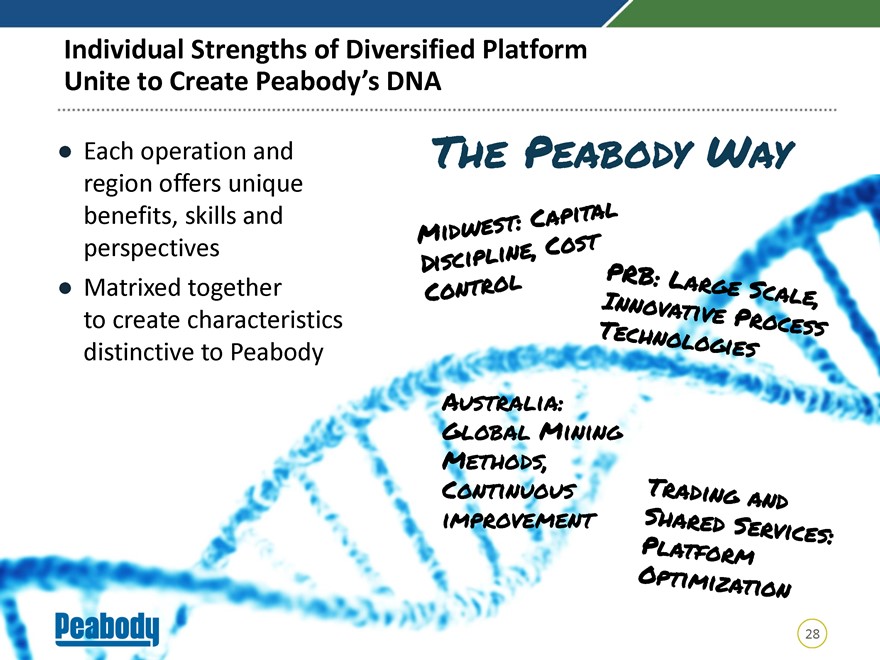 |
Individual Strengths of Diversified Platform Unite to Create Peabody’s DNA Each operation and The Peabody Way region offers unique benefits, skills and perspectives Matrixed together to create characteristics distinctive to Peabody Australia: Global Mining Methods, Continuous improvement 28
Peabody: Integrated Approach Creates Maximum Value The Peabody team delivered powerful achievements in 2017, and we’re not about to stop We are committed to outlining approach and then delivering We have the right assets, financial strength, people and strategies to succeed We are continuing to progress actions that will drive continued valuation uplifts throughout the commodity cycles Let’s take you a bit further beneath the surface, exploring who we are, what we do and how we intend to create value 29
Peabody Positioned to Create Value in All Industry Conditions Bryan Galli Group Executive and Chief Marketing Officer February 22, 2018
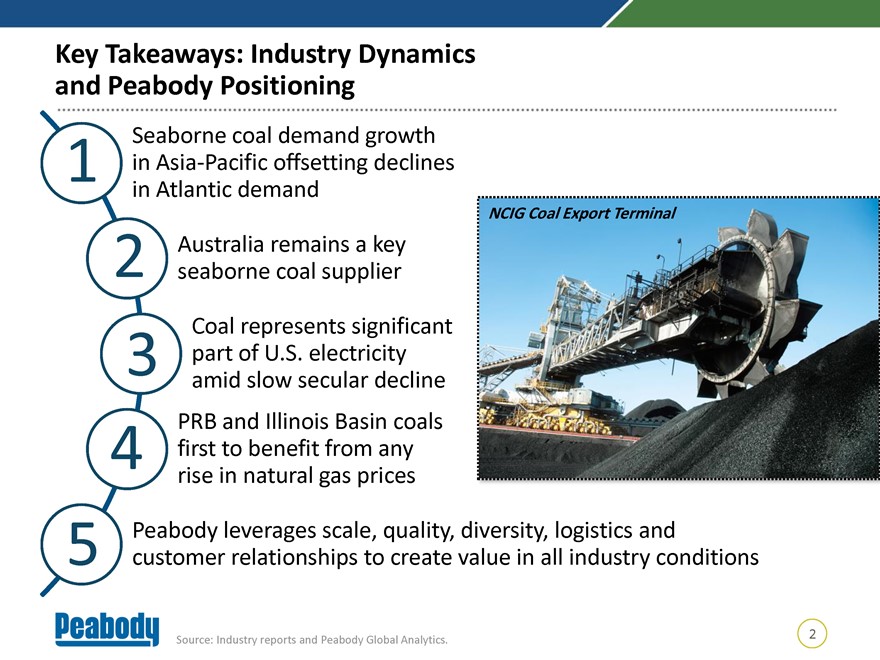
Key Takeaways: Industry Dynamics and Peabody Positioning Seaborne coal demand growth 1 Asia-Pacific offsetting declines Atlantic demand NCIG Coal Export Terminal 2 Australia remains a key seaborne coal supplier Coal represents significant 3 part of U.S. electricity amid slow secular decline PRB and Illinois Basin coals 4 first to benefit from any rise in natural gas prices Peabody leverages scale, quality, diversity, logistics and 5 customer relationships to create value in all industry conditions 2 Source: Industry reports and Peabody Global Analytics.
|
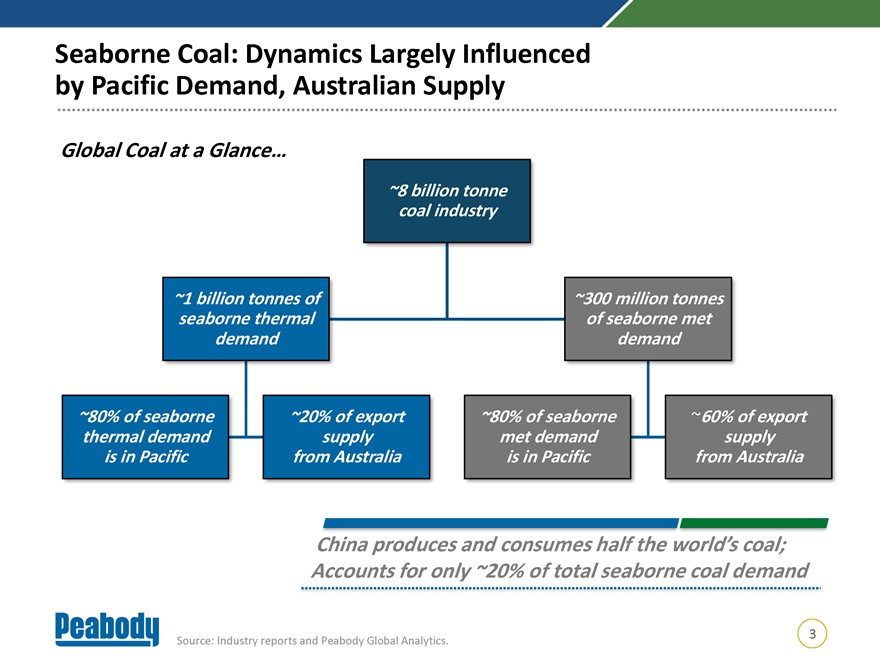 |
Seaborne Coal: Dynamics Largely Influenced by Pacific Demand, Australian Supply Global Coal at a Glance… ~8 billion tonne coal industry ~1 billion tonnes of ~300 million tonnes seaborne thermal of seaborne met demand demand ~80% of seaborne ~20% of export ~80% of seaborne ~60% of export thermal demand supply met demand supply is in Pacific from Australia is in Pacific from Australia China produces and consumes half the world’s coal; Accounts for only ~20% of total seaborne coal demand 3 Source: Industry reports and Peabody Global Analytics.
|
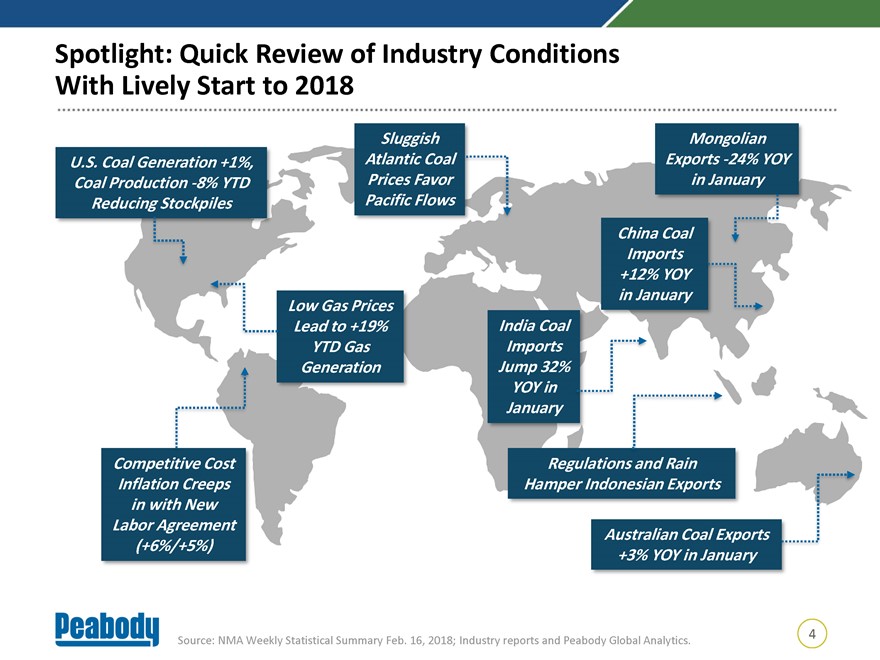 |
Spotlight: Quick Review of Industry Conditions With Lively Start to 2018 Sluggish Mongolian U.S. Coal Generation +1%, Atlantic Coal Exports-24% YOY Coal Production-8% YTD Prices Favor in January Reducing Stockpiles Pacific Flows China Coal Imports +12% YOY in January Low Gas Prices Lead to +19% India Coal YTD Gas Imports Generation Jump 32% YOY in January Competitive Cost Regulations and Rain Inflation Creeps Hamper Indonesian Exports in with New Labor Agreement Australian Coal Exports (+6%/+5%) +3% YOY in January 4 Source: NMA Weekly Statistical Summary Feb. 16, 2018; Industry reports and Peabody Global Analytics.
|
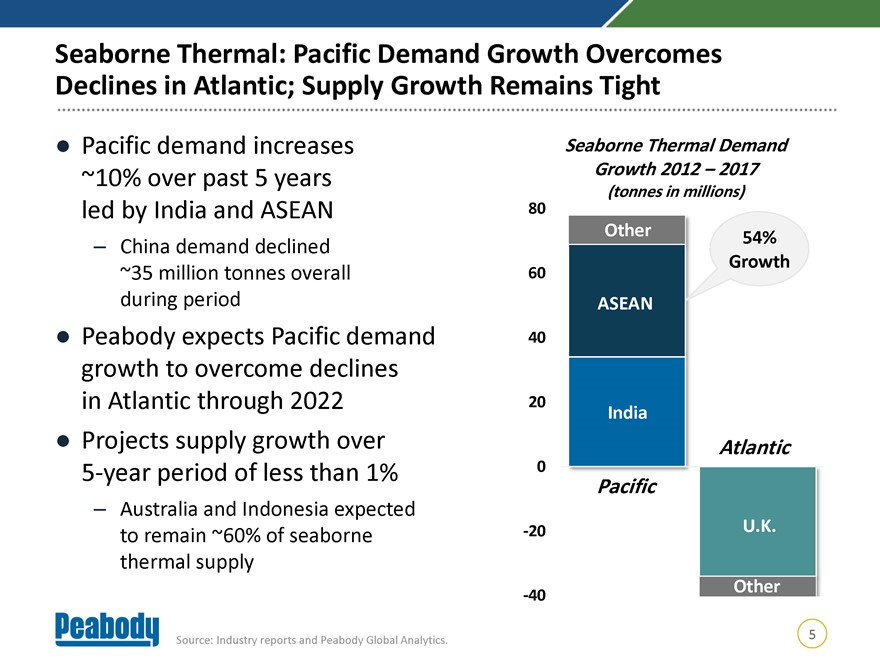 |
Seaborne Thermal: Pacific Demand Growth Overcomes Declines in Atlantic; Supply Growth Remains Tight Pacific demand increases Seaborne Thermal Demand ~10% over past 5 years Growth 2012 – 2017 (tonnes in millions) led by India and ASEAN 80 Other 54% – China demand declined Growth ~35 million tonnes overall 60 during period ASEAN Peabody expects Pacific demand 40 growth to overcome declines in Atlantic through 2022 20 India Projects supply growth over5-year period of less than 1% 0 – Australia and Indonesia expected-20 U.K. to remain ~60% of seaborne thermal supply Other-40 5 Source: Industry reports and Peabody Global Analytics.
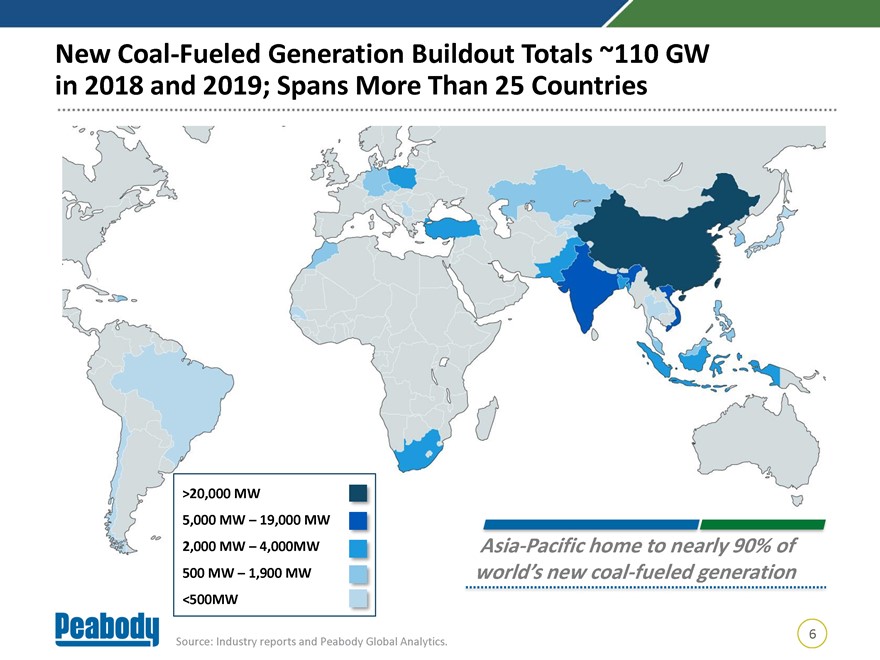
New Coal-Fueled Generation Buildout Totals ~110 GW in 2018 and 2019; Spans More Than 25 Countries >20,000 MW 5,000 MW – 19,000 MW 2,000 MW – 4,000MW Asia-Pacific home to nearly 90% of 500 MW – 1,900 MW world’s new coal-fueled generation <500MW 6 Source: Industry reports and Peabody Global Analytics.
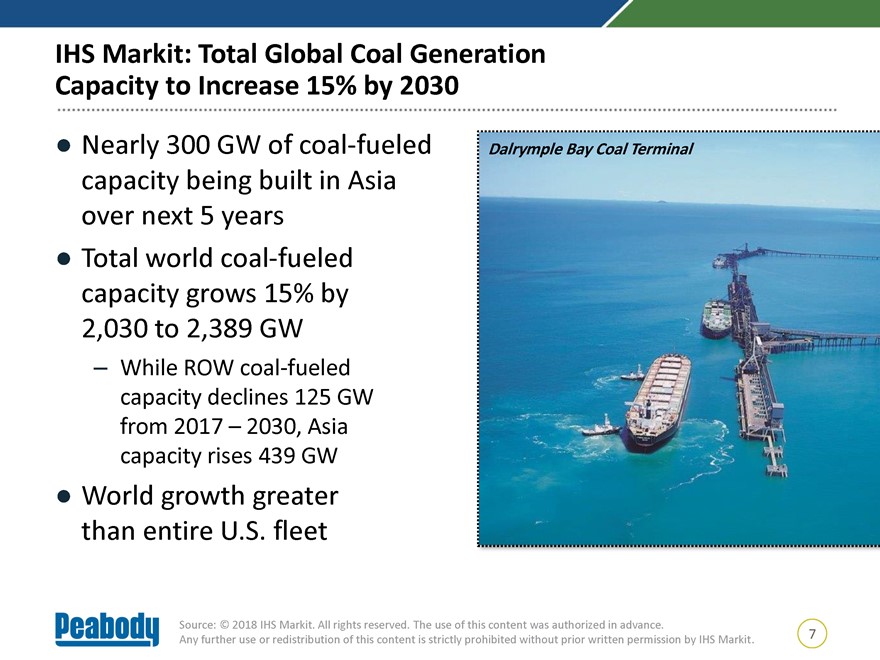
IHS Markit: Total Global Coal Generation Capacity to Increase 15% by 2030 Nearly 300 GW of coal-fueled Dalrymple Bay Coal Terminal capacity being built in Asia over next 5 years Total world coal-fueled capacity grows 15% by 2,030 to 2,389 GW – While ROW coal-fueled capacity declines 125 GW from 2017 – 2030, Asia capacity rises 439 GW World growth greater than entire U.S. fleet Source: © 2018 IHS Markit. All rights reserved. The use of this content was authorized in advance. 7 Any further use or redistribution of this content is strictly prohibited without prior written permission by IHS Markit.
|
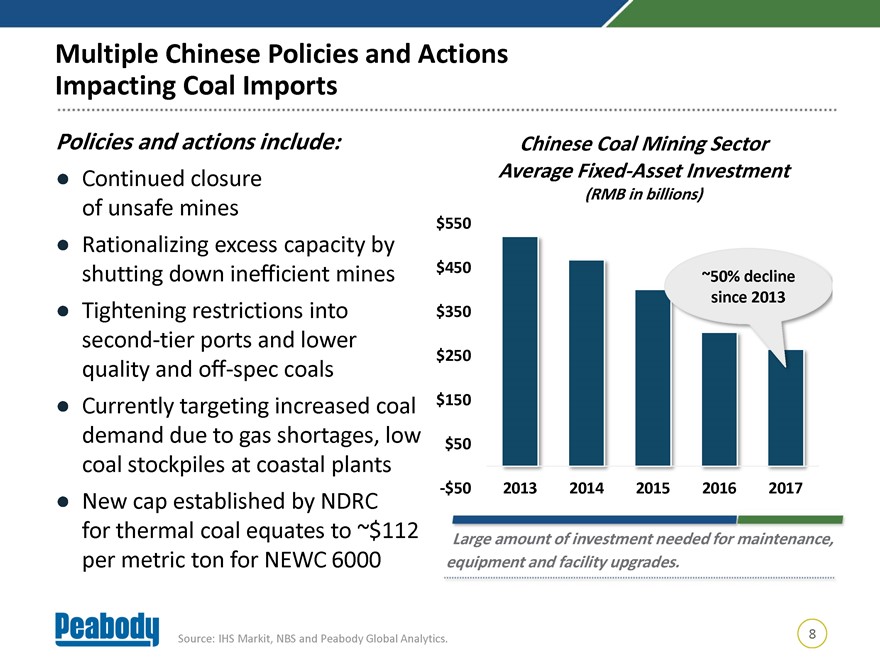 |
Multiple Chinese Policies and Actions Impacting Coal Imports Policies and actions include: Chinese Coal Mining Sector Continued closure Average Fixed-Asset Investment (RMB in billions) of unsafe mines $550 Rationalizing excess capacity by shutting down inefficient mines $450 ~50% decline since 2013 Tightening restrictions into $350 second-tier ports and lower $250 quality andoff-spec coals Currently targeting increased coal $150 demand due to gas shortages, low $50 coal stockpiles at coastal plants -$50 2013 2014 2015 2016 2017 New cap established by NDRC for thermal coal equates to ~$112 Large amount of investment needed for maintenance, per metric ton for NEWC 6000 equipment and facility upgrades. Source: IHS Markit, NBS and Peabody Global Analytics. 8
|
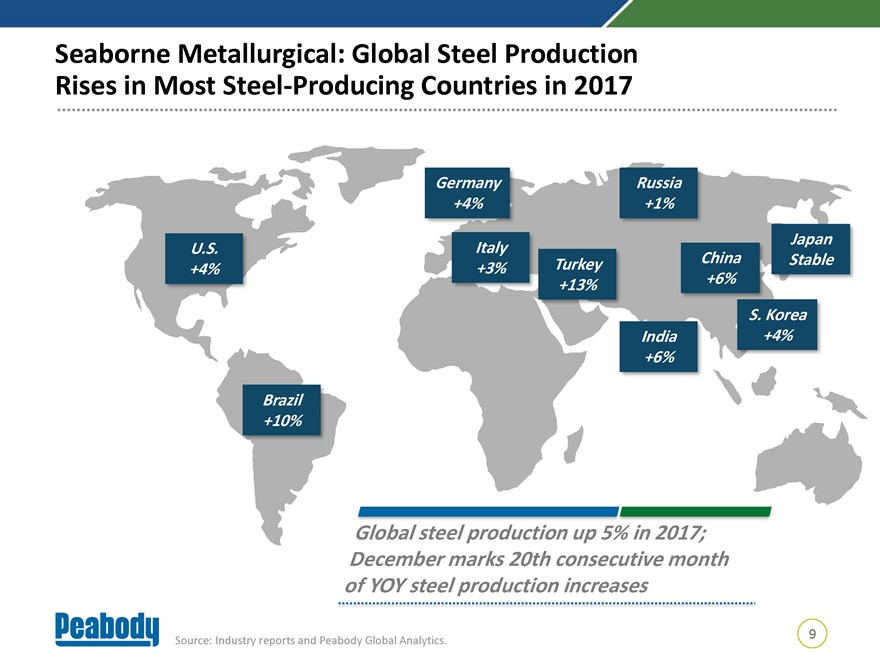 |
Seaborne Metallurgical: Global Steel Production Rises in Most Steel-Producing Countries in 2017 Germany Russia +4% +1% Japan U.S. Italy Turkey China Stable +4% +3% +13% +6% S. Korea India +4% +6% Brazil +10% Global steel production up 5% in 2017; December marks 20th consecutive month of YOY steel production increases 9 Source: Industry reports and Peabody Global Analytics.
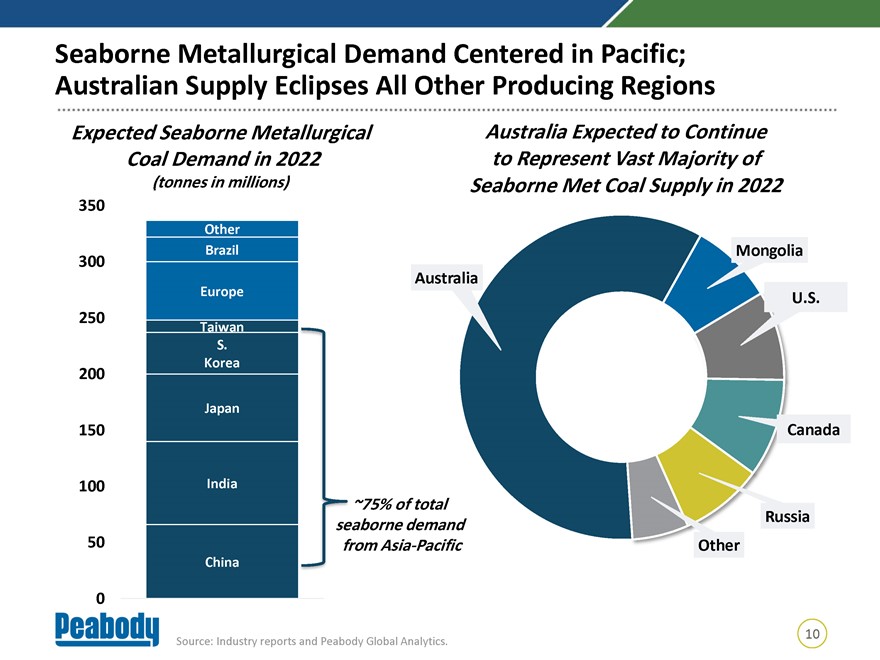
Seaborne Metallurgical Demand Centered in Pacific; Australian Supply Eclipses All Other Producing Regions Expected Seaborne Metallurgical Australia Expected to Continue Coal Demand in 2022 to Represent Vast Majority of (tonnes in millions) Seaborne Met Coal Supply in 2022 350 Other Brazil Mongolia 300 Australia Europe U.S. 250 Taiwan S. Korea 200 Japan 150 Canada 100 India ~75% of total Russia aborne demand 50 om Asia-Pacific Other China 0 10 Source: Industry reports and Peabody Global Analytics.
|
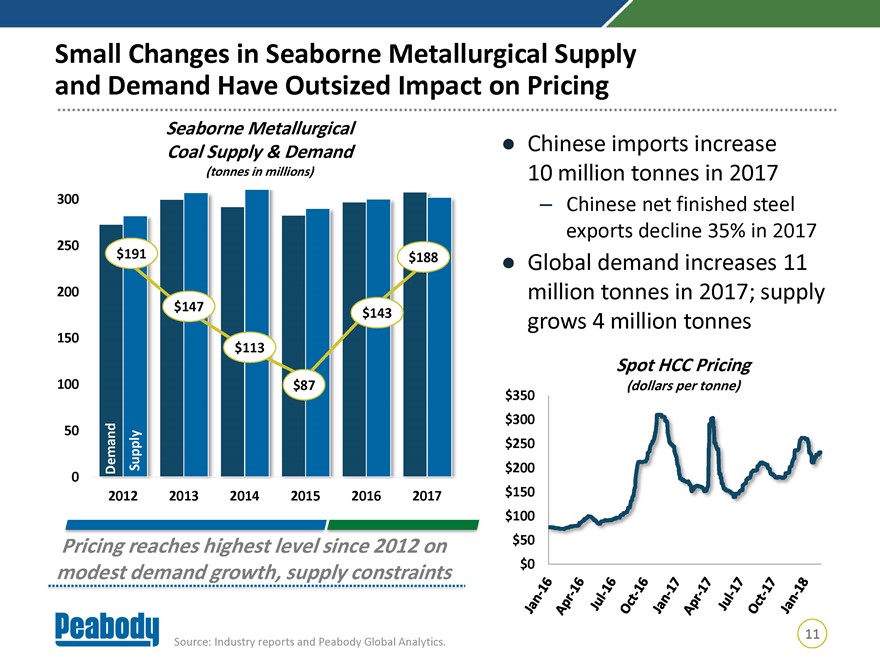 |
Small Changes in Seaborne Metallurgical Supply and Demand Have Outsized Impact on Pricing Seaborne Metallurgical Coal Supply & Demand Chinese imports increase (tonnes in millions) 10 million tonnes in 2017 300 – Chinese net finished steel exports decline 35% in 2017 250 $191 $188 Global demand increases 11 200 million tonnes in 2017; supply $147 $143 grows 4 million tonnes 150 $113 Spot HCC Pricing 100 $87 $350 (dollars per tonne) 50 $300 Supply $250 Demand $200 0 2012 2013 2014 2015 2016 2017 $150 $100 Pricing reaches highest level since 2012 on $50 modest demand growth, supply constraints $0 11 Source: Industry reports and Peabody Global Analytics.
|
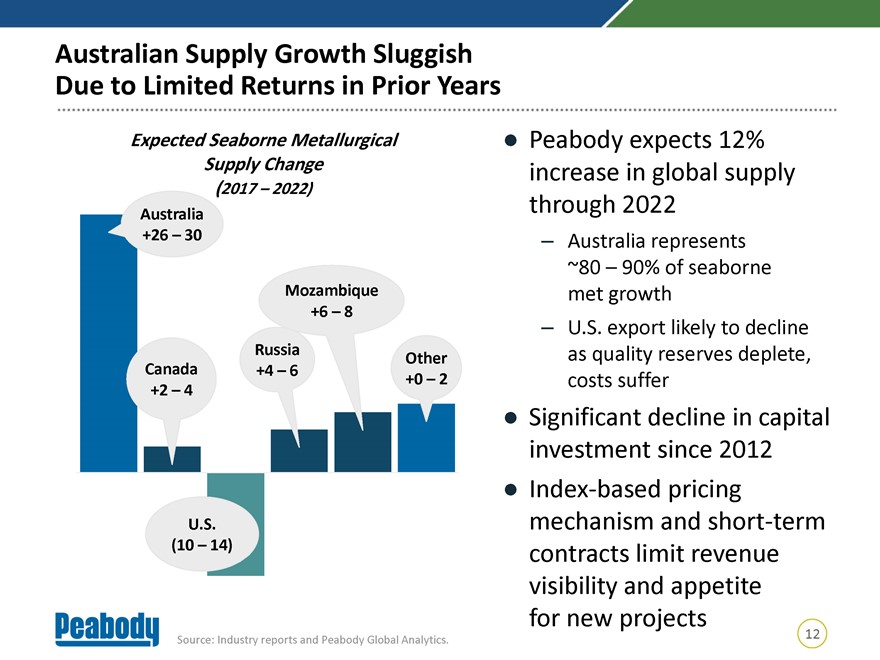 |
Australian Supply Growth Sluggish Due to Limited Returns in Prior Years Expected Seaborne Metallurgical Peabody expects 12% Supply Change increase in global supply (2017 – 2022) through 2022 Australia +26 – 30 – Australia represents ~80 – 90% of seaborne Mozambique met growth +6 – 8 – U.S. export likely to decline Russia as quality reserves deplete, Other Canada +4 – 6 +0 – 2 costs suffer +2 – 4 Significant decline in capital investment since 2012 Index-based pricing U.S. mechanism and short-term (10 – 14) contracts limit revenue visibility and appetite for new projects 12 Source: Industry reports and Peabody Global Analytics.
|
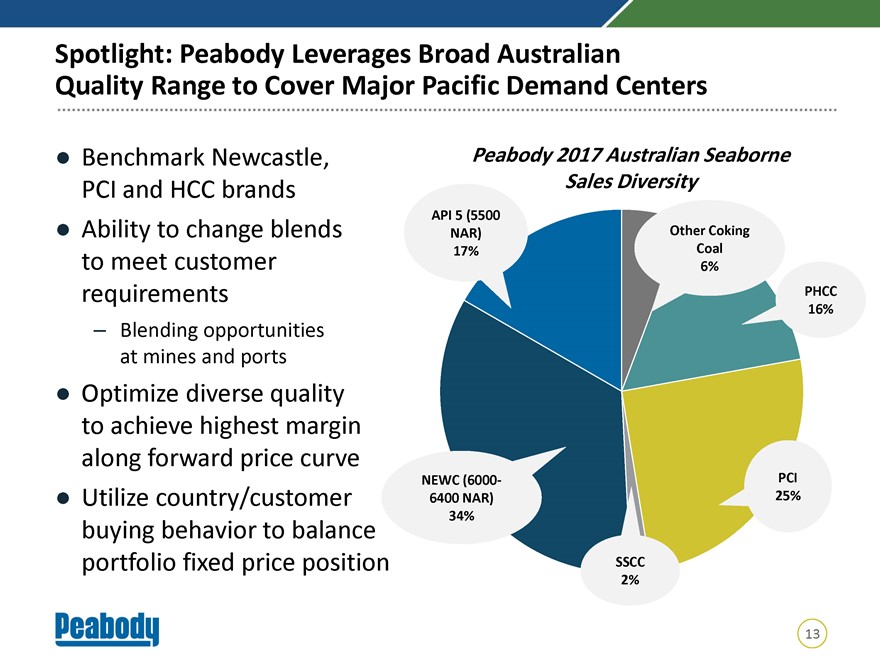 |
Spotlight: Peabody Leverages Broad Australian Quality Range to Cover Major Pacific Demand Centers Benchmark Newcastle, Peabody 2017 Australian Seaborne PCI and HCC brands Sales Diversity API 5 (5500 Ability to change blends NAR) Other Coking 17% Coal to meet customer 6% requirements PHCC 16% – Blending opportunities at mines and ports Optimize diverse quality to achieve highest margin along forward price curve NEWC (6000- PCI Utilize country/customer 6400 NAR) 25% 34% buying behavior to balance portfolio fixed price position SSCC 2% 13
|
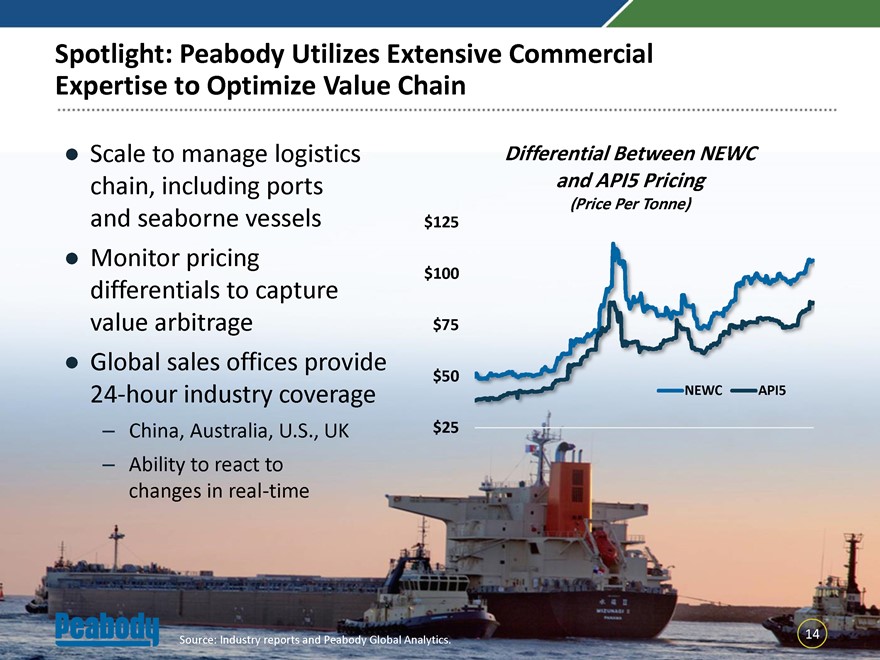 |
Spotlight: Peabody Utilizes Extensive Commercial Expertise to Optimize Value Chain Scale to manage logistics Differential Between NEWC chain, including ports and API5 Pricing (Price Per Tonne) and seaborne vessels $125 Monitor pricing $100 differentials to capture value arbitrage $75 Global sales offices provide $5024-hour industry coverage NEWC API5 – China, Australia, U.S., UK $25 – Ability to react to changes in real-time 14 Source: Industry reports and Peabody Global Analytics.
|
 |
U.S. Fundamentals: Coal Demand Impacted by Multiple Factors Over Last Decade Electricity Generation Natural Gas Production Increased energy efficiency (Thousand GWh) (billion cubic feet per day) and low growth rates result in slight decline 4,157 73 in electricity demand 4,043 Natural gas production and distribution rises 53 substantially resulting in strong supply and lower pricing Intense regulation takes target at coal mining and use Wind and solar 2007 2017 2007 2017 buildout heavily supported by subsidies 15 Source: Industry reports and Peabody Global Analytics. 2017 natural gas production from EIA through October 2017.
|
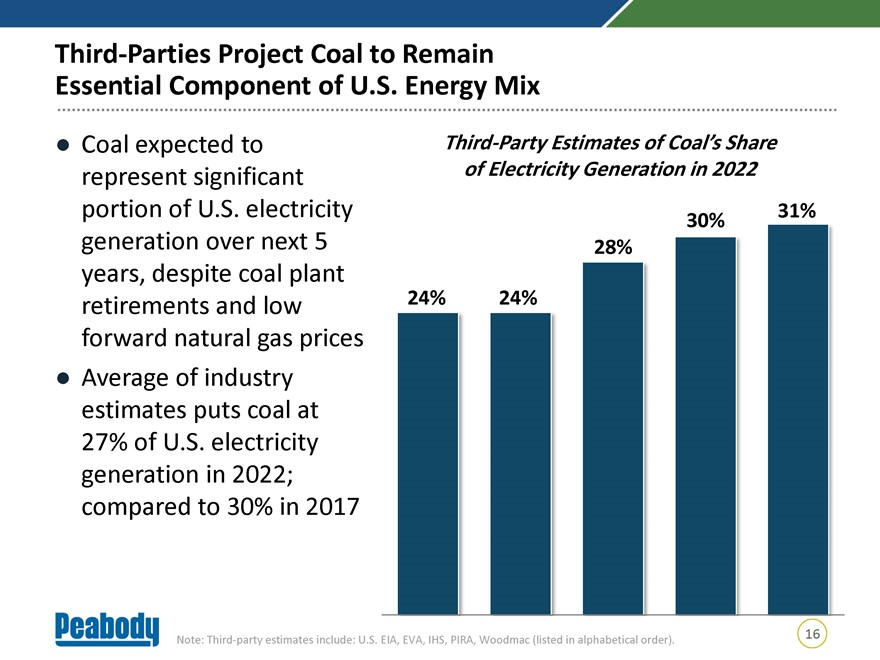 |
Third-Parties Project Coal to Remain Essential Component of U.S. Energy Mix Coal expected to Third-Party Estimates of Coal’s Share represent significant of Electricity Generation in 2022 portion of U.S. electricity 31% 30% generation over next 5 28% years, despite coal plant retirements and low 24% 24% forward natural gas prices Average of industry estimates puts coal at 27% of U.S. electricity generation in 2022; compared to 30% in 2017 16 Note: Third-party estimates include: U.S. EIA, EVA, IHS, PIRA, Woodmac (listed in alphabetical order).
|
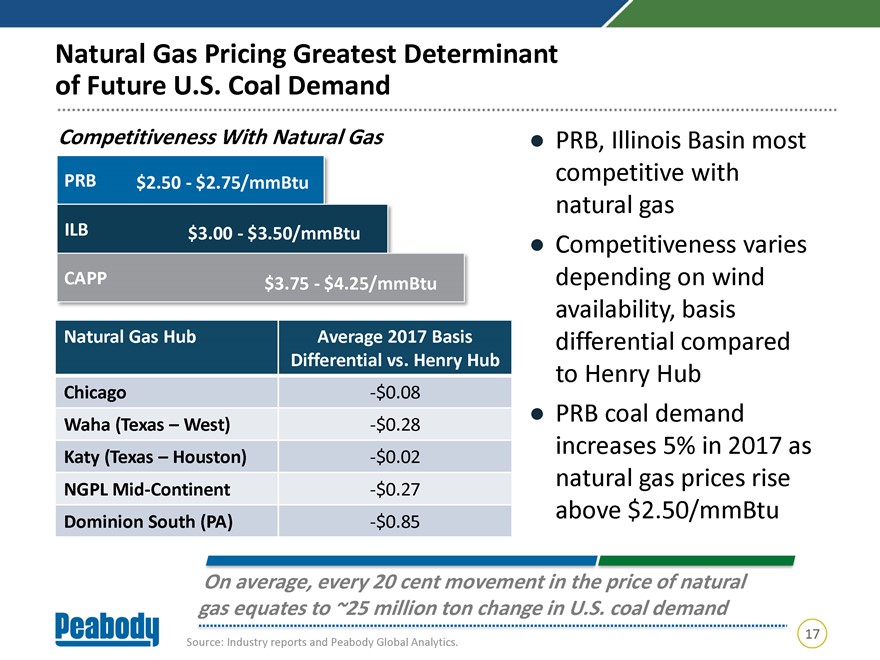 |
Natural Gas Pricing Greatest Determinant of Future U.S. Coal Demand Competitiveness With Natural Gas PRB, Illinois Basin most PRB competitive with $2.50—$2.75/mmBtu natural gas ILB $3.00—$3.50/mmBtu Competitiveness varies CAPP $3.75—$4.25/mmBtu depending on wind availability, basis Natural Gas Hub Average 2017 Basis differential compared Differential vs. Henry Hub to Henry Hub Chicago -$0.08 PRB coal demand Waha (Texas – West) -$0.28 increases 5% in 2017 as Katy (Texas – Houston) -$0.02 natural gas prices rise NGPLMid-Continent -$0.27 above $2.50/mmBtu Dominion South (PA) -$0.85 On average, every 20 cent movement in the price of natural gas equates to ~25 million ton change in U.S. coal demand 17 Source: Industry reports and Peabody Global Analytics.
|
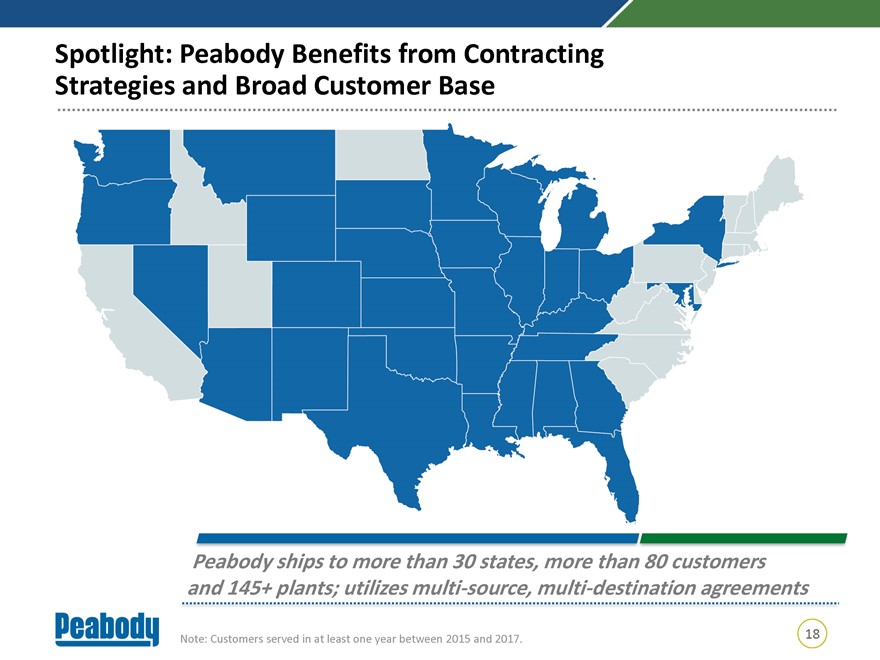 |
Spotlight: Peabody Benefits from Contracting Strategies and Broad Customer Base Peabody ships to more than 30 states, more than 80 customers and 145+ plants; utilizes multi-source, multi-destination agreements Note: Customers served in at least one year between 2015 and 2017. 18
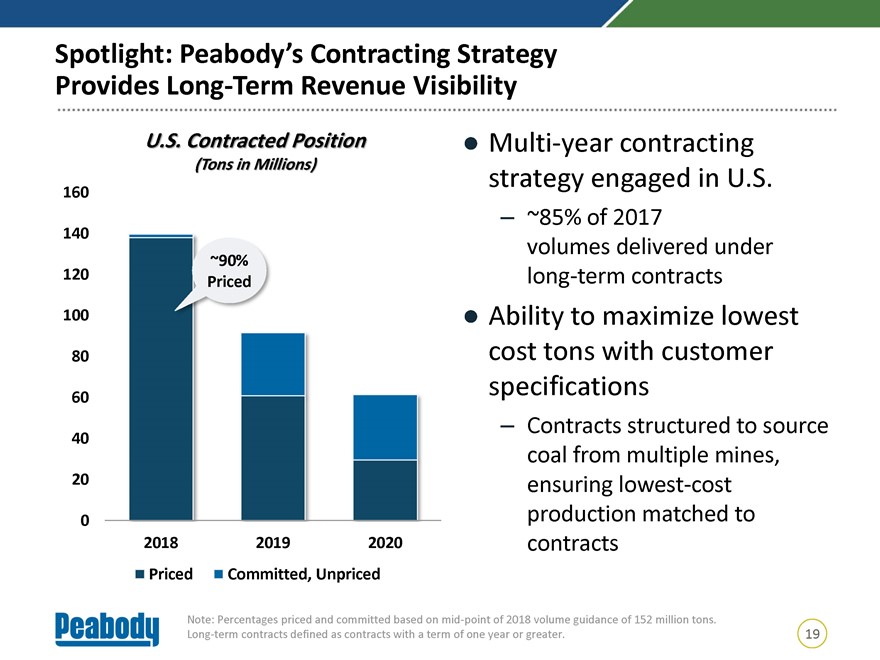
Spotlight: Peabody’s Contracting Strategy Provides Long-Term Revenue Visibility U.S. Contracted Position Multi-year contracting (Tons in Millions) strategy engaged in U.S. 160 – ~85% of 2017 140 volumes delivered under ~90% 120 long-term contracts Priced 100 Ability to maximize lowest 80 cost tons with customer specifications 60 – Contracts structured to source 40 coal from multiple mines, 20 ensuring lowest-cost 0 production matched to 2018 2019 2020 contracts Priced Committed, Unpriced Note: Percentages priced and committed based onmid-point of 2018 volume guidance of 152 million tons. Long-term contracts defined as contracts with a term of one year or greater. 19
|
 |
Closing Thoughts: Peabody has thoughtful, deliberate marketing strategy to take advantage of significant scale, geographic and product diversity Company has vast understanding of customer needs and provides products to meet their specific requirements Sophisticated blending capabilities and understanding of“value-in-use” allows Peabody to maximize returns 20
Australia: Right Place, Right Products Generating Meaningful Returns George J. Schuller Jr. President Australia February 22, 2018
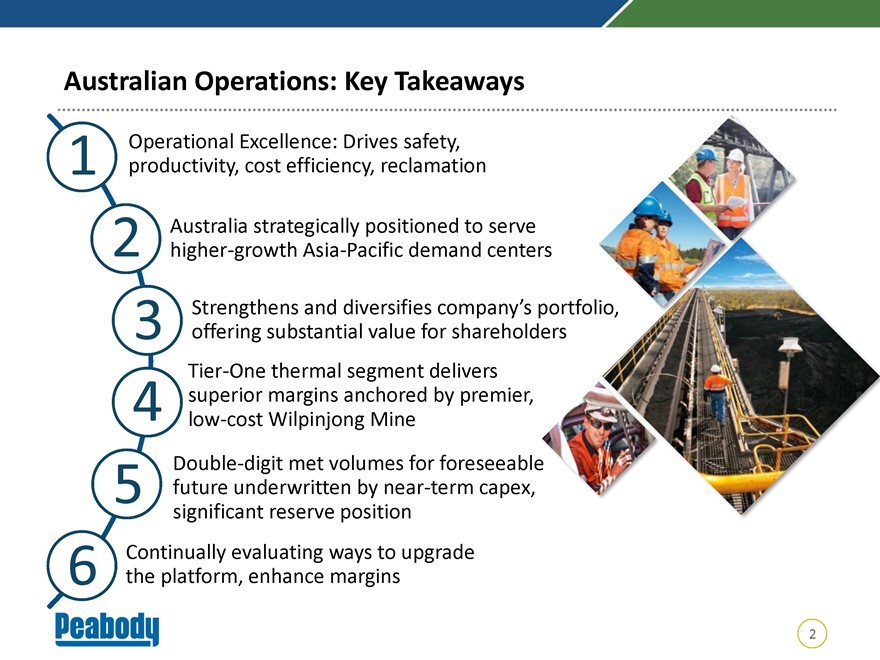
Australian Operations: Key Takeaways Operational Excellence: Drives safety, 1 productivity, cost efficiency, reclamation 2 Australia strategically positioned to serve higher-growth Asia-Pacific demand centers Strengthens and diversifies company’s portfol 3 offering substantial value for shareholdersTier-One thermal segment delivers 4 superior margins anchored by premier,low-cost Wilpinjong Mine Double-digit met volumes for foreseeable 5 future underwritten by near-term capex, significant reserve position Continually evaluating ways to upgrade 6 the platform, enhance margins 2
Australia Well-Positioned to Serve Higher-Growth Demand Centers Strategy Operate safe and sustainable mines serving higher-growth Asian-Pacific demand centers, while exploring means to upgrade the platform and improve our cost position Nine operations providing a range of met and thermal coal products to customers in multiple countries 3
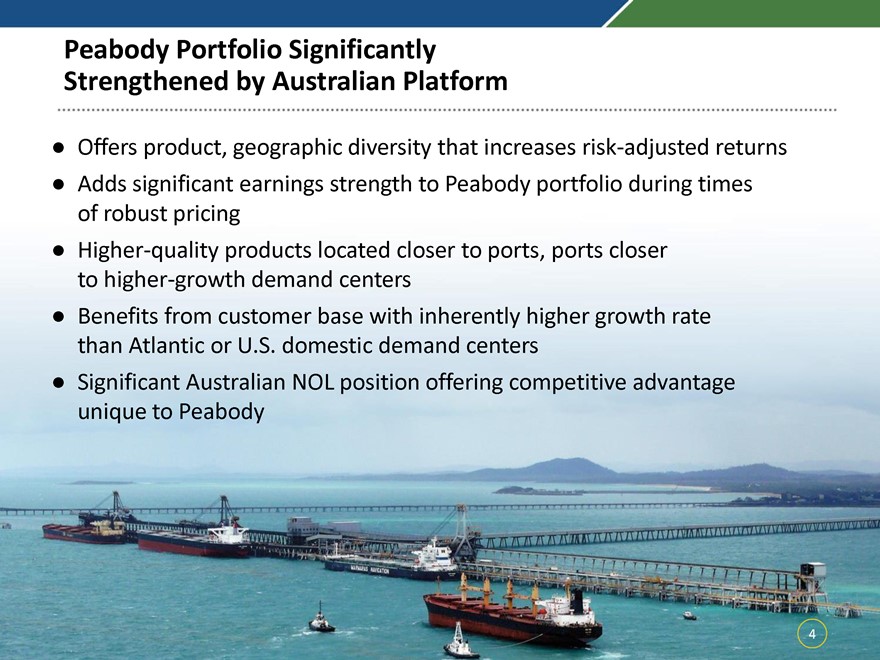
Peabody Portfolio Significantly Strengthened by Australian Platform Offers product, geographic diversity that increases risk-adjusted returns Adds significant earnings strength to Peabody portfolio during times of robust pricing Higher-quality products located closer to ports, ports closer to higher-growth demand centers Benefits from customer base with inherently higher growth rate than Atlantic or U.S. domestic demand centers Significant Australian NOL position offering competitive advantage unique to Peabody 4
|
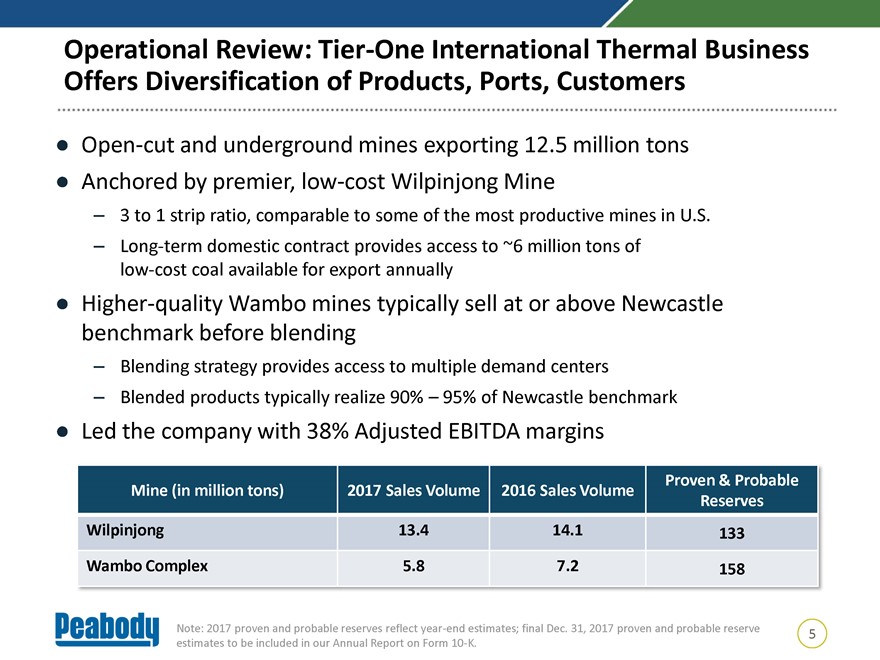 |
Operational Review:Tier-One International Thermal Business Offers Diversification of Products, Ports,Customers Open-cut and underground mines exporting 12.5 million tons Anchored by premier,low-cost Wilpinjong Mine – 3 to 1 strip ratio, comparable to some of the most productive mines in U.S. – Long-term domestic contract provides access to ~6 million tons oflow-cost coal available for export annually Higher-quality Wambo mines typically sell at or above Newcastle benchmark before blending – Blending strategy provides access to multiple demand centers – Blended products typically realize 90% – 95% of Newcastle benchmark Led the company with 38% Adjusted EBITDA margins Proven & Probable Mine (in million tons) 2017 Sales Volume 2016 Sales Volume Reserves Wilpinjong 13.4 14.1 133 Wambo Complex 5.8 7.2 158 Note: 2017 proven and probable reserves reflectyear-end estimates; final Dec. 31, 2017 proven and probable reserve 5 estimates to be included in our Annual Report on Form10-K.
|
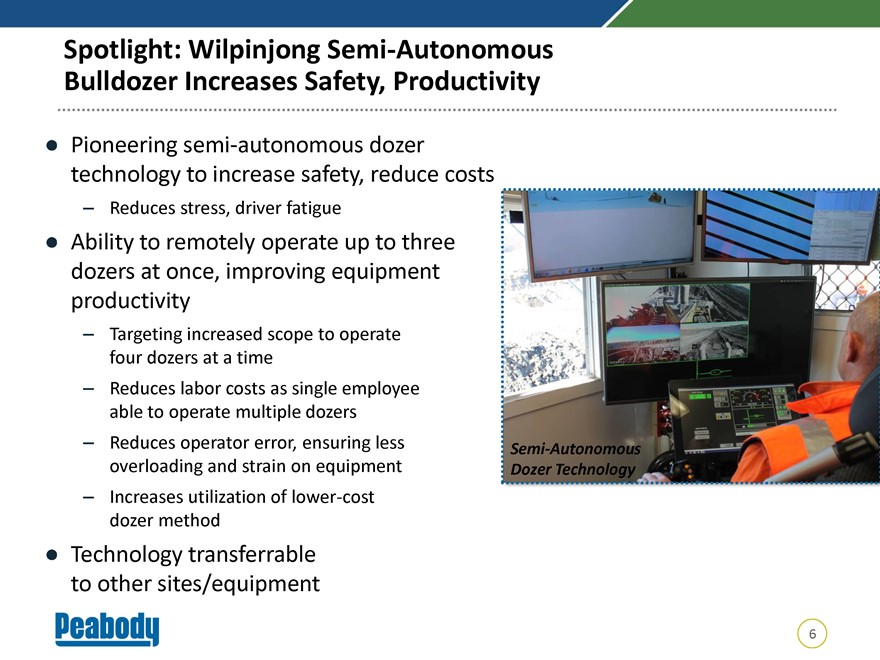 |
Spotlight: Wilpinjong Semi-Autonomous Bulldozer Increases Safety, Productivity Pioneering semi-autonomous dozer technology to increase safety, reduce costs – Reduces stress, driver fatigue Ability to remotely operate up to three dozers at once, improving equipment productivity – Targeting increased scope to operate four dozers at a time – Reduces labor costs as single employee able to operate multiple dozers – Reduces operator error, ensuring less Semi-Autonomous overloading and strain on equipment Dozer Technology – Increases utilization of lower-cost dozer method Technology transferrable to other sites/equipment 6
|
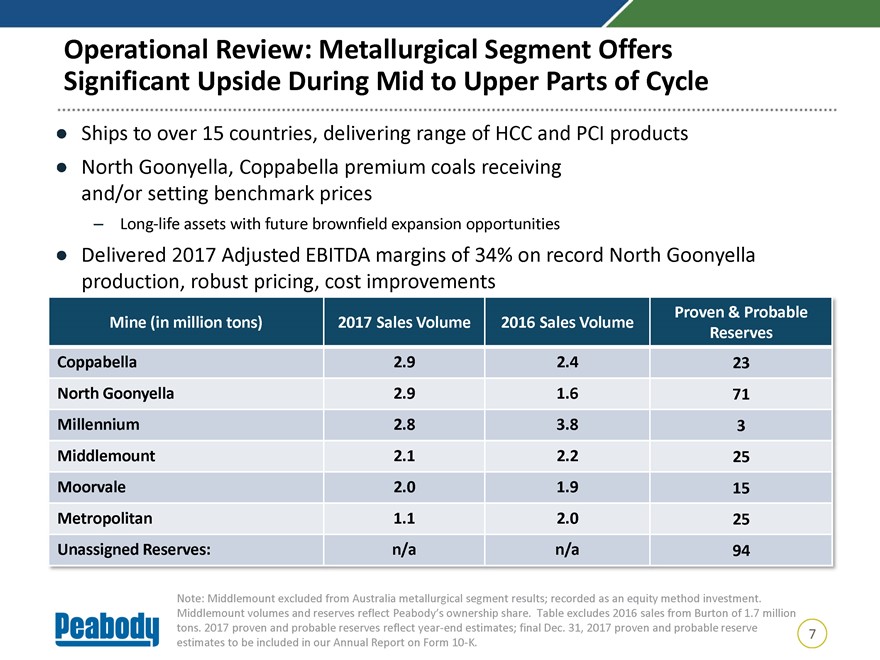 |
Operational Review: Metallurgical Segment Offers Significant Upside During Mid to Upper Parts of Cycle Ships to over 15 countries, delivering range of HCC and PCI products North Goonyella, Coppabella premium coals receiving and/or setting benchmark prices – Long-life assets with future brownfield expansion opportunities Delivered 2017 Adjusted EBITDA margins of 34% on record North Goonyella production, robust pricing, cost improvements Proven & Probable Mine (in million tons) 2017 Sales Volume 2016 Sales Volume Reserves Coppabella 2.9 2.4 23 North Goonyella 2.9 1.6 71 Millennium 2.8 3.8 3 Middlemount 2.1 2.2 25 Moorvale 2.0 1.9 15 Metropolitan 1.1 2.0 25 Unassigned Reserves: n/a n/a 94 Note: Middlemount excluded from Australia metallurgical segment results; recorded as an equity method investment. Middlemount volumes and reserves reflect Peabody’s ownership share. Table excludes 2016 sales from Burton of 1.7 million tons. 2017 proven and probable reserves reflectyear-end estimates; final Dec. 31, 2017 proven and probable reserve 7 estimates to be included in our Annual Report on Form10-K.
|
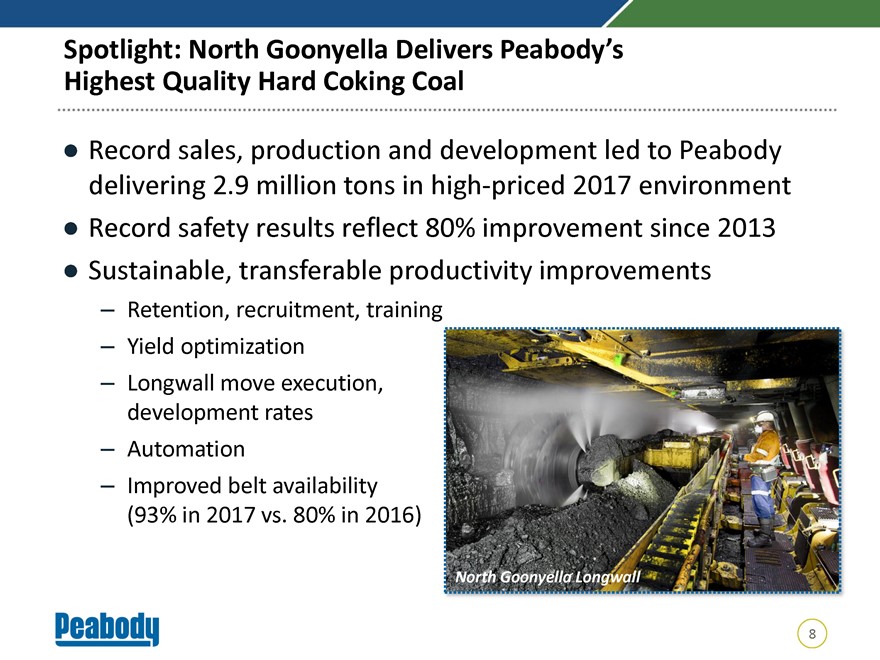 |
Spotlight: North Goonyella Delivers Peabody’s Highest Quality Hard Coking Coal Record sales, production and development led to Peabody delivering 2.9 million tons in high-priced 2017 environment Record safety results reflect 80% improvement since 2013 Sustainable, transferable productivity improvements – Retention, recruitment, training – Yield optimization – Longwall move execution, development rates – Automation – Improved belt availability (93% in 2017 vs. 80% in 2016) North Goonyella Longwall 8
|
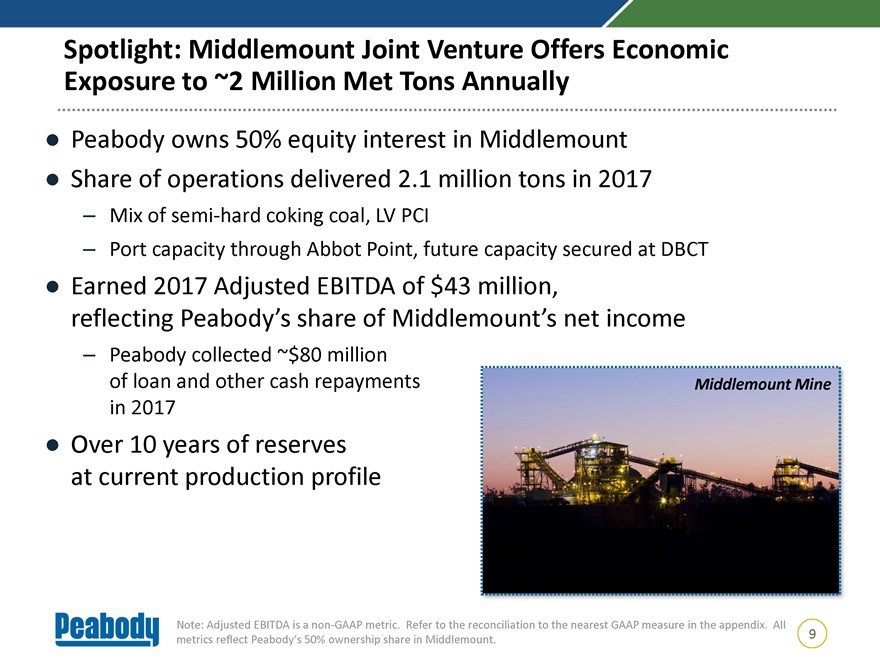 |
Spotlight: Middlemount Joint Venture Offers Economic Exposure to ~2 Million Met Tons Annually Peabody owns 50% equity interest in Middlemount Share of operations delivered 2.1 million tons in 2017 – Mix of semi-hard coking coal, LV PCI – Port capacity through Abbot Point, future capacity secured at DBCT Earned 2017 Adjusted EBITDA of $43 million, reflecting Peabody’s share of Middlemount’s net income – Peabody collected ~$80 million of loan and other cash repayments Middlemount Mine in 2017 Over 10 years of reserves at current production profile Note: Adjusted EBITDA is anon-GAAP metric. Refer to the reconciliation to the nearest GAAP measure in the appendix. All 9 metrics reflect Peabody’s 50% ownership share in Middlemount.
|
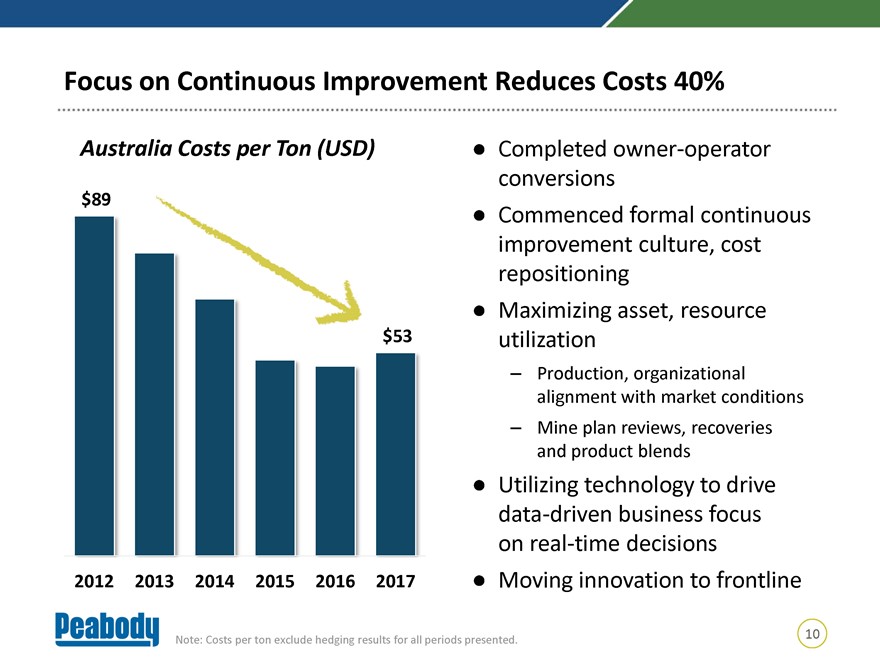 |
Focus on Continuous Improvement Reduces Costs 40% Australia Costs per Ton (USD) Completed owner-operator conversions $89 Commenced formal continuous improvement culture, cost repositioning Maximizing asset, resource $53 utilization – Production, organizational alignment with market conditions – Mine plan reviews, recoveries and product blends Utilizing technology to drive data-driven business focus on real-time decisions 2012 2013 2014 2015 2016 2017 Moving innovation to frontline 10 Note: Costs per ton exclude hedging results for all periods presented.
|
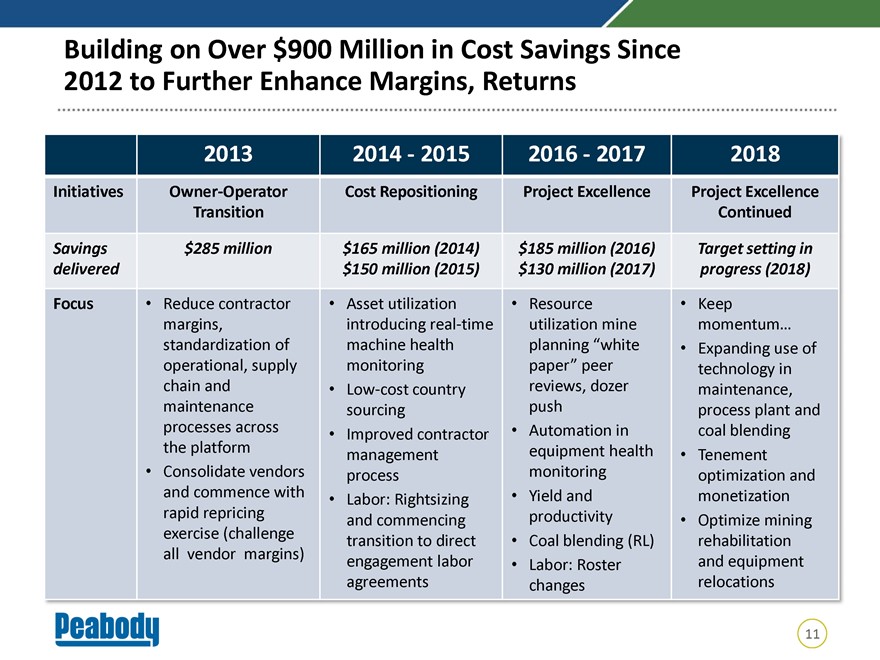 |
Building on Over $900 Million in Cost Savings Since 2012 to Further Enhance Margins, Returns 2013 2014—2015 2016—2017 2018 Initiatives Owner-Operator Cost Repositioning Project Excellence Project Excellence Transition Continued Savings $285 million $165 million (2014) $185 million (2016) Target setting in delivered $150 million (2015) $130 million (2017) progress (2018) Focus Reduce contractor Asset utilization Resource Keep margins, introducing real-time utilization mine momentum… standardization of machine health planning “white Expanding use of operational, supply monitoring paper” peer technology in chain andLow-cost country reviews, dozer maintenance, maintenance sourcing push process plant and processes across Automation in coal blending the platform Improved contractor management equipment health Tenement Consolidate vendors process monitoring optimization and and commence with Yield and monetization rapid repricing Labor: Rightsizing and commencing productivity Optimize mining exercise (challenge all vendor margins) transition to direct Coal blending (RL) rehabilitation engagement labor Labor: Roster and equipment agreements changes relocations 11
|
 |
Targeting 2018 Volumes, Costs in Line with 2017; Focused on Further Improving Competitiveness Continued, deliberate focus on costs, productivity improvements mitigates external cost pressures of ~$5 to $7 per ton – Major A$ fluctuations, sales-related royalties, fuel costs Targeted total thermal volumes of 18.5 – 20.5 million tons in line with 2017 – Export volumes of 11.5 – 12.5 million tons expected to be impacted by increased domestic sales to meet customer contract – Would look to move available capacity into export market to extent domestic volumes are lower Targeting met volumes of 11 – 12 million tons, even with North Goonyella longwall move, ramp down of Millennium Operations tasked with further cost improvements to drive productivity, maximize margins Note: Middlemount volumes excluded from targeted 2018 met sales volume of 11 – 12 million tons. Middlemount provides Peabody with an additional 2 million tons of economic met coal exposure. 12
|
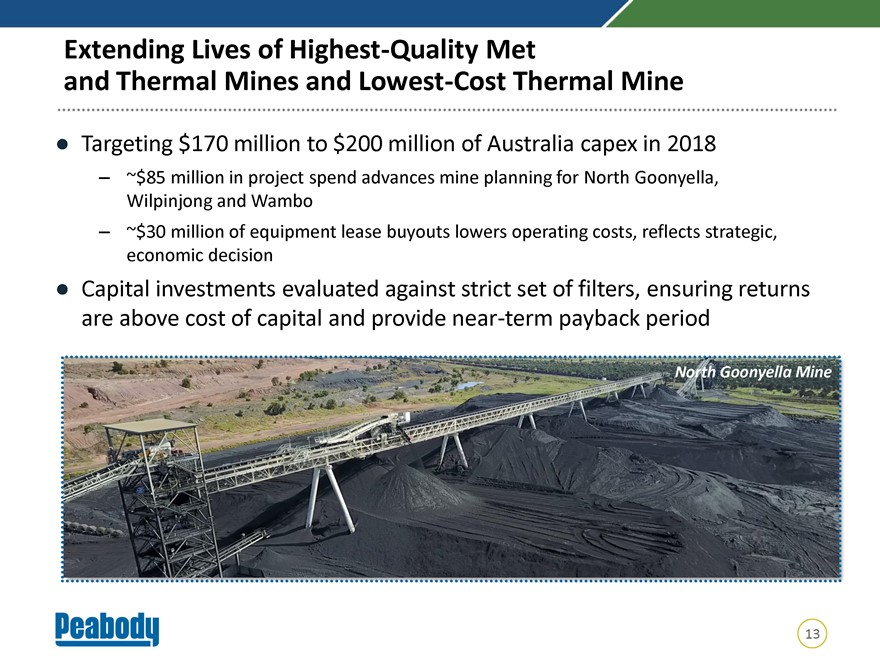 |
Extending Lives of Highest-Quality Met and Thermal Mines and Lowest-Cost Thermal Mine Targeting $170 million to $200 million of Australia capex in 2018 – ~$85 million in project spend advances mine planning for North Goonyella, Wilpinjong and Wambo – ~$30 million of equipment lease buyouts lowers operating costs, reflects strategic, economic decision Capital investments evaluated against strict set of filters, ensuring returns are above cost of capital and provide near-term payback period North Goonyella Mine 13
|
 |
Exploring Means to Expand Quality Thermal and Met Production Over Five-Year Planning Horizon Strong reserve portfolio, with nearly 15 years of thermal reserves and over 20 years of met reserves Wilpinjong Extension Project extends life oflow-cost, low strip-ratio mine WamboOpen-Cut / Glencore JV improves strip ratio over time, provides access to incremental reserves Evaluating longer-term options to extend life of Wambo complex Accelerating access of higher-quality reserves at North Goonyella Extending Moorvale Mine to 2025 through increased productivity, identification of additional coal areas, option to develop satellite pits utilizing existing infrastructure Continue to identify opportunistic investments for extensions or expansions to upgrade the met portfolio over time – Potential to extend North Goonyella through 2045 – Option to expand Coppabella – Potential organic opportunities over time Note: Reserve life based on Dec. 31, 2017 proven and probable reserve position and current production levels; final Dec. 31, 14 2017 proven and probable reserve estimates to be included in our Annual Report on Form10-K.
|
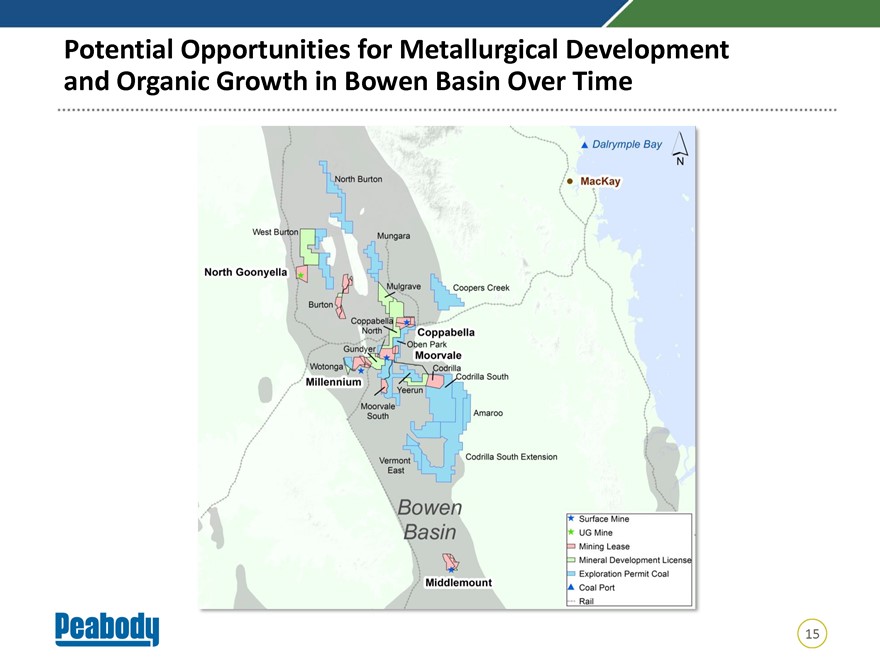 |
Potential Opportunities for Metallurgical Development and Organic Growth in Bowen Basin Over Time 15
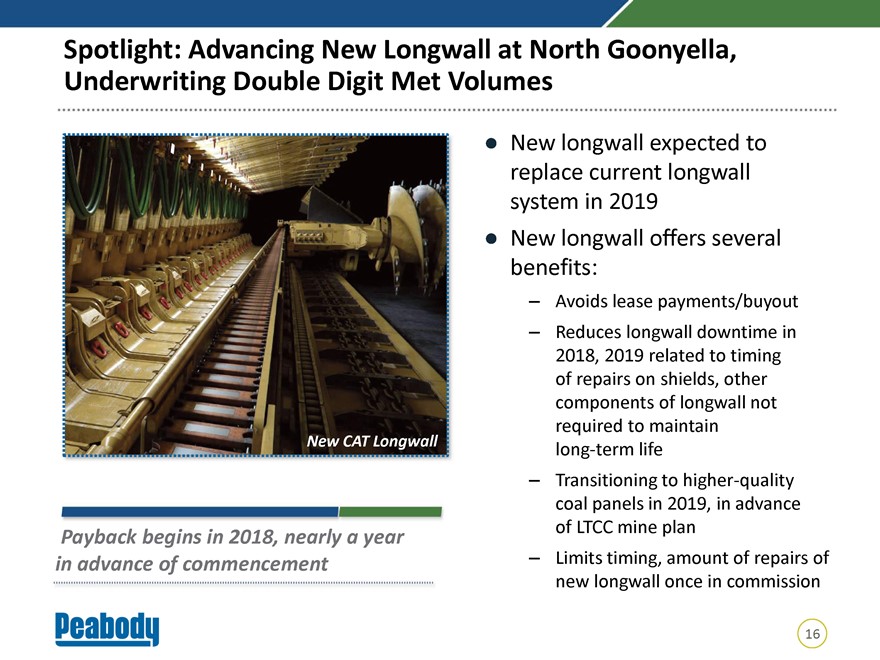
Spotlight: Advancing New Longwall at North Goonyella, Underwriting Double Digit Met Volumes New longwall expected to replace current longwall system in 2019 New longwall offers several benefits: – Avoids lease payments/buyout – Reduces longwall downtime in 2018, 2019 related to timing of repairs on shields, other components of longwall not required to maintain New CAT Longwall long-term life – Transitioning to higher-quality coal panels in 2019, in advance of LTCC mine plan Payback begins in 2018, nearly a year in advance of commencement – Limits timing, amount of repairs of new longwall once in commission 16
|
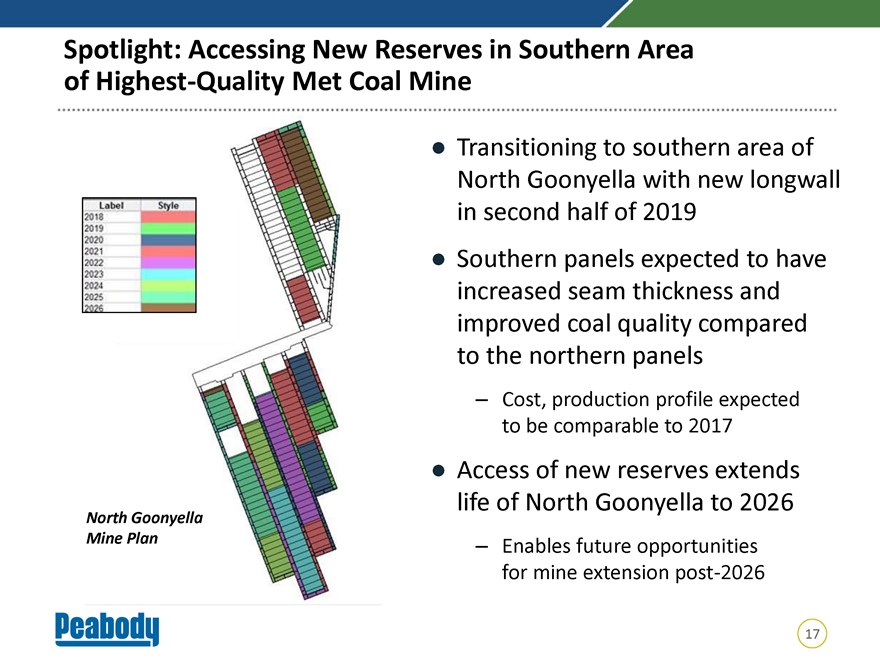 |
Spotlight: Accessing New Reserves in Southern Area of Highest-Quality Met Coal Mine Transitioning to southern area of North Goonyella with new longwall in second half of 2019 Southern panels expected to have increased seam thickness and improved coal quality compared to the northern panels – Cost, production profile expected to be comparable to 2017 Access of new reserves extends North Goonyella life of North 2012 2013 Goonyella 2014 2015 2016 to 2026 2017 Mine Plan – Enables future opportunities for mine extension post-2026 17
|
 |
Peabody Australia’s Platform: Key Integrated Part of Peabody Value Proposition Location matters…Peabody is strategically positioned to serve higher-growth Asia-Pacific demand centers Products matter…Delivering high-quality products drives shareholder value Returns matter…Peabody focused on generating meaningful returns across the operations – Maximizing margins through blending strategies – Focusing on continuous improvement to reduce costs – Executing on projects, delivering returns in excess of cost of capital and with a reasonable payback period Safety, environment and our people matter…Key components in ensuring a successful business and culture 18
Americas:Tier-One Assets in a Competitive Environment Kemal Williamson President Americas February 22, 2018
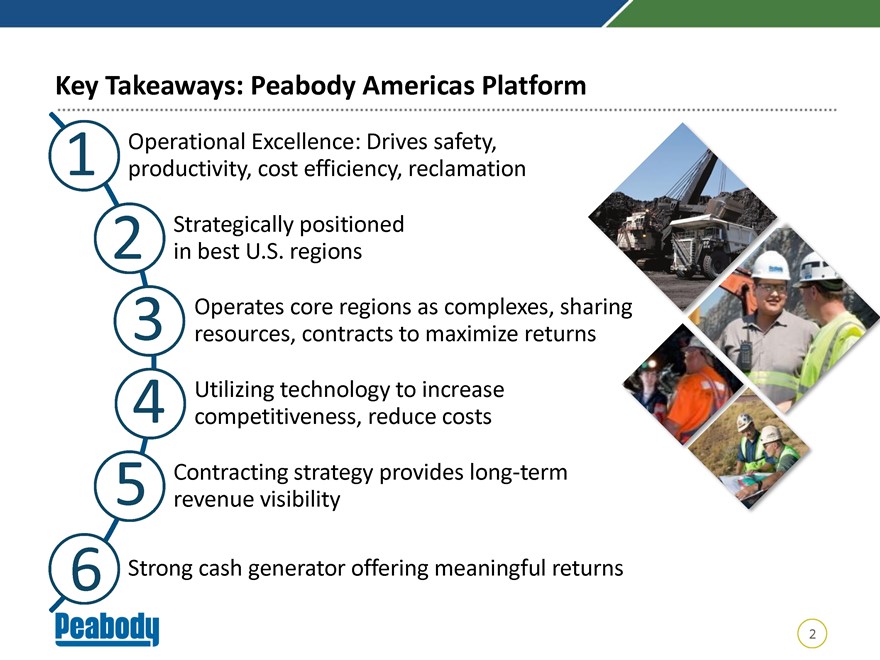
Key Takeaways: Peabody Americas Platform 1 Operational Excellence: Drives safety, productivity, cost efficiency, reclamation 2 Strategically positioned in best U.S. regions 3 Operates core regions as complexes, shari resources, contracts to maximize returns 4 Utilizing technology to increase competitiveness, reduce costs 5 Contracting strategy provides long-term revenue visibility 6 Strong cash generator offering meaningful returns 2
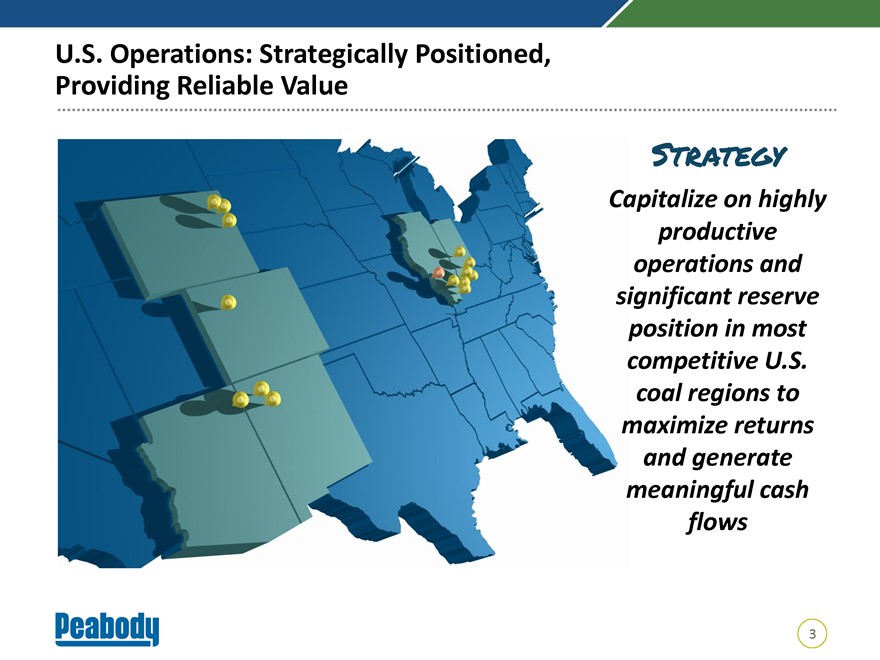
U.S. Operations: Strategically Positioned, Providing Reliable Value Strategy Capitalize on highly productive operations and significant reserve position in most competitive U.S. coal regions to maximize returns and generate meaningful cash flows 3
|
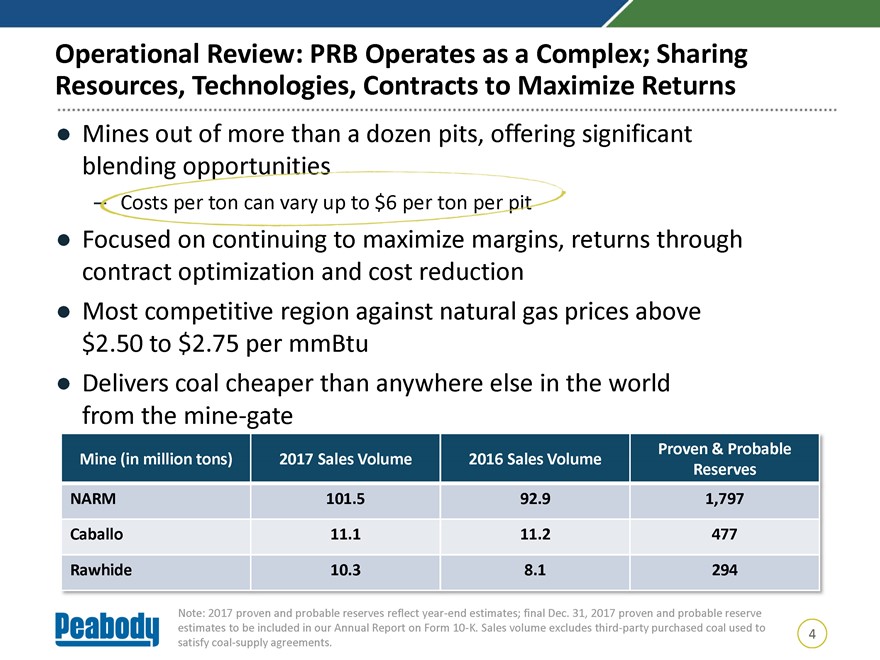 |
Operational Review: PRB Operates as a Complex; Sharing Resources, Technologies, Contracts to Maximize Returns Mines out of more than a dozen pits, offering significant blending opportunities Focused on continuing to maximize margins, returns through contract optimization and cost reduction Most competitive region against natural gas prices above $2.50 to $2.75 per mmBtu Delivers coal cheaper than anywhere else in the world from the mine-gate Proven & Probable Mine (in million tons) 2017 Sales Volume 2016 Sales Volume Reserves NARM 101.5 92.9 1,797 Caballo 11.1 11.2 477 Rawhide 10.3 8.1 294 Note: 2017 proven and probable reserves reflectyear-end estimates; final Dec. 31, 2017 proven and probable reserve estimates to be included in our Annual Report on Form10-K. Sales volume excludes third-party purchased coal used to 4 satisfy coal-supply agreements.
|
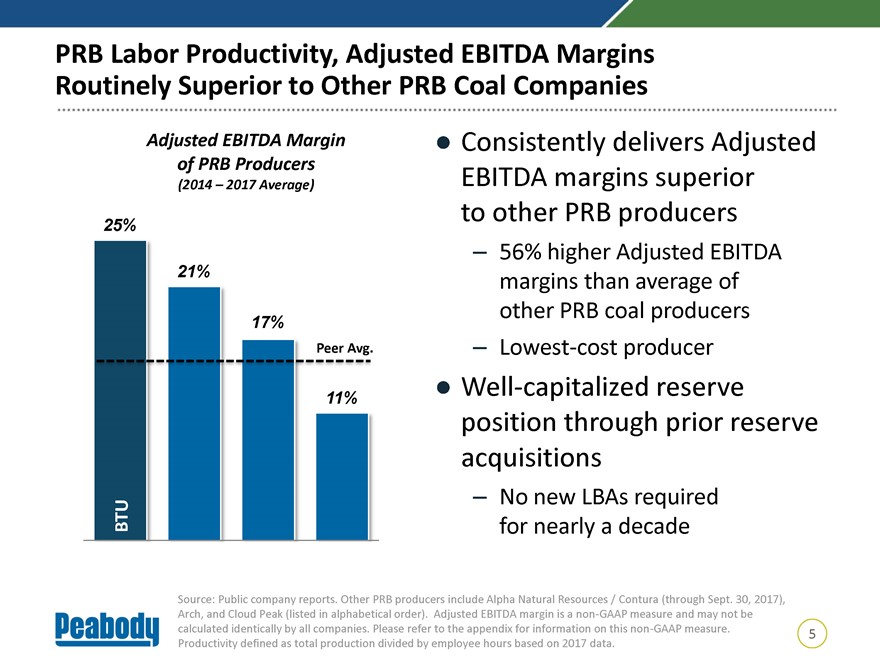 |
PRB Labor Productivity, Adjusted EBITDA Margins Routinely Superior to Other PRB Coal Companies Adjusted EBITDA Margin Consistently delivers Adjusted of PRB Producers (2014 – 2017 Average) EBITDA margins superior to other PRB producers 25% – 56% higher Adjusted EBITDA 21% margins than average of other PRB coal producers 17% Peer Avg. – Lowest-cost producer Well-capitalized reserve 11% position through prior reserve acquisitions – No new LBAs required BTU for nearly a decade Source: Public company reports. Other PRB producers include Alpha Natural Resources / Contura (through Sept. 30, 2017), Arch, and Cloud Peak (listed in alphabetical order). Adjusted EBITDA margin is anon-GAAP measure and may not be calculated identically by all companies. Please refer to the appendix for information on thisnon-GAAP measure. 5 Productivity defined as total production divided by employee hours based on 2017 data.
|
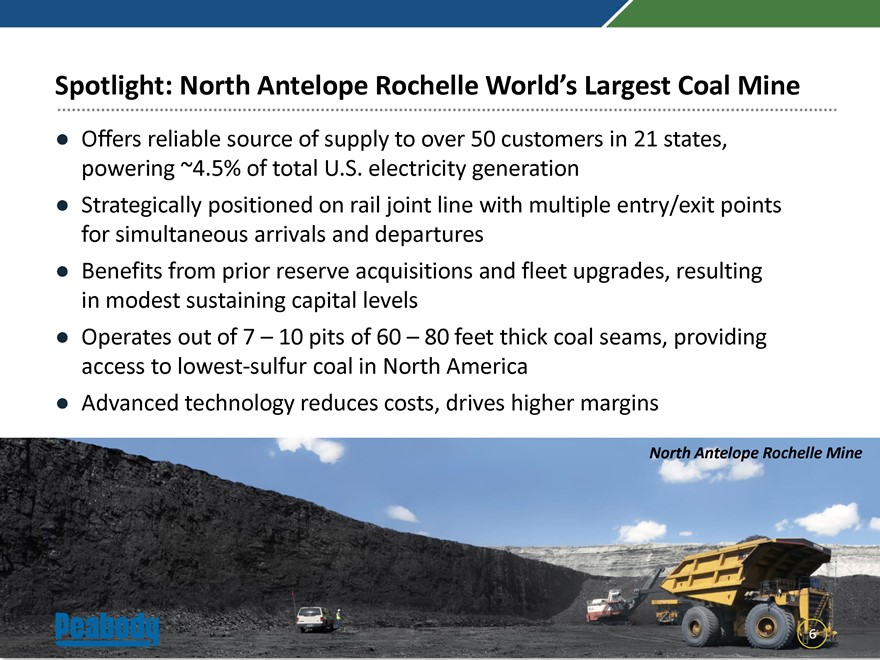 |
Spotlight: North Antelope Rochelle World’s Largest Coal Mine Offers reliable source of supply to over 50 customers in 21 states, powering ~4.5% of total U.S. electricity generation Strategically positioned on rail joint line with multiple entry/exit points for simultaneous arrivals and departures Benefits from prior reserve acquisitions and fleet upgrades, resulting in modest sustaining capital levels Operates out of 7 – 10 pits of 60 – 80 feet thick coal seams, providing access to lowest-sulfur coal in North America Advanced technology reduces costs, drives higher margins North Antelope Rochelle Mine 6
|
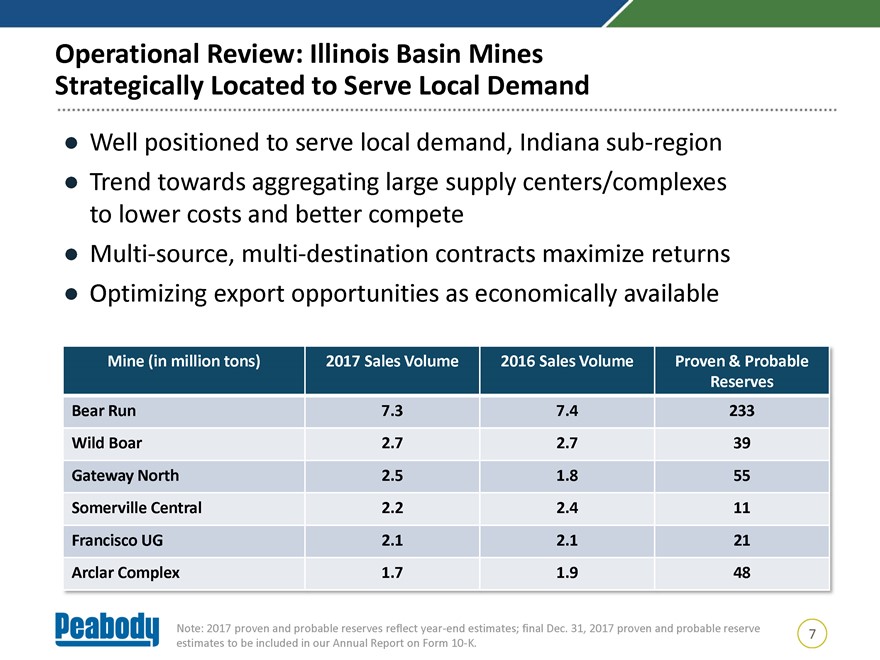 |
Operational Review: Illinois Basin Mines Strategically Located to Serve Local Demand Well positioned to serve local demand, Indianasub-region Trend towards aggregating large supply centers/complexes to lower costs and better compete Multi-source, multi-destination contracts maximize returns Optimizing export opportunities as economically available Mine (in million tons) 2017 Sales Volume 2016 Sales Volume Proven & Probable Reserves Bear Run 7.3 7.4 233 Wild Boar 2.7 2.7 39 Gateway North 2.5 1.8 55 Somerville Central 2.2 2.4 11 Francisco UG 2.1 2.1 21 Arclar Complex 1.7 1.9 48 Note: 2017 proven and probable reserves reflectyear-end estimates; final Dec. 31, 2017 proven and probable reserve 7 estimates to be included in our Annual Report on Form10-K.
|
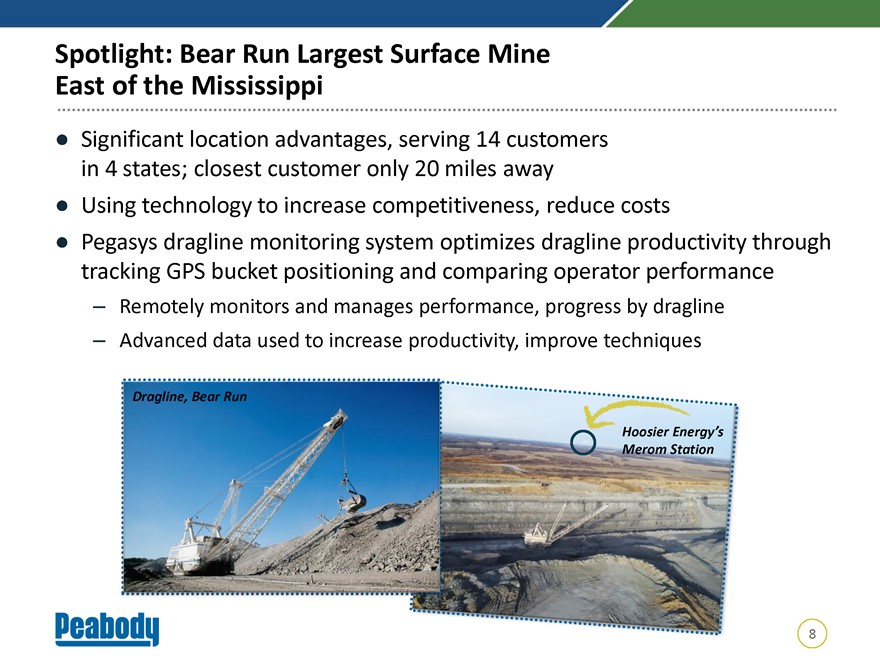 |
Spotlight: Bear Run Largest Surface Mine East of the Mississippi Significant location advantages, serving 14 customers in 4 states; closest customer only 20 miles away Using technology to increase competitiveness, reduce costs Pegasys dragline monitoring system optimizes dragline productivity through tracking GPS bucket positioning and comparing operator performance – Remotely monitors and manages performance, progress by dragline – Advanced data used to increase productivity, improve techniques Dragline, Bear Run Hoosier Energy’s Merom Station 8
|
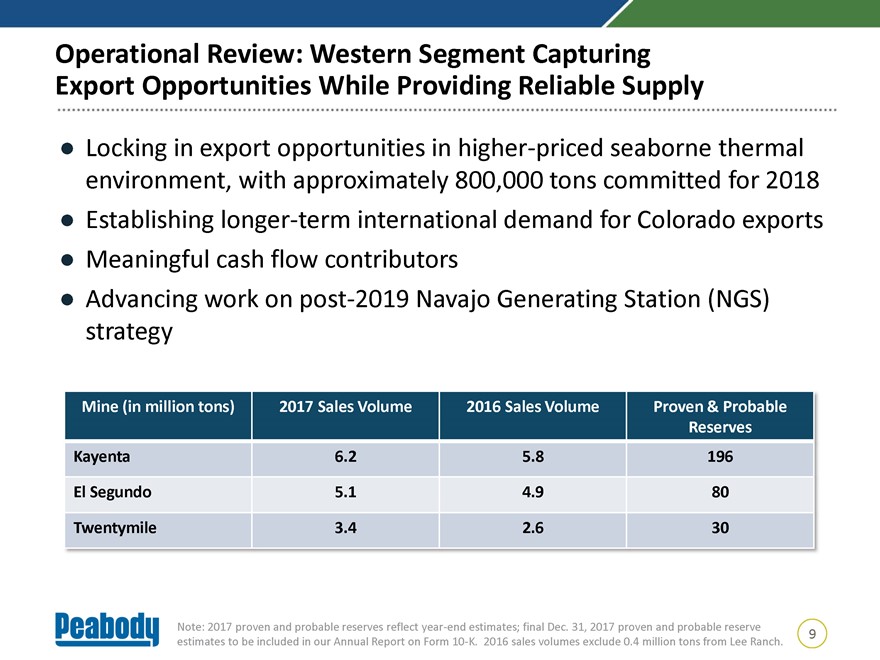 |
Operational Review: Western Segment Capturing Export Opportunities While Providing Reliable Supply Locking in export opportunities in higher-priced seaborne thermal environment, with approximately 800,000 tons committed for 2018 Establishing longer-term international demand for Colorado exports Meaningful cash flow contributors Advancing work on post-2019 Navajo Generating Station (NGS) strategy Mine (in million tons) 2017 Sales Volume 2016 Sales Volume Proven & Probable Reserves Kayenta 6.2 5.8 196 El Segundo 5.1 4.9 80 Twentymile 3.4 2.6 30 Note: 2017 proven and probable reserves reflectyear-end estimates; final Dec. 31, 2017 proven and probable reserve 9 estimates to be included in our Annual Report on Form10-K. 2016 sales volumes exclude 0.4 million tons from Lee Ranch.
|
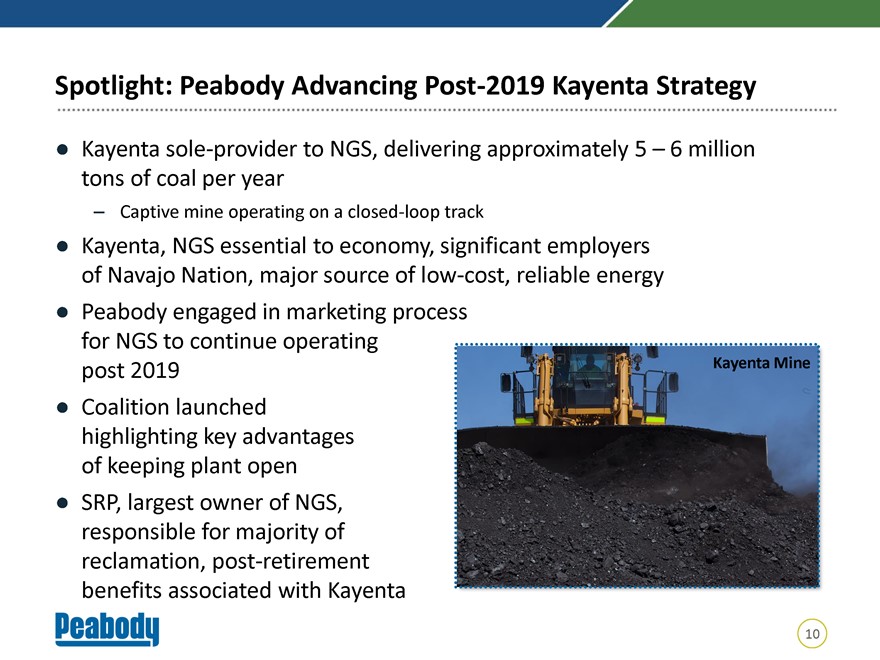 |
Spotlight: Peabody Advancing Post-2019 Kayenta Strategy Kayenta sole-provider to NGS, delivering approximately 5 – 6 million tons of coal per year – Captive mine operating on a closed-loop track Kayenta, NGS essential to economy, significant employers of Navajo Nation, major source oflow-cost, reliable energy Peabody engaged in marketing process for NGS to continue operating post 2019 Kayenta Mine Coalition launched highlighting key advantages of keeping plant open SRP, largest owner of NGS, responsible for majority of reclamation, post-retirement benefits associated with Kayenta 10
|
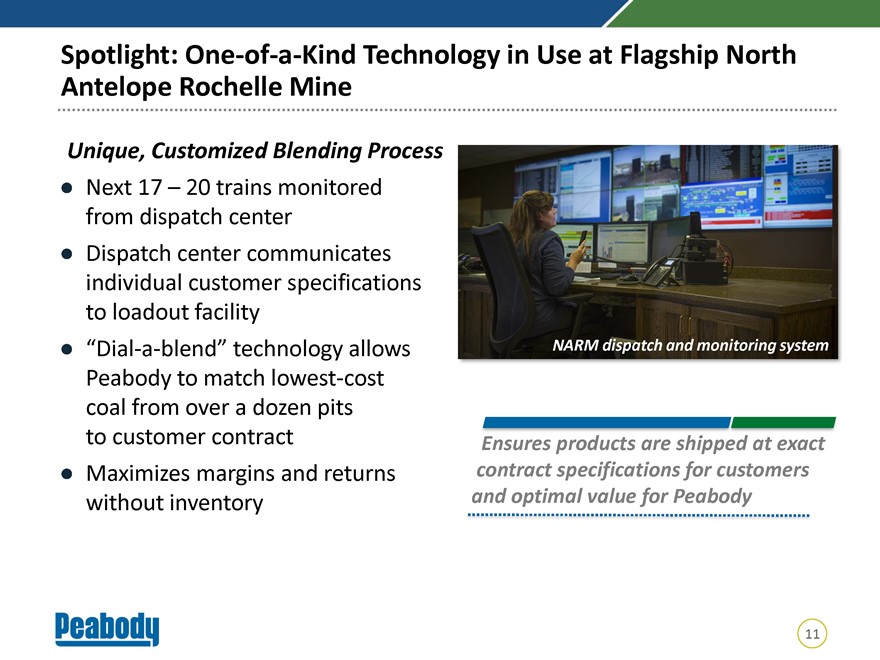 |
Spotlight:One-of-a-Kind Technology in Use at Flagship North Antelope Rochelle Mine Unique, Customized Blending Process Next 17 – 20 trains monitored from dispatch center Dispatch center communicates individual customer specifications to loadout facility“Dial-a-blend” technology allows NARM dispatch and monitoring system Peabody to match lowest-cost coal from over a dozen pits to customer contract Ensures products are shipped at exact Maximizes margins and returns contract specifications for customers without inventory and optimal value for Peabody 11
|
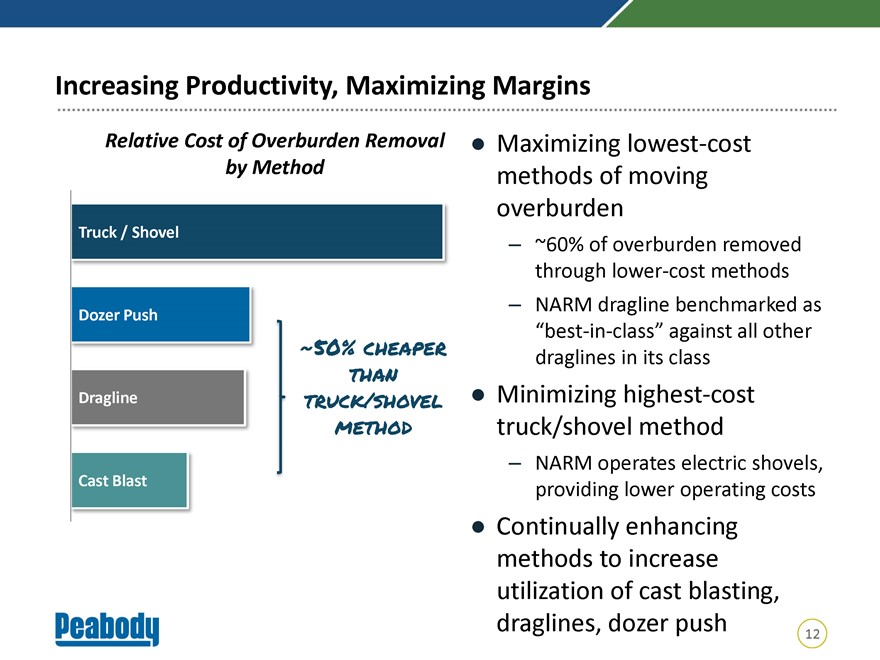 |
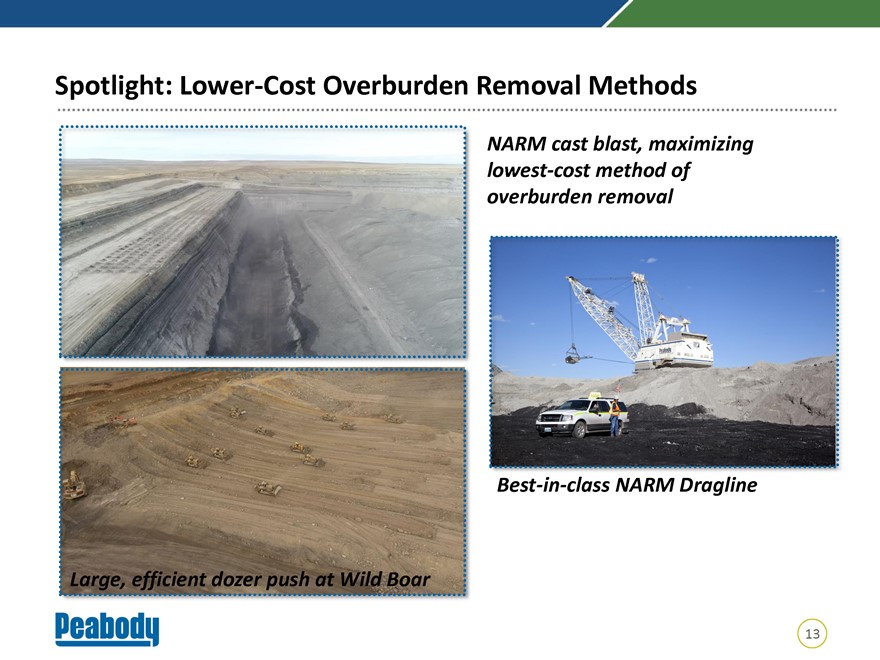
Increasing Productivity, Maximizing Margins Relative Cost of Overburden Removal Maximizing lowest-cost by Method methods of moving overburden Truck / Shovel – ~60% of overburden removed through lower-cost methods – NARM dragline benchmarked as Dozer Push“best-in-class” against all other ~50% cheaper draglines in its class $than 0.43 Dragline truck/shovel Minimizing highest-cost method truck/shovel method – NARM operates electric shovels, Cast Blast providing lower operating costs Continually enhancing methods to increase utilization of cast blasting, draglines, dozer push 12
Spotlight: Lower-Cost Overburden Removal Methods NARM cast blast, maximizing lowest-cost method of overburden removalBest-in-class NARM Dragline Large, efficient dozer push at Wild Boar 13
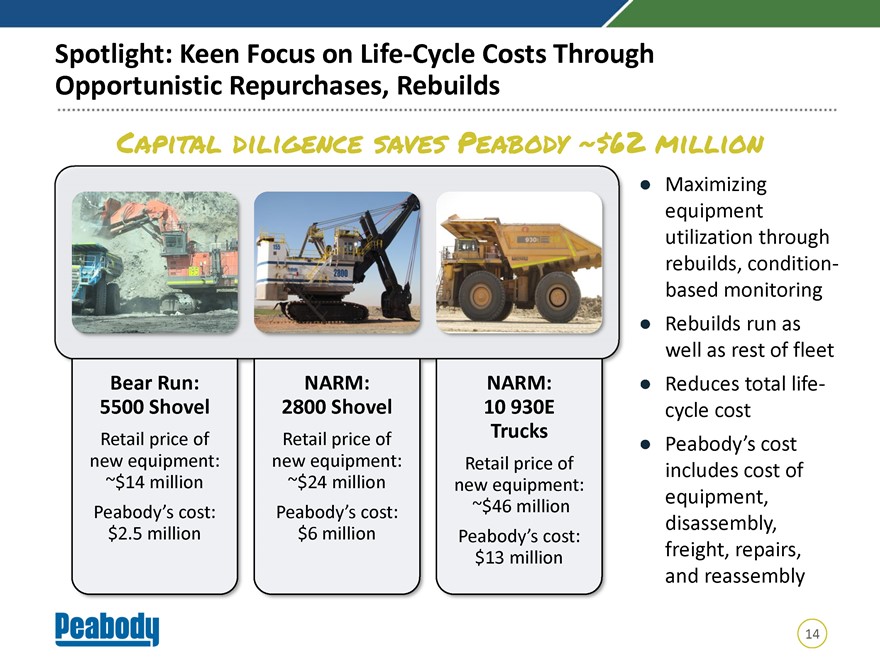
Spotlight: Keen Focus on Life-Cycle Costs Through Opportunistic Repurchases, Rebuilds Capital diligence saves Peabody ~$62 million Maximizing equipment utilization through rebuilds, condition-based monitoring Rebuilds run as well as rest of fleet Bear Run: NARM: NARM: Reduces total life- 5500 Shovel 2800 Shovel 10 930E cycle cost Trucks Retail price of Retail price of Peabody’s cost new equipment: new equipment: Retail price of includes cost of ~$14 million ~$24 million new equipment: equipment, Peabody’s cost: Peabody’s cost: ~$46 million disassembly, $2.5 million $6 million Peabody’s cost: freight, repairs, $13 million and reassembly 14
|
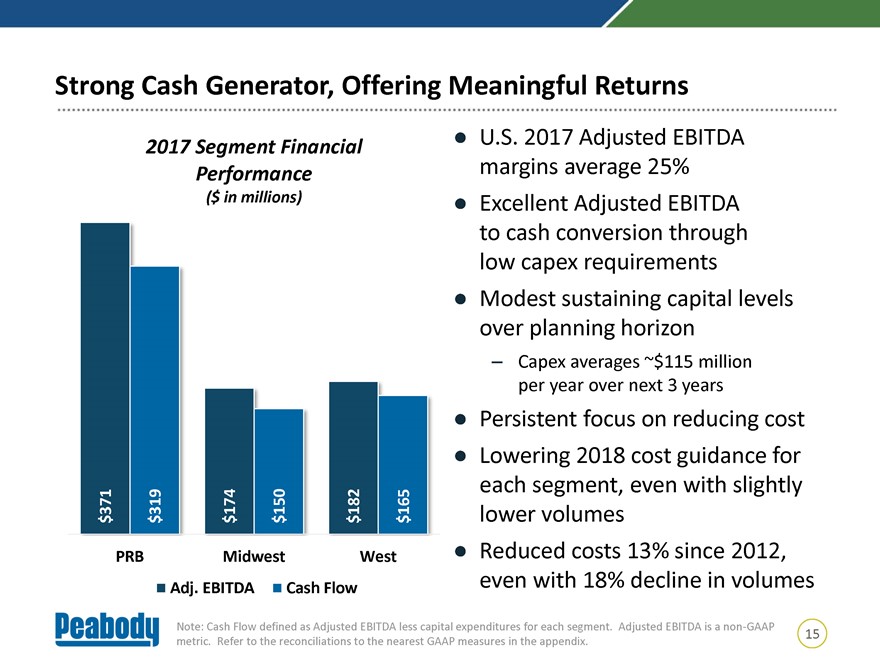 |
Strong Cash Generator, Offering Meaningful Returns U.S. 2017 Adjusted EBITDA 2017 Segment Financial Performance margins average 25% ($ in millions) Excellent Adjusted EBITDA to cash conversion through low capex requirements Modest sustaining capital levels over planning horizon – Capex averages ~$115 million per year over next 3 years Persistent focus on reducing cost Lowering 2018 cost guidance for 371 319 174 150 182165 each segment, even with slightly $ $ $ $ $ $ lower volumes PRB Midwest West Reduced costs 13% since 2012, Adj. EBITDA Cash Flow even with 18% decline in volumes Note: Cash Flow defined as Adjusted EBITDA less capital expenditures for each segment. Adjusted EBITDA is anon-GAAP 15 metric. Refer to the reconciliations to the nearest GAAP measures in the appendix.
|
 |
Peabody Americas Platform: Closing Thoughts Location matters… Peabody is well positioned in the best, lowest-cost U.S. basins of the PRB and Illinois Basin Returns matter… Peabody focused on generating meaningful returns across the operations – Maximizing revenues through contracting strategy, blending techniques – Optimizing how we move overburden, mine coal to deliver lowest unit costs – Managing capital to provide returns in excess of cost of capital within reasonable payback period Reliability matters… Peabody provides reliability of supply and serves as strong cash generator Safety, environment and our people matter… Key components in ensuring successful business and culture 16
Maximizing Competitiveness “The Peabody Way” Charles Meintjes Executive Vice President Corporate Services and Chief Commercial Officer February 22, 2018
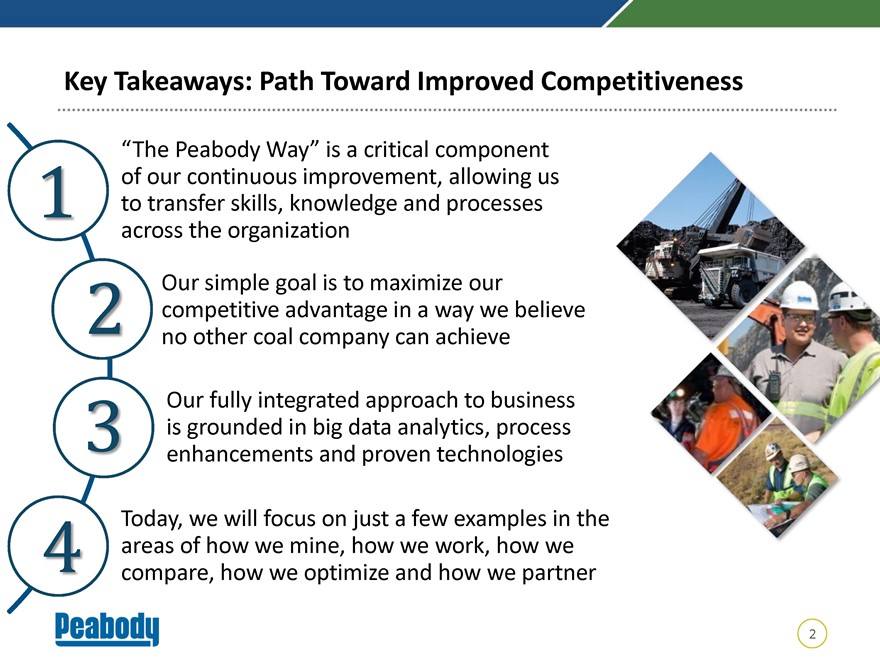
Key Takeaways: Path Toward Improved Competitiveness The Peabody Way” is a critical component of our continuous improvement, allowing us 1 o transfer skills, knowledge and processes across the organization r simple goal is to maximize our 2 ompetitive advantage in a way we believe other coal company can achieve Our fully integrated approach to business 3 grounded in big data analytics, process enhancements and proven technologies y, we will focus on just a few examples in the 4 eas of how we mine, how we work, how we ompare, how we optimize and how we partner 2
|
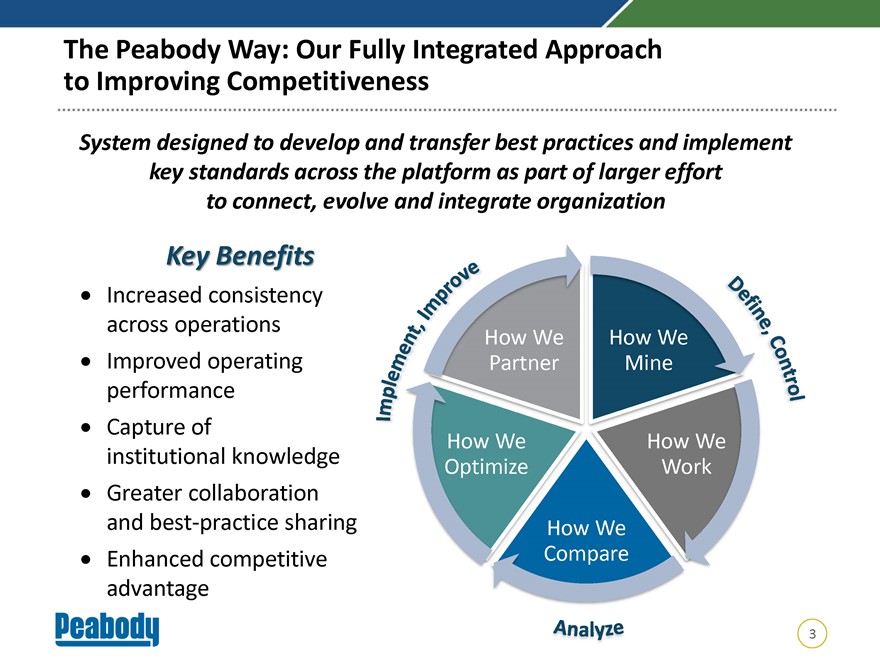 |
The Peabody Way: Our Fully Integrated Approach to Improving Competitiveness System designed to develop and transfer best practices and implement key standards across the platform as part of larger effort to connect, evolve and integrate organization Key Benefits Increased consistency across operations Improved operating performance Capture of We institutional knowledge ize Greater collaboration and best-practice sharing We Enhanced competitive advantage 3
|
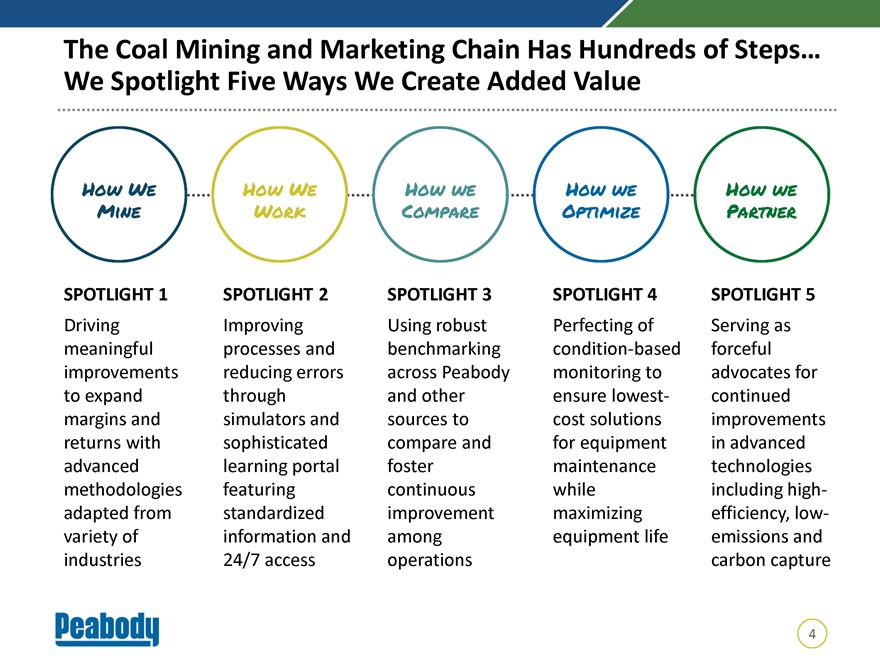 |
The Coal Mining and Marketing Chain Has Hundreds of Steps… We Spotlight Five Ways We Create Added Value How We How We How we How we How we Mine Work Compare Optimize Partner SPOTLIGHT 1 SPOTLIGHT 2 SPOTLIGHT 3 SPOTLIGHT 4 SPOTLIGHT 5 Driving Improving Using robust Perfecting of Serving as meaningful processes and benchmarking condition-based forceful improvements reducing errors across Peabody monitoring to advocates for to expand through and other ensure lowest- continued margins and simulators and sources to cost solutions improvements returns with sophisticated compare and for equipment in advanced advanced learning portal foster maintenance technologies methodologies featuring continuous while including high-adapted from standardized improvement maximizing efficiency,low-variety of information and among equipment life emissions and industries 24/7 access operations carbon capture 4
|
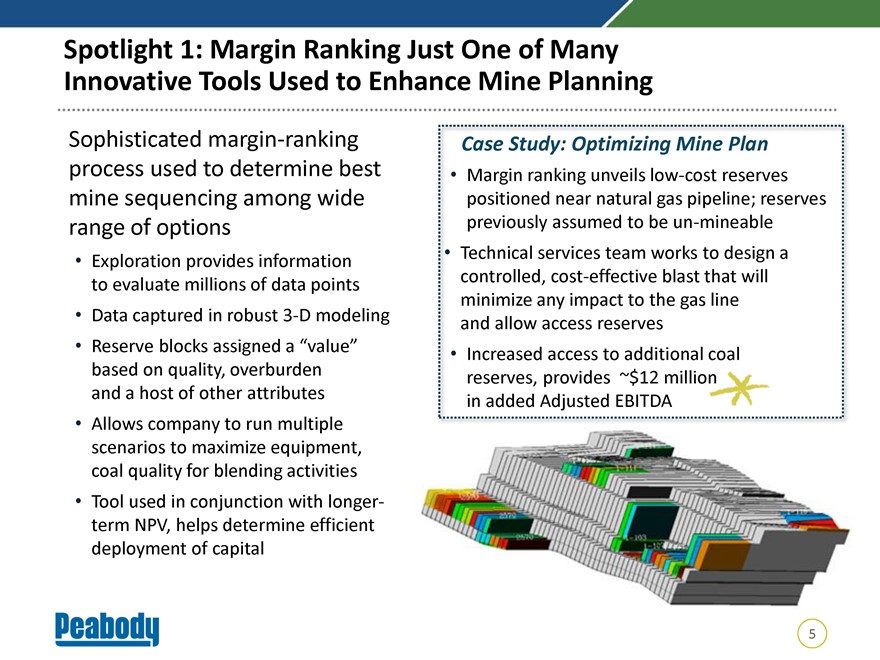 |
Spotlight 1: Margin Ranking Just One of Many Innovative Tools Used to Enhance Mine Planning Sophisticated margin-ranking Case Study: Optimizing Mine Plan process used to determine best Margin ranking unveilslow-cost reserves mine sequencing among wide positioned near natural gas pipeline; reserves range of options previously assumed to beun-mineable Technical services team works to design a Exploration provides information controlled, cost-effective blast that will to evaluate millions of data points minimize any impact to the gas line Data captured in robust3-D modeling and allow access reserves Reserve blocks assigned a “value” Increased access to additional coal based on quality, overburden reserves, provides ~$12 million and a host of other attributes in added Adjusted EBITDA Allows company to run multiple scenarios to maximize equipment, coal quality for blending activities Tool used in conjunction with longer-term NPV, helps determine efficient deployment of capital 5
|
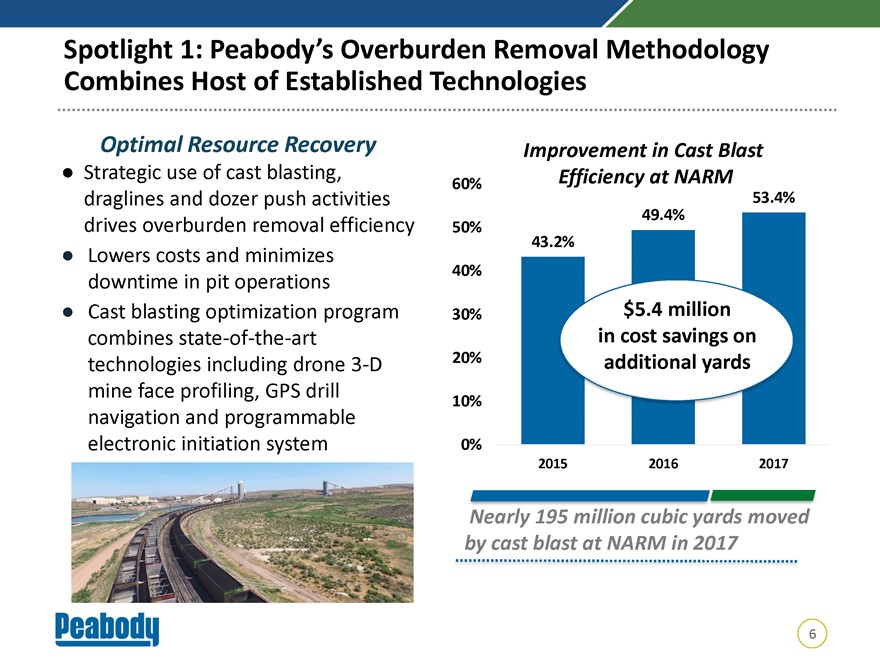 |
Spotlight 1: Peabody’s Overburden Removal Methodology Combines Host of Established Technologies Optimal Resource Recovery Improvement in Cast Blast Strategic use of cast blasting, Efficiency at NARM 60% draglines and dozer push activities 53.4% 49.4% drives overburden removal efficiency 50% 43.2% Lowers costs and minimizes 40% downtime in pit operations Cast blasting optimization program 30% $5.4 million combinesstate-of-the-art in cost savings on technologies including drone3-D 20% additional yards mine face profiling, GPS drill 10% navigation and programmable electronic initiation system 0% 2015 2016 2017 Nearly 195 million cubic yards moved by cast blast at NARM in 2017 6
|
 |
Spotlight 2: Increasing Operator Proficiency Through Training Programs, Collaboration Networks High-Tech Simulators Utilize computer-based modeling of surface/underground mining functions Allows Peabody to train new employees and analyze techniques in a virtual setting Ensures employee safety, reduces time and cost requirements associated with physical equipment activities eLearning Portal Interactive training portal provides24-hour access to standardized, self-paced programs that align skills with specific roles Speeds up onboarding by mitigating errors and variations in process Sites reporting improved safety, costs and accuracy 7
|
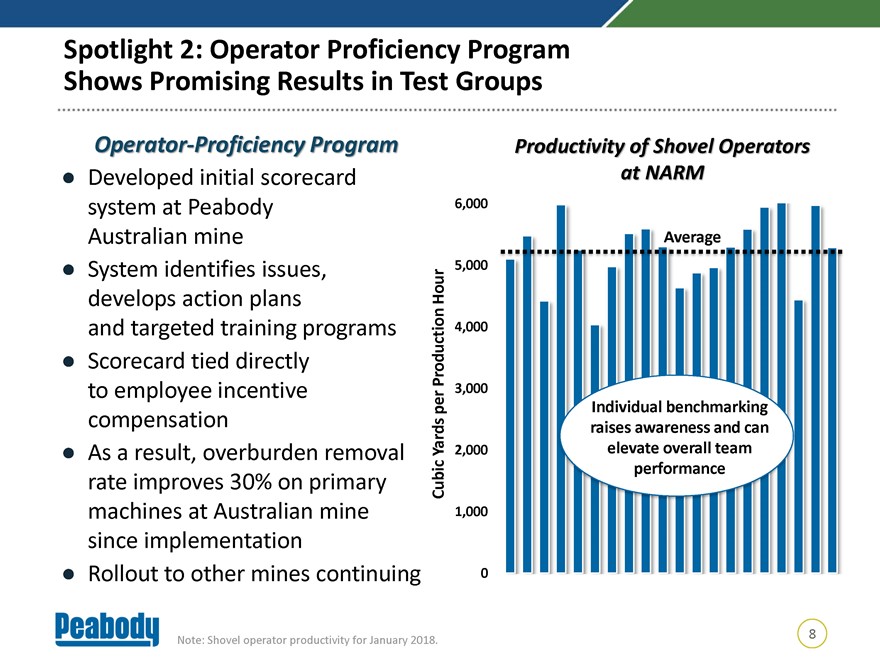 |
Spotlight 2: Operator Proficiency Program Shows Promising Results in Test Groups Operat Proficiency Program Productivity of Shovel Operators Developed initial scorecard at NARM system at Peabody 6,000 Australian mine Average System identifies issues, Hour 5,000 develops action plans and targeted training programs 4,000 Scorecard tied directly Production to employee incentive 3,000 per Individual benchmarking compensation raises awareness and can Yards 2,000 elevate overall team As a result, overburden removal performance rate improves 30% on primary Cubic machines at Australian mine 1,000 since implementation Rollout to other mines continuing 0 8 Note: Shovel operator productivity for January 2018.
|
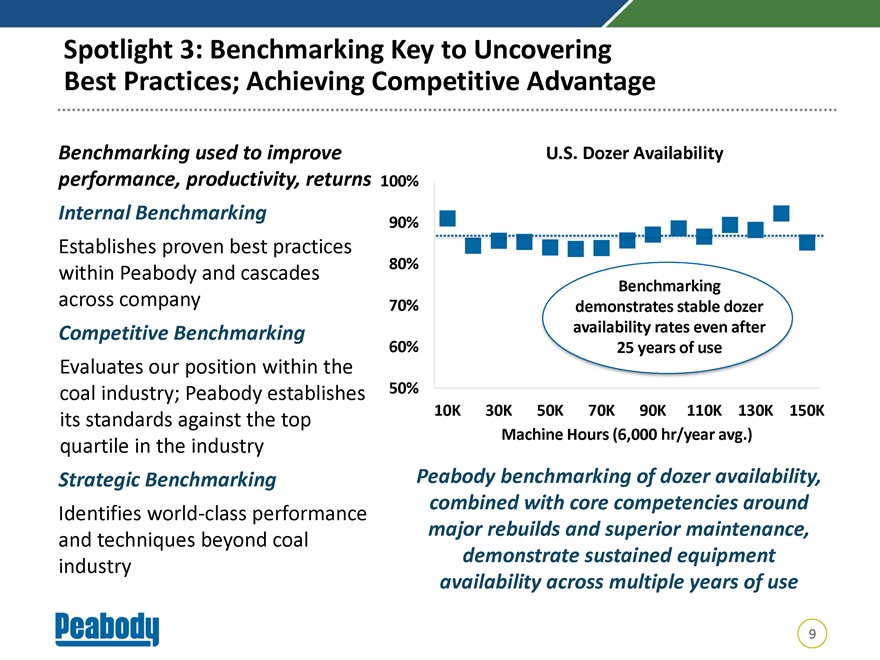 |
Spotlight 3: Benchmarking Key to Uncovering Best Practices; Achieving Competitive Advantage Benchmarking used to improve U.S. Dozer Availability performance, productivity, returns 100% Internal Benchmarking 90% Establishes proven best practices 80% within Peabody and cascades Benchmarking across company 70% demonstrates stable dozer Competitive Benchmarking availability rates even after 60% 25 years of use Evaluates our position within the coal industry; Peabody establishes 50% 10K 30K 50K 70K 90K 110K 130K 150K its standards against the top Machine Hours (6,000 hr/year avg.) quartile in the industry Strategic Benchmarking Peabody benchmarking of dozer availability, combined with core competencies around Identifies world-class performance major rebuilds and superior maintenance, and techniques beyond coal demonstrate sustained equipment industry availability across multiple years of use 9
|
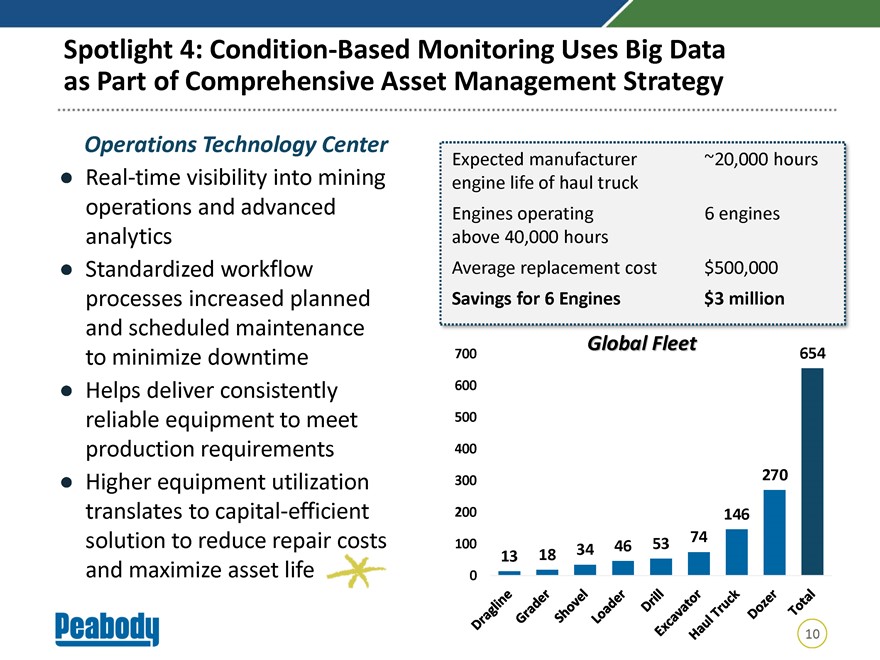 |
Spotlight 4: Condition-Based Monitoring Uses Big Data as Part of Comprehensive Asset Management Strategy Operations Technology Center Expected manufacturer ~20,000 hours Real-time visibility into mining engine life of haul truck operations and advanced Engines operating 6 engines analytics above 40,000 hours Standardized workflow Average replacement cost $500,000 processes increased planned Savings for 6 Engines $3 million and scheduled maintenance Global Fleet to minimize downtime 700 654 Helps deliver consistently 600 reliable equipment to meet 500 production requirements 400 Higher equipment utilization 300 270 translates to capital-efficient 200 146 solution to reduce repair costs 74 100 34 46 53 13 18 and maximize asset life 0 10
|
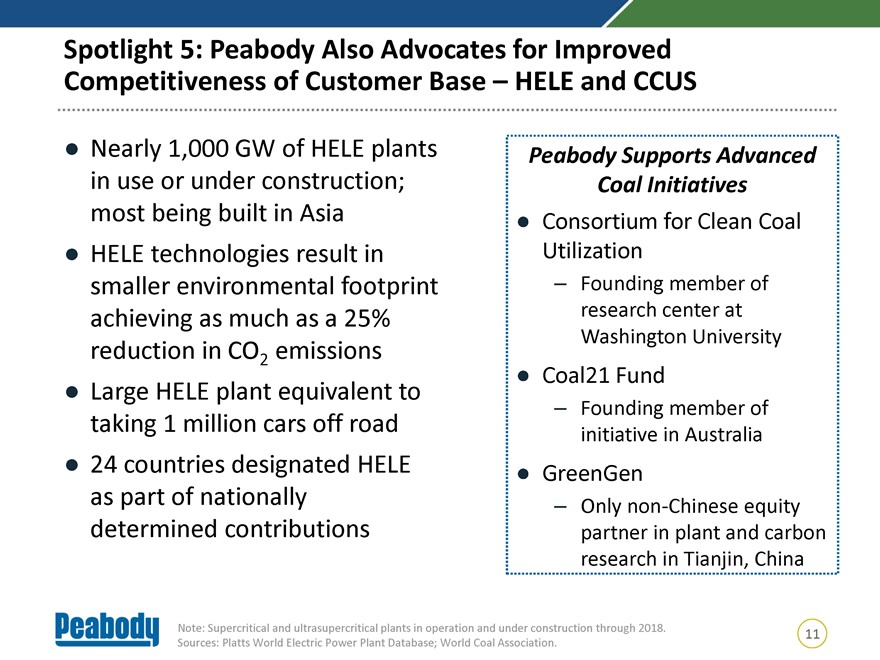 |
Spotlight 5: Peabody Also Advocates for Improved Competitiveness of Customer Base – HELE and CCUS Nearly 1,000 GW of HELE plants Peabody Supports Advanced in use or under construction; Coal Initiatives most being built in Asia Consortium for Clean Coal HELE technologies result in Utilization smaller environmental footprint – Founding member of achieving as much as a 25% research center at Washington University reduction in CO2 emissions Coal21 Fund Large HELE plant equivalent to – Founding member of taking 1 million cars off road initiative in Australia 24 countries designated HELE GreenGen as part of nationally – Onlynon-Chinese equity determined contributions partner in plant and carbon research in Tianjin, China Note: Supercritical and ultrasupercritical plants in operation and under construction through 2018. 11 Sources: Platts World Electric Power Plant Database; World Coal Association.
|
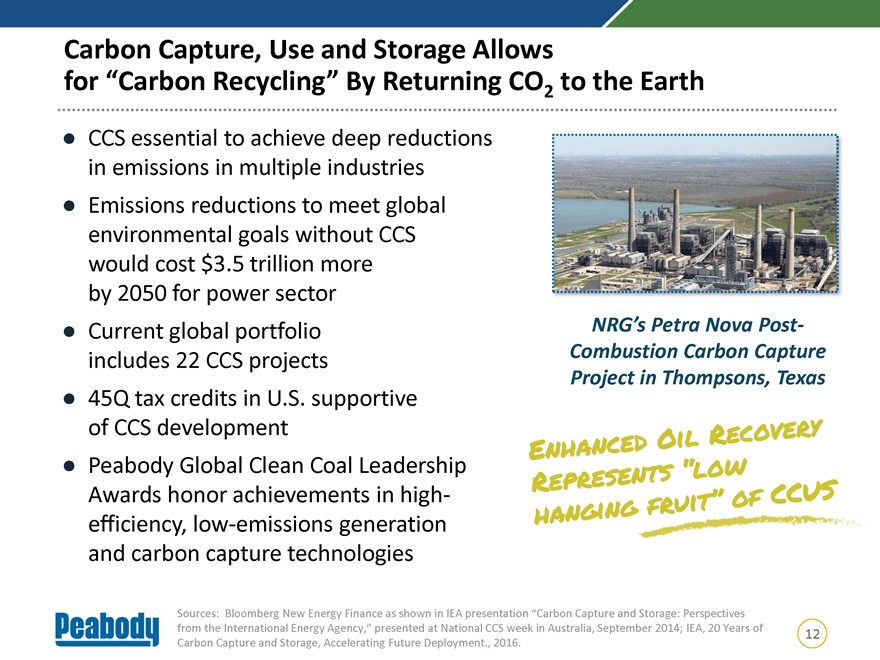 |
Carbon Capture, Use and Storage Allows for “Carbon Recycling” By Returning CO2 to the Earth CCS essential to achieve deep reductions in emissions in multiple industries Emissions reductions to meet global environmental goals without CCS would cost $3.5 trillion more by 2050 for power sector Current global portfolio NRG’s Petra Nova Post- includes 22 CCS projects Combustion Carbon Capture Project in Thompsons, Texas 45Q tax credits in U.S. supportive of CCS development Peabody Global Clean Coal Leadership Awards honor achievements in high-efficiency,low-emissions generation and carbon capture technologies Sources: Bloomberg New Energy Finance as shown in IEA presentation “Carbon Capture and Storage: Perspectives from the International Energy Agency,” presented at National CCS week in Australia, September 2014; IEA, 20 Years of 12 Carbon Capture and Storage, Accelerating Future Deployment., 2016.
|
 |
Closing Thoughts… Peabody’s approach to continuous improvement is a deliberate, integrated andall-encompassing endeavor Team assesses available technologies and techniques within mining and other industries around the world to drive real improvements and meaningful returns Company benefits from access to multiple mining regions; Solutions to unique challenges are met and retrofitted to elevate entire platform The Peabody Way is designed to ensure that isolated advancements are shared, replicated, standardized and improved upon across our global operations 13
Finance Strategies: Targeting Maximum Returns and Value Amy Schwetz Executive Vice President and Chief Financial Officer February 22, 2018
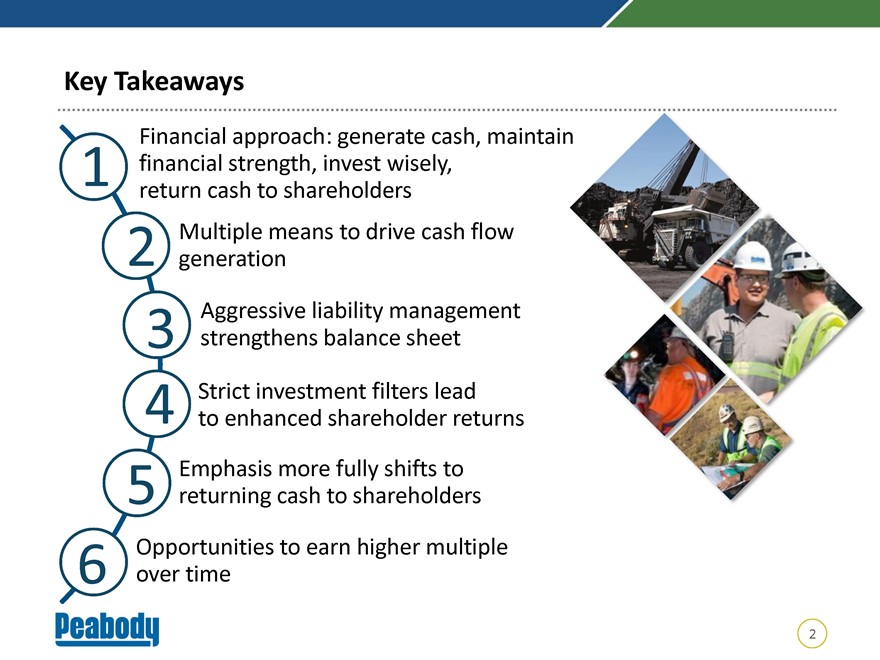
Key Takeaways Financial approach: generate cash, maintain 1 financial strength, invest wisely, return cash to shareholders 2 Multiple means to drive cash flow generation Aggressive liability management 3 strengthens balance sheet 4 Strict investment filters lead to enhanced shareholder returns Emphasis more fully shifts to 5 returning cash to shareholders Opportunities to earn higher multiple 6 over time 2
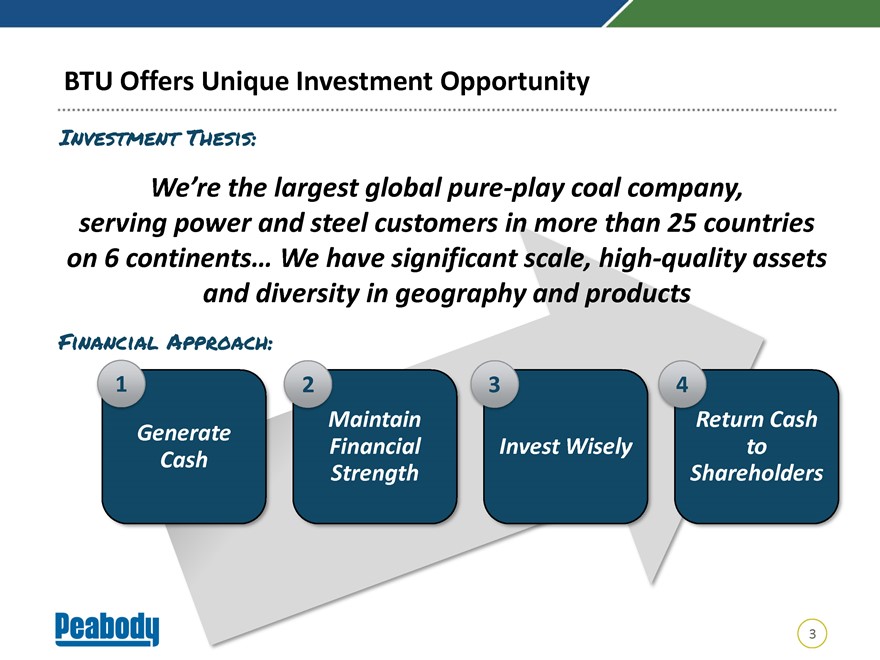
BTU Offers Unique Investment Opportunity Investment Thesis: We’re the largest global pure-play coal company, serving power and steel customers in more than 25 countries on 6 continents… We have significant scale, high-quality assets and diversity in geography and products Financial Approach: 1 2 3 4 Maintain Return Cash Generate Financial Invest Wisely to Cash Strength Shareholders 3
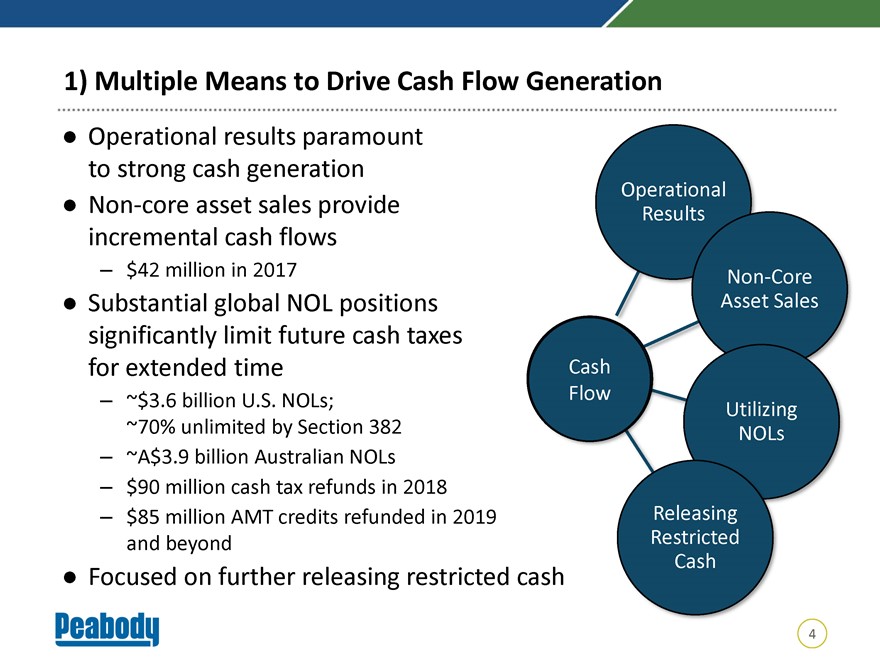
1) Multiple Means to Drive Cash Flow Generation • Operational results paramount to strong cash generation Operational •Non-core asset sales provide Result incremental cash flows – $42 million in 2017Non-Core • Substantial global NOL positions Asset Sales significantly limit future cash taxes for extended time Cash – ~$3.6 billion U.S. NOLs; Flow Utilizing ~70% unlimited by Section 382 NOLs – ~A$3.9 billion Australian NOLs – $90 million cash tax refunds in 2018 – $85 million AMT credits refunded in 2019 Releasing and beyond Restricted Cash • Focused on further releasing restricted cash 4
|
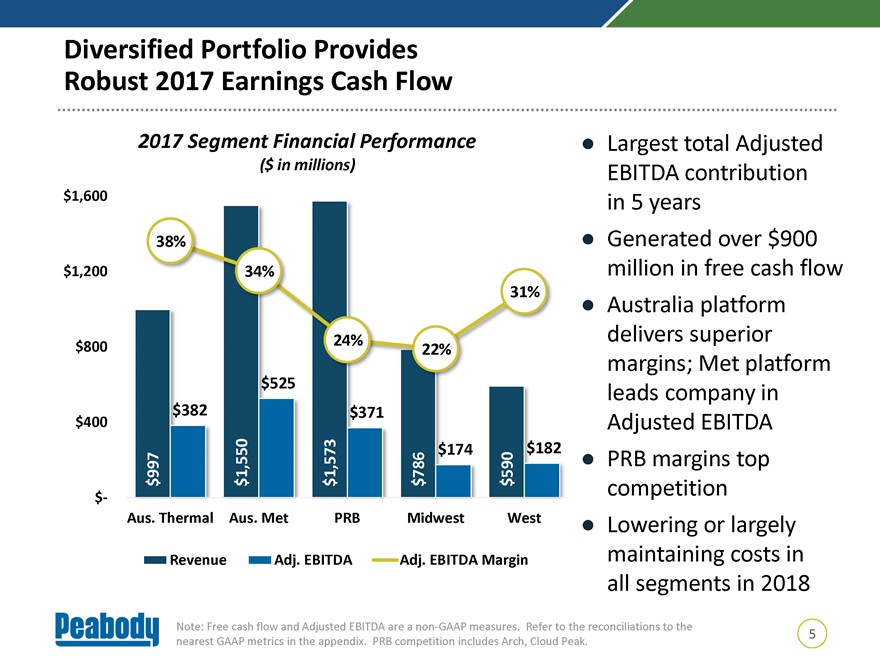 |
Diversified Portfolio Provides Robust 2017 Earnings Cash Flow 2017 Segment Financial Performance • Largest total Adjusted ($ in millions) EBITDA contribution $1,600 in 5 years 38% • Generated over $900 $1,200 34% million in free cash flow 31% • Australia platform 24% delivers superior $800 22% margins; Met platform $525 leads company in $400 $382 $371 Adjusted EBITDA 997 1,550 1,573786 $174 590 $182 • PRB margins top $ $ $ $ $ competition $- Aus. Thermal Aus. Met PRB Midwest West • Lowering or largely Revenue Adj. EBITDA Adj. EBITDA Margin maintaining costs in all segments in 2018 Note: Free cash flow and Adjusted EBITDA are anon-GAAP measures. Refer to the reconciliations to the 5 nearest GAAP metrics in the appendix. PRB competition includes Arch, Cloud Peak.
|
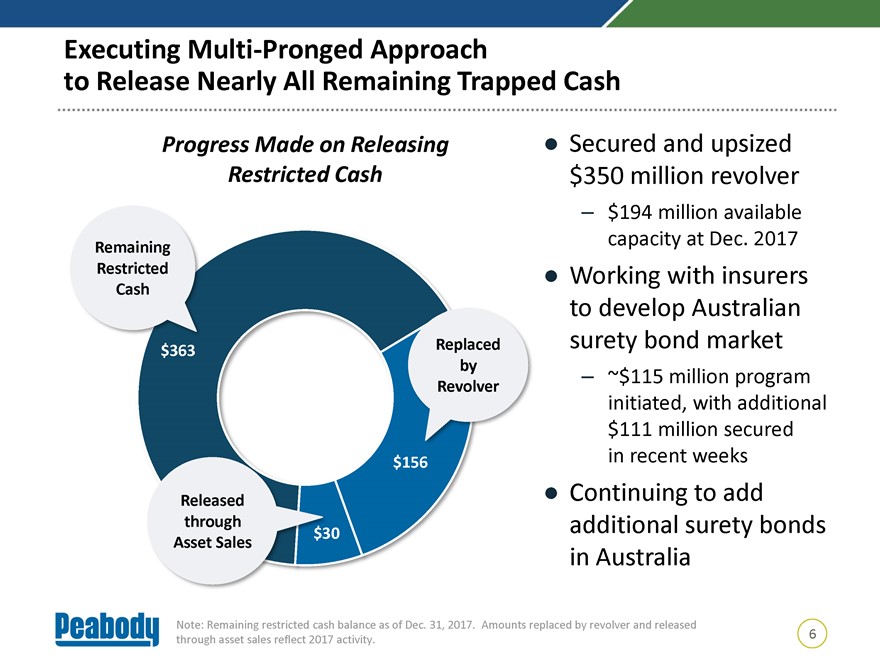 |
Executing Multi-Pronged Approach to Release Nearly All Remaining Trapped Cash Progress Made on Releasing • Secured and upsized Restricted Cash $350 million revolver – $194 million available capacity at Dec. 2017 Remaining Restricted • Working with insurers Cash to develop Australian Replaced surety bond market $363 by – ~$115 million program Revolver initiated, with additional $111 million secured $156 in recent weeks Released • Continuing to add through additional surety bonds $30 Asset Sales in Australia Note: Remaining restricted cash balance as of Dec. 31, 2017. Amounts replaced by revolver and released 6 through asset sales reflect 2017 activity.
|
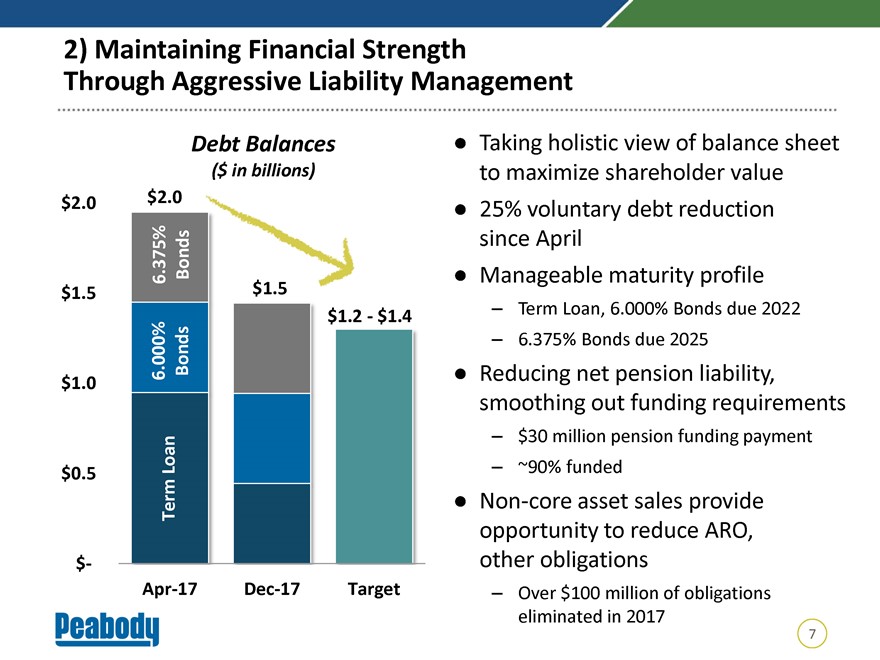 |
2) Maintaining Financial Strength Through Aggressive Liability Management Debt Balances • Taking holistic view of balance sheet ($ in billions) to maximize shareholder value $2.0 $2.0 • 25% voluntary debt reduction Bonds since April 6.375% • Manageable maturity profile $1.5 – Term Loan, 6.000% Bonds due 2022 $1.2—$1.4 6.000% Bonds – 6.375% Bonds due 2025 • Reducing net pension liability, $1.0 smoothing out funding requirements – $30 million pension funding payment Loan – ~90% funded $0.5 Term •Non-core asset sales provide opportunity to reduce ARO, $- other obligationsApr-17Dec-17 Target – Over $100 million of obligations eliminated in 2017 7
|
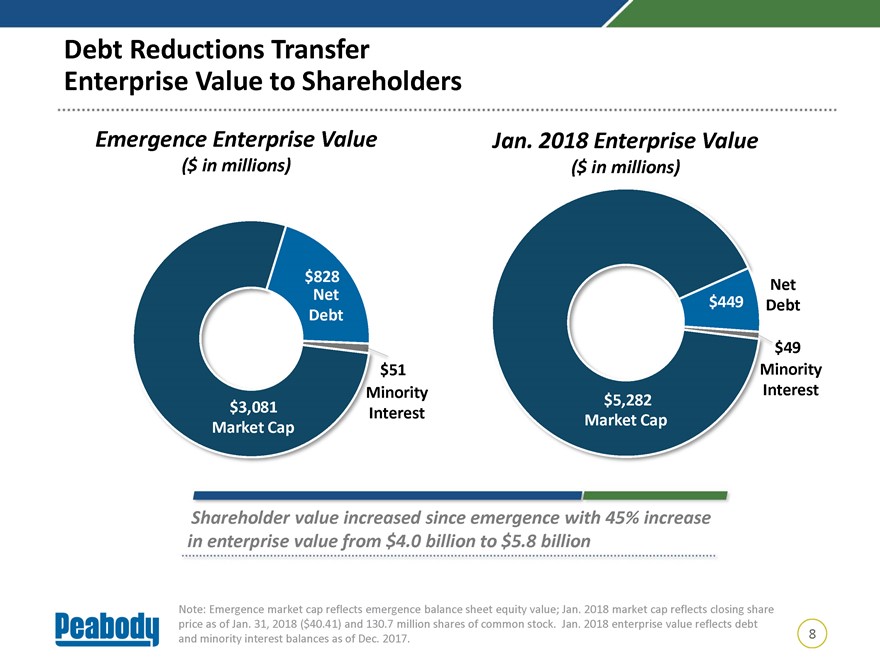 |
Debt Reductions Transfer Enterprise Value to Shareholders Emergence Enterprise Value Jan. 2018 Enterprise Value ($ in millions) ($ in millions) $828 Net Net Debt $449 Debt $49 $51 Minority Minority Interest $5,282 $3,081 Interest Market Cap Market Cap Shareholder value increased since emergence with 45% increase in enterprise value from $4.0 billion to $5.8 billion Note: Emergence market cap reflects emergence balance sheet equity value; Jan. 2018 market cap reflects closing share price as of Jan. 31, 2018 ($40.41) and 130.7 million shares of common stock. Jan. 2018 enterprise value reflects debt 8 and minority interest balances as of Dec. 2017.
|
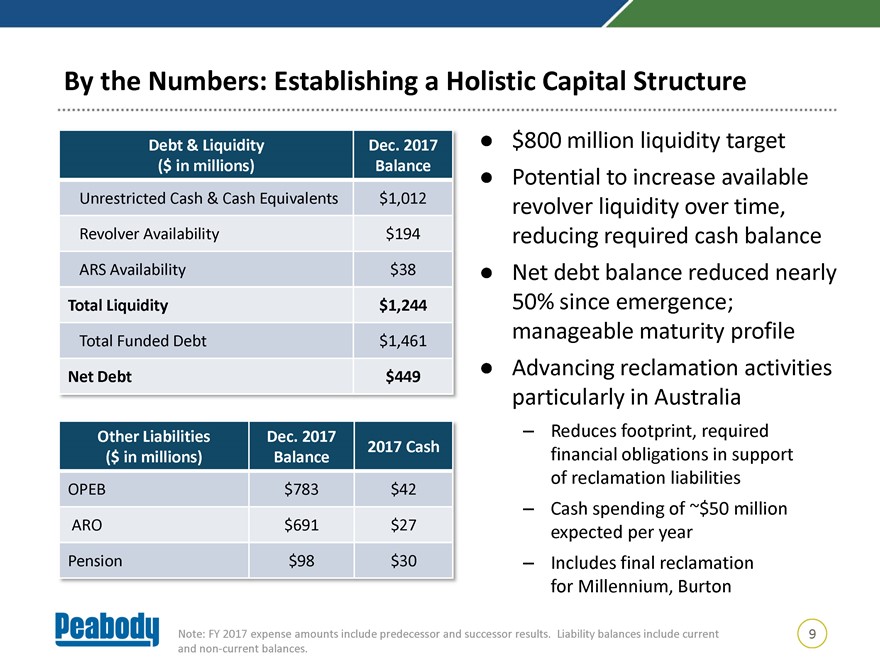 |
By the Numbers: Establishing a Holistic Capital Structure Debt & Liquidity Dec. 2017 • $800 million liquidity target ($ in millions) Balance • Potential to increase available Unrestricted Cash & Cash Equivalents $1,012 revolver liquidity over time, Revolver Availability $194 reducing required cash balance ARS Availability $38 • Net debt balance reduced nearly Total Liquidity $1,244 50% since emergence; manageable maturity profile Total Funded Debt $1,461 • Advancing reclamation activities Net Debt $449 particularly in Australia Other Liabilities Dec. 2017 – Reduces footprint, required 2017 Cash ($ in millions) Balance financial obligations in support of reclamation liabilities OPEB $783 $42 – Cash spending of ~$50 million ARO $691 $27 expected per year Pension $98 $30 – Includes final reclamation for Millennium, Burton Note: FY 2017 expense amounts include predecessor and successor results. Liability balances include current 9 andnon-current balances.
|
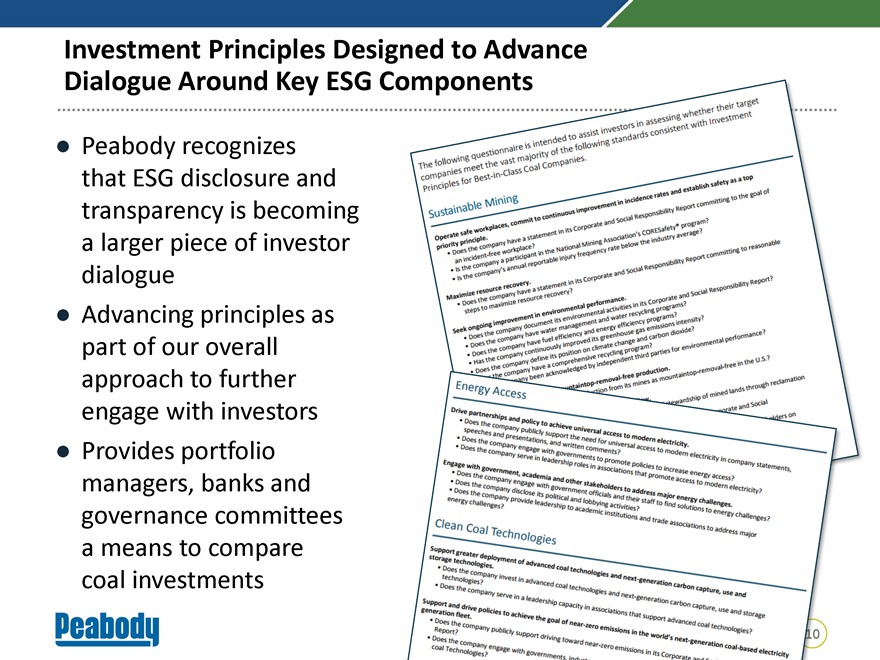 |
Investment Principles Designed to Advance Dialogue Around Key ESG Components • Peabody recognizes that ESG disclosure and transparency is becoming a larger piece of investor dialogue • Advancing principles as part of our overall approach to further engage with investors • Provides portfolio managers, banks and governance committees a means to compare coal investments
|
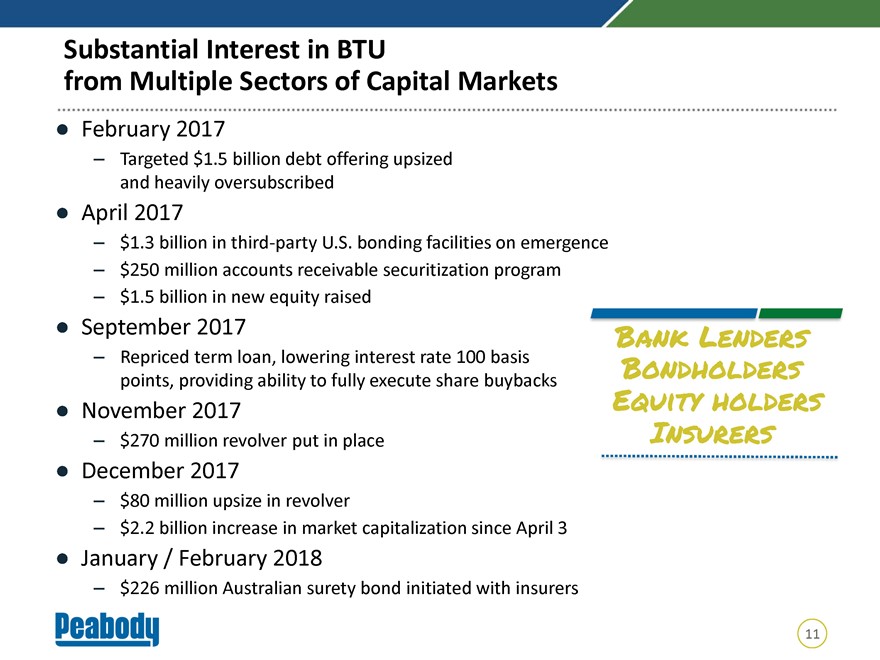 |
Substantial Interest in BTU from Multiple Sectors of Capital Markets • February 2017 – Targeted $1.5 billion debt offering upsized and heavily oversubscribed • April 2017 – $1.3 billion in third-party U.S. bonding facilities on emergence – $250 million accounts receivable securitization program – $1.5 billion in new equity raised • September 2017 Bank Lenders – Repriced term loan, lowering interest rate 100 basis Bondholders points, providing ability to fully execute share buybacks • November 2017 Equity holders – $270 million revolver put in place Insurers • December 2017 – $80 million upsize in revolver – $2.2 billion increase in market capitalization since April 3 • January / February 2018 – $226 million Australian surety bond initiated with insurers 11
|
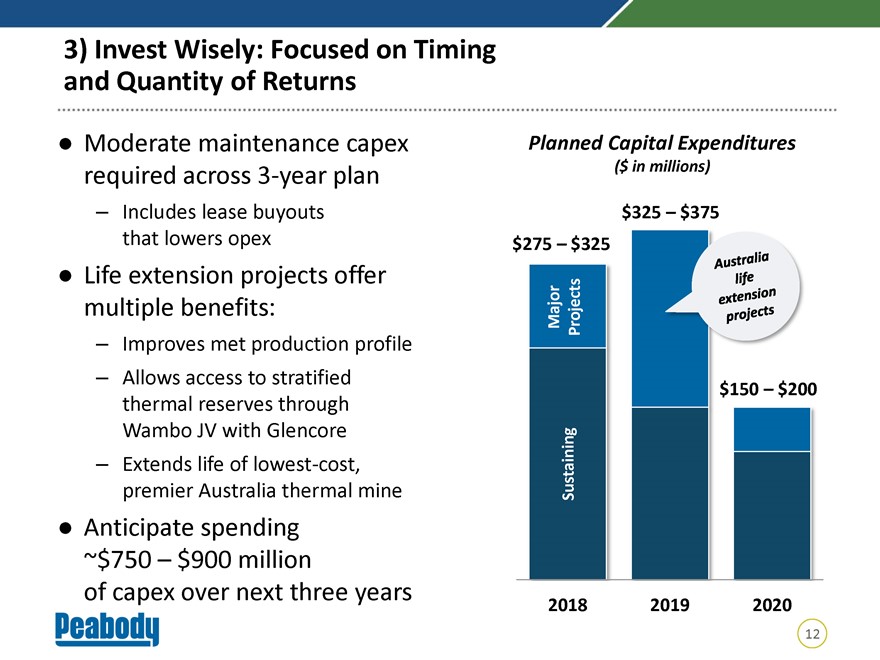 |
3) Invest Wisely: Focused on Timing and Quantity of Returns Moderate maintenance capex Planned Capital Expenditures required across3-year plan ($ in millions) – Includes lease buyouts $325 – $375 that lowers opex $275 – $325 Life extension projects offer s multiple benefits: Major Project – Improves met production profile – Allows access to stratified $150 – $200 thermal reserves through Wambo JV with Glencore – Extends life of lowest-cost, premier Australia thermal mine Sustaining Anticipate spending ~$750 – $900 million of capex over next three years 2018 2019 2020 12
|
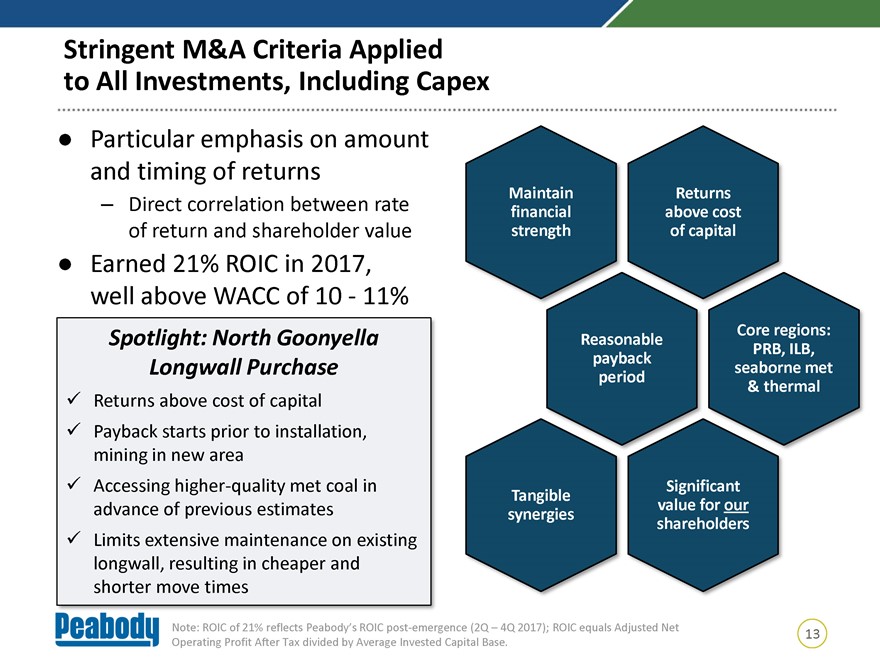 |
Stringent M&A Criteria Applied to All Investments, Including Capex Particular emphasis on amount and timing of returns Maintain Returns – Direct correlation between rate financial above cost of return and shareholder value strength of capital Earned 21% ROIC in 2017, well above WACC of 10—11% Core regions: Spotlight: North Goonyella Reasonable PRB, ILB, payback Longwall Purchase seaborne met period above cost of capital & thermal Returns Payback starts prior to installation, mining in new area Accessing higher-quality met coal in Significant Tangible advance of previous estimates value for our synergies shareholders Limits extensive maintenance on existing longwall, resulting in cheaper and shorter move times Note: ROIC of 21% reflects Peabody’s ROIC post-emergence (2Q – 4Q 2017); ROIC equals Adjusted Net 13 Operating Profit After Tax divided by Average Invested Capital Base.
|
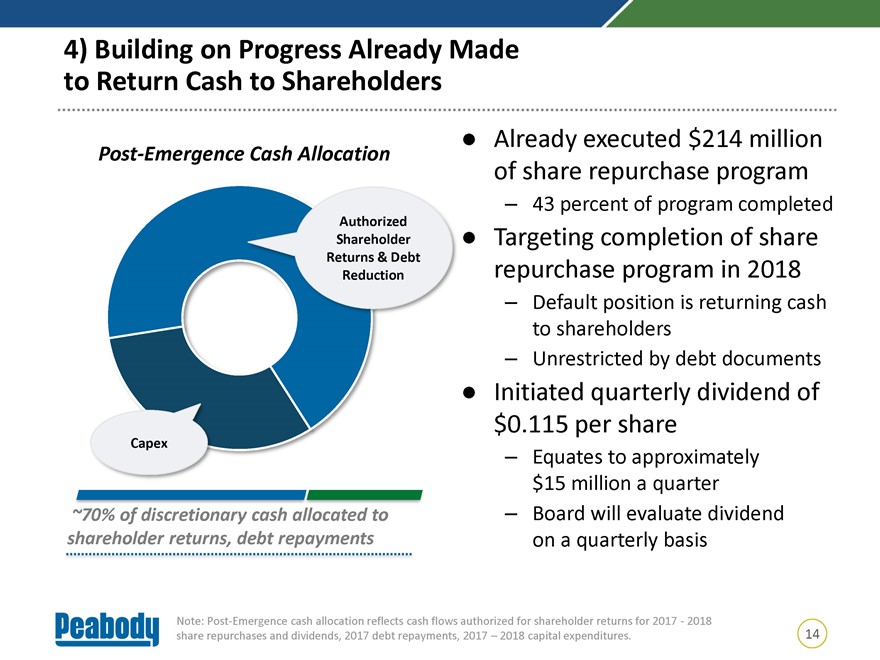 |
4) Building on Progress Already Made to Return Cash to Shareholders Already executed $214 million Post-Emergence Cash Allocation of share repurchase program – 43 percent of program completed Authorized Shareholder Targeting completion of share Returns & Debt Reduction repurchase program in 2018 – Default position is returning cash to shareholders – Unrestricted by debt documents Initiated quarterly dividend of $0.115 per share Capex Equates to – approximately $15 million a quarter ~70% of discretionary cash allocated to – Board will evaluate dividend shareholder returns, debt repayments on a quarterly basis Note: Post-Emergence cash allocation reflects cash flows authorized for shareholder returns for 2017—2018 share repurchases and dividends, 2017 debt repayments, 2017 – 2018 capital expenditures. 14
|
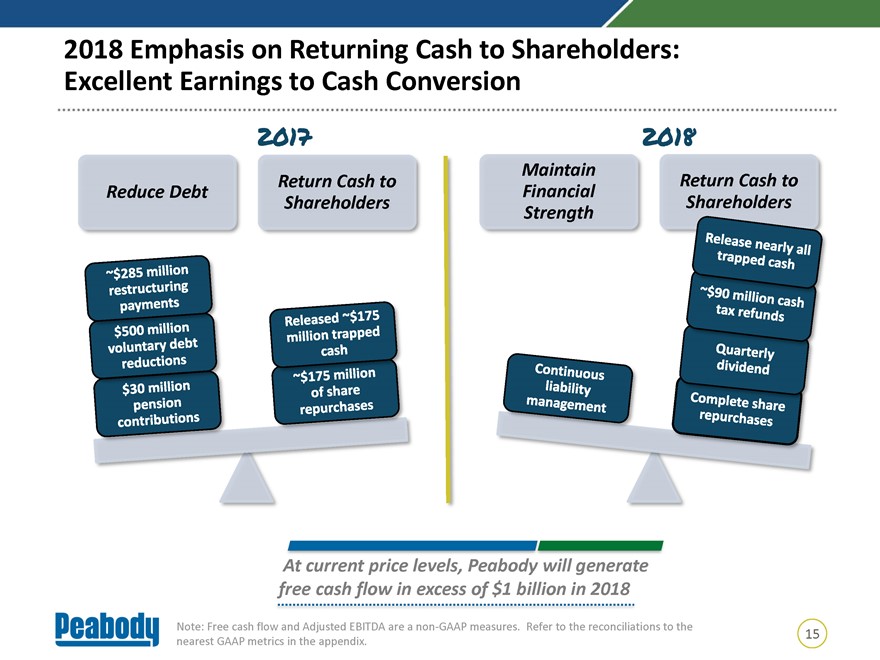 |
2018 Emphasis on Returning Cash to Shareholders: Excellent Earnings to Cash Conversion 2017 2018 Maintain Return Cash to Return Cash to Reduce Debt Financial Shareholders Shareholders Strength At current price levels, Peabody will generate free cash flow in excess of $1 billion in 2018 Note: Free cash flow and Adjusted EBITDA are anon-GAAP measures. Refer to the reconciliations to the 15 nearest GAAP metrics in the appendix.
|
 |
BTU Actively Pursuing Multiple Paths to Boost Shareholder Value, Earn a Premium Multiple Diversified platform offers numerous benefits, includingnon-correlative demand drivers balancing divergence in industry fundamentals Management team dedicated to transparency and execution against guidance targets Committed to maximizing margins during all cycles Highly focused on return on investments, consistently applying tight set of filters to evaluate any potential investments, M&A Disciplined capital allocation strategy provides roadmap to continue to return cash to shareholders through dividends, buybacks 16
|
 |
Earning a Higher Multiple Has Potential to Further Enhance Shareholder Value in 2018 Scenario Implied Percent Share Price Change Recent Share Price $41 Price Target (“Hold”) Analysts $42 +2% Price Target (“Buy”) Analysts $50 +22% Applying Avg. Historical EV/EBITDA Multiple $79 +93% Applying Avg. Historical BTU Premium $60 +46% Applying Current DJIA P/E Multiple $58 +41% Focused on Earning Improved Multiple With Strong Performance, Disciplined Capital Allocation, Healthy Returns Above Cost of Capital Note: Recent share price as of Feb. 14, 2018; Historical EV/EBITDA Multiple represents BTU’s averageone-year forward EV/EBITDA multiple from 2004-2014 of 8.2x times 2018 EBITDA consensus; Historical BTU Premium represents BTU’s average premium over other U.S. coal companies from 2004-2014 of 1.8x compared to current U.S. coal company average EV/EBITDA multiple of 4.5x; Implied share prices calculated based on 2018 consensus EBITDA of $1,314 million 17 as of Feb. 14, 2018. Current DJIA (Dow Jones Industrial Average) P/E multiple: 16.1.
|
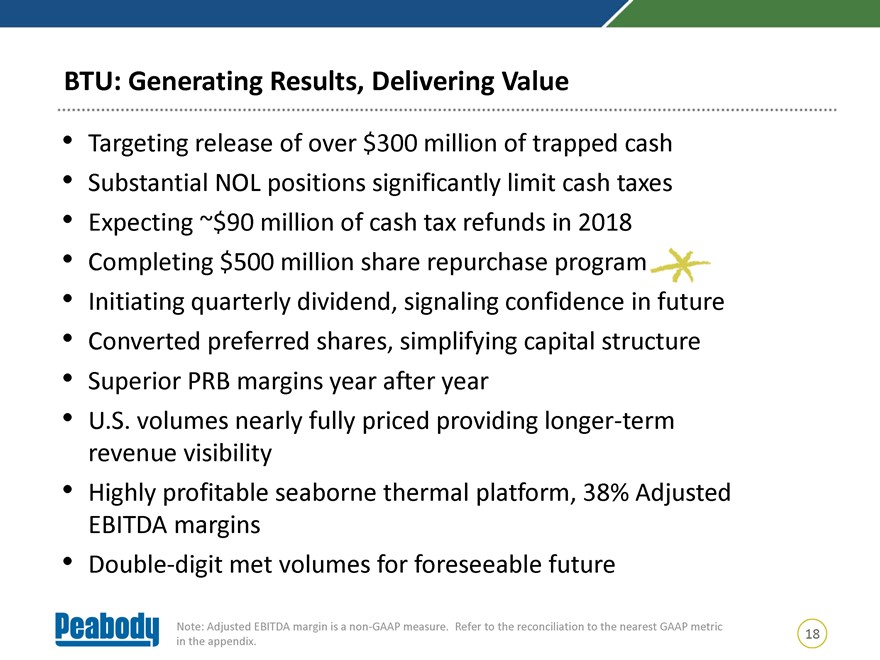 |
BTU: Generating Results, Delivering Value • Targeting release of over $300 million of trapped cash • Substantial NOL positions significantly limit cash taxes • Expecting ~$90 million of cash tax refunds in 2018 • Completing $500 million share repurchase program • Initiating quarterly dividend, signaling confidence in future • Converted preferred shares, simplifying capital structure • Superior PRB margins year after year • U.S. volumes nearly fully priced providing longer-term revenue visibility • Highly profitable seaborne thermal platform, 38% Adjusted EBITDA margins • Double-digit met volumes for foreseeable future Note: Adjusted EBITDA margin is anon-GAAP measure. Refer to the reconciliation to the nearest GAAP metric 18 in the appendix.
Peabody Analyst and Investor Day Appendix February 22, 2018
|
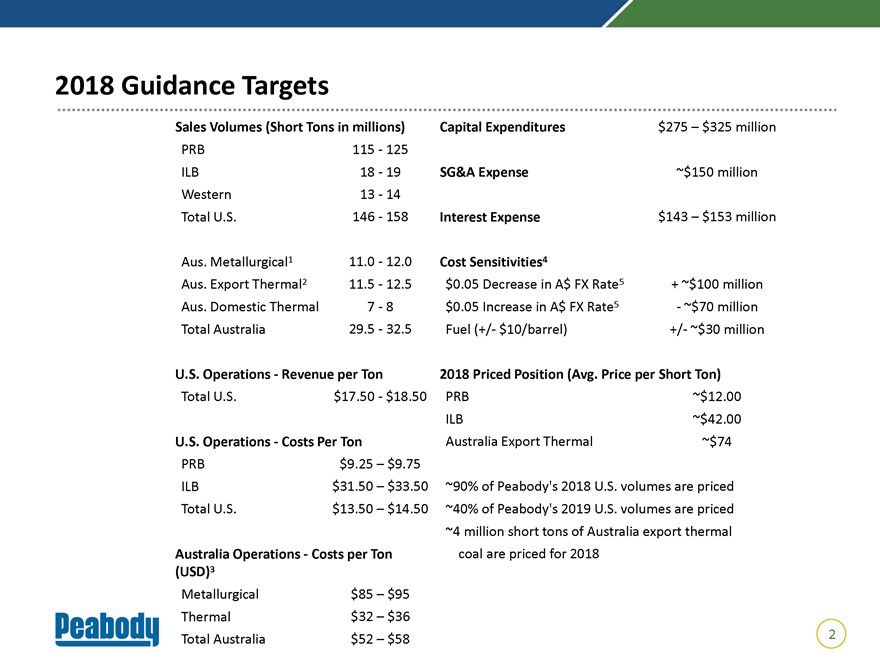 |
2018 Guidance Targets Sales Volumes (Short Tons in millions) Capital Expenditures $275 – $325 million PRB 115—125 ILB 18—19 SG&A Expense ~$150 million Western 13—14 Total U.S. 146—158 Interest Expense $143 – $153 million Aus. Metallurgical1 11.0—12.0 Cost Sensitivities4 Aus. Export Thermal2 11.5—12.5 $0.05 Decrease in A$ FX Rate5 + ~$100 million Aus. Domestic Thermal 7—8 $0.05 Increase in A$ FX Rate5—~$70 million Total Australia 29.5—32.5 Fuel (+/- $10/barrel) +/- ~$30 million U.S. Operations—Revenue per Ton 2018 Priced Position (Avg. Price per Short Ton) Total U.S. $17.50—$18.50 PRB ~$12.00 ILB ~$42.00 U.S. Operations—Costs Per Ton Australia Export Thermal ~$74 PRB $9.25 – $9.75 ILB $31.50 – $33.50 ~90% of Peabody’s 2018 U.S. volumes are priced Total U.S. $13.50 – $14.50 ~40% of Peabody’s 2019 U.S. volumes are priced ~4 million short tons of Australia export thermal Australia Operations—Costs per Ton coal are priced for 2018 (USD)3 Metallurgical $85 – $95 Thermal $32 – $36 Total Australia $52 – $58 2
|
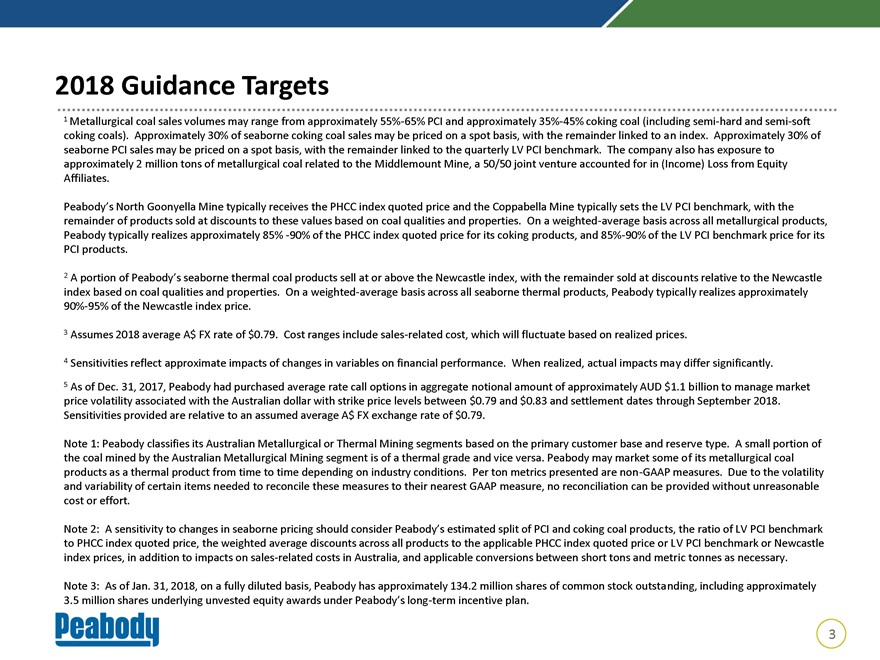 |
2018 Guidance Targets 1 Metallurgical coal sales volumes may range from approximately55%-65% PCI and approximately35%-45% coking coal (including semi-hard and semi-soft coking coals). Approximately 30% of seaborne coking coal sales may be priced on a spot basis, with the remainder linked to an index. Approximately 30% of seaborne PCI sales may be priced on a spot basis, with the remainder linked to the quarterly LV PCI benchmark. The company also has exposure to approximately 2 million tons of metallurgical coal related to the Middlemount Mine, a 50/50 joint venture accounted for in (Income) Loss from Equity Affiliates. Peabody’s North Goonyella Mine typically receives the PHCC index quoted price and the Coppabella Mine typically sets the LV PCI benchmark, with the remainder of products sold at discounts to these values based on coal qualities and properties. On a weighted-average basis across all metallurgical products, Peabody typically realizes approximately 85%-90% of the PHCC index quoted price for its coking products, and85%-90% of the LV PCI benchmark price for its PCI products. 2 A portion of Peabody’s seaborne thermal coal products sell at or above the Newcastle index, with the remainder sold at discounts relative to the Newcastle index based on coal qualities and properties. On a weighted-average basis across all seaborne thermal products, Peabody typically realizes approximately90%-95% of the Newcastle index price. 3 Assumes 2018 average A$ FX rate of $0.79. Cost ranges include sales-related cost, which will fluctuate based on realized prices. 4 Sensitivities reflect approximate impacts of changes in variables on financial performance. When realized, actual impacts may differ significantly. 5 As of Dec. 31, 2017, Peabody had purchased average rate call options in aggregate notional amount of approximately AUD $1.1 billion to manage market price volatility associated with the Australian dollar with strike price levels between $0.79 and $0.83 and settlement dates through September 2018. Sensitivities provided are relative to an assumed average A$ FX exchange rate of $0.79. Note 1: Peabody classifies its Australian Metallurgical or Thermal Mining segments based on the primary customer base and reserve type. A small portion of the coal mined by the Australian Metallurgical Mining segment is of a thermal grade and vice versa. Peabody may market some of its metallurgical coal products as a thermal product from time to time depending on industry conditions. Per ton metrics presented arenon-GAAP measures. Due to the volatility and variability of certain items needed to reconcile these measures to their nearest GAAP measure, no reconciliation can be provided without unreasonable cost or effort. Note 2: A sensitivity to changes in seaborne pricing should consider Peabody’s estimated split of PCI and coking coal products, the ratio of LV PCI benchmark to PHCC index quoted price, the weighted average discounts across all products to the applicable PHCC index quoted price or LV PCI benchmark or Newcastle index prices, in addition to impacts on sales-related costs in Australia, and applicable conversions between short tons and metric tonnes as necessary. Note 3: As of Jan. 31, 2018, on a fully diluted basis, Peabody has approximately 134.2 million shares of common stock outstanding, including approximately 3.5 million shares underlying unvested equity awards under Peabody’s long-term incentive plan. 3
|
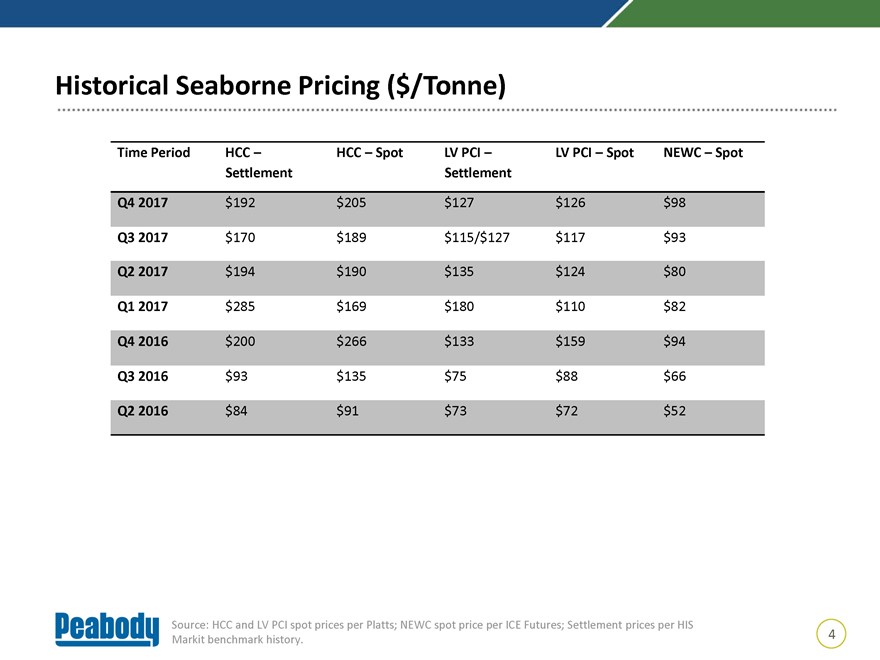 |
Historical Seaborne Pricing ($/Tonne) Time Period HCC – HCC – Spot LV PCI – LV PCI – Spot NEWC – Spot Settlement Settlement Q4 2017 $192 $205 $127 $126 $98 Q3 2017 $170 $189 $115/$127 $117 $93 Q2 2017 $194 $190 $135 $124 $80 Q1 2017 $285 $169 $180 $110 $82 Q4 2016 $200 $266 $133 $159 $94 Q3 2016 $93 $135 $75 $88 $66 Q2 2016 $84 $91 $73 $72 $52 Source: HCC and LV PCI spot prices per Platts; NEWC spot price per ICE Futures; Settlement prices per HIS 4 Markit benchmark history.
|
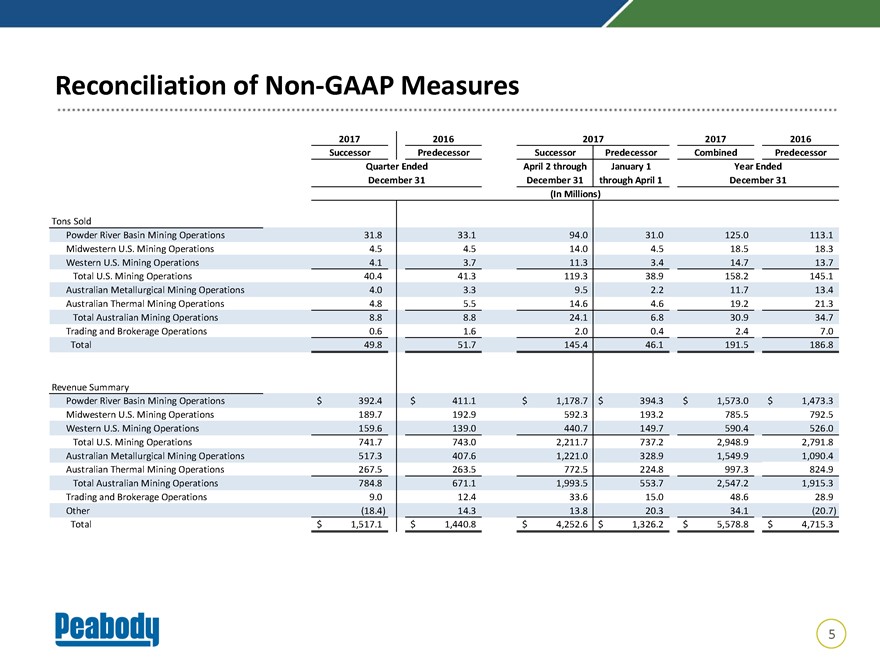 |
Reconciliation of Non-GAAP Measures 2017 2016 2017 2017 2016 Successor Predecessor Successor Predecessor Combined Predecessor Quarter Ended April 2 through January 1 Year Ended December 31 December 31 through April 1 December 31 (In Millions) Tons Sold Powder River Basin Mining Operations 31.8 33.1 94.0 31.0 125.0 113.1 Midwestern U.S. Mining Operations 4.5 4.5 14.0 4.5 18.5 18.3 Western U.S. Mining Operations 4.1 3.7 11.3 3.4 14.7 13.7 Total U.S. Mining Operations 40.4 41.3 119.3 38.9 158.2 145.1 Australian Metallurgical Mining Operations 4.0 3.3 9.5 2.2 11.7 13.4 Australian Thermal Mining Operations 4.8 5.5 14.6 4.6 19.2 21.3 Total Australian Mining Operations 8.8 8.8 24.1 6.8 30.9 34.7 Trading and Brokerage Operations 0.6 1.6 2.0 0.4 2.4 7.0 Total 49.8 51.7 145.4 46.1 191.5 186.8 Revenue Summary Powder River Basin Mining Operations $ 392.4 $ 411.1 $ 1,178.7 $ 394.3 $ 1,573.0 $ 1,473.3 Midwestern U.S. Mining Operations 189.7 192.9 592.3 193.2 785.5 792.5 Western U.S. Mining Operations 159.6 139.0 440.7 149.7 590.4 526.0 Total U.S. Mining Operations 741.7 743.0 2,211.7 737.2 2,948.9 2,791.8 Australian Metallurgical Mining Operations 517.3 407.6 1,221.0 328.9 1,549.9 1,090.4 Australian Thermal Mining Operations 267.5 263.5 772.5 224.8 997.3 824.9 Total Australian Mining Operations 784.8 671.1 1,993.5 553.7 2,547.2 1,915.3 Trading and Brokerage Operations 9.0 12.4 33.6 15.0 48.6 28.9 Other (18.4) 14.3 13.8 20.3 34.1 (20.7) Total $ 1,517.1 $ 1,440.8 $ 4,252.6 $ 1,326.2 $ 5,578.8 $ 4,715.3 5
|
 |
Reconciliation ofNon-GAAP Measures 2017 2016 2017 2017 2016 Successor Predecessor Successor Predecessor Combined Predecessor Quarter Ended April 2 through January 1 Year Ended December 31 December 31 through April 1 December 31 (In Millions, Except Per Ton Data) Reconciliation ofNon-GAAP Financial Measures Income (Loss) from Continuing Operations, Net of Income Taxes $ 378.0 $ (175.2) $ 713.1 $ (195.5) $ 517.6 $ (663.8) Depreciation, Depletion and Amortization 178.8 119.9 521.6 119.9 641.5 465.4 Asset Retirement Obligation Expenses 18.9 4.5 41.2 14.6 55.8 41.8 Selling and Administrative Expenses Related to Debt Restructuring — — — — — 21.5 NetMark-to-Market Adjustment on Actuarially Determined Liabilities (45.2) — (45.2) — (45.2) -Asset Impairment — 230.7 — 30.5 30.5 247.9 Changes in Deferred Tax Asset Valuation Allowance and Amortization of Basis Difference Related to Equity Affiliates (9.6) (6.9) (17.3) (5.2) (22.5) (7.5) Interest Expense 35.9 54.9 119.7 32.9 152.6 298.6 Loss on Early Debt Extinguishment 8.0 29.5 20.9 — 20.9 29.5 Interest Income (2.1) (1.7) (5.6) (2.7) (8.3) (5.7) Reorganization Items, Net — 33.9 — 627.2 627.2 159.0 Gain on Disposal of Reclamation Liability (31.2) — (31.2) — (31.2) -Gain on Disposal of Burton Mine (52.2) — (52.2) — (52.2) -Break Fees Related to Terminated Asset Sales — — (28.0) — (28.0) -Unrealized Losses (Gains) on Economic Hedges 21.6 (9.3) 23.0 (16.6) 6.4 39.8 Unrealized Losses onNon-Coal Trading Derivative Contracts 3.0 — 1.5 — 1.5 -Coal InventoryRevaluation — — 67.3 — 67.3 -Take-or-Pay Contract-Based Intangible Recognition (6.1) — (22.5) — (22.5) -Income Tax (Benefit) Provision (81.6) 13.7 (161.0) (263.8) (424.8) (94.5) Adjusted EBITDA (1) $ 416.2 $ 294.0 $ 1,145.3 $ 341.3 $ 1,486.6 $ 532.0 Net Cash Provided by (Used in) Operating Activities $ 466.9 $ 224.0 $ 797.2 $ 214.0 $ 1,011.2 $ (52.8) Net Cash (Used in) Provided by Investing Activities (58.5) (44.4) (93.4) 15.1 (78.3) (244.1) Free Cash Flow (2) $ 408.4 $ 179.6 $ 703.8 $ 229.1 $ 932.9 $ (296.9) Adjusted EBITDA (1) Powder River Basin Mining Operations $ 81.3 $ 101.6 $ 278.8 $ 91.7 $ 370.5 $ 379.9 Midwestern U.S. Mining Operations 28.4 44.9 124.4 50.0 174.4 217.3 Western U.S. Mining Operations 52.4 18.4 131.8 50.0 181.8 101.6 Total U.S. Mining Operations 162.1 164.9 535.0 191.7 726.7 698.8 Australian Metallurgical Mining Operations 199.9 104.7 414.9 109.6 524.5 (16.3) Australian Thermal Mining Operations 102.9 80.4 306.6 75.6 382.2 217.6 Total Australian Mining Operations 302.8 185.1 721.5 185.2 906.7 201.3 Trading and Brokerage (4.5) 8.9 (6.9) 8.8 1.9 (32.4) Selling and Administrative Expenses (Excluding Debt Restructuring) (37.6) (38.8) (105.4) (37.2) (142.6) (131.9) Other Operating Costs, Net 3.6 17.1 5.5 20.4 25.9 (15.4) Restructuring Charges (6.5) — (7.6) — (7.6) (15.5) Gain on UMWA VEBA Settlement — — — — — 68.1 Corporate Hedging Results (3.7) (43.2) 3.2 (27.6) (24.4) (241.0) Adjusted EBITDA (1) $ 416.2 $ 294.0 $ 1,145.3 $ 341.3 $ 1,486.6 $ 532.0 Note: Refer to definition of Adjusted EBITDA on following slide. 6
|
 |
Reconciliation ofNon-GAAP Measures: Definitions 1 Adjusted EBITDA is anon-GAAP measure defined as income (loss) from continuing operations before deducting net interest expense, income taxes, asset retirement obligation expenses, depreciation, depletion and amortization and reorganization items, net. Adjusted EBITDA is also adjusted for the discrete items that management excluded in analyzing the segments’ operating performance as displayed in the reconciliation. Adjusted EBITDA is used by management as one of the primary metrics to measure our operating performance. Management also believesnon-GAAP performance measures are used by investors to measure our operating performance and lenders to measure our ability to incur and service debt. Adjusted EBITDA is not intended to serve as an alternative to U.S. GAAP measures of performance and may not be comparable to similarly-titled measures presented by other companies. 2 Free cash flow is anon-GAAP measure defined as net cash provided by operating activities less net cash used in investing activities. Free cash flow is used by management as a measure of our financial performance and our ability to generate excess cash flow from our business operations. Free cash flow is not intended to serve as an alternative to U.S. GAAP measures of performance and may not be comparable to similarly-titled measures presented by other companies. 7