Table of Contents
As filed with the Securities and Exchange Commission on January 21, 2003
Registration No. 333-101688
UNITED STATES SECURITIES AND EXCHANGE COMMISSION
WASHINGTON, D.C. 20549
Pre-Effective Amendment No. 2
to
FORM S-1
REGISTRATION STATEMENT UNDER THE
SECURITIES ACT OF 1933
Resource Bankshares Corporation
(Exact name of registrant as specified in its charter)
Virginia | 6712 | 54-1904386 | ||
(State or other jurisdiction of incorporation or organization) | (Primary Standard Industrial Classification Code Number) | (IRS Employer Identification No.) |
3720 Virginia Beach Blvd.
Virginia Beach, Virginia 23452
(757) 463-2265
(Address, including zip code, and telephone number, including area code,
of registrant’s principal executive offices)
Lawrence N. Smith, Chief Executive Officer
Resource Bankshares Corporation
3720 Virginia Beach Blvd.
Virginia Beach, Virginia 23452
(757) 463-2265
(Name, address, including zip code, and telephone number, including
area code, of agent for service)
Copies to:
T. Richard Litton, Jr., Esq. Jeffrey A. D. Cohen, Esq. Kaufman & Canoles, P.C. 150 West Main Street Suite 2100 Norfolk, Virginia 23510 (757) 624-3000 | Scott H. Richter, Esq. Christopher J. Lange, Esq. LeClair Ryan, A Professional Corporation 707 East Main Street 11th Floor Richmond, Virginia 23219 (804) 783-2003 |
Approximate date of commencement of proposed sale to the public: As soon as practicable after this Registration Statement becomes effective.
If any of the securities being registered on this Form are to be offered on a delayed or continuous basis pursuant to Rule 415 under the Securities Act, check the following box.¨
If this Form is filed to register additional securities for an offering pursuant to Rule 462(b) under the Securities Act, check the following box and list the Securities Act registration statement number of the earlier effective registration statement for the same offering.¨
If this Form is a post-effective amendment filed pursuant to Rule 462(c) under the Securities Act, check the following box and list the Securities Act registration statement number of the earlier effective registration statement for the same offering.¨
If this Form is a post-effective amendment filed pursuant to Rule 462(d) under the Securities Act, check the following box and list the Securities Act registration statement number of the earlier effective registration statement for the same offering.¨
If delivery of the prospectus is expected to be made pursuant to Rule 434, please check the following box.¨
The registrant hereby amends this registration statement on such date or dates as may be necessary to delay its effective date until the registrant shall file a further amendment which specifically states that this registration statement shall thereafter become effective in accordance with Section 8(a) of the Securities Act, or until the registration statement shall become effective on such date as the Commission, acting pursuant to said Section 8(a), may determine.
Table of Contents
The information in this prospectus is not complete and may be changed. We may not sell these securities until the registration statement filed with the Securities and Exchange Commission is effective. This prospectus is not an offer to sell these securities and we are not soliciting offers to buy these securities in any state where the offer or sale is not permitted.
SUBJECT TO COMPLETION, DATED JANUARY , 2003
700,000 Shares
RESOURCE BANKSHARES CORPORATION

Common Stock
We are selling 700,000 shares of our common stock.
Our common stock is quoted on the Nasdaq National Market under the symbol “RBKV.” The last reported sale price of our common stock on January 17, 2003 was $20.62 per share.
Investing in our common stock involves risks. See “Risk Factors” on page 7 to read about factors you should consider before buying shares of our common stock.
Neither the Securities and Exchange Commission nor any other regulatory body has approved or disapproved of these securities or passed upon the accuracy or adequacy of this prospectus. Any representation to the contrary is a criminal offense.
The shares of common stock we are offering are not deposit accounts and are not insured or guaranteed by the Federal Deposit Insurance Corporation or any other government agency.
Per Share | Total | |||||
Public offering price | $ | $ | ||||
| Underwriting discount | $ | $ | ||||
| Proceeds, before expenses, to Resource Bankshares | $ | $ | ||||
This is a firm commitment underwriting. The underwriters may also purchase up to 105,000 additional shares from us at the public offering price, less the underwriting discount, to cover over-allotments.
The underwriters expect to deliver the shares to purchasers on , 2003.
Joint Lead Managers
BB&T Capital Markets |  | |||
| A Division of Scott & Stringfellow, Inc. | ||||
TRIDENT SECURITIES | ||||
A Division of McDonald Investments Inc. | ||||
This prospectus is dated , 2003.
Table of Contents
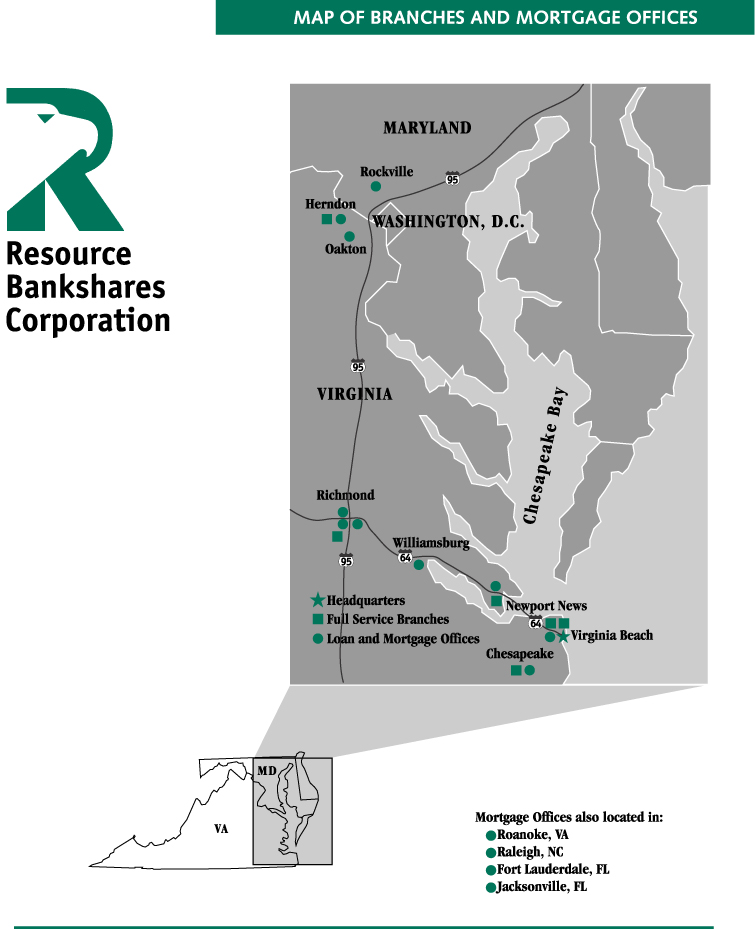
Table of Contents
This summary highlights information about our company and the offering. This summary does not contain all the information that you should consider before investing in our common stock. You should read the entire prospectus carefully.
Resource Bankshares Corporation
Resource Bankshares Corporation is a bank holding company headquartered in Virginia Beach, Virginia. Our wholly owned subsidiary, Resource Bank, began operating as a Virginia commercial bank in September 1988. We provide our financial services primarily to customers located in the three largest metropolitan areas in Virginia—Greater Hampton Roads, northern Virginia and Greater Richmond. In recent years, these areas have seen significant population growth and each has developed an energetic business climate, which has in turn promoted further growth. We continue to capitalize on these growth markets by obtaining, building and enhancing relationships with customers that require sophisticated financial services, but that also value personal relationship banking.
As of September 30, 2002, we had assets of $647.4 million, deposits of $464.7 million and stockholders’ equity of $30.7 million. We reported net income of $4.3 million, or $1.40 per share, for the first nine months of 2002. Our assets increased by 22.5% and our net income increased by 33.8%, compared to the same nine-month period in 2001. Loans outstanding as of September 30, 2002 amounted to $421.2 million, an increase of 28.7% from September 30, 2001.
Banking Operations
Resource Bank has six full service banking offices—two in Virginia Beach, Virginia, and one each in Chesapeake, Newport News, Richmond and Herndon, Virginia. Resource Bank markets its products to individuals, small to medium sized businesses and professionals by emphasizing personalized service, local decision making and rapid responsiveness. The bank’s financial products include checking and savings accounts, certificates of deposit and charge cards, as well as services typically associated with larger banks, such as sweep account capacity, automatic reconciliation and corporate credit cards. Additionally, we offer online banking services, providing customers with the ability to conduct banking business 24 hours per day through our Internet site, www.ResourceBankOnline.com. The bank’s commercial lending group generates most of our loans and consists of 22 senior lenders with an average of 24 years of banking experience. During the nine months ended September 30, 2002, our bank related operations generated 74.4% of our total income before income taxes.
Resource Mortgage, the bank’s mortgage division, originates mortgage loans and sells them to investors in the national secondary market. Resource Mortgage originates both conforming and non-conforming single-family loans on a national basis. During 2001, we originated and sold mortgage loans totaling over $797.7 million. In the first nine months of 2002, we originated and sold mortgage loans totaling over $635.3 million. During the nine months ended September 30, 2002, the bank’s mortgage division generated 25.6% of our total income before income taxes.
Table of Contents
Management Team
Our senior management team consists of six officers that average over 30 years of experience in the banking industry. These officers received much of their industry training in major regional financial institutions. This experience includes managing loan portfolios much larger than Resource Bank’s current loan portfolio and also includes direct involvement in developing asset and liability management policies, customer information systems, cost allocation of technology systems, operational systems and managing major retail systems for large regional banks.
The chart below evidences the experience of our senior management team.
Name | Position | Years Experience in Banking Industry | ||
| Lawrence N. Smith | Chief Executive Officer | 38 | ||
| T. A. Grell, Jr. | President | 31 | ||
| Harvard R. Birdsong, II | EVP-Chief Credit Officer | 31 | ||
| Debra C. Dyckman | EVP-Retail Banking | 34 | ||
| James M. Miller | EVP-Operations/Finance | 22 | ||
| Eleanor J. Whitehurst | Chief Financial Officer | 31 |
Our Strategy
Implementing our strategic plan has allowed us to experience steady growth while improving profitability. Our strategic plan has five primary components:
| • | Hire experienced lending officers. Resource Bank has hired a group of talented and experienced senior lending officers from major regional banks. These officers have been able to attract customers with which they have built relationships over the years, typically allowing the officers to enhance our loan production immediately. Resource Bank currently has 22 senior lending officers with an average age of 48 and an average of 24 years of experience in the financial services industry. These senior lending officers, together with our executive management team, have broad experience during a variety of economic cycles in asset and liability management, loan production and credit administration—key strengths in building and growing our company. |
| • | Grow and expand our loan portfolio in Virginia’s largest metropolitan markets. We have grown our loan portfolio by expanding in our current metropolitan markets and by penetrating new geographic markets. When seeking to enter new markets, our strategy is to identify a market with growth potential, hire a small group of lenders with experience in the market, and then allow those lenders to operate a loan production office and generate a profitable portfolio of loans. Once a loan production office is sufficiently profitable, the bank has the ability, on a cost effective basis, to convert the office into a full service branch that offers deposit and related products. Since 2000, the bank has implemented this strategy in Chesapeake, Newport News and Richmond, Virginia. In addition to growing our asset base in this manner, we intend to pursue “de novo” branch openings and selective branch and financial institution acquisitions when attractive opportunities arise. |
| • | Fund asset growth with the lowest cost sources possible. Our liability funding strategy is to generate the lowest cost deposits possible through various sources, while also diversifying our sources of funds and liquidity risks. Our bank funds its asset growth with a combination of local deposits, Internet deposits, national market deposits, federal fund borrowings and Federal Home Loan Bank, or FHLB borrowings. The bank’s asset and liability committee surveys our three major markets on a weekly basis, sets interest rates on deposits and makes funding decisions based on current market rates and maturities needed to fund new asset growth. This committee provides specific guidance on the mix of |
2
Table of Contents
liabilities necessary to match fund our forecasted net growth in loans for the next thirty days. Our target liability mix is 40% in local and Internet deposits, 40% in national deposits and 20% in borrowings. The bank has a liability funding desk that reviews all segments of these markets on a daily basis. The bank also enters into interest rate swaps to fund loans that reprice on movements of the prime rate. By using interest rate swaps, the bank is able to maintain stable interest rate margins in both rising and falling interest rate environments.
| • | Maximize efficiencies in asset and liability management. Relying on the extensive industry experience of our senior management, we use sophisticated financial models to forecast future net interest income and financial margins. These models include detailed asset and liability maturities by month, current rollover yields/costs and volume forecasts, and also consider the current interest rate and economic environment, including any recent interest rate changes by the Board of Governors of the Federal Reserve System. The bank’s asset liability management committee also reviews the interest rate and volume analysis of each major asset and liability category and its impact on profitability, and maintains an interest rate analysis report that match funds each asset and liability group by maturity. Our financial models, which are reviewed by our board of directors each month, allow us to be proactive in our budget forecasts and maximize profitability in changing economic conditions. |
| • | Generate significant non-interest income. In addition to increasing our overall profitability, our mortgage operations are an integral part of the bank’s ability to meet customer needs—from the purchase of a building lot to a construction loan to build a home, to the ultimate placement of the permanent residential mortgage loan in the national market. We have expanded our mortgage operations and increased our non-interest income by hiring experienced mortgage loan officers and by making strategic acquisitions. We are also pursuing other strategic initiatives to generate non-interest income from ancillary sources, including insurance and asset management products, that we believe can be cross-sold effectively to our existing and expanding customer base. |
We believe that the net proceeds raised in this offering will allow us to further implement our strategy by providing the equity capital necessary to support future loan production and asset growth, branch expansion in new and existing markets, and potential acquisitions to expand our retail branch network.
3
Table of Contents
The Offering
| Common stock offered by Resource Bankshares | 700,000 shares. |
| Common stock outstanding after the offering | 3,761,961 shares. |
| Use of proceeds | We will use the net proceeds to increase Resource Bank’s equity capital and for general corporate purposes, including the future growth and expansion of Resource Bank. See “Use of Proceeds” on page 13. |
| Dividends | We have declared quarterly cash dividends for each of the last 20 fiscal quarters. These dividends have increased from $0.06 to $0.14 per share. See “Market For Common Stock” on page 14. |
| Nasdaq National Market symbol | RBKV |
| Risk factors | You should read the “Risk Factors” section beginning on page 7 before deciding to purchase any of our shares. |
The number of shares of our common stock outstanding after this offering is based on the number of shares outstanding on September 30, 2002, and excludes 531,147 shares of common stock issuable upon exercise of stock options outstanding under our stock option plans on September 30, 2002, of which 233,497 were exercisable.
Except as otherwise indicated, all information in this prospectus assumes no exercise of the underwriters’ over-allotment option.
We were founded as a Virginia corporation in 1998 for the sole purpose of becoming a holding company for Resource Bank. Resource Bank, our wholly owned subsidiary, began operating as a Virginia commercial bank in September 1988. Our principal executive offices are located at 3720 Virginia Beach Blvd., Virginia Beach, Virginia 23452. Our telephone number is (757) 463-2265.
Except as otherwise indicated or required by the context, references in this prospectus to we, our, us, or Resource Bankshares refer to Resource Bankshares Corporation and its subsidiaries collectively. Financial information in this prospectus for periods before the date Resource Bankshares became a holding company for Resource Bank reflects the results of operations of Resource Bank.
4
Table of Contents
Summary Consolidated Financial Information
The following table sets forth summary consolidated financial information for Resource Bankshares Corporation. The financial information for the five years ended December 31, 2001 are derived from our consolidated financial statements. The financial information for the nine-month periods ended September 30, 2002 and 2001 are derived from our unaudited consolidated financial statements. Operating results for the nine months ended September 30, 2002 are not necessarily indicative of the results that may be expected for the year ending December 31, 2002. You should read the following summary consolidated financial information with our financial statements and accompanying notes that are included elsewhere in the prospectus and the information contained in “Management’s Discussion and Analysis of Financial Condition and Results of Operations” beginning on page 16.
Nine Months Ended September 30, | Years Ended December 31, | |||||||||||||||||||||||||||
2002 | 2001 | 2001 | 2000 | 1999 | 1998 | 1997 | ||||||||||||||||||||||
(unaudited) | ||||||||||||||||||||||||||||
(Dollars in thousands, except per share data) | ||||||||||||||||||||||||||||
Income Statement Data: | ||||||||||||||||||||||||||||
| Net interest income | $ | 11,529 | $ | 7,730 | $ | 11,033 | $ | 9,437 | $ | 8,946 | $ | 8,410 | $ | 4,954 | ||||||||||||||
| Provision for loan losses | 975 | 45 | 195 | 1,100 | 4,667 | 150 | 155 | |||||||||||||||||||||
| Non-interest income | 17,043 | 13,897 | 20,144 | 11,890 | 6,811 | 7,943 | 4,520 | |||||||||||||||||||||
| Non-interest expense | 21,439 | 16,997 | 24,521 | 14,109 | 12,168 | 11,565 | 6,533 | |||||||||||||||||||||
| Income taxes (benefit) | 1,817 | 1,341 | 1,918 | 1,886 | (387 | ) | 1,591 | 965 | ||||||||||||||||||||
| Net income (loss) | $ | 4,341 | $ | 3,244 | $ | 4,543 | $ | 4,233 | $ | (691 | )(1) | $ | 3,047 | $ | 1,821 | |||||||||||||
Per Share Data(2): | ||||||||||||||||||||||||||||
| Net income (loss)(3): | ||||||||||||||||||||||||||||
| Basic | $ | 1.40 | $ | 1.15 | $ | 1.57 | $ | 1.63 | $ | (0.27 | )(1) | $ | 1.24 | $ | 0.92 | |||||||||||||
| Diluted | 1.32 | 1.08 | 1.49 | 1.56 | (0.27 | ) | 1.13 | 0.83 | ||||||||||||||||||||
| Book value at period end | 10.04 | 9.12 | 9.27 | 7.50 | 6.25 | 7.18 | 6.36 | |||||||||||||||||||||
| Tangible book value at period end | 9.78 | 8.90 | 9.03 | 7.47 | 6.25 | 7.18 | 6.36 | |||||||||||||||||||||
| Cash dividends declared | 0.42 | 0.36 | 0.48 | 0.42 | 0.40 | 0.24 | 0.12 | |||||||||||||||||||||
| Dividend payout ratio | 31.82 | % | 33.33 | % | 32.21 | % | 26.92 | % | (148.15 | %) | 21.24 | % | 14.46 | % | ||||||||||||||
Balance Sheet Data: | ||||||||||||||||||||||||||||
| Total assets | $ | 647,361 | $ | 528,247 | $ | 564,850 | $ | 404,494 | $ | 306,690 | $ | 233,460 | $ | 209,330 | ||||||||||||||
| Total loans (net of unearned income) | 421,246 | 327,261 | 344,936 | 288,513 | 255,671 | 188,522 | 150,590 | |||||||||||||||||||||
| Total deposits | 464,725 | 496,302 | 411,504 | 330,645 | 260,469 | 206,219 | 169,508 | |||||||||||||||||||||
| Stockholders’ equity | 30,736 | 28,710 | 28,779 | 19,672 | 15,870 | 17,789 | 15,602 | |||||||||||||||||||||
Performance Ratios(4): | ||||||||||||||||||||||||||||
| Return (loss) on average assets | 0.97 | % | 0.95 | % | 0.95 | % | 1.21 | % | (0.25 | )% | 1.27 | % | 1.40 | % | ||||||||||||||
| Return (loss) on average stockholders’ equity | 19.93 | 18.91 | 18.73 | 24.13 | (3.90 | ) | 18.19 | 18.59 | ||||||||||||||||||||
| Net interest margin(5) | 2.79 | 2.47 | 2.52 | 2.92 | 3.42 | 3.62 | 3.90 | |||||||||||||||||||||
Asset Quality Ratios: | ||||||||||||||||||||||||||||
| Allowance to period-end loans | 1.08 | % | 1.13 | % | 1.07 | % | 1.22 | % | 1.04 | % | 1.33 | % | 1.71 | % | ||||||||||||||
| Allowance to nonperforming loans | 545.13 | 109.32 | 227.93 | 263.75 | 361.51 | 264.55 | 58.50 | |||||||||||||||||||||
| Nonperforming assets to total assets | 0.14 | 0.65 | 0.29 | 0.33 | 0.25 | 0.68 | 2.43 | |||||||||||||||||||||
| Net charge-offs (recoveries) to average loans(4) | 0.04 | (0.04 | ) | 0.01 | 0.10 | 2.06 | 0.13 | 0.02 | ||||||||||||||||||||
Capital Ratios: | ||||||||||||||||||||||||||||
| Tier 1 risk-based capital | 8.88 | % | 10.06 | % | 9.49 | % | 8.74 | % | 8.20 | % | 9.23 | % | 9.69 | % | ||||||||||||||
| Total risk-based capital | 10.62 | 11.07 | 10.44 | 10.75 | 9.24 | 10.48 | 10.93 | |||||||||||||||||||||
| Leverage capital ratio | 6.38 | 7.46 | 6.88 | 6.69 | 7.19 | 7.52 | 9.67 | |||||||||||||||||||||
| Total equity to total assets | 4.75 | 5.43 | 5.09 | 4.86 | 5.17 | 7.62 | 7.45 | |||||||||||||||||||||
| (1) | Our loss in 1999 was attributable to a $4.7 million provision for loan losses in the third quarter that occurred as a result of credit problems with a significant borrower in our now discontinued asset based lending portfolio. |
| (2) | All per share figures have been adjusted to reflect a two-for-one stock split on July 1, 1998. |
| (3) | Net income per share is computed using the basic and diluted weighted average outstanding shares. |
| (4) | Ratios for the nine months ended September 30, 2002 and 2001 have been annualized. |
| (5) | Net interest margin is calculated as tax-equivalent net interest income divided by average earning assets and represents our net yield on earning assets. |
5
Table of Contents
Recent Developments
For the year ended December 31, 2002, our net income was $6.3 million, a 39.3% increase over the $4.5 million reported in 2001. Diluted earnings per share for this period increased 29.5% to $1.93 in 2002, from $1.49 for the same period in 2001. The primary factor contributing to the increase in our net income was our net interest income, which grew 48.4% from $11.0 million for the year ended 2001 to $16.3 million for the year ended 2002. Net interest income growth occurred as the result of increases in average earning assets, from $454.8 million at year end 2001 to $584.4 million at year end 2002, up 28.5%, and also from a 0.35% improvement in our net interest margin which increased from 2.52% in 2001 to 2.87% in 2002. Our returns on average equity and assets improved to 21.5% and 1.0% from 18.7% and 0.9% for the years ended December 31, 2002 and 2001, respectively.
As of December 31, 2002, our net loans totaled $427.7 million, up 25.3% compared to $341.2 million at the end of 2001. Our ratio of nonperforming assets to total assets declined to 0.11% at December 31, 2002, versus 0.29% at December 31, 2001. Mortgage banking net income increased from $2.4 million in 2001 to $2.7 million in 2002, up 12.5%, as mortgage loans originated grew 17.8%, from $797.7 million in 2001 to $940.0 million in 2002.
The following table sets forth selected consolidated financial data for the years ended December 31, 2002 and 2001. The financial data for the year ended December 31, 2002 is unaudited.
Year Ended December 31, | ||||||||
2002 | 2001 | |||||||
(Unaudited) | (Audited) | |||||||
(Dollars in thousands, except per share data) | ||||||||
Income Statement Data: | ||||||||
| Net interest income | $ | 16,373 | $ | 11,033 | ||||
| Provision for loan losses | 1,550 | 195 | ||||||
| Non-interest income | 24,176 | 20,144 | ||||||
| Non-interest expense | 30,312 | 24,521 | ||||||
| Income taxes | 2,358 | 1,918 | ||||||
| Net income | 6,329 | 4,543 | ||||||
Per Share Data: | ||||||||
| Net income (1): | ||||||||
| Basic | $ | 2.05 | $ | 1.57 | ||||
| Diluted | 1.93 | 1.49 | ||||||
| Book value at period end | 10.63 | 9.27 | ||||||
| Tangible book value at period end | 10.36 | 9.03 | ||||||
| Cash dividends declared | 0.56 | 0.48 | ||||||
| Dividend payout ratio | 29.02 | % | 32.21 | % | ||||
Balance Sheet Data: | ||||||||
| Total assets | $ | 715,167 | $ | 564,850 | ||||
| Net loans | 427,735 | 341,239 | ||||||
| Deposits | 516,449 | 411,504 | ||||||
| Stockholders’ equity | 32,167 | 28,779 | ||||||
Performance Ratios: | ||||||||
| Return on average assets | 1.00 | % | 0.92 | % | ||||
| Return on average stockholders’ equity | 21.55 | 18.73 | ||||||
| Net interest margin (2) | 2.87 | 2.52 | ||||||
Asset Quality Ratios: | ||||||||
| Allowance to period-end loans | 1.16 | % | 1.07 | % | ||||
| Allowance to nonperforming loans | 619.93 | 227.93 | ||||||
| Nonperforming assets to total assets | 0.11 | 0.29 | ||||||
| Net charge-offs to average loans | 0.06 | 0.01 | ||||||
Capital Ratios: | ||||||||
| Tier 1 risk-based capital | 8.36 | % | 9.49 | % | ||||
| Total risk-based capital | 10.64 | 10.44 | ||||||
| Leverage capital ratio | 6.63 | 6.88 | ||||||
| Total equity to total assets | 4.50 | 5.09 | ||||||
| (1) | Net income per share is computed using the basic and diluted weighted average outstanding shares. |
| (2) | Net interest margin is calculated as tax-equivalent net interest income divided by average earning assets and represents our net yield on earning assets. |
6
Table of Contents
An investment in our common stock involves risk. You should carefully read and consider the risks described below together with all of the other information included in this prospectus, before you decide to purchase our common stock.
As we continue to grow our loan portfolio, we may experience additional loan defaults which may adversely affect our financial condition and results of operations.
Our loans outstanding have grown from $288.5 million at December 31, 2000 to $421.2 million at September 30, 2002, an increase of 45.9%. As we continue to increase the number and size of our outstanding loans, we may experience a corresponding increase in loan defaults. The risk of loan defaults is unavoidable in the banking industry, and we try to limit exposure to this risk by monitoring carefully the amount of loans in specific industries and by exercising prudent lending practices. However, we cannot eliminate the risk, and substantial credit losses could result in reduced earnings or losses.
We maintain an allowance for loan losses that we believe is appropriate to provide for any potential losses in our loan portfolio. The amount of this allowance is determined by management through a periodic review and consideration of several factors, including:
| • | an ongoing review of the quality, size and diversity of our loan portfolio; |
| • | evaluation of nonperforming loans; |
| • | historical loan loss experience; and |
| • | the amount and quality of collateral, including guarantees, securing the loans. |
Our allowance for loan losses was $4.5 million at September 30, 2002. Although we believe this loan loss allowance is adequate to absorb probable losses in our loan portfolio, we cannot predict such losses or that our allowance will be adequate. Our ability to predict the probable losses in our loan portfolio is made even more difficult by the fact that nearly half of our outstanding loans were originated after December 2000 and are, consequently, unseasoned. Excess loan losses could have a material adverse effect on our financial condition and results of operations.
We have been sued in a class action lawsuit under the Telephone Consumer Protection Act, and it is possible that we will suffer material losses as a result of this lawsuit.
Resource Mortgage, a division of Resource Bank, historically has used facsimiles to disseminate product and interest rate information to mortgage brokers on a national basis. The facsimile form of business communication is consistent with traditional industry practice. In March 2002, Resource Bankshares and Resource Bank were sued in Indiana state court in a class action lawsuit under the Telephone Consumer Protection Act, or TCPA. The lawsuit alleges that Resource Bank violated the TCPA by sending unsolicited fax advertisements without obtaining prior express invitation or permission to send the faxes. Resource Bankshares has been dismissed from the litigation but the lawsuit is still pending against Resource Bank.
Under the TCPA, recipients of unsolicited fax advertisements are entitled to damages of $500 per fax for inadvertent violations of the TCPA and up to $1,500 per fax for knowing or willful violations. While we are continuing to investigate the number of faxes transmitted during the period for which the plaintiff in the lawsuit seeks class certification, we expect the number of faxes to be significant.
We are contesting the lawsuit vigorously and asserting a number of defenses. We also have insurance coverage for any litigation costs and damages associated with the lawsuit, including attorneys’ fees and expenses, subject to a policy limit of $3 million. However, it is possible that the plaintiff ultimately may prevail in the litigation and it is also possible that any adverse judgment against Resource Bank may significantly exceed our $3 million insurance coverage. Any such adverse judgment could materially and adversely affect our financial condition. In addition, our insurance coverage does not apply to violations of law that are found to be willful on our part or to civil fines or penalties. See “Business-Legal Proceedings,” on page .
7
Table of Contents
We may be unable to successfully manage our sustained growth using the net proceeds from this offering.
We have grown substantially from $404.5 million of total assets at December 31, 2000 to $647.4 million in total assets at September 30, 2002, an increase of 60.0%, and maintained an average growth rate in assets of 42.5% over the last four years. Although we do not expect to continue to grow as fast as we have since the beginning of 1998, it is our intention to expand our asset base. In particular, we intend to use the funds raised in this offering to support anticipated increases in our deposits and loans. Additional capital also would increase our legal lending limit under federal law, which in turn would allow us to compete more actively in our market area for larger loans. Our future profitability will depend in part on our ability to manage growth successfully. Our ability to manage growth successfully will depend on our ability to maintain cost controls and asset quality while attracting additional loans and deposits, as well as on factors beyond our control, such as economic conditions and interest rate trends. If we grow too quickly and are not able to control costs and maintain asset quality, growth could materially adversely affect our financial performance.
Falling interest rates could have a negative impact on our profitability.
Our profitability depends in substantial part on our net interest margin, which is the difference between the rates we receive on loans and investments and the rates we pay for deposits and other sources of funds. Our net interest margin depends on many factors that are partly or completely outside of our control, including competition, federal economic, monetary and fiscal policies, and economic conditions generally. Recently, net interest margins for some financial institutions have changed in response to these and other factors. Falling interest rates could negatively affect our profitability. We try to minimize our exposure to interest rate risk, but we are unable to completely eliminate this risk.
As of September 30, 2002, assets re-pricing exceeded liabilities re-pricing for the following calendar quarter by $107.5 million, or 17.4% of total interest bearing assets. For the next three calendar quarters, we anticipate that liabilities re-pricing will exceed assets re-pricing by $75.4 million, or 12.2% of interest earning assets. Accordingly, if short-term interest rates were reduced 1% by the Board of Governors of the Federal Reserve System, or Federal Reserve, our financial models, which include a number of assumptions, indicate that our net interest income would be reduced by approximately $269,000 in the following calendar quarter, and would be reduced in the aggregate by approximately $320,000 during the next three calendar quarters. Should short-term rates increase, we would experience a positive impact to our net interest income in a similar manner.
Periods of rising interest rates will adversely affect our income from our mortgage division.
One of the components of our strategic plan is to generate significant non-interest income from our mortgage division. In periods of rising interest rates, consumer demand for new mortgages and re-financings decreases, which in turn adversely impacts our mortgage division. For example, decreases in market interest rates during 2001 caused an increase of 144.5% in our residential mortgage volume and 154.5% in our mortgage banking income. However, increases in market interest rates during 1999 and the first half of 2000 resulted in only a modest increase of 14.1% in our 2000 residential mortgage volume and a resultant increase of 21.2% in our mortgage banking income. Of our $653.3 million in mortgage loan volume for the first nine months of 2002, approximately 40% was related to the refinancing of homes. In the event that market interest rates increase in the future, we will likely experience reductions in our mortgage banking income. Because interest rates depend on factors outside of our control, we cannot eliminate the interest rate risk associated with our mortgage operations.
We may be adversely affected by changes in government monetary policy.
As a bank holding company, our business is affected by the monetary policies established by the Federal Reserve, which regulates the national money supply in order to mitigate recessionary and inflationary pressures. In setting its policy, the Federal Reserve may utilize techniques such as the following:
| • | engaging in open market transactions in United States government securities; |
| • | setting the discount rate on member bank borrowings; and |
| • | determining reserve requirements. |
8
Table of Contents
These techniques may have an adverse effect on our deposit levels, net interest margin, loan demand or our business and operations.
Our future success will depend on our ability to compete effectively in the highly competitive financial services industry.
We face substantial competition in all phases of our operations from a variety of different competitors. In particular, there is very strong competition for financial services in the three large metropolitan areas of Virginia in which we conduct a substantial portion of our business. Our future growth and success will depend on our ability to compete effectively in this highly competitive financial services environment. Many of our competitors offer products and services which we do not, and many have substantially greater resources, name recognition and market presence that benefit them in attracting business. In addition, larger competitors may be able to price loans and deposits more aggressively than we do. Some of the financial services organizations with which we compete are not subject to the same degree of regulation as is imposed on bank holding companies and federally insured state-chartered banks, national banks and federal savings institutions. As a result, these nonbank competitors have certain advantages over us in accessing funding and in providing various services.
We depend on the services of a number of key personnel, and a loss of any of those personnel could disrupt our operations and result in reduced revenues.
We are a relationship-driven organization. Our growth and development to date have depended in large part on the efforts of our senior officers: Lawrence N. Smith, Chief Executive Officer; T.A. Grell, Jr., President; Harvard R. Birdsong, II, EVP-Chief Credit Officer; Debra C. Dyckman, EVP-Retail Banking; James M. Miller, EVP Operations/Finance; and Eleanor J. Whitehurst, Chief Financial Officer. These senior officers have primary contact with our customers and are extremely important in maintaining personalized relationships with our customer base, a key aspect of our business strategy, and in increasing our market presence. The unexpected loss of services of one or more of these key employees could have a material adverse effect on our operations and possibly result in reduced revenues.
Our senior officers have many years of experience in the banking industry and are extremely valuable to us and would be difficult to replace. The loss of the services of these officers could have a material adverse effect upon our future prospects. Although we have entered into employment contracts with each of our senior officers, and have purchased key man life insurance policies to mitigate the risk of an unforeseen departure or death of our senior officers, we cannot offer any assurance that they and other key employees will remain employed by us.
We cannot assure you that economic conditions in the markets in which we operate will remain favorable.
We provide our financial services primarily to customers located in Virginia’s three largest metropolitan areas—Greater Hampton Roads, northern Virginia, and Greater Richmond. Our financial success is dependent to a certain extent upon the general economic conditions in these geographic markets. An economic downturn in these market areas could cause any of the following consequences, each of which could adversely affect our business:
| • | demand for our products and services could decline; |
| • | loan delinquencies may increase; and |
| • | problem assets and foreclosures may increase. |
Additionally, the adverse consequences to us in the event of an economic downturn in our three primary markets could be compounded by the fact that 75% of our commercial and real estate loans are secured by real estate located in these markets. A significant decline in real estate values in these markets would mean that the collateral for many of our loans would provide less security. As a result, we would be more likely to suffer losses
9
Table of Contents
on defaulted loans because our ability to fully recover on defaulted loans by selling the real estate collateral securing the loans would be diminished. In addition, many of our loans are dependent on the successful completion of real estate projects and the demand for the sale of homes, both of which could be adversely affected by a decline in the real estate markets.
Future economic conditions in our markets will depend on factors outside of our control such as political and market conditions, broad trends in industry and finance, legislative and regulatory changes, changes in governments, military and fiscal policies and inflation. Recently, the United States economy experienced a significant downturn and is currently growing at a moderate pace. Additionally, it is possible that the United States may go to war with Iraq in the near future. Adverse changes in economic conditions in Resource Bank’s geographic markets would likely impair its ability to collect loans and could otherwise have a negative effect on our financial condition.
Our executive officers and directors will be able to influence the outcome of any shareholder vote.
After the offering, five of our senior officers: Messrs. Smith, Grell, Birdsong and Miller and Ms. Dyckman will, assuming they exercised all of their currently exercisable stock options, own approximately 6% of our outstanding common stock. Additionally, all of our directors and executive officers as a group will, assuming they exercised all of their currently exercisable stock options, own approximately 20% of our outstanding common stock. Accordingly, our executive officers and directors will be able to influence the outcome of all matters that are submitted to our shareholders for approval, including the election of members to our board of directors or other significant corporate transactions.
We may not pay dividends to shareholders in the future.
Although we have paid cash dividends to our shareholders for the past 20 fiscal quarters, we cannot assure you that we will pay cash dividends in the future. Historically, our dividend payout ratio has ranged from approximately 14.5% to 33.3%, and our board of directors currently targets a dividend payout ratio in a range of 25% to 35% of our after-tax earnings. We will not pay any dividends to our shareholders if, after making such dividends, we would be undercapitalized under federal or state banking regulations. Additionally, we may elect to retain our earnings to support the development and growth of our business. Our board of directors will determine our future dividend policy based on an analysis of factors that the board deems relevant. Our ability to pay dividends to our shareholders is also limited by certain restrictions imposed by state and federal laws. Pursuant to federal banking law, we may not, without prior regulatory approval, pay a dividend if the total of all of the dividends declared by us in any calendar year exceeds the total of our net profits for that year combined with our retained net profits of the preceding two calendar years, less any required transfers to surplus or to a fund for the retirement of any preferred stock. Additionally, Resource Bank’s ability to pay us dividends is generally limited to the amount of its retained earnings, which could affect our ability to pay dividends to our shareholders. As of September 30, 2002, Resource Bank could pay us up to $10.3 million in dividends without having to obtain prior regulatory approval.
Resource Bank’s ability to pay us dividends is subject to regulatory limitations which may affect our ability to service our debt and pay dividends to our shareholders.
We are a separate entity from Resource Bank and do not have significant operations of our own. We currently depend on our cash and liquidity as well as dividends from Resource Bank to pay our operating expenses. In addition, at September 30, 2002, we had an aggregate outstanding amount of $16.2 million in trust preferred securities. As of September 30, 2002, our annual interest payments due on our trust preferred securities, based on applicable interest rates as of that date, were approximately $1.2 million. In addition, the availability of dividends from Resource Bank is limited to the amount of its retained earnings. As of September 30, 2002, Resource Bank could pay us up to $10.3 million in dividends without having to gain any prior regulatory approval. In the event that Resource Bank is unable to pay dividends sufficient to satisfy our obligations, we may not be able to service our
10
Table of Contents
debt, pay our obligations as they become due, or pay dividends on our common stock. Under such circumstances, an inability to receive dividends from Resource Bank could adversely affect our financial condition, results of operations and prospects and could also negatively affect the price of our common stock.
Our common stock trades publicly, but has a limited trading volume compared to other stocks.
Our common stock is traded publicly on the Nasdaq National Market under the symbol “RBKV.” However, daily trading volumes for our stock are relatively small compared to many other stocks quoted on the Nasdaq National Market. Although we have several market makers in our stock, this alone does not assure significant trading volume or liquidity. During the nine months ended September 30, 2002, the average daily trading volume of our stock was 3,277 shares. We cannot assure you that this offering will increase the trading volume for our stock.
Provisions in Virginia law and in our articles of incorporation and employment agreements may prevent or delay a change in control and thereby potentially adversely impact the price of our common stock.
Pursuant to our articles of incorporation, our board of directors has the authority to issue shares of preferred stock and to determine the price, rights, preferences and restrictions, including the voting rights, of those shares without any further vote or action by stockholders. The rights of the holders of our common stock will be subject to, and may be adversely affected by, the rights of the holders of any preferred stock that may be issued in the future.
Additionally, Virginia corporate law and our charter documents contain several other provisions that may make it more difficult for a third party to acquire control of us without the approval of our board of directors, and may make it more difficult or expensive for a third party to acquire a majority of our outstanding common stock. For example, our articles of incorporation divide our board of directors into three classes serving staggered three-year terms, and therefore it would take several years for our shareholders to replace a majority of the members of our board if they so desired.
Additionally, our employment agreements include provisions which require payments to be made to our executive and senior loan officers in the event of a change in control of us or our subsidiaries. Provisions in Virginia law and in our articles of incorporation and employment agreements may, in some circumstances, have the effect of delaying, deferring or preventing a change in control of us and may discourage bids for our common stock at a premium over the current market price. To the extent that these provisions are negatively perceived by investors, there may be an adverse impact on our stock price.
11
Table of Contents
Some of the matters discussed under the captions “Prospectus Summary,” “Risk Factors,” “Management’s Discussion and Analysis of Financial Condition and Results of Operations,” “Business” and elsewhere in this prospectus include forward-looking statements. These forward-looking statements include statements regarding profitability, liquidity, allowance for loan losses, interest rate sensitivity, market risk, and financial and other goals. Forward-looking statements often use words such as “believes,” “expects,” “plans,” “may,” “will,” “should,” “projects,” “contemplates,” “anticipates,” “forecasts,” “intends” or other words of similar meaning. You can also identify them by the fact that they do not relate strictly to historical or current facts. The forward-looking statements we use in this prospectus are subject to significant risks, assumptions and uncertainties, including, among other things, the following important factors that could effect the actual outcome of future events:
| • | fluctuations in market rates of interest and loan and deposit pricing, which could negatively affect our net interest margin, asset valuations and expense projections; |
| • | adverse changes in the economies of our market areas, which might effect our business prospects and could cause credit-related losses and expenses; |
| • | continuing the well-established and valued relationships we have built with our customers; |
| • | adverse developments in our loan origination volume; |
| • | competitive factors in the banking industry, such as the trend towards consolidation in the markets in which we operate; |
| • | an unfavorable resolution to the class action lawsuit to which Resource Bank currently is a party; and |
| • | changes in banking legislation or the regulatory requirements of federal and state agencies applicable to bank holding companies and banks like ours. |
Because of these and other uncertainties, our actual future results may be materially different from the results indicated by these forward-looking statements. In addition, our past results of operations do not necessarily indicate our future results.
We caution you that the above list of important factors is not exclusive, and other factors are discussed in more detail under “Risk Factors” in this prospectus. These forward-looking statements are made as of the date of this prospectus and we may not undertake to update forward-looking statements to reflect the impact of circumstances or events that arise after the date the forward-looking statement was made.
12
Table of Contents
Based on an assumed public offering price of $20.62 (the closing price of our common stock on the Nasdaq National Market on January 17, 2003), our net proceeds from the sale of 700,000 shares of our common stock will be approximately $13.3 million, after deducting the underwriting discount and our estimated offering expenses. We anticipate that approximately $6.0 million of these proceeds will be contributed to Resource Bank’s capital to support its future loan production and asset growth. We anticipate that the approximately $7.3 million in remaining proceeds will be retained by us for working capital and other general corporate purposes, including branch expansion in new and existing markets and potential acquisitions to expand our retail branch network. We currently have no commitments or agreements with respect to branch expansion or acquisitions. Our officers and directors will have broad authority in deciding how to utilize the net proceeds of the offering. Pending application of the net proceeds as described above, we intend to invest the net proceeds of this offering in short-term investment grade securities.
The following table shows (a) our capitalization at September 30, 2002, and (b) our capitalization at September 30, 2002, as adjusted to reflect the receipt of $13.3 million in net proceeds from the sale of 700,000 shares of our common stock in this offering at an assumed public offering price of $20.62 per share (the closing price of our common stock on the Nasdaq National Market on January 17, 2003), after giving effect to the underwriting discount and our estimated offering expenses.
At September 30, 2002 | ||||||||
Actual | As Adjusted | |||||||
(in thousands) | ||||||||
| Stockholders’ equity: | ||||||||
| Preferred stock, par value $10.00; 500,000 shares authorized; none issued and outstanding | $ | — | $ | — | ||||
| Common stock, par value $1.50; 6,666,666 shares authorized; 3,061,961 shares issued and outstanding, 3,761,961 shares issued and outstanding, as adjusted | 4,593 | 5,643 | ||||||
| Additional paid-in capital | 14,977 | 27,227 | ||||||
| Retained earnings | 11,199 | 11,199 | ||||||
| Accumulated other comprehensive income (loss) | (33 | ) | (33 | ) | ||||
| Total stockholders’ equity | $ | 30,736 | $ | 44,036 | ||||
The table excludes 531,147 shares of common stock issuable upon the exercise of stock options outstanding under our stock option plans on September 30, 2002, of which 233,497 were exercisable.
13
Table of Contents
Our common stock trades on the Nasdaq National Market under the symbol “RBKV.” The following table shows the high and low closing sales prices of our common stock and the dividends declared per share for the periods indicated.
High | Low | Cash Dividend Declared | |||||||
2003 | |||||||||
| First Quarter (through January 17, 2003) | $ | 21.01 | $ | 20.43 | $ | 0.17 | |||
2002 | |||||||||
| Fourth Quarter | 22.21 | 19.00 | 0.14 | ||||||
| Third Quarter | 20.99 | 17.65 | 0.14 | ||||||
| Second Quarter | 20.29 | 18.15 | 0.14 | ||||||
| First Quarter | 19.65 | 18.00 | 0.14 | ||||||
2001 | |||||||||
| Fourth Quarter | 17.00 | 14.50 | 0.12 | ||||||
| Third Quarter | 17.99 | 14.50 | 0.12 | ||||||
| Second Quarter | 16.00 | 14.00 | �� | 0.12 | |||||
| First Quarter | 16.50 | 10.13 | 0.12 | ||||||
2000 | |||||||||
| Fourth Quarter | 11.00 | 9.63 | 0.12 | ||||||
| Third Quarter | 10.00 | 7.88 | 0.10 | ||||||
| Second Quarter | 10.63 | 8.63 | 0.10 | ||||||
| First Quarter | 12.63 | 8.63 | 0.10 | ||||||
As of September 30, 2002, there were 3,061,961 shares of our common stock outstanding held by approximately 800 shareholders of record.
We have declared and paid cash dividends for the past 20 fiscal quarters. Our dividend payout ratio during this period has ranged from approximately 14.5% to 33.3%. Currently, our board of directors targets a dividend payout ratio in a range of 25% to 35% of our after-tax earnings. We will not pay any dividends to our shareholders if, after making such dividends, we would be undercapitalized under federal or state banking regulations. Additionally, declarations of dividends are at the discretion of our board of directors, and we cannot assure you that dividends will be declared at any time in the future.
Federal banking law does not permit us, without prior regulatory approval, to pay a dividend if the total of all of the dividends declared by us in any calendar year exceeds the total of our net profits for that year combined with our retained net profits of the preceding two calendar years, less any required transfers to surplus or to a fund for the retirement of any preferred stock. Additionally, we depend on dividends we receive from Resource Bank to provide funding for future dividends, if any, on our common stock. As a banking corporation organized under Virginia law, Resource Bank’s ability to pay us dividends is generally limited to the amount of its retained earnings. As of September 30, 2002, Resource Bank could pay us up to $10.3 million in dividends without having to obtain prior regulatory approval.
The Federal Reserve recommends that banking organizations pay dividends only if the net income available to shareholders in the past year fully funds those dividends and the expected rate of earnings retention is consistent with capital needs, asset quality and overall financial condition. Our dividend policy complies with this recommendation.
14
Table of Contents
The following table sets forth selected consolidated financial data for Resource Bankshares Corporation. The financial data for the five years ended December 31, 2001 are derived from our consolidated financial statements. The financial data for the nine-month periods ended September 30, 2002 and 2001 are derived from our unaudited consolidated financial statements. Operating results for the nine months ended September 30, 2002 are not necessarily indicative of the results that may be expected for the year ending December 31, 2002. You should read the consolidated selected financial data in conjunction with “Management’s Discussion and Analysis of Financial Condition and Results of Operations,” our consolidated financial statements, and accompanying notes and other financial data included elsewhere in this prospectus.
Nine Months Ended September 30, | Years Ended December 31, | |||||||||||||||||||||||||||
2002 | 2001 | 2001 | 2000 | 1999 | 1998 | 1997 | ||||||||||||||||||||||
(Unaudited) | ||||||||||||||||||||||||||||
(Dollars in thousands, except per share data) | ||||||||||||||||||||||||||||
Income Statement Data: | ||||||||||||||||||||||||||||
| Net interest income | $ | 11,529 | $ | 7,730 | $ | 11,033 | $ | 9,437 | $ | 8,946 | $ | 8,410 | $ | 4,954 | ||||||||||||||
| Provision for loan losses | 975 | 45 | 195 | 1,100 | 4,667 | 150 | 155 | |||||||||||||||||||||
| Non-interest income | 17,043 | 13,897 | 20,144 | 11,890 | 6,811 | 7,943 | 4,520 | |||||||||||||||||||||
| Non-interest expense | 21,439 | 16,997 | 24,521 | 14,109 | 12,168 | 11,565 | 6,533 | |||||||||||||||||||||
| Income taxes (benefit) | 1,817 | 1,341 | 1,918 | 1,886 | (387 | ) | 1,591 | 965 | ||||||||||||||||||||
| Net income (loss) | $ | 4,341 | $ | 3,244 | $ | 4,543 | $ | 4,233 | $ | (691 | )(1) | $ | 3,047 | $ | 1,821 | |||||||||||||
Per Share Data(2): | ||||||||||||||||||||||||||||
| Net income (loss)(3): | ||||||||||||||||||||||||||||
| Basic | $ | 1.40 | $ | 1.15 | $ | 1.57 | $ | 1.63 | $ | (0.27 | )(1) | $ | 1.24 | $ | 0.92 | |||||||||||||
| Diluted | 1.32 | 1.08 | 1.49 | 1.56 | (0.27 | ) | 1.13 | 0.83 | ||||||||||||||||||||
| Book value at period end | 10.04 | 9.12 | 9.27 | 7.50 | 6.25 | 7.18 | 6.36 | |||||||||||||||||||||
| Tangible book value at period end | 9.78 | 8.90 | 9.03 | 7.47 | 6.25 | 7.18 | 6.36 | |||||||||||||||||||||
| Cash dividends declared | 0.42 | 0.36 | 0.48 | 0.42 | 0.40 | 0.24 | 0.12 | |||||||||||||||||||||
| Dividend payout ratio | 31.82 | % | 33.33 | % | 32.21 | % | 26.92 | % | (148.15 | %) | 21.24 | % | 14.46 | % | ||||||||||||||
Balance Sheet Data: | ||||||||||||||||||||||||||||
| Total assets | $ | 647,361 | $ | 528,247 | $ | 564,850 | $ | 404,494 | $ | 306,690 | $ | 233,460 | $ | 209,330 | ||||||||||||||
| Total loans (net of unearned income) | 421,246 | 327,261 | 344,936 | 288,513 | 255,671 | 188,522 | 150,590 | |||||||||||||||||||||
| Total deposits | 464,725 | 496,302 | 411,504 | 330,645 | 260,469 | 206,219 | 169,508 | |||||||||||||||||||||
| Stockholders’ equity | 30,736 | 28,710 | 28,779 | 19,672 | 15,870 | 17,789 | 15,602 | |||||||||||||||||||||
Performance Ratios(4): | ||||||||||||||||||||||||||||
| Return (loss) on average assets | 0.97 | % | 0.95 | % | 0.95 | % | 1.21 | % | (0.25 | )% | 1.27 | % | 1.40 | % | ||||||||||||||
| Return (loss) on average stockholders’ equity | 19.93 | 18.91 | 18.73 | 24.13 | (3.90 | ) | 18.19 | 18.59 | ||||||||||||||||||||
| Net interest margin(5) | 2.79 | 2.47 | 2.52 | 2.92 | 3.42 | 3.62 | 3.90 | |||||||||||||||||||||
Asset Quality Ratios: | ||||||||||||||||||||||||||||
| Allowance to period-end loans | 1.08 | % | 1.13 | % | 1.07 | % | 1.22 | % | 1.04 | % | 1.33 | % | 1.71 | % | ||||||||||||||
| Allowance to nonperforming loans | 545.13 | 109.32 | 227.93 | 263.75 | 361.51 | 264.55 | 58.50 | |||||||||||||||||||||
| Nonperforming assets to total assets | 0.14 | 0.65 | 0.29 | 0.33 | 0.25 | 0.68 | 2.43 | |||||||||||||||||||||
| Net charge-offs (recoveries) to average loans(4) | 0.04 | (0.04 | ) | 0.01 | 0.10 | 2.06 | 0.13 | 0.02 | ||||||||||||||||||||
Capital Ratios: | ||||||||||||||||||||||||||||
| Tier 1 risk-based capital | 8.88 | % | 10.06 | % | 9.49 | % | 8.74 | % | 8.20 | % | 9.23 | % | 9.69 | % | ||||||||||||||
| Total risk-based capital | 10.62 | 11.07 | 10.44 | 10.75 | 9.24 | 10.48 | 10.93 | |||||||||||||||||||||
| Leverage capital ratio | 6.38 | 7.46 | 6.88 | 6.69 | 7.19 | 7.52 | 9.67 | |||||||||||||||||||||
| Total equity to total assets | 4.75 | 5.43 | 5.09 | 4.86 | 5.17 | 7.62 | 7.45 | |||||||||||||||||||||
| (1) | Our loss in 1999 was attributable to a $4.7 million provision for loan losses in the third quarter that occurred as a result of credit problems with a significant borrower in our now discontinued asset based lending portfolio. |
| (2) | All per share figures have been adjusted to reflect a two-for-one stock split on July 1, 1998. |
| (3) | Net income per share is computed using the basic and diluted weighted average outstanding shares. |
| (4) | Ratios for the nine months ended September 30, 2002 and 2001 have been annualized. |
| (5) | Net interest margin is calculated as tax-equivalent net interest income divided by average earning assets and represents our net yield on earning assets. |
15
Table of Contents
AND RESULTS OF OPERATIONS
The following discussion is intended to assist readers in understanding and evaluating our financial condition and results of operations. In conjunction with reviewing the following discussion, you should also read and review our consolidated financial statements and accompanying notes that are included elsewhere in this prospectus.
Overview
For the nine months ended September 30, 2002, our net income increased by 33.8% compared to the same period in 2001 from $3.2 million to $4.3 million. Earnings per share for the first nine months of 2002 were $1.40 per share compared to $1.15 for the comparable period of 2001. This increase primarily resulted from loan growth and increases in mortgage banking fee income, as continued low interest rates generated greater demand for new residential mortgage loans and refinancings. Our return on average assets was 0.97% for the first nine months of 2002, compared to 0.95% for the first nine months of 2001. Our return on average equity was 19.9% and 18.9% for the nine months ended September 30, 2002 and 2001, respectively.
In 2001, we had net income of $4.5 million compared to net income $4.2 million in 2000 and a net loss of $690,800 in 1999. Our earnings per share were $1.57 in 2001 compared to $1.63 in 2000 and a $0.27 per share loss in 1999. Our loss in 1999 was directly attributable to a $4.7 million provision for loan losses taken in the third quarter of that year, which occurred primarily as a result of credit problems with an affiliated group of borrowers in our asset based lending portfolio. Since the loan loss in 1999, we have terminated our asset based lending program.
During the first nine months of 2002, total loans increased 22.1% from $344.9 million at December 31, 2001 to $421.2 million at September 30, 2002. Total deposits at September 30, 2002 were $464.7 million, a 12.9% increase from $411.5 million at December 31, 2001. During 2001, our total loans grew 19.6% from $288.5 million at year end 2000 to $344.9 million at year end 2001, and our total deposits grew 24.5% from $330.6 million at year end 2000 to $411.5 million at year end 2001. The growth in our loans and deposits reflects Resource Bank’s sustained growth and continued penetration in its markets.
Our allowance for loan losses was $4.5 million at September 30, 2002 compared to $3.7 million at September 30, 2001. The allowance for loan losses as a percentage of period end loans was 1.1% at September 30, 2002 and September 30, 2001. The provisions for loan losses were $975,000 and $45,000 for the nine months ended September 30, 2002 and 2001, respectively. Total nonperforming assets, which includes non-accrual loans, loans 90 days or more past due and still accruing and other foreclosed real estate owned were $901,000 at September 30, 2002, down from $1.7 million at December 31, 2001.
Nine Months Ended September 30, 2002 and September 30, 2001
Results of Operations
Summary. For the nine months ended September 30, 2002, our net income increased by 33.8% compared to the same period in 2001 from $3.2 million to $4.3 million. Earnings per share for the nine months ended September 30, 2002 were $1.40 per share compared to $1.15 for the comparable period of 2001. The increase in our net income occurred primarily as a result of growth in interest bearing assets and increases in mortgage banking income. Our return on average assets was 0.97% for the first nine months of 2002, compared to 0.95% for the same period of 2001. Our return on average equity was 19.9% and 18.9% for the nine months ended September 30, 2002 and 2001, respectively.
Net Interest Income. As the largest component of income, net interest income represents the amount that interest and fees earned on loans and investments exceed the interest costs of funds used to support these earning
16
Table of Contents
assets. Net interest income is determined by the relative levels, rates and mix of earning assets and interest-bearing liabilities. Our net interest income for the nine months ended September 30, 2002 compared to the first nine months of 2001 increased by 49.1% from $7.7 million to $11.5 million. On a tax equivalent basis, net interest income was $11.8 million in the nine months ended September 30, 2002 compared to $8.1 million during the comparable period of 2001. The increase in our net interest income was attributable to a 29.6% increase in average interest earning assets and an increase in our net interest margin from 2.47% for the nine months ended September 30, 2001 to 2.79% for the nine months ended September 30, 2002.
Non-interest Income. Our non-interest income for the nine months ended September 30, 2002 compared to the first nine months of 2001 increased by 22.3% from $13.9 million to $17.0 million. The increase in our non-interest income was primarily attributable to increased activity in our mortgage banking division, which accounted for 86.0% and 87.0% of total non-interest income for the periods ended September 30, 2002 and 2001, respectively. For the nine months ended September 30, 2002 compared to the same period for 2001, mortgage banking income increased by 20.7% from $12.1 million to $14.6 million. We derive our mortgage banking income primarily from discount fees, or points, collected on loans originated, premiums received on the sale of mortgage loans and their related servicing rights to investors, and other fees. The increased income and profitability in our mortgage division occurred in large part because of a declining interest rate environment. During periods of declining or continued low interest rates, demand for new residential mortgages, particularly re-financings, tends to increase significantly. In addition, other non-interest income generated primarily from title insurance sales commissions, service charges and fee income, and gains on the sale of assets, increased for the nine months ended September 30, 2002 compared to the first nine months of 2001 by 33.3% from $1.8 million to $2.4 million.
Non-interest Expense. Our non-interest expense for the nine months ended September 30, 2002 compared to the first nine months of 2001 increased 25.9% from $17.0 million to $21.4 million. This increase was primarily the result of the acquisition of Atlantic Mortgage and Investment, a commercial mortgage company, and First Jefferson Mortgage Corporation, a residential mortgage company, late in the first quarter of 2001. For the period ended September 30, 2002, a full nine months of expenses are reflected for these businesses, whose operations have been consolidated with our mortgage division. The largest component of non-interest expense, salaries and employee benefits, which represents 67.4% of total non-interest expense, increased 26.4% to $14.4 million for the nine months ended September 30, 2002 over the same period in 2001, and was primarily attributable to these acquisitions. Occupancy expense increased by 13.7% to $1.3 million, depreciation and equipment maintenance increased by 19.3% to $1.5 million, marketing and business development increased 38.6% to $535,000, and outside computer services increased 30.7% to $694,000 for the nine months ended September 30, 2002 as compared to the same period in 2001. Total other non-interest expense categories increased 31.6% to $2.9 million for the nine months ended September 30, 2002 over the same period in 2001.
Income Taxes. We incurred income taxes of $1.8 million in the nine months ended September 30, 2002 compared to $1.3 million for the comparable period of 2001, resulting in effective tax rates of 29.5% and 29.3% for the respective periods. Our effective federal tax rate is positively impacted primarily by our investments in tax-free municipal securities and bank-owned life insurance. For the nine months ended September 30, 2002, total income from these tax-exempt items was $833,000. In addition, a Virginia commercial bank is subject to a franchise tax based upon components of its balance sheet, which is reflected in other non-interest expense rather than income taxes.
Analysis of Financial Condition
Summary. During the nine months ended September 30, 2002, total assets grew from $564.9 million at December 31, 2001 to $647.3 million, an increase of $82.4 million or 14.6%. This increase occurred primarily because of the $76.3 million growth in our loan portfolio during the period. Total deposits and FHLB advances increased 12.9% and 14.6% from December 31, 2001 to September 30, 2002, respectively, to fund this growth in our loan portfolio.
17
Table of Contents
Investment Securities. Our securities available for sale were $21.8 million at September 30, 2002, a decrease of 81.0% or $92.9 million from a balance of $114.6 million at December 31, 2001. Securities held to maturity increased in the nine months ended September 30, 2002, from $0 at December 31, 2001 to $110.2 million at September 30, 2002. Funds advanced in settlement of mortgage loans were $64.4 million at September 30, 2002, a slight decrease of $7.6 million or 10.5% compared to a balance of $72.0 million at year end 2001.
Loans. During the nine months ended September 30, 2002, total loans increased 22.1% from $344.9 million at December 31, 2001 to $421.2 million at September 30, 2002. Average loans represented 68.0% of average interest earning assets for the nine months ended September 30, 2002, compared to 68.8% for the first nine months of 2001.
Asset Quality. Our allowance for loan losses was $4.5 million at September 30, 2002, compared to $3.7 million at December 31, 2001 and September 30, 2001. The allowance for loan losses as a percentage of period end loans was 1.1% at September 30, 2002 and 2001. The provisions for loan losses were $975,000 and $45,000 for the nine months ended September 30, 2002 and 2001, respectively. Total nonperforming assets, which includes non-accrual loans, loans 90 days or more past due and still accruing and other foreclosed real estate owned were $901,000 at September 30, 2002, down from $1.7 million at December 31, 2001.
Deposits. Total deposits at September 30, 2002 were $464.7 million, up 12.9% from $411.5 million at December 31, 2001. Of our average interest bearing deposits during the nine months ended September 30, 2002, 80.2% were certificates of deposit, 18.6% were demand or money market accounts and 1.2% were savings accounts. The composition of our deposits at September 30, 2002 approximated our target deposit mix of 50% in local and Internet deposits and 50% in national markets.
Borrowed Funds. FHLB advances were $96.0 million at September 30, 2002, an increase of 14.6% from the balance of $83.8 million December 31, 2001.
Capital Structure. Stockholders’ equity was $30.7 million at September 30, 2002, an increase of $2.0 million or 7.0% from December 31, 2001.
Three Years Ended December 31, 2001
Results of Operations
Summary. In 2001, we had net income of $4.5 million, compared to net income of $4.2 million for 2000, and compared to a net loss of $690,800 in 1999. Our earnings per share were $1.57 in 2001, compared to $1.63 in 2000, and compared to a $0.27 per share loss in 1999. Our loss in 1999 was directly attributable to a $4.7 million provision for loan losses taken in the third quarter. Management concluded this provision was necessary as a result of credit problems with an affiliated group of borrowers in our asset based lending portfolio. Since the loss in 1999, we have terminated our asset based lending program.
In 2001, our mortgage banking division reported net income before taxes of $2.3 million, compared to $673,990 for 2000, and compared to a $418,897 net loss before taxes in 1999. The loss in our mortgage division in 1999 occurred as a result of expenses associated with reorganizing our mortgage division and decreased loan origination volume. Rising interest rates in 1999 resulted in a decrease in mortgage loan originations for the year.
Net Interest Income. For the year ended December 31, 2001, net interest income was $11.0 million, an increase of approximately $1.6 million, or 16.9%, over $9.4 million for the same period in 2000. Average interest earning assets increased $119.0 million from 2000 to 2001 while average interest bearing liabilities increased $118.7 million. The yield on average interest earning assets for the year ended December 31, 2001 was 7.3% compared with 8.6% for the comparable 2000 period. The 2001 yield on loans was 7.2% compared to 8.7% in 2000. The cost on average interest bearing liabilities decreased 1.1% during 2001 to 5.0%, compared to 6.1% during 2000.
18
Table of Contents
Net interest income for the year ended December 31, 2000 increased 5.5%, or $492,000, over 1999. Average interest earning assets increased $74.4 million from 1999 to 2000 while average interest bearing liabilities increased $75.3 million. The yield on average interest earning assets for the year ended December 31, 2000 was 8.6% compared with 8.2% for the comparable 1999 period. The 2000 yield on loans was 8.7%, compared to 8.3% in 1999. The cost on average interest bearing liabilities increased 82 basis points during 2000 to 6.1%, compared to 5.3% during 1999.
Our net interest income is sensitive to the loan origination volume of our mortgage banking division. All loans originated by the mortgage banking division are sold, servicing released, in the secondary mortgage market. Each mortgage loan originated is sold when the borrower locks in the interest rate on the loan. When the volume of mortgage loan originations increases, typically in a declining interest rate environment, “funds advanced in settlement of mortgage loans” increase. This balance sheet item represents funds advanced to close mortgage loans, pending delivery of the loans to the loan purchaser. Until a mortgage loan is transferred to the purchaser, we receive interest on the loan at the note rate. Funds advanced in settlement of mortgage loans are financed to a large extent with short term borrowings and short term certificates of deposit. Thus, as funds advanced in settlement of mortgage loans increase, a corresponding increase in net interest income occurs. The average balance of funds advanced in settlement of mortgage loans was $45.6 million for the year ended December 31, 2001, $16.2 million for the year ended December 31, 2000, and $16.1 million in the year ended December 31, 1999.
19
Table of Contents
The following table sets forth average balances of total interest earning assets and total interest bearing liabilities for the periods indicated, showing the average distribution of assets, liabilities, stockholders’ equity and the related income, expense and corresponding weighted-average yields and costs.
Average Balances, Interest Income and Expenses, and Average Yields and Rates
Year Ended December 31, | ||||||||||||||||||||||||||||||
2001 | 2000 | 1999 | ||||||||||||||||||||||||||||
Average Balance(1) | Income/ Expense | Yield/ Rate(2) | Average Balance(1) | Income/ Expense | Yield/ Rate(2) | Average Balance(1) | Income/ Expense | Yield/ Rate(2) | ||||||||||||||||||||||
(Dollars in thousands) | ||||||||||||||||||||||||||||||
| Assets: | ||||||||||||||||||||||||||||||
| Interest Earning Assets: | ||||||||||||||||||||||||||||||
| Securities(3) | $ | 92,626 | $ | 7,079 | 7.64 | % | $ | 48,012 | $ | 3,870 | 8.06 | % | $ | 21,791 | $ | 1,468 | 6.74 | % | ||||||||||||
| Loans(4) | 306,802 | 22,148 | 7.22 | % | 263,110 | 22,821 | 8.67 | % | 217,598 | 18,072 | 8.31 | % | ||||||||||||||||||
| Interest bearing deposits in other banks | 9,791 | 366 | 3.74 | % | 8,487 | 537 | 6.33 | % | 5,974 | 293 | 4.90 | % | ||||||||||||||||||
| Other earning assets(5) | 45,596 | 3,523 | 7.73 | % | 16,227 | 1,561 | 9.62 | % | 16,118 | 1,548 | 9.60 | % | ||||||||||||||||||
| Total interest earning assets | 454,815 | 33,116 | 7.28 | % | 335,836 | 28,789 | 8.57 | % | 261,481 | 21,381 | 8.18 | % | ||||||||||||||||||
| Non-interest earning assets: | ||||||||||||||||||||||||||||||
| Cash and due from banks | 5,946 | 5,025 | 4,280 | |||||||||||||||||||||||||||
| Premises and equipment | 6,943 | 3,392 | 3,717 | |||||||||||||||||||||||||||
| Other assets | 12,504 | 8,828 | 5,644 | |||||||||||||||||||||||||||
| Less: Allowance for loan losses | (3,718 | ) | (3,083 | ) | (2,606 | ) | ||||||||||||||||||||||||
| Total non-interest earning assets | 21,675 | 14,162 | 11,035 | |||||||||||||||||||||||||||
| Total assets | $ | 476,490 | $ | 349,998 | $ | 272,516 | ||||||||||||||||||||||||
| Liabilities and Stockholders’ Equity: | ||||||||||||||||||||||||||||||
| Interest Bearing Liabilities: | ||||||||||||||||||||||||||||||
| Interest bearing deposits: | ||||||||||||||||||||||||||||||
| Demand/MMDA accounts | $ | 120,288 | $ | 5,065 | 4.21 | % | $ | 67,844 | $ | 4,053 | 5.97 | % | $ | 12,362 | $ | 410 | 3.32 | % | ||||||||||||
| Savings | 4,465 | 140 | 3.14 | % | 14,618 | 631 | 4.32 | % | 22,943 | 1,034 | 4.51 | % | ||||||||||||||||||
| Certificates of deposit | 243,807 | 13,299 | 5.45 | % | 200,137 | 12,296 | 6.14 | % | 180,764 | 9,593 | 5.31 | % | ||||||||||||||||||
| Total interest bearing deposits | 368,560 | 18,504 | 5.02 | % | 282,599 | 16,980 | 6.01 | % | 216,069 | 11,037 | 5.11 | % | ||||||||||||||||||
| FHLB advances and other borrowings | 51,904 | 2,276 | 4.39 | % | 19,625 | 1,156 | 5.89 | % | 12,506 | 697 | 5.57 | % | ||||||||||||||||||
| Capital debt securities | 9,666 | 879 | 9.09 | % | 9,200 | 839 | 9.12 | % | 7,528 | 702 | 9.33 | % | ||||||||||||||||||
| Total interest bearing liabilities | 430,130 | 21,659 | 5.04 | % | 311,424 | 18,975 | 6.09 | % | 236,103 | 12,436 | 5.27 | % | ||||||||||||||||||
| Non-interest Bearing Liabilities: | ||||||||||||||||||||||||||||||
| Demand deposits | 16,386 | 16,407 | 16,541 | |||||||||||||||||||||||||||
| Other liabilities | 5,722 | 4,623 | 2,139 | |||||||||||||||||||||||||||
| Total liabilities | 22,108 | 21,030 | 18,680 | |||||||||||||||||||||||||||
| Stockholders’ equity | 24,252 | 17,544 | 17,733 | |||||||||||||||||||||||||||
| Total liabilities and stockholders’ equity | $ | 476,490 | $ | 349,998 | $ | 272,516 | ||||||||||||||||||||||||
| Interest spread(6) | 2.24 | % | 2.48 | % | 2.91 | % | ||||||||||||||||||||||||
| Net interest income/net interest margin(7) | $ | 11,457 | 2.52 | % | $ | 9,814 | 2.92 | % | $ | 8,945 | 3.42 | % | ||||||||||||||||||
| (1) | Average balances are computed on daily balances and our management believes such balances are representative of operations. |
| (2) | Yield and rate percentages are all computed through the annualization of interest income and expenses versus the average balance of their respective accounts. |
| (3) | Tax equivalent basis. The tax equivalent adjustment to net interest income was $424,000, $377,000 and $0 for the years ended December 31, 2001, 2000, and 1999, respectively. |
| (4) | Non-accrual loans are included in the average loan balances, and income on such loans is recognized on a cash basis. |
| (5) | Consists of funds advanced in settlement of loans. |
| (6) | Interest spread is the average yield earned on earning assets, less the average rate incurred on interest bearing liabilities. |
| (7) | Net interest margin is net interest income, expressed as a percentage of average earning assets. |
20
Table of Contents
Net interest income is affected by changes in both average interest rates and average volumes of interest earning assets and interest bearing liabilities. During the period of June 1999 through May 2000, the Federal Reserve increased interest rates six times, raising short term rates by 150 basis points during this period. During the period of June 2000 through December 2001, the Federal Reserve decreased interest rates eleven times, lowering short term rates by 475 basis points. The Federal Reserve took no monetary policy action in 2002 until the 50 basis point rate cut at its November 7 meeting. Increases in rates are intended to slow economic growth and reduce borrowing activities while decreases in rates are intended to promote economic growth and increase borrowing activities.
The following table sets forth the amounts of the total change in interest income that can be attributed to changes in the volume of interest-bearing assets and liabilities and the amount of the change that can be attributed to changes in interest rates. The amount of the change not solely due to rate or volume changes was allocated between the change due to rate and the change due to volume based on the relative size of the rate and volume changes.
Year Ended December 31, | |||||||||||||||||||||
2001 compared to 2000 Increase (Decrease) Due To Changes In: | 2000 compared to 1999 Increase (Decrease) Due to Changes In: | ||||||||||||||||||||
Volume | Rate | Net | Volume | Rate | Net | ||||||||||||||||
(Dollars in thousands) | |||||||||||||||||||||
Interest Income: | |||||||||||||||||||||
| Securities | $ | 3,420 | $ | (211 | ) | $ | 3,209 | $ | 2,065 | $ | 337 | $ | 2,402 | ||||||||
| Loans(1) | 5,727 | (4,438 | ) | 1,289 | 3,964 | 798 | 4,762 | ||||||||||||||
| Interest bearing deposit in other banks | 74 | (245 | ) | (171 | ) | 145 | 99 | 244 | |||||||||||||
| Total | $ | 9,221 | $ | (4,894 | ) | $ | 4,327 | $ | 6,174 | $ | 1,234 | $ | 7,408 | ||||||||
Interest Expense: | |||||||||||||||||||||
| Interest bearing deposits | $ | 4,618 | $ | (3,094 | ) | $ | 1,524 | 3,782 | 2,161 | 5,943 | |||||||||||
| FHLB advances and other borrowing | 1,788 | (628 | ) | 1,160 | 608 | (12 | ) | 596 | |||||||||||||
| Total | 6,406 | (3,722 | ) | 2,684 | 4,390 | 2,149 | 6,539 | ||||||||||||||
| Increase (decrease) in net interest income | $ | 2,815 | $ | (1,172 | ) | $ | 1,643 | $ | 1,784 | $ | (915 | ) | $ | 869 | |||||||
| (1) | Loans include funds advanced in settlement of loans. |
Provision for Loan Losses. Provisions for loan losses are charged to income to bring the total allowance for loan losses to a level we deem appropriate and are based on such factors as our judgment of anticipated losses within our loan portfolio, loan growth, net charge-offs, changes in the composition of our loan portfolio, delinquencies and our assessment of the quality of our loan portfolio and general economic conditions.
The provisions for loan loss taken by us for the years ended December 31, 2001, 2000 and 1999 were $195,000, $1.1 million, and $4.7 million, respectively. The significant increase in the provision for loan loss in 1999 was primarily the result of credit problems with an affiliated group of borrowers in our asset based lending program. This related group of borrowers defaulted on a series of loans secured by receivables, which resulted in our large loan loss in 1999. When we exited the asset based lending program in 2000, we took an additional provision for loan losses of $1.1 million to account for the risks associated with unresolved accounts. By the end of 2000, our exit from the program was complete and only $396,000 in additional loan charge-offs related to the asset based lending program were made during the year. As a result of these better than expected loss results, we were able to take a less than normal provision of $195,000 in 2001 to maintain an adequate allowance.
Non-interest Income. Non-interest income in 2001 was $20.1 million, up 69.4% from $11.9 million in 2000 due to the increased income derived from our residential mortgage banking operations and placement fees from our commercial mortgage operations. Non-interest income in 2000 was up 74.6% from $6.8 million in 1999. During the third quarter of 2000, we sold a banking branch in Reston, Virginia, for a gain of $2.5 million, as well as the furniture and equipment associated with the branch, for a gain of $529,938. Also during the same
21
Table of Contents
quarter, we sold a parcel of real estate acquired with the property on which we built our northern Virginia headquarters, for a gain of $619,755. Excluding nonrecurring transactions, non-interest income in 2000 would have been $8.2 million, up 20.5% over 1999. Decreases in market interest rates in 2001 caused an increase of 144.5% in the residential mortgage market volume and a resultant increase of our mortgage banking income of 154.5% to $17.6 million. Increases in market interest rates during 1999 and the first half of 2000 resulted in a modest increase of 14.1% in the 2000 residential mortgage market volume and a resultant increase of our mortgage banking income of 21.2% to $6.9 million. We derive our mortgage banking income primarily from points collected on loans originated, premiums received on the sale of mortgage loans and their related servicing rights to investors, and other fees. Because of the uncertainty of future loan origination volume and the future level of interest rates, we may experience reductions in mortgage banking income in future periods. Service charge income decreased 11.3% to $648,809 and decreased 3.8% to $731,473 in 2001 and 2000, respectively and decreased 0.2% to $759,289 in 1999.
Non-interest Expenses. Total non-interest expense was $24.5 million in 2001, an increase of 73.8% from $14.1 million in 2000. Compared to 1999, non-interest expense increased 16.0% in 2000 from $12.2 million in 1999. Non-interest expense increased in 2001 over 2000 as a result of the acquisitions of First Jefferson and Atlantic Mortgage during the first quarter of 2001 and the related costs associated with the additional loan production offices that could not be integrated into existing offices. The increase in 2000 over 1999 was a result of adding a full service banking operation in Newport News during the first quarter of 2000 and establishing loan production offices in Newport News and Richmond, as well as absorbing expenses associated with the offering of online banking services. The largest component of non-interest expense, salaries and employee benefits, increased 101.8% in 2001 to $16.3 million, increased 19.8% in 2000 to $8.1 million, and increased slightly (by 0.7%) in 1999 to $6.7 million. This category comprised 66.4% of our total non-interest expense in 2001, 57.2% in 2000 and 55.4% in 1999. Occupancy expense increased to $1.6 million in 2001 (up 30.8%) over 2000 and increased to $1.2 million in 2000 (up 2.2%) over 1999 and increased to $1.2 million in 1999 (up 8.9%). Depreciation and equipment maintenance expense increased by 81.1% in 2001 to $1.8 million, increased by 5.4% in 2000 to $976,982 and increased by 22.0% in 1999 to $926,702. The 2001 depreciation and equipment maintenance expense increased as a result of the acquisitions of First Jefferson and Atlantic Mortgage while the 2000 depreciation and equipment maintenance expense increased as a result of the opening of the Newport News banking branch and establishing loan production offices in Newport News and Richmond. Outside computer service expense increased by 56.6% in 2001 to $812,684, and increased by 6.9% in 2000 to $518,982. Professional fees increased 46.6% in 2001, decreased 16.1% in 2000 and increased significantly (by 110%) in 1999 to $340,821, as the result of the previously discussed credit problems in the now discontinued asset based lending program.
Federal Deposit Insurance Corporation, or FDIC, premiums decreased 32.3% in 2001, increased 68.7% in 2000 to $98,062 and increased 10.6% to $58,125 in 1999. The decrease in 2001 was a result of the risk classification and related assessment rates. As the result of a merger in 1997 between Resource Bank and Eastern American Bank FSB, a federal savings bank, FDIC insurance premiums are assessed on Resource Bank’s deposit base on a pro rata basis whereby approximately 68% of Resource Bank’s deposits are subject to Bank Insurance Fund, or BIF, rates, and approximately 32% of deposits are subject to Savings Association Insurance Fund, or SAIF, rates. This ratio of BIF and SAIF assessment rates was established at the time of merger, based on the relative sizes of Resource Bank’s and Eastern American Bank’s deposit bases.
Stationery and supplies expense increased by 65.2% in 2001 to $681,761, decreased by 16.9% in 2000 to $412,683 and decreased 5.6% in 1999 to $496,814. Marketing and business development increased by 12.8% to $536,850 in 2001, increased by 18.7% to $475,778 in 2000 and increased 16.8% in 1999 to $400,938.
Other non-interest expenses increased by 13.1% in 2001 to $2.3 million, increased by 34.8% in 2000 to $2.0 million and increased 5.3% in 1999 to $1.5 million. For the years ended December 31, 2001 and 2000, other non-interest expenses included write-downs of other assets in the amounts of $50,000 and $500,000, respectively. The asset written down consisted of restricted stock of a private company that was taken in foreclosure of a loan related to our now discontinued asset based lending program. The value of this stock was
22
Table of Contents
adversely affected by general declines in the market values of early-stage technology companies. We evaluated the stock on a quarterly basis, with values established based on trades between private parties. Periodic write-downs were made after our determination that the stock’s value was permanently impaired.
Income Taxes. Applicable income taxes on 2001 earnings amounted to $1.9 million, resulting in an effective tax rate of 29.7% and income taxes on 2000 earnings amounted to $1.9 million, resulting in an effective tax rate of 30.8%. These rates are lower as a result of the increase in tax-free municipals in Resource Bank’s securities portfolio. The income tax benefit from our 1999 loss was $386,958, resulting in an effective tax rate of 35.9%.
Analysis of Financial Condition
Investment Securities. The following tables present certain information on our investment securities portfolio for the periods indicated:
Securities Available for Sale at December 31,(1) | |||||||||
2001 | 2000 | 1999 | |||||||
(Dollars in thousands) | |||||||||
| U. S. Government Agencies | $ | 59,505 | $ | 14,918 | $ | 4,662 | |||
| State and Municipal Securities | 12,888 | — | — | ||||||
| Federal Reserve Bank Stock | 867 | 673 | 587 | ||||||
| Federal Home Loan Bank Stock | 4,240 | 1,560 | 915 | ||||||
| Preferred Stock | 33,311 | 1,043 | 351 | ||||||
| Corporate Bonds | 2,720 | — | — | ||||||
| Other | 1,104 | 123 | 144 | ||||||
| Total | $ | 114,635 | $ | 18,317 | $ | 6,659 | |||
| (1) | Carried at fair value. |
Securities Held to Maturity at December 31,(1) | |||||||||
2001 | 2000 | 1999 | |||||||
(Dollars in thousands) | |||||||||
| U. S. Government Agencies | $ | — | $ | 28,664 | $ | 151 | |||
| State and Municipal Securities | — | 15,969 | 746 | ||||||
| Corporate Bonds | — | 7,201 | 7,208 | ||||||
| Preferred Stock | — | 11,970 | 8,431 | ||||||
| Total | $ | — | $ | 63,804 | $ | 16,536 | |||
| (1) | Carried at cost, adjusted for amortization of premium or accretion of discount using the interest method. |
23
Table of Contents
The following table presents information on the maturities and weighted average yields of our investment securities at December 31, 2001. The weighted average yields are calculated on the basis of book value of the investment securities and on the interest income of the investments adjusted for amortization of premium and accretion of discount.
December 31, 2001 | |||||||||
Available for Sale | |||||||||
Amortized Cost | Fair Value | Weighted Average Yield | |||||||
(Dollars in thousands) | |||||||||
| U. S. Government Agencies: | |||||||||
| Within one year | $ | — | $ | — | |||||
| After one year to five years | — | — | |||||||
| After five years through ten years | 31 | 34 | |||||||
| After ten years | 59,393 | 59,471 | 6.94 | % | |||||
| Total | 59,424 | 59,505 | 6.94 | % | |||||
| State and Municipals Securities: | |||||||||
| Within one year | — | — | |||||||
| After one year to five years | 415 | 425 | 4.90 | % | |||||
| After five years through ten years | — | — | |||||||
| After ten years | 11,861 | 12,463 | 5.86 | % | |||||
| Total | 12,276 | 12,888 | 5.83 | % | |||||
| Other securities: | |||||||||
| Within one year | — | — | |||||||
| After one year to five years | — | — | |||||||
| After five years through ten years | — | — | |||||||
| After ten years | 33,754 | 33,312 | |||||||
| Total | 33,754 | 33,312 | 7.73 | % | |||||
| Total debt securities | $ | 105,454 | $ | 105,705 | 7.06 | % | |||
| Equity and others | 9,424 | 8,930 | 7.04 | % | |||||
| Total securities | $ | 114,878 | $ | 114,635 | 7.06 | % | |||
Loans. Resource Bank’s loan portfolio is the largest category of our earnings assets and is comprised of commercial loans, commercial real estate loans, real estate construction loans, residential real estate loans and consumer or installment loans. Our bank concentrates its lending within the Greater Hampton Roads, northern Virginia and Greater Richmond metropolitan areas.
Commercial business loans totaled $77.7 million, or 23%, of Resource Bank’s loan portfolio at December 31, 2001. These loans are typically made on the basis of the borrower’s ability to make repayment from cash flow from its business and are secured by business assets, such as commercial real estate, accounts receivable, equipment and inventory. Commercial real estate loans and real estate construction loans collectively amounted to $211.5 million, or 61.0%, of the loan portfolio at December 31, 2001. These loans typically involve larger loan balances concentrated with single borrowers or groups of related borrowers and payment experience is typically dependent on the successful operation of a business or real estate project. Residential real estate loans amounted to $51.9 million, or 15.0%, of Resource Bank’s loan portfolio at December 31, 2001. Consumer or installment loans totaled $3.9 million, and accounted for less than 2.0% of Resource Bank’s loan portfolio at December 31, 2001. Consumer loans include home improvement loans, automobile loans and unsecured lines of credit. Of our $199.0 million of net loans due after one year outstanding at December 31, 2001, $104 million, or 52.3%, of such loans had fixed interest rates and $95.0 million, or 47.7%, had adjustable rates.
24
Table of Contents
The table below classifies loans, net of unearned income, by major category and percentage distribution at the dates indicated:
December 31, | ||||||||||||||||||||||||||||||
2001 | 2000 | 1999 | 1998 | 1997 | ||||||||||||||||||||||||||
Description | Amount | Percentage | Amount | Percentage | Amount | Percentage | Amount | Percentage | Amount | Percentage | ||||||||||||||||||||
(Dollars in thousands) | ||||||||||||||||||||||||||||||
| Commercial | $ | 77,705 | 22.53 | % | $ | 68,274 | 23.66 | % | $ | 77,507 | 30.32 | % | $ | 68,569 | 36.37 | % | $ | 50,713 | 33.68 | % | ||||||||||
| Real estate—construction | 86,283 | 25.01 | 72,395 | 25.09 | 68,076 | 26.63 | 44,607 | 23.66 | 37,626 | 24.99 | ||||||||||||||||||||
| Commercial real estate | 125,193 | 36.29 | 98,844 | 34.26 | 64,158 | 25.09 | 42,483 | 22.53 | 9,016 | 5.99 | ||||||||||||||||||||
| Residential real estate | 51,888 | 15.04 | 44,817 | 15.53 | 41,554 | 16.25 | 28,702 | 15.22 | 49,416 | 32.81 | ||||||||||||||||||||
| Installment and consumer | 3,867 | 1.12 | 4,183 | 1.45 | 4,375 | 1.71 | 4,163 | 2.21 | 3,819 | 2.53 | ||||||||||||||||||||
| Total | $ | 344,936 | 100.00 | % | $ | 288,513 | 100.00 | % | $ | 255,671 | 100.00 | % | $ | 188,522 | 100.00 | % | $ | 150,590 | 100.00 | % | ||||||||||
The table below presents information regarding the maturity of our loans at December 31, 2001:
December 31, 2001 | ||||||||||||
One Year or less | Over one through Five Years | Five Years or more | Total | |||||||||
(Dollars in thousands) | ||||||||||||
| Commercial | $ | 29,404 | $ | 28,141 | $ | 20,160 | $ | 77,705 | ||||
| Real estate—construction | 75,740 | 10,406 | 137 | 86,283 | ||||||||
| Commercial real estate | 34,132 | 60,832 | 30,229 | 125,193 | ||||||||
| Residential real estate | 4,622 | 9,398 | 37,868 | 51,888 | ||||||||
| Installment and consumer | 2,067 | 1,785 | 15 | 3,867 | ||||||||
| $ | 145,965 | $ | 110,562 | $ | 88,409 | $ | 344,936 | |||||
Asset Quality. Unless well secured and in the process of collection, we place loans on non-accrual status after being delinquent greater than 90 days, or earlier in situations in which the loans have developed inherent problems that indicate payment of principal and interest may not be made in full. Whenever the accrual of interest is stopped, previously accrued but uncollected income is reversed. Thereafter, interest is recognized only as cash is received. The loan is reinstated to an accrual basis after it has been brought current as to principal and interest under the contractual terms of the loan. As of December 31, 2001, 2000, and 1999, non-accrual loans amounted to $536,000, $1.0 million, and $473,000, respectively. A summary of nonperforming assets at December 31 is shown for each of the years presented in the following table.
December 31, | ||||||||||||||||||||
2001 | 2000 | 1999 | 1998 | 1997 | ||||||||||||||||
(Dollars in thousands) | ||||||||||||||||||||
| Non-accrual loans | $ | 536 | $ | 1,015 | $ | 473 | $ | 533 | $ | 3,059 | ||||||||||
| Loans contractually past due 90 days or more and still accruing | 1,086 | 320 | 270 | 412 | 1,339 | |||||||||||||||
| Troubled debt restructuring | — | — | — | — | — | |||||||||||||||
| Total nonperforming loans | 1,622 | 1,335 | 743 | 945 | 4,398 | |||||||||||||||
| Other real estate owned | 43 | — | 31 | 647 | 684 | |||||||||||||||
| Total nonperforming assets | $ | 1,665 | $ | 1,335 | $ | 774 | $ | 1,592 | $ | 5,082 | ||||||||||
| Total nonperforming assets to total loans | 0.48 | % | 0.46 | % | 0.30 | % | 0.84 | % | 3.37 | % | ||||||||||
| Total nonperforming assets to total assets | 0.29 | % | 0.33 | % | 0.25 | % | 0.68 | % | 2.43 | % | ||||||||||
25
Table of Contents
We continually monitor our loan portfolio to ensure that all loans potentially having a material adverse impact on future operating results, liquidity or capital resource have been classified as nonperforming. Should economic conditions deteriorate in our markets, the inability of distressed customers to service their existing debt could cause higher levels of nonperforming loans.
The allowance for loan losses is increased by the provision for loan losses and reduced by loans charged off, net of recoveries. The allowance for loan losses is established and maintained at a level judged by management to be adequate to cover any anticipated loan losses to be incurred in the collection of outstanding loans. In determining the adequate level of the allowance for loan losses, management considers the following factors: (a) loan loss experience; (b) problem loans, including loans judged to exhibit potential charge-off characteristics, loans on which interest is no longer being accrued, loans which are past due and loans which have been classified in the most recent regulatory examination; and (c) anticipated economic conditions and the potential impact these conditions may have on individual classifications of borrowers.
We believe the established allowance for loan losses is adequate to absorb inherent losses that relate to loans outstanding at December 31, 2001, although future additions to the reserve may be necessary based on changes in economic and/or other performance related conditions. In view of our plans to continue loan growth, we will continue to monitor closely the performance of Resource Bank’s loan portfolio and make additional provisions as necessary. In addition, various regulatory agencies periodically review our allowance for loan losses as an integral component of the examination process. These agencies may require the recognition of additions to the allowance based on their judgments of information available to them at the time of their examinations. We do not presently anticipate that such provisions will have a material adverse impact on our results of operations for future periods.
The following table presents Resource Bank’s loan loss experience for the periods indicated:
Year Ended December 31, | ||||||||||||||||||||
2001 | 2000 | 1999 | 1998 | 1997 | ||||||||||||||||
(Dollars in thousands) | ||||||||||||||||||||
| Allowance for loan losses at beginning of period | $ | 3,521 | $ | 2,686 | $ | 2,500 | $ | 2,573 | $ | 1,040 | ||||||||||
| Loans charged off: | ||||||||||||||||||||
| Commercial | (203 | ) | (228 | ) | (4,436 | ) | (126 | ) | (2 | ) | ||||||||||
| Real Estate | (109 | ) | (156 | ) | (84 | ) | (141 | ) | (56 | ) | ||||||||||
| Consumer | (44 | ) | (11 | ) | (6 | ) | (20 | ) | (7 | ) | ||||||||||
| Total | (356 | ) | (395 | ) | (4,526 | ) | (287 | ) | (65 | ) | ||||||||||
| Recoveries of loans previously charged off: | ||||||||||||||||||||
| Commercial | 202 | 124 | 35 | 1 | 34 | |||||||||||||||
| Real Estate | 134 | 5 | 7 | 40 | — | |||||||||||||||
| Consumer | 1 | 1 | 3 | 23 | 9 | |||||||||||||||
| Total | 337 | 130 | 45 | 64 | 43 | |||||||||||||||
| Net loans charged off: | (19 | ) | (265 | ) | (4,481 | ) | (223 | ) | (22 | ) | ||||||||||
| Provision for loan losses | 195 | 1,100 | 4,667 | 150 | 155 | |||||||||||||||
| Allowance acquired through business combination | — | — | — | — | 1,400 | |||||||||||||||
| Allowance for loan losses end of period | $ | 3,697 | $ | 3,521 | $ | 2,686 | $ | 2,500 | $ | 2,573 | ||||||||||
| Average total loans (net of unearned income) | $ | 306,802 | $ | 263,110 | $ | 217,598 | $ | 168,271 | $ | 93,839 | ||||||||||
| Total loans (net of unearned income) at period-end | $ | 344,936 | $ | 288,513 | $ | 255,671 | $ | 188,522 | $ | 150,590 | ||||||||||
| Ratio of net charge-offs to average loans | 0.01 | % | 0.10 | % | 2.06 | % | 0.13 | % | 0.02 | % | ||||||||||
| Ratio of provision for loan losses to average loans | 0.06 | % | 0.42 | % | 2.14 | % | 0.09 | % | 0.17 | % | ||||||||||
| Ratio of provision for loan losses to net charge-offs | 1,026.32 | % | 415.09 | % | 104.15 | % | 67.26 | % | 704.55 | % | ||||||||||
| Allowance for loan losses to period-end loans | 1.07 | % | 1.22 | % | 1.05 | % | 1.33 | % | 1.71 | % | ||||||||||
| Allowance to nonperforming assets | 222.04 | % | 263.75 | % | 347.03 | % | 157.04 | % | 50.63 | % | ||||||||||
26
Table of Contents
In establishing the allowance for loan losses, in addition to the factors described above, we consider the following risk elements in the loan portfolio:
| • | Construction lending often involves larger loan balances with single borrowers. Construction loans involve risks attributable to the fact that loan funds are advanced upon the security of the home under construction, which is of uncertain value prior to the completion of construction. If there is a default, we may be required to complete and sell the home. |
| • | Commercial real estate loans typically involve larger loan balances concentrated with single borrowers or groups of related borrowers. Additionally, the payment experience on loans secured by income producing properties is typically dependent on the successful operation of a business or a real estate project and thus may be subject to a greater extent to adverse conditions in the real estate market or in the economy generally. Many of our real estate loans have personal endorsements as additional security. |
| • | Consumer loans entail risks, particularly in the case of consumer loans which are unsecured, such as lines of credit, or secured by rapidly depreciable assets such as automobiles. In such cases, any repossessed collateral for a defaulted consumer loan may not provide an adequate source of repayment of the outstanding loan balance as a result of the greater likelihood of damage, loss or depreciation. The remaining deficiency often does not warrant further substantial collection efforts against the borrower. In addition, consumer loan collections are dependent on the borrower’s continuing financial stability and thus are more likely to be adversely affected by job loss, divorce, illness or personal bankruptcy. Furthermore, the application of various federal and state laws, including federal and state bankruptcy laws, may limit the amount which we can recover on these types of loans. These loans may also give rise to claims and defenses by a consumer loan borrower against an assignee of such loan, and a borrower may be able to assert against the assignee claims and defenses which it has against the seller of the underlying collateral. |
| • | Commercial business loans typically are made on the basis of the borrower’s ability to make repayment from cash flow from its business and are secured by business assets, such as commercial real estate, accounts receivable, equipment and inventory. As a result, the availability of funds for the repayment of commercial business loans may be substantially dependent on the success of the business itself. Further, the collateral for commercial business loans may depreciate over time and cannot be appraised with as much precision as residential real estate. |
In determining our allowance for loan losses, we analyze our loan portfolio and classify individual loans which display certain elements of weakness as substandard, doubtful or loss. All loans and/or borrowing relationships in excess of $100,000 are reviewed on a quarterly basis; lesser amounts are evaluated as a group unless they are not performing. Loans classified as substandard receive an allowance allocation of 15% of principal outstanding; doubtful 50%; and loss 100%, as prescribed by bank regulators. The unallocated component of our allowance represents the results of our analyses that estimate probable losses inherent in the loan portfolio which are not addressed in the allowance allocated for classified and/or nonperforming loans, including evaluations of industry and regional concentrations, economic conditions and historical loss rates. This method estimates the amounts of probable losses in our loan portfolio. In addition, industry standards and bank regulatory bodies dictate a minimum allowance for loan losses of 1% of total loans. Our board of directors has mandated a minimum level for the allowance for loan losses of 1% of total loans excluding funds advanced in settlement of mortgage loans; and during periods of rapid loan growth, the allowance is targeted for levels of between 1% and 1.2% of total loans excluding funds advanced in settlement of mortgage loans.
Based upon our loan charge-off experience for the last three years, we anticipate total gross loan charge-offs in 2003 to be approximately $394,000. In particular, the average annualized gross charge-off rates to average loans outstanding since January 2000 for commercial, real estate and consumer loans have been 0.036%, 0.004% and 0.047%, respectively. As a result, we anticipate total gross loan charge-offs in 2003 to be approximately $252,000 for commercial loans, $123,000 for real estate loans and $19,000 for consumer loans.
27
Table of Contents
Deposits. We primarily use deposits to fund our loan and investment portfolio. Resource Bank offers a variety of deposit accounts to individuals and businesses. Deposit accounts include checking, savings, money market and certificates of deposit. The table below presents average deposits and average rates paid, by major category, at the dates indicated:
Year Ended December 31, | ||||||||||||||||||
2001 | 2000 | 1999 | ||||||||||||||||
Average Balance | Average Rate | Average Balance | Average Rate | Average Balance | Average Rate | |||||||||||||
(Dollars in thousands) | ||||||||||||||||||
| Interest bearing deposits: | ||||||||||||||||||
| Demand/MMDA accounts | $ | 120,288 | 4.21 | % | $ | 67,844 | 5.97 | % | $ | 12,362 | 3.32 | % | ||||||
| Savings | 4,465 | 3.14 | % | 14,618 | 4.32 | % | 22,943 | 4.51 | % | |||||||||
| Certificates of deposit | 243,807 | 5.45 | % | 200,137 | 6.14 | % | 180,764 | 5.31 | % | |||||||||
| Total interest bearing deposits | 368,560 | 5.02 | % | 282,599 | 6.01 | % | 216,069 | 5.11 | % | |||||||||
| Non interest bearing deposits | 16,386 | — | 16,407 | — | 16,541 | — | ||||||||||||
| Total average deposits | $ | 384,946 | 4.81 | % | $ | 299,006 | 5.68 | % | $ | 232,610 | 4.74 | % | ||||||
The following table is a summary of time deposits of $100,000 or more by remaining maturities at December 31, 2001:
Amount | Percent | |||||
(Dollars in thousands) | ||||||
| Three months or less | $ | 3,704 | 36.74 | % | ||
| Three to six months | 4,839 | 47.99 | % | |||
| Six to twelve months | 1,249 | 12.39 | % | |||
| Over twelve months | 290 | 2.88 | % | |||
| Total | $ | 10,082 | 100.00 | % | ||
We generally maintain maturity dates of our time deposits to match the maturity dates of our interest earning assets. As of September 30, 2002, we had $248.1 million, or 38.0%, of our interest earning assets maturing or re-pricing within a three-month period, and therefore we also had a need for a similar amount of short-term deposits to fund these assets. As of September 30, 2002, Resource Bank had $140.7 million of interest bearing deposits maturing or re-pricing during the same three-month period. Our asset liability management committee surveys all of our local markets, the national retail markets and internet banking markets to determine the most favorable interest rates and maturities for deposits to fund interest earning assets. We use each of these three markets to gather deposits to mitigate risk associated with their short-term nature. Most of our local customers want certificates of deposit with a term of one year or less, therefore, most of our local deposits are of shorter duration. We have used this funding model for the past nine years.
Borrowed Funds. The following table sets forth consolidated short term borrowings. These borrowings represent advances to Resource Bank by the Federal Home Loan Bank of Atlanta and are secured by FHLB stock, investment securities and first mortgage loans and federal funds purchased. During 2001, Resource Bank purchased federal funds on an unsecured basis for up to 30 consecutive days from a correspondent bank.
Years Ended December 31, | ||||||||||||
2001 | 2000 | 1999 | ||||||||||
(Dollars in thousands) | ||||||||||||
| Balance at period end | $ | 36,500 | $ | 7,546 | $ | 13,000 | ||||||
| Average balance during period | $ | 16,871 | $ | 7,030 | $ | 7,289 | ||||||
| Average rate | 3.35 | % | 6.37 | % | 5.60 | % | ||||||
| Maximum outstanding during period | $ | 57,433 | $ | 23,246 | $ | 16,000 | ||||||
28
Table of Contents
Liquidity. Our funding requirements are supplied from a range of traditional sources, including various types of demand deposits, money market accounts, certificates of deposit and short-term borrowings. Large certificates of deposit accounted for 2.5% and 2.0% of our total deposits at December 31, 2001 and 2000, respectively. FHLB of Atlanta advances are also utilized as funding sources, with $83.8 million and $30.3 million in such advances outstanding at December 31, 2001 and December 31, 2000, respectively. Pursuant to the terms of a variable rate line of credit with the FHLB, Resource Bank may borrow up to 30% of its assets. This FHLB credit facility has no expiration date, but is re-evaluated periodically to determine our credit worthiness. Resource Bank also has a $75 million warehouse line of credit collateralized by first mortgage loans, which is renewable annually. As of December 31, 2001, there was no balance on this line of credit. Management has no reason to believe these funding arrangements will not be renewed.
Management seeks to ensure adequate liquidity to fund loans and meet our financial requirements and opportunities. To provide liquidity for current, ongoing and unanticipated needs, we maintain federal funds sold, money market accounts and a portfolio of debt securities. We also structure and monitor the flow of funds from debt securities and from maturing loans. Securities are generally purchased to provide a source of liquidity. At December 31, 2001, we had $114.6 million, fair market value, in securities available-for-sale and no securities in held-to-maturity. Unrealized holding gains and losses for available-for-sale securities are excluded from earnings and reported as a net amount in a separate component of stockholders’ equity until realized. Securities are composed of governmental or quasi-governmental agencies, and preferred stocks and bonds of corporations with a credit rating no less than an S&P rating of BBB. Net unrealized depreciation, net of tax effect, on securities available-for-sale was ($160,570) and ($258,222) at December 31, 2001 and 2000, respectively. There were no federal funds sold to correspondent institutions at year end 2001 and 2000, respectively.
Gross unrealized losses on securities available for sale were $1.4 million at December 31, 2001 and $339,000 at December 31, 2000 and gross unrealized gains were $1.2 million and $25,000 at December 31, 2001 and 2000, respectively. At December 31, 1999 gross unrealized gains on securities available for sale were $13,200 and gross unrealized losses on securities available for sale were $115,000. At December 31, 2001 there were no securities in the held to maturity category. At December 31, 2000, gross unrealized gains and losses on securities held to maturity were $1.5 million and $1.3 million respectively. At December 31, 1999 gross unrealized gains and losses on securities held to maturity were $4,000 and $2.2 million, respectively.
We raised approximately $3.0 million of additional capital in the fourth quarter of 2002 by offering 3,000 trust preferred securities at a price of $1,000.00 per security. These securities bear a variable distribution rate per annum, reset quarterly, equal to LIBOR plus 3.45%, provided that the applicable interest rate may not exceed 12.5% through the interest payment date in November 2007. These securities have a mandatory redemption date of November 7, 2032 and are subject to varying call provisions at our option beginning November 7, 2007.
We raised approximately $5.0 million of additional capital in the fourth quarter of 2001 by offering 5,000 trust preferred securities at a price of $1,000.00 per security. These securities bear a variable distribution rate per annum, reset semi-annually, equal to LIBOR plus 3.75%, provided that the applicable interest rate may not exceed 11.0% through the interest payment date in December 2006. These securities have a mandatory redemption date of December 8, 2031, and are subject to varying call provisions at our option beginning December 8, 2006.
In the second quarter of 2001, we raised net proceeds of $6.4 million by issuing 500,000 shares of common stock at a public offering price of $14.00 per share before underwriting discounts. On July 9, 2001, we raised an additional $898,175 of net proceeds through the sale of 72,500 additional shares as part of the same offering. We invested $4.9 million of the offering proceeds in Resource Bank in the form of capital.
We raised approximately $9.2 million of additional capital in the first quarter of 1999 by offering 368,000 trust preferred securities at a price of $25.00 per security. The securities feature a 9.25% coupon. We, in turn, purchased $7.3 million of non-cumulative 9.25% preferred stock issued by Resource Bank during the course of 1999. This preferred stock qualifies as Tier 1 capital for Resource Bank for regulatory purposes. This
29
Table of Contents
additional Tier 1 capital provided us with an increased loans to one borrower limitation, and the ability to continue to grow our balance sheet. The preferred stock 9.25% coupon matches the coupon of the trust preferred securities. The remainder of funds generated by the trust preferred securities offering, estimated at $1.6 million after offering expenses, were invested in marketable securities and used by us in our stock repurchase program. These marketable securities are held as available-for-sale to meet liquidity needs. We repurchased and retired $1 million of these securities in August 2002, leaving $8.2 million outstanding.
We currently depend on our cash and liquidity as well as dividends from Resource Bank to pay our operating expenses. In addition, as a result of the trust preferred securities offerings discussed above, at September 30, 2002, we had an aggregate outstanding amount of $16.2 million trust preferred securities. As of September 30, 2002, our annual interest payments due on our trust preferred securities, based on applicable interest rates as of that date, were approximately $1.2 million. The availability of dividends from Resource Bank is limited by various federal or state statutes and regulations. As of September 30, 2002, Resource Bank could pay us up to $10.3 million in dividends without having to gain any prior regulatory approval. In the event that Resource Bank is unable to pay dividends sufficient to satisfy our obligations, we may not be able to service our debt, pay our obligations as they become due, or pay dividends on our common stock.
Interest Rate Sensitivity Analysis
Our management evaluates interest sensitivity through the use of an asset/liability management reporting model on a quarterly basis and then formulates strategies regarding asset generation and pricing, funding sources and pricing, and off-balance sheet commitments in order to decrease sensitivity risk. These strategies are based on management’s outlook regarding interest rate movements, the state of the regional and national economies and other financial and business risk factors. In addition, we establish prices for deposits and loans based on local market conditions and manage our securities portfolio under policies that incorporate interest rate risk tolerances.
The following table presents the amounts of our interest sensitive assets and liabilities that mature or re-price in the periods indicated.
December 31, 2001 Maturing or Repricing | |||||||||||||||||||
Within 3 Months | 4-12 Months | 1-5 Years | Over 5 Years | Total | |||||||||||||||
(Dollars in thousands) | |||||||||||||||||||
Interest Earning Assets: | |||||||||||||||||||
| Investment securities | $ | 47,835 | $ | 6,521 | $ | 10,731 | $ | 49,548 | $ | 114,635 | |||||||||
| Loans | 185,177 | 37,192 | 92,654 | 29,913 | 344,936 | ||||||||||||||
| Interest bearing deposits | 1,682 | — | — | — | 1,682 | ||||||||||||||
| Other interest earning assets | 71,971 | — | — | — | 71,971 | ||||||||||||||
| Total interest earning assets | 306,665 | 43,713 | 103,385 | 79,461 | 533,224 | ||||||||||||||
Interest Bearing Liabilities: | |||||||||||||||||||
| Deposits | |||||||||||||||||||
| Demand and savings(1) | 85,056 | 990 | 14,268 | — | 100,314 | ||||||||||||||
| Time deposits, $100,000 and over | 3,704 | 6,088 | 290 | — | 10,082 | ||||||||||||||
| Other time deposits | 87,468 | 132,011 | 65,662 | — | 285,141 | ||||||||||||||
| Other interest bearing liabilities | 17,800 | 19,000 | 66,000 | — | 102,800 | ||||||||||||||
| Capital debt securities | — | 5,000 | — | 9,200 | 14,200 | ||||||||||||||
| Total interest bearing liabilities | 194,028 | 163,089 | 146,220 | 9,200 | 512,537 | ||||||||||||||
| Period Gap | $ | 112,637 | $ | (119,376 | ) | $ | (42,835 | ) | $ | 70,261 | $ | 20,687 | |||||||
| Cumulative Gap | $ | 112,637 | $ | (6,739 | ) | $ | (49,574 | ) | $ | 20,687 | |||||||||
| Ratio cumulative gap to total interest earning Assets | 21.12 | % | (1.26 | )% | (9.30 | )% | 3.88 | % | |||||||||||
| (1) | Our management has determined that interest checking, money market (except those generated by e-banking) and savings accounts are not sensitive to changes in related market rates and, therefore, have been placed in the 1-5 years category. |
30
Table of Contents
The December 31, 2001 results of the rate sensitivity analysis show that we had $112.6 million more in assets than liabilities subject to repricing within three months or less and we were, therefore, in an asset sensitive position.
The cumulative gap at the end of one year was a negative $6.7 million, a liability-sensitive position. Approximately $222.4 million, or 64.5% of the total loan portfolio, matures or re-prices within one year or less. An asset-sensitive institution’s net interest margin and net interest income generally will be impacted favorably by rising interest rates, while that of a liability sensitive institution generally will be impacted favorably by declining rates.
Increases and decreases in our mortgage banking income, which consists primarily of gains on sales of mortgage loans, tend to offset decreases and increases in the net interest margin. In a climate of lower or declining interest rates, our net interest margin will tend to decrease as the yield on interest earning assets decreases faster than the cost of interest bearing liabilities. Mortgage banking income, in contrast, tends to increase in times of lower or declining interest rates, as refinancing activity leads to an increase in mortgage loan originations. In a climate of rising or higher interest rates, the net interest margin will tend to increase, while a decrease in mortgage loan originations leads to a decrease in mortgage banking income.
Interest Rate Risk
Our methodology to measure interest rate sensitivity includes an analysis of the potential gain or loss in future fair values of interest rate sensitive instruments. Our analysis assumes a hypothetical 200 basis point instantaneous and parallel shift in the yield curve in interest rates. A present value computation is used in determining the effect of the hypothetical interest rate changes on the fair value of our interest rate sensitive instruments as of December 31, 2001. Computations of prospective effects of hypothetical interest rate changes are based on many assumptions, including relative levels of market interest rates, loan prepayments and deposit decay. They should not be relied upon as indicative of actual results. Further, the computations do not contemplate certain actions we could undertake in response to changes in interest rates. Certain shortcomings are inherent in this method of analysis. If market conditions vary from assumptions used in the calculation of present value, actual values may differ from those projected. However, if a hypothetical, parallel and instantaneous 200 basis point increase and decrease were experienced, net fair values of interest sensitive instruments would be decreased by $8.5 million and decreased by $911,000, respectively.
This fair value analysis, performed for us by a third party vendor, tends to overstate interest rate risk within our balance sheet. The analysis assigns the contractual long term maturity to mortgage loans within the funds advanced for settlement account. Such loans are generally held by us for less than 60 days, being pre-sold to third party purchasers when the individual borrowers lock in their interest rates. This extension of loan terms within this category of our balance sheet increases interest rate risk sensitivity calculated by the analysis.
The analysis also does not include a forecast of loan and deposit volume changes due to the hypothetical 200 basis point interest rate change. In addition, anticipated increased volume in our mortgage banking operation from a 200 basis point decrease in rates is not included in the analysis. This expected volume increase in mortgage lending as the result of a decline in interest rates would positively impact our earnings.
The standard algebraic formula for calculating present value is utilized. The calculation discounts the future cash flows of our portfolio of interest rate sensitive instruments to present value utilizing techniques designed to approximate current market rates for securities, current offering rates for loans, and the cost of alternative funding for the given maturity of deposits, and then assumes a 200 basis point instantaneous and parallel shift in these rates. The difference between these numbers represents the resulting hypothetical change in the fair value of interest rate sensitive instruments.
31
Table of Contents
Other significant assumptions used in the calculation include: (1) no growth in volume (i.e., replacement of maturities in like instruments, with no change in balance sheet mix); (2) constant market interest rates reflecting the average rate from the last month of the given quarter; and (3) pricing spreads to market rates derived from an historical analysis, or from assumptions by instrument type.
Return on Equity and Assets
The following table sets forth ratios considered to be significant indicators of our profitability and financial condition during the periods indicated:
Year Ended December 31, | |||||||||
2001 | 2000 | 1999 | |||||||
| Return on average assets | 0.95 | % | 1.21 | % | (0.25 | )% | |||
| Return on average equity | 18.73 | % | 24.13 | % | (3.90 | )% | |||
Critical Accounting Policies and Judgments
The accounting principles followed by us and the methods of applying these principles conform with generally accepted accounting principles and to general practices within the banking industry. Our most critical accounting policies require our judgment to ascertain the valuation of assets, liabilities, commitments and contingencies. These policies require the use of subjective and complex estimates, assumptions and judgments, which are based on information available as of the date of the financial statements, that are important to the portrayal of our financial condition and results. Accordingly, as this information changes, our financial statements could reflect different estimates, assumptions and judgments. Certain policies inherently have a greater reliance on the use of estimates, assumptions and judgments and as such have a greater possibility of producing results that could be materially different than originally reported.
The allowance for loan losses is established and maintained at levels deemed adequate by management to cover losses inherent in the loan portfolio, based upon our evaluation of the risks in the portfolio and changes in the nature and volume of loan activity. Estimates for loan losses are determined by analyzing historical loan losses, current trends in delinquencies and charge-offs, the opinions of our regulators, changes in the size and composition of the loan portfolio and industry data. We also consider the impact of economic events, the outcome of which are uncertain. While we use the best information available in establishing the allowance, future adjustments may be necessary if economic conditions differ substantially from our assumptions used in making valuations, or if required by regulators based upon information available to them at the time of their examinations. Although we believe that our allowance for loan losses is adequate and properly recorded in our financial statements, differing economic conditions or alternate methods of estimation could result in materially different amounts of loan losses.
As part of our funding strategy, we use derivative financial instruments to reduce exposure to changes in interest rates and market prices for financial instruments. All of these derivative financial instruments are interest rate swaps, which are designated as hedges for financial reporting purposes. The application of the hedge accounting policy requires judgment in the assessment of hedge effectiveness, and measurement of changes in the fair value of hedged items. We believe that our techniques for addressing these judgmental areas are in accordance with generally accepted accounting principles and in line with industry practices in assessing hedge effectiveness. However, if in the future the derivative financial instruments we use no longer qualify for hedge accounting treatment and, consequently, the change in fair value of hedged items could not be recognized in earnings, the impact on our consolidated results of operations and reported earnings could be significant. We believe hedge effectiveness is evaluated properly in preparation of our financial statements. All of the derivative financial instruments used by us have active markets and indications of fair value can be readily obtained.
The estimation of fair value is significant to a number of our assets, including funds advanced in settlement of mortgage loans, available for sale investment securities, commercial real estate mortgage servicing rights, and other real estate owned, as well as assets and liabilities associated with derivative financial instruments. These are all recorded at either fair value or at the lower of cost or fair value. Fair values can be volatile and may be influenced by a number of factors, including market interest rates, prepayment speeds, discount rates and market conditions, among others. Since these factors can change significantly and rapidly, fair values are difficult to predict and are subject to material changes, which could impact our financial condition.
32
Table of Contents
Recent Accounting Pronouncements
The Financial Accounting Standards Board, or FASB, has issued FASB Issues Interpretation No. 45, “Guarantor’s Accounting and Disclosure Requirements for Guarantees, including Indirect Guarantees of Indebtedness of Others.” This interpretation elaborates on the disclosures to be made by a guarantor in its interim and annual financial statements about its obligations under certain guarantees that it has issued. It also requires a guarantor to recognize, at the inception of a guarantee, a liability for the fair value of the obligation undertaken in issuing the guarantee. The FASB did not prescribe a specific approach for subsequently measuring the guarantor’s recognized liability over the term of the related guarantee. This interpretation also incorporates, without change, the guidance in FASB Interpretation No. 34, “Disclosure of Indirect Guarantees of Indebtedness of Others,” which is being superseded by this document. Certain guarantee arrangements are completely excluded from the scope of this interpretation and certain others are only excluded from the recognition and measurement provisions.
The incremental disclosure requirements in this interpretation are effective for financial statements of interim or annual periods ending after December 15, 2002. The initial recognition and initial measurement provisions of this interpretation are applicable to guarantees issued or modified after December 31, 2002, irrespective of the guarantor’s fiscal year end. In other words, a calendar year end company must provide the required disclosures in its December 31, 2002 financial statements, and all companies must begin to recognize the fair value of guarantees issued or modified beginning January 1, 2003. The accounting followed by the guarantor on prior guarantees may not be changed to conform with the guidance in this interpretation. We are currently assessing the effect of this interpretation on our financial condition and results of operations.
33
Table of Contents
General
Resource Bankshares Corporation, a Virginia corporation, was established in 1998 and is headquartered in Virginia Beach, Virginia. We were capitalized on July 1, 1998 as the result of a share exchange with Resource Bank, a Virginia state chartered bank. In the share exchange, the shareholders of Resource Bank exchanged each of their shares of common stock for two shares of our common stock, and Resource Bank became our wholly owned subsidiary. We conduct virtually all of our business through Resource Bank. The bank markets its financial services to individuals, small to medium-sized businesses and professional firms located in the three largest metropolitan areas in Virginia—Greater Hampton Roads, northern Virginia and Greater Richmond.
Our primary source of revenue is the interest income and fees which we earn by lending and investing the funds which are held on deposit. Because loans generally earn higher rates of interest than investments, we seek to employ as much of our deposit funds as possible in the form of loans to individuals, businesses, professionals and other organizations. In the interest of liquidity, however, portions of our deposits are maintained in cash, government securities, deposits with other financial institutions, and overnight loans of excess reserves, known as federal funds sold, to large correspondent banks. The revenue that we earn, before deducting overhead expenses, is essentially a function of the amount of our loans and deposits, as well as the profit margin, or interest spread, and fee income which can be generated on the loans. During the nine months ended September 30, 2002, our commercial banking and related operations generated 74.4% of our total net income before income taxes.
Our strategic plan is directed toward enhancing our franchise value and operating profitability by:
| • | increasing our asset size by hiring experienced lending officers that can attract customers to the bank; |
| • | growing and expanding our loan portfolio in our current metropolitan markets and by expanding into new geographic markets; |
| • | funding this growth with the lowest cost sources possible; |
| • | maximizing efficiencies in asset and liability management; and |
| • | generating significant non-interest income, primarily by building our mortgage operation. |
The bank has expanded, and expects to continue to expand, in the markets in which we operate. In June 1999, Resource Bank opened a banking office in Chesapeake, Virginia and in February 2000 the bank opened a banking office in Newport News, Virginia. Additionally, at the end of 2001 the bank transformed its loan production office in Richmond, Virginia, which was opened in May 1995, into a full-service banking office. During 2001, we finished construction and moved into our new northern Virginia regional office located in Herndon, Virginia, on Elden Street, a main business thoroughfare in the Dulles corridor. We opened our sixth full service banking office in Virginia Beach, Virginia in December 2002.
Furthering the expansion strategy related to our mortgage operation, we completed several acquisitions in 2000 and 2001 and entered into a joint venture in 2000. In February 2001, the bank acquired the operating assets of Atlantic Mortgage and Investment Company, a company that specializes in commercial loan originations, placements and servicing in the mid-Atlantic region of the United States. In 2000, the year prior to this acquisition, Atlantic closed over $99 million in mortgage loans. In addition, the bank acquired the operating assets of First Jefferson Mortgage Corporation, a Virginia based residential mortgage loan origination company, in March 2001. In 2000, the year prior to this acquisition, First Jefferson closed over $250 million in mortgage loans. We also acquired two title abstract and real estate closing agency companies: PRC Title, LLC, in May of 2001; and CW and Company of Virginia, in June 2000. Additionally, during August 2000, Resource Service Corporation, our wholly-owned non-operating subsidiary entered into a joint venture with Financial Planners’ Mortgage Company, Inc. by forming Financial Planners Mortgage, LLP, a limited partnership which participates in residential one to four family loan production. These acquisitions and the joint venture have expanded the scope of mortgage services we market, and we believe have enhanced our mortgage operation. During the nine months ended September 30, 2002, the bank’s mortgage division generated 25.6% of our total net income before income taxes.
34
Table of Contents
Market Areas
Resource Bank provides its financial services primarily to individuals and businesses located in the three largest metropolitan areas in Virginia—Greater Hampton Roads, northern Virginia and Greater Richmond. When combined, these areas accounted for over 73.9% of all deposits in Virginia as of June 30, 2002, the most recent date that deposit numbers are available. In the past decade, these areas have seen significant population growth, and each has developed an energetic business climate, which has in turn promoted further population growth. Ancillary effects from this growth are increases in both small to medium-sized businesses and professional firms—primary market groups for the bank. The following provides highlights on our three market areas.
Greater Hampton Roads
| • | Population—estimated at 1.6 million in 2002. The population of the Greater Hampton Roads region has grown by 8.4% since 1990 and is projected to grow another 10.4% by 2010. |
| • | Deposits—financial institution deposits in the region totaled $12.5 billion as of June 30, 2002, representing 10.6% of the total deposits in Virginia. |
| • | Household Income—median household income in the region grew 33.7% to $51,000 in 2001 from 1990 and is projected to grow another 9.0% by 2005. |
For the purposes of the information presented directly above, the Greater Hampton Roads area consists of the Norfolk-Virginia Beach-Newport News Metropolitan Statistical Area.
Northern Virginia
| • | Population—estimated at 2.2 million in 2002. The population of northern Virginia has grown by 25.1% since 1990 and is projected to grow another 14.9% by 2010. |
| • | Deposits—financial institution deposits in the region totaled $53.0 billion as of June 30, 2002, representing 45.0% of the total deposits in Virginia. |
| • | Household Income—median household income in the region grew 47.4% to $85,600 in 2001 from 1990 and is projected to grow another 14.1% by 2005. |
For the purposes of the information presented directly above, northern Virginia consists of the Virginia portion of the Washington D.C. Primary Metropolitan Statistical Area.
Greater Richmond
| • | Population—estimated at 1.0 million in 2002. The population of Greater Richmond has grown 15.1% since 1990 and is projected to grow another 11.4% by 2010. |
| • | Deposits—financial institution deposits in the region totaled $21.5 billion as of June 30, 2002, representing 18.6% of the total deposits in Virginia. |
| • | Household Income—median household income in the region grew 30% to $61,800 in 2001 from 1990 and is projected to grow another 9.3% by 2005. |
For the purposes of the information presented directly above, Greater Richmond consists of the Richmond-Petersburg Metropolitan Statistical Area.
Banking Services
Resource Bank has six full service banking offices—two in Virginia Beach, Virginia, and one each in Chesapeake, Newport News, Richmond and Herndon, Virginia.
Resource Bank markets its services to consumers, small to medium sized businesses and professional persons. We emphasize personal relationship banking and strive to build customer loyalty. The bank’s services include checking and savings accounts, certificates of deposit and charge cards, as well as services typically associated with larger banks, such as sweep account capacity, automatic reconciliation and corporate credit cards.
35
Table of Contents
We have contracted with a nationally recognized Internet banking software company to provide a secure, comprehensive Internet package to market our products and services to our customers. Our Internet branch, located at www.ResourceBankOnline.com, provides customers with the ability to conduct banking business through a personal computer or other secure browser-enabled device 24 hours per day. We offer special deposit accounts through ResourceBankOnline, which features competitive interest rates and ready access to funds on deposit. Online bill payment and a download capability for most personal financial software packages are also included on our Internet branch.
Resource Bank is a preferred lender under the Small Business Administration, or SBA, loan program in both the Richmond, Virginia and Washington, D.C. SBA districts, ranking first in the number of SBA loans for regional banks in the Richmond district and in the top 10 in the number of SBA loans for regional banks in the Washington, D.C. district in the nine month period ending September 30, 2002.
The bank’s commercial lending group generates most of our loans and consists of 22 senior lenders with an average of 24 years of banking experience. At September 30, 2002, 58.1% of the bank’s loan portfolio was attributable to borrowers in the Greater Hampton Roads area, 20.1% to borrowers in northern Virginia and 16.7% to borrowers in Greater Richmond. For loans attributed to the Greater Hampton Roads area, 47.2% were generated primarily in the Chesapeake, Norfolk and Virginia Beach areas, and 10.9% were generated in Hampton, Newport News and York County.
Resource Mortgage, the bank’s mortgage division, originates residential mortgage loans and sells them to approximately 30 different investors in the national secondary market. Resource Mortgage originates both conforming and non-conforming single-family loans on a national basis. During 2001, Resource Mortgage originated and sold mortgage loans in excess of $797.7 million. In the first nine months of 2002, we originated and sold mortgage loans totaling over $635.3 million.
Consistent with standard industry practice, Resource Mortgage has written contracts with each of the investors purchasing its mortgage loans and does not sell any loans to affiliated special purpose entities. However, Resource Bank does retain a small percentage of loans originated for its own permanent loan portfolio. All of the investors purchasing our loans are unaffiliated third parties. The terms and conditions of these contracts are particular to each investor and normally define the loan product underwriting standards, conforming and non-conforming products, designated underwriting and lock-in procedures and any special procedures to be followed. Under these contractual arrangements, we are compensated by investor-purchasers based upon pricing published in daily rate sheet. Specifically, premiums are received upon the sale of mortgage loans and their related servicing rights. These premiums are established at the time the subject loans are “locked in” with the investor.
Resource Mortgage has a contract with each investor which defines the “lock-in” procedure for selling a loan to the investor. We have only a “best efforts basis” obligation to sell loans to investors, with no mandatory delivery contracts nor commitments to investors. We follow the standard industry practice in originating and selling loans to investors. When the customer locks in their rate, we lock in the rate with our investor within twenty-four hours or as soon as is practicable. At the time of rate lock, the investor agrees to the terms and conditions of that particular loan and the loan is delivered after closing to the investor, normally within a 5 to 30 day period, depending on market volume and the investor’s requirements. When each loan is locked and funded, there is an obligation by both parties to deliver the loan and fund. We maintain a reserve for mortgage loans to cover any fees not collected or small accounting adjustments with our investors. We believe that this reserve and our exposure in this regard is not material relative to Resource Mortgage’s loan volume.
Strategic Plan
We believe that implementing our strategic plan has allowed us to experience steady growth while improving profitability. We also believe that the net proceeds raised in this offering will allow us to further implement our strategic plan by providing the equity capital necessary to support future loan production and asset
36
Table of Contents
growth, branch expansion in new and existing markets and potential acquisitions to expand our retail branch network. Our strategic plan has five primary components:
| • | Hire experienced lending officers. Resource Bank has hired a group of talented and experienced senior lending officers from major regional banks. These officers have been able to attract customers with which they have built relationships over the years, typically allowing the officers to enhance our loan production immediately. Resource Bank currently has 22 senior lending officers with an average age of 48 and an average of 24 years of experience in the financial services industry. These senior lending officers, together with our executive management team, have broad experience during a variety of economic cycles in asset and liability management, loan production and credit administration—key strengths in building and growing our company. We currently have six profit centers within our commercial lending operation, two in Virginia Beach and one each in Herndon, Chesapeake, Newport News and Richmond, Virginia, each headed by a highly experienced lending officer. Each of these groups have more than $40 million in loans outstanding, with four of the six ranging from $52 million to more than $85 million in loans outstanding and greater than $1 million in profitability annually. We expect the other two units to reach similar volume and profitability levels in the near term, and all units to experience continued strong growth. |
| • | Grow and expand our loan portfolio in Virginia’s largest metropolitan markets. We have grown our loan portfolio by expanding in our current metropolitan markets and by penetrating new geographic markets. When seeking to enter new markets, our strategy is to identify a market with growth potential, hire a small group of lenders with experience in the market, and then allow those lenders to operate a loan production office and generate a profitable portfolio of loans. Once a loan production office is sufficiently profitable, the bank has the ability, on a cost effective basis, to convert the office into a full service branch that offers deposit and related products. Since 2000, the bank has implemented this strategy in Chesapeake, Newport News and Richmond, Virginia. In addition to growing our asset base in this manner, we intend to pursue “de novo” branch openings and selective branch and financial institution acquisitions when attractive opportunities arise. We believe the demographics of the Greater Hampton Roads, northern Virginia and Greater Richmond markets provide the greatest opportunities to expand our business in Virginia. We will continue to seek expansion opportunities along the Interstate 64 and 95 corridors that connect these three markets. In particular, we have targeted the Williamsburg and Fredericksburg areas, located between Hampton Roads and Richmond, and Richmond and northern Virginia, respectively, as possible venues for expansion. We believe that both of these areas offer significant new business development potential because of their growing local economies and their proximity to our already established territories surrounding them. |
| • | Fund asset growth with the lowest cost sources possible. Our liability funding strategy is to generate the lowest cost deposits possible through various sources, while also diversifying our sources of funds and liquidity risks. Our bank funds its asset growth with a combination of local deposits, Internet deposits, national market deposits, federal fund borrowings and FHLB borrowings. The bank’s asset and liability committee surveys our three major markets on a weekly basis, sets interest rates on deposits and makes funding decisions based on current market rates and maturities needed to fund new asset growth. This committee provides specific guidance on the mix of liabilities necessary to match fund our forecasted net growth in loans for the next thirty days. Our target liability mix is 40% in local and Internet deposits, 40% in national deposits and 20% in borrowings. The bank has a liability funding desk that reviews all segments of these markets on a daily basis. The bank also enters into interest rate swaps to fund loans that reprice on movements of the prime rate. By using interest rate swaps, the bank is able to maintain stable interest rate margins in both rising and falling interest rate environments. We intend to increase our retail branch network with adding one or more de novo branches each year. We anticipate that our branch expansion in the future will be consistent with our current practice of first establishing a loan production office and converting it into a full service branch when its profitability |
37
Table of Contents
| permits a cost effective branch office operation. In addition, we will also look for branch opportunities within our established lending territories that can link our lenders and their borrowing clientele with full banking services. We believe that such additions to our branch network will provide us with core deposit growth, particularly more low interest cost commercial deposit accounts. |
| • | Maximize efficiencies in asset and liability management. Relying on the extensive industry experience of our senior management, we use sophisticated financial models to forecast future net interest income and financial margins. These models include detailed asset and liability maturities by month, current rollover yields/costs and volume forecasts, and also consider the current interest rate and economic environment, including any recent interest rate changes by the Federal Reserve. The bank’s asset liability management committee also reviews the interest rate and volume analysis of each major asset and liability category and its impact on profitability, and maintains an interest rate analysis report that match funds each asset and liability group by maturity. Our financial models, which are reviewed by our board of directors each month, allow us to be proactive in our budget forecasts and maximize profitability in changing economic conditions. These financial models, which contain many assumptions, enable us to forecast our net interest margin and net interest income for the upcoming twelve-month period. In addition, we believe the dynamics of the models provide flexibility in forecasting growth and asset liability mixes, which are used in management decisions for planning one to three years into the future. |
| • | Generate significant non-interest income. In addition to increasing our overall profitability, our mortgage operations are an integral part of the bank’s ability to meet customer needs—from the purchase of a building lot to a construction loan to build a home, to the ultimate placement of the permanent residential mortgage loan in the national market. We have expanded our mortgage operations and increased our non-interest income by hiring experienced mortgage loan officers and by making strategic acquisitions. We are also pursuing other strategic initiatives to generate non-interest income from ancillary sources, including insurance and asset management products, which we believe can be cross-sold effectively to our existing and expanding customer base. For example, we are engaged in a newly formed partnership with the Virginia Bankers Association called Bankers Investments, LLC, which will provide a platform to sell fixed annuities as well as other investment products including stocks, mutual funds and variable annuities. We anticipate that this entity will become operational in the first half of 2003. Also, we believe the addition of an insurance agency would provide excellent cross selling opportunities to our commercial and retail clientele, and we are continuing to seek such a strategic acquisition. |
Credit Administration
Loan Policy and Approval Authorization. Management has developed, and Resource Bank’s board of directors has approved, detailed credit policies and procedures which provide for prudent loan decisions through the consistent use of sound underwriting practices. In addition, these policies provide for various levels of loan authorization for individual lending personnel. When aggregate outstanding loans (on both a direct and indirect basis) exceed an individual loan officer’s lending authority, the loan request must receive the additional approval of a senior lending officer who possesses a higher level of authority, or by the bank’s loan committee. This committee meets not less than weekly and consists of eleven members of management. All loans in excess of $500,000 receive subsequent review and ratification by the board of directors.
Loan Review. All lending personnel, in concert with loan administration staff, conduct an ongoing review of all “special mentioned” and “classified” credits as well as all loans which are past due in excess of 30 days. Prior to each monthly board meeting, a report is developed and presented citing all special mentioned and classified loans, all loans over 30 days past due, all non-accrual loans, and real estate owned. Further, on a quarterly basis, the bank loan review staff conducts an independent review of all loans $100,000 or greater and
38
Table of Contents
has discussions, as necessary, with the appropriate loan manager. Based on this review and discussion, a report is developed for the board’s review, which presents the risk profile of the portfolio. Any modifications to the list of classified credits are reflected in the monthly reports presented to the board.
In addition to the quarterly review described above, the loan review staff has developed a loan review plan, which requires specific focus on the loan portfolios of individual regions as well as individual officers. These reviews require, in some cases, on site reviews allowing for the examination of documentation. The bank’s board of directors reviews, on a monthly basis:
| • | all new loans of $500,000 or more; |
| • | all loans delinquent 30 days or more; |
| • | all non-accrual loans; |
| • | all restructured loans; |
| • | all loans currently identified as either special mentioned or classified; |
| • | all loans originated to facilitate the sale of real estate owned; and |
| • | all insider loans as defined under Federal Reserve regulations. |
In addition, a random sampling of not less than 2% of those loans not included in the above-mentioned categories is reviewed to ensure proper classification and compliance with internal and external policies and regulations. The results of these reviews are presented to management with any significant issues or adverse trends reported directly to the board of directors.
Concentration of Risk. Resource Bank has developed a business strategy focused on serving small to medium sized business customers, and providing credit facilities to developers and builders of single-family residential communities and selected commercial projects. Currently, approximately 75% of the bank’s loan portfolio consists of loans to real estate related projects, with the remainder consisting of loans to operating or commercial concerns. Our exposure to real estate related lending is consistent with management’s philosophy to seek adequate collateralization for every loan. This strategy has proven to be advantageous for the bank based on its levels of non-performing assets and, with the exception of an isolated event in 1999, its levels of loan loss. The loss in 1999 was related to our asset based lending program which has since been discontinued.
In order to keep management and the board of directors informed about the bank’s real estate activities, a semi-annual analysis of the bank’s real estate loan activities is prepared and reported to the board. This analysis sets out the detail of our real estate activity and cites any area or developments of concern.
Acquisition Program
We believe that our franchise value and operating profitability would be enhanced by a significant increase in our asset size. For this reason, we have in the past explored, and expect to continue to explore in the future, merger and acquisition opportunities that would accelerate our progress toward the achievement of our strategic plan. We cannot assure you that we will be successful in implementing any of the future plans described above or that, even if implemented, the actions will produce the desired financial results. You should take into account the matters described in this section when considering the more specific discussion of our financial performance provided elsewhere in this prospectus.
Competition
We operate in highly competitive environments in all of our service areas, competing for deposits and loans with major regional and national banks, as well as other financial institutions, many of which have greater
39
Table of Contents
financial resources than us. Most maintain numerous banking locations and many perform services, such as trust services, which we do not offer. Additionally, many of these competitors have higher lending limits than us. We have been able to compete effectively with other financial institutions by
| • | emphasizing personal relationship banking; |
| • | promoting local management and decision making in our marketing strategies; |
| • | responding rapidly to customer opportunities; |
| • | establishing long-term customer relationships; |
| • | building customer loyalty; and |
| • | providing products and services designed to address the specific needs of our customers. |
Properties
The leases covering our banking facilities are long-term with renewal provisions designed to assure that we will be able to operate in these facilities for the foreseeable future. Details of our leases may be reviewed in the notes to our consolidated financial statements that accompany this prospectus. The leases covering our loan production offices are generally terminable by us with very short notice. We own the three-story office building in Herndon, Virginia from which our northern Virginia operations are conducted. Additionally, we own a four acre parcel of land in Virginia Beach, Virginia for which we are currently evaluating the best use.
Employees
At September 30, 2002, we had 289 full time and 29 part time employees. None of our employees are represented by any collective bargaining unit, and we believe that relations with our employees are good.
Legal Proceedings
Resource Mortgage, a division of Resource Bank, historically has used facsimiles to disseminate product and interest rate information to mortgage brokers on a nationwide basis. The facsimile form of business communication is consistent with traditional industry practice because obtaining time sensitive information is critical in order for mortgage brokers to obtain the best possible interest rates for their customers.
On March 8, 2002, Cohen & Malad, LLP, an Indianapolis, Indiana law firm acting as plaintiff, filed a class action complaint in the Circuit/Superior Court of Marion County, Indiana against us and Resource Bank. The suit alleges that Resource Bank violated the Telephone Consumer Protection Act, by sending unsolicited advertisements by facsimile without obtaining prior express invitation or permission to send the facsimiles. We believe that the facsimile allegedly received by the plaintiff was transmitted by a third party fax service provider retained by the bank. Subsequently, Resource Bankshares was dismissed as a party to the litigation but the lawsuit is still pending against Resource Bank.
The suit seeks certification of a class action to pursue statutory claims by recipients of unsolicited facsimiles and seeks monetary damages. Under the TCPA, recipients of unsolicited fax advertisements are entitled to damages of $500 per fax for inadvertent violations of the TCPA and $1,500 per fax for knowing or willful violations. Because Resource Bank’s mortgage division often uses third party fax service providers to disseminate product and interest rate information, the bank has not yet been able to determine the number of faxes sent during the relevant class period. However, we expect the number to be significant.
Resource Bank is defending the lawsuit vigorously and has filed initial briefs and motions with the court. The court will not establish a trial date until ruling on dispositive motions. Initially, Resource Bank has filed a motion to dismiss the lawsuit on the grounds that the TCPA is unconstitutional. The motion to dismiss asserts
40
Table of Contents
that the TCPA is unconstitutional on several grounds, including violation of the First Amendment right to free commercial speech and violation of Eighth Amendment due process rights in connection with the TCPA’s penalty provisions. The most recent federal court case addressing the constitutionality of the TCPA found the Act to be an unconstitutional prohibition on commercial speech. However, this ruling is on appeal and other federal courts addressing the issue have held that the TCPA is constitutional.
Resource Bank is asserting additional constitutional and other defenses in the litigation. In particular, the bank intends to contest vigorously class certification on the grounds that individual issues surrounding each facsimile preclude class certification. However, the bank believes that courts in Marion County, Indiana recently have granted class certifications in other class action lawsuits filed under the TCPA. Resource Bank does not yet know whether the factual claims underlying these class action lawsuits are similar or dissimilar to the litigation to which the bank is a party. If appropriate, the bank also will explore vigorously possible causes of action against the fax service provider that transmitted the facsimile allegedly received by the plaintiff in the lawsuit.
Resource Bank has insurance coverage for any litigation costs associated with the lawsuit, including attorneys’ fees and expenses, subject to a policy limit of $3 million.
Because Resource Bank intends to defend the lawsuit vigorously, and because that defense includes the filing of various dispositive motions that will require court rulings in advance of a trial, the bank cannot predict when the lawsuit will be resolved. In addition, because the plaintiff and Resource Bank will have the opportunity to appeal the trial court’s rulings on these dispositive motions, it is likely that the lawsuit will remain pending for the foreseeable future. See “Risk Factors—We have been sued in a class action lawsuit under the Telephone Consumer Protection Act and it is possible that we will suffer material losses as a result of this lawsuit,” on page .
In addition to the litigation above, from time to time, we may be involved in litigation relating to claims arising out of our operations in the normal course of business.
41
Table of Contents
Directors and Executive Officers
The following contains information concerning our directors and executive officers as of December 31, 2002, each of whom is expected to continue to serve in the following capacities for us and Resource Bank after this offering.
Name | Age | Position | ||||
| Alfred E. Abiouness | 71 | Director | ||||
| T. A. Grell, Jr. | 53 | Director and President | ||||
| Thomas W. Hunt | 46 | Director and Chairman | ||||
| Louis R. Jones | 66 | Director | ||||
| A. Russell Kirk | 55 | Director | ||||
| Lawrence N. Smith | 65 | Director and Chief Executive Officer | ||||
| Elizabeth A. Twohy | 50 | Director | ||||
| Harvard R. Birdsong, II | 53 | Executive Vice President—Chief Credit Officer | ||||
| Debra C. Dyckman | 52 | Executive Vice President—Retail Banking | ||||
| James M. Miller | 43 | Executive Vice President—Operations/Finance | ||||
| Eleanor J. Whitehurst | 60 | Senior Vice President and Chief Financial Officer |
Alfred E. Abiounesshas been President of Abiouness, Cross & Bradshaw, Inc., a Norfolk structural engineering and architectural consulting firm, since 1974. Mr. Abiouness is a past Commissioner of the Norfolk Redevelopment and Housing Authority. He has served as a director of Resource Bankshares since its inception in 1998 and as a director of Resource Bank since 1988.
T. A. Grell, Jr.has been President of Resource Bankshares since November 2001 and President and Chief Operating Officer of Resource Bank since December 1998. Mr. Grell has also served as a director of Resource Bankshares and Resource Bank since October 2000. From 1984 until joining Resource Bank, he was a senior officer at Central Fidelity Bank, ultimately serving as Executive Vice President prior to Wachovia Bank’s acquisition of Central Fidelity. Mr. Grell has 30 years of experience in the banking industry.
Thomas W. Huntis the Vice President of Summit Enterprises, Inc. of McLean, Virginia, an investment management company focused primarily on venture capital opportunities, where he has been employed since 1984. He is the former Chairman of the Board of Directors of Eastern American Bank, FSB, which Resource Bank acquired in 1997. Mr. Hunt is a director of Bryce Office Systems, Inc., Intelisys Electronic Commerce and Digital Access Control, each of which are privately held companies. Mr. Hunt currently serves as the Chairman of the Board of each of Resource Bankshares and Resource Bank. He has served as a director of Resource Bankshares since its inception in 1998 and as a director of Resource Bank since 1997.
Louis R. Joneshas been President of Hollomon-Brown Funeral Home, Inc. since 1954. Mr. Jones is also Chairman of the Board of Snelling Funeral Homes, Inc. and is President of Allstate Leasing Corporation, Memorial Services Planning Corporation, Advance Charge Plan, Inc., Tidewater Cemetery Corporation and Lu-El Realty, Inc. Mr. Jones serves on the City Council of Virginia Beach. He has served as a director of Resource Bankshares since its inception in 1998 and as a director of Resource Bank since 1993.
A. Russell Kirkhas been the Vice Chairman of Armada-Hoffler Holding Company, a real estate, land development, construction and properties management firm since 2002 and served as its President from 1983 until assuming his current position. Previously, Mr. Kirk served as the Co-Chief Executive Officer of Goodman Segar Hogan Hoffler, also a real estate development, construction and properties management firm from 1983 to 1993. Mr. Kirk was appointed to the Virginia Port Authority by the Governor of Virginia in 1986, serving as its Chairman from 1994 to 1996. He has served as director of Resource Bankshares since its inception in 1998 and as a director of Resource Bank since 1992.
42
Table of Contents
Lawrence N. Smithjoined Resource Bank in December 1992 and served as its President and Chief Executive Officer until the formation of Resource Bankshares in 1998, at which time he was appointed its President and Chief Executive Officer. Mr. Smith continues to serve as the Chief Executive Officer of Resource Bankshares and Resource Bank. He has served as a director of Resource Bankshares since its inception in 1998 and as a director of Resource Bank since 1992. Mr. Smith has over 20 years of experience with United Virginia Bank/Seaboard National and United Virginia Bank—Eastern Region, predecessor to Crestar Bank—Eastern Region. From 1973 until May 1983, Mr. Smith was President of United Virginia Bank and also served on major committees of its holding company, United Virginia Bankshares, Inc., the predecessor of Crestar Bankshares, Inc. He retired from United Virginia Bank in May 1983. Mr. Smith formed Essex Financial Group, Inc., a financial holding company, in May 1983. Mr. Smith serves on the boards of directors of Empire Machinery and Supply Corporation, a Norfolk based supplier of industrial products and General Foam Plastics Corp., a Norfolk based manufacturer of plastic products, and previously served on the board of Heilig-Meyers Corporation, a national furniture retailer that filed for bankruptcy protection in August 2000.
Elizabeth A. Twohyis President of Capital Concrete, Inc. of Norfolk, Virginia, a ready-mixed concrete manufacturer, where she has been employed since 1975. She is two times past president of the Virginia Ready-Mixed Concrete Association. She is currently on the board of the National Ready Mix Concrete Association. Ms. Twohy is also serving her second term as a trustee of the Board of Visitors of the University of Virginia and is a board member of the Virginia Sports Hall of Fame in Portsmouth, Virginia. She has served as a director of Resource Bankshares since its inception in 1998 and as a director of Resource Bank since 1993.
Harvard R. Birdsong, IIhas been an Executive Vice President of Resource Bankshares since October 2001 and an Executive Vice President of Resource Bank since June 2001 and continues to serve as the Chief Credit Officer of Resource Bank. Prior to accepting these positions, Mr. Birdsong served as a Senior Vice President of Resource Bankshares and a Senior Vice President and Chief Credit Officer of Resource Bank. Before joining Resource Bank in 1997, he was a Senior Credit Officer at Essex Savings Bank, FSB, where he was employed from 1984 through 1996. He has been employed in the banking industry for 31 years.
Debra C. Dyckmanhas been an Executive Vice President of Resource Bankshares since October 2001 and an Executive Vice President of Resource Bank since June 2001. Prior to accepting these positions, Ms. Dyckman had served as a Senior Vice President of Operations and Secretary of Resource Bank since 1992 and of Resource Bankshares since its inception in 1998. Ms. Dyckman has been in banking for 31 years and serves on the Board of Trustees of Cape Henry Collegiate School.
James M. Miller has been an Executive Vice President of Resource Bankshares since October 2001 and an Executive Vice President of Resource Bank since June 2001. Mr. Miller served as President of Resource Bank’s northern Virginia region from 1997 until August 2001, and as a Senior Vice President of Resource Bankshares until October 2001. Mr. Miller was President of Eastern American Bank, FSB prior to its merger with Resource Bank in December 1997. He is active in civic affairs and has 22 years experience in banking and finance.
Eleanor J. Whitehursthas been a Senior Vice President and Chief Financial Officer of Resource Bank since 1992 and of Resource Bankshares since its inception in 1998. She has more than 31 years of experience in the banking industry.
Board Structure
Our board of directors is divided into three classes serving staggered three year terms. The terms of Messrs. Grell, Hunt and Smith expire in 2003, the terms of Messrs. Jones and Kirk expire in 2004, and the terms of Mr. Abiouness and Ms. Twohy expire in 2005.
43
Table of Contents
Compensation of Directors
Directors who are also our employees do not receive any extra compensation for attendance at board or committee meetings of Resource Bankshares or Resource Bank. The members of our board of directors and Resource Bank’s board of directors are currently the same, and directors do not receive separate compensation for serving on both boards. During 2002, non-employee directors of Resource Bank received compensation for their service on its board of directors in the amount of $1,900 for each meeting attended. In addition, an annual retainer of $14,000 was paid to the Chairman of Resource Bank’s board and an annual retainer of $12,000 was paid to the other non-employee directors. Non-employee directors also received $500 for each audit committee and compensation committee meeting attended.
Executive Compensation
The following table presents an overview of compensation paid by Resource Bankshares and our subsidiaries during 2002, 2001 and 2000 to our chief executive officer and our other four most highly compensated executive officers.
Summary Compensation Table
Long Term Compensation | |||||||||||||
Annual Compensation | Securities Underlying Options | All Other Compensation(1) | |||||||||||
Name and Principal Position | Year | Salary | Bonus | ||||||||||
Lawrence N. Smith CEO of Resource Bankshares and Resource Bank | 2002 2001 2000 | $ | 342,000 325,000 275,625 | $ | 290,000 276,250 220,000 | — — 20,000 | $ | 6,000 5,100 5,100 | |||||
T. A. Grell, Jr. President of Resource Bankshares and Resource Bank | 2002 2001 2000 | $ | 232,000 220,500 210,000 | $ | 162,000 154,000 186,000 | — 20,000 5,000 | $ | 6,000 5,100 5,100 | |||||
Harvard R. Birdsong, II Executive Vice President of Resource Bankshares and Resource Bank | 2002 2001 2000 | $ | 147,000 121,500 115,763 | $ | 95,000 84,000 60,000 | — 6,500 2,500 | $ | 6,000 5,100 2,131 | |||||
Debra C. Dyckman Executive Vice President of Resource Bankshares and Resource Bank | 2002 2001 2000 | $ | 131,500 111,500 106,050 | $ | 77,500 75,000 60,000 | — 3,000 2,500 | $ | 6,000 5,100 2,108 | |||||
| James M. Miller | 2002 | $ | 157,500 | $ | 122,500 | — | $ | 5,500 | |||||
Executive Vice President of Resource Bankshares and Resource Bank | 2001 2000 | 141,000 121,800 | 90,000 100,000 | 4,500 2,500 | 5,100 5,100 | ||||||||
| (1) | Consists of contributions to 401(k) Plan. |
44
Table of Contents
Fiscal Year-End Options Values
The table below sets forth information regarding the exercise of stock options by the executive officers named in the summary compensation table during 2002 and the exercisable and unexercisable stock options held as of December 31, 2002 by these executive officers. There were no stock options granted to these executive officers in 2002.
Number of Securities Underlying Unexercised Options at Fiscal Year-End (#) | Value of Unexercised In-the-Money Options at Fiscal Year-End (1) | |||||||||||||||
Name | Shares Acquired Upon Exercise (#) | Value Realized ($) | Exercisable | Unexercisable | Exercisable | Unexercisable | ||||||||||
| Lawrence N. Smith | 10,000 | 154,000(2) | 48,267 | 10,000 | $ | 622,369 | (3) | $ | 90,700 | (4) | ||||||
| T. A. Grell, Jr. | — | — | — | 40,000 | — | 75,813 | (5) | |||||||||
| Harvard R. Birdsong, II | 3,000 | 12,480(6) | 12,000 | 9,000 | 57,720 | (7) | 31,060 | (8) | ||||||||
| Debra C. Dyckman | 6,666 | 102,656.40(9) | 14,400 | 5,500 | 206,064 | (10) | 26,545 | (11) | ||||||||
| James M. Miller | — | — | 15,000 | 7,000 | 72,150 | (12) | 45,070 | (13) | ||||||||
| (1) | The closing price of our common stock on the Nasdaq National Market on December 31, 2002 was $20.56 per share. Under Securities and Exchange Commission rules, an option was “in-the-money” on December 31, 2002 if the exercise price per share was less than $20.56. |
| (2) | The exercise price of these options was $3.00 per share and the Closing Price on March 21, 2002 was $18.40. |
| (3) | 16,667 of the options are exercisable at $3.00 per share and 21,600 of the options are exercisable at $6.25 per share. 10,000 of the options are exercisable at $18.50 per share. |
| (4) | The exercise price of these 10,000 options is $9.12 per share. |
| (5) | The exercise price of 5,000 of these options is $9.12 per share, the exercise price of 14,571 of these options is $17.87 per share, and the exercise price of 20,000 of these options is $16.90 per share. The exercise price of 429 of these options is $21.75 per share, and these options therefore were not in-the-money on December 31, 2002. |
| (6) | The exercise price of these options was $15.75 per share and the closing price on December 18, 2002 was $19.91. |
| (7) | These options are exercisable at $15.75 per share. |
| (8) | The exercise price of 2,500 of these options is $9.12 per share and the exercise price of 6,500 of these options is $16.90 per share. |
| (9) | The exercise price of these options was $3.00 per share and the Closing Price on March 21, 2002 was $18.40. |
| (10) | These options are exercisable at $6.25 per share. |
| (11) | The exercise price of 2,500 of these options is $9.12 per share and the exercise price of 3,000 of these options is $16.90 per share. |
| (12) | These options are exercisable at $15.75 per share. |
| (13) | The exercise price of 2,500 of these options is $9.12 per share and the exercise price of 4,500 of these options is $16.90 per share. |
Retirement Savings Plan
Employees that are eligible may participate in Resource Bank’s Retirement Savings Plan. The plan is a combined 401(k) profit sharing, stock bonus and employee stock ownership plan, which means that contributions may be made by Resource Bank to the plan in either cash or Resource Bankshares common stock and are derived from current or accumulated profits. The plan’s assets may be invested in shares of Resource Bankshares common stock purchased from third parties on the open market. The plan’s 401(k) provisions permit employees to contribute to the plan through voluntary payroll savings on a pretax basis. These contributions are matched by Resource Bank in an amount equal to 50% of payroll savings contributions made by employees, up to 6% of an employee’s total compensation.
45
Table of Contents
Retirement Benefits and Key Man Insurance Policies
During 1996, the board of directors of Resource Bank approved a plan for the payment of retirement benefits to certain key employees and entered into limited binding agreements with these key employees. Under the terms of the plan, Resource Bank may fund the liabilities associated with the plan with life insurance contracts. In connection with funding the projected retirement benefits, Resource Bank paid premiums on applicable life insurance contracts in the amount of approximately $275,000 during 2002, and may continue to pay, in its sole discretion, the same annual amount of insurance premiums over the next two years. Resource Bank owns the insurance polices and, under the plan, will recoup all the premiums advanced upon the death of the individual officer.
Stock Option Plans
At our 2001 annual meeting of shareholders, our shareholders adopted and approved the 2001 Stock Incentive Plan, which authorizes the issuance of stock based awards to our directors and key employees. At our 2002 annual meeting of shareholders, our shareholders approved an amendment to the plan that increased the total number of shares available for award under the plan by 100,000 shares. Under this plan, as amended, 200,000 shares of our common stock are available for awards.
In addition to the 2001 Stock Incentive Plan, we currently have three stock option plans under which our directors and officers have been granted options. These plans were initially adopted by Resource Bank and were converted into plans of Resource Bankshares shortly after we were formed to be the holding company for Resource Bank. The 1993 Long-Term Incentive Plan provided for the issuance of options to purchase shares of our common stock to our key employees. The 1994 Long-Term Director Incentive Plan provided for the issuance of options to purchase shares of our common stock to our directors.
The 1996 Long-Term Incentive Plan provided for the issuance of options to purchase shares of our common stock to our directors and key employees. We do not anticipate issuing any further stock options pursuant to these three plans but the plans will remain in effect for as long as awards remain outstanding. Options to purchase an aggregate of 443,568 shares of our common stock are currently outstanding under these three plans.
In most cases, options granted to our employees do not vest and become exercisable unless the employee is still providing services to us five years after the option grant date. In addition, all of our options have been granted at an exercise price that is equal to, or in limited cases higher than, the fair market value of our common stock on the date of grant.
Employment Agreements
We believe that employment agreements are an important component of attracting and retaining quality management and key personnel. We also believe that our employment agreements provide us important protection by imposing certain non-competition, confidentiality, and non-solicitation of employee covenants upon our executive officers and other key employees. To provide us flexibility with respect to our employment needs, however, most of our employment agreements are terminable by us with or without cause, subject generally to severance payment obligations by us if we terminate employment without cause.
We entered into an employment agreement with Lawrence N. Smith in June 2002, under which Mr. Smith serves as our Chief Executive Officer and as the Chief Executive Officer of Resource Bank. The initial term of Mr. Smith’s agreement is five years. Under the terms of his agreement, Mr. Smith’s current annual base salary is $360,000. On an ongoing basis, Resource Bank’s board of directors will determine Mr. Smith’s annual salary in a manner commensurate with his position and performance, provided, however, Mr. Smith’s salary under the agreement is required to be at least $342,000. Mr. Smith is also eligible to participate in benefit, disability and retirement plans and in bonus programs as determined by the boards of directors of Resource Bankshares or Resource Bank from time to time.
If Resource Bank terminates Mr. Smith’s employment “without cause” (as defined in the agreement), it is required to pay his regular base salary for the lesser of the remainder of the initial five year term or a three year
46
Table of Contents
period following termination. However, no further payments would be payable if Mr. Smith violates the non- competition covenants set forth in his agreement. Upon a “change of control” (as defined in the agreement) of Resource Bank in which Mr. Smith is not given reasonably equivalent duties, responsibilities and compensation, Mr. Smith’s employment with Resource Bank may be terminated or he may resign and, in either case, Mr. Smith will be entitled to receive a one time payment of 2.99 times the average of his total W-2 income, which would include his regular base salary and bonus, for the three year period prior to the change of control.
In addition to the agreement with Mr. Smith, Resource Bank entered into an employment agreement with T. A. Grell, Jr. in June 2002, under which Mr. Grell now serves as our President and as President of Resource Bank. Mr. Grell’s agreement has substantially the same terms as Mr. Smith’s agreement, except that Mr. Grell’s current annual base salary is $244,000.
Resource Bank has also entered into written employment agreements with our other executive officers, including Debra C. Dyckman, Harvard R. Birdsong, II and James M. Miller. These employment agreements are substantially similar to the agreements described in the preceding paragraphs, except that the initial annual base salaries differ from employee to employee and severance payments upon termination of employment without cause generally would be made for the lesser of the remainder of the initial term of the agreements or 18 months following termination of employment. The current annual salary under Ms. Dyckman’s employment agreement is $138,500, the current annual salary under Mr. Birdsong’s employment agreement is $155,000 and the current annual salary under Mr. Miller’s employment agreement is $165,500.
In addition to employment agreements with our executive officers, we have also entered into employment agreements with key employees in Resource Bank’s mortgage division and with many of our senior lending officers. Employment agreements for our mortgage division executives typically have terms of five years, provide for certain severance payments upon termination without cause and provide for change of control payments of 2.99 times base salary. Of our 22 senior lending officers, we currently have written employment agreements with 16. We also have written employment agreements with our five mortgage division executives.
Compensation Committee Interlocks and Insider Participation
No member of our compensation committee was also an officer or employee of Resource Bank or Resource Bankshares during 2002. During 2002, none of our executive officers served as a member of the compensation committee of another entity, nor did any of our executive officers serve as a director of another entity, one of whose executive officers served on our compensation committee.
Two members of our compensation committee, Alfred Abiouness and Russell Kirk, have outstanding loans with Resource Bank. Each of these loans was made in the ordinary course of business on substantially the same terms, including interest rates, collateral and repayment terms, as those prevailing at the time for comparable transactions with unrelated parties and did not involve more than the normal risk of collectibility or present other unfavorable features. In addition, Mr. Kirk is the Vice Chairman of Armada-Hoffler Holding Company, the parent of Armada-Hoffler Construction. Armada-Hoffler Construction, was the site and building general contractor for our new Herndon, Virginia branch facility, which was built during 2001. During 2001, in connection with its services as general contractor Armada-Hoffler Construction received approximately 7% of the $3.3 million we paid to construct this facility. We believe that the terms and conditions of Armada-Hoffler Construction’s services were comparable to those that would have been offered by other unaffiliated third parties in an arms-length transaction.
Certain Relationships and Related Transactions
The directors and executive officers of Resource Bank and Resource Bankshares, and their family members and certain business organizations and individuals associated with each of them, have been customers of
47
Table of Contents
Resource Bank, have had normal banking transactions, including loans, with Resource Bank, and are expected to continue to do so in the future. As of December 31, 2002, Resource Bank had aggregate direct and indirect loans to the directors and executive officers of Resource Bankshares and Resource Bank totaling approximately $6.25 million, which represented approximately 21.7% of our stockholders’ equity as of that date. Each of these transactions was made in the ordinary course of business on substantially the same terms, including interest rates, collateral and repayment terms, as those prevailing at the time for comparable transactions with unrelated parties and did not involve more than the normal risk of collectibility or present other unfavorable features.
In addition, Mr. Kirk is the Vice Chairman of Armada-Hoffler Holding Company. Armada-Hoffler Construction, a subsidiary of Armada-Hoffler Company, was the site and building general contractor for our new Herndon, Virginia branch facility, which was built during 2001. During 2001, in connection with its services as general contractor Armada-Hoffler Construction received approximately 7% of the $3.3 million we paid to construct this facility. As discussed above, we believe that the terms and conditions of Armada-Hoffler Construction’s services were comparable to those that would have been offered by other unaffiliated third parties in an arms-length transaction.
48
Table of Contents
AND CERTAIN BENEFICIAL OWNERS
The following table sets forth information as of December 31, 2002, relating to the beneficial ownership of our common stock by each of our directors and executive officers and all of our directors and executive officers as a group. The executive officers consist of those individuals for whom compensation information is provided in the “Summary Compensation Table” appearing on page of this prospectus. Except as otherwise set forth below, we are not aware of any person or group of affiliated persons who owns more than 5% of our common stock. The address of each of the persons in this table is c/o Resource Bankshares Corporation, 3720 Virginia Beach Blvd., Virginia Beach, Virginia 23452.
Name | Number of Shares Beneficially Owned | Percent of Outstanding Shares | ||||
| Alfred E. Abiouness | 89,846 | (1) | 2.94 | % | ||
| T. A. Grell, Jr. | 11,584 | * | ||||
| Thomas W. Hunt | 107,191 | (2) | 3.52 | |||
| Louis R. Jones | 296,386 | (3) | 9.73 | |||
| A. Russell Kirk | 114,054 | (4) | 3.75 | |||
| Lawrence N. Smith | 148,743 | (5) | 4.83 | |||
| Elizabeth A. Twohy | 43,138 | (6) | 1.42 | |||
| Harvard R. Birdsong, II | 21,502 | (7) | * | |||
| Debra C. Dyckman | 47,953 | (8) | 1.58 | |||
| James M. Miller | 38,380 | (9) | 1.26 | |||
| All directors and executive officers as a group (11 persons) | 943,680 | (10) | 29.23 | % |
| * | Less than 1% ownership |
| (1) | Includes options to purchase 30,166 shares that are currently exercisable. |
| (2) | Includes options to purchase 15,000 shares that are currently exercisable; 40,528 shares owned by Mr. Hunt’s wife and 21,110 shares owned by Mr. Hunt’s children, for which Mr. Hunt shares voting and investment power. Does not include 87,408 shares held jointly by Mr. Hunt’s spouse and Alan M. Voorhees as trustees for the benefit of Mr. Voorhees’ great grandchildren, for which Mr. Hunt does not share voting or investment power. |
| (3) | Includes options to purchase 20,166 shares that are currently exercisable. |
| (4) | Includes options to purchase 13,500 shares that are currently exercisable. |
| (5) | Includes options to purchase 48,267 shares that are currently exercisable. Also includes 52,202 shares owned by the Smith Family Partnership for which Mr. Smith shares voting and investment power and 10,500 shares owned by the Smith Family Trust for which Mr. Smith has sole voting and investment power. |
| (6) | Includes options to purchase 20,166 shares that are currently exercisable. Also includes 6,764 shares owned by Ms. Twohy’s minor children. |
| (7) | Includes options to purchase 12,000 shares that are currently exercisable. |
| (8) | Includes options to purchase 14,400 shares that are currently exercisable. |
| (9) | Includes options to purchase 15,000 shares that are currently exercisable and 8,488 shares in a family trust for which Mr. Miller has voting and investment power. |
| (10) | Includes options to purchase 201,065 shares that are currently exercisable. |
49
Table of Contents
Set forth below is a summary of statutes and regulations affecting bank holding companies like Resource Bankshares and banks like Resource Bank. Federal and state laws and regulations provide regulatory oversight for virtually all aspects of our operations. This summary is qualified in its entirety by reference to these statutes and regulations.
Supervision and Regulation of Resource Bankshares
General Banking Regulation. Resource Bankshares is a bank holding company within the meaning of the Bank Holding Company Act of 1956 and the Virginia Banking Act. As a bank holding company, Resource Bankshares is required to file with the Federal Reserve periodic reports and information regarding its business operations and those of Resource Bank. Resource Bankshares also must provide the Virginia Bureau of Financial Institutions with information regarding itself and Resource Bank. Resource Bankshares and Resource Bank also are examined by the Federal Reserve and by the Virginia Bureau of Financial Institutions.
A bank holding company is required to obtain prior approval from the Federal Reserve before acquiring control of substantially all the assets of any non-affiliated bank or more than 5% of the voting shares of any bank it does not already own, or before it merges or consolidates with another institution or engages in any business other than banking or managing, controlling or furnishing services to banks and other subsidiaries, and a limited list of activities closely related to or incidental to banking. Similarly, approval of the Virginia Bureau of Financial Institutions is required for certain acquisitions of other banks and bank holding companies. The Federal Reserve will approve the ownership by a bank holding company of shares in a company engaged in activities determined by order or regulation to be so closely related to banking or to managing or controlling banks as to be a proper incident thereto. In other words, regulatory involvement, and frequently approval, is required if we engage in non-banking activities.
Resource Bankshares would be compelled by the Federal Reserve to invest additional capital in the event Resource Bank experiences either significant loan losses or rapid growth of loans or deposits. The Federal Reserve requires a bank holding company to act as a source of financial strength and to take measures to preserve and protect its bank subsidiaries.
Holding Company Capital Guidelines. As a bank holding company, we operate under the capital adequacy guidelines established by the Federal Reserve. Under the Federal Reserve’s current risk-based capital guidelines for bank holding companies, the minimum required ratio for total capital to risk weighted assets we are required to maintain is 8%, with at least 4% consisting of Tier 1 capital. Tier 1 capital consists of common and qualifying preferred stock, certain other qualifying instruments, and minority interests in equity accounts of consolidated subsidiaries, less goodwill and other intangible assets. These risk-based capital guidelines establish minimum standards, and bank holding companies generally are expected to operate well above the minimum standards. We may raise this capital with certain types of debt, and we may raise capital by selling company stock, as we are doing with this offering.
Financial Modernization Legislation. A bank holding company generally is restricted to activities related or incidental to banking. In the past, bank holding companies were specifically prohibited from engaging in the issue, flotation, underwriting, public sale, or distribution of third party securities. Limits also were placed on underwriting and selling insurance. The activities permissible to bank holding companies and their affiliates were substantially expanded by the Gramm-Leach-Bliley Act, which became effective in March 2000. This new act repeals the banking/securities industry anti-affiliation rules and permits the common ownership of commercial banks, investment banks, and insurance companies. Under this new law, a bank holding company can elect to be treated as a financial holding company, which may engage in any activity that the Federal Reserve determines is financial in nature. A financial holding company also may engage in any activity that is complementary to a financial activity and does not pose a substantial risk to the safety and soundness of the related depository institutions or the financial system generally.
50
Table of Contents
In order for a bank holding company to qualify as a financial holding company, all of its depository subsidiaries (i.e., banks and thrifts) must be well capitalized and well managed, and must meet their Community Reinvestment Act, or CRA, obligations, as explained below. The bank holding company also must declare its intention to become a financial holding company to the Federal Reserve and certify that it meets the requirements. Banks and thrifts acquired by a financial holding company within 12 months prior to the date on which the election is filed may be excluded from this test if they have less than a satisfactory CRA rating, but they must submit a plan to the applicable federal banking agency describing how the CRA rating will be brought into conformance.
Financial holding company powers that are either specified in the statute or have been determined by the Federal Reserve to be financial in nature include the following:
| • | underwriting insurance or annuities; |
| • | providing financial or investment advice; |
| • | underwriting, dealing in, or making markets in securities; |
| • | merchant banking, subject to limitations on size and capital restrictions; |
| • | insurance portfolio investing, subject to limitations; and |
| • | any other activities previously found to be closely related to banking by the Federal Reserve. |
The Act also establishes a system of functional regulation for financial holding companies and banks providing regulation of securities by the SEC and state securities regulators, regulation of futures by the Commodity Futures Trading Commission, and regulation of insurance activities by the state insurance regulators. Banks may sell title insurance only when specifically permitted under applicable state law.
This new law also imposes new customer privacy requirements on financial institutions. Financial institutions generally are prohibited from disclosing customer information to non-affiliated third parties, unless the customer has been given the opportunity to object and has not objected to such disclosure. Financial institutions must disclose their specific privacy policies to their customers annually. Upon making such disclosure, there is no specific restriction on financial institutions disclosing customer information to affiliated parties. Financial institutions must comply with state law, however, if it protects customer privacy more fully than federal law.
The new law also revises the present FHLB system, imposing new capital requirements on Federal Home Loan Banks and authorizing them to issue two classes of stock with differing dividend rates and redemption requirements.
Effective March 8, 2002, Resource Bankshares became a “financial holding company” under the terms of this new law. We are unable to predict the impact of this new law on our competition or our operations at this time.
Securities. Resource Bankshares also must comply with the requirements of the Securities Exchange Act of 1934, or Exchange Act, which include the filing of annual, quarterly and other reports with the Securities and Exchange Commission, or SEC.
Supervision and Regulation of Resource Bank
General. Resource Bank is a state bank and member of the Federal Reserve System. The Federal Reserve and the Virginia Bureau of Financial Institutions regulate and monitor all significant aspects of Resource Bank’s operations. The Federal Reserve requires quarterly reports on Resource Bank’s financial condition, and both federal and state regulators conduct periodic examinations of the bank. The cost of complying with these regulations and reporting requirements can be significant. In addition, some of these regulations impact investors
51
Table of Contents
directly. For example, Resource Bank may pay dividends only out of its net undivided profits after deducting expenses, bad debts, losses, interest and taxes accrued, and contribution to capital necessary for the bank’s original capital to be restored. The Federal Reserve recommends that banks pay dividends only if the net income available to shareholders in the past year fully funds those dividends, and the expected rate of earnings retention is consistent with capital needs, asset quality, and overall financial condition. Regulatory restrictions on Resource Bank’s ability to pay dividends may adversely impact Resource Bankshares’ ability to pay dividends to its shareholders.
As a member of the Federal Reserve, Resource Bank also will have to comply with rules that restrict preferential loans by the bank to “insiders,” require Resource Bank to keep information on loans to principal shareholders and executive officers, and prohibit certain director and officer interlocks between financial institutions. Resource Bank’s loan operations, particularly for consumer and residential real estate loans, are also subject to numerous legal requirements as are its deposit activities. In addition to regulatory compliance costs, these laws may create the risk of liability to Resource Bank for noncompliance.
FDIC Insurance. Resource Bank’s deposits are insured by the FDIC for a maximum of $100,000 per depositor. For this protection, Resource Bank pays a semi-annual statutory assessment and must comply with the rules and regulations of the FDIC. FDIC assessments can change, affecting Resource Bank’s costs, depending on the solvency of the banking industry as a whole. In addition, the cost of complying with FDIC rules and regulations may negatively impact Resource Bank’s profitability. For member banks like Resource Bank, the Federal Reserve has the authority to prevent the continuance or development of unsound and unsafe banking practices and to approve conversions, mergers and consolidations. Obtaining regulatory approval of these transactions can be expensive, time consuming, and ultimately may not be successful.
Bank Capital Guidelines. Federal bank regulatory authorities have adopted risk-based capital adequacy guidelines that redefine traditional capital ratios to take into account assessments of risks related to each balance sheet category, as well as off-balance sheet financing activities. This represents an effort to measure capital adequacy in a way that is more sensitive to the individual risk profiles of specific financial institutions. The risk-weighted asset base is equal to the sum of the aggregate dollar value of assets and certain off-balance sheet items (such as currency or interest rate swaps) in each of the four separate risk categories, multiplied by the risk weight assigned to each specific asset category. After the items in each category have been totaled and multiplied by the category’s risk factor, category totals are aggregated to derive the total risk-weighted assets, and the total adjusted capital base is divided by the total risk-weighted assets to derive a ratio.
Under the Federal Reserve’s current risk-based capital guidelines for member banks, Resource Bank is required to maintain a minimum ratio of total capital to risk weighted assets of 8%, with at least 4% consisting of Tier 1 capital. Tier 1 capital consists of common and qualifying preferred stock, certain other qualifying instruments, and minority interests in equity accounts of consolidated subsidiaries, less goodwill and other intangible assets. In addition, the Federal Reserve requires its member banks to maintain a minimum ratio of Tier 1 capital to average total assets. This capital measure generally is referred to as the leverage capital ratio. The minimum required leverage capital ratio is 4% if the Federal Reserve determines that the institution is not anticipating or experiencing significant growth and has well-diversified risks—including no undue interest rate exposure, excellent asset quality, high liquidity and good earnings—and, in general, is considered a strong banking organization and rated Composite 1 under the Uniform Financial Institutions Rating Systems. If Resource Bank does not satisfy any of these criteria it may be required to maintain a ratio of total capital to risk-based assets of 10% and a ratio of Tier 1 capital to risk-based assets of at least 6%. Resource Bank would then be required to maintain a 5% leverage capital ratio. These regulations can impact Resource Bank by requiring it to hold more capital and thereby inhibit its ability to grow. At September 30, 2002, Resource Bankshares and Resource Bank had the following risk-based capital and leverage ratios relative to regulatory minimums:
Ratio | Resource Bankshares | Resource Bank | Minimum | ||||||
| Tier 1 risk-based capital | 8.88 | % | 9.23 | % | 4.00 | % | |||
| Total risk-based capital | 10.62 | % | 10.25 | % | 8.00 | % | |||
| Leverage | 6.38 | % | 6.66 | % | 4.00 | % |
52
Table of Contents
Affiliate Transactions and Branching. The Federal Reserve Act restricts loans, investments, asset purchases and other transactions between banks and their affiliates, including placing collateral requirements and requiring that those transactions are on terms and under conditions substantially the same as those prevailing at the time for comparable transactions with non-affiliates. Resource Bank may branch without geographic restriction in Virginia, and it may acquire branches or banks or merge across state lines in most cases.
Community Reinvestment Act. The Community Reinvestment Act of 1977, or CRA, requires that federal banking regulators evaluate the record of the financial institutions in meeting the credit needs of their local communities, including low and moderate income neighborhoods, consistent with the safe and sound operation of those institutions. These factors are also considered in evaluating mergers, acquisitions, and applications to open a branch or facility. Resource Bank received a “Satisfactory” CRA rating in its latest CRA examination.
Other Regulation. Resource Bank is subject to a variety of other regulations. State and federal laws restrict interest rates on loans, potentially affecting our income. The Truth in Lending Act and the Home Mortgage Disclosure Act impose information requirements on Resource Bank in making loans. The Equal Credit Opportunity Act prohibits discrimination in lending on the basis of race, creed, or other prohibited factors. The Fair Credit Reporting Act governs the use and release of information to credit reporting agencies. The Truth in Savings Act requires disclosure of yields and costs of deposits and deposit accounts. Other acts govern confidentiality of consumer financial records, automatic deposits and withdrawals, check settlement, endorsement and presentment, and disclosure of cash transactions exceeding $10,000 to the Internal Revenue Service.
Recent Legislation
USA Patriot Act of 2001. In October 2001, the USA Patriot Act of 2001 was enacted in response to the terrorist attacks in New York, Pennsylvania and Washington, D.C. which occurred on September 11, 2001. The Patriot Act is intended to strengthen the ability of U.S. law enforcement agencies and the intelligence communities to work cohesively to combat terrorism on a variety of fronts. The potential impact of the Patriot Act on financial institutions of all kinds is significant and wide ranging. The Patriot Act contains sweeping anti-money laundering and financial transparency laws and imposes various regulations, including standards for verifying client identification at account opening, and rules to promote cooperation among financial institutions, regulators and law enforcement entities in identifying parties that may be involved in terrorism or money laundering.
Sarbanes-Oxley Act of 2002. On July 30, 2002, President Bush signed into law the Sarbanes-Oxley Act of 2002, or the SOA. The stated goals of the SOA are to increase corporate responsibility, to provide for enhanced penalties for accounting and auditing improprieties at publicly traded companies and to protect investors by improving the accuracy and reliability of corporate disclosures pursuant to the securities laws.
The SOA is the most far-reaching U.S. securities legislation enacted since the 1930’s. The SOA generally applies to all companies that file or are required to file periodic reports with the SEC under the Exchange Act. Given the SEC’s extensive role in implementing rules relating to many of the SOA’s new requirements, the final scope of these requirements remains to be determined.
The SOA includes very specific additional disclosure requirements and new corporate governance rules, requires the SEC and securities exchanges to adopt extensive additional disclosure, corporate governance and other related rules and mandates further studies of specified issues by the SEC. The SOA represents significant federal involvement in matters traditionally left to state regulatory systems, such as the regulation of the accounting profession, and to state corporate law, such as the relationship between a board of directors and management and between a board of directors and its committees.
53
Table of Contents
The SOA addresses, among other matters:
| • | audit committees; |
| • | certification of financial statements by the chief executive officer and the chief financial officer; |
| • | the forfeiture of bonuses or other incentive-based compensation and profits from the sale of an issuer’s securities by directors and senior officers in the twelve month period following initial publication of any financial statements that later require restatement; |
| • | a prohibition on insider trading during pension plan black out periods; |
| • | disclosure of off-balance sheet transactions; |
| • | a prohibition on personal loans to directors and officers; |
| • | expedited filing requirements for Forms 4’s; |
| • | disclosure of a code of ethics and filing a Form 8-K for a change or waiver of such code; |
| • | “real time” filing of periodic reports; |
| • | the formation of a public accounting oversight board; |
| • | auditor independence; and |
| • | various increased criminal penalties for violations of securities laws. |
The SOA contains provisions which became effective upon enactment on July 30, 2002 and provisions which will become effective from within 30 days to one year from enactment. The SEC has been delegated the task of enacting rules to implement various provisions with respect to, among other matters, disclosure in periodic filings pursuant to the Exchange Act.
Monetary Policy
Banking is a business that depends on interest rate differentials. The difference between the interest rates paid by Resource Bank on its deposits and other borrowings and the interest rates received on loans extended to its customers and on securities held in its portfolio comprises the major portion of Resource Bank’s earnings.
The earnings and growth of Resource Bank will be affected not only by general economic conditions, both domestic and foreign, but also by the monetary and fiscal policies of the United States and its agencies, particularly the Federal Reserve. The Federal Reserve implements national monetary policy by its open market operations in United States government securities, adjustments in the amount of industry reserves that banks and other financial institutions are required to maintain and adjustments to the discount rates applicable to borrowings by banks from the Federal Reserve. The actions of the Federal Reserve in these areas influence the growth of bank loans, investments, and deposits and also affect interest rates charged and paid on deposits. We cannot predict the nature and impact of any future changes in monetary policies.
54
Table of Contents
Our Articles of Incorporation authorize 6,666,666 shares of common stock, of which 3,061,961 shares were issued and outstanding on September 30, 2002. As of September 30, 2002, there were approximately 800 shareholders of record of our common stock and approximately 1,200 beneficial holders. In addition, our Articles authorize 500,000 shares of preferred stock. There are no shares of preferred stock outstanding. The board may issue shares of common stock and preferred stock as the board deems advisable without further shareholder approval, except, for example, in the case of an acquisition of or combination with another bank or company. In other words, the board may decide to issue additional stock and dilute your ownership interest.
Summary of Shareholders Rights
Dividend Rights. Resource Bankshares may pay dividends as declared from time to time by the board out of funds that are legally available, subject to certain restrictions imposed by state and federal laws. See “Dividend Policy” on page .
Voting Rights. In all elections of directors, a shareholder has the right to cast one vote for each share of stock held by him or her for as many persons as there are directors to be elected. We do not have cumulative voting rights. On any other question to be determined by a vote of shares at any meeting of shareholders, each shareholder is entitled to one vote for each share of stock held by him or her and entitled to vote.
Preemptive Rights. Holders of common stock do not have preemptive rights with respect to issuances of common stock. Accordingly, your share ownership may be diluted if the board decides to issue additional stock in the future.
Liquidation Rights. Upon liquidation, after payment of all creditors, our remaining assets would be distributed to the holders of common stock on a pro-rata basis.
Calls and Assessments. All common stock outstanding is fully paid and non-assessable.
Indemnification of Officers and Directors. Our Articles of Incorporation provide for the indemnification of our officers and directors for their actions unless a court finds them liable for willful misconduct or a knowing violation of the criminal law. In any proceeding brought by shareholders against an officer or director in connection with his or her position with Resource Bankshares or Resource Bank, no damages may be assessed against that officer or director unless he or she is liable for willful misconduct or a knowing violation of criminal or securities laws. We are advised that in the opinion of the SEC, indemnification of directors, officers, and controlling persons for liabilities under the Securities Act of 1933 is against public policy and is, therefore, unenforceable.
Reports to Shareholders. We furnish shareholders with annual reports, including audited financial statements.
Anti-Takeover Provisions in Articles of Incorporation
There are several provisions in our Articles of Incorporation that may discourage attempts to acquire control of Resource Bankshares. First, our Articles of Incorporation authorize our board of directors to issue shares of preferred stock without shareholder approval on terms that the board deems appropriate. Although we currently have no plans to utilize the issuance of preferred stock as a deterrent to possible takeover attempts, the power to issue shares of preferred stock without shareholder approval and to determine rights and preferences with respect to each series of preferred stock could allow our board of directors to issue shares of preferred stock for the purpose of deterring a takeover attempt.
In addition, our Articles of Incorporation provide that our directors are divided into three separate classes, each of which class serves a three year term, and that shareholders may only remove directors for cause.
55
Table of Contents
Together, these provisions make it more difficult for shareholders to change the composition of our board of directors and, therefore, may deter attempts to acquire control of Resource Bankshares.
Virginia Anti-Takeover Statutes
State Anti-Takeover Statutes. Virginia law restricts transactions between a Virginia corporation and its affiliates and potential acquirers. The following discussion summarizes the two Virginia statutes that may discourage an attempt to acquire control of Resource Bankshares. We encourage you to read the entire statutes referenced below.
Affiliated Transaction. Virginia Code Sections 13.1-725—727.1 govern “Affiliated Transactions.” These provisions, with several exceptions discussed below, require approval by the holders of at least two-thirds of the remaining voting shares of material acquisition transactions between a Virginia corporation and any holder of more than 10% of any class of its outstanding voting shares. Affiliated Transactions include mergers, share exchanges, material dispositions of corporate assets not in the ordinary course of business, any dissolution of the corporation proposed by or on behalf of an interested shareholder, or any reclassification, including a reverse stock split, recapitalization, or merger of the corporation with its subsidiaries which increases the percentage of voting shares owned beneficially by any 10% shareholder by more than 5%.
For three years following the time that a shareholder becomes an owner of 10% of the outstanding voting shares, a Virginia corporation cannot engage in an Affiliated Transaction with that shareholder without approval of two-thirds of the voting shares other than those shares beneficially owned by that shareholder, and majority approval of the disinterested directors. A disinterested director is a member of the Resource Bankshares board of directors who was (1) a member on the date the shareholder acquired more than 10% and (2) recommended for election by, or was elected to fill a vacancy and received the affirmative vote of, a majority of the disinterested directors then on the board. At the expiration of the three-year period, the statute requires approval of Affiliated Transactions by two-thirds of the voting shares other than those beneficially owned by the 10% shareholder.
The principal exceptions to the special voting requirement apply to transactions proposed after the three-year period has expired and require either that the transaction be approved by a majority of the corporation’s disinterested directors or that the transaction satisfy the fair-price requirement of the statute. In general, the fair-price requirement provides that in a two-step acquisition transaction, the 10% shareholder must pay the shareholders in the second step either the same amount of cash or the same amount and type of consideration paid to acquire the Virginia corporation’s shares in the first step.
None of the foregoing limitations and special voting requirements applies to a transaction with any 10% shareholder whose acquisition of shares taking him or her over 10% was approved by a majority of the corporation’s disinterested directors.
These provisions were designed to deter certain takeovers of Virginia corporations. In addition, the statute provides that, by affirmative vote of a majority of the voting shares other than shares owned by any 10% shareholder, a corporation can adopt an amendment to its articles of incorporation or bylaws providing that the Affiliated Transactions provisions shall not apply to the corporation. We have not “opted out” of the Affiliated Transactions provisions.
Control Share Acquisitions. Virginia law also provides that shares acquired in a transaction that would cause the acquiring person’s voting strength to meet or exceed any of the three thresholds (20%, 33 ?% or 50%) have no voting rights for those shares exceeding that threshold, unless granted by a majority vote of shares not owned by the acquiring person. This provision empowers an acquiring person to require the Virginia corporation to hold a special meeting of shareholders to consider the matter within 50 days of the request.
Both of these statutes provide impediments to a hostile or unwelcome takeover of Resource Bankshares. In doing so, they may discourage transactions that some shareholders may feel are in their best interest.
56
Table of Contents
We and the underwriters for the offering named below have entered into an underwriting agreement with respect to the shares being offered. Subject to the terms and conditions contained in the underwriting agreement, each underwriter has severally agreed to purchase the number of shares of common stock set forth opposite its name below. The underwriters’ obligations are several, which means that each underwriter is required to purchase a specified number of shares, but it is not responsible for the commitment of any other underwriter to purchase shares.
Name | Number of Shares | |
| BB&T Capital Markets, A Division of Scott & Stringfellow, Inc. | ||
| Ryan Beck & Co. | ||
| Trident Securities, Inc., A Division of McDonald Investments Inc. | ||
| Total |
The underwriters propose to offer the shares of common stock directly to the public at the public offering price set forth on the cover of this prospectus and to certain securities dealers at that price less a concession not to exceed $ per share. The underwriters may allow, and these dealers may re-allow, a discount not more than $ per share on sales to other brokers or dealers. If all of the shares are not sold at the public offering price, the underwriters may change the offering price and other selling terms.
We have granted to the underwriters an option, exercisable for 30 days after the date of this prospectus, to purchase up to 105,000 additional shares of our common stock at the public offering price less the underwriting discount set forth on the cover page of this prospectus. The underwriters may exercise this option only to cover over-allotments, if any, made in connection with this offering. We will be obligated, pursuant to the option, to sell these additional shares of common stock to the underwriters to the extent the option is exercised. If any additional shares of common stock are purchased, the underwriter will offer the additional shares on the same terms as those on which the 700,000 shares are being offered.
The underwriting agreement provides that the obligations of the underwriters are conditional and may be terminated at their discretion based on their assessment of the state of the financial markets. The obligations of the underwriters may also be terminated upon the occurrence of the events specified in the underwriting agreement. The underwriting agreement provides that the underwriters are obligated to purchase all the shares of common stock in this offering if any are purchased, other than those shares covered by the over-allotment option described above.
The shares of common stock are being offered by the several underwriters, subject to prior sale, when, as and if issued to and accepted by them, subject to approval of certain legal matters by counsel for the underwriters and other conditions specified in the underwriting agreement. The underwriters reserve the right to withdraw, cancel or modify this offer and to reject orders in whole or in part.
The following table shows the per share and total underwriting discount we will pay to the underwriters. These amounts are shown assuming both no exercise and full exercise of the underwriters’ over-allotment option to purchase additional shares.
Without Over-Allotment | With Over-Allotment | |||
| Per share | ||||
| Total |
We estimate that the total expenses of the offering, excluding underwriting discount, will be approximately $ and are payable by us.
57
Table of Contents
Each of our executive officers and directors have agreed that they will not offer, sell, contract to sell or otherwise dispose of any shares of common stock or any securities exercisable for or convertible into common stock owned by them or acquired in the offering, in the open market or otherwise, for a period of 90 days from the date of this prospectus, without the prior written consent of the underwriters. This consent may be given at any time without public notice.
Our common stock is quoted on the Nasdaq National Market under the symbol “RBKV.” The last reported sale price of our common stock on January 17, 2003 was $20.62 per share.
In connection with this offering, the underwriters may engage in stabilizing transactions, over-allotment transactions, syndicate covering transactions and penalty bids.
| • | Stabilizing transactions permit bids to purchase shares of common stock so long as the stabilizing bids do not exceed a specified maximum, and are engaged in for the purpose of preventing or retarding a decline in the market price of the common stock while the offering is in progress. |
| • | Over-allotment transactions involve sales by the underwriters of shares of common stock in excess of the number of shares the underwriters are obligated to purchase. This creates a syndicate short position which may be either a covered short position or a naked short position. In a covered short position, the number of shares over-alloted by the underwriters is not greater than the number of shares that they may purchase in the over-allotment option. In a naked short position, the number of shares involved is greater than the number of shares in the over-allotment option. The underwriters may close out any short position by exercising their over-allotment option and/or purchasing shares in the open market. |
| • | Syndicate covering transactions involve purchases of common stock in the open market after the distribution has been completed in order to cover syndicate short positions. In determining the source of shares to close out the short position, the underwriters will consider, among other things, the price of shares available for purchase in the open market as compared with the price at which they may purchase shares through exercise of the over-allotment option. If the underwriters sell more shares than could be covered by exercise of the over-allotment option and, therefore, have a naked short position, the position can be closed out only by buying shares in the open market. A naked short position is more likely to be created if the underwriters are concerned that after pricing there could be downward pressure on the price of the shares in the open market that could adversely affect investors who purchase in the offering. |
| • | Penalty bids permit the representative to reclaim a selling concession from a syndicate member when the common stock originally sold by that syndicate member is purchased in stabilizing or syndicate covering transaction to cover syndicate short positions. |
These stabilizing transactions, syndicate covering transactions and penalty bids may have the effect of raising or maintaining the market price of our common stock or preventing or retarding a decline in the market price of our common stock. As a result, the price of our common stock in the open market may be higher than it would otherwise be in the absence of these transactions. Neither we nor the underwriters make any representation or prediction as to the effect that the transactions described above may have on the price of our common stock. These transactions may be effected on the Nasdaq National Market or otherwise and, if commenced, may be discontinued at any time.
We have agreed to indemnify the underwriters against specified liabilities, including liabilities under the Securities Act of 1933, or Securities Act, and to contribute to payments that the underwriters may be required to make in respect thereof.
From time to time, some of the underwriters have provided, and may continue to provide, investment banking services to us in the ordinary course of their respective businesses.
58
Table of Contents
Certain matters in this offering, including the legality of the common stock offered pursuant to this prospectus, will be passed upon for Resource Bankshares by Kaufman & Canoles, a Professional Corporation, Norfolk, Virginia. Certain matters in this offering will be passed upon for the underwriters by LeClair Ryan, A Professional Corporation, Richmond, Virginia.
Goodman & Company, L.L.P., independent auditors, audited the consolidated financial statements of Resource Bankshares as of December 31, 2001 and 2000 and for the years ended December 31, 2001, 2000 and 1999 included in this prospectus. Their report on the financial statements referred to in the preceding sentence included in this prospectus is included in reliance on the report of Goodman & Company, L.L.P., given on their authority as experts in accounting and auditing.
We filed with the SEC a registration statement on Form S-1 under the Securities Act for the common stock sold in this offering. This prospectus, which is part of the registration statement, does not contain all of the information set forth in the registration statement and accompanying exhibits. This prospectus contains descriptions of the contents of certain agreements or documents that are exhibits to the registration statement. The statements as to the contents of such exhibits, however, are brief descriptions and are not necessarily complete, and each statement is qualified in all respects by reference to such agreement or document. In addition, we file annual, quarterly and other reports, proxy statements and other information with the SEC. Our current SEC filings and the registration statement and accompanying exhibits may be inspected without charge at the public reference facilities of the SEC located at 450 Fifth Street, N.W., Washington, D.C. 20549. You may obtain copies of this information at prescribed rates. The SEC also maintains a website that contains reports, proxy statements, registration statements and other information. The SEC website address iswww.sec.gov. You may call the SEC at 1-800-SEC-0330 to obtain further information on the operations of the public reference room.
59
Table of Contents
INDEX TO CONSOLIDATED FINANCIAL STATEMENTS
Page | ||
| INTERIM PERIODS (UNAUDITED) | ||
| Consolidated Balance Sheets as of September 30, 2002 and December 31, 2001 | F-2 | |
| Consolidated Statements of Income for the nine months and the three months ended September 30, 2002 and 2001 | F-3 | |
| Consolidated Statements of Stockholders’ Equity for the nine months ended September 30, 2002 | F-4 | |
| Consolidated Statements of Cash Flows for the nine months ended September 30, 2002 and 2001 | F-5 | |
| Notes to Consolidated Financial Statements | F-6 | |
| FULL FISCAL YEARS (AUDITED) | ||
| Independent Auditors’ Report | F-10 | |
| Consolidated Balance Sheets as of December 31, 2001 and 2000 | F-11 | |
| Consolidated Statements of Operations for years ended December 31, 2001, 2000 and 1999 | F-12 | |
| Consolidated Statements of Stockholders’ Equity for years ended December 31, 2001, 2000 and 1999 | F-13 | |
| Consolidated Statements of Cash Flows for years ended December 31, 2001, 2000 and 1999 | F-14 | |
| Notes to Consolidated Financial Statements | F-15 |
F-1
Table of Contents
RESOURCE BANKSHARES CORPORATION
CONSOLIDATED BALANCE SHEETS
September 30, 2002 | December 31, 2001 | |||||||
(Unaudited) | ||||||||
(Dollars in thousands) | ||||||||
ASSETS | ||||||||
| Cash and due from banks | $ | 5,845 | $ | 7,928 | ||||
| Interest bearing deposits | 236 | 1,682 | ||||||
| 6,081 | 9,610 | |||||||
| Funds advanced in settlement of mortgage loans | 64,392 | 71,971 | ||||||
| Securities available for sale (amortized cost of $21,825 and $114,878, respectively) | 21,766 | 114,635 | ||||||
| Securities held to maturity (fair value of $114,269 and $0, respectively) | 110,232 | — | ||||||
| Loans, net | ||||||||
| Commercial | 93,737 | 77,705 | ||||||
| Real estate—construction | 122,769 | 86,283 | ||||||
| Commercial real estate | 155,921 | 125,194 | ||||||
| Residential real estate | 44,674 | 51,888 | ||||||
| Installment and consumer loans | 4,145 | 3,866 | ||||||
| TOTAL LOANS | 421,246 | 344,936 | ||||||
| Allowance for loan losses | (4,530 | ) | (3,697 | ) | ||||
| NET LOANS | 416,716 | 341,239 | ||||||
| Other real estate owned | 70 | 43 | ||||||
| Premises and equipment, net | 9,908 | 8,912 | ||||||
| Cash surrender value of life insurance | 9,438 | 8,899 | ||||||
| Accrued interest | 3,745 | 3,367 | ||||||
| Other assets | 5,013 | 6,174 | ||||||
| $ | 647,361 | $ | 564,850 | |||||
LIABILITIES AND STOCKHOLDERS’ EQUITY | ||||||||
| Deposits: | ||||||||
| Non interest bearing | $ | 19,874 | $ | 15,966 | ||||
| Interest bearing | 444,851 | 395,538 | ||||||
| TOTAL DEPOSITS | 464,725 | 411,504 | ||||||
| Federal funds purchased and securities sold under agreements to repurchase | 33,665 | 19,000 | ||||||
| FHLB advances | 96,000 | 83,800 | ||||||
| Capital debt securities | 13,200 | 14,200 | ||||||
| Accrued interest | 2,864 | 4,178 | ||||||
| Other liabilities | 6,171 | 3,389 | ||||||
| TOTAL LIABILITIES | 616,625 | 536,071 | ||||||
| STOCKHOLDERS’ EQUITY | ||||||||
| Preferred stock, par value $10 per share, Shares authorized: 500,000; none issued and outstanding | — | — | ||||||
| Common stock, par value $1.50 per share Shares authorized: 6,666,666 | ||||||||
| Shares issued and outstanding: 2002—3,061,961; 2001—3,103,495 | 4,593 | 4,655 | ||||||
| Additional paid in capital | 14,977 | 16,124 | ||||||
| Retained earnings | 11,199 | 8,160 | ||||||
| Accumulated other comprehensive loss | (33 | ) | (160 | ) | ||||
| 30,736 | 28,779 | |||||||
| $ | 647,361 | $ | 564,850 | |||||
See notes to consolidated financial statements.
F-2
Table of Contents
RESOURCE BANKSHARES CORPORATION
CONSOLIDATED STATEMENTS OF INCOME
(UNAUDITED)
Three months ended September 30, | Nine months ended September 30, | |||||||||||
2002 | 2001 | 2002 | 2001 | |||||||||
(Dollars in thousands) | (Dollars in thousands) | |||||||||||
Interest and dividend income | ||||||||||||
| Interest and fees on loans | $ | 5,930 | $ | 5,473 | $ | 17,020 | $ | 17,022 | ||||
| Interest on investment securities: | ||||||||||||
| Taxable | 1,957 | 1,652 | 5,770 | 4,390 | ||||||||
| Tax exempt | 184 | 192 | 546 | 688 | ||||||||
| 2,141 | 1,844 | 6,316 | 5,078 | |||||||||
| Interest on funds advanced in settlement of mortgage loans | 1,059 | 1,030 | 2,824 | 2,250 | ||||||||
Total interest income | 9,130 | 8,347 | 26,160 | 24,350 | ||||||||
Interest expense | ||||||||||||
| Interest on deposits | 3,312 | 4,813 | 10,180 | 14,415 | ||||||||
| Interest on borrowings | 1,253 | 567 | 3,608 | 1,567 | ||||||||
| Interest on capital debt securities | 267 | 213 | 843 | 638 | ||||||||
Total interest expense | 4,832 | 5,593 | 14,631 | 16,620 | ||||||||
Net interest income | 4,298 | 2,754 | 11,529 | 7,730 | ||||||||
Provision for loan losses | 270 | — | 975 | 45 | ||||||||
Net interest income after provision for loan losses | 4,028 | 2,754 | 10,554 | 7,685 | ||||||||
Noninterest income | ||||||||||||
| Mortgage banking income | 5,824 | 4,935 | 14,565 | 12,065 | ||||||||
| Service charges | 171 | 181 | 501 | 445 | ||||||||
| Gain on sale of assets | — | 214 | 711 | 408 | ||||||||
| Gain on sale of securities | — | 114 | 236 | 298 | ||||||||
| Other | 51 | 248 | 1,030 | 681 | ||||||||
| 6,046 | 5,692 | 17,043 | 13,897 | |||||||||
Noninterest expense | ||||||||||||
| Salaries and employee benefits | 5,336 | 4,477 | 14,453 | 11,432 | ||||||||
| Occupancy expenses | 427 | 411 | 1,275 | 1,121 | ||||||||
| Depreciation and equipment maintenance | 502 | 493 | 1,535 | 1,287 | ||||||||
| Stationery and supplies | 185 | 189 | 572 | 502 | ||||||||
| Marketing and business development | 179 | 135 | 535 | 386 | ||||||||
| Professional fees | 101 | 148 | 408 | 281 | ||||||||
| Outside computer services | 219 | 255 | 694 | 531 | ||||||||
| FDIC insurance | 17 | 18 | 53 | 49 | ||||||||
| Other | 751 | 536 | 1,914 | 1,408 | ||||||||
| 7,717 | 6,662 | 21,439 | 16,997 | |||||||||
Income before income tax | 2,357 | 1,784 | 6,158 | 4,585 | ||||||||
Income tax expense | 711 | 535 | 1,817 | 1,341 | ||||||||
Net income | $ | 1,646 | $ | 1,249 | $ | 4,341 | $ | 3,244 | ||||
Cash dividends declared per common share | $ | 0.14 | $ | 0.12 | $ | 0.42 | $ | 0.36 | ||||
Basic earnings per common share | $ | 0.53 | $ | 0.40 | $ | 1.40 | $ | 1.15 | ||||
Diluted earnings per common share | $ | 0.50 | $ | 0.37 | $ | 1.32 | $ | 1.08 | ||||
See notes to consolidated financial statements.
F-3
Table of Contents
RESOURCE BANKSHARES CORPORATION
STATEMENT OF STOCKHOLDERS’ EQUITY
(UNAUDITED)
Nine Months Ended September 30, 2002 | |||||||||||||||||||||||
Common Shares | Stock Amount | Additional Paid-in Capital | Retained Earnings | Accumulated Other Comprehensive Income (Loss) | Total | ||||||||||||||||||
(Dollars in thousands) | |||||||||||||||||||||||
| Balance, December 31, 2001 | 3,103,495 | $ | 4,655 | $ | 16,124 | $ | 8,160 | $ | (160 | ) | $ | 28,779 | |||||||||||
| Comprehensive income: | |||||||||||||||||||||||
| Net income | 4,341 | 4,341 | |||||||||||||||||||||
| Changes in unrealized gains (losses) on securities, net | 314 | 314 | |||||||||||||||||||||
| Change in unrealized gains (losses) on derivative financial instruments | (187 | ) | (187 | ) | |||||||||||||||||||
| Total comprehensive income | 4,468 | ||||||||||||||||||||||
| Reacquisition of common stock | (68,000 | ) | (102 | ) | (1,247 | ) | (1,349 | ) | |||||||||||||||
| Proceeds from exercise of stock options | 26,466 | 40 | 100 | 140 | |||||||||||||||||||
| Cash dividends declared—$0.42 per share | (1,302 | ) | (1,302 | ) | |||||||||||||||||||
| Balance, September 30, 2002 | 3,061,961 | $ | 4,593 | $ | 14,977 | $ | 11,199 | $ | (33 | ) | $ | 30,736 | |||||||||||
F-4
Table of Contents
RESOURCE BANKSHARES CORPORATION
CONSOLIDATED STATEMENTS OF CASH FLOWS (UNAUDITED)
Nine months ended | ||||||||
Sept. 30, 2002 | Sept. 30, 2001 | |||||||
(Dollars in thousands) | ||||||||
| Operating activities | ||||||||
| Net income | $ | 4,341 | $ | 3,244 | ||||
| Adjustments to reconcile to net cash provided (used) by operating activities: | ||||||||
| Provision for losses on loans and other real estate owned | 975 | 45 | ||||||
| Provision for losses on funds advanced in settlement of mortgage loans | 145 | — | ||||||
| Depreciation and amortization | 934 | 570 | ||||||
| Amortization of investment securities premiums, net of discounts | (923 | ) | (869 | ) | ||||
| Gain on sale of loans or other real estate owned | (711 | ) | (408 | ) | ||||
| Gain on sale of securities | (236 | ) | (298 | ) | ||||
| Deferred loan origination fees, net of costs | 482 | 178 | ||||||
| Increases in funds advanced in settlement of mortgage loans | (593,894 | ) | (491,203 | ) | ||||
| Sales proceeds from funds advanced in settlement of mortgage loans | 601,328 | 455,060 | ||||||
| Changes in: | ||||||||
| Interest receivable | (378 | ) | (515 | ) | ||||
| Interest payable | (1,314 | ) | 377 | |||||
| Other assets | 622 | (8,177 | ) | |||||
| Other liabilities | 1,433 | (238 | ) | |||||
| Net cash provided(used) by operating activities | 12,804 | (42,234 | ) | |||||
| Investing activities: | ||||||||
| Proceeds from sales and maturities of available-for-sale securities | 2,903 | 12,628 | ||||||
| Proceeds from sales and maturities of held-to-maturity securities | 23,111 | 14,723 | ||||||
| Purchases of available-for-sale securities | (41,741 | ) | (56,883 | ) | ||||
| Proceeds from sale of other real estate owned | 46 | — | ||||||
| Proceeds from sale of loans | 21,847 | — | ||||||
| Loan originations, net of principal repayments | (98,144 | ) | (38,432 | ) | ||||
| Net cash used for acquisitions | — | (1,125 | ) | |||||
| Purchases of premises, equipment and other assets | (1,930 | ) | (5,313 | ) | ||||
| Net cash used by investing activities | (93,908 | ) | (74,402 | ) | ||||
| Financing activities: | ||||||||
| Proceeds from exercise of stock options and warrants | 140 | — | ||||||
| Payments to reacquire common stock | (1,349 | ) | (781 | ) | ||||
| Proceeds from stock offering | — | 7,341 | ||||||
| Cash dividends paid | (1,302 | ) | (1,011 | ) | ||||
| Proceeds from federal funds purchased | 14,665 | 21,918 | ||||||
| Net proceeds in FHLB advances | 12,200 | 27,000 | ||||||
| Net decrease in demand deposits, NOW accounts and savings accounts | (26,260 | ) | (11,979 | ) | ||||
| Net increase in certificates of deposits | 79,481 | 77,637 | ||||||
| Net cash provided by financing activities | 77,575 | 120,125 | ||||||
| Increase(decrease) in cash and cash equivalents | (3,529 | ) | 3,489 | |||||
| Cash and cash equivalents at beginning of period | 9,610 | 9,342 | ||||||
| Cash and cash equivalents at end of period | $ | 6,081 | $ | 12,831 | ||||
| Supplemental schedules and disclosures of cash flow information: | ||||||||
| Cash paid for: | ||||||||
| Interest on deposits and other borrowings | $ | 15,944 | $ | 16,243 | ||||
| Supplemental schedule of non cash investing and financing activities: | ||||||||
| Transfer from loans to real estate acquired through foreclosure | $ | 70 | $ | 43 | ||||
See notes to consolidated financial statements.
F-5
Table of Contents
RESOURCE BANKSHARES CORPORATION
NOTES TO CONSOLIDATED FINANCIAL STATEMENTS
September 30, 2002
(UNAUDITED)
(Dollars in thousands, except per share data)
Organization and Summary of Significant Accounting Policies
(1) GENERAL
Resource Bankshares Corporation, a Virginia Corporation (the “Company”), was incorporated under the laws of the Commonwealth of Virginia on February 4, 1998, primarily to serve as a holding company for Resource Bank (the “Bank”).
The consolidated financial statements of the Company include the accounts of its wholly owned subsidiary, Resource Bank and the Bank’s wholly owned subsidiaries, CW and Company of Virginia, and Resource Service Corporation. All significant intercompany balances and transactions have been eliminated in consolidation.
The accompanying unaudited financial statements have been prepared in accordance with the instructions to Form 10-Q, and therefore, do not include all of the disclosures and notes required by generally accepted accounting principles. In the opinion of management, all adjustments in the normal recurring nature which are necessary for a fair presentation of the financial statements included herein have been reflected in the financial statements. Certain reclassifications have been made to prior year’s information to conform with the current year presentation. The results of operations for the interim periods are not necessarily indicative of the results to be expected for the full year.
(2) CASH AND CASH EQUIVALENTS
For purposes of reporting cash flows, cash and cash equivalents include cash and due from banks, interest-bearing deposits with banks, and federal funds sold.
(3) ALLOWANCE FOR LOAN LOSSES
Changes in the allowance for loan losses are as follows:
| Balance as of January 1, 2002 | $ | 3,697 | ||
| Provision for loan losses | 975 | |||
| Loans charged off | (175 | ) | ||
| Recoveries | 33 | |||
| Balance at September 30, 2002 | $ | 4,530 | ||
(4) NET INCOME PER SHARE
Basic EPS excludes dilution and is computed by dividing income available to common shareholders by the weighted-average number of shares outstanding for the period. Diluted EPS reflects the potential dilution that could occur if securities or other contracts to issue common stock were exercised, converted into common stock or resulted in the issuance of common stock that then shares in the earnings of the entity. The weighted average number of basic shares outstanding for the three and nine months ended September 30, 2002, were 3,081,852 and 3,096,538, respectively, and for the three and nine months ended September 30, 2001 were 3,160,150 and 2,817,810, respectively. The diluted weighted average number of shares for the three and nine months ended September 30, 2002 were 3,270,647, and 3,283,312, respectively, and for the same periods of 2001 were 3,358,402 and 2,989,771 respectively.
F-6
Table of Contents
EPS Reconciliation
Three months ended September 30, | Nine months ended September 30, | |||||||||||
2002 | 2001 | 2002 | 2001 | |||||||||
| Net income (numerator, basic and diluted) | $ | 1,645,870 | $ | 1,248,937 | $ | 4,341,121 | $ | 3,243,860 | ||||
| Weighted average shares outstanding (denominator) | 3,081,852 | 3,160,150 | 3,096,538 | 2,817,810 | ||||||||
| Earnings per common share—basic | $ | 0.53 | $ | 0.40 | 1.40 | 1.15 | ||||||
| Effect of dilutive securities: | ||||||||||||
| Weighted average shares outstanding | 3,081,852 | 3,160,150 | 3,096,538 | 2,817,810 | ||||||||
| Effect of stock options | 188,795 | 198,252 | 186,774 | 171,961 | ||||||||
| Diluted average shares outstanding (denominator) | 3,270,647 | 3,358,402 | 3,283,312 | 2,989,771 | ||||||||
| Earnings (loss) per common share—assuming dilution | $ | 0.50 | $ | 0.37 | $ | 1.32 | $ | 1.08 | ||||
(5) COMPREHENSIVE INCOME
The components of other comprehensive income and related tax effects for the nine months ended September 30, 2002 and 2001 are as follows:
Nine months ended September 30, | ||||||||
2002 | 2001 | |||||||
| Available for sale securities | ||||||||
| Unrealized holding gains arising during the period on available-for-sale securities | $ | 713 | $ | 592 | ||||
| Reclassification adjustment for gains realized in income | (236 | ) | (298 | ) | ||||
| Net unrealized gains | 477 | 294 | ||||||
| Tax effect | (163 | ) | (49 | ) | ||||
| Net-of tax amount | $ | 314 | $ | 245 | ||||
| Derivative financial instruments | ||||||||
| Unrealized losses arising during the period on interest rate swaps, net of reclassification adjustment and tax | $ | (187 | ) | $ | — | |||
(6) SUBSEQUENT EVENTS
In October 2002, the Board of Directors of the Company declared a $0.14 per common share dividend to shareholders of record as of October 15, 2002. The dividend was paid on October 29, 2002.
The Company raised approximately $3,000,000 of additional capital in the fourth quarter of 2002 by offering 3,000 Trust Preferred Securities at a price of $1,000.00 per Security. These securities bear a variable distribution rate per annum, reset quarterly, equal to LIBOR plus 3.45%, provided that the applicable interest rate may not exceed 12.5% through the interest payment date in November 2007. These securities have a mandatory redemption date of November 7, 2032 and are subject to varying call provisions at the option of the Company beginning November 7, 2007.
F-7
Table of Contents
(7) DERIVATIVE FINANCIAL INSTRUMENTS
Derivative financial instruments are components of the Company’s risk management profile. The Company monitors its sensitivity to changes in interest rates and may use derivative instruments to hedge this risk. In accordance with SFAS No. 133 all derivatives are recorded in the financial statements at fair value. During the third quarter of 2002 the Company entered into a series of interest rate swaps with a total notional amount of $50 million to hedge certain certificate of deposit liabilities. These transactions were designated and qualify for cash flow hedge accounting. Unrealized gains or losses on these instruments are included in accumulated other comprehensive income and will be reclassified into interest expense in the same period that the hedged cash flows impact earnings.
(8) SECURITIES
During the second quarter of 2002, management elected to reclassify securities with a fair value of $113,599 at the time of transfer and an amortized cost of $113,298 from the available for sale classification to the held to maturity classification as of May 31, 2002. The difference of $301 has been recorded as an adjustment to the amortized cost of the securities and is being amortized over their respective lives.
(9) RECENT ACCOUNTING PRONOUNCEMENTS
The FASB has issued Statement No. 146,Accounting for Costs Associated with Exit or Disposal Activities.This Statement addresses financial accounting and reporting for costs associated with exit or disposal activities and nullifies EITF Issue No. 94-3,Liability Recognition for Certain Employee Termination Benefits and Other Costs to Exit an Activity (including Certain Cost Incurred in a Restructuring).This Statement requires recognition of a liability for a cost associated with an exit or disposal activity when the liability is incurred, as opposed to when the entity commits to an exit plan under EITF No. 94-3. The Statement is effective for exit and disposal activities initiated after December 31, 2002. The Company is currently assessing the effect of this Statement on financial condition and results of operations, but does not currently expect the Statement to have a material effect on its financial statements in the foreseeable future.
The FASB issued Statement of Financial Accounting Standard No. 147,Acquisition of Certain Financial Institutions, an amendment of FASB Statements No. 72 and 144 and FASB Interpretation No. 9 (SFAS 147) in October 2002. SFAS 147 removes the acquisition of financial institutions from the scope of both SFAS 72 and Interpretation 9, and requires that those transactions be accounted for in accordance with SFAS 141,Business Combinations and SFAS 142,Goodwill and Other Intangible Assets. Thus the requirement in paragraph 5 of SFAS 72 to recognize (and subsequently amortize) any excess of the fair value of liabilities assumed over the fair value of tangible and identifiable intangible assets acquired as an unidentifiable intangible asset no longer applies to acquisitions within the scope of this statement. Additionally, this statement amends SFAS 144,Accounting for Impairment or Disposal of Long-Lived Assets, to include in its scope long-term customer-relationship intangible assets of financial institutions. Consequently, those intangible assets are subject to the same undiscounted cash flow recoverability test and impairment loss recognition and measurement provisions that SFAS 144 requires for other long-lived assets that are held and used. The provisions of this Statement are effective for transactions dated on or after October 1, 2002. The transitional provisions of SFAS 147 require previously recognized unidentifiable intangible assets acquired in a business combination that occurred before October 1, 2002 to be reclassified as goodwill. The Company transferred approximately $700,000 in unidentifiable intangible assets to goodwill at October 1, 2002. The Company does not expect the adoption of this statement to have a material impact on the Company’s financial position or results of operations.
F-8
Table of Contents
(10) SEGMENT REPORTING
The Company has two reportable segments, its mortgage banking operations and its commercial and other banking operations. The mortgage banking segment originates residential loans and subsequently sells them to investors. The commercial banking and other banking segment provides a broad range of lending and deposit services to individual and commercial customers, including such products as commercial and construction loans, as well as other business financing arrangements.
The Company’s reportable segments are strategic business units that offer different products and services. They are managed separately because each segment appeals to different markets and, accordingly, requires different technology and marketing strategies.
The mortgage banking segment’s most significant revenue and expense are non-interest income and non-interest expense, respectively. The Company’s segments are reported below for the periods ended September 30, 2002 and 2001, respectively.
Selected Financial Information
Commercial and Other Operations | Mortgage Banking Operations | Total | ||||||||||
Nine Months ended September 30, 2002: | ||||||||||||
| Net interest income after provisions for loan losses | $ | 10,554 | $ | 0 | $ | 10,554 | ||||||
| Noninterest income | 2,478 | 14,565 | 17,043 | |||||||||
| Noninterest expense | (8,453 | ) | (12,986 | ) | (21,439 | ) | ||||||
| Net income before income taxes | $ | 4,579 | $ | 1,579 | $ | 6,158 | ||||||
Nine Months ended September 30, 2001: | ||||||||||||
| Non interest income after provisions for loan losses | $ | 7,685 | $ | 0 | $ | 7,685 | ||||||
| Noninterest income | 1,832 | 12,065 | 13,897 | |||||||||
| Noninterest expense | (6,278 | ) | (10,719 | ) | (16,997 | ) | ||||||
| Net income before income taxes | $ | 3,239 | $ | 1,346 | $ | 4,585 | ||||||
Segment Assets | ||||||||||||
Commercial and Other Operations | Mortgage Banking Operations | Total | ||||||||||
| September 30, 2002 | $ | 645,992 | $ | 1,369 | $ | 647,361 | ||||||
| September 30, 2001 | $ | 525,277 | $ | 2,970 | $ | 528,247 | ||||||
(11) CONTINGENCY
The Bank is the defendant in a class action lawsuit under the Telephone Consumer Protection Act, or TCPA. The lawsuit alleges that the Bank violated the TCPA by sending unsolicited fax advertisements without obtaining express invitation or permission to send the faxes. These faxes were sent by Resource Mortgage, a division of Resource Bank, which has historically used facsimiles to disseminate product and interest rate information to mortgage brokers on a national basis. This facsimile form of business communication is consistent with industry practice.
Under the TCPA, recipients of unsolicited fax advertisements are entitled to damages from $500 to $1,500 per fax. The number of faxes transmitted during the period for which the plaintiff seeks class certification is not known currently, however the number of faxes is likely to be significant.
The Bank is contesting the lawsuit vigorously and asserting a number of defenses. In addition, the Bank has filed a motion to dismiss the lawsuit on constitutional grounds. The Bank has insurance coverage for the litigation subject to a policy limit of $3 million.
As this lawsuit will remain pending for the foreseeable future, it is not possible to determine the possible outcome of the case, nor is it possible at this stage to determine the range of loss if the outcome were unfavorable.
F-9
Table of Contents
REPORT OF INDEPENDENT AUDITORS
Board of Directors and Stockholders
Resource Bankshares Corporation and Subsidiaries
We have audited the accompanying consolidated balance sheets ofResource Bankshares Corporation and Subsidiaries as of December 31, 2001 and 2000, and the related consolidated statements of operations, stockholders’ equity and cash flows for each of the years in the three-year period ended December 31, 2001. These consolidated financial statements are the responsibility ofResource Bankshares Corporation and Subsidiaries’ management. Our responsibility is to express an opinion on these consolidated financial statements based on our audits.
We conducted our audits in accordance with auditing standards generally accepted in the United States of America. Those standards require that we plan and perform the audits to obtain reasonable assurance about whether the consolidated financial statements are free of material misstatement. An audit includes examining, on a test basis, evidence supporting the amounts and disclosures in the consolidated financial statements. An audit also includes assessing the accounting principles used and significant estimates made by management, as well as evaluating the overall financial statement presentation. We believe that our audits provide a reasonable basis for our opinion.
In our opinion, the consolidated financial statements referred to above present fairly, in all material respects, the financial position ofResource Bankshares Corporation and Subsidiariesas of December 31, 2001 and 2000, and the results of their operations and their cash flows for each of the years in the three year period ended December 31, 2001, in conformity with accounting principles generally accepted in the United States of America.
/s/ Goodman & Company, L.L.P.
Norfolk, Virginia
January 30, 2002
F-10
Table of Contents
RESOURCE BANKSHARES CORPORATION AND SUBSIDIARIES
CONSOLIDATED BALANCE SHEETS
December 31, | ||||||||
2001 | 2000 | |||||||
ASSETS | ||||||||
| Cash and due from banks | $ | 7,927,954 | $ | 7,146,330 | ||||
| Interest bearing deposits with banks | 1,681,829 | 2,195,282 | ||||||
| Cash and cash equivalents | 9,609,783 | 9,341,612 | ||||||
| Funds advanced in settlement of mortgage loans | 71,971,362 | 15,445,028 | ||||||
| Investment securities | ||||||||
| Available-for-sale (amortized cost of $114,877,807 and $18,631,296, respectively) | 114,634,519 | 18,317,479 | ||||||
| Held-to-maturity (fair value of $0 and $64,024,299, respectively) | — | 63,804,083 | ||||||
| Loans, net of allowance of $3,696,860 in 2001 and $3,520,702 in 2000 | 341,239,293 | 284,991,714 | ||||||
| Other real estate owned | 42,899 | — | ||||||
| Premises and equipment | 8,911,972 | 3,761,309 | ||||||
| Cash surrender value of life insurance | 8,899,367 | 2,432,471 | ||||||
| Other assets | 6,173,526 | 3,389,525 | ||||||
| Accrued interest | 3,366,858 | 3,010,793 | ||||||
$ | 564,849,579 | $ | 404,494,014 | |||||
LIABILITIES AND STOCKHOLDERS’ EQUITY | ||||||||
| Deposits | ||||||||
| Noninterest-bearing deposits | $ | 15,966,359 | $ | 13,511,442 | ||||
| Interest-bearing deposits | 395,537,396 | 317,133,366 | ||||||
411,503,755 | 330,644,808 | |||||||
| Capital Trust borrowings | 14,200,000 | 9,200,000 | ||||||
| Federal funds purchased and securities sold under agreements to repurchase | 19,000,000 | 7,546,000 | ||||||
| FHLB advances | 83,800,000 | 30,300,000 | ||||||
| Other liabilities | 3,389,182 | 4,321,000 | ||||||
| Accrued interest | 4,177,969 | 2,810,506 | ||||||
| Total liabilities | 536,070,906 | 384,822,314 | ||||||
| Stockholders’ equity | ||||||||
| Preferred stock, par value $10 per share, 500,000 shares authorized; none issued and outstanding | — | — | ||||||
| Common stock, $1.50 par value—6,666,666 shares authorized; shares issued and outstanding: 2001—3,103,495; 2000—2,623,861 | 4,655,242 | 3,935,791 | ||||||
| Additional paid-in capital | 16,124,348 | 10,988,620 | ||||||
| Retained earnings | 8,159,653 | 5,005,511 | ||||||
| Accumulated other comprehensive loss | (160,570 | ) | (258,222 | ) | ||||
| Total stockholders’ equity | 28,778,673 | 19,671,700 | ||||||
$ | 564,849,579 | $ | 404,494,014 | |||||
The notes to the consolidated financial statements are an integral part of this statement.
F-11
Table of Contents
RESOURCE BANKSHARES CORPORATION AND SUBSIDIARIES
CONSOLIDATED STATEMENTS OF OPERATIONS
Years Ended December 31, | ||||||||||||
2001 | 2000 | 1999 | ||||||||||
Interest and dividend income | ||||||||||||
| Interest and fees on loans | $ | 22,147,882 | $ | 22,820,733 | $ | 18,071,728 | ||||||
| Interest on investment securities: | ||||||||||||
| Taxable | 6,167,752 | 2,981,967 | 1,687,444 | |||||||||
| Tax exempt | 852,282 | 806,855 | — | |||||||||
7,020,034 | 3,788,822 | 1,687,444 | ||||||||||
| Interest on federal funds sold | 483 | 242,662 | 73,997 | |||||||||
| Interest on funds advanced in settlement of mortgage loans | 3,523,255 | 1,560,582 | 1,548,039 | |||||||||
Total interest income | 32,691,654 | 28,412,799 | 21,381,208 | |||||||||
Interest expense | ||||||||||||
| Interest on deposits | 18,503,723 | 16,980,295 | 11,036,446 | |||||||||
| Interest on short-term borrowings | 565,189 | 448,259 | 408,263 | |||||||||
| Interest on long-term borrowings | 2,589,973 | 1,546,748 | 990,839 | |||||||||
Total interest expense | 21,658,885 | 18,975,302 | 12,435,548 | |||||||||
Net interest income | 11,032,769 | 9,437,497 | 8,945,660 | |||||||||
Provision for loan losses | (195,000 | ) | (1,100,000 | ) | (4,667,000 | ) | ||||||
Net interest income after provision for loan losses | 10,837,769 | 8,337,497 | 4,278,660 | |||||||||
Noninterest income | ||||||||||||
| Mortgage banking income | 17,604,747 | 6,916,584 | 5,709,225 | |||||||||
| Service charges | 648,809 | 731,473 | 759,289 | |||||||||
| Gain on sale of investment securities | 454,918 | — | — | |||||||||
| Gain on sale of assets | 413,444 | 1,688,140 | 332,245 | |||||||||
| Gain on sale of branch deposits | — | 2,532,260 | — | |||||||||
| Other | 1,021,943 | 21,611 | 10,583 | |||||||||
20,143,861 | 11,890,068 | 6,811,342 | ||||||||||
Noninterest expense | ||||||||||||
| Salaries and employee benefits | 16,289,407 | 8,071,927 | 6,735,896 | |||||||||
| Occupancy expenses | 1,585,141 | 1,211,649 | 1,185,861 | |||||||||
| Depreciation and equipment maintenance | 1,768,822 | 976,982 | 926,702 | |||||||||
| Professional fees | 419,049 | 285,861 | 340,821 | |||||||||
| Outside computer service | 812,684 | 518,982 | 485,458 | |||||||||
| FDIC insurance | 66,340 | 98,062 | 58,125 | |||||||||
| Stationery and supplies | 681,761 | 412,683 | 496,814 | |||||||||
| Marketing and business development | 536,850 | 475,778 | 400,938 | |||||||||
| Miscellaneous loan expense | 88,460 | 47,859 | 46,489 | |||||||||
| Other | 2,272,287 | 2,009,363 | 1,490,664 | |||||||||
24,520,801 | 14,109,146 | 12,167,768 | ||||||||||
Income (loss) before income taxes | 6,460,829 | 6,118,419 | (1,077,766 | ) | ||||||||
Income tax expense (benefit) | 1,918,208 | 1,885,689 | (386,958 | ) | ||||||||
Net income (loss) | $ | 4,542,621 | $ | 4,232,730 | $ | (690,808 | ) | |||||
Basic earnings (loss) per common share | $ | 1.57 | $ | 1.63 | $ | (0.27 | ) | |||||
Diluted earnings (loss) per share | $ | 1.49 | $ | 1.56 | $ | (0.27 | ) | |||||
The notes to the consolidated financial statements are an integral part of this statement.
F-12
Table of Contents
RESOURCE BANKSHARES CORPORATION AND SUBSIDIARIES
CONSOLIDATED STATEMENTS OF STOCKHOLDERS’ EQUITY
Years Ended December 31, 2001, 2000 and 1999 | |||||||||||||||||||||||
Common Stock | Additional Paid-in Capital | Retained Earnings | Accumulated Other Comprehensive Income (Loss) | Total | |||||||||||||||||||
Shares | Amount | ||||||||||||||||||||||
Balance, December 31, 1998 | 2,477,124 | 3,715,686 | 10,702,187 | 3,310,630 | 60,929 | 17,789,432 | |||||||||||||||||
Comprehensive income: | |||||||||||||||||||||||
| Net loss | — | — | — | (690,808 | ) | — | (690,808 | ) | |||||||||||||||
| Changes in unrealized appreciation (depreciation) on securities available-for-sale, net of reclassification adjustment and tax effect | — | — | — | — | (186,965 | ) | (186,965 | ) | |||||||||||||||
| Total comprehensive loss | (877,773 | ) | |||||||||||||||||||||
Proceeds from exercise of stock options and warrants | 90,888 | 136,332 | 389,216 | — | — | 525,548 | |||||||||||||||||
Reacquisition of common stock | (29,099 | ) | (43,648 | ) | (512,592 | ) | — | — | (556,240 | ) | |||||||||||||
Cash dividends declared, $.40 per share | — | — | — | (1,011,428 | ) | — | (1,011,428 | ) | |||||||||||||||
Balance, December 31, 1999 | 2,538,913 | 3,808,370 | 10,578,811 | 1,608,394 | (126,036 | ) | 15,869,539 | ||||||||||||||||
Comprehensive income: | |||||||||||||||||||||||
| Net income | — | — | — | 4,232,730 | — | 4,232,730 | |||||||||||||||||
| Changes in unrealized appreciation (depreciation) on securities available-for-sale, net of reclassification adjustment and tax effect | — | — | — | — | (132,186 | ) | (132,186 | ) | |||||||||||||||
| Total comprehensive income | 4,100,544 | ||||||||||||||||||||||
Proceeds from exercise of stock options | 35,332 | 52,997 | 52,748 | — | — | 105,745 | |||||||||||||||||
Common stock issued as a result of business combination | 56,792 | 85,188 | 424,812 | — | — | 510,000 | |||||||||||||||||
Reacquisition of common stock | (7,176 | ) | (10,764 | ) | (67,751 | ) | — | — | (78,515 | ) | |||||||||||||
Cash dividends declared, $.32 per share | — | — | — | (835,613 | ) | — | (835,613 | ) | |||||||||||||||
Balance, December 31, 2000 | 2,623,861 | $ | 3,935,791 | $ | 10,988,620 | $ | 5,005,511 | $ | (258,222 | ) | $ | 19,671,700 | |||||||||||
Comprehensive income: | |||||||||||||||||||||||
| Net income | — | — | — | 4,542,621 | — | 4,542,621 | |||||||||||||||||
| Changes in unrealized appreciation (depreciation) on securities available-for-sale, net of reclassification adjustment and tax effect | — | — | — | — | 97,652 | 97,652 | |||||||||||||||||
| Total comprehensive income | 4,640,273 | ||||||||||||||||||||||
Proceeds from common stock issued—net of issuance costs | 572,500 | 858,750 | 6,483,461 | — | — | 7,342,211 | |||||||||||||||||
Reacquisition of common stock | (92,866 | ) | (139,299 | ) | (1,347,733 | ) | — | — | (1,487,032 | ) | |||||||||||||
Cash dividends declared, $.48 per share | — | — | — | (1,388,479 | ) | — | (1,388,479 | ) | |||||||||||||||
Balance, December 31, 2001 | 3,103,495 | $ | 4,655,242 | $ | 16,124,348 | $ | 8,159,653 | $ | (160,570 | ) | $ | 28,778,673 | |||||||||||
The notes to the consolidated financial statements are an integral part of this statement.
F-13
Table of Contents
RESOURCE BANKSHARES CORPORATION AND SUBSIDIARIES
CONSOLIDATED STATEMENTS OF CASH FLOWS
Years Ended December 31, | ||||||||||||
2001 | 2000 | 1999 | ||||||||||
Operating activities | ||||||||||||
| Net income (loss) | $ | 4,542,621 | $ | 4,232,730 | $ | (690,808 | ) | |||||
| Adjustments to reconcile to net cash provided (used) by operating activities: | ||||||||||||
| Provision for losses on loans | 195,000 | 1,100,000 | 4,667,000 | |||||||||
| Provision for losses on funds advanced on settlement of mortgage loans | 170,000 | 75,000 | 275,000 | |||||||||
| Depreciation and amortization | 979,181 | 646,670 | 475,212 | |||||||||
| Amortization of investment securities premiums, net of discounts | (1,367,501 | ) | (326,499 | ) | 47,426 | |||||||
| Gain on sale of investment securities | (454,918 | ) | — | — | ||||||||
| Gain on sale of assets | (413,444 | ) | (1,688,140 | ) | 2,960 | |||||||
| Gain on sale of deposits | — | (2,532,260 | ) | — | ||||||||
| Deposits disposed of in branch sale | — | (51,782,936 | ) | — | ||||||||
| Deferred loan origination fees, net of costs | 478,687 | 1,192,793 | 904,392 | |||||||||
| Increases in funds advanced in settlement of mortgage loans | (730,779,359 | ) | (290,291,274 | ) | (238,318,553 | ) | ||||||
| Sales proceeds from funds advanced in settlement of mortgage loans | 674,083,025 | 286,545,097 | 247,173,568 | |||||||||
| Changes in: | ||||||||||||
| Interest receivable | (356,065 | ) | (1,007,257 | ) | (401,346 | ) | ||||||
| Interest payable | 1,367,463 | 1,569,701 | 589,274 | |||||||||
| Other assets | (8,280,588 | ) | (195,851 | ) | (2,968,422 | ) | ||||||
| Other liabilities | (931,818 | ) | 3,082,218 | (8,699,380 | ) | |||||||
Net cash provided (used) by operating activities | (60,767,716 | ) | (49,380,008 | ) | 3,056,323 | |||||||
Investing activities | ||||||||||||
| Proceeds from sales and maturities of available-for-sale securities | 41,366,493 | 627,188 | 3,003,770 | |||||||||
| Proceeds from maturities and prepayments of held-to-maturity securities | 14,723,400 | 825,001 | 321,750 | |||||||||
| Purchases of available-for-sale securities | (86,528,087 | ) | (12,500,393 | ) | (1,252,675 | ) | ||||||
| Purchases of held-to-maturity securities | — | (47,749,915 | ) | (15,760,235 | ) | |||||||
| Net cash used for acquisitions | (1,125,000 | ) | — | — | ||||||||
| Loan originations, net of principal repayments | (56,550,722 | ) | (34,140,721 | ) | (72,696,479 | ) | ||||||
| Proceeds from sales of foreclosed real estate | — | — | 940,620 | |||||||||
| Proceeds from sales of premises and equipment | — | 2,786,708 | 1,400 | |||||||||
| Purchases of premises and equipment and other assets | (6,129,844 | ) | (1,419,927 | ) | (1,247,479 | ) | ||||||
Net cash used by investing activities | (94,243,760 | ) | (91,572,059 | ) | (86,689,328 | ) | ||||||
Financing activities | ||||||||||||
| Proceeds from federal funds purchased and securities sold under agreements to repurchase | 11,454,000 | 7,546,000 | 8,809,573 | |||||||||
| Proceeds from sale of common stock, net of issuance costs | 7,342,211 | — | — | |||||||||
| Proceeds from exercise of stock options | — | 105,745 | 525,548 | |||||||||
| Proceeds from capital trust borrowings | 5,000,000 | — | 9,200,000 | |||||||||
| Payments to reacquire common stock | (1,487,032 | ) | (78,515 | ) | (556,240 | ) | ||||||
| Cash dividends paid | (1,388,479 | ) | (835,613 | ) | (1,011,428 | ) | ||||||
| Proceeds from FHLB advances | 53,500,000 | 12,000,000 | 11,000,000 | |||||||||
| Net (decrease) increase in demand deposits, NOW accounts and savings accounts | (37,871,976 | ) | 120,001,370 | 3,613,095 | ||||||||
| Net increase in certificates of deposit | 118,730,923 | 4,489,760 | 50,636,584 | |||||||||
Net cash provided by financing activities | 155,279,647 | 143,228,747 | 82,217,132 | |||||||||
Increase (decrease) in cash and cash equivalents | 268,171 | 2,276,680 | (1,415,873 | ) | ||||||||
Cash and cash equivalents at beginning of year | 9,341,612 | 7,064,932 | 8,480,805 | |||||||||
Cash and cash equivalents at end of year | $ | 9,609,783 | $ | 9,341,612 | $ | 7,064,932 | ||||||
Supplemental schedules and disclosures of cash flow information | ||||||||||||
| Cash paid for: | ||||||||||||
| Income taxes paid | $ | 1,610,000 | $ | 870,000 | $ | 850,000 | ||||||
| Interest on deposits and other borrowings | 20,291,422 | 17,405,601 | 11,846,274 | |||||||||
Supplemental schedule of noncash investing and financing activities | ||||||||||||
| Transfers from loans to real estate acquired through foreclosure | $ | 42,899 | $ | — | $ | 312,027 | ||||||
The notes to the consolidated financial statements are an integral part of this statement.
F-14
Table of Contents
RESOURCE BANKSHARES CORPORATION AND SUBSIDIARIES
NOTES TO CONSOLIDATED FINANCIAL STATEMENTS
December 31, 2001 and 2000
NOTE 1—ORGANIZATION AND BUSINESS
Resource Bankshares Corporation (the “Corporation”) is a Virginia corporation organized in June 1998 by Resource Bank (the “Bank”) for the purpose of becoming a unitary holding company of the Bank. The Corporation’s assets consist primarily of its investment in the Bank.
The Bank is a state-chartered commercial bank headquartered in Virginia Beach, Virginia where its commercial bank and operations office is located. The Bank was organized in April, 1987, and commenced operations on September 1, 1988. The Bank’s primary market areas are Fairfax County and Virginia Beach, Virginia and, to a lesser extent, in the surrounding cities of the South Hampton Roads area.
The Bank’s principal business consists of providing a broad range of lending and deposit services to individual and commercial customers with an emphasis on those services traditionally associated with independent community banks. These services include checking and savings accounts, certificates of deposit and charge cards. The Bank’s lending activities include commercial and personal loans, lines of credit, installment loans, home improvement loans, overdraft protection, construction loans, and other commercial finance transactions.
The Bank also operates a mortgage company which, as a division of the Bank, originates residential mortgage loans and subsequently sells them to investors. A competitive range of mortgage financing is provided through offices in the Richmond and Hampton Roads metropolitan areas, and the Northern Virginia/Washington, D.C. metropolitan area.
On June, 2000, the Bank purchased CW and Company of Virginia (“CW”), a title insurance and real estate closing agency, for a purchase price of $510,000, which was paid through the issuance of common stock of the Company. CW, which trades under the name “Real Estate Investment Protection Agency,” operates as a wholly owned subsidiary of the Bank.
On August, 2000, Resource Service Corporation, a wholly owned subsidiary of the Bank, entered into a joint venture with Financial Planners Mortgage Company, Inc. and formed a partnership titled Financial Planners Mortgage, LLP. The partnership will participate in real estate settlement activities.
During 2001 the Bank purchased Atlantic Mortgage and Investment Company (“AMIC”), a commercial mortgage company, First Jefferson Mortgage Corporation (“First Jefferson”), a mortgage loan origination company, and PRC Title LLC (“PRC”), a title insurance agency and real estate closing agency. All three transactions were accounted for under the purchase method of accounting, and resulted in the acquisition of $772,670 of fixed assets and the capitalization of $469,000 of mortgage servicing rights, and the capitalization of $716,650 of other intangible assets and goodwill. First Jefferson and AMIC were integrated into divisions within the Bank, PRC operates as a wholly owned subsidiary of the Bank.
Resource Capital Trust I and II, wholly owned subsidiaries of the Corporation, are finance subsidiaries, whose sole purpose is to hold Capital Trust securities.
NOTE 2—SUMMARY OF SIGNIFICANT ACCOUNTING POLICIES
Basis of Presentation and Consolidation
The consolidated financial statements include the accounts of Resource Bankshares Corporation and its wholly-owned subsidiaries, Resource Bank and Resource Capital Trust. All significant intercompany balances and transactions have been eliminated in consolidation.
F-15
Table of Contents
RESOURCE BANKSHARES CORPORATION AND SUBSIDIARIES
NOTES TO CONSOLIDATED FINANCIAL STATEMENTS—(Continued)
December 31, 2001 and 2000
Cash and Cash Equivalents
For purposes of reporting cash flows, cash and cash equivalents include cash on hand, amounts due from banks, interest bearing deposits with banks and federal funds sold. Generally, federal funds are sold for one-day periods. Interest bearing deposits with maturities extending beyond 90 days are not considered cash equivalents for cash flow reporting purposes. The Corporation had no such deposits at December 31, 2001 and 2000.
Securities
Securities that management has both the positive intent and ability to hold to maturity are classified as securities held to maturity and are carried at cost, adjusted for amortization of premium or accretion of discount using the interest method. Securities purchased for trading purposes, if any, are held in the trading portfolio at market value, with market adjustments included in noninterest income. Securities not classified as held to maturity or trading are classified as available for sale. Available for sale securities may be sold prior to maturity for asset/liability management purposes, in response to changes in interest rates or prepayment risk, to increase regulatory capital or other similar factors. Securities available for sale are carried at fair value, with any adjustments to fair value, after tax, reported as a separate component of other comprehensive income.
Interest and dividends on securities, including the amortization of premiums and the accretion of discounts, are reported in interest and dividends on securities using the interest method. Gains and losses on the sale of securities are recorded on the trade date and are calculated using the specific identification method. Declines in the fair value of individual held-to-maturity and available-for-sale securities below their cost that are other than temporary, if any, are included in earnings as realized losses.
Funds Advanced in Settlement of Mortgage Loans
The Corporation advances funds in settlement of mortgage loans originated on behalf of investor banks. Mortgage banking income, which consists of discount fees, or points, collected on loans originated, premiums received on the sale of mortgage loans and their related servicing rights to investors and other fees, is recognized when control over the related mortgage instrument is transferred to the investor bank.
Transfers of Financial Assets
Transfers of financial assets are accounted for as sales, when control over the assets has been surrendered. Control over transferred assets is deemed to be surrendered when (1) the assets have been isolated from the Corporation, (2) the transferee obtains the right (free of conditions that constrain it from taking advantage of that right) to pledge or exchange the transferred assets, and (3) the Corporation does not maintain effective control over the transferred assets through an agreement to repurchase them before their maturity.
Loans
Loans that management has the intent and ability to hold for the foreseeable future or until maturity or pay-off generally are stated at their outstanding unpaid principal balances net of any deferred fees or costs on originated loans, or unamortized premiums or discounts on purchased loans. Interest income is accrued on the unpaid principal balance. Discounts and premiums are amortized to income using the interest method. Loan origination fees, net of certain direct origination costs, are deferred and recognized as an adjustment to the yield (interest income) of the related loans.
F-16
Table of Contents
RESOURCE BANKSHARES CORPORATION AND SUBSIDIARIES
NOTES TO CONSOLIDATED FINANCIAL STATEMENTS—(Continued)
December 31, 2001 and 2000
Allowance for Loan Losses
A loan is considered impaired, based on current information and events, if it is probable that the Bank will be unable to collect the scheduled payments of principal or interest when due according to the contractual terms of the loan agreement. The measurement of impaired loans is generally based on the present value of expected future cash flows discounted at the historical effective interest rate, except that all collateral-dependent loans are measured for impairment based on the fair value of the collateral.
The adequacy of the allowance for loan losses is periodically evaluated by the Bank, in order to maintain the allowance at a level that is sufficient to absorb probable credit losses. Management’s determination of the allowance is based on a review of the Bank’s historical loss experience, known and inherent risks in the loan portfolio, including adverse circumstances that may affect the ability of the borrower to repay interest and/or principal, the estimated value of collateral, and an analysis of the levels and trends of delinquencies, charge-offs, and the risk ratings of the various loan categories. Such factors as the level and trend of interest rates and the condition of the national and local economies are also considered. In addition, various regulatory agencies, as an integral part of their examination process, periodically review the Bank’s allowance for losses on loans. Such agencies may require the Bank to recognize additions to the allowance based on their judgments of information available to them at the time of their examination.
The allowance for loan losses is established through charges to earnings in the form of a provision for loan losses. Increases and decreases in the allowance due to changes in the measurement of impaired loans, if applicable, are included in the provision for loan losses. Loans continue to be classified as impaired unless they are brought fully current and the collection of scheduled interest and principal is considered probable.
When a loan or portion of a loan is determined to be uncollectible, the portion deemed uncollectible is charged against the allowance and subsequent recoveries, if any, are credited to the allowance.
Income Recognition on Impaired and Nonaccrual Loans
Loans, including impaired loans, are generally classified as nonaccrual if they are past due as to maturity or payment of principal or interest for a period of more than 90 days, unless such loans are well-secured and in the process of collection. If a loan or a portion of a loan is adversely classified, or is partially charged off, the loan is generally classified as nonaccrual. Loans that are on a current payment status or past due less than 90 days may also be classified as nonaccrual, if repayment in full of principal and/or interest is in doubt.
Loans may be returned to accrual status when all principal and interest amounts contractually due (including arrearages) are reasonably assured of repayment within an acceptable period of time, and there is a sustained period of repayment performance by the borrower, in accordance with the contractual terms of interest and principal.
While a loan is classified as nonaccrual and the future collectibility of the recorded loan balance is doubtful, collections of interest and principal are generally applied as a reduction to principal outstanding. When the future collectibility of the recorded loan balance is expected, interest income may be recognized on a cash basis. In the case where a nonaccrual loan had been partially charged off, recognition of interest on a cash basis is limited to that which would have been recognized on the recorded loan balance at the contractual interest rate. Cash interest receipts in excess of that amount are recorded as recoveries to the allowance for loan losses until prior charge-offs have been fully recovered.
F-17
Table of Contents
RESOURCE BANKSHARES CORPORATION AND SUBSIDIARIES
NOTES TO CONSOLIDATED FINANCIAL STATEMENTS—(Continued)
December 31, 2001 and 2000
Other Real Estate Owned
Real estate acquired through foreclosure is initially recorded at the lower of fair value or the loan balance at date of foreclosure. Property that is held for resale is carried at the lower of cost or fair value minus estimated selling costs. Costs relating to the development and improvement of property are capitalized, whereas those relating to holding the property are charged to expense.
Valuations are periodically performed by management, and an allowance for losses is established by a charge to operations if the carrying value of a property exceeds its fair value minus estimated selling costs.
Restructured Loans
Loans are considered troubled debt restructurings if, for economic or legal reasons, a concession has been granted to the borrower related to the borrower’s financial difficulties that the Bank would not have otherwise considered. The Bank has restructured certain loans in instances where a determination was made that greater economic value will be realized under new terms than through foreclosure, liquidation, or other disposition. The terms of the renegotiation generally involve some or all of the following characteristics: a reduction in the interest pay rate to reflect actual operating income, an extension of the loan maturity date to allow time for stabilization of operating income, and partial forgiveness of principal and interest.
The carrying value of a restructured loan is reduced by the fair value of any assets or equity interest received, if any. In addition, if the present value of future cash receipts required under the new terms does not equal the recorded investment in the loan at the time of restructuring, the carrying value would be further reduced by a charge to the allowance. In addition, at the time of restructuring, loans are generally classified as impaired. A restructured loan that is not impaired, based on the restructured terms and that has a stated interest rate greater than or equal to a market interest rate at the date of the restructuring, is reclassified as unimpaired in the year immediately following the year it was disclosed as restructured.
Premises and Equipment
Premises and equipment are stated at cost less accumulated depreciation. For financial reporting purposes, assets are depreciated over their estimated useful lives using the straight-line and accelerated methods. For income tax purposes, the accelerated cost recovery system and the modified accelerated cost recovery system are used.
Income Taxes
Income taxes are provided for the tax effects of transactions reported in the financial statements, and consist of taxes currently due plus deferred taxes related primarily to differences between the basis of investment securities, deferred loan fees, allowance for loan losses, allowance for losses on foreclosed real estate, accumulated depreciation and intangible assets for financial and income tax reporting. The deferred tax assets and liabilities represent the future tax return consequences of those differences, which will either be taxable or deductible when the assets and liabilities are recovered or settled.
Advertising Costs
Advertising costs are expensed as incurred.
F-18
Table of Contents
RESOURCE BANKSHARES CORPORATION AND SUBSIDIARIES
NOTES TO CONSOLIDATED FINANCIAL STATEMENTS—(Continued)
December 31, 2001 and 2000
Deferred Compensation Plans
The Corporation maintains deferred compensation and retirement arrangements with certain officers. The Corporation’s policy is to accrue the estimated amounts to be paid under the contracts over the expected period of active employment. The Corporation purchased life insurance contracts to fund the expected liabilities under the contracts.
Stock Compensation Plans
FASB Statement No. 123,Accounting for Stock-Based Compensation, encourages all entities to adopt a fair value based method of accounting for employee stock compensation plans, whereby compensation cost is measured at the grant date based on the value of the award and is recognized over the service period, which is usually the vesting period. However, it also allows an entity to continue to measure compensation cost for those plans using the intrinsic value based method of accounting prescribed by Accounting Principles Board Opinion No. 25,Accounting for Stock Issued to Employees, whereby compensation cost is the excess, if any, of the quoted market price of the stock at the grant date (or other measurement date) over the amount an employee must pay to acquire the stock. Stock options issued under the Corporation’s stock option plan have no intrinsic value at the grant date, and under Opinion No. 25 no compensation cost is recognized for them. The Corporation has elected to continue with the accounting methodology in Opinion No. 25 and, as a result, has provided pro forma disclosures of net income and earnings per share and other disclosures, as if the fair value based method of accounting had been applied. The pro forma disclosures include the effects of all awards granted on or after January 1, 1995.
Earnings Per Common Share
Basic earnings per share (EPS) excludes dilution and is computed by dividing income available to common shareholders by the weighted-average number of shares outstanding for the period. Diluted EPS reflects the potential dilution that could occur if securities or other contracts to issue common stock were exercised, converted into common stock or resulted in the issuance of common stock that then shared in the earnings of the entity.
Comprehensive Income
Accounting principles generally require that recognized revenue, expenses, gains and losses be included in net income. Although certain changes in assets and liabilities, such as unrealized gains and losses on available-for-sale securities, are reported as a separate component of the equity section of the balance sheet, such items, along with net income, are components of comprehensive income.
The components of other comprehensive income and related tax effects are as follows:
Years Ended December 31, | ||||||||||||
2001 | 2000 | 1999 | ||||||||||
| Unrealized holding gains (losses) arising during the year on available-for-sale securities | $ | 602,876 | $ | (205,530 | ) | $ | (287,742 | ) | ||||
| Reclassification adjustment for losses (gains) realized in income | (454,918 | ) | — | — | ||||||||
| Net unrealized gains (losses) | 147,958 | (205,530 | ) | (287,742 | ) | |||||||
| Tax effect | (50,306 | ) | 73,344 | 100,777 | ||||||||
| Net-of-tax amount | $ | 97,652 | $ | (132,186 | ) | $ | (186,965 | ) | ||||
F-19
Table of Contents
RESOURCE BANKSHARES CORPORATION AND SUBSIDIARIES
NOTES TO CONSOLIDATED FINANCIAL STATEMENTS—(Continued)
December 31, 2001 and 2000
Segment Reporting
Public business enterprises are required to report information about operating segments in annual financial statements and selected information about operating segments in financial reports issued to shareholders. Operating segments are components of an enterprise about which separate financial information is available that is evaluated regularly by management in deciding how to allocate resources and in assessing performance. Generally, financial information is required to be reported on the basis that it is used internally for evaluating segment performance and deciding how to allocate resources to segments.
Derivative Instruments and Hedging Transactions
On April 1, 1999, the Corporation adopted FASB Statement No. 133,Accounting for Derivative Instruments and Hedging Activities, which established accounting and reporting standards for derivative instruments, including certain derivative instruments embedded in other contracts (collectively referred to as derivatives) and for hedging activities. It requires that an entity recognize all derivatives as either assets or liabilities in the statement of financial position and measure those instruments at fair value. The Corporation’s adoption of this statement did not materially impact the consolidated financial condition or consolidated results of operations.
Computer Software
During the year ended December 31, 1999, the Corporation adopted Statement of Position (SOP) 98-1,Accounting for Costs of Computer Software Developed or Obtained for Internal Use. This SOP was effective for financial statements for fiscal years beginning after December 31, 1998. The SOP requires entities to capitalize certain internal-use software costs once certain criteria are met. Generally, internal costs with respect to software configuration and interface, coding, installation to hardware, testing (including parallel processing), and data conversion costs allowing access of old data by new systems should be capitalized. All other data conversion costs, training, application maintenance, and ongoing support activities should be expensed. The Corporation’s adoption of this SOP on January 1, 1999 did not materially impact the consolidated financial condition or results of operations.
Start-up Activities
During the year ended December 31, 1999, the Corporation adopted SOP 98-5,Reporting on the Cost of Start-up Activities. The SOP requires such costs to be expensed as incurred instead of being capitalized and amortized. It applies to start-up activities and costs of organization for both development stage and established operating activities as those one-time activities that relate to the opening of a new facility, introduction of a new product or service, doing business in a new territory, initiating a new process in an existing facility, doing business with a new class of customer or beneficiary, or commencing some new operation. The SOP was effective for financial statements for fiscal years beginning after December 15, 1998. Consistent with banking industry practice, the Corporation’s policy is to expense such costs. Therefore, its adoption, on January 1, 1999, did not effect the Corporation’s consolidated financial position or results of operations.
Off-Balance-Sheet Financial Instruments
In the ordinary course of business, the Bank has entered into off-balance-sheet financial instruments consisting of commitments to extend credit, commitments under credit card arrangements, commercial letters of credit, standby letters of credit, and financial guarantees written. Such financial instruments are recorded in the financial statements when they become payable.
F-20
Table of Contents
RESOURCE BANKSHARES CORPORATION AND SUBSIDIARIES
NOTES TO CONSOLIDATED FINANCIAL STATEMENTS—(Continued)
December 31, 2001 and 2000
Use of Estimates
The preparation of financial statements requires management to make estimates and assumptions that affect the reported amounts of assets and liabilities and disclosure of contingent assets and liabilities at the date of the financial statements and the reported amounts of revenues and expenses during the reporting period. Actual results could differ from those estimates.
Material estimates that are particularly susceptible to significant change relate to the determination of the allowance for losses on loans and the valuation of real estate acquired in connection with foreclosures or in satisfaction of loans. While management uses available information to recognize losses on loans and foreclosed real estate, future additions to the allowances may be necessary based on changes in local economic conditions and other factors.
Reclassifications
Certain reclassifications have been made to prior year’s information to conform with the current year presentation.
NOTE 3—RESTRICTIONS ON CASH AND DUE FROM BANK ACCOUNTS
The Bank is required by the Federal Reserve Bank to maintain average reserve balances. The average amount of these reserve balances was approximately $776,000 for the year ended December 31, 2001. On December 31, 2001, the required reserve balance was $568,000.
NOTE 4—SECURITIES
Securities at December 31, 2001 and 2000 are as follows:
Amortized Cost | Gross Unrealized Gains | Gross Unrealized Losses | Fair Value | |||||||||
December 31, 2001 | ||||||||||||
Securities available-for-sale: | ||||||||||||
U.S. government agencies | $ | 59,423,698 | $ | 233,251 | $ | 152,199 | $ | 59,504,750 | ||||
State and municipal securities | 12,275,891 | 642,796 | 30,728 | 12,887,959 | ||||||||
Federal Reserve Bank stock | 866,550 | — | — | 866,550 | ||||||||
Federal Home Loan Bank stock | 4,240,000 | — | — | 4,240,000 | ||||||||
Preferred stock | 33,754,132 | 311,098 | 754,065 | 33,311,165 | ||||||||
Corporate bonds | 3,103,820 | — | 384,240 | 2,719,580 | ||||||||
Other | 1,213,716 | 5,496 | 114,697 | 1,104,515 | ||||||||
$ | 114,877,807 | $ | 1,192,641 | $ | 1,435,929 | $ | 114,634,519 | |||||
F-21
Table of Contents
RESOURCE BANKSHARES CORPORATION AND SUBSIDIARIES
NOTES TO CONSOLIDATED FINANCIAL STATEMENTS—(Continued)
December 31, 2001 and 2000
There were no held-to-maturity securities at December 31, 2001.
Amortized Cost | Gross Unrealized Gains | Gross Unrealized Losses | Fair Value | |||||||||
| December 31, 2000 | ||||||||||||
| Securities available-for-sale: | ||||||||||||
| U.S. government agencies | $ | 14,896,711 | $ | 25,312 | $ | 3,559 | $ | 14,918,464 | ||||
| Federal Reserve Bank stock | 673,000 | — | — | 673,000 | ||||||||
| Federal Home Loan Bank stock | 1,559,900 | — | — | 1,559,900 | ||||||||
| Preferred stock | 1,308,817 | — | 265,558 | 1,043,259 | ||||||||
| Other | 192,868 | — | 70,012 | 122,856 | ||||||||
| $ | 18,631,296 | $ | 25,312 | $ | 339,129 | $ | 18,317,479 | |||||
Amortized Cost | Gross Unrealized Gains | Gross Unrealized Losses | Fair Value | |||||||||
| December 31, 2000 | ||||||||||||
| Securities held to maturity: | ||||||||||||
| U.S. government agencies | $ | 28,664,005 | $ | 86,483 | $ | 211,215 | $ | 28,539,273 | ||||
| State and municipal securities | 15,968,975 | 1,370,041 | — | 17,339,016 | ||||||||
| Corporate bonds | 7,200,723 | — | 975,969 | 6,224,754 | ||||||||
| Preferred stock | 11,970,380 | 60,485 | 109,609 | 11,921,256 | ||||||||
| $ | 63,804,083 | $ | 1,517,009 | $ | 1,296,793 | $ | 64,024,299 | |||||
Federal Reserve Bank stock and Federal Home Loan Bank stock are restricted securities, carried at cost, and periodically evaluated for impairment. These securities do not have a readily determinable fair value, and lack a market.
At December 31, 2001 and 2000, securities with a carrying value of approximately $5,137,700 and $915,000, respectively, were pledged to secure deposits of the U.S. government or the Commonwealth of Virginia. In addition, securities with a carrying value of $37,060,700 and $42,978,700 are pledged to secure Federal Home Loan Bank advances as of December 31, 2001 and 2000, respectively.
In the second quarter of 2001, securities were sold from the held-to-maturity investment portfolio for reasons other than those identified in SFAS 115 paragraph 8(a)-(f). In conformity with SFAS 115, the remaining securities, with a fair value of $49,994,919 at the time of transfer and an amortized cost of $49,309,701, were transferred from the held-to-maturity classification to the available-for-sale classification. The gross unrealized gains and losses amounted to $2,202,424 and $1,517,206, respectively, at the time of transfer. In particular, concerns over the corporate credit exposure within the investment securities portfolio lead management to conclude that corporate investment securities, including all non-financial corporate issues, should be liquidated in a re-structuring of the portfolio to shield the Corporation from a perceived growing credit risk in a weakening economy.
F-22
Table of Contents
RESOURCE BANKSHARES CORPORATION AND SUBSIDIARIES
NOTES TO CONSOLIDATED FINANCIAL STATEMENTS—(Continued)
December 31, 2001 and 2000
The amortized cost and fair value of securities by maturity date at December 31, 2001 are as follows:
Securities Held-to-Maturity | Securities Available-for-Sale | |||||||||||
Amortized Cost | Fair Value | Amortized Cost | Fair Value | |||||||||
| Due in one year or less | $ | — | $ | — | $ | — | $ | — | ||||
| Due from one to five years | — | — | 415,000 | 424,638 | ||||||||
| Due from five to ten years | — | — | 30,569 | 33,833 | ||||||||
| Due after ten years | — | — | 71,254,020 | 71,934,238 | ||||||||
| Total debt securities | — | — | 71,699,589 | 72,392,709 | ||||||||
| Federal Reserve Bank stock | — | — | 866,550 | 866,550 | ||||||||
| Federal Home Loan Bank stock | — | — | 4,240,000 | 4,240,000 | ||||||||
| Preferred stock | — | — | 33,754,132 | 33,311,165 | ||||||||
| Other | — | — | 4,317,536 | 3,824,095 | ||||||||
| $ | — | $ | $ | 114,877,807 | $ | 114,634,519 | ||||||
Gross realized gains and losses on available-for-sale securities were:
December 31, | |||||||||
2001 | 2000 | 1999 | |||||||
| Gross realized gains | $ | 1,095,850 | $ | — | $ | — | |||
| Gross realized losses | $ | 640,932 | $ | — | $ | ||||
NOTE 5—LOANS
Loans consist of the following:
December 31, | ||||||||
2001 | 2000 | |||||||
| Gross loans: | ||||||||
| Commercial | $ | 77,704,777 | $ | 68,273,676 | ||||
| Real estate—construction | 86,282,832 | 72,395,198 | ||||||
| Commercial real estate | 125,193,601 | 98,843,705 | ||||||
| Residential real estate mortgages | 51,888,131 | 44,817,286 | ||||||
| Installment and consumer loans | 3,866,812 | 4,182,551 | ||||||
| Total gross loans | 344,936,153 | 288,512,416 | ||||||
| Less—allowance for loan losses | (3,696,860 | ) | (3,520,702 | ) | ||||
| Loans, net | $ | 341,239,293 | $ | 284,991,714 | ||||
Gross loans include deferred loan costs in excess of unearned loan income of $2,930,753 and $2,452,065 at December 31, 2001 and 2000, respectively.
F-23
Table of Contents
RESOURCE BANKSHARES CORPORATION AND SUBSIDIARIES
NOTES TO CONSOLIDATED FINANCIAL STATEMENTS—(Continued)
December 31, 2001 and 2000
A summary of the activity in the allowance for loan losses account is as follows:
Years Ended December 31, | ||||||||||||
2001 | 2000 | 1999 | ||||||||||
| Balance, beginning of year | $ | 3,520,702 | $ | 2,686,468 | $ | 2,500,193 | ||||||
| Provision charged to operations | 195,000 | 1,100,000 | 4,667,000 | |||||||||
| Loans charged-off | (356,294 | ) | (395,564 | ) | (4,526,324 | ) | ||||||
| Recoveries | 337,452 | 129,798 | 45,599 | |||||||||
| Balance, end of year | $ | 3,696,860 | $ | 3,520,702 | $ | 2,686,468 | ||||||
Accounting standards require certain disclosures concerning impaired loans, as defined by generally accepted accounting principles, regardless of whether or not an impairment loss exists. Impaired loans amount to $535,706 and $1,015,060 as of December 31, 2001 and 2000, respectively. Impaired loans have a valuation allowance allocation of $84,899 and $190,173 at those respective dates. The average recorded investment in impaired loans was approximately $1,336,419, $636,476, and $828,846 in 2001, 2000 and 1999, respectively. The Bank recognized $30,955, $58,614 and $19,997 of interest income on impaired loans during 2001, 2000 and 1999, respectively.
Loans on which the accrual of interest has been discontinued amounted to $535,706 and $1,015,060 at December 31, 2001 and 2000, respectively. If interest on those loans had been accrued, such income would have approximated $12,293, $30,631, and $17,045 for the years ended December 31, 2001, 2000 and 1999, respectively.
NOTE 6—PREMISES AND EQUIPMENT
Premises and equipment consist of the following:
December 31, | ||||||||
2001 | 2000 | |||||||
| Land | $ | 900,499 | $ | 900,499 | ||||
| Buildings | 5,333,346 | — | ||||||
| Leasehold improvements | 854,165 | 713,110 | ||||||
| Equipment, furniture and fixtures | 3,433,602 | 2,086,788 | ||||||
| Software | 963,764 | 666,382 | ||||||
| Construction in progress | — | 1,091,235 | ||||||
11,485,376 | 5,458,014 | |||||||
| Less—accumulated depreciation | (2,573,404 | ) | (1,696,705 | ) | ||||
$ | 8,911,972 | $ | 3,761,309 | |||||
Depreciation charged to operating expense for 2001, 2000 and 1999 was $979,181, $646,670,and $475,212, respectively.
F-24
Table of Contents
RESOURCE BANKSHARES CORPORATION AND SUBSIDIARIES
NOTES TO CONSOLIDATED FINANCIAL STATEMENTS—(Continued)
December 31, 2001 and 2000
NOTE 7—DEPOSITS
Interest-bearing deposits consist of the following:
December 31, | ||||||
2001 | 2000 | |||||
| Money market and NOW account deposits | $ | 93,676,068 | $ | 132,833,257 | ||
| Savings deposits | 6,637,763 | 5,741,637 | ||||
| Time deposits $100,000 and over | 10,082,665 | 6,685,784 | ||||
| Other time deposits | 285,140,900 | 171,872,688 | ||||
$ | 395,537,396 | $ | 317,133,366 | |||
The scheduled maturities of time deposits at December 31, 2001 are as follows:
| Less than one year | $ | 229,231,403 | |
| One to two years | 64,258,024 | ||
| Three to five years | 1,734,138 | ||
| Over five years | 0 | ||
| $ | 295,223,565 | ||
NOTE 8—FEDERAL HOME LOAN BANK ADVANCES AND OTHER BORROWINGS
Federal Home Loan Bank (FHLB) advances consist of the following:
December 31, | ||||||
2001 | 2000 | |||||
| 5.82% FHLB advance due April 5, 2010 | $ | 5,000,000 | $ | 5,000,000 | ||
| 5.69% FHLB advance due February 6, 2002 | 300,000 | 300,000 | ||||
| 5.45% FHLB advance due September 15, 2010 | 25,000,000 | 25,000,000 | ||||
| 4.21% FHLB advance due August 1, 2003 | 2,000,000 | |||||
| 4.64% FHLB advance due August 7, 2006 | 2,000,000 | |||||
| 3.86% FHLB advance due November 7, 2011 | 10,000,000 | |||||
| 3.98% FHLB advance due November 28 2011 | 10,000,000 | |||||
| 3.14% FHLB advance due December 4, 2011 | 12,000,000 | |||||
| 1.83% FHLB advance due January 16, 2002 | 17,500,000 | |||||
$ | 83,800,000 | $ | 30,300,000 | |||
Information regarding FHLB advances is summarized below:
2001 | 2000 | 1999 | ||||||||||
| Weighted average rate | 4.98 | % | 5.51 | % | 5.72 | % | ||||||
| Average balance | $ | 42,690,685 | $ | 18,352,954 | $ | 10,136,728 | ||||||
| Maximum outstanding at month-end | $ | 83,800,000 | $ | 30,300,000 | $ | 18,300,000 | ||||||
F-25
Table of Contents
RESOURCE BANKSHARES CORPORATION AND SUBSIDIARIES
NOTES TO CONSOLIDATED FINANCIAL STATEMENTS—(Continued)
December 31, 2001 and 2000
As of December 31, 2001 and 2000, advances were collateralized by FHLB stock with a cost of $4,240,000 and $1,559,900, respectively. In addition, securities of $37,060,700 and $42,978,700 were pledged against these advances, as of December 31, 2001 and 2000, respectively. Mortgage loans of $65,373,500 also served to provide additional collateral for these advances at December 31, 2001. Pursuant to the terms of the variable rate line of credit, the Bank may borrow up to 25% of the Bank’s total assets. The FHLB advances arrangement has no expiration date, but is reevaluated periodically to determine the Bank’s credit worthiness. Additionally, the Bank has a warehouse line of credit of $75,000,000 collateralized by first mortgage loans and expiring February 19, 2003. As of December 31, 2001, the Bank had not drawn from this line of credit.
Resource Capital Trust I (Trust I) and Resource Capital Trust II (Trust II) are wholly-owned special purpose finance subsidiaries of the Parent, operating in the form of a grantor trust.
Trust I was created in 1999 solely to issue capital securities and remit the proceeds to the Corporation. The Corporation is the sole owner of the common stock securities of the Trust. In 1999, Trust I issued 368,000 shares of preferred stock capital securities (Trust I preferred stock) with a stated value of $25 per share, and a fixed dividend yield of 9.25% of the stated value. The stated value of the Trust preferred stock is unconditionally guaranteed on a subordinated basis by the Parent. The Trust I securities have a mandatory redemption date of April 15, 2029, and are subject to varying call provisions at the option of the Corporation beginning April 15, 2004.
Trust II was created in 2001 solely to issue capital securities and remit the proceeds to the Corporation. The Corporation is the sole owner of the common stock securities of the Trust. In 2001, Trust II issued 5,000 shares of preferred stock capital securities (Trust II preferred stock) with a stated value of $1,000 per share, and bearing a variable distribution rate per annum, reset semi-annually, equal to LIBOR plus 3.75% provided, that the applicable interest rate may not exceed 11.0% through the interest payment date in December 2006. The Trust II securities have a mandatory redemption date of December 8, 2031, and are subject to varying call provisions at the option of the Corporation beginning December 8, 2006.
The Parent unconditionally guarantees the stated value of the Trust preferred stock on a subordinated basis. Through an intercompany lending transaction, proceeds received by Trust I and Trust II from sale of the securities were lent to the Parent for general corporate purposes.
The Trust preferred stock is senior to the Corporation’s common stock in event of claims against Resource, but is subordinate to all senior and subordinated debt securities. The Corporation has the right to terminate the Trust upon the occurrence of certain events, including (a) dividend payments on the preferred stock securities are no longer deemed tax-deductible, or the Trust is taxed on the income received from the underlying intercompany debt agreement with the Parent, (b) the capital securities are no longer considered Tier 1 capital under Federal Reserve Bank guidelines, or (c) the Trust, through a change of law, is deemed to be an investment company under the Investment Company Act of 1940 (the Act) and subject to that Act’s reporting requirements.
Shares of the Trust preferred stock are capital securities, which are distinct from the common stock or preferred stock of the Corporation, and the dividends thereon are tax-deductible. Dividends accrued for payment by the Trust are classified as interest expense on long-term debt in the consolidated statement of operations of the Corporation. The Trust preferred stock is shown as “Capital Trust Borrowings” and classified as a liability in the consolidated balance sheets.
F-26
Table of Contents
RESOURCE BANKSHARES CORPORATION AND SUBSIDIARIES
NOTES TO CONSOLIDATED FINANCIAL STATEMENTS—(Continued)
December 31, 2001 and 2000
NOTE 9—STOCKHOLDERS’ EQUITY
In 2001, no stock options were exercised, however, the Corporation reacquired 92,866 shares of its outstanding common stock at an average price of $16.01 per share.
In 2000, stock options were exercised resulting in the issuance of 35,332 additional common shares. In June, 2000, the Corporation issued 56,792 shares of its common stock as a result of the acquisition of CW Company of Virginia. The Corporation also reacquired 7,176 shares of its outstanding common stock at an average price of $10.94 per share.
In 1999, stock options and warrants were exercised resulting in the issuance of 90,888 additional common shares. The Corporation also reacquired 29,099 shares of its outstanding common stock at an average price of $19.11 per share.
NOTE 10—EMPLOYEE BENEFIT PLANS
401(k) Profit Sharing Plan
The Corporation has a 401(k) Profit Sharing Plan whereby substantially all employees participate in the Plan. Employees may contribute up to 15% of their compensation subject to certain limits based on federal tax laws. The Corporation makes matching contributions equal to 50% of the first 6% of an employee’s compensation contributed to the Plan. The Corporation may also make a discretionary profit sharing contribution based on certain eligibility requirements as set forth in the Plan. Employer account contributions vest to the employee equally over a three-year period. For 2001, 2000 and 1999, expenses attributable to the Plan amounted to $343,500, $214,700, and $181,000, respectively.
Stock Compensation Plans
At December 31, 2001, the Corporation has five stock compensation plans for its officers and directors. Each plan is a fixed option plan. Three of these plans, the May 1993 Long-Term Incentive Plan, the December 1993 Long-Term Incentive Plan, and the 1994 Long-Term Incentive Plan were implemented and grants were made prior to the effective date of FASB Statement No. 123,Accounting for Stock Based Compensation.The Corporation applies APB Opinion No. 25,Accounting for Stock Issued to Employees,and related interpretations in accounting for all its plans. Accordingly, no compensation cost has been recognized for these plans against earnings.
The Corporation’s 1996 Long-Term Incentive Plan authorized the granting of options to management personnel and directors of 47,000 shares of the Bank’s common stock in 1997. All options have 10-year terms, and are not exercisable for five years from the date of grant. No stock options were granted in 1998. During 1999, this Plan was amended allowing additional shares to management. The Corporation granted 27,321 and 86,750 of these shares in 2001 and 2000, respectively.
In May, 2001, the Corporation’s shareholders approved the Resource Bankshares Corporation 2001 Stock Incentive Plan. This plan, which expires in May, 2001, makes available up to 100,000 shares of common stock for the granting of awards in the form of incentive stock options, nonqualified stock options, or other stock based awards. During the year ended December 31, 2001 the Corporation granted, at fair value, 62,247 incentive stock options and 23,823 nonqualified options under this plan.
Pro forma information regarding net income and earnings per share is required by FASB Statement No. 123, and has been determined as if the Corporation had accounted for its employee stock options under the fair value
F-27
Table of Contents
RESOURCE BANKSHARES CORPORATION AND SUBSIDIARIES
NOTES TO CONSOLIDATED FINANCIAL STATEMENTS—(Continued)
December 31, 2001 and 2000
method of that statement. The fair value for these options was estimated at the date of grant using a Black-Scholes option pricing model.
The Black-Scholes option model was developed for use in estimating the fair value of traded options that have no vesting restrictions and are fully transferable. In addition, option valuation models require the input of highly subjective assumptions including the expected stock price volatility. Because the Corporation’s employee stock options have characteristics significantly different from those of traded options, and because changes in the subjective input assumptions can materially affect the fair value estimate, in management’s opinion, the existing models do not necessarily provide a reliable single measure of the fair value of its employee stock options.
Had compensation cost for the Corporation’s stock options been determined based on the fair value method prescribed by FASB No. 123, the Corporation’s net income and earnings per share would have been reduced to the pro-forma amounts indicated for the year ended December 31:
2001 | 2000 | 1999 | ||||||||||
| Net income (loss) | As reported | $ | 4,542,621 | $ | 4,232,730 | $ | (690,808 | ) | ||||
| Pro forma | $ | 4,251,910 | $ | 4,069,411 | $ | (815,864 | ) | |||||
| Basic earnings per share | As reported | $ | 1.57 | $ | 1.63 | $ | (0.27 | ) | ||||
| Pro forma | $ | 1.47 | $ | 1.57 | $ | (0.32 | ) | |||||
| Diluted earnings per share | As reported | $ | 1.49 | $ | 1.56 | $ | (0.27 | ) | ||||
| Pro forma | $ | 1.39 | $ | 1.50 | $ | (0.32 | ) | |||||
The fair value of each option granted is estimated at the date of grant using the Black-Scholes option-pricing model with the following weighted-average assumptions:
2001 | 2000 | 1999 | |||||||
| Dividend yield | 2.67 | % | 4 | % | 2.35 | % | |||
| Expected life | 5 years | 7 years | 7 years | ||||||
| Expected volatility | 53 | % | 43 | % | 36 | % | |||
| Risk-free interest rate | 4.50 | % | 5.50 | % | 6.25 | % |
The following is a summary of the Corporation’s stock option activity, and related information for the years ended December 31:
2001 | 2000 | 1999 | ||||||||||||||||
Options | Weighted- Average Exercise Price | Options | Weighted- Average Exercise Price | Options | Weighted- Average Exercise Price | |||||||||||||
| Outstanding—beginning of year | 450,209 | $ | 9.86 | 401,791 | $ | 9.17 | 339,024 | $ | 6.16 | |||||||||
| Granted | 113,400 | 16.61 | 86,750 | 10.39 | 90,500 | 19.06 | ||||||||||||
| Exercised | — | — | (35,332 | ) | 2.99 | (27,733 | ) | 4.75 | ||||||||||
| Forfeited | (4,996 | ) | 12.25 | (3,000 | ) | 12.25 | — | — | ||||||||||
| Outstanding—end of year | 558,613 | 11.19 | 450,209 | 9.86 | 401,791 | 9.17 | ||||||||||||
| Exercisable—end of year | 254,463 | $ | 6.06 | 238,959 | $ | 5.44 | 264,291 | $ | 4.61 | |||||||||
| Weighted average fair value of options granted during the year | $ | 5.58 | $ | 3.30 | $ | 7.34 | ||||||||||||
F-28
Table of Contents
RESOURCE BANKSHARES CORPORATION AND SUBSIDIARIES
NOTES TO CONSOLIDATED FINANCIAL STATEMENTS—(Continued)
December 31, 2001 and 2000
Information pertaining to options outstanding at December 31, 2001 is as follows:
Options Outstanding | Options Exercisable | |||||||||||
Range of Exercise Prices | Number Outstanding | Weighted Average Remaining Contractual Life | Weighted Average Exercise Price | Number Exercisable | Weighted Average Exercise Price | |||||||
| $ 2.98—$ 4.85 | 96,663 | 1.9 years | $ | 3.00 | 96,663 | $ | 3.00 | |||||
| $ 4.86—$ 6.72 | 132,300 | 4.5 years | $ | 6.25 | 132,300 | $ | 6.25 | |||||
| $ 8.61—$12.35 | 85,250 | 8.2 years | $ | 9.67 | 500 | $ | 9.12 | |||||
| $14.24—$16.11 | 55,500 | 6.6 years | $ | 15.68 | 15,000 | $ | 15.75 | |||||
| $16.12—$17.99 | 117,471 | 9.5 years | $ | 16.99 | — | $ | — | |||||
| $18.00—$19.86 | 40,000 | 7.3 years | $ | 18.90 | 10,000 | $ | 18.50 | |||||
| Outstanding at end of year | 558,613 | 6.2 years | $ | 11.19 | 254,463 | $ | 6.06 | |||||
NOTE 11—INCOME TAXES
The principal components of the income tax expense (benefit) were as follows:
2001 | 2000 | 1999 | |||||||||
| Federal—current | $ | 1,914,075 | $ | 2,179,986 | $ | (957,512 | ) | ||||
| Federal—deferred | 4,133 | (294,297 | ) | 570,554 | |||||||
$ | 1,918,208 | $ | 1,885,689 | $ | (386,958 | ) | |||||
The differences between expected federal income taxes at statutory rates to actual income tax expense are summarized as follows:
2001 | 2000 | 1999 | ||||||||||
| Income tax expense (benefit) computed at federal statutory rates | $ | 2,196,682 | $ | 2,080,260 | $ | (366,440 | ) | |||||
| Tax effects of: | ||||||||||||
| Tax-exempt interest | (264,247 | ) | (233,180 | ) | (18,716 | ) | ||||||
| Nondeductible merger and reorganization expenses | 5,469 | 5,469 | 5,469 | |||||||||
| Other | (19,696 | ) | 33,140 | (7,271 | ) | |||||||
$ | 1,918,208 | $ | 1,885,689 | $ | (386,958 | ) | ||||||
F-29
Table of Contents
RESOURCE BANKSHARES CORPORATION AND SUBSIDIARIES
NOTES TO CONSOLIDATED FINANCIAL STATEMENTS—(Continued)
December 31, 2001 and 2000
The Corporation’s deferred tax assets and liabilities and their components are as follows:
December 31, | ||||||
2001 | 2000 | |||||
| Deferred tax assets: | ||||||
| Intangible assets | $ | 13,599 | $ | 15,688 | ||
| Bad debts and other provisions | 969,740 | 741,036 | ||||
| Fixed assets | 155,685 | 280,189 | ||||
| Other | 28,605 | 5,795 | ||||
| Deferred compensation | 148,208 | 95,125 | ||||
| Unrealized loss on securities | 82,718 | 135,151 | ||||
| Total deferred tax asset | 1,398,285 | 1,272,984 | ||||
| Deferred tax liabilities: | ||||||
| Loans | 235,072 | 256,605 | ||||
| Deposits | 171,039 | 186,707 | ||||
| Deferred fees | 1,405,756 | 1,181,954 | ||||
| FHLB stock | 17,821 | 17,821 | ||||
| Other | — | 4,734 | ||||
| Total deferred tax liability | 1,829,688 | 1,647,821 | ||||
| Net deferred tax liability | $ | 431,403 | $ | 374,837 | ||
NOTE 12—COMMITMENTS AND CONTINGENCIES
The Bank leases office space in Hampton Roads and Richmond as well as various offices for the mortgage division. The Bank owns its office space in Northern Virginia. The leases provide for options to renew for various periods. All escalation clauses based on fixed percentages are included in the disclosure below. Pursuant to the terms of these leases, the following is a schedule, by year, of future minimum lease payments required under noncancelable lease agreements.
Lease Payments | |||
| 2002 | $ | 1,141,461 | |
| 2003 | 1,049,282 | ||
| 2004 | 802,707 | ||
| 2005 | 456,050 | ||
| 2006 | 437,377 | ||
| Thereafter | 266,788 | ||
| $ | 4,153,665 | ||
F-30
Table of Contents
RESOURCE BANKSHARES CORPORATION AND SUBSIDIARIES
NOTES TO CONSOLIDATED FINANCIAL STATEMENTS—(Continued)
December 31, 2001 and 2000
Total rental expense was $1,165,439, $894,131 and $878,234 for 2001, 2000 and 1999, respectively.
The Corporation and the Bank are defendants in certain claims and legal actions arising in the ordinary course of business. In the opinion of management, after consultation with legal counsel, the ultimate disposition of these matters is not expected to have a material adverse effect on the financial position of the Bank.
NOTE 13—RELATED PARTY TRANSACTIONS
In the ordinary course of business, the Bank has loan and deposit transactions with its officers and directors, and with companies in which the officers and directors have a significant financial interest. A summary of related party loan activity during 2001 is as follows:
| Balance, December 31, 2000 | $ | 8,848,295 | ||
| Originations – 2001 | 2,650,198 | |||
| Repayments – 2001 | (5,243,704 | ) | ||
Balance, December 31, 2001 | $ | 6,254,789 | ||
Mr. Russell Kirk, a director of the Corporation and the Bank, is also an officer of Armada Hoffler Holding Company, the parent of Armada-Hoffler Construction Company. During 2001, the Bank paid Armada-Hoffler $3.3 million in connection with its services as general contractor for the Bank’s New Herndon, Virginia. branch facility. As general contractor, Armada-Hoffler retained approximately 7% of this amount as its fee for conducting the project; the remainder was passed through to subcontractors. The terms and conditions of the Armada-Hoffler services were comparable to those that would have been offered by other unaffiliated third parties in an arms length transaction. In addition, loans due from, or guaranteed by, Mr. Kirk or Armada-Hoffler totaled $5,441,140 and $3,502,023 at December 31, 2001 and 2000, respectively. Each of these loan transactions was made in the ordinary course of business on substantially the same terms, including interest rates, collateral and repayment terms, as those prevailing at the time for comparable transactions with unrelated parties and did not involve more than the normal risk of collectibility or present other unfavorable features.
Commitments to extend credit to related parties amounted to $0 and $77,000 at December 31, 2001 and 2000.
Deposits from related parties held by the Bank at December 31, 2001 and 2000 amounted to $6,111,000 and $6,413,000, respectively.
NOTE 14—CREDIT COMMITMENTS AND CONCENTRATIONS OF CREDIT RISK
The Bank has outstanding at any time a significant dollar amount of commitments to extend credit. To accommodate major customers, the Bank also provides standby letters of credit and guarantees to third parties. Those arrangements are subject to strict credit control assessments. Guarantees and standby letters of credit specify limits to the Bank’s obligations. The amounts of loan commitments, guarantees and standby letters of credit are set out in the following table as of December 31, 2001 and 2000. Because many commitments and almost all standby letters of credit and guarantees expire without being funded in whole or in part, the contract amounts are not estimates of future cash flows.
F-31
Table of Contents
RESOURCE BANKSHARES CORPORATION AND SUBSIDIARIES
NOTES TO CONSOLIDATED FINANCIAL STATEMENTS—(Continued)
December 31, 2001 and 2000
Variable Rate Commitments | Fixed Rate Commitments | |||||
December 31, 2001 | ||||||
| Loan commitments | $ | 109,192,896 | $ | 6,280,351 | ||
| Standby letters of credit and guarantees written | $ | 5,571,615 | $ | — | ||
December 31, 2000 | ||||||
| Loan commitments | $ | 93,450,425 | $ | 4,198,687 | ||
| Standby letters of credit and guarantees written | $ | 4,797,965 | $ | — | ||
Loan commitments, standby letters of credit and guarantees written have off-balance-sheet credit risk because only origination fees and accruals for probable losses, if any, are recognized in the statement of financial position until the commitments are fulfilled or the standby letters of credit or guarantees expire. Credit risk represents the accounting loss that would be recognized at the reporting date if counterparties failed completely to perform as contracted. The credit risk amounts are equal to the contractual amounts, assuming that the amounts are fully advanced and that, in accordance with the requirements of FASB Statement No. 105,Disclosure of Information about Financial Instruments with Off-Balance-Sheet Risk and Financial Instruments with Concentrations of Credit Risk,collateral or other security is of no value. The Bank’s policy is to require customers to provide collateral prior to the disbursement of approved loans. For retail loans, the Bank usually retains a security interest in the property or products financed, which provides repossession rights in the event of default by the customer. For business loans and financial guarantees, collateral is usually in the form of inventory or marketable securities (held in trust) or property (notations on title). The number of obligors of letters of credit or guarantees issued by the Bank at December 31, 2001 and 2000 was approximately 55 and 58, respectively. There were no letters of credit or guarantees considered individually significant at those dates.
There are no commitments to extend credit on impaired loans at December 31, 2001.
Concentrations of credit risk (whether on or off balance sheet) arising from financial instruments exist in relation to certain groups of customers. A group concentration arises when a number of counterparties have similar economic characteristics that would cause their ability to meet contractual obligations to be similarly affected by changes in economic or other conditions. The Bank does not have significant exposure to any individual customer or counterparty. However, a geographic concentration arises because the Bank operates primarily in southeastern and northern Virginia.
The credit risk amounts represent the maximum accounting loss that would be recognized at the reporting date if counterparties failed completely to perform as contracted and any collateral or security proved to be of no value. The Bank has experienced little difficulty in accessing collateral when required. The amounts of credit risk shown, therefore, greatly exceed expected losses, which are included in the allowance for loan losses.
NOTE 15—REGULATORY MATTERS
The Corporation (on a consolidated basis) and the Bank are subject to various regulatory capital requirements administered by the federal banking agencies. Failure to meet minimum capital requirements can initiate certain mandatory, and possibly additional discretionary, actions by regulators that, if undertaken, could have a direct material effect on the Corporation’s and the Bank’s financial statements. Under capital adequacy guidelines and the regulatory framework for prompt corrective action, the Corporation and the Bank must meet specific capital guidelines that involve quantitative measures of the Bank’s assets, liabilities, and certain off-balance-sheet items as calculated under regulatory accounting practices. The Corporation’s and the Bank’s
F-32
Table of Contents
RESOURCE BANKSHARES CORPORATION AND SUBSIDIARIES
NOTES TO CONSOLIDATED FINANCIAL STATEMENTS—(Continued)
December 31, 2001 and 2000
capital amounts and classification are also subject to qualitative judgments by the regulators about components, risk weighting, and other factors.
Quantitative measures established by regulation to ensure capital adequacy require the Corporation and the Bank to maintain minimum amounts and ratios (set forth in the table below) of total and Tier I capital (as defined in the regulations) to risk-weighted assets (as defined), and of Tier I capital (as defined) to average assets (as defined). Management believes, as of December 31, 2001, the Corporation and the Bank meet all capital adequacy requirements to which it is subject.
As of December 31, 2001, the most recent notification from the Federal Deposit Insurance Corporation categorized the Bank as well capitalized under the regulatory framework for prompt corrective action. To be categorized as well capitalized the Bank must maintain minimum total risk-based, Tier I risk-based, and Tier I leverage ratios as set forth in the table. There are no conditions or events since that notification that management believes have changed the institution’s category.
The Corporation’s and the Bank’s actual capital amounts and ratios are presented in the table below.
Actual | For Capital Adequacy Purposes | To Be Well Capitalized Under Prompt Corrective Action Provisions | |||||||||||||||||
Amount | Ratio | Amount | Ratio | Amount | Ratio | ||||||||||||||
As of December 31, 2001: | |||||||||||||||||||
Total Capital (to Risk-Weighted Assets) | |||||||||||||||||||
Consolidated | $ | 40,903,000 | 10.44 | % | $ | 31,352,000 | ³ | 8 | % | N/A | N/A | ||||||||
Bank | $ | 39,051,000 | 10.00 | % | $ | 31,256,000 | ³ | 8 | % | $39,070,000 | ³ | 10 | % | ||||||
Tier I Capital (to Risk-Weighted Assets) | |||||||||||||||||||
Consolidated | $ | 37,206,000 | 9.49 | % | $ | 15,676,000 | ³ | 4 | % | N/A | N/A | ||||||||
Bank | $ | 35,354,000 | 9.05 | % | $ | 15,628,000 | ³ | 4 | % | $23,442,000 | ³ | 6 | % | ||||||
Tier I Capital (to Average Assets) | |||||||||||||||||||
Consolidated | $ | 37,206,000 | 6.88 | % | $ | 21,628,000 | ³ | 4 | % | N/A | N/A | ||||||||
Bank | $ | 35,354,000 | 6.58 | % | $ | 21,476,000 | ³ | 4 | % | $26,845,000 | ³ | 5 | % | ||||||
| As of December 31, 2000: | |||||||||||||||||||
| Total Capital (to Risk-Weighted Assets) | |||||||||||||||||||
| Consolidated | $ | 32,543,000 | 10.75 | % | $ | 24,220,000 | ³ | 8 | % | N/A | N/A | ||||||||
| Bank | $ | 30,294,000 | 10.04 | % | $ | 24,151,000 | ³ | 8 | % | $30,188,000 | ³ | 10 | % | ||||||
| Tier I Capital (to Risk-Weighted Assets) | |||||||||||||||||||
| Consolidated | $ | 26,450,000 | 8.74 | % | $ | 12,110,000 | ³ | 4 | % | N/A | N/A | ||||||||
| Bank | $ | 26,773,000 | 8.87 | % | $ | 12,075,000 | ³ | 4 | % | $18,113,000 | ³ | 6 | % | ||||||
| Tier I Capital (to Average Assets) | |||||||||||||||||||
| Consolidated | $ | 26,450,000 | 6.69 | % | $ | 15,816,000 | ³ | 4 | % | N/A | N/A | ||||||||
| Bank | $ | 26,773,000 | 6.80 | % | $ | 15,573,000 | ³ | 4 | % | $19,691,000 | ³ | 5 | % | ||||||
F-33
Table of Contents
RESOURCE BANKSHARES CORPORATION AND SUBSIDIARIES
NOTES TO CONSOLIDATED FINANCIAL STATEMENTS—(Continued)
December 31, 2001 and 2000
NOTE 16—FAIR VALUE OF FINANCIAL INSTRUMENTS
The following table presents the carrying amounts and fair value of the Bank’s financial instruments as of December 31, 2001 and 2000. FASB Statement No. 107,Disclosures about Fair Value of Financial Instruments,defines the fair value of financial instruments as the amount at which the instrument could be exchanged in a current transaction between willing parties, other than in a forced or liquidation sale. The carrying amounts in the table are included in the balance sheets under the indicated captions.
2001 | 2000 | |||||||||||
Carrying Amount | Fair Value | Carrying Amount | Fair Value | |||||||||
(Dollars in thousands) | ||||||||||||
| Financial Assets: | ||||||||||||
| Cash and cash equivalents | $ | 9,610 | $ | 9,610 | $ | 9,342 | $ | 9,342 | ||||
| Loans, net | 341,239 | 352,916 | 284,992 | 293,420 | ||||||||
| Investment securities | 114,635 | 114,635 | 82,122 | 82,342 | ||||||||
| Funds advanced in settlement of mortgage loans | 71,971 | 71,971 | 15,445 | 15,445 | ||||||||
| Accrued interest receivable | 3,367 | 3,367 | 3,011 | 3,011 | ||||||||
| Financial Liabilities: | ||||||||||||
| Deposit liabilities | 411,504 | 416,791 | 330,645 | 331,384 | ||||||||
| Short-term borrowings | 36,800 | 36,800 | 7,546 | 7,546 | ||||||||
| Long-term borrowings | 80,200 | 75,692 | 39,500 | 38,056 | ||||||||
| Accrued interest payable | 4,178 | 4,178 | 2,811 | 2,811 | ||||||||
Estimation of Fair Values
The following notes summarize the major methods and assumptions used in estimating the fair value of financial instruments:
Short-term financial instruments are valued at their carrying amounts included in the Bank’s balance sheet, which are reasonable estimates of fair value due to the relatively short period to maturity of the instruments. This approach applies to cash and cash equivalents, deposits in other banks, funds advanced in settlement of mortgage loans, and short-term borrowings.
Loans are valued on the basis of estimated future receipts of principal and interest, discounted at various rates. Loan prepayments are assumed to occur at the same rate as in previous periods when interest rates were at levels similar to current levels. Future cash flows for homogeneous categories of consumer loans, such as motor vehicle loans, are estimated on a portfolio basis and discounted at current rates offered for similar loan terms to new borrowers with similar credit profiles. The fair value of nonaccrual loans also is estimated on a present value basis, using higher discount rates appropriate to the higher risk involved.
Investment securities are valued at quoted market prices if available. For unquoted securities, the fair value is estimated by the Bank on the basis of financial and other information.
The fair value ofdemand deposits and deposits with no defined maturity is taken to be the amount payable on demand at the reporting date. The fair value offixed—maturity deposits is estimated using rates currently offered for deposits of similar remaining maturities. The intangible value of long-term relationships with depositors is not taken into account in estimating the fair values disclosed.
The carrying amounts ofaccrued interest receivable and payable, and certain other assets approximate fair value.
F-34
Table of Contents
RESOURCE BANKSHARES CORPORATION AND SUBSIDIARIES
NOTES TO CONSOLIDATED FINANCIAL STATEMENTS—(Continued)
December 31, 2001 and 2000
It is not practicable to separately estimate the fair values foroff-balance-sheet credit commitments,including standby letters of credit and guarantees written, due to the lack of cost effective, reliable measurement methods for these instruments.
NOTE 17—EARNINGS PER SHARE RECONCILIATION
The following is a reconciliation of the numerators and denominators of the basic and diluted earnings per share computations.
2001 | 2000 | 1999 | ||||||||
| Net income (loss) (numerator, basic and diluted) | $ | 4,542,621 | $ | 4,232,730 | $ | (690,808 | ) | |||
| Weighted average shares outstanding (denominator) | 2,895,508 | 2,595,474 | 2,524,337 | |||||||
Earnings (loss) per common share-basic | $ | 1.57 | $ | 1.63 | $ | (.27 | ) | |||
| Effect of dilutive securities: | ||||||||||
| Weighted average shares outstanding | 2,895,508 | 2,595,474 | 2,524,337 | |||||||
| Effect of stock options | 157,537 | 118,473 | — | |||||||
| Diluted average shares outstanding (denominator) | 3,053,045 | 2,713,947 | 2,524,337 | |||||||
Earnings (loss) per common share—assuming dilution | $ | 1.49 | $ | 1.56 | $ | (.27 | ) | |||
The effect of dilutive securities was not used to compute diluted earnings per share for 1999, because the effect would have been antidilutive.
F-35
Table of Contents
RESOURCE BANKSHARES CORPORATION AND SUBSIDIARIES
NOTES TO CONSOLIDATED FINANCIAL STATEMENTS—(Continued)
December 31, 2001 and 2000
NOTE 18—CONDENSED FINANCIAL STATEMENTS OF PARENT COMPANY
Financial information pertaining only to Resource Bankshares Corporation is as follows:
Balance Sheets
December 31, | |||||||||||
2001 | 2000 | ||||||||||
Assets | |||||||||||
| Cash and due from banks | $ | 604,274 | $ | 1,450,893 | |||||||
| Cash on deposit at Resource Bank | 5,846,768 | 1,004,331 | |||||||||
| Total cash and due from banks | 6,451,042 | 2,455,224 | |||||||||
| Investment securities available for sale | 51,146 | 278,236 | |||||||||
| Due to Resource Bank | — | (992,167 | ) | ||||||||
| Investment in preferred stock of Resource Capital Trust I | 284,550 | 284,550 | |||||||||
| Investment in preferred stock of Resource Capital Trust II | 155,000 | — | |||||||||
| Investment in preferred stock of Resource Bank | 9,200,000 | 7,350,000 | |||||||||
| Investment in common stock of Resource Bank | 26,931,150 | 19,345,213 | |||||||||
| Other assets | 553,217 | 612,486 | |||||||||
Total assets | $ | 43,626,105 | $ | 29,333,542 | |||||||
Liabilities and Stockholders’ equity | |||||||||||
| Interest payable | $ | 205,634 | $ | 177,292 | |||||||
| Other liabilities | 2,248 | — | |||||||||
| Capital Trust borrowings | 14,639,550 | 9,484,550 | |||||||||
14,847,432 | 9,661,842 | ||||||||||
| Stockholders’ equity | 28,778,673 | 19,671,700 | |||||||||
Total liabilities and stockholders’ equity | $ | 43,626,105 | $ | 29,333,542 | |||||||
Statements of Operations | |||||||||||
Years Ended December 31, | |||||||||||
2001 | 2000 | 1999 | |||||||||
| Income | |||||||||||
| Dividends from Resource Bank | $ | 2,152,645 | $ | 1,486,851 | $ | 1,290,213 | |||||
| Interest and dividends on investments | 43,803 | 58,622 | 30,674 | ||||||||
| Management and service fees | 28,200 | 480,300 | 349,800 | ||||||||
| Gain on sale of assets | 81,311 | — | — | ||||||||
2,305,959 | 2,025,773 | 1,670,687 | |||||||||
| Expenses | |||||||||||
| Interest expense—Capital Trust borrowings | 879,342 | 839,181 | 702,075 | ||||||||
| Other expenses | 213,577 | 204,736 | 179,798 | ||||||||
1,092,919 | 1,043,917 | 881,873 | |||||||||
| Income before income taxes and equity in undistributed net income of Resource Bank | 1,213,040 | 981,856 | 788,814 | ||||||||
| Equity in undistributed net income (loss) of Resource Bank | 3,010,115 | 3,076,146 | (1,653,106 | ) | |||||||
| Income (loss) before tax benefit | 4,223,155 | 4,058,002 | (864,292 | ) | |||||||
| Income tax benefit | 319,466 | 174,728 | 173,484 | ||||||||
| Net income (loss) | $ | 4,542,621 | $ | 4,232,730 | $ | (690,808 | ) | ||||
F-36
Table of Contents
RESOURCE BANKSHARES CORPORATION AND SUBSIDIARIES
NOTES TO CONSOLIDATED FINANCIAL STATEMENTS—(Continued)
December 31, 2001 and 2000
Years Ended December 31, | ||||||||||||
2001 | 2000 | 1999 | ||||||||||
Statement of Cash Flows | ||||||||||||
Cash flows from operating activities | ||||||||||||
| Net income (loss) | $ | 4,542,621 | $ | 4,232,730 | $ | (690,808 | ) | |||||
| Adjustments to reconcile to net cash provided by operating activities: | ||||||||||||
| Accretion of investment securities discounts net of premiums | — | — | (4,448 | ) | ||||||||
| Equity in undistributed net (income) loss of Resource Bank | (3,010,115 | ) | (3,076,146 | ) | 1,653,106 | |||||||
| Gain on sale of assets | (81,311 | ) | — | — | ||||||||
| Changes in: | ||||||||||||
| Other assets | (30,425 | ) | 290,095 | (463,889 | ) | |||||||
| Accrued expenses | 28,342 | (12,417 | ) | 189,111 | ||||||||
| Other liabilities | (989,919 | ) | 388,276 | 104,725 | ||||||||
Net cash provided by operating activities | 459,193 | 1,822,538 | 787,797 | |||||||||
Cash flows from investing activities | ||||||||||||
| Proceeds from sales and maturities of available-for-sale securities | 515,287 | — | — | |||||||||
| Purchases of available-for-sale securities | (19,539 | ) | (33,236 | ) | (426,850 | ) | ||||||
| Purchase of Resource Capital Trust preferred stock | (155,000 | ) | — | (284,550 | ) | |||||||
| Capital contributed to Resource Bank | (4,575,822 | ) | — | — | ||||||||
| Purchase of Resource Bank preferred stock | (1,850,000 | ) | — | (7,350,000 | ) | |||||||
Net cash used by investing activities | (6,085,074 | ) | (33,236 | ) | (8,061,400 | ) | ||||||
Cash flows from financing activities | ||||||||||||
| Proceeds from Capital Trust borrowings | 5,155,000 | — | 9,484,550 | |||||||||
| Proceeds from sale of common stock, net of issuance costs | — | — | — | |||||||||
| Proceeds from sale of common stock upon exercise of stock options | 7,342,211 | 105,745 | 525,548 | |||||||||
| Payments to reacquire common stock | (1,487,033 | ) | (78,515 | ) | (556,240 | ) | ||||||
| Cash dividends paid on common stock | (1,388,479 | ) | (835,613 | ) | (1,011,429 | ) | ||||||
Net cash provided (used) by financing activities | 9,621,699 | (808,383 | ) | 8,442,429 | ||||||||
Net increase in cash and cash equivalents | 3,995,818 | 980,919 | 1,168,826 | |||||||||
Cash and cash equivalents at beginning of year | 2,455,224 | 1,474,305 | 305,479 | |||||||||
Cash and cash equivalents at end of year | $ | 6,451,042 | $ | 2,455,224 | $ | 1,474,305 | ||||||
Federal and state banking regulations place certain restrictions on dividends paid and loans or advances made by the Bank to the Corporation. The total amount of dividends which may be paid at any date is generally limited to the retained earnings of the Bank, and loans or advances are limited to 10% of the Bank's capital stock and surplus on a secured basis.
At December 31, 2001, the Bank's retained earnings available for the payment of dividends without prior regulatory approval was $7,400,000, and funds available for loans or advances amounted to $1,968,000.
In addition, dividends paid by the Bank to the Corporation would be prohibited if the effect thereof would cause the Bank's capital to be reduced below applicable minimum capital requirements.
F-37
Table of Contents
RESOURCE BANKSHARES CORPORATION AND SUBSIDIARIES
NOTES TO CONSOLIDATED FINANCIAL STATEMENTS—(Continued)
December 31, 2001 and 2000
NOTE 19—SEGMENT REPORTING
The Corporation has two reportable segments, its mortgage banking operations and its commercial and other banking operations. The mortgage banking segment originates residential loans and subsequently sells them to investors. The commercial banking and other banking operations provide a broad range of lending and deposit services to individual and commercial customers, including such products as construction loans, and other business financing arrangements. The Corporation does not have other reportable operating segments.
The accounting policies of the segment are the same as those described in the summary of significant accounting policies. The chief operating decision maker of the Corporation evaluates performance based on profit or loss from operations before income taxes.
The Corporation’s reportable segments are strategic business units that offer different products and services. They are managed separately because each segment appeals to different markets and, accordingly, requires different technology and marketing strategies.
The mortgage banking segment’s most significant revenue and expense is noninterest income and noninterest expense, respectively. The segments are reported below for the years ended December 31.
Selected Financial Information
Year Ended December 31, 2001 | Mortgage Banking Operations | Commercial and Other Banking | Total | |||||||||
Net interest income after provision for loan losses | $ | — | $ | 10,837,769 | $ | 10,837,769 | ||||||
Noninterest income | 17,604,748 | 2,539,113 | 20,143,861 | |||||||||
Noninterest expense | (15,274,745 | ) | (9,246,056 | ) | (24,520,801 | ) | ||||||
Net income before income taxes | $ | 2,330,003 | $ | 4,130,826 | $ | 6,460,829 | ||||||
| Year Ended December 31, 2000 | ||||||||||||
| Net interest income after provision for loan losses | $ | — | $ | 8,337,497 | $ | 8,337,497 | ||||||
| Noninterest income | 6,916,584 | 4,973,484 | 11,890,068 | |||||||||
| Noninterest expense | (6,242,594 | ) | (7,866,552 | ) | (14,109,146 | ) | ||||||
| Net income before income taxes | $ | 673,990 | $ | 5,444,429 | $ | 6,118,419 | ||||||
| Year Ended December 31, 1999 | ||||||||||||
| Net interest income after provision for loan losses | $ | — | $ | 4,278,660 | $ | 4,278,660 | ||||||
| Noninterest income | 5,709,225 | 1,102,117 | 6,811,342 | |||||||||
| Noninterest expense | (6,128,122 | ) | (6,039,646 | ) | (12,167,768 | ) | ||||||
| Net loss before income taxes | $ | (418,897 | ) | $ | (658,869 | ) | $ | (1,077,766 | ) | |||
Segment Assets | Mortgage Banking Operations | Commercial Banking | Total | ||||||
| 2001 | $ | 2,398,888 | $ | 562,450,691 | $ | 564,849,579 | |||
| 2000 | $ | 709,879 | $ | 403,784,135 | $ | 404,494,014 | |||
| 1999 | $ | 675,597 | $ | 306,014,088 | $ | 306,689,685 | |||
The Corporation does not have a single external customer from which it derives 10 percent or more of its revenues.
F-38
Table of Contents
RESOURCE BANKSHARES CORPORATION AND SUBSIDIARIES
NOTES TO CONSOLIDATED FINANCIAL STATEMENTS—(Continued)
December 31, 2001 and 2000
NOTE 20—QUARTERLY DATA (UNAUDITED)
Year Ended December 31, 2001 | ||||||||||||||||
Fourth Quarter | Third Quarter | Second Quarter | First Quarter | |||||||||||||
| Interest and dividend income | $ | 8,341,548 | $ | 8,346,969 | $ | 8,019,004 | $ | 7,984,133 | ||||||||
| Interest expense | (5,038,794 | ) | (5,592,928 | ) | (5,538,810 | ) | (5,488,353 | ) | ||||||||
| Net interest income | 3,302,754 | 2,754,041 | 2,480,194 | 2,495,780 | ||||||||||||
| Provision for loan losses | (150,000 | ) | — | — | (45,000 | ) | ||||||||||
| Net interest income after provision for loan losses | 3,152,754 | 2,754,041 | 2,480,194 | 2,450,780 | ||||||||||||
| Noninterest income | 6,246,715 | 5,692,710 | 5,186,460 | 3,017,976 | ||||||||||||
| Noninterest expenses | (7,523,752 | ) | (6,662,303 | ) | (6,204,377 | ) | (4,130,369 | ) | ||||||||
| Income before income taxes | 1,875,717 | 1,784,448 | 1,462,277 | 1,338,387 | ||||||||||||
| Provision for income taxes | (576,967 | ) | (535,500 | ) | (417,355 | ) | (388,386 | ) | ||||||||
| $ | 1,298,750 | $ | 1,248,948 | $ | 1,044,922 | $ | 950,001 | |||||||||
| Earnings per common share: | ||||||||||||||||
| Basic | $ | 0.42 | $ | 0.40 | $ | 0.39 | $ | 0.36 | ||||||||
| Diluted | $ | 0.41 | $ | 0.37 | $ | 0.37 | $ | 0.34 | ||||||||
Year Ended December 31, 2000 | ||||||||||||||||
Fourth Quarter | Third Quarter | Second Quarter | First Quarter | |||||||||||||
| Interest and dividend income | $ | 8,224,008 | $ | 7,252,787 | $ | 6,682,881 | $ | 6,253,123 | ||||||||
| Interest expense | (5,689,192 | ) | (4,901,647 | ) | (4,354,037 | ) | (4,030,426 | ) | ||||||||
| Net interest income | 2,534,816 | 2,351,140 | 2,328,844 | 2,222,697 | ||||||||||||
| Provision for loan losses | — | (1,000,000 | ) | — | (100,000 | ) | ||||||||||
| Net interest income after provision for loan losses | 2,534,816 | 1,351,140 | 2,328,844 | 2,122,697 | ||||||||||||
| Noninterest income | 1,921,563 | 5,712,400 | 2,079,396 | 2,176,709 | ||||||||||||
| Noninterest expenses | (3,307,490 | ) | (4,376,871 | ) | (3,267,390 | ) | (3,157,395 | ) | ||||||||
| Income before income taxes | 1,148,889 | 2,686,669 | 1,140,850 | 1,142,011 | ||||||||||||
| Provision for income taxes | (322,948 | ) | (873,926 | ) | (340,843 | ) | (347,972 | ) | ||||||||
| $ | 825,941 | $ | 1,812,743 | $ | 800,007 | $ | 794,039 | |||||||||
| Earnings per common share: | ||||||||||||||||
| Basic | $ | 0.32 | $ | 0.69 | $ | 0.31 | $ | 0.31 | ||||||||
| Diluted | $ | 0.30 | $ | 0.66 | $ | 0.30 | $ | 0.30 | ||||||||
F-39
Table of Contents
No dealer, salesperson or other person is authorized to give any information or to represent anything not contained in this prospectus. You must not rely on any unauthorized information or representations. This prospectus is an offer to sell only the shares offered hereby, but only under circumstances and in jurisdictions where it is lawful to do so. The information contained in this prospectus is current only as of its date.
| 1 | ||
| 7 | ||
| 12 | ||
| 13 | ||
| 13 | ||
| 14 | ||
| 14 | ||
| 15 | ||
| 16 | ||
| 34 | ||
| 42 | ||
| 49 | ||
| 50 | ||
| 55 | ||
| 57 | ||
| 59 | ||
| 59 | ||
| 59 | ||
| F-1 |
700,000 Shares

Common Stock
PROSPECTUS
BB&T Capital Markets
A Division of Scott & Stringfellow, Inc.

TRIDENT SECURITIES
A Division of McDonald Investments Inc.
, 2003
Table of Contents
PART II
INFORMATION NOT REQUIRED IN PROSPECTUS
Item 13. Other Expenses of Issuance and Distribution
| Securities and Exchange Commission Registration Fee | $ | 1,514 | |
| National Association of Securities Dealers Examination Fee | $ | 1,500 | |
| Nasdaq National Market Fee | $ | 5,000 | |
| Printing Expenses | $ | 15,000 | |
| Accounting Fees and Expenses | $ | 10,000 | |
| Legal Fees and Expenses | $ | 75,000 | |
| Blue Sky Fees and Expenses | $ | 1,000 | |
| Miscellaneous Expenses | $ | 30,986 | |
| Total | $ | 140,000 | |
| * | Represents actual expenses. All other expenses are estimates. |
Item 14. Indemnification of Directors and Officers
Article 10 of Chapter 9 of Title 13.1 of the Code of Virginia, 1950, as amended (the “Code”), permits a Virginia corporation to indemnify any director or officer for reasonable expenses incurred in any legal proceeding in advance of final disposition of the proceeding, if the director or officer furnishes the corporation a written statement of his good faith belief that he has met the standard of conduct prescribed by the Code, and a determination is made by the board of directors that such standard has been met. In a proceeding by or in the right of the corporation, no indemnification shall be made in respect of any matter as to which an officer or director is adjudged to be liable to the corporation, unless the court in which the proceeding took place determines that, despite such liability, such person is reasonably entitled to indemnification in view of all the relevant circumstances. In any other proceeding, no indemnification shall be made if the director or officer is adjudged liable to the corporation on the basis that personal benefit was improperly received by him. Corporations are given the power to make any other or further indemnity, including advance of expenses, to any director or officer that may be authorized by the articles of incorporation or any bylaw made by the shareholders, or any resolution adopted, before or after the event, by the shareholders, except an indemnity against willful misconduct or a knowing violation of the criminal law. Unless limited by its articles of incorporation, indemnification of a director or officer is mandatory when he entirely prevails in the defense of any proceeding to which he is a party because he is or was a director or officer.
The Articles of Incorporation of Resource Bankshares Corporation contain provisions indemnifying the directors and officers of Resource Bankshares Corporation against expenses and liabilities incurred in legal proceedings to the fullest extent permitted by Virginia law.
Item 15. Recent Sales of Unregistered Securities
None.
Item 16. Exhibits and Financial Statement Schedules
See Exhibit Index.
Item 17. Undertakings
Insofar as indemnification for liabilities arising under the Securities Act may be permitted to directors, officers and controlling persons of a Registrant pursuant to the foregoing provisions, or otherwise, the Registrant
II-1
Table of Contents
has been advised that in the opinion of the Commission such indemnification is against public policy as expressed in the Securities Act and is, therefore, unenforceable. In the event that a claim for indemnification against such liabilities (other than the payment by a Registrant of expenses incurred or paid by a director, officer or controlling person of a Registrant in the successful defense of any action, suit or proceeding) is asserted by such director, officer or controlling person in connection with the securities being registered, such Registrant will, unless in the opinion of its counsel the matter has been settled by controlling precedent, submit to a court of appropriate jurisdiction the question whether such indemnification by it is against public policy as expressed in the Securities Act and will be governed by the final adjudication of such issue.
For the purposes of determining any liability under the Securities Act of 1933, the information omitted from the form of prospectus filed as part of this Registration Statement in reliance upon Rule 430A and contained in a form of prospectus filed by the Registrant pursuant to Rule 424(b)(1) or (4) or 497(h) under the Securities Act shall be deemed to be part of this Registration Statement as of the time it was declared effective.
For the purposes of determining any liability under the Securities Act of 1933, each post-effective amendment that contains a form of prospectus shall be deemed to be a new registration statement relating to the securities offered therein and the offering of such securities at that time shall be deemed to be the initial bona fide offering thereof.
II-2
Table of Contents
SIGNATURES
Pursuant to the requirements of the Securities Act of 1933, as amended, the registrant has duly caused this registration statement to be signed on its behalf by the undersigned, thereunto duly authorized, in the City of Virginia Beach, Commonwealth of Virginia, on January 21, 2003.
| RESOURCE BANKSHARES CORPORATION | ||
| By: | /s/ LAWRENCE N. SMITH | |
Lawrence N. Smith Chief Executive Officer | ||
Pursuant to the requirements of the Securities Act of 1933, as amended, this registration statement has been signed by the following persons in the capacities and on the dates indicated.
Signature | Title | Date | ||
* Thomas W. Hunt | Chairman of the Board | January 21, 2003 | ||
* Lawrence N. Smith | Chief Executive Officer and Director (Principal Executive Officer) | January 21, 2003 | ||
* Eleanor J. Whitehurst | Senior Vice President and Chief Financial Officer (Principal Financial Officer and Accounting Officer) | January 21, 2003 | ||
* Alfred E. Abiouness | Director | January 21, 2003 | ||
* T. A. Grell, Jr. | Director | January 21, 2003 | ||
* Louis R. Jones | Director | January 21, 2003 | ||
* A. Russell Kirk | Director | January 21, 2003 | ||
* Elizabeth A. Twohy | Director | January 21, 2003 |
* Lawrence N. Smith, by signing his name hereto, signs this document on behalf of each of the persons indicated by an asterisk above pursuant to a power of attorney duly executed by each such persons and previously filed with the Securities and Exchange Commission as part of the registration statement.
Date: January 21, 2003
/s/ LAWRENCE N. SMITH | ||
Lawrence N. Smith, attorney in fact | ||
II-3
Table of Contents
Exhibit Index
Exhibit No. | Description | ||||
| 1.1 | Underwriting Agreement. | ** | |||
| 2.1 | Amended and Restated Agreement and Plan of Merger, dated as of April 8, 1997 between Resource Bank and Eastern American Bank FSB. (Incorporated by reference to Resource Bank’s Proxy Statement previously filed with the Federal Reserve on June 24, 1997). | * | |||
| 3.1 | Amended and Restated Articles of Incorporation of Resource Bankshares Corporation. (Incorporated by reference to Registrant’s Form 10-Q previously filed with the Commission on August 11, 2000). | * | |||
| 3.2 | Amended and Restated Bylaws of Resource Bankshares Corporation. (Incorporated by reference to Registrant’s Form 10-Q previously filed with the Commission on May 14, 2002). | * | |||
| 4.1 | Certificate of Trust of Resource Capital Trust I. (Incorporated by reference to the Registrant’s Registration Statement on Form S-2, Commission File No. 333-70361, previously filed with the Commission on January 8, 1999). | * | |||
| 4.1 | (a) | Specimen certificate representing shares of common stock. (Incorporated by reference to the Registrant’s Form 8-A, previously filed with the Commission on July 20, 1998) | * | ||
| 4.2 | Trust Agreement dated December 23, 1998 between Resource Bankshares Corporation and Wilmington Trust Company. (Incorporated by reference to the Registrant’s Registration Statement on Form S-2, Commission File No. 333-70361, previously filed with the Commission on January 8, 1999). | * | |||
| 4.3 | Form of Amended and Restated Declaration of Trust for Resource Capital Trust I. (Incorporated by reference to the Registrant’s Registration Statement on Form S-2, Commission File No. 333-70361, previously filed with the Commission on January 8, 1999). | * | |||
| 4.4 | Form of Junior Subordinated Indenture between Resource Bankshares Corporation and Wilmington Trust Company, as Trustee. (Incorporated by reference to the Registrant’s Registration Statement on Form S-2, Commission File No. 333-70361, previously filed with the Commission on January 8, 1999). | * | |||
| 4.5 | Form of Capital Security (included in Exhibit 4.3 above). (Incorporated by reference to the Registrant’s Registration Statement on Form S-2, Commission File No. 333-70361, previously filed with the Commission on January 8, 1999). | * | |||
| 4.6 | Form of Junior Subordinated Debt Security (included in Exhibit 4.4 above). (Incorporated by reference to the Registrant’s Registration Statement on Form S-2, Commission File No. 333-70361, previously filed with the Commission on January 8, 1999). | * | |||
| 4.7 | Form of Guarantee Agreement with respect to Trust Securities issued by Resource Capital Trust I. (Incorporated by reference to the Registrant’s Registration Statement on Form S-2, Commission File No. 333-70361, previously filed with the Commission on January 8, 1999). | * | |||
| 4.8 | Form of Escrow Agreement among McKinnon & Company, Inc., Resource Capital Trust I, Resource Bankshares Corporation and Wilmington Trust Company. (Incorporated by reference to the Registrant’s Registration Statement on Form S-2, Commission File No. 333-70361, previously filed with the Commission on January 8, 1999). | * | |||
| 4.9 | Form of Capital Securities Subscription Agreement among Resource Capital Trust II, Resource Bankshares Corporation and MM Community Funding II, LTD, dated November 14, 2001 (Incorporated by reference to the Registrant’s Form 10-K previously filed with the Commission on March 29, 2002). | * |
II-4
Table of Contents
Exhibit No. | Description | |||
| 4.10 | Form of Resource Capital Trust II Placement Agreement, among Resource Capital Trust II, Resource Bankshares Corporation and Sandler O’Neill & Partners, L.P., dated November 14, 2001 (Incorporated by reference to the Registrant’s Form 10-K previously filed with the Commission on March 29, 2002). | * | ||
| 4.11 | Form of Declaration of Trust of Resource Capital Trust II between Resource Bankshares Corporation and Wilmington Trust Company, dated November 7, 2001 (Incorporated by reference to the Registrant’s Form 10-K previously filed with the Commission on March 29, 2002). | * | ||
| 4.12 | Form of Amended and Restated Declaration of Trust – Resource Capital Trust II, dated November 28, 2001 (Incorporated by reference to the Registrant’s Form 10-K previously filed with the Commission on March 29, 2002). | * | ||
| 4.13 | Form of Guarantee Agreement dated November 28, 2001, with respect to the Capital Securities issued by Resource Capital Trust II (Incorporated by reference to the Registrant’s Form 10-K previously filed with the Commission on March 29, 2002). | * | ||
| 4.14 | Form of Capital Security Certificate (Incorporated by reference to the Registrant’s Form 10-K previously filed with the Commission on March 29, 2002). | * | ||
| 4.15 | Form of Common Securities Subscription Agreement, dated November 28, 2001, between Resource Capital Trust II and Resource Bankshares Corporation (Incorporated by reference to the Registrant’s Form 10-K previously filed with the Commission on March 29, 2002). | * | ||
| 4.16 | Form of Common Security Certificate (Incorporated by reference to the Registrant’s Form 10-K previously filed with the Commission on March 29, 2002). | * | ||
| 4.17 | Form of Indenture dated November 28, 2001 between Resource Bankshares Corporation and Wilmington Trust Company (Incorporated by reference to the Registrant’s Form 10-K previously filed with the Commission on March 29, 2002). | * | ||
| 4.18 | Form of Debenture Subscription Agreement, dated November 28, 2001, between Resource Bankshares Corporation and Resource Capital Trust II (Incorporated by reference to the Registrant’s Form 10-K previously filed with the Commission on March 29, 2002). | * | ||
| 4.19 | Form of Junior Subordinated Debt Security (Incorporated by reference to the Registrant’s Form 10-K previously filed with the Commission on March 29, 2002). | * | ||
| 4.20 | Form of Capital Securities Subscription Agreement among Resource Capital Trust III, Resource Bankshares Corporation and TPref Funding II, LTD, dated October 16, 2002. (Incorporated by reference to the Registrant’s Registration Statement on Form S-1, previously filed with the Commission on December 6, 2002). | * | ||
| 4.21 | Form of Resource Capital Trust III Placement Agreement, among Resource Capital Trust III, Resource Bankshares Corporation and Bear, Stearns & Co. Inc. dated October 29, 2002, (Incorporated by reference to the Registrant’s Registration Statement on Form S-1, previously filed with the Commission on December 6, 2002). | * | ||
| 4.22 | Form of Amended and Restated Declaration of Trust – Resource Capital Trust III, dated October 29, 2002. (Incorporated by reference to the Registrant’s Registration Statement on Form S-1, previously filed with the Commission on December 6, 2002). | * | ||
| 4.23 | Form of Guarantee Agreement dated October 29, 2002, with respect to the Capital Securities issued by Resource Capital Trust III. (Incorporated by reference to the Registrant’s Registration Statement on Form S-1, previously filed with the Commission on December 6, 2002). | * |
II-5
Table of Contents
Exhibit No. | Description | |||
| 4.24 | Form of Capital Security Certificate. (Incorporated by reference to the Registrant’s Registration Statement on Form S-1, previously filed with the Commission on December 6, 2002). | * | ||
| 4.25 | Form of Common Securities Subscription Agreement, dated October 29, 2002, between Resource Capital Trust III and Resource Bankshares Corporation. (Incorporated by reference to the Registrant’s Registration Statement on Form S-1, previously filed with the Commission on December 6, 2002). | * | ||
| 4.26 | Form of Common Security Certificate. (Incorporated by reference to the Registrant’s Registration Statement on Form S-1, previously filed with the Commission on December 6, 2002). | * | ||
| 4.27 | Form of Indenture dated October 29, 2002 between Resource Bankshares Corporation and Wells Fargo Bank, National Association. (Incorporated by reference to the Registrant’s Registration Statement on Form S-1, previously filed with the Commission on December 6, 2002). | * | ||
| 4.28 | Form of Debenture Subscription Agreement, dated October 29, 2002, between Resource Bankshares Corporation and Resource Capital Trust III. (Incorporated by reference to the Registrant’s Registration Statement on Form S-1, previously filed with the Commission on December 6, 2002). | * | ||
| 4.29 | Form of Junior Subordinated Debt Security. | ** | ||
| 5.1 | Opinion of Kaufman & Canoles as to legality of securities being offered. | ** | ||
| 10.1 | Director’s Stock Option Agreement dated June 15, 1989. (Incorporated by reference to Registrant’s Form 10-KSB previously filed with the Federal Reserve on April 28, 1993). | * | ||
| 10.2 | Non-Employee Director Incentive Stock Option Plan dated June 15, 1989. (Incorporated by reference to Registrant’s Form 10-KSB previously filed with the Federal Reserve on April 28, 1993). | * | ||
| 10.3 | Lease Agreement dated November 1, 1990 by and between Birchwood Mall Associates and Resource Bank and letter dated November 12, 1992 from Resource Bank to Fleder, Caplan, Jaffee Associates to amend the lease. (Incorporated by reference to Registrant’s Form 10-KSB previously filed with the Federal Reserve on April 28, 1993). | * | ||
| 10.4 | Resource Bank 1993 Long-Term Incentive Plan. (Incorporated by reference to Registrant’s Form 10-KSB previously filed with the Federal Reserve on March 22, 1994). | * | ||
| 10.5 | Resource Bank 1993 Long-Term Incentive Plan, First Amendment. (Incorporated by reference to Registrant’s Form 10-KSB previously filed with the Federal Reserve on March 30, 1995). | * | ||
| 10.6 | Lease Agreement dated September 22, 1994 by and between Resource Mortgage and A.R. Marketing, Inc. (Incorporated by reference to Registrant’s Form 10-KSB previously filed with the Federal Reserve on March 30, 1995). | * | ||
| 10.7 | Assignment of Lease dated February 28, 1994 with Resource Mortgage to Contract Publishing, Inc. (Incorporated by reference to Registrant’s Form 10-KSB previously filed with the Federal Reserve on March 30, 1995). | * | ||
| 10.8 | Resource Bank 1994 Long-Term Incentive Plan. (Incorporated by reference to Registrant’s Form 10-KSB previously filed with the Federal Reserve on March 30, 1995). | * | ||
| 10.9 | Lease Agreement and Addendum to Lease both dated April 20, 1995, and First Lease Amendment dated December 13, 1995 to Lease by and between Glen Forst Professional Center Associates and Resource Bank. (Incorporated by reference to Registrant’s Form 10-KSB previously filed with the Federal Reserve on March 20, 1996). | * |
II-6
Table of Contents
Exhibit No. | Description | |||
| 10.10 | Lease Agreement dated April 1, 1994 by and between Whooping Crane Limited Partnership and Southern Mortgage Financial Company. (Incorporated by reference to Registrant’s Form 10-KSB previously filed with the Federal Reserve on March 20, 1996). | * | ||
| 10.11 | Resource Bank Retirement Savings Plan. (Incorporated by reference to Registrant’s Form 10-KSB previously filed with the Federal Reserve on March 20, 1996). | * | ||
| 10.12 | Resource Bank 1993 Long-Term Incentive Plan, Second Amendment. (Incorporated by reference to Registrant’s Form 10-KSB previously filed with the Federal Reserve on March 31, 1997). | * | ||
| 10.13 | Lease Agreement and Addendum to Lease both dated May 1, 1996 by and between Birchwood Mall Associates and Resource Bank. (Incorporated by reference to Registrant’s Form 10-KSB previously filed with the Federal Reserve on March 31, 1997). | * | ||
| 10.14 | Resource Bank 1994 Long-Term Incentive Plan, First Amendment. (Incorporated by reference to Registrant’s Form 10-KSB previously filed with the Federal Reserve on March 31, 1997). | * | ||
| 10.15 | Resource Bank 1996 Long-Term Incentive Plan, Amended and Restated. (Incorporated by reference to Registrant’s Form 10-KSB previously filed with the Federal Reserve on March 31, 1998). | * | ||
| 10.16 | Lease Agreement dated July 22, 1997 by and between Washington Real Estate Investment Trust and Resource Bank. (Incorporated by reference to Registrant’s Form 10-KSB previously filed with the Federal Reserve on March 31, 1998). | * | ||
| 10.17 | Lease Agreement dated July 19, 1993 by and between Reston North Point Village Limited Partnership and Eastern American Bank, FSB. (Incorporated by reference to Registrant’s Form 10-KSB previously filed with the Federal Reserve on March 31, 1998). | * | ||
| 10.18 | Lease Agreement dated July 18, 1995 by and between The Richmond Corporation and Eastern American Bank, FSB. (Incorporated by reference to Registrant’s Form 10-KSB previously filed with the Federal Reserve on March 31, 1998). | * | ||
| 10.19 | Lease Agreement dated October 31, 1995 by and between Elden Investments, L.L.C. and Eastern American Bank, FSB. (Incorporated by reference to Registrant’s Form 10-KSB previously filed with the Federal Reserve on March 31, 1998) | * | ||
| 10.20 | Lease Agreement dated October 24, 1994 by and between Greenbrier Point Partners, L.P. and CitizensBanc Mortgage Company and Assignment, Assumption and Release Agreement dated January 7, 1997 among Citizens Mortgage Company, Resource Bank and Greenbrier Point Partners, L.P. (Incorporated by reference to Registrant’s Form 10-KSB previously filed with the Federal Reserve on March 31, 1998). | * | ||
| 10.21 | Lease Agreement dated December 5, 1996 and Amendment dated August 5, 1997 by and between The Bon Air Green Company and Resource Bank. (Incorporated by reference to Registrant’s Form 10-KSB previously filed with the Federal Reserve on March 31, 1998). | * | ||
| 10.22 | Employment Agreement dated January 1, 1999 by and between Resource Bank and T. A. Grell, Jr. (Incorporated by reference to Registrant’s Form 10-K previously filed with the Securities & Exchange Commission on March 31, 1999). | * | ||
| 10.23 | Employment Agreement dated January 1, 1999 by and between Resource Bank and Harvard R. Birdsong, as amended. (Incorporated by reference to Registrant’s Form 10-Q previously filed with the Securities & Exchange Commission on August 16, 1999). | * | ||
| 10.24 | Employment Agreement dated January 1, 1999 by and between Resource Bank and Debra C. Dyckman, as amended. (Incorporated by reference to Registrant’s Form 10-Q previously filed with the Securities & Exchange Commission on August 16, 1999). | * |
II-7
Table of Contents
Exhibit No. | Description | |||
| 10.25 | Employment Agreement dated January 1, 1999 by and between Resource Bank and Lawrence N. Smith, as amended. (Incorporated by reference to Registrant’s Form 10-Q previously filed with the Securities & Exchange Commission on August 16, 1999). | * | ||
| 10.26 | Employment Agreement dated January 1, 1999 by and between Resource Bank and Eleanor J. Whitehurst, as amended. (Incorporated by reference to Registrant’s Form 10-Q previously filed with the Securities & Exchange Commission on August 16, 1999). | * | ||
| 10.27 | First Amendment to Employment Agreement dated January 1, 1999 by and between Resource Bank and T. A. Grell, Jr. (Incorporated by reference to Registrant’s Form 10-Q previously filed with the Securities & Exchange Commission on August 16, 1999). | * | ||
| 10.28 | Employment Agreement dated June 27, 2002 by and between Resource Bank and Lawrence N. Smith. (Incorporated by reference to the Registrant’s Registration Statement on Form S-1, previously filed with the Commission on December 6, 2002). | * | ||
| 10.29 | Employment Agreement dated June 27, 2002 by and between Resource Bank and T. A. Grell, Jr. | * | ||
| 10.30 | Employment Agreement dated June 27, 2002 by and between Resource Bank and Harvard R. Birdsong. (Incorporated by reference to the Registrant’s Registration Statement on Form S-1, previously filed with the Commission on December 6, 2002). | * | ||
| 10.31 | Employment Agreement dated June 27, 2002 by and between Resource Bank and Debra C. Dyckman. (Incorporated by reference to the Registrant’s Registration Statement on Form S-1, previously filed with the Commission on December 6, 2002). | * | ||
| 10.32 | Employment Agreement dated June 27, 2002 by and between Resource Bank and James M. Miller. (Incorporated by reference to the Registrant’s Registration Statement on Form S-1, previously filed with the Commission on December 6, 2002). | * | ||
| 10.33 | Amended and Restated Resource Bank Stock and 401(k) Savings Plan. (Incorporated by reference to the Registrant’s Registration Statement on Form S-1, previously filed with the Commission on December 6, 2002). | * | ||
| 10.34 | Amendment to Resource Bankshares Corporation 2001 Stock Incentive Plan. (Incorporated by reference to Registrant’s Form S-8 previously filed with the Securities & Exchange Commission on November 27, 2002). | * | ||
| 10.35 | Amendment No. Two to Resource Bank Stock and 401(k) Savings Plan. | ** | ||
| 21.1 | Subsidiaries of Registrant. (Incorporated by reference to the Registrant’s Form 10-K, previously filed with the Commission on March 29, 2002) | * | ||
| 23.1 | Consent of Kaufman & Canoles contained in Exhibit 5.1 hereto. | ** | ||
| 23.2 | Consent of Goodman & Company, L.L.P. | ** | ||
| 24.1 | Powers of Attorney (included on signature page). | * |
| * | Not filed herewith; incorporated by reference. |
| ** | Filed herewith. |
| *** | To be filed by amendment. |
II-8