Exhibit 99.1
July 15, 2015
Fellow shareholders,
In Q2, we eclipsed 65 million members, with over 42 million in the US and 23 million internationally. We are at the forefront of a wave of global Internet TV adoption and intend to make our service available throughout the world by the end of 2016. Our summary results and Q3 forecast are below.
|
| | | | | | | | | | | | | | | | | | |
| (in millions except per share data and Streaming Content Obligations) | Q2 '14 | Q3 '14 | Q4 '14 | Q1 '15 | Q2 '15 | Q3 '15 Forecast |
| Total Streaming: | | | | | | |
| Revenue | $ | 1,146 |
| $ | 1,223 |
| $ | 1,305 |
| $ | 1,400 |
| $ | 1,481 |
| $ | 1,593 |
|
| Contribution Profit | $ | 212 |
| $ | 220 |
| $ | 178 |
| $ | 247 |
| $ | 248 |
| $ | 272 |
|
| Contribution Margin | 18.5 | % | 18.0 | % | 13.6 | % | 17.7 | % | 16.7 | % | 17.1 | % |
| Paid Memberships | 47.99 |
| 50.65 |
| 54.48 |
| 59.62 |
| 62.71 |
| 66.61 |
|
| Total Memberships | 50.05 |
| 53.06 |
| 57.39 |
| 62.27 |
| 65.55 |
| 69.10 |
|
| Net Additions | 1.69 |
| 3.02 |
| 4.33 |
| 4.88 |
| 3.28 |
| 3.55 |
|
| | | | | | | |
| US Streaming: | | | | | | |
| Revenue | $ | 838 |
| $ | 877 |
| $ | 917 |
| $ | 985 |
| $ | 1,026 |
| $ | 1,069 |
|
| Contribution Profit | $ | 227 |
| $ | 251 |
| $ | 257 |
| $ | 312 |
| $ | 340 |
| $ | 349 |
|
| Contribution Margin | 27.1 | % | 28.6 | % | 28.0 | % | 31.7 | % | 33.1 | % | 32.6 | % |
| Paid Memberships | 35.09 |
| 36.27 |
| 37.70 |
| 40.32 |
| 41.06 |
| 42.51 |
|
| Total Memberships | 36.24 |
| 37.22 |
| 39.11 |
| 41.40 |
| 42.30 |
| 43.45 |
|
| Net Additions | 0.57 |
| 0.98 |
| 1.90 |
| 2.28 |
| 0.90 |
| 1.15 |
|
| | | | | | | |
| International Streaming: | | | | | | |
| Revenue | $ | 307 |
| $ | 346 |
| $ | 388 |
| $ | 415 |
| $ | 455 |
| $ | 524 |
|
| Contribution Profit (Loss) | $ | (15 | ) | $ | (31 | ) | $ | (79 | ) | $ | (65 | ) | $ | (92 | ) | $ | (77 | ) |
| Contribution Margin | -5.0 | % | -8.9 | % | -20.3 | % | -15.6 | % | -20.2 | % | -14.7 | % |
| Paid Memberships | 12.91 |
| 14.39 |
| 16.78 |
| 19.30 |
| 21.65 |
| 24.10 |
|
| Total Memberships | 13.80 |
| 15.84 |
| 18.28 |
| 20.88 |
| 23.25 |
| 25.65 |
|
| Net Additions | 1.12 |
| 2.04 |
| 2.43 |
| 2.60 |
| 2.37 |
| 2.40 |
|
| | | | | | | |
| Total (including DVD): | | | | | | |
| Operating Income | $ | 130 |
| $ | 110 |
| $ | 65 |
| $ | 97 |
| $ | 75 |
| $ | 81 |
|
| Net Income* | $ | 71 |
| $ | 59 |
| $ | 83 |
| $ | 24 |
| $ | 26 |
| $ | 31 |
|
| EPS* | $ | 0.16 |
| $ | 0.14 |
| $ | 0.19 |
| $ | 0.05 |
| $ | 0.06 |
| $ | 0.07 |
|
| | | | | | | |
| Free Cash Flow | $ | 16 |
| $ | (74 | ) | $ | (78 | ) | $ | (163 | ) | $ | (229 | ) | |
| EBITDA | $ | 172 |
| $ | 155 |
| $ | 110 |
| $ | 140 |
| $ | 119 |
| |
| Shares (FD)* | 431.4 |
| 432.7 |
| 432.5 |
| 433.8 |
| 436.1 |
| |
| Streaming Content Obligations** ($B) | 7.7 |
| 8.9 |
| 9.5 |
| 9.8 |
| 10.1 |
| |
| * EPS and shares adjusted for 7-for-1 stock split. Q4'14 Net Income/EPS includes a $39m / $0.10 benefit from a tax accrual release related to resolution of tax audit |
| **Corresponds to our total known streaming content obligations as defined in our financial statements and related notes in our most recently filed SEC Form 10-K |
Q2 Results and Q3 Forecast
We added a Q2 record 3.3 million new streaming members, compared to 1.7 million in the previous year quarter. As a reminder, the quarterly guidance we provide is our actual internal forecast at the time we report and we clearly under-forecast in Q2 (forecast was 2.5 million net adds). We strive for accuracy in the forecast and our Q3 estimates are based on everything we know up to today.
We gained 0.9 million members in the US and added 2.4 million members internationally in Q2. We believe the higher than anticipated level of acquisition was fueled by the growing strength of our original programming slate, which in Q2 included the first seasons of Marvel’s Daredevil, Sense8, Dragons: Race to the Edge and Grace and Frankie as well as season 3 of Orange is the New Black. US revenue growth was also driven by a 5% year over year increase in ASP due to uptake in our HD 2-stream plan. We continue to target a 40% US contribution margin by 2020, even though we are running ahead of plan given stronger than expected top line performance and lower content and other streaming costs. We are forecasting Q3 US net adds of 1.15 million, slightly higher than the year ago period.
Our international segment is growing at a rapid pace. We did not add additional markets in Q2 but saw continued improvement across existing markets, including a full quarter of additions from our successful March 24, 2015 launch in Australia/New Zealand. We project Q3 international net adds of 2.4 million.
International revenue grew 48% year over year, despite an -$83 million impact from currency (+5% ASP growth x-F/X). As we expected, international losses increased sequentially with a full quarter of operating costs in AU/NZ. We expect this trend to continue in the second half as we launch additional markets (Japan in Q3 and Spain, Italy and Portugal in Q4) and prepare for further global expansion in 2016, including China as we continue to explore options there.
EPS for Q2 amounted to $0.06 after adjustment for our 7-for-1 stock split (EPS would have been $0.42 using pre-split share count). We remain committed to running around break-even globally on a net income basis through 2016, and to then deliver material global profits in 2017 and beyond.
Content
We are making great progress shifting to exclusive content and expanding our original content, which differentiates our service, drives enjoyment for existing members and helps motivate consumers to join Netflix.
In Q2, we launched our largest number to date of high profile Netflix original series. On April 10, Marvel’s Daredevil debuted to strong audience engagement, particularly for a new show. Grace and Frankie, the bittersweet comedy starring Lily Tomlin and Jane Fonda which launched on May 8, also has found a broad and appreciative audience around the world. Both series have already begun their second season of production.
Our global expansion extends to our content strategy as well. Sense8, the mind-bending cinematic thriller from the Wachowski siblings and J. Michael Straczynski that debuted June 5, is an ambitious, truly international show with talent behind and in front of the camera from multiple countries. Similarly, on August 7, we will launch in all territories our first non-English language original, Club de Cuervos1, a family comedy set in the world of futbol from Mexican filmmaker Gaz Alazraki, and on August 28, Narcos2, a gripping account of the roots of the cocaine trade, shot in Colombia and starring the great Brazilian star Wagner Moura as Pablo Escobar.
_______________
1https://www.youtube.com/watch?v=9x3c8P3ooik&feature=youtu.be
2https://www.youtube.com/watch?v=U7elNhHwgBU&feature=youtu.be
The original documentary Chef’s Table and our latest DreamWorks Animation series Dragons: Race to the Edge are among our most viewed new originals to date. They are the perfect example of what we strive for in our original programming; an elevated version of popular genres that reach a large audience globally.
We closed the quarter with season 3 of Orange is the New Black, which went live on June 11 and set off a social media shockwave around the world. On the following Sunday, Netflix members globally watched a record number of hours in a single day, led by Orange, despite the season finale of HBO’s Game of Thrones and game five of the NBA finals also falling on that Sunday. Global enthusiasm for the third season of Orange underlines our ability to create franchise properties that bring new members to Netflix as well as delighting current ones. Nearly ninety percent of Netflix members have engaged with Netflix original content, another indicator that we are on the right path.
We anticipate that as our global content spend approaches $5 billion in 2016 on a P&L basis (over $6 billion cash), we will devote more investment to originals both in absolute dollars and percentage terms. This includes not only series, documentaries and stand-up but also original feature films.
We are moving into the original film business in order to have new, high-quality movies that our global members can find only on Netflix. As with series, we’ve chosen to take a portfolio approach covering a wide variety of genres and based around creators with great track records and stories they are passionate about. The first of our films, Beasts of No Nation, a gripping war drama from the award-winning director Cary Fukunaga (True Detective) and starring award-winning Idris Elba (Mandela, Luther, The Wire) will be available to all Netflix members and in select theaters in October. In June, we announced War Machine, a provocative satirical comedy starring Brad Pitt, which will be exclusively available to Netflix members and in select theaters next year. The release schedule for our slate of original films can be found here3.
Product
In June, we unveiled the new Netflix website, our first major update in over four years. The new experience has been built from the ground up to make it faster and easier for our members to discover great content to watch. The UI is a richer and more visual experience with improved title art and a better details view. It also works more like an app and less like a series of linked web pages. Early feedback has been positive from both members and the media, and retention should benefit.
In support of expanding our service globally, we are focused on adding more languages, optimizing our personalization algorithms for a global library in local markets, and expanding support for a range of device, operator and payment partnerships. We are also placing a greater emphasis on optimizing for mobile, which is the main means for Internet access in many emerging markets where we will be expanding in the future.
_______________
3https://pr.netflix.com/WebClient/getNewsSummary.do?newsId=2282
Strong Net Neutrality
Charter Communications made net neutrality history today by committing to open and free interconnection across the Charter/TWC network, if their pending merger is approved. This move ensures that all online video providers can aggressively compete for consumers' favor, without selective and increasing fees paid to ISPs. Charter's interconnection policy is the right way to scale the Internet. It means consumer will receive the fast connection speeds they expect. The Charter/TWC transaction, with this condition, would deliver significant public interest benefits to broadband consumers, and we urge its timely approval.
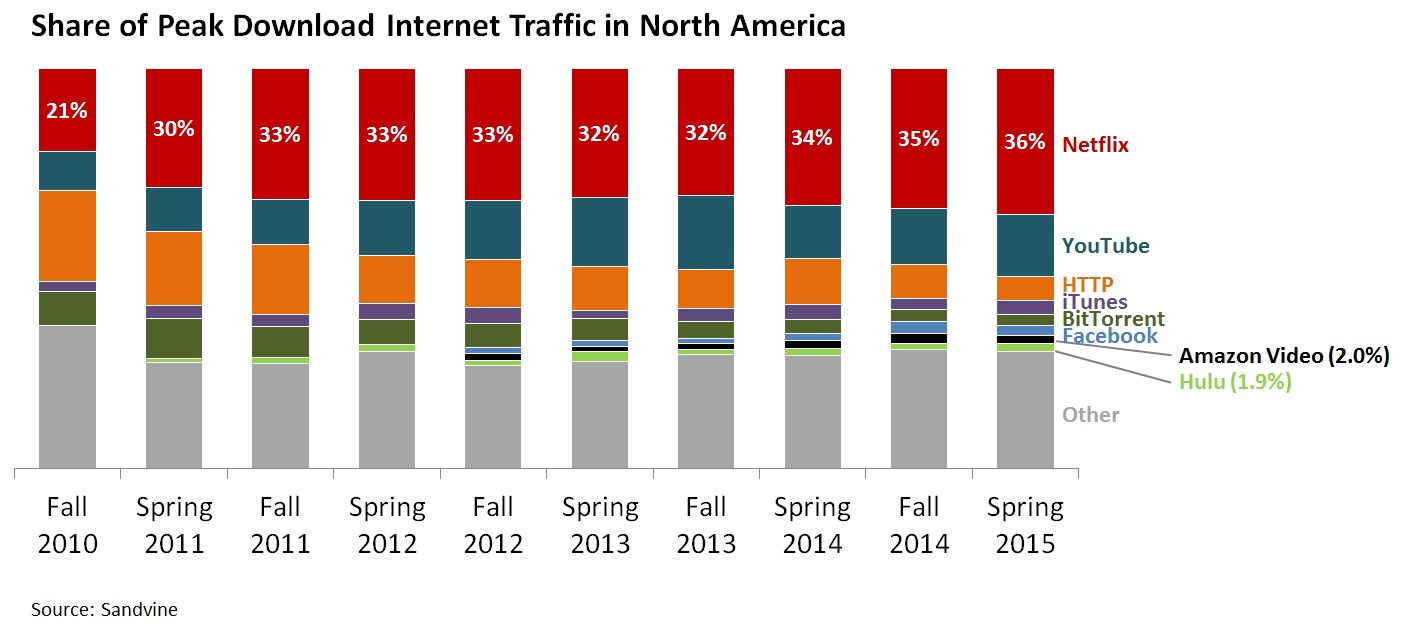
Competition
We compete with linear TV, PPV, video piracy, other Internet networks, video gaming and many other sources of entertainment. The recent Sandvine results from North America show that, looking at just the Internet networks segment, we continue to improve faster than others. Note that this data measures peak megabits, not peak viewing hours, so YouTube, for example, with more modest average video quality, is underrepresented in terms of hours.
DVD
Our DVD-by-mail business in the US continues to serve 5.3 million members and provided $77.9 million in contribution profit in Q2. The broad selection of titles, including new release movies and TV shows, remains appealing to a core user base and means that the tail on this business should be quite long.
Free Cash Flow & Capital
Free cash flow in Q2 amounted to -$229 million, compared with -$163 million in Q1. As we have previously detailed, our investment in originals is working capital intensive, which results in higher cash spent upfront relative to content amortization, and, we anticipate this trend to continue given our increased investment in originals. At the end of Q2, gross debt totaled $2.4 billion, which represented 4.6x LTM EBITDA and we ended the quarter with $2.8 billion in cash & equivalents and short term investments.
Reference
For quick reference, our eight most recent investor letters are: April 20154, January 20155, October 20146,July 20147,April 20148, January 20149, October 201310, July 201311.
Summary
We’re pleased to see the growing momentum of our original programming driving strong growth in the US and abroad. With our first set of international markets having achieved contribution profitability, we’ll be making our first foray into Asia this Fall with our Japan launch, and are gearing up to offer our service around the globe.
Sincerely,
|
| |
| |
| Reed Hastings, CEO | David Wells, CFO |
| |
________________________
4http://files.shareholder.com/downloads/NFLX/4124769775x7871834x821407/DB785B50-90FE-44DA-9F5B-37DBF0DCD0E1/Q1_15_Earnings_Letter_final_tables.pdf
5http://files.shareholder.com/downloads/NFLX/4124769775x7871834x804108/043a3015-36ec-49b9-907c-27960f1a7e57/Q4_14_Letter_to_shareholders.pdf
6http://files.shareholder.com/downloads/NFLX/3754169286x0x786677/6974d8e9-5cb3-4009-97b1-9d4a5953a6a5/Q3_14_Letter_to_shareholders.pdf
7http://files.shareholder.com/downloads/NFLX/3527949458x0x769748/9b21df7f-743c-4f0f-94da-9f13e384a3d2/July2014EarningsLetter_7.21.14_final.pdf
8http://files.shareholder.com/downloads/NFLX/3337146746x0x745654/fb5aaae0-b991-4e76-863c-3b859c8dece8/Q114%20Earnings%20Letter%204.21.14%20final.pdf
9http://files.shareholder.com/downloads/NFLX/3337146746x0x720306/119321bc-89c3-4306-93ac-93c02da2354f/Q4%2013%20Letter%20to%20shareholders.pdf
10http://files.shareholder.com/downloads/NFLX/2531040512x0x698481/ecfe1ab4-66f5-4e23-a64a-1ca025216e5e/Q313%20Earnings%20Letter%2010.21.13%2010.30am.pdf
11http://files.shareholder.com/downloads/NFLX/2531040512x0x678215/a9076739-bc08-421e-8dba-52570f4e489e/Q213%20Investor%20Letter.pdf
July 15th, 2015 Earnings Interview
Reed Hastings, David Wells and Ted Sarandos will participate in a live video interview today at 1:30 p.m. Pacific Time at youtube.com/netflixir. The discussion will be moderated by Mark Mahaney, RBC Capital Markets and Rich Greenfield, BTIG Research. Questions that investors would like to see asked should be sent to mark.mahaney@rbccm.com or michael@moffettnathanson.com.
|
| |
| IR Contact: | PR Contact: |
| Spencer Wang | Jonathan Friedland |
| Vice President, Finance & Investor Relations | Chief Communications Officer |
| 408 540-3700 | 310 734-2958 |
Use of Non-GAAP Measures
This shareholder letter and its attachments include reference to the non-GAAP financial measures of net income on a pro forma basis excluding the release of tax reserves, free cash flow and EBITDA. Management believes that the non-GAAP measures of net income on a pro forma basis excluding the release of tax reserves provides useful information as these measures exclude effects that are not indicative of our core operating results. Management believes that free cash flow and EBITDA are important liquidity metrics because they measure, during a given period, the amount of cash generated that is available to repay debt obligations, make investments and for certain other activities. However, these non-GAAP measures should be considered in addition to, not as a substitute for or superior to, net income, operating income, diluted earnings per share and net cash provided by operating activities, or other financial measures prepared in accordance with GAAP. Reconciliation to the GAAP equivalent of these non-GAAP measures are contained in tabular form on the attached unaudited financial statements.
Forward-Looking Statements
This shareholder letter contains certain forward-looking statements within the meaning of the federal securities laws, including statements regarding US contribution margin growth; international expansion; content launches; product improvements; content spend, including investments in originals; lifespan of our DVD business; member growth domestically and internationally, including net, total and paid; revenue; contribution profit (loss) and contribution margin for both domestic (streaming and DVD) and international operations, as well as consolidated operating income, net income, earnings per share and free cash flow. The forward-looking statements in this letter are subject to risks and uncertainties that could cause actual results and events to differ, including, without limitation: our ability to attract new members and retain existing members; our ability to compete effectively; maintenance and expansion of device platforms for streaming; fluctuations in consumer usage of our service; service disruptions; production risks; actions of Internet Service Providers; and, competition, including consumer adoption of different modes of viewing in-home filmed entertainment. A detailed discussion of these and other risks and uncertainties that could cause actual results and events to differ materially from such forward-looking statements is included in our filings with the Securities and Exchange Commission, including our Annual Report on Form 10-K filed with the Securities and Exchange Commission on January 29, 2015. The Company provides internal forecast numbers. Investors should anticipate that actual performance will vary from these forecast numbers based on risks and uncertainties discussed above and in our Annual Report on Form 10-K. We undertake no obligation to update forward-looking statements to reflect events or circumstances occurring after the date of this shareholder letter.
Netflix, Inc.
Consolidated Statements of Operations
(unaudited)
(in thousands, except per share data)
|
| | | | | | | | | | | | | | | | | | | |
| | Three Months Ended | | Six Months Ended |
| | June 30,
2015 | | March 31,
2015 | | June 30,
2014 | | June 30,
2015 | | June 30,
2014 |
| Revenues | $ | 1,644,694 |
| | $ | 1,573,129 |
| | $ | 1,340,407 |
| | $ | 3,217,823 |
| | $ | 2,610,496 |
|
| Cost of revenues | 1,121,752 |
| | 1,046,401 |
| | 914,848 |
| | 2,168,153 |
| | 1,784,034 |
|
| Marketing | 197,140 |
| | 194,677 |
| | 120,763 |
| | 391,817 |
| | 257,861 |
|
| Technology and development | 155,061 |
| | 143,106 |
| | 115,182 |
| | 298,167 |
| | 225,492 |
|
| General and administrative | 95,906 |
| | 91,489 |
| | 60,014 |
| | 187,395 |
| | 115,914 |
|
| Operating income | 74,835 |
| | 97,456 |
| | 129,600 |
| | 172,291 |
| | 227,195 |
|
| Other income (expense): | | | | | | | | | |
| Interest expense | (35,217 | ) | | (26,737 | ) | | (13,328 | ) | | (61,954 | ) | | (23,380 | ) |
| Interest and other income (expense) | 872 |
| | (32,293 | ) | | 1,100 |
| | (31,421 | ) | | 2,501 |
|
| Income before income taxes | 40,490 |
| | 38,426 |
| | 117,372 |
| | 78,916 |
| | 206,316 |
|
| Provision for income taxes | 14,155 |
| | 14,730 |
| | 46,354 |
| | 28,885 |
| | 82,183 |
|
| Net income | $ | 26,335 |
| | $ | 23,696 |
| | $ | 71,018 |
| | $ | 50,031 |
| | $ | 124,133 |
|
| Earnings per share: | | | | | | | | | |
| Basic | $ | 0.06 |
| | $ | 0.06 |
| | $ | 0.17 |
| | $ | 0.12 |
| | $ | 0.30 |
|
| Diluted | $ | 0.06 |
| | $ | 0.05 |
| | $ | 0.16 |
| | $ | 0.12 |
| | $ | 0.29 |
|
| Weighted-average common shares outstanding: | | | | | | | | | |
| Basic | 425,340 |
| | 423,624 |
| | 419,974 |
| | 424,486 |
| | 419,349 |
|
| Diluted | 436,097 |
| | 433,809 |
| | 431,441 |
| | 434,958 |
| | 431,141 |
|
Netflix, Inc.
Consolidated Balance Sheets
(unaudited)
(in thousands, except share and par value data)
|
| | | | | | | |
| | As of |
| | June 30,
2015 | | December 31,
2014 |
| Assets | | | |
| Current assets: | | | |
| Cash and cash equivalents | $ | 2,293,872 |
| | $ | 1,113,608 |
|
| Short-term investments | 502,886 |
| | 494,888 |
|
| Current content library, net | 2,510,946 |
| | 2,125,702 |
|
| Other current assets | 292,806 |
| | 206,271 |
|
| Total current assets | 5,600,510 |
| | 3,940,469 |
|
| Non-current content library, net | 3,640,767 |
| | 2,773,326 |
|
| Property and equipment, net | 171,396 |
| | 149,875 |
|
| Other non-current assets | 242,188 |
| | 192,981 |
|
| Total assets | $ | 9,654,861 |
| | $ | 7,056,651 |
|
| Liabilities and Stockholders' Equity | | | |
| Current liabilities: | | | |
| Current content liabilities | $ | 2,556,180 |
| | $ | 2,117,241 |
|
| Accounts payable | 211,729 |
| | 201,581 |
|
| Accrued expenses | 150,406 |
| | 69,746 |
|
| Deferred revenue | 301,754 |
| | 274,586 |
|
| Total current liabilities | 3,220,069 |
| | 2,663,154 |
|
| Non-current content liabilities | 1,942,624 |
| | 1,575,832 |
|
| Long-term debt | 2,400,000 |
| | 900,000 |
|
| Other non-current liabilities | 60,093 |
| | 59,957 |
|
| Total liabilities | 7,622,786 |
| | 5,198,943 |
|
| Stockholders' equity: | | | |
| Common stock | 1,200,880 |
| | 1,042,870 |
|
| Accumulated other comprehensive loss | (38,120 | ) | | (4,446 | ) |
| Retained earnings | 869,315 |
| | 819,284 |
|
| Total stockholders' equity | 2,032,075 |
| | 1,857,708 |
|
| Total liabilities and stockholders' equity | $ | 9,654,861 |
| | $ | 7,056,651 |
|
Netflix, Inc.
Consolidated Statements of Cash Flows
(unaudited)
(in thousands)
|
| | | | | | | | | | | | | | | | | | | |
| | Three Months Ended | | Six Months Ended |
| | June 30,
2015 | | March 31,
2015 | | June 30,
2014 | | June 30,
2015 | | June 30,
2014 |
| Cash flows from operating activities: | | | | | | | | | |
| Net income | $ | 26,335 |
| | $ | 23,696 |
| | $ | 71,018 |
| | $ | 50,031 |
| | $ | 124,133 |
|
| Adjustments to reconcile net income to net cash (used in) provided by operating activities: | | | | | | | | | |
| Additions to streaming content library | (1,273,677 | ) | | (1,611,925 | ) | | (813,314 | ) | | (2,885,602 | ) | | (1,562,713 | ) |
| Change in streaming content liabilities | 191,154 |
| | 626,325 |
| | 78,359 |
| | 817,479 |
| | 120,603 |
|
| Amortization of streaming content library | 822,600 |
| | 749,518 |
| | 639,037 |
| | 1,572,118 |
| | 1,239,772 |
|
| Amortization of DVD content library | 20,813 |
| | 21,185 |
| | 16,923 |
| | 41,998 |
| | 33,044 |
|
| Depreciation and amortization of property, equipment and intangibles | 15,581 |
| | 15,167 |
| | 12,977 |
| | 30,748 |
| | 25,359 |
|
| Stock-based compensation expense | 28,590 |
| | 27,441 |
| | 29,285 |
| | 56,031 |
| | 55,110 |
|
| Excess tax benefits from stock-based compensation | (39,427 | ) | | (29,001 | ) | | (14,628 | ) | | (68,428 | ) | | (47,360 | ) |
| Other non-cash items | 6,682 |
| | 6,306 |
| | 3,251 |
| | 12,988 |
| | 5,447 |
|
| Deferred taxes | (4,232 | ) | | (37,042 | ) | | (16,569 | ) | | (41,274 | ) | | (29,672 | ) |
| Changes in operating assets and liabilities: | | | | | | | | | |
| Other current assets | (39,614 | ) | | 23,109 |
| | (20,685 | ) | | (16,505 | ) | | 14,381 |
|
| Accounts payable | 6,447 |
| | (10,625 | ) | | (3,086 | ) | | (4,178 | ) | | 19,726 |
|
| Accrued expenses | 41,624 |
| | 35,922 |
| | 59,008 |
| | 77,546 |
| | 58,566 |
|
| Deferred revenue | 16,414 |
| | 10,754 |
| | 11,315 |
| | 27,168 |
| | 25,563 |
|
| Other non-current assets and liabilities | (633 | ) | | 21,788 |
| | 3,133 |
| | 21,155 |
| | 10,424 |
|
| Net cash (used in) provided by operating activities | (181,343 | ) | | (127,382 | ) | | 56,024 |
| | (308,725 | ) | | 92,383 |
|
| Cash flows from investing activities: | | | | | | | | | |
| Acquisition of DVD content library | (19,786 | ) | | (22,906 | ) | | (20,981 | ) | | (42,692 | ) | | (35,895 | ) |
| Purchases of property and equipment | (27,538 | ) | | (13,036 | ) | | (19,869 | ) | | (40,574 | ) | | (33,203 | ) |
| Other assets | (639 | ) | | 225 |
| | 1,129 |
| | (414 | ) | | 1,424 |
|
| Purchases of short-term investments | (67,949 | ) | | (90,940 | ) | | (170,908 | ) | | (158,889 | ) | | (231,454 | ) |
| Proceeds from sale of short-term investments | 48,412 |
| | 51,948 |
| | 89,662 |
| | 100,360 |
| | 232,710 |
|
| Proceeds from maturities of short-term investments | 19,170 |
| | 31,887 |
| | 92,014 |
| | 51,057 |
| | 95,104 |
|
| Net cash (used in) provided by investing activities | (48,330 | ) | | (42,822 | ) | | (28,953 | ) | | (91,152 | ) | | 28,686 |
|
| Cash flows from financing activities: | | | | | | | | | |
| Proceeds from issuance of common stock | 23,804 |
| | 10,916 |
| | 14,469 |
| | 34,720 |
| | 46,917 |
|
| Proceeds from issuance of debt | — |
| | 1,500,000 |
| | — |
| | 1,500,000 |
| | 400,000 |
|
| Issuance costs | (397 | ) | | (17,232 | ) | | (353 | ) | | (17,629 | ) | | (7,080 | ) |
| Excess tax benefits from stock-based compensation | 39,427 |
| | 29,001 |
| | 14,628 |
| | 68,428 |
| | 47,360 |
|
| Principal payments of lease financing obligations | (287 | ) | | (251 | ) | | (271 | ) | | (538 | ) | | (538 | ) |
| Net cash provided by financing activities | 62,547 |
| | 1,522,434 |
| | 28,473 |
| | 1,584,981 |
| | 486,659 |
|
| Effect of exchange rate changes on cash and cash equivalents | 6,221 |
| | (11,061 | ) | | 1,250 |
| | (4,840 | ) | | 1,551 |
|
| Net (decrease) increase in cash and cash equivalents | (160,905 | ) | | 1,341,169 |
| | 56,794 |
| | 1,180,264 |
| | 609,279 |
|
| Cash and cash equivalents, beginning of period | 2,454,777 |
| | 1,113,608 |
| | 1,157,450 |
| | 1,113,608 |
| | 604,965 |
|
| Cash and cash equivalents, end of period | $ | 2,293,872 |
| | $ | 2,454,777 |
| | $ | 1,214,244 |
| | $ | 2,293,872 |
| | $ | 1,214,244 |
|
| | | | | | | | | | |
| | Three Months Ended | | Six Months Ended |
| | June 30,
2015 | | March 31,
2015 | | June 30,
2014 | | June 30,
2015 | | June 30,
2014 |
| Non-GAAP free cash flow reconciliation: | | | | | | | | | |
| Net cash (used in) provided by operating activities | $ | (181,343 | ) | | $ | (127,382 | ) | | $ | 56,024 |
| | $ | (308,725 | ) | | $ | 92,383 |
|
| Acquisition of DVD content library | (19,786 | ) | | (22,906 | ) | | (20,981 | ) | | (42,692 | ) | | (35,895 | ) |
| Purchases of property and equipment | (27,538 | ) | | (13,036 | ) | | (19,869 | ) | | (40,574 | ) | | (33,203 | ) |
| Other assets | (639 | ) | | 225 |
| | 1,129 |
| | (414 | ) | | 1,424 |
|
| Non-GAAP free cash flow | $ | (229,306 | ) | | $ | (163,099 | ) | | $ | 16,303 |
| | $ | (392,405 | ) | | $ | 24,709 |
|
Netflix, Inc.
Segment Information
(unaudited)
(in thousands)
|
| | | | | | | | | | | | | | | | | | | |
| | As of / Three Months Ended | | As of/ Six Months Ended |
| | June 30,
2015 | | March 31,
2015 | | June 30,
2014 | | June 30,
2015 | | June 30,
2014 |
| Domestic Streaming | | | | | | | | | |
| Total memberships at end of period | 42,300 |
| | 41,397 |
| | 36,244 |
| | 42,300 |
| | 36,244 |
|
| Paid memberships at end of period | 41,057 |
| | 40,315 |
| | 35,085 |
| | 41,057 |
| | 35,085 |
|
| | | | | | | | | | |
| Revenues | $ | 1,025,913 |
| | $ | 984,532 |
| | $ | 838,225 |
| | $ | 2,010,445 |
| | $ | 1,636,842 |
|
| Cost of revenues | 612,691 |
| | 582,529 |
| | 546,223 |
| | 1,195,220 |
| | 1,063,317 |
|
| Marketing | 73,427 |
| | 89,551 |
| | 64,727 |
| | 162,978 |
| | 144,985 |
|
| Contribution profit | 339,795 |
| | 312,452 |
| | 227,275 |
| | 652,247 |
| | 428,540 |
|
| | | | | | | | | | |
| International Streaming | | | | | | | | | |
| Total memberships at end of period | 23,251 |
| | 20,877 |
| | 13,801 |
| | 23,251 |
| | 13,801 |
|
| Paid memberships at end of period | 21,649 |
| | 19,304 |
| | 12,907 |
| | 21,649 |
| | 12,907 |
|
| | | | | | | | | | |
| Revenues | $ | 454,763 |
| | $ | 415,397 |
| | $ | 307,461 |
| | $ | 870,160 |
| | $ | 574,579 |
|
| Cost of revenues | 422,966 |
| | 375,278 |
| | 266,697 |
| | 798,244 |
| | 511,964 |
|
| Marketing | 123,713 |
| | 105,126 |
| | 56,036 |
| | 228,839 |
| | 112,876 |
|
| Contribution profit (loss) | (91,916 | ) | | (65,007 | ) | | (15,272 | ) | | (156,923 | ) | | (50,261 | ) |
| | | | | | | | | | |
| Domestic DVD | | | | | | | | | |
| Total memberships at end of period | 5,314 |
| | 5,564 |
| | 6,261 |
| | 5,314 |
| | 6,261 |
|
| Paid memberships at end of period | 5,219 |
| | 5,470 |
| | 6,167 |
| | 5,219 |
| | 6,167 |
|
| | | | | | | | | | |
| Revenues | $ | 164,018 |
| | $ | 173,200 |
| | $ | 194,721 |
| | $ | 337,218 |
| | $ | 399,075 |
|
| Cost of revenues | 86,095 |
| | 88,594 |
| | 101,928 |
| | 174,689 |
| | 208,753 |
|
| Contribution profit | 77,923 |
| | 84,606 |
| | 92,793 |
| | 162,529 |
| | 190,322 |
|
| | | | | | | | | | |
| Consolidated | | | | | | | | | |
| | | | | | | | | | |
| Revenues | $ | 1,644,694 |
| | $ | 1,573,129 |
| | $ | 1,340,407 |
| | $ | 3,217,823 |
| | $ | 2,610,496 |
|
| Cost of revenues | 1,121,752 |
| | 1,046,401 |
| | 914,848 |
| | 2,168,153 |
| | 1,784,034 |
|
| Marketing | 197,140 |
| | 194,677 |
| | 120,763 |
| | 391,817 |
| | 257,861 |
|
| Contribution profit | 325,802 |
| | 332,051 |
| | 304,796 |
| | 657,853 |
| | 568,601 |
|
| Other operating expenses | 250,967 |
| | 234,595 |
| | 175,196 |
| | 485,562 |
| | 341,406 |
|
| Operating income | 74,835 |
| | 97,456 |
| | 129,600 |
| | 172,291 |
| | 227,195 |
|
| Other income (expense) | (34,345 | ) | | (59,030 | ) | | (12,228 | ) | | (93,375 | ) | | (20,879 | ) |
| Provision for income taxes | 14,155 |
| | 14,730 |
| | 46,354 |
| | 28,885 |
| | 82,183 |
|
| Net income | $ | 26,335 |
| | $ | 23,696 |
| | $ | 71,018 |
| | $ | 50,031 |
| | $ | 124,133 |
|
Netflix, Inc.
Non-GAAP Information
(unaudited)
(in thousands, except per share data)
|
| | | | | | | | | | | | | | | | | | | |
| | Three Months Ended |
| | June 30,
2014 | | September 30,
2014 | | December 31,
2014 | | March 31,
2015 | | June 30,
2015 |
| Non-GAAP Adjusted EBITDA reconciliation: | | | | | | | | | |
| GAAP net income | $ | 71,018 |
| | $ | 59,295 |
| | $ | 83,371 |
| | $ | 23,696 |
| | $ | 26,335 |
|
| Add: | | | | | | | | | |
| Interest and other (income) expense | 12,228 |
| | 12,870 |
| | 19,530 |
| | 59,030 |
| | 34,345 |
|
| Provision (benefit) for income taxes | 46,354 |
| | 38,242 |
| | (37,855 | ) | | 14,730 |
| | 14,155 |
|
| Depreciation and amortization of property, equipment and intangibles | 12,977 |
| | 14,357 |
| | 14,312 |
| | 15,167 |
| | 15,581 |
|
| Stock based compensation | 29,285 |
| | 29,878 |
| | 30,251 |
| | 27,441 |
| | 28,590 |
|
| Adjusted EBITDA | $ | 171,862 |
| | $ | 154,642 |
| | $ | 109,609 |
| | $ | 140,064 |
| | $ | 119,006 |
|
|
| | | | |
| | | Three Months Ended |
| | | December 31,
2014 |
| Non-GAAP net income reconciliation: | | |
| GAAP net income | | $ | 83,371 |
|
| Less: Release of tax accrual | | (38,612 | ) |
| Non-GAAP net income | | $ | 44,759 |
|
| Non-GAAP earnings per share: | | |
| Basic | | 0.11 |
|
| Diluted | | 0.10 |
|
| Weighted-average common shares outstanding: | | |
| Basic | | 422,244 |
|
| Diluted | | 432,514 |
|