Exhibit 99.1
July 18, 2016
Fellow shareholders,
We grew by 1.7m members in Q2 finishing with over 83 million members. This is below our forecast of 2.5m net new members and our prior year Q2 net additions of 3.3m. We are growing, but not as fast as we would like or have been. Disrupting a big market can be bumpy, but the opportunity ahead is as big as ever and we continue to improve every aspect of our business.
|
| | | | | | | | | | | | | | | | | | |
| (in millions except per share data and Streaming Content Obligations) | Q2 '15 | Q3 '15 | Q4 '15 | Q1 '16 | Q2 '16 | Q3 '16 Forecast |
| Total Streaming: | | | | | | |
| Revenue | $ | 1,481 |
| $ | 1,581 |
| $ | 1,672 |
| $ | 1,813 |
| $ | 1,966 |
| $ | 2,155 |
|
| Contribution Profit | $ | 248 |
| $ | 277 |
| $ | 270 |
| $ | 309 |
| $ | 345 |
| $ | 365 |
|
| Contribution Margin | 16.7 | % | 17.5 | % | 16.2 | % | 17.0 | % | 17.6 | % | 16.9 | % |
| Paid Memberships | 62.71 |
| 66.02 |
| 70.84 |
| 77.71 |
| 79.90 |
| 82.40 |
|
| Total Memberships | 65.55 |
| 69.17 |
| 74.76 |
| 81.50 |
| 83.18 |
| 85.48 |
|
| Net Additions | 3.28 |
| 3.62 |
| 5.59 |
| 6.74 |
| 1.68 |
| 2.30 |
|
| | | | | | | |
| US Streaming: | | | | | | |
| Revenue | $ | 1,026 |
| $ | 1,064 |
| $ | 1,106 |
| $ | 1,161 |
| $ | 1,208 |
| $ | 1,309 |
|
| Contribution Profit | $ | 340 |
| $ | 344 |
| $ | 379 |
| $ | 413 |
| $ | 414 |
| $ | 460 |
|
| Contribution Margin | 33.1 | % | 32.4 | % | 34.3 | % | 35.5 | % | 34.3 | % | 35.1 | % |
| Paid Memberships | 41.06 |
| 42.07 |
| 43.40 |
| 45.71 |
| 46.00 |
| 46.40 |
|
| Total Memberships | 42.30 |
| 43.18 |
| 44.74 |
| 46.97 |
| 47.13 |
| 47.43 |
|
| Net Additions | 0.90 |
| 0.88 |
| 1.56 |
| 2.23 |
| 0.16 |
| 0.30 |
|
| | | | | | | |
| International Streaming: | | | | | | |
| Revenue | $ | 455 |
| $ | 517 |
| $ | 566 |
| $ | 652 |
| $ | 758 |
| $ | 846 |
|
| Contribution Profit (Loss) | $ | (92 | ) | $ | (68 | ) | $ | (109 | ) | $ | (104 | ) | $ | (69 | ) | $ | (95 | ) |
| Contribution Margin | -20.2 | % | -13.1 | % | -19.2 | % | -16.0 | % | -9.1 | % | -11.2 | % |
| Paid Memberships | 21.65 |
| 23.95 |
| 27.44 |
| 31.99 |
| 33.89 |
| 35.99 |
|
| Total Memberships | 23.25 |
| 25.99 |
| 30.02 |
| 34.53 |
| 36.05 |
| 38.05 |
|
| Net Additions | 2.37 |
| 2.74 |
| 4.04 |
| 4.51 |
| 1.52 |
| 2.00 |
|
| | | | | | | |
| Total (including DVD): | | | | | | |
| Operating Income | $ | 75 |
| $ | 74 |
| $ | 60 |
| $ | 49 |
| $ | 70 |
| $ | 64 |
|
| Operating Margin | 4.6 | % | 4.2 | % | 3.3 | % | 2.5 | % | 3.3 | % | 2.8 | % |
| Net Income* | $ | 26 |
| $ | 29 |
| $ | 43 |
| $ | 28 |
| $ | 41 |
| $ | 22 |
|
| EPS* | $ | 0.06 |
| $ | 0.07 |
| $ | 0.10 |
| $ | 0.06 |
| $ | 0.09 |
| $ | 0.05 |
|
| | | | | | | |
| Free Cash Flow | $ | (229 | ) | $ | (252 | ) | $ | (276 | ) | $ | (261 | ) | $ | (254 | ) | |
| EBITDA | $ | 119 |
| $ | 123 |
| $ | 111 |
| $ | 107 |
| $ | 129 |
| |
| Shares (FD)* | 436.1 |
| 437.6 |
| 438.3 |
| 438.0 |
| 438.2 |
| |
| Streaming Content Obligations** ($B) | 10.1 |
| 10.4 |
| 10.9 |
| 12.3 |
| 13.2 |
| |
| * EPS and shares adjusted for 7-for-1 stock split. Q4'15 Net Income/EPS includes a $13m / $0.03 benefit from a tax accrual release related to resolution of tax audits. |
| **Corresponds to our total known streaming content obligations as defined in our financial statements and related notes in our most recently filed SEC Form 10-K |
Q2 Results and Q3 Forecast
Our global member forecast for Q2 was 2.5m and we came in at 1.7m. Gross additions were on target, but churn ticked up slightly and unexpectedly, coincident with the press coverage1 in early April of our plan to un-grandfather longer tenured members and remained elevated through the quarter. We think some members perceived the news as an impending new price increase rather than the completion of two years of grandfathering. Churn of members who were actually un-grandfathered is modest and conforms to our expectations. With our large subscriber base, slight variances in retention versus forecast can result in significant swings in net adds, particularly in a seasonally small net add quarter like Q2.
While un-grandfathering and associated media coverage may moderate near-term membership growth, we believe that un-grandfathering will provide us with more revenue to invest in our content to satisfy members, thus driving long-term growth. Over the second half of this year, we’ll complete un-grandfathering. Our three-tier pricing (in the US: $7.99 SD, $9.99 HD, and $11.99 UHD) is working well for us and for new members, and our gross additions remain healthy.
On earnings, we slightly under-forecast the quarter, ending Q2 with operating income of $70 million and net income of $41 million against a forecast of $47 million and $9 million with the variance largely due to lower-than-expected content and other costs.
As a reminder, the quarterly guidance we provide is our actual internal forecast at the time we report and our goal is to be accurate, not conservative. Therefore, in some quarters, we may come in high versus our forecast and, in other quarters, we may come in low.
In the US, our Q2 net additions were 0.16 million against a forecast of 0.50 million. US revenue rose 18% year over year with domestic ASP growing 4.5% year over year. As expected, US contribution margin at 34.3% expanded more moderately year over year, owing to the timing of content spend. In addition, marketing expenses rose sequentially in support of our growing slate of originals and business partnerships, which we expect to continue.
As Internet TV rises in popularity, so do the SVOD offerings. In the US, for example, CBS All Access, Seeso, Amazon Prime Video, Hulu, YouTube Red, and many others are all growing. Our view, however, is that we are all growing primarily against linear TV hours and that competition did not contribute materially to our miss in Q2. First, increased competition would show up mostly in soft gross additions rather than churn. Second, we experienced a similar uptick in churn in early April in Canada, where there has been no recent increase in SVOD competition but where un-grandfathering is also underway.
Similarly, we don’t believe market saturation is a key factor in the US given that we experienced similar performance over the same period in multiple countries with differing levels of Netflix market penetration.
Our global membership forecast for Q3 includes an impact from the spectacle of the Olympics, on par with what we experienced four years ago, and does not include any boost in the US from the Comcast X1 launch due to uncertainty on timing as we and Comcast will only release Netflix on the X1 when the viewer experience is great.
________________________________________
1 https://www.google.com/trends/explore#q=netflix%20price%20increase&date=7%2F2014%2025m&cmpt=q&tz=Etc%2FGMT%2B7
For Q3, we forecast US net adds of 0.3 million as un-grandfathering continues. We expect US contribution margin to improve year over year in both Q3 and Q4 and we anticipate meeting our 40% US contribution margin target by 2020, or even earlier.
International net additions in Q2 came to 1.5 million compared to our 2.0 million forecast. Un-grandfathering occurred in Canada, UK/Ireland, Latin America, and the Nordics during Q2 where, like the US, we saw a similar, earlier-than-expected impact on retention. In our newer markets, we continue to learn and believe that growth will unfold over a multi-year period, similar to our experience in Latin America.
International revenue rose 67% year over year. Excluding the impact of F/X (-$37 million impact on a y/y basis), international ASP increased 8.7%. International contribution profit totaled -$69 million as content spending was slightly lower than our forecast.
For Q3, we expect international net additions of 2.0m. Our approach in expanding our global footprint in January was to launch a service targeting early adopters and then to listen, learn and iterate quickly. Now that we are six months in, we will localize Netflix in Poland and Turkey with the addition of local language in the user interface, subtitles and dubbing. Localization in other markets will take place over time as economically prudent.
International contribution loss in Q3 is expected to be -$95 million as improving profitability in our earlier foreign markets funds the investment in newer international territories. We remain confident in these investments because of our success in all of the markets launched prior to 2014 which are individually profitable on a contribution profit basis. These 2010-2013 launch markets are on track to deliver aggregate contribution profit of around $500 million in 2016.
Prior to the global launch of our service in January, Netflix was available in 60 countries. In these earlier expansion markets, our adoption rate in the first several months (as measured by penetration of broadband households) has been highly varied and the initial uptake is not necessarily indicative of our long-term penetration. We have already achieved success (contribution profits) in many types of markets including those where English is not the main language (e.g. Chile); that have low pay TV penetration (e.g. Australia); that have historically had high levels of piracy (e.g. Nordics); that have payment or broadband infrastructure challenges (e.g. Mexico with payments and Canada with low data caps); that have big competition (e.g. UK); that have low disposable income (e.g. Brazil); or that have many of these factors (e.g. most of Latin America).
Unfortunately, this year the regulatory climate in China for our service has become more challenging. Disney’s streaming service, launched in conjunction with Alibaba, was closed down, as was Apple’s movie offering. We continue to explore options and, in the meantime, have plenty of work to do in our newly opened markets.
Our global expansion is an exciting opportunity that will unfold over many years. Continued US growth will be a part of it and there is no change to our view that in the US Netflix can reach 60-90 million members. We continue to expect to run around break-even on a net income basis in 2016 and to generate material profits in 2017 and beyond. We will drive operating profit growth in 2017 by reducing our international losses and continuing to grow US profit.
Content
In Q2, we continued to expand the pace and breadth of original series, films and documentaries released on Netflix, including the 4th season of Orange is the New Black2 and the second of our Adam Sandler films, The Do Over3, which, at launch, was the number one most-watched film on Netflix in every territory of the world and remains in the top 10 in many countries, including the US.
The substantial viewing of our growing slate of originals4 around the world is a testament to how well high quality English-language TV travels. Local content constitutes a small minority of total viewing in our international segment. We do not plan on trying to outcompete local TV networks in local content in every nation of the world. Rather, we selectively complement our service with licensed and original local content. We are developing non-English language original series and films in more than a dozen countries including Brazil, Germany, India, Italy, Japan, Mexico, Colombia, South Korea, Argentina and Spain when we find compelling, high quality projects with attractive economics and a potentially large audience around the world. Narcos5, only partially in English, is an early success in this area.
We are also pleased with the critical acclaim received by our original programming. Last week, 17 of our original series, documentaries, films and comedy specials received 54 Primetime Emmy nominations, up from 34 last year. Netflix saw the largest increase in nominations among networks and has the third most total nominations of any domestic network (behind only FX and HBO). Earlier, nine of our kids’ shows received 33 Daytime Emmy nominations, more than any other network. We have made good progress since launching our first original series Lilyhammer in 2012.
While ramping up originals, we are also actively acquiring high quality, licensed content. We’ve extended our licensing agreement with The CW Network, making Netflix the US SVOD home for prior seasons of all scripted series broadcast on The CW beginning with the 2015-2016 TV season. Netflix members will be able to stream full seasons of programs like Legends of Tomorrow, Supergirl, Arrow and The Flash, just eight days after each season finale. Next year, Netflix will also be the exclusive home of the new Star Trek series from CBS outside the US and Canada, with new episodes arriving in 188 countries within 24 hours of their North American premiere.
Marketing
We primarily market our originals to drive member acquisition. Building off that, this past quarter we began testing the availability of select episodes of a few of our original shows on linear television in partnership with broadcasters. One week after its premiere on Netflix, the first two episodes of our first French original series, Marseille, aired on French broadcast network TF1. Season one episodes (but not season two) of Narcos and Club de Cuervos will air on Univision and Unimas, respectively, in the US. Through these tactics, we’re aiming to entice consumers to join Netflix to complete their binge. The danger is diluting the perception that Netflix original content is only on Netflix, so we are testing cautiously.
____________________________________
2 https://www.youtube.com/watch?v=c6O9rfoz0f8
3 http://www.ew.com/article/2016/05/27/do-over-ew-review
4 https://media.netflix.com/en/only-on-netflix#/new?page=1
5 https://www.youtube.com/watch?v=A2m7bPax-00&feature=youtu.be
Product and Partnerships
As we have noted in the past, our global expansion in January means that we are now operating in some markets where consumers access the Internet primarily through mobile devices. This has led us to invest more in our mobile experience including sign up, authentication, user interface, payments and streaming efficiency for cellular networks. In Q2, we began testing Google Play in-app payment on Android devices, which we think will aid our ability to acquire new customers in many international markets, as our iOS in-app payments have done.
To date, we have partnered with over 40 MVPDs across the world to make it easier for consumers to enjoy and pay for Netflix, to grow awareness of our service in certain markets and to reach different demographic segments. In the US, we are excited that Netflix will be available on the Comcast X1 set-top box later this year.
Strong Net Neutrality
We continue to make progress with Open Connect, and the approval of the Charter/TWC merger with a seven year condition of settlement-free interconnect is a helpful precedent. When ISPs around the world agree to take our Open Connect servers in or near their networks for free, they see reductions in their network costs, and as a result, the program has continued to grow in popularity.
Competition
Our goal remains to win as many “moments of truth” as we can. Given all the leisure activities consumers can engage in - reading a book, playing videogames, watching a sports match, etc. - we compete with a very broad set of alternatives. Our focus is to improve Netflix every day across multiple dimensions including content, streaming quality, device footprint, payment options, and more. If we can do that, we believe we have ample room to grow.
There are an increasing number of virtual MVPDs, like Sony Vue, DISH’s Sling TV, Amazon’s Streaming Partners Program, and Hulu’s forthcoming service6, which offer a smaller bundle of TV channels at a lower cost per month. To the degree these services provide an improved MVPD experience or spur improvement amongst incumbent MVPDs to become more Internet-centric (on-demand, multi-screen, personalized), they will become increased competition for entertainment time.
_____________________________________
6 http://www.wsj.com/articles/hulu-is-developing-a-cable-style-online-tv-service-1462150982
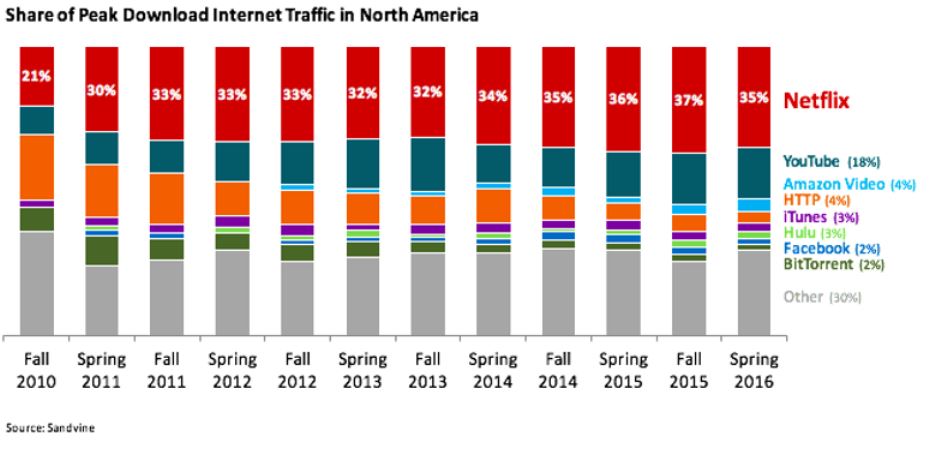
In the most recent Sandvine report, our share of North American Internet traffic was 35%. As we referenced in our Q4 ’15 letter7 in January, our implementation of more efficient encoding would reduce our results in the Sandvine report, which measures peak megabits, not peak viewing hours.
Free Cash Flow and Capital Structure
In Q2’16, free cash flow amounted to -$254 million, compared with -$261 million in Q1’16. We finished the quarter with cash and equivalents of $1.8 billion, while gross debt was unchanged at $2.4 billion. We still plan to raise additional capital through the high yield market later in 2016/early 2017.
Our capital requirements continue to be driven by our investment in original content, particularly programming that we produce, which requires more cash upfront relative to licensed content. Original content provides Netflix with many benefits: new programming that debuts on Netflix, exclusivity, greater creative and business control, global rights and brand halo. These merits outweigh the timing of cash payments.
Our choice to fund these requirements through debt rather than equity is based on our desire to optimize our capital structure to yield the lowest possible weighted average cost of capital. Given our low debt to total capital ratio, the after tax cost of debt is currently more attractive than equity.
DVD
We finished Q2’16 with 4.5 million DVD members in the US, and contribution profit of $71 million.
__________________________
7 http://files.shareholder.com/downloads/NFLX/1662264494x0x870685/C6213FF9-5498-4084-A0FF-74363CEE35A1/Q4_15_Letter_to_Shareholders_-_COMBINED.pdf
Reference
For quick reference, our eight most recent investor letters are: April 20168, January, 20169, October 201510, July 201511, April 201512, January 201513, October 201414, July 201415.
Summary
While we did not grow as fast as forecast in Q2, we are optimistic about the future owing to our singular focus, global scale and the growth of Internet TV viewing. We are in the very early days of the shift from linear television to on-demand viewing and there are nearly 1 billion pay TV subscribers worldwide who will migrate to Internet TV over the coming decades.
On a personal note, this week we release season three of Bojack Horseman -- since you all follow the media business, this is a series you may love as much as we do.
July 18th, 2016 Earnings Interview
Reed Hastings, David Wells and Ted Sarandos will participate in a live video interview today at 2:00 p.m. Pacific Time at youtube.com/netflixir16. The discussion will be moderated by Ben Swinburne, Morgan Stanley and Scott Devitt, Stifel. Questions that investors would like to see asked should be sent to benjamin.swinburne@morganstanley.com or swdevitt@stifel.com.
|
| |
IR Contact: Spencer Wang Vice President, Finance & Investor Relations 408 809-5360 | PR Contact: Jonathan Friedland Chief Communications Officer 310 734-2958 |
_____________________________________________________________
8http://files.shareholder.com/downloads/NFLX/1662264494x0x886428/5FB5A3DF-F23A-4BB1-AC37-583BAEF2A1EE/Q116LettertoShareholders_W_TABLES_.pdf
9http://files.shareholder.com/downloads/NFLX/1481171463x0x870685/C6213FF9-5498-4084-A0FF-74363CEE35A1/Q4_15_Letter_to_Shareholders_-_COMBINED.pdf
10http://files.shareholder.com/downloads/NFLX/4124769775x7871834x854558/9B28F30F-BF2F-4C5D-AAFF-AA9AA8F4779D/FINAL_Q3_15_Letter_to_Shareholders_With_Tables_.pdf
11http://files.shareholder.com/downloads/NFLX/4124769775x7871834x839404/C3CE9EE2-C8F3-40A1-AC9A-FFE0AFA20B21/FINAL_Q2_15_Letter_to_Shareholders_With_Tables_.pdf
12http://files.shareholder.com/downloads/NFLX/4124769775x7871834x821407/DB785B50-90FE-44DA-9F5B-37DBF0DCD0E1/Q1_15_Earnings_Letter_final_tables.pdf
13http://files.shareholder.com/downloads/NFLX/4124769775x7871834x804108/043a3015-36ec-49b9-907c-27960f1a7e57/Q4_14_Letter_to_shareholders.pdf
14http://files.shareholder.com/downloads/NFLX/3754169286x0x786677/6974d8e9-5cb3-4009-97b1-9d4a5953a6a5/Q3_14_Letter_to_shareholders.pdf
15http://files.shareholder.com/downloads/NFLX/3527949458x0x769748/9b21df7f-743c-4f0f-94da-9f13e384a3d2/July2014EarningsLetter_7.21.14_final.pdf
16https://www.youtube.com/c/netflixir
Use of Non-GAAP Measures
This shareholder letter and its attachments include reference to the non-GAAP financial measure of net income on a pro forma basis excluding the release of tax reserves, and to free cash flow and EBITDA. Management believes that the non-GAAP measure of net income on a pro forma basis excluding the release of tax reserves provides useful information as this measure excludes effects that are not indicative of our core operating results. Management believes that free cash flow and EBITDA are important liquidity metrics because they measure, during a given period, the amount of cash generated that is available to repay debt obligations, make investments and for certain other activities or the amount of cash used in operations, including investments in global streaming content. However, these non-GAAP measures should be considered in addition to, not as a substitute for or superior to, net income, operating income, diluted earnings per share and net cash provided by operating activities, or other financial measures prepared in accordance with GAAP. Reconciliation to the GAAP equivalent of these non-GAAP measures are contained in tabular form on the attached unaudited financial statements.
Forward-Looking Statements
This shareholder letter contains certain forward-looking statements within the meaning of the federal securities laws, including statements regarding impacts on subscriber growth and revenue arising from un-grandfathering; marketing expense in support of originals and partnerships; growth of Internet TV; impacts on our business from competition; US growth, contribution margin and long-term subscriber numbers; international growth, net additions and contribution loss; localization efforts; profitability in 2017 and beyond; content strategy, including local content, original and licensed content investments; future capital raises and timing of such raises; forecasts for domestic and international net, total and paid subscribers; revenue; contribution profit (loss) and contribution margin for both domestic (streaming and DVD) and international operations, as well as consolidated operating income, net income, earnings per share and free cash flow. The forward-looking statements in this letter are subject to risks and uncertainties that could cause actual results and events to differ, including, without limitation: our ability to attract new members and retain existing members; our ability to compete effectively; maintenance and expansion of device platforms for streaming; fluctuations in consumer usage of our service; service disruptions; production risks; actions of Internet Service Providers; and, competition, including consumer adoption of different modes of viewing in-home filmed entertainment. A detailed discussion of these and other risks and uncertainties that could cause actual results and events to differ materially from such forward-looking statements is included in our filings with the Securities and Exchange Commission, including our Annual Report on Form 10-K filed with the Securities and Exchange Commission on January 28, 2016. The Company provides internal forecast numbers. Investors should anticipate that actual performance will vary from these forecast numbers based on risks and uncertainties discussed above and in our Annual Report on Form 10-K. We undertake no obligation to update forward-looking statements to reflect events or circumstances occurring after the date of this shareholder letter.
Netflix, Inc.
Consolidated Statements of Operations
(unaudited)
(in thousands, except per share data)
|
| | | | | | | | | | | | | | | | | | | |
| | Three Months Ended | | Six Months Ended |
| | June 30,
2016 | | March 31,
2016 | | June 30,
2015 | | June 30,
2016 | | June 30,
2015 |
| Revenues | $ | 2,105,204 |
| | $ | 1,957,736 |
| | $ | 1,644,694 |
| | $ | 4,062,940 |
| | $ | 3,217,823 |
|
| Cost of revenues | 1,473,098 |
| | 1,369,540 |
| | 1,121,752 |
| | 2,842,638 |
| | 2,168,153 |
|
| Marketing | 216,029 |
| | 208,010 |
| | 197,140 |
| | 424,039 |
| | 391,817 |
|
| Technology and development | 207,300 |
| | 203,508 |
| | 155,061 |
| | 410,808 |
| | 298,167 |
|
| General and administrative | 138,407 |
| | 127,225 |
| | 95,906 |
| | 265,632 |
| | 187,395 |
|
| Operating income | 70,370 |
| | 49,453 |
| | 74,835 |
| | 119,823 |
| | 172,291 |
|
| Other income (expense): | | | | | | | | | |
| Interest expense | (35,455 | ) | | (35,537 | ) | | (35,217 | ) | | (70,992 | ) | | (61,954 | ) |
| Interest and other income | 16,317 |
| | 25,963 |
| | 872 |
| | 42,280 |
| | (31,421 | ) |
| Income before income taxes | 51,232 |
| | 39,879 |
| | 40,490 |
| | 91,111 |
| | 78,916 |
|
| Provision for income taxes | 10,477 |
| | 12,221 |
| | 14,155 |
| | 22,698 |
| | 28,885 |
|
| Net income | $ | 40,755 |
| | $ | 27,658 |
| | $ | 26,335 |
| | $ | 68,413 |
| | $ | 50,031 |
|
| Earnings per share: | | | | | | | | | |
| Basic | $ | 0.10 |
| | $ | 0.06 |
| | $ | 0.06 |
| | $ | 0.16 |
| | $ | 0.12 |
|
| Diluted | $ | 0.09 |
| | $ | 0.06 |
| | $ | 0.06 |
| | $ | 0.16 |
| | $ | 0.12 |
|
| Weighted-average common shares outstanding: | | | | | | | | | |
| Basic | 428,483 |
| | 428,117 |
| | 425,340 |
| | 428,300 |
| | 424,486 |
|
| Diluted | 438,154 |
| | 437,993 |
| | 436,097 |
| | 438,073 |
| | 434,958 |
|
Netflix, Inc.
Consolidated Balance Sheets
(unaudited)
(in thousands, except share and par value data)
|
| | | | | | | |
| | As of |
| | June 30,
2016 | | December 31,
2015 |
| Assets | | | |
| Current assets: | | | |
| Cash and cash equivalents | $ | 1,390,925 |
| | $ | 1,809,330 |
|
| Short-term investments | 443,303 |
| | 501,385 |
|
| Current content assets, net | 3,349,262 |
| | 2,905,998 |
|
| Other current assets | 203,428 |
| | 215,127 |
|
| Total current assets | 5,386,918 |
| | 5,431,840 |
|
| Non-current content assets, net | 5,742,938 |
| | 4,312,817 |
|
| Property and equipment, net | 162,864 |
| | 173,412 |
|
| Other non-current assets | 300,787 |
| | 284,802 |
|
| Total assets | $ | 11,593,507 |
| | $ | 10,202,871 |
|
| Liabilities and Stockholders' Equity | | | |
| Current liabilities: | | | |
| Current content liabilities | $ | 3,242,330 |
| | $ | 2,789,023 |
|
| Accounts payable | 240,458 |
| | 253,491 |
|
| Accrued expenses | 172,073 |
| | 140,389 |
|
| Deferred revenue | 396,976 |
| | 346,721 |
|
| Total current liabilities | 4,051,837 |
| | 3,529,624 |
|
| Non-current content liabilities | 2,698,520 |
| | 2,026,360 |
|
| Long-term debt | 2,373,085 |
| | 2,371,362 |
|
| Other non-current liabilities | 54,231 |
| | 52,099 |
|
| Total liabilities | 9,177,673 |
| | 7,979,445 |
|
| Stockholders' equity: | | | |
| Common stock | 1,443,707 |
| | 1,324,809 |
|
| Accumulated other comprehensive loss | (38,211 | ) | | (43,308 | ) |
| Retained earnings | 1,010,338 |
| | 941,925 |
|
| Total stockholders' equity | 2,415,834 |
| | 2,223,426 |
|
| Total liabilities and stockholders' equity | $ | 11,593,507 |
| | $ | 10,202,871 |
|
Netflix, Inc.
Consolidated Statements of Cash Flows
(unaudited)
(in thousands)
|
| | | | | | | | | | | | | | | | | | | |
| | Three Months Ended | | Six Months Ended |
| | June 30,
2016 |
| March 31,
2016 |
| June 30,
2015 |
| June 30,
2016 |
| June 30,
2015 |
| Cash flows from operating activities: | | | | | | | | | |
| Net income | $ | 40,755 |
| | $ | 27,658 |
| | $ | 26,335 |
| | $ | 68,413 |
| | $ | 50,031 |
|
| Adjustments to reconcile net income to net cash used in operating activities: | | | | | | | | | |
| Additions to streaming content assets | (1,791,766 | ) | | (2,316,599 | ) | | (1,276,643 | ) | | (4,108,365 | ) | | (2,916,860 | ) |
| Change in streaming content liabilities | 238,517 |
| | 905,723 |
| | 191,154 |
| | 1,144,240 |
| | 817,479 |
|
| Amortization of streaming content assets | 1,175,361 |
| | 1,058,521 |
| | 822,600 |
| | 2,233,882 |
| | 1,572,118 |
|
| Amortization of DVD content assets | 20,021 |
| | 20,441 |
| | 20,813 |
| | 40,462 |
| | 41,998 |
|
| Depreciation and amortization of property, equipment and intangibles | 14,131 |
| | 14,798 |
| | 15,581 |
| | 28,929 |
| | 30,748 |
|
| Stock-based compensation expense | 44,112 |
| | 42,422 |
| | 28,590 |
| | 86,534 |
| | 56,031 |
|
| Excess tax benefits from stock-based compensation | (13,323 | ) | | (11,316 | ) | | (39,427 | ) | | (24,639 | ) | | (68,428 | ) |
| Other non-cash items | 9,040 |
| | 12,757 |
| | 6,682 |
| | 21,797 |
| | 12,988 |
|
| Deferred taxes | (17,876 | ) | | (16,603 | ) | | (4,232 | ) | | (34,479 | ) | | (41,274 | ) |
| Changes in operating assets and liabilities: | | | | | | | | | |
| Other current assets | 24,091 |
| | 14,308 |
| | (36,648 | ) | | 38,399 |
| | 14,753 |
|
| Accounts payable | 8,795 |
| | (19,898 | ) | | 6,447 |
| | (11,103 | ) | | (4,178 | ) |
| Accrued expenses | 2,099 |
| | 41,232 |
| | 41,624 |
| | 43,331 |
| | 77,546 |
|
| Deferred revenue | 22,753 |
| | 27,502 |
| | 16,414 |
| | 50,255 |
| | 27,168 |
|
| Other non-current assets and liabilities | (3,003 | ) | | (29,536 | ) | | (633 | ) | | (32,539 | ) | | 21,155 |
|
| Net cash used in operating activities | (226,293 | ) | | (228,590 | ) | | (181,343 | ) | | (454,883 | ) | | (308,725 | ) |
| Cash flows from investing activities: | | | | | | | | | |
| Acquisition of DVD content assets | (17,924 | ) | | (23,207 | ) | | (19,786 | ) | | (41,131 | ) | | (42,692 | ) |
| Purchases of property and equipment | (10,814 | ) | | (8,425 | ) | | (27,538 | ) | | (19,239 | ) | | (40,574 | ) |
| Change in other assets | 907 |
| | (356 | ) | | (639 | ) | | 551 |
| | (414 | ) |
| Purchases of short-term investments | (18,492 | ) | | (34,962 | ) | | (67,949 | ) | | (53,454 | ) | | (158,889 | ) |
| Proceeds from sale of short-term investments | 18,752 |
| | 8,188 |
| | 48,412 |
| | 26,940 |
| | 100,360 |
|
| Proceeds from maturities of short-term investments | 24,675 |
| | 63,025 |
| | 19,170 |
| | 87,700 |
| | 51,057 |
|
| Net cash provided by (used in) investing activities | (2,896 | ) | | 4,263 |
| | (48,330 | ) | | 1,367 |
| | (91,152 | ) |
| Cash flows from financing activities: | | | | | | | | | |
| Proceeds from issuance of common stock | 4,232 |
| | 3,536 |
| | 23,804 |
| | 7,768 |
| | 34,720 |
|
| Proceeds from issuance of debt | — |
| | — |
| | — |
| | — |
| | 1,500,000 |
|
| Issuance costs | — |
| | — |
| | (397 | ) | | — |
| | (17,629 | ) |
| Excess tax benefits from stock-based compensation | 13,323 |
| | 11,316 |
| | 39,427 |
| | 24,639 |
| | 68,428 |
|
| Other financing activities | 57 |
| | 55 |
| | (287 | ) | | 112 |
| | (538 | ) |
| Net cash provided by financing activities | 17,612 |
| | 14,907 |
| | 62,547 |
| | 32,519 |
| | 1,584,981 |
|
| Effect of exchange rate changes on cash and cash equivalents | (2,742 | ) | | 5,334 |
| | 6,221 |
| | 2,592 |
| | (4,840 | ) |
| Net (decrease) increase in cash and cash equivalents | (214,319 | ) | | (204,086 | ) | | (160,905 | ) | | (418,405 | ) | | 1,180,264 |
|
| Cash and cash equivalents, beginning of period | 1,605,244 |
| | 1,809,330 |
| | 2,454,777 |
| | 1,809,330 |
| | 1,113,608 |
|
| Cash and cash equivalents, end of period | $ | 1,390,925 |
| | $ | 1,605,244 |
| | $ | 2,293,872 |
| | $ | 1,390,925 |
| | $ | 2,293,872 |
|
| | | | | | | | | | |
| | Three Months Ended | | Six Months Ended |
| | June 30,
2016 | | March 31,
2016 | | June 30,
2015 | | June 30,
2016 | | June 30,
2015 |
| Non-GAAP free cash flow reconciliation: | | | | | | | | | |
| Net cash used in operating activities | $ | (226,293 | ) | | $ | (228,590 | ) | | $ | (181,343 | ) | | $ | (454,883 | ) | | $ | (308,725 | ) |
| Acquisition of DVD content assets | (17,924 | ) | | (23,207 | ) | | (19,786 | ) | | (41,131 | ) | | (42,692 | ) |
| Purchases of property and equipment | (10,814 | ) | | (8,425 | ) | | (27,538 | ) | | (19,239 | ) | | (40,574 | ) |
| Change in other assets | 907 |
| | (356 | ) | | (639 | ) | | 551 |
| | (414 | ) |
| Non-GAAP free cash flow | $ | (254,124 | ) | | $ | (260,578 | ) | | $ | (229,306 | ) | | $ | (514,702 | ) | | $ | (392,405 | ) |
NOTE - Certain prior year amounts have been reclassified to conform to the current year presentation.
Netflix, Inc.
Segment Information
(unaudited)
(in thousands)
|
| | | | | | | | | | | | | | | | | | | |
| | As of / Three Months Ended | | As of/ Six Months Ended |
| | June 30,
2016 | | March 31,
2016 | | June 30,
2015 | | June 30,
2016 | | June 30,
2015 |
| Domestic Streaming | | | | | | | | | |
| Total memberships at end of period | 47,129 |
| | 46,967 |
| | 42,300 |
| | 47,129 |
| | 42,300 |
|
| Paid memberships at end of period | 46,004 |
| | 45,714 |
| | 41,057 |
| | 46,004 |
| | 41,057 |
|
| | | | | | | | | | |
| Revenues | $ | 1,208,271 |
| | $ | 1,161,241 |
| | $ | 1,025,913 |
| | $ | 2,369,512 |
| | $ | 2,010,445 |
|
| Cost of revenues | 707,106 |
| | 666,546 |
| | 612,691 |
| | 1,373,652 |
| | 1,195,220 |
|
| Marketing | 86,806 |
| | 81,942 |
| | 73,427 |
| | 168,748 |
| | 162,978 |
|
| Contribution profit | 414,359 |
| | 412,753 |
| | 339,795 |
| | 827,112 |
| | 652,247 |
|
| | | | | | | | | | |
| International Streaming | | | | | | | | | |
| Total memberships at end of period | 36,048 |
| | 34,533 |
| | 23,251 |
| | 36,048 |
| | 23,251 |
|
| Paid memberships at end of period | 33,892 |
| | 31,993 |
| | 21,649 |
| | 33,892 |
| | 21,649 |
|
| | | | | | | | | | |
| Revenues | $ | 758,201 |
| | $ | 651,748 |
| | $ | 454,763 |
| | $ | 1,409,949 |
| | $ | 870,160 |
|
| Cost of revenues | 698,162 |
| | 629,899 |
| | 422,966 |
| | 1,328,061 |
| | 798,244 |
|
| Marketing | 129,223 |
| | 126,068 |
| | 123,713 |
| | 255,291 |
| | 228,839 |
|
| Contribution profit (loss) | (69,184 | ) | | (104,219 | ) | | (91,916 | ) | | (173,403 | ) | | (156,923 | ) |
| | | | | | | | | | |
| Domestic DVD | | | | | | | | | |
| Total memberships at end of period | 4,530 |
| | 4,741 |
| | 5,314 |
| | 4,530 |
| | 5,314 |
|
| Paid memberships at end of period | 4,435 |
| | 4,647 |
| | 5,219 |
| | 4,435 |
| | 5,219 |
|
| | | | | | | | | | |
| Revenues | $ | 138,732 |
| | $ | 144,747 |
| | $ | 164,018 |
| | $ | 283,479 |
| | $ | 337,218 |
|
| Cost of revenues | 67,830 |
| | 73,095 |
| | 86,095 |
| | 140,925 |
| | 174,689 |
|
| Contribution profit | 70,902 |
| | 71,652 |
| | 77,923 |
| | 142,554 |
| | 162,529 |
|
| | | | | | | | | | |
| Consolidated | | | | | | | | | |
| | | | | | | | | | |
| Revenues | $ | 2,105,204 |
| | $ | 1,957,736 |
| | $ | 1,644,694 |
| | $ | 4,062,940 |
| | $ | 3,217,823 |
|
| Cost of revenues | 1,473,098 |
| | 1,369,540 |
| | 1,121,752 |
| | 2,842,638 |
| | 2,168,153 |
|
| Marketing | 216,029 |
| | 208,010 |
| | 197,140 |
| | 424,039 |
| | 391,817 |
|
| Contribution profit | 416,077 |
| | 380,186 |
| | 325,802 |
| | 796,263 |
| | 657,853 |
|
| Other operating expenses | 345,707 |
| | 330,733 |
| | 250,967 |
| | 676,440 |
| | 485,562 |
|
| Operating income | 70,370 |
| | 49,453 |
| | 74,835 |
| | 119,823 |
| | 172,291 |
|
| Other income (expense) | (19,138 | ) | | (9,574 | ) | | (34,345 | ) | | (28,712 | ) | | (93,375 | ) |
| Provision for income taxes | 10,477 |
| | 12,221 |
| | 14,155 |
| | 22,698 |
| | 28,885 |
|
| Net income | $ | 40,755 |
| | $ | 27,658 |
| | $ | 26,335 |
| | $ | 68,413 |
| | $ | 50,031 |
|
Netflix, Inc.
Non-GAAP Information
(unaudited)
(in thousands, except per share data)
|
| | | | | | | | | | | | | | | | | | | |
| | Three Months Ended |
| | June 30,
2015 | | September 30,
2015 | | December 31,
2015 | | March 31,
2016 | | June 30,
2016 |
| Non-GAAP Adjusted EBITDA reconciliation: | | | | | | | | | |
| GAAP net income | $ | 26,335 |
| | $ | 29,432 |
| | $ | 43,178 |
| | $ | 27,658 |
| | $ | 40,755 |
|
| Add: | | | | | | | | | |
| Interest and other (income) expense | 34,345 |
| | 31,403 |
| | 39,163 |
| | 9,574 |
| | 19,138 |
|
| Provision (benefit) for income taxes | 14,155 |
| | 12,806 |
| | (22,447 | ) | | 12,221 |
| | 10,477 |
|
| Depreciation and amortization of property, equipment and intangibles | 15,581 |
| | 16,047 |
| | 15,488 |
| | 14,798 |
| | 14,131 |
|
| Stock-based compensation expense | 28,590 |
| | 32,834 |
| | 35,860 |
| | 42,422 |
| | 44,112 |
|
| Adjusted EBITDA | $ | 119,006 |
| | $ | 122,522 |
| | $ | 111,242 |
| | $ | 106,673 |
| | $ | 128,613 |
|
|
| | | | |
| | | Three Months Ended |
| | | December 31,
2015 |
| Non-GAAP net income reconciliation: | | |
| GAAP net income | | $ | 43,178 |
|
| Less: Release of tax accrual | | (13,438 | ) |
| Non-GAAP net income | | $ | 29,740 |
|
| Non-GAAP earnings per share: | | |
| Basic | | 0.07 |
|
| Diluted | | 0.07 |
|
| Weighted-average common shares outstanding: | | |
| Basic | | 427,668 |
|
| Diluted | | 438,257 |
|