Exhibit 99.1
January 17, 2019
Fellow shareholders,
We grew annual revenue 35% to $16 billion in 2018, and nearly doubled operating profits to $1.6 billion. Fueling this growth was our high member satisfaction, which propelled us to finish 2018 with 139 million paying memberships, up 9 million from quarter start and up 29 million from the beginning of the year. |
| | | | | | | | | | | | | | | | | | |
| (in millions except per share data and Streaming Content Obligations) | Q4'17 | Q1'18 | Q2'18 | Q3'18 | Q4'18 | Q1'19 Forecast |
| Revenue | $ | 3,286 |
| $ | 3,701 |
| $ | 3,907 |
| $ | 3,999 |
| $ | 4,187 |
| $ | 4,494 |
|
| Y/Y % Growth | 32.6 | % | 40.4 | % | 40.3 | % | 34.0 | % | 27.4 | % | 21.4 | % |
| Operating Income | $ | 245 |
| $ | 447 |
| $ | 462 |
| $ | 481 |
| $ | 216 |
| $ | 400 |
|
| Operating Margin | 7.5 | % | 12.1 | % | 11.8 | % | 12.0 | % | 5.2 | % | 8.9 | % |
| Net Income | $ | 186 |
| $ | 290 |
| $ | 384 |
| $ | 403 |
| $ | 134 |
| $ | 253 |
|
| Diluted EPS | $ | 0.41 |
| $ | 0.64 |
| $ | 0.85 |
| $ | 0.89 |
| $ | 0.30 |
| $ | 0.56 |
|
| | | | | | | |
| Global Streaming Paid Memberships | 110.64 |
| 118.90 |
| 124.35 |
| 130.42 |
| 139.26 |
| 148.16 |
|
| Y/Y % Growth | 24.2 | % | 26.0 | % | 25.6 | % | 25.4 | % | 25.9 | % | 24.6 | % |
| Global Streaming Paid Net Additions | 6.62 |
| 8.26 |
| 5.45 |
| 6.07 |
| 8.84 |
| 8.90 |
|
| | | | | | | |
| Net cash (used in) operating activities | $ | (488 | ) | $ | (237 | ) | $ | (518 | ) | $ | (690 | ) | $ | (1,235 | ) | |
| Free Cash Flow | $ | (524 | ) | $ | (287 | ) | $ | (559 | ) | $ | (859 | ) | $ | (1,315 | ) | |
| EBITDA | $ | 313 |
| $ | 534 |
| $ | 563 |
| $ | 584 |
| $ | 328 |
| |
| Shares (FD) | 448.1 |
| 450.4 |
| 451.6 |
| 451.9 |
| 451.1 |
| |
| Streaming Content Obligations* ($B) | 17.7 |
| 17.9 |
| 18.4 |
| 18.6 |
| 19.3 |
| |
| Note: Figures are consolidated, including DVD. | | | | | | |
| *Corresponds to our total known streaming content obligations as defined in our financial statements and related notes in our most recently filed SEC Form 10-K |
Q4 Results and Q1 Forecast
Average paid memberships and ASP rose 26% and 3% year over year, respectively. Excluding the impact of F/X, international ASP increased 6% year over year and 1% sequentially. Foreign exchange headwinds continued to move against us in the quarter, similar to the trend we saw in Q3’18.
As expected, Q4 operating margin dipped to 5.2% vs. 7.5% prior year due to so many titles launching in the quarter. Our full year 2018 operating margin of 10% was in-line with our target. EPS of $0.30 vs. $0.41 included a $22 million non-cash unrealized gain from F/X remeasurement on our Euro denominated debt.
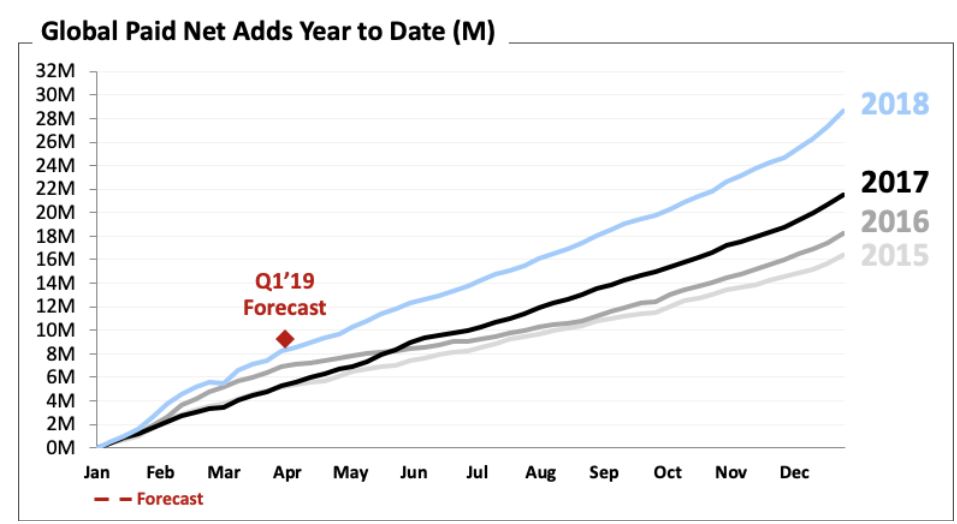
We added a record 8.8m paid memberships (1.5m in the US and 7.3m internationally), higher than our beginning-of-quarter expectation for 7.6m paid net adds and up 33% year over year. For the full year, paid net adds grew 33% to 29m vs. the 22m we added in 2017.
As discussed in our last letter, we reclassified1 certain personnel costs from G&A to Cost of Revenues and Marketing, and from Technology & Development to Other Cost of Revenues. This change has no impact on operating profit or margin or total operating expenses and historical quarterly pro forma financial statements for 2016-2018 can be found here2.
The quarterly guidance we provide is our actual internal forecast at the time we report and we strive for accuracy. For Q1’19, we forecast global paid net additions of 8.9m, +8% year over year, with 1.6m in the US and 7.3m internationally. Our Q1’19 revenue forecast represents 21% year over year growth (27% FX neutral). Our paid member growth is fairly consistent. Quarter to quarter, revenue growth varies due to factors like FX changes and timing of price changes across different markets. For example, we forecast Q1’19 international ASP will be up year over year, excluding FX.
___________________________________
1 https://d18rn0p25nwr6d.cloudfront.net/CIK-0001065280/d11fdb4f-97b7-4ff1-b3b0-9ddc7df9e73c.pdf
2 https://www.netflixinvestor.com/financials/financial-statements/default.aspx
We change pricing from time to time as we continue investing in great entertainment and improving the overall Netflix experience. We want to ensure that Netflix is a good value for the money and that our entry price is affordable. We just increased our US prices for new members, as we did in Q4 in Canada and Argentina, and in Japan in Q3. The new pricing in the US will be phased in for existing members over Q1 and Q2, which we anticipate will lift ASP.
Our multi-year plan is to keep significantly growing our content while increasing our revenue faster to expand our operating margins. We’re targeting a 9% operating margin in Q1’19, which we expect will grow over the course of the year and our full year operating margin target for 2019 remains 13% vs. 10% in 2018. A majority of our revenue is not in dollars, so when there are material FX moves, investors know to expect proportionate top line changes. In such FX cases, we’ll seek to adjust our prices and costs over time, but since that will lag the revenue changes, and since we don’t hedge FX, this would lead to short-term margin variations from our steady progression.
Content
In its first 4 weeks on Netflix, we estimate that Bird Box from director Susanne Bier will be enjoyed by over 80 million member households, and we are seeing high repeat viewing. In combination with our other movie hits such as: Dumplin’ from director Anne Fletcher, Chris Columbus-produced The Christmas Chronicles,3 Alfonso Cuarón’s critically acclaimed ROMA,4 Paul Greengrass’ 22 July, Tamara Jenkins’ Private Life5 and the Coen brothers’ The Ballad of Buster Scruggs,6 we are beginning to have our original movie7 offering mirror the success of our series offering for consumer enjoyment. The global reach of our audience and the quality of the experience producing for Netflix continues to attract the world’s top directors. We are expanding the film market: while our films drew bigger and bigger audiences in Q4, the North American box office also set records. Today, five weeks after its Netflix debut, ROMA is still being exhibited in theaters and has played on over 900 unique screens around the world, including some special 70mm format presentations. People love films...at home and in theaters.
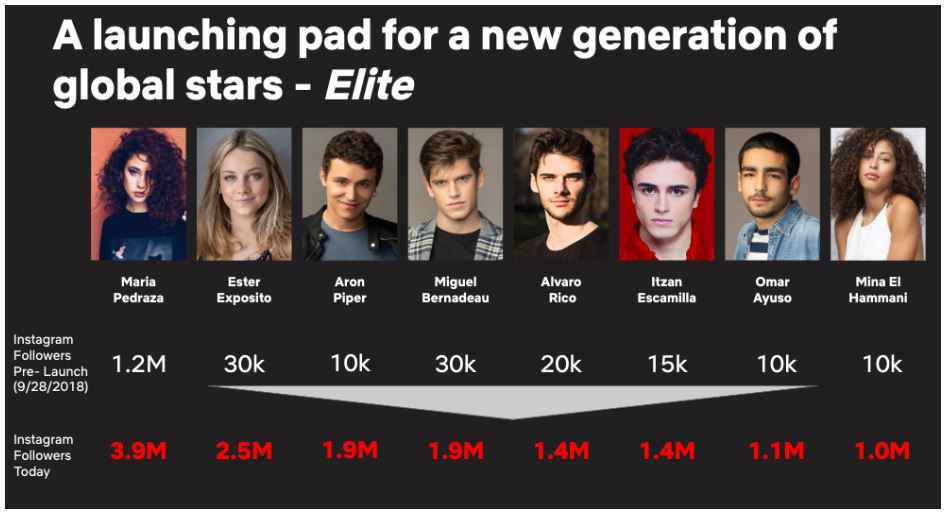
Around the world, our titles are not only pleasing consumers, but they are transforming the careers of our talent. Elite, our Spanish original, has been a huge success with over 20 million member households around the world enjoying the series in its first four weeks on service.8 In addition to being highly watched, social engagement has been phenomenal and the cast’s popularity on social media skyrocketed, continuing to demonstrate our ability to be a launching pad for talent.
___________________________________
3 https://www.hollywoodreporter.com/news/christmas-chronicles-director-chris-columbus-kurt-russell-santa-1163161
4 https://www.rollingstone.com/movies/movie-reviews/roma-movie-review-758113/
5 https://www.rottentomatoes.com/m/private_life_2018
6 https://www.vanityfair.com/hollywood/2018/11/ballad-of-buster-scruggs-movie-review-coen-brothers-netflix
7 https://variety.com/2019/film/opinion/top-10-best-netflix-original-films-of-2018-1203097500/
8 For series, due to their highly variable length, we count a viewer if they substantially complete at least one episode (70%). For a film, it is if they substantially complete the film (70%).
We’re making significant investments in productions all over the world because we have seen that great stories transcend borders. For example, Bodyguard (co-produced with BBC One, from ITV Studios) ranks as one of our most enjoyed co-productions. Baby, our second original series from Italy, and The Protector, our first Turkish original series, both saw strong viewing both inside and outside their home countries. All three of these debut seasons from around the world were each enjoyed by over 10 million member households in their first four weeks.
From Hollywood, in Q4 we launched new global scripted series like The Haunting of Hill House,9 Chilling Adventures of Sabrina, and The Kominsky Method (from Chuck Lorre, starring Michael Douglas and Alan Arkin), as well as new seasons of returning shows like adult animation Big Mouth and Narcos: Mexico, the latest installment in the Narcos franchise. We were very pleased with our launch of You10 three weeks ago; we estimate it will be watched by over 40 million member households in its first 4 weeks on Netflix. This binge-worthy show started as a Lifetime linear series in the US, but is now a full Netflix global original. A week ago, we launched Sex Education from the UK and it is also tracking to be a huge hit (estimated over 40 million households watching the title within the first 4 weeks).
Netflix films and TV shows picked up five 2019 Golden Globe wins,11 including Best Comedy Series for The Kominsky Method and Best Actor in a Comedy Series for Michael Douglas and Best Actor in a Drama Series for Richard Madden from Bodyguard. Alfonso Cuarón won the Golden Globe for Best Feature Director and Best Foreign Language Feature for ROMA.
___________________________________
9 https://www.rollingstone.com/tv/tv-features/the-haunting-of-hill-house-review-737658/
10 https://www.theringer.com/tv/2019/1/11/18177643/you-netflix-effect
11 https://variety.com/2019/film/awards/golden-globes-2019-winners-recap-1203100429/
As a result of our success with original content, we’re becoming less focused on 2nd run programming. For example, we launched our originals strategy for the unscripted genre only two years ago. Today, Netflix originals, like Tidying Up with Marie Kondo,12 account for a majority of total unscripted view share on Netflix, while viewing of all unscripted programming has increased meaningfully during that time. We are ready to pay top-of-market prices for second run content when the studios, networks and producers are willing to sell, but we are also prepared to keep our members ecstatic with our incredible original content if others choose to retain their content for their own services.
Looking forward in 2019, we will be launching many new highly-anticipated titles including The Umbrella Academy (February 15th); Triple Frontier from J.C. Chandor (March); The Irishman from Martin Scorsese; 6 Underground from Michael Bay; and The Politician from Ryan Murphy; as well as returning seasons of The Crown led by a new cast including Olivia Colman, Ben Daniels, and Helena Bonham Carter; 13 Reasons Why, La Casa de Papel, Elite, and, of course, Season 3 of the epic Stranger Things, coming to members all around the world on July 4th.
Product and Partnerships
We test many different approaches to our business in order to learn how to grow quickly. We continue to test new plan options (both below and above our existing offers) in certain markets. We are also expanding our bundled offerings which now include: Telefonica in Spain, Comcast and T-Mobile in the US, Sky in the UK and Germany, Free in France, and KDDI in Japan. As discussed in our Q1’18 investor letter, in the case of these hard bundles, we report revenue net of economics we share with our partners.
On December 28, we released Black Mirror: Bandersnatch, our first interactive movie for adults, allowing viewers to make decisions on behalf of the lead character. We’ve created thousands of different pathways to make it through the story, including multiple endings. This level of complexity necessitated the creation of a system to make such storytelling manageable. “Branch Manager” helped series creator and writer Charlie Brooker and our internal teams produce this popular multi-branched movie. We’ll be using Branch Manager to construct additional interactive projects going forward. We’re thrilled with the global excitement that Bandersnatch has created and it serves as a strong example of how we can marry technology and entertainment to evolve video storytelling.
Competition
In the US, we earn around 10% of television screen time13 and less than that of mobile screen time. In other countries, we earn a lower percentage of screen time due to lower penetration of our service. We earn consumer screen time, both mobile and television, away from a very broad set of competitors. We compete with (and lose to) Fortnite more than HBO. When YouTube went down globally for a few minutes in October, our viewing and signups spiked for that time. Hulu is small compared to YouTube for viewing time, and they are successful in the US, but non-existent in Canada, which creates a comparison point: our penetration in the two countries is pretty similar. There are thousands of competitors in this highly-fragmented market vying to entertain consumers and low barriers to entry for those with great experiences. Our growth is based on how good our experience is, compared to all the other screen time experiences from which consumers choose. Our focus is not on Disney+, Amazon or others, but on how we can improve our experience for our members.
___________________________________
12 https://www.theringer.com/tv/2019/1/15/18182690/marie-kondo-tidying-up-netflix-instagram-social-media-phenomenon
13 We serve on average about 100 million hours a day to television screens in the US, and we estimate television screens in the US are on about a billion hours daily (120m homes x 2 TVs x 4 hours, plus hotels, bars, etc).
Free Cash Flow and Capital Structure
Free cash flow in Q4’18 was -$1.3 billion vs. -$0.5 billion in Q4’17, totalling -$3 billion for 2018 (compared to our original forecasted range of -$3 to -$4 billion for the full year). We expect 2019 FCF will be similar to 2018 and then will improve each year thereafter (assuming, as we do, no material transactions). This FCF improvement will be driven by growing operating margin, which will allow us to fund more of our investment needs internally.
During Q4, we raised €1.1 billion 4.625% senior notes and $800 million 6.375% senior notes (weighted average coupon of 5.3%). As long as we judge our marginal after-tax cost of debt to be lower than our marginal cost of equity, we’ll continue to finance our working capital needs through the high yield market. We finished the year with cash of $3.8 billion and our $500 million unsecured credit facility remains undrawn.
Spence Neumann joins as CFO
We’re pleased that Spence Neumann has joined Netflix as our new CFO and we thank David Wells for his many contributions to Netflix. Spence is a veteran entertainment executive who brings a wealth of experience and new perspectives to the company as we expand our original content around the world.
Reference
For quick reference, our eight most recent investor letters are: October 2018,14 July 2018,15 April 2018,16 January 2018,17 October 2017,18 July 2017,19 April 2017,20 January 2017.21
Appendix
|
| | | | | | | | | | | | | | | | | | |
| (in millions) | Q4'17 | Q1'18 | Q2'18 | Q3'18 | Q4'18 | Q1'19 Forecast |
| US Streaming: | | | | | | |
| Revenue | $ | 1,630 |
| $ | 1,820 |
| $ | 1,893 |
| $ | 1,937 |
| $ | 1,996 |
| $ | 2,064 |
|
| Contribution Profit* | $ | 503 |
| $ | 633 |
| $ | 672 |
| $ | 688 |
| $ | 590 |
| $ | 705 |
|
| Contribution Margin* | 30.9 | % | 34.8 | % | 35.5 | % | 35.5 | % | 29.6 | % | 34.2 | % |
| Paid Memberships | 52.81 |
| 55.09 |
| 55.96 |
| 56.96 |
| 58.49 |
| 60.09 |
|
| Paid Net Additions | 1.47 |
| 2.28 |
| 0.87 |
| 1.00 |
| 1.53 |
| 1.60 |
|
| Free Trials | 1.94 |
| 1.62 |
| 1.42 |
| 1.51 |
| 2.07 |
| |
| | | | | | | |
| International Streaming: | | | | | | |
| Revenue | $ | 1,550 |
| $ | 1,782 |
| $ | 1,921 |
| $ | 1,973 |
| $ | 2,106 |
| $ | 2,350 |
|
| Contribution Profit* | $ | 39 |
| $ | 174 |
| $ | 188 |
| $ | 218 |
| $ | 82 |
| $ | 230 |
|
| Contribution Margin* | 2.5 | % | 9.8 | % | 9.8 | % | 11.0 | % | 3.9 | % | 9.8 | % |
| Paid Memberships | 57.83 |
| 63.82 |
| 68.39 |
| 73.46 |
| 80.77 |
| 88.07 |
|
| Paid Net Additions | 5.16 |
| 5.98 |
| 4.58 |
| 5.07 |
| 7.31 |
| 7.30 |
|
| Free Trials | 5.00 |
| 4.48 |
| 4.37 |
| 5.17 |
| 7.13 |
| |
| | | | | | | |
| *Certain prior period amounts have been reclassified from G&A to Cost of revenues and Marketing and from Tech & Dev to Cost of revenues to conform to current period presentation |
___________________________________
14 https://s22.q4cdn.com/959853165/files/doc_financials/quarterly_reports/2018/q3/FINAL-Q3-18-Shareholder-Letter.pdf
15 https://s22.q4cdn.com/959853165/files/doc_financials/quarterly_reports/2018/q2/FINAL-Q2-18-Shareholder-Letter.pdf
16 https://s22.q4cdn.com/959853165/files/doc_financials/quarterly_reports/2018/q1/FINAL-Q1-18-Shareholder-Letter.pdf
17 https://s22.q4cdn.com/959853165/files/doc_financials/quarterly_reports/2017/q4/COMBINED-Q4-17-Shareholder-Letter-FINAL.pdf
18 https://s22.q4cdn.com/959853165/files/doc_financials/quarterly_reports/2017/q3/Q3_17_Shareholder_Letter_COMBINED.pdf
19 https://s22.q4cdn.com/959853165/files/doc_financials/quarterly_reports/2017/q2/Q2_17_Shareholder_Letter.pdf
20 https://s22.q4cdn.com/959853165/files/doc_financials/quarterly_reports/2017/q1/Q117ShareholderLetterV2FINAL.pdf
21 https://s22.q4cdn.com/959853165/files/doc_financials/quarterly_reports/2016/q4/Q416ShareholderLetter.pdf
January 17, 2019 Earnings Interview, 3pm PST
Our video interview with Eric Sheridan of UBS will be on youtube/netflixir at 3pm PST today. Questions that investors would like to see asked should be sent to eric.sheridan@ubs.com. Reed Hastings, CEO, Spence Neumann, CFO, Ted Sarandos, Chief Content Officer, Greg Peters, Chief Product Officer and Spencer Wang, VP of IR/Corporate Development will all be on the video to answer Eric’s questions.
|
| |
IR Contact: | PR Contact: |
| Spencer Wang | Richard Siklos |
| VP, Finance/IR & Corporate Development | VP, Corporate Communications |
| 408 809-5360 | 408 540-2629 |
Use of Non-GAAP Measures
This shareholder letter and its attachments include reference to the non-GAAP financial measure of free cash flow and EBITDA. Management believes that free cash flow and EBITDA are important liquidity metrics because they measure, during a given period, the amount of cash generated that is available to repay debt obligations, make investments and for certain other activities or the amount of cash used in operations, including investments in global streaming content. However, these non-GAAP measures should be considered in addition to, not as a substitute for or superior to, net income, operating income, diluted earnings per share and net cash provided by operating activities, or other financial measures prepared in accordance with GAAP. Reconciliation to the GAAP equivalent of these non-GAAP measures are contained in tabular form on the attached unaudited financial statements.
Forward-Looking Statements
This shareholder letter contains certain forward-looking statements within the meaning of the federal securities laws, including statements regarding content investment; multi-year business plan; content performance; price changes; reliance on 2nd run programming; future content offerings, including interactive projects; partnerships; effect of competition on growth; free cash flow; future capital raises; domestic and international net and paid subscribers; revenue; contribution profit (loss) and contribution margin for both domestic international operations, as well as consolidated operating income, operating margin; net income, earnings per share and free cash flow. The forward-looking statements in this letter are subject to risks and uncertainties that could cause actual results and events to differ, including, without limitation: our ability to attract new members and retain existing members; our ability to compete effectively; maintenance and expansion of device platforms for streaming; fluctuations in consumer usage of our service; service disruptions; production risks; actions of internet service providers; changes in government regulation; and, competition, including consumer adoption of different modes of viewing in-home filmed entertainment. A detailed discussion of these and other risks and uncertainties that could cause actual results and events to differ materially from such forward-looking statements is included in our filings with the Securities and Exchange Commission, including our Annual Report on Form 10-K, as amended by Form 10-K/A, filed with the Securities and Exchange Commission on February 5, 2018. The Company provides internal forecast numbers. Investors should anticipate that actual performance will vary from these forecast numbers based on risks and uncertainties discussed above and in our Annual Report on Form 10-K, as amended by Form 10-K/A. We undertake no obligation to update forward-looking statements to reflect events or circumstances occurring after the date of this shareholder letter.
Netflix, Inc.
Consolidated Statements of Operations
(unaudited)
(in thousands, except per share data)
|
| | | | | | | | | | | | | | | | | | | |
| | Three Months Ended | | Twelve Months Ended |
| | December 31,
2018 | | September 30,
2018 | | December 31,
2017 | | December 31,
2018 | | December 31,
2017 |
| Revenues | $ | 4,186,841 |
| | $ | 3,999,374 |
| | $ | 3,285,755 |
| | $ | 15,794,341 |
| | $ | 11,692,713 |
|
| Cost of revenues | 2,733,400 |
| | 2,531,128 |
| | 2,214,334 |
| | 9,967,538 |
| | 8,033,000 |
|
| Marketing | 730,355 |
| | 510,330 |
| | 466,527 |
| | 2,369,469 |
| | 1,436,281 |
|
| Technology and development | 331,789 |
| | 308,620 |
| | 247,132 |
| | 1,221,814 |
| | 953,710 |
|
| General and administrative | 175,530 |
| | 168,628 |
| | 112,459 |
| | 630,294 |
| | 431,043 |
|
| Operating income | 215,767 |
| | 480,668 |
| | 245,303 |
| | 1,605,226 |
| | 838,679 |
|
| Other income (expense): | | | | | | | | | |
| Interest expense | (128,807 | ) | | (108,862 | ) | | (75,292 | ) | | (420,493 | ) | | (238,204 | ) |
| Interest and other income (expense) | 32,436 |
| | 7,004 |
| | (38,681 | ) | | 41,725 |
| | (115,154 | ) |
| Income before income taxes | 119,396 |
| | 378,810 |
| | 131,330 |
| | 1,226,458 |
| | 485,321 |
|
| Provision for (benefit from) income taxes | (14,538 | ) | | (24,025 | ) | | (54,187 | ) | | 15,216 |
| | (73,608 | ) |
| Net income | $ | 133,934 |
| | $ | 402,835 |
| | $ | 185,517 |
| | $ | 1,211,242 |
| | $ | 558,929 |
|
| Earnings per share: | | | | | | | | | |
| Basic | $ | 0.31 |
| | $ | 0.92 |
| | $ | 0.43 |
| | $ | 2.78 |
| | $ | 1.29 |
|
| Diluted | $ | 0.30 |
| | $ | 0.89 |
| | $ | 0.41 |
| | $ | 2.68 |
| | $ | 1.25 |
|
| Weighted-average common shares outstanding: | | | | | | | | | |
| Basic | 436,385 |
| | 435,809 |
| | 433,108 |
| | 435,374 |
| | 431,885 |
|
| Diluted | 451,116 |
| | 451,919 |
| | 448,142 |
| | 451,244 |
| | 446,814 |
|
Netflix, Inc.
Consolidated Balance Sheets
(unaudited)
(in thousands)
|
| | | | | | | |
| | As of |
| | December 31,
2018 | | December 31,
2017 |
| Assets | | | |
| Current assets: | | | |
| Cash and cash equivalents | $ | 3,794,483 |
| | $ | 2,822,795 |
|
| Current content assets, net | 5,151,186 |
| | 4,310,934 |
|
| Other current assets | 748,466 |
| | 536,245 |
|
| Total current assets | 9,694,135 |
| | 7,669,974 |
|
| Non-current content assets, net | 14,960,954 |
| | 10,371,055 |
|
| Property and equipment, net | 418,281 |
| | 319,404 |
|
| Other non-current assets | 901,030 |
| | 652,309 |
|
| Total assets | $ | 25,974,400 |
| | $ | 19,012,742 |
|
| Liabilities and Stockholders' Equity | | | |
| Current liabilities: | | | |
| Current content liabilities | $ | 4,686,019 |
| | $ | 4,173,041 |
|
| Accounts payable | 562,985 |
| | 359,555 |
|
| Accrued expenses | 477,417 |
| | 315,094 |
|
| Deferred revenue | 760,899 |
| | 618,622 |
|
| Total current liabilities | 6,487,320 |
| | 5,466,312 |
|
| Non-current content liabilities | 3,759,026 |
| | 3,329,796 |
|
| Long-term debt | 10,360,058 |
| | 6,499,432 |
|
| Other non-current liabilities | 129,231 |
| | 135,246 |
|
| Total liabilities | 20,735,635 |
| | 15,430,786 |
|
| Stockholders' equity: | | | |
| Common stock | 2,315,988 |
| | 1,871,396 |
|
| Accumulated other comprehensive loss | (19,582 | ) | | (20,557 | ) |
| Retained earnings | 2,942,359 |
| | 1,731,117 |
|
| Total stockholders' equity | 5,238,765 |
| | 3,581,956 |
|
| Total liabilities and stockholders' equity | $ | 25,974,400 |
| | $ | 19,012,742 |
|
Netflix, Inc.
Consolidated Statements of Cash Flows
(unaudited)
(in thousands)
|
| | | | | | | | | | | | | | | | | | | |
| | Three Months Ended | | Twelve Months Ended |
| | December 31,
2018 |
| September 30,
2018 |
| December 31,
2017 |
| December 31,
2018 | | December 31,
2017 |
| Cash flows from operating activities: | | | | | | | | | |
| Net income | $ | 133,934 |
| | $ | 402,835 |
| | $ | 185,517 |
| | $ | 1,211,242 |
| | $ | 558,929 |
|
| Adjustments to reconcile net income to net cash used in operating activities: | | | | | | | | | |
| Additions to streaming content assets | (3,784,252 | ) | | (3,238,717 | ) | | (2,477,659 | ) | | (13,043,437 | ) | | (9,805,763 | ) |
| Change in streaming content liabilities | 266,653 |
| | 65,868 |
| | 53,446 |
| | 999,880 |
| | 900,006 |
|
| Amortization of streaming content assets | 2,053,660 |
| | 1,911,767 |
| | 1,713,863 |
| | 7,532,088 |
| | 6,197,817 |
|
| Amortization of DVD content assets | 8,965 |
| | 9,959 |
| | 12,289 |
| | 41,212 |
| | 60,657 |
|
| Depreciation and amortization of property, equipment and intangibles | 23,219 |
| | 21,161 |
| | 19,073 |
| | 83,157 |
| | 71,911 |
|
| Stock-based compensation expense | 88,714 |
| | 82,316 |
| | 48,530 |
| | 320,657 |
| | 182,209 |
|
| Other non-cash items | 9,336 |
| | 8,962 |
| | 14,126 |
| | 40,428 |
| | 57,207 |
|
| Foreign currency remeasurement loss (gain) on long-term debt | (21,953 | ) | | (7,670 | ) | | 25,740 |
| | (73,953 | ) | | 140,790 |
|
| Deferred taxes | (14,479 | ) | | (39,453 | ) | | (104,132 | ) | | (85,520 | ) | | (208,688 | ) |
| Changes in operating assets and liabilities: | | | | | | | | | |
| Other current assets | (88,359 | ) | | (30,364 | ) | | (87,090 | ) | | (200,192 | ) | | (234,090 | ) |
| Accounts payable | 121,831 |
| | (4,449 | ) | | 63,969 |
| | 199,198 |
| | 74,559 |
|
| Accrued expenses | (49,776 | ) | | 134,000 |
| | (5,169 | ) | | 150,422 |
| | 114,337 |
|
| Deferred revenue | 44,176 |
| | 18,983 |
| | 83,197 |
| | 142,277 |
| | 177,974 |
|
| Other non-current assets and liabilities | (26,741 | ) | | (25,609 | ) | | (33,657 | ) | | 2,062 |
| | (73,803 | ) |
| Net cash used in operating activities | (1,235,072 | ) | | (690,411 | ) | | (487,957 | ) | | (2,680,479 | ) | | (1,785,948 | ) |
| Cash flows from investing activities: | | | | | | | | | |
| Acquisition of DVD content assets | (7,507 | ) | | (7,731 | ) | | (10,507 | ) | | (38,586 | ) | | (53,720 | ) |
| Purchases of property and equipment | (70,120 | ) | | (39,333 | ) | | (21,585 | ) | | (173,946 | ) | | (173,302 | ) |
| Change in other assets | (2,731 | ) | | (121,630 | ) | | (3,749 | ) | | (126,588 | ) | | (6,689 | ) |
| Purchases of short-term investments | — |
| | — |
| | — |
| | — |
| | (74,819 | ) |
| Proceeds from sale of short-term investments | — |
| | — |
| | — |
| | — |
| | 320,154 |
|
| Proceeds from maturities of short-term investments | — |
| | — |
| | — |
| | — |
| | 22,705 |
|
| Net cash provided by (used in) investing activities | (80,358 | ) | | (168,694 | ) | | (35,841 | ) | | (339,120 | ) | | 34,329 |
|
| Cash flows from financing activities: | | | | | | | | | |
| Proceeds from issuance of debt | 2,061,852 |
| | — |
| | 1,600,000 |
| | 3,961,852 |
| | 3,020,510 |
|
| Debt issuance costs | (18,879 | ) | | — |
| | (16,828 | ) | | (35,871 | ) | | (32,153 | ) |
| Proceeds from issuance of common stock | 11,450 |
| | 29,781 |
| | 14,705 |
| | 124,502 |
| | 88,378 |
|
| Other financing activities | (559 | ) | | (544 | ) | | 66 |
| | (1,956 | ) | | 255 |
|
| Net cash provided by financing activities | 2,053,864 |
| | 29,237 |
| | 1,597,943 |
| | 4,048,527 |
| | 3,076,990 |
|
| Effect of exchange rate changes on cash, cash equivalents, and restricted cash | (4,957 | ) | | (5,562 | ) | | 2,181 |
| | (39,682 | ) | | 29,848 |
|
| Net increase (decrease) in cash, cash equivalents, and restricted cash | 733,477 |
| | (835,430 | ) | | 1,076,326 |
| | 989,246 |
| | 1,355,219 |
|
| Cash, cash equivalents, and restricted cash at beginning of period | 3,078,564 |
| | 3,913,994 |
| | 1,746,469 |
| | 2,822,795 |
| | 1,467,576 |
|
| Cash, cash equivalents, and restricted cash at end of period | $ | 3,812,041 |
| | $ | 3,078,564 |
| | $ | 2,822,795 |
| | $ | 3,812,041 |
| | $ | 2,822,795 |
|
| | | | | | | | | | |
| | Three Months Ended | | Twelve Months Ended |
| | December 31,
2018 | | September 30,
2018 | | December 31,
2017 | | December 31,
2018 | | December 31,
2017 |
| Non-GAAP free cash flow reconciliation: | | | | | | | | | |
| Net cash used in operating activities | $ | (1,235,072 | ) | | $ | (690,411 | ) | | $ | (487,957 | ) | | $ | (2,680,479 | ) | | $ | (1,785,948 | ) |
| Acquisition of DVD content assets | (7,507 | ) | | (7,731 | ) | | (10,507 | ) | | (38,586 | ) | | (53,720 | ) |
| Purchases of property and equipment | (70,120 | ) | | (39,333 | ) | | (21,585 | ) | | (173,946 | ) | | (173,302 | ) |
| Change in other assets | (2,731 | ) | | (121,630 | ) | | (3,749 | ) | | (126,588 | ) | | (6,689 | ) |
| Non-GAAP free cash flow | $ | (1,315,430 | ) | | $ | (859,105 | ) | | $ | (523,798 | ) | | $ | (3,019,599 | ) | | $ | (2,019,659 | ) |
Netflix, Inc.
Segment Information
(unaudited)
(in thousands)
|
| | | | | | | | | | | | | | | | | | | |
| | As of / Three Months Ended | | As of/ Twelve Months Ended |
| | December 31,
2018 | | September 30,
2018 | | December 31,
2017 | | December 31,
2018 | | December 31,
2017 |
| Domestic Streaming | | | | | | | | | |
| Paid memberships at end of period | 58,486 |
| | 56,957 |
| | 52,810 |
| | 58,486 |
| | 52,810 |
|
| Paid net membership additions | 1,529 |
| | 998 |
| | 1,465 |
| | 5,676 |
| | 4,905 |
|
| Free trials | 2,065 |
| | 1,507 |
| | 1,940 |
| | 2,065 |
| | 1,940 |
|
| | | | | | | | | | |
| Revenues | $ | 1,996,092 |
| | $ | 1,937,314 |
| | $ | 1,630,274 |
| | $ | 7,646,647 |
| | $ | 6,153,025 |
|
| Cost of revenues | 1,093,446 |
| | 1,038,473 |
| | 916,100 |
| | 4,038,394 |
| | 3,470,859 |
|
| Marketing | 312,739 |
| | 210,595 |
| | 211,057 |
| | 1,025,351 |
| | 603,746 |
|
| Contribution profit | 589,907 |
| | 688,246 |
| | 503,117 |
| | 2,582,902 |
| | 2,078,420 |
|
| | | | | | | | | | |
| International Streaming | | | | | | | | | |
| Paid memberships at end of period | 80,773 |
| | 73,465 |
| | 57,834 |
| | 80,773 |
| | 57,834 |
|
| Paid net membership additions | 7,308 |
| | 5,070 |
| | 5,156 |
| | 22,939 |
| | 16,649 |
|
| Free trials | 7,131 |
| | 5,170 |
| | 4,998 |
| | 7,131 |
| | 4,998 |
|
| | | | | | | | | | |
| Revenues | $ | 2,105,592 |
| | $ | 1,973,283 |
| | $ | 1,550,329 |
| | $ | 7,782,105 |
| | $ | 5,089,191 |
|
| Cost of revenues | 1,606,275 |
| | 1,455,554 |
| | 1,255,749 |
| | 5,776,047 |
| | 4,359,616 |
|
| Marketing | 417,616 |
| | 299,735 |
| | 255,470 |
| | 1,344,118 |
| | 832,535 |
|
| Contribution profit (loss) | 81,701 |
| | 217,994 |
| | 39,110 |
| | 661,940 |
| | (102,960 | ) |
| | | | | | | | | | |
| Domestic DVD | | | | | | | | | |
| Paid memberships at end of period | 2,706 |
| | 2,828 |
| | 3,330 |
| | 2,706 |
| | 3,330 |
|
| Free trials | 25 |
| | 24 |
| | 53 |
| | 25 |
| | 53 |
|
| | | | | | | | | | |
| Revenues | $ | 85,157 |
| | $ | 88,777 |
| | $ | 105,152 |
| | $ | 365,589 |
| | $ | 450,497 |
|
| Cost of revenues | 33,679 |
| | 37,101 |
| | 42,485 |
| | 153,097 |
| | 202,525 |
|
| Contribution profit | 51,478 |
| | 51,676 |
| | 62,667 |
| | 212,492 |
| | 247,972 |
|
| | | | | | | | | | |
| Consolidated | | | | | | | | | |
| | | | | | | | | | |
| Revenues | $ | 4,186,841 |
| | $ | 3,999,374 |
| | $ | 3,285,755 |
| | $ | 15,794,341 |
| | $ | 11,692,713 |
|
| Cost of revenues | 2,733,400 |
| | 2,531,128 |
| | 2,214,334 |
| | 9,967,538 |
| | 8,033,000 |
|
| Marketing | 730,355 |
| | 510,330 |
| | 466,527 |
| | 2,369,469 |
| | 1,436,281 |
|
| Contribution profit | 723,086 |
| | 957,916 |
| | 604,894 |
| | 3,457,334 |
| | 2,223,432 |
|
| Other operating expenses | 507,319 |
| | 477,248 |
| | 359,591 |
| | 1,852,108 |
| | 1,384,753 |
|
| Operating income | 215,767 |
| | 480,668 |
| | 245,303 |
| | 1,605,226 |
| | 838,679 |
|
| Other expense | (96,371 | ) | | (101,858 | ) | | (113,973 | ) | | (378,768 | ) | | (353,358 | ) |
| Provision for (benefit from) income taxes | (14,538 | ) | | (24,025 | ) | | (54,187 | ) | | 15,216 |
| | (73,608 | ) |
| Net income | $ | 133,934 |
| | $ | 402,835 |
| | $ | 185,517 |
| | $ | 1,211,242 |
| | $ | 558,929 |
|
Netflix, Inc.
Reclassification Reconciliation
(unaudited)
(in thousands)
|
| | | | | | | | | | | |
| | Three Months Ended December 31, 2018 |
| | Per Previous Classification | | Reclassifications | | As Reported |
| Consolidated | | | | | |
| Revenues | $ | 4,186,841 |
| | $ | — |
| | $ | 4,186,841 |
|
| Cost of revenues | 2,599,089 |
| | 134,311 |
| | 2,733,400 |
|
| Marketing | 646,938 |
| | 83,417 |
| | 730,355 |
|
| Technology and development | 350,283 |
| | (18,494 | ) | | 331,789 |
|
| General and administrative | 374,764 |
| | (199,234 | ) | | 175,530 |
|
| Operating Income | 215,767 |
| | — |
| | 215,767 |
|
| Operating Margin | 5.2 | % | | — | % | | 5.2 | % |
| | | | | | |
| Domestic Streaming | | | | | |
| Revenues | $ | 1,996,092 |
| | $ | — |
| | $ | 1,996,092 |
|
| Cost of revenues | 1,041,126 |
| | 52,320 |
| | 1,093,446 |
|
| Marketing | 282,228 |
| | 30,511 |
| | 312,739 |
|
| Contribution Profit | 672,738 |
| | (82,831 | ) | | 589,907 |
|
| Contribution Margin | 33.7 | % | | (4.1 | )% | | 29.6 | % |
| | | | | | |
| International Streaming | | | | | |
| Revenues | $ | 2,105,592 |
| | $ | — |
| | $ | 2,105,592 |
|
| Cost of revenues | 1,524,284 |
| | 81,991 |
| | 1,606,275 |
|
| Marketing | 364,710 |
| | 52,906 |
| | 417,616 |
|
| Contribution Profit | 216,598 |
| | (134,897 | ) | | 81,701 |
|
| Contribution Margin | 10.3 | % | | (6.4 | )% | | 3.9 | % |
Netflix, Inc.
Non-GAAP Information
(unaudited)
(in thousands)
|
| | | | | | | | | | | | | | | | | | | |
| | |
| | December 31,
2017 | | March 31,
2018 | | June 30,
2018 | | September 30,
2018 | | December 31,
2018 |
| Non-GAAP Adjusted EBITDA reconciliation: | | | | | | | | | |
| GAAP net income | $ | 185,517 |
| | $ | 290,124 |
| | $ | 384,349 |
| | $ | 402,835 |
| | $ | 133,934 |
|
| Add: | | | | | | | | | |
| Other expense | 113,973 |
| | 146,962 |
| | 33,577 |
| | 101,858 |
| | 96,371 |
|
| Provision for (benefit from) income taxes | (54,187 | ) | | 9,492 |
| | 44,287 |
| | (24,025 | ) | | (14,538 | ) |
| Depreciation and amortization of property, equipment and intangibles | 19,073 |
| | 19,041 |
| | 19,736 |
| | 21,161 |
| | 23,219 |
|
| Stock-based compensation expense | 48,530 |
| | 68,395 |
| | 81,232 |
| | 82,316 |
| | 88,714 |
|
| Adjusted EBITDA | $ | 312,906 |
| | $ | 534,014 |
| | $ | 563,181 |
| | $ | 584,145 |
| | $ | 327,700 |
|