Exhibit 99.1
| FOR RELEASE AT 1:02 PM PST | | IR CONTACT: | | Deborah Crawford |
| Wednesday, October 15, 2003 | | | | Director of Investor Relations 408 317-3712 |
| | | PR CONTACT: | | Lynn Brinton Director of Corporate Communications 408 317-3726 |
NETFLIX REPORTS THIRD QUARTER GAAP NET INCOME OF $3.3 MILLION
AND NON-GAAP NET INCOME OF $6.1 MILLION
| | • | | Revenue of $72.2 million, up 77 percent year-over-year and up 14 percent sequentially. |
| | • | | GAAP net income of $3.3 million or $0.10 per diluted share. |
| | • | | Non-GAAP net income of $6.1 million or $0.19 per diluted share. |
| | • | | Non-GAAP free cash flow of $7.9 million. GAAP net cash provided by operating activities of $22.0 million. |
LOS GATOS, CA — October 15, 2003 — Netflix, Inc. (Nasdaq: NFLX) announced record financial results for the third quarter ended September 30, 2003. “This record quarter and the consistent, steady progress we’ve made as a public company shows the power of our business model and its ability to scale as our subscriber base grows,” said Reed Hastings, founder and CEO of Netflix. “Service improvements continue to fuel our evangelical grassroots marketing efforts and to push retention to an all-time high.”
1
Revenue, Subscribers, and Churn
Total revenue for the third quarter was a record $72.2 million, up 77 percent compared to $40.7 million for the third quarter 2002, and up 14 percent compared to $63.2 million for the second quarter 2003.
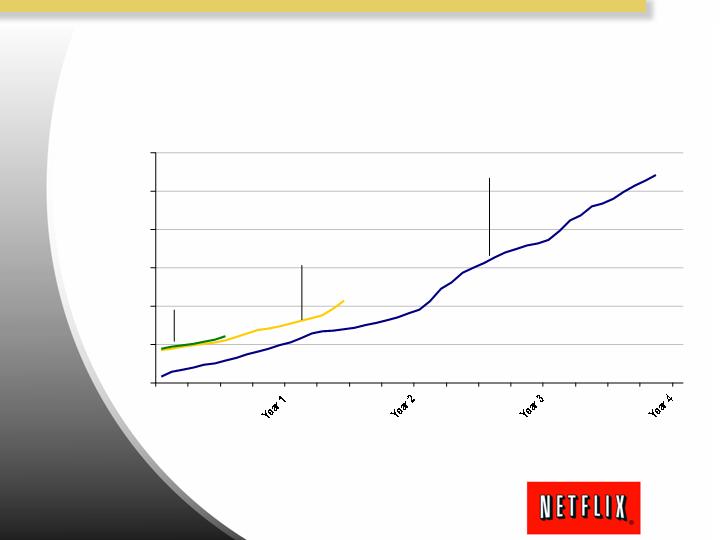
Netflix ended the third quarter of 2003 with approximately 1,291,000 total subscribers, up 144,000 or 13% sequentially. During the quarter Netflix acquired 383,000 new trial subscribers, a 38 percent year-over-year increase from the 277,000 new trial subscribers acquired in the third quarter of 2002 and a sequential increase of 17 percent from the 327,000 new trial subscribers acquired in the second quarter of 2003. For a graphical presentation of the Company’s household penetration growth for its metro shipping markets, please link to:http://ir.netflix.com/news/hubgrowth2.pdf.
Average monthly subscriber churn1 for the third quarter of 2003 was 5.2 percent as compared to 7.2 percent in the third quarter of 2002 and 5.6 percent in the second quarter of 2003. Churn improved across the subscriber base during the quarter in response to steady improvements in the quality of the Netflix service. Churn includes free trial subscribers as well as paying subscribers who elect not to renew their monthly subscription service during the quarter.
Gross Margin
Gross margin for the third quarter was 46.5 percent, up from 44.2 percent in the second quarter of 2003. Gross margin increased in the third quarter due to lower than expected content costs. Disc usage per average paid subscriber increased slightly during the quarter.
Subscriber Acquisition Cost
Subscriber acquisition cost2 for the third quarter was $31.81 per new-trial subscriber compared to a cost of $33.57 for the third quarter of 2002 and a cost of $30.45 for the second quarter of 2003. The Company continues to benefit from rapid growth in word of mouth as an acquisition source.
1 Monthly churn is defined as customer cancellations in the quarter divided by the sum of beginning subscribers and gross subscriber additions, divided by three months. This is the same churn definition as previously given but restated in plain-English for clarity.
2
GAAP Net Income (Loss), Non-GAAP Net Income (Loss), and Free Cash Flow
Netflix reported GAAP net income of $3.3 million, or $0.10 per diluted share, for the third quarter of 2003 compared to a GAAP net loss of $2.9 million, or $0.13 per diluted share, for the third quarter of 2002 and GAAP net income of $3.3 million, or $0.11 per diluted share, for the second quarter of 2003.
Non-GAAP net income was $6.1 million, or $0.19 per diluted share, for the third quarter of 2003 compared to a Non-GAAP net loss of $228 thousand, or $0.01 per diluted share, for the third quarter of 2002 and Non-GAAP net income of $5.0 million, or $0.16 per diluted share, for the second quarter of 2003. Non-GAAP net income (loss) equals net income (loss) on a GAAP basis before stock-based compensation expense.
Free cash flow for the third quarter 2003 was $7.9 million or 11 percent of revenue, up 36 percent from $5.8 million in the third quarter of 2002 and up 82 percent compared to $4.3 million for the second quarter of 2003. This is the Company’s eighth consecutive quarter of positive free cash flow. For the twelve months ended September 30, 2003, the Company generated $22.3 million of free cash flow and finished the third quarter with $124.4 million of cash and short-term investments. Less outstanding debt of $0.6 million, this equates to net cash of $123.8 million or $3.94 per diluted share. Non-GAAP free cash flow is defined as cash flows from operating activities less cash flows used in investing activities excluding purchases and sales of short-term investments. Cash provided by operating activities for the third quarter 2003 was $22.0 million, up 99 percent from $11.1 million in the third quarter 2002 and down 7 percent compared to $23.6 million for the second quarter of 2003.
Use of Non-GAAP Measures
Management believes that Non-GAAP net income (loss) is a useful measure of operating performance because it excludes the non-cash impact of stock option accounting. In addition, management believes that free cash flow is a useful measure of liquidity
2 “Subscriber acquisition cost” (“SAC”) is defined as the total marketing expense on the Company’s Statement of Operations divided by total new trial subscribers in the quarter.
3
because it excludes the non-operational cash flows from purchases and sales of short-term investments and cash flows from financing activities. However, these Non-GAAP measures should be considered in addition to, not as a substitute for, or superior to net income (loss) and net cash provided by operating activities, or other financial measures prepared in accordance with GAAP. A reconciliation to the GAAP equivalents of these Non-GAAP measures is contained in tabular form on the attached unaudited financial statements.
Revised Guidance
The Company revised guidance for the fourth quarter as follows:
| | • | | Ending subscribers of 1,425 to 1,475 thousand, from 1,400 to 1,475 thousand |
| | • | | Revenue of $77 to $81 million, from $74 to $80 million |
| | • | | GAAP net loss of $0.2 million to net income of $2.3 million, from a net loss of $2.5 million to net income of $1.5 million |
| | • | | Non-GAAP net income before stock-based compensation expense of $3.0 to $6.0 million, from $0.5 to $3.5 million |
| | • | | Gross margin of 42.5 to 44.5 percent, from 42 to 44 percent |
| | • | | SAC of $30 to $33, from $32 to $35 |
| | • | | Churn of 4.9 to 5.4 percent, from 5.2 to 5.8 percent |
Float, Lock Up Expiration, and Diluted Shares
The Company estimates the public float at approximately 17,212,257 shares as of September 30, 2003 based on registered shares held in street name with the Depository Trust and Clearing Corporation. The IPO lock up has expired, and no outstanding shares are subject to a lock-up agreement of any kind. From time to time executive officers of Netflix may elect to sell stock in Netflix. All such sales are made pursuant to the terms of 10b5-1 Trading Plans approved by the Company and generally adopted no less than three months prior to the first date of sale under such plan.
Earnings Call
The Netflix earnings call will be webcast today at 5:00 p.m. Eastern Time / 2:00 p.m. Pacific Time, and may be accessed athttp://ir.netflix.com or at
4
http://www.prnewswire.com. Following the conclusion of the webcast, a replay of the call will be available via Netflix’s website athttp://ir.netflix.com. For those without access to the Internet, a replay of the call will be available from 5:00 p.m. Pacific Time on October 15, 2003 through October 22, 2003. To listen to a replay, call (719) 457-0820, access code 711903. The Company plans to include discussion of its business outlook in the conference call.
About Netflix
Launched in 1998, Netflix is the world’s largest online movie rental service, providing more than one million subscribers with access to a comprehensive library of more than 15,000 DVD titles. For $19.95 a month, Netflix subscribers can rent as many DVDs as they want, with three movies out at a time, and keep them for as long as they like. There are no due dates and no late fees. DVDs are delivered directly to the subscriber’s address by first-class mail from shipping centers throughout the United States. Netflix can reach more than 70 percent of its subscribers with generally overnight delivery. The Company also provides background information on DVD releases, including critic reviews, member reviews and ratings and personalized movie recommendations. For more information, visithttp://www.netflix.com.
Forward-Looking Statements
This press release contains certain forward-looking statements within the meaning of the federal securities laws, including statements regarding our subscriber growth, revenues, GAAP net income (loss), Non-GAAP net income (loss), gross margin, subscriber acquisition cost and churn for the fourth quarter of 2003. These statements are subject to risks and uncertainties that could cause actual results and events to differ, including, without limitation: our ability to manage our growth, in particular managing our subscriber acquisition cost as well as the mix between revenue sharing titles and titles not subject to revenue sharing that are delivered to our subscribers; our ability to attract new subscribers and retain existing subscribers; fluctuations in consumer usage of our service, customer spending on DVD players, DVDs and related products; competition; disruption in service on our website or with our computer systems; deterioration of the U.S. economy or conditions specific to online commerce or the filmed entertainment industry; conditions that effect our delivery through the U.S. Postal Service, including increases in first class postage; increases in the costs of acquiring DVDs; and, widespread consumer adoption of different modes of viewing in-home filmed entertainment. A detailed discussion of these and other risks and uncertainties that could cause actual results and events to differ materially from such forward-looking statements is included in our filings with the Securities and Exchange Commission, including our Annual Report on Form 10-K filed with the SEC on March 31, 2003. We undertake no obligation to update forward-looking statements to reflect events or circumstances occurring after the date of this press release.
5
Netflix, Inc.
Statements of Operations
(Unaudited)
(in thousands, except per share data)
| | | Three Months Ended | | | | | Nine Months Ended | |
| |
| | |
|
| | | September 30, 2002 | | | June 30, 2003 | | | September 30, 2003 | | | | | September 30, 2002 | | | September 30, 2003 | |
| |
| | |
|
Revenues: | | | | | | | | | | | | | | | | | | | | | | |
Subscription | | $ | 40,163 | | | $ | 63,071 | | | $ | 71,278 | | | | | $ | 105,840 | | | $ | 189,630 | |
Sales | | | 568 | | | | 116 | | | | 924 | | | | | | 1,778 | | | | 1,428 | |
| | |
|
Total revenues | | | 40,731 | | | | 63,187 | | | | 72,202 | | | | | | 107,618 | | | | 191,058 | |
Cost of revenues: | | | | | | | | | | | | | | | | | | | | | | |
Subscription | | | 21,147 | | | | 35,148 | | | | 38,326 | | | | | | 53,798 | | | | 103,402 | |
Sales | | | 349 | | | | 93 | | | | 322 | | | | | | 948 | | | | 494 | |
| | |
|
Total cost of revenues | | | 21,496 | | | | 35,241 | | | | 38,648 | | | | | | 54,746 | | | | 103,896 | |
| | |
|
Gross profit | | | 19,235 | | | | 27,946 | | | | 33,554 | | | | | | 52,872 | | | | 87,162 | |
Operating expenses: | | | | | | | | | | | | | | | | | | | | | | |
Fulfillment | | | 4,908 | | | | 7,221 | | | | 8,322 | | | | | | 13,917 | | | | 21,926 | |
Technology and development | | | 3,966 | | | | 4,123 | | | | 4,738 | | | | | | 10,665 | | | | 13,044 | |
Marketing | | | 9,299 | | | | 9,957 | | | | 12,183 | | | | | | 25,291 | | | | 35,347 | |
General and administrative | | | 1,870 | | | | 2,093 | | | | 2,678 | | | | | | 4,817 | | | | 7,019 | |
Stock-based compensation | | | 2,622 | | | | 1,704 | | | | 2,777 | | | | | | 6,115 | | | | 6,887 | |
| | |
|
Total operating expenses | | | 22,665 | | | | 25,098 | | | | 30,698 | | | | | | 60,805 | | | | 84,223 | |
| | |
|
Operating income (loss) | | | (3,430 | ) | | | 2,848 | | | | 2,856 | | | | | | (7,933 | ) | | | 2,939 | |
Other income (expense): | | | | | | | | | | | | | | | | | | | | | | |
Interest and other income | | | 711 | | | | 560 | | | | 534 | | | | | | 1,060 | | | | 1,675 | |
Interest and other expense | | | (131 | ) | | | (95 | ) | | | (87 | ) | | | | | (11,821 | ) | | | (373 | ) |
| | |
|
Net income (loss) | | $ | (2,850 | ) | | $ | 3,313 | | | $ | 3,303 | | | | | $ | (18,694 | ) | | $ | 4,241 | |
| | |
|
Net income (loss) per share: | | | | | | | | | | | | | | | | | | | | | | |
Basic | | $ | (.13 | ) | | $ | .14 | | | $ | .14 | | | | | $ | (1.64 | ) | | $ | .18 | |
| | |
|
Diluted | | $ | (.13 | ) | | $ | .11 | | | $ | .10 | | | | | $ | (1.64 | ) | | $ | .14 | |
| | |
|
Weighted average common shares outstanding: | | | | | | | | | | | | | | | | | | | | | | |
Basic | | | 21,922 | | | | 23,648 | | | | 24,086 | | | | | | 11,395 | | | | 23,495 | |
| | |
|
Diluted | | | 21,922 | | | | 30,812 | | | | 31,460 | | | | | | 11,395 | | | | 30,684 | |
| | |
|
| | | | | | |
| Reconciliation of Non-GAAP Financial Measures | | | | | | | | | | | | | | | | | | | | | | |
(Unaudited) | | | | | | | | | | | | | | | | | | | | | | |
| Non-GAAP net income (loss) reconciliation: | | | | | | | | | | | | | | | | | | | | | | |
Net income (loss) | | $ | (2,850 | ) | | $ | 3,313 | | | $ | 3,303 | | | | | $ | (18,694 | ) | | $ | 4,241 | |
Add back: | | | | | | | | | | | | | | | | | | | | | | |
Stock-based compensation | | | 2,622 | | | | 1,704 | | | | 2,777 | | | | | | 6,115 | | | | 6,887 | |
Non-cash interest on early repayment of debt | | | — | | | | — | | | | — | | | | | | 10,695 | | | | — | |
| | |
|
Non-GAAP net income (loss) | | $ | (228 | ) | | $ | 5,017 | | | $ | 6,080 | | | | | $ | (1,884 | ) | | $ | 11,128 | |
| | |
|
Non-GAAP net income (loss) per share: | | | | | | | | | | | | | | | | | | | | | | |
Basic | | $ | (.01 | ) | | $ | .21 | | | $ | .25 | | | | | $ | (.17 | ) | | $ | .47 | |
| | |
|
Diluted | | $ | (.01 | ) | | $ | .16 | | | $ | .19 | | | | | $ | (.17 | ) | | $ | .36 | |
| | |
|
6
Netflix, Inc.
Balance Sheets
(Unaudited)
(in thousands, except share and per share data)
| | | As of | |
| |
|
| | | December 31, 2002 | | | September 30, 2003 | |
| |
|
| Assets | | | | | | | | |
Current assets: | | | | | | | | |
Cash and cash equivalents | | $ | 59,814 | | | $ | 79,170 | |
Short-term investments | | | 43,796 | | | | 45,237 | |
Prepaid expenses | | | 2,753 | | | | 1,943 | |
Prepaid revenue sharing expenses | | | 303 | | | | 957 | |
Other current assets | | | 409 | | | | 295 | |
|
Total current assets | | | 107,075 | | | | 127,602 | |
DVD library, net | | | 9,972 | | | | 18,441 | |
Intangible assets, net | | | 6,094 | | | | 3,704 | |
Property and equipment, net | | | 5,620 | | | | 6,586 | |
Deposits | | | 1,690 | | | | 1,684 | |
Other assets | | | 79 | | | | 847 | |
|
Total assets | | $ | 130,530 | | | $ | 158,864 | |
|
| | |
| Liabilities and Stockholders’ Equity | | | | | | | | |
Current liabilities: | | | | | | | | |
Accounts payable | | $ | 20,350 | | | $ | 28,459 | |
Accrued expenses | | | 9,102 | | | | 10,954 | |
Deferred revenue | | | 9,743 | | | | 13,771 | |
Current portion of capital lease obligations | | | 1,231 | | | | 371 | |
|
Total current liabilities | | | 40,426 | | | | 53,555 | |
Deferred rent | | | 288 | | | | 263 | |
Capital lease obligations, less current portion | | | 460 | | | | 185 | |
|
Total liabilities | | | 41,174 | | | | 54,003 | |
Commitments and contingencies | | | | | | | | |
Stockholders’ equity: | | | | | | | | |
Common stock, $0.001 par value; 150,000,000 and 80,000,000 shares authorized at December 31, 2002 and September 30, 2003, respectively; 22,445,795 and 24,227,548 issued and outstanding at December 31, 2002 and September 30, 2003, respectively | | | 22 | | | | 24 | |
Additional paid-in capital | | | 260,067 | | | | 265,791 | |
Deferred stock-based compensation | | | (11,702 | ) | | | (6,508 | ) |
Accumulated other comprehensive income | | | 774 | | | | 1,118 | |
Accumulated deficit | | | (159,805 | ) | | | (155,564 | ) |
|
Total stockholders’ equity | | | 89,356 | | | | 104,861 | |
|
Total liabilities and stockholders’ equity | | $ | 130,530 | | | $ | 158,864 | |
|
7
Netflix, Inc.
Statements of Cash Flows
(Unaudited)
(in thousands)
| | | Three Months Ended | | | | | Nine Months Ended | |
| |
| | |
|
| | | September 30, 2002 | | | June 30, 2003 | | | September 30, 2003 | | | | | September 30, 2002 | | | September 30, 2003 | |
| |
| | |
|
| Cash flows from operating activities: | | | | | | | | | | | | | | | | | | | | | | |
Net income (loss) | | $ | (2,850 | ) | | $ | 3,313 | | | $ | 3,303 | | | | | $ | (18,694 | ) | | $ | 4,241 | |
Adjustments to reconcile net income (loss) to net cash provided by operating activities: | | | | | | | | | | | | | | | | | | | | | | |
Depreciation of property and equipment | | | 1,576 | | | | 1,140 | | | | 1,118 | | | | | | 4,481 | | | | 3,591 | |
Amortization of DVD library | | | 4,663 | | | | 9,392 | | | | 12,323 | | | | | | 11,568 | | | | 28,335 | |
Amortization of intangible assets | | | 808 | | | | 808 | | | | 773 | | | | | | 2,333 | | | | 2,390 | |
Noncash charges for equity instruments granted to non-employees | | | 40 | | | | — | | | | — | | | | | | 40 | | | | — | |
Stock-based compensation expense | | | 2,622 | | | | 1,704 | | | | 2,777 | | | | | | 6,115 | | | | 6,887 | |
Gain on disposal of DVDs | | | (512 | ) | | | (94 | ) | | | (868 | ) | | | | | (1,469 | ) | | | (1,329 | ) |
Noncash interest expense | | | 37 | | | | 36 | | | | 16 | | | | | | 11,353 | | | | 84 | |
Changes in operating assets and liabilities: | | | | | | | | | | | | | | | | | | | | | | |
Prepaid expenses and other current assets | | | (505 | ) | | | (398 | ) | | | 65 | | | | | | (316 | ) | | | 270 | |
Accounts payable | | | 4,777 | | | | 5,791 | | | | 450 | | | | | | 4,433 | | | | 8,109 | |
Accrued expenses | | | 289 | | | | 769 | | | | 660 | | | | | | 3,564 | | | | 1,852 | |
Deferred revenue | | | 113 | | | | 1,167 | | | | 1,377 | | | | | | 2,242 | | | | 4,028 | |
Deferred rent | | | 16 | | | | (8 | ) | | | (8 | ) | | | | | 45 | | | | (25 | ) |
| | |
|
Net cash provided by operating activities | | | 11,074 | | | | 23,620 | | | | 21,986 | | | | | | 25,695 | | | | 58,433 | |
| | |
|
| Cash flows from investing activities: | | | | | | | | | | | | | | | | | | | | | | |
Purchases of short-term investments | | | (467 | ) | | | (363 | ) | | | (354 | ) | | | | | (42,614 | ) | | | (1,097 | ) |
Purchases of property and equipment | | | (719 | ) | | | (2,400 | ) | | | (1,596 | ) | | | | | (1,563 | ) | | | (4,557 | ) |
Acquisitions of DVD library | | | (5,673 | ) | | | (17,027 | ) | | | (13,467 | ) | | | | | (15,314 | ) | | | (36,903 | ) |
Proceeds from sale of DVDs | | | 568 | | | | 116 | | | | 924 | | | | | | 1,778 | | | | 1,428 | |
Deposits and other assets | | | 524 | | | | 20 | | | | 11 | | | | | | 533 | | | | (762 | ) |
| | |
|
Net cash used in investing activities | | | (5,767 | ) | | | (19,654 | ) | | | (14,482 | ) | | | | | (57,180 | ) | | | (41,891 | ) |
| | |
|
| Cash flows from financing activities: | | | | | | | | | | | | | | | | | | | | | | |
Proceeds from issuance of common stock | | | 91 | | | | 1,496 | | | | 988 | | | | | | 86,606 | | | | 4,033 | |
Repurchases of common stock | | | — | | | | — | | | | — | | | | | | (3 | ) | | | — | |
Principal payments on notes payable and capital lease obligations | | | (836 | ) | | | (261 | ) | | | (551 | ) | | | | | (16,928 | ) | | | (1,219 | ) |
| | |
|
Net cash provided by (used in) financing activities | | | (745 | ) | | | 1,235 | | | | 437 | | | | | | 69,675 | | | | 2,814 | |
| | |
|
Net increase in cash and cash equivalents | | | 4,562 | | | | 5,201 | | | | 7,941 | | | | | | 38,190 | | | | 19,356 | |
Cash and cash equivalents, beginning of period | | | 49,759 | | | | 66,028 | | | | 71,229 | | | | | | 16,131 | | | | 59,814 | |
| | |
|
Cash and cash equivalents, end of period | | $ | 54,321 | | | $ | 71,229 | | | $ | 79,170 | | | | | $ | 54,321 | | | $ | 79,170 | |
| | |
|
| | | | | | |
| Non-GAAP Free Cash Flow reconciliation: | | | | | | | | | | | | | | | | | | | | | | |
Net cash provided by operating activities | | $ | 11,074 | | | $ | 23,620 | | | $ | 21,986 | | | | | $ | 25,695 | | | $ | 58,433 | |
Purchases of property and equipment | | | (719 | ) | | | (2,400 | ) | | | (1,596 | ) | | | | | (1,563 | ) | | | (4,557 | ) |
Acquisitions of DVD library | | | (5,673 | ) | | | (17,027 | ) | | | (13,467 | ) | | | | | (15,314 | ) | | | (36,903 | ) |
Proceeds from sale of DVDs | | | 568 | | | | 116 | | | | 924 | | | | | | 1,778 | | | | 1,428 | |
Deposits and other assets | | | 524 | | | | 20 | | | | 11 | | | | | | 533 | | | | (762 | ) |
| | |
|
Non-GAAP Free Cash Flow | | $ | 5,774 | | | $ | 4,329 | | | $ | 7,858 | | | | | $ | 11,129 | | | $ | 17,639 | |
| | |
|
8
Netflix, Inc.
Other Data
(Unaudited)
(in thousands, except subscriber acquisition cost)
| | | Three Months Ended | | | | | Nine Months Ended | |
| |
| | |
|
| | | September 30, 2002 | | | June 30, 2003 | | | September 30, 2003 | | | | | September 30, 2002 | | | September 30, 2003 | |
| |
| | |
|
Subscribers: | | | | | | | | | | | | | | | | | | | | | | |
New trial subscribers: during period | | | 277 | | | | 327 | | | | 383 | | | | | | 825 | | | | 1,127 | |
New trial subscribers year-to-year change | | | 158.9 | % | | | 38.6 | % | | | 38.3 | % | | | | | 143.4 | % | | | 36.6 | % |
New trial subscribers quarter-to-quarter sequential change | | | 17.4 | % | | | (21.6 | %) | | | 17.1 | % | | | | | | | | | | |
Subscribers: end of period | | | 742 | | | | 1,147 | | | | 1,291 | | | | | | 742 | | | | 1,291 | |
Subscribers year-to-year change | | | 122.2 | % | | | 71.2 | % | | | 74.0 | % | | | | | 122.2 | % | | | 74.0 | % |
Subscribers quarter-to-quarter sequential change | | | 10.7 | % | | | 9.0 | % | | | 12.6 | % | | | | | | | | | | |
Free subscribers: end of period | | | 34 | | | | 46 | | | | 49 | | | | | | 34 | | | | 49 | |
Free subscribers as percentage of ending subscribers | | | 4.6 | % | | | 4.0 | % | | | 3.8 | % | | | | | 4.6 | % | | | 3.8 | % |
Paid subscribers: end of period | | | 708 | | | | 1,101 | | | | 1,242 | | | | | | 708 | | | | 1,242 | |
Year-to-year change | | | 124.8 | % | | | 73.9 | % | | | 75.4 | % | | | | | 124.8 | % | | | 75.4 | % |
Quarter-to-quarter sequential change | | | 11.8 | % | | | 9.1 | % | | | 12.8 | % | | | | | | | | | | |
Subscriber churn (monthly) | | | 7.2 | % | | | 5.6 | % | | | 5.2 | % | | | | | 7.0 | % | | | 5.5 | % |
Subscriber acquisition cost | | $ | 33.5 | 7 | | $ | 30.4 | 5 | | $ | 31.8 | 1 | | | | $ | 30.6 | 6 | | $ | 31.3 | 6 |
| | |
|
| | | | | | |
Margins: | | | | | | | | | | | | | | | | | | | | | | |
Gross margin | | | 47.2 | % | | | 44.2 | % | | | 46.5 | % | | | | | 49.1 | % | | | 45.6 | % |
Operating margin | | | (8.4 | %) | | | 4.5 | % | | | 4.0 | % | | | | | (7.4 | %) | | | 1.5 | % |
Net margin | | | (7.0 | %) | | | 5.2 | % | | | 4.6 | % | | | | | (17.4 | %) | | | 2.2 | % |
Non-GAAP net margin | | | (0.6 | %) | | | 7.9 | % | | | 8.4 | % | | | | | (1.8 | %) | | | 5.8 | % |
Expenses as percentage of revenues: | | | | | | | | | | | | | | | | | | | | | | |
Fulfillment | | | 12.0 | % | | | 11.4 | % | | | 11.5 | % | | | | | 12.9 | % | | | 11.5 | % |
Technology and development | | | 9.7 | % | | | 6.5 | % | | | 6.6 | % | | | | | 9.9 | % | | | 6.8 | % |
Marketing | | | 22.8 | % | | | 15.8 | % | | | 16.9 | % | | | | | 23.5 | % | | | 18.5 | % |
General and administrative | | | 4.6 | % | | | 3.3 | % | | | 3.7 | % | | | | | 4.5 | % | | | 3.7 | % |
| | |
|
Operating expenses before stock-based compensation | | | 49.2 | % | | | 37.0 | % | | | 38.7 | % | | | | | 50.8 | % | | | 40.5 | % |
Stock-based compensation | | | 6.4 | % | | | 2.7 | % | | | 3.8 | % | | | | | 5.7 | % | | | 3.6 | % |
| | |
|
Total operating expenses | | | 55.6 | % | | | 39.7 | % | | | 42.5 | % | | | | | 56.5 | % | | | 44.1 | % |
| | |
|
| | | | | | |
Year-to-year change: | | | | | | | | | | | | | | | | | | | | | | |
Total revenues | | | 115.8 | % | | | 73.8 | % | | | 77.3 | % | | | | | 98.2 | % | | | 77.5 | % |
Fulfillment | | | 49.5 | % | | | 48.8 | % | | | 69.6 | % | | | | | 32.7 | % | | | 57.5 | % |
Technology and development | | | (11.1 | %) | | | 17.2 | % | | | 19.5 | % | | | | | (28.1 | %) | | | 22.3 | % |
Marketing | | | 170.0 | % | | | 23.6 | % | | | 31.0 | % | | | | | 78.3 | % | | | 39.8 | % |
General and administrative | | | 86.4 | % | | | 27.8 | % | | | 43.2 | % | | | | | 35.8 | % | | | 45.7 | % |
| | |
|
Operating expenses before stock-based compensation and restructuring charges | | | 64.4 | % | | | 29.5 | % | | | 39.3 | % | | | | | 27.0 | % | | | 41.4 | % |
Restructuring charges | | | (100 | %) | | | — | | | | — | | | | | | (100 | %) | | | — | |
Stock-based compensation | | | 64.0 | % | | | (29.9 | %) | | | 5.9 | % | | | | | 12.3 | % | | | 12.6 | % |
| | |
|
Total operating expenses | | | 56.7 | % | | | 22.5 | % | | | 35.4 | % | | | | | 23.7 | % | | | 38.5 | % |
| | |
|
9
Netflix, Inc.
Non-GAAP Guidance Reconciliation Schedule
(Unaudited)
(in thousands)
| | | Fourth Quarter, 2003 Guidance Range |
| |
|
| Non-GAAP net income (loss) reconciliation: | | | | | | | |
Net income (loss) | | $ | (200 | ) | | $ | 2,300 |
Add back: | | | | | | | |
Stock-based compensation | | | 3,200 | | | | 3,700 |
|
Non-GAAP net income | | $ | 3,000 | | | $ | 6,000 |
|
10
Netflix Market Penetration
0%
1%
2%
3%
4%
5%
6%
Time from Commencement of 1 Day Service
5.4%
7 Hubs Opened in '03
12 Hubs Opened in '02
SF Bay Area