EXHIBIT 99.1

| FOR IMMEDIATE RELEASE | | IR CONTACT: | | Deborah Crawford |
| Wednesday, January 21, 2004 | | | | Director of Investor Relations |
| | | | | 408 317-3712 |
| | | PR CONTACT: | | Lynn Brinton |
| | | | | Director of Corporate Communications |
| | | | | 408 317-3726 |
NETFLIX ANNOUNCES Q4 REVENUE GROWTH OF 80% YEAR OVER YEAR
AND A 2-FOR-1 STOCK SPLIT
| | • | Revenue of $81.2 million, up 80% year over year |
| | • | GAAP net income of $2.3 million, or $0.07 per diluted share |
| | • | Non-GAAP net income of $6.1 million, or $0.19 per diluted share |
| | • | Free cash flow of $9.2 million, GAAP net cash provided by operating activities of $31.4 million |
| | • | 2004 revenue guidance of $450 to $475 million, GAAP net income of $14.6 to $21.6 million and Non-GAAP net income of $38 to $45 million |
LOS GATOS, CA — January 21, 2004 — Netflix, Inc. (Nasdaq: NFLX) announced record financial results for the fourth quarter and year ended December 31, 2003.
Revenue, Subscribers and Churn
Total revenue for the fourth quarter was a record $81.2 million, up 80 percent compared to $45.2 million for the fourth quarter of 2002, and up 12 percent compared to $72.2 million for the third quarter of 2003. Revenue for fiscal 2003 was a record $272.2 million, up 78 percent compared to $152.8 million for fiscal 2002.
“Our Q4 performance and the announced stock split reflect the strong, organic and sustained growth of the Netflix model,” said Reed Hastings, founder and CEO of Netflix. “Robust growth will continue in 2004 as will efficient investment in those initiatives that will sustain momentum in 2005 and beyond.”
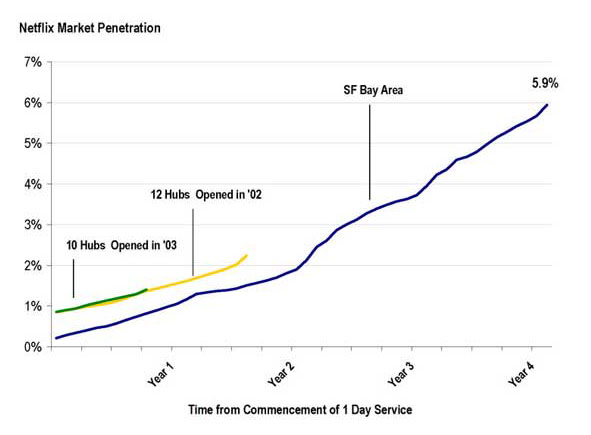
Netflix ended the fourth quarter of 2003 with approximately 1,487,000 total subscribers. During the quarter Netflix acquired 444,000 new trial subscribers, a 41 percent year-over-year increase from the 315,000 new trial subscribers acquired in the fourth quarter of 2002 and a sequential increase of 16 percent over the 383,000 new trial subscribers acquired in the third quarter of 2003. Household penetration continued to rise in all markets, particularly those reached by generally overnight delivery (more than 80 percent of Netflix subscribers). For a graphical representation of the Company’s household penetration growth for its metro shipping markets, please link to:http://ir.netflix.com/downloads/marketpenetration012104.pdf
Average monthly subscriber churn1 for the fourth quarter of 2003 was 4.8 percent as compared to 5.2 percent in the third quarter of 2003 and 6.3 percent in the fourth quarter of 2002. Churn reached a record low percentage in the quarter. Churn includes free trial subscribers as well as paying subscribers who elect not to renew their monthly subscription service during the quarter. The churn rate continued to drop in the quarter as retention rose across the subscriber base in response to the steady improvements in the quality of the Netflix service.
Gross Margin
Gross margin for the fourth quarter was 45.2 percent, slightly above the Company’s guidance and, as expected, down slightly from 46.5 percent in the third quarter of 2003. The decrease in gross margin was due to increased content costs. Disc usage per average paid subscriber declined slightly during the quarter in line with expectations and was not a contributing factor to lower gross margins.
Subscriber Acquisition Cost
Subscriber acquisition cost2 for the fourth quarter was $32.89 per new-trial subscriber compared to a cost of $33.31 for the fourth quarter of 2002 and a cost of $31.81 for the third quarter of 2003. This planned sequential increase in subscriber acquisition cost was attributable to television advertising testing during the quarter.
GAAP Net Income (Loss), Non-GAAP Net Income, and Free Cash Flow
Netflix reported GAAP net income of $2.3 million, or $0.07 per diluted share, for the fourth quarter of 2003 compared to a GAAP net loss of $2.3 million, or a loss of $0.10 per diluted share, for the fourth quarter of 2002 and a GAAP net income of $3.3 million, or $0.10 per diluted share, for the third quarter of 2003.
| 1 | Monthly churn is defined as customer cancellations in the quarter divided by the sum of beginning subscribers and gross subscriber additions, divided by three months. |
| 2 | Subscriber acquisition cost is defined as the total marketing expense on the Company’s Statement of Operations divided by total gross subscriber additions in the quarter. |
Non-GAAP net income was $6.1 million, or $0.19 per diluted share, for the fourth quarter of 2003 compared to a Non-GAAP net income of $463 thousand, or $0.02 per diluted share for the fourth quarter of 2002 and a Non-GAAP net income of $6.1 million, or $0.19 per diluted share for the third quarter of 2003. Non-GAAP net income equals net income on a GAAP basis before stock-based compensation expense.
Free cash flow3 for the fourth quarter of 2003 was a record $9.2 million or 11 percent of revenue, up 95 percent from $4.7 million in the fourth quarter of 2002 and up 17 percent compared to $7.9 million for the third quarter of 2003. This is the Company’s ninth consecutive quarter of positive free cash flow. Cash provided by operating activities for the fourth quarter of 2003 was $31.4 million, up 117 percent from $14.4 million in the fourth quarter of 2002 and up 43 percent compared to $22.0 million for the third quarter of 2003.
Use of Non-GAAP Measures
Management believes that Non-GAAP net income is a useful measure of operating performance because it excludes the non-cash impact of stock option accounting. In addition, management believes that free cash flow is a useful measure of liquidity because it excludes the non-operational cash flows from purchases and sales of short-term investments and cash flows from financing activities. However, these Non-GAAP measures should be considered in addition to, not as a substitute for, or superior to net income and net cash provided by operating activities, or other financial measures prepared in accordance with GAAP. A reconciliation to the GAAP equivalents of these Non-GAAP measures is contained in tabular form on the attached unaudited financial statements.
| 3 | Free cash flow is defined as cash flows from operating activities less cash flows used in investing activities excluding purchases and sales of short-term investments. |
Business Outlook
The Company’s performance expectations for the first quarter of 2004 and the full year of 2004 are as follows:
First Quarter 2004
| | • | Ending subscribers of 1,750 to 1,825 thousand |
| | • | Revenue of $94 to $99 million |
| | • | GAAP net loss of $1.2 to $3.7 million |
| | • | Non-GAAP net income of $1.0 to $3.5 million |
| | • | Gross margin of 44 to 46 percent |
| | • | Churn of 4.8 to 5.3 percent |
Full Year 2004
| | • | Ending subscribers of 2,225 to 2,525 thousand |
| | • | Revenue of $450 to $475 million |
| | • | GAAP net income of $14.6 to $21.6 million |
| | • | Non-GAAP net income of $38 to $45 million |
| | • | Gross margin of 44 to 46 percent |
| | • | Churn of 4.3 to 5.3 percent |
Stock Split
In addition, Netflix’s Board of Directors has approved a two-for-one split of all outstanding shares of the Company’s common stock. Stockholders on the record date of February 2, 2004 will be entitled to one additional share for every share they own on that date. New shares will be issued by the Company’s transfer agent, EquiServe Trust Company, on February 11, 2004. Starting February 12, 2004, the stock will begin trading at its post-split price on the Nasdaq National Market.
Other News
Also today, Chief Financial Officer, Barry McCarthy, announced his plans to leave Netflix at the end of 2004. Mr. McCarthy said, “I’ve learned a tremendous amount from Reed about the right way to build and sustain a business. He will continue to run Netflix for years to come with great success. It’s time for me to find a challenging CEO or COO role of my own.” Netflix CEO Reed Hastings said, “Barry has been instrumental in our growth from zero to 1.5 million subscribers these last five years. I’m thrilled Netflix could provide him a platform for personal and professional growth. When he leaves in a year we will miss him greatly.”
Float and Trading Plans
The Company estimates the public float at approximately 19,166,484 shares as of December 31, 2003 based on registered shares held in street name with the Depository Trust and Clearing Corporation. No outstanding shares are subject to a lock-up agreement of any kind. From time to time executive officers of Netflix may elect to sell stock in Netflix. All such sales are made pursuant to the terms of 10b5-1 Trading Plans approved by the Company and generally adopted no less than three months prior to the first date of sale under such plan.
Earnings Call
The Netflix earnings call will be webcast today at 5:00 p.m. Eastern Time / 2:00 p.m. Pacific Time, and may be accessedat http://ir.netflix.com or athttp://prnewswire.com. Following the conclusion of the webcast, a replay of the call will be available via Netflix’s website athttp://ir.netflix.com. For those without access to the Internet, a replay of the call will be available from 5:00 p.m. Pacific Time on January 21, 2004 through January 28, 2004. To listen to a replay, call (719) 457-0820, access code 261290. The Company also plans to include discussion of its business outlook in the conference call.
About Netflix
Netflix (Nasdaq: NFLX) is the world’s largest online movie rental service, providing more than one million subscribers access to over 15,000 DVD titles. For $19.95 a month, Netflix subscribers rent as many DVDs as they want, and keep them as long as they want, with three movies out at a time. There are no due dates, no late fees and no shipping fees. DVDs are delivered for free by first-class mail from regional shipping centers located throughout the United States. Netflix can reach more than 80 percent of its subscribers with generally next-day delivery. The Company provides subscribers extensive information about DVD movies, including critic reviews, member reviews, online trailers, ratings, and personalized movie recommendations. For more information, visitwww.netflix.com.
Forward-Looking Statements
This press release contains certain forward-looking statements within the meaning of the federal securities laws, including statements regarding our subscriber growth, revenues, GAAP net income (loss), Non-GAAP net income, gross margin, subscriber acquisition cost and churn for the first quarter and full year of 2004. These statements are subject to risks and uncertainties that could cause actual results and events to differ, including, without limitation: our ability to manage our growth, in particular managing our subscriber acquisition cost as well as the mix between revenue sharing titles and titles not subject to revenue sharing that are delivered to our subscribers; our ability to attract new subscribers and retain existing subscribers; fluctuations in consumer usage of our service, customer spending on DVD players, DVDs and related products; competition; disruption in service on our website or with our computer systems; deterioration of the U.S. economy or conditions specific to online commerce or the filmed entertainment industry; conditions that effect our delivery through the U.S. Postal Service, including increases in first class postage; increases in the costs of acquiring DVDs; and, widespread consumer adoption of different modes of viewing in-home filmed entertainment. In addition, the full year guidance for 2004 does not reflect any material financial impact associated with our potential international expansion and is therefore subject to such additional risks and uncertainties, including, without limitation, our incurring significant additional costs and expense in establishing foreign operations that would cause the guidance set forth above to be materially different. The GAAP net income guidance is subject to the additional risk and uncertainty associated with fluctuations in our stock price as the calculation includes an estimate of the stock-based compensation expense that is a function of the anticipated price of our stock, which is difficult to predict given its volatility. A detailed discussion of these and other risks and uncertainties that could cause actual results and events to differ materially from such forward-looking statements is included in our filings with the Securities and Exchange Commission, including our Annual Report on Form 10-K filed with the SEC on March 31, 2003. We undertake no obligation to update forward-looking statements to reflect events or circumstances occurring after the date of this press release.
Netflix, Inc.
Statements of Operations
(unaudited)
(in thousands, except per share data)
| | | Three Months Ended
| | | Year Ended
| |
| | | December 31,
2002
| | | September 30,
2003
| | | December 31,
2003
| | | December 31,
2002
| | | December 31,
2003
| |
Revenues: | | | | | | | | | | | | | | | | | | | | |
Subscription | | $ | 44,978 | | | $ | 71,278 | | | $ | 80,780 | | | $ | 150,818 | | | $ | 270,410 | |
Sales | | | 210 | | | | 924 | | | | 405 | | | | 1,988 | | | | 1,833 | |
| | |
|
|
| |
|
|
| |
|
|
| |
|
|
| |
|
|
|
Total revenues | | | 45,188 | | | | 72,202 | | | | 81,185 | | | | 152,806 | | | | 272,243 | |
Cost of revenues: | | | | | | | | | | | | | | | | | | | | |
Subscription | | | 23,246 | | | | 38,326 | | | | 44,334 | | | | 77,044 | | | | 147,736 | |
Sales | | | 144 | | | | 322 | | | | 130 | | | | 1,092 | | | | 624 | |
| | |
|
|
| |
|
|
| |
|
|
| |
|
|
| |
|
|
|
Total cost of revenues | | | 23,390 | | | | 38,648 | | | | 44,464 | | | | 78,136 | | | | 148,360 | |
| | |
|
|
| |
|
|
| |
|
|
| |
|
|
| |
|
|
|
Gross profit | | | 21,798 | | | | 33,554 | | | | 36,721 | | | | 74,670 | | | | 123,883 | |
Operating expenses: | | | | | | | | | | | | | | | | | | | | |
Fulfillment | | | 5,449 | | | | 8,322 | | | | 9,348 | | | | 19,366 | | | | 31,274 | |
Technology and development | | | 3,960 | | | | 4,738 | | | | 4,840 | | | | 14,625 | | | | 17,884 | |
Marketing | | | 10,492 | | | | 12,183 | | | | 14,602 | | | | 35,783 | | | | 49,949 | |
General and administrative | | | 1,920 | | | | 2,678 | | | | 2,566 | | | | 6,737 | | | | 9,585 | |
Stock-based compensation | | | 2,717 | | | | 2,777 | | | | 3,832 | | | | 8,832 | | | | 10,719 | |
| | |
|
|
| |
|
|
| |
|
|
| |
|
|
| |
|
|
|
Total operating expenses | | | 24,538 | | | | 30,698 | | | | 35,188 | | | | 85,343 | | | | 119,411 | |
| | |
|
|
| |
|
|
| |
|
|
| |
|
|
| |
|
|
|
Operating income (loss) | | | (2,740 | ) | | | 2,856 | | | | 1,533 | | | | (10,673 | ) | | | 4,472 | |
Other income (expense): | | | | | | | | | | | | | | | | | | | | |
Interest and other income | | | 637 | | | | 534 | | | | 782 | | | | 1,697 | | | | 2,457 | |
Interest and other expense | | | (151 | ) | | | (87 | ) | | | (44 | ) | | | (11,972 | ) | | | (417 | ) |
| | |
|
|
| |
|
|
| |
|
|
| |
|
|
| |
|
|
|
Net income (loss) | | $ | (2,254 | ) | | $ | 3,303 | | | $ | 2,271 | | | $ | (20,948 | ) | | $ | 6,512 | |
| | |
|
|
| |
|
|
| |
|
|
| |
|
|
| |
|
|
|
Net income (loss) per share: | | | | | | | | | | | | | | | | | | | | |
Basic | | $ | (0.10 | ) | | $ | .14 | | | $ | .09 | | | $ | (1.49 | ) | | $ | .27 | |
| | |
|
|
| |
|
|
| |
|
|
| |
|
|
| |
|
|
|
Diluted | | $ | (0.10 | ) | | $ | .10 | | | $ | .07 | | | $ | (1.49 | ) | | $ | .21 | |
| | |
|
|
| |
|
|
| |
|
|
| |
|
|
| |
|
|
|
Weighted-average common shares outstanding: | | | | | | | | | | | | | | | | | | | | |
Basic | | | 22,223 | | | | 24,086 | | | | 25,077 | | | | 14,102 | | | | 23,893 | |
| | |
|
|
| |
|
|
| |
|
|
| |
|
|
| |
|
|
|
Diluted | | | 22,223 | | | | 31,460 | | | | 32,141 | | | | 14,102 | | | | 31,442 | |
| | |
|
|
| |
|
|
| |
|
|
| |
|
|
| |
|
|
|
Non-GAAP net income (loss) reconciliation: | | | | | | | | | | | | | | | | | | | | |
Net income (loss) | | $ | (2,254 | ) | | $ | 3,303 | | | $ | 2,271 | | | $ | (20,948 | ) | | $ | 6,512 | |
Add back: | | | | | | | | | | | | | | | | | | | | |
Stock-based compensation | | | 2,717 | | | | 2,777 | | | | 3,832 | | | | 8,832 | | | | 10,719 | |
Non-cash interest on early repayment of debt | | | — | | | | — | | | | — | | | | 10,695 | | | | — | |
| | |
|
|
| |
|
|
| |
|
|
| |
|
|
| |
|
|
|
Non-GAAP net income (loss) | | $ | 463 | | | $ | 6,080 | | | $ | 6,103 | | | $ | (1,421 | ) | | $ | 17,231 | |
| | |
|
|
| |
|
|
| |
|
|
| |
|
|
| |
|
|
|
Non-GAAP net income (loss) per share: | | | | | | | | | | | | | | | | | | | | |
Basic | | $ | 0.02 | | | $ | .25 | | | $ | .24 | | | $ | (.10 | ) | | $ | .72 | |
| | |
|
|
| |
|
|
| |
|
|
| |
|
|
| |
|
|
|
Diluted | | $ | 0.02 | | | $ | .19 | | | $ | .19 | | | $ | (.10 | ) | | $ | .55 | |
| | |
|
|
| |
|
|
| |
|
|
| |
|
|
| |
|
|
|
Netflix, Inc.
Balance Sheets
(unaudited)
(in thousands, except share and per share data)
| | | As of
| |
| | | December 31, 2002
| | | December 31, 2003
| |
Assets | | | | | | | | |
Current assets: | | | | | | | | |
Cash and cash equivalents | | $ | 59,814 | | | $ | 89,894 | |
Short-term investments | | | 43,796 | | | | 45,297 | |
Prepaid expenses | | | 2,753 | | | | 2,605 | |
Prepaid revenue sharing expenses | | | 303 | | | | 905 | |
Other current assets | | | 409 | | | | 245 | |
| | |
|
|
| |
|
|
|
Total current assets | | | 107,075 | | | | 138,946 | |
DVD library, net | | | 9,972 | | | | 22,238 | |
Intangible assets, net | | | 6,094 | | | | 2,948 | |
Property and equipment, net | | | 5,620 | | | | 9,772 | |
Deposits | | | 1,690 | | | | 1,272 | |
Other assets | | | 79 | | | | 836 | |
| | |
|
|
| |
|
|
|
Total assets | | $ | 130,530 | | | $ | 176,012 | |
| | |
|
|
| |
|
|
|
| | |
Liabilities and Stockholders’ Equity | | | | | | | | |
Current liabilities: | | | | | | | | |
Accounts payable | | $ | 20,350 | | | $ | 32,654 | |
Accrued expenses | | | 9,102 | | | | 11,625 | |
Deferred revenue | | | 9,743 | | | | 18,324 | |
Current portion of capital lease obligations | | | 1,231 | | | | 416 | |
| | |
|
|
| |
|
|
|
Total current liabilities | | | 40,426 | | | | 63,019 | |
Deferred rent | | | 288 | | | | 241 | |
Capital lease obligations, less current portion | | | 460 | | | | 44 | |
| | |
|
|
| |
|
|
|
Total liabilities | | | 41,174 | | | | 63,304 | |
Stockholders’ equity: | | | | | | | | |
Common stock, $0.001 par value; 150,000,000 and 80,000,000 shares authorized at December 31, 2002 and 2003, respectively; 22,445,795 and 25,424,685 issued and outstanding at December 31, 2002 and 2003, respectively | | | 22 | | | | 25 | |
Additional paid-in capital | | | 260,067 | | | | 270,862 | |
Deferred stock-based compensation | | | (11,702 | ) | | | (5,482 | ) |
Accumulated other comprehensive income | | | 774 | | | | 596 | |
Accumulated deficit | | | (159,805 | ) | | | (153,293 | ) |
| | |
|
|
| |
|
|
|
Total stockholders’ equity | | | 89,356 | | | | 112,708 | |
| | |
|
|
| |
|
|
|
Total liabilities and stockholders’ equity | | $ | 130,530 | | | $ | 176,012 | |
| | |
|
|
| |
|
|
|
Netflix, Inc.
Statements of Cash Flows
(unaudited)
(in thousands)
| | | Three Months Ended
| | | Year Ended
| |
| | | December 31, 2002
| | | September 30, 2003
| | | December 31, 2003
| | | December 31, 2002
| | | December 31, 2003
| |
Cash flows from operating activities: | | | | | | | | | | | | | | | | | | | | |
Net income (loss) | | $ | (2,254 | ) | | $ | 3,303 | | | $ | 2,271 | | | $ | (20,948 | ) | | $ | 6,512 | |
Adjustments to reconcile net income (loss) to net cash provided by operating activities: | | | | | | | | | | | | | | | | | | | | |
Depreciation of property and equipment | | | 1,438 | | | | 1,118 | | | | 1,129 | | | | 5,919 | | | | 4,720 | |
Amortization of DVD library | | | 5,849 | | | | 12,323 | | | | 14,790 | | | | 17,417 | | | | 43,125 | |
Amortization of intangible assets | | | 808 | | | | 773 | | | | 756 | | | | 3,141 | | | | 3,146 | |
Noncash charges for equity instruments granted to non-employees | | | — | | | | — | | | | — | | | | 40 | | | | — | |
Stock-based compensation expense | | | 2,717 | | | | 2,777 | | | | 3,832 | | | | 8,832 | | | | 10,719 | |
Gain on disposal of DVDs | | | (205 | ) | | | (868 | ) | | | (275 | ) | | | (1,674 | ) | | | (1,604 | ) |
Noncash interest expense | | | 31 | | | | 16 | | | | 19 | | | | 11,384 | | | | 103 | |
Changes in operating assets and liabilities: | | | | | | | | | | | | | | | | | | | | |
Prepaid expenses and other current assets | | | 272 | | | | 65 | | | | (560 | ) | | | (44 | ) | | | (290 | ) |
Accounts payable | | | 2,202 | | | | 450 | | | | 4,195 | | | | 6,635 | | | | 12,304 | |
Accrued expenses | | | 994 | | | | 660 | | | | 671 | | | | 4,558 | | | | 2,523 | |
Deferred revenue | | | 2,564 | | | | 1,377 | | | | 4,553 | | | | 4,806 | | | | 8,581 | |
Deferred rent | | | 3 | | | | (8 | ) | | | (22 | ) | | | 48 | | | | (47 | ) |
| | |
|
|
| |
|
|
| |
|
|
| |
|
|
| |
|
|
|
Net cash provided by operating activities | | | 14,419 | | | | 21,986 | | | | 31,359 | | | | 40,114 | | | | 89,792 | |
| | |
|
|
| |
|
|
| |
|
|
| |
|
|
| |
|
|
|
Cash flows from investing activities: | | | | | | | | | | | | | | | | | | | | |
Purchases of short-term investments | | | (408 | ) | | | (354 | ) | | | (582 | ) | | | (43,022 | ) | | | (1,679 | ) |
Purchases of property and equipment | | | (1,188 | ) | | | (1,596 | ) | | | (4,315 | ) | | | (2,751 | ) | | | (8,872 | ) |
Acquisitions of DVD library | | | (8,756 | ) | | | (13,467 | ) | | | (18,717 | ) | | | (24,070 | ) | | | (55,620 | ) |
Proceeds from sale of DVDs | | | 210 | | | | 924 | | | | 405 | | | | 1,988 | | | | 1,833 | |
Deposits and other assets | | | 21 | | | | 11 | | | | 423 | | | | 554 | | | | (339 | ) |
| | |
|
|
| |
|
|
| |
|
|
| |
|
|
| |
|
|
|
Net cash used in investing activities | | | (10,121 | ) | | | (14,482 | ) | | | (22,786 | ) | | | (67,301 | ) | | | (64,677 | ) |
| | |
|
|
| |
|
|
| |
|
|
| |
|
|
| |
|
|
|
Cash flows from financing activities: | | | | | | | | | | | | | | | | | | | | |
Proceeds from issuance of common stock | | | 1,414 | | | | 988 | | | | 2,266 | | | | 88,020 | | | | 6,299 | |
Repurchases of common stock | | | (3 | ) | | | — | | | | — | | | | (6 | ) | | | — | |
Principal payments on notes payable and capital lease obligations | | | (216 | ) | | | (551 | ) | | | (115 | ) | | | (17,144 | ) | | | (1,334 | ) |
| | |
|
|
| |
|
|
| |
|
|
| |
|
|
| |
|
|
|
Net cash provided by financing activities | | | 1,195 | | | | 437 | | | | 2,151 | | | | 70,870 | | | | 4,965 | |
| | |
|
|
| |
|
|
| |
|
|
| |
|
|
| |
|
|
|
Net increase in cash and cash equivalents | | | 5,493 | | | | 7,941 | | | | 10,724 | | | | 43,683 | | | | 30,080 | |
Cash and cash equivalents, beginning of period | | | 54,321 | | | | 71,229 | | | | 79,170 | | | | 16,131 | | | | 59,814 | |
| | |
|
|
| |
|
|
| |
|
|
| |
|
|
| |
|
|
|
Cash and cash equivalents, end of period | | $ | 59,814 | | | $ | 79,170 | | | $ | 89,894 | | | $ | 59,814 | | | $ | 89,894 | |
| | |
|
|
| |
|
|
| |
|
|
| |
|
|
| |
|
|
|
Non-GAAP Free Cash Flow Reconciliation: | | | | | | | | | | | | | | | | | | | | |
Net cash provided by operating activities | | $ | 14,419 | | | $ | 21,986 | | | $ | 31,359 | | | $ | 40,114 | | | $ | 89,792 | |
Purchases of property and equipment | | | (1,188 | ) | | | (1,596 | ) | | | (4,315 | ) | | | (2,751 | ) | | | (8,872 | ) |
Acquisitions of DVD library | | | (8,756 | ) | | | (13,467 | ) | | | (18,717 | ) | | | (24,070 | ) | | | (55,620 | ) |
Proceeds from sale of DVDs | | | 210 | | | | 924 | | | | 405 | | | | 1,988 | | | | 1,833 | |
Deposits and other assets | | | 21 | | | | 11 | | | | 423 | | | | 554 | | | | (339 | ) |
| | |
|
|
| |
|
|
| |
|
|
| |
|
|
| |
|
|
|
Non-GAAP Free Cash Flow | | $ | 4,706 | | | $ | 7,858 | | | $ | 9,155 | | | $ | 15,835 | | | $ | 26,794 | |
| | |
|
|
| |
|
|
| |
|
|
| |
|
|
| |
|
|
|
Netflix, Inc.
Other Data
(unaudited)
(in thousands, except percentages and subscriber acquisition cost)
| | | As of / Three Months Ended
| | | As of / Year Ended
| |
| | | December 31, 2002
| | | September 30, 2003
| | | December 31, 2003
| | | December 31, 2002
| | | December 31, 2003
| |
| | | | | | |
Subscriber Information: | | | | | | | | | | | | | | | |
New trial subscribers: during period | | 315 | | | 383 | | | 444 | | | 1,140 | | | 1,571 | |
New trial subscribers year-to-year change | | 38.8 | % | | 38.3 | % | | 41.0 | % | | 101.4 | % | | 37.8 | % |
New trial subscribers quarter-to-quarter sequential change | | 13.7 | % | | 17.1 | % | | 15.9 | % | | — | | | — | |
Subscribers: end of period | | 857 | | | 1,291 | | | 1,487 | | | 857 | | | 1,487 | |
Subscribers year-to-year change | | 87.9 | % | | 74.0 | % | | 73.5 | % | | 87.9 | % | | 73.5 | % |
Subscribers quarter-to-quarter sequential change | | 15.5 | % | | 12.6 | % | | 15.2 | % | | — | | | — | |
Free subscribers: end of period | | 61 | | | 49 | | | 71 | | | 61 | | | 71 | |
Free subscribers as percentage of ending subscribers | | 7.1 | % | | 3.8 | % | | 4.8 | % | | 7.1 | % | | 4.8 | % |
Paid subscribers: end of period | | 796 | | | 1,242 | | | 1,416 | | | 796 | | | 1,416 | |
Paid subscribers year-to-year change | | 99.0 | % | | 75.4 | % | | 77.9 | % | | 99.0 | % | | 77.9 | % |
Paid subscribers quarter-to-quarter sequential change | | 12.4 | % | | 12.8 | % | | 14.0 | % | | — | | | — | |
Subscriber churn (monthly) | | 6.3 | % | | 5.2 | % | | 4.8 | % | | — | | | — | |
Subscriber acquisition cost | | $33.31 | | | $31.81 | | | $32.89 | | | $31.39 | | | $31.79 | |
| | | | | |
Margins: | | | | | | | | | | | | | | | |
Gross margin | | 48.2 | % | | 46.5 | % | | 45.2 | % | | 48.9 | % | | 45.5 | % |
Operating margin | | (6.1 | %) | | 4.0 | % | | 1.9 | % | | (7.0 | %) | | 1.6 | % |
Net margin | | (5.0 | %) | | 4.6 | % | | 2.8 | % | | (13.7 | %) | | 2.4 | % |
Non-GAAP net margin | | 1.0 | % | | 8.4 | % | | 7.5 | % | | (0.9 | %) | | 6.3 | % |
| | | | | |
Expenses as percentage of revenues: | | | | | | | | | | | | | | | |
Fulfillment | | 12.1 | % | | 11.5 | % | | 11.5 | % | | 12.7 | % | | 11.5 | % |
Technology and development | | 8.8 | % | | 6.6 | % | | 5.9 | % | | 9.6 | % | | 6.6 | % |
Marketing | | 23.2 | % | | 16.9 | % | | 18.0 | % | | 23.4 | % | | 18.3 | % |
General and administrative | | 4.2 | % | | 3.7 | % | | 3.2 | % | | 4.4 | % | | 3.5 | % |
| | |
|
| |
|
| |
|
| |
|
| |
|
|
Operating expenses before stock-based compensation | | 48.3 | % | | 38.7 | % | | 38.6 | % | | 50.1 | % | | 39.9 | % |
Stock-based compensation | | 6.0 | % | | 3.8 | % | | 4.7 | % | | 5.8 | % | | 3.9 | % |
| | |
|
| |
|
| |
|
| |
|
| |
|
|
Total operating expenses | | 54.3 | % | | 42.5 | % | | 43.3 | % | | 55.9 | % | | 43.8 | % |
| | |
|
| |
|
| |
|
| |
|
| |
|
|
Year-to-year change: | | | | | | | | | | | | | | | |
Total revenues | | 109.0 | % | | 77.3 | % | | 79.7 | % | | 101.3 | % | | 78.2 | % |
Fulfillment | | 83.7 | % | | 69.6 | % | | 71.6 | % | | 44.0 | % | | 61.5 | % |
Technology and development | | 36.5 | % | | 19.5 | % | | 22.2 | % | | (17.5 | %) | | 22.3 | % |
Marketing | | 53.3 | % | | 31.0 | % | | 39.2 | % | | 70.1 | % | | 39.6 | % |
General and administrative | | 73.0 | % | | 43.2 | % | | 33.6 | % | | 44.6 | % | | 42.3 | % |
Operating expenses before stock-based compensation and restructuring charges | | 57.9 | % | | 39.3 | % | | 43.7 | % | | 34.5 | % | | 42.1 | % |
Restructuring charges | | — | | | — | | | — | | | (100.0 | %) | | — | |
Stock-based compensation | | 237.9 | % | | 5.9 | % | | 41.0 | % | | 41.3 | % | | 21.4 | % |
Total operating expenses | | 67.8 | % | | 35.4 | % | | 43.4 | % | | 33.8 | % | | 39.9 | % |
Netflix, Inc.
Non-GAAP Guidance Reconciliation Schedule
(unaudited)
(in thousands)
| | | First Quarter, 2004 Guidance Range
| |
Non-GAAP net income reconciliation: | | | | | | | | |
Net loss | | $ | (3,700 | ) | | $ | (1,200 | ) |
Add back: | | | | | | | | |
Stock-based compensation | | | 4,700 | | | | 4,700 | |
| | |
|
|
| |
|
|
|
Non-GAAP net income | | $ | 1,000 | | | $ | 3,500 | |
| | |
|
|
| |
|
|
|
| |
| | | Full Year, 2004 Guidance Range
| |
Non-GAAP net income reconciliation: | | | | | | | | |
Net income | | $ | 14,600 | | | $ | 21,600 | |
Add back: | | | | | | | | |
Stock-based compensation | | | 23,400 | | | | 23,400 | |
| | |
|
|
| |
|
|
|
Non-GAAP net income | | $ | 38,000 | | | $ | 45,000 | |
| | |
|
|
| |
|
|
|