Exhibit 99.1

| | | | | | | | |
| | | |
FOR IMMEDIATE RELEASE Thursday, April 15, 2004 | | | | IR CONTACT: | | Deborah Crawford Director of Investor Relations 408 317-3712 |
| | | |
| | | | | PR CONTACT: | | Lynn Brinton Director of Corporate Communications 408 317-3726 |
NETFLIX ANNOUNCES $100 MILLION IN REVENUE, RECORD LOW CHURN
AND RAISES GUIDANCE FOR 2004
| | • | Q1 revenue of $100.4 million, up 80 percent year over year |
| | • | Q1 churn of 4.7 percent, down from 5.8 percent one year ago |
| | • | Q1 free cash flow of $9.0 million; up 64% from one year ago. GAAP net cash provided by operating activities of $33.8 million |
| | • | Revenue guidance of $485 to $535 million and GAAP net income of $10.5 to $18.5 million for 2004, after international expansion |
| | • | New pricing for the standard Netflix service. Effective June 15, 2004, the price will increase from $19.95 to $21.99 |
LOS GATOS, CA — April 15, 2004 — Netflix, Inc. (Nasdaq: NFLX) announced strong financial results for the first quarter ended March 31, 2004.
Revenue, Subscribers and Churn
Total revenue for the first quarter was a record $100.4 million, up 24 percent compared to $81.2 million for the fourth quarter of 2003, and up 80 percent compared to $55.7 million for the first quarter of 2003.
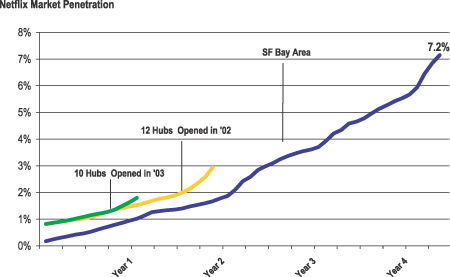
Netflix ended the first quarter of 2004 with approximately 1,932,000 total subscribers. During the quarter Netflix acquired 760,000 new trial subscribers, an 82 percent year-over-year increase from the 417,000 new trial subscribers acquired in the first quarter of 2003 and a sequential increase of 71 percent over the 444,000 new trial subscribers acquired in the fourth quarter of 2003. Household penetration continued to rise in all markets, particularly those reached by generally next-day delivery
(more than 80 percent of Netflix subscribers). For a graphical representation of the Company’s household penetration growth for its metro shipping markets, please link to:http://ir.netflix.com/downloads/marketpenetration041504.pdf
Average monthly subscriber churn1 for the first quarter of 2004 was 4.7 percent as compared to 4.8 percent in the fourth quarter of 2003 and 5.8 percent in the first quarter of 2003. Churn reached a record low percentage this quarter. This is the sixth consecutive quarter that low churn established a new record. Churn includes free trial subscribers as well as paying subscribers who elect not to renew their monthly subscription service during the quarter.
“Quarter after quarter we strive to relentlessly improve our service with faster delivery, better selection, and a more individually-tailored web site. Our strategy is paying off in terms of increased satisfaction, reduced churn, and faster growth,” said Reed Hastings, founder and CEO.
Gross Margin
Gross margin for the first quarter was 43.6 percent, in the low end of the range of the Company’s guidance and, as expected, down from 45.2 percent in the fourth quarter of 2003. Gross margin includes a 1.3 percent favorable impact as a result of certain non-recurring credits during the quarter. The decline in gross margin was primarily due to increased movie rentals per average paying subscriber. Excluding non-recurring credits, gross margin would have been 42.3 percent.
Subscriber Acquisition Cost
Subscriber acquisition cost2 for the first quarter was $35.12 per new-trial subscriber compared to a cost of $31.67 for the first quarter of 2003 and a cost of $32.89 for the fourth quarter of 2003. This planned sequential increase in subscriber acquisition cost was attributable to modest television advertising during the quarter.
GAAP Net Income (Loss), Non-GAAP Net Income (Loss), and Free Cash Flow
GAAP net loss for the first quarter was $5.8 million, or a loss of $0.11 per diluted share, compared to a GAAP net loss of $2.4 million, or a loss of $0.05 per diluted share, for the first quarter of 2003 and GAAP net income of $2.3 million, or $0.04 per diluted share, for the fourth quarter of 2003. GAAP net loss was in the low end of management’s guidance for the quarter. The Company guided to a net
| 1 | Monthly churn is defined as customer cancellations in the quarter divided by the sum of beginning subscribers and gross subscriber additions, divided by three months. |
| 2 | Subscriber acquisition cost is defined as the total marketing expense on the Company’s Statement of Operations divided by total gross subscriber additions during the quarter. |
loss due to rapid subscriber growth and the marketing expense associated with new subscribers, which is immediately expensed when a subscriber joins the service.
Non-GAAP net loss was $1.4 million, or a loss of $0.03 per diluted share, for the first quarter of 2004 compared to Non-GAAP net income of $31 thousand, or $0.00 per diluted share for the first quarter of 2003 and Non-GAAP net income of $6.1 million, or $0.09 per diluted share for the fourth quarter of 2003. Non-GAAP net income (loss) equals net income (loss) on a GAAP basis before stock-based compensation expense.
Free cash flow3 for the first quarter of 2004 was $9.0 million or 8.9 percent of revenue, up 64 percent from $5.5 million in the first quarter of 2003 and down 2 percent compared to $9.2 million for the fourth quarter of 2003. This is the Company’s tenth consecutive quarter of positive free cash flow. Cash provided by operating activities for the first quarter of 2004 was $33.8 million, up 164 percent from $12.8 million in the first quarter of 2003 and up 8 percent compared to $31.4 million for the fourth quarter of 2003.
Price Increase
The Company plans to increase the price of the standard Netflix service from $19.95 to $21.99 per month, beginning in mid-June.
“Over the past four years Netflix has created the premier online DVD rental service and transformed the home entertainment experience of nearly two million members,” said Mr. Hastings. “As we continue investments in this service, we are changing its price to reflect the robust offering we provide and the inherent value of that service.”
Associated with this price increase will be an increase in content spending to improve the rental experience to further reduce churn. In Q2 the price increase may elevate churn and depress year over year growth in new subscriber trials. Following this transition quarter, the price increase could allow the Company to maintain 42 to 45 percent gross margins, to invest more in new release content, and to improve churn for the balance of 2004.
| 3 | Free cash flow is defined as cash flows from operating activities less cash flows used in investing activities excluding purchases and sales of short-term investments. |
“Our commitment to ongoing investments in service quality has steadily improved customer satisfaction and retention,” said Mr. Hastings. “At our new price, we will make the world’s best movie service even better, and, as a result, we expect to reduce churn to below four percent in 2005.”
Business Outlook
Taking into account the Company’s expectation of the effects of the price increase, guidance for the second quarter is:
| | • | Ending subscribers of 1,935 to 2,140 thousand |
| | • | Revenue of $116 to $120 million |
| | • | GAAP net income of $1.0 to $3.5 million |
| | • | Non-GAAP net income of $6.4 to $8.9 million |
| | • | Gross margin of 40 to 42 percent |
| | • | Churn of 4.9 to 5.9 percent |
The Company’s revised guidance for the full year of 2004 is:
| | • | Ending subscribers of 2,200 to 2,700 thousand from 2,400 to 2,700 thousand |
| | • | Revenue of $485 to $535 million from $480 to $505 million |
| | • | GAAP net income of $10.5 to $18.5 million (the Company’s guidance includes the cost of international expansion) from $4 to $10 million (the Company’s prior guidance excluded the cost of international expansion) |
| | • | Non-GAAP net income of $26.5 to $34.5 million (the Company’s guidance update on February 26, 2004 did not include Non-GAAP net income) |
During the third and fourth quarters, we expect the U.S. business to operate in the following ranges on a quarterly basis for the balance of the calendar year:
| | • | Gross margin of 42 to 45 percent from 43 to 45 percent |
| | • | Churn of 4.0 to 5.0 percent from 4.3 to 5.1 percent |
| | • | SAC of $34 to $36, unchanged |
GAAP and Non-GAAP net income guidance includes an estimated net loss resulting from our anticipated international expansion of approximately $7.5 million. The Company has not previously provided guidance for its international expansion.
Float and Trading Plans
The Company estimates the public float at approximately 43,521,526 shares as of March 31, 2004 based on registered shares held in street name with the Depository Trust and Clearing Corporation. No outstanding shares are subject to a lock-up agreement of any kind. From time to time executive officers of Netflix may elect to buy or sell stock in Netflix. All such purchases or sales are made pursuant to the terms of 10b5-1 Trading Plans approved by the Company and generally adopted no less than three months prior to the first date of sale under such plan.
Earnings Call
The Netflix earnings call will be webcast today at 5:00 p.m. Eastern Time / 2:00 p.m. Pacific Time, and may be accessed athttp://ir.netflix.com. Following the conclusion of the webcast, a replay of the call will be available via Netflix’s website athttp://ir.netflix.com. For those without access to the Internet, a replay of the call will be available from 5:00 p.m. Pacific Time on April 15, 2004 through April 21, 2004. To listen to a replay, call (719) 457-0820, access code 477609. The Company also plans to include discussion of its business outlook in the conference call.
Use of Non-GAAP Measures
Management believes that Non-GAAP net income (loss) is a useful measure of operating performance because it excludes the non-cash impact of stock option accounting. In addition, management believes that free cash flow is a useful measure of liquidity because it excludes the non-operational cash flows from purchases and sales of short-term investments and cash flows from financing activities. However, these Non-GAAP measures should be considered in addition to, not as a substitute for, or superior to net income (loss) and net cash provided by operating activities, or other financial measures prepared in accordance with GAAP. A reconciliation to the GAAP equivalents of these Non-GAAP measures is contained in tabular form on the attached unaudited financial statements. Management believes that gross margin and SAC guidance for the U.S. business in the third and fourth quarters are useful measures because they give insight to investors with respect to the ongoing operations of the Company’s primary business and allow for an equivalent comparison to prior results. Furthermore, there is no reconciliation to consolidated GAAP measures as the Company has no finalized line-item detail with respect to its future consolidated operation.
About Netflix
Netflix (Nasdaq: NFLX) is the world’s largest online movie rental service, providing more than one million subscribers access to over 18,000 DVD titles. For $21.99 a month, Netflix subscribers rent as many DVDs as they want, and keep them as long as they want, with three movies out at a time. There are no due dates, no late fees and no shipping fees. DVDs are delivered for free by first-class mail from regional shipping centers located throughout the United States. Netflix can reach more than 80 percent of its subscribers with generally next business day delivery. The Company provides subscribers extensive information about DVD movies, including critic reviews, member reviews, online trailers, ratings, and personalized movie recommendations. For more information, visitwww.netflix.com.
Forward-Looking Statements
This press release contains certain forward-looking statements within the meaning of the federal securities laws, including statements regarding our subscriber growth, revenues, GAAP net income
(loss), Non-GAAP net income (loss), gross margin, subscriber acquisition cost and churn for the remaining quarters and full year of 2004. In addition, this press release contains forward looking statements regarding the impact and effects of our pending price increase, including potential negative short-term impacts on churn and new trial acquisitions and the potential positive long-term impacts on gross margins, churn, and content acquisition. This press release also contains forward-looking statements regarding our anticipated net loss in connection with international expansion. The forward looking statements in this release are subject to risks and uncertainties that could cause actual results and events to differ, including, without limitation: long-term negative impacts to churn, subscriber acquisition or other aspects of our business arising out of our subscription service price increase; our ability to manage our growth, in particular managing our subscriber acquisition cost as well as the mix between revenue sharing titles and titles not subject to revenue sharing that are delivered to our subscribers; our ability to attract new subscribers and retain existing subscribers; fluctuations in consumer usage of our service, risks associated with our plan to expand into international markets, including unforeseen cost and management distraction, customer spending on DVD players, DVDs and related products; competition; disruption in service on our website or with our computer systems; deterioration of the U.S. economy or conditions specific to online commerce or the filmed entertainment industry; conditions that effect our delivery through the U.S. Postal Service, including increases in first class postage; increases in the costs of acquiring DVDs; and, widespread consumer adoption of different modes of viewing in-home filmed entertainment. The GAAP net income guidance is subject to the risk and uncertainty associated with fluctuations in our stock price as the calculation includes an estimate of the stock-based compensation expense that is a function of the anticipated price of our stock, which is difficult to predict given its volatility. A detailed discussion of these and other risks and uncertainties that could cause actual results and events to differ materially from such forward-looking statements is included in our filings with the Securities and Exchange Commission, including our Annual Report on Form 10-K filed with the SEC on February 27, 2004. We undertake no obligation to update forward-looking statements to reflect events or circumstances occurring after the date of this press release.
Netflix, Inc.
Statements of Operations
(unaudited)
(in thousands, except per share data)
| | | | | | | | | | | | |
| | | Three Months Ended
| |
| | | March 31,
2003
| | | December 31,
2003
| | | March 31,
2004
| |
Revenues: | | | | | | | | | | | | |
Subscription | | $ | 55,281 | | | $ | 80,780 | | | $ | 99,823 | |
Sales | | | 388 | | | | 405 | | | | 547 | |
| | |
|
|
| |
|
|
| |
|
|
|
Total revenues | | | 55,669 | | | | 81,185 | | | | 100,370 | |
Cost of revenues: | | | | | | | | | | | | |
Subscription | | | 29,928 | | | | 44,334 | | | | 56,444 | |
Sales | | | 79 | | | | 130 | | | | 183 | |
| | |
|
|
| |
|
|
| |
|
|
|
Total cost of revenues | | | 30,007 | | | | 44,464 | | | | 56,627 | |
| | |
|
|
| |
|
|
| |
|
|
|
Gross profit | | | 25,662 | | | | 36,721 | | | | 43,743 | |
Operating expenses: | | | | | | | | | | | | |
Fulfillment | | | 6,383 | | | | 9,348 | | | | 10,790 | |
Technology and development | | | 4,183 | | | | 4,840 | | | | 5,039 | |
Marketing | | | 13,207 | | | | 14,602 | | | | 26,693 | |
General and administrative | | | 2,248 | | | | 2,566 | | | | 3,136 | |
Stock-based compensation | | | 2,406 | | | | 3,832 | | | | 4,435 | |
| | |
|
|
| |
|
|
| |
|
|
|
Total operating expenses | | | 28,427 | | | | 35,188 | | | | 50,093 | |
| | |
|
|
| |
|
|
| |
|
|
|
Operating income (loss) | | | (2,765 | ) | | | 1,533 | | | | (6,350 | ) |
Other income (expense): | | | | | | | | | | | | |
Interest and other income | | | 581 | | | | 782 | | | | 591 | |
Interest and other expense | | | (191 | ) | | | (44 | ) | | | (31 | ) |
| | |
|
|
| |
|
|
| |
|
|
|
Net income (loss) | | $ | (2,375 | ) | | $ | 2,271 | | | $ | (5,790 | ) |
| | |
|
|
| |
|
|
| |
|
|
|
Net income (loss) per share: | | | | | | | | | | | | |
Basic | | $ | (.05 | ) | | $ | .05 | | | $ | (.11 | ) |
| | |
|
|
| |
|
|
| |
|
|
|
Diluted | | $ | (.05 | ) | | $ | .04 | | | $ | (.11 | ) |
| | |
|
|
| |
|
|
| |
|
|
|
Weighted-average common shares outstanding: | | | | | | | | | | | | |
Basic | | | 45,474 | | | | 50,154 | | | | 51,282 | |
| | |
|
|
| |
|
|
| |
|
|
|
Diluted | | | 45,474 | | | | 64,282 | | | | 51,282 | |
| | |
|
|
| |
|
|
| |
|
|
|
Non-GAAP net income (loss) reconciliation: | | | | | | | | | | | | |
Net income (loss) | | $ | (2,375 | ) | | $ | 2,271 | | | $ | (5,790 | ) |
Add back: | | | | | | | | | | | | |
Stock-based compensation | | | 2,406 | | | | 3,832 | | | | 4,435 | |
| | |
|
|
| |
|
|
| |
|
|
|
Non-GAAP net income (loss) | | $ | 31 | | | $ | 6,103 | | | $ | (1,355 | ) |
| | |
|
|
| |
|
|
| |
|
|
|
Non-GAAP net income (loss) per share: | | | | | | | | | | | | |
Basic | | $ | — | | | $ | .12 | | | $ | (.03 | ) |
| | |
|
|
| |
|
|
| |
|
|
|
Diluted | | $ | — | | | $ | .09 | | | $ | (.03 | ) |
| | |
|
|
| |
|
|
| |
|
|
|
Netflix, Inc.
Balance Sheets
(unaudited)
(in thousands, except share and per share data)
| | | | | | | | |
| | | As of
| |
| | | December 31, 2003
| | | March 31, 2004
| |
Assets | | | | | | | | |
Current assets: | | | | | | | | |
Cash and cash equivalents | | $ | 89,894 | | | $ | 100,188 | |
Short-term investments | | | 45,297 | | | | 46,014 | |
Prepaid expenses | | | 2,231 | | | | 1,338 | |
Prepaid revenue sharing expenses | | | 905 | | | | 877 | |
Other current assets | | | 619 | | | | 541 | |
| | |
|
|
| |
|
|
|
Total current assets | | | 138,946 | | | | 148,958 | |
DVD library, net | | | 22,238 | | | | 27,498 | |
Intangible assets, net | | | 2,948 | | | | 2,322 | |
Property and equipment, net | | | 9,772 | | | | 10,328 | |
Deposits | | | 1,272 | | | | 1,302 | |
Other assets | | | 836 | | | | 825 | |
| | |
|
|
| |
|
|
|
Total assets | | $ | 176,012 | | | $ | 191,233 | |
| | |
|
|
| |
|
|
|
Liabilities and Stockholders’ Equity | | | | | | | | |
Current liabilities: | | | | | | | | |
Accounts payable | | $ | 32,654 | | | $ | 43,183 | |
Accrued expenses | | | 11,625 | | | | 12,461 | |
Deferred revenue | | | 18,324 | | | | 21,496 | |
Current portion of capital lease obligations | | | 416 | | | | 360 | |
| | |
|
|
| |
|
|
|
Total current liabilities | | | 63,019 | | | | 77,500 | |
Deferred rent | | | 241 | | | | 208 | |
Capital lease obligations, less current portion | | | 44 | | | | — | |
| | |
|
|
| |
|
|
|
Total liabilities | | | 63,304 | | | | 77,708 | |
Stockholders’ equity: | | | | | | | | |
Common stock, $0.001 par value; 80,000,000 shares authorized at December 31, 2003 and March 31, 2004; 50,849,370 and 51,546,080 shares issued and outstanding at December 31, 2003 and March 31, 2004, respectively | | | 51 | | | | 52 | |
Additional paid-in capital | | | 270,836 | | | | 275,775 | |
Deferred stock-based compensation | | | (5,482 | ) | | | (4,168 | ) |
Accumulated other comprehensive income | | | 596 | | | | 949 | |
Accumulated deficit | | | (153,293 | ) | | | (159,083 | ) |
| | |
|
|
| |
|
|
|
Total stockholders’ equity | | | 112,708 | | | | 113,525 | |
| | |
|
|
| |
|
|
|
Total liabilities and stockholders’ equity | | $ | 176,012 | | | $ | 191,233 | |
| | |
|
|
| |
|
|
|
Netflix, Inc.
Statements of Cash Flows
(unaudited)
(in thousands)
| | | | | | | | | | | | |
| | | Three Months Ended
| |
| | | March 31,
2003
| | | December 31,
2003
| | | March 31,
2004
| |
Cash flows from operating activities: | | | | | | | | | | | | |
Net income (loss) | | $ | (2,375 | ) | | $ | 2,271 | | | $ | (5,790 | ) |
Adjustments to reconcile net income (loss) to net cash provided by operating activities: | | | | | | | | | | | | |
Depreciation of property and equipment | | | 1,333 | | | | 1,129 | | | | 1,252 | |
Amortization of DVD library | | | 6,620 | | | | 14,790 | | | | 18,127 | |
Amortization of intangible assets | | | 809 | | | | 756 | | | | 626 | |
Stock-based compensation expense | | | 2,406 | | | | 3,832 | | | | 4,435 | |
Gain on disposal of DVDs | | | (367 | ) | | | (275 | ) | | | (364 | ) |
Non-cash interest expense | | | 32 | | | | 19 | | | | 11 | |
Changes in operating assets and liabilities: | | | | | | | | | | | | |
Prepaid expenses and other current assets | | | 603 | | | | (560 | ) | | | 999 | |
Accounts payable | | | 1,868 | | | | 4,195 | | | | 10,529 | |
Accrued expenses | | | 423 | | | | 671 | | | | 836 | |
Deferred revenue | | | 1,484 | | | | 4,553 | | | | 3,172 | |
Deferred rent | | | (9 | ) | | | (22 | ) | | | (33 | ) |
| | |
|
|
| |
|
|
| |
|
|
|
Net cash provided by operating activities | | | 12,827 | | | | 31,359 | | | | 33,800 | |
| | |
|
|
| |
|
|
| |
|
|
|
Cash flows from investing activities: | | | | | | | | | | | | |
Purchases of short-term investments | | | (380 | ) | | | (582 | ) | | | (364 | ) |
Purchases of property and equipment | | | (561 | ) | | | (4,315 | ) | | | (1,808 | ) |
Acquisitions of DVD library | | | (6,409 | ) | | | (18,717 | ) | | | (23,570 | ) |
Proceeds from sale of DVDs | | | 388 | | | | 405 | | | | 547 | |
Deposits and other assets | | | (793 | ) | | | 423 | | | | (19 | ) |
| | |
|
|
| |
|
|
| |
|
|
|
Net cash used in investing activities | | | (7,755 | ) | | | (22,786 | ) | | | (25,214 | ) |
| | |
|
|
| |
|
|
| |
|
|
|
Cash flows from financing activities: | | | | | | | | | | | | |
Proceeds from issuance of common stock | | | 1,549 | | | | 2,266 | | | | 1,819 | |
Principal payments on notes payable and capital lease obligations | | | (407 | ) | | | (115 | ) | | | (111 | ) |
| | |
|
|
| |
|
|
| |
|
|
|
Net cash provided by financing activities | | | 1,142 | | | | 2,151 | | | | 1,708 | |
| | |
|
|
| |
|
|
| |
|
|
|
Net increase in cash and cash equivalents | | | 6,214 | | | | 10,724 | | | | 10,294 | |
Cash and cash equivalents, beginning of period | | | 59,814 | | | | 79,170 | | | | 89,894 | |
| | |
|
|
| |
|
|
| |
|
|
|
Cash and cash equivalents, end of period | | $ | 66,028 | | | $ | 89,894 | | | $ | 100,188 | |
| | |
|
|
| |
|
|
| |
|
|
|
Non-GAAP free cash flow reconciliation: | | | | | | | | | | | | |
Net cash provided by operating activities | | $ | 12,827 | | | $ | 31,359 | | | $ | 33,800 | |
Purchases of property and equipment | | | (561 | ) | | | (4,315 | ) | | | (1,808 | ) |
Acquisitions of DVD library | | | (6,409 | ) | | | (18,717 | ) | | | (23,570 | ) |
Proceeds from sale of DVDs | | | 388 | | | | 405 | | | | 547 | |
Deposits and other assets | | | (793 | ) | | | 423 | | | | (19 | ) |
| | |
|
|
| |
|
|
| |
|
|
|
Non-GAAP free cash flow | | $ | 5,452 | | | $ | 9,155 | | | $ | 8,950 | |
| | |
|
|
| |
|
|
| |
|
|
|
Netflix, Inc.
Other Data
(unaudited)
(in thousands, except percentages and subscriber acquisition cost)
| | | | | | | | | | | | |
| | | As of / Three Months Ended
| |
| | | March 31,
2003
| | | December 31,
2003
| | | March 31,
2004
| |
Subscriber information: | | | | | | | | | | | | |
New trial subscribers: during period | | | 417 | | | | 444 | | | | 760 | |
New trial subscribers year-to-year change | | | 33.7 | % | | | 41.0 | % | | | 82.3 | % |
New trial subscribers quarter-to-quarter sequential change | | | 32.4 | % | | | 15.9 | % | | | 71.2 | % |
Subscribers: end of period | | | 1,052 | | | | 1,487 | | | | 1,932 | |
Subscribers year-to-year change | | | 74.5 | % | | | 73.5 | % | | | 83.7 | % |
Subscribers quarter-to-quarter sequential change | | | 22.8 | % | | | 15.2 | % | | | 29.9 | % |
Free subscribers: end of period | | | 43 | | | | 71 | | | | 87 | |
Free subscribers as percentage of ending subscribers | | | 4.1 | % | | | 4.8 | % | | | 4.5 | % |
Paid subscribers: end of period | | | 1,009 | | | | 1,416 | | | | 1,845 | |
Paid subscribers year-to-year change | | | 79.5 | % | | | 77.9 | % | | | 82.9 | % |
Paid subscribers quarter-to-quarter sequential change | | | 26.8 | % | | | 14.0 | % | | | 30.3 | % |
Subscriber churn (monthly) | | | 5.8 | % | | | 4.8 | % | | | 4.7 | % |
Subscriber acquisition cost | | $ | 31.67 | | | $ | 32.89 | | | $ | 35.12 | |
| | | |
Margins: | | | | | | | | | | | | |
Gross margin | | | 46.1 | % | | | 45.2 | % | | | 43.6 | % |
Operating margin | | | (5.0 | %) | | | 1.9 | % | | | (6.3 | %) |
Net margin | | | (4.3 | %) | | | 2.8 | % | | | (5.8 | %) |
| | | |
Expenses as percentage of revenues: | | | | | | | | | | | | |
Fulfillment | | | 11.5 | % | | | 11.5 | % | | | 10.8 | % |
Technology and development | | | 7.5 | % | | | 5.9 | % | | | 5.0 | % |
Marketing | | | 23.7 | % | | | 18.0 | % | | | 26.6 | % |
General and administrative | | | 4.0 | % | | | 3.2 | % | | | 3.1 | % |
| | |
|
|
| |
|
|
| |
|
|
|
Operating expenses before stock-based compensation | | | 46.7 | % | | | 38.6 | % | | | 45.5 | % |
Stock-based compensation | | | 4.3 | % | | | 4.7 | % | | | 4.4 | % |
| | |
|
|
| |
|
|
| |
|
|
|
Total operating expenses | | | 51.0 | % | | | 43.3 | % | | | 49.9 | % |
| | |
|
|
| |
|
|
| |
|
|
|
| | | |
Year-to-year change: | | | | | | | | | | | | |
Total revenues | | | 82.4 | % | | | 79.7 | % | | | 80.3 | % |
Fulfillment | | | 53.6 | % | | | 71.6 | % | | | 69.0 | % |
Technology and development | | | 31.5 | % | | | 22.2 | % | | | 20.5 | % |
Marketing | | | 66.4 | % | | | 39.2 | % | | | 102.1 | % |
General and administrative | | | 71.7 | % | | | 33.6 | % | | | 39.5 | % |
Operating expenses before stock-based compensation | | | 56.9 | % | | | 43.7 | % | | | 75.5 | % |
Stock-based compensation | | | 126.8 | % | | | 41.0 | % | | | 84.3 | % |
Total operating expenses | | | 61.1 | % | | | 43.4 | % | | | 76.2 | % |
Netflix, Inc.
Non-GAAP Guidance Reconciliation Schedule
(unaudited)
(in thousands)
| | | | | | |
| | | Second Quarter, 2004 Guidance Range
|
Non-GAAP net income reconciliation: | | | | | | |
Net income | | $ | 1,000 | | $ | 3,500 |
Add back: | | | | | | |
Stock-based compensation | | | 5,400 | | | 5,400 |
| | |
|
| |
|
|
Non-GAAP net income | | $ | 6,400 | | $ | 8,900 |
| | |
|
| |
|
|
| |
| | | Full Year, 2004 Guidance Range
|
Non-GAAP net income reconciliation: | | | | | | |
Net income | | $ | 10,500 | | $ | 18,500 |
Add back: | | | | | | |
Stock-based compensation | | | 16,000 | | | 16,000 |
| | |
|
| |
|
|
Non-GAAP net income | | $ | 26,500 | | $ | 34,500 |
| | |
|
| |
|
|