Exhibit 99.2
| Netflix Q1 FY 2010 Earnings | April 21, 2010 |
Safe Harbor Statement
Today’s management commentary contains forward-looking statements relating to future events or future financial performance that involve risks and uncertainties. Actual results may differ materially from those anticipated in these statements based on a number of factors, including those identified in the company’s annual report on Form 10-K filed with the SEC on February 22, 2010.
This commentary also contains references to non-GAAP financial measures. A presentation of and reconciliation to the most directly comparable GAAP financial measure, where such can be done without unreasonable effort, can be found on our Web site at http://ir.netflix.com.
Reed Hastings, CEO, Netflix
Our goal, as always, is to grow subscribers, revenue and earnings, while expanding into streaming. We delivered on our goals with the huge success in Q1, and, as our guidance implies, we expect continued success.
Our results reflect the increasing popularity of our $9 a month plan as streaming becomes more central to our service. This plan hits the sweet spot of astounding value and high convenience for subscribers. We believe it expands the size of our available market, and the ability to grow earnings on such low prices deepens our competitive moat.
In the first quarter the percentage of our subscribers that were actively streaming increased from 48% to 55%, and part of the reason we accomplished this was our improved streaming content. We continue to license more content for streaming from a wide range of providers, including all of the major film studios. Recently, for example, we announced a major expansion of our streaming license with Fox. In addition, over the last two years we have steadily broadened our selection of TV shows, and now TV shows represent a significant percentage of our weekly viewing hours. TV shows are not a replacement for movies, but prior-season viewing is a great extension for Netflix. By expanding our content proposition to include TV shows as a first-class part of our service we not only make our subscribers happier, but we also significantly broaden the number of companies from which we can license content. This gives us increased flexibility in where we spend and what we license.
1
| Netflix Q1 FY 2010 Earnings | April 21, 2010 |
We plan to continue to build on the success we have had with NBC, ABC and most recently with Fox, and do it in a way that is not detrimental to broadcast and cable networks’ revenue streams. Our positioning is to offer complete previous seasons of shows, just as we do with TV on DVD. When a network like ABC has a hot show like “Lost,” they understandably want to monetize the most current episodes themselves. Netflix represents a new way to monetize previous seasons of shows in addition to the syndication market, which can be lucrative but only for a few shows, and DVD box sales, which is a shrinking source of revenue for studios and networks. Just as we have with movies and TV shows on DVD, we are using personalization and superior user interface to find audiences for a very broad selection of shows. We now feature the full catalog of great TV shows from Fox’s “24” and NBC’s “30 Rock” to Discovery’s “Deadliest Catch” and The Disney Channel’s “Wizard’s of Waverly Place.”
Increased streaming viewing was driven not only by our enhanced content but also by our expanded breadth of devices and improving user interface.
Our first-generation TV user interface was a single row of movies and TV shows which the consumer had earlier chosen from a laptop. Then nine months ago, the Xbox 360 team used our APIs to pioneer a second generation user interface that enables consumers to select content from a set of personalized lists directly from their TV. Not surprisingly, consumers watch more and retain better when they can choose their content directly from the TV. We quickly adapted this second generation user interface to many of our more recent devices including Vizio TVs, Insignia Blu-ray players, Sony Playstation3 (PS3), and Nintendo Wii. Roku will also soon update their entire installed base with a custom version of this new high-performance second generation user interface.
Our Nintendo Wii application has been very popular with our members and we’ll ship millions of free Netflix instant streaming discs for Wii this year. The wow for Wii owners of playing streaming video with a flick of their Wii Remote is palpable. In connection with our Nintendo launch, we’ll be starting a Wii-specific TV ad campaign in a few weeks that will draw attention to the wow of Netflix on Wii.
Finally, on the iPad, I have to say I’m stunned by the accomplishments of our team. In less than 60 days they created an amazing iPad application and it is only a beginning. The technical issues to expand from the iPad to the iPhone and iPod Touch are not material, but we’ll take a few months to get the user interface right for the smaller screen. Since we don’t do new release pay-per-view, there is almost no revenue conflict between iTunes and Netflix streaming, which is probably part of why Apple helped us with the iPad application.
2
| Netflix Q1 FY 2010 Earnings | April 21, 2010 |
On the DVD side of the business, our disc shipments continued to grow during the first quarter. No doubt this is helped by many video stores closing, and this trend is likely to continue. Given the growth in our DVD shipments, we continue to invest in strengthening our service to achieve more consistent delivery and lower costs, and we are seeing nice improvements. Our big automation project for rental return, which we’ve talked about in the past, is on track and we’ll start the rollout of this equipment in the second half of this year. With the growth of streaming it is easy to overlook the importance of DVD, but most Netflix subscribers watch DVDs from us every quarter. Blu-ray players are selling well, and our percentage of Blu-ray enabled subscribers continues to climb.
As I mentioned last quarter, we signed an innovative deal with Warner Bros., which provides us with lots of discs 28 days after the retail window availability. This helps Warner Bros. increase DVD sales, pay-per-view transactions, and premium $4-5 rentals, where the studios can collect a few dollars per transaction. The deal helps Netflix because we save money on discs and reinvest those savings into more streaming content. We now have similar deals in place with Universal, Fox and HBO. As these four suppliers show increased profits, we think it is likely that the model will spread to other studios over the coming years. The fact that pay-per-view, premium rental, and DVD sales gain their own window doesn’t trouble us much; our value proposition of $9 per month is very strong, and new release has always been a relatively small percent of what we rent.
The $1 DVD rental kiosks continue to grow rapidly in their segment. They focus on top new releases only and have had a significant impact on stores. In the Salt Lake City area, which Redbox identifies as their most penetrated market, we are growing faster than our national average. Interestingly, of the few subscribers in Salt Lake City that leave Netflix, about three times more name kiosks as their next source for movies as name video stores, which suggests that as kiosks grow in the rest of the nation to match Salt Lake City levels, the relevance to us of video stores will continue to shrink. In the long term, kiosks and by-mail will be the majority of DVD rental.
3
| Netflix Q1 FY 2010 Earnings | April 21, 2010 |
In other news, Wal*mart recently purchased a streaming pay-per-view service called Vudu. Presumably, Vudu will be built into CE devices that are sold at Wal*mart. Similarly, Best Buy has a streaming pay-per-view service called Blu Sky, and Amazon has Unbox. We are committed to stay out of the pay-per-view segment and that is probably one of the reasons these retailers tolerate us also being on devices such as Xbox, PS3, Wii, and Samsung and other Blu-ray players that they sell. As with iTunes, there is almost no revenue conflict between the content viewed through Netflix streaming and the content viewed through these pay-per-view services. Pay-per-view for new releases will be quite successful, without negatively impacting Netflix.
In terms of subscription, we hear speculation that Hulu may be expanding from ad-supported to directly competing with us in subscription. Since they are flash-video based, and haven’t had as stringent DRM restrictions as we have had, Hulu would be playable from the Wii Internet Browser and the Sony PS3 Internet browser at launch, and could rapidly be on all the major devices. Our core advantages against new direct competitors like Hulu are our scale, which results in lower subscriber acquisition costs (SAC), and our integration with DVD rental.
In regards to international, we don’t have anything new to report – our plan remains to launch in a single foreign country with a streaming-only service later this year.
To wrap up, we had another great quarter and we are well positioned to continue to prosper as Internet video grows.
Barry McCarthy, CFO, Netflix
On last quarter’s earnings call I talked about our expectations for 2010. In particular I talked about substantial year-over-year growth in streamed content spending and the returns we expected to realize on that spending in the form of faster subscriber growth, lower SAC, lower churn, and faster EPS growth.
Fast forward ninety days, and last quarter’s comments accurately describe the Q1 results we reported today. The entire business performed well, including the lowest SAC and the lowest churn in our history. We posted terrific results.
4
| Netflix Q1 FY 2010 Earnings | April 21, 2010 |
Q1 Results
Turning first to Q1 results, gross margin improved 360 basis points on a year-over-year basis to 37.8%. Sequentially gross margin declined 20 basis points reflecting a seasonal increase in DVD usage. The year-over-year increase in gross margin is primarily related to the increased popularity of our $8.99 plan, which is primarily related to the broad-based appeal of watch instantly. The decline in SAC and churn, and the growth in lifetime value that results from lower churn, are also primarily related to the increased popularity of watch instantly.
Blu-ray enabled subscribers also contributed to margin expansion on a year-over-year basis in Q1. The impact on gross margin will diminish in Q2 when we begin to comp off of last year’s Q2 Blu-ray price increase.
We achieved record low churn of 3.8% in the quarter, an improvement of 40 basis points on a year-over-year basis. This is the fourth consecutive quarter of sequentially lower churn and a significant trend in the business. The principal driver of lower churn appears to be increased subscriber engagement with streaming. As Reed pointed out in his comments, we’re working hard to continue to make streaming a better value and a better user experience than it is today. If we continue to improve the service in the current competitive environment, then churn should continue to move lower, which would increase the lifetime value of our subscribers.
SAC declined 16% on a year-over-year basis to a record low of $21.54, even as gross profit per paid sub increased 5% year-over-year. The consumer appeal of our hybrid service is the primary driver of lower SAC, and we believe that SAC will remain low in the current competitive environment. Meanwhile the growing availability of Netflix on consumer electronic devices continues to stimulate consumer awareness and interest in our hybrid service.
Buyback Update
We were aggressive buyers of Netflix shares in the first quarter, as we have been in past quarters. In total, we spent $108 million repurchasing 1.67 million shares at an average cost of $64.51 per share in the first quarter.
Cumulatively, we have returned $732 million to shareholders by repurchasing 21.1 million Netflix shares at an average cost of $34.67 per share. This represents 38% of the 56.2 million fully diluted shares outstanding at quarter end. We expect to be active again this quarter repurchasing Netflix shares.
5
| Netflix Q1 FY 2010 Earnings | April 21, 2010 |
We finished the quarter with $266.3 million in cash and short-term investments and $200 million in long term debt, which represents less than one “turn” of debt. The balance sheet remains quite strong.
Free Cash Flow
Free cash flow for the quarter was $35.8 million, up 137% year- over-year and 19% sequentially. Principal contributors to Q1 free cash flow were growth in profitability coupled with a shift from purchase to revenue sharing agreements with studio partners for DVD content.
Closing Thoughts
Finally, a few thoughts about guidance.
First, a reminder that our goal is to manage the business to an annual operating margin of approximately 11% for the calendar year 2010. The mid-point of our guidance assumes 27% year-over-year growth in EPS which still allows us the operating flexibility to continue to aggressively invest in growing subscribers and our library of licensed content for streaming as well as international expansion.
Second, as you can see from our guidance, we expect our subscriber growth rate to continue to increase in the second quarter. The principal contributors to fast growth include the Wii launch, a large year-over-year increase in marketing expense, and continued strong momentum from word-of-mouth.
In the second half of the year, we plan to increase our spending on content for streaming. We plan to fund the increase with money we would otherwise have spent on marketing. As a result, we expect our marketing spend to decline on a year-over-year basis in Q3 and Q4 and our subscriber growth to be slower than in the first half of the year. You see these assumptions reflected in the guidance we issued in today’s earnings release. If the business outperforms our expectations, you will likely see us invest the upside in marketing to drive faster subscriber growth and future profits.
6
| Netflix Q1 FY 2010 Earnings | April 21, 2010 |
In summary, our investment in streaming has broadened our available market and accelerated our growth. The competitive environment is relatively benign, and we have our foot firmly planted on the accelerator. The business model is working well. Subscribers, revenue, and earnings per share are all growing fast. The balance sheet is strong. The business is well capitalized, and the future continues to look bright.
7
 Q1’10 Financial Highlights | April 21, 2010 |
 This presentation contains forward-looking statements relating to future events or future financial performance that involve risks and uncertainties. Actual results may differ materially from those anticipated in these statements based on a number of factors, including those identified in the company’s annual report on Form 10-K filed with the SEC on February 22, 2010. This presentation also contains references to non-GAAP financial measures. A presentation of and reconciliation to the most directly comparable GAAP financial measure, where such can be done without unreasonable effort, can be found on our Web site at http://ir.netflix.com. Forward-Looking Statements and Non-GAAP Financial Measurements |
 Netflix Goals > Be a great Internet movie and TV show service by combining Internet streaming with DVD by mail > Materially grow subscribers and EPS every year |
 Q1 Results Actual Q1’10 Guidance $490m $496m 13,500k 13,800k $26m $32m 13,967k $493.7m $32.3m Subscribers Revenue GAAP Net Income |
 (in thousands) Netflix Subscribers Subscriber Growth |
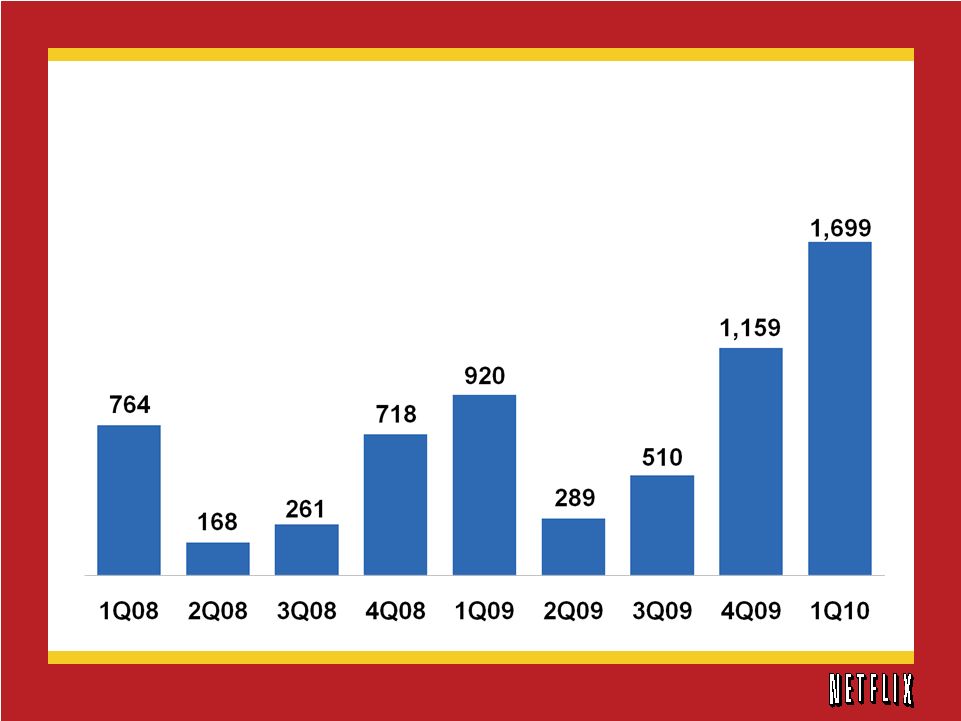 Record Net Additions (in thousands) Net Subscriber Additions |
 Note: Netflix implemented price reductions in July 2007 Q1 Revenue (in millions) Total Revenue |
 Q1 GAAP Net Income & Fully Diluted EPS (in millions) Net Income Earnings per Share |
 Churn |
 Subscriber Acquisition Cost |
 Free Cash Flow 1Q09 2Q09 3Q09 4Q09 1Q10 Non-GAAP Free Cash Flow Reconciliation: Net cash provided by operating activities $65,633 $75,302 $78,311 $105,817 $75,412 Purchases of property and equipment (6,572) (6,933) (9,994) (22,433) (6,393) Acquisition of intangible asset (200) – – – (130) Acquisitions of content library (46,499) (43,224) (46,273) (57,048) (36,902) Proceeds from sale of DVDs 2,726 1,159 3,345 3,934 3,984 Other assets (2) 11 134 (72) (172) Non-GAAP Free Cash Flow $15,086 $26,315 $25,523 $30,198 $35,799 (in thousands) |
 2Q10 FY ’10 Subscribers 14.7 – 15.0M 16.5 – 17.3M Revenue $517 – 525M $2.11 – 2.16B GAAP Net Income $34 – 40M $132 – 144M GAAP EPS* $0.62 – 0.73 $2.41 – 2.63 *Fully Diluted Business Outlook |
 1Q09 2Q09 3Q09 4Q09 1Q10 Mid-point of Guidance 2Q10 Subscribers (M) 10.3 10.6 11.1 12.3 14.0 14.9 Y/Y Change 25% 26% 28% 31% 35% 40% Revenue (M) $394 $409 $423 $445 $494 $521 Y/Y Change 21% 21% 24% 24% 25% 28% Operating Profit (M) $36 $53 $49 $53 $58 -- Y/Y Change 138% 54% 45% 41% 60% Net Income (M) $22 $32 $30 $31 $32 $37 Y/Y Change 68% 22% 48% 36% 44% 14% EPS* $0.37 $0.54 $0.52 $0.56 $0.59 $0.68 Y/Y Change 76% 29% 58% 47% 59% 26% % of Subscribers Watching Instantly > 15 minutes 36% 37% 41% 48% 55% -- * Fully Diluted Quarterly Summary Financials |
 2005 2006 2007 2008 2009 Mid-point of Guidance 2010 Subscribers (M) 4.2 6.3 7.5 9.4 12.3 16.9 Y/Y Change 60% 51% 18% 26% 31% 38% Revenue (M) $682 $997 $1,205 $1,365 $1,670 $2,135 Y/Y Change 36% 46% 21% 13% 22% 28% Operating Profit (M) $3 $65 $92 $122 $192 -- Y/Y Change -86% 2387% 41% 32% 58% Net Income (M) $42 $49 $67 $83 $116 $138 Y/Y Change 96% 17% 36% 25% 40% 19% EPS* $0.64 $0.71 $0.97 $1.32 $1.98 $2.52 Y/Y Change 94% 11% 37% 36% 50% 27% % of Subscribers Watching Instantly > 15 minutes NA NA NA 28% 48% -- * Fully Diluted Fiscal Year Summary Financials |
 Q1’10 Financial Highlights | April 21, 2010 |