Exhibit 99.1
January 26, 2011
Dear Fellow Shareholder,
In the closing hours of the final day of 2010, Netflix surpassed 20 million subscribers. We are thrilled to be able to report another outstanding quarter:
| | • | | Subscribers – 20.01 million |
| | • | | Net Subscriber Additions – 3.08 million |
| | • | | Operating Income – $78 million |
| | • | | Net Income – $47 million |
| | • | | EPS – $0.87 per diluted share |
To summarize Q4, we would say that our huge subscriber growth, fueled by the excitement of watching instantly, impressed even us. More subscriber growth enables us to spend more on streaming content, making the Netflix service even better in 2011.
Instead of reporting our results in several different documents, we’ll include everything in this letter. As in past quarters, we’ll also answer investor questions on a 3 p.m. PST conference call today.
To put in context the increasing strength of our business, we’ve included the table below:
Summary Results for Prior Nine Quarters
| | | | | | | | | | | | | | | | | | | | | | | | | | | | | | | | | | | | |
| (in millions except per share data) | | Q4 08 | | | Q1 09 | | | Q2 09 | | | Q3 09 | | | Q4 09 | | | Q1 10 | | | Q2 10 | | | Q3 10 | | | Q4 10 | |
Net Subscriber Additions | | | 0.72 | | | | 0.92 | | | | 0.29 | | | | 0.51 | | | | 1.16 | | | | 1.70 | | | | 1.03 | | | | 1.93 | | | | 3.08 | |
Y/Y Change | | | 59 | % | | | 20 | % | | | 72 | % | | | 95 | % | | | 61 | % | | | 85 | % | | | 255 | % | | | 278 | % | | | 166 | % |
| | | | | | | | | |
Subscribers | | | 9.39 | | | | 10.31 | | | | 10.60 | | | | 11.11 | | | | 12.27 | | | | 13.97 | | | | 15.00 | | | | 16.93 | | | | 20.01 | |
Y/Y Change | | | 26 | % | | | 25 | % | | | 26 | % | | | 28 | % | | | 31 | % | | | 35 | % | | | 42 | % | | | 52 | % | | | 63 | % |
| | | | | | | | | |
Revenue | | $ | 360 | | | $ | 394 | | | $ | 409 | | | $ | 423 | | | $ | 445 | | | $ | 494 | | | $ | 520 | | | $ | 553 | | | $ | 596 | |
Y/Y Change | | | 19 | % | | | 21 | % | | | 21 | % | | | 24 | % | | | 24 | % | | | 25 | % | | | 27 | % | | | 31 | % | | | 34 | % |
| | | | | | | | | |
Operating Income | | $ | 38 | | | $ | 36 | | | $ | 53 | | | $ | 49 | | | $ | 53 | | | $ | 58 | | | $ | 77 | | | $ | 70 | | | $ | 78 | |
Y/Y Change | | | 87 | % | | | 138 | % | | | 54 | % | | | 45 | % | | | 39 | % | | | 61 | % | | | 45 | % | | | 43 | % | | | 47 | % |
| | | | | | | | | |
Net Income | | $ | 23 | | | $ | 22 | | | $ | 32 | | | $ | 30 | | | $ | 31 | | | $ | 32 | | | $ | 44 | | | $ | 38 | | | $ | 47 | |
Y/Y Change | | | 45 | % | | | 68 | % | | | 22 | % | | | 48 | % | | | 35 | % | | | 45 | % | | | 38 | % | | | 27 | % | | | 52 | % |
| | | | | | | | | |
EPS | | $ | 0.38 | | | $ | 0.37 | | | $ | 0.54 | | | $ | 0.52 | | | $ | 0.56 | | | $ | 0.59 | | | $ | 0.80 | | | $ | 0.70 | | | $ | 0.87 | |
Y/Y Change | | | 65 | % | | | 76 | % | | | 29 | % | | | 58 | % | | | 47 | % | | | 59 | % | | | 48 | % | | | 35 | % | | | 55 | % |
| | | | | | | | | |
Free Cash Flow | | $ | 51 | | | $ | 15 | | | $ | 26 | | | $ | 26 | | | $ | 30 | | | $ | 38 | | | $ | 34 | | | $ | 8 | | | $ | 51 | |
Buyback | | $ | 10 | | | $ | 43 | | | $ | 73 | | | $ | 130 | | | $ | 79 | | | $ | 108 | | | $ | 45 | | | $ | 57 | | | $ | — | |
Shares (FD) | | | 60 | | | | 61 | | | | 60 | | | | 58 | | | | 55 | | | | 55 | | | | 54 | | | | 54 | | | | 54 | |
1
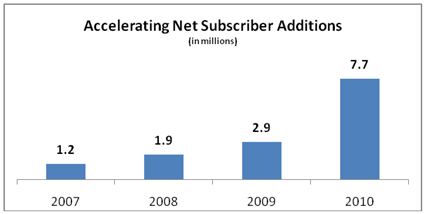
Subscriber Growth
Our extraordinary growth of 7.7 million net subscriber additions for 2010 underscores the momentum of the business.
At the start of 2010, our best estimate for net additions for the year was about 3.6 million, which shows how hard annual forecasting is when the opportunity is expanding so rapidly. Part of what makes forecasting subscriber growth challenging is we continue to improve our service, which creates a better value proposition and expands our market opportunity.
We think our subscriber growth in any given geography will follow the ‘S’ curve of adoption, and we are excited to still be in the accelerating phase of the ‘S’ curve today. We expect three phases: (a) a period of increasing net additions (seasonally adjusted); then (b) a period of steady net additions; and then finally (c) a period of shrinking net additions until the subscriber base growth slows to follow GDP and population growth. We are working hard to improve our service rapidly enough to stay in the first phase for as long as possible.
In November last year we introduced our $7.99 per month pure streaming plan, and we increased the prices on our combination plans, which include streaming and unlimited DVD rentals. As you can see from our strong Q1 subscriber guidance, our pure streaming plan has a great deal of consumer appeal.More than one third of new subscribers are signing up for the pure streaming plan, and we expect that percentage to grow over time. The balance of new subscribers primarily takes our $9.99 1-DVD combination plan. Very few of our existing subscribers are downgrading to the pure streaming plan.
Our three virtuous cycles of subscriber growth are:
| | 1. | More subscribers means more money to license content with,which drives more subscriber growth |
| | 2. | More subscribers means more word-of-mouth from subscribers to those who are not yet subscribers,which drives more subscriber growth |
| | 3. | More subscribers means we can increase R&D spend to improve our user experience,which drives more subscriber growth |
2
You can see the power of these virtuous cycles in our marketing spend in Q4: we spent about 10% fewer dollars in marketing than one year ago, yet subscribers grew 63% over the last year. At the end of Q4, about 9% of subscribers were active free trials. This is more than we’ve ever had before, due to the expanded use of one month free trials over two week free trials, and to strong growth in December. We expect the percentage of subscribers in active free trials will be less in Q1 than Q4, because Q1 growth is front-loaded rather than back-loaded.
DVD
While streaming is much bigger for us than DVD, in hours of entertainment delivered, and streaming is growing much faster than DVD, our DVD shipment and content costs are still very material. Fortunately, disc shipments in the quarter increased only modestly over Q4 2009, and we expect year-over-year shipments to decline in the coming quarters. If Blockbuster liquidates this year, like Movie Gallery did last year, we may see a modest boost in shipments, but we think the bulk of the remaining video store customers will tend to visit kiosks for $1-a-day DVDs, and they will get streaming from Netflix. Even though we expect DVD shipments to decline this year, we want to be clear that we intend to continue to offer great DVD-by-mail service for many years to come.
Most of the studios have negotiated 28-day deals with Coinstar, NCR, and Netflix. This allows the studios, and the major retailers such as Walmart, BestBuy and Amazon, to build awareness that DVD purchase and pay-per-view have the first home availability window, which is helpful to studio profitability. Warner Bros. has speculated publicly that the 28-day window perhaps should be longer, and over the coming years the studios may negotiate separately with Coinstar, NCR and us for that. As we expand more into streaming, this window issue will matter less to us.
International
Last year we introduced a pure streaming offering in Canada and our results have been excellent. We are significantly increasing our available content in Canada, and expect to be profitable on a run-rate basis in Q3 of this year. Assuming that Canada continues to perform well for us, we will expand into an additional market in the second half of this year. Our estimate is that international operating losses for the second half of the year will be in the neighborhood of $50 million, but there is considerable variability to that number depending on how well we do in our second international market. After launch, if we gain confidence in this second international market getting to profitability in less than eight quarters, with substantial profitability after that, then we will continue to expand and invest aggressively in 2012 around the globe. Each country represents a new market, where we have global process knowledge and technology, but no brand or content until we invest locally. In our financial reporting going forward, we’ll report by domestic and international, so you’ll be able to track our progress.
3
CE Devices
There are now hundreds of CE device SKUs that support streaming from Netflix, and our efforts are turning to rapidly improving our user interface on all of these devices. Some of the improvements that we’ve recently developed, and tested in controlled trials, have measurably increased viewing and retention, which are our two best indicators of satisfaction. We have a long list of promising concepts that we can’t wait to test over the coming years. Some of these are purely visual, such as optimal content graphic size, but most are algorithmic, driving a very specific personalized set of suggestions for each subscriber.
The devices with large installed bases – meaning Windows and Mac laptops, Sony PS3, Microsoft Xbox, and Nintendo Wii – are the most popular devices for watching instantly from Netflix. AppleTV has done very well for us, and in just four months has passed the also-growing iPad in Netflix viewing hours. The Roku player remains a strong performer. Our iPhone and Windows phone applications are very popular, and we’ll have support for several Android phones this year. While Google TV has not yet gone mainstream, the concept of Android and Chrome built into televisions and Blu-ray players is powerful; we’re confident that they will be very successful, and we are investing in our Google TV application. Blu-ray players and TVs with Internet connectivity are the big growth categories for us, as more and more providers are building in Wi-Fi across their product lines.
Our partners are finding that Netflix is their most popular service for Internet video viewing, and they are seeking ways to make their products easier to use. At the Consumer Electronics Show a few weeks ago, we announced the launch of our “one-click access” program where CE device remote controls have a red Netflix button providing convenient, direct access to Netflix for consumers. Initial partners include Samsung, Sony, Toshiba, Roku, and Boxee, with more coming. An example remote control is below:
4

Streaming Content
We continue to expand our selection of movies and TV shows available to watch instantly. Our Epix deal just completed its first full quarter of current studio releases and great catalog movies. We also closed an expansive new deal with ABC/Disney that includes all previous seasons of “Lost,” “Desperate Housewives,” and “Brothers and Sisters” from ABC and “Phineas and Ferb,” “Good Luck Charlie” and a host of other popular shows and original movies from the Disney Channel.
Our unique direct deals with independent producers and distributors have made it possible for us to bringall five of the just-announced 2011 Academy Awards-nominated Best Documentary Feature films to our growing streaming library. Two of those films – “Exit Through the Gift Shop” and “Restrepo”– are available to stream now. “Waste Land” is coming on March 29 and “Gasland” and “Inside Job” will be coming soon through existing deals.
Our interest in television shows is high. Our primary strategy is to offer complete previous seasons of shows rather than offering those shows the day of, or a few days after, broadcast, during the critical ratings and revenue window. This is in the best interest of content owners and is consistent with our desire to offer a very low-cost service for consumers. As with theatrical ticket sales, VOD and the 28-day DVD sale window, this allows studios to capture the market for those most interested in seeing content right away. You will occasionally see us offering shows day after broadcast, as we do with “Saturday Night Live,” or 15 days after broadcast, as we do with Disney Channel programs, but it doesn’t represent a change in our overall TV strategy.
5
Our specific focus is on being one of the few ways to enjoy the complete history of a series, instantly and commercial free.
While we have a broad range of content, carrying Starz is one of our most important deals. We’ll be working with Starz over this year to explore renewal options. Since our current deal does not expire until the middle of Q1 in 2012, we have plenty of time for the discussions. We won’t be saying more than this about our Starz relationship or negotiations.
Netflix streaming has become a valuable additional profit stream for content owners. Some content owners fear that licensing to Netflix will undercut other, larger profit streams. The Starz example suggests otherwise. We have carried Starz since October 2008 and we have not licensed HBO. Over that time, Starz’ Multichannel Video Programming Distributor (MVPD) subscriber count has grown, and HBO’s has not. At a more granular level, the Starz Original “Spartacus” was available at the same time on Netflix as on MVPD, and it was a big success in MVPD viewing, as shown by its Nielsen ratings. Even the DVD box sets have been a great success. So having content on Netflix does not appear to materially harm the revenue of that content on other channels. In other words, the evidence is pretty clear that content that is also licensed to Netflix generates more money for its owners than content that is withheld from Netflix.
Stepping back, some consternation about Netflix success is natural. Like the rise of the Fox broadcast network 20 years ago, a new entrant bids up the price of content, and the incumbent aggregators are not pleased. Netflix is good for consumers, good for content producers, and is one more competitor for existing aggregators. Many of the major media companies are part content producer, and part aggregator, which leads to Netflix being a frequent topic of discussion.
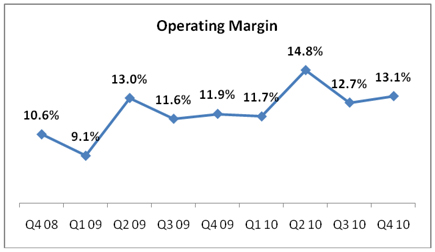
Operating Margins
Managing to a target operating margin has proven to be effective for us, and we plan to continue to do so. For the next few quarters we will target a domestic operating margin of about 14%, which we believe is a good balance of growth and earnings. The variable costs of DVD shipments, and the seasonal nature of big DVD releases, contributed to material expense seasonality in the past. While this remains true of DVD, this expense seasonality will smooth out as streaming becomes the majority of our content expense. Seasonality of subscriber growth will remain, but the domestic margin structure going forward should be less seasonal than in the past. Occasionally, we will have the opportunity to close a big streaming content deal, and our margins will dip temporarily, but most of the streaming deals are less lumpy, and we will be able to manage close to the domestic 14% target.
The international operating margins will be lumpy and negative in the near term, representing the entry into new territories. We define international operating margin as revenues less content, marketing and other cost of subscription expenses for territories outside the U.S (no general overhead allocation is included). We target each specific territory to achieve a positive operating margin within two years of launch, and in Canada we expect to achieve that in one year or less from launch.
6
Q4 & Q1 Forecasting
Q4 subscriber growth is particularly tough for us to predict because so much of the growth is back-loaded in the quarter. No excuse, we mis-forecast the subscriber number, but we have greater confidence in our Q1 subscriber forecast because the growth is front-loaded in Q1.
Operating income was better than expected in Q4 because disc shipments did not grow as much as we had forecast. Relative to our forecast, we also had an additional $1.8 million in net income from the extension of the R&D tax credits that were included in the new tax law passed in December. Our effective tax rate (ETR) was lowered to 36.8% as a result of this and the tax benefits from options exercises. We expect our ETR to increase in Q1 to 39% and to be between 39% - 41% going forward, absent any one-time items.
Coming into Q1, the trend in DVD shipments is lower than we expected even 2 months ago, and we’ve redirected the savings from this lower rate of shipments into more streaming content and marketing. The growing complexity and size of our streaming contracts translate into a need for more lead time to spend on content relative to marketing. As a result, we’ll likely see a temporary uptick in domestic gross margin in Q1 as we put more into marketing in the short term. As we spend more on streaming in future quarters, our domestic gross margin will come back down to the 30% - 35% range.
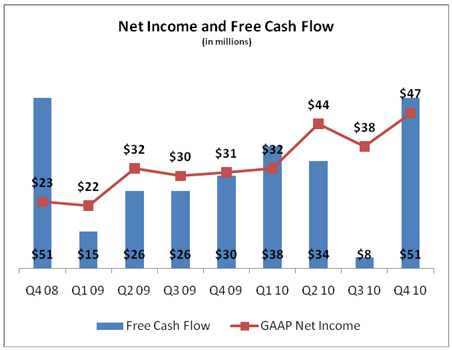
FCF & Cash
Historically, in some cases we have accepted streaming content deals where we paid earlier than the expense was recognized. Going forward we are insisting upon close matching of cash and expense for streaming content, even if that means we have to pay slightly more. PPE has been flat for many quarters, and should remain an immaterial consumer of cash. In comparing FCF to Net Income the major recurring sources of free cash flow are stock option expense and deferred revenue associated with gift subscriptions, and the use is prepaid content.
7
During 2010 we made great progress in moving our service from our own data centers into Amazon Web Services (AWS), a cloud platform offering. We now run on thousands of AWS servers and the majority of our computing is at AWS. We’ve been very pleased with this initiative in terms of the service Amazon provides, and in terms of the flexibility it gives us, which allows us to more quickly improve our global streaming business. This is part of why we’ll have minimal CAPEX going forward for IT, and it will be mostly OPEX. AWS has given us multiple assurances that they want us as a strong reference customer, independent of how much or little the retail side of Amazon eventually competes with Netflix.
Our strategy over recent years has been to use excess cash to buy back stock. We took a break from that in Q4 to reassess our cash needs and the buyback strategy, but plan to return to buying back stock in Q1. The objective of our buyback program is simply to return money to our shareholders, similar to a dividend; consequently, we are neither price sensitive nor market timers. Given our long-term content commitments, we don’t see it as likely in the near term that we would add more leverage to our capital structure through additional long-term debt.
Challenges
The long-term threats to our profit stream haven’t changed much over the past year. There is the substitution threat of better offerings from MVPDs, with free TV Everywhere, in particular, making supplemental services like Netflix and Hulu Plus less desired. There is the threat of growing piracy from websites like Megavideo and others, especially in international markets. There is the threat of direct competition, such as Hulu Plus or perhaps HBO Go or Amazon. There is the content cost threat: that content pricing uniformly rises so sharply that we can afford fewer titles, thus our service becomes less amazing to consumers, and our growth is slowed. Finally, there are various ISP-related threats, which we’ll look at in detail below.
8
Recently the FCC adopted a version of net neutrality for wired networks in the U.S., and it’s a step in the right direction. The focus is on fair-playwithin an ISP’s network, but does not explicitly addressentry into the ISP’s network.
Delivering Internet video in scale creates costs for both Netflix and for ISPs. We think the cost sharing between Internet video suppliers and ISPs should be that we have to haul the bits to the various regional front-doors that the ISPs operate, and that they then carry the bits the last mile to the consumer who has requested them, with each side paying its own costs. This open, regional, no-charges, interchange model is something for which we are advocating. Today, some ISPs charge us, or our CDN partners, to let in the bits their customers have requested from us, and we think this is inappropriate. As long as we pay for getting the bits to the regional interchanges of the ISP’s choosing, we don’t think they should be able to use their exclusive control of their residential customers to force us to pay them to let in the data their customers’ desire. Their customers already pay them to deliver the bits ontheirnetwork, and requiring us to pay even though we deliver the bits to their network is an inappropriate reflection of their last mile exclusive control of their residential customers. Conversely, this open, regional, no-charges model should disallow content providers like Netflix and ESPN3 from shutting off certain ISPs unless those ISPs pay the content provider. Hopefully, we can get broad voluntary agreement on this open, regional, no-charges, interchange model. Some ISPs already operate by this open, regional, no-charges, interchange model, but without any commitment to maintain it going forward.
Tomorrow, we’ll publish on our blog ongoing performance statistics about ISPs collected from our 20 million subscribers detailing which ISPs provide the best, most-consistent high speed internet for streaming Netflix. We can tell you now, though, that for our subscribers streaming Netflix, Charter is the highest-performance ISP in the United States.
Recently, there was a report that at peak times Netflix subscribers in the U.S. were driving about 20% of peak downstream last-mile Internet traffic. This may or may not be accurate, but it should be noted that because we pay for the data to be delivered to regional ISP front doors, little of this traffic goes over the Internet or ISP backbone networks, thereby minimizing ISP costs, avoiding congestion, and improving performance for end-using consumers.
An independent negative issue for Netflix and other Internet video providers would be a move by wired ISPs to shift consumers to pay-per-gigabyte models instead of the current unlimited-up-to-a-large-cap approach. We hope this doesn’t happen, and will do what we can to promote the unlimited-up-to-a-large-cap model. Wired ISPs have large fixed costs of building and maintaining their last mile network of residential cable and fiber. The ISPs’ costs, however, to deliver a marginal gigabyte, which is about an hour of viewing, from one of our regional interchange points over their last mile wired network to the consumer isless than a penny, and falling, so there is no reason that pay-per-gigabyte is economically necessary. Moreover, at $1 per gigabyte over wired networks, it would be grossly overpriced.
9
Business Opportunity
When we were primarily a DVD-by-mail service, we measured our market in terms of households. Households subscribed to Netflix and members of the household watched the DVDs as they wanted. Similarly, MVPDs measure their market in terms of households, and will support multiple receivers, one for each television. Online streaming video, however, is more naturally individual, since it is watched onpersonal screens like phones, tablets, and laptops, as well as onshared large screen televisions. Our long-term goal is to evolve the Netflix service so that it feels more natural to have a personal account. Our $7.99-per-month plan is for one stream at a time, and later this year we’ll be able to offer consumers some account options to watch multiple simultaneous streams. In addition, we’re working on an extensive Facebook integration, which will further the notion of a personal Netflix account. This evolution from household to personal relationship will take several years, and there will always be some households that only have one account. With this shift, we are starting internally to think of our available market as the number of active mobile phones in a territory, rather than the number of households, because that is the number of people who have the means to subscribe to a service like ours.
Business Outlook
Going forward we are providing more detail in our guidance for the current quarter by breaking out domestic versus international and by providing operating income guidance. Our business is so dynamic that we will be doing less calendar year guidance than in the past.
Our domestic guidance for Q1 2011 is:
| | • | | Subscribers between 21.9 million and 22.8 million |
| | • | | Revenue between $684 million and $704 million |
| | • | | Operating Income between $98 million and $116 million |
Our international guidance for Q1 2011 is:
| | • | | Subscribers between 0.75 million and 0.9 million |
| | • | | Revenue between $10 million and $13 million |
| | • | | Operating Loss between $10 million and $14 million |
Our global guidance for Q1 2011 is:
| | • | | Net Income between $49 million and $62 million |
| | • | | EPS between $0.90 and $1.13 |
For the year 2011:
| | • | | We expect to operate domestically at approximately a 14% operating margin |
| | • | | We expect domestic subscriber net additions to continue to grow in 2011 |
| | • | | We expect our Canadian operations to have a positive operating margin in Q3 |
| | • | | We expect to have approximately $50 million in operating losses in international in 2H of 2011 as we expand beyond Canada |
10
Metrics Evolution
In terms of metrics, more and more we internally focus on net additions, and don’t pay as much attention to gross additions and churn as they are both driven by our service quality and they both drive net additions. Consequently, in 2012, we will cease providing gross subscriber additions, subscriber acquisition costs, and churn. For 2011, we’ll continue to report on them for our domestic business. Net additions, along with revenue and operating income, are our core performance measurements.
Two Fundamental Questions
We think there are two fundamental questions for investors:
| | (a) | What will our domestic growth trajectory be over the coming years, given our strategy to maintain modest domestic operating margins so that we can invest aggressively in additional streaming content? |
| | (b) | How successful will Netflix become outside of the United States? |
Our goal in communications like this one is to provide enough information and perspective to investors so they can come to their own conclusions on these two core questions. We’ll write a shareholder letter similar to this, but perhaps briefer, every quarter to give you our most recent perspective on our business. We hope you find it an effective approach to our earnings review. We will also strive in the future to improve our Q&A format to make it even more useful for investors. We welcome your comments.
Sincerely,
| | |
| Reed Hastings, CEO | | David Wells, CFO |
11
Q&A session
Netflix management will host a webcast Q&A session at 3:00 p.m. Pacific Time to answer questions about the Company’s financial results and business outlook. Please email your questions toir@netflix.com. The company will read the questions aloud on the call and respond to as many questions as possible.
The live webcast, and the replay, of the earnings Q&A session can be accessed at ir.netflix.com.
| | |
IR Contact: | | PR Contact: |
| Deborah Crawford | | Steve Swasey |
| VP, Investor Relations | | VP, Corporate Communications |
| 408 540-3712 | | 408 540-3947 |
Use of Non-GAAP Measures
This shareholder letter and its attachments include reference to the non-GAAP financial measure of free cash flow. Management believes that free cash flow is an important liquidity metric because it measures, during a given period, the amount of cash generated that is available to repay debt obligations, make investments, repurchase stock and for certain other activities. However, this non-GAAP measure should be considered in addition to, not as a substitute for or superior to, net income and net cash provided by operating activities, or other financial measures prepared in accordance with GAAP. Reconciliation to the GAAP equivalent of this non-GAAP measure is contained in tabular form on the attached unaudited financial statements.
12
Forward-Looking Statements
This shareholder letter contains certain forward-looking statements within the meaning of the federal securities laws, including statements regarding additional content acquisitions; our subscriber growth pattern assumptions; our subscription plan sign-up mix; DVD usage and shipments; business performance related to our Canadian operations and international expansion plans; improvements and applications for various consumer electronic devices offering Netflix; our operating margins, both domestic and international; free cash flow and our stock repurchase program; threats to our business; evolution of our service offerings; our subscriber growth, revenue, net income, operating income and earnings per share for the first quarter of 2011 and operating margins for domestic operations, subscriber net additions, Canadian operating margins and losses related to international expansion for 2011. The forward-looking statements in this letter are subject to risks and uncertainties that could cause actual results and events to differ, including, without limitation: our ability to attract new subscribers and retain existing subscribers; our ability to compete effectively; the continued availability of content on terms and conditions acceptable to us; maintenance and expansion of device platforms for instant streaming; fluctuations in consumer usage of our service; consumer spending on DVDs and related products; disruption in service on our website or with third-party computer systems that help us operate our service; conditions that effect our deliver through the U.S. Postal Service, including regulatory changes and postal rate increases; competition and widespread consumer adoption of different modes of viewing in-home filmed entertainment. A detailed discussion of these and other risks and uncertainties that could cause actual results and events to differ materially from such forward-looking statements is included in our filings with the Securities and Exchange Commission, including our Annual Report on Form 10-K filed with the Securities and Exchange Commission on February 22, 2010. We undertake no obligation to update forward-looking statements to reflect events or circumstances occurring after the date of this press release.
13
Netflix, Inc.
Consolidated Statements of Operations
(unaudited)
(in thousands, except per share data)
| | | | | | | | | | | | | | | | | | | | |
| | | Three Months Ended | | | Twelve Months Ended | |
| | | December 31,
2010 | | | September 30,
2010 | | | December 31,
2009 | | | December 31,
2010 | | | December 31,
2009 | |
Revenues | | $ | 595,922 | | | $ | 553,219 | | | $ | 444,542 | | | $ | 2,162,625 | | | $ | 1,670,269 | |
Cost of revenues: | | | | | | | | | | | | | | | | | | | | |
Subscription | | | 336,756 | | | | 292,406 | | | | 231,598 | | | | 1,154,109 | | | | 909,461 | |
Fulfillment expenses | | | 54,034 | | | | 52,063 | | | | 43,888 | | | | 203,246 | | | | 169,810 | |
| | | | | | | | | | | | | | | | | | | | |
Total cost of revenues | | | 390,790 | | | | 344,469 | | | | 275,486 | | | | 1,357,355 | | | | 1,079,271 | |
| | | | | | | | | | | | | | | | | | | | |
Gross profit | | | 205,132 | | | | 208,750 | | | | 169,056 | | | | 805,270 | | | | 590,998 | |
Operating expenses: | | | | | | | | | | | | | | | | | | | | |
Technology and development | | | 45,959 | | | | 42,108 | | | | 33,209 | | | | 163,329 | | | | 114,542 | |
Marketing | | | 62,849 | | | | 81,238 | | | | 70,715 | | | | 293,839 | | | | 237,744 | |
General and administrative | | | 19,108 | | | | 17,135 | | | | 13,524 | | | | 70,555 | | | | 51,333 | |
Gain on disposal of DVDs | | | (1,237 | ) | | | (1,232 | ) | | | (1,741 | ) | | | (6,094 | ) | | | (4,560 | ) |
| | | | | | | | | | | | | | | | | | | | |
Total operating expenses | | | 126,679 | | | | 139,249 | | | | 115,707 | | | | 521,629 | | | | 399,059 | |
| | | | | | | | | | | | | | | | | | | | |
Operating income | | | 78,453 | | | | 69,501 | | | | 53,349 | | | | 283,641 | | | | 191,939 | |
Other income (expense): | | | | | | | | | | | | | | | | | | | | |
Interest expense | | | (4,832 | ) | | | (4,945 | ) | | | (4,457 | ) | | | (19,629 | ) | | | (6,475 | ) |
Interest and other income | | | 938 | | | | 853 | | | | 2,444 | | | | 3,684 | | | | 6,728 | |
| | | | | | | | | | | | | | | | | | | | |
Income before income taxes | | | 74,559 | | | | 65,409 | | | | 51,336 | | | | 267,696 | | | | 192,192 | |
Provision for income taxes | | | 27,464 | | | | 27,442 | | | | 20,423 | | | | 106,843 | | | | 76,332 | |
| | | | | | | | | | | | | | | | | | | | |
Net income | | $ | 47,095 | | | $ | 37,967 | | | $ | 30,913 | | | $ | 160,853 | | | $ | 115,860 | |
| | | | | | | | | | | | | | | | | | | | |
Net income per share: | | | | | | | | | | | | | | | | | | | | |
Basic | | $ | 0.90 | | | $ | 0.73 | | | $ | 0.58 | | | $ | 3.06 | | | $ | 2.05 | |
Diluted | | $ | 0.87 | | | $ | 0.70 | | | $ | 0.56 | | | $ | 2.96 | | | $ | 1.98 | |
Weighted average common shares outstanding: | | | | | | | | | | | | | | | | | | | | |
Basic | | | 52,584 | | | | 52,142 | | | | 53,609 | | | | 52,529 | | | | 56,560 | |
Diluted | | | 54,194 | | | | 53,931 | | | | 55,479 | | | | 54,304 | | | | 58,416 | |
14
Netflix, Inc.
Consolidated Balance Sheets
(unaudited)
(in thousands, except share and par value data)
| | | | | | | | |
| | | As of | |
| | | December 31,
2010 | | | December 31,
2009 | |
Assets | | | | | | | | |
Current assets: | | | | | | | | |
Cash and cash equivalents | | $ | 194,499 | | | $ | 134,224 | |
Short-term investments | | | 155,888 | | | | 186,018 | |
Current content library, net | | | 181,006 | | | | 37,329 | |
Prepaid content | | | 62,217 | | | | 26,741 | |
Other current assets | | | 47,357 | | | | 26,701 | |
| | | | | | | | |
Total current assets | | | 640,967 | | | | 411,013 | |
Content library, net | | | 180,973 | | | | 108,810 | |
Property and equipment, net | | | 128,570 | | | | 131,653 | |
Deferred tax assets | | | 17,467 | | | | 15,958 | |
Other non-current assets | | | 14,090 | | | | 12,300 | |
| | | | | | | | |
Total assets | | $ | 982,067 | | | $ | 679,734 | |
| | | | | | | | |
Liabilities and Stockholders’ Equity | | | | | | | | |
Current liabilities: | | | | | | | | |
Accounts payable | | $ | 222,824 | | | $ | 92,542 | |
Accrued expenses | | | 36,489 | | | | 33,387 | |
Current portion of lease financing obligations | | | 2,083 | | | | 1,410 | |
Deferred revenue | | | 127,183 | | | | 100,097 | |
| | | | | | | | |
Total current liabilities | | | 388,579 | | | | 227,436 | |
Long-term debt | | | 200,000 | | | | 200,000 | |
Lease financing obligations, excluding current portion | | | 34,123 | | | | 36,572 | |
Other non-current liabilities | | | 69,201 | | | | 16,583 | |
| | | | | | | | |
Total liabilities | | | 691,903 | | | | 480,591 | |
Stockholders’ equity: | | | | | | | | |
Common stock, $0.001 par value; 160,000,000 shares authorized at December 31, 2010 and December 31, 2009; 52,781,949 and 53,440,073 issued and outstanding at December 31, 2010 and December 31, 2009, respectively | | | 53 | | | | 53 | |
Additional paid-in capital | | | 51,622 | | | | — | |
Accumulated other comprehensive income, net | | | 750 | | | | 273 | |
Retained earnings | | | 237,739 | | | | 198,817 | |
| | | | | | | | |
Total stockholders’ equity | | | 290,164 | | | | 199,143 | |
| | | | | | | | |
Total liabilities and stockholders’ equity | | $ | 982,067 | | | $ | 679,734 | |
| | | | | | | | |
15
Netflix, Inc.
Consolidated Statements of Cash Flows
(unaudited)
(in thousands)
| | | | | | | | | | | | | | | | | | | | |
| | | Three Months Ended | | | Twelve Months Ended | |
| | | December 31,
2010 | | | September 30,
2010 | | | December 31,
2009 | | | December 31,
2010 | | | December 31,
2009 | |
Cash flows from operating activities: | | | | | | | | | | | | | | | | | | | | |
Net income | | $ | 47,095 | | | $ | 37,967 | | | $ | 30,913 | | | $ | 160,853 | | | $ | 115,860 | |
Adjustments to reconcile net income to net cash provided by operating activities: | | | | | | | | | | | | | | | | | | | | |
Acquisition of streaming content library | | | (174,429 | ) | | | (115,149 | ) | | | (22,785 | ) | | | (406,210 | ) | | | (64,217 | ) |
Amortization of content library | | | 96,015 | | | | 77,146 | | | | 60,261 | | | | 300,596 | | | | 219,490 | |
Depreciation and amortization of property, equipment and intangibles | | | 9,253 | | | | 8,678 | | | | 10,238 | | | | 38,099 | | | | 38,044 | |
Amortization of discounts and premiums on investments | | | 189 | | | | 200 | | | | 168 | | | | 859 | | | | 607 | |
Amortization of debt issuance costs | | | 139 | | | | 140 | | | | 1,124 | | | | 514 | | | | 1,124 | |
Stock-based compensation expense | | | 8,270 | | | | 7,296 | | | | 2,976 | | | | 27,996 | | | | 12,618 | |
Excess tax benefits from stock-based compensation | | | (27,515 | ) | | | (16,093 | ) | | | (3,584 | ) | | | (62,214 | ) | | | (12,683 | ) |
Loss on disposal of property and equipment | | | 140 | | | | 254 | | | | — | | | | 394 | | | | 254 | |
Gain on sale of short-term investments | | | (348 | ) | | | (206 | ) | | | (54 | ) | | | (1,033 | ) | | | (1,509 | ) |
Gain on disposal of DVDs | | | (1,434 | ) | | | (2,142 | ) | | | (2,607 | ) | | | (9,862 | ) | | | (7,637 | ) |
Gain on sale of business | | | — | | | | — | | | | (1,783 | ) | | | — | | | | (1,783 | ) |
Deferred taxes | | | 1,999 | | | | 3,194 | | | | 1,789 | | | | (962 | ) | | | 6,328 | |
Changes in operating assets and liabilities: | | | | | | | | | | | | | | | | | | | | |
Prepaid content | | | (2,895 | ) | | | (25,485 | ) | | | (8,235 | ) | | | (35,476 | ) | | | (5,643 | ) |
Other current assets | | | (9,726 | ) | | | (3,374 | ) | | | (1,155 | ) | | | (21,763 | ) | | | (5,358 | ) |
Accounts payable | | | 61,245 | | | | 41,692 | | | | 9,961 | | | | 139,983 | | | | (1,189 | ) |
Accrued expenses | | | 27,543 | | | | 18,003 | | | | 7,506 | | | | 67,209 | | | | 13,169 | |
Deferred revenue | | | 24,197 | | | | 1,567 | | | | 20,974 | | | | 27,086 | | | | 16,970 | |
Other assets and liabilities | | | 36,979 | | | | 8,539 | | | | 110 | | | | 50,332 | | | | 618 | |
| | | | | | | | | | | | | | | | | | | | |
Net cash provided by operating activities | | | 96,717 | | | | 42,227 | | | | 105,817 | | | | 276,401 | | | | 325,063 | |
| | | | | | | | | | | | | | | | | | | | |
Cash flows from investing activities: | | | | | | | | | | | | | | | | | | | | |
Acquisitions of DVD content library | | | (32,908 | ) | | | (29,900 | ) | | | (57,048 | ) | | | (123,901 | ) | | | (193,044 | ) |
Purchases of short-term investments | | | (34,193 | ) | | | (15,379 | ) | | | (125,841 | ) | | | (107,362 | ) | | | (228,000 | ) |
Proceeds from sale of short-term investments | | | 15,794 | | | | 42,238 | | | | 36,037 | | | | 120,857 | | | | 166,706 | |
Proceeds from maturities of short-term investments | | | 5,500 | | | | 1,995 | | | | 4,688 | | | | 15,818 | | | | 35,673 | |
Purchases of property and equipment | | | (14,431 | ) | | | (7,342 | ) | | | (22,433 | ) | | | (33,837 | ) | | | (45,932 | ) |
Acquisitions of intangible assets | | | — | | | | (375 | ) | | | — | | | | (505 | ) | | | (200 | ) |
Proceeds from sale of DVDs | | | 2,011 | | | | 3,109 | | | | 3,934 | | | | 12,919 | | | | 11,164 | |
Proceeds from sale of investment in business | | | — | | | | — | | | | 7,483 | | | | — | | | | 7,483 | |
Other assets | | | 44 | | | | 48 | | | | (72 | ) | | | (70 | ) | | | 71 | |
| | | | | | | | | | | | | | | | | | | | |
Net cash used in investing activities | | | (58,183 | ) | | | (5,606 | ) | | | (153,252 | ) | | | (116,081 | ) | | | (246,079 | ) |
| | | | | | | | | | | | | | | | | | | | |
Cash flows from financing activities: | | | | | | | | | | | | | | | | | | | | |
Principal payments of lease financing obligations | | | (480 | ) | | | (470 | ) | | | (300 | ) | | | (1,776 | ) | | | (1,158 | ) |
Proceeds from issuance of common stock | | | 15,822 | | | | 10,927 | | | | 9,182 | | | | 49,776 | | | | 35,274 | |
Excess tax benefits from stock-based compensation | | | 27,515 | | | | 16,093 | | | | 3,584 | | | | 62,214 | | | | 12,683 | |
Borrowings on line of credit, net of issuance costs | | | — | | | | — | | | | 18,978 | | | | — | | | | 18,978 | |
Payments on line of credit | | | — | | | | — | | | | (20,000 | ) | | | — | | | | (20,000 | ) |
Proceeds from issuance of debt, net of issuance costs | | | — | | | | — | | | | 193,917 | | | | — | | | | 193,917 | |
Repurchases of common stock | | | — | | | | (57,390 | ) | | | (79,419 | ) | | | (210,259 | ) | | | (324,335 | ) |
| | | | | | | | | | | | | | | | | | | | |
Net cash provided by (used in) financing activities | | | 42,857 | | | | (30,840 | ) | | | 125,942 | | | | (100,045 | ) | | | (84,641 | ) |
| | | | | | | | | | | | | | | | | | | | |
Net increase (decrease) in cash and cash equivalents | | | 81,391 | | | | 5,781 | | | | 78,507 | | | | 60,275 | | | | (5,657 | ) |
Cash and cash equivalents, beginning of period | | | 113,108 | | | | 107,327 | | | | 55,717 | | | | 134,224 | | | | 139,881 | |
| | | | | | | | | | | | | | | | | | | | |
Cash and cash equivalents, end of period | | $ | 194,499 | | | $ | 113,108 | | | $ | 134,224 | | | $ | 194,499 | | | $ | 134,224 | |
| | | | | | | | | | | | | | | | | | | | |
| | |
| | | Three Months Ended | | | Twelve Months Ended | |
| | | December 31,
2010 | | | September 30,
2010 | | | December 31,
2009 | | | December 31,
2010 | | | December 31,
2009 | |
Non-GAAP free cash flow reconciliation: | | | | | | | | | | | | | | | | | | | | |
Net cash provided by operating activities | | $ | 96,717 | | | $ | 42,227 | | | $ | 105,817 | | | $ | 276,401 | | | $ | 325,063 | |
Acquisitions of DVD content library | | | (32,908 | ) | | | (29,900 | ) | | | (57,048 | ) | | | (123,901 | ) | | | (193,044 | ) |
Purchases of property and equipment | | | (14,431 | ) | | | (7,342 | ) | | | (22,433 | ) | | | (33,837 | ) | | | (45,932 | ) |
Acquisitions of intangible assets | | | — | | | | (375 | ) | | | — | | | | (505 | ) | | | (200 | ) |
Proceeds from sale of DVDs | | | 2,011 | | | | 3,109 | | | | 3,934 | | | | 12,919 | | | | 11,164 | |
Other assets | | | 44 | | | | 48 | | | | (72 | )�� | | | (70 | ) | | | 71 | |
| | | | | | | | | | | | | | | | | | | | |
Non-GAAP free cash flow | | $ | 51,433 | | | $ | 7,767 | | | $ | 30,198 | | | $ | 131,007 | | | $ | 97,122 | |
| | | | | | | | | | | | | | | | | | | | |
16
Netflix, Inc.
Consolidated Other Data
(unaudited)
(in thousands, except percentages, average monthly revenue per
paying subscriber, average monthly gross profit per paying
subscriber and subscriber acquisition cost)
| | | | | | | | | | | | |
| | | As of / Three Months Ended | |
| | | December 31,
2010 | | | September 30,
2010 | | | December 31,
2009 | |
Subscriber information: | | | | | | | | | | | | |
Subscribers: beginning of period | | | 16,933 | | | | 15,001 | | | | 11,109 | |
Gross subscriber additions: during period | | | 5,649 | | | | 4,101 | | | | 2,803 | |
Gross subscriber additions year-to-year change | | | 101.5 | % | | | 88.1 | % | | | 34.4 | % |
Gross subscriber additions quarter-to-quarter sequential change | | | 37.7 | % | | | 34.1 | % | | | 28.6 | % |
Less subscriber cancellations: during period | | | (2,572 | ) | | | (2,169 | ) | | | (1,644 | ) |
Subscribers: end of period | | | 20,010 | | | | 16,933 | | | | 12,268 | |
Subscribers year-to-year change | | | 63.1 | % | | | 52.4 | % | | | 30.6 | % |
Subscribers quarter-to-quarter sequential change | | | 18.2 | % | | | 12.9 | % | | | 10.4 | % |
Free subscribers: end of period | | | 1,742 | | | | 1,070 | | | | 376 | |
Free subscribers as percentage of ending subscribers | | | 8.7 | % | | | 6.3 | % | | | 3.1 | % |
Paid subscribers: end of period | | | 18,268 | | | | 15,863 | | | | 11,892 | |
Paid subscribers year-to-year change | | | 53.6 | % | | | 46.4 | % | | | 29.8 | % |
Paid subscribers quarter-to-quarter sequential change | | | 15.2 | % | | | 8.8 | % | | | 9.8 | % |
Average monthly revenue per paying subscriber | | $ | 11.64 | | | $ | 12.12 | | | $ | 13.04 | |
Average monthly gross profit per paying subscriber | | $ | 4.01 | | | $ | 4.57 | | | $ | 4.96 | |
Churn | | | 3.8 | % | | | 3.8 | % | | | 3.9 | % |
Subscriber acquisition cost | | $ | 11.13 | | | $ | 19.81 | | | $ | 25.23 | |
Margins: | | | | | | | | | | | | |
Gross margin | | | 34.4 | % | | | 37.7 | % | | | 38.0 | % |
Operating margin | | | 13.1 | % | | | 12.6 | % | | | 12.0 | % |
Net margin | | | 7.9 | % | | | 6.9 | % | | | 7.0 | % |
Expenses as percentage of revenues: | | | | | | | | | | | | |
Technology and development | | | 7.7 | % | | | 7.6 | % | | | 7.5 | % |
Marketing | | | 10.5 | % | | | 14.7 | % | | | 15.9 | % |
General and administrative | | | 3.2 | % | | | 3.1 | % | | | 3.0 | % |
Gain on disposal of DVDs | | | (0.1 | %) | | | (0.2 | %) | | | (0.4 | %) |
| | | | | | | | | | | | |
Total operating expenses | | | 21.3 | % | | | 25.2 | % | | | 26.0 | % |
Year-to-year change: | | | | | | | | | | | | |
Total revenues | | | 34.1 | % | | | 30.7 | % | | | 23.6 | % |
Cost of subscription | | | 45.4 | % | | | 25.4 | % | | | 19.6 | % |
Fulfillment expenses | | | 23.1 | % | | | 23.4 | % | | | 11.9 | % |
Technology and development | | | 38.4 | % | | | 40.3 | % | | | 38.1 | % |
Marketing | | | (11.1 | %) | | | 38.7 | % | | | 27.1 | % |
General and administrative | | | 41.3 | % | | | 48.4 | % | | | 25.7 | % |
Gain on disposal of DVDs | | | (28.9 | %) | | | (23.2 | %) | | | 8.6 | % |
Total operating expenses | | | 9.5 | % | | | 41.4 | % | | | 30.3 | % |
17