Exhibit 99.1
July 25th, 2011
Dear Fellow Shareholders,
We are happy to report that Q2 was another great quarter for Netflix. Streaming is continuing to grow rapidly, and with the recently introduced price changes, we’ll be able to further increase the scope and quality of our streaming content. At the end of the quarter, Netflix had over 25 million global subscribers, up 70% from 15 million just one year ago. Our summary results are below:
| | | | | | | | | | | | | | | | | | | | | | | | | | | | | | | | | | | | |
(in millions except per share data) | | Q2 ’09 | | | Q3 ’09 | | | Q4 ’09 | | | Q1 ’10 | | | Q2 ’10 | | | Q3 ’10 | | | Q4 ’10 | | | Q1 ’11 | | | Q2 ’11 | |
Domestic: | | | | | | | | | | | | | | | | | | | | | | | | | | | | | | | | | | | | |
Net Subscriber Additions | | | 0.29 | | | | 0.51 | | | | 1.16 | | | | 1.70 | | | | 1.03 | | | | 1.80 | | | | 2.70 | | | | 3.30 | | | | 1.80 | |
Y/Y Change | | | 72 | % | | | 95 | % | | | 61 | % | | | 85 | % | | | 255 | % | | | 253 | % | | | 133 | % | | | 94 | % | | | 75 | % |
| | | | | | | | | |
Subscribers | | | 10.60 | | | | 11.11 | | | | 12.27 | | | | 13.97 | | | | 15.00 | | | | 16.80 | | | | 19.50 | | | | 22.80 | | | | 24.59 | |
Y/Y Change | | | 26 | % | | | 28 | % | | | 31 | % | | | 35 | % | | | 42 | % | | | 51 | % | | | 59 | % | | | 63 | % | | | 64 | % |
| | | | | | | | | |
Revenue | | $ | 409 | | | $ | 423 | | | $ | 445 | | | $ | 494 | | | $ | 520 | | | $ | 553 | | | $ | 592 | | | $ | 706 | | | $ | 770 | |
Y/Y Change | | | 21 | % | | | 24 | % | | | 24 | % | | | 25 | % | | | 27 | % | | | 31 | % | | | 33 | % | | | 43 | % | | | 48 | % |
| | | | | | | | | |
Contribution Profit | | $ | 93 | | | $ | 89 | | | $ | 98 | | | $ | 111 | | | $ | 130 | | | $ | 130 | | | $ | 152 | | | $ | 187 | | | $ | 213 | |
Y/Y Change | | | 38 | % | | | 32 | % | | | 38 | % | | | 53 | % | | | 40 | % | | | 46 | % | | | 55 | % | | | 68 | % | | | 64 | % |
| | | | | | | | | |
Operating Income | | $ | 53 | | | $ | 49 | | | $ | 53 | | | $ | 58 | | | $ | 77 | | | $ | 72 | | | $ | 88 | | | $ | 113 | | | $ | 125 | |
Y/Y Change | | | 54 | % | | | 45 | % | | | 39 | % | | | 61 | % | | | 45 | % | | | 47 | % | | | 66 | % | | | 95 | % | | | 62 | % |
| | | | | | | | | |
International: | | | | | | | | | | | | | | | | | | | | | | | | | | | | | | | | | | | | |
Net Subscriber Additions | | | — | | | | — | | | | — | | | | — | | | | — | | | | 0.13 | | | | 0.38 | | | | 0.29 | | | | 0.16 | |
| | | | | | | | | |
Subscribers | | | — | | | | — | | | | — | | | | — | | | | — | | | | 0.13 | | | | 0.51 | | | | 0.80 | | | | 0.97 | |
| | | | | | | | | |
Revenue | | | — | | | | — | | | | — | | | | — | | | | — | | | $ | — | | | $ | 4 | | | $ | 12 | | | $ | 19 | |
| | | | | | | | | |
Contribution Profit (Loss) | | | — | | | | — | | | | — | | | | — | | | | — | | | $ | (3 | ) | | $ | (9 | ) | | $ | (11 | ) | | $ | (9 | ) |
| | | | | | | | | |
Operating Income (Loss) | | | — | | | | — | | | | — | | | | — | | | | — | | | $ | (3 | ) | | $ | (9 | ) | | $ | (11 | ) | | $ | (10 | ) |
| | | | | | | | | |
Global: | | | | | | | | | | | | | | | | | | | | | | | | | | | | | | | | | | | | |
Subscribers | | | 10.60 | | | | 11.11 | | | | 12.27 | | | | 13.97 | | | | 15.00 | | | | 16.93 | | | | 20.01 | | | | 23.60 | | | | 25.56 | |
Y/Y Change | | | 26 | % | | | 28 | % | | | 31 | % | | | 35 | % | | | 42 | % | | | 52 | % | | | 63 | % | | | 69 | % | | | 70 | % |
| | | | | | | | | |
Revenue | | $ | 409 | | | $ | 423 | | | $ | 445 | | | $ | 494 | | | $ | 520 | | | $ | 553 | | | $ | 596 | | | $ | 719 | | | $ | 789 | |
Y/Y Change | | | 21 | % | | | 24 | % | | | 24 | % | | | 25 | % | | | 27 | % | | | 31 | % | | | 34 | % | | | 46 | % | | | 52 | % |
| | | | | | | | | |
Net Income | | $ | 32 | | | $ | 30 | | | $ | 31 | | | $ | 32 | | | $ | 44 | | | $ | 38 | | | $ | 47 | | | $ | 60 | | | $ | 68 | |
Y/Y Change | | | 22 | % | | | 48 | % | | | 35 | % | | | 45 | % | | | 38 | % | | | 27 | % | | | 52 | % | | | 88 | % | | | 55 | % |
| | | | | | | | | |
EPS | | $ | 0.54 | | | $ | 0.52 | | | $ | 0.56 | | | $ | 0.59 | | | $ | 0.80 | | | $ | 0.70 | | | $ | 0.87 | | | $ | 1.11 | | | $ | 1.26 | |
Y/Y Change | | | 29 | % | | | 58 | % | | | 47 | % | | | 59 | % | | | 48 | % | | | 35 | % | | | 55 | % | | | 88 | % | | | 58 | % |
| | | | | | | | | |
Free Cash Flow | | $ | 26 | | | $ | 26 | | | $ | 30 | | | $ | 38 | | | $ | 34 | | | $ | 8 | | | $ | 51 | | | $ | 79 | | | $ | 60 | |
Buyback | | $ | 73 | | | $ | 130 | | | $ | 79 | | | $ | 108 | | | $ | 45 | | | $ | 57 | | | $ | — | | | $ | 109 | | | $ | 51 | |
Shares (FD) | | | 59.7 | | | | 57.9 | | | | 55.5 | | | | 54.8 | | | | 54.3 | | | | 53.9 | | | | 54.2 | | | | 54.2 | | | | 53.9 | |
| | |
 | | 1 |
Domestic Q2 results
We were thrilled to add 1.8 million domestic subscribers in Q2, 75% more than Q2 of last year when we significantly increased subs by launching Netflix on the Wii game platform. The virtuous cycle we’ve mentioned before of increased investment in streaming content, strong word of mouth and an expanding range of devices continued to bear fruit. In the U.S., we ended the quarter with 24.6 million domestic subscribers, 64% more than the comparable previous year period.
During the quarter, the streaming only plan continued to gain in popularity, with nearly 75% of our new subscribers signing up for it. As a result, our average subscription price reverted to a slight quarter-over-quarter decline, after the one quarter impact in Q1 of our November 2010 price change.
With the rapid adoption of streaming, DVD shipments for Netflix have likely peaked. Also, in Q2 the total number of subscribers who were on hybrid plans (and, therefore eligible to receive DVDs) declined slightly from Q1.
We’ve spoken frequently of how we are directing savings generated from declining DVD demand into additional streaming content and marketing. During the quarter, we substantially increased sequential spending on streaming content as titles from our new content deals (discussed below) became available for streaming. At the same time, though, we maintained a disciplined approach to what content we license and at what price, spending somewhat less on streaming content than we budgeted for in the quarter. Also, DVD shipments came in even lower than forecasted, in part due to the popularity of our streaming only plan.
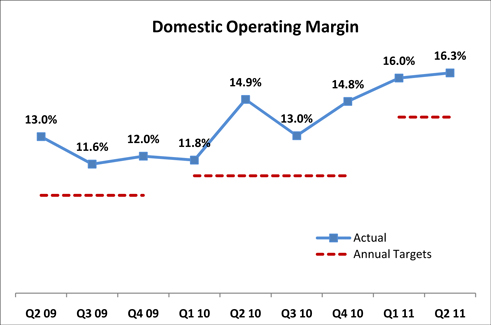
The net impact: our domestic operating margin came in at 16.3%, above our 14% target. Going forward in the second half of 2011, we expect to increase our investment in streaming content, thus reaching our 14% domestic operating margin target.
| | |
| | 2 |
Domestic content licensing
During Q2, we secured great new content for streaming and expanded our existing partnerships with movie studios and broadcast and cable networks.
For feature films, we reached agreements with Miramax and Revolution Studios to add several hundred movies on a rotating basis, giving our subscribers access to critically acclaimed films such as “Pulp Fiction,” “Good Will Hunting,” “Black Hawk Down,” “Across the Universe,” and “Shakespeare in Love” as well as box office favorites like “Daddy Day Care,” “Hellboy,” and “Anger Management.” We also announced a multi-year deal with Open Road Films to exclusively offer an exciting slate of first-run films to watch instantly shortly after they are released on DVD. The first films from our previously announced deal with Relativity Media have just started to flow and “The Fighter” and “Skyline” are shaping up to be big hits with our subscribers.
Netflix members love great television shows as much as they love movies, and are now spending over half of overall streaming hours enjoying a wide range of TV programming. In Q2, we added thousands of TV episodes through significant multi-year renewals with Viacom’s media networks and NBC Universal. These agreements not only add new seasons of shows that have enjoyed great success among our subscribers, but expand to new shows licensed by these companies.
In the case of NBCU, we’ve secured access to great NBC primetime hits on a prior-season basis, including “30 Rock,” “Parenthood,” and “The Office.” Complete previous seasons of cable favorites like SyFy’s “Warehouse 13,” USA’s “Psych,” and E’s “Keeping Up with the Kardashians” are also part of the deal.
With Viacom, we’ve expanded our agreement to include a wide range of programming from MTV, Nickelodeon, Comedy Central, BET and TV Land, including complete seasons of “Jersey Shore,” “SpongeBob SquarePants,” “South Park,” “Hot in Cleveland,” and “Basketball Wives.”
In a few days, every episode of “Mad Men” will become available in syndication exclusively on Netflix. Additional seasons will become available on Netflix once they complete their run on AMC. Since Mad Men is strongly serialized, we expect significant viewing of prior seasons as new viewers get hooked and seek the back story during the upcoming fifth season and beyond.
Netflix subscribers now have access to a wide range of programming from all four major U.S. broadcast networks and from nearly every major cable channel, as well as thousands of films, including those in their first subscription window, from Paramount, MGM, Disney, Lionsgate and a host of mini-major and independent studios.
In June, we told our members that Sony movies through Starz Plus would be unavailable to watch instantly from Netflix due to a contract dispute between Sony and Starz, to which we are not a party. As we said then, we are hopeful these two valued partners will resolve this issue soon. Additionally, we continue to be in discussions with Starz to renew our agreement beyond the first quarter of 2012.
Domestic competition
As we’ve said previously, our largest competitor over time is likely to be an improved MVPD service offering more Internet video on-demand, and thus reducing the number of people who will be attracted
| | |
| | 3 |
by a supplementary service like Netflix. HBO GO is an example of this: HBO subscribers can watch HBO on-demand through their MVPD provider web interface (DishOnline.com, say), or through the HBO GO dedicated application.
Over time, both the DishOnline application and the HBO GO application, amongst others, will likely get built into smart TVs or be available in smart TV app stores. While HBO GO and Netflix do not have overlapping content, and many consumers subscribe to both Netflix and HBO, we do compete with HBO for studio content and for viewers’ time. Our task is to consistently improve the quality of our service and stay two steps ahead, so that consumers will continue to enjoy Netflix.
We are also mindful of Hulu Plus and Amazon Prime. Hulu Plus added about 325,000 subs in Q2; we added close to 2 million. We invest much more than Hulu Plus in content, in marketing, and in R&D. Since Hulu is likely to be sold in the near term, it is unknown who will run it and how much they will invest in the subscription part of the Hulu service. We aren’t planning to bid on Hulu because most of its revenue is from providing free ad-supported streaming of current season TV shows, which is not our focus.
Amazon recently added thousands of films and TV shows, and includes them as a free service to subscribers of its Prime shipping service. We have vastly more streaming content, are available on more streaming devices and are purely focused on subscription video streaming. So far, we haven’t detected an impact on our business from Amazon Prime.
Separating DVD by mail and streaming into two distinct plans in the U.S.
Earlier this month, we separated DVD by mail and streaming into two distinct plans, and we feel each one represents unbeatable value in the marketplace.
Our new pricing, $7.99 for unlimited DVD by mail, is the lowest price for DVD by mail offered by anyone, and we have the best service levels. In addition, $7.99 for unlimited commercial-free streaming is an extremely attractive proposition, with our new subscribers overwhelmingly choosing this plan. Combined, for $15.98, these two plans provide a tremendous entertainment value for consumers who want both DVD and streaming.
We didn’t change the pricing for our streaming only subscribers, and those members will get to enjoy more and better streaming content going forward. Subscribers who only want DVDs from us are happy with the introduction of DVD only plans, because they can pay $7.99 instead of $9.99, a 20% savings. It is expected and unfortunate that our DVD subscribers who also use streaming don’t like our price change, which can be as much as a 60% increase for them from $9.99 to $15.98, when it goes into effect for each subscriber upon their renewal date in September.
Some subscribers will cancel Netflix or downgrade their Netflix plans. We expect most to stay with us because each of our $7.99 plans is an incredible value. We hate making our subscribers upset with us, but we feel like we provide a fantastic service and we’re working hard to further improve the quality and range of our streaming content in Q4 and beyond.
| | |
| | 4 |
In addition to separating the plans, we are setting up a dedicated DVD division, led by twelve-year Netflix veteran Andy Rendich, to focus on running a successful DVD by mail service in the U.S. for a long time. Andy and his team will be located nearby in San Jose, and are already planning some great improvements for the DVD service. Because we believe we can best generate profits and satisfaction by keeping DVD by mail as a division, we have no intention of selling it. In Q4, we’ll also return to marketing our DVD by mail service, something we haven’t done for many quarters. Our goal is to keep DVD as healthy as possible for as many years as possible.
Our estimate is that by end of Q3 in the U.S., we’ll have about 22 million people subscribing to our streaming service, about 15 million people subscribing to our DVD service, and about 25 million total U.S. subscribers (with about 12 million people subscribing to both streaming and DVD).

In Q3 we will see only the negative impact of the pricing change, given that the announcement was early in the quarter and that the increases won’t take effect until late in the quarter (September 15th on average). We expect domestic net additions in Q3 to be lower than the previous year Q3, and because of the timing of the price change, revenues will only grow slightly on a sequential basis.
In Q4, we expect domestic net additions to return to a pattern of year-over-year growth while revenue will reflect a full quarter’s impact of the pricing changes, which could result in Q4 being our first billion dollar global revenue quarter, driven by strong U.S. performance.
While we expect our revenue to increase in Q4 from this pricing change, we are still targeting a 14% domestic operating margin because we will continue to increase our spending on streaming content, ensuring the service remains by far the best value out there when it comes to enjoying instant, on-demand movies and TV shows.
Q4 will also be the first quarter with a clean separation of the costs for our DVD and streaming services. In January, we’ll report on Q4 with greater segment detail, breaking out domestic DVD, domestic streaming and international streaming. Domestic DVD will incorporate its own technology and
| | |
| | 5 |
development costs, as well as G&A, providing a straightforward picture of operating income. Domestic and international streaming share technology, development and G&A expenses, so we’ll be reporting contribution profit (i.e. gross profit less marketing) for each segment as well as the shared global streaming technology, development and G&A costs. Starting this quarter, contribution profit has been added to our segment reporting as a new metric.
Canada results
We continue to generate strong subscriber growth in Canada, and we’re up to nearly 1 million subscribers in just 10 months. We continue to learn from our experiences in Canada in preparation for other international markets. We recently launched Canadian French support for our service, and Netflix looks great, of course, in French:

The key to continued growth, both domestically and internationally, is constant improvements to the service. We’ll be adding more content to our Canadian service and now expect that we’ll come in at between $1 million contribution loss and $1 million contribution profit in Q3.
Latin America and beyond…
Early this month, we announced that we would be launching in Latin America as our second international market later this year. Consumers in 43 countries across Mexico, South America and the Caribbean will soon be able to enjoy unlimited TV shows and movies streamed instantly over the Internet to their TVs and computers at one low monthly subscription price. We will have more to say about this new market at the time of launch, but we are very excited about the opportunity. Specifically, Latin America represents a large and rapidly growing market of broadband households (currently, ~ 40 million), consumers there enjoy Hollywood content, and we are able to take advantage of economies of scale by licensing content regionally.
| | |
| | 6 |
As we said last quarter, we intend to launch our third international market in Q1 2012. Depending on content licensing discussions underway, we may launch one or more new countries in Q1. As in Latin America, we intend to offer a compelling mix of Hollywood, regional and local content.
In April of this year, we anticipated generating international operating losses of up to $70 million in the second half of this year, which we were comfortable with given the size of the opportunity in Latin America. Our current estimate for international operating losses in the second half of 2011 is now up to $80 million which includes pre-launch expenses for the one or more countries we may launch in Q1 2012.
New user interface on laptops
In June, we updated the Netflix website with a new interface to provide more focus on the TV shows & movies available to watch instantly, making it even easier for subscribers to find something they’d love to watch. The title images are larger, there are more of them on the page and play buttons appear when you track over the title image. Star ratings, synopsis and other functions are also easier and more intuitive to access.
We are always testing new approaches to improve the service, so we were very pleased that hours viewed have increased since the new interface was launched. We also received tremendous feedback, not all of it positive, on the change and are incorporating some of that feedback into making the user experience even better. We’re constantly testing ways to improve the website experience and the overall service.
Facebook
We’ve made great progress over the quarter on our Facebook integration and we’ll likely launch it before our next earnings report. At this point, we plan to launch this initiative only in Canada and Latin America, as the VPPA (Video Privacy Protection Act) discourages us from launching our Facebook integration domestically. Under the VPPA, it is ambiguous when and how a user can give permission for his or her video viewing data to be shared. A bipartisan group of lawmakers has introduced a simple clarification, HR2471, which says when and how a user can give such permission. We’re hoping HR2471 passes, enabling us to offer our Facebook integration to our U.S. subscribers who desire it.
Cord mending
For the second quarter in a row, U.S. MVPD households grew in Q1, adding nearly 500,000 additional households and deepening evidence that cord-cutting in the past was prompted by economic hard times rather than the substitution of over-the-top (OTT) services for cable.
Since MVPD households are growing while online video use explodes, the data suggests that OTT services like Netflix are complementary to, rather than competitive with, cable television. In this way, the growth of Netflix streaming is no different to the prior growth of the DVD rental market – both supplemental to the programming offering of the MVPDs. Our subscribers overwhelmingly enjoy both Netflix and the wide variety of sports, current season TV shows, news and entertainment available through MVPDs.
| | |
| | 7 |
Netflix beating Bit Torrent piracy
In May, analysis at Sandvine published a report on global broadband trends suggesting that people are watching and downloading more video over the Internet than ever before. Given the popularity of our streaming service and the growth we’ve experienced in streaming subscribers and hours viewed, we were not surprised by this finding. What did pleasantly surprise us was how we compared to other providers of Internet video. Our low cost, high quality, on demand streaming service has become so good that the largest percentage of the Internet’s traffic is forpaid content instead of illegal free peer to peer sites like Bit Torrent. Over coming quarters we’ll see if we can recreate this “beat piracy” feat outside of North America.
FCF & buyback
Free cash flow of $59.5 million increased sharply year-over-year (74%), but was down 25% quarter-over-quarter. The sequential decrease was driven by lower deferred revenue, and interest payment in the quarter, partially offset by higher net income.
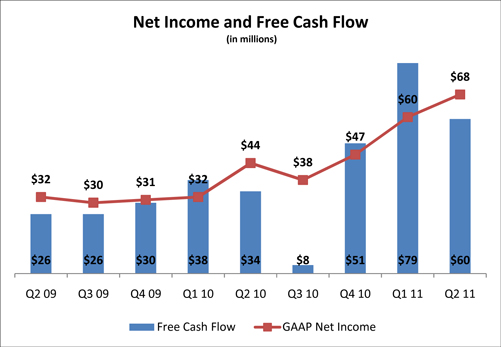
The expected ramp up in our streaming content investment discussed in our January and April letters is reflected on our cash flow statements as a significant sequential increase in additions to our streaming content library: $192 million in Q1 rising to $613 million in Q2. The increase in library additions reflects several large previously announced content deals (e.g. MTV, Miramax, Fox, CBS & NBCU) becoming available for streaming, and therefore being recognized as assets on our balance sheet. Due to this increase in library assets, our streaming content liabilities also reflected a significant increase of $420 million related to all payments not yet due under these contracts.
As a reminder, when a content license agreement meets
| | |
| | 8 |
the criteria for library asset recognition, we recognize the full value of the agreement as an asset in our content library while unpaid portions are recognized as liabilities. Since many of our agreements are multi-year, the additions will be amortized and the liabilities paid, in most cases, over several years. In sum, A/P and other non-current liabilities (long-term A/P) will increase as titles from new deals become available on our service.
We’ve provided additional disclosures on our cash flow statements this quarter to help investors better understand the accounting for our streaming content licenses – specifically, we have broken out the change in streaming content liabilities from all other A/P and other non-current liabilities. We have also separated amortization of streaming content from amortization of DVD content.
As we’ve stated previously, we continue to insist on close matching of cash and expense for our streaming content deals. Our Latin American launch will require some minor up-front spending that will moderate our free cash flow in Q3.
We used $51.4 million in Q2 to repurchase 216,000 shares at an average cost basis of $238, and ended the quarter with $376 million in cash, cash equivalents and short-term investments.
Debt
Our current $200 million of issued debt trades at a nearly 400 basis point spread to similar-duration treasuries. We don’t expect to issue additional debt while our pricing is at these BB levels. Since we used the $200 million for stock buyback at sub $100 prices, we are very happy with our debt issue overall. Our debt, which has an 8.5% coupon, is first callable in November 2013.
Business Outlook
| | |
| Guidance |
Domestic Q3 2011: | | |
Total U.S. Subscribers | | 24.6m to 25.4m |
U.S. Streaming Subscriptions | | 21.6m to 23.3m |
U.S. DVD Subscriptions | | 14.6m to 15.7m |
Revenue | | $780m to $805m |
Operating Income | | $95m to $120m |
| |
International Q3 2011: | | |
Subscribers | | 1,150k to 1,450k |
Revenue | | $19.5m to $23.5m |
Operating Loss | | ($27.5m) to ($22.5m) |
| |
Global Q3 2011: | | |
Net Income | | $39m to $58m |
EPS | | $0.72 to $1.07 |
| | |
| | 9 |
Summary
We’re proud to be able to announce another strong quarter of subscriber and earnings growth. At the same time, we are enthusiastically focused on expanding our streaming content library and improving the user experience to stay ahead of our domestic competition and to give us substantial advantage as we move to become a global leader in video streaming.
Sincerely,
| | |

| |  |
| |
Reed Hastings, CEO | | David Wells, CFO |
| |

| |  |
Conference Call Q&A Session
Netflix management will host a webcast Q&A session at 3:00 p.m. Pacific Time today to answer questions about the Company’s financial results and business outlook. Please email your questions toir@netflix.com. The company will read the questions aloud on the call and respond to as many questions as possible.
The live webcast, and the replay, of the earnings Q&A session can be accessed atir.netflix.com.
| | |
IR Contact: Ellie Mertz VP, Finance & Investor Relations 408 540-3977 | | PR Contact: Steve Swasey VP, Corporate Communications 408 540-3947 |
| | |
| | 10 |
Use of Non-GAAP Measures
This shareholder letter and its attachments include reference to the non-GAAP financial measures of free cash flow and contribution profit. Management believes that free cash flow is an important liquidity metric because it measures, during a given period, the amount of cash generated that is available to repay debt obligations, make investments, repurchase stock and for certain other activities. Management believes that contribution profit is useful in assessing the relative contribution to operating income of each segment by eliminating any allocation of Technology & Development and G&A expenses that apply across these segments. However, this non-GAAP measure should be considered in addition to, not as a substitute for or superior to, net income, operating income and net cash provided by operating activities, or other financial measures prepared in accordance with GAAP. Reconciliation to the GAAP equivalent of this non-GAAP measure is contained in tabular form on the attached unaudited financial statements.
Forward-Looking Statements
This shareholder letter contains certain forward-looking statements within the meaning of the federal securities laws, including statements regarding increases in scope and quality of our streaming content, operating margin targets, subscriber reaction as well as impacts to revenue, net addition and subscriber mix arising from our recent service and price changes; a return to marketing DVD by mail; Canadian contribution profit; international expansion plans and estimated operating losses related thereto; our subscriber growth, revenue, and operating income (loss) for both domestic and international operations as well as net income and earnings per share for the third quarter of 2011. The forward-looking statements in this letter are subject to risks and uncertainties that could cause actual results and events to differ, including, without limitation: our ability to attract new subscribers and retain existing subscribers; our ability to compete effectively; the continued availability of content on terms and conditions acceptable to us; maintenance and expansion of device platforms for instant streaming; fluctuations in consumer usage of our service; disruption in service on our website or with third-party computer systems that help us operate our service; competition and widespread consumer adoption of different modes of viewing in-home filmed entertainment. A detailed discussion of these and other risks and uncertainties that could cause actual results and events to differ materially from such forward-looking statements is included in our filings with the Securities and Exchange Commission, including our Annual Report on Form 10-K filed with the Securities and Exchange Commission on February 18, 2011. We undertake no obligation to update forward-looking statements to reflect events or circumstances occurring after the date of this press release.
| | |
| | 11 |
Netflix, Inc.
Consolidated Statements of Operations
(unaudited)
(in thousands, except per share data)
| | | | | | | | | | | | | | | | | | | | |
| | | Three Months Ended | | | Six Months Ended | |
| | | June 30
2011 | | | March 31
2011 | | | June 30
2010 | | | June 30
2011 | | | June 30
2010 | |
Revenues | | $ | 788,610 | | | $ | 718,553 | | | $ | 519,819 | | | $ | 1,507,163 | | | $ | 1,013,484 | |
Cost of revenues: | | | | | | | | | | | | | | | | | | | | |
Subscription | | | 428,203 | | | | 376,992 | | | | 265,387 | | | | 805,195 | | | | 524,947 | |
Fulfillment expenses | | | 61,775 | | | | 61,159 | | | | 49,547 | | | | 122,934 | | | | 97,149 | |
| | | | | | | | | | | | | | | | | | | | |
Total cost of revenues | | | 489,978 | | | | 438,151 | | | | 314,934 | | | | 928,129 | | | | 622,096 | |
| | | | | | | | | | | | | | | | | | | | |
Gross profit | | | 298,632 | | | | 280,402 | | | | 204,885 | | | | 579,034 | | | | 391,388 | |
Operating expenses: | | | | | | | | | | | | | | | | | | | | |
Technology and development | | | 57,865 | | | | 50,905 | | | | 37,863 | | | | 108,770 | | | | 75,262 | |
Marketing | | | 94,983 | | | | 104,259 | | | | 74,533 | | | | 199,242 | | | | 149,752 | |
General and administrative * | | | 30,670 | | | | 22,998 | | | | 15,147 | | | | 53,668 | | | | 30,687 | |
| | | | | | | | | | | | | | | | | | | | |
Total operating expenses | | | 183,518 | | | | 178,162 | | | | 127,543 | | | | 361,680 | | | | 255,701 | |
| | | | | | | | | | | | | | | | | | | | |
Operating income | | | 115,114 | | | | 102,240 | | | | 77,342 | | | | 217,354 | | | | 135,687 | |
Other income (expense): | | | | | | | | | | | | | | | | | | | | |
Interest expense | | | (5,303 | ) | | | (4,865 | ) | | | (4,893 | ) | | | (10,168 | ) | | | (9,852 | ) |
Interest and other income | | | 1,013 | | | | 865 | | | | 921 | | | | 1,878 | | | | 1,893 | |
| | | | | | | | | | | | | | | | | | | | |
Income before income taxes | | | 110,824 | | | | 98,240 | | | | 73,370 | | | | 209,064 | | | | 127,728 | |
Provision for income taxes | | | 42,610 | | | | 38,007 | | | | 29,851 | | | | 80,617 | | | | 51,937 | |
| | | | | | | | | | | | | | | | | | | | |
Net income | | $ | 68,214 | | | $ | 60,233 | | | $ | 43,519 | | | $ | 128,447 | | | $ | 75,791 | |
| | | | | | | | | | | | | | | | | | | | |
Net income per share: | | | | | | | | | | | | | | | | | | | | |
Basic | | $ | 1.30 | | | $ | 1.14 | | | $ | 0.83 | | | $ | 2.44 | | | $ | 1.44 | |
Diluted | | $ | 1.26 | | | $ | 1.11 | | | $ | 0.80 | | | $ | 2.37 | | | $ | 1.39 | |
Weighted average common shares outstanding: | | | | | | | | | | | | | | | | | | | | |
Basic | | | 52,470 | | | | 52,759 | | | | 52,486 | | | | 52,614 | | | | 52,697 | |
Diluted | | | 53,909 | | | | 54,246 | | | | 54,324 | | | | 54,077 | | | | 54,548 | |
| * | Includes gain on disposal of DVDs. |
| | |
| | 12 |
Netflix, Inc.
Consolidated Balance Sheets
(unaudited)
(in thousands, except share and par value data)
| | | | | | | | |
| | | As of | |
| | | June 30,
2011 | | | December 31,
2010 | |
Assets | | | | | | | | |
Current assets: | | | | | | | | |
Cash and cash equivalents | | $ | 175,207 | | | $ | 194,499 | |
Short-term investments | | | 201,200 | | | | 155,888 | |
Current content library, net | | | 499,434 | | | | 181,006 | |
Prepaid content | | | 59,811 | | | | 62,217 | |
Other current assets | | | 33,792 | | | | 47,357 | |
| | | | | | | | |
Total current assets | | | 969,444 | | | | 640,967 | |
Content library, net | | | 425,246 | | | | 180,973 | |
Property and equipment, net | | | 136,948 | | | | 128,570 | |
Deferred tax assets | | | 25,883 | | | | 17,467 | |
Other non-current assets | | | 13,172 | | | | 14,090 | |
| | | | | | | | |
Total assets | | $ | 1,570,693 | | | $ | 982,067 | |
| | | | | | | | |
Liabilities and Stockholders’ Equity | | | | | | | | |
Current liabilities: | | | | | | | | |
Accounts payable | | $ | 533,436 | | | $ | 222,824 | |
Accrued expenses | | | 44,137 | | | | 36,489 | |
Current portion of lease financing obligations | | | 2,199 | | | | 2,083 | |
Deferred revenue | | | 146,937 | | | | 127,183 | |
| | | | | | | | |
Total current liabilities | | | 726,709 | | | | 388,579 | |
Long-term debt | | | 200,000 | | | | 200,000 | |
Lease financing obligations, excluding current portion | | | 32,986 | | | | 34,123 | |
Other non-current liabilities | | | 276,964 | | | | 69,201 | |
| | | | | | | | |
Total liabilities | | | 1,236,659 | | | | 691,903 | |
Stockholders’ equity: | | | | | | | | |
Common stock, $0.001 par value; 160,000,000 shares authorized at June 30, 2011 and December 31, 2010; 52,536,246 and 52,781,949 issued and outstanding at June, 2011 and December 31, 2010, respectively | | | 53 | | | | 53 | |
Additional paid-in capital | | | — | | | | 51,622 | |
Accumulated other comprehensive income, net | | | 884 | | | | 750 | |
Retained earnings | | | 333,097 | | | | 237,739 | |
| | | | | | | | |
Total stockholders’ equity | | | 334,034 | | | | 290,164 | |
| | | | | | | | |
Total liabilities and stockholders’ equity | | $ | 1,570,693 | | | $ | 982,067 | |
| | | | | | | | |
| | |
| | 13 |
Netflix, Inc.
Consolidated Statements of Cash Flows
(unaudited)
(in thousands)
| | | | | | | | | | | | | | | | | | | | |
| | | Three Months Ended | | | Six Months Ended | |
| | | June 30,
2011 | | | March 31,
2011 | | | June 30,
2010 | | | June 30,
2011 | | | June 30,
2010 | |
Cash flows from operating activities: | | | | | | | | | | | | | | | | | | | | |
Net income | | $ | 68,214 | | | $ | 60,233 | | | $ | 43,519 | | | $ | 128,447 | | | $ | 75,791 | |
Adjustments to reconcile net income to net cash provided by operating activities: | | | | | | | | | | | | | | | | | | | | |
Additions to streaming content library | | | (612,595 | ) | | | (192,307 | ) | | | (66,157 | ) | | | (804,902 | ) | | | (116,632 | ) |
Change in streaming content liabilities | | | 419,832 | | | | 82,068 | | | | 18,308 | | | | 501,900 | | | | 29,559 | |
Amortization of streaming content library | | | 144,466 | | | | 85,937 | | | | 29,844 | | | | 230,403 | | | | 48,523 | |
Amortization of DVD content library | | | 24,000 | | | | 26,990 | | | | 35,299 | | | | 50,990 | | | | 78,912 | |
Depreciation and amortization of property, equipment and intangibles | | | 10,182 | | | | 9,826 | | | | 9,309 | | | | 20,008 | | | | 20,168 | |
Stock-based compensation expense | | | 15,536 | | | | 12,264 | | | | 6,928 | | | | 27,800 | | | | 12,430 | |
Excess tax benefits from stock-based compensation | | | (17,868 | ) | | | (15,654 | ) | | | (11,182 | ) | | | (33,522 | ) | | | (18,606 | ) |
Other non-cash items | | | (802 | ) | | | (925 | ) | | | (2,900 | ) | | | (1,727 | ) | | | (6,060 | ) |
Deferred taxes | | | (3,927 | ) | | | (4,982 | ) | | | (3,394 | ) | | | (8,909 | ) | | | (6,155 | ) |
Changes in operating assets and liabilities: | | | | | | | | | | | | | | | | | | | | |
Prepaid content | | | 14,787 | | | | (12,380 | ) | | | (2,133 | ) | | | 2,407 | | | | (7,096 | ) |
Other current assets | | | 4,660 | | | | 9,084 | | | | (9,211 | ) | | | 13,744 | | | | (8,663 | ) |
Other accounts payable | | | (4,465 | ) | | | 14,835 | | | | 1,472 | | | | 10,370 | | | | 12,160 | |
Accrued expenses | | | 17,941 | | | | 22,670 | | | | 7,917 | | | | 40,611 | | | | 21,663 | |
Deferred revenue | | | 3,892 | | | | 15,862 | | | | 1,310 | | | | 19,754 | | | | 1,322 | |
Other non-current assets and liabilities | | | 2,539 | | | | 2,802 | | | | 1,323 | | | | 5,341 | | | | 141 | |
| | | | | | | | | | | | | | | | | | | | |
Net cash provided by operating activities | | | 86,392 | | | | 116,323 | | | | 60,252 | | | | 202,715 | | | | 137,457 | |
| | | | | | | | | | | | | | | | | | | | |
Cash flows from investing activities: | | | | | | | | | | | | | | | | | | | | |
Acquisitions of DVD content library | | | (19,065 | ) | | | (22,119 | ) | | | (24,191 | ) | | | (41,184 | ) | | | (61,093 | ) |
Purchases of short-term investments | | | (40,597 | ) | | | (52,266 | ) | | | (21,795 | ) | | | (92,863 | ) | | | (57,790 | ) |
Proceeds from sale of short-term investments | | | 16,510 | | | | 14,961 | | | | 32,055 | | | | 31,471 | | | | 62,825 | |
Proceeds from maturities of short-term investments | | | 15,985 | | | | 650 | | | | 4,310 | | | | 16,635 | | | | 8,323 | |
Purchases of property and equipment | | | (8,626 | ) | | | (16,320 | ) | | | (5,671 | ) | | | (24,946 | ) | | | (12,064 | ) |
Other assets | | | 844 | | | | 1,419 | | | | 3,825 | | | | 2,263 | | | | 7,507 | |
| | | | | | | | | | | | | | | | | | | | |
Net cash used in investing activities | | | (34,949 | ) | | | (73,675 | ) | | | (11,467 | ) | | | (108,624 | ) | | | (52,292 | ) |
| | | | | | | | | | | | | | | | | | | | |
Cash flows from financing activities: | | | | | | | | | | | | | | | | | | | | |
Principal payments of lease financing obligations | | | (520 | ) | | | (501 | ) | | | (465 | ) | | | (1,021 | ) | | | (826 | ) |
Proceeds from issuance of common stock | | | 7,418 | | | | 6,762 | | | | 13,109 | | | | 14,180 | | | | 23,027 | |
Excess tax benefits from stock-based compensation | | | 17,868 | | | | 15,654 | | | | 11,182 | | | | 33,522 | | | | 18,606 | |
Repurchases of common stock | | | (51,421 | ) | | | (108,643 | ) | | | (45,145 | ) | | | (160,064 | ) | | | (152,869 | ) |
| | | | | | | | | | | | | | | | | | | | |
Net cash used in financing activities | | | (26,655 | ) | | | (86,728 | ) | | | (21,319 | ) | | | (113,383 | ) | | | (112,062 | ) |
| | | | | | | | | | | | | | | | | | | | |
Net increase (decrease) in cash and cash equivalents | | | 24,788 | | | | (44,080 | ) | | | 27,466 | | | | (19,292 | ) | | | (26,897 | ) |
Cash and cash equivalents, beginning of period | | | 150,419 | | | | 194,499 | | | | 79,861 | | | | 194,499 | | | | 134,224 | |
| | | | | | | | | | | | | | | | | | | | |
Cash and cash equivalents, end of period | | $ | 175,207 | | | $ | 150,419 | | | $ | 107,327 | | | $ | 175,207 | | | $ | 107,327 | |
| | | | | | | | | | | | | | | | | | | | |
| | |
| | | Three Months Ended | | | Six Months Ended | |
| | | June 30,
2011 | | | March 31,
2011 | | | June 30,
2010 | | | June 30,
2011 | | | June 30,
2010 | |
Non-GAAP free cash flow reconciliation: | | | | | | | | | | | | | | | | | | | | |
Net cash provided by operating activities | | $ | 86,392 | | | $ | 116,323 | | | $ | 60,252 | | | $ | 202,715 | | | $ | 137,457 | |
Acquisitions of DVD content library | | | (19,065 | ) | | | (22,119 | ) | | | (24,191 | ) | | | (41,184 | ) | | | (61,093 | ) |
Purchases of property and equipment | | | (8,626 | ) | | | (16,320 | ) | | | (5,671 | ) | | | (24,946 | ) | | | (12,064 | ) |
Other assets | | | 844 | | | | 1,419 | | | | 3,825 | | | | 2,263 | | | | 7,507 | |
| | | | | | | | | | | | | | | | | | | | |
Non-GAAP free cash flow | | $ | 59,545 | | | $ | 79,303 | | | $ | 34,215 | | | $ | 138,848 | | | $ | 71,807 | |
| | | | | | | | | | | | | | | | | | | | |
| | |
| | 14 |
Netflix, Inc.
Other Data
(unaudited)
(in thousands, except percentages, average monthly revenue per paying subscriber and subscriber acquisition cost)
| | | | | | | | | | | | |
| | | As of / Three Months Ended | |
| | | June 30,
2011 | | | March 31,
2011 | | | June 30,
2010 | |
Domestic subscriber information: | | | | | | | | | | | | |
Subscribers: beginning of period | | | 22,797 | | | | 19,501 | | | | 13,967 | |
Gross subscriber additions: during period | | | 5,315 | | | | 6,299 | | | | 3,059 | |
Gross subscriber additions year-to-year change | | | 73.7 | % | | | 80.4 | % | | | 58.0 | % |
Gross subscriber additions quarter-to-quarter sequential change | | | (15.6 | %) | | | 22.7 | % | | | (12.4 | %) |
Less subscriber cancellations: during period | | | (3,518 | ) | | | (3,003 | ) | | | (2,025 | ) |
Net subscriber additions: during period | | | 1,797 | | | | 3,296 | | | | 1,034 | |
Subscribers: end of period | | | 24,594 | | | | 22,797 | | | | 15,001 | |
Subscribers year-to-year change | | | 63.9 | % | | | 63.2 | % | | | 41.5 | % |
Subscribers quarter-to-quarter sequential change | | | 7.9 | % | | | 16.9 | % | | | 7.4 | % |
Free subscribers: end of period | | | 1,331 | | | | 1,392 | | | | 424 | |
Free subscribers as percentage of ending subscribers | | | 5.4 | % | | | 6.1 | % | | | 2.8 | % |
Paid subscribers: end of period | | | 23,263 | | | | 21,405 | | | | 14,577 | |
Paid subscribers year-to-year change | | | 59.6 | % | | | 57.1 | % | | | 40.5 | % |
Paid subscribers quarter-to-quarter sequential change | | | 8.7 | % | | | 19.3 | % | | | 7.0 | % |
Average monthly revenue per paying subscriber | | $ | 11.49 | | | $ | 11.97 | | | $ | 12.29 | |
Domestic churn | | | 4.2 | % | | | 3.9 | % | | | 4.0 | % |
Domestic subscriber acquisition cost | | $ | 15.09 | | | $ | 14.38 | | | $ | 24.37 | |
| |
| | | Three Months Ended | |
| | | June 30,
2011 | | | March 31,
2011 | | | June 30,
2010 | |
Consolidated margins: | | | | | | | | | | | | |
Gross margin | | | 37.9 | % | | | 39.0 | % | | | 39.4 | % |
Operating margin | | | 14.6 | % | | | 14.2 | % | | | 14.9 | % |
Net margin | | | 8.6 | % | | | 8.4 | % | | | 8.4 | % |
Consolidated expenses as percentage of revenues: | | | | | | | | | | | | |
Technology and development | | | 7.3 | % | | | 7.1 | % | | | 7.3 | % |
Marketing | | | 12.0 | % | | | 14.5 | % | | | 14.3 | % |
General and administrative | | | 4.0 | % | | | 3.2 | % | | | 2.9 | % |
| | | | | | | | | | | | |
Total operating expenses | | | 23.3 | % | | | 24.8 | % | | | 24.5 | % |
Consolidated year-to-year change: | | | | | | | | | | | | |
Total revenues | | | 51.7 | % | | | 45.6 | % | | | 27.2 | % |
Cost of subscription | | | 61.4 | % | | | 45.2 | % | | | 16.7 | % |
Fulfillment expenses | | | 24.7 | % | | | 28.5 | % | | | 18.2 | % |
Technology and development | | | 52.8 | % | | | 36.1 | % | | | 39.6 | % |
Marketing | | | 27.4 | % | | | 38.6 | % | | | 61.2 | % |
General and administrative | | | 102.5 | % | | | 48.0 | % | | | 15.3 | % |
Total operating expenses | | | 43.9 | % | | | 39.0 | % | | | 47.5 | % |
| | |
| | 15 |
Netflix, Inc.
Segment Information
(unaudited)
(in thousands)
| | | | | | | | | | | | | | | | | | | | |
| | | As of / Three Months Ended | | | As of / Six Months Ended | |
| | | June 30,
2011 | | | March 31,
2011 | | | June 30,
2010 | | | June 30,
2011 | | | June 30,
2010 | |
Domestic | | | | | | | | | | | | | | | | | | | | |
Free subscribers at end of period | | | 1,331 | | | | 1,392 | | | | 424 | | | | 1,331 | | | | 424 | |
Paid subscribers at end of period | | | 23,263 | | | | 21,405 | | | | 14,577 | | | | 23,263 | | | | 14,577 | |
| | | | | | | | | | | | | | | | | | | | |
Total subscribers at end of period | | | 24,594 | | | | 22,797 | | | | 15,001 | | | | 24,594 | | | | 15,001 | |
| | | | | |
Revenue | | $ | 769,714 | | | $ | 706,274 | | | $ | 519,819 | | | $ | 1,475,988 | | | $ | 1,013,484 | |
Cost of revenues and marketing expenses | | | 556,719 | | | | 519,389 | | | | 389,467 | | | | 1,076,108 | | | | 771,848 | |
| | | | | | | | | | | | | | | | | | | | |
Contribution profit * | | | 212,995 | | | | 186,885 | | | | 130,352 | | | | 399,880 | | | | 241,636 | |
Other operating expenses | | | 87,871 | | | | 73,903 | | | | 53,010 | | | | 161,774 | | | | 105,949 | |
| | | | | | | | | | | | | | | | | | | | |
Segment operating income | | $ | 125,124 | | | $ | 112,982 | | | $ | 77,342 | | | $ | 238,106 | | | $ | 135,687 | |
| | | | | |
International | | | | | | | | | | | | | | | | | | | | |
Free subscribers at end of period | | | 110 | | | | 130 | | | | — | | | | 110 | | | | — | |
Paid subscribers at end of period | | | 857 | | | | 673 | | | | — | | | | 857 | | | | — | |
| | | | | | | | | | | | | | | | | | | | |
Total subscribers at end of period | | | 967 | | | | 803 | | | | — | | | | 967 | | | | — | |
| | | | | |
Revenue | | $ | 18,896 | | | $ | 12,279 | | | $ | — | | | $ | 31,175 | | | $ | — | |
Cost of revenues and marketing expenses | | | 28,242 | | | | 23,021 | | | | — | | | | 51,263 | | | | — | |
| | | | | | | | | | | | | | | | | | | | |
Contribution profit (loss) * | | | (9,346 | ) | | | (10,742 | ) | | | — | | | | (20,088 | ) | | | — | |
Other operating expenses | | | 664 | | | | — | | | | — | | | | 664 | | | | — | |
| | | | | | | | | | | | | | | | | | | | |
Segment operating income (loss) | | $ | (10,010 | ) | | $ | (10,742 | ) | | $ | — | | | $ | (20,752 | ) | | $ | — | |
| | | | | |
Consolidated | | | | | | | | | | | | | | | | | | | | |
Free subscribers at end of period | | | 1,441 | | | | 1,522 | | | | 424 | | | | 1,441 | | | | 424 | |
Paid subscribers at end of period | | | 24,120 | | | | 22,078 | | | | 14,577 | | | | 24,120 | | | | 14,577 | |
| | | | | | | | | | | | | | | | | | | | |
Total subscribers at end of period | | | 25,561 | | | | 23,600 | | | | 15,001 | | | | 25,561 | | | | 15,001 | |
| | | | | |
Revenue | | $ | 788,610 | | | $ | 718,553 | | | $ | 519,819 | | | $ | 1,507,163 | | | $ | 1,013,484 | |
Cost of revenues and marketing expenses | | | 584,961 | | | | 542,410 | | | | 389,467 | | | | 1,127,371 | | | | 771,848 | |
| | | | | | | | | | | | | | | | | | | | |
Contribution profit * | | | 203,649 | | | | 176,143 | | | | 130,352 | | | | 379,792 | | | | 241,636 | |
Other operating expenses | | | 88,535 | | | | 73,903 | | | | 53,010 | | | | 162,438 | | | | 105,949 | |
| | | | | | | | | | | | | | | | | | | | |
Operating income | | $ | 115,114 | | | $ | 102,240 | | | $ | 77,342 | | | $ | 217,354 | | | $ | 135,687 | |
Other income (expense) | | | (4,290 | ) | | | (4,000 | ) | | | (3,972 | ) | | | (8,290 | ) | | | (7,959 | ) |
Provision for income taxes | | | 42,610 | | | | 38,007 | | | | 29,851 | | | | 80,617 | | | | 51,937 | |
| | | | | | | | | | | | | | | | | | | | |
Net Income | | $ | 68,214 | | | $ | 60,233 | | | $ | 43,519 | | | $ | 128,447 | | | $ | 75,791 | |
| | | | | | | | | | | | | | | | | | | | |
| * | Contribution profit (loss) is defined as revenues less cost of revenues and marketing expenses. |
| | |
| | 16 |