SECURITIES AND EXCHANGE COMMISSION
Washington, DC 20549
FORM 6-K
REPORT OF FOREIGN ISSUER
PURSUANT TO RULE 13a-16 OR 15d-16 OF
THE SECURITIES EXCHANGE ACT OF 1934
| For the month of November, 2005 |
| Commission File Number 000-29872 |
ATI TECHNOLOGIES INC.
(Translation of Registrant's Name into English)
1 Commerce Valley Drive East, Markham, Ontario, Canada L3T 7X6
(Address of Principal Executive Offices)
Indicate by check mark whether the registrant files or will file annual reports under cover of Form 20-F or Form 40-F.
Form 20-F Form 40-F X
Indicate by check mark whether the registrant by furnishing the information contained in this Form is also thereby furnishing the information to the Commission pursuant to Rule 12g3-2(b) under the Securities Exchange Act of 1934.
Yes No X
Page 1 of 75 Pages
Index is located on Page 2
1 of 75
| INDEX | |||
| Document | Page Number | ||
| 2005 Annual Report | 3 | ||
| Signature Page | 75 | ||
2 of 75
A T I T E C H N O L O G I E S I N C . 2 0 0 5 A N N U A L R E P O R T

3 of 75
ATI Technologies Inc. is a world leader in the design and manufacture of innovative 3D graphics and digital media silicon solutions. An industry pioneer since 1985, ATI is the world’s foremost graphics processor unit (GPU) provider. ATI is dedicated to delivering leading-edge performance solutions for the full range of PC and Mac desktop and notebook platforms, workstation, digital television, game console and handheld markets. With 2005 revenues of approximately $2.2 billion, ATI has more than 3,300 employees in the Americas, Europe and Asia. ATI common shares trade on NASDAQ (ATYT) and the Toronto Stock Exchange (ATY).
4 of 75
T H E P O W E R O F I N N O V A T I O N
IN 1985, THE PC WAS IN ITS INFANCY. THE CELL PHONE WAS STILL A NOVELTY. ONLY 2,000 COMPUTERS WORLDWIDE HAD ACCESS TO THE INTERNET.
TWENTY YEARS LATER, WE FIND OURSELVES AT THE HEART OF A CONNECTED VISUAL WORLD – A KEY PLAYER IN THE DIGITAL REVOLUTION THAT HAS FUNDAMENTALLY ALTERED THE WAY WE ENGAGE, EDUCATE AND ENTERTAIN.
MUCH HAS CHANGED, BUT NOT THIS: WHEN YOU BELIEVE IN THE POWER OF INNOVATION, EVERYTHING IS POSSIBLE.
5 of 75
2 ATI 2005
6 of 75
ATI 2005 3
7 of 75
To Our Shareholders
S E E I T. S A V E I T. S A V O R I T.
8 of 75
| 1985 | On August 18, 2005, ATI Technologies celebrated its 20th anniversary. Since its inception, ATI has been recognized as a world leader in the supply of graphics, video and multimedia products. An industry pioneer, ATI creates revolutionary products that offer customers the ultimate visual experience for their desktop and notebook PCs, digital televisions, mobile phones and game consoles. ATI’s success is firmly built upon the strength of its 3,300 employees worldwide, product excellence and an unwavering commitment to customer satisfaction. | • ATI Technologies Inc. is established on August 20, 1985 • ATI develops its first graphic controller and introduces its first graphics board product |
ATI HAS BEEN A PIONEER AT THE FOREFRONT OF THE GRAPHICS INDUSTRY SINCE IT WAS FOUNDED TWENTY YEARS AGO WITH SIX EMPLOYEES WHO INSTILLED A PASSION FOR INNOVATION AND A VISION OF GREAT THINGS TO COME.
TODAY, THAT VISION HAS BECOME A REALITY, AS OUR REVENUES HAVE SURPASSED $2.2 BILLION, OUR TEAM HAS GROWN TO MORE THAN 3,300, AND AS OUR TOTAL ADDRESSABLE MARKET HAS EXPANDED DRAMATICALLY TO MORE THAN $14 BILLION. ONCE LIMITED TO THE PC, OUR MULTIMEDIA PROCESSORS HAVE BECOME A TECHNOLOGICAL CORNERSTONE OF TODAY’S MOST PERVASIVE CONSUMER ELECTRONICS, INCLUDING MOBILE PHONES, DIGITAL TELEVISIONS AND GAME CONSOLES.
Stepping it up
Innovation is a critical aspect of bringing world-class products to market; however, execution is just as important. In 2005, we discovered that the company’s rapid growth of the last few years had left some gaps in our organizational structure, which impacted our ability to meet a number of our goals. While the first half of fiscal 2005 consisted of our two strongest revenue quarters ever, we lost momentum in the second half amid slower than expected product ramps, a critical product delay, operational challenges and a slowdown in demand for certain products. These factors contributed to reduced revenues and gross margins, an inventory write-down in the fourth quarter, and disappointing financial results for the year.
We are moving quickly to improve our effectiveness in these areas with initiatives aimed at controlling expenses, reducing product costs and improving product margins, expanding our markets and market share, and optimizing our supply chain to improve customer deliveries. In short, we are taking the steps needed to ensure that our vigorous pace of innovation will be accompanied by world-class execution.
Gross margin improvement remains a top priority in 2006. While we fell short of our target margins in the latter part of the year, we are focused on driving margin improvement with the initiatives above and through compelling new desktop products and higher-margin digital consumer products.
ATI 2005 5
9 of 75
| 1987 | • ATI releases EGA Wonder™ and VGA Wonder™, a single card able to work with every graphics interface, software and monitor on the market, providing faster graphics than was previously possible on conventional personal computers | 1989 | • ATI assists in establishment of VESA standard in the graphics industry |
TO OUR SHAREHOLDERS
| TOGETHER, WE WILL CONTINUE TO ENTERTAIN, EDUCATE AND ENGAGE CONSUMERS ON THE MOST PERVASIVE AND POWERFUL DEVICES IN THE CONNECTED VISUAL WORLD. |
Innovative products, unlimited possibilities
As it has for the last two decades, innovation once again led the way in fiscal 2005:
- The Radeon X1000 family of 90 nanometer GPUs, launched in October 2005, have reinvigorated our desktopproduct stack and reclaimed top-to-bottom performance leadership. Additional product introductions over the nextfew months will bring to notebook PC users new levels of performance, power management and overall value.
- We introduced important new platform technologies, such as AvivoTMand CrossFireTM. Leveraging our expertisein PC and DTV visual quality, the Avivo display engine allows users to experience superb video quality on thePC and enjoy premium high-definition video content based on emerging standards such as Blu-Ray and HD-DVD.
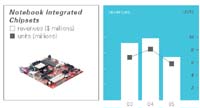
CrossFire, our multi-GPU technology aimed at gaming and other PC enthusiasts, is yet another exciting platformstrategy with positive implications for both our GPU and chipset businesses. - Superior performance and functionality have made our Radeon Xpress 200 the industry’s fastest-growingintegrated chipset product line and a significant part of our business, accounting for nearly 20 percent of ourtotal revenues in the fourth quarter. We remain laser-focused on delivering a new wave of cost-improvedintegrated solutions, and improving chipset gross margins.
- In the handheld or mobile phone market, we shipped more than 40 million Imageon processors in fiscal 2005and expanded our customer base to now include four of the top six global handset OEMs. ATI remains extremelywell positioned as the mobile phone continues to claim its share in the “battle for the belt”. We will continueto bring new innovative technologies, such as mobile TV, 3D graphics, and high-quality audio to our Imageonline of multimedia co-processors in 2006.
- Revenues from our Xilleon line of digital television products grew nearly 70%, while continued innovation andinvestment has paved the way for long-term growth. The recently launched Xilleon 240, which combines frontand back-end functionality onto a single chipset, has garnered numerous design wins and is expected to be amajor driver of our DTV revenues in 2006. We continue to focus on the North American market while developingour offerings for international markets such as Europe and China.
- With the Microsoft Xbox 360 GPU, we introduced groundbreaking features such as a unified shaderarchitecture and intelligent memory, and helped to usher in the era of high-definition gaming. We remain veryexcited about our relationships with Microsoft and Nintendo as they bring the next generation of breathtakingnew consoles to market.
6 ATI 2005
10 of 75
| 1991 | • ATI releases ATI Mach8™ in both chip and board products, capable of processing graphics independently of the central processing unit (CPU) | 1992 | • ATI releases Mach32™, an integrated graphics controller and graphics accelerator in one chip | • ATI releases VLB (VESA Local Bus) products and, after that, PCI (peripheral component interconnect) bus products |
Looking ahead
With its incredible versatility, the PC is quickly becoming the centerpiece of the modern home. Consumers are craving richer and more immersive visual experiences, and are turning to their PCs as a storage and delivery mechanism for music, television and other forms of multimedia and digital content. At the same time, its connectivity with other consumer electronics devices in the digital home is driving the industry towards seamless convergence. As a result, the need for powerful and intelligent GPUs to drive the ultimate visual experience has never been greater. With its unsurpassed expertise in visualization on PCs, Digital TVs, handheld devices and gaming platforms, ATI is uniquely poised to seize the opportunities that lie ahead in this emerging connected visual world.
We are entering fiscal 2006 with the strongest product line-up in our history, with top-to-bottom technology leadership across our core market segments, together with exciting platform technologies to drive visual processing to new heights. While challenges remain, we are confident in our ability to deliver new products and platform technologies, make the required changes to drive growth in our PC and digital consumer businesses, and improve our financial performance.
Before closing, we would like to thank our many business partners, customers, employees and shareholders for their ongoing support. Together, we will continue to entertain, educate and engage consumers on the most pervasive and powerful devices in the connected visual world.
| /s/ K.Y. Ho | /s/ David E. Orton | |
| K.Y. Ho | David E. Orton | |
| Chairman of the Board | President and Chief Executive Officer | |
| November 1, 2005 |
MESSAGE FROM THE BOARD OF DIRECTORS AND MANAGEMENT:
After more than 20 years with ATI, as a principal founder, CEO and Chairman, K.Y. Ho has decided to embark upon a well deserved retirement. The Board of Directors and management would like to extend their sincere thanks and gratitude to K.Y. for his vision and leadership in guiding ATI over the past 20 years to its position as the leading graphics company in the world.
Best wishes for the future, K.Y.
ATI 2005 7
11 of 75
| 1993 | • ATI becomes a public company, trading on the Toronto Stock Exchange (TSX), trading symbol: ATY | 1994 | • ATI introduces the Mach64 chip and a new set of graphics boards -- the first graphics boards to accelerate motion video | • ATI localizes application software in 13 different international languages |
Management’s Discussion and Analysis
Table of Contents
The MD&A is presented in seven sections:
About Our Business– p. 9
describes our business, target markets, objectives, strategy and outlook.
Fiscal 2005 Overview and Highlights– p. 13
offers a brief look at our performance and key highlights in fiscal 2005.
Business Outlook for Fiscal 2006– p. 16
provides our business outlook for next fiscal year.
Financial Results Analysis– p. 17
provides a detailed review of our financial and operating performance for the past three years.
Liquidity and Capital Resources– p. 26
explains how we manage our cash and capital resources.
Risks and Uncertainties– p. 30
examines uncertainties and challenges that could affect our business.
Our Critical Accounting Policies– p. 32
describe our critical accounting policies and the key estimates and assumptions that management has made in the preparation of our financial statements. It also provides a description of changes in accounting standards used to prepare our financial statements.
Please refer to the glossary on page 67 for a description of some of the technical terms used throughout this MD&A to describe our business.
This Management’s Discussion and Analysis (“MD&A”) comments on ATI’s operations, performance and financial condition for the two fiscal years ended August 31, 2005 and 2004. The MD&A should be read in conjunction with ATI’s 2005 consolidated financial statements and accompanying notes beginning on page 38 of this Annual Report. All tabular amounts are expressed in thousands of U.S. dollars except per share amounts. Unless otherwise noted, “2005” and “2004” refer to our fiscal 2005 and fiscal 2004 years, respectively. This MD&A is based on information available to us at November 1, 2005, unless otherwise indicated.
As of our fiscal 2005 year-end, an evaluation was carried out under the supervision of and with the participation of Management, including our Chief Executive Officer and Chief Financial Officer, of the effectiveness of our disclosure controls and procedures. Based on that evaluation, our Chief Executive Officer and Chief Financial Officer concluded that the design and operation of these disclosure controls and procedures were effective as of August 31, 2005, the end of the period covered by the Annual Report, to ensure that material information relating to ATI Technologies and its consolidated subsidiaries would be made known to them by others within those entities.
About Forward-looking Statements
Forward-looking statements look into the future and provide an opinion as to the effect of certain events and trends on the business. Forward-looking statements may include words such as “plans”, “intends”, “anticipates”, “should”, “estimates”, “expects”, “believes”, “indicates”, “targeting”, “suggests” and similar expressions.
This Annual Report and MD&A, and in particular our Business Outlook for Fiscal 2006 on page 16 and the discussion of our Target Operating Model on page 11, contain forward-looking statements about ATI’s objectives, strategies, financial condition and results, as well as statements with respect to our beliefs, expectations, anticipations, estimates and intentions. These “forward-looking” statements are based on current expectations and various factors and assumptions. Accordingly, these statements entail various risks and uncertainties. The material factors and assumptions that were applied in making the forward-looking statements in this Annual Report and MD&A are as follows:
- the expected rate of growth of the PC andConsumer markets;
- the expected mix of discrete and integratedchipsets that will be sold in the PC market;
- our expected market share across variouscustomers and product segments;
- our expected future design wins both in thePC and Consumer markets;
- our expected product and production costs;
- the timely introduction of our new productsfor the PC and Consumer markets;
- the expected product specific average sellingprice (“ASP”);
- in the digital television (“DTV”) segment, theexpected rate of consumer adoption of high-definition television (“HDTV”); and;
- our overall competitive position and thecompetitiveness of our current and futureproducts.
It is important to note that:
- Unless otherwise indicated, forward-lookingstatements in this Annual Report andMD&A describe our expectations as ofNovember 1, 2005.
8 ATI 2005
12 of 75
| 1995 | • ATI becomes the first graphics company to ship Mac-compatible graphics boards, proving ATI is committed to both PC and Mac platforms | • ATI announces an agreement with United Microelectronics Corporation (UMC) and other joint ventures to build a semiconductor manufacturing facility in Taiwan |
- We caution readers not to place undue relianceon these statements as our actual resultsmay differ materially from our expectations ifknown and unknown risks or uncertaintiesaffect our business, or if our estimates orassumptions prove inaccurate. Therefore, wecannot provide any assurance that forward-lookingstatements will materialize.
- We assume no obligation to update or reviseany forward-looking statement, whether as aresult of new information, future events orany other reason.
For a description of material factors that could cause our actual results to differ materially from the forward-looking statements in this Annual Report and MD&A, please see the Risks and Uncertainties section of this MD&A on page 30 and Item 3.12 “Narrative Description of the Business – Risks and Uncertainties” in our 2005 Annual Information Form.
In this MD&A, the termsATI,we,usandourrefer to ATI Technologies Inc. and its subsidiaries.
Additional informationregarding ATI and our business is contained in our filings with securities regulatory authorities, including our Annual Information Form and Management Information Circular. These documents are available on SEDAR atwww.sedar.comor on our company website atwww.ati.com. Our Form 40-F and other filings we make with the U.S. Securities and Exchange Commission are available atwww.sec.gov.
| ABOUT OUR BUSINESS |

ATI Technologies Inc. is one of the world’s leading providers of graphics processors and technologies. Our graphics processing units (GPUs) are highly specialized semiconductors that increase the speed, complexity and visual fidelity of digital images that can be displayed on graphical interfaces. Our products are found in desktop and notebook computers (PCs), and consumer electronic devices such as mobile phones, digital televisions and game consoles.
At August 31, 2005, we employed more than 3,300 people in the Americas, Europe and Asia. Our common shares trade on the NASDAQ Stock Market under the symbol “ATYT” and on the Toronto Stock Exchange under the symbol “ATY”.
Business Segments
Effective the first quarter of fiscal 2005, we began to report our financial results in two segments –PCandConsumer– reflecting the two primary markets for our semiconductor graphics products.
- The PC segment includes all 3D graphics,video and multimedia products, and chipsetsdeveloped for use in desktop and notebookcomputers, including professional workstations,servers and home media PCs.
- The Consumer segment includes products used in mobile phones, PDAs, DTVs and consumer electronics, as well as royalties and contract engineering services derived from mobile phone and game console products.
Seenote 17to the consolidated financial statements for more information on our segmented reporting.
Products and Target Markets
We develop products and technologies for the markets set out below.Current product information and specifications can be found on our website at www.ati.com.
ATI 2005 9
13 of 75
| 1996 | • | ATI releases the first 3D chip in the graphics industry. Sales exceed one million chips | • | ATI establishes ATEL (ATI Ireland), the Company’s distribution headquarters in Europe | • | ATI announces Macintosh-based boards, making the Company the first manufacturer of PCI-based boards for the Mac, other than Apple itself | |
| One million chips sold |
| MANAGEMENT’S DISCUSSION AND ANALYSIS(CONT.) |
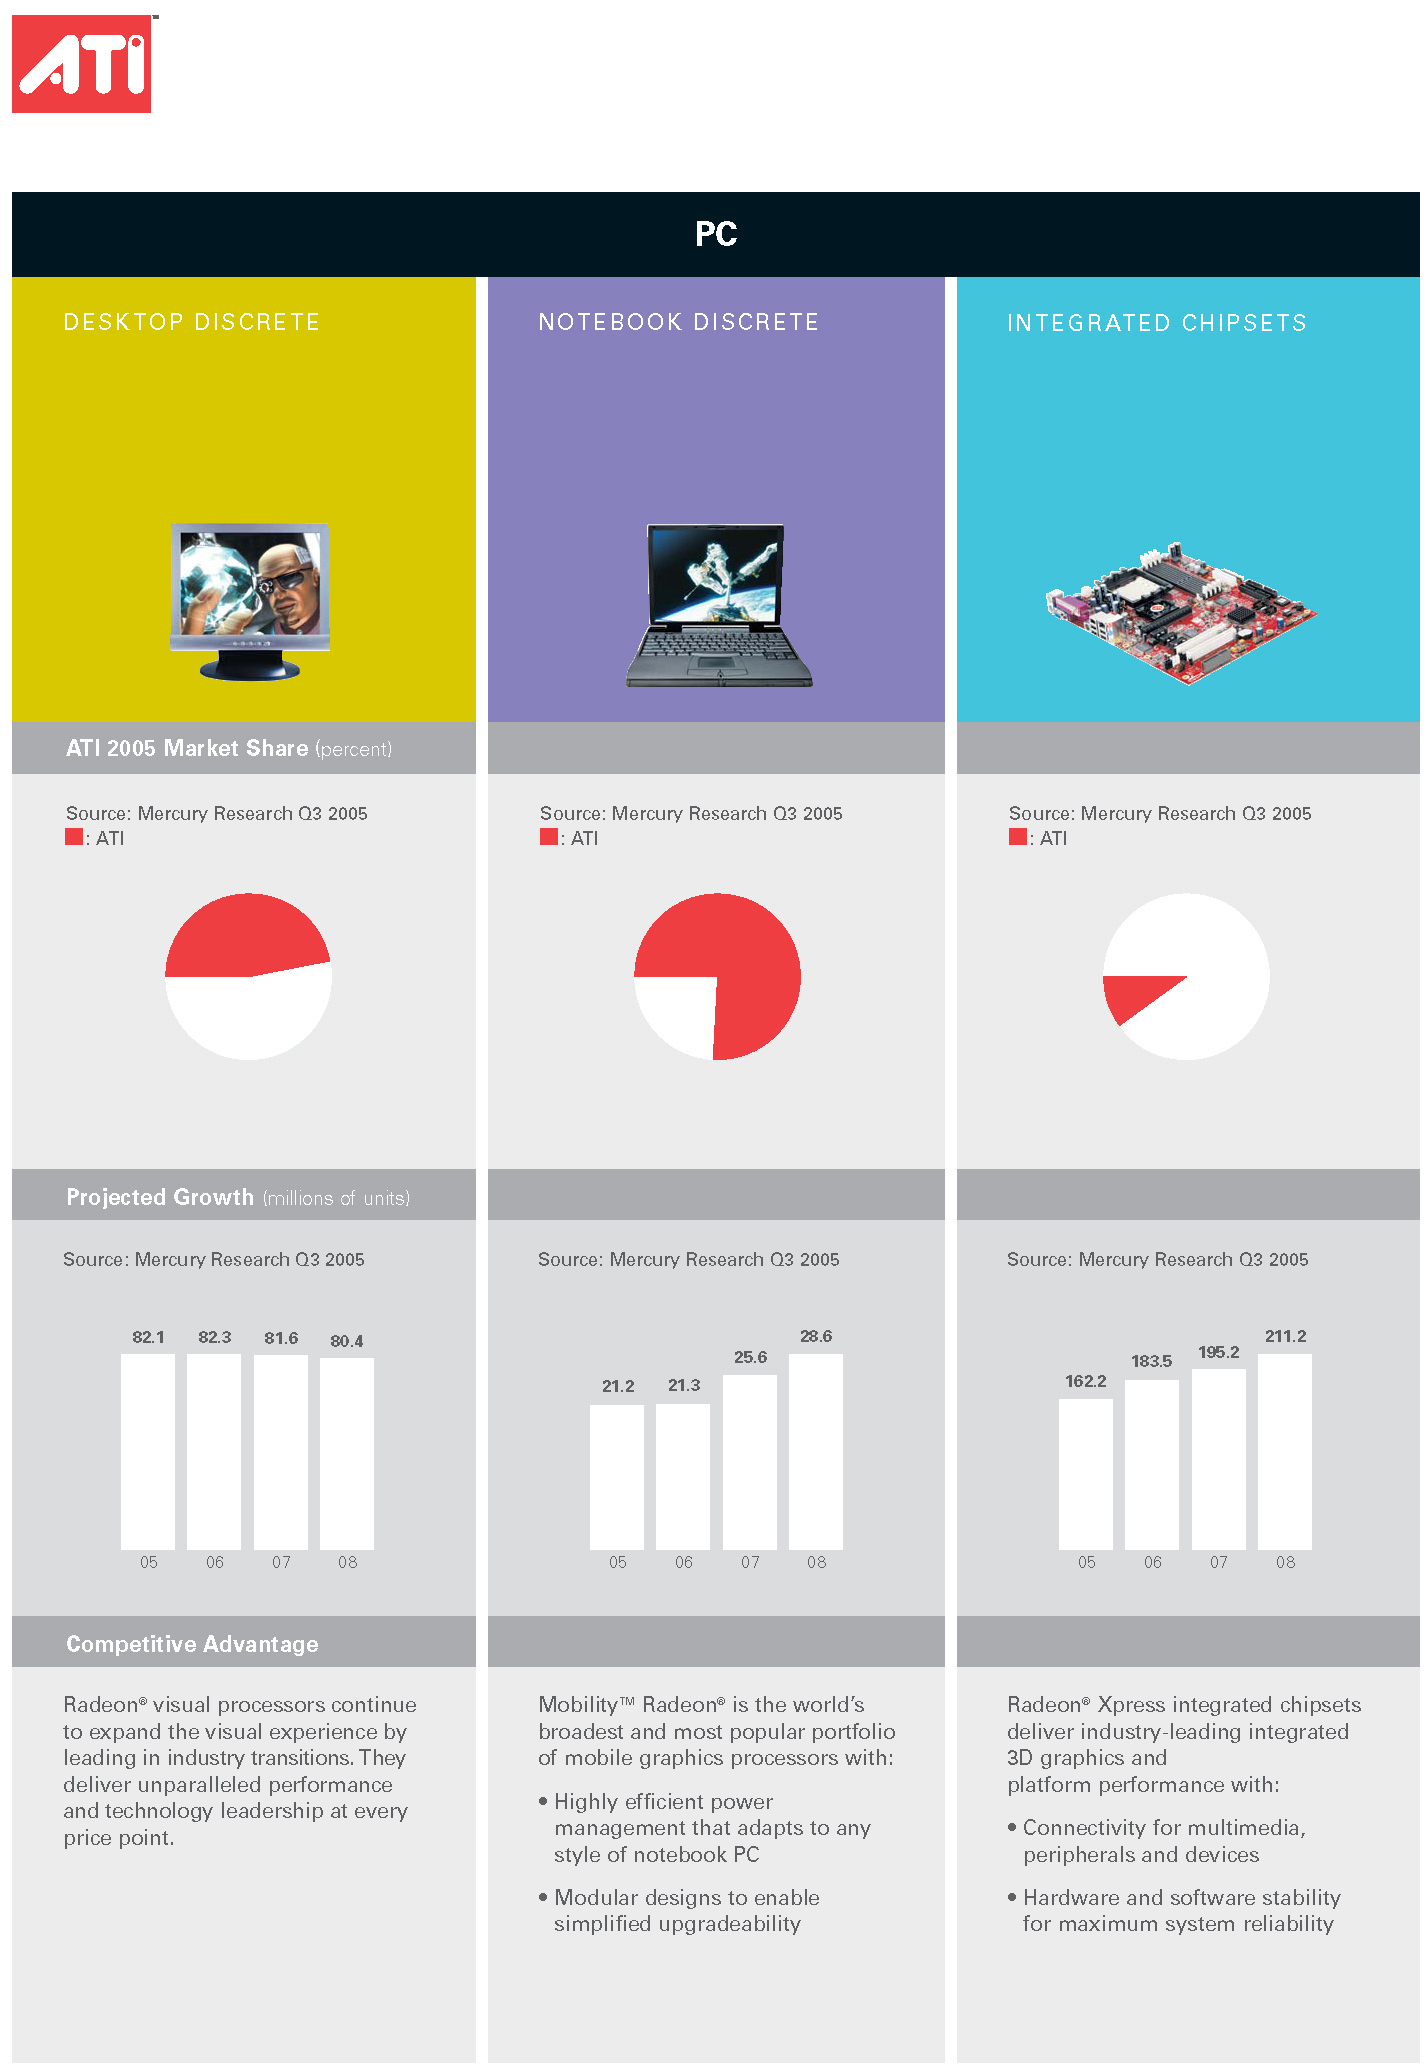
 | THE PC SEGMENT INCLUDES ALL 3D GRAPHICS, VIDEO AND MULTIMEDIA PRODUCTS, AND CHIPSETS DEVELOPED FOR USE IN DESKTOP AND NOTEBOOK COMPUTERS, INCLUDING PROFESSIONAL WORKSTATIONS, SERVERS AND HOME MEDIA PCs. |
P C
| Desktop discrete | Notebook discrete | Chipsets (integrated and discrete) | ||
| Our desktop GPUs address desktop PC | Our notebook GPUs address the portable or | Our chipset products feature core logic | ||
| markets where customers expect high levels | laptop computer segment. In this category, | functionality, are targeted to motherboard | ||
| of performance and a compelling visual | low power consumption and visual | manufacturers and OEMs, and are available | ||
| experience. We cater to all four segments of | performance are the uppermost considerations | with or without integrated graphics. Our | ||
| the desktop PC market: value, mainstream, | of our customers. We focus on designing | Radeon Xpress 200 integrated chipsets for | ||
| performance and enthusiast. We also design | notebook GPUs that meet and exceed these | the desktop and notebook markets include | ||
| and build GPU solutions for the advanced | expectations in the enthusiast, performance | graphics functionality and are geared | ||
| workstation and home media markets. | thin, value mainstream, and thin and light | towards the value or price-sensitive segment | ||
| Our primary brands include Radeon | categories. Mobility Radeon is our brand for | of the PC market. Radeon Xpress CrossFire | ||
| (desktop products), FireGLTM(workstations) | notebook discrete products. | Edition chipsets do not contain integrated | ||
| and All-in-Wonder®(multimedia products). | graphics and are designed to be used in | |||
| conjunction with one or more discrete | ||||
| graphics chips in graphically demanding | ||||
| applications such as gaming. |
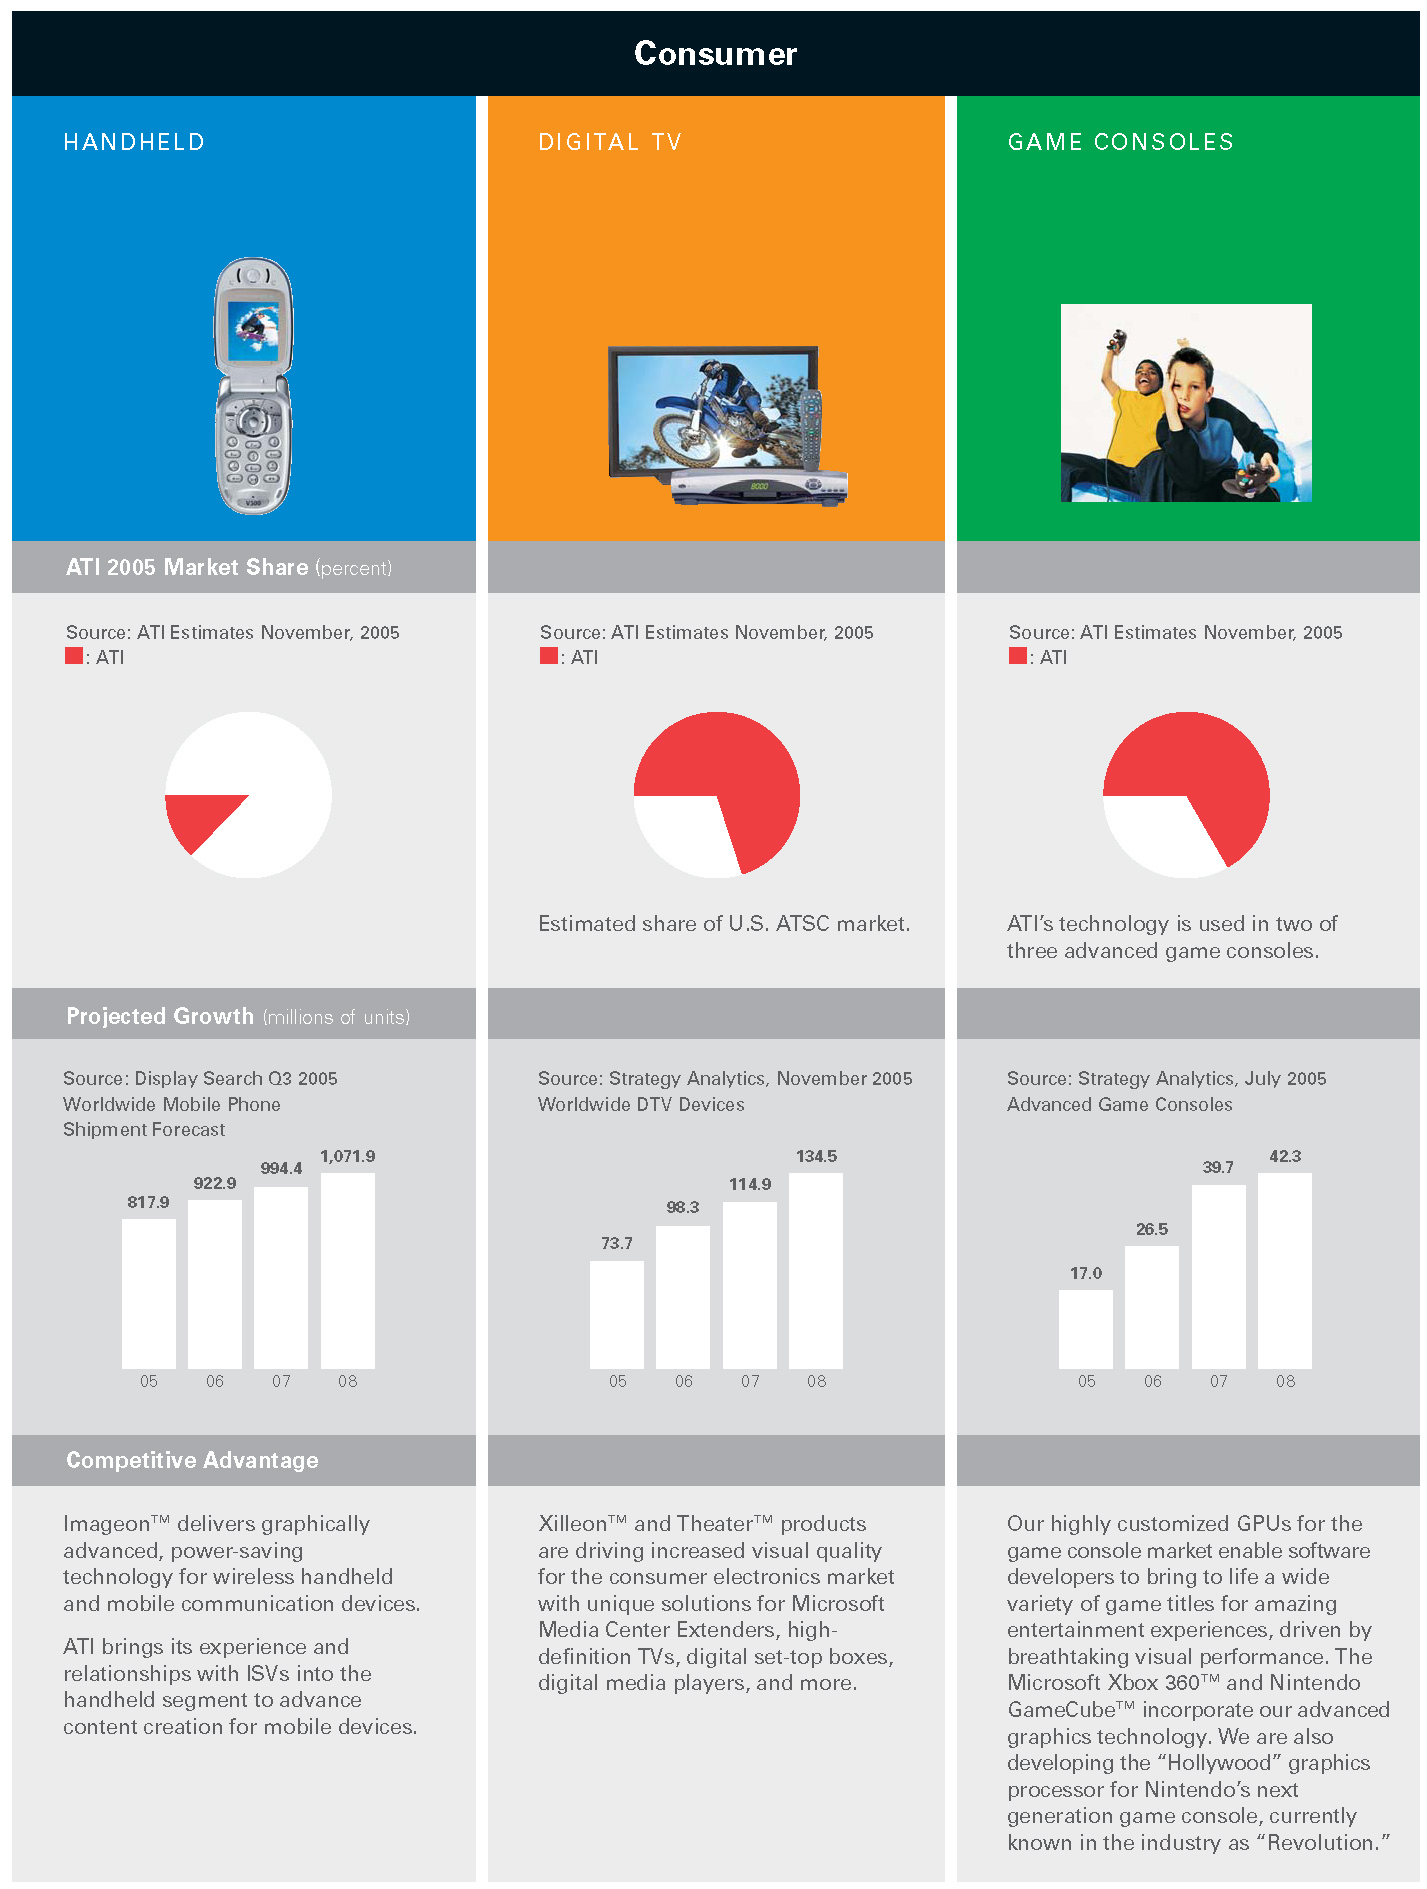
 | THE CONSUMER SEGMENT INCLUDES PRODUCTS USED IN MOBILE PHONES, PDAs, DIGITAL TELEVISIONS (“DTVs”) CONSUMER ELECTRONICS, AS WELL AS ROYALTIES AND CONTRACT ENGINEERING SERVICES DERIVED FROM MOBILE PHONE AND GAME CONSOLE PRODUCTS. |
C O N S U M E R
| Handheld devices | Digital television | Game consoles | ||
| Our products are designed to provide | Our Xilleon and Theater products are cost- | In recent years, we have successfully | ||
| advanced visual and audio processing for | effective and highly integrated visual and | leveraged our core visual processing | ||
| color mobile phones and other handheld | signal processing solutions offered to DTV | technology into the game console market. | ||
| devices. Higher resolution panels, higher | and set-top box manufacturers. The U.S. | The Microsoft Xbox 360 and Nintendo | ||
| performing embedded processors as well | Federal Communications Commission has | GameCube both use our technology to deliver | ||
| as increased internal and removable storage | issued a mandate requiring the integration of | breathtaking graphics performance. We are | ||
| are contributing to the revolution in | digital tuners into TV sets by 2007. This | also developing the “Hollywood” graphics | ||
| handheld and mobile communication devices. | mandate, together with the superior picture | processor for Nintendo’s next generation | ||
| Our Imageon product line delivers advanced | quality and functionality offered by digital | game console, currently known | ||
| visual and audio processing along with | technology, is driving consumer interest and | in the industry as “Revolution.” | ||
| power saving technology and a high level | the adoption of DTV. | |||
| of integration to this market. |
10 ATI 2005
14 of 75
| 1996 | • ATI becomes the first graphics company to introduce a hardware chip to display computer graphics on a television | • ATI becomes the first graphics company to introduce a fully 3D-enabled chip for the notebook personal computer market | • ATI becomes the first graphics company to introduce a combination graphics and TV tuner card, enabling users to receive and capture analog TV signals |
Business Strategy and Objectives
We strive to be the foremost innovator and provider of advanced graphics processors and technology for the PC and digital consumer markets. We aim to deliver products that excite our customers while ensuring that our roadmap is aligned with key industry inflection points.
We use a “fabless” manufacturing strategy, whereby we outsource wafer manufacturing, assembly, testing and packaging to suppliers with established expertise in these areas. By outsourcing these functions, we are able to reduce our capital requirements for our PC, handheld and DTV products, lower our fixed costs, and focus resources on the design, development and marketing of our products.
We sell our products through a variety of channels and to different customers, including:
- original equipment manufacturers (OEMs);
- system integrators (SIs) who build our productsinto their PCs;
- original design manufacturers (ODMs) andadd-in-board manufacturers (AIBs) who addour products to their PC motherboard productsor graphic board products; and
- distributors and retailers, both traditionaland online.
In our game console business, rather than supplying actual graphics processors, we typically design highly customized and optimized GPUs in exchange for non-recurring engineering revenues (“NRE”) and royalty payments.
The following are the key strategies used to pursue our objectives:
Sustain product and technology leadership in our GPU products.Maintain performance leadership across our product segments and successfully drive the technology through all segments of the market.
Build a strong and sustainable franchise in the integrated chipset market.Grow our share of the growing desktop and notebook integrated chipset market with products that deliver superior graphics performance and maximum value in the industry.
Expand in select Consumer market segments. Continue to increase the revenue and profit contribution from new products for rapidly growing consumer electronics markets such as handheld, digital television and game consoles.
Innovate cost-effectively and improve operating and financial performance.Translate technology and industry leadership into strong financial performance for our shareholders, and drive efficiencies through scale.
Target Operating Model
The following contains forward-looking statements about our target operating model. Reference should be made to “About forward-looking statements” on page 8. For a description of material factors that could cause our actual results to differ from the forward-looking statements in the following, please see the Risks and Uncertainties section of this MD&A on page 30 and Item 3.12 “Narrative Description of the Business – Risks and Uncertainties” in our 2005 Annual Information Form.
The following discussion and table highlight the target operating model that we are working to achieve over the next several years. Our overall gross margins are highly dependent on product mix, as gross margins may vary considerably by line of business. Gross margins are also influenced by a number of other key factors, including the cost of input materials, the manufacturing yield of wafers received from foundries and the average selling prices of our products. The continuous change in these factors, most of which are beyond our control, cause our overall gross margins to fluctuate from quarter to quarter. As a result, the target operating model reflects our aspirations over the next several years.
ATI 2005 11
15 of 75
| 1997 | • | ATI ships 3D RAGE™ II+ DVD chip, the first graphic accelerator with motion compensation DVD software | • | ATI becomes the first graphics company to release products with full support for the Accelerated Graphics Port (AGP 2X) | • | ATI becomes the first graphics company to provide hardware support for DVD acceleration and display |
MANAGEMENT’S DISCUSSION AND ANALYSIS(CONT.)
We are targeting to achieve gross margins in our core PC discrete business of approximately 32%–35% of revenues over the long term. Our target gross margin for chipsets is 25%–30% of revenues. However, we believe that our ability to leverage core technology and resources from the PC discrete business will allow us to maintain operating margins for chipsets that are close to those of PC discrete. In our Consumer segment, which typically carries higher gross margins than the PC segment, we are targeting to maintain gross margins above 40% of revenues.
We are targeting to achieve consolidated gross margins in the range of 34%–38% of revenues while maintaining operating expenses within the ranges listed below, and we are targeting to achieve pre-tax operating income (defined for this purpose as gross margin less research and development, selling and marketing, and administrative expenses) in the range of 11%–15% of revenues.
Please see the Risks and Uncertainties section of this MD&A for a list of the various risk factors that could impact gross margins and operating margins and prevent us from achieving our targets.
| ATI (CONSOLIDATED) | |||||||||||||||||||||||||
| Target | 2005 | 2004 | 2003 | ||||||||||||||||||||||
| As a percentage of revenues | 2005–2007 | Performance | Performance | Performance | |||||||||||||||||||||
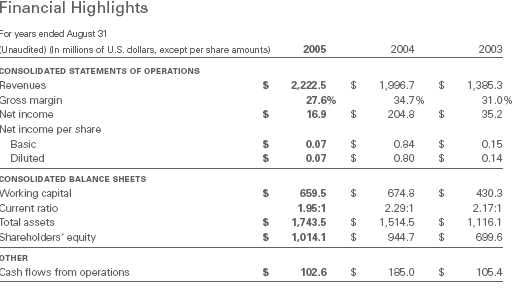
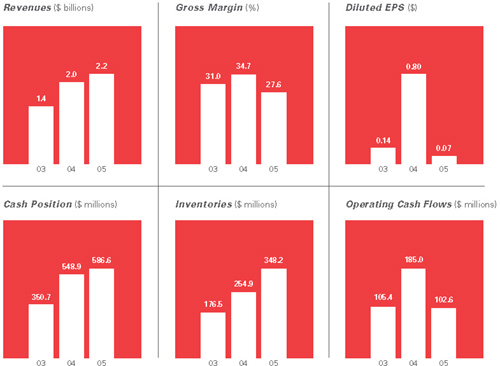
| Gross margin | 34%–38% | 27.6% | 34.7% | 31.0% | |||||||||||||||||||||
| R&D | 13%–15% | 14.7% | 13.3% | 15.4% | |||||||||||||||||||||
| SG&A | 8%–10% | 9.4% | 8.2% | 9.5% | |||||||||||||||||||||
| Pre-tax operating income | 11%–15% | 3.5% | 13.2% | 6.1% | |||||||||||||||||||||
Fiscal 2006 Strategic Priorities
The following summarizes our key strategic priorities for fiscal 2006:
- Drive PC growth through technology leadership, innovation and strategic platforms
- Increase integrated chipset gross margins through R&D and operational improvements
- Improve operational consistency in product delivery and ramping of new technologies
- Focus on new customers and accelerating growth in the Consumer business
- Implement expense management strategies including expansion into lower-cost geographies
12 ATI 2005
16 of 75
| 1998 | • ATI becomes the first company to introduce a complete set-top box design | • ATI secures more design wins with the top ten OEM personal computer manufacturers than any other graphics company • ATI, the AGP market leader, ships its ten millionth AGP chip | • ATI launches RAGE MAGNUM™ deemed to be OEM's best choice for fastest graphics performance for high-end PC graphics |
FISCAL 2005 OVERVIEW
AND HIGHLIGHTS
Despite solid progress in many key areas, overall financial performance in fiscal 2005 fell below expectations. Results for the first half were positive as we reported the two strongest revenue quarters in our history. However, a number of challenges prevented us from carrying this momentum into the latter part of the year and our performance in the second half suffered as a result.
These challenges included slower than expected product ramps, a critical product delay, operational issues, and a slowdown in demand for certain desktop discrete products in the third and fourth quarters. These factors, combined with the timing of new products, led to gross margin and inventory pressures in the second half of the year and an inventory write-down in the fourth quarter. In addition, sales of integrated chipsets, which currently have considerably lower gross margins than our other products, comprised almost 15% of total revenues in the second half as compared with approximately 6% in the first half. As a result, we were not able to achieve stronger earnings in fiscal 2005 compared to fiscal 2004 as we had anticipated in the MD&A in our 2004 Annual Report.
Among our accomplishments in fiscal 2005, revenue increased by 11% to approximately $2.2 billion and shipments approached 115 million units, both new records. We also gained overall market share in discrete graphics and gained significant traction in our consumer, workstation and desktop chipset businesses. Subsequent to fiscal year-end, we launched a new family of desktop discrete products, which we believe will strengthen our competitive position and contribute to stronger performance in discrete graphics going forward.
Looking ahead to fiscal 2006, we have undertaken a number of initiatives aimed at providing greater visibility into the dynamics of our distribution channels. We believe these initiatives will lead to a more solid foundation on which to build our business in fiscal 2006 and beyond.
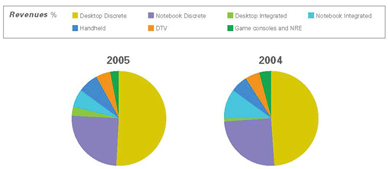
Product Line Review and Highlights
In addition to our segmented reporting, the following section includes a discussion of our results by key product line to give further insight into our results. For competitive reasons, the charts below and on the following two pages do not provide figures for revenue.Current product information and specifications can be found on our website at www.ati.com.
The chart below illustrates the composition of our consolidated revenues by major product line:
ATI 2005 13
17 of 75
| 1998 | • | ATI introduces next-generation RAGE™ 128 GL graphics chip delivering the world’s best performance and features to the high performance PC market | • | ATI’s new RAGE 128 VR graphics chip delivers a new level of 3D graphics performance on the motherboard | • | ATI’s RAGE LT PRO brings no- compromise 2D, 3D and DVD to leading notebooks |
MANAGEMENT’S DISCUSSION AND ANALYSIS(CONT.)
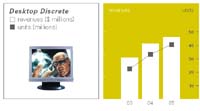
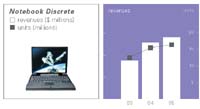
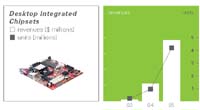
P C P R O D U C T S
 |
| ||
 |
| ||
 |
| ||
 |
|
14 ATI 2005
18 of 75
| 1998 | • ATI becomes the first graphics company to intro- duce a DTV-enabled chip that allows users to watch DVD on a personal computer | • K.Y. Ho, President & CEO, selected as Canada's Entrepreneur of the Year |
C O N S U M E R P R O D U C T S
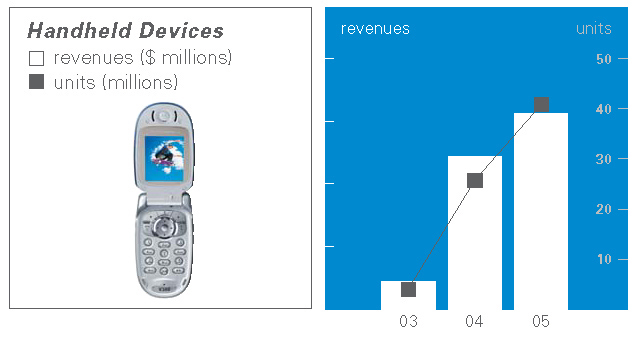 | • | Revenue grew nearly 30% to approximately 7% of consolidated revenues in fiscal 2005. | ||
| • | Shipments increased nearly 60% and exceeded 40 million units. | |||
| • | Ended the year with design wins from four of the top six mobile phone manufacturers. | |||
| • | Acquired CuTe Solutions Private Limited (CuTe), of India, with expertise in audio and digital media solutions. | |||
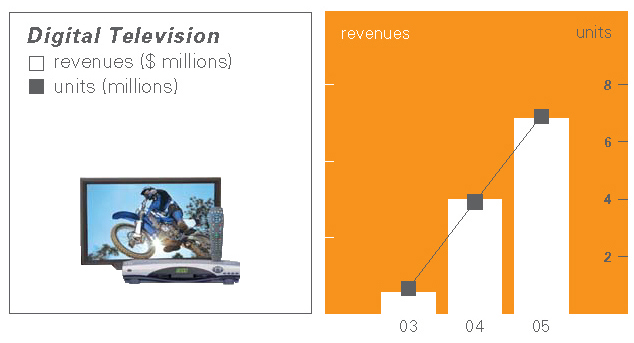 | • | Revenue was up 70% to nearly 5% of consolidated revenues. | ||
| • | Shipments increased 80% and approached seven million units. | |||
| • | Maintained strong market share and secured design wins with leading DTV manufacturers. | |||
| • | Acquired cable modem technology from Terayon Communication Systems Inc. (Terayon), extending ATI's leadership in DTV as the industry moves towards interactive digital cable ready (IDCR) technology. | |||
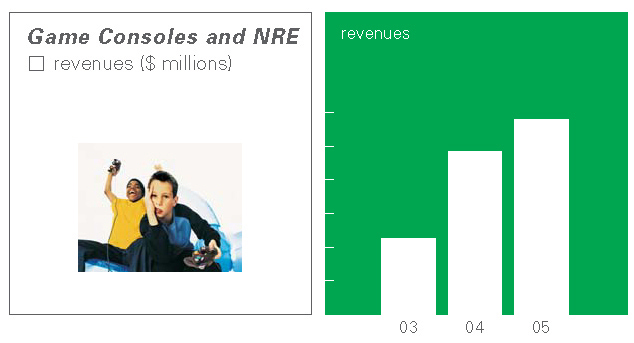 | • | Revenue from royalties and engineering revenues increased approximately $10 million and accounted for approximately 3% of consolidated revenues. | ||
| • | Introduced the GPU for the Microsoft Xbox 360 based on 90 nanometer process technology. | |||
| • | Continued development of graphics technology for Nintendo's next generation game console, Revolution, anticipated in 2006. |
ATI 2005 15
19 of 75
| 1999 | • K.Y. Ho, President & CEO, selected as one of the top 25 business leaders in the world byBusiness Week Magazine | • ATI announces RAGE Mobility M1 – the world’s first notebook PC graphics accelerator with 8MB of integrated memory |
MANAGEMENT’S DISCUSSION AND ANALYSIS(CONT.)
BUSINESS OUTLOOK FOR FISCAL 2006
The following contains forward-looking statements about ATI’s business outlook for fiscal 2006. Reference should be made to “About forward-looking statements” on page 8. For a description of material factors that could cause our actual results to differ materially from the forward-looking statements in the following, please see the Risks and Uncertainties section of this MD&A on page 30 and Item 3.12 “Narrative Description of the Business – Risks and Uncertainties” in our 2005 Annual Information Form.
PC
Our success in the PC segment in fiscal 2006 will depend on our ability to introduce and deliver new products in a timely fashion, improve operational efficiencies, manage the ongoing PCI Express and lead-free transitions, and transition to advanced process technologies. We are further working to ensure that we are well-positioned to capitalize on future industry inflection points, including the introduction of Microsoft’s next operating system, Windows Vista, expected by the industry to launch in calendar 2006.
Subsequent to our fiscal year-end, we launched a family of desktop discrete products based on 90 nanometer process technology that targets the enthusiast, performance and mainstream segments of the market. We also began volume shipments of Crossfire, our high-performance multi-GPU chipset platform. In the first half of fiscal 2006, we expect to introduce new 90 nanometer discrete products for the notebook market. One of our key priorities in the PC segment for the coming year is to successfully roll out these new products and reassert broad-based technology leadership in PC graphics.
We expect our sales from integrated chipsets in fiscal 2006 will continue to grow. We remain intently focused on increasing chipset gross margins through aggressive cost reductions including product and packaging redesign and manufacturing and yield improvements.
Consumer
Handheld, DTV and game console revenues are expected to remain key growth and profit drivers for ATI. We expect Consumer revenues in fiscal 2006 to increase both on an absolute basis and as a percentage of consolidated revenues.
Handheld revenue is expected to grow on increased sales of Imageon processors to meet the growing consumer demand for feature-rich multimedia mobile phones. According to Display Search, a market research firm, the mobile phone market is expected to grow from approximately 817.9 million units in calendar 2005 to 1,071.9 million units by 2008, with nearly 98% of mobile phones having color display.
We expect sales of our DTV products to increase in fiscal 2006 with the continued roll-out of digital television in the North American market. In addition, we are beginning to focus our development on products for the European and Asian markets to fuel future growth. According to Strategy Analytics, a market research firm, worldwide DTV shipments are predicted to be 73.7 million units in calendar 2005, climbing to an estimated 134.5 million units by 2008.
We expect a stronger contribution from our game console segment in fiscal 2006 due to the incremental royalties that are expected from sales of Microsoft’s Xbox 360. Nintendo’s Revolution console, the successor to the GameCube, will also contain our graphics technology and is widely expected by the industry to launch sometime in calendar 2006.
Consolidated
We continue to work aggressively to improve our operational capabilities and achieve a higher level of overall efficiency.
While we believe gross margins will remain under some pressure in the near-term due to the growing contribution from integrated chipsets, we expect gross margins to improve modestly as the year progresses. We also expect fiscal 2006 to yield both revenue and earnings growth relative to fiscal 2005.
16 ATI 2005
20 of 75
| 1999 | • ATI’s RAGE 128 first to break the 3DWinBench 99 700 barrier. Mercury Research report proves RAGE 128-based RAGE FURY 32MB board at 743 Winmarks, the fastest in the world | • ATI ships five million RAGE Mobility graphics chips. The family of products sets new industry record, shipping nearly one million 3D units per month |
| Quarterly Financial Data | |||||||||||||||||||||||||||||||||
| FINANCIAL RESULTS | |||||||||||||||||||||||||||||||||
| ANALYSIS | (Unaudited) (In thousands of U.S. dollars, except per share amounts) | ||||||||||||||||||||||||||||||||
| Fiscal 2005 | Fiscal 2004 | ||||||||||||||||||||||||||||||||
| Aug. 31 | May 31 | Feb. 28 | Nov. 30 | Aug. 31 | May 31 | Feb. 29 | Nov. 30 | ||||||||||||||||||||||||||
| 2005 | 2005 | 2005 | 2004 | 2004 | 2004 | 2004 | 2003 | ||||||||||||||||||||||||||
| Revenues | $ 470,227 | $ 530,235 | $ 608,188 | $ 613,859 | $ 572,218 | $ 491,457 | $ 463,337 | $ 469,705 | |||||||||||||||||||||||||
| Gross Margin(1) | 42,345 | 154,429 | 208,303 | 208,850 | 192,382 | 172,539 | 160,423 | 167,571 | |||||||||||||||||||||||||
| Operating Expenses | 159,085 | 157,057 | 141,867 | 131,099 | 119,958 | 112,355 | 103,561 | 107,310 | |||||||||||||||||||||||||
| Net Income (Loss) | (103,522) | (445) | 57,193 | 63,703 | 61,156 | 48,619 | 47,585 | 47,439 | |||||||||||||||||||||||||
| Net Income (Loss) | |||||||||||||||||||||||||||||||||
| per Share (Basic) | $(0.41) | $0.00 | $0.23 | $0.26 | $0.25 | $0.20 | $0.19 | $0.20 | |||||||||||||||||||||||||
| Net Income (Loss) | |||||||||||||||||||||||||||||||||
| per Share (Diluted) | $(0.41) | $0.00 | $0.22 | $0.25 | $0.24 | $0.19 | $0.19 | $0.19 | |||||||||||||||||||||||||
| (1)Gross margin for the fourth quarter of fiscal 2005 includes an inventory write-down of $67 million. | |||||||||||||||||||||||||||||||||
Fourth Quarter Performance
2005 versus 2004
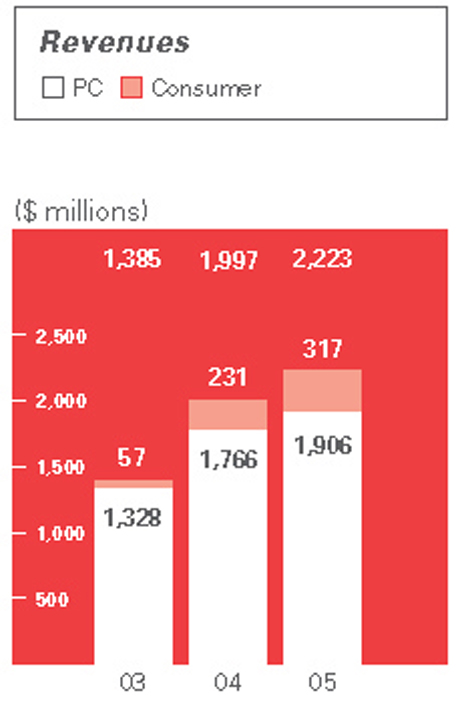
Revenues declined 18% to $470.2 million from $572.2 million in the same period last year. The PC segment accounted for 80% of total revenues in the fourth quarter with the Consumer segment accounting for the remaining 20%.
PC revenues for the quarter declined 22% to $376.9 million on a 4% increase in volumes. The primary reason for the decline was lower sales of performance and enthusiast desktop products in the Add-in-Board (AIB) and retail channels. The combination of lower volumes and reductions in average selling price (ASP) to stimulate demand led to the decline in revenues. In the first quarter of fiscal 2006, we launched a new family of desktop discrete products which we expect will improve our competitive position and performance in this segment. Revenue from notebook discrete products declined approximately 20% reflecting the market trend towards increased use of integrated chipsets.
The sales declines in discrete were partially offset by a significant increase in desktop chipset revenues, which were approximately seven times greater than in the same period in 2004. The increase was driven by OEM design wins and strong demand for the Radeon Xpress 200 product line for AMD and Intel platforms. Sales of notebook integrated chipsets were down slightly year over year.
Consumer revenue increased 6% to $93.3 million. Handheld unit shipments increased 30%, however, revenues only increased by 4% due to a higher concentration of sales to the mainstream market where ASPs are generally lower. Sales of DTV products rose 4% year over year on a unit increase of more than 20%. In DTV, growth was impacted by an expected decline in business from a set-top box customer and a slower-than-expected industry transition to digital. This transition is expected to accelerate in future quarters.
Gross margin fell to $42.3 million from $192.4 million in the same period last year. As a percentage of sales, gross margin fell to 9.0% from 33.6% . We recorded an inventory write-down of $67 million in the quarter largely related to performance and enthusiast level desktop discrete products. This write-down accounted for a majority of the gross margin decline in the quarter. Excluding the inventory write-down, gross margin fell to 23.3%, reflecting weaker product mix and more aggressive ASP reductions to stimulate AIB channel demand. In addition, sales of integrated chipsets, which currently have considerably lower margins than our other products, comprised almost 20% of revenues in the quarter as compared with 10% in the same period last year. Consumer product gross margins remained stable due to a continued focus on cost reduction strategies.
ATI 2005 17
21 of 75
| 1999 | • ATI becomes the first graphics company to ship a fully-enabled DVI chip, permitting direct connection to a digital flat panel monitor | • ATI tops US$1 billion mark in annual revenues |
One Billion
(US) annual revenue
MANAGEMENT’S DISCUSSION AND ANALYSIS(CONT.)
Selling and marketing, administrative, and research and development expenses rose 34%, 50% and 16%, respectively, from the same period one year ago. Operating expenses rose due to increased personnel, higher marketing and advertising costs, and increased development and prototyping costs related to new products, including a new family of discrete products based on 90 nanometer process technology.
Stock-based compensation expense was $11.2 million in the fourth quarter of fiscal 2005 as compared with $1.7 million for the same period last year. The increase was primarily related to ATI beginning the expensing of stock options in compliance with Canadian GAAP during the first quarter of fiscal 2005.
Net loss for the fourth quarter was $103.5 million ($0.41 per diluted share), as compared with net income of $61.2 million ($0.24 per diluted share) in the fourth quarter of 2004.
During the fourth quarter, we repurchased and cancelled two million common shares at a total cost of $23.9 million. Our cash position at August 31, 2005 was $586.6 million, up from $548.9 million last year.
Fiscal 2005
Comparison of Operating Results
The following table compares operating results for our three most recent fiscal years. Each line item is also expressed as a percentage of revenues.
| (Unaudited) (In thousands of U.S. dollars, except per share amounts) | |||||||||||||||||||
| 2005 | 2004 | 2003 | |||||||||||||||||
| REVENUES | $ 2,222,509 | 100.0% | $ 1,996,717 | 100.0% | $ 1,385,293 | 100.0% | |||||||||||||
| Cost of revenues | 1,608,582 | 72.4% | 1,303,802 | 65.3% | 956,116 | 69.0% | |||||||||||||
| GROSS MARGIN | 613,927 | 27.6% | 692,915 | 34.7% | 429,177 | 31.0% | |||||||||||||
| OPERATING EXPENSES | |||||||||||||||||||
| Selling and marketing | 146,352 | 6.6% | 117,597 | 5.9% | 92,810 | 6.7% | |||||||||||||
| Research and development | 327,017 | 14.7% | 265,491 | 13.3% | 212,976 | 15.4% | |||||||||||||
| Administrative | 61,808 | 2.8% | 46,702 | 2.3% | 39,413 | 2.8% | |||||||||||||
| Amortization of intangible assets | 8,919 | 0.4% | 6,115 | 0.3% | 10,767 | 0.8% | |||||||||||||
| Stock-based compensation | 42,504 | 1.9% | 7,583 | 0.4% | – | – | |||||||||||||
| Other charges (recoveries) | 2,508 | 0.1% | (304) | – | 28,724 | 2.1% | |||||||||||||
| 589,108 | 26.5% | 443,184 | 22.2% | 384,690 | 27.8% | ||||||||||||||
| INCOME FROM OPERATIONS | 24,819 | 1.1% | 249,731 | 12.5% | 44,487 | 3.2% | |||||||||||||
| Interest and other income, net | 14,935 | 0.7% | 2,950 | 0.2% | 4,382 | 0.3% | |||||||||||||
| Interest expense | (2,096) | (0.1%) | (2,058) | (0.1%) | (1,899) | (0.1%) | |||||||||||||
| INCOME BEFORE INCOME TAXES | 37,658 | 1.7% | 250,623 | 12.6% | 46,970 | 3.4% | |||||||||||||
| Income taxes | 20,729 | 0.9% | 45,824 | 2.3% | 11,741 | 0.9% | |||||||||||||
| NET INCOME | $ 16,929 | 0.8% | $ 204,799 | 10.3% | $ 35,229 | 2.5% | |||||||||||||
| NET INCOME PER SHARE | |||||||||||||||||||
| Basic | $0.07 | $0.84 | $0.15 | ||||||||||||||||
| Diluted | 0.07 | 0.80 | 0.14 | ||||||||||||||||
18 ATI 2005
22 of 75
| 2000 | • ATI becomes the worldwide leader in the supply of mobile graphics solutions, according to Mercury Research | • ATI completed the acquisition of ArtX, Inc. – a leading developer of high- performance graphics for both PCs and consumer appliances |
  | Revenues |
2005 versus 2004 | |
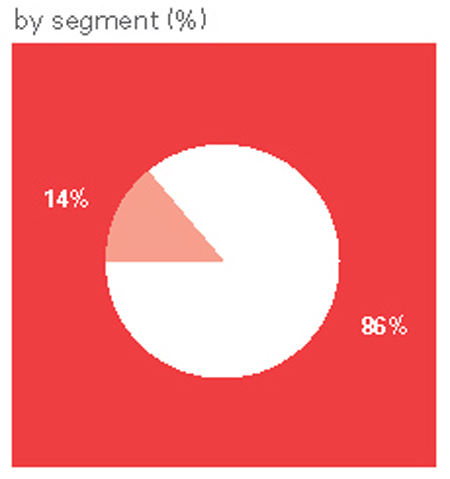
Revenues increased 11% to approximately $2.2 billion from approximately $2.0 billion in 2004. The revenue growth was a result of higher sales in the PC and Consumer segments. The PC segment accounted for 86% of consolidated revenues in fiscal 2005 with Consumer accounting for the remaining 14%. Annual shipments grew more than 30% on broad-based demand and approached 115 million units for the fiscal year. | |
In 2005, two customers accounted for 10.7% and 10.3%, respectively, of our consolidated revenues. In 2004, one customer accounted for 10.6% of total revenues. Our top ten customers accounted for 61.2% of revenues in 2005 compared with 61.9% in 2004. | |
PC | |
Desktop revenue, consisting of both discrete and integrated sales, increased more than 15% in fiscal 2005. While volumes grew more than 30%, a product mix shift towards lower-ASP mainstream and value parts in the second half of the year partially offset the dollar increase. | |
Desktop discrete revenue represented approximately half of our overall business in both 2005 and 2004. Strong sales growth in the first half of the year was partially offset by a decline in AIB and retail desktop discrete sales in the third and fourth quarters. Desktop integrated chipset revenue rose nearly 250% in 2005, making it our fastest-growing product line in 2005. Notebook revenue, consisting of both discrete and integrated sales, was essentially flat year over year. Notebook discrete sales, which accounted for more than three-quarters of total notebook revenues, rose approximately 10%. This was offset by a significant decline in notebook integrated sales. | |
Approximately 30% of consolidated revenues in 2005 were generated by sales from our notebook products, compared with approximately 35% in 2004. The decline in notebook revenue resulted from growth in desktop and consumer, as well as the notebook market’s continued transition towards integrated chipsets, where our market share is well below that of discrete. | |
Consumer | |
Consumer revenues, consisting predominantly of handheld and DTV product sales, as well as royalty income and non-recurring engineering revenues (“NRE”), rose about 37% in fiscal 2005. Handheld products represented nearly half of our Consumer revenues for 2005. While handheld unit shipments rose almost 60%, revenue increased almost 30% due primarily to product mix and more modest ASPs in the mainstream mobile phone segment where sales were concentrated. Increased sales of Imageon processors to OEM customers, primarily Motorola, accounted for the increase in handheld business. |
| DTV revenue rose 70% in fiscal 2005 on higher sales of Xilleon and Theater processors to leading DTV and set-top box manufacturers. While unit shipments increased approximately 80%, the increase in dollar terms was offset by lower blended ASPs. The royalty income we received from Nintendo for our graphics technology used in their GameCube products, which is accounted for at 100% gross margin, was flat relative to the prior year. NRE revenues associated with our development contracts with Microsoft and Nintendo rose approximately $10 million from 2004. On a combined basis, royalties and NRE continued to represent less than 3% of consolidated revenues in 2005. |
| 2004 versus 2003 |
| Our revenues for 2004 increased 44%, to approximately $2.0 billion, compared with approximately $1.4 billion in 2003. The revenue growth was a result of sales increases in all our main business lines. |
ATI 2005 19
23 of 75
| 2000 | • ATI launches Radeon: the world’s most powerful and feature-packed graphics processor. Radeon marks ATI’s entry and market leadership in the high-end gaming and 3D workstation segments | • ATI releases its integrated graphics chip, combining the northbridge chipset function on-chip and providing a low-cost yet full- featured graphics and video solution for OEMs | ||
MANAGEMENT’S DISCUSSION AND ANALYSIS(CONT.)
Desktop revenue increased by more than 30% as the number of units sold grew by nearly 50%. Desktop revenues represented a little less than half of our overall business in 2004, versus about 55% in 2003. Overall business grew due to a more competitive product stack, particularly in the mainstream and value segments of the desktop market, and greater penetration in the AIB channel.
Notebook revenue growth was driven by growth in the notebook market overall, as well as improvement in ATI’s notebook discrete market share. This was slightly offset by a decline in our share of the growing notebook integrated graphics market.
About 35% of consolidated revenues in 2004 were generated by our notebook products, compared with approximately 40% in 2003.
In 2004, about three-quarters of total notebook revenue was generated from discrete products while the remainder was integrated. Notebook revenue continued to grow rapidly in fiscal 2004. However, notebook’s share of ATI’s total revenue declined because of the extraordinarily high growth in Consumer revenue.
Approximately 12% of our consolidated 2004 revenues were generated by Consumer products. Our handheld products represented slightly more than one-half of Consumer revenue. DTV accounted for approximately one-quarter of Consumer revenue.
Royalties from our Nintendo business and NRE continued to represent less than 3% of consolidated revenues in 2004, and in absolute dollars more than doubled in 2004 relative to 2003.
In 2004, one customer accounted for 10.6% of total revenues. In 2003, three customers accounted for 16.2%, 13.0% and 10.6%, respectively, of total revenues. Our top 10 customers accounted for 61.9% of revenues in 2004 compared with 69.6% in 2003.
Gross Margin
2005 versus 2004
Gross margin for fiscal 2005 was $613.9 million or 27.6% of sales as compared with $692.9 million or 34.7% of sales in fiscal 2004. Strong gross margins in each of the first two quarters of fiscal 2005 were offset by a decline in PC margins in the second half of the year. During the third and fourth quarters, soft demand among AIB and retail customers for performance and enthusiast level desktop discrete products led to lower volumes, weaker product mix and lower ASPs, which impacted gross margin.
The decline in gross margins relative to last year is mostly attributable to the following factors:
- a net inventory write-down of $67.4 million in the fourth quarter;
- weaker product mix and demand-stimulating initiatives in the AIB and retail channels in the second half; and
- low gross margins on integrated chipsets.
Excluding the impact of the inventory write-down, gross margin for fiscal 2005 was 30.7% .
During fiscal 2005, our desktop chipset business experienced significant revenue growth but at low gross margins. A margin improvement program is in place to increase gross margins in our chipset business and to achieve long-term gross margins of 25% to 30% for this business. The program includes cost improvement initiatives, a focus on new product introductions, and achieving improved cost effectiveness through product design.
Gross margins in handheld and DTV remained strong in fiscal 2005, as cost reduction initiatives helped to offset the effect of normal ASP declines. Handheld gross margins remained level with the prior year while DTV margins increased modestly over 2004.
20 ATI 2005
24 of 75
| 2001 | • ATI unveils the Mobility Radeon chip for the notebook personal computer | • ATI acquires workstation graphics processor pioneer FireGL Graphics, formalizing its entry into the high- performance workstation graphics segment of the PC graphics industry | • ATI unveils new hybrid business model, whereby company permits OEMs and AIBs to use its patented chip technology in their products |
2004 versus 2003
Gross margin percentage for fiscal 2004 was 34.7% or 3.7% higher than the 31.0% achieved in fiscal 2003. Margin improvement was driven by increases in margin levels on PC products as well as by the greater share of revenues resulting from higher-margin consumer electronics products.
The increased competitiveness of our desktop products along with less aggressive ASP reductions drove the improvement in desktop discrete PC margins. As we continued to increase the share of revenues derived from the relatively higher margin Consumer business, the change in revenue mix also contributed to overall margin improvement. This increase was slightly offset by the decline in our PC discrete product margins in the fourth quarter due to the introduction of our PCI Express products.
Operating Expenses
2005 versus 2004
Operating expenses, including selling and marketing, R&D, and administrative expenses, and excluding stock-based compensation, amortization of intangible assets and other charges, increased $105.4 million or 24.5% as compared with fiscal 2004. The percentage growth in operating expenses exceeded percentage growth in revenues due primarily to a revenue shortfall in the second half of the year, as well as increased investments in R&D to develop our next-generation products and marketing efforts on design wins to support our future revenue growth.
Our Canadian overhead and staff costs were approximately Cdn. $260 million in fiscal 2005 compared to approximately Cdn. $220 million in fiscal 2004. The appreciation of the Canadian dollar relative to the U.S. dollar, from an average rate of 75 cents in fiscal 2004 to an average rate of 80 cents in fiscal 2005, had approximately $13 million in negative impact on 2005 operating expenses, as ATI reports and measures its results in U.S. dollars. Continuing strength in the Canadian dollar relative to the U.S. dollar will result in upward pressure on operating expenses in fiscal 2006.
During the third quarter of fiscal 2005, we purchased forward foreign exchange contracts (”Forwards”) to buy $94.5 million Canadian dollars over the next nine months at an average exchange rate of 1.2579. All of the Forwards have become favorable to us since their inception and had a fair value of $4.7 million at August 31, 2005.
In accordance with Canadian GAAP, beginning with the first quarter of fiscal 2005, ATI expensed compensation costs associated with stock options granted to employees after September 1, 2002. This expense item, along with the expense associated with restricted share units and deferred share units, is reflected in the expense for stock-based compensation included in the attached consolidated statements of operations and retained earnings. Prior to the first quarter of fiscal 2005, the expenses associated with restricted share units and deferred share units were reflected in selling and marketing, R&D and administrative expenses. These amounts have been reclassified for comparative purposes.
2004 versus 2003
Our overhead and staffing costs were approximately Cdn. $220 million in fiscal 2004 compared with approximately Cdn. $160 million in fiscal 2003. The rise in the value of the Canadian dollar relative to the U.S. dollar, from an average rate of 67 cents in fiscal 2003 to an average rate of 75 cents in fiscal 2004, had an approximate $18.0 million negative impact on our operating expenses in 2004.
ATI 2005 21
25 of 75
| 2001 | • ATI acquires HydraVision™ desktop management software application from Appian Graphics | • ATI unveils FireGL 8800 workstation graphics board, the first such product to evolve out of its acquisition of FireGL graphics |
MANAGEMENT’S DISCUSSION AND ANALYSIS (CONT.)
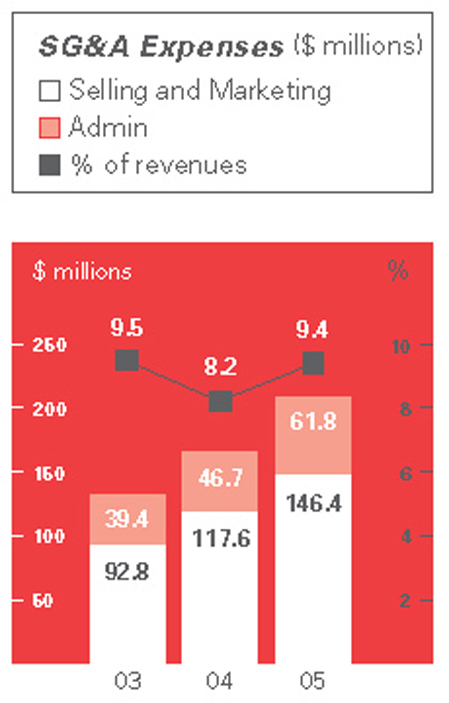 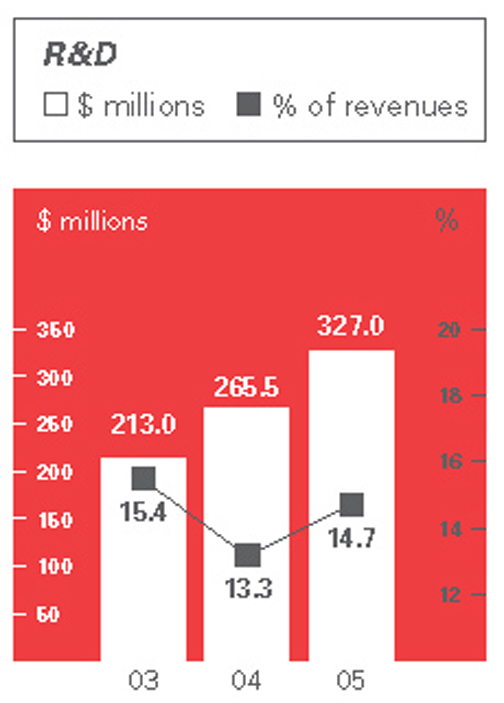 | Selling and Marketing Expenses 2005 versus 2004 Selling and marketing expenses consist primarily of salaries, commissions and bonuses, sales promotions and advertising, and travel and entertainment expenses related to product marketing, including trade shows and launch events. Selling and marketing expenses rose $28.8 million or 24.5% in fiscal 2005 due to additional personnel as well as advertising and other promotional expenses related to trade shows and product launches. Other marketing costs such as travel and customer samples contributed to the increase. As a percentage of revenues, our selling and marketing expenses rose to 6.6% from 5.9%. In 2005, we purchased certain assets of RT&C International (RT&C ), one of our third-party sales and distribution partners in South Korea, as well as the remaining assets of AMI Technologies Corp. (AMI), certain assets of which were acquired the previous year. As a result, our fixed selling costs increased in 2005 due to these acquisitions; however, the decrease in commissions paid more than offset the increase. These investments are expected to support further revenue growth in the Asia-Pacific region. 2004 versus 2003 Our selling and marketing expenses in 2004 rose $24.8 million or 26.7% to $117.6 million. As a percentage of revenues, our selling and marketing expenses declined to 5.9% from 6.7% in 2003. The largest contributor to the increase in selling and marketing expenses was staffing costs, including additional sales and marketing personnel in North America and in the Asia-Pacific region, and higher incentive-based compensation that resulted from higher sales. Increased advertising expenditures related to product launches, videogame developer programs and co-marketing programs with our OEM, AIB and retail partners also contributed to the year over year increase. Our purchase of certain assets of AMI, one of our third-party sales and distribution partners in Asia-Pacific, in early 2004 helped to reduce the growth in expenses associated with sales into this region in fiscal 2004. Although fixed selling costs increased in 2004 due to the acquisition, the decrease in commissions paid more than offset the increase. Research and Development (R&D) Expenses 2005 versus 2004 R&D expenses include engineering salaries, costs of development tools and software, component and board prototype costs, consulting fees, licensed technology fees and patent filing fees. R&D expenses increased by $61.5 million or 23.2% in fiscal 2005 primarily due to a $46.2 million increase related to additional personnel and a $21.4 million increase in development and engineering costs related to product tape-outs and prototype materials. R&D as a percentage of revenues was 14.7% and in line with our target range of 13%–15%. In 2005, we acquired CuTe, a company specializing in audio and digital media solutions located in India. We also acquired certain cable modem silicon intellectual property and hired certain employees of Terayon. While this has increased our expenses in the current year, it will allow us to support continued product and technology leadership. Investment in R&D is a key part of our strategy to maintain product and technology leadership. R&D is essential to our continued achievement of our strategic objectives of product and technology leadership, establishing a strong franchise in the integrated chipset market and securing market leadership in consumer digital electronics. Investment in R&D effectively drives ATI’s future revenue growth and we will continue to invest in R&D in support of these strategic objectives. |
22 ATI 2005
26 of 75
| 2001 | • ATI announces Mobility Radeon 7500, the most powerful, feature-rich mobile solution in the world for the notebook personal computer | • ATI introduces the All-in- Wonder Radeon 8500DV, the world’s most advanced multimedia graphics board | • ATI introduces Xilleon 220; the world’s most highly integrated system-on-chip for the digital set-top box market |
| 2004 versus 2003 R&D expenses increased by 24.7% to $265.5 million; however, they declined as a percentage of revenues to 13.3% from 15.4% in 2003. The dollar increase was related to increased staffing costs, particularly in our consumer products business to support our growing color mobile phone business. Other factors include the expansion of our software engineering competencies, as well as higher incentive-based compensation; increased investments in our desktop products business, including an additional $15.0 million in prototyping expenses; the impact of a stronger Canadian dollar; and higher licensing fees, which include increases in computer-aided design (CAD) tool expenditures to support the development of new products. Administrative Expenses 2005 versus 2004 Administrative expenses consist of salaries and expenses of the corporate infrastructure groups, including the operations, human resources, finance, legal and information technology functions. Most of our administrative expenditures are denominated in Canadian dollars. Administrative expenses increased $15.1 million or 32.3% to $61.8 million or 2.8% of revenues, primarily due to increased staffing and professional and consulting fees, including fees related to compliance with evolving regulatory requirements such as those imposed by theSarbanes-Oxley Act of 2002. 2004 versus 2003 Our administrative expenses increased 18.5% to $46.7 million in 2004. As a percentage of revenues, administrative expenses in 2004 declined to 2.3% from 2.8% in 2003. The increase in administrative expenses in 2004 was primarily a result of increased staffing to support our growing business, higher incentive-based compensation, and the stronger Canadian dollar. Stock-based Compensation In accordance with Canadian GAAP, beginning with the first quarter of fiscal 2005, we began expensing compensation costs associated with stock options granted to employees after September 1, 2002. This expense item, along with the expense associated with restricted share units and deferred share units, is reflected in the expense for stock-based compensation in the attached consolidated statements of operations and retained earnings. Prior to fiscal 2005, the expense associated with restricted share units and deferred share units were reflected in the selling and marketing, R&D and administrative expenses. These amounts have been reclassified for comparative purposes. Stock options, restricted share units and deferred share units comprise all stock-based compensation currently awarded by ATI to our employees and directors. Stock-based compensation costs were $42.5 million in 2005 as compared with $7.6 million last year. The increase in stock-based compensation was primarily related to ATI commencing the expensing of stock options in compliance with Canadian GAAP during the first quarter of fiscal 2005. The $42.5 million expense in fiscal 2005 included $34.0 million for compensation costs associated with stock options and $8.5 million for compensation costs associated with restricted share units and deferred share units. Amortization of Intangible Assets 2005 versus 2004 Our total amortization expense increased from $6.1 million to $8.9 million in 2005. The increase is primarily due to incremental amortization related to the core technology and other intangibles assumed as a result of the acquisition of CuTe and the acquisition of certain assets of Terayon, RT&C and AMI. |
ATI 2005 23
27 of 75
| 2001 | • ATI introduces Radeon 7000 and 7200 boards – the latest additions to the most powerful, innovative graphics family in the world | • ATI unveils Mobility™ FireGL 7800 – the world’s fastest and most powerful mobile workstation GPU designed for 3D animation and CAD/CAM | • ATI unveils FireGL 8700 workstation graphics board, a new entry-level offering for the digital content creation, 3D animation and MCAD workstation customer |
MANAGEMENT’S DISCUSSION AND ANALYSIS(CONT.)
| 2004 versus 2003 Our total amortization expense declined by $4.7 million, or 43.2%, to $6.1 million in 2004. The decrease was primarily the result of the completion of the amortization of intangibles related to the acquisition of NxtWave Communications Inc. Other Charges 2005 versus 2004 On March 29, 2005, a panel of the Ontario Securities Commission (“OSC”) approved a settlement agreement reached between Staff of the OSC and us. As part of the settlement, we agreed to pay a total of Cdn. $900,000 in costs and settlement payments. The balance of other charges relate to legal fees incurred in respect of the investigation and OSC proceedings. Seenote 16to the consolidated financial statements. 2004 versus 2003 We recorded a recovery of $0.3 million in respect of other charges in 2004. The amount resulted from recoveries in excess of the estimated amount from the restructuring of our European operations and the reversal of a lease exit charge incurred in 2003, less a charge to address issues related to an investigation by the OSC. Seenote 16to the consolidated financial statements. Interest and Other Income, Net (Unaudited) (In thousands of U.S. dollars) |
| 2005 | 2004 | 2003 | ||
|---|---|---|---|---|
| Interest income on cash and short-term investments | $ 14,330 | $ 4,352 | $ 2,802 | |
| Gain (loss) on investments | (1,580) | (1,307) | 3,876 | |
| Gain on foreign exchange | 1,174 | 540 | 819 | |
| Loss on disposal of fixed assets | (25) | (3,087) | (3,932) | |
| Insurance claim on Taiwan earthquake | -- | 578 | -- | |
| Other income | 1,036 | 1,874 | 817 | |
| Interest and other income, net | $ 14,935 | $ 2,950 | $ 4,382 | |
Interest Expense 2005 versus 2004 Interest expense remained flat year over year at $2.1 million. Our interest expense relates primarily to our capital lease obligation and mortgage for a building facility located in Markham, Ontario, a joint venture in which we hold a 50.0% interest. 2004 versus 2003 Our interest expense increased to $2.1 million in 2004 from $1.9 million in the prior year mostly as a result of the foreign exchange impact of the rise of the Canadian dollar versus the U.S. dollar. |
24 ATI 2005
28 of 75
| 2001 | • ATI unveils its technology for the Nintendo GameCube at the Electronic Entertainment Expo (E3), officially marking its entry into the game console market |
Income Taxes 2005 versus 2004 versus 2003 (Unaudited) (In thousands of U.S. dollars) |
| 2005 | 2004 | 2003 | ||
|---|---|---|---|---|
| Operating income tax expense | $ 29,715 | $ 46,393 | $ 15,570 | |
| Stock-based compensation | (3,360) | -- | -- | |
| Recovery of future tax liability related to intangible assets (other than goodwill) | (312) | (532) | (1,679) | |
| Income tax recovery related to inventory write-down and other charges | (5,314) | (37) | (2,150) | |
| $ 20,729 | $ 45,824 | $ 11,741 | ||
Income tax expense declined to $20.7 million due to our lower net income in 2005. Income tax expense increased to $45.8 million in 2004 from $11.7 million in 2003 due to our higher net income in 2004 as compared with 2003. ATI’s operating tax rate, which excludes the impact of the amortization of intangible assets related to acquisitions, inventory write-down and other charges and stock-based compensation costs was 18.0% in 2005, 18.0% in 2004, and 18.9% in 2003. ATI’s tax rate is affected by the amount of net income earned in its various operating jurisdictions. Seenote 13to the consolidated financial statements. Net Income 2005 versus 2004 Net income in 2005 declined to $16.9 million from $204.8 million in 2004. The decrease in net income was the result of a 7.1% decrease in gross margins and the increase in operating expenses outlined in earlier sections of this MD&A. Diluted earnings per share fell to $0.07 from $0.80 in fiscal 2004. 2004 versus 2003 Net income in 2004 was $204.8 million, an increase of $169.6 million from $35.2 million in 2003. The increase in net income was a result of the significant increase in revenues and continuing strong margins throughout 2004. |
ATI 2005 25
29 of 75
| 2002 | • ATI elevated to permanent membership in OpenGL standards board | • ATI unveils Radeon 8500 Mac Edition and Radeon 7000 Mac Edition dual display PCI graphics card | • ATI enters wireless market with Imageon 100, the most advanced display co-processor for PDAs and smart phones |
MANAGEMENT’S DISCUSSION AND ANALYSIS (CONT.)
| LIQUIDITY AND CAPITAL RESOURCES | This section explains how we manage our cash and capital resources to carry out our strategy and deliver financial results. Cash Position The table below summarizes our cash inflows and outflows for each of the past three years: (Unaudited) (In thousands of U.S. dollars) |
| 2005 | 2004 | 2003 | ||
|---|---|---|---|---|
| Net income | $ 16,929 | $ 204,799 | $ 35,229 | |
| Non-cash add backs | 35,411 | 23,367 | 12,883 | |
| Working capital changes | 50,298 | (43,215) | 57,337 | |
| Issue of common shares | 30,170 | 56,531 | 20,977 | |
| Repurchase of common shares (net of proceeds from sale of ordinary shares) | (23,847) | (22,100) | -- | |
| Bank indebtedness | -- | -- | (12,015) | |
| Net movement in long-term debt | (1,663) | (1,442) | 9,645 | |
| Net purchases of capital assets | (48,831) | (18,182) | (16,390) | |
| Net proceeds from investments, net of purchases | 880 | (98) | 7,569 | |
| Net purchases of short-term investments | (174,062) | (139,524) | (135) | |
| Acquisitions | (22,057) | (2,071) | -- | |
| Other | -- | -- | (1,140) | |
| (136,772) | 58,065 | 113,960 | ||
| Foreign exchange gain (loss) | 441 | 638 | (181) | |
| Net increase (decrease) in cash and cash equivalents | $ (136,331) | $ 58,703 | $ 113,779 | |
| Cash, cash equivalents and short-term investments | $ 586,647 | $ 548,916 | $ 350,689 | |
| | ||||
| | ||||
| | 2005 versus 2004 Our cash position (cash, cash equivalents and short-term investments) at August 31, 2005 increased 7% to $586.6 million from $548.9 million at fiscal 2004 year-end. Our cash position increased mainly as a result of cash flow from operations in the fiscal year. During the year, $23.9 million was spent on the repurchase of two million common shares under a normal course issuer bid. We have access to $21.0 million in credit facilities at August 31, 2005 compared to $43.0 million at August 31, 2004. With our large cash position we took action to reduce our credit facilities during the year and correspondingly reduce costs. There are no amounts outstanding on these facilities as of the date of this MD&A. 2004 versus 2003 Our cash position (cash, cash equivalents and short-term investments) increased 56.5% to $548.9 million in 2004 as a result of increased cash flow from operations throughout the fiscal year. We had access to $43.0 million in credit facilities at August 31, 2004 compared to $25.4 million at August 31, 2003. |
26 ATI 2005
30 of 75
| 2002 | • With ATI’s Remote Wonder™, users can take control of their computer. New remote enables multimedia access from anywhere in your room, house, stage or classroom | • ATI launches System Integrator Partner Program in North America | • ATI acquires NxtWave Communications giving ATI the set-top box technology to provide complete solutions for customers |
Commitments As at August 31, 2005, we were committed to the following minimum payments related to office premises, license and royalty agreements, building under capital lease payments, mortgage payments and non-cancellable inventory purchases: |
| (Unaudited) (In thousands of U.S. dollars) | Total | 2006 | 2007 | 2008 | 2009 | 2010 | Thereafter |
| Commitments related to office premises, license and royalty agreements | $ 87,903 | $ 26,941 | $ 20,937 | $ 16,593 | $ 8,875 | $ 6,946 | $ 7,611 |
| Commitment related to capital lease | 27,285 | 2,078 | 2,164 | 2,285 | 2,285 | 2,285 | 16,188 |
| Commitment related to mortgage | 16,086 | 1,739 | 1,739 | 1,739 | 1,739 | 1,739 | 7,391 |
| Commitment related to non-cancellable inventory purchase | 223,600 | 223,600 | -- | -- | -- | -- | -- |
| Total commitments | $ 354,874 | $ 254,358 | $ 24,840 | $ 20,617 | $ 12,899 | $ 10,970 | $ 31,190 |
We believe that cash flows from operating activities, together with our cash position and borrowings available under our credit facilities, will be sufficient to fund currently anticipated working capital, planned operating and capital expenditures and debt service requirements, during fiscal 2006. Normal Course Issuer Bid Under the terms of a normal course issuer bid announced on March 24, 2005, we may purchase up to 24.7 million common shares, representing approximately 10% of our “public float” as of March 17, 2005. Purchases will be made on the open market by us through the facilities of the TSX or the NASDAQ Stock Market Inc. (“NASDAQ”). The prices we will pay for any purchased common shares will be the market price of such shares on the TSX or NASDAQ, as the case may be, at the time of acquisition. We will make no purchases of common shares other than open-market purchases. In fiscal 2005, a total of two million common shares were repurchased for a total consideration of $23.9 million for cancellation under the terms of the normal course issuer bid. In fiscal 2006, we repurchased 408,100 common shares for a total consideration of $5.69 million for cancellation. The normal course issuer bid will terminate on March 29, 2006 or on such earlier date as we complete our purchases under the terms of the normal course issuer bid. We will cancel any common shares repurchased under this normal course issuer bid. Operating Activities – Working Capital 2005 versus 2004 Accounts Receivable Our accounts receivable increased by 5.6% to $386.3 million at August 31, 2005 compared to the prior year-end, due to the timing of sales during the fourth quarter. Our accounts receivable are within our target range for current sales levels. At August 31, 2005, 93.9% of accounts receivable were less than 60 days outstanding, compared with 94.8% at August 31, 2004. Days’ sales in accounts receivable increased to 65 days in 2005 compared to 50 days in 2004. The increase is attributable to the higher proportion of shipments within the last month of the fiscal year as well as the timing of revenues relating to certain engineering services. At August 31, 2005, one of our customers accounted for 12% of our accounts receivable balance. At August 31, 2004, none of our customers accounted for 10% or more of our accounts receivable balance. Inventories Inventory at August 31, 2005 increased 36.6% to $348.2 million from $254.9 million in fiscal 2004. Our inventory position at fiscal year-end includes the impact of an inventory write-down of $67.4 million in the fourth quarter of fiscal 2005 consisting predominantly of mid- to high-end PCI Express and AGP desktop discrete products. Following the inventory write-down, days of inventory on hand at the end of fiscal 2005 were 85 as compared with our long-term target of 70 days. |
ATI 2005 27
31 of 75
| 2002 | • ATI and Massive render The Lord of the Rings: The Fellowship of the Ring™ in real time in Linux® at SIGGRAPH 2002 | • ATI’s new FireGL X1 powers DCC and CAD workstations into new era of content creation. ATI has the world’s most advanced workstation graphics board with OpenGL®, Microsoft® DirectX® 9.0 and Linux® in one graphics solution |
MANAGEMENT’S DISCUSSION AND ANALYSIS(CONT.)
| Accounts Payable and Accrued Liabilities Accounts payable increased 32.1% to $362.9 million in 2005 from $274.8 million in 2004 as a result of increased inventory purchases required to support our sales increase. Accounts payable are within our target range for current sales levels. Accrued liabilities increased 37.5% to $302.0 million in 2005 from $219.6 million in 2004. The increase is largely a result of the timing of payments related to sales rebates and price protection which are directly related to sales levels. Deferred Revenue Deferred revenue declined 15.6% to $24.6 million from $29.1 million in 2004. The higher balance in 2004 was a result of the timing of cash received from customers in advance of meeting our applicable revenue recognition criteria. Deferred revenue primarily relates to payments associated with development contracts where revenue is recognized on a percentage of completion basis. Seenote 1(j)to the consolidated financial statements. Financing Activities 2005 versus 2004 We generated cash from common shares issued from the exercise of stock options totaling $30.2 million in 2005 compared to $56.5 million in 2004. In fiscal 2005, we re-purchased two million common shares at a total cost of $23.9 million for cancellation under a normal course issuer bid. 2004 versus 2003 We generated cash from common shares issued from the exercise of stock options totaling $56.5 million in 2004 compared to $21.0 million in 2003. In 2004, approximately 1.5 million shares of the Company were acquired for the amount of $22.1 million to satisfy employee incentive obligations. Seenote 12(d)to the consolidated financial statements. Investing Activities 2005 versus 2004 Capital Assets Capital expenditures net of proceeds on disposals increased 168.6% to $48.8 million in 2005 from $18.2 million in 2004. The increase was driven by an investment in land and building of $7.3 million and laboratory, computer equipment and software purchases of $32.3 million (2004 –$16.9 million). Please refer tonotes 1(e), 1(h),and5to the consolidated financial statements. Short-term Investments Please refer tonotes 1(c)and3to the consolidated financial statements. Long-term Investments 2005 versus 2004 From time to time, we make equity investments in other companies, generally in conjunction with a technology relationship. We made no such equity investment in fiscal 2005. During the year, we fully wrote down the book value of a long-term investment in a private company and realized a loss of $2.5 million. |
28 ATI 2005
32 of 75
| 2002 | • ATI launches Radeon 9700. Radeon 9700 delivers double the performance of any graphics product currently on the market | • ATI unleashes two more revolutionary family members of Radeon visual processors, Radeon 9000 and Radeon 9000 PRO, delivering high-end graphics to the mainstream for the first time | • ATI introduces Mobility Radeon 9000, the world’s first mobile graphics solution with programmable pixel shaders delivering stunning 3D performance and impeccable photo-realism |
In 2004, we invested $0.1 million in these types of investments, compared with $2.5 million in 2003. Acquisitions Our growth strategy is based on internal expansion and strategic acquisitions of companies, technologies or other key assets where they will enhance our competitive position. In 2005, we acquired CuTe, a company specializing in audio and digital media solutions located in India, for $4.1 million. We also acquired certain assets from Terayon, RT&C and AMI for a combined cash consideration of $17.5 million net of contingent payments still outstanding. In 2004, we acquired certain assets of AMI for cash consideration of $3.1 million of which $1.0 million was paid in 2005. Outstanding Shares As at November 1, 2005, there were 251,492,202 common shares of ATI outstanding. Seenotes 12(a)and14to the consolidated financial statements. Claims and Proceedings Ontario Securities Commission Hearing On December 16, 2002, we disclosed that staff of the OSC had raised concerns regarding the timeliness of our announcement on May 24, 2000 of a shortfall in our revenues and earnings for the third quarter of our 2000 fiscal year. We also reported that we were aware that OSC staff had raised concerns about trading that took place prior to the announcement by certain of our insiders and others, including certain directors and officers. On January 16, 2003, OSC staff filed a notice of hearing and statement of allegations in relation to us and others. The notice alleged that we failed to disclose information concerning the shortfall in revenues and earnings that occurred in the third quarter of fiscal 2000, as required by the listing rules of the TSX. The notice also alleged that we made a misleading statement to OSC staff in August 2000 regarding the events leading up to the disclosure on May 24, 2000 of the shortfall. Seven individuals were named in the notice. The notice alleged that six of these individuals, including K.Y. Ho, Chairman and then Chief Executive Officer of ATI, engaged in insider trading contrary to the Securities Act (Ontario). On March 29, 2005, a panel of the OSC approved a settlement agreement reached between us and OSC staff. As part of the settlement, we agreed to pay Cdn. $900,000 in costs and settlement payments and agreed to provide a letter of comfort confirming our practices and procedures related to trading and corporate governance. The individuals named in the notice, other than Mr. Ho and his wife, also entered into settlement agreements with the OSC. In October 2005, a panel of three commissioners of the OSC (including the Vice-Chair of the OSC) dismissed all allegations of insider trading against K.Y. Ho and his wife. The panel’s decision completely exonerated Mr. Ho and his wife. The decision was made following a hearing which was held by the OSC panel in the spring of 2005. American Video Graphics LLP American Video Graphics LLP filed a series of suits in the Eastern District of Texas alleging infringement of several patents against various PC manufacturers, game console manufacturers and videogame publishers. After some reconfiguration of the suits, there are a total of six suits pending. Of these six suits, there are two suits pending against the entire group of PC manufacturers and two suits pending against the entire group of game console manufacturers. We voluntarily intervened in these four suits. We have participated in two distinct court ordered mediations for these matters. Neither mediation resulted in settlement. The first trial involving the PC manufacturers is currently scheduled for September 2006 and the first trial involving the game console manufacturers is scheduled for December 2006. |
ATI 2005 29
33 of 75
| 2002 | • ATI’s Radeon 9700 PRO graphics board based on newly introduced GPU architecture delivers double the performance of any graphics card available • ATI demonstrates world’s first graphics cards powered by DDR-2 technology | • ATI Mobility FireGL 9000 visual processor for mobile workstations becomes the world’s most powerful anytime, anywhere mobile workstation graphics accelerator driving DCC and CAD/CAM forward a generation | • ATI’S Radeon 9700 PRO winsPC Magazine2002 Award for Technical Excellence. The world’s fastest, most complex graphics architecture nominated and awarded in components category |
MANAGEMENT’S DISCUSSION AND ANALYSIS(CONT.)
| U.S. Securities Class Action Lawsuits In August and September 2005, five class action lawsuits were filed in the United States District Court for the Eastern District of Pennsylvania against us and certain of our directors and officers on behalf of shareholders who purchased our common shares between October 7, 2004 and on or about June 23, 2005. The claims allege that we and certain of our directors and officers violated U.S. securities laws by failing to disclose material facts and making statements that contained misrepresentations about our business and future outlook. It is alleged that as a result of the failure to disclose material facts and the alleged misrepresentations, our stock traded at artificially inflated prices until the stock price dropped on the news of our third quarter results in June 2005. The claims further allege that while in possession of material undisclosed information, certain directors and officers sold a portion of their common shares at inflated prices. These claims are at a very preliminary stage. U.S. Shareholder Complaint In August 2005, a shareholder complaint was filed in the Superior Court of the State of California for the County of Santa Clara by a shareholder on behalf of the Company. The defendants to the complaint include us, members of the board of directors and certain officers. The complaint alleges breach of California Law, including breaches of fiduciary duties, abuse of control, gross mismanagement, waste of corporate assets, unjust enrichment and violation of the California Corporations Code during the period between October 2004 and August 26, 2005. We have been served with the complaint. This complaint is at a very preliminary stage. We currently believe the amount of ultimate liability, if any, with respect to these legal proceedings, including the class action lawsuits and the shareholder complaint, will not materially affect our financial position, results of operations, or liquidity. We and the named directors and officers intend to defend ourselves vigorously. However, the ultimate outcome of any litigation is uncertain and should any of these actions or proceedings against us be successful, we may be subject to significant damages awards, which could have a material adverse effect on our financial condition. |
| RISKS AND UNCERTAINTIES | Our operating results have been and will continue to be subject to quarterly and other fluctuations due to changing market and economic conditions and various other factors set out below. As a result, our revenues can fluctuate from quarter to quarter, and, within a quarter, revenues may vary from month to month. In addition, because our operating expenses are largely independent of revenues in any particular period, we may be unable to rapidly adjust our spending to compensate for an unexpected revenue shortfall, which could harm quarterly operating results. As a result, it is difficult to accurately predict revenues and profits or losses. Our reported operating results may vary from prior periods or may be adversely impacted in periods when we are undergoing a product line transition during which sales of new products may be ramped up to replace sales of our older products. These older products often come under significant pricing and margin pressure as a result of competitors’ actions in the marketplace. Product transitions expose us to inventory risk and potential inventory write-downs. In addition, newer products may be more costly to produce in the early stages of their introduction, which may adversely affect margins and our results of operations. Should our products not offer the features and performance required by our customers or fail to achieve meaningful market share, our operating results will be negatively impacted. Our ability to continue to sell and develop our products is dependent upon our ability to obtain licenses to industry technology or other intellectual property rights, which may not be readily available or available on commercially reasonable terms. As a result of any combination of these or other issues referred to below, our operating results and common share price may be subject to a significant level of volatility, particularly on a quarterly basis. |
30 ATI 2005
34 of 75
| 2003 | • ATI launches the most comprehensive and feature-rich product lineup in graphics history with Radeon 9800, Radeon 9600 & Radeon 9200 | • ATI announces the Mobility Radeon 9600 family of mobile visual processors | • ATI Technologies Inc. introduces high-end FireGL X2-256 and the entry-level FireGL T2-128, now offering a complete top-to-bottom line of workstation graphics accelerators | • ATI announces that Valve, a leading game developer, has named ATI as the preferred graphics card partner for its upcoming game Half-Life 2 |
Factors that have affected our operating results in the past or could affect them in the future include, among other things:
|
ATI 2005 31
35 of 75
| 2003 | • ATI announces agreements with Microsoft and Nintendo to develop graphics solutions for future game consoles | • ATI extends its global reach with the acquisition of AMI Technologies, its distributor in the Asia-Pacific region | • ATI is added to the NASDAQ-100 Index® |
MANAGEMENT’S DISCUSSION AND ANALYSIS(CONT.)
| As a result of the factors listed above, period-to-period comparisons of our operating results should not be relied upon as an indication of future performance. The results of any quarterly period are not indicative of results to be expected for a full fiscal year. Accordingly, our operating results may be below the expectations of securities analysts and investors. Our failure to meet these expectations could adversely affect the market price of our common shares. For a more complete discussion of general risks and uncertainties which apply to our business and our operating results, please see Item 3.12 “Narrative Description of the Business – Risks and Uncertainties” in our Annual Information Form, and our other filings with Canadian and U.S. securities regulatory authorities. For a description of certain legal proceedings affecting our business, please seenotes 16and22to the consolidated financial statements. |
| OUR CRITICAL ACCOUNTING POLICIES | We prepare our consolidated financial statements using Canadian GAAP and have provided a reconciliation of our financial statements to U.S. GAAP in note 21 to the consolidated financial statements. Significant accounting policies and methods used in preparation of our consolidated financial statements are described in note 1 to the consolidated financial statements. Under Canadian GAAP, we are required to make estimates and assumptions when we account for and report assets, liabilities, revenue and expenses and disclose contingent assets and liabilities in our financial statements. We are also required to constantly evaluate the estimates and assumptions we use. We base our estimates and assumptions on historical experience and other factors that we believe are reasonable in the circumstances. Because our estimates and assumptions involve judgment and varying degrees of uncertainty, actual results could materially differ from our estimates and assumptions. We make significant estimates when determining provisions for sales returns and allowances, our allowance for doubtful accounts, our provision for inventory obsolescence, the fair value of reporting units for goodwill impairment testing, the valuation of long-lived assets, our worldwide income tax provision, the realization of future tax assets and hedging relationships. We believe the following are the most critical accounting policies we follow as they rely heavily on our judgment and estimates: Revenue Recognition We recognize revenue when evidence of an arrangement exists, risks and rewards of ownership have been transferred to customers, selling price is fixed and determinable, and collectibility is reasonably assured. Sales made to distributors and retailers under agreements allowing for price protection and/or rights of return are recognized at the time of sale to these customers. Estimated returns and allowances, price protection and sales rebates are recorded as a reduction of revenue at the time of revenue recognition. Estimates are based on historical experience, planned customer incentive programs and other relevant factors. If estimates of future market conditions and changing product life cycles in the marketplace are inaccurate, it may be necessary to increase customer incentive offerings, which could necessitate a further reduction of revenue. Such increases are recorded as a reduction of revenue at the time the program is introduced or enhanced. We also provide for the estimated cost of product warranties at the time of revenue recognition. We primarily use a binding purchase order as evidence of its sales arrangements and, in certain cases, use contractual agreements. We consider delivery to occur upon shipment, provided risk and rewards of ownership, including transfer of title, have passed to the customer. At the point of sale, we assess whether collection is reasonably assured. If we determine that collection is not reasonably assured, we defer recognition of the revenue until collection becomes reasonably assured, which is generally upon the receipt of cash. |
32 ATI 2005
36 of 75
| 2004 | • ATI announces the first 3D gaming chip for mobile phones. The Imageon 2300 enables game developers to create visually rich gaming experiences for mobile phones | • ATI leads the PCI-Express transition with the first native products for desk- top, notebook and workstation platforms based on the new PC architecture | • ATI ships more than 5 million chips for high- definition digital televisions and set-top boxes in the year | • ATI tops US$2 billion in annual revenues |
| Two Billion | |||
| (US) annual revenue |
We follow the percentage-of-completion method of accounting for contracts requiring us to develop customized technology to meet a customer’s specifications. Under such contracts, revenue is recognized based on the ratio of total costs incurred to date to overall estimated costs. Provisions for estimated losses on contracts are recognized when identified.
Where estimating the final outcome of a project is impractical, except to ensure that no loss will be incurred, we use a zero estimate of profit until results can be estimated more precisely. Under this method, the portion of total contract revenue earned to date is determined by measuring total cost incurred. We then record an equal amount of revenue against costs. Cost of revenue is adjusted to recognize the profit element from the arrangement once we are able to estimate total revenue and total costs.
Cash received from customers in advance of meeting our applicable revenue recognition criteria is recorded as deferred revenue.
Accounts Receivable
We maintain an allowance for doubtful accounts receivable for estimated losses resulting from the inability of our customers to make required payments. Management determines this allowance, which consists of an amount identified for specific customer issues. Our overall estimated exposure excludes significant amounts that are covered by credit insurance and letters of credit. If the financial condition of our customers, the financial institutions providing letters of credit, or our credit insurance carrier were to deteriorate, resulting in an impairment of their ability to make payments, additional allowances may be required that could adversely affect our operating results. Furthermore, there can be no assurance that we will be able to obtain credit insurance in the future.
Inventory Valuation
We record raw materials at the lower of cost and replacement cost. Finished goods and work in process are stated at the lower of cost and net realizable value. Cost is determined on a first-in, first-out basis. We write down our inventory for estimated obsolescence, and excess inventories based upon assumptions about future demand and market conditions. The business environment in which we operate is subject to rapid change in technology and customer demand. If actual market conditions are less favorable than those estimated or if our future product purchase commitments to our suppliers exceed our forecasted future demand for such products, additional material inventory write-downs may be required.
Goodwill
We perform our annual goodwill impairment test in the fourth quarter of each year, and more frequently if events or changes in circumstances indicate that an impairment loss may have been incurred. We test for impairment at the reporting unit level by comparing the reporting unit’s carrying value with its fair value. The fair values of the reporting units are estimated using a discounted cash flow approach. The process we follow when determining a reporting unit’s fair value is subjective and requires judgment in making assumptions about future results, including revenue and cash flow projections at the reporting unit level, and discount rates. Future goodwill impairment tests may result in material impairment charges.
Valuation of Long-lived Assets
We review long-lived assets, such as property and equipment and intangible assets subject to amortization, whenever events or changes in circumstances indicate that the carrying amount of such assets may not be recoverable. We utilize a two-step approach to testing long-lived assets for impairment. The first step tests for possible impairment indicators. If an impairment indicator is present, the second step measures whether the asset is recoverable based on a comparison of the carrying amount of the asset to the estimated undiscounted future cash flows expected to be generated by the asset. If the carrying amount of an asset exceeds its estimated future cash flows, an impairment charge is recognized by the amount by which the carrying amount of an asset exceeds the fair value of the asset. Our review requires the use of judgment and estimates. No such impairment charges have occurred to date. However, future events or circumstances may result in a charge to earnings if we determine that the carrying value of a long-lived asset is not recoverable.
ATI 2005 33
37 of 75
| 2005 | • ATI acquires key assets from Terayon Communication Systems Inc., adding interactive digital cable modem technology to its DTV portfolio | • ATI broadens its expertise in audio and digital media with the acquisition of CuTe Solutions Private Limited. The company also becomes the cornerstone of ATI’s new R&D centre in India | • ATI introduces the GPU for the Microsoft Xbox 360, featuring revolutionary technologies and ushering in the era of high-definition gaming |
MANAGEMENT’S DISCUSSION AND ANALYSIS(CONT.)
Income Taxes
Our worldwide income tax provision is impacted by the amount of net income earned in each taxing jurisdiction and the rate of tax payable in respect of that income. In the ordinary course of our global business, there are many transactions and calculations where the ultimate tax outcome is uncertain. The final tax outcome of these matters may be different than the estimates we have made in determining our income tax provisions and accruals. If our estimates and assumptions are determined to be inaccurate there could be a material effect on our income tax provision and net income in the period in which the determination is made.
We record a valuation allowance to reduce our future tax assets to the amount of future tax benefit that is more likely than not to be realized. We consider future taxable income in our operating jurisdictions and ongoing prudent and feasible tax planning strategies in determining the need for the valuation allowance. If we were to determine that we could realize our future tax assets in excess of their recorded amounts we would record an adjustment to the future tax asset and increase income in the period the determination is made. Alternatively, if we were to determine that we could not realize all or parts of our future tax assets, we may record a material charge to income in the period the determination is made.
Hedging Relationships
We engaged in activities to purchase certain derivative financial instruments, principally forward foreign exchange contracts, to manage foreign currency exposure. ATI’s policy is not to utilize derivative financial instruments for trading or speculative purposes.
We formally document all relationships between hedging instruments and hedged items, as well as the risk management objective and strategy for undertaking various hedge transactions. This process includes linking all derivatives to specific assets and liabilities on the balance sheet or to specific firm commitments or anticipated transactions. We also formally assess, both at the hedge’s inception and on an ongoing basis, whether the derivatives that are used in hedging transactions are highly effective in offsetting changes in fair values or cash flows of hedged items.
We purchase forward foreign exchange contracts to hedge anticipated Canadian dollar expenses pertaining to our operations in Canada. These instruments are not recognized in the consolidated financial statements at inception. Foreign exchange gains and losses on these contracts are deferred off-balance sheet and recognized as an adjustment to the operating expenses when the operating expenses are incurred.
Realized and unrealized gains and losses associated with derivative instruments, which have been terminated or cease to be effective prior to maturity, are deferred under other current, or non-current, assets or liabilities on the balance sheet and recognized in income in the period in which the underlying hedged transaction is recognized. In the event a designated hedged item is sold, extinguished or matures prior to the termination of the related derivative instrument, any realized or unrealized gain or loss on such derivative instrument is recognized in income.
34 ATI 2005
38 of 75
| 2005 | • ATI introduces Radeon Xpress 200 CrossFire Edition chipsets supporting multi-GPU capability | • ATI launches the X1000 series of products – the industry’s first available GPUs based on 90 nanometer silicon process technology |
New Accounting Policies
During 2005 we have applied changes as a result of newly issued accounting standards as follows:
Stock-based Compensation
We adopted the revised CICA Handbook Section 3870 “Stock-based Compensation and Other Stock-based Payments” which requires the application of a fair value method of accounting to all stock-based compensation arrangements with employees. As a result, we are required to estimate the fair value of all stock options granted and expense the fair value over the service period, which in all cases equals the vesting period, of the stock options. Prior to September 1, 2004, we recorded no compensation cost on the grant of stock options to employees. In accordance with the transitional provisions of Section 3870, we have retroactively applied the fair value method of accounting for stock option grants awarded since September 1, 2002, using the Black-Scholes option pricing models, and recorded an adjustment to opening retained earnings at September 1, 2004.
Generally Accepted Accounting Principles
In July 2003, the CICA issued Handbook Section 1100, “Generally Accepted Accounting Principles.” This section establishes standards for financial reporting in accordance with Canadian GAAP. It describes what constitutes Canadian GAAP and its sources. This section also provides guidance on sources to consult when selecting accounting policies and determining appropriate disclosures when a matter is not dealt with explicitly in the primary sources of Canadian GAAP. This guideline is effective for our 2005 fiscal year. We were not impacted by the adoption of this standard.
Liabilities and Equity
In November 2003, the CICA approved amendments to Handbook Section 3860, “Financial Instruments – Presentation and Disclosure,” to require obligations that may be settled, at the issuer’s option, by a variable number of the issuer’s own equity instruments to be presented as liabilities. Thus securities issued by an enterprise that give the issuer unrestricted rights to settle the principal amount in cash or in the equivalent value of its own equity instruments will no longer be presented as equity.
The CICA concluded that not all such obligations establish the type of relationship that exists between an entity and its owners, but rather they convey more of a debtor/creditor relationship because they require the issuer to convey a fixed amount of value to the holder that does not vary with changes in the fair value of the issuer’s equity instruments. Therefore, these instruments should be presented as liabilities.
The standard will be effective for the Company’s 2006 fiscal year. We expect that the adoption of this standard will have no material impact on our financial position, results of operations or cash flows.
In addition to the standards we have applied in the year, there are additional new standards that will be applied in future years as follows:
Financial Instruments
In January 2005, the CICA issued Section 3855, “Financial Instruments – Recognition and Measurement,” Section 1530, “Comprehensive Income” and Section 3865, “Hedges.” The new standards will be effective for interim and annual financial statements commencing in our 2007 fiscal year. Earlier adoption is permitted. Most significantly for us, the new standards will require presentation of a separate statement of comprehensive income. Foreign exchange gains and losses on the translation of the financial statements of self-sustaining subsidiaries previously recorded in a separate section of shareholders’ equity will be presented in comprehensive income. Derivative financial instruments will be recorded in the balance sheet at fair value and the changes in fair value of derivatives designated as cash flow hedges will be reported in comprehensive income. The existing hedging principles of AcG-13 will be maintained. We are assessing the impact of the new standards.
ATI 2005 35
39 of 75
| Quarterly Information | |||||||||||||||||||||||||
| (Unaudited) (In thousands of U.S. dollars, except per share amounts) | |||||||||||||||||||||||||
| November 30 | February 28/29 | May 31 | August 31 | ||||||||||||||||||||||
| 2004 | 2003 | 2005 | 2004 | 2005 | 2004 | 2005 | 2004 | ||||||||||||||||||
| REVENUES | $ 613,859 | $ 469,705 | $ 608,188 | $ 463,337 | $ 530,235 | $ 491,457 | $ 470,227 | $ 572,218 | |||||||||||||||||
| Cost of revenues | 405,009 | 302,134 | 399,885 | 302,914 | 375,806 | 318,918 | 427,882 | 379,836 | |||||||||||||||||
| Gross margin | 208,850 | 167,571 | 208,303 | 160,423 | 154,429 | 172,539 | 42,345 | 192,382 | |||||||||||||||||
| OPERATING EXPENSES: | |||||||||||||||||||||||||
| Selling and marketing | 33,125 | 30,079 | 36,352 | 27,031 | 37,744 | 31,243 | 39,131 | 29,244 | |||||||||||||||||
| Research and development | 73,114 | 63,278 | 77,726 | 60,809 | 88,508 | 65,539 | 87,669 | 75,865 | |||||||||||||||||
| Administrative | 12,676 | 11,487 | 15,793 | 11,532 | 16,013 | 12,166 | 17,326 | 11,517 | |||||||||||||||||
| Amortization of | |||||||||||||||||||||||||
| intangible assets | 1,244 | 1,542 | 1,389 | 1,541 | 3,046 | 1,546 | 3,240 | 1,486 | |||||||||||||||||
| Stock-based compensation | 10,558 | 751 | 10,329 | 2,826 | 10,395 | 2,315 | 11,222 | 1,691 | |||||||||||||||||
| Other charges (recoveries) | 382 | 173 | 278 | (178) | 1,351 | (454) | 497 | 155 | |||||||||||||||||
| 131,099 | 107,310 | 141,867 | 103,561 | 157,057 | 112,355 | 159,085 | 119,958 | ||||||||||||||||||
| INCOME (LOSS) FROM | |||||||||||||||||||||||||
| OPERATIONS | 77,751 | 60,261 | 66,436 | 56,862 | (2,628) | 60,184 | (116,740) | 72,424 | |||||||||||||||||
| Interest and other | |||||||||||||||||||||||||
| income (expense), net | 2,176 | (1,754) | 4,504 | 1,856 | 3,914 | 33 | 4,341 | 2,815 | |||||||||||||||||
| Interest expense | (519) | (515) | (537) | (531) | (525) | (513) | (515) | (499) | |||||||||||||||||
| Income (loss) before | |||||||||||||||||||||||||
| income taxes | 79,408 | 57,992 | 70,403 | 58,187 | 761 | 59,704 | (112,914) | 74,740 | |||||||||||||||||
| Income taxes (recoveries) | 15,705 | 10,553 | 13,210 | 10,602 | 1,206 | 11,085 | (9,392) | 13,584 | |||||||||||||||||
| NET INCOME (LOSS) | 63,703 | 47,439 | 57,193 | 47,585 | (445) | 48,619 | (103,522) | 61,156 | |||||||||||||||||
| RETAINED EARNINGS, | |||||||||||||||||||||||||
| BEGINNING OF PERIOD | 308,825 | 104,026 | 358,685 | 151,465 | 415,878 | 199,050 | 415,433 | 247,669 | |||||||||||||||||
| Adjustments to opening | |||||||||||||||||||||||||
| retained earnings: | |||||||||||||||||||||||||
| Change in accounting | |||||||||||||||||||||||||
| policy on stock-based | |||||||||||||||||||||||||
| compensation | (13,843) | – | – | – | – | – | – | – | |||||||||||||||||
| Repurchase of | |||||||||||||||||||||||||
| common shares | – | – | – | – | – | – | (18,541) | – | |||||||||||||||||
| RETAINED EARNINGS, | |||||||||||||||||||||||||
| END OF PERIOD | $ 358,685 | $ 151,465 | $ 415,878 | $ 199,050 | $ 415,433 | $ 247,669 | $ 293,370 | $ 308,825 | |||||||||||||||||
| Net income (loss) per share: | |||||||||||||||||||||||||
| Basic | $ 0.26 | $ 0.20 | $ 0.23 | $ 0.19 | $ 0.00 | $ 0.20 | $ (0.41) | $ 0.25 | |||||||||||||||||
| Diluted | 0.25 | 0.19 | 0.22 | 0.19 | 0.00 | 0.19 | (0.41) | 0.24 | |||||||||||||||||
| WEIGHTED AVERAGE | |||||||||||||||||||||||||
| NUMBER OF SHARES (000s): | |||||||||||||||||||||||||
| Basic | 249,027 | 242,998 | 251,046 | 244,373 | 251,602 | 245,960 | 251,045 | 247,699 | |||||||||||||||||
| Diluted | 257,917 | 254,109 | 259,743 | 255,876 | 251,602 | 256,650 | 251,045 | 258,198 | |||||||||||||||||
| OUTSTANDING NUMBER | |||||||||||||||||||||||||
| OF SHARES, END OF | |||||||||||||||||||||||||
| PERIOD (000s): | 251,324 | 244,239 | 252,258 | 246,604 | 252,845 | 247,886 | 251,473 | 249,287 | |||||||||||||||||
36 ATI 2005
40 of 75
Management’s Responsibility for Consolidated Financial Statements
Management of ATI Technologies Inc. is responsible for the integrity of the accompanying consolidated financial statements and all other information in this Annual Report. The consolidated financial statements have been prepared by Management in accordance with accounting principles generally accepted in Canada. The preparation of the consolidated financial statements necessarily involves the use of estimates and careful judgment, particularly in those circumstances where transactions affecting a current period are dependent upon future events. All financial information presented in this Annual Report is consistent with the consolidated financial statements.
To discharge its responsibilities for financial reporting and safeguarding of assets, Management believes that it has established appropriate systems of internal accounting controls that provide reasonable assurance that the financial records are reliable and form a proper basis for the timely and accurate preparation of financial statements. Consistent with the concept of reasonable assurance, Management recognizes that the relative cost of maintaining these controls should not exceed their expected benefits. Management further ensures the quality of the financial records through careful selection and training of personnel and the adoption and communication of financial and other relevant policies.
The Board of Directors discharges its responsibilities with respect to the consolidated financial statements primarily through the activities of its Audit Committee, which is composed entirely of directors who are not employees of the Company. This committee meets quarterly with Management and with the Company’s independent auditors to review the Company’s reported financial performance and to discuss audit, internal control, accounting policy and financial reporting matters. The consolidated financial statements were reviewed by the Audit Committee and approved by the Board of Directors.
The consolidated financial statements have been audited by KPMG LLP, who were appointed by the shareholders at the last Annual General Meeting of Shareholders. Their report is presented herein.
| /s/ K.Y. Ho K.Y. Ho | /s/ David E. Orton David E. Orton | /s/ Patrick Crowley Patrick Crowley | ||
| Chairman | President and | Senior Vice President, Finance and | ||
| Chief Executive Officer | Chief Financial Officer | |||
| October 4, 2005 |
Auditors’ Report to the Shareholders
We have audited the consolidated balance sheets of ATI Technologies Inc. as at August 31, 2005 and 2004 and the consolidated statements of operations and retained earnings and cash flows for each of the years in the three-year period ended August 31, 2005. These financial statements are the responsibility of the Company’s management. Our responsibility is to express an opinion on these financial statements based on our audits.
We conducted our audits in accordance with Canadian generally accepted auditing standards. Those standards require that we plan and perform an audit to obtain reasonable assurance whether the financial statements are free of material misstatement. An audit includes examining, on a test basis, evidence supporting the amounts and disclosures in the financial statements. An audit also includes assessing the accounting principles used and significant estimates made by management, as well as evaluating the overall financial statement presentation.
In our opinion, these consolidated financial statements present fairly, in all material respects, the financial position of the Company as at August 31, 2005 and 2004 and the results of its operations and its cash flows for each of the years in the three-year period ended August 31, 2005 in accordance with Canadian generally accepted accounting principles.
/s/ KPMG LLP
Chartered Accountants
Toronto, Canada
October 4, 2005
ATI 2005 37
41 of 75
Consolidated Statements of Operations and Retained Earnings
(In thousands of U.S. dollars, except per share amounts)
| Years ended August 31 | 2005 | 2004 | 2003 | |||
| REVENUES | $ 2,222,509 | $ 1,996,717 | $ 1,385,293 | |||
| Cost of revenues | 1,608,582 | 1,303,802 | 956,116 | |||
| Gross margin | 613,927 | 692,915 | 429,177 | |||
| OPERATING EXPENSES: | ||||||
| Selling and marketing | 146,352 | 117,597 | 92,810 | |||
| Research and development | 327,017 | 265,491 | 212,976 | |||
| Administrative | 61,808 | 46,702 | 39,413 | |||
| Amortization of intangible assets (note 7) | 8,919 | 6,115 | 10,767 | |||
| Stock-based compensation | 42,504 | 7,583 | – | |||
| Other charges (recoveries) (note 16) | 2,508 | (304) | 28,724 | |||
| 589,108 | 443,184 | 384,690 | ||||
| Income from operations | 24,819 | 249,731 | 44,487 | |||
| Interest and other income, net (note 8) | 14,935 | 2,950 | 4,382 | |||
| Interest expense (note 11) | (2,096) | (2,058) | (1,899) | |||
| Income before income taxes | 37,658 | 250,623 | 46,970 | |||
| Income taxes (note 13) | 20,729 | 45,824 | 11,741 | |||
| NET INCOME | 16,929 | 204,799 | 35,229 | |||
| RETAINED EARNINGS, beginning of year | 308,825 | 104,026 | 68,797 | |||
| Adjustment to opening retained earnings: | ||||||
| Change in accounting policy on stock-based compensation (note 1(o)) | (13,843) | – | – | |||
| Repurchase of common shares (note 12(a)) | (18,541) | – | – | |||
| Retained earnings, end of year | $ 293,370 | $ 308,825 | $ 104,026 | |||
| NET INCOME PER SHARE(note 14): | ||||||
| Basic | $ 0.07 | $ 0.84 | $ 0.15 | |||
| Diluted | 0.07 | 0.80 | 0.14 | |||
| WEIGHTED AVERAGE NUMBER OF SHARES (000s): | ||||||
| Basic | 250,680 | 245,257 | 238,251 | |||
| Diluted | 258,314 | 256,208 | 244,353 | |||
| See accompanying notes to consolidated financial statements. | ||||||
38 ATI 2005
42 of 75
Consolidated Balance Sheets
(In thousands of U.S. dollars)
| August 31 | 2005 | 2004 | ||
| ASSETS | ||||
| Current assets: | ||||
| Cash and cash equivalents | $ | 223,277 | $ | 359,608 |
| Short-term investments (note 3) | 363,370 | 189,308 | ||
| Accounts receivable | 386,264 | 365,644 | ||
| Inventories (note 4) | 348,209 | 254,867 | ||
| Prepayments and sundry receivables | 24,463 | 22,395 | ||
| Future income tax assets (note 13) | 5,348 | 8,022 | ||
| Total current assets | 1,350,931 | 1,199,844 | ||
| Capital assets (note 5) | 112,875 | 85,943 | ||
| Intangible assets (note 7) | 17,631 | 5,558 | ||
| Goodwill (note 7) | 190,095 | 190,095 | ||
| Long-term investments (note 8) | 291 | 2,751 | ||
| Tax credits recoverable | 59,080 | 29,149 | ||
| Future income tax assets (note 13) | 12,588 | 1,114 | ||
| Total assets | $ | 1,743,491 | $ | 1,514,454 |
| LIABILITIES AND SHAREHOLDERS’ EQUITY | ||||
| Current liabilities: | ||||
| Accounts payable | $ | 362,926 | $ | 274,772 |
| Accrued liabilities | 302,028 | 219,607 | ||
| Deferred revenue (note 10) | 24,576 | 29,131 | ||
| Current portion of long-term debt (note 11) | 1,852 | 1,571 | ||
| Total current liabilities | 691,382 | 525,081 | ||
| Long-term debt (note 11) | 29,110 | 28,053 | ||
| Future income tax liabilities (note 13) | 8,861 | 16,632 | ||
| Total liabilities | 729,353 | 569,766 | ||
| Shareholders’ equity (note 12): | ||||
| Share capital: | ||||
| Authorized: | ||||
| Unlimited preferred shares | ||||
| Unlimited common shares | ||||
| Issued and outstanding: | ||||
| 251,473,305 common shares (2004 – 249,287,125) | 665,566 | 638,985 | ||
| Treasury stock | (14,867) | (22,100) | ||
| Contributed surplus | 61,795 | 10,704 | ||
| Retained earnings | 293,370 | 308,825 | ||
| Currency translation adjustment | 8,274 | 8,274 | ||
| Total shareholders’ equity | 1,014,138 | 944,688 | ||
| Total liabilities and shareholders’ equity | $ | 1,743,491 | $ | 1,514,454 |
Commitments and contingencies (notes 4, 6, 18 and 22)
Guarantees (note 15)
See accompanying notes to consolidated financial statements.
On behalf of the Board:
| /s/ K.Y. Ho K.Y. Ho | /s/ James D. Fleck James D. Fleck | |
| Director | Director |
ATI 2005 39
43 of 75
Consolidated Statements of Cash Flows
(In thousands of U.S. dollars)
| Years ended August 31 | 2005 | 2004 | 2003 | |||
| CASH PROVIDED BY (USED IN): | ||||||
| Operating activities: | ||||||
| Net income | $ | 16,929 | $ | 204,799 | $ | 35,229 |
| Items which do not involve cash: | ||||||
| Future income taxes | (12,839) | (2,275) | (1,802) | |||
| Stock-based compensation (note 12) | 41,882 | 5,849 | – | |||
| Depreciation and amortization | 31,575 | 26,031 | 34,705 | |||
| Other charges | – | – | 1,400 | |||
| Loss (gain) on investments | 1,580 | 1,307 | (3,876) | |||
| Gain on sale of long-lived assets (note 16(c)(i)) | – | (538) | – | |||
| Unrealized foreign exchange loss | 2,560 | 961 | 3,637 | |||
| Changes in non-cash operating working capital: | ||||||
| Accounts receivable | (20,620) | (131,096) | (93,422) | |||
| Inventories | (93,342) | (78,373) | 15,627 | |||
| Prepayments and sundry receivables | (1,950) | 9,358 | (8,678) | |||
| Accounts payable | 88,148 | 83,576 | 19,103 | |||
| Accrued liabilities | 82,617 | 81,858 | 87,288 | |||
| Deferred revenue | (4,555) | (8,538) | 37,419 | |||
| Tax credits recoverable | (29,347) | (7,968) | (21,181) | |||
| 102,638 | 184,951 | 105,449 | ||||
| Financing activities: | ||||||
| Decrease in bank indebtedness | – | – | (12,015) | |||
| Addition to long-term debt | – | – | 10,709 | |||
| Principal payments on long-term debt | (1,663) | (1,442) | (1,064) | |||
| Settlement of swap contract | – | – | (1,365) | |||
| Issuance of common shares | 30,170 | 56,531 | 20,977 | |||
| Repurchase of common shares (note 12(a) and (d)) | (23,856) | (22,100) | – | |||
| Repayment of share purchase loans | – | – | 225 | |||
| Proceeds from sale of treasury stock | 9 | – | – | |||
| 4,660 | 32,989 | 17,467 | ||||
| Investing activities: | ||||||
| Purchase of short-term investments | (495,971) | (268,515) | (49,784) | |||
| Maturity and proceeds from sales of short-term investments | 321,909 | 128,991 | 49,649 | |||
| Additions to capital assets | (48,831) | (20,671) | (16,390) | |||
| Purchase of long-term investments | – | (98) | (2,460) | |||
| Proceeds from investments | 880 | – | 10,029 | |||
| Proceeds from sale of long-lived assets (note 16(c)(i)) | – | 2,489 | – | |||
| Acquisitions, net of cash acquired (note 6) | (22,057) | (2,071) | – | |||
| (244,070) | (159,875) | (8,956) | ||||
| Foreign exchange gain (loss) on cash held in foreign currency | 441 | 638 | (181) | |||
| INCREASE (DECREASE) IN CASH AND CASH EQUIVALENTS | (136,331) | 58,703 | 113,779 | |||
| CASH AND CASH EQUIVALENTS, beginning of year | 359,608 | 300,905 | 187,126 | |||
| CASH AND CASH EQUIVALENTS, end of year | 223,277 | 359,608 | 300,905 | |||
| Short-term investments | 363,370 | 189,308 | 49,784 | |||
| Cash position, end of year | $ | 586,647 | $ | 548,916 | $ | 350,689 |
Supplemental cash flow information (note 20)
See accompanying notes to consolidated financial statements.
40 ATI 2005
44 of 75
Notes to Consolidated Financial Statements
Years ended August 31, 2005, 2004 and 2003 (Tabular amounts in thousands of U.S. dollars, except per share amounts)
The principal business activities of ATI Technologies Inc. (the “Company”) are the design, manufacture and sale of innovative 3D graphics and digital media silicon solutions. The Company markets its products to original equipment manufacturers, system builders, distributors and retailers primarily in North America, Europe and the Asia-Pacific region.
| NOTE 1. | (a) Basis of presentation | |||||
| Significant accounting policies | These consolidated financial statements have been prepared in accordance with Canadian generally accepted accounting principles (“Canadian GAAP”) and are presented in U.S. dollars. No material differences would result if these consolidated financial statements were prepared in accordance with accounting principles generally accepted in the United States (“U.S. GAAP”) and the rules and regulations of the Securities and Exchange Commission, except as disclosed in note 21. | |||||
| (b) Principles of consolidation | ||||||
| These consolidated financial statements include the accounts of the Company and its wholly owned subsidiaries, as well as the Company’s proportionate 50.0% ownership in a joint venture formed to own an office building in Markham, Ontario. All significant intercompany transactions and balances have been eliminated upon consolidation. | ||||||
| (c) Cash and cash equivalents and short-term investments | ||||||
| Cash and cash equivalents include all highly liquid instruments with a maturity of less than 90 days from the acquisition date. The carrying amounts of cash and cash equivalents are stated at cost, which approximates their fair values. The Company’s short-term investments include: (i) highly liquid instruments with a maturity date of 90 days or more but less than one year from the acquisition date that are carried at cost, which approximates their fair values; (ii) auction rate paper that is carried at cost, which approximates fair value; (iii) portfolio investments, consisting of actively managed funds holding government and corporate obligations, agency discount notes, money market funds, commercial paper, and auction rate paper; and (iv) corporate bonds. Both portfolio investments and corporate bonds are carried at amortized cost plus accrued interest. The Company regularly reviews the carrying value of its investments. Should there be a decline in value that is other than a temporary decline, the Company measures the amount of the write-down based on the quoted market value of the investments and charges such write-down to the consolidated statements of operations and retained earnings. | ||||||
| (d) Inventories | ||||||
| Raw materials are stated at the lower of cost and replacement cost. Finished goods and work in process are stated at the lower of cost and net realizable value. In determining net realizable value, the Company considers factors such as market conditions, the aging of inventory and forecasted future demand. Cost is determined on a first-in, first-out basis. | ||||||
| (e) Capital assets | ||||||
| Capital assets are recorded at cost, net of related investment tax credits, and are depreciated over their estimated useful lives. Estimated useful lives for principal asset categories are as follows: | ||||||
| Asset | Method | Rate | ||||
| Buildings | Diminishing balance | 5.0% | ||||
| Building under capital lease | Straight line | 15 years | ||||
| Laboratory and computer equipment | Diminishing balance/straight line | 331/3%/over one to five years | ||||
| Computer software | Diminishing balance/straight line | 50.0%/over two to three years | ||||
| Production equipment | Diminishing balance/straight line | 20.0%/over one year | ||||
| Office equipment | Diminishing balance/straight line | 20.0%/over three years | ||||
| Leasehold improvements | Straight line | Over term of lease | ||||
ATI 2005 41
45 of 75
NOTES TO CONSOLIDATED FINANCIAL STATEMENTS(CONT.)
Years ended August 31, 2005, 2004 and 2003 (Tabular amounts in thousands of U.S. dollars, except per share amounts)
| (f) Goodwill | ||||
| The Company does not amortize goodwill but is required to evaluate goodwill annually or whenever events or changes in circumstances indicate that the carrying amount may not be recoverable. Impairment is tested at the reporting unit level by comparing the carrying value of the reporting unit in which the goodwill resides to its fair value. The fair values of the reporting units are estimated using a discounted cash flow approach. To the extent a reporting unit’s carrying amount exceeds its fair value, an impairment of goodwill exists. Impairment is then measured by comparing the fair value of goodwill, determined in a manner similar to a purchase price allocation, to its carrying amount. During the fourth quarters of fiscal 2005 and 2004, the Company performed its annual goodwill impairment test and determined that there was no goodwill impairment. | ||||
| (g) Intangible assets | ||||
| Intangible assets are recorded at cost and are amortized on a straight-line basis over their estimated useful lives as follows: | ||||
| Purchased in-process research and development | 1 year | |||
| Core technology | 2–5 years | |||
| Other | 8 months–3 years | |||
| (h) Impairment of long-lived assets | ||||
| The Company reviews capital and intangible assets for impairment on a regular basis or whenever events or changes in circumstances indicate that the carrying amount may not be recoverable. Recoverability is assessed by comparing the carrying amount to the projected undiscounted, future net cash flows that the long-lived assets are expected to generate. If the carrying amount exceeds such cash flows, an impairment charge is recognized equal to the excess of the assets’ carrying value over their fair value. | ||||
| (i) Long-term investments Investees over which the Company does not have control or significant influence are accounted for by the cost method. | ||||
| The Company regularly reviews the carrying values of its long-term investments. Should there be a decline in value of the Company’s long-term investments that is other than a temporary decline, the Company measures the amount of the write-down based on the fair value of the shares of the investee and charges such write-down to the consolidated statements of operations and retained earnings. | ||||
| (j) Revenue recognition | ||||
| Revenue is recognized when evidence of an arrangement exists, risks and rewards of ownership have been transferred to customers, selling price is fixed and determinable and collectibility is reasonably assured. Sales made to distributors and retailers under agreements allowing for price protection and/or rights of return are recognized at the time of sale to these customers. Estimated returns and allowances, price protection and sales rebates are recorded as a reduction of revenue at the time of revenue recognition. Estimates are based on historical experience, planned customer incentive programs and other relevant factors. If estimates of future market conditions and changing product life cycles in the marketplace are inaccurate, it may be necessary to increase customer incentive offerings, which could necessitate a further reduction in revenue. Such increases are recorded as a reduction of revenue at the time the program is introduced or enhanced. The Company also provides for the estimated cost of product warranties at the time of revenue recognition. | ||||
| The Company primarily uses a binding purchase order as evidence of its sales arrangements and, in certain cases, uses contractual agreements. The Company considers delivery to occur upon shipment, provided risk and rewards of ownership, including transfer of title, have passed to the customer. At the point of sale, the Company assesses whether collection is reasonably assured. If the Company determines that collection is not reasonably assured, the Company defers recognition of the revenue until collection becomes reasonably assured, which is generally upon receipt of cash. | ||||
42 ATI 2005
46 of 75
| The Company follows the percentage-of-completion method of accounting for contracts requiring the Company to develop customized technology to meet a customer’s specifications. Under such contracts, revenue is recognized based on the ratio of total costs incurred to date to overall estimated costs. Provisions for estimated losses on contracts, if any, are recognized when identified. | ||
| Where estimating the final outcome of a project is impractical, except to ensure that no loss will be incurred, the Company uses a zero estimate of profit until results can be estimated more precisely. Under this method, the portion of total contract revenue earned to date is determined by measuring total cost incurred. The Company then records an equal amount of revenue against costs. Cost of revenue is adjusted to recognize the profit element from the arrangement once the Company is able to estimate total revenue and total costs. | ||
| Cash received from customers in advance of the Company meeting its applicable revenue recognition criteria is recorded as deferred revenue. | ||
| (k) Foreign currency translation | ||
| The Company’s functional currency and that of its subsidiaries is the U.S. dollar. The Company’s subsidiaries are accounted for as integrated foreign operations. Transactions of the Company and its subsidiaries originating in foreign currencies are translated into U.S. dollars at the prevailing rates approximating those at the dates of the transactions. Monetary assets and liabilities are translated at the year-end rates of exchange and non-monetary items are translated at historical exchange rates. The resulting net gain or loss is included in the consolidated statements of operations and retained earnings. | ||
| (l) Research and development (“R&D”) expenditures | ||
| Research costs, other than capital expenditures, are expensed as incurred. Development costs are expensed as incurred unless they meet the criteria under Canadian GAAP for deferral and amortization. The Company has not deferred any such development costs to date. R&D costs are reduced by related investment tax credits. The total investment tax credits for fiscal 2005 amounted to $45.5 million (2004 – $29.0 million; 2003 – $21.7 million). | ||
| (m) Income taxes | ||
| The Company uses the asset and liability method of accounting for income taxes. Future income tax assets and liabilities are recognized for future income tax consequences attributable to differences between the financial statement carrying amounts of existing assets and liabilities and their respective tax bases, net operating loss carryforwards and undeducted R&D pools. Future income tax assets and liabilities are measured using enacted or substantively enacted tax rates expected to apply to taxable income in the years in which those temporary differences are expected to be recovered or settled. The effect of a change in tax rates is recognized in the year that includes the substantive enactment date. A valuation allowance is recorded against any future income tax asset if it is more likely than not that the asset will not be realized. Income tax expense or recovery is, primarily, the sum of the Company’s provision for current income taxes and the difference between opening and closing balances of future income tax assets and liabilities. | ||
| (n) Net income per share | ||
| Basic net income per share has been calculated by dividing the net income for the year by the weighted average number of common shares outstanding during the year. The Company uses the treasury stock method for calculating diluted net income per share. Diluted net income per share is computed similar to basic net income per share, except that the weighted average number of common shares outstanding is increased to include additional shares from the assumed exercise of stock options and equity-settled restricted share units (“RSUs”), if dilutive. The number of additional shares is calculated by assuming that outstanding stock options and RSUs were exercised and that the proceeds from such exercises were used to acquire shares of common stock at the average market price during the reporting year. | ||
| (o) Stock-based awards (i) Stock options The Company has share option plans, which are described in note 12. Any consideration paid by employees on exercise of stock options or purchase of stock is credited to share capital. | ||
ATI 2005 43
47 of 75
NOTES TO CONSOLIDATED FINANCIAL STATEMENTS(CONT.)
Years ended August 31, 2005, 2004 and 2003 (Tabular amounts in thousands of U.S. dollars, except per share amounts)
| On September 1, 2004, the Company adopted the revised CICA Handbook Section 3870, “Stock-based Compensation and Other Stock-based Payments,” which requires the application of a fair value method of accounting to all stock-based compensation arrangements with employees. As a result, the Company is required to estimate the fair value of the stock options granted and expense that fair value over the service period which, in all cases, equals the vesting period of the stock options. Prior to September 1, 2004, the Company recorded no compensation cost on the grant of stock options to employees. In accordance with the transitional provisions of Section 3870, the Company has retroactively, without restatement, applied the fair value method of accounting for stock option awards granted since September 1, 2002, using the Black-Scholes option pricing model, and recorded an adjustment to opening retained earnings at September 1, 2004 in the amount of $13.8 million, representing the stock option expense, net of income taxes, for fiscal 2003 and 2004. The offsets to retained earnings are increases in contributed surplus and future income tax assets in the amounts of $17.5 million and $3.7 million, respectively. The stock option expense for the year ended August 31, 2005 was $34.0 million. | ||||||
| The following table reports certain pro forma amounts, adjusted to reflect stock-based compensation expense measured by the fair value method based on stock options issued subsequent to September 1, 2002, for the years ended August 31, 2004 and 2003: | ||||||
| 2004 | 2003 | |||||
| Net income: | ||||||
| As reported | $ 204,799 | $ 35,229 | ||||
| Pro forma | 191,481 | 34,704 | ||||
| Basic net income per share: | ||||||
| As reported | 0.84 | 0.15 | ||||
| Pro forma | 0.78 | 0.15 | ||||
| Diluted net income per share: | ||||||
| As reported | 0.80 | 0.14 | ||||
| Pro forma | 0.75 | 0.14 | ||||
| (ii) Restricted share units and deferred share units | ||||||
| The Company has RSU and deferred share unit (“DSU”) plans, which are described in note 12. For equity-settled RSUs, stock-based compensation, representing the underlying value of the common shares of the Company at the date of grant of the RSUs, is recognized evenly over the three-year vesting period. RSUs and DSUs that will be settled in cash are recorded as liabilities. The measurement of the liability and compensation costs for these awards is based on the intrinsic value of the award and is recorded as a charge to operating income over the vesting period of the award. Changes in the Company’s payment obligation subsequent to grant of the award and prior to the settlement date, due to changes in the market value of the underlying Company common shares, are recorded as a charge to operating income in the period incurred. The payment amount is established for cash-settled RSUs as of the vesting date of the award and for DSUs as of the later of the date of termination of employment or directorship. | ||||||
| (p) Use of estimates | ||||||
| The preparation of consolidated financial statements requires management to make estimates and assumptions that affect the reported amounts of assets and liabilities and disclosure of contingent assets and liabilities at the dates of the consolidated financial statements and the reported amounts of revenue and expenses during the reporting years presented. Significant estimates are used in determining the allowance for doubtful accounts, provision for inventory obsolescence, useful lives of long-lived assets, goodwill and long-lived asset impairment testing, valuation of long-term investments, realization of future tax assets, and estimates for sales returns and allowances, price protection and sales rebates. Management makes its estimates based on historical experience and on various other assumptions it believes are reasonable. Actual results could differ from those estimates. | ||||||
44 ATI 2005
48 of 75
| (q) Financial instruments | ||
| During fiscal 2004, the Company adopted CICA Accounting Guideline (“AcG”) No. 13, “Hedging Relationships,” for its derivative instruments. The Company engages in activities to purchase certain derivative financial instruments, principally forward foreign exchange contracts, to manage its foreign currency exposures. The Company’s policy is not to utilize derivative financial instruments for trading or speculative purposes. | ||
| The Company formally documents all relationships between hedging instruments and hedged items, as well as the risk management objective and strategy for undertaking various hedge transactions. This process includes linking all derivatives to specific assets and liabilities on the balance sheet or to specific firm commitments or anticipated transactions. The Company also formally assesses, both at the hedge’s inception and on an ongoing basis, whether the derivatives that are used in hedging transactions are highly effective in offsetting changes in fair values or cash flows of hedged items. | ||
| The Company purchases forward foreign exchange contracts to hedge anticipated Canadian dollar expenses pertaining to its operations in Canada. These instruments are not recognized in the consolidated financial statements at inception. Foreign exchange gains and losses on these contracts are deferred off-balance sheet and recognized as an adjustment to the operating expenses when the operating expenses are incurred. | ||
| Realized and unrealized gains or losses associated with derivative instruments, which have been terminated prior to the occurrence of the hedge transaction or cease to be effective prior to maturity, are deferred under other current, or non-current, assets or liabilities on the balance sheet and recognized in income in the period in which the underlying hedged transaction is recognized. In the event a designated hedged item is sold or extinguished or matures prior to the termination of the related derivative instrument, any realized or unrealized gain or loss on such derivative instrument is recognized in income. | ||
| (r) Accounting changes (i) Generally accepted accounting principles In July 2003, the CICA issued Handbook Section 1100, “Generally Accepted Accounting Principles.” This Section establishes standards for financial reporting in accordance with Canadian GAAP. It describes what constitutes Canadian GAAP and its sources. This section also provides guidance on sources to consult when selecting accounting policies and determining appropriate disclosures when a matter is not dealt with explicitly in the primary sources of Canadian GAAP. This guideline is effective for the Company’s 2005 fiscal year. The Company was not impacted by the adoption of this standard. | ||
| (ii) Consolidation of variable interest entities | ||
| In November 2004, the CICA revised AcG No. 15, “Consolidation of Variable Interest Entities,” to AcG-15R, which provides guidance for determining when an enterprise includes the assets, liabilities and results of activities of entities that are subject to control on a basis other than ownership of voting interests (a “variable interest entity”). This guideline is effective for the Company’s 2005 fiscal year. The adoption of this standard did not have an impact on the Company’s financial position, results of operations or cash flows. | ||
| (iii) Liabilities and equity | ||
| In November 2003, the CICA approved amendments to Handbook Section 3860, “Financial Instruments – Presentation and Disclosure,” to require obligations that may be settled, at the issuer’s option, by a variable number of the issuer’s own equity instruments to be presented as liabilities. Thus, securities issued by an enterprise that give the issuer unrestricted rights to settle the principal amount in cash or in the equivalent value of its own equity instruments will no longer be presented as equity. | ||
| The CICA concluded that not all such obligations establish the type of relationship that exists between an entity and its owners, but rather they convey more of a debtor/creditor relationship because they require the issuer to convey a fixed amount of value to the holder that does not vary with changes in the fair value of the issuer’s equity instruments. Therefore, these instruments should be presented as liabilities. | ||
ATI 2005 45
49 of 75
NOTES TO CONSOLIDATED FINANCIAL STATEMENTS(CONT.)
Years ended August 31, 2005, 2004 and 2003 (Tabular amounts in thousands of U.S. dollars, except per share amounts)
| The standard will be effective for the Company’s 2006 fiscal year. The Company expects that the adoption of this standard will have no material impact on its financial position, results of operations or cash flows. | ||
| (s) Recently issued accounting pronouncement Financial Instruments In January 2005, the CICA issued Section 3855, “Financial Instruments – Recognition and Measurement,” Section 1530, “Comprehensive Income” and Section 3865, “Hedges.” The new standards will be effective for interim and annual financial statements commencing in the Company’s 2007 fiscal year. Earlier adoption is permitted. Most significantly for the Company, the new standards will require presentation of a separate statement of comprehensive income. Foreign exchange gains and losses on the translation of the financial statements of self-sustaining subsidiaries previously recorded in a separate section of shareholders’ equity will be presented in comprehensive income. Derivative financial instruments will be recorded in the balance sheet at fair value and the changes in fair value of derivatives designated as cash flow hedges will be reported in comprehensive income. The existing hedging principles of AcG-13 will be maintained. The Company is assessing the impact of the new standards. | ||
| NOTE 2. Financial instruments | Financial instruments, which potentially subject the Company to concentrations of credit risk, consist primarily of cash and cash equivalents, short-term investments, accounts receivable and sundry receivables. The Company invests only in high-quality cash and cash equivalents and short-term investments. A majority of the Company’s accounts receivable is derived from sales to original equipment manufacturers, add-in-board manufacturers, original design manufacturers, distributors and retailers in the personal computer, cellular phone and digital television industries. The Company performs ongoing credit evaluations of its customers’ financial condition and limits the amount of credit extended when deemed necessary. In addition, a significant portion of the total accounts receivable is insured against possible losses. The Company maintains adequate reserves for potential credit losses as estimated by management. | |
| The joint venture Commerce Valley Realty Holdings Inc. (“CVRH”), in which the Company has a 50.0% ownership, entered into an interest rate swap contract in fiscal 2001 to hedge its exposure to the interest rate risk applicable to its mortgage for a building facility in Markham, Ontario. This interest rate swap contract closed on September 10, 2002, resulting in a proportionate loss of $1.4 million to the Company. The loss is treated as a deferred expense item in the consolidated balance sheets and is charged to the consolidated statements of operations and retained earnings as a yield adjustment to the interest expense over the term of the mortgage (note 19). | ||
| The carrying amounts of cash equivalents, short-term investments, accounts receivable, sundry receivables, accounts payable and accrued liabilities approximate their fair market values because of the short-term nature of these instruments. | ||
| The fair values of the obligation under capital lease and mortgage payable approximate their carrying values. | ||
| The financial condition, operating results and cash flows of the Company may be materially and adversely impacted by a substantial weakening of the U.S. dollar against local currencies as the Company’s long-term debt and a significant amount of its operating expenses are paid in local currencies other than the U.S. dollar. | ||
| The Company enters into forward foreign exchange contracts (“Forwards”) to hedge its foreign currency exposure on expenses incurred for its Canadian operations. The Forwards obligate the Company to sell U.S. dollars for Canadian dollars in the future at predetermined exchange rates and are matched with anticipated future operating expenses in Canada. The Forwards do not subject the Company to risk from exchange rate movements because gains and losses on such contracts offset losses and gains on exposures being hedged. The counterparties to the Forwards are multinational commercial banks and, therefore, the credit risk of counterparty non-performance is low. | ||
46 ATI 2005
50 of 75
| As at August 31, 2005, the Company has $94.5 million Canadian dollars (2004 – Cdn. $35.0 million) outstanding in Forwards that mature in the next six months at an average exchange rate of 1.2579. All of the Forwards have become favorable to the Company since their inception and have an unrealized fair value of $4.7 million at August 31, 2005 (2004 – $1.3 million). | ||
| NOTE 3. | Less than | Greater than | ||||||||||||||||||||||||||||
| Short-term | one year | one year | Yield to | |||||||||||||||||||||||||||
| investments | 2005 | maturities | maturities | Total | maturity | |||||||||||||||||||||||||
| Portfolio investments | $ | 102,466 | $ | – | $ | 102,466 | 3.59%–3.61% | |||||||||||||||||||||||
| Corporate obligations | 47,607 | – | 47,607 | 2.17%–3.86% | ||||||||||||||||||||||||||
| Auction rate paper | 210,775 | – | 210,775 | 3.49%–3.80% | ||||||||||||||||||||||||||
| Term deposits/certificates of deposit | 2,522 | – | 2,522 | 3.20%–5.70% | ||||||||||||||||||||||||||
| $ | 363,370 | $ | – | $ | 363,370 | 2.17%–5.70% | ||||||||||||||||||||||||
| Less than | Greater than | |||||||||||||||||||||||||||||
| one year | one year | Yield to | ||||||||||||||||||||||||||||
| 2004 | maturities | maturities | Total | maturity | ||||||||||||||||||||||||||
| Portfolio investments | $ | 60,139 | $ | – | $ | 60,139 | 1.64%–2.19% | |||||||||||||||||||||||
| Corporate obligations | 16,051 | 25,918 | 41,969 | 1.42%–2.45% | ||||||||||||||||||||||||||
| Auction rate paper | 87,200 | – | 87,200 | 1.72%–1.85% | ||||||||||||||||||||||||||
| $ | 163,390 | $ | 25,918 | $ | 189,308 | 1.42%–2.45% | ||||||||||||||||||||||||
| At August 31, 2005 and 2004, the carrying value of short-term investments approximated their quoted market value. All short-term investments have a minimum credit rating of either A1 by Standard and Poor’s or P1 by Moody’s. | ||||||||||||||||||||||||||||||
| NOTE 4. | 2005 | 2004 | ||||||||||||||||||||||||||||
| Inventories | ||||||||||||||||||||||||||||||
| Raw materials | $ | 32,599 | $ | 44,882 | ||||||||||||||||||||||||||
| Work in process | 193,448 | 122,020 | ||||||||||||||||||||||||||||
| Finished goods | 122,162 | 87,965 | ||||||||||||||||||||||||||||
| $ | 348,209 | $ | 254,867 | |||||||||||||||||||||||||||
| At August 31, 2005, the Company had non-cancellable inventory purchase commitments totalling $223.6 million (2004 – $181.1 million). | ||||||||||||||||||||||||||||||
| NOTE 5. | Accumulated | Net book | ||||||||||||||||||||||||||||
| Capital assets | 2005 | Cost | depreciation | value | ||||||||||||||||||||||||||
| Land | $ | 2,968 | $ | – | $ | 2,968 | ||||||||||||||||||||||||
| Buildings | 17,198 | 2,906 | 14,292 | |||||||||||||||||||||||||||
| Building under capital lease | 33,268 | 7,574 | 25,694 | |||||||||||||||||||||||||||
| Laboratory and computer equipment | 86,118 | 45,090 | 41,028 | |||||||||||||||||||||||||||
| Computer software | 24,278 | 16,244 | 8,034 | |||||||||||||||||||||||||||
| Production equipment | 6,153 | 2,175 | 3,978 | |||||||||||||||||||||||||||
| Office equipment | 12,813 | 5,348 | 7,465 | |||||||||||||||||||||||||||
| Leasehold improvements | 14,110 | 4,694 | 9,416 | |||||||||||||||||||||||||||
| $ | 196,906 | $ | 84,031 | $ | 112,875 | |||||||||||||||||||||||||
ATI 2005 47
51 of 75
NOTES TO CONSOLIDATED FINANCIAL STATEMENTS(CONT.)
Years ended August 31, 2005, 2004 and 2003 (Tabular amounts in thousands of U.S. dollars, except per share amounts)
| Accumulated | Net book | ||||||||||||
| 2004 | Cost | depreciation | value | ||||||||||
| Land | $ | 1,506 | $ | – | $ | 1,506 | |||||||
| Building | 10,659 | 2,339 | 8,320 | ||||||||||
| Building under capital lease | 33,268 | 5,357 | 27,911 | ||||||||||
| Laboratory and computer equipment | 61,427 | 32,613 | 28,814 | ||||||||||
| Computer software | 17,010 | 12,531 | 4,479 | ||||||||||
| Production equipment | 2,745 | 1,769 | 976 | ||||||||||
| Office equipment | 8,901 | 3,554 | 5,347 | ||||||||||
| Leasehold improvements | 12,100 | 3,510 | 8,590 | ||||||||||
| $ | 147,616 | $ | 61,673 | $ | 85,943 | ||||||||
| Depreciation expense related to capital assets amounted to $22.7 million in fiscal 2005 (2004 – $19.9 million; 2003 – $23.9 million). | ||||||||||
| NOTE 6. Acquisitions | (a) On March 9, 2005, the Company acquired certain cable modem silicon intellectual property assets and certain employees of Terayon Communications Systems, Inc. (“Terayon”) for cash consideration of $11.3 million. Under the terms of the agreement, Terayon was eligible to receive additional consideration of up to $3.25 million, contingent upon achieving certain future deliverables. The purchase price was allocated to the net assets acquired, comprised of intangible assets of $13.3 million and other assets of $0.5 million based on their relative fair values at the date of acquisition. The useful life of intangible assets acquired ranges from one to three years. | |||||||||
| As at August 31, 2005, $2.5 million of the contingency was earned. This remaining contingency will be recorded when determinable. | ||||||||||
| (b) On February 24, 2005, the Company acquired CuTe Solutions Private Limited (“CuTe”) for cash consideration of $4.1 million. CuTe, a high-technology embedded solutions provider, is located in India. The acquisition was accounted for using the purchase method, whereby the results of operations of CuTe have been included in the consolidated statements of operations and retained earnings and cash flows from the date of acquisition. | ||||||||||
| The fair values of the net assets acquired were as follows: | ||||||||||
| Net assets: | ||||||
| Current assets, including cash of $41 | $ 159 | |||||
| Capital assets | 245 | |||||
| Core technology | 2,891 | |||||
| Other intangible | 1,100 | |||||
| Liabilities assumed | (248) | |||||
| Cash consideration | $ 4,147 | |||||
| Core technology and the other intangible are being amortized as follows: |
| Core technology | 2 years | |||||
| Other intangible | 8 months | |||||
| (c) On September 2, 2003, the Company acquired certain assets from AMI Technologies Corp., its exclusive sales organization for Taiwan and China since 1992, for cash consideration of $3.1 million. The purchase price was allocated to the net assets acquired, including intangible assets of $2.9 million, based on their relative fair values at the date of acquisition. The useful life of intangible assets acquired was approximately one year. | ||||||||||
48 ATI 2005
52 of 75
| On September 30, 2004, the Company acquired the remaining assets located in Taiwan and China from AMI Technologies Corp. for cash consideration of $1.6 million. This acquisition was accounted for as a business combination. The purchase price was allocated to the net assets acquired, comprising intangible assets of $1.6 million and other assets of $12,000, based on their relative fair values at the date of acquisition. The useful life of intangible assets acquired is approximately one year. (d) On September 1, 2004, the Company acquired certain assets of RT&C International (“RT&C”), its sales organization for South Korea, for cash consideration of $1.3 million. This acquisition was accounted for as a business combination. The purchase price was allocated to the net assets acquired, comprising intangible assets of $1.3 million and other assets of $37,000, based on their relative fair values at the date of acquisition. The useful life of the intangible assets acquired is approximately 16 months. Under the terms of the agreement, RT&C is eligible to receive cash consideration up to $1.5 million, contingent upon RT&C achieving future performance targets within one year after the closing date. As at August 31, 2005, $750,000 of the contingency was earned. No further amounts will be earned in connection with this contingency. | ||||||||||||||||||||||||||
| NOTE 7. | The net book values of intangible assets and goodwill acquired are as follows: | |||||||||||||||||||||||||
| Intangible assets | Accumulated | Net book | ||||||||||||||||||||||||
| and goodwill | 2005 | Cost | amortization | value | ||||||||||||||||||||||
| Core technology | $ | 38,226 | $ | 23,038 | $ | 15,188 | ||||||||||||||||||||
| Other | 9,298 | 6,855 | 2,443 | |||||||||||||||||||||||
| Total intangible assets | $ | 47,524 | $ | 29,893 | $ | 17,631 | ||||||||||||||||||||
| Goodwill | $ | 376,788 | $ | 186,693 | $ | 190,095 | ||||||||||||||||||||
| Accumulated | Net book | |||||||||||||||||||||||||
| 2004 | Cost | amortization | value | |||||||||||||||||||||||
| Purchased in-process R&D | $ | 56,250 | $ | 56,250 | $ | – | ||||||||||||||||||||
| Core technology | 23,670 | 18,112 | 5,558 | |||||||||||||||||||||||
| Other | 2,862 | 2,862 | – | |||||||||||||||||||||||
| Total intangible assets | $ | 82,782 | $ | 77,224 | $ | 5,558 | ||||||||||||||||||||
| Goodwill | $ | 376,788 | $ | 186,693 | $ | 190,095 | ||||||||||||||||||||
| Amortization expense related to intangible assets amounted to $8.9 million for fiscal 2005 (2004 – $6.1 million; 2003 – $10.8 million). | ||||||||||||||||||||||||||
| NOTE 8. | 2005 | 2004 | ||||||||||||||||||||||||
| Long-term | ||||||||||||||||||||||||||
| investments | Share investments | $ | 291 | $ | 2,751 | |||||||||||||||||||||
| Share investments consist of investments in other companies in which the Company has ownership interests ranging from approximately 0.8% to 13.2%. | ||||||||||||||||||||||||||
| (a) During fiscal 2005, the Company fully wrote down its 13.2% investment in a private technology-based company, originally acquired in fiscal 2003, in the amount of $2.5 million, to reflect the other than temporary decline in its value. | ||||||||||||||||||||||||||
| (b) During fiscal 2004, the Company acquired an additional 130,027 shares in one of its private technology-based companies for cash consideration of $0.1 million that was part of a round of financing | ||||||||||||||||||||||||||
ATI 2005 49
53 of 75
NOTES TO CONSOLIDATED FINANCIAL STATEMENTS(CONT.)
Years ended August 31, 2005, 2004 and 2003 (Tabular amounts in thousands of U.S. dollars, except per share amounts)
| that reduced the Company’s ownership in the investment from 1.0% to 0.8%. The Company subsequently wrote down the entire investment by the amount of $1.3 million to reflect an other than temporary decline in its value. | ||
| (c) During fiscal 2003, the Company disposed of all its shares in the two publicly traded companies, realizing a gain in the aggregate amount of $3.8 million. | ||
| Gains and losses from long-term investments are included in interest and other income, net, in the consolidated statements of operations and retained earnings. | ||
| NOTE 9. Credit facilities | At August 31, 2005, the Company had available bank credit facilities of $21.0 million. The credit facilities are secured by way of general security agreements and personal property, covering the cash, credit balances and deposit instruments of the Company. Interest rates on the credit facilities vary and are based on the bank’s U.S. base rate, Canadian bank prime rate, U.S. dollar best lending rate or the LIBOR rate. At August 31, 2005 and 2004, there were no borrowings outstanding under these facilities. | |
| Standby fees are calculated at rates of 0.125% to 0.2% per annum on the unused portion of the facilities. | ||
| NOTE 10. Deferred revenue | Deferred revenue includes $22.1 million (2004 – $28.8 million), which represents milestone payments made by or owing from certain customers in connection with custom development arrangements entered into by the Company. | |
| NOTE 11. | Interest rate | 2005 | 2004 | |||||||||
| Long-term debt | ||||||||||||
| Obligation under capital lease (a) | 6.31% | $ 19,077 | $ 18,049 | |||||||||
| Mortgage payable (b) | 6.96% | 11,885 | 11,575 | |||||||||
| 30,962 | 29,624 | |||||||||||
| Less current portion | 1,852 | 1,571 | ||||||||||
| $ 29,110 | $ 28,053 | |||||||||||
| (a) Obligation under capital lease The Company’s obligation under capital lease represents the lease on a building facility occupied by the Company in Markham, Ontario. The capital lease is denominated in Canadian dollars. As at August 31, 2005, the remaining amount outstanding on the capital lease was $19.1 million (Cdn. $22.7 million). |
(b) Mortgage payable On September 10, 2002, CVRH, a joint venture in which the Company has a 50.0% ownership interest, entered into a mortgage agreement with a lender to finance a building facility occupied by the Company. The Company’s proportionate share of the mortgage as at August 31, 2005 amounted to $11.9 million (Cdn. $14.1 million). The mortgage has a repayment term of 12 years and is denominated in Canadian dollars. |
50 ATI 2005
54 of 75
| (c) The Company’s obligations under this mortgage and capital lease are as follows: | ||||||||||||||
| Year ending August 31: | ||||||||||||||
| 2006 | $ | 3,817 | ||||||||||||
| 2007 | 3,903 | |||||||||||||
| 2008 | 4,024 | |||||||||||||
| 2009 | 4,024 | |||||||||||||
| 2010 | 4,024 | |||||||||||||
| Thereafter through 2017 | 23,579 | |||||||||||||
| Total minimum payments on long-term debt | 43,371 | |||||||||||||
| Less amount representing interest | 12,409 | |||||||||||||
| Present value of net minimum payments on long-term debt | 30,962 | |||||||||||||
| Less current portion of long-term debt | 1,852 | |||||||||||||
| $ | 29,110 | |||||||||||||
| Interest of $1.2 million and $0.9 million relating to the capital lease obligation and the mortgage payable, respectively, is included in interest expense for fiscal 2005 (2004 – $1.1 million and $0.9 million; 2003 – $1.1 million and $0.7 million). | ||||||||||||||
| NOTE 12. | (a) Common shares issued and outstanding | |||||||||||||
| Shareholders’ | Number | Amount | ||||||||||||
| equity | ||||||||||||||
| Outstanding, August 31, 2002 | 236,870,685 | $ | 561,477 | |||||||||||
| Issued for cash | 4,871,428 | 20,977 | ||||||||||||
| Outstanding, August 31, 2003 | 241,742,113 | 582,454 | ||||||||||||
| Issued for cash | 7,545,012 | 56,531 | ||||||||||||
| Outstanding, August 31, 2004 | 249,287,125 | 638,985 | ||||||||||||
| Issued for cash | 4,186,180 | 30,170 | ||||||||||||
| Repurchased and cancelled | (2,000,000) | (5,280) | ||||||||||||
| Stock option expense transferred from contributed surplus | ||||||||||||||
| due to exercise of stock options by employees | – | 1,691 | ||||||||||||
| Outstanding, August 31, 2005 | 251,473,305 | $ | 665,566 | |||||||||||
| In March 2005, the Board of Directors authorized a share repurchase program of up to 24.7 million common shares through a normal course issuer bid. In fiscal 2005, the Company repurchased and cancelled a total of two million shares for an aggregate cost of $23.9 million. If considered advisable, additional shares may be repurchased from time to time on the open market through March 29, 2006 at prevailing market prices. The timing and amount of purchases, if any, will be dependent upon the availability and alternative uses of capital, market conditions and other factors. |
| (b) Preferred shares An unlimited number of preferred shares, ranking in priority upon distribution of assets over common shares, may be issued in series with additional provisions as fixed by the Board of Directors. |
| No preferred shares have been issued to date. |
| (c) Common share option plans (i) The Company maintains a share option plan (the “ATI Plan”) for the benefit of management directors, officers and employees. The ATI Plan, as amended, provides that the aggregate number of common shares available for issuance pursuant to options granted under the ATI Plan and all other share compensation arrangements is limited to 47,000,000 common shares. In general, the maximum number of common shares reserved for issuance in respect of any one individual may not exceed 5.0%, or in respect of insiders of the Company, may not exceed 10.0%, of the number of common shares issued and outstanding. |
ATI 2005 51
55 of 75
NOTES TO CONSOLIDATED FINANCIAL STATEMENTS(CONT.)
Years ended August 31, 2005, 2004 and 2003 (Tabular amounts in thousands of U.S. dollars, except per share amounts)
| Options are granted under the ATI Plan at the discretion of the Board of Directors at exercise prices determined as the weighted average of the trading prices of the Company’s common shares on The Toronto Stock Exchange or NASDAQ for the five trading days preceding the effective date of the grant. In general, options granted under the ATI Plan vest over a period of up to four years from the grant date and expire by no later than the seventh anniversary of the date of grant. |
| Commencing the third quarter of fiscal 2005, the Company amended the ATI Plan to provide the Board of Directors with the discretion to award tandem stock appreciation rights (“tandem SARs”) in connection with all or a portion of the existing and future options granted under the ATI Plan. Tandem SARs provide an optionee with the right to surrender vested options for termination in return for common shares with a market value equal to the net proceeds that the optionee would have otherwise received had such optionee exercised the vested options and immediately sold the underlying shares. During the year ended August 31, 2005, tandem SARs were attached to new option grants only. Options subject to tandem SARs numbered 3,169,015 at August 31, 2005. |
| (ii) When the Company acquired ArtX, on April 4, 2000, it assumed the ArtX common shares options plan (the ”ArtX Plan”). No new options have been issued under this plan since the date of acquisition. The Company maintains the ArtX Plan for the benefit of former directors, officers, employees and consultants of ArtX. |
| (iii) Under an incentive plan entered into in June 2002, the Company provided certain employees with a performance incentive, consisting of a combination of cash and options, the receipt of which was conditional upon the Company entering into a specified business arrangement with a third party by April 2003, later extended to July 28, 2003. The cash portion of the incentive consisted of three equal payments of $2.7 million, with each payment to be made upon achievement of specified milestones under the arrangement with the third party. Under the plan, the employees were also granted options to purchase 2.6 million common shares at an exercise price of $6.96 per share. The options vest 25.0% on the first anniversary of the grant date and, thereafter, at 6.25% per quarter and are only exercisable in the event the Company is successful in entering into the aforementioned arrangement. In February 2003, the Company successfully entered into the business arrangement with the third party and all the conditions under the plan were determined to have been met in July 2003. As a result, the first payment of the cash portion of the incentive, in the amount of $2.7 million, was paid and included as compensation expense during 2003. The remaining two payments aggregating $5.4 million were accrued at August 31, 2003 and have been amortized over 18 months. During fiscal 2005, the amount recorded as compensation expense was $1.9 million (2004 – $3.5 million). |
| The following is a summary of the maximum number of common shares issuable pursuant to outstanding stock options: |
| 2005 | 2004 | 2003 | ||||||||||||||||
| Number of | Weighted | Number of | Weighted | Number of | Weighted | |||||||||||||
| options | average | options | average | options | average | |||||||||||||
| outstanding | price | outstanding | price | outstanding | price | |||||||||||||
| Options outstanding, | ||||||||||||||||||
| beginning of year | 27,883,127 | $ | 11.22 | 27,731,851 | $ | 8.31 | 32,813,005 | $ | 7.18 | |||||||||
| Grant of additional options | 5,354,205 | 15.95 | 8,639,607 | 16.21 | 907,550 | 4.89 | ||||||||||||
| Cancellation/expiry of options | (2,134,628) | 16.28 | (943,319) | 11.77 | (1,117,276) | 9.03 | ||||||||||||
| Exercise of options | (4,186,180) | 7.20 | (7,545,012) | 7.50 | (4,871,428) | 4.10 | ||||||||||||
| Options outstanding, end of year | 26,916,524 | $ | 13.14 | 27,883,127 | $ | 11.22 | 27,731,851 | $ | 8.31 | |||||||||
| Exercisable, end of year | 14,365,985 | $ | 10.81 | 13,771,306 | $ | 8.99 | 15,727,485 | $ | 8.35 | |||||||||
52 ATI 2005
56 of 75
| As at August 31, 2005, the ranges of exercise prices for options outstanding and exercisable (vested) are as follows: |
| Number of | Weighted | Weighted | Number | Weighted | ||||||||||||
| options | average | average | of options | average | ||||||||||||
| Price range | outstanding | life (years) | price | exercisable | price | |||||||||||
| $0.09–$0.93 | 758,566 | 4.24 | $ | 0.33 | 758,566 | $ | 0.33 | |||||||||
| $3.94–$5.86 | 4,037,257 | 2.74 | 5.75 | 3,806,507 | 5.82 | |||||||||||
| $6.13–$9.00 | 2,725,677 | 3.61 | 7.17 | 1,817,170 | 7.25 | |||||||||||
| $9.31–$13.54 | 3,948,598 | 2.86 | 11.89 | 3,097,584 | 11.69 | |||||||||||
| $14.47–$20.86 | 15,446,426 | 5.45 | 17.07 | 4,886,158 | 17.10 | |||||||||||
| 26,916,524 | 4.44 | $ | 13.14 | 14,365,985 | $ | 10.81 | ||||||||||
| As at August 31, 2005, the price range of $0.09 to $0.93, as noted above, represents all of the options unexercised relating to the ArtX Plan. All other options outstanding or exercisable relate to the ATI Plan. During the year ended August 31, 2005, 846,495 options relating to the ArtX Plan were exercised at a weighted average price of $0.33 and no options were cancelled. | ||||||||||||||||
| The weighted average estimated fair value at the date of grant for the options granted during fiscal 2005 was $8.04 per share (2004 – $8.96; 2003 – $2.65) . The fair value of each option granted was estimated on the date of the grant using the Black-Scholes option pricing model with the following assumptions: | ||||||||||||||||
| 2005 | 2004 | 2003 | |||||
| Risk-free interest rate | 3.7% | 3.7% | 3.1% | ||||
| Dividend yield | – | – | – | ||||
| Volatility factor of the expected market price of the Company’s common shares | 62.1% | 69.2% | 71.1% | ||||
| Expected life of the options | 4.1 years | 4.2 years | 4.2 years | ||||
| The estimated fair value of the stock options is amortized to expense on a straight-line basis over the options’ vesting period and the related expense for the year ended August 31, 2005 amounted to $34.0 million. The stock option expense by functional areas is as follows: |
| Cost of revenues | $ 1,774 | ||||
| Selling and marketing | 6,609 | ||||
| Research and development | 20,105 | ||||
| Administrative | 5,481 | ||||
| $ 33,969 | |||||
| (d) Restricted share units In October 2003, the Company adopted three plans to grant RSUs as part of its overall stock-based compensation plan. The RSU Plans allow participants to earn actual shares (or, for non-North American participants, the cash equivalent) of the Company over time, rather than options that give employees the right to purchase stock at a set price. The RSU Plans include: a plan for Canadian employees and directors; a plan for U.S. employees and directors; and a plan for all other employees and directors outside of North America. In accordance with the terms of the RSU Plans, the Board of Directors approves which employees and directors are entitled to participate in the respective plans and the number of RSUs to be awarded. Each RSU awarded conditionally entitles the participant to the delivery of one common share (or cash in lieu of such share for participants resident outside of North America) upon attainment of the RSU vesting period. RSUs awarded to participants vest in accordance with terms determined by the Board of Directors, which terms may include certain performance criteria in which the number of common shares (or cash in lieu of such common shares for participants resident outside of North America) to be delivered to a participant in respect of each RSU awarded is dependent upon the Company’s performance and/or market price of the common shares, as determined by the Board of Directors. At the time that RSUs are granted to participants in North America, the Board of Directors must determine whether the common shares to be delivered to participants upon the vesting of such RSUs will be purchased on the open market, issued from treasury or obtained from a combination of market purchases and treasury issuances. For participants outside of North America, if common shares are not issued from treasury, they are only entitled to receive a cash payment from the Company equal to the number of RSUs awarded to such participants multiplied by the value of the common shares on the NASDAQ Stock Market at the relevant vesting date. Each common share issued from treasury upon the vesting of such RSUs reduces the number of common shares available for issuance under the RSU plans. A total of three million common shares have been reserved for issuance from treasury under the RSU plans. RSUs that are satisfied through the purchase of common shares on the market vest over a maximum period ending December 31 of the third calendar year after the date of grant. Grants of RSUs to participants residing outside of North America are recognized at their face value, whereby the value of the RSUs and their related amortization are adjusted based on the underlying value of the Company’s common shares at the end of each fiscal quarter. |
ATI 2005 53
57 of 75
NOTES TO CONSOLIDATED FINANCIAL STATEMENTS(CONT.)
Years ended August 31, 2005, 2004 and 2003 (Tabular amounts in thousands of U.S. dollars, except per share amounts)
| During fiscal 2004, the Company granted a total of 1,556,244 RSUs to certain employees to replace the annual grant of options for the 2003 calendar year. The Company advanced $22.1 million to the trustee of the RSU plans to enable the trustee to purchase the Company’s common shares in the open market for future delivery of such shares to the participants on the vesting dates of the RSUs. The cost of the purchase of these shares is classified as treasury stock and presented as a reduction of shareholders’ equity in the Company’s consolidated balance sheets. In addition, the Company also awarded a onetime cash payment of $7.8 million to the non-executive employees who were eligible to participate in the RSU plans. The full amount of the cash payment was expensed in fiscal 2004. Of the RSUs granted, 42,327 were forfeited during fiscal 2004. |
| In fiscal 2005, 508,803 RSUs vested and were settled by delivery of common shares of the Company to the participants or by cash equivalent to their market value on the vesting date. At August 31, 2005, 983,033 common shares of the Company were held by the trustee. |
| During fiscal 2005, the Company started granting RSUs to its employees which are settled through the issuance of common shares of the Company from treasury. The number of RSUs granted in fiscal 2005 was 1,183,488 and the number of RSUs forfeited was 57,084. Of the RSUs granted in fiscal 2005, 1,084,723 are subject to performance-related factors which result in the number of common shares that may be issued upon the settlement of such RSUs at each vesting date being dependent on the Company achieving certain performance targets. As at August 31, 2005, there were 2,131,518 RSUs awarded and outstanding. |
| The total expenses incurred by functional area for fiscal 2005 and 2004 pertaining to the amortization of RSUs are summarized in the following table: |
| 2005 | 2004 | ||||||||
| Cost of revenues | $ 961 | $ 16 | |||||||
| Selling and marketing | 1,271 | 1,000 | |||||||
| Research and development | 5,008 | 4,423 | |||||||
| Administrative | 1,054 | 961 | |||||||
| $ 8,294 | $ 6,400 | ||||||||
54 ATI 2005
58 of 75
| (e) Deferred share units During fiscal 2004, the Company established a plan to grant DSUs to its non-management directors. This plan was retroactively applied and 51,457 DSUs were granted for service related to fiscal 2003. Under this plan, the directors will receive DSUs, in addition to cash payments, as part of their annual compensation package. A DSU is a unit equivalent in value to one common share of the Company based on the five-day average trading price of the Company’s common shares on NASDAQ (the “Weighted Average Price”) immediately prior to the date on which the value of the DSU is determined. DSUs vest quarterly over a period of one year and may not be redeemed until the director leaves the board, thereby providing an ongoing equity stake in the Company throughout the director’s period of service. On termination or retirement from the Board, directors will be able to redeem DSUs during the six-month period following their departure from the Board. DSUs, however, must be redeemed prior to the end of the year following departure from the Board, based on the Weighted Average Price at the time of redemption. Alternatively, a director may elect to receive RSUs in lieu of DSUs provided the market value of his holdings in the Company’s common stock equity is greater than $350,000. DSUs granted during fiscal 2005 numbered 40,625 (2004 – 40,625). As at August 31, 2005, there were 132,707 DSUs outstanding, of which 109,009 were vested. As of the date of the grant, the fair values of the DSUs outstanding, being the fair market value of the Company’s common shares at that date, are recorded as a liability on the Company’s consolidated balance sheet and are amortized over the one-year vesting period of the DSU. The value of the DSU liability is adjusted to reflect changes in the market value of the Company’s common shares. The expense for fiscal 2005 related to DSUs granted to the directors for services rendered was $0.2 million (2004 – $1.2 million). (f) Contributed surplus During fiscal 2005, a net total of $51.1 million was added to contributed surplus, of which $17.5 million related to the change in accounting for stock-based compensation (note 1(o)), $34.0 million and $8.1 million related to the amortization of stock option expense and RSU expense, respectively, and $0.4 million related to the tax effect on the stock option expense. The above increase was partly offset by $7.2 million worth of RSUs granted to employees that were exchanged for common shares upon vesting of the RSUs and $1.7 million pertaining to the amortization of stock option expense being reclassified to the share capital account as the related options were exercised during 2005. During 2004, a total of $5.8 million was added to contributed surplus relating to the amortization of RSU expenses for the employees residing in North America. |
| NOTE 13. | Income (loss) before income taxes consist of the following: | |||||||||||||||
| Income taxes | 2005 | 2004 | 2003 | |||||||||||||
| Income (loss) before income taxes: | ||||||||||||||||
| Canadian | $ | (10,587) | $ | 51,682 | $ | 2,081 | ||||||||||
| Foreign | 48,245 | 198,941 | 44,889 | |||||||||||||
| Income before income taxes | $ | 37,658 | $ | 250,623 | $ | 46,970 | ||||||||||
| The income tax expense (recovery) consists of the following: | ||||||||||||||||
| 2005 | 2004 | 2003 | ||||||||||||||
| Current: | ||||||||||||||||
| Canadian | $ | 9,690 | $ | 28,586 | $ | 9,572 | ||||||||||
| Foreign | 23,878 | 19,513 | 3,971 | |||||||||||||
| Future: | ||||||||||||||||
| Canadian | (4,458) | (802) | 2,234 | |||||||||||||
| Foreign | (8,381) | (1,473) | (4,036) | |||||||||||||
| Income tax expense | $ | 20,729 | $ | 45,824 | $ | 11,741 | ||||||||||
ATI 2005 55
59 of 75
NOTES TO CONSOLIDATED FINANCIAL STATEMENTS(CONT.)
Years ended August 31, 2005, 2004 and 2003 (Tabular amounts in thousands of U.S. dollars, except per share amounts)
| The following is a summary of the components of the future tax assets and liabilities: |
| 2005 | 2004 | |||||||||
| FUTURE INCOME TAXES | ||||||||||
| Assets: | ||||||||||
| Capital assets | $ | 10,597 | $ | 4,320 | ||||||
| Reserves | 7,334 | 11,399 | ||||||||
| Tax loss carryforwards and undeducted R&D pools | 97,310 | 65,044 | ||||||||
| Stock-based compensation | 10,568 | 2,483 | ||||||||
| Other | 7,252 | 6,652 | ||||||||
| Total gross future tax assets | 133,061 | 89,898 | ||||||||
| Valuation allowance | (82,304) | (61,252) | ||||||||
| Net future tax assets | 50,757 | 28,646 | ||||||||
| Liabilities: | ||||||||||
| Capital assets | 14,097 | 15,732 | ||||||||
| Investment tax credits | 22,204 | 17,597 | ||||||||
| Intangible assets | 177 | 367 | ||||||||
| Deferred revenue | 5,204 | 2,256 | ||||||||
| Other | – | 190 | ||||||||
| Total gross future tax liabilities | 41,682 | 36,142 | ||||||||
| Net future tax assets (liabilities) | $ | 9,075 | $ | (7,496) | ||||||
| Net future tax assets (liabilities) are classified for balance sheet purposes as follows: | ||||||||||
| 2005 | 2004 | |||||||||
| Current assets | $ | 5,348 | $ | 8,022 | ||||||
| Long-term assets | 12,588 | 1,114 | ||||||||
| Long-term liabilities | (8,861) | (16,632) | ||||||||
| $ | 9,075 | $ | (7,496) | |||||||
| Income tax expense in the consolidated statements of operations and retained earnings varies from the amount that would be computed by applying the basic Canadian federal and provincial income tax rates to income before income taxes, as shown in the following table. |
| 2005 | 2004 | 2003 | |||||||||||
| Income before income taxes | $ | 37,658 | $ | 250,623 | $ | 46,970 | |||||||
| Income taxes at Canadian rates | $ | 13,557 | $ | 85,212 | $ | 17,379 | |||||||
| Tax effect of: | |||||||||||||
| Utilization of provincial research | |||||||||||||
| and development tax incentives | (5,673) | (3,008) | (2,076) | ||||||||||
| Foreign exchange | (12,070) | (7,787) | (8,704) | ||||||||||
| Tax rate differences of foreign jurisdictions | 3,939 | (41,242) | 8,348 | ||||||||||
| Change in valuation allowance for future tax assets | 21,052 | 21,657 | (691) | ||||||||||
| Tax effect related to stock options | 3,649 | (6,731) | (1,926) | ||||||||||
| Change in tax rates | (986) | (1,029) | 221 | ||||||||||
| Other | (2,739) | (1,248) | (810) | ||||||||||
| Income taxes | $ | 20,729 | $ | 45,824 | $ | 11,741 | |||||||
| No provision for Canadian income taxes was made for undistributed income for certain non-Canadian subsidiaries. The Company intends to reinvest this income indefinitely in operations outside Canada. |
| As at August 31, 2005, the Company had $58.9 million of net operating losses for income tax purposes. Income tax benefits have not been recognized in these financial statements for a significant portion of these losses. These losses will begin to expire commencing in fiscal 2010. |
56 ATI 2005
60 of 75
| NOTE 14. | The following table presents a reconciliation of the numerators and denominators used in the calculations of the basic and diluted net income per share: | |||||||||||||||||||||
| Net income per share | 2005 | 2004 | 2003 | ||||||||||
| Net income | $ 16,929 | $ 204,799 | $ 35,229 | ||||||||||
| Weighted average number of common | |||||||||||||
| shares outstanding (000s): | |||||||||||||
| Basic | 250,680 | 245,257 | 238,251 | ||||||||||
| Effect of stock options | 7,634 | 10,951 | 6,102 | ||||||||||
| Diluted | 258,314 | 256,208 | 244,353 | ||||||||||
| Net income per share: | |||||||||||||
| Basic | $0.07 | $0.84 | $0.15 | ||||||||||
| Diluted | 0.07 | 0.80 | 0.14 | ||||||||||
| As at August 31, 2005, options to purchase 8,556,598 shares (2004 – 5,167,670; 2003 –16,154,211) of common stock were outstanding but were not included in the calculation of diluted net income per share because to do so would have been anti-dilutive. | ||||||||||||||
| NOTE 15. Guarantees | The Company and other owners of CVRH have jointly and severally provided a guarantee for the mortgage payment on a building facility occupied by the Company. In the event that CVRH is unable to meet the underlying mortgage payment to the lender, the Company and other owners of CVRH will be jointly and severally responsible under this guarantee. | |||||||||||||
| In addition, the Company posted a letter of credit in the amount of $2.5 million (Cdn. $3.0 million) in favour of CVRH. CVRH has assigned this letter of credit to the exclusive benefit of the lender as additional security of the mortgage. The letter of credit has a term of five years and will expire on November 5, 2007. In the event of a lease default by the Company, the proceeds of the letter of credit will be paid to the lender. | ||||||||||||||
| NOTE 16. Other charges (recoveries) | Other charges (recoveries) include the following items: | |||||||||||||
| 2005 | 2004 | 2003 | ||||||||||||
| Settlement of class action lawsuits (a) | $ – | $ – | $ 4,670 | |||||||||||
| Regulatory matters (b) | 2,508 | 1,885 | 5,828 | |||||||||||
| Restructuring charge (recovery) – | ||||||||||||||
| European operations (c) | – | (725) | 6,542 | |||||||||||
| Lease exit charge (recovery) (d) | – | (1,464) | 2,684 | |||||||||||
| Settlement of patent litigation with | ||||||||||||||
| Cirrus Logic, Inc. (e) | – | – | 9,000 | |||||||||||
| $ 2,508 | $ (304) | $ 28,724 | ||||||||||||
| (a) Settlement of class action lawsuits On February 7, 2003, the Company announced that it had reached an agreement for the full and complete settlement of all remaining claims alleged in the shareholder class action lawsuits filed in May 2001 in the United States District Court for the Eastern District of Pennsylvania for a cash payment of $8.0 million. This litigation related to alleged misrepresentations and omissions made by the Company and certain directors and officers during a period preceding its May 2000 earnings warning. The terms of the Stipulation and Agreement of Settlement received final Court approval on April 28, 2003 and included no admission of liability or wrongdoing by the Company or other defendants. During fiscal 2003, the Company received $3.3 million from its insurer as its contribution towards the settlement. |
ATI 2005 57
61 of 75
NOTES TO CONSOLIDATED FINANCIAL STATEMENTS(CONT.)
Years ended August 31, 2005, 2004 and 2003 (Tabular amounts in thousands of U.S. dollars, except per share amounts)
| (b) Regulatory matters On January 16, 2003, the staff of the Ontario Securities Commission (the “OSC”) filed a notice of hearing and statement of allegations (the ”Notice”). The Notice alleged that the Company failed to disclose information concerning the shortfall in revenues and earnings that occurred in the third quarter of fiscal 2000, as required by the listing rules of The Toronto Stock Exchange. The Notice also alleged that the Company made a misleading statement to the staff of the OSC in August 2000 regarding the events leading up to the disclosure on May 24, 2000 of the shortfall. Seven individuals were named in the Notice. The Notice alleged that six of these individuals, including K.Y. Ho, the Chairman and then Chief Executive Officer of the Company, engaged in insider trading contrary to the Securities Act (Ontario). On March 29, 2005, a panel of the OSC approved a settlement agreement reached between the Company and OSC staff. As part of the settlement, the Company agreed to pay Cdn. $900,000 in costs and settlement payments and agreed to provide a letter of comfort confirming its practices and procedures related to trading and corporate governance. The individuals named in the Notice, other than Mr. Ho and his wife, also entered into settlement agreements with the OSC. In October 2005, a panel of three commissioners of the OSC (including the Vice-Chair of the OSC) dismissed all allegations of insider trading against K.Y. Ho and his wife. The panel’s decision completely exonerated Mr. Ho and his wife. The decision was made following a hearing which was held by the OSC panel in the spring of 2005. |
| (c) Restructuring charge (recovery) – European operations The following table details the activity through the restructuring liabilities accrual: |
| 2005 | 2004 | ||||||||
| Balance, beginning of year | $ 18 | $ 4,246 | |||||||
| Recovery | – | (187) | |||||||
| Cash payments | (18) | (4,041) | |||||||
| Balance, end of year | $ – | $ 18 | |||||||
| (i) During the second quarter of fiscal 2003, the Company announced the closure of ATI Technologies (Europe) Limited (“ATEL”), its subsidiary in Dublin, Ireland, and recorded a pre-tax charge of $2.8 million. The charge included a $1.4 million write-down of ATEL’s building facility to estimated fair value less cost to sell. The Company completed the major components of the exit plan for ATEL in July 2003. During fiscal 2004, the Company was able to sell ATEL’s building facility at a higher price than originally estimated, resulting in a recovery of $0.5 million from the restructuring charge. The Company also paid out the remaining cash portion of the restructuring charge of $0.5 million during fiscal 2004. |
| (ii) During the fourth quarter of fiscal 2003, the Company decided to close the operations of ATI Research GmbH, its FireGL product division located in Starnberg, Germany, in order to consolidate its research and development activities. As a result, the Company recorded a pre-tax charge of $3.8 million for the quarter pertaining to the closure of ATI Research GmbH. During fiscal 2004, the Company recovered $0.2 million related to the restructuring charge of ATI Research GmbH. During fiscal 2004, the Company made a cash payment of $3.5 million relating to the pre-tax charge recorded in fiscal 2003. The Company completed the major components of its exit plan for ATI Research GmbH in December 2003. During fiscal 2005, the Company paid off the remaining balance of $18,000 relating to the restructuring liabilities accrual. |
| (d) Lease exit charge (recovery) During the second quarter of fiscal 2003, the Company determined that it would exit the two leased properties located in Markham, Ontario. As a result, the Company recognized the fair value of the future net costs related to the leases in the amount of $2.4 million as a charge in the second quarter. During the fourth quarter of fiscal 2003, the Company recorded an additional charge of $0.3 million related to the exit costs of the above-mentioned lease properties due to a change in estimate of the fair value of the future net costs. |
58 ATI 2005
62 of 75
| During fiscal 2004, the Company determined that it would re-occupy the two leased properties, due to an expansion of business. This resulted in a reduction of the previously accrued exit charge liability in the amount of $1.5 million. | ||||||||||||||||||||||||||||||||||||||
| (e) Settlement of patent litigation with Cirrus Logic, Inc. Subsequent to the fiscal 2003 year-end, the Company and Cirrus Logic, Inc. (“Cirrus”) announced that they had entered into a cross-license agreement and had settled all outstanding litigation between the companies related to certain patent infringement lawsuits. | ||||||||||||||||||||||||||||||||||||||
| Under the settlement agreement, all outstanding claims and counterclaims in the lawsuits between the Company and Cirrus were dismissed. In connection with the settlement, Cirrus transferred to the Company a portion of its patent portfolio relating to the former graphics products group of its PC products division, a business that Cirrus exited several years ago, for a cash payment of $9.0 million from the Company. | ||||||||||||||||||||||||||||||||||||||
| NOTE 17. Segmented information | The Company designs and manufactures innovative 3D graphics and digital media silicon solutions. The Company determined in the first quarter of fiscal 2005 that it operates in two reportable segments: Personal Computer (“PC”) and Consumer. The PC segment includes all 3D graphics, video and multimedia products and chipsets which are developed for use in desktop and notebook personal computers including professional workstations, servers and home media PCs. The Consumer segment includes products used in mobile phones, PDAs, DTVs and set-top boxes. The Consumer segment also includes royalties and contract engineering services derived from mobile phone and game console products. Previously, the Company reported as a single reportable segment. Fiscal 2004 and 2003 amounts have been presented below based on the reportable segments identified in 2005. | |||||||||||||||||||||||||||||||||||||
| The Company’s management evaluates segment performance based on revenue and on operating income (loss) which is calculated as income (loss) from operations before taxes, excluding expenses related to stock-based compensation, amortization of intangible assets and other charges. | ||||||||||||||||||||||||||||||||||||||
| The Company does not identify or allocate total assets by reportable segment. In addition, there are no inter-segment revenues. The accounting policies for all operating segments are the same as those described in the summary of significant accounting policies. | ||||||||||||||||||||||||||||||||||||||
| The following table presents the revenues and operating income (loss) of the two reportable segments for the years ended August 31, 2005, 2004 and 2003: | ||||||||||||||||||||||||||||||||||||||
| Consolidated | PC | Consumer | ||||||||||||||||||||||||||||||||||||
| 2005 | 2004 | 2003 | 2005 | 2004 | 2003 | 2005 | 2004 | 2003 | ||||||||||||||||||||||||||||||
| Revenues | $2,222,509 | $1,996,717 | $1,385,293 | $1,905,759 | $1,765,595 | $1,328,390 | $316,750 | $231,122 | $ 56,903 | |||||||||||||||||||||||||||||
| Operating | ||||||||||||||||||||||||||||||||||||||
| income (loss) | 78,750 | 263,125 | 83,978 | 47,248 | 247,514 | 109,323 | 31,502 | 15,611 | (25,345) | |||||||||||||||||||||||||||||
| The following table reconciles total operating income for reportable segments to income from operations as reported in the Consolidated Statement of Operations and Retained Earnings: | ||||||||||||||||||||||||||||||||||||||
| 2005 | 2004 | 2003 | ||||||
| Total operating income for reportable segments | $ 78,750 | $ 263,125 | $ 83,978 | |||||
| Unallocated amounts: | ||||||||
| Amortization of intangible assets | (8,919 | ) | (6,115 | ) | (10,767 | ) | ||
| Stock-based compensation expense | (42,504 | ) | (7,583 | ) | -- | |||
| Other (charges) recoveries | (2,508 | ) | 304 | (28,724 | ) | |||
| Income from operations in | ||||||||
| Consolidated Statement of Operations | $ 24,819 | $ 249,731 | $ 44,487 | |||||
ATI 2005 59
63 of 75
NOTES TO CONSOLIDATED FINANCIAL STATEMENTS(CONT.)
Years ended August 31, 2005, 2004 and 2003 (Tabular amounts in thousands of U.S. dollars, except per share amounts)
| The following tables provide revenues by geographic area, as well as capital assets, intangible assets and goodwill by geographic area. The breakdown in revenues by geographic area in the following table is based on customer and royalty payer location, whereas the breakdown in capital assets, intangible assets and goodwill is based on physical location. |
| 2005 | 2004 | 2003 | |||||||||||||
| Revenues: | |||||||||||||||
| Canada | $ 20,359 | $ 22,439 | $ 20,065 | ||||||||||||
| United States | 253,594 | 257,542 | 258,545 | ||||||||||||
| Europe | 82,817 | 95,287 | 113,193 | ||||||||||||
| Asia-Pacific | 1,865,739 | 1,621,449 | 993,490 | ||||||||||||
| Consolidated revenues | $2,222,509 | $1,996,717 | $1,385,293 | ||||||||||||
| 2005 | 2004 | ||||||||||||||
| Capital and intangible assets and goodwill: | |||||||||||||||
| Canada | $ 98,602 | $ 73,863 | |||||||||||||
| United States | 212,348 | 206,147 | |||||||||||||
| Europe | 231 | 165 | |||||||||||||
| Asia-Pacific | 9,420 | 1,421 | |||||||||||||
| Consolidated capital, intangible assets and goodwill | $ 320,601 | $ 281,596 | |||||||||||||
| At August 31, 2005, one of the Company’s customers accounted for 12.0% of consolidated accounts receivable balance (2004 – no customer accounted for 10.0% or more). In fiscal 2005, one customer accounted for 10.7% and another customer accounted for 10.3% of consolidated revenues (2004 – one customer accounted for 10.6%; 2003 – three customers accounted for 16.2%, 13.0% and 10.6%, respectively). | ||||||||||||||||||||||||||
| NOTE 18. Commitments | The Company is committed to the following minimum payments related to office premises and license and royalty agreements: | |||||||||||||||||||||||||
| License and | |||||||||||||||
| Office | royalty | ||||||||||||||
| Year ending August 31 | premises | agreements | Total | ||||||||||||
| 2006 | $ 10,640 | $ 16,301 | $ 26,941 | ||||||||||||
| 2007 | 9,774 | 11,163 | 20,937 | ||||||||||||
| 2008 | 9,088 | 7,505 | 16,593 | ||||||||||||
| 2009 | 8,256 | 619 | 8,875 | ||||||||||||
| 2010 | 6,946 | – | 6,946 | ||||||||||||
| 2011 and thereafter | 7,611 | – | 7,611 | ||||||||||||
| NOTE 19. Joint venture | In February 1999, the Company entered into a 50.0% ownership joint venture agreement for the purpose of constructing a new building facility in Markham, Ontario. The building facility was completed in April 2002 and is fully occupied by the Company. The completed cost of the building facility amounted to $33.3 million. |
60 ATI 2005
64 of 75
| The following amounts represent the Company’s proportionate interest in the joint venture: | ||||||||||
| 2005 | 2004 | |||||||||
| Condensed balance sheet information: | ||||||||||
| Current assets | $ | 1,470 | $ | 1,473 | ||||||
| Other current liabilities | (1,278) | (897) | ||||||||
| Long-term debt | (10,932) | (10,769) | ||||||||
| Condensed cash flows: | ||||||||||
| Financing activities | $ | (1,261) | $ | (967) | ||||||
| Operating activities | 1,124 | 23 | ||||||||
| On May 23, 2001, the joint venture entered into an interest rate swap contract to hedge its exposure to the interest rate risk applicable to its expected future mortgage requirement. This contract was a forward start pay fixed derivative agreement for a notional amount of Cdn. $38.0 million. The agreement provided for the joint venture to pay a fixed rate of 6.42% in exchange for a floating rate equivalent to one-month Canadian bankers’ acceptances. The Company and the other joint venture partners are guarantors of the credit facility. This interest rate swap contract closed on September 10, 2002, resulting in a proportionate loss of $1.4 million to the Company. The loss was charged to the consolidated statements of operations and retained earnings as a yield adjustment to the interest expense over the term of the mortgage. | ||||||||||||||||||||||||||
| NOTE 20. | 2005 | 2004 | 2003 | |||||||||||||||||||||||
| Supplemental cash | ||||||||||||||||||||||||||
| flow information | Supplemental cash flow information: | |||||||||||||||||||||||||
| Interest paid | $ 1,990 | $ 1,946 | $ 1,739 | |||||||||||||||||||||||
| Interest received | 12,421 | 4,358 | 2,902 | |||||||||||||||||||||||
| Income taxes paid | 2,960 | 1,653 | 2,127 | |||||||||||||||||||||||
| NOTE 21. Canadian and United States accounting policies differences | (a) The following table reconciles net income for the year as reported on the consolidated statements of operations and retained earnings prepared in accordance with Canadian GAAP to the consolidated net income for the year that would have been reported had the financial statements been prepared in accordance with U.S. GAAP: | |||||||||||||||||||||||||
| 2005 | 2004 | 2003 | ||||||||||||||||||||||||
| Net income in accordance with Canadian GAAP | $ 16,929 | $ 204,799 | $ 35,229 | |||||||||||||||||||||||
| Amortization of purchased in-process R&D (a)(i) | – | – | 4,417 | |||||||||||||||||||||||
| Expenses related to stock options (a)(ii) | 33,969 | – | – | |||||||||||||||||||||||
| Stock-based compensation expenses (a)(iii), (a)(iv) | (1,458) | (9,579) | (25,486) | |||||||||||||||||||||||
| Tax effect of stock options (a)(ii), (a)(iii), (a)(vi) | (7,876) | (7,291) | (2,083) | |||||||||||||||||||||||
| Other (a)(v) | 112 | 112 | 94 | |||||||||||||||||||||||
| Net income in accordance with U.S. GAAP | $ 41,676 | $ 188,041 | $ 12,171 | |||||||||||||||||||||||
| Net income per share in accordance with U.S. GAAP: | ||||||||||||||||||||||||||
| Basic | $0.17 | $0.77 | $0.05 | |||||||||||||||||||||||
| Diluted | 0.16 | 0.73 | 0.05 | |||||||||||||||||||||||
| Weighted average number of shares (000s): | ||||||||||||||||||||||||||
| Basic | 250,680 | 245,257 | 238,251 | |||||||||||||||||||||||
| Diluted | 258,314 | 256,208 | 244,353 | |||||||||||||||||||||||
ATI 2005 61
65 of 75
NOTES TO CONSOLIDATED FINANCIAL STATEMENTS(CONT.)
Years ended August 31, 2005, 2004 and 2003 (Tabular amounts in thousands of U.S. dollars, except per share amounts)
| (i) Under Canadian GAAP, purchased in-process R&D is capitalized and amortized over its estimated useful life. Asset recoverability is reviewed on an ongoing basis. Under U.S. GAAP, purchased in-process R&D is written off at the time of acquisition. |
| (ii) Under Canadian GAAP, effective September 1, 2004, the Company adopted the fair value method of recognizing stock-based compensation. For U.S. GAAP purposes, the intrinsic value method is used to account for stock-based compensation for employees. Compensation expense of $34.0 million (note 12(c)) recognized under Canadian GAAP would not be recognized under U.S. GAAP for the year ended August 31, 2005. In addition, the retroactive adoption of the policy described in note 1(o)(i) would not be recognized. The exercise price of stock options is equal to the market value of the underlying shares at the date of grant; therefore, except as indicated below, there is no expense under the intrinsic method for U.S. GAAP purposes for fiscal 2005. As described in note 12(c)(i), the Company granted tandem SARs. These awards have been accounted for using the fair value method under Canadian GAAP. For U.S. GAAP purposes, variable plan accounting under the intrinsic method is used to account for tandem SARs. Under variable plan accounting, compensation expense is adjusted to reflect increases in the market value of the Company’s common shares to the measurement date. There is no compensation expense under U.S. GAAP for the tandem SARs in fiscal 2005, as the exercise price for the awards exceeds the market price at year-end. |
| (iii) Under U.S. GAAP, options granted after January 18, 2001, with an exercise price denominated in a currency other than the currency of the primary economic environment of either the employer or the employee, are required to be accounted for under the variable plan method. During the period from January 19, 2001 to February 28, 2002, certain options were granted with exercise prices in Canadian dollars. Under Canadian GAAP, there is no equivalent requirement. There were no such options granted after February 28, 2002. |
| (iv) Under U.S. GAAP, the intrinsic value of the stock options issued under the incentive plan entered into in June 2002 (note 12(c)(iii)) is calculated as the increase in the Company’s stock price between the grant date and the date on which all the conditions of the specified business arrangement were determined to have been met. The compensation expense is recognized over the vesting period of the options. Under Canadian GAAP, there is no equivalent requirement. |
| (v) Under Canadian GAAP, loss on a hedging transaction is allowed to be amortized over the term of the mortgage. Under U.S. GAAP, loss on a hedging transaction is written off when the hedge is determined to be ineffective. |
| (vi) The Company accounts for its share options under the provisions of the Accounting Principles Board Opinion No. 25, “Accounting for Stock Issued to Employees” (“APB 25”), and related interpretations. Accordingly, for U.S. GAAP purposes, compensation expense for its share option plans, based on the intrinsic value, has been recorded in the reconciliation above for all periods presented. For U.S. GAAP purposes, had compensation expense for the Company’s share option plans been determined based on the fair value at the grant dates for awards under the plans consistent with the method prescribed under Financial Accounting Standards Board (“FASB”) Statement of Financial Accounting Standards (“SFAS”) No. 123, “Accounting for Stock-based Compensation,” the Company’s net income and net income per share would have been reported as the pro forma amounts indicated in the table below: |
62 ATI 2005
66 of 75
| 2005 | 2004 | 2003 | ||||||||
| Net income in accordance with | ||||||||||
| U.S. GAAP, as reported above | $ 41,676 | $ 188,041 | $ 12,171 | |||||||
| Stock compensation (a)(iii) and (iv) | 1,458 | 9,579 | 25,486 | |||||||
| Pro forma adjustment for SFAS No. 123 | (35,044 | ) | (22,009 | ) | (16,700 | ) | ||||
| Pro forma net income | $ 8,090 | $ 175,611 | $ 20,957 | |||||||
| Pro forma net income per share: | ||||||||||
| Basic | $ 0.03 | $ 0.72 | $ 0.09 | |||||||
| Diluted | 0.03 | 0.69 | 0.09 | |||||||
| The weighted average estimated fair values at the date of the grant, as defined by SFAS No. 123, for options granted in fiscal 2005, 2004 and 2003 were $8.04, $8.96 and $2.65 per share option, respectively. The fair value of each option grant was estimated on the date of the grant using the Black-Scholes fair value option pricing model with the following assumptions: |
| 2005 | 2004 | 2003 | ||||||||
| Risk-free interest rate | 3.7 | % | 3.7 | % | 3.1 | % | ||||
| Dividend yield | -- | -- | -- | |||||||
| Volatility factor of the expected market price of the Company’s common shares | 62.1 | % | 69.2 | % | 71.1 | % | ||||
| Expected life of the options | 4.1 years | 4.2 years | 4.2 years | |||||||
| For the purposes of pro forma disclosures, the estimated fair value of the options is amortized to expense on a straight-line basis over the options’ vesting period. |
(b) The following table indicates the differences between the amounts of certain consolidated balance sheet items determined in accordance with Canadian and U.S. GAAP: |
| 2005 | 2004 | |||||||||||||
| U.S. GAAP | Canadian GAAP | Difference | U.S. GAAP | Canadian GAAP | Difference | |||||||||
|---|---|---|---|---|---|---|---|---|---|---|---|---|---|---|
| Assets: | ||||||||||||||
| Prepayments and sundry receivables (a)(v) | $ 28,085 | $ 24,463 | $ 3,622 | $ 22,512 | $ 22,395 | $ 117 | ||||||||
| Goodwill (b)(v) | 170,367 | 190,095 | (19,728 | ) | 170,367 | 190,095 | (19,728 | ) | ||||||
| Future income tax assets -- long-term | 4,824 | 12,588 | (7,764 | ) | -- | -- | -- | |||||||
| Liabilities and shareholders' equity: | ||||||||||||||
| Share capital | 656,454 | 665,566 | (9,112 | ) | 627,283 | 638,985 | (11,702 | ) | ||||||
| Contributed surplus | 48,725 | 61,795 | (13,070 | ) | 46,466 | 10,704 | 35,762 | |||||||
| Retained earnings | 314,496 | 293,370 | 21,126 | 291,361 | 308,825 | (17,464 | ) | |||||||
| Accumulated other comprehensive income | 4,669 | -- | 4,669 | 1,276 | -- | 1,276 | ||||||||
| Currency translation adjustments | (19,209 | ) | 8,274 | (27,483 | ) | (19,209 | ) | 8,274 | (27,483 | ) | ||||
ATI 2005 63
67 of 75
NOTES TO CONSOLIDATED FINANCIAL STATEMENTS(CONT.)
Years ended August 31, 2005, 2004 and 2003 (Tabular amounts in thousands of U.S. dollars, except per share amounts)
| (i) Canadian GAAP requires the proportionate consolidation of interests in joint ventures. Proportionate consolidation is not permitted under U.S. GAAP and interests in joint ventures are accounted for in accordance with the equity basis of accounting. |
| Although the adoption of proportionate consolidation has no impact on net income or shareholders’ equity, it does increase assets, liabilities, revenue, expenses and cash flows from operations from those amounts otherwise reported under U.S. GAAP. As allowed for under the rules of the Securities and Exchange Commission, this difference has not been reflected in the table of certain consolidated balance sheet items presented above. |
| (ii) Additional disclosures as required in accordance with U.S. GAAP: |
| (A) As at August 31, 2005, the consolidated accounts receivable provision for returns and doubtful accounts was approximately $22.4 million (2004 – $17.1 million). |
| (B) As at August 31, 2005, sales rebates payable represent 24.8% of total consolidated current liabilities (2004 – 22.0%) . |
| (C) For the year ended August 31, 2005, the net foreign exchange gain was approximately $1.2 million (2004 – gain of $0.5 million; 2003 – gain of $0.8 million). |
| (D) For the year ended August 31, 2005, the advertising costs incurred by the Company were approximately $27.5 million (2004 – $22.5 million; 2003 – $14.0 million). |
| (iii) Comprehensive income: |
| SFAS No. 130, “Reporting Comprehensive Income,” requires disclosure of comprehensive income, which includes reported net income adjusted for other comprehensive income. Other comprehensive income is defined as the change in equity of a business enterprise during a period from transactions and other events and circumstances from non-owner sources. The following table presents comprehensive income and its components: |
| 2005 | 2004 | 2003 | ||||||
| Net income in accordance with U.S. GAAP | $41,676 | $188,041 | $12,171 | |||||
| Other comprehensive income: | ||||||||
| Unrealized gain on forward | ||||||||
| foreign exchange contracts(1) | 3,393 | 1,276 | – | |||||
| Comprehensive income | $45,069 | $189,317 | $12,171 | |||||
| (1) As at August 31, 2005, the Company had Cdn. $94.5 million (2004 – Cdn. $35.0 million) outstanding in forward exchange contracts that mature in the next six months at an average exchange rate of 1.2579. All of the forward foreign exchange contracts have become favorable to the Company since their inception and have an unrealized fair value of $4.7 million at August 31, 2005 (2004 – $1.3 million). |
| (iv) Operating, financing and investing cash flows presented on the consolidated statement of cash flows under Canadian GAAP would not differ from amounts disclosed in a consolidated cash flow statement prepared under U.S. GAAP. |
| (v) Under Canadian GAAP, the aggregate purchase price of ArtX was based on the average closing market price of the Company’s common shares around the closing date of the transaction. Under U.S. GAAP, the aggregate purchase price of ArtX was based on the average closing market price of the Company’s common shares around the date of the announcement of the transactions. As a result, the recorded amount of goodwill and related amount of accumulated amortization differ. |
| (c) New United States accounting pronouncements |
| In December 2004, the FASB issued SFAS No. 123R, “Share-Based Payment.” SFAS No. 123R requires employee stock options and rights to purchase shares under stock participation plans to be accounted for under the fair value method, and eliminates the ability to account for these instruments under the intrinsic value method prescribed by APB Opinion No. 25, as allowed under the original provisions of SFAS No. 123. SFAS No. 123R requires the use of an option pricing model for estimating fair value, which is amortized to expense over the service periods. The requirements of SFAS No. 123R are effective for the first fiscal year beginning after June 15, 2005. SFAS No. 123R allows for either prospective recognition of compensation expense or retrospective recognition, which may be back to the original issuance of SFAS No. 123. The Company is currently evaluating the impact of the adoption of SFAS No. 123R. |
64 ATI 2005
68 of 75
| In March 2005, the SEC staff issued guidance on SFAS No. 123R. Staff Accounting Bulletin No. 107 (“SAB 107”) was issued to assist preparers by simplifying some of the implementation challenges of SFAS No. 123R while enhancing the information that investors receive. SAB 107 creates a framework that is premised on two overarching themes: (i) considerable judgment will be required by preparers to successfully implement SFAS No. 123R, specifically when valuing employee stock options; and (ii) reasonable individuals, acting in good faith, may conclude differently on the fair value of employee stock options. Key topics covered by SAB 107 include: (a) valuation models – SAB 107 reinforces the flexibility allowed by SFAS No. 123R to choose an option pricing model that meets the standard’s fair value measurement objective; (b) expected volatility – SAB 107 provides guidance on when it would be appropriate to rely exclusively on either historical or implied volatility in estimating expected volatility; and (c) expected term – the new guidance includes examples and some simplified approaches to determining the expected term under certain circumstances. The Company will apply the principles of SAB 107 in conjunction with its adoption of SFAS No. 123R. |
| In November 2004, the FASB issued SFAS No. 151, Inventory Costs, an amendment of APB No. 43, Chapter 4. SFAS No. 151 amends APB No. 43, Chapter 4, to clarify that abnormal amounts of idle facility expense, freight, handling costs and wasted material (spoilage) should be recognized as current period charges. In addition, SFAS No. 151 requires that allocation of fixed production overhead to the cost of conversion be based on the normal capacity of the production facilities. The provision of SFAS No. 151 shall be effective for inventory costs incurred during fiscal years beginning after June 15, 2005. The Company does not expect the adoption of SFAS No. 151 to have a material impact on its consolidated financial statements. |
| In December 2004, the FASB issued SFAS No. 153, Exchanges of Non-monetary Assets – An Amendment of APB Opinion No. 29 (“APB No. 29”), Accounting for Non-monetary Transactions. SFAS No. 153 eliminates the exception from fair value measurement for non-monetary exchanges of similar productive assets in paragraph 21(b) of APB No. 29 and replaces it with an exception for exchanges that do not have commercial substance. SFAS No. 153 specifies that a non-monetary exchange has commercial substance if the future cash flows of the entity are expected to change significantly as a result of the exchange. SFAS No. 153 is effective for fiscal periods beginning after June 15, 2005. The Company does not expect the adoption of SFAS No. 153 to have a material impact on its consolidated financial statements. |
| In June 2005, the FASB issued SFAS No. 154, Accounting Changes and Error Corrections, a replacement of APB Opinion No. 20, Accounting Changes, and FASB No. 3, Reporting Accounting Changes in Interim Financial Statements. The statement applies to all voluntary changes in accounting principle and changes the requirements for accounting for and reporting of a change in accounting principle. SFAS No. 154 requires retrospective application to prior periods’ consolidated financial statements of a voluntary change in accounting principle unless to do so is impracticable. It is effective for accounting changes and corrections of errors made in fiscal years beginning after December 15, 2005. Earlier application is permitted for accounting changes and corrections of errors made occurring in fiscal years beginning after June 1, 2005. The Company does not expect the effect of SFAS No. 154 to have a material impact on its consolidated financial statements. |
ATI 2005 65
69 of 75
NOTES TO CONSOLIDATED FINANCIAL STATEMENTS(CONT.)
Years ended August 31, 2005, 2004 and 2003 (Tabular amounts in thousands of U.S. dollars, except per share amounts)
| NOTE 22. | (a) American Video Graphics LLP |
| Litigation | American Video Graphics LLP filed a series of suits in the Eastern District of Texas alleging infringement of several patents against various PC manufacturers, game console manufacturers and videogame publishers. After some reconfiguration of the suits, there are a total of six suits pending. Of these six suits, there are two suits pending against the entire group of PC manufacturers and two suits pending against the entire group of game console manufacturers. The Company voluntarily intervened in these four suits. The Company participated in two district court-ordered mediations for these matters. Neither mediation resulted in settlement. The first trial involving the PC manufacturers is currently scheduled for September 2006 and the first trial involving the game console manufacturers is scheduled for December 2006. |
| (b) U.S. securities class action lawsuits |
| In August and September 2005, five class action lawsuits were filed in the United States District Court for the Eastern District of Pennsylvania against the Company and certain of its directors and officers on behalf of shareholders who purchased the Company’s common shares between October 7, 2004 and on or about June 23, 2005. The claims allege that the Company and certain of its directors and officers violated U.S. securities laws by failing to disclose material facts and making statements that contained misrepresentations about the Company’s business and future outlook. It is alleged that as a result of the failure to disclose material facts and the alleged misrepresentations, the Company’s stock traded at artificially inflated prices until the stock price dropped on the news of the Company’s third quarter results in June 2005. The claims further allege that, while in possession of material undisclosed information, certain directors and officers sold a portion of their common shares at inflated prices. These claims are at a very preliminary stage. |
| (c) U.S. shareholder complaint |
| In August 2005, a shareholder complaint was filed in the Superior Court of the State of California for the County of Santa Clara by a shareholder on behalf of the Company. The defendants to the complaint include the Company, members of the Board of Directors and certain officers. The complaint alleges breach of California Law, including breaches of fiduciary duties, abuse of control, gross mismanagement, waste of corporate assets, unjust enrichment and violation of the California Corporations Code during the period between October 2004 and August 26, 2005. The Company has been served with the complaint. This complaint is at a very preliminary stage. |
| The Company currently believes the amount of ultimate liability, if any, with respect to these legal proceedings, including the class action lawsuits and the shareholder complaint, will not materially affect its financial position, results of operations, or liquidity. The Company and the named directors and officers intend to defend themselves vigorously. However, the ultimate outcome of any litigation is uncertain and should any of these actions or proceedings against the Company be successful, the Company may be subject to significant damages awards, which could have a material adverse effect on its financial condition. |
| NOTE 23. Comparative figures | Certain fiscal 2004 and 2003 figures have been reclassified to conform with the consolidated financial statement presentation adopted in fiscal 2005. |
66 ATI 2005
70 of 75
| Glossary of Terms |
| Certain technical terms used in this Annual Report are defined as follows: |
| “AGP” means accelerated graphics port. This is a dedicated expansion port located on a motherboard which allows higher throughput from the graphics card to the processor for faster 3D graphics rendering. |
| “AIB” means add-in board. AIB refers to graphics boards that can be added to a computer at any time, including by an OEM at the time it is manufactured, by a reseller at the time of distribution or by an end-user. |
| “ASP” means average selling price. |
| “Chipset” means a set of chips that provides the interfaces between all of the PC’s subsystems. A PC chipset provides all the core logic, or primary processing logic, on the motherboard except for the CPU. |
| “CPU” means central processing unit, the central unit in a computer which contains the logic circuitry that performs the instructions of a computer’s programs. |
| “DTV” means digital television (including set-top boxes). Digital television refers to the standard of transmitting and receiving television signals using digital rather than analog transmission. |
| “GPU” means graphics processing unit, an advanced semiconductor chip that provides greater graphics functionality, such as cinematic rendering in real time. |
| “HDTV” means high-definition television, a digital television format providing high-resolution video and digital audio for a high-quality viewing experience. |
| “IGP” means integrated graphics processor. An IGP includes both the functionality of a chipset (which controls the functions and features on a motherboard) and graphics. |
| “Inflection Point” refers to a dramatic change in the development of a company, industry or market. |
| “Integrated Chipset” refers to a chipset containing integrated graphics. |
| “ISV” means independent software vendor.“ |
| Motherboard” means the main circuit board of a microcomputer. |
| “Nanometer” is a unit of measurement equal to one-billionth of a meter. |
| “NASDAQ” means the NASDAQ Stock Market Inc. |
| “NRE” means non-recurring engineering and refers to the one-time cost of product development, such as designing a GPU for a specific customer. |
| “ODM” means original design manufacturer and generally refers to companies that provide not only manufacturing services but also product designs or design services and may (or may not) sell their own branded products. The use of ODMs has increased among OEMs and other companies. |
| “OEM” means original equipment manufacturer. |
| “PC” means personal computer and generally refers to a computer meant for use by one person at a time. |
| “PCB” means printed circuit board. |
| “PCI Express” refers to the third-generation, high-speed, general purpose I/O architecture that provides greater bandwidth to support the increasing demands on today’s PCs and facilitates graphically intensive applications such as video editing and high-definition content. |
| “SI” means system integrator, a manufacturer of “whitebox, clone or non-branded” PCs. |
| “TSX” means The Toronto Stock Exchange. |
| “Workstation” means a type of computer used for design, engineering or other applications requiring higher-than-normal performance, particularly graphics. |
ATI 2005 67
71 of 75
Directors and Officers
| BOARD OF DIRECTORS K.Y. Ho* Chairman of the Board, ATI Technologies Inc. John E. Caldwell1,2,3 President and Chief Executive Officer, SMTC Corporation Ronald Chwang3 Chairman and President, iD Ventures America, L.L.C. James D. Fleck1,2,3,4 Chairman, Fleck Management Services Ltd. Alan D. Horn1 Vice President, Finance and Chief Financial Officer, Rogers Communications Inc. Paul Russo2 Chairman, President & Chief Executive Officer, Silicon Optix Inc. Robert A. Young1 Managing Director, Mirador Capital, L.L.C. 1 Member of the Audit Committee 2 Member of the Human Resource and Compensation Committee 3 Member of the Governance and Nominations Committee 4 Lead Director 5 Employee of ATI Technologies Singapore Pte. Ltd. * Retired, November 2005 | SENIOR MANAGEMENT K.Y. Ho Chairman of the Board David Orton President & Chief Executive Officer Rick Bergman Senior Vice President and General Manager, PC Group Michel Cadieux Senior Vice President, Corporate Services Patrick Crowley Senior Vice President, Finance and Chief Financial Officer John Docherty5 Senior Vice President, Operations Phil Eisler Senior Vice President and General Manager, Integrated and Mobile Adrian Hartog Senior Vice President and General Manager, Consumer Group Rick Hegberg Senior Vice President, Worldwide Sales Ben Bar-Haim Vice President, Software Engineering Gilbert Christie Vice President, Board Operations | David Di Orio Vice President and General Manager, DTV Robert Feldstein Vice President, Engineering, ATI Research Inc. Rich Heye Vice President & General Manager, Desktop Peter Hourihan Vice President, Information Technology Allen Lee Vice President, Engineering, Integrated Graphics Raymond Li Vice President, Hardware Engineering Paul Lypaczewski Vice President and General Manager, Multimedia Jason Peterson Vice President, Finance Henry Quan Vice President, Corporate Development Paul Dal Santo Vice President and General Manager, Handheld Jim Seto Vice President, ASIC Operations Steven Turner Vice President, Engineering, Handheld Richard Brait General Counsel Dean Blain Corporate Secretary |
Corporate Information
| ANNUAL MEETING OF SHAREHOLDERS The Annual Meeting of Shareholders will be held on Thursday, January 26, 2006, at 2:00 p.m. at The Design Exchange, 234 Bay Street, Toronto, Ontario, M5K 1B2. All shareholders and others interested in ATI are invited to attend. LISTING OF COMMON SHARES The common shares of ATI are listed on the Toronto Stock Exchange under the stock symbol “ATY” and the NASDAQ Stock Market under the symbol “ATYT.” | AUDITORS KPMG LLP Yonge Corporate Centre 4100 Yonge Street, Suite 200 Toronto, Ontario Canada M2P 2H3 LEGAL COUNSEL Gowling Lafleur Henderson LLP Suite 1600, 1 First Canadian Place 100 King Street West Toronto, Ontario Canada M5X 1G5 Shearman & Sterling LLP Commerce Court West 199 Bay Street Suite 4405 Toronto, Ontario Canada M5L 1E8 | BANKERS HSBC Bank Canada 70 York Street Toronto, Ontario M5J 1S9 TRANSFER AGENT AND REGISTRAR CIBC Mellon Trust Company 320 Bay Street 6th Floor Toronto, Ontario Canada M5H 4A6 Tel: (416) 643-5500 Toll free: 1-800-387-0825 INVESTOR RELATIONS ATI Technologies Inc. 1 Commerce Valley Drive East Markham, Ontario L3T 7X6 Tel: (905) 882-2600 ext. 3878 |
68 ATI 2005
72 of 75
Copyright 2005, ATI Technologies Inc. All Rights Reserved. ATI and ATI’s product names are trademarks and/or registered trademarks of
ATI Technologies Inc. All other Company and/or product names are trademarks and/or registered trademarks of their respective owners.
73 of 75
 ATI Technologies 1 Commerce Valley Drive East Markham, Ontario Canada L3T 7X6 T 905.882.2600 F 905.882.2620 visit our website at www.ati.com |
74 of 75
SIGNATURES
Pursuant to the requirements of the Securities Exchange Act of 1934, the registrant has duly caused this report to be signed on its behalf by the undersigned, thereunto duly authorized.
| ATI TECHNOLOGIES INC. | |||||
| Date: November 25, 2005 | By: | /s/ Richard Brait Name: Richard Brait Title: General Counsel | |||
75 of 75