
0 0 WEYERHAEUSER Growing a Truly Great Company INVESTOR MEETING December 9, 2014 | New York, NY

1 FORWARD-LOOKING STATEMENTS AND NON-GAAP FINANCIAL MEASURES This presentation contains statements that are forward-looking statements within the meaning of the Private Securities Litigation Reform Act of 1995, including, without limitation, with respect to future prospects, business strategies, benefits and impacts of the Longview Timber LLC acquisition and the disposition of Weyerhaeuser Real Estate Company (including cost savings and operational and other synergies), revenues, earnings, cash flow, taxes, funds available for distribution, pricing, production, supply, dividend levels, share repurchases, business priorities, performance, cost reductions and other initiatives (including operational excellence and SG&A targets), demand drivers and levels, margins, growth, housing markets, capital structure, credit ratings, capital expenditures, cash position, debt levels, and harvests and export markets. Forward-looking statements can be identified by the fact that they do not relate strictly to historical or current facts. We may use words such as “anticipate,” “believe,” “could,” “forecast,” “estimate,” “outlook,” “goal,” “will,” “plan,” “expect,” “target,” “plan,” “would” and similar terms and phrases, or we may refer to assumptions, to identify forward-looking statements. Forward-looking statements are made based on management’s current expectations and assumptions concerning future events. These are inherently subject to uncertainties and factors relating to our operations and business environment that are difficult to predict and often beyond the company’s control. Many factors could cause actual results to differ materially from those expressed or implied in these forward-looking statements, including, without limitation, the effect of general economic conditions, including employment rates, housing starts, interest rate levels, availability of financing for home mortgages, strength of the U.S. dollar, market demand for our products, which is related to the strength of the various U.S. business segments and U.S. and international economic conditions, domestic and foreign competition, the successful execution of our internal performance plans, including restructurings and cost reduction initiatives, raw material prices, energy prices, the effect of weather, the risk of loss from fires, floods, windstorms, hurricanes, pest infestation and other natural disasters, transportation availability and costs, federal tax policies, the effect of forestry, land use, environmental and other governmental regulations, legal proceedings, performance of pension fund investments and related derivatives, the effect of timing of retirements and changes in market price of our common stock on charges for share-based compensation, changes in accounting principles, and the other risk factors described in filings we make with the SEC, including in our annual report on Form 10-K for the year ended December 31, 2013 and our subsequent quarterly reports on Form 10-Q. There is no guarantee that any of the anticipated events or results will occur or, if they occur, what effect they will have on the company’s operations or financial condition. The forward-looking statements contained herein apply only as of the date of this presentation and we do not undertake any obligation to update these forward-looking statements. Nothing on our website is included or incorporated by reference herein. Included in this presentation are certain non-GAAP financial measures which management believes complement the financial information presented in accordance with U.S. generally accepted accounting principles. Management believes such measures are useful to investors. Our non-GAAP financial measures may not be comparable to similarly titled captions of other companies due to potential inconsistencies in the metrics of calculation. For a reconciliation of non-GAAP measures to GAAP measures see the appendices to this presentation.

2

3 DRIVING VALUE FOR SHAREHOLDERS Growing a Truly Great Company LEVERS Portfolio Performance: Operational Excellence Capital Allocation

4 FOCUSED PORTFOLIO *Excludes 13.8 million mandatory convertible preference shares, which convert to common shares on July 1, 2016. Total Assets $11.0B 525 MM common shares* 2014 Q3 Timberlands Cellulose Fibers Wood Products Timberlands Cellulose Fibers Wood Products WRECO (Divested) BEFORE AFTER Total Assets $10.4B 542 MM common shares Year End 2012 Longview Timberlands (Acquired)

5 PORTFOLIO Supports a growing and sustainable dividend TIMBERLANDS Strong, productive asset base COMPLEMENTARY MANUFACTURING OPERATIONS Enhance timberlands cash flow Well-positioned businesses with improving cost structures Wood Products: Strong upside from US housing Cellulose Fibers: Strong cash flow and growing demand from global markets (100) 200 500 800 1,100 1,400 1,700 2011 2012 2013 2014 (LTM) $ M il li o n s Timberlands Wood Products Cellulose Fibers EBITDA* Supporting a Growing and Sustainable Dividend *Adjusted EBITDA, LTM as of 2014 Q3. Unallocated items not included. See appendix for reconciliation to GAAP amounts.
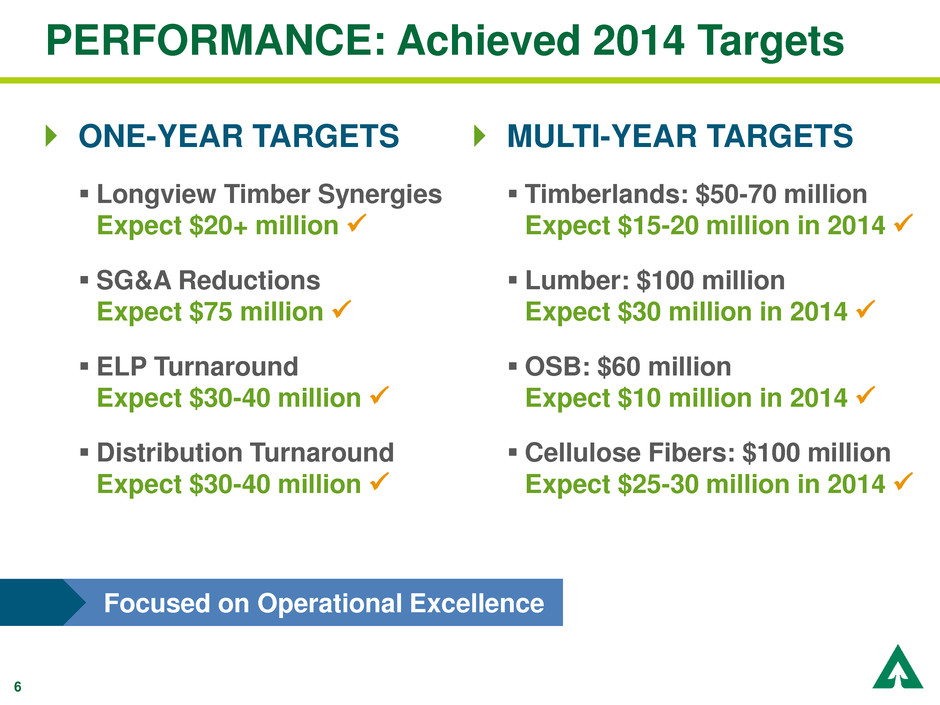
6 PERFORMANCE: Achieved 2014 Targets ONE-YEAR TARGETS Longview Timber Synergies Expect $20+ million SG&A Reductions Expect $75 million ELP Turnaround Expect $30-40 million Distribution Turnaround Expect $30-40 million MULTI-YEAR TARGETS Timberlands: $50-70 million Expect $15-20 million in 2014 Lumber: $100 million Expect $30 million in 2014 OSB: $60 million Expect $10 million in 2014 Cellulose Fibers: $100 million Expect $25-30 million in 2014 Focused on Operational Excellence

7 CAPITAL ALLOCATION: KEY ACTIONS Returning cash to shareholders 32% GROWTH IN 2014 REPURCHASED AUG-SEPT 2014 $130 MILLION DIVIDEND SHARE REPURCHASE $700 MILLION APPROVED

8 $70 $80 $90 $100 $110 $120 $130 PERFORMANCE: Creating shareholder value Weyerhaeuser S&P Global Timber & Forest Products Potlatch Plum Creek Rayonier TOTAL SHAREHOLDER RETURN

9 TIMBERLANDS Rhonda Hunter Senior Vice President, Timberlands

10 TIMBERLANDS: Ownership PACIFIC NORTHWEST Largest timberland holder in region 2.6 million acres west of Cascade mountains Douglas fir domestic and export value U.S. SOUTH More than four million acres Primarily Southern yellow pine URUGUAY More than 300,000 acres Loblolly pine and eucalyptus Scale, Expertise and Geographic Diversity Create Competitive Advantage U.S. SOUTH U.S. WEST

11 TIMBERLANDS: OPX Target Set in 2013 Source for competitor data: public SEC filings, National Council of Real Estate Investment Fiduciaries (NCREIF). *See appendix for reconciliation to GAAP amounts. **Data for Rayonier as reported during 2014 Q3. 2011 data unavailable. EBITDA* / ACRE OWNED 0 200 400 600 800 2012 2016 - 2018 (Outlook) $ M il li on s BASE BASE Longview Timber Operational Excellence TIMBERLANDS EBITDA* 50 75 100 125 150 175 200 2011 2012 2013 Annualized U.S. West NCREIF Rayonie ** Pope Resources WY (excl LV) 0 20 40 60 8 2011 2012 2013 Annualized U.S. South NCREIF Rayonier** Deltic WY Plum Creek

12 TIMBERLANDS: OPX Performance OPERATIONAL EXCELLENCE 0 25 50 75 Base 2014 2015 Goal 0 75 150 Base 2014 Goal $ m il li o n s Operational Excellence EBITDA $ m il li o n s $175-185MM, incl. $20 MM synergies $50-70MM Longview Timber EBITDA & Synergies $15-20MM $20-30MM 2014 INITIATIVES Merchandising and marketing wood for value Silviculture prescriptions and treatment costs Harvesting and transportation efficiencies Harvest flex to seasonal and short-term market opportunities 2015 INITIATIVES Continue focus on marketing and merchandising Continue focus on high- leverage cost activities Non-timber revenue improvement

13 TIMBERLANDS: Current Relative Performance EBITDA* / ACRE OWNED U.S. WEST Maintaining Top Position EBITDA* / ACRE OWNED U.S. SOUTH Maintaining Top Position Source for competitor data: public SEC filings, National Council of Real Estate Investment Fiduciaries (NCREIF). *LTM as of 2014 Q3. See appendix for reconciliation to GAAP amounts. **Data for Rayonier as reported during 2014 Q3. 2011 data unavailable. ***Pope Resources 2014 LTM includes a significant land sale. Excluding this sale, 2014 LTM EBITDA/acre = $155MM. ****WY results include Longview Timber beginning 2014 LTM. $ m ill ion s $ m ill ion s 50 100 150 200 250 2011 2012 2013 2014 (LTM) NCREIF Rayonier** Pope Resources*** WY**** 0 20 40 60 80 2011 2012 2013 2014 (LTM) NCREIF Rayonier** Deltic WY Plum Creek

14 2015-2020 2021-2025 2026-2030 TIMBERLANDS: Sustainable Harvest 0 5 10 15 20 25 30 2012 2013 2014 Forecast WEYERHAEUSER FEE HARVEST VOLUME M il li ons o f m 3 Projected Average Annual Harvest U.S. South U.S. West (includes Longview beginning 2013 Q3) Uruguay Annual Harvest Actual Actual 2012 BASELINE

15 0.0 0.3 0.5 0.8 1.0 1.3 1.5 1.8 2.0 2.3 2000 2002 2004 2006 2008 2010 2012 2014 WEST COAST SOFTWOOD LOG EXPORTS TO ASIA BBF Japan Korea China Est. 0 100 200 300 400 500 600 700 800 900 1996 1998 2000 2002 2004 2006 2008 2010 2012 2014 2016 2018 $/MBF Forecast* YTD FEA RISI WESTERN LOG MARKETS: Prices Have Strengthened, With More Upside DEMAND DRIVERS Japan & Korea: Long-term demand for wood-based housing China: Rising wealth/urbanization drives significant demand for industrial & interior wood California: Single-family housing starts 65% below normalized levels WESTERN LOG PRICE DELIVERED DOUGLAS FIR #2 Source: Random Lengths Yardstick, US Dept of Commerce Source: Log Lines, *FEA, *RISI Annual Annual

16 SUPPLY FROM CANADA CONSTRAINED: Benefits Southern Lumber & Logs Canadian production drops to 25% of U.S. market by 2015, expected to be 5-7BBF below peak Southern pine lumber expanding; limited growth in Canadian imports SOUTHERN LOG PRICE DELIVERED SOUTHERN AVERAGE PINE SAWLOG 0 10 20 30 40 50 60 70 80 1996 1998 2000 2002 2004 2006 2008 2010 2012 2014 2016 2018 $/Green Ton Forecast* YTD FEA RISI 0.0 5.0 10.0 15.0 20.0 25.0 2004 2005 2006 2007 2008 2009 2010 2011 2012 2013 2014 US South Lumber Production Canadian Shipments to US BBF of Lumber US LUMBER SUPPLY SOURCES Source: Census, WWPA, COFI YTD Southern log price recovery still ahead Source: Timber Mart-South, *FEA, *RISI Annual Annual

17 World-class timber holdings Scale operations in Pacific Northwest and US South Industry-leading silviculture expertise and sustainability practices Unique export and domestic market access, with strong customer relationships and infrastructure Focused on driving improvement through operational excellence TIMBERLANDS: Summary Well-positioned to win

18 Adrian Blocker Senior Vice President, Lumber LUMBER

19 Lumber mills – 18 Douglas Fir Hem-fir Spruce-Pine-Fir Southern Yellow Pine Production Capacity 4.6 billion board feet LUMBER BUSINESS

20 0 50 100 2013 Base Benchmark LUMBER: OPX Target Set in 2013 OPERATIONAL EXCELLENCE** Controllable Manufacturing Cost $ / M B F EBITDA MARGIN* Closing the Gap = $100 MM **Benchmark is mill Best in Class; Mfg cost = Cost Net of Logs, excluding depreciation and inflation. Source for competitor data: public SEC filings *See appendix for reconciliation to GAAP amounts. -5.0% 0.0% 5.0% 10.0% 15.0% 20.0% 25.0% 2011 2012 2013 YTD Q3 Canfor Lumber Interfor Lumber West Fraser Lumber WY Lumber

21 LUMBER: OPX Performance 2014 INITIATIVES Labor productivity Process efficiency Operating expense 2015 INITIATIVES Labor productivity Process efficiency Reliability Capital execution OPERATIONAL EXCELLENCE* Controllable Manufacturing Cost *Benchmark is mill Best in Class. Mfg cost = Cost Net of Logs, excluding depreciation and inflation. 0 50 100 2013 Base 2014 2015 Benchmark Closing the Gap =$100 MM $30 MM $20-25 MM $ / M B F

22 LUMBER: Current Relative Performance EBITDA MARGIN* Closing the Gap to Take Top Position Source for competitor data: public SEC filings *See appendix for reconciliation to GAAP amounts. -5% 0% 5% 10% 15% 20% 2011 2012 2013 2014 YTD Q3 Canfor Lumber Interfor Lumber West Fraser Lumber WY Lumber

23 SUPPLY FROM CANADA CONSTRAINED: Benefits Southern Lumber & Logs Canadian production drops to 25% of U.S. market by 2015, expected to be 5-7BBF below peak Southern pine lumber expanding; limited growth in Canadian imports 0% 5% 10% 15% 20% 25% 30% 35% 40% 2005 2010 2015 2020 CANADIAN LUMBER SHARE OF U.S. MARKET Share Annual Forecast* Source: COFI, WWPA*

24 LUMBER: Summary Scale mills in diverse geographies Diversified products and customers Reducing controllable manufacturing cost through operational excellence Well-positioned to win

25 Cathy Slater Senior Vice President, OSB, ELP & Distribution OSB, ENGINEERED LUMBER & DISTRIBUTION

26 OSB, ENGINEERED LUMBER & DISTRIBUTION Distribution Centers — 21 OSB mills — 6 Production Capacity 3.0 billion square feet ELP Mills — 6 Veneer/Plywood Supply Facilities — 3 Production Capacity Solid Section: 32 million cubic feet I-Joists: 304 million lineal feet Plywood: 460 million square feet

27 OSB: OPX Target Set in 2013 EBITDA MARGIN* 50 75 100 2013 Base Benchmark $50 MM % Reli a b ilit y **Reliability benchmark is mill Best in Class; 2013 Base = Q3 2013 YTD. Improve Product Mix 0 25 50 75 2013 Base Goal $10 MM % V alue A d d ed P ro d u c t OPERATIONAL EXCELLENCE** Improve Reliability Source for competitor data: public SEC filings. *See appendix for reconciliation to GAAP amounts. -10.0% 0.0% 10.0% 20.0% 30.0% 40.0% 2011 2012 2013 YTD Q3 Ainsworth OSB LPX OSB Norbord OSB WY OSB

28 OSB: OPX Performance 2014 INITIATIVES Maintenance practices Resin usage Energy reduction Automation 2015 INITIATIVES Press reliability Automation Enhanced product mix Transportation reliability OPERATIONAL EXCELLENCE* 0 25 50 75 2013 Base 2014 2015 Goal *Reliability benchmark is mill Best in Class. 2013 Base = Q3 2013 YTD. % V a lu e A d d e d P rod u c t 50 75 100 2013 Base 2014 2015 Benchmark GOAL: $60 MM Improve Product Mix Improve Reliability & Controllable Cost % R e li a b il it y 2014: $10 MM 2015: $10-15 MM

29 OSB: Current Relative Performance EBITDA MARGIN* Highly competitive results Source for competitor data: public SEC filings *See appendix for reconciliation to GAAP amounts. -10% 0% 10% 20% 30% 40% 2011 2012 2013 2014 YTD Q3 Ainsworth OSB LPX OSB Norbord OSB WY OSB

30 ELP & DISTRIBUTION: Turnaround Commitment Source for competitor data: public SEC filings *See appendix for reconciliation to GAAP amounts. -4.0% -2.0% 0.0% 2.0% 4.0% 6.0% 8.0% 10.0% 12.0% 2011 2012 2013 YTD Q3 2014 Outlook Boise ELP LPX ELP WY ELP -10.0% -8.0% -6.0% -4.0% -2.0% 0.0% 2.0% 4.0% 2011 2012 2013 YTD Q3 2014 Outlook Boise Distribution Blue Linx Distribution WY Distribution ENGINEERED LUMBER PRODUCTS EBITDA MARGIN* DISTRIBUTION EBITDA MARGIN* 2014 Target = $30-40MM improvement vs. 2013 in each business
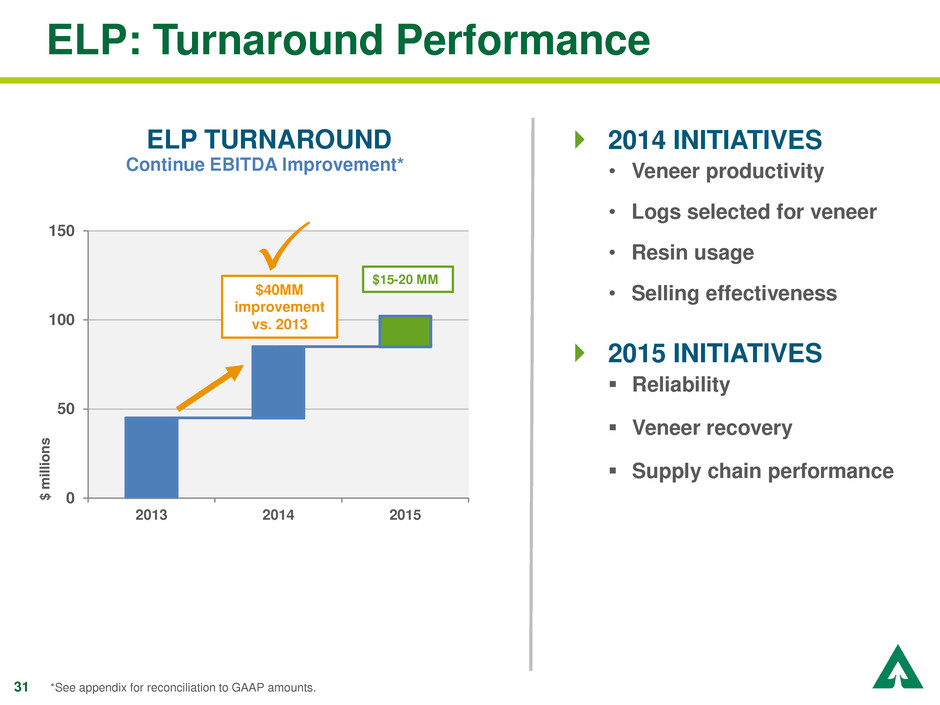
31 ELP: Turnaround Performance 2014 INITIATIVES • Veneer productivity • Logs selected for veneer • Resin usage • Selling effectiveness 2015 INITIATIVES Reliability Veneer recovery Supply chain performance ELP TURNAROUND 0 50 100 150 2013 2014 2015 Continue EBITDA Improvement* $ m il li o n s $40MM improvement vs. 2013 $15-20 MM *See appendix for reconciliation to GAAP amounts.

32 ELP: Current Relative Performance EBITDA MARGIN* Significantly Improved Competitive Position Source for competitor data: public SEC filings *See appendix for reconciliation to GAAP amounts. -4% -2% 0% 2% 4% 6% 8% 10% 12% 2011 2012 2013 2014 YTD Q3 Boise ELP LPX ELP WY ELP
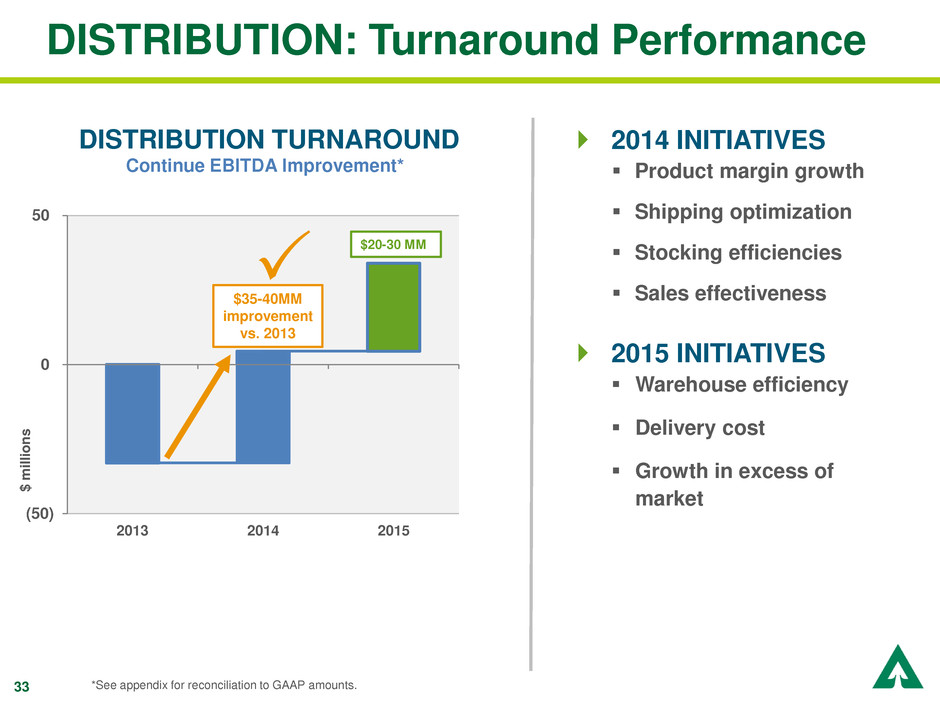
33 DISTRIBUTION: Turnaround Performance 2014 INITIATIVES Product margin growth Shipping optimization Stocking efficiencies Sales effectiveness 2015 INITIATIVES Warehouse efficiency Delivery cost Growth in excess of market DISTRIBUTION TURNAROUND Continue EBITDA Improvement* (50) 0 50 2013 2014 2015 $35-40MM improvement vs. 2013 $20-30 MM $ m il li o n s *See appendix for reconciliation to GAAP amounts.

34 DISTRIBUTION: Current Relative Performance EBITDA MARGIN* Closing the Gap Source for competitor data: public SEC filings *See appendix for reconciliation to GAAP amounts. -10% -8% -6% -4% -2% 0% 2% 4% 2011 2012 2013 2014 YTD Q3 Boise Distribution Blue Linx Distribution WY Distribution

35 OSB, ENGINEERED LUMBER & DISTRIBUTION: Summary OSB Continuing focus on cost reduction and reliability Leveraging our market-leading position in flooring Engineered Lumber & Distribution: Achieving 2014 turnaround targets Expect significant additional progress to come Well-positioned to win

36 Shaker Chandrasekaran Senior Vice President, Cellulose Fibers CELLULOSE FIBERS

37 CELLULOSE FIBERS BUSINESS Pulp Mills — 5 Capacity: 1.8 million metric tons Converting Facilities — 2 Liquid Packaging Board — 1 Capacity: 315,000 metric tons GDANSK, POLAND

38 CELLULOSE FIBERS: OPX Target Set in 2013 EBITDA MARGIN* OPERATIONAL EXCELLENCE** Reduce Controllable Cost 625 675 725 2013 Base Goal $ / T o n $100 MM **Cost of Goods Sold, excluding inflation. 2013 Base = Q3 2013 YTD. 0.0% 5.0% 10.0% 15.0% 20.0% 25.0% 30.0% 35.0% 40.0% 45.0% 2011 FY 2012 FY 2013 YTD Q3 Canfor Mercer Rayonier WY CF Source for competitor data: public SEC filings *See appendix for reconciliation to GAAP amounts.
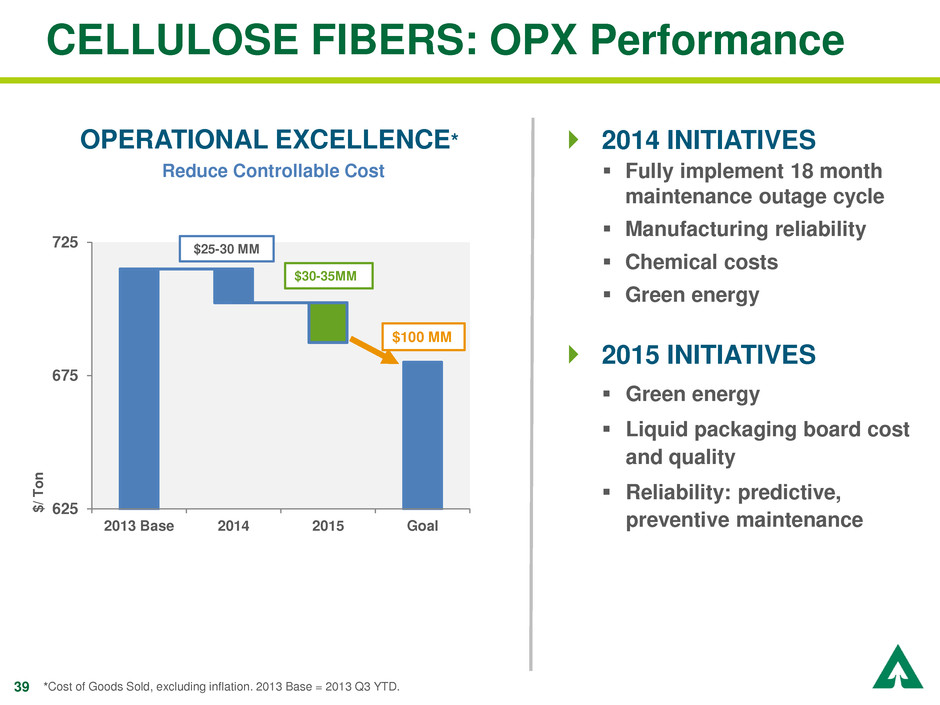
39 CELLULOSE FIBERS: OPX Performance 2014 INITIATIVES Fully implement 18 month maintenance outage cycle Manufacturing reliability Chemical costs Green energy 2015 INITIATIVES Green energy Liquid packaging board cost and quality Reliability: predictive, preventive maintenance OPERATIONAL EXCELLENCE* 625 675 725 2013 Base 2014 2015 Goal Reduce Controllable Cost $ / T o n $100 MM *Cost of Goods Sold, excluding inflation. 2013 Base = 2013 Q3 YTD. $25-30 MM $30-35MM

40 CELLULOSE FIBERS: Current Relative Performance EBITDA MARGIN* Narrowing the Gap to Take Top Position Source for competitor data: public SEC filings *See appendix for reconciliation to GAAP amounts. **Rayonier reflects Rayonier Performance Fibers segment for 2011-2013 and Rayonier Advanced Materials for 2014 YTD. 0% 5% 10% 15% 20% 25% 30% 35% 40% 45% 2011 2012 2013 2014 YTD Q3 Canfor Mercer Rayonier** WY CF

41 - 2.0 4.0 6.0 2003 2008 2013 2017 Expect fluff pulp demand growth of 3.8% per year Supply position: Southern Pine fiber ideal for fluff Strategically located manufacturing sites with globally competitive costs FLUFF DEMAND: Emerging market growth FLUFF MARKET PULP CONSUMPTION BY REGION Forecast* Rest of World Rest of Asia Europe North America China M ill io n T o n s Relatively Flat Growth Growing Markets *Source: RISI Outlook for the World Fluff Pulp Market Study (2014)

42 CELLULOSE FIBERS: Summary Strategically located mills with abundant fiber supply Long-term strategic customer relationships Relentless and disciplined execution of operational excellence initiatives Well-positioned to win

43 Patty Bedient Executive Vice President & Chief Financial Officer

44 SG&A COST STRUCTURE

45 PERFORMANCE: Reducing SG&A Expense ACHIEVING REDUCTION GOAL Reduce SG&A Expense Note: SG&A includes R&D *Base = FY 2013 selling, general &administrative and R&D expense of $708 MM, less WRECO direct SG&A of approximately $145 MM 200 250 300 350 400 450 500 550 600 2013 Base* 2014 Year-End Run Rate $ M il li on s $75 MM 2014 INITIATIVES Simplify and reduce work Reduce headcount Restructure IT services

46 IMPROVING MARKETS

47 POSITIVE TRENDS FOR OUR PRODUCTS Continued improvement in US housing market Anticipate 1.1-1.2 million starts in 2015 Accelerating single-family recovery Higher demand and prices for US logs and wood products: Rebound in US housing Steady export demand Canadian timber supply shortage Growing markets for fluff products driven by emerging country demand and global growth
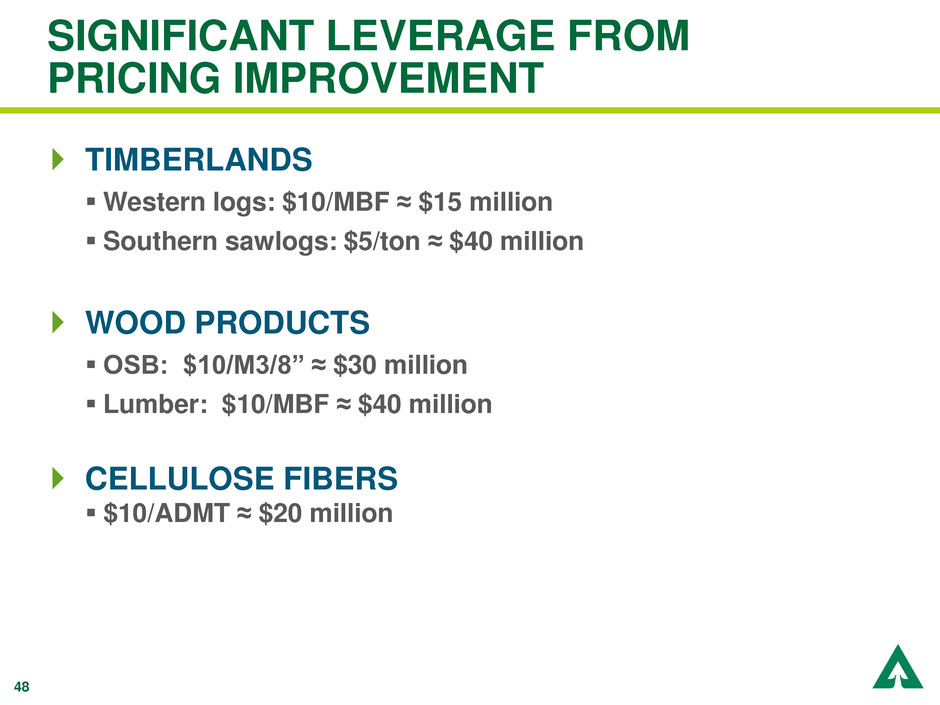
48 SIGNIFICANT LEVERAGE FROM PRICING IMPROVEMENT TIMBERLANDS Western logs: $10/MBF ≈ $15 million Southern sawlogs: $5/ton ≈ $40 million WOOD PRODUCTS OSB: $10/M3/8” ≈ $30 million Lumber: $10/MBF ≈ $40 million CELLULOSE FIBERS $10/ADMT ≈ $20 million

49 CAPITAL ALLOCATION

50 CAPITAL ALLOCATION PRIORITIES Return cash to shareholders Invest in our businesses Maintain appropriate capital structure

51 RETURNING CASH TO SHAREHOLDERS: Sustainable and Growing Dividend QUARTERLY DIVIDEND Up 93% since 2011 Increased by 32% to $0.29 per common share effective 2014 Q3 PAYOUT GUIDELINE 75% of Funds Available for Distribution (FAD) over the cycle* *Funds Available for Distribution: cash flow before major acquisitions and dispositions and financing activities including dividends $0.15 $0.17 $0.20 $0.22 $0.29 2011 Q1 2012 Q4 2013 Q2 2013 Q3 2014 Q3 +13% +18% +10% +32% INCREASING QUARTERLY DIVIDEND PER SHARE

52 $700 million share repurchase program Authorized in August 2014 Approximates cash proceeds received as part of WRECO divestiture Repurchased 19% of authorization during Q3 $130 million in repurchases Share count reduced by approximately 4 million RETURNING CASH TO SHAREHOLDERS: Share Repurchase Returning cash to shareholders
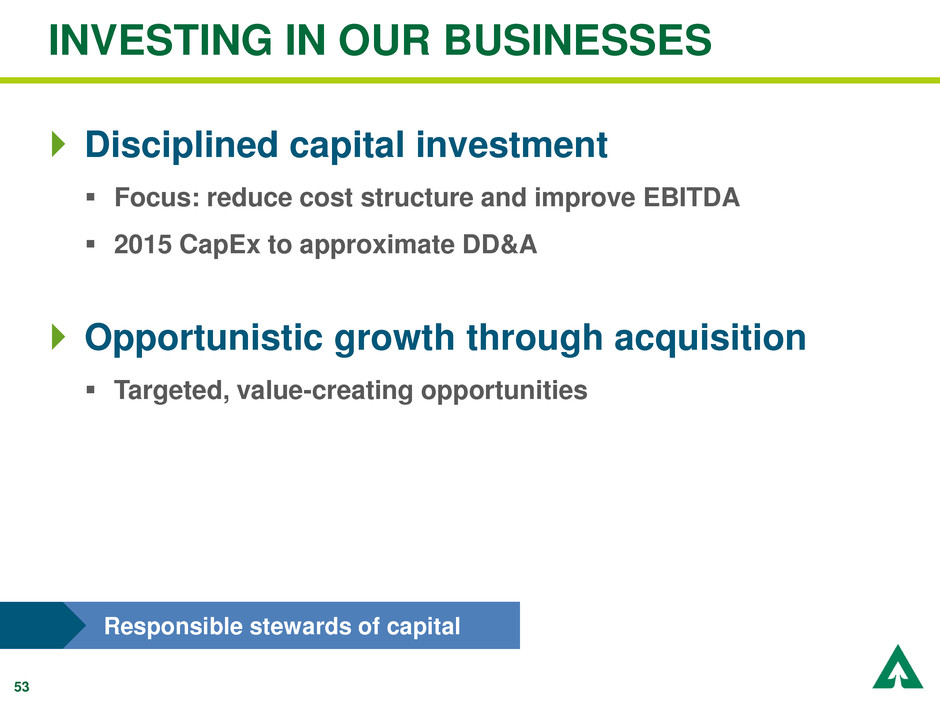
53 INVESTING IN OUR BUSINESSES Disciplined capital investment Focus: reduce cost structure and improve EBITDA 2015 CapEx to approximate DD&A Opportunistic growth through acquisition Targeted, value-creating opportunities Responsible stewards of capital

54 MAINTAIN APPROPRIATE CAPITAL STRUCTURE Liquidity Long-term debt of approximately $4.9 billion Investment grade rating KEY FINANCIAL RATIOS TARGET CURRENT* Gross Debt / EBITDA (LTM)* < 3.5 3.1 EBITDA / Pro Forma Interest (LTM)* > 5.0 4.7 *Current and LTM as of 2014 Q3. Pro forma interest excludes $25 million loss on extinguishment of debt related to the Longview Timber acquisition.

55

56 0 WEYERHAEUSER Growing a Truly Great Company INVESTOR MEETING December 9, 2014 | New York, NY

57 BIOGRAPHIES
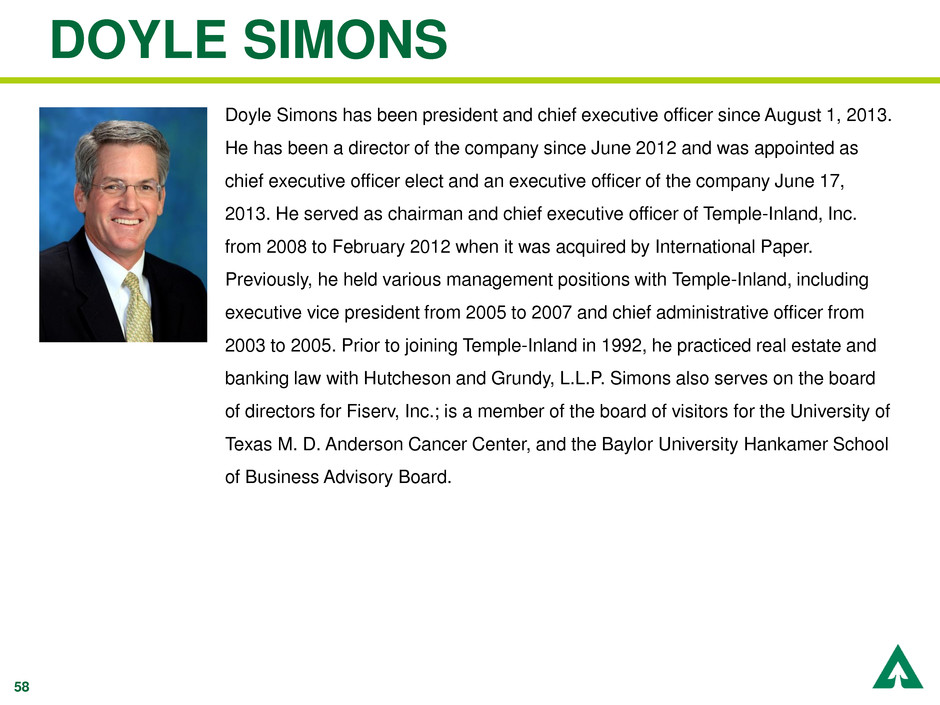
58 DOYLE SIMONS Doyle Simons has been president and chief executive officer since August 1, 2013. He has been a director of the company since June 2012 and was appointed as chief executive officer elect and an executive officer of the company June 17, 2013. He served as chairman and chief executive officer of Temple-Inland, Inc. from 2008 to February 2012 when it was acquired by International Paper. Previously, he held various management positions with Temple-Inland, including executive vice president from 2005 to 2007 and chief administrative officer from 2003 to 2005. Prior to joining Temple-Inland in 1992, he practiced real estate and banking law with Hutcheson and Grundy, L.L.P. Simons also serves on the board of directors for Fiserv, Inc.; is a member of the board of visitors for the University of Texas M. D. Anderson Cancer Center, and the Baylor University Hankamer School of Business Advisory Board.

59 PATTY BEDIENT Patty Bedient has been executive vice president and chief financial officer since 2007. She was senior vice president, Finance and Strategic Planning, from February 2006 to 2007. She served as vice president, Strategic Planning, from 2003, when she joined the company, to 2006. Prior to joining the company, she was a partner with Arthur Andersen LLP (Independent Accountant) from 1987 to 2002 and served as the managing partner for the Seattle office and as the partner in charge of the firm’s forest products practice from 1999 to 2002. She is on the board of directors for Alaska Air Group and also serves as Treasurer and board member of Overlake Hospital Medical Center. She is a CPA and member of the American Institute of CPAs.

60 DENISE MERLE Denise M. Merle, has been senior vice president, Human Resources, since February 28, 2014 and senior vice president Investor Relations since August 1, 2014. She was director, Finance and Human Resources for the Lumber business since 2013. Prior to that role, she was director, Compliance & Enterprise Planning from 2009 to 2013, and director of Internal Audit from 2004 to 2009. She held various roles in the company’s paper and packaging businesses, including finance, capital planning and analysis, and business development. She joined the company in 1981. She is a licensed CPA in the state of Washington. She holds a Bachelor of Accounting from Pacific Lutheran University and an MBA from Seattle University. She is on the board of advisors for Seattle University School of Business.

61 RHONDA HUNTER Rhonda Hunter has been senior vice president Timberlands, since January 1, 2014. Prior to her current position, she was vice president, Southern Timberlands, from 2010 to 2014. She held a number of leadership positions in the Southern Timberlands organization with experience in inventory and planning, regional timberlands management, environmental and work systems, finance, and land acquisition. Hunter joined Weyerhaeuser in 1987 as an accountant. She serves on the board of governors for the National Council for Air and Stream Improvement (NCASI) and on the board of trustees for the American Forest Foundation.

62 ADRIAN BLOCKER Adrian Blocker has been senior vice president, Lumber since August 21, 2013. He joined Weyerhaeuser in May 2013 as vice president, Lumber. Prior to that role, he served as CEO of the Wood Products Council and Chairman. Throughout his career in the industry, Blocker held numerous leadership positions at West Fraser, International Paper and Champion International focused on forest management, fiber procurement, consumer packaging, strategic planning, business development and manufacturing.
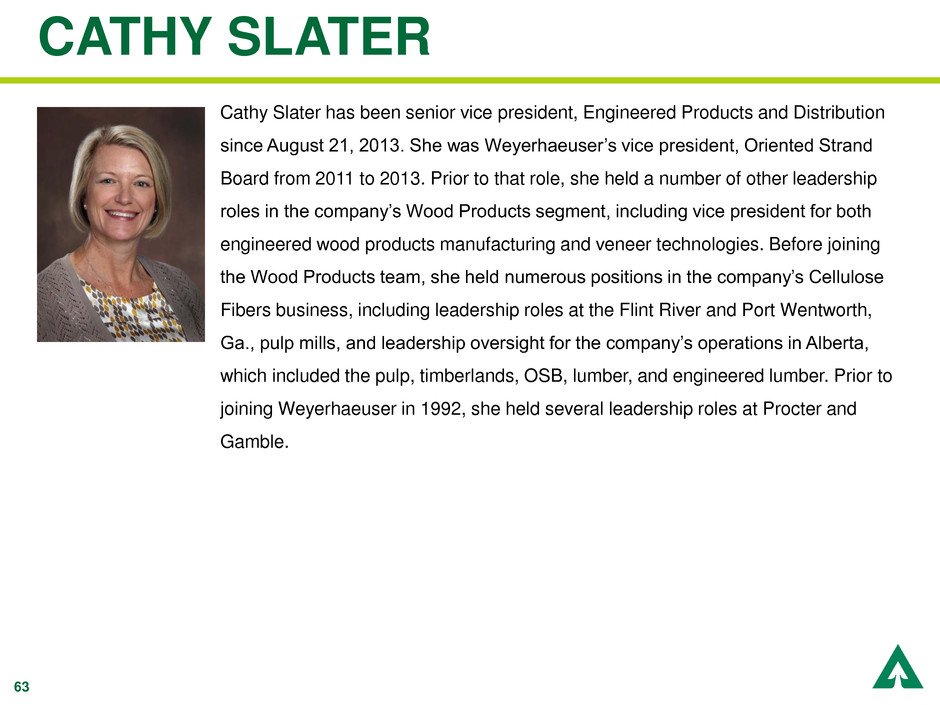
63 CATHY SLATER Cathy Slater has been senior vice president, Engineered Products and Distribution since August 21, 2013. She was Weyerhaeuser’s vice president, Oriented Strand Board from 2011 to 2013. Prior to that role, she held a number of other leadership roles in the company’s Wood Products segment, including vice president for both engineered wood products manufacturing and veneer technologies. Before joining the Wood Products team, she held numerous positions in the company’s Cellulose Fibers business, including leadership roles at the Flint River and Port Wentworth, Ga., pulp mills, and leadership oversight for the company’s operations in Alberta, which included the pulp, timberlands, OSB, lumber, and engineered lumber. Prior to joining Weyerhaeuser in 1992, she held several leadership roles at Procter and Gamble.

64 SHAKER CHANDRASEKARAN Shaker Chandrasekaran has been senior vice president, Cellulose Fibers, since 2006. He was vice president, Manufacturing, Cellulose Fibers, from 2005 to 2006; vice president and mill manager at the Kamloops, British Columbia, Cellulose Fibers mill from 2003 to 2005; and vice president and mill manager at the Kingsport, Tennessee, paper mill from 2002 to 2003. He joined Weyerhaeuser in 2002 with the company's acquisition of Willamette Industries Inc. "Shaker" began his career in the pulp and paper industry in 1972 and migrated to the United States in 1980. He held a number of leadership positions in Mead Corporation and Willamette Industries Inc. He is on the board of trustees for the Pulp & Paper Foundation, Miami University, Oxford, Ohio.

65 APPENDIX
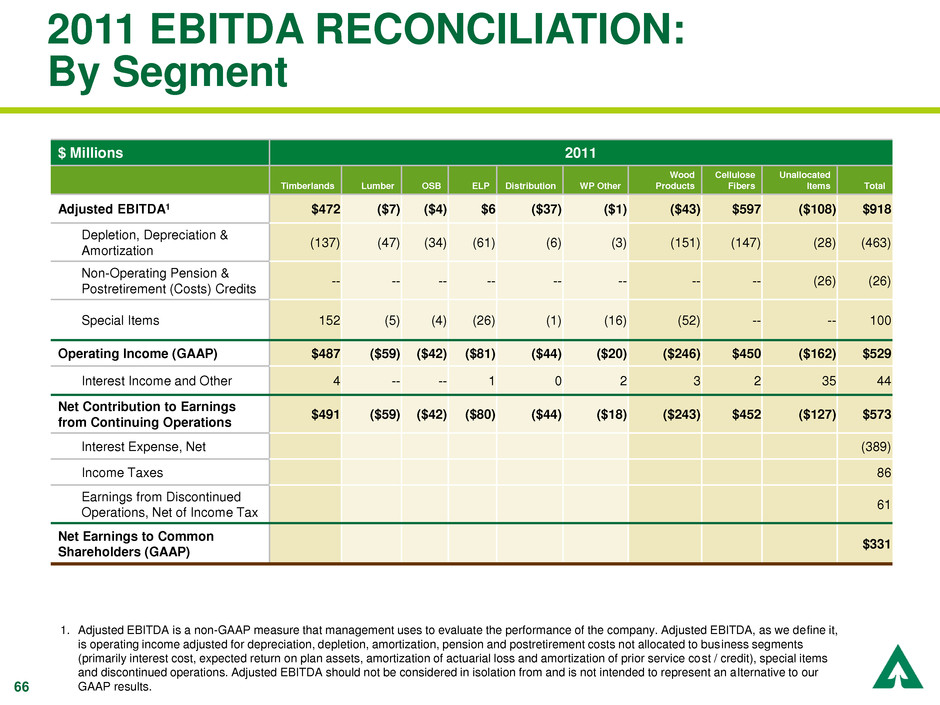
66 2011 EBITDA RECONCILIATION: By Segment $ Millions 2011 Timberlands Lumber OSB ELP Distribution WP Other Wood Products Cellulose Fibers Unallocated Items Total Adjusted EBITDA1 $472 ($7) ($4) $6 ($37) ($1) ($43) $597 ($108) $918 Depletion, Depreciation & Amortization (137) (47) (34) (61) (6) (3) (151) (147) (28) (463) Non-Operating Pension & Postretirement (Costs) Credits -- -- -- -- -- -- -- -- (26) (26) Special Items 152 (5) (4) (26) (1) (16) (52) -- -- 100 Operating Income (GAAP) $487 ($59) ($42) ($81) ($44) ($20) ($246) $450 ($162) $529 Interest Income and Other 4 -- -- 1 0 2 3 2 35 44 Net Contribution to Earnings from Continuing Operations $491 ($59) ($42) ($80) ($44) ($18) ($243) $452 ($127) $573 Interest Expense, Net (389) Income Taxes 86 Earnings from Discontinued Operations, Net of Income Tax 61 Net Earnings to Common Shareholders (GAAP) $331 1. Adjusted EBITDA is a non-GAAP measure that management uses to evaluate the performance of the company. Adjusted EBITDA, as we define it, is operating income adjusted for depreciation, depletion, amortization, pension and postretirement costs not allocated to business segments (primarily interest cost, expected return on plan assets, amortization of actuarial loss and amortization of prior service cost / credit), special items and discontinued operations. Adjusted EBITDA should not be considered in isolation from and is not intended to represent an alternative to our GAAP results.

67 2012 EBITDA RECONCILIATION: By Segment 1. Adjusted EBITDA is a non-GAAP measure that management uses to evaluate the performance of the company. Adjusted EBITDA, as we define it, is operating income adjusted for depreciation, depletion, amortization, pension and postretirement costs not allocated to business segments (primarily interest cost, expected return on plan assets, amortization of actuarial loss and amortization of prior service cost / credit), special items and discontinued operations. Adjusted EBITDA should not be considered in isolation from and is not intended to represent an alternative to our GAAP results. $ Millions 2012 Timberlands Lumber OSB ELP Distribution WP Other Wood Products Cellulose Fibers Unallocated Items Total Adjusted EBITDA1 $460 $130 $143 $17 ($29) ($15) $246 $368 ($78) $996 Depletion, Depreciation & Amortization (142) (45) (31) (51) (5) (1) (133) (150) (19) (444) Non-Operating Pension & Postretirement (Costs) Credits -- -- -- -- -- -- -- -- (29) (29) Special Items -- -- -- -- -- 6 6 -- 89 95 Operating Income (GAAP) $318 $85 $112 ($34) ($34) ($10) $119 $218 ($37) $618 Interest Income and Other 3 -- -- -- -- 1 1 5 39 48 Loss Attributable to Non- Controlling Interest 1 -- -- -- -- -- -- -- -- 1 Net Contribution to Earnings from Continuing Operations $322 $85 $112 ($34) ($34) ($9) $120 $223 $2 $667 Interest Expense, Net (344) Income Taxes (10) Earnings from Discontinued Operations, Net of Income Tax 72 Net Earnings to Common Shareholders (GAAP) $385

68 2013 Q3 YTD EBITDA RECONCILIATION: By Segment $ Millions 2013 Q3 YTD Timberlands Lumber OSB ELP Distribution WP Other Wood Products Cellulose Fibers Unallocated Items Total Adjusted EBITDA1 $448 $258 $223 $34 ($27) ($2) $486 $252 ($33) $1,153 Depletion, Depreciation & Amortization (115) (30) (23) (35) (4) (1) (93) (116) (9) (333) Non-Operating Pension & Postretirement (Costs) Credits -- -- -- -- -- -- -- -- (31) (31) Special Items -- -- -- -- -- -- -- -- -- -- Operating Income (GAAP) $333 $228 $200 ($1) ($31) ($3) $393 $136 ($73) $789 Interest Income and Other 3 -- -- -- -- -- -- (1) 37 39 Net Contribution to Earnings from Continuing Operations $336 $228 $200 ($1) ($31) ($3) $393 $135 ($36) $828 Interest Expense, Net (256) Income Taxes (99) Earnings from Discontinued Operations, Net of Income Tax 36 Net Earnings (GAAP) $509 Dividends on preference shares (12) Net Earnings to Common Shareholders (GAAP) $497 1. Adjusted EBITDA is a non-GAAP measure that management uses to evaluate the performance of the company. Adjusted EBITDA, as we define it, is operating income adjusted for depreciation, depletion, amortization, pension and postretirement costs not allocated to business segments (primarily interest cost, expected return on plan assets, amortization of actuarial loss and amortization of prior service cost / credit), special items and discontinued operations. Adjusted EBITDA should not be considered in isolation from and is not intended to represent an alternative to our GAAP results.
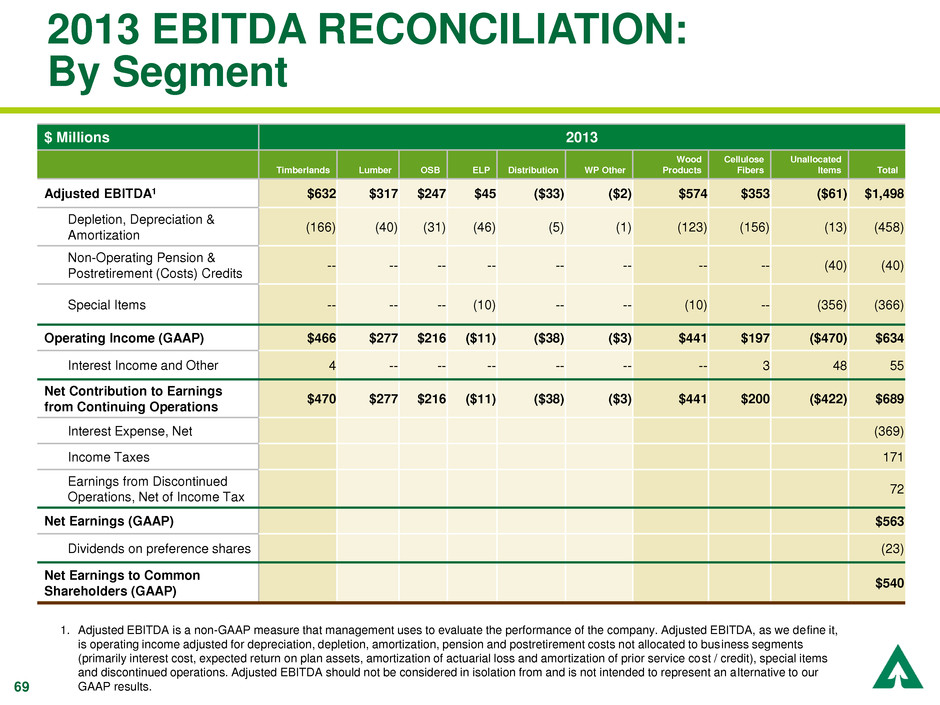
69 2013 EBITDA RECONCILIATION: By Segment $ Millions 2013 Timberlands Lumber OSB ELP Distribution WP Other Wood Products Cellulose Fibers Unallocated Items Total Adjusted EBITDA1 $632 $317 $247 $45 ($33) ($2) $574 $353 ($61) $1,498 Depletion, Depreciation & Amortization (166) (40) (31) (46) (5) (1) (123) (156) (13) (458) Non-Operating Pension & Postretirement (Costs) Credits -- -- -- -- -- -- -- -- (40) (40) Special Items -- -- -- (10) -- -- (10) -- (356) (366) Operating Income (GAAP) $466 $277 $216 ($11) ($38) ($3) $441 $197 ($470) $634 Interest Income and Other 4 -- -- -- -- -- -- 3 48 55 Net Contribution to Earnings from Continuing Operations $470 $277 $216 ($11) ($38) ($3) $441 $200 ($422) $689 Interest Expense, Net (369) Income Taxes 171 Earnings from Discontinued Operations, Net of Income Tax 72 Net Earnings (GAAP) $563 Dividends on preference shares (23) Net Earnings to Common Shareholders (GAAP) $540 1. Adjusted EBITDA is a non-GAAP measure that management uses to evaluate the performance of the company. Adjusted EBITDA, as we define it, is operating income adjusted for depreciation, depletion, amortization, pension and postretirement costs not allocated to business segments (primarily interest cost, expected return on plan assets, amortization of actuarial loss and amortization of prior service cost / credit), special items and discontinued operations. Adjusted EBITDA should not be considered in isolation from and is not intended to represent an alternative to our GAAP results.

70 $ Millions 2014 Q3 YTD Timberlands Lumber OSB ELP Distribution WP Other Wood Products Cellulose Fibers Unallocated Items Total Adjusted EBITDA1 $624 $254 $39 $65 $3 ($1) $360 $321 ($47) $1,258 Depletion, Depreciation & Amortization (154) (31) (23) (31) (4) -- (89) (116) (9) (368) Non-Operating Pension & Postretirement (Costs) Credits -- -- -- -- -- -- -- -- 33 33 Special Items -- -- -- -- -- -- -- -- 103 103 Operating Income (GAAP) $470 $223 $16 $34 ($1) ($1) $271 $205 $80 $1,026 Interest Income and Other -- -- -- -- -- -- -- (1) 28 27 Net Contribution to Earnings from Continuing Operations $470 $223 $16 $34 ($1) ($1) $271 $204 $108 $1,053 Interest Expense, Net (254) Income Taxes (148) Earnings from Discontinued Operations, Net of Income Tax 998 Net Earnings (GAAP) $1,649 Dividends on preference shares (33) Net Earnings to Common Shareholders (GAAP) $1,616 2014 Q3 YTD EBITDA RECONCILIATION: By Segment 1. Adjusted EBITDA is a non-GAAP measure that management uses to evaluate the performance of the company. Adjusted EBITDA, as we define it, is operating income adjusted for depreciation, depletion, amortization, pension and postretirement costs not allocated to business segments (primarily interest cost, expected return on plan assets, amortization of actuarial loss and amortization of prior service cost / credit), special items and discontinued operations. Adjusted EBITDA should not be considered in isolation from and is not intended to represent an alternative to our GAAP results.

71 $ Millions 2014 Q3 LTM1 Timberlands Lumber OSB ELP Distribution WP Other Wood Products Cellulose Fibers Unallocated Items Total Adjusted EBITDA2 $808 $313 $63 $76 ($3) ($1) $448 $422 ($75) $1,603 Depletion, Depreciation & Amortization (205) (41) (31) (42) (5) -- (119) (156) (13) (493) Non-Operating Pension & Postretirement (Costs) Credits -- -- -- -- -- -- -- -- 24 24 Special Items -- -- -- (10) -- -- (10) -- (253) (263) Operating Income (GAAP) $603 $272 $32 $24 ($8) ($1) $319 $266 ($317) $871 Interest Income and Other 1 -- -- -- -- -- -- 3 39 43 Net Contribution to Earnings from Continuing Operations $604 $272 $32 $24 ($8) ($1) $319 $269 ($278) $914 Interest Expense, Net (367) Income Taxes 122 Earnings from Discontinued Operations, Net of Income Tax 1,304 Net Earnings (GAAP) $1,703 Dividends on preference shares (44) Net Earnings to Common Shareholders (GAAP) $1,659 2014 Q3 LTM EBITDA RECONCILIATION: By Segment 1. LTM = last twelve months. 2. Adjusted EBITDA is a non-GAAP measure that management uses to evaluate the performance of the company. Adjusted EBITDA, as we define it, is operating income adjusted for depreciation, depletion, amortization, pension and postretirement costs not allocated to business segments (primarily interest cost, expected return on plan assets, amortization of actuarial loss and amortization of prior service cost / credit), special items and discontinued operations. Adjusted EBITDA should not be considered in isolation from and is not intended to represent an alternative to our GAAP results.

72 EBITDA RECONCILIATION: Timberlands $ Millions 2011 2012 2013 2014 Q3 (LTM) West1 $273 $250 $361 $556 South 214 218 225 257 Other1 (15) (8) 46 (5) Adjusted EBITDA2 $472 $460 $632 $808 Depletion, Depreciation & Amortization (137) (142) (166) (205) Special Items 152 -- -- -- Operating Income (GAAP) $487 $318 $466 $603 Interest Income and Other 4 3 4 1 Loss Attributable to Non-Controlling Interest -- 1 -- -- Net Contribution to Earnings $491 $322 $470 $604 1. Results from Longview Timber are included with Western Timberlands for 2014 Q3 LTM. For 2013, results from Longview Timber are included in Other due to acquisition in July 2013. 2. Adjusted EBITDA is a non-GAAP measure that management uses to evaluate the performance of the company. Adjusted EBITDA, as we define it, is operating income adjusted for depreciation, depletion, amortization, pension and postretirement costs not allocated to business segments (primarily interest cost, expected return on plan assets, amortization of actuarial loss and amortization of prior service cost / credit), special items and discontinued operations. Adjusted EBITDA should not be considered in isolation from and is not intended to represent an alternative to our GAAP results.


