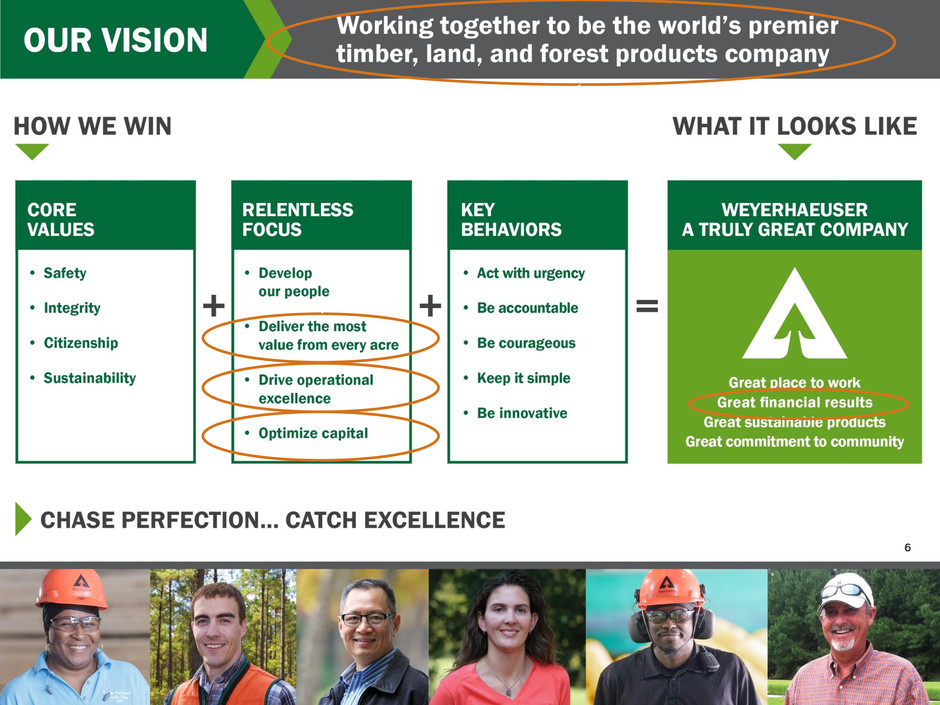
Working together to be the world’s premier timber, land, and forest products company Investor Meetings | June 2016 1
FORWARD-LOOKING STATEMENTS AND NON-GAAP FINANCIAL MEASURES 2 This presentation contains statements that are forward-looking statements within the meaning of the Private Securities Litigation Reform Act of 1995, including, without limitation, with respect to future prospects, business strategies, revenues, earnings, cash flow, taxes, funds available for distribution, pricing, production, supply, dividend levels, share repurchases, business priorities, performance, cost reductions, operational excellence initiatives, costs and operational synergies, demand drivers and levels, margins, growth, housing markets, capital structure, credit ratings, capital expenditures, cash position, debt levels, and harvests and export markets. Forward-looking statements can be identified by the fact that they do not relate strictly to historical or current facts. We may use words such as “anticipate,” “believe,”, “continue”, “could,” “forecast,” “estimate,” “outlook,” “goal,” “will,” “plan,” “expect,” “target,” “plan,” “would” and similar terms and phrases, or we may refer to assumptions, goals or targets or reference expected performance through a future date, to identify forward-looking statements. Forward-looking statements are made based on management’s current expectations and assumptions concerning future events. These are inherently subject to uncertainties and factors relating to our operations and business environment that are difficult to predict and often beyond the company’s control. Many factors could cause actual results to differ materially from those expressed or implied in these forward-looking statements, including, without limitation, our ability to successfully integrate the Plum Creek merger, our ability to successfully execute our performance plans, including cost reductions and other operational excellence initiatives, the effect of general economic conditions, including employment rates, housing starts, interest rate levels, availability of financing for home mortgages, strength of the U.S. dollar, market demand for our products, which is related to the strength of the various U.S. business segments and U.S. and international economic conditions, domestic and foreign competition, raw material prices, energy prices, the effect of weather, the risk of loss from fires, floods, windstorms, hurricanes, pest infestation and other natural disasters, transportation availability and costs, federal tax policies, the effect of forestry, land use, environmental and other governmental regulations, legal proceedings, performance of pension fund investments and related derivatives, the effect of timing of retirements and changes in market price of our common stock on charges for share-based compensation, changes in accounting principles, and the other risk factors described in filings we make with the SEC, including in our annual report on Form 10-K for the year ended December 31, 2015. There is no guarantee that any of the anticipated events or results will occur or, if they occur, what effect they will have on the company’s operations or financial condition. The forward-looking statements contained herein apply only as of the date of this presentation and we do not undertake any obligation to update these forward-looking statements. Nothing on our website is included or incorporated by reference herein. Included in this presentation are certain non-GAAP financial measures which management believes complement the financial information presented in accordance with U.S. generally accepted accounting principles. Management believes such measures may be useful to investors. Our non-GAAP financial measures may not be comparable to similarly titled captions of other companies due to potential inconsistencies in the metrics of calculation. For a reconciliation of non-GAAP measures to GAAP measures see the appendices to this presentation.
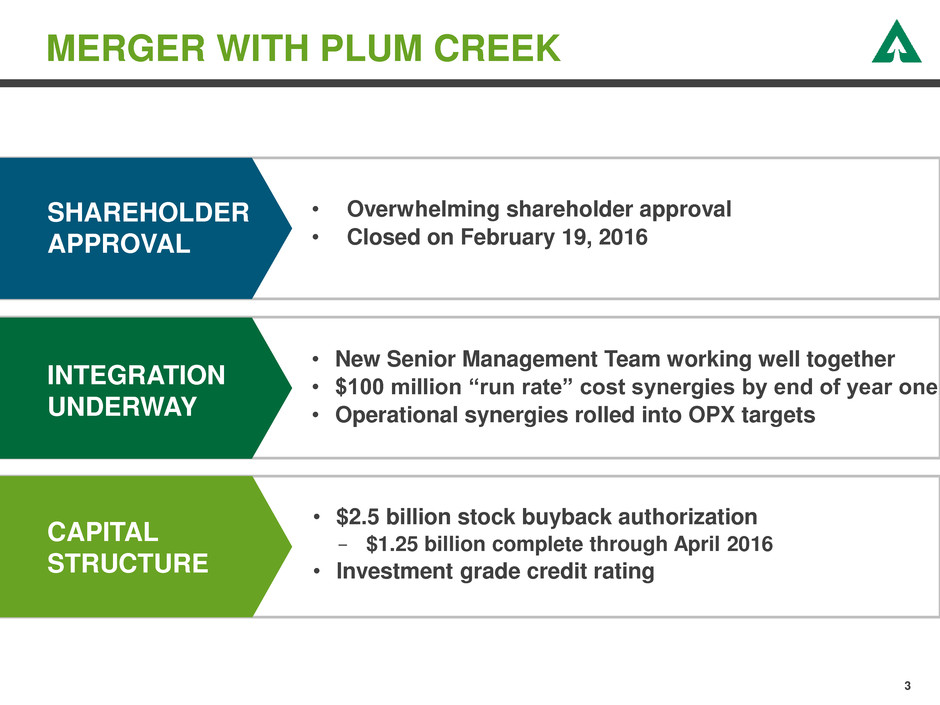
MERGER WITH PLUM CREEK 3 SHAREHOLDER APPROVAL INTEGRATION UNDERWAY CAPITAL STRUCTURE • Overwhelming shareholder approval • Closed on February 19, 2016 • New Senior Management Team working well together • $100 million “run rate” cost synergies by end of year one • Operational synergies rolled into OPX targets • $2.5 billion stock buyback authorization - $1.25 billion complete through April 2016 • Investment grade credit rating
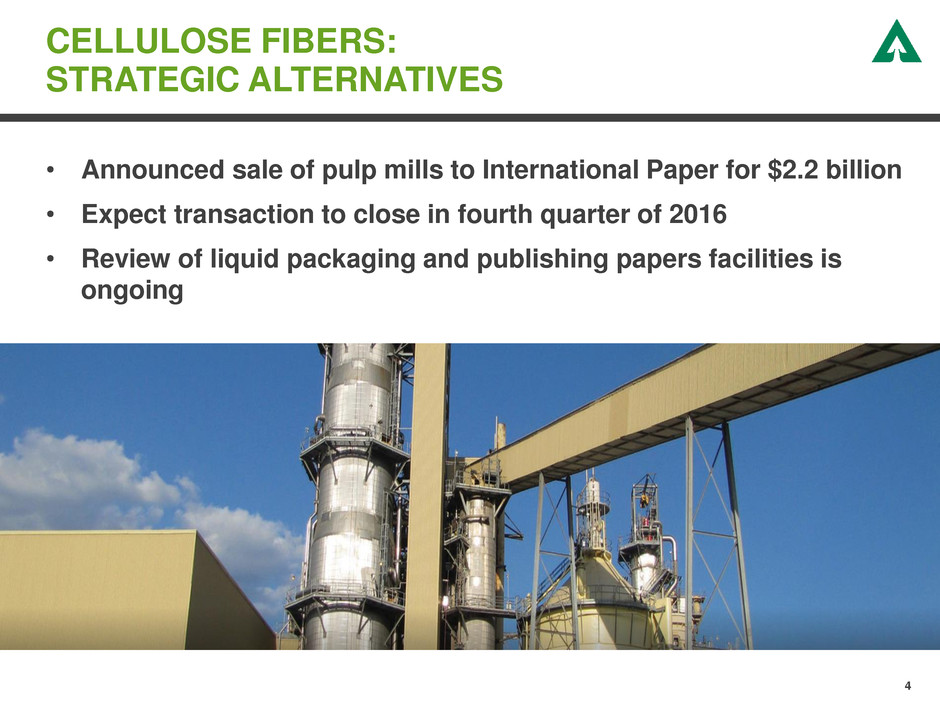
• Announced sale of pulp mills to International Paper for $2.2 billion • Expect transaction to close in fourth quarter of 2016 • Review of liquid packaging and publishing papers facilities is ongoing CELLULOSE FIBERS: STRATEGIC ALTERNATIVES 4 Creating the World’s Premier Timber, Land & Forest Products Company
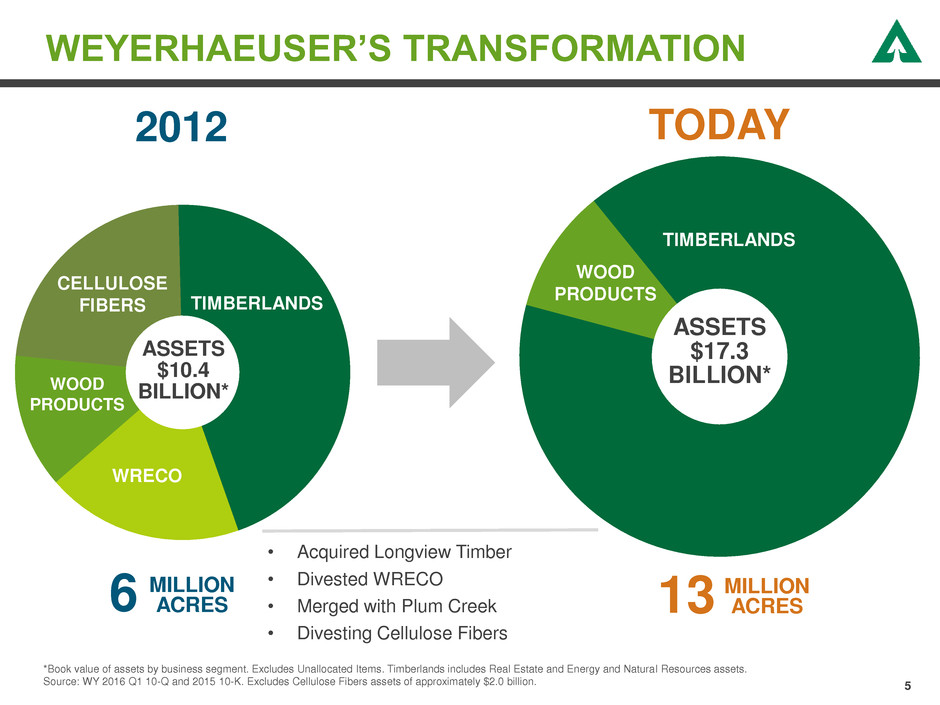
WEYERHAEUSER’S TRANSFORMATION 5 TIMBERLANDS WOOD PRODUCTS CELLULOSE FIBERS WOOD PRODUCTS WRECO • Acquired Longview Timber • Divested WRECO • Merged with Plum Creek • Divesting Cellulose Fibers *Book value of assets by business segment. Excludes Unallocated Items. Timberlands includes Real Estate and Energy and Natural Resources assets. Source: WY 2016 Q1 10-Q and 2015 10-K. Excludes Cellulose Fibers assets of approximately $2.0 billion. 6 13 WOOD PRODUCTS TIMBERLANDS WOOD PRODUCTS CELLULOSE FIBERS TIMBERLANDS WRECO ASSETS $17.3 BILLION* TODAY 2012 ASSETS $10.4 BILLION* MILLION ACRES MILLION ACRES
6
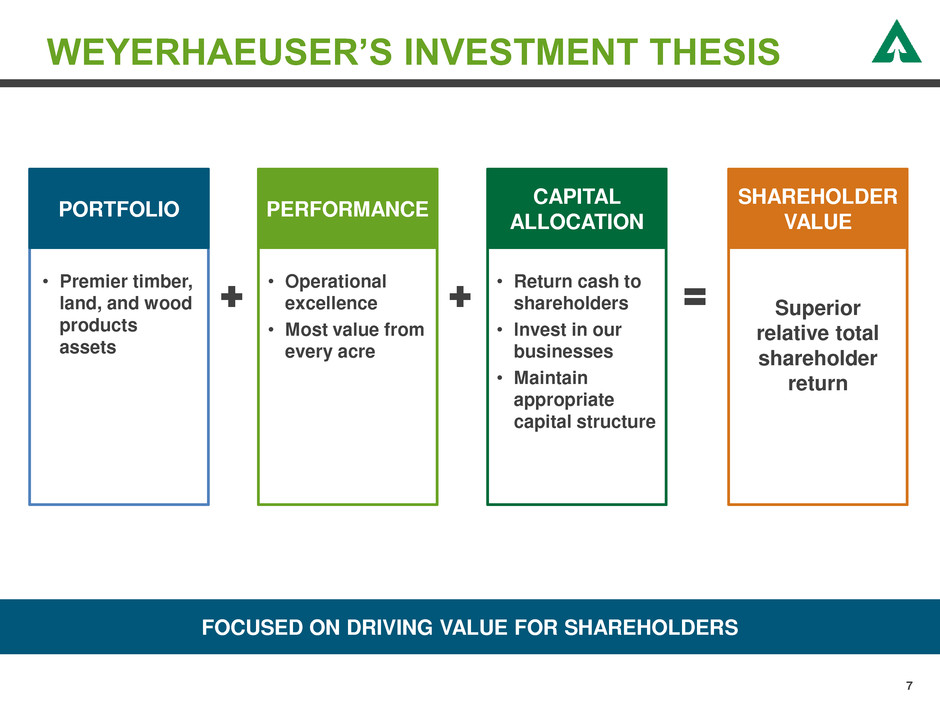
WEYERHAEUSER’S INVESTMENT THESIS FOCUSED ON DRIVING VALUE FOR SHAREHOLDERS 7 • Operational excellence • Most value from every acre • Return cash to shareholders • Invest in our businesses • Maintain appropriate capital structure • Premier timber, land, and wood products assets Superior relative total shareholder return PORTFOLIO PERFORMANCE CAPITAL ALLOCATION SHAREHOLDER VALUE
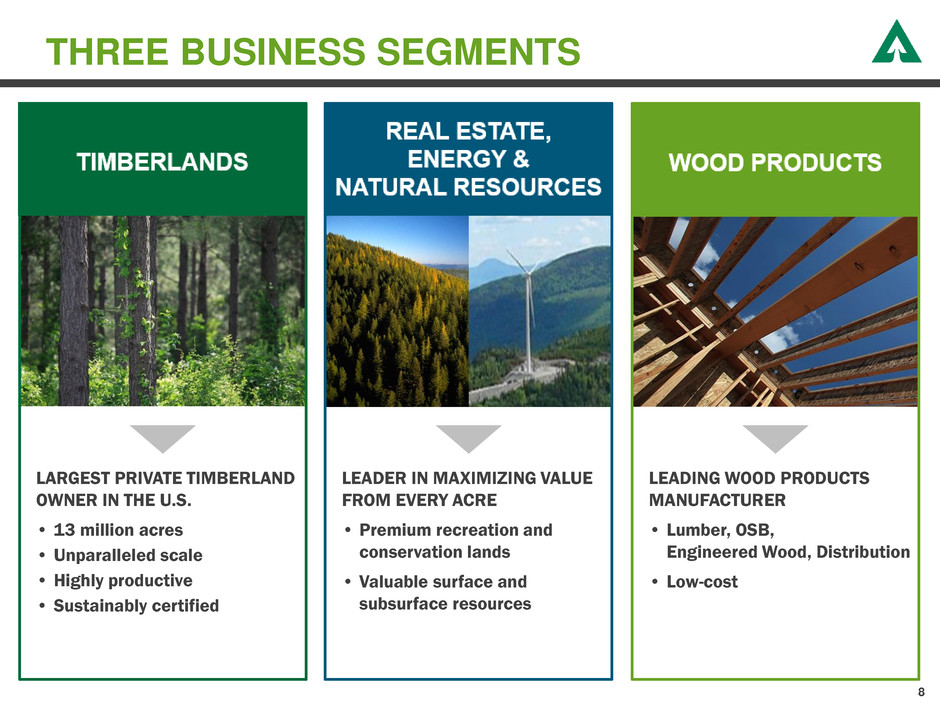
THREE BUSINESS SEGMENTS TIMBERLANDS REAL ESTATE, ENERGY & NATURAL RESOURCES WOOD PRODUCTS 8 LARGEST PRIVATE TIMBERLAND OWNER IN THE U.S. • 13 million acres • Unparalleled scale • Highly productive • Sustainably certified LEADER IN MAXIMIZING VALUE FROM EVERY ACRE • Premium recreation and conservation lands • Valuable surface and subsurface resources LEADING WOOD PRODUCTS MANUFACTURER • Lumber, OSB, Engineered Wood, Distribution • Low-cost
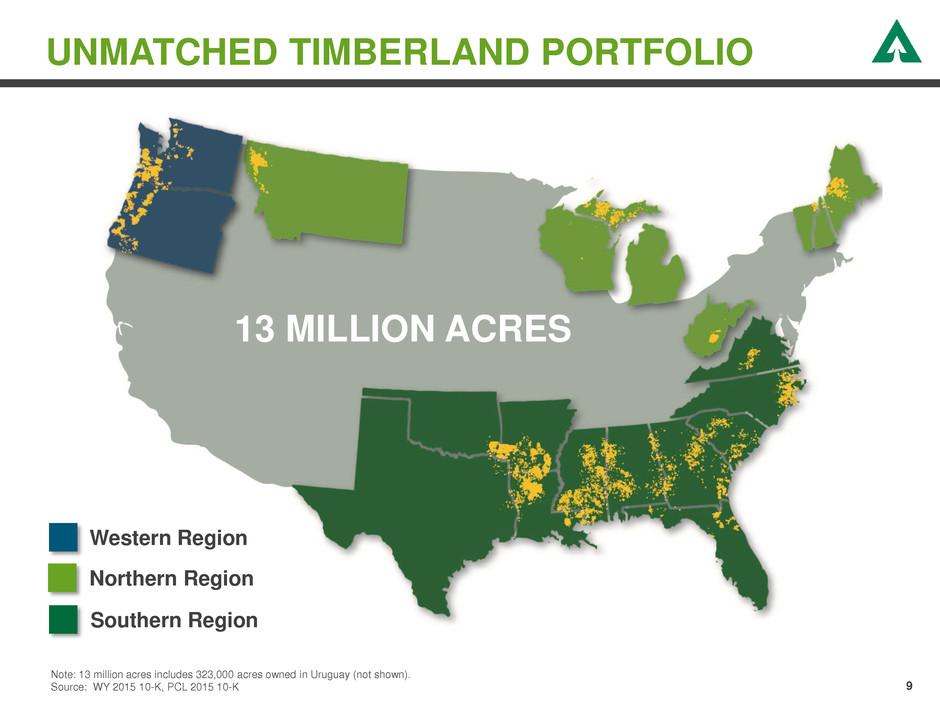
UNMATCHED TIMBERLAND PORTFOLIO Note: 13 million acres includes 323,000 acres owned in Uruguay (not shown). Source: WY 2015 10-K, PCL 2015 10-K 9 13 MILLION ACRES Western Region Southern Region Northern Region
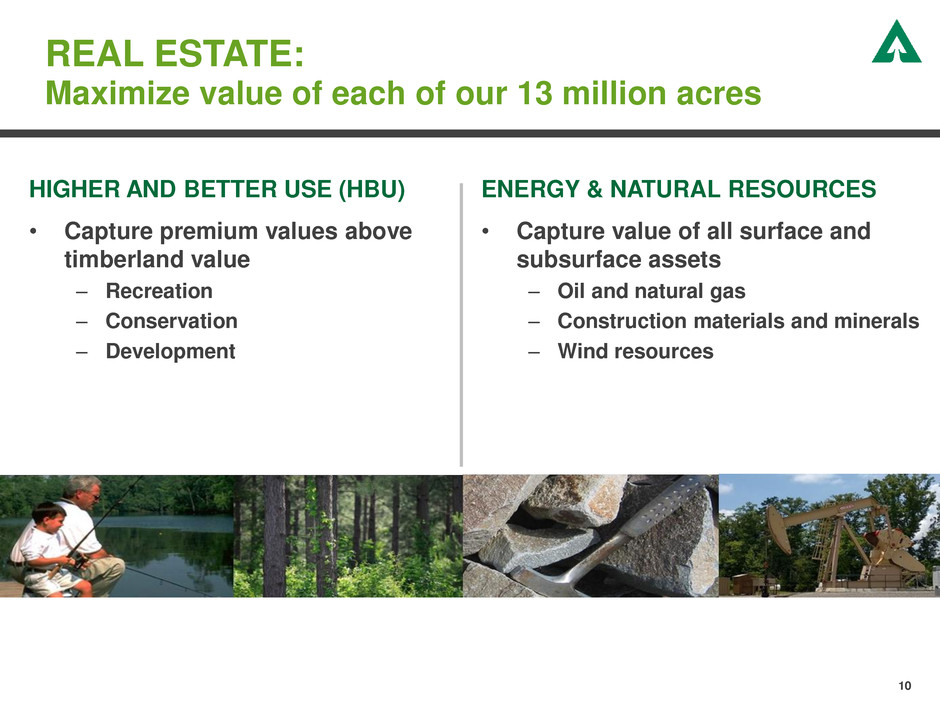
10 REAL ESTATE: Maximize value of each of our 13 million acres ENERGY & NATURAL RESOURCES • Capture value of all surface and subsurface assets – Oil and natural gas – Construction materials and minerals – Wind resources HIGHER AND BETTER USE (HBU) • Capture premium values above timberland value – Recreation – Conservation – Development
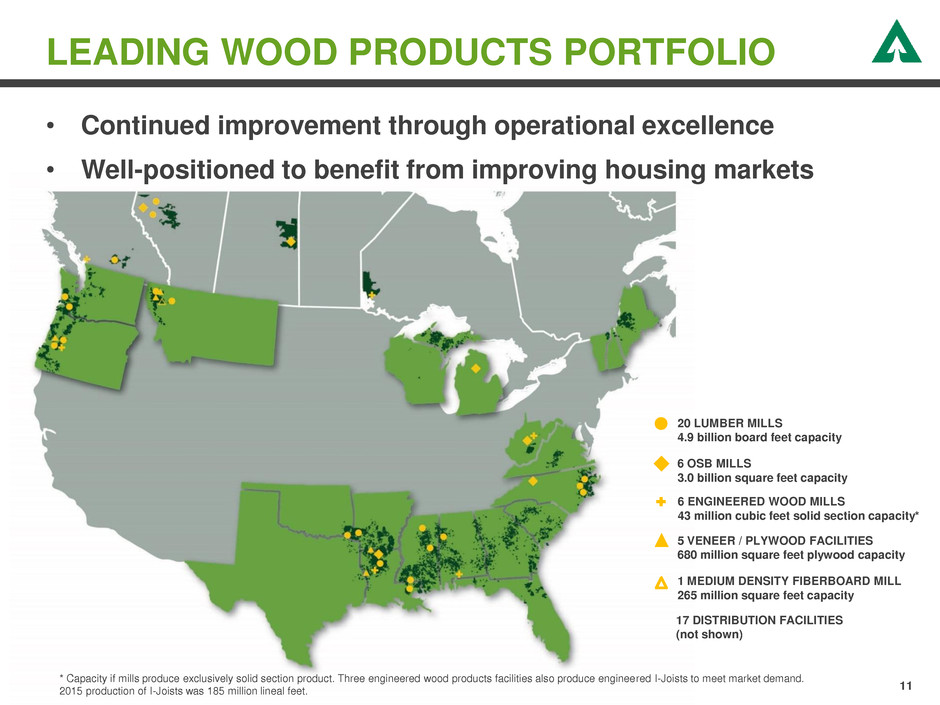
• Continued improvement through operational excellence • Well-positioned to benefit from improving housing markets 11 LEADING WOOD PRODUCTS PORTFOLIO * Capacity if mills produce exclusively solid section product. Three engineered wood products facilities also produce engineered I-Joists to meet market demand. 2015 production of I-Joists was 185 million lineal feet. 5 VENEER / PLYWOOD FACILITIES 680 million square feet plywood capacity 6 ENGINEERED WOOD MILLS 43 million cubic feet solid section capacity* 20 LUMBER MILLS 4.9 billion board feet capacity 6 OSB MILLS 3.0 billion square feet capacity 1 MEDIUM DENSITY FIBERBOARD MILL 265 million square feet capacity 17 DISTRIBUTION FACILITIES (not shown)
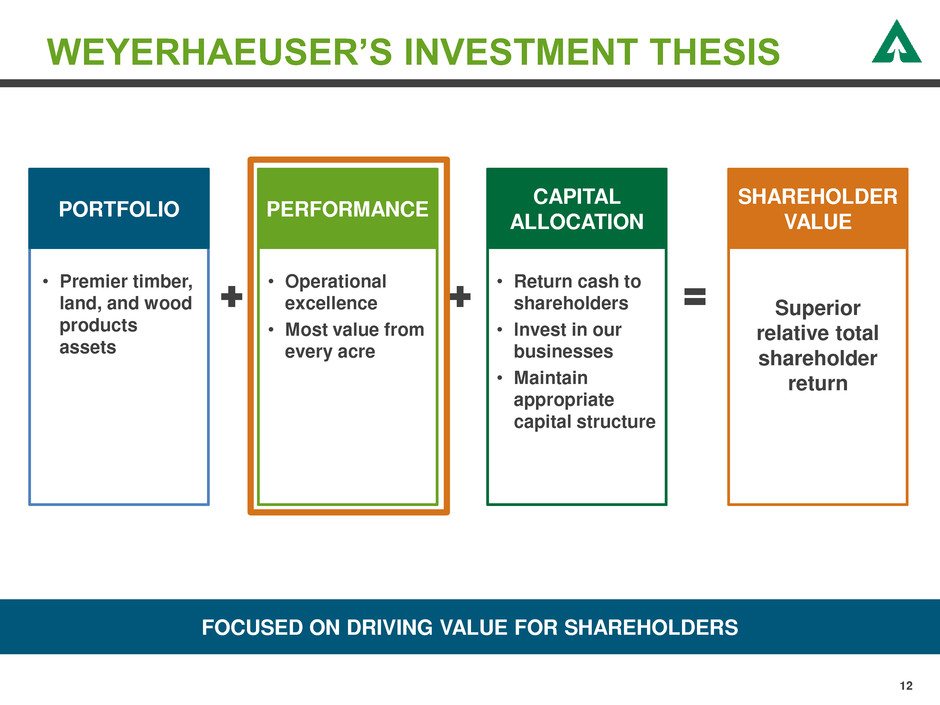
WEYERHAEUSER’S INVESTMENT THESIS FOCUSED ON DRIVING VALUE FOR SHAREHOLDERS 12 • Operational excellence • Most value from every acre • Return cash to shareholders • Invest in our businesses • Maintain appropriate capital structure • Premier timber, land, and wood products assets Superior relative total shareholder return PORTFOLIO PERFORMANCE CAPITAL ALLOCATION SHAREHOLDER VALUE
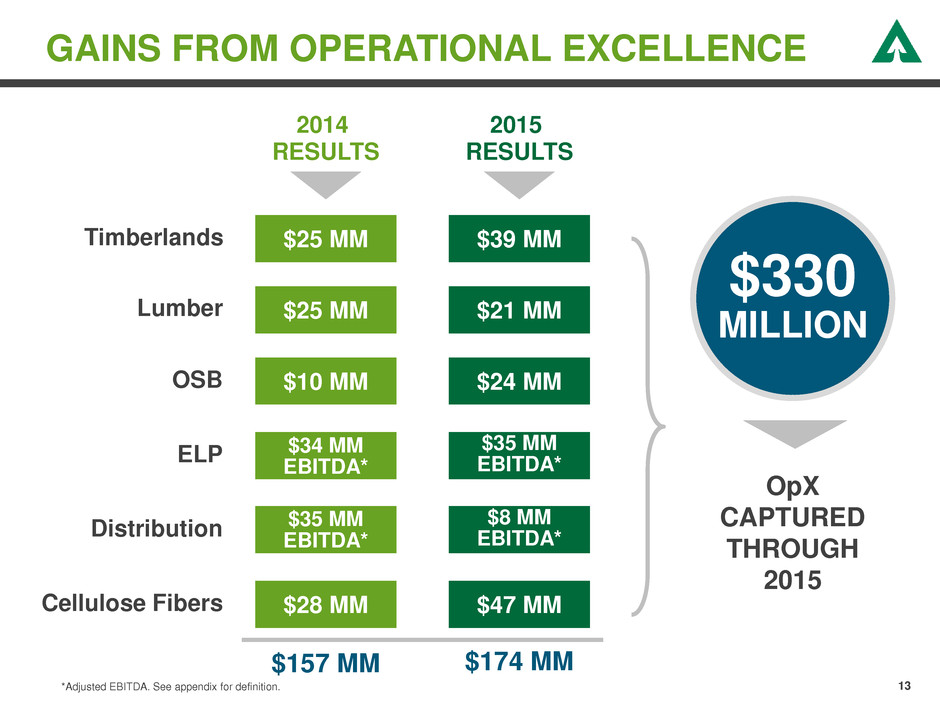
GAINS FROM OPERATIONAL EXCELLENCE 13 Timberlands Lumber OSB ELP Distribution Cellulose Fibers $39 MM $21 MM $24 MM $35 MM EBITDA* $8 MM EBITDA* $47 MM $25 MM $25 MM $10 MM $35 MM EBITDA* $28 MM $34 MM EBITDA* OpX CAPTURED THROUGH 2015 $157 MM $174 MM $330 MILLION 2014 RESULTS 2015 RESULTS *Adjusted EBITDA. See appendix for definition.
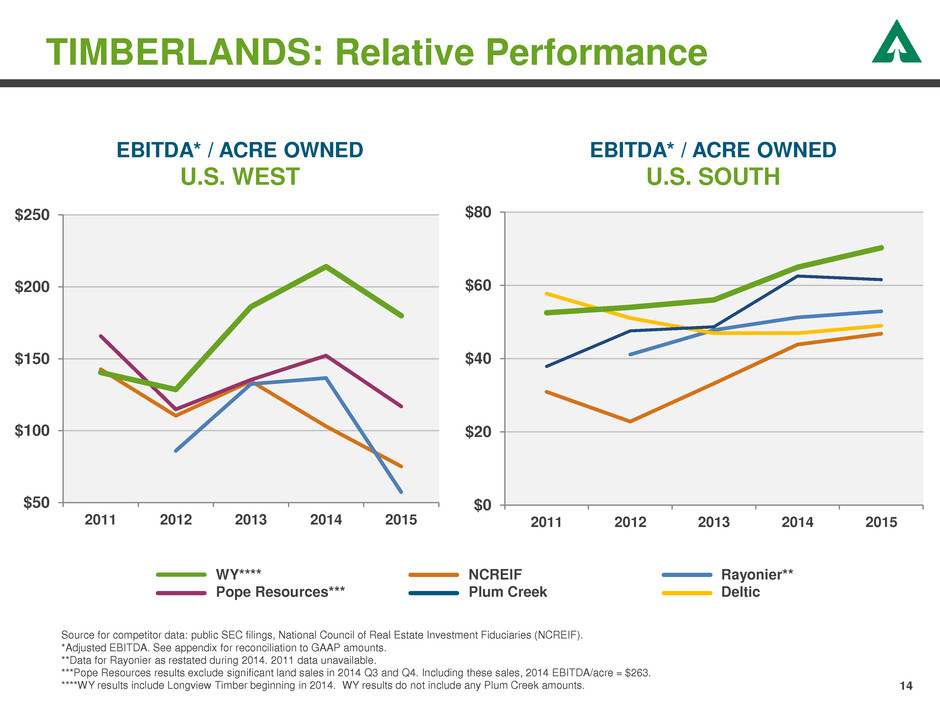
14 TIMBERLANDS: Relative Performance EBITDA* / ACRE OWNED U.S. WEST EBITDA* / ACRE OWNED U.S. SOUTH Source for competitor data: public SEC filings, National Council of Real Estate Investment Fiduciaries (NCREIF). *Adjusted EBITDA. See appendix for reconciliation to GAAP amounts. **Data for Rayonier as restated during 2014. 2011 data unavailable. ***Pope Resources results exclude significant land sales in 2014 Q3 and Q4. Including these sales, 2014 EBITDA/acre = $263. ****WY results include Longview Timber beginning in 2014. WY results do not include any Plum Creek amounts. $50 $100 $150 $200 $250 2011 2012 2013 2014 2015 $0 $20 $40 $60 $80 2011 2012 2013 2014 2015 WY**** NCREIF Rayonier** Pope Resources*** Plum Creek Deltic
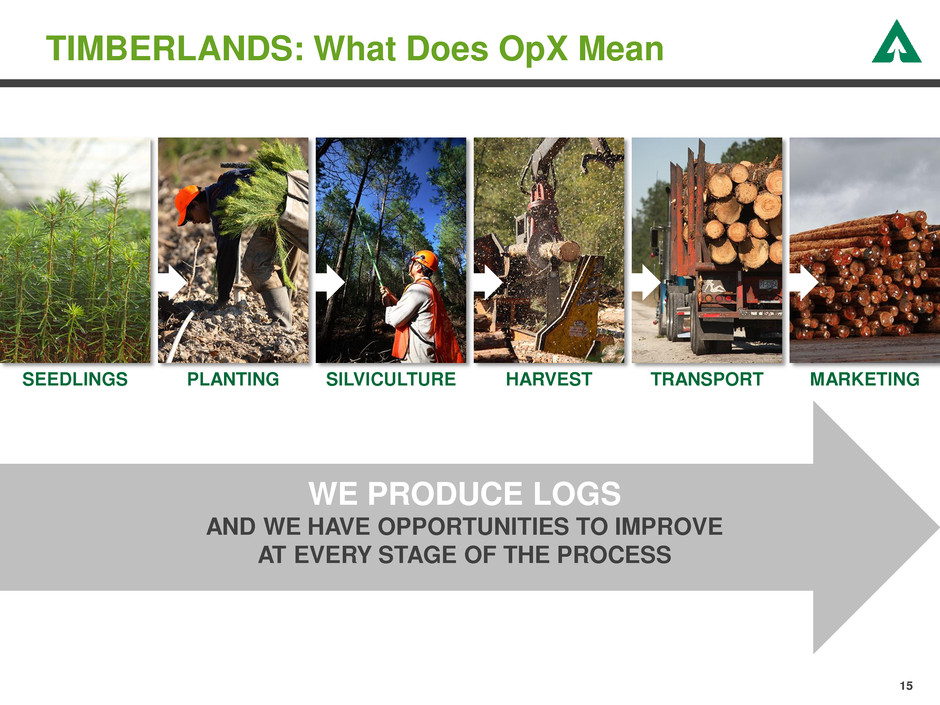
TIMBERLANDS: What Does OpX Mean WE PRODUCE LOGS AND WE HAVE OPPORTUNITIES TO IMPROVE AT EVERY STAGE OF THE PROCESS SEEDLINGS PLANTING SILVICULTURE HARVEST TRANSPORT MARKETING 15
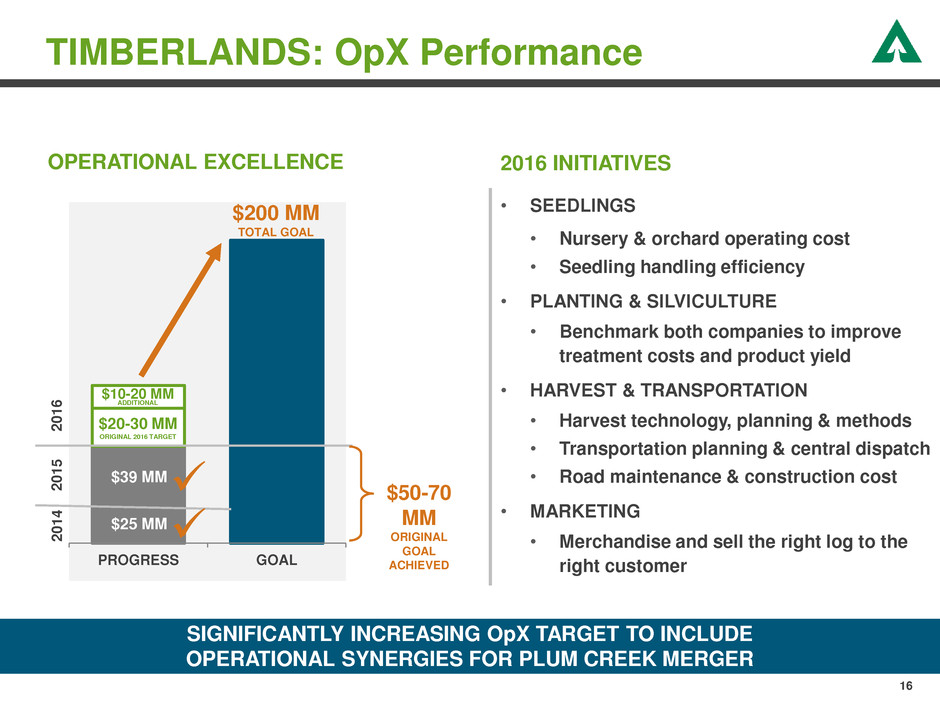
16 TIMBERLANDS: OpX Performance 2016 INITIATIVES • SEEDLINGS • Nursery & orchard operating cost • Seedling handling efficiency • PLANTING & SILVICULTURE • Benchmark both companies to improve treatment costs and product yield • HARVEST & TRANSPORTATION • Harvest technology, planning & methods • Transportation planning & central dispatch • Road maintenance & construction cost • MARKETING • Merchandise and sell the right log to the right customer OPERATIONAL EXCELLENCE SIGNIFICANTLY INCREASING OpX TARGET TO INCLUDE OPERATIONAL SYNERGIES FOR PLUM CREEK MERGER 2 0 1 4 2 0 1 5 2 0 1 6 PROGRESS GOAL $25 MM $39 MM $10-20 MM $50-70 MM ORIGINAL GOAL ACHIEVED $20-30 MM ORIGINAL 2016 TARGET ADDITIONAL $200 MM TOTAL GOAL
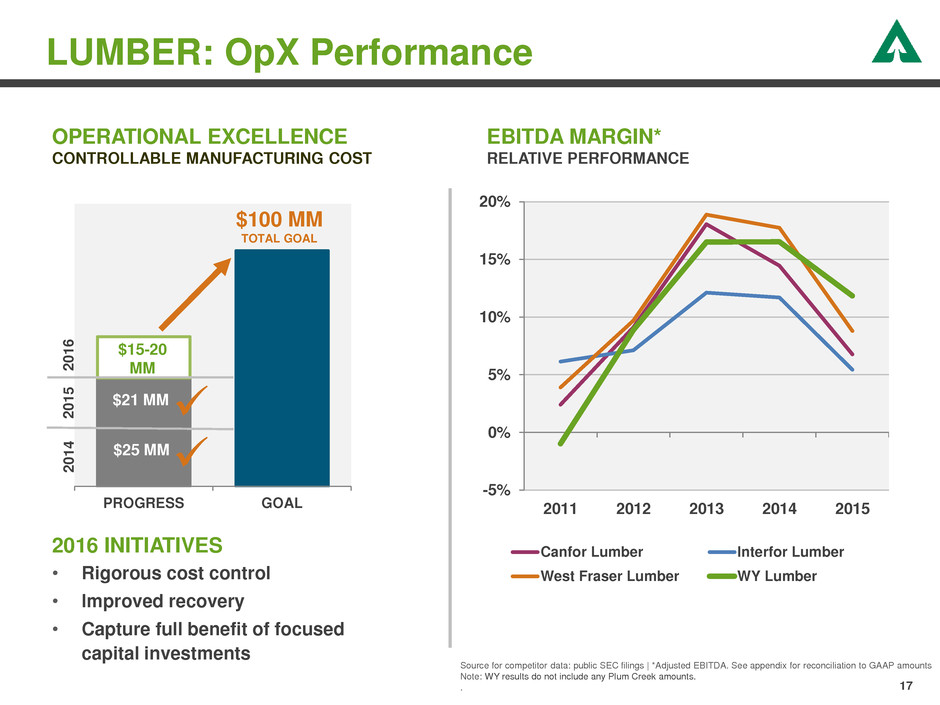
17 LUMBER: OpX Performance EBITDA MARGIN* RELATIVE PERFORMANCE Source for competitor data: public SEC filings | *Adjusted EBITDA. See appendix for reconciliation to GAAP amounts Note: WY results do not include any Plum Creek amounts. . 2016 INITIATIVES • Rigorous cost control • Improved recovery • Capture full benefit of focused capital investments OPERATIONAL EXCELLENCE CONTROLLABLE MANUFACTURING COST -5% 0% 5% 10% 15% 20% 2011 2012 2013 2014 2015 Canfor Lumber Interfor Lumber West Fraser Lumber WY Lumber PROGRESS GOAL $25 MM $21 MM $15-20 MM 2 0 1 4 2 0 1 5 2 0 1 6 $100 MM TOTAL GOAL
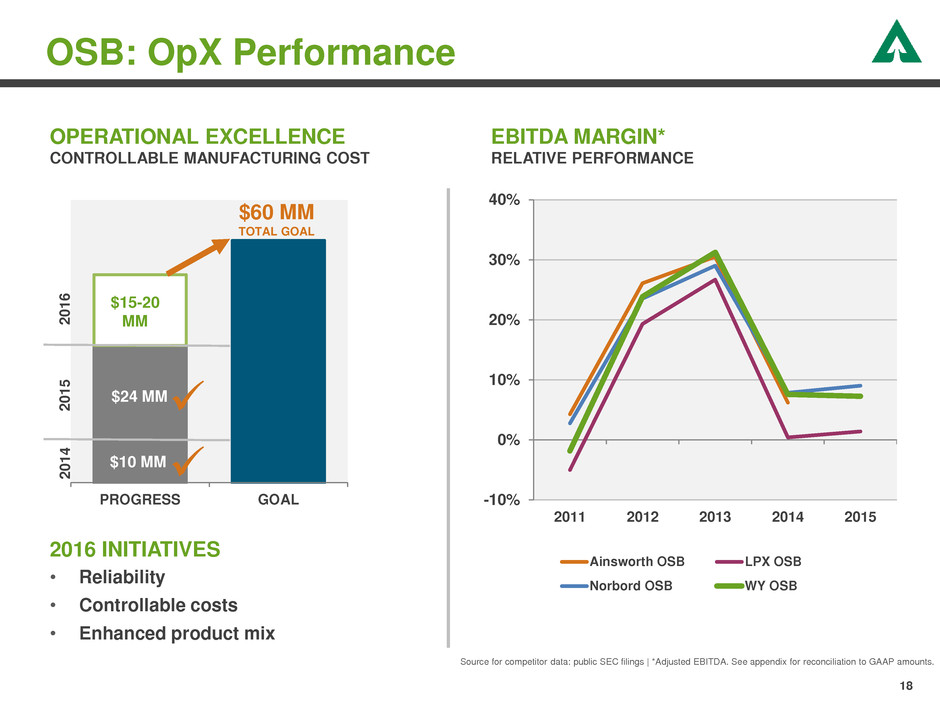
18 OSB: OpX Performance EBITDA MARGIN* RELATIVE PERFORMANCE Source for competitor data: public SEC filings | *Adjusted EBITDA. See appendix for reconciliation to GAAP amounts. 2016 INITIATIVES • Reliability • Controllable costs • Enhanced product mix OPERATIONAL EXCELLENCE CONTROLLABLE MANUFACTURING COST -10% 0% 10% 20% 30% 40% 2011 2012 2013 2014 2015 Ainsworth OSB LPX OSB Norbord OSB WY OSB PROGRESS GOAL $10 MM $24 MM $15-20 MM 2 0 1 4 2 0 1 5 2 0 1 6 $60 MM TOTAL GOAL
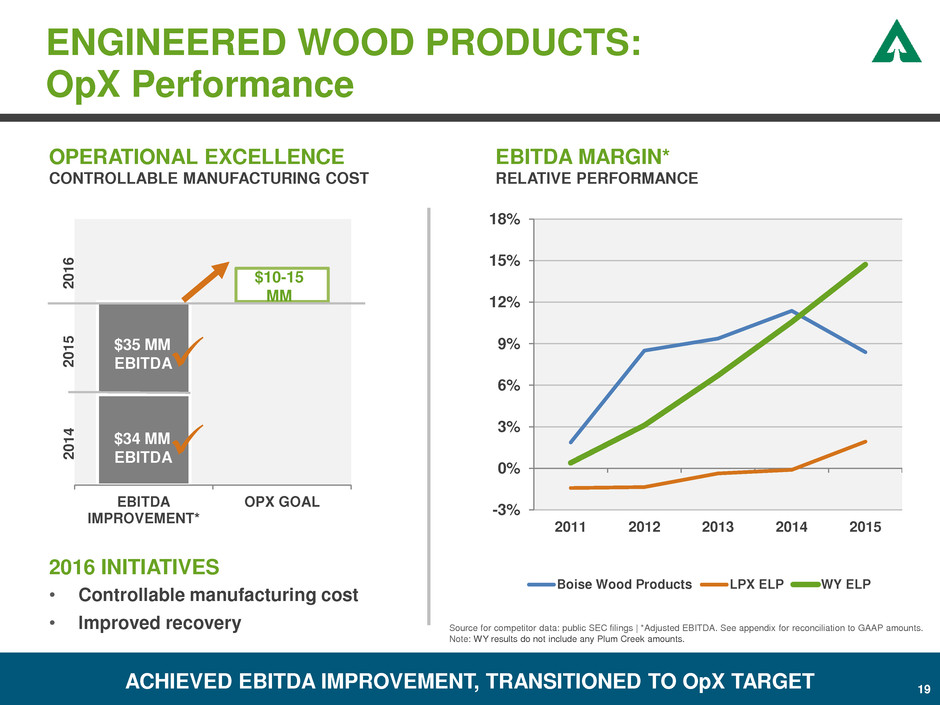
ENGINEERED WOOD PRODUCTS: OpX Performance EBITDA MARGIN* RELATIVE PERFORMANCE Source for competitor data: public SEC filings | *Adjusted EBITDA. See appendix for reconciliation to GAAP amounts. Note: WY results do not include any Plum Creek amounts. 2016 INITIATIVES • Controllable manufacturing cost • Improved recovery OPERATIONAL EXCELLENCE CONTROLLABLE MANUFACTURING COST -3% 0% 3% 6% 9% 12% 15% 18% 2011 2012 2013 2014 2015 Boise Wood Products LPX ELP WY ELP ACHIEVED EBITDA IMPROVEMENT, TRANSITIONED TO OpX TARGET EBITDA IMPROVEMENT* OPX GOAL $34 MM EBITDA $35 MM EBITDA $10-15 MM 2 0 1 4 2 0 1 5 2 0 1 6 19
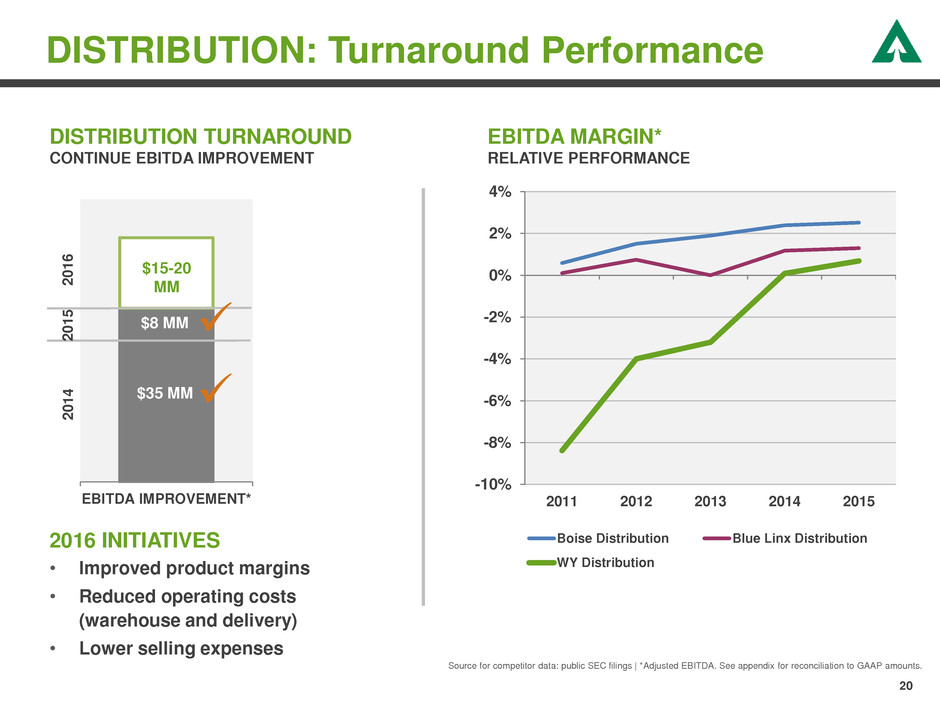
20 DISTRIBUTION: Turnaround Performance EBITDA MARGIN* RELATIVE PERFORMANCE Source for competitor data: public SEC filings | *Adjusted EBITDA. See appendix for reconciliation to GAAP amounts. 2016 INITIATIVES • Improved product margins • Reduced operating costs (warehouse and delivery) • Lower selling expenses DISTRIBUTION TURNAROUND CONTINUE EBITDA IMPROVEMENT -10% -8% -6% -4% -2% 0% 2% 4% 2011 2012 2013 2014 2015 Boise Distribution Blue Linx Distribution WY Distribution EBITDA IMPROVEMENT* $35 MM $8 MM $15-20 MM 2 0 1 4 2 0 1 6 2 0 1 5
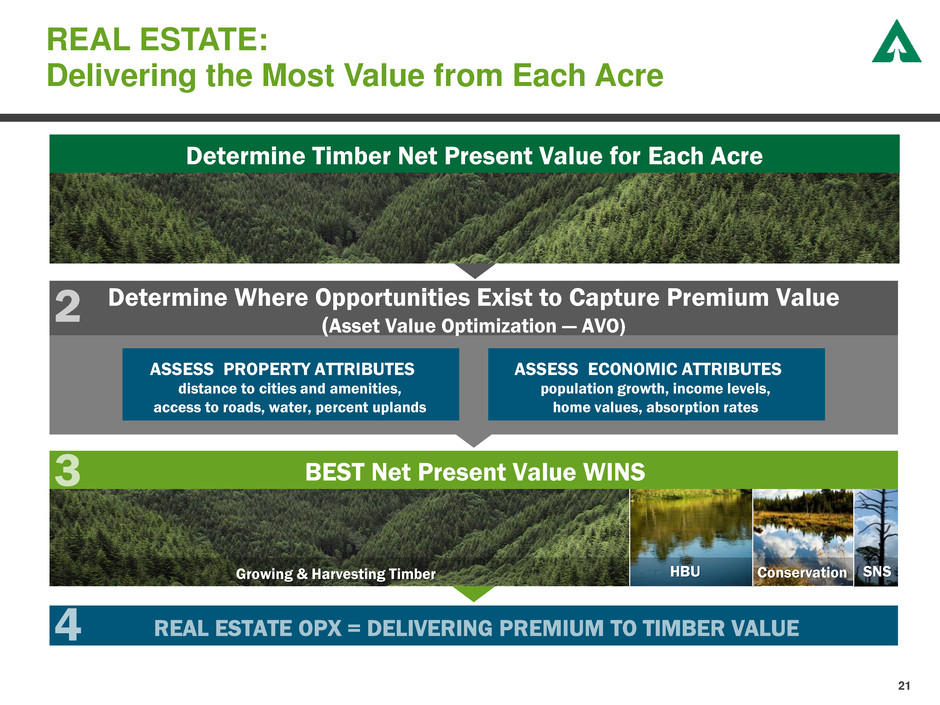
REAL ESTATE: Delivering the Most Value from Each Acre 21 21 Growing & Harvesting Timber Conservation HBU Determine Where Opportunities Exist to Capture Premium Value (Asset Value Optimization — AVO) ASSESS PROPERTY ATTRIBUTES distance to cities and amenities, access to roads, water, percent uplands Determine Timber Net Present Value for Each Acre SNS ASSESS ECONOMIC ATTRIBUTES population growth, income levels, home values, absorption rates BEST Net Present Value WINS
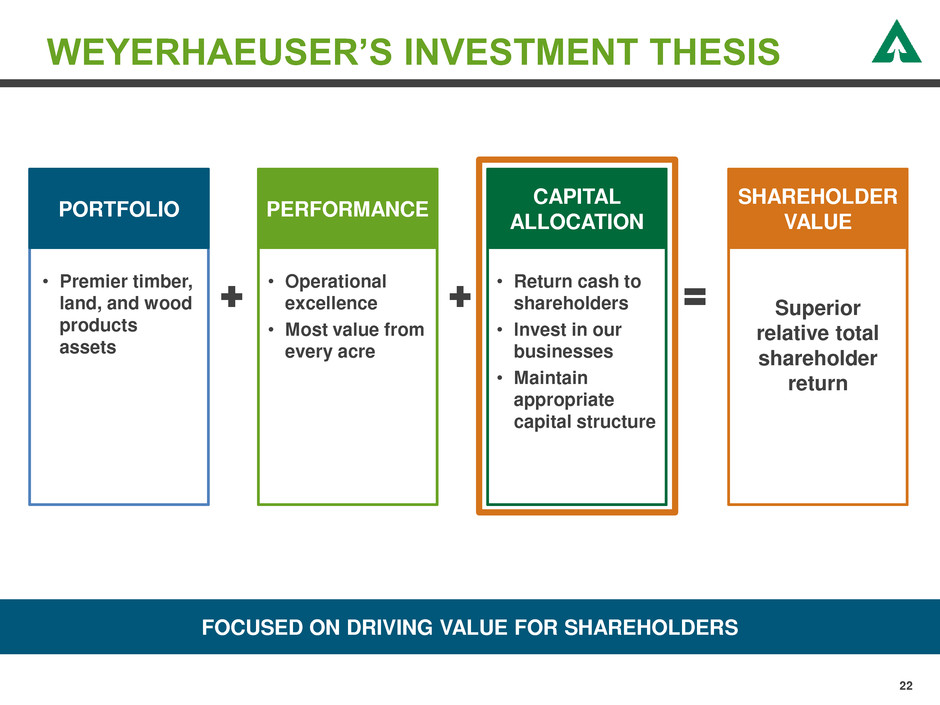
WEYERHAEUSER’S INVESTMENT THESIS FOCUSED ON DRIVING VALUE FOR SHAREHOLDERS 22 • Operational excellence • Most value from every acre • Return cash to shareholders • Invest in our businesses • Maintain appropriate capital structure • Premier timber, land, and wood products assets Superior relative total shareholder return PORTFOLIO PERFORMANCE CAPITAL ALLOCATION SHAREHOLDER VALUE
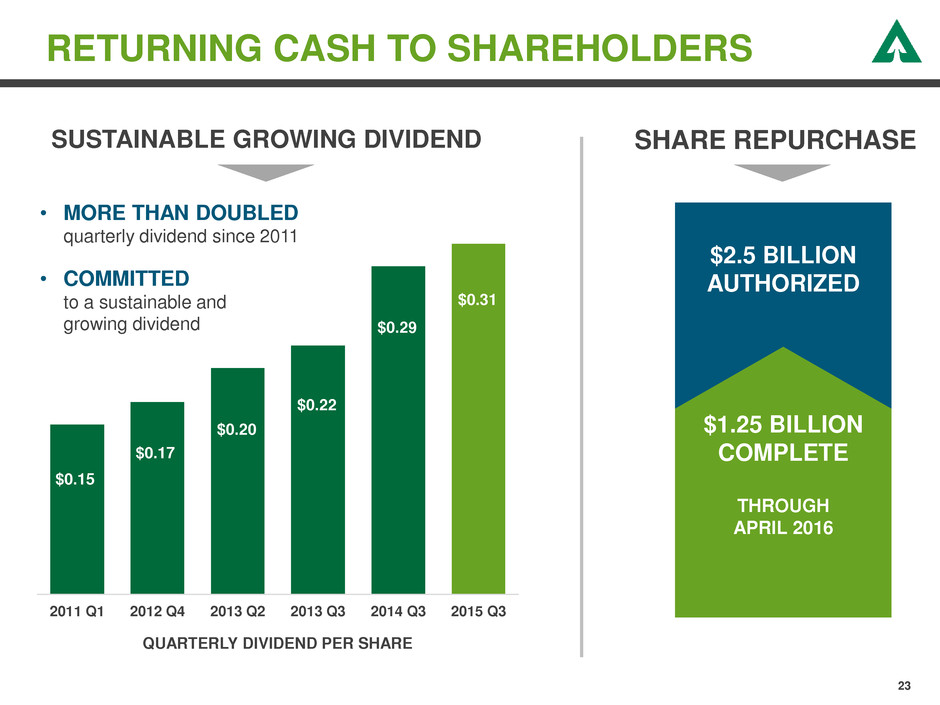
RETURNING CASH TO SHAREHOLDERS 23 $0.15 $0.17 $0.20 $0.22 $0.29 $0.31 2011 Q1 2012 Q4 2013 Q2 2013 Q3 2014 Q3 2015 Q3 • MORE THAN DOUBLED quarterly dividend since 2011 • COMMITTED to a sustainable and growing dividend QUARTERLY DIVIDEND PER SHARE $2.5 BILLION AUTHORIZED $1.25 BILLION COMPLETE THROUGH APRIL 2016 SUSTAINABLE GROWING DIVIDEND SHARE REPURCHASE
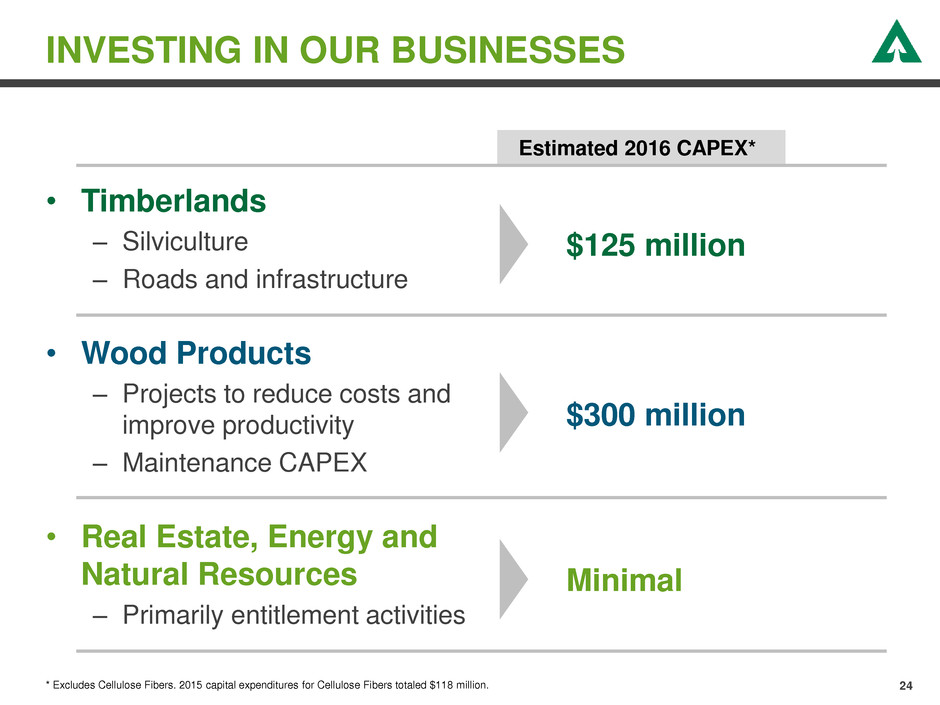
• Timberlands – Silviculture – Roads and infrastructure • Wood Products – Projects to reduce costs and improve productivity – Maintenance CAPEX • Real Estate, Energy and Natural Resources – Primarily entitlement activities 24 INVESTING IN OUR BUSINESSES * Excludes Cellulose Fibers. 2015 capital expenditures for Cellulose Fibers totaled $118 million. Estimated 2016 CAPEX* $125 million $300 million Minimal
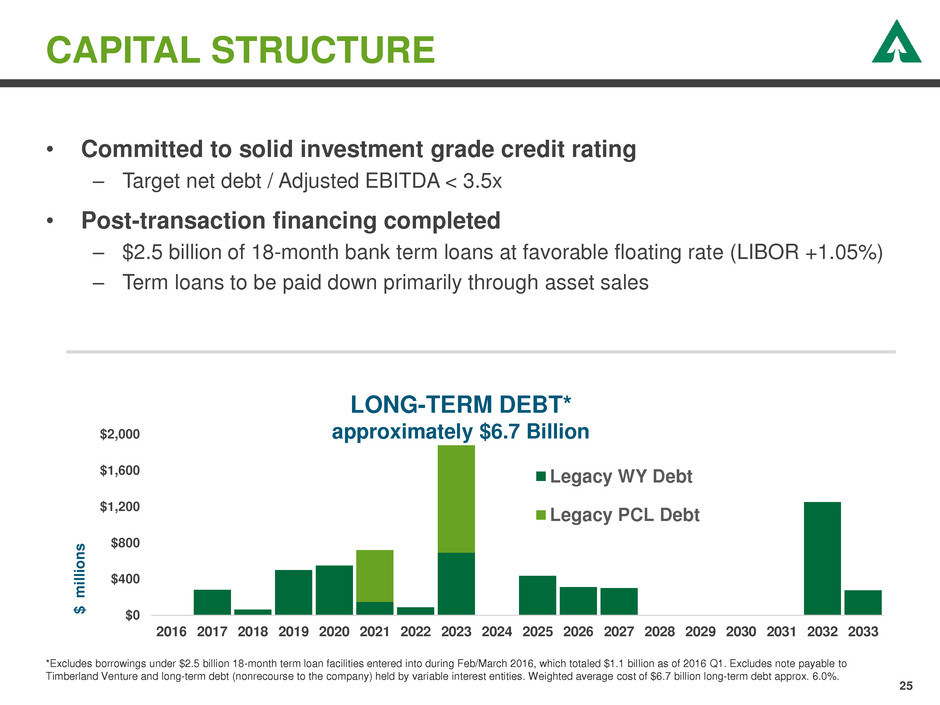
• Committed to solid investment grade credit rating – Target net debt / Adjusted EBITDA < 3.5x • Post-transaction financing completed – $2.5 billion of 18-month bank term loans at favorable floating rate (LIBOR +1.05%) – Term loans to be paid down primarily through asset sales 25 CAPITAL STRUCTURE $0 $400 $800 $1,200 $1,600 $2,000 2016 2017 2018 2019 2020 2021 2022 2023 2024 2025 2026 2027 2028 2029 2030 2031 2032 2033 $ m il li o n s Legacy WY Debt Legacy PCL Debt LONG-TERM DEBT* approximately $6.7 Billion *Excludes borrowings under $2.5 billion 18-month term loan facilities entered into during Feb/March 2016, which totaled $1.1 billion as of 2016 Q1. Excludes note payable to Timberland Venture and long-term debt (nonrecourse to the company) held by variable interest entities. Weighted average cost of $6.7 billion long-term debt approx. 6.0%.
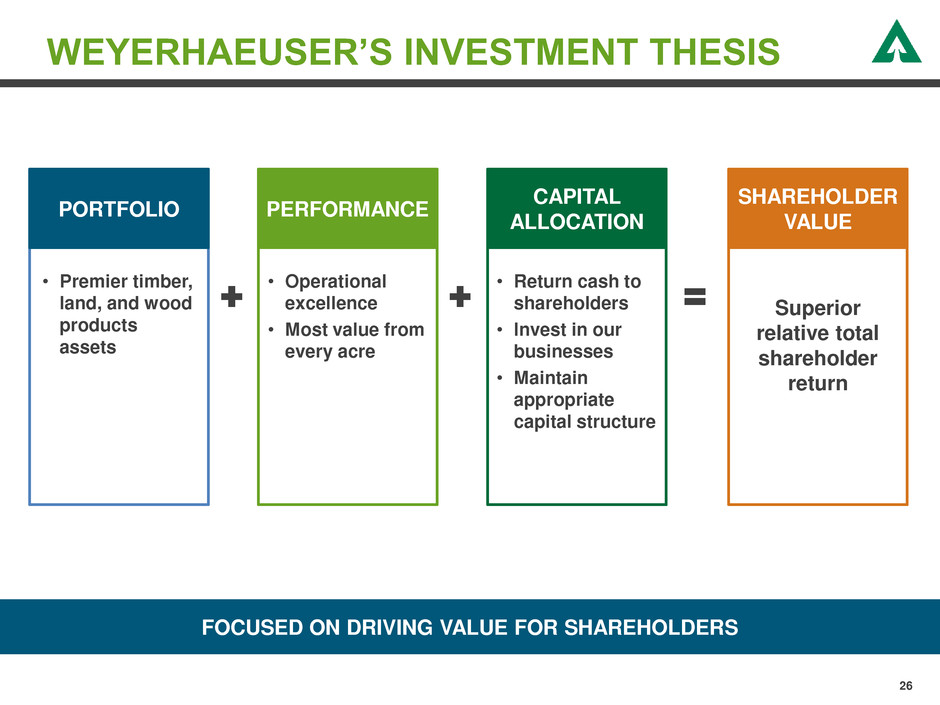
WEYERHAEUSER’S INVESTMENT THESIS FOCUSED ON DRIVING VALUE FOR SHAREHOLDERS 26 • Operational excellence • Most value from every acre • Return cash to shareholders • Invest in our businesses • Maintain appropriate capital structure • Premier timber, land, and wood products assets Superior relative total shareholder return PORTFOLIO PERFORMANCE CAPITAL ALLOCATION SHAREHOLDER VALUE
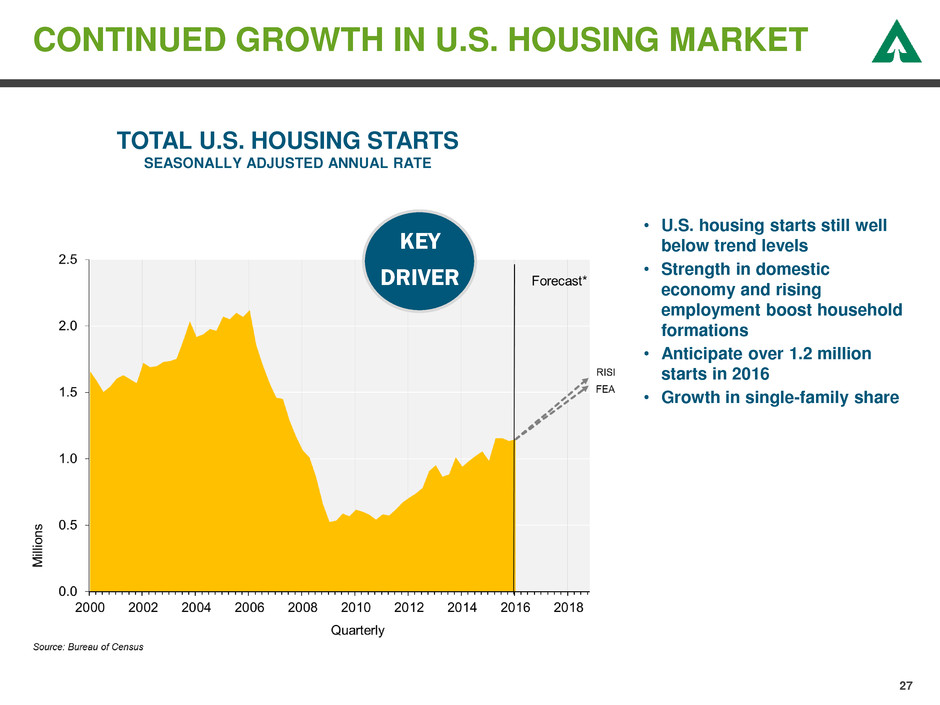
TOTAL U.S. HOUSING STARTS SEASONALLY ADJUSTED ANNUAL RATE 27 CONTINUED GROWTH IN U.S. HOUSING MARKET • U.S. housing starts still well below trend levels • Strength in domestic economy and rising employment boost household formations • Anticipate over 1.2 million starts in 2016 • Growth in single-family share KEY DRIVER
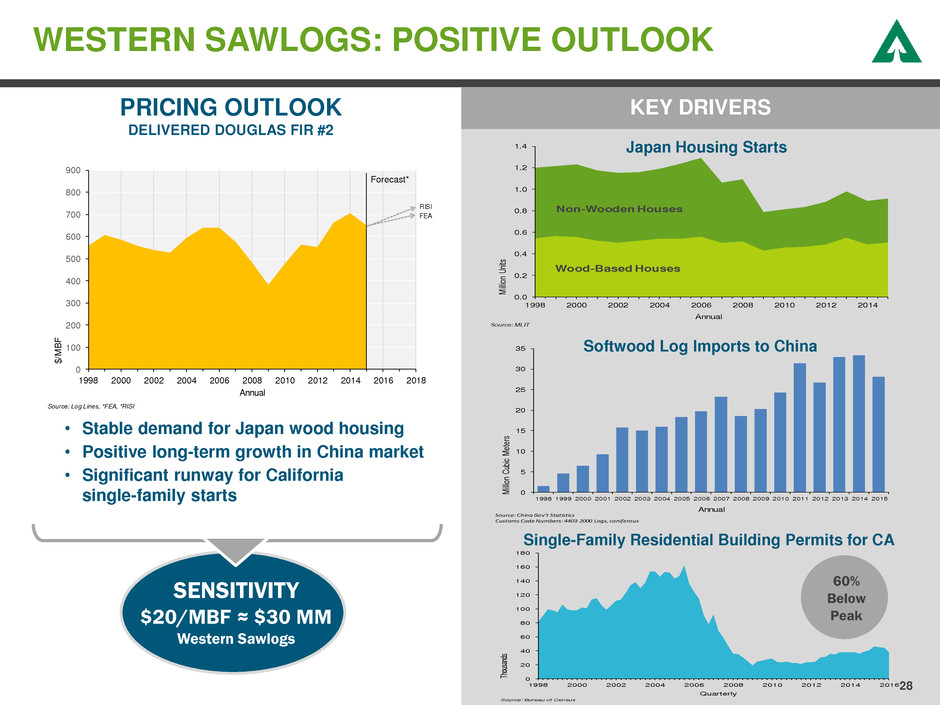
0 100 200 300 400 500 600 700 800 900 1998 2000 2002 2004 2006 2008 2010 2012 2014 2016 2018 $/ M BF Annual Forecast* Source: Log Lines, *FEA, *RISI RISI FEA 28 WESTERN SAWLOGS: POSITIVE OUTLOOK • Stable demand for Japan wood housing • Positive long-term growth in China market • Significant runway for California single-family starts KEY DRIVERS Japan Housing Starts Softwood Log Imports to China Single-Family Residential Building Permits for CA PRICING OUTLOOK DELIVERED DOUGLAS FIR #2 0 20 40 60 80 100 120 140 160 180 1998 2000 2002 2004 2006 2008 2010 2012 2014 2016 Tho usa nds Quarterly Source: Bureau of Census SENSITIVITY $20/MBF ≈ $30 MM Western Sawlogs 60% Below Peak 0.0 .2 0.4 .6 0.8 1.0 1.2 1.4 1998 2000 2002 2004 2006 2008 2010 2012 2014 Mi llio n U nit s Annual Source: MLIT Wood-Based Houses Non-Wooden Houses 0 5 10 15 20 25 30 35 1998 1999 2000 2001 2002 2003 2004 2005 2006 2007 2008 2009 2010 2011 2012 2013 2014 2015 Mi llio n C ub ic Me ter s Annual So rce: China Gov't Statistics Customs Code Numbers: 4403-2000 Logs, coniferous
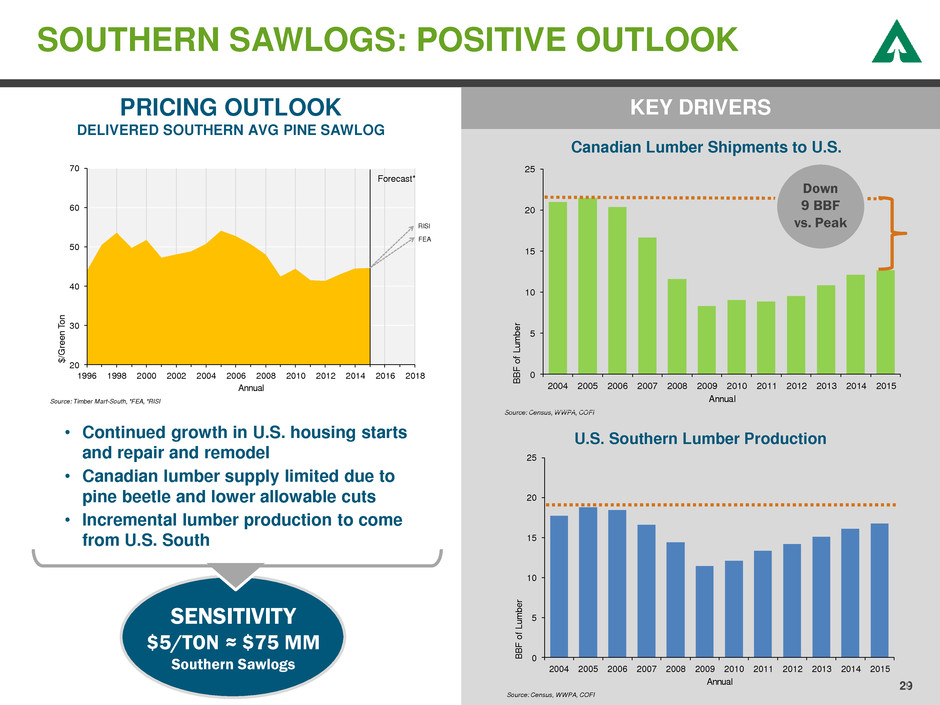
20 30 40 50 60 70 1996 1998 2000 2002 2004 2006 2008 2010 2012 2014 2016 2018 $/ G re en T on Annual Forecast* Source: Timber Mart-South, *FEA, *RISI RISI FEA 29 SOUTHERN SAWLOGS: POSITIVE OUTLOOK • Continued growth in U.S. housing starts and repair and remodel • Canadian lumber supply limited due to pine beetle and lower allowable cuts • Incremental lumber production to come from U.S. South Canadian Lumber Shipments to U.S. PRICING OUTLOOK DELIVERED SOUTHERN AVG PINE SAWLOG 0 5 10 15 20 25 2 4 2 05 2 06 2 07 2 08 20 9 2010 2011 2012 2013 2014 2015 BB F of L um be r Annual Source: Census, WWPA, COFI KEY DRIVERS 0 5 10 15 20 25 2004 2005 2006 2007 2008 2009 2010 2011 2012 2013 2014 2015 BB F of L um be r Annual Source: Census, WWPA, COFI U.S. Southern Lumber Production Down 9 BBF vs. Peak SENSITIVITY $5/TON ≈ $75 MM Southern Sawlogs
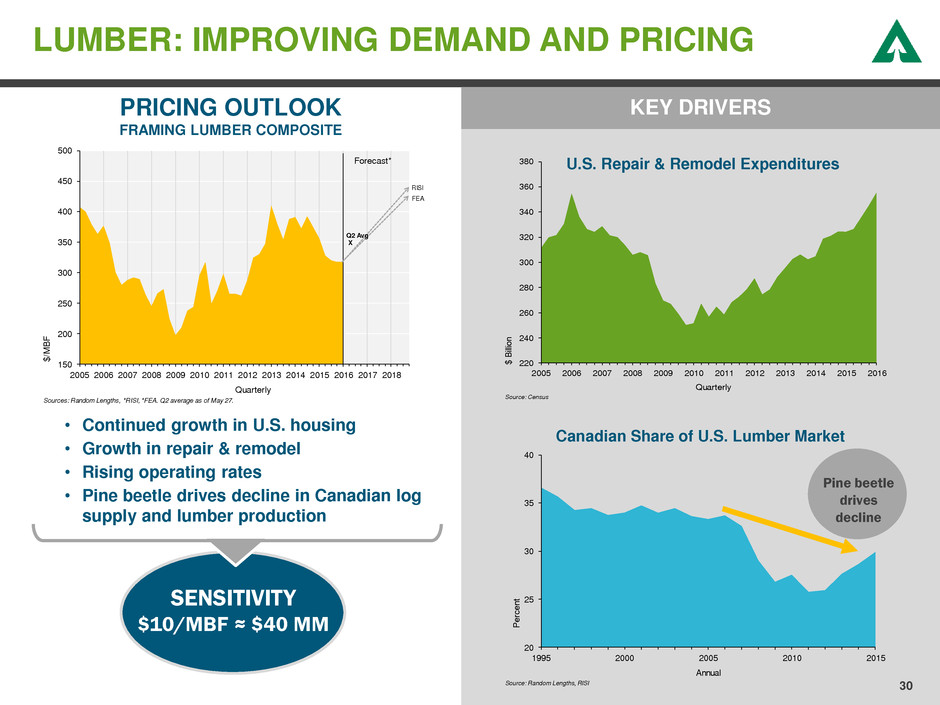
30 LUMBER: IMPROVING DEMAND AND PRICING • Continued growth in U.S. housing • Growth in repair & remodel • Rising operating rates • Pine beetle drives decline in Canadian log supply and lumber production SENSITIVITY $10/MBF ≈ $40 MM U.S. Repair & Remodel Expenditures KEY DRIVERS Canadian Share of U.S. Lumber Market PRICING OUTLOOK FRAMING LUMBER COMPOSITE 20 25 30 35 40 1995 2000 2005 2010 2015 Pe rc en t Annual Source: Random Lengths, RISI Pine beetle drives decline 220 240 260 280 300 320 340 360 380 2005 2006 2007 2008 2009 2010 2011 2012 2013 2014 2015 2016 $ Bi llio n Quarterly Source: Census 150 200 250 300 350 400 450 500 2005 2006 7 20 8 2009 2010 2 11 2012 2013 2014 2015 2016 2017 2018 $/ M BF Quarterly Sources: Random Lengths, *RISI, *FEA. Q2 average as of May 27. Forecast* RISI FEA Q2 Avg X
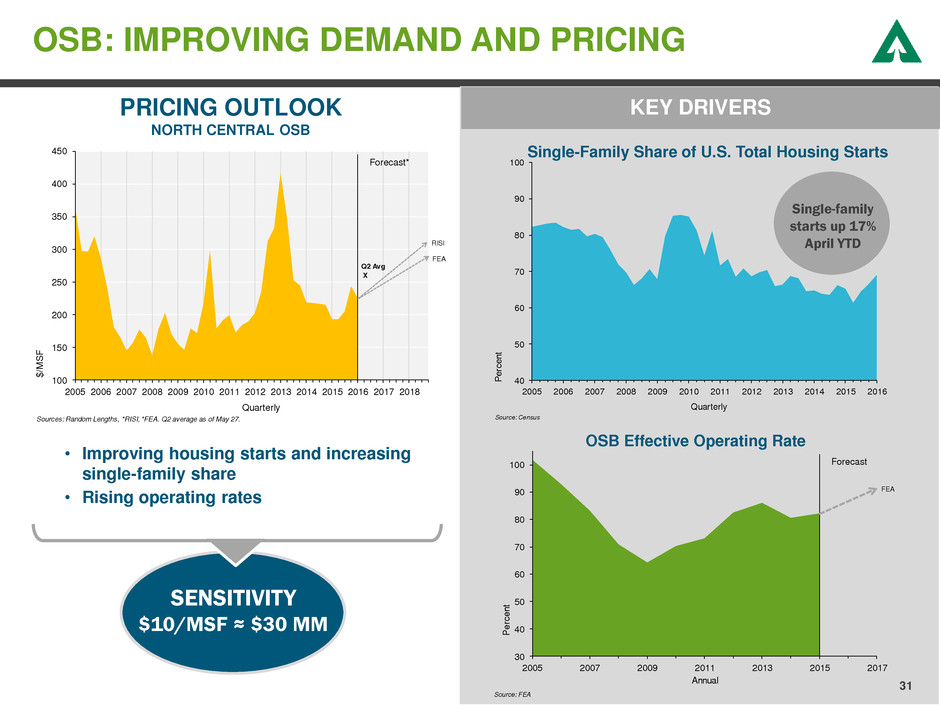
31 OSB: IMPROVING DEMAND AND PRICING • Improving housing starts and increasing single-family share • Rising operating rates Single-Family Share of U.S. Total Housing Starts PRICING OUTLOOK NORTH CENTRAL OSB KEY DRIVERS OSB Effective Operating Rate SENSITIVITY $10/MSF ≈ $30 MM 40 50 60 70 80 90 100 2005 2006 2007 2008 2009 2010 2011 2012 2013 2014 2015 2016 Pe rc en t Quarterly Source: Census Single-family starts up 17% April YTD 100 150 200 250 300 350 400 450 2005 2006 2 07 8 20 9 201 2011 2012 2013 2014 2015 2016 2017 2018 $/ M SF Quarterly Sources: Random Lengths, *RISI, *FEA. Q2 average as of May 27. Forecast* RISI FEA Q2 Avg X 30 40 50 60 7 80 90 100 2005 2007 2009 2011 2013 2015 2017 Pe rc en t Annual Forecast Source: FEA FEA
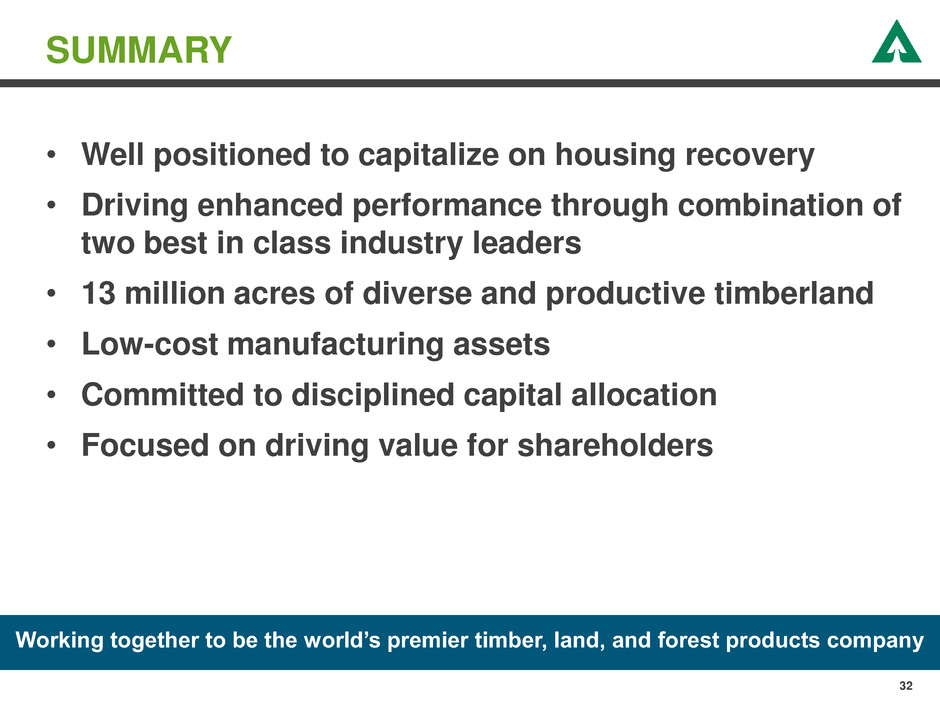
• Well positioned to capitalize on housing recovery • Driving enhanced performance through combination of two best in class industry leaders • 13 million acres of diverse and productive timberland • Low-cost manufacturing assets • Committed to disciplined capital allocation • Focused on driving value for shareholders 32 SUMMARY Working together to be the world’s premier timber, land, and forest products company
APPENDIX
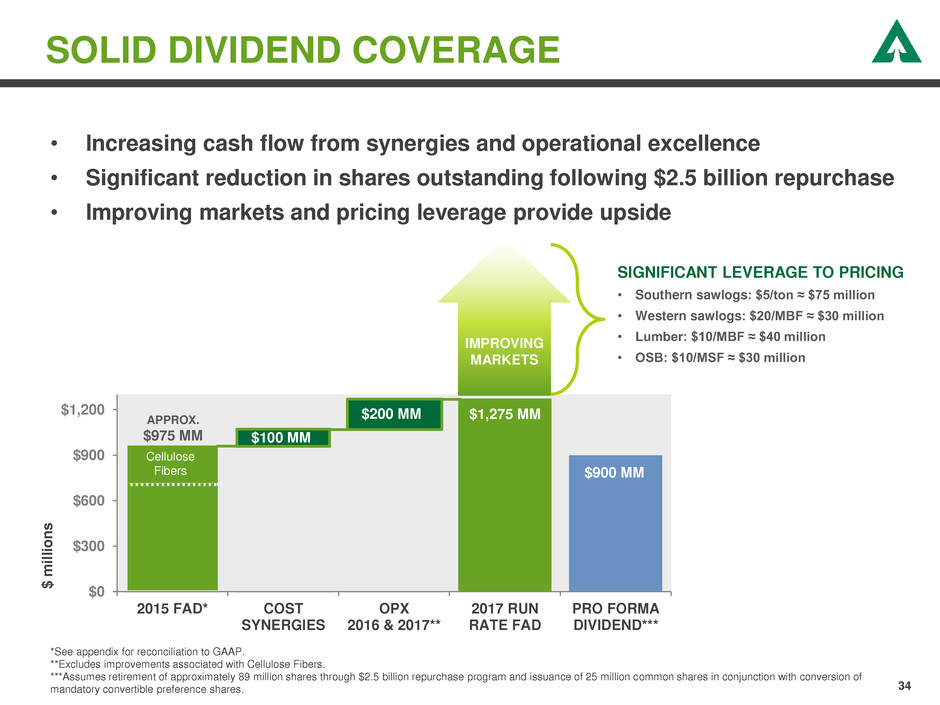
34 SOLID DIVIDEND COVERAGE • Increasing cash flow from synergies and operational excellence • Significant reduction in shares outstanding following $2.5 billion repurchase • Improving markets and pricing leverage provide upside *See appendix for reconciliation to GAAP. **Excludes improvements associated with Cellulose Fibers. ***Assumes retirement of approximately 89 million shares through $2.5 billion repurchase program and issuance of 25 million common shares in conjunction with conversion of mandatory convertible preference shares. CELLULOSE FIBERS $0 $300 $600 $900 $1,200 2015 FAD* COST SYNERGIES OPX 2016 & 2017** 2017 RUN RATE FAD PRO FORMA DIVIDEND*** Cellulose Fibers IMPROVING MARKETS APPROX. $975 MM $ m il li o n s $200 MM $900 MM $1,275 MM $100 MM SIGNIFICANT LEVERAGE TO PRICING • Southern sawlogs: $5/ton ≈ $75 million • Western sawlogs: $20/MBF ≈ $30 million • Lumber: $10/MBF ≈ $40 million • OSB: $10/MSF ≈ $30 million
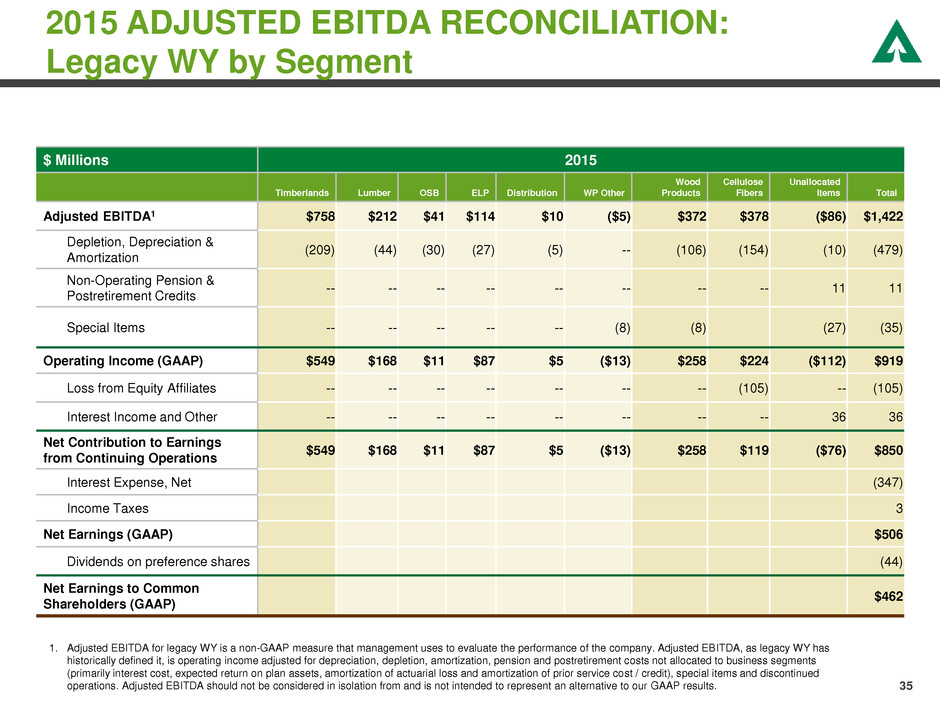
35 2015 ADJUSTED EBITDA RECONCILIATION: Legacy WY by Segment $ Millions 2015 Timberlands Lumber OSB ELP Distribution WP Other Wood Products Cellulose Fibers Unallocated Items Total Adjusted EBITDA1 $758 $212 $41 $114 $10 ($5) $372 $378 ($86) $1,422 Depletion, Depreciation & Amortization (209) (44) (30) (27) (5) -- (106) (154) (10) (479) Non-Operating Pension & Postretirement Credits -- -- -- -- -- -- -- -- 11 11 Special Items -- -- -- -- -- (8) (8) (27) (35) Operating Income (GAAP) $549 $168 $11 $87 $5 ($13) $258 $224 ($112) $919 Loss from Equity Affiliates -- -- -- -- -- -- -- (105) -- (105) Interest Income and Other -- -- -- -- -- -- -- -- 36 36 Net Contribution to Earnings from Continuing Operations $549 $168 $11 $87 $5 ($13) $258 $119 ($76) $850 Interest Expense, Net (347) Income Taxes 3 Net Earnings (GAAP) $506 Dividends on preference shares (44) Net Earnings to Common Shareholders (GAAP) $462 1. Adjusted EBITDA for legacy WY is a non-GAAP measure that management uses to evaluate the performance of the company. Adjusted EBITDA, as legacy WY has historically defined it, is operating income adjusted for depreciation, depletion, amortization, pension and postretirement costs not allocated to business segments (primarily interest cost, expected return on plan assets, amortization of actuarial loss and amortization of prior service cost / credit), special items and discontinued operations. Adjusted EBITDA should not be considered in isolation from and is not intended to represent an alternative to our GAAP results.
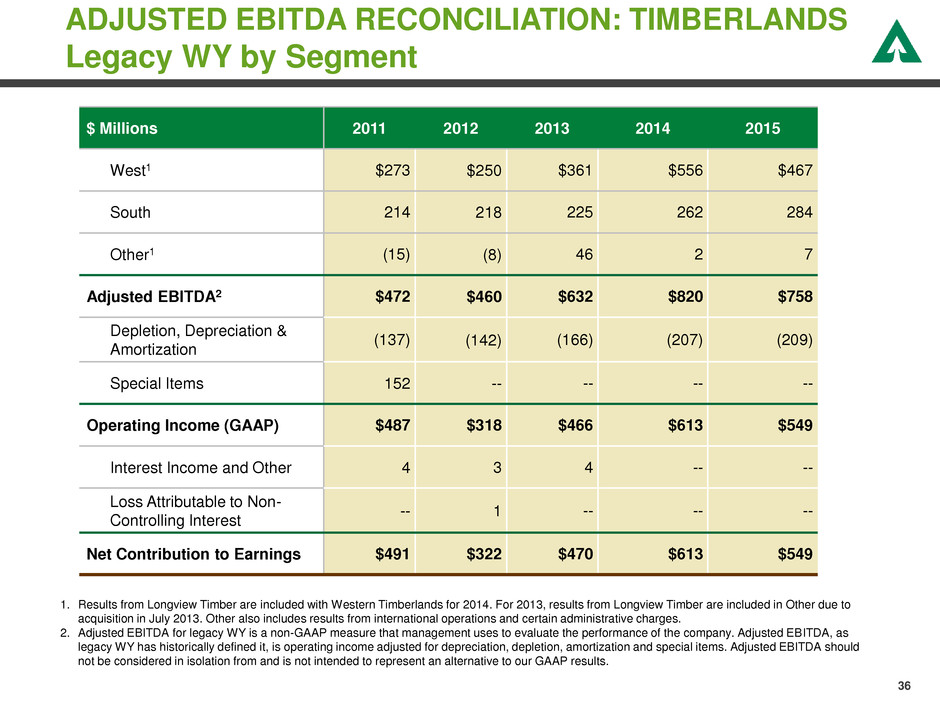
ADJUSTED EBITDA RECONCILIATION: TIMBERLANDS Legacy WY by Segment $ Millions 2011 2012 2013 2014 2015 West1 $273 $250 $361 $556 $467 South 214 218 225 262 284 Other1 (15) (8) 46 2 7 Adjusted EBITDA2 $472 $460 $632 $820 $758 Depletion, Depreciation & Amortization (137) (142) (166) (207) (209) Special Items 152 -- -- -- -- Operating Income (GAAP) $487 $318 $466 $613 $549 Interest Income and Other 4 3 4 -- -- Loss Attributable to Non- Controlling Interest -- 1 -- -- -- Net Contribution to Earnings $491 $322 $470 $613 $549 1. Results from Longview Timber are included with Western Timberlands for 2014. For 2013, results from Longview Timber are included in Other due to acquisition in July 2013. Other also includes results from international operations and certain administrative charges. 2. Adjusted EBITDA for legacy WY is a non-GAAP measure that management uses to evaluate the performance of the company. Adjusted EBITDA, as legacy WY has historically defined it, is operating income adjusted for depreciation, depletion, amortization and special items. Adjusted EBITDA should not be considered in isolation from and is not intended to represent an alternative to our GAAP results. 36
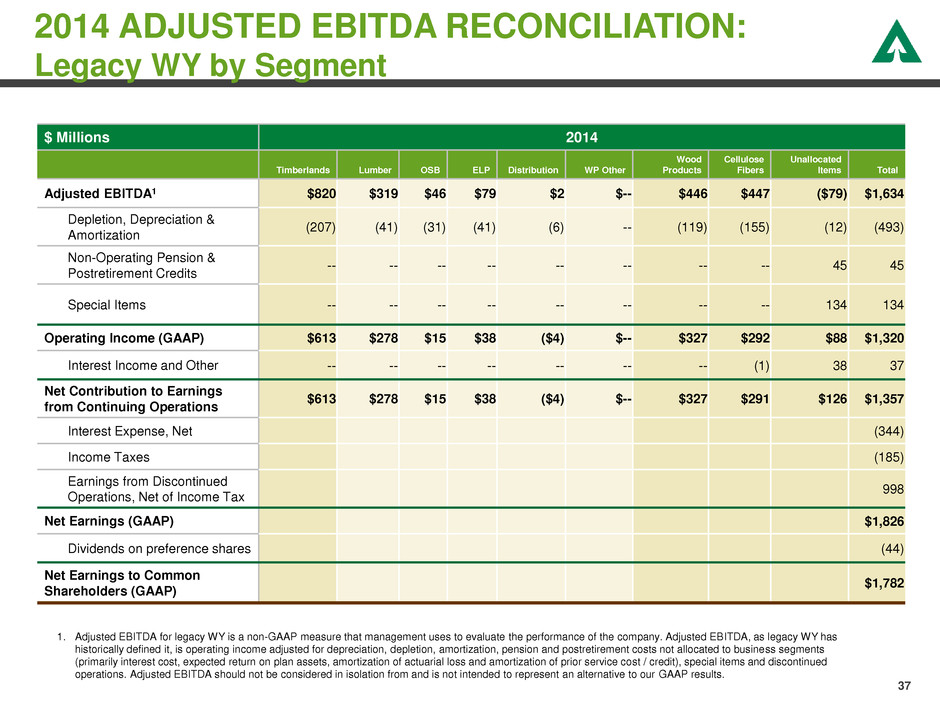
$ Millions 2014 Timberlands Lumber OSB ELP Distribution WP Other Wood Products Cellulose Fibers Unallocated Items Total Adjusted EBITDA1 $820 $319 $46 $79 $2 $-- $446 $447 ($79) $1,634 Depletion, Depreciation & Amortization (207) (41) (31) (41) (6) -- (119) (155) (12) (493) Non-Operating Pension & Postretirement Credits -- -- -- -- -- -- -- -- 45 45 Special Items -- -- -- -- -- -- -- -- 134 134 Operating Income (GAAP) $613 $278 $15 $38 ($4) $-- $327 $292 $88 $1,320 Interest Income and Other -- -- -- -- -- -- -- (1) 38 37 Net Contribution to Earnings from Continuing Operations $613 $278 $15 $38 ($4) $-- $327 $291 $126 $1,357 Interest Expense, Net (344) Income Taxes (185) Earnings from Discontinued Operations, Net of Income Tax 998 Net Earnings (GAAP) $1,826 Dividends on preference shares (44) Net Earnings to Common Shareholders (GAAP) $1,782 2014 ADJUSTED EBITDA RECONCILIATION: Legacy WY by Segment 1. Adjusted EBITDA for legacy WY is a non-GAAP measure that management uses to evaluate the performance of the company. Adjusted EBITDA, as legacy WY has historically defined it, is operating income adjusted for depreciation, depletion, amortization, pension and postretirement costs not allocated to business segments (primarily interest cost, expected return on plan assets, amortization of actuarial loss and amortization of prior service cost / credit), special items and discontinued operations. Adjusted EBITDA should not be considered in isolation from and is not intended to represent an alternative to our GAAP results. 37
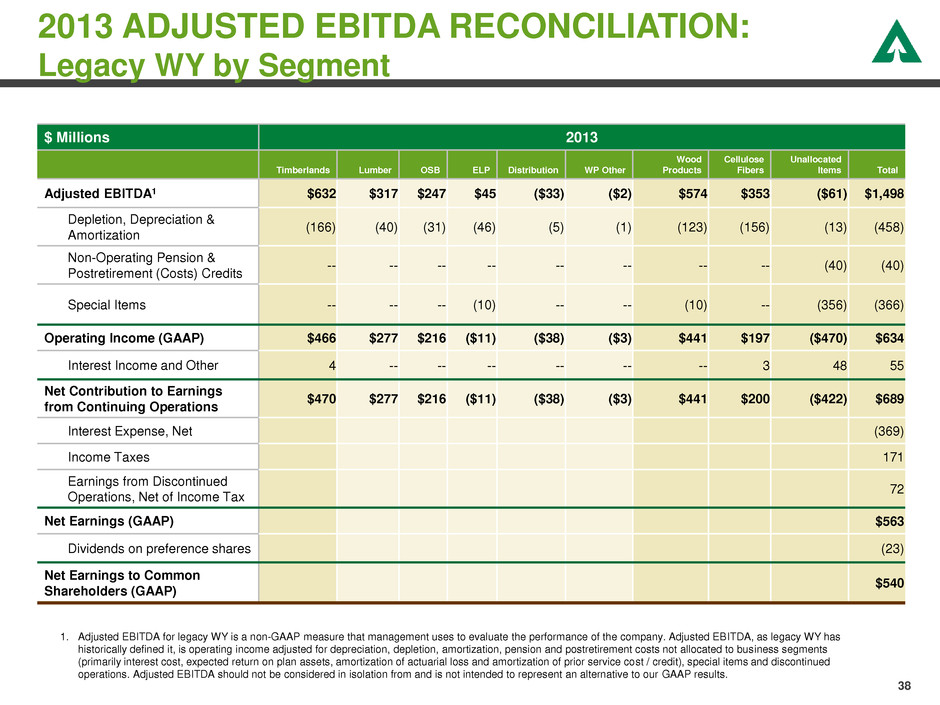
2013 ADJUSTED EBITDA RECONCILIATION: Legacy WY by Segment $ Millions 2013 Timberlands Lumber OSB ELP Distribution WP Other Wood Products Cellulose Fibers Unallocated Items Total Adjusted EBITDA1 $632 $317 $247 $45 ($33) ($2) $574 $353 ($61) $1,498 Depletion, Depreciation & Amortization (166) (40) (31) (46) (5) (1) (123) (156) (13) (458) Non-Operating Pension & Postretirement (Costs) Credits -- -- -- -- -- -- -- -- (40) (40) Special Items -- -- -- (10) -- -- (10) -- (356) (366) Operating Income (GAAP) $466 $277 $216 ($11) ($38) ($3) $441 $197 ($470) $634 Interest Income and Other 4 -- -- -- -- -- -- 3 48 55 Net Contribution to Earnings from Continuing Operations $470 $277 $216 ($11) ($38) ($3) $441 $200 ($422) $689 Interest Expense, Net (369) Income Taxes 171 Earnings from Discontinued Operations, Net of Income Tax 72 Net Earnings (GAAP) $563 Dividends on preference shares (23) Net Earnings to Common Shareholders (GAAP) $540 1. Adjusted EBITDA for legacy WY is a non-GAAP measure that management uses to evaluate the performance of the company. Adjusted EBITDA, as legacy WY has historically defined it, is operating income adjusted for depreciation, depletion, amortization, pension and postretirement costs not allocated to business segments (primarily interest cost, expected return on plan assets, amortization of actuarial loss and amortization of prior service cost / credit), special items and discontinued operations. Adjusted EBITDA should not be considered in isolation from and is not intended to represent an alternative to our GAAP results. 38
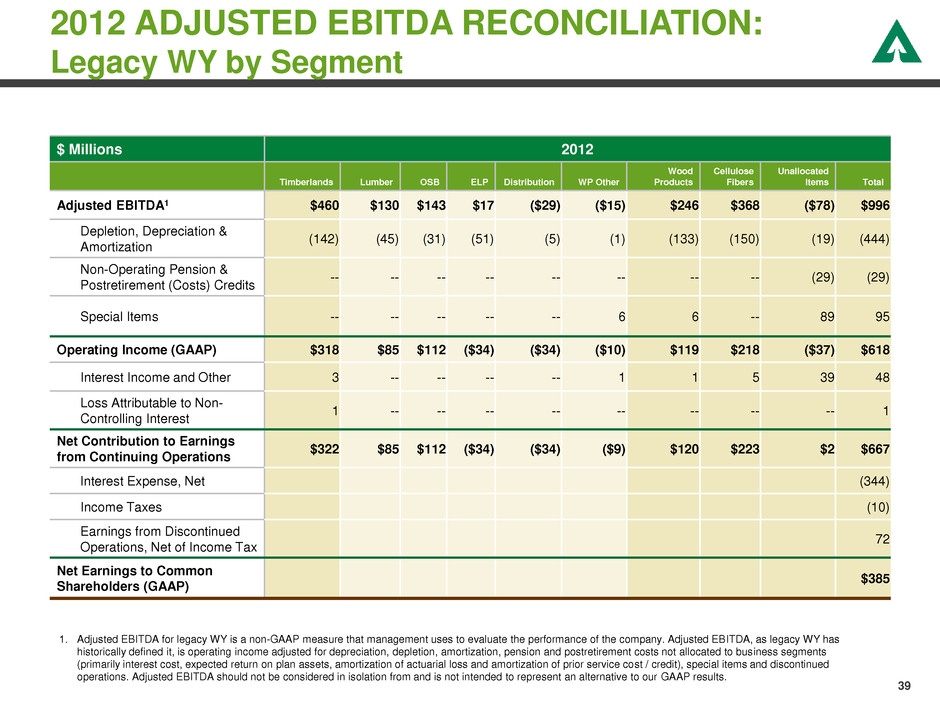
2012 ADJUSTED EBITDA RECONCILIATION: Legacy WY by Segment 1. Adjusted EBITDA for legacy WY is a non-GAAP measure that management uses to evaluate the performance of the company. Adjusted EBITDA, as legacy WY has historically defined it, is operating income adjusted for depreciation, depletion, amortization, pension and postretirement costs not allocated to business segments (primarily interest cost, expected return on plan assets, amortization of actuarial loss and amortization of prior service cost / credit), special items and discontinued operations. Adjusted EBITDA should not be considered in isolation from and is not intended to represent an alternative to our GAAP results. $ Millions 2012 Timberlands Lumber OSB ELP Distribution WP Other Wood Products Cellulose Fibers Unallocated Items Total Adjusted EBITDA1 $460 $130 $143 $17 ($29) ($15) $246 $368 ($78) $996 Depletion, Depreciation & Amortization (142) (45) (31) (51) (5) (1) (133) (150) (19) (444) Non-Operating Pension & Postretirement (Costs) Credits -- -- -- -- -- -- -- -- (29) (29) Special Items -- -- -- -- -- 6 6 -- 89 95 Operating Income (GAAP) $318 $85 $112 ($34) ($34) ($10) $119 $218 ($37) $618 Interest Income and Other 3 -- -- -- -- 1 1 5 39 48 Loss Attributable to Non- Controlling Interest 1 -- -- -- -- -- -- -- -- 1 Net Contribution to Earnings from Continuing Operations $322 $85 $112 ($34) ($34) ($9) $120 $223 $2 $667 Interest Expense, Net (344) Income Taxes (10) Earnings from Discontinued Operations, Net of Income Tax 72 Net Earnings to Common Shareholders (GAAP) $385 39
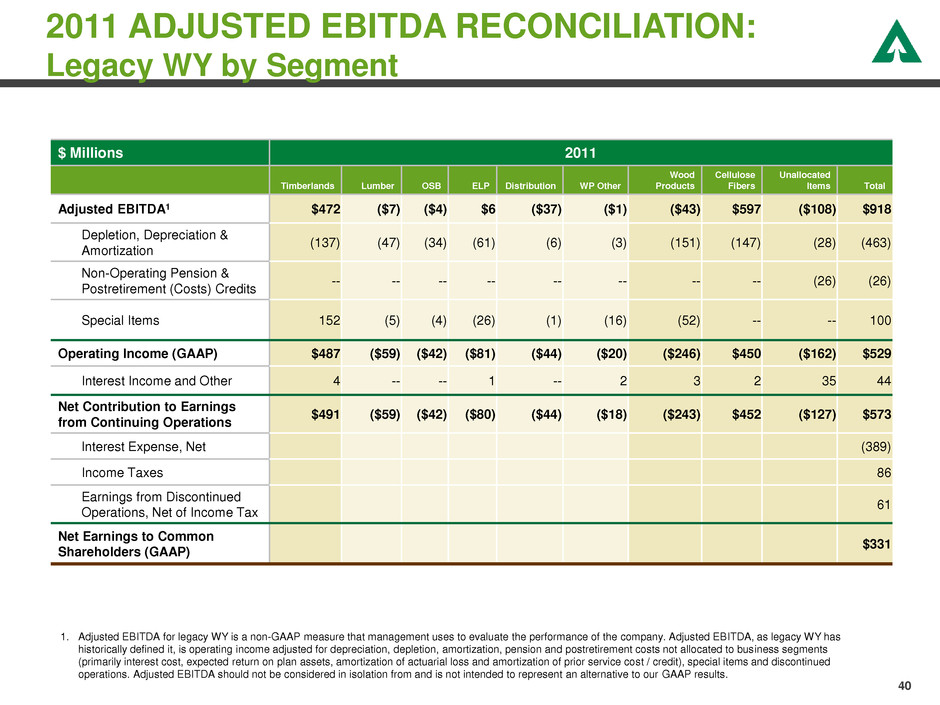
2011 ADJUSTED EBITDA RECONCILIATION: Legacy WY by Segment $ Millions 2011 Timberlands Lumber OSB ELP Distribution WP Other Wood Products Cellulose Fibers Unallocated Items Total Adjusted EBITDA1 $472 ($7) ($4) $6 ($37) ($1) ($43) $597 ($108) $918 Depletion, Depreciation & Amortization (137) (47) (34) (61) (6) (3) (151) (147) (28) (463) Non-Operating Pension & Postretirement (Costs) Credits -- -- -- -- -- -- -- -- (26) (26) Special Items 152 (5) (4) (26) (1) (16) (52) -- -- 100 Operating Income (GAAP) $487 ($59) ($42) ($81) ($44) ($20) ($246) $450 ($162) $529 Interest Income and Other 4 -- -- 1 -- 2 3 2 35 44 Net Contribution to Earnings from Continuing Operations $491 ($59) ($42) ($80) ($44) ($18) ($243) $452 ($127) $573 Interest Expense, Net (389) Income Taxes 86 Earnings from Discontinued Operations, Net of Income Tax 61 Net Earnings to Common Shareholders (GAAP) $331 1. Adjusted EBITDA for legacy WY is a non-GAAP measure that management uses to evaluate the performance of the company. Adjusted EBITDA, as legacy WY has historically defined it, is operating income adjusted for depreciation, depletion, amortization, pension and postretirement costs not allocated to business segments (primarily interest cost, expected return on plan assets, amortization of actuarial loss and amortization of prior service cost / credit), special items and discontinued operations. Adjusted EBITDA should not be considered in isolation from and is not intended to represent an alternative to our GAAP results. 40
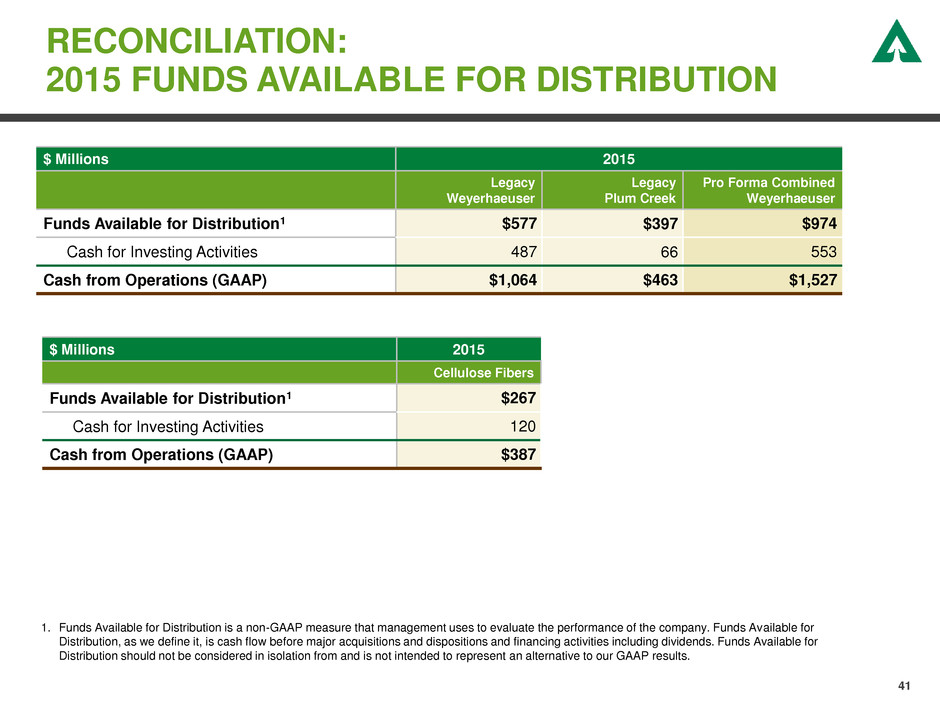
RECONCILIATION: 2015 FUNDS AVAILABLE FOR DISTRIBUTION 41 $ Millions 2015 Legacy Weyerhaeuser Legacy Plum Creek Pro Forma Combined Weyerhaeuser Funds Available for Distribution1 $577 $397 $974 Cash for Investing Activities 487 66 553 Cash from Operations (GAAP) $1,064 $463 $1,527 $ Millions 2015 Cellulose Fibers Funds Available for Distribution1 $267 Cash for Investing Activities 120 Cash from Operations (GAAP) $387 1. Funds Available for Distribution is a non-GAAP measure that management uses to evaluate the performance of the company. Funds Available for Distribution, as we define it, is cash flow before major acquisitions and dispositions and financing activities including dividends. Funds Available for Distribution should not be considered in isolation from and is not intended to represent an alternative to our GAAP results.