 WEYERHAEUSER COMPANY 2010 Investor Meeting MAY 27, 2010 Exhibit 99.1 |
 Kathy McAuley Vice President, Investor Relations |
 Forward-looking Statement This news release contains statements concerning the company’s future results and performance that are forward-looking statements within the meaning of the Private Securities Litigation Reform Act of 1995. These statements are based on various assumptions and may not be accurate because of risks and uncertainties surrounding these assumptions. Factors listed below, as well as other factors, may cause actual results to differ significantly from these forward-looking statements. There is no guarantee that any of the events anticipated by these forward-looking statements will occur. If any of the events occur, there is no guarantee what effect they will have on company operations or financial condition. The company will not update these forward-looking statements after the date of this news release. Some forward-looking statements discuss the company’s plans, strategies and intentions. They use words such as “expects,” “may,” “will,” “believes,” “should,” “approximately,” “anticipates,” “estimates,” and “plans.” In addition, these words may use the positive or negative or other variations of those terms. This release contains forward-looking statements regarding the company’s expectations during the second quarter of 2010, including a lower grade mix, higher silviculture and road costs and lower sales of non-strategic timberlands in our Timberlands segment; improved sales realizations and volumes, improved operating costs and production rates, and higher log costs in the Wood Products segment; higher pulp price realizations, increased expenses for annual planned maintenance and freight in the Cellulose Fiber segment; and increases in home sale closings and lower average sales prices in our single-family homebuilding operations. Major risks, uncertainties and assumptions that affect the company’s businesses and may cause actual results to differ from these forward-looking statements, include, but are not limited to: the effect of general economic conditions, including the level of interest rates, availability of financing for home mortgages, strength of the U.S. dollar, employment rates and housing starts; market demand for the company’s products, which is related to the strength of the various U.S. business segments and economic conditions; the successful execution of internal performance plans, including restructurings and cost reduction initiatives; performance of the company’s manufacturing operations, including maintenance requirements and operating efficiencies; raw material prices; energy prices; transportation costs; changes in the Company’s business support functions and support costs; changes in legislation or tax rules; the level of competition from domestic and foreign producers; the effect of forestry, land use, environmental and other governmental regulations; legal proceedings; the effect of weather; the risk of loss from fires, floods, windstorms, hurricanes, pest infestation and other natural disasters; changes in accounting principles; performance of pension fund investments and related derivatives; the effect of timing of retirements and changes in the market price of company stock on charges for stock-based compensation; and other factors described under “Risk Factors” in the Company’s annual report on Form 10-K. The company also is a large exporter and is affected by changes in economic activity in Europe and Asia, particularly Japan, China and Korea. It also is affected by changes in currency exchange rates, particularly the relative value of the U.S. dollar to the euro and the Canadian dollar. Restrictions on international trade or tariffs imposed on imports also may affect the company. |
 Agenda Dan Fulton: Introduction Larry Burrows: Weyerhaeuser Real Estate Company (WRECO) Tom Gideon: Wood Products, Cellulose Fibers, Timberlands Miles Drake: Applied Technology Patty Bedient: REIT and Financial Update Dan Fulton: Conclusion and Q&A |
 Dan Fulton President and Chief Executive Officer |
 Larry Burrows President – Weyerhaeuser Real Estate Company (WRECO) |
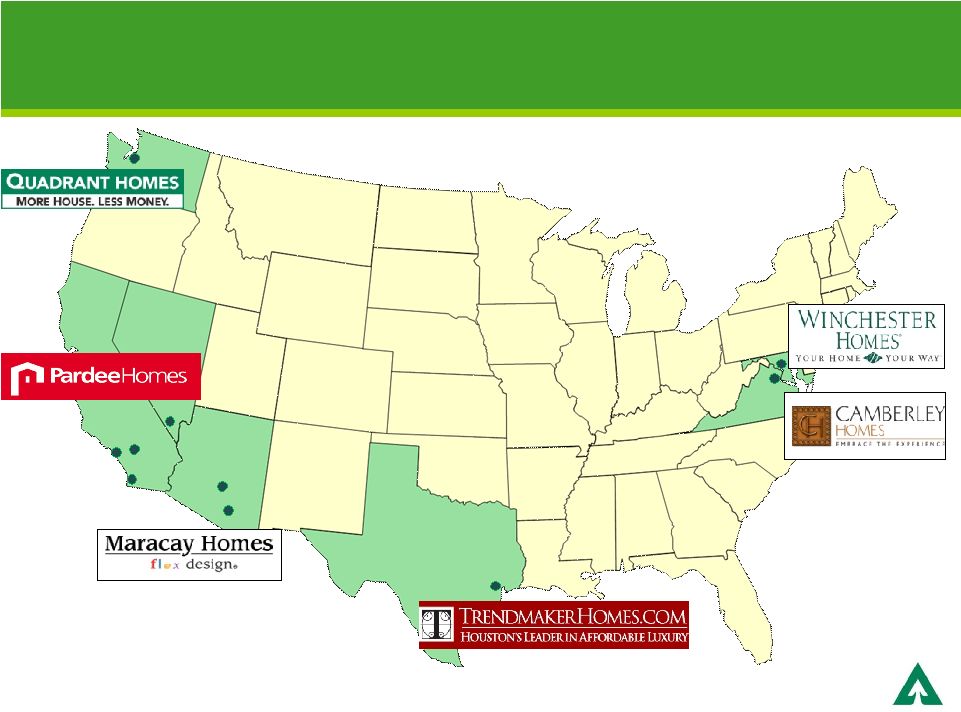 WRECO Overview Located in Desirable Markets 7 |
 Leading Brands, Local Value Propositions 8 |
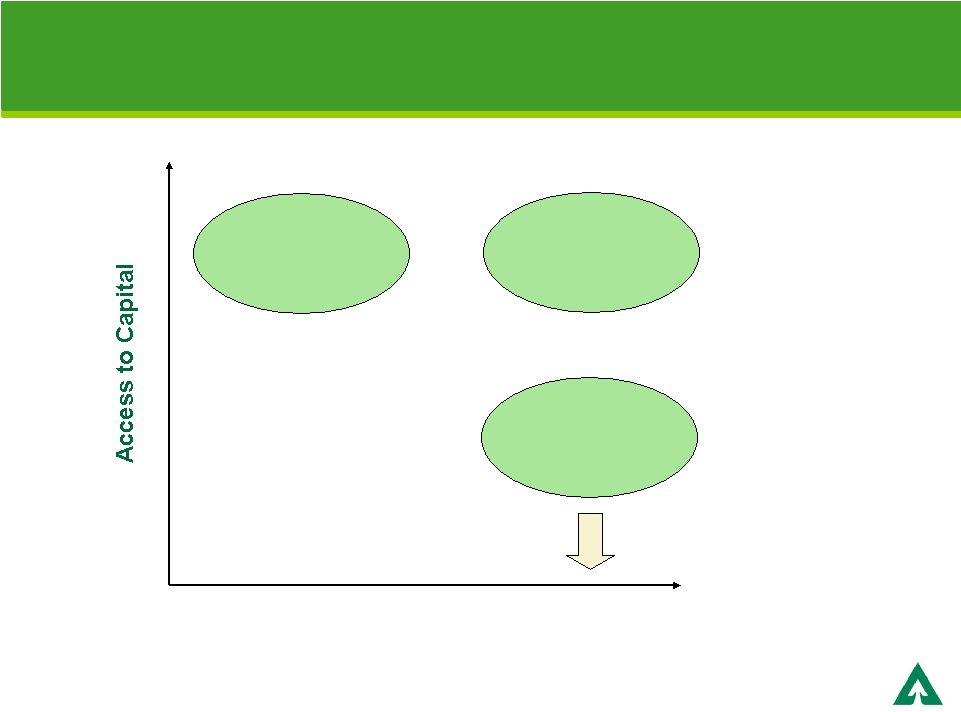 Local Value Proposition National Homebuilders WRECO Local Builders Decreasing access in downturn Financial Strength, Local Agility 9 |
 Strategic Initiatives Adapting to Local Market Conditions Reduced hard costs approximately 30%; monthly sales increased by 300% Extended product line to move-up buyer; increased sales in community by 15% Universal and green design features incorporated into active adult product line and offered as options in core product line 10 |
 Offer distinctive <$200,000 product line in highly competitive sub-market; monthly sales increased 400% Tap underserved second home rural/beach market on customer’s lot Exploit new land opportunity through re-designed product Strategic Initiatives Adapting to Local Market Conditions 11 |
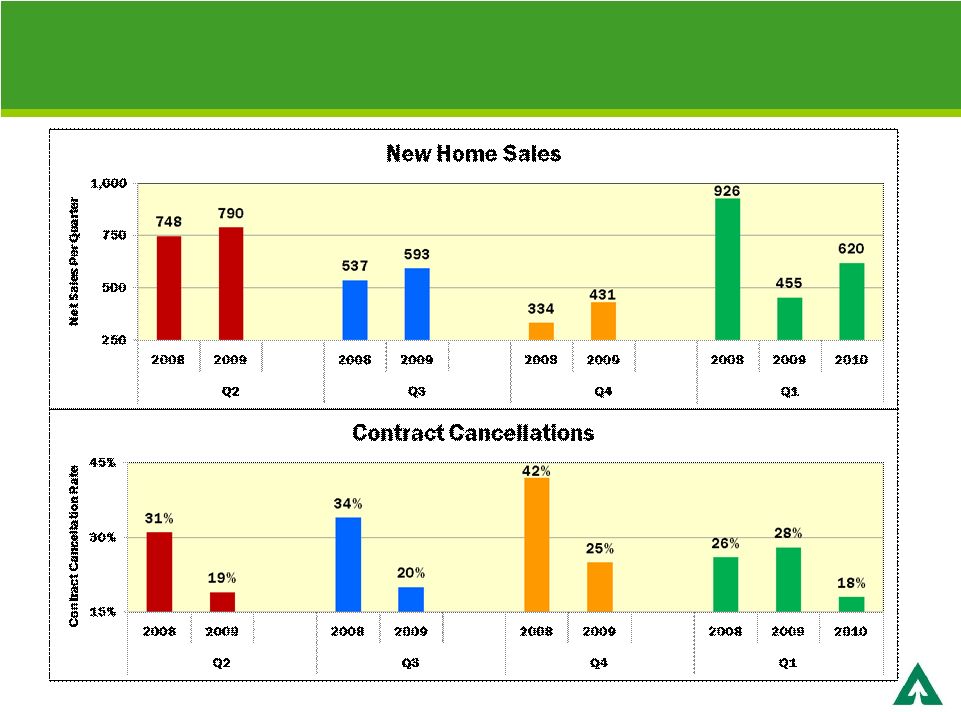 Market Performance Year Over Year Improvement for 4 Consecutive Quarters 12 |
 Operational Improvements Residential Lots Sold 2007 572 2008 5,141 2009 5,011 2010.1 40 13 |
 Improved Margins and Sales Velocity Source: SEC filings Sales Per Community Per Month 2010.1 Single-Family Gross Margins (1) (1) Single-family gross margin = revenue less direct cost of sales, indirect cost of sales and period costs without regard to impairment charges 14 |
 Well-Positioned Land in Target Markets Positioning Allows Opportunistic Sales to Land-Light Builders Distribution of WRECO Owned Lots California 57% Nevada 32% VA & MD 6% Texas 2% Washington 2% Arizona 1% 15 |
 Well-Positioned for Recovery 2010 priorities Return to profitability Generate positive cash flow Flexibility to adjust land pipeline for current market opportunity Long-term opportunities Housing fundamentals are favorable Market recovery creates further opportunities to reposition land portfolio 16 |
 Tom Gideon Executive Vice President – Forest Products Wood Products |
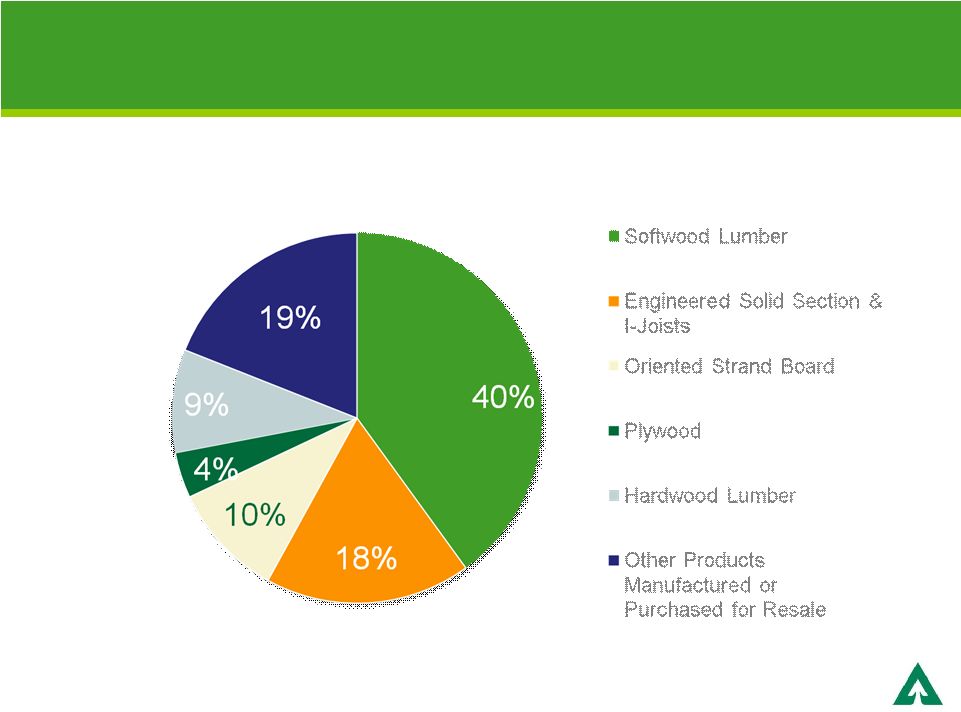 2009 Wood Products Net Sales $2.2 Billion Focus on Residential Structural Frame 18 |
 Aggressive Action to Restructure Operations Significantly reduced costs Closed and curtailed facilities Reduced staff Optimized manufacturing efficiencies 19 |
 Well-Positioned for Recovery Leveraging scale and market position to maximize returns as markets recover Capitalizing on the gains resulting from the actions taken during the downturn Disciplined approach to working capital management 20 |
 Cellulose Fibers |
 Focus on Absorbents and Specialty Fibers Value-added, innovative specialty fibers create a competitive advantage Leading producer of absorbent fluff Proprietary fibers for specialty applications Strong markets experiencing global growth Constant focus on operational improvement Achieve world class performance Capture value by reducing operating costs 22 |
 Creating Value through Collaboration and Innovation Key customers offer growth opportunities Develop technology solutions through targeted collaboration Differentiated absorbent products Non-wovens Composite materials Green energy solutions 23 |
 Timberlands |
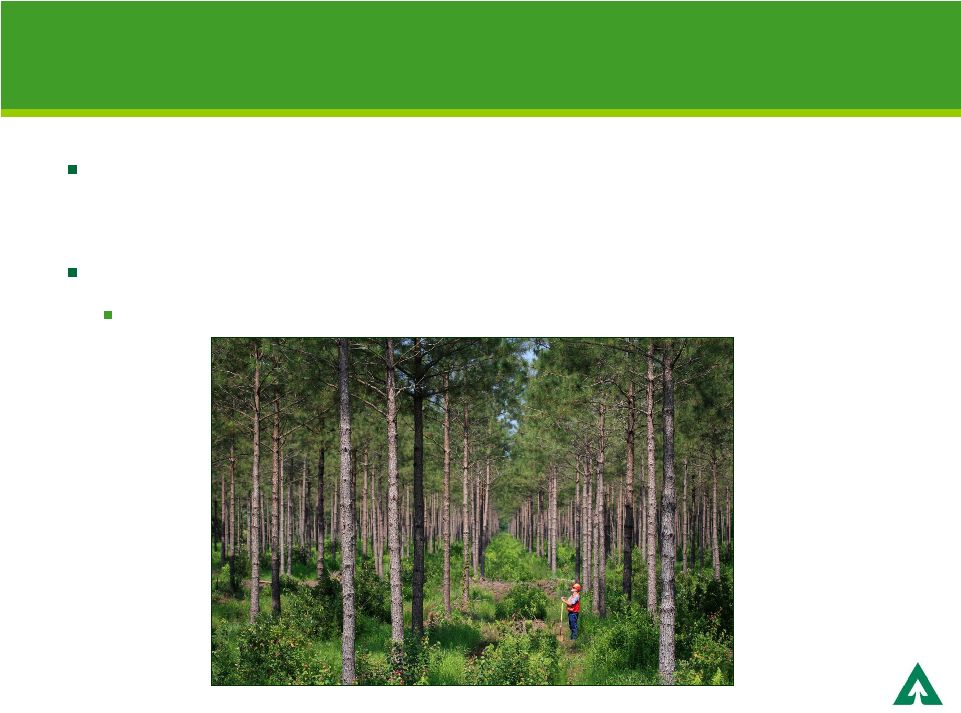
 Timberlands Strategy Grow and manage financially attractive, sustainable forests Position harvest for US recovery Apply market knowledge to create additional value Operate at scale and capture cost advantages Explore opportunities for future growth Increasing cash flow and asset value 25 |
 Asset Base is Over 90% Productive Timberlands High quality sawtimber Source of environmental and public benefits Does not include 15.2 million acres of forestland under license in Canada Timberlands Acres (000) % US West US South Uruguay China JV Total Core 1,850 3,720 341 45 5,956 90.7% Non-Core 213 394 - - 607 9.3% TOTAL 2,063 4,114 341 45 6,563 100% 26 |
 Generating Earnings from Non-Core Land Exchange for core land Sales of higher-and-better use (HBU) and non-strategic land Conservation and wetlands mitigation opportunities 27 |
 Canadian Licensed Timberlands Managed for Manufacturing Operations Timberlands leased from provincial governments to secure volume for our iLevel and Cellulose Fibers facilities Lands managed according to provincial standards Province Acres (millions) Alberta 5.3 British Columbia 2.3 Ontario 2.6 Saskatchewan 5.0 Total 15.2 28 |
 All Lands are Independently Certified Under Applicable Standards Key stakeholder involvement Based on sound science Open, independent, peer reviewed research Program broad in scope Lands managed for productivity and ecosystem values Recognized as an industry leader by the Dow Jones Sustainability Index 29 |
 Sawtimber Expertise Creates Highest Operating Values Sawtimber increases in volume and value as it grows Weyerhaeuser’s precision forestry further improves value Age of Timber Stand Higher Harvest Values Under Precision Forest Management WY Precision Forestry: Increased yields and higher value products Growth at Biological Rates Approximate graphical representation 30 |
 Timberlands Inventory Demonstrates Species Preference and Age Class Distribution Age Class Distributions DOUGLAS FIR / CEDAR WHITEWOOD OTHER CONIFER HARDWOOD US West 76% 18% 5% 1% Douglas fir – most desired, highest value species Sustainable harvest volumes 93%+ Sawlogs, remaining stable 2.1 million acres and 160 million cubic meters 31 |
 SOUTHERN YELLOW PINE HARDWOOD US South 24% 76% Age Class Distributions Southern yellow pine – most desired/highest- valued species 60%+ Sawlogs, increasing to 65% over the next five years 4.1 million acres and 140 million cubic meters Timberlands Inventory Demonstrates Species Preference and Age Class Distribution 32 |
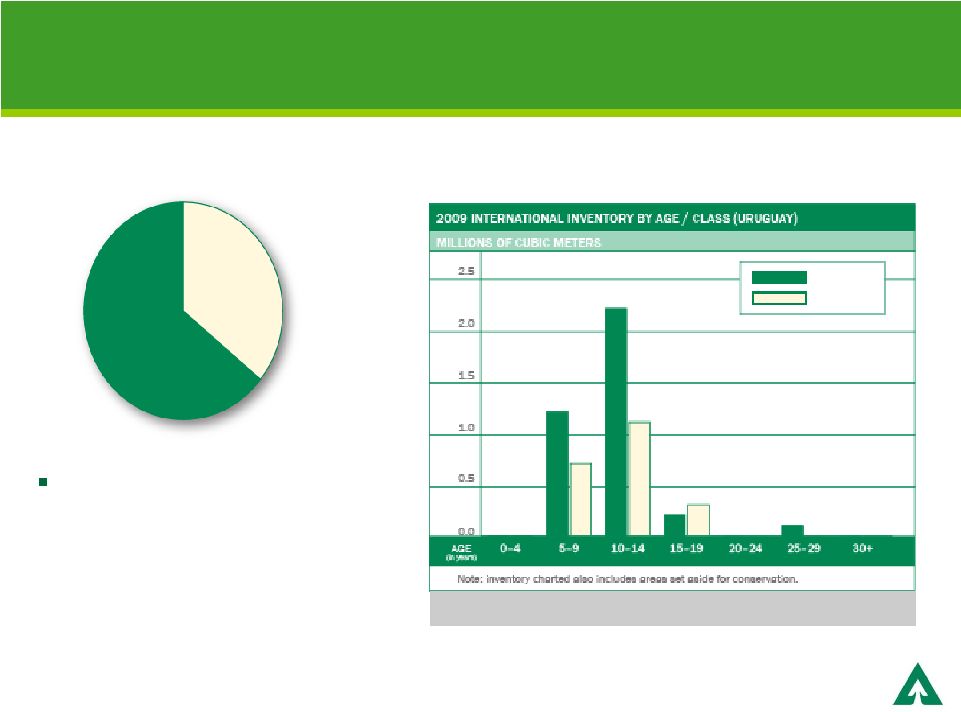 CONIFER EUCALYPTUS Uruguay 36% 64% Age Class Distributions 30% Peeler Grade logs, increasing to 45%+ over the next 10 years 341 thousand acres and 6 million cubic meters Timberlands Inventory Demonstrates Species Preference and Age Class Distribution 33 |
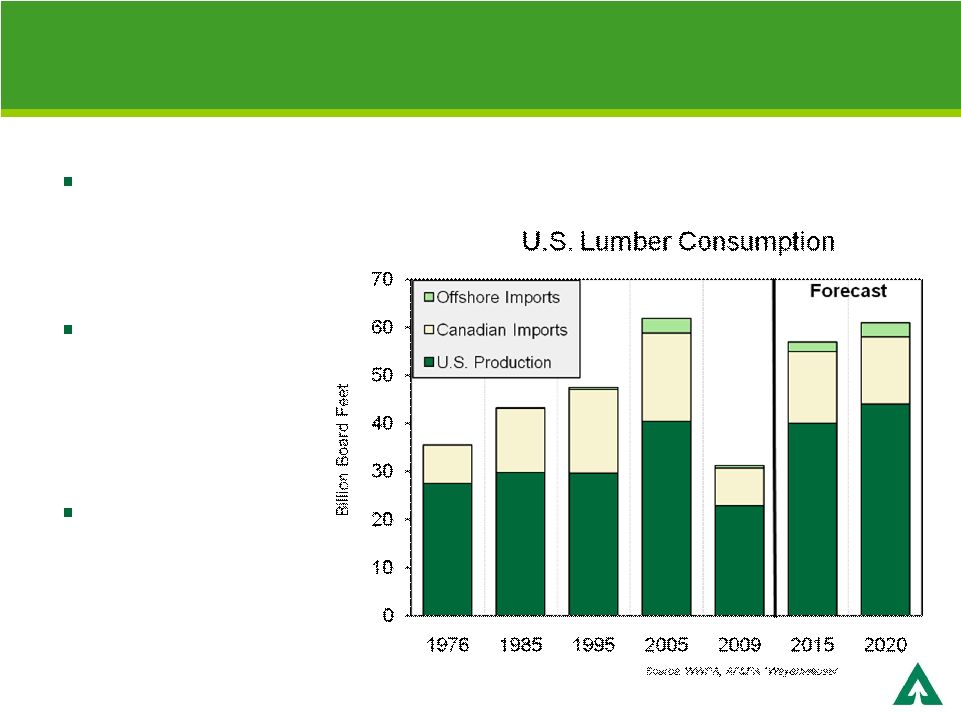 US Trend Log Demand Exceeds Domestic Supply US lumber demand will recover from cyclical low Canadian lumber imports will not return to prior peaks Expect log values will improve 34 * |
 BC Supplies Constrained Going Forward Opportunity for US suppliers as Canadian production falls off Annual allowable cut (AAC) reductions in British Columbia (BC) due to impact of pine beetle Source: BCMOF 0 20 40 60 80 Pre Uplift AAC 2005-06 Peak 2015 2021+ Harvested Beetle Kill AAC Inventory Adjustment Estimated Impacts of Mountain Pine Beetle Infestation on Timber Harvests in BC Interior Million Cubic Meters Log Volume per Year 35 |
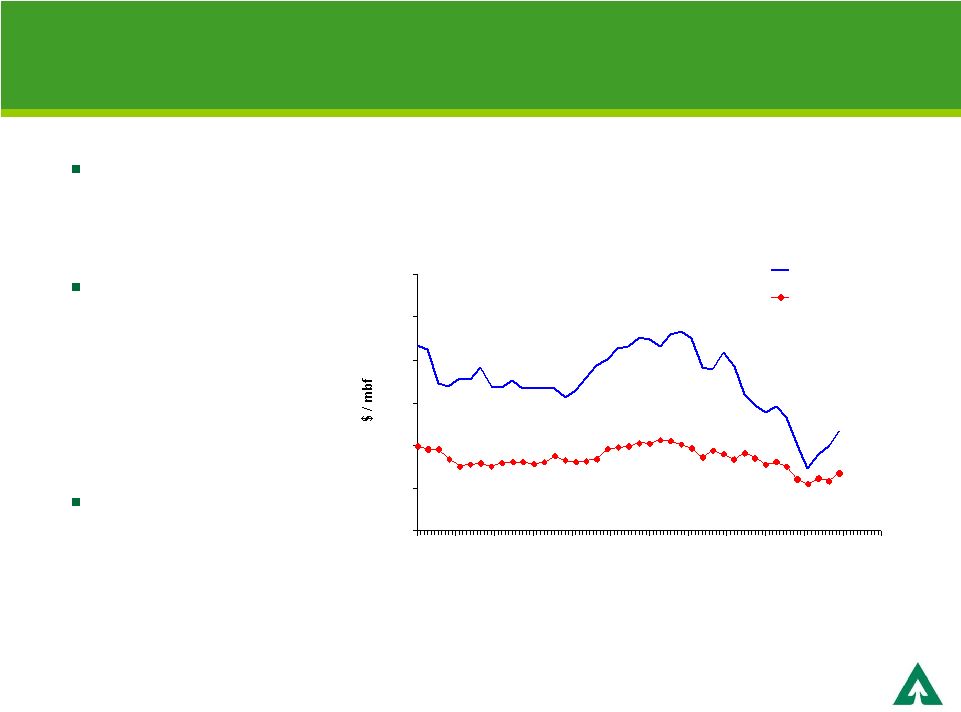 US Log Prices Have Bottomed, Now Rebounding Q1 2010 Western prices up over 25% from Q2 2009 Expect continued improvement with gradual recovery in housing and wood product demand Earnings improve as deferred volume is harvested Sawlog Prices Douglas Fir #2 and Southern Yellow Pine 200 300 400 500 600 700 800 2000 2000 2001 2002 2003 2004 2005 2006 2007 2008 2009 2010 2011 DF #2 Sawlog Price SYP Sawlog Price Source: Log Lines, Timber Mart South 36 |
 International Markets Add to Weyerhaeuser’s Competitive Advantage Japan is a premium market for logs China and Korea have increased imports of US timber through the downturn 37 |
 Harvest Volume Outlook is Positive Harvest expected to increase 71% (2009 – 2019) US will rise 60%; international to increase 4-fold Cash flow driven by increased harvest and price recovery Weyerhaeuser Global Fee Harvest Volume 0 5 10 15 20 25 30 35 0 1 2 3 4 5 6 7 8 9 International North America Fee Acres Owned 38 |
 Timberland Values Have Held Up Land prices did not follow log prices through cycle Risk profile and option value being bid into land prices $0 $500 $1,000 $1,500 $2,000 $2,500 $3,000 $3,500 2000 2001 2002 2003 2004 2005 2006 2007 2008 2009 2010 2011 NCREIF Average Timberland Values Pacific Northwest South 39 |
 Scale and Logistics Provide Cost Advantages Best practices and know- how shared across company Logistical coordination eliminates bottlenecks and increases capacity Hauling / dispatch trucking Harvesting Silviculture 40 |
    Silviculture Results in Greater Productivity and Margin Leader in advanced silviculture Increase productivity, reduce costs and gain value Sustainability Sustainability • US West • US South • Uruguay • China • US West • US South • Uruguay • China 41 |
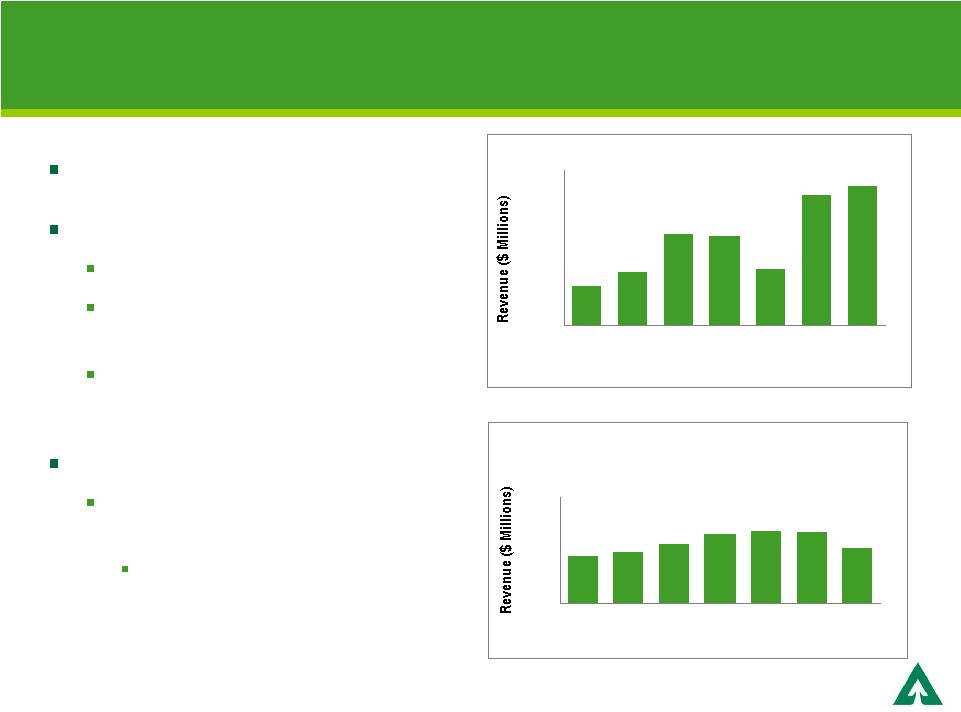 US Oil, Natural Gas, Aggregates and Minerals Have Growth Potential 7.1 million net mineral acres Oil and gas Haynesville Shale (LA) Revenue interest in >1000 producing wells Developing equity participation program in selected wells Aggregates and minerals $10+ million annual business with growth potential Economic downturn affected 2008-2009 revenues Oil and gas $0 $10 $20 $30 $40 $50 $60 2003 2004 2005 2006 2007 2008 2009 Aggregates and minerals $0 $5 $10 $15 2003 2004 2005 2006 2007 2008 2009 42 |
 Exploring Timberlands Growth Opportunities Rising global demand for wood fiber and environmental solutions will drive timberland values Selective acquisition opportunities United States South America, China and other emerging geographies 43 |
 Well-positioned to Capitalize on Attractive Outlook Increasing harvest levels will generate higher cash flows Positioned to bring deferred harvest to market as market conditions improve Ongoing precision forestry will continue to generate higher value sawtimber Optimizing log export market opportunities Further improving operational efficiencies Evaluating portfolio growth opportunities 44 |
 Miles Drake Chief Technology Officer |
 Applied Technologies Capture Highest Value Benefits to core strategy Increased high quality sawtimber yield in North America Reduced costs of forest interventions Shorter rotation time Optimized harvest planning Enhance license to operate – sustainability Underpins new opportunities Biomass Environmental offsets 46 |
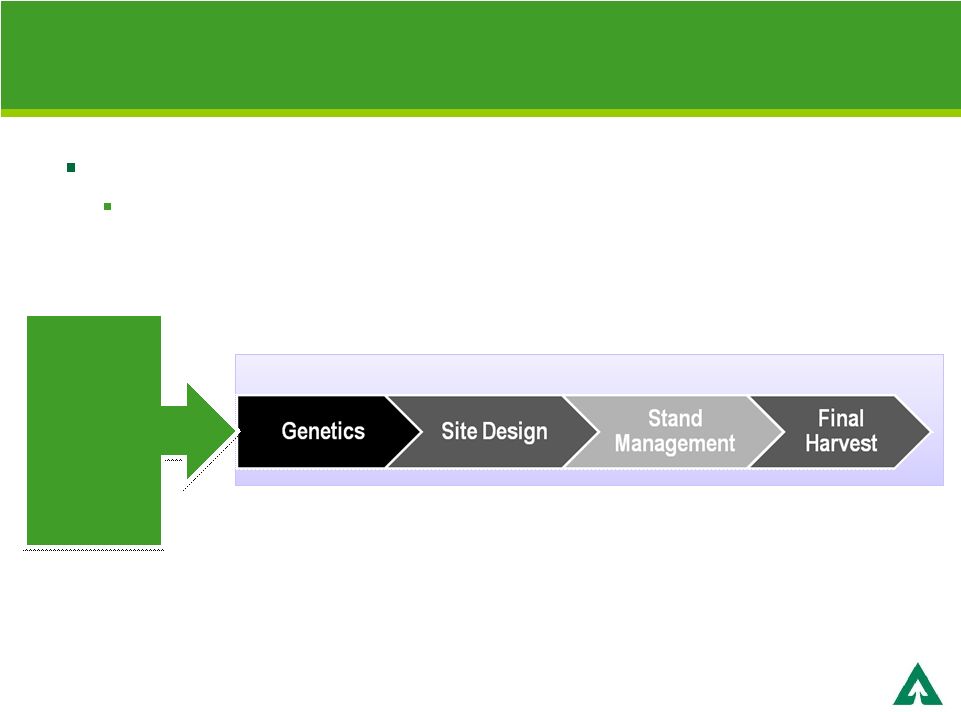
 Applied Technologies are Embedded in the Timberlands Business Model Applied Technology Land Portfolio Forest Management Market Focus Scale Operations Timberlands: Maximize Cash Flow and Asset Value 47 |
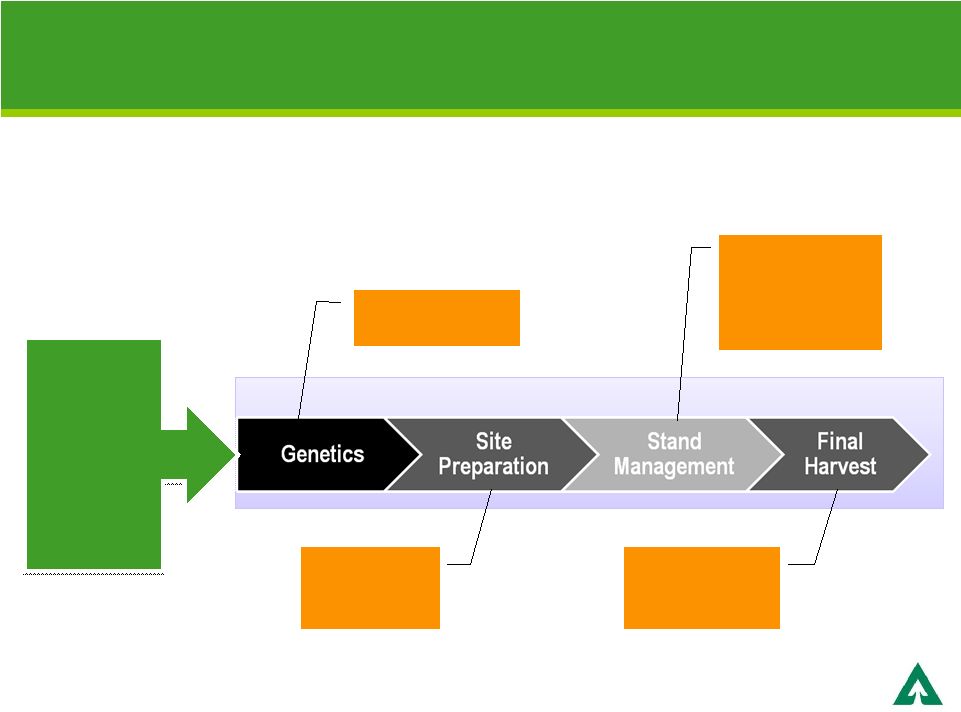    Silviculture Optimized through the Rotation for Highest Value Product Mix Sustainability Sustainability • US West • US South • Uruguay • China • US West • US South • Uruguay • China Financial Optimization Fertilizer, Thinning and Pruning Vision Forestry Seedlings 48 |
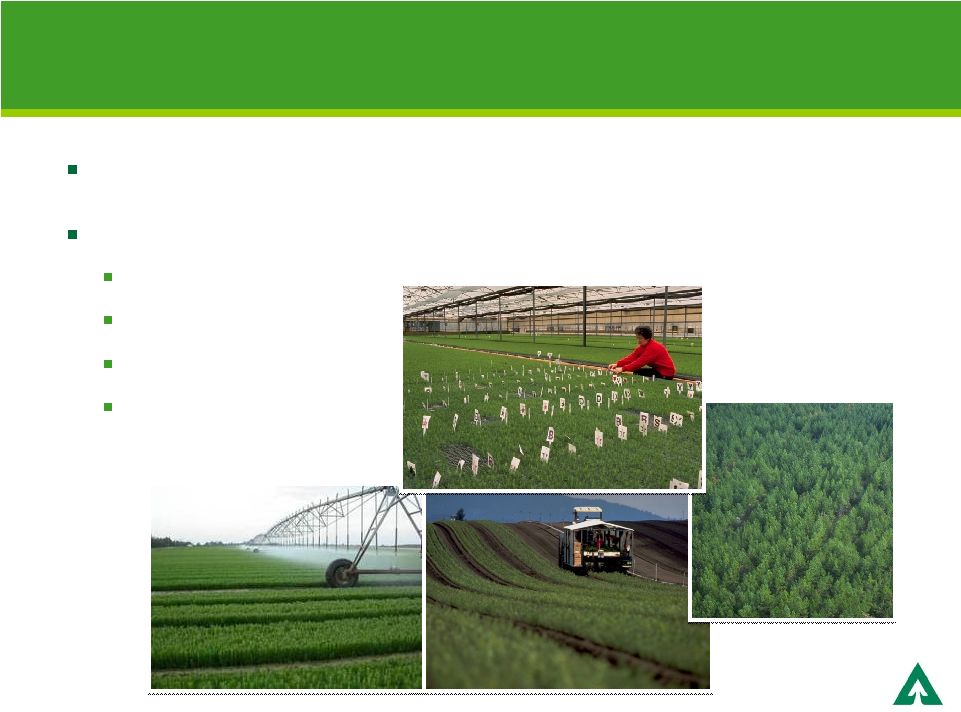        Putting the Right Seedling in the Right Place for the Right Product Scale nurseries produce genetically improved trees For sawtimber, traits focused on Volume growth Strength Straightness Disease resistance 49 |
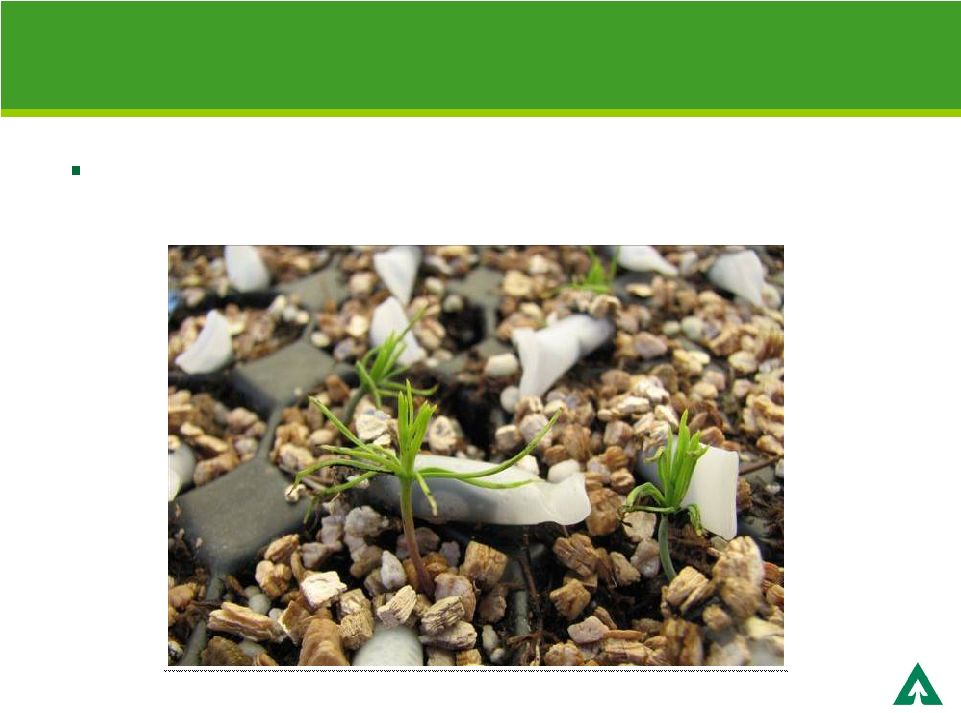  Taking Seedling Improvement to the Next Level Patented manufactured seed technology to deploy desirable traits at scale and reduce cycle time for tree improvement 50 |
 Vision Forestry Lowers Costs and Generates Greater Returns Innovative site design for maximum survival and growth of seedlings Treatments focused only on acres to be planted Allows efficient movement of people and equipment 51 |
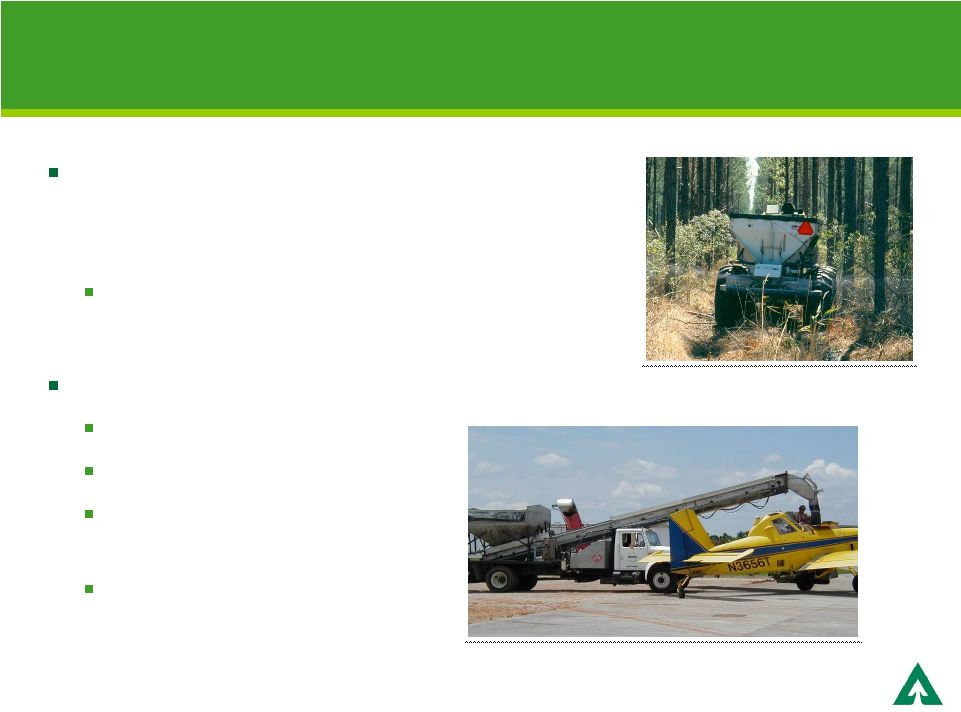 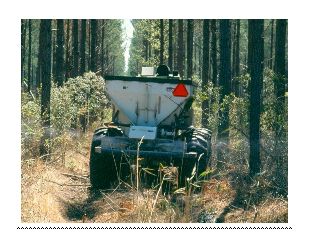 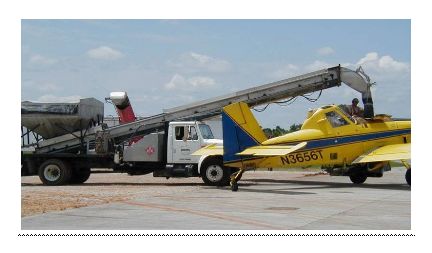 Precision Fertilization Accelerates Growth and Reduces Cost Fertilizer is applied at differing rates to stands at different stages of tree growth Precision application done at lower cost Proprietary Weyerhaeuser fertilizer Reduces / controls volatility Balanced nutrients Nutrients available in single spot Additional value through licensing to third parties 52 |
   Deploying Next Generation Technology to Optimize Harvest Timing Sensing technologies and growth and yield models ensure harvest at financial optimum Growth and yield planning Remote sensing Environmental management 53 |
    Sustainability and Environmental Capabilities Increase Ownership Value Environmental competencies Enable higher yields throughout a rotation Meet ecological and sustainability requirements Ensure license-to-operate and regulatory compliance 54 |
   Collaborative Approach Critical to Ensure Broad Acceptance of Results Working with stakeholders Industry, academia, government, public Landscape scale field research trials Large, well managed and instrumented sites Open, independent, peer reviewed research University, government and NGO participation Life cycle impact studies Impact on soil nutrients, carbon, wildlife, water and greenhouse gases 55 |
 Applied Technologies Increase Cash Generation and Create Value Improved value at harvest Example: Enhanced sawtimber yield in the South generates enhancement of $75 per acre at harvest today over industry average Increased cash generation through operational efficiencies Example: Fertilization savings $8.5 million in year one of introduction 56 |
 Positioning for Emerging Business Opportunities Global requirements for sustainable products, green energy and more productive resource systems are leading to new business opportunities Biomass Environmental offsets Land management Exploring new technologies, partnerships and on-the-ground pilots 57 |
 Biomass Markets are Developing Rapidly • Mill residuals • Forest residuals • Energy crops • Mills • Logistics • Procurement systems • Power production • Utility co-fire • Biomass boilers • Industrial • Transportation fuels • Chemicals and materials Sustainable Feedstocks Conversion & Supply Chain End Use 58 |
 Weyerhaeuser US Biomass Feedstock Volume Harvest residuals represent most of available biomass supply Weyerhaeuser Biomass 0 5 10 15 20 25 30 Total Available Other Harvest Residuals 59 |
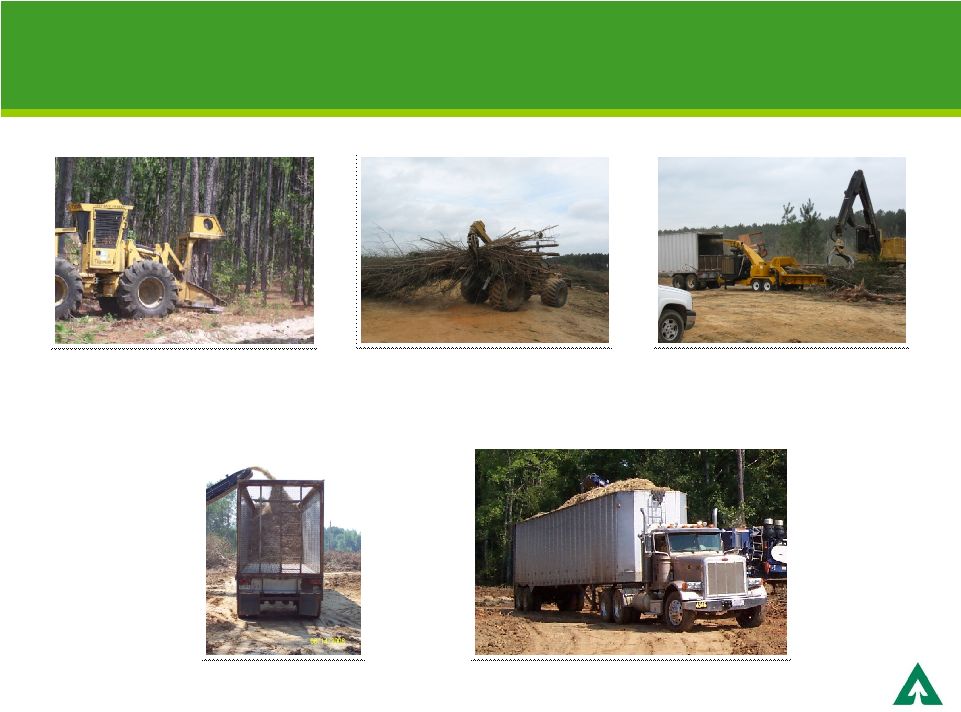      Logistics and Supply Chain Management a Competitive Requirement Felling of Logs and Understory Material Skidding Chipping Loading Transport 60 |
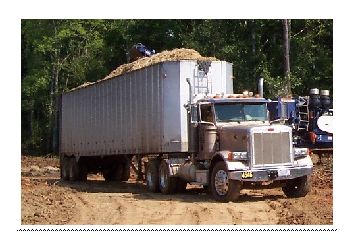
       Integrating New Biomass Sources into Precision Forestry Grow rows of pine trees and an energy crop Perennial energy crop harvested annually Trees managed for wood products and fiber Legend: Sawtimber Fiber Site Prep Intercrop Vision Forestry Intercropping 61 |
  New Co-Products Biofuel Pulp Power Opportunity to Leverage Current Biomass and Mill Co-products Pulp Mill 62 Biomass from Forests |
    Exploring New Partnerships to Open Up New Value Chains Energy producers – power and transportation fuels Supply chain partners Energy-intensive companies looking for sustainable services and products beyond biomass Proven carbon sequestration Sustainable resource management Knowledge Experience Reputation 63 |
 Technology Joint Venture with Chevron to Develop Transportation Fuels from Forests Sustainable feedstocks at scale Conversion technology High quality fuels to customers 64 |
 Potential to Leverage our Expertise Exploring global opportunities to provide solutions to others Forest management Afforestation Watershed and habitat improvement / management Carbon sequestration Erosion mitigation 65 |
 Benefits of Applied Technologies Maximizing value per acre Forest systems with high sawtimber values in the US Adapting forest regimes to increase total sustainable biomass harvest while preserving timber values Pursuing global opportunities to bring our expertise to others 66 |
 Patty Bedient Executive Vice President and Chief Financial Officer |
 REIT structure best supports strategic direction Benefit to the Company Qualified earnings distributed to shareholders not taxed at corporate level Benefit to shareholders Most dividends to shareholders taxed at capital gains rate No changes needed in legal structure or business mix Need to payout accumulated earnings and profits REIT Conversion Likely in 2010 68 |
 Earnings and Profits (E&P) Current estimate of E&P dividend: $5.5 to $5.7 billion Cash portion of E&P dividend will be capped at 10% of total Need to distribute by the end of the year of REIT conversion Process governed by SEC and IRS rules and regulations 69 |
 Action Approximate Days Declare dividend 0 Ex-dividend date 7 Dividend record date; File prospectus with SEC 10 Notify holders regarding election of stock or cash dividend 14 Election forms due 40 Stock valuation dates 41-43 Dividend payment date 47-50 Process for E&P Distribution 70 |
 Total Earnings and Profits Distribution $ 5.7 billion Current Shares Outstanding 211.40 million E&P Dividend per Share $26.96 per share Share Calculation Total E&P $ 5.7 billion Cash Portion of E&P (10%) $ .57 billion Stock Portion of E&P (90%) $ 5.13 billion Assumed Market Value of Stock at Ex-dividend Date $45.00 per share E&P Dividend per Share $26.96 per share Theoretical Share Price $18.04 per share Estimated Stock Portion of E&P $ 5.13 billion Theoretical Share Price $18.04 per share Theoretical Shares Issued for E&P 284.42 million shares Current Shares Outstanding 211.40 million shares Total Pro-forma Shares Outstanding 495.82 million shares Hypothetical Share Impact: E&P Distribution (For illustrative purposes only) Assumptions: $5.7 billion E&P $45 stock price at ex-dividend date 211.40 million shares outstanding 71 |
 Hypothetical Market Capitalization Impact: E&P Distribution (For illustrative purposes only) Assumptions: $5.7 billion E&P $45 stock price at ex-dividend date 211.40 million shares outstanding Value Share Count Per Share Pre-Distribution Market Capitalization $9,513 211.4 $45.00 Total E&P Distribution ($5,700) ______________________________________ 211.4 _________________________________________________ ($26.96) _________________________________________________ Ex Dividend Value of Original Stock $3,813 211.4 $18.04 Stock Received in E&P Distribution (90%) $5,130 _______________________________________ 284.4 _________________________________________________ $18.04 _________________________________________________ Pro Forma Post-Distribution Market Capitalization $8,943 495.8 $18.04 Cash Received in E&P Distribution (10%) $570 ______________________________________ Total Value for Shareholders $9,513 in millions except per share amounts 72 |
 Accounting Impact of E&P Distribution (Assuming $5.7 billion E&P, and 90% stock and 10% cash distribution) Pro-forma changes to balance sheet Cash reduced by $570 million Deferred tax liability reduced by approximately $1.0 billion Shareholders’ equity increased by $430 million Pro-forma changes to income statement Tax benefit of $1.0 billion, as a result of the elimination of deferred taxes 2010 income tax expense recalculated to reflect REIT treatment Stock portion of E&P dividend treated as share issuance, and EPS will be adjusted on a prospective basis 73 |
 Ongoing REIT Requirements REITs are generally required to distribute 90% of tax basis income as a dividend, with certain exceptions for capital gain income Asset Test (Quarterly) 75% of fair market value of REIT assets must be qualified assets – primarily timberlands and cash Net investment in Taxable REIT Subsidiary (TRS) limited to 25% of REIT’s gross assets Income Test (Annual) At least 75% of a REIT’s gross income must come from rent and sales of real property, including standing timber on a pay as cut basis At least 95% of a REIT’s gross income must come from rent and sales of real property plus interest or dividends (including dividends from the TRS) 74 |
 Substantial Near-Term Liquidity Cash Balance (3/31/2010): $2.1 billion Bank Revolving Credit Facility: $1.0 billion (Expires 12/2011) Total Debt (3/31/2010): $5.7 billion Current Credit Ratings: 2010 2011 2012 2013 2014 2017-2033 $43 $30 $1,263 $433 $15 $3,891 Debt Maturity Schedule ($ millions) S&P: BBB- (negative) DBRS: BBBH (negative) Moody’s: Ba1 (developing) Fitch: BB+ (negative) 75 |
 Key Dividend Considerations Macroeconomic climate Earning potential of the company Target capital structure Appropriate debt levels Long term liquidity Maintaining access to capital Affordability Future growth opportunities 76 |
 Updated Second Quarter 2010 Outlook Segment Q2 Outlook Compared to Q1 Earnings Timberlands Log prices expected to increase, partially offset by a lower grade mix and higher silviculture and road costs Excluding the disposition of non-strategic timberlands, Q2 operating earnings are expected to be comparable to Q1 Disposition of non-strategic timberlands are expected to be lower than Q1 Wood Products Improved sales realizations and volumes anticipated Manufacturing unit costs are expected to improve as production increases, partially offset by higher log costs Segment expected to be profitable in Q2 Cellulose Fibers Expect higher pulp price realizations, partially offset by increased freight and slightly higher annual maintenance costs Q2 earnings expected to be substantially higher than Q1 Real Estate Anticipate an increase in home closings, offset by lower average sales prices due to mix Q2 loss from single-family homebuilding operations expected to be comparable to Q1 77 |
 Dan Fulton President and Chief Executive Officer |
 Recognized Leader in Sustainability 79 |
 Reasons to Own Weyerhaeuser Most attractive timberland in the world Leader in adding and extracting value from timberlands Uniquely positioned to benefit from the recovery Focused on returning value to shareholders 80 |
 |