
May 29, 2009
2009 Investor Meeting
Weyerhaeuser Company

Forward Looking Statement
This presentation contains statements concerning the company’s future results and performance that are forward-looking statements within the meaning of the Private Securities
Litigation Reform Act of 1995. These statements are based on various assumptions and may not be accurate because of risks and uncertainties surrounding these assumptions.
Factors listed below, as well as other factors, may cause actual results to differ significantly from these forward-looking statements. There is no guarantee that any of the events
anticipated by these forward-looking statements will occur. If any of the events occur, there is no guarantee what effect they will have on company operations or financial condition. The
company will not update these forward-looking statements after the date of this presentation.
Some forward-looking statements discuss the company’s plans, strategies and intentions. They use words such as “expects,” “may,” “will,” “believes,” “should,” “approximately,”
“anticipates,” “estimates,” and “plans.” In addition, these words may use the positive or negative or other variations of those terms.
We make forward-looking statements regarding the company’s expectations during the second quarter of 2009, including the company’s markets, the effect of facility closures and cost
control measures in the wood products segment, fee timber harvests and log prices, demand and pricing for our wood products, decreases in raw material costs for our wood products
segment, increased expenses for annual planned maintenance in the Cellulose Fiber segment, the effect of potential alternative fuel mixture tax credits, demand and prices for pulp,
home sale closings and prices, earnings and performance of our business segments, capital expenditures and the timing of debt repayments. Major risks, uncertainties and assumptions
that affect the company’s businesses and may cause actual results to differ from these forward-looking statements, include, but are not limited to:
the effect of general economic conditions, including the level of interest rates, availability of financing for home mortgages, strength of the U.S. dollar, employment rates and housing
starts;
market demand for the company’s products, which is related to the strength of the various U.S. business segments and economic conditions;
the successful execution of internal performance plans, including restructurings and cost reduction initiatives;
the restructuring of the company’s business support functions;
performance of the company’s manufacturing operations, including maintenance requirements;
raw material prices;
energy prices;
transportation costs;
performance of pension fund investments and related derivatives;
contributions to pension plans
the effect of timing of retirements and changes in the market price of company stock on charges for stock-based compensation;
the level of competition from domestic and foreign producers;
the effect of forestry, land use, environmental and other governmental regulations;
legal proceedings;
projected tax rates and IRS audit outcomes;
changes in accounting principles;
the effect of weather;
loss from fires, floods, windstorms, hurricanes, pest infestation and other natural disasters; and
other factors described under “Risk Factors” in the company’s annual report on Form 10-K or periodic reports.
The company is a large exporter and is affected by changes in economic activity in Europe and Asia, particularly Japan and China. It also is affected by changes in currency exchange
rates, particularly the relative value of the U.S. dollar to the euro and the Canadian dollar. Restrictions on international trade or tariffs imposed on imports also may affect the company.

Today’s presenters
Dan Fulton President and Chief Executive Officer
Patty Bedient Executive Vice President – Chief Financial Officer
Tom Gideon Executive Vice President – Forest Products
Larry Burrows President and Chief Executive Officer – WRECO
Kathy McAuley Vice President – Investor Relations
Lynn Michaelis Vice President – Chief Economist

Dan Fulton
President and Chief Executive Officer
Opening Remarks

Lynn Michaelis
VP – Chief Economist
Economic Overview

Economic setting for 2009
U.S. in recession since early 2008, accelerated with financial crisis
Aggressive fiscal and monetary policy are crucial to arrest the downward spiral
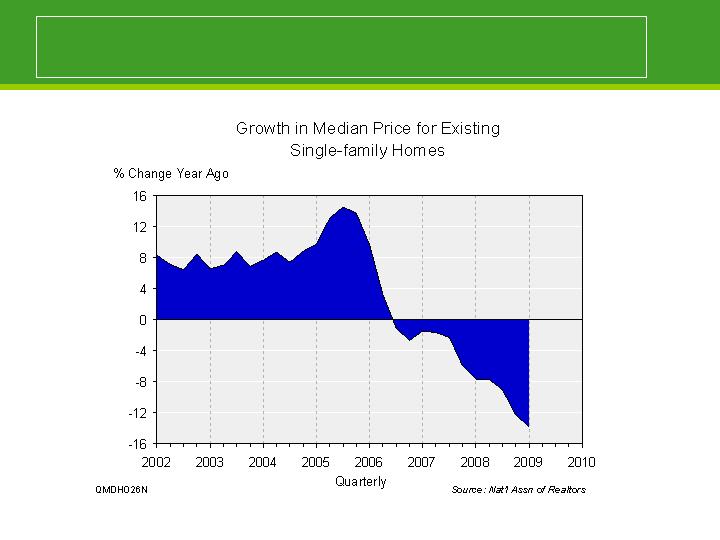
Decline in home prices triggered financial crisis
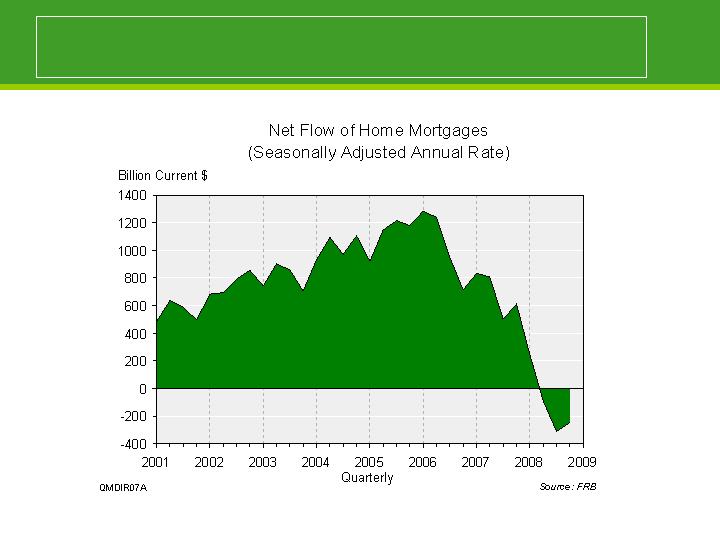
Dramatic shift in available credit and tougher standards
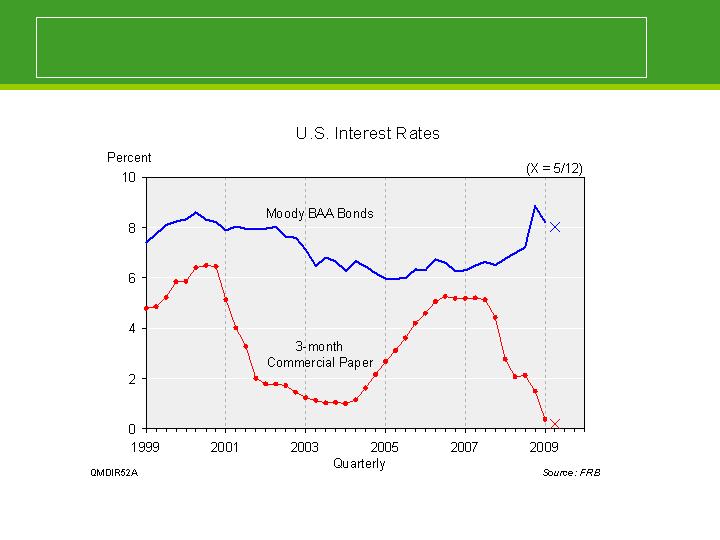
Fed taking actions to stabilize financial system
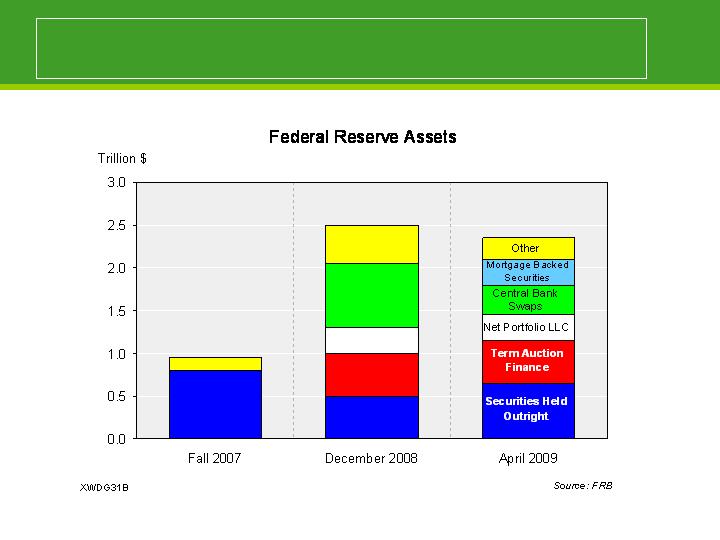
Aggressive action to stabilize financial system

Economic setting for 2009
U.S. in recession since early 2008, accelerated with financial crisis
Aggressive fiscal and monetary policy are crucial to arrest the downward spiral
Dramatic drop in consumer spending has hit U.S. and global economies
Consumer spending uncertain given employment and wealth issues
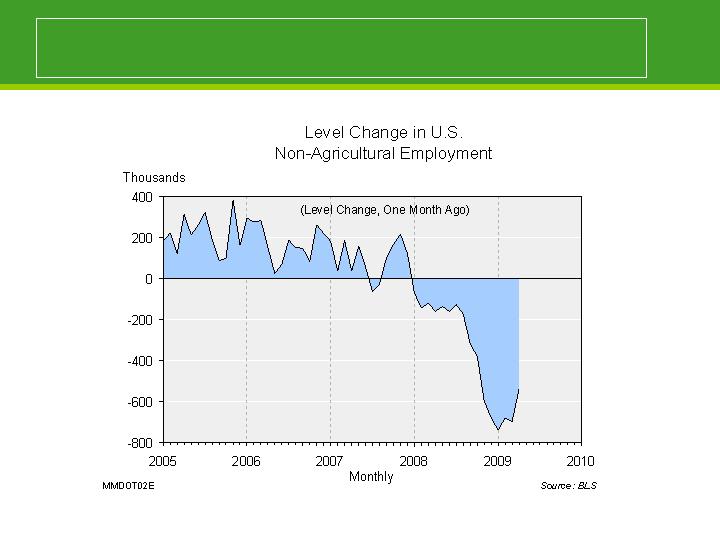
Massive job losses
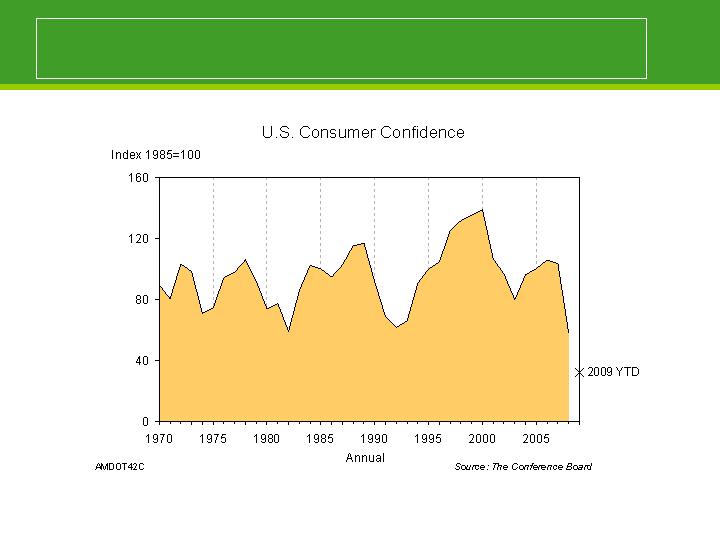
Consumer confidence near record low
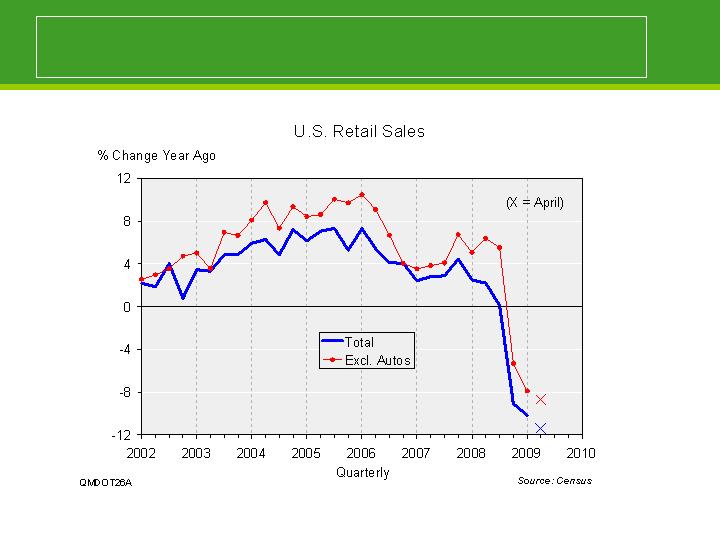
Serious drop in consumer spending
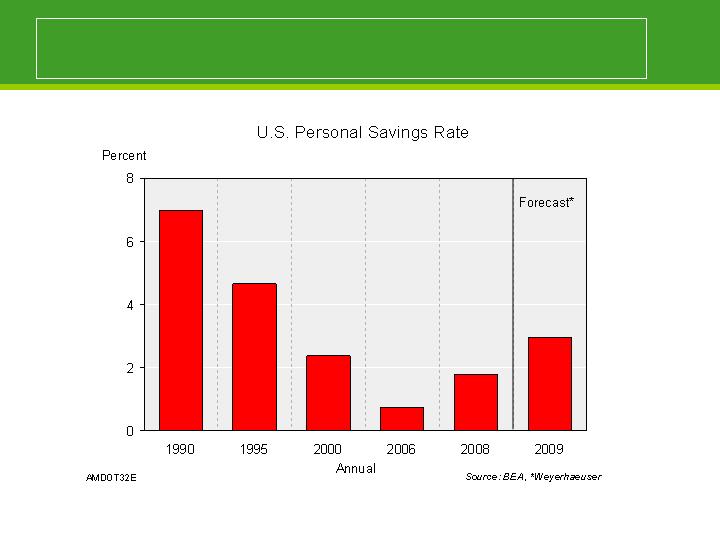
Leads consumer to defer some purchases

Economic setting for 2009
U.S. in recession since early 2008, accelerated with financial crisis
Aggressive fiscal and monetary policy are crucial to arrest the downward spiral
Dramatic drop in consumer spending has hit U.S. and global economies
Traditional sources of rebound are absent:
Simultaneous collapse in global growth — complicates the situation for the
U.S.
Housing not playing traditional role — not rebounding quickly
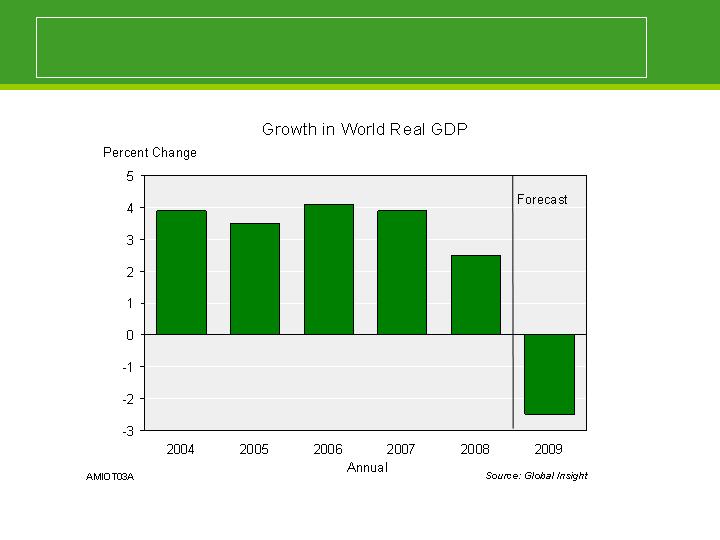
Crisis was a global event – serious recession in 2009
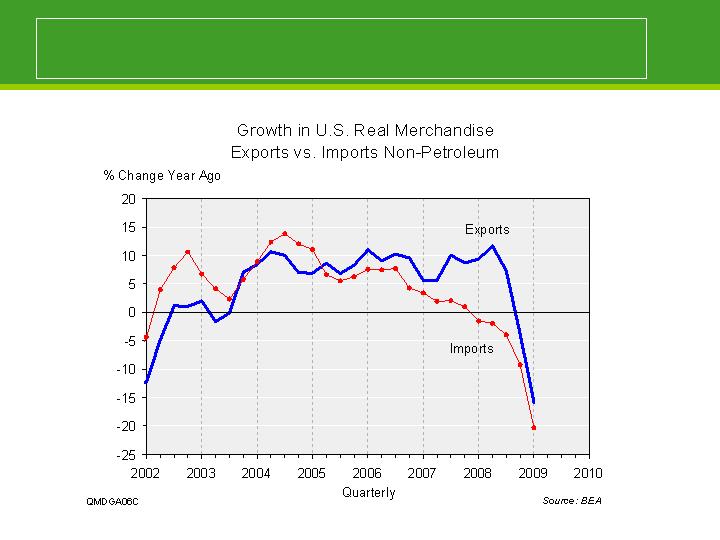
Net exports were helping, until late 2008

Economic setting for 2009
U.S. in recession since early 2008, accelerated with financial crisis
Aggressive fiscal and monetary policy are crucial to arrest the downward spiral
Dramatic drop in consumer spending has hit U.S. and global economies
Traditional sources of rebound are absent
Federal government primary source for turnaround
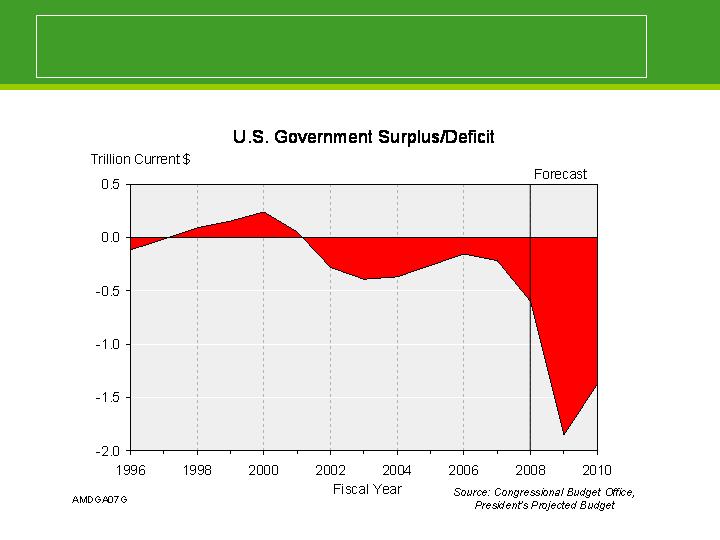
Massive deficits to offset consumer spending decline
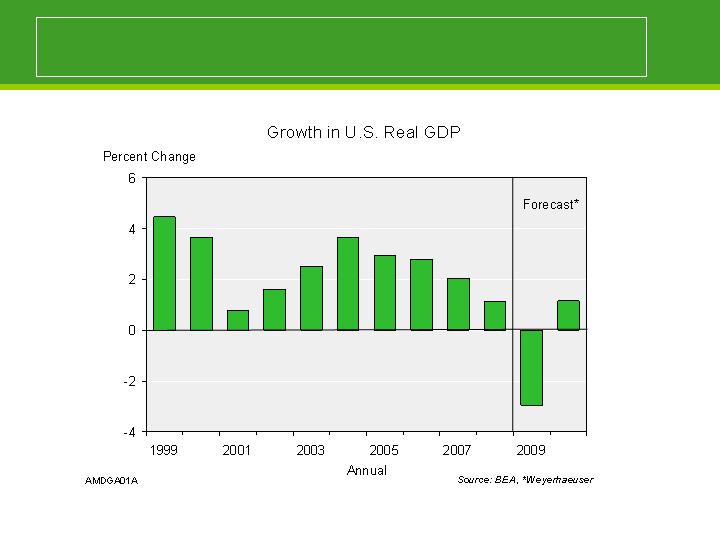
Signs recession will end this year

Key Messages - Cellulose Fibers
Pulp prices hit hard in late 2008
Rebound in the U.S. dollar against Euro and C$
Deterioration in pulp demand
Corresponding surge in pulp inventories
Recent weakness in dollar favorable for pulp prices
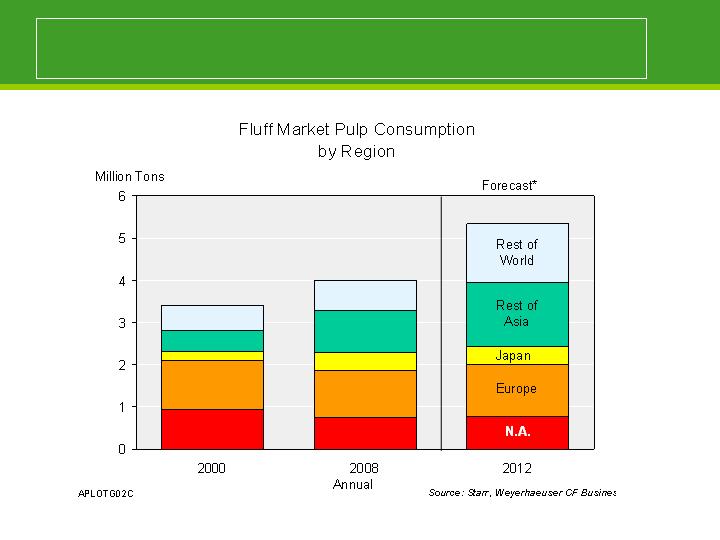
Fluff market is global and growing
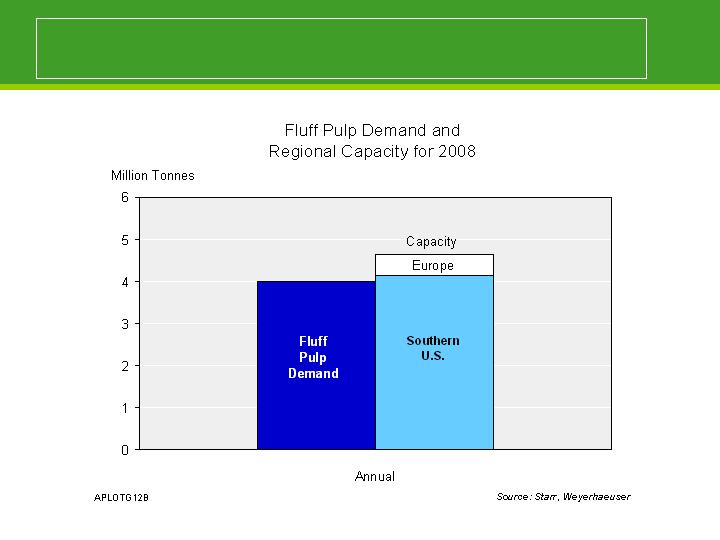
U.S. South primary source of fluff
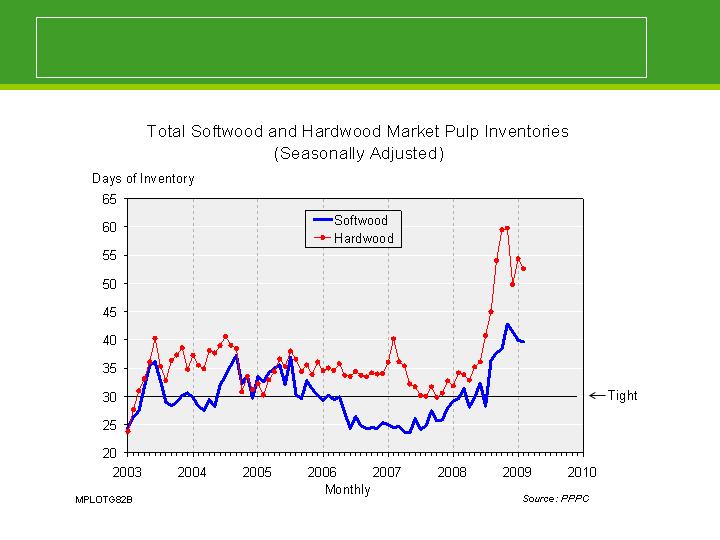
Excess inventory dampens prices

Fluff pulp prices held up better

Softwood capacity declining
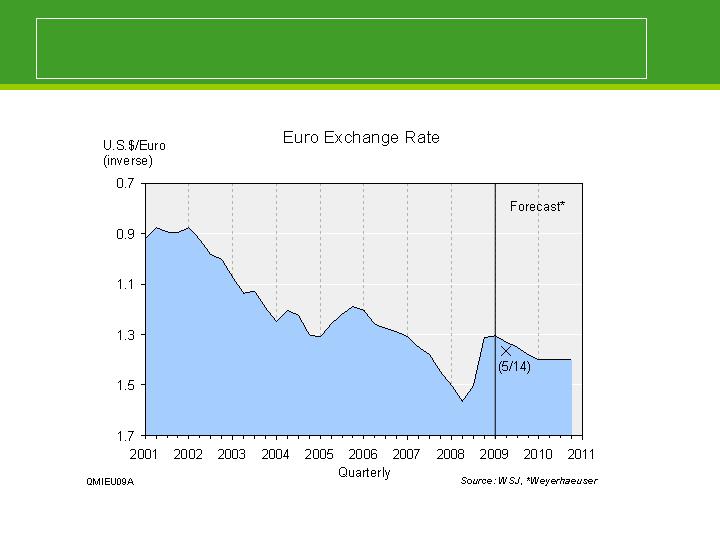
Expect dollar decline to continue

Summary - Cellulose Fibers
Fluff pulp prices have held up relative to NBSK prices
Dollar decline is critical to price outlook

Tom Gideon
Executive Vice President – Forest Products
Cellulose Fibers
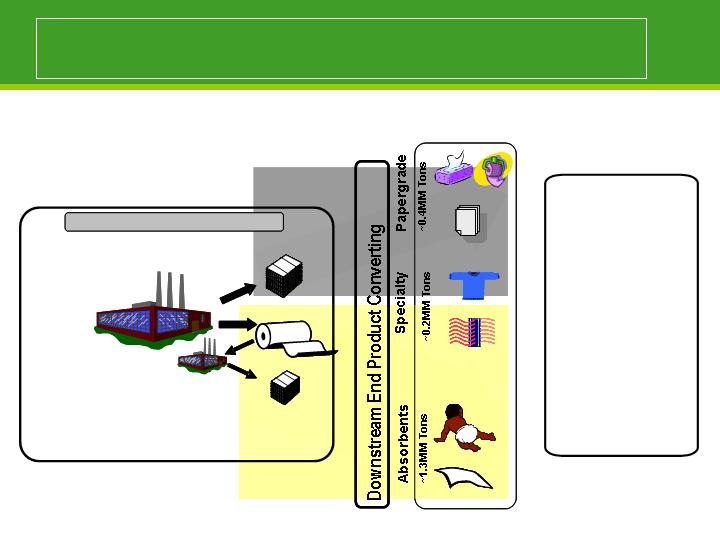
Cellulose Fibers business
End Uses
Operations
6 Manufacturing Facilities
~1.9MM Tons
5
“
Primary
”
Mills
Bales
Rolls
Bales
Grande Prairie, AB
Flint River, GA
Pt Wentworth, GA
Columbus, MS
New Bern, NC
6 Manufacturing Facilities
~1.9MM Tons
5
“
Primary
”
Mills
1
“Converting”
Plant
Columbus, MS (
“CMF”)
Bales
Rolls
Bales
Grande Prairie, AB
Flint River, GA
Pt Wentworth, GA
Columbus, MS
New Bern, NC
Towel/Tissue
Paper
Textiles
Filter Media
Diapers
Wipes
Towel/Tissue
Paper
Textiles
Filter Media
Diapers
Wipes
Towel/Tissue
Towel/Tissue
Paper
Paper
Textiles
Filter Media
Textiles
Filter Media
Diapers
Wipes
Diapers
Wipes
35% - Europe
35% - North
America
30% - Asia, South
America
End Product
Flows
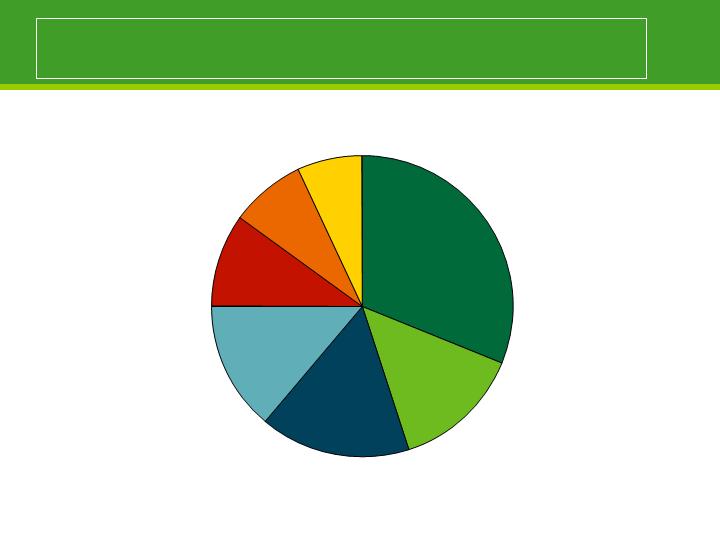
Cash cost of goods sold in 2008
Fiber
31%
Chemicals
14%
Freight 16%
Maintenance
14%
Labor Cost
10%
Energy
8%
Packaging,
Supplies & Other
7%

Addressing the short-term, positioning for the long-term
Continuing our leadership position with key customers
Aggressively reducing costs
Slowed back each mill to achieve lowest cost position
Reduced chemical and other costs
Cut all discretionary spending
Extended salary freeze to hourly workers

Lynn Michaelis
VP – Chief Economist
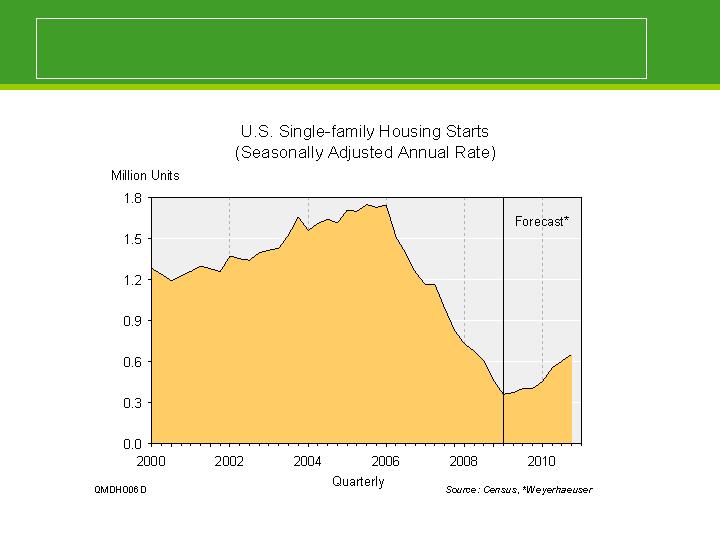
Economic Overview - Housing

Key messages – housing industry
At bottom, expect slow rebound in 2009
High inventory, foreclosures and tougher lending standards
Increase in existing home sales is a bright spot
The bubble markets were hit hard
But low prices and improved affordability are resulting in a surge
of existing home sales
Rate of rebound depends on national policy actions and
regional employment
At bottom in 2009, but gains momentum in 2010
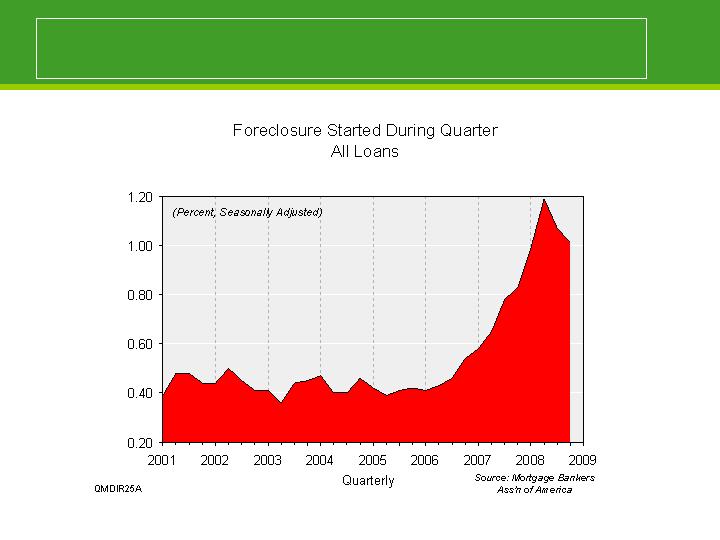
Foreclosure rate remains high
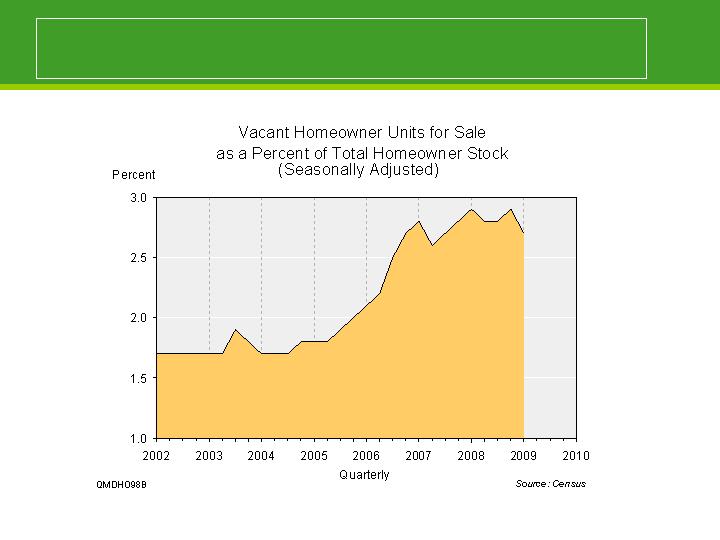
High vacant stock of units for sale
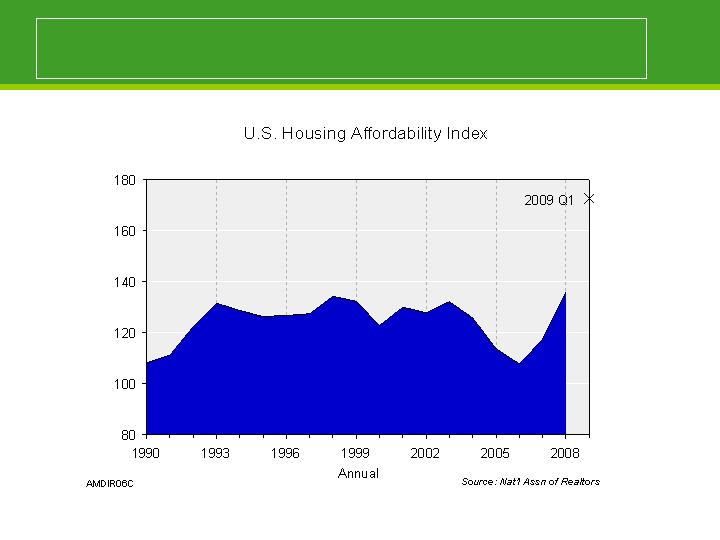
Affordability is now at record levels

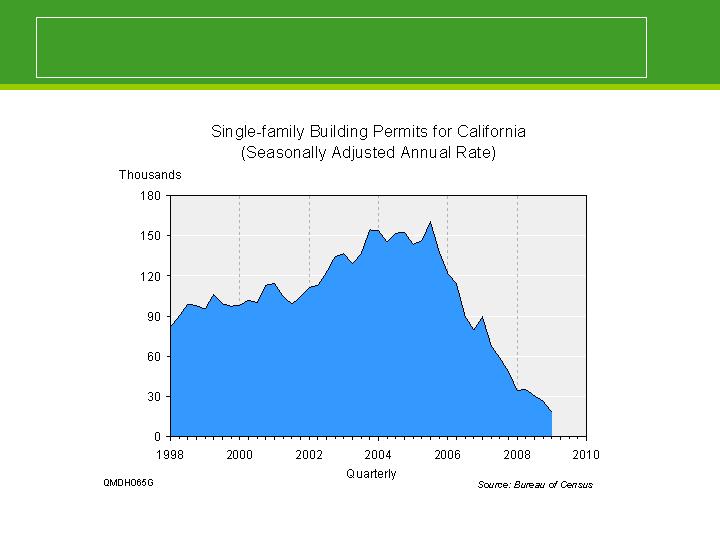
All WRECO regions are below 2002 levels
Single
-
family Building Permits
(Thousands)
2002
2005
2008
Las Vegas
25
30
6
Phoenix
40
51
11
Washington DC
30
25
9
Seattle
10
18
6
Houston
29
51
28
Source: Census
California housing seriously challenged

Housing prices down 65% from peak
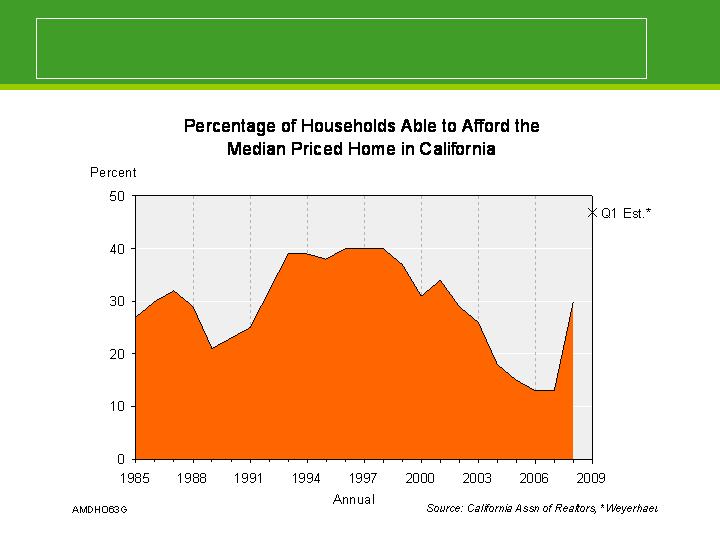
Housing affordability at record levels
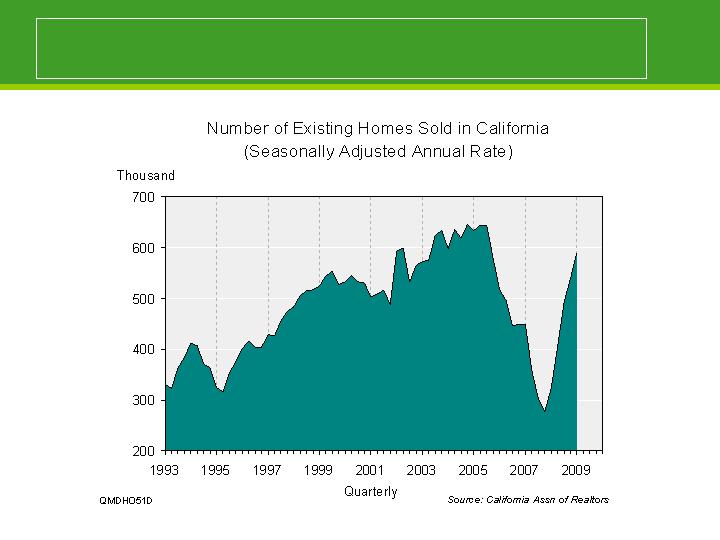
At current prices, houses are selling

Summary - housing
Another challenging year in 2009, but most of house price decline is behind us
Varies by region
Variety of factors helping stabilize housing and construction market in 2009
Recent home sales are encouraging
Single-family housing starts double by end of 2010, with upside potential

Larry Burrows
President and CEO — Weyerhaeuser Real Estate Company
Weyerhaeuser Real Estate Company
(WRECO)

WRECO’s competitive strengths
Geographic diversity
Local value propositions
Land entitlement and development expertise
Customer satisfaction
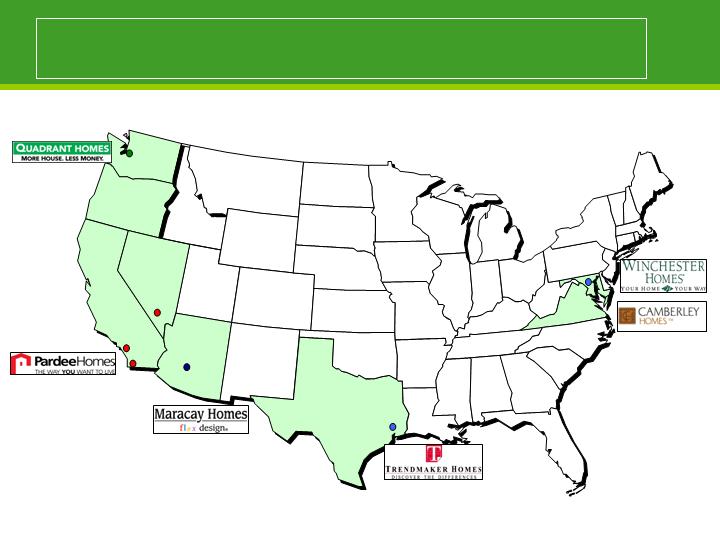
Located in diverse and high-growth geographies

Unique brands with distinctive value propositions

High levels of customer satisfaction
Willingness to Refer
84
88
92
96
100
2007
2008
Q1 2009
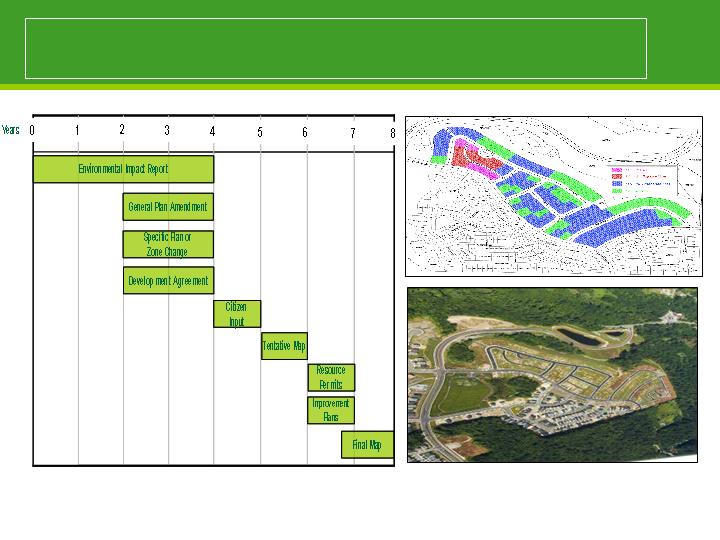
Creating value through entitling and developing land
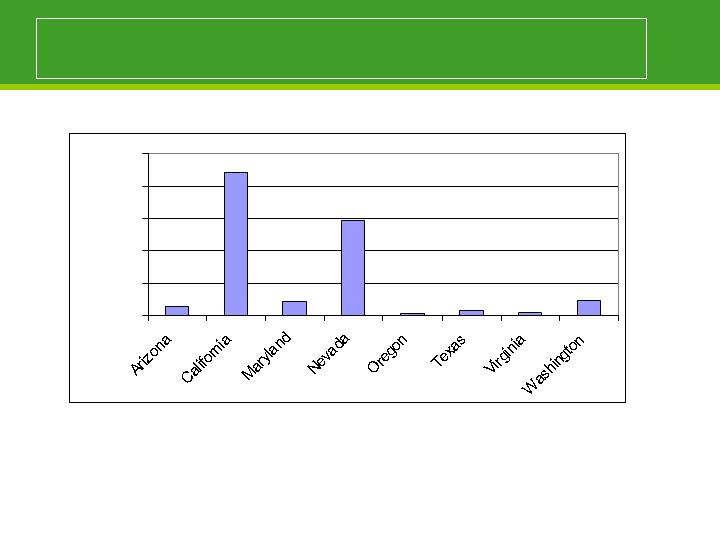
WRECO residential lot position
Total lots owned – 44,000; an additional 72,000 lots are controlled via option agreements
Number of lots owned as of 3/31/09
0
5,000
10,000
15,000
20,000
25,000
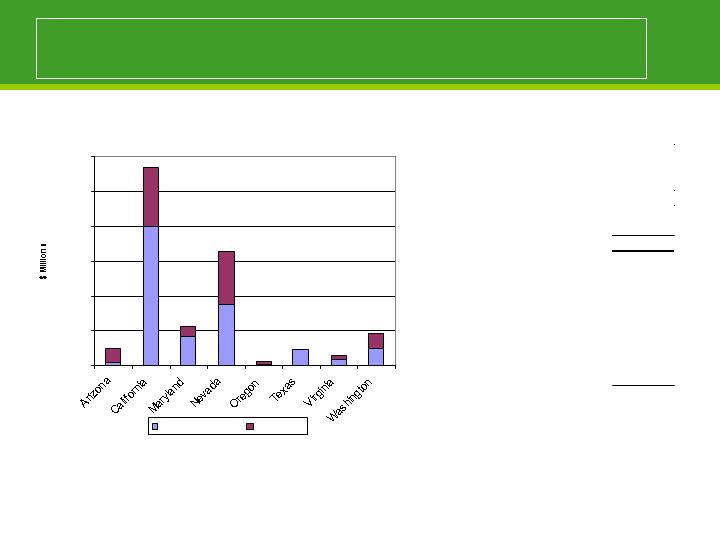
* Historic cost includes land purchase price, entitlement and development costs, taxes, and capitalized interest
WRECO residential lots – dollars invested
Consolidated Totals ($ Millions)
Historic Cost *
$2,500
Impairments to historic cost
-$900
Current book value of residential lots
$1,600
Balance Sheet Classification ($Millions)
Real estate in process of development
and for sale
$700
Land being processed for development
$1,200
Less: Completed & in process home
inventory, and commercial acreage
-$300
Current book value of residential lots
$1,600
Investment as of 3/31/09
$0
$200
$400
$600
$800
$1,000
$1,200
Current Book Value
Impairment

* Historic cost includes land purchase price , entitlement and development costs, taxes, and capitalized interest
WRECO residential lots – California by sub-markets
Totals ($ Millions)
Historic Cost*
$1,100
Impairments to historic cost
-$300
Current book value of residential lots
$800
Mennifee
Preserve / Candlewood
Tournament Hills
LA Ventura
Spring Canyon
No Cal
Las Positas
Nevada
Investment as of 3/31/09
$0
$100
$200
$300
$400
Inland Empire
LA/Ventura
Northern California
San Diego
Current Book Value
Impairment

Managing through the cycle
Adjusted staffing
40% reduction since Q1 2008
Additional 20% reduction by year end
Reduced unsold completed inventory by 30% from Q1 2008
Selectively selling non-strategic residential lots
Curtailing spending on land acquisitions and development

Repositioning product to meet market conditions
2007 – Fairbrook Plan #2
2009 – Montclaire Plan #2
Priced at $420,000-$560,000
Priced at $320,000-$410,000
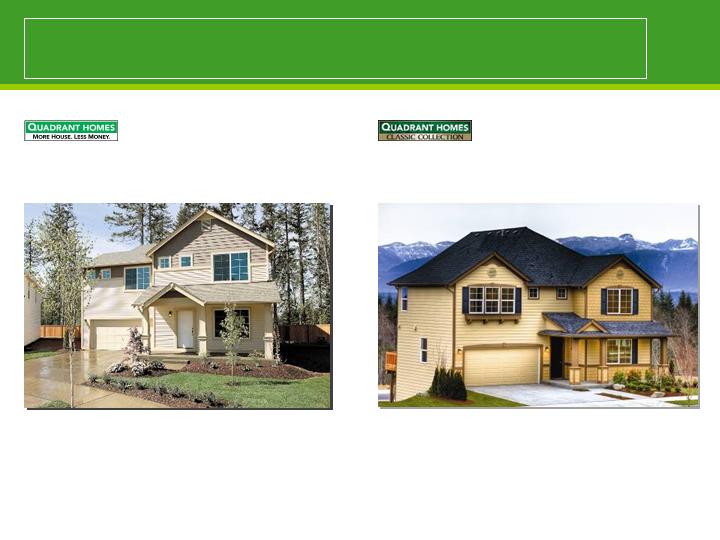
Offering a second product line to expand buyer pool
Cascade 2440
Classic Collection 3450
Priced at $360,000 to 480,000
Priced at $490,000-580,000
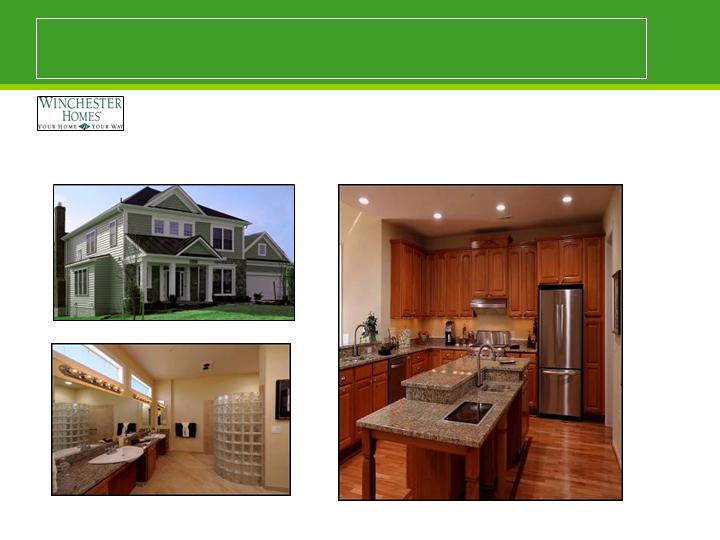
Repositioning product to meet emerging trends
Designed for the “ages” with enhanced green features
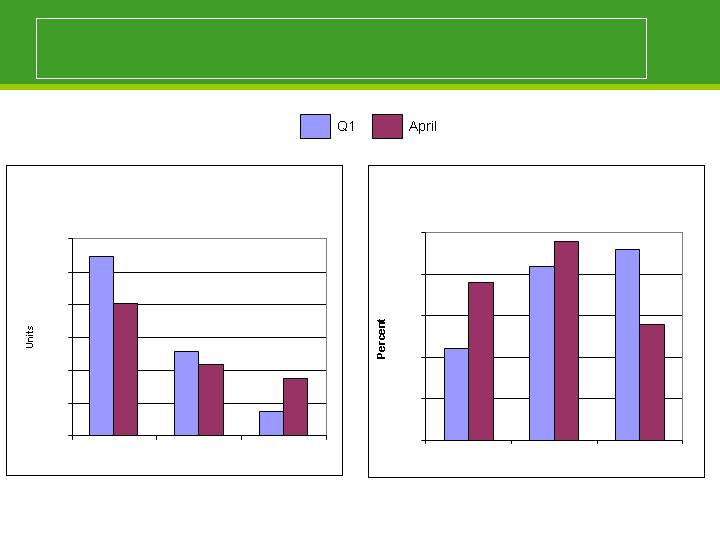
Improving signs in April
Average Sales per Week
20
40
60
80
100
120
140
2007
2008
2009
Cancellation Rate
5
10
15
20
25
30
2007
2008
2009

Addressing the short-term, positioning for the long-term
Long-term single-family housing fundamentals are favorable
WRECO is well-positioned in desirable markets
Market downturn is creating opportunities
Major business imperatives
Generate cash
Reduce and rebalance land position
Re-underwrite all option deals: either renegotiate or walk
Sell non-strategic assets

Lynn Michaelis
VP – Chief Economist
Economic Overview – Wood
Products

Key messages – Wood Products markets
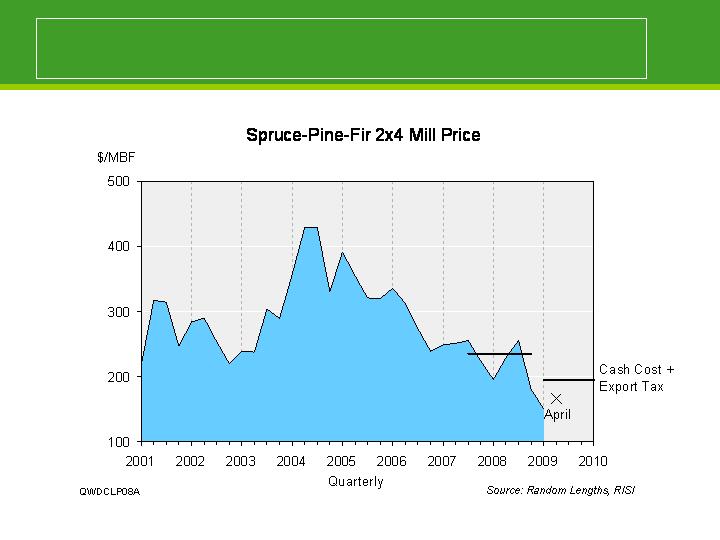
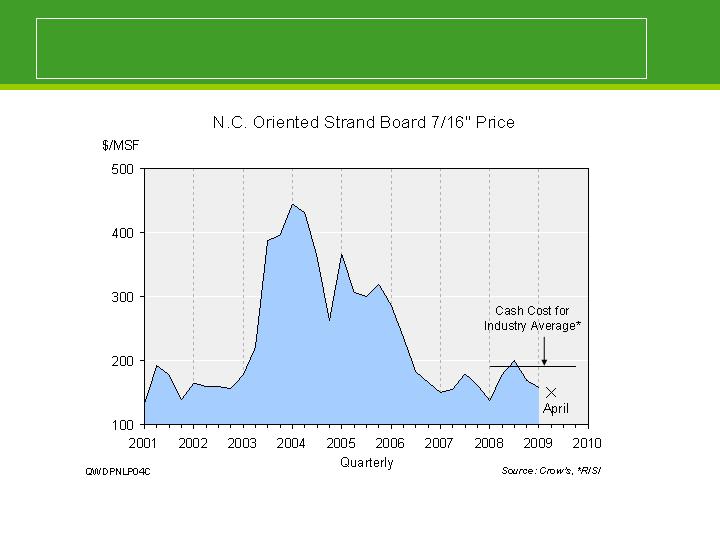
Unprecedented demand drop has driven prices to levels below cash
operating costs
Prices should rebound to cover cash operating costs for an average mill
For lumber, need to see prices cover Canadian mill costs
Canadian dollar is a major issue for both the lumber and OSB price outlook
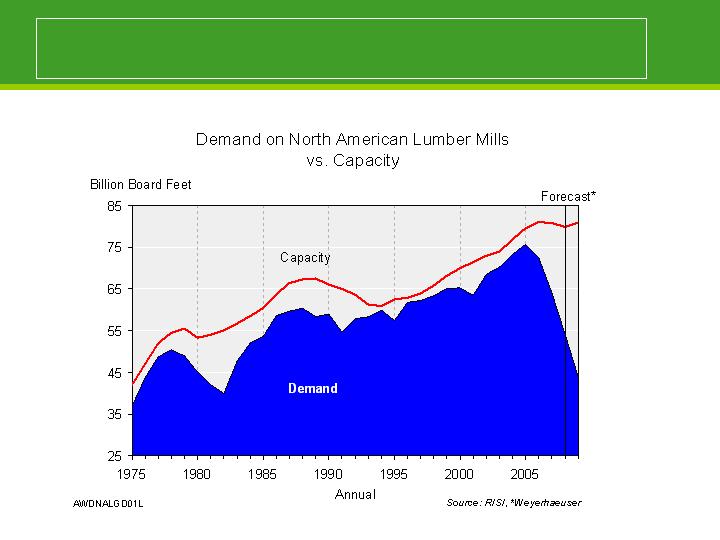
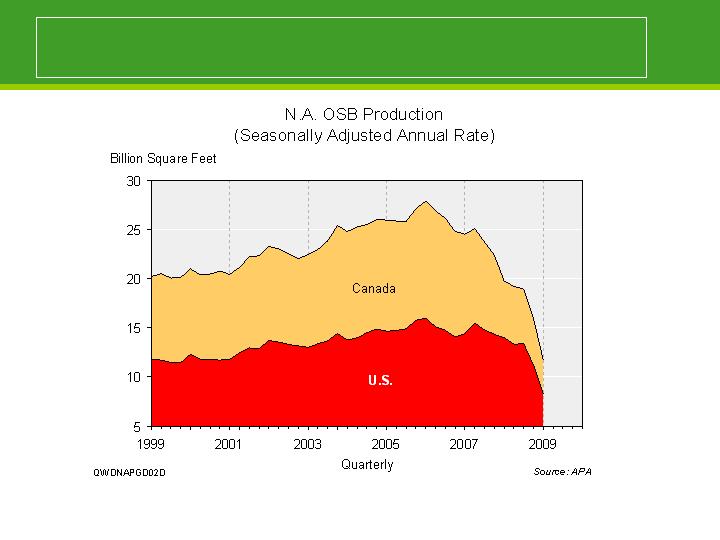
Severity compared to earlier cycles
All regions curtailed output, but bigger hit for Canada
Prices fell below cash cost to force closures
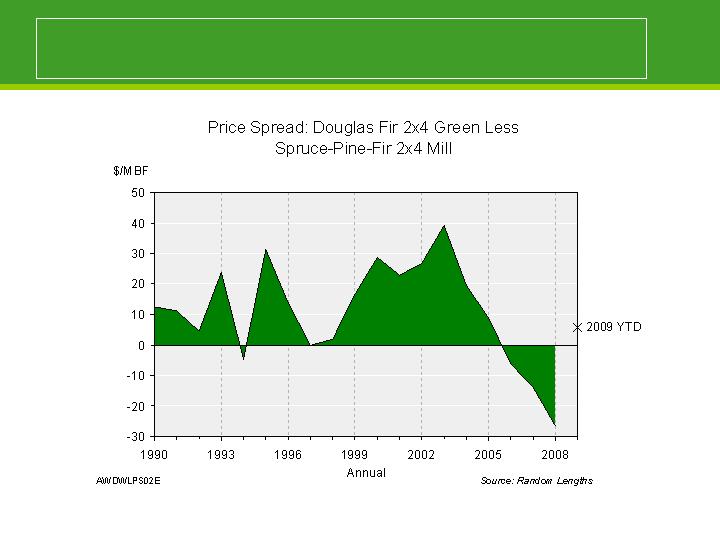
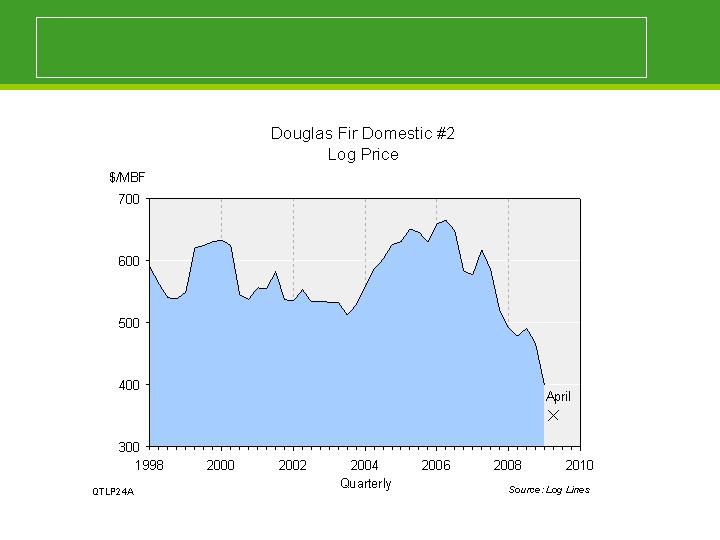
Another anomaly: Douglas Fir below Spruce
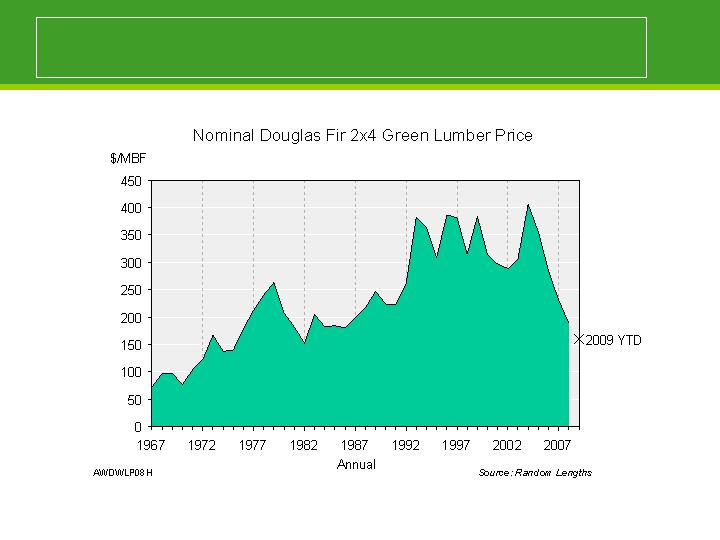
In nominal dollars, prices back to 1982 levels
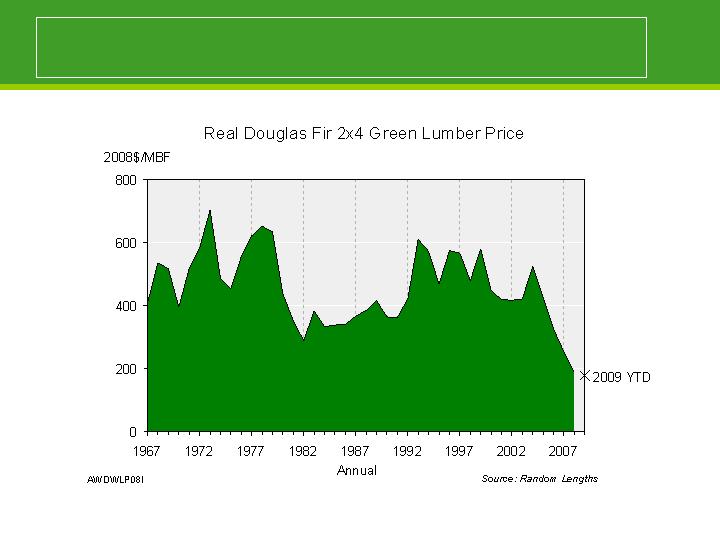
But adjusted for inflation — 1935?

Canadian lumber delivered costs eventually drive U.S. lumber and log
markets
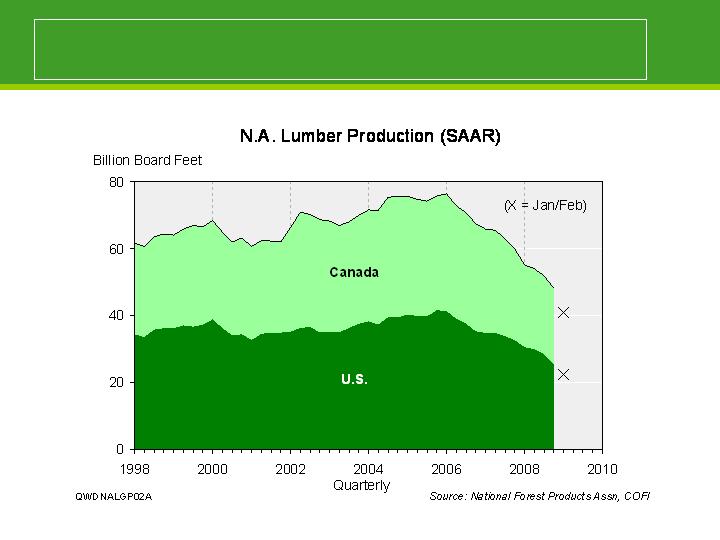
U.S. lumber production not sufficient to meet U.S. demand
Cost structure in Canada is primarily operating costs, not stumpage
Canadian exchange rate can significantly shift relative cost structure
between U.S. and Canadian mills
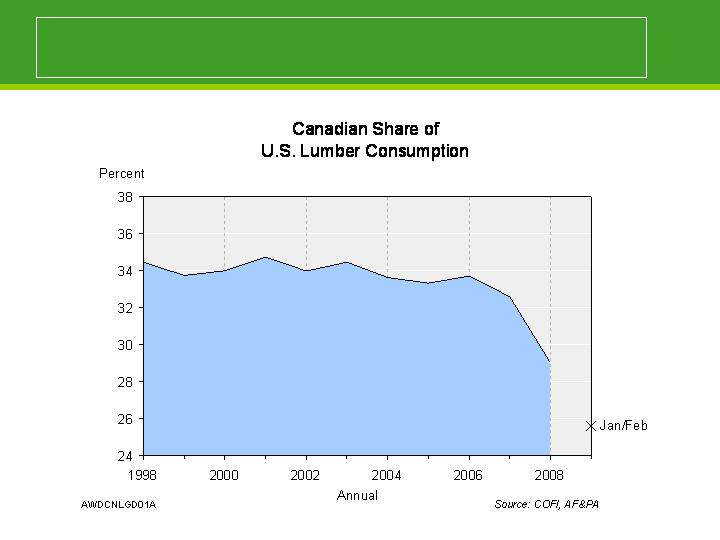
Canada accounts for over 25% of U.S. needs

Different cost structure in Canadian lumber industry
In Canada, labor and energy costs account for 75-85% of total lumber
costs
Much higher delivered log prices due to harvest and haul costs
Stumpage is formula driven
In U.S., labor and energy costs account for only 40-50% of labor cost
Stumpage prices reflect logistic advantage and species premiums

For average mill to breakeven, need $25/mbf price lift
Production Costs and Margins for an
Average B.C. Interior Mill
2007
Q
3
2008
April
2009
Cash Costs in C$**
253
2
27
201
Cash Costs in U.S.$**
236
2
18
165
SPF 2x4 Price*
245
256
167
Less Export Tax
33
22
Mill Net
222
145
Implied Margin for Avg. Mill
4
(20)
*
Random Lengths
**Based on RISI Survey
–
Average B.C. Mill

Expect C$ to hold or strengthen in 2009
Drop in housing revealed structural change
Reason Canadian output has collapsed
Shift has kept prices below cash operating costs

Summary - Wood Products
Another challenging year given housing starts and excess capacity
Prices need to reflect cash operating costs for average mills eventually
Log prices moved sharply lower in late 2008—will help U.S. sawmill cost
position in 2009
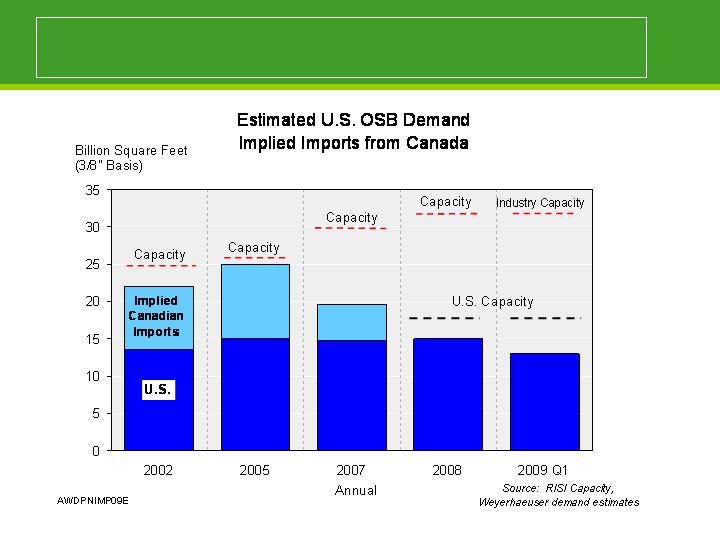
Very challenging for OSB and engineered lumber in 2009-10 given low
operating rates

Tom Gideon
Executive Vice President – Forest Products
Wood Products

Actions
Impact
Lumber
Announced closure of 4 mills
Announced shift reductions at 5 mills
Total capacity reduction of 1.2 bbf
OSB
All mills now operating at 5/2
Total capacity reduced by 2.7bsf
550 msf since Jan
Veneer
5 mills closed
Capacity Reduction
25% reduction in TJI’s
28% reduction in Microllam &
35% reduction in Veneer
Timberstrand
Permanently idled East Kentucky
Capacity reduced 39%
SGA
Headcount reduced by 200+
SG&A reduced by 13% to 15%
compared to last year
Aggressive actions this year

Cash cost of production in 2008
Raw
Materials*
Salaries /
Labor
Energy
Resins &
Additives
Other
Lumber
64%
19%
4%
0%
13%
OSB
31%
17%
8%
24%
21%
EWP - TJI
79%
10%
1%
4%
6%
* Raw materials are
Logs for lumber and OSB
LVL and OSB for TJI
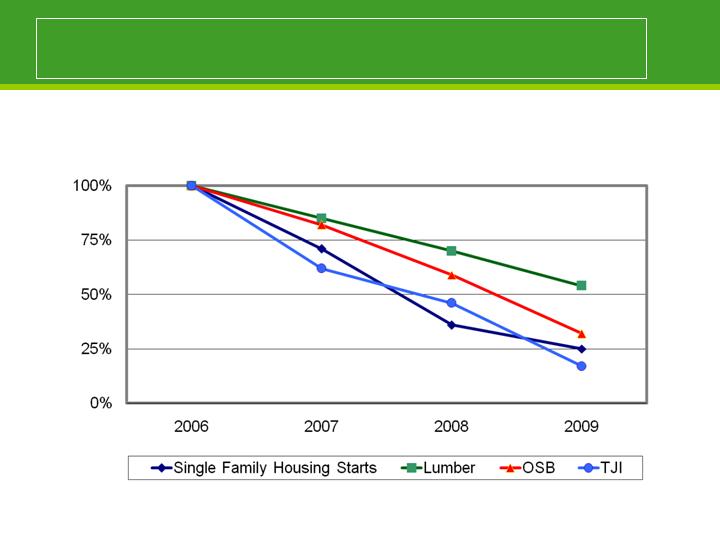
Production response to lower housing starts
Volume as a percentage of 2006 levels

Addressing the short-term, positioning for the long-term
Significant short-term challenges
Adjusting the controllable variables
Relentlessly reducing costs
Ensuring the best balance between demand and supply
Maintaining pricing discipline across all product lines

Lynn Michaelis
VP – Chief Economist
Economic Overview –
Timberlands

Key messages - Timberlands
Log prices in the West fell over 25% during the last two months
Log prices in the South are also adjusting, but not as severely
Timberland prices remain stable reflecting favorable long-term outlook
Log prices lag lumber prices

Western production now below early 1990’s
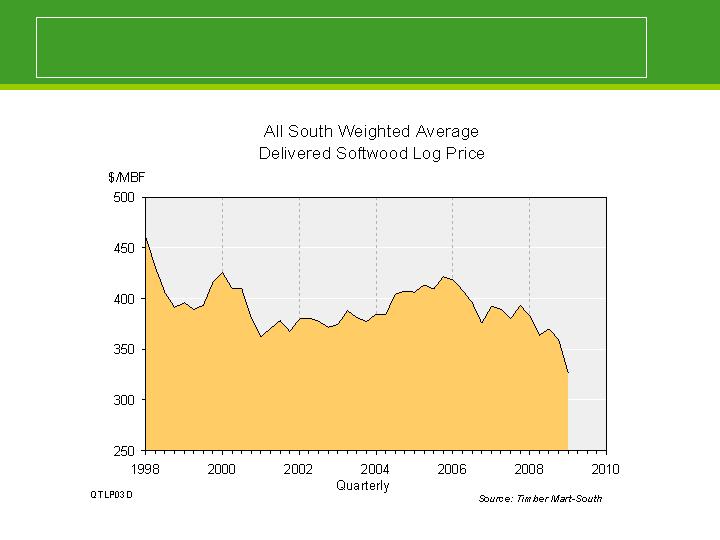
Southern log prices have held up better

Timberland prices reflect long-term outlook
Financial owners taking longer term view
Long-term trend appreciation based on:
Historic returns and expected rebound in housing starts
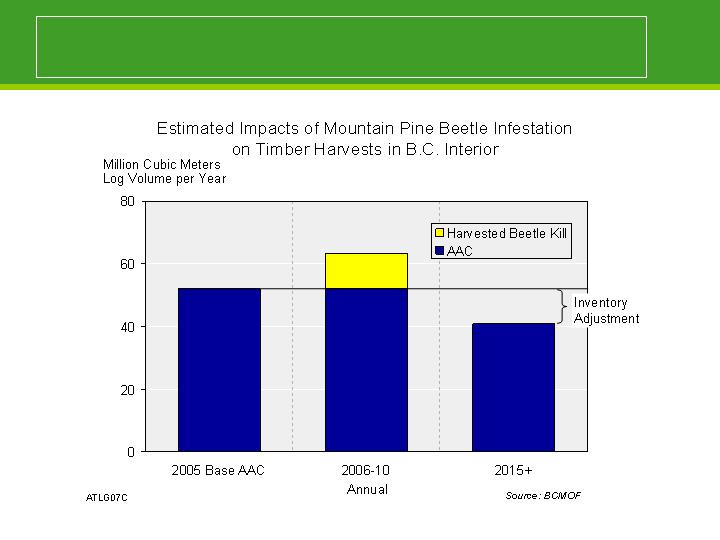
Decline in Canadian harvest due to Mountain pine beetle
Additional revenue from non-traditional sources
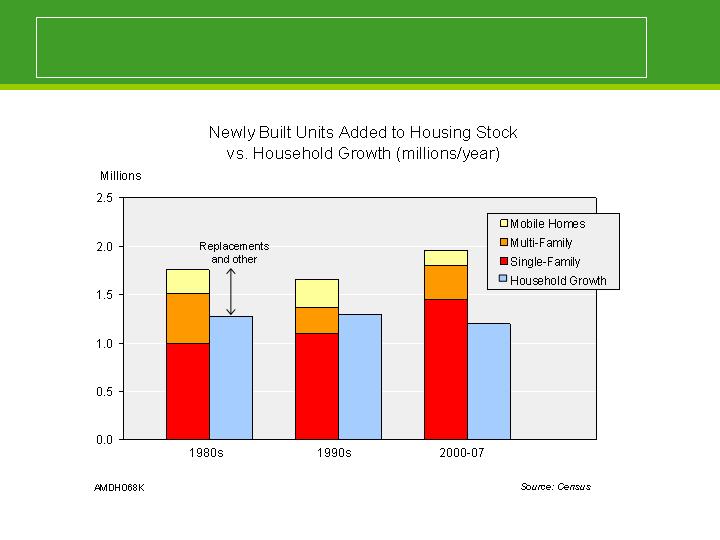
Housing demand driven by formation of households
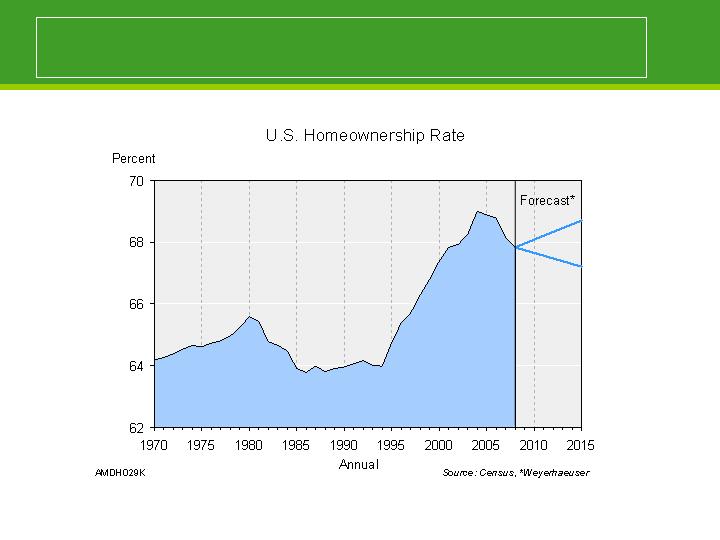
Share of single family determined by ownership trend
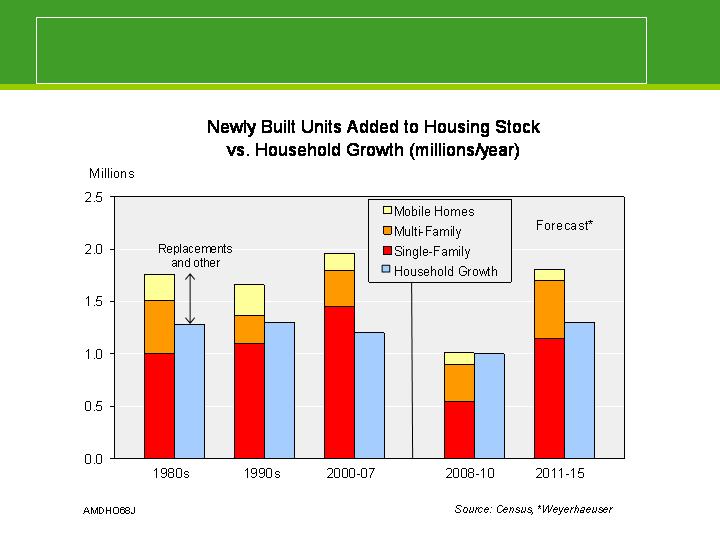
Expect favorable single-family housing starts even if
ownership trends lower
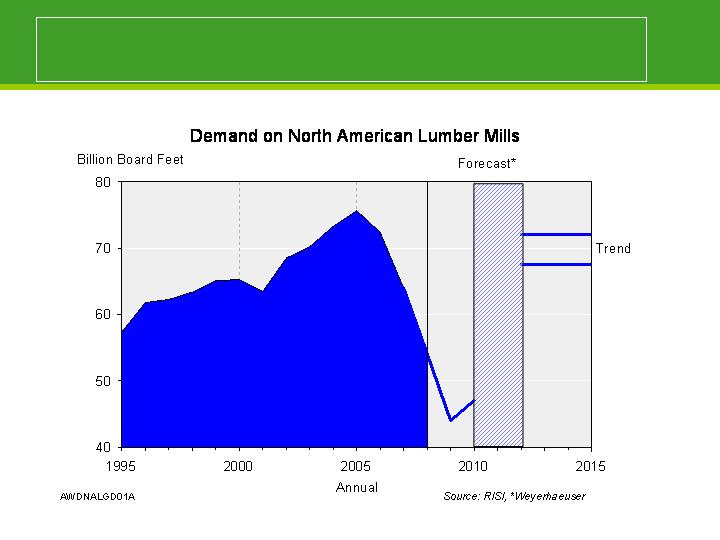
Given trend demand range for housing — lumber approaches 2005 peak
Reason lumber capacity expected to decline by 2015

Trend value for U.S. timber driven by Canadian costs
U.S. needs Canadian supply to meet lumber demand
Marginal supply has price setting role
U.S. producers bid improving lumber prices back to log prices

U.S. needs Canadian lumber through the cycle

Trend price logic: step one
Production Costs for Average B.C. Interior Mills
2008
201
1
-
1
5
*
In Canadian $
/MBF
Net Wood Cost
121
18
9
Manufacturing
9
9
110
Margin
27
34
__
__
___
___
__
___
Total
Long
-
Term
Cost
190
3
35
Duties
29
34
____
__
___
_
_
___
SPF 2x4
in C$
/MBF
219
3
69
Exchange Rate (C$/US$)
1.02
1.25
__
__
__
____
_
_
__
SPF 2x4
(US$
/MBF
)
215
2
95
*Extrapolation not a forecast
Source: RISI

Trend price logic: step two
Trend Price for West Coast
Lumber and Logs
201
1
-
1
5
*
SPF 2X4
(MBF)
$
295
-
$310
Plus
historic
spread
25
Implied DF 2X4
(MBF)
$
320
-
$335
Less mfg
95
Plus residuals
45
Less margin
24
Equals Wood Cost
$246
-
$261
Implied log price
(MBF Scribner)
$59
0
-
$625
*RISI mfg costs, Random Lengths
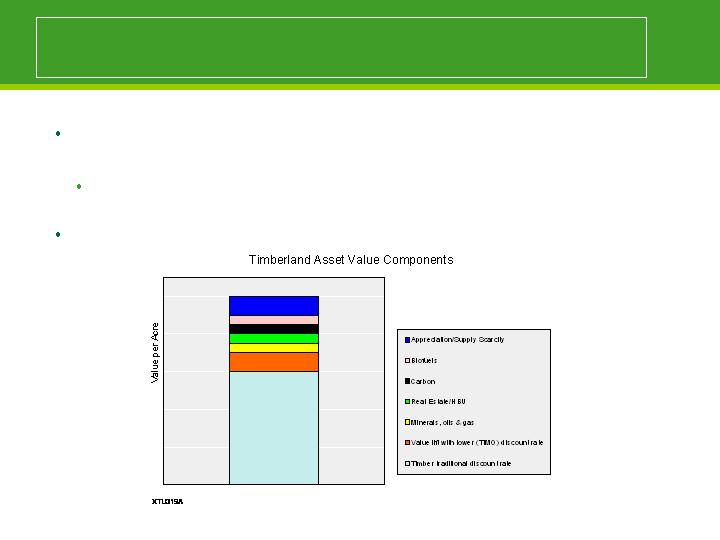
More to timberland valuation story
Finite resource capable of providing multiple values such as land
appreciation, timber production and appreciation, and non-timber income
Potential government actions could boost those values
Timberland are part of the asset mix of many diversified portfolios

Summary - Timberlands
Log prices fell into line with lumber prices
Timberland prices have been relatively stable

Tom Gideon
Executive Vice President – Forest Products
Timberlands

Global footprint
Thousands of Acres
Fee
Ownership
Long-term
Lease
Total Fee and
Lease
License
Arrangements
U.S. West
2,220
2,220
U.S. South
3,433
696
4,129
Canada
15,178
Uruguay
321
26
347
China
52
Total
5,974
722
6,696
15,230

Tree species
Loblolly pine in the South
Fast early growth, resulting in younger
harvest ages (compared to Douglas fir)
Responsive to management to influence
growth and reduce risk of insect loss
Douglas fir in the West
Manageable to increase yields
Taller / older at normal harvest ages compared to pine
Products generally command higher market values
Current market conditions are unprecedented
Loblolly Pine
Douglas Fir
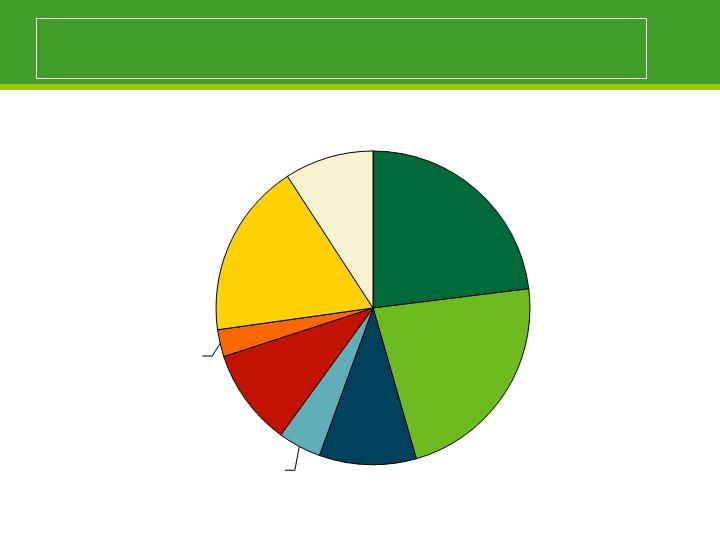
Cash costs of production for 2008
Logging
23%
Hauling &
Roads
23%
Export OSP
10%
Forestry
10%
Canadian
Operations
18%
Other
9%
Marketing/Handling
4%
International
Operations
3%

Cash costs of production in 2008
Logging
Hauling &
Roads
Marketing
& Handling
Forestry
Export
OSP
Other
U.S. West
30%
28%
8%
5%
19%
10%
U.S.
South
32%
33%
3%
20%
0%
12%
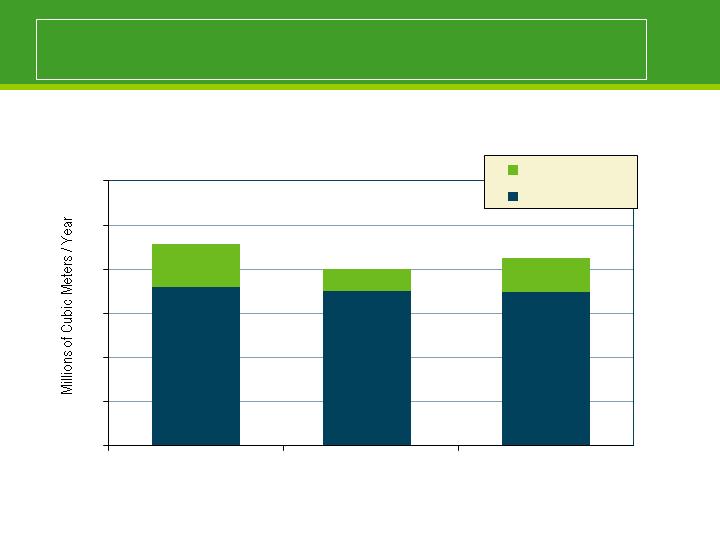
Sustainable harvest availability
Actual
Estimated Availability
U.S. Timberlands Harvest
0
5
10
15
20
25
30
2004-2008
2009-2013
2014-2018
Commercial Thin
Final Harvest
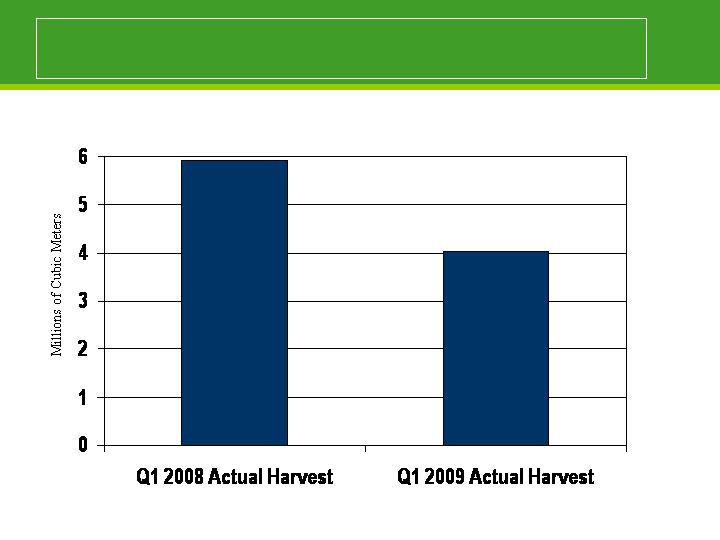
Deferring harvest in 2009

Minerals
Weyerhaeuser routinely reserves mineral rights when selling timberlands
acreage – in the U.S. as of year end 2008 our managed assets included
6.4 million surface acres
6.8 million net minerals acres
A leader in developing mineral, oil and gas revenue
Royalty payments on oil and gas production
Bonus income from oil and gas leasing and exploration activity
Royalty payments on hard minerals (rock, sand and gravel)
Geothermal lease and option revenues

Addressing the short-term, positioning for the long-term
Flexing harvest volumes to meet market needs
Capturing export market value
Continuing cost reductions
Consolidating export facilities and operating areas
Optimizing silviculture investments on a site by site basis
Continuing to develop all potential value streams
Minerals
Biomass / energy
Conservation easements
Carbon credits

Patty Bedient
Executive Vice President – Chief Financial Officer
Financial Overview

Liquidity and debt maturities
Over $1.7 billion cash and short-term investments
at March 31, 2009
Near-term debt maturities (including WRECO)
2009 $458 million
2010 43 million
2011 30 million
$2.2 billion in unused committed bank facilities
BBB- (stable) / Ba1 (stable)

Reducing cash expenditures
Variable cost reductions
$375 million SG&A target reached
Froze salaries
Eliminated 401-K match
More actions to come
Capital expenditures less than $200 million
Quarterly dividend $0.25/share

REIT update
Actions taken to increase flexibility to consider REIT conversion
Calendar year adopted
Legal reorganization
Wholly owned subsidiary of Weyerhaeuser Company holds
manufacturing and real estate assets

Conversion unlikely in 2009
Limitations on NOL carryback
Low level of timber income reduces 2009 benefit
Earnings and profit distribution

Other considerations
REIT technical tests
TRS market value less than 25% of gross REIT assets
Dividends from TRS limited to 25% of REIT qualifying income
Other income limited to 5%
Monitoring potential tax policy changes

Dan Fulton
President and Chief Executive Officer
Closing Remarks

Questions