Exhibit 99.1
| Deutsche Bank Leveraged Finance Conference September 24, 2008 Mark Spears Executive Vice President and CFO |
| 2 Forward-Looking Statements Certain statements in this presentation that are not historical are forward looking statements within the meaning of the Private Securities Litigation Reform Act of 1995. These forward looking statements generally include expectations, beliefs, hopes, intentions or strategies regarding our future. Forward looking statements are subject to risks, uncertainties and other factors some of which are not currently known to us. Actual events or results may differ materially from those expressed or implied in the forward looking statements as a result of various factors. Some of such risks, uncertainties and other factors are described in our Form 10-K for the period ending December 31, 2007, and are described in other periodic filings with the Securities Exchange Commission. We assume no obligation to publicly update any forward looking statement to reflect events or circumstances arising after the date on which it was made, except as required by law. |
| 3 $328 $425 $547 $789 $1,127 $976 $0 $300 $600 $900 2003 2004 2005 2006 2007 Q2 2008 YTD LKQ Company Overview Largest provider of alternative auto collision parts - Recycled OEM parts - Refurbished OE parts - Aftermarket parts Compelling value proposition as “one-stop” solution for recycled OEM parts, aftermarket replacement parts, and refinished wheels and bumper covers Results driven by both organic and acquisition growth, product expansion and increasing market share Strong Earnings Growth Consistent Revenue Growth ($ in millions) CAGR 36% $0.20 $0.23 $0.32 $0.40 $0.55 $0.44 $0.00 $0.25 $0.50 $0.75 $1.00 2003 2004 2005 2006 2007 Q2 2008 YTD CAGR 29 % |

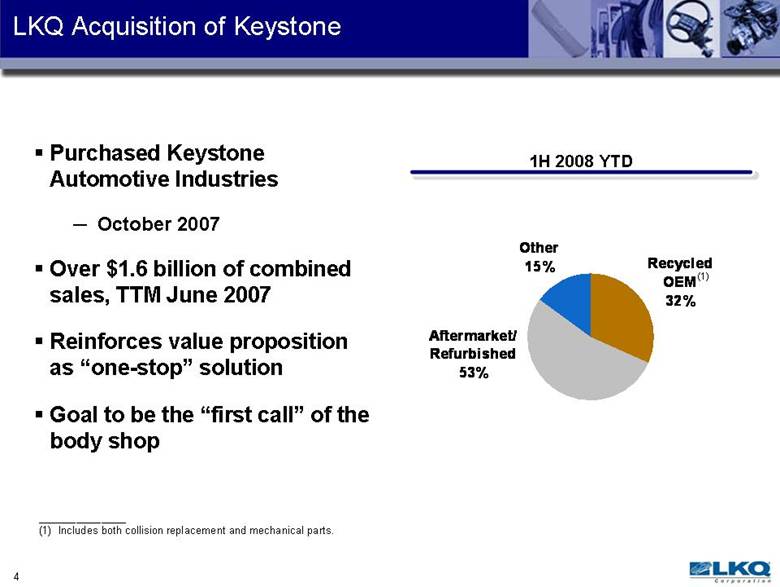
| 4 LKQ Acquisition of Keystone Purchased Keystone Automotive Industries - October 2007 Over $1.6 billion of combined sales, TTM June 2007 Reinforces value proposition as “one-stop” solution Goal to be the “first call” of the body shop 1H 2008 YTD Recycled OEM 32% Other 15% Aftermarket/ Refurbished 53% (1) _____________________ (1) Includes both collision replacement and mechanical parts. |
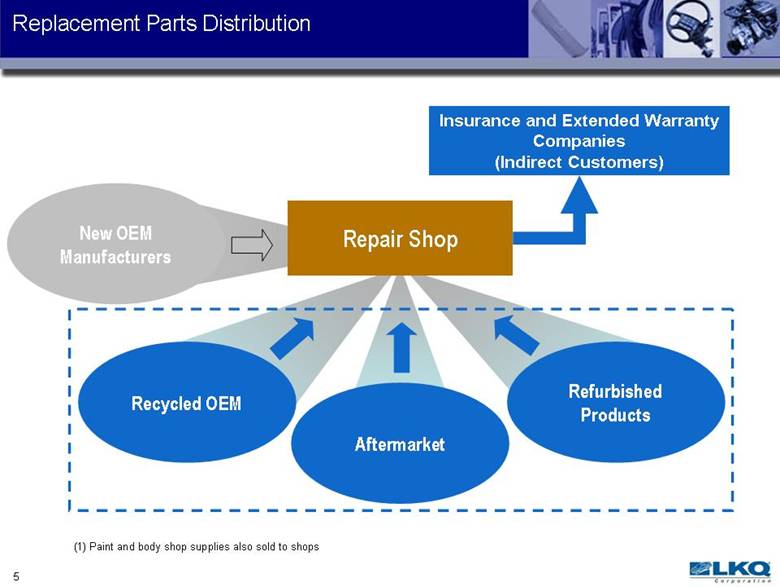
| 5 Repair Shop Replacement Parts Distribution New OEM Manufacturers Aftermarket Recycled OEM Refurbished Products Insurance and Extended Warranty Companies (Indirect Customers) (1) Paint and body shop supplies also sold to shops |
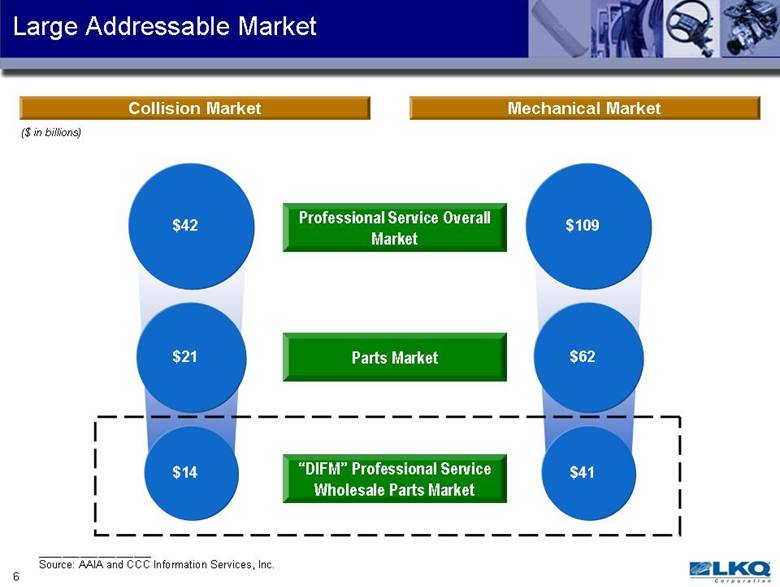
| 6 Large Addressable Market $109 $62 $41 $42 $21 $14 ($ in billions) Professional Service Overall Market Parts Market “DIFM” Professional Service Wholesale Parts Market Collision Market Mechanical Market ___________________ Source: AAIA and CCC Information Services, Inc. |
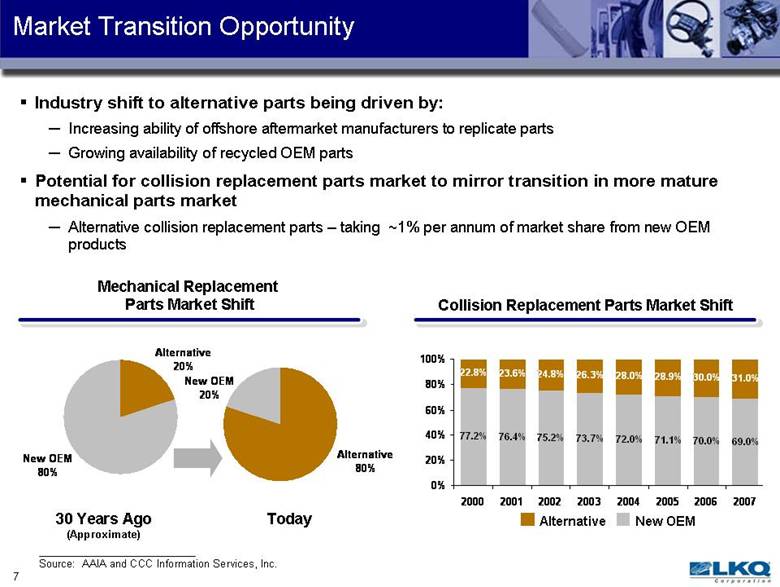
| 7 Industry shift to alternative parts being driven by: - Increasing ability of offshore aftermarket manufacturers to replicate parts - Growing availability of recycled OEM parts Potential for collision replacement parts market to mirror transition in more mature mechanical parts market - Alternative collision replacement parts – taking ~1% per annum of market share from new OEM products Market Transition Opportunity 77.2% 75.2% 73.7% 72.0% 71.1% 70.0% 69.0% 22.8% 23.6% 24.8% 26.3% 28.0% 28.9% 30.0% 31.0% 76.4% 0% 20% 40% 60% 80% 100% 2000 2001 2002 2003 2004 2005 2006 2007 Alternative New OEM Alternative 80% New OEM 20% New OEM 80% Alternative 20% 30 Years Ago (Approximate) Today Collision Replacement Parts Market Shift Mechanical Replacement Parts Market Shift Source: AAIA and CCC Information Services, Inc. |
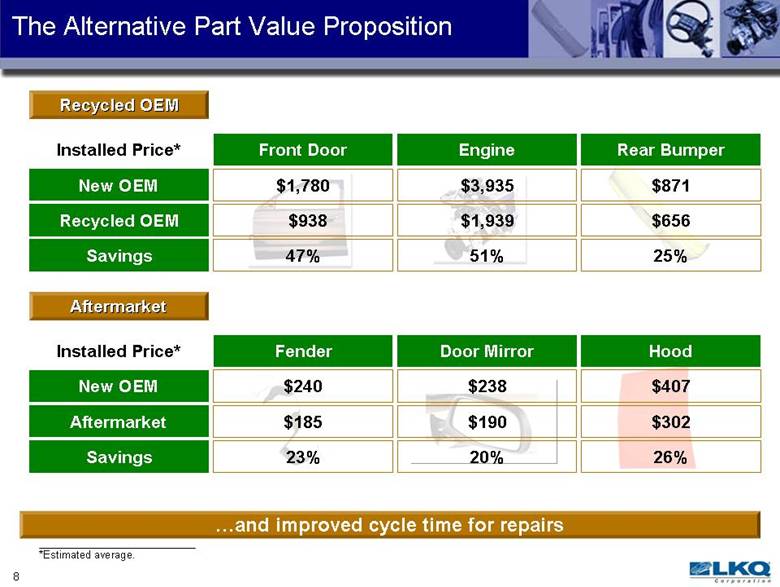
| 8 The Alternative Part Value Proposition Recycled OEM *Estimated average. ...and improved cycle time for repairs Aftermarket Installed Price* New OEM Recycled OEM Savings Front Door $1,780 $938 47% Engine $3,935 $1,939 51% Rear Bumper $871 $656 25% Installed Price* New OEM Aftermarket Savings Fender $240 $185 23% Door Mirror $238 $190 20% Hood $407 $302 26% |
| 9 Strong Investment Considerations Growing industry Alternative parts usually the lowest cost alternative Industry shifting toward non-OEM parts Favorable Industry Dynamics Market Leader #1 provider of OEM recycled parts, collision repair aftermarket parts & collision repair refurbished parts. Opportunities to Increase Market Share Ultimate consumer addressable market is $188 billion and highly fragmented Continue to consolidate and professionalize the alternative parts industry Strong Free Cash Flow Generation Continued organic and acquisition driven revenue growth EBITDA margin expansion through operating leverage and cost efficiencies Low capital expenditures and working capital needs Proven Business Model Quick delivery of broad range of products via unique distribution model and national footprint Disciplined procurement, inventory management and pricing Experienced Management Team Successfully completed over 60 acquisitions in last 10 years Field management with significant industry experience |

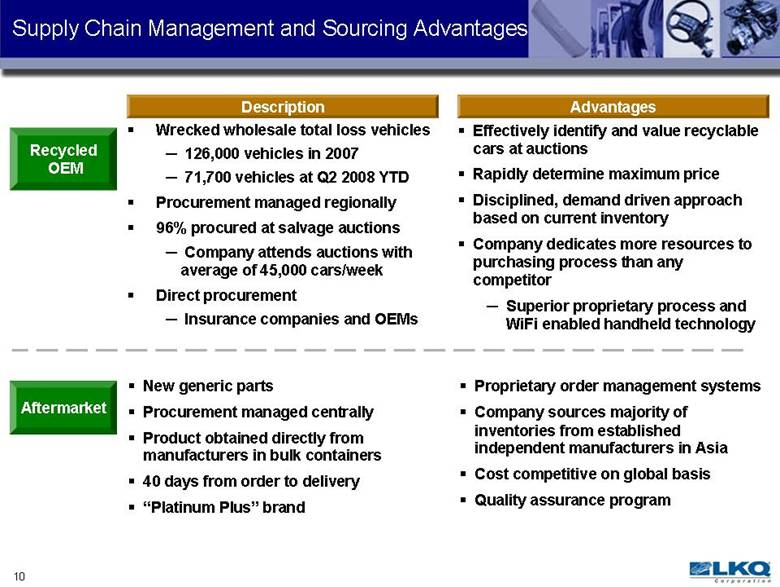
| 10 Supply Chain Management and Sourcing Advantages Effectively identify and value recyclable cars at auctions Rapidly determine maximum price Disciplined, demand driven approach based on current inventory Company dedicates more resources to purchasing process than any competitor - Superior proprietary process and WiFi enabled handheld technology Description Wrecked wholesale total loss vehicles - 126,000 vehicles in 2007 - 71,700 vehicles at Q2 2008 YTD Procurement managed regionally 96% procured at salvage auctions - Company attends auctions with average of 45,000 cars/week Direct procurement - Insurance companies and OEMs Recycled OEM Aftermarket Advantages Proprietary order management systems Company sources majority of inventories from established independent manufacturers in Asia Cost competitive on global basis Quality assurance program New generic parts Procurement managed centrally Product obtained directly from manufacturers in bulk containers 40 days from order to delivery “Platinum Plus” brand |
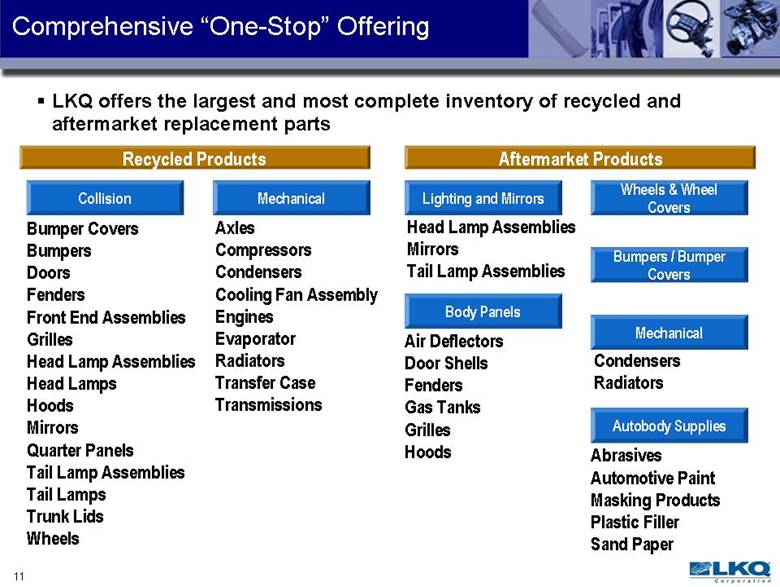
| 11 Comprehensive “One-Stop” Offering LKQ offers the largest and most complete inventory of recycled and aftermarket replacement parts Recycled Products Bumper Covers Bumpers Doors Fenders Front End Assemblies Grilles Head Lamp Assemblies Head Lamps Hoods Mirrors Quarter Panels Tail Lamp Assemblies Tail Lamps Trunk Lids Wheels Aftermarket Products Collision Condensers Mechanical Head Lamp Assemblies Mirrors Tail Lamp Assemblies Lighting and Mirrors Axles Compressors Condensers Cooling Fan Assembly Engines Evaporator Transfer Case Transmissions Body Panels Air Deflectors Door Shells Fenders Gas Tanks Grilles Hoods Mechanical Abrasives Automotive Paint Masking Products Plastic Filler Sand Paper Autobody Supplies Wheels & Wheel Covers Bumpers / Bumper Covers |
| 12 Significant Distribution Network National network of close to 300 distribution points Distribution network results in recycled OEM product fulfillment rates of 65% - above industry average of 40-50% - leveraging distribution infrastructure Next day delivery routes in most markets Advanced technology systems provide access to extensive inventory across network Combined Aftermarket Recycled OEM Regional Warehouses Branch Location Bumper Remanufacturing Wheel Remanufacturing |

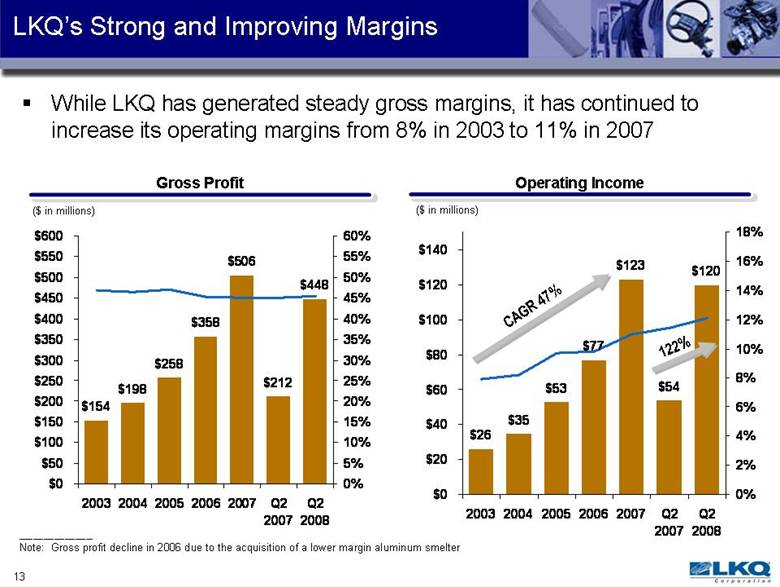
| 13 While LKQ has generated steady gross margins, it has continued to increase its operating margins from 8% in 2003 to 11% in 2007 $154 $198 $258 $358 $506 $212 $448 $0 $50 $100 $150 $200 $250 $300 $350 $400 $450 $500 $550 $600 2003 2004 2005 2006 2007 Q2 2007 Q2 2008 0% 5% 10% 15% 20% 25% 30% 35% 40% 45% 50% 55% 60% Gross Profit ($ in millions) Operating Income ($ in millions) LKQ’s Strong and Improving Margins $26 $35 $53 $77 $123 $54 $120 $0 $20 $40 $60 $80 $100 $120 $140 2003 2004 2005 2006 2007 Q2 2007 Q2 2008 0% 2% 4% 6% 8% 10% 12% 14% 16% 18% _____________________ Note: Gross profit decline in 2006 due to the acquisition of a lower margin aluminum smelter CAGR 47% 122% |
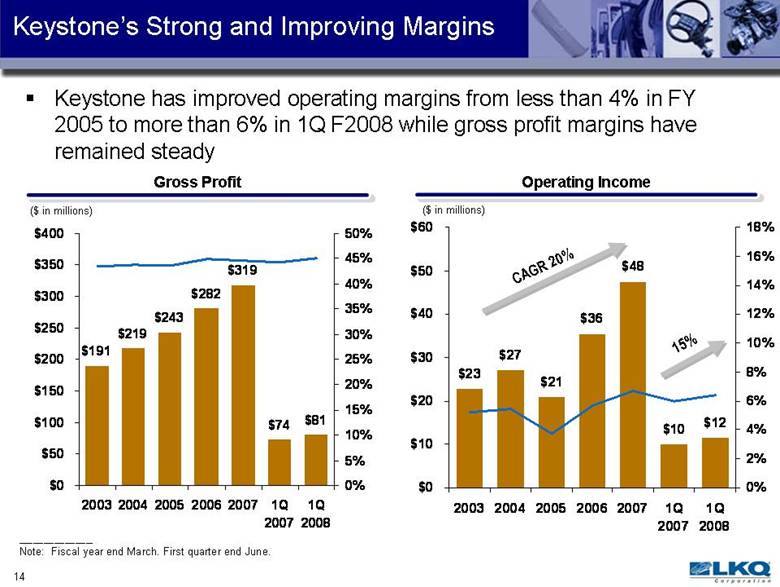
| 14 Keystone’s Strong and Improving Margins Keystone has improved operating margins from less than 4% in FY 2005 to more than 6% in 1Q F2008 while gross profit margins have remained steady $191 $219 $243 $282 $319 $74 $81 $0 $50 $100 $150 $200 $250 $300 $350 $400 2003 2004 2005 2006 2007 1Q 2007 1Q 2008 0% 5% 10% 15% 20% 25% 30% 35% 40% 45% 50% $23 $27 $21 $36 $48 $10 $12 $0 $10 $20 $30 $40 $50 $60 2003 2004 2005 2006 2007 1Q 2007 1Q 2008 0% 2% 4% 6% 8% 10% 12% 14% 16% 18% CAGR 20% 15% Gross Profit ($ in millions) Operating Income ($ in millions) _____________________ Note: Fiscal year end March. First quarter end June. |
| 15 Favorable 2008 Outlook Note: As of July 31, 2008. 2007 2008 Guidance Year-Over-Year Change Net Income $65.9M $120 -- $124M 82% -- 88% Diluted EPS $0.55 $0.85 -- $0.88 55% -- 60% Cashflow provided by Operations $54.4M Greater than $100M More than 85% Capital Expenditures $37.8M $68M -- $78M 80% -- 100+% Guidance excludes restructuring expenses of $4.3 million incurred through June 30, 2008 and any future restructuring expenses. |

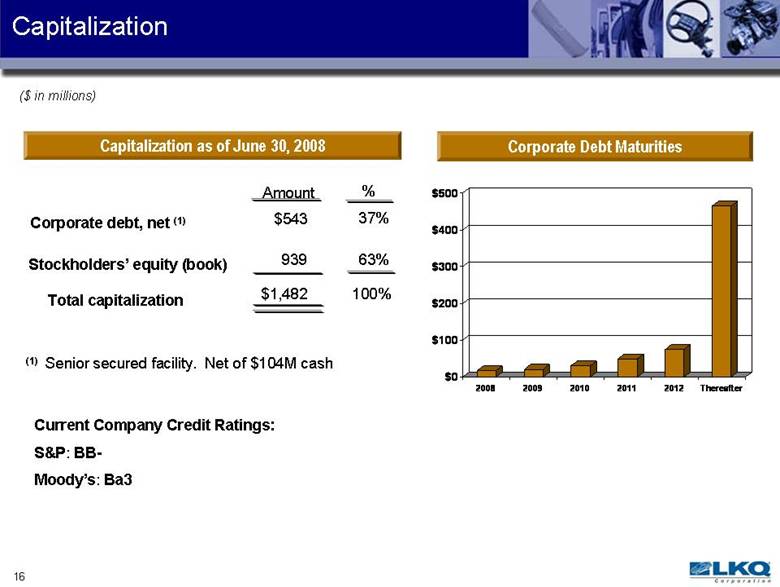
| 16 Capitalization ($ in millions) Current Company Credit Ratings: S&P: BB Moody’s: Ba3 Capitalization as of June 30, 2008 Amount % Corporate debt, net (1) $543 37% Stockholders’ equity (book) 939 Total capitalization 63% $1,482 100% Corporate Debt Maturities $0 $100 $200 $300 $400 $500 2008 2009 2010 2011 2012 Thereafter (1) Senior secured facility. Net of $104M cash |
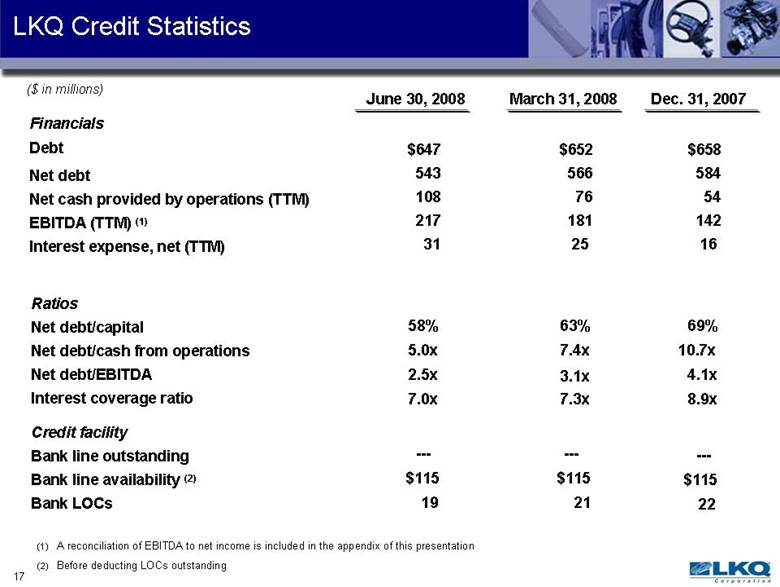
| 17 LKQ Credit Statistics Financials Debt Net debt Net cash provided by operations (TTM) EBITDA (TTM) (1) Interest expense, net (TTM) Ratios Net debt/capital Net debt/cash from operations Net debt/EBITDA Interest coverage ratio Credit facility Bank line outstanding Bank line availability (2) Bank LOCs June 30, 2008 March 31, 2008 Dec. 31, 2007 $647 543 108 217 31 $652 566 76 181 25 $658 584 54 142 16 58% 5.0x 7.0x 2.5x 69% 10.7x 8.9x 4.1x 63% 7.4x 7.3x 3.1x $115 --- 19 $115 --- 21 $115 --- 22 (1) A reconciliation of EBITDA to net income is included in the appendix of this presentation (2) Before deducting LOCs outstanding ($ in millions) |
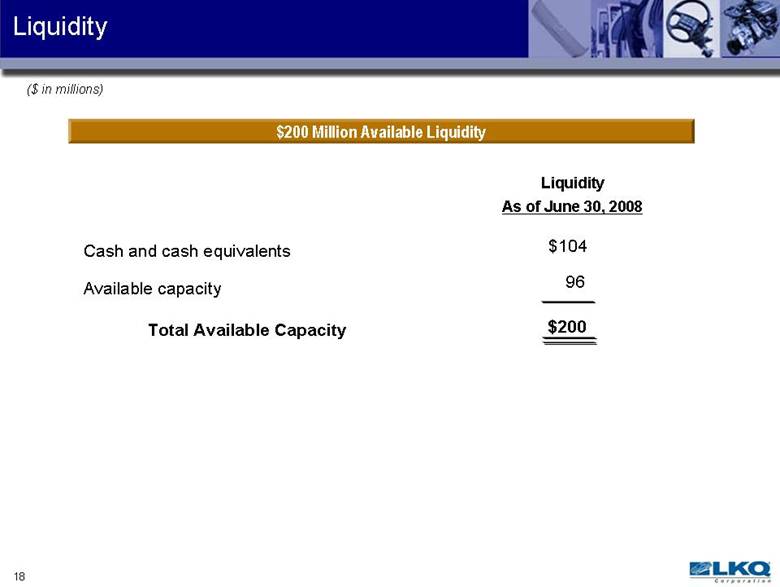
| 18 Liquidity Cash and cash equivalents ($ in millions) $200 Million Available Liquidity Liquidity As of June 30, 2008 Available capacity Total Available Capacity $104 96 $200 |
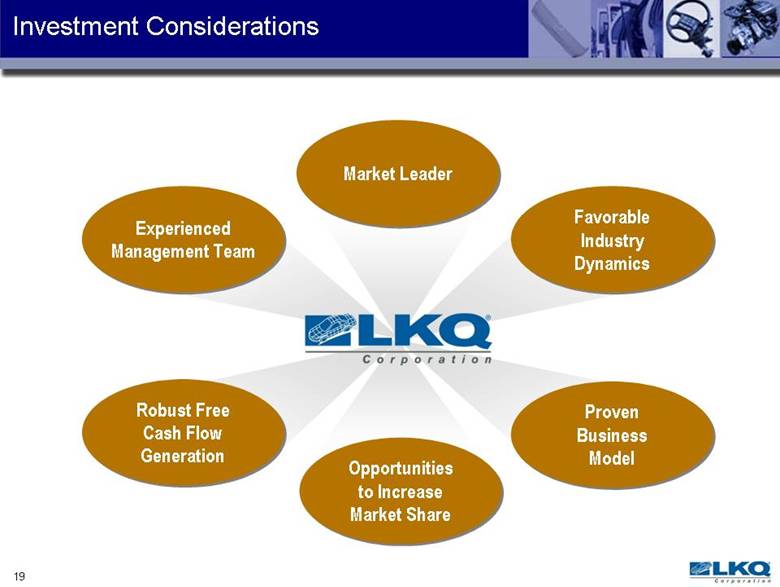
| 19 Investment Considerations Experienced Management Team Robust Free Cash Flow Generation Opportunities to Increase Market Share Proven Business Model Favorable Industry Dynamics Market Leader |
| 20 Appendix |
| 21 EBITDA Reconciliation 30-Jun-08 (TTM) 31-Mar-08 (TTM) 31-Dec-07 (TTM) Net income 98 81 66 Depreciation and amortization 27 22 18 Interest expense, net 31 25 16 Provision for income taxes 61 53 42 Earnings before interest, taxes, depreciation and amortization ** 217 181 142 * Keystone was acquired on Oct. 12, 2007. **We define EBITDA as Earnings before interest, taxes, depreciation and amortization. We have typically provided a reconciliation of Net Income to EBITDA as we believe it provides investors, security analysts and other interested parties useful information regarding our results of operations because it assists in analyzing our performance and the value of our business. EBITDA provides insight into our profitability trends, and allows management and investors to analyze our operating results with and without the impact of depreciation, amortization, interest and income tax expense. We believe EBITDA is used by security analysts, investors, and other interested parties in evaluating companies, many of which present EBITDA when reporting their results. ($ in millions) |

| [LOGO] |