UNITED STATES
SECURITIES AND EXCHANGE COMMISSION
Washington, D.C. 20549
FORM N-CSR
CERTIFIED SHAREHOLDER REPORT OF
REGISTERED MANAGEMENT INVESTMENT COMPANIES
Investment Company Act file number 811-8879
MFS VARIABLE INSURANCE TRUST III
(Exact name of registrant as specified in charter)
111 Huntington Avenue, Boston, Massachusetts 02199
(Address of principal executive offices) (Zip code)
Christopher R. Bohane
Massachusetts Financial Services Company
111 Huntington Avenue
Boston, Massachusetts 02199
(Name and address of agents for service)
Registrant’s telephone number, including area code: (617) 954-5000
Date of fiscal year end: December 31
Date of reporting period: June 30, 2021
| ITEM 1. | REPORTS TO STOCKHOLDERS. |
Semiannual Report
June 30, 2021
MFS® Blended Research®
Small Cap Equity Portfolio
MFS® Variable Insurance Trust III
MFS® Blended Research® Small Cap Equity Portfolio
The report is prepared for the general information of contract owners. It is authorized for distribution to prospective investors only when preceded or accompanied by a current prospectus.
NOT FDIC INSURED • MAY LOSE VALUE • NO BANK OR CREDIT UNION GUARANTEE •
NOT A DEPOSIT • NOT INSURED BY ANY FEDERAL GOVERNMENT AGENCY OR NCUA/NCUSIF
MFS Blended Research Small Cap Equity Portfolio
Dear Contract Owners:
After experiencing dramatic swings in the early days of the coronavirus pandemic, global equity markets have performed strongly over the past year. Though the speedy development of vaccines brightened the economic and market outlook, uncertainty remains as new variants of the virus appear, and questions persist over how fast vaccines can be made widely available in the developing world.
Global central banks have taken aggressive steps to cushion the economic and market fallout related to the virus, and governments are deploying unprecedented levels of fiscal support. Having passed a $1.9 trillion stimulus package in March, the U.S. Congress could approve additional stimulus later this year, some of it focused on infrastructure. Along with extraordinary government expenditures, pent-up consumer demand fueled a surge in economic activity as coronavirus restrictions were eased, pushing up inflation, at least temporarily. Markets initially reacted by pushing up yields on global government bonds, though some of the rate rise has since been corrected.
A spirited debate is underway among investors over whether the current price pressures will persist or prove to be temporary, caused by pandemic-induced bottlenecks. The policy measures put in place to counteract the pandemic's effects have helped build a supportive environment and are encouraging economic recovery; however, if markets disconnect from fundamentals, they can sow the seeds of instability. As such, recent dramatic increases in speculative trading in cryptocurrencies, special purpose acquisition companies (SPACs), and the like bear watching.
In the aftermath of the crisis, we could see societal changes as households, businesses, and governments adjust to a new reality, and any such alterations could affect the investment landscape. For investors, events such as the COVID-19 outbreak demonstrate the importance of having a deep understanding of company fundamentals, and we have built our global research platform to do just that.
At MFS®, we put our clients’ assets to work responsibly by carefully navigating the increasing complexity of global markets and economies. Guided by our long-term philosophy and adhering to our commitment to sustainable investing, we tune out the noise and aim to uncover what we believe are the best, most durable investment opportunities in the market. Our unique global investment platform combines collective expertise, long-term discipline, and thoughtful risk management to create sustainable value for investors.
Respectfully,
Michael W. Roberge
Chief Executive Officer
MFS Investment Management
August 13, 2021
The opinions expressed in this letter are subject to change and may not be relied upon for investment advice. No forecasts can be guaranteed.
MFS Blended Research Small Cap Equity Portfolio
Top ten holdings
| Box, Inc., “A” | 1.6% |
| Prestige Consumer Healthcare, Inc. | 1.5% |
| Evercore Partners, Inc. | 1.5% |
| CNO Financial Group, Inc. | 1.4% |
| Texas Roadhouse, Inc. | 1.4% |
| National Storage Affiliates Trust, REIT | 1.4% |
| Element Solutions, Inc. | 1.4% |
| UMB Financial Corp. | 1.3% |
| Brunswick Corp. | 1.3% |
| Magnolia Oil & Gas Corp., “A” | 1.3% |
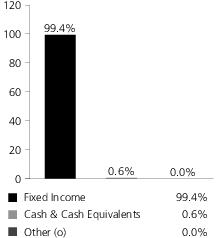
GICS equity sectors (g)
| Health Care | 20.8% |
| Information Technology | 14.7% |
| Financials | 14.0% |
| Consumer Discretionary | 13.6% |
| Industrials | 13.0% |
| Real Estate | 7.6% |
| Materials | 5.0% |
| Energy | 4.3% |
| Consumer Staples | 2.7% |
| Communication Services | 2.6% |
| Utilities | 1.5% |
| (g) | The Global Industry Classification Standard (GICS®) was developed by and/or is the exclusive property of MSCI, Inc. and S&P Global Market Intelligence Inc. (“S&P Global Market Intelligence”). GICS is a service mark of MSCI and S&P Global Market Intelligence and has been licensed for use by MFS. MFS has applied its own internal sector/industry classification methodology for equity securities and non-equity securities that are unclassified by GICS. |
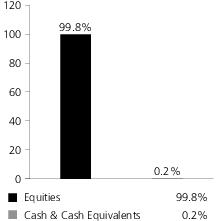
Cash & Cash Equivalents includes any cash, investments in money market funds, short-term securities, and other assets less liabilities. Please see the Statement of Assets and Liabilities for additional information related to the fund’s cash position and other assets and liabilities.
Percentages are based on net assets as of June 30, 2021.
The portfolio is actively managed and current holdings may be different.
MFS Blended Research Small Cap Equity Portfolio
Expense Table
Fund Expenses Borne by the Contract Holders during the Period,
January 1, 2021 through June 30, 2021
As a contract holder of the fund, you incur ongoing costs, including management fees; distribution and/or service (12b-1) fees; and other fund expenses. This example is intended to help you understand your ongoing costs (in dollars) of investing in the fund and to compare these costs with the ongoing costs of investing in other mutual funds.
The example is based on an investment of $1,000 invested at the beginning of the period and held for the entire period January 1, 2021 through June 30, 2021.
Actual Expenses
The first line for each share class in the following table provides information about actual account values and actual expenses. You may use the information in this line, together with the amount you invested, to estimate the expenses that you paid over the period. Simply divide your account value by $1,000 (for example, an $8,600 account value divided by $1,000 = 8.6), then multiply the result by the number in the first line under the heading entitled “Expenses Paid During Period” to estimate the expenses you paid on your account during this period.
Hypothetical Example for Comparison Purposes
The second line for each share class in the following table provides information about hypothetical account values and hypothetical expenses based on the fund’s actual expense ratio and an assumed rate of return of 5% per year before expenses, which is not the fund’s actual return. The hypothetical account values and expenses may not be used to estimate the actual ending account balance or expenses you paid for the period. You may use this information to compare the ongoing costs of investing in the fund and other funds. To do so, compare this 5% hypothetical example with the 5% hypothetical examples that appear in the shareholder reports of the other funds.
Please note that the expenses shown in the table are meant to highlight the fund's ongoing costs only and do not take into account the fees and expenses imposed under the variable contracts through which your investment in the fund is made. Therefore, the second line for each share class in the table is useful in comparing ongoing costs associated with an investment in vehicles (such as the fund) which fund benefits under variable annuity and variable life insurance contracts and to qualified pension and retirement plans only, and will not help you determine the relative total costs of investing in the fund through variable annuity and variable life insurance contracts. If the fees and expenses imposed under the variable contracts were included, your costs would have been higher.
Share
Class | | Annualized
Expense
Ratio | Beginning
Account Value
1/01/21 | Ending
Account Value
6/30/21 | Expenses
Paid During
Period (p)
1/01/21-6/30/21 |
| Initial Class | Actual | 0.52% | $1,000.00 | $1,231.90 | $2.88 |
| Hypothetical (h) | 0.52% | $1,000.00 | $1,022.22 | $2.61 |
| Service Class | Actual | 0.77% | $1,000.00 | $1,229.52 | $4.26 |
| Hypothetical (h) | 0.77% | $1,000.00 | $1,020.98 | $3.86 |
| (h) | 5% class return per year before expenses. |
| (p) | “Expenses Paid During Period” are equal to each class's annualized expense ratio, as shown above, multiplied by the average account value over the period, multiplied by 181/365 (to reflect the one-half year period). |
MFS Blended Research Small Cap Equity Portfolio
Portfolio of Investments − 6/30/21 (unaudited)
The Portfolio of Investments is a complete list of all securities owned by your fund. It is categorized by broad-based asset classes.
| Issuer | | | Shares/Par | Value ($) |
| Common Stocks – 99.8% |
| Aerospace & Defense – 0.7% | |
| CACI International, Inc., “A” (a) | | 2,666 | $ 680,150 |
| Apparel Manufacturers – 1.5% | |
| FIGS, Inc. (a) | | 4,505 | $ 225,700 |
| Skechers USA, Inc., “A” (a) | | 26,767 | 1,333,800 |
| | | | | $1,559,500 |
| Automotive – 0.5% | |
| REV Group, Inc. | | 20,927 | $ 328,345 |
| Stoneridge, Inc. (a) | | 1,424 | 42,008 |
| XPEL, Inc. (a) | | 1,439 | 120,689 |
| | | | | $491,042 |
| Biotechnology – 7.5% | |
| Adaptive Biotechnologies Corp. (a) | | 9,936 | $ 405,985 |
| Agios Pharmaceuticals, Inc. (a) | | 1,385 | 76,327 |
| Alkermes PLC (a) | | 15,434 | 378,442 |
| AnaptysBio, Inc. (a) | | 21,350 | 553,605 |
| Avid Bioservices, Inc. (a) | | 5,934 | 152,207 |
| Clovis Oncology, Inc. (a) | | 28,406 | 164,755 |
| Coherus BioSciences, Inc. (a) | | 24,365 | 336,968 |
| CymaBay Therapeutics, Inc. (a) | | 52,598 | 229,327 |
| CytomX Therapeutics, Inc. (a) | | 64,787 | 410,102 |
| Eiger BioPharmaceuticals, Inc. (a) | | 6,947 | 59,188 |
| Exelixis, Inc. (a) | | 4,154 | 75,686 |
| ImmunoGen, Inc. (a) | | 19,407 | 127,892 |
| Lexicon Pharmaceuticals, Inc. (a) | | 33,448 | 153,526 |
| Macrogenics, Inc. (a) | | 17,632 | 473,596 |
| Meridian Bioscience, Inc. (a) | | 27,574 | 611,591 |
| Novavax, Inc. (a) | | 2,047 | 434,599 |
| Organogenesis Holdings, Inc. (a) | | 29,548 | 491,088 |
| Prothena Corp. PLC (a) | | 9,479 | 487,315 |
| Radius Health, Inc. (a) | | 10,895 | 198,725 |
| Sorrento Therapeutics, Inc. (a) | | 5,909 | 57,258 |
| Translate Bio, Inc. (a) | | 15,475 | 426,182 |
| Travere Therapeutics, Inc. (a) | | 21,826 | 318,441 |
| Vanda Pharmaceuticals, Inc. (a) | | 33,931 | 729,856 |
| Varex Imaging Corp. (a) | | 14,005 | 375,614 |
| | | | | $7,728,275 |
| Brokerage & Asset Managers – 1.5% | |
| Evercore Partners, Inc. | | 10,634 | $ 1,496,948 |
| Business Services – 2.7% | |
| Forrester Research, Inc. (a) | | 17,889 | $ 819,316 |
| MoneyGram International, Inc. (a) | | 48,043 | 484,273 |
| RE/MAX Holdings, Inc., “A” | | 23,377 | 779,155 |
| Rush Enterprises, Inc., “A” | | 9,123 | 394,479 |
| TaskUs, Inc., “A” (a) | | 10,170 | 348,221 |
| | | | | $2,825,444 |
| Chemicals – 1.8% | |
| Element Solutions, Inc. | | 59,430 | $ 1,389,473 |
| Rayonier Advanced Materials, Inc. (a) | | 72,506 | 485,065 |
| | | | | $1,874,538 |
| Issuer | | | Shares/Par | Value ($) |
| Common Stocks – continued |
| Computer Software – 4.6% | |
| ACI Worldwide, Inc. (a) | | 12,671 | $ 470,601 |
| Altair Engineering, Inc., “A” (a) | | 2,132 | 147,044 |
| Cornerstone OnDemand, Inc. (a) | | 12,253 | 632,010 |
| Digital Turbine, Inc. (a) | | 10,145 | 771,324 |
| Pagerduty, Inc. (a) | | 20,461 | 871,229 |
| Paylocity Holding Corp. (a) | | 4,697 | 896,188 |
| Ribbon Communications, Inc. (a) | | 10,237 | 77,904 |
| Sprout Social, Inc. (a) | | 4,575 | 409,097 |
| Tenable Holdings, Inc. (a) | | 10,150 | 419,702 |
| | | | | $4,695,099 |
| Computer Software - Systems – 3.2% | |
| Box, Inc., “A” (a) | | 65,318 | $ 1,668,875 |
| Extreme Networks, Inc. (a) | | 8,781 | 97,996 |
| Five9, Inc. (a) | | 6,260 | 1,148,021 |
| Rimini Street, Inc. (a) | | 6,460 | 39,794 |
| Verint Systems, Inc. (a) | | 7,635 | 344,109 |
| | | | | $3,298,795 |
| Construction – 2.6% | |
| Builders FirstSource, Inc. (a) | | 23,746 | $ 1,013,004 |
| Century Communities, Inc. | | 3,718 | 247,396 |
| Eagle Materials, Inc. | | 7,109 | 1,010,260 |
| GMS, Inc. (a) | | 8,408 | 404,761 |
| | | | | $2,675,421 |
| Consumer Products – 2.9% | |
| Energizer Holdings, Inc. | | 20,685 | $ 889,041 |
| Nu Skin Enterprises, Inc., “A” | | 5,923 | 335,538 |
| Prestige Consumer Healthcare, Inc. (a) | | 30,438 | 1,585,820 |
| Tupperware Brands Corp. (a) | | 7,629 | 181,189 |
| | | | | $2,991,588 |
| Consumer Services – 1.3% | |
| Grand Canyon Education, Inc. (a) | | 11,143 | $ 1,002,536 |
| Medifast, Inc. | | 1,131 | 320,050 |
| | | | | $1,322,586 |
| Electrical Equipment – 1.8% | |
| Advanced Drainage Systems, Inc. | | 6,690 | $ 779,853 |
| TriMas Corp. (a) | | 36,124 | 1,095,641 |
| | | | | $1,875,494 |
| Electronics – 5.5% | |
| Advanced Energy Industries, Inc. | | 11,811 | $ 1,331,218 |
| Alpha and Omega Semiconductor Ltd. (a) | | 7,800 | 237,042 |
| Amkor Technology, Inc. | | 40,701 | 963,393 |
| Jabil Circuit, Inc. | | 10,336 | 600,728 |
| Plexus Corp. (a) | | 11,270 | 1,030,191 |
| Sanmina Corp. (a) | | 11,592 | 451,624 |
| Silicon Laboratories, Inc. (a) | | 6,633 | 1,016,507 |
| | | | | $5,630,703 |
MFS Blended Research Small Cap Equity Portfolio
Portfolio of Investments (unaudited) – continued
| Issuer | | | Shares/Par | Value ($) |
| Common Stocks – continued |
| Energy - Independent – 1.7% | |
| Antero Resources Corp. (a) | | 13,534 | $ 203,416 |
| CONSOL Energy, Inc. (a) | | 13,035 | 240,757 |
| Magnolia Oil & Gas Corp., “A” (a) | | 85,607 | 1,338,037 |
| | | | | $1,782,210 |
| Engineering - Construction – 2.5% | |
| APi Group, Inc. (a) | | 52,523 | $ 1,097,205 |
| Comfort Systems USA, Inc. | | 7,266 | 572,488 |
| Quanta Services, Inc. | | 10,049 | 910,138 |
| | | | | $2,579,831 |
| Food & Beverages – 1.2% | |
| Hostess Brands, Inc. (a) | | 74,824 | $ 1,211,401 |
| Forest & Paper Products – 0.4% | |
| Verso Corp., “A” | | 23,817 | $ 421,561 |
| Gaming & Lodging – 2.1% | |
| Everi Holdings, Inc. (a) | | 27,232 | $ 679,166 |
| Penn National Gaming, Inc. (a) | | 6,610 | 505,599 |
| Wyndham Hotels & Resorts, Inc. | | 13,906 | 1,005,265 |
| | | | | $2,190,030 |
| Insurance – 2.5% | |
| CNO Financial Group, Inc. | | 62,453 | $ 1,475,140 |
| Reinsurance Group of America, Inc. | | 9,309 | 1,061,226 |
| | | | | $2,536,366 |
| Internet – 2.1% | |
| Brightcove, Inc. (a) | | 7,486 | $ 107,424 |
| Cars.com, Inc. (a) | | 58,384 | 836,643 |
| QuinStreet, Inc. (a) | | 26,333 | 489,267 |
| TechTarget (a) | | 7,258 | 562,422 |
| TrueCar, Inc. (a) | | 24,132 | 136,346 |
| | | | | $2,132,102 |
| Leisure & Toys – 3.9% | |
| Brunswick Corp. | | 13,620 | $ 1,356,825 |
| Funko, Inc., “A” (a) | | 59,719 | 1,270,820 |
| Malibu Boats, Inc., “A” (a) | | 17,116 | 1,255,116 |
| MasterCraft Boat Holdings, Inc. (a) | | 2,941 | 77,319 |
| Nautilus, Inc. (a) | | 5,505 | 92,759 |
| | | | | $4,052,839 |
| Machinery & Tools – 2.1% | |
| ACCO Brands Corp. | | 7,874 | $ 67,953 |
| AGCO Corp. | | 777 | 101,305 |
| ITT, Inc. | | 5,595 | 512,446 |
| Regal Beloit Corp. | | 9,669 | 1,290,908 |
| Titan Machinery, Inc. (a) | | 7,310 | 226,171 |
| | | | | $2,198,783 |
| Medical & Health Technology & Services – 4.0% | |
| Community Health Systems, Inc. (a) | | 19,730 | $ 304,631 |
| Covetrus, Inc. (a) | | 5,307 | 143,289 |
| LifeStance Health Group, Inc. (a) | | 13,948 | 388,591 |
| Owens & Minor, Inc. | | 17,356 | 734,680 |
| Signify Health, Inc., “A” (a) | | 10,609 | 322,832 |
| Syneos Health, Inc. (a) | | 11,723 | 1,049,091 |
| Issuer | | | Shares/Par | Value ($) |
| Common Stocks – continued |
| Medical & Health Technology & Services – continued | |
| Tenet Healthcare Corp. (a) | | 17,051 | $ 1,142,247 |
| | | | | $4,085,361 |
| Medical Equipment – 4.8% | |
| Accuray, Inc. (a) | | 46,746 | $ 211,292 |
| Alphatec Holdings, Inc. (a) | | 20,493 | 313,953 |
| AngioDynamics, Inc. (a) | | 18,039 | 489,398 |
| Avanos Medical, Inc. (a) | | 11,312 | 411,417 |
| Envista Holdings Corp. (a) | | 2,656 | 114,766 |
| Integer Holdings Corp. (a) | | 8,397 | 790,997 |
| LivaNova PLC (a) | | 1,337 | 112,455 |
| Maravai Lifesciences Holdings, Inc., “A” (a) | | 23,835 | 994,635 |
| Merit Medical Systems, Inc. (a) | | 5,507 | 356,083 |
| OraSure Technologies, Inc. (a) | | 18,166 | 184,203 |
| Orthofix Medical, Inc. (a) | | 4,539 | 182,059 |
| Quidel Corp. (a) | | 4,605 | 589,993 |
| Zynex, Inc. (a)(l) | | 14,459 | 224,548 |
| | | | | $4,975,799 |
| Metals & Mining – 1.6% | |
| Alcoa Corp. (a) | | 17,542 | $ 646,247 |
| Ryerson Holding Corp. (a) | | 24,208 | 353,437 |
| Schnitzer Steel Industries, Inc., “A” | | 1,917 | 94,029 |
| TimkenSteel Corp. (a) | | 24,869 | 351,896 |
| United States Steel Corp. | | 7,018 | 168,432 |
| | | | | $1,614,041 |
| Natural Gas - Distribution – 0.3% | |
| MDU Resources Group, Inc. | | 9,484 | $ 297,229 |
| Natural Gas - Pipeline – 0.6% | |
| Antero Midstream Corp. | | 21,621 | $ 224,642 |
| Equitrans Midstream Corp. | | 48,602 | 413,603 |
| | | | | $638,245 |
| Network & Telecom – 0.5% | |
| Cambium Networks Corp. (a) | | 11,006 | $ 532,140 |
| Oil Services – 2.7% | |
| Cactus, Inc., “A” | | 31,084 | $ 1,141,405 |
| ChampionX Corp. (a) | | 28,723 | 736,745 |
| Liberty Oilfield Services, Inc. (a) | | 9,250 | 130,980 |
| MRC Global, Inc. (a) | | 81,938 | 770,217 |
| | | | | $2,779,347 |
| Other Banks & Diversified Financials – 10.1% | |
| Bank OZK | | 28,786 | $ 1,213,618 |
| Cathay General Bancorp, Inc. | | 32,341 | 1,272,942 |
| First Hawaiian, Inc. | | 24,806 | 703,002 |
| Hanmi Financial Corp. | | 56,081 | 1,068,904 |
| Herc Holdings, Inc. (a) | | 699 | 78,337 |
| Prosperity Bancshares, Inc. | | 11,762 | 844,511 |
| Signature Bank | | 3,292 | 808,680 |
| SLM Corp. | | 61,452 | 1,286,805 |
| UMB Financial Corp. | | 14,630 | 1,361,468 |
| Umpqua Holdings Corp. | | 43,441 | 801,486 |
| Wintrust Financial Corp. | | 12,505 | 945,753 |
| | | | | $10,385,506 |
MFS Blended Research Small Cap Equity Portfolio
Portfolio of Investments (unaudited) – continued
| Issuer | | | Shares/Par | Value ($) |
| Common Stocks – continued |
| Pharmaceuticals – 2.9% | |
| Amneal Pharmaceuticals, Inc. (a) | | 17,911 | $ 91,704 |
| Collegium Pharmaceutical, Inc. (a) | | 15,505 | 366,538 |
| Emergent BioSolutions, Inc. (a) | | 6,229 | 392,365 |
| G1 Therapeutics, Inc. (a) | | 8,745 | 191,865 |
| Gritstone bio, Inc. (a) | | 17,097 | 156,096 |
| IDEAYA Biosciences, Inc. (a) | | 15,049 | 315,878 |
| KalVista Pharmaceuticals, Inc. (a) | | 9,549 | 228,794 |
| OPKO Health, Inc. (a) | | 9,755 | 39,508 |
| Phibro Animal Health Corp., “A” | | 13,525 | 390,602 |
| TCR Therapeutics, Inc. (a) | | 1,275 | 20,923 |
| United Therapeutics Corp. (a) | | 4,419 | 792,813 |
| | | | | $2,987,086 |
| Pollution Control – 0.5% | |
| U.S. Ecology, Inc. (a) | | 13,230 | $ 496,390 |
| Printing & Publishing – 0.2% | |
| Gannett Co., Inc. (a) | | 35,045 | $ 192,397 |
| Railroad & Shipping – 0.4% | |
| Genco Shipping & Trading Ltd. | | 20,395 | $ 385,058 |
| Real Estate – 6.9% | |
| CorePoint Lodging, Inc., REIT (a) | | 21,436 | $ 229,365 |
| Corporate Office Properties Trust, REIT | | 8,963 | 250,874 |
| Empire State Realty Trust, REIT, “A” | | 88,215 | 1,058,580 |
| Industrial Logistics Properties Trust, REIT | | 11,191 | 292,533 |
| Innovative Industrial Properties, Inc., REIT | | 1,374 | 262,462 |
| Life Storage, Inc., REIT | | 463 | 49,703 |
| National Storage Affiliates Trust, REIT | | 28,177 | 1,424,629 |
| Plymouth Industrial, Inc., REIT | | 2,589 | 51,832 |
| Spirit Realty Capital, Inc., REIT | | 19,304 | 923,503 |
| STAG Industrial, Inc., REIT | | 31,185 | 1,167,255 |
| STORE Capital Corp., REIT | | 30,835 | 1,064,116 |
| Uniti Group, Inc., REIT | | 28,368 | 300,417 |
| | | | | $7,075,269 |
| Restaurants – 1.4% | |
| Texas Roadhouse, Inc. | | 15,300 | $ 1,471,860 |
| Specialty Chemicals – 1.5% | |
| Kraton Corp. (a) | | 5,683 | $ 183,504 |
| Univar Solutions, Inc. (a) | | 53,970 | 1,315,789 |
| | | | | $1,499,293 |
| Issuer | | | Shares/Par | Value ($) |
| Common Stocks – continued |
| Specialty Stores – 3.0% | |
| Camping World Holdings, Inc. “A” | | 13,857 | $ 567,998 |
| Overstock.com, Inc. (a) | | 8,681 | 800,388 |
| Petco Health & Wellness Co., Inc. (a) | | 20,387 | 456,873 |
| Signet Jewelers Ltd. | | 1,275 | 103,007 |
| Urban Outfitters, Inc. (a) | | 27,516 | 1,134,210 |
| | | | | $3,062,476 |
| Telecommunications - Wireless – 0.3% | |
| Telephone and Data Systems, Inc. | | 11,539 | $ 261,474 |
| Telephone Services – 0.2% | |
| Consolidated Communications Holdings, Inc. (a) | | 23,330 | $ 205,071 |
| Trucking – 0.1% | |
| Daseke, Inc. (a) | | 11,669 | $ 75,615 |
| Utilities - Electric Power – 1.2% | |
| Portland General Electric Co. | | 26,390 | $ 1,216,051 |
| Total Common Stocks (Identified Cost, $74,109,122) | | $102,486,414 |
| Investment Companies (h) – 0.3% |
| Money Market Funds – 0.3% | |
| MFS Institutional Money Market Portfolio, 0.02% (v) (Identified Cost, $327,878) | | | 327,878 | $ 327,878 |
| Collateral for Securities Loaned – 0.1% |
| State Street Navigator Securities Lending Government Money Market Portfolio, 0.02% (j) (Identified Cost, $101,472) | | | 101,472 | $ 101,472 |
| Other Assets, Less Liabilities – (0.2)% | | (245,291) |
| Net Assets – 100.0% | $102,670,473 |
| (a) | Non-income producing security. | | | |
| (h) | An affiliated issuer, which may be considered one in which the fund owns 5% or more of the outstanding voting securities, or a company which is under common control. At period end, the aggregate values of the fund's investments in affiliated issuers and in unaffiliated issuers were $327,878 and $102,587,886, respectively. | | | |
| (j) | The rate quoted is the annualized seven-day yield of the fund at period end. | | | |
| (l) | A portion of this security is on loan. See Note 2 for additional information. | | | |
| (v) | Affiliated issuer that is available only to investment companies managed by MFS. The rate quoted for the MFS Institutional Money Market Portfolio is the annualized seven-day yield of the fund at period end. | | | |
| The following abbreviations are used in this report and are defined: |
| REIT | Real Estate Investment Trust |
See Notes to Financial Statements
MFS Blended Research Small Cap Equity Portfolio
| Financial Statements | Statement of Assets and Liabilities (unaudited) |
This statement represents your fund’s balance sheet, which details the assets and liabilities comprising the total value of the fund.
| At 6/30/21Assets | |
| Investments in unaffiliated issuers, at value, including $98,491 of securities on loan (identified cost, $74,210,594) | $102,587,886 |
| Investments in affiliated issuers, at value (identified cost, $327,878) | 327,878 |
| Receivables for | |
| Investments sold | 466,119 |
| Fund shares sold | 25,521 |
| Interest and dividends | 68,608 |
| Other assets | 661 |
| Total assets | $103,476,673 |
| Liabilities | |
| Payables for | |
| Fund shares reacquired | $650,218 |
| Collateral for securities loaned, at value | 101,472 |
| Payable to affiliates | |
| Investment adviser | 2,191 |
| Administrative services fee | 134 |
| Shareholder servicing costs | 59 |
| Distribution and/or service fees | 881 |
| Accrued expenses and other liabilities | 51,245 |
| Total liabilities | $806,200 |
| Net assets | $102,670,473 |
| Net assets consist of | |
| Paid-in capital | $62,043,695 |
| Total distributable earnings (loss) | 40,626,778 |
| Net assets | $102,670,473 |
| Shares of beneficial interest outstanding | 7,835,275 |
| | Net assets | Shares
outstanding | Net asset value
per share |
| Initial Class | $38,926,373 | 2,896,908 | $13.44 |
| Service Class | 63,744,100 | 4,938,367 | 12.91 |
See Notes to Financial Statements
MFS Blended Research Small Cap Equity Portfolio
| Financial Statements | Statement of Operations (unaudited) |
This statement describes how much your fund earned in investment income and accrued in expenses. It also describes any gains and/or losses generated by fund operations.
| Six months ended 6/30/21 | |
| Net investment income (loss) | |
| Income | |
| Dividends | $458,666 |
| Other | 10,371 |
| Income on securities loaned | 2,714 |
| Dividends from affiliated issuers | 194 |
| Total investment income | $471,945 |
| Expenses | |
| Management fee | $201,109 |
| Distribution and/or service fees | 78,557 |
| Shareholder servicing costs | 5,972 |
| Administrative services fee | 11,919 |
| Independent Trustees' compensation | 1,802 |
| Custodian fee | 1,547 |
| Shareholder communications | 7,522 |
| Audit and tax fees | 28,015 |
| Legal fees | 317 |
| Miscellaneous | 11,432 |
| Total expenses | $348,192 |
| Reduction of expenses by investment adviser | (5,991) |
| Net expenses | $342,201 |
| Net investment income (loss) | $129,744 |
| Realized and unrealized gain (loss) | |
| Realized gain (loss) (identified cost basis) | |
| Unaffiliated issuers | $15,349,867 |
| Change in unrealized appreciation or depreciation | |
| Unaffiliated issuers | $5,517,287 |
| Net realized and unrealized gain (loss) | $20,867,154 |
| Change in net assets from operations | $20,996,898 |
See Notes to Financial Statements
MFS Blended Research Small Cap Equity Portfolio
| Financial Statements | Statements of Changes in Net Assets |
These statements describe the increases and/or decreases in net assets resulting from operations, any distributions, and any shareholder transactions.
| | Six months ended | Year ended |
| | 6/30/21
(unaudited) | 12/31/20 |
| Change in net assets | | |
| From operations | | |
| Net investment income (loss) | $129,744 | $770,676 |
| Net realized gain (loss) | 15,349,867 | (3,204,516) |
| Net unrealized gain (loss) | 5,517,287 | 7,925,642 |
| Change in net assets from operations | $20,996,898 | $5,491,802 |
| Total distributions to shareholders | $— | $(7,515,113) |
| Change in net assets from fund share transactions | $(11,547,646) | $(1,294,777) |
| Total change in net assets | $9,449,252 | $(3,318,088) |
| Net assets | | |
| At beginning of period | 93,221,221 | 96,539,309 |
| At end of period | $102,670,473 | $93,221,221 |
See Notes to Financial Statements
MFS Blended Research Small Cap Equity Portfolio
| Financial Statements | Financial Highlights |
The financial highlights table is intended to help you understand the fund's financial performance for the semiannual period and the past 5 fiscal years. Certain information reflects financial results for a single fund share. The total returns in the table represent the rate that an investor would have earned (or lost) on an investment in the fund share class (assuming reinvestment of all distributions) held for the entire period.
| Initial Class | Six months
ended | Year ended |
| | 6/30/21
(unaudited) | 12/31/20 | 12/31/19 | 12/31/18 | 12/31/17 | 12/31/16 |
| Net asset value, beginning of period | $10.91 | $11.66 | $11.25 | $13.47 | $13.23 | $12.29 |
| Income (loss) from investment operations | | | | | | |
| Net investment income (loss) (d) | $0.03 | $0.10 | $0.10 | $0.09 | $0.11 | $0.11(c) |
| Net realized and unrealized gain (loss) | 2.50 | 0.01(g) | 2.56 | (0.40) | 1.70 | 2.35 |
| Total from investment operations | $2.53 | $0.11 | $2.66 | $(0.31) | $1.81 | $2.46 |
| Less distributions declared to shareholders | | | | | | |
| From net investment income | $— | $(0.09) | $(0.10) | $(0.13) | $(0.12) | $(0.16) |
| From net realized gain | — | (0.77) | (2.15) | (1.78) | (1.45) | (1.36) |
| Total distributions declared to shareholders | $— | $(0.86) | $(2.25) | $(1.91) | $(1.57) | $(1.52) |
| Net asset value, end of period (x) | $13.44 | $10.91 | $11.66 | $11.25 | $13.47 | $13.23 |
| Total return (%) (k)(r)(s)(x) | 23.19(n) | 2.23 | 26.78 | (5.11) | 14.97 | 20.90(c) |
Ratios (%) (to average net assets)
and Supplemental data: | | | | | | |
| Expenses before expense reductions (f) | 0.54(a) | 0.55 | 0.54 | 0.54 | 0.53 | 0.42(c) |
| Expenses after expense reductions (f) | 0.52(a) | 0.54 | 0.53 | 0.53 | 0.52 | 0.41(c) |
| Net investment income (loss) | 0.42(a)(l) | 1.05 | 0.81 | 0.69 | 0.82 | 0.92(c) |
| Portfolio turnover | 43(n) | 84 | 59 | 72 | 81 | 72 |
| Net assets at end of period (000 omitted) | $38,926 | $33,850 | $35,441 | $29,936 | $36,195 | $28,715 |
See Notes to Financial Statements
MFS Blended Research Small Cap Equity Portfolio
Financial Highlights - continued
| Service Class | Six months
ended | Year ended |
| | 6/30/21
(unaudited) | 12/31/20 | 12/31/19 | 12/31/18 | 12/31/17 | 12/31/16 |
| Net asset value, beginning of period | $10.50 | $11.24 | $10.92 | $13.12 | $12.92 | $12.03 |
| Income (loss) from investment operations | | | | | | |
| Net investment income (loss) (d) | $0.01 | $0.07 | $0.07 | $0.06 | $0.07 | $0.08(c) |
| Net realized and unrealized gain (loss) | 2.40 | 0.02(g) | 2.46 | (0.39) | 1.67 | 2.29 |
| Total from investment operations | $2.41 | $0.09 | $2.53 | $(0.33) | $1.74 | $2.37 |
| Less distributions declared to shareholders | | | | | | |
| From net investment income | $— | $(0.06) | $(0.06) | $(0.09) | $(0.09) | $(0.12) |
| From net realized gain | — | (0.77) | (2.15) | (1.78) | (1.45) | (1.36) |
| Total distributions declared to shareholders | $— | $(0.83) | $(2.21) | $(1.87) | $(1.54) | $(1.48) |
| Net asset value, end of period (x) | $12.91 | $10.50 | $11.24 | $10.92 | $13.12 | $12.92 |
| Total return (%) (k)(r)(s)(x) | 22.95(n) | 2.14 | 26.36 | (5.35) | 14.70 | 20.58(c) |
Ratios (%) (to average net assets)
and Supplemental data: | | | | | | |
| Expenses before expense reductions (f) | 0.79(a) | 0.80 | 0.79 | 0.79 | 0.78 | 0.67(c) |
| Expenses after expense reductions (f) | 0.77(a) | 0.79 | 0.78 | 0.78 | 0.77 | 0.66(c) |
| Net investment income (loss) | 0.16(a)(l) | 0.80 | 0.56 | 0.43 | 0.55 | 0.66(c) |
| Portfolio turnover | 43(n) | 84 | 59 | 72 | 81 | 72 |
| Net assets at end of period (000 omitted) | $63,744 | $59,371 | $61,099 | $55,648 | $71,366 | $74,453 |
| (a) | Annualized. |
| (c) | Amount reflects a one-time reimbursement of expenses by the custodian (or former custodian) without which net investment income and performance would be lower and expenses would be higher. |
| (d) | Per share data is based on average shares outstanding. |
| (f) | Ratios do not reflect reductions from fees paid indirectly, if applicable. |
| (g) | The per share amount varies from the net realized and unrealized gain/loss for the period because of the timing of sales of fund shares and the per share amount of realized and unrealized gains and losses at such time. |
| (k) | The total return does not reflect expenses that apply to separate accounts. Inclusion of these charges would reduce the total return figures for all periods shown. |
| (l) | Recognition of net investment income by the fund may be affected by the timing of the declaration of dividends by companies in which the fund invests and the actual annual net investment income ratio may differ. |
| (n) | Not annualized. |
| (r) | Certain expenses have been reduced without which performance would have been lower. |
| (s) | From time to time the fund may receive proceeds from litigation settlements, without which performance would be lower. |
| (x) | The net asset values and total returns have been calculated on net assets which include adjustments made in accordance with U.S. generally accepted accounting principles required at period end for financial reporting purposes. |
See Notes to Financial Statements
MFS Blended Research Small Cap Equity Portfolio
Notes to Financial Statements (unaudited)
(1) Business and Organization
MFS Blended Research Small Cap Equity Portfolio (the fund) is a diversified series of MFS Variable Insurance Trust III (the trust). The trust is organized as a Delaware statutory trust and is registered under the Investment Company Act of 1940, as amended, as an open-end management investment company. The shareholders of each series of the trust are separate accounts of insurance companies, which offer variable annuity and/or life insurance products, and qualified retirement and pension plans.
The fund is an investment company and accordingly follows the investment company accounting and reporting guidance of the Financial Accounting Standards Board (FASB) Accounting Standards Codification Topic 946 Financial Services - Investment Companies.
(2) Significant Accounting Policies
General — The preparation of financial statements in conformity with U.S. generally accepted accounting principles requires management to make estimates and assumptions that affect the reported amounts of assets and liabilities, and disclosure of contingent assets and liabilities at the date of the financial statements and the reported amounts of increases and decreases in net assets from operations during the reporting period. Actual results could differ from those estimates. In the preparation of these financial statements, management has evaluated subsequent events occurring after the date of the fund’s Statement of Assets and Liabilities through the date that the financial statements were issued. The fund will generally focus on securities of small size companies which may be more volatile than those of larger companies.
Certain of the fund's investments, derivatives, debt and other contracts may be based on reference interest rates such as the London Interbank Offered Rate (“LIBOR”). In 2017, the regulatory authority that oversees financial services firms in the United Kingdom announced plans to transition away from LIBOR by the end of 2021. In March 2021, the administrator of LIBOR announced the extension of the publication of the more commonly used U.S. dollar LIBOR settings to the end of June 2023. Although the full impacts of the transition away from LIBOR are not fully known, the transition may result in, among other things, an increase in volatility or illiquidity of the markets for instruments that currently rely on LIBOR to determine interest rates and this could have an adverse impact on the fund's performance. With respect to the fund's accounting for investments, derivatives, debt and other contracts that undergo reference rate-related modifications as a result of the transition, management will rely upon the relief provided by FASB Codification Topic 848 – Reference Rate Reform (Topic 848). The guidance in Topic 848 permits the fund to disregard the GAAP accounting requirements around certain contract modifications resulting from the LIBOR transition such that for contracts considered in scope, the fund can account for those modified contracts as a continuation of the existing contracts.
Balance Sheet Offsetting — The fund's accounting policy with respect to balance sheet offsetting is that, absent an event of default by the counterparty or a termination of the agreement, the International Swaps and Derivatives Association (ISDA) Master Agreement, or similar agreement, does not result in an offset of reported amounts of financial assets and financial liabilities in the Statement of Assets and Liabilities across transactions between the fund and the applicable counterparty. The fund's right to setoff may be restricted or prohibited by the bankruptcy or insolvency laws of the particular jurisdiction to which a specific master netting agreement counterparty is subject. Balance sheet offsetting disclosures, to the extent applicable to the fund, have been included in the fund’s Significant Accounting Policies note under the captions for each of the fund’s in-scope financial instruments and transactions.
Investment Valuations — Equity securities, including restricted equity securities, are generally valued at the last sale or official closing price on their primary market or exchange as provided by a third-party pricing service. Equity securities, for which there were no sales reported that day, are generally valued at the last quoted daily bid quotation on their primary market or exchange as provided by a third-party pricing service. Short-term instruments with a maturity at issuance of 60 days or less may be valued at amortized cost, which approximates market value. Open-end investment companies are generally valued at net asset value per share.
Securities and other assets generally valued on the basis of information from a third-party pricing service may also be valued at a broker/dealer bid quotation. In determining values, third-party pricing services can utilize both transaction data and market information such as yield, quality, coupon rate, maturity, type of issue, trading characteristics, and other market data. The values of foreign securities and other assets and liabilities expressed in foreign currencies are converted to U.S. dollars using the mean of bid and asked prices for rates provided by a third-party pricing service.
The Board of Trustees has delegated primary responsibility for determining or causing to be determined the value of the fund’s investments (including any fair valuation) to the adviser pursuant to valuation policies and procedures approved by the Board. If the adviser determines that reliable market quotations are not readily available, investments are valued at fair value as determined in good faith by the adviser in accordance with such procedures under the oversight of the Board of Trustees. Under the fund’s valuation policies and procedures, market quotations are not considered to be readily available for most types of debt instruments and floating rate loans and many types of derivatives. These investments are generally valued at fair value based on information from third-party pricing services. In addition, investments may be valued at fair value if the adviser determines that an investment’s value
MFS Blended Research Small Cap Equity Portfolio
Notes to Financial Statements (unaudited) - continued
has been materially affected by events occurring after the close of the exchange or market on which the investment is principally traded (such as foreign exchange or market) and prior to the determination of the fund’s net asset value, or after the halt of trading of a specific security where trading does not resume prior to the close of the exchange or market on which the security is principally traded. Events that occur after foreign markets close (such as developments in foreign markets and significant movements in the U.S. markets) and prior to the determination of the fund’s net asset value may be deemed to have a material effect on the value of securities traded in foreign markets. Accordingly, the fund’s foreign equity securities may often be valued at fair value. The adviser generally relies on third-party pricing services or other information (such as the correlation with price movements of similar securities in the same or other markets; the type, cost and investment characteristics of the security; the business and financial condition of the issuer; and trading and other market data) to assist in determining whether to fair value and at what value to fair value an investment. The value of an investment for purposes of calculating the fund’s net asset value can differ depending on the source and method used to determine value. When fair valuation is used, the value of an investment used to determine the fund’s net asset value may differ from quoted or published prices for the same investment. There can be no assurance that the fund could obtain the fair value assigned to an investment if it were to sell the investment at the same time at which the fund determines its net asset value per share.
Various inputs are used in determining the value of the fund's assets or liabilities. These inputs are categorized into three broad levels. In certain cases, the inputs used to measure fair value may fall into different levels of the fair value hierarchy. In such cases, an investment's level within the fair value hierarchy is based on the lowest level of input that is significant to the fair value measurement. The fund's assessment of the significance of a particular input to the fair value measurement in its entirety requires judgment, and considers factors specific to the investment. Level 1 includes unadjusted quoted prices in active markets for identical assets or liabilities. Level 2 includes other significant observable market-based inputs (including quoted prices for similar securities, interest rates, prepayment speed, and credit risk). Level 3 includes unobservable inputs, which may include the adviser's own assumptions in determining the fair value of investments. The following is a summary of the levels used as of June 30, 2021 in valuing the fund's assets or liabilities:
| Financial Instruments | Level 1 | Level 2 | Level 3 | Total |
| Equity Securities | $102,486,414 | $— | $— | $102,486,414 |
| Mutual Funds | 429,350 | — | — | 429,350 |
| Total | $102,915,764 | $— | $— | $102,915,764 |
For further information regarding security characteristics, see the Portfolio of Investments.
Security Loans — Under its Securities Lending Agency Agreement with the fund, State Street Bank and Trust Company, as lending agent, loans the securities of the fund to certain qualified institutions (the “Borrowers”) approved by the fund. Security loans can be terminated at the discretion of either the lending agent or the fund and the related securities must be returned within the earlier of the standard trade settlement period for such securities or within three business days. The loans are collateralized by cash and/or U.S. Treasury and federal agency obligations in an amount typically at least equal to the market value of the securities loaned. On loans collateralized by cash, the cash collateral is invested in a money market fund. The market value of the loaned securities is determined at the close of business of the fund and any additional required collateral is delivered to the fund on the next business day. The lending agent provides the fund with indemnification against Borrower default. In the event of Borrower default, the lending agent will, for the benefit of the fund, either purchase securities identical to those loaned or, when such purchase is commercially impracticable, pay the fund the market value of the loaned securities. In return, the lending agent assumes the fund's rights to the related collateral. If the collateral value is less than the cost to purchase identical securities, the lending agent is responsible for the shortfall, but only to the extent that such shortfall is not due to a decline in collateral value resulting from collateral reinvestment for which the fund bears the risk of loss. At period end, the fund had investment securities on loan, all of which were classified as equity securities in the fund's Portfolio of Investments, with a fair value of $98,491. The fair value of the fund's investment securities on loan and a related liability of $101,472 for cash collateral received on securities loaned are both presented gross in the Statement of Assets and Liabilities. The collateral on securities loaned exceeded the value of securities on loan at period end. The liability for cash collateral for securities loaned is carried at fair value, which is categorized as level 2 within the fair value hierarchy. A portion of the income generated upon investment of the collateral is remitted to the Borrowers, and the remainder is allocated between the fund and the lending agent. On loans collateralized by U.S. Treasury and/or federal agency obligations, a fee is received from the Borrower, and is allocated between the fund and the lending agent. Income from securities lending is separately reported in the Statement of Operations. The dividend and interest income earned on the securities loaned is accounted for in the same manner as other dividend and interest income.
Indemnifications — Under the fund's organizational documents, its officers and Trustees may be indemnified against certain liabilities and expenses arising out of the performance of their duties to the fund. Additionally, in the normal course of business, the fund enters into agreements with service providers that may contain indemnification clauses. The fund's maximum exposure under these agreements is unknown as this would involve future claims that may be made against the fund that have not yet occurred.
MFS Blended Research Small Cap Equity Portfolio
Notes to Financial Statements (unaudited) - continued
Investment Transactions and Income — Investment transactions are recorded on the trade date. Interest income is recorded on the accrual basis. Dividends received in cash are recorded on the ex-dividend date. Certain dividends from foreign securities will be recorded when the fund is informed of the dividend if such information is obtained subsequent to the ex-dividend date. Dividend payments received in additional securities are recorded on the ex-dividend date in an amount equal to the value of the security on such date.
The fund may receive proceeds from litigation settlements. Any proceeds received from litigation involving portfolio holdings are reflected in the Statement of Operations in realized gain/loss if the security has been disposed of by the fund or in unrealized gain/loss if the security is still held by the fund. Any other proceeds from litigation not related to portfolio holdings are reflected as other income in the Statement of Operations.
Tax Matters and Distributions — The fund intends to qualify as a regulated investment company, as defined under Subchapter M of the Internal Revenue Code, and to distribute all of its taxable income, including realized capital gains. As a result, no provision for federal income tax is required. The fund’s federal tax returns, when filed, will remain subject to examination by the Internal Revenue Service for a three year period. Management has analyzed the fund’s tax positions taken on federal and state tax returns for all open tax years and does not believe that there are any uncertain tax positions that require recognition of a tax liability. Foreign taxes, if any, have been accrued by the fund in the accompanying financial statements in accordance with the applicable foreign tax law. Foreign income taxes may be withheld by certain countries in which the fund invests. Additionally, capital gains realized by the fund on securities issued in or by certain foreign countries may be subject to capital gains tax imposed by those countries.
Distributions to shareholders are recorded on the ex-dividend date. Income and capital gain distributions are determined in accordance with income tax regulations, which may differ from U.S. generally accepted accounting principles. Certain capital accounts in the financial statements are periodically adjusted for permanent differences in order to reflect their tax character. These adjustments have no impact on net assets or net asset value per share. Temporary differences which arise from recognizing certain items of income, expense, gain or loss in different periods for financial statement and tax purposes will reverse at some time in the future.
Book/tax differences primarily relate to wash sale loss deferrals.
The tax character of distributions declared to shareholders for the last fiscal year is as follows:
| | Year ended
12/31/20 |
| Ordinary income (including any short-term capital gains) | $1,857,641 |
| Long-term capital gains | 5,657,472 |
| Total distributions | $7,515,113 |
The federal tax cost and the tax basis components of distributable earnings were as follows:
| As of 6/30/21 | |
| Cost of investments | $75,268,184 |
| Gross appreciation | 29,048,989 |
| Gross depreciation | (1,401,409) |
| Net unrealized appreciation (depreciation) | $27,647,580 |
| As of 12/31/20 | |
| Undistributed ordinary income | 769,347 |
| Capital loss carryforwards | (3,322,161) |
| Net unrealized appreciation (depreciation) | 22,182,694 |
The aggregate cost above includes prior fiscal year end tax adjustments, if applicable.
As of December 31, 2020, the fund had capital loss carryforwards available to offset future realized gains. These net capital losses may be carried forward indefinitely and their character is retained as short-term and/or long-term losses. Such losses are characterized as follows:
| Short-Term | $(2,619,187) |
| Long-Term | (702,974) |
| Total | $(3,322,161) |
MFS Blended Research Small Cap Equity Portfolio
Notes to Financial Statements (unaudited) - continued
Multiple Classes of Shares of Beneficial Interest — The fund offers multiple classes of shares, which differ in their respective distribution and/or service fees. The fund's income, realized and unrealized gain (loss), and common expenses are allocated to shareholders based on the daily net assets of each class. Dividends are declared separately for each class. Differences in per share dividend rates are generally due to differences in separate class expenses. The fund’s distributions declared to shareholders as reported in the Statements of Changes in Net Assets are presented by class as follows:
| | Six months
ended
6/30/21 | | Year
ended
12/31/20 |
| Initial Class | $— | | $2,607,703 |
| Service Class | — | | 4,907,410 |
| Total | $— | | $7,515,113 |
(3) Transactions with Affiliates
Investment Adviser — The fund has an investment advisory agreement with MFS to provide overall investment management and related administrative services and facilities to the fund. The management fee is computed daily and paid monthly at an annual rate of 0.40% of the fund’s average daily net assets. MFS has agreed in writing to reduce its management fee by a specified amount if certain MFS mutual fund assets exceed thresholds agreed to by MFS and the fund's Board of Trustees. For the six months ended June 30, 2021, this management fee reduction amounted to $5,991, which is included in the reduction of total expenses in the Statement of Operations. The management fee incurred for the six months ended June 30, 2021 was equivalent to an annual effective rate of 0.39% of the fund's average daily net assets.
The investment adviser has agreed in writing to pay a portion of the fund’s total annual operating expenses, excluding interest, taxes, extraordinary expenses, brokerage and transaction costs, and investment-related expenses, such that total annual operating expenses do not exceed 0.60% of average daily net assets for the Initial Class shares and 0.85% of average daily net assets for the Service Class shares. This written agreement will continue until modified by the fund’s Board of Trustees, but such agreement will continue at least until April 30, 2023. For the six months ended June 30, 2021, the fund’s actual operating expenses did not exceed the limit and therefore, the investment adviser did not pay any portion of the fund’s expenses related to this agreement.
Distributor — MFS Fund Distributors, Inc. (MFD), a wholly-owned subsidiary of MFS, is the distributor of shares of the fund. The Trustees have adopted a distribution plan for the Service Class shares pursuant to Rule 12b-1 under the Investment Company Act of 1940.
The fund's distribution plan provides that the fund will pay MFD distribution and/or service fees equal to 0.25% per annum of its average daily net assets attributable to Service Class shares as partial consideration for services performed and expenses incurred by MFD and financial intermediaries (including participating insurance companies that invest in the fund to fund variable annuity and variable life insurance contracts, sponsors of qualified retirement and pension plans that invest in the fund, and affiliates of these participating insurance companies and plan sponsors) in connection with the sale and distribution of the Service Class shares. MFD may subsequently pay all, or a portion, of the distribution and/or service fees to financial intermediaries.
Shareholder Servicing Agent — MFS Service Center, Inc. (MFSC), a wholly-owned subsidiary of MFS, receives a fee from the fund for its services as shareholder servicing agent. For the six months ended June 30, 2021, the fee was $5,599, which equated to 0.0111% annually of the fund's average daily net assets. MFSC also receives reimbursement from the fund for out-of-pocket expenses paid by MFSC on behalf of the fund. For the six months ended June 30, 2021, these costs amounted to $373.
Administrator — MFS provides certain financial, legal, shareholder communications, compliance, and other administrative services to the fund. Under an administrative services agreement, the fund reimburses MFS the costs incurred to provide these services. The fund is charged an annual fixed amount of $17,500 plus a fee based on average daily net assets. The administrative services fee incurred for the six months ended June 30, 2021 was equivalent to an annual effective rate of 0.0237% of the fund's average daily net assets.
Trustees’ and Officers’ Compensation — The fund pays compensation to independent Trustees in the form of a retainer, attendance fees, and additional compensation to Board and Committee chairpersons. The fund does not pay compensation directly to Trustees or officers of the fund who are also officers of the investment adviser, all of whom receive remuneration from MFS for their services to the fund. Certain officers and Trustees of the fund are officers or directors of MFS, MFD, and MFSC.
Other — The fund invests in the MFS Institutional Money Market Portfolio which is managed by MFS and seeks current income consistent with preservation of capital and liquidity. This money market fund does not pay a management fee to MFS but does incur investment and operating costs.
MFS Blended Research Small Cap Equity Portfolio
Notes to Financial Statements (unaudited) - continued
The adviser has voluntarily undertaken to reimburse the fund from its own resources on a quarterly basis for the cost of investment research embedded in the cost of the fund’s securities trades. This agreement may be rescinded at any time. For the six months ended June 30, 2021, this reimbursement amounted to $10,349, which is included in “Other” income in the Statement of Operations.
The fund is permitted to engage in purchase and sale transactions with funds and accounts for which MFS serves as investment adviser or sub-adviser (“cross-trades”) pursuant to a policy adopted by the Board of Trustees. This policy has been designed to ensure that cross-trades conducted by the fund comply with Rule 17a-7 under the Investment Company Act of 1940. During the six months ended June 30, 2021, the fund engaged in purchase transactions pursuant to this policy, which amounted to $331,854.
(4) Portfolio Securities
For the six months ended June 30, 2021, purchases and sales of investments, other than short-term obligations, aggregated $42,965,303 and $54,043,348, respectively.
(5) Shares of Beneficial Interest
The fund's Declaration of Trust permits the Trustees to issue an unlimited number of full and fractional shares of beneficial interest. Transactions in fund shares were as follows:
| | Six months ended
6/30/21 | | Year ended
12/31/20 |
| | Shares | Amount | | Shares | Amount |
| Shares sold | | | | | |
| Initial Class | 123,510 | $1,574,246 | | 825,995 | $6,434,636 |
| Service Class | 284,405 | 3,527,917 | | 1,413,665 | 11,455,698 |
| | 407,915 | $5,102,163 | | 2,239,660 | $17,890,334 |
Shares issued to shareholders
in reinvestment of distributions | | | | | |
| Initial Class | — | $— | | 281,002 | $2,607,703 |
| Service Class | — | — | | 549,542 | 4,907,410 |
| | — | $— | | 830,544 | $7,515,113 |
| Shares reacquired | | | | | |
| Initial Class | (328,165) | $(4,189,684) | | (1,046,160) | $(10,004,310) |
| Service Class | (1,002,114) | (12,460,125) | | (1,740,816) | (16,695,914) |
| | (1,330,279) | $(16,649,809) | | (2,786,976) | $(26,700,224) |
| Net change | | | | | |
| Initial Class | (204,655) | $(2,615,438) | | 60,837 | $(961,971) |
| Service Class | (717,709) | (8,932,208) | | 222,391 | (332,806) |
| | (922,364) | $(11,547,646) | | 283,228 | $(1,294,777) |
(6) Line of Credit
The fund and certain other funds managed by MFS participate in a $1.25 billion unsecured committed line of credit of which $1 billion is reserved for use by the fund and certain other MFS U.S. funds. The line of credit is provided by a syndicate of banks under a credit agreement. Borrowings may be made for temporary financing needs. Interest is charged to each fund, based on its borrowings, generally at a rate equal to the highest of one month LIBOR, the Federal Funds Effective Rate and the Overnight Bank Funding Rate, plus an agreed upon spread. A commitment fee, based on the average daily, unused portion of the committed line of credit, is allocated among the participating funds. In addition, the fund and other funds managed by MFS have established unsecured uncommitted borrowing arrangements with certain banks for temporary financing needs. Interest is charged to each fund, based on its borrowings, at rates equal to customary reference rates plus an agreed upon spread. For the six months ended June 30, 2021, the fund’s commitment fee and interest expense were $177 and $0, respectively, and are included in “Miscellaneous” expense in the Statement of Operations.
(7) Investments in Affiliated Issuers
An affiliated issuer may be considered one in which the fund owns 5% or more of the outstanding voting securities, or a company which is under common control. For the purposes of this report, the following were affiliated issuers:
MFS Blended Research Small Cap Equity Portfolio
Notes to Financial Statements (unaudited) - continued
| Affiliated Issuers | Beginning
Value | Purchases | Sales
Proceeds | Realized
Gain
(Loss) | Change in
Unrealized
Appreciation or
Depreciation | Ending
Value |
| MFS Institutional Money Market Portfolio | $529,846 | $7,718,129 | $7,920,097 | $— | $— | $327,878 |
| Affiliated Issuers | Dividend
Income | Capital Gain
Distributions |
| MFS Institutional Money Market Portfolio | $194 | $— |
(8) Impacts of COVID-19
The pandemic related to the global spread of novel coronavirus disease (COVID-19), which was first detected in December 2019, has resulted in significant disruptions to global business activity and the global economy, as well as the economies of individual countries, the financial performance of individual companies and sectors, and the securities and commodities markets in general. Multiple surges in cases globally, the availability and widespread adoption of vaccines, and the emergence of variant strains of the virus continue to create uncertainty as to the future and long-term impacts resulting from the pandemic including impacts to the prices and liquidity of the fund's investments and the fund's performance.
MFS Blended Research Small Cap Equity Portfolio
Statement Regarding Liquidity Risk Management Program
The fund has adopted and implemented a liquidity risk management program (the “Program”) as required by Rule 22e-4 under the Investment Company Act of 1940, as amended. The fund’s Board of Trustees (the “Board”) has designated MFS as the administrator of the Program. The Program is reasonably designed to assess and manage the liquidity risk of the fund. Liquidity risk is the risk that the fund could not meet requests to redeem shares issued by the fund without significant dilution of remaining investors' interests.
MFS provided a written report to the Board for consideration at its April 2021 meeting that addressed the operation of the Program and provided an assessment of the adequacy and effectiveness of the Program during the period from January 1, 2020 to December 31, 2020 (the “Covered Period”). The report concluded that during the Covered Period the Program had operated effectively and had adequately and effectively been implemented to assess and manage the fund’s liquidity risk. MFS also reported that there were no liquidity events that impacted the fund or its ability to timely meet redemptions without dilution to existing shareholders during the Covered Period.
There can be no assurance that the Program will achieve its objectives in the future. Further information on liquidity risk, and other principal risks to which an investment in the fund may be subject, can be found in the prospectus.
MFS Blended Research Small Cap Equity Portfolio
Proxy Voting Policies and Information
MFS votes proxies on behalf of the fund pursuant to proxy voting policies and procedures that are available without charge, upon request, by calling 1-800-225-2606, by visiting mfs.com/proxyvoting, or by visiting the SEC’s Web site at http://www.sec.gov.
Information regarding how the fund voted proxies relating to portfolio securities during the most recent twelve-month period ended June 30 is available by August 31 of each year without charge by visiting mfs.com/proxyvoting, or by visiting the SEC’s Web site at http://www.sec.gov.
Quarterly Portfolio Disclosure
The fund files a complete schedule of portfolio holdings with the SEC for the first and third quarters of each fiscal year as an exhibit to its reports on Form N-PORT. The fund’s Form N-PORT reports are available on the SEC’s Web site at http://www.sec.gov. A shareholder can obtain the portfolio holdings report for the first and third quarters of the fund's fiscal year at mfs.com/vit3 by choosing the fund's name and then scrolling to the “Resources” section and clicking on the “Prospectus and Reports” tab.
FURTHER INFORMATION
From time to time, MFS may post important information about the fund or the MFS Funds on the MFS Web site (mfs.com). This information is available at https://www.mfs.com/announcements or at mfs.com/vit3 by choosing the fund's name and then scrolling to the “Resources” section and clicking on the “Announcements” tab, if any.
Information About Fund Contracts and Legal Claims
The fund has entered into contractual arrangements with an investment adviser, administrator, distributor, shareholder servicing agent, 529 program manager (if applicable), and custodian who each provide services to the fund. Unless expressly stated otherwise, shareholders are not parties to, or intended beneficiaries of these contractual arrangements, and these contractual arrangements are not intended to create any shareholder right to enforce them against the service providers or to seek any remedy under them against the service providers, either directly or on behalf of the fund.
Under the Trust’s By-Laws and Declaration of Trust, any claims asserted against or on behalf of the MFS Funds, including claims against Trustees and Officers, must be brought in state and federal courts located within the Commonwealth of Massachusetts.
Semiannual Report
June 30, 2021
MFS® Conservative
Allocation Portfolio
MFS® Variable Insurance Trust III
MFS® Conservative Allocation Portfolio
The report is prepared for the general information of contract owners. It is authorized for distribution to prospective investors only when preceded or accompanied by a current prospectus.
NOT FDIC INSURED • MAY LOSE VALUE • NO BANK OR CREDIT UNION GUARANTEE •
NOT A DEPOSIT • NOT INSURED BY ANY FEDERAL GOVERNMENT AGENCY OR NCUA/NCUSIF
MFS Conservative Allocation Portfolio
Dear Contract Owners:
After experiencing dramatic swings in the early days of the coronavirus pandemic, global equity markets have performed strongly over the past year. Though the speedy development of vaccines brightened the economic and market outlook, uncertainty remains as new variants of the virus appear, and questions persist over how fast vaccines can be made widely available in the developing world.
Global central banks have taken aggressive steps to cushion the economic and market fallout related to the virus, and governments are deploying unprecedented levels of fiscal support. Having passed a $1.9 trillion stimulus package in March, the U.S. Congress could approve additional stimulus later this year, some of it focused on infrastructure. Along with extraordinary government expenditures, pent-up consumer demand fueled a surge in economic activity as coronavirus restrictions were eased, pushing up inflation, at least temporarily. Markets initially reacted by pushing up yields on global government bonds, though some of the rate rise has since been corrected.
A spirited debate is underway among investors over whether the current price pressures will persist or prove to be temporary, caused by pandemic-induced bottlenecks. The policy measures put in place to counteract the pandemic's effects have helped build a supportive environment and are encouraging economic recovery; however, if markets disconnect from fundamentals, they can sow the seeds of instability. As such, recent dramatic increases in speculative trading in cryptocurrencies, special purpose acquisition companies (SPACs), and the like bear watching.
In the aftermath of the crisis, we could see societal changes as households, businesses, and governments adjust to a new reality, and any such alterations could affect the investment landscape. For investors, events such as the COVID-19 outbreak demonstrate the importance of having a deep understanding of company fundamentals, and we have built our global research platform to do just that.
At MFS®, we put our clients’ assets to work responsibly by carefully navigating the increasing complexity of global markets and economies. Guided by our long-term philosophy and adhering to our commitment to sustainable investing, we tune out the noise and aim to uncover what we believe are the best, most durable investment opportunities in the market. Our unique global investment platform combines collective expertise, long-term discipline, and thoughtful risk management to create sustainable value for investors.
Respectfully,
Michael W. Roberge
Chief Executive Officer
MFS Investment Management
August 13, 2021
The opinions expressed in this letter are subject to change and may not be relied upon for investment advice. No forecasts can be guaranteed.
MFS Conservative Allocation Portfolio
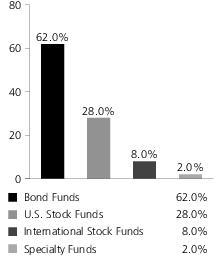
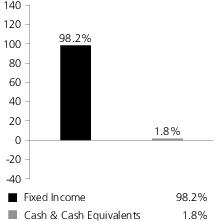
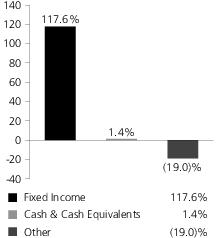
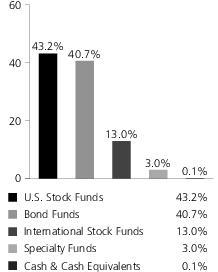
Portfolio target allocation
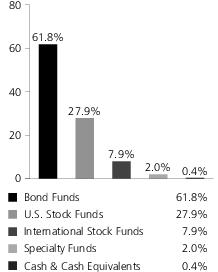
Portfolio actual allocation
Portfolio holdings
| MFS Total Return Bond Series | 17.0% |
| MFS Limited Maturity Portfolio | 12.0% |
| MFS Government Securities Portfolio | 10.0% |
| MFS Inflation-Adjusted Bond Portfolio | 9.9% |
| MFS Global Governments Portfolio | 7.9% |
| MFS Growth Series | 6.0% |
| MFS Research Series | 6.0% |
| MFS Value Series | 6.0% |
| MFS High Yield Portfolio | 5.0% |
| MFS Mid Cap Growth Series | 4.0% |
| MFS Mid Cap Value Portfolio | 3.9% |
| MFS Research International Portfolio | 3.9% |
| MFS International Intrinsic Value Portfolio | 2.0% |
| MFS International Growth Portfolio | 2.0% |
| MFS Global Real Estate Portfolio | 2.0% |
| MFS New Discovery Series | 1.0% |
| MFS New Discovery Value Portfolio | 1.0% |
| Cash & Cash Equivalents | 0.4% |
Cash & Cash Equivalents includes any cash, investments in money market funds, short-term securities, and other assets less liabilities. MFS endeavors to fully invest all MFS funds-of-funds in underlying funds on a daily basis. Any divergence from 0.0% in Cash & Cash Equivalents is typically due to the timing of fund subscriptions/redemptions and the settlement of subsequent investment in/divestment from the underlying funds. While the MFS funds-of-funds' subscriptions/redemptions are processed at the same day NAV of the underlying funds, a positive/negative cash balance will be reflected on the MFS funds-of-funds' Statements of Assets and Liabilities until the trades with the underlying funds settle, which is typically two business days. Please see the fund's Statement of Assets and Liabilities for additional information related to the fund’s cash position and other assets and liabilities.
Percentages are based on net assets as of June 30, 2021.
The portfolio is actively managed and current holdings may be different.
MFS Conservative Allocation Portfolio
Expense Table
Fund Expenses Borne by the Contract Holders during the Period,
January 1, 2021 through June 30, 2021
As a contract holder of the fund, you incur ongoing costs, including distribution and/or service (12b-1) fees; and other fund expenses. This example is intended to help you understand your ongoing costs (in dollars) of investing in the fund and to compare these costs with the ongoing costs of investing in other mutual funds.
In addition to the fees and expenses which the fund bears directly, the fund indirectly bears a pro rata share of the fees and expenses of the underlying funds in which the fund invests. Because the underlying funds have varied expenses and fee levels and the fund may own different proportions of the underlying funds at different times, the amount of fees and expenses incurred indirectly by the fund will vary. If these indirect costs were included, your costs would have been higher.
The example is based on an investment of $1,000 invested at the beginning of the period and held for the entire period January 1, 2021 through June 30, 2021.
Actual Expenses
The first line for each share class in the following table provides information about actual account values and actual expenses. You may use the information in this line, together with the amount you invested, to estimate the expenses that you paid over the period. Simply divide your account value by $1,000 (for example, an $8,600 account value divided by $1,000 = 8.6), then multiply the result by the number in the first line under the heading entitled “Expenses Paid During Period” to estimate the expenses you paid on your account during this period.
Hypothetical Example for Comparison Purposes
The second line for each share class in the following table provides information about hypothetical account values and hypothetical expenses based on the fund’s actual expense ratio and an assumed rate of return of 5% per year before expenses, which is not the fund’s actual return. The hypothetical account values and expenses may not be used to estimate the actual ending account balance or expenses you paid for the period. You may use this information to compare the ongoing costs of investing in the fund and other funds. To do so, compare this 5% hypothetical example with the 5% hypothetical examples that appear in the shareholder reports of the other funds.
Please note that the expenses shown in the table are meant to highlight the fund's ongoing costs only and do not take into account the fees and expenses imposed under the variable contracts through which your investment in the fund is made. Therefore, the second line for each share class in the table is useful in comparing ongoing costs associated with an investment in vehicles (such as the fund) which fund benefits under variable annuity and variable life insurance contracts and to qualified pension and retirement plans only, and will not help you determine the relative total costs of investing in the fund through variable annuity and variable life insurance contracts. If the fees and expenses imposed under the variable contracts were included, your costs would have been higher.
Share
Class | | Annualized
Expense
Ratio | Beginning
Account Value
1/01/21 | Ending
Account Value
6/30/21 | Expenses
Paid During
Period (p)
1/01/21-6/30/21 |
| Initial Class | Actual | 0.03% | $1,000.00 | $1,039.33 | $0.15 |
| Hypothetical (h) | 0.03% | $1,000.00 | $1024.65 | $0.15 |
| Service Class | Actual | 0.28% | $1,000.00 | $1,038.37 | $1.42 |
| Hypothetical (h) | 0.28% | $1,000.00 | $1,023.41 | $1.40 |
| (h) | 5% class return per year before expenses. |
| (p) | “Expenses Paid During Period” are equal to each class’s annualized expense ratio, as shown above, multiplied by the average account value over the period, multiplied by 181/365 (to reflect the one-half year period). In addition to the fees and expenses which the fund bears directly, the fund indirectly bears a pro rata share of the fees and expenses of the underlying funds in which the fund invests. If these indirect costs were included, your costs would have been higher. |
MFS Conservative Allocation Portfolio
Portfolio of Investments − 6/30/21 (unaudited)
The Portfolio of Investments is a complete list of all securities owned by your fund. It is categorized by broad-based asset classes.
| Issuer | | | Shares/Par | Value ($) |
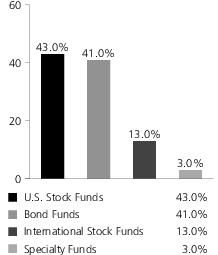
| Investment Companies (h) – 100.0% |
| Bond Funds – 61.8% |
| MFS Global Governments Portfolio - Initial Class | | | 2,968,464 | $ 32,979,632 |
| MFS Government Securities Portfolio - Initial Class | | | 3,292,270 | 41,647,218 |
| MFS High Yield Portfolio - Initial Class | | | 3,583,991 | 20,858,825 |
| MFS Inflation-Adjusted Bond Portfolio - Initial Class | | | 3,470,699 | 41,440,149 |
| MFS Limited Maturity Portfolio - Initial Class | | | 4,761,155 | 49,992,123 |
| MFS Total Return Bond Series - Initial Class | | | 5,069,516 | 70,922,537 |
| | | | | $ 257,840,484 |
| International Stock Funds – 7.9% |
| MFS International Growth Portfolio - Initial Class | | | 477,837 | $ 8,271,364 |
| MFS International Intrinsic Value Portfolio - Initial Class | | | 225,178 | 8,277,537 |
| MFS Research International Portfolio - Initial Class | | | 845,697 | 16,499,539 |
| | | | | $33,048,440 |
| Specialty Funds – 2.0% |
| MFS Global Real Estate Portfolio - Initial Class | | | 477,527 | $ 8,251,675 |
| Issuer | | | Shares/Par | Value ($) |
| Investment Companies (h) – continued |
| U.S. Stock Funds – 27.9% |
| MFS Growth Series - Initial Class | | | 301,237 | $ 25,102,108 |
| MFS Mid Cap Growth Series - Initial Class | | | 1,254,690 | 16,699,922 |
| MFS Mid Cap Value Portfolio - Initial Class | | | 1,617,574 | 16,547,778 |
| MFS New Discovery Series - Initial Class | | | 141,690 | 4,158,606 |
| MFS New Discovery Value Portfolio - Initial Class | | | 374,424 | 4,126,153 |
| MFS Research Series - Initial Class | | | 664,609 | 25,049,097 |
| MFS Value Series - Initial Class | | | 1,066,498 | 24,977,393 |
| | | | | $ 116,661,057 |
| Money Market Funds – 0.4% | |
| MFS Institutional Money Market Portfolio, 0.02% (v) | | | 1,651,796 | $ 1,651,796 |
| Total Investment Companies (Identified Cost, $335,145,147) | $ 417,453,452 |
| Other Assets, Less Liabilities – (0.0)% | | (48,379) |
| Net Assets – 100.0% | $ 417,405,073 |
| (h) | An affiliated issuer, which may be considered one in which the fund owns 5% or more of the outstanding voting securities, or a company which is under common control. At period end, the aggregate value of the fund’s investments in affiliated issuers was $417,453,452. | | | |
| (v) | Affiliated issuer that is available only to investment companies managed by MFS. The rate quoted for the MFS Institutional Money Market Portfolio is the annualized seven-day yield of the fund at period end. | | | |
See Notes to Financial Statements
MFS Conservative Allocation Portfolio
| Financial Statements | Statement of Assets and Liabilities (unaudited) |
This statement represents your fund’s balance sheet, which details the assets and liabilities comprising the total value of the fund.
| At 6/30/21Assets | |
| Investments in affiliated issuers, at value (identified cost, $335,145,147) | $417,453,452 |
| Receivables for | |
| Investments sold | 665,486 |
| Fund shares sold | 52,690 |
| Other assets | 1,689 |
| Total assets | $418,173,317 |
| Liabilities | |
| Payables for | |
| Investments purchased | $50,044 |
| Fund shares reacquired | 668,131 |
| Payable to affiliates | |
| Administrative services fee | 96 |
| Shareholder servicing costs | 42 |
| Distribution and/or service fees | 5,689 |
| Accrued expenses and other liabilities | 44,242 |
| Total liabilities | $768,244 |
| Net assets | $417,405,073 |
| Net assets consist of | |
| Paid-in capital | $304,679,613 |
| Total distributable earnings (loss) | 112,725,460 |
| Net assets | $417,405,073 |
| Shares of beneficial interest outstanding | 33,536,390 |
| | Net assets | Shares
outstanding | Net asset value
per share |
| Initial Class | $3,140,405 | 252,884 | $12.42 |
| Service Class | 414,264,668 | 33,283,506 | 12.45 |
See Notes to Financial Statements
MFS Conservative Allocation Portfolio
| Financial Statements | Statement of Operations (unaudited) |
This statement describes how much your fund earned in investment income and accrued in expenses. It also describes any gains and/or losses generated by fund operations.
| Six months ended 6/30/21 | |
| Net investment income (loss) | |
| Income | |
| Dividends from affiliated issuers | $441 |
| Other | 65 |
| Total investment income | $506 |
| Expenses | |
| Distribution and/or service fees | $521,054 |
| Shareholder servicing costs | 4,094 |
| Administrative services fee | 8,679 |
| Independent Trustees' compensation | 3,919 |
| Custodian fee | 2,821 |
| Shareholder communications | 5,819 |
| Audit and tax fees | 20,274 |
| Legal fees | 1,580 |
| Miscellaneous | 13,224 |
| Total expenses | $581,464 |
| Net investment income (loss) | $(580,958) |
| Realized and unrealized gain (loss) | |
| Realized gain (loss) (identified cost basis) | |
| Investments in affiliated issuers | $10,579,664 |
| Change in unrealized appreciation or depreciation | |
| Affiliated issuers | $5,849,874 |
| Net realized and unrealized gain (loss) | $16,429,538 |
| Change in net assets from operations | $15,848,580 |
See Notes to Financial Statements
MFS Conservative Allocation Portfolio
| Financial Statements | Statements of Changes in Net Assets |
These statements describe the increases and/or decreases in net assets resulting from operations, any distributions, and any shareholder transactions.
| | Six months ended | Year ended |
| | 6/30/21
(unaudited) | 12/31/20 |
| Change in net assets | | |
| From operations | | |
| Net investment income (loss) | $(580,958) | $8,306,512 |
| Net realized gain (loss) | 10,579,664 | 15,354,842 |
| Net unrealized gain (loss) | 5,849,874 | 23,432,452 |
| Change in net assets from operations | $15,848,580 | $47,093,806 |
| Total distributions to shareholders | $— | $(28,736,522) |
| Change in net assets from fund share transactions | $(29,733,641) | $(22,299,766) |
| Total change in net assets | $(13,885,061) | $(3,942,482) |
| Net assets | | |
| At beginning of period | 431,290,134 | 435,232,616 |
| At end of period | $417,405,073 | $431,290,134 |
See Notes to Financial Statements
MFS Conservative Allocation Portfolio
| Financial Statements | Financial Highlights |
The financial highlights table is intended to help you understand the fund's financial performance for the semiannual period and the past 5 fiscal years. Certain information reflects financial results for a single fund share. The total returns in the table represent the rate that an investor would have earned (or lost) on an investment in the fund share class (assuming reinvestment of all distributions) held for the entire period.
| Initial Class | Six months
ended | Year ended |
| | 6/30/21
(unaudited) | 12/31/20 | 12/31/19 | 12/31/18 | 12/31/17 | 12/31/16 |
| Net asset value, beginning of period | $11.95 | $11.44 | $10.58 | $11.61 | $10.95 | $11.09 |
| Income (loss) from investment operations | | | | | | |
| Net investment income (loss) (d)(l) | $(0.00)(w) | $0.27 | $0.28 | $0.27 | $0.22 | $0.22(c) |
| Net realized and unrealized gain (loss) | 0.47 | 1.09 | 1.47 | (0.55) | 1.02 | 0.36 |
| Total from investment operations | $0.47 | $1.36 | $1.75 | $(0.28) | $1.24 | $0.58 |
| Less distributions declared to shareholders | | | | | | |
| From net investment income | $— | $(0.31) | $(0.31) | $(0.26) | $(0.26) | $(0.32) |
| From net realized gain | — | (0.54) | (0.58) | (0.49) | (0.32) | (0.40) |
| Total distributions declared to shareholders | $— | $(0.85) | $(0.89) | $(0.75) | $(0.58) | $(0.72) |
| Net asset value, end of period (x) | $12.42 | $11.95 | $11.44 | $10.58 | $11.61 | $10.95 |
| Total return (%) (k)(r)(s)(x) | 3.93(n) | 12.31 | 16.87 | (2.73) | 11.48 | 5.03(c) |
Ratios (%) (to average net assets)
and Supplemental data: | | | | | | |
| Expenses before expense reductions (f)(h) | 0.03(a) | 0.03 | 0.03 | 0.03 | 0.02 | 0.02(c) |
| Expenses after expense reductions (f)(h) | N/A | N/A | N/A | N/A | N/A | N/A |
| Net investment income (loss) (l) | (0.03)(a) | 2.40 | 2.47 | 2.34 | 1.94 | 1.92(c) |
| Portfolio turnover | 1(n) | 7 | 2 | 1 | 0(b) | 1 |
| Net assets at end of period (000 omitted) | $3,140 | $3,061 | $2,029 | $2,062 | $2,338 | $2,266 |
See Notes to Financial Statements
MFS Conservative Allocation Portfolio
Financial Highlights - continued
| Service Class | Six months
ended | Year ended |
| | 6/30/21
(unaudited) | 12/31/20 | 12/31/19 | 12/31/18 | 12/31/17 | 12/31/16 |
| Net asset value, beginning of period | $11.99 | $11.47 | $10.61 | $11.63 | $10.96 | $11.10 |
| Income (loss) from investment operations | | | | | | |
| Net investment income (loss) (d)(l) | $(0.02) | $0.23 | $0.25 | $0.23 | $0.19 | $0.19(c) |
| Net realized and unrealized gain (loss) | 0.48 | 1.11 | 1.47 | (0.53) | 1.02 | 0.35 |
| Total from investment operations | $0.46 | $1.34 | $1.72 | $(0.30) | $1.21 | $0.54 |
| Less distributions declared to shareholders | | | | | | |
| From net investment income | $— | $(0.28) | $(0.28) | $(0.23) | $(0.22) | $(0.28) |
| From net realized gain | — | (0.54) | (0.58) | (0.49) | (0.32) | (0.40) |
| Total distributions declared to shareholders | $— | $(0.82) | $(0.86) | $(0.72) | $(0.54) | $(0.68) |
| Net asset value, end of period (x) | $12.45 | $11.99 | $11.47 | $10.61 | $11.63 | $10.96 |
| Total return (%) (k)(r)(s)(x) | 3.84(n) | 12.06 | 16.48 | (2.92) | 11.24 | 4.73(c) |
Ratios (%) (to average net assets)
and Supplemental data: | | | | | | |
| Expenses before expense reductions (f)(h) | 0.28(a) | 0.28 | 0.28 | 0.28 | 0.27 | 0.27(c) |
| Expenses after expense reductions (f)(h) | N/A | N/A | N/A | N/A | N/A | N/A |
| Net investment income (loss) (l) | (0.28)(a) | 1.98 | 2.18 | 2.05 | 1.63 | 1.66(c) |
| Portfolio turnover | 1(n) | 7 | 2 | 1 | 0(b) | 1 |
| Net assets at end of period (000 omitted) | $414,265 | $428,229 | $433,203 | $442,988 | $552,579 | $612,965 |
| (a) | Annualized. |
| (b) | Less than 0.5%. |
| (c) | Amount reflects a one-time reimbursement of expenses by the custodian (or former custodian) without which net investment income and performance would be lower and expenses would be higher. |
| (d) | Per share data is based on average shares outstanding. |
| (f) | Ratios do not reflect reductions from fees paid indirectly, if applicable. |
| (h) | In addition to the fees and expenses which the fund bears directly, the fund indirectly bears a pro rata share of the fees and expenses of the underlying affiliated funds in which the fund invests. Accordingly, the expense ratio for the fund reflects only those fees and expenses borne directly by the fund. Because the underlying affiliated funds have varied expense and fee levels and the fund may own different proportions of the underlying affiliated funds at different times, the amount of fees and expenses incurred indirectly by the fund will vary. |
| (k) | The total return does not reflect expenses that apply to separate accounts. Inclusion of these charges would reduce the total return figures for all periods shown. |
| (l) | Recognition of net investment income by the fund may be affected by the timing of the declaration of dividends by the underlying affiliated funds in which the fund invests and for interim net investment income ratios, the actual annual net investment income ratio may differ. The ratios and per share amounts do not include net investment income of the underlying affiliated funds in which the fund invests. |
| (n) | Not annualized. |
| (r) | Certain expenses have been reduced without which performance would have been lower. |
| (s) | From time to time the fund may receive proceeds from litigation settlements, without which performance would be lower. |
| (w) | Per share amount was less than $0.01. |
| (x) | The net asset values and total returns have been calculated on net assets which include adjustments made in accordance with U.S. generally accepted accounting principles required at period end for financial reporting purposes. |
See Notes to Financial Statements
MFS Conservative Allocation Portfolio
Notes to Financial Statements (unaudited)
(1) Business and Organization
MFS Conservative Allocation Portfolio (the fund) is a diversified series of MFS Variable Insurance Trust III (the trust). The trust is organized as a Delaware statutory trust and is registered under the Investment Company Act of 1940, as amended, as an open-end management investment company. The shareholders of each series of the trust are separate accounts of insurance companies, which offer variable annuity and/or life insurance products, and qualified retirement and pension plans.
The fund is an investment company and accordingly follows the investment company accounting and reporting guidance of the Financial Accounting Standards Board (FASB) Accounting Standards Codification Topic 946 Financial Services - Investment Companies.
(2) Significant Accounting Policies
General — The preparation of financial statements in conformity with U.S. generally accepted accounting principles requires management to make estimates and assumptions that affect the reported amounts of assets and liabilities, and disclosure of contingent assets and liabilities at the date of the financial statements and the reported amounts of increases and decreases in net assets from operations during the reporting period. Actual results could differ from those estimates. In the preparation of these financial statements, management has evaluated subsequent events occurring after the date of the fund’s Statement of Assets and Liabilities through the date that the financial statements were issued.
The fund is a “fund of funds”, which invests the majority of its assets in other MFS mutual funds (hereafter referred to as “underlying affiliated funds” or “underlying funds”), which may have different fiscal year ends than the funds. The underlying funds, in turn, may engage in a number of investment techniques and practices, which involve certain risks. Certain underlying funds invest their portfolio in high-yield securities rated below investment grade. Investments in below investment grade quality securities can involve a substantially greater risk of default or can already be in default, and their values can decline significantly. Below investment grade quality securities tend to be more sensitive to adverse news about the issuer, or the market or economy in general, than higher quality debt instruments. Certain underlying funds invest a significant portion of their assets in asset-backed and/or mortgage-backed securities. For these securities, the value of the debt instrument also depends on the credit quality and adequacy of the underlying assets or collateral as well as whether there is a security interest in the underlying assets or collateral. Enforcing rights, if any, against the underlying assets or collateral may be difficult. U.S. Government securities not supported as to the payment of principal or interest by the U.S. Treasury, such as those issued by Fannie Mae, Freddie Mac, and the Federal Home Loan Banks, are subject to greater credit risk than are U.S. Government securities supported by the U.S. Treasury, such as those issued by Ginnie Mae. Certain underlying funds invest in foreign securities, including securities of emerging market issuers. Investments in foreign securities are vulnerable to the effects of changes in the relative values of the local currency and the U.S. dollar and to the effects of changes in each country’s market, economic, industrial, political, regulatory, geopolitical, environmental, public health, and other conditions. Investments in emerging markets can involve additional and greater risks than the risks associated with investments in developed foreign markets. Emerging markets can have less developed markets, greater custody and operational risk, less developed legal, regulatory, and accounting, and auditing systems, and greater political, social, and economic instability than developed markets.
The accounting policies of the underlying funds in which the fund invests are outlined in the underlying funds’ shareholder reports, which are available without charge by calling 1-800-225-2606, at mfs.com and on the Securities and Exchange Commission (SEC) web site at http://www.sec.gov. The underlying funds' shareholder reports are not covered by this report.
Certain of the fund's investments, derivatives, debt and other contracts may be based on reference interest rates such as the London Interbank Offered Rate (“LIBOR”). In 2017, the regulatory authority that oversees financial services firms in the United Kingdom announced plans to transition away from LIBOR by the end of 2021. In March 2021, the administrator of LIBOR announced the extension of the publication of the more commonly used U.S. dollar LIBOR settings to the end of June 2023. Although the full impacts of the transition away from LIBOR are not fully known, the transition may result in, among other things, an increase in volatility or illiquidity of the markets for instruments that currently rely on LIBOR to determine interest rates and this could have an adverse impact on the fund's performance. With respect to the fund's accounting for investments, derivatives, debt and other contracts that undergo reference rate-related modifications as a result of the transition, management will rely upon the relief provided by FASB Codification Topic 848 – Reference Rate Reform (Topic 848). The guidance in Topic 848 permits the fund to disregard the GAAP accounting requirements around certain contract modifications resulting from the LIBOR transition such that for contracts considered in scope, the fund can account for those modified contracts as a continuation of the existing contracts.
Investment Valuations — Open-end investment companies (underlying funds) are generally valued at their net asset value per share. The investments of underlying funds managed by the adviser are valued as described below. For purposes of this policy disclosure, “fund” also refers to the underlying funds in which the fund-of-funds invests.
MFS Conservative Allocation Portfolio
Notes to Financial Statements (unaudited) - continued
Equity securities, including restricted equity securities and equity securities sold short, are generally valued at the last sale or official closing price on their primary market or exchange as provided by a third-party pricing service. Equity securities, for which there were no sales reported that day, are generally valued at the last quoted daily bid quotation on their primary market or exchange as provided by a third-party pricing service. Equity securities sold short, for which there were no sales reported that day, are generally valued at the last quoted daily ask quotation on their primary market or exchange as provided by a third-party pricing service. Debt instruments and floating rate loans, including restricted debt instruments, are generally valued at an evaluated or composite bid as provided by a third-party pricing service. Debt instruments sold short are generally valued at an evaluated or composite mean as provided by a third-party pricing service. Short-term instruments with a maturity at issuance of 60 days or less may be valued at amortized cost, which approximates market value. Exchange-traded options are generally valued at the last sale or official closing price on their primary exchange as provided by a third-party pricing service. Exchange-traded options for which there were no sales reported that day are generally valued at the last daily bid quotation on their primary exchange as provided by a third-party pricing service. For put options, the position may be valued at the last daily ask quotation if there are no trades reported during the day. Options not traded on an exchange are generally valued at a broker/dealer bid quotation. Foreign currency options are generally valued at valuations provided by a third-party pricing service. Futures contracts are generally valued at last posted settlement price on their primary exchange as provided by a third-party pricing service. Futures contracts for which there were no trades that day for a particular position are generally valued at the closing bid quotation on their primary exchange as provided by a third-party pricing service. Forward foreign currency exchange contracts are generally valued at the mean of bid and asked prices for the time period interpolated from rates provided by a third-party pricing service for proximate time periods. Swap agreements are generally valued using valuations provided by a third-party pricing service, which for cleared swaps includes an evaluation of any trading activity at the clearinghouses. Open-end investment companies are generally valued at net asset value per share. Securities and other assets generally valued on the basis of information from a third-party pricing service may also be valued at a broker/dealer bid quotation. In determining values, third-party pricing services can utilize both transaction data and market information such as yield, quality, coupon rate, maturity, type of issue, trading characteristics, and other market data. The values of foreign securities and other assets and liabilities expressed in foreign currencies are converted to U.S. dollars using the mean of bid and asked prices for rates provided by a third-party pricing service.
The Board of Trustees has delegated primary responsibility for determining or causing to be determined the value of the fund’s investments (including any fair valuation) to the adviser pursuant to valuation policies and procedures approved by the Board. If the adviser determines that reliable market quotations are not readily available, investments are valued at fair value as determined in good faith by the adviser in accordance with such procedures under the oversight of the Board of Trustees. Under the fund’s valuation policies and procedures, market quotations are not considered to be readily available for most types of debt instruments and floating rate loans and many types of derivatives. These investments are generally valued at fair value based on information from third-party pricing services. In addition, investments may be valued at fair value if the adviser determines that an investment’s value has been materially affected by events occurring after the close of the exchange or market on which the investment is principally traded (such as foreign exchange or market) and prior to the determination of the fund’s net asset value, or after the halt of trading of a specific security where trading does not resume prior to the close of the exchange or market on which the security is principally traded. Events that occur after foreign markets close (such as developments in foreign markets and significant movements in the U.S. markets) and prior to the determination of the fund’s net asset value may be deemed to have a material effect on the value of securities traded in foreign markets. Accordingly, the fund’s foreign equity securities may often be valued at fair value. The adviser generally relies on third-party pricing services or other information (such as the correlation with price movements of similar securities in the same or other markets; the type, cost and investment characteristics of the security; the business and financial condition of the issuer; and trading and other market data) to assist in determining whether to fair value and at what value to fair value an investment. The value of an investment for purposes of calculating the fund’s net asset value can differ depending on the source and method used to determine value. When fair valuation is used, the value of an investment used to determine the fund’s net asset value may differ from quoted or published prices for the same investment. There can be no assurance that the fund could obtain the fair value assigned to an investment if it were to sell the investment at the same time at which the fund determines its net asset value per share.
Various inputs are used in determining the value of the fund's assets or liabilities. These inputs are categorized into three broad levels. In certain cases, the inputs used to measure fair value may fall into different levels of the fair value hierarchy. In such cases, an investment's level within the fair value hierarchy is based on the lowest level of input that is significant to the fair value measurement. The fund's assessment of the significance of a particular input to the fair value measurement in its entirety requires judgment, and considers factors specific to the investment. Level 1 includes unadjusted quoted prices in active markets for identical assets or liabilities. Level 2 includes other significant observable market-based inputs (including quoted prices for similar securities, interest rates, prepayment speed, and credit risk). Level 3 includes unobservable inputs, which may include the adviser's own assumptions in determining the fair value of investments. The following is a summary of the levels used as of June 30, 2021 in valuing the fund's assets or liabilities:
MFS Conservative Allocation Portfolio
Notes to Financial Statements (unaudited) - continued
| Financial Instruments | Level 1 | Level 2 | Level 3 | Total |
| Mutual Funds | $417,453,452 | $— | $— | $417,453,452 |
For further information regarding security characteristics, see the Portfolio of Investments. Please refer to the underlying funds’ shareholder reports for further information regarding the levels used in valuing the underlying funds’ assets or liabilities.
Derivatives — The fund does not invest in derivatives directly. The fund does invest in underlying funds that may use derivatives primarily to increase or decrease exposure to a particular market or segment of the market, or security, to increase or decrease interest rate or currency exposure, or as alternatives to direct investments. Derivatives are used for hedging or non-hedging purposes. While hedging can reduce or eliminate losses, it can also reduce or eliminate gains. When the underlying funds use derivatives as an investment to increase market exposure, or for hedging purposes, gains and losses from derivative instruments may be substantially greater than the derivative’s original cost.
Indemnifications — Under the fund's organizational documents, its officers and Trustees may be indemnified against certain liabilities and expenses arising out of the performance of their duties to the fund. Additionally, in the normal course of business, the fund enters into agreements with service providers that may contain indemnification clauses. The fund's maximum exposure under these agreements is unknown as this would involve future claims that may be made against the fund that have not yet occurred.
Investment Transactions and Income — Investment transactions are recorded on the trade date. Interest income is recorded on the accrual basis. All premium and discount is amortized or accreted for financial statement purposes in accordance with U.S. generally accepted accounting principles. Distributions of income and capital gains from the underlying funds are recorded on the ex-dividend date. Recognition of net investment income by the fund is affected by the timing of the declaration of distributions by the underlying funds in which the fund invests. In determining the net gain or loss on securities sold, the cost of securities is determined on the identified cost basis.
The fund and/or the underlying funds may receive proceeds from litigation settlements. Any proceeds received from litigation involving portfolio holdings are reflected in the Statement of Operations in realized gain/loss if the security has been disposed of by the fund or in unrealized gain/loss if the security is still held by the fund. Any other proceeds from litigation not related to portfolio holdings are reflected as other income in the Statement of Operations.
Tax Matters and Distributions — The fund intends to qualify as a regulated investment company, as defined under Subchapter M of the Internal Revenue Code, and to distribute all of its taxable income, including realized capital gains. As a result, no provision for federal income tax is required. The fund’s federal tax returns, when filed, will remain subject to examination by the Internal Revenue Service for a three year period. Management has analyzed the fund’s tax positions taken on federal and state tax returns for all open tax years and does not believe that there are any uncertain tax positions that require recognition of a tax liability.
Distributions to shareholders are recorded on the ex-dividend date. Income and capital gain distributions are determined in accordance with income tax regulations, which may differ from U.S. generally accepted accounting principles. Certain capital accounts in the financial statements are periodically adjusted for permanent differences in order to reflect their tax character. These adjustments have no impact on net assets or net asset value per share. Temporary differences which arise from recognizing certain items of income, expense, gain or loss in different periods for financial statement and tax purposes will reverse at some time in the future.
Book/tax differences primarily relate to wash sale loss deferrals.
The tax character of distributions declared to shareholders for the last fiscal year is as follows:
| | Year ended
12/31/20 |
| Ordinary income (including any short-term capital gains) | $10,462,384 |
| Long-term capital gains | 18,274,138 |
| Total distributions | $28,736,522 |
The federal tax cost and the tax basis components of distributable earnings were as follows:
MFS Conservative Allocation Portfolio
Notes to Financial Statements (unaudited) - continued
| As of 6/30/21 | |
| Cost of investments | $338,595,781 |
| Gross appreciation | 80,340,215 |
| Gross depreciation | (1,482,544) |
| Net unrealized appreciation (depreciation) | $78,857,671 |
| As of 12/31/20 | |
| Undistributed ordinary income | 10,076,487 |
| Undistributed long-term capital gain | 13,792,596 |
| Net unrealized appreciation (depreciation) | 73,007,797 |
The aggregate cost above includes prior fiscal year end tax adjustments, if applicable.
Multiple Classes of Shares of Beneficial Interest — The fund offers multiple classes of shares, which differ in their respective distribution and/or service fees. The fund's income, realized and unrealized gain (loss), and common expenses are allocated to shareholders based on the daily net assets of each class. Dividends are declared separately for each class. Differences in per share dividend rates are generally due to differences in separate class expenses. The fund’s distributions declared to shareholders as reported in the Statements of Changes in Net Assets are presented by class as follows:
| | Six months
ended
6/30/21 | | Year
ended
12/31/20 |
| Initial Class | $— | | $204,461 |
| Service Class | — | | 28,532,061 |
| Total | $— | | $28,736,522 |
(3) Transactions with Affiliates
Investment Adviser — The fund has an investment advisory agreement with MFS to provide overall investment management and related administrative services and facilities to the fund. MFS receives no compensation under this agreement; however MFS receives management fees from the underlying MFS funds.
The investment adviser has agreed in writing to pay a portion of the fund’s operating expenses, excluding distribution and/or service fees, interest, taxes, extraordinary expenses, brokerage and transaction costs, and investment-related expenses such as fees and expenses associated with investments in investment companies and other similar investment vehicles such that fund operating expenses do not exceed 0.20% annually of the fund’s average daily net assets. This written agreement will continue until modified by the fund’s Board of Trustees, but such agreement will continue at least until April 30, 2023. For the six months ended June 30, 2021, the fund’s actual operating expenses did not exceed the limit and therefore, the investment adviser did not pay any portion of the fund’s expenses related to this agreement.
In addition to the fees and expenses which the fund bears directly, the fund indirectly bears a pro rata share of the fees and expenses of the underlying funds in which the fund invests. Accordingly, the expense ratio for the fund reflects only those fees and expenses borne directly by the fund.
Distributor — MFS Fund Distributors, Inc. (MFD), a wholly-owned subsidiary of MFS, is the distributor of shares of the fund. The Trustees have adopted a distribution plan for the Service Class shares pursuant to Rule 12b-1 under the Investment Company Act of 1940.
The fund's distribution plan provides that the fund will pay MFD distribution and/or service fees equal to 0.25% per annum of its average daily net assets attributable to Service Class shares as partial consideration for services performed and expenses incurred by MFD and financial intermediaries (including participating insurance companies that invest in the fund to fund variable annuity and variable life insurance contracts, sponsors of qualified retirement and pension plans that invest in the fund, and affiliates of these participating insurance companies and plan sponsors) in connection with the sale and distribution of the Service Class shares. MFD may subsequently pay all, or a portion, of the distribution and/or service fees to financial intermediaries.
Shareholder Servicing Agent — MFS Service Center, Inc. (MFSC), a wholly-owned subsidiary of MFS, receives a fee from the fund for its services as shareholder servicing agent. For the six months ended June 30, 2021, the fee was $4,022, which equated to 0.0019% annually of the fund's average daily net assets. MFSC also receives reimbursement from the fund for out-of-pocket expenses paid by MFSC on behalf of the fund. For the six months ended June 30, 2021, these costs amounted to $72.
MFS Conservative Allocation Portfolio
Notes to Financial Statements (unaudited) - continued
Administrator — MFS provides certain financial, legal, shareholder communications, compliance, and other administrative services to the fund. Under an administrative services agreement, the fund reimburses MFS the costs incurred to provide these services. The fund pays an annual fixed amount of $17,500. The administrative services fee incurred for the six months ended June 30, 2021 was equivalent to an annual effective rate of 0.0041% of the fund's average daily net assets.
Trustees’ and Officers’ Compensation — The fund pays compensation to independent Trustees in the form of a retainer, attendance fees, and additional compensation to Board and Committee chairpersons. The fund does not pay compensation directly to Trustees or officers of the fund who are also officers of the investment adviser, all of whom receive remuneration from MFS for their services to the fund. Certain officers and Trustees of the fund are officers or directors of MFS, MFD, and MFSC.
Other — The fund invests in the MFS Institutional Money Market Portfolio which is managed by MFS and seeks current income consistent with preservation of capital and liquidity. This money market fund does not pay a management fee to MFS but does incur investment and operating costs.
(4) Portfolio Securities
For the six months ended June 30, 2021, purchases and sales of shares of underlying funds, excluding the MFS Institutional Money Market Portfolio, aggregated $2,563,545 and $32,869,411, respectively.
(5) Shares of Beneficial Interest
The fund's Declaration of Trust permits the Trustees to issue an unlimited number of full and fractional shares of beneficial interest. Transactions in fund shares were as follows:
| | Six months ended
6/30/21 | | Year ended
12/31/20 |
| | Shares | Amount | | Shares | Amount |
| Shares sold | | | | | |
| Initial Class | 14,142 | $175,108 | | 128,703 | $1,465,862 |
| Service Class | 291,722 | 3,519,254 | | 685,857 | 7,863,331 |
| | 305,864 | $3,694,362 | | 814,560 | $9,329,193 |
Shares issued to shareholders
in reinvestment of distributions | | | | | |
| Initial Class | — | $— | | 18,062 | $204,461 |
| Service Class | — | — | | 2,509,416 | 28,532,061 |
| | — | $— | | 2,527,478 | $28,736,522 |
| Shares reacquired | | | | | |
| Initial Class | (17,471) | $(209,965) | | (67,990) | $(753,310) |
| Service Class | (2,730,270) | (33,218,038) | | (5,236,313) | (59,612,171) |
| | (2,747,741) | $(33,428,003) | | (5,304,303) | $(60,365,481) |
| Net change | | | | | |
| Initial Class | (3,329) | $(34,857) | | 78,775 | $917,013 |
| Service Class | (2,438,548) | (29,698,784) | | (2,041,040) | (23,216,779) |
| | (2,441,877) | $(29,733,641) | | (1,962,265) | $(22,299,766) |
(6) Line of Credit
The fund and certain other funds managed by MFS participate in a $1.25 billion unsecured committed line of credit of which $1 billion is reserved for use by the fund and certain other MFS U.S. funds. The line of credit is provided by a syndicate of banks under a credit agreement. Borrowings may be made for temporary financing needs. Interest is charged to each fund, based on its borrowings, generally at a rate equal to the highest of one month LIBOR, the Federal Funds Effective Rate and the Overnight Bank Funding Rate, plus an agreed upon spread. A commitment fee, based on the average daily, unused portion of the committed line of credit, is allocated among the participating funds. In addition, the fund and other funds managed by MFS have established unsecured uncommitted borrowing arrangements with certain banks for temporary financing needs. Interest is charged to each fund, based on its borrowings, at rates equal to customary reference rates plus an agreed upon spread. For the six months ended June 30, 2021, the fund’s commitment fee and interest expense were $770 and $0, respectively, and are included in “Miscellaneous” expense in the Statement of Operations.
MFS Conservative Allocation Portfolio
Notes to Financial Statements (unaudited) - continued
(7) Investments in Affiliated Issuers
An affiliated issuer may be considered one in which the fund owns 5% or more of the outstanding voting securities, or a company which is under common control. For the purposes of this report, the following were affiliated issuers:
| Affiliated Issuers | Beginning
Value | Purchases | Sales
Proceeds | Realized
Gain
(Loss) | Change in
Unrealized
Appreciation or
Depreciation | Ending
Value |
| MFS Global Governments Portfolio | $34,251,986 | $475,240 | $47,955 | $183 | $(1,699,822) | $32,979,632 |
| MFS Global Real Estate Portfolio | 8,706,919 | 3,815 | 1,691,038 | 446,449 | 785,530 | 8,251,675 |
| MFS Government Securities Portfolio | 41,854,392 | 556,137 | 80,640 | (5,460) | (677,211) | 41,647,218 |
| MFS Growth Series | 26,070,201 | 304,436 | 4,437,408 | 2,823,815 | 341,064 | 25,102,108 |
| MFS High Yield Portfolio | 21,508,098 | 24,132 | 1,185,361 | (76,861) | 588,817 | 20,858,825 |
| MFS Inflation-Adjusted Bond Portfolio | 43,215,292 | 110,396 | 1,465,236 | 180,645 | (600,948) | 41,440,149 |
| MFS Institutional Money Market Portfolio | 1,658,652 | 536,359 | 543,215 | — | — | 1,651,796 |
| MFS International Growth Portfolio | 8,732,163 | 1,515 | 1,092,322 | 351,287 | 278,721 | 8,271,364 |
| MFS International Intrinsic Value Portfolio | 8,706,814 | 20,988 | 860,027 | 446,860 | (37,098) | 8,277,537 |
| MFS Limited Maturity Portfolio | 50,602,857 | 120,723 | 971,149 | (430) | 240,122 | 49,992,123 |
| MFS Mid Cap Growth Series | 17,529,411 | 363,348 | 2,109,100 | 965,628 | (49,365) | 16,699,922 |
| MFS Mid Cap Value Portfolio | 17,447,117 | 15,524 | 3,967,430 | 723,715 | 2,328,852 | 16,547,778 |
| MFS New Discovery Series | 4,400,343 | 74,966 | 699,733 | 287,499 | 95,531 | 4,158,606 |
| MFS New Discovery Value Portfolio | 4,380,552 | 3,000 | 1,268,798 | 287,259 | 724,140 | 4,126,153 |
| MFS Research International Portfolio | 17,455,372 | 1,288 | 2,214,064 | 672,229 | 584,714 | 16,499,539 |
| MFS Research Series | 26,119,129 | 29,562 | 4,616,442 | 1,796,854 | 1,719,994 | 25,049,097 |
| MFS Total Return Bond Series | 72,553,252 | 424,654 | 1,390,233 | 11,067 | (676,203) | 70,922,537 |
| MFS Value Series | 26,144,086 | 33,821 | 4,772,475 | 1,668,925 | 1,903,036 | 24,977,393 |
| | $431,336,636 | $3,099,904 | $33,412,626 | $10,579,664 | $5,849,874 | $417,453,452 |
| Affiliated Issuers | Dividend
Income | Capital Gain
Distributions |
| MFS Global Governments Portfolio | $— | $— |
| MFS Global Real Estate Portfolio | — | — |
| MFS Government Securities Portfolio | — | — |
| MFS Growth Series | — | — |
| MFS High Yield Portfolio | — | — |
| MFS Inflation-Adjusted Bond Portfolio | — | — |
| MFS Institutional Money Market Portfolio | 441 | — |
| MFS International Growth Portfolio | — | — |
| MFS International Intrinsic Value Portfolio | — | — |
| MFS Limited Maturity Portfolio | — | — |
| MFS Mid Cap Growth Series | — | — |
| MFS Mid Cap Value Portfolio | — | — |
| MFS New Discovery Series | — | — |
| MFS New Discovery Value Portfolio | — | — |
| MFS Research International Portfolio | — | — |
| MFS Research Series | — | — |
| MFS Total Return Bond Series | — | — |
| MFS Value Series | — | — |
| | $441 | $— |
MFS Conservative Allocation Portfolio
Notes to Financial Statements (unaudited) - continued
(8) Impacts of COVID-19
The pandemic related to the global spread of novel coronavirus disease (COVID-19), which was first detected in December 2019, has resulted in significant disruptions to global business activity and the global economy, as well as the economies of individual countries, the financial performance of individual companies and sectors, and the securities and commodities markets in general. Multiple surges in cases globally, the availability and widespread adoption of vaccines, and the emergence of variant strains of the virus continue to create uncertainty as to the future and long-term impacts resulting from the pandemic including impacts to the prices and liquidity of the fund's investments and the fund's performance.
MFS Conservative Allocation Portfolio
Statement Regarding Liquidity Risk Management Program
The fund has adopted and implemented a liquidity risk management program (the “Program”) as required by Rule 22e-4 under the Investment Company Act of 1940, as amended. The fund’s Board of Trustees (the “Board”) has designated MFS as the administrator of the Program. The Program is reasonably designed to assess and manage the liquidity risk of the fund. Liquidity risk is the risk that the fund could not meet requests to redeem shares issued by the fund without significant dilution of remaining investors' interests.
MFS provided a written report to the Board for consideration at its April 2021 meeting that addressed the operation of the Program and provided an assessment of the adequacy and effectiveness of the Program during the period from January 1, 2020 to December 31, 2020 (the “Covered Period”). The report concluded that during the Covered Period the Program had operated effectively and had adequately and effectively been implemented to assess and manage the fund’s liquidity risk. MFS also reported that there were no liquidity events that impacted the fund or its ability to timely meet redemptions without dilution to existing shareholders during the Covered Period.
There can be no assurance that the Program will achieve its objectives in the future. Further information on liquidity risk, and other principal risks to which an investment in the fund may be subject, can be found in the prospectus.
MFS Conservative Allocation Portfolio
Proxy Voting Policies and Information
MFS votes proxies on behalf of the fund pursuant to proxy voting policies and procedures that are available without charge, upon request, by calling 1-800-225-2606, by visiting mfs.com/proxyvoting, or by visiting the SEC’s Web site at http://www.sec.gov.
Information regarding how the fund voted proxies relating to portfolio securities during the most recent twelve-month period ended June 30 is available by August 31 of each year without charge by visiting mfs.com/proxyvoting, or by visiting the SEC’s Web site at http://www.sec.gov.
Quarterly Portfolio Disclosure
The fund files a complete schedule of portfolio holdings with the SEC for the first and third quarters of each fiscal year as an exhibit to its reports on Form N-PORT. The fund’s Form N-PORT reports are available on the SEC’s Web site at http://www.sec.gov. A shareholder can obtain the portfolio holdings report for the first and third quarters of the fund's fiscal year at mfs.com/vit3 by choosing the fund's name and then scrolling to the “Resources” section and clicking on the “Prospectus and Reports” tab.
FURTHER INFORMATION
From time to time, MFS may post important information about the fund or the MFS Funds on the MFS Web site (mfs.com). This information is available at https://www.mfs.com/announcements or at mfs.com/vit3 by choosing the fund's name and then scrolling to the “Resources” section and clicking on the “Announcements” tab, if any.
Information About Fund Contracts and Legal Claims
The fund has entered into contractual arrangements with an investment adviser, administrator, distributor, shareholder servicing agent, 529 program manager (if applicable), and custodian who each provide services to the fund. Unless expressly stated otherwise, shareholders are not parties to, or intended beneficiaries of these contractual arrangements, and these contractual arrangements are not intended to create any shareholder right to enforce them against the service providers or to seek any remedy under them against the service providers, either directly or on behalf of the fund.
Under the Trust’s By-Laws and Declaration of Trust, any claims asserted against or on behalf of the MFS Funds, including claims against Trustees and Officers, must be brought in state and federal courts located within the Commonwealth of Massachusetts.
Semiannual Report
June 30, 2021
MFS® Global Real
Estate Portfolio
MFS® Variable Insurance Trust III
MFS® Global Real Estate Portfolio
The report is prepared for the general information of contract owners. It is authorized for distribution to prospective investors only when preceded or accompanied by a current prospectus.
NOT FDIC INSURED • MAY LOSE VALUE • NO BANK OR CREDIT UNION GUARANTEE •
NOT A DEPOSIT • NOT INSURED BY ANY FEDERAL GOVERNMENT AGENCY OR NCUA/NCUSIF
MFS Global Real Estate Portfolio
Dear Contract Owners:
After experiencing dramatic swings in the early days of the coronavirus pandemic, global equity markets have performed strongly over the past year. Though the speedy development of vaccines brightened the economic and market outlook, uncertainty remains as new variants of the virus appear, and questions persist over how fast vaccines can be made widely available in the developing world.
Global central banks have taken aggressive steps to cushion the economic and market fallout related to the virus, and governments are deploying unprecedented levels of fiscal support. Having passed a $1.9 trillion stimulus package in March, the U.S. Congress could approve additional stimulus later this year, some of it focused on infrastructure. Along with extraordinary government expenditures, pent-up consumer demand fueled a surge in economic activity as coronavirus restrictions were eased, pushing up inflation, at least temporarily. Markets initially reacted by pushing up yields on global government bonds, though some of the rate rise has since been corrected.
A spirited debate is underway among investors over whether the current price pressures will persist or prove to be temporary, caused by pandemic-induced bottlenecks. The policy measures put in place to counteract the pandemic's effects have helped build a supportive environment and are encouraging economic recovery; however, if markets disconnect from fundamentals, they can sow the seeds of instability. As such, recent dramatic increases in speculative trading in cryptocurrencies, special purpose acquisition companies (SPACs), and the like bear watching.
In the aftermath of the crisis, we could see societal changes as households, businesses, and governments adjust to a new reality, and any such alterations could affect the investment landscape. For investors, events such as the COVID-19 outbreak demonstrate the importance of having a deep understanding of company fundamentals, and we have built our global research platform to do just that.
At MFS®, we put our clients’ assets to work responsibly by carefully navigating the increasing complexity of global markets and economies. Guided by our long-term philosophy and adhering to our commitment to sustainable investing, we tune out the noise and aim to uncover what we believe are the best, most durable investment opportunities in the market. Our unique global investment platform combines collective expertise, long-term discipline, and thoughtful risk management to create sustainable value for investors.
Respectfully,
Michael W. Roberge
Chief Executive Officer
MFS Investment Management
August 13, 2021
The opinions expressed in this letter are subject to change and may not be relied upon for investment advice. No forecasts can be guaranteed.
MFS Global Real Estate Portfolio
Portfolio structure
Top ten holdings
| Prologis, Inc., REIT | 6.2% |
| Welltower, Inc., REIT | 3.4% |
| Extra Space Storage, Inc., REIT | 3.3% |
| AvalonBay Communities, Inc., REIT | 3.0% |
| American Homes 4 Rent, “A”, REIT | 2.9% |
| Goodman Group, REIT | 2.7% |
| Equinix, Inc., REIT | 2.5% |
| Simon Property Group, Inc., REIT | 2.5% |
| DeutscheWohnen SE | 2.5% |
| Cellnex Telecom S.A. | 2.4% |
GICS equity industries (g)
| Real Estate | 93.9% |
| Communication Services | 4.1% |
| Health Care | 0.9% |
Issuer country weightings (x)
| United States | 58.2% |
| Hong Kong | 6.0% |
| United Kingdom | 5.9% |
| Japan | 4.7% |
| Singapore | 4.1% |
| Germany | 4.1% |
| Australia | 4.1% |
| Belgium | 3.4% |
| Canada | 2.6% |
| Other Countries | 6.9% |
Currency exposure weightings (y)
| United States Dollar | 58.2% |
| Euro | 9.9% |
| British Pound Sterling | 7.6% |
| Hong Kong Dollar | 6.0% |
| Japanese Yen | 4.7% |
| Singapore Dollar | 4.1% |
| Australian Dollar | 4.1% |
| Canadian Dollar | 2.6% |
| Mexican Peso | 1.6% |
| Other Currencies | 1.2% |
| (g) | The Global Industry Classification Standard (GICS®) was developed by and/or is the exclusive property of MSCI, Inc. and S&P Global Market Intelligence Inc. (“S&P Global Market Intelligence”). GICS is a service mark of MSCI and S&P Global Market Intelligence and has been licensed for use by MFS. MFS has applied its own internal sector/industry classification methodology for equity securities and non-equity securities that are unclassified by GICS. |
| (x) | Represents the portfolio’s exposure to issuer countries as a percentage of a portfolio’s net assets. For purposes of this presentation, United States includes Cash & Cash Equivalents. |
| (y) | Represents the portfolio’s exposure to a particular currency as a percentage of a portfolio's net assets. For purposes of this presentation, United States Dollar includes Cash & Cash Equivalents. |
Cash & Cash Equivalents includes any cash, investments in money market funds, short-term securities, and other assets less liabilities. Please see the Statement of Assets and Liabilities for additional information related to the fund’s cash position and other assets and liabilities.
Percentages are based on net assets as of June 30, 2021.
The portfolio is actively managed and current holdings may be different.
MFS Global Real Estate Portfolio
Expense Table
Fund Expenses Borne by the Contract Holders during the Period,
January 1, 2021 through June 30, 2021
As a contract holder of the fund, you incur ongoing costs, including management fees; distribution and/or service (12b-1) fees; and other fund expenses. This example is intended to help you understand your ongoing costs (in dollars) of investing in the fund and to compare these costs with the ongoing costs of investing in other mutual funds.
The example is based on an investment of $1,000 invested at the beginning of the period and held for the entire period January 1, 2021 through June 30, 2021.
Actual Expenses
The first line for each share class in the following table provides information about actual account values and actual expenses. You may use the information in this line, together with the amount you invested, to estimate the expenses that you paid over the period. Simply divide your account value by $1,000 (for example, an $8,600 account value divided by $1,000 = 8.6), then multiply the result by the number in the first line under the heading entitled “Expenses Paid During Period” to estimate the expenses you paid on your account during this period.
Hypothetical Example for Comparison Purposes
The second line for each share class in the following table provides information about hypothetical account values and hypothetical expenses based on the fund’s actual expense ratio and an assumed rate of return of 5% per year before expenses, which is not the fund’s actual return. The hypothetical account values and expenses may not be used to estimate the actual ending account balance or expenses you paid for the period. You may use this information to compare the ongoing costs of investing in the fund and other funds. To do so, compare this 5% hypothetical example with the 5% hypothetical examples that appear in the shareholder reports of the other funds.
Please note that the expenses shown in the table are meant to highlight the fund's ongoing costs only and do not take into account the fees and expenses imposed under the variable contracts through which your investment in the fund is made. Therefore, the second line for each share class in the table is useful in comparing ongoing costs associated with an investment in vehicles (such as the fund) which fund benefits under variable annuity and variable life insurance contracts and to qualified pension and retirement plans only, and will not help you determine the relative total costs of investing in the fund through variable annuity and variable life insurance contracts. If the fees and expenses imposed under the variable contracts were included, your costs would have been higher.
Share
Class | | Annualized
Expense
Ratio | Beginning
Account Value
1/01/21 | Ending
Account Value
6/30/21 | Expenses
Paid During
Period (p)
1/01/21-6/30/21 |
| Initial Class | Actual | 0.92% | $1,000.00 | $1,153.54 | $4.91 |
| Hypothetical (h) | 0.92% | $1,000.00 | $1,020.23 | $4.61 |
| Service Class | Actual | 1.17% | $1,000.00 | $1,152.89 | $6.25 |
| Hypothetical (h) | 1.17% | $1,000.00 | $1,018.99 | $5.86 |
| (h) | 5% class return per year before expenses. |
| (p) | “Expenses Paid During Period” are equal to each class's annualized expense ratio, as shown above, multiplied by the average account value over the period, multiplied by 181/365 (to reflect the one-half year period). |
MFS Global Real Estate Portfolio
Portfolio of Investments − 6/30/21 (unaudited)
The Portfolio of Investments is a complete list of all securities owned by your fund. It is categorized by broad-based asset classes.
| Issuer | | | Shares/Par | Value ($) |
| Common Stocks – 98.9% |
| Construction – 8.2% | |
| American Homes 4 Rent, “A”, REIT | | 153,946 | $ 5,980,802 |
| AvalonBay Communities, Inc., REIT | | 29,007 | 6,053,471 |
| Mid-America Apartment Communities, Inc., REIT | | 27,699 | 4,665,066 |
| | | | | $16,699,339 |
| Forest & Paper Products – 1.6% | |
| Rayonier, Inc., REIT | | 92,311 | $ 3,316,734 |
| Medical & Health Technology & Services – 0.9% | |
| Encompass Health Corp. | | 22,589 | $ 1,762,620 |
| Network & Telecom – 5.7% | |
| CoreSite Realty Corp., REIT | | 24,863 | $ 3,346,560 |
| Equinix, Inc., REIT | | 6,416 | 5,149,481 |
| QTS Realty Trust, Inc., REIT, “A” | | 38,583 | 2,982,466 |
| | | | | $11,478,507 |
| Real Estate – 76.4% | |
| Advance Residence Investment Corp., REIT | | 1,001 | $ 3,333,813 |
| Alexandria Real Estate Equities, Inc., REIT | | 21,011 | 3,822,741 |
| Allied Properties, REIT | | 43,923 | 1,596,266 |
| Ascendas India Trust, REIT | | 1,645,600 | 1,701,037 |
| Big Yellow Group PLC, REIT | | 190,314 | 3,440,826 |
| Boston Properties, Inc., REIT | | 22,761 | 2,608,183 |
| Brixmor Property Group, Inc., REIT | | 155,435 | 3,557,907 |
| Corporacion Inmobiliaria Vesta S.A.B. de C.V. | | 755,064 | 1,468,917 |
| Deutsche Wohnen SE | | 81,891 | 5,008,535 |
| Douglas Emmett, Inc., REIT | | 74,594 | 2,507,850 |
| Embassy Office Parks, REIT | | 398,600 | 1,878,938 |
| Empire State Realty Trust, REIT, “A” | | 84,743 | 1,016,916 |
| Equity Lifestyle Properties, Inc., REIT | | 63,621 | 4,727,677 |
| ESR Cayman Ltd. (a) | | 1,124,800 | 3,795,546 |
| Extra Space Storage, Inc., REIT | | 40,771 | 6,679,105 |
| Fibra Uno Administracion S.A. de C.V., REIT | | 1,577,958 | 1,704,296 |
| Goodman Group, REIT | | 349,727 | 5,552,421 |
| Grainger PLC | | 857,651 | 3,381,208 |
| Granite REIT | | 54,369 | 3,617,582 |
| Host Hotels & Resorts, Inc., REIT (a) | | 170,584 | 2,915,281 |
| Japan Logistics Fund, Inc., REIT | | 882 | 2,651,676 |
| Katitas Co. Ltd. | | 123,800 | 3,476,808 |
| LEG Immobilien SE | | 22,965 | 3,307,175 |
| Link REIT | | 306,964 | 2,975,032 |
| Mapletree Commercial Trust, REIT | | 1,970,800 | 3,165,708 |
| Issuer | | | Shares/Par | Value ($) |
| Common Stocks – continued |
| Real Estate – continued | |
| Mapletree Logistics Trust, REIT | | 2,286,531 | $ 3,485,825 |
| Medical Properties Trust, Inc., REIT | | 163,970 | 3,295,797 |
| Multiplan Empreendimentos Imobiliarios S.A. | | 131,119 | 619,506 |
| National Retail Properties, Inc., REIT | | 67,200 | 3,150,336 |
| National Storage, REIT | | 1,849,049 | 2,745,655 |
| Prologis, Inc., REIT | | 105,810 | 12,647,469 |
| Shaftesbury PLC, REIT | | 465,751 | 3,669,137 |
| Shurgard Self Storage S.A. | | 52,038 | 2,511,355 |
| Simon Property Group, Inc., REIT | | 39,391 | 5,139,738 |
| Sino Land Co. Ltd. | | 1,540,613 | 2,428,693 |
| STAG Industrial, Inc., REIT | | 101,657 | 3,805,021 |
| STORE Capital Corp., REIT | | 105,276 | 3,633,075 |
| Sun Communities, Inc., REIT | | 27,423 | 4,700,302 |
| Swire Properties Ltd. | | 1,000,200 | 2,982,192 |
| Unite Group PLC, REIT | | 105,733 | 1,570,837 |
| Urban Edge Properties, REIT | | 164,058 | 3,133,508 |
| VICI Properties, Inc., REIT | | 145,962 | 4,527,741 |
| Warehouses De Pauw, REIT | | 113,738 | 4,342,648 |
| Welltower, Inc., REIT | | 81,839 | 6,800,821 |
| | | | | $ 155,081,100 |
| Real Estate - Other – 0.5% | |
| EPR Properties, REIT (a) | | 18,938 | $ 997,654 |
| Telecommunications - Wireless – 3.9% | |
| American Tower Corp., REIT | | 11,303 | $ 3,053,393 |
| Cellnex Telecom S.A. | | 77,799 | 4,955,679 |
| | | | | $8,009,072 |
| Telephone Services – 1.7% | |
| Helios Tower PLC (a) | | 1,495,777 | $ 3,372,646 |
| Total Common Stocks (Identified Cost, $130,773,280) | | $200,717,672 |
| Investment Companies (h) – 0.9% |
| Money Market Funds – 0.9% | |
| MFS Institutional Money Market Portfolio, 0.02% (v) (Identified Cost, $1,701,121) | | | 1,701,121 | $ 1,701,121 |
| Other Assets, Less Liabilities – 0.2% | | 480,344 |
| Net Assets – 100.0% | $202,899,137 |
| (a) | Non-income producing security. | | | |
| (h) | An affiliated issuer, which may be considered one in which the fund owns 5% or more of the outstanding voting securities, or a company which is under common control. At period end, the aggregate values of the fund's investments in affiliated issuers and in unaffiliated issuers were $1,701,121 and $200,717,672, respectively. | | | |
| (v) | Affiliated issuer that is available only to investment companies managed by MFS. The rate quoted for the MFS Institutional Money Market Portfolio is the annualized seven-day yield of the fund at period end. | | | |
| The following abbreviations are used in this report and are defined: |
| REIT | Real Estate Investment Trust |
See Notes to Financial Statements
MFS Global Real Estate Portfolio
| Financial Statements | Statement of Assets and Liabilities (unaudited) |
This statement represents your fund’s balance sheet, which details the assets and liabilities comprising the total value of the fund.
| At 6/30/21Assets | |
| Investments in unaffiliated issuers, at value (identified cost, $130,773,280) | $200,717,672 |
| Investments in affiliated issuers, at value (identified cost, $1,701,121) | 1,701,121 |
| Cash | 15,395 |
| Receivables for | |
| Fund shares sold | 84,359 |
| Dividends | 582,648 |
| Receivable from investment adviser | 4,420 |
| Other assets | 1,049 |
| Total assets | $203,106,664 |
| Liabilities | |
| Payable to custodian | $43 |
| Payables for | |
| Fund shares reacquired | 143,935 |
| Payable to affiliates | |
| Administrative services fee | 206 |
| Shareholder servicing costs | 71 |
| Distribution and/or service fees | 847 |
| Accrued expenses and other liabilities | 62,425 |
| Total liabilities | $207,527 |
| Net assets | $202,899,137 |
| Net assets consist of | |
| Paid-in capital | $130,282,062 |
| Total distributable earnings (loss) | 72,617,075 |
| Net assets | $202,899,137 |
| Shares of beneficial interest outstanding | 11,205,848 |
| | Net assets | Shares
outstanding | Net asset value
per share |
| Initial Class | $141,595,515 | 8,194,225 | $17.28 |
| Service Class | 61,303,622 | 3,011,623 | 20.36 |
See Notes to Financial Statements
MFS Global Real Estate Portfolio
| Financial Statements | Statement of Operations (unaudited) |
This statement describes how much your fund earned in investment income and accrued in expenses. It also describes any gains and/or losses generated by fund operations.
| Six months ended 6/30/21 | |
| Net investment income (loss) | |
| Income | |
| Dividends | $2,869,689 |
| Other | 5,127 |
| Dividends from affiliated issuers | 1,003 |
| Foreign taxes withheld | (106,557) |
| Total investment income | $2,769,262 |
| Expenses | |
| Management fee | $869,091 |
| Distribution and/or service fees | 74,666 |
| Shareholder servicing costs | 6,803 |
| Administrative services fee | 17,846 |
| Independent Trustees' compensation | 2,367 |
| Custodian fee | 12,450 |
| Shareholder communications | 9,428 |
| Audit and tax fees | 34,394 |
| Legal fees | 679 |
| Miscellaneous | 12,902 |
| Total expenses | $1,040,626 |
| Reduction of expenses by investment adviser | (77,145) |
| Net expenses | $963,481 |
| Net investment income (loss) | $1,805,781 |
| Realized and unrealized gain (loss) | |
| Realized gain (loss) (identified cost basis) | |
| Unaffiliated issuers | $5,834,589 |
| Foreign currency | 1,022 |
| Net realized gain (loss) | $5,835,611 |
| Change in unrealized appreciation or depreciation | |
| Unaffiliated issuers | $20,397,428 |
| Translation of assets and liabilities in foreign currencies | (1,122) |
| Net unrealized gain (loss) | $20,396,306 |
| Net realized and unrealized gain (loss) | $26,231,917 |
| Change in net assets from operations | $28,037,698 |
See Notes to Financial Statements
MFS Global Real Estate Portfolio
| Financial Statements | Statements of Changes in Net Assets |
These statements describe the increases and/or decreases in net assets resulting from operations, any distributions, and any shareholder transactions.
| | Six months ended | Year ended |
| | 6/30/21
(unaudited) | 12/31/20 |
| Change in net assets | | |
| From operations | | |
| Net investment income (loss) | $1,805,781 | $3,300,962 |
| Net realized gain (loss) | 5,835,611 | (500,441) |
| Net unrealized gain (loss) | 20,396,306 | 2,028,325 |
| Change in net assets from operations | $28,037,698 | $4,828,846 |
| Total distributions to shareholders | $— | $(11,999,202) |
| Change in net assets from fund share transactions | $(10,696,072) | $1,689,470 |
| Total change in net assets | $17,341,626 | $(5,480,886) |
| Net assets | | |
| At beginning of period | 185,557,511 | 191,038,397 |
| At end of period | $202,899,137 | $185,557,511 |
See Notes to Financial Statements
MFS Global Real Estate Portfolio
| Financial Statements | Financial Highlights |
The financial highlights table is intended to help you understand the fund's financial performance for the semiannual period and the past 5 fiscal years. Certain information reflects financial results for a single fund share. The total returns in the table represent the rate that an investor would have earned (or lost) on an investment in the fund share class (assuming reinvestment of all distributions) held for the entire period.
| Initial Class | Six months
ended | Year ended |
| | 6/30/21
(unaudited) | 12/31/20 | 12/31/19 | 12/31/18 | 12/31/17 | 12/31/16 |
| Net asset value, beginning of period | $14.98 | $15.91 | $13.10 | $14.27 | $14.01 | $13.55 |
| Income (loss) from investment operations | | | | | | |
| Net investment income (loss) (d) | $0.15 | $0.28 | $0.35 | $0.42 | $0.37 | $0.37(c) |
| Net realized and unrealized gain (loss) | 2.15 | (0.14) | 3.14 | (0.79) | 1.42 | 0.74 |
| Total from investment operations | $2.30 | $0.14 | $3.49 | $(0.37) | $1.79 | $1.11 |
| Less distributions declared to shareholders | | | | | | |
| From net investment income | $— | $(0.70) | $(0.58) | $(0.58) | $(0.63) | $(0.39) |
| From net realized gain | — | (0.37) | (0.10) | (0.22) | (0.90) | (0.26) |
| Total distributions declared to shareholders | $— | $(1.07) | $(0.68) | $(0.80) | $(1.53) | $(0.65) |
| Net asset value, end of period (x) | $17.28 | $14.98 | $15.91 | $13.10 | $14.27 | $14.01 |
| Total return (%) (k)(r)(s)(x) | 15.35(n) | 1.49 | 26.87 | (3.03) | 13.33 | 7.94(c) |
Ratios (%) (to average net assets)
and Supplemental data: | | | | | | |
| Expenses before expense reductions (f) | 1.00(a) | 1.02 | 1.01 | 1.01 | 1.00 | 0.97(c) |
| Expenses after expense reductions (f) | 0.92(a) | 0.92 | 0.92 | 0.92 | 0.92 | 0.91(c) |
| Net investment income (loss) | 1.95(a) | 2.00 | 2.31 | 3.00 | 2.56 | 2.63(c) |
| Portfolio turnover | 16(n) | 43 | 36 | 24 | 24 | 30 |
| Net assets at end of period (000 omitted) | $141,596 | $127,523 | $132,530 | $99,826 | $114,198 | $115,023 |
See Notes to Financial Statements
MFS Global Real Estate Portfolio
Financial Highlights - continued
| Service Class | Six months
ended | Year ended |
| | 6/30/21
(unaudited) | 12/31/20 | 12/31/19 | 12/31/18 | 12/31/17 | 12/31/16 |
| Net asset value, beginning of period | $17.66 | $18.56 | $15.17 | $16.41 | $15.89 | $15.28 |
| Income (loss) from investment operations | | | | | | |
| Net investment income (loss) (d) | $0.16 | $0.29 | $0.36 | $0.44 | $0.38 | $0.38(c) |
| Net realized and unrealized gain (loss) | 2.54 | (0.17)(g) | 3.66 | (0.93) | 1.62 | 0.83 |
| Total from investment operations | $2.70 | $0.12 | $4.02 | $(0.49) | $2.00 | $1.21 |
| Less distributions declared to shareholders | | | | | | |
| From net investment income | $— | $(0.65) | $(0.53) | $(0.53) | $(0.58) | $(0.34) |
| From net realized gain | — | (0.37) | (0.10) | (0.22) | (0.90) | (0.26) |
| Total distributions declared to shareholders | $— | $(1.02) | $(0.63) | $(0.75) | $(1.48) | $(0.60) |
| Net asset value, end of period (x) | $20.36 | $17.66 | $18.56 | $15.17 | $16.41 | $15.89 |
| Total return (%) (k)(r)(s)(x) | 15.29(n) | 1.15 | 26.68 | (3.33) | 13.07 | 7.70(c) |
Ratios (%) (to average net assets)
and Supplemental data: | | | | | | |
| Expenses before expense reductions (f) | 1.25(a) | 1.27 | 1.26 | 1.26 | 1.25 | 1.22(c) |
| Expenses after expense reductions (f) | 1.17(a) | 1.17 | 1.17 | 1.17 | 1.17 | 1.16(c) |
| Net investment income (loss) | 1.69(a) | 1.75 | 2.07 | 2.74 | 2.31 | 2.37(c) |
| Portfolio turnover | 16(n) | 43 | 36 | 24 | 24 | 30 |
| Net assets at end of period (000 omitted) | $61,304 | $58,035 | $58,508 | $53,577 | $70,167 | $75,253 |
| (a) | Annualized. |
| (c) | Amount reflects a one-time reimbursement of expenses by the custodian (or former custodian) without which net investment income and performance would be lower and expenses would be higher. |
| (d) | Per share data is based on average shares outstanding. |
| (f) | Ratios do not reflect reductions from fees paid indirectly, if applicable. |
| (g) | The per share amount varies from the net realized and unrealized gain/loss for the period because of the timing of sales of fund shares and the per share amount of realized and unrealized gains and losses at such time. |
| (k) | The total return does not reflect expenses that apply to separate accounts. Inclusion of these charges would reduce the total return figures for all periods shown. |
| (n) | Not annualized. |
| (r) | Certain expenses have been reduced without which performance would have been lower. |
| (s) | From time to time the fund may receive proceeds from litigation settlements, without which performance would be lower. |
| (x) | The net asset values and total returns have been calculated on net assets which include adjustments made in accordance with U.S. generally accepted accounting principles required at period end for financial reporting purposes. |
See Notes to Financial Statements
MFS Global Real Estate Portfolio
Notes to Financial Statements (unaudited)
(1) Business and Organization
MFS Global Real Estate Portfolio (the fund) is a diversified series of MFS Variable Insurance Trust III (the trust). The trust is organized as a Delaware statutory trust and is registered under the Investment Company Act of 1940, as amended, as an open-end management investment company. The shareholders of each series of the trust are separate accounts of insurance companies, which offer variable annuity and/or life insurance products, and qualified retirement and pension plans.
The fund is an investment company and accordingly follows the investment company accounting and reporting guidance of the Financial Accounting Standards Board (FASB) Accounting Standards Codification Topic 946 Financial Services - Investment Companies.
(2) Significant Accounting Policies
General — The preparation of financial statements in conformity with U.S. generally accepted accounting principles requires management to make estimates and assumptions that affect the reported amounts of assets and liabilities, and disclosure of contingent assets and liabilities at the date of the financial statements and the reported amounts of increases and decreases in net assets from operations during the reporting period. Actual results could differ from those estimates. In the preparation of these financial statements, management has evaluated subsequent events occurring after the date of the fund’s Statement of Assets and Liabilities through the date that the financial statements were issued. The fund invests a significant amount of its net assets in U.S. and foreign real estate related investments and as a result is subject to certain risks associated with the direct ownership of real estate and the real estate industry in general. These include risks related to general, regional and local economic conditions; difficulties in valuing and disposing of real estate; fluctuations in interest rates and property tax rates, shifts in zoning laws, environmental regulations and other governmental action; cash flow dependency; increased operating expenses; lack of availability of mortgage funds; losses due to natural disasters; overbuilding; losses due to casualty or condemnation; changes in property values and rental rates; the management skill and creditworthiness of the manager; and other factors. The fund invests in foreign securities. Investments in foreign securities are vulnerable to the effects of changes in the relative values of the local currency and the U.S. dollar and to the effects of changes in each country’s market, economic, industrial, political, regulatory, geopolitical, environmental, public health, and other conditions.
Certain of the fund's investments, derivatives, debt and other contracts may be based on reference interest rates such as the London Interbank Offered Rate (“LIBOR”). In 2017, the regulatory authority that oversees financial services firms in the United Kingdom announced plans to transition away from LIBOR by the end of 2021. In March 2021, the administrator of LIBOR announced the extension of the publication of the more commonly used U.S. dollar LIBOR settings to the end of June 2023. Although the full impacts of the transition away from LIBOR are not fully known, the transition may result in, among other things, an increase in volatility or illiquidity of the markets for instruments that currently rely on LIBOR to determine interest rates and this could have an adverse impact on the fund's performance. With respect to the fund's accounting for investments, derivatives, debt and other contracts that undergo reference rate-related modifications as a result of the transition, management will rely upon the relief provided by FASB Codification Topic 848 – Reference Rate Reform (Topic 848). The guidance in Topic 848 permits the fund to disregard the GAAP accounting requirements around certain contract modifications resulting from the LIBOR transition such that for contracts considered in scope, the fund can account for those modified contracts as a continuation of the existing contracts.
Balance Sheet Offsetting — The fund's accounting policy with respect to balance sheet offsetting is that, absent an event of default by the counterparty or a termination of the agreement, the International Swaps and Derivatives Association (ISDA) Master Agreement, or similar agreement, does not result in an offset of reported amounts of financial assets and financial liabilities in the Statement of Assets and Liabilities across transactions between the fund and the applicable counterparty. The fund's right to setoff may be restricted or prohibited by the bankruptcy or insolvency laws of the particular jurisdiction to which a specific master netting agreement counterparty is subject. Balance sheet offsetting disclosures, to the extent applicable to the fund, have been included in the fund’s Significant Accounting Policies note under the captions for each of the fund’s in-scope financial instruments and transactions.
Investment Valuations — Equity securities, including restricted equity securities, are generally valued at the last sale or official closing price on their primary market or exchange as provided by a third-party pricing service. Equity securities, for which there were no sales reported that day, are generally valued at the last quoted daily bid quotation on their primary market or exchange as provided by a third-party pricing service. Short-term instruments with a maturity at issuance of 60 days or less may be valued at amortized cost, which approximates market value. Open-end investment companies are generally valued at net asset value per share.
Securities and other assets generally valued on the basis of information from a third-party pricing service may also be valued at a broker/dealer bid quotation. In determining values, third-party pricing services can utilize both transaction data and market information such as yield, quality, coupon rate, maturity, type of issue, trading characteristics, and other market data. The values of foreign securities and other assets and liabilities expressed in foreign currencies are converted to U.S. dollars using the mean of bid and asked prices for rates provided by a third-party pricing service.
MFS Global Real Estate Portfolio
Notes to Financial Statements (unaudited) - continued
The Board of Trustees has delegated primary responsibility for determining or causing to be determined the value of the fund’s investments (including any fair valuation) to the adviser pursuant to valuation policies and procedures approved by the Board. If the adviser determines that reliable market quotations are not readily available, investments are valued at fair value as determined in good faith by the adviser in accordance with such procedures under the oversight of the Board of Trustees. Under the fund’s valuation policies and procedures, market quotations are not considered to be readily available for most types of debt instruments and floating rate loans and many types of derivatives. These investments are generally valued at fair value based on information from third-party pricing services. In addition, investments may be valued at fair value if the adviser determines that an investment’s value has been materially affected by events occurring after the close of the exchange or market on which the investment is principally traded (such as foreign exchange or market) and prior to the determination of the fund’s net asset value, or after the halt of trading of a specific security where trading does not resume prior to the close of the exchange or market on which the security is principally traded. Events that occur after foreign markets close (such as developments in foreign markets and significant movements in the U.S. markets) and prior to the determination of the fund’s net asset value may be deemed to have a material effect on the value of securities traded in foreign markets. Accordingly, the fund’s foreign equity securities may often be valued at fair value. The adviser generally relies on third-party pricing services or other information (such as the correlation with price movements of similar securities in the same or other markets; the type, cost and investment characteristics of the security; the business and financial condition of the issuer; and trading and other market data) to assist in determining whether to fair value and at what value to fair value an investment. The value of an investment for purposes of calculating the fund’s net asset value can differ depending on the source and method used to determine value. When fair valuation is used, the value of an investment used to determine the fund’s net asset value may differ from quoted or published prices for the same investment. There can be no assurance that the fund could obtain the fair value assigned to an investment if it were to sell the investment at the same time at which the fund determines its net asset value per share.
Various inputs are used in determining the value of the fund's assets or liabilities. These inputs are categorized into three broad levels. In certain cases, the inputs used to measure fair value may fall into different levels of the fair value hierarchy. In such cases, an investment's level within the fair value hierarchy is based on the lowest level of input that is significant to the fair value measurement. The fund's assessment of the significance of a particular input to the fair value measurement in its entirety requires judgment, and considers factors specific to the investment. Level 1 includes unadjusted quoted prices in active markets for identical assets or liabilities. Level 2 includes other significant observable market-based inputs (including quoted prices for similar securities, interest rates, prepayment speed, and credit risk). Level 3 includes unobservable inputs, which may include the adviser's own assumptions in determining the fair value of investments. The following is a summary of the levels used as of June 30, 2021 in valuing the fund's assets or liabilities:
| Financial Instruments | Level 1 | Level 2 | Level 3 | Total |
| Equity Securities | $200,717,672 | $— | $— | $200,717,672 |
| Mutual Funds | 1,701,121 | — | — | 1,701,121 |
| Total | $202,418,793 | $— | $— | $202,418,793 |
For further information regarding security characteristics, see the Portfolio of Investments.
Foreign Currency Translation — Purchases and sales of foreign investments, income, and expenses are converted into U.S. dollars based upon currency exchange rates prevailing on the respective dates of such transactions or on the reporting date for foreign denominated receivables and payables. Gains and losses attributable to foreign currency exchange rates on sales of securities are recorded for financial statement purposes as net realized gains and losses on investments. Gains and losses attributable to foreign exchange rate movements on receivables, payables, income and expenses are recorded for financial statement purposes as foreign currency transaction gains and losses. That portion of both realized and unrealized gains and losses on investments that results from fluctuations in foreign currency exchange rates is not separately disclosed.
Indemnifications — Under the fund's organizational documents, its officers and Trustees may be indemnified against certain liabilities and expenses arising out of the performance of their duties to the fund. Additionally, in the normal course of business, the fund enters into agreements with service providers that may contain indemnification clauses. The fund's maximum exposure under these agreements is unknown as this would involve future claims that may be made against the fund that have not yet occurred.
Investment Transactions and Income — Investment transactions are recorded on the trade date. Dividends received in cash are recorded on the ex-dividend date. Certain dividends from foreign securities will be recorded when the fund is informed of the dividend if such information is obtained subsequent to the ex-dividend date. Dividend payments received in additional securities are recorded on the ex-dividend date in an amount equal to the value of the security on such date. Distributions from REITs may be characterized as ordinary income, net capital gain, or a return of capital to the fund. The proper characterization of REIT distributions is generally not known until after the end of each calendar year. As such, estimates are used in reporting the character of income and distributions for financial statement purposes. The fund receives substantial distributions from holdings in REITs.
MFS Global Real Estate Portfolio
Notes to Financial Statements (unaudited) - continued
The fund may receive proceeds from litigation settlements. Any proceeds received from litigation involving portfolio holdings are reflected in the Statement of Operations in realized gain/loss if the security has been disposed of by the fund or in unrealized gain/loss if the security is still held by the fund. Any other proceeds from litigation not related to portfolio holdings are reflected as other income in the Statement of Operations.
Tax Matters and Distributions — The fund intends to qualify as a regulated investment company, as defined under Subchapter M of the Internal Revenue Code, and to distribute all of its taxable income, including realized capital gains. As a result, no provision for federal income tax is required. The fund’s federal tax returns, when filed, will remain subject to examination by the Internal Revenue Service for a three year period. Management has analyzed the fund’s tax positions taken on federal and state tax returns for all open tax years and does not believe that there are any uncertain tax positions that require recognition of a tax liability. Foreign taxes, if any, have been accrued by the fund in the accompanying financial statements in accordance with the applicable foreign tax law. Foreign income taxes may be withheld by certain countries in which the fund invests. Additionally, capital gains realized by the fund on securities issued in or by certain foreign countries may be subject to capital gains tax imposed by those countries.
Distributions to shareholders are recorded on the ex-dividend date. Income and capital gain distributions are determined in accordance with income tax regulations, which may differ from U.S. generally accepted accounting principles. Certain capital accounts in the financial statements are periodically adjusted for permanent differences in order to reflect their tax character. These adjustments have no impact on net assets or net asset value per share. Temporary differences which arise from recognizing certain items of income, expense, gain or loss in different periods for financial statement and tax purposes will reverse at some time in the future.
Book/tax differences primarily relate to passive foreign investment companies and wash sale loss deferrals.
The tax character of distributions declared to shareholders for the last fiscal year is as follows:
| | Year ended
12/31/20 |
| Ordinary income (including any short-term capital gains) | $8,783,594 |
| Long-term capital gains | 3,215,608 |
| Total distributions | $11,999,202 |
The federal tax cost and the tax basis components of distributable earnings were as follows:
| As of 6/30/21 | |
| Cost of investments | $137,411,867 |
| Gross appreciation | 66,026,158 |
| Gross depreciation | (1,019,232) |
| Net unrealized appreciation (depreciation) | $65,006,926 |
| As of 12/31/20 | |
| Undistributed ordinary income | 2,731,243 |
| Capital loss carryforwards | (2,762,236) |
| Other temporary differences | 872 |
| Net unrealized appreciation (depreciation) | 44,609,498 |
The aggregate cost above includes prior fiscal year end tax adjustments, if applicable.
As of December 31, 2020, the fund had capital loss carryforwards available to offset future realized gains. These net capital losses may be carried forward indefinitely and their character is retained as short-term and/or long-term losses. Such losses are characterized as follows:
Multiple Classes of Shares of Beneficial Interest — The fund offers multiple classes of shares, which differ in their respective distribution and/or service fees. The fund's income, realized and unrealized gain (loss), and common expenses are allocated to shareholders based on the daily net assets of each class. Dividends are declared separately for each class. Differences in per share dividend rates are generally due to differences in separate class expenses. The fund’s distributions declared to shareholders as reported in the Statements of Changes in Net Assets are presented by class as follows:
MFS Global Real Estate Portfolio
Notes to Financial Statements (unaudited) - continued
| | Six months
ended
6/30/21 | | Year
ended
12/31/20 |
| Initial Class | $— | | $8,887,288 |
| Service Class | — | | 3,111,914 |
| Total | $— | | $11,999,202 |
(3) Transactions with Affiliates
Investment Adviser — The fund has an investment advisory agreement with MFS to provide overall investment management and related administrative services and facilities to the fund. The management fee is computed daily and paid monthly at the following annual rates based on the fund's average daily net assets:
| Up to $1 billion | 0.90% |
| In excess of $1 billion and up to $2.5 billion | 0.75% |
| In excess of $2.5 billion | 0.65% |
MFS has agreed in writing to reduce its management fee by a specified amount if certain MFS mutual fund assets exceed thresholds agreed to by MFS and the fund's Board of Trustees. For the six months ended June 30, 2021, this management fee reduction amounted to $11,558, which is included in the reduction of total expenses in the Statement of Operations. The management fee incurred for the six months ended June 30, 2021 was equivalent to an annual effective rate of 0.89% of the fund's average daily net assets.
The investment adviser has agreed in writing to pay a portion of the fund’s total annual operating expenses, excluding interest, taxes, extraordinary expenses, brokerage and transaction costs, and investment-related expenses, such that total annual operating expenses do not exceed 0.92% of average daily net assets for the Initial Class shares and 1.17% of average daily net assets for the Service Class shares. This written agreement will continue until modified by the fund’s Board of Trustees, but such agreement will continue at least until April 30, 2023. For the six months ended June 30, 2021, this reduction amounted to $65,587, which is included in the reduction of total expenses in the Statement of Operations.
Distributor — MFS Fund Distributors, Inc. (MFD), a wholly-owned subsidiary of MFS, is the distributor of shares of the fund. The Trustees have adopted a distribution plan for the Service Class shares pursuant to Rule 12b-1 under the Investment Company Act of 1940.
The fund's distribution plan provides that the fund will pay MFD distribution and/or service fees equal to 0.25% per annum of its average daily net assets attributable to Service Class shares as partial consideration for services performed and expenses incurred by MFD and financial intermediaries (including participating insurance companies that invest in the fund to fund variable annuity and variable life insurance contracts, sponsors of qualified retirement and pension plans that invest in the fund, and affiliates of these participating insurance companies and plan sponsors) in connection with the sale and distribution of the Service Class shares. MFD may subsequently pay all, or a portion, of the distribution and/or service fees to financial intermediaries.
Shareholder Servicing Agent — MFS Service Center, Inc. (MFSC), a wholly-owned subsidiary of MFS, receives a fee from the fund for its services as shareholder servicing agent. For the six months ended June 30, 2021, the fee was $6,471, which equated to 0.0067% annually of the fund's average daily net assets. MFSC also receives reimbursement from the fund for out-of-pocket expenses paid by MFSC on behalf of the fund. For the six months ended June 30, 2021, these costs amounted to $332.
Administrator — MFS provides certain financial, legal, shareholder communications, compliance, and other administrative services to the fund. Under an administrative services agreement, the fund reimburses MFS the costs incurred to provide these services. The fund is charged an annual fixed amount of $17,500 plus a fee based on average daily net assets. The administrative services fee incurred for the six months ended June 30, 2021 was equivalent to an annual effective rate of 0.0185% of the fund's average daily net assets.
Trustees’ and Officers’ Compensation — The fund pays compensation to independent Trustees in the form of a retainer, attendance fees, and additional compensation to Board and Committee chairpersons. The fund does not pay compensation directly to Trustees or officers of the fund who are also officers of the investment adviser, all of whom receive remuneration from MFS for their services to the fund. Certain officers and Trustees of the fund are officers or directors of MFS, MFD, and MFSC.
Other — The fund invests in the MFS Institutional Money Market Portfolio which is managed by MFS and seeks current income consistent with preservation of capital and liquidity. This money market fund does not pay a management fee to MFS but does incur investment and operating costs.
MFS Global Real Estate Portfolio
Notes to Financial Statements (unaudited) - continued
The fund is permitted to engage in purchase and sale transactions with funds and accounts for which MFS serves as investment adviser or sub-adviser (“cross-trades”) pursuant to a policy adopted by the Board of Trustees. This policy has been designed to ensure that cross-trades conducted by the fund comply with Rule 17a-7 under the Investment Company Act of 1940. During the six months ended June 30, 2021, the fund engaged in sale transactions pursuant to this policy, which amounted to $76,260. The sales transactions resulted in net realized gains (losses) of $7,903.
The adviser has voluntarily undertaken to reimburse the fund from its own resources on a quarterly basis for the cost of investment research embedded in the cost of the fund’s securities trades. This agreement may be rescinded at any time. For the six months ended June 30, 2021, this reimbursement amounted to $5,092, which is included in “Other” income in the Statement of Operations.
(4) Portfolio Securities
For the six months ended June 30, 2021, purchases and sales of investments, other than short-term obligations, aggregated $30,998,835 and $37,453,311, respectively.
(5) Shares of Beneficial Interest
The fund's Declaration of Trust permits the Trustees to issue an unlimited number of full and fractional shares of beneficial interest. Transactions in fund shares were as follows:
| | Six months ended
6/30/21 | | Year ended
12/31/20 |
| | Shares | Amount | | Shares | Amount |
| Shares sold | | | | | |
| Initial Class | 916,179 | $14,703,589 | | 1,465,745 | $18,719,764 |
| Service Class | 175,981 | 3,363,101 | | 582,456 | 9,074,052 |
| | 1,092,160 | $18,066,690 | | 2,048,201 | $27,793,816 |
Shares issued to shareholders
in reinvestment of distributions | | | | | |
| Initial Class | — | $— | | 646,819 | $8,887,288 |
| Service Class | — | — | | 191,857 | 3,111,914 |
| | — | $— | | 838,676 | $11,999,202 |
| Shares reacquired | | | | | |
| Initial Class | (1,237,061) | $(19,980,106) | | (1,925,007) | $(27,485,394) |
| Service Class | (449,928) | (8,782,656) | | (641,479) | (10,618,154) |
| | (1,686,989) | $(28,762,762) | | (2,566,486) | $(38,103,548) |
| Net change | | | | | |
| Initial Class | (320,882) | $(5,276,517) | | 187,557 | $121,658 |
| Service Class | (273,947) | (5,419,555) | | 132,834 | 1,567,812 |
| | (594,829) | $(10,696,072) | | 320,391 | $1,689,470 |
The fund is one of several mutual funds in which certain MFS funds may invest. The MFS funds do not invest in the underlying funds for the purpose of exercising management or control. At the end of the period, the MFS Moderate Allocation Portfolio, the MFS Growth Allocation Portfolio, and the MFS Conservative Allocation Portfolio were the owners of record of approximately 21%, 9%, and 7%, respectively, of the value of outstanding voting shares of the fund.
(6) Line of Credit
The fund and certain other funds managed by MFS participate in a $1.25 billion unsecured committed line of credit of which $1 billion is reserved for use by the fund and certain other MFS U.S. funds. The line of credit is provided by a syndicate of banks under a credit agreement. Borrowings may be made for temporary financing needs. Interest is charged to each fund, based on its borrowings, generally at a rate equal to the highest of one month LIBOR, the Federal Funds Effective Rate and the Overnight Bank Funding Rate, plus an agreed upon spread. A commitment fee, based on the average daily, unused portion of the committed line of credit, is allocated among the participating funds. In addition, the fund and other funds managed by MFS have established
MFS Global Real Estate Portfolio
Notes to Financial Statements (unaudited) - continued
unsecured uncommitted borrowing arrangements with certain banks for temporary financing needs. Interest is charged to each fund, based on its borrowings, at rates equal to customary reference rates plus an agreed upon spread. For the six months ended June 30, 2021, the fund’s commitment fee and interest expense were $334 and $0, respectively, and are included in “Miscellaneous” expense in the Statement of Operations.
(7) Investments in Affiliated Issuers
An affiliated issuer may be considered one in which the fund owns 5% or more of the outstanding voting securities, or a company which is under common control. For the purposes of this report, the following were affiliated issuers:
| Affiliated Issuers | Beginning
Value | Purchases | Sales
Proceeds | Realized
Gain
(Loss) | Change in
Unrealized
Appreciation or
Depreciation | Ending
Value |
| MFS Institutional Money Market Portfolio | $4,097,142 | $29,676,390 | $32,072,411 | $— | $— | $1,701,121 |
| Affiliated Issuers | Dividend
Income | Capital Gain
Distributions |
| MFS Institutional Money Market Portfolio | $1,003 | $— |
(8) Impacts of COVID-19
The pandemic related to the global spread of novel coronavirus disease (COVID-19), which was first detected in December 2019, has resulted in significant disruptions to global business activity and the global economy, as well as the economies of individual countries, the financial performance of individual companies and sectors, and the securities and commodities markets in general. Multiple surges in cases globally, the availability and widespread adoption of vaccines, and the emergence of variant strains of the virus continue to create uncertainty as to the future and long-term impacts resulting from the pandemic including impacts to the prices and liquidity of the fund's investments and the fund's performance.
MFS Global Real Estate Portfolio
Statement Regarding Liquidity Risk Management Program
The fund has adopted and implemented a liquidity risk management program (the “Program”) as required by Rule 22e-4 under the Investment Company Act of 1940, as amended. The fund’s Board of Trustees (the “Board”) has designated MFS as the administrator of the Program. The Program is reasonably designed to assess and manage the liquidity risk of the fund. Liquidity risk is the risk that the fund could not meet requests to redeem shares issued by the fund without significant dilution of remaining investors' interests.
MFS provided a written report to the Board for consideration at its April 2021 meeting that addressed the operation of the Program and provided an assessment of the adequacy and effectiveness of the Program during the period from January 1, 2020 to December 31, 2020 (the “Covered Period”). The report concluded that during the Covered Period the Program had operated effectively and had adequately and effectively been implemented to assess and manage the fund’s liquidity risk. MFS also reported that there were no liquidity events that impacted the fund or its ability to timely meet redemptions without dilution to existing shareholders during the Covered Period.
There can be no assurance that the Program will achieve its objectives in the future. Further information on liquidity risk, and other principal risks to which an investment in the fund may be subject, can be found in the prospectus.
MFS Global Real Estate Portfolio
Proxy Voting Policies and Information
MFS votes proxies on behalf of the fund pursuant to proxy voting policies and procedures that are available without charge, upon request, by calling 1-800-225-2606, by visiting mfs.com/proxyvoting, or by visiting the SEC’s Web site at http://www.sec.gov.
Information regarding how the fund voted proxies relating to portfolio securities during the most recent twelve-month period ended June 30 is available by August 31 of each year without charge by visiting mfs.com/proxyvoting, or by visiting the SEC’s Web site at http://www.sec.gov.
Quarterly Portfolio Disclosure
The fund files a complete schedule of portfolio holdings with the SEC for the first and third quarters of each fiscal year as an exhibit to its reports on Form N-PORT. The fund’s Form N-PORT reports are available on the SEC’s Web site at http://www.sec.gov. A shareholder can obtain the portfolio holdings report for the first and third quarters of the fund's fiscal year at mfs.com/vit3 by choosing the fund's name and then scrolling to the “Resources” section and clicking on the “Prospectus and Reports” tab.
FURTHER INFORMATION
From time to time, MFS may post important information about the fund or the MFS Funds on the MFS Web site (mfs.com). This information is available at https://www.mfs.com/announcements or at mfs.com/vit3 by choosing the fund's name and then scrolling to the “Resources” section and clicking on the “Announcements” tab, if any.
Information About Fund Contracts and Legal Claims
The fund has entered into contractual arrangements with an investment adviser, administrator, distributor, shareholder servicing agent, 529 program manager (if applicable), and custodian who each provide services to the fund. Unless expressly stated otherwise, shareholders are not parties to, or intended beneficiaries of these contractual arrangements, and these contractual arrangements are not intended to create any shareholder right to enforce them against the service providers or to seek any remedy under them against the service providers, either directly or on behalf of the fund.
Under the Trust’s By-Laws and Declaration of Trust, any claims asserted against or on behalf of the MFS Funds, including claims against Trustees and Officers, must be brought in state and federal courts located within the Commonwealth of Massachusetts.
Semiannual Report
June 30, 2021
MFS® Growth Allocation Portfolio
MFS® Variable Insurance Trust III
MFS® Growth Allocation Portfolio
The report is prepared for the general information of contract owners. It is authorized for distribution to prospective investors only when preceded or accompanied by a current prospectus.
NOT FDIC INSURED • MAY LOSE VALUE • NO BANK OR CREDIT UNION GUARANTEE •
NOT A DEPOSIT • NOT INSURED BY ANY FEDERAL GOVERNMENT AGENCY OR NCUA/NCUSIF
MFS Growth Allocation Portfolio
Dear Contract Owners:
After experiencing dramatic swings in the early days of the coronavirus pandemic, global equity markets have performed strongly over the past year. Though the speedy development of vaccines brightened the economic and market outlook, uncertainty remains as new variants of the virus appear, and questions persist over how fast vaccines can be made widely available in the developing world.
Global central banks have taken aggressive steps to cushion the economic and market fallout related to the virus, and governments are deploying unprecedented levels of fiscal support. Having passed a $1.9 trillion stimulus package in March, the U.S. Congress could approve additional stimulus later this year, some of it focused on infrastructure. Along with extraordinary government expenditures, pent-up consumer demand fueled a surge in economic activity as coronavirus restrictions were eased, pushing up inflation, at least temporarily. Markets initially reacted by pushing up yields on global government bonds, though some of the rate rise has since been corrected.
A spirited debate is underway among investors over whether the current price pressures will persist or prove to be temporary, caused by pandemic-induced bottlenecks. The policy measures put in place to counteract the pandemic's effects have helped build a supportive environment and are encouraging economic recovery; however, if markets disconnect from fundamentals, they can sow the seeds of instability. As such, recent dramatic increases in speculative trading in cryptocurrencies, special purpose acquisition companies (SPACs), and the like bear watching.
In the aftermath of the crisis, we could see societal changes as households, businesses, and governments adjust to a new reality, and any such alterations could affect the investment landscape. For investors, events such as the COVID-19 outbreak demonstrate the importance of having a deep understanding of company fundamentals, and we have built our global research platform to do just that.
At MFS®, we put our clients’ assets to work responsibly by carefully navigating the increasing complexity of global markets and economies. Guided by our long-term philosophy and adhering to our commitment to sustainable investing, we tune out the noise and aim to uncover what we believe are the best, most durable investment opportunities in the market. Our unique global investment platform combines collective expertise, long-term discipline, and thoughtful risk management to create sustainable value for investors.
Respectfully,
Michael W. Roberge
Chief Executive Officer
MFS Investment Management
August 13, 2021
The opinions expressed in this letter are subject to change and may not be relied upon for investment advice. No forecasts can be guaranteed.
MFS Growth Allocation Portfolio
Portfolio target allocation
Portfolio actual allocation
Portfolio holdings
| MFS Growth Series | 11.3% |
| MFS Value Series | 11.0% |
| MFS Research Series | 10.1% |
| MFS Mid Cap Growth Series | 9.1% |
| MFS Mid Cap Value Portfolio | 9.0% |
| MFS Research International Portfolio | 8.9% |
| MFS Global Real Estate Portfolio | 5.0% |
| MFS International Intrinsic Value Portfolio | 5.0% |
| MFS International Growth Portfolio | 5.0% |
| MFS High Yield Portfolio | 5.0% |
| MFS Inflation-Adjusted Bond Portfolio | 4.9% |
| MFS Total Return Bond Series | 4.9% |
| MFS Global Governments Portfolio | 3.8% |
| MFS New Discovery Series | 2.0% |
| MFS New Discovery Value Portfolio | 2.0% |
| MFS Limited Maturity Portfolio | 1.9% |
| MFS Emerging Markets Equity Portfolio | 1.0% |
| Cash & Cash Equivalents | 0.1% |
Cash & Cash Equivalents includes any cash, investments in money market funds, short-term securities, and other assets less liabilities. MFS endeavors to fully invest all MFS funds-of-funds in underlying funds on a daily basis. Any divergence from 0.0% in Cash & Cash Equivalents is typically due to the timing of fund subscriptions/redemptions and the settlement of subsequent investment in/divestment from the underlying funds. While the MFS funds-of-funds' subscriptions/redemptions are processed at the same day NAV of the underlying funds, a positive/negative cash balance will be reflected on the MFS funds-of-funds' Statements of Assets and Liabilities until the trades with the underlying funds settle, which is typically two business days. Please see the fund's Statement of Assets and Liabilities for additional information related to the fund’s cash position and other assets and liabilities.
Percentages are based on net assets as of June 30, 2021.
The portfolio is actively managed and current holdings may be different.
MFS Growth Allocation Portfolio
Expense Table
Fund Expenses Borne by the Contract Holders during the Period,
January 1, 2021 through June 30, 2021
As a contract holder of the fund, you incur ongoing costs, including distribution and/or service (12b-1) fees; and other fund expenses. This example is intended to help you understand your ongoing costs (in dollars) of investing in the fund and to compare these costs with the ongoing costs of investing in other mutual funds.
In addition to the fees and expenses which the fund bears directly, the fund indirectly bears a pro rata share of the fees and expenses of the underlying funds in which the fund invests. Because the underlying funds have varied expenses and fee levels and the fund may own different proportions of the underlying funds at different times, the amount of fees and expenses incurred indirectly by the fund will vary. If these indirect costs were included, your costs would have been higher.
The example is based on an investment of $1,000 invested at the beginning of the period and held for the entire period January 1, 2021 through June 30, 2021.
Actual Expenses
The first line for each share class in the following table provides information about actual account values and actual expenses. You may use the information in this line, together with the amount you invested, to estimate the expenses that you paid over the period. Simply divide your account value by $1,000 (for example, an $8,600 account value divided by $1,000 = 8.6), then multiply the result by the number in the first line under the heading entitled “Expenses Paid During Period” to estimate the expenses you paid on your account during this period.
Hypothetical Example for Comparison Purposes
The second line for each share class in the following table provides information about hypothetical account values and hypothetical expenses based on the fund’s actual expense ratio and an assumed rate of return of 5% per year before expenses, which is not the fund’s actual return. The hypothetical account values and expenses may not be used to estimate the actual ending account balance or expenses you paid for the period. You may use this information to compare the ongoing costs of investing in the fund and other funds. To do so, compare this 5% hypothetical example with the 5% hypothetical examples that appear in the shareholder reports of the other funds.
Please note that the expenses shown in the table are meant to highlight the fund's ongoing costs only and do not take into account the fees and expenses imposed under the variable contracts through which your investment in the fund is made. Therefore, the second line for each share class in the table is useful in comparing ongoing costs associated with an investment in vehicles (such as the fund) which fund benefits under variable annuity and variable life insurance contracts and to qualified pension and retirement plans only, and will not help you determine the relative total costs of investing in the fund through variable annuity and variable life insurance contracts. If the fees and expenses imposed under the variable contracts were included, your costs would have been higher.
Share
Class | | Annualized
Expense
Ratio | Beginning
Account Value
1/01/21 | Ending
Account Value
6/30/21 | Expenses
Paid During
Period (p)
1/01/21-6/30/21 |
| Initial Class | Actual | 0.03% | $1,000.00 | $1,093.70 | $0.16 |
| Hypothetical (h) | 0.03% | $1,000.00 | $1,024.65 | $0.15 |
| Service Class | Actual | 0.28% | $1,000.00 | $1,092.74 | $1.45 |
| Hypothetical (h) | 0.28% | $1,000.00 | $1,023.41 | $1.40 |
| (h) | 5% class return per year before expenses. |
| (p) | “Expenses Paid During Period” are equal to each class's annualized expense ratio, as shown above, multiplied by the average account value over the period, multiplied by 181/365 (to reflect the one-half year period). In addition to the fees and expense which the fund bears directly, the fund indirectly bears a pro rate share of the fees and expenses of the underlying funds in which the fund invests. If these indirect costs were included, your costs would have been higher. |
MFS Growth Allocation Portfolio
Portfolio of Investments − 6/30/21 (unaudited)
The Portfolio of Investments is a complete list of all securities owned by your fund. It is categorized by broad-based asset classes.
| Issuer | | | Shares/Par | Value ($) |
| Investment Companies (h) – 100.0% |
| Bond Funds – 20.5% |
| MFS Global Governments Portfolio - Initial Class | | | 1,252,393 | $ 13,914,086 |
| MFS High Yield Portfolio - Initial Class | | | 3,123,075 | 18,176,300 |
| MFS Inflation-Adjusted Bond Portfolio - Initial Class | | | 1,496,169 | 17,864,258 |
| MFS Limited Maturity Portfolio - Initial Class | | | 675,669 | 7,094,521 |
| MFS Total Return Bond Series - Initial Class | | | 1,271,586 | 17,789,487 |
| | | | | $74,838,652 |
| International Stock Funds – 19.9% |
| MFS Emerging Markets Equity Portfolio - Initial Class | | | 198,364 | $ 3,594,344 |
| MFS International Growth Portfolio - Initial Class | | | 1,053,012 | 18,227,637 |
| MFS International Intrinsic Value Portfolio - Initial Class | | | 497,067 | 18,272,193 |
| MFS Research International Portfolio - Initial Class | | | 1,672,457 | 32,629,635 |
| | | | | $72,723,809 |
| Specialty Funds – 5.0% |
| MFS Global Real Estate Portfolio - Initial Class | | | 1,059,700 | $ 18,311,613 |
| Issuer | | | Shares/Par | Value ($) |
| Investment Companies (h) – continued |
| U.S. Stock Funds – 54.5% |
| MFS Growth Series - Initial Class | | | 493,086 | $ 41,088,859 |
| MFS Mid Cap Growth Series - Initial Class | | | 2,501,063 | 33,289,143 |
| MFS Mid Cap Value Portfolio - Initial Class | | | 3,190,840 | 32,642,298 |
| MFS New Discovery Series - Initial Class | | | 250,685 | 7,357,608 |
| MFS New Discovery Value Portfolio - Initial Class | | | 661,797 | 7,292,998 |
| MFS Research Series - Initial Class | | | 980,122 | 36,940,809 |
| MFS Value Series - Initial Class | | | 1,712,165 | 40,098,915 |
| | | | | $ 198,710,630 |
| Money Market Funds – 0.1% | |
| MFS Institutional Money Market Portfolio, 0.02% (v) | | | 188,525 | $ 188,526 |
| Total Investment Companies (Identified Cost, $231,700,462) | $ 364,773,230 |
| Other Assets, Less Liabilities – (0.0)% | | (43,623) |
| Net Assets – 100.0% | $ 364,729,607 |
| (h) | An affiliated issuer, which may be considered one in which the fund owns 5% or more of the outstanding voting securities, or a company which is under common control. At period end, the aggregate value of the fund’s investments in affiliated issuers was $364,773,230. | | | |
| (v) | Affiliated issuer that is available only to investment companies managed by MFS. The rate quoted for the MFS Institutional Money Market Portfolio is the annualized seven-day yield of the fund at period end. | | | |
See Notes to Financial Statements
MFS Growth Allocation Portfolio
| Financial Statements | Statement of Assets and Liabilities (unaudited) |
This statement represents your fund’s balance sheet, which details the assets and liabilities comprising the total value of the fund.
| At 6/30/21Assets | |
| Investments in affiliated issuers, at value (identified cost, $231,700,462) | $364,773,230 |
| Receivables for | |
| Investments sold | 959,284 |
| Fund shares sold | 17,676 |
| Other assets | 1,535 |
| Total assets | $365,751,725 |
| Liabilities | |
| Payables for | |
| Fund shares reacquired | $976,961 |
| Payable to affiliates | |
| Administrative services fee | 96 |
| Shareholder servicing costs | 38 |
| Distribution and/or service fees | 4,960 |
| Accrued expenses and other liabilities | 40,063 |
| Total liabilities | $1,022,118 |
| Net assets | $364,729,607 |
| Net assets consist of | |
| Paid-in capital | $198,723,484 |
| Total distributable earnings (loss) | 166,006,123 |
| Net assets | $364,729,607 |
| Shares of beneficial interest outstanding | 26,923,344 |
| | Net assets | Shares
outstanding | Net asset value
per share |
| Initial Class | $4,446,891 | 328,533 | $13.54 |
| Service Class | 360,282,716 | 26,594,811 | 13.55 |
See Notes to Financial Statements
MFS Growth Allocation Portfolio
| Financial Statements | Statement of Operations (unaudited) |
This statement describes how much your fund earned in investment income and accrued in expenses. It also describes any gains and/or losses generated by fund operations.
| Six months ended 6/30/21 | |
| Net investment income (loss) | |
| Income | |
| Other | $55 |
| Dividends from affiliated issuers | 51 |
| Total investment income | $106 |
| Expenses | |
| Distribution and/or service fees | $441,455 |
| Shareholder servicing costs | 3,682 |
| Administrative services fee | 8,679 |
| Independent Trustees' compensation | 3,464 |
| Custodian fee | 2,135 |
| Shareholder communications | 4,468 |
| Audit and tax fees | 20,263 |
| Legal fees | 1,249 |
| Miscellaneous | 12,914 |
| Total expenses | $498,309 |
| Net investment income (loss) | $(498,203) |
| Realized and unrealized gain (loss) | |
| Realized gain (loss) (identified cost basis) | |
| Investments in affiliated issuers | $9,075,524 |
| Change in unrealized appreciation or depreciation | |
| Affiliated issuers | $23,349,616 |
| Net realized and unrealized gain (loss) | $32,425,140 |
| Change in net assets from operations | $31,926,937 |
See Notes to Financial Statements
MFS Growth Allocation Portfolio
| Financial Statements | Statements of Changes in Net Assets |
These statements describe the increases and/or decreases in net assets resulting from operations, any distributions, and any shareholder transactions.
| | Six months ended | Year ended |
| | 6/30/21
(unaudited) | 12/31/20 |
| Change in net assets | | |
| From operations | | |
| Net investment income (loss) | $(498,203) | $5,225,862 |
| Net realized gain (loss) | 9,075,524 | 20,896,461 |
| Net unrealized gain (loss) | 23,349,616 | 23,000,370 |
| Change in net assets from operations | $31,926,937 | $49,122,693 |
| Total distributions to shareholders | $— | $(34,751,411) |
| Change in net assets from fund share transactions | $(26,069,682) | $(10,633,184) |
| Total change in net assets | $5,857,255 | $3,738,098 |
| Net assets | | |
| At beginning of period | 358,872,352 | 355,134,254 |
| At end of period | $364,729,607 | $358,872,352 |
See Notes to Financial Statements
MFS Growth Allocation Portfolio
| Financial Statements | Financial Highlights |
The financial highlights table is intended to help you understand the fund's financial performance for the semiannual period and the past 5 fiscal years. Certain information reflects financial results for a single fund share. The total returns in the table represent the rate that an investor would have earned (or lost) on an investment in the fund share class (assuming reinvestment of all distributions) held for the entire period.
| Initial Class | Six months
ended | Year ended |
| | 6/30/21
(unaudited) | 12/31/20 | 12/31/19 | 12/31/18 | 12/31/17 | 12/31/16 |
| Net asset value, beginning of period | $12.38 | $11.93 | $10.64 | $12.21 | $10.97 | $11.27 |
| Income (loss) from investment operations | | | | | | |
| Net investment income (loss) (d)(l) | $(0.00)(w) | $0.23 | $0.22 | $0.26 | $0.21 | $0.20(c) |
| Net realized and unrealized gain (loss) | 1.16 | 1.53 | 2.53 | (0.78) | 1.91 | 0.62 |
| Total from investment operations | $1.16 | $1.76 | $2.75 | $(0.52) | $2.12 | $0.82 |
| Less distributions declared to shareholders | | | | | | |
| From net investment income | $— | $(0.25) | $(0.29) | $(0.23) | $(0.23) | $(0.32) |
| From net realized gain | — | (1.06) | (1.17) | (0.82) | (0.65) | (0.80) |
| Total distributions declared to shareholders | $— | $(1.31) | $(1.46) | $(1.05) | $(0.88) | $(1.12) |
| Net asset value, end of period (x) | $13.54 | $12.38 | $11.93 | $10.64 | $12.21 | $10.97 |
| Total return (%) (k)(r)(s)(x) | 9.37(n) | 15.80 | 26.96 | (5.20) | 19.86 | 7.15(c) |
Ratios (%) (to average net assets)
and Supplemental data: | | | | | | |
| Expenses before expense reductions (f)(h) | 0.03(a) | 0.04 | 0.03 | 0.03 | 0.03 | 0.03(c) |
| Expenses after expense reductions (f)(h) | N/A | N/A | N/A | N/A | N/A | N/A |
| Net investment income (loss) (l) | (0.03)(a) | 2.02 | 1.88 | 2.13 | 1.75 | 1.81(c) |
| Portfolio turnover | 1(n) | 6 | 0(b) | 2 | 2 | 1 |
| Net assets at end of period (000 omitted) | $4,447 | $4,602 | $3,905 | $3,770 | $4,116 | $3,140 |
See Notes to Financial Statements
MFS Growth Allocation Portfolio
Financial Highlights - continued
| Service Class | Six months
ended | Year ended |
| | 6/30/21
(unaudited) | 12/31/20 | 12/31/19 | 12/31/18 | 12/31/17 | 12/31/16 |
| Net asset value, beginning of period | $12.40 | $11.95 | $10.65 | $12.22 | $10.98 | $11.27 |
| Income (loss) from investment operations | | | | | | |
| Net investment income (loss) (d)(l) | $(0.02) | $0.18 | $0.20 | $0.22 | $0.17 | $0.17(c) |
| Net realized and unrealized gain (loss) | 1.17 | 1.55 | 2.52 | (0.77) | 1.92 | 0.63 |
| Total from investment operations | $1.15 | $1.73 | $2.72 | $(0.55) | $2.09 | $0.80 |
| Less distributions declared to shareholders | | | | | | |
| From net investment income | $— | $(0.22) | $(0.25) | $(0.20) | $(0.20) | $(0.29) |
| From net realized gain | — | (1.06) | (1.17) | (0.82) | (0.65) | (0.80) |
| Total distributions declared to shareholders | $— | $(1.28) | $(1.42) | $(1.02) | $(0.85) | $(1.09) |
| Net asset value, end of period (x) | $13.55 | $12.40 | $11.95 | $10.65 | $12.22 | $10.98 |
| Total return (%) (k)(r)(s)(x) | 9.27(n) | 15.46 | 26.66 | (5.46) | 19.51 | 6.94(c) |
Ratios (%) (to average net assets)
and Supplemental data: | | | | | | |
| Expenses before expense reductions (f)(h) | 0.28(a) | 0.29 | 0.28 | 0.28 | 0.28 | 0.28(c) |
| Expenses after expense reductions (f)(h) | N/A | N/A | N/A | N/A | N/A | N/A |
| Net investment income (loss) (l) | (0.28)(a) | 1.57 | 1.70 | 1.80 | 1.40 | 1.50(c) |
| Portfolio turnover | 1(n) | 6 | 0(b) | 2 | 2 | 1 |
| Net assets at end of period (000 omitted) | $360,283 | $354,270 | $351,229 | $330,320 | $415,923 | $420,657 |
| (a) | Annualized. |
| (b) | Less than 0.5%. |
| (c) | Amount reflects a one-time reimbursement of expenses by the custodian (or former custodian) without which net investment income and performance would be lower and expenses would be higher. |
| (d) | Per share data is based on average shares outstanding. |
| (f) | Ratios do not reflect reductions from fees paid indirectly, if applicable. |
| (h) | In addition to the fees and expenses which the fund bears directly, the fund indirectly bears a pro rata share of the fees and expenses of the underlying affiliated funds in which the fund invests. Accordingly, the expense ratio for the fund reflects only those fees and expenses borne directly by the fund. Because the underlying affiliated funds have varied expense and fee levels and the fund may own different proportions of the underlying affiliated funds at different times, the amount of fees and expenses incurred indirectly by the fund will vary. |
| (k) | The total return does not reflect expenses that apply to separate accounts. Inclusion of these charges would reduce the total return figures for all periods shown. |
| (l) | Recognition of net investment income by the fund may be affected by the timing of the declaration of dividends by the underlying affiliated funds in which the fund invests and for interim net investment income ratios, the actual annual net investment income ratio may differ. The ratios and per share amounts do not include net investment income of the underlying affiliated funds in which the fund invests. |
| (n) | Not annualized. |
| (r) | Certain expenses have been reduced without which performance would have been lower. |
| (s) | From time to time the fund may receive proceeds from litigation settlements, without which performance would be lower. |
| (w) | Per share amount was less than $0.01. |
| (x) | The net asset values and total returns have been calculated on net assets which include adjustments made in accordance with U.S. generally accepted accounting principles required at period end for financial reporting purposes. |
See Notes to Financial Statements
MFS Growth Allocation Portfolio
Notes to Financial Statements (unaudited)
(1) Business and Organization
MFS Growth Allocation Portfolio (the fund) is a diversified series of MFS Variable Insurance Trust III (the trust). The trust is organized as a Delaware statutory trust and is registered under the Investment Company Act of 1940, as amended, as an open-end management investment company. The shareholders of each series of the trust are separate accounts of insurance companies, which offer variable annuity and/or life insurance products, and qualified retirement and pension plans.
The fund is an investment company and accordingly follows the investment company accounting and reporting guidance of the Financial Accounting Standards Board (FASB) Accounting Standards Codification Topic 946 Financial Services - Investment Companies.
(2) Significant Accounting Policies
General — The preparation of financial statements in conformity with U.S. generally accepted accounting principles requires management to make estimates and assumptions that affect the reported amounts of assets and liabilities, and disclosure of contingent assets and liabilities at the date of the financial statements and the reported amounts of increases and decreases in net assets from operations during the reporting period. Actual results could differ from those estimates. In the preparation of these financial statements, management has evaluated subsequent events occurring after the date of the fund’s Statement of Assets and Liabilities through the date that the financial statements were issued.
The fund is a “fund of funds”, which invests the majority of its assets in other MFS mutual funds (hereafter referred to as “underlying affiliated funds” or “underlying funds”), which may have different fiscal year ends than the funds. The underlying funds, in turn, may engage in a number of investment techniques and practices, which involve certain risks. Certain underlying funds invest their portfolio in high-yield securities rated below investment grade. Investments in below investment grade quality securities can involve a substantially greater risk of default or can already be in default, and their values can decline significantly. Below investment grade quality securities tend to be more sensitive to adverse news about the issuer, or the market or economy in general, than higher quality debt instruments. Certain underlying funds invest a significant portion of their assets in asset-backed and/or mortgage-backed securities. For these securities, the value of the debt instrument also depends on the credit quality and adequacy of the underlying assets or collateral as well as whether there is a security interest in the underlying assets or collateral. Enforcing rights, if any, against the underlying assets or collateral may be difficult. U.S. Government securities not supported as to the payment of principal or interest by the U.S. Treasury, such as those issued by Fannie Mae, Freddie Mac, and the Federal Home Loan Banks, are subject to greater credit risk than are U.S. Government securities supported by the U.S. Treasury, such as those issued by Ginnie Mae. Certain underlying funds invest in foreign securities, including securities of emerging market issuers. Investments in foreign securities are vulnerable to the effects of changes in the relative values of the local currency and the U.S. dollar and to the effects of changes in each country’s market, economic, industrial, political, regulatory, geopolitical, environmental, public health, and other conditions. Investments in emerging markets can involve additional and greater risks than the risks associated with investments in developed foreign markets. Emerging markets can have less developed markets, greater custody and operational risk, less developed legal, regulatory, and accounting, and auditing systems, and greater political, social, and economic instability than developed markets.
The accounting policies of the underlying funds in which the fund invests are outlined in the underlying funds’ shareholder reports, which are available without charge by calling 1-800-225-2606, at mfs.com and on the Securities and Exchange Commission (SEC) web site at http://www.sec.gov. The underlying funds' shareholder reports are not covered by this report.
Certain of the fund's investments, derivatives, debt and other contracts may be based on reference interest rates such as the London Interbank Offered Rate (“LIBOR”). In 2017, the regulatory authority that oversees financial services firms in the United Kingdom announced plans to transition away from LIBOR by the end of 2021. In March 2021, the administrator of LIBOR announced the extension of the publication of the more commonly used U.S. dollar LIBOR settings to the end of June 2023. Although the full impacts of the transition away from LIBOR are not fully known, the transition may result in, among other things, an increase in volatility or illiquidity of the markets for instruments that currently rely on LIBOR to determine interest rates and this could have an adverse impact on the fund's performance. With respect to the fund's accounting for investments, derivatives, debt and other contracts that undergo reference rate-related modifications as a result of the transition, management will rely upon the relief provided by FASB Codification Topic 848 – Reference Rate Reform (Topic 848). The guidance in Topic 848 permits the fund to disregard the GAAP accounting requirements around certain contract modifications resulting from the LIBOR transition such that for contracts considered in scope, the fund can account for those modified contracts as a continuation of the existing contracts.
Investment Valuations — Open-end investment companies (underlying funds) are generally valued at their net asset value per share. The investments of underlying funds managed by the adviser are valued as described below. For purposes of this policy disclosure, “fund” also refers to the underlying funds in which the fund-of-funds invests.
MFS Growth Allocation Portfolio
Notes to Financial Statements (unaudited) - continued
Equity securities, including restricted equity securities and equity securities sold short, are generally valued at the last sale or official closing price on their primary market or exchange as provided by a third-party pricing service. Equity securities, for which there were no sales reported that day, are generally valued at the last quoted daily bid quotation on their primary market or exchange as provided by a third-party pricing service. Equity securities sold short, for which there were no sales reported that day, are generally valued at the last quoted daily ask quotation on their primary market or exchange as provided by a third-party pricing service. Debt instruments and floating rate loans, including restricted debt instruments, are generally valued at an evaluated or composite bid as provided by a third-party pricing service. Debt instruments sold short are generally valued at an evaluated or composite mean as provided by a third-party pricing service. Short-term instruments with a maturity at issuance of 60 days or less may be valued at amortized cost, which approximates market value. Exchange-traded options are generally valued at the last sale or official closing price on their primary exchange as provided by a third-party pricing service. Exchange-traded options for which there were no sales reported that day are generally valued at the last daily bid quotation on their primary exchange as provided by a third-party pricing service. For put options, the position may be valued at the last daily ask quotation if there are no trades reported during the day. Options not traded on an exchange are generally valued at a broker/dealer bid quotation. Foreign currency options are generally valued at valuations provided by a third-party pricing service. Futures contracts are generally valued at last posted settlement price on their primary exchange as provided by a third-party pricing service. Futures contracts for which there were no trades that day for a particular position are generally valued at the closing bid quotation on their primary exchange as provided by a third-party pricing service. Forward foreign currency exchange contracts are generally valued at the mean of bid and asked prices for the time period interpolated from rates provided by a third-party pricing service for proximate time periods. Swap agreements are generally valued using valuations provided by a third-party pricing service, which for cleared swaps includes an evaluation of any trading activity at the clearinghouses. Open-end investment companies are generally valued at net asset value per share. Securities and other assets generally valued on the basis of information from a third-party pricing service may also be valued at a broker/dealer bid quotation. In determining values, third-party pricing services can utilize both transaction data and market information such as yield, quality, coupon rate, maturity, type of issue, trading characteristics, and other market data. The values of foreign securities and other assets and liabilities expressed in foreign currencies are converted to U.S. dollars using the mean of bid and asked prices for rates provided by a third-party pricing service.
The Board of Trustees has delegated primary responsibility for determining or causing to be determined the value of the fund’s investments (including any fair valuation) to the adviser pursuant to valuation policies and procedures approved by the Board. If the adviser determines that reliable market quotations are not readily available, investments are valued at fair value as determined in good faith by the adviser in accordance with such procedures under the oversight of the Board of Trustees. Under the fund’s valuation policies and procedures, market quotations are not considered to be readily available for most types of debt instruments and floating rate loans and many types of derivatives. These investments are generally valued at fair value based on information from third-party pricing services. In addition, investments may be valued at fair value if the adviser determines that an investment’s value has been materially affected by events occurring after the close of the exchange or market on which the investment is principally traded (such as foreign exchange or market) and prior to the determination of the fund’s net asset value, or after the halt of trading of a specific security where trading does not resume prior to the close of the exchange or market on which the security is principally traded. Events that occur after foreign markets close (such as developments in foreign markets and significant movements in the U.S. markets) and prior to the determination of the fund’s net asset value may be deemed to have a material effect on the value of securities traded in foreign markets. Accordingly, the fund’s foreign equity securities may often be valued at fair value. The adviser generally relies on third-party pricing services or other information (such as the correlation with price movements of similar securities in the same or other markets; the type, cost and investment characteristics of the security; the business and financial condition of the issuer; and trading and other market data) to assist in determining whether to fair value and at what value to fair value an investment. The value of an investment for purposes of calculating the fund’s net asset value can differ depending on the source and method used to determine value. When fair valuation is used, the value of an investment used to determine the fund’s net asset value may differ from quoted or published prices for the same investment. There can be no assurance that the fund could obtain the fair value assigned to an investment if it were to sell the investment at the same time at which the fund determines its net asset value per share.
Various inputs are used in determining the value of the fund's assets or liabilities. These inputs are categorized into three broad levels. In certain cases, the inputs used to measure fair value may fall into different levels of the fair value hierarchy. In such cases, an investment's level within the fair value hierarchy is based on the lowest level of input that is significant to the fair value measurement. The fund's assessment of the significance of a particular input to the fair value measurement in its entirety requires judgment, and considers factors specific to the investment. Level 1 includes unadjusted quoted prices in active markets for identical assets or liabilities. Level 2 includes other significant observable market-based inputs (including quoted prices for similar securities, interest rates, prepayment speed, and credit risk). Level 3 includes unobservable inputs, which may include the adviser's own assumptions in determining the fair value of investments. The following is a summary of the levels used as of June 30, 2021 in valuing the fund's assets or liabilities:
MFS Growth Allocation Portfolio
Notes to Financial Statements (unaudited) - continued
| Financial Instruments | Level 1 | Level 2 | Level 3 | Total |
| Mutual Funds | $364,773,230 | $— | $— | $364,773,230 |
For further information regarding security characteristics, see the Portfolio of Investments. Please refer to the underlying funds’ shareholder reports for further information regarding the levels used in valuing the underlying funds’ assets or liabilities.
Derivatives — The fund does not invest in derivatives directly. The fund does invest in underlying funds that may use derivatives primarily to increase or decrease exposure to a particular market or segment of the market, or security, to increase or decrease interest rate or currency exposure, or as alternatives to direct investments. Derivatives are used for hedging or non-hedging purposes. While hedging can reduce or eliminate losses, it can also reduce or eliminate gains. When the underlying funds use derivatives as an investment to increase market exposure, or for hedging purposes, gains and losses from derivative instruments may be substantially greater than the derivative’s original cost.
Indemnifications — Under the fund's organizational documents, its officers and Trustees may be indemnified against certain liabilities and expenses arising out of the performance of their duties to the fund. Additionally, in the normal course of business, the fund enters into agreements with service providers that may contain indemnification clauses. The fund's maximum exposure under these agreements is unknown as this would involve future claims that may be made against the fund that have not yet occurred.
Investment Transactions and Income — Investment transactions are recorded on the trade date. Interest income is recorded on the accrual basis. All premium and discount is amortized or accreted for financial statement purposes in accordance with U.S. generally accepted accounting principles. Distributions of income and capital gains from the underlying funds are recorded on the ex-dividend date. Recognition of net investment income by the fund is affected by the timing of the declaration of distributions by the underlying funds in which the fund invests. In determining the net gain or loss on securities sold, the cost of securities is determined on the identified cost basis.
The fund and/or the underlying funds may receive proceeds from litigation settlements. Any proceeds received from litigation involving portfolio holdings are reflected in the Statement of Operations in realized gain/loss if the security has been disposed of by the fund or in unrealized gain/loss if the security is still held by the fund. Any other proceeds from litigation not related to portfolio holdings are reflected as other income in the Statement of Operations.
Tax Matters and Distributions — The fund intends to qualify as a regulated investment company, as defined under Subchapter M of the Internal Revenue Code, and to distribute all of its taxable income, including realized capital gains. As a result, no provision for federal income tax is required. The fund’s federal tax returns, when filed, will remain subject to examination by the Internal Revenue Service for a three year period. Management has analyzed the fund’s tax positions taken on federal and state tax returns for all open tax years and does not believe that there are any uncertain tax positions that require recognition of a tax liability.
Distributions to shareholders are recorded on the ex-dividend date. Income and capital gain distributions are determined in accordance with income tax regulations, which may differ from U.S. generally accepted accounting principles. Certain capital accounts in the financial statements are periodically adjusted for permanent differences in order to reflect their tax character. These adjustments have no impact on net assets or net asset value per share. Temporary differences which arise from recognizing certain items of income, expense, gain or loss in different periods for financial statement and tax purposes will reverse at some time in the future.
Book/tax differences primarily relate to wash sale loss deferrals.
The tax character of distributions declared to shareholders for the last fiscal year is as follows:
| | Year ended
12/31/20 |
| Ordinary income (including any short-term capital gains) | $6,588,358 |
| Long-term capital gains | 28,163,053 |
| Total distributions | $34,751,411 |
The federal tax cost and the tax basis components of distributable earnings were as follows:
MFS Growth Allocation Portfolio
Notes to Financial Statements (unaudited) - continued
| As of 6/30/21 | |
| Cost of investments | $233,654,538 |
| Gross appreciation | 131,129,310 |
| Gross depreciation | (10,618) |
| Net unrealized appreciation (depreciation) | $131,118,692 |
| As of 12/31/20 | |
| Undistributed ordinary income | 6,856,590 |
| Undistributed long-term capital gain | 19,453,520 |
| Net unrealized appreciation (depreciation) | 107,769,076 |
The aggregate cost above includes prior fiscal year end tax adjustments, if applicable.
Multiple Classes of Shares of Beneficial Interest — The fund offers multiple classes of shares, which differ in their respective distribution and/or service fees. The fund's income, realized and unrealized gain (loss), and common expenses are allocated to shareholders based on the daily net assets of each class. Dividends are declared separately for each class. Differences in per share dividend rates are generally due to differences in separate class expenses. The fund’s distributions declared to shareholders as reported in the Statements of Changes in Net Assets are presented by class as follows:
| | Six months
ended
6/30/21 | | Year
ended
12/31/20 |
| Initial Class | $— | | $473,162 |
| Service Class | — | | 34,278,249 |
| Total | $— | | $34,751,411 |
(3) Transactions with Affiliates
Investment Adviser — The fund has an investment advisory agreement with MFS to provide overall investment management and related administrative services and facilities to the fund. MFS receives no compensation under this agreement; however MFS receives management fees from the underlying MFS funds.
The investment adviser has agreed in writing to pay a portion of the fund’s operating expenses, excluding distribution and/or service fees, interest, taxes, extraordinary expenses, brokerage and transaction costs, and investment-related expenses such as fees and expenses associated with investments in investment companies and other similar investment vehicles such that fund operating expenses do not exceed 0.20% annually of the fund’s average daily net assets. This written agreement will continue until modified by the fund’s Board of Trustees, but such agreement will continue at least until April 30, 2023. For the six months ended June 30, 2021, the fund’s actual operating expenses did not exceed the limit and therefore, the investment adviser did not pay any portion of the fund’s expenses related to this agreement.
In addition to the fees and expenses which the fund bears directly, the fund indirectly bears a pro rata share of the fees and expenses of the underlying funds in which the fund invests. Accordingly, the expense ratio for the fund reflects only those fees and expenses borne directly by the fund.
Distributor — MFS Fund Distributors, Inc. (MFD), a wholly-owned subsidiary of MFS, is the distributor of shares of the fund. The Trustees have adopted a distribution plan for the Service Class shares pursuant to Rule 12b-1 under the Investment Company Act of 1940.
The fund's distribution plan provides that the fund will pay MFD distribution and/or service fees equal to 0.25% per annum of its average daily net assets attributable to Service Class shares as partial consideration for services performed and expenses incurred by MFD and financial intermediaries (including participating insurance companies that invest in the fund to fund variable annuity and variable life insurance contracts, sponsors of qualified retirement and pension plans that invest in the fund, and affiliates of these participating insurance companies and plan sponsors) in connection with the sale and distribution of the Service Class shares. MFD may subsequently pay all, or a portion, of the distribution and/or service fees to financial intermediaries.
Shareholder Servicing Agent — MFS Service Center, Inc. (MFSC), a wholly-owned subsidiary of MFS, receives a fee from the fund for its services as shareholder servicing agent. For the six months ended June 30, 2021, the fee was $3,593, which equated to 0.0020% annually of the fund's average daily net assets. MFSC also receives reimbursement from the fund for out-of-pocket expenses paid by MFSC on behalf of the fund. For the six months ended June 30, 2021, these costs amounted to $89.
MFS Growth Allocation Portfolio
Notes to Financial Statements (unaudited) - continued
Administrator — MFS provides certain financial, legal, shareholder communications, compliance, and other administrative services to the fund. Under an administrative services agreement, the fund reimburses MFS the costs incurred to provide these services. The fund pays an annual fixed amount of $17,500. The administrative services fee incurred for the six months ended June 30, 2021 was equivalent to an annual effective rate of 0.0048% of the fund's average daily net assets.
Trustees’ and Officers’ Compensation — The fund pays compensation to independent Trustees in the form of a retainer, attendance fees, and additional compensation to Board and Committee chairpersons. The fund does not pay compensation directly to Trustees or officers of the fund who are also officers of the investment adviser, all of whom receive remuneration from MFS for their services to the fund. Certain officers and Trustees of the fund are officers or directors of MFS, MFD, and MFSC.
Other — The fund invests in the MFS Institutional Money Market Portfolio which is managed by MFS and seeks current income consistent with preservation of capital and liquidity. This money market fund does not pay a management fee to MFS but does incur investment and operating costs.
(4) Portfolio Securities
For the six months ended June 30, 2021, purchases and sales of shares of underlying funds, excluding the MFS Institutional Money Market Portfolio, aggregated $3,733,480 and $30,295,955, respectively.
(5) Shares of Beneficial Interest
The fund's Declaration of Trust permits the Trustees to issue an unlimited number of full and fractional shares of beneficial interest. Transactions in fund shares were as follows:
| | Six months ended
6/30/21 | | Year ended
12/31/20 |
| | Shares | Amount | | Shares | Amount |
| Shares sold | | | | | |
| Initial Class | 57,406 | $726,103 | | 57,049 | $708,716 |
| Service Class | 393,208 | 5,144,242 | | 750,638 | 7,706,079 |
| | 450,614 | $5,870,345 | | 807,687 | $8,414,795 |
Shares issued to shareholders
in reinvestment of distributions | | | | | |
| Initial Class | — | $— | | 41,836 | $473,162 |
| Service Class | — | — | | 3,022,773 | 34,278,249 |
| | — | $— | | 3,064,609 | $34,751,411 |
| Shares reacquired | | | | | |
| Initial Class | (100,729) | $(1,316,537) | | (54,241) | $(634,499) |
| Service Class | (2,368,428) | (30,623,490) | | (4,587,950) | (53,164,891) |
| | (2,469,157) | $(31,940,027) | | (4,642,191) | $(53,799,390) |
| Net change | | | | | |
| Initial Class | (43,323) | $(590,434) | | 44,644 | $547,379 |
| Service Class | (1,975,220) | (25,479,248) | | (814,539) | (11,180,563) |
| | (2,018,543) | $(26,069,682) | | (769,895) | $(10,633,184) |
(6) Line of Credit
The fund and certain other funds managed by MFS participate in a $1.25 billion unsecured committed line of credit of which $1 billion is reserved for use by the fund and certain other MFS U.S. funds. The line of credit is provided by a syndicate of banks under a credit agreement. Borrowings may be made for temporary financing needs. Interest is charged to each fund, based on its borrowings, generally at a rate equal to the highest of one month LIBOR, the Federal Funds Effective Rate and the Overnight Bank Funding Rate, plus an agreed upon spread. A commitment fee, based on the average daily, unused portion of the committed line of credit, is allocated among the participating funds. In addition, the fund and other funds managed by MFS have established unsecured uncommitted borrowing arrangements with certain banks for temporary financing needs. Interest is charged to each fund, based on its borrowings, at rates equal to customary reference rates plus an agreed upon spread. For the six months ended June 30, 2021, the fund’s commitment fee and interest expense were $635 and $0, respectively, and are included in “Miscellaneous” expense in the Statement of Operations.
MFS Growth Allocation Portfolio
Notes to Financial Statements (unaudited) - continued
(7) Investments in Affiliated Issuers
An affiliated issuer may be considered one in which the fund owns 5% or more of the outstanding voting securities, or a company which is under common control. For the purposes of this report, the following were affiliated issuers:
| Affiliated Issuers | Beginning
Value | Purchases | Sales
Proceeds | Realized
Gain
(Loss) | Change in
Unrealized
Appreciation or
Depreciation | Ending
Value |
| MFS Emerging Markets Equity Portfolio | $3,666,772 | $49,388 | $303,385 | $68,880 | $112,689 | $3,594,344 |
| MFS Global Governments Portfolio | 13,722,638 | 879,373 | — | — | (687,925) | 13,914,086 |
| MFS Global Real Estate Portfolio | 18,065,736 | 5,783 | 2,391,561 | 607,729 | 2,023,926 | 18,311,613 |
| MFS Growth Series | 39,301,739 | 128,053 | 3,286,970 | 1,501,285 | 3,444,752 | 41,088,859 |
| MFS High Yield Portfolio | 17,449,141 | 306,801 | 14,080 | (806) | 435,244 | 18,176,300 |
| MFS Inflation-Adjusted Bond Portfolio | 17,502,873 | 531,810 | — | — | (170,425) | 17,864,258 |
| MFS Institutional Money Market Portfolio | 192,576 | 786,229 | 790,279 | — | — | 188,526 |
| MFS International Growth Portfolio | 18,147,299 | 163 | 1,257,528 | 367,187 | 970,516 | 18,227,637 |
| MFS International Intrinsic Value Portfolio | 18,093,576 | 37,331 | 732,317 | 371,657 | 501,946 | 18,272,193 |
| MFS Limited Maturity Portfolio | 6,756,000 | 305,743 | — | — | 32,778 | 7,094,521 |
| MFS Mid Cap Growth Series | 32,699,102 | 359,400 | 1,495,858 | 536,447 | 1,190,052 | 33,289,143 |
| MFS Mid Cap Value Portfolio | 32,761,701 | 86,073 | 6,071,784 | 930,369 | 4,935,939 | 32,642,298 |
| MFS New Discovery Series | 7,375,385 | 79,268 | 738,152 | 311,302 | 329,805 | 7,357,608 |
| MFS New Discovery Value Portfolio | 7,381,681 | 3,113 | 1,820,252 | 304,186 | 1,424,270 | 7,292,998 |
| MFS Research International Portfolio | 32,709,118 | 9,331 | 2,483,577 | 701,034 | 1,693,729 | 32,629,635 |
| MFS Research Series | 36,160,614 | — | 4,245,368 | 1,569,661 | 3,455,902 | 36,940,809 |
| MFS Total Return Bond Series | 17,076,988 | 861,492 | — | — | (148,993) | 17,789,487 |
| MFS Value Series | 39,851,677 | 90,358 | 5,455,124 | 1,806,593 | 3,805,411 | 40,098,915 |
| | $358,914,616 | $4,519,709 | $31,086,235 | $9,075,524 | $23,349,616 | $364,773,230 |
| Affiliated Issuers | Dividend
Income | Capital Gain
Distributions |
| MFS Emerging Markets Equity Portfolio | $— | $— |
| MFS Global Governments Portfolio | — | — |
| MFS Global Real Estate Portfolio | — | — |
| MFS Growth Series | — | — |
| MFS High Yield Portfolio | — | — |
| MFS Inflation-Adjusted Bond Portfolio | — | — |
| MFS Institutional Money Market Portfolio | 51 | — |
| MFS International Growth Portfolio | — | — |
| MFS International Intrinsic Value Portfolio | — | — |
| MFS Limited Maturity Portfolio | — | — |
| MFS Mid Cap Growth Series | — | — |
| MFS Mid Cap Value Portfolio | — | — |
| MFS New Discovery Series | — | — |
| MFS New Discovery Value Portfolio | — | — |
| MFS Research International Portfolio | — | — |
| MFS Research Series | — | — |
| MFS Total Return Bond Series | — | — |
| MFS Value Series | — | — |
| | $51 | $— |
MFS Growth Allocation Portfolio
Notes to Financial Statements (unaudited) - continued
(8) Impacts of COVID-19
The pandemic related to the global spread of novel coronavirus disease (COVID-19), which was first detected in December 2019, has resulted in significant disruptions to global business activity and the global economy, as well as the economies of individual countries, the financial performance of individual companies and sectors, and the securities and commodities markets in general. Multiple surges in cases globally, the availability and widespread adoption of vaccines, and the emergence of variant strains of the virus continue to create uncertainty as to the future and long-term impacts resulting from the pandemic including impacts to the prices and liquidity of the fund's investments and the fund's performance.
MFS Growth Allocation Portfolio
Statement Regarding Liquidity Risk Management Program
The fund has adopted and implemented a liquidity risk management program (the “Program”) as required by Rule 22e-4 under the Investment Company Act of 1940, as amended. The fund’s Board of Trustees (the “Board”) has designated MFS as the administrator of the Program. The Program is reasonably designed to assess and manage the liquidity risk of the fund. Liquidity risk is the risk that the fund could not meet requests to redeem shares issued by the fund without significant dilution of remaining investors' interests.
MFS provided a written report to the Board for consideration at its April 2021 meeting that addressed the operation of the Program and provided an assessment of the adequacy and effectiveness of the Program during the period from January 1, 2020 to December 31, 2020 (the “Covered Period”). The report concluded that during the Covered Period the Program had operated effectively and had adequately and effectively been implemented to assess and manage the fund’s liquidity risk. MFS also reported that there were no liquidity events that impacted the fund or its ability to timely meet redemptions without dilution to existing shareholders during the Covered Period.
There can be no assurance that the Program will achieve its objectives in the future. Further information on liquidity risk, and other principal risks to which an investment in the fund may be subject, can be found in the prospectus.
MFS Growth Allocation Portfolio
Proxy Voting Policies and Information
MFS votes proxies on behalf of the fund pursuant to proxy voting policies and procedures that are available without charge, upon request, by calling 1-800-225-2606, by visiting mfs.com/proxyvoting, or by visiting the SEC’s Web site at http://www.sec.gov.
Information regarding how the fund voted proxies relating to portfolio securities during the most recent twelve-month period ended June 30 is available by August 31 of each year without charge by visiting mfs.com/proxyvoting, or by visiting the SEC’s Web site at http://www.sec.gov.
Quarterly Portfolio Disclosure
The fund files a complete schedule of portfolio holdings with the SEC for the first and third quarters of each fiscal year as an exhibit to its reports on Form N-PORT. The fund’s Form N-PORT reports are available on the SEC’s Web site at http://www.sec.gov. A shareholder can obtain the portfolio holdings report for the first and third quarters of the fund's fiscal year at mfs.com/vit3 by choosing the fund's name and then scrolling to the “Resources” section and clicking on the “Prospectus and Reports” tab.
FURTHER INFORMATION
From time to time, MFS may post important information about the fund or the MFS Funds on the MFS Web site (mfs.com). This information is available at https://www.mfs.com/announcements or at mfs.com/vit3 by choosing the fund's name and then scrolling to the “Resources” section and clicking on the “Announcements” tab, if any.
Information About Fund Contracts and Legal Claims
The fund has entered into contractual arrangements with an investment adviser, administrator, distributor, shareholder servicing agent, 529 program manager (if applicable), and custodian who each provide services to the fund. Unless expressly stated otherwise, shareholders are not parties to, or intended beneficiaries of these contractual arrangements, and these contractual arrangements are not intended to create any shareholder right to enforce them against the service providers or to seek any remedy under them against the service providers, either directly or on behalf of the fund.
Under the Trust’s By-Laws and Declaration of Trust, any claims asserted against or on behalf of the MFS Funds, including claims against Trustees and Officers, must be brought in state and federal courts located within the Commonwealth of Massachusetts.
Semiannual Report
June 30, 2021
MFS® Inflation-Adjusted
Bond Portfolio
MFS® Variable Insurance Trust III
MFS® Inflation-Adjusted Bond Portfolio
The report is prepared for the general information of contract owners. It is authorized for distribution to prospective investors only when preceded or accompanied by a current prospectus.
NOT FDIC INSURED • MAY LOSE VALUE • NO BANK OR CREDIT UNION GUARANTEE •
NOT A DEPOSIT • NOT INSURED BY ANY FEDERAL GOVERNMENT AGENCY OR NCUA/NCUSIF
MFS Inflation-Adjusted Bond Portfolio
Dear Contract Owners:
After experiencing dramatic swings in the early days of the coronavirus pandemic, global equity markets have performed strongly over the past year. Though the speedy development of vaccines brightened the economic and market outlook, uncertainty remains as new variants of the virus appear, and questions persist over how fast vaccines can be made widely available in the developing world.
Global central banks have taken aggressive steps to cushion the economic and market fallout related to the virus, and governments are deploying unprecedented levels of fiscal support. Having passed a $1.9 trillion stimulus package in March, the U.S. Congress could approve additional stimulus later this year, some of it focused on infrastructure. Along with extraordinary government expenditures, pent-up consumer demand fueled a surge in economic activity as coronavirus restrictions were eased, pushing up inflation, at least temporarily. Markets initially reacted by pushing up yields on global government bonds, though some of the rate rise has since been corrected.
A spirited debate is underway among investors over whether the current price pressures will persist or prove to be temporary, caused by pandemic-induced bottlenecks. The policy measures put in place to counteract the pandemic's effects have helped build a supportive environment and are encouraging economic recovery; however, if markets disconnect from fundamentals, they can sow the seeds of instability. As such, recent dramatic increases in speculative trading in cryptocurrencies, special purpose acquisition companies (SPACs), and the like bear watching.
In the aftermath of the crisis, we could see societal changes as households, businesses, and governments adjust to a new reality, and any such alterations could affect the investment landscape. For investors, events such as the COVID-19 outbreak demonstrate the importance of having a deep understanding of company fundamentals, and we have built our global research platform to do just that.
At MFS®, we put our clients’ assets to work responsibly by carefully navigating the increasing complexity of global markets and economies. Guided by our long-term philosophy and adhering to our commitment to sustainable investing, we tune out the noise and aim to uncover what we believe are the best, most durable investment opportunities in the market. Our unique global investment platform combines collective expertise, long-term discipline, and thoughtful risk management to create sustainable value for investors.
Respectfully,
Michael W. Roberge
Chief Executive Officer
MFS Investment Management
August 13, 2021
The opinions expressed in this letter are subject to change and may not be relied upon for investment advice. No forecasts can be guaranteed.
MFS Inflation-Adjusted Bond Portfolio
Portfolio structure (i)
Fixed income sectors (i)
| Non-U.S. Government Bonds | 51.2% |
| U.S. Treasury Securities | 42.0% |
| Commercial Mortgage-Backed Securities | 1.3% |
| Collateralized Debt Obligations | 1.3% |
| Municipal Bonds | 1.1% |
| Investment Grade Corporates | 1.0% |
| Mortgage-Backed Securities | 0.8% |
| Emerging Markets Bonds | 0.5% |
| U.S. Government Agencies | 0.2% |
Composition including fixed income credit quality (a)(i)
| AAA | 7.0% |
| AA | 25.3% |
| A | 3.7% |
| BBB | 19.9% |
| BB | 0.5% |
| U.S. Government | 42.0% |
| Federal Agencies | 1.0% |
| Cash & Cash Equivalents | 0.6% |
| Other (o) | 0.0% |
Portfolio facts (i)
| Average Duration (d) | 11.9 |
| Average Effective Maturity (m) | 12.6 yrs. |
Issuer country weightings (i)(x)
| United States | 48.1% |
| United Kingdom | 22.3% |
| Italy | 13.0% |
| Spain | 6.3% |
| Japan | 3.0% |
| Sweden | 2.6% |
| Canada | 1.5% |
| France | 1.3% |
| Australia | 1.2% |
| Other Countries | 0.7% |
Currency exposure weightings (i)(y)
| United States Dollar | 45.3% |
| British Pound Sterling | 29.3% |
| Euro | 16.1% |
| Canadian Dollar | 2.2% |
| Norwegian Krone | 2.0% |
| Japanese Yen | 1.8% |
| Swedish Krona | 1.2% |
| New Zealand Dollar | 1.0% |
| Australian Dollar | 0.9% |
| Other Currencies | 0.2% |
| (a) | For all securities other than those specifically described below, ratings are assigned to underlying securities utilizing ratings from Moody’s, Fitch, and Standard & Poor’s rating agencies and applying the following hierarchy: If all three agencies provide a rating, the middle rating (after dropping the highest and lowest ratings) is assigned; if two of the three agencies rate a security, the lower of the two is assigned. If none of the 3 rating agencies above assign a rating, but the security is rated by DBRS Morningstar, then the DBRS Morningstar rating is assigned. If none of the 4 ratings agencies listed above rate the security, but the security is rated by the Kroll Bond Rating Agency (KBRA), then the KBRA rating is assigned. Ratings are shown in the S&P and Fitch scale (e.g., AAA). Securities rated BBB or higher are considered investment grade. All ratings are subject to change. U.S. Government includes securities issued by the U.S. Department of the Treasury. Federal Agencies includes rated and unrated U.S. Agency fixed-income securities, U.S. Agency mortgage-backed securities, and collateralized mortgage obligations of U.S. Agency mortgage-backed securities. Not Rated includes fixed income securities and fixed income derivatives that have not been rated by any rating agency. The fund may or may not have held all of these instruments on this date. The fund is not rated by these agencies. |
| (d) | Duration is a measure of how much a bond’s price is likely to fluctuate with general changes in interest rates, e.g., if rates rise 1.00%, a bond with a 5-year duration is likely to lose about 5.00% of its value due to the interest rate move. |
MFS Inflation-Adjusted Bond Portfolio
Portfolio Composition - continued
| (i) | For purposes of this presentation, the components include the value of securities, and reflect the impact of the equivalent exposure of derivative positions, if any. These amounts may be negative from time to time. Equivalent exposure is a calculated amount that translates the derivative position into a reasonable approximation of the amount of the underlying asset that the portfolio would have to hold at a given point in time to have the same price sensitivity that results from the portfolio’s ownership of the derivative contract. When dealing with derivatives, equivalent exposure is a more representative measure of the potential impact of a position on portfolio performance than value. The bond component will include any accrued interest amounts. |
| (m) | In determining each instrument’s effective maturity for purposes of calculating the fund’s dollar-weighted average effective maturity, MFS uses the instrument’s stated maturity or, if applicable, an earlier date on which MFS believes it is probable that a maturity-shortening device (such as a put, pre-refunding or prepayment) will cause the instrument to be repaid. Such an earlier date can be substantially shorter than the instrument’s stated maturity. |
| (x) | Represents the portfolio’s exposure to issuer countries as a percentage of a portfolio’s net assets. For purposes of this presentation, United States includes Cash & Cash Equivalents and Other. |
| (y) | Represents the portfolio’s exposure to a particular currency as a percentage of a portfolio's net assets. For purposes of this presentation, United States Dollar includes Cash & Cash Equivalents. |
Where the fund holds convertible bonds, they are treated as part of the equity portion of the portfolio.
Cash & Cash Equivalents includes any cash, investments in money market funds, short-term securities, and other assets less liabilities. Please see the Statement of Assets and Liabilities for additional information related to the fund’s cash position and other assets and liabilities.
Other includes equivalent exposure from currency derivatives and/or any offsets to derivative positions and may be negative.
Percentages are based on net assets as of June 30, 2021.
The portfolio is actively managed and current holdings may be different.
MFS Inflation-Adjusted Bond Portfolio
Expense Table
Fund Expenses Borne by the Contract Holders during the Period,
January 1, 2021 through June 30, 2021
As a contract holder of the fund, you incur ongoing costs, including management fees; distribution and/or service (12b-1) fees; and other fund expenses. This example is intended to help you understand your ongoing costs (in dollars) of investing in the fund and to compare these costs with the ongoing costs of investing in other mutual funds.
The example is based on an investment of $1,000 invested at the beginning of the period and held for the entire period January 1, 2021 through June 30, 2021.
Actual Expenses
The first line for each share class in the following table provides information about actual account values and actual expenses. You may use the information in this line, together with the amount you invested, to estimate the expenses that you paid over the period. Simply divide your account value by $1,000 (for example, an $8,600 account value divided by $1,000 = 8.6), then multiply the result by the number in the first line under the heading entitled “Expenses Paid During Period” to estimate the expenses you paid on your account during this period.
Hypothetical Example for Comparison Purposes
The second line for each share class in the following table provides information about hypothetical account values and hypothetical expenses based on the fund’s actual expense ratio and an assumed rate of return of 5% per year before expenses, which is not the fund’s actual return. The hypothetical account values and expenses may not be used to estimate the actual ending account balance or expenses you paid for the period. You may use this information to compare the ongoing costs of investing in the fund and other funds. To do so, compare this 5% hypothetical example with the 5% hypothetical examples that appear in the shareholder reports of the other funds.
Please note that the expenses shown in the table are meant to highlight the fund's ongoing costs only and do not take into account the fees and expenses imposed under the variable contracts through which your investment in the fund is made. Therefore, the second line for each share class in the table is useful in comparing ongoing costs associated with an investment in vehicles (such as the fund) which fund benefits under variable annuity and variable life insurance contracts and to qualified pension and retirement plans only, and will not help you determine the relative total costs of investing in the fund through variable annuity and variable life insurance contracts. If the fees and expenses imposed under the variable contracts were included, your costs would have been higher.
Share
Class | | Annualized
Expense
Ratio | Beginning
Account Value
1/01/21 | Ending
Account Value
6/30/21 | Expenses
Paid During
Period (p)
1/01/21-6/30/21 |
| Initial Class | Actual | 0.56% | $1,000.00 | $990.05 | $2.76 |
| Hypothetical (h) | 0.56% | $1,000.00 | $1,022.02 | $2.81 |
| Service Class | Actual | 0.81% | $1,000.00 | $989.09 | $3.99 |
| Hypothetical (h) | 0.81% | $1,000.00 | $1,020.78 | $4.06 |
| (h) | 5% class return per year before expenses. |
| (p) | “Expenses Paid During Period” are equal to each class's annualized expense ratio, as shown above, multiplied by the average account value over the period, multiplied by 181/365 (to reflect the one-half year period). |
MFS Inflation-Adjusted Bond Portfolio
Portfolio of Investments − 6/30/21 (unaudited)
The Portfolio of Investments is a complete list of all securities owned by your fund. It is categorized by broad-based asset classes.
| Issuer | | | Shares/Par | Value ($) |
| Bonds – 99.2% |
| Asset-Backed & Securitized – 2.6% |
| Bancorp Commercial Mortgage Trust, 2019-CRE6, “A”, FLR, 1.174% (LIBOR - 1mo. + 1.05%), 9/15/2036 (n) | | $ | 159,945 | $ 159,845 |
| BBCMS Mortgage Trust, 2021-C10, “XA”, 1.434%, 7/15/2054 (i)(w) | | | 2,097,574 | 210,938 |
| BBCMS Mortgage Trust, 2021-C9, “XA”, 1.769%, 2/15/2054 (i) | | | 1,347,230 | 168,666 |
| Benchmark Mortgage Trust, 2019-B12, “A5”, 3.115%, 8/15/2052 | | | 710,554 | 772,591 |
| Benchmark Mortgage Trust, 2021-B23, “XA”, 1.385%, 2/15/2054 (i) | | | 4,297,586 | 408,030 |
| Benchmark Mortgage Trust, 2021-B24, “XA”, 1.274%, 3/15/2054 (i) | | | 2,525,876 | 218,039 |
| Benchmark Mortgage Trust, 2021-B26, “XA”, 0.999%, 6/15/2054 (i) | | | 2,802,641 | 193,524 |
| Benchmark Mortgage Trust, 2021-B27, “XA”, 1.273%, 7/15/2054 (i) | | | 3,307,489 | 333,503 |
| Commercial Mortgage Pass-Through Certificates, 2021-BN31,“XA”, 1.444%, 2/15/2054 (i) | | | 3,332,734 | 343,947 |
| Galaxy CLO Ltd., 2018-29A, “A”, FLR, 0.945% (LIBOR - 3mo. + 0.79%), 11/15/2026 (n) | | | 240,046 | 239,935 |
| Madison Park Funding Ltd., 2014-13A, “BR2”, FLR, 1.689% (LIBOR - 3mo. + 1.5%), 4/19/2030 (n) | | | 901,666 | 906,050 |
| MF1 CLO Ltd., 2021-FL5, “B”, FLR, 1.574% (LIBOR - 1mo. + 1.45%), 7/15/2036 (n) | | | 940,500 | 939,618 |
| MF1 Multi-Family Housing Mortgage Loan Trust, 2020-FL4, “A”, FLR, 1.824% (LIBOR - 1mo. + 1.7%), 11/15/2035 (n) | | | 467,000 | 470,794 |
| Morgan Stanley Capital I Trust, 2021-L5, “XA”, 1.425%, 5/15/2054 (i) | | | 1,659,172 | 162,607 |
| Symphony CLO Ltd., 2016-17A, “BR”, FLR, 1.383% (LIBOR - 3mo. + 1.2%), 4/15/2028 (n) | | | 764,124 | 761,775 |
| Wells Fargo Commercial Mortgage Trust, 2019-C54, “A4”, 3.146%, 12/15/2052 | | | 392,680 | 427,234 |
| | | | | $6,717,096 |
| Issuer | | | Shares/Par | Value ($) |
| Bonds – continued |
| Automotive – 0.5% |
| Hyundai Capital America, 2.85%, 11/01/2022 (n) | | $ | 444,000 | $ 456,529 |
| Hyundai Capital America, 2.375%, 2/10/2023 (n) | | | 225,000 | 230,951 |
| Volkswagen Group of America Finance LLC, 2.7%, 9/26/2022 (n) | | | 441,000 | 453,226 |
| | | | | $1,140,706 |
| Consumer Services – 0.1% |
| Conservation Fund, 3.474%, 12/15/2029 | | $ | 312,000 | $ 333,873 |
| Emerging Market Sovereign – 0.5% |
| Hellenic Republic (Republic of Greece), 0.75%, 6/18/2031 (n) | | EUR | 1,115,000 | $ 1,312,627 |
| Industrial – 0.1% |
| Howard University, Washington D.C., 2.638%, 10/01/2021 | | $ | 52,000 | $ 52,275 |
| Howard University, Washington D.C., 2.738%, 10/01/2022 | | | 55,000 | 56,320 |
| Howard University, Washington D.C., 2.801%, 10/01/2023 | | | 60,000 | 61,384 |
| Howard University, Washington D.C., AGM, 2.416%, 10/01/2024 | | | 66,000 | 67,747 |
| Howard University, Washington D.C., AGM, 2.516%, 10/01/2025 | | | 82,000 | 84,433 |
| | | | | $322,159 |
| International Market Sovereign – 51.0% |
| Commonwealth of Australia, Inflation Linked Bond, 3%, 9/20/2025 | | AUD | 807,911 | $ 712,988 |
| Commonwealth of Australia, Inflation Linked Bond, 2.5%, 9/20/2030 | | | 2,085,216 | 2,009,173 |
| Commonwealth of Australia, Inflation Linked Bond, 1.25%, 8/21/2040 | | | 347,729 | 319,950 |
| Government of Canada, Inflation Linked Bond, 4%, 12/01/2031 | | CAD | 609,518 | 721,322 |
| Government of Canada, Inflation Linked Bond, 3%, 12/01/2036 | | | 2,517,438 | 3,016,417 |
| Government of Japan, Inflation Linked Bond, 0.1%, 3/10/2026 | | JPY | 822,133,800 | 7,551,983 |
| Kingdom of Spain, Inflation Linked Bond, 0.15%, 11/30/2023 | | EUR | 2,091,440 | 2,596,705 |
| Kingdom of Spain, Inflation Linked Bond, 0.65%, 11/30/2027 | | | 3,236,996 | 4,348,282 |
| Kingdom of Spain, Inflation Linked Bond, 1%, 11/30/2030 | | | 898,539 | 1,277,660 |
| Kingdom of Spain, Inflation Linked Bond, 0.7%, 11/30/2033 (n) | | | 5,594,602 | 7,884,669 |
| Kingdom of Sweden, Inflation Linked Bond, 3.5%, 12/01/2028 | | SEK | 40,520,238 | 6,622,316 |
| Republic of France, Inflation Linked Bond, 1.8%, 7/25/2040 | | EUR | 658,546 | 1,239,374 |
MFS Inflation-Adjusted Bond Portfolio
Portfolio of Investments (unaudited) – continued
| Issuer | | | Shares/Par | Value ($) |
| Bonds – continued |
| International Market Sovereign – continued |
| Republic of France, Inflation Linked Bond, 0.1%, 7/25/2047 | | EUR | 1,410,296 | $ 2,115,407 |
| Republic of Italy, Inflation Linked Bond, 2.6%, 9/15/2023 | | | 1,945,152 | 2,517,847 |
| Republic of Italy, Inflation Linked Bond, 2.35%, 9/15/2024 | | | 3,745,420 | 4,975,347 |
| Republic of Italy, Inflation Linked Bond, 3.1%, 9/15/2026 | | | 5,307,569 | 7,697,519 |
| Republic of Italy, Inflation Linked Bond, 1.3%, 5/15/2028 | | | 4,200,549 | 5,674,099 |
| Republic of Italy, Inflation Linked Bond, 0.4%, 5/15/2030 | | | 3,916,166 | 5,016,011 |
| Republic of Italy, Inflation Linked Bond, 2.35%, 9/15/2035 | | | 2,100,384 | 3,367,197 |
| Republic of Italy, Inflation Linked Bond, 2.55%, 9/15/2041 | | | 2,234,051 | 3,931,780 |
| United Kingdom Treasury, Inflation Linked Bond, 0.75%, 3/22/2034 | | GBP | 998,351 | 2,048,097 |
| United Kingdom Treasury, Inflation Linked Bond, 2%, 1/26/2035 | | | 1,359,297 | 3,255,684 |
| United Kingdom Treasury, Inflation Linked Bond, 0.125%, 11/22/2036 | | | 2,084,382 | 4,244,114 |
| United Kingdom Treasury, Inflation Linked Bond, 1.125%, 11/22/2037 | | | 1,057,048 | 2,497,726 |
| United Kingdom Treasury, Inflation Linked Bond, 0.625%, 3/22/2040 | | | 616,045 | 1,431,491 |
| United Kingdom Treasury, Inflation Linked Bond, 0.625%, 11/22/2042 | | | 1,899,021 | 4,674,976 |
| United Kingdom Treasury, Inflation Linked Bond, 0.125%, 3/22/2044 | | | 1,819,603 | 4,204,694 |
| United Kingdom Treasury, Inflation Linked Bond, 0.125%, 3/22/2046 | | | 940,240 | 2,249,928 |
| United Kingdom Treasury, Inflation Linked Bond, 0.75%, 11/22/2047 | | | 2,054,994 | 5,744,900 |
| United Kingdom Treasury, Inflation Linked Bond, 0.125%, 8/10/2048 | | | 246,539 | 621,002 |
| United Kingdom Treasury, Inflation Linked Bond, 0.5%, 3/22/2050 | | | 1,477,286 | 4,129,155 |
| United Kingdom Treasury, Inflation Linked Bond, 0.25%, 3/22/2052 | | | 1,610,928 | 4,442,399 |
| United Kingdom Treasury, Inflation Linked Bond, 1.25%, 11/22/2055 | | | 742,568 | 2,718,899 |
| United Kingdom Treasury, Inflation Linked Bond, 0.125%, 11/22/2056 | | | 449,008 | 1,315,103 |
| United Kingdom Treasury, Inflation Linked Bond, 0.125%, 3/22/2058 | | | 1,229,277 | 3,713,426 |
| United Kingdom Treasury, Inflation Linked Bond, 0.375%, 3/22/2062 | | | 1,115,897 | 3,882,183 |
| United Kingdom Treasury, Inflation Linked Bond, 0.125%, 11/22/2065 | | | 531,824 | 1,890,708 |
| United Kingdom Treasury, Inflation Linked Bond, 0.125%, 3/22/2068 | | | 1,061,148 | 4,071,446 |
| | | | | $ 130,731,977 |
| Issuer | | | Shares/Par | Value ($) |
| Bonds – continued |
| Medical & Health Technology & Services – 0.3% |
| ProMedica Toledo Hospital, “B”, AGM, 5.325%, 11/15/2028 | | $ | 487,000 | $ 582,100 |
| ProMedica Toledo Hospital, “B”, AGM, 5.75%, 11/15/2038 | | | 144,000 | 175,284 |
| | | | | $757,384 |
| Mortgage-Backed – 0.8% | |
| Freddie Mac, 3.85%, 5/25/2028 | | $ | 390,000 | $ 451,208 |
| Freddie Mac, 3.854%, 6/25/2028 | | | 555,000 | 642,911 |
| Freddie Mac, 1.915%, 4/25/2030 (i) | | | 564,669 | 81,369 |
| Freddie Mac, 1.765%, 5/25/2030 (i) | | | 1,221,668 | 164,808 |
| Freddie Mac, 1.262%, 9/25/2030 (i) | | | 646,322 | 63,981 |
| Freddie Mac, 0.423%, 1/25/2031 (i) | | | 4,884,997 | 135,093 |
| Freddie Mac, 0.873%, 1/25/2031 (i) | | | 1,882,263 | 130,491 |
| Freddie Mac, 1.026%, 1/25/2031 (i) | | | 1,425,035 | 116,355 |
| Freddie Mac, 0.625%, 3/25/2031 (i) | | | 5,964,350 | 270,018 |
| Freddie Mac, 1.224%, 5/25/2031 (i) | | | 709,327 | 78,086 |
| | | | | $2,134,320 |
| Municipals – 1.2% |
| Chicago, IL, Board of Education, “E”, BAM, 6.138%, 12/01/2039 | | $ | 550,000 | $ 735,481 |
| Florida State Board of Administration Finance Corp. Rev., “A”, 1.705%, 7/01/2027 | | | 458,000 | 465,413 |
| Illinois Sales Tax Securitization Corp., Second Lien, “B”, BAM, 3.411%, 1/01/2043 | | | 480,000 | 518,685 |
| Port Authority of NY & NJ, “AAA”, 1.086%, 7/01/2023 | | | 410,000 | 415,218 |
| Texas Transportation Commission, Central Texas Turnpike System First Tier Refunding Rev., Taxable, “B”, 1.98%, 8/15/2042 | | | 380,000 | 386,449 |
| University of California, General Taxable Rev., “BG”, 1.614%, 5/15/2030 | | | 410,000 | 406,145 |
| | | | | $2,927,391 |
| U.S. Government Agencies and Equivalents – 0.2% |
| Tennessee Valley Authority, 0.75%, 5/15/2025 | | $ | 394,000 | $ 396,354 |
| U.S. Treasury Inflation Protected Securities – 41.9% |
| U.S. Treasury Bonds, 0.375%, 7/15/2023 | | $ | 4,107,046 | $ 4,368,950 |
| U.S. Treasury Bonds, 0.625%, 1/15/2024 | | | 5,205,322 | 5,605,888 |
| U.S. Treasury Bonds, 0.25%, 1/15/2025 | | | 11,237,792 | 12,162,276 |
| U.S. Treasury Bonds, 2.375%, 1/15/2025 | | | 6,620,519 | 7,692,992 |
| U.S. Treasury Bonds, 2%, 1/15/2026 | | | 2,124,560 | 2,499,429 |
| U.S. Treasury Bonds, 0.375%, 1/15/2027 | | | 1,335,492 | 1,478,067 |
| U.S. Treasury Bonds, 2.375%, 1/15/2027 | | | 864,735 | 1,059,166 |
| U.S. Treasury Bonds, 1.75%, 1/15/2028 | | | 1,910,835 | 2,309,175 |
MFS Inflation-Adjusted Bond Portfolio
Portfolio of Investments (unaudited) – continued
| Issuer | | | Shares/Par | Value ($) |
| Bonds – continued |
| U.S. Treasury Inflation Protected Securities – continued |
| U.S. Treasury Bonds, 3.625%, 4/15/2028 | | $ | 774,380 | $ 1,044,052 |
| U.S. Treasury Bonds, 3.875%, 4/15/2029 | | | 1,569,248 | 2,206,530 |
| U.S. Treasury Bonds, 2.125%, 2/15/2040 | | | 521,406 | 776,936 |
| U.S. Treasury Bonds, 2.125%, 2/15/2041 | | | 2,252,361 | 3,392,736 |
| U.S. Treasury Bonds, 0.75%, 2/15/2042 | | | 6,300,496 | 7,670,525 |
| U.S. Treasury Bonds, 0.625%, 2/15/2043 | | | 2,166,291 | 2,586,179 |
| U.S. Treasury Bonds, 1.375%, 2/15/2044 | | | 1,146 | 1,580 |
| U.S. Treasury Bonds, 1%, 2/15/2046 | | | 670,607 | 875,971 |
| U.S. Treasury Bonds, 1%, 2/15/2048 | | | 2,015,389 | 2,686,397 |
| U.S. Treasury Bonds, 1%, 2/15/2049 | | | 1,040,045 | 1,399,524 |
| U.S. Treasury Bonds, 0.25%, 2/15/2050 | | | 3,238,376 | 3,662,864 |
| U.S. Treasury Notes, 0.125%, 1/15/2023 | | | 19,705,513 | 20,588,028 |
| U.S. Treasury Notes, 0.125%, 7/15/2024 | | | 7,740,117 | 8,322,843 |
| U.S. Treasury Notes, 0.375%, 7/15/2025 | | | 7,531,557 | 8,269,120 |
| Issuer | | | Shares/Par | Value ($) |
| Bonds – continued |
| U.S. Treasury Inflation Protected Securities – continued |
| U.S. Treasury Notes, 0.375%, 7/15/2027 | | $ | 1,363,558 | $ 1,520,581 |
| U.S. Treasury Notes, 0.25%, 7/15/2029 | | | 771,531 | 858,268 |
| U.S. Treasury Notes, 0.125%, 1/15/2030 | | | 2,543,027 | 2,791,336 |
| U.S. Treasury Notes, 0.125%, 7/15/2030 | | | 1,260,324 | 1,390,229 |
| | | | | $ 107,219,642 |
| Total Bonds (Identified Cost, $226,262,032) | | $ 253,993,529 |
| Investment Companies (h) – 1.9% |
| Money Market Funds – 1.9% | |
| MFS Institutional Money Market Portfolio, 0.02% (v) (Identified Cost, $4,946,250) | | | 4,946,250 | $ 4,946,250 |
| Other Assets, Less Liabilities – (1.1)% | | (2,756,058) |
| Net Assets – 100.0% | $ 256,183,721 |
| (h) | An affiliated issuer, which may be considered one in which the fund owns 5% or more of the outstanding voting securities, or a company which is under common control. At period end, the aggregate values of the fund's investments in affiliated issuers and in unaffiliated issuers were $4,946,250 and $253,993,529, respectively. | | | |
| (i) | Interest only security for which the fund receives interest on notional principal (Par amount). Par amount shown is the notional principal and does not reflect the cost of the security. | | | |
| (n) | Securities exempt from registration under Rule 144A of the Securities Act of 1933. These securities may be sold in the ordinary course of business in transactions exempt from registration, normally to qualified institutional buyers. At period end, the aggregate value of these securities was $13,816,019, representing 5.4% of net assets. | | | |
| (v) | Affiliated issuer that is available only to investment companies managed by MFS. The rate quoted for the MFS Institutional Money Market Portfolio is the annualized seven-day yield of the fund at period end. | | | |
| (w) | When-issued security. | | | |
| The following abbreviations are used in this report and are defined: |
| AGM | Assured Guaranty Municipal |
| BAM | Build America Mutual |
| CLO | Collateralized Loan Obligation |
| FLR | Floating Rate. Interest rate resets periodically based on the parenthetically disclosed reference rate plus a spread (if any). The period-end rate reported may not be the current rate. All reference rates are USD unless otherwise noted. |
| LIBOR | London Interbank Offered Rate |
| Abbreviations indicate amounts shown in currencies other than the U.S. dollar. All amounts are stated in U.S. dollars unless otherwise indicated. A list of abbreviations is shown below: |
| AUD | Australian Dollar |
| CAD | Canadian Dollar |
| DKK | Danish Krone |
| EUR | Euro |
| GBP | British Pound |
| JPY | Japanese Yen |
| NOK | Norwegian Krone |
| NZD | New Zealand Dollar |
| SEK | Swedish Krona |
MFS Inflation-Adjusted Bond Portfolio
Portfolio of Investments (unaudited) – continued
| Derivative Contracts at 6/30/21 |
| Forward Foreign Currency Exchange Contracts |
Currency
Purchased | Currency
Sold | Counterparty | Settlement
Date | Unrealized
Appreciation
(Depreciation) |
| Asset Derivatives |
| CAD | 3,208,000 | USD | 2,568,763 | Brown Brothers Harriman | 7/16/2021 | $ 19,142 |
| CAD | 1,621,000 | USD | 1,299,016 | JPMorgan Chase Bank N.A. | 7/16/2021 | 8,650 |
| GBP | 9,186,191 | USD | 12,623,360 | JPMorgan Chase Bank N.A. | 7/16/2021 | 84,441 |
| GBP | 716,062 | USD | 988,254 | State Street Bank Corp. | 7/16/2021 | 2,317 |
| NOK | 10,945,000 | USD | 1,263,746 | Deutsche Bank AG | 7/16/2021 | 7,518 |
| USD | 1,948,852 | AUD | 2,496,000 | Deutsche Bank AG | 7/16/2021 | 76,839 |
| USD | 1,340,013 | AUD | 1,751,702 | Morgan Stanley Capital Services, Inc. | 7/16/2021 | 26,227 |
| USD | 1,922,398 | AUD | 2,474,000 | State Street Bank Corp. | 7/16/2021 | 66,885 |
| USD | 1,297,772 | CAD | 1,571,000 | Morgan Stanley Capital Services, Inc. | 7/16/2021 | 30,441 |
| USD | 1,293,236 | EUR | 1,062,000 | Barclays Bank PLC | 7/16/2021 | 33,598 |
| USD | 598,669 | EUR | 489,000 | BNP Paribas S.A. | 7/16/2021 | 18,666 |
| USD | 1,299,187 | EUR | 1,064,000 | Brown Brothers Harriman | 7/16/2021 | 37,177 |
| USD | 1,288,258 | EUR | 1,073,000 | Citibank N.A. | 7/16/2021 | 15,573 |
| USD | 6,519,253 | EUR | 5,443,465 | Deutsche Bank AG | 7/16/2021 | 62,766 |
| USD | 5,703,383 | EUR | 4,783,289 | JPMorgan Chase Bank N.A. | 7/16/2021 | 29,927 |
| USD | 8,633,808 | EUR | 7,131,469 | Morgan Stanley Capital Services, Inc. | 7/16/2021 | 175,179 |
| USD | 750,788 | EUR | 618,000 | State Street Bank Corp. | 7/16/2021 | 17,778 |
| USD | 256,294 | GBP | 184,000 | Barclays Bank PLC | 7/16/2021 | 1,756 |
| USD | 364,586 | GBP | 257,000 | Brown Brothers Harriman | 7/16/2021 | 9,063 |
| USD | 204,478 | GBP | 147,000 | Goldman Sachs International | 7/16/2021 | 1,124 |
| USD | 408,836 | GBP | 294,000 | JPMorgan Chase Bank N.A. | 7/16/2021 | 2,128 |
| USD | 1,524,398 | GBP | 1,100,000 | Morgan Stanley Capital Services, Inc. | 7/16/2021 | 2,703 |
| USD | 666,017 | GBP | 470,000 | State Street Bank Corp. | 7/16/2021 | 15,838 |
| USD | 45,785 | JPY | 5,000,000 | Brown Brothers Harriman | 7/16/2021 | 774 |
| USD | 1,296,191 | JPY | 143,300,000 | Citibank N.A. | 7/16/2021 | 6,160 |
| USD | 396,044 | JPY | 43,151,986 | Deutsche Bank AG | 7/16/2021 | 7,577 |
| USD | 1,344,965 | JPY | 148,141,000 | State Street Bank Corp. | 7/16/2021 | 11,354 |
| USD | 1,909,107 | NOK | 15,921,000 | Brown Brothers Harriman | 7/16/2021 | 59,879 |
| USD | 1,307,111 | NOK | 10,878,000 | Citibank N.A. | 7/16/2021 | 43,629 |
| USD | 645,886 | NZD | 907,000 | Deutsche Bank AG | 7/16/2021 | 11,906 |
| USD | 1,928,320 | NZD | 2,704,000 | State Street Bank Corp. | 7/16/2021 | 38,264 |
| USD | 638,228 | SEK | 5,450,000 | Brown Brothers Harriman | 7/16/2021 | 1,320 |
| USD | 2,158,497 | SEK | 18,358,116 | JPMorgan Chase Bank N.A. | 7/16/2021 | 13,097 |
| USD | 1,283,942 | SEK | 10,839,000 | Merrill Lynch International | 7/16/2021 | 17,255 |
| USD | 864,083 | SEK | 7,200,000 | Morgan Stanley Capital Services, Inc. | 7/16/2021 | 22,664 |
| USD | 6,891,512 | SEK | 57,242,362 | State Street Bank Corp. | 7/16/2021 | 201,951 |
| | | | | | | $ 1,181,566 |
| Liability Derivatives |
| AUD | 721,281 | USD | 557,955 | Brown Brothers Harriman | 7/16/2021 | $ (16,990) |
| AUD | 923,083 | USD | 711,286 | Deutsche Bank AG | 7/16/2021 | (18,968) |
| AUD | 1,651,000 | USD | 1,271,019 | Goldman Sachs International | 7/16/2021 | (32,760) |
| AUD | 2,443,000 | USD | 1,901,571 | JPMorgan Chase Bank N.A. | 7/16/2021 | (69,309) |
| CAD | 2,109,092 | USD | 1,749,566 | Brown Brothers Harriman | 7/16/2021 | (48,153) |
| CAD | 2,383,000 | USD | 1,926,485 | Morgan Stanley Capital Services, Inc. | 7/16/2021 | (4,111) |
| DKK | 3,369,185 | USD | 541,770 | JPMorgan Chase Bank N.A. | 7/16/2021 | (4,386) |
| EUR | 2,475,000 | USD | 2,990,893 | Brown Brothers Harriman | 7/16/2021 | (55,297) |
| EUR | 1,711,000 | USD | 2,070,684 | Deutsche Bank AG | 7/16/2021 | (41,269) |
| EUR | 1,449,108 | USD | 1,757,833 | HSBC Bank | 7/16/2021 | (39,048) |
| EUR | 750,000 | USD | 903,344 | JPMorgan Chase Bank N.A. | 7/16/2021 | (13,770) |
| EUR | 4,321,898 | USD | 5,253,258 | State Street Bank Corp. | 7/16/2021 | (127,059) |
| GBP | 918,000 | USD | 1,287,598 | Brown Brothers Harriman | 7/16/2021 | (17,674) |
MFS Inflation-Adjusted Bond Portfolio
Portfolio of Investments (unaudited) – continued
| Forward Foreign Currency Exchange Contracts - continued |
Currency
Purchased | Currency
Sold | Counterparty | Settlement
Date | Unrealized
Appreciation
(Depreciation) |
| Liability Derivatives - continued |
| GBP | 918,000 | USD | 1,299,205 | Citibank N.A. | 7/16/2021 | $ (29,281) |
| GBP | 962,000 | USD | 1,357,801 | Goldman Sachs International | 7/16/2021 | (27,010) |
| GBP | 1,173,003 | USD | 1,626,659 | Morgan Stanley Capital Services, Inc. | 7/16/2021 | (3,975) |
| GBP | 870,000 | USD | 1,216,313 | NatWest Markets PLC | 7/16/2021 | (12,791) |
| GBP | 650,000 | USD | 923,554 | State Street Bank Corp. | 7/16/2021 | (24,370) |
| NOK | 5,688,000 | USD | 666,362 | Brown Brothers Harriman | 7/16/2021 | (5,699) |
| NOK | 10,980,000 | USD | 1,289,227 | Citibank N.A. | 7/16/2021 | (13,898) |
| NOK | 10,691,000 | USD | 1,275,820 | Morgan Stanley Capital Services, Inc. | 7/16/2021 | (34,058) |
| NOK | 32,297,683 | USD | 3,811,089 | State Street Bank Corp. | 7/16/2021 | (59,707) |
| NZD | 903,000 | USD | 645,212 | Brown Brothers Harriman | 7/16/2021 | (14,028) |
| NZD | 1,788,000 | USD | 1,303,936 | Citibank N.A. | 7/16/2021 | (54,150) |
| NZD | 867,608 | USD | 611,160 | JPMorgan Chase Bank N.A. | 7/16/2021 | (4,714) |
| NZD | 1,400,436 | USD | 1,003,378 | Merrill Lynch International | 7/16/2021 | (24,493) |
| NZD | 2,279,911 | USD | 1,657,738 | State Street Bank Corp. | 7/16/2021 | (64,114) |
| SEK | 5,382,000 | USD | 650,316 | Brown Brothers Harriman | 7/16/2021 | (21,354) |
| SEK | 10,783,000 | USD | 1,305,256 | Citibank N.A. | 7/16/2021 | (45,113) |
| SEK | 9,000,000 | USD | 1,086,366 | JPMorgan Chase Bank N.A. | 7/16/2021 | (34,592) |
| SEK | 43,354,000 | USD | 5,137,669 | Morgan Stanley Capital Services, Inc. | 7/16/2021 | (71,154) |
| USD | 2,945,278 | CAD | 3,689,470 | Deutsche Bank AG | 7/16/2021 | (31,031) |
| USD | 1,322,882 | CAD | 1,659,000 | Morgan Stanley Capital Services, Inc. | 7/16/2021 | (15,439) |
| | | | | | | $(1,079,765) |
See Notes to Financial Statements
MFS Inflation-Adjusted Bond Portfolio
| Financial Statements | Statement of Assets and Liabilities (unaudited) |
This statement represents your fund’s balance sheet, which details the assets and liabilities comprising the total value of the fund.
| At 6/30/21Assets | |
| Investments in unaffiliated issuers, at value (identified cost, $226,262,032) | $253,993,529 |
| Investments in affiliated issuers, at value (identified cost, $4,946,250) | 4,946,250 |
| Cash | 39 |
| Foreign currency, at value (identified cost, $21) | 20 |
| Receivables for | |
| Forward foreign currency exchange contracts | 1,181,566 |
| Fund shares sold | 79,638 |
| Interest | 716,574 |
| Other assets | 1,131 |
| Total assets | $260,918,747 |
| Liabilities | |
| Payables for | |
| Forward foreign currency exchange contracts | $1,079,765 |
| Investments purchased | 3,325,050 |
| Fund shares reacquired | 42,260 |
| When-issued investments purchased | 212,133 |
| Payable to affiliates | |
| Investment adviser | 6,846 |
| Administrative services fee | 243 |
| Shareholder servicing costs | 28 |
| Distribution and/or service fees | 1,724 |
| Accrued expenses and other liabilities | 66,977 |
| Total liabilities | $4,735,026 |
| Net assets | $256,183,721 |
| Net assets consist of | |
| Paid-in capital | $210,006,483 |
| Total distributable earnings (loss) | 46,177,238 |
| Net assets | $256,183,721 |
| Shares of beneficial interest outstanding | 21,595,394 |
| | Net assets | Shares
outstanding | Net asset value
per share |
| Initial Class | $130,496,453 | 10,930,700 | $11.94 |
| Service Class | 125,687,268 | 10,664,694 | 11.79 |
See Notes to Financial Statements
MFS Inflation-Adjusted Bond Portfolio
| Financial Statements | Statement of Operations (unaudited) |
This statement describes how much your fund earned in investment income and accrued in expenses. It also describes any gains and/or losses generated by fund operations.
| Six months ended 6/30/21 | |
| Net investment income (loss) | |
| Income | |
| Interest | $3,892,020 |
| Dividends from affiliated issuers | 1,483 |
| Other | 43 |
| Total investment income | $3,893,546 |
| Expenses | |
| Management fee | $634,085 |
| Distribution and/or service fees | 154,660 |
| Shareholder servicing costs | 2,765 |
| Administrative services fee | 21,726 |
| Independent Trustees' compensation | 2,787 |
| Custodian fee | 13,891 |
| Shareholder communications | 7,121 |
| Audit and tax fees | 22,400 |
| Legal fees | 933 |
| Miscellaneous | 14,485 |
| Total expenses | $874,853 |
| Reduction of expenses by investment adviser | (15,164) |
| Net expenses | $859,689 |
| Net investment income (loss) | $3,033,857 |
| Realized and unrealized gain (loss) | |
| Realized gain (loss) (identified cost basis) | |
| Unaffiliated issuers | $9,434,435 |
| Futures contracts | 390,157 |
| Forward foreign currency exchange contracts | 317,974 |
| Foreign currency | 16,543 |
| Net realized gain (loss) | $10,159,109 |
| Change in unrealized appreciation or depreciation | |
| Unaffiliated issuers | $(15,279,669) |
| Futures contracts | 43,071 |
| Forward foreign currency exchange contracts | (537,708) |
| Translation of assets and liabilities in foreign currencies | (14,622) |
| Net unrealized gain (loss) | $(15,788,928) |
| Net realized and unrealized gain (loss) | $(5,629,819) |
| Change in net assets from operations | $(2,595,962) |
See Notes to Financial Statements
MFS Inflation-Adjusted Bond Portfolio
| Financial Statements | Statements of Changes in Net Assets |
These statements describe the increases and/or decreases in net assets resulting from operations, any distributions, and any shareholder transactions.
| | Six months ended | Year ended |
| | 6/30/21
(unaudited) | 12/31/20 |
| Change in net assets | | |
| From operations | | |
| Net investment income (loss) | $3,033,857 | $795,128 |
| Net realized gain (loss) | 10,159,109 | 5,079,831 |
| Net unrealized gain (loss) | (15,788,928) | 23,596,313 |
| Change in net assets from operations | $(2,595,962) | $29,471,272 |
| Total distributions to shareholders | $— | $(4,060,387) |
| Change in net assets from fund share transactions | $(268,120) | $(23,509,756) |
| Total change in net assets | $(2,864,082) | $1,901,129 |
| Net assets | | |
| At beginning of period | 259,047,803 | 257,146,674 |
| At end of period | $256,183,721 | $259,047,803 |
See Notes to Financial Statements
MFS Inflation-Adjusted Bond Portfolio
| Financial Statements | Financial Highlights |
The financial highlights table is intended to help you understand the fund's financial performance for the semiannual period and the past 5 fiscal years. Certain information reflects financial results for a single fund share. The total returns in the table represent the rate that an investor would have earned (or lost) on an investment in the fund share class (assuming reinvestment of all distributions) held for the entire period.
| Initial Class | Six months
ended | Year ended |
| | 6/30/21
(unaudited) | 12/31/20 | 12/31/19 | 12/31/18 | 12/31/17 | 12/31/16 |
| Net asset value, beginning of period | $12.06 | $10.81 | $10.15 | $10.81 | $9.98 | $9.73 |
| Income (loss) from investment operations | | | | | | |
| Net investment income (loss) (d) | $0.15 | $0.05 | $0.12 | $0.19 | $0.13 | $0.07(c) |
| Net realized and unrealized gain (loss) | (0.27) | 1.40 | 0.72 | (0.67) | 0.70 | 0.18 |
| Total from investment operations | $(0.12) | $1.45 | $0.84 | $(0.48) | $0.83 | $0.25 |
| Less distributions declared to shareholders | | | | | | |
| From net investment income | $— | $(0.05) | $(0.18) | $(0.18) | $— | $— |
| From net realized gain | — | (0.15) | — | — | — | — |
| Total distributions declared to shareholders | $— | $(0.20) | $(0.18) | $(0.18) | $— | $— |
| Net asset value, end of period (x) | $11.94 | $12.06 | $10.81 | $10.15 | $10.81 | $9.98 |
| Total return (%) (k)(r)(s)(x) | (1.00)(n) | 13.55 | 8.26 | (4.47) | 8.32 | 2.57(c) |
Ratios (%) (to average net assets)
and Supplemental data: | | | | | | |
| Expenses before expense reductions (f) | 0.57(a) | 0.58 | 0.57 | 0.57 | 0.56 | 0.55(c) |
| Expenses after expense reductions (f) | 0.56(a) | 0.57 | 0.56 | 0.56 | 0.55 | 0.54(c) |
| Net investment income (loss) | 2.50(a)(l) | 0.45 | 1.11 | 1.78 | 1.28 | 0.65(c) |
| Portfolio turnover | 49(n) | 46 | 62 | 63 | 40 | 47 |
| Net assets at end of period (000 omitted) | $130,496 | $132,577 | $131,221 | $134,599 | $162,429 | $168,857 |
See Notes to Financial Statements
MFS Inflation-Adjusted Bond Portfolio
Financial Highlights - continued
| Service Class | Six months
ended | Year ended |
| | 6/30/21
(unaudited) | 12/31/20 | 12/31/19 | 12/31/18 | 12/31/17 | 12/31/16 |
| Net asset value, beginning of period | $11.92 | $10.69 | $10.03 | $10.68 | $9.89 | $9.66 |
| Income (loss) from investment operations | | | | | | |
| Net investment income (loss) (d) | $0.13 | $0.02 | $0.09 | $0.16 | $0.11 | $0.04(c) |
| Net realized and unrealized gain (loss) | (0.26) | 1.38 | 0.72 | (0.66) | 0.68 | 0.19 |
| Total from investment operations | $(0.13) | $1.40 | $0.81 | $(0.50) | $0.79 | $0.23 |
| Less distributions declared to shareholders | | | | | | |
| From net investment income | $— | $(0.02) | $(0.15) | $(0.15) | $— | $— |
| From net realized gain | — | (0.15) | — | — | — | — |
| Total distributions declared to shareholders | $— | $(0.17) | $(0.15) | $(0.15) | $— | $— |
| Net asset value, end of period (x) | $11.79 | $11.92 | $10.69 | $10.03 | $10.68 | $9.89 |
| Total return (%) (k)(r)(s)(x) | (1.09)(n) | 13.21 | 8.05 | (4.70) | 7.99 | 2.38(c) |
Ratios (%) (to average net assets)
and Supplemental data: | | | | | | |
| Expenses before expense reductions (f) | 0.82(a) | 0.83 | 0.82 | 0.82 | 0.81 | 0.80(c) |
| Expenses after expense reductions (f) | 0.81(a) | 0.82 | 0.81 | 0.81 | 0.80 | 0.79(c) |
| Net investment income (loss) | 2.28(a)(l) | 0.19 | 0.86 | 1.54 | 1.03 | 0.40(c) |
| Portfolio turnover | 49(n) | 46 | 62 | 63 | 40 | 47 |
| Net assets at end of period (000 omitted) | $125,687 | $126,471 | $125,926 | $131,678 | $165,418 | $169,077 |
| (a) | Annualized. |
| (c) | Amount reflects a one-time reimbursement of expenses by the custodian (or former custodian) without which net investment income and performance would be lower and expenses would be higher. |
| (d) | Per share data is based on average shares outstanding. |
| (f) | Ratios do not reflect reductions from fees paid indirectly, if applicable. |
| (k) | The total return does not reflect expenses that apply to separate accounts. Inclusion of these charges would reduce the total return figures for all periods shown. |
| (l) | Recognition of net investment income by the fund may be affected by inflation/deflation adjustments through period end and the actual annual net investment income ratio may differ. |
| (n) | Not annualized. |
| (r) | Certain expenses have been reduced without which performance would have been lower. |
| (s) | From time to time the fund may receive proceeds from litigation settlements, without which performance would be lower. |
| (x) | The net asset values and total returns have been calculated on net assets which include adjustments made in accordance with U.S. generally accepted accounting principles required at period end for financial reporting purposes. |
See Notes to Financial Statements
MFS Inflation-Adjusted Bond Portfolio
Notes to Financial Statements (unaudited)
(1) Business and Organization
MFS Inflation-Adjusted Bond Portfolio (the fund) is a non-diversified series of MFS Variable Insurance Trust III (the trust). The trust is organized as a Delaware statutory trust and is registered under the Investment Company Act of 1940, as amended, as an open-end management investment company. The shareholders of each series of the trust are separate accounts of insurance companies, which offer variable annuity and/or life insurance products, and qualified retirement and pension plans.
The fund is an investment company and accordingly follows the investment company accounting and reporting guidance of the Financial Accounting Standards Board (FASB) Accounting Standards Codification Topic 946 Financial Services - Investment Companies.
(2) Significant Accounting Policies
General — The preparation of financial statements in conformity with U.S. generally accepted accounting principles requires management to make estimates and assumptions that affect the reported amounts of assets and liabilities, and disclosure of contingent assets and liabilities at the date of the financial statements and the reported amounts of increases and decreases in net assets from operations during the reporting period. Actual results could differ from those estimates. In the preparation of these financial statements, management has evaluated subsequent events occurring after the date of the fund’s Statement of Assets and Liabilities through the date that the financial statements were issued. The fund invests in foreign securities. Investments in foreign securities are vulnerable to the effects of changes in the relative values of the local currency and the U.S. dollar and to the effects of changes in each country’s market, economic, industrial, political, regulatory, geopolitical, environmental, public health, and other conditions.
Certain of the fund's investments, derivatives, debt and other contracts may be based on reference interest rates such as the London Interbank Offered Rate (“LIBOR”). In 2017, the regulatory authority that oversees financial services firms in the United Kingdom announced plans to transition away from LIBOR by the end of 2021. In March 2021, the administrator of LIBOR announced the extension of the publication of the more commonly used U.S. dollar LIBOR settings to the end of June 2023. Although the full impacts of the transition away from LIBOR are not fully known, the transition may result in, among other things, an increase in volatility or illiquidity of the markets for instruments that currently rely on LIBOR to determine interest rates and this could have an adverse impact on the fund's performance. With respect to the fund's accounting for investments, derivatives, debt and other contracts that undergo reference rate-related modifications as a result of the transition, management will rely upon the relief provided by FASB Codification Topic 848 – Reference Rate Reform (Topic 848). The guidance in Topic 848 permits the fund to disregard the GAAP accounting requirements around certain contract modifications resulting from the LIBOR transition such that for contracts considered in scope, the fund can account for those modified contracts as a continuation of the existing contracts.
Balance Sheet Offsetting — The fund's accounting policy with respect to balance sheet offsetting is that, absent an event of default by the counterparty or a termination of the agreement, the International Swaps and Derivatives Association (ISDA) Master Agreement, or similar agreement, does not result in an offset of reported amounts of financial assets and financial liabilities in the Statement of Assets and Liabilities across transactions between the fund and the applicable counterparty. The fund's right to setoff may be restricted or prohibited by the bankruptcy or insolvency laws of the particular jurisdiction to which a specific master netting agreement counterparty is subject. Balance sheet offsetting disclosures, to the extent applicable to the fund, have been included in the fund’s Significant Accounting Policies note under the captions for each of the fund’s in-scope financial instruments and transactions.
Investment Valuations — Debt instruments and floating rate loans, including restricted debt instruments, are generally valued at an evaluated or composite bid as provided by a third-party pricing service. Short-term instruments with a maturity at issuance of 60 days or less may be valued at amortized cost, which approximates market value. Futures contracts are generally valued at last posted settlement price on their primary exchange as provided by a third-party pricing service. Futures contracts for which there were no trades that day for a particular position are generally valued at the closing bid quotation on their primary exchange as provided by a third-party pricing service. Forward foreign currency exchange contracts are generally valued at the mean of bid and asked prices for the time period interpolated from rates provided by a third-party pricing service for proximate time periods. Open-end investment companies are generally valued at net asset value per share. Securities and other assets generally valued on the basis of information from a third-party pricing service may also be valued at a broker/dealer bid quotation. In determining values, third-party pricing services can utilize both transaction data and market information such as yield, quality, coupon rate, maturity, type of issue, trading characteristics, and other market data. The values of foreign securities and other assets and liabilities expressed in foreign currencies are converted to U.S. dollars using the mean of bid and asked prices for rates provided by a third-party pricing service.
The Board of Trustees has delegated primary responsibility for determining or causing to be determined the value of the fund’s investments (including any fair valuation) to the adviser pursuant to valuation policies and procedures approved by the Board. If the adviser determines that reliable market quotations are not readily available, investments are valued at fair value as determined in
MFS Inflation-Adjusted Bond Portfolio
Notes to Financial Statements (unaudited) - continued
good faith by the adviser in accordance with such procedures under the oversight of the Board of Trustees. Under the fund’s valuation policies and procedures, market quotations are not considered to be readily available for most types of debt instruments and floating rate loans and many types of derivatives. These investments are generally valued at fair value based on information from third-party pricing services. In addition, investments may be valued at fair value if the adviser determines that an investment’s value has been materially affected by events occurring after the close of the exchange or market on which the investment is principally traded (such as foreign exchange or market) and prior to the determination of the fund’s net asset value, or after the halt of trading of a specific security where trading does not resume prior to the close of the exchange or market on which the security is principally traded. The adviser generally relies on third-party pricing services or other information (such as the correlation with price movements of similar securities in the same or other markets; the type, cost and investment characteristics of the security; the business and financial condition of the issuer; and trading and other market data) to assist in determining whether to fair value and at what value to fair value an investment. The value of an investment for purposes of calculating the fund’s net asset value can differ depending on the source and method used to determine value. When fair valuation is used, the value of an investment used to determine the fund’s net asset value may differ from quoted or published prices for the same investment. There can be no assurance that the fund could obtain the fair value assigned to an investment if it were to sell the investment at the same time at which the fund determines its net asset value per share.
Various inputs are used in determining the value of the fund's assets or liabilities. These inputs are categorized into three broad levels. In certain cases, the inputs used to measure fair value may fall into different levels of the fair value hierarchy. In such cases, an investment's level within the fair value hierarchy is based on the lowest level of input that is significant to the fair value measurement. The fund's assessment of the significance of a particular input to the fair value measurement in its entirety requires judgment, and considers factors specific to the investment. Level 1 includes unadjusted quoted prices in active markets for identical assets or liabilities. Level 2 includes other significant observable market-based inputs (including quoted prices for similar securities, interest rates, prepayment speed, and credit risk). Level 3 includes unobservable inputs, which may include the adviser's own assumptions in determining the fair value of investments. Other financial instruments are derivative instruments, such as forward foreign currency exchange contracts. The following is a summary of the levels used as of June 30, 2021 in valuing the fund's assets or liabilities:
| Financial Instruments | Level 1 | Level 2 | Level 3 | Total |
| U.S. Treasury Bonds & U.S. Government Agencies & Equivalents | $— | $107,615,996 | $— | $107,615,996 |
| Non - U.S. Sovereign Debt | — | 132,044,604 | — | 132,044,604 |
| Municipal Bonds | — | 2,927,391 | — | 2,927,391 |
| U.S. Corporate Bonds | — | 2,100,896 | — | 2,100,896 |
| Residential Mortgage-Backed Securities | — | 2,134,320 | — | 2,134,320 |
| Commercial Mortgage-Backed Securities | — | 3,398,924 | — | 3,398,924 |
| Asset-Backed Securities (including CDOs) | — | 3,318,172 | — | 3,318,172 |
| Foreign Bonds | — | 453,226 | — | 453,226 |
| Mutual Funds | 4,946,250 | — | — | 4,946,250 |
| Total | $4,946,250 | $253,993,529 | $— | $258,939,779 |
| Other Financial Instruments | | | | |
| Forward Foreign Currency Exchange Contracts – Assets | $— | $1,181,566 | $— | $1,181,566 |
| Forward Foreign Currency Exchange Contracts – Liabilities | — | (1,079,765) | — | (1,079,765) |
For further information regarding security characteristics, see the Portfolio of Investments.
Inflation-Adjusted Debt Securities — The fund invests in inflation-adjusted debt securities issued by the U.S. Treasury. The fund also invests in inflation-adjusted debt securities issued by U.S. Government agencies and instrumentalities other than the U.S. Treasury and by other entities such as U.S. and foreign corporations and foreign governments. The principal value of these debt securities is adjusted through income according to changes in the Consumer Price Index or another general price or wage index. These debt securities typically pay a fixed rate of interest, but this fixed rate is applied to the inflation-adjusted principal amount. The principal paid at maturity of the debt security is typically equal to the inflation-adjusted principal amount, or the security’s original par value, whichever is greater. Other types of inflation-adjusted securities may use other methods to adjust for other measures of inflation.
Foreign Currency Translation — Purchases and sales of foreign investments, income, and expenses are converted into U.S. dollars based upon currency exchange rates prevailing on the respective dates of such transactions or on the reporting date for foreign denominated receivables and payables. Gains and losses attributable to foreign currency exchange rates on sales of securities are recorded for financial statement purposes as net realized gains and losses on investments. Gains and losses attributable to foreign
MFS Inflation-Adjusted Bond Portfolio
Notes to Financial Statements (unaudited) - continued
exchange rate movements on receivables, payables, income and expenses are recorded for financial statement purposes as foreign currency transaction gains and losses. That portion of both realized and unrealized gains and losses on investments that results from fluctuations in foreign currency exchange rates is not separately disclosed.
Derivatives — The fund uses derivatives primarily to increase or decrease exposure to a particular market or segment of the market, or security, to increase or decrease interest rate or currency exposure, or as alternatives to direct investments. Derivatives are used for hedging or non-hedging purposes. While hedging can reduce or eliminate losses, it can also reduce or eliminate gains. When the fund uses derivatives as an investment to increase market exposure, or for hedging purposes, gains and losses from derivative instruments may be substantially greater than the derivative’s original cost.
The derivative instruments used by the fund during the period were futures contracts and forward foreign currency exchange contracts. Depending on the type of derivative, a fund may exit a derivative position by entering into an offsetting transaction with a counterparty or exchange, negotiating an agreement with the derivative counterparty, or novating the position to a third party. The fund's period end derivatives, as presented in the Portfolio of Investments and the associated Derivative Contract tables, generally are indicative of the volume of its derivative activity during the period.
The following table presents, by major type of derivative contract, the fair value, on a gross basis, of the asset and liability components of derivatives held by the fund at June 30, 2021 as reported in the Statement of Assets and Liabilities:
| | | Fair Value |
| Risk | Derivative Contracts | Asset Derivatives | Liability Derivatives |
| Foreign Exchange | Forward Foreign Currency Exchange Contracts | $1,181,566 | $(1,079,765) |
The following table presents, by major type of derivative contract, the realized gain (loss) on derivatives held by the fund for the six months ended June 30, 2021 as reported in the Statement of Operations:
| Risk | Futures
Contracts | Forward Foreign
Currency
Exchange
Contracts |
| Interest Rate | $390,157 | $— |
| Foreign Exchange | — | 317,974 |
| Total | $390,152 | $317,974 |
The following table presents, by major type of derivative contract, the change in unrealized appreciation or depreciation on derivatives held by the fund for the six months ended June 30, 2021 as reported in the Statement of Operations:
| Risk | Futures
Contracts | Forward Foreign
Currency
Exchange
Contracts |
| Interest Rate | $43,071 | $— |
| Foreign Exchange | — | (537,708) |
| Total | $43,071 | $(537,708) |
Derivative counterparty credit risk is managed through formal evaluation of the creditworthiness of all potential counterparties. On certain, but not all, uncleared derivatives, the fund attempts to reduce its exposure to counterparty credit risk whenever possible by entering into an ISDA Master Agreement on a bilateral basis. The ISDA Master Agreement gives each party to the agreement the right to terminate all transactions traded under such agreement if there is a specified deterioration in the credit quality of the other party. Upon an event of default or a termination of the ISDA Master Agreement, the non-defaulting party has the right to close out all transactions traded under such agreement and to net amounts owed under each agreement to one net amount payable by one party to the other. This right to close out and net payments across all transactions traded under the ISDA Master Agreement could result in a reduction of the fund's credit risk to such counterparty equal to any amounts payable by the fund under the applicable transactions, if any.
Collateral and margin requirements differ by type of derivative. For cleared derivatives (e.g., futures contracts, cleared swaps, and exchange-traded options), margin requirements are set by the clearing broker and the clearing house and collateral, in the form of cash or securities, is posted by the fund directly with the clearing broker. Collateral terms are counterparty agreement specific for uncleared derivatives (e.g., forward foreign currency exchange contracts, uncleared swap agreements, and uncleared options) and collateral, in the form of cash and securities, is held in segregated accounts with the fund's custodian in connection with these
MFS Inflation-Adjusted Bond Portfolio
Notes to Financial Statements (unaudited) - continued
agreements. For derivatives traded under an ISDA Master Agreement, which contains a collateral support annex, the collateral requirements are netted across all transactions traded under such counterparty-specific agreement and an amount is posted from one party to the other to collateralize such obligations. Cash that has been segregated or delivered to cover the fund's collateral or margin obligations under derivative contracts, if any, will be reported separately in the Statement of Assets and Liabilities as restricted cash for uncleared derivatives and/or deposits with brokers for cleared derivatives. Securities pledged as collateral or margin for the same purpose, if any, are noted in the Portfolio of Investments. The fund may be required to make payments of interest on uncovered collateral or margin obligations with the broker. Any such payments are included in “Miscellaneous” expense in the Statement of Operations.
Futures Contracts — The fund entered into futures contracts which may be used to hedge against or obtain broad market exposure, interest rate exposure, or to manage duration. A futures contract represents a commitment for the future purchase or sale of an asset at a specified price on a specified date.
Upon entering into a futures contract, the fund is required to deposit with the broker, either in cash or securities, an initial margin in an amount equal to a specified percentage of the notional amount of the contract. Subsequent payments (variation margin) are made or received by the fund each day, depending on the daily fluctuations in the value of the contract, and are recorded for financial statement purposes as unrealized gain or loss by the fund until the contract is closed or expires at which point the gain or loss on futures contracts is realized.
The fund bears the risk of interest rates or securities prices moving unexpectedly, in which case, the fund may not achieve the anticipated benefits of the futures contracts and may realize a loss. While futures contracts may present less counterparty risk to the fund since the contracts are exchange traded and the exchange’s clearinghouse guarantees payments to the broker, there is still counterparty credit risk due to the insolvency of the broker. The fund's maximum risk of loss due to counterparty credit risk is equal to the margin posted by the fund to the broker plus any gains or minus any losses on the outstanding futures contracts.
Forward Foreign Currency Exchange Contracts — The fund entered into forward foreign currency exchange contracts for the purchase or sale of a specific foreign currency at a fixed price on a future date. These contracts may be used to hedge the fund’s currency risk or for non-hedging purposes. For hedging purposes, the fund may enter into contracts to deliver or receive foreign currency that the fund will receive from or use in its normal investment activities. The fund may also use contracts to hedge against declines in the value of foreign currency denominated securities due to unfavorable exchange rate movements. For non-hedging purposes, the fund may enter into contracts with the intent of changing the relative exposure of the fund’s portfolio of securities to different currencies to take advantage of anticipated exchange rate changes.
Forward foreign currency exchange contracts are adjusted by the daily exchange rate of the underlying currency and any unrealized gains or losses are recorded as a receivable or payable for forward foreign currency exchange contracts until the contract settlement date. On contract settlement date, any gain or loss on the contract is recorded as realized gains or losses on forward foreign currency exchange contracts.
Risks may arise upon entering into these contracts from unanticipated movements in the value of the contract and from the potential inability of counterparties to meet the terms of their contracts. Generally, the fund’s maximum risk due to counterparty credit risk is the unrealized gain on the contract due to the use of Continuous Linked Settlement, a multicurrency cash settlement system for the centralized settlement of foreign transactions. This risk is mitigated in cases where there is an ISDA Master Agreement between the fund and the counterparty providing for netting as described above and, where applicable, by the posting of collateral by the counterparty to the fund to cover the fund’s exposure to the counterparty under such ISDA Master Agreement.
Indemnifications — Under the fund's organizational documents, its officers and Trustees may be indemnified against certain liabilities and expenses arising out of the performance of their duties to the fund. Additionally, in the normal course of business, the fund enters into agreements with service providers that may contain indemnification clauses. The fund's maximum exposure under these agreements is unknown as this would involve future claims that may be made against the fund that have not yet occurred.
Investment Transactions and Income — Investment transactions are recorded on the trade date. Interest income is recorded on the accrual basis. Interest payments received in additional securities are recorded on the ex-interest date in an amount equal to the value of the security on such date. All premium and discount is amortized or accreted for financial statement purposes in accordance with U.S. generally accepted accounting principles. Inflation-indexed bonds are fixed-income securities whose principal value is periodically adjusted upward or downward based on the rate of inflation. Interest is accrued based on the principal value, which is adjusted for inflation. Any increase or decrease in the principal amount of an inflation-indexed bond is generally recorded as an increase or decrease in interest income, respectively, even though the adjusted principal is not received until maturity.
MFS Inflation-Adjusted Bond Portfolio
Notes to Financial Statements (unaudited) - continued
The fund may receive proceeds from litigation settlements. Any proceeds received from litigation involving portfolio holdings are reflected in the Statement of Operations in realized gain/loss if the security has been disposed of by the fund or in unrealized gain/loss if the security is still held by the fund. Any other proceeds from litigation not related to portfolio holdings are reflected as other income in the Statement of Operations.
Tax Matters and Distributions — The fund intends to qualify as a regulated investment company, as defined under Subchapter M of the Internal Revenue Code, and to distribute all of its taxable income, including realized capital gains. As a result, no provision for federal income tax is required. The fund’s federal tax returns, when filed, will remain subject to examination by the Internal Revenue Service for a three year period. Management has analyzed the fund’s tax positions taken on federal and state tax returns for all open tax years and does not believe that there are any uncertain tax positions that require recognition of a tax liability. Foreign taxes, if any, have been accrued by the fund in the accompanying financial statements in accordance with the applicable foreign tax law. Foreign income taxes may be withheld by certain countries in which the fund invests. Additionally, capital gains realized by the fund on securities issued in or by certain foreign countries may be subject to capital gains tax imposed by those countries.
Distributions to shareholders are recorded on the ex-dividend date. Income and capital gain distributions are determined in accordance with income tax regulations, which may differ from U.S. generally accepted accounting principles. Certain capital accounts in the financial statements are periodically adjusted for permanent differences in order to reflect their tax character. These adjustments have no impact on net assets or net asset value per share. Temporary differences which arise from recognizing certain items of income, expense, gain or loss in different periods for financial statement and tax purposes will reverse at some time in the future.
Book/tax differences primarily relate to amortization and accretion of debt securities, wash sale loss deferrals, and derivative transactions.
The tax character of distributions declared to shareholders for the last fiscal year is as follows:
| | Year ended
12/31/20 |
| Ordinary income (including any short-term capital gains) | $1,154,218 |
| Long-term capital gains | 2,906,169 |
| Total distributions | $4,060,387 |
The federal tax cost and the tax basis components of distributable earnings were as follows:
| As of 6/30/21 | |
| Cost of investments | $231,984,101 |
| Gross appreciation | 27,373,161 |
| Gross depreciation | (417,483) |
| Net unrealized appreciation (depreciation) | $26,955,678 |
| As of 12/31/20 | |
| Undistributed ordinary income | 3,480,767 |
| Undistributed long-term capital gain | 3,149,918 |
| Other temporary differences | 8,117 |
| Net unrealized appreciation (depreciation) | 42,134,398 |
The aggregate cost above includes prior fiscal year end tax adjustments, if applicable.
Multiple Classes of Shares of Beneficial Interest — The fund offers multiple classes of shares, which differ in their respective distribution and/or service fees. The fund's income, realized and unrealized gain (loss), and common expenses are allocated to shareholders based on the daily net assets of each class. Dividends are declared separately for each class. Differences in per share dividend rates are generally due to differences in separate class expenses. The fund’s distributions declared to shareholders as reported in the Statements of Changes in Net Assets are presented by class as follows:
| | Six months
ended
6/30/21 | | Year
ended
12/31/20 |
| Initial Class | $— | | $2,232,579 |
| Service Class | — | | 1,827,808 |
| Total | $— | | $4,060,387 |
MFS Inflation-Adjusted Bond Portfolio
Notes to Financial Statements (unaudited) - continued
(3) Transactions with Affiliates
Investment Adviser — The fund has an investment advisory agreement with MFS to provide overall investment management and related administrative services and facilities to the fund. The management fee is computed daily and paid monthly at an annual rate of 0.50% of the fund’s average daily net assets.
MFS has agreed in writing to reduce its management fee by a specified amount if certain MFS mutual fund assets exceed thresholds agreed to by MFS and the fund's Board of Trustees. For the six months ended June 30, 2021, this management fee reduction amounted to $15,164, which is included in the reduction of total expenses in the Statement of Operations. The management fee incurred for the six months ended June 30, 2021 was equivalent to an annual effective rate of 0.49% of the fund's average daily net assets.
Distributor — MFS Fund Distributors, Inc. (MFD), a wholly-owned subsidiary of MFS, is the distributor of shares of the fund. The Trustees have adopted a distribution plan for the Service Class shares pursuant to Rule 12b-1 under the Investment Company Act of 1940.
The fund's distribution plan provides that the fund will pay MFD distribution and/or service fees equal to 0.25% per annum of its average daily net assets attributable to Service Class shares as partial consideration for services performed and expenses incurred by MFD and financial intermediaries (including participating insurance companies that invest in the fund to fund variable annuity and variable life insurance contracts, sponsors of qualified retirement and pension plans that invest in the fund, and affiliates of these participating insurance companies and plan sponsors) in connection with the sale and distribution of the Service Class shares. MFD may subsequently pay all, or a portion, of the distribution and/or service fees to financial intermediaries.
Shareholder Servicing Agent — MFS Service Center, Inc. (MFSC), a wholly-owned subsidiary of MFS, receives a fee from the fund for its services as shareholder servicing agent. For the six months ended June 30, 2021, the fee was $2,666, which equated to 0.0021% annually of the fund's average daily net assets. MFSC also receives reimbursement from the fund for out-of-pocket expenses paid by MFSC on behalf of the fund. For the six months ended June 30, 2021, these costs amounted to $99.
Administrator — MFS provides certain financial, legal, shareholder communications, compliance, and other administrative services to the fund. Under an administrative services agreement, the fund reimburses MFS the costs incurred to provide these services. The fund is charged an annual fixed amount of $17,500 plus a fee based on average daily net assets. The administrative services fee incurred for the six months ended June 30, 2021 was equivalent to an annual effective rate of 0.0171% of the fund's average daily net assets.
Trustees’ and Officers’ Compensation — The fund pays compensation to independent Trustees in the form of a retainer, attendance fees, and additional compensation to Board and Committee chairpersons. The fund does not pay compensation directly to Trustees or officers of the fund who are also officers of the investment adviser, all of whom receive remuneration from MFS for their services to the fund. Certain officers and Trustees of the fund are officers or directors of MFS, MFD, and MFSC.
Other — The fund invests in the MFS Institutional Money Market Portfolio which is managed by MFS and seeks current income consistent with preservation of capital and liquidity. This money market fund does not pay a management fee to MFS but does incur investment and operating costs.
(4) Portfolio Securities
For the six months ended June 30, 2021, purchases and sales of investments, other than short-term obligations, were as follows:
| | Purchases | Sales |
| U.S. Government securities | $61,395,712 | $64,671,158 |
| Non-U.S. Government securities | 60,342,445 | 56,246,824 |
(5) Shares of Beneficial Interest
The fund's Declaration of Trust permits the Trustees to issue an unlimited number of full and fractional shares of beneficial interest. Transactions in fund shares were as follows:
MFS Inflation-Adjusted Bond Portfolio
Notes to Financial Statements (unaudited) - continued
| | Six months ended
6/30/21 | | Year ended
12/31/20 |
| | Shares | Amount | | Shares | Amount |
| Shares sold | | | | | |
| Initial Class | 193,858 | $2,312,664 | | 374,195 | $4,175,215 |
| Service Class | 746,030 | 8,648,805 | | 858,418 | 9,808,809 |
| | 939,888 | $10,961,469 | | 1,232,613 | $13,984,024 |
Shares issued to shareholders
in reinvestment of distributions | | | | | |
| Initial Class | — | $— | | 194,137 | $2,232,579 |
| Service Class | — | — | | 160,616 | 1,827,808 |
| | — | $— | | 354,753 | $4,060,387 |
| Shares reacquired | | | | | |
| Initial Class | (258,909) | $(3,095,229) | | (1,708,677) | $(18,314,665) |
| Service Class | (693,870) | (8,134,360) | | (2,189,184) | (23,239,502) |
| | (952,779) | $(11,229,589) | | (3,897,861) | $(41,554,167) |
| Net change | | | | | |
| Initial Class | (65,051) | $(782,565) | | (1,140,345) | $(11,906,871) |
| Service Class | 52,160 | 514,445 | | (1,170,150) | (11,602,885) |
| | (12,891) | $(268,120) | | (2,310,495) | $(23,509,756) |
The fund is one of several mutual funds in which certain MFS funds may invest. The MFS funds do not invest in the underlying funds for the purpose of exercising management or control. At the end of the period, the MFS Moderate Allocation Portfolio, the MFS Conservative Allocation Portfolio, and the MFS Growth Allocation Portfolio were the owners of record of approximately 27%, 16%, and 7%, respectively, of the value of outstanding voting shares of the fund.
(6) Line of Credit
The fund and certain other funds managed by MFS participate in a $1.25 billion unsecured committed line of credit of which $1 billion is reserved for use by the fund and certain other MFS U.S. funds. The line of credit is provided by a syndicate of banks under a credit agreement. Borrowings may be made for temporary financing needs. Interest is charged to each fund, based on its borrowings, generally at a rate equal to the highest of one month LIBOR, the Federal Funds Effective Rate and the Overnight Bank Funding Rate, plus an agreed upon spread. A commitment fee, based on the average daily, unused portion of the committed line of credit, is allocated among the participating funds. In addition, the fund and other funds managed by MFS have established unsecured uncommitted borrowing arrangements with certain banks for temporary financing needs. Interest is charged to each fund, based on its borrowings, at rates equal to customary reference rates plus an agreed upon spread. For the six months ended June 30, 2021, the fund’s commitment fee and interest expense were $452 and $0, respectively, and are included in “Miscellaneous” expense in the Statement of Operations.
(7) Investments in Affiliated Issuers
An affiliated issuer may be considered one in which the fund owns 5% or more of the outstanding voting securities, or a company which is under common control. For the purposes of this report, the following were affiliated issuers:
| Affiliated Issuers | Beginning
Value | Purchases | Sales
Proceeds | Realized
Gain
(Loss) | Change in
Unrealized
Appreciation or
Depreciation | Ending
Value |
| MFS Institutional Money Market Portfolio | $1,558,229 | $76,643,701 | $73,255,680 | $— | $— | $4,946,250 |
| Affiliated Issuers | Dividend
Income | Capital Gain
Distributions |
| MFS Institutional Money Market Portfolio | $1,483 | $— |
MFS Inflation-Adjusted Bond Portfolio
Notes to Financial Statements (unaudited) - continued
(8) Impacts of COVID-19
The pandemic related to the global spread of novel coronavirus disease (COVID-19), which was first detected in December 2019, has resulted in significant disruptions to global business activity and the global economy, as well as the economies of individual countries, the financial performance of individual companies and sectors, and the securities and commodities markets in general. Multiple surges in cases globally, the availability and widespread adoption of vaccines, and the emergence of variant strains of the virus continue to create uncertainty as to the future and long-term impacts resulting from the pandemic including impacts to the prices and liquidity of the fund's investments and the fund's performance.
MFS Inflation-Adjusted Bond Portfolio
Statement Regarding Liquidity Risk Management Program
The fund has adopted and implemented a liquidity risk management program (the “Program”) as required by Rule 22e-4 under the Investment Company Act of 1940, as amended. The fund’s Board of Trustees (the “Board”) has designated MFS as the administrator of the Program. The Program is reasonably designed to assess and manage the liquidity risk of the fund. Liquidity risk is the risk that the fund could not meet requests to redeem shares issued by the fund without significant dilution of remaining investors' interests.
MFS provided a written report to the Board for consideration at its April 2021 meeting that addressed the operation of the Program and provided an assessment of the adequacy and effectiveness of the Program during the period from January 1, 2020 to December 31, 2020 (the “Covered Period”). The report concluded that during the Covered Period the Program had operated effectively and had adequately and effectively been implemented to assess and manage the fund’s liquidity risk. MFS also reported that there were no liquidity events that impacted the fund or its ability to timely meet redemptions without dilution to existing shareholders during the Covered Period.
There can be no assurance that the Program will achieve its objectives in the future. Further information on liquidity risk, and other principal risks to which an investment in the fund may be subject, can be found in the prospectus.
MFS Inflation-Adjusted Bond Portfolio
Proxy Voting Policies and Information
MFS votes proxies on behalf of the fund pursuant to proxy voting policies and procedures that are available without charge, upon request, by calling 1-800-225-2606, by visiting mfs.com/proxyvoting, or by visiting the SEC’s Web site at http://www.sec.gov.
Information regarding how the fund voted proxies relating to portfolio securities during the most recent twelve-month period ended June 30 is available by August 31 of each year without charge by visiting mfs.com/proxyvoting, or by visiting the SEC’s Web site at http://www.sec.gov.
Quarterly Portfolio Disclosure
The fund files a complete schedule of portfolio holdings with the SEC for the first and third quarters of each fiscal year as an exhibit to its reports on Form N-PORT. The fund’s Form N-PORT reports are available on the SEC’s Web site at http://www.sec.gov. A shareholder can obtain the portfolio holdings report for the first and third quarters of the fund's fiscal year at mfs.com/vit3 by choosing the fund's name and then scrolling to the “Resources” section and clicking on the “Prospectus and Reports” tab.
FURTHER INFORMATION
From time to time, MFS may post important information about the fund or the MFS Funds on the MFS Web site (mfs.com). This information is available at https://www.mfs.com/announcements or at mfs.com/vit3 by choosing the fund's name and then scrolling to the “Resources” section and clicking on the “Announcements” tab, if any.
Information About Fund Contracts and Legal Claims
The fund has entered into contractual arrangements with an investment adviser, administrator, distributor, shareholder servicing agent, 529 program manager (if applicable), and custodian who each provide services to the fund. Unless expressly stated otherwise, shareholders are not parties to, or intended beneficiaries of these contractual arrangements, and these contractual arrangements are not intended to create any shareholder right to enforce them against the service providers or to seek any remedy under them against the service providers, either directly or on behalf of the fund.
Under the Trust’s By-Laws and Declaration of Trust, any claims asserted against or on behalf of the MFS Funds, including claims against Trustees and Officers, must be brought in state and federal courts located within the Commonwealth of Massachusetts.
Semiannual Report
June 30, 2021
MFS® Limited Maturity Portfolio
MFS® Variable Insurance Trust III
MFS® Limited Maturity Portfolio
The report is prepared for the general information of contract owners. It is authorized for distribution to prospective investors only when preceded or accompanied by a current prospectus.
NOT FDIC INSURED • MAY LOSE VALUE • NO BANK OR CREDIT UNION GUARANTEE •
NOT A DEPOSIT • NOT INSURED BY ANY FEDERAL GOVERNMENT AGENCY OR NCUA/NCUSIF
MFS Limited Maturity Portfolio
Dear Contract Owners:
After experiencing dramatic swings in the early days of the coronavirus pandemic, global equity markets have performed strongly over the past year. Though the speedy development of vaccines brightened the economic and market outlook, uncertainty remains as new variants of the virus appear, and questions persist over how fast vaccines can be made widely available in the developing world.
Global central banks have taken aggressive steps to cushion the economic and market fallout related to the virus, and governments are deploying unprecedented levels of fiscal support. Having passed a $1.9 trillion stimulus package in March, the U.S. Congress could approve additional stimulus later this year, some of it focused on infrastructure. Along with extraordinary government expenditures, pent-up consumer demand fueled a surge in economic activity as coronavirus restrictions were eased, pushing up inflation, at least temporarily. Markets initially reacted by pushing up yields on global government bonds, though some of the rate rise has since been corrected.
A spirited debate is underway among investors over whether the current price pressures will persist or prove to be temporary, caused by pandemic-induced bottlenecks. The policy measures put in place to counteract the pandemic's effects have helped build a supportive environment and are encouraging economic recovery; however, if markets disconnect from fundamentals, they can sow the seeds of instability. As such, recent dramatic increases in speculative trading in cryptocurrencies, special purpose acquisition companies (SPACs), and the like bear watching.
In the aftermath of the crisis, we could see societal changes as households, businesses, and governments adjust to a new reality, and any such alterations could affect the investment landscape. For investors, events such as the COVID-19 outbreak demonstrate the importance of having a deep understanding of company fundamentals, and we have built our global research platform to do just that.
At MFS®, we put our clients’ assets to work responsibly by carefully navigating the increasing complexity of global markets and economies. Guided by our long-term philosophy and adhering to our commitment to sustainable investing, we tune out the noise and aim to uncover what we believe are the best, most durable investment opportunities in the market. Our unique global investment platform combines collective expertise, long-term discipline, and thoughtful risk management to create sustainable value for investors.
Respectfully,
Michael W. Roberge
Chief Executive Officer
MFS Investment Management
August 13, 2021
The opinions expressed in this letter are subject to change and may not be relied upon for investment advice. No forecasts can be guaranteed.
MFS Limited Maturity Portfolio
Portfolio structure at value (v)
Portfolio structure reflecting equivalent exposure of derivative positions (i)
Fixed income sectors (i)
| Investment Grade Corporates | 49.5% |
| U.S. Treasury Securities | 39.1% |
| Collateralized Debt Obligations | 7.5% |
| Commercial Mortgage-Backed Securities | 7.2% |
| Asset-Backed Securities | 4.2% |
| Municipal Bonds | 3.8% |
| Emerging Markets Bonds | 2.4% |
| High Yield Corporates | 1.3% |
| Residential Mortgage-Backed Securities | 1.3% |
| Mortgage-Backed Securities | 1.3% |
Composition including fixed income credit quality (a)(i)
| AAA | 9.2% |
| AA | 10.4% |
| A | 23.3% |
| BBB | 33.0% |
| BB | 1.2% |
| B | 0.1% |
| U.S. Government | 20.1% |
| Federal Agencies | 1.3% |
| Not Rated | 19.0% |
| Cash & Cash Equivalents | 1.4% |
| Other | (19.0)% |
Portfolio facts (i)
| Average Duration (d) | 1.9 |
| Average Effective Maturity (m) | 2.2 yrs. |
| (a) | For all securities other than those specifically described below, ratings are assigned to underlying securities utilizing ratings from Moody’s, Fitch, and Standard & Poor’s rating agencies and applying the following hierarchy: If all three agencies provide a rating, the middle rating (after dropping the highest and lowest ratings) is assigned; if two of the three agencies rate a security, the lower of the two is assigned. If none of the 3 rating agencies above assign a rating, but the security is rated by DBRS Morningstar, then the DBRS Morningstar rating is assigned. If none of the 4 ratings agencies listed above rate the security, but the security is rated by the Kroll Bond Rating Agency (KBRA), then the KBRA rating is assigned. Ratings are shown in the S&P and Fitch scale (e.g., AAA). Securities rated BBB or higher are considered investment grade. All ratings are subject to change. U.S. Government includes securities issued by the U.S. Department of the Treasury. Federal Agencies includes rated and unrated U.S. Agency fixed-income securities, U.S. Agency mortgage-backed securities, and collateralized mortgage obligations of U.S. Agency mortgage-backed securities. Not Rated includes fixed income securities and fixed income derivatives that have not been rated by any rating agency. The fund may or may not have held all of these instruments on this date. The fund is not rated by these agencies. |
MFS Limited Maturity Portfolio
Portfolio Composition - continued
| (d) | Duration is a measure of how much a bond’s price is likely to fluctuate with general changes in interest rates, e.g., if rates rise 1.00%, a bond with a 5-year duration is likely to lose about 5.00% of its value due to the interest rate move. |
| (i) | For purposes of this presentation, the components include the value of securities, and reflect the impact of the equivalent exposure of derivative positions, if any. These amounts may be negative from time to time. Equivalent exposure is a calculated amount that translates the derivative position into a reasonable approximation of the amount of the underlying asset that the portfolio would have to hold at a given point in time to have the same price sensitivity that results from the portfolio’s ownership of the derivative contract. When dealing with derivatives, equivalent exposure is a more representative measure of the potential impact of a position on portfolio performance than value. The bond component will include any accrued interest amounts. |
| (m) | In determining each instrument’s effective maturity for purposes of calculating the fund’s dollar-weighted average effective maturity, MFS uses the instrument’s stated maturity or, if applicable, an earlier date on which MFS believes it is probable that a maturity-shortening device (such as a put, pre-refunding or prepayment) will cause the instrument to be repaid. Such an earlier date can be substantially shorter than the instrument’s stated maturity. |
| (v) | For purposes of this presentation, market value of fixed income and/or equity derivatives, if any, is included in Cash & Cash Equivalents. |
Where the fund holds convertible bonds, they are treated as part of the equity portion of the portfolio.
Cash & Cash Equivalents includes any cash, investments in money market funds, short-term securities, and other assets less liabilities. Please see the Statement of Assets and Liabilities for additional information related to the fund’s cash position and other assets and liabilities.
Other includes equivalent exposure from currency derivatives and/or any offsets to derivative positions and may be negative.
Percentages are based on net assets as of June 30, 2021.
The portfolio is actively managed and current holdings may be different.
MFS Limited Maturity Portfolio
Expense Table
Fund Expenses Borne by the Contract Holders during the Period,
January 1, 2021 through June 30, 2021
As a contract holder of the fund, you incur ongoing costs, including management fees; distribution and/or service (12b-1) fees; and other fund expenses. This example is intended to help you understand your ongoing costs (in dollars) of investing in the fund and to compare these costs with the ongoing costs of investing in other mutual funds.
The example is based on an investment of $1,000 invested at the beginning of the period and held for the entire period January 1, 2021 through June 30, 2021.
Actual Expenses
The first line for each share class in the following table provides information about actual account values and actual expenses. You may use the information in this line, together with the amount you invested, to estimate the expenses that you paid over the period. Simply divide your account value by $1,000 (for example, an $8,600 account value divided by $1,000 = 8.6), then multiply the result by the number in the first line under the heading entitled “Expenses Paid During Period” to estimate the expenses you paid on your account during this period.
Hypothetical Example for Comparison Purposes
The second line for each share class in the following table provides information about hypothetical account values and hypothetical expenses based on the fund’s actual expense ratio and an assumed rate of return of 5% per year before expenses, which is not the fund’s actual return. The hypothetical account values and expenses may not be used to estimate the actual ending account balance or expenses you paid for the period. You may use this information to compare the ongoing costs of investing in the fund and other funds. To do so, compare this 5% hypothetical example with the 5% hypothetical examples that appear in the shareholder reports of the other funds.
Please note that the expenses shown in the table are meant to highlight the fund's ongoing costs only and do not take into account the fees and expenses imposed under the variable contracts through which your investment in the fund is made. Therefore, the second line for each share class in the table is useful in comparing ongoing costs associated with an investment in vehicles (such as the fund) which fund benefits under variable annuity and variable life insurance contracts and to qualified pension and retirement plans only, and will not help you determine the relative total costs of investing in the fund through variable annuity and variable life insurance contracts. If the fees and expenses imposed under the variable contracts were included, your costs would have been higher.
Share
Class | | Annualized
Expense
Ratio | Beginning
Account Value
1/01/21 | Ending
Account Value
6/30/21 | Expenses
Paid During
Period (p)
1/01/21-6/30/21 |
| Initial Class | Actual | 0.44% | $1,000.00 | $1,004.79 | $2.19 |
| Hypothetical (h) | 0.44% | $1,000.00 | $1,022.61 | $2.21 |
| Service Class | Actual | 0.69% | $1,000.00 | $1,002.87 | $3.43 |
| Hypothetical (h) | 0.69% | $1,000.00 | $1,021.37 | $3.46 |
| (h) | 5% class return per year before expenses. |
| (p) | “Expenses Paid During Period” are equal to each class's annualized expense ratio, as shown above, multiplied by the average account value over the period, multiplied by 181/365 (to reflect the one-half year period). |
MFS Limited Maturity Portfolio
Portfolio of Investments − 6/30/21 (unaudited)
The Portfolio of Investments is a complete list of all securities owned by your fund. It is categorized by broad-based asset classes.
| Issuer | | | Shares/Par | Value ($) |
| Bonds – 98.2% |
| Aerospace & Defense – 0.6% |
| Boeing Co., 1.167%, 2/04/2023 | | $ | 438,000 | $ 439,816 |
| Boeing Co., 1.433%, 2/04/2024 | | | 876,000 | 878,318 |
| Huntington Ingalls Industries, Inc., 3.844%, 5/01/2025 | | | 1,049,000 | 1,143,117 |
| Raytheon Technologies Corp., 3.65%, 8/16/2023 | | | 114,000 | 120,976 |
| | | | | $2,582,227 |
| Asset-Backed & Securitized – 20.2% |
| AmeriCredit Automobile Receivables Trust, 2017-2, “C”, 2.97%, 3/20/2023 | | $ | 629,881 | $ 632,366 |
| AmeriCredit Automobile Receivables Trust, 2020-1, “C”, 1.59%, 10/20/2025 | | | 659,000 | 670,199 |
| Arbor Realty Trust, Inc., CLO, 2019-FL1, “A”, FLR, 1.222% (LIBOR - 1mo. + 1.15%), 5/15/2037 (n) | | | 2,210,000 | 2,210,689 |
| AREIT CRE Trust, 2019-CRE3, “AS”, FLR, 1.424% (LIBOR - 1mo. + 1.3%), 9/14/2036 (n) | | | 647,000 | 646,197 |
| AREIT CRE Trust, 2019-CRE3, “B”, FLR, 1.674% (LIBOR - 1mo. + 1.55%), 9/14/2036 (n) | | | 319,500 | 317,914 |
| AREIT CRE Trust, 2019-CRE3, “C”, FLR, 2.024% (LIBOR - 1mo. + 1.9%), 9/14/2036 (n) | | | 264,000 | 262,361 |
| Avery Point CLO Ltd., 2014-1A, “CR”, FLR, 2.525% (LIBOR - 3mo. + 2.35%), 4/25/2026 (n) | | | 1,720,000 | 1,722,946 |
| Ballyrock Ltd., CLO, 2018-1A, “A2”, FLR, 1.788% (LIBOR - 3mo. + 1.6%), 4/20/2031 (n) | | | 1,748,737 | 1,740,590 |
| Ballyrock Ltd., CLO, 2018-1A, “B”, FLR, 2.088% (LIBOR - 3mo. + 1.9%), 4/20/2031 (n) | | | 741,069 | 736,812 |
| Bancorp Commercial Mortgage Trust, 2018-CRE3, “B”, FLR, 1.622% (LIBOR - 1mo. + 1.55%), 1/15/2033 (n) | | | 1,549,391 | 1,543,056 |
| Bancorp Commercial Mortgage Trust, 2019-CRE5, “A”, FLR, 1.072% (LIBOR - 1mo. + 1%), 3/15/2036 (n) | | | 263,610 | 263,610 |
| Bancorp Commercial Mortgage Trust, 2019-CRE5, “AS”, FLR, 1.422% (LIBOR - 1mo. + 1.35%), 3/15/2036 (n) | | | 1,247,481 | 1,246,738 |
| Bancorp Commercial Mortgage Trust, 2019-CRE5, “B”, FLR, 1.572% (LIBOR - 1mo. + 1.5%), 3/15/2036 (n) | | | 1,727,281 | 1,726,252 |
| Bancorp Commercial Mortgage Trust, 2019-CRE6, “AS”, FLR, 1.424% (LIBOR - 1mo. + 1.3%), 9/15/2036 (n) | | | 1,410,155 | 1,409,312 |
| Bancorp Commercial Mortgage Trust, 2019-CRE6, “B”, FLR, 1.674% (LIBOR - 1mo. + 1.55%), 9/15/2036 (n) | | | 1,776,462 | 1,773,636 |
| Barclays Commercial Mortgage Securities LLC, 2018-C2, “XA”, 0.932%, 12/15/2051 (i)(n) | | | 22,017,856 | 1,057,793 |
| BBCMS Mortgage Trust, 2021-C10, “XA”, 1.434%, 7/15/2054 (i)(w) | | | 5,799,066 | 583,170 |
| Issuer | | | Shares/Par | Value ($) |
| Bonds – continued |
| Asset-Backed & Securitized – continued |
| Benchmark Mortgage Trust, 2021-B23, “XA”, 1.385%, 2/15/2054 (i) | | $ | 10,430,884 | $ 990,351 |
| Benchmark Mortgage Trust, 2021-B27, “XA”, 1.273%, 7/15/2054 (i) | | | 11,351,124 | 1,144,563 |
| BSPRT Ltd., 2018-FL4, “A”, FLR, 2.172% (LIBOR - 1mo. + 2.1%), 9/15/2035 (n) | | | 2,076,000 | 2,068,229 |
| Business Jet Securities LLC, 2020-1A, “A”, 2.981%, 11/15/2035 (n) | | | 344,188 | 350,403 |
| Business Jet Securities LLC, 2021-1A, “A”, 2.162%, 4/15/2036 (n) | | | 393,729 | 396,756 |
| Business Jet Securities LLC, 2021-1A, “B”, 2.918%, 4/15/2036 (n) | | | 96,560 | 97,363 |
| BXMT Ltd., 2020-FL2, “B”, FLR, 1.524% (LIBOR - 1mo. + 1.4%), 2/15/2038 (n) | | | 1,445,000 | 1,443,646 |
| Capital Automotive, 2020-1A, “A4”, REIT, 3.19%, 2/15/2050 (n) | | | 556,332 | 572,770 |
| Caravana Auto Receivables Trust, 2019-1A, “B”, 3.29%, 8/15/2023 (n) | | | 1,002,805 | 1,006,545 |
| CD Commercial Mortgage Trust, 2017-CD4, “XA”, 1.282%, 5/10/2050 (i) | | | 17,185,352 | 892,863 |
| CF Hippolyta Issuer LLC, 2020-1, “A1”, 1.69%, 7/15/2060 (n) | | | 356,478 | 362,230 |
| CF Hippolyta Issuer LLC, 2020-1, “B1”, 2.28%, 7/15/2060 (n) | | | 112,767 | 114,624 |
| Commercial Mortgage Pass-Through Certificates, 2019-BN24,“XA”, 0.763%, 11/15/2062 (i) | | | 8,891,106 | 427,545 |
| Commercial Mortgage Pass-Through Certificates, 2021-BN31,“XA”, 1.444%, 2/15/2054 (i) | | | 9,206,407 | 950,125 |
| Commercial Mortgage Pass-Through Certificates, 2021-BN34, “XA”, 0.98%, 6/15/2063 (i) | | | 8,881,464 | 673,535 |
| Credit Acceptance Auto Loan Trust, 2021-2A, “A”, 0.96%, 2/15/2030 (n) | | | 373,000 | 373,247 |
| Credit Acceptance Auto Loan Trust, 2021-2A, “B”, 1.26%, 4/15/2030 (n) | | | 250,000 | 249,785 |
| Credit Acceptance Auto Loan Trust, 2021-3A, “B”, 1.38%, 7/15/2030 (n) | | | 250,000 | 249,638 |
| Credit Acceptance Auto Loan Trust, 2021-3A, “C”, 1.63%, 9/16/2030 (n) | | | 250,000 | 249,916 |
| Dell Equipment Finance Trust, 2018-2, “B”, 3.55%, 10/22/2023 (n) | | | 1,054,127 | 1,056,926 |
| Dell Equipment Finance Trust, 2020-1, “A2”, 2.26%, 6/22/2022 (n) | | | 388,728 | 391,179 |
| Exeter Automobile Receivables Trust, 2019-3A, “C”, 2.79%, 5/15/2024 (n) | | | 2,150,000 | 2,177,131 |
| Exeter Automobile Receivables Trust, 2020-1, 2.26%, 4/15/2024 (n) | | | 356,100 | 357,873 |
| Exeter Automobile Receivables Trust, 2020-1A, 2.49%, 1/15/2025 (n) | | | 500,000 | 508,892 |
| General Motors, 2019-1, “B”, 2.86%, 4/15/2024 (n) | | | 1,228,000 | 1,252,227 |
| General Motors, 2019-1, “C”, 3.06%, 4/15/2024 (n) | | | 945,000 | 963,847 |
| GLS Auto Receivables Trust, 2020-1A, “A”, 2.17%, 2/15/2024 (n) | | | 290,086 | 291,730 |
MFS Limited Maturity Portfolio
Portfolio of Investments (unaudited) – continued
| Issuer | | | Shares/Par | Value ($) |
| Bonds – continued |
| Asset-Backed & Securitized – continued |
| GM Financial Automobile Leasing Trust, 2020-1, “B”, 1.84%, 12/20/2023 | | $ | 622,000 | $ 631,175 |
| GM Financial Automobile Leasing Trust, 2020-1, “C”, 2.04%, 12/20/2023 | | | 456,000 | 463,515 |
| Grand Avenue CRE Ltd., 2019-FL1, “A”, FLR, 1.192% (LIBOR - 1mo. + 1.12%), 6/15/2037 (n) | | | 522,268 | 522,269 |
| GS Mortgage Securities Trust, 2017-GS6, “XA”, 1.029%, 5/10/2050 (i) | | | 15,661,595 | 834,146 |
| GS Mortgage Securities Trust, 2017-GS7, “XA”, 1.115%, 8/10/2050 (i) | | | 15,617,312 | 804,201 |
| GS Mortgage Securities Trust, 2020-GC47, “A5”, 1.246%, 5/12/2053 (i) | | | 8,350,485 | 719,866 |
| Invitation Homes Trust, 2018-SFR1, “B”, FLR, 1.032% (LIBOR - 1mo. + 0.95%), 3/17/2037 (n) | | | 1,366,000 | 1,367,886 |
| Invitation Homes Trust, 2018-SFR2, “A”, FLR, 0.932% (LIBOR - 1mo. + 0.85%), 12/17/2036 (n) | | | 2,507,651 | 2,509,849 |
| Invitation Homes Trust, 2018-SFR2, “A”, FLR, 0.973% (LIBOR - 1mo. + 0.9%), 6/17/2037 (n) | | | 1,802,482 | 1,806,638 |
| JPMorgan Chase Commercial Mortgage Securities Corp., 1.192%, 9/15/2050 (i) | | | 14,817,013 | 693,891 |
| KKR Real Estate Financial Trust, Inc., 2018-FL1, “C”, FLR, 2.081% (LIBOR - 1mo. + 2%), 6/15/2036 (n) | | | 1,355,500 | 1,356,769 |
| LoanCore Ltd., 2018-CRE1, “AS”, FLR, 1.572% (LIBOR - 1mo. + 1.5%), 5/15/2028 (n) | | | 2,225,000 | 2,225,000 |
| LoanCore Ltd., 2018-CRE1, “C”, FLR, 2.622% (LIBOR - 1mo. + 2.55%), 5/15/2028 (n) | | | 741,500 | 737,792 |
| LoanCore Ltd., 2019-CRE3, “A”, FLR, 1.122% (LIBOR - 1mo. + 1.05%), 4/15/2034 (n) | | | 852,547 | 852,547 |
| LoanCore Ltd., 2019-CRE3, “AS”, FLR, 1.442% (LIBOR - 1mo. + 1.37%), 4/15/2034 (n) | | | 1,980,450 | 1,977,978 |
| LoanCore Ltd., 2021-CRE5, “AS”, 1.823%, 7/15/2036 (n) | | | 1,344,000 | 1,345,257 |
| LoanCore Ltd., 2021-CRE5, “B”, FLR, 2.072% (LIBOR - 1mo. + 2%), 7/15/2036 (n) | | | 567,500 | 568,032 |
| Madison Park Funding Ltd., 2014-13A, “BR2”, FLR, 1.689% (LIBOR - 3mo. + 1.5%), 4/19/2030 (n) | | | 2,779,008 | 2,792,520 |
| Magnetite CLO Ltd., 2015-16A, “BR”, FLR, 1.389% (LIBOR - 3mo. + 1.2%), 1/18/2028 (n) | | | 3,559,000 | 3,551,626 |
| Man GLG U.S. CLO Ltd., 2018-2A, “BR”, FLR, 2.633% (LIBOR - 3mo. + 2.45%), 10/15/2028 | | | 2,309,265 | 2,309,006 |
| MF1 CLO Ltd., 2019-FL2, “A”, FLR, 1.262% (LIBOR - 1mo. + 1.13%), 12/25/2034 (n) | | | 462,749 | 462,749 |
| MF1 CLO Ltd., 2019-FL2, “AS”, FLR, 1.562% (LIBOR - 1mo. + 1.43%), 12/25/2034 (n) | | | 1,307,000 | 1,306,999 |
| Issuer | | | Shares/Par | Value ($) |
| Bonds – continued |
| Asset-Backed & Securitized – continued |
| MF1 Ltd., 2020-FL3, “B”, FLR, 3.874% (LIBOR - 1mo. + 3.75%), 7/15/2035 (z) | | $ | 192,000 | $ 194,998 |
| MF1 Ltd., 2020-FL3, “C”, FLR, 4.624% (LIBOR - 1mo. + 4.5%), 7/15/2035 (z) | | | 274,500 | 279,472 |
| MF1 Multi-Family Housing Mortgage Loan Trust, 2020-FL4, “B”, FLR, 2.874% (LIBOR - 1mo. + 2.75%), 11/15/2035 (n) | | | 1,946,000 | 1,971,537 |
| Morgan Stanley Bank of America Merrill Lynch Trust, 2017-C33, “XA”, 1.425%, 5/15/2050 (i) | | | 14,402,413 | 816,667 |
| Morgan Stanley Capital I Trust, 2017-H1, “XA”, 1.507%, 6/15/2050 (i) | | | 7,142,009 | 410,518 |
| Morgan Stanley Capital I Trust, 2018-H4, “XA”, 1.026%, 12/15/2051 (i) | | | 17,903,619 | 945,562 |
| Morgan Stanley Capital I Trust, 2021-L5, “XA”, 1.425%, 5/15/2054 (i) | | | 7,326,757 | 718,060 |
| Multi-Family Housing Mortgage, MF1-2021, FLR, “B”, 1.75% (LIBOR - 1mo. + 1.65%), 7/16/2036 (n) | | | 1,598,887 | 1,599,883 |
| Nationstar HECM Loan Trust, 2019-1A, “A”, 2.651%, 6/25/2029 (n) | | | 242,527 | 242,888 |
| Navistar Financial Dealer Note Master Owner Trust, 2020-1, “A”, FLR, 1.041% (LIBOR - 1mo. + 0.95%), 7/25/2025 (n) | | | 367,000 | 369,863 |
| Navistar Financial Dealer Note Master Owner Trust, 2020-1, “B”, FLR, 1.441% (LIBOR - 1mo. + 1.35%), 7/25/2025 (n) | | | 338,000 | 340,836 |
| Navistar Financial Dealer Note Master Owner Trust, 2020-1, “C”, FLR, 2.241% (LIBOR - 1mo. + 2.15%), 7/25/2025 (n) | | | 279,000 | 282,074 |
| NextGear Floorplan Master Owner Trust, 2019-2A, “A2”, 2.07%, 10/15/2024 (n) | | | 1,050,000 | 1,073,424 |
| OneMain Financial Issuance Trust, 2020-1A, “A”, 3.84%, 5/14/2032 (n) | | | 1,723,824 | 1,798,386 |
| Santander Drive Auto Receivables Trust, 2019-2, “B”, 2.79%, 1/16/2024 | | | 382,048 | 382,970 |
| Securitized Term Auto Receivable Trust, 2019-CRTA, “B”, 2.453%, 3/25/2026 (n) | | | 186,524 | 189,652 |
| Securitized Term Auto Receivable Trust, 2019-CRTA, “C”, 2.849%, 3/25/2026 (n) | | | 239,155 | 244,089 |
| Shackleton CLO Ltd., 2013-4RA, “B”, FLR, 2.087% (LIBOR - 3mo. + 1.9%), 4/13/2031 (n) | | | 927,055 | 904,039 |
| Shackleton CLO Ltd., 2015-8A, “CR”, FLR, 1.838% (LIBOR - 3mo. + 1.65%), 10/20/2027 (n) | | | 709,957 | 707,831 |
| Shelter Growth CRE, 2019-FL2, “A”, FLR, 1.172% (LIBOR - 1mo. + 1.1%), 5/15/2036 (n) | | | 293,756 | 293,756 |
| Starwood Property Trust, Inc., REIT, FLR, 1.882% (LIBOR - 1mo. + 1.8%), 4/18/2038 (n) | | | 764,000 | 765,195 |
| Student Loan Consolidation Center, “A”, FLR, 1.311% (LIBOR - 1mo. + 1.22%), 10/25/2027 (n) | | | 98,404 | 98,912 |
| TICP CLO Ltd., 2018-3R, “B”, FLR, 1.538% (LIBOR - 3mo. + 1.35%), 4/20/2028 (n) | | | 870,756 | 870,237 |
MFS Limited Maturity Portfolio
Portfolio of Investments (unaudited) – continued
| Issuer | | | Shares/Par | Value ($) |
| Bonds – continued |
| Asset-Backed & Securitized – continued |
| TICP CLO Ltd., 2018-3R, “C”, FLR, 1.988% (LIBOR - 3mo. + 1.8%), 4/20/2028 (n) | | $ | 1,528,084 | $ 1,528,281 |
| TPG Real Estate Finance, 2018-FL2, “AS”, FLR, 1.531% (LIBOR - 1mo. + 1.45%), 11/15/2037 (n) | | | 2,192,500 | 2,192,500 |
| UBS Commercial Mortgage Trust, 2017-C1, “XA”, 1.149%, 11/15/2050 (i) | | | 11,914,317 | 522,010 |
| UBS Commercial Mortgage Trust, 2018-C14, “XA”, 1.163%, 12/15/2051 (i) | | | 8,981,955 | 536,754 |
| Veros Auto Receivables Trust, 2020-1, “A”, 1.67%, 9/15/2023 (n) | | | 308,826 | 309,578 |
| Wind River CLO Ltd., 2015-2A, “CR”, FLR, 1.883% (LIBOR - 3mo. + 1.7%), 10/15/2027 (n) | | | 864,053 | 865,639 |
| | | | | $89,452,902 |
| Automotive – 3.4% |
| Daimler Finance North America LLC, 0.75%, 3/01/2024 (n) | | $ | 870,000 | $ 871,829 |
| Ford Motor Credit Co. LLC, 3.087%, 1/09/2023 | | | 857,000 | 874,140 |
| General Motors Financial Co., 1.7%, 8/18/2023 | | | 1,491,000 | 1,521,774 |
| Harley-Davidson Financial Services, 4.05%, 2/04/2022 (n) | | | 1,203,000 | 1,228,262 |
| Hyundai Capital America, 2.85%, 11/01/2022 (n) | | | 355,000 | 365,018 |
| Hyundai Capital America, 2.375%, 2/10/2023 (n) | | | 534,000 | 548,124 |
| Hyundai Capital America, 5.75%, 4/06/2023 (n) | | | 1,733,000 | 1,883,121 |
| Hyundai Capital America, 0.8%, 1/08/2024 (n) | | | 154,000 | 153,326 |
| Hyundai Capital America, 5.875%, 4/07/2025 (n) | | | 1,872,000 | 2,161,318 |
| Volkswagen Group of America Finance LLC, 4%, 11/12/2021 (n) | | | 1,356,000 | 1,374,885 |
| Volkswagen Group of America Finance LLC, 2.9%, 5/13/2022 (n) | | | 560,000 | 571,888 |
| Volkswagen Group of America Finance LLC, 3.125%, 5/12/2023 (n) | | | 234,000 | 244,347 |
| Volkswagen Group of America Finance LLC, 2.85%, 9/26/2024 (n) | | | 1,120,000 | 1,182,675 |
| Volkswagen Group of America Finance LLC, 3.35%, 5/13/2025 (n) | | | 1,212,000 | 1,307,878 |
| Volkswagen Group of America Finance LLC, 1.25%, 11/24/2025 (n) | | | 916,000 | 910,594 |
| | | | | $15,199,179 |
| Brokerage & Asset Managers – 1.4% |
| Charles Schwab Corp., 0.75%, 3/18/2024 | | $ | 1,049,000 | $ 1,054,935 |
| E*TRADE Financial Corp., 2.95%, 8/24/2022 | | | 2,157,000 | 2,215,410 |
| NASDAQ, Inc., 0.445%, 12/21/2022 | | | 500,000 | 499,837 |
| National Securities Clearing Corp., 1.2%, 4/23/2023 (n) | | | 600,000 | 609,402 |
| Issuer | | | Shares/Par | Value ($) |
| Bonds – continued |
| Brokerage & Asset Managers – continued |
| National Securities Clearing Corp., 0.4%, 12/07/2023 (n) | | $ | 500,000 | $ 500,513 |
| National Securities Clearing Corp., 1.5%, 4/23/2025 (n) | | | 250,000 | 254,957 |
| National Securities Clearing Corp., 0.75%, 12/07/2025 (n) | | | 1,000,000 | 986,284 |
| | | | | $6,121,338 |
| Business Services – 1.0% |
| Equinix, Inc., 1.25%, 7/15/2025 | | $ | 375,000 | $ 375,899 |
| Global Payments, Inc., 1.2%, 3/01/2026 | | | 1,216,000 | 1,204,387 |
| Tencent Holdings Ltd., 1.81%, 1/26/2026 (n) | | | 1,481,000 | 1,503,911 |
| Western Union Co., 1.35%, 3/15/2026 | | | 1,091,000 | 1,083,537 |
| | | | | $4,167,734 |
| Cable TV – 0.6% |
| SES S.A., 3.6%, 4/04/2023 (n) | | $ | 2,469,000 | $ 2,580,380 |
| Computer Software – 0.4% |
| Dell International LLC/EMC Corp., 4%, 7/15/2024 | | $ | 1,415,000 | $ 1,538,643 |
| Dell International LLC/EMC Corp., 5.85%, 7/15/2025 | | | 340,000 | 398,893 |
| | | | | $1,937,536 |
| Computer Software - Systems – 0.2% |
| Apple, Inc., 1.7%, 9/11/2022 | | $ | 862,000 | $ 877,160 |
| Conglomerates – 1.0% |
| Carrier Global Corp., 2.242%, 2/15/2025 | | $ | 1,434,000 | $ 1,491,029 |
| Roper Technologies, Inc., 2.8%, 12/15/2021 | | | 666,000 | 672,322 |
| Westinghouse Air Brake Technologies Corp., 4.4%, 3/15/2024 | | | 2,237,000 | 2,423,762 |
| | | | | $4,587,113 |
| Consumer Products – 0.1% |
| Reckitt Benckiser Treasury Services PLC, 2.375%, 6/24/2022 (n) | | $ | 550,000 | $ 560,545 |
| Containers – 0.5% |
| Berry Global, Inc., 0.95%, 2/15/2024 (n) | | $ | 662,000 | $ 662,576 |
| Berry Global, Inc., 1.65%, 1/15/2027 (n) | | | 1,534,000 | 1,520,716 |
| | | | | $2,183,292 |
| Electronics – 0.8% |
| Broadcom, Inc., 4.7%, 4/15/2025 | | $ | 493,000 | $ 555,397 |
| Broadcom, Inc., 3.15%, 11/15/2025 | | | 600,000 | 643,068 |
| Microchip Technology, Inc., 0.983%, 9/01/2024 (n) | | | 1,895,000 | 1,885,813 |
| Skyworks Solutions, Inc., 0.9%, 6/01/2023 | | | 590,000 | 591,754 |
| | | | | $3,676,032 |
MFS Limited Maturity Portfolio
Portfolio of Investments (unaudited) – continued
| Issuer | | | Shares/Par | Value ($) |
| Bonds – continued |
| Emerging Market Quasi-Sovereign – 1.1% |
| Bharat Petroleum Corp. Ltd., 4.625%, 10/25/2022 | | $ | 1,865,000 | $ 1,942,099 |
| DAE Funding LLC (United Arab Emirates), 1.55%, 8/01/2024 (n) | | | 619,000 | 617,744 |
| Indian Oil Corp. Ltd., 5.75%, 8/01/2023 | | | 933,000 | 1,015,023 |
| Sinopec Group Overseas Development (2018) Ltd. (People's Republic of China), 1.45%, 1/08/2026 (n) | | | 1,302,000 | 1,302,910 |
| | | | | $4,877,776 |
| Emerging Market Sovereign – 0.4% |
| Emirate of Abu Dhabi, 0.75%, 9/02/2023 (n) | | $ | 1,572,000 | $ 1,581,432 |
| Energy - Independent – 0.6% |
| Diamondback Energy, Inc., 0.9%, 3/24/2023 | | $ | 963,000 | $ 963,207 |
| Pioneer Natural Resources Co., 0.55%, 5/15/2023 | | | 204,000 | 204,195 |
| Pioneer Natural Resources Co., 0.75%, 1/15/2024 | | | 1,364,000 | 1,362,747 |
| | | | | $2,530,149 |
| Energy - Integrated – 1.0% |
| Cenovus Energy, Inc., 5.375%, 7/15/2025 | | $ | 1,227,000 | $ 1,403,728 |
| Eni S.p.A., 4%, 9/12/2023 (n) | | | 1,857,000 | 1,983,336 |
| Exxon Mobil Corp., 1.571%, 4/15/2023 | | | 683,000 | 698,187 |
| Husky Energy, Inc., 3.95%, 4/15/2022 | | | 468,000 | 476,382 |
| | | | | $4,561,633 |
| Financial Institutions – 2.0% |
| AerCap Ireland Capital DAC, 4.875%, 1/16/2024 | | $ | 1,585,000 | $ 1,725,494 |
| AerCap Ireland Capital DAC, 3.15%, 2/15/2024 | | | 1,399,000 | 1,468,433 |
| AerCap Ireland Capital DAC, 6.5%, 7/15/2025 | | | 1,212,000 | 1,421,570 |
| Avolon Holdings Funding Ltd., 3.625%, 5/01/2022 (n) | | | 241,000 | 246,566 |
| Avolon Holdings Funding Ltd., 3.95%, 7/01/2024 (n) | | | 1,214,000 | 1,294,709 |
| Avolon Holdings Funding Ltd., 2.125%, 2/21/2026 (n) | | | 1,574,000 | 1,567,482 |
| Avolon Holdings Funding Ltd., 4.25%, 4/15/2026 (n) | | | 506,000 | 548,340 |
| Century Housing Corp., 3.995%, 11/01/2021 | | | 748,000 | 750,324 |
| | | | | $9,022,918 |
| Food & Beverages – 0.4% |
| Mondelez International, Inc., 0.625%, 7/01/2022 | | $ | 1,800,000 | $ 1,806,948 |
| Food & Drug Stores – 0.7% |
| 7-Eleven, Inc., 0.625%, 2/10/2023 (n) | | $ | 1,785,000 | $ 1,786,063 |
| 7-Eleven, Inc., 0.8%, 2/10/2024 (n) | | | 1,339,000 | 1,335,684 |
| | | | | $3,121,747 |
| Issuer | | | Shares/Par | Value ($) |
| Bonds – continued |
| Gaming & Lodging – 0.8% |
| GLP Capital LP/GLP Financing II, Inc., 5.375%, 11/01/2023 | | $ | 1,459,000 | $ 1,585,408 |
| Marriott International, Inc., 2.3%, 1/15/2022 | | | 1,564,000 | 1,575,128 |
| Marriott International, Inc., 3.75%, 10/01/2025 | | | 370,000 | 398,612 |
| | | | | $3,559,148 |
| Industrial – 0.1% |
| Howard University, Washington D.C., 2.738%, 10/01/2022 | | $ | 96,000 | $ 98,304 |
| Howard University, Washington D.C., 2.801%, 10/01/2023 | | | 106,000 | 108,445 |
| Howard University, Washington D.C., AGM, 2.638%, 10/01/2021 | | | 91,000 | 91,482 |
| Howard University, Washington D.C., AGM, 2.416%, 10/01/2024 | | | 117,000 | 120,097 |
| Howard University, Washington D.C., AGM, 2.516%, 10/01/2025 | | | 144,000 | 148,272 |
| | | | | $566,600 |
| Insurance – 0.7% |
| AIG Global Funding, 0.8%, 7/07/2023 (n) | | $ | 913,000 | $ 919,178 |
| Equitable Financial Life Insurance Co., 1.4%, 7/07/2025 (n) | | | 882,000 | 889,414 |
| Metropolitan Life Global Funding I, 0.4%, 1/07/2024 (n) | | | 1,365,000 | 1,361,694 |
| | | | | $3,170,286 |
| Insurance - Property & Casualty – 0.4% |
| Aon PLC, 2.2%, 11/15/2022 | | $ | 821,000 | $ 841,116 |
| Marsh & McLennan Cos., Inc., 2.75%, 1/30/2022 | | | 807,000 | 817,281 |
| | | | | $1,658,397 |
| Internet – 0.3% |
| Baidu, Inc., 3.875%, 9/29/2023 | | $ | 1,263,000 | $ 1,342,086 |
| Machinery & Tools – 0.7% |
| CNH Industrial Capital LLC, 4.2%, 1/15/2024 | | $ | 2,262,000 | $ 2,447,671 |
| CNH Industrial Capital LLC, 1.875%, 1/15/2026 | | | 448,000 | 455,596 |
| | | | | $2,903,267 |
| Major Banks – 14.6% |
| Bank of America Corp., 2.881%, 4/24/2023 | | $ | 2,896,000 | $ 2,955,331 |
| Bank of America Corp., 4.2%, 8/26/2024 | | | 692,000 | 758,595 |
| Bank of America Corp., 1.734% to 7/22/2026, FLR (SOFR + 0.96%) to 7/22/2027 | | | 3,526,000 | 3,553,119 |
| Bank of Montreal, 2.05%, 11/01/2022 | | | 1,168,000 | 1,195,127 |
| Barclays PLC, 4.61% to 2/15/2022, FLR (LIBOR - 3mo. + 1.4%) to 2/15/2023 | | | 2,947,000 | 3,022,450 |
| Barclays PLC, 1.007%, 12/10/2024 | | | 207,000 | 207,738 |
| Barclays PLC, 2.852% to 5/07/2025, FLR (LIBOR - 3mo. + 2.452%) to 5/07/2026 | | | 550,000 | 581,060 |
MFS Limited Maturity Portfolio
Portfolio of Investments (unaudited) – continued
| Issuer | | | Shares/Par | Value ($) |
| Bonds – continued |
| Major Banks – continued |
| Credit Agricole, “A”, FLR, 1.617% (LIBOR - 3mo. + 1.43%), 1/10/2022 (n) | | $ | 1,270,000 | $ 1,279,194 |
| Credit Suisse Group AG, 3.574%, 1/09/2023 (n) | | | 872,000 | 885,808 |
| Credit Suisse Group AG, 4.207% to 6/12/2023, FLR (LIBOR - 3mo. + 1.24%) to 6/12/2024 (n) | | | 443,000 | 471,820 |
| Deutsche Bank AG, 0.898%, 5/28/2024 | | | 421,000 | 419,083 |
| Deutsche Bank AG, 1.447% to 4/1/2024, FLR (SOFR + 1.131%) to 4/01/2025 | | | 2,012,000 | 2,024,095 |
| Goldman Sachs Group, Inc., 0.481%, 1/27/2023 | | | 1,613,000 | 1,613,889 |
| Goldman Sachs Group, Inc., 3.5%, 4/01/2025 | | | 750,000 | 813,673 |
| Goldman Sachs Group, Inc., 1.093% to 12/09/2025, FLR (SOFR + 0.789%) to 12/09/2026 | | | 821,000 | 808,253 |
| HSBC Holdings PLC, 3.262% to 3/13/2022, FLR (LIBOR - 3mo. + 1.055%) to 3/13/2023 | | | 1,521,000 | 1,551,726 |
| HSBC Holdings PLC, 3.033% to 11/22/2022, FLR (LIBOR - 3mo. + 0.923%) to 11/22/2023 | | | 491,000 | 508,558 |
| HSBC Holdings PLC, 2.099% to 6/04/2025, FLR (SOFR + 1.929%) to 6/04/2026 | | | 910,000 | 935,177 |
| HSBC Holdings PLC, 1.589% to 5/24/2026, FLR (SOFR + 1.29%) to 5/24/2027 | | | 623,000 | 624,201 |
| JPMorgan Chase & Co., 3.207% to 4/01/2022, FLR (LIBOR - 3mo. + 0.695%) to 4/01/2023 | | | 2,827,000 | 2,888,360 |
| JPMorgan Chase & Co., 2.776% to 4/25/2022, FLR (LIBOR - 3mo. + 0.935%) to 4/25/2023 | | | 2,701,000 | 2,752,936 |
| JPMorgan Chase & Co., 3.797% to 7/23/2023, FLR (LIBOR - 3mo. + 0.89%) to 7/23/2024 | | | 1,380,000 | 1,470,430 |
| JPMorgan Chase & Co., 2.005% to 3/13/2025, FLR (SOFR + 1.585%) to 3/13/2026 | | | 1,642,000 | 1,695,201 |
| JPMorgan Chase & Co., 1.04% to 2/04/2026, FLR (SOFR + 0.695%) to 2/04/2027 | | | 1,071,000 | 1,053,395 |
| JPMorgan Chase & Co., 1.578% to 4/22/2026, FLR (SOFR + 0.885%) to 4/22/2027��� | | | 862,000 | 866,466 |
| Mitsubishi UFJ Financial Group, Inc., 3.535%, 7/26/2021 | | | 1,623,000 | 1,626,619 |
| Mitsubishi UFJ Financial Group, Inc., 2.623%, 7/18/2022 | | | 1,921,000 | 1,968,315 |
| Mizuho Financial Group, 0.849% to 9/08/2023, FLR (LIBOR - 3mo. + 0.61%) to 9/08/2024 | | | 600,000 | 602,892 |
| Morgan Stanley, 0.56% to 11/10/2022, FLR (SOFR + 0.466%) to 11/10/2023 | | | 1,637,000 | 1,639,066 |
| Morgan Stanley, 0.529% to 1/25/2023, FLR (SOFR + 0.455%) to 1/25/2024 | | | 2,151,000 | 2,149,910 |
| Issuer | | | Shares/Par | Value ($) |
| Bonds – continued |
| Major Banks – continued |
| Morgan Stanley, 0.864% to 10/21/2024, FLR (SOFR + 0.745%) to 10/21/2025 | | $ | 1,635,000 | $ 1,634,390 |
| NatWest Group PLC, 2.359% to 5/22/2023, FLR (CMT - 1yr. + 2.15%) to 5/22/2024 | | | 1,038,000 | 1,069,506 |
| NatWest Group PLC, 4.269% to 3/22/2024, FLR (LIBOR - 3mo. + 1.762%) to 3/22/2025 | | | 2,018,000 | 2,188,892 |
| Royal Bank of Canada, 0.5%, 10/26/2023 | | | 1,750,000 | 1,752,058 |
| Standard Chartered PLC, 1.319% to 10/14/2022, FLR (CMT - 1yr. + 1.17%) to 10/14/2023 (n) | | | 1,457,000 | 1,469,545 |
| Standard Chartered PLC, 0.991% to 1/12/2024, FLR (CMT - 1yr. + 0.78%) to 1/12/2025 (n) | | | 1,361,000 | 1,356,718 |
| Standard Chartered PLC, 1.214% to 3/23/2024, FLR (CMT - 1yr. + 0.88%) to 3/23/2025 (n) | | | 437,000 | 438,559 |
| State Street Corp., 2.825% to 3/30/2022, FLR (SOFR + 2.69%) to 3/30/2023 | | | 383,000 | 390,160 |
| State Street Corp., 2.901% to 3/30/2025, FLR (SOFR + 2.6%) to 3/30/2026 | | | 157,000 | 167,629 |
| Sumitomo Mitsui Financial Group, Inc., 0.508%, 1/12/2024 | | | 455,000 | 453,118 |
| Sumitomo Mitsui Financial Group, Inc., 1.474%, 7/08/2025 | | | 1,613,000 | 1,628,849 |
| Sumitomo Mitsui Trust Bank Ltd., 0.85%, 3/25/2024 (n) | | | 944,000 | 945,442 |
| Toronto-Dominion Bank, 0.25%, 1/06/2023 | | | 910,000 | 909,108 |
| Toronto-Dominion Bank, 0.75%, 1/06/2026 | | | 637,000 | 628,359 |
| UBS Group AG, 3.491%, 5/23/2023 (n) | | | 278,000 | 285,519 |
| UBS Group AG, 1.008% to 7/30/2023, FLR (CMT - 1yr. + 0.83%) to 7/30/2024 (n) | | | 924,000 | 930,654 |
| UniCredito Italiano S.p.A., 6.572%, 1/14/2022 (n) | | | 1,373,000 | 1,415,374 |
| UniCredito Italiano S.p.A., 3.75%, 4/12/2022 (n) | | | 1,687,000 | 1,727,582 |
| Wells Fargo & Co., 2.164% to 2/11/2025, FLR (LIBOR - 3mo. + 0.75%) to 2/11/2026 | | | 2,242,000 | 2,327,005 |
| | | | | $64,640,954 |
| Medical & Health Technology & Services – 0.5% |
| Becton, Dickinson and Co., 2.894%, 6/06/2022 | | $ | 478,000 | $ 488,514 |
| HCA, Inc., 5%, 3/15/2024 | | | 1,692,000 | 1,869,533 |
| | | | | $2,358,047 |
MFS Limited Maturity Portfolio
Portfolio of Investments (unaudited) – continued
| Issuer | | | Shares/Par | Value ($) |
| Bonds – continued |
| Metals & Mining – 1.5% |
| Anglo American Capital PLC, 3.625%, 9/11/2024 (n) | | $ | 533,000 | $ 574,287 |
| Glencore Finance (Canada) Ltd., 4.95%, 11/15/2021 (n) | | | 899,000 | 913,711 |
| Glencore Funding LLC, 3%, 10/27/2022 (n) | | | 848,000 | 871,854 |
| Glencore Funding LLC, 4.125%, 3/12/2024 (n) | | | 1,354,000 | 1,459,676 |
| Glencore Funding LLC, 4.625%, 4/29/2024 (n) | | | 422,000 | 462,554 |
| Glencore Funding LLC, 1.625%, 9/01/2025 (n) | | | 1,100,000 | 1,112,507 |
| Glencore Funding LLC, 1.625%, 4/27/2026 (n) | | | 1,191,000 | 1,195,046 |
| | | | | $6,589,635 |
| Midstream – 2.0% |
| Energy Transfer Operating Co., 2.9%, 5/15/2025 | | $ | 569,000 | $ 598,861 |
| Gray Oak Pipeline LLC, 2%, 9/15/2023 (n) | | | 968,000 | 987,306 |
| MPLX LP, 3.5%, 12/01/2022 | | | 2,340,000 | 2,430,465 |
| MPLX LP, 3.375%, 3/15/2023 | | | 642,000 | 671,208 |
| Plains All American Pipeline LP, 3.85%, 10/15/2023 | | | 750,000 | 794,936 |
| Plains All American Pipeline LP/PAA Finance Corp., 4.65%, 10/15/2025 | | | 992,000 | 1,109,833 |
| Western Midstream Operating LP, 4.35%, 2/01/2025 | | | 796,000 | 841,046 |
| Western Midstream Operating LP, FLR, 2.287% (LIBOR - 3mo. + 0.85%), 1/13/2023 | | | 1,222,000 | 1,215,901 |
| | | | | $8,649,556 |
| Mortgage-Backed – 1.3% | |
| Fannie Mae, 5.5%, 5/01/2025 | | $ | 1,216 | $ 1,226 |
| Fannie Mae, 5%, 7/01/2039-3/01/2042 | | | 669,485 | 766,270 |
| Fannie Mae, 2%, 5/25/2044 | | | 826,962 | 836,351 |
| Freddie Mac, 1.016%, 4/25/2024 (i) | | | 536,833 | 10,185 |
| Freddie Mac, 1.699%, 4/25/2030 (i) | | | 6,147,474 | 734,624 |
| Freddie Mac, 3%, 4/15/2033-6/15/2045 | | | 2,578,378 | 2,756,117 |
| Freddie Mac, 2%, 7/15/2042 | | | 462,182 | 476,392 |
| | | | | $5,581,165 |
| Municipals – 3.8% |
| California Earthquake Authority Rev., “B”, 1.227%, 7/01/2021 | | $ | 195,000 | $ 195,000 |
| California Earthquake Authority Rev., “B”, 1.327%, 7/01/2022 | | | 620,000 | 626,156 |
| California Earthquake Authority Rev., “B”, 1.477%, 7/01/2023 | | | 440,000 | 448,486 |
| California Municipal Finance Authority Rev. (Century Housing Corp.), 1.486%, 11/01/2022 | | | 235,000 | 237,419 |
| California Municipal Finance Authority Rev. (Century Housing Corp.), 1.605%, 11/01/2023 | | | 280,000 | 283,506 |
| Issuer | | | Shares/Par | Value ($) |
| Bonds – continued |
| Municipals – continued |
| Clifton, TX, Higher Education Finance Corp. Rev. (Idea Public Schools), 0.75%, 8/15/2050 (n) | | $ | 1,615,000 | $ 1,616,850 |
| Illinois Sales Tax Securitization Corp., Second Lien, “B”, BAM, 2.128%, 1/01/2023 | | | 300,000 | 306,711 |
| Illinois Sales Tax Securitization Corp., Second Lien, “B”, BAM, 2.225%, 1/01/2024 | | | 730,000 | 754,077 |
| Long Island, NY, Power Authority, Electric System General Rev., “C”, 0.659%, 3/01/2022 | | | 135,000 | 135,048 |
| Long Island, NY, Power Authority, Electric System General Rev., “C”, 0.764%, 3/01/2023 | | | 595,000 | 597,382 |
| Massachusetts Educational Financing Authority, Education Loan Rev., “A”, 1.904%, 7/01/2023 | | | 65,000 | 66,425 |
| Massachusetts Educational Financing Authority, Education Loan Rev., “A”, 2.156%, 7/01/2024 | | | 190,000 | 196,085 |
| Massachusetts Educational Financing Authority, Education Loan Rev., “A”, 2.306%, 7/01/2025 | | | 150,000 | 155,668 |
| Massachusetts Educational Financing Authority, Education Loan Rev., “A”, 2.562%, 7/01/2026 | | | 185,000 | 193,377 |
| Michigan Finance Authority Tobacco Settlement Asset-Backed Rev. (2006 Sold Tobacco Receipts), “A-1”, 2.326%, 6/01/2030 | | | 611,257 | 637,483 |
| New Jersey Economic Development Authority Rev., School Facilities Construction, “HHH”, 3.75%, 9/01/2022 (n) | | | 2,885,000 | 2,981,163 |
| New Jersey Economic Development Authority State Pension Funding Rev., Capital Appreciation, “B”, AGM, 0%, 2/15/2023 | | | 4,091,000 | 4,066,054 |
| New Jersey Transportation Trust Fund Authority, Transportation System, “B”, 2.384%, 6/15/2022 | | | 455,000 | 461,973 |
| New Jersey Transportation Trust Fund Authority, Transportation System, “B”, 2.551%, 6/15/2023 | | | 465,000 | 478,945 |
| New Jersey Transportation Trust Fund Authority, Transportation System, “B”, 2.631%, 6/15/2024 | | | 440,000 | 457,329 |
| Port Authority of NY & NJ, “AAA”, 1.086%, 7/01/2023 | | | 1,060,000 | 1,073,490 |
| Texas Transportation Commission, Central Texas Turnpike System First Tier Refunding Rev., Taxable, “B”, 1.98%, 8/15/2042 | | | 680,000 | 691,540 |
| | | | | $16,660,167 |
| Natural Gas - Distribution – 0.3% |
| CenterPoint Energy Resources Corp., 0.7%, 3/02/2023 | | $ | 1,302,000 | $ 1,302,123 |
MFS Limited Maturity Portfolio
Portfolio of Investments (unaudited) – continued
| Issuer | | | Shares/Par | Value ($) |
| Bonds – continued |
| Network & Telecom – 0.8% |
| AT&T, Inc., 0.9%, 3/25/2024 | | $ | 2,621,000 | $ 2,626,714 |
| Verizon Communications, Inc., 0.75%, 3/22/2024 | | | 986,000 | 990,237 |
| | | | | $3,616,951 |
| Oil Services – 0.0% |
| Halliburton Co., 3.8%, 11/15/2025 | | $ | 111,000 | $ 122,688 |
| Oils – 1.0% |
| Marathon Petroleum Corp., 4.75%, 12/15/2023 | | $ | 1,919,000 | $ 2,093,955 |
| Valero Energy Corp., 1.2%, 3/15/2024 | | | 1,330,000 | 1,341,507 |
| Valero Energy Corp., 3.4%, 9/15/2026 | | | 771,000 | 834,927 |
| | | | | $4,270,389 |
| Other Banks & Diversified Financials – 3.6% |
| American Express Co., 3.7%, 11/05/2021 | | $ | 497,000 | $ 501,535 |
| Banque Federative du Credit Mutuel, 0.65%, 2/27/2024 (n) | | | 1,833,000 | 1,827,870 |
| BBVA USA, 2.875%, 6/29/2022 | | | 2,443,000 | 2,500,813 |
| BBVA USA Bancshares, Inc., 2.5%, 8/27/2024 | | | 1,183,000 | 1,244,880 |
| Groupe BPCE S.A., 4%, 9/12/2023 (n) | | | 1,385,000 | 1,484,590 |
| Groupe BPCE S.A., FLR, 1.359% (LIBOR - 3mo. + 1.24%), 9/12/2023 (n) | | | 1,385,000 | 1,413,191 |
| Macquarie Group Ltd., 1.34% to 1/12/2026, FLR (SOFR + 1.069%) to 1/12/2027 (n) | | | 1,200,000 | 1,189,923 |
| National Bank of Canada, 2.15%, 10/07/2022 (n) | | | 1,348,000 | 1,377,807 |
| National Bank of Canada, 0.9% to 8/15/2022, FLR (CMT - 1yr. + 0.77%) to 8/15/2023 | | | 523,000 | 525,864 |
| National Bank of Canada, 0.55%, 11/15/2024 | | | 250,000 | 249,120 |
| SunTrust Banks, Inc., 2.8%, 5/17/2022 | | | 2,056,000 | 2,097,883 |
| Truist Financial Corp., 1.267% to 3/02/2026, FLR (SOFR + 0.609%) to 3/02/2027 | | | 1,306,000 | 1,304,533 |
| UBS AG, 1.75%, 4/21/2022 (n) | | | 390,000 | 394,367 |
| | | | | $16,112,376 |
| Personal Computers & Peripherals – 0.0% |
| Equifax, Inc., 2.6%, 12/15/2025 | | $ | 164,000 | $ 172,597 |
| Pharmaceuticals – 1.0% |
| AbbVie, Inc., 2.15%, 11/19/2021 | | $ | 834,000 | $ 840,058 |
| AbbVie, Inc., 3.45%, 3/15/2022 | | | 886,000 | 900,940 |
| Royalty Pharma PLC, 0.75%, 9/02/2023 (n) | | | 1,481,000 | 1,485,349 |
| Viatris, Inc., 1.125%, 6/22/2022 (n) | | | 1,200,000 | 1,208,557 |
| | | | | $4,434,904 |
| Real Estate - Office – 0.2% |
| Corporate Office Property LP, 2.25%, 3/15/2026 | | $ | 697,000 | $ 716,096 |
| Issuer | | | Shares/Par | Value ($) |
| Bonds – continued |
| Retailers – 0.8% |
| Alibaba Group Holding Ltd., 2.8%, 6/06/2023 | | $ | 1,223,000 | $ 1,271,712 |
| Kohl's Corp., 9.5%, 5/15/2025 | | | 1,587,000 | 2,014,392 |
| Macy's Retail Holdings, Inc., 3.875%, 1/15/2022 | | | 352,000 | 355,080 |
| | | | | $3,641,184 |
| Specialty Stores – 0.5% |
| Nordstrom, Inc., 2.3%, 4/08/2024 (n) | | $ | 519,000 | $ 520,627 |
| Ross Stores, Inc., 0.875%, 4/15/2026 | | | 1,622,000 | 1,587,857 |
| | | | | $2,108,484 |
| Telecommunications - Wireless – 0.8% |
| American Tower Corp., REIT, 2.25%, 1/15/2022 | | $ | 302,000 | $ 305,123 |
| Crown Castle International Corp., 3.15%, 7/15/2023 | | | 1,037,000 | 1,088,667 |
| Crown Castle International Corp., 1.35%, 7/15/2025 | | | 257,000 | 258,749 |
| T-Mobile USA, Inc., 3.5%, 4/15/2025 | | | 1,901,000 | 2,060,389 |
| | | | | $3,712,928 |
| Tobacco – 0.9% |
| B.A.T. Capital Corp., 3.222%, 8/15/2024 | | $ | 1,047,000 | $ 1,112,081 |
| Imperial Tobacco Finance PLC, 3.75%, 7/21/2022 (n) | | | 2,045,000 | 2,098,342 |
| Philip Morris International, Inc., 1.125%, 5/01/2023 | | | 796,000 | 806,463 |
| | | | | $4,016,886 |
| Transportation - Services – 1.1% |
| Element Fleet Management Corp., 1.6%, 4/06/2024 (n) | | $ | 2,849,000 | $ 2,895,350 |
| ERAC USA Finance LLC, 2.7%, 11/01/2023 (n) | | | 872,000 | 910,630 |
| ERAC USA Finance LLC, 3.85%, 11/15/2024 (n) | | | 551,000 | 600,651 |
| ERAC USA Finance LLC, 3.8%, 11/01/2025 (n) | | | 551,000 | 608,215 |
| | | | | $5,014,846 |
| U.S. Treasury Obligations – 20.0% |
| U.S. Treasury Note, 0.25%, 5/15/2024 | | $ | 13,337,400 | $ 13,264,461 |
| U.S. Treasury Notes, 0.125%, 6/30/2022 | | | 18,900,000 | 18,904,430 |
| U.S. Treasury Notes, 0.125%, 9/30/2022 | | | 21,322,500 | 21,319,169 |
| U.S. Treasury Notes, 2.375%, 1/31/2023 (f) | | | 17,178,000 | 17,771,849 |
| U.S. Treasury Notes, 0.125%, 4/30/2023 | | | 8,879,300 | 8,862,651 |
| U.S. Treasury Notes, 0.125%, 12/15/2023 | | | 8,813,000 | 8,766,525 |
| | | | | $88,889,085 |
| Utilities - Electric Power – 4.1% |
| CenterPoint Energy, Inc., 1.45%, 6/01/2026 | | $ | 843,000 | $ 843,600 |
| Emera U.S. Finance LP, 0.833%, 6/15/2024 (n) | | | 589,000 | 585,674 |
| Enel Finance International N.V., 2.875%, 5/25/2022 (n) | | | 2,470,000 | 2,524,052 |
| FirstEnergy Corp., 4.75%, 3/15/2023 | | | 1,027,000 | 1,084,051 |
MFS Limited Maturity Portfolio
Portfolio of Investments (unaudited) – continued
| Issuer | | | Shares/Par | Value ($) |
| Bonds – continued |
| Utilities - Electric Power – continued |
| FirstEnergy Corp., 2.05%, 3/01/2025 | | $ | 929,000 | $ 935,967 |
| FirstEnergy Corp., 1.6%, 1/15/2026 | | | 513,000 | 501,457 |
| Florida Power & Light Co., FLR, 0.564% (LIBOR - 3mo. + 0.38%), 7/28/2023 | | | 2,067,000 | 2,067,152 |
| NextEra Energy Capital Holdings, Inc., 2.9%, 4/01/2022 | | | 1,458,000 | 1,487,116 |
| NextEra Energy, Inc., 0.65%, 3/01/2023 | | | 1,049,000 | 1,053,281 |
| Pacific Gas & Electric Co., 1.75%, 6/16/2022 | | | 536,000 | 535,704 |
| Pacific Gas & Electric Co., 1.367%, 3/10/2023 | | | 432,000 | 432,020 |
| Pacific Gas & Electric Co., 3%, 6/15/2028 | | | 437,000 | 438,966 |
| Pacific Gas & Electric Co., FLR, 1.53% (LIBOR - 3mo. + 1.375%), 11/15/2021 | | | 1,837,000 | 1,840,764 |
| Southern California Edison Co.'s First & Refunding Mortgage Bonds, 1.2%, 2/01/2026 | | | 1,463,000 | 1,452,169 |
| Issuer | | | Shares/Par | Value ($) |
| Bonds – continued |
| Utilities - Electric Power – continued |
| WEC Energy Group, Inc., 0.8%, 3/15/2024 | | $ | 612,000 | $ 613,411 |
| Xcel Energy, Inc., 0.5%, 10/15/2023 | | | 1,753,000 | 1,752,639 |
| | | | | $18,148,023 |
| Total Bonds (Identified Cost, $428,930,632) | | $435,386,909 |
| Investment Companies (h) – 1.6% |
| Money Market Funds – 1.6% | |
| MFS Institutional Money Market Portfolio, 0.02% (v) (Identified Cost, $7,293,992) | | | 7,293,992 | $ 7,293,992 |
| Other Assets, Less Liabilities – 0.2% | | 915,719 |
| Net Assets – 100.0% | $443,596,620 |
| (f) | All or a portion of the security has been segregated as collateral for open futures contracts and cleared swap agreements. |
| (h) | An affiliated issuer, which may be considered one in which the fund owns 5% or more of the outstanding voting securities, or a company which is under common control. At period end, the aggregate values of the fund's investments in affiliated issuers and in unaffiliated issuers were $7,293,992 and $435,386,909, respectively. |
| (i) | Interest only security for which the fund receives interest on notional principal (Par amount). Par amount shown is the notional principal and does not reflect the cost of the security. |
| (n) | Securities exempt from registration under Rule 144A of the Securities Act of 1933. These securities may be sold in the ordinary course of business in transactions exempt from registration, normally to qualified institutional buyers. At period end, the aggregate value of these securities was $155,034,652, representing 34.9% of net assets. |
| (v) | Affiliated issuer that is available only to investment companies managed by MFS. The rate quoted for the MFS Institutional Money Market Portfolio is the annualized seven-day yield of the fund at period end. |
| (w) | When-issued security. |
| (z) | Restricted securities are not registered under the Securities Act of 1933 and are subject to legal restrictions on resale. These securities generally may be resold in transactions exempt from registration or to the public if the securities are subsequently registered. Disposal of these securities may involve time-consuming negotiations and prompt sale at an acceptable price may be difficult. The fund holds the following restricted securities: |
| Restricted Securities | Acquisition
Date | Cost | Value |
| MF1 Ltd., 2020-FL3, “B”, FLR, 3.874% (LIBOR - 1mo. + 3.75%), 7/15/2035 | 6/12/20 | $192,000 | $194,998 |
| MF1 Ltd., 2020-FL3, “C”, FLR, 4.624% (LIBOR - 1mo. + 4.5%), 7/15/2035 | 6/12/20 | 274,500 | 279,472 |
| Total Restricted Securities | | | $474,470 |
| % of Net assets | | | 0.1% |
| The following abbreviations are used in this report and are defined: |
| AGM | Assured Guaranty Municipal |
| BAM | Build America Mutual |
| CLO | Collateralized Loan Obligation |
| CMT | Constant Maturity Treasury |
| FLR | Floating Rate. Interest rate resets periodically based on the parenthetically disclosed reference rate plus a spread (if any). The period-end rate reported may not be the current rate. All reference rates are USD unless otherwise noted. |
| LIBOR | London Interbank Offered Rate |
| REIT | Real Estate Investment Trust |
| SOFR | Secured Overnight Financing Rate |
MFS Limited Maturity Portfolio
Portfolio of Investments (unaudited) – continued
| Derivative Contracts at 6/30/21 |
| Futures Contracts |
| Description | Long/
Short | Currency | Contracts | Notional
Amount | Expiration
Date | Value/Unrealized
Appreciation
(Depreciation) |
| Liability Derivatives |
| Interest Rate Futures | | |
| U.S. Treasury Note 2 yr | Long | USD | 102 | $22,472,672 | September – 2021 | $(39,920) |
| Cleared Swap Agreements |
Maturity
Date | Notional
Amount | Counterparty | Cash Flows
to Receive/
Frequency | Cash Flows
to Pay/
Frequency | Unrealized
Appreciation
(Depreciation) | | Net Unamortized
Upfront Payments
(Receipts) | | Value |
| Asset Derivatives | | | | | |
| Interest Rate Swaps | | | | | |
| 7/15/21 | USD | 38,000,000 | centrally cleared | 1.88%/Semi-annually | 0.24% FLR (3-Month LIBOR)/Quarterly | $342,213 | | $— | | $342,213 |
| 9/19/21 | USD | 23,300,000 | centrally cleared | 1.57%/Semi-annually | 0.15% FLR (1-Month LIBOR)/Monthly | 179,068 | | — | | 179,068 |
| | | | | | | $521,281 | | $— | | $521,281 |
At June 30, 2021, the fund had liquid securities with an aggregate value of $66,729 to cover any collateral or margin obligations for certain derivative contracts.
See Notes to Financial Statements
MFS Limited Maturity Portfolio
| Financial Statements | Statement of Assets and Liabilities (unaudited) |
This statement represents your fund’s balance sheet, which details the assets and liabilities comprising the total value of the fund.
| At 6/30/21Assets | |
| Investments in unaffiliated issuers, at value (identified cost, $428,930,632) | $435,386,909 |
| Investments in affiliated issuers, at value (identified cost, $7,293,992) | 7,293,992 |
| Receivables for | |
| Net daily variation margin on open cleared swap agreements | 2,622 |
| Net daily variation margin on open futures contracts | 2,395 |
| Fund shares sold | 680 |
| Interest | 2,194,232 |
| Other assets | 1,761 |
| Total assets | $444,882,591 |
| Liabilities | |
| Payables for | |
| Fund shares reacquired | $601,657 |
| When-issued investments purchased | 586,475 |
| Payable to affiliates | |
| Investment adviser | 9,419 |
| Administrative services fee | 376 |
| Shareholder servicing costs | 35 |
| Distribution and/or service fees | 1,530 |
| Accrued expenses and other liabilities | 86,479 |
| Total liabilities | $1,285,971 |
| Net assets | $443,596,620 |
| Net assets consist of | |
| Paid-in capital | $422,062,479 |
| Total distributable earnings (loss) | 21,534,141 |
| Net assets | $443,596,620 |
| Shares of beneficial interest outstanding | 42,263,131 |
| | Net assets | Shares
outstanding | Net asset value
per share |
| Initial Class | $331,962,402 | 31,614,869 | $10.50 |
| Service Class | 111,634,218 | 10,648,262 | 10.48 |
See Notes to Financial Statements
MFS Limited Maturity Portfolio
| Financial Statements | Statement of Operations (unaudited) |
This statement describes how much your fund earned in investment income and accrued in expenses. It also describes any gains and/or losses generated by fund operations.
| Six months ended 6/30/21 | |
| Net investment income (loss) | |
| Income | |
| Interest | $4,486,103 |
| Dividends from affiliated issuers | 2,611 |
| Other | 66 |
| Total investment income | $4,488,780 |
| Expenses | |
| Management fee | $871,131 |
| Distribution and/or service fees | 137,239 |
| Shareholder servicing costs | 3,428 |
| Administrative services fee | 33,358 |
| Independent Trustees' compensation | 3,974 |
| Custodian fee | 12,377 |
| Shareholder communications | 15,148 |
| Audit and tax fees | 33,737 |
| Legal fees | 1,589 |
| Miscellaneous | 18,067 |
| Total expenses | $1,130,048 |
| Reduction of expenses by investment adviser | (26,032) |
| Net expenses | $1,104,016 |
| Net investment income (loss) | $3,384,764 |
| Realized and unrealized gain (loss) | |
| Realized gain (loss) (identified cost basis) | |
| Unaffiliated issuers | $746,902 |
| Futures contracts | 12,412 |
| Swap agreements | 479,126 |
| Net realized gain (loss) | $1,238,440 |
| Change in unrealized appreciation or depreciation | |
| Unaffiliated issuers | $(2,233,179) |
| Futures contracts | (64,753) |
| Swap agreements | (479,501) |
| Net unrealized gain (loss) | $(2,777,433) |
| Net realized and unrealized gain (loss) | $(1,538,993) |
| Change in net assets from operations | $1,845,771 |
See Notes to Financial Statements
MFS Limited Maturity Portfolio
| Financial Statements | Statements of Changes in Net Assets |
These statements describe the increases and/or decreases in net assets resulting from operations, any distributions, and any shareholder transactions.
| | Six months ended | Year ended |
| | 6/30/21
(unaudited) | 12/31/20 |
| Change in net assets | | |
| From operations | | |
| Net investment income (loss) | $3,384,764 | $8,957,325 |
| Net realized gain (loss) | 1,238,440 | 3,694,215 |
| Net unrealized gain (loss) | (2,777,433) | 4,099,813 |
| Change in net assets from operations | $1,845,771 | $16,751,353 |
| Total distributions to shareholders | $— | $(12,889,047) |
| Change in net assets from fund share transactions | $2,826,367 | $(25,806,563) |
| Total change in net assets | $4,672,138 | $(21,944,257) |
| Net assets | | |
| At beginning of period | 438,924,482 | 460,868,739 |
| At end of period | $443,596,620 | $438,924,482 |
See Notes to Financial Statements
MFS Limited Maturity Portfolio
| Financial Statements | Financial Highlights |
The financial highlights table is intended to help you understand the fund's financial performance for the semiannual period and the past 5 fiscal years. Certain information reflects financial results for a single fund share. The total returns in the table represent the rate that an investor would have earned (or lost) on an investment in the fund share class (assuming reinvestment of all distributions) held for the entire period.
| Initial Class | Six months
ended | Year ended |
| | 6/30/21
(unaudited) | 12/31/20 | 12/31/19 | 12/31/18 | 12/31/17 | 12/31/16 |
| Net asset value, beginning of period | $10.45 | $10.34 | $10.10 | $10.18 | $10.17 | $10.14 |
| Income (loss) from investment operations | | | | | | |
| Net investment income (loss) (d) | $0.08 | $0.23 | $0.29 | $0.23 | $0.18 | $0.15(c) |
| Net realized and unrealized gain (loss) | (0.03) | 0.21 | 0.23 | (0.10) | (0.00)(w) | 0.02 |
| Total from investment operations | $0.05 | $0.44 | $0.52 | $0.13 | $0.18 | $0.17 |
| Less distributions declared to shareholders | | | | | | |
| From net investment income | $— | $(0.33) | $(0.28) | $(0.21) | $(0.17) | $(0.14) |
| Net asset value, end of period (x) | $10.50 | $10.45 | $10.34 | $10.10 | $10.18 | $10.17 |
| Total return (%) (k)(r)(s)(x) | 0.48(n) | 4.34 | 5.19 | 1.28 | 1.73 | 1.68(c) |
Ratios (%) (to average net assets)
and Supplemental data: | | | | | | |
| Expenses before expense reductions (f) | 0.46(a) | 0.46 | 0.45 | 0.45 | 0.45 | 0.42(c) |
| Expenses after expense reductions (f) | 0.44(a) | 0.45 | 0.44 | 0.44 | 0.45 | 0.42(c) |
| Net investment income (loss) | 1.62(a) | 2.18 | 2.81 | 2.31 | 1.77 | 1.43(c) |
| Portfolio turnover | 20(n) | 51 | 39 | 62 | 54 | 30 |
| Net assets at end of period (000 omitted) | $331,962 | $326,075 | $343,507 | $359,909 | $434,320 | $473,730 |
| Service Class | Six months
ended | Year ended |
| | 6/30/21
(unaudited) | 12/31/20 | 12/31/19 | 12/31/18 | 12/31/17 | 12/31/16 |
| Net asset value, beginning of period | $10.45 | $10.33 | $10.09 | $10.17 | $10.16 | $10.12 |
| Income (loss) from investment operations | | | | | | |
| Net investment income (loss) (d) | $0.07 | $0.20 | $0.26 | $0.21 | $0.16 | $0.12(c) |
| Net realized and unrealized gain (loss) | (0.04) | 0.23 | 0.23 | (0.11) | (0.01) | 0.03 |
| Total from investment operations | $0.03 | $0.43 | $0.49 | $0.10 | $0.15 | $0.15 |
| Less distributions declared to shareholders | | | | | | |
| From net investment income | $— | $(0.31) | $(0.25) | $(0.18) | $(0.14) | $(0.11) |
| Net asset value, end of period (x) | $10.48 | $10.45 | $10.33 | $10.09 | $10.17 | $10.16 |
| Total return (%) (k)(r)(s)(x) | 0.29(n) | 4.15 | 4.90 | 0.99 | 1.45 | 1.48(c) |
Ratios (%) (to average net assets)
and Supplemental data: | | | | | | |
| Expenses before expense reductions (f) | 0.71(a) | 0.71 | 0.70 | 0.70 | 0.70 | 0.68(c) |
| Expenses after expense reductions (f) | 0.69(a) | 0.70 | 0.69 | 0.69 | 0.70 | 0.67(c) |
| Net investment income (loss) | 1.37(a) | 1.93 | 2.56 | 2.06 | 1.52 | 1.18(c) |
| Portfolio turnover | 20(n) | 51 | 39 | 62 | 54 | 30 |
| Net assets at end of period (000 omitted) | $111,634 | $112,850 | $117,362 | $117,798 | $142,696 | $153,979 |
See Notes to Financial Statements
MFS Limited Maturity Portfolio
Financial Highlights - continued
| (a) | Annualized. |
| (c) | Amount reflects a one-time reimbursement of expenses by the custodian (or former custodian) without which net investment income and performance would be lower and expenses would be higher. |
| (d) | Per share data is based on average shares outstanding. |
| (f) | Ratios do not reflect reductions from fees paid indirectly, if applicable. |
| (k) | The total return does not reflect expenses that apply to separate accounts. Inclusion of these charges would reduce the total return figures for all periods shown. |
| (n) | Not annualized. |
| (r) | Certain expenses have been reduced without which performance would have been lower. |
| (s) | From time to time the fund may receive proceeds from litigation settlements, without which performance would be lower. |
| (w) | Per share amount was less than $0.01. |
| (x) | The net asset values and total returns have been calculated on net assets which include adjustments made in accordance with U.S. generally accepted accounting principles required at period end for financial reporting purposes. |
See Notes to Financial Statements
MFS Limited Maturity Portfolio
Notes to Financial Statements (unaudited)
(1) Business and Organization
MFS Limited Maturity Portfolio (the fund) is a diversified series of MFS Variable Insurance Trust III (the trust). The trust is organized as a Delaware statutory trust and is registered under the Investment Company Act of 1940, as amended, as an open-end management investment company. The shareholders of each series of the trust are separate accounts of insurance companies, which offer variable annuity and/or life insurance products, and qualified retirement and pension plans.
The fund is an investment company and accordingly follows the investment company accounting and reporting guidance of the Financial Accounting Standards Board (FASB) Accounting Standards Codification Topic 946 Financial Services - Investment Companies.
(2) Significant Accounting Policies
General — The preparation of financial statements in conformity with U.S. generally accepted accounting principles requires management to make estimates and assumptions that affect the reported amounts of assets and liabilities, and disclosure of contingent assets and liabilities at the date of the financial statements and the reported amounts of increases and decreases in net assets from operations during the reporting period. Actual results could differ from those estimates. In the preparation of these financial statements, management has evaluated subsequent events occurring after the date of the fund’s Statement of Assets and Liabilities through the date that the financial statements were issued. The fund invests in foreign securities. Investments in foreign securities are vulnerable to the effects of changes in the relative values of the local currency and the U.S. dollar and to the effects of changes in each country’s market, economic, industrial, political, regulatory, geopolitical, environmental, public health, and other conditions.
Certain of the fund's investments, derivatives, debt and other contracts may be based on reference interest rates such as the London Interbank Offered Rate (“LIBOR”). In 2017, the regulatory authority that oversees financial services firms in the United Kingdom announced plans to transition away from LIBOR by the end of 2021. In March 2021, the administrator of LIBOR announced the extension of the publication of the more commonly used U.S. dollar LIBOR settings to the end of June 2023. Although the full impacts of the transition away from LIBOR are not fully known, the transition may result in, among other things, an increase in volatility or illiquidity of the markets for instruments that currently rely on LIBOR to determine interest rates and this could have an adverse impact on the fund's performance. With respect to the fund's accounting for investments, derivatives, debt and other contracts that undergo reference rate-related modifications as a result of the transition, management will rely upon the relief provided by FASB Codification Topic 848 – Reference Rate Reform (Topic 848). The guidance in Topic 848 permits the fund to disregard the GAAP accounting requirements around certain contract modifications resulting from the LIBOR transition such that for contracts considered in scope, the fund can account for those modified contracts as a continuation of the existing contracts.
Balance Sheet Offsetting — The fund's accounting policy with respect to balance sheet offsetting is that, absent an event of default by the counterparty or a termination of the agreement, the International Swaps and Derivatives Association (ISDA) Master Agreement, or similar agreement, does not result in an offset of reported amounts of financial assets and financial liabilities in the Statement of Assets and Liabilities across transactions between the fund and the applicable counterparty. The fund's right to setoff may be restricted or prohibited by the bankruptcy or insolvency laws of the particular jurisdiction to which a specific master netting agreement counterparty is subject. Balance sheet offsetting disclosures, to the extent applicable to the fund, have been included in the fund’s Significant Accounting Policies note under the captions for each of the fund’s in-scope financial instruments and transactions.
Investment Valuations — Debt instruments and floating rate loans, including restricted debt instruments, are generally valued at an evaluated or composite bid as provided by a third-party pricing service. Short-term instruments with a maturity at issuance of 60 days or less may be valued at amortized cost, which approximates market value. Futures contracts are generally valued at last posted settlement price on their primary exchange as provided by a third-party pricing service. Futures contracts for which there were no trades that day for a particular position are generally valued at the closing bid quotation on their primary exchange as provided by a third-party pricing service. Swap agreements are generally valued using valuations provided by a third-party pricing service, which for cleared swaps includes an evaluation of any trading activity at the clearinghouses. Open-end investment companies are generally valued at net asset value per share. Securities and other assets generally valued on the basis of information from a third-party pricing service may also be valued at a broker/dealer bid quotation. In determining values, third-party pricing services can utilize both transaction data and market information such as yield, quality, coupon rate, maturity, type of issue, trading characteristics, and other market data. The values of foreign securities and other assets and liabilities expressed in foreign currencies are converted to U.S. dollars using the mean of bid and asked prices for rates provided by a third-party pricing service.
The Board of Trustees has delegated primary responsibility for determining or causing to be determined the value of the fund’s investments (including any fair valuation) to the adviser pursuant to valuation policies and procedures approved by the Board. If the adviser determines that reliable market quotations are not readily available, investments are valued at fair value as determined in
MFS Limited Maturity Portfolio
Notes to Financial Statements (unaudited) - continued
good faith by the adviser in accordance with such procedures under the oversight of the Board of Trustees. Under the fund’s valuation policies and procedures, market quotations are not considered to be readily available for most types of debt instruments and floating rate loans and many types of derivatives. These investments are generally valued at fair value based on information from third-party pricing services. In addition, investments may be valued at fair value if the adviser determines that an investment’s value has been materially affected by events occurring after the close of the exchange or market on which the investment is principally traded (such as foreign exchange or market) and prior to the determination of the fund’s net asset value, or after the halt of trading of a specific security where trading does not resume prior to the close of the exchange or market on which the security is principally traded. The adviser generally relies on third-party pricing services or other information (such as the correlation with price movements of similar securities in the same or other markets; the type, cost and investment characteristics of the security; the business and financial condition of the issuer; and trading and other market data) to assist in determining whether to fair value and at what value to fair value an investment. The value of an investment for purposes of calculating the fund’s net asset value can differ depending on the source and method used to determine value. When fair valuation is used, the value of an investment used to determine the fund’s net asset value may differ from quoted or published prices for the same investment. There can be no assurance that the fund could obtain the fair value assigned to an investment if it were to sell the investment at the same time at which the fund determines its net asset value per share.
Various inputs are used in determining the value of the fund's assets or liabilities. These inputs are categorized into three broad levels. In certain cases, the inputs used to measure fair value may fall into different levels of the fair value hierarchy. In such cases, an investment's level within the fair value hierarchy is based on the lowest level of input that is significant to the fair value measurement. The fund's assessment of the significance of a particular input to the fair value measurement in its entirety requires judgment, and considers factors specific to the investment. Level 1 includes unadjusted quoted prices in active markets for identical assets or liabilities. Level 2 includes other significant observable market-based inputs (including quoted prices for similar securities, interest rates, prepayment speed, and credit risk). Level 3 includes unobservable inputs, which may include the adviser's own assumptions in determining the fair value of investments. Other financial instruments are derivative instruments, such as futures contracts and swap agreements. The following is a summary of the levels used as of June 30, 2021 in valuing the fund's assets or liabilities:
| Financial Instruments | Level 1 | Level 2 | Level 3 | Total |
| U.S. Treasury Bonds & U.S. Government Agencies & Equivalents | $— | $88,889,085 | $— | $88,889,085 |
| Non - U.S. Sovereign Debt | — | 6,459,208 | — | 6,459,208 |
| Municipal Bonds | — | 16,660,167 | — | 16,660,167 |
| U.S. Corporate Bonds | — | 143,114,600 | — | 143,114,600 |
| Residential Mortgage-Backed Securities | — | 11,265,538 | — | 11,265,538 |
| Commercial Mortgage-Backed Securities | — | 31,636,130 | — | 31,636,130 |
| Asset-Backed Securities (including CDOs) | — | 52,132,399 | — | 52,132,399 |
| Foreign Bonds | — | 85,229,782 | — | 85,229,782 |
| Mutual Funds | 7,293,992 | — | — | 7,293,992 |
| Total | $7,293,992 | $435,386,909 | $— | $442,680,901 |
| Other Financial Instruments | | | | |
| Futures Contracts – Liabilities | $(39,920) | $— | $— | $(39,920) |
| Swap Agreements – Assets | — | 521,281 | — | 521,281 |
For further information regarding security characteristics, see the Portfolio of Investments.
Foreign Currency Translation — Purchases and sales of foreign investments, income, and expenses are converted into U.S. dollars based upon currency exchange rates prevailing on the respective dates of such transactions or on the reporting date for foreign denominated receivables and payables. Gains and losses attributable to foreign currency exchange rates on sales of securities are recorded for financial statement purposes as net realized gains and losses on investments. Gains and losses attributable to foreign exchange rate movements on receivables, payables, income and expenses are recorded for financial statement purposes as foreign currency transaction gains and losses. That portion of both realized and unrealized gains and losses on investments that results from fluctuations in foreign currency exchange rates is not separately disclosed.
Derivatives — The fund uses derivatives primarily to increase or decrease exposure to a particular market or segment of the market, or security, to increase or decrease interest rate or currency exposure, or as alternatives to direct investments. Derivatives are used for hedging or non-hedging purposes. While hedging can reduce or eliminate losses, it can also reduce or eliminate gains. When the fund uses derivatives as an investment to increase market exposure, or for hedging purposes, gains and losses from derivative instruments may be substantially greater than the derivative’s original cost.
MFS Limited Maturity Portfolio
Notes to Financial Statements (unaudited) - continued
The derivative instruments used by the fund during the period were futures contracts and swap agreements. Depending on the type of derivative, a fund may exit a derivative position by entering into an offsetting transaction with a counterparty or exchange, negotiating an agreement with the derivative counterparty, or novating the position to a third party. The fund may be unable to promptly close out a futures position in instances where the daily fluctuation in the price for that type of future exceeds the daily limit set by the exchange. The fund's period end derivatives, as presented in the Portfolio of Investments and the associated Derivative Contract tables, generally are indicative of the volume of its derivative activity during the period.
The following table presents, by major type of derivative contract, the fair value, on a gross basis, of the asset and liability components of derivatives held by the fund at June 30, 2021 as reported in the Statement of Assets and Liabilities:
| | | Fair Value (a) |
| Risk | Derivative Contracts | Asset Derivatives | Liability Derivatives |
| Interest Rate | Interest Rate Swaps | $521,281 | $— |
| Interest Rate | Interest Rate Futures | — | (39,920) |
| Total | | $521,281 | $(39,920) |
(a) Values presented in this table for futures contracts and cleared swap agreements correspond to the values reported in the Portfolio of Investments. Only the current day net variation margin for futures contracts and cleared swap agreements is separately reported within the Statement of Assets and Liabilities.
The following table presents, by major type of derivative contract, the realized gain (loss) on derivatives held by the fund for the six months ended June 30, 2021 as reported in the Statement of Operations:
| Risk | Futures
Contracts | Swap
Agreements |
| Interest Rate | $12,412 | $479,126 |
The following table presents, by major type of derivative contract, the change in unrealized appreciation or depreciation on derivatives held by the fund for the six months ended June 30, 2021 as reported in the Statement of Operations:
| Risk | Futures
Contracts | Swap
Agreements |
| Interest Rate | $(64,753) | $(479,501) |
Derivative counterparty credit risk is managed through formal evaluation of the creditworthiness of all potential counterparties. On certain, but not all, uncleared derivatives, the fund attempts to reduce its exposure to counterparty credit risk whenever possible by entering into an ISDA Master Agreement on a bilateral basis. The ISDA Master Agreement gives each party to the agreement the right to terminate all transactions traded under such agreement if there is a specified deterioration in the credit quality of the other party. Upon an event of default or a termination of the ISDA Master Agreement, the non-defaulting party has the right to close out all transactions traded under such agreement and to net amounts owed under each agreement to one net amount payable by one party to the other. This right to close out and net payments across all transactions traded under the ISDA Master Agreement could result in a reduction of the fund's credit risk to such counterparty equal to any amounts payable by the fund under the applicable transactions, if any.
Collateral and margin requirements differ by type of derivative. For cleared derivatives (e.g., futures contracts, cleared swaps, and exchange-traded options), margin requirements are set by the clearing broker and the clearing house and collateral, in the form of cash or securities, is posted by the fund directly with the clearing broker. Collateral terms are counterparty agreement specific for uncleared derivatives (e.g., forward foreign currency exchange contracts, uncleared swap agreements, and uncleared options) and collateral, in the form of cash and securities, is held in segregated accounts with the fund's custodian in connection with these agreements. For derivatives traded under an ISDA Master Agreement, which contains a collateral support annex, the collateral requirements are netted across all transactions traded under such counterparty-specific agreement and an amount is posted from one party to the other to collateralize such obligations. Cash that has been segregated or delivered to cover the fund's collateral or margin obligations under derivative contracts, if any, will be reported separately in the Statement of Assets and Liabilities as restricted cash for uncleared derivatives and/or deposits with brokers for cleared derivatives. Securities pledged as collateral or margin for the same purpose, if any, are noted in the Portfolio of Investments. The fund may be required to make payments of interest on uncovered collateral or margin obligations with the broker. Any such payments are included in “Miscellaneous” expense in the Statement of Operations.
Futures Contracts — The fund entered into futures contracts which may be used to hedge against or obtain broad market exposure, interest rate exposure, currency exposure, or to manage duration. A futures contract represents a commitment for the future purchase or sale of an asset at a specified price on a specified date.
MFS Limited Maturity Portfolio
Notes to Financial Statements (unaudited) - continued
Upon entering into a futures contract, the fund is required to deposit with the broker, either in cash or securities, an initial margin in an amount equal to a specified percentage of the notional amount of the contract. Subsequent payments (variation margin) are made or received by the fund each day, depending on the daily fluctuations in the value of the contract, and are recorded for financial statement purposes as unrealized gain or loss by the fund until the contract is closed or expires at which point the gain or loss on futures contracts is realized.
The fund bears the risk of interest rates, exchange rates or securities prices moving unexpectedly, in which case, the fund may not achieve the anticipated benefits of the futures contracts and may realize a loss. While futures contracts may present less counterparty risk to the fund since the contracts are exchange traded and the exchange’s clearinghouse guarantees payments to the broker, there is still counterparty credit risk due to the insolvency of the broker. The fund’s maximum risk of loss due to counterparty credit risk is equal to the margin posted by the fund to the broker plus any gains or minus any losses on the outstanding futures contracts.
Swap Agreements — During the period the fund entered into swap agreements. Swap agreements generally involve a periodic exchange of cash payments on a net basis, at specified intervals or upon the occurrence of specified events, between the fund and a counterparty. Certain swap agreements may be entered into as a bilateral contract (“uncleared swaps”) while others are required to be centrally cleared (“cleared swaps”). In a cleared swap transaction, the ultimate counterparty to the transaction is a clearinghouse (the “clearinghouse”). The contract is transferred and accepted by the clearinghouse immediately following execution of the swap contract with an executing broker. Thereafter, throughout the term of the cleared swap, the fund interfaces indirectly with the clearinghouse through a clearing broker and has counterparty risk to the clearing broker as well.
Both cleared and uncleared swap agreements are marked to market daily. The value of uncleared swap agreements is reported in the Statement of Assets and Liabilities as “Uncleared swaps, at value” which includes any related interest accruals to be paid or received by the fund. For cleared swaps, payments (variation margin) are made or received by the fund each day, depending on the daily fluctuations in the value of the cleared swap, such that only the current day net receivable or payable for variation margin is reported in the Statement of Assets and Liabilities.
For both cleared and uncleared swaps, the periodic exchange of net cash payments, at specified intervals or upon the occurrence of specified events as stipulated by the agreement, is recorded as realized gain or loss on swap agreements in the Statement of Operations. Premiums paid or received at the inception of the agreements are amortized using the effective interest method over the term of the agreement as realized gain or loss on swap agreements in the Statement of Operations. A liquidation payment received or made upon early termination is recorded as a realized gain or loss on swap agreements in the Statement of Operations. The change in unrealized appreciation or depreciation on swap agreements in the Statement of Operations reflects the aggregate change over the reporting period in the value of swaps net of any unamortized premiums paid or received.
Risks related to swap agreements include the possible lack of a liquid market, unfavorable market and interest rate movements of the underlying instrument and the failure of the counterparty to perform under the terms of the agreements. The fund's maximum risk of loss from counterparty credit risk is the discounted net value of the cash flows to be received from/paid to the counterparty over the contract's remaining life, to the extent that the amount is positive. To address counterparty risk, uncleared swap agreements are limited to only highly-rated counterparties. Risk is further reduced by having an ISDA Master Agreement between the fund and the counterparty providing for netting as described above and, where applicable, by the posting of collateral by the counterparty to the fund to cover the fund’s exposure to the counterparty under such ISDA Master Agreement. The fund's counterparty risk due to cleared swaps is mitigated by the fact that the clearinghouse is the true counterparty to the transaction and the regulatory requirement safeguards in the event of a clearing broker bankruptcy.
The fund entered into interest rate swap agreements in order to manage its exposure to interest or foreign exchange rate fluctuations. Interest rate swap agreements involve the periodic exchange of cash flows, between the fund and a counterparty, based on the difference between two interest rates applied to a notional principal amount. The two interest rates exchanged may either be a fixed rate and a floating rate or two floating rates based on different indices.
Indemnifications — Under the fund's organizational documents, its officers and Trustees may be indemnified against certain liabilities and expenses arising out of the performance of their duties to the fund. Additionally, in the normal course of business, the fund enters into agreements with service providers that may contain indemnification clauses. The fund's maximum exposure under these agreements is unknown as this would involve future claims that may be made against the fund that have not yet occurred.
Investment Transactions and Income — Investment transactions are recorded on the trade date. Some securities may be purchased or sold on an extended settlement basis, which means that the receipt or delivery of the securities by the fund and related payments occur at a future date, usually beyond the customary settlement period. Interest income is recorded on the accrual basis.
Interest payments received in additional securities are recorded on the ex-interest date in an amount equal to the value of the security on such date. All premium and discount is amortized or accreted for financial statement purposes in accordance with U.S. generally accepted accounting principles.
MFS Limited Maturity Portfolio
Notes to Financial Statements (unaudited) - continued
The fund may receive proceeds from litigation settlements. Any proceeds received from litigation involving portfolio holdings are reflected in the Statement of Operations in realized gain/loss if the security has been disposed of by the fund or in unrealized gain/loss if the security is still held by the fund. Any other proceeds from litigation not related to portfolio holdings are reflected as other income in the Statement of Operations.
The fund invests a significant portion of its assets in asset-backed and/or mortgage-backed securities. For these securities, the value of the debt instrument also depends on the credit quality and adequacy of the underlying assets or collateral as well as whether there is a security interest in the underlying assets or collateral. Enforcing rights, if any, against the underlying assets or collateral may be difficult. U.S. Government securities not supported as to the payment of principal or interest by the U.S. Treasury, such as those issued by Fannie Mae, Freddie Mac, and the Federal Home Loan Banks, are subject to greater credit risk than are U.S. Government securities supported by the U.S. Treasury, such as those issued by Ginnie Mae.
The fund may purchase or sell securities on a when-issued or delayed delivery basis. In these extended settlement transactions, the receipt or delivery of the securities by the fund and related payments occur at a future date, usually beyond the normal settlement period. The price of such security and the date that the security will be settled are generally fixed at the time the transaction is negotiated. The value of the security varies with market fluctuations and for debt securities no interest accrues to the fund until settlement takes place. When the fund sells securities on a when-issued or delayed delivery basis, the fund typically owns or has the right to acquire securities equivalent in kind and amount to the securities sold. Purchase and sale commitments for when-issued or delayed delivery securities are held at carrying amount, which approximates fair value and are categorized as level 2 within the fair value hierarchy, and included in When-issued investments purchased in the Statement of Assets and Liabilities. Losses may arise due to changes in the value of the underlying securities prior to settlement date or if the counterparty does not perform under the contract’s terms, or if the issuer does not issue the securities due to political, economic or other factors. At the time that it enters into a when-issued or delayed delivery transaction, the fund is required to have sufficient cash and/or liquid securities to cover its commitments.
To mitigate the counterparty credit risk on TBA transactions, mortgage dollar rolls, and other types of forward settling mortgage-backed and asset-backed security transactions, the fund whenever possible enters into a Master Securities Forward Transaction Agreement (“MSFTA”) on a bilateral basis with each of the counterparties with whom it undertakes a significant volume of transactions. The MSFTA gives each party to the agreement the right to terminate all transactions traded under such agreement if there is a specified deterioration in the credit quality of the other party. Upon an event of default or a termination of the MSFTA, the non-defaulting party has the right to close out all transactions traded under such agreement and to net amounts owed under each transaction to one net amount payable by one party to the other. This right to close out and net payments across all transactions traded under the MSFTA could result in a reduction of the fund's credit risk to such counterparty equal to any amounts payable by the fund under the applicable transactions, if any.
For mortgage-backed and asset-backed securities traded under a MSFTA, the collateral and margining requirements are contract specific. Collateral amounts across all transactions traded under such agreement are netted and an amount is posted from one party to the other to collateralize such obligations. Cash that has been pledged to cover the fund's collateral or margin obligations under a MSFTA, if any, will be reported separately on the Statement of Assets and Liabilities as restricted cash. Securities pledged as collateral or margin for the same purpose, if any, are noted in the Portfolio of Investments.
Tax Matters and Distributions — The fund intends to qualify as a regulated investment company, as defined under Subchapter M of the Internal Revenue Code, and to distribute all of its taxable income, including realized capital gains. As a result, no provision for federal income tax is required. The fund’s federal tax returns, when filed, will remain subject to examination by the Internal Revenue Service for a three year period. Management has analyzed the fund’s tax positions taken on federal and state tax returns for all open tax years and does not believe that there are any uncertain tax positions that require recognition of a tax liability. Foreign taxes, if any, have been accrued by the fund in the accompanying financial statements in accordance with the applicable foreign tax law. Foreign income taxes may be withheld by certain countries in which the fund invests. Additionally, capital gains realized by the fund on securities issued in or by certain foreign countries may be subject to capital gains tax imposed by those countries.
Distributions to shareholders are recorded on the ex-dividend date. Income and capital gain distributions are determined in accordance with income tax regulations, which may differ from U.S. generally accepted accounting principles. Certain capital accounts in the financial statements are periodically adjusted for permanent differences in order to reflect their tax character. These adjustments have no impact on net assets or net asset value per share. Temporary differences which arise from recognizing certain items of income, expense, gain or loss in different periods for financial statement and tax purposes will reverse at some time in the future.
Book/tax differences primarily relate to derivative transactions.
The tax character of distributions declared to shareholders for the last fiscal year is as follows:
MFS Limited Maturity Portfolio
Notes to Financial Statements (unaudited) - continued
| | Year ended
12/31/20 |
| Ordinary income (including any short-term capital gains) | $12,889,047 |
The federal tax cost and the tax basis components of distributable earnings were as follows:
| As of 6/30/21 | |
| Cost of investments | $436,677,956 |
| Gross appreciation | 6,397,241 |
| Gross depreciation | (394,296) |
| Net unrealized appreciation (depreciation) | $6,002,945 |
| As of 12/31/20 | |
| Undistributed ordinary income | 9,618,049 |
| Undistributed long-term capital gain | 826,159 |
| Net unrealized appreciation (depreciation) | 9,244,162 |
The aggregate cost above includes prior fiscal year end tax adjustments, if applicable.
Multiple Classes of Shares of Beneficial Interest — The fund offers multiple classes of shares, which differ in their respective distribution and/or service fees. The fund's income, realized and unrealized gain (loss), and common expenses are allocated to shareholders based on the daily net assets of each class. Dividends are declared separately for each class. Differences in per share dividend rates are generally due to differences in separate class expenses. The fund’s distributions declared to shareholders as reported in the Statements of Changes in Net Assets are presented by class as follows:
| | Six months ended
6/30/21 | | Year ended
12/31/20 |
| Initial Class | $— | | $9,805,387 |
| Service Class | — | | 3,083,660 |
| Total | $— | | $12,889,047 |
(3) Transactions with Affiliates
Investment Adviser — The fund has an investment advisory agreement with MFS to provide overall investment management and related administrative services and facilities to the fund. The management fee is computed daily and paid monthly at an annual rate of 0.40% of the fund’s average daily net assets.
MFS has agreed in writing to reduce its management fee by a specified amount if certain MFS mutual fund assets exceed thresholds agreed to by MFS and the fund's Board of Trustees. For the six months ended June 30, 2021, this management fee reduction amounted to $26,032, which is included in the reduction of total expenses in the Statement of Operations. The management fee incurred for the six months ended June 30, 2021 was equivalent to an annual effective rate of 0.39% of the fund's average daily net assets.
Distributor — MFS Fund Distributors, Inc. (MFD), a wholly-owned subsidiary of MFS, is the distributor of shares of the fund. The Trustees have adopted a distribution plan for the Service Class shares pursuant to Rule 12b-1 under the Investment Company Act of 1940.
The fund's distribution plan provides that the fund will pay MFD distribution and/or service fees equal to 0.25% per annum of its average daily net assets attributable to Service Class shares as partial consideration for services performed and expenses incurred by MFD and financial intermediaries (including participating insurance companies that invest in the fund to fund variable annuity and variable life insurance contracts, sponsors of qualified retirement and pension plans that invest in the fund, and affiliates of these participating insurance companies and plan sponsors) in connection with the sale and distribution of the Service Class shares. MFD may subsequently pay all, or a portion, of the distribution and/or service fees to financial intermediaries.
Shareholder Servicing Agent — MFS Service Center, Inc. (MFSC), a wholly-owned subsidiary of MFS, receives a fee from the fund for its services as shareholder servicing agent. For the six months ended June 30, 2021, the fee was $3,316, which equated to 0.0015% annually of the fund's average daily net assets. MFSC also receives reimbursement from the fund for out-of-pocket expenses paid by MFSC on behalf of the fund. For the six months ended June 30, 2021, these costs amounted to $112.
MFS Limited Maturity Portfolio
Notes to Financial Statements (unaudited) - continued
Administrator — MFS provides certain financial, legal, shareholder communications, compliance, and other administrative services to the fund. Under an administrative services agreement, the fund reimburses MFS the costs incurred to provide these services. The fund is charged an annual fixed amount of $17,500 plus a fee based on average daily net assets. The administrative services fee incurred for the six months ended June 30, 2021 was equivalent to an annual effective rate of 0.0153% of the fund's average daily net assets.
Trustees’ and Officers’ Compensation — The fund pays compensation to independent Trustees in the form of a retainer, attendance fees, and additional compensation to Board and Committee chairpersons. The fund does not pay compensation directly to Trustees or officers of the fund who are also officers of the investment adviser, all of whom receive remuneration from MFS for their services to the fund. Certain officers and Trustees of the fund are officers or directors of MFS, MFD, and MFSC.
Other — The fund invests in the MFS Institutional Money Market Portfolio which is managed by MFS and seeks current income consistent with preservation of capital and liquidity. This money market fund does not pay a management fee to MFS but does incur investment and operating costs.
The fund is permitted to engage in purchase and sale transactions with funds and accounts for which MFS serves as investment adviser or sub-adviser (“cross-trades”) pursuant to a policy adopted by the Board of Trustees. This policy has been designed to ensure that cross-trades conducted by the fund comply with Rule 17a-7 under the Investment Company Act of 1940. During the six months ended June 30, 2021, the fund engaged in purchase transactions pursuant to this policy, which amounted to $47,360.
(4) Portfolio Securities
For the six months ended June 30, 2021, purchases and sales of investments, other than short-term obligations, were as follows:
| | Purchases | Sales |
| U.S. Government securities | $22,185,175 | $736,828 |
| Non-U.S. Government securities | 73,751,490 | 85,780,361 |
(5) Shares of Beneficial Interest
The fund's Declaration of Trust permits the Trustees to issue an unlimited number of full and fractional shares of beneficial interest. Transactions in fund shares were as follows:
| | Six months ended
6/30/21 | | Year ended
12/31/20 |
| | Shares | Amount | | Shares | Amount |
| Shares sold | | | | | |
| Initial Class | 2,093,126 | $21,925,987 | | 3,696,952 | $38,599,012 |
| Service Class | 730,327 | 7,642,548 | | 2,044,603 | 21,385,756 |
| | 2,823,453 | $29,568,535 | | 5,741,555 | $59,984,768 |
Shares issued to shareholders
in reinvestment of distributions | | | | | |
| Initial Class | — | $— | | 949,215 | $9,805,387 |
| Service Class | — | — | | 298,226 | 3,083,660 |
| | — | $— | | 1,247,441 | $12,889,047 |
| Shares reacquired | | | | | |
| Initial Class | (1,672,058) | $(17,517,718) | | (6,676,938) | $(68,856,790) |
| Service Class | (881,228) | (9,224,450) | | (2,901,729) | (29,823,588) |
| | (2,553,286) | $(26,742,168) | | (9,578,667) | $(98,680,378) |
| Net change | | | | | |
| Initial Class | 421,068 | $4,408,269 | | (2,030,771) | $(20,452,391) |
| Service Class | (150,901) | (1,581,902) | | (558,900) | (5,354,172) |
| | 270,167 | $2,826,367 | | (2,589,671) | $(25,806,563) |
The fund is one of several mutual funds in which certain MFS funds may invest. The MFS funds do not invest in the underlying funds for the purpose of exercising management or control. At the end of the period, the MFS Moderate Allocation Portfolio, the MFS Conservative Allocation Portfolio, and the MFS Growth Allocation Portfolio were the owners of record of approximately 13%, 11%, and 2%, respectively, of the value of outstanding voting shares of the fund.
MFS Limited Maturity Portfolio
Notes to Financial Statements (unaudited) - continued
(6) Line of Credit
The fund and certain other funds managed by MFS participate in a $1.25 billion unsecured committed line of credit of which $1 billion is reserved for use by the fund and certain other MFS U.S. funds. The line of credit is provided by a syndicate of banks under a credit agreement. Borrowings may be made for temporary financing needs. Interest is charged to each fund, based on its borrowings, generally at a rate equal to the highest of one month LIBOR, the Federal Funds Effective Rate and the Overnight Bank Funding Rate, plus an agreed upon spread. A commitment fee, based on the average daily, unused portion of the committed line of credit, is allocated among the participating funds. In addition, the fund and other funds managed by MFS have established unsecured uncommitted borrowing arrangements with certain banks for temporary financing needs. Interest is charged to each fund, based on its borrowings, at rates equal to customary reference rates plus an agreed upon spread. For the six months ended June 30, 2021, the fund’s commitment fee and interest expense were $725 and $0, respectively, and are included in “Miscellaneous” expense in the Statement of Operations.
(7) Investments in Affiliated Issuers
An affiliated issuer may be considered one in which the fund owns 5% or more of the outstanding voting securities, or a company which is under common control. For the purposes of this report, the following were affiliated issuers:
| Affiliated Issuers | Beginning
Value | Purchases | Sales
Proceeds | Realized
Gain
(Loss) | Change in
Unrealized
Appreciation or
Depreciation | Ending
Value |
| MFS Institutional Money Market Portfolio | $8,636,845 | $85,745,880 | $87,088,733 | $— | $— | $7,293,992 |
| Affiliated Issuers | Dividend
Income | Capital Gain
Distributions |
| MFS Institutional Money Market Portfolio | $2,611 | $— |
(8) Impacts of COVID-19
The pandemic related to the global spread of novel coronavirus disease (COVID-19), which was first detected in December 2019, has resulted in significant disruptions to global business activity and the global economy, as well as the economies of individual countries, the financial performance of individual companies and sectors, and the securities and commodities markets in general. Multiple surges in cases globally, the availability and widespread adoption of vaccines, and the emergence of variant strains of the virus continue to create uncertainty as to the future and long-term impacts resulting from the pandemic including impacts to the prices and liquidity of the fund's investments and the fund's performance.
MFS Limited Maturity Portfolio
Statement Regarding Liquidity Risk Management Program
The fund has adopted and implemented a liquidity risk management program (the “Program”) as required by Rule 22e-4 under the Investment Company Act of 1940, as amended. The fund’s Board of Trustees (the “Board”) has designated MFS as the administrator of the Program. The Program is reasonably designed to assess and manage the liquidity risk of the fund. Liquidity risk is the risk that the fund could not meet requests to redeem shares issued by the fund without significant dilution of remaining investors' interests.
MFS provided a written report to the Board for consideration at its April 2021 meeting that addressed the operation of the Program and provided an assessment of the adequacy and effectiveness of the Program during the period from January 1, 2020 to December 31, 2020 (the “Covered Period”). The report concluded that during the Covered Period the Program had operated effectively and had adequately and effectively been implemented to assess and manage the fund’s liquidity risk. MFS also reported that there were no liquidity events that impacted the fund or its ability to timely meet redemptions without dilution to existing shareholders during the Covered Period.
There can be no assurance that the Program will achieve its objectives in the future. Further information on liquidity risk, and other principal risks to which an investment in the fund may be subject, can be found in the prospectus.
MFS Limited Maturity Portfolio
Proxy Voting Policies and Information
MFS votes proxies on behalf of the fund pursuant to proxy voting policies and procedures that are available without charge, upon request, by calling 1-800-225-2606, by visiting mfs.com/proxyvoting, or by visiting the SEC’s Web site at http://www.sec.gov.
Information regarding how the fund voted proxies relating to portfolio securities during the most recent twelve-month period ended June 30 is available by August 31 of each year without charge by visiting mfs.com/proxyvoting, or by visiting the SEC’s Web site at http://www.sec.gov.
Quarterly Portfolio Disclosure
The fund files a complete schedule of portfolio holdings with the SEC for the first and third quarters of each fiscal year as an exhibit to its reports on Form N-PORT. The fund’s Form N-PORT reports are available on the SEC’s Web site at http://www.sec.gov. A shareholder can obtain the portfolio holdings report for the first and third quarters of the fund's fiscal year at mfs.com/vit3 by choosing the fund's name and then scrolling to the “Resources” section and clicking on the “Prospectus and Reports” tab.
FURTHER INFORMATION
From time to time, MFS may post important information about the fund or the MFS Funds on the MFS Web site (mfs.com). This information is available at https://www.mfs.com/announcements or at mfs.com/vit3 by choosing the fund's name and then scrolling to the “Resources” section and clicking on the “Announcements” tab, if any.
Information About Fund Contracts and Legal Claims
The fund has entered into contractual arrangements with an investment adviser, administrator, distributor, shareholder servicing agent, 529 program manager (if applicable), and custodian who each provide services to the fund. Unless expressly stated otherwise, shareholders are not parties to, or intended beneficiaries of these contractual arrangements, and these contractual arrangements are not intended to create any shareholder right to enforce them against the service providers or to seek any remedy under them against the service providers, either directly or on behalf of the fund.
Under the Trust’s By-Laws and Declaration of Trust, any claims asserted against or on behalf of the MFS Funds, including claims against Trustees and Officers, must be brought in state and federal courts located within the Commonwealth of Massachusetts.
Semiannual Report
June 30, 2021
MFS® Mid Cap Value Portfolio
MFS® Variable Insurance Trust III
MFS® Mid Cap Value Portfolio
The report is prepared for the general information of contract owners. It is authorized for distribution to prospective investors only when preceded or accompanied by a current prospectus.
NOT FDIC INSURED • MAY LOSE VALUE • NO BANK OR CREDIT UNION GUARANTEE •
NOT A DEPOSIT • NOT INSURED BY ANY FEDERAL GOVERNMENT AGENCY OR NCUA/NCUSIF
MFS Mid Cap Value Portfolio
Dear Contract Owners:
After experiencing dramatic swings in the early days of the coronavirus pandemic, global equity markets have performed strongly over the past year. Though the speedy development of vaccines brightened the economic and market outlook, uncertainty remains as new variants of the virus appear, and questions persist over how fast vaccines can be made widely available in the developing world.
Global central banks have taken aggressive steps to cushion the economic and market fallout related to the virus, and governments are deploying unprecedented levels of fiscal support. Having passed a $1.9 trillion stimulus package in March, the U.S. Congress could approve additional stimulus later this year, some of it focused on infrastructure. Along with extraordinary government expenditures, pent-up consumer demand fueled a surge in economic activity as coronavirus restrictions were eased, pushing up inflation, at least temporarily. Markets initially reacted by pushing up yields on global government bonds, though some of the rate rise has since been corrected.
A spirited debate is underway among investors over whether the current price pressures will persist or prove to be temporary, caused by pandemic-induced bottlenecks. The policy measures put in place to counteract the pandemic's effects have helped build a supportive environment and are encouraging economic recovery; however, if markets disconnect from fundamentals, they can sow the seeds of instability. As such, recent dramatic increases in speculative trading in cryptocurrencies, special purpose acquisition companies (SPACs), and the like bear watching.
In the aftermath of the crisis, we could see societal changes as households, businesses, and governments adjust to a new reality, and any such alterations could affect the investment landscape. For investors, events such as the COVID-19 outbreak demonstrate the importance of having a deep understanding of company fundamentals, and we have built our global research platform to do just that.
At MFS®, we put our clients’ assets to work responsibly by carefully navigating the increasing complexity of global markets and economies. Guided by our long-term philosophy and adhering to our commitment to sustainable investing, we tune out the noise and aim to uncover what we believe are the best, most durable investment opportunities in the market. Our unique global investment platform combines collective expertise, long-term discipline, and thoughtful risk management to create sustainable value for investors.
Respectfully,
Michael W. Roberge
Chief Executive Officer
MFS Investment Management
August 13, 2021
The opinions expressed in this letter are subject to change and may not be relied upon for investment advice. No forecasts can be guaranteed.
MFS Mid Cap Value Portfolio
Top ten holdings
| Johnson Controls International PLC | 1.3% |
| Zebra Technologies Corp., “A” | 1.2% |
| Arthur J. Gallagher & Co. | 1.2% |
| Eastman Chemical Co. | 1.2% |
| Life Storage, Inc., REIT | 1.2% |
| Stanley Black & Decker, Inc. | 1.2% |
| Eaton Corp. PLC | 1.2% |
| Hartford Financial Services Group, Inc. | 1.2% |
| LKQ Corp. | 1.1% |
| KBR, Inc. | 1.1% |
GICS equity sectors (g)
| Financials | 20.3% |
| Industrials | 16.7% |
| Consumer Discretionary | 9.4% |
| Materials | 8.6% |
| Information Technology | 8.1% |
| Health Care | 8.0% |
| Utilities | 7.6% |
| Real Estate | 7.3% |
| Energy | 5.1% |
| Consumer Staples | 4.9% |
| Communication Services | 1.9% |
| (g) | The Global Industry Classification Standard (GICS®) was developed by and/or is the exclusive property of MSCI, Inc. and S&P Global Market Intelligence Inc. (“S&P Global Market Intelligence”). GICS is a service mark of MSCI and S&P Global Market Intelligence and has been licensed for use by MFS. MFS has applied its own internal sector/industry classification methodology for equity securities and non-equity securities that are unclassified by GICS. |
Cash & Cash Equivalents includes any cash, investments in money market funds, short-term securities, and other assets less liabilities. Please see the Statement of Assets and Liabilities for additional information related to the fund’s cash position and other assets and liabilities.
Percentages are based on net assets as of June 30, 2021.
The portfolio is actively managed and current holdings may be different.
MFS Mid Cap Value Portfolio
Expense Table
Fund Expenses Borne by the Contract Holders during the Period,
January 1, 2021 through June 30, 2021
As a contract holder of the fund, you incur ongoing costs, including management fees; distribution and/or service (12b-1) fees; and other fund expenses. This example is intended to help you understand your ongoing costs (in dollars) of investing in the fund and to compare these costs with the ongoing costs of investing in other mutual funds.
The example is based on an investment of $1,000 invested at the beginning of the period and held for the entire period January 1, 2021 through June 30, 2021.
Actual Expenses
The first line for each share class in the following table provides information about actual account values and actual expenses. You may use the information in this line, together with the amount you invested, to estimate the expenses that you paid over the period. Simply divide your account value by $1,000 (for example, an $8,600 account value divided by $1,000 = 8.6), then multiply the result by the number in the first line under the heading entitled “Expenses Paid During Period” to estimate the expenses you paid on your account during this period.
Hypothetical Example for Comparison Purposes
The second line for each share class in the following table provides information about hypothetical account values and hypothetical expenses based on the fund’s actual expense ratio and an assumed rate of return of 5% per year before expenses, which is not the fund’s actual return. The hypothetical account values and expenses may not be used to estimate the actual ending account balance or expenses you paid for the period. You may use this information to compare the ongoing costs of investing in the fund and other funds. To do so, compare this 5% hypothetical example with the 5% hypothetical examples that appear in the shareholder reports of the other funds.
Please note that the expenses shown in the table are meant to highlight the fund's ongoing costs only and do not take into account the fees and expenses imposed under the variable contracts through which your investment in the fund is made. Therefore, the second line for each share class in the table is useful in comparing ongoing costs associated with an investment in vehicles (such as the fund) which fund benefits under variable annuity and variable life insurance contracts and to qualified pension and retirement plans only, and will not help you determine the relative total costs of investing in the fund through variable annuity and variable life insurance contracts. If the fees and expenses imposed under the variable contracts were included, your costs would have been higher.
Share
Class | | Annualized
Expense
Ratio | Beginning
Account Value
1/01/21 | Ending
Account Value
6/30/21 | Expenses
Paid During
Period (p)
1/01/21-6/30/21 |
| Initial Class | Actual | 0.79% | $1,000.00 | $1,190.92 | $4.29 |
| Hypothetical (h) | 0.79% | $1,000.00 | $1,020.88 | $3.96 |
| Service Class | Actual | 1.04% | $1,000.00 | $1,189.41 | $5.65 |
| Hypothetical (h) | 1.04% | $1,000.00 | $1,019.64 | $5.21 |
| (h) | 5% class return per year before expenses. |
| (p) | “Expenses Paid During Period” are equal to each class's annualized expense ratio, as shown above, multiplied by the average account value over the period, multiplied by 181/365 (to reflect the one-half year period). |
MFS Mid Cap Value Portfolio
Portfolio of Investments − 6/30/21 (unaudited)
The Portfolio of Investments is a complete list of all securities owned by your fund. It is categorized by broad-based asset classes.
| Issuer | | | Shares/Par | Value ($) |
| Common Stocks – 97.9% |
| Aerospace & Defense – 3.3% | |
| Howmet Aerospace, Inc. (a) | | 59,706 | $ 2,058,066 |
| KBR, Inc. | | 140,984 | 5,378,540 |
| L3Harris Technologies, Inc. | | 23,167 | 5,007,547 |
| Leidos Holdings, Inc. | | 35,034 | 3,541,937 |
| | | | | $15,986,090 |
| Airlines – 0.8% | |
| Alaska Air Group, Inc. (a) | | 39,046 | $ 2,354,864 |
| Delta Air Lines, Inc. (a) | | 35,564 | 1,538,499 |
| | | | | $3,893,363 |
| Apparel Manufacturers – 1.1% | |
| PVH Corp. (a) | | 21,802 | $ 2,345,677 |
| Skechers USA, Inc., “A” (a) | | 63,870 | 3,182,642 |
| | | | | $5,528,319 |
| Automotive – 2.0% | |
| Lear Corp. | | 24,571 | $ 4,306,805 |
| LKQ Corp. (a) | | 111,875 | 5,506,487 |
| | | | | $9,813,292 |
| Broadcasting – 0.5% | |
| Discovery Communications, Inc., “C” (a) | | 86,598 | $ 2,509,610 |
| Brokerage & Asset Managers – 2.4% | |
| Apollo Global Management, Inc. | | 70,344 | $ 4,375,397 |
| Cboe Global Markets, Inc. | | 24,667 | 2,936,606 |
| Raymond James Financial, Inc. | | 32,298 | 4,195,510 |
| | | | | $11,507,513 |
| Business Services – 1.5% | |
| Amdocs Ltd. | | 53,628 | $ 4,148,662 |
| Global Payments, Inc. | | 17,326 | 3,249,318 |
| | | | | $7,397,980 |
| Cable TV – 0.8% | |
| Liberty Broadband Corp. (a) | | 22,174 | $ 3,850,737 |
| Chemicals – 2.4% | |
| Celanese Corp. | | 24,558 | $ 3,722,993 |
| Eastman Chemical Co. | | 50,658 | 5,914,321 |
| FMC Corp. | | 17,164 | 1,857,145 |
| | | | | $11,494,459 |
| Computer Software – 0.4% | |
| McAfee Corp. | | 70,240 | $ 1,968,125 |
| Computer Software - Systems – 1.6% | |
| Verint Systems, Inc. (a) | | 34,822 | $ 1,569,427 |
| Zebra Technologies Corp., “A” (a) | | 11,393 | 6,032,480 |
| | | | | $7,601,907 |
| Construction – 5.7% | |
| Armstrong World Industries, Inc. | | 22,028 | $ 2,362,723 |
| Fortune Brands Home & Security, Inc. | | 34,521 | 3,438,637 |
| Masco Corp. | | 63,484 | 3,739,843 |
| Issuer | | | Shares/Par | Value ($) |
| Common Stocks – continued |
| Construction – continued | |
| Mid-America Apartment Communities, Inc., REIT | | 27,201 | $ 4,581,192 |
| Stanley Black & Decker, Inc. | | 28,210 | 5,782,768 |
| Toll Brothers, Inc. | | 84,488 | 4,884,251 |
| Vulcan Materials Co. | | 16,878 | 2,937,954 |
| | | | | $27,727,368 |
| Consumer Products – 1.4% | |
| Energizer Holdings, Inc. | | 50,223 | $ 2,158,585 |
| Newell Brands, Inc. | | 105,571 | 2,900,035 |
| Reynolds Consumer Products, Inc. | | 60,911 | 1,848,649 |
| | | | | $6,907,269 |
| Consumer Services – 0.5% | |
| Grand Canyon Education, Inc. (a) | | 29,503 | $ 2,654,385 |
| Containers – 3.3% | |
| Berry Global, Inc. (a) | | 51,599 | $ 3,365,287 |
| Crown Holdings, Inc. | | 22,478 | 2,297,476 |
| Graphic Packaging Holding Co. | | 184,733 | 3,351,057 |
| Owens Corning | | 35,348 | 3,460,569 |
| WestRock Co. | | 69,820 | 3,715,820 |
| | | | | $16,190,209 |
| Electrical Equipment – 2.6% | |
| Johnson Controls International PLC | | 93,659 | $ 6,427,817 |
| Sensata Technologies Holding PLC (a) | | 57,354 | 3,324,812 |
| TE Connectivity Ltd. | | 22,297 | 3,014,777 |
| | | | | $12,767,406 |
| Electronics – 3.1% | |
| Corning, Inc. | | 72,999 | $ 2,985,659 |
| Marvell Technology, Inc. | | 80,886 | 4,718,080 |
| NXP Semiconductors N.V. | | 22,285 | 4,584,470 |
| ON Semiconductor Corp. (a) | | 72,098 | 2,759,912 |
| | | | | $15,048,121 |
| Energy - Independent – 3.6% | |
| Cabot Oil & Gas Corp. | | 100,922 | $ 1,762,098 |
| Devon Energy Corp. | | 97,146 | 2,835,692 |
| Diamondback Energy, Inc. | | 33,911 | 3,183,904 |
| Hess Corp. | | 40,883 | 3,569,904 |
| Pioneer Natural Resources Co. | | 23,722 | 3,855,299 |
| Valero Energy Corp. | | 31,052 | 2,424,540 |
| | | | | $17,631,437 |
| Engineering - Construction – 0.7% | |
| Quanta Services, Inc. | | 36,465 | $ 3,302,635 |
| Food & Beverages – 2.9% | |
| Archer Daniels Midland Co. | | 45,328 | $ 2,746,877 |
| Coca-Cola Europacific Partners PLC | | 54,656 | 3,242,194 |
| Ingredion, Inc. | | 24,992 | 2,261,776 |
| J.M. Smucker Co. | | 21,635 | 2,803,247 |
| Kellogg Co. | | 50,195 | 3,229,044 |
| | | | | $14,283,138 |
MFS Mid Cap Value Portfolio
Portfolio of Investments (unaudited) – continued
| Issuer | | | Shares/Par | Value ($) |
| Common Stocks – continued |
| Food & Drug Stores – 0.9% | |
| Albertsons Cos., Inc., “A” (l) | | 127,284 | $ 2,502,403 |
| Kroger Co. | | 53,541 | 2,051,156 |
| | | | | $4,553,559 |
| Gaming & Lodging – 0.5% | |
| Wyndham Hotels & Resorts, Inc. | | 32,188 | $ 2,326,871 |
| General Merchandise – 0.4% | |
| Dollar Tree, Inc. (a) | | 17,627 | $ 1,753,887 |
| Insurance – 8.5% | |
| American International Group, Inc. | | 47,226 | $ 2,247,958 |
| Arthur J. Gallagher & Co. | | 42,574 | 5,963,766 |
| Assurant, Inc. | | 26,870 | 4,196,557 |
| Athene Holding Ltd. (a) | | 57,535 | 3,883,612 |
| Cincinnati Financial Corp. | | 27,896 | 3,253,232 |
| Equitable Holdings, Inc. | | 142,236 | 4,331,086 |
| Everest Re Group Ltd. | | 13,205 | 3,327,792 |
| Hanover Insurance Group, Inc. | | 17,369 | 2,355,931 |
| Hartford Financial Services Group, Inc. | | 90,645 | 5,617,271 |
| Reinsurance Group of America, Inc. | | 23,413 | 2,669,082 |
| Willis Towers Watson PLC | | 14,768 | 3,396,935 |
| | | | | $41,243,222 |
| Leisure & Toys – 2.1% | |
| Brunswick Corp. | | 32,485 | $ 3,236,156 |
| Electronic Arts, Inc. | | 20,546 | 2,955,131 |
| Mattel, Inc. (a) | | 118,963 | 2,391,156 |
| Polaris, Inc. | | 13,174 | 1,804,311 |
| | | | | $10,386,754 |
| Machinery & Tools – 4.5% | |
| Eaton Corp. PLC | | 38,906 | $ 5,765,091 |
| Ingersoll Rand, Inc. (a) | | 61,078 | 2,981,217 |
| ITT, Inc. | | 30,524 | 2,795,693 |
| PACCAR, Inc. | | 40,406 | 3,606,236 |
| Regal Beloit Corp. | | 27,137 | 3,623,061 |
| Wabtec Corp. | | 36,397 | 2,995,473 |
| | | | | $21,766,771 |
| Major Banks – 1.9% | |
| Comerica, Inc. | | 39,676 | $ 2,830,486 |
| KeyCorp | | 179,297 | 3,702,483 |
| State Street Corp. | | 33,061 | 2,720,259 |
| | | | | $9,253,228 |
| Medical & Health Technology & Services – 3.9% | |
| AmerisourceBergen Corp. | | 21,128 | $ 2,418,945 |
| ICON PLC (a) | | 3,451 | 713,356 |
| Laboratory Corp. of America Holdings (a) | | 13,792 | 3,804,523 |
| PRA Health Sciences, Inc. (a) | | 20,800 | 3,436,368 |
| Premier, Inc., “A” | | 61,602 | 2,143,134 |
| Quest Diagnostics, Inc. | | 23,756 | 3,135,079 |
| Universal Health Services, Inc. | | 24,161 | 3,537,895 |
| | | | | $19,189,300 |
| Issuer | | | Shares/Par | Value ($) |
| Common Stocks – continued |
| Medical Equipment – 3.4% | |
| Boston Scientific Corp. (a) | | 66,370 | $ 2,837,981 |
| Dentsply Sirona, Inc. | | 47,225 | 2,987,454 |
| Hologic, Inc. (a) | | 30,832 | 2,057,111 |
| PerkinElmer, Inc. | | 24,469 | 3,778,258 |
| Zimmer Biomet Holdings, Inc. | | 29,113 | 4,681,953 |
| | | | | $16,342,757 |
| Natural Gas - Distribution – 0.3% | |
| Atmos Energy Corp. | | 17,030 | $ 1,636,753 |
| Natural Gas - Pipeline – 1.1% | |
| Equitrans Midstream Corp. | | 67,107 | $ 571,081 |
| Plains GP Holdings LP | | 211,510 | 2,525,429 |
| Targa Resources Corp. | | 48,585 | 2,159,603 |
| | | | | $5,256,113 |
| Network & Telecom – 0.9% | |
| Motorola Solutions, Inc. | | 19,446 | $ 4,216,865 |
| Oil Services – 0.4% | |
| Halliburton Co. | | 77,394 | $ 1,789,349 |
| Other Banks & Diversified Financials – 7.3% | |
| Discover Financial Services | | 39,403 | $ 4,660,981 |
| East West Bancorp, Inc. | | 34,045 | 2,440,686 |
| Element Fleet Management Corp. | | 200,660 | 2,340,709 |
| Northern Trust Corp. | | 32,876 | 3,801,123 |
| Prosperity Bancshares, Inc. | | 36,617 | 2,629,101 |
| Signature Bank | | 15,343 | 3,769,008 |
| SLM Corp. | | 206,154 | 4,316,865 |
| SVB Financial Group (a) | | 6,274 | 3,491,042 |
| Umpqua Holdings Corp. | | 129,463 | 2,388,592 |
| Wintrust Financial Corp. | | 27,103 | 2,049,800 |
| Zions Bancorp NA | | 71,756 | 3,793,022 |
| | | | | $35,680,929 |
| Pharmaceuticals – 0.7% | |
| Organon & Co. (a) | | 56,239 | $ 1,701,792 |
| Viatris, Inc. | | 113,500 | 1,621,915 |
| | | | | $3,323,707 |
| Pollution Control – 0.8% | |
| Republic Services, Inc. | | 33,183 | $ 3,650,462 |
| Real Estate – 6.6% | |
| Annaly Mortgage Management, Inc., REIT | | 120,693 | $ 1,071,754 |
| Boston Properties, Inc., REIT | | 14,022 | 1,606,781 |
| Brixmor Property Group, Inc., REIT | | 133,482 | 3,055,403 |
| Host Hotels & Resorts, Inc., REIT (a) | | 159,320 | 2,722,779 |
| Life Storage, Inc., REIT | | 54,149 | 5,812,895 |
| Medical Properties Trust, Inc., REIT | | 137,265 | 2,759,026 |
| Spirit Realty Capital, Inc., REIT | | 40,382 | 1,931,875 |
| STAG Industrial, Inc., REIT | | 40,536 | 1,517,262 |
| Sun Communities, Inc., REIT | | 24,320 | 4,168,448 |
| VICI Properties, Inc., REIT | | 134,429 | 4,169,988 |
| W.P. Carey, Inc., REIT | | 41,453 | 3,093,223 |
| | | | | $31,909,434 |
MFS Mid Cap Value Portfolio
Portfolio of Investments (unaudited) – continued
| Issuer | | | Shares/Par | Value ($) |
| Common Stocks – continued |
| Restaurants – 1.4% | |
| Aramark | | 72,116 | $ 2,686,321 |
| Performance Food Group Co. (a) | | 24,434 | 1,184,805 |
| Wendy's Co. | | 129,180 | 3,025,395 |
| | | | | $6,896,521 |
| Specialty Chemicals – 3.5% | |
| Ashland Global Holdings, Inc. | | 35,141 | $ 3,074,837 |
| Axalta Coating Systems Ltd. (a) | | 120,453 | 3,672,612 |
| Corteva, Inc. | | 86,805 | 3,849,802 |
| DuPont de Nemours, Inc. | | 50,238 | 3,888,924 |
| Univar Solutions, Inc. (a) | | 100,639 | 2,453,579 |
| | | | | $16,939,754 |
| Specialty Stores – 0.6% | |
| Urban Outfitters, Inc. (a) | | 66,050 | $ 2,722,581 |
| Trucking – 0.4% | |
| Knight-Swift Transportation Holdings, Inc. | | 39,245 | $ 1,784,078 |
| Utilities - Electric Power – 7.2% | |
| AES Corp. | | 151,913 | $ 3,960,372 |
| Ameren Corp. | | 36,467 | 2,918,819 |
| CenterPoint Energy, Inc. | | 125,120 | 3,067,942 |
| CMS Energy Corp. | | 62,223 | 3,676,135 |
| Edison International | | 40,108 | 2,319,045 |
| Issuer | | | Shares/Par | Value ($) |
| Common Stocks – continued |
| Utilities - Electric Power – continued | |
| Eversource Energy | | 46,371 | $ 3,720,809 |
| PG&E Corp. (a) | | 413,160 | 4,201,837 |
| Pinnacle West Capital Corp. | | 47,056 | 3,857,180 |
| Public Service Enterprise Group, Inc. | | 70,131 | 4,189,626 |
| Sempra Energy | | 25,121 | 3,328,030 |
| | | | | $35,239,795 |
| Total Common Stocks (Identified Cost, $309,719,426) | | $475,926,053 |
| Investment Companies (h) – 1.8% |
| Money Market Funds – 1.8% | |
| MFS Institutional Money Market Portfolio, 0.02% (v) (Identified Cost, $8,705,670) | | | 8,705,670 | $ 8,705,670 |
| Collateral for Securities Loaned – 0.2% |
| State Street Navigator Securities Lending Government Money Market Portfolio, 0.02% (j) (Identified Cost, $1,073,462) | | | 1,073,462 | $ 1,073,462 |
| Other Assets, Less Liabilities – 0.1% | | 327,481 |
| Net Assets – 100.0% | $486,032,666 |
| (a) | Non-income producing security. | | | |
| (h) | An affiliated issuer, which may be considered one in which the fund owns 5% or more of the outstanding voting securities, or a company which is under common control. At period end, the aggregate values of the fund's investments in affiliated issuers and in unaffiliated issuers were $8,705,670 and $476,999,515, respectively. | | | |
| (j) | The rate quoted is the annualized seven-day yield of the fund at period end. | | | |
| (l) | A portion of this security is on loan. See Note 2 for additional information. | | | |
| (v) | Affiliated issuer that is available only to investment companies managed by MFS. The rate quoted for the MFS Institutional Money Market Portfolio is the annualized seven-day yield of the fund at period end. | | | |
| The following abbreviations are used in this report and are defined: |
| REIT | Real Estate Investment Trust |
See Notes to Financial Statements
MFS Mid Cap Value Portfolio
| Financial Statements | Statement of Assets and Liabilities (unaudited) |
This statement represents your fund’s balance sheet, which details the assets and liabilities comprising the total value of the fund.
| At 6/30/21Assets | |
| Investments in unaffiliated issuers, at value, including $1,029,476 of securities on loan (identified cost, $310,792,888) | $476,999,515 |
| Investments in affiliated issuers, at value (identified cost, $8,705,670) | 8,705,670 |
| Cash | 6,087 |
| Receivables for | |
| Fund shares sold | 1,146,702 |
| Interest and dividends | 587,742 |
| Other assets | 1,875 |
| Total assets | $487,447,591 |
| Liabilities | |
| Payables for | |
| Fund shares reacquired | $261,381 |
| Collateral for securities loaned, at value | 1,073,462 |
| Payable to affiliates | |
| Investment adviser | 19,572 |
| Administrative services fee | 405 |
| Shareholder servicing costs | 122 |
| Distribution and/or service fees | 2,634 |
| Accrued expenses and other liabilities | 57,349 |
| Total liabilities | $1,414,925 |
| Net assets | $486,032,666 |
| Net assets consist of | |
| Paid-in capital | $291,158,974 |
| Total distributable earnings (loss) | 194,873,692 |
| Net assets | $486,032,666 |
| Shares of beneficial interest outstanding | 47,737,260 |
| | Net assets | Shares
outstanding | Net asset value
per share |
| Initial Class | $292,906,020 | 28,631,820 | $10.23 |
| Service Class | 193,126,646 | 19,105,440 | 10.11 |
See Notes to Financial Statements
MFS Mid Cap Value Portfolio
| Financial Statements | Statement of Operations (unaudited) |
This statement describes how much your fund earned in investment income and accrued in expenses. It also describes any gains and/or losses generated by fund operations.
| Six months ended 6/30/21 | |
| Net investment income (loss) | |
| Income | |
| Dividends | $3,825,942 |
| Income on securities loaned | 31,217 |
| Other | 13,421 |
| Dividends from affiliated issuers | 1,959 |
| Foreign taxes withheld | (6,844) |
| Total investment income | $3,865,695 |
| Expenses | |
| Management fee | $1,697,238 |
| Distribution and/or service fees | 210,087 |
| Shareholder servicing costs | 11,894 |
| Administrative services fee | 34,421 |
| Independent Trustees' compensation | 3,910 |
| Custodian fee | 7,168 |
| Shareholder communications | 8,206 |
| Audit and tax fees | 28,755 |
| Legal fees | 1,201 |
| Miscellaneous | 13,664 |
| Total expenses | $2,016,544 |
| Reduction of expenses by investment adviser | (27,089) |
| Net expenses | $1,989,455 |
| Net investment income (loss) | $1,876,240 |
| Realized and unrealized gain (loss) | |
| Realized gain (loss) (identified cost basis) | |
| Unaffiliated issuers | $22,249,882 |
| Foreign currency | (18) |
| Net realized gain (loss) | $22,249,864 |
| Change in unrealized appreciation or depreciation | |
| Unaffiliated issuers | $52,938,354 |
| Translation of assets and liabilities in foreign currencies | (124) |
| Net unrealized gain (loss) | $52,938,230 |
| Net realized and unrealized gain (loss) | $75,188,094 |
| Change in net assets from operations | $77,064,334 |
See Notes to Financial Statements
MFS Mid Cap Value Portfolio
| Financial Statements | Statements of Changes in Net Assets |
These statements describe the increases and/or decreases in net assets resulting from operations, any distributions, and any shareholder transactions.
| | Six months ended | Year ended |
| | 6/30/21
(unaudited) | 12/31/20 |
| Change in net assets | | |
| From operations | | |
| Net investment income (loss) | $1,876,240 | $3,733,563 |
| Net realized gain (loss) | 22,249,864 | 2,451,364 |
| Net unrealized gain (loss) | 52,938,230 | 20,625,771 |
| Change in net assets from operations | $77,064,334 | $26,810,698 |
| Total distributions to shareholders | $— | $(17,052,598) |
| Change in net assets from fund share transactions | $(5,078,478) | $68,439,512 |
| Total change in net assets | $71,985,856 | $78,197,612 |
| Net assets | | |
| At beginning of period | 414,046,810 | 335,849,198 |
| At end of period | $486,032,666 | $414,046,810 |
See Notes to Financial Statements
MFS Mid Cap Value Portfolio
| Financial Statements | Financial Highlights |
The financial highlights table is intended to help you understand the fund's financial performance for the semiannual period and the past 5 fiscal years. Certain information reflects financial results for a single fund share. The total returns in the table represent the rate that an investor would have earned (or lost) on an investment in the fund share class (assuming reinvestment of all distributions) held for the entire period.
| Initial Class | Six months
ended | Year ended |
| | 6/30/21
(unaudited) | 12/31/20 | 12/31/19 | 12/31/18 | 12/31/17 | 12/31/16 |
| Net asset value, beginning of period | $8.59 | $8.74 | $7.42 | $9.01 | $8.29 | $7.84 |
| Income (loss) from investment operations | | | | | | |
| Net investment income (loss) (d) | $0.04 | $0.09 | $0.11 | $0.10 | $0.07 | $0.10(c) |
| Net realized and unrealized gain (loss) | 1.60 | 0.19 | 2.09 | (1.03) | 1.03 | 1.12 |
| Total from investment operations | $1.64 | $0.28 | $2.20 | $(0.93) | $1.10 | $1.22 |
| Less distributions declared to shareholders | | | | | | |
| From net investment income | $— | $(0.10) | $(0.12) | $(0.08) | $(0.11) | $(0.07) |
| From net realized gain | — | (0.33) | (0.76) | (0.58) | (0.27) | (0.70) |
| Total distributions declared to shareholders | $— | $(0.43) | $(0.88) | $(0.66) | $(0.38) | $(0.77) |
| Net asset value, end of period (x) | $10.23 | $8.59 | $8.74 | $7.42 | $9.01 | $8.29 |
| Total return (%) (k)(r)(s)(x) | 19.09(n) | 3.87 | 31.12 | (11.45) | 13.67 | 15.98(c) |
Ratios (%) (to average net assets)
and Supplemental data: | | | | | | |
| Expenses before expense reductions (f) | 0.80(a) | 0.81 | 0.81 | 0.81 | 0.81 | 0.77(c) |
| Expenses after expense reductions (f) | 0.79(a) | 0.80 | 0.80 | 0.80 | 0.81 | 0.76(c) |
| Net investment income (loss) | 0.92(a) | 1.22 | 1.31 | 1.13 | 0.82 | 1.31(c) |
| Portfolio turnover | 14(n) | 35 | 30 | 32 | 36 | 32 |
| Net assets at end of period (000 omitted) | $292,906 | $271,131 | $261,832 | $210,218 | $268,291 | $271,001 |
See Notes to Financial Statements
MFS Mid Cap Value Portfolio
Financial Highlights - continued
| Service Class | Six months
ended | Year ended |
| | 6/30/21
(unaudited) | 12/31/20 | 12/31/19 | 12/31/18 | 12/31/17 | 12/31/16 |
| Net asset value, beginning of period | $8.50 | $8.65 | $7.35 | $8.93 | $8.22 | $7.78 |
| Income (loss) from investment operations | | | | | | |
| Net investment income (loss) (d) | $0.03 | $0.08 | $0.09 | $0.08 | $0.05 | $0.08(c) |
| Net realized and unrealized gain (loss) | 1.58 | 0.18 | 2.06 | (1.02) | 1.02 | 1.12 |
| Total from investment operations | $1.61 | $0.26 | $2.15 | $(0.94) | $1.07 | $1.20 |
| Less distributions declared to shareholders | | | | | | |
| From net investment income | $— | $(0.08) | $(0.09) | $(0.06) | $(0.09) | $(0.06) |
| From net realized gain | — | (0.33) | (0.76) | (0.58) | (0.27) | (0.70) |
| Total distributions declared to shareholders | $— | $(0.41) | $(0.85) | $(0.64) | $(0.36) | $(0.76) |
| Net asset value, end of period (x) | $10.11 | $8.50 | $8.65 | $7.35 | $8.93 | $8.22 |
| Total return (%) (k)(r)(s)(x) | 18.94(n) | 3.67 | 30.71 | (11.61) | 13.41 | 15.76(c) |
Ratios (%) (to average net assets)
and Supplemental data: | | | | | | |
| Expenses before expense reductions (f) | 1.05(a) | 1.06 | 1.06 | 1.06 | 1.06 | 1.02(c) |
| Expenses after expense reductions (f) | 1.04(a) | 1.05 | 1.05 | 1.05 | 1.05 | 1.01(c) |
| Net investment income (loss) | 0.68(a) | 1.01 | 1.06 | 0.86 | 0.59 | 1.06(c) |
| Portfolio turnover | 14(n) | 35 | 30 | 32 | 36 | 32 |
| Net assets at end of period (000 omitted) | $193,127 | $142,916 | $74,018 | $55,837 | $85,643 | $59,545 |
| (a) | Annualized. |
| (c) | Amount reflects a one-time reimbursement of expenses by the custodian (or former custodian) without which net investment income and performance would be lower and expenses would be higher. |
| (d) | Per share data is based on average shares outstanding. |
| (f) | Ratios do not reflect reductions from fees paid indirectly, if applicable. |
| (k) | The total return does not reflect expenses that apply to separate accounts. Inclusion of these charges would reduce the total return figures for all periods shown. |
| (n) | Not annualized. |
| (r) | Certain expenses have been reduced without which performance would have been lower. |
| (s) | From time to time the fund may receive proceeds from litigation settlements, without which performance would be lower. |
| (x) | The net asset values and total returns have been calculated on net assets which include adjustments made in accordance with U.S. generally accepted accounting principles required at period end for financial reporting purposes. |
See Notes to Financial Statements
MFS Mid Cap Value Portfolio
Notes to Financial Statements (unaudited)
(1) Business and Organization
MFS Mid Cap Value Portfolio (the fund) is a diversified series of MFS Variable Insurance Trust III (the trust). The trust is organized as a Delaware statutory trust and is registered under the Investment Company Act of 1940, as amended, as an open-end management investment company. The shareholders of each series of the trust are separate accounts of insurance companies, which offer variable annuity and/or life insurance products, and qualified retirement and pension plans.
The fund is an investment company and accordingly follows the investment company accounting and reporting guidance of the Financial Accounting Standards Board (FASB) Accounting Standards Codification Topic 946 Financial Services - Investment Companies.
(2) Significant Accounting Policies
General — The preparation of financial statements in conformity with U.S. generally accepted accounting principles requires management to make estimates and assumptions that affect the reported amounts of assets and liabilities, and disclosure of contingent assets and liabilities at the date of the financial statements and the reported amounts of increases and decreases in net assets from operations during the reporting period. Actual results could differ from those estimates. In the preparation of these financial statements, management has evaluated subsequent events occurring after the date of the fund’s Statement of Assets and Liabilities through the date that the financial statements were issued.
Certain of the fund's investments, derivatives, debt and other contracts may be based on reference interest rates such as the London Interbank Offered Rate (“LIBOR”). In 2017, the regulatory authority that oversees financial services firms in the United Kingdom announced plans to transition away from LIBOR by the end of 2021. In March 2021, the administrator of LIBOR announced the extension of the publication of the more commonly used U.S. dollar LIBOR settings to the end of June 2023. Although the full impacts of the transition away from LIBOR are not fully known, the transition may result in, among other things, an increase in volatility or illiquidity of the markets for instruments that currently rely on LIBOR to determine interest rates and this could have an adverse impact on the fund's performance. With respect to the fund's accounting for investments, derivatives, debt and other contracts that undergo reference rate-related modifications as a result of the transition, management will rely upon the relief provided by FASB Codification Topic 848 – Reference Rate Reform (Topic 848). The guidance in Topic 848 permits the fund to disregard the GAAP accounting requirements around certain contract modifications resulting from the LIBOR transition such that for contracts considered in scope, the fund can account for those modified contracts as a continuation of the existing contracts.
Balance Sheet Offsetting — The fund's accounting policy with respect to balance sheet offsetting is that, absent an event of default by the counterparty or a termination of the agreement, the International Swaps and Derivatives Association (ISDA) Master Agreement, or similar agreement, does not result in an offset of reported amounts of financial assets and financial liabilities in the Statement of Assets and Liabilities across transactions between the fund and the applicable counterparty. The fund's right to setoff may be restricted or prohibited by the bankruptcy or insolvency laws of the particular jurisdiction to which a specific master netting agreement counterparty is subject. Balance sheet offsetting disclosures, to the extent applicable to the fund, have been included in the fund’s Significant Accounting Policies note under the captions for each of the fund’s in-scope financial instruments and transactions.
Investment Valuations — Equity securities, including restricted equity securities, are generally valued at the last sale or official closing price on their primary market or exchange as provided by a third-party pricing service. Equity securities, for which there were no sales reported that day, are generally valued at the last quoted daily bid quotation on their primary market or exchange as provided by a third-party pricing service. Short-term instruments with a maturity at issuance of 60 days or less may be valued at amortized cost, which approximates market value. Open-end investment companies are generally valued at net asset value per share.
Securities and other assets generally valued on the basis of information from a third-party pricing service may also be valued at a broker/dealer bid quotation. In determining values, third-party pricing services can utilize both transaction data and market information such as yield, quality, coupon rate, maturity, type of issue, trading characteristics, and other market data. The values of foreign securities and other assets and liabilities expressed in foreign currencies are converted to U.S. dollars using the mean of bid and asked prices for rates provided by a third-party pricing service.
The Board of Trustees has delegated primary responsibility for determining or causing to be determined the value of the fund’s investments (including any fair valuation) to the adviser pursuant to valuation policies and procedures approved by the Board. If the adviser determines that reliable market quotations are not readily available, investments are valued at fair value as determined in good faith by the adviser in accordance with such procedures under the oversight of the Board of Trustees. Under the fund’s valuation policies and procedures, market quotations are not considered to be readily available for most types of debt instruments and floating rate loans and many types of derivatives. These investments are generally valued at fair value based on information from third-party pricing services. In addition, investments may be valued at fair value if the adviser determines that an investment’s value has been materially affected by events occurring after the close of the exchange or market on which the investment is principally
MFS Mid Cap Value Portfolio
Notes to Financial Statements (unaudited) - continued
traded (such as foreign exchange or market) and prior to the determination of the fund’s net asset value, or after the halt of trading of a specific security where trading does not resume prior to the close of the exchange or market on which the security is principally traded. Events that occur after foreign markets close (such as developments in foreign markets and significant movements in the U.S. markets) and prior to the determination of the fund’s net asset value may be deemed to have a material effect on the value of securities traded in foreign markets. Accordingly, the fund’s foreign equity securities may often be valued at fair value. The adviser generally relies on third-party pricing services or other information (such as the correlation with price movements of similar securities in the same or other markets; the type, cost and investment characteristics of the security; the business and financial condition of the issuer; and trading and other market data) to assist in determining whether to fair value and at what value to fair value an investment. The value of an investment for purposes of calculating the fund’s net asset value can differ depending on the source and method used to determine value. When fair valuation is used, the value of an investment used to determine the fund’s net asset value may differ from quoted or published prices for the same investment. There can be no assurance that the fund could obtain the fair value assigned to an investment if it were to sell the investment at the same time at which the fund determines its net asset value per share.
Various inputs are used in determining the value of the fund's assets or liabilities. These inputs are categorized into three broad levels. In certain cases, the inputs used to measure fair value may fall into different levels of the fair value hierarchy. In such cases, an investment's level within the fair value hierarchy is based on the lowest level of input that is significant to the fair value measurement. The fund's assessment of the significance of a particular input to the fair value measurement in its entirety requires judgment, and considers factors specific to the investment. Level 1 includes unadjusted quoted prices in active markets for identical assets or liabilities. Level 2 includes other significant observable market-based inputs (including quoted prices for similar securities, interest rates, prepayment speed, and credit risk). Level 3 includes unobservable inputs, which may include the adviser's own assumptions in determining the fair value of investments. The following is a summary of the levels used as of June 30, 2021 in valuing the fund's assets or liabilities:
| Financial Instruments | Level 1 | Level 2 | Level 3 | Total |
| Equity Securities | $475,926,053 | $— | $— | $475,926,053 |
| Mutual Funds | 9,779,132 | — | — | 9,779,132 |
| Total | $485,705,185 | $— | $��� | $485,705,185 |
For further information regarding security characteristics, see the Portfolio of Investments.
Foreign Currency Translation — Purchases and sales of foreign investments, income, and expenses are converted into U.S. dollars based upon currency exchange rates prevailing on the respective dates of such transactions or on the reporting date for foreign denominated receivables and payables. Gains and losses attributable to foreign currency exchange rates on sales of securities are recorded for financial statement purposes as net realized gains and losses on investments. Gains and losses attributable to foreign exchange rate movements on receivables, payables, income and expenses are recorded for financial statement purposes as foreign currency transaction gains and losses. That portion of both realized and unrealized gains and losses on investments that results from fluctuations in foreign currency exchange rates is not separately disclosed.
Security Loans — Under its Securities Lending Agency Agreement with the fund, State Street Bank and Trust Company, as lending agent, loans the securities of the fund to certain qualified institutions (the “Borrowers”) approved by the fund. Security loans can be terminated at the discretion of either the lending agent or the fund and the related securities must be returned within the earlier of the standard trade settlement period for such securities or within three business days. The loans are collateralized by cash and/or U.S. Treasury and federal agency obligations in an amount typically at least equal to the market value of the securities loaned. On loans collateralized by cash, the cash collateral is invested in a money market fund. The market value of the loaned securities is determined at the close of business of the fund and any additional required collateral is delivered to the fund on the next business day. The lending agent provides the fund with indemnification against Borrower default. In the event of Borrower default, the lending agent will, for the benefit of the fund, either purchase securities identical to those loaned or, when such purchase is commercially impracticable, pay the fund the market value of the loaned securities. In return, the lending agent assumes the fund's rights to the related collateral. If the collateral value is less than the cost to purchase identical securities, the lending agent is responsible for the shortfall, but only to the extent that such shortfall is not due to a decline in collateral value resulting from collateral reinvestment for which the fund bears the risk of loss. At period end, the fund had investment securities on loan, all of which were classified as equity securities in the fund's Portfolio of Investments, with a fair value of $1,029,476. The fair value of the fund's investment securities on loan and a related liability of $1,073,462 for cash collateral received on securities loaned are both presented gross in the Statement of Assets and Liabilities. The collateral on securities loaned exceeded the value of securities on loan at period end. The liability for cash collateral for securities loaned is carried at fair value, which is categorized as level 2 within the fair value hierarchy. A portion of the income generated upon investment of the collateral is remitted to the Borrowers, and the remainder
MFS Mid Cap Value Portfolio
Notes to Financial Statements (unaudited) - continued
is allocated between the fund and the lending agent. On loans collateralized by U.S. Treasury and/or federal agency obligations, a fee is received from the Borrower, and is allocated between the fund and the lending agent. Income from securities lending is separately reported in the Statement of Operations. The dividend and interest income earned on the securities loaned is accounted for in the same manner as other dividend and interest income.
Indemnifications — Under the fund's organizational documents, its officers and Trustees may be indemnified against certain liabilities and expenses arising out of the performance of their duties to the fund. Additionally, in the normal course of business, the fund enters into agreements with service providers that may contain indemnification clauses. The fund's maximum exposure under these agreements is unknown as this would involve future claims that may be made against the fund that have not yet occurred.
Investment Transactions and Income — Investment transactions are recorded on the trade date. Interest income is recorded on the accrual basis. Dividends received in cash are recorded on the ex-dividend date. Certain dividends from foreign securities will be recorded when the fund is informed of the dividend if such information is obtained subsequent to the ex-dividend date. Dividend payments received in additional securities are recorded on the ex-dividend date in an amount equal to the value of the security on such date.
The fund may receive proceeds from litigation settlements. Any proceeds received from litigation involving portfolio holdings are reflected in the Statement of Operations in realized gain/loss if the security has been disposed of by the fund or in unrealized gain/loss if the security is still held by the fund. Any other proceeds from litigation not related to portfolio holdings are reflected as other income in the Statement of Operations.
Tax Matters and Distributions — The fund intends to qualify as a regulated investment company, as defined under Subchapter M of the Internal Revenue Code, and to distribute all of its taxable income, including realized capital gains. As a result, no provision for federal income tax is required. The fund’s federal tax returns, when filed, will remain subject to examination by the Internal Revenue Service for a three year period. Management has analyzed the fund’s tax positions taken on federal and state tax returns for all open tax years and does not believe that there are any uncertain tax positions that require recognition of a tax liability. Foreign taxes, if any, have been accrued by the fund in the accompanying financial statements in accordance with the applicable foreign tax law. Foreign income taxes may be withheld by certain countries in which the fund invests. Additionally, capital gains realized by the fund on securities issued in or by certain foreign countries may be subject to capital gains tax imposed by those countries.
Distributions to shareholders are recorded on the ex-dividend date. Income and capital gain distributions are determined in accordance with income tax regulations, which may differ from U.S. generally accepted accounting principles. Certain capital accounts in the financial statements are periodically adjusted for permanent differences in order to reflect their tax character. These adjustments have no impact on net assets or net asset value per share. Temporary differences which arise from recognizing certain items of income, expense, gain or loss in different periods for financial statement and tax purposes will reverse at some time in the future.
Book/tax differences primarily relate to wash sale loss deferrals.
The tax character of distributions declared to shareholders for the last fiscal year is as follows:
| | Year ended
12/31/20 |
| Ordinary income (including any short-term capital gains) | $6,003,306 |
| Long-term capital gains | 11,049,292 |
| Total distributions | $17,052,598 |
The federal tax cost and the tax basis components of distributable earnings were as follows:
| As of 6/30/21 | |
| Cost of investments | $322,699,859 |
| Gross appreciation | 165,201,433 |
| Gross depreciation | (2,196,107) |
| Net unrealized appreciation (depreciation) | $163,005,326 |
| As of 12/31/20 | |
| Undistributed ordinary income | 5,694,650 |
| Undistributed long-term capital gain | 1,370,375 |
| Other temporary differences | 190 |
| Net unrealized appreciation (depreciation) | 110,744,143 |
MFS Mid Cap Value Portfolio
Notes to Financial Statements (unaudited) - continued
The aggregate cost above includes prior fiscal year end tax adjustments, if applicable.
Multiple Classes of Shares of Beneficial Interest — The fund offers multiple classes of shares, which differ in their respective distribution and/or service fees. The fund's income, realized and unrealized gain (loss), and common expenses are allocated to shareholders based on the daily net assets of each class. Dividends are declared separately for each class. Differences in per share dividend rates are generally due to differences in separate class expenses. The fund’s distributions declared to shareholders as reported in the Statements of Changes in Net Assets are presented by class as follows:
| | Six months
ended
6/30/21 | | Year
ended
12/31/20 |
| Initial Class | $— | | $13,255,627 |
| Service Class | — | | 3,796,971 |
| Total | $— | | $17,052,598 |
(3) Transactions with Affiliates
Investment Adviser — The fund has an investment advisory agreement with MFS to provide overall investment management and related administrative services and facilities to the fund. The management fee is computed daily and paid monthly at the following annual rates based on the fund's average daily net assets:
| Up to $1 billion | 0.75% |
| In excess of $1 billion | 0.70% |
MFS has agreed in writing to reduce its management fee by a specified amount if certain MFS mutual fund assets exceed thresholds agreed to by MFS and the fund's Board of Trustees. For the six months ended June 30, 2021, this management fee reduction amounted to $27,089, which is included in the reduction of total expenses in the Statement of Operations. The management fee incurred for the six months ended June 30, 2021 was equivalent to an annual effective rate of 0.74% of the fund's average daily net assets.
The investment adviser has agreed in writing to pay a portion of the fund’s total annual operating expenses, excluding interest, taxes, extraordinary expenses, brokerage and transaction costs, and investment-related expenses, such that total annual operating expenses do not exceed 0.92% of average daily net assets for the Initial Class shares and 1.17% of average daily net assets for the Service Class shares. This written agreement will continue until modified by the fund’s Board of Trustees, but such agreement will continue at least until April 30, 2023. For the six months ended June 30, 2021, the fund's actual operating expenses did not exceed the limit and therefore, the investment adviser did not pay any portion of the fund's expenses related to this agreement.
Distributor — MFS Fund Distributors, Inc. (MFD), a wholly-owned subsidiary of MFS, is the distributor of shares of the fund. The Trustees have adopted a distribution plan for the Service Class shares pursuant to Rule 12b-1 under the Investment Company Act of 1940.
The fund's distribution plan provides that the fund will pay MFD distribution and/or service fees equal to 0.25% per annum of its average daily net assets attributable to Service Class shares as partial consideration for services performed and expenses incurred by MFD and financial intermediaries (including participating insurance companies that invest in the fund to fund variable annuity and variable life insurance contracts, sponsors of qualified retirement and pension plans that invest in the fund, and affiliates of these participating insurance companies and plan sponsors) in connection with the sale and distribution of the Service Class shares. MFD may subsequently pay all, or a portion, of the distribution and/or service fees to financial intermediaries.
Shareholder Servicing Agent — MFS Service Center, Inc. (MFSC), a wholly-owned subsidiary of MFS, receives a fee from the fund for its services as shareholder servicing agent. For the six months ended June 30, 2021, the fee was $11,240, which equated to 0.0050% annually of the fund's average daily net assets. MFSC also receives reimbursement from the fund for out-of-pocket expenses paid by MFSC on behalf of the fund. For the six months ended June 30, 2021, these costs amounted to $654.
Administrator — MFS provides certain financial, legal, shareholder communications, compliance, and other administrative services to the fund. Under an administrative services agreement, the fund reimburses MFS the costs incurred to provide these services. The fund is charged an annual fixed amount of $17,500 plus a fee based on average daily net assets. The administrative services fee incurred for the six months ended June 30, 2021 was equivalent to an annual effective rate of 0.0152% of the fund's average daily net assets.
MFS Mid Cap Value Portfolio
Notes to Financial Statements (unaudited) - continued
Trustees’ and Officers’ Compensation — The fund pays compensation to independent Trustees in the form of a retainer, attendance fees, and additional compensation to Board and Committee chairpersons. The fund does not pay compensation directly to Trustees or officers of the fund who are also officers of the investment adviser, all of whom receive remuneration from MFS for their services to the fund. Certain officers and Trustees of the fund are officers or directors of MFS, MFD, and MFSC.
Other — The fund invests in the MFS Institutional Money Market Portfolio which is managed by MFS and seeks current income consistent with preservation of capital and liquidity. This money market fund does not pay a management fee to MFS but does incur investment and operating costs.
The fund is permitted to engage in purchase and sale transactions with funds and accounts for which MFS serves as investment adviser or sub-adviser (“cross-trades”) pursuant to a policy adopted by the Board of Trustees. This policy has been designed to ensure that cross-trades conducted by the fund comply with Rule 17a-7 under the Investment Company Act of 1940. During the six months ended June 30, 2021, the fund engaged in purchase transactions pursuant to this policy, which amounted to $226,592.
The adviser has voluntarily undertaken to reimburse the fund from its own resources on a quarterly basis for the cost of investment research embedded in the cost of the fund’s securities trades. This agreement may be rescinded at any time. For the six months ended June 30, 2021, this reimbursement amounted to $13,367, which is included in “Other” income in the Statement of Operations.
(4) Portfolio Securities
For the six months ended June 30, 2021, purchases and sales of investments, other than short-term obligations, aggregated $61,040,476 and $67,773,914, respectively.
(5) Shares of Beneficial Interest
The fund's Declaration of Trust permits the Trustees to issue an unlimited number of full and fractional shares of beneficial interest. Transactions in fund shares were as follows:
| | Six months ended
6/30/21 | | Year ended
12/31/20 |
| | Shares | Amount | | Shares | Amount |
| Shares sold | | | | | |
| Initial Class | 2,474,099 | $24,005,313 | | 7,662,072 | $50,759,215 |
| Service Class | 4,305,457 | 41,760,499 | | 9,879,543 | 76,631,018 |
| | 6,779,556 | $65,765,812 | | 17,541,615 | $127,390,233 |
Shares issued to shareholders
in reinvestment of distributions | | | | | |
| Initial Class | — | $— | | 1,788,885 | $13,255,627 |
| Service Class | — | — | | 517,298 | 3,796,971 |
| | — | $— | | 2,306,183 | $17,052,598 |
| Shares reacquired | | | | | |
| Initial Class | (5,410,252) | $(51,629,838) | | (7,844,938) | $(59,601,370) |
| Service Class | (2,018,991) | (19,214,452) | | (2,135,128) | (16,401,949) |
| | (7,429,243) | $(70,844,290) | | (9,980,066) | $(76,003,319) |
| Net change | | | | | |
| Initial Class | (2,936,153) | $(27,624,525) | | 1,606,019 | $4,413,472 |
| Service Class | 2,286,466 | 22,546,047 | | 8,261,713 | 64,026,040 |
| | (649,687) | $(5,078,478) | | 9,867,732 | $68,439,512 |
The fund is one of several mutual funds in which certain MFS funds may invest. The MFS funds do not invest in the underlying funds for the purpose of exercising management or control. At the end of the period, the MFS Moderate Allocation Portfolio, the MFS Growth Allocation Portfolio, and the MFS Conservative Allocation Portfolio were the owners of record of approximately 20%, 7%, and 3%, respectively, of the value of outstanding voting shares of the fund.
MFS Mid Cap Value Portfolio
Notes to Financial Statements (unaudited) - continued
(6) Line of Credit
The fund and certain other funds managed by MFS participate in a $1.25 billion unsecured committed line of credit of which $1 billion is reserved for use by the fund and certain other MFS U.S. funds. The line of credit is provided by a syndicate of banks under a credit agreement. Borrowings may be made for temporary financing needs. Interest is charged to each fund, based on its borrowings, generally at a rate equal to the highest of one month LIBOR, the Federal Funds Effective Rate and the Overnight Bank Funding Rate, plus an agreed upon spread. A commitment fee, based on the average daily, unused portion of the committed line of credit, is allocated among the participating funds. In addition, the fund and other funds managed by MFS have established unsecured uncommitted borrowing arrangements with certain banks for temporary financing needs. Interest is charged to each fund, based on its borrowings, at rates equal to customary reference rates plus an agreed upon spread. For the six months ended June 30, 2021, the fund’s commitment fee and interest expense were $806 and $0, respectively, and are included in “Miscellaneous” expense in the Statement of Operations.
(7) Investments in Affiliated Issuers
An affiliated issuer may be considered one in which the fund owns 5% or more of the outstanding voting securities, or a company which is under common control. For the purposes of this report, the following were affiliated issuers:
| Affiliated Issuers | Beginning
Value | Purchases | Sales
Proceeds | Realized
Gain
(Loss) | Change in
Unrealized
Appreciation or
Depreciation | Ending
Value |
| MFS Institutional Money Market Portfolio | $6,444,072 | $53,577,209 | $51,315,611 | $— | $— | $8,705,670 |
| Affiliated Issuers | Dividend
Income | Capital Gain
Distributions |
| MFS Institutional Money Market Portfolio | $1,959 | $— |
(8) Impacts of COVID-19
The pandemic related to the global spread of novel coronavirus disease (COVID-19), which was first detected in December 2019, has resulted in significant disruptions to global business activity and the global economy, as well as the economies of individual countries, the financial performance of individual companies and sectors, and the securities and commodities markets in general. Multiple surges in cases globally, the availability and widespread adoption of vaccines, and the emergence of variant strains of the virus continue to create uncertainty as to the future and long-term impacts resulting from the pandemic including impacts to the prices and liquidity of the fund's investments and the fund's performance.
MFS Mid Cap Value Portfolio
Statement Regarding Liquidity Risk Management Program
The fund has adopted and implemented a liquidity risk management program (the “Program”) as required by Rule 22e-4 under the Investment Company Act of 1940, as amended. The fund’s Board of Trustees (the “Board”) has designated MFS as the administrator of the Program. The Program is reasonably designed to assess and manage the liquidity risk of the fund. Liquidity risk is the risk that the fund could not meet requests to redeem shares issued by the fund without significant dilution of remaining investors' interests.
MFS provided a written report to the Board for consideration at its April 2021 meeting that addressed the operation of the Program and provided an assessment of the adequacy and effectiveness of the Program during the period from January 1, 2020 to December 31, 2020 (the “Covered Period”). The report concluded that during the Covered Period the Program had operated effectively and had adequately and effectively been implemented to assess and manage the fund’s liquidity risk. MFS also reported that there were no liquidity events that impacted the fund or its ability to timely meet redemptions without dilution to existing shareholders during the Covered Period.
There can be no assurance that the Program will achieve its objectives in the future. Further information on liquidity risk, and other principal risks to which an investment in the fund may be subject, can be found in the prospectus.
MFS Mid Cap Value Portfolio
Proxy Voting Policies and Information
MFS votes proxies on behalf of the fund pursuant to proxy voting policies and procedures that are available without charge, upon request, by calling 1-800-225-2606, by visiting mfs.com/proxyvoting, or by visiting the SEC’s Web site at http://www.sec.gov.
Information regarding how the fund voted proxies relating to portfolio securities during the most recent twelve-month period ended June 30 is available by August 31 of each year without charge by visiting mfs.com/proxyvoting, or by visiting the SEC’s Web site at http://www.sec.gov.
Quarterly Portfolio Disclosure
The fund files a complete schedule of portfolio holdings with the SEC for the first and third quarters of each fiscal year as an exhibit to its reports on Form N-PORT. The fund’s Form N-PORT reports are available on the SEC’s Web site at http://www.sec.gov. A shareholder can obtain the portfolio holdings report for the first and third quarters of the fund's fiscal year at mfs.com/vit3 by choosing the fund's name and then scrolling to the “Resources” section and clicking on the “Prospectus and Reports” tab.
FURTHER INFORMATION
From time to time, MFS may post important information about the fund or the MFS Funds on the MFS Web site (mfs.com). This information is available at https://www.mfs.com/announcements or at mfs.com/vit3 by choosing the fund's name and then scrolling to the “Resources” section and clicking on the “Announcements” tab, if any.
Information About Fund Contracts and Legal Claims
The fund has entered into contractual arrangements with an investment adviser, administrator, distributor, shareholder servicing agent, 529 program manager (if applicable), and custodian who each provide services to the fund. Unless expressly stated otherwise, shareholders are not parties to, or intended beneficiaries of these contractual arrangements, and these contractual arrangements are not intended to create any shareholder right to enforce them against the service providers or to seek any remedy under them against the service providers, either directly or on behalf of the fund.
Under the Trust’s By-Laws and Declaration of Trust, any claims asserted against or on behalf of the MFS Funds, including claims against Trustees and Officers, must be brought in state and federal courts located within the Commonwealth of Massachusetts.
Semiannual Report
June 30, 2021
MFS® Moderate
Allocation Portfolio
MFS® Variable Insurance Trust III
MFS® Moderate Allocation Portfolio
The report is prepared for the general information of contract owners. It is authorized for distribution to prospective investors only when preceded or accompanied by a current prospectus.
NOT FDIC INSURED • MAY LOSE VALUE • NO BANK OR CREDIT UNION GUARANTEE •
NOT A DEPOSIT • NOT INSURED BY ANY FEDERAL GOVERNMENT AGENCY OR NCUA/NCUSIF
MFS Moderate Allocation Portfolio
Dear Contract Owners:
After experiencing dramatic swings in the early days of the coronavirus pandemic, global equity markets have performed strongly over the past year. Though the speedy development of vaccines brightened the economic and market outlook, uncertainty remains as new variants of the virus appear, and questions persist over how fast vaccines can be made widely available in the developing world.
Global central banks have taken aggressive steps to cushion the economic and market fallout related to the virus, and governments are deploying unprecedented levels of fiscal support. Having passed a $1.9 trillion stimulus package in March, the U.S. Congress could approve additional stimulus later this year, some of it focused on infrastructure. Along with extraordinary government expenditures, pent-up consumer demand fueled a surge in economic activity as coronavirus restrictions were eased, pushing up inflation, at least temporarily. Markets initially reacted by pushing up yields on global government bonds, though some of the rate rise has since been corrected.
A spirited debate is underway among investors over whether the current price pressures will persist or prove to be temporary, caused by pandemic-induced bottlenecks. The policy measures put in place to counteract the pandemic's effects have helped build a supportive environment and are encouraging economic recovery; however, if markets disconnect from fundamentals, they can sow the seeds of instability. As such, recent dramatic increases in speculative trading in cryptocurrencies, special purpose acquisition companies (SPACs), and the like bear watching.
In the aftermath of the crisis, we could see societal changes as households, businesses, and governments adjust to a new reality, and any such alterations could affect the investment landscape. For investors, events such as the COVID-19 outbreak demonstrate the importance of having a deep understanding of company fundamentals, and we have built our global research platform to do just that.
At MFS®, we put our clients’ assets to work responsibly by carefully navigating the increasing complexity of global markets and economies. Guided by our long-term philosophy and adhering to our commitment to sustainable investing, we tune out the noise and aim to uncover what we believe are the best, most durable investment opportunities in the market. Our unique global investment platform combines collective expertise, long-term discipline, and thoughtful risk management to create sustainable value for investors.
Respectfully,
Michael W. Roberge
Chief Executive Officer
MFS Investment Management
August 13, 2021
The opinions expressed in this letter are subject to change and may not be relied upon for investment advice. No forecasts can be guaranteed.
MFS Moderate Allocation Portfolio
Portfolio target allocation
Portfolio actual allocation
Portfolio holdings
| MFS Total Return Bond Series | 12.0% |
| MFS Government Securities Portfolio | 9.9% |
| MFS Growth Series | 9.1% |
| MFS Value Series | 9.0% |
| MFS Research Series | 8.1% |
| MFS Mid Cap Growth Series | 7.0% |
| MFS Mid Cap Value Portfolio | 7.0% |
| MFS Research International Portfolio | 7.0% |
| MFS High Yield Portfolio | 5.0% |
| MFS Inflation-Adjusted Bond Portfolio | 5.0% |
| MFS Global Governments Portfolio | 4.8% |
| MFS Limited Maturity Portfolio | 4.0% |
| MFS International Intrinsic Value Portfolio | 3.0% |
| MFS International Growth Portfolio | 3.0% |
| MFS Global Real Estate Portfolio | 3.0% |
| MFS New Discovery Series | 1.5% |
| MFS New Discovery Value Portfolio | 1.5% |
| Cash & Cash Equivalents | 0.1% |
Cash & Cash Equivalents includes any cash, investments in money market funds, short-term securities, and other assets less liabilities. MFS endeavors to fully invest all MFS funds-of-funds in underlying funds on a daily basis. Any divergence from 0.0% in Cash & Cash Equivalents is typically due to the timing of fund subscriptions/redemptions and the settlement of subsequent investment in/divestment from the underlying funds. While the MFS funds-of-funds' subscriptions/redemptions are processed at the same day NAV of the underlying funds, a positive/negative cash balance will be reflected on the MFS funds-of-funds' Statements of Assets and Liabilities until the trades with the underlying funds settle, which is typically two business days. Please see the fund's Statement of Assets and Liabilities for additional information related to the fund’s cash position and other assets and liabilities.
Percentages are based on net assets as of June 30, 2021.
The portfolio is actively managed and current holdings may be different.
MFS Moderate Allocation Portfolio
Expense Table
Fund Expenses Borne by the Contract Holders during the Period,
January 1, 2021 through June 30, 2021
As a contract holder of the fund, you incur ongoing costs, including management fees; distribution and/or service (12b-1) fees; and other fund expenses. This example is intended to help you understand your ongoing costs (in dollars) of investing in the fund and to compare these costs with the ongoing costs of investing in other mutual funds.
In addition to the fees and expenses which the fund bears directly, the fund indirectly bears a pro rata share of the fees and expenses of the underlying funds in which the fund invests. Because the underlying funds have varied expenses and fee levels and the fund may own different proportions of the underlying funds at different times, the amount of fees and expenses incurred indirectly by the fund will vary. If these indirect costs were included, your costs would have been higher.
The example is based on an investment of $1,000 invested at the beginning of the period and held for the entire period January 1, 2021 through June 30, 2021.
Actual Expenses
The first line for each share class in the following table provides information about actual account values and actual expenses. You may use the information in this line, together with the amount you invested, to estimate the expenses that you paid over the period. Simply divide your account value by $1,000 (for example, an $8,600 account value divided by $1,000 = 8.6), then multiply the result by the number in the first line under the heading entitled “Expenses Paid During Period” to estimate the expenses you paid on your account during this period.
Hypothetical Example for Comparison Purposes
The second line for each share class in the following table provides information about hypothetical account values and hypothetical expenses based on the fund’s actual expense ratio and an assumed rate of return of 5% per year before expenses, which is not the fund’s actual return. The hypothetical account values and expenses may not be used to estimate the actual ending account balance or expenses you paid for the period. You may use this information to compare the ongoing costs of investing in the fund and other funds. To do so, compare this 5% hypothetical example with the 5% hypothetical examples that appear in the shareholder reports of the other funds.
Please note that the expenses shown in the table are meant to highlight the fund's ongoing costs only and do not take into account the fees and expenses imposed under the variable contracts through which your investment in the fund is made. Therefore, the second line for each share class in the table is useful in comparing ongoing costs associated with an investment in vehicles (such as the fund) which fund benefits under variable annuity and variable life insurance contracts and to qualified pension and retirement plans only, and will not help you determine the relative total costs of investing in the fund through variable annuity and variable life insurance contracts. If the fees and expenses imposed under the variable contracts were included, your costs would have been higher.
Share
Class | | Annualized
Expense
Ratio | Beginning
Account Value
1/01/21 | Ending
Account Value
6/30/21 | Expenses
Paid During
Period (p)
1/01/21-6/30/21 |
| Initial Class | Actual | 0.01% | $1,000.00 | $1,067.10 | $0.05 |
| Hypothetical (h) | 0.01% | $1,000.00 | $1,024.74 | $0.05 |
| Service Class | Actual | 0.26% | $1,000.00 | $1,065.66 | $1.33 |
| Hypothetical (h) | 0.26% | $1,000.00 | $1,023.51 | $1.30 |
| (h) | 5% class return per year before expenses. |
| (p) | “Expenses Paid During Period” are equal to each class’s annualized expense ratio, as shown above, multiplied by the average account value over the period, multiplied by 181/365 (to reflect the one-half year period). In addition to the fees and expenses which the fund bears directly, the fund indirectly bears a pro rata share of the fees and expenses of the underlying funds in which the fund invests. If these indirect costs were included, your costs would have been higher. |
MFS Moderate Allocation Portfolio
Portfolio of Investments − 6/30/21 (unaudited)
The Portfolio of Investments is a complete list of all securities owned by your fund. It is categorized by broad-based asset classes.
| Issuer | | | Shares/Par | Value ($) |
| Investment Companies (h) – 100.0% |
| Bond Funds – 40.7% |
| MFS Global Governments Portfolio - Initial Class | | | 6,125,452 | $ 68,053,772 |
| MFS Government Securities Portfolio - Initial Class | | | 11,062,137 | 139,936,037 |
| MFS High Yield Portfolio - Initial Class | | | 12,155,063 | 70,742,467 |
| MFS Inflation-Adjusted Bond Portfolio - Initial Class | | | 5,880,666 | 70,215,148 |
| MFS Limited Maturity Portfolio - Initial Class | | | 5,343,517 | 56,106,927 |
| MFS Total Return Bond Series - Initial Class | | | 12,094,108 | 169,196,578 |
| | | | | $574,250,929 |
| International Stock Funds – 13.0% |
| MFS International Growth Portfolio - Initial Class | | | 2,434,148 | $ 42,135,101 |
| MFS International Intrinsic Value Portfolio - Initial Class | | | 1,148,783 | 42,229,260 |
| MFS Research International Portfolio - Initial Class | | | 5,026,166 | 98,060,497 |
| | | | | $182,424,858 |
| Specialty Funds – 3.0% |
| MFS Global Real Estate Portfolio - Initial Class | | | 2,437,685 | $ 42,123,197 |
| Issuer | | | Shares/Par | Value ($) |
| Investment Companies (h) – continued |
| U.S. Stock Funds – 43.2% |
| MFS Growth Series - Initial Class | | | 1,542,055 | $ 128,499,413 |
| MFS Mid Cap Growth Series - Initial Class | | | 7,477,990 | 99,532,051 |
| MFS Mid Cap Value Portfolio - Initial Class | | | 9,612,522 | 98,336,098 |
| MFS New Discovery Series - Initial Class | | | 722,629 | 21,209,162 |
| MFS New Discovery Value Portfolio - Initial Class | | | 1,909,279 | 21,040,248 |
| MFS Research Series - Initial Class | | | 3,015,986 | 113,672,517 |
| MFS Value Series - Initial Class | | | 5,431,255 | 127,199,996 |
| | | | | $609,489,485 |
| Money Market Funds – 0.1% | |
| MFS Institutional Money Market Portfolio, 0.02% (v) | | | 1,515,916 | $ 1,515,916 |
| Total Investment Companies (Identified Cost, $1,019,328,227) | $ 1,409,804,385 |
| Other Assets, Less Liabilities – (0.0)% | | (83,136) |
| Net Assets – 100.0% | $ 1,409,721,249 |
| (h) | An affiliated issuer, which may be considered one in which the fund owns 5% or more of the outstanding voting securities, or a company which is under common control. At period end, the aggregate value of the fund’s investments in affiliated issuers was $1,409,804,385. | | | |
| (v) | Affiliated issuer that is available only to investment companies managed by MFS. The rate quoted for the MFS Institutional Money Market Portfolio is the annualized seven-day yield of the fund at period end. | | | |
See Notes to Financial Statements
MFS Moderate Allocation Portfolio
| Financial Statements | Statement of Assets and Liabilities (unaudited) |
This statement represents your fund’s balance sheet, which details the assets and liabilities comprising the total value of the fund.
| At 6/30/21Assets | |
| Investments in affiliated issuers, at value (identified cost, $1,019,328,227) | $1,409,804,385 |
| Receivables for | |
| Investments sold | 2,842,635 |
| Other assets | 4,829 |
| Total assets | $1,412,651,849 |
| Liabilities | |
| Payables for | |
| Fund shares reacquired | $2,842,634 |
| Payable to affiliates | |
| Administrative services fee | 96 |
| Shareholder servicing costs | 121 |
| Distribution and/or service fees | 19,245 |
| Accrued expenses and other liabilities | 68,504 |
| Total liabilities | $2,930,600 |
| Net assets | $1,409,721,249 |
| Net assets consist of | |
| Paid-in capital | $894,152,462 |
| Total distributable earnings (loss) | 515,568,787 |
| Net assets | $1,409,721,249 |
| Shares of beneficial interest outstanding | 95,435,089 |
| | Net assets | Shares
outstanding | Net asset value
per share |
| Initial Class | $9,537,759 | 644,757 | $14.79 |
| Service Class | 1,400,183,490 | 94,790,332 | 14.77 |
See Notes to Financial Statements
MFS Moderate Allocation Portfolio
| Financial Statements | Statement of Operations (unaudited) |
This statement describes how much your fund earned in investment income and accrued in expenses. It also describes any gains and/or losses generated by fund operations.
| Six months ended 6/30/21 | |
| Net investment income (loss) | |
| Income | |
| Dividends from affiliated issuers | $405 |
| Other | 174 |
| Total investment income | $579 |
| Expenses | |
| Distribution and/or service fees | $1,751,879 |
| Shareholder servicing costs | 11,620 |
| Administrative services fee | 8,679 |
| Independent Trustees' compensation | 10,330 |
| Custodian fee | 10,157 |
| Shareholder communications | 12,075 |
| Audit and tax fees | 20,380 |
| Legal fees | 5,117 |
| Miscellaneous | 17,469 |
| Total expenses | $1,847,706 |
| Net investment income (loss) | $(1,847,127) |
| Realized and unrealized gain (loss) | |
| Realized gain (loss) (identified cost basis) | |
| Investments in affiliated issuers | $46,845,241 |
| Change in unrealized appreciation or depreciation | |
| Affiliated issuers | $45,762,116 |
| Net realized and unrealized gain (loss) | $92,607,357 |
| Change in net assets from operations | $90,760,230 |
See Notes to Financial Statements
MFS Moderate Allocation Portfolio
| Financial Statements | Statements of Changes in Net Assets |
These statements describe the increases and/or decreases in net assets resulting from operations, any distributions, and any shareholder transactions.
| | Six months ended | Year ended |
| | 6/30/21
(unaudited) | 12/31/20 |
| Change in net assets | | |
| From operations | | |
| Net investment income (loss) | $(1,847,127) | $24,567,367 |
| Net realized gain (loss) | 46,845,241 | 61,595,792 |
| Net unrealized gain (loss) | 45,762,116 | 92,863,183 |
| Change in net assets from operations | $90,760,230 | $179,026,342 |
| Total distributions to shareholders | $— | $(112,743,754) |
| Change in net assets from fund share transactions | $(115,200,724) | $(53,557,712) |
| Total change in net assets | $(24,440,494) | $12,724,876 |
| Net assets | | |
| At beginning of period | 1,434,161,743 | 1,421,436,867 |
| At end of period | $1,409,721,249 | $1,434,161,743 |
See Notes to Financial Statements
MFS Moderate Allocation Portfolio
| Financial Statements | Financial Highlights |
The financial highlights table is intended to help you understand the fund's financial performance for the semiannual period and the past 5 fiscal years. Certain information reflects financial results for a single fund share. The total returns in the table represent the rate that an investor would have earned (or lost) on an investment in the fund share class (assuming reinvestment of all distributions) held for the entire period.
| Initial Class | Six months
ended | Year ended |
| | 6/30/21
(unaudited) | 12/31/20 | 12/31/19 | 12/31/18 | 12/31/17 | 12/31/16 |
| Net asset value, beginning of period | $13.86 | $13.23 | $11.95 | $13.33 | $12.25 | $12.48 |
| Income (loss) from investment operations | | | | | | |
| Net investment income (loss) (d)(l) | $(0.00)(w) | $0.29 | $0.30 | $0.30 | $0.26 | $0.24(c) |
| Net realized and unrealized gain (loss) | 0.93 | 1.51 | 2.28 | (0.74) | 1.60 | 0.55 |
| Total from investment operations | $0.93 | $1.80 | $2.58 | $(0.44) | $1.86 | $0.79 |
| Less distributions declared to shareholders | | | | | | |
| From net investment income | $— | $(0.32) | $(0.35) | $(0.29) | $(0.28) | $(0.37) |
| From net realized gain | — | (0.85) | (0.95) | (0.65) | (0.50) | (0.65) |
| Total distributions declared to shareholders | $— | $(1.17) | $(1.30) | $(0.94) | $(0.78) | $(1.02) |
| Net asset value, end of period (x) | $14.79 | $13.86 | $13.23 | $11.95 | $13.33 | $12.25 |
| Total return (%) (k)(s)(x) | 6.71(n) | 14.29 | 22.23 | (3.85) | 15.52 | 6.16(c) |
Ratios (%) (to average net assets)
and Supplemental data: | | | | | | |
| Expenses before expense reductions (f)(h) | 0.01(a) | 0.01 | 0.01 | 0.01 | 0.01 | 0.02(c) |
| Expenses after expense reductions (f)(h) | N/A | N/A | N/A | N/A | N/A | N/A |
| Net investment income (loss) (l) | (0.01)(a) | 2.24 | 2.28 | 2.29 | 1.98 | 1.95(c) |
| Portfolio turnover | 2(n) | 7 | 1 | 1 | 0(b) | 0(b) |
| Net assets at end of period (000 omitted) | $9,538 | $7,891 | $6,448 | $5,333 | $6,053 | $5,460 |
See Notes to Financial Statements
MFS Moderate Allocation Portfolio
Financial Highlights - continued
| Service Class | Six months
ended | Year ended |
| | 6/30/21
(unaudited) | 12/31/20 | 12/31/19 | 12/31/18 | 12/31/17 | 12/31/16 |
| Net asset value, beginning of period | $13.86 | $13.22 | $11.94 | $13.32 | $12.24 | $12.47 |
| Income (loss) from investment operations | | | | | | |
| Net investment income (loss) (d)(l) | $(0.02) | $0.24 | $0.26 | $0.27 | $0.22 | $0.21(c) |
| Net realized and unrealized gain (loss) | 0.93 | 1.54 | 2.28 | (0.75) | 1.60 | 0.54 |
| Total from investment operations | $0.91 | $1.78 | $2.54 | $(0.48) | $1.82 | $0.75 |
| Less distributions declared to shareholders | | | | | | |
| From net investment income | $— | $(0.29) | $(0.31) | $(0.25) | $(0.24) | $(0.33) |
| From net realized gain | — | (0.85) | (0.95) | (0.65) | (0.50) | (0.65) |
| Total distributions declared to shareholders | $— | $(1.14) | $(1.26) | $(0.90) | $(0.74) | $(0.98) |
| Net asset value, end of period (x) | $14.77 | $13.86 | $13.22 | $11.94 | $13.32 | $12.24 |
| Total return (%) (k)(s)(x) | 6.57(n) | 14.08 | 21.90 | (4.13) | 15.23 | 5.87(c) |
Ratios (%) (to average net assets)
and Supplemental data: | | | | | | |
| Expenses before expense reductions (f)(h) | 0.26(a) | 0.26 | 0.26 | 0.26 | 0.26 | 0.27(c) |
| Expenses after expense reductions (f)(h) | N/A | N/A | N/A | N/A | N/A | N/A |
| Net investment income (loss) (l) | (0.26)(a) | 1.81 | 1.98 | 2.02 | 1.66 | 1.71(c) |
| Portfolio turnover | 2(n) | 7 | 1 | 1 | 0(b) | 0(b) |
| Net assets at end of period (000 omitted) | $1,400,183 | $1,426,271 | $1,414,989 | $1,364,874 | $1,686,004 | $1,721,397 |
| (a) | Annualized. |
| (b) | Less than 0.5%. |
| (c) | Amount reflects a one-time reimbursement of expenses by the custodian (or former custodian) without which net investment income and performance would be lower and expenses would be higher. |
| (d) | Per share data is based on average shares outstanding. |
| (f) | Ratios do not reflect reductions from fees paid indirectly, if applicable. |
| (h) | In addition to the fees and expenses which the fund bears directly, the fund indirectly bears a pro rata share of the fees and expenses of the underlying affiliated funds in which the fund invests. Accordingly, the expense ratio for the fund reflects only those fees and expenses borne directly by the fund. Because the underlying affiliated funds have varied expense and fee levels and the fund may own different proportions of the underlying affiliated funds at different times, the amount of fees and expenses incurred indirectly by the fund will vary. |
| (k) | The total return does not reflect expenses that apply to separate accounts. Inclusion of these charges would reduce the total return figures for all periods shown. |
| (l) | Recognition of net investment income by the fund may be affected by the timing of the declaration of dividends by the underlying affiliated funds in which the fund invests and for interim net investment income ratios, the actual annual net investment income ratio may differ. The ratios and per share amounts do not include net investment income of the underlying affiliated funds in which the fund invests. |
| (n) | Not annualized. |
| (s) | From time to time the fund may receive proceeds from litigation settlements, without which performance would be lower. |
| (w) | Per share amount was less than $0.01. |
| (x) | The net asset values and total returns have been calculated on net assets which include adjustments made in accordance with U.S. generally accepted accounting principles required at period end for financial reporting purposes. |
See Notes to Financial Statements
MFS Moderate Allocation Portfolio
Notes to Financial Statements (unaudited)
(1) Business and Organization
MFS Moderate Allocation Portfolio (the fund) is a diversified series of MFS Variable Insurance Trust III (the trust). The trust is organized as a Delaware statutory trust and is registered under the Investment Company Act of 1940, as amended, as an open-end management investment company. The shareholders of each series of the trust are separate accounts of insurance companies, which offer variable annuity and/or life insurance products, and qualified retirement and pension plans.
The fund is an investment company and accordingly follows the investment company accounting and reporting guidance of the Financial Accounting Standards Board (FASB) Accounting Standards Codification Topic 946 Financial Services - Investment Companies.
(2) Significant Accounting Policies
General — The preparation of financial statements in conformity with U.S. generally accepted accounting principles requires management to make estimates and assumptions that affect the reported amounts of assets and liabilities, and disclosure of contingent assets and liabilities at the date of the financial statements and the reported amounts of increases and decreases in net assets from operations during the reporting period. Actual results could differ from those estimates. In the preparation of these financial statements, management has evaluated subsequent events occurring after the date of the fund’s Statement of Assets and Liabilities through the date that the financial statements were issued.
The fund is a “fund of funds”, which invests the majority of its assets in other MFS mutual funds (hereafter referred to as “underlying affiliated funds” or “underlying funds”), which may have different fiscal year ends than the funds. The underlying funds, in turn, may engage in a number of investment techniques and practices, which involve certain risks. Certain underlying funds invest their portfolio in high-yield securities rated below investment grade. Investments in below investment grade quality securities can involve a substantially greater risk of default or can already be in default, and their values can decline significantly. Below investment grade quality securities tend to be more sensitive to adverse news about the issuer, or the market or economy in general, than higher quality debt instruments. Certain underlying funds invest a significant portion of their assets in asset-backed and/or mortgage-backed securities. For these securities, the value of the debt instrument also depends on the credit quality and adequacy of the underlying assets or collateral as well as whether there is a security interest in the underlying assets or collateral. Enforcing rights, if any, against the underlying assets or collateral may be difficult. U.S. Government securities not supported as to the payment of principal or interest by the U.S. Treasury, such as those issued by Fannie Mae, Freddie Mac, and the Federal Home Loan Banks, are subject to greater credit risk than are U.S. Government securities supported by the U.S. Treasury, such as those issued by Ginnie Mae. Certain underlying funds invest in foreign securities, including securities of emerging market issuers. Investments in foreign securities are vulnerable to the effects of changes in the relative values of the local currency and the U.S. dollar and to the effects of changes in each country’s market, economic, industrial, political, regulatory, geopolitical, environmental, public health, and other conditions. Investments in emerging markets can involve additional and greater risks than the risks associated with investments in developed foreign markets. Emerging markets can have less developed markets, greater custody and operational risk, less developed legal, regulatory, and accounting, and auditing systems, and greater political, social, and economic instability than developed markets.
The accounting policies of the underlying funds in which the fund invests are outlined in the underlying funds’ shareholder reports, which are available without charge by calling 1-800-225-2606, at mfs.com and on the Securities and Exchange Commission (SEC) web site at http://www.sec.gov. The underlying funds' shareholder reports are not covered by this report.
Certain of the fund's investments, derivatives, debt and other contracts may be based on reference interest rates such as the London Interbank Offered Rate (“LIBOR”). In 2017, the regulatory authority that oversees financial services firms in the United Kingdom announced plans to transition away from LIBOR by the end of 2021. In March 2021, the administrator of LIBOR announced the extension of the publication of the more commonly used U.S. dollar LIBOR settings to the end of June 2023. Although the full impacts of the transition away from LIBOR are not fully known, the transition may result in, among other things, an increase in volatility or illiquidity of the markets for instruments that currently rely on LIBOR to determine interest rates and this could have an adverse impact on the fund's performance. With respect to the fund's accounting for investments, derivatives, debt and other contracts that undergo reference rate-related modifications as a result of the transition, management will rely upon the relief provided by FASB Codification Topic 848 – Reference Rate Reform (Topic 848). The guidance in Topic 848 permits the fund to disregard the GAAP accounting requirements around certain contract modifications resulting from the LIBOR transition such that for contracts considered in scope, the fund can account for those modified contracts as a continuation of the existing contracts.
Investment Valuations — Open-end investment companies (underlying funds) are generally valued at their net asset value per share. The investments of underlying funds managed by the adviser are valued as described below. For purposes of this policy disclosure, “fund” also refers to the underlying funds in which the fund-of-funds invests.
MFS Moderate Allocation Portfolio
Notes to Financial Statements (unaudited) - continued
Equity securities, including restricted equity securities and equity securities sold short, are generally valued at the last sale or official closing price on their primary market or exchange as provided by a third-party pricing service. Equity securities, for which there were no sales reported that day, are generally valued at the last quoted daily bid quotation on their primary market or exchange as provided by a third-party pricing service. Equity securities sold short, for which there were no sales reported that day, are generally valued at the last quoted daily ask quotation on their primary market or exchange as provided by a third-party pricing service. Debt instruments and floating rate loans, including restricted debt instruments, are generally valued at an evaluated or composite bid as provided by a third-party pricing service. Debt instruments sold short are generally valued at an evaluated or composite mean as provided by a third-party pricing service. Short-term instruments with a maturity at issuance of 60 days or less may be valued at amortized cost, which approximates market value. Exchange-traded options are generally valued at the last sale or official closing price on their primary exchange as provided by a third-party pricing service. Exchange-traded options for which there were no sales reported that day are generally valued at the last daily bid quotation on their primary exchange as provided by a third-party pricing service. For put options, the position may be valued at the last daily ask quotation if there are no trades reported during the day. Options not traded on an exchange are generally valued at a broker/dealer bid quotation. Foreign currency options are generally valued at valuations provided by a third-party pricing service. Futures contracts are generally valued at last posted settlement price on their primary exchange as provided by a third-party pricing service. Futures contracts for which there were no trades that day for a particular position are generally valued at the closing bid quotation on their primary exchange as provided by a third-party pricing service. Forward foreign currency exchange contracts are generally valued at the mean of bid and asked prices for the time period interpolated from rates provided by a third-party pricing service for proximate time periods. Swap agreements are generally valued using valuations provided by a third-party pricing service, which for cleared swaps includes an evaluation of any trading activity at the clearinghouses. Open-end investment companies are generally valued at net asset value per share. Securities and other assets generally valued on the basis of information from a third-party pricing service may also be valued at a broker/dealer bid quotation. In determining values, third-party pricing services can utilize both transaction data and market information such as yield, quality, coupon rate, maturity, type of issue, trading characteristics, and other market data. The values of foreign securities and other assets and liabilities expressed in foreign currencies are converted to U.S. dollars using the mean of bid and asked prices for rates provided by a third-party pricing service.
The Board of Trustees has delegated primary responsibility for determining or causing to be determined the value of the fund’s investments (including any fair valuation) to the adviser pursuant to valuation policies and procedures approved by the Board. If the adviser determines that reliable market quotations are not readily available, investments are valued at fair value as determined in good faith by the adviser in accordance with such procedures under the oversight of the Board of Trustees. Under the fund’s valuation policies and procedures, market quotations are not considered to be readily available for most types of debt instruments and floating rate loans and many types of derivatives. These investments are generally valued at fair value based on information from third-party pricing services. In addition, investments may be valued at fair value if the adviser determines that an investment’s value has been materially affected by events occurring after the close of the exchange or market on which the investment is principally traded (such as foreign exchange or market) and prior to the determination of the fund’s net asset value, or after the halt of trading of a specific security where trading does not resume prior to the close of the exchange or market on which the security is principally traded. Events that occur after foreign markets close (such as developments in foreign markets and significant movements in the U.S. markets) and prior to the determination of the fund’s net asset value may be deemed to have a material effect on the value of securities traded in foreign markets. Accordingly, the fund’s foreign equity securities may often be valued at fair value. The adviser generally relies on third-party pricing services or other information (such as the correlation with price movements of similar securities in the same or other markets; the type, cost and investment characteristics of the security; the business and financial condition of the issuer; and trading and other market data) to assist in determining whether to fair value and at what value to fair value an investment. The value of an investment for purposes of calculating the fund’s net asset value can differ depending on the source and method used to determine value. When fair valuation is used, the value of an investment used to determine the fund’s net asset value may differ from quoted or published prices for the same investment. There can be no assurance that the fund could obtain the fair value assigned to an investment if it were to sell the investment at the same time at which the fund determines its net asset value per share.
Various inputs are used in determining the value of the fund's assets or liabilities. These inputs are categorized into three broad levels. In certain cases, the inputs used to measure fair value may fall into different levels of the fair value hierarchy. In such cases, an investment's level within the fair value hierarchy is based on the lowest level of input that is significant to the fair value measurement. The fund's assessment of the significance of a particular input to the fair value measurement in its entirety requires judgment, and considers factors specific to the investment. Level 1 includes unadjusted quoted prices in active markets for identical assets or liabilities. Level 2 includes other significant observable market-based inputs (including quoted prices for similar securities, interest rates, prepayment speed, and credit risk). Level 3 includes unobservable inputs, which may include the adviser's own assumptions in determining the fair value of investments. The following is a summary of the levels used as of June 30, 2021 in valuing the fund's assets or liabilities:
MFS Moderate Allocation Portfolio
Notes to Financial Statements (unaudited) - continued
| Financial Instruments | Level 1 | Level 2 | Level 3 | Total |
| Mutual Funds | $1,409,804,385 | $— | $— | $1,409,804,385 |
For further information regarding security characteristics, see the Portfolio of Investments. Please refer to the underlying funds’ shareholder reports for further information regarding the levels used in valuing the underlying funds’ assets or liabilities.
Derivatives — The fund does not invest in derivatives directly. The fund does invest in underlying funds that may use derivatives primarily to increase or decrease exposure to a particular market or segment of the market, or security, to increase or decrease interest rate or currency exposure, or as alternatives to direct investments. Derivatives are used for hedging or non-hedging purposes. While hedging can reduce or eliminate losses, it can also reduce or eliminate gains. When the underlying funds use derivatives as an investment to increase market exposure, or for hedging purposes, gains and losses from derivative instruments may be substantially greater than the derivative’s original cost.
Indemnifications — Under the fund's organizational documents, its officers and Trustees may be indemnified against certain liabilities and expenses arising out of the performance of their duties to the fund. Additionally, in the normal course of business, the fund enters into agreements with service providers that may contain indemnification clauses. The fund's maximum exposure under these agreements is unknown as this would involve future claims that may be made against the fund that have not yet occurred.
Investment Transactions and Income — Investment transactions are recorded on the trade date. Interest income is recorded on the accrual basis. All premium and discount is amortized or accreted for financial statement purposes in accordance with U.S. generally accepted accounting principles. Distributions of income and capital gains from the underlying funds are recorded on the ex-dividend date. Recognition of net investment income by the fund is affected by the timing of the declaration of distributions by the underlying funds in which the fund invests. In determining the net gain or loss on securities sold, the cost of securities is determined on the identified cost basis.
The fund and/or the underlying funds may receive proceeds from litigation settlements. Any proceeds received from litigation involving portfolio holdings are reflected in the Statement of Operations in realized gain/loss if the security has been disposed of by the fund or in unrealized gain/loss if the security is still held by the fund. Any other proceeds from litigation not related to portfolio holdings are reflected as other income in the Statement of Operations.
Tax Matters and Distributions — The fund intends to qualify as a regulated investment company, as defined under Subchapter M of the Internal Revenue Code, and to distribute all of its taxable income, including realized capital gains. As a result, no provision for federal income tax is required. The fund’s federal tax returns, when filed, will remain subject to examination by the Internal Revenue Service for a three year period. Management has analyzed the fund’s tax positions taken on federal and state tax returns for all open tax years and does not believe that there are any uncertain tax positions that require recognition of a tax liability.
Distributions to shareholders are recorded on the ex-dividend date. Income and capital gain distributions are determined in accordance with income tax regulations, which may differ from U.S. generally accepted accounting principles. Certain capital accounts in the financial statements are periodically adjusted for permanent differences in order to reflect their tax character. These adjustments have no impact on net assets or net asset value per share. Temporary differences which arise from recognizing certain items of income, expense, gain or loss in different periods for financial statement and tax purposes will reverse at some time in the future.
Book/tax differences primarily relate to wash sale loss deferrals.
The tax character of distributions declared to shareholders for the last fiscal year is as follows:
| | Year ended
12/31/20 |
| Ordinary income (including any short-term capital gains) | $31,753,653 |
| Long-term capital gains | 80,990,101 |
| Total distributions | $112,743,754 |
The federal tax cost and the tax basis components of distributable earnings were as follows:
MFS Moderate Allocation Portfolio
Notes to Financial Statements (unaudited) - continued
| As of 6/30/21 | |
| Cost of investments | $1,026,331,603 |
| Gross appreciation | 387,740,846 |
| Gross depreciation | (4,268,064) |
| Net unrealized appreciation (depreciation) | $383,472,782 |
| As of 12/31/20 | |
| Undistributed ordinary income | 31,405,717 |
| Undistributed long-term capital gain | 55,692,174 |
| Net unrealized appreciation (depreciation) | 337,710,666 |
The aggregate cost above includes prior fiscal year end tax adjustments, if applicable.
Multiple Classes of Shares of Beneficial Interest — The fund offers multiple classes of shares, which differ in their respective distribution and/or service fees. The fund's income, realized and unrealized gain (loss), and common expenses are allocated to shareholders based on the daily net assets of each class. Dividends are declared separately for each class. Differences in per share dividend rates are generally due to differences in separate class expenses. The fund’s distributions declared to shareholders as reported in the Statements of Changes in Net Assets are presented by class as follows:
| | Six months
ended
6/30/21 | | Year
ended
12/31/20 |
| Initial Class | $— | | $623,766 |
| Service Class | — | | 112,119,988 |
| Total | $— | | $112,743,754 |
(3) Transactions with Affiliates
Investment Adviser — The fund has an investment advisory agreement with MFS to provide overall investment management and related administrative services and facilities to the fund. MFS receives no compensation under this agreement; however MFS receives management fees from the underlying MFS funds.
The investment adviser has agreed in writing to pay a portion of the fund’s operating expenses, excluding distribution and/or service fees, interest, taxes, extraordinary expenses, brokerage and transaction costs, and investment-related expenses such as fees and expenses associated with investments in investment companies and other similar investment vehicles such that fund operating expenses do not exceed 0.20% annually of the fund’s average daily net assets. This written agreement will continue until modified by the fund’s Board of Trustees, but such agreement will continue at least until April 30, 2023. For the six months ended June 30, 2021, the fund’s actual operating expenses did not exceed the limit and therefore, the investment adviser did not pay any portion of the fund’s expenses related to this agreement.
In addition to the fees and expenses which the fund bears directly, the fund indirectly bears a pro rata share of the fees and expenses of the underlying funds in which the fund invests. Accordingly, the expense ratio for the fund reflects only those fees and expenses borne directly by the fund.
Distributor — MFS Fund Distributors, Inc. (MFD), a wholly-owned subsidiary of MFS, is the distributor of shares of the fund. The Trustees have adopted a distribution plan for the Service Class shares pursuant to Rule 12b-1 under the Investment Company Act of 1940.
The fund's distribution plan provides that the fund will pay MFD distribution and/or service fees equal to 0.25% per annum of its average daily net assets attributable to Service Class shares as partial consideration for services performed and expenses incurred by MFD and financial intermediaries (including participating insurance companies that invest in the fund to fund variable annuity and variable life insurance contracts, sponsors of qualified retirement and pension plans that invest in the fund, and affiliates of these participating insurance companies and plan sponsors) in connection with the sale and distribution of the Service Class shares. MFD may subsequently pay all, or a portion, of the distribution and/or service fees to financial intermediaries.
Shareholder Servicing Agent — MFS Service Center, Inc. (MFSC), a wholly-owned subsidiary of MFS, receives a fee from the fund for its services as shareholder servicing agent. For the six months ended June 30, 2021, the fee was $11,534, which equated to 0.0016% annually of the fund's average daily net assets. MFSC also receives reimbursement from the fund for out-of-pocket expenses paid by MFSC on behalf of the fund. For the six months ended June 30, 2021, these costs amounted to $86.
MFS Moderate Allocation Portfolio
Notes to Financial Statements (unaudited) - continued
Administrator — MFS provides certain financial, legal, shareholder communications, compliance, and other administrative services to the fund. Under an administrative services agreement, the fund reimburses MFS the costs incurred to provide these services. The fund pays an annual fixed amount of $17,500. The administrative services fee incurred for the six months ended June 30, 2021 was equivalent to an annual effective rate of 0.0012% of the fund's average daily net assets.
Trustees’ and Officers’ Compensation — The fund pays compensation to independent Trustees in the form of a retainer, attendance fees, and additional compensation to Board and Committee chairpersons. The fund does not pay compensation directly to Trustees or officers of the fund who are also officers of the investment adviser, all of whom receive remuneration from MFS for their services to the fund. Certain officers and Trustees of the fund are officers or directors of MFS, MFD, and MFSC.
Other — The fund invests in the MFS Institutional Money Market Portfolio which is managed by MFS and seeks current income consistent with preservation of capital and liquidity. This money market fund does not pay a management fee to MFS but does incur investment and operating costs.
(4) Portfolio Securities
For the six months ended June 30, 2021, purchases and sales of shares of underlying funds, excluding the MFS Institutional Money Market Portfolio, aggregated $28,860,022 and $145,884,794, respectively.
(5) Shares of Beneficial Interest
The fund's Declaration of Trust permits the Trustees to issue an unlimited number of full and fractional shares of beneficial interest. Transactions in fund shares were as follows:
| | Six months ended
6/30/21 | | Year ended
12/31/20 |
| | Shares | Amount | | Shares | Amount |
| Shares sold | | | | | |
| Initial Class | 91,714 | $1,320,516 | | 73,652 | $1,010,328 |
| Service Class | 107,762 | 1,543,651 | | 671,675 | 7,815,165 |
| | 199,476 | $2,864,167 | | 745,327 | $8,825,493 |
Shares issued to shareholders
in reinvestment of distributions | | | | | |
| Initial Class | — | $— | | 48,354 | $623,766 |
| Service Class | — | — | | 8,684,740 | 112,119,988 |
| | — | $— | | 8,733,094 | $112,743,754 |
| Shares reacquired | | | | | |
| Initial Class | (16,217) | $(230,875) | | (40,060) | $(529,008) |
| Service Class | (8,252,464) | (117,834,016) | | (13,418,043) | (174,597,951) |
| | (8,268,681) | $(118,064,891) | | (13,458,103) | $(175,126,959) |
| Net change | | | | | |
| Initial Class | 75,497 | $1,089,641 | | 81,946 | $1,105,086 |
| Service Class | (8,144,702) | (116,290,365) | | (4,061,628) | (54,662,798) |
| | (8,069,205) | $(115,200,724) | | (3,979,682) | $(53,557,712) |
(6) Line of Credit
The fund and certain other funds managed by MFS participate in a $1.25 billion unsecured committed line of credit of which $1 billion is reserved for use by the fund and certain other MFS U.S. funds. The line of credit is provided by a syndicate of banks under a credit agreement. Borrowings may be made for temporary financing needs. Interest is charged to each fund, based on its borrowings, generally at a rate equal to the highest of one month LIBOR, the Federal Funds Effective Rate and the Overnight Bank Funding Rate, plus an agreed upon spread. A commitment fee, based on the average daily, unused portion of the committed line of credit, is allocated among the participating funds. In addition, the fund and other funds managed by MFS have established unsecured uncommitted borrowing arrangements with certain banks for temporary financing needs. Interest is charged to each fund, based on its borrowings, at rates equal to customary reference rates plus an agreed upon spread. For the six months ended June 30, 2021, the fund’s commitment fee and interest expense were $2,577 and $0, respectively, and are included in “Miscellaneous” expense in the Statement of Operations.
MFS Moderate Allocation Portfolio
Notes to Financial Statements (unaudited) - continued
(7) Investments in Affiliated Issuers
An affiliated issuer may be considered one in which the fund owns 5% or more of the outstanding voting securities, or a company which is under common control. For the purposes of this report, the following were affiliated issuers:
| Affiliated Issuers | Beginning
Value | Purchases | Sales
Proceeds | Realized
Gain
(Loss) | Change in
Unrealized
Appreciation or
Depreciation | Ending
Value |
| MFS Global Governments Portfolio | $69,066,438 | $2,697,164 | $161,222 | $(1,216) | $(3,547,392) | $68,053,772 |
| MFS Global Real Estate Portfolio | 43,906,947 | — | 8,000,704 | 2,102,337 | 4,114,617 | 42,123,197 |
| MFS Government Securities Portfolio | 132,926,692 | 10,747,539 | 1,436,782 | (85,311) | (2,216,101) | 139,936,037 |
| MFS Growth Series | 131,079,855 | 985,032 | 19,486,366 | 11,230,144 | 4,690,748 | 128,499,413 |
| MFS High Yield Portfolio | 70,565,854 | 1,058,235 | 2,600,490 | (173,901) | 1,892,769 | 70,742,467 |
| MFS Inflation-Adjusted Bond Portfolio | 70,575,265 | 1,638,777 | 1,296,408 | 292 | (702,778) | 70,215,148 |
| MFS Institutional Money Market Portfolio | 1,530,642 | 1,771,967 | 1,786,693 | — | — | 1,515,916 |
| MFS International Growth Portfolio | 44,246,260 | 198 | 5,299,246 | 1,628,436 | 1,559,453 | 42,135,101 |
| MFS International Intrinsic Value Portfolio | 44,088,152 | 686 | 3,932,687 | 2,090,704 | (17,595) | 42,229,260 |
| MFS Limited Maturity Portfolio | 54,051,512 | 3,251,027 | 1,465,275 | (1,455) | 271,118 | 56,106,927 |
| MFS Mid Cap Growth Series | 104,633,358 | 697 | 10,320,951 | 4,731,953 | 486,994 | 99,532,051 |
| MFS Mid Cap Value Portfolio | 104,033,955 | 8,088 | 23,624,423 | 3,279,977 | 14,638,501 | 98,336,098 |
| MFS New Discovery Series | 23,013,558 | 120 | 3,673,142 | 1,712,004 | 156,622 | 21,209,162 |
| MFS New Discovery Value Portfolio | 22,913,234 | 407 | 6,966,771 | 1,039,950 | 4,053,428 | 21,040,248 |
| MFS Research International Portfolio | 103,540,989 | 29 | 12,883,288 | 3,870,966 | 3,531,801 | 98,060,497 |
| MFS Research Series | 117,254,115 | — | 19,353,661 | 7,513,424 | 8,258,639 | 113,672,517 |
| MFS Total Return Bond Series | 164,602,721 | 8,466,812 | 2,342,155 | (4,533) | (1,526,267) | 169,196,578 |
| MFS Value Series | 132,206,979 | 5,210 | 23,041,222 | 7,911,470 | 10,117,559 | 127,199,996 |
| | $1,434,236,526 | $30,631,988 | $147,671,486 | $46,845,241 | $45,762,116 | $1,409,804,385 |
| Affiliated Issuers | Dividend
Income | Capital Gain
Distributions |
| MFS Global Governments Portfolio | $— | $— |
| MFS Global Real Estate Portfolio | — | — |
| MFS Government Securities Portfolio | — | — |
| MFS Growth Series | — | — |
| MFS High Yield Portfolio | — | — |
| MFS Inflation-Adjusted Bond Portfolio | — | — |
| MFS Institutional Money Market Portfolio | 405 | — |
| MFS International Growth Portfolio | — | — |
| MFS International Intrinsic Value Portfolio | — | — |
| MFS Limited Maturity Portfolio | — | — |
| MFS Mid Cap Growth Series | — | — |
| MFS Mid Cap Value Portfolio | — | — |
| MFS New Discovery Series | — | — |
| MFS New Discovery Value Portfolio | — | — |
| MFS Research International Portfolio | — | — |
| MFS Research Series | — | — |
| MFS Total Return Bond Series | — | — |
| MFS Value Series | — | — |
| | $405 | $— |
MFS Moderate Allocation Portfolio
Notes to Financial Statements (unaudited) - continued
(8) Impacts of COVID-19
The pandemic related to the global spread of novel coronavirus disease (COVID-19), which was first detected in December 2019, has resulted in significant disruptions to global business activity and the global economy, as well as the economies of individual countries, the financial performance of individual companies and sectors, and the securities and commodities markets in general. Multiple surges in cases globally, the availability and widespread adoption of vaccines, and the emergence of variant strains of the virus continue to create uncertainty as to the future and long-term impacts resulting from the pandemic including impacts to the prices and liquidity of the fund's investments and the fund's performance.
MFS Moderate Allocation Portfolio
Statement Regarding Liquidity Risk Management Program
The fund has adopted and implemented a liquidity risk management program (the “Program”) as required by Rule 22e-4 under the Investment Company Act of 1940, as amended. The fund’s Board of Trustees (the “Board”) has designated MFS as the administrator of the Program. The Program is reasonably designed to assess and manage the liquidity risk of the fund. Liquidity risk is the risk that the fund could not meet requests to redeem shares issued by the fund without significant dilution of remaining investors' interests.
MFS provided a written report to the Board for consideration at its April 2021 meeting that addressed the operation of the Program and provided an assessment of the adequacy and effectiveness of the Program during the period from January 1, 2020 to December 31, 2020 (the “Covered Period”). The report concluded that during the Covered Period the Program had operated effectively and had adequately and effectively been implemented to assess and manage the fund’s liquidity risk. MFS also reported that there were no liquidity events that impacted the fund or its ability to timely meet redemptions without dilution to existing shareholders during the Covered Period.
There can be no assurance that the Program will achieve its objectives in the future. Further information on liquidity risk, and other principal risks to which an investment in the fund may be subject, can be found in the prospectus.
MFS Moderate Allocation Portfolio
Proxy Voting Policies and Information
MFS votes proxies on behalf of the fund pursuant to proxy voting policies and procedures that are available without charge, upon request, by calling 1-800-225-2606, by visiting mfs.com/proxyvoting, or by visiting the SEC’s Web site at http://www.sec.gov.
Information regarding how the fund voted proxies relating to portfolio securities during the most recent twelve-month period ended June 30 is available by August 31 of each year without charge by visiting mfs.com/proxyvoting, or by visiting the SEC’s Web site at http://www.sec.gov.
Quarterly Portfolio Disclosure
The fund files a complete schedule of portfolio holdings with the SEC for the first and third quarters of each fiscal year as an exhibit to its reports on Form N-PORT. The fund’s Form N-PORT reports are available on the SEC’s Web site at http://www.sec.gov. A shareholder can obtain the portfolio holdings report for the first and third quarters of the fund's fiscal year at mfs.com/vit3 by choosing the fund's name and then scrolling to the “Resources” section and clicking on the “Prospectus and Reports” tab.
FURTHER INFORMATION
From time to time, MFS may post important information about the fund or the MFS Funds on the MFS Web site (mfs.com). This information is available at https://www.mfs.com/announcements or at mfs.com/vit3 by choosing the fund's name and then scrolling to the “Resources” section and clicking on the “Announcements” tab, if any.
Information About Fund Contracts and Legal Claims
The fund has entered into contractual arrangements with an investment adviser, administrator, distributor, shareholder servicing agent, 529 program manager (if applicable), and custodian who each provide services to the fund. Unless expressly stated otherwise, shareholders are not parties to, or intended beneficiaries of these contractual arrangements, and these contractual arrangements are not intended to create any shareholder right to enforce them against the service providers or to seek any remedy under them against the service providers, either directly or on behalf of the fund.
Under the Trust’s By-Laws and Declaration of Trust, any claims asserted against or on behalf of the MFS Funds, including claims against Trustees and Officers, must be brought in state and federal courts located within the Commonwealth of Massachusetts.
Semiannual Report
June 30, 2021
MFS® New Discovery
Value Portfolio
MFS® Variable Insurance Trust III
MFS® New Discovery Value Portfolio
The report is prepared for the general information of contract owners. It is authorized for distribution to prospective investors only when preceded or accompanied by a current prospectus.
NOT FDIC INSURED • MAY LOSE VALUE • NO BANK OR CREDIT UNION GUARANTEE •
NOT A DEPOSIT • NOT INSURED BY ANY FEDERAL GOVERNMENT AGENCY OR NCUA/NCUSIF
MFS New Discovery Value Portfolio
Dear Contract Owners:
After experiencing dramatic swings in the early days of the coronavirus pandemic, global equity markets have performed strongly over the past year. Though the speedy development of vaccines brightened the economic and market outlook, uncertainty remains as new variants of the virus appear, and questions persist over how fast vaccines can be made widely available in the developing world.
Global central banks have taken aggressive steps to cushion the economic and market fallout related to the virus, and governments are deploying unprecedented levels of fiscal support. Having passed a $1.9 trillion stimulus package in March, the U.S. Congress could approve additional stimulus later this year, some of it focused on infrastructure. Along with extraordinary government expenditures, pent-up consumer demand fueled a surge in economic activity as coronavirus restrictions were eased, pushing up inflation, at least temporarily. Markets initially reacted by pushing up yields on global government bonds, though some of the rate rise has since been corrected.
A spirited debate is underway among investors over whether the current price pressures will persist or prove to be temporary, caused by pandemic-induced bottlenecks. The policy measures put in place to counteract the pandemic's effects have helped build a supportive environment and are encouraging economic recovery; however, if markets disconnect from fundamentals, they can sow the seeds of instability. As such, recent dramatic increases in speculative trading in cryptocurrencies, special purpose acquisition companies (SPACs), and the like bear watching.
In the aftermath of the crisis, we could see societal changes as households, businesses, and governments adjust to a new reality, and any such alterations could affect the investment landscape. For investors, events such as the COVID-19 outbreak demonstrate the importance of having a deep understanding of company fundamentals, and we have built our global research platform to do just that.
At MFS®, we put our clients’ assets to work responsibly by carefully navigating the increasing complexity of global markets and economies. Guided by our long-term philosophy and adhering to our commitment to sustainable investing, we tune out the noise and aim to uncover what we believe are the best, most durable investment opportunities in the market. Our unique global investment platform combines collective expertise, long-term discipline, and thoughtful risk management to create sustainable value for investors.
Respectfully,
Michael W. Roberge
Chief Executive Officer
MFS Investment Management
August 13, 2021
The opinions expressed in this letter are subject to change and may not be relied upon for investment advice. No forecasts can be guaranteed.
MFS New Discovery Value Portfolio
Portfolio structure
Top ten holdings
| SLM Corp. | 1.9% |
| Berry Global, Inc. | 1.6% |
| Skechers USA, Inc., “A” | 1.6% |
| Textainer Group Holdings Ltd. | 1.5% |
| Element Solutions, Inc. | 1.5% |
| Umpqua Holdings Corp. | 1.5% |
| UMB Financial Corp. | 1.4% |
| Cathay General Bancorp, Inc. | 1.4% |
| Graphic Packaging Holding Co. | 1.4% |
| LKQ Corp. | 1.4% |
GICS equity sectors (g)
| Financials | 23.9% |
| Industrials | 14.9% |
| Consumer Discretionary | 14.2% |
| Materials | 11.6% |
| Real Estate | 7.9% |
| Health Care | 6.6% |
| Information Technology | 6.4% |
| Energy | 5.5% |
| Utilities | 4.6% |
| Consumer Staples | 2.4% |
| Communication Services | 0.5% |
| (g) | The Global Industry Classification Standard (GICS®) was developed by and/or is the exclusive property of MSCI, Inc. and S&P Global Market Intelligence Inc. (“S&P Global Market Intelligence”). GICS is a service mark of MSCI and S&P Global Market Intelligence and has been licensed for use by MFS. MFS has applied its own internal sector/industry classification methodology for equity securities and non-equity securities that are unclassified by GICS. |
Cash & Cash Equivalents includes any cash, investments in money market funds, short-term securities, and other assets less liabilities. Please see the Statement of Assets and Liabilities for additional information related to the fund’s cash position and other assets and liabilities.
Percentages are based on net assets as of June 30, 2021.
The portfolio is actively managed and current holdings may be different.
MFS New Discovery Value Portfolio
Expense Table
Fund Expenses Borne by the Contract Holders during the Period,
January 1, 2021 through June 30, 2021
As a contract holder of the fund, you incur ongoing costs, including management fees; distribution and/or service (12b-1) fees; and other fund expenses. This example is intended to help you understand your ongoing costs (in dollars) of investing in the fund and to compare these costs with the ongoing costs of investing in other mutual funds.
The example is based on an investment of $1,000 invested at the beginning of the period and held for the entire period January 1, 2021 through June 30, 2021.
Actual Expenses
The first line for each share class in the following table provides information about actual account values and actual expenses. You may use the information in this line, together with the amount you invested, to estimate the expenses that you paid over the period. Simply divide your account value by $1,000 (for example, an $8,600 account value divided by $1,000 = 8.6), then multiply the result by the number in the first line under the heading entitled “Expenses Paid During Period” to estimate the expenses you paid on your account during this period.
Hypothetical Example for Comparison Purposes
The second line for each share class in the following table provides information about hypothetical account values and hypothetical expenses based on the fund’s actual expense ratio and an assumed rate of return of 5% per year before expenses, which is not the fund’s actual return. The hypothetical account values and expenses may not be used to estimate the actual ending account balance or expenses you paid for the period. You may use this information to compare the ongoing costs of investing in the fund and other funds. To do so, compare this 5% hypothetical example with the 5% hypothetical examples that appear in the shareholder reports of the other funds.
Please note that the expenses shown in the table are meant to highlight the fund's ongoing costs only and do not take into account the fees and expenses imposed under the variable contracts through which your investment in the fund is made. Therefore, the second line for each share class in the table is useful in comparing ongoing costs associated with an investment in vehicles (such as the fund) which fund benefits under variable annuity and variable life insurance contracts and to qualified pension and retirement plans only, and will not help you determine the relative total costs of investing in the fund through variable annuity and variable life insurance contracts. If the fees and expenses imposed under the variable contracts were included, your costs would have been higher.
Share
Class | | Annualized
Expense
Ratio | Beginning
Account Value
1/01/21 | Ending
Account Value
6/30/21 | Expenses
Paid During
Period (p)
1/01/21-6/30/21 |
| Initial Class | Actual | 0.88% | $1,000.00 | $1,256.56 | $4.92 |
| Hypothetical (h) | 0.88% | $1,000.00 | $1,020.43 | $4.41 |
| Service Class | Actual | 1.13% | $1,000.00 | $1,256.06 | $6.32 |
| Hypothetical (h) | 1.13% | $1,000.00 | $1,019.19 | $5.66 |
| (h) | 5% class return per year before expenses. |
| (p) | “Expenses Paid During Period” are equal to each class's annualized expense ratio, as shown above, multiplied by the average account value over the period, multiplied by 181/365 (to reflect the one-half year period). |
MFS New Discovery Value Portfolio
Portfolio of Investments − 6/30/21 (unaudited)
The Portfolio of Investments is a complete list of all securities owned by your fund. It is categorized by broad-based asset classes.
| Issuer | | | Shares/Par | Value ($) |
| Common Stocks – 98.5% |
| Aerospace & Defense – 3.4% | |
| CACI International, Inc., “A” (a) | | 2,222 | $ 566,877 |
| KBR, Inc. | | 18,442 | 703,562 |
| PAE, Inc. (a) | | 61,461 | 547,003 |
| | | | | $1,817,442 |
| Apparel Manufacturers – 2.6% | |
| PVH Corp. (a) | | 5,225 | $ 562,158 |
| Skechers USA, Inc., “A” (a) | | 16,818 | 838,041 |
| | | | | $1,400,199 |
| Automotive – 3.4% | |
| LKQ Corp. (a) | | 14,787 | $ 727,816 |
| Methode Electronics, Inc. | | 12,529 | 616,552 |
| Stoneridge, Inc. (a) | | 7,382 | 217,769 |
| Visteon Corp. (a) | | 2,283 | 276,106 |
| | | | | $1,838,243 |
| Business Services – 2.0% | |
| Paya, Inc. (a) | | 34,033 | $ 375,044 |
| Stamps.com, Inc. (a) | | 2,409 | 482,498 |
| WNS (Holdings) Ltd., ADR (a) | | 2,639 | 210,777 |
| | | | | $1,068,319 |
| Chemicals – 1.5% | |
| Element Solutions, Inc. | | 33,512 | $ 783,511 |
| Computer Software – 0.9% | |
| 8x8, Inc. (a) | | 9,104 | $ 252,727 |
| ACI Worldwide, Inc. (a) | | 5,747 | 213,444 |
| | | | | $466,171 |
| Computer Software - Systems – 1.7% | |
| Softchoice Corp. (a) | | 23,293 | $ 413,208 |
| Verint Systems, Inc. (a) | | 10,722 | 483,241 |
| | | | | $896,449 |
| Construction – 1.5% | |
| Armstrong World Industries, Inc. | | 2,236 | $ 239,833 |
| GMS, Inc. (a) | | 4,212 | 202,766 |
| Toll Brothers, Inc. | | 6,591 | 381,026 |
| | | | | $823,625 |
| Consumer Products – 2.5% | |
| Energizer Holdings, Inc. | | 7,464 | $ 320,803 |
| Newell Brands, Inc. | | 12,829 | 352,413 |
| Prestige Consumer Healthcare, Inc. (a) | | 12,956 | 675,007 |
| | | | | $1,348,223 |
| Consumer Services – 2.0% | |
| BrightView Holdings, Inc. (a) | | 13,678 | $ 220,490 |
| Grand Canyon Education, Inc. (a) | | 6,960 | 626,191 |
| Regis Corp. (a) | | 24,270 | 227,167 |
| | | | | $1,073,848 |
| Issuer | | | Shares/Par | Value ($) |
| Common Stocks – continued |
| Containers – 5.2% | |
| Berry Global, Inc. (a) | | 12,892 | $ 840,816 |
| Graphic Packaging Holding Co. | | 41,788 | 758,034 |
| Owens Corning | | 2,890 | 282,931 |
| Pactiv Evergreen, Inc. | | 33,850 | 510,120 |
| Silgan Holdings, Inc. | | 9,460 | 392,590 |
| | | | | $2,784,491 |
| Electrical Equipment – 2.5% | |
| nVent Electric PLC | | 14,263 | $ 445,576 |
| TriMas Corp. (a) | | 15,829 | 480,094 |
| WESCO International, Inc. (a) | | 4,015 | 412,822 |
| | | | | $1,338,492 |
| Electronics – 1.6% | |
| nLIGHT, Inc. (a) | | 5,613 | $ 203,640 |
| Plexus Corp. (a) | | 7,208 | 658,883 |
| | | | | $862,523 |
| Energy - Independent – 2.6% | |
| Devon Energy Corp. | | 11,047 | $ 322,462 |
| Magnolia Oil & Gas Corp., “A” (a) | | 41,684 | 651,521 |
| Viper Energy Partners LP | | 20,829 | 392,210 |
| | | | | $1,366,193 |
| Engineering - Construction – 1.6% | |
| APi Group, Inc. (a) | | 28,136 | $ 587,761 |
| Quanta Services, Inc. | | 2,748 | 248,886 |
| | | | | $836,647 |
| Entertainment – 0.5% | |
| IMAX Corp. (a) | | 12,610 | $ 271,115 |
| Food & Beverages – 1.8% | |
| Hostess Brands, Inc. (a) | | 30,204 | $ 489,003 |
| Nomad Foods Ltd. (a) | | 16,239 | 459,076 |
| | | | | $948,079 |
| Gaming & Lodging – 1.9% | |
| International Game Technology PLC (a) | | 28,037 | $ 671,767 |
| Wyndham Hotels & Resorts, Inc. | | 4,981 | 360,076 |
| | | | | $1,031,843 |
| Insurance – 4.0% | |
| CNO Financial Group, Inc. | | 23,960 | $ 565,935 |
| Everest Re Group Ltd. | | 1,627 | 410,020 |
| Hanover Insurance Group, Inc. | | 3,431 | 465,381 |
| Selective Insurance Group, Inc. | | 5,395 | 437,804 |
| SiriusPoint Ltd. (a) | | 23,666 | 238,317 |
| | | | | $2,117,457 |
| Leisure & Toys – 1.1% | |
| Brunswick Corp. | | 3,328 | $ 331,535 |
| Funko, Inc., “A” (a) | | 11,148 | 237,230 |
| | | | | $568,765 |
MFS New Discovery Value Portfolio
Portfolio of Investments (unaudited) – continued
| Issuer | | | Shares/Par | Value ($) |
| Common Stocks – continued |
| Machinery & Tools – 1.2% | |
| Enerpac Tool Group Corp. | | 6,910 | $ 183,944 |
| Regal Beloit Corp. | | 1,466 | 195,726 |
| Rexnord Corp. | | 5,450 | 272,718 |
| | | | | $652,388 |
| Medical & Health Technology & Services – 3.7% | |
| ICON PLC (a) | | 249 | $ 51,471 |
| PRA Health Sciences, Inc. (a) | | 4,018 | 663,814 |
| Premier, Inc., “A” | | 15,636 | 543,976 |
| Syneos Health, Inc. (a) | | 7,778 | 696,053 |
| | | | | $1,955,314 |
| Medical Equipment – 1.3% | |
| Agiliti Health, Inc. (a) | | 20,193 | $ 441,621 |
| Quidel Corp. (a) | | 1,988 | 254,702 |
| | | | | $696,323 |
| Metals & Mining – 1.2% | |
| Arconic Corp. (a) | | 13,070 | $ 465,553 |
| Kaiser Aluminum Corp. | | 1,641 | 202,647 |
| | | | | $668,200 |
| Natural Gas - Distribution – 2.2% | |
| New Jersey Resources Corp. | | 13,163 | $ 520,860 |
| South Jersey Industries, Inc. | | 25,159 | 652,373 |
| | | | | $1,173,233 |
| Natural Gas - Pipeline – 1.2% | |
| Plains GP Holdings LP | | 55,335 | $ 660,700 |
| Oil Services – 1.7% | |
| ChampionX Corp. (a) | | 26,382 | $ 676,698 |
| Frank's International N.V. (a) | | 72,701 | 220,284 |
| | | | | $896,982 |
| Other Banks & Diversified Financials – 21.2% | |
| Air Lease Corp. | | 6,948 | $ 290,009 |
| Bank of Hawaii Corp. | | 6,285 | 529,323 |
| Brookline Bancorp, Inc. | | 32,104 | 479,955 |
| Cathay General Bancorp, Inc. | | 19,269 | 758,428 |
| East West Bancorp, Inc. | | 7,084 | 507,852 |
| Element Fleet Management Corp. | | 47,612 | 555,396 |
| Encore Capital Group, Inc. (a) | | 15,055 | 713,456 |
| First Hawaiian, Inc. | | 24,350 | 690,079 |
| Hanmi Financial Corp. | | 18,795 | 358,233 |
| Lakeland Financial Corp. | | 7,291 | 449,417 |
| Prosperity Bancshares, Inc. | | 8,562 | 614,752 |
| Sandy Spring Bancorp, Inc. | | 6,325 | 279,122 |
| Signature Bank | | 1,649 | 405,077 |
| SLM Corp. | | 49,318 | 1,032,719 |
| Textainer Group Holdings Ltd. (a) | | 23,265 | 785,659 |
| Triton International Ltd. of Bermuda | | 5,676 | 297,082 |
| UMB Financial Corp. | | 8,226 | 765,511 |
| Umpqua Holdings Corp. | | 42,348 | 781,321 |
| Wintrust Financial Corp. | | 6,939 | 524,797 |
| Zions Bancorp NA | | 9,360 | 494,770 |
| | | | | $ 11,312,958 |
| Issuer | | | Shares/Par | Value ($) |
| Common Stocks – continued |
| Pharmaceuticals – 0.4% | |
| Organon & Co. (a) | | 6,783 | $ 205,254 |
| Pollution Control – 0.6% | |
| U.S. Ecology, Inc. (a) | | 8,553 | $ 320,909 |
| Real Estate – 9.2% | |
| Brixmor Property Group, Inc., REIT | | 18,115 | $ 414,652 |
| Broadstone Net Lease, Inc. | | 20,492 | 479,718 |
| Douglas Emmett, Inc., REIT | | 6,263 | 210,562 |
| Empire State Realty Trust, REIT, “A” | | 36,927 | 443,124 |
| Industrial Logistics Properties Trust, REIT | | 24,577 | 642,443 |
| Lexington Realty Trust, REIT | | 39,967 | 477,606 |
| Life Storage, Inc., REIT | | 4,676 | 501,968 |
| National Storage Affiliates Trust, REIT | | 6,650 | 336,224 |
| Office Properties Income Trust, REIT | | 11,492 | 336,830 |
| STAG Industrial, Inc., REIT | | 9,419 | 352,553 |
| Two Harbors Investment Corp., REIT | | 94,644 | 715,509 |
| | | | | $4,911,189 |
| Specialty Chemicals – 4.9% | |
| Atotech, Ltd. (a) | | 18,070 | $ 461,327 |
| Avient Corp. | | 13,702 | 673,590 |
| Axalta Coating Systems Ltd. (a) | | 7,870 | 239,956 |
| Compass Minerals International, Inc. | | 6,788 | 402,257 |
| Diversey Holdings Ltd. (a) | | 24,971 | 447,231 |
| Univar Solutions, Inc. (a) | | 16,118 | 392,957 |
| | | | | $2,617,318 |
| Specialty Stores – 2.4% | |
| Urban Outfitters, Inc. (a) | | 15,963 | $ 657,995 |
| Zumiez, Inc. (a) | | 12,848 | 629,423 |
| | | | | $1,287,418 |
| Trucking – 0.6% | |
| Schneider National, Inc. | | 13,624 | $ 296,594 |
| Utilities - Electric Power – 2.4% | |
| Black Hills Corp. | | 10,264 | $ 673,626 |
| Portland General Electric Co. | | 13,617 | 627,472 |
| | | | | $1,301,098 |
| Total Common Stocks (Identified Cost, $32,256,309) | | $ 52,597,513 |
| Investment Companies (h) – 1.4% |
| Money Market Funds – 1.4% | |
| MFS Institutional Money Market Portfolio, 0.02% (v) (Identified Cost, $753,682) | | | 753,682 | $ 753,682 |
| Other Assets, Less Liabilities – 0.1% | | 47,204 |
| Net Assets – 100.0% | $ 53,398,399 |
MFS New Discovery Value Portfolio
Portfolio of Investments (unaudited) – continued
| (a) | Non-income producing security. | | | |
| (h) | An affiliated issuer, which may be considered one in which the fund owns 5% or more of the outstanding voting securities, or a company which is under common control. At period end, the aggregate values of the fund's investments in affiliated issuers and in unaffiliated issuers were $753,682 and $52,597,513, respectively. | | | |
| (v) | Affiliated issuer that is available only to investment companies managed by MFS. The rate quoted for the MFS Institutional Money Market Portfolio is the annualized seven-day yield of the fund at period end. | | | |
| The following abbreviations are used in this report and are defined: |
| ADR | American Depositary Receipt |
| REIT | Real Estate Investment Trust |
See Notes to Financial Statements
MFS New Discovery Value Portfolio
| Financial Statements | Statement of Assets and Liabilities (unaudited) |
This statement represents your fund’s balance sheet, which details the assets and liabilities comprising the total value of the fund.
| At 6/30/21Assets | |
| Investments in unaffiliated issuers, at value (identified cost, $32,256,309) | $52,597,513 |
| Investments in affiliated issuers, at value (identified cost, $753,682) | 753,682 |
| Receivables for | |
| Fund shares sold | 16,267 |
| Dividends | 65,493 |
| Receivable from investment adviser | 9,516 |
| Other assets | 430 |
| Total assets | $53,442,901 |
| Liabilities | |
| Payables for | |
| Fund shares reacquired | $4,994 |
| Payable to affiliates | |
| Administrative services fee | 98 |
| Shareholder servicing costs | 24 |
| Distribution and/or service fees | 180 |
| Accrued expenses and other liabilities | 39,206 |
| Total liabilities | $44,502 |
| Net assets | $53,398,399 |
| Net assets consist of | |
| Paid-in capital | $27,439,410 |
| Total distributable earnings (loss) | 25,958,989 |
| Net assets | $53,398,399 |
| Shares of beneficial interest outstanding | 4,858,812 |
| | Net assets | Shares
outstanding | Net asset value
per share |
| Initial Class | $40,217,340 | 3,648,520 | $11.02 |
| Service Class | 13,181,059 | 1,210,292 | 10.89 |
See Notes to Financial Statements
MFS New Discovery Value Portfolio
| Financial Statements | Statement of Operations (unaudited) |
This statement describes how much your fund earned in investment income and accrued in expenses. It also describes any gains and/or losses generated by fund operations.
| Six months ended 6/30/21 | |
| Net investment income (loss) | |
| Income | |
| Dividends | $408,891 |
| Other | 3,791 |
| Dividends from affiliated issuers | 123 |
| Income on securities loaned | 91 |
| Foreign taxes withheld | (738) |
| Total investment income | $412,158 |
| Expenses | |
| Management fee | $237,845 |
| Distribution and/or service fees | 14,339 |
| Shareholder servicing costs | 2,548 |
| Administrative services fee | 8,878 |
| Independent Trustees' compensation | 1,533 |
| Custodian fee | 1,971 |
| Shareholder communications | 2,523 |
| Audit and tax fees | 28,010 |
| Legal fees | 172 |
| Miscellaneous | 12,083 |
| Total expenses | $309,902 |
| Reduction of expenses by investment adviser | (62,799) |
| Net expenses | $247,103 |
| Net investment income (loss) | $165,055 |
| Realized and unrealized gain (loss) | |
| Realized gain (loss) (identified cost basis) | |
| Unaffiliated issuers | $7,458,634 |
| Foreign currency | 988 |
| Net realized gain (loss) | $7,459,622 |
| Change in unrealized appreciation or depreciation | |
| Unaffiliated issuers | $4,582,189 |
| Translation of assets and liabilities in foreign currencies | (5) |
| Net unrealized gain (loss) | $4,582,184 |
| Net realized and unrealized gain (loss) | $12,041,806 |
| Change in net assets from operations | $12,206,861 |
See Notes to Financial Statements
MFS New Discovery Value Portfolio
| Financial Statements | Statements of Changes in Net Assets |
These statements describe the increases and/or decreases in net assets resulting from operations, any distributions, and any shareholder transactions.
| | Six months ended | Year ended |
| | 6/30/21
(unaudited) | 12/31/20 |
| Change in net assets | | |
| From operations | | |
| Net investment income (loss) | $165,055 | $412,717 |
| Net realized gain (loss) | 7,459,622 | (1,738,583) |
| Net unrealized gain (loss) | 4,582,184 | 6,776,692 |
| Change in net assets from operations | $12,206,861 | $5,450,826 |
| Total distributions to shareholders | $— | $(4,690,161) |
| Change in net assets from fund share transactions | $(13,856,853) | $3,672,055 |
| Total change in net assets | $(1,649,992) | $4,432,720 |
| Net assets | | |
| At beginning of period | 55,048,391 | 50,615,671 |
| At end of period | $53,398,399 | $55,048,391 |
See Notes to Financial Statements
MFS New Discovery Value Portfolio
| Financial Statements | Financial Highlights |
The financial highlights table is intended to help you understand the fund's financial performance for the semiannual period and the past 5 fiscal years. Certain information reflects financial results for a single fund share. The total returns in the table represent the rate that an investor would have earned (or lost) on an investment in the fund share class (assuming reinvestment of all distributions) held for the entire period.
| Initial Class | Six months
ended | Year ended |
| | 6/30/21
(unaudited) | 12/31/20 | 12/31/19 | 12/31/18 | 12/31/17 | 12/31/16 |
| Net asset value, beginning of period | $8.77 | $9.33 | $8.45 | $11.13 | $10.79 | $9.44 |
| Income (loss) from investment operations | | | | | | |
| Net investment income (loss) (d) | $0.03 | $0.07 | $0.10 | $0.08 | $0.05 | $0.09(c) |
| Net realized and unrealized gain (loss) | 2.22 | 0.14 | 2.46 | (0.94) | 1.44 | 2.34 |
| Total from investment operations | $2.25 | $0.21 | $2.56 | $(0.86) | $1.49 | $2.43 |
| Less distributions declared to shareholders | | | | | | |
| From net investment income | $— | $(0.08) | $(0.08) | $(0.06) | $(0.11) | $(0.10) |
| From net realized gain | — | (0.69) | (1.60) | (1.76) | (1.04) | (0.98) |
| Total distributions declared to shareholders | $— | $(0.77) | $(1.68) | $(1.82) | $(1.15) | $(1.08) |
| Net asset value, end of period (x) | $11.02 | $8.77 | $9.33 | $8.45 | $11.13 | $10.79 |
| Total return (%) (k)(r)(s)(x) | 25.66(n) | 4.19 | 33.65 | (10.78) | 15.24 | 27.03(c) |
Ratios (%) (to average net assets)
and Supplemental data: | | | | | | |
| Expenses before expense reductions (f) | 1.12(a) | 1.14 | 1.13 | 1.11 | 1.08 | 1.05(c) |
| Expenses after expense reductions (f) | 0.88(a) | 0.88 | 0.88 | 0.88 | 0.88 | 0.87(c) |
| Net investment income (loss) | 0.67(a) | 0.90 | 1.02 | 0.72 | 0.48 | 0.91(c) |
| Portfolio turnover | 22(n) | 84 | 38 | 55 | 52 | 48 |
| Net assets at end of period (000 omitted) | $40,217 | $44,834 | $41,098 | $36,665 | $45,470 | $46,635 |
See Notes to Financial Statements
MFS New Discovery Value Portfolio
Financial Highlights - continued
| Service Class | Six months
ended | Year ended |
| | 6/30/21
(unaudited) | 12/31/20 | 12/31/19 | 12/31/18 | 12/31/17 | 12/31/16 |
| Net asset value, beginning of period | $8.67 | $9.25 | $8.38 | $11.05 | $10.72 | $9.38 |
| Income (loss) from investment operations | | | | | | |
| Net investment income (loss) (d) | $0.02 | $0.05 | $0.07 | $0.05 | $0.03 | $0.06(c) |
| Net realized and unrealized gain (loss) | 2.20 | 0.12 | 2.45 | (0.93) | 1.43 | 2.33 |
| Total from investment operations | $2.22 | $0.17 | $2.52 | $(0.88) | $1.46 | $2.39 |
| Less distributions declared to shareholders | | | | | | |
| From net investment income | $— | $(0.06) | $(0.05) | $(0.03) | $(0.09) | $(0.07) |
| From net realized gain | — | (0.69) | (1.60) | (1.76) | (1.04) | (0.98) |
| Total distributions declared to shareholders | $— | $(0.75) | $(1.65) | $(1.79) | $(1.13) | $(1.05) |
| Net asset value, end of period (x) | $10.89 | $8.67 | $9.25 | $8.38 | $11.05 | $10.72 |
| Total return (%) (k)(r)(s)(x) | 25.61(n) | 3.73 | 33.43 | (11.00) | 15.01 | 26.73(c) |
Ratios (%) (to average net assets)
and Supplemental data: | | | | | | |
| Expenses before expense reductions (f) | 1.37(a) | 1.39 | 1.38 | 1.36 | 1.33 | 1.30(c) |
| Expenses after expense reductions (f) | 1.13(a) | 1.13 | 1.13 | 1.13 | 1.13 | 1.12(c) |
| Net investment income (loss) | 0.46(a) | 0.66 | 0.78 | 0.45 | 0.24 | 0.66(c) |
| Portfolio turnover | 22(n) | 84 | 38 | 55 | 52 | 48 |
| Net assets at end of period (000 omitted) | $13,181 | $10,215 | $9,518 | $8,387 | $10,907 | $8,376 |
| (a) | Annualized. |
| (c) | Amount reflects a one-time reimbursement of expenses by the custodian (or former custodian) without which net investment income and performance would be lower and expenses would be higher. |
| (d) | Per share data is based on average shares outstanding. |
| (f) | Ratios do not reflect reductions from fees paid indirectly, if applicable. |
| (k) | The total return does not reflect expenses that apply to separate accounts. Inclusion of these charges would reduce the total return figures for all periods shown. |
| (n) | Not annualized. |
| (r) | Certain expenses have been reduced without which performance would have been lower. |
| (s) | From time to time the fund may receive proceeds from litigation settlements, without which performance would be lower. |
| (x) | The net asset values and total returns have been calculated on net assets which include adjustments made in accordance with U.S. generally accepted accounting principles required at period end for financial reporting purposes. |
See Notes to Financial Statements
MFS New Discovery Value Portfolio
Notes to Financial Statements (unaudited)
(1) Business and Organization
MFS New Discovery Value Portfolio (the fund) is a diversified series of MFS Variable Insurance Trust III (the trust). The trust is organized as a Delaware statutory trust and is registered under the Investment Company Act of 1940, as amended, as an open-end management investment company. The shareholders of each series of the trust are separate accounts of insurance companies, which offer variable annuity and/or life insurance products, and qualified retirement and pension plans.
The fund is an investment company and accordingly follows the investment company accounting and reporting guidance of the Financial Accounting Standards Board (FASB) Accounting Standards Codification Topic 946 Financial Services - Investment Companies.
(2) Significant Accounting Policies
General — The preparation of financial statements in conformity with U.S. generally accepted accounting principles requires management to make estimates and assumptions that affect the reported amounts of assets and liabilities, and disclosure of contingent assets and liabilities at the date of the financial statements and the reported amounts of increases and decreases in net assets from operations during the reporting period. Actual results could differ from those estimates. In the preparation of these financial statements, management has evaluated subsequent events occurring after the date of the fund’s Statement of Assets and Liabilities through the date that the financial statements were issued. The fund will generally focus on securities of small size companies which may be more volatile than those of larger companies.
Certain of the fund's investments, derivatives, debt and other contracts may be based on reference interest rates such as the London Interbank Offered Rate (“LIBOR”). In 2017, the regulatory authority that oversees financial services firms in the United Kingdom announced plans to transition away from LIBOR by the end of 2021. In March 2021, the administrator of LIBOR announced the extension of the publication of the more commonly used U.S. dollar LIBOR settings to the end of June 2023. Although the full impacts of the transition away from LIBOR are not fully known, the transition may result in, among other things, an increase in volatility or illiquidity of the markets for instruments that currently rely on LIBOR to determine interest rates and this could have an adverse impact on the fund's performance. With respect to the fund's accounting for investments, derivatives, debt and other contracts that undergo reference rate-related modifications as a result of the transition, management will rely upon the relief provided by FASB Codification Topic 848 – Reference Rate Reform (Topic 848). The guidance in Topic 848 permits the fund to disregard the GAAP accounting requirements around certain contract modifications resulting from the LIBOR transition such that for contracts considered in scope, the fund can account for those modified contracts as a continuation of the existing contracts.
Balance Sheet Offsetting — The fund's accounting policy with respect to balance sheet offsetting is that, absent an event of default by the counterparty or a termination of the agreement, the International Swaps and Derivatives Association (ISDA) Master Agreement, or similar agreement, does not result in an offset of reported amounts of financial assets and financial liabilities in the Statement of Assets and Liabilities across transactions between the fund and the applicable counterparty. The fund's right to setoff may be restricted or prohibited by the bankruptcy or insolvency laws of the particular jurisdiction to which a specific master netting agreement counterparty is subject. Balance sheet offsetting disclosures, to the extent applicable to the fund, have been included in the fund’s Significant Accounting Policies note under the captions for each of the fund’s in-scope financial instruments and transactions.
Investment Valuations — Equity securities, including restricted equity securities, are generally valued at the last sale or official closing price on their primary market or exchange as provided by a third-party pricing service. Equity securities, for which there were no sales reported that day, are generally valued at the last quoted daily bid quotation on their primary market or exchange as provided by a third-party pricing service. Short-term instruments with a maturity at issuance of 60 days or less may be valued at amortized cost, which approximates market value. Open-end investment companies are generally valued at net asset value per share.
Securities and other assets generally valued on the basis of information from a third-party pricing service may also be valued at a broker/dealer bid quotation. In determining values, third-party pricing services can utilize both transaction data and market information such as yield, quality, coupon rate, maturity, type of issue, trading characteristics, and other market data. The values of foreign securities and other assets and liabilities expressed in foreign currencies are converted to U.S. dollars using the mean of bid and asked prices for rates provided by a third-party pricing service.
The Board of Trustees has delegated primary responsibility for determining or causing to be determined the value of the fund’s investments (including any fair valuation) to the adviser pursuant to valuation policies and procedures approved by the Board. If the adviser determines that reliable market quotations are not readily available, investments are valued at fair value as determined in good faith by the adviser in accordance with such procedures under the oversight of the Board of Trustees. Under the fund’s valuation policies and procedures, market quotations are not considered to be readily available for most types of debt instruments and floating rate loans and many types of derivatives. These investments are generally valued at fair value based on information from third-party pricing services. In addition, investments may be valued at fair value if the adviser determines that an investment’s value
MFS New Discovery Value Portfolio
Notes to Financial Statements (unaudited) - continued
has been materially affected by events occurring after the close of the exchange or market on which the investment is principally traded (such as foreign exchange or market) and prior to the determination of the fund’s net asset value, or after the halt of trading of a specific security where trading does not resume prior to the close of the exchange or market on which the security is principally traded. Events that occur after foreign markets close (such as developments in foreign markets and significant movements in the U.S. markets) and prior to the determination of the fund’s net asset value may be deemed to have a material effect on the value of securities traded in foreign markets. Accordingly, the fund’s foreign equity securities may often be valued at fair value. The adviser generally relies on third-party pricing services or other information (such as the correlation with price movements of similar securities in the same or other markets; the type, cost and investment characteristics of the security; the business and financial condition of the issuer; and trading and other market data) to assist in determining whether to fair value and at what value to fair value an investment. The value of an investment for purposes of calculating the fund’s net asset value can differ depending on the source and method used to determine value. When fair valuation is used, the value of an investment used to determine the fund’s net asset value may differ from quoted or published prices for the same investment. There can be no assurance that the fund could obtain the fair value assigned to an investment if it were to sell the investment at the same time at which the fund determines its net asset value per share.
Various inputs are used in determining the value of the fund's assets or liabilities. These inputs are categorized into three broad levels. In certain cases, the inputs used to measure fair value may fall into different levels of the fair value hierarchy. In such cases, an investment's level within the fair value hierarchy is based on the lowest level of input that is significant to the fair value measurement. The fund's assessment of the significance of a particular input to the fair value measurement in its entirety requires judgment, and considers factors specific to the investment. Level 1 includes unadjusted quoted prices in active markets for identical assets or liabilities. Level 2 includes other significant observable market-based inputs (including quoted prices for similar securities, interest rates, prepayment speed, and credit risk). Level 3 includes unobservable inputs, which may include the adviser's own assumptions in determining the fair value of investments. The following is a summary of the levels used as of June 30, 2021 in valuing the fund's assets or liabilities:
| Financial Instruments | Level 1 | Level 2 | Level 3 | Total |
| Equity Securities | $52,597,513 | $— | $— | $52,597,513 |
| Mutual Funds | 753,682 | — | — | 753,682 |
| Total | $53,351,195 | $— | $— | $53,351,195 |
For further information regarding security characteristics, see the Portfolio of Investments.
Foreign Currency Translation — Purchases and sales of foreign investments, income, and expenses are converted into U.S. dollars based upon currency exchange rates prevailing on the respective dates of such transactions or on the reporting date for foreign denominated receivables and payables. Gains and losses attributable to foreign currency exchange rates on sales of securities are recorded for financial statement purposes as net realized gains and losses on investments. Gains and losses attributable to foreign exchange rate movements on receivables, payables, income and expenses are recorded for financial statement purposes as foreign currency transaction gains and losses. That portion of both realized and unrealized gains and losses on investments that results from fluctuations in foreign currency exchange rates is not separately disclosed.
Security Loans — Under its Securities Lending Agency Agreement with the fund, State Street Bank and Trust Company, as lending agent, loans the securities of the fund to certain qualified institutions (the “Borrowers”) approved by the fund. Security loans can be terminated at the discretion of either the lending agent or the fund and the related securities must be returned within the earlier of the standard trade settlement period for such securities or within three business days. The loans are collateralized by cash and/or U.S. Treasury and federal agency obligations in an amount typically at least equal to the market value of the securities loaned. On loans collateralized by cash, the cash collateral is invested in a money market fund. The market value of the loaned securities is determined at the close of business of the fund and any additional required collateral is delivered to the fund on the next business day. The lending agent provides the fund with indemnification against Borrower default. In the event of Borrower default, the lending agent will, for the benefit of the fund, either purchase securities identical to those loaned or, when such purchase is commercially impracticable, pay the fund the market value of the loaned securities. In return, the lending agent assumes the fund's rights to the related collateral. If the collateral value is less than the cost to purchase identical securities, the lending agent is responsible for the shortfall, but only to the extent that such shortfall is not due to a decline in collateral value resulting from collateral reinvestment for which the fund bears the risk of loss. A portion of the income generated upon investment of the collateral is remitted to the Borrowers, and the remainder is allocated between the fund and the lending agent. On loans collateralized by U.S. Treasury and/or federal agency obligations, a fee is received from the Borrower, and is allocated between the fund and the lending agent. Income from securities lending is separately reported in the Statement of Operations. The dividend and interest income earned on the securities loaned is accounted for in the same manner as other dividend and interest income. At June 30, 2021, there were no securities on loan or collateral outstanding.
MFS New Discovery Value Portfolio
Notes to Financial Statements (unaudited) - continued
Indemnifications — Under the fund's organizational documents, its officers and Trustees may be indemnified against certain liabilities and expenses arising out of the performance of their duties to the fund. Additionally, in the normal course of business, the fund enters into agreements with service providers that may contain indemnification clauses. The fund's maximum exposure under these agreements is unknown as this would involve future claims that may be made against the fund that have not yet occurred.
Investment Transactions and Income — Investment transactions are recorded on the trade date. Interest income is recorded on the accrual basis. Dividends received in cash are recorded on the ex-dividend date. Certain dividends from foreign securities will be recorded when the fund is informed of the dividend if such information is obtained subsequent to the ex-dividend date. Dividend payments received in additional securities are recorded on the ex-dividend date in an amount equal to the value of the security on such date.
The fund may receive proceeds from litigation settlements. Any proceeds received from litigation involving portfolio holdings are reflected in the Statement of Operations in realized gain/loss if the security has been disposed of by the fund or in unrealized gain/loss if the security is still held by the fund. Any other proceeds from litigation not related to portfolio holdings are reflected as other income in the Statement of Operations.
Tax Matters and Distributions — The fund intends to qualify as a regulated investment company, as defined under Subchapter M of the Internal Revenue Code, and to distribute all of its taxable income, including realized capital gains. As a result, no provision for federal income tax is required. The fund’s federal tax returns, when filed, will remain subject to examination by the Internal Revenue Service for a three year period. Management has analyzed the fund’s tax positions taken on federal and state tax returns for all open tax years and does not believe that there are any uncertain tax positions that require recognition of a tax liability. Foreign taxes, if any, have been accrued by the fund in the accompanying financial statements in accordance with the applicable foreign tax law. Foreign income taxes may be withheld by certain countries in which the fund invests. Additionally, capital gains realized by the fund on securities issued in or by certain foreign countries may be subject to capital gains tax imposed by those countries.
Distributions to shareholders are recorded on the ex-dividend date. Income and capital gain distributions are determined in accordance with income tax regulations, which may differ from U.S. generally accepted accounting principles. Certain capital accounts in the financial statements are periodically adjusted for permanent differences in order to reflect their tax character. These adjustments have no impact on net assets or net asset value per share. Temporary differences which arise from recognizing certain items of income, expense, gain or loss in different periods for financial statement and tax purposes will reverse at some time in the future.
Book/tax differences primarily relate to wash sale loss deferrals.
The tax character of distributions declared to shareholders for the last fiscal year is as follows:
| | Year ended
12/31/20 |
| Ordinary income (including any short-term capital gains) | $1,229,747 |
| Long-term capital gains | 3,460,414 |
| Total distributions | $4,690,161 |
The federal tax cost and the tax basis components of distributable earnings were as follows:
| As of 6/30/21 | |
| Cost of investments | $36,652,639 |
| Gross appreciation | 16,719,627 |
| Gross depreciation | (21,071) |
| Net unrealized appreciation (depreciation) | $16,698,556 |
| As of 12/31/20 | |
| Undistributed ordinary income | 1,293,331 |
| Undistributed long-term capital gain | 275,665 |
| Other temporary differences | 4 |
| Net unrealized appreciation (depreciation) | 12,183,128 |
The aggregate cost above includes prior fiscal year end tax adjustments, if applicable.
MFS New Discovery Value Portfolio
Notes to Financial Statements (unaudited) - continued
Multiple Classes of Shares of Beneficial Interest — The fund offers multiple classes of shares, which differ in their respective distribution and/or service fees. The fund's income, realized and unrealized gain (loss), and common expenses are allocated to shareholders based on the daily net assets of each class. Dividends are declared separately for each class. Differences in per share dividend rates are generally due to differences in separate class expenses. The fund’s distributions declared to shareholders as reported in the Statements of Changes in Net Assets are presented by class as follows:
| | Six months
ended
6/30/21 | | Year
ended
12/31/20 |
| Initial Class | $— | | $3,822,814 |
| Service Class | — | | 867,347 |
| Total | $— | | $4,690,161 |
(3) Transactions with Affiliates
Investment Adviser — The fund has an investment advisory agreement with MFS to provide overall investment management and related administrative services and facilities to the fund. The management fee is computed daily and paid monthly at the following annual rates based on the fund's average daily net assets:
| Up to $250 million | 0.90% |
| In excess of $250 million | 0.85% |
MFS has agreed in writing to reduce its management fee by a specified amount if certain MFS mutual fund assets exceed thresholds agreed to by MFS and the fund's Board of Trustees. For the six months ended June 30, 2021, this management fee reduction amounted to $3,149, which is included in the reduction of total expenses in the Statement of Operations. The management fee incurred for the six months ended June 30, 2021 was equivalent to an annual effective rate of 0.89% of the fund's average daily net assets.
The investment adviser has agreed in writing to pay a portion of the fund’s total annual operating expenses, excluding interest, taxes, extraordinary expenses, brokerage and transaction costs, and investment-related expenses, such that total annual operating expenses do not exceed 0.88% of average daily net assets for the Initial Class shares and 1.13% of average daily net assets for the Service Class shares. This written agreement will continue until modified by the fund’s Board of Trustees, but such agreement will continue at least until April 30, 2023. For the six months ended June 30, 2021, this reduction amounted to $59,650, which is included in the reduction of total expenses in the Statement of Operations.
Distributor — MFS Fund Distributors, Inc. (MFD), a wholly-owned subsidiary of MFS, is the distributor of shares of the fund. The Trustees have adopted a distribution plan for the Service Class shares pursuant to Rule 12b-1 under the Investment Company Act of 1940.
The fund's distribution plan provides that the fund will pay MFD distribution and/or service fees equal to 0.25% per annum of its average daily net assets attributable to Service Class shares as partial consideration for services performed and expenses incurred by MFD and financial intermediaries (including participating insurance companies that invest in the fund to fund variable annuity and variable life insurance contracts, sponsors of qualified retirement and pension plans that invest in the fund, and affiliates of these participating insurance companies and plan sponsors) in connection with the sale and distribution of the Service Class shares. MFD may subsequently pay all, or a portion, of the distribution and/or service fees to financial intermediaries.
Shareholder Servicing Agent — MFS Service Center, Inc. (MFSC), a wholly-owned subsidiary of MFS, receives a fee from the fund for its services as shareholder servicing agent. For the six months ended June 30, 2021, the fee was $2,366, which equated to 0.0090% annually of the fund's average daily net assets. MFSC also receives reimbursement from the fund for out-of-pocket expenses paid by MFSC on behalf of the fund. For the six months ended June 30, 2021, these costs amounted to $182.
Administrator — MFS provides certain financial, legal, shareholder communications, compliance, and other administrative services to the fund. Under an administrative services agreement, the fund reimburses MFS the costs incurred to provide these services. The fund is charged an annual fixed amount of $17,500 plus a fee based on average daily net assets. The administrative services fee incurred for the six months ended June 30, 2021 was equivalent to an annual effective rate of 0.0336% of the fund's average daily net assets.
Trustees’ and Officers’ Compensation — The fund pays compensation to independent Trustees in the form of a retainer, attendance fees, and additional compensation to Board and Committee chairpersons. The fund does not pay compensation directly to Trustees or officers of the fund who are also officers of the investment adviser, all of whom receive remuneration from MFS for their services to the fund. Certain officers and Trustees of the fund are officers or directors of MFS, MFD, and MFSC.
MFS New Discovery Value Portfolio
Notes to Financial Statements (unaudited) - continued
Other — The fund invests in the MFS Institutional Money Market Portfolio which is managed by MFS and seeks current income consistent with preservation of capital and liquidity. This money market fund does not pay a management fee to MFS but does incur investment and operating costs.
The adviser has voluntarily undertaken to reimburse the fund from its own resources on a quarterly basis for the cost of investment research embedded in the cost of the fund’s securities trades. This agreement may be rescinded at any time. For the six months ended June 30, 2021, this reimbursement amounted to $3,776, which is included in “Other” income in the Statement of Operations.
(4) Portfolio Securities
For the six months ended June 30, 2021, purchases and sales of investments, other than short-term obligations, aggregated $11,707,576 and $25,656,268, respectively.
(5) Shares of Beneficial Interest
The fund's Declaration of Trust permits the Trustees to issue an unlimited number of full and fractional shares of beneficial interest. Transactions in fund shares were as follows:
| | Six months ended
6/30/21 | | Year ended
12/31/20 |
| | Shares | Amount | | Shares | Amount |
| Shares sold | | | | | |
| Initial Class | 254,195 | $2,618,158 | | 2,799,875 | $18,594,474 |
| Service Class | 253,551 | 2,663,800 | | 490,466 | 3,256,939 |
| | 507,746 | $5,281,958 | | 3,290,341 | $21,851,413 |
Shares issued to shareholders
in reinvestment of distributions | | | | | |
| Initial Class | — | $— | | 534,659 | $3,822,814 |
| Service Class | — | — | | 122,507 | 867,347 |
| | — | $— | | 657,166 | $4,690,161 |
| Shares reacquired | | | | | |
| Initial Class | (1,719,412) | $(16,902,541) | | (2,623,597) | $(19,254,515) |
| Service Class | (220,968) | (2,236,270) | | (464,712) | (3,615,004) |
| | (1,940,380) | $(19,138,811) | | (3,088,309) | $(22,869,519) |
| Net change | | | | | |
| Initial Class | (1,465,217) | $(14,284,383) | | 710,937 | $3,162,773 |
| Service Class | 32,583 | 427,530 | | 148,261 | 509,282 |
| | (1,432,634) | $(13,856,853) | | 859,198 | $3,672,055 |
Effective at the close of business on August 14, 2019, the fund is closed to new investors subject to certain exceptions. Please see the fund’s prospectus for details.
The fund is one of several mutual funds in which certain MFS funds may invest. The MFS funds do not invest in the underlying funds for the purpose of exercising management or control. At the end of the period, the MFS Moderate Allocation Portfolio, the MFS Growth Allocation Portfolio, and the MFS Conservative Allocation Portfolio were the owners of record of approximately 39%, 14%, and 8%, respectively, of the value of outstanding voting shares of the fund.
(6) Line of Credit
The fund and certain other funds managed by MFS participate in a $1.25 billion unsecured committed line of credit of which $1 billion is reserved for use by the fund and certain other MFS U.S. funds. The line of credit is provided by a syndicate of banks under a credit agreement. Borrowings may be made for temporary financing needs. Interest is charged to each fund, based on its borrowings, generally at a rate equal to the highest of one month LIBOR, the Federal Funds Effective Rate and the Overnight Bank Funding Rate, plus an agreed upon spread. A commitment fee, based on the average daily, unused portion of the committed line of credit, is allocated among the participating funds. In addition, the fund and other funds managed by MFS have established
MFS New Discovery Value Portfolio
Notes to Financial Statements (unaudited) - continued
unsecured uncommitted borrowing arrangements with certain banks for temporary financing needs. Interest is charged to each fund, based on its borrowings, at rates equal to customary reference rates plus an agreed upon spread. For the six months ended June 30, 2021, the fund’s commitment fee and interest expense were $106 and $0, respectively, and are included in “Miscellaneous” expense in the Statement of Operations.
(7) Investments in Affiliated Issuers
An affiliated issuer may be considered one in which the fund owns 5% or more of the outstanding voting securities, or a company which is under common control. For the purposes of this report, the following were affiliated issuers:
| Affiliated Issuers | Beginning
Value | Purchases | Sales
Proceeds | Realized
Gain
(Loss) | Change in
Unrealized
Appreciation or
Depreciation | Ending
Value |
| MFS Institutional Money Market Portfolio | $497,322 | $10,067,521 | $9,811,161 | $— | $— | $753,682 |
| Affiliated Issuers | Dividend
Income | Capital Gain
Distributions |
| MFS Institutional Money Market Portfolio | $123 | $— |
(8) Impacts of COVID-19
The pandemic related to the global spread of novel coronavirus disease (COVID-19), which was first detected in December 2019, has resulted in significant disruptions to global business activity and the global economy, as well as the economies of individual countries, the financial performance of individual companies and sectors, and the securities and commodities markets in general. Multiple surges in cases globally, the availability and widespread adoption of vaccines, and the emergence of variant strains of the virus continue to create uncertainty as to the future and long-term impacts resulting from the pandemic including impacts to the prices and liquidity of the fund's investments and the fund's performance.
MFS New Discovery Value Portfolio
Statement Regarding Liquidity Risk Management Program
The fund has adopted and implemented a liquidity risk management program (the “Program”) as required by Rule 22e-4 under the Investment Company Act of 1940, as amended. The fund’s Board of Trustees (the “Board”) has designated MFS as the administrator of the Program. The Program is reasonably designed to assess and manage the liquidity risk of the fund. Liquidity risk is the risk that the fund could not meet requests to redeem shares issued by the fund without significant dilution of remaining investors' interests.
MFS provided a written report to the Board for consideration at its April 2021 meeting that addressed the operation of the Program and provided an assessment of the adequacy and effectiveness of the Program during the period from January 1, 2020 to December 31, 2020 (the “Covered Period”). The report concluded that during the Covered Period the Program had operated effectively and had adequately and effectively been implemented to assess and manage the fund’s liquidity risk. MFS also reported that there were no liquidity events that impacted the fund or its ability to timely meet redemptions without dilution to existing shareholders during the Covered Period.
There can be no assurance that the Program will achieve its objectives in the future. Further information on liquidity risk, and other principal risks to which an investment in the fund may be subject, can be found in the prospectus.
MFS New Discovery Value Portfolio
Proxy Voting Policies and Information
MFS votes proxies on behalf of the fund pursuant to proxy voting policies and procedures that are available without charge, upon request, by calling 1-800-225-2606, by visiting mfs.com/proxyvoting, or by visiting the SEC’s Web site at http://www.sec.gov.
Information regarding how the fund voted proxies relating to portfolio securities during the most recent twelve-month period ended June 30 is available by August 31 of each year without charge by visiting mfs.com/proxyvoting, or by visiting the SEC’s Web site at http://www.sec.gov.
Quarterly Portfolio Disclosure
The fund files a complete schedule of portfolio holdings with the SEC for the first and third quarters of each fiscal year as an exhibit to its reports on Form N-PORT. The fund’s Form N-PORT reports are available on the SEC’s Web site at http://www.sec.gov. A shareholder can obtain the portfolio holdings report for the first and third quarters of the fund's fiscal year at mfs.com/vit3 by choosing the fund's name and then scrolling to the “Resources” section and clicking on the “Prospectus and Reports” tab.
FURTHER INFORMATION
From time to time, MFS may post important information about the fund or the MFS Funds on the MFS Web site (mfs.com). This information is available at https://www.mfs.com/announcements or at mfs.com/vit3 by choosing the fund's name and then scrolling to the “Resources” section and clicking on the “Announcements” tab, if any.
Information About Fund Contracts and Legal Claims
The fund has entered into contractual arrangements with an investment adviser, administrator, distributor, shareholder servicing agent, 529 program manager (if applicable), and custodian who each provide services to the fund. Unless expressly stated otherwise, shareholders are not parties to, or intended beneficiaries of these contractual arrangements, and these contractual arrangements are not intended to create any shareholder right to enforce them against the service providers or to seek any remedy under them against the service providers, either directly or on behalf of the fund.
Under the Trust’s By-Laws and Declaration of Trust, any claims asserted against or on behalf of the MFS Funds, including claims against Trustees and Officers, must be brought in state and federal courts located within the Commonwealth of Massachusetts.
Not applicable
During the period covered by this report, the Registrant has not amended any provision in its Code of Ethics (the “Code”) that relates to an element of the Code’s definitions enumerated in paragraph (b) of Item 2 of this Form N-CSR. During the period covered by this report, the Registrant did not grant a waiver, including an implicit waiver, from any provision of the Code.
| ITEM 3. | AUDIT COMMITTEE FINANCIAL EXPERT. |
Not applicable for semi-annual reports.
| ITEM 4. | PRINCIPAL ACCOUNTANT FEES AND SERVICES. |
Not applicable for semi-annual reports.
| ITEM 5. | AUDIT COMMITTEE OF LISTED REGISTRANTS. |
Not applicable to the Registrant.
A schedule of investments for each series of the Registrant is included as part of the report to shareholders of such series under Item 1(a) of this Form N-CSR.
| ITEM 7. | DISCLOSURE OF PROXY VOTING POLICIES AND PROCEDURES FOR CLOSED-END MANAGEMENT INVESTMENT COMPANIES. |
Not applicable to the Registrant.
| ITEM 8. | PORTFOLIO MANAGERS OF CLOSED-END MANAGEMENT INVESTMENT COMPANIES. |
Not applicable to the Registrant.
| ITEM 9. | PURCHASES OF EQUITY SECURITIES BY CLOSED-END MANAGEMENT INVESTMENT COMPANY AND AFFILIATED PURCHASERS. |
Not applicable to the Registrant.
| ITEM 10. | SUBMISSION OF MATTERS TO A VOTE OF SECURITY HOLDERS. |
There were no material changes to the procedures by which shareholders may send recommendations to the Board for nominees to the Registrant’s Board since the Registrant last provided disclosure as to such procedures in response to the requirements of Item 407 (c)(2)(iv) of Regulation S-K or this Item.
| ITEM 11. | CONTROLS AND PROCEDURES. |
| (a) | Based upon their evaluation of the effectiveness of the registrant’s disclosure controls and procedures (as defined in Rule 30a-3(c) under the Investment Company Act of 1940 (the “Act”)) as conducted within 90 days of the filing date of this report on Form N-CSR, the registrant’s principal financial officer and principal executive officer have concluded that those disclosure controls and procedures provide reasonable assurance that the material information required to be disclosed by the registrant on this report is recorded, processed, summarized and reported within the time periods specified in the Securities and Exchange Commission’s rules and forms. |
| (b) | There were no changes in the registrant’s internal controls over financial reporting (as defined in Rule 30a-3(d) under the Act) that occurred during the period covered by the report that have materially affected, or are reasonably likely to materially affect, the registrant’s internal control over financial reporting. |
| ITEM 12. | DISCLOSURE OF SECURITIES LENDING ACTIVITIES FOR CLOSED-END MANAGEMENT INVESTMENT COMPANIES. |
Not applicable to the Registrant.
| (a) (1) | Any code of ethics, or amendment thereto, that is the subject of the disclosure required by Item 2, to the extent that the registrant intends to satisfy the Item 2 requirements through filing of an exhibit. Not applicable. |
| | (2) | A separate certification for each principal executive officer and principal financial officer of the registrant as required by Rule 30a-2(a) under the Act (17 CFR 270.30a-2): Attached hereto as EX-99.302CERT. |
| | (3) | Any written solicitation to purchase securities under Rule 23c-1 under the Act (17 CFR 270.23c-1) sent or given during the period covered by the report by or on behalf of the registrant to 10 or more persons. Not applicable. |
| | (4) | Change in the registrant’s independent public accountant. Not applicable. |
| (b) | If the report is filed under Section 13(a) or 15(d) of the Exchange Act, provide the certifications required by Rule 30a-2(b) under the Act (17 CFR 270.30a-2(b)), Rule 13a-14(b) or Rule 15d-14(b) under the Exchange Act (17 CFR 240.13a-14(b) or 240.15d-14(b)) and Section 1350 of Chapter 63 of Title 18 of the United States Code (18 U.S.C. 1350) as an exhibit. A certification furnished pursuant to this paragraph will not be deemed “filed” for the purposes of Section 18 of the Exchange Act (15 U.S.C. 78r), or otherwise subject to the liability of that section. Such certification will not be deemed to be incorporated by reference into any filing under the Securities Act of 1933 or the Exchange Act, except to the extent that the registrant specifically incorporates it by reference. Attached hereto as EX-99.906CERT. |
Notice
Notice is hereby given that this instrument is executed on behalf of the Registrant by an officer of the Registrant as an officer and not individually and the obligations of or arising out of this instrument are not binding upon any of the Trustees or shareholders individually, but are binding only upon the assets and property of the respective constituent series of the Registrant.
SIGNATURES
Pursuant to the requirements of the Securities Exchange Act of 1934 and the Investment Company Act of 1940, the registrant has duly caused this report to be signed on its behalf by the undersigned, thereunto duly authorized.
(Registrant) MFS VARIABLE INSURANCE TRUST III
| | |
| By (Signature and Title)* | | /S/ DAVID L. DILORENZO |
| | David L. DiLorenzo, President |
Date: August 13, 2021
Pursuant to the requirements of the Securities Exchange Act of 1934 and the Investment Company Act of 1940, this report has been signed below by the following persons on behalf of the registrant and in the capacities and on the dates indicated.
| | |
| By (Signature and Title)* | | /S/ DAVID L. DILORENZO |
| | David L. DiLorenzo, President (Principal Executive Officer) |
Date: August 13, 2021
| | |
| By (Signature and Title)* | | /S/ JAMES O. YOST |
| | James O. Yost, Treasurer (Principal Financial Officer and Accounting Officer) |
Date: August 13, 2021
| * | Print name and title of each signing officer under his or her signature. |