Exhibit 99.2
Link to searchable text of slide shown above

Link to searchable text of slide shown above
Link to searchable text of slide shown above
Link to searchable text of slide shown above
Link to searchable text of slide shown above
Link to searchable text of slide shown above
Link to searchable text of slide shown above
Link to searchable text of slide shown above
Link to searchable text of slide shown above

Link to searchable text of slide shown above

Link to searchable text of slide shown above

Link to searchable text of slide shown above
Link to searchable text of slide shown above

Link to searchable text of slide shown above
Link to searchable text of slide shown above
Link to searchable text of slide shown above

Link to searchable text of slide shown above

Link to searchable text of slide shown above
Link to searchable text of slide shown above
Link to searchable text of slide shown above

Link to searchable text of slide shown above

Link to searchable text of slide shown above
Link to searchable text of slide shown above
Link to searchable text of slide shown above
Link to searchable text of slide shown above
Link to searchable text of slide shown above
Link to searchable text of slide shown above

Link to searchable text of slide shown above
Link to searchable text of slide shown above
Link to searchable text of slide shown above
Searchable text section of graphics shown above

First Quarter 2006 Earnings Presentation
April 27, 2006
Gary Black | | Dave Martin |
Chief Executive Officer and Chief Investment Officer | | Executive Vice President and Chief Financial Officer |
C-0406-100 7-15-06
Highlights (1)
• 1Q 2006 GAAP EPS of $0.17 versus $0.05 in 4Q 2005 ($0.16 adjusted) and $0.09 in 1Q 2005 ($0.11 adjusted)
• Long-term net inflows for 1Q 2006 of $3.5 billion
• Janus (ex-INTECH) long-term net flows of $(0.5) billion in 1Q 2006 versus $(0.9) billion in 4Q 2005 and $(3.9) billion in 1Q 2005
• INTECH net flows of $4.0 billion bring total INTECH Assets Under Management (“AUM”) above $50 billion
• 5-year relative performance in-line with continued strong 1- and 3- year performance
• 72%, 65%, and 62% of JIF funds in the top 2 Lipper quartiles on a 1-, 3-, and 5-year total return basis, respectively, as of March 31, 2006 (2)
• Other key items in the quarter:
• Purchased an additional 5% stake in INTECH for $90 million
• IRS acceptance of Janus’ 355 tax position
• $125 million of stock repurchases resulting in a 2.1% net share reduction
Notes:
(1) The amounts presented and the discussions of our results on our Earnings Call are on a GAAP basis, unless otherwise indicated. For informational purposes, the tables on pp. 25 and 26 present a detailed reconciliation of GAAP to adjusted basis results.
(2) Data presented reflects past performance which is no guarantee of future results. Please see p. 8 for complete Lipper rankings.
2
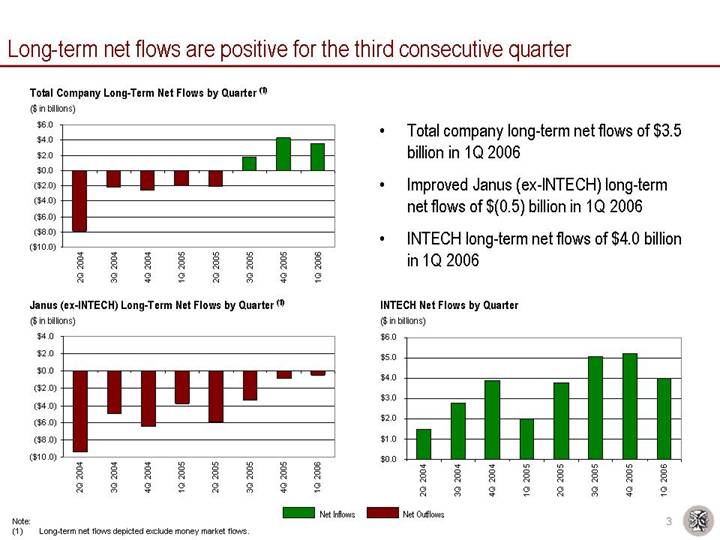
Long-term net flows are positive for the third consecutive quarter
Total Company Long-Term Net Flows by Quarter (1)
($ in billions)
[CHART]
Janus (ex-INTECH) Long-Term Net Flows by Quarter (1)
($ in billions)
[CHART]
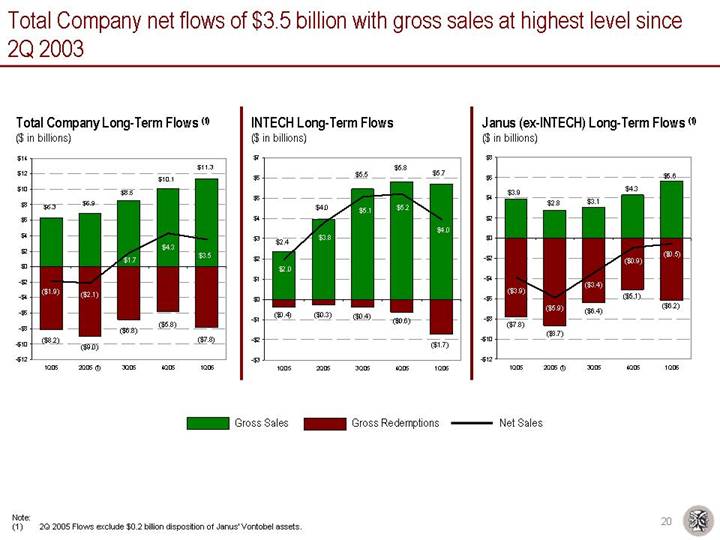
• Total company long-term net flows of $3.5 billion in 1Q 2006
• Improved Janus (ex-INTECH) long-term net flows of $(0.5) billion in 1Q 2006
• INTECH long-term net flows of $4.0 billion in 1Q 2006
INTECH Net Flows by Quarter
($ in billions)
[CHART]
Note:
(1) Long-term net flows depicted exclude money market flows.
3
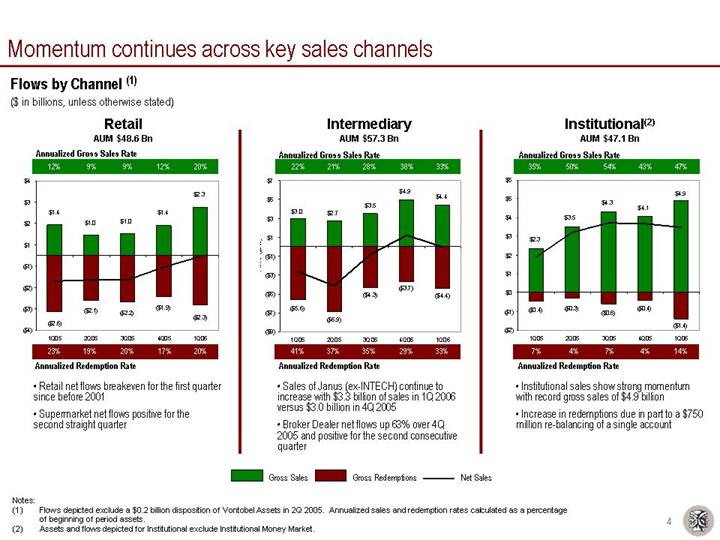
Momentum continues across key sales channels
Flows by Channel (1)
($ in billions, unless otherwise stated)
Retail | | Intermediary | | Institutional(2) |
AUM $48.6 Bn | | AUM $57.3 Bn | | AUM $47.1 Bn |
| | | | |
Annualized Gross Sales Rate | | Annualized Gross Sales Rate | | Annualized Gross Sales Rate |
| | | | |
[CHART] | | [CHART] | | [CHART] |
| | | | |
Annualized Redemption Rate | | Annualized Redemption Rate | | Annualized Redemption Rate |
| | | | |
• Retail net flows breakeven for the first quarter since before 2001 • Supermarket net flows positive for the second straight quarter | | • Sales of Janus (ex-INTECH) continue to increase with $3.3 billion of sales in 1Q 2006 versus $3.0 billion in 4Q 2005 • Broker Dealer net flows up 63% over 4Q 2005 and positive for the second consecutive quarter | | • Institutional sales show strong momentum with record gross sales of $4.9 billion • Increase in redemptions due in part to a $750 million re-balancing of a single account |
Notes:
(1) Flows depicted exclude a $0.2 billion disposition of Vontobel Assets in 2Q 2005. Annualized sales and redemption rates calculated as a percentage of beginning of period assets.
(2) Assets and flows depicted for Institutional exclude Institutional Money Market.
4
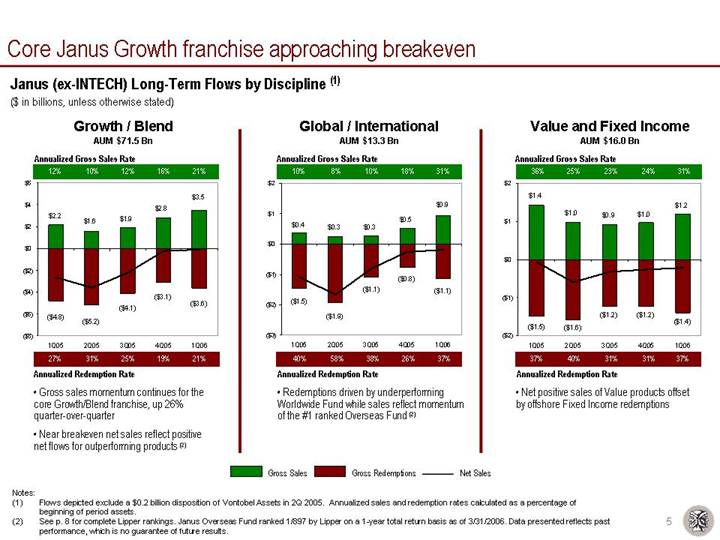
Core Janus Growth franchise approaching breakeven
Janus (ex-INTECH) Long-Term Flows by Discipline (1)
($ in billions, unless otherwise stated)
Growth / Blend | | Global / International | | Value and Fixed Income |
AUM $71.5 Bn | | AUM $13.3 Bn | | AUM $16.0 Bn |
| | | | |
Annualized Gross Sales Rate | | Annualized Gross Sales Rate | | Annualized Gross Sales Rate |
| | | | |
[CHART] | | [CHART] | | [CHART] |
| | | | |
Annualized Redemption Rate | | Annualized Redemption Rate | | Annualized Redemption Rate |
| | | | |
• Gross sales momentum continues for the core Growth/Blend franchise, up 26% quarter-over-quarter • Near breakeven net sales reflect positive net flows for outperforming products (2) | | • Redemptions driven by underperforming Worldwide Fund while sales reflect momentum of the #1 ranked Overseas Fund (2) | | • Net positive sales of Value products offset by offshore Fixed Income redemptions |
Notes:
(1) Flows depicted exclude a $0.2 billion disposition of Vontobel Assets in 2Q 2005. Annualized sales and redemption rates calculated as a percentage of beginning of period assets.
(2) See p. 8 for complete Lipper rankings. Janus Overseas Fund ranked 1/897 by Lipper on a 1-year total return basis as of 3/31/2006. Data presented reflects past performance, which is no guarantee of future results.
5
Investment performance remains strong
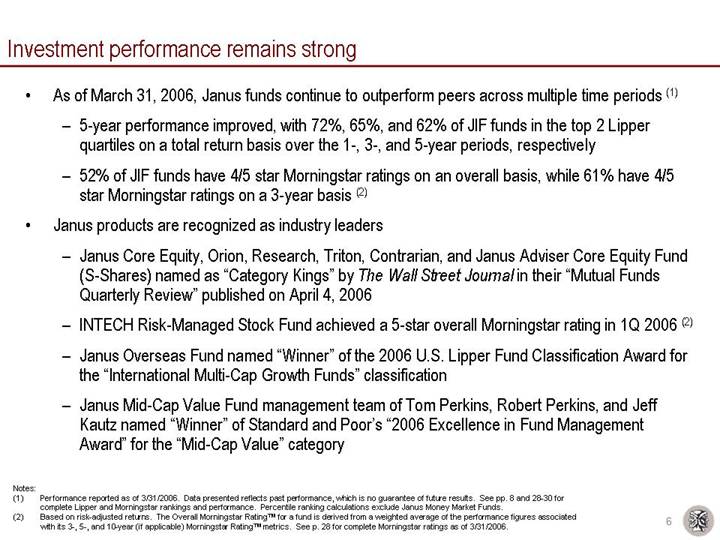
• As of March 31, 2006, Janus funds continue to outperform peers across multiple time periods (1)
• 5-year performance improved, with 72%, 65%, and 62% of JIF funds in the top 2 Lipper quartiles on a total return basis over the 1-, 3-, and 5-year periods, respectively
• 52% of JIF funds have 4/5 star Morningstar ratings on an overall basis, while 61% have 4/5 star Morningstar ratings on a 3-year basis (2)
• Janus products are recognized as industry leaders
• Janus Core Equity, Orion, Research, Triton, Contrarian, and Janus Adviser Core Equity Fund (S-Shares) named as “Category Kings” by The Wall Street Journal in their “Mutual Funds Quarterly Review” published on April 4, 2006
• INTECH Risk-Managed Stock Fund achieved a 5-star overall Morningstar rating in 1Q 2006 (2)
• Janus Overseas Fund named “Winner” of the 2006 U.S. Lipper Fund Classification Award for the “International Multi-Cap Growth Funds” classification
• Janus Mid-Cap Value Fund management team of Tom Perkins, Robert Perkins, and Jeff Kautz named “Winner” of Standard and Poor’s “2006 Excellence in Fund Management Award” for the “Mid-Cap Value” category
Notes:
(1) Performance reported as of 3/31/2006. Data presented reflects past performance, which is no guarantee of future results. See pp. 8 and 28-30 for complete Lipper and Morningstar rankings and performance. Percentile ranking calculations exclude Janus Money Market Funds.
(2) Based on risk-adjusted returns. The Overall Morningstar RatingTM for a fund is derived from a weighted average of the performance figures associated with its 3-, 5-, and 10-year (if applicable) Morningstar RatingTM metrics. See p. 28 for complete Morningstar ratings as of 3/31/2006.
6
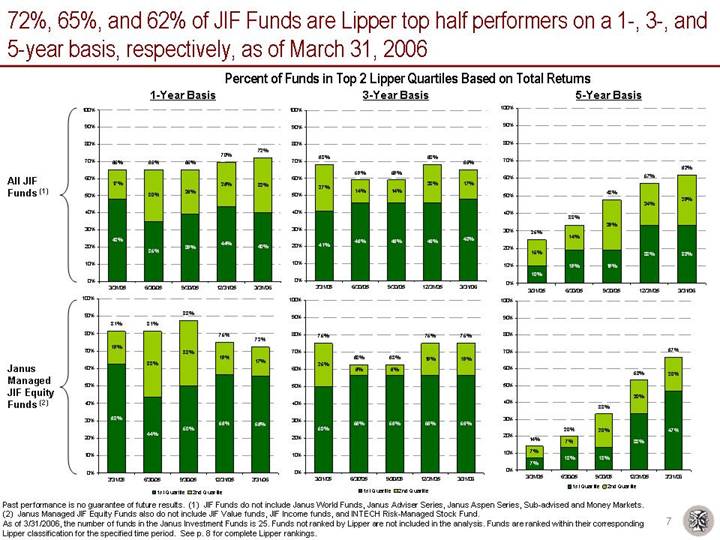
72%, 65%, and 62% of JIF Funds are Lipper top half performers on a 1-, 3-, and 5-year basis, respectively, as of March 31, 2006
Percent of Funds in Top 2 Lipper Quartiles Based on Total Returns
| | 1-Year Basis | | 3-Year Basis | | 5-Year Basis | |
| | | | | | | |
All JIF
Funds (1) | | [CHART] | | [CHART] | | [CHART] | |
| | | | | | | |
Janus
Managed
JIF Equity
Funds (2) | | [CHART] | | [CHART] | | [CHART] | |
Past performance is no guarantee of future results. (1) JIF Funds do not include Janus World Funds, Janus Adviser Series, Janus Aspen Series, Sub-advised and Money Markets.
(2) Janus Managed JIF Equity Funds also do not include JIF Value funds, JIF Income funds, and INTECH Risk-Managed Stock Fund.
As of 3/31/2006, the number of funds in the Janus Investment Funds is 25. Funds not ranked by Lipper are not included in the analysis. Funds are ranked within their corresponding Lipper classification for the specified time period. See p. 8 for complete Lipper rankings.
7
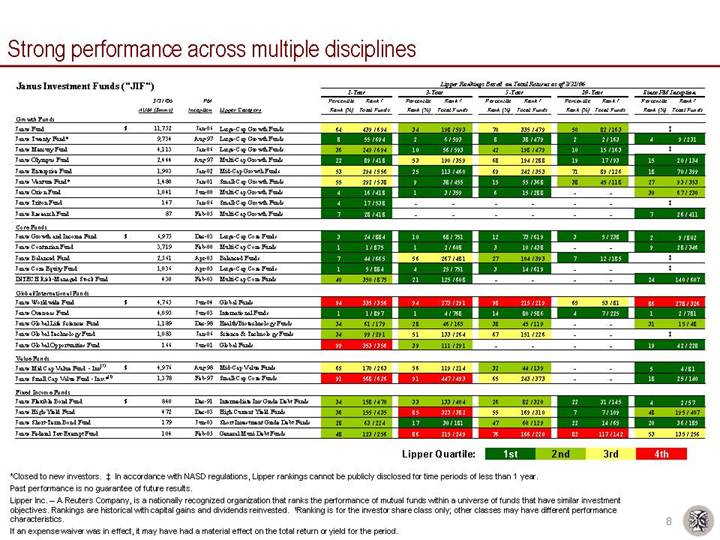
Strong performance across multiple disciplines
Janus Investment Funds (“JIF”)
| | | | | | | | Lipper Rankings Based on Total Returns as of 3/31/06 | |
| | | | | | | | 1-Year | | 3-Year | | 5-Year | | 10-Year | | Since PM Inception | |
| | 3/31/06
AUM ($mms) | | PM
Inception | | Lipper Category | | Percentile
Rank (%) | | Rank /
Total Funds | | Percentile
Rank (%) | | Rank /
Total Funds | | Percentile
Rank (%) | | Rank /
Total Funds | | Percentile
Rank (%) | | Rank /
Total Funds | | Percentile
Rank (%) | | Rank /
Total Funds | |
Growth Funds | | | | | | | | | | | | | | | | | | | | | | | | | | | |
Janus Fund | | $ | 11,752 | | Jan-06 | | Large-Cap Growth Funds | | 64 | | 439 / 694 | | 34 | | 198 / 593 | | 70 | | 335 / 479 | | 50 | | 82 / 163 | | | ‡ | | |
Janus Twenty Fund* | | 9,734 | | Aug-97 | | Large-Cap Growth Funds | | 8 | | 55 / 694 | | 2 | | 6 / 593 | | 8 | | 38 / 479 | | 2 | | 2 / 163 | | 4 | | 9 / 231 | |
Janus Mercury Fund | | 4,113 | | Jan-06 | | Large-Cap Growth Funds | | 36 | | 249 / 694 | | 10 | | 56 / 593 | | 42 | | 198 / 479 | | 10 | | 15 / 163 | | | ‡ | | |
Janus Olympus Fund | | 2,444 | | Aug-97 | | Multi-Cap Growth Funds | | 22 | | 89 / 418 | | 53 | | 190 / 359 | | 68 | | 194 / 288 | | 19 | | 17 / 93 | | 15 | | 20 / 134 | |
Janus Enterprise Fund | | 1,903 | | Jan-02 | | Mid-Cap Growth Funds | | 53 | | 294 / 556 | | 25 | | 113 / 460 | | 69 | | 242 / 353 | | 71 | | 89 / 126 | | 18 | | 70 / 399 | |
Janus Venture Fund* | | 1,480 | | Jan-01 | | Small-Cap Growth Funds | | 55 | | 292 / 538 | | 9 | | 38 / 455 | | 15 | | 55 / 368 | | 38 | | 45 / 118 | | 27 | | 93 / 353 | |
Janus Orion Fund | | 1,041 | | Jun-00 | | Multi-Cap Growth Funds | | 4 | | 16 / 418 | | 1 | | 3 / 359 | | 6 | | 15 / 288 | | — | | — | | 30 | | 67 / 230 | |
Janus Triton Fund | | 147 | | Jan-06 | | Small-Cap Growth Funds | | 4 | | 17 / 538 | | — | | — | | — | | — | | — | | — | | | ‡ | | |
Janus Research Fund | | 87 | | Feb-05 | | Multi-Cap Growth Funds | | 7 | | 28 / 418 | | — | | — | | — | | — | | — | | — | | 7 | | 26 / 411 | |
| | | | | | | | | | | | | | | | | | | | | | | | | | | |
Core Funds | | | | | | | | | | | | | | | | | | | | | | | | | | | |
Janus Growth and Income Fund | | $ | 6,975 | | Dec-03 | | Large-Cap Core Funds | | 3 | | 24 / 884 | | 10 | | 68 / 751 | | 12 | | 73 / 619 | | 3 | | 5 / 238 | | 2 | | 9 / 802 | |
Janus Contrarian Fund | | 3,719 | | Feb-00 | | Multi-Cap Core Funds | | 1 | | 1 / 875 | | 1 | | 2 / 608 | | 3 | | 10 / 438 | | — | | — | | 9 | | 28 / 346 | |
Janus Balanced Fund | | 2,561 | | Apr-05 | | Balanced Funds | | 7 | | 44 / 665 | | 56 | | 267 / 481 | | 27 | | 104 / 393 | | 7 | | 12 / 185 | | | ‡ | | |
Janus Core Equity Fund | | 1,036 | | Apr-05 | | Large-Cap Core Funds | | 1 | | 5 / 884 | | 4 | | 25 / 751 | | 3 | | 14 / 619 | | — | | — | | | ‡ | | |
INTECH Risk-Managed Stock Fund | | 430 | | Feb-03 | | Multi-Cap Core Funds | | 40 | | 350 / 875 | | 21 | | 125 / 608 | | — | | — | | — | | — | | 24 | | 140 / 607 | |
| | | | | | | | | | | | | | | | | | | | | | | | | | | |
Global/International Funds | | | | | | | | | | | | | | | | | | | | | | | | | | | |
Janus Worldwide Fund | | $ | 4,765 | | Jun-04 | | Global Funds | | 94 | | 335 / 356 | | 94 | | 273 / 291 | | 98 | | 215 / 219 | | 65 | | 53 / 81 | | 86 | | 278 / 326 | |
Janus Overseas Fund | | 4,095 | | Jun-03 | | International Funds | | 1 | | 1 / 897 | | 1 | | 4 / 768 | | 14 | | 80 / 586 | | 4 | | 7 / 225 | | 1 | | 2 / 781 | |
Janus Global Life Sciences Fund | | 1,189 | | Dec-98 | | Health/Biotechnology Funds | | 34 | | 61 / 179 | | 28 | | 46 / 165 | | 38 | | 45 / 119 | | — | | — | | 31 | | 15 / 48 | |
Janus Global Technology Fund | | 1,083 | | Jan-06 | | Science & Technology Funds | | 34 | | 99 / 291 | | 51 | | 133 / 264 | | 67 | | 151 / 226 | | — | | — | | | ‡ | | |
Janus Global Opportunities Fund | | 166 | | Jun-01 | | Global Funds | | 99 | | 353 / 356 | | 39 | | 111 / 291 | | — | | — | | — | | — | | 19 | | 42 / 228 | |
| | | | | | | | | | | | | | | | | | | | | | | | | | | |
Value Funds | | | | | | | | | | | | | | | | | | | | | | | | | | | |
Janus Mid Cap Value Fund - Inv(1) | | $ | 4,976 | | Aug-98 | | Mid-Cap Value Funds | | 65 | | 170 / 263 | | 56 | | 119 / 214 | | 32 | | 44 / 139 | | — | | — | | 5 | | 4 / 81 | |
Janus Small Cap Value Fund - Inv.*(1) | | 1,378 | | Feb-97 | | Small-Cap Core Funds | | 91 | | 568 / 626 | | 91 | | 447 / 493 | | 65 | | 243 / 373 | | — | | — | | 18 | | 25 / 140 | |
| | | | | | | | | | | | | | | | | | | | | | | | | | | |
Fixed Income Funds | | | | | | | | | | | | | | | | | | | | | | | | | | | |
Janus Flexible Bond Fund | | $ | 840 | | Dec-91 | | Intermediate Inv Grade Debt Funds | | 34 | | 158 / 470 | | 33 | | 133 / 404 | | 26 | | 82 / 320 | | 22 | | 31 / 145 | | 4 | | 2 / 57 | |
Janus High-Yield Fund | | 472 | | Dec-03 | | High Current Yield Funds | | 36 | | 155 / 435 | | 85 | | 323 / 382 | | 55 | | 169 / 310 | | 7 | | 7 / 109 | | 48 | | 195 / 407 | |
Janus Short-Term Bond Fund | | 179 | | Jun-03 | | Short Investment Grade Debt Funds | | 28 | | 63 / 224 | | 17 | | 30 / 181 | | 47 | | 60 / 129 | | 22 | | 14 / 65 | | 20 | | 36 / 185 | |
Janus Federal Tax-Exempt Fund | | 104 | | Feb-05 | | General Muni Debt Funds | | 48 | | 123 / 256 | | 86 | | 215 / 249 | | 76 | | 166 / 220 | | 82 | | 117 / 142 | | 53 | | 135 / 256 | |
| | | | | | | | | | | | | | | | | | | | | | | | | | | |
| | | | | | | | | | | | Lipper Quartile: | | 1st | | 2nd | | 3rd | | 4th | | | |
*Closed to new investors. ‡ In accordance with NASD regulations, Lipper rankings cannot be publicly disclosed for time periods of less than 1 year.
Past performance is no guarantee of future results.
Lipper Inc. – A Reuters Company, is a nationally recognized organization that ranks the performance of mutual funds within a universe of funds that have similar investment objectives. Rankings are historical with capital gains and dividends reinvested. (1)Ranking is for the investor share class only; other classes may have different performance characteristics.
If an expense waiver was in effect, it may have had a material effect on the total return or yield for the period.
8
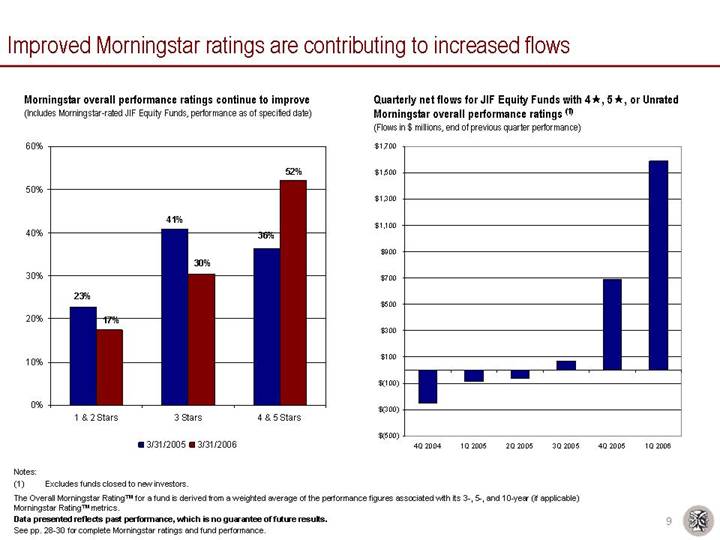
Improved Morningstar ratings are contributing to increased flows
Morningstar overall performance ratings continue to improve
(Includes Morningstar-rated JIF Equity Funds, performance as of specified date)
[CHART]
Quarterly net flows for JIF Equity Funds with 4*, 5*, or Unrated Morningstar overall performance ratings (1)
(Flows in $ millions, end of previous quarter performance)
[CHART]
Notes:
(1) Excludes funds closed to new investors.
The Overall Morningstar RatingTM for a fund is derived from a weighted average of the performance figures associated with its 3-, 5-, and 10-year (if applicable) Morningstar RatingTM metrics.
Data presented reflects past performance, which is no guarantee of future results.
See pp. 28-30 for complete Morningstar ratings and fund performance.
9
Financials
Dave Martin
Executive Vice President and Chief Financial Officer
1Q 2006 Financial Overview (1)
• 1Q 2006 GAAP EPS of $0.17 versus $0.05 in 4Q 2005 ($0.16 adjusted) and $0.09 in 1Q 2005 ($0.11 adjusted)
• Investment Management (“IM”) operating margin of 27.1% up from 4Q 2005 IM operating margin of 24.6% and 20.6% in 1Q 2005
• 1Q 2006 results include a net favorable $5 million impact of unusual items ($10 million insurance recovery offset by $5 million of severance and other G&A items)
• IM revenue of $233 million up 3% ($7 million) from 4Q 2005, while IM operating expenses, including the unusual items above, remained relatively flat at $170 million
• Revenue results reflect an 8% increase in average assets to $154 billion partially offset by a decline in INTECH performance fees, shift in asset mix, and fewer days in the first quarter
• Performance-based accelerated vesting of LTI impacts expenses by approximately $2 million in 1Q 2006 (2)
• Additional 5% purchase of INTECH adds approximately $1.0 million per quarter of intangible amortization to IM operating expenses (offset by a decrease in minority interest expense)
Notes:
(1) The amounts presented and the discussions of our results on our Earnings Call are on a GAAP basis, unless otherwise indicated. For informational purposes, the tables on pp. 25 and 26 present a detailed reconciliation of GAAP to adjusted basis results.
(2) Impact of acceleration of vesting began on 2/1/2006. See p. 24 for more detail.
11
Continued asset mix shift driving a decline in Management Fee yield
• Since 3Q 2004, the overall Management Fee yield has declined 5%, from 51.3 bps to 48.8 bps due to the continuing shift in asset mix
• INTECH assets have grown from approximately 14% of average assets to 31% of average assets
• The impact of the long-term asset mix shift on Management Fee yield was somewhat offset by the decline in money market assets
AUM mix shift and its effects on Management Fee yield
(% of Avg. AUM for each quarter, management fees as bps of Avg. AUM)
[CHART]
12
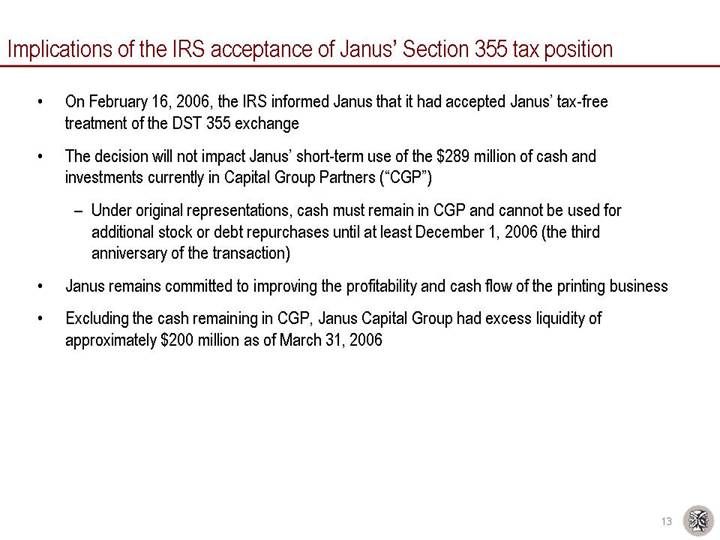
Implications of the IRS acceptance of Janus’ Section 355 tax position
• On February 16, 2006, the IRS informed Janus that it had accepted Janus’ tax-free treatment of the DST 355 exchange
• The decision will not impact Janus’ short-term use of the $289 million of cash and investments currently in Capital Group Partners (“CGP”)
• Under original representations, cash must remain in CGP and cannot be used for additional stock or debt repurchases until at least December 1, 2006 (the third anniversary of the transaction)
• Janus remains committed to improving the profitability and cash flow of the printing business
• Excluding the cash remaining in CGP, Janus Capital Group had excess liquidity of approximately $200 million as of March 31, 2006
13
Janus continues to return excess cash to shareholders
Janus cumulative stock buyback activity since 2Q 2004
(Amount of buybacks in $ millions, shares outstanding in millions)
[CHART]
• On March 7, 2006, the Board of Directors approved a new $500 million buyback authorization
• Original $500 million program completed:
• $500 million of repurchases
• 31.6 million shares repurchased
• $15.82 average price per share
• 11.6% net share reduction
• 1Q 2006 Buyback Activity:
• $125 million of repurchases
• 5.7 million shares repurchased
• $21.87 average price per share
• 2.1% net share reduction
14
Janus Today
• Positive organic growth
• Strong, consistent investment performance across 1-, 3-, and 5-year periods (1)
• Smooth transition of recent portfolio management changes
• Distribution build-out nearly complete and demonstrating results
• Focused on achieving greater than 50% incremental operating margins
• Acceptance of Section 355 tax position
• Ongoing commitment to returning excess cash to shareholders
Note:
(1) References performance reported as of 3/31/2006. Data presented reflects past performance, which is no guarantee of future results. See pp. 8 and 28-30 for complete Lipper and Morningstar rankings and performance.
15
Safe Harbor Statement
This presentation includes statements concerning potential future events involving Janus Capital Group Inc. that could differ materially from the events that actually occur. The differences could be caused by a number of factors including those factors identified in Janus’ Annual Report on Form 10-K for the year ended December 31, 2005, on file with the Securities and Exchange Commission (Commission file no. 001-15253), including those that appear under headings such as “Risk Factors” and “Management’s Discussion and Analysis of Financial Condition and Results of Operations.” Many of these factors are beyond the control of the company and its management. Any forward-looking statements contained in this presentation are as of the date on which such statements were made. The company assumes no duty to update them, even if experience, unexpected events, or future changes make it clear that any projected results express or implied therein will not be realized.
16
Other Important Disclosures
Please consider the charges, risks, expenses and investment objectives carefully before investing. For a prospectus containing this and other information, please call Janus at 1-800-525-3713 or download the file from janus.com. Read it carefully before you invest or send money.
Janus Capital Group consists of Janus Capital Management LLC, Enhanced Investment Technologies, LLC (INTECH), and Capital Group Partners, Inc. Janus Capital Group owns 30% of Perkins, Wolf, McDonnell and Company, LLC.
INTECH is a subsidiary of Janus Capital Group Inc.
Differences between compared investments may include objectives, sales and management fees, liquidity, volatility, tax features and other features, which may result in differences in performance.
Janus funds distributed by Janus Distributors LLC (04/06)
17
Appendix
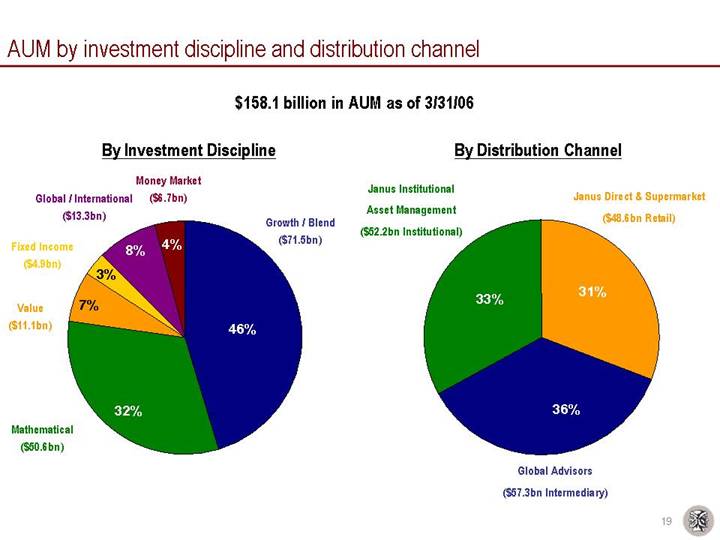
AUM by investment discipline and distribution channel
$158.1 billion in AUM as of 3/31/06
By Investment Discipline | | By Distribution Channel |
| | |
[CHART] | | [CHART] |
19
Total Company net flows of $3.5 billion with gross sales at highest level since 2Q 2003
Total Company Long-Term Flows (1) | | INTECH Long-Term Flows | | Janus (ex-INTECH) Long-Term Flows (1) |
($ in billions) | | ($ in billions) | | ($ in billions) |
| | | | |
[CHART] | | [CHART] | | [CHART] |
Note:
(1) 2Q 2005 Flows exclude $0.2 billion disposition of Janus’ Vontobel assets.
20
1Q 2006 EPS of $0.17 up quarter-over-quarter on flat expenses and higher revenues
Consolidated Entity
| | Quarter Ended | | Quarter Ended | |
($ in millions, except AUM and per share) | | March 31,
2006 | | December 31,
2005 | | Variance
(%) | | March 31,
2006 | | March 31,
2005 | | Variance
(%) | |
| | | | | | | | | | | | | |
Average AUM (in billions) | | $ | 154.4 | | $ | 142.6 | | 8.3 | % | $ | 154.4 | | $ | 133.8 | | 15.4 | % |
Investment Management Segment | | | | | | | | | | | | | |
Revenue | | $ | 232.5 | | $ | 225.2 | | 3.2 | % | $ | 232.5 | | $ | 216.0 | | 7.6 | % |
Operating expenses | | 169.6 | | 169.8 | | -0.1 | % | 169.6 | | 171.6 | | -1.2 | % |
Operating income | | 62.9 | | 55.4 | | 13.5 | % | 62.9 | | 44.4 | | 41.7 | % |
Investment Management Operating Margin | | 27.1 | % | 24.6 | % | | | 27.1 | % | 20.6 | % | | |
| | | | | | | | | | | | | |
Printing and Fulfillment Segment | | | | | | | | | | | | | |
Revenue | | 23.6 | | 22.1 | | 6.8 | % | 23.6 | | 23.0 | | 2.6 | % |
Operating expenses | | 27.3 | | 25.5 | | 7.1 | % | 27.3 | | 26.1 | | 4.6 | % |
Goodwill impairment | | — | | 20.0 | | -100.0 | % | — | | — | | 0.0 | % |
Printing and Fulfillment Operating Loss | | (3.7 | ) | (23.4 | ) | -84.2 | % | (3.7 | ) | (3.1 | ) | 19.4 | % |
| | | | | | | | | | | | | |
Consolidated Operating Income | | 59.2 | | 32.0 | | 85.0 | % | 59.2 | | 41.3 | | 43.3 | % |
| | | | | | | | | | | | | |
Interest expense | | (7.0 | ) | (7.0 | ) | 0.0 | % | (7.0 | ) | (7.2 | ) | -2.8 | % |
Other income, net | | 9.0 | | 10.7 | | -15.9 | % | 9.0 | | 9.3 | | -3.2 | % |
Income tax provision | | (22.2 | ) | (20.3 | ) | 9.4 | % | (22.2 | ) | (21.4 | ) | 3.7 | % |
Equity earnings of unconsolidated affiliate | | 1.7 | | 1.8 | | -5.6 | % | 1.7 | | 1.7 | | 0.0 | % |
Minority interest in consolidated earnings | | (5.4 | ) | (6.4 | ) | -15.6 | % | (5.4 | ) | (4.1 | ) | 31.7 | % |
| | | | | | | | | | | | | |
Net income | | $ | 35.3 | | $ | 10.8 | | 226.9 | % | $ | 35.3 | | $ | 19.6 | | 80.1 | % |
Diluted earnings per share | | $ | 0.17 | | $ | 0.05 | | 240.0 | % | $ | 0.17 | | $ | 0.09 | | 88.9 | % |
21
Despite the decrease in performance fees this quarter, IM revenues increased 3%
Investment Management Segment
| | Quarter Ended | | Quarter Ended | |
($ in millions, except AUM) | | March 31,
2006 | | December 31,
2005 | | Variance
(%) | | March 31,
2006 | | March 31,
2005 | | Variance
(%) | |
| | | | | | | | | | | | | |
Average AUM (billions) | | $ | 154.4 | | $ | 142.6 | | 8.3 | % | $ | 154.4 | | $ | 133.8 | | 15.4 | % |
Revenue | | | | | | | | | | | | | |
Investment management fees | | $ | 185.6 | | $ | 176.0 | | | | $ | 185.6 | | $ | 165.8 | | | |
Performance fees | | 4.2 | | 7.3 | | | | 4.2 | | 7.3 | | | |
Other | | 42.7 | | 41.9 | | | | 42.7 | | 42.9 | | | |
Total revenue | | 232.5 | | 225.2 | | 3.2 | % | 232.5 | | 216.0 | | 7.6 | % |
| | | | | | | | | | | | | |
Basis points | | | | | | | | | | | | | |
Investment management fees | | 48.8 | | 49.0 | | | | 48.8 | | 50.3 | | | |
Investment management fees and performance fees | | 49.9 | | 51.0 | | | | 49.9 | | 52.5 | | | |
| | | | | | | | | | | | | |
Operating expenses | | | | | | | | | | | | | |
Employee compensation and benefits | | 83.4 | | 78.7 | | | | 83.4 | | 71.3 | | | |
Long-term incentive compensation | | 22.0 | | 19.5 | | | | 22.0 | | 19.0 | | | |
Marketing and advertising | | 5.4 | | 6.3 | | | | 5.4 | | 9.7 | | | |
Distribution | | 26.8 | | 24.4 | | | | 26.8 | | 27.1 | | | |
Depreciation and amortization | | 8.3 | | 7.9 | | | | 8.3 | | 10.2 | | | |
General, administrative and occupancy | | 33.7 | | 33.0 | | | | 33.7 | | 32.1 | | | |
Restructuring and impairments | | — | | — | | | | — | | 5.5 | | | |
Mutual fund investigation recoveries, net of charges | | (10.0 | ) | — | | | | (10.0 | ) | (3.3 | ) | | |
Total operating expense | | 169.6 | | 169.8 | | -0.1 | % | 169.6 | | 171.6 | | -1.2 | % |
| | | | | | | | | | | | | |
Operating income | | $ | 62.9 | | $ | 55.4 | | 13.5 | % | $ | 62.9 | | $ | 44.4 | | 41.7 | % |
| | | | | | | | | | | | | |
Operating margin | | 27.1 | % | 24.6 | % | | | 27.1 | % | 20.6 | % | | |
22
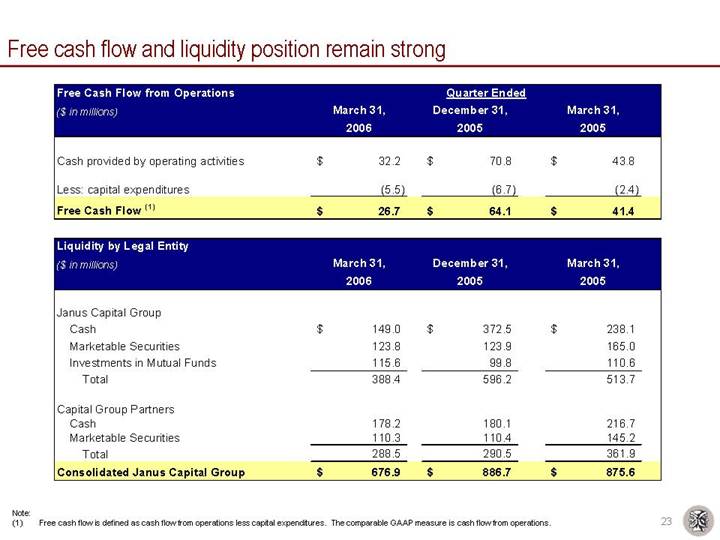
Free cash flow and liquidity position remain strong
| | Quarter Ended | |
Free Cash Flow from Operations
($ in millions) | | March 31,
2006 | | December 31,
2005 | | March 31,
2005 | |
| | | | | | | |
Cash provided by operating activities | | $ | 32.2 | | $ | 70.8 | | $ | 43.8 | |
| | | | | | | |
Less: capital expenditures | | (5.5 | ) | (6.7 | ) | (2.4 | ) |
Free Cash Flow (1) | | $ | 26.7 | | $ | 64.1 | | $ | 41.4 | |
| | | | | | | |
Liquidity by Legal Entity
($ in millions) | | March 31,
2006 | | December 31,
2005 | | March 31,
2005 | |
| | | | | | | |
Janus Capital Group | | | | | | | |
Cash | | $ | 149.0 | | $ | 372.5 | | $ | 238.1 | |
Marketable Securities | | 123.8 | | 123.9 | | 165.0 | |
Investments in Mutual Funds | | 115.6 | | 99.8 | | 110.6 | |
Total | | 388.4 | | 596.2 | | 513.7 | |
| | | | | | | |
Capital Group Partners | | | | | | | |
Cash | | 178.2 | | 180.1 | | 216.7 | |
Marketable Securities | | 110.3 | | 110.4 | | 145.2 | |
Total | | 288.5 | | 290.5 | | 361.9 | |
Consolidated Janus Capital Group | | $ | 676.9 | | $ | 886.7 | | $ | 875.6 | |
Note:
(1) Free cash flow is defined as cash flow from operations less capital expenditures. The comparable GAAP measure is cash flow from operations.
23
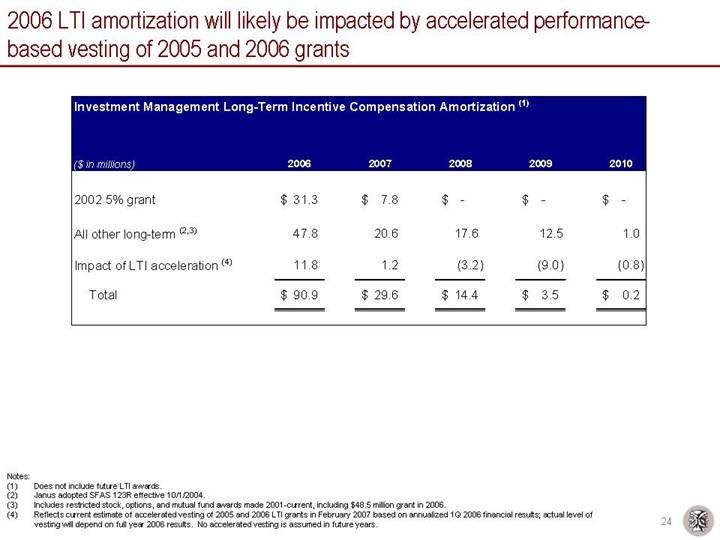
2006 LTI amortization will likely be impacted by accelerated performance-based vesting of 2005 and 2006 grants
Investment Management Long-Term Incentive Compensation Amortization (1)
($ in millions) | | 2006 | | 2007 | | 2008 | | 2009 | | 2010 | |
| | | | | | | | | | | |
2002 5% grant | | $ | 31.3 | | $ | 7.8 | | $ | — | | $ | — | | $ | — | |
| | | | | | | | | | | |
All other long-term (2),(3) | | 47.8 | | 20.6 | | 17.6 | | 12.5 | | 1.0 | |
| | | | | | | | | | | |
Impact of LTI acceleration (4) | | 11.8 | | 1.2 | | (3.2 | ) | (9.0 | ) | (0.8 | ) |
| | | | | | | | | | | |
Total | | $ | 90.9 | | $ | 29.6 | | $ | 14.4 | | $ | 3.5 | | $ | 0.2 | |
Notes:
(1) Does not include future LTI awards.
(2) Janus adopted SFAS 123R effective 10/1/2004.
(3) Includes restricted stock, options, and mutual fund awards made 2001-current, including $48.5 million grant in 2006.
(4) Reflects current estimate of accelerated vesting of 2005 and 2006 LTI grants in February 2007 based on annualized 1Q 2006 financial results; actual level of vesting will depend on full year 2006 results. No accelerated vesting is assumed in future years.
24
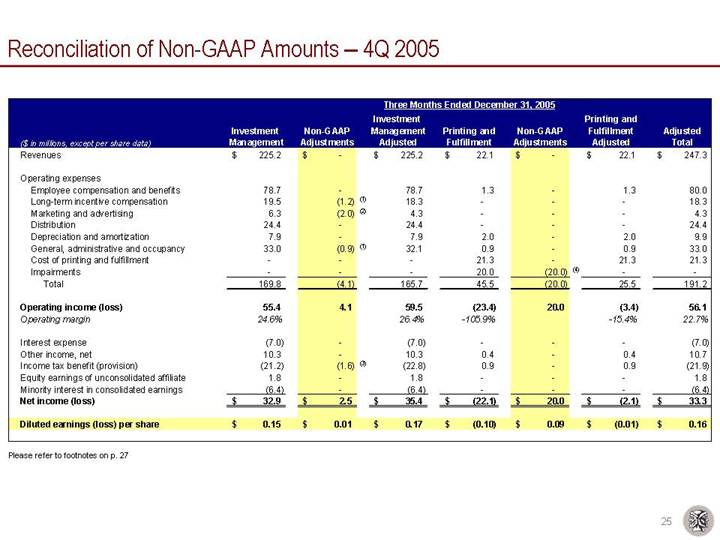
Reconciliation of Non-GAAP Amounts – 4Q 2005
| | Three Months Ended December 31, 2005 | |
($ in millions, except per share data) | | Investment
Management | | Non-GAAP
Adjustments | | Investment
Management
Adjusted | | Printing and
Fulfillment | | Non-GAAP
Adjustments | | Printing and
Fulfillment
Adjusted | | Adjusted
Total | |
Revenues | | $ | 225.2 | | $ | — | | $ | 225.2 | | $ | 22.1 | | $ | — | | $ | 22.1 | | $ | 247.3 | |
| | | | | | | | | | | | | | | |
Operating expenses | | | | | | | | | | | | | | | |
Employee compensation and benefits | | 78.7 | | — | | 78.7 | | 1.3 | | — | | 1.3 | | 80.0 | |
Long-term incentive compensation | | 19.5 | | (1.2 | )(1) | 18.3 | | — | | — | | — | | 18.3 | |
Marketing and advertising | | 6.3 | | (2.0 | )(2) | 4.3 | | — | | — | | — | | 4.3 | |
Distribution | | 24.4 | | — | | 24.4 | | — | | — | | — | | 24.4 | |
Depreciation and amortization | | 7.9 | | — | | 7.9 | | 2.0 | | — | | 2.0 | | 9.9 | |
General, administrative and occupancy | | 33.0 | | (0.9 | )(1) | 32.1 | | 0.9 | | — | | 0.9 | | 33.0 | |
Cost of printing and fulfillment | | — | | — | | — | | 21.3 | | — | | 21.3 | | 21.3 | |
Impairments | | — | | — | | — | | 20.0 | | (20.0 | )(4) | — | | — | |
Total | | 169.8 | | (4.1 | ) | 165.7 | | 45.5 | | (20.0 | ) | 25.5 | | 191.2 | |
| | | | | | | | | | | | | | | |
Operating income (loss) | | 55.4 | | 4.1 | | 59.5 | | (23.4 | ) | 20.0 | | (3.4 | ) | 56.1 | |
Operating margin | | 24.6 | % | | | 26.4 | % | -105.9 | % | | | -15.4 | % | 22.7 | % |
| | | | | | | | | | | | | | | |
Interest expense | | (7.0 | ) | — | | (7.0 | ) | — | | — | | — | | (7.0 | ) |
Other income, net | | 10.3 | | — | | 10.3 | | 0.4 | | — | | 0.4 | | 10.7 | |
Income tax benefit (provision) | | (21.2 | ) | (1.6 | )(3) | (22.8 | ) | 0.9 | | — | | 0.9 | | (21.9 | ) |
Equity earnings of unconsolidated affiliate | | 1.8 | | — | | 1.8 | | — | | — | | — | | 1.8 | |
Minority interest in consolidated earnings | | (6.4 | ) | — | | (6.4 | ) | — | | — | | — | | (6.4 | ) |
Net income (loss) | | $ | 32.9 | | $ | 2.5 | | $ | 35.4 | | $ | (22.1 | ) | $ | 20.0 | | $ | (2.1 | ) | $ | 33.3 | |
| | | | | | | | | | | | | | | |
Diluted earnings (loss) per share | | $ | 0.15 | | $ | 0.01 | | $ | 0.17 | | $ | (0.10 | ) | $ | 0.09 | | $ | (0.01 | ) | $ | 0.16 | |
Please refer to footnotes on p. 27
25
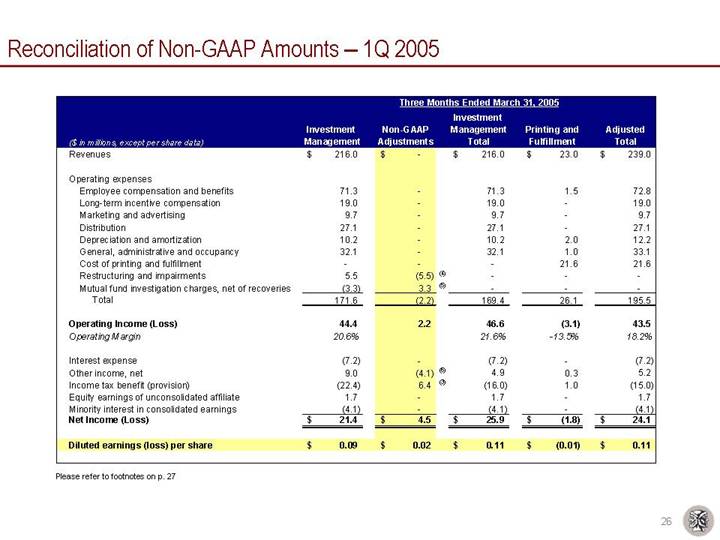
Reconciliation of Non-GAAP Amounts – 1Q 2005
| | Three Months Ended March 31, 2005 | |
($ in millions, except per share data) | | Investment
Management | | Non-GAAP
Adjustments | | Investment
Management
Total | | Printing and
Fulfillment | | Adjusted
Total | |
Revenues | | $ | 216.0 | | $ | — | | $ | 216.0 | | $ | 23.0 | | $ | 239.0 | |
| | | | | | | | | | | |
Operating expenses | | | | | | | | | | | |
Employee compensation and benefits | | 71.3 | | — | | 71.3 | | 1.5 | | 72.8 | |
Long-term incentive compensation | | 19.0 | | — | | 19.0 | | — | | 19.0 | |
Marketing and advertising | | 9.7 | | — | | 9.7 | | — | | 9.7 | |
Distribution | | 27.1 | | — | | 27.1 | | — | | 27.1 | |
Depreciation and amortization | | 10.2 | | — | | 10.2 | | 2.0 | | 12.2 | |
General, administrative and occupancy | | 32.1 | | — | | 32.1 | | 1.0 | | 33.1 | |
Cost of printing and fulfillment | | — | | — | | — | | 21.6 | | 21.6 | |
Restructuring and impairments | | 5.5 | | (5.5 | )(4) | — | | — | | — | |
Mutual fund investigation charges, net of recoveries | | (3.3 | ) | 3.3 | (5) | — | | — | | — | |
Total | | 171.6 | | (2.2 | ) | 169.4 | | 26.1 | | 195.5 | |
| | | | | | | | | | | |
Operating Income (Loss) | | 44.4 | | 2.2 | | 46.6 | | (3.1 | ) | 43.5 | |
Operating Margin | | 20.6 | % | | | 21.6 | % | -13.5 | % | 18.2 | % |
| | | | | | | | | | | |
Interest expense | | (7.2 | ) | — | | (7.2 | ) | — | | (7.2 | ) |
Other income, net | | 9.0 | | (4.1 | )(6) | 4.9 | | 0.3 | | 5.2 | |
Income tax benefit (provision) | | (22.4 | ) | 6.4 | (3) | (16.0 | ) | 1.0 | | (15.0 | ) |
Equity earnings of unconsolidated affiliate | | 1.7 | | — | | 1.7 | | — | | 1.7 | |
Minority interest in consolidated earnings | | (4.1 | ) | — | | (4.1 | ) | — | | (4.1 | ) |
Net Income (Loss) | | $ | 21.4 | | $ | 4.5 | | $ | 25.9 | | $ | (1.8 | ) | $ | 24.1 | |
| | | | | | | | | | | |
Diluted earnings (loss) per share | | $ | 0.09 | | $ | 0.02 | | $ | 0.11 | | $ | (0.01 | ) | $ | 0.11 | |
Please refer to footnotes on p. 27
26
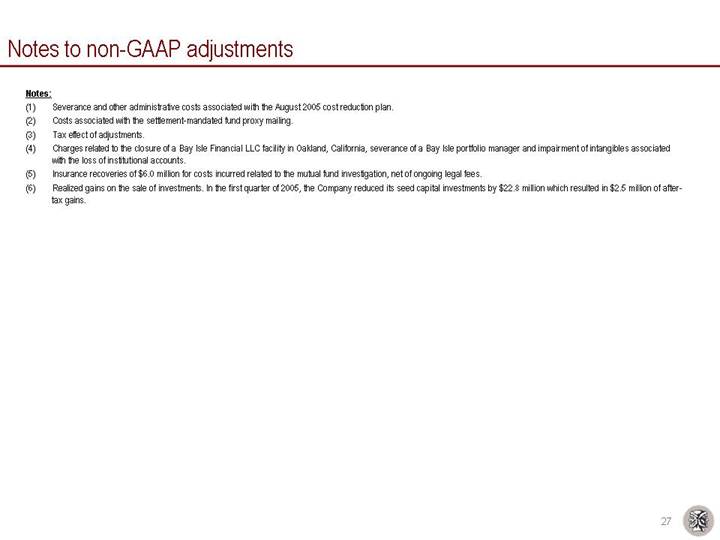
Notes to non-GAAP adjustments
Notes:
(1) Severance and other administrative costs associated with the August 2005 cost reduction plan.
(2) Costs associated with the settlement-mandated fund proxy mailing.
(3) Tax effect of adjustments.
(4) Charges related to the closure of a Bay Isle Financial LLC facility in Oakland, California, severance of a Bay Isle portfolio manager and impairment of intangibles associated with the loss of institutional accounts.
(5) Insurance recoveries of $6.0 million for costs incurred related to the mutual fund investigation, net of ongoing legal fees.
(6) Realized gains on the sale of investments. In the first quarter of 2005, the Company reduced its seed capital investments by $22.8 million which resulted in $2.5 million of after-tax gains.
27
Morningstar RatingTM Based on Risk-Adjusted Returns as of March 31, 2006
Janus Investment Fund (“JIF”) | | The Overall Morningstar RatingTM is derived from a weighted average of the performance figures associated with its three-, five-, and ten-year (if applicable) Morningstar RatingTM metrics. |
| | | | Overall Rating | | Three-Year Rating | | Five-Year Rating | | Ten-Year Rating | |
Fund | | Category | | Stars | | # of Funds | | Stars | | # of Funds | | Stars | | # of Funds | | Stars | | # of Funds | |
| | | | | | | | | | | | | | | | | | | |
Janus Fund | | Large Growth Funds | | *** | | 1350 | | *** | | 1350 | | ** | | 1077 | | *** | | 389 | |
Janus Enterprise Fund | | Mid-Cap Growth Funds | | ** | | 796 | | **** | | 796 | | ** | | 622 | | ** | | 219 | |
Janus Growth and Income Fund | | Large Growth Funds | | ***** | | 1350 | | **** | | 1350 | | **** | | 1077 | | ***** | | 389 | |
Janus Mercury Fund | | Large Growth Funds | | *** | | 1350 | | **** | | 1350 | | *** | | 1077 | | *** | | 389 | |
Janus Olympus Fund | | Large Growth Funds | | **** | | 1350 | | **** | | 1350 | | *** | | 1077 | | **** | | 389 | |
Janus Orion Fund | | Mid-Cap Growth Funds | | **** | | 796 | | ***** | | 796 | | **** | | 622 | | | | N/A | |
Janus Twenty Fund(1) | | Large Growth Funds | | **** | | 1350 | | ***** | | 1350 | | **** | | 1077 | | **** | | 389 | |
Janus Venture Fund(1) | | Small Growth Funds | | *** | | 657 | | **** | | 657 | | *** | | 524 | | *** | | 182 | |
Janus Triton Fund | | Small Growth Funds | | | | N/A | | | | N/A | | | | N/A | | | | N/A | |
Janus Research Fund | | Large Growth Funds | | | | N/A | | | | N/A | | | | N/A | | | | N/A | |
Janus Global Life Sciences Fund | | Specialty-Health Funds | | *** | | 198 | | **** | | 198 | | *** | | 139 | | | | N/A | |
Janus Global Technology Fund | | Specialty-Technology Funds | | *** | | 298 | | *** | | 298 | | *** | | 256 | | | | N/A | |
Janus Overseas Fund | | Foreign Large Growth Funds | | **** | | 194 | | ***** | | 194 | | **** | | 150 | | **** | | 64 | |
Janus Worldwide Fund | | World Stock Funds | | ** | | 396 | | * | | 396 | | * | | 301 | | ** | | 129 | |
Janus Global Opportunities Fund | | World Stock Funds | | *** | | 396 | | *** | | 396 | | | | N/A | | | | N/A | |
Janus Balanced Fund | | Moderate Allocation Funds | | **** | | 814 | | *** | | 814 | | **** | | 646 | | **** | | 301 | |
INTECH Risk-Managed Stock Fund | | Large Blend Funds | | ***** | | 1478 | | ***** | | 1478 | | | | N/A | | | | N/A | |
Janus Core Equity Fund | | Large Blend Funds | | **** | | 1478 | | ***** | | 1478 | | ***** | | 1162 | | | | N/A | |
Janus Contrarian Fund | | Large Blend Funds | | ***** | | 1478 | | ***** | | 1478 | | ***** | | 1162 | | | | N/A | |
Janus Mid Cap Value Fund - Investor Shares(2) | | Mid-Cap Value Funds | | **** | | 262 | | *** | | 262 | | **** | | 158 | | | | N/A | |
Janus Small Cap Value Fund - Investor Shares(1)(2) | | Small Value Funds | | ** | | 284 | | ** | | 284 | | ** | | 202 | | **** | | 64 | |
Janus Federal Tax-Exempt Fund | | Muni National Long Funds | | ** | | 299 | | ** | | 299 | | ** | | 276 | | ** | | 196 | |
Janus Flexible Bond Fund | | Intermediate-Term Bond Funds | | **** | | 900 | | **** | | 900 | | **** | | 707 | | **** | | 356 | |
Janus High-Yield Fund | | High Yield Bond Funds | | **** | | 459 | | ** | | 459 | | *** | | 378 | | ***** | | 140 | |
Janus Short-Term Bond Fund | | Short-Term Bond Funds | | *** | | 322 | | **** | | 322 | | *** | | 235 | | *** | | 137 | |
Percent of funds rated 4 / 5 Stars | | | | 52.2 | % | | | 60.9 | % | | | 42.9 | % | | | 53.3 | % | | |
Data presented reflects past performance, which is no guarantee of future results.
Notes: (1) Closed to new investors. (2)Rating is for this share class only; other classes may have different performance characteristics.
For each fund with at least a three-year history, Morningstar calculates a Morningstar RatingTM based on a Morningstar Risk-Adjusted Return measure that accounts for variation in a fund’s monthly performance (including the effects of sales charges, loads, and redemption fees), placing more emphasis on downward variations and rewarding consistent performance. The top 10% of the funds in each category receive 5 stars, the next 22.5% receive 4 stars, the next 35% receive 3 stars, the next 22.5% receive 2 stars, and the bottom 10% receive 1 star. (Each share class is counted as a fraction of one fund within this scale and rated separately, which may cause slight variations in the distribution percentages.)
28
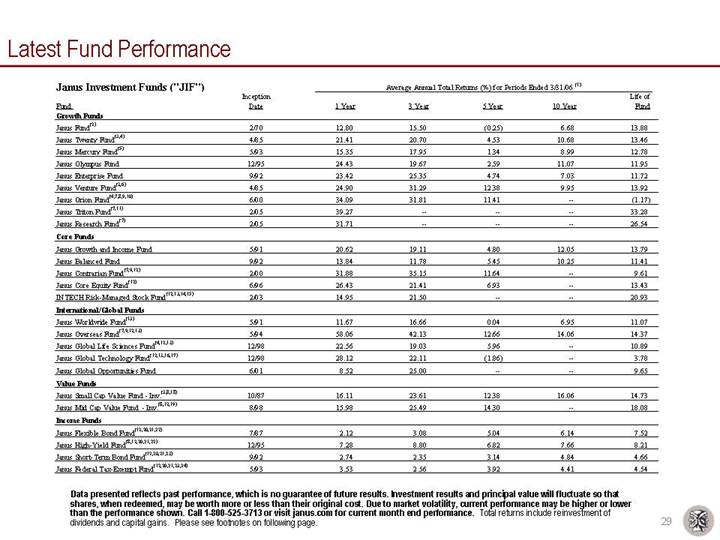
Latest Fund Performance
Janus Investment Funds (“JIF”)
| | Average Annual Total Returns (%) for Periods Ended 3/31/06 (1) | |
| | Inception | | | | | | | | | | Life of | |
Fund | | Date | | 1 Year | | 3 Year | | 5 Year | | 10 Year | | Fund | |
Growth Funds | | | | | | | | | | | | | |
Janus Fund(2) | | 2/70 | | 12.80 | | 15.50 | | (0.25 | ) | 6.68 | | 13.88 | |
Janus Twenty Fund(3),(4) | | 4/85 | | 21.41 | | 20.70 | | 4.53 | | 10.68 | | 13.46 | |
Janus Mercury Fund(5) | | 5/93 | | 15.35 | | 17.95 | | 1.34 | | 8.99 | | 12.78 | |
Janus Olympus Fund | | 12/95 | | 24.43 | | 19.67 | | 2.59 | | 11.07 | | 11.95 | |
Janus Enterprise Fund | | 9/92 | | 23.42 | | 25.35 | | 4.74 | | 7.03 | | 11.72 | |
Janus Venture Fund(3),(6) | | 4/85 | | 24.90 | | 31.29 | | 12.38 | | 9.95 | | 13.92 | |
Janus Orion Fund(4),(7),(8),(9),(10) | | 6/00 | | 34.09 | | 31.81 | | 11.41 | | — | | (1.17 | ) |
Janus Triton Fund(7),(11) | | 2/05 | | 39.27 | | — | | — | | — | | 33.28 | |
Janus Research Fund(7) | | 2/05 | | 31.71 | | — | | — | | — | | 26.54 | |
| | | | | | | | | | | | | |
Core Funds | | | | | | | | | | | | | |
Janus Growth and Income Fund | | 5/91 | | 20.62 | | 19.11 | | 4.80 | | 12.05 | | 13.79 | |
Janus Balanced Fund | | 9/92 | | 13.84 | | 11.78 | | 5.45 | | 10.25 | | 11.41 | |
Janus Contrarian Fund(7),(9),(12) | | 2/00 | | 31.88 | | 35.15 | | 11.64 | | — | | 9.61 | |
Janus Core Equity Fund(12) | | 6/96 | | 26.43 | | 21.41 | | 6.93 | | — | | 13.43 | |
INTECH Risk-Managed Stock Fund(12),(13),(14),(15) | | 2/03 | | 14.95 | | 21.50 | | — | | — | | 20.93 | |
| | | | | | | | | | | | | |
International/Global Funds | | | | | | | | | | | | | |
Janus Worldwide Fund(13) | | 5/91 | | 11.67 | | 16.66 | | 0.04 | | 6.95 | | 11.07 | |
Janus Overseas Fund(7),(9),(12),(13) | | 5/94 | | 58.06 | | 42.13 | | 12.66 | | 14.06 | | 14.37 | |
Janus Global Life Sciences Fund(4),(12),(13) | | 12/98 | | 22.56 | | 19.03 | | 5.96 | | — | | 10.89 | |
Janus Global Technology Fund(12),(13),(16),(17) | | 12/98 | | 28.12 | | 22.11 | | (1.86 | ) | — | | 3.78 | |
Janus Global Opportunities Fund | | 6/01 | | 8.52 | | 25.00 | | — | | — | | 9.65 | |
| | | | | | | | | | | | | |
Value Funds | | | | | | | | | | | | | |
Janus Small Cap Value Fund - Inv.(3),(8),(18) | | 10/87 | | 16.11 | | 23.61 | | 12.38 | | 16.06 | | 14.73 | |
Janus Mid Cap Value Fund - Inv.(8),(12),(19) | | 8/98 | | 15.98 | | 25.49 | | 14.30 | | — | | 18.08 | |
| | | | | | | | | | | | | |
Income Funds | | | | | | | | | | | | | |
Janus Flexible Bond Fund(12),(20),(21),(22) | | 7/87 | | 2.12 | | 3.08 | | 5.04 | | 6.14 | | 7.52 | |
Janus High-Yield Fund(8),(12),(20),(21),(22) | | 12/95 | | 7.28 | | 8.80 | | 6.82 | | 7.66 | | 8.21 | |
Janus Short-Term Bond Fund(12),(20),(21),(23) | | 9/92 | | 2.74 | | 2.35 | | 3.14 | | 4.84 | | 4.66 | |
Janus Federal Tax-Exempt Fund(12),(20),(21),(23),(24) | | 5/93 | | 3.53 | | 2.56 | | 3.92 | | 4.41 | | 4.54 | |
Data presented reflects past performance, which is no guarantee of future results. Investment results and principal value will fluctuate so that shares, when redeemed, may be worth more or less than their original cost. Due to market volatility, current performance may be higher or lower than the performance shown. Call 1-800-525-3713 or visit janus.com for current month end performance. Total returns include reinvestment of dividends and capital gains. Please see footnotes on following page.
29
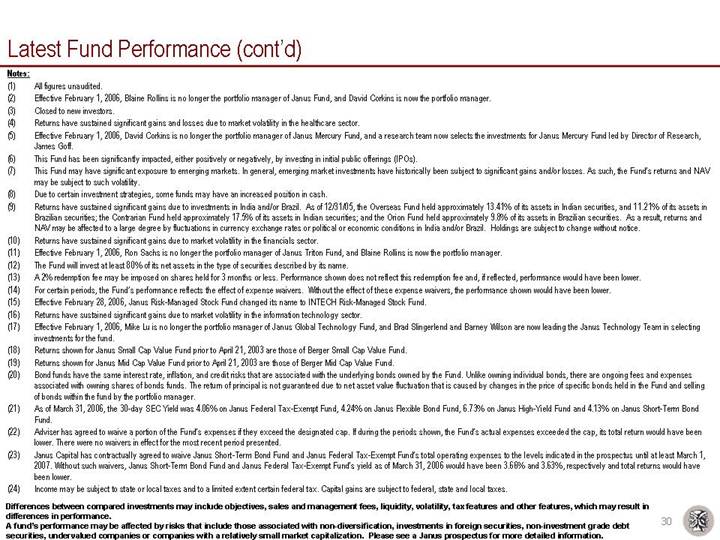
Notes:
(1) All figures unaudited.
(2) Effective February 1, 2006, Blaine Rollins is no longer the portfolio manager of Janus Fund, and David Corkins is now the portfolio manager.
(3) Closed to new investors.
(4) Returns have sustained significant gains and losses due to market volatility in the healthcare sector.
(5) Effective February 1, 2006, David Corkins is no longer the portfolio manager of Janus Mercury Fund, and a research team now selects the investments for Janus Mercury Fund led by Director of Research, James Goff.
(6) This Fund has been significantly impacted, either positively or negatively, by investing in initial public offerings (IPOs).
(7) This Fund may have significant exposure to emerging markets. In general, emerging market investments have historically been subject to significant gains and/or losses. As such, the Fund’s returns and NAV may be subject to such volatility.
(8) Due to certain investment strategies, some funds may have an increased position in cash.
(9) Returns have sustained significant gains due to investments in India and/or Brazil. As of 12/31/05, the Overseas Fund held approximately 13.41% of its assets in Indian securities, and 11.21% of its assets in Brazilian securities; the Contrarian Fund held approximately 17.5% of its assets in Indian securities; and the Orion Fund held approximately 9.8% of its assets in Brazilian securities. As a result, returns and NAV may be affected to a large degree by fluctuations in currency exchange rates or political or economic conditions in India and/or Brazil. Holdings are subject to change without notice.
(10) Returns have sustained significant gains due to market volatility in the financials sector.
(11) Effective February 1, 2006, Ron Sachs is no longer the portfolio manager of Janus Triton Fund, and Blaine Rollins is now the portfolio manager.
(12) The Fund will invest at least 80% of its net assets in the type of securities described by its name.
(13) A 2% redemption fee may be imposed on shares held for 3 months or less. Performance shown does not reflect this redemption fee and, if reflected, performance would have been lower.
(14) For certain periods, the Fund’s performance reflects the effect of expense waivers. Without the effect of these expense waivers, the performance shown would have been lower.
(15) Effective February 28, 2006, Janus Risk-Managed Stock Fund changed its name to INTECH Risk-Managed Stock Fund.
(16) Returns have sustained significant gains due to market volatility in the information technology sector.
(17) Effective February 1, 2006, Mike Lu is no longer the portfolio manager of Janus Global Technology Fund, and Brad Slingerlend and Barney Wilson are now leading the Janus Technology Team in selecting investments for the fund.
(18) Returns shown for Janus Small Cap Value Fund prior to April 21, 2003 are those of Berger Small Cap Value Fund.
(19) Returns shown for Janus Mid Cap Value Fund prior to April 21, 2003 are those of Berger Mid Cap Value Fund.
(20) Bond funds have the same interest rate, inflation, and credit risks that are associated with the underlying bonds owned by the Fund. Unlike owning individual bonds, there are ongoing fees and expenses associated with owning shares of bonds funds. The return of principal is not guaranteed due to net asset value fluctuation that is caused by changes in the price of specific bonds held in the Fund and selling of bonds within the fund by the portfolio manager.
(21) As of March 31, 2006, the 30-day SEC Yield was 4.06% on Janus Federal Tax-Exempt Fund, 4.24% on Janus Flexible Bond Fund, 6.73% on Janus High-Yield Fund and 4.13% on Janus Short-Term Bond Fund.
(22) Adviser has agreed to waive a portion of the Fund’s expenses if they exceed the designated cap. If during the periods shown, the Fund’s actual expenses exceeded the cap, its total return would have been lower. There were no waivers in effect for the most recent period presented.
(23) Janus Capital has contractually agreed to waive Janus Short-Term Bond Fund and Janus Federal Tax-Exempt Fund’s total operating expenses to the levels indicated in the prospectus until at least March 1, 2007. Without such waivers, Janus Short-Term Bond Fund and Janus Federal Tax-Exempt Fund’s yield as of March 31, 2006 would have been 3.66% and 3.63%, respectively and total returns would have been lower.
(24) Income may be subject to state or local taxes and to a limited extent certain federal tax. Capital gains are subject to federal, state and local taxes.
Differences between compared investments may include objectives, sales and management fees, liquidity, volatility, tax features and other features, which may result in differences in performance.
A fund’s performance may be affected by risks that include those associated with non-diversification, investments in foreign securities, non-investment grade debt securities, undervalued companies or companies with a relatively small market capitalization. Please see a Janus prospectus for more detailed information.
30