Searchable text section of graphics shown above
[JANUS CAPITAL GROUP LOGO]
Fourth Quarter 2005 Earnings Presentation
January 26, 2006
Gary Black | Dave Martin |
Chief Executive Officer and Chief Investment Officer | Executive Vice President and Chief Financial Officer |
| |
Highlights (adjusted basis) (1)
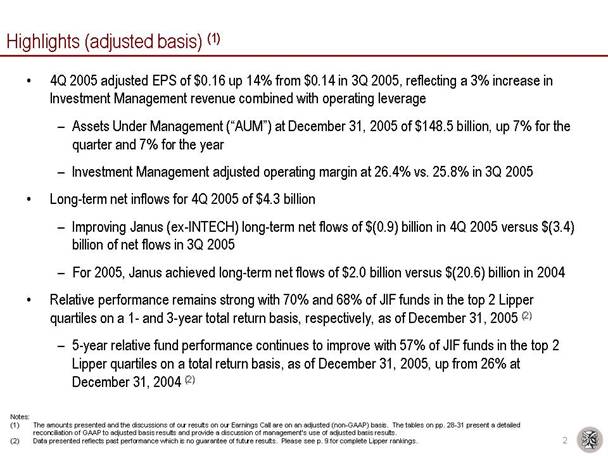
• 4Q 2005 adjusted EPS of $0.16 up 14% from $0.14 in 3Q 2005, reflecting a 3% increase in Investment Management revenue combined with operating leverage
— Assets Under Management (“AUM”) at December 31, 2005 of $148.5 billion, up 7% for the quarter and 7% for the year
— Investment Management adjusted operating margin at 26.4% vs. 25.8% in 3Q 2005
• Long-term net inflows for 4Q 2005 of $4.3 billion
— Improving Janus (ex-INTECH) long-term net flows of $(0.9) billion in 4Q 2005 versus $(3.4) billion of net flows in 3Q 2005
— For 2005, Janus achieved long-term net flows of $2.0 billion versus $(20.6) billion in 2004
• Relative performance remains strong with 70% and 68% of JIF funds in the top 2 Lipper quartiles on a 1- and 3-year total return basis, respectively, as of December 31, 2005 (2)
— 5-year relative fund performance continues to improve with 57% of JIF funds in the top 2 Lipper quartiles on a total return basis, as of December 31, 2005, up from 26% at December 31, 2004 (2)
Notes:
(1) The amounts presented and the discussions of our results on our Earnings Call are on an adjusted (non-GAAP) basis. The tables on pp. 28-31 present a detailed reconciliation of GAAP to adjusted basis results and provide a discussion of management’s use of adjusted basis results.
(2) Data presented reflects past performance which is no guarantee of future results. Please see p. 9 for complete Lipper rankings.
[GRAPHIC]
2
2005 Accomplishments and 2006 Goals
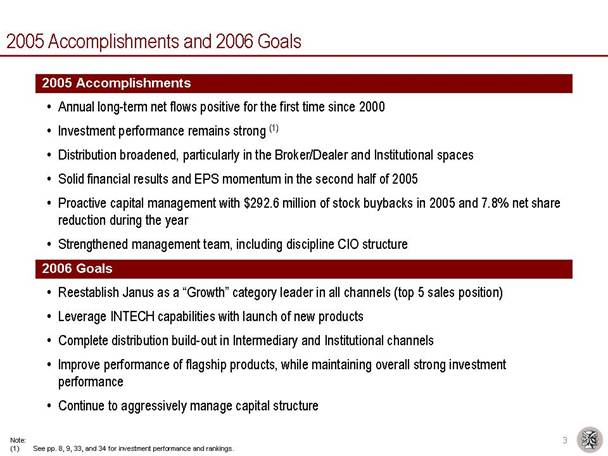
2005 Accomplishments
• Annual long-term net flows positive for the first time since 2000
• Investment performance remains strong (1)
• Distribution broadened, particularly in the Broker/Dealer and Institutional spaces
• Solid financial results and EPS momentum in the second half of 2005
• Proactive capital management with $292.6 million of stock buybacks in 2005 and 7.8% net share reduction during the year
• Strengthened management team, including discipline CIO structure
2006 Goals
• Reestablish Janus as a “Growth” category leader in all channels (top 5 sales position)
• Leverage INTECH capabilities with launch of new products
• Complete distribution build-out in Intermediary and Institutional channels
• Improve performance of flagship products, while maintaining overall strong investment performance
• Continue to aggressively manage capital structure
Note:
(1) See pp. 8, 9, 33, and 34 for investment performance and rankings.
3
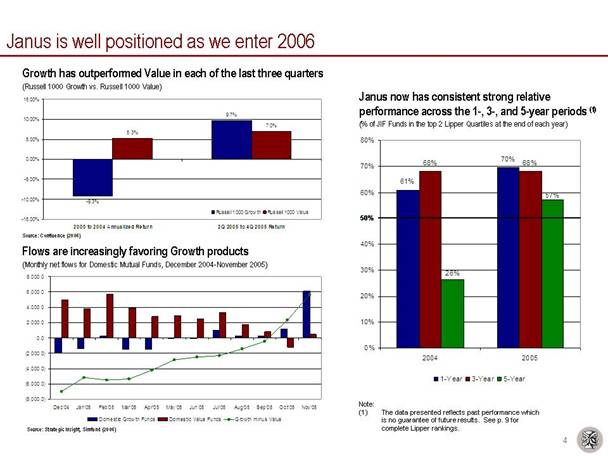
Janus is well positioned as we enter 2006
Growth has outperformed Value in each of the last three quarters
(Russell 1000 Growth vs. Russell 1000 Value)
[CHART]
[KEY]
Source: Confluence (2006)
Flows are increasingly favoring Growth products
(Monthly net flows for Domestic Mutual Funds, December 2004-November 2005)
[CHART]
[KEY]
Source: Strategic Insight, Simfund (2006)
Janus now has consistent strong relative
performance across the 1-, 3-, and 5-year periods (1)
(% of JIF Funds in the top 2 Lipper Quartiles at the end of each year)
[CHART]
[KEY]
Note:
(1) The data presented reflects past performance which is no guarantee of future results. See p. 9 for complete Lipper rankings.
4
Long-term net flows are positive for the second consecutive quarter and for full year 2005
Total Company Long-Term Net Flows by Quarter (1)
($ in billions, 1Q 2004-4Q 2005)
[CHART]
Janus (ex-INTECH) Long-Term Net Flows by Quarter (1)
($ in billions, 1Q 2004—4Q 2005)
[CHART]
• Total Company long-term net flows of $4.3 billion in 4Q 2005
— Full year net flows of $2 billion up $22.6 billion from 2004 net flows of $(20.6) billion
• Janus (ex-INTECH) net outflows of $0.9 billion in 4Q 2005 at lowest level since 4Q 2001
• Another record quarter for INTECH with net inflows of $5.2 billion in 4Q 2005
INTECH Net Flows by Quarter
($ in billions, 1Q 2004—4Q 2005)
[CHART]
[KEY]
Note:
(1) Long-term net flows depicted exclude money market flows.
5
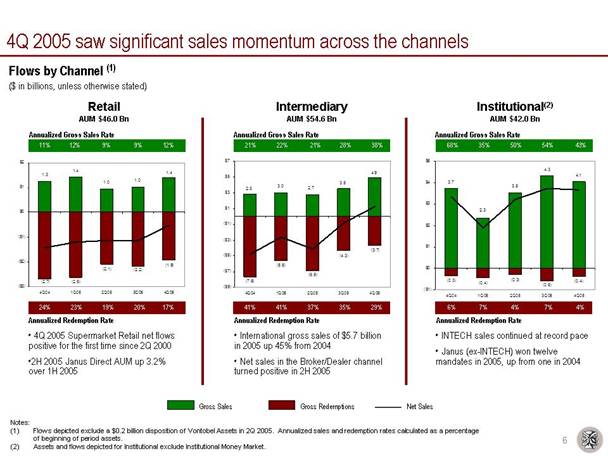
4Q 2005 saw significant sales momentum across the channels
Flows by Channel (1)
($ in billions, unless otherwise stated)
Retail
AUM $46.0 Bn
[CHART]
• 4Q 2005 Supermarket Retail net flows positive for the first time since 2Q 2000
• 2H 2005 Janus Direct AUM up 3.2% over 1H 2005
Intermediary
AUM $54.6 Bn
[CHART]
• International gross sales of $5.7 billion in 2005 up 45% from 2004
• Net sales in the Broker/Dealer channel turned positive in 2H 2005
Institutional(2)
AUM $42.0 Bn
[CHART]
• INTECH sales continued at record pace
• Janus (ex-INTECH) won twelve mandates in 2005, up from one in 2004
[KEY]
Notes:
(1) Flows depicted exclude a $0.2 billion disposition of Vontobel Assets in 2Q 2005. Annualized sales and redemption rates calculated as a percentage of beginning of period assets.
(2) Assets and flows depicted for Institutional exclude Institutional Money Market.
6
Investment performance remains strong
• �� Janus funds continue to outperform peers (1)
— 70% and 68% of JIF funds are in the top 2 Lipper Quartiles on a total return basis over the 1- and 3-year periods, respectively, as of December 31, 2005
— 57% of JIF Funds are in the top 2 Lipper Quartiles on a 5-year total return basis as of December 31, 2005, up from 26% as of December 31, 2004
— As of December 31, 2005, 41% of JIF funds have 4/5 star Morningstar ratings on an overall basis, while 64% have 4/5 star Morningstar ratings on a 3-year basis (2)
• Actions are being taken in an effort to improve performance of the flagship products
— Jonathan Coleman and David Decker named U.S. Equity Growth/Blend Co-CIOs
— David Corkins to manage Janus Fund
— Continued investment in International research to bolster Worldwide Fund
Notes:
(1) Performance reported as of 12/31/2005. Data presented reflects past performance, which is no guarantee of future results. See pp. 9, 33, and 34, for complete Lipper and Morningstar rankings and performance. Percentile ranking calculations exclude Janus Money Market Funds.
(2) Based on risk-adjusted returns. The Overall Morningstar RatingTM for a fund is derived from a weighted average of the performance figures associated with its 3-, 5- and 10-year (if applicable) Morningstar RatingTM metrics.
7
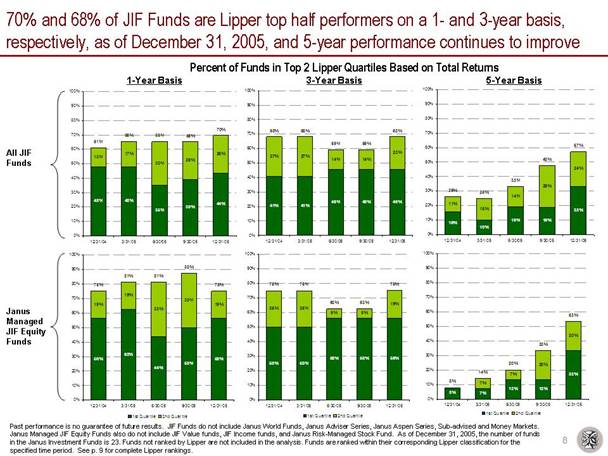
70% and 68% of JIF Funds are Lipper top half performers on a 1- and 3-year basis, respectively, as of December 31, 2005, and 5-year performance continues to improve
Percent of Funds in Top 2 Lipper Quartiles Based on Total Returns
| | 1-Year Basis | | 3-Year Basis | | 5-Year Basis | |
| | | | | | | |
All JIF Funds | | [CHART] | | [CHART] | | [CHART] | |
| | | | | | | |
Janus Managed JIF Equity Funds | | [CHART] | | [CHART] | | [CHART] | |
| | | | | | | |
| | [KEY] | | [KEY] | | [KEY] | |
Past performance is no guarantee of future results. JIF Funds do not include Janus World Funds, Janus Adviser Series, Janus Aspen Series, Sub-advised and Money Markets. Janus Managed JIF Equity Funds also do not include JIF Value funds, JIF Income funds, and Janus Risk-Managed Stock Fund. As of December 31, 2005, the number of funds in the Janus Investment Funds is 23. Funds not ranked by Lipper are not included in the analysis. Funds are ranked within their corresponding Lipper classification for the specified time period. See p. 9 for complete Lipper rankings.
8
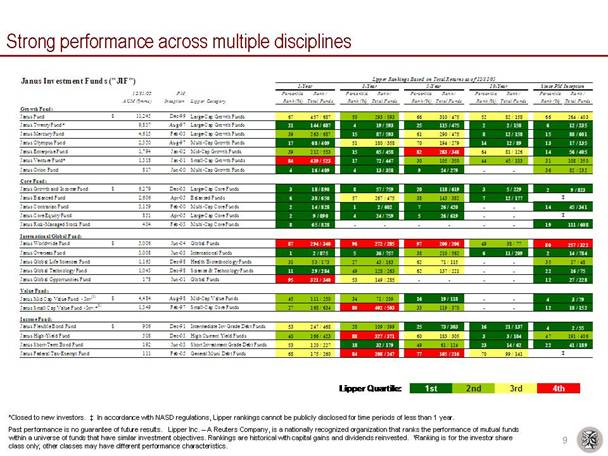
Strong performance across multiple disciplines
Janus Investment Funds ("JIF")
| | 12/31/05
AUM ($mms) | | PM
Inception | | Lipper Category | |
| | | | | | | |
Growth Funds | | | | | | | |
Janus Fund | | $ | 11,245 | | Dec-99 | | Large-Cap Growth Funds | |
Janus Twenty Fund* | | 9,837 | | Aug-97 | | Large-Cap Growth Funds | |
Janus Mercury Fund | | 4,615 | | Feb-03 | | Large-Cap Growth Funds | |
Janus Olympus Fund | | 2,350 | | Aug-97 | | Multi-Cap Growth Funds | |
Janus Enterprise Fund | | 1,794 | | Jan-02 | | Mid-Cap Growth Funds | |
Janus Venture Fund* | | 1,318 | | Jan-01 | | Small-Cap Growth Funds | |
Janus Orion Fund | | 817 | | Jun-00 | | Multi-Cap Growth Funds | |
Core Funds | | | | | | | |
Janus Growth and Income Fund | | $ | 6,279 | | Dec-03 | | Large-Cap Core Funds | |
Janus Balanced Fund | | 2,606 | | Apr-05 | | Balanced Funds | |
Janus Contrarian Fund | | 3,159 | | Feb-00 | | Multi-Cap Core Funds | |
Janus Core Equity Fund | | 851 | | Apr-05 | | Large-Cap Core Funds | |
Janus Risk-Managed Stock Fund | | 404 | | Feb-03 | | Multi-Cap Core Funds | |
International/Global Funds | | | | | | | |
Janus Worldwide Fund | | $ | 5,006 | | Jun-04 | | Global Funds | |
Janus Overseas Fund | | 3,008 | | Jun-03 | | International Funds | |
Janus Global Life Sciences Fund | | 1,163 | | Dec-98 | | Health/Biotechnology Funds | |
Janus Global Technology Fund | | 1,043 | | Dec-98 | | Science & Technology Funds | |
Janus Global Opportunities Fund | | 178 | | Jun-01 | | Global Funds | |
Value Funds | | | | | | | |
Janus Mid Cap Value Fund - Inv(1) | | $ | 4,484 | | Aug-98 | | Mid-Cap Value Funds | |
Janus Small Cap Value Fund - Inv.*(1) | | 1,349 | | Feb-97 | | Small-Cap Core Funds | |
Income Funds | | | | | | | |
Janus Flexible Bond Fund | | $ | 906 | | Dec-91 | | Intermediate Inv Grade Debt Funds | |
Janus High-Yield Fund | | 508 | | Dec-03 | | High Current Yield Funds | |
Janus Short-Term Bond Fund | | 192 | | Jun-03 | | Short Investment Grade Debt Funds | |
Janus Federal Tax-Exempt Fund | | 111 | | Feb-05 | | General Muni Debt Funds | |
| | Lipper Rankings Based on Total Returns as of 12/31/05 | |
| | 1-Year | | 3-Year | | 5-Year | | 10-Year | | Since PM Inception | |
| | Percentile
Rank (%) | | Rank /
Total Funds | | Percentile
Rank (%) | | Rank /
Total Funds | | Percentile
Rank (%) | | Rank /
Total Funds | | Percentile
Rank (%) | | Rank /
Total Funds | | Percentile
Rank (%) | | Rank /
Total Funds | |
| | | | | | | | | | | | | | | | | | | | | |
Growth Funds | | | | | | | | | | | | | | | | | | | | | |
Janus Fund | | 67 | | 457 / 687 | | 50 | | 293 / 593 | | 66 | | 310 / 475 | | 52 | | 82 / 158 | | 66 | | 264 / 403 | |
Janus Twenty Fund* | | 21 | | 144 / 687 | | 4 | | 19 / 593 | | 25 | | 115 / 475 | | 2 | | 2 / 158 | | 6 | | 12 / 235 | |
Janus Mercury Fund | | 39 | | 263 / 687 | | 15 | | 87 / 593 | | 61 | | 290 / 475 | | 8 | | 12 / 158 | | 15 | | 88 / 601 | |
Janus Olympus Fund | | 17 | | 68 / 409 | | 51 | | 180 / 358 | | 70 | | 194 / 279 | | 14 | | 12 / 89 | | 13 | | 17 / 135 | |
Janus Enterprise Fund | | 39 | | 212 / 553 | | 15 | | 65 / 458 | | 82 | | 283 / 348 | | 64 | | 81 / 126 | | 14 | | 56 / 405 | |
Janus Venture Fund* | | 84 | | 439 / 523 | | 17 | | 72 / 447 | | 30 | | 105 / 350 | | 44 | | 45 / 103 | | 31 | | 108 / 350 | |
Janus Orion Fund | | 4 | | 16 / 409 | | 4 | | 13 / 358 | | 9 | | 24 / 279 | | — | | — | | 36 | | 82 / 232 | |
Core Funds | | | | | | | | | | | | | | | | | | | | | |
Janus Growth and Income Funds | | 3 | | 18 / 890 | | 8 | | 57 / 759 | | 20 | | 118 / 619 | | 3 | | 5 / 229 | | 2 | | 9 / 823 | |
Janus Balanced Fund | | 6 | | 38 / 650 | | 57 | | 267 / 475 | | 38 | | 143 / 382 | | 7 | | 12 / 177 | | ‡ | |
Janus Contrarian Fund | | 2 | | 14 / 828 | | 1 | | 2 / 602 | | 7 | | 26 / 420 | | — | | — | | 14 | | 45 / 341 | |
Janus Core Equity Funf | | 2 | | 9 / 890 | | 4 | | 24 / 759 | | 5 | | 26 / 619 | | — | | — | | ‡ | |
Janus Risk-Managed Stock Fund | | 8 | | 65 / 828 | | — | | — | | — | | — | | — | | — | | 19 | | 111 / 608 | |
International/Global Funds | | | | | | | | | | | | | | | | | | | | | |
Janus Worldwide Fund | | 87 | | 294 / 340 | | 96 | | 272 / 285 | | 97 | | 200 / 206 | | 49 | | 38 / 77 | | 80 | | 257 / 322 | |
Janus Overseas Fund | | 1 | | 2 / 875 | | 5 | | 36 / 757 | | 38 | | 210 / 562 | | 6 | | 11 / 209 | | 2 | | 14 / 784 | |
Janus Global Life Sciences Fund | | 31 | | 53 / 173 | | 27 | | 43 / 163 | | 62 | | 71 / 115 | | — | | — | | 35 | | 17 / 48 | |
Janus Global Technology Fund | | 11 | | 29 / 284 | | 49 | | 128 / 263 | | 62 | | 137 / 221 | | — | | — | | 22 | | 16 / 75 | |
Janus Global Opportunities Fund | | 95 | | 321 / 340 | | 53 | | 149 / 285 | | — | | — | | — | | — | | 12 | | 27 / 228 | |
Value Funds | | | | | | | | | | | | | | | | | | | | | |
Janus Mid Cap Value Fund — Inv(1) | | 45 | | 111 / 250 | | 34 | | 71 / 209 | | 16 | | 19 / 118 | | — | | — | | 4 | | 3 / 79 | |
Janus Small Cap Value Fund — Inv.*(1) | | 27 | | 168 / 634 | | 80 | | 402 / 503 | | 33 | | 119 / 370 | | — | | — | | 12 | | 18 / 152 | |
Income Funds | | | | | | | | | | | | | | | | | | | | | |
Janus Flexible Bond Fund | | 53 | | 247 / 468 | | 28 | | 109 / 399 | | 25 | | 73 / 303 | | 16 | | 21 / 137 | | 4 | | 2 / 55 | |
Janus High-Yield Fund | | 40 | | 166 / 423 | | 88 | | 327 / 371 | | 60 | | 183 / 305 | | 3 | | 3 / 104 | | 47 | | 191 / 406 | |
Janus Short-Term Bond Fund | | 53 | | 120 / 227 | | 18 | | 32 / 179 | | 49 | | 61 / 124 | | 23 | | 14 / 62 | | 22 | | 41 / 189 | |
Janus Federal Tax-Exempt Fund | | 68 | | 175 / 260 | | 84 | | 208 / 247 | | 77 | | 165 / 216 | | 70 | | 99 / 141 | | ‡ | |
| | | | | | | | | | Lipper Quartile | 1st | 2nd | 3rd | 4th | |
*Closed to new investors. ‡ In accordance with NASD regulations, Lipper rankings cannot be publicly disclosed for time periods of less than 1 year.
Past performance is no guarantee of future results. Lipper Inc. — A Reuters Company, is a nationally recognized organization that ranks the performance of mutual funds within a universe of funds that have similar investment objectives. Rankings are historical with capital gains and dividends reinvested. (1)Ranking is for the investor share class only; other classes may have different performance characteristics.
9
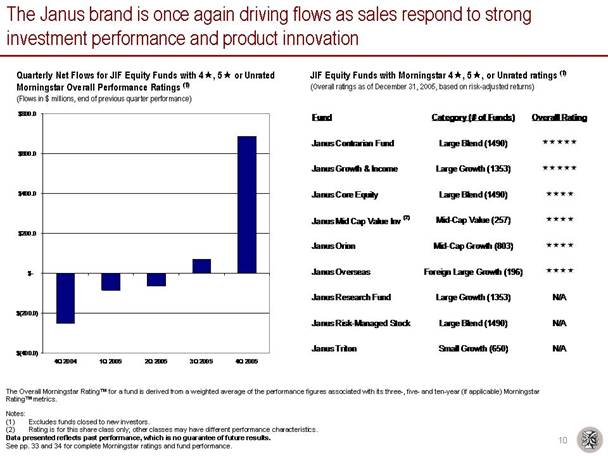
The Janus brand is once again driving flows as sales respond to strong investment performance and product innovation
Quarterly Net Flows for JIF Equity Funds with 4*, 5* or Unrated Morningstar Overall Performance Ratings (1)
(Flows in $ millions, end of previous quarter performance)
[CHART]
JIF Equity Funds with Morningstar 4*, 5*, or Unrated ratings (1)
(Overall ratings as of December 31, 2005, based on risk-adjusted returns)
Fund | | Category (# of Funds) | | Overall Rating |
| | | | |
Janus Contrarian Fund | | Large Blend (1490) | | ***** |
| | | | |
Janus Growth & Income | | Large Growth (1353) | | ***** |
| | | | |
Janus Core Equity | | Large Blend (1490) | | **** |
| | | | |
Janus Mid Cap Value Inv(2) | | Mid-Cap Value (257) | | **** |
| | | | |
Janus Orion | | Mid-Cap Growth (803) | | **** |
| | | | |
Janus Overseas | | Foreign Large Growth (196) | | **** |
| | | | |
Janus Research Fund | | Large Growth (1353) | | N/A |
| | | | |
Janus Risk-Managed Stock | | Large Blend (1490) | | N/A |
| | | | |
Janus Triton | | Small Growth (650) | | N/A |
The Overall Morningstar RatingTM for a fund is derived from a weighted average of the performance figures associated with its three-, five- and ten-year (if applicable) Morningstar RatingTM metrics.
Notes:
(1) Excludes funds closed to new investors.
(2) Rating is for this share class only; other classes may have different performance characteristics.
Data presented reflects past performance, which is no guarantee of future results.
See pp. 33 and 34 for complete Morningstar ratings and fund performance.
10
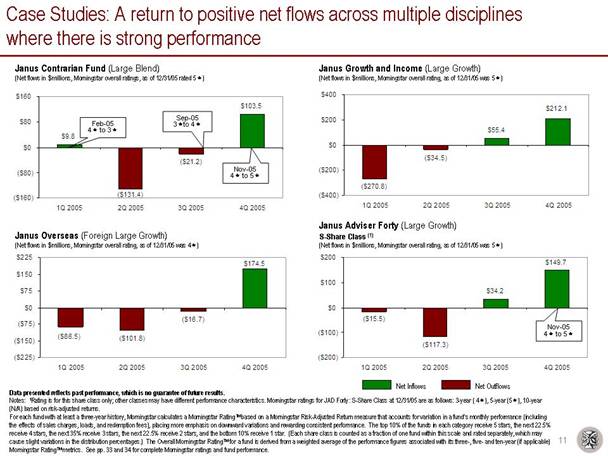
Case Studies: A return to positive net flows across multiple disciplines where there is strong performance
Janus Contrarian Fund (Large Blend)
(Net flows in $ millions, Morningstar overall ratings, as of 12/31/05 rated 5*)
[CHART]
Janus Overseas (Foreign Large Growth)
(Net flows in $ millions, Morningstar overall rating, as of 12/31/05 was 4*)
[CHART]
Janus Growth and Income (Large Growth)
(Net flows in $ millions, Morningstar overall rating, as of 12/31/05 was 5*)
[CHART]
Janus Adviser Forty (Large Growth)
S-Share Class (1)
(Net flows in $ millions, Morningstar overall rating, as of 12/31/05 was 5*)
[CHART]
Data presented reflects past performance, which is no guarantee of future results.
Notes: (1)Rating is for this share class only; other classes may have different performance characteristics. Morningstar ratings for JAD Forty: S-Share Class at 12/31/05 are as follows: 3-year ( 4*), 5-year (5*), 10-year (N/A) based on risk-adjusted returns.
For each fund with at least a three-year history, Morningstar calculates a Morningstar RatingTM based on a Morningstar Risk-Adjusted Return measure that accounts for variation in a fund’s monthly performance (including the effects of sales charges, loads, and redemption fees), placing more emphasis on downward variations and rewarding consistent performance. The top 10% of the funds in each category receive 5 stars, the next 22.5% receive 4 stars, the next 35% receive 3 stars, the next 22.5% receive 2 stars, and the bottom 10% receive 1 star. (Each share class is counted as a fraction of one fund within this scale and rated separately, which may cause slight variations in the distribution percentages.) The Overall Morningstar RatingTM for a fund is derived from a weighted average of the performance figures associated with its three-, five- and ten-year (if applicable) Morningstar RatingTM metrics. See pp. 33 and 34 for complete Morningstar ratings and fund performance.
11
Strong and innovative products will drive future sales
• New product innovations to meet our clients’ needs
— Janus Smart Portfolios
— Risk-Managed suite of JAD Funds
— Janus Long/Short
— INTECH Global
— Institutional Small Cap Growth
— Institutional International Growth
— Research and Triton Funds
• Repositioning existing products to better address market demand
— New Institutional share class (JAD: I-class)
— Launch of four JIF products into JAD series
— SMA platform
12
Financials
Dave Martin
Executive Vice President and Chief Financial Officer
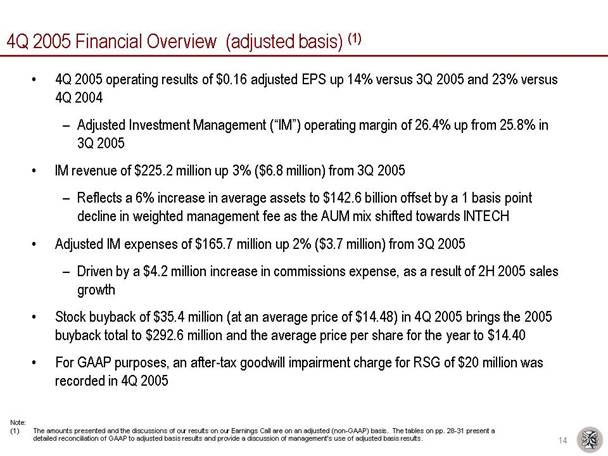
4Q 2005 Financial Overview (adjusted basis) (1)
• 4Q 2005 operating results of $0.16 adjusted EPS up 14% versus 3Q 2005 and 23% versus 4Q 2004
— Adjusted Investment Management (“IM”) operating margin of 26.4% up from 25.8% in 3Q 2005
• IM revenue of $225.2 million up 3% ($6.8 million) from 3Q 2005
— Reflects a 6% increase in average assets to $142.6 billion offset by a 1 basis point decline in weighted management fee as the AUM mix shifted towards INTECH
• Adjusted IM expenses of $165.7 million up 2% ($3.7 million) from 3Q 2005
— Driven by a $4.2 million increase in commissions expense, as a result of 2H 2005 sales growth
• Stock buyback of $35.4 million (at an average price of $14.48) in 4Q 2005 brings the 2005 buyback total to $292.6 million and the average price per share for the year to $14.40
• For GAAP purposes, an after-tax goodwill impairment charge for RSG of $20 million was recorded in 4Q 2005
Note:
(1) The amounts presented and the discussions of our results on our Earnings Call are on an adjusted (non-GAAP) basis. The tables on pp. 28-31 present a detailed reconciliation of GAAP to adjusted basis results and provide a discussion of management’s use of adjusted basis results.
14
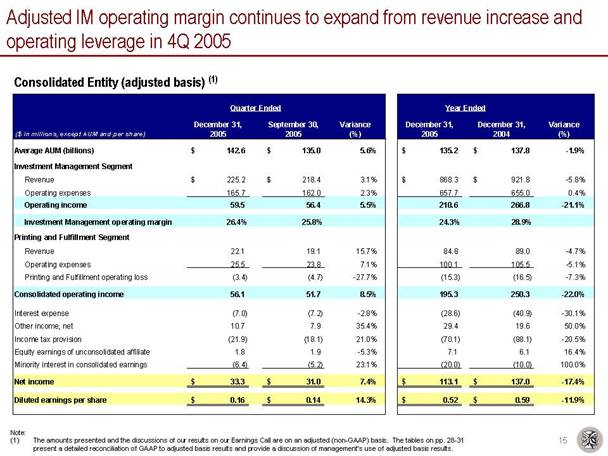
Adjusted IM operating margin continues to expand from revenue increase and operating leverage in 4Q 2005
Consolidated Entity (adjusted basis) (1)
| | Quarter Ended | | | | Year Ended | | | |
($ in millions, except AUM and per share) | | December 31,
2005 | | September 30,
2005 | | Variance
(%) | | December 31,
2005 | | December 31,
2004 | | Variance
(%) | |
| | | | | | | | | | | | | |
Average AUM (billions) | | $ | 142.6 | | $ | 135.0 | | 5.6 | % | $ | 135.2 | | $ | 137.8 | | -1.9 | % |
| | | | | | | | | | | | | |
Investment Management Segment | | | | | | | | | | | | | |
Revenue | | $ | 225.2 | | $ | 218.4 | | 3.1 | % | $ | 868.3 | | $ | 921.8 | | -5.8 | % |
Operating expenses | | 165.7 | | 162.0 | | 2.3 | % | 657.7 | | 655.0 | | 0.4 | % |
Operating income | | 59.5 | | 56.4 | | 5.5 | % | 210.6 | | 266.8 | | -21.1 | % |
| | | | | | | | | | | | | |
Investment Management operating margin | | 26.4 | % | 25.8 | % | | | 24.3 | % | 28.9 | % | | |
| | | | | | | | | | | | | |
Printing and Fulfillment Segment | | | | | | | | | | | | | |
Revenue | | 22.1 | | 19.1 | | 15.7 | % | 84.8 | | 89.0 | | -4.7 | % |
Operating expenses | | 25.5 | | 23.8 | | 7.1 | % | 100.1 | | 105.5 | | -5.1 | % |
Printing and Fulfillment operating loss | | (3.4 | ) | (4.7 | ) | -27.7 | % | (15.3 | ) | (16.5 | ) | -7.3 | % |
| | | | | | | | | | | | | |
Consolidated operating income | | 56.1 | | 51.7 | | 8.5 | % | 195.3 | | 250.3 | | -22.0 | % |
| | | | | | | | | | | | | |
Interest expense | | (7.0 | ) | (7.2 | ) | -2.8 | % | (28.6 | ) | (40.9 | ) | -30.1 | % |
Other income, net | | 10.7 | | 7.9 | | 35.4 | % | 29.4 | | 19.6 | | 50.0 | % |
Income tax provision | | (21.9 | ) | (18.1 | ) | 21.0 | % | (70.1 | ) | (88.1 | ) | -20.5 | % |
Equity earnings of unconsolidated affiliate | | 1.8 | | 1.9 | | -5.3 | % | 7.1 | | 6.1 | | 16.4 | % |
Minority interest in consolidated earnings | | (6.4 | ) | (5.2 | ) | 23.1 | % | (20.0 | ) | (10.0 | ) | 100.0 | % |
| | | | | | | | | | | | | |
Net income | | $ | 33.3 | | $ | 31.0 | | 7.4 | % | $ | 113.1 | | $ | 137.0 | | -17.4 | % |
| | | | | | | | | | | | | |
Diluted earnings per share | | $ | 0.16 | | $ | 0.14 | | 14.3 | % | $ | 0.52 | | $ | 0.59 | | -11.9 | % |
Note:
(1) The amounts presented and the discussions of our results on our Earnings Call are on an adjusted (non-GAAP) basis. The tables on pp. 28-31 present a detailed reconciliation of GAAP to adjusted basis results and provide a discussion of management’s use of adjusted basis results.
15
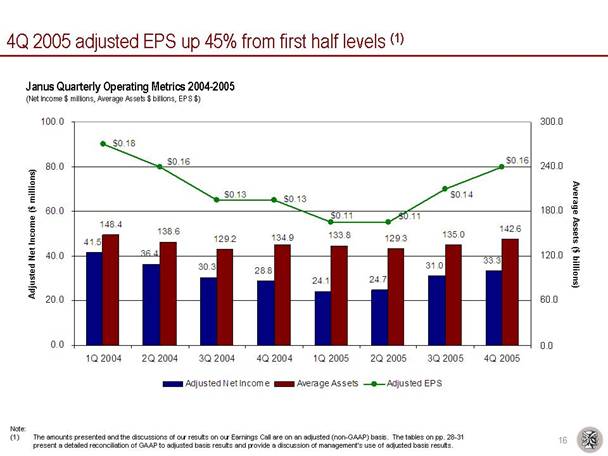
4Q 2005 adjusted EPS up 45% from first half levels (1)
Janus Quarterly Operating Metrics 2004-2005
(Net Income $ millions, Average Assets $ billions, EPS $)
[CHART]
[KEY]
Note:
(1) The amounts presented and the discussions of our results on our Earnings Call are on an adjusted (non-GAAP) basis. The tables on pp. 28-31 present a detailed reconciliation of GAAP to adjusted basis results and provide a discussion of management’s use of adjusted basis results.
16
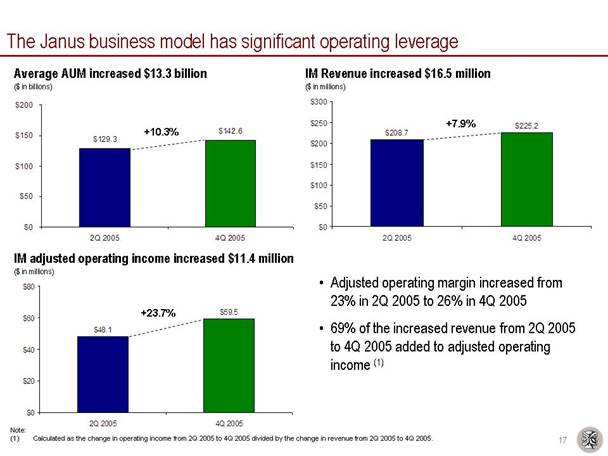
The Janus business model has significant operating leverage
Average AUM increased $13.3 billion
($ in billions)
[CHART]
IM adjusted operating income increased $11.4 million
($ in millions)
[CHART]
IM Revenue increased $16.5 million
($ in millions)
[CHART]
• Adjusted operating margin increased from 23% in 2Q 2005 to 26% in 4Q 2005
• 69% of the increased revenue from 2Q 2005 to 4Q 2005 added to adjusted operating income (1)
Note:
(1) Calculated as the change in operating income from 2Q 2005 to 4Q 2005 divided by the change in revenue from 2Q 2005 to 4Q 2005.
17
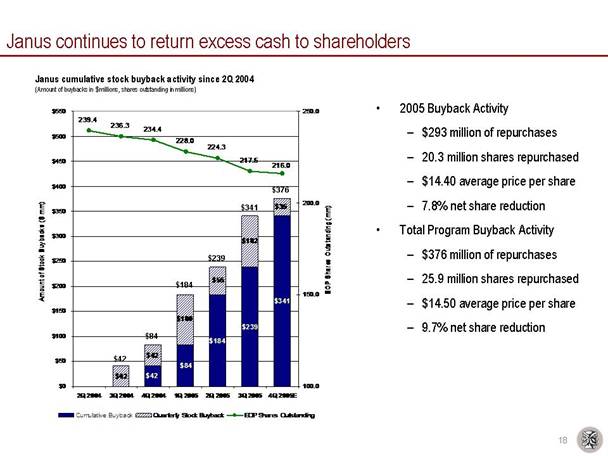
Janus continues to return excess cash to shareholders
Janus cumulative stock buyback activity since 2Q 2004
(Amount of buybacks in $ millions, shares outstanding in millions)
[CHART]
[KEY]
• 2005 Buyback Activity
— $293 million of repurchases
— 20.3 million shares repurchased
— $14.40 average price per share
— 7.8% net share reduction
• Total Program Buyback Activity
— $376 million of repurchases
— 25.9 million shares repurchased
— $14.50 average price per share
— 9.7% net share reduction
18
Janus today
• Flows positive and improving
• Strong, consistent relative investment performance
• Firm focused on Growth and Mathematical investing
• Successfully leveraging product platform to new distribution channels
• Organizational stability
• Benefiting from Growth outperforming Value
• Excess cash that can be returned to shareholders
• Positive EPS trend
Past performance is no guarantee of future results. See pp. 9 and 34 for standardized fund performance and rankings.
19
Safe Harbor Statement
This presentation includes statements concerning potential future events involving Janus Capital Group Inc. that could differ materially from the events that actually occur. The differences could be caused by a number of factors including those factors identified in Janus’ Annual Report on Form 10-K for the year ended December 31, 2004, on file with the Securities and Exchange Commission (Commission file no. 001-15253), including those that appear under headings such as “Risk Factors” and “Management’s Discussion and Analysis of Financial Condition and Results of Operations.” Many of these factors are beyond the control of the company and its management. Any forward-looking statements contained in this presentation are as of the date on which such statements were made. The company assumes no duty to update them, even if experience, unexpected events, or future changes make it clear that any projected results express or implied therein will not be realized.
20
Other Important Disclosures
Please consider the charges, risks, expenses and investment objectives carefully before investing. For a prospectus containing this and other information, please call Janus at 1-800-525-3713 or download the file from janus.com. Read it carefully before you invest or send money.
Janus Capital Group consists of Janus Capital Management LLC, Enhanced Investment Technologies, LLC (INTECH), and Capital Group Partners, Inc. Janus Capital Group owns 30% of Perkins, Wolf, McDonnell and Company, LLC.
Indexes are not available for direct investment; therefore their performance does not reflect the expenses associated with the active management of an actual portfolio
The S&P 500 Index is the Standard & Poor’s composite index of 500 stocks, a widely recognized, unmanaged index of common stock prices.
The Russell 1000 Growth Index measures the performance of those Russell 1000 companies with higher price-to-book ratios and higher forecasted growth values.
The Russell 1000 Value Index measures the performance of those Russell 1000 companies with lower price-to-book ratios and lower forecasted growth values.
Differences between compared investments may include objectives, sales and management fees, liquidity, volatility, tax features and other features, which may result in differences in performance.
Janus funds distributed by Janus Distributors LLC (01/06)
21
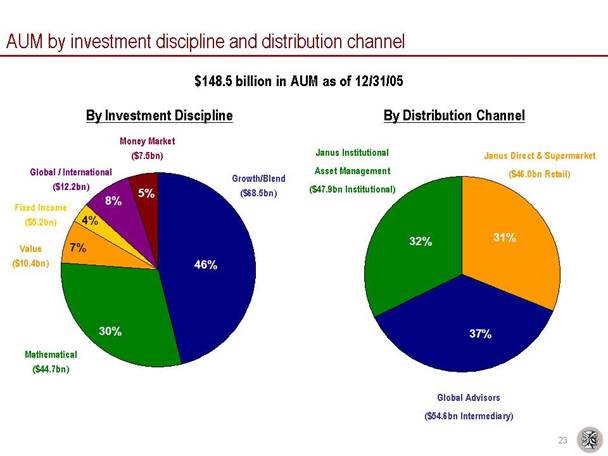
AUM by investment discipline and distribution channel
$148.5 billion in AUM as of 12/31/05
By Investment Discipline
[CHART]
By Distribution Channel
[CHART]
23
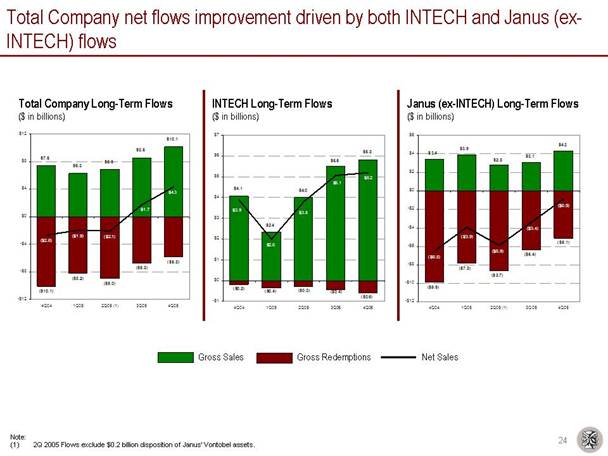
Total Company net flows improvement driven by both INTECH and Janus (ex-INTECH) flows
Total Company Long-Term Flows
($ in billions)
[CHART]
INTECH Long-Term Flows
($ in billions)
[CHART]
Janus (ex-INTECH) Long-Term Flows
($ in billions)
[CHART]
[KEY]
Note:
(1) 2Q 2005 Flows exclude $0.2 billion disposition of Janus’ Vontobel assets.
24
Improving 5-year performance is nearly in-line with the 1- and 3-year track record
Percent of JIF Funds by Lipper Quartile
(% of JIF Funds, Period ending 12/31/2005, total return basis)
[CHART]
[KEY]
Past performance is no guarantee of future results. Does not include Janus World Funds, Janus Adviser Series, Janus Aspen Series, Sub-advised and Money Markets. As of December 31, 2005, the number of funds in the Janus Investment Funds is 23. Funds not ranked by Lipper are not included in the analysis. Funds are ranked within their corresponding Lipper classification for the specified time period. See p. 9 for complete Lipper Rankings.
25
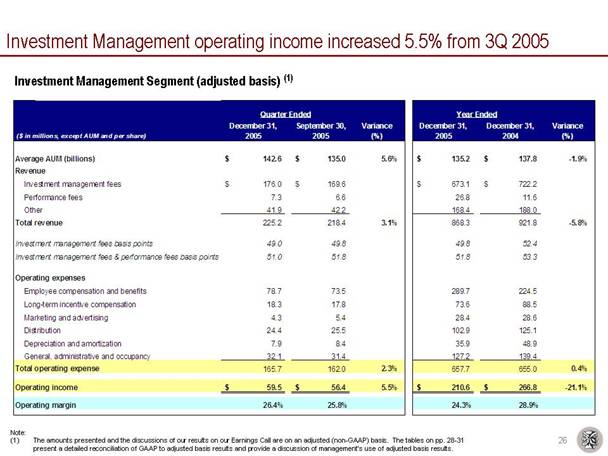
Investment Management operating income increased 5.5% from 3Q 2005
Investment Management Segment (adjusted basis) (1)
| | Quarter Ended | | | | Year Ended | | | |
($ in millions, except AUM and per share) | | December 31,
2005 | | September 30,
2005 | | Variance
(%) | | December 31,
2005 | | December 31,
2004 | | Variance
(%) | |
| | | | | | | | | | | | | |
Average AUM (billions) | | $ | 142.6 | | $ | 135.0 | | 5.6 | % | $ | 135.2 | | $ | 137.8 | | -1.9 | % |
Revenue | | | | | | | | | | | | | |
Investment management fees | | $ | 176.0 | | $ | 169.6 | | | | $ | 673.1 | | $ | 722.2 | | | |
Performance fees | | 7.3 | | 6.6 | | | | 26.8 | | 11.6 | | | |
Other | | 41.9 | | 42.2 | | | | 168.4 | | 188.0 | | | |
Total revenue | | 225.2 | | 218.4 | | 3.1 | % | 868.3 | | 921.8 | | -5.8 | % |
| | | | | | | | | | | | | |
Investment management fees basis points | | 49.0 | | 49.8 | | | | 49.8 | | 52.4 | | | |
Investment management fees & performance fees basis points | | 51.0 | | 51.8 | | | | 51.8 | | 53.3 | | | |
| | | | | | | | | | | | | |
Operating expenses | | | | | | | | | | | | | |
Employee compensation and benefits | | 78.7 | | 73.5 | | | | 289.7 | | 224.5 | | | |
Long-term incentive compensation | | 18.3 | | 17.8 | | | | 73.6 | | 88.5 | | | |
Marketing and advertising | | 4.3 | | 5.4 | | | | 28.4 | | 28.6 | | | |
Distribution | | 24.4 | | 25.5 | | | | 102.9 | | 125.1 | | | |
Depreciation and amortization | | 7.9 | | 8.4 | | | | 35.9 | | 48.9 | | | |
General, administrative and occupancy | | 32.1 | | 31.4 | | | | 127.2 | | 139.4 | | | |
Total operating expense | | 165.7 | | 162.0 | | 2.3 | % | 657.7 | | 655.0 | | 0.4 | % |
| | | | | | | | | | | | | |
Operating income | | $ | 59.5 | | $ | 56.4 | | 5.5 | % | $ | 210.6 | | $ | 266.8 | | -21.1 | % |
| | | | | | | | | | | | | |
Operating margin | | 26.4 | % | 25.8 | % | | | 24.3 | % | 28.9 | % | | |
Note:
(1) The amounts presented and the discussions of our results on our Earnings Call are on an adjusted (non-GAAP) basis. The tables on pp. 28-31 present a detailed reconciliation of GAAP to adjusted basis results and provide a discussion of management’s use of adjusted basis results.
26
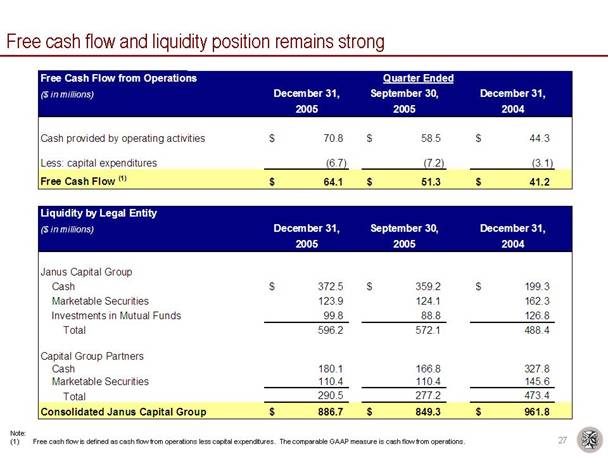
Free cash flow and liquidity position remains strong
Free Cash Flow from Operations | | Quarter Ended | |
($ in millions) | | December 31, | | September 30, | | December 31, | |
| | 2005 | | 2005 | | 2004 | |
| | | | | | | |
Cash provided by operating activities | | $ | 70.8 | | $ | 58.5 | | $ | 44.3 | |
| | | | | | | |
Less: capital expenditures | | (6.7 | ) | (7.2 | ) | (3.1 | ) |
Free Cash Flow(1) | | $ | 64.1 | | $ | 51.3 | | $ | 41.2 | |
Liquidity by Legal Entity | | | | | | | |
($ in millions) | | December 31, | | September 30, | | December 31, | |
| | 2005 | | 2005 | | 2004 | |
| | | | | | | |
Janus Capital Group | | | | | | | |
Cash | | $ | 372.5 | | $ | 359.2 | | $ | 199.3 | |
Marketable Securities | | 123.9 | | 124.1 | | 162.3 | |
Investments in Mutual Funds | | 99.8 | | 88.8 | | 126.8 | |
Total | | 596.2 | | 572.1 | | 488.4 | |
| | | | | | | |
Capital Group Partners | | | | | | | |
Cash | | 180.1 | | 166.8 | | 327.8 | |
Marketable Securities | | 110.4 | | 110.4 | | 145.6 | |
Total | | 290.5 | | 277.2 | | 473.4 | |
Consolidated Janus Capital Group | | $ | 886.7 | | $ | 849.3 | | $ | 961.8 | |
Note:
(1) Free cash flow is defined as cash flow from operations less capital expenditures. The comparable GAAP measure is cash flow from operations.
27
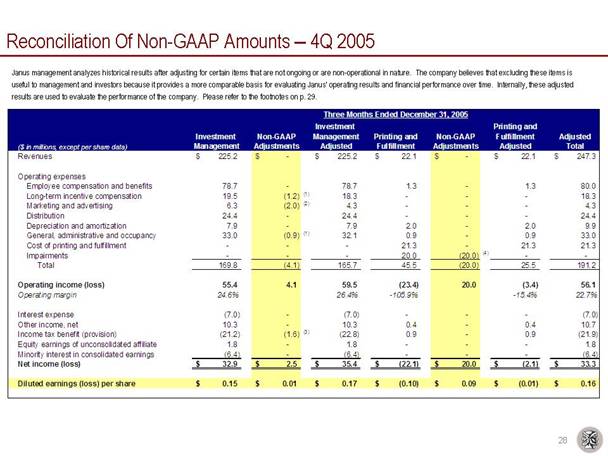
Reconciliation Of Non-GAAP Amounts — 4Q 2005
Janus management analyzes historical results after adjusting for certain items that are not ongoing or are non-operational in nature. The company believes that excluding these items is useful to management and investors because it provides a more comparable basis for evaluating Janus’ operating results and financial performance over time. Internally, these adjusted results are used to evaluate the performance of the company. Please refer to the footnotes on p. 29.
| | Three Months Ended December 31, 2005 | |
| | | | | | Investment | | | | | | Printing and | | | |
| | Investment | | Non-GAAP | | Management | | Printing and | | Non-GAAP | | Fulfillment | | Adjusted | |
($ in millions, except per share data) | | Management | | Adjustments | | Adjusted | | Fulfillment | | Adjustments | | Adjusted | | Total | |
Revenues | | $ | 225.2 | | $ | — | | $ | 225.2 | | $ | 22.1 | | $ | — | | $ | 22.1 | | $ | 247.3 | |
| | | | | | | | | | | | | | | |
Operating expenses | | | | | | | | | | | | | | | |
Employee compensation and benefits | | 78.7 | | — | | 78.7 | | 1.3 | | — | | 1.3 | | 80.0 | |
Long-term incentive compensation | | 19.5 | | (1.2 | )(1) | 18.3 | | — | | — | | — | | 18.3 | |
Marketing and advertising | | 6.3 | | (2.0 | )(2) | 4.3 | | — | | — | | — | | 4.3 | |
Distribution | | 24.4 | | — | | 24.4 | | — | | — | | — | | 24.4 | |
Depreciation and amortization | | 7.9 | | — | | 7.9 | | 2.0 | | — | | 2.0 | | 9.9 | |
General, administrative and occupancy | | 33.0 | | (0.9 | )(1) | 32.1 | | 0.9 | | — | | 0.9 | | 33.0 | |
Cost of printing and fulfillment | | — | | — | | — | | 21.3 | | — | | 21.3 | | 21.3 | |
Impairments | | — | | — | | — | | 20.0 | | (20.0 | )(4) | — | | — | |
Total | | 169.8 | | (4.1 | ) | 165.7 | | 45.5 | | (20.0 | ) | 25.5 | | 191.2 | |
| | | | | | | | | | | | | | | |
Operating income (loss) | | 55.4 | | 4.1 | | 59.5 | | (23.4 | ) | 20.0 | | (3.4 | ) | 56.1 | |
Operating margin | | 24.6 | % | | | 26.4 | % | -105.9 | % | | | -15.4 | % | 22.7 | % |
| | | | | | | | | | | | | | | |
Interest expense | | (7.0 | ) | — | | (7.0 | ) | — | | — | | — | | (7.0 | ) |
Other income, net | | 10.3 | | — | | 10.3 | | 0.4 | | — | | 0.4 | | 10.7 | |
Income tax benefit (provision) | | (21.2 | ) | (1.6 | )(3) | (22.8 | ) | 0.9 | | — | | 0.9 | | (21.9 | ) |
Equity earnings of unconsolidated affiliate | | 1.8 | | — | | 1.8 | | — | | — | | — | | 1.8 | |
Minority interest in consolidated earnings | | (6.4 | ) | — | | (6.4 | ) | — | | — | | — | | (6.4 | ) |
Net income (loss) | | $ | 32.9 | | $ | 2.5 | | $ | 35.4 | | $ | (22.1 | ) | $ | 20.0 | | $ | (2.1 | ) | $ | 33.3 | |
| | | | | | | | | | | | | | | |
Diluted earnings (loss) per share | | $ | 0.15 | | $ | 0.01 | | $ | 0.17 | | $ | (0.10 | ) | $ | 0.09 | | $ | (0.01 | ) | $ | 0.16 | |
28
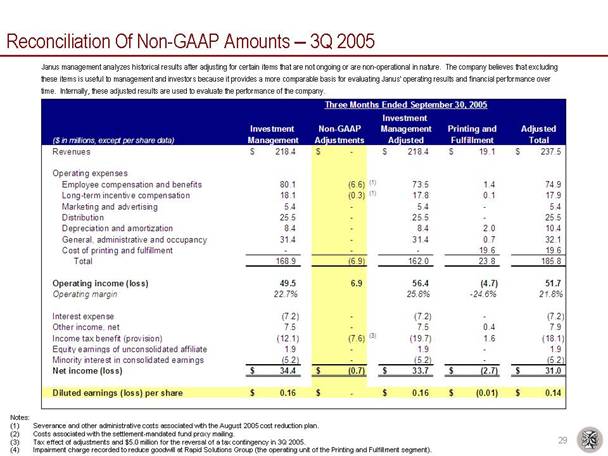
Reconciliation Of Non-GAAP Amounts — 3Q 2005
Janus management analyzes historical results after adjusting for certain items that are not ongoing or are non-operational in nature. The company believes that excluding these items is useful to management and investors because it provides a more comparable basis for evaluating Janus’ operating results and financial performance over time. Internally, these adjusted results are used to evaluate the performance of the company.
| | Three Months Ended September 30, 2005 | |
| | | | | | Investment | | | | | |
| | Investment | | Non-GAAP | | Management | | Printing and | | Adjusted | |
($in millions, except per share data) | | Management | | Adjustments | | Adjusted | | Fulfillment | | Total | |
Revenues | | $218.4 | | $— | | $218.4 | | $19.1 | | $237.5 | |
Operating expenses | | | | | | | | | | | |
Employee compensation and benefits | | 80.1 | | (6.6 | )(1) | 73.5 | | 1.4 | | 74.9 | |
Long-term incentive compensation | | 18.1 | | (0.3 | )(1) | 17.8 | | 0.1 | | 17.9 | |
Marketing and advertising | | 5.4 | | — | | 5.4 | | — | | 5.4 | |
Distribution | | 25.5 | | — | | 25.5 | | — | | 25.5 | |
Depreciation and amortization | | 8.4 | | — | | 8.4 | | 2.0 | | 10.4 | |
General, administrative and occupancy | | 31.4 | | — | | 31.4 | | 0.7 | | 32.1 | |
Cost of printing and fulfillment | | — | | — | | — | | 19.6 | | 19.6 | |
Total | | 168.9 | | (6.9 | ) | 162.0 | | 23.8 | | 185.8 | |
Operating income (loss) | | 49.5 | | 6.9 | | 56.4 | | (4.7 | ) | 51.7 | |
Operating margin | | 22.7 | % | | | 25.8 | % | -24.6 | % | 21.8 | % |
Interest expense | | (7.2 | ) | — | | (7.2 | ) | — | | (7.2 | ) |
Other income, net | | 7.5 | | — | | 7.5 | | 0.4 | | 7.9 | |
Income tax benefit (provision) | | (12.1 | ) | (7.6 | )(3) | (19.7 | ) | 1.6 | | (18.1 | ) |
Equity earnings of unconsolidated affiliate | | 1.9 | | — | | 1.9 | | — | | 1.9 | |
Minority interest in consolidated earnings | | (5.2 | ) | — | | (5.2 | ) | — | | (5.2 | ) |
Net income (loss) | | $34.4 | | $(0.7 | ) | $33.7 | | $(2.7 | ) | $31.0 | |
Diluted earnings (loss) per share | | $0.16 | | $— | | $0.16 | | $(0.01 | ) | $0.14 | |
Notes:
(1) Severance and other administrative costs associated with the August 2005 cost reduction plan.
(2) Costs associated with the settlement-mandated fund proxy mailing.
(3) Tax effect of adjustments and $5.0 million for the reversal of a tax contingency in 3Q 2005.
(4) Impairment charge recorded to reduce goodwill at Rapid Solutions Group (the operating unit of the Printing and Fulfillment segment).
29
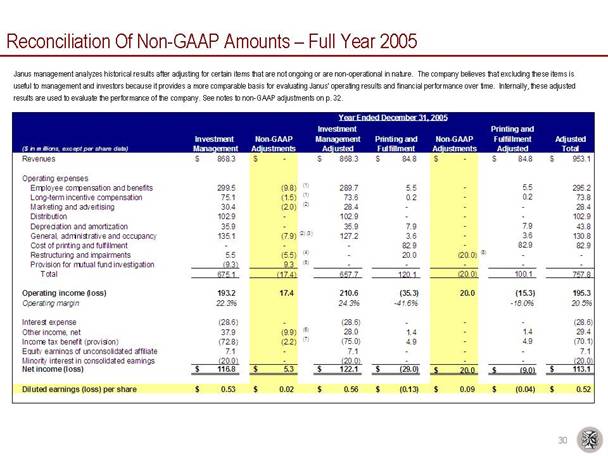
Reconciliation Of Non-GAAP Amounts — Full Year 2005
Janus management analyzes historical results after adjusting for certain items that are not ongoing or are non-operational in nature. The company believes that excluding these items is useful to management and investors because it provides a more comparable basis for evaluating Janus’ operating results and financial performance over time. Internally, these adjusted results are used to evaluate the performance of the company. See notes to non-GAAP adjustments on p. 32.
| | Year Ended December 31, 2005 | |
($ in millions, except per share data) | | Investment
Management | | Non-GAAP
Adjustments | | Investment
Management
Adjusted | | Printing and
Fulfillment | | Non-GAAP
Adjustments | | Printing and
Fulfillment
Adjusted | | Adjusted
Total | |
Revenues | | $ | 868.3 | | $ | — | | $ | 868.3 | | $ | 84.8 | | $ | — | | $ | 84.8 | | $ | 953.1 | |
| | | | | | | | | | | | | | | | | | | | |
Operating expenses | | | | | | | | | | | | | | | |
Employee compensation and benefits | | 299.5 | | (9.8 | )(1) | 289.7 | | 5.5 | | — | | 5.5 | | 295.2 | |
Long-term incentive compensation | | 75.1 | | (1.5 | )(1) | 73.6 | | 0.2 | | — | | 0.2 | | 73.8 | |
Marketing and advertising | | 30.4 | | (2.0 | )(2) | 28.4 | | — | | — | | — | | 28.4 | |
Distribution | | 102.9 | | — | | 102.9 | | — | | — | | — | | 102.9 | |
Depreciation and amortization | | 35.9 | | — | | 35.9 | | 7.9 | | — | | 7.9 | | 43.8 | |
General, administrative and occupancy | | 135.1 | | (7.9 | )(2)(3) | 127.2 | | 3.6 | | — | | 3.6 | | 130.8 | |
Cost of printing and fulfillment | | — | | — | | — | | 82.9 | | — | | 82.9 | | 82.9 | |
Restructuring and impairments | | 5.5 | | (5.5 | )(4) | — | | 20.0 | | (20.0 | )(8) | — | | — | |
Provision for mutual fund investigation | | (9.3 | ) | 9.3 | (5) | — | | — | | — | | — | | — | |
Total | | 675.1 | | (17.4 | ) | 657.7 | | 120.1 | | (20.0 | ) | 100.1 | | 757.8 | |
| | | | | | | | | | | | | | | |
Operating income (loss) | | 193.2 | | 17.4 | | 210.6 | | (35.3 | ) | 20.0 | | (15.3 | ) | 195.3 | |
Operating margin | | 22.3 | % | | | 24.3 | % | -41.6 | % | | | -18.0 | % | 20.5 | % |
| | | | | | | | | | | | | | | |
Interest expense | | (28.6 | ) | — | | (28.6 | ) | — | | — | | — | | (28.6 | ) |
Other income, net | | 37.9 | | (9.9 | )(6) | 28.0 | | 1.4 | | — | | 1.4 | | 29.4 | |
Income tax benefit (provision) | | (72.8 | ) | (2.2 | )(7) | (75.0 | ) | 4.9 | | — | | 4.9 | | (70.1 | ) |
Equity earnings of unconsolidated affiliate | | 7.1 | | — | | 7.1 | | — | | — | | — | | 7.1 | |
Minority interest in consolidated earnings | | (20.0 | ) | — | | (20.0 | ) | — | | — | | — | | (20.0 | ) |
Net income (loss) | | $ | 116.8 | | $ | 5.3 | | $ | 122.1 | | $ | (29.0 | ) | $ | 20.0 | | $ | (9.0 | ) | $ | 113.1 | |
| | | | | | | | | | | | | | | | | | | | | | |
Diluted earnings (loss) per share | | $ | 0.53 | | $ | 0.02 | | $ | 0.56 | | $ | (0.13 | ) | $ | 0.09 | | $ | (0.04 | ) | $ | 0.52 | |
| | | | | | | | | | | | | | | | | | | | | | | | |
30
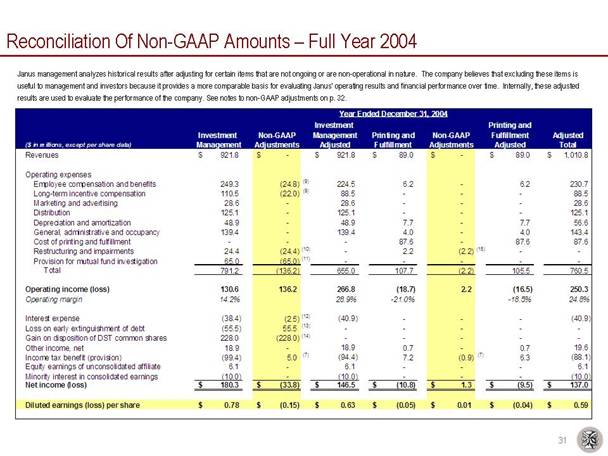
Reconciliation Of Non-GAAP Amounts — Full Year 2004
Janus management analyzes historical results after adjusting for certain items that are not ongoing or are non-operational in nature. The company believes that excluding these items is useful to management and investors because it provides a more comparable basis for evaluating Janus' operating results and financial performance over time. Internally, these adjusted results are used to evaluate the performance of the company. See notes to non-GAAP adjustments on p. 32.
| | Year Ended December 31, 2004 | |
($ in millions, except per share data) | | Investment
Management | | Non-GAAP
Adjustments | | Investment
Management
Adjusted | | Printing and
Fulfillment | | Non-GAAP
Adjustments | | Printing and
Fulfillment
Adjusted | | Adjusted
Total | |
Revenues | | $ | 921.8 | | $ | — | | $ | 921.8 | | $ | 89.0 | | $ | — | | $ | 89.0 | | $ | 1,010.8 | |
| | | | | | | | | | | | | | | |
Operating expenses | | | | | | | | | | | | | | | |
Employee compensation and benefits | | 249.3 | | (24.8 | )(9) | 224.5 | | 6.2 | | — | | 6.2 | | 230.7 | |
Long-term incentive compensation | | 110.5 | | (22.0 | )(9) | 88.5 | | — | | — | | — | | 88.5 | |
Marketing and advertising | | 28.6 | | — | | 28.6 | | — | | — | | — | | 28.6 | |
Distribution | | 125.1 | | — | | 125.1 | | — | | — | | — | | 125.1 | |
Depreciation and amortization | | 48.9 | | — | | 48.9 | | 7.7 | | — | | 7.7 | | 56.6 | |
General, administrative and occupancy | | 139.4 | | — | | 139.4 | | 4.0 | | — | | 4.0 | | 143.4 | |
Cost of printing and fulfillment | | — | | — | | — | | 87.6 | | — | | 87.6 | | 87.6 | |
Restructuring and impairments | | 24.4 | | (24.4 | )(10) | — | | 2.2 | | (2.2 | )(15) | — | | — | |
Provision for mutual fund investigation | | 65.0 | | (65.0 | )(11) | — | | — | | — | | — | | — | |
Total | | 791.2 | | (136.2 | ) | 655.0 | | 107.7 | | (2.2 | ) | 105.5 | | 760.5 | |
| | | | | | | | | | | | | | | |
Operating income (loss) | | 130.6 | | 136.2 | | 266.8 | | (18.7 | ) | 2.2 | | (16.5 | ) | 250.3 | |
Operating margin | | 14.2 | % | | | 28.9 | % | -21.0 | % | | | -18.5 | % | 24.8 | % |
| | | | | | | | | | | | | | | |
Interest expense | | (38.4 | ) | (2.5 | )(12) | (40.9 | ) | — | | — | | — | | (40.9 | ) |
Loss on early extinguishment of debt | | (55.5 | ) | 55.5 | (13) | — | | — | | — | | — | | — | |
Gain on disposition of DST common shares | | 228.0 | | (228.0 | )(14) | — | | — | | — | | — | | — | |
Other income, net | | 18.9 | | — | | 18.9 | | 0.7 | | — | | 0.7 | | 19.6 | |
Income tax benefit (provision) | | (99.4 | ) | 5.0 | (7) | (94.4 | ) | 7.2 | | (0.9 | )(7) | 6.3 | | (88.1 | ) |
Equity earnings of unconsolidated affiliate | | 6.1 | | — | | 6.1 | | — | | — | | — | | 6.1 | |
Minority interest in consolidated earnings | | (10.0 | ) | — | | (10.0 | ) | — | | — | | — | | (10.0 | ) |
Net income (loss) | | $ | 180.3 | | $ | (33.8 | ) | $ | 146.5 | | $ | (10.8 | ) | $ | 1.3 | | $ | (9.5 | ) | $ | 137.0 | |
| | | | | | | | | | | | | | | |
Diluted earnings (loss) per share | | $ | 0.78 | | $ | (0.15 | ) | $ | 0.63 | | $ | (0.05 | ) | $ | 0.01 | | $ | (0.04 | ) | $ | 0.59 | |
| | | | | | | | | | | | | | | | | | | | | | | |
31
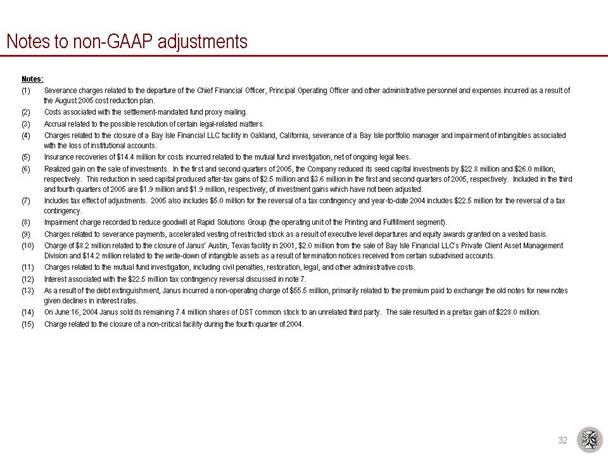
Notes to non-GAAP adjustments
Notes:
(1) Severance charges related to the departure of the Chief Financial Officer, Principal Operating Officer and other administrative personnel and expenses incurred as a result of the August 2005 cost reduction plan.
(2) Costs associated with the settlement-mandated fund proxy mailing.
(3) Accrual related to the possible resolution of certain legal-related matters.
(4) Charges related to the closure of a Bay Isle Financial LLC facility in Oakland, California, severance of a Bay Isle portfolio manager and impairment of intangibles associated with the loss of institutional accounts.
(5) Insurance recoveries of $14.4 million for costs incurred related to the mutual fund investigation, net of ongoing legal fees.
(6) Realized gain on the sale of investments. In the first and second quarters of 2005, the Company reduced its seed capital investments by $22.8 million and $26.0 million, respectively. This reduction in seed capital produced after-tax gains of $2.5 million and $3.6 million in the first and second quarters of 2005, respectively. Included in the third and fourth quarters of 2005 are $1.9 million and $1.9 million, respectively, of investment gains which have not been adjusted.
(7) Includes tax effect of adjustments. 2005 also includes $5.0 million for the reversal of a tax contingency and year-to-date 2004 includes $22.5 million for the reversal of a tax contingency.
(8) Impairment charge recorded to reduce goodwill at Rapid Solutions Group (the operating unit of the Printing and Fulfillment segment).
(9) Charges related to severance payments, accelerated vesting of restricted stock as a result of executive level departures and equity awards granted on a vested basis.
(10) Charge of $8.2 million related to the closure of Janus’ Austin, Texas facility in 2001, $2.0 million from the sale of Bay Isle Financial LLC’s Private Client Asset Management Division and $14.2 million related to the write-down of intangible assets as a result of termination notices received from certain subadvised accounts.
(11) Charges related to the mutual fund investigation, including civil penalties, restoration, legal, and other administrative costs.
(12) Interest associated with the $22.5 million tax contingency reversal discussed in note 7.
(13) As a result of the debt extinguishment, Janus incurred a non-operating charge of $55.5 million, primarily related to the premium paid to exchange the old notes for new notes given declines in interest rates.
(14) On June 16, 2004 Janus sold its remaining 7.4 million shares of DST common stock to an unrelated third party. The sale resulted in a pretax gain of $228.0 million.
(15) Charge related to the closure of a non-critical facility during the fourth quarter of 2004.
32
Morningstar RatingTM Based on Risk-Adjusted Returns as of 12/31/05
Janus Investment Fund ("JIF")
The Overall Morningstar RatingTM is derived from a weighted average of the performance figures associated with its three-, five-, and ten-year (if applicable) Morningstar RatingTM metrics.
| | | | Overall Rating | | Three-Year Rating | | Five-Year Rating | | Ten-Year Rating |
Fund | | Category | | Stars | | # of Funds | | Stars | | # of Funds | | Stars | | # of Funds | | Stars | | # of Funds |
Janus Fund | | Large Growth Funds | | *** | | 1353 | | *** | | 1353 | | ** | | 1065 | | *** | | 370 |
Janus Enterprise Fund | | Mid-Cap Growth Funds | | ** | | 803 | | **** | | 803 | | ** | | 613 | | ** | | 215 |
Janus Growth and Income Fund | | Large Growth Funds | | ***** | | 1353 | | **** | | 1353 | | **** | | 1065 | | ***** | | 370 |
Janus Mercury Fund | | Large Growth Funds | | *** | | 1353 | | **** | | 1353 | | ** | | 1065 | | *** | | 370 |
Janus Olympus Fund | | Large Growth Funds | | *** | | 1353 | | **** | | 1353 | | ** | | 1065 | | **** | | 370 |
Janus Orion Fund | | Mid-Cap Growth Funds | | **** | | 803 | | ***** | | 803 | | **** | | 613 | | N/A | | |
Janus Twenty Fund(1) | | Large Growth Funds | | **** | | 1353 | | ***** | | 1353 | | *** | | 1065 | | **** | | 370 |
Janus Venture Fund(1) | | Small Growth Funds | | *** | | 650 | | **** | | 650 | | *** | | 507 | | ** | | 174 |
Janus Global Life Sciences Fund | | Specialty-Health Funds | | *** | | 194 | | **** | | 194 | | *** | | 136 | | N/A | | |
Janus Global Technology Fund | | Specialty-Technology Funds | | *** | | 292 | | *** | | 292 | | *** | | 248 | | N/A | | |
Janus Overseas Fund | | Foreign Large Growth Funds | | **** | | 196 | | ***** | | 196 | | **** | | 151 | | **** | | 62 |
Janus Worldwide Fund | | World Stock Funds | | ** | | 392 | | * | | 392 | | * | | 285 | | *** | | 126 |
Janus Global Opportunities | | World Stock Funds | | *** | | 392 | | *** | | 392 | | N/A | | | | N/A | | N/A |
Janus Balanced Fund | | Moderate Allocation Funds | | *** | | 868 | | *** | | 868 | | *** | | 664 | | **** | | 296 |
Janus Core Equity Fund | | Large Blend Funds | | **** | | 1490 | | ***** | | 1490 | | **** | | 1155 | | N/A | | |
Janus Contrarian Fund | | Large Blend Funds | | ***** | | 1490 | | ***** | | 1490 | | ***** | | 1155 | | N/A | | |
Janus Mid Cap Value Fund — Investor Shares(2) | | Mid-Cap Value Funds | | **** | | 257 | | **** | | 257 | | **** | | 140 | | N/A | | |
Janus Small Cap Value Fund - Investor Shares(1)(2) | | Small Value Funds | | *** | | 276 | | ** | | 276 | | ** | | 192 | | **** | | 59 |
Janus Federal Tax-Exempt Fund | | Muni National Long Funds | | ** | | 307 | | ** | | 307 | | ** | | 285 | | ** | | 205 |
Janus Flexible Bond Fund | | Intermediate-Term Bond Funds | | **** | | 901 | | **** | | 901 | | **** | | 691 | | **** | | 351 |
Janus High-Yield Fund | | High Yield Bond Funds | | **** | | 447 | | ** | | 447 | | *** | | 373 | | ***** | | 135 |
Janus Short-Term Bond Fund | | Short-Term Bond Funds | | *** | | 317 | | **** | | 317 | | *** | | 227 | | *** | | 131 |
Percent of funds rated 4 / 5 Stars | | | | 40.9 | % | | | 63.6 | % | | | 33.3 | % | | | 53.3 | % | |
Data presented reflects past performance, which is no guarantee of future results.
Notes: (1)Closed to new investors. (2)Rating is for this share class only; other classes may have different performance characteristics.
For each fund with at least a three-year history, Morningstar calculates a Morningstar RatingTM based on a Morningstar Risk-Adjusted Return measure that accounts for variation in a fund’s monthly performance (including the effects of sales charges, loads, and redemption fees), placing more emphasis on downward variations and rewarding consistent performance. The top 10% of the funds in each category receive 5 stars, the next 22.5% receive 4 stars, the next 35% receive 3 stars, the next 22.5% receive 2 stars, and the bottom 10% receive 1 star. (Each share class is counted as a fraction of one fund within this scale and rated separately, which may cause slight variations in the distribution percentages.) The Overall Morningstar RatingTM for a fund is derived from a weighted average of the performance figures associated with its three-, five- and ten-year (if applicable) Morningstar RatingTM metrics.
33
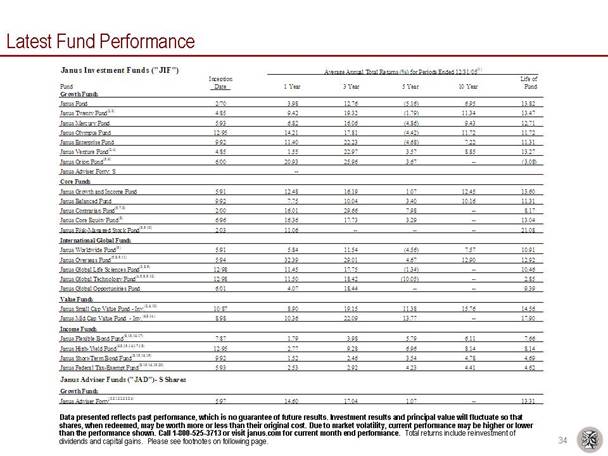
Latest Fund Performance
Janus Investment Funds ("JIF")
| | Average Annual Total Returns (%) for Periods Ended 12/31/05(1) | |
| | Inception | | | | | | | | | | Life of | |
Fund | | Date | | 1 Year | | 3 Year | | 5 Year | | 10 Year | | Fund | |
Growth Funds | | | | | | | | | | | | | |
Janus Fund | | 2/70 | | 3.98 | | 12.76 | | (5.16 | ) | 6.95 | | 13.82 | |
Janus Twenty Fund(2,3) | | 4/85 | | 9.42 | | 19.32 | | (1.79 | ) | 11.34 | | 13.47 | |
Janus Mercury Fund | | 5/93 | | 6.82 | | 16.06 | | (4.86 | ) | 9.43 | | 12.71 | |
Janus Olympus Fund | | 12/95 | | 14.21 | | 17.81 | | (4.42 | ) | 11.72 | | 11.72 | |
Janus Enterprise Fund | | 9/92 | | 11.40 | | 22.23 | | (4.68 | ) | 7.22 | | 11.31 | |
Janus Venture Fund(2,4) | | 4/85 | | 1.55 | | 22.97 | | 3.57 | | 8.85 | | 13.27 | |
Janus Orion Fund(5,6) | | 6/00 | | 20.93 | | 25.96 | | 3.67 | | — | | (3.08 | ) |
Janus Adviser Forty: S | | — | | | | | | | | | | | |
Core Funds | | | | | | | | | | | | | |
Janus Growth and Income Fund | | 5/91 | | 12.48 | | 16.19 | | 1.07 | | 12.45 | | 13.60 | |
Janus Balanced Fund | | 9/92 | | 7.75 | | 10.04 | | 3.40 | | 10.16 | | 11.31 | |
Janus Contrarian Fund(5,7,8) | | 2/00 | | 16.01 | | 29.66 | | 7.98 | | — | | 8.17 | |
Janus Core Equity Fund(8) | | 6/96 | | 16.36 | | 17.73 | | 3.29 | | — | | 13.04 | |
Janus Risk-Managed Stock Fund(8,9,10) | | 2/03 | | 11.06 | | — | | — | | — | | 21.08 | |
International/Global Funds | | | | | | | | | | | | | |
Janus Worldwide Fund(9) | | 5/91 | | 5.84 | | 11.54 | | (4.56 | ) | 7.57 | | 10.91 | |
Janus Overseas Fund(5,8,9,11) | | 5/94 | | 32.39 | | 29.01 | | 4.67 | | 12.90 | | 12.92 | |
Janus Global Life Sciences Fund(3,8,9) | | 12/98 | | 11.45 | | 17.75 | | (1.34 | ) | — | | 10.46 | |
Janus Global Technology Fund(4,5,8,9,12) | | 12/98 | | 11.50 | | 18.42 | | (10.05 | ) | — | | 2.85 | |
Janus Global Opportunities Fund | | 6/01 | | 4.07 | | 18.44 | | — | | — | | 9.39 | |
Value Funds | | | | | | | | | | | | | |
Janus Small Cap Value Fund — Inv.(2,6,13) | | 10/87 | | 8.90 | | 19.15 | | 11.38 | | 15.76 | | 14.56 | |
Janus Mid Cap Value Fund — Inv.(6,8,14) | | 8/98 | | 10.36 | | 22.09 | | 13.77 | | — | | 17.90 | |
Income Funds | | | | | | | | | | | | | |
Janus Flexible Bond Fund(8,15,16,17) | | 7/87 | | 1.79 | | 3.98 | | 5.79 | | 6.11 | | 7.66 | |
Janus High-Yield Fund(6,8,15,16,17,18) | | 12/95 | | 2.77 | | 9.28 | | 6.96 | | 8.14 | | 8.14 | |
Janus Short-Term Bond Fund(8,15,16,19) | | 9/92 | | 1.52 | | 2.46 | | 3.54 | | 4.78 | | 4.69 | |
Janus Federal Tax-Exempt Fund(8,15,16,19,20) | | 5/93 | | 2.53 | | 2.92 | | 4.23 | | 4.41 | | 4.62 | |
Janus Adviser Funds ("JAD")— S Shares | | | | | | | | | | | | | |
Growth Funds | | | | | | | | | | | | | |
Janus Adviser Forty(3,21,22,23,24) | | 5/97 | | 14.60 | | 17.04 | | 1.07 | | — | | 13.31 | |
Data presented reflects past performance, which is no guarantee of future results. Investment results and principal value will fluctuate so that shares, when redeemed, may be worth more or less than their original cost. Due to market volatility, current performance may be higher or lower than the performance shown. Call 1-800-525-3713 or visit janus.com for current month end performance. Total returns include reinvestment of dividends and capital gains. Please see footnotes on following page.
34
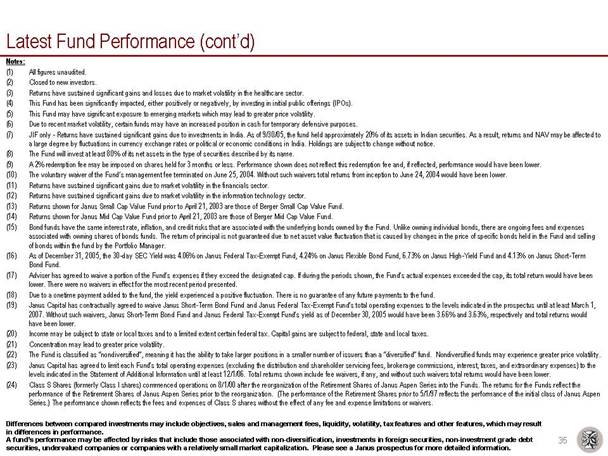
Notes:
(1) All figures unaudited.
(2) Closed to new investors.
(3) Returns have sustained significant gains and losses due to market volatility in the healthcare sector.
(4) This Fund has been significantly impacted, either positively or negatively, by investing in initial public offerings (IPOs).
(5) This Fund may have significant exposure to emerging markets which may lead to greater price volatility.
(6) Due to recent market volatility, certain funds may have an increased position in cash for temporary defensive purposes.
(7) JIF only - Returns have sustained significant gains due to investments in India. As of 9/30/05, the fund held approximately 20% of its assets in Indian securities. As a result, returns and NAV may be affected to a large degree by fluctuations in currency exchange rates or political or economic conditions in India. Holdings are subject to change without notice.
(8) The Fund will invest at least 80% of its net assets in the type of securities described by its name.
(9) A 2% redemption fee may be imposed on shares held for 3 months or less. Performance shown does not reflect this redemption fee and, if reflected, performance would have been lower.
(10) The voluntary waiver of the Fund’s management fee terminated on June 25, 2004. Without such waivers total returns from inception to June 24, 2004 would have been lower.
(11) Returns have sustained significant gains due to market volatility in the financials sector.
(12) Returns have sustained significant gains due to market volatility in the information technology sector.
(13) Returns shown for Janus Small Cap Value Fund prior to April 21, 2003 are those of Berger Small Cap Value Fund.
(14) Returns shown for Janus Mid Cap Value Fund prior to April 21, 2003 are those of Berger Mid Cap Value Fund.
(15) Bond funds have the same interest rate, inflation, and credit risks that are associated with the underlying bonds owned by the Fund. Unlike owning individual bonds, there are ongoing fees and expenses associated with owning shares of bonds funds. The return of principal is not guaranteed due to net asset value fluctuation that is caused by changes in the price of specific bonds held in the Fund and selling of bonds within the fund by the Portfolio Manager.
(16) As of December 31, 2005, the 30-day SEC Yield was 4.06% on Janus Federal Tax-Exempt Fund, 4.24% on Janus Flexible Bond Fund, 6.73% on Janus High-Yield Fund and 4.13% on Janus Short-Term Bond Fund.
(17) Adviser has agreed to waive a portion of the Fund’s expenses if they exceed the designated cap. If during the periods shown, the Fund’s actual expenses exceeded the cap, its total return would have been lower. There were no waivers in effect for the most recent period presented.
(18) Due to a onetime payment added to the fund, the yield experienced a positive fluctuation. There is no guarantee of any future payments to the fund.
(19) Janus Capital has contractually agreed to waive Janus Short-Term Bond Fund and Janus Federal Tax-Exempt Fund’s total operating expenses to the levels indicated in the prospectus until at least March 1, 2007. Without such waivers, Janus Short-Term Bond Fund and Janus Federal Tax-Exempt Fund’s yield as of December 30, 2005 would have been 3.66% and 3.63%, respectively and total returns would have been lower.
(20) Income may be subject to state or local taxes and to a limited extent certain federal tax. Capital gains are subject to federal, state and local taxes.
(21) Concentration may lead to greater price volatility.
(22) The Fund is classified as “nondiversified”, meaning it has the ability to take larger positions in a smaller number of issuers than a “diversified” fund. Nondiversified funds may experience greater price volatility.
(23) Janus Capital has agreed to limit each Fund’s total operating expenses (excluding the distribution and shareholder servicing fees, brokerage commissions, interest, taxes, and extraordinary expenses) to the levels indicated in the Statement of Additional Information until at least 12/1/06. Total returns shown include fee waivers, if any, and without such waivers total returns would have been lower.
(24) Class S Shares (formerly Class I shares) commenced operations on 8/1/00 after the reorganization of the Retirement Shares of Janus Aspen Series into the Funds. The returns for the Funds reflect the performance of the Retirement Shares of Janus Aspen Series prior to the reorganization. (The performance of the Retirement Shares prior to 5/1/97 reflects the performance of the initial class of Janus Aspen Series.) The performance shown reflects the fees and expenses of Class S shares without the effect of any fee and expense limitations or waivers.
Differences between compared investments may include objectives, sales and management fees, liquidity, volatility, tax features and other features, which may result in differences in performance.
A fund’s performance may be affected by risks that include those associated with non-diversification, investments in foreign securities, non-investment grade debt securities, undervalued companies or companies with a relatively small market capitalization. Please see a Janus prospectus for more detailed information.
35