 Corporate Finance. May 1, 2006. Valuation Report pursuant to CVM Instruction Number 361* *(Free English Translation of Portuguese Original) Embratel Participações S.A. Version prepared exclusively in order to comply with (i) the requirements formulated in items 2.2 and 2.3 of Letter CVM/SRE/GER-1/N O 1225/2006, of June 8, 2006, and (ii) Letter CVM/SRE/GER-1/N O 1480/2006, of July 18, 2006, of the Comissão de Valores Mobiliários - CVM. This version does not constitute an update, revision or correction of the Valuation prepared by Banco ABN AMRO S.A. on May 1 , 2006 Exhibit 99.2 st |
 2 Important Notice 1. Banco ABN AMRO Real S.A. (“ABN AMRO ”) was retained by TELÉFONOS DE MÉXICO S.A. DE C.V. (“Offeror”), the controlling shareholder of EMBRATEL PARTICIPAÇÕES S.A. (“Embrapar” or the “Company”), to render an economic-financial valuation (“Valuation”) of EMBRATEL within the context of a public tender offering for acquisition of shares for cancellation of Company´s registration as a public company, in accordance with art. 4 § 4 of Law 6.404/76, as amended, and of Instruction No. 361, dated March 5, 2002, of the Comissão de Valores Mobiliários – CVM (the “Offering”). 2. The Valuation of the Company, subject to the disclaimers listed below, includes a valuation (i) of its direct and indirect subsidiaries, including Embratel S.A. (“Embratel”), Vesper São Paulo S.A. and Vesper S.A. (together, “Vesper”), Telmex do Brasil Ltda. (“TDB”), Star One S.A (“Star One ”) and Primesys Soluções Empresariais S.A. (“Primesys”), hereinafter collectively referred to as “Subsidiaries”, and (ii) of its affiliated companies, GB Empreendimentos e Participações S.A. (“GB Empreendimentos ”) and Net Serviços de Comunicação S.A. (“Net”), hereinafter collectively referred to as “Affiliates”. 3. The Valuation is the intellectual property of ABN AMRO and was prepared by ABN AMRO exclusively pursuant to art. 4 O § 4 O of Law 6.404/76, as amended, and for no other purposes. Furthermore, this Valuation may be used by the Offeror within the framework of a voluntary offer to the acquisition of Embrapar shares, according to the provisions set forth in paragraph 1, article 31, instruction no. 361, as the Offeror is entitled in the terms of letter CVM/SRE/GER-1/Nº1480/2006 of July 18, 2006 of Comissão de Valores Mobiliários ("CVM"). The Valuation must not be used by third parties or for any other purposes and may not be disclosed or submitted to third parties, or distributed, reproduced or used for any other purpose without prior written consent from ABN AMRO, except for the disclosure of the Valuation, in its entirety, by the Offeror for the purposes of the Offering and exclusively in order to comply with applicable legal and regulatory requirements including its full disclosure to the CVM and to the U.S. Securities and Exchange Commission (“SEC”) pursuant to applicable regulations. The Valuation was prepared exclusively in Portuguese, and in the case that it is translated to another language, the Portuguese version shall always prevail for all purposes. 4. ABN AMRO did not make and will not make any recommendation, nor will it express any explicit or implicit opinion with respect to the terms and conditions of the Offering. 5. The Valuation is based on data from March 31, 2006. |
 3 6. The Company and its Subsidiaries were valued by discounted cash flow methodology, observing what is outlined in paragraph 7 below. To calculate the equity value of the Company, the following criteria were adopted: (i) using Financial Statements (as defined below) dated as of March 31, 2006, net debt, net contingencies, accrued liabilities, dividends and interest on accrued capital stock (“Net Indebtedness ”) were subtracted from the financial-economic total value (enterprise value) of the Company and its Subsidiaries; (ii) GB Empreendimentos was valued based on the economic value of its participation in Net, and (iii) Net Indebtedness of GB Empreendimentos was discounted from its enterprise value. 7. For purposes of the Valuation of the Affiliates of the Company, ABN AMRO used the market value of Net calculated using the weighted average price of the preferred shares issued by Net on the Bolsa de Valores de São Paulo – BOVESPA during the period of 90 (ninety) days before April 29, 2006. 8. The Company, its Subsidiaries and Affiliates were valued as independent, “stand alone” operations, and the subsequent success or failure of the Offering was not considered in the results of the Valuation. ABN AMRO does not express any opinion about any effect on the Company that could potentially be generated from the consummation of the Offering. 9. The Valuation took the following financial statements provided by the Company: (i) annual fiscal year financial statements as of December 31, 2005 and quarterly financial statements as of March 31, 2006 of the Company, respectively, audited and revised by Ernst & Young Auditores Independentes S.S. (“Ernst & Young ”); (ii) unaudited or revised, tentative fiscal year balance sheets as at December 31, 2005 and from the quarter ending as of March 31, 2006 of GB Empreendimentos; (iii) annual fiscal year financial statements as of December 31, 2005 and quarterly financial statements as of March 31, 2006 of Embratel, respectively audited and revised by Ernst & Young; and (iv) annual fiscal year financial statements as of December 31, 2005 and quarterly statements as of March 31, 2006 of Star One, respectively audited and revised by Ernst & Young (hereinafter collectively referred to as “Financial Statements ”). Important Notice (cont.) |
 4 10. The Valuation was conducted by ABN AMRO based on information that was provided by the Offeror and/or by the Company or discussed with representatives from the Offeror and/or of the Company who were referred to ABN AMRO by the Offeror (“Designated Representatives”) as well as other available public information in addition to projections, estimates and analyses derived by ABN AMRO, based upon its expertise and experience. Estimates and projections that were provided to ABN AMRO or discussed with ABN AMRO, especially those whose occurrence depends upon future or uncertain events (including projections of earnings, expenses, investments, operating income or net income), were based on the opinion of the Designated Representatives with regard to these events. 11. ABN AMRO based its Valuation upon, among other things, the following information or documents that were provided to ABN AMRO up to April 28, 2006: (i) public information about the industry of the Subsidiaries and Affiliates of the Company; (ii) public information about the macroeconomic parameters where the Company, its Subsidiaries and Affiliates have a relevant presence; (iii) business plans from the Company’s Subsidiaries for the period from 2006 to 2015 that were developed and approved by their respective management; (iv) historical financial and operating information of the Company, its Subsidiaries and Affiliates; (v) value of Net Indebtedness of the Company and its Subsidiaries, and of GB Empreendimentos, and equity participation interests of the Company and its Subsidiaries and of GB Empreendimentos and (vi) discussions with the Designated Representatives regarding past performance of and expectations for the Company’s and its Subsidiaries' future businesses. 12. In preparing the Valuation, ABN AMRO reviewed other studies and financial and market analyses and took into consideration other factors it deemed to be necessary, including the assessment of economic, monetary and market conditions. 13. In connection with the Valuation of Net, ABN AMRO requested Net’s business plan from the Offeror and was informed by the Offeror and by the Company that they did not have access to a management-approved business plan for Net that reflects its current and future financial, operational and commercial situation, and that they did not have either a budget for the year 2006, nor any other analyses, studies or projects after January 1, 2006. ABN AMRO did not have access to representatives from Net for discussion of their prospects for future performance, estimates and projections. For the purposes of the Valuation of Net, ABN AMRO exclusively used the methodology described in paragraph 7 above. Important Notice (cont.) |
 5 14. Financial Statements, public information, estimates, projections, business plans, budgets, discussions and all other information referred to in paragraphs 9 to 14 above and in this paragraph 13, such as public market information about volumes and trading prices of shares issued by Net are hereinafter collectively designated as “Information”. 15. The preparation of economic/financial valuations is a complex process that involves subjective judgment and is not susceptible to a partial analysis or brief description. ABN AMRO did not attribute specific importance to certain factors considered in the Valuation, but, on the contrary, undertook a qualitative analysis of the importance and relevance of all factors considered herein. As such, the Valuation must be analyzed as a whole, and the analysis of selected parts, summaries or specific aspects of the Valuation without knowledge and analysis of the Valuation in its entirety could result in an incomplete or incorrect understanding of the analysis undertaken by ABN AMRO and of the conclusions contained in the Valuation. 16. Information on the demographics, macroeconomic scenario, regulations, the telecommunications market in Brazil and the BOVESPA stock market mentioned in the Valuation were taken from, among others, recognized, reliable public sources (trade associations, government organizations and specialized publications) such as Instituto Brasileiro de Geografia e Estatística – IBGE (Brazilian Institute of Geography and Statistics), Agência Nacional de Telecomunicações – ANATEL (National Telecommunications Agency), Banco Central do Brasil (Central Bank of Brazil), Comissão de Valores Mobiliários – CVM (Securities and Exchange Commission), Bloomberg, Economática, Global Investment Return Yearbook 2006 (ABN AMRO and London Business School) and the ABN AMRO Economic Department. 17. Based on the assertions from the Designated Representatives, ABN AMRO made the following assumptions: that (i) the financial projections provided reflect the best estimates for the period in which they were provided as well as the best judgment of the management from the Company and its Subsidiaries with regard to expected future performance of the Company and its Subsidiaries and (ii) the estimates and projections that were provided to ABN AMRO or discussed among ABN AMRO and the Company, especially those whose occurrence depends upon future or uncertain events (including projected earnings, expenses, investments, operational profit or net profit) were based on the best judgment of the management of the Company and its Subsidiaries. Important Notice (cont.) |
 6 18. Estimates and projections contained in this Valuation are intrinsically subject to uncertainties and various events or factors that are beyond the control of the Offeror, Company, its Subsidiaries as well as ABN AMRO, especially those whose occurrence depends upon future or uncertain events. There is no guarantee that the estimates and projections used in the Valuation will be realized. Actual future results could significantly diverge from those suggested in the Valuation. As such, ABN AMRO does not assume any liability or obligation for indemnification in the case that future results differ from the estimates and projections presented in the Valuation and does not make any declaration or warranty regarding those estimates or projections. ABN AMRO does not assume any responsibility regarding the referred estimates and projections, nor regarding the form in which they were elaborated. 19. ABN AMRO assumes that the Information is true and complete, without any independent verification and, hence, does not assume any responsibility for the content, exactness, veracity, integrity, consistency, sufficiency or precision of such Information, including, without limitation, the statements related to projections or forecasts of the Company, of its Subsidiaries, the assumptions and estimates on which these statements and projections were based and of the information discussed with the Designated Representatives. ABN AMRO did not conduct (i) any appraisal of the assets and liabilities (contingent or not) of the Company, its Subsidiaries and Affiliates; (ii) any revision or audit of financial statements from the Company, its Subsidiaries and Affiliates and of Net Indebtedness; (iii) any technical audit of operations of the Company, its Subsidiaries and Affiliates; (iv) any valuation of the solvency of the Company, its Subsidiaries and Affiliates in accordance with any legislation regarding bankruptcy, insolvency or similar issues; or (v) any physical inspection of the properties, installations or assets of Company, its Subsidiaries and Affiliates. Important Notice (cont.) |
 7 20. ABN AMRO presumes and relies upon the exactness, veracity, integrity, consistency, sufficiency and precision of all Information used in the preparation of the Valuation. ABN AMRO was informed by the Offeror and by the Company that all Information provided to ABN AMRO or in some way made available to or discussed with ABN AMRO is correct; that all financial projections provided to ABN AMRO or in some way made available to or discussed with ABN AMRO were prepared in a reasonable manner and that they reflect the best estimates and valuations from the period in which they were made available; and that, from the time of delivery of the Information, documents and reports provided up to the delivery of the Valuation, to our knowledge there has not been any material alteration in the businesses, nor in the financial situation, assets, liabilities, business prospects, commercial transactions or in the number of stocks or options of the Company, its Subsidiaries and Affiliates, nor with respect to any other material factor that could alter the Information and financial projections either provided to ABN AMRO or in some way made available or discussed with ABN AMRO, or make them incorrect or imprecise in any material respect or that could have a material effect on the conclusions presented in the Valuation. 21. ABN AMRO does not make, nor will it make, expressly or implicitly, any representation, declaration or warranty with relation to the Information used for the preparation of the Valuation, nor does it assume any liability or obligation for indemnification related to the content, exactness, veracity, integrity, consistency, sufficiency and precision of such Information, each of which are the sole and exclusive responsibility of the Offeror and/or the Company. ABN AMRO did not provide any auditing, accounting or legal consulting services and the preparation of the Valuation by ABN AMRO does not include any service or opinions of such nature. 22. ABN AMRO does not take liability for any direct or indirect losses or decreased revenues that could occur as a result of the use of the Valuation. 23. ABN AMRO does not express through means of the Valuation any judgment regarding the distribution of economic value among the various types and/or classes of shares of the Company, or of its Subsidiaries or Affiliates. Important Notice (cont.) |
 8 24. The Valuation does not constitute a judgment, opinion or recommendation to the management of the Offeror and/or the Company, to the shareholders of the Offeror and/or the Company or to any third party with respect to the appropriateness or opportunity of the Offering or regarding the decision of making or accepting the Offering (including the decision of the Company shareholders in accepting or not accepting the Offering). In addition, the Valuation is not meant to be the basis for any decision of investment or disinvestment. 25. Except where another date is specifically indicated, the Valuation reflects the financial and accounting conditions of the Company, its Subsidiaries and Affiliates as of March 31, 2006 and is based on Information available up to April 28, 2006, such that any alteration in such conditions and Information after to such date could alter the results that have been presented herein. ABN AMRO is not obligated, at any time, to update, revise, correct or reaffirm any information contained in the Valuation nor to provide any additional information related to the Valuation. 26. Other valuations of companies and sectors prepared by ABN AMRO could treat market assumptions in a different way than was framed in this Valuation; the research departments and other departments of ABN AMRO and its affiliated companies may use other analyses, reports and publications, estimates, projections and different methodologies than those used in the Valuation, as well as such analyses, reports and publications may contain different conclusions from those set out in the Valuation. 27. ABN AMRO has provided, directly or through its affiliated companies, certain financial and investment banking services to the Company, its Subsidiaries and Affiliates, as well as to its controlling shareholders, for which it received remuneration, continues to provide these services and could, at any time, provide them again. ABN AMRO, directly or through its affiliated companies, is or could become a creditor of the Offeror and the Company, its Subsidiaries and Affiliates as well as of the controlling shareholder of the Offeror in certain financial operations. 28. In the normal course of its activities, ABN AMRO could, directly or through its affiliated companies, trade in securities of the Company and of the Offeror and of their respective controlling shareholders, subsidiaries and affiliates, on its own behalf or on behalf of its clients and, consequently, could, at any time, retain buying or selling positions with respect to such securities. Important Notice (cont.) |
 9 29. ABN AMRO declares that the Offeror, its controlling shareholder and its management did not direct, interfere, limit, render difficult nor undertake any action that compromised the access to, utilization or attainment of the information, goods, documents or working methodologies relevant to the quality of the conclusions presented herein, nor did they either determine or restrict the capacity of ABN AMRO to determine the methodology used to reach the conclusions presented in the Valuation or restrict the capacity of ABN AMRO to determine the conclusions presented in the Valuation. São Paulo, May 1, 2006 BANCO ABN AMRO REAL S.A. ___________________________ ___________________________ Waldo Edwin Perez Leskovar Joel Michael Roberto Executive Superintendent Executive Superintendent Important Notice (cont.) |
 10 30. In order to comply with the dispositions of article 8 o , paragraph 3 o of CVM´s Instruction n o 361, of March 5 2002, ABN AMRO states that the professionals responsible for the Valuation Report are Mr. Joel Michael Roberto and Mr. Waldo Edwin Perez Leskovar. Important Notice (cont.) |
 11 Concerning the requirement found in item 2.3 of letter CVM/SRE/GER-1/N. o 1225/2006, referring to the presentation of comments to CVM with respect to the valuation report of Embrapar prepared by Banco Bradesco S.A. in August 2004, ABN AMRO clarifies, first of all, that the values per lot of one thousand shares in the two evaluations must not be compared, because Embrapar conducted significant transactions after August 2004, which had a great impact on its stockholding base. In May 2005, Embrapar implemented a capital increase of approximately 1.8 billion by issuing 423,906,976 thousand new shares at a price of R$ 4.30 per lot of one thousand shares, increasing its stockholding base by 127%. In addition, Embrapar completed the merger of Telmex do Brasil and of the participation of Telmex in the Net, whose impact was an increase by approximately 230,452,650 thousand Embrapar shares. Thus, the total number of shares issued by Embrapar increased from 334,399 thousand shares in August 2004 to 987,726,487 thousand shares in May 2006. In addition, the evaluations were prepared at a time when the competitive scenario of the telecommunications industry was different. Therefore, it was not appropriate for ABN AMRO to make any value judgment concerning the premises adopted at the time by Banco Bradesco S.A. in its study. ABN AMRO based its evaluation on the updated business plan of Embrapar and under the current market conditions and competitive scenario, which may therefore be different from those, used as reference by Banco Bradesco S.A. in its evaluation. Thus, ABN AMRO believes that the price comparison analyzed by CVM may present distortions in light of the aforementioned events. Furthermore, ABN AMRO declares that, in preparing its Valuation, did not review or conduct any independent audit of the information contained in the evaluation done by Banco Bradesco S.A. in August 2004, because it was not included in the scope of the work for which it was retained by the Offeror. ABN AMRO does not assume any liability concerning said evaluation prepared by Banco Bradesco S.A., or for the form in which it was prepared. The preparation of economic-financial evaluations is a complex process that involves subjective judgments and cannot be analyzed partially. In this sense, the analysis of select parts, summaries or specific aspects of the evaluation made by Banco Bradesco S.A., without knowing the premises adopted and the analysis of said evaluation in its entirety may lead to an incomplete and incorrect understanding of said analysis and its conclusions. Compliance with the requirement formulated in item 2.3 of Letter CVM/SRE/GER-1/N o 1225/2006 |
 12 Executive Summary |
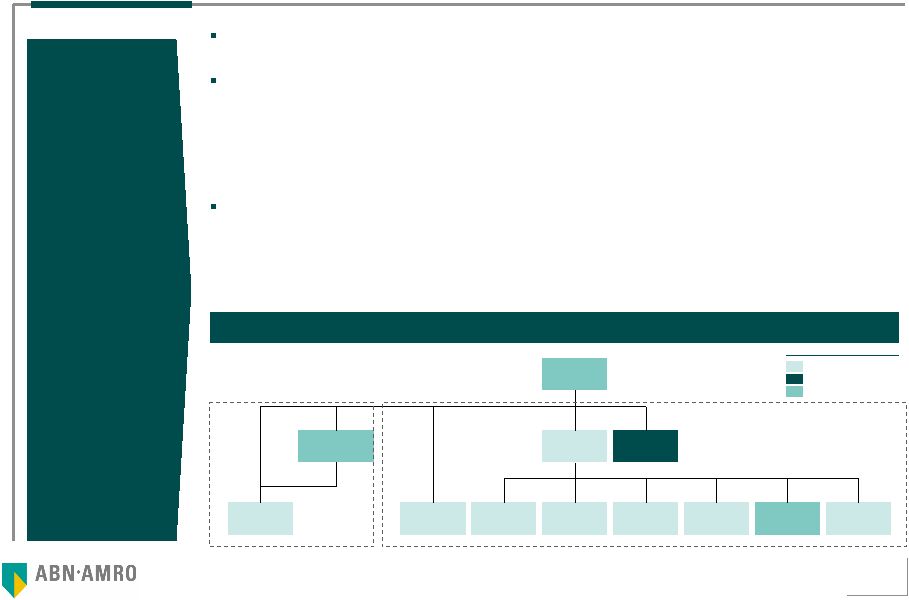 13 Executive Summary The Valuation is for the purpose of determining the financial-economic value of Embrapar in the context of the Offering Pursuant to instruction CVM No. 361 of March 2002, ABN AMRO conducted an analysis employing the following methodologies: – Economic value, based on an analysis of Discounted Cash Flow (“DCF”) – Weighted average share price per volume traded during the last twelve months – Shareholders’ equity per share value of the shares To determine the fair price of the Embrapar shares, ABN AMRO employed a methodology of economic value based on – the DCF in relation to the Subsidiaries, based on business plans of the operating companies – The weighted average price per volume traded of preferred shares of Net in the last 90 days and the net debt of GB Empreendimentos Purpose of the study by ABN AMRO Current simplified corporate structure (1) ONs: 49,00% Total: 83,00% Total: 98,99% Total: 99,99% ONs: 37,44% ONs: 51,00% Total: 19,81% Total: 20,80% Total: 100,00% Total: 80,01% Total: 98,00% Total:100,00% Total: 99,99% Total: 100,00% Total: 100,00% Vésper S.A. Vésper São Paulo S.A. Embratel Soluções Ltda. Click 21 Com. de Publicidade Ltda. Primesys Soluções Empresariais S.A. Net Serviços de Comunicação S.A. Embratel S.A. Embratel Participações S.A. Star One S.A. BrasilCenter Comunicações Ltda. (2) GB Empreendimentos e Participações S.A. Telmex do Brasil Ltda. Legend Operational Not operational Holding Notes: (1) only includes Brazilian companies and does not consider non-operating companies being dissolved, with the exception of Embratel Soluções Ltda., which is also in the process of being dissolved; (2) Embratel Participações S.A. has a direct share of 2.00% in BrasilCenter Comunicações Ltda. (“BrasilCenter”) Source: Embrapar Affiliates Subsidiarie s |
 14 Executive Summary (cont.) The calculation for determining the Equity Value of Embrapar is summarized as follows: Subsidiaries – Economic value of the assets determined based on the DCF methodology for the operating companies. A value of zero was assigned to the non-operating companies (holding companies) – The consolidated Net Indebtedness of the Company was deducted from the value calculated above Affiliates – Net: Equity Value determined based on the market value of preferred shares in the last 90 days (details on page 32) – GB Empreendimentos: Equity Value calculated based on the economic value of its participation in Net (Equity Value calculated based on its market value) deducted from its Net Indebtedness Share participations of the Company and Affiliates used in the Valuation refer to the stock ownership as of March 31, 2006 Summary of the Valuation methodology Embratel StarOne TDB Primesys Others (1) Subsidiaries = Equity value of Embrapar Embrapar Consolidated Net indebtedness (2) - + Affiliates GB Empreendimentos Net Enterprise Value Equity Value Note: (1) includes BrasilCenter, Vésper, Click 21; (2) consolidates the Net Indebtedness of all the Subsidiaries |
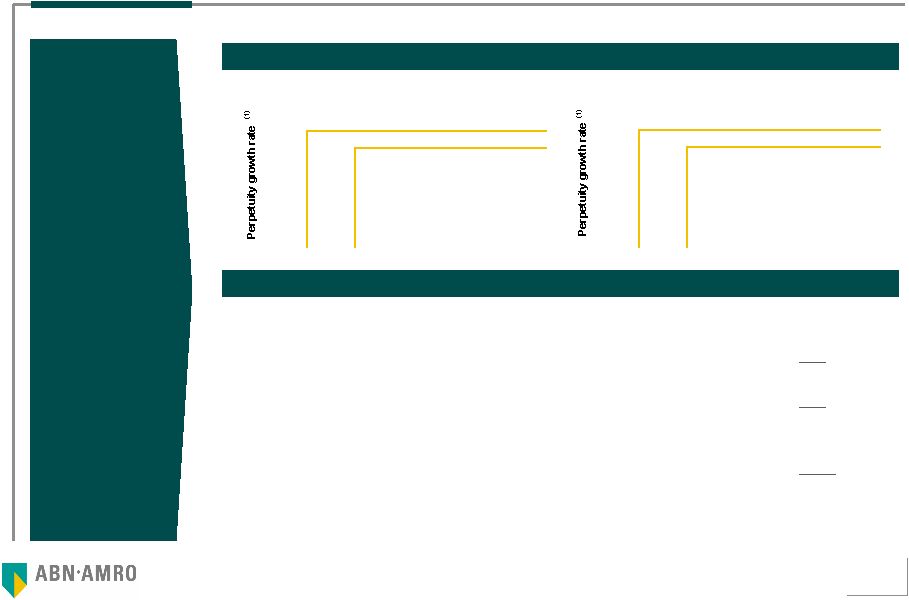 15 Executive Summary (cont.) Result of Embrapar Valuation Analysis of the economic value of the Affiliates based on the market value Analysis of the economic value of the Subsidiaries based on the DCF Enterprise value, excluding Net (R$ million) Equity value, excluding Net (R$ million) Notes: (1) Nominal dollars; (2) weighted average price per traded volume of preferred shares (PN) of Net for the 90 days prior to April 29, 2006 (3) total number of Net shares (excluding Treasury Shares) at March 31, 2006; (4) number of shares held directly or indirectly by Embrapar through GB Empreendimentos at March 31, 2006 (1,466,390,024 shares); (5) calculated based on the position of March 31, 2006; (6) participation of Embrapar in GB Empreendimentos on March 31, 2006 1,666 I=(E-H) Total Value of Embrapar’s Ownership Interest in Affiliates 0.036 H=(F*G) Net debt of GB Emprendimentos relative to its stock participation in Embrapar 83.00% G Embrapar stock participation in GB Emprendimentos (6) 0.044 F Net debt of GB Emprendimentos (5) 1,666 E=(A*D) Equity value of Net held by Embrapar 1,466 D Number of direct and indirect Net shares held by Embrapar (million) (4) 4,493 C=(A*B) Equity value of Net 3,955 B Total number of Net shares (million) (3) 1.136 A Price of Net shares considered for the Valuation (R$ per share) (2) Value in millions of Reais (except where indicated otherwise) Star One 10.94% 11.19% 11.44% Embrapar 11.70% 11.95% 12.20% 3.42% 0.35% 7,477 7,336 7,200 3.67% 0.61% 7,536 7,390 7,251 3.93% 0.86% 7,598 7,448 7,305 WACC Star One 10.94% 11.19% 11.44% Embrapar 11.70% 11.95% 12.20% 3.42% 0.35% 5,280 5,138 5,002 3.67% 0.61% 5,338 5,193 5,053 3.93% 0.86% 5,400 5,250 5,107 WACC (1) (1) |
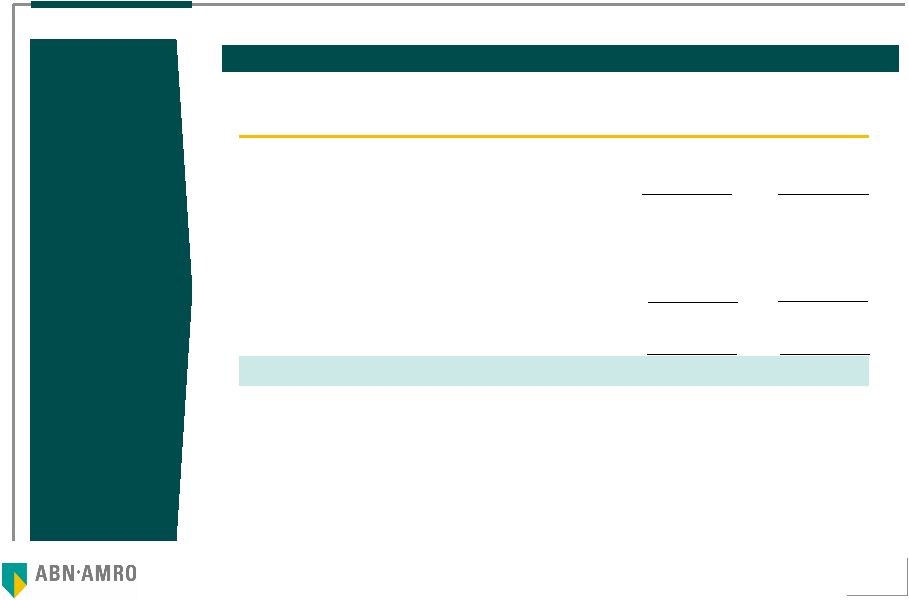 16 Executive Summary (cont.) Result of Embrapar Valuation Analysis of the total economic value of Embrapar Notes: (1) it already considers the 80.01% share held by Embratel in Star One; (2) calculated in accordance with the definition of Net Indebtedness described in the Important Notice on page 3. The 80.01% of Net Indebtedness of Star One is being considered; (3) calculated based on the weighted average price per volume traded over the last 90 days of the PN shares multiplied by the number of Net shares as of March 31, 2006 (3,954,663,665 shares); (4) ABN AMRO considered the number of shares issued by the company and outstanding on March 31, 2006. As reported by the representatives of the Company, there were no changes in the number of shares issued by the Company and outstanding since March 31, 2006. Values in million of Reias (except where indicated otherwise) Mínimo - Máximo Enterpriese value of operating Controlled Companies (1) A 7,200 7,598 Net debt of Embrapar Consolidated (2) B 2,198 2,198 Equity value of Embrapar and its Controled Companies C=(A-B) 5,002 5,400 Net total Equity Value D 4,493 4,493 Equity value of Net shares held by Embrapar (1,466 million shares) (3) E 1,666 1,666 Total Equity Value F=(C+E) 6,668 7,066 Number of Embrapar shares (million) (4) G 987,726 987,726 Price per share (R$ one thousand lot) F/G 6.75 - 7.15 |
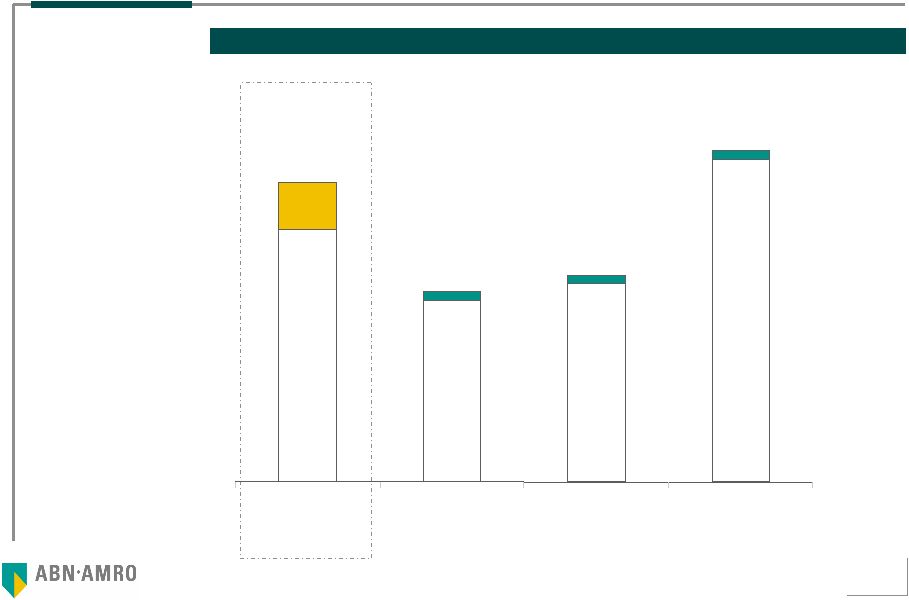 17 Summary of Embrapar Valuations The value of the shares of the Company determined by ABN AMRO is between R$ 6.75 per lot of one thousand shares and R$ 7.15 per lot of one thousand shares Value per share (R$ per lot of one thousand shares ) 5.29 4.83 6.75 7.15 7.59 Value of Shareholders’ Equity Weighted Average Price of PN Shares Weighted Average Price of ON Shares Valuation range |
 18 1 Declarations and qualifications of the Financial Advisor 17 2 Description of Embrapar and Net 21 3 Financial-economic valuation of Embrapar 27 a Methodology 28 b Valuation of Embrapar (excluding stock ownership in Net) 43 c Valuation of stock ownership in Net 52 d Valuation of Embrapar (including stock ownership in Net) 56 4 Valuation by average weighted price of shares 59 5 Valuation by value of shareholders’ equity per share 64 6 Summary of valuation of Embrapar shares 66 7 Glossary 68 Table of contents |
 19 1 Financial Advisor Information |
 20 In compliance with the provisions of article 8 o of Instruction No. 361, dated as of March 05, 2002 issued by the Securities Exchange Comission (Comissão de Valores Mobiliários - CVM) ABN AMRO renders the following representations: ABN AMRO does not own shares issued by the Company, either directly or through its controlling or controlled companies or persons associated therewith, in its own name or under its discretionary administration, except as stated below: – ABN AMRO FI AÇÕES IBOVESPA: 75,750,000 preferred Embrapar shares (position as of 04/28/2006) – SUDAMERIS FI AÇÕES INDEX: 76,000,000 preferred Embrapar shares (position as of 04/28/2006) – SUDAMERIS FI AÇÕES SUL ENERGY (position as of 04/28/2006) In compliance with the provisions of article 8, V, “b” of Instruction CVM No. 361, dated as of March 05, 2002, among the valuation criteria set forth in the Valuation, ABN AMRO considers the discounted cash flow methodology the most appropriate method for purposes of its valuation of the Company and its Subsidiaries, provided that the valuation of the Company’s minority interest (37,08%) in Net was based on historical market value according to the weighted average trading price of Net’s preferred shares on BOVESPA, in the period of 90 (ninety) days prior to April 29, 2006 ABN AMRO has no conflict of interest with respect to the Offeror, the Company, their controlling stockholders and their management, that would diminish the autonomy necessary for the performance of its functions with respect to the preparation of the Valuation Representations of the Financial Advisor |
 21 For the services relating to the Valuation, regardless of the outcome of the Offering, ABN AMRO will receive US$ 500,000.00 (five hundred thousand dollars) from the Offeror. The Offeror has agreed to indemnify ABN AMRO and its affiliates for certain liabilities that may arise from the performance of the Valuation services, and has agreed to reimburse ABN AMRO for legal fees of its advisors incurred in the preparation of the Valuation Pursuant to article 8 o , §6 o , of CVM Instruction 361, ABN AMRO declares that during the 12 (twelve) months prior to the date of the Valuation it received from the Offeor and from the Company an amount equivalent in Reais to Euro 838,000.00 (eight hundred thirty-eight thousand Euros), as compensation for consulting, evaluation, audit and similar services (in compliance with the request made in item 2.2 of Letter CVM/SRE/GER-1/N o 1225/2006) This Valuation presents: – Information on Embrapar shares, including the stock composition, the accounting net worth value per share, and the average weighted price per traded volume of Company shares on BOVESPA over the last 12 months – Economic value of the shares based on the Discounted Cash Flow (DCF) – Information tables with the assumptions used in the DCF valuation Representations of the Financial Advisor (cont.) |
 22 The ABN AMRO Corporate Finance department in Brazil is headquartered in São Paulo and has 14 duly certified professionals. The department also has the support of the Corporate Finance global department of the ABN AMRO Group, through sector teams in London, Amsterdam and Hong Kong, with approximately 350 professionals Recent experiences involving the valuation of publicly traded companies in Brazil include, among others, the valuation of TIM Celular S.A. (2006), TIM Participações S.A. (2006 and 2005), TIM Sul S.A. (2005), TIM Nordeste Telecomunicações S.A. (2005), Embratel Participações S.A. (2005), Tele Celular Sul Participações S.A. (2004), Tele Nordeste Celular Participações S.A. (2004), Telpe Celular S.A.(2004). Telasa Celular S.A. (2004), Telepisa Celular S.A. (2004), Telern Celular S.A. (2004), Telpa Celular S.A. (2004), Teleceara Celular S.A. (2004), Zivi S.A (2003), Eberle S.A.(2003), Biobrás S.A. (2002), Copene (2002), Copesul (2002) and Trikem (2002). The internal approval process of the Valuation independently issued by ABN AMRO includes a review by an internal committee, which includes professionals outside the Corporate Finance department of ABN AMRO Qualifications of ABN AMRO |
 23 2 Description of Embrapar and Net |
 24 Embrapar: history of the industry In 1998, the Brazilian government dismantled the Telebras system and privatized the sector, which up to that time had been controlled by the government. Fixed telephony operations were divided in four regions: Region I (North/Northeast/part of Southeast), Region II (South/Center-West), Region III (State of São Paulo) and Region IV (all the national territory). In regions I through III, the right to explore fixed telephony services in local and long distance forms, intra-state and intra-region, was granted to a single company (Telemar in Region I, Brasil Telecom in Region II, Telefónica in Region III). Fixed telephony services in national and international long distance forms (Region IV) were also granted to a single company, Embratel Embrapar is the holding company created in 1998 to retain control of Embratel upon its privatization. Since 2002, Embratel is also authorized to operate a fixed telephony service in local form. Its subsidiary Star One is authorized to offer signal transmission services via satellite to the entire nation Immediately after privatization, ANATEL auctioned, for each of the four regions, additional licenses for fixed telephony services in intra-state and intra-region long distance forms, as well as national and international long distance services In 1999, the Brazilian government opened the market of inter-urban calls with the introduction of the compulsory selection of a long distance operator. Initially, operators of fixed telephony in the local and long distance intra-state and intra-region forms were not allowed to carry long distance calls among the three regions defined in the privatization process. In 2002, two of the three fixed telephony operators (Telefónica and Telemar) received from ANATEL the authorization to operate inter-regional and international long distance calls; the third one (Brasil Telecom) was authorized in 2004 Source: 20F 2004 Embrapar Report |
 25 Embrapar: competitive scenario Subsequently, providers of personal mobile service began to require their clients to select an operator for long distance calls originated from their mobile phones In the area of international long distance calls, Embratel faces competition from the so-called resalers of telephony services operating outside Brazil. Using different technology, these companies offer international calls services at significantly lower rates Currently, Embratel has other businesses beyond long distance calls, including data, local telephony (recently also through VoIP technology), communication via satellite and services of information technology, among others The increase in the number of players acting in the same segments where the Company operates meant an intensification of the competition in those markets The telecommunication industry is subject to rapid technological changes that may have an adverse impact on the operations of Embratel Source: 20F 2004 Embrapar Report |
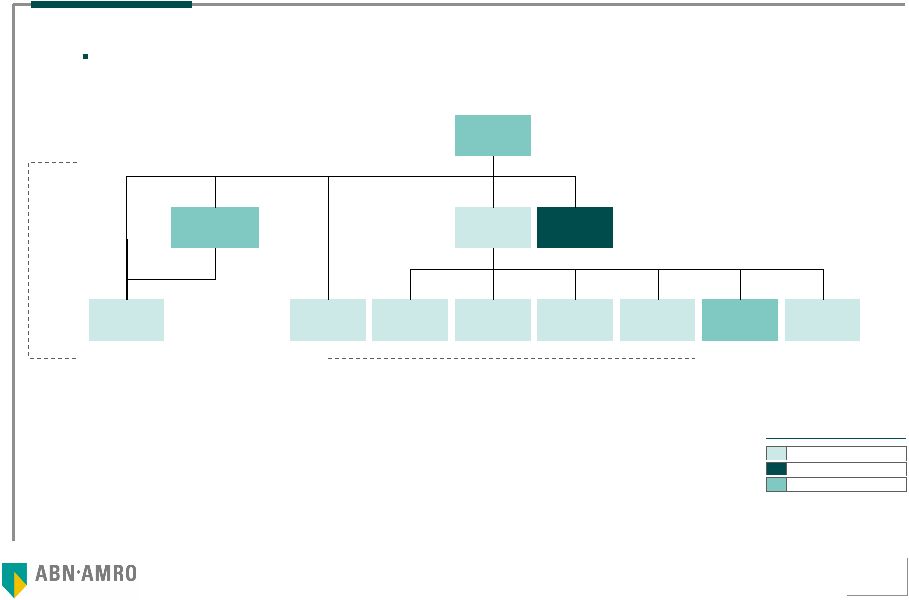 26 Legend Operational Not operational Holding Embrapar simplified corporate structure (1) , according to information received by its Designated Representatives, is shown in the following diagram: Embrapar: simplified corporate structure Notes: (1) only includes Brazilian companies and does not consider non-operating companies in the process of being dissolved, with the exception of Embratel Soluções Ltda., which is also in the process of being dissolved; (2) Embratel Participações S.A. has a direct share of 2.00% in BrasilCenter Comunicações Ltda. Source: Embrapar Affiliates Subsidiaries ONs: 49.00% Total: 83.00% Total: 98.99% Total: 99.99% ONs: 37.44% ONs: 51.00% Total: 19.81% Total: 20.80% Total: 100.00% Total: 80.01% Total: 98.00% Total:100.00% Total: 99.99% Total: 100.00% Total: 100.00% Net Serviços de Comunicação S.A. Embratel S.A. Embratel Participações S.A. Star One S.A. BrasilCenter Comunicações Ltda. (2) GB Empreendimentos e Participações S.A. Telmex do Brasil Ltda. Primesys Soluções Empresariais S.A. Embratel Soluções Ltda. Click 21 Com. de Publicidade Ltda. Vésper S.A. Vésper São Paulo S.A. |
 27 Net: history of the industry In Brazil, Pay-TV services are provided through cable TV systems, MMDS and DTH via satellite, which are granted and regulated by ANATEL In accordance with Law No. 8,977/95 and Decree No. 2,206/97, cable TV operators must obtain a concession from ANATEL to be able to provide such services in Brazil. None of the concessions to provide cable TV services in a specific area are exclusive. Concessions are granted by ANATEL for a period of 15 years and they are subject to renewal for equal and successive periods. The license may only be granted to Brazilians who are citizens by birth or who have been naturalized for more than 10 years or to companies regularly incorporated under Brazilian laws. headquartered in Brazil and for whom 51% of whose voting capital stock is held by Brazilians who are citizens by birth or who have been naturalized for more than 10 years In 1999, ANATEL provided through Resolution No. 190, that subscription television providers may also offer audio and video signals through their cable networks, and that they may thereby offer high speed Internet access The Brazilian subscription television market witnessed profound growth beginning in the second half of the 90’s, achieving by the end of 2005 the equivalent of 4,101 thousand subscribers Source: Net annual report for 2005 and Brazilian Association of Television by Subscription (Associação Brasileira de Televisão por Assinatura - ABTA) |
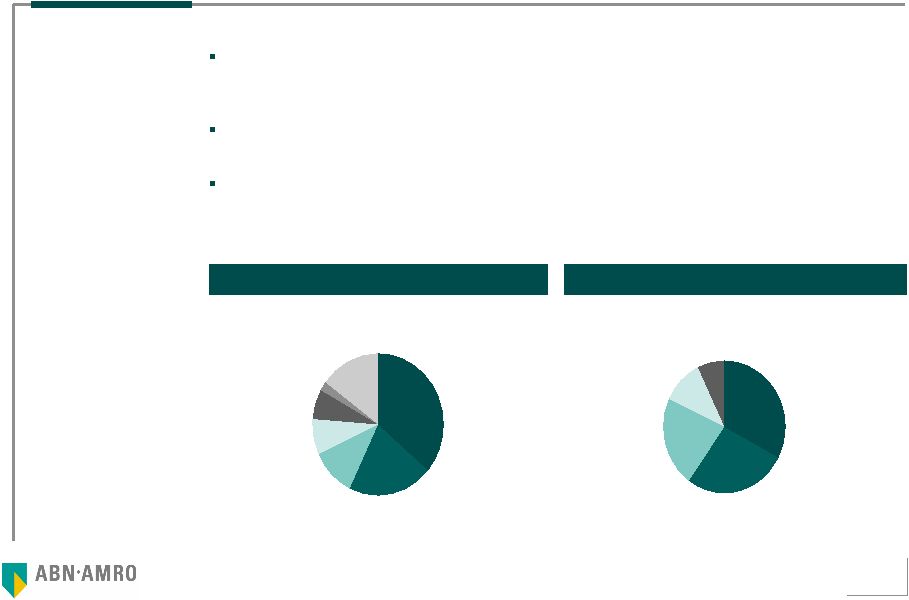 28 Sky 21% DirecTV 11% TVA 8% Vivax 7% Net 36% TV Cidade 2% Outros 15% Net: competitive scenario Net is the main provider of Pay-TV in Brazil. At December 31, 2005, Net subscribers represented 60% of the entire cable television structure in Brazil (6.7 million homes reached) and 36% of the total Pay- TV subscribers Starting in 2002, Net also increased its offerings of broadband services. reaching a market share of approximately 11% by the end of 2005 Net operates in a select demographic region. As of the end of 2005 it was present in 44 cities which, according to IBGE data, represent in aggregate, more than 45% of the Brazilian GDP and comprise close to one-third of Class A and B households Market share of Pay-TV operators (end of 2005) Market share of broadband Internet providers (end of 2005) Source: presentation by Net based on 2005 annual results Speedy 33% BrTurbo 27% Velox 22% Vírtua 11% Outros 7% As of March 31, Net had 1,599.5 thousand cable television subscribers and 451.6 thousand broadband subscribers |
 29 3 Financial-economic valuation of Embrapar |
 30 3a Methodology |
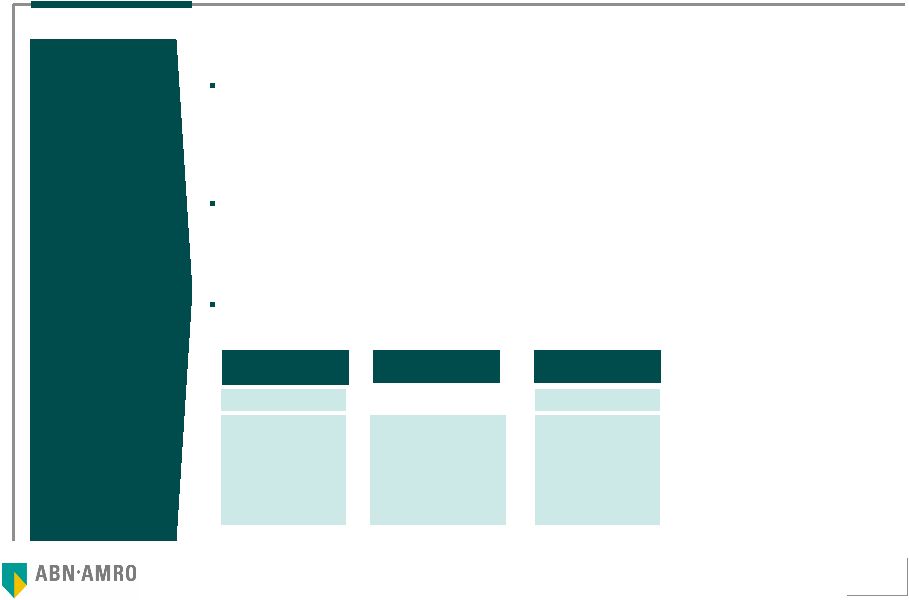
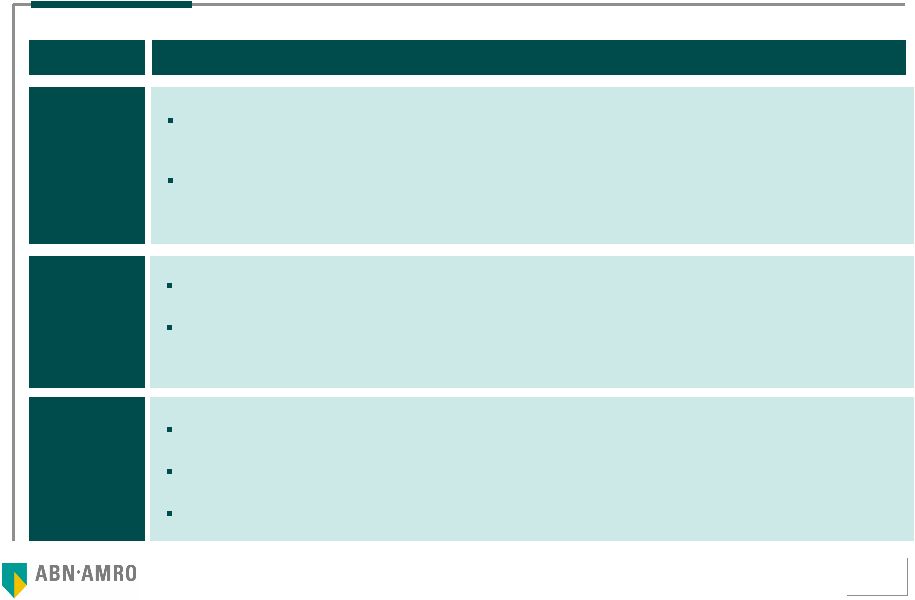 31 Methodological considerations The weighted average quotation of a stock is the result of the daily financial volume trades in a specific period, divided by the number of shares trades in that same period This methodology is most applicable in cases where (i) necessary information (mainly long-term projections) to make a valuation based on the DCF method is not available and (ii) the shares have liquidity (presence in Ibovespa) and dispersion (free float higher than 50%) The value of the company is determined by the expectations of its future results, measured by its capacity for cash generation and the risk associated with that generation, discounted to present value by an appropriate discount rate This method captures the growth potential and future profit prospects, adequately reflecting the expected return in light of the country-risk and the risk intrinsic to this type of business; it is also appropriate for adequately capturing business opportunities and for adjustment for extraordinary events The shareholders’ equity per share value is determined by dividing the net worth of the company, at the date of the valuation, by its respective share base This methodology does not necessarily reflect the growth potential or possibilities of future profit, nor the intrinsic risk of the business It may also be distorted by the accounting policy adopted by the company Methodology Description Average weighted price of the shares Discounted Cash Flow Value of the shareholders’ equity per share |
 32 Methodological considerations The calculation for determining the Equity Value of Embrapar is summarized as follows: Subsidiaries – economic value of the assets determined based on the DCF methodology for the operating Subsidiaries. A value of zero was assigned to the non-operating companies (holding companies) – The consolidated Net Indebtedness of the Company was deducted from the value calculated above Affiliates – Net: Equity Value determined based on the market value of preferred shares over the last 90 days (details on page 32) – GB Empreendimentos: Equity Value calculated based on its participation in Net (Equity Value calculated based on its market value) deducted from its Net Indebtedness Share participations of the Company and Affiliates used in the Valuation refer to the stock ownership as of March 31, 2006 Summary of the valuation methodology Embratel StarOne TDB Primesys Others (1) Subsidiaries = Equity Value of Embrapar Embrapar Consolidated Net Indebtedness (2) - + Affiliates GB Empreendimentos Net Enterprise Value Equity Value Note: (1) includes BrasilCenter, Vésper, Click 21; (2) consolidates the Net Indebtedness of all the Subsidiaries |
 33 Calculation Methodology of the value of Subsidiaries ABN AMRO believes that the DCF methodology should be the most appropriate, should the information necessary for the preparation of a DCF be available, since DCF takes the operational cash flow of the enterprises into consideration discounted by the respective projected cost of capital. In that manner, the risk profile and the cash generation potential are projected in greater detail Cash flow projections were made in nominal Reais and converted to nominal Dollars in accordance with the average exchange rates expected for each year of the projected period in conformity with the table of macroeconomic projections indicated on page 44. The conversion of cash flow to nominal Dollars was made to adjust such flows to the WACC, which was expressed in nominal Dollars The net present value of the tax benefit related to the utilization of the tax losses and the negative Embratel C.S.L.L. base as of March 31, 2006 (VPL calculated on the basis on a WACC of 11.95%) was also added to the calculation of the Enterprise Value of the Subsidiaries After the net present value of the Subsidiaries was calculated in Dollars, the amount was converted into Reais at the Ptax rate 800 of R$/US$ 2.17 on March 31, 2006 The result of the valuation of the Subsidiaries is presented in an interval manner on the basis of the following variables: – WACC, in nominal Dollars, varying by 0.25 percentage points; and – Rate of growth in perpetuity, in nominal Dollars, varying by 0.255 percentage points; it is 0.61% in the base scenario for the Subsidiaries, except for Star One where it was 3.67% The base date utilized for this Valuation is March 31, 2006 and the projection horizon includes the period from 2006 to 2015 Subsidiaries |
 34 Calculation Methodology of the Interval of Value of the Operational Subsidiaries (Net) For the valuation of Embrapar’s holdings in Net, the utilization of Net's market value was chosen because: – ABN AMRO did not have access to the business plan of Net that reflects its financial, operational and commercial situation, present and future, and which was approved by its administration, or access to the budget for the year 2006 or other analyses, studies and projections as of January 1, 2006 – ABN AMRO did not have access to Net representatives for discussions in regard to Net prospects, estimates and projections of future performance – The class of shares used to value Net presents broad liquidity (presence on the IBOVESPA) and dispersion (preferred shares have a free float greater than 50%) – CVM 361 instruction and Article170 the Corporation Law provide the possibility of the adoption of such methodology The quotes of Net preferred shares were adopted as the market reference because: They have greater liquidity than the common shares. Net PN shares form a part of the BOVESPA Index that groups the 30 most liquid securities on the Market, ON shares do not form a part of that index; – At the same time, they do not present any loss of value because of a tag along difference since Net, present at level 2 of the BOVESPA Differentiated Corporate Governing Practices, guarantees 100% of tag along for preferred shares – PN dispersion is greater than 50% Weighted average price by the daily traded volume of Net preferred shares were analyzed over periods of 1 year, 6 months and 3 months Operational Subsidiaries (Net) |
 35 The economic-financial valuations of the Embrapar Subsidiaries were based on the DCF methodology Non-leveraged operational cash flow utilized in the DCF valuation method was constituted in the following manner: (+) Earnings Before Interest and Taxes (EBIT) (-) Income Tax and Corporate Contribution based on EBIT (+) Depreciation and Amortization (-) Capital Expenditures (investments in fixed assets) (+ -) Changes in Working Capital (=) Unleveraged Operating Free Cash Flow of the Business Discounted Cash Flow Method (DCF) Components of the Cash Flow |
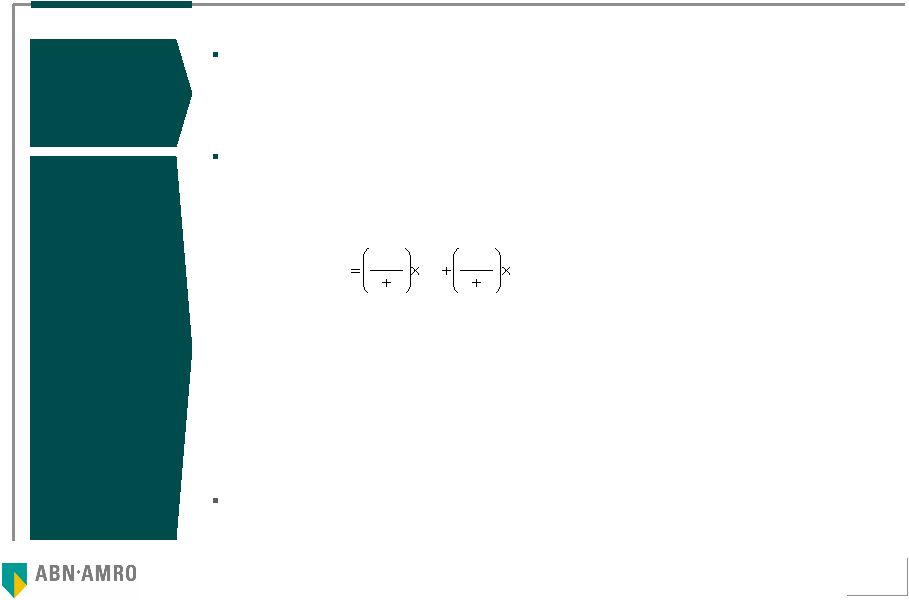 36 The DCF valuation model calculates the value of a business by discounting future cash flows based on the WACC (Weighted Average Cost of Capital). WACC is determined by the weighted average cost of debt and cost of equity within the optimal capital structure for the Company and is directly related to the risk associated with future cash flows WACC is determined by the weighted average cost of equity and debt of the Company. Such costs are weighted by the respective equity and debt proportions in the Company’s capital structure, in accordance with the following formula: D : Value of the total debt of the business E : Value of Shareholders’ Equity Re : Cost of Equity Rd : Cost of Debt* (1-T) T : IR and CSLL Once the WACC was calculated in nominal Dollars and the financial projections were made in nominal Reais. the free non-leveraged cash flow of the business was converted into nominal Dollars Discounted Cash Flow Method (DCF) FCD Method Weighted Average Cost of Capital (WACC) Rd E D D Re E D E WACC |
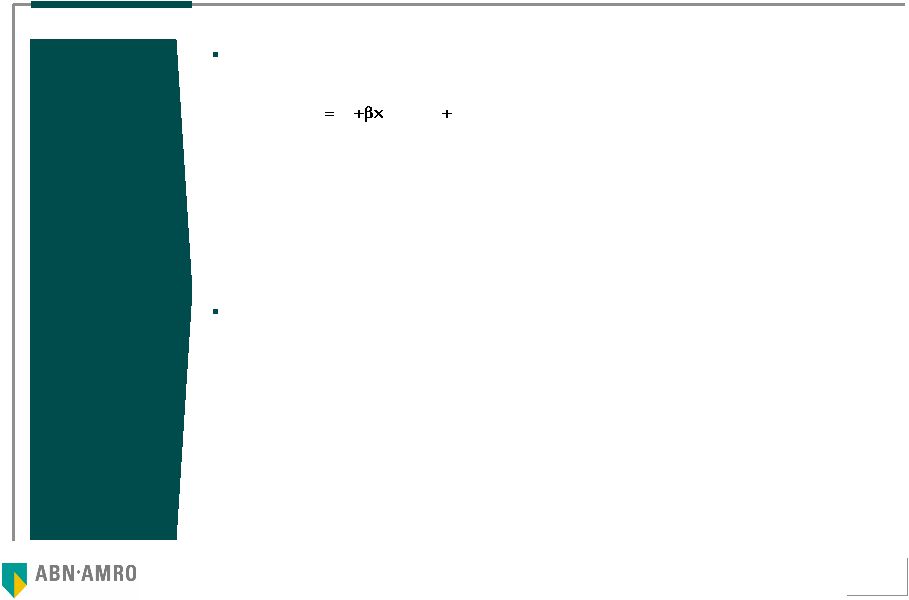 37 The following adjustments to the CAPM model (Capital Asset Pricing Model) are used to calculate the cost of equity of the Company: Re : Cost of equity of the Company Rf : Risk-free rate of return on investment in the US Rm - Rf : Average expected return on the stock market ß : beta estimated for a business acting in the Subsidiaries’ industry Z : Additional risk factor for businesses that operate in Brazil (“Country Risk”) The methodology considered to calculate the cost of equity of the Company was based on data obtained from companies operating in the same segment in the USA and Europe, to which a country risk premium was added Cost of the equity capital Cost of equity Z Rf) - (Rm Rf Re |
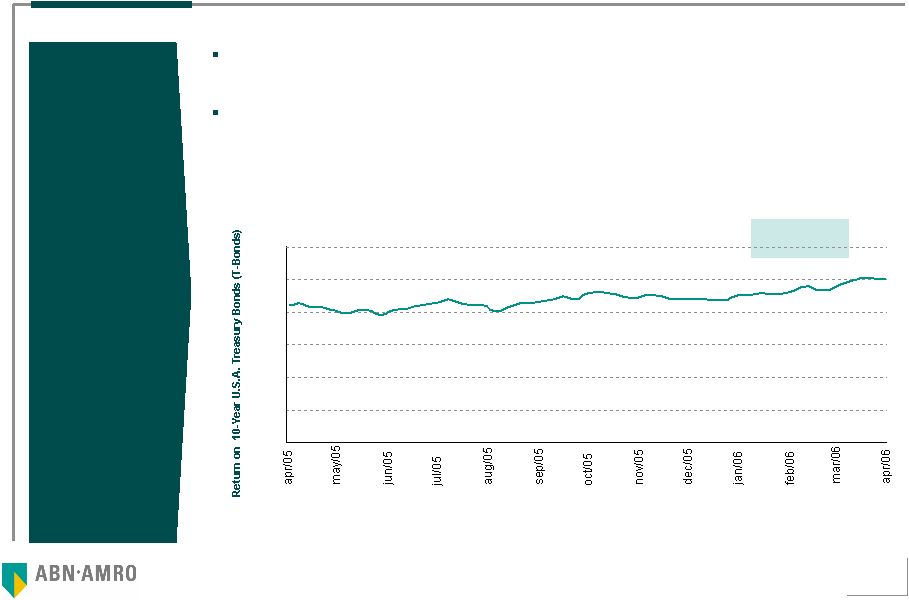 38 We believe that the best estimate for the risk-free rate of return is the yield of the United States Treasury Bond. We considered the 10-year bond since it is the long-term bond with the closest duration to the Brazilian Global 27 bond, which will be used to estimate the country risk of Brazil The average yield over the last 12 months of the 10-year United States Treasury bond is 4.39% per annum Risk-Free Rate Risk-Free Rate Note: average of the last 12 months prior to April 29, 2006 Source: Bloomberg 0.0 1.0 2.0 3.0 4.0 5.0 6.0 1-year average 4.39% |
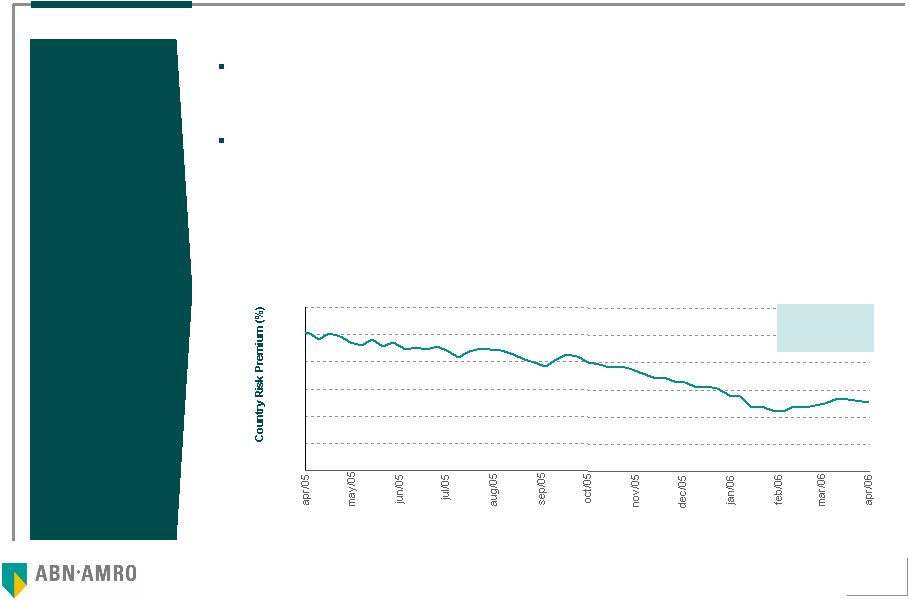 39 We believe that the best estimate of Brazilian country risk is given by the difference (spread) between (i) the return on the Global 27 bond – the Brazilian sovereign long-term bond, denominated in U.S. Dollars and (ii) the return on the 10-year U.S. Treasury bond, since the two have a similar duration. The graph below shows the behavior of Brazilian country risk over the last twelve months. Given Brazil's macroeconomic stability and the country risk tendency observed, we consider that a historic series of spreads over a longer term has become less applicable and we therefore utilize the average spread for the last twelve months, calculated at 3.75% per annum. Country Risk Country Risk Premium 0.0 1.0 2.0 3.0 4.0 5.0 6.0 1-year average 3.75% Note: average of the last 12 months prior to April 29, 2006 Source: Bloomberg |
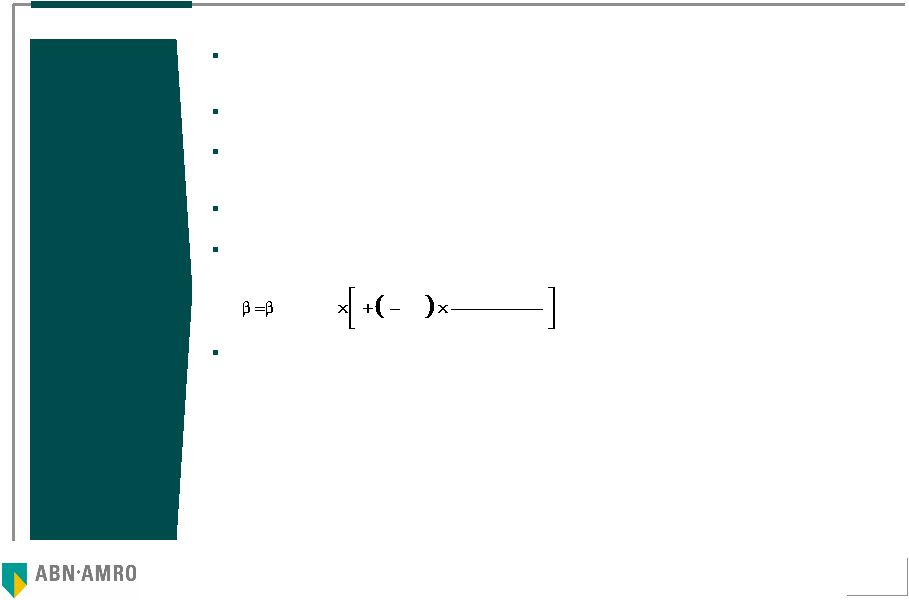 40 Beta is a measurement of market risk / system risk / non-diversiable risk. The beta coefficient attempts to indicate the sensitivity of the price of the stock to the variation in the price of the market portfolio, i.e., a stock that has a beta equal to 2 would tend to rise 2% when the market rises 1% That coefficient is calculated by means of a linear regression between a series of variations in the company's stock price and a series of variations in the price of the market portfolio In order to estimate the beta, we considered a sample of businesses operating in the Subsidiaries' industry. We therefore considered the average of the unleveraged betas of the businesses in the sample as a proxy for the Subsidiaries' betas In order to make those betas comparable, we took the beta of each business excluding the corresponding degree of indebtedness, which results in the unleveraged betas In order to take into account the risk derived from the Subsidiaries capital structure, we calculated the beta of the companies by means of the following formula: The leveraged beta considered in the valuations of the Embrapar Subsidiaries were: – Embratel: 1.28 – Star One: 1.02 Beta Beta Note: (1)marginal income tax and CSLL rate T Equity Debt 1 1 (1) unleveraged |
 41 Market risk premium is the additional return required by investors to compensate for an element of greater uncertainty (risk) in investments in stocks versus investments considered risk free The estimate used for overall market risk is the long-term historic average (1900 to 2005) of the differences between the return on an index representing the global stock market denominated in Dollars and the return on an overall index of long-term sovereign bonds of credit risk-free countries ABN AMRO favors a longer period (since 1900) because that period reflects a more diverse set of economic environments such as wars, depressions and periods of expansion, that are not satisfactorily reflected in shorter periods ABN AMRO favors the historic focus rather than the focus on the future due to the fact that it does not believe that the market risk premium is predictable within a period of 3 to 4 years. Since the market risk premium is a random value, historic data represent a better estimate for the future. The value of the market risk premium utilized in the valuation of the Embrapar Subsidiaries is 5.10% (that value is the result of the “Global Investment Return Yearbook 2006” study carried out by ABN AMRO in conjunction with the London Business School) Market Risk Premium Market Risk Premium |
 42 The cost of debt is estimated based on the average long term cost observed in capital raising operations by enterprises with a credit profile similar to those of the Company’s Subsidiaries. Thus the cost of future debt must represent the cost that the enterprise would pay should it issue long term bonds. That cost is directly connected to the enterprise’s risk profile Since interest paid is deductible from income tax and the corporate contribution, we must reduce the cost of debt before taxes by the long term income tax and the corporate contribution rate in order to arrive at a post-tax cost of debt The weight assigned to equity in the calculation of the average weighted cost of capital must be based on the (estimated) market value of the equity and debt, since the cost of capital must reflect the remuneration required by investors in accordance with the business risk of the enterprise The target financial leverage (total debt / total capital) used in the valuations of the Embrapar Subsidiaries were: – Embratel: 32.41% – Star One: 21.93% Cost of Debt and the Capital Structure Cost of the Debt (cost capital of third parties) Capital Structure |
 43 The life of a business is theoretically infinite. Nevertheless, we are not able to project future cash flows in a precise manner beyond a certain period. Therefore, a part of the value of the business, known as the terminal value, will be generated by the cash flows of the years that follow the last year of the period of projection The calculation of the terminal value is adjusted to standardize the Star One Capex. Each year, until infinity, the free cash flow will grow in conformity with its growth rate, which is referred to as the perpetuity growth rate The financial projections were prepared in nominal Reais and then converted into nominal Dollars in accordance with the average exchange rates expected for each of the period projected, in accordance with the table of macroeconomic projections indicated on page 44. In that manner the perpetuity growth rate of free cash flows should, coherently, be a rate in nominal Dollars. The nominal rate of growth in perpetuity utilized by ABN AMRO is 0.61% in nominal Dollars for the Subsidiaries, except for Star One which was 3.67% in nominal Dollars Terminal value and perpetuity growth rate Terminal value and perpetuity growth rate |
 44 WACC Weighted Average Capital Cost (WACC) WACC 11.19% WACC (nominal US$) 13.33% Cost of Equity Adjusted for Country Risk (US$) 3.53% 78.07% 21.93% Cost of Debt after IR and CSLL (US$) Capital Structure: % of equity % of third party 0.86 34.00% 28.08% 1.02 Non-leveraged Beta of the Sector Income Tax D/E Leveraged Beta Star One 11.95% WACC (nominal US$) 14.65% Cost of Equity Adjusted for Country Risk (US$) 6.32% 67.59% 32.41% Cost of Debt after IR and CSLL (US$) Capital Structure: % of equity % of third party 0.97 34.00% 47.95% 1.28 Non-leveraged Beta of the Sector Income Tax D/E Leveraged Beta Embrapar (including Subsidiaries. but not Star One) 4.39% 5.10% 3.75% Return on Ten-Year United States Treasury Bond (T-Bond) Stock Market Risk Premium Country Risk Premium Cost of Capital for the Company (US$) |
 45 3b Embrapar Valuation (excluding participation in Net) |
 46 Macroeconomic Assumptions Principal Macroeconomic Assumptions 2006 2007 2008 2009 2010 2011 2012 2013 2014 2015 Inflation (IPCA) 4.24% 3.97% 3.38% 3.32% 3.42% 3.55% 3.67% 3.74% 3.74% 3.74% Inflation (IGPM) 3.46% 4.02% 3.88% 3.83% 5.88% 4.43% 4.07% 3.97% 3.97% 3.97% Exchange Rate - end of period (R$/US$) 2.35 2.45 2.55 2.65 2.86 2.98 3.10 3.22 3.27 3.33 Average Exchange Rate during the period (R$/US$) 2.20 2.40 2.50 2.60 2.76 2.92 3.04 3.16 3.21 3.30 Selic Rate (average for the year) 15.15% 13.48% 13.01%12.03%10.86% 8.96% 8.96% 9.04% 9.04% 9.04% Real GDP Growth 3.97% 4.03% 4.44% 4.64% 4.52% 4.48% 4.34% 4.12% 4.12% 4.12% |
 47 Embrapar Subsidiaries: main operational assumptions The Valuation of Embrapar is based on: (i) public information about the sector in which the Company Subsidiaries are active; (ii) public information with regards to macroeconomic parameters where the Company and its Subsidiaries have a relevance; (iii) business plans of the Company Subsidiaries for the period from 2006 to 2015 prepared and approved by their respective managements; (iv) historical, financial and operational information about the Company and its Subsidiaries and (v) discussions with the Designated Representatives in relation to past performance and the expectations for the future of the Company and its Subsidiaries. Growth in national long distance traffic services in line with GDP, mainly coming from cellular connections, VIP phone and 0800 services and a decrease in international long distance traffic services as a result of the competition in relation to tariffs and a decrease in unit prices per minute is expected in long distance as a result of the stimulus of competition In general terms, the services of the Embrapar Subsidiaries in Data and Internet segments are growing in line with the market There is an expectation of the introduction of VoIP service beginning in 2006 with a strong growth on the basis of subscribers according to information furnished by the Designated Representatives Interconnection tariffs show a reduction in the years beginning in 2006 as a result of new regulatory developments Operational expenses are growing as a function of inflation and present no significant improvements in real terms Beginning in 2006 a biannual concession rate of 2% will be charged on revenues from long distance services Capex refers principally to the expansion of local services, maintenance of infrastructure for data transmission, internet services and VoIP services In relation to Primesys, growth is expected in its activities in line with the GDP and the maintenance of margins In relation to Star One, accelerated growth of revenue is predicted with respect to broadband Internet services and a greater area of coverage with the new Q-band satellites The costs of interconnection and of renting transponders is stabilizing in terms of percentages of net revenues Investments in new satellites to replace and maintain the present fleet were considered in the projection Summary of the Operational Assumptions for the Valuation of Embrapar |
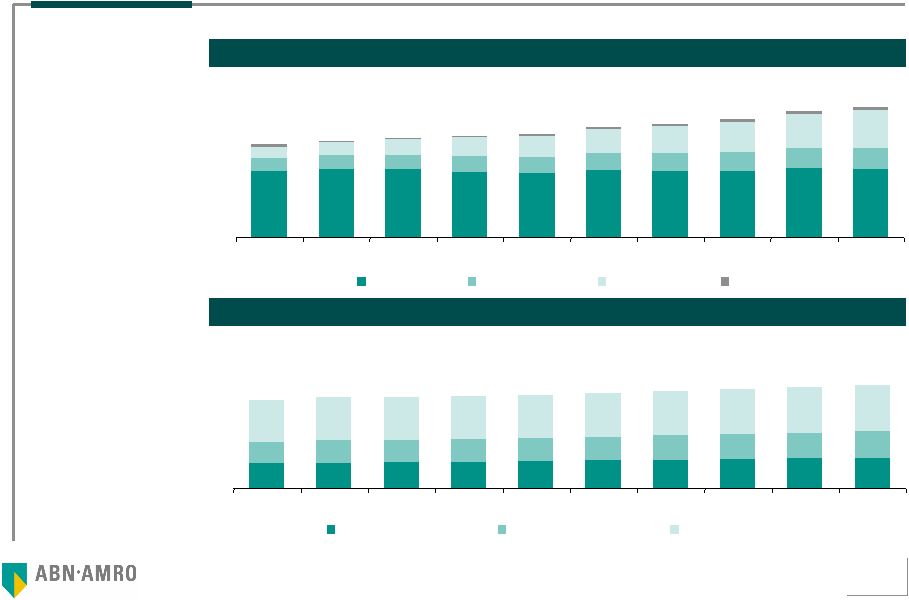
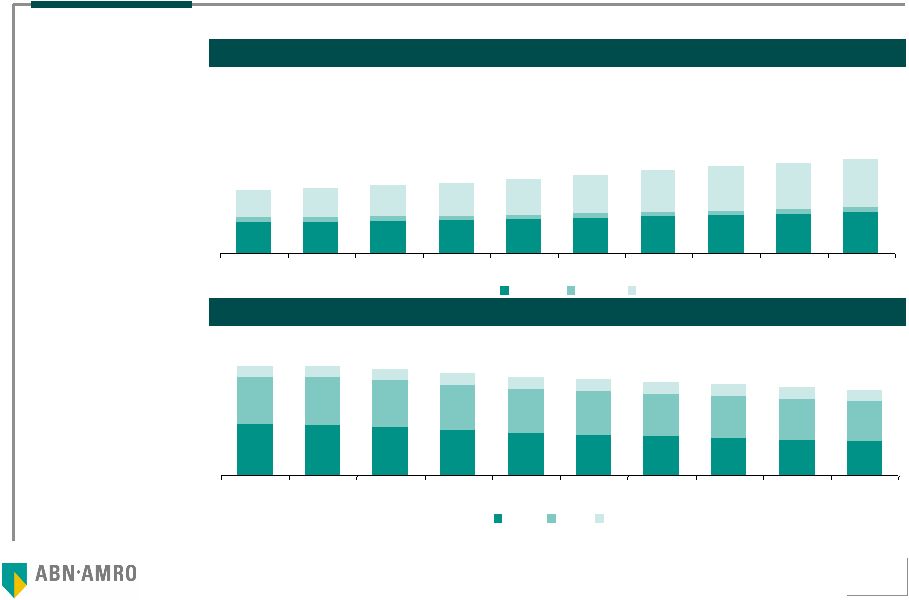 48 12,902 12,917 13,312 13,623 14,080 14,565 15,139 15,715 16,336 16,973 26,151 26,918 28,042 29,088 30,713 32,515 34,356 35,905 37,534 39,187 1,964 1,932 1,902 1,908 1,892 1,866 1,886 1,901 1,904 2,034 11,215 12,098 12,829 13,578 14,767 16,058 17,309 18,288 19,267 20,250 2006 2007 2008 2009 2010 2011 2012 2013 2014 2015 DLD ILD Local services Traffic (Millions of Minutes) Growth in local and national long distance telephone traffic and modest drop in international long distance telephone traffic Reduction in national and international long distance rates and increase in local telephone rates Embrapar: operational variables Traffic (million of minutes) Net average tariff (R$ nominal / minute) 0.33 0.32 0.31 0.29 0.27 0.26 0.25 0.24 0.23 0.22 0.30 0.31 0.30 0.29 0.29 0.28 0.28 0.27 0.27 0.26 0.08 0.07 0.07 0.07 0.07 0.07 0.07 0.07 0.07 0.08 2006 2007 2008 2009 2010 2011 2012 2013 2014 2015 DLD ILD Local service Average Net Rates (nominal R$ / minute) |
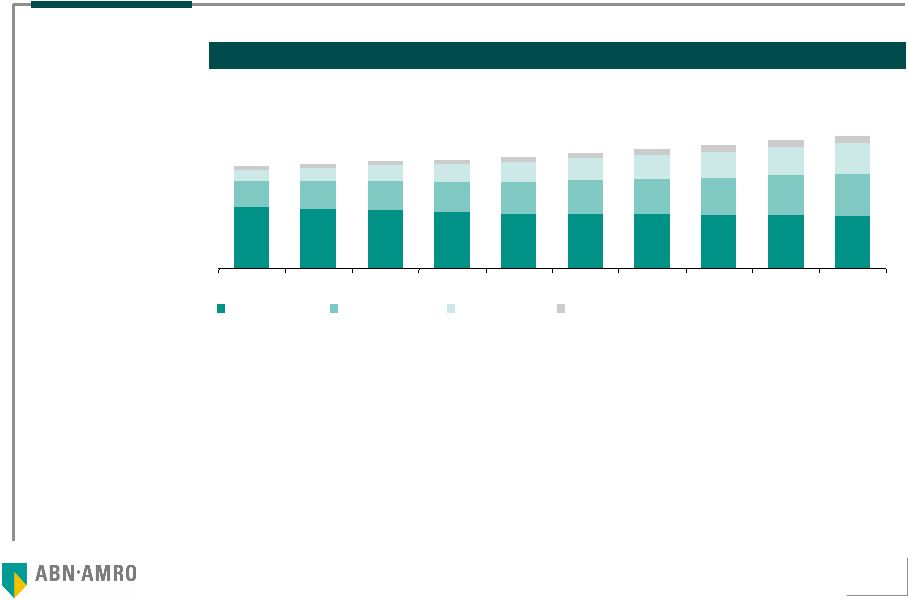 49 4,874 4,750 4,670 4,479 4,341 4,335 4,299 4,272 4,230 4,189 2,195 2,312 2,410 2,516 2,629 2,784 2,883 3,022 3,264 3,405 1,941 2,117 2,298 2,486 1,401 1,579 1,762 1,234 1,068 899 268 301 331 358 393 428 467 507 549 593 10,673 10,341 9,918 9,590 9,310 8,942 8,754 8,644 8,431 8,235 2006 2007 2008 2009 2010 2011 2012 2013 2014 2015 Long distance Data and Internet Local services Other services Revenues for long distance telephone service represents the largest part of Embrapar revenues but their relative contribution decreases over the years. Data transmission. Internet. local and other services grow over the years Note: Values of net revenues consider the integral consolidation of Star One revenues, with the elimination of intercompany operations Embrapar: Net Revenues Composition of Net Revenues (R$ nominal millions) |
 50 Interconnection costs are the greatest portion of Embrapar costs Personnel and third party expenses are the greatest portion of Embrapar expenses Embrapar: Costs and Expenses Composition of Expenses (R$ nominal millions) Composition of Costs (R$ nominal millions) Note: Cost and expenses values consider the integral consolidation of Star One receipts, eliminating intercompany operations 691 711 726 741 757 774 793 812 831 851 620 631 638 649 667 684 702 719 737 1,203 2,453 2,538 2,554 2,571 2,610 2,666 2,714 2,777 2,824 2,878 610 1,152 1,207 1,198 1,192 1,224 1,238 1,263 1,274 1,290 2006 2007 2008 2009 2010 2011 2012 2013 2014 2015 Personal Expenses Third part services Others 2,396 2,466 2,451 2,372 2,306 2,417 2,393 2,387 2,501 2,453 774 759 721 684 649 618 587 558 530 503 477 372 479 579 676 877 991 1,111 1,239 1,375 110 20 113 98 84 72 61 55 42 29 3,355 3,469 3,588 3,648 3,721 3,974 4,105 4,266 4,558 4,701 2006 2007 2008 2009 2010 2011 2012 2013 2014 2015 Interconnection Data and Internet Local services Others |
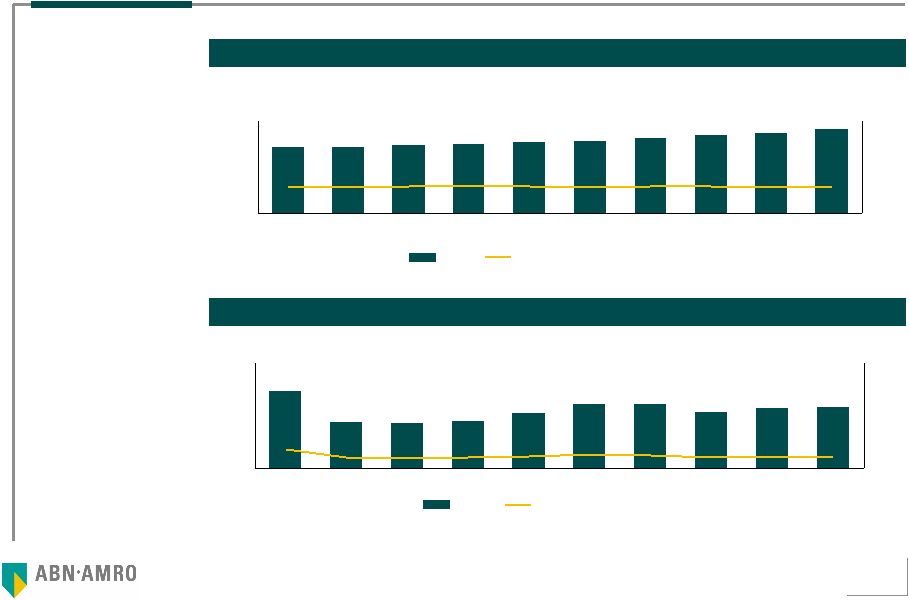 51 The EBITDA margin remains stable during the period of the projection The value observed in 2006 principally reflects investments in Star One satellites and investments for the expansion of local telephone services Embrapar: EBITDA and Capex Note: EBITDA and Capex values consider the integral consolidation of Star One EBITDA and Capex. with the elimination of intercompany operations Capex (R$ nominal millions) EBITDA (R$ nominal millions) EBITDA 2,427 2,424 2,502 2,535 2,611 2,670 2,771 2,875 2,959 3,094 29.5% 28.7% 28.9% 29.0% 29.2% 28.7% 28.9% 29.0% 28.6% 29.0% 0 1,000 2,000 3,000 2006 2007 2008 2009 2010 2011 2012 2013 2014 2015 0% 50% 100% EBITDA margin 1,464 881 864 889 1,054 1,218 1,219 1,068 1,140 1,161 17.8% 10.4% 10.0% 10.2% 11.8% 13.1% 12.7% 10.8% 11.0% 10.9% 0 1,000 2,000 2006 2007 2008 2009 2010 2011 2012 2013 2014 2015 0% 50% 100% Capex Capex as % of net revenues |
 52 Embrapar: Results of Operations and Cash Flows Note: Simplified financial statements consider the integral consolidation of Star One. with the elimination of intercompany operations For the perpetuity calculation it was assumed: (i) an EBITDA adjustment to reflect a long term annual concession rate (1% per year versus 2% biannual) and (ii) an average Capex to reflect the maintenance and renovation of the current fleet of Star One satellites DRE (R$ nominal millions ) Free Cash Flow (R$ nominal millions) Ending on December 31 2006 2007 2008 2009 2010 2011 2012 2013 2014 2015 Net revenues 8,235 8,431 8,644 8,754 8,942 9,310 9,590 9,918 10,341 10,673 Operational Costs and Expenses (5,808) (6,007) (6,143) (6,219) (6,330) (6,639) (6,819) (7,043) (7,382) (7,579) EBITDA 2,427 2,424 2,502 2,535 2,611 2,670 2,771 2,875 2,959 3,094 Margin (%) 29.5% 28.7% 28.9% 29.0% 29.2% 28.7% 28.9% 29.0% 28.6% 29.0% Earnings before Taxes 880 555 641 715 588 734 918 1,025 1,056 1,221 Net profit 852 532 629 698 570 710 884 966 992 1,142 Ending on December 31 2006 2007 2008 2009 2010 2011 2012 2013 2014 2015 EBIT 1,349 1,025 1,126 1,208 1,099 1,254 1,532 1,714 1,731 1,928 Taxes on EBIT (IR and CSLL) (459) (348) (383) (411) (374) (426) (521) (583) (589) (655) Depreciation and Amortization 1,078 1,399 1,375 1,327 1,512 1,417 1,239 1,161 1,228 1,166 Capex (1,464) (881) (864) (889) (1,054) (1,218) (1,219) (1,068) (1,140) (1,161) Changes in Working Capital (213) (83) (66) (20) (91) (116) (104) (111) (109) (108) Free Cash Flow of the Subsidiaries 291 1,112 1,189 1,216 1,092 909 927 1,113 1,121 1,169 |
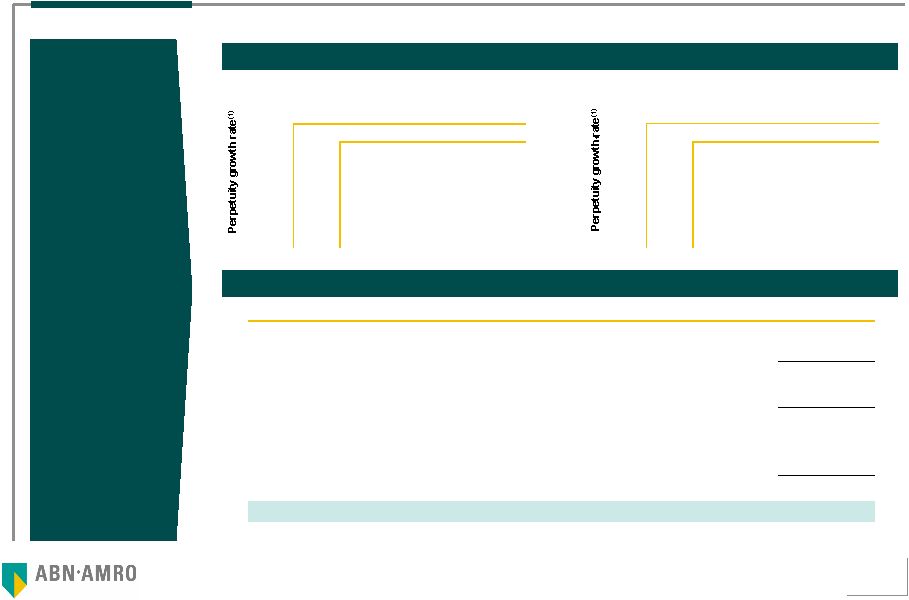
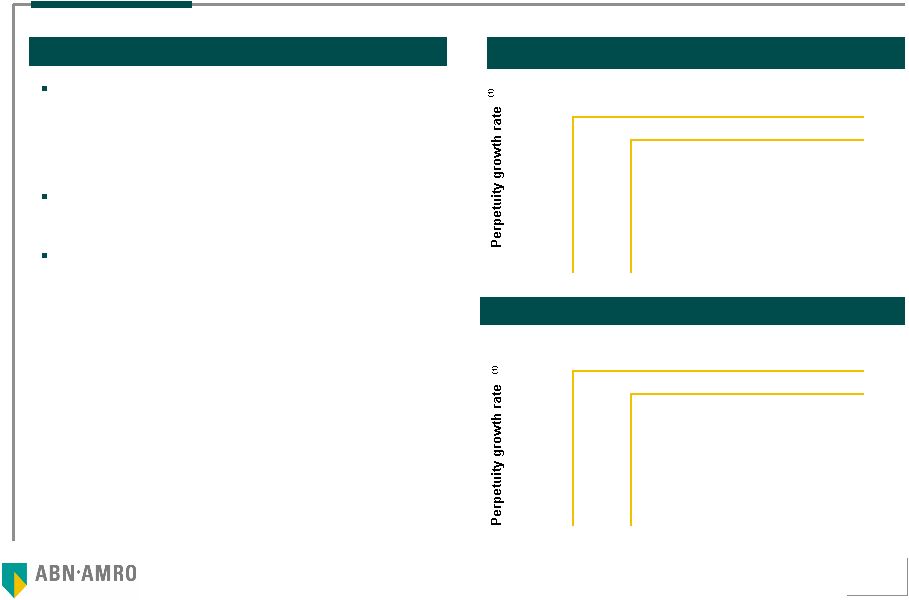 53 Notes: (1) Nominal Dollars; (2) ABN AMRO considered the number of shares issued and outstanding by the Company on March 31, 2006. As reported by Company representatives, there were no changes in the number of shares issued and outstanding by the Company during the period since March 31, 2006 Embrapar Subsidiaries (ex-Net): Discounted Cash Flow - Interval of Value Sensitivity of the value of Enterprise value The financial-economic equity value of Embrapar takes into account its share of 80.01% in Star One and its respective Net Indebtedness as of March 31, 2006. In the case of Embrapar, the Net Indebtedness also includes the deduction of the participation of the minority shareholders in Embratel The valuation was conducted in nominal Dollars converted into nominal Reais at the PTAX 800 rate of exchange of R$/US$ 2.17 on base date of March 31, 2006 The number of Embrapar shares (2) on March 31, 2006 was 987,726,487,230 (not including 1,032,167,077 treasury shares as of March 31, 2006) General Comments Sensitivity of the value of Equity value Star One 10.94% 11.19% 11.44% Embrapar 11.70% 11.95% 12.20% 3.42% 0.35% 7,477 7,336 7,200 3.67% 0.61% 7,536 7,390 7,251 3.93% 0.86% 7,598 7,448 7,305 WACC (1) WACC (1) Star One 10.94% 11.19% 11.44% Embrapar 11.70% 11.95% 12.20% 3.42% 0.35% 5,280 5,138 5,002 3.67% 0.61% 5,338 5,193 5,053 3.93% 0.86% 5,400 5,250 5,107 |
 54 3c Valuation of the Participation in Net |
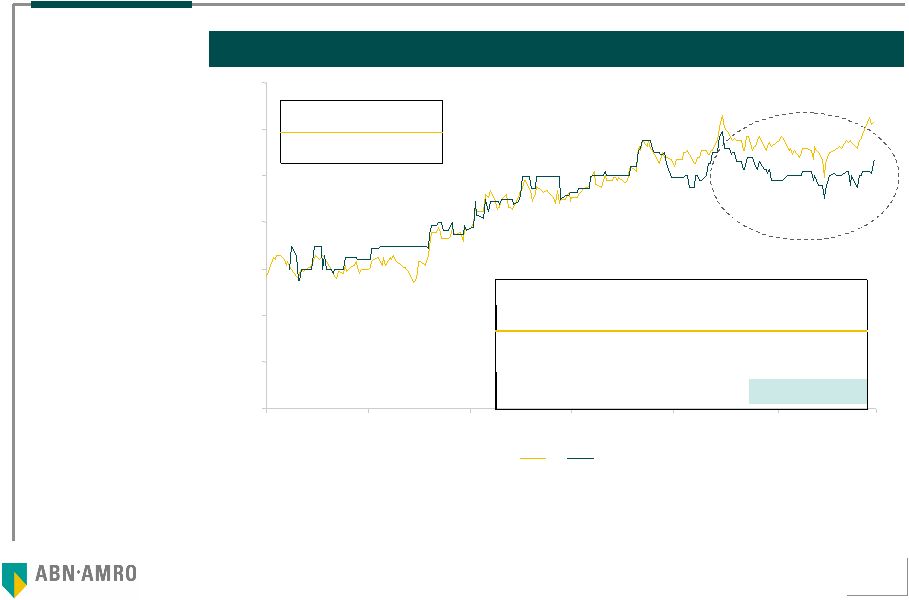
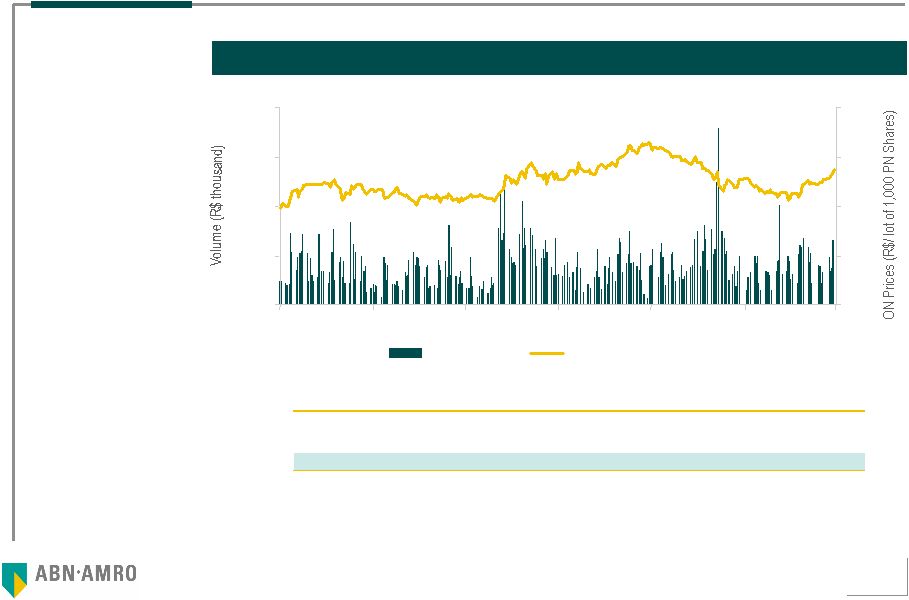
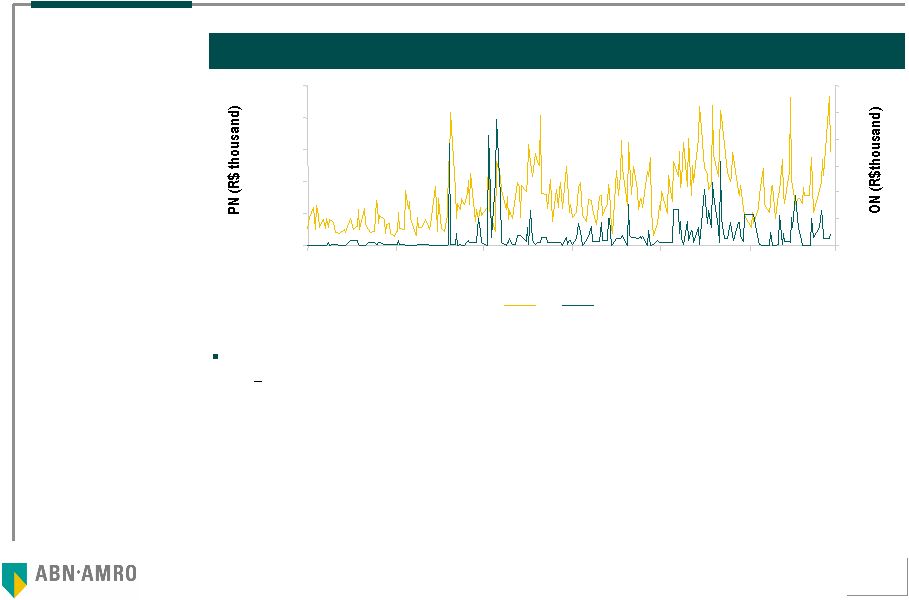 55 100,000 60 - 20,000 40,000 60,000 80,000 04/28/2005 06/28/2005 08/28/2005 10/28/2005 12/28/2005 02/28/2006 04/28/2006 0 10 20 30 40 50 PN ON Analysis of Changes in the Trading Volume of ON and PN Shares Daily Trading Volume of PNs versus ONs Source: Economática The daily trading volume of preferred shares is more than 9,000 times higher than the volume of common shares Quotes of Net preferred shares were adopted as market references because: They have greater liquidity than common shares. Net PN shares form a part of the BOVESPA Index that groups the 30 most liquid securities of the market. ON shares do not participate in that Index. – At the same time they do not present a loss of value due to a difference in tag along rights, since Net guarantees 100% tag along rights for preferred shares, consistent with level 2 of BOVESPA's Differentiated Corporate Governance Practices – PN dispersion is greater than 50% |
 56 Analysis of the Evolution of ON and PN Share Prices Evolution of the Price per Share Adjusted for dividends (R$ per share) Source: Economática Preferred and common shares are generally trade at similar prices Price of shares (R$ per share) PN ON Minimum 0.54 0.55 Maximum 1.26 1.19 0.00 0.20 0.40 0.60 0.80 1.00 1.20 1.40 04/28/2005 06/282005 08/28/2005 10/28/2005 12/28/2005 02/28/2006 04/28/2006 PN ON Volume (R$ thousand) Weighted volume (thousand) 1 year 31,076 33,264 180 days 38,677 35,120 90 days 40,901 36,000 1.101 1.136 Daily average Weighted average (R$ per share) 0.934 Last 90 days |
 57 Valuation of Participation in Net ABN AMRO believes that the best reference period to value Net shares corresponds to the 90 days prior to April 29, 2006, for the following reasons: – During the past 12 months Net concluded a financial restructuring process that had a significant impact on the value of its shares – Terms of the agreement with Embratel for offering joint services has continued to evolve in recent months – The recovery movement of the market for cable TV continues and the strong expansion of the broadband residential market in 2006 Period Chosen as Reference Calculation of the Value of Net Notes: (1) Corresponds to the average price weighted by the trading volume of PN shares of Net during the last 90 days prior to April 29, 2006; (2) Total number of Net shares excluding treasury shares on March 31, 2006; (3) Direct and indirect participation (through Empreendimentos) of Embrapar in Net as of March 31, 2006; (4) Calculated based on the position on March 31, 2006 ; (5) Embrapar participation in GB Empreendimentos as of March 31, 2006 1,666 I=(E-H) Total Value of Affiliates Belonging to Embrapar 0,036 H=(F*G) Net debt of GB Empreendimentos in proportion to Embrapar ownership interest 83.00% G Embrapar participation in GB Empreendimentos (5) 0,044 F Net Debt of GB Empreendimentos (4) 1,666 E=(A*D) Equity value of Net held by Embrapar 1,466 D Number of shares held directly or indirectly by Embrapar (millions) (3) 4,493 C=(A*B) Equity Value of Net 3,955 B Total number of shares of Net (millions) (2) 1.136 A Price of shares of Net considered in the Valuation (R$ per share) (1) Value in Millions of Reais (except when indicated to the contrary) |
 58 3d Embrapar Valuation (including participation in Net) |
 59 Result of the Valuation of Embrapar’s Subsidiaries and Affiliates Result of the Valuation of Embrapar Analysis of the Economic Value of the Affiliates on the basis of Market Value Analysis of the Economic Value of the Subsidiaries on the basis of DCF Enterprise value, excluding Net (R$ millions) Equity value, excluding Net (R$ millions (1) Star One 10.94% 11.19% 11.44% Embrapar 11.70% 11.95% 12.20% 3.42% 0.35% 7,477 7,336 7,200 3.67% 0.61% 7,536 7,390 7,251 3.93% 0.86% 7,598 7,448 7,305 WACC Notes: (1) Nominal Dollars; (2) Corresponds to the average price weighted by the trading volume of PN shares of Net during the last 90 days prior to April 29, 2006; (3) Total number of Net shares excluding treasury shares as of March 31, 2006; (4) Number of shares held directly or indirectly by Embrapar through GB Empreendimentos as of March 31, 2006; (5) Calculated on the basis of the March 31, 2006 position; (6) Embrapar participation in GB Empreendimentos as of March 31, 2006 Star One 10.94% 11.19% 11.44% Embrapar 11.70% 11.95% 12.20% 3.42% 0.35% 5,280 5,138 5,002 3.67% 0.61% 5,338 5,193 5,053 3.93% 0.86% 5,400 5,250 5,107 WACC (1) Values in million of Reais (except when indicated to the contrary) Net share price considered in Valuation (R$ per share) (2) A 1.136 Total number of shares of Net (millions) (3) B 3,955 Equity valueof Net C=(A*B) 4,493 Number of shares held directly or indirectly by Embrapar (millions) (4) D 1,466 Equity valueof Net held by Embrapar E=(A*D) 1,666 Net Debt of GB Empreendimentos (5) F 0.044 Embrapar participation in GB Empreendimentos (6) G 83.00% Net Debt of GB Empreendimentos in proportion to Embrapar participation H=(F*G) 0.036 Total value of Subsidiaries belonging to Embrapar I=(E-H) 1,666 |
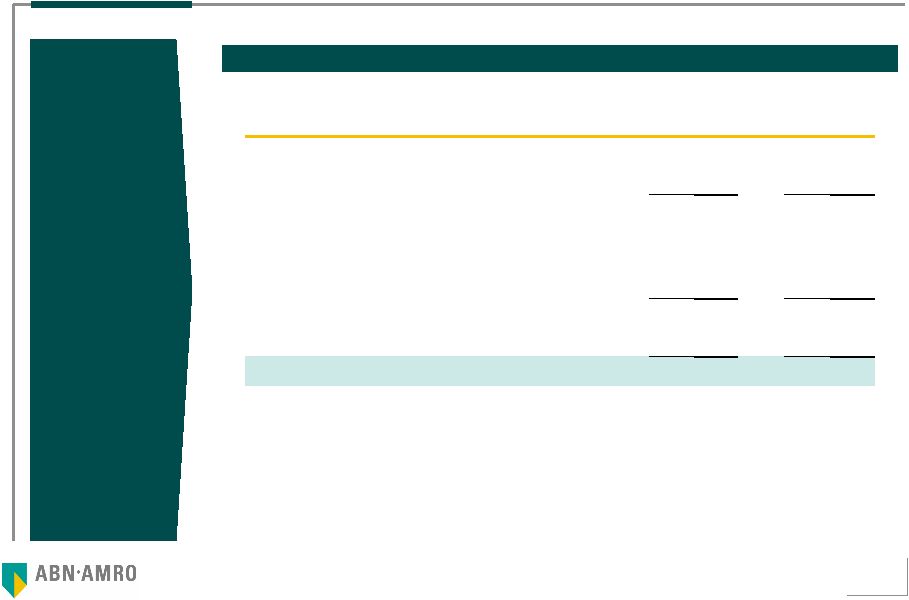 60 Results of the Valuation of Embrapar’s Subsidiaries and Affiliates (cont.) Results of the Valuation of Embrapar Analysis of the Total Economic Value of Embrapar Notes: (1) The 80.01% share that Embratel holds in Star One has already been considered; (2) Calculated in conformity with the definition of Net Indebtedness described in the Important Notice on Page 3. The 80.01% Net Debt of Star One is being considered; (3) Calculated on the basis of the average price weighted by the trading volume over the last 90 days of PN shares multiplied by the base Net shares as of March 31, 2006 (3,954,663,665 shares); (4) ABN AMRO considered the number of shares issued by the Company and in circulation as of March 31, 2006. As reported by Company representatives. there were no changes in the number of shares issued by the Company and in circulation as of March 31, 2006 Values in million of Reias (except where indicated otherwise) Mínimo - Máximo Enterpriese value of operating Controlled Companies (1) A 7,200 7,598 Net debt of Embrapar Consolidated (2) B 2,198 2,198 Equity value of Embrapar and its Controled Companies C=(A-B) 5,002 5,400 Net total Equity Value D 4,493 4,493 Equity value of Net shares held by Embrapar (1,466 million shares) (3) E 1,666 1,666 Total Equity Value F=(C+E) 6,668 7,066 Number of Embrapar shares (million) (4) G 987,726 987,726 Price per share (R$ one thousand lot) F/G 6.75 - 7.15 |
 61 4 Valuation by the Average Weighted Price of Shares |
 62 Valuation by the Average Weighted Price of ON Shares of Embrapar Source: Economática Price Evolution of Embrapar ON Shares and Trading Volume (EBTP3) Volume Closing - ON 0 250 500 750 1,000 1,250 1,500 apr/05 jun/05 aug/05 oct/05 dec/05 feb/06 apr/06 0.00 1.00 2.00 3.00 4.00 5.00 6.00 7.00 EBTP 3 Number of titles (thd) Volume (R$ thousand) Share price (R$ / 1,000 shares) Daily average for last month 33,050 164 4.98 Daily average for last six months 26,983 140 5.20 Daily average for last twelve months 24,612 115 4.87 |
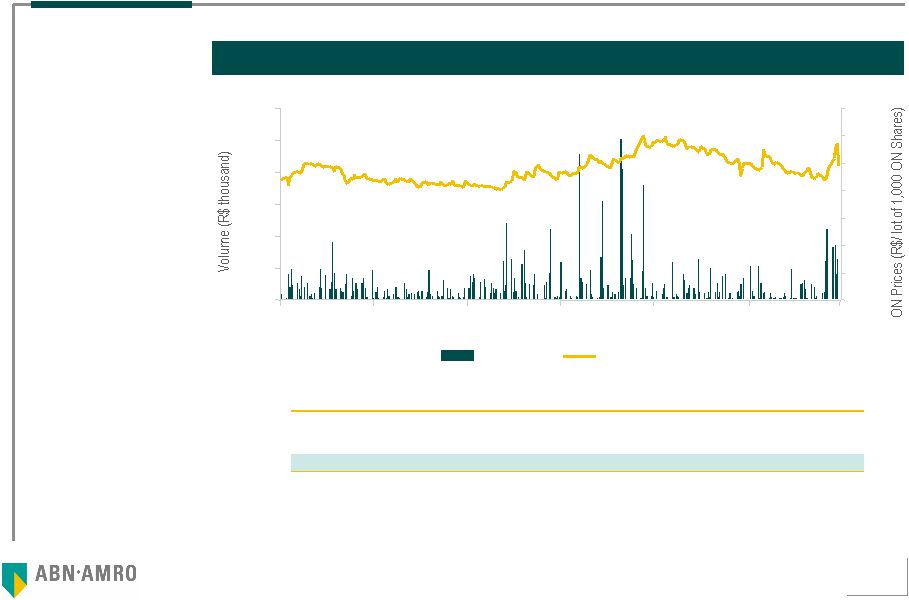
 63 Valuation by the average weighted price of Embrapar PN Shares Price Evolution of Embrapar PN shares and Trading Volume (EBTP4) Source: Economática Volume Closing PN 0 20,000 40,000 60,000 80,000 apr/05 jun/05 aug/05 oct/05 dec/05 feb/06 apr/06 0.00 2.00 4.00 6.00 8.00 EBTP 4 Number of titles (thd) Volume (R$ thousand) Share price (R$ / 1,000 shares) Daily average for last month 3,509,068 17,884 5.10 Daily average for last six months 2,997,701 16,872 5.63 Daily average for last twelve months 3,087,640 16,254 5.29 |
 64 0 2,000 4,000 6,000 8,000 apr/05 jun/05 aug/05 oct/05 dec/05 feb/06 apr/06 0.00 4.00 8.00 12.00 16.00 Volume Closing - ADR Valuation by the Average Weighted price of Embrapar ADRs Source: Economática Note: (1) One ADR represents 5 lots of one thousand preferred shares per lot Evolution of the Prices of Embrapar ADR (1) s and the Volume Negotiated (EBT) EBT Number of titles (thd) Volume (US$ thousand) Share price (US$ / 5,000 shares) Daily average for last month 230 2,747 11.94 Daily average for last six months 153 1,931 12.65 Daily average for last twelve months 160 1,844 11.53 |
 65 Valuation by the Average Weighted Price of Embrapar Shares (cont.) Note: (1) Average weighted price during the 12 months prior to April 29, 2006. (2) One ADR represents 5 lots of one thousand preferred shares Results Obtained by Valuation of the Average Weighted Price of Shares The average weighted price of Embrapar shares on the BOVESPA during the last 12 months prior to April 29, 2006 and the daily average trading volume were, respectively: – EBTP 3: R$ 4.83 per lot of one thousand shares and approximately R$ 115 thousand per day – EBTP 4: R$ 5.29 per lot of one thousand shares and approximately R$ 16,254 thousand per day The average weighted price of Embrapar ADRs during the last 12 months prior to April 29, 2006 and the daily average of ADR negotiations were. respectively: – EBT (2) : US$ 11.53 per lot of five thousand shares and approximately US$ 1,844 thousand per day |
 66 5 Valuation by the value of Shareholders’ Equity |
 67 Valuation by the Value of Shareholders’ Equity Embrapar – Shareholders’ Equity Source: Company information Note (1): The number of Company shares considered for the calculation of Shareholders’ Equity of Embrapar excludes treasury shares The value of Shareholders’ Equity on the basis of the Company's balance sheet as of March 31, 2006 is R$ 7.59 per lot of one thousand shares Equity Shares - March 31, 2006 Equity value of Embrapar at March 21, 2006 (in millions R$) 7,493 Number of shares of Embrapar (millions) (1) 987,726 Equity of value of Embrapar (R$/ thousand shares) 7.59 |
 68 6 Summary of the Valuation of Embrapar Shares |
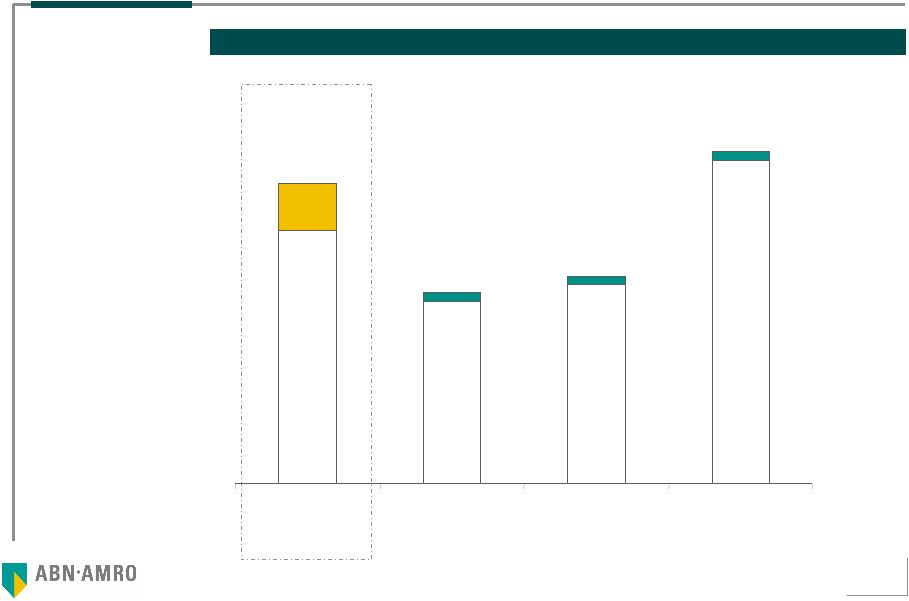 69 Summary of Embrapar Valuations The value of the shares of the Company determined by ABN AMRO is between R$ 6.75 per lot of one thousand shares and R$ 7.15 per lot of one thousand shares Value per share (R$ per lot of one thousand shares ) 5.29 4.83 6.75 7.15 7.59 Value of Shareholders’ Equity Weighted Average Price of PN Shares Weighted Average Price of ON Shares Valuation Range |
 70 7 Glossary |
 71 Glossary We include the glossary below in order to facilitate the understanding of this document by persons unfamiliar with the methodology of valuing enterprises by discounted cash flow methodology. In this manner, the clarification given for each term was couched in didactic language to facilitate the understanding of the concepts utilized Beta: is a measure of market risk / system risk / non-diversifiable risk. The Beta coefficient indicates the sensitivity of the stock price to changes in the price of the market portfolio. The index is measured by means of a linear regression between a series of variations in the price of the enterprise's stock and a series of variations in the price of the market portfolio Capital Asset Pricing Model (CAPM): The CAPM model is utilized to calculate the Cost of the Company's Capital or the Cost of the Shareholder's Equity. The model follows the financial premise of risk and return, so that the greater the risk, the greater the return on investment required by the shareholder. The calculation considers the beta, the risk-free rate and the market premium Capital Expenditures (Capex): investments in fixed assets |
 72 Glossary (cont.) Cost of Equity: The cost of equity is the return required by the shareholder in regard to the capital invested. The calculation considers that a specific asset must pay the invester the cost of opportunity plus a risk premium Cost of Debt: This is a measure of the cost associated with capital that comes from third parties in the form of loans, financing and market funding, among others Weighted Average Cost of Capital (WACC): This is a measure of the cost of a company’s capital. WACC is determined by a weighted average on the basis of the long term capital structure, the costs of debt and equity. It is directly related to the risk associated with future cash flows Dispersion: free float greater than 50% of the class of share analyzed Dollar: United States of America Dollar DTH: Direct-To-Home Technology “Earnings Before Interests, Taxes, Depreciation and Amortization” (EBITDA): These are the operational earnings generated by the company that effectively generate cash for the company, thus the calculation of EBITDA considers only the expenses that generate outflows of cash “Earnings Before Interests and Taxes” (EBIT): These are the operational earnings generated by the company, i.e., the EBITDA after the expenses of depreciation and amortization have been deducted. |
 73 Glossary (cont.) Operational Cash Flow: Operational cash flow only takes into consideration revenues and expenses actually received or disbursed as the result of company operations. Thus financial receipts and expenses and other non-operational items are not considered in the calculation Liquidity: In the context of this valuation, liquidity refers to the shares that form a part of the BOVESPA Index MDS: Multipoint Distribution System technology Market Risk Premium: market risk premium is the additional return that investers require to compensate for the greater element of uncertainty (risk) in investment in stocks as opposed to risk-free investments Country Risk: This is the premium paid for the political uncertainty and instability of a specific country. A method frequently utilized to estimate this premium is the difference (spread) between the sovereign securities of the country in question and the sovereign bonds of the U.S.A. Risk Free Rate: This is the interest rate paid for a risk-free asset. In practice, U.S.A. Treasury Bonds are utilized as a parameter for risk free interest rates Equity Value: The value of the capital of the business for the shareholder Terminal Value: Considering that, in theory, the life of a company is infinite and that it is not possible to precisely project future cash flows beyond a certain period, a part of the company's value will be generated by cash flows in years subsequent to the last year of the period of the projection. That estimate of value is called the terminal value. Determination of the terminal value is based on the principle that in the long run the company will reach its stage of maturity and that it must then grow at a constant rate VoIP: Voice over Internet Protocol technology VPL: Present líquid value |
Neither Teléfonos de México, S.A. de C.V. nor any of its affiliates has commenced the tender offer to which this communication relates. Shareholders of Embratel Participações S.A. are advised to read the Tender Offer Statement, the Offer to Purchase and the other documents relating to the tender offer that are filed with the SEC when they become available, because they will contain important information. Shareholders of Embratel Participações S.A. may obtain copies of these documents free of charge, when they become available, at the SEC’s website at www.sec.gov or from the Information Agent to be appointed in connection with the tender offer.
74