UNITED STATES
SECURITIES AND EXCHANGE COMMISSION
Washington, D.C. 20549
FORM 6-K
REPORT OF FOREIGN PRIVATE ISSUER PURSUANT TO RULE 13a-16 OR 15d-16 UNDER THE SECURITIES EXCHANGE ACT OF 1934
For the month of May, 2019
Commission File Number: 001-14475
TELEFÔNICA BRASIL S.A.
(Exact name of registrant as specified in its charter)
TELEFONICA BRAZIL S.A.
(Translation of registrant’s name into English)
Av. Eng° Luís Carlos Berrini, 1376 - 28º andar
São Paulo, S.P.
Federative Republic of Brazil
(Address of principal executive office)
Indicate by check mark whether the registrant files or will file annual reports under cover of Form 20-F or Form 40-F:
Form 20-F | X |
| Form 40-F |
|
Indicate by check mark if the registrant is submitting the Form 6-K in paper as permitted by Regulation S-T Rule 101(b)(1):
Yes |
|
| No | X |
Indicate by check mark if the registrant is submitting the Form 6-K in paper as permitted by Regulation S-T Rule 101(b)(7):
Yes |
|
| No | X |

![]()
HIGHLIGHTS
Consolidated leader of high-end services in the telecom industry
· Mobile market share of32.1%in March 2019 (7.5 p.p. higher than the second player);
· Postpaid accesses accounted for55.8% of the total mobile customer base, with a market share of 40.1% in March 2019;
· 4.5G coverage was present in1,022 cities and FTTH was available in130 cities in March 2019;
· FTTH customers totaled 2,034 thousand, with141 thousandnet additions in the first quarter of 2019.
Change in the revenue mix, focused on high-value services
· Net revenues rose1.7% y-o-y, due to the solid performance of postpaid revenues, handsets and FTTH;
· Mobile service revenues increased1.6% y-o-y, driven by strong growth in ARPU and postpaid accesses;
· FTTH revenues reachedR$ 437 million (+49.6% y-o-y), accounting for31.5%of broadband revenues;
· IPTV revenues came toR$ 199 million (+45.1% y-o-y), accounting for42.3%of pay TV revenues.
Cost efficiency ensure higher profitability
· Operating costs increased1.1% y-o-y, mainly due to higher expenses related to handset sales, offset by simplification, efficiency and digitalization initiatives. Excluding the cost of goods sold, total costs fell 2.9% y-o-y;
· EBITDA totaledR$ 3,903 million in 1Q19,up 2.9% y-o-y, with an EBITDA margin of35.6% (+0.4 p.p. y-o-y).
Double-digit growth in net income and cash flow, supporting solid shareholder remuneration
· Capex totaledR$ 1,696 millionin 1Q19, focused on FTTH and on the expansion of coverage and capacity in 4G/4.5G;
· Free cash flow from business activities increased16.1% toR$ 1,165 million in 1Q19, driven by EBITDA growth, lower interest expenses and efficient management of working capital;
· Net income increased 22.2% y-o-y, toR$ 1,342 million in 1Q19, representing anet margin of12.2%(+2.0 p.p. y-o-y);
· R$ 1,270 million declared as interest on equity up to April 2019.
1
![]()
Telefônica Brasil S.A. (B3: VIVT3 and VIVT4, NYSE: VIV) discloses today its results for the first quarter of 2019, presented in accordance with the International Financial Reporting Standards (IFRS) and with the pronouncements, interpretations and guidelines provided by the Accounting Pronouncements Committee. Totals are subject to differences due to rounding up or down.
2019 Income Statement and Balance Sheet are presented under IFRS 161.
For a better understanding and comparability of the information, we present below the consolidated statements of income for the three-month periods ended March 30, 2019 and 2018 in two scenarios, as follows:
Pro forma:excluding the effects of the adoption of IFRS 16¹ in 2019 figures (comparable to 2018).
Reported:considering the effects of the adoption of IFRS 161 (referring to the new methodology for allocation of lease contracts) only for 2019 figures.
For comparison purposes, the text herein will refer to pro-forma figures, except where we mention the use of figures under IFRS 16.1
In addition, there were some reclassifications of past results to better reflect the dynamics of the business. The spreadsheet with the data is available on the Investor Relations websitehttp://www.telefonica.com.br/ir.
General Data
Consolidated in R$ million | Pro forma (ex-IFRS 16)¹ | Reported | ||||
| 1Q19 | 1Q18 | ∆% YoY | 1Q19 | 1Q18 | ∆% YoY |
NET OPERATING REVENUES | 10,975 | 10,789 | 1.7 | 10,975 | 10,789 | 1.7 |
Net Mobile Revenues | 7,081 | 6,765 | 4.7 | 7,081 | 6,765 | 4.7 |
Net Handsets Revenues | 598 | 386 | 55.1 | 598 | 386 | 55.1 |
Net Fixed Revenues | 3,894 | 4,024 | (3.2) | 3,894 | 4,024 | (3.2) |
OPERATING COSTS | (7,072) | (6,995) | 1.1 | (6,614) | (6,995) | (5.4) |
EBITDA | 3,903 | 3,795 | 2.9 | 4,360 | 3,795 | 14.9 |
EBITDA MARGIN | 35.6% | 35.2% | 0.4 p.p. | 39.7% | 35.2% | 4.6 p.p. |
NET INCOME | 1,387 | 1,098 | 26.3 | 1,342 | 1,098 | 22.2 |
CAPEX | 1,696 | 1,547 | 9.6 | 1,696 | 1,547 | 9.6 |
OPERATING CASH FLOW (EBITDA - CAPEX) | 2,207 | 2,247 | (1.8) | 2,665 | 2,247 | 18.6 |
TOTAL SUBSCRIBERS (THOUSAND) | 94,994 | 97,812 | (2.9) | 94,994 | 97,812 | (2.9) |
Mobile Subscribers | 73,529 | 75,098 | (2.1) | 73,529 | 75,098 | (2.1) |
Fixed Subscribers | 21,465 | 22,714 | (5.5) | 21,465 | 22,714 | (5.5) |
2
1 New accounting standard in effect since January 2019, which requires lessees to recognize assets and liabilities for all leases (except for short-term leases and leases of low-value assets) in the statement of financial position. The Company is a lessee in a significant number of lease contracts for different assets, especially towers and the respective land where they are located, circuits, offices, stores and commercial properties.
![]()
MOBILE BUSINESS
Operating Performance
Thousand | 1Q19 | 1Q18 | ∆% YoY |
TOTAL SUBSCRIBERS | 73,529 | 75,098 | (2.1) |
Postpaid | 41,023 | 37,499 | 9.4 |
M2M | 8,684 | 6,674 | 30.1 |
Prepaid | 32,506 | 37,599 | (13.5) |
MARKET SHARE | 32.1% | 31.8% | 0.3 p.p. |
Postpaid | 40.1% | 41.4% | (1.3) p.p. |
Prepaid | 25.7% | 25.9% | (0.2) p.p. |
ARPU (R$/month)2 | 29.5 | 28.4 | 3.8 |
Postpaid (Human) | 53.2 | 52.4 | 1.6 |
M2M | 2.9 | 2.6 | 10.4 |
Prepaid | 12.1 | 12.9 | (6.2) |
MONTHLY CHURN | 3.2% | 3.1% | 0.1 p.p. |
Postpaid (ex-M2M) | 1.7% | 1.6% | 0.1 p.p. |
Prepaid | 5.0% | 4.5% | 0.5 p.p. |
Total accesses reached 73,529 thousand at the close of the quarter, down 2.1% from 1Q18. The postpaid segment continued to grow consistently, reaching 41,023 thousand accesses (+9.4% y-o-y), equivalent to 55.8% of mobile accesses, 5.9 p.p. more than in 1Q18.
Total market share came to 32.1% in March 2019. In thepostpaid segment, Telefônica Brasil accounted for 23.4% of market net additions between January and March 2019, reaching a market share of 40.1% in March 2019. The Company remains the leader in 4G-technology handsets, with a market share of 31.2% (5.0 p.p. more than the second player), maintaining the quality of the customer base and the Company’s strategy focused on data and digital services.
Postpaid net additions reached 617 thousand in 1Q19, while prepaid net disconnections totaled 248 thousand accesses in the same period. The commercial performance is related to the Company’s strategy of focusing on value, reflected by the price adjustments carried out in 4Q18, especially in hybrid plans, and by the strategy of disconnecting non-profitable prepaid customers.
In theMachine-to-Machine (M2M) segment, the access base continued to grow substantially, reaching 8,684 thousand customers in March 2019, up 30.1% over March 2018. Telefônica Brasil is the market leader in this segment, with a market share of 41.0% in March 2019.
Mobile ARPU grew 3.8% y-o-y in 1Q19, mainly due to recent price increases and to a decline in the average accesses base, due to the disconnection of non-profitable customers, pursuant to ANATEL rules.
3
1 Pro-forma data, excluding the effects of IFRS 16.
![]()
Financial Performance
Consolidated in R$ million | 1Q19 | 1Q18 | ∆% YoY |
NET OPERATING MOBILE REVENUES | 7,081 | 6,765 | 4.7 |
Net Mobile Service Revenues | 6,482 | 6,379 | 1.6 |
Data and Digital Services | 5,345 | 4,948 | 8.0 |
Voice | 1,133 | 1,431 | (20.8) |
Others | 5 | 1 | 702.4 |
Net Handset Revenues | 598 | 386 | 55.1 |
Net mobile revenues increased 4.7% y-o-y in 1Q19, mainly due to the growth of data and digital service revenues (+8.0% y-o-y) and higher handset revenues (+55.1% y-o-y), resulting form strong sales activities in the period and upselling of the customer base to postpaid plans with higher data volume. On the other hand, voice revenues continue to be affected by the macroeconomic scenario, by the maturity of this service with the voice-to-data migration, by the expansion of unlimited voice plans and by lower interconnection tariffs.
Data and digital servicerevenues grew 8.0% over 1Q18, driven by our strategy focused on data. This performance was once again fueled by the increase in data usage and value-added services, in addition to the increased penetration of family plans. In the quarter, data and digital service revenues accounted for 82.4% of net mobile services revenues, up 4.9 p.p. y-o-y.
Voice revenues fell 20.8% versus 1Q18, reflecting the migration of consumption to data services due to the maturity of the service.
Net handset revenues rose 55.1% compared to 1Q18, in line with the strategy of gaining market share in this relevant and growing market, with the sale of handsets and accessories with positive margins, attracting high-end consumers to our physical and online stores.
4
![]()
FIXED LINE BUSINESS
Operating Performance
Thousand | 1Q19 | 1Q18 | ∆% YoY |
TOTAL SUBSCRIBERS | 21,465 | 22,714 | (5.5) |
Fixed Broadband | 7,386 | 7,443 | (0.8) |
FTTH | 2,034 | 1,412 | 44.1 |
Other Technologies | 5,352 | 6,031 | (11.3) |
Pay TV | 1,522 | 1,591 | (4.4) |
IPTV | 617 | 430 | 43.5 |
Other Technologies | 904 | 1,161 | (22.1) |
Voice | 12,558 | 13,679 | (8.2) |
MARKET SHARE | Fixed Broadband | 23.9% | 25.4% | (6.2) |
Market Share | FTTH | 32.1% | 38.8% | (17.2) |
MARKET SHARE | Pay TV | 8.8% | 8.9% | (0.3) |
Market Share | IPTV | 80.6% | 84.6% | (4.8) |
MARKET SHARE | Voice | 34.0% | 34.3% | (0.9) |
ARPU | Broadband (R$/month) | 62.2 | 55.2 | 12.7 |
ARPU | Pay TV (R$/month) | 101.8 | 99.0 | 2.8 |
ARPU | Voice (R$/month)5 | 35.5 | 40.8 | (12.9) |
Thefixed customer base totaled 21,465 thousand accesses in 1Q19, down 5.5% from 1Q18, mainly influenced by the performance of voice and xDSL broadband accesses, due to the maturity of these services, and by the strategic decision to stop prioritizing growth in the pay TV business using DTH technology.
Fixed broadband accesses came to 7,386 thousand customers in 1Q19, down 0.8% from 1Q18. On the other hand, the FTTH customer base grew 44.1% over 1Q18, to 2,034 thousand accesses in 1Q19. The customer base connected using other technologies declined 11.3% y-o-y, mainly due to the disconnection of xDSL customers and upselling to more advanced technologies, offering higher speeds and a better customer experience.
Pay TV accesses decreased 4.4% y-o-y in 1Q19, ending the first quarter with 1,522 thousand subscribers, due to the Company's strategic decision to stop prioritizing DTH technology. On the other hand, there was an improvement in the customer mix due to the increase in IPTV accesses, up 43.5% y-o-y in 1Q19. Pay TV ARPU increased 2.8% y-o-y in this quarter, reflecting the Company's strategy of focusing on high-end customers.
Voice accesses totaled 12,558 thousand in 1Q19, down 8.2% from 1Q18, mainly reflecting the fixed-to-mobile substitution and the voice-to-data migration. As a result, voice ARPU declined 12.9% in the annual comparison.
5
3 Changes in the presentation of voice revenues (outgoing voice + interconnection + other services) led to changes in ARPU. The updated base since 2016 is available on our Investor Relations website www.telefonica.com.br/ri.
![]()
Financial Performance
Consolidated in R$ million | 1Q19 | 1Q18 | ∆% YoY |
NET OPERATING FIXED REVENUES | 3,894 | 4,024 | (3.2) |
Broadband6 | 1,386 | 1,231 | 12.6 |
FTTH | 437 | 292 | 49.6 |
Other Technologies | 949 | 939 | 1.1 |
Pay TV | 471 | 471 | 0.0 |
IPTV | 199 | 138 | 45.1 |
Other Technologies | 272 | 334 | (18.5) |
Corporate Data and IT | 616 | 588 | 4.8 |
Fixed Voice | 1,409 | 1,726 | (18.4) |
Others | 12 | 7 | 61.9 |
Net fixed revenues fell 3.2% y-o-y in 1Q19, impacted by the decrease of voice revenues, partially offset by the positive evolution of broadband revenues.
Broadband revenues rose 12.6% y-o-y in 1Q19, fueled by the 49.6% increase of FTTH revenues, that accounted for 31.6% of this line in the period, reflecting the Company’s efforts to expand the base and encourage customers’ migration to higher speeds, boosting fiber accesses, whose ARPU is higher, in addition to the expansion of the FTTH network to nine new cities in the first three months of 2019.
Pay TVrevenues remained in line with 1Q18, due to the Company’s more selective strategy for this service, designed to improve the customer experience and optimize profitability, focusing on higher-value products, such as IPTV, whose revenues grew 45.1% over 1Q18.
Corporate data and ITrevenues increased 4.8% y-o-y in 1Q19, mainly due to revenues from new services, including data, cloud and IT.
Voice revenues dropped 18.4% compared to 1Q18, mainly because of the maturity of the service, the fixed-to-mobile substitution and the latest reduction in TU-RL and TU-RIU in February 2019.
6
1 Broadband revenues include residential and SME customers.
![]()
OPERATING COSTS
Consolidated in R$ million | ��Pro forma (ex-IFRS 16) | Reported | ||||
1Q19 | 1Q18 | ∆% YoY | 1Q19 | 1Q18 | ∆% YoY | |
OPERATING COSTS | (7,072) | (6,995) | 1.1 | (6,614) | (6,995) | (5.4) |
Personnel | (904) | (959) | (5.8) | (904) | (959) | (5.8) |
Costs of Services Rendered | (2,854) | (2,777) | 2.8 | (2,450) | (2,777) | (11.8) |
Interconnection | (305) | (284) | 7.4 | (305) | (284) | 7.4 |
Taxes and Contributions | (409) | (414) | (1.1) | (409) | (414) | (1.1) |
Third-party Services | (1,379) | (1,369) | 0.7 | (1,379) | (1,369) | 0.7 |
Others | (760) | (710) | 7.1 | (356) | (710) | (49.9) |
Cost of Goods Sold | (754) | (484) | 55.7 | (754) | (484) | 55.7 |
Commercial Expenses | (2,229) | (2,228) | 0.1 | (2,216) | (2,228) | (0.5) |
Provision for Bad Debt | (426) | (398) | 7.0 | (426) | (398) | 7.0 |
Third-party Services | (1,724) | (1,736) | (0.7) | (1,724) | (1,736) | (0.7) |
Others | (79) | (94) | (15.8) | (66) | (94) | (29.6) |
General and Administrative Expenses | (346) | (374) | (7.4) | (306) | (374) | (18.2) |
Other Net Operating Revenues (Expenses) | 15 | (172) | n.a. | 15 | (172) | n.a. |
Operating Costs, excluding depreciation and amortization expenses, increased 1.1% over the same period last year, to R$ 7,072 million in the quarter, while inflation was +4.6% (IPCA-12M).
Personnel costsfell 5.8% y-o-y, mainly due to the organizational restructuring in 2018 and 2019 and lower spending on variable compensation.
Thecost of services rendered moved up 2.8% over 1Q18, driven by higher costs with related to our network infrastructure in the period, resulting from the expansion of the 4G, 4.5G and fiber coverage. Considering the effects of IFRS 16, the cost of services rendered fell 11.8% y-o-y.
Thecost of goods soldgrew 55.7% y-o-y in 1Q19, due to the Company's strategy of focusing on handset and equipment sales since 4Q17, generating additional revenues with positive margins.
Selling expenses remained virtually flat (+0.1% y-o-y in 1Q19), mainly due to higher commission expenses, driven by the acceleration in sales of high-end products, partially offset by lower billing, posting, call center and back office expenses, thanks to the positive results of digitalization, efficiency and simplification initiatives.
Theprovision for doubtful accounts totaled R$ 426 million, corresponding to 2.6% of gross revenues in 1Q19, remaining virtually in line with 1Q18 despite the postpaid customer base growth.
Third-party services fell 0.7% compared to 1Q18. The growing digitalization of customer relations was reflected in the larger share of e-commerce in product, service and recharge sales, in the accelerated adoption of e-billing by new and existing customers and in the increasing use of virtual channels and MEU VIVO app, leading to a reduction in call center, back office and billing and posting expenses, offering our customers a unique and customized experience.
General and administrative expensesfell 7.4% in 1Q19, thanks to ongoing cost control in these lines.
Other net operating revenues (expenses) presented a positive evolution in the quarter, due to revenues related to contractual fines and tax recovery, combined with lower provisions for labor and civil contingencies in the period.
7
![]()
EBITDA
EBITDA(earnings before interest, taxes, depreciation and amortization) totaled R$ 3,903 million in 1Q19, up 2.9% over 1Q18, with anEBITDA margin of 35.6%, 0.4 p.p. higher than in 1Q18.
The increase in EBITDA was due to growth in mobile and ultra-broadband revenues, combined with effective and lasting cost-efficiency measures adopted by the Company in the period.
DEPRECIATION AND AMORTIZATION
Consolidated in R$ million | Pro forma (ex-IFRS 16) | Reported | ||||
1Q19 | 1Q18 | ∆% YoY | 1Q19 | 1Q18 | ∆% YoY | |
Depreciation and Amortization | (2,155) | (1,998) | 7.9 | (2,588) | (1,998) | 29.5 |
Depreciation | (1,455) | (1,343) | 8.3 | (1,888) | (1,343) | 40.6 |
Amortization of Intangibles | (397) | (353) | 12.3 | (397) | (353) | 12.3 |
Other Amortizations | (304) | (302) | 0.6 | (304) | (302) | 0.6 |
Depreciation and amortization moved up 7.9% over 1Q18, mainly due the growth of the permanent asset base related to the fiber network expansion. Considering the effects of IFRS 16, depreciation and amortization costs grew 29.5% y-o-y.
FINANCIAL RESULT
Consolidated in R$ million | Pro forma (ex-IFRS 16) | Reported | ||||
1Q19 | 1Q18 | ∆% YoY | 1Q19 | 1Q18 | ∆% YoY | |
Net Financial Result | 3 | (173) | n.a. | (90) | (173) | (48.1) |
Income from Financial Investments | 55 | 72 | (23.2) | 55 | 72 | (23.2) |
Debt Interest | (103) | (157) | (34.8) | (195) | (157) | 23.9 |
Gains (Losses) on Derivative Transactions | 19 | 8 | 150.6 | 19 | 8 | 150.6 |
Monetary and Exchange Variation and Other | 31 | (95) | n.a. | 31 | (95) | n.a. |
Thenet financial result was a gain of R$ 3 million in 1Q19. The y-o-y decline in financial expenses in 1Q19 was mainly due to a reduction in net debt, lower interest rates and a decrease in monetary variation expenses, combined with the financial restatement of the non-recurring credit generated in 2018 related to the decision to exclude ICMS from the PIS/Cofins calculation base.
Considering the effects of IFRS 16, the Company recorded a net financial expense of R$ 90 million, R$ 83.1 million lower than 1Q18.
NET INCOME
Reported net income reached R$ 1,342 million in 1Q19, up 22.2% y-o-y, because of ongoing cost control, strong EBITDA growth and lower financial expenses in the period.
8
![]()
CAPEX
Consolidated in R$ million | 1Q19 | 1Q18 | ∆% YoY |
CAPITAL EXPENDITURES | 1,696 | 1,547 | 9.6 |
Network | 1,514 | 1,383 | 9.5 |
Technology / Information System | 160 | 124 | 29.4 |
Products and Services, Channels, Adm. and Others | 21 | 41 | (47.6) |
CAPEX / NOR | 15.5% | 14.3% | 1.1 p.p. |
Capex rose 9.6% versus 1Q18, to R$ 1,696 million, representing 15.5% of net operating revenues in the period.
Investments were mainly focused on FTTH implementation and footprint expansion and increasing 4G/4.5G technology coverage and capacity.
CASH FLOW
Consolidated in R$ million | 1Q19 | 1Q18 | ∆% YoY |
Recurring EBITDA | 3,903 | 3,795 | 2.9 |
Capital Expenditures | (1,696) | (1,547) | 9.6 |
Interest, Taxes and Other Financial Revenues (Expenses) | (132) | (242) | (45.3) |
Working Capital Variation | (910) | (1,001) | (9.1) |
FREE CASH FLOW FROM BUSINESS ACTIVITIES | 1,165 | 1,004 | 16.1 |
Non-recurring Itens | (44) | (100) | (55.9) |
FREE CASH FLOW AFTER NON-RECURRING EFFECTS | 1,121 | 904 | 24.1 |
Free cash flow from business activities reached R$ 1,165 million in 1Q19, 16.1% (R$ 161 million) higher than in 1Q18, reflecting the growth in EBITDA and the reduction in interest, taxes and other financial expenses, in addition to better management of working capital.
Free cash flow after non-recurring items increased R$ 217 million in 1Q19. The non-recurring items refer to the payment of R$ 44 million in 1Q19 related to the organizational restructuring, and the payment of R$ 100 million for the cleaning of the 700MHz 4G spectrum in 1Q18.
9
![]()
DEBT
Loans, Financing and Debentures
ISSUANCES | CURRENCY | INTEREST RATE | DUE DATE | SHORT TERM | LONG TERM | TOTAL |
TOTAL | Pro forma |
|
|
| 1,324 | 4,568 | 5,892 |
Issuances | local currency |
|
|
| 1,269 | 4,568 | 5,837 |
BNDES | UR TJLP | LTIR + 0.00% to 4.08% | 2023 | 410 | 361 | 772 |
BNDES | R$ | 2.5% to 6.0% | 2023 | 65 | 89 | 154 |
BNDES | R$ | SELIC D-2 + 2.32% | 2023 | 81 | 229 | 311 |
BNB | R$ | 7.0% to 10.0% | 2022 | 15 | 36 | 51 |
Confirming | R$ | 110.7% to 118.7% of CDI | 2020 | 536 | 8 | 544 |
Debentures 4th Issue - Series 3 | R$ | IPCA + 4.0% | 2019 | 42 | - | 42 |
Debentures 1st Issue - Minas Comunica | R$ | IPCA + 0.5% | 2021 | 26 | 53 | 79 |
Debentures 5th Issue - Single Series | R$ | 108.25% of CDI | 2022 | 17 | 1,998 | 2,015 |
Debentures 6th Issue - Single Series | R$ | 100.00% of CDI + 0.24% | 2020 | 21 | 1,000 | 1,021 |
Financial Leases | R$ | IPCA and IGP-M | 2033 | 55 | 323 | 378 |
Contingent Consideration | R$ | SELIC | 2025 | - | 470 | 470 |
Issuances | foreign currency |
|
|
| 56 | - | 56 |
BNDES | UMBND | ECM + 2.38% | 2019 | 56 | - | 56 |
|
|
|
|
|
|
|
TOTAL | IFRS 16 |
|
|
| 2,993 | 11,201 | 14,194 |
IFRS 16 effects | Financial Leases | R$ | IPCA and IGP-M | 2033 | 1,668 | 6,634 | 8,302 |
| Net Debt | ex-IFRS 16 | L. T. Debt Profile | ||||||
Consolidated in R$ million | 03/31/2019 | 12/31/2018 | 03/31/2018 |
| 1Q19 | ||
Short-Term Debt | 1,324 | 1,464 | 2,819 |
| Year | Pro forma | IFRS 16 |
Long-Term Debt | 4,568 | 4,675 | 5,210 |
| (R$ million) | (R$ million) | |
Total Debt | 5,892 | 6,139 | 8,029 |
| 2020 | 1,331 | 2,850 |
Cash and Cash Equivalents7 | (4,088) | (3,394) | (4,366) |
| 2021 | 1,299 | 2,674 |
Net Derivatives Position | (55) | (56) | (128) |
| 2022 | 1,246 | 2,352 |
Contingent Consideration Guarantee Asset8 | (470) | (466) | (451) |
| 2023 | 52 | 955 |
Net Debt | 1,279 | 2,224 | 3,084 |
| After 2023 | 640 | 2,371 |
Net Debt / EBITDA9 | 0.07 | 0.12 | 0.21 |
| Total | 4,568 | 11,201 |
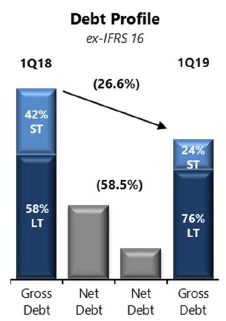 | The Company closed 1Q19 with agross debt of R$ 5,892 million, excluding the recognition of liabilities for all leases, related to IFRS 16, such as towers and its land, circuits, offices, stores and commercial properties. The reduction in gross debt was driven by the settlement of loans and financing in the period. Currently, 0.9% of our gross debt is denominated in foreign currency, fully covered by hedge operations. Net debtex-IFRS 16totaled R$ 1,279 million at the close of 1Q19, representing 0.07x LTM EBITDA. When compared to 1Q18, net debt fell R$ 1,805 million, mainly because of increased cash generation. Considering the impact of the adoption of IFRS 16, net debt reached R$ 9,581 million at the end of the period. |
10
7 Includes the investment in BNB given as a guarantee for the loan from that bank.
8 Alignment of the classification criterion for the asset backing the contingent consideration to calculate pro-forma net debt.
9 LTM EBITDA.
![]()
OWNERSHIP STRUCTURE
03/31/2019 | Common | Preferred | Total |
Controlling Company Shareholders | 540,033,264 | 704,207,855 | 1,244,241,119 |
94.47% | 62.91% | 73.58% | |
Minority Shareholders | 29,320,789 | 415,131,868 | 444,452,657 |
5.13% | 37.09% | 26.28% | |
Treasury | 2,290,164 | 983 | 2,291,147 |
0.40% | 0.00% | 0.14% | |
Total Number of Shares | 571,644,217 | 1,119,340,706 | 1,690,984,923 |
|
|
|
|
Book Value per Share: | R$ 42.78 |
| |
Subscribed/Paid-in Capital: | R$ 63,571.4 | million |
CAPITAL MARKET
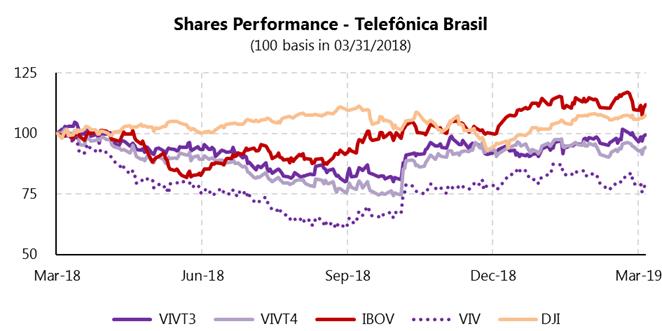
Telefônica Brasil's common (ON) and preferred (PN) shares are traded on B3 under the tickers VIVT3 and VIVT4, respectively. The Company's ADRs are traded on the NYSE, under the ticker VIV.
VIVT3 and VIVT4 shares closed 1Q19 at R$ 44.00 and R$ 47.50, respectively, recording an appreciation of 6.6% and 2.7%, respectively, over the closing price at the end of 2018. In the same period, the daily trading volume of VIVT3 and VIVT4 averaged R$ 2,160 thousand and R$ 92,305 thousand, respectively. Total shareholder return (TSR) was 11.6% for common shares and 7.7% for preferred shares in period.
The ADRs closed 1Q19 at US$12.07, up 1.8% over the closing price at the end of 2018, and the daily trading volume of ADRs averaged US$21,927 thousand in the same period.
The chart below shows the Company's stock performance:
11
![]()
DIVIDENDS AND INTEREST ON EQUITY
On February 15, 2019, the Board of Directors approved the payment of interest on equity related to fiscal year 2019, totaling the gross amount of R$ 700 million. This interest will be considered as part of the mandatory minimum dividends for the fiscal year 2019,ad referendum of the Shareholders' Meeting to be held in 2020. The payment will be made by the end of fiscal year 2020, on a date to be defined by the Board of Executive Officers, to common and preferred shareholders of record on February 28, 2019.
On April 17, 2019, the Board of Directors approved the payment of interest on equity related to fiscal year 2019, totaling the gross amount of R$ 570 million. This interest will be considered as part of the mandatory minimum dividends for the fiscal year 2019,ad referendum of the Shareholders' Meeting to be held in 2020. The payment will be made by the end of fiscal year 2020, on a date to be defined by the Board of Executive Officers, to common and preferred shareholders of record on April 30, 2019.
The table below shows the amounts to be distributed per share:
2019 | Deliberation | ShareholdingPosition | Gross Amount (BRL million) | Net Amount (BRL million) | Share Class | Gross Amount (BRL) | Net Amount (BRL) | Payment Date |
IOC | 04/17/2019 | 04/30/2019 | 570 | 485 | Common | 0.316556 | 0.269073 | Up to 12/31/2020 |
(based on Mar-19) | Preferred | 0.348212 | 0.295980 | |||||
IOC | 02/15/2019 | 02/28/2019 | 700 | 560 | Common | 0.388753 | 0.330440 | Up to 12/31/2020 |
(based on Jan-19) | Preferred | 0.427629 | 0.363484 | |||||
2018 | Deliberation | ShareholdingPosition | Gross Amount (BRL million) | Net Amount (BRL million) | Share Class | Gross Amount per Share (BRL) | Net Amount per Share (BRL) | Payment Date |
Dividends | 04/11/2019 | 04/11/2019 | 2,469 | 2,469 | Common | 1.371013 | 1.371013 | 12/17/2019 |
(based on Dec-18) | Preferred | 1.508114 | 1.508114 | |||||
IOC | 12/04/2018 | 12/17/2018 | 1,350 | 1,148 | Common | 0.749739 | 0.637278 | 12/17/2019 |
(based on Oct-18) | Preferred | 0.824712 | 0.701006 | |||||
IOC | 09/05/2018 | 09/17/2018 | 2,800 | 2,380 | Common | 1.555013 | 1.321761 | 08/20/2019 |
(based on Jul-18) | Preferred | 1.710515 | 1.453937 | |||||
IOC | 06/18/2018 | 06/29/2018 | 400 | 340 | Common | 0.222145 | 0.188823 | 08/20/2019 |
(based on May-18) | Preferred | 0.244359 | 0.207705 |
12
![]()
INCOME STATEMENT
Reported10
Consolidated in R$ million | 1Q19 | 1Q18 | ∆% YoY |
GROSS OPERATING REVENUE | 16,683 | 16,334 | 2.1 |
Gross Operating Mobile Revenue | 10,846 | 10,361 | 4.7 |
Gross Operating Fixed Revenue | 5,837 | 6,003 | (2.8) |
NET OPERATING REVENUE | 10,975 | 10,789 | 1.7 |
Net Operating Mobile Revenue | 7,081 | 6,765 | 4.7 |
Net Operating Fixed Revenue | 3,894 | 4,024 | (3.2) |
OPERATING COSTS | (6,614) | (6,995) | (5.4) |
Personnel | (904) | (959) | (5.8) |
Costs of Services Rendered | (2,450) | (2,777) | (11.8) |
Interconnection | (305) | (284) | 7.4 |
Taxes and Contributions | (409) | (414) | (1.1) |
Third-party Services | (1,379) | (1,369) | 0.7 |
Others | (356) | (710) | (49.9) |
Cost of Goods Sold | (754) | (484) | 55.7 |
Commercial Expenses | (2,216) | (2,228) | (0.5) |
Provision for Bad Debt | (426) | (398) | 7.0 |
Third-party Services | (1,724) | (1,736) | (0.7) |
Others | (66) | (94) | (29.6) |
General and Administrative Expenses | (306) | (374) | (18.2) |
Other Net Operating Revenue (Expenses) | 15 | (172) | n.a. |
EBITDA | 4,360 | 3,795 | 14.9 |
EBITDA Margin % | 39.7% | 35.2% | 4.6 p.p. |
DEPRECIATION AND AMORTIZATION | (2,588) | (1,998) | 29.5 |
Depreciation | (1,888) | (1,343) | 40.6 |
Amortization of Intangibles | (397) | (353) | 12.3 |
Others Amortizations | (304) | (302) | 0.6 |
EBIT | 1,772 | 1,796 | (1.3) |
FINANCIAL RESULT | (90) | (173) | (48.1) |
GAIN (LOSS) ON INVESTMENTS | (0) | 1 | n.a. |
Taxes | (340) | (526) | (35.3) |
NET INCOME | 1,342 | 1,098 | 22.2 |
13
10 Considering the effects of the adoption of IFRS 16 (referring to the new methodology for allocation of lease contracts) only for 2019 figures.
![]()
BALANCE SHEET
Reported11
Consolidated in R$ million | 03/31/2019 | 12/31/2018 | ∆% YoY |
ASSETS | 111,040 | 102,561 | 8.3 |
Current Assets | 20,213 | 18,363 | 10.1 |
Cash and Cash Equivalents | 4,075 | 3,381 | 20.5 |
Accounts Receivable from Customers | 10,007 | 9,720 | 3.0 |
Provision for Doubtful Accounts | (1,460) | (1,415) | 3.2 |
Inventories | 545 | 462 | 17.8 |
Recoverable Income Tax and Social Contribution | 384 | 275 | 39.7 |
Recoverable Taxes, Fees and Contributions | 4,808 | 4,674 | 2.9 |
Escrow Deposits and Frozen Assets | 303 | 313 | (3.4) |
Derivative Financial Instruments | 58 | 69 | (15.6) |
Prepaid Expenses | 1,179 | 582 | 102.7 |
Other Assets | 315 | 303 | 4.2 |
Non-Current Assets | 90,827 | 84,198 | 7.9 |
Accounts Receivable from Customers | 547 | 509 | 7.4 |
Provision for Doubtful Accounts | (86) | (83) | 4.5 |
Financial Investments | 73 | 77 | (4.8) |
Recoverable Taxes, Fees and Contributions | 2,057 | 3,222 | (36.2) |
Deferred Income Tax and Social Contribution | 211 | 230 | (8.5) |
Escrow Deposits and Frozen Assets | 3,608 | 3,597 | 0.3 |
Derivative Financial Instruments | 32 | 27 | 19.6 |
Other Assets | 188 | 181 | 3.5 |
Investments | 100 | 102 | (1.3) |
Property, Plant and Equipment, Net | 42,208 | 34,115 | 23.7 |
Intangible Assets, Net | 41,890 | 42,221 | (0.8) |
LIABILITIES AND SHAREHOLDERS' EQUITY | 111,040 | 102,561 | 8.3 |
LIABILITIES | 38,792 | 30,954 | 25.3 |
Current Liabilities | 17,952 | 17,161 | 4.6 |
Payroll and Related Charges | 551 | 783 | (29.6) |
Suppliers and Accounts Payable | 7,109 | 7,643 | (7.0) |
Income Tax and Social Contribution | 9 | 12 | (21.7) |
Taxes, Fees and Contributions | 1,268 | 1,798 | (29.5) |
Loans, Financing, Debentures and Leasing | 2,993 | 1,464 | 104.4 |
Interest on Capital and Dividends | 4,771 | 4,173 | 14.3 |
Provisions and Contingencies | 383 | 378 | 1.2 |
Derivative Financial Instruments | 6 | 17 | (61.2) |
Deferred Revenues | 500 | 526 | (4.9) |
Other Liabilities | 362 | 368 | (1.8) |
Non-Current Liabilities | 20,841 | 13,793 | 51.1 |
Payroll and Related Charges | 15 | 12 | 28.6 |
Taxes, Fees and Contributions | 258 | 39 | 559.2 |
Deferred Income Tax and Social Contribution | 2,280 | 1,983 | 15.0 |
Loans, Financing, Debentures and Leasing | 11,201 | 4,675 | 139.6 |
Provisions and Contingencies | 5,880 | 5,881 | (0.0) |
Derivative Financial Instruments | 28 | 23 | 23.7 |
Deferred Revenues | 223 | 251 | (11.0) |
Other Liabilities | 955 | 929 | 2.7 |
SHAREHOLDERS' EQUITY | 72,248 | 71,607 | 0.9 |
Capital Stock | 63,571 | 63,571 | 0.0 |
Capital Reserve | 1,214 | 1,214 | 0.0 |
Profit Reserve | 4,328 | 4,324 | 0.1 |
Additional Proposed Dividends | 2,469 | 2,469 | 0.0 |
Other Comprehensive Income | 28 | 29 | (4.8) |
Accumulated Profits | 638 | 0 | n.a. |
14
11 Considering the effects of the adoption of IFRS 16 (referring to the new methodology for allocation of lease contracts) only for 2019 figures.
![]()
CONFERENCE CALL
English
Date: May 9, 2019 (Thursday)
Time:10:00 a.m. (Brasília) / 9:00 a.m. (New York)
Telephone: (+1 412) 317-6353
HD Web Phone:click here
Access code:Telefônica Brasil
Click hereto access the webcast.
A replay of the conference call will be available one hour after the event untilMay 15, 2019 at(+1 412) 317-0088 (Code:10130446)
TELEFÔNICA BRASIL Investor Relations |
Christian Gebara David Melcon Luis Plaster João Pedro Carneiro
|
Av. Eng. Luis Carlos Berrini, 1376 - 17º Andar – Cidade Monções – SP – 04571-000
Telephone: (+55 11) 3430-3687 E-mail:ir.br@telefonica.com Information available on the website: http://www.telefonica.com.br/ir
|
|
|
This document may contain forward-looking statements. Such statements do not constitute historical facts and merely reflect the expectations of the Company's management. Such terms as "anticipate", "believe", "estimate", "expect", "foresee", "intend", "plan", "project", "target", and similar are intended to identify such statements, which evidently involve risks and uncertainties, both foreseen and unforeseen by the Company. Consequently, the Company's future operating results may differ from present expectations, and readers should not place undue reliance on the information contained herein. These forward-looking statements express opinions formed solely on the date on which they were issued, and the Company is under no obligation to update them in line with new information or future developments. |

15
SIGNATURE
Pursuant to the requirements of the Securities Exchange Act of 1934, the registrant has duly caused this report to be signed on its behalf by the undersigned, thereunto duly authorized.
|
| TELEFÔNICA BRASIL S.A. | |||
Date: | May 8, 2019 |
| By: | /s/Luis Carlos da Costa Plaster | |
|
|
|
| Name: | Luis Carlos da Costa Plaster |
|
|
|
| Title: | Investor Relations Director |