UNITED STATES
SECURITIES AND EXCHANGE COMMISSION
Washington, D.C. 20549
FORM 6-K
REPORT OF FOREIGN PRIVATE ISSUER PURSUANT TO RULE 13a-16 OR 15d-16 UNDER THE SECURITIES EXCHANGE ACT OF 1934
For the month of March, 2020
Commission File Number: 001-14475
TELEFÔNICA BRASIL S.A.
(Exact name of registrant as specified in its charter)
TELEFONICA BRAZIL S.A.
(Translation of registrant’s name into English)
Av. Eng° Luís Carlos Berrini, 1376 - 28º andar
São Paulo, S.P.
Federative Republic of Brazil
(Address of principal executive office)
Indicate by check mark whether the registrant files or will file annual reports under cover of Form 20-F or Form 40-F:
Form 20-F | X |
| Form 40-F |
|
Indicate by check mark if the registrant is submitting the Form 6-K in paper as permitted by Regulation S-T Rule 101(b)(1):
Yes |
|
| No | X |
Indicate by check mark if the registrant is submitting the Form 6-K in paper as permitted by Regulation S-T Rule 101(b)(7):
Yes |
|
| No | X |
![]()
MANAGEMENT REPORT
TELEFÔNICA BRASIL S.A.
Dear shareholders,
In accordance with legal and statutory provisions, the Management of Telefônica Brasil S.A. (“Telefônica Brasil”, “Company” or “Vivo”) hereby submits for your appreciation the Company’s Management Report and individual and consolidated Financial Statements, together with the Independent Auditors’ report and the opinions of the Company’s Board of Directors, Fiscal Council and Audit and Control Committee for the year ended December 31, 2019.
1. Message from Management
We are beginning a new decade, in which technology is even more present, exponentially transforming people's daily lives. We are currently going through new stages of this evolution, with accelerated digital connection between people, things, businesses and society as a whole. As Vivo, we want to continue to contribute to the digitalization of Brazil, from North to South.
In both urban and rural areas, the population demands high-quality connectivity. As the leading company in the country, we have consistently invested in the development of a differentiated infrastructure, focusing on superior technologies, such as fiber, 4G and 4.5G, to offer our 100 million users a unique experience in mobile and fixed connections.
In 2019, even in a context of a gradual economic recovery, Vivo’s investments reached an all-time high of R$9 billion, equivalent to approximately 20% of our revenue. By the end of 2020, Vivo will have invested R$26.5 billion in the Brazilian economy, completing its three-year investment plan announced two years ago on the New York Stock Exchange (NYSE). To shareholders and investors, we presented a consistent financial result, with a unique combination of revenue growth, EBITDA expansion, increased cash generation and higher shareholder remuneration. Cash generation reached a record level of R$8.2 billion in 2019, 19% more than in 2018, despite the cycle of higher investments.
In 2020, we will further accelerate this transformation, guided by a purpose that goes far beyond financial results and will define the way we work:Digitalizing to bring people closer, with content, entertainment, technology and education. To achieve this, we have four strategic pillars that will guide our activities.
The first of them is#TemVivopratudo(#Vivoservesallpurposes). Here, we present the best mobile and fixed connection technologies and our expansion in Brazil, which will be intensified throughout 2020. In 2019, we expanded our fiber presence to 43 new cities, far exceeding the expansion carried out in 2018. Altogether, we cover 164 municipalities and about 11 million homes and businesses. In terms of mobile coverage, we started to serve 89% of the populationwith 4G network, and 66% with 4.5G. We were elected the best mobile network in Brazil, according to the results of the “P3 Mobile Benchmark Brazil” survey1.
1
We also use two business models to expand our capillarity: the Vivo Fiber franchising project and a partnership with American Tower, which will drive expansion in Minas Gerais over the next three years.
The second pillar is#TemtudonaVivo(#YoufindeverythingatVivo), which translates into the vision that we are a technology company focused on all the needs of our customers, delivering the most desired digital content on the market through partnerships with major brands, such as NBA, NFL, Amazon Prime Video, Tidal, Spotify, Rappi and Netflix. We have changed the concept of our stores, which are now true technology hubs that offer a consultative and participative environment. There, our customers can find all kinds of devices, such as handsets, cameras, sensors, smart lamps, accessories and even drones.
We also made progress on other fronts and launched Vivo Car, a Wi-Fi device that turns cars into connected vehicles. In the financial segment, we are piloting an uncomplicatedloan service for our customers, calledVivo Money. In the corporate market, companies have also chosen us to digitalize their business, with the best cyber security, cloud computing, internet of things and big data services, in partnership with important global players, such as Cisco, Dell, Microsoft and Nokia.
All our initiatives are linked to the third pillar,#DNAVivo (#Vivo’sDNA):reliable, easy, efficient and dazzling. We are turning Vivo into a benchmark in customer service. In order to achieve this goal, we are seeking to engage our employees in all points of contact.
We want to deliver a unique and differentiated experience in our stores, call centers and digital channels. Meu Vivo, for example, already has more than 16 million unique users. A survey shows that 80% of users rate the interaction as close and clear. AURA, our artificial intelligence, performs around 20 million monthly transactions, with more than 90% accuracy, providing personalized answers about services, data consumption, account, recharge and other questions.
We are an inclusive company that wants diversity to be increasingly present, both in terms of gender, color, LGBTQ+ and people with disabilities and in terms of behavior, skills and attitudes. We look for people who have a passion for innovation and a desire to live in an environment in which difference enriches and inspires creativity and the achievement of sustainable results.
Without a doubt, Vivo's cultural change goes hand in hand with the digital transformation process. Our employees work based on agile models, such as squads, with multidisciplinary teams using Design Thinking and Agile to improve the customer experience. We have adopted coworking spaces that favor a collaborative environment and expanded remote work to two days a week. This change in culture has increased business agility and company satisfaction levels, as reflected in our latest e-NPS, an indicator that shows how likely employees are to recommend Vivo as a good place to work, which reached 72.5 points in 2019, a very high number for the Technology and Telecom sectors worldwide.
However, being close to customers and employees is not enough. We need to understand our leading role in the country's development, with results beyond the financial area and benefits to society.
With# Vivosustentável (#SustainableVivo), our fourth pillar, we developed actions, practices and initiatives that promote the well-being of society. Our approach to sustainability is based on economic, environmental and social balance. In the economic area, we are a publicly traded company that employs 33 thousand direct employees across Brazil and produces consistent results.
1 Analysis conducted by P3’s benchmarking experts and by Connect magazine on Brazil’s mobile network quality
2
In the social sphere, the Telefônica Vivo Foundation celebrated its 20th anniversary in 2019, providing digital training to 66 thousand educators, with an impact on 1.5 million students in 745 public schools. It has also provided capacity building in social entrepreneurship to 162 thousand young people by creating new solutions and opportunities for them and their communities through digital thinking. Innovating again, in 2019, the Foundation enabled the arrival of “42” in São Paulo, a pioneering initiative in Latin America that originated in Europe, focused on providing free disruptive training to data programmers.
Regarding environmental issues, 100% of our energy came from renewable sources. We reduced our emissions by more than 50% in absolute terms in 2019, exceeding the global targets for 2025 and offsetting 100% of the remaining emissions.
In theRecicle com a Vivo (Recycle with Vivo) program, we were pioneers in electronics reverse logistics. Since 2006, we have collected more than 110 tons of unused handsets, chargers and batteries, encouraging the ecological disposal of these materials. We have recycled over 62 thousand tons of electronic waste and cables from our operation in the past seven years. In addition, working used handsets can be exchanged for new devices with special discounts throughVivo Renova (Vivo Renews). We also maintained our participation in B3's Corporate Sustainability Index - ISE portfolio for the eighth consecutive year in 2019.
All these initiatives have been and will be increasingly reflected in the positioning of our brand, which was born to connect millions of people from all over Brazil. We connect people through sports, by sponsoring the Brazilian Soccer Team, cheering together with the country; through art, by supporting museums and maintaining the Vivo Theater; and through awareness-raising campaigns, with theTem Hora pra Tudo (There is a time for everything) campaign, which proposes a reflection on the conscious use of technology.
At the end of last year, we launchedVivo Brincar (Vivo Play) campaign, encouraging parents and children to redress the balance between technology and free play, bringing this reflection to the children's universe in a playful way.
As I complete my first year as CEO of Telefônica Brasil, I would like to thank our shareholders for their trust, our suppliers for their partnership and, above all, our employees for their dedication.
We will continue to work daily to strengthen our purpose, digitalizing and bringing people together.
Christian Gebara
CEO of Telefônica Brasil
2. Economic and Industry Environment
2.1.Economic Environment
After facing a period of uncertainty in the first half of 2019, the second semester was marked by the consolidation of economic recovery in Brazil. The external scenario was less favorable to emerging economies. The risk of a slowdown in global economic activity that emerged as of the third quarter increased risk aversion and contributed to reducing global liquidity. On the domestic front, the approval of the pension reform, together with advances in privatization and microeconomic reforms, reinforced the government's commitment to a pro-market economic policy. In an environment of low interest rates and inflation, economic agents regained confidence and started making new consumption and investment decisions as of the third quarter of the year. The effects of improved confidence and low interest rates should continue to be seen in the medium term. Risks associated with the evolution of the external scenario and domestic governance have to be monitored, since they can negatively impact financial assets.
3
On the fiscal front, the cumulative 12-month public sector primary deficit decreased to 0.7% of GDP in 20192, against 1.6% of GDP in 2018. The government's strict control of expenditures, the improvement in revenue stemming from economic recovery and additional revenue mainly generated by auctions contributed to the significant improvement in the fiscal result compared to the previous year. Nonetheless, gross debt rose from 74.2% in 2018 to 75.8% in 2019. However, the nominal public deficit fell from 7.1% of GDP to 5.9% of GDP, on the same comparison basis, as a result of the drop in interest rates.
Inflation accelerated in 2019. Wholesale inflation accelerated under the influence of the appreciation of the dollar. Retail inflation slowed down slightly, amid anchored inflation expectations. The IGP-DI, the General Price Index - Internal Availability, calculated by the Getúlio Vargas Foundation, stood at 7.7% in 2019, versus 7.1% in 2018, reflecting the increase in the IPA-DI, the Wholesale Price Index, which stood at 9.6% in 2019, versus 8.8% in 2018, and the IPC, Consumer Price Index, which stood at 4.1% in 2019, versus 4.3% in 2018. IPCA, the Extended Consumer Price Index, calculated by the Brazilian Institute of Geography and Statistics (IBGE) and used by the Central Bank of Brazil as a benchmark for its inflation targeting system, came to 4.3% in 2019, a 0.6 percentage point hike over the 3.7% recorded in 2018, close to the inflation target of 4.25% for the year.
In light of the benign inflation scenario, the Monetary Policy Committee (Copom) began a new cycle of cuts in the Selic interest rate in the second half of 2019, reducing it from 6.5% at the end of 2018 to 4.5% at the end of 2019. If we deduct annual inflation from this rate, we obtain a real interest rate of 0.2% at the end of 2019, versus 2.8% at the end of 2018.
Despite the positive balance in the domestic environment in 2019, the external environment was less favorable to emerging economies, amid risk of a slowdown in global economic activity and constant trade tensions between the United States and China.
This scenario contributed to the depreciation of the real over the course of the year, ending 2019 at US$1/R$4.03 (against US$1/R$3.87 at the end of 2018). The real depreciated 4.0% compared to the previous year. The average exchange rate for the year, of US$1/R$3.95, was 7.9% higher than in the previous year.
Last year was less favorable to external accounts.Brazil posted a US$50.8 billion trade surplus in 2019 (versus US$41.5 billion in 2018), as imports declined 6.3% and exports fell only 0.8%. Thus, the current account deficit increased to 2.8% of GDP at the end of 2019, versus 2.2% of GDP at the end of 2018. In terms of the country’s international reserves, Brazil ended the year with US$356.9 billion, compared to US$374.7 billion at the end of the previous year. The decline was mainly due to the use of part of the reserves to curb exchange rate volatility.
The recovery in economic activity became more consistent in 2019. After a first semester marked by uncertainty regarding governance and its impacts on the progress of economic reforms, the most important reform (social security) was approved in the second semester. Meanwhile, the government has also moved forward on the privatization and microeconomic reform agendas. As a result, economic agents regained confidence, in an environment of low inflation and interest rates, which stimulated consumption and investment decisions. GDP is estimated to have grown about 1.2% in 20193, after the 1.3% print recorded in 2018.
2.2.Competitive Environment
With the gradual improvement in the country's economic activity, investments in the telecommunications market continued to grow, reflecting an increase in confidence in the sector. Traditional businesses continued to be under pressure, with lower consumption of Landline Voice and Pay TV services being offset by the strong performance of the Fixed Broadband andPostpaid segments. On the other hand, digital services are becoming increasingly relevant in terms of the value perceived by consumers and companies. Given this situation, operators attempted to gain market share by increasing the number of bundled users, intensifying competition for high-end customers and delivering greater quality and innovation to consumers.
2Market expectation according to the Focus Bulletin.
4
In the Fixed market, Broadband continued to be the main driver of growth, increasing the number of accesses by 1.3 million in 2019, reaching over 32 million accesses4. Fiber expansion stood out once again, driven by the growth of regional providers, which gained market share both in large cities and in underserved locations.
The large operators, in turn, have focused on investments in expanding the next generation network in response to the market demand. Pay TV did not show the same resilience observed in previous years and accelerated the pace of customer base decline (reduction of 1.7 million in 20192), while demand for Over-the-top (OTT) video services increased. Landline Voice services continued to decline sharply, losing more than 3 million accesses in 20192.
With regard to the Mobile market, the operators remained focused on the prepaid-to-postpaid migration and competition for high-end customers, with delivery of coverage and better access quality, adapting their infrastructure to serve the growing demand for data. In the market, 4.5G coverage reached 2,693 municipalities in 2019 and is now available to 86% of the Brazilian population (versus 79% at the end of 2018)5. The Mobile dynamic was also marked by more aggressive commercial offers, with an increase in data allowances not accompanied a proportional price adjustment. Prepaid revenue fell less than in the previous year, positively influenced by increased use of data and the improvement in the country's economic activity.
The industry focused even more on market consolidation in 2019. One of the main drivers of this movement is the large fragmentation of regional fixed broadband providers, with 116 M&A transactions involving internet providers in the first half of 2019 (against 73 in the first half of 2018)6. Among the major operators, we highlight the acquisition of Nextel by Grupo América Móvil and the hiring by Oi of a financial advisory firm to assess its mobile operation.
Telefônica Brasil maintained its track record of delivering significant results throughout the year. In the Mobile business, it remained the leader in the Postpaid segment, with the largest share of high-end customers on the market, as a result of its commitment to quality and to delivering innovative solutions. In the Landline business, the year was marked by the expansion of its fiber network, reinforcing its positioning as the Brazilian operator with the greatest FTTH (Fiber to the Home) coverage. The Company also announced alternative models to accelerate the Fiber expansion with lower CAPEX and a better time-to-market, via a partnership with American Tower in more than 40 cities in the state of Minas Gerais and via a franchise model focused on neighborhoods and Brazilian municipalities in which it is not available.
2.3.Regulatory Environment
On the regulatory front, there were important events for the sectors. The main regulatory issues on the agenda of Telefônica Brasil, Anatel (National Telecommunications Agency) and the federal government are listed below:
· 5G Auction
· National IoT Plan
· New Regulatory Framework for Telecommunications
· International Roaming
· Silent Consent and Right of Passage
· New Quality Regulations
4Source: Anatel.
5Source: Teleco.
6Source: KPMG – Mergers and Acquisitions in the second quarter of 2019.
5
· Code of Conduct for Reducing Telesales Calls
The issues listed above are detailed in item 7.5 of the Company’s Reference Form, available on the Investor Relations websitewww.telefonica.com.br/ir
3. Business Strategy
In 2019, small players grew significantly in the fixed broadband market. These players have different pricing and positioning strategies and, in general, operate locally, but together they were the ones that grew the most in the year.
Despite the growth of these competitors, we continue to focus on expanding the fiber optic network in the country to deliver high-quality, high-speed broadband. Additionally, the Company continued to invest in digital transformation, increasing the number of customers with access to Meu Vivo and reducing the dependence on traditional contact channels.
With regard to offers in the fixed business, we increased the value proposition by offering speed trial periods in Fiber (FTTH), with a focus on delivering high speeds ranging from 100Mbps to 200Mbps.
In the Postpaid segment, the Company continues to lead the market with a 39.4% share, thanks to its strong positioning in the Vivo Postpaid Family category, which has evolved to deliver more benefits to customers, including increased allowances and more days of use outside the country for these customers. In addition, the Company drove growth in the postpaid segment through customer totalization, offering benefits, such as aggressive discounts and allowance bonuses for customers with Vivo broadband. This way, the Company was able to increase the volume of sales of postpaid plans.
Betting on digital transformation, we kept investing in Vivo Easy, a plan that is customizable trough the app by clients. We kept reinforcing that there is no monthly fees nor validity period for purchased services, such as internet and apps. There were also advances in the structure (back/front-end), contributing to product performance, and, mainly, in app interface and usability, improving the customer experience. In order to further diversify the portfolio, new partners were added, such as the TIKTOK social network and the MOOVIT mobility app. Internet allowance prices have been adjusted to make them more attractive and competitive for new and existing customers. In addition to these changes, aggressive offers now include cashback rewards, a practice that is widespread in digital media. The results of these actions, coupled with a broad digital media strategy focused on conversion, had a positive impact in the last quarter of 2019, with a significant increase in Vivo Easy plan adhesions and positive customer reviews of the app.
The Prepaid segment recorded significantly better results in 2019, supported by the expansion of the offer portfolio with new weekly and fortnightly options. These launches give customers more choice and maximize the profitability of the base. Vivo also maintained its Giga Chip offer, with double the amount of internet for 6 months, unlimited WhatsApp and 15 days free of charge. We innovated with a more segmented performance, using algorithms and machine learning to understand key moments in the customer's relationship with Vivo and provide a more personalized experience.
Finally, in line with the trend of delivering an increasingly personalized customer experience, theVivo Valoriza (Vivo Values) relationship program was restructured and relaunched in early 2020, delivering rewards based on the interests and preferences of each client in a simple and digital journey through the Meu Vivo app. The Company also launched a project to create and implement a customer relationship scale to establish a transparent, effective and dazzling dialogue throughout the life cycle, adjusting the content, timing, recurrence and channels by customer profile and implementing a new communication tone that brings Vivo closer to its customers.
6
3.1.Corporate Business
In 2019, the B2B market was again impacted by low economic growth, which forced companies to rationalize expenses, affecting the consumption of telecommunications services. Unemployment rates remained high and the informality ratio reached an all-time high. This scenario required an adjustment of the value proposition of mobile and fixed offers. In IT, growing demand for business digitalization and infrastructure upgrades, supported by the expansion of our portfolio of products and offers, led to consistent revenue growth.
In the Mobile business, the operating strategy for theSmart Empresas (Smart Companies) portfolio, focused on plans with unlimited voice and shared data packages, proved to be effective and adherent to market expectations. The portfolio already represents 60% of the mobile access base, and its value proposition increased due to its positioning as a secure connection for companies through digital solutions. International roaming offers have also become more robust and more cost-effective after the launch of Vivo Travel with monthly voice and data packages.
In the Corporate Fixed segment, the growth of FTTH Broadband highlights our positioning and commitment to offering high-speed connectivity. Fiber already represents 70% of adhesions, 75% of which at speeds starting at 300Mbps, boosting ARPU. This strategy was reinforced by the launch of speeds of up to 1Gbps throughout 2019 and played a major role in the success of Black Friday. In advanced data, we improved our value proposition through new dedicated internet plans, which already accounted for 58% of sales.
4. Business Performance
Telefônica Brasil S.A. and its wholly owned subsidiaries operate mainly as nationwide providers of landline and mobile telephone services through a Concession Agreement for Switched Fixed Telephone Services (STFC) and authorizations granted by ANATEL to provide other telecommunications services, such as data communication, broadband internet and pay TV, as well as value-added services not classified as telecommunications.
4.1.Customer Service
In 2019, digitalization and operational improvements led to a drop of over 20% in calls to the call center compared to 2018. Moreover, there was an improvement in the customer experience, with a reduction in average wait times and greater representative autonomy, improving the first call resolution indicator. This was partly due to the efforts to expand the digital channels and develop more self-service options.
The main digitalization projects include the new features implemented in the Meu Vivo app, increasing its adoption and reaching 15 million unique users at the end of 2019. The app is connected to Aura, Vivo's artificial intelligence, and plays an essential role in the migration of traditional calls to a digital experience. In addition, the launch of WhatsApp as a service channel has already served a significant number of customers in 2019.
Despite efforts to attract customers to our digital channels, some of them still prefer the traditional channel. To ensure that all customers have access to their preferred channel, we expanded our Cognitive Call Center, with more than 20 million contacts served by Bot in 2019, providing a friendly, fast and humanized experience and helping improve retention on electronic channels.
To assess the perceived quality of all contact points, we launched the DNA Thermometer program, a methodology to capture the customer's perception of our services, ensuring monitoring and agile solutions. The purpose of all these actions is to further improve the customer experience, aligning their journey with our corporate culture of being reliable, easy, pleasant and efficient.
7
4.2. Infrastructure and Network
Since 2013, the Company has been consolidating a robust network capable of fulfilling customers’ expectations. We have been able to make progress on migration from Time Division Multiplex (TDM) to Next Generation Networks (NGN), reaching 72.8% of migrated landline traffic, while modernizing central offices and adapting the data center infrastructure.
At the end of 2019, the Company’s mobile network provided LTE Advanced Pro, LTE, WCDMA, GSM/EDGE and CDMA digital technologies to 4,658 municipalities. This represents 83.6% of all Brazilian municipalities, or 96.5% of the population. The 2G/GSM-EDGE network ended 2019 with coverage in 645 municipalities in the state of São Paulo and in 3,758 municipalities in Brazil. In the same period, the 3G/WCDMA network was running in 645 municipalities in the state of São Paulo and 4,502 municipalities in Brazil.
The 4G (LTE) technology, launched in 2013, was an important step forward for the mobile network, since its transmission rates surpass those of the 3G network. We are continuing to expand the coverage of this technology, ending the year with 3,206 municipalities covered by the 4G network in Brazil.
The nationwide expansion of the LTE Advanced Pro (or 4.5G) network was an important milestone for the Company. This technology allows customers with compatible handsets to achieve even higher transmission rates than those of traditional 4G. In 2019, we finally managed to roll out this technology in 1,208 municipalities.
The implementation of the fiber network (GPON technology) achieved total coverage of 21.1 million homes passed in 2019, of which 9.1 million in the state of São Paulo and 12 million in other Brazilian states, with speeds of up to 300Mbps. Our fiber optics product portfolio includes a high-definition IPTV service (HDTV). In addition to IPTV, the Company’s portfolio of advanced products for corporate customers includes the GPON fiber optic service.
4.3.Sales
Telefônica Brasil’s commercial structure ended 2019 with approximately 1.6 thousand points of sale, including its own and those managed by authorized resellers, and approximately 14 thousand points of sale in retail outlets, in addition to remote channels such as telephone and online sales. The capillarity strategy focused on efficiency and operational excellence, combined with acceleration in the channel digitalization process, has enabled us to intelligently allocate resources and maintain our leadership in the Brazilian telecommunications market, dominating the high-end segment.
In the case of stores, we continued the process of transforming our points of sale into points of experience by making continuous significant advances towards improving infrastructure, systems, customer service, micromanagement and capillarity in order to ensure an even more efficient, profitable and dazzling operation. Lastly, the Company reached the mark of eight iconic stores, five stores in store and 142 Plus stores, a store concept created to serve small and medium towns.
The Distribution channel, which comprises newsstands, drugstores, bakeries and other small retailers, currently accounts for 87% of prepaid captures and 70% of recharges. The channel continued to boost commercial and operational efficiency by improving its micromanagement tools, which can manage capillarity and supply in real time, optimizing the performance of the sales force from end to end of the chain.
In the Retail channel, we seek to simplify the calculation of commissions, processes and KPIs, in addition to strengthening structural sales and the entry in new retail chains.
Door-to-door sales are undergoing change through the optimization of the partner network, the introduction of more structured national partners (without increasing unit costs) and capillarityfocused on the Fiber network. With an increasing focus on quality, this channel accounted for more than 70% of Fiber sales in the months of launch in new cities. In addition, the door-to-door channel's continuous improvements have increased sales in high-end condominiums, reaching a representation of 40% on this segment.
8
Telesales closed, on average, 560 thousand sales per month. The channel focused on expanding the base with quality, seeking new customers and migrating current customers to plans more suited to the consumption profile. There were 3.8 million migrations in the Control portfolio and 360 thousand Fiber sales, accounting for 38% of the Company's sales. The channel relies on artificial intelligence, connecting customers to the most appropriate operator. This match helps map better business arguments and generated more than 83 thousand additional sales.
In 2019, the Company launched the Digital Sales Acceleration project, which has already benefited e-commerce results, mainly B2C mobile sales, up 60% in the year, and fiber, up 58%. Finally, the partnership with Mercado Pago on Recarga Digital (Digital Recharge) brought higher revenue and decreased unit costs, resulting in lower sales commissions.
Meu Vivo, the Company’s main self-service channel, strengthened its digital service strategy and contributed to the positive performance of the digital channels: the number of unique users of the app rose 21% in 2019, and app recharges grew 86% over 2018.
4.4.Information Systems
In 2019, we worked focused on the three priorities for IT: Business Transformation, with programs that promote the digitalization and simplification of our system map; Delivery Acceleration, seeking to add more value to the business; and Operational Excellence, ensuring a robust and resilient operation.
Business Transformation - the FullStack B2C project continues to advance and already has 7.6 million postpaid and control mobile accesses. In addition, we started developing convergence with fiber products, which will allow us to have a complete view of our customers. As for FullStack B2B, we made the first deliveries of features in the pre-sale cycle, such as product migration and implementation in the face-to-face sales channel, generating better and more assertive sales. In the new OCS (Online Charging System), we have already started business simulations with postpaid customers. As for digital services, we have also started to restructure our sales channels through investments in the development of a new e-commerce platform.
Delivery Acceleration – the TI2X program celebrated its first anniversary with surprising results, such as doubling the project delivery capacity, increasing on-time delivery and reducing the time to market, without increasing investment levels. These results were achieved through process improvement actions and internalization of knowledge of technologies and critical IT functions, through the hiring of 971 people, reducing the outsourcing level from 73% to 59%.
Operational Excellence – we continue to pursue the server virtualization strategy, reaching 83.7% of the total, increasing management efficiency and reducing obsolescence. We seek to make our architecture increasingly simple, secure and robust, and address the root causes of availability offenders.
The sum of these efforts can be seen in our 99.89% system availability in 2019.
5. Corporate Governance
The fundamental principles of corporate governance at Telefônica Brasil S.A. are set forth in its Bylaws and in the internal rules and regulations that supplement the concepts contained in the law and standards governing the securities market. The purpose of these principles, which guide the activities of the Company’s management, can be summarized as follows:
9
· | Maximizing the Company’s value; |
· | Transparency in the Company’s accounts and disclosure of material information of interest to the market; |
· | Transparency in relations with shareholders, employees, investors, customers and public agencies; |
· | Equal treatment of shareholders; |
· | Engagement of the Board of Directors in overseeing and managing the Company and in accountability to shareholders; |
· | Engagement of the Board of Directors with Corporate Responsibility, ensuring the Company’s continuity. |
Inspired by these concepts and in an effort to promote good corporate governance, the Company has instituted measures that render its actions clear and objective, while avoiding conflicts of interest.
The Company’s Board of Directors currently consists of twelve members, one of whom is elected by preferred shareholders in a separate vote and without the participation of the parent company, while the others are elected by a general vote of common shareholders. In 2019, the Board of Directors met 19 times in the exercise of its functions.
The Fiscal Council of the Company consists of three full members and three alternates and, in 2019, it met nine times in the exercise of its duties.
The Executive Board currently consists of three members with the following positions: Chief Executive Officer, Chief Financial and Investor Relations Officer, and General-Secretary and Legal Officer.
5.1.Investor Relations
In order for its shares to achieve fair valuation, the Company adopts practices designed to provide transparency on its strategy, business evolution, policies and any events to shareholders, investors and analysts.
Material information is made available on the Company’s internet portal (www.telefonica.com.br/ir), with versions in Portuguese and English. The Company also has an Investor Relations team that answers questions by telephone or in one-to-one meetings, when so requested.
5.2.Independent Auditors
In compliance with CVM Instruction 381, of January 14, 2003, and Circular Letter CVM/SNC/SEP 01/2007, of February 14, 2007, the Company and its subsidiaries state that the Company’s policy regarding its independent auditors and their services not related to the independent audit is based on principles that preserve the independence of the auditors. These principles state that the auditors should never audit their own work, function as management, act as an advocate for their client or render any other services that are prohibited by current regulations, thus maintaining the independence of the audit work.
In 2019, no services other than the independent audit were contracted with the independent auditors, PriceWaterhouseCoopers Auditores Independentes.
6. Human Resources
In 2019, the Company consolidated its global strategic plan, #RECONECTA, launched in 2018.
10
Attentive to a fast-changing world and with the goal to support the Company’s growth plan, the Vice-Presidency of People elected four strategic challenges: Promote a high-performance culture; Attract and retain the best talents; Drive efficient management with a focus on processes, management and systems; and Improve employee satisfaction and make employees proud to work at Vivo. Faced with this challenge, the Company has transformed its way of working and delivering results.
New forms of work and other assertive and innovative management methods, such as OKRs (Objectives and Key Results) and Design Thinking, were used to deliver plans for strategic challenges.
To support our transformation, we carried out a culture study that allowed us to identify Vivo's strengths in the face of our long-term strategy through a survey, answered by more than 17 thousand employees, in addition to interviews with leaders and focus groups with employees. The Motivation Survey has also been restructured and is more focused on employee needs, corporate culture and market trends and is aligned with our strategy. The main employee satisfaction indicator of this survey is the eNPS (Employee Net Promoter Score), based on the same methodology used to measure customer satisfaction (NPS). The motivation survey was answered by 87% of employees and the e-NPS was 72.5 points.
Changing Environment
In 2019, the Vice-Presidency of People worked to provide an environment in which self-expression, flexibility and diversity of people and ideas are embodied in management principles to attract and retain the best talents. The Vivo Diversity program, which celebrated its first anniversary, values diversity of points of view, origins, identities and orientation, so that everyone feels comfortable to be the way they are in an environment of respect for differences.
The Company defined goals for increasing representativeness of all the strategic pillars of diversity (gender, race, LGBTI+ and people with disabilities), and the platform was structured with two objectives: promoting an inclusive culture and increasing the representativeness of different groups across all hierarchical levels of the Company. We work with affinity groups formed by volunteer employees engaged with the issues, who discuss and suggest affirmative actions to ensure equal growth conditions within the organization.
Collaborative spaces also gained prominence in 2019, being implemented in other regions, with new buildings that fit the concept. In addition, the mobility initiative was expanded to allow eligible employees to work remotely two days a week. This change increased productivity and improved the quality of life of employees.
In this collaborative environment, which values the participation and expression of all our staff, internal communication implemented innovative actions and channels, such as Workplace, generating an open, accessible and transparent dialogue. In addition, we have the DNA in Action program, in which more than 350 members of management, including VPs, officers and managers, visited stores, door-to-door, field, call center and court hearings and had the opportunity to learn more about and experience the service offered to our customers.
Employee Value Proposition
In December 2019, the Company had 32,793 employees (versus 32,638 employees in December 2018). To attract and retain the best talents, the Company implemented a new recruitment and selection model and created the employee value proposition – EVP.A survey conducted with several employees identified the value proposition they recognize in relation to working at Vivo and listed four attributes: Human Connections, Leading Company in Transformation, Challenges and Development, and Benefits.
The new recruitment model reflects the journeys of candidates and managers with new digital and innovative processes and solutions. We have invested in new recruitment and selectionplatforms that use artificial intelligence and provide a better user experience. Among the new digital platforms, we highlight a personalized videobot solution for sending hiring proposals and a tool for receiving admission documents digitally using mobile devices, thus reducing costs with external consultants.
11
6.1.Compensation and Benefits
In order to attract and retain the best talents and recognize their individual performance, the Company adopts compensation strategies compatible with the best market practices. Overall employee compensation is composed of fixed compensation, variable short- and long-term compensation and benefits.
In 2019, the Company adopted a new compensation strategy and repositioned its executives. In 2019, 3,761 professionals were promoted and 7,615 were included in the salary increase process, which adds up to 11,376 professionals who received an increase in compensation, in addition to the legal adjustments applied.
6.2.Education and Development Programs
In 2019, the Company invested around R$55.7 million in education, based on a face-to-face and online training strategy that tripled the participation of employees and partners compared to 2018, reaching over 1,900 thousand participations.
6.3.Safety and Prevention
In 2019, we carried out mandatory training and recycling for work at height (NR 35), totaling more than 21 thousand hours; work in proximity to electrical installation (NR 10), totaling more than 20 thousand; and call center work (NR 17), totaling 3 thousand hours.
The Company maintains areas dedicated to Occupational Health and Safety, focused on promoting a healthy work environment, supported by services provided by health professionals (doctors, nutritionists, psychologists, physical therapists) and vaccination campaigns, among others. Held in September, the Health Week reached 25,523 employees with the goal of raising awareness and encouraging healthy and safe behavior in the daily lives of employees.
7. Sustainability
Applying sustainability in our strategy allows us to identify opportunities offered by new technologies for creating value for society and effectively managing the impacts that are inherent in our activities, making our business increasingly responsible.
The conduct of our business establishes targets to be achieved by 2021, which implies acting in an upright and transparent way and making a commitment to sustainable development, in order to generate a positive social impact and create shared value, with a vision of sustainability that puts people at the very center of what we do and reduces the negative impacts on our operation.
For this reason, the Telefônica Group developed its Global Responsible Business Plan, which is based on seven pillars:
· Promise to the Customer and Digital Trust
· Supply Chain Sustainability Management
· Diversity and Talent Management
· Environment
· Sustainable Innovation
12
· Contribution to Progress
· Ethics
In line with these commitments, the most relevant and priority issues in our business are addressed within Telefônica Brasil through projects and goals that involve all of the Company’s areas, within the scope of our Responsible Business Plan.
Issues such as climate change, diversity and digital trust, among others, are becoming increasingly important to society and can change the way we relate to our customers and other stakeholders in our value chain.
In addition, we were the first Brazilian telecommunications company to launch a Privacy Center to discuss and provide clarifications regarding this matter. According to a survey carried out by Internet Lab, an independent center for direct interdisciplinary research in law and technology, in October 2019, we were the Brazilian internet operator most committed to the privacy of user data, both in fixed broadband and in mobile internet.
We are a signatory to and actively participate in other relevant initiatives that also contribute to sustainable development, such as theGlobal Compact, theGHG Protocol (Gold Seal) and theCarbon Disclosure Project (CDP), and we have also made public commitments to the organizations that work on the pillars of the Vivo Diversity Program: the Principles of Women's Empowerment,Movimento Mulher 360(Women 360 Movement),Fórum de Empresas e Direitos LGBT+ (Forum of Business and LGBT+ Rights),Rede Empresarial de Inclusão Social (Business Network for Social Inclusion) andCoalizão Empresarial para Equidade Racial e de Gênero (Business Coalition for Racial and Gender Equity). In this context, we were awarded the Gold Seal at the third edition of the WEPs Brazil Award, an important recognition of our efforts to promote equality in the work environment, value chain and communities.
In 2019, Telefônica Brasil was included in the main domestic and international sustainability rankings. For the eighth consecutive quarter, the Company was included in B3’s Corporate Sustainability Index - ISE. Once again, we figured in theSustainability Guide of EXAME magazineand were included, for the fifth consecutive year, in the Best Emerging Markets Performers Ranking of VIGEO EIRIS.
Once a year, the Company publishes its Annual Sustainability Report, which is prepared in accordance with the standards of the Global Reporting Initiative (GRI). The report is available at the Sustainability area of our website www.telefonica.com.bror on the Investor Relations website www.telefonica.com.br/ri.
7.1. Private Social Investment
The Telefônica Vivo Foundation, which is responsible for Vivo’s social projects, believes in educational innovation as a way of inspiring new paths for Brazil’s development based on education. The Foundation develops projects in the areas of education, social entrepreneurship and volunteer work. Present in Brazil since 1999, the Foundation is part of a network that consists of 17 other Telefônica Group foundations located in Europe and Latin America. In 2019, we benefitted roughly 1.4 million people and invested R$72 million.
To find out more about Telefônica Vivo Foundation, visitwww.fundacaotelefonica.org.br
8. Operating Performance
At the end of 2019, the Company totaled 74,582 thousand mobile accesses, confirming its leadership position with a 32.9% market share. The postpaid customer base accounted for 57.9% of the mobile base at the end of 2019, 2.7 p.p. more than in 2018.
13
In relation to landline service, the Company ended 2019 with 19,044 thousand revenue generating units, a decline of 13.5% from the previous year, mainly on account of the maturity of landline voice service and the more selective strategy for the pay-TV service.
Broadband - totaled 6,908 thousand customers at the end of 2019, a decline of 7.4% from 2018. Fiber optic accesses (FTTH) registered 2,477 thousand customers, moving up 30.8% over 2018 and representing 35.9% of all broadband accesses.
Lines in Service - totaled 10,817 thousand customers in 2019, a 16.8% decrease in relation to 2018, mainly due to the maturity of the landline voice service and the fixed-to-mobile substitution.
Pay-TV - totaled 1,320 thousand customers in 2019, a 15.8% reduction against 2018, reflecting the Company’s selectivity and focus on high-end customers and the strategic decision to stop selling DTH services. IPTV totaled 715 thousand users, 23.4% more than in 2018.
As a result, the Company ended 2019 with 93,627 thousand customers, a 1.6% drop in relation to the previous year, mainly due to disconnections of landline voice customers and prepaid mobile customers.
9. Financial Performance
9.1.Net Operating Revenue
In 2019, the Company posted consolidated net operating revenue of R$44,268.2 million, up 1.9% over 2018, when we recorded net revenue of R$43,462.7 million. This growth was driven by higher data and mobile digital service revenue, as well as higher fixed broadband revenue, partially offset by lower voice and pay-TV revenue.
9.2.Operating Costs and Expenses
Operating costs and expenses, excluding depreciation and amortization, totaled R$26,134.5 million in 2019, an increase of 1.9% over 2018 (R$25,637.9 million), below inflation for the period (4.3%). The increase was chiefly due to the non-recurring effect related to a judicial decision in favor of the Company regarding the tax contingency recorded in 2018, in addition to the higher cost of goods sold, reflecting the strategy of greater focus on the sale of handsets and equipment with a margin. On the other hand, the intense digitization and automation process the Company is going through resulted in lower printing and mailing costs, thanks to the adoption of e-billing; lower commission costs, due to growth in e-commerce of products, services and recharges; and lower customer service costs, as a result of the increased penetration of the Meu Vivo app.
9.3.EBITDA
EBITDA totaled R$18,133.7 million in 2019, a 1.7% increase from R$17,824.8 million in 2018. The EBITDA margin stood at 41.0% in 2019.This result was due to higher revenue from mobile, ultra-broadband, corporate data and IT services, as well as the efficiency and digitalization measures adopted by the Company, partially offset by a non-recurring effect in connection with a favorable judicial decision regarding tax contingency. Excluding this effect, the recurring EBITDA margin increased 4.7 p.p. from 35.8% in 2018.
14
In millions of reais – Consolidated |
|
| ||
|
| 2019 |
| 2018 |
Operating income before financial income and expenses and equity pick-up (*) |
| 7,213.9 |
| 9,456.2 |
Depreciation and amortization expenses |
|
|
|
|
In service costs |
| 8,624.2 |
| 6,487.9 |
In selling expenses |
| 1,501.1 |
| 1,352.6 |
In general and administrative expenses |
| 794.5 |
| 528.1 |
EBITDA |
| 18,133.7 |
| 17,824.8 |
|
|
|
|
|
EBITDA margin |
|
|
|
|
a) EBITDA |
| 18,133.7 |
| 17,824.8 |
b) Net operating revenue (*) |
| 44,268.2 |
| 43,462.7 |
a) / b) |
| 41.0% |
| 41.0% |
Recurring EBITDA margin |
| 40.5% |
| 35.8% |
(*) See income statements.
9.4.Indebtedness
In millions of reais – Consolidated |
| 2019 |
| 2018 |
|
|
|
|
|
Loans and financing |
| (1,045.1) |
| (2,106.8) |
Debentures |
| (3,104.4) |
| (3,173.9) |
Leases |
| (9,191.2) |
| (393.0) |
GVT contingent consideration |
| (484.0) |
| (465.7) |
Total indebtedness |
| (13,824.7) |
| (6,139.4) |
Derivative transactions |
| 16.0 |
| 56.1 |
Indebtedness after derivatives |
| (13,808.7) |
| (6,083.3) |
The Company ended 2019 with gross debt of R$13,808.7 million (R$6,083.3 million in 2018), equivalent to 19.6% of shareholders’ equity (8.5% in 2018). The funds raised are fully denominated in local currency,
9.5.Net Result
The consolidated result for the year, in accordance with the requirements of Brazilian Corporate Law, shows net income of R$5,001.0 million in 2019 (R$8,928.3 million in 2018), a decline of 44.0% from 2018. Telefônica Brasil’s net margin stood at 11.3% in 2019 (20.5% in 2018).
In millions of reais |
| 2019 |
| 2018 |
|
|
|
|
|
a) Net income for the year (*) |
| 5,001.0 |
| 8,928.3 |
b) Net operating revenue (*) |
| 44,268.2 |
| 43,462.7 |
a) / b) |
| 11.3% |
| 20.5% |
(*) See income statements.
9.6.Investments
In 2019, the Company invested R$8,844.3 million, 7.9% more than in 2018 (R$8,199.9 million).
15
In 2019, we continued to expand our landline services by providing fiber optic services (FTTH) in an additional 43 cities and building roughly 2.3 million new homes passed. As a result, Telefônica Brasil provides FTTH services in more than 164 cities and has approximately 11 million homes passed in the country.
In 2019, we invested heavily in the maintenance and expansion of mobile internet and voice services and consolidated the implementation of 4G, reaching the impressive mark of 3,206 municipalities. In addition, we have improved signal quality in a number of regions and invested significant resources in maintenance actions (both proactive and reactive).
Telefônica Brasil also invested in integrating the systems of its landline and mobile business, as well as improving its business support infrastructure (systems, points of sale and service). In 2019, we continued to invest in improving, expanding and integrating operating systems, especially the ongoing transformation of the billing environment and the Big Data projects, which will provide support for the rollout of new products and services, focusing primarily on the customer experience.

10. Capital Market
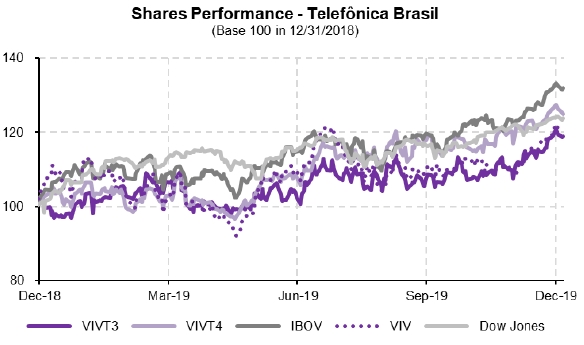
The Company’s common (VIVT3) and preferred (VIVT4) shares closed 2019 at R$49.04 and R$57.98, respectively, recording an appreciation of 18.8% and 25.4%, respectively, over the closing price at the end of 2018. In the same period, the daily trading volume of VIVT3 and VIVT4 averaged R$2,252 thousand and R$87,061 thousand respectively. Total shareholder return (TSR) reached 26.9% for common shares and 33.4% for preferred shares in the last twelve months.
The ADRs (VIV) traded on the NYSE closed 4Q19 at US$14.32, up 20.0% over the closing price at the end of 2018. The daily trading volume of ADRs averaged US$19,819 thousand in the same period.
The chart below shows the performance of the shares in 2019:
16
10.1 Shareholder Remuneration
Under its bylaws, the Company is required to distribute a minimum of 25% of its annual adjusted net income as dividends, while the holders of preferred shares are guaranteed an amount 10% higher than that attributed to each common share.
Interest on shareholders’ equity and dividends declared by Telefônica Brasil based on net income for 2019 totaled R$5.8 billion, which translates into a payout ratio of 116%, as detailed in the table below:
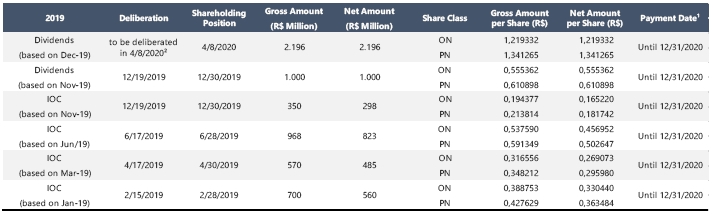
1 – The Company’s Executive Board resolved that the interest on equity declared and the dividends proposed, if approved, will be paid on the dates listed above.
2 – Dividends proposed by Management to be resolved by the Annual Shareholders’ Meeting, to be held on April 8th, 2020.
11. Outlook
The growing importance of digital services is changing consumption patterns in the telecommunications sector. Customers demand not only better connections and higher traffic speeds, but also bundles of relevant digital services that provide an increasingly personalized experience. In addition, brand reputation and data security and privacy concerns are becoming increasingly important in customer choice, supported by the new General Data Protection Regulation (LGPD), which will come into force in 2020.
The macroeconomic scenario should continue to recover, as the new government is calling for significant political and economic reforms, such as the approval of the Social Security Reform. A more pro-market approach also tends to favor the regulatory scenario, as embodied by the approval of PLC 79. Such measures contribute to the recovery of the telecommunications sector. On the revenue side, the offer of bundled services and the exponential consumption of data and digital connectivity services will continue to be essential for growth. In addition, the competitive environment should become more conducive to mergers and acquisitions and focused on offering unique traditional and digital products and services, combined with high quality and a better customer experience, which will require more investments in newer and more efficient technologies, such as FTTH and 4.5G.
In this context, Telefônica Brasil is well structured to maintain its leadership position in the Brazilian telecommunications market and continue to serve its more than 93 million customers. Relevance, Revenue, Return, Responsibility and Motivation make up the Company’s strategic pillars that will enable it to fulfill its purpose of digitalizing to bring people closer.
Christian Mauad Gebara
Chief Executive Officer
David Melcon Sanchez-Friera
Chief Financial and Investor Relations Officer
17
Breno Rodrigo Pacheco de Oliveira
General-Secretary and Legal Officer
Carlos Cesar Mazur
Accountant – CRC – 1PR-028067
18
OPINION OF THE AUDIT AND CONTROL COMMITTEE
The members of the Audit and Control Committee of Telefônica Brasil S.A. (“Company” or “Telefônica Brasil”), in the exercise of their duties and legal responsibilities, have examined and analyzed the Company’s Financial Statements, together with the Independent Auditors’ Report and the Annual Management Report for the year ended December 31, 2019 (“2019 Annual Financial Statements”), as well as the Proposed Capital Budget for the year 2020, including the 2019 budget implementation report and the Proposed Allocation of Net Income for 2019, and, taking into account the information provided by Telefônica Brasil’s Executive Board and the independent auditors, PriceWaterhouseCoopers Auditores Independentes, vote unanimously in favor of the aforesaid documents and declare that they fairly represent, in all material aspects, the Company’s equity and financial position. Accordingly, they recommend their approval by Telefônica Brasil’s Board of Directors and their submission to the Annual Shareholders’ Meeting, under the terms of Brazilian Corporate Law.
São Paulo, February 14, 2020.
José María Del Rey Osorio
Chairman of the Audit and Control Committee
Julio Esteban Linares Lopez
Member of the Audit and Control Committee
Narcís Serra Serra
Member of the Audit and Control Committee
19
OPINION OF THE BOARD OF DIRECTORS
The members of the Board of Directors of Telefônica Brasil S.A. (“Company” or “Telefônica Brasil”), in the exercise of their duties and legal responsibilities, as set forth in Brazilian Corporate Law and in the company’s Bylaws, have examined and analyzed the Company’s Financial Statements, together with the Independent Auditors’ Report and the Annual Management’s Report for the year ended December 31, 2019 (“2019 Annual Financial Statements”), as well as the Proposed Capital Budget for the year 2020, including the 2019 budget implementation report and the Proposed Allocation of Net Income for 2019, and, taking into account the information provided by Telefônica Brasil’s Executive Board and the independent auditors, PriceWaterhouseCoopers Auditores Independentes, and the favorable opinion of the Fiscal Council members and the members of the Audit and Control Committee, vote unanimously in favor of the aforesaid documents and declare that they fairly represent, in all material aspects, the Company’s equity and financial position. Accordingly, they determine that the aforesaid documents be submitted for approval by the Annual Shareholders’ Meeting, under the terms of Brazilian Corporate Law.
São Paulo, February 14, 2020.
Eduardo Navarro de Carvalho Chairman of the Board of Directors
| Luiz Fernando Furlan Member of the Board of Directors
|
Julio Esteban Linares Lopez Member of the Board of Directors
| Francisco Javier de Paz Mancho Member of the Board of Directors
|
Ana Theresa Masetti Borsari Member of the Board of Directors
| Christian Mauad Gebara Member of the Board of Directors
|
Antonio Carlos Valente da Silva Member of the Board of Directors
| Sonia Julia Sulzbeck Villalobos Member of the Board of Directors
|
José María Del Rey Osorio Member of the Board of Directors
| Claudia Maria Costin Member of the Board of Directors
|
Luis Miguel Gilpérez Lopez Member of the Board of Directors | Narcís Serra Member of the Board of Directors |
20
OPINION OF THE FISCAL COUNCIL
The members of the Fiscal Council of Telefônica Brasil S.A. (“Company” or “Telefônica Brasil”), in the exercise of their duties and legal responsibilities, as provided for in article 163 of Brazilian Corporate Law, have examined and analyzed the Company’s Financial Statements, together with the Independent Auditors’ Report and the Annual Management Report for the year ended December 31, 2019 (“2019 Annual Financial Statements”), as well as the Proposed Capital Budget for the year 2020, including the 2019 budget implementation report and the Proposed Allocation of Net Income for 2019, and, taking into account the information provided by Telefônica Brasil’s Executive Board and the independent auditors, PriceWaterhouseCoopers Auditores Independentes, vote unanimously in favor of the aforesaid documents and declare that they fairly represent, in all material aspects, the Company’s equity and financial position. Accordingly, they determine that the aforesaid documents be submitted to the Annual Shareholders’ Meeting, under the terms of Brazilian Corporate Law.
São Paulo, February 14, 2020.
Flavio Stamm Full member of the Fiscal Council | Cremênio Medola Netto Full member of the Fiscal Council | Charles Edwards Allen Full member of the Fiscal Council |
21
Telefônica Brasil S.A.
Consolidated Financial Statements
On December 31, 2019 and 2018 and for the years ended December 31, 2019, 2018 and 2017
Contents
Report of independent registered
public accounting firm
To the Board of Directors and Shareholders
Telefônica Brasil S.A.
Opinions on the financial statements and
internal control over financial reporting
We have audited the accompanying consolidated balance sheets of Telefônica Brasil S.A. and its subsidiaries (the “Company”) as of December 31, 2019 and December 31, 2018, and the related consolidated statements of income, other comprehensive income, changes in equity and cash flows for each of the three years in the period ended December 31, 2019, including the related notes (collectively referred to as the “consolidated financial statements”). We also have audited the Company's internal control over financial reporting as of December 31, 2019, based on criteria established in Internal Control - Integrated Framework (2013) issued by the Committee of Sponsoring Organizations of the Treadway Commission (COSO).
In our opinion, the consolidated financial statements referred to above present fairly, in all material respects, the financial position of the Company as of December 31, 2019 and December 31, 2018, and the results of its operations and its cash flows for each of the three years in the period ended December 31, 2019 in conformity with International Financial Reporting Standards as issued by the International Accounting Standards Board. Also in our opinion, the Company maintained, in all material respects, effective internal control over financial reporting as of December 31, 2019, based on criteria established in Internal Control - Integrated Framework (2013) issued by the COSO.
Change in accounting principle
As discussed in Note 2f to the consolidated financial statements, the Company changed the manner in which it accounts for leases in 2019. This matter is also described in the “Critical Audit Matters” section of our report.
Basis for opinions
The Company's management is responsible for these consolidated financial statements, for maintaining effective internal control over financial reporting, and for its assessment of the effectiveness of internal control over financial reporting, included in item 15 – Controls and Procedures – Management´s Annual Report on Internal Control over Financial Reporting. Our responsibility is to express opinions on the Company’s consolidated financial statements and on the Company's internal control over financial reporting based on our audits. We are a public accounting firm registered with the Public Company Accounting Oversight Board (United States) (PCAOB) and are required to be independent with respect to the Company in accordance with the U.S. federal securities laws and the applicable rules and regulations of the Securities and Exchange Commission and the PCAOB.
F-1
We conducted our audits in accordance with the standards of the PCAOB. Those standards require that we plan and perform the audits to obtain reasonable assurance about whether the consolidated financial statements are free of material misstatement, whether due to error or fraud, and whether effective internal control over financial reporting was maintained in all material respects.
Our audits of the consolidated financial statements included performing procedures to assess the risks of material misstatement of the consolidated financial statements, whether due to error or fraud, and performing procedures that respond to those risks. Such procedures included examining, on a test basis, evidence regarding the amounts and disclosures in the consolidated financial statements. Our audits also included evaluating the accounting principles used and significant estimates made by management, as well as evaluating the overall presentation of the consolidated financial statements. Our audit of internal control over financial reporting included obtaining an understanding of internal control over financial reporting, assessing the risk that a material weakness exists, and testing and evaluating the design and operating effectiveness of internal control based on the assessed risk. Our audits also included performing such other procedures as we considered necessary in the circumstances. We believe that our audits provide a reasonable basis for our opinions.
Definition and limitations of internal control over financial reporting
A company's internal control over financial reporting is a process designed to provide reasonable assurance regarding the reliability of financial reporting and the preparation of financial statements for external purposes in accordance with generally accepted accounting principles. A company's internal control over financial reporting includes those policies and procedures that (i) pertain to the maintenance of records that, in reasonable detail, accurately and fairly reflect the transactions and dispositions of the assets of the company; (ii) provide reasonable assurance that transactions are recorded as necessary to permit preparation of financial statements in accordance with generally accepted accounting principles, and that receipts and expenditures of the company are being made only in accordance with authorizations of management and directors of the company; and (iii) provide reasonable assurance regarding prevention or timely detection of unauthorized acquisition, use, or disposition of the company's assets that could have a material effect on the financial statements.
Because of its inherent limitations, internal control over financial reporting may not prevent or detect misstatements. Also, projections of any evaluation of effectiveness to future periods are subject to the risk that controls may become inadequate because of changes in conditions, or that the degree of compliance with the policies or procedures may deteriorate.
Critical audit matters
The critical audit matters communicated below are matters arising from the current period audit of the consolidated financial statements that were communicated or required to be communicated to the audit committee and that (i) relate to accounts or disclosures that are material to the consolidated financial statements and (ii) involved our especially challenging, subjective, or complex judgments. The communication of critical audit matters does not alter in any way our opinion on the consolidated financial statements, taken as a whole, and we are not, by communicating the critical audit matters below, providing separate opinions on the critical audit matters or on the accounts or disclosures to which they relate.
F-2
First-time adoption of IFRS 16 Leases
As described in Note 2F to the consolidated financial statements, the Company adopted the IFRS 16-Leases as effective dated January 1, 2019. The Company transitioned to IFRS 16 using the modified retrospective approach. The comparative information for prior-year periods was not restated. The adoption of this new standard gave rise to right of use assets and lease liabilities of R$8,618,072 thousand as of January 1, 2019. As described by management in Note 2, the adoption was complex due to factors such as the high number of contracts affected that required an evaluation to consider if the contracts contain a lease under this standard, the diversity of data source systems, the implementation of new systems to map all the leases information and the management judgement involved in some assumptions like lease terms and discount rate.
The principal considerations for our determination that performing procedures relating to the first-time adoption of IFRS 16-Leases is a critical audit matter are the degree of complexity of the process due to the volume of contracts, among others, and estimation and judgment applied to the initial application of the new standard. This in turn led to a high degree of auditor subjective and effort in performing the procedures designed to evaluate the first-time adoption of IFRS 16-Leases.
Our approach to addressing the matter involved performing procedures and evaluating audit evidence in connection with forming our overall opinion on the consolidated financial statements. These procedures included testing the effectiveness of controls related to the first-time adoption of IFRS 16-Leases standard. The procedures also included, among others, (1) assessing the accounting policies employed by management in the determination, calculation and accounting of leases under this standard, as well as the practical expedients employed, (2) testing the completeness and accuracy of the lease contracts identified and recorded in the systems, (3) evaluating the significant assumptions utilized by management such as the lease terms and discount rates and (4) evaluating the appropriateness of the Company’s disclosures. Professionals with specialized skill and knowledge were used to assist in the evaluation of Company´s adoption of this standard and the reasonableness of the discount rate. This matter is also described in the Change in Accounting Principle section of our report.
Tax and regulatory litigations
As described in Notes 7(g) and 19 to the consolidated financial statements, the Company has recorded
provision for tax and regulatory litigations of R$2,808,197 thousand and has disclosed contingent liabilities related to these tax litigations of R$ 41,559,190 as of December 31, 2019. The Company recognizes provision in the consolidated financial statements for the resolution of pending litigation when the Company has a present obligation as a result of a past event and management determines that a loss is probable and the amount of the loss can be reasonably estimated. No provision for tax litigation is recognized in the consolidated financial statements for unfavorable outcomes when, after assessing the information available, (i) management concludes that it is not probable that a loss has been incurred in any of the pending litigation; or (ii) management is unable to estimate the loss of the pending matters. In case of income tax pending litigations, management determines whether is probable or not that taxation authority will accept the uncertain tax treatment. If the Company concludes it is not probable that taxation authority will accept the uncertain tax treatment, a provision for income tax is recognized. The Company also discloses the contingency in circumstances where management concludes (i) no loss is probable or reasonably estimable, but it is reasonably possible that a loss may be incurred or, (ii) in case of income tax pending litigations, is probable that the taxation authority will accept the uncertain tax treatment.
F-3
The principal considerations for our determination that performing procedures relating to litigation contingencies is a critical audit matter are there was significant judgment by management when assessing the likelihood of a loss being incurred and when determining whether a reasonable estimate of the loss and possible outcomes for each claim can be made, which in turn led to a high degree of auditor judgment, effort, and subjectivity in evaluating management´s assessment of the loss contingencies associated with tax and regulatory litigations.
Addressing the matter involved performing procedures and evaluating audit evidence in connection with forming our overall opinion on the consolidated financial statements. These procedures included testing the effectiveness of controls relating to management´s evaluation of pending litigation, including controls over determining whether a loss is probable and whether the amount of loss can be reasonably estimated or whether the taxation authority will probably not accept the income tax pending litigations , as well as financial statement disclosures. These procedures also included among others, (1) obtaining and evaluating the letters of audit inquiry with internal and external legal counsel, (2) evaluating the reasonableness of management´s assessment regarding unfavorable outcomes, and (3) evaluating the sufficiency of the Company´s disclosures. Professionals with specialized skill and knowledge were used to assist in the evaluation of Company´s assessment regarding unfavorable outcomes.
Revenue recognition - unbilled
As described in Notes 4 and 24 to the consolidated financial statements, of the total gross revenue recognized by the Company for the year ended December 31, 2019, R$ 2,866,196 thousand relates to services rendered and not yet billed. When the revenue billing cycle does not align with the account closing date, management estimates the amount to be recognized for services rendered and not yet billed at the year-end. These estimates are based on different cycles of information, on data obtained from different sources and processed by a large number of applications and systems.
The principal considerations for our determination that performing procedures relating to unbilled revenue, is a critical audit matter are the judgments made by management for estimating the amount of unbilled revenue. This in turn led to a high degree of auditor judgment and effort in performing audit procedures to evaluate unbilled revenue recognition.
Our approach to addressing the matter involved performing procedures and evaluating audit evidence in connection with forming our overall opinion on the consolidated financial statements. These procedures included testing the effectiveness of controls relating to unbilled revenue recognition. The procedures also included, among others, (1) testing billings completed following the year-end and consistency with the estimates made and (2) assessing the reasonableness of the criteria employed by management to estimate revenue rendered and not yet billed including the accuracy of the underlying data.
São Paulo, February20, 2020
/s/ PricewaterhouseCoopers
Auditores Independentes
We have served as the Company´s auditor since 2017.
F-4
Consolidated Balance Sheets
On December 31, 2019 and 2018
(In thousands of reais)
ASSETS |
| Note |
| 12.31.19 |
| 12.31.18 |
Current assets |
|
|
| 18,644,678 |
| 18,362,992 |
Cash and cash equivalents |
| 3 |
| 3,393,377 |
| 3,381,328 |
Trade accounts receivable |
| 4 |
| 8,719,497 |
| 8,304,382 |
Inventories |
| 5 |
| 578,003 |
| 462,053 |
Income and social contribution taxes recoverable |
| 7 |
| 411,595 |
| 274,589 |
Taxes, charges and contributions recoverable |
| 8 |
| 4,176,362 |
| 4,674,218 |
Judicial deposits and garnishments |
| 9 |
| 277,468 |
| 313,007 |
Prepaid expenses |
| 6 |
| 686,503 |
| 581,743 |
Derivative financial instruments |
| 31 |
| 19,282 |
| 69,065 |
Other assets |
| 10 |
| 382,591 |
| 302,607 |
|
|
|
|
|
|
|
Non-current assets |
|
|
| 89,645,044 |
| 84,198,326 |
Short-term investments pledged as collateral |
|
|
| 63,766 |
| 76,934 |
Trade accounts receivable |
| 4 |
| 440,453 |
| 426,252 |
Taxes, charges and contributions recoverable |
| 8 |
| 841,198 |
| 3,222,262 |
Deferred taxes |
| 7 |
| 171,042 |
| 230,097 |
Judicial deposits and garnishments |
| 9 |
| 3,393,417 |
| 3,597,007 |
Prepaid expenses |
| 6 |
| 220,082 |
| 134,232 |
Derivative financial instruments |
| 31 |
| 52,881 |
| 26,468 |
Other assets |
| 10 |
| 235,738 |
| 47,105 |
Investments |
| 11 |
| 104,251 |
| 101,657 |
Property, plant and equipment |
| 12 |
| 42,847,264 |
| 34,115,327 |
Intangible assets |
| 13 |
| 41,274,952 |
| 42,220,985 |
|
|
|
|
|
|
|
TOTAL ASSETS |
|
| �� | 108,289,722 |
| 102,561,318 |
The accompanying notes are an integral part of these Consolidated Financial Statements.
F-5
TELEFÔNICA BRASIL S.A.
Consolidated Balance Sheets
On December 31, 2019 and 2018
(In thousands of reais)
LIABILITIES AND EQUITY |
| Note |
| 12.31.19 |
| 12.31.18 |
Current liabilities |
|
|
| 17,732,088 |
| 17,160,820 |
Personnel, social charges and benefits |
| 15 |
| 752,246 |
| 782,630 |
Trade accounts payable |
| 16 |
| 6,871,799 |
| 7,642,782 |
Income and social contribution taxes payable |
| 7 |
| 6,585 |
| 12,009 |
Taxes, charges and contributions payable |
| 17 |
| 1,139,812 |
| 1,797,965 |
Dividends and interest on equity |
| 18 |
| 3,587,417 |
| 4,172,916 |
Provisions and contingencies |
| 19 |
| 374,445 |
| 377,929 |
Deferred income |
| 21 |
| 506,181 |
| 525,509 |
Loans, financing, debentures and leases |
| 20 |
| 4,126,490 |
| 1,464,166 |
Derivative financial instruments |
| 31 |
| 1,921 |
| 16,538 |
Other liabilities |
| 22 |
| 365,192 |
| 368,376 |
|
|
|
|
|
|
|
Non-current liabilities |
|
|
| 20,102,056 |
| 13,793,471 |
Personnel, social charges and benefits |
| 15 |
| 36,028 |
| 11,903 |
Income and social contribution taxes payable |
| 7 |
| 86,512 |
| - |
Taxes, charges and contributions payable |
| 17 |
| 285,055 |
| 39,245 |
Deferred taxes |
| 7 |
| 3,146,453 |
| 1,982,952 |
Provisions and contingencies |
| 19 |
| 5,160,973 |
| 5,881,396 |
Deferred income |
| 21 |
| 211,901 |
| 250,526 |
Loans, financing, debentures and leases |
| 20 |
| 9,698,183 |
| 4,675,271 |
Derivative financial instruments |
| 31 |
| 54,212 |
| 22,845 |
Other liabilities |
| 22 |
| 1,422,739 |
| 929,333 |
|
|
|
|
|
|
|
TOTAL LIABILITIES |
|
|
| 37,834,144 |
| 30,954,291 |
|
|
|
|
|
|
|
Equity |
|
|
| 70,455,578 |
| 71,607,027 |
Capital |
| 23 |
| 63,571,416 |
| 63,571,416 |
Capital reserves |
| 23 |
| 1,165,463 |
| 1,213,532 |
Income reserves |
| 23 |
| 3,492,387 |
| 4,324,170 |
Other comprehensive income acumulated |
| 23 |
| 30,737 |
| 29,225 |
Additional proposed dividends |
| 23 |
| 2,195,575 |
| 2,468,684 |
|
|
|
|
|
|
|
TOTAL LIABILITIES AND EQUITY |
|
|
| 108,289,722 |
| 102,561,318 |
The accompanying notes are an integral part of these Consolidated Financial Statements.
F-6
Consolidated Statements of Income
Years ended December 31, 2019, 2018 and 2017
(In thousands of reais, except earnings per share)
|
| Note |
| 2019 |
| 2018 |
| 2017 | |||
Net operating revenue |
| 24 |
| 44,268,171 |
|
| 43,462,740 |
|
| 43,206,832 |
|
Cost of sales |
| 25 |
| (22,158,947 | ) |
| (21,025,767 | ) |
| (20,272,530 | ) |
Gross profit |
|
|
| 22,109,224 |
|
| 22,436,973 |
|
| 22,934,302 |
|
|
|
|
|
|
|
|
|
|
|
|
|
Operating income (expenses) |
|
|
| (14,895,300 | ) |
| (12,980,789 | ) |
| (16,302,065 | ) |
Selling expenses |
| 25 |
| (12,701,222 | ) |
| (12,832,741 | ) |
| (13,136,474 | ) |
General and administrative expenses |
| 25 |
| (2,498,096 | ) |
| (2,598,970 | ) |
| (2,443,105 | ) |
Other operating income |
| 26 |
| 929,498 |
|
| 4,077,003 |
|
| 464,182 |
|
Other operating expenses |
| 26 |
| (625,480 | ) |
| (1,626,081 | ) |
| (1,186,668 | ) |
Operating income |
|
|
| 7,213,924 |
|
| 9,456,184 |
|
| 6,632,237 |
|
|
|
|
|
|
|
|
|
|
|
|
|
Financial income |
| 27 |
| 1,132,870 |
|
| 4,112,640 |
|
| 1,755,958 |
|
Financial expenses |
| 27 |
| (1,953,011 | ) |
| (2,285,487 | ) |
| (2,659,002 | ) |
Equity pickup |
| 11 |
| 752 |
|
| (5,847 | ) |
| 1,580 |
|
Income before taxes |
|
|
| 6,394,535 |
|
| 11,277,490 |
|
| 5,730,773 |
|
Income and social contribution taxes |
| 7 |
| (1,393,521 | ) |
| (2,349,232 | ) |
| (1,121,983 | ) |
|
|
|
|
|
|
|
|
|
|
|
|
Net income for the year |
|
|
| 5,001,014 |
|
| 8,928,258 |
|
| 4,608,790 |
|
|
|
|
|
|
|
|
|
|
|
|
|
Basic and diluted earnings per common share (in R$) |
| 23 |
| 2.78 |
|
| 4.96 |
|
| 2.56 |
|
Basic and diluted earnings per preferred share (in R$) |
| 23 |
| 3.06 |
|
| 5.45 |
|
| 2.82 |
|
The accompanying notes are an integral part of these Consolidated Financial Statements.
F-7
Consolidated Statements of Other Comprehensive Income
Years ended December 31, 2019, 2018 and 2017
(In thousands of reais)
|
| Note |
| 2019 |
| 2018 |
| 2017 | |||
Net income for the year |
|
|
| 5,001,014 |
|
| 8,928,258 |
|
| 4,608,790 |
|
|
|
|
|
|
|
|
|
|
|
|
|
Other comprehensive income (losses) that may be reclassified into income (losses) in subsequent periods |
|
|
| 1,523 |
|
| 8,309 |
|
| 9,644 |
|
Losses on derivative financial instruments |
| 31 |
| (509 | ) |
| (2,450 | ) |
| (2,417 | ) |
Taxes |
| 7 |
| 173 |
|
| 832 |
|
| 822 |
|
|
|
|
|
|
|
|
|
|
|
|
|
Cumulative Translation Adjustments (CTA) on transactions in foreign currency |
| 11 |
| 1,859 |
|
| 9,927 |
|
| 11,239 |
|
|
|
|
|
|
|
|
|
|
|
|
|
Other comprehensive income (losses) not to be reclassified into income (losses) in subsequent periods |
|
|
| (132,131 | ) |
| (63,151 | ) |
| (113,588 | ) |
Unrealized gains (losses) on financial assets at fair value through other comprehensive income |
| 11 |
| (17 | ) |
| (625 | ) |
| 338 |
|
Actuarial losses and limitation effect of the assets of surplus plan |
| 30 |
| (201,660 | ) |
| (93,491 | ) |
| (171,296 | ) |
Taxes |
| 7 |
| 69,546 |
|
| 30,965 |
|
| 57,370 |
|
|
|
|
|
|
|
|
|
|
|
|
|
Other comprehensive losses |
|
|
| (130,608 | ) |
| (54,842 | ) |
| (103,944 | ) |
|
|
|
|
|
|
|
|
|
|
|
|
Total comprehensive income for the year |
|
|
| 4,870,406 |
|
| 8,873,416 |
|
| 4,504,846 |
|
The accompanying notes are an integral part of these Consolidated Financial Statements.
F-8
Consolidated Statements of Changes in Equity
Years ended December 31, 2019, 2018 and 2017
(In thousands of reais)
|
|
|
| Capital reserves |
| Income reserves |
|
|
|
|
|
|
|
| |||||||||||||||||||
|
| Capital |
| Special goodwill reserve |
| Other capital reserves |
| Treasury shares |
| Legal reserve |
| Tax incentive reserve |
| Expansion and modernization reserve |
| Retained earnings |
| Proposed additional dividends |
| Other comprehensive income acumulated |
| Total equity | |||||||||||
Balance on December 31, 2016 |
| 63,571,416 |
|
| 63,074 |
|
| 1,297,297 |
|
| (87,790 | ) |
| 1,907,905 |
|
| 17,069 |
|
| 550,000 |
|
| - |
|
| 1,913,987 |
|
| 11,461 |
|
| 69,244,419 |
|
Payment of additional dividend for 2016 |
| - |
|
| - |
|
| - |
|
| - |
|
| - |
|
| - |
|
| - |
|
| - |
|
| (1,913,987 | ) |
| - |
|
| (1,913,987 | ) |
Unclaimed dividends and interest on equity |
| - |
|
| - |
|
| - |
|
| - |
|
| - |
|
| - |
|
| - |
|
| 101,778 |
|
| - |
|
| - |
|
| 101,778 |
|
Repurchase of preferred shares |
| - |
|
| - |
|
| - |
|
| (32 | ) |
| - |
|
| - |
|
| - |
|
| - |
|
| - |
|
| - |
|
| (32 | ) |
Preferred shares delivered referring to the judicial process of expansion plan |
| - |
|
| - |
|
| - |
|
| 2 |
|
| - |
|
| - |
|
| - |
|
| - |
|
| - |
|
| - |
|
| 2 |
|
DIPJ adjustment - Tax incentives |
| - |
|
| - |
|
| - |
|
| - |
|
| - |
|
| 10,815 |
|
| - |
|
| (10,815 | ) |
| - |
|
| - |
|
| - |
|
Other comprehensive income |
| - |
|
| - |
|
| - |
|
| - |
|
| - |
|
| - |
|
| - |
|
| (113,811 | ) |
| - |
|
| 9,867 |
|
| (103,944 | ) |
Equity transactions (Note 1 c) |
| - |
|
| - |
|
| (59,029 | ) |
| - |
|
| - |
|
| - |
|
| - |
|
| - |
|
| - |
|
| - |
|
| (59,029 | ) |
Net income for the year |
| - |
|
| - |
|
| - |
|
| - |
|
| - |
|
| - |
|
| - |
|
| 4,608,790 |
|
| - |
|
| - |
|
| 4,608,790 |
|
Allocation of income: |
|
|
|
|
|
|
|
|
|
|
|
|
|
|
|
|
|
|
|
|
|
|
|
|
|
|
|
|
|
|
|
|
|
Legal reserve |
| - |
|
| - |
|
| - |
|
| - |
|
| 230,439 |
|
| - |
|
| - |
|
| (230,439 | ) |
| - |
|
| - |
|
| - |
|
Interim interest on equity |
| - |
|
| - |
|
| - |
|
| - |
|
| - |
|
| - |
|
| - |
|
| (2,416,639 | ) |
| - |
|
| - |
|
| (2,416,639 | ) |
Reversal of expansion and Modernization Reserve |
| - |
|
| - |
|
| - |
|
| - |
|
| - |
|
| - |
|
| (550,000 | ) |
| 550,000 |
|
| - |
|
| - |
|
| - |
|
Expansion and Modernization Reserve |
| - |
|
| - |
|
| - |
|
| - |
|
| - |
|
| - |
|
| 297,000 |
|
| (297,000 | ) |
| - |
|
| - |
|
| - |
|
Additional proposed dividends |
| - |
|
| - |
|
| - |
|
| - |
|
| - |
|
| - |
|
| - |
|
| (2,191,864 | ) |
| 2,191,864 |
|
| - |
|
| - |
|
Balance on December 31, 2017 |
| 63,571,416 |
|
| 63,074 |
|
| 1,238,268 |
|
| (87,820 | ) |
| 2,138,344 |
|
| 27,884 |
|
| 297,000 |
|
| - |
|
| 2,191,864 |
|
| 21,328 |
|
| 69,461,358 |
|
Effects of the initial adoption of IFRS 9 and 15, net of taxes |
| - |
|
| - |
|
| - |
|
| - |
|
| - |
|
| - |
|
| - |
|
| (138,663 | ) |
| - |
|
| - |
|
| (138,663 | ) |
Balance on January 1, 2018 |
| 63,571,416 |
|
| 63,074 |
|
| 1,238,268 |
|
| (87,820 | ) |
| 2,138,344 |
|
| 27,884 |
|
| 297,000 |
|
| (138,663 | ) |
| 2,191,864 |
|
| 21,328 |
|
| 69,322,695 |
|
Payment of additional dividend for 2017 |
| - |
|
| - |
|
| - |
|
| - |
|
| - |
|
| - |
|
| - |
|
| - |
|
| (2,191,864 | ) |
| - |
|
| (2,191,864 | ) |
Unclaimed dividends and interest on equity |
| - |
|
| - |
|
| - |
|
| - |
|
| - |
|
| - |
|
| - |
|
| 152,770 |
|
| - |
|
| - |
|
| 152,770 |
|
DIPJ adjustment - Tax incentives |
| - |
|
| - |
|
| - |
|
| - |
|
| - |
|
| 11,529 |
|
| - |
|
| (11,529 | ) |
| - |
|
| - |
|
| - |
|
Other comprehensive income |
| - |
|
| - |
|
| - |
|
| - |
|
| - |
|
| - |
|
| - |
|
| (62,739 | ) |
| - |
|
| 7,897 |
|
| (54,842 | ) |
Equity transactions |
| - |
|
| - |
|
| 10 |
|
| - |
|
| - |
|
| - |
|
| - |
|
| - |
|
| - |
|
| - |
|
| 10 |
|
Net income for the year |
| - |
|
| - |
|
| - |
|
| - |
|
| - |
|
| - |
|
| - |
|
| 8,928,258 |
|
| - |
|
| - |
|
| 8,928,258 |
|
Allocation of income: |
|
|
|
|
|
|
|
|
|
|
|
|
|
|
|
|
|
|
|
|
|
|
|
|
|
|
|
|
|
|
|
|
|
Legal reserve |
| - |
|
| - |
|
| - |
|
| - |
|
| 446,413 |
|
| - |
|
| - |
|
| (446,413 | ) |
| - |
|
| - |
|
| - |
|
Interim interest on equity |
| - |
|
| - |
|
| - |
|
| - |
|
| - |
|
| - |
|
| - |
|
| (4,550,000 | ) |
| - |
|
| - |
|
| (4,550,000 | ) |
Reversal of expansion and Modernization Reserve |
| - |
|
| - |
|
| - |
|
| - |
|
| - |
|
| - |
|
| (297,000 | ) |
| 297,000 |
|
| - |
|
| - |
|
| - |
|
Expansion and Modernization Reserve |
| - |
|
| - |
|
| - |
|
| - |
|
| - |
|
| - |
|
| 1,700,000 |
|
| (1,700,000 | ) |
| - |
|
| - |
|
| - |
|
Additional proposed dividends |
| - |
|
| - |
|
| - |
|
| - |
|
| - |
|
| - |
|
| - |
|
| (2,468,684 | ) |
| 2,468,684 |
|
| - |
|
| - |
|
Balance on December 31, 2018 |
| 63,571,416 |
|
| 63,074 |
|
| 1,238,278 |
|
| (87,820 | ) |
| 2,584,757 |
|
| 39,413 |
|
| 1,700,000 |
|
| 0 |
|
| 2,468,684 |
|
| 29,225 |
|
| 71,607,027 |
|
Payment of additional dividend for 2018 |
| - |
|
| - |
|
| - |
|
| - |
|
| - |
|
| - |
|
| - |
|
| - |
|
| (2,468,684 | ) |
| - |
|
| (2,468,684 | ) |
Unclaimed dividends and interest on equity |
| - |
|
| - |
|
| - |
|
| - |
|
| - |
|
| - |
|
| - |
|
| 82,898 |
|
| - |
|
| - |
|
| 82,898 |
|
DIPJ adjustment - Tax incentives |
| - |
|
| - |
|
| - |
|
| - |
|
| - |
|
| 18,166 |
|
| - |
|
| (18,166 | ) |
| - |
|
| - |
|
| - |
|
Other comprehensive income |
| - |
|
| - |
|
| - |
|
| - |
|
| - |
|
| - |
|
| - |
|
| (132,120 | ) |
| - |
|
| 1,512 |
|
| (130,608 | ) |
Equity transactions (Note 1 c.1) |
| - |
|
| - |
|
| (48,135 | ) |
| - |
|
| - |
|
| - |
|
| - |
|
| - |
|
| - |
|
| - |
|
| (48,135 | ) |
Other |
| - |
|
| - |
|
| 66 |
|
| - |
|
| - |
|
| - |
|
| - |
|
| - |
|
| - |
|
| - |
|
| 66 |
|
Net income for the year |
| - |
|
| - |
|
| - |
|
| - |
|
| - |
|
| - |
|
| - |
|
| 5,001,014 |
|
| - |
|
| - |
|
| 5,001,014 |
|
Allocation of income: |
|
|
|
|
|
|
|
|
|
|
|
|
|
|
|
|
|
|
|
|
|
|
|
|
|
|
|
|
|
|
|
|
|
Legal reserve |
| - |
|
| - |
|
| - |
|
| - |
|
| 250,051 |
|
| - |
|
| - |
|
| (250,051 | ) |
| - |
|
| - |
|
| - |
|
Interim interest on equity and dividends |
| - |
|
| - |
|
| - |
|
| - |
|
| - |
|
| - |
|
| - |
|
| (3,588,000 | ) |
| - |
|
| - |
|
| (3,588,000 | ) |
Reversal of expansion and Modernization Reserve |
| - |
|
| - |
|
| - |
|
| - |
|
| - |
|
| - |
|
| (1,700,000 | ) |
| 1,700,000 |
|
| - |
|
| - |
|
| - |
|
Expansion and Modernization Reserve |
| - |
|
| - |
|
| - |
|
| - |
|
| - |
|
| - |
|
| 600,000 |
|
| (600,000 | ) |
| - |
|
| - |
|
| - |
|
Additional proposed dividends |
| - |
|
| - |
|
| - |
|
| - |
|
| - |
|
| - |
|
| - |
|
| (2,195,575 | ) |
| 2,195,575 |
|
| - |
|
| - |
|
Balance on December 31, 2019 |
| 63,571,416 |
|
| 63,074 |
|
| 1,190,209 |
|
| (87,820 | ) |
| 2,834,808 |
|
| 57,579 |
|
| 600,000 |
|
| - |
|
| 2,195,575 |
|
| 30,737 |
|
| 70,455,578 |
|
F-9
Consolidated Statements of Cash Flows
Years ended December 31, 2019, 2018 and 2017
(In thousands in reais)
|
| 2019 |
| 2018 |
| 2017 | ||||||
Cash flows from operating activities |
|
|
|
|
|
| ||||||
|
|
|
|
|
|
| ||||||
Income before taxes |
|
| 6,394,535 |
|
|
| 11,277,490 |
|
|
| 5,730,773 |
|
Adjustment for: |
|
|
|
|
|
|
|
|
|
|
|
|
Depreciation and amortization |
|
| 10,919,792 |
|
|
| 8,368,623 |
|
|
| 7,853,734 |
|
Foreign exchange on loans and derivative financial instruments |
|
| (5,271 | ) |
|
| 30,664 |
|
|
| 57,832 |
|
Indexation accruals on assets and liabilities |
|
| 518,833 |
|
|
| 801,912 |
|
|
| 543,852 |
|
Equity pickup |
|
| (752 | ) |
|
| 5,847 |
|
|
| (1,580 | ) |
Losses (gains) on write-off/sale of assets |
|
| (329,603 | ) |
|
| (63,881 | ) |
|
| (74,337 | ) |
Impairment losses - trade accounts receivable |
|
| 1,682,348 |
|
|
| 1,533,660 |
|
|
| 1,481,015 |
|
Change in liability provisions |
|
| (116,717 | ) |
|
| (80,333 | ) |
|
| (93,479 | ) |
Write-off and reversals for impairment - inventories |
|
| (95,988 | ) |
|
| (45,223 | ) |
|
| (45,089 | ) |
Pension plans and other post-retirement benefits |
|
| 56,012 |
|
|
| 52,885 |
|
|
| 31,511 |
|
Provisions for tax, civil, labor and regulatory contingencies |
|
| 625,480 |
|
|
| 1,098,251 |
|
|
| 999,419 |
|
Interest expense |
|
| 782,921 |
|
|
| 497,797 |
|
|
| 926,220 |
|
Other |
|
| (143,208 | ) |
|
| (14,089 | ) |
|
| (8,737 | ) |
|
|
|
|
|
|
|
|
|
|
|
|
|
Changes in assets and liabilities |
|
|
|
|
|
|
|
|
|
|
|
|
Trade accounts receivable |
|
| (2,078,801 | ) |
|
| (1,603,002 | ) |
|
| (1,274,181 | ) |
Inventories |
|
| (15,843 | ) |
|
| (68,127 | ) |
|
| 106,393 |
|
Taxes recoverable |
|
| 87,550 |
|
|
| (5,849,648 | ) |
|
| (330,398 | ) |
Prepaid expenses |
|
| (188,641 | ) |
|
| 41,166 |
|
|
| 11,051 |
|
Other assets |
|
| 70,265 |
|
|
| (20,225 | ) |
|
| 82,109 |
|
Personnel, social charges and benefits |
|
| (13,303 | ) |
|
| 47,870 |
|
|
| (42,830 | ) |
Trade accounts payable |
|
| 286,513 |
|
|
| 1,056,817 |
|
|
| 121,577 |
|
Taxes, charges and contributions |
|
| 1,872,920 |
|
|
| 223,059 |
|
|
| 180,915 |
|
Provisions for tax, civil, labor and regulatory contingencies |
|
| (1,727,178 | ) |
|
| (3,928,925 | ) |
|
| (1,592,860 | ) |
Other liabilities |
|
| (11,477 | ) |
|
| (249,571 | ) |
|
| (472,771 | ) |
|
|
| 12,175,852 |
|
|
| 1,835,527 |
|
|
| 8,459,366 |
|
|
|
|
|
|
|
|
|
|
|
|
|
|
Cash generated from operations |
|
| 18,570,387 |
|
|
| 13,113,017 |
|
|
| 14,190,139 |
|
|
|
|
|
|
|
|
|
|
|
|
|
|
Interest paid |
|
| (746,986 | ) |
|
| (494,931 | ) |
|
| (859,586 | ) |
Income and social contribution taxes paid |
|
| (102,205 | ) |
|
| (676,659 | ) |
|
| (689,493 | ) |
|
|
|
|
|
|
|
|
|
|
|
|
|
Net cash generated by operating activities |
|
| 17,721,196 |
|
|
| 11,941,427 |
|
|
| 12,641,060 |
|
|
|
|
|
|
|
|
|
|
|
|
|
|
Cash flows from investing activities |
|
|
|
|
|
|
|
|
|
|
|
|
Additions to PP&E, intangible assets and others |
|
| (8,838,641 | ) |
|
| (8,517,458 | ) |
|
| (8,367,660 | ) |
Proceeds from sale of PP&E |
|
| 698,643 |
|
|
| 9,053 |
|
|
| 20,672 |
|
Cash paid for acquisition of companies, net of cash acquired |
|
| (70,844 | ) |
|
| - |
|
|
| (206,649 | ) |
Cash received from sale of investments |
|
| - |
|
|
| 10 |
|
|
| 31,804 |
|
Redemption net of judicial deposits |
|
| 277,894 |
|
|
| 2,832,062 |
|
|
| 83,500 |
|
Cash and cash equivalents by acquisition |
|
| 5,760 |
|
|
| - |
|
|
| - |
|
Other |
|
| - |
|
|
| - |
|
|
| 111 |
|
|
|
|
|
|
|
|
|
|
|
|
|
|
Net cash used in investing activities |
|
| (7,927,188 | ) |
|
| (5,676,333 | ) |
|
| (8,438,222 | ) |
|
|
|
|
|
|
|
|
|
|
|
|
|
Cash flows from financing activities |
|
|
|
|
|
|
|
|
|
|
|
|
Payment of loans, financing, debentures and leases |
|
| (3,696,660 | ) |
|
| (2,893,219 | ) |
|
| (4,485,495 | ) |
Loans and financing raised |
|
| - |
|
|
| - |
|
|
| 3,055,876 |
|
Receipts - derivative financial instruments |
|
| 192,124 |
|
|
| 181,117 |
|
|
| 107,846 |
|
Payments - derivative financial instruments |
|
| (100,581 | ) |
|
| (85,124 | ) |
|
| (267,254 | ) |
Dividend and interest on equity paid |
|
| (6,176,842 | ) |
|
| (4,136,878 | ) |
|
| (3,668,551 | ) |
Treasury shares |
|
| - |
|
|
| - |
|
|
| (32 | ) |
|
|
|
|
|
|
|
|
|
|
|
|
|
Net cash used in financing activities |
|
| (9,781,959 | ) |
|
| (6,934,104 | ) |
|
| (5,257,610 | ) |
|
|
|
|
|
|
|
|
|
|
|
|
|
Increase (decrease) in cash and cash equivalents |
|
| 12,049 |
|
|
| (669,010 | ) |
|
| (1,054,772 | ) |
Cash and cash equivalents at beginning of the year |
|
| 3,381,328 |
|
|
| 4,050,338 |
|
|
| 5,105,110 |
|
Cash and cash equivalents at end of the year |
|
| 3,393,377 |
|
|
| 3,381,328 |
|
|
| 4,050,338 |
|
F-10
Notes to Consolidated Financial Statements
Years ended December 31, 2019, 2018 and 2017
(In thousands of reais, unless otherwise stated)
1) | OPERATIONS |
a)Background information
Telefônica Brasil S.A. (the “Company” or “Telefônica Brasil”) is a publicly-held corporation whose corporate purpose includes operating telecommunications services; development of activities necessary or complementary to the execution of such services, in accordance with the concessions, authorizations and permissions granted; exploration of value-added services; offering of integrated solutions, management and provision of services related to: (i) data centers, including hosting and co-location; (ii) storage, processing and management of data, information, texts, images, videos, applications and information systems and similar; (iii) information technology; (iv) information and communication security; (v) telecommunications; and (vi) electronic security systems; licensing and sublicensing of software of any nature, among others.
The Company’s principal offices are located at 1376, Engenheiro Luis Carlos Berrini Avenue, in the city and state of São Paulo, Brazil. It is a member of the Telefónica Group (“Group”), based in Spain and operates in several countries across Europe and Latin America.
On December 31, 2019 and 2018, Telefónica S.A. (“Telefónica”), the Group holding company, held a total direct and indirect interest in the Company of 73.58% (Note 23).
The Company is registered with the Brazilian Securities Commission ("CVM") as a publicly held company under Category A (issuers authorized to trade any marketable securities). Its shares are traded on the B3. The Company is also registered with the Securities and Exchange Commission ("SEC"), of the United States of America, and its American Depositary Shares ("ADSs") Level II, backed preferred shares are traded on the New York Stock Exchange ("NYSE").
b)Operations
The Company renders services for: (i) Fixed Switched Telephone Service Concession Arrangement ("STFC"); (ii) Multimedia Communication Service ("SCM", data communication, including broadband internet); (iii) Personal Mobile Service ("SMP"); and (iv) Conditioned Access Service ("SEAC" - Pay TV), throughout Brazil, through concessions and authorizations, in addition to other activities.
Service concessions and authorizations are granted by Brazil's Telecommunications Regulatory Agency ("ANATEL"), the agency responsible for the regulation of the Brazilian telecommunications sector under the terms of Law No. 9472 of July 16, 1997 - General Telecommunications Law ("Lei Geral das Telecomunicações" - LGT).
In accordance with the STFC service concession agreement, every two years, during the agreement's 20-year term to December 31, 2025, the Company will pay a fee equivalent to 2% of its prior-year STFC revenue, net of applicable taxes and social contribution taxes (Note 22).
F-11
With the sanction of Law No. 13.879 / 2019, the terms of authorization to use radio frequencies associated with the SMP may be extendable for successive periods - until then, a single renewal with a validity of up to 15 years was allowed. The extension of these terms is granted against payment.
Currently, every two years after the first renewal of these agreements, the Company will pay a fee equivalent to 2% of its prior-year SMP revenue, net of applicable taxes and social contribution taxes (Note 22), and for certain terms, in the 15th year, the Company will pay 1% of its prior-year revenue. The calculation will consider the net revenue from Basic and Alternative Services Plans (Note 22).
The Company's authorization terms ("TA") for the operation of SMP, according to the SMP General Authorization Plan ("PGA"), are: (i) Region I - TA n. 078/2012 / PVCP / SPV-ANATEL; (ii) Region II - TA n ° 005/2010 / PVCP / SPV-ANATEL; and (iii) Region III - TA n ° 006/2010 / PVCP / SPV-ANATEL.
The terms of authorization for the use of the radio frequency bands are granted based on the results obtained in the respective radio frequency auction conducted by ANATEL.
The following is a summary of the authorizations for use of radio frequency bands, granted to the Company, according to the terms of authorization to operate the service in each region.
Radiofrequency |
| Band (MHz) |
| License Expiration (Year) |
450 MHz |
| 14 |
| 2027 |
700 MHz |
| 20 |
| 2029 |
800 MHz |
| 25 |
| 2020-2028 |
900 MHz |
| 5 |
| 2020-2023 |
1800 MHz |
| 20-50 |
| 2020-2023 |
2100 MHz |
| 20-30 |
| 2023 |
2500 MHz |
| 40-60 |
| 2027-2031 |
c)Corporate events that occurred in 2019 and 2018
c.1)Acquisition of TIS by Wholly Owned Subsidiary - 2019
On September 26, 2019, the Company announced that its wholly-owned subsidiary Terra Networks Brasil S.A. ("Terra Networks") had acquired all the shares representing the capital stock of Telefônica Infraestrutura e Segurança Ltda.("TIS"), owned by Telefônica Ingeniería de Seguridad S.A. and Telefônica Digital Espanã, S.L.U. ("Transaction").
TIS renders services and technology of information security systems, technical support and other services related to the infrastructure, technology and information.
The Transaction will enable Terra Networks, which includes among its activities the development of systems, to expand consulting and operational assistance, maximize commercialization of systems, licenses and applications, enabling the expansion of the portfolio of professional and managed services and the allow for the integration of the TIS and Terra Networks business offerings generating added value for the Company's client portfolio. Synergies will accrue from the companies as these are under the same management, in the activities of information technology, security, IoT and connectivity.
The TIS share price purchase consideration was R$70,844, due in a single installment. This was paid in cash by Terra Networks without need of financing. The purchase price was calculated based on the economic value of the TIS on the discounted cash flow criterion, at August 31, 2019, based on an appraisal report contracted by Terra Networks’ Board of Directors.
F-12
The sale and purchase agreement contain terms and provisions common to such transactions, such as seller's representations and warranties, indemnity and others. The Transaction was also preceded by an accounting, financial, legal and procedural audit of TIS.
Completion of the Transaction is not subject to regulatory or regulatory authorizations, or approvals by Company bodies. It was approved by Terra Networks' Board of Executive Officers pursuant to its by-laws.
The Transaction does not change the Company's ownership structure or cause any dilution to its shareholder value by accelerating their growth and increasing operational efficiency.
This Transaction, which involves companies under common control, was accounted for at the book value of the net assets acquired (“Predecessor Value Method”), as certain requirements for the use of the acquisition method set forth in IFRS 3 (R). Consequently, the difference between the consideration given in exchange for the equity interest obtained and the value of the net assets acquired was recorded in Terra Network’s equity.
Upon completion of the Transaction, as from September 1, 2019, TIS became a direct subsidiary of Terra Networks and indirectly owned by the Company.
c.2)Corporate Restructuring - 2018
At the Extraordinary General Meeting ("AGE") held on November 30, 2018, the corporate restructuring was approved, with the merger of the wholly owned subsidiary Telefônica Data SA ("TData") by the Company, with operational effects as from December 1, 2018.
TData was a subsidiary of the Company based in Brazil, whose purpose was to provide services, including, without limitation, the provision of audio, video, image and text content, applications and the like, exploration of integrated solutions and the provision of value-added services.
TData was the parent company of Telefônica Transportes e Logística Ltda. ("TGLog"), which exploits logistics activity; the administration and operation of general and customs warehouses throughout the national territory, among other logistics activities and of Terra Networks Brasil SA ("Terra Networks"), which provides digital services (value-added services ("SVA") and third parts and carrier billing, as well as mobile channels for sales and relationship) and advertising, with both companies headquartered in Brazil.
The TData merger had the objective of standardizing the rendering of services, simplifying the Group current organizational and corporate structure, and assisting in the integration of the Company's business with TData.
2) | BASIS OF PREPARATION AND PRESENTATION OF FINANCIAL STATEMENTS |
a)Statement of compliance
The consolidated financial statements were prepared and are presented in accordance with the International Financial Reporting Standards (“IFRS”), as issued by the International Accounting Standards Board (“IASB”).
b)Basis of preparation and presentation
The financial statements were prepared on a historical cost basis (except where different criteria are required) and adjusted to reflect the valuation of assets and liabilities measured at fair value or considering the mark-to-market valuation when such valuations are required by IFRS.
F-13
The Statement of Cash Flows was prepared in accordance with IAS 7 - Statement of Cash Flows and reflects the changes in cash that occurred in the years presented using the indirect method.
Assets and liabilities are classified as current when it is probable that their realization or settlement will occur in the next 12 months. Otherwise, they are classified and shown as non-current. The only exception relates to the balances of deferred tax assets and liabilities, which are classified and fully shown as non-current.
The Board of Directors authorized the issue of these individual and consolidated financial statements at the meeting held on February 14, 2020.
c)Functional and reporting currency
The Company’s financial statements for the years ended December 31, 2019, 2018 and 2017 are presented in thousands of Brazilian Real/Reais (R$), unless otherwise stated.
The Company’s functional and reporting currency is the Brazilian Real. Transactions in foreign currency are translated into Brazilian Reais as follows: (i) assets, liabilities and shareholders' equity (excluding capital stock and capital reserves) are translated at the closing exchange rate on the balance sheet date; (ii) expenses and revenues are translated at the average exchange rate, except for specific transactions that are converted by the transaction date rate; and (iii) the capital stock and capital reserves are converted at the transaction date rate.
Gains and losses from the conversion of investments abroad are recognized in the statement of comprehensive income. Gains and losses from the translation of monetary assets and liabilities between the exchange rate prevailing at the date of the transaction and the year-end closing (except for the conversion of investments abroad) are recognized in the statement of income.
d)Basis of consolidation
Interest held in subsidiaries or joint ventures is measured under the equity method in the individual financial statements. In the consolidated financial statements, investments and all asset and liability balances, revenues and expenses arising from transactions and interest held in subsidiaries are fully eliminated. Investments in joint ventures are measured under the equity method in the consolidated financial statements.
On December 31, 2019 and 2018, the Company holds direct equity interests in subsidiaries and joint ventures. Selected information on the Company's investees is as follows:
Investees |
| Type of investment |
| Equity interests |
| Country (Headquarters) |
| Core activity |
Terra Networks Brasil S.A. ("Terra Networks") |
| Subsidiary |
| 100.00% |
| Brazil |
| Telecommunications |
Telefônica Transportes e Logística Ltda ("TGLog") |
| Subsidiary |
| 99.99% |
| Brazil |
| Transports and logistics |
POP Internet Ltda ("POP") |
| Subsidiary |
| 99.99% |
| Brazil |
| Internet |
Aliança Atlântica Holding B.V. ("Aliança") |
| Joint venture |
| 50.00% |
| Brazil |
| Telecommunications sector holdings |
Companhia AIX de Participações ("AIX") |
| Joint venture |
| 50.00% |
| Holland |
| Operation of underground telecommunications networks |
Companhia ACT de Participações ("ACT") |
| Joint venture |
| 50.00% |
| Brazil |
| Technical assistance in telecommunication networks |
F-14
Terra Networks: The Company's direct and wholly-owned subsidiary on December 1, 2018 (Note 1 c.1), with headquarters in Brazil, has the purpose of providing digital services (own value-added services ("VAS") and third parties and carrier billing, as well as mobile channels for sales and relationship) and advertising.
Since September 1, 2019, Terra Networks became the direct parent company of TIS (Note 1 c.1), a company headquartered in Brazil, engaged in the exploration and provision of services and technology, information security systems, technical support and other services related to the infrastructure, technology and information.
TGLog: The Company's direct subsidiary on December 1, 2018 (Note 1 c.2), with its head office in Brazil, has as its object the provision of logistics activities; and the administration and operation of general and customs warehouses throughout the national territory, among other logistics activities.
POP: The Company's direct subsidiary with headquarters in Brazil, is engaged in the performance of activities related to information technology, internet and any other networks; hosting services and the commercial operation of websites and portals; handling, provision and storage of information and data; sale of software, hardware, telecommunication equipment and electronics; development, licensing and maintenance of information systems and routines; development of electronic commerce; creation and administration of own and/or third-party databases; sale of publicity and advertising and, banner vehicles; and holding interest in other companies as member or shareholder, and may also form consortia and/or other forms of association.
POP is the direct parent of Innoweb Ltda ("Innoweb"), whose business purpose is to operate as an internet provider; performing information activities; all forms of telecommunications activities, including the transmission of voice, data and information; sale of telecommunications and electronic equipment and/or accessories; and holding interest in other companies as member or shareholder, and may also form consortia and/or other forms of association.
Aliança: Joint venture, headquartered in Amsterdam, Netherlands, with 50% interest held by the Company, this entity is engaged in the acquisition and management of subsidiaries, and holding interest in companies of the telecommunications industry.
AIX: Joint venture, headquartered in Brazil, with 50% interest held by the Company, this entity is engaged in holding interest in Consórcio Refibra, and in performing activities related to the direct and indirect operation of activities associated with the construction, completion and operation of underground networks for optical fiber ducts.
ACT: Joint venture, headquartered in Brazil, with 50% interest held by the Company, this entity is engaged in holding interest in Consórcio Refibra, and in performing activities related to the rendering of technical support services for the preparation of projects and completion of networks, by means of studies required to make them economically feasible, and monitor the progress of Consortium-related activities.
e)Segment reporting
Business segments are defined as components of a company for which separate financial information is available and regularly assessed by the operational decision-making professional in definition of how to allocate funds to an individual segment and in the assessment of segment performance. Considering that: (i) all officers and managers' decisions are based on consolidated reports; (ii) the Company and its subsidiaries’ mission is to provide their customers with quality telecommunications services; and (iii) all decisions related to strategic planning, finance, purchases, short- and long-term investments are made on a consolidated basis, the Company and its subsidiaries operate in a single operating segment, namely the provision of telecommunications services.
F-15
f)Significant accounting practices
Significant and relevant accounting policies for the understanding of the basis of recognition and measurement applied in the preparation of the Company's financial statements are included in the respective notes to which they refer.
The accounting policies adopted in the preparation of the consolidated financial statements for the year ended December 31, 2019 are consistent with those used in the preparation of the consolidated annual financial statements for the year ended December 31, 2018, except for the changes required by the new pronouncements, interpretations and amendments approved for the IASB, which came into effect as of January 1, 2019, as follows:
Standards and amendments | ||
Improvements to IFRS Standards |
| 2015-2017 Cycle |
IFRS 16 |
| Leases |
IFRIC23 |
| Uncertainty over Income Tax Treatments |
Amendments to IFRS 9 |
| Prepayment Features with Negative Compensation |
Amendments to IAS 19 |
| Plan Amendment, Curtailment or Settlement |
Amendments to IAS 28 |
| Long-term Interest in associates and Joint Ventures |
The adoption of these standards, changes and interpretations did not have any significant impact on the consolidated financial statements in the initial adoption period, except for the purposes of IFRS 16 and IFRIC 23, which had significant impacts on the individual and consolidated financial position at the time of their adoption and prospectively.
The Company does not anticipate the early adoption of any pronouncement, interpretation or amendment that has been issued, before application is mandatory.
IFRS 16 Leases
IFRS 16 requires lessees to recognize assets and liabilities arising from all leases (except for short-term leases and leases of low-value assets) in the statement of financial position.
The Company is a lessee under a significant number of leases for various assets, such as towers and the respective land where they are located, circuits, offices, stores and commercial real estate.
The Company concluded its assessment of the impact of this new standard for such contracts. This analyze included an estimate of the lease term, based on the non-cancellable period and the periods covered by options to extend the lease when exercise is at the sole discretion of the Company and where such exercise is reasonably certain. This depends, to a large extent, on the specific facts and circumstances applicable to the main class of assets in the telecom industry (technology, regulation, competition, business model, among others). The Company adopted assumptions to calculate the discount rate, which was based on the incremental borrowing rate of interest over the estimated term. The Company has not separately recognized non-lease components from lease components for those classes of assets in which non-lease components are not material with respect to the total value of the lease.
F-16
The standard allows for two transition methods: retrospectively for all periods presented, or a modified retrospective approach that the cumulative effect of adoption is recognized on the dateof initial application. The Company has adopted the modified retrospective approach as a practical expedient that allows it to avoid having to re-evaluate whether a contract is or contains a lease on the date of the initial adoption of IFRS 16. It will directly apply the new requirements to all contracts that, under the current standard, have been identified as leasing contracts. Certain assumptions are permitted to be adopted on the first application in connection with the right to use, asset measurement, discount rates, impairment, leases that terminate within 12 months from the date of first adoption, direct start-up costs, and contract term of leasing.
Accordingly, the Company opted to adopt the following practical transition expedients to the new criteria: (i) use of a common discount rate for groups of contracts with similar characteristics in terms of term, contract object, currency and economic environment; (ii) non-requirement to adopt the new criteria for contracts that expire in 12 months from the date of the initial adoption; and (iii) exclusion of initial direct costs from the initial valuation of the rights-of-use assets on the date of the initial adoption.
Because of the number of contracts affected, as well as the high monetary value of future lease commitments, the adoption of IFRS 16 by the Company has had a significant impact on its financial information as of the date of its adoption (January 1, 2019), including recognition of the balance of the rights-of-use assets (Note 12) and their corresponding lease obligations (Note 19) for most of the contracts.
The following are the effects of the initial adoption of IFRS 16 on January 1, 2019:
Nominal value payable |
|
| 9,999,696 |
|
Unrealized financial expenses |
|
| (1,381,624 | ) |
Present value payable |
|
| 8,618,072 |
|
|
|
|
|
|
Current |
|
| 1,711,092 |
|
Non-current |
|
| 6,906,980 |
|
|
|
|
|
|
Initial adoption effects: |
|
|
|
|
Property, plant and equipment (Note 12) |
|
| 8,618,072 |
|
Loans, financing, debentures and leases (Note 20) |
|
| 8,618,072 |
|
The amortization of rights-of-use assets and the recognition of interest costs over the lease obligation in the statement of incomes replaced the amounts recognized as operating lease expenses in accordance with the lease standards. The classification of lease payments in the statement of cash flows is also affected by the requirements of the new lease standard.
To facilitate the understanding and comparability of information, the Company discloses in Note 34 the consolidated income statement for the year ended December 31, 2019, excluding the effects of adopting IFRS 16.
IFRIC 23 - Uncertainties over Income Tax Treatments
IFRIC 23 (Uncertainty about income tax treatment) deals with the accounting of income tax when tax treatments involve uncertainties that affect the application of IAS 12. This interpretation clarifies that the approach that best predicts the resolution of uncertainty must be followed and specifically addresses the assumptions an entity makes about the examination of tax treatments by tax authorities and how an entity determines taxable profit, tax base, tax losses and unused tax credits and tax rates, where there is uncertainty about the treatment of the tax income.
With the application of these requirements, on January 1, 2019, the Company carried out an asset reclassification in the amount of R$68,945 between the groups "Provisions and Contingencies" and "Income Tax and Social Contribution to be collected" (notes 7 and 19).
F-17
Amendments to IFRS 9 - Prepayment Features with Negative Compensation
Under IFRS 9, a debt instrument can be measured at amortized cost or at fair value through other comprehensive income, provided that the contractual cash flows are ‘solely payments of principal and interest on the principal amount outstanding’ (the SPPI criterion) and the instrument is held within the appropriate business model for that classification. The amendments to IFRS 9 clarify that a financial asset passes the SPPI criterion regardless of the event or circumstance that causes the early termination of the contract and irrespective of which party pays or receives reasonable compensation for the early termination of the contract.
Amendments to IAS 19 - Plan Amendment, Curtailment or Settlement
The amendments to IAS 19 specify that when a plan amendment, curtailment or settlement occurs during the annual reporting period, an entity is required to:
· | Determine current service cost for the remainder of the period after the plan amendment, curtailment or settlement, using the actuarial assumptions used to remeasure the net defined benefit liability (asset) reflecting the benefits offered under the plan and the plan assets after that event. |
· | Determine net interest for the remainder of the period after the plan amendment, curtailment or settlement using: the net defined benefit liability (asset) reflecting the benefits offered under the plan and the plan assets after that event; and the discount rate used to remeasure that net defined benefit liability (asset). |
The amendments also clarify that an entity first determines any past service cost, or a gain or loss on settlement, without considering the effect of the asset ceiling. This amount is recognized in profit or loss. An entity then determines the effect of the asset ceiling after the plan amendment, curtailment or settlement. Any change in that effect, excluding amounts included in the net interest, is recognized in other comprehensive income.
Amendments to IAS 28 - Long-term interests in associates and joint ventures
The amendments clarify that an entity applies IFRS 9 to long-term interests in an associate or joint venture to which the equity method is not applied but that, in substance, form part of the net investment in the associate or joint venture (long-term interests). This clarification is relevant because it implies that the expected credit loss model in IFRS 9 applies to such long-term interests. The amendments also clarify that, in applying IFRS 9, an entity does not take account of any losses of the associate or joint venture, or any impairment losses on the net investment, recognized as adjustments to the net investment in the associate or joint venture that arise from applying IAS 28 Investments in Associates and Joint Ventures.
Annual Improvements to IFRS Standards 2015-2017 Cycle
This text includes a number of improvements to existing IFRSs, mainly to eliminate inconsistencies and clarify the wording of some of these standards.
IFRS 3 Business Combinations
The amendments clarify that, when an entity obtains control of a business that is a joint operation, it applies the requirements for a business combination achieved in stages, including remeasuring previously held Interests in the assets and liabilities of the joint operation at fair value. In doing so, the acquirer remeasures its entire previously held interest in the joint operation.
F-18
IFRS 11 Joint Arrangements
A party that participates in, but does not have joint control of, a joint operation might obtain joint control of the joint operation in which the activity of the joint operation constitutes a business as defined in IFRS 3. The amendments clarify that the previously held interests in that joint operation are not remeasured.
IAS 12 Income Taxes
The amendments clarify that the income tax consequences of dividends are linked more directly to past transactions or events that generated distributable profits than to distributions to owners. Therefore, an entity recognises the income tax consequences of dividends in profit or loss, other comprehensive income or equity according to where the entity original recognized those past transactions or events.
IAS 23 Borrowing Costs
The amendments clarify that an entity treats as part of general borrowings any borrowing originally made to develop a qualifying asset when substantially all of the activities necessary to prepare that asset for its intended use or sale are complete.
New IFRS pronouncements, issues, amendments and interpretations of the IASB
In addition to the previously issued and amended standards, at the date of preparation of these financial statements, the following issues and changes in IFRS and IFRICs had been published but were not mandatory.
Standards and amendments |
| Mandatory application: annual periods beginning on or after | ||
Amendments to References to the Conceptual Framework in IFRS Standards |
| January 1, 2020 | ||
Amendments to IFRS 3 |
| Definition of a Business |
| January 1, 2020 |
Amendments to IAS 1 and IAS 8 |
| Definition of Material |
| January 1, 2020 |
IFRS 17 |
| Insurance Contracts |
| January 1, 2021 |
The adoption of these standards, amendments and interpretations will not have a significant impact on the consolidated financial statements in the initial period of adoption.
The Company does not anticipate the early adoption for the year ended December 31, 2019 of any pronouncement, interpretation or amendment that has been issued before application is mandatory.
F-19
g)Significant accounting judgments estimates and assumptions
The preparation of the financial statements requires the use of certain critical accounting estimates and the exercise of judgment by the Company's management in applying its accounting policies. These estimates are based on experience, knowledge, information available at the end of the year, and other factors, including expectations of future events that are believed to be reasonable in the circumstances. Actual results involving these estimates could differ in values from those recorded in the financial statements due to the criteria inherent in the estimation process. The Company reviews its estimates at least annually.
The significant and relevant estimates and judgments applied by the Company in the preparation of these financial statements are presented in the following notes: trade accounts receivable (Note 4); income and social contribution taxes (Note 7); property, plant and equipment (Note 12); intangible assets (Note 13); provision and contingencies (Note 19); net operating revenue (Note 24); pension plans and other post-employment benefits (Note 30); and financial instruments and risk and capital management (Note 31).
3) CASH AND CASH EQUIVALENTS
a) | Accounting policy |
These are financial assets classified at amortized cost or measured at fair value through profit or loss maintained in order to meet short-term cash commitments and not for investment or other purposes.The Company and its subsidiaries consider cash equivalents a short-term investment readily convertible into a known amount of cash and subject to insignificant risk of change in value. Short-term investments are classified as cash equivalents when redeemable within 90 days.
b) | Breakdown |
|
| 12.31.19 |
|
| 12.31.18 |
| ||
Cash and banks |
|
| 250,168 |
|
|
| 205,598 |
|
Short-term investments |
|
| 3,143,209 |
|
|
| 3,175,730 |
|
Total |
|
| 3,393,377 |
|
|
| 3,381,328 |
|
Highly liquid short-term investments basically comprise Bank Deposit Certificates (“CDB”) and Repurchase Agreements with first tier rated financial institutions, indexed to the Interbank Deposit Certificate (“CDI”) rate, with original maturities of up to three months, and with immaterial risk of change in value. Income from these investments are recorded as financial income.
4) TRADE ACCOUNTS RECEIVABLE
a) | Accounting policy |
These are financial assets measured initially at fair value and subsequently, at amortized cost and are evaluated by the value of the services provided and goods sold in accordance with the contracted conditions, net of estimated impairment losses. These include the services provided to customers, which were still not billed at the balance sheet date, as well as other trade accounts receivable related to the sale of cell phones, SIM cards, accessories, advertising and rent of IT equipment (“Soluciona TI” product).
The Company measures the provision for estimated impairment losses in an amount equal to the loss of credit expected for a lifetime.
F-20
b)Critical estimates and judgments
In determining whether the credit risk of a financial asset has increased significantly since the initial recognition and in estimating the expected credit losses, the Company considers reasonable and bearable information that is relevant and available. This includes quantitative and qualitative information and analysis, based on the Company's historical experience, credit assessment and considering forward-looking information. Although the Company believes that the assumptions used are reasonable, the results may be different.
c)Breakdown
|
| 12.31.19 |
|
| 12.31.18 |
| ||
Billed amounts |
|
| 7,018,601 |
|
|
| 6,789,257 |
|
Unbilled amounts |
|
| 2,866,196 |
|
|
| 2,454,810 |
|
Interconnection amounts |
|
| 790,046 |
|
|
| 835,887 |
|
Amounts from related parties (Note 28) |
|
| 129,904 |
|
|
| 148,814 |
|
Gross accounts receivable |
|
| 10,804,747 |
|
|
| 10,228,768 |
|
Estimated impairment losses |
|
| (1,644,797 | ) |
|
| (1,498,134 | ) |
Total |
|
| 9,159,950 |
|
|
| 8,730,634 |
|
|
|
|
|
|
|
|
|
|
Current |
|
| 8,719,497 |
|
|
| 8,304,382 |
|
Non-current |
|
| 440,453 |
|
|
| 426,252 |
|
Consolidated balances of non-current trade accounts receivable include:
|
| 12.31.19 |
|
| 12.31.18 |
| ||
Portion resale of goods to legal entities, receivable within 24 months |
|
| 182,286 |
|
|
| 180,065 |
|
Portion of accounts receivable from the OI group - Bankruptcy process of companies |
|
| 89,647 |
|
|
| 119,365 |
|
Soluciona IT product(1) |
|
| 317,988 |
|
|
| 293,531 |
|
Nominal amount receivable |
|
| 589,921 |
|
|
| 592,961 |
|
Deferred financial income |
|
| (48,086 | ) |
|
| (84,060 | ) |
Present value of accounts receivable |
|
| 541,835 |
|
|
| 508,901 |
|
Estimated impairment losses |
|
| (101,382 | ) |
|
| (82,649 | ) |
Net amount receivable |
|
| 440,453 |
|
|
| 426,252 |
|
(1) | The maturity schedule of the nominal amounts and the present value of the Soluciona IT product is up to five years. |
There are no unsecured residual values resulting in benefits to the lessor nor contingent payments recognized as revenue for the year.
The following are amounts receivable, net of estimated losses for impairment of accounts receivable, by maturity:
|
| 12.31.19 |
|
| 12.31.18 |
| ||
Falling due |
|
| 6,862,054 |
|
|
| 6,485,154 |
|
Overdue – 1 to 30 days |
|
| 966,986 |
|
|
| 1,096,639 |
|
Overdue – 31 to 60 days |
|
| 306,956 |
|
|
| 305,019 |
|
Overdue – 61 to 90 days |
|
| 192,622 |
|
|
| 200,401 |
|
Overdue – 91 to 120 days |
|
| 250,029 |
|
|
| 220,221 |
|
Overdue – over 120 days |
|
| 581,303 |
|
|
| 423,200 |
|
Total |
|
| 9,159,950 |
|
|
| 8,730,634 |
|
|
|
|
|
|
|
|
|
|
On December 31, 2019 and 2018, no customer represented more than 10% of trade accounts receivable, net.
F-21
d)Changes in contractual assets
The following table shows the changes in contractual assets (arising from the initial adoption of IFRS 15 on January 1, 2018), in the years ended December 31, 2019 and 2018:
|
| Contract assets, gross |
| Provision for losses |
| Contract assets, net | ||||||
Initial adoption on 01.01.18 |
|
| 193,675 |
|
|
| (33,196 | ) |
|
| 160,479 |
|
Additions |
|
| 587,733 |
|
|
| (512 | ) |
|
| 587,221 |
|
Amortizations |
|
| (585,675 | ) |
|
| - |
|
|
| (585,675 | ) |
Balance on 12.31.18 |
|
| 195,733 |
|
|
| (33,708 | ) |
|
| 162,025 |
|
Additions |
|
| 558,883 |
|
|
| (12,486 | ) |
|
| 546,397 |
|
Amortizations |
|
| (485,108 | ) |
|
| - |
|
|
| (485,108 | ) |
Balance on 12.31.19 |
|
| 269,508 |
|
|
| (46,194 | ) |
|
| 223,314 |
|
|
|
|
|
|
|
|
|
|
|
|
|
|
e)Changes in estimated losses for impairment
The following table shows the changes in estimated losses for impairment of accounts receivable.
Balance on 12.31.17 |
|
| (1,433,471 | ) |
Initial adoption IFRS 9 on 01.01.18 |
|
| (364,456 | ) |
Supplement to estimated losses, net of resersal (Note 25) |
|
| (1,533,660 | ) |
Write-offs |
|
| 1,833,453 |
|
Balance on 12.31.18 |
|
| (1,498,134 | ) |
Supplement to estimated losses, net of resersal (Note 25) |
|
| (1,682,348 | ) |
Write-offs |
|
| 1,547,577 |
|
Business combinations (Note 1 c.1) |
|
| (11,892 | ) |
Balance on 12.31.19 |
|
| (1,644,797 | ) |
|
|
|
|
|
5) | INVENTORIES |
a) | Accounting policy |
These are evaluated and presented at the lower of average acquisition cost and net realizable value, whichever is lower. These include resale materials such as cellphones, SIM cards, prepaid cards, accessories, consumption materials and maintenance. Net realizable value is the estimated selling price in the ordinary course of business, less estimated costs to sell.
Estimated impairment losses are set up for materials and devices considered obsolete or whose carrying amounts are in excess of those usually sold by the Company within a reasonable period. Additions and reversals of estimated impairment losses and inventory obsolescence are included in cost of goods sold (Note 25).
F-22
b) | Breakdown |
|
| 12.31.19 |
|
| 12.31.18 |
| ||
Materials for resale |
|
| 539,822 |
|
|
| 413,843 |
|
Materials for consumption |
|
| 41,584 |
|
|
| 61,819 |
|
Other inventories |
|
| 24,115 |
|
|
| 30,013 |
|
Gross total |
|
| 605,521 |
|
|
| 505,675 |
|
Estimated losses from impairment or obsolescence |
|
| (27,518 | ) |
|
| (43,622 | ) |
Total |
|
| 578,003 |
|
|
| 462,053 |
|
6) | PREPAID EXPENSES |
a) | Accounting policy |
These are stated at amounts effectively disbursed referring to services contracted but not yet incurred. Prepaid expenses are allocated to the statement of incomes to the extent that related services are rendered, and economic benefits are obtained.
Includes the amounts of incremental costs related to obtaining a contract (sales commissions and other acquisition costs from third parties), resulting from the adoption of IFRS 15 on January 1, 2018, are amortized over the same period as the revenue associated with that asset.
b) | Breakdown |
|
| 12.31.19 |
|
| 12.31.18 |
| ||
Advertising and publicity |
|
| 249,433 |
|
|
| 252,900 |
|
Insurance |
|
| 20,459 |
|
|
| 24,867 |
|
Rental |
|
| 184,248 |
|
|
| 32,792 |
|
Software and networks maintenance |
|
| 33,863 |
|
|
| 17,485 |
|
Incremental costs - IFRS 15 |
|
| 330,919 |
|
|
| 255,391 |
|
Financial charges |
|
| 30,521 |
|
|
| 43,853 |
|
Personal |
|
| 30,135 |
|
|
| 33,970 |
|
Taxes and other |
|
| 27,007 |
|
|
| 54,717 |
|
Total |
|
| 906,585 |
|
|
| 715,975 |
|
|
|
|
|
|
|
|
|
|
Current |
|
| 686,503 |
|
|
| 581,743 |
|
Non-current |
|
| 220,082 |
|
|
| 134,232 |
|
7) | INCOME AND SOCIAL CONTRIBUTION TAXES |
a) | Accounting policy |
a.1)Current taxes
Current tax assets and liabilities are measured at the estimated amount recoverable from, or payable to, the tax authorities. The tax rates and laws used in calculating the amounts referred to above are those in effect, or substantially in effect, at year-end. In the balance sheet, current taxes are presented net of prepayments over the year.
Current income and social contribution taxes, related to items directly recognized in equity, are also recognized in equity. Management regularly assesses the tax position in circumstances in which tax regulation requires interpretation and sets up provision therefore when appropriate.
F-23
a.2)Deferred taxes
Deferred tax assets are recognized for all deductible temporary differences, unused tax credits and losses, to the extent that taxable profit is likely to be available for realization of deductibletemporary differences and unused tax credits and losses are likely to be used, except: (i) when the deferred tax asset related to the deductible temporary difference arises from initial recognition of an asset or liability in a transaction other than a business combination and does not impact, at the transaction date, the book profit, income or loss for tax purposes; and (ii) on deductible temporary differences related to investments in subsidiaries that deferred tax assets are recognized only to the extent that it is probable that temporary differences will be reversed in the near future and taxable profit is likely be available so that temporary differences can be used.
The carrying amount of deferred tax assets is reviewed at each reporting date and reduced to the extent that it is no longer probable that sufficient taxable profit shall be available to allow all or part of the deferred tax asset to be used. Derecognized deferred tax assets are reassessed at each reporting date and are recognized to the extent that it has become probable that future taxable profits will allow the deferred tax asset to be recovered.
Deferred tax liabilities are recognized on all temporary tax differences, except: (i) when the deferred tax liability arises from initial recognition of goodwill, or an asset or liability in a transaction other than a business combination, and does not affect book profit or taxable profit or tax losses on the transaction date; and (ii) on temporary tax differences related to investments in subsidiaries, in which the temporary difference reversal period can be controlled and temporary differences are not likely to be reversed in the near future.
Deferred tax assets and liabilities are measured at the tax rate expected to be applicable for the year the asset will be realized, or the liability will be settled, based on the rates provided in tax legislation and that were published as at year-end.
Deferred tax assets and liabilities are not discounted to present value and are classified in the balance sheet as non-current, irrespective of their expected realization.
The tax effects of items recorded directly in equity are also recognized in equity. Deferred tax items are recognized based on the transaction which gave rise to that deferred tax, in comprehensive income or directly in equity.
Deferred tax assets and liabilities are presented net when there is a legal or constructive right to offset a tax asset against a tax liability and deferred taxes relate to the same taxpaying entity and are subject to the same tax authority.
b)Critical estimates and judgments
There are uncertainties regarding the interpretation of complex tax regulations and the amount and timing of future taxable profits. The Company and its subsidiaries set up provision, based on estimates, for possible consequences of different interpretation by the tax authorities. The amount of this provision is based on various factors, such as previous tax audit experience and different interpretations of tax regulations by the taxable entity and by the relevant tax authority. Such differences in interpretation may arise on a wide variety of issues depending on the conditions prevailing in the respective domicile of the Company or those of its subsidiaries.
The Company and its subsidiaries evaluate the recoverability of deferred tax assets based on estimates of future profits. This recoverability ultimately depends on the ability to generate taxable profits over the period in which the deferred tax asset is deductible. The analysis considers the reversal period of deferred tax liabilities, as well as estimates of taxable profits, based on updated internal projections reflecting the latest trends.
F-24
Determining the proper classification of the tax items depends on several factors, including an estimate of the period and the realization of the deferred tax asset and the expected date of payments of these taxes. The actual flow of receipt and payment of income tax could differ fromestimates made by the Company and its subsidiaries, as a result of changes in tax laws or of unexpected future transactions that may have an impact on tax balances.
c)Income and social contribution taxes recoverable
|
| 12.31.19 |
|
| 12.31.18 |
| ||
Income taxes recoverable |
|
| 380,314 |
|
|
| 245,883 |
|
Social contribution taxes recoverable |
|
| 31,281 |
|
|
| 28,706 |
|
Total |
|
| 411,595 |
|
|
| 274,589 |
|
|
|
|
|
|
|
|
|
|
d)Income and social contribution taxes payable
|
| 12.31.19 |
|
| 12.31.18 |
| ||
Income taxes payable |
|
| 76,483 |
|
|
| 8,756 |
|
Social contribution taxes payable |
|
| 16,614 |
|
|
| 3,253 |
|
Total |
|
| 93,097 |
|
|
| 12,009 |
|
|
|
|
|
|
|
|
|
|
Current |
|
| 6,585 |
|
|
| 12,009 |
|
Non-current |
|
| 86,512 |
|
|
| - |
|
The amount of R$86,512, recorded at the Company and consolidated on December 31, 2019, arises from the initial adoption ofIFRIC 23 - Uncertainties over Income Tax Treatment on January 1, 2019 (R$68,945) and its movements during the fiscal year. 2019 (Note 19).
F-25
e)Deferred taxes
Significant components of deferred income and social contribution taxes are as follows:
|
| Balance on 12.31.17 |
| Income statement |
| Comprehensive income |
| Effects of the initial adoption of IFRS 9 and IFRS 15 |
| Balance on 12.31.18 |
| Income statement |
| Comprehensive income |
| Balance on 12.31.19 | ||||||||||||||||
Deferred tax assets (liabilities) |
|
|
|
|
|
|
|
|
|
|
|
|
|
|
|
| ||||||||||||||||
Income and social contribution taxes on tax losses (1) |
|
| 793,933 |
|
|
| 634,543 |
|
|
| - |
|
|
| - |
|
|
| 1,428,476 |
|
|
| 51,360 |
|
|
| - |
|
|
| 1,479,836 |
|
Income and social contribution taxes on temporary differences (2) |
|
| (1,131,850 | ) |
|
| (2,151,290 | ) |
|
| 31,797 |
|
|
| 70,012 |
|
|
| (3,181,331 | ) |
|
| (1,343,635 | ) |
|
| 69,719 |
|
|
| (4,455,247 | ) |
Provisions for legal, labor, tax civil and regulatory contingencies |
|
| 2,298,735 |
|
|
| (333,035 | ) |
|
| - |
|
|
| - |
|
|
| 1,965,700 |
|
|
| (275,109 | ) |
|
| - |
|
|
| 1,690,591 |
|
Trade accounts payable and other provisions |
|
| 651,417 |
|
|
| (79,683 | ) |
|
| - |
|
|
| - |
|
|
| 571,734 |
|
|
| (40,393 | ) |
|
| - |
|
|
| 531,341 |
|
Customer portfolio and trademarks |
|
| 254,418 |
|
|
| (69,815 | ) |
|
| - |
|
|
| - |
|
|
| 184,603 |
|
|
| (86,525 | ) |
|
| - |
|
|
| 98,078 |
|
Estimated losses on impairment of accounts receivable |
|
| 434,960 |
|
|
| (115,661 | ) |
|
| - |
|
|
| 122,977 |
|
|
| 442,276 |
|
|
| 36,354 |
|
|
| - |
|
|
| 478,630 |
|
Estimated losses from modems and other P&E items |
|
| 200,941 |
|
|
| (24,811 | ) |
|
| - |
|
|
| - |
|
|
| 176,130 |
|
|
| 6,869 |
|
|
| - |
|
|
| 182,999 |
|
Pension plans and other post-employment benefits |
|
| 174,534 |
|
|
| 20,934 |
|
|
| 30,753 |
|
|
| - |
|
|
| 226,221 |
|
|
| 91,746 |
|
|
| 69,540 |
|
|
| 387,507 |
|
Profit sharing |
|
| 110,046 |
|
|
| 19,643 |
|
|
| - |
|
|
| - |
|
|
| 129,689 |
|
|
| (9,695 | ) |
|
| - |
|
|
| 119,994 |
|
Licenses |
|
| (1,636,886 | ) |
|
| (216,328 | ) |
|
| - |
|
|
| - |
|
|
| (1,853,214 | ) |
|
| (216,330 | ) |
|
| - |
|
|
| (2,069,544 | ) |
Goodwill (Spanish and Navytree, Vivo Part. and GVTPart.) |
|
| (3,598,172 | ) |
|
| (1,002,768 | ) |
|
| - |
|
|
| - |
|
|
| (4,600,940 | ) |
|
| (1,002,768 | ) |
|
| - |
|
|
| (5,603,708 | ) |
Property, plant and equipment of small value |
|
| - |
|
|
| (395,606 | ) |
|
| - |
|
|
| - |
|
|
| (395,606 | ) |
|
| 107,155 |
|
|
| - |
|
|
| (288,451 | ) |
Technological Innovation Law |
|
| (97,533 | ) |
|
| 47,406 |
|
|
| - |
|
|
| - |
|
|
| (50,127 | ) |
|
| 25,562 |
|
|
| - |
|
|
| (24,565 | ) |
Other temporary differences (3) |
|
| 75,690 |
|
|
| (1,566 | ) |
|
| 1,044 |
|
|
| (52,965 | ) |
|
| 22,203 |
|
|
| 19,499 |
|
|
| 179 |
|
|
| 41,881 |
|
Total deferred tax assets (liabilities), noncurrent |
|
| (337,917 | ) |
|
| (1,516,747 | ) |
|
| 31,797 |
|
|
| 70,012 |
|
|
| (1,752,855 | ) |
|
| (1,292,275 | ) |
|
| 69,719 |
|
|
| (2,975,411 | ) |
|
|
|
|
|
|
|
|
|
|
|
|
|
|
|
|
|
|
|
|
|
|
|
|
|
|
|
|
|
|
|
|
|
Deferred tax assets |
|
| 5,288,176 |
|
|
|
|
|
|
|
|
|
|
|
|
|
|
| 5,569,885 |
|
|
|
|
|
|
|
|
|
|
| 5,548,581 |
|
Deferred tax liabilities |
|
| (5,626,093 | ) |
|
|
|
|
|
|
|
|
|
|
|
|
|
| (7,322,740 | ) |
|
|
|
|
|
|
|
|
|
| (8,523,992 | ) |
Deferred tax assets (liabilities), net |
|
| (337,917 | ) |
|
|
|
|
|
|
|
|
|
|
|
|
|
| (1,752,855 | ) |
|
|
|
|
|
|
|
|
|
| (2,975,411 | ) |
|
|
|
|
|
|
|
|
|
|
|
|
|
|
|
|
|
|
|
|
|
|
|
|
|
|
|
|
|
|
|
|
|
Represented in the balance sheet as follows: |
|
|
|
|
|
|
|
|
|
|
|
|
|
|
|
|
|
|
|
|
|
|
|
|
|
|
|
|
|
|
|
|
Deferred tax assets |
|
| 371,408 |
|
|
|
|
|
|
|
|
|
|
|
|
|
|
| 230,097 |
|
|
|
|
|
|
|
|
|
|
| 171,042 |
|
Deferred tax liabilities |
|
| (709,325 | ) |
|
|
|
|
|
|
|
|
|
|
|
|
|
| (1,982,952 | ) |
|
|
|
|
|
|
|
|
|
| (3,146,453 | ) |
(1) | Under Brazilian tax legislation these may be offset up to 30% of the annual taxable income but otherwise have no expiry date.
| |
(2) | Amounts that will be realized upon payment of provision, occurrence of impairment losses for trade accounts receivable, or realization of inventories, as well as upon reversal of other provision.
| |
(3) | Deferred taxes from other temporary differences, such as deferred income, renewal of licenses, and subsidy on the sale of mobile phones, among others. |
F-26
On December 31, 2019, deferred tax assets (income and social contribution tax losses) were not recognized in the subsidiaries' (Innoweb, TGLog and TIS) accounting records, in the amount of R$54,570 (R$12,649 on December 31, 2018), as it is not probable that future taxable profits will be sufficient for offset for these subsidiaries to benefit from such tax credits.
Expected realization of deferred taxes, net, non-current. The amounts are based on projections subject to change in the future.
Year |
|
| ||
2020 |
|
| 1,614,967 |
|
2021 |
|
| 550,558 |
|
2022 |
|
| 531,585 |
|
2023 |
|
| 786,837 |
|
2024 |
|
| 654,638 |
|
2025 onwards |
|
| (7,113,996 | ) |
Total |
|
| (2,975,411 | ) |
|
|
|
|
|
f)Reconciliation of income tax and social contribution expense
The Company and its subsidiaries recognize income and social contribution taxes on a monthly basis, on an accrual basis, and pay taxes based on estimates, as per the tax auxiliary trial balance. Taxes calculated on profits up to the balance sheet date are recorded in liabilities or assets, as applicable.
Reconciliation of the reported tax expense and the amounts is calculated by applying the statutory tax rate of 34% (income tax of 25% and social contribution tax of 9%) in the table below for the year ended December 31, 2019, 2018 and 2017.
|
| 2019 |
|
| 2018 |
|
| 2017 |
| |||
Income before taxes |
|
| 6,394,535 |
|
|
| 11,277,490 |
|
|
| 5,730,773 |
|
Income and social contribution tax expenses, at the tax rate of 34% |
|
| (2,174,142 | ) |
|
| (3,834,347 | ) |
|
| (1,948,463 | ) |
Permanent differences |
|
|
|
|
|
|
|
|
|
|
|
|
Equity pickup, net of effects from interest on equity received and surplus value of the assets purchased attributed to the Company (Note 11) |
|
| 256 |
|
|
| (1,988 | ) |
|
| 537 |
|
Unclaimed interest on equity |
|
| (13,825 | ) |
|
| (14,426 | ) |
|
| (21,843 | ) |
Temporary differences in subsidiaries |
|
| - |
|
|
| - |
|
|
| 2,007 |
|
Non-deductible expenses, gifts, incentives |
|
| (84,487 | ) |
|
| (76,671 | ) |
|
| (94,413 | ) |
Deferred taxes recognized in subsidiaries on tax loss carryforwards, negative basis and temporary differences referring to prior years |
|
| - |
|
|
| - |
|
|
| 132,080 |
|
Tax benefit related to interest on equity allocated |
|
| 879,920 |
|
|
| 1,547,000 |
|
|
| 821,657 |
|
Other (additions) exclusions |
|
| (1,243 | ) |
|
| 31,200 |
|
|
| (13,545 | ) |
Tax debits |
|
| (1,393,521 | ) |
|
| (2,349,232 | ) |
|
| (1,121,983 | ) |
|
|
|
|
|
|
|
|
|
|
|
|
|
Effective rate |
|
| 21.8 | % |
|
| 20.8 | % |
|
| 19.6 | % |
Current income and social contribution taxes |
|
| (101,246 | ) |
|
| (832,485 | ) |
|
| (580,578 | ) |
Deferred income and social contribution taxes |
|
| (1,292,275 | ) |
|
| (1,516,747 | ) |
|
| (541,405 | ) |
g)Uncertainties about Income Tax Treatments
The Company and its subsidiaries has several assessments filed by the Federal Revenue of Brazil (“RFB”) for alleged undue deductions of expenses, mainly related to the amortization of goodwill, in various administrative instances and in the judicial system, in the amount of R$9,895,728. Management, supported by the position of its legal advisors, understands that a large part of these deductions will probably be accepted in decisions of higher courts of last resort (acceptance probability greater than 50%).
F-27
For tax treatments in which the Company and its subsidiaries believes that the probability of acceptance by the tax authority is less than 50%, an income tax and social contribution liability was recognized in the amount of R$86,512 (R$69,945 on January 1, 2019), in relation to these actions.
8) TAXES, CHARGES AND CONTRIBUTIONS RECOVERABLE
|
| 12.31.19 |
|
| 12.31.18 |
| ||
State VAT (ICMS) (1) |
|
| 2,664,499 |
|
|
| 2,549,006 |
|
Withholding taxes and contributions (2) |
|
| 142,940 |
|
|
| 129,741 |
|
PIS and COFINS (3) |
|
| 2,125,186 |
|
|
| 5,000,677 |
|
Fistel, INSS, ISS and other taxes |
|
| 84,935 |
|
|
| 217,056 |
|
Total |
|
| 5,017,560 |
|
|
| 7,896,480 |
|
|
|
|
|
|
|
|
|
|
Current |
|
| 4,176,362 |
|
|
| 4,674,218 |
|
Non-current |
|
| 841,198 |
|
|
| 3,222,262 |
|
(1) | Includes ICMS credits from the acquisition of property and equipment, available to offset in 48 months; requests for refund of ICMS paid on invoices that were subsequently cancelled; for the rendering of services; tax substitution; and tax rate difference; among others. Non-current consolidated amounts include credits arising from the acquisition of property and equipment of R$537,209 and R$509,920 on December 31, 2019 and 2018, respectively.
| |
(2) | Withholding income tax (“IRRF”) credits on short-term investments, interest on equity and others, which are used as deduction in operations for the period and social contribution tax withheld at source on services provided to public agencies.
| |
(3) | The balances of December 31, 2019 and 2018 include the tax credits of PIS and COFINS plus interest accruals based on the SELIC, in the amounts of R$2,046,274 and R$4,915,139, respectively, arising from the final judicial processes on May 17, 2018 and August 28, 2018, in favor of the Company and its subsidiary, which recognized the right to deduct ICMS from the basis of the calculation of PIS and COFINS contributions for the periods from September 2003 to June 2017 and July 2004 to July 2013, respectively. On December 31, 2019 the remaining current balance was R$2,046,274. On December 31, 2018, current and non-current balances were R$2,520,990 and R$2,394,149, respectively.
The Internal Revenue Service filed a review, pursuant to Law 13,670/18, with the purpose of approving the PIS and COFINS credits resulting from the dispute that dealt with the exclusion of ICMS from the bases of these contributions. The Company has made every effort, including judicial measures, to meet in a timely manner the requests of this audit procedure and thus continue offsetting its tax credits.
The Company has three other lawsuits of the same nature in progress (including lawsuits of companies that have already been merged - GVT and Telemig), treated as contingent assets, which cover several periods between December 2001 and June 2017, whose ranges of values we estimate between R$1,700 million to R$2,200 million. |
9) | JUDICIAL DEPOSITS AND GARNISHMENTS |
When granted suspension of tax liability, judicial deposits are required to be made by law to secure the continuance of the claims under discussion.
Judicial deposits are recorded at historical cost-plus legal indexation/interest accruals.
|
| 12.31.19 |
|
| 12.31.18 |
| ||
Judicial deposits |
|
|
|
|
|
|
|
|
Tax |
|
| 2,007,074 |
|
|
| 1,929,594 |
|
Labor |
|
| 316,009 |
|
|
| 522,201 |
|
Civil |
|
| 1,049,922 |
|
|
| 1,164,835 |
|
Regulatory |
|
| 261,005 |
|
|
| 208,447 |
|
Total |
|
| 3,634,010 |
|
|
| 3,825,077 |
|
Garnishments |
|
| 36,875 |
|
|
| 84,937 |
|
Total |
|
| 3,670,885 |
|
|
| 3,910,014 |
|
|
|
|
|
|
|
|
|
|
Current |
|
| 277,468 |
|
|
| 313,007 |
|
Non-current |
|
| 3,393,417 |
|
|
| 3,597,007 |
|
F-28
The table below presents the classified balances on December 31, 2019 and 2018 of the tax judicial deposits (classified by tax).
|
| 12.31.19 |
|
| 12.31.18 |
| ||
Telecommunications Inspection Fund (FISTEL) |
|
| 46,167 |
|
|
| 44,771 |
|
Corporate Income Tax (IRPJ) and Social Contribution Tax (CSLL) |
|
| 575,426 |
|
|
| 551,937 |
|
Universal Telecommunication Services Fund (FUST) |
|
| 518,372 |
|
|
| 503,246 |
|
Social Contribution Tax for Intervention in the Economic Order (CIDE) |
|
| 286,270 |
|
|
| 278,685 |
|
State Value-Added Tax (ICMS) |
|
| 269,483 |
|
|
| 239,220 |
|
Social Security, work accident insurance (SAT) and funds to third parties (INSS) |
|
| 140,186 |
|
|
| 141,759 |
|
Withholding Income Tax (IRRF) |
|
| 57,142 |
|
|
| 55,425 |
|
Contribution tax on gross revenue for Social Integration Program (PIS) and for Social Security Financing (COFINS) |
|
| 34,983 |
|
|
| 39,672 |
|
Other taxes, charges and contributions |
|
| 79,045 |
|
|
| 74,879 |
|
Total |
|
| 2,007,074 |
|
|
| 1,929,594 |
|
10) | OTHER ASSETS |
|
| 12.31.19 |
|
| 12.31.18 |
| ||
Advances to employees and suppliers |
|
| 73,849 |
|
|
| 83,094 |
|
Related-party receivables (Note 28) |
|
| 64,966 |
|
|
| 120,776 |
|
Receivables from suppliers |
|
| 167,540 |
|
|
| 114,175 |
|
Surplus from post-employment benefit plans (Note 30)(1) |
|
| 220,939 |
|
|
| 10,997 |
|
Goods for sale(2) |
|
| 76,912 |
|
|
| - |
|
Other amounts receivable (3) |
|
| 14,123 |
|
|
| 20,670 |
|
Total |
|
| 618,329 |
|
|
| 349,712 |
|
|
|
|
|
|
|
|
|
|
Current |
|
| 382,591 |
|
|
| 302,607 |
|
Non-current |
|
| 235,738 |
|
|
| 47,105 |
|
(1) | On December 31, 2019, includes the amount of R$209,347, referring to the distribution of the PBS-A surplus (Note 30).
| |
(2) | Refers to the residual balance of property, plant and equipment available for sale, resulting from the contract entered into by the Company on November 28, 2019, for the sale of 1,909 structures (rooftops and towers) owned by the Company to Telxius Torres Brasil Ltda (note 12).
| |
(3) | On December 31, 2019, includes a receivable of R$10,226 from a subletting agreement in the Curitiba Data Center, for a period of 22 years. There are no unsecured residual amounts that result in lessor benefits and no contingent payments recognized as income during the year (Note 12).
Selected information on subletting agreements on December 31, 2019; |
Nominal value receivable |
|
| 16,966 |
|
Deferred financial income |
|
| (6,740 | ) |
Present value of accounts receivable |
|
| 10,226 |
|
|
|
|
|
|
Current |
|
| 759 |
|
Non-current |
|
| 9,467 |
|
F-29
Schedule of amounts receivable from the subletting agreement, segregated into nominal values and present value:
Year |
| Nominal value receivable |
|
| Present value receivable |
| ||
2020 |
|
| 780 |
|
|
| 759 |
|
2021 |
|
| 780 |
|
|
| 721 |
|
2022 |
|
| 780 |
|
|
| 685 |
|
2023 |
|
| 780 |
|
|
| 651 |
|
2024 |
|
| 780 |
|
|
| 619 |
|
2025 onwards |
|
| 13,066 |
|
|
| 6,791 |
|
Total |
|
| 16,966 |
|
|
| 10,226 |
|
11) INVESTMENTS
a) | Accounting policy |
The consolidation of a subsidiary begins when the Company obtains control over the subsidiary and ends when the Company ceases to exercise said control. Assets, liabilities and results of a subsidiary acquired or sold during the year are included in the consolidated financial statements from the date on which the Company obtains control until the date on which the Company ceases to exercise control over the subsidiary.
Joint control is the contractually agreed sharing of a control, only existing when decisions about relevant activities call for unanimous agreement by the parties sharing control.
Control is obtained when the Company is exposed or has the right to variable returns based on its involvement with the investee and has the capacity of affecting those returns through the power exercised over an investee.
Based on the equity method, investments are recorded in balance sheets at cost plus changes after the acquisition of the equity interest. The statement of income reflects the portion of the results of operations of the investees.
When changes are directly recognized in the investees' equity, the Company will recognize its portion in variations occurred, and record these variations in the statements of changes in equity and in the statements of comprehensive income, where applicable.
The financial statements of investees are prepared for the same reporting period of the Company. Whenever necessary, adjustments are made so that the accounting policies are in accordance with those adopted by the Company.
After the equity method is applied, the Company determines whether there is any need to recognize additional impairment of its investment in investees. At each closing date, the Company determines whether there is objective evidence of impairment of investment in the affiliate. If so, the Company calculates the recoverable amount as the difference between the recoverable value of the investees and their carrying amount and recognizes the amount in the statement of incomes.
When there is loss of significant influence over the investees, the Company evaluates and recognizes the investment, at that moment, at fair value.Any difference between the investees’ carrying amount by the time it loses significant influence and the fair value of the remaining investment and revenue from sale is recognized in the statement of incomes.
Foreign exchange variations in Aliança’s equity (jointly controlled entity) are recognized in the Company’s equity in other comprehensive income (“Effects on conversion of investments abroad”, Note 23).
F-30
b) | Information on investees |
Selected financial data of the direct investees in which the Company holds an interest and corporate changes are described in Note 1 d.
|
| Joint Ventures (Aliança / AIX / ACT) | ||||||
|
| 12.31.19 |
| 12.31.18 | ||||
|
|
|
|
| ||||
Equity interest |
|
| 50.00 | % |
|
| 50.00 | % |
|
|
|
|
|
|
|
|
|
Summary of balance sheets: |
|
|
|
|
|
|
|
|
Current assets |
|
| 221,183 |
|
|
| 213,481 |
|
Non-current assets |
|
| 10,556 |
|
|
| 12,327 |
|
Total assets |
|
| 231,739 |
|
|
| 225,808 |
|
|
|
|
|
|
|
|
|
|
Current liabilities |
|
| 7,140 |
|
|
| 7,103 |
|
Non-current liabilities |
|
| 16,773 |
|
|
| 16,101 |
|
Equity |
|
| 207,826 |
|
|
| 202,604 |
|
Total liabilities and equity |
|
| 231,739 |
|
|
| 225,808 |
|
|
|
|
|
|
|
|
|
|
Investment Book value |
|
| 103,913 |
|
|
| 101,302 |
|
|
|
|
|
|
|
|
|
|
|
| Joint Ventures (Aliança / AIX / ACT) | ||||||||||
Summary Statements of Income: |
| 2019 |
|
| 2018 |
|
| 2017 |
| |||
Net operating income |
|
| 45,567 |
|
|
| 45,608 |
|
|
| 45,704 |
|
Operating costs and expenses |
|
| (44,325 | ) |
|
| (58,773 | ) |
|
| (43,571 | ) |
Financial income (expenses), net |
|
| 1,030 |
|
|
| 1,334 |
|
|
| 1,713 |
|
Income and social contribution taxes |
|
| (768 | ) |
|
| 137 |
|
|
| (686 | ) |
Net income (loss) for the year |
|
| 1,504 |
|
|
| (11,694 | ) |
|
| 3,160 |
|
|
|
|
|
|
|
|
|
|
|
|
|
|
Equity pickup, according to interest held |
|
| 752 |
|
|
| (5,847 | ) |
|
| 1,580 |
|
|
|
|
|
|
|
|
|
|
|
|
|
|
c) | Changes in investments |
|
| Joint Ventures (Aliança / AIX / ACT) |
| Other investments (1) |
| Total investments | ||||||
Balance on 12.31.17 |
|
| 97,222 |
|
|
| 1,680 |
|
|
| 98,902 |
|
Equity pick-up |
|
| (5,847 | ) |
|
| - |
|
|
| (5,847 | ) |
Provision for losses on investments |
|
| - |
|
|
| (700 | ) |
|
| (700 | ) |
Other comprehensive income |
|
| 9,927 |
|
|
| (625 | ) |
|
| 9,302 |
|
Balance on 12.31.18 |
|
| 101,302 |
|
|
| 355 |
|
|
| 101,657 |
|
Equity pick-up |
|
| 752 |
|
|
| - |
|
|
| 752 |
|
Other comprehensive income |
|
| 1,859 |
|
|
| (17 | ) |
|
| 1,842 |
|
Balance on 12.31.19 |
|
| 103,913 |
|
|
| 338 |
|
|
| 104,251 |
|
(1) | Other investments are measured at fair value. |
F-31
12) | PROPERTY, PLANT AND EQUIPMENT |
a) | Accounting policy |
It is measured at acquisition and/or construction cost, net of accumulated depreciation and/or accumulated impairment losses, if any. Such cost includes the borrowing costs for long-term construction projects if the recognition criteria are met and is stated net of ICMS (State VAT) credits, which were recorded as recoverable taxes.
Asset costs are capitalized until the asset becomes operational. Costs incurred after the asset becomes operational and that do not improve the functionality or extend the useful life of the asset are immediately recognized on an accrual basis. When significant parts of fixed assets are required to be replaced at intervals, the Company recognizes such parts as individual assets with specific useful lives and depreciation. Likewise, expenses that represent asset improvement (expanded installed capacity or useful life) are capitalized. All the other repair and maintenance costs are recognized in the statement of income as incurred.
The present value of the expected cost for the decommissioning of property, plant and equipment items (towers and equipment on leased property) is capitalized at the cost of the respective asset matched against the provision for dismantling obligations (Note 19) and depreciated over the useful lives of the related assets, which do not exceed the lease term.
Depreciation is calculated by the straight-line method over the useful lives of assets at rates that take into account the estimated useful lives of assets based on technical analyses. The assets’ residual values, useful lives and methods of depreciation are reviewed on a yearly basis, adjusted prospectively, if appropriate. Useful lives in terms of depreciation rates are reviewed annually by the Company.
Property, plant and equipment items are written off when sold or when no future economic benefit is expected from their use or sale. Any gains or losses arising from write-off of assets (measured as the difference between the net disposal proceeds and the carrying amount of the asset) are recognized in the statement of income in the year in which the asset is written off.
b)Critical estimates and judgments
The accounting treatment of investment in fixed assets includes estimating the useful life period for depreciation purposes, particularly for assets acquired in business combinations.
Useful life determination requires estimates regarding the expected technological developments and alternative uses of assets. The hypotheses related to the technological aspect and its future development imply a significant level of analysis, considering the difficulties in forecasting the time and nature of future technological changes.
An impairment loss exists when the carrying amount of an asset or cash-generating unit ("CGU") exceeds its recoverable amount, which is the higher of fair value less costs to sell and value in use. The calculation of fair value less costs to sell is based on available information from sales transactions of similar assets or market prices less additional costs to dispose of the asset. The calculation of the value in use is based on the discounted cash flow model. The recoverable amount is sensitive to the discount rate used in the discounted cash flow method, as well as the expected future cash receipts and the growth rate used for extrapolation purposes.
The Company periodically reviews the performance of the defined CGU in order to identify a possible devaluation. The determination of the recoverable value of the CGU also includes the use of assumptions and estimates and requires a significant degree of judgment and criterion.
c)Breakdown and changes
We present a brief description of the main items that make up fixed assets and their movements.
F-32
· | Switching and transmission media equipment: Includes switching and control centers, gateway, platforms, base radio station, microcells, minicells, repeaters, antennas, radios, access networks, concentrators, cables, TV equipment and other switching and transmission media equipment.
| |
· | Terminal/modem equipment: Includes cellphones and modems (rent and free lease), CPCT, public telephones and other terminal equipment.
| |
· | Infrastructure: This includes buildings, elevators, central air conditioning equipment, towers, posts, containers, energy equipment, land piping, support and protectors, leasehold improvements, etc.
| |
· | Other fixed asset items: These include vehicles, repair and construction tools and instruments, telesupervision equipment, IT equipment, testing and measurement equipment, fixtures and other goods for general use. |
|
| Switching and transmission equipment |
| Terminal equipment / modems |
| Infrastructure |
| Land |
| Other P&E |
| Estimated losses (1) |
| Assets and facilities under construction |
| Total | ||||||||||||||||
|
|
|
|
|
|
|
|
|
|
|
|
|
|
|
|
| ||||||||||||||||
Balances and changes: |
|
|
|
|
|
|
|
|
|
|
|
|
|
|
|
| ||||||||||||||||
Balance on 12.31.17 |
|
| 22,809,109 |
|
|
| 2,724,332 |
|
|
| 3,885,297 |
|
|
| 314,353 |
|
|
| 830,452 |
|
|
| (228,052 | ) |
|
| 2,886,825 |
|
|
| 33,222,316 |
|
Additions |
|
| 10,670 |
|
|
| 129,640 |
|
|
| 101,798 |
|
|
| 550 |
|
|
| 204,041 |
|
|
| (8,975 | ) |
|
| 6,527,074 |
|
|
| 6,964,798 |
|
Write-offs, net |
|
| (45,719 | ) |
|
| (1,721 | ) |
|
| (8,461 | ) |
|
| (71 | ) |
|
| (2,926 | ) |
|
| 80,135 |
|
|
| (61,430 | ) |
|
| (40,193 | ) |
Net transfers |
|
| 5,380,744 |
|
|
| 1,098,380 |
|
|
| 449,369 |
|
|
| - |
|
|
| 124,772 |
|
|
| - |
|
|
| (7,239,573 | ) |
|
| (186,308 | ) |
Depreciation (Note 25) |
|
| (3,486,592 | ) |
|
| (1,379,547 | ) |
|
| (658,915 | ) |
|
| - |
|
|
| (320,232 | ) |
|
| - |
|
|
| - |
|
|
| (5,845,286 | ) |
Balance on 12.31.18 |
|
| 24,668,212 |
|
|
| 2,571,084 |
|
|
| 3,769,088 |
|
|
| 314,832 |
|
|
| 836,107 |
|
|
| (156,892 | ) |
|
| 2,112,896 |
|
|
| 34,115,327 |
|
Initial adoption IFRS 16 effects |
|
| 91,836 |
|
|
| - |
|
|
| 8,526,236 |
|
|
| - |
|
|
| - |
|
|
| - |
|
|
| - |
|
|
| 8,618,072 |
|
Additions |
|
| 114,517 |
|
|
| 142,975 |
|
|
| 1,790,185 |
|
|
| - |
|
|
| 258,854 |
|
|
| (20,465 | ) |
|
| 6,576,296 |
|
|
| 8,862,362 |
|
Write-offs, net (2) |
|
| (17,069 | ) |
|
| (268 | ) |
|
| (139,857 | ) |
|
| (5,735 | ) |
|
| (2,182 | ) |
|
| 3,540 |
|
|
| (21,750 | ) |
|
| (183,321 | ) |
Net transfers |
|
| 4,265,573 |
|
|
| 1,299,368 |
|
|
| 504,010 |
|
|
| - |
|
|
| 88,100 |
|
|
| - |
|
|
| (6,242,551 | ) |
|
| (85,500 | ) |
Transfers of goods destined for sale (3) |
|
| (1,183 | ) |
|
| - |
|
|
| (248,175 | ) |
|
| (30,585 | ) |
|
| (67,143 | ) |
|
| - |
|
|
| (340 | ) |
|
| (347,426 | ) |
Subletting (4) |
|
| - |
|
|
| - |
|
|
| (10,310 | ) |
|
| - |
|
|
| - |
|
|
| - |
|
|
| - |
|
|
| (10,310 | ) |
Depreciation (Note 25) |
|
| (3,936,572 | ) |
|
| (1,426,890 | ) |
|
| (2,471,456 | ) |
|
| - |
|
|
| (297,234 | ) |
|
| - |
|
|
| - |
|
|
| (8,132,152 | ) |
Business combinations (Note 1 c.1) |
|
| - |
|
|
| 9 |
|
|
| 343 |
|
|
| - |
|
|
| 10,551 |
|
|
| (691 | ) |
|
| - |
|
|
| 10,212 |
|
Balance on 12.31.19 |
|
| 25,185,314 |
|
|
| 2,586,278 |
|
|
| 11,720,064 |
|
|
| 278,512 |
|
|
| 827,053 |
|
|
| (174,508 | ) |
|
| 2,424,551 |
|
|
| 42,847,264 |
|
|
|
|
|
|
|
|
|
|
|
|
|
|
|
|
|
|
|
|
|
|
|
|
|
|
|
|
|
|
|
|
|
|
Balance on 12.31.18 |
|
|
|
|
|
|
|
|
|
|
|
|
|
|
|
|
|
|
|
|
|
|
|
|
|
|
|
|
|
|
|
|
Cost |
|
| 79,002,102 |
|
|
| 18,033,246 |
|
|
| 16,154,562 |
|
|
| 314,832 |
|
|
| 4,996,170 |
|
|
| (156,892 | ) |
|
| 2,112,896 |
|
|
| 120,456,916 |
|
Accumulated depreciation |
|
| (54,333,890 | ) |
|
| (15,462,162 | ) |
|
| (12,385,474 | ) |
|
| - |
|
|
| (4,160,063 | ) |
|
| - |
|
|
| - |
|
|
| (86,341,589 | ) |
Total |
|
| 24,668,212 |
|
|
| 2,571,084 |
|
|
| 3,769,088 |
|
|
| 314,832 |
|
|
| 836,107 |
|
|
| (156,892 | ) |
|
| 2,112,896 |
|
|
| 34,115,327 |
|
|
|
|
|
|
|
|
|
|
|
|
|
|
|
|
|
|
|
|
|
|
|
|
|
|
|
|
|
|
|
|
|
|
Balance on 12.31.19 |
|
|
|
|
|
|
|
|
|
|
|
|
|
|
|
|
|
|
|
|
|
|
|
|
|
|
|
|
|
|
|
|
Cost |
|
| 83,028,079 |
|
|
| 19,329,470 |
|
|
| 26,269,769 |
|
|
| 278,512 |
|
|
| 5,218,153 |
|
|
| (174,508 | ) |
|
| 2,424,551 |
|
|
| 136,374,026 |
|
Accumulated depreciation |
|
| (57,842,765 | ) |
|
| (16,743,192 | ) |
|
| (14,549,705 | ) |
|
| - |
|
|
| (4,391,100 | ) |
|
| - |
|
|
| - |
|
|
| (93,526,762 | ) |
Total |
|
| 25,185,314 |
|
|
| 2,586,278 |
|
|
| 11,720,064 |
|
|
| 278,512 |
|
|
| 827,053 |
|
|
| (174,508 | ) |
|
| 2,424,551 |
|
|
| 42,847,264 |
|
F-33
(1) | The Company and its subsidiaries recognized estimated losses for potential obsolescence of materials used for property and equipment maintenance, based on levels of historical use and expected future use.
| |
(2) | Includes the amount of R$12,065 in the Infrastructure, related to cancellation of lease agreements (Note 20).
| |
(3) | Refers to assets sold from the Tamboré and Curitiba (CIC) data centers, sold for the amounts of R$419,690 to a company controlled by Asterion Industrial Partners SGEIC, SA, pursuant to an agreement entered into by the Company on May 8, 2019 and concluded. with the settlement on July 24, 2019, generating a gain in operating income of R$64,275.
It also includes the residual balance of property, plant and equipment intended for sale, resulting from the contract entered into by the Company on November 28, 2019, for the sale of 1,909 structures (rooftops and towers) owned by the Company to Telxius Torres Brasil Ltda (note 10).
| |
(4) | Refers to the lease of areas in the Curitiba data center. |
d)Depreciation rates
In the years ended December 31, 2019 and 2018, the Company performed valuations of useful lives applied to its property, plant and equipment using the direct comparative method of market data. The results of these evaluations indicated the need for changes in useful lives.
For the year ended December 31, 2019 and 2018, this change in accounting estimate, which was applied, increased depreciation expense by R$283,552 and R$267,657 in 2019 and 2018, respectively.
The depreciation rates below were reviewed as of January 1, 2019, upon adoption of IFRS 16, generating an increase of R$1,882,950 in depreciation costs and expenses in the year ended December 31, 2019. The following is a comparative table of these rates.
Description |
|
|
|
| 12.31.19 |
| 12.31.18 |
Switching and transmission equipment and media |
|
|
| 2.50% to 92.31% |
| 2.50% to 25.00% | |
Terminal equipment / modems |
|
|
|
| 6.67% to 66.67% |
| 6.67% to 66.67% |
Infrastructure |
|
|
|
| 2.50% to 92.31% |
| 2.50% to 66.67% |
Other P&E assets |
|
|
|
| 10.00% to 25.00% |
| 10.00% to 25.00% |
e)Additional information on leases
Changes in leases, after the adoption of IFRS 16, already included inthe asset movement tables (Note 12.c), are as follows.
|
| Switching and transmission equipment |
| Infrastructure |
| Other |
| Total | ||||||||
|
|
|
|
|
|
|
|
| ||||||||
Annual depreciation rate (%) |
|
| 5.00 to 92.31 |
|
|
| 3.13 to 92.31 |
|
|
| 20.00 |
|
|
|
|
|
|
|
|
|
|
|
|
|
|
|
|
|
|
|
|
| |
Balances and changes: |
|
|
|
|
|
|
|
|
|
|
|
|
|
|
|
|
Balance on 12.31.18(1) |
|
| 186,554 |
|
|
| 189,455 |
|
|
| 10,950 |
|
|
| 386,959 |
|
Initial Adoption on 01.01.19 |
|
| 91,836 |
|
|
| 8,526,236 |
|
|
| - |
|
|
| 8,618,072 |
|
Additions |
|
| 107,108 |
|
|
| 1,696,833 |
|
|
| - |
|
|
| 1,803,941 |
|
Subletting (Note 12.c) |
|
| - |
|
|
| (10,310 | ) |
|
|
|
|
|
| (10,310 | ) |
Depreciation and write-offs, net (IAS 17) |
|
| - |
|
|
| (50,819 | ) |
|
| (7,730 | ) |
|
| (58,549 | ) |
Depreciation (IFRS 16) |
|
| (39,192 | ) |
|
| (1,843,758 | ) |
|
| - |
|
|
| (1,882,950 | ) |
Cancellation of contracts |
|
| - |
|
|
| (105,952 | ) |
|
| - |
|
|
| (105,952 | ) |
Balance on 12.31.19 |
|
| 346,306 |
|
|
| 8,401,685 |
|
|
| 3,220 |
|
|
| 8,751,211 |
|
(1) Includes lease under IAS 17 and provision for dismantling for the leases.
F-34
f)Property and equipment items pledged in guarantee
On December 31, 2019, the Company had property and equipment pledged in guarantee for lawsuits, of R$81,416 (R$94,641 on December 31, 2018).
g)Reversible assets
The STFC service concession arrangement establishes that all assets owned by the Company and that are indispensable to the provision of the services described in the arrangement are considered “reversible” (returnable to the concession authority). On December 31, 2019, estimated residual value of reversible assets was R$8,259,852 (R$8,621,863 on December 31, 2018), which comprised switching and transmission equipment and public use terminals, external network equipment, energy, system and operational support equipment.
13) INTANGIBLE ASSETS
a) | Accounting policy |
Intangible assets acquired separately are measured at acquisition / construction cost upon their initial recognition. The cost of an intangible asset acquired in a business combination is its fair value at the acquisition date.
After initial recognition, intangible assets are stated at acquisition and/or buildup cost, net of amortization and accumulated provision for impairment, where applicable. Intangible assets generated internally, excluding capitalized development costs, are not capitalized, and the expense is reflected in the statement of income for the year in which it is incurred.
The useful lives of intangible assets are considered finite or indefinite.
· | Intangible assets with finite useful lives are amortized over their economic useful lives under the straight-line method and are tested for impairment whenever there is any indication of impairment loss. The amortization period and the amortization method for an intangible asset with a finite useful life are reviewed on an annual basis.
| |
Changes in the estimated useful life or the expected pattern of consumption of future economic benefits embodied in an asset are accounted for by changing the amortization period or method, as appropriate, and treated as changes in accounting estimates. The amortization expense on intangible assets with finite lives is recognized in the statement of income in the cost/expense category consistent with the function of the intangible assets.
| ||
· | Intangible assets with indefinite useful lives are not amortized, but are tested for impairment annually, either individually or at the CGU level. The assessment of indefinite life is reviewed annually to determine whether the indefinite life continues to be justifiable. Otherwise, changes in useful life – from indefinite to finite - are carried out prospectively. Goodwill generated upon investment acquisition is treated as an intangible asset with indefinite useful lifes. |
F-35
Gains and losses arising from derecognition of an intangible asset are measured as the difference between the net disposal proceeds and the carrying amount of the asset and recognized in the statement of income on disposal.
b)Critical estimates and judgments
An impairment loss exists when the carrying amount of an asset or CGU exceeds its recoverable amount, which is the higher of fair value less costs to sell and value in use. The calculation of fair value less costs to sell is based on available information from sales transactions of similar assets or market prices less additional costs to dispose of the asset. The calculation of the value in use is based on the discounted cash flow model. The recoverable amount is sensitive to the discount rate used in the discounted cash flow method, as well as the expected future cash receipts and the growth rate used for extrapolation purposes.
The Company periodically reviews the performance of the defined CGU in order to identify a possible devaluation in goodwill and other assets. The determination of the recoverable value of the CGU to which the goodwill is attributed also includes the use of assumptions and estimates and requires a significant degree of judgment and criterion.
The accounting treatment of the investment in intangible assets includes making estimates to determine the useful life for amortization purposes, particularly for assets acquired in business combinations.
The determination of the useful lives requires estimates in relation to the expected technological evolution and the alternative use of the assets. Hypotheses related to the technological aspect and its future development imply a significant degree of analysis, since the timing and nature of future technological changes are difficult to predict.
c)Breakdown, changes and amortization rates
A brief description of the key intangible asset items with finite useful lives, is as follows:
· | Software: This includes licenses for software used in the Company’s operating, commercial and administrative activities.
| |
· | Customer portfolio and trademarks: This includes intangible assets acquired through business combination.
| |
· | Licenses: These include concession and authorization licenses, acquired from ANATEL for provision of telecommunication services. These also include licenses from business combinations. |
F-36
|
| Indefinite useful life |
| Finite useful life |
|
| ||||||||||||||||||||||||||||||
|
| Goodwill |
| Software |
| Customer portfolio |
| Trademarks |
| Licenses |
| Other intangible assets |
| Estimated losses for software |
| Software under development |
| Total | ||||||||||||||||||
|
|
|
|
|
|
|
|
|
|
|
|
|
|
|
|
|
|
| ||||||||||||||||||
Annual amortization rate (%) |
|
|
|
|
|
| 20.00 to 50.00 |
|
|
| 11.76 to 12.85 |
|
|
| 5.13 to 66.67 |
|
|
| 3.60 to 6.67 |
|
|
| 6.67 to 20.00 |
|
|
|
|
|
|
|
|
|
|
|
|
|
|
|
|
|
|
|
|
|
|
|
|
|
|
|
|
|
|
|
|
|
|
|
|
|
|
|
|
|
|
|
|
|
|
|
|
|
|
Balances and changes: |
|
|
|
|
|
|
|
|
|
|
|
|
|
|
|
|
|
|
|
|
|
|
|
|
|
|
|
|
|
|
|
|
|
|
|
|
Balance on 12.31.17 |
|
| 23,062,421 |
|
|
| 2,720,806 |
|
|
| 1,978,863 |
|
|
| 1,073,615 |
|
|
| 13,969,606 |
|
|
| 20,952 |
|
|
| (499 | ) |
|
| 506,140 |
|
|
| 43,331,904 |
|
Additions |
|
| - |
|
|
| 970,172 |
|
|
| - |
|
|
| - |
|
|
| 6,647 |
|
|
| - |
|
|
| - |
|
|
| 249,307 |
|
|
| 1,226,126 |
|
Write-offs, net |
|
| - |
|
|
| (16 | ) |
|
| - |
|
|
| - |
|
|
| - |
|
|
| - |
|
|
| - |
|
|
| - |
|
|
| (16 | ) |
Net transfers |
|
| - |
|
|
| 519,539 |
|
|
| - |
|
|
| - |
|
|
| - |
|
|
| 32,539 |
|
|
| - |
|
|
| (365,770 | ) |
|
| 186,308 |
|
Amortization (Note 25) |
|
| - |
|
|
| (965,459 | ) |
|
| (549,589 | ) |
|
| (84,205 | ) |
|
| (920,116 | ) |
|
| (3,968 | ) |
|
| - |
|
|
| - |
|
|
| (2,523,337 | ) |
Balance on 12.31.18 |
|
| 23,062,421 |
|
|
| 3,245,042 |
|
|
| 1,429,274 |
|
|
| 989,410 |
|
|
| 13,056,137 |
|
|
| 49,523 |
|
|
| (499 | ) |
|
| 389,677 |
|
|
| 42,220,985 |
|
Additions |
|
| - |
|
|
| 374,690 |
|
|
| - |
|
|
| - |
|
|
| - |
|
|
| - |
|
|
| - |
|
|
| 1,390,731 |
|
|
| 1,765,421 |
|
Write-offs, net (1) |
|
| (3,249 | ) |
|
| (5,066 | ) |
|
| - |
|
|
| - |
|
|
| - |
|
|
| (58 | ) |
|
| - |
|
|
| - |
|
|
| (8,373 | ) |
Net transfers |
|
| - |
|
|
| 1,314,978 |
|
|
| - |
|
|
| - |
|
|
| - |
|
|
| (6 | ) |
|
| - |
|
|
| (1,229,472 | ) |
|
| 85,500 |
|
Transfers of goods destined for sale (2) |
|
| - |
|
|
| (1,537 | ) |
|
| - |
|
|
| - |
|
|
| - |
|
|
| - |
|
|
| - |
|
|
| - |
|
|
| (1,537 | ) |
Business combinations (Note 1 c.1) |
|
| - |
|
|
| 596 |
|
|
| - |
|
|
| - |
|
|
| - |
|
|
| - |
|
|
| - |
|
|
| - |
|
|
| 596 |
|
Amortization (Note 25) |
|
| - |
|
|
| (1,234,949 | ) |
|
| (500,441 | ) |
|
| (84,205 | ) |
|
| (964,316 | ) |
|
| (3,729 | ) |
|
| - |
|
|
| - |
|
|
| (2,787,640 | ) |
Balance on 12.31.19 |
|
| 23,059,172 |
|
|
| 3,693,754 |
|
|
| 928,833 |
|
|
| 905,205 |
|
|
| 12,091,821 |
|
|
| 45,730 |
|
|
| (499 | ) |
|
| 550,936 |
|
|
| 41,274,952 |
|
|
|
|
|
|
|
|
|
|
|
|
|
|
|
|
|
|
|
|
|
|
|
|
|
|
|
|
|
|
|
|
|
|
|
|
|
|
Balance on 12.31.18 |
|
|
|
|
|
|
|
|
|
|
|
|
|
|
|
|
|
|
|
|
|
|
|
|
|
|
|
|
|
|
|
|
|
|
|
|
Cost |
|
| 23,062,421 |
|
|
| 16,604,769 |
|
|
| 4,513,278 |
|
|
| 1,658,897 |
|
|
| 20,244,219 |
|
|
| 270,741 |
|
|
| (499 | ) |
|
| 389,677 |
|
|
| 66,743,503 |
|
Accumulated amortization |
|
| - |
|
|
| (13,359,727 | ) |
|
| (3,084,004 | ) |
|
| (669,487 | ) |
|
| (7,188,082 | ) |
|
| (221,218 | ) |
|
| - |
|
|
| - |
|
|
| (24,522,518 | ) |
Total |
|
| 23,062,421 |
|
|
| 3,245,042 |
|
|
| 1,429,274 |
|
|
| 989,410 |
|
|
| 13,056,137 |
|
|
| 49,523 |
|
|
| (499 | ) |
|
| 389,677 |
|
|
| 42,220,985 |
|
|
|
|
|
|
|
|
|
|
|
|
|
|
|
|
|
|
|
|
|
|
|
|
|
|
|
|
|
|
|
|
|
|
|
|
|
|
Balance on 12.31.19 |
|
|
|
|
|
|
|
|
|
|
|
|
|
|
|
|
|
|
|
|
|
|
|
|
|
|
|
|
|
|
|
|
|
|
|
|
Cost |
|
| 23,059,172 |
|
|
| 18,310,812 |
|
|
| 4,513,278 |
|
|
| 1,658,897 |
|
|
| 20,244,219 |
|
|
| 270,000 |
|
|
| (499 | ) |
|
| 550,936 |
|
|
| 68,606,815 |
|
Accumulated amortization |
|
| - |
|
|
| (14,617,058 | ) |
|
| (3,584,445 | ) |
|
| (753,692 | ) |
|
| (8,152,398 | ) |
|
| (224,270 | ) |
|
| - |
|
|
| - |
|
|
| (27,331,863 | ) |
Total |
|
| 23,059,172 |
|
|
| 3,693,754 |
|
|
| 928,833 |
|
|
| 905,205 |
|
|
| 12,091,821 |
|
|
| 45,730 |
|
|
| (499 | ) |
|
| 550,936 |
|
|
| 41,274,952 |
|
(1) | Refers to proportional write-off in the amount of R$3,249, made in July 2019, resulting from the sale of the Tamboré and Curitiba (CIC) data centers, pursuant to paragraph 86 of IAS 36.
| |
(2) | Refers to transfers of assets from the Tamboré and Curitiba (CIC) data centers, sold for the amounts of R$419,690 to a company controlled by Asterion Industrial Partners SGEIC, SA, pursuant to an agreement entered into by the Company on May 8, 2019 and concluded. with the settlement on July 24, 2019, generating a gain in operating income of R$64,275. |
F-37
d)Goodwill
d.1)Accounting policy
Business combinations are accounted for using the acquisition method. The cost of an acquisition is measured as the aggregate of the consideration transferred, recorded at fair value on the acquisition date, and the fair value of any non-controlling interest in the acquiree.
For each business combination, the Company measures non-controlling interests in the acquiree either at its fair value or based on its proportional share in the identifiable net assets of the acquiree. Costs directly attributable to an acquisition are recorded as expenses, as incurred.
Upon acquiring a business, the Company assesses financial assets acquired and liabilities assumed so as to classify and allocate them in accordance with contractual terms, economic circumstances and relevant conditions on the acquisition date, including the segregation, by the acquiree, of embedded derivatives existing in host contracts in the acquiree.
In the event a business combination is conducted in stages, the ownership interest previously held in the acquiree’s capital is reassessed at fair value on the date control is acquired, and any impacts are recognized in the statement of income.
Any contingent portion to be transferred by the acquirer shall be recognized at fair value on the acquisition date. Subsequent changes in the fair value of the contingent portion to be considered as an asset or liability is recognized in the statement of income. Contingent consideration on acquisition of a business that is not classified as equity is subsequently measured at fair value through profit or loss, whether or not included in the scope of IFRS 9.
Goodwill is initially measured as excess transferred payment amount in relation to acquired net assets (identifiable net assets acquired, and liabilities assumed). If consideration is lower than the fair value of acquired net assets, the difference must be recognized as a gain in the statement of income.
After initial recognition, goodwill is measured at cost, less any accumulated impairment losses. For the purpose of impairment testing, goodwill acquired in a business combination is, from the acquisition date, allocated to the CGUs that are expected to benefit from the combination, irrespective of whether other assets or liabilities of the acquiree are assigned to those units.
When goodwill has been allocated to a CGU and part of the operation within that CGU is disposed that, the goodwill associated with that operation is included in the carrying amount of the operation when determining the gain or loss on disposal. Goodwill disposed in these circumstances is allocated based on the relative fair values of the disposed operation and the portion of the CGU retained.
d.2)Goodwill breakdown
The table below shows the composition of the goodwill recorded by the Company as of December 31, 2019 and 2018.
|
| 12.31.19 |
| 12.31.18 | ||||
Ajato Telecomunicação Ltda. |
|
| 149 |
|
|
| 149 |
|
Spanish and Figueira, by the merger of Telefônica Data Brasil Holding (TDBH) in 2006 |
|
| 212,058 |
|
|
| 212,058 |
|
Santo Genovese Participações, Atrium Telecomunicações, which took place in 2004 |
|
| 71,892 |
|
|
| 71,892 |
|
Telefônica Televisão Participações, former Navytree, occurred in 2008 |
|
| 780,693 |
|
|
| 780,693 |
|
Vivo Participações, occurred in 2011(1) |
|
| 9,157,239 |
|
|
| 9,160,488 |
|
GVT Participações, occurred in 2015 |
|
| 12,837,141 |
|
|
| 12,837,141 |
|
Total |
|
| 23,059,172 |
|
|
| 23,062,421 |
|
(1) | The proportional write-off in the amount of R$3,249, made in July 2019, resulting from the sale of the Tamboré and Curitiba (CIC) data centers, pursuant to paragraph 86 of IAS 36. |
F-38
14) | IMPAIRMENT OF NON-FINANCIAL ASSETS |
a) | Accounting policy |
The Company annually reviews the net carrying amount of assets in order to evaluate events or changes in economic, operating or technological circumstances that may indicate impairment losses. When such evidence is found, and net carrying amount exceeds recoverable amount, a provision for impairment is recorded so as to adjust the net carrying amount to the recoverable amount.
The recoverable amount of an asset or a CGU is defined as the higher of value in use and net sales value. Thus, considering the convergence of product and service offerings, in addition, the Company's main operating asset is a single, broadly integrated network, which is used to provide all telecommunications services to its customers, therefore, the Company defines your business as a single CGU.
Upon estimation of the value in use of an asset or cash-generating unit, estimated future cash flows are discounted at present value using a discount rate Weighted Average Cost of Capital “WACC” which reflects the weighted rate between (i) the cost of capital (including specific risks) based on the Capital Asset Pricing Model; and (ii) the debt these components being applicable to the asset or CGU before taxes.
Whenever possible, the net sale value is determined based on a firm sale agreement executed on an arm’s length basis between knowledgeable and willing parts, adjusted by expenses attributable to the sale of assets or, when there is no firm sale agreement, based on the market price of an active market, or on the latest transaction price involving similar assets.
For assets excluding goodwill, an assessment is made at each reporting date as to whether there is any indication that previously recognized impairment losses may no longer exist or may have decreased.
A previously recognized impairment loss is reversed only if there has been a change in the assumptions used to determine an asset’s or CGU recoverable amount since the last impairment loss was recognized. Any reversal is limited so that the carrying amount of the asset does not exceed its recoverable amount or exceeds the carrying amount that would have been determined, net of depreciation, had no impairment loss been recognized for the asset in prior years. Such reversal is recognized in the statement of income.
The following assets have specific characteristics for impairment testing:
· | Goodwill: Goodwill is tested for impairment annually at the reporting date or earlier when circumstances indicate that the carrying amount may be impaired. Where the recoverable amount is lower than the carrying amount, an impairment loss is recognized. Impairment losses relating to goodwill cannot be reversed in future periods.
| |
· | Intangible assets: Intangible assets with indefinite useful lives are tested for impairment annually at the reporting date either individually or at the CGU level, as appropriate, and when circumstances indicate that the carrying amount may be impaired. |
F-39
· | Determination of value in use: The key assumptions used to estimate value in use are: (i) revenues (projected considering the growth in customer base, growth in market revenue against GDP and the Company’s share of this market); (ii) variable costs and expenses (projected in accordance with the dynamics of the customer base, and fixed costs are projected in line with the historical performance of the Company, as well as with revenue growth); and (iii) capital investments (estimated considering the technological infrastructure necessary to enable the provision of services). |
b)Key assumptions used in the calculation of value in use:
The value in use is mainly impacted by the following assumptions:
· | Revenue growth: is based on the observation of the historical behavior of each revenue line, as well as trends based on market analysis. The projected revenue differs between product lines and services with a tendency of growth in broadband services, pay TV and IT compared to voice services (fixed). Mobile revenues follow the market trend, including mainly migrations from prepaid to postpaid, price convergence and growth in data and M2M.
| |
· | Capex volume: the projects and future needs were considered, both in line with the evolution of expected revenues and always aiming at better efficiency in the use of these investments. The Capex volume may also be impacted by inflation and currency fluctuations.
| |
· | Discount rate: represents the assessment of risks in the current market. The calculation of the discount rate is based on the Company’s specific circumstances and being calculated based on the WACC. The WACC takes into account both debt and equity. The cost of equity is derived from the expected return on investment by Company investors. The cost of debt is based on loans with interest income that the Company is obliged to honor. The specific risk segment is incorporated by applying individual notably Beta factors.
| |
· | Perpetuity growth rate: reflects the Company's condition to generate cash flow in an eternal manner. The percentage considered mainly takes into account investments over the projected period and reproduces the Company's condition in perpetuity. |
c)Sensitivity to changes in assumptions:
The Company carries out a sensitivity analysis of the impairment test by considering reasonable changes in the main assumptions used in such test.
The following table shows the increases in/decreases in the percentage points (pp) which were assumed for the years ended December 31, 2019 and 2018:
Changes in key assumptions | In percentage points (p.p) |
Financial variables |
|
Discount rate | +/- 1.0 |
Perpetuity growth rates | +/- 0.5 |
|
|
Operating variables |
|
OIBDA Margin | +/- 2.0 |
Capex/Revenues Margin | +/- 1.5 |
The sensitivity analysis performed at year-end 2019 and 2018 indicates that there are no significant risks arising from possible changes in the financial and operating variables, considered individually. In other words, the Company considers that within the above limits, no losses would be recognized.
F-40
d)Goodwill impairment testing
The Company assessed recoverability of goodwill carrying amounts based on the value in use and discounted cash flow method.
The process for determination of the value in use involves the use of assumptions, judgments and estimates on cash flows, such as revenue, cost and expense growth rates, estimated future investments and working capital and discount rates. The assumptions about cash flow increase projections were based on management’s estimates, market studies and macroeconomic projections. Future cash flows were discounted at the WACC rate.
Consistent with the economic analysis techniques, the assessment of value in use is made for a period of five years, and thereafter, considering the perpetuity of the assumptions based on the capacity of business continuity for an indefinite time. Management considered that the period of five years is adequate, based on its past experience in preparing cash flow projections.
The growth rate used to extrapolate projections beyond the five years period was 4.5% in 2019 and 2018.
The estimated future cash flows were discounted at a discount rate of 10.22% and 11.15%, which before taxes are 11.38% and 13.99% in 2019 and 2018, respectively, also in nominal values.
The inflation rate for the period analyzed in the projected cash flows was 3.8% and 4.0% in 2019 and 2018, respectively.
Key assumptions were based on the Company’s historical performance and reasonable macroeconomic assumptions grounded on financial market projections, documented and approved by the Company’s management.
Based on annual impairment testing of the Company’s assets, prepared using projections considering the financial statements on December 31, 2019 and 2018, growth projections and operating results for the year ended December 31, 2019 and 2018, no impairment losses or evidence of losses were identified, since the value was in use is higher than the net carrying amount as at the assessment date.
15) | PERSONNEL, SOCIAL CHARGES AND BENEFITS |
|
| 12.31.19 |
| 12.31.18 | ||||
Salaries and wages |
|
| 38,363 |
|
|
| 34,767 |
|
Social charges and benefits |
|
| 400,470 |
|
|
| 385,695 |
|
Profit sharing |
|
| 308,918 |
|
|
| 265,433 |
|
Share-based payment plans (Note 29) |
|
| 40,523 |
|
|
| 22,638 |
|
Other compensation |
|
| - |
|
|
| 86,000 |
|
Total |
|
| 788,274 |
|
|
| 794,533 |
|
|
|
|
|
|
|
|
|
|
Current |
|
| 752,246 |
|
|
| 782,630 |
|
Non-current |
|
| 36,028 |
|
|
| 11,903 |
|
F-41
16) | TRADE ACCOUNTS PAYABLE |
a) | Accounting policy |
These are obligations to pay for goods, services or goods that were acquired in the normal course of business. They are initially recognized at fair value and subsequently measured at amortized cost using the effective tax rate method, if applicable.
b) | Breakdown |
|
| 12.31.19 |
| 12.31.18 | ||||
Sundry suppliers (Opex, Capex, Services and Material) |
|
| 5,958,280 |
|
|
| 6,790,882 |
|
Amounts payable (operators, cobilling) |
|
| 303,087 |
|
|
| 198,942 |
|
Interconnection / interlink |
|
| 205,161 |
|
|
| 269,446 |
|
Related parties (Note 28) |
|
| 405,271 |
|
|
| 383,512 |
|
Total |
|
| 6,871,799 |
|
|
| 7,642,782 |
|
|
|
|
|
|
|
|
|
|
17) TAXES, CHARGES AND CONTRIBUTIONS
|
| 12.31.19 |
| 12.31.18 | ||||
ICMS |
|
| 906,447 |
|
|
| 1,094,769 |
|
PIS and COFINS |
|
| 331,863 |
|
|
| 512,714 |
|
Fust and Funttel |
|
| 89,394 |
|
|
| 89,794 |
|
ISS, CIDE and other taxes |
|
| 97,163 |
|
|
| 139,933 |
|
Total |
|
| 1,424,867 |
|
|
| 1,837,210 |
|
|
|
|
|
|
|
|
|
|
Current |
|
| 1,139,812 |
|
|
| 1,797,965 |
|
Non-current |
|
| 285,055 |
|
|
| 39,245 |
|
18) | DIVIDENDS AND INTEREST ON EQUITY |
a) | Accounting policy |
a.1)Dividends
Minimum mandatory dividends are stated in the balance sheet as legal obligations (provision in current liabilities). Dividends in excess of such minimum amount, not yet approved in the Shareholders’ Meeting, are recorded in equity as proposed additional dividends. After approval at the Shareholders’ Meeting, the dividends in excess of the mandatory minimum are transferred to current liabilities and classified as legal obligations.
a.2)Interest on equity
Brazilian legislation allows companies to pay interest on equity, which is similar to payment of dividends; however, this is deductible for income tax calculation purposes. In order to comply with Brazilian tax legislation, the Company and its subsidiaries provision, in its accounting records, the amount due to match against the financial expenses account in the statement of income for the year. For the presentation of these financial statements, that expense is reversed against a direct charge to equity, resulting in the same accounting treatment adopted for dividends. The distribution of interest on equity to shareholders is subject to withholding income tax at a 15% rate.
a.3)Unclaimed dividends and interest on equity
The rights to receive unclaimed interest on equity and dividends prescribe after three years from the initial date available for payment. When dividends and interest on equity expire, these amounts are reversed to retained earnings.
F-42
b) | Dividends and interest on equity payable |
b.1)Breakdown:
|
| 12.31.19 |
|
| 12.31.18 |
| ||
Telefónica Latinoamérica Holding |
|
| 787,823 |
|
|
| 952,217 |
|
Telefónica |
|
| 948,662 |
|
|
| 1,146,619 |
|
SP Telecomunicações Participações |
|
| 598,064 |
|
|
| 722,862 |
|
Telefónica Chile |
|
| 1,667 |
|
|
| 2,015 |
|
Non-controlling interest |
|
| 1,251,201 |
|
|
| 1,349,203 |
|
Total |
|
| 3,587,417 |
|
|
| 4,172,916 |
|
b.2)Changes:
Balance on 12.31.17 |
|
| 2,396,116 |
|
Supplementary dividends for 2017 |
|
| 2,191,864 |
|
Interim interest on equity (net of IRRF) |
|
| 3,867,500 |
|
Unclaimed dividends and interest on equity |
|
| (152,770 | ) |
Payment of dividends and interest on equity |
|
| (4,136,878 | ) |
IRRF on shareholders exempt/immune from interest on equity |
|
| 7,084 |
|
Balance on 12.31.18 |
|
| 4,172,916 |
|
Supplementary dividends for 2018 |
|
| 2,468,684 |
|
Interim interest on equity (net of IRRF) and dividends |
|
| 3,199,800 |
|
Unclaimed dividends and interest on equity |
|
| (82,898 | ) |
Payment of dividends and interest on equity |
|
| (6,176,842 | ) |
IRRF on shareholders exempt/immune from interest on equity |
|
| 5,757 |
|
Balance on 12.31.19 |
|
| 3,587,417 |
|
For purposes of the cash flow statement, interest on equity and dividends paid to shareholders are recognized in “Financing Activities”.
19) PROVISION AND CONTINGENCIES
a) | Accounting policy |
Provision is recognized when the Company has a present obligation (legal or constructive) as a result of a past event, when it is probable that economic benefits are required to settle the obligation and a reliable estimate of the value of the obligation can be made. Provision is restated at the balance sheet date considering the likely amount of loss and the nature of each provision.
Provision amounts for contingencies are presented at their gross amount, less the corresponding judicial deposits, and are classified as provision for civil, labor, tax and regulatory contingencies.
Judicial deposits are classified as assets given that the conditions required for their net presentation with provision do not exist.
Provision for civil, labor, tax and regulatory legal claims
The Company and its subsidiaries are parts to administrative; labor, tax, civil and regulatory claims, and accounting provision amounts have been recorded in respect of claims whose likelihood of loss was classified as probable. The assessment of the likelihood of loss includes an analysis of available evidence, the hierarchy of laws, available case law, the latest court decisions law and their relevance in the legal system, as well as the opinion of outside legalcounsel. Provision is reviewed and adjusted considering changes in existing circumstances, such as the applicable statute of limitations, tax audit conclusions, or additional exposures identified based on new matters or court decisions.
F-43
Provision for decommissioning of assets
Refers to costs to be incurred due to returning sites to owners (locations intended for tower and equipment installation on leased property) in the same condition as these were found at the time of execution of the initial lease agreement.
These costs are provisioned as the present value from amounts expected to settle the obligation using estimated cash flows and they are recognized as part of the cost of the corresponding asset. The cash flows are discounted at a current pre-tax rate that reflects the risks specific to decommissioning of assets. The financial effect of the discount is recorded as incurred and recognized in the statement of income as a finance cost. The estimated future costs of decommissioning are reviewed annually and adjusted as appropriate.
Changes in the estimated future costs or in the discount rate applied are added to, or deducted from, the cost of the asset.
Contingent liabilities recognized in a business combination
A contingent liability recognized in business combination is initially measured at fair value.
Refers to contingent liabilities from the Purchase Price Allocation (PPA) on acquisition of the controlling interest of Vivo Participações in 2011 and GVTPart. in 2015.
b)Critical estimates and judgments
Provision is recognized when the Company has a present obligation arising from a past event, settlement of which requires an outflow of resources rated as probable and when it can be reliably estimated. This obligation can be legal or constructive, derived from, among other factors, regulations, contracts, customary practices or public commitments that expose third parties to a valid expectation that the Company or its subsidiaries will assume certain responsibilities. The determination of the provision is based on the best estimate of the disbursement required to settle the corresponding obligation, considering the information available as at the closing date, including the opinion of independent experts, such as legal advisors.
c)Information on provisions and contingencies
The Company and its subsidiaries are parts to administrative and judicial proceedings and labor, tax and civil claims filed in different courts. The management of the Company and its subsidiaries, based on the opinion of its legal counsel, recognized provision for proceedings for which an unfavorable outcome is considered probable.
Breakdown of changes in provision for cases in which an unfavorable outcome is probable, in addition to contingent liabilities and provision for decommissioning are as follows:
F-44
|
| Provisions for contingencies |
|
|
|
| ||||||||||||||||||||||
|
| Labor |
| Tax |
| Civil |
| Regulatory |
| Contingent liabilities (PPA) |
| Provision for decommissioning |
| Total | ||||||||||||||
Balance on 12.31.17 |
|
| 980,596 |
|
|
| 3,579,208 |
|
|
| 1,055,877 |
|
|
| 1,103,792 |
|
|
| 845,796 |
|
|
| 579,481 |
|
|
| 8,144,750 |
|
Additions (reversal), net (Note 26) |
|
| 319,056 |
|
|
| 452,746 |
|
|
| 395,631 |
|
|
| (41,837 | ) |
|
| (27,345 | ) |
|
| - |
|
|
| 1,098,251 |
|
Other additions (reversal) (1) |
|
| (99,372 | ) |
|
| (2,443,047 | ) |
|
| (14,119 | ) |
|
| - |
|
|
| - |
|
|
| 16,752 |
|
|
| (2,539,786 | ) |
Write-offs due to payment |
|
| (541,749 | ) |
|
| (51,924 | ) |
|
| (598,294 | ) |
|
| (117,599 | ) |
|
| - |
|
|
| - |
|
|
| (1,309,566 | ) |
Monetary restatement |
|
| 121,155 |
|
|
| 414,914 |
|
|
| 165,708 |
|
|
| 77,860 |
|
|
| 8,824 |
|
|
| 77,215 |
|
|
| 865,676 |
|
Balance on 12.31.18 |
|
| 779,686 |
|
|
| 1,951,897 |
|
|
| 1,004,803 |
|
|
| 1,022,216 |
|
|
| 827,275 |
|
|
| 673,448 |
|
|
| 6,259,325 |
|
Initial adoption IFRIC 23 (Note 7) |
|
| - |
|
|
| (68,945 | ) |
|
| - |
|
|
| - |
|
|
| - |
|
|
| - |
|
|
| (68,945 | ) |
Additions (reversal), net (Note 26) |
|
| 152,105 |
|
|
| 32,719 |
|
|
| 364,008 |
|
|
| 93,634 |
|
|
| (16,986 | ) |
|
| (90,159 | ) |
|
| 535,321 |
|
Other additions (reversal) (1) |
|
| (5,709 | ) |
|
| - |
|
|
| (2,381 | ) |
|
| - |
|
|
| - |
|
|
| (4,191 | ) |
|
| (12,281 | ) |
Write-offs due to payment |
|
| (485,539 | ) |
|
| (364,992 | ) |
|
| (833,579 | ) |
|
| (43,068 | ) |
|
| - |
|
|
| - |
|
|
| (1,727,178 | ) |
Monetary restatement |
|
| 99,526 |
|
|
| 25,270 |
|
|
| 264,590 |
|
|
| 72,954 |
|
|
| 21,433 |
|
|
| 57,591 |
|
|
| 541,364 |
|
Business combinations (Note 1 c.1) |
|
| 7,805 |
|
|
| - |
|
|
| 7 |
|
|
| - |
|
|
| - |
|
|
| - |
|
|
| 7,812 |
|
Balance on 12.31.19 |
|
| 547,874 |
|
|
| 1,575,949 |
|
|
| 797,448 |
|
|
| 1,145,736 |
|
|
| 831,722 |
|
|
| 636,689 |
|
|
| 5,535,418 |
|
|
|
|
|
|
|
|
|
|
|
|
|
|
|
|
|
|
|
|
|
|
|
|
|
|
|
|
|
|
Balance on 12.31.18 |
|
|
|
|
|
|
|
|
|
|
|
|
|
|
|
|
|
|
|
|
|
|
|
|
|
|
|
|
Current |
|
| 245,805 |
|
|
| - |
|
|
| 132,124 |
|
|
| - |
|
|
| - |
|
|
| - |
|
|
| 377,929 |
|
Non-current |
|
| 533,881 |
|
|
| 1,951,897 |
|
|
| 872,679 |
|
|
| 1,022,216 |
|
|
| 827,275 |
|
|
| 673,448 |
|
|
| 5,881,396 |
|
|
|
|
|
|
|
|
|
|
|
|
|
|
|
|
|
|
|
|
|
|
|
|
|
|
|
|
|
|
Balance on 12.31.19 |
|
|
|
|
|
|
|
|
|
|
|
|
|
|
|
|
|
|
|
|
|
|
|
|
|
|
|
|
Current |
|
| 236,130 |
|
|
| - |
|
|
| 113,307 |
|
|
| 25,008 |
|
|
| - |
|
|
| - |
|
|
| 374,445 |
|
Non-current |
|
| 311,744 |
|
|
| 1,575,949 |
|
|
| 684,141 |
|
|
| 1,120,728 |
|
|
| 831,722 |
|
|
| 636,689 |
|
|
| 5,160,973 |
|
(1) Refers mainly to the amounts of inflows and losses against judicial deposits (Note 9).
c.1)Labor provision and contingencies
|
| Amounts involved | ||||||
Nature/Degree of Risk |
| 12.31.19 |
|
| 12.31.18 |
| ||
Provisions |
|
| 547,874 |
|
|
| 779,686 |
|
Possible losses |
|
| 452,070 |
|
|
| 191,398 |
|
Labor provision and contingencies involve labor claims filed by former employees and outsourced employees (the latter involving subsidiary or joint liability) claiming for, among other issues, overtime, salary equalization, post-retirement benefits, allowance for health hazard and risk premium, and matters relating to outsourcing.
The Company is also a defendant in labor claims filed by retired former employees who are covered by the Retired Employees Medical Assistance Plan ("PAMA"), and, among other issues, are demanding the cancellation of amendments to this plan. Most of these claims await a decision by the Superior Labor Court. Based on the opinion of its legal counsel and recent decisions of the courts, management considers the risk of loss in these cases as possible. No amount has been specified for these claims, since is not possible to estimate the cost to the Company in the event of loss.
In addition, the Company is a part to Public Civil Actions filed by the Public Prosecution Service whose purpose is essentially the determination of the Company to stop hiring a company to perform the Company's core activities. In August 2018, the majority of the Federal Supreme Court (“STF”) Ministers ruled the unrestricted outsourcing to be legally valid, including the end activity, safeguarding the subsidiary responsibility of the service receiver. However, a final judgment has yet to clarify the scope of this decision, including in cases already final and unappealable. The application of the decision will need to be individually evaluated for each case under discussion. Given these considerations, it is not feasible to estimate amounts or likelihood of loss for the Company.
F-45
c.2)Tax provision and contingencies
|
| Amounts involved | ||||||
Nature/Degree of Risk |
| 12.31.19 |
| 12.31.18 | ||||
Provisions |
|
| 1,575,949 |
|
|
| 1,951,897 |
|
Federal (1) |
|
| 573,229 |
|
|
| 526,943 |
|
State |
|
| 466,164 |
|
|
| 909,547 |
|
Municipal |
|
| 34,915 |
|
|
| 33,607 |
|
FUST |
|
| 501,641 |
|
|
| 481,800 |
|
Possible losses |
|
| 26,104,867 |
|
|
| 36,103,128 |
|
Federal (1) |
|
| 2,233,733 |
|
|
| 12,025,529 |
|
State |
|
| 15,460,028 |
|
|
| 16,294,685 |
|
Municipal |
|
| 669,114 |
|
|
| 637,690 |
|
FUST, FUNTTEL and FISTEL |
|
| 7,741,992 |
|
|
| 7,145,224 |
|
(1) | On January 1, 2019, the Company applied the requirements ofIFRIC 23 - Uncertainties on Income Tax Treatment and, accordingly, we present the information on income tax and social contribution of December 31, 2019 in note 7 |
c.2.1)Tax provisions
Management, under advice of legal counsel believes that the following losses are probable in the following federal, state, municipal and regulatory (FUST) tax proceedings:
Federal taxes
The Company and/or its subsidiaries are parts to administrative and legal proceedings at the federal level relating to: (i) claims resulting from the non-ratification of compensation and refund requests formulated; (ii) CIDE levied on the remittance of amounts abroad related to technical and administrative assistance and similar services, as well as royalties; (iii) withholding income tax on interest on equity; (iv) Social Investment Fund (Finsocial) offset amounts; and (v) additional charges to the PIS and COFINS tax base, as well as additional charges to COFINS required by Law No. 9,718/98.
State taxes
The Company and/or its subsidiaries are parts to administrative and judicial proceedings at the state level relating to ICMS, regarding: (i) disallowance credits; (ii) non-taxation of alleged telecommunications services; (iii) tax credit for challenges/disputes over telecommunication services not provided or wrongly charged (Agreement 39/01); (iv) aliquot differential; (v) leasing of infrastructure necessary for internet services (data); (vi) outflows of goods with prices lower than those of acquisition; and (vii) non-taxation of amounts granted as discounts to customers.
Municipal taxes
The Company and/or its subsidiaries are parts to various municipal tax proceedings, at the judicial level, relating to: (i) Property tax (“IPTU”); (ii) Services tax (“ISS”) on equipment leasing services, non-core activities and supplementary activities; and (iii) withholding of ISS on contractors' services.
FUST
The Company and/or its subsidiaries have judicial proceedings related to the non-inclusion of interconnection expenses and industrial exploitation of a dedicated line in the calculation basis of FUST.
F-46
c.2.2)Possible losses - tax contingencies
Management, under advice of legal counsel believes that the following losses are possible in the following federal, state, municipal and regulatory (FUST, FUNTTEL and FISTEL):
Federal taxes
The Company and/or its subsidiaries are parts to various administrative and judicial proceedings, at the federal level, which are awaiting decision in different court levels.
The more significant of these proceedings are: (i) statements of dissatisfaction resulting from failure to approve requests for compensation submitted by the Company; (ii) INSS (a) on compensation payment for salary losses arising from the "Plano Verão" and the "Plano Bresser"; (b) SAT, social security amounts owed to third parts (INCRA and SEBRAE); (c) supply of meals to employees, withholding of 11% (assignment of workforce); and (d) Stock Options - requirement of social security contributions on amounts paid to employees under the stock option plan; (iii) withholding income tax and CIDE on the funds remitted abroad related to technical services and to administrative support and similar services, etc., and royalties; (iv) deduction of COFINS on swap operation losses; (v) PIS and COFINS: (a) accrual basis versus cash basis; (b) levied on value-added services; and (c) monthly subscription services; (vi) ex-tariff, cancellation of the benefits under CAMEX Resolution No. 6, increase in the import duty from 4% to 28%; (vii) IPI levied on shipment of fixed access units from the Company's establishment; and (viii) Financial transaction tax (IOF) - required on loan transactions, intercompany loans and credit transactions.
State taxes
The Company and/or its subsidiaries are parts to various administrative and judicial proceedings, at the state level, related to ICMS, which are awaiting decision in different court levels: (i) rental of movable property; (ii) international calls; (iii) reversal of previously unused credits; (iv) service provided outside São Paulo state paid to São Paulo state; (v) co-billing; (vi) tax substitution with a fictitious tax base (tax guideline); (vii) use of credits related to acquisition of electric power; (viii) secondary activities, value added and supplementary services; (ix) tax credits related to opposition/challenges regarding telecommunications services not provided or mistakenly charged (Agreement 39/01); (x) deferred collection of interconnection (“DETRAF” - Traffic and Service Provision Document); (xi) credits derived from tax benefits granted by other states; (xii) disallowance of tax incentives related to cultural projects; (xiii) transfers of assets among business units owned by the Company; (xiv) communications service tax credits used in provision of services of the same nature; (xv) card donation for prepaid service activation; (xvi) reversal of credit from return and free lease in connection with assignment of networks (used by the Company itself and exemption of public bodies); (xvii) DETRAF fine; (xviii) own consumption; (xix) exemption of public bodies; (xx) amounts given by way of discounts; (xxi) new tax register bookkeeping without prior authorization by tax authorities; (xxii) advertising services; (xxiii) unmeasured services; and (xxiv) monthly subscription, which is in the STF with declaration liens and the Company awaits the judgment of the STF on the request for modulation.
Municipal taxes
The Company and/or its subsidiaries are parts to various administrative and judicial proceedings, at the municipal level, which are awaiting decision in different court levels.
The more significant of these proceedings are: (i) ISS on: (a) non-core activity, value-added and supplementary services; (b) withholding at source; (c) call identification and mobile phone licensing services; (d) full-time services, provision, returns and cancelled tax receipts; (e) data processing and antivirus congeners; (f) charge for use of mobile network and lease ofinfrastructure; (g) advertising services; (h) services provided by third parties; and (i) advisory services in corporate management provided by Telefónica Latino América Holding; (ii) IPTU; (iii) land use tax; and (iv) various municipal charges.
F-47
FUST, FUNTTEL and FISTEL
Universal Telecommunications Services Fund ("FUST")
Writs of mandamus were filed seeking the right to not include revenues with interconnection and Industrial Use of Dedicated Line (“EILD”) in the FUST tax base, according to Abridgment No. 7 of December 15, 2005, as it does not comply with the provisions contained in the sole paragraph of Article 6 of Law No. 9,998/00, which are awaiting a decision from Higher Courts.
Various delinquency notices were issued by ANATEL at the administrative level to collect charges on interconnections, EILD and other revenues not earned from the provision of telecommunication services.
On December 31, 2019, the consolidated amount involved totaled R$4,411,759 (R$3,701,208 on December 31, 2018).
Fund for Technological Development of Telecommunications ("FUNTTEL")
Proceedings have been filed for the right not to include interconnection revenues and any others arising from the use of resources that are part of the networks in the FUNTTEL calculation basis, as determined by Law 10,052/00 and Decree No. 3,737/01, therefore avoiding the improper application of Article 4, paragraph 5, of Resolution 95/13.
There are several notifications of debits drawn up by the Ministry of Communications in administrative actions for constitution of the tax credit related to the interconnection, network resources and other revenues that do not originate from the provision of telecommunication services.
On December 31, 2019, the consolidated amount involved totaled R$723,105 (R$618,473 on December 31, 2018).
Telecommunications Inspection Fund ("FISTEL")
There are judicial actions for the collection of TFI on: (i) extensions of the term of validity of the licenses for use of telephone exchanges associated with the operation of the fixed switched telephone service; and (ii) extensions of the period of validity of the right to use radiofrequency associated with the operation of the telephone service personal mobile service.
On December 31, 2019, the consolidated amount involved totaled R$2,607,128 (R$2,825,543 on December 31, 2018).
c.3)Civil provision civil contingencies
|
| Amounts involved | ||||||
Nature/Degree of Risk |
| 12.31.19 |
|
| 12.31.18 |
| ||
Provisions |
|
| 797,448 |
|
|
| 1,004,803 |
|
Possible losses |
|
| 3,494,626 |
|
|
| 3,493,655 |
|
c.3.1)Civil provisions
Management, under advice of legal counsel, believes that the following will result in probable losses from civil proceedings:
F-48
· | The Company is part to proceedings involving rights to the supplementary amounts from shares calculated on network expansion plans since 1996 (supplement of share proceedings). These proceedings are at different stages: lower courts, court of justice and high court of justice. On December 31, 2019, the consolidated amount involved totaled R$297,641 (R$334,877 on December 31, 2018).
| |
· | The Company and/or its subsidiaries are parts to various civil proceedings related to consumers at the administrative and judicial level, relating to the non-provision of services and/or products sold. On December 31, 2019, the consolidated amount involved totaled R$211,865 (R$353,850 on December 31, 2018).
| |
· | The Company and/or its subsidiaries are parts to various civil proceedings of a non-consumer nature at administrative and judicial levels, all arising in the ordinary course of business. On December 31, 2019, the consolidated amount involved totaled R$287,942 (R$316,076 on December 31, 2018). |
c.3.2)Possible losses - civil contingencies
Management, under advice of legal counsel, believes that losses are possible from the following civil proceedings:
· | Collective Action filed by SISTEL Participants' Association (“ASTEL”) in the state of São Paulo, in which SISTEL associates in the state of São Paulo challenge the changes made in the PAMA and claim for the reestablishment of the prior "status quo". This proceeding is still in the appeal phase and awaits a decision on the Interlocutory Appeal filed by the Company against the decision on possible admission of the appeal to higher and supreme courts filed in connection with the Court of Appeals' decision, which partially changed the decision rendering the matter groundless. The amount cannot be estimated, and the claims cannot be settled due to their unenforceability because it entails the return to the prior plan conditions.
| |
· | Civil Class Actions proposed by ASTEL and the Brazilian National Federation of Associations of Retirees, Pensioners and Pension Fund Members of the Telecommunications Industry “(FENAPAS”), both against SISTEL, the Company and other carriers, in order to annul the spin-off of the PBS private pension plan, alleging, in short, the "windup of the supplementary private pension plan of the SISTEL Foundation", which led to various specific mirror PBS plans, and corresponding allocation of funds from technical surplus and tax contingencies existing at the time of the spin-off. As for the action proposed only by ASTEL, there was a favorable decision in the first degree. Subsequently, ASTEL appealed and the appeal was withdrawn, maintaining a favorable decision. As for the action proposed by FENAPAS, the amount cannot be estimated, and the claims cannot be settled due to their unenforceability because this involves the return of the spun-off assets of SISTEL relating to telecommunication carriers of the former Telebrás System.
| |
· | The Company is part to other civil claims, at several levels, related to service rendering rights. Such claims have been filed by individual consumers, civil associations representing consumer rights or by the Bureau of Consumer Protection (“PROCON”), as well as by the Federal and State Public Prosecutor's Office. The Company is also part to other claims of several types related to the ordinary course of business. On December 31, 2019, the consolidated amount totaled R$3,467,941 (R$3,466,522 on December 31, 2018).
| |
· | Terra Networks is a part to: (i) a supplier action related to the transmission of events; (ii) PROCON fine (annulment action); (iii) indemnification action related to the use of content; (iv) ECAD action on copyright collection; and (v) claim actions filed by former subscribers regarding unrecognized collection, collection of undue value and contractual non-compliance. On December 31, 2019, the amount was R$15,443 (R$12,926 on December 31, 2018). |
F-49
· | The Company has received notices regarding non-compliance with the Customer Service (“SAC”) Decree. The Company is currently a part to various lawsuits (administrative and legal proceedings). On December 31, 2019, 2019 the amount was R$11,626 (R$14,207 on December 31, 2018).
| |
· | Intellectual Property: Lune Projetos Especiais Telecomunicação Comércio e Ind.Ltda. (“Lune”), a Brazilian company, filed an action on November 20, 2001 against 23 wireless carriers claiming to own the patent for caller ID and the trademark "Bina". The purpose of that lawsuit was to interrupt provision of such service by carriers and to seek indemnification equivalent to the amount paid by consumers for using the service.
| |
An unfavorable decision was handed down determining that the Company should refrain from selling mobile phones with caller ID service ("Bina"), subject to a daily fine of R$10 (ten thousand reais) in the event of non-compliance. Furthermore, according to that decision, the Company must pay indemnification for royalties, to be calculated on settlement. Motions for Clarification were proposed by all parts and Lune's motions for clarification were accepted since an injunctive relief in this stage of the proceedings was deemed applicable. A bill of review appeal was filed in view of the current decision which granted a stay of execution suspending that unfavorable decision until final judgment of the review. A bill of review was filed in view of the sentence handed down on September 30, 2016, by the 4th Chamber of the Court of Justice of the Federal District, in order to annul the lower court sentence and remit the proceedings back to the lower court for a new examination. There is no way to determine at this time the extent of potential liability with respect to this claim as the expertise is in its early stages.
| ||
· | The Company and other wireless carriers are defendants in several lawsuits filed by the Public Prosecutor's Office and consumer associations challenging the defined period for use of prepaid minutes. The plaintiffs allege that the prepaid minutes should not expire after a specific period. Conflicting decisions were handed down by courts on the matter, even though the Company understands that its criteria for the period determination comply with ANATEL standards. |
c.4)Regulatory provision and contingencies
|
| Amounts involved | ||||||
Nature/Degree of Risk |
| 12.31.19 |
|
| 12.31.18 |
| ||
Provisions |
|
| 1,145,736 |
|
|
| 1,022,216 |
|
Possible losses |
|
| 5,645,107 |
|
|
| 6,119,136 |
|
c.4.1)Regulatory provisions
Management, under advice of legal counsel, believes the likelihood of loss of the following regulatory proceedings is probable:
The Company is part to administrative proceedings initiated mainly by ANATEL, which were initiated on the grounds of alleged non-compliance with obligations established in the sectoral regulations, as well as in lawsuits that discuss, in the great majority, sanctions applied by ANATEL at the administrative level.
c.4.2)Possible losses - regulatory contingencies
Management, under advice of legal counsel believes the likelihood of loss of the following regulatory proceedings is possible:
F-50
The Company is part to administrative proceedings filed by ANATEL (other agents, including other operators, also have claims against the Company) alleging non-compliance with the obligations set forth in industry regulations, as well as legal claims which discuss the mostly sanctions applied by ANATEL at the administrative level.
Relevant cases in the possible regulatory contingency portfolio include:
· | Administrative and legal proceedings that discuss how ANATEL calculates the amount of the charge due to the extension of the radio frequencies associated with the SMP. In the view of the Agency, the calculation of encumbrances should consider the application of a percentage of 2% over the entire economic benefit resulting from the provision of the STFC / SMP service. In the Company's view, however, revenues that are not part of the STFC / SMP service plans, as defined by the regulations at the time of signing the authorization terms / concession contracts, should not be considered when calculating the burden. As a result of this divergence of understanding, the Company filed administrative claims and lawsuits to challenge ANATEL charge collections. | |
| ||
· | In May 2018, the Company filed a lawsuit to annul ANATEL final decision, of March of the same year, in the records of the Procedure for Determining Noncompliance with Obligations (“PADO”) for alleged violations of the fixed telephony regulation. The fine imposed by ANATEL, and object of the lawsuit, totals R$211 million as the principal amount. On December 31, 2019, the restated amount, plus interest and monetary restatement, reached approximately R$505 million. On December 31, 2018, this amount was approximately R$482 million. The Company believes that the fine imposed is illegal and undue based, fundamentally, on the following defense arguments: (i) ANATEL's mistake in determining the universe of users considered in the fine (the number of users affected is less than that considered by the ANATEL) and; (ii) the calculation of the fine penalty is disproportionate and without foundation. The lawsuit is in the lower court and, at this moment, awaits judgment, after the Company has gathered an expert report that supports the arguments in favor of reducing the fine. |
d)Guarantees
The Company and its subsidiaries granted guarantees for tax, civil, labor and regulatory proceedings, as follows:
|
| 12.31.19 |
| 12.31.18 | ||||
Property and equipment |
|
| 81,416 |
|
|
| 94,641 |
|
Judicial deposits and garnishments |
|
| 3,670,885 |
|
|
| 3,910,014 |
|
Letters of guarantee |
|
| 2,608,463 |
|
|
| 2,301,210 |
|
Total |
|
| 6,360,764 |
|
|
| 6,305,865 |
|
On December 31, 2019, in addition to the guarantees presented above, the Company and its subsidiaries had amounts under short-term investment withheld by courts (except for loan-related investments) in the consolidated amount of R$50,554 (R$64,461 on December 31, 2018).
20) LOANS, FINANCING, DEBENTURES AND LEASES
a) | Accounting policy |
These are financial liabilities measured initially and recognized by fair value, net of costs incurred to obtain them and subsequently measured by amortized cost (plus pro-rata charges and interest), considering the effective interest rate of each operation, or by fair value through profit or loss.
F-51
They are classified as current unless the Company has the unconditional right to settle the liability for at least 12 months after the closing date of the year.
Borrowing costs directly related to the acquisition, construction or production of an asset that necessarily requires more than 18 months to be completed for use or sale purposes are capitalized as part of the cost of the corresponding asset. The Company did not capitalize borrowing and financing costs and debentures due to the absence of qualifying assets.
All other costs of loans, financing, debentures and leases are recorded in expense in the period in which they are incurred. The costs of loans, financing and debentures comprise interest and other costs incurred.
F-52
b) | Breakdown |
|
| Information on December 31, 2019 |
| 12.31.19 |
| 12.31.18 | ||||||||||||||||||||||||||||||
|
| Currency |
| Annual interest rate |
| Maturity |
| Guarantees |
| Current |
| Non-current |
| Total |
| Current |
| Non-current |
| Total | ||||||||||||||||
Local currency |
|
|
|
|
|
|
|
|
|
|
|
|
|
| 4,126,490 |
|
|
| 9,698,183 |
|
|
| 13,824,673 |
|
|
| 1,367,551 |
|
|
| 4,675,271 |
|
|
| 6,042,822 |
|
|
|
|
|
|
|
|
|
|
|
|
|
|
|
|
|
|
|
|
|
|
|
|
|
|
|
|
|
|
|
|
|
|
|
|
|
|
Financial institutions (b.1) |
|
|
|
|
|
|
|
|
|
|
|
|
|
| 23,865 |
|
|
| 24,985 |
|
|
| 48,850 |
|
|
| 666,213 |
|
|
| 819,742 |
|
|
| 1,485,955 |
|
BNDES FINEM |
|
| URTJLP |
|
| TJLP+ 0 to 4.08% |
|
|
|
|
|
|
|
| - |
|
|
| - |
|
|
| - |
|
|
| 214,012 |
|
|
| - |
|
|
| 214,012 |
|
BNDES FINEM |
|
| URTJLP |
|
| TJLP+ 0 to 3.38% |
|
|
|
|
|
|
|
| - |
|
|
| - |
|
|
| - |
|
|
| 184,200 |
|
|
| 122,011 |
|
|
| 306,211 |
|
BNDES FINEM |
|
| R$ |
|
| 5.00% |
|
|
|
|
|
|
|
| - |
|
|
| - |
|
|
| - |
|
|
| 13,403 |
|
|
| - |
|
|
| 13,403 |
|
BNDES FINEM |
|
| URTJLP |
|
| TJLP+ 0 to 3.12% |
|
|
|
|
|
|
|
| - |
|
|
| - |
|
|
| - |
|
|
| 103,486 |
|
|
| 316,269 |
|
|
| 419,755 |
|
BNDES FINEM |
|
| R$ |
|
| 4.00% to 6.00% |
|
|
|
|
|
|
|
| - |
|
|
| - |
|
|
| - |
|
|
| 37,837 |
|
|
| 94,516 |
|
|
| 132,353 |
|
BNDES FINEM |
|
| R$ |
|
| Selic Acum. D-2 + 2.32% |
|
|
|
|
|
|
|
| - |
|
|
| - |
|
|
| - |
|
|
| 80,014 |
|
|
| 245,887 |
|
|
| 325,901 |
|
PSI |
|
| R$ |
|
| 2.5% to 5.5% |
|
| Jan-23 |
|
| (1) |
|
| 8,847 |
|
|
| 112 |
|
|
| 8,959 |
|
|
| 18,207 |
|
|
| 1,263 |
|
|
| 19,470 |
|
BNB |
|
| R$ |
|
| 7.06% to 10% |
|
| Aug-22 |
|
| (2) |
|
| 15,018 |
|
|
| 24,873 |
|
|
| 39,891 |
|
|
| 15,054 |
|
|
| 39,796 |
|
|
| 54,850 |
|
|
|
|
|
|
|
|
|
|
|
|
|
|
|
|
|
|
|
|
|
|
|
|
|
|
|
|
|
|
|
|
|
|
|
|
|
|
Suppliers (b.2) |
|
| R$ |
|
| 109.2% to 122.5% of CDI |
|
| Jan-21 |
|
|
|
|
| 996,177 |
|
|
| 97 |
|
|
| 996,274 |
|
|
| 524,244 |
|
|
| - |
|
|
| 524,244 |
|
|
|
|
|
|
|
|
|
|
|
|
|
|
|
|
|
|
|
|
|
|
|
|
|
|
|
|
|
|
|
|
|
|
|
|
|
|
Debentures (b.3) |
|
|
|
|
|
|
|
|
|
|
|
|
|
| 1,077,183 |
|
|
| 2,027,167 |
|
|
| 3,104,350 |
|
|
| 123,961 |
|
|
| 3,049,949 |
|
|
| 3,173,910 |
|
4th issue – Series 3 |
|
| R$ |
|
| IPCA+4.00% |
|
| Oct-19 |
|
| (3) |
|
| - |
|
|
| - |
|
|
| - |
|
|
| 41,121 |
|
|
| - |
|
|
| 41,121 |
|
1st issue – Minas Comunica |
|
| R$ |
|
| IPCA+0.50% |
|
| Jul-21 |
|
| (3) |
|
| 28,366 |
|
|
| 28,366 |
|
|
| 56,732 |
|
|
| 26,250 |
|
|
| 52,499 |
|
|
| 78,749 |
|
5th issue |
|
| R$ |
|
| 108.25% of CDI |
|
| Feb-22 |
|
| (3) |
|
| 44,504 |
|
|
| 1,998,801 |
|
|
| 2,043,305 |
|
|
| 51,233 |
|
|
| 1,997,694 |
|
|
| 2,048,927 |
|
6th issue |
|
| R$ |
|
| 100% of CDI + 0.24% |
|
| Nov-20 |
|
| (3) |
|
| 1,004,313 |
|
|
| - |
|
|
| 1,004,313 |
|
|
| 5,357 |
|
|
| 999,756 |
|
|
| 1,005,113 |
|
|
|
|
|
|
|
|
|
|
|
|
|
|
|
|
|
|
|
|
|
|
|
|
|
|
|
|
|
|
|
|
|
|
|
|
|
|
Leases (b.4) |
|
| R$ |
|
| 4.90% / IPCA |
|
|
|
|
|
|
|
| 2,029,265 |
|
|
| 7,161,886 |
|
|
| 9,191,151 |
|
|
| 53,133 |
|
|
| 339,894 |
|
|
| 393,027 |
|
|
|
|
|
|
|
|
|
|
|
|
|
|
|
|
|
|
|
|
|
|
|
|
|
|
|
|
|
|
|
|
|
|
|
|
|
|
Contingent consideration (b.5) |
|
| R$ |
|
| Selic |
|
|
|
|
|
|
|
| - |
|
|
| 484,048 |
|
|
| 484,048 |
|
|
| - |
|
|
| 465,686 |
|
|
| 465,686 |
|
|
|
|
|
|
|
|
|
|
|
|
|
|
|
|
|
|
|
|
|
|
|
|
|
|
|
|
|
|
|
|
|
|
|
|
|
|
Foreign currency |
|
|
|
|
|
|
|
|
|
|
|
|
|
| - |
|
|
| - |
|
|
| - |
|
|
| 96,615 |
|
|
| - |
|
|
| 96,615 |
|
|
|
|
|
|
|
|
|
|
|
|
|
|
|
|
|
|
|
|
|
|
|
|
|
|
|
|
|
|
|
|
|
|
|
|
|
|
Financial institutions (b.1) |
|
|
|
|
|
|
|
|
|
|
|
|
|
| - |
|
|
| - |
|
|
| - |
|
|
| 96,615 |
|
|
| - |
|
|
| 96,615 |
|
BNDES FINEM |
|
| UMBND |
|
| ECM + 2.38% |
|
|
|
|
|
|
|
| - |
|
|
| - |
|
|
| - |
|
|
| 96,615 |
|
|
| - |
|
|
| 96,615 |
|
Total |
|
|
|
|
|
|
|
|
|
|
|
|
|
| 4,126,490 |
|
|
| 9,698,183 |
|
|
| 13,824,673 |
|
|
| 1,464,166 |
|
|
| 4,675,271 |
|
|
| 6,139,437 |
|
|
|
|
|
|
|
|
|
|
|
|
|
|
|
|
|
|
|
|
|
|
|
|
|
|
|
|
|
|
|
|
|
|
|
|
|
|
F-53
Guarantees:
(1) | Pledge of financed assets. |
(2) | Bank guarantee provided by Banco Safra in an amount equivalent to 100% of the outstanding financing debt balance. Setting up a liquidity fund represented by financial investments in the amount equivalent to three installments of repayment referenced to the average post-grace period performance. Balances were R$13,212 and R$12,473 on December 31, 2019 and 2018, respectively. |
(3) | Unsecured. |
F-54
b.1)Loans and financing - Financial Institutions
Some financing agreements with the financial institutions have lower interest rates than those prevailing in the market. These operations fall within the scope of IAS 20 and therefore the subsidies granted up to December 31, 2017 were adjusted to present value and deferred in accordance with the useful lives of the financed assets.
The grants on January 1, 2018 adjusted to present value, were recorded in property, plant and equipment and are being depreciated according to the useful lives of the financed underlying assets.
b.2)Financing - Suppliers
Under bilateral agreements with suppliers, the Company obtained extension of the terms for payment of trade accounts payable at a cost based on the fixed CDI rate for the corresponding periods, with the net cost equivalent to between 109.2% to 122.5% of the CDI (107.9% to 115.9% of the CDI on December 31, 2018).
b.3)Debentures
The following is a summary of the debentures in effect on December 31, 2019.
|
|
|
| Amounts |
|
| ||||||||
Issue |
| Issue date |
| Issued |
| Outstanding |
| Issue value | ||||||
4th issue – Series 3(1) |
| 10/15/2009 |
|
| 810,000 |
|
|
| - |
|
|
| 810,000 |
|
1st issue – Minas Comunica |
| 12/17/2007 |
|
| 5,550 |
|
|
| 5,550 |
|
|
| 55,500 |
|
5th issue |
| 2/8/2017 |
|
| 200,000 |
|
|
| 200,000 |
|
|
| 2,000,000 |
|
6th issue |
| 11/27/2017 |
|
| 100,000 |
|
|
| 100,000 |
|
|
| 1,000,000 |
|
(1) On October 15, 2019, this issue was settled in the amount of R$42,895.
Transaction costs in connection with the 4th, 5th and 6th issues, totaling R$2,550 on December 31, 2019 (R$3,951 on December 31, 2018), were treated as a reduction of liabilities as costs to be incurred and are recognized as financial expenses, according to the contractual terms of each issue.
b.4)Leases
The Company has agreements classified as lease agreements as a lessee: (i) lease of towers and rooftops arising from sale and leaseback transactions; (ii) lease of Built to Suit ("BTS") sites to install antennas and other equipment and transmission facilities; (iii) lease of information technology equipment and; (iv) lease of infrastructure and transmission facilities associated with the power transmission network. The net carrying amount of the assets has remained unchanged until sale thereof, and a liability is recognized corresponding to the present value of mandatory minimum installments as per the agreement.
The amounts recorded in property, plant and equipment are depreciated over the estimated useful lives of the assets or the lease term, whichever is shorter.
Balances of lease payments payable, including the effects of the adoption of IFRS 16 (Note 2.f):
|
| 12.31.19 |
|
| 12.31.18 |
| ||
Nominal value payable |
|
| 10,932,789 |
|
|
| 766,215 |
|
Unrealized financial expenses |
|
| (1,741,638 | ) |
|
| (373,188 | ) |
Present value payable |
|
| 9,191,151 |
|
|
| 393,027 |
|
|
|
|
|
|
|
|
|
|
Current |
|
| 2,029,265 |
|
|
| 53,133 |
|
Non-current |
|
| 7,161,886 |
|
|
| 339,894 |
|
F-55
The following is a schedule of the amounts payable on leases on December 31, 2019, settled in nominal amounts and at present value:
Year |
| Nominal value payable |
| Present value payable | ||||
2020 |
|
| 2,098,941 |
|
|
| 2,029,265 |
|
2021 |
|
| 1,896,313 |
|
|
| 1,751,557 |
|
2022 |
|
| 1,670,508 |
|
|
| 1,470,364 |
|
2023 |
|
| 1,484,652 |
|
|
| 1,241,102 |
|
2024 |
|
| 1,086,093 |
|
|
| 856,502 |
|
2025 onwards |
|
| 2,696,282 |
|
|
| 1,842,361 |
|
Total |
|
| 10,932,789 |
|
|
| 9,191,151 |
|
The weighted annual interest rate on lease contracts on December 31, 2019 is 4.90%, with an average maturity of 6.18 years.
The present value of lease agreements is measured by discounting future fixed payment flows, which do not include the projected inflation, at market interest rates, estimated with the Company's intrinsic risk spread.
The use of nominal or real rates, in estimating future flows, as long as they are applied consistently to the discount rate, would have immaterial effects on the updated balance of the lease liabilities as of December 31, 2019, as well as their respective effects on the income for the year ending on this date.
The discount curves used are constructed based on observable data. Real and nominal market interest rates are extracted from B3 and the Company's risk spread is estimated from debt securities issued by companies with comparable risk. Accordingly, the final discount curve reliably reflects the Company's incremental loan interest rate.
There were no unsecured residual values resulting in benefits to the lessor or contingent payments recognized as revenue on December 31, 2019 and 2018.
b.5)Contingent consideration
As part of the Purchase and Sale Agreement and Other Covenants executed by and between the Company and Vivendi to acquire all shares in GVTPart., a contingent consideration relating to the judicial deposit made by GVT for the monthly installments of deferred income tax and social contribution on goodwill amortization was agreed, arising from the corporate restructuring process completed by GVT in 2013. If these funds are realized (being reimbursed, refunded, or via netting), they will be returned to Vivendi, as long as they are obtained in a final unappealable decision. Reimbursement will be made within 15 years and this amount is subject to monthly restatement at the SELIC rate.
c)Repayment schedule
On December 31, 2019, the breakdown of non-current loans, financing, debentures, leases and contingent consideration by year of maturity was as follows:
F-56
Year |
| Loans and financing - financial institutions |
| Financing - suppliers |
| Debentures |
| Leases |
| Contingent consideration |
| Total | |||||||||||||
2021 |
|
|
| 14,984 |
|
|
| 97 |
|
|
| 1,027,167 |
|
|
| 1,751,557 |
|
|
| - |
|
|
| 2,793,805 |
|
2022 |
|
|
| 9,996 |
|
|
| - |
|
|
| 1,000,000 |
|
|
| 1,470,364 |
|
|
| - |
|
|
| 2,480,360 |
|
2023 |
|
|
| 5 |
|
|
| - |
|
|
| - |
|
|
| 1,241,102 |
|
|
| - |
|
|
| 1,241,107 |
|
2024 |
|
|
| - |
|
|
| - |
|
|
| - |
|
|
| 856,502 |
|
|
| - |
|
|
| 856,502 |
|
2025 onwards |
|
|
| - |
|
|
| - |
|
|
| - |
|
|
| 1,842,361 |
|
|
| 484,048 |
|
|
| 2,326,409 |
|
Total |
|
|
| 24,985 |
|
|
| 97 |
|
|
| 2,027,167 |
|
|
| 7,161,886 |
|
|
| 484,048 |
|
|
| 9,698,183 |
|
d)Covenants
Loans and financing with financial institutions and debentures carry specific covenants involving a penalty in the event of breach of contract. A breach of contract as provided for in the agreements with the institutions listed above in item b), is characterized as non-compliance with covenants (analyzed on a quarterly, half-yearly or yearly basis), being a breach of a contractual clause, resulting in the early maturity of the contract.
On December 31, 2019 and December 31, 2018, the Company was in compliance with all economic and financial indices.
e)Changes
Changes in loans and financing, debentures, leases agreements and contingent considerations are as follows:
|
| Loans and financing |
| Debentures |
| Leases |
| Financing - suppliers |
| Contingent consideration |
| Total | ||||||||||||
Balance on 12.31.17 |
|
| 2,502,346 |
|
|
| 4,520,739 |
|
|
| 385,460 |
|
|
| 607,152 |
|
|
| 446,144 |
|
|
| 8,461,841 |
|
Additions |
|
| - |
|
|
| - |
|
|
| 18,672 |
|
|
| 506,397 |
|
|
| - |
|
|
| 525,069 |
|
Government grants (Note 21) |
|
| (40 | ) |
|
| - |
|
|
| - |
|
|
| - |
|
|
| - |
|
|
| (40 | ) |
Financial charges (Note 27) |
|
| 169,771 |
|
|
| 242,415 |
|
|
| 45,501 |
|
|
| 33,169 |
|
|
| 19,542 |
|
|
| 510,398 |
|
Issue costs |
|
| - |
|
|
| 1,471 |
|
|
| - |
|
|
| - |
|
|
| - |
|
|
| 1,471 |
|
Foreign exchange variation (Note 27) |
|
| 28,848 |
|
|
| - |
|
|
| - |
|
|
| - |
|
|
| - |
|
|
| 28,848 |
|
Payments |
|
| (1,118,355 | ) |
|
| (1,590,715 | ) |
|
| (56,606 | ) |
|
| (622,474 | ) |
|
| - |
|
|
| (3,388,150 | ) |
Balance on 12.31.18 |
|
| 1,582,570 |
|
|
| 3,173,910 |
|
|
| 393,027 |
|
|
| 524,244 |
|
|
| 465,686 |
|
|
| 6,139,437 |
|
Initial adoption IFRS 16 (Note 2.f) |
|
| - |
|
|
| - |
|
|
| 8,618,072 |
|
|
| - |
|
|
| - |
|
|
| 8,618,072 |
|
Additions |
|
| - |
|
|
| - |
|
|
| 1,803,941 |
|
|
| 967,313 |
|
|
| - |
|
|
| 2,771,254 |
|
Government grants (Note 21) |
|
| 15,787 |
|
|
| - |
|
|
| - |
|
|
| - |
|
|
| - |
|
|
| 15,787 |
|
Financial charges (Note 27) |
|
| 111,013 |
|
|
| 197,386 |
|
|
| 457,985 |
|
|
| 45,940 |
|
|
| 18,362 |
|
|
| 830,686 |
|
Issue costs |
|
| - |
|
|
| 1,400 |
|
|
| - |
|
|
| - |
|
|
| - |
|
|
| 1,400 |
|
Foreign exchange variation (Note 27) |
|
| (1,104 | ) |
|
| - |
|
|
| - |
|
|
| - |
|
|
| - |
|
|
| (1,104 | ) |
Write-offs (cancellation of contracts) |
|
| - |
|
|
| - |
|
|
| (107,213 | ) |
|
| - |
|
|
| - |
|
|
| (107,213 | ) |
Payments |
|
| (1,659,416 | ) |
|
| (268,346 | ) |
|
| (1,974,661 | ) |
|
| (541,223 | ) |
|
| - |
|
|
| (4,443,646 | ) |
Balance on 12.31.19 |
|
| 48,850 |
|
|
| 3,104,350 |
|
|
| 9,191,151 |
|
|
| 996,274 |
|
|
| 484,048 |
|
|
| 13,824,673 |
|
|
|
|
|
|
|
|
|
|
|
|
|
|
|
|
|
|
|
|
|
|
|
|
|
|
f)Additions and payments
Summary of additions and payments:
|
| 2019 |
| 2018 | ||||||||||||||||||||||||||||
|
|
|
| Write-offs (payments) |
|
|
| Write-offs (payments) | ||||||||||||||||||||||||
|
| Additions |
| Principal |
| Financial charges |
| Total |
| Additions |
| Principal |
| Financial charges |
| Total | ||||||||||||||||
Loans and financing |
|
| - |
|
|
| (1,564,258 | ) |
|
| (95,158 | ) |
|
| (1,659,416 | ) |
|
| - |
|
|
| (961,687 | ) |
|
| (156,668 | ) |
|
| (1,118,355 | ) |
BNDES |
|
| - |
|
|
| (1,549,335 | ) |
|
| (91,939 | ) |
|
| (1,641,274 | ) |
|
| - |
|
|
| (946,763 | ) |
|
| (152,447 | ) |
|
| (1,099,210 | ) |
BNB |
|
| - |
|
|
| (14,923 | ) |
|
| (3,219 | ) |
|
| (18,142 | ) |
|
| - |
|
|
| (14,924 | ) |
|
| (4,221 | ) |
|
| (19,145 | ) |
Debêntures |
|
| - |
|
|
| (66,830 | ) |
|
| (201,516 | ) |
|
| (268,346 | ) |
|
| - |
|
|
| (1,324,723 | ) |
|
| (265,992 | ) |
|
| (1,590,715 | ) |
4th issue – Series 3 |
|
| - |
|
|
| - |
|
|
| - |
|
|
| - |
|
|
| - |
|
|
| - |
|
|
| (1,583 | ) |
|
| (1,583 | ) |
1st issue – Minas Comunica |
|
| - |
|
|
| (25,583 | ) |
|
| (1,761 | ) |
|
| (27,344 | ) |
|
| - |
|
|
| (24,723 | ) |
|
| (1,082 | ) |
|
| (25,805 | ) |
4th issue |
|
| - |
|
|
| (41,247 | ) |
|
| (1,650 | ) |
|
| (42,897 | ) |
|
| - |
|
|
| (1,300,000 | ) |
|
| (47,257 | ) |
|
| (1,347,257 | ) |
5th issue |
|
| - |
|
|
| - |
|
|
| (135,242 | ) |
|
| (135,242 | ) |
|
| - |
|
|
| - |
|
|
| (149,795 | ) |
|
| (149,795 | ) |
6th issue |
|
| - |
|
|
| - |
|
|
| (62,863 | ) |
|
| (62,863 | ) |
|
| - |
|
|
| - |
|
|
| (66,275 | ) |
|
| (66,275 | ) |
Suppliers |
|
| 967,313 |
|
|
| (506,407 | ) |
|
| (34,816 | ) |
|
| (541,223 | ) |
|
| 506,397 |
|
|
| (571,434 | ) |
|
| (51,040 | ) |
|
| (622,474 | ) |
Leases (1) |
|
| 10,422,013 |
|
|
| (1,559,165 | ) |
|
| (415,496 | ) |
|
| (1,974,661 | ) |
|
| 18,672 |
|
|
| (35,375 | ) |
|
| (21,231 | ) |
|
| (56,606 | ) |
Total |
|
| 11,389,326 |
|
|
| (3,696,660 | ) |
|
| (746,986 | ) |
|
| (4,443,646 | ) |
|
| 525,069 |
|
|
| (2,893,219 | ) |
|
| (494,931 | ) |
|
| (3,388,150 | ) |
(1) Additions include the amount of the initial adoption of IFRS 16 (Note 2.f).
F-57
21) | DEFERRED INCOME |
|
| 12.31.19 |
|
| 12.31.18 |
| ||
Disposal of PP&E (1) |
|
| 94,383 |
|
|
| 89,835 |
|
Government grants (2) |
|
| 61,613 |
|
|
| 94,335 |
|
Contractual Liabilities - IFRS 15 (3) |
|
| 499,035 |
|
|
| 532,207 |
|
Other (4) |
|
| 63,051 |
|
|
| 59,658 |
|
Total |
|
| 718,082 |
|
|
| 776,035 |
|
|
|
|
|
|
|
|
|
|
Current |
|
| 506,181 |
|
|
| 525,509 |
|
Non-current |
|
| 211,901 |
|
|
| 250,526 |
|
(1) | Includes the net balances of the residual values from sale of non-strategic towers and rooftops, transferred to income as the conditions for recognition are fulfilled and a portion of the amount arising from the sale of the Tamboré and Curitiba (CIC) data centers to a company controlled by Asterion Industrial Partners SGEIC, S.A, to be recognized in profit or loss over 10 years, pursuant to contractual conditions. | |
| ||
(2) | This refers to: i) government subsidy arising from funds obtained from credit lines to be used in the acquisition of domestic equipment, which have been amortized over the useful life cycle of the equipment; and ii) subsidies arising from projects related to state taxes, which are being amortized over the contractual period. | |
| ||
(3) | Refers to the balance of contractual liabilities of customers, being deferred to the extent that they relate to performance obligations that are satisfied over time. | |
| ||
(4) | Includes amounts of the reimbursement for costs for leaving radio frequency sub-bands 2,500MHz to 2,690MHz due to cancellation of the Multichannel Multipoint Distribution Service. |
Changes in contractual liabilities (IFRS 15), mainly related to the sale of prepaid credits in the years ended December 31, 2019 and 2018:
Initial adoption on 01.01.18 |
|
| 178,897 |
|
Reclassification on 01.01.18 |
|
| 383,688 |
|
Additions |
|
| 7,271,614 |
|
Write-offs, net |
|
| (7,301,992 | ) |
Balance on 12.31.18 |
|
| 532,207 |
|
Additions |
|
| 6,762,607 |
|
Write-offs, net |
|
| (6,795,779 | ) |
Balance on 12.31.19 |
|
| 499,035 |
|
|
|
|
|
|
Current |
|
| 468,776 |
|
Non-current |
|
| 30,259 |
|
Below, we present the expected periods of realization of contractual liabilities.
Year |
|
| ||
2020 |
|
| 468,776 |
|
2021 |
|
| 11,342 |
|
2022 |
|
| 3,468 |
|
2023 |
|
| 3,468 |
|
2024 |
|
| 3,468 |
|
2025 onwards |
|
| 8,513 |
|
Total |
|
| 499,035 |
|
|
|
|
|
|
F-58
22) OTHER LIABILITIES
|
| 12.31.19 |
|
| 12.31.18 |
| ||
Liabilities with ANATEL(1) |
|
| 300,119 |
|
|
| 346,950 |
|
Liabilities with related parties (Note 28) |
|
| 30,114 |
|
|
| 31,716 |
|
Third-party withholdings(2) |
|
| 222,056 |
|
|
| 120,711 |
|
Surplus from post-employment benefit plans (Note 30) |
|
| 1,155,067 |
|
|
| 679,478 |
|
Amounts to be refunded to subscribers |
|
| 43,794 |
|
|
| 56,897 |
|
Other liabilities |
|
| 36,781 |
|
|
| 61,957 |
|
Total |
|
| 1,787,931 |
|
|
| 1,297,709 |
|
|
|
|
|
|
|
|
|
|
Current |
|
| 365,192 |
|
|
| 368,376 |
|
Non-current |
|
| 1,422,739 |
|
|
| 929,333 |
|
(a) | Includes the cost of renewing STFC and SMP licenses. |
| |
(b) | This refers to payroll withholdings and taxes withheld from pay-outs of interest on equity and on provision of services. |
23) | EQUITY |
a)Capital
Pursuant to its Articles of Incorporation, the Company is authorized to increase its share capital up to 1,850,000,000 common and preferred shares. The Board of Directors is the competent body to decide on any increase and consequent issue of new shares within the authorized capital limit.
Brazilian Corporation Law (Law nº 6404/76, Article 166, item IV) - establishes that capital may be increased by means of a Special Shareholders’ Meeting Resolution by modifying the Articles of Incorporation, if the authorized capital increase limit has been reached.
Capital increases are not necessarily in proportion to the number of shares in existing classes, however the number of non-voting or restricted-voting preferred shares must not exceed two-thirds of total shares issued. Preferred shares are non-voting, except for cases set forth in Articles 9 and 10 of the Articles of Incorporation but have priority in the event of reimbursement of capital, without premium, and are entitled to dividends 10% higher than those paid on common shares, as per Article 7 of the Company's Articles of Incorporation and item II, paragraph 1, Article 17 of Law No. 6404/76.
Preferred shares are also entitled to full voting rights if the Company fails to pay the minimum dividend to which they are entitled for three consecutive financial years. This right continues until payment of said dividend.
Subscribed and paid-in capital on December 31, 2019 and 2018 amounted to R$63,571,416, divided into shares without par value, held as follows:
|
| Common Shares |
| Preferred Shares |
| Grand Total | ||||||||||||||||||
Shareholders |
| Number |
| % |
| Number |
| % |
| Number |
| % | ||||||||||||
Controlling Group |
|
| 540,033,264 |
|
|
| 94.47 | % |
|
| 704,207,855 |
|
|
| 62.91 | % |
|
| 1,244,241,119 |
|
|
| 73.58 | % |
Telefónica Latinoamérica Holding, S.L. |
|
| 46,746,635 |
|
|
| 8.18 | % |
|
| 360,532,578 |
|
|
| 32.21 | % |
|
| 407,279,213 |
|
|
| 24.09 | % |
Telefónica |
|
| 198,207,608 |
|
|
| 34.67 | % |
|
| 305,122,195 |
|
|
| 27.26 | % |
|
| 503,329,803 |
|
|
| 29.76 | % |
SP Telecomunicações Participações |
|
| 294,158,155 |
|
|
| 51.46 | % |
|
| 38,537,435 |
|
|
| 3.44 | % |
|
| 332,695,590 |
|
|
| 19.67 | % |
Telefónica Chile |
|
| 920,866 |
|
|
| 0.16 | % |
|
| 15,647 |
|
|
| 0.00 | % |
|
| 936,513 |
|
|
| 0.06 | % |
Other shareholders |
|
| 29,320,789 |
|
|
| 5.13 | % |
|
| 415,131,868 |
|
|
| 37.09 | % |
|
| 444,452,657 |
|
|
| 26.28 | % |
Treasury Shares |
|
| 2,290,164 |
|
|
| 0.40 | % |
|
| 983 |
|
|
| 0.00 | % |
|
| 2,291,147 |
|
|
| 0.14 | % |
Total shares |
|
| 571,644,217 |
|
|
| 100.00 | % |
|
| 1,119,340,706 |
|
|
| 100.00 | % |
|
| 1,690,984,923 |
|
|
| 100.00 | % |
Treasury Shares |
|
| (2,290,164 | ) |
|
|
|
|
|
| (983 | ) |
|
|
|
|
|
| (2,291,147 | ) |
|
|
|
|
Total shares outstanding |
|
| 569,354,053 |
|
|
|
|
|
|
| 1,119,339,723 |
|
|
|
|
|
|
| 1,688,693,776 |
|
|
|
|
|
F-59
b)Capital reserves
b.1)Special goodwill reserve
This represents the tax benefit generated by the merger of Telefonica Data do Brasil Ltda. which will be capitalized in favor of the controlling shareholders (SP Telecomunicações Participações) after the tax credits are realized under the terms of CVM Ruling No. 319/99.
The balance of this account on December 31, 2019 and 2018 totaled R$63,074.
b.2)Other capital reserves
The breakdown on December 31, 2019 and 2018 was as follows.
|
| 12.31.19 |
|
| 12.31.18 |
| ||
Excess of the value in the issue or capitalization, in relation to the basic value of the share on the issue date(1) |
|
| 2,735,930 |
|
|
| 2,735,930 |
|
Cancelation of treasury shares according to the Special Shareholders' Meeting (SGM) of 3/12/15(2) |
|
| (112,107 | ) |
|
| (112,107 | ) |
Direct costs of capital increases(3) |
|
| (62,433 | ) |
|
| (62,433 | ) |
Incorporation of shares of GVTPart.(4) |
|
| (1,188,707 | ) |
|
| (1,188,707 | ) |
Effects of the acquisition of Lemontree and GTR by Company and Tglog by TData(5) |
|
| (75,388 | ) |
|
| (75,388 | ) |
Preferred shares delivered referring to the judicial process of expansion plan(6) |
|
| 2 |
|
|
| 2 |
|
Effects of the acquisition of Terra Networks Brasil by TData(7) |
|
| (59,029 | ) |
|
| (59,029 | ) |
Effects of the acquisition of TIS by Terra Networks(8) |
|
| (48,135 | ) |
|
| - |
|
Other |
|
| 76 |
|
|
| 10 |
|
Total |
|
| 1,190,209 |
|
|
| 1,238,278 |
|
(1) | It referes the excess of the value in the issue or capitalization, in relation to the basic value of the share on the issue date. | |
| ||
(2) | The cancellation of 2,332,686 shares issued by the Company, held in treasury, approved at the Special Shareholders' Meeting held on March 12, 2015. | |
| ||
(3) | The value refers direct costs (net of taxes) of Company capital that increased on April 30,2015, arising from the Primary Offering of Shares. | |
| ||
(4) | The value refers the difference between the economic values that comes from the merger of shares owned by GVTPart, issued on the transaction closing date. | |
| ||
(5) | Regarding the effects of the acquisition of shares of non-controlling shareholders that, with the adoption of IFRS 10, 35 and 36. It would be recorded in equity when there is no change in the shareholding control. | |
| ||
(6) | It refers about the effects of write-offs due to the transfer of 62 preferred shares in treasury to outstanding shares, for compliance with judicial process decisions in which the Company is involved regarding rights to the complementary receipt of shares calculated in relation to network expansion plans after 1996. | |
| ||
(7) | The effects refer the acquisition of Terra Networks by TData, related to the difference between the consideration given in exchange for the equity interest obtained and the value of the net assets acquired (Note 1 c.2). |
F-60
(8) | The effects referee the acquisition of TIS by Terra Networks, related to the difference between the consideration given in exchange for the equity interest obtained and the value of the net assets acquired (Note 1 c.1). |
b.3)Treasury shares
These are equity instruments that are repurchased and recognized at cost and deducted from shareholders' equity. No gain or loss is recognized in the statement of income on the purchase, sale, issue or cancellation of the equity instruments of the Company.
The Company's shares held in treasury whose balance is resulting: (i) from the exercise of the right to withdraw from the Company's common and preferred shareholders, who expressed their dissent regarding the acquisition of GVTPart.; (ii) the acquisition of preferred shares in the financial market in accordance with the share buyback program in effect at the time of the transaction; and (iii) transfers of preferred shares, related to compliance with court decisions in which the Company is involved, which deals with rights to the complementary receipt of shares calculated in relation to network expansion plans after 1996.
The balance of this account on December 31, 2019 and 2018 totaled R$87,820, consisting of 2,290,164 common shares and 983 preferred shares.
c)Income reserves
c.1)Legal Reserve
This reserve is obligatorily constituted by the Company on the basis of 5% of net income for the year, up to 20% of the paid-in capital stock. The legal reserve may only be used to increase share capital and to offset accumulated losses.
c.2)Expansion and Modernization Reserve
This reserve is constituted based on the capital budget, whose purpose is to guarantee the expansion of the network capacity to meet the Company's increasing demand and guarantee the quality of service rendering. In accordance with Article 196 of Law No. 6404/76, the capital budget will be submitted for appreciation and approval by the Annual Shareholders' Meeting.
c.3)Tax Incentives
The Company has State VAT (ICMS) tax benefits in the states of Minas Gerais and Espírito Santo, relating to tax credits approved by the relevant bodies of said states, in connection with investments in the installation of SMP support equipment, fully operational, in accordance with the rules in force, ensuring that the localities listed in the call for bid be included in the SMP coverage area. The portion of profit subject to the incentive was excluded from dividend calculation and may be used only in the event of capital increase or loss absorption.
c.4)Changes of income reserves
The amounts of the income reserves are distributed as follows:
|
| Legal reserve |
| Expansion and Modernization Reserve |
| Tax incentives |
| Total | ||||||||
Balance on 12.31.17 |
|
| 2,138,344 |
|
|
| 297,000 |
|
|
| 27,884 |
|
|
| 2,463,228 |
|
Reversal of reserves |
|
| - |
|
|
| (297,000 | ) |
|
| - |
|
|
| (297,000 | ) |
Recording of reserves |
|
| 446,413 |
|
|
| 1,700,000 |
|
|
| 11,529 |
|
|
| 2,157,942 |
|
Balance on 12.31.18 |
|
| 2,584,757 |
|
|
| 1,700,000 |
|
|
| 39,413 |
|
|
| 4,324,170 |
|
Reversal of reserves |
|
| - |
|
|
| (1,700,000 | ) |
|
| - |
|
|
| (1,700,000 | ) |
Recording of reserves |
|
| 250,051 |
|
|
| 600,000 |
|
|
| 18,166 |
|
|
| 868,217 |
|
Balance on 12.31.19 |
|
| 2,834,808 |
|
|
| 600,000 |
|
|
| 57,579 |
|
|
| 3,492,387 |
|
F-61
d)Dividend and interest on equity (IOE)
d.1)Additional dividends proposed for 2018
On April 11, 2019, the Annual General Meeting approved the allocation of proposed additional dividends for 2018, not yet distributed, amounting to R$2,468,684 to the holders of common and preferred shares that were registered in the Company's records at the end of the day of the Ordinary General Meeting. The amount was paid on December 17, 2019.
d.2)Remuneration to shareholders
The dividends are calculated in accordance with the Company Articles of Incorporation and the Corporation Law. The table below shows the calculation of dividends and interest on equity for 2019 and 2018:
|
| 2019 |
|
| 2018 |
| ||
Net income for the year |
|
| 5,001,014 |
|
|
| 8,928,258 |
|
Allocation to legal reserve |
|
| (250,051 | ) |
|
| (446,413 | ) |
(-) Tax incentives - not distributable |
|
| (18,166 | ) |
|
| (11,529 | ) |
Adjusted net income |
|
| 4,732,797 |
|
|
| 8,470,316 |
|
|
|
|
|
|
|
|
|
|
Dividend and IOE distributed for the year: |
|
| (3,588,000 | ) |
|
| (4,550,000 | ) |
Interest on equity (gross) |
|
| (2,588,000 | ) |
|
| (4,550,000 | ) |
Interim dividends |
|
| (1,000,000 | ) |
|
| - |
|
Balance of unallocated net income |
|
| 1,144,797 |
|
|
| 3,920,316 |
|
|
|
|
|
|
|
|
|
|
(+) Reversal special reserve for modernization and expansion |
|
| 1,700,000 |
|
|
| 297,000 |
|
(-) Effects of the initial adoption of IFRS 9 and 15, net of taxes on 01.01.18 |
|
| - |
|
|
| (138,663 | ) |
(+) Unclaimed dividends and interest on equity |
|
| 82,898 |
|
|
| 152,770 |
|
(+-) Actuarial gains (losses) recognized and effect of limitation of surplus plan assets, net of taxes and other changes |
|
| (132,120 | ) |
|
| (62,739 | ) |
Income available to be distributed |
|
| 2,795,575 |
|
|
| 4,168,684 |
|
|
|
|
|
|
|
|
|
|
Proposal for Distributions: |
|
|
|
|
|
|
|
|
Special reserve for modernization and expansion |
|
| 600,000 |
|
|
| 1,700,000 |
|
Additional proposed dividends |
|
| 2,195,575 |
|
|
| 2,468,684 |
|
Proposed additional dividends - Net income for the year |
|
| 495,575 |
|
|
| 2,171,684 |
|
Proposed additional dividends - Based on prior year's net income, referring to the reversal of the special reserve for expansion and modernization |
|
| 1,700,000 |
|
|
| 297,000 |
|
Total |
|
| 2,795,575 |
|
|
| 4,168,684 |
|
|
|
|
|
|
|
|
|
|
Mandatory minimum dividend - 25% of adjusted net income |
|
| 1,183,199 |
|
|
| 2,117,579 |
|
The proposal to management of the 2019 financial year that is presented above will be submitted to the annual general meeting to be held in 2020.
Total proposed for deliberation - per share |
| 2019 |
|
| 2018 |
| ||
Common shares |
|
| 1.219339 |
|
|
| 1.371013 |
|
Preferred shares |
|
| 1.341273 |
|
|
| 1.508114 |
|
F-62
In 2019 and 2018, the Company allocated interim dividends and interest on equity, which were allocated to mandatory minimum dividends, as follows:
2019
|
| Dates |
| Gross Amount |
| Net Value |
| Amount per Share | ||||||||||||||||||||||||||||||||||||
Nature |
| Approval |
| Credit |
| Beginning of Payment |
| Common |
| Preferred |
| Total |
| Common |
| Preferred |
| Total |
| Common |
| Preferred | ||||||||||||||||||||||
|
|
|
|
|
|
|
|
|
|
|
|
|
|
|
|
|
|
|
|
|
|
| ||||||||||||||||||||||
IOE |
|
| 02/15/19 |
|
|
| 02/28/19 |
|
|
| Until 12/31/20 |
|
|
| 221,338 |
|
|
| 478,662 |
|
|
| 700,000 |
|
|
| 188,137 |
|
|
| 406,863 |
|
|
| 595,000 |
|
|
| 0.33044031480 |
|
|
| 0.36348434628 |
|
IOE |
|
| 04/17/19 |
|
|
| 04/30/19 |
|
|
| Until 12/31/20 |
|
|
| 180,233 |
|
|
| 389,767 |
|
|
| 570,000 |
|
|
| 153,198 |
|
|
| 331,302 |
|
|
| 484,500 |
|
|
| 0.26907282777 |
|
|
| 0.29598011054 |
|
IOE |
|
| 06/17/19 |
|
|
| 06/28/19 |
|
|
| Until 12/31/20 |
|
|
| 306,079 |
|
|
| 661,921 |
|
|
| 968,000 |
|
|
| 260,167 |
|
|
| 562,633 |
|
|
| 822,800 |
|
|
| 0.45695174961 |
|
|
| 0.50264692458 |
|
IOE |
|
| 12/19/19 |
|
|
| 12/30/19 |
|
|
| Until 12/31/20 |
|
|
| 110,669 |
|
|
| 239,331 |
|
|
| 350,000 |
|
|
| 94,069 |
|
|
| 203,431 |
|
|
| 297,500 |
|
|
| 0.16522015740 |
|
|
| 0.18174217314 |
|
Dividends |
|
| 12/19/19 |
|
|
| 12/30/19 |
|
|
| Until 12/31/20 |
|
|
| 316,198 |
|
|
| 683,802 |
|
|
| 1,000,000 |
|
|
| 316,198 |
|
|
| 683,802 |
|
|
| 1,000,000 |
|
|
| 0.55536187362 |
|
|
| 0.61089806098 |
|
Total |
|
|
|
|
|
|
|
|
|
|
|
|
|
| 1,134,517 |
|
|
| 2,453,483 |
|
|
| 3,588,000 |
|
|
| 1,011,769 |
|
|
| 2,188,031 |
|
|
| 3,199,800 |
|
|
|
|
|
|
|
|
|
2018
|
| Dates |
| Gross Amount |
| Net Value |
| Amount per Share | ||||||||||||||||||||||||||||||||||||
Nature |
| Approval |
| Credit |
| Beginning of Payment |
| Common |
| Preferred |
| Total |
| Common |
| Preferred |
| Total |
| Common |
| Preferred | ||||||||||||||||||||||
|
|
|
|
|
|
|
|
|
|
|
|
|
|
|
|
|
|
|
|
|
|
| ||||||||||||||||||||||
IOE |
|
| 06/18/18 |
|
|
| 06/29/18 |
|
|
| 08/20/19 |
|
|
| 126,479 |
|
|
| 273,521 |
|
|
| 400,000 |
|
|
| 107,507 |
|
|
| 232,493 |
|
|
| 340,000 |
|
|
| 0.18882303703 |
|
|
| 0.20770534073 |
|
IOE |
|
| 09/05/18 |
|
|
| 09/17/18 |
|
|
| 08/20/19 |
|
|
| 885,353 |
|
|
| 1,914,647 |
|
|
| 2,800,000 |
|
|
| 752,550 |
|
|
| 1,627,450 |
|
|
| 2,380,000 |
|
|
| 1.32176125923 |
|
|
| 1.45393738515 |
|
IOE |
|
| 12/04/18 |
|
|
| 12/17/18 |
|
|
| 12/17/19 |
|
|
| 426,867 |
|
|
| 923,133 |
|
|
| 1,350,000 |
|
|
| 362,837 |
|
|
| 784,663 |
|
|
| 1,147,500 |
|
|
| 0.63727774998 |
|
|
| 0.70100552498 |
|
Total |
|
|
|
|
|
|
|
|
|
|
|
|
|
| 1,438,699 |
|
|
| 3,111,301 |
|
|
| 4,550,000 |
|
|
| 1,222,894 |
|
|
| 2,644,606 |
|
|
| 3,867,500 |
|
|
|
|
|
|
|
|
|
The amounts of IOE are calculated and presented net of Withholding Income Tax (IRRF). Exempt shareholders received the full IOE amount, without withholding income tax at source.
The gross and net values for the preferred shares are 10% higher than those attributed to each common share, as per article 7 of the Company's Articles of Incorporation.
F-63
d.3)Unclaimed dividends and interest on equity
Pursuant to Article 287, paragraph II, item “a” of Law No. 6404, of December 15, 1976, the dividends and interest on equity unclaimed by shareholders are subject to the statute of limitation three years, as from the initial payment date. The Company reverses the amounts of unclaimed dividends and IOE to equity once the statute of limitation occurred.
For the years ended December 31, 2019 and 2018, the Company reversed unclaimed dividends and interest on equity amounting to R$82,898 and R$152,770, respectively, which were included in calculations for decisions on Company dividends.
e)Other comprehensive income
Financial assets at fair value through other comprehensive income: These refer to changes in fair value of financial assets available for sale.
Derivative financial instruments: These refer to the effective part of cash flow hedges up to the balance sheet date.
Currency translation effects for foreign investments: This refers to currency translation differences arising from the translation of financial statements of Aliança (joint venture).
Changes in other comprehensive income were as follows:
|
| Financial assets at fair value through other comprehensive income |
| Derivative transactions |
| Currency translation effects - foreign investments |
| Total | ||||||||
Balance on 12.31.17 |
|
| (8,658 | ) |
|
| 1,954 |
|
|
| 28,032 |
|
|
| 21,328 |
|
Translation gains |
|
| - |
|
|
| - |
|
|
| 9,927 |
|
|
| 9,927 |
|
Losses from future contracts |
|
| - |
|
|
| (1,618 | ) |
|
| - |
|
|
| (1,618 | ) |
Losses on financial assets at fair value through other comprehensive income |
|
| (412 | ) |
|
| - |
|
|
| - |
|
|
| (412 | ) |
Balance on 12.31.18 |
|
| (9,070 | ) |
|
| 336 |
|
|
| 37,959 |
|
|
| 29,225 |
|
Translation gains |
|
| - |
|
|
| - |
|
|
| 1,859 |
|
|
| 1,859 |
|
Losses from future contracts |
|
| - |
|
|
| (336 | ) |
|
| - |
|
|
| (336 | ) |
Losses on financial assets at fair value through other comprehensive income |
|
| (11 | ) |
|
| - |
|
|
| - |
|
|
| (11 | ) |
Balance on 12.31.19 |
|
| (9,081 | ) |
|
| - |
|
|
| 39,818 |
|
|
| 30,737 |
|
f)Company share repurchase program
On December 7, 2018 the Company's Board of Directors, in accordance with Article 17, item XV of the law, the programs were approved for the repurchase of common and preferred shares pursuant to CVM Instruction 567, of September 17, 2015. The acquisition of own shares was made with the intention of subsequently cancelling, selling or holding in treasury, without reducing the capital stock, thereby increasing shareholder value through the efficient application of available resources in cash and optimize the Company's capital allocation.
F-64
The repurchase will be made through using the balance capital reserve that was included in the balance sheet of September 30, 2018.
This program will be in force until June 6, 2020, with the acquisitions made on B3, at market prices, observing the legal and regulatory limits. The maximum amounts authorized for acquisition are 583,422 common shares and 37,736,465 preferred shares.
During the year ended December 31, 2019, there were no acquisitions of shares within the Company's share repurchase program to be held in treasury for further sale and / or cancellation.
g)Earnings per share
Basic and diluted earnings per share were calculated by dividing profit attributed to the Company’s shareholders by the weighted average number of outstanding common and preferred shares.
The table below sets out the calculation of earnings per share for the years ended December 31, 2019, 2018 and 2017:
|
| 2019 |
|
| 2018 |
|
| 2017 |
| |||
Net income for the year |
|
| 5,001,014 |
|
|
| 8,928,258 |
|
|
| 4,608,790 |
|
Common shares |
|
| 1,581,308 |
|
|
| 2,823,093 |
|
|
| 1,457,288 |
|
Preferred shares |
|
| 3,419,706 |
|
|
| 6,105,165 |
|
|
| 3,151,502 |
|
|
|
|
|
|
|
|
|
|
|
|
|
|
Number of shares (thousands): |
|
| 1,688,694 |
|
|
| 1,688,694 |
|
|
| 1,688,694 |
|
Weighted average number of outstanding common shares for the year |
|
| 569,354 |
|
|
| 569,354 |
|
|
| 569,354 |
|
Weighted average number of outstanding preferred shares for the year |
|
| 1,119,340 |
|
|
| 1,119,340 |
|
|
| 1,119,340 |
|
|
|
|
|
|
|
|
|
|
|
|
|
|
Basic and diluted earnings per share: |
|
|
|
|
|
|
|
|
|
|
|
|
Common shares |
|
| 2.78 |
|
|
| 4.96 |
|
|
| 2.56 |
|
Preferred shares |
|
| 3.06 |
|
|
| 5.45 |
|
|
| 2.82 |
|
24) | NET OPERATING REVENUE |
a) | Accounting policy |
Recognition of revenues from services and goods
With the adoption of IFRS 15 on January 1, 2018, for packages combining various fixed network, mobile, data, internet or television products or services, total revenue is now allocated to each performance obligation based on its independent selling prices in relation to the total consideration of the package and recognized when (or as soon as) the obligation is met, regardless of whether or not items are delivered. When packages include a discount on the equipment, there is an increase in revenues recognized for the sale of handsets and other equipment, to the detriment of ongoing service revenue over subsequent periods. To the extent that the packages are marketed at a discount, the difference between the revenue from the sale of equipment and the consideration received from the customer in advance is recognized as a contractual asset in the statement of financial position.
Revenues correspond substantially to the value of the consideration received or receivable arising from the provision of telecommunications, communications, sales of goods, advertising and other revenues, and are presented net of taxes, rebates and returns (in the case of sale of goods), incident on them.
F-65
Revenues from sales of public telephone cards and prepaid cellular recharge credits, as well as the respective taxes due are deferred and recognized in income as services are effectively rendered.
Revenues from leasing contracts for equipment classified as financial leasing ("Soluciona IT" product) are recognized at the installation of the equipment, at which time the actual transfer of risk occurs. Revenues are recognized at the present value of future minimum contract payments.
Revenue from the sale of appliances to dealers is accounted for at the time of delivery and not at the time of sale to the final customer.
Revenues from services and goods are basically subject to the following indirect taxes: ICMS or ISS (as the case may be), PIS and COFINS, as the case may be.
b)Critical estimates and judgments
The Company has billing systems for services with intermediate cut-off dates. Thus, at the end of each month there are revenues already received by the Company, but not effectively invoiced to its customers. These unbilled revenues are recorded based on estimates, which take into account historical consumption data, number of days elapsed since the last billing date, different cycles of information, and data obtained from different sources which is processed by a large number of application and system, among others. These estimates are subject to significant uncertainties.
c)Breakdown
|
| 2019 |
|
| 2018 |
|
| 2017 |
| |||
Gross operating revenue |
|
| 66,571,866 |
|
|
| 65,794,397 |
|
|
| 66,243,174 |
|
Services(1) |
|
| 60,129,579 |
|
|
| 61,292,362 |
|
|
| 62,696,433 |
|
Sale of goods (2) |
|
| 6,442,287 |
|
|
| 4,502,035 |
|
|
| 3,546,741 |
|
|
|
|
|
|
|
|
|
|
|
|
|
|
Deductions from gross operating revenue |
|
| (22,303,695 | ) |
|
| (22,331,657 | ) |
|
| (23,036,342 | ) |
Taxes |
|
| (13,894,361 | ) |
|
| (14,559,915 | ) |
|
| (16,058,584 | ) |
Services |
|
| (12,678,809 | ) |
|
| (13,820,784 | ) |
|
| (15,468,315 | ) |
Sale of goods |
|
| (1,215,552 | ) |
|
| (739,131 | ) |
|
| (590,269 | ) |
|
|
|
|
|
|
|
|
|
|
|
|
|
Discounts granted and return of goods |
|
| (8,409,334 | ) |
|
| (7,771,742 | ) |
|
| (6,977,758 | ) |
Services |
|
| (6,319,584 | ) |
|
| (6,288,941 | ) |
|
| (5,340,476 | ) |
Sale of goods |
|
| (2,089,750 | ) |
|
| (1,482,801 | ) |
|
| (1,637,282 | ) |
|
|
|
|
|
|
|
|
|
|
|
|
|
Net operating revenue |
|
| 44,268,171 |
|
|
| 43,462,740 |
|
|
| 43,206,832 |
|
Services |
|
| 41,131,186 |
|
|
| 41,182,637 |
|
|
| 41,887,642 |
|
Sale of Goods |
|
| 3,136,985 |
|
|
| 2,280,103 |
|
|
| 1,319,190 |
|
(1) | These include telephone services, use of interconnection network, data and SVA services, cable TV and other services. | |
| ||
(2) | These include sale of goods (handsets, SIM cards and accessories) and equipment of “Soluciona TI”. |
No single customer contributed more than 10% of gross operating revenue for the years ended December 31, 2019, 2018 and 2017.
F-66
25) OPERATING COSTS AND EXPENSES
|
| 2019 | ||||||||||||||
|
| Cost of sales and services |
| Selling expenses |
| General and administrative expenses |
| Total | ||||||||
Personnel (1) |
|
| (758,780 | ) |
|
| (2,568,363 | ) |
|
| (430,409 | ) |
|
| (3,757,552 | ) |
Third-party services(2) |
|
| (6,601,587 | ) |
|
| (6,686,452 | ) |
|
| (1,154,823 | ) |
|
| (14,442,862 | ) |
Rental, insurance, condominium and connection means(3) |
|
| (1,388,217 | ) |
|
| (78,401 | ) |
|
| (57,359 | ) |
|
| (1,523,977 | ) |
Taxes, charges and contributions (4) |
|
| (1,597,066 | ) |
|
| (41,810 | ) |
|
| (31,127 | ) |
|
| (1,670,003 | ) |
Estimated impairment losses on accounts receivable (Note 4) |
|
| - |
|
|
| (1,682,348 | ) |
|
| - |
|
|
| (1,682,348 | ) |
Depreciation and amortization(5) |
|
| (8,624,228 | ) |
|
| (1,501,096 | ) |
|
| (794,468 | ) |
|
| (10,919,792 | ) |
Cost of goods sold |
|
| (3,156,964 | ) |
|
| - |
|
|
| - |
|
|
| (3,156,964 | ) |
Materials and other operating costs and expenses |
|
| (32,105 | ) |
|
| (142,752 | ) |
|
| (29,910 | ) |
|
| (204,767 | ) |
Total |
|
| (22,158,947 | ) |
|
| (12,701,222 | ) |
|
| (2,498,096 | ) |
|
| (37,358,265 | ) |
|
|
|
|
|
|
|
|
|
|
|
|
|
|
|
|
|
|
| 2018 | ||||||||||||||
|
| Cost of sales and services |
| Selling expenses |
| General and administrative expenses |
| Total | ||||||||
Personnel (1) |
|
| (872,032 | ) |
|
| (2,574,498 | ) |
|
| (549,610 | ) |
|
| (3,996,140 | ) |
Third-party services(2) |
|
| (6,656,924 | ) |
|
| (6,989,006 | ) |
|
| (1,237,527 | ) |
|
| (14,883,457 | ) |
Rental, insurance, condominium and connection means(3) |
|
| (2,957,489 | ) |
|
| (147,613 | ) |
|
| (202,881 | ) |
|
| (3,307,983 | ) |
Taxes, charges and contributions (4) |
|
| (1,594,836 | ) |
|
| (30,703 | ) |
|
| (36,122 | ) |
|
| (1,661,661 | ) |
Estimated impairment losses on accounts receivable (Note 4) |
|
| - |
|
|
| (1,533,660 | ) |
|
| - |
|
|
| (1,533,660 | ) |
Depreciation and amortization(5) |
|
| (6,487,909 | ) |
|
| (1,352,638 | ) |
|
| (528,076 | ) |
|
| (8,368,623 | ) |
Cost of goods sold |
|
| (2,406,099 | ) |
|
| - |
|
|
| - |
|
|
| (2,406,099 | ) |
Materials and other operating costs and expenses |
|
| (50,478 | ) |
|
| (204,623 | ) |
|
| (44,754 | ) |
|
| (299,855 | ) |
Total |
|
| (21,025,767 | ) |
|
| (12,832,741 | ) |
|
| (2,598,970 | ) |
|
| (36,457,478 | ) |
|
| 2017 | ||||||||||||||
|
| Cost of sales and services |
| Selling expenses |
| General and administrative expenses |
| Total | ||||||||
Personnel (1) |
|
| (845,358 | ) |
|
| (2,387,314 | ) |
|
| (493,095 | ) |
|
| (3,725,767 | ) |
Third-party services(2) |
|
| (7,032,252 | ) |
|
| (7,438,937 | ) |
|
| (1,232,379 | ) |
|
| (15,703,568 | ) |
Rental, insurance, condominium and connection means(3) |
|
| (2,624,405 | ) |
|
| (151,455 | ) |
|
| (204,701 | ) |
|
| (2,980,561 | ) |
Taxes, charges and contributions (4) |
|
| (1,792,764 | ) |
|
| (39,050 | ) |
|
| (34,779 | ) |
|
| (1,866,593 | ) |
Estimated impairment losses on accounts receivable (Note 4) |
|
| - |
|
|
| (1,481,015 | ) |
|
| - |
|
|
| (1,481,015 | ) |
Depreciation and amortization(5) |
|
| (5,963,153 | ) |
|
| (1,433,297 | ) |
|
| (457,284 | ) |
|
| (7,853,734 | ) |
Cost of goods sold |
|
| (1,955,890 | ) |
|
| - |
|
|
| - |
|
|
| (1,955,890 | ) |
Materials and other operating costs and expenses |
|
| (58,708 | ) |
|
| (205,406 | ) |
|
| (20,867 | ) |
|
| (284,981 | ) |
Total |
|
| (20,272,530 | ) |
|
| (13,136,474 | ) |
|
| (2,443,105 | ) |
|
| (35,852,109 | ) |
F-67
(1) | Includes costs and expenses with fees, salaries, social charges and benefits, profit sharing, stock-based compensation plans, pension plans and other post-employment benefits, training, transportation, health and nutrition. | |
| ||
(2) | Includes costs and expenses for interconnection and use of networks, advertising and publicity, plant maintenance, electricity, security, cleaning, TV content purchase, commercial brokerage and intermediation, partnerships, call center, back office, logistics and storage, preparation and posting of telephone bills, banking services, among others. | |
| ||
(3) | Includes costs and expenses of infrastructure, real estate, equipment, vehicles, insurance and means of connection. | |
| ||
(4) | Includes costs and expenses with FISTEL, FUST, FUNTTEL, liens for renewal of licenses and other taxes, fees and contributions. | |
| ||
(5) | Includes the consolidated amounts of R$1,913,241, R$29,631 and R$30,291 in the years ended December 31, 2019 2018 and 2017, respectively, related to the leases depreciation. In 2017, includes R$1,267, related to non-cumulative PIS and COFINS tax credits. |
26) | OTHER OPERATING INCOME (EXPENSES) |
|
| 2019 |
|
| 2018 |
|
| 2017 |
| |||
Recovered expenses and fines(1) |
|
| 503,777 |
|
|
| 3,962,150 |
|
|
| 355,415 |
|
Provisions for labor, tax and civil contingencies (Note 19)(2) |
|
| (625,480 | ) |
|
| (1,258,966 | ) |
|
| (999,419 | ) |
Net gain (loss) on asset disposal/loss |
|
| 408,160 |
|
|
| 114,853 |
|
|
| 108,767 |
|
Other operating income (expenses) |
|
| 17,561 |
|
|
| (367,115 | ) |
|
| (187,249 | ) |
Total |
|
| 304,018 |
|
|
| 2,450,922 |
|
|
| (722,486 | ) |
|
|
|
|
|
|
|
|
|
|
|
|
|
Other operating income |
|
| 929,498 |
|
|
| 4,077,003 |
|
|
| 464,182 |
|
Other operating expenses |
|
| (625,480 | ) |
|
| (1,626,081 | ) |
|
| (1,186,668 | ) |
Total |
|
| 304,018 |
|
|
| 2,450,922 |
|
|
| (722,486 | ) |
|
|
|
|
|
|
|
|
|
|
|
|
|
(1) | For the year ended December 31, 2018, includes tax credits amount to R$3,386,433, from the final court proceeding in favor of the Company and its subsidiary, which recognized the right to exclude ICMS (VAT) from the basis of calculation of PIS and COFINS contributions for the periods from September 2003 to June 2017 and July 2004 to June 2013 (Note 8). | |
| ||
(2) | For the year ended December 31, 2018, includes the write-off of judicial deposits in the amount of R$160,715. |
a) | Accounting policy |
These include interest, monetary and exchange variations arising from short-term investments, derivative transactions, loans, financing, debentures, present value adjustments of transactions that generate monetary assets and liabilities and other financial transactions. These are recognized on an accrual basis when earned or incurred by the Company.
For all financial instruments measured at amortized cost and interest-yielding financial assets classified as financial assets at fair value through other comprehensive income, interest income or expense is recognized using the effective interest method, which exactly discounts estimated future cash payments or receipts over the expected life of the financial instrument or, where appropriate, a shorter period, to the net carrying amount of the financial asset or liability.
F-68
b) | Breakdown |
|
| 2019 |
| 2018 |
| 2017 | ||||||
Financial Income |
|
|
|
|
|
| ||||||
Interest income |
|
| 272,158 |
|
|
| 246,083 |
|
|
| 655,474 |
|
Interest receivable (customers, taxes and other) |
|
| 177,636 |
|
|
| 118,476 |
|
|
| 124,391 |
|
Gain on derivative transactions (Note 31) |
|
| 315,351 |
|
|
| 305,996 |
|
|
| 373,971 |
|
Foreign exchange variations on loans and financing (Note 20) |
|
| 5,140 |
|
|
| 32,326 |
|
|
| 113,203 |
|
Other revenues from foreign exchange and monetary variation(1) |
|
| 209,447 |
|
|
| 3,341,211 |
|
|
| 406,013 |
|
Other financial income |
|
| 153,138 |
|
|
| 68,548 |
|
|
| 82,906 |
|
Total |
|
| 1,132,870 |
|
|
| 4,112,640 |
|
|
| 1,755,958 |
|
|
|
|
|
|
|
|
|
|
|
|
|
|
Financial Expenses |
|
|
|
|
|
|
|
|
|
|
|
|
Loan, financing, debenture and finance lease charges (Nota 20) (3) |
|
| (830,686 | ) |
|
| (510,398 | ) |
|
| (932,727 | ) |
Foreign exchange variation on loans and financing (Note 20) |
|
| (4,036 | ) |
|
| (61,174 | ) |
|
| (129,049 | ) |
Loss on derivative transactions (Note 31) |
|
| (263,388 | ) |
|
| (295,208 | ) |
|
| (415,956 | ) |
Interest payable (financial institutions, provisions, trade accounts payable, taxes and other) |
|
| (144,779 | ) |
|
| (186,238 | ) |
|
| (136,425 | ) |
Other expenses with foreign exchange and monetary variation |
|
| (615,291 | ) |
|
| (963,463 | ) |
|
| (876,948 | ) |
IOF, Pis, Cofins and other financial expenses(2) |
|
| (94,831 | ) |
|
| (269,006 | ) |
|
| (167,897 | ) |
Total |
|
| (1,953,011 | ) |
|
| (2,285,487 | ) |
|
| (2,659,002 | ) |
|
|
|
|
|
|
|
|
|
|
|
|
|
Financial income (expenses), net |
|
| (820,141 | ) |
|
| 1,827,153 |
|
|
| (903,044 | ) |
(1) | For the year ended December 31, 2018, includes tax credits amounting to R$2,926,247, arising from the final court proceeding in favor of the Company and its subsidiary (TData), which recognized the right to exclude ICMS (VAT) from the basis of calculation of PIS and COFINS contributions for the periods from September 2003 to June 2017 and July 2004 to June 2013 (Note 8). | |
| ||
(2) | For the year ended December 31, 2018, includes the amount of R$136,070 of PIS and COFINS on the indexation for inflation credits in (1) above. | |
| ||
(3) | Includes the consolidated amounts of R$457,98, R$45,501 and R$45,265 in the years ended December 31, 2019, 2018 and 2017, respectively, related to leases charges. |
28) BALANCES AND TRANSACTIONS WITH RELATED PARTS
a) | Balances and transactions with related parts |
The main balances of assets and liabilities with related parties arises from transactions with companies related to the controlling group carried out at the prices and other commercial conditions agreed in contracts between the parts as follows:
a) | Fixed and mobile telephony services provided by Telefónica Group companies. | |
| ||
b) | Digital TV services provided by Media Networks Latino America. | |
| ||
c) | Rental, maintenance of safety equipment and construction services provided by Telefônica Infraestrutura e Segurança (formerly Telefônica Inteligência e Segurança Brasil). The controlling interest of this company was acquired by Terra Networks (Note 1.c.1) and, therefore, the amounts presented in the income statement refer to the period from January to August 2019. |
F-69
d) | Corporate services passed through at the cost effectively incurred for these services. | |
e) | Right to use certain software licenses, including maintenance and support, provided by Telefónica Global Technology. | |
f) | International transmission infrastructure for several data circuits and roaming services provided by Telxius Cable Brasil, Telefónica International Wholesale Services Espanha, Telefónica USA; and Telefónica International Wholesale Services Brazil (formerly Media Net Brazil). | |
g) | Operations by Telefónica Group companies, relating to the purchase of internet content, advertising and auditing services. | |
h) | Marketing services provided by Telefónica Group companies. | |
i) | Information access services through the electronic communications network, provided by Telefonica de Espanha. | |
j) | Data communication services and integrated solutions provided by Telefónica International Wholesale Services Espanha and Telefónica USA. | |
k) | Long distance call and international roaming services provided by Telefónica Group companies. | |
l) | Sundry expenses and costs to be reimbursed by Telefónica Group companies. | |
m) | Brand fee for assignment of rights to use the brand paid to Telefónica. | |
n) | Platform of health services provided by Axismed. | |
o) | Cost Sharing Agreement for digital-business related expenses reimbursed to Telefónica Digital. | |
p) | Leases/rentals of Telefónica Group companies’ buildings. | |
q) | Financial Clearing House roaming, inflows of funds for payments and receipts arising from roaming operation between group companies operated by Telfisa. | |
r) | Integrated e-learning, online education and training solutions provided by Telefônica Serviços de Ensino. | |
s) | Factoring transactions, credit facilities for services provided by the Group's suppliers. | |
t) | Social investment in Fundação Telefônica, innovative use of technology to enhance learning and knowledge, contributing to personal and social development. | |
u) | Contracts or agreements assigning user rights for cable ducts, optical fiber duct rental services, and right-of-way related occupancy agreements with several highway concessionaires provided by Companhia AIX. | |
v) | Adquira Sourcing platform - online solution provided by Telefónica Compras Electrónicas to transact purchase and sale of all types of goods and services. |
F-70
w) | Digital media; marketing and sales, in-store and outdoor digital marketing services provided by Telefônica On The Spot Soluções Digitais Brasil. | |
x) | Tower lease transactions between Telefonica Brasil and Telxius Torres Brasil. | |
y) | Amounts to be reimbursed by SPTE as a result of contractual clause of the purchase of Terra Networks Brasil equity interest. | |
z) | Sale of digital products, creation of an exclusive band channel that responds to the commercial demand for these digital services and products. | |
aa) | Hosting services, housing and telecommunications solutions for the corporate market provided by Acens. | |
bb) | Consulting services, technical support, import and export of goods with the company Telefonica Ingeniería de Seguridad. | |
cc) | Negotiations with suppliers in the different global categories provided by Telefónica Global Services GmBH. |
The Company and its subsidiaries sponsor pension plans and other post-employment benefits for its employees with Visão Prev and Sistel (Note 30).
F-71
The following table summarizes the consolidated balances with related parts:
|
|
|
| Balance Sheet - Assets | ||||||||||||||||||||||
|
|
|
| 12.31.19 |
| 12.31.18 | ||||||||||||||||||||
Companies |
| Type of transaction |
| Cash and cash equivalents |
| Accounts receivable |
| Other assets and prepaid expenses |
| Cash and cash equivalents |
| Accounts receivable |
| Other assets | ||||||||||||
Parent Companies |
|
|
|
|
|
|
|
|
|
|
|
|
|
|
|
|
|
|
|
|
|
|
|
|
|
|
SP Telecomunicações Participações |
| d) / l) |
|
| - |
|
|
| 6 |
|
|
| 4,924 |
|
|
| - |
|
|
| - |
|
|
| 10,083 |
|
Telefónica LatinoAmerica Holding |
| l) |
|
| - |
|
|
| - |
|
|
| 40,105 |
|
|
| - |
|
|
| - |
|
|
| 60,387 |
|
Telefónica |
| l) / z) |
|
| - |
|
|
| 10,873 |
|
|
| 2,555 |
|
|
| - |
|
|
| 9,300 |
|
|
| 29,757 |
|
|
|
|
|
| - |
|
|
| 10,879 |
|
|
| 47,584 |
|
|
| - |
|
|
| 9,300 |
|
|
| 100,227 |
|
Other Group companies |
|
|
|
|
|
|
|
|
|
|
|
|
|
|
|
|
|
|
|
|
|
|
|
|
|
|
Colombia Telecomunicaciones |
| k) / l) |
|
| - |
|
|
| 159 |
|
|
| 520 |
|
|
| - |
|
|
| 1,334 |
|
|
| 520 |
|
Telefónica International Wholesale Services |
| a) / d) / l) / p) |
|
| - |
|
|
| 1,961 |
|
|
| 3,602 |
|
|
| - |
|
|
| 903 |
|
|
| 4,051 |
|
T.O2 Germany GMBH CO. OHG |
| k) |
|
| - |
|
|
| 1,688 |
|
|
| - |
|
|
| - |
|
|
| 20,877 |
|
|
| - |
|
Telefónica Venezolana |
| k) |
|
| - |
|
|
| 6,498 |
|
|
| 2,196 |
|
|
| - |
|
|
| 5,926 |
|
|
| 2,196 |
|
Telefônica Digital España |
| g) / l) |
|
| - |
|
|
| 696 |
|
|
| 300 |
|
|
| - |
|
|
| 197 |
|
|
| 294 |
|
Telefônica Factoring do Brasil |
| a) / d) / l) / s) |
|
| - |
|
|
| 2,782 |
|
|
| 45 |
|
|
| - |
|
|
| 6,360 |
|
|
| 133 |
|
Telefônica Infraestrutura e Segurança (formerly Telefônica Inteligência e Segurança Brasil) |
| a) / d) / l) |
|
| - |
|
|
| - |
|
|
| - |
|
|
| - |
|
|
| 800 |
|
|
| 986 |
|
Telefónica International Wholesale Services Espanha |
| j) / k) |
|
| - |
|
|
| 58,490 |
|
|
| - |
|
|
| - |
|
|
| 46,537 |
|
|
| - |
|
Telefônica Serviços de Ensino |
| a) / p) |
|
| - |
|
|
| 153 |
|
|
| 14 |
|
|
| - |
|
|
| 286 |
|
|
| - |
|
Telefónica Moviles Argentina |
| k) |
|
| - |
|
|
| 5,145 |
|
|
| - |
|
|
| - |
|
|
| 5,074 |
|
|
| - |
|
Telefónica Moviles Espanha |
| k) |
|
| - |
|
|
| 1,536 |
|
|
| - |
|
|
| - |
|
|
| 7,576 |
|
|
| - |
|
Telefónica USA |
| j) |
|
| - |
|
|
| 5,319 |
|
|
| - |
|
|
| - |
|
|
| 9,005 |
|
|
| - |
|
Telfisa Global BV |
| q) |
|
| 59,657 |
|
|
| - |
|
|
| - |
|
|
| 46,755 |
|
|
| - |
|
|
| - |
|
Telxius Cable Brasil |
| a) / d) / l) / p) |
|
| - |
|
|
| 11,382 |
|
|
| 5,100 |
|
|
| - |
|
|
| 11,628 |
|
|
| 5,295 |
|
Telxius Torres Brasil |
| d) / p) / x) |
|
| - |
|
|
| 5,429 |
|
|
| 6,611 |
|
|
| - |
|
|
| 6,776 |
|
|
| 4,268 |
|
Terra Networks Chile, Terra Networks México, Terra Networks Perú, Terra Networks Argentina and Terra Networks Colômbia |
| g) / h) |
|
| - |
|
|
| 5,598 |
|
|
| - |
|
|
| - |
|
|
| 5,341 |
|
|
| - |
|
Other |
| a) / d) / k) / l) / p) / bb) |
|
| - |
|
|
| 12,189 |
|
|
| 2,732 |
|
|
| - |
|
|
| 10,894 |
|
|
| 2,806 |
|
|
|
|
|
| 59,657 |
|
|
| 119,025 |
|
|
| 21,120 |
|
|
| 46,755 |
|
|
| 139,514 |
|
|
| 20,549 |
|
Total |
|
|
|
| 59,657 |
|
|
| 129,904 |
|
|
| 68,704 |
|
|
| 46,755 |
|
|
| 148,814 |
|
|
| 120,776 |
|
|
|
|
|
|
|
|
|
|
|
|
|
|
|
|
|
|
|
|
|
|
|
|
|
|
|
|
Current assets |
|
|
|
|
|
|
|
|
|
|
|
|
|
|
|
|
|
|
|
|
|
|
|
|
|
|
Cash and cash equivalents (Note 3) |
|
|
|
| 59,657 |
|
|
| - |
|
|
| - |
|
|
| 46,755 |
|
|
| - |
|
|
| - |
|
Accounts receivable (Note 4) |
|
|
|
| - |
|
|
| 129,904 |
|
|
| - |
|
|
| - |
|
|
| 148,814 |
|
|
| - |
|
Prepaid expenses (Note 6) |
|
|
|
| - |
|
|
| - |
|
|
| 3,738 |
|
|
| - |
|
|
| - |
|
|
| - |
|
Other assets (Note 10) |
|
|
|
| - |
|
|
| - |
|
|
| 64,471 |
|
|
| - |
|
|
| - |
|
|
| 114,715 |
|
Non-current assets |
|
|
|
|
|
|
|
|
|
|
|
|
|
|
|
|
|
|
|
|
|
|
|
|
|
|
Prepaid expenses (Note 6) |
|
|
|
| - |
|
|
| - |
|
|
| - |
|
|
| - |
|
|
| - |
|
|
| - |
|
Other assets (Note 10) |
|
|
|
| - |
|
|
| - |
|
|
| 495 |
|
|
| - |
|
|
| - |
|
|
| 6,061 |
|
F-72
|
|
|
| Balance Sheet - Liabilities | ||||||||||||
|
|
|
| 12.31.19 |
| 12.31.18 | ||||||||||
Companies |
| Type of transaction |
| Trade accounts payable and other payables |
| Other liabilities and leases |
| Trade accounts payable and other payables |
| Other liabilities | ||||||
Parent Companies |
|
|
|
|
|
|
|
|
|
|
|
|
|
| ||
SP Telecomunicações Participações |
| l) / y) |
|
| - |
|
|
| 23,524 |
|
|
| - |
|
| 21,901 |
Telefónica |
| l) / m) |
|
| 2,907 |
|
|
| 40 |
|
|
| 687 |
|
| 1,393 |
|
|
|
|
| 2,907 |
|
|
| 23,564 |
|
|
| 687 |
|
| 23,294 |
Other Group companies |
|
|
|
|
|
|
|
|
|
|
|
|
|
| ||
Colombia Telecomunicaciones |
| k) |
|
| 816 |
|
|
| - |
|
|
| 1,056 |
|
| - |
Fundação Telefônica |
| l) |
|
| - |
|
|
| 86 |
|
|
| - |
|
| 82 |
Media Networks Latina America SAC |
| b) |
|
| 9,245 |
|
|
| - |
|
|
| 10,212 |
|
| - |
Telefónica International Wholesale Services |
| f) |
|
| 44,835 |
|
|
| 318 |
|
|
| 44,693 |
|
| 318 |
T.O2 Germany GMBH CO. OHG |
| k) |
|
| 5,000 |
|
|
| - |
|
|
| 5,706 |
|
| - |
Telefónica Venezolana |
| k) |
|
| 6,044 |
|
|
| - |
|
|
| 5,410 |
|
| - |
Telefónica Compras Electrónicas |
| v) |
|
| 28,169 |
|
|
| - |
|
|
| 32,582 |
|
| - |
Telefônica Digital España |
| o) |
|
| 68,015 |
|
|
| - |
|
|
| 43,340 |
|
| - |
Telefônica Factoring do Brasil |
| l) / s) |
|
| - |
|
|
| 4,057 |
|
|
| - |
|
| 2,770 |
Telefónica Global Technology |
| e) |
|
| 28,854 |
|
|
| - |
|
|
| 28,750 |
|
| - |
Telefônica Infraestrutura e Segurança (formerly Telefônica Inteligência e Segurança Brasil) |
| c) / l) |
|
| - |
|
|
| - |
|
|
| 52,184 |
|
| 27 |
Telefónica International Wholesale Services Espanha |
| f) / k) |
|
| 66,976 |
|
|
| - |
|
|
| 26,097 |
|
| - |
Telefônica Serviços de Ensino |
| r) |
|
| 8,373 |
|
|
| - |
|
|
| 22,518 |
|
| - |
Telefónica Moviles Argentina |
| k) |
|
| 3,638 |
|
|
| - |
|
|
| 4,160 |
|
| - |
Telefónica Moviles Espanha |
| k) |
|
| 3,488 |
|
|
| - |
|
|
| 5,233 |
|
| - |
Telefónica USA |
| f) |
|
| 16,015 |
|
|
| 267 |
|
|
| 4,411 |
|
| 200 |
Telxius Cable Brasil |
| f) / l) |
|
| 47,168 |
|
|
| 1,572 |
|
|
| 39,662 |
|
| 2,067 |
Telxius Torres Brasil |
| x) |
|
| 30,018 |
|
|
| 480,589 |
|
|
| 38,735 |
|
| 1,926 |
Terra Networks Chile, Terra Networks México, Terra Networks Perú, Terra Networks Argentina and Terra Networks Colômbia |
| h) |
|
| 7,105 |
|
|
| - |
|
|
| 1,766 |
|
| - |
Other | a) / d) / g) / k) / h) / l) / bb) |
|
| 28,605 |
|
|
| 42 |
|
|
| 16,310 |
|
| 1,032 | |
|
|
|
|
| 402,364 |
|
|
| 486,931 |
|
|
| 382,825 |
|
| 8,422 |
Total |
|
|
|
| 405,271 |
|
|
| 510,495 |
|
|
| 383,512 |
|
| 31,716 |
|
|
|
|
|
|
|
|
|
|
|
|
|
|
| ||
Current liabilities |
|
|
|
|
|
|
|
|
|
|
|
|
|
| ||
Trade accounts payable and other payables (Note 15) |
|
|
|
| 405,271 |
|
|
| - |
|
|
| 383,512 |
|
| - |
Leases (Note 20) |
|
|
|
| - |
|
|
| 480,381 |
|
|
| - |
|
| - |
Other liabilities (Note 22) |
|
|
|
| - |
|
|
| 29,529 |
|
|
| - |
|
| 22,220 |
Non-current liabilities |
|
|
|
|
|
|
|
|
|
|
|
|
|
| ||
Leases (Note 20) |
|
|
|
| - |
|
|
| - |
|
|
| - |
|
| - |
Other liabilities (Note 22) |
|
|
|
| - |
|
|
| 585 |
|
|
| - |
|
| 9,496 |
F-73
|
|
| Income statement | ||||||||||||||||
|
| 2019 |
| 2018 |
| 2017 | |||||||||||||
Companies | Type of transaction |
| Operating revenues |
| Cost and other expenses (revenues) operating |
| Financial result |
| Operating revenues |
| Cost and other expenses (revenues) operating |
| Financial result |
| Operating revenues |
| Cost and other expenses (revenues) operating |
| Financial result |
Parent Companies |
|
|
|
|
|
|
|
|
|
|
|
|
|
|
|
|
|
|
|
SP Telecomunicações Participações | d) / l) |
| 5 |
| 497 |
| - |
| - |
| 347 |
| - |
| - |
| 268 |
| - |
Telefónica LatinoAmerica Holding | l) |
| - |
| 18,309 |
| 851 |
| - |
| 16,466 |
| 9,077 |
| - |
| 36,523 |
| 11,030 |
Telefónica | l) / m) |
| - |
| (422,958) |
| (5,226) |
| - |
| (373,690) |
| (16,680) |
| - |
| (331,684) |
| (996) |
|
|
| 5 |
| (404,152) |
| (4,375) |
| - |
| (356,877) |
| (7,603) |
| - |
| (294,893) |
| 10,034 |
Other Group companies |
|
|
|
|
|
|
|
|
|
|
|
|
|
|
|
|
|
|
|
Colombia Telecomunicaciones | k) |
| 111 |
| 321 |
| (17) |
| 250 |
| (4,280) |
| (2,145) |
| 349 |
| (10) |
| 604 |
Companhia AIX de Participações | a) / u) |
| 38 |
| (24,174) |
| - |
| 75 |
| (22,645) |
| - |
| 36 |
| (22,738) |
| - |
Fundação Telefônica | l) / t) |
| - |
| (11,971) |
| - |
| - |
| (12,223) |
| - |
| - |
| (11,395) |
| - |
Telefónica International Wholesale Services | a) / d) / f) / l) / p) |
| 757 |
| (104,105) |
| (54) |
| 2,006 |
| (101,272) |
| - |
| 601 |
| (57,177) |
| - |
Media Networks Latina America SAC | b) |
| - |
| (41,023) |
| (596) |
| - |
| (34,791) |
| (1,007) |
| - |
| (33,133) |
| (516) |
Telefônica Serviços de Ensino | a) / p) / r) |
| 1,085 |
| (35,228) |
| - |
| 1,158 |
| (49,130) |
| - |
| 292 |
| (54,781) |
| - |
T.O2 Germany GMBH CO. OHG | k) |
| (100) |
| 489 |
| 1,845 |
| 148 |
| (1,975) |
| - |
| 75 |
| (1,409) |
| - |
Telefónica Compras Electrónicas | v) |
| - |
| (30,814) |
| - |
| - |
| (34,534) |
| - |
| - |
| (29,062) |
| - |
Telefônica Digital España | l) / o) |
| 299 |
| (127,182) |
| (3,016) |
| - |
| (124,537) |
| (813) |
| - |
| (81,893) |
| (2,600) |
Telefônica Factoring do Brasil | a) / d) / l) / s) |
| 2,418 |
| 239 |
| (4,048) |
| 2,416 |
| 212 |
| 2,601 |
| 69 |
| 828 |
| 61 |
Telefónica Global Technology, S.A.U. | e) / l) |
| - |
| (63,947) |
| 388 |
| - |
| (36,738) |
| (4,134) |
| - |
| (36,395) |
| 40 |
Telefônica Infraestrutura e Segurança (formerly Telefônica Inteligência e Segurança Brasil) | a) / c) / d) / l) / p) |
| 591 |
| (27,079) |
| - |
| 1,568 |
| (54,210) |
| - |
| 706 |
| (40,918) |
| - |
Telefónica International Wholesale Services Espanha | f) / j) / k) |
| 48,819 |
| (75,693) |
| (4,128) |
| 53,357 |
| (64,036) |
| 9,771 |
| 56,728 |
| (49,960) |
| (2,564) |
Telefónica Moviles Argentina | k) |
| 4,030 |
| (3,437) |
| 90 |
| 5,916 |
| (3,437) |
| - |
| 3,746 |
| 6,147 |
| - |
Telefónica Moviles Espanha | k) |
| 410 |
| (1,737) |
| 545 |
| (209) |
| (4,166) |
| - |
| 1,048 |
| (1,969) |
| - |
Telefónica USA | f) / j) |
| 38 |
| (19,793) |
| 1,700 |
| 1,518 |
| (19,441) |
| (539) |
| 2,392 |
| (13,202) |
| (2,185) |
Telxius Cable Brasil | a) / d) / f) / l) / p) |
| 13,585 |
| (252,436) |
| (7,415) |
| 49,777 |
| (206,095) |
| (7,896) |
| 15,045 |
| (200,537) |
| 787 |
Telxius Torres Brasil | d) / l) / p) / x) |
| 3,652 |
| 756 |
| (24,144) |
| 3,218 |
| (129,706) |
| - |
| - |
| (107,373) |
| - |
Terra Networks Chile, Terra Networks México, Terra Networks Perú, Terra Networks Argentina and Terra Networks Colômbia | h) |
| 2,535 |
| (5,639) |
| 567 |
| - |
| (2,794) |
| 1,450 |
| - |
| 1,072 |
| (59) |
Other | a) / d) / g) / i) / k) / l) / n) / p) / w) / aa) / bb) / cc) |
| 6,269 |
| (31,684) |
| 588 |
| 4,840 |
| (27,116) |
| (244) |
| 9,311 |
| (29,409) |
| 182 |
|
|
| 84,537 |
| (854,137) |
| (37,695) |
| 126,038 |
| (932,914) |
| (2,956) |
| 90,398 |
| (763,314) |
| (6,250) |
Total |
|
| 84,542 |
| (1,258,289) |
| (42,070) |
| 126,038 |
| (1,289,791) |
| (10,559) |
| 90,398 |
| (1,058,207) |
| 3,784 |
|
|
|
|
|
|
|
|
|
|
|
|
|
|
|
|
|
|
|
|
F-74
b) | Management compensation |
Consolidated key management compensation paid by the Company to its Board of Directors and Statutory Officers for the years ended December 31, 2019 and 2018 totaled R$25,483 and R$26,431, respectively. Of this amount, R$16,758 (R$17,493 on December 31, 2018) corresponds to salaries, benefits and social charges and R$8,725 (R$8,938 on December 31, 2018) to variable compensation.
These were recorded as personnel expenses in General and administrative expenses (Note 25).
For the years ended December 31, 2019 and 2018, the Directors and Officers received no pension, retirement or similar benefits.
29) | SHARE-BASED PAYMENT PLANS |
a) | Accounting policy |
The Company and subsidiaries measure the cost of transactions settled with shares issued by the parent company (Telefónica), to its officers and employees.
The Company and its subsidiaries measure the cost of transactions settled with employees and officers based on shares issued by the parent company (Telefónica), by reference to the fair value of the shares on the date at which they are granted, using the binomial valuation model. This fair value is charged to the statement of income over the period until the vesting date.
The Company and its subsidiaries reimburse Telefónica for the fair value of the benefit delivered on the grant date to the officers and employees.
b) | Information on share-based payment plans |
Telefónica as the Company´s parent has different share-based payment plans which are also offered to management and employees of its subsidiaries, including the Company and its subsidiaries.
The granting of shares is conditional upon: (i) maintenance of an active employment relationship within the Telefónica Group on the cycle consolidation date; and (ii) achievement, by Telefónica, of results representing fulfillment of the objectives established for the plan.
The level of success is based on a comparison of growth in Telefónica shareholder earnings, including their quotations and dividends (Total Shareholder Return - “TSR”), compared with the growth in TSR for companies of the Group in an established basis of comparison and the Telefónica Group's FCF.
On December 31, 2019, the value of Telefónica’ share price was Eur 6.2270.
Company and subsidiaries share-based compensation plans expenses described above, where applicable, are recorded as personnel expenses, divided into the groups cost of services, selling expenses and general and administrative expenses (Note 25), corresponding to R$10,833 and R$10,433 for the years ended December 31, 2019 and 2018.
The main plans in effect on December 31, 2019 are detailed below:
b.1)Talent for the Future Share Plan (“TFSP”), for its Senior Managers, Managers and Experts at a global level
F-75
Telefónica's Annual Shareholders' Meeting, held on June 8, 2018, approved a long-term program with the objective of rewarding the commitment, outstanding performance and high potential of its executives at a global level with the attribution of shares of Telefónica.
Participants do not have to pay for their assigned initial actions. The total planned duration of the plan is three years. The cycles are independent of each other. The number of shares is announced at the beginning of the cycle and after the three years period from the grant date, the shares will be transferred to the participants if the goal is achieved.
The 2018-2020 cycle (January 1, 2018 to December 31, 2020): includes 158 active executives the potential rights to receive 113,250 shares of Telefónica.
The 2019-2021 cycle (January 1, 2019 to December 31, 2021): includes 158 active executives the potential rights to receive 128,750 shares of Telefónica.
b.2)Perform Share Plan (“PSP”), for its Vice-Presidents and Directors at the global level
Telefónica's Annual Shareholders' Meeting, held on June 8, 2018, approved a long-term program with the objective of rewarding the commitment, outstanding performance and high potential of its Directors at the global level with the attribution of shares of Telefónica.
Participants do not have to pay for their assigned shares. The total planned duration of the plan is three years. The cycles are independent of each other. The number of shares is announced at the beginning of the cycle and after the three years period from the grant date, the shares will be transferred to the participants if the target is reached.
The 2018-2020 cycle (January 1, 2018 to December 31, 2020): includes 102 active executives (including 3 executives appointed under the Company's by-laws), with the potential right to receive 728,256 shares of Telefónica.
The 2019-2021 cycle (January 1, 2019 to December 31, 2021): includes 102 active executives (including 3 executives appointed under the Company's by-laws), with the potential right to receive 997,477 shares of Telefónica.
b.3)Global Employee Share Plan (“GESP”)
Employees enrolled in the plan acquired Telefónica shares through monthly contributions of €25 to €150 (or the equivalent in local currency) up to €1,800 over 12 months (acquisition period).
The 12 months following the purchase period are the retention period for the purchased shares. At the end of the 2nd year, reward shares will be delivered, that is, for every two shares purchased by the employee, a free share will be granted
The cycle of this plan is effective from July 1, 2019 to June 31, 2021.
The delivery of shares will take place after the vesting period of the plan, after July 31, 2021, and is subject to: (i) remaining in the company during the two years of the program (vesting period), subject to certain special conditions in relation to casualties; and (ii) the exact number of shares to be delivered at the end of the vesting period depends on the number of shares acquired and held by employees. Thus, employees enrolled in the plan, and who remain in the Telefónica Group, who have maintained the acquired shares for an additional period of another twelve months after the end of the purchase period, will be entitled to receive one free share for every two shares they have acquired and maintained until the end of the vesting period.
F-76
30) | PENSION PLANS AND OTHER POST-EMPLOYMENT BENEFITS |
a) | Accounting policy |
The Company and its subsidiaries individually sponsor pension funds of post-retirement benefits for active and retired employees, in addition to a multisponsor supplementary retirement plan and health care plan for former employees. Contributions are determined on an actuarial basis and recorded on an accrual basis. Liabilities relating to defined benefit plans are determined based on actuarial evaluations at each year-end, in order to ensure that sufficient reserves have been set up for both current and future commitments.
Actuarial liabilities related to defined benefit plans were calculated using the projected unit credit method. Actuarial gains and losses are recognized immediately in equity (in other comprehensive income).
For plans with defined contribution characteristics, the obligation is limited to the contributions payable, which are recognized in the P&L in the respective accrual periods.
The asset or liability related to defined benefit plan to be recognized in the financial statements corresponds to the present value of the obligation for the defined benefit (using a discount rate based on long-term National Treasury Notes - “NTNs”), less the fair value of plan assets that will be used to settle the obligations. Plan assets are assets held by a privately held supplementary pension plan entity. Plan assets are not available to the Company’s creditors or those of its subsidiaries and cannot be paid directly to the Company or its subsidiaries. The fair value is based on information on market prices and, in the case of securities quoted, on the purchase price disclosed. The value of any defined benefit asset then recognized is limited to the present value of any economic benefits available as a reduction in future plan contribution from the Company.
Actuarial costs recognized in the statement of income are limited to the service cost and cost of interest on the defined benefit plan obligation. Any changes in the measurement of plan assets and obligations are initially recognized in other comprehensive income, and immediately reclassified to retained earnings in P&L.
The Company and its subsidiaries manage and individually sponsors a health care plan for retired employees and former employees with fixed contributions to the plan, in accordance with Law No. 9656/98 (which provides for private health care and health insurance plans). As provided for in Articles 30 and 31 of said law, participants shall have the right to the health care plan in which they participated while they were active employees.
b)Critical estimates and judgments
The cost of pension plans with defined benefits and other post-employment health care benefits and the present value of the pension obligation are determined using actuarial valuation methods. Actuarial valuation involves use of assumptions about discount rates, future salary increases, mortality rates and future increases in pension and annuity benefits. The obligation for defined benefits is highly sensitive to changes in these assumptions. All assumptions are reviewed on an annual basis.
The mortality rate is based on publicly available mortality tables in the country. Future salary increases, and pension increases are based on expected future inflation rates for the country.
c) | Information on pension plans and other post-employment benefits |
The plans sponsored by the Company and its subsidiaries and the related benefit types are as follows:
F-77
Plan |
| Type |
| Entity |
| Sponsor |
PBS-A |
| Defined benefit (DB) |
| Sistel |
| Telefônica Brasil, jointly with other telecoms resulting from privatization of the Sistema Telebrás |
PAMA / PCE |
| Defined benefit (DB) |
| Sistel |
| Telefônica Brasil, jointly with other telecoms resulting from privatization of the Sistema Telebrás |
Healthcare - Law No. 9656/98 |
| Defined benefit (DB) |
| Telefônica Brasil |
| Telefônica Brasil, Terra Networks, TGLog and TIS |
CTB |
| Defined benefit (DB) |
| Telefônica Brasil |
| Telefônica Brasil |
Telefônica BD |
| Defined benefit (DB) |
| VisãoPrev |
| Telefônica Brasil |
VISÃO |
| Defined contribution (DC) / Hybrid |
| VisãoPrev |
| Telefônica Brasil, Terra Networks, TGLog and TIS |
The Company has participation in the decisions that directly affect the governance of the plans, with members nominated for both the Deliberative Council and the Fiscal Council of the administrators Sistel and Visão Prev.
The defined benefit obligation is made up of different components, according to the pension characteristic of each plan, and may include the actuarial liabilities of supplementary pension liabilities, health care benefits to retirees and dependents or compensation for death or disability of members. This liability is exposed to economic and demographic risks, such as: (i) increases in medical costs that could impact the cost of health care plans; (ii) salary growth; (iii) long-term inflation rate; (iv) nominal discount rate; and (v) life expectancy of members and pensioners.
The fair value of plan assets is primarily comprised of fixed income investments (NTN's, LFT’s, LTN's, repurchase agreements, CDBs, debentures, letters of guarantee and FIDC shares) and equity investments (highly liquid, well regarded, large company shares and investments in market indices).
Due to the concentration of fixed income and floating rate investments plan assets are mainly exposed to the risks inherent in the financial market and economic environment such as: (i) market risk in the economic sectors where variable income investments are concentrated; (ii) risk events that impact the economic environment and market indices where variable income investments are concentrated; and (iii) the long-term inflation rate that may erode the profitability of fixed income investments at fixed rates.
The companies that administer post-employment benefits plans sponsored by the Company (Visão Prev and Sistel) seek to meet the flows of assets and liabilities through the acquisition of fixed income securities and other long-term assets.
With the exception of the Companhia Telefônica Brasileira ("CTB") and the healthcare plan under Law No. 9656/98, generally all benefit plans that have funds constituted present a surplus position. The economic benefit recorded in the Company's assets or that of its subsidiaries does not reflect the total surplus determined in these plans. The economic benefit stated under assets considers only the portion of the surplus which presents a real possibility of recovery. The means of plan surplus recovery is solely through reductions in future contributions and given that not all plans currently receive enough contributions for full recovery of surpluses, the economic benefit recorded under assets is limited to the total possible recovery amount in accordance with projected future contributions.
F-78
The position of plan assets is on December 31, 2019 and 2018, respectively, and plan assets were apportioned based on the Company’s actuarial liabilities in relation to the total actuarial liabilities of the plan.
The actuarial gains and losses generated in each year are immediately recognized in equity (in other comprehensive income).
The following is a summary of the pension plans and other post-employment benefits:
c.1)Post-Employment Health Benefits Plans
The actuarial valuation made for the PAMA health plan used the registration of the participants with a base date of October 31, 2019, while the actuarial valuation made for the health plan Law No. 9,656/98 used the registration of the participants with a base date of December 31, 2019, both plans projected for December 31, 2019. For comparative exercises, the actuarial valuation made for the PAMA health plan and health plan Law No. 9,656/98 used the participants of October 31, 2018 and September 30, 2018, respectively, both plans projected for December 31, 2018.
c.1.1)Healthcare Plan to Retirees and Special Coverage Program (PAMA and PAMA-PCE)
The Company, together with other companies of the former Telebrás System, at shared cost, sponsor health care plans (PAMA and PAMA-PCE) to retirees. These plans are managed by Fundação Sistel and are closed plans, not admitting new members.
Contributions to the plans are determined based on actuarial valuations prepared by independent actuaries, in accordance with the rules in force in Brazil. The funding procedure is the capitalization method and the sponsor’s contribution are at the fixed percentage of payroll of employees covered by the Telefônica BD plan.
c.1.2)Health care plan – Law No. 9656/98
The Company manages and together with its subsidiaries sponsors a health care plan to retired employees and former employees with fixed contributions to the plan, in accordance with Law No. 9656/98.
As provided for in Articles 30 and 31 of said law, participants shall have the right to the health care plan in which they participated while they were active employees. Benefitted participants are classified as retirees and their dependents and dismissed employees and their dependents.
Retirees and dismissed employees, in order to keep their right to the benefits, must make contributions to the plan in accordance with the contribution tables by age bracket established by carriers and/or insurance companies.
c.2)Post-employment Social Security Plans
The actuarial valuation made for the pension plan (CTB, PBS-A, Telefônica BD and Visão Plans) used the registration of the participants with a base date of July 31, 2019, projected for December 31, 2019 and the registration of the participants with a base date of July 31, 2018, projected for December 31, 2018.
On August 15, 2018, Visão Prev obtained approvals from the National Superintendence of Private Pension Plans (“PREVIC”) for the incorporation of the TCO Prev plan into the Visão Telefônica and Telefônica BD plans. Thus, as of November 1, 2018, all participants in the TCO Prev plan became participants in the Visão Telefônica and Telefônica BD plans, according totheir profile. This unification preserves all acquired rights and provides the participants of the merged plan with access to the benefits of the Visão Telefônica and Telefônica BD plans.
F-79
The main objective of the spin-off and merger is to create greater synergy in the benefits offered to participants.
They include the PBS Assisted Plans (“PBS-A"), CTB, Telefônica DB and Visão.
c.2.1)PBS Assisted Plan (PBS-A)
The PBS-A plan is a defined benefit private pension plan managed by Sistel and sponsored by the Company jointly with the other telecommunications companies originating in the privatization of the Telebrás System. The plan is subject to funding by sponsors in the case of any asset insufficiency to ensure pension supplementation of participants in the future.
The PBS-A plan comprises assisted participants of the Sistel Benefit Plan who were already retirees on January 31, 2000, from all the participating sponsors, with joint liability of all sponsors to the plan and Sistel.
According to PREVIC Ordinance No. 1,061, of December 5, 2019, published in the DOU on December 9, 2019, Sistel approved the distribution of part of its surplus, in the form of PBS-A's special reserve, with reversal of values to sponsors and improvement of benefits, in the form of temporary income, to those assisted.
The participation corresponding to the Company in the distribution of this reserve was calculated in the amount of R$215,328, with expected distribution in the form of 36 monthly payments, the first in the amount of R$5,981 (amount already received by the Company in December 2019) and the others in same amount but corrected by the plan's income (Note 10).
Even considering the distribution of the reserve approved by PREVIC, PBS-A still has assets in excess of actuarial obligations as of December 31, 2019 and 2018. These surpluses were not recognized due to the lack of legal provision for their reimbursement and, as they are not a contributory plan, no deduction is possible in future contributions.
c.2.2)CTB Plan
Contributions to the CTB plan are determined based on actuarial valuations prepared by independent actuaries, in accordance with the rules in force in Brazil. The funding procedure is the capitalization method and the sponsor’s contribution are a fixed percentage of payroll of employees covered by the plan.
The Company also individually manages and sponsors the CTB plan, originally provided to former employees of CTB who were in the Company in 1977, with whom an individual retirement concession agreement was executed to encourage their resignation. This is an informal pension supplementation benefit paid to former employees directly by the Company. These plans are closed, and no other members are admitted.
c.2.3)Telefônica DB Plan
The Company individually sponsors a defined benefit retirement plan, the Telefônica DB plan.
In order to improve allocation of Telefônica DB plan assets and analyze the coverage ratio of plan obligations in future years, a stochastic ALM study was prepared by Visão Prev and Willis Towers Watson. This ALM study aimed at projecting the ratio between coverage of liabilities (solvency ratio) and the risk of mismatching measured by the standard deviation of the solvencyratio. The study concluded that the plan presents sustainable projection of their coverage ratio with the current investments’ portfolio.
F-80
At the time of the concession, a benefit is calculated, which will be paid in a lifelong form and updated by inflation. This plan is not open to new accessions.
The contributions are defined according to the costing plan, which is calculated considering financial, demographic and economic hypotheses in order to accumulate enough resources to pay the benefits to the participants who are already receiving them, and to the new pensions.
c.2.4)VISÃO Plans
The Visão Telefônica and Visão Multi plans will hereinafter be shown jointly under the name VISÃO, due to their similarity.
The Company and its subsidiaries sponsor defined contribution pension plans with defined benefit components (hybrid plans), i.e. the VISÃO Plans, managed by Visão Prev. The contribution is attributed to each subsidiary in the economic and demographic proportion of its respective obligation to the plan.
The contributions made by the Company and subsidiaries related to defined contribution plans totaled R$27,963 on December 31, 2019 (R$39,967 on December 31, 2018).
The contributions to the Visão Telefônica and Visão Multi plans are: (i) basic and additional contribution, with contributions made by the participant and sponsor; and (ii) additional, sporadic and specific contribution, with contributions made only by the participant.
In addition, the participant has the possibility to choose one of five investment profiles to apply to their balance, and they are: Super Conservative, Conservative, Moderate, Aggressive and Aggressive Fixed Income Long-Term.
c.3)Consolidated information on pension plans and other post-employment benefits
c.3.1)Reconciliation of net liabilities (assets):
|
| 12.31.19 |
| 12.31.18 | ||||||||||||||||||||
|
| Post-retirement pension plans |
| Post-retirement health plans |
| Total |
| Post-retirement pension plans |
| Post-retirement health plans |
| Total | ||||||||||||
Present value of DB plan obligations |
|
| 2,429,478 |
|
|
| 2,016,614 |
|
|
| 4,446,092 |
|
|
| 2,011,355 |
|
|
| 1,313,157 |
|
|
| 3,324,512 |
|
Fair value of plan assets |
|
| 3,696,914 |
|
|
| 1,001,112 |
|
|
| 4,698,026 |
|
|
| 2,999,669 |
|
|
| 763,325 |
|
|
| 3,762,994 |
|
Net liabilities (assets) |
|
| (1,267,436 | ) |
|
| 1,015,502 |
|
|
| (251,934 | ) |
|
| (988,314 | ) |
|
| 549,832 |
|
|
| (438,482 | ) |
|
|
|
|
|
|
|
|
|
|
|
|
|
|
|
|
|
|
|
|
|
|
|
|
|
Asset limitation |
|
| 1,128,691 |
|
|
| 57,371 |
|
|
| 1,186,062 |
|
|
| 1,056,682 |
|
|
| 50,281 |
|
|
| 1,106,963 |
|
|
|
|
|
|
|
|
|
|
|
|
|
|
|
|
|
|
|
|
|
|
|
|
|
|
Current assets |
|
| (71,776 | ) |
|
| - |
|
|
| (71,776 | ) |
|
| 0 |
|
|
| - |
|
|
| 0 |
|
Non-current assets |
|
| (149,163 | ) |
|
| 0 |
|
|
| (149,163 | ) |
|
| (10,997 | ) |
|
| 0 |
|
|
| (10,997 | ) |
Current liabilities |
|
| 6,937 |
|
|
| 18,620 |
|
|
| 25,557 |
|
|
| 8,114 |
|
|
| 11,553 |
|
|
| 19,667 |
|
Non-current liabilities |
|
| 75,257 |
|
|
| 1,054,253 |
|
|
| 1,129,510 |
|
|
| 71,251 |
|
|
| 588,560 |
|
|
| 659,811 |
|
c.3.2)Total expenses recognized in the statement of income:
|
| 2019 |
| 2018 |
| 2017 | ||||||||||||||||||||||||||||||
|
| Post-retirement pension plans |
| Post-retirement health plans |
| Total |
| Post-retirement pension plans |
| Post-retirement health plans |
| Total |
| Post-retirement pension plans |
| Post-retirement health plans |
| Total | ||||||||||||||||||
Current service cost |
|
| 3,155 |
|
|
| 16,293 |
|
|
| 19,448 |
|
|
| 2,931 |
|
|
| 13,722 |
|
|
| 16,653 |
|
|
| 3,044 |
|
|
| 7,606 |
|
|
| 10,650 |
|
Net interest on net actuarial assets/liabilities |
|
| 5,713 |
|
|
| 56,612 |
|
|
| 62,325 |
|
|
| 6,074 |
|
|
| 45,892 |
|
|
| 51,966 |
|
|
| 5,258 |
|
|
| 29,325 |
|
|
| 34,583 |
|
Total |
|
| 8,868 |
|
|
| 72,905 |
|
|
| 81,773 |
|
|
| 9,005 |
|
|
| 59,614 |
|
|
| 68,619 |
|
|
| 8,302 |
|
|
| 36,931 |
|
|
| 45,233 |
|
|
|
|
|
|
|
|
|
|
|
|
|
|
|
|
|
|
|
|
|
|
|
|
|
|
|
|
|
|
|
|
|
|
|
|
|
|
F-81
c.3.3)Amounts recognized in other comprehensive income (loss)
|
| 2019 |
| 2018 |
| 2017 | ||||||||||||||||||||||||||||||
|
| Post-retirement pension plans |
| Post-retirement health plans |
| Total |
| Post-retirement pension plans |
| Post-retirement health plans |
| Total |
| Post-retirement pension plans |
| Post-retirement health plans |
| Total | ||||||||||||||||||
Actuarial (losses) gains |
|
| (188,889 | ) |
|
| 412,416 |
|
|
| 223,527 |
|
|
| (186,170 | ) |
|
| 184,527 |
|
|
| (1,643 | ) |
|
| 325,292 |
|
|
| 208,195 |
|
|
| 533,487 |
|
Asset limitation effect |
|
| (24,297 | ) |
|
| 2,430 |
|
|
| (21,867 | ) |
|
| 188,259 |
|
|
| (93,125 | ) |
|
| 95,134 |
|
|
| (309,780 | ) |
|
| (52,411 | ) |
|
| (362,191 | ) |
Total |
|
| (213,186 | ) |
|
| 414,846 |
|
|
| 201,660 |
|
|
| 2,089 |
|
|
| 91,402 |
|
|
| 93,491 |
|
|
| 15,512 |
|
|
| 155,784 |
|
|
| 171,296 |
|
|
|
|
|
|
|
|
|
|
|
|
|
|
|
|
|
|
|
|
|
|
|
|
|
|
|
|
|
|
|
|
|
|
|
|
|
|
c.3.4)Changes in amount net of liability (asset) of defined benefit, net
|
| 12.31.19 |
| 12.31.18 | ||||||||||||||||||||
|
| Post-retirement pension plans |
| Post-retirement health plans |
| Total |
| Post-retirement pension plans |
| Post-retirement health plans |
| Total | ||||||||||||
Net defined benefit liability (asset) at the beginning of the year |
|
| 68,368 |
|
|
| 600,113 |
|
|
| 668,481 |
|
|
| 67,148 |
|
|
| 454,957 |
|
|
| 522,105 |
|
Business combinations |
|
| - |
|
|
| 1,994 |
|
|
| 1,994 |
|
|
| - |
|
|
| - |
|
|
| - |
|
Expenses |
|
| 8,868 |
|
|
| 72,905 |
|
|
| 81,773 |
|
|
| 9,005 |
|
|
| 59,614 |
|
|
| 68,619 |
|
Sponsor contributions |
|
| (8,776 | ) |
|
| (16,985 | ) |
|
| (25,761 | ) |
|
| (9,874 | ) |
|
| (5,860 | ) |
|
| (15,734 | ) |
Amounts recognized in OCI |
|
| (213,186 | ) |
|
| 414,846 |
|
|
| 201,660 |
|
|
| 2,089 |
|
|
| 91,402 |
|
|
| 93,491 |
|
Distribution of reserves |
|
| 5,981 |
|
|
| - |
|
|
| 5,981 |
|
|
| - |
|
|
| - |
|
|
| - |
|
Net defined benefit liability (asset) at the end of the year |
|
| (138,745 | ) |
|
| 1,072,873 |
|
|
| 934,128 |
|
|
| 68,368 |
|
|
| 600,113 |
|
|
| 668,481 |
|
Actuarial assets per balance sheet |
|
| (220,939 | ) |
|
| - |
|
|
| (220,939 | ) |
|
| (10,997 | ) |
|
| - |
|
|
| (10,997 | ) |
Actuarial liabilities per balance sheet |
|
| 82,194 |
|
|
| 1,072,873 |
|
|
| 1,155,067 |
|
|
| 79,365 |
|
|
| 600,113 |
|
|
| 679,478 |
|
c.3.5)Changes in defined benefit liability
|
| 12.31.19 |
| 12.31.18 | ||||||||||||||||||||
|
| Post-retirement pension plans |
| Post-retirement health plans |
| Total |
| Post-retirement pension plans |
| Post-retirement health plans |
| Total | ||||||||||||
Defined benefit liability at the beginning of the year |
|
| 2,011,355 |
|
|
| 1,313,157 |
|
|
| 3,324,512 |
|
|
| 1,861,651 |
|
|
| 1,050,576 |
|
|
| 2,912,227 |
|
Liability assumed after acquisition of company |
|
| - |
|
|
| 1,994 |
|
|
| 1,994 |
|
|
| - |
|
|
| - |
|
|
| - |
|
Current service costs |
|
| 3,155 |
|
|
| 16,293 |
|
|
| 19,448 |
|
|
| 2,931 |
|
|
| 13,722 |
|
|
| 16,653 |
|
Interest on actuarial liabilities |
|
| 175,695 |
|
|
| 121,088 |
|
|
| 296,783 |
|
|
| 173,842 |
|
|
| 103,617 |
|
|
| 277,459 |
|
Benefits paid |
|
| (165,929 | ) |
|
| (53,724 | ) |
|
| (219,653 | ) |
|
| (136,916 | ) |
|
| (37,838 | ) |
|
| (174,754 | ) |
Member contributions paid |
|
| 323 |
|
|
| - |
|
|
| 323 |
|
|
| 451 |
|
|
| - |
|
|
| 451 |
|
Actuarial losses (gains) adjusted by experience |
|
| 93,699 |
|
|
| 226,928 |
|
|
| 320,627 |
|
|
| 80,126 |
|
|
| 64,278 |
|
|
| 144,404 |
|
Actuarial losses (gains) adjusted by demographic assumptions |
|
| - |
|
|
| (44,249 | ) |
|
| (44,249 | ) |
|
| - |
|
|
| 46,122 |
|
|
| 46,122 |
|
Actuarial losses (gains) adjusted by financial assumptions |
|
| 311,180 |
|
|
| 435,127 |
|
|
| 746,307 |
|
|
| 29,270 |
|
|
| 72,680 |
|
|
| 101,950 |
|
Defined benefit liability at the end of the year |
|
| 2,429,478 |
|
|
| 2,016,614 |
|
|
| 4,446,092 |
|
|
| 2,011,355 |
|
|
| 1,313,157 |
|
|
| 3,324,512 |
|
F-82
c.3.6)Changes in the fair value of plan assets
|
| 12.31.19 |
| 12.31.18 | ||||||||||||||||||||
|
| Post-retirement pension plans |
| Post-retirement health plans |
| Total |
| Post-retirement pension plans |
| Post-retirement health plans |
| Total | ||||||||||||
Fair value of plan assets at the beginning of the year |
|
| 2,999,669 |
|
|
| 763,325 |
|
|
| 3,762,994 |
|
|
| 2,585,679 |
|
|
| 726,060 |
|
|
| 3,311,739 |
|
Benefits paid |
|
| (159,001 | ) |
|
| (36,774 | ) |
|
| (195,775 | ) |
|
| (128,991 | ) |
|
| (32,011 | ) |
|
| (161,002 | ) |
Participants contributions paid |
|
| 323 |
|
|
| - |
|
|
| 323 |
|
|
| 451 |
|
|
| - |
|
|
| 451 |
|
Sponsor contributions paid |
|
| 1,848 |
|
|
| 35 |
|
|
| 1,883 |
|
|
| 1,949 |
|
|
| 33 |
|
|
| 1,982 |
|
Interest income on plan assets |
|
| 266,287 |
|
|
| 69,137 |
|
|
| 335,424 |
|
|
| 245,014 |
|
|
| 70,690 |
|
|
| 315,704 |
|
Return on plan assets excluding interest income |
|
| 593,769 |
|
|
| 205,389 |
|
|
| 799,158 |
|
|
| 295,567 |
|
|
| (1,447 | ) |
|
| 294,120 |
|
Distribution of reserves |
|
| (5,981 | ) |
|
| - |
|
|
| (5,981 | ) |
|
| - |
|
|
| - |
|
|
| - |
|
Fair value of plan assets at the end of the year |
|
| 3,696,914 |
|
|
| 1,001,112 |
|
|
| 4,698,026 |
|
|
| 2,999,669 |
|
|
| 763,325 |
|
|
| 3,762,994 |
|
c.3.7)Changes in asset limitation
|
| 12.31.19 |
| 12.31.18 | ||||||||||||||||||||
|
| Post-retirement pension plans |
| Post-retirement health plans |
| Total |
| Post-retirement pension plans |
| Post-retirement health plans |
| Total | ||||||||||||
Asset Limitation at the beginning of the year |
|
| 1,056,682 |
|
|
| 50,281 |
|
|
| 1,106,963 |
|
|
| 791,177 |
|
|
| 130,440 |
|
|
| 921,617 |
|
Interest on the asset limitation |
|
| 96,306 |
|
|
| 4,661 |
|
|
| 100,967 |
|
|
| 77,246 |
|
|
| 12,966 |
|
|
| 90,212 |
|
Changes in the assets limitation, except interest |
|
| (24,297 | ) |
|
| 2,429 |
|
|
| (21,868 | ) |
|
| 188,259 |
|
|
| (93,125 | ) |
|
| 95,134 |
|
Asset Limitation at the end of the year |
|
| 1,128,691 |
|
|
| 57,371 |
|
|
| 1,186,062 |
|
|
| 1,056,682 |
|
|
| 50,281 |
|
|
| 1,106,963 |
|
c.3.8)Results projected for 2020
|
| Post-retirement pension plans |
| Post-retirement health plans |
| Total | ||||||
Current service cost |
|
| 3,037 |
|
|
| 26,575 |
|
|
| 29,612 |
|
Net interest on net defined benefit liability/asset |
|
| (10,386 | ) |
|
| 82,150 |
|
|
| 71,764 |
|
Total |
|
| (7,349 | ) |
|
| 108,725 |
|
|
| 101,376 |
|
|
|
|
|
|
|
|
|
|
|
|
|
|
c.3.9)Sponsoring company contributions projected for 2020
|
| Post-retirement pension plans |
| Post-retirement health plans |
| Total | ||||||
Sponsor contributions |
|
| 2,189 |
|
|
| 6,937 |
|
|
| 9,126 |
|
Benefits paid directly by the sponsor |
|
| 38 |
|
|
| 18,630 |
|
|
| 18,668 |
|
Total |
|
| 2,227 |
|
|
| 25,567 |
|
|
| 27,794 |
|
|
|
|
|
|
|
|
|
|
|
|
|
|
c.3.10)Average weighted duration of defined benefit liability
|
| Post-retirement pension plans |
| Post-retirement health plans |
In 2019 |
| 8.3 years |
| 18.1 years |
In 2018 |
| 7.8 years |
| 16.5 years |
F-83
c.3.11)Actuarial assumptions
|
| 12.31.19 | ||
|
| Post-retirement pension plans |
| Post-retirement health plans |
Discount rate to present value of defined benefit liability |
| Visão: 6.6% |
| PAMA and PCE: 7.4% |
Future salary growth rate |
| CTB and PBS-A: N/A |
| N/A |
Medical expense growth rate |
| N/A |
| 6.9% |
Nominal annual adjustment rate of pension benefits |
| 3.8% |
| N/A |
Medical service eligibility age |
| N/A |
| Female participants: 59 years |
Estimated retirement age |
| PBS-A, CTB and Telefônica BD: 57 years |
| Female participants: 59 years |
Mortality table for nondisabled individuals |
| PBS-A, CTB and Telefônica BD: AT-2000 Basic segregated by gender, down-rated by 10% Visão: AT-2000 Basic segregated by gender, down-rated by 50% |
| AT-2000 Basic segregated by gender, down-rated by 10% |
Mortality table for disabled individuals |
| PBS-A, CTB and Telefônica BD: RP-2000 Disabled Female, down-rated by 40% Visão: N/A |
| RP-2000 Disabled Feminina, down-rated by 40% |
Disability table |
| Telefônica BD: Light-Forte |
| Light-Forte |
Turnover |
| PBS-A, CTB and Telefônica BD: N/A Visão: Turnover experience in VISÃO plans (2015 to 2017) |
| PAMA and PCE: N/A Law No. 9656/98: Turnover experience in VISÃO plans (2015 to 2017) |
|
| 12.31.18 | ||
|
| Post-retirement pension plans |
| Post-retirement health plans |
Discount rate to present value of defined benefit liability |
| Visão: 9.0% |
| 9.3% |
Future salary growth rate |
| CTB and PBS-A: N/A |
| N/A |
Medical expense growth rate |
| N/A |
| 7.1% |
Nominal annual adjustment rate of pension benefits |
| 4.0% |
| N/A |
Medical service eligibility age |
| N/A |
| Eligibility on retirement 100% to 57 years |
Estimated retirement age |
| PBS-A, CTB and Telefônica BD: 57 years |
| 57 years |
Mortality table for nondisabled individuals |
| PBS-A, CTB and Telefônica BD: AT-2000 Basic segregated by gender, down-rated by 10% Visão: AT-2000 Basic segregated by gender, down-rated by 50% |
| AT-2000 Basic segregated by gender, down-rated by 10% |
Mortality table for disabled individuals |
| PBS-A, CTB and Telefônica BD: RP-2000 Disabled Female, down-rated by 40% Visão: N/A |
| RP-2000 Disabled Feminina, down-rated by 40% |
Disability table |
| Telefônica BD: Light-Forte |
| Light-Forte |
Turnover |
| PBS-A, CTB and Telefônica BD: N/A Visão: Turnover experience in VISÃO plans (2015 to 2017) |
| PAMA and PCE: N/A Law No. 9656/98: Turnover experience in VISÃO plans (2015 to 2017)
|
Further to the assumptions stated above, other assumptions common to all plans were adopted in 2019 and 2018 as follows: (i) Long-term inflation rate 3.8%; and (ii) Annual increase in the use of medical services according to age: 4.0%.
F-84
c.3.12)Changes in actuarial assumptions in relation to the prior year
In order to adjust some actuarial assumptions to the economic and demographic reality, a study was conducted for the plans administered by Visão Prev and Sistel, which adopted the definition of the assumptions in their Deliberative Councils.
The main economic and financial assumptions that have changed in relation to the previous fiscal year and that interfere with the defined benefit liability are: (i) rates for discount to present value of the defined benefit liability; (ii) long-term inflation rate; (iii) rate of future wage growth; (iv) rate of growth of medical costs; and (v) annual nominal index of adjustment of social security benefits.
The impacts on the plans’ defined benefit liabilities due to the new definition of the actuarial assumptions are as follows:
|
| Post-retirement pension plans |
| Post-retirement health plans |
| Total | ||||||
Defined benefit liability, based on current actuarial assumptions |
|
| 2,429,478 |
|
|
| 2,016,614 |
|
|
| 4,446,092 |
|
Defined benefit liability, based on prior-year actuarial assumptions |
|
| 2,118,297 |
|
|
| 1,625,737 |
|
|
| 3,744,034 |
|
Difference from change in actuarial assumptions |
|
| 311,181 |
|
|
| 390,877 |
|
|
| 702,058 |
|
|
|
|
|
|
|
|
|
|
|
|
|
|
c.3.13)Sensitivity analysis for actuarial assumptions
The Company believes that the significant actuarial assumptions with reasonable likelihood of variation due to financial and economic scenarios, which could significantly change the amount of the defined benefit obligation, are the discount rate used to adjust the defined benefit liability to present value and the rate of growth of medical costs.
Sensitivity analysis of the defined benefit liability for scenarios involving a 0.5% increase and a 0.5% decrease in the discount rate used to discount the defined benefit liability to present value is as follows:
|
| Post-retirement pension plans |
| Post-retirement health plans |
| Total | ||||||
Defined benefit liability, discounted to present value at current rate |
|
| 2,429,478 |
|
|
| 2,016,614 |
|
|
| 4,446,092 |
|
Defined benefit liability, discounted to present value considering a rate increased by 0.5% |
|
| 2,331,330 |
|
|
| 1,860,204 |
|
|
| 4,191,534 |
|
Defined benefit liability, discounted to present value considering a rate decreased by 0.5% |
|
| 2,536,178 |
|
|
| 2,193,844 |
|
|
| 4,730,022 |
|
The following is a sensitivity analysis of the defined benefit obligation for scenarios of 1% increase and 1% reduction in the rate of growth of medical costs:
|
| Post-retirement pension plans |
| Post-retirement health plans |
| Total | ||||||
Defined benefit liability, projected by the current medical cost growth rate |
|
| 2,429,478 |
|
|
| 2,016,614 |
|
|
| 4,446,092 |
|
Defined benefit liability, projected by the current medical cost growth considering a rate increased by 1% |
|
| 2,429,478 |
|
|
| 2,384,419 |
|
|
| 4,813,897 |
|
Defined benefit liability, projected by the current medical cost growth considering a rate decreased by 1% |
|
| 2,429,478 |
|
|
| 1,724,584 |
|
|
| 4,154,062 |
|
F-85
c.3.14)Allocation of plan assets
|
| 12.31.19 |
| 12.31.18 | ||||||||||||
|
| Post-retirement pension plans |
| Post-retirement health plans |
| Post-retirement pension plans |
| Post-retirement health plans | ||||||||
Investments with market value quoted in active market: |
|
|
|
|
|
|
|
| ||||||||
Fixed income investments |
|
|
|
|
|
|
|
| ||||||||
National Treasury Note (NTN) |
|
| 3,067,926 |
|
|
| 940,144 |
|
|
| 2,437,547 |
|
|
| 702,946 |
|
Treasury Financial Letter |
|
| 270,676 |
|
|
| 60,968 |
|
|
| 177,319 |
|
|
| 60,379 |
|
Repurchase operations |
|
| 172,895 |
|
|
| - |
|
|
| 196,830 |
|
|
| - |
|
Debentures |
|
| 16,818 |
|
|
| - |
|
|
| 13,487 |
|
|
| - |
|
Treasury Financial Letter (LFT) |
|
| 14,238 |
|
|
| - |
|
|
| 12,556 |
|
|
| - |
|
FIDC shares / Others |
|
| 24,517 |
|
|
| - |
|
|
| 2,356 |
|
|
| - |
|
National Treasury Notes (LTN) |
|
| 282 |
|
|
| - |
|
|
| 462 |
|
|
| - |
|
Bank Deposit Certificates (CDB) |
|
| - |
|
|
| - |
|
|
| 232 |
|
|
| - |
|
Variable income investments |
|
|
|
|
|
|
|
|
|
|
|
|
|
|
|
|
Investments in energy sector |
|
| - |
|
|
| - |
|
|
| 138 |
|
|
| - |
|
Investments in food and beverage industry |
|
| - |
|
|
| - |
|
|
| 17,921 |
|
|
| - |
|
Investments in mining sector |
|
| - |
|
|
| - |
|
|
| 287 |
|
|
| - |
|
Investments linked to funds and market indexes |
|
| 6,265 |
|
|
| - |
|
|
| 4,242 |
|
|
| - |
|
Investments in other sectors(1) |
|
| 622 |
|
|
| - |
|
|
| 1,580 |
|
|
| - |
|
Real estate investments |
|
| 100,701 |
|
|
| - |
|
|
| 111,417 |
|
|
| - |
|
Loans to participants |
|
| 19,870 |
|
|
| - |
|
|
| 20,561 |
|
|
| - |
|
Structured and overseas investments |
|
| 2,104 |
|
|
| - |
|
|
| 2,734 |
|
|
| - |
|
Total |
|
| 3,696,914 |
|
|
| 1,001,112 |
|
|
| 2,999,669 |
|
|
| 763,325 |
|
(1) | Investments in variable income in the following industries: oil, gas and biofuel; telephony; steel and metals; construction and engineering; sales and distribution; transportation; wood and paper; education; financial services and banks; real estate, among; others. |
31) | FINANCIAL INSTRUMENTS AND RISK AND CAPITAL MANAGEMENT |
a) | Accounting policy |
a.1)Financial assets
Initial recognition and measurement
On initial recognition, a financial asset is classified in the following measurement categories: (i) at fair value through profit or loss; (ii) at amortized cost; or (iii) at fair value through other comprehensive income, depending on the situation.
F-86
The classification of financial assets according to IFRS 9 is generally based on the business model in which a financial asset is managed and its characteristics of contractual cash flows.
The Company’s consolidated financial assets include cash and cash equivalents, trade accounts receivable, short-term investments pledged as collateral and derivative financial instruments.
Subsequent measurement
Subsequent measurement of financial assets depends on their classification, as follows:
Financial assets at fair value through profit or loss: these assets are subsequently measured at fair value. Net income, including interest, is recognized directly in income.
Financial assets at amortized cost: these assets are subsequently measured at amortized cost using the effective interest method. The amortized cost is reduced by impairment losses. Interest income, foreign exchange gains and losses and impairment are recognized in income. Any gain or loss on derecognition is recognized in profit or loss.
Financial assets at fair value through other comprehensive income: these assets are subsequently measured at fair value. Interest income is calculated using the effective interest method, and foreign exchange gains and losses and impairment are recognized in profit or loss. Other net income is recognized in other comprehensive income. In derecognition, the accumulated result in other comprehensive income is reclassified to the statement of income.
Derecognition
A financial asset (or, whenever the case, a part of a financial asset, or a part of a group of similar financial assets) is derecognized when:
· | The rights to receive the cash flows from the asset have expired; | |
| ||
· | The Company has transferred its rights to receive cash flows from it has assumed obligation to pay the received cash flows in full without material delay to a third part under a ‘pass-through’ arrangement; and either (i) the Company has transferred substantially all the risks and rewards of the asset, or (ii) the Company has neither transferred nor retained substantially all the risks and rewards of the asset, but has transferred control of the asset. |
a.2)Impairment of financial assets
The Company and its subsidiaries apply an impairment model for financial assets based on expected credit losses, using a simplified method for certain short and long-term assets (commercial receivables, lease receivables and contractual assets).
Under this simplified approach, credit impairment is recognized by reference to expected credit losses over the life of the asset. For this purpose, the Company and its subsidiaries use matrices based on historical bad debt experience by geographical area on a portfolio segmented by customer category according to credit pattern. The matrix for each category has a defined time horizon divided into intervals in accordance with the collection management policy and is fed with historical data that covers at least 24 collection cycles. This data is updated on a regular basis. Based on the information observable at each close, the Company and its subsidiaries assess the need to adjust the rates resulting from these matrices, considering current conditions and future economic forecasts.
a.3)Financial liabilities
F-87
Initial recognition and measurement
Upon initial recognition, the Company’s financial liabilities are classified in the following categories: financial liabilities measured at fair value through profit or loss and other financial liabilities.
Financial liabilities are initially recognized at fair value plus, in the case of loans and financing, transaction cost directly attributable thereto.
The Company’s consolidated financial liabilities include trade accounts payable, loans and financing, debentures, leases, contingent payments and derivative financial instruments.
Subsequent measurement
Measurement of financial liabilities depends on their classification, as follows:
Financial liabilities at fair value through profit or loss: financial liabilities are designated at initial recognition at fair value through profit or loss. This category also includes derivative financial instruments contracted, except those designated as derivative financial instruments of cash flow hedge. Interest, monetary and exchange variations and changes arising from the valuation at fair value, when applicable, are recognized in the statement of income when incurred.
Financial liabilities at amortized cost: after initial recognition, loans and financing subject to interest are subsequently measured at amortized cost using the effective interest rate method. Gains and losses are recognized in the statement of income at the time of write-off of liabilities, as well as during the amortization process using the effective interest rate method.
Derecognition
A financial liability is derecognized when the obligation has been revoked, cancelled or expired.
When an existing financial liability is replaced by another of the same lender, and the terms of the instruments are substantially different, or when the terms of an existing debt instrument are substantially modified, this replacement or modification is treated as derecognition of the original liability and recognition of a new liability, and the difference in the corresponding carrying amounts is recognized in the statement of income.
a.4)Fair value measurement
Fair value is the price that would be received to sell an asset or paid to transfer a liability in an orderly transaction between market participants on the measurement date. Fair value measurement is based on the assumption that the transaction to sell the asset or transfer the liability will take place (i) in the principal market for the asset or liability; or (ii) in the absence of a principal market, in the most advantageous market for that asset or liability.
The Company and or its subsidiaries must have access to the principal (or most advantageous) market.
The fair value of an asset or a liability is measured using the assumptions that market participants would use when pricing an asset or liability, assuming that market participants act in their best economic interests.
Fair value measurement of a non-financial asset takes into consideration the capacity of a market participant to generate economic benefits through the best use of the asset or selling it to another market participant that would also make the best use of the asset.
F-88
The Company and its subsidiaries use adequate valuation techniques in the circumstances and for which there is sufficient data to measure the fair value, that maximizes the use of relevant observable inputs and minimizes the use of unobservable inputs.
For assets and liabilities recurrently recognized in the financial statements, the Company determines whether there were transfers between the hierarchy levels, revaluating the classification (based on the lowest level input that is significant to the overall fair value measurement) at the end of each reporting period.
For the purposes of fair value disclosures, the Company and its subsidiaries determined classes of assets or liabilities based on the nature, characteristics and risks of those assets or liabilities and the fair value hierarchy level, as mentioned above.
a.5)Financial instruments - net
Financial assets and liabilities are presented net in the balance sheet if, and only if, there is a current enforceable legal right to offset the amounts recognized and if there is an intention to offset or realize the asset or settle the liability simultaneously.
a.6)Derivative financial instruments and hedge accounting
IFRS 9 introduced a new accounting record model for hedges, which is less restrictive, which aligns the accounting treatment with risk management activities by requiring an economic relationship between the hedged item and the hedging instrument and that the coverage ratio is the same as the entity applies to its risk management. With this new model, the documentation criteria for hedging relationships are modified and improvements are included in the disclosures about hedging activities.
The Company uses derivative financial instruments, such as currency and interest rate swaps or currency non-deliverable forward contracts to hedge against currency risks.
Derivative financial instruments designated in hedge transactions are initially recognized at fair value on the date on which the derivative contract is entered into, and subsequently revalued also at fair value. Derivatives are presented as financial assets when the fair value of the instrument is positive and as financial liabilities when the fair value of the instrument is negative.
Any gains or losses resulting from changes in fair value of derivatives during the year are posted directly to the statement of income, except for the effective portion of cash flow hedges, which is recognized directly in equity as other comprehensive income and subsequently reclassified to P&L when the hedged item affects P&L.
On the inception initial recognition of a hedge relationship, the Company formally designates and documents the hedge relationship to which it wishes to apply hedge accounting, the risk management objective and strategy for undertaking the hedge.
The documentation includes identification of the hedging instrument, the hedged item or transaction, the nature of the hedged risk, the nature of the risks excluded from the hedge relationship, the prospective statement of hedge effectiveness and how the Company shall assess the effectiveness of changes in the hedging instrument’s fair value in offsetting the exposure to changes in the hedged item’s fair value or cash flows attributable to the hedged risk.
For the purpose of hedge accounting, hedges are classified as cash flow hedges and fair value hedges.
F-89
Cash flow hedges
Cash flow hedges meeting the recording criteria are accounted for as follows: (i) the portion of gain or loss from the hedge instrument determined as an effective hedge shall be recognized directly in equity (other comprehensive income), and (ii) the ineffective portion of gain or loss from the hedge instrument shall be recognized in the statement of income.
When the Company’s documented risk management strategy for any given hedge relationship excludes from the hedge effectiveness evaluation any particular component of gain or loss or the corresponding cash flows from the hedge instrument, that gains or loss component is recognized in financial income (expenses).
Amounts recorded in other comprehensive income are immediately transferred to the statement of income when the hedged transaction affects P&L. When a hedged item is the cost of a non-financial asset or liability, amounts recorded in equity are transferred at the initial carrying amount of the non-financial assets and liabilities.
If the hedging instrument expires or is sold, terminated or exercised without replacement or rollover (as part of the hedging strategy), or if its designation as a hedge is revoked, or when the hedge fails to meet the hedge accounting criteria, any cumulative gain or loss previously recognized in other comprehensive income remains separately in equity until the forecast transaction occurs or the firm commitment is fulfilled.
The Company's contracts are classified as cash flow hedges when they provide protection against changes in cash flows that are attributable to a particular risk associated with a recognized liability that may affect the profit or loss and fair value when they provide protection against exposure to changes in the fair value of the identified part of certain liabilities that is attributable to a particular risk (exchange variation) and may affect the profit or loss.
Fair value hedges
Fair value hedges meeting the accounting criteria are accounted for as follows: (i) gain or loss from changes in fair value of a hedge instrument shall be recognized in the statement of income as finance costs; and (ii) gain or loss from a hedged item attributable to the hedged risk shall adjust the recorded amount of the hedged item to be recognized in the statement of income, as finance costs.
For fair value hedges relating to items carried at amortized cost, any adjustment to carrying amount is amortized through profit or loss over the remaining term of the hedge using the effective interest method. The effective interest rate amortization may begin as soon as any adjustment exists and no later than the point that the hedged item ceases to be adjusted for changes in its fair value attributable to the risk being hedged.
If the hedged item is derecognized, the unamortized fair value is recognized immediately in the statement of income.
When an unrecognized firm commitment is designated as a hedged item, the subsequent cumulative change in the fair value of the firm commitment attributable to the hedged risk is recognized as an asset or liability with a corresponding gain or loss recognized in profit and loss.
Classification between current and non-current
Derivative financial instruments are classified as current and non-current or segregated into short and long-term portions based on an evaluation of the contractual cash flows.
When the Company maintains a derivative as an economic hedge (and does not apply hedge accounting), for a period exceeding 12 months after the balance sheet date, the derivative isclassified as non-current (or segregated into current and non-current portions), in line with the classification of the corresponding item.
F-90
Derivative instruments that are designated as effective hedging instruments are classified consistently with the classification of the underlying hedged item.
The derivative instrument is segregated into current and non-current portions only when amounts can be reliably allocated.
b)Critical estimates and judgments
When the fair value of financial assets and liabilities stated in the balance sheet cannot be obtained in active markets, it will be determined using valuation techniques, including the discounted cash flow method. Data for these methods is based on those adopted in the market, whenever possible. However, when this is not feasible, a certain level of judgment is required for fair value determination. Judgment includes consideration of the inputs used, such as liquidity risk, credit risk and volatility. Changes in the assumptions about these factors could affect the reported fair value of financial instruments.
c)Derivative transactions
The derivative financial instruments contracted by the Company are mainly used for hedging against foreign exchange risk from assets and liabilities in foreign currency and the effects of inflation on leases indexed to the IPCA. There are no derivative financial instruments held for speculative purposes, possible currency risks are hedged.
Management believes that the Company's internal controls for its derivatives are adequate to control risks associated with each strategy for the market. Gains/losses obtained or sustained by the Company in relation to its derivatives show that its risk management has been appropriate.
As long as these derivative contracts qualify for hedge accounting, the hedged item is adjusted to fair value, offsetting the result of the derivatives, pursuant to the rules of hedge accounting. This hedge accounting applies both to financial liabilities and probable cash flows in foreign currency.
Derivatives contracts include specific penalties for breach of contract. Breach of contract provided for in agreements made with financial institutions leads to the anticipated liquidation of the contract.
On December 31, 2019 and 2018, the Company held no embedded derivatives contracts.
c.1)Fair value of derivative financial instruments
The valuation method used to calculate the fair value of financial liabilities (if applicable) and derivative financial instruments was the discounted cash flow method, based on expected settlements or realization of liabilities and assets at market rates prevailing at the balance sheet date.
The fair values of positions in Reais are calculated by projecting future inflows from transactions using B3 yield curves and discounting these flows to present value using market DI rates for swaps announced by B3.
The market values of foreign exchange derivatives were obtained using the market exchange rates in effect at the balance sheet date and projected market rates obtained from the currency's coupon-rate yield curves. The linear convention of 360 calendar days was used to determinecoupon rates of positions indexed in foreign currencies, while the exponential convention of 252 business days was used to determine coupon rates for positions indexed to CDI rates.
F-91
Consolidated derivatives financial instruments shown below are registered with B3 and classified as swaps, usually, that do not require margin deposits.
|
|
|
|
|
| Accumulated effects from fair value | ||||||||||
|
| Notional Value |
| Amount receivable (payable) | ||||||||||||
Description |
| 12.31.19 |
| 12.31.18 |
| 12.31.19 |
| 12.31.18 | ||||||||
Long position |
|
| 515,261 |
|
|
| 1,184,064 |
|
|
| 72,163 |
|
|
| 95,533 |
|
|
|
|
|
|
|
|
|
|
|
|
|
|
|
|
|
|
Foreign Currency |
|
| 72,790 |
|
|
| 335,194 |
|
|
| - |
|
|
| 50,536 |
|
US$ (1) (2) |
|
| 72,790 |
|
|
| 241,332 |
|
|
| - |
|
|
| 24,608 |
|
EUR (2) |
|
| - |
|
|
| 51,971 |
|
|
| - |
|
|
| - |
|
LIBOR US$ (1) |
|
| - |
|
|
| 41,891 |
|
|
| - |
|
|
| 25,928 |
|
|
|
|
|
|
|
|
|
|
|
|
|
|
|
|
|
|
Floating rate |
|
| 369,491 |
|
|
| 699,595 |
|
|
| 1,818 |
|
|
| 7,737 |
|
CDI (1) (2) |
|
| 369,491 |
|
|
| 554,336 |
|
|
| 1,818 |
|
|
| - |
|
TJLP (4) |
|
| - |
|
|
| 145,259 |
|
|
| - |
|
|
| 7,737 |
|
|
|
|
|
|
|
|
|
|
|
|
|
|
|
|
|
|
Inflation rates |
|
| 72,980 |
|
|
| 149,275 |
|
|
| 70,345 |
|
|
| 37,260 |
|
IPCA (3) (5) |
|
| 72,980 |
|
|
| 149,275 |
|
|
| 70,345 |
|
|
| 37,260 |
|
|
|
|
|
|
|
|
|
|
|
|
|
|
|
|
|
|
Short position |
|
| (515,261 | ) |
|
| (1,184,064 | ) |
|
| (56,133 | ) |
|
| (39,383 | ) |
|
|
|
|
|
|
|
|
|
|
|
|
|
|
|
|
|
Floating rate |
|
| (145,770 | ) |
|
| (608,782 | ) |
|
| (56,133 | ) |
|
| (24,916 | ) |
CDI (1) (2) (3) (4) (5) |
|
| (145,770 | ) |
|
| (608,782 | ) |
|
| (56,133 | ) |
|
| (24,916 | ) |
|
|
|
|
|
|
|
|
|
|
|
|
|
|
|
|
|
Foreign Currency |
|
| (369,491 | ) |
|
| (575,282 | ) |
|
| - |
|
|
| (14,467 | ) |
US$ (2) |
|
| (365,161 | ) |
|
| (439,103 | ) |
|
| - |
|
|
| (9,396 | ) |
EUR (1) (2) |
|
| (4,330 | ) |
|
| (115,233 | ) |
|
| - |
|
|
| (222 | ) |
LIBOR US$ (1) |
|
| - |
|
|
| (20,946 | ) |
|
| - |
|
|
| (4,849 | ) |
|
|
|
|
|
|
|
|
|
|
|
|
|
|
|
|
|
|
|
| Long position |
|
|
|
|
|
|
| 72,163 |
|
|
| 95,533 |
|
|
|
| Current |
|
|
|
|
|
|
| 19,282 |
|
|
| 69,065 |
|
|
|
| Non-current |
|
|
|
|
|
|
| 52,881 |
|
|
| 26,468 |
|
|
|
|
|
|
|
|
|
|
|
|
|
|
|
|
|
|
|
|
| Short position |
|
|
|
|
|
|
| (56,133 | ) |
|
| (39,383 | ) |
|
|
| Current |
|
|
|
|
|
|
| (1,921 | ) |
|
| (16,538 | ) |
|
|
| Non-current |
|
|
|
|
|
|
| (54,212 | ) |
|
| (22,845 | ) |
|
|
| Amounts receivable, net |
|
|
|
|
|
|
| 16,030 |
|
|
| 56,150 |
|
(1) | Foreign currency swaps (US$ and LIBOR) x CDI - swap transactions with maturities up to July 2019, according to the debt maturities, with the purpose of hedging the exchange rate risk of the Company's dollar lending operation. | |
| ||
(2) | Foreign currency swaps (Euro and CDI x Euro) (R$4,334) and (US$ and CDI x US$) (R$292,347) - maturing through October 30, 2019 to hedge currency risk affecting net amounts payable (carrying amount R$3,806 in Euros and LIBOR) and receivables (carrying amount R$292,347 in US$). | |
| ||
(3) | IPCA x CDI rate swaps to hedge the same flow as the debentures (4th issue - 3rd series) indexed to the IPCA settled on October 15, 2019. |
F-92
(4) | TJLP x CDI swaps transactions contracted with maturities up to July 2019 to hedge the risk of TJLP variation on loan with BNDES. | |
| ||
(5) | IPCA x CDI swaps (R$262,817) - maturing in 2033 to hedge risk of change rate pegged to IPCA (carrying amount R$319,550). |
|
| Maturing in |
|
| ||||||||||||||||
Swap contract |
| 2020 |
| 2021 |
| 2022 |
| 2023 onwards |
| Amount receivable (payable) on 12.31.19 | ||||||||||
Foreign currency x CDI |
|
| (1,921 | ) |
|
| - |
|
|
| - |
|
|
| - |
|
|
| (1,921 | ) |
CDI x Foreign Currency |
|
| 1,818 |
|
|
| - |
|
|
| - |
|
|
| - |
|
|
| 1,818 |
|
IPCA x CDI |
|
| 17,464 |
|
|
| 3,239 |
|
|
| 3,507 |
|
|
| (8,077 | ) |
|
| 16,133 |
|
Total |
|
| 17,361 |
|
|
| 3,239 |
|
|
| 3,507 |
|
|
| (8,077 | ) |
|
| 16,030 |
|
For the purposes of preparing its financial statements, the Company adopted the fair value hedge accounting methodology for its foreign currency swaps x CDI and IPCA x CDI for hedging or financial debt. Under this arrangement, both derivatives and hedged risk are recognized at fair value.
On December 31, 2019 and 2018, the transactions with derivatives generated consolidated positive results of R$51,963 and R$10,788, respectively (Note 27).
c.2)Sensitivity analysis to the Company’s risk variables
CVM Resolution 475/08 requires listed companies to disclose sensitivity analyses for each type of market risk that management understands to be significant when originated by financial instruments to which the entity is exposed at the end of each period, including all derivative financial instrument transactions.
In making the above analysis, each of the transactions with derivative financial instruments was assessed and assumptions included a probable scenario and two others that could adversely impact the Company.
In the probable scenario assumption used, on the maturity dates of each of the transactions, were the market rates for the B3 yield curves (currencies and interest rates), and data from the IBGE, Central Bank, FGV, among others. In the probable scenario, there is no impact on the fair value of the above-mentioned derivatives. However, for Scenarios II and III, as per CVM ruling, risk variables were stressed by 25% and 50% respectively.
Since the Company only holds derivatives to hedge its foreign currency assets and liabilities, changing scenarios are tracked by the corresponding hedged items the effects are almost non-existent. For these transactions, the Company reported the consolidated net exposure in each of the above-mentioned three scenarios on December 31, 2019.
F-93
Transaction |
| Risk |
| Probable |
| 25% depreciation |
| 50% depreciation | ||||||
Hedge (long position) |
| Derivatives (depreciation risk EUR) |
|
| (4,334 | ) |
|
| (5,418 | ) |
|
| (6,501 | ) |
Payables in EUR |
| Debt (appreciation risk EUR) |
|
| (25,633 | ) |
|
| (32,041 | ) |
|
| (38,449 | ) |
Receivables in EUR |
| Debt (depreciation risk EUR) |
|
| 29,439 |
|
|
| 36,799 |
|
|
| 44,158 |
|
|
| Net Exposure |
|
| (528 | ) |
|
| (660 | ) |
|
| (792 | ) |
|
|
|
|
|
|
|
|
|
|
|
|
|
|
|
Hedge (short position) |
| Derivatives (depreciation risk US$) |
|
| (292,347 | ) |
|
| (365,433 | ) |
|
| (438,520 | ) |
Payables in US$ |
| Debt (appreciation risk US$) |
|
| (185,022 | ) |
|
| (231,277 | ) |
|
| (277,532 | ) |
Receivables in US$ |
| Debt (depreciation risk US$) |
|
| 477,369 |
|
|
| 596,710 |
|
|
| 716,052 |
|
|
| Net Exposure |
|
| - |
|
|
| - |
|
|
| - |
|
|
|
|
|
|
|
|
|
|
|
|
|
|
|
|
Hedge (long position) |
| Derivatives (risk of decrease in IPCA) |
|
| 262,817 |
|
|
| 250,228 |
|
|
| 238,939 |
|
Debt in IPCA |
| Debt (risk of increase in IPCA) |
|
| (319,550 | ) |
|
| (306,961 | ) |
|
| (295,672 | ) |
|
| Net Exposure |
|
| (56,733 | ) |
|
| (56,733 | ) |
|
| (56,733 | ) |
|
|
|
|
|
|
|
|
|
|
|
|
|
|
|
Hedge (CDI position) |
|
|
|
|
|
|
|
|
|
|
|
|
|
|
Hedge US$ and EUR (short and long position) |
| Derivatives (risk of decrease in CDI) |
|
| (295,777 | ) |
|
| (295,547 | ) |
|
| (295,320 | ) |
Hedge IPCA (short position) |
| Derivatives (risk of increase in CDI) |
|
| (262,817 | ) |
|
| (250,228 | ) |
|
| (238,939 | ) |
|
| Net Exposure |
|
| (558,594 | ) |
|
| (545,775 | ) |
|
| (534,259 | ) |
|
|
|
|
|
|
|
|
|
|
|
|
|
|
|
Total net exposure in each scenario |
|
|
|
| (615,855 | ) |
|
| (603,168 | ) |
|
| (591,784 | ) |
|
|
|
|
|
|
|
|
|
|
|
|
|
|
|
Net effect on changes in current fair value |
|
|
|
| - |
|
|
| 12,687 |
|
|
| 24,071 |
|
The assumptions used by the Company for the sensitivity analysis on December 31, 2019 were as follows:
Risk Variable |
| Probable |
| 25% depreciation |
| 50% depreciation | ||||||
US$ |
|
| 4.0307 |
|
|
| 5.0384 |
|
|
| 6.0461 |
|
EUR |
|
| 4.5102 |
|
|
| 5.6377 |
|
|
| 6.7652 |
|
IPCA |
|
| 4.05 | % |
|
| 5.06 | % |
|
| 6.07 | % |
IGPM |
|
| 3.37 | % |
|
| 4.21 | % |
|
| 5.05 | % |
CDI |
|
| 6.42 | % |
|
| 8.03 | % |
|
| 9.63 | % |
For calculation of the net exposure for the sensitivity analysis, all derivatives were considered at market value and hedged items designated for hedges for accounting purposes were also considered at fair value.
The fair values shown in the table above are based on the portfolio position on December 31, 2019, but do not reflect an estimate for realization due to the dynamism of the market, which is constantly monitored by the Company. The use of different assumptions could significantly affect the estimates.
d)Fair value
The Company and its subsidiaries assessed their financial assets and liabilities in relation to market values using available information and appropriate valuation methodologies. However, both the interpretation of market data and the selection of valuation methods require considerable judgment and reasonable estimates to produce the most adequate realization value. As a result, the estimates shown do not necessarily indicate amounts that could be realized in the current market. The use of different assumptions for the market and/or methodologies may have a material effect on estimated realization values.
F-94
The fair values of all assets and liabilities are classified within the fair value hierarchy described below, based on the lowest level of information that is significant to the fair value measurement as a whole:
Level 1: quoted market prices (unadjusted) in active markets for identical assets or liabilities;
Level 2: valuation techniques for which there is a significantly lower level of information to measure the fair value directly or indirectly observable; and
Level 3: valuation techniques for which the lowest and significant level of information to measure the fair value is not available.
During the periods shown in the tables below, there were no transfers between fair value measurements of Level 3 and Levels 1 and 2.
e)Classification of financial assets and liabilities by category and fair value hierarchy
The tables below present the composition and classification of financial assets and liabilities on December 31, 2019 and 2018.
|
|
|
| Fair value hierarchy |
| Book value |
| Fair value | ||||
|
| Classification by category |
|
| 12.31.19 |
| 12.31.18 |
| 12.31.19 |
| 12.31.18 | |
Financial Assets |
|
|
|
|
|
|
|
|
|
|
|
|
Current |
|
|
|
|
|
|
|
|
|
|
|
|
Cash and cash equivalents (Note 3) |
| Amortized cost |
|
|
| 3,393,377 |
| 3,381,328 |
| 3,393,377 |
| 3,381,328 |
Trade accounts receivable (Note 4) |
| Amortized cost |
|
|
| 8,719,497 |
| 8,304,382 |
| 8,719,497 |
| 8,304,382 |
Derivative transactions (Note 31) |
| Measured at fair value through OCI |
| Level 2 |
| 19,282 |
| 69,065 |
| 19,282 |
| 69,065 |
|
|
|
|
|
|
|
|
|
|
|
|
|
Non-current |
|
|
|
|
|
|
|
|
|
|
|
|
Investments pledged as collateral |
| Amortized cost |
|
|
| 63,766 |
| 76,934 |
| 63,766 |
| 76,934 |
Trade accounts receivable (Note 4) |
| Amortized cost |
|
|
| 440,453 |
| 426,252 |
| 440,453 |
| 426,252 |
Derivative transactions (Note 31) |
| Measured at fair value through OCI |
| Level 2 |
| 52,881 |
| 26,468 |
| 52,881 |
| 26,468 |
Total financial assets |
|
|
|
|
| 12,689,256 |
| 12,284,429 |
| 12,689,256 |
| 12,284,429 |
|
|
|
|
|
|
|
|
|
|
|
|
|
|
|
|
|
|
|
|
|
| ||||
Financial Liabilities |
|
|
|
|
|
|
|
|
|
|
| |
Current |
|
|
|
|
|
|
|
|
|
|
|
|
Trade accounts payable, net (Note 16) |
| Amortized cost |
|
|
| 6,871,799 |
| 7,642,782 |
| 6,871,799 |
| 7,642,782 |
Loans, financing and leases (Note 20) |
| Amortized cost |
|
|
| 1,020,061 |
| 1,076,451 |
| 1,021,810 |
| 1,135,732 |
Loans, financing and leases (Note 20) |
| Measured at fair value through profit or loss |
| Level 2 |
| 2,029,246 |
| 263,754 |
| 2,029,246 |
| 263,754 |
Debentures (Note 20) |
| Amortized cost |
|
|
| 1,077,183 |
| 82,840 |
| 1,104,539 |
| 237,144 |
Debentures (Note 20) |
| Measured at fair value through profit or loss |
| Level 2 |
| - |
| 41,121 |
| - |
| 41,121 |
Derivative transactions (Note 31) |
| Measured at fair value through profit or loss |
| Level 2 |
| 1,921 |
| 16,316 |
| 1,921 |
| 16,316 |
Derivative transactions (Note 31) |
| Measured at fair value through OCI |
| Level 2 |
| - |
| 222 |
| - |
| 222 |
|
|
|
|
|
|
|
|
|
|
|
|
|
Non-current |
|
|
|
|
|
|
|
|
|
|
|
|
Loans, financing and leases (Note 20) |
| Amortized cost |
|
|
| 25,093 |
| 817,908 |
| 24,106 |
| 796,481 |
Loans, financing and leases (Note 20) |
| Measured at fair value through profit or loss |
| Level 2 |
| 7,161,875 |
| 341,728 |
| 7,161,875 |
| 341,728 |
Contingent consideration (Note 20) |
| Measured at fair value through profit or loss |
| Level 2 |
| 484,048 |
| 465,686 |
| 484,048 |
| 465,686 |
Debentures (Note 20) |
| Amortized cost |
|
|
| 2,027,167 |
| 3,049,949 |
| 1,948,705 |
| 2,866,981 |
Derivative transactions (Note 31) |
| Measured at fair value through OCI |
| Level 2 |
| 54,212 |
| 22,845 |
| 54,212 |
| 22,845 |
Total financial liabilities |
|
|
|
|
| 20,752,605 |
| 13,821,602 |
| 20,702,261 |
| 13,830,792 |
F-95
f)Capital management
The purpose of the Company's capital management is to ensure maintenance of a high credit rating and an optimal capital ratio to support the Company's business and maximize shareholder value.
The Company manages its capital structure by making adjustments and adapting to current economic conditions. For this purpose, the Company may pay dividends, obtain new loans, issue debentures and contract derivatives. For the year ended December 31, 2019, there were no changes in capital structure objectives, policies or processes.
The Company’s debt structure includes loans, financing, debentures, leases, contingent consideration and transactions with derivatives, less cash and cash equivalents, short-term investments to secure BNB financing and guarantor of the contingent consideration liability.
The Company’s ratio of consolidated debt to shareholders’ equity consists of the following:
|
| 12.31.19 |
| 12.31.18 | ||||
Cash and cash equivalents |
|
| 3,393,377 |
|
|
| 3,381,328 |
|
Loans, financing, debentures, leases and contingent consideration (1) |
|
| (13,824,673 | ) |
|
| (6,139,437 | ) |
Derivative transactions, net |
|
| 16,030 |
|
|
| 56,150 |
|
Short-term investment pledged as collateral |
|
| 13,212 |
|
|
| 12,473 |
|
Asset guarantor of contingent consideration |
|
| 484,048 |
|
|
| 465,686 |
|
Net debt |
|
| 9,918,006 |
|
|
| 2,223,800 |
|
Net equity |
|
| 70,455,578 |
|
|
| 71,607,027 |
|
Net debt-to-equity ratio |
|
| 14.08 | % |
|
| 3.11 | % |
(1) | As of December 31, 2019, includes the effects of the adoption of IFRS 16 on January 1, 2019 (Note 19). |
g)Risk management policy
The Company and its subsidiaries are exposed to several market risks as a result of its commercial operations, debts contracted to finance its activities and debt-related financial instruments.
g.1)Currency Risk
Risk arising from foreign exchange rate volatility, affecting loans denominated in foreign currencies.
There is also foreign exchange risk for financial assets and liabilities denominated in foreign currencies, which may generate a smaller amount receivable or larger amount payable depending on the exchange rate in the period.
Hedging transactions were executed to minimize the risks associated with exchange rate on financial assets and liabilities in foreign currencies. This balance is subject to daily changes due to the dynamics of the business. However, the Company intends to cover the net balance of these assets and obligations (US$72,530 thousand receivable, €974 thousand and £110 thousand paid by December 31, 2019 and US$61,909 thousand and €15,624 thousand receivable by December 31, 2018) to mitigate its foreign exchange risks.
F-96
g.2)Interest and Inflation Risk
This risk may arise from an unfavorable change in the domestic interest rate, which may adversely affect financial expenses from the portion of debentures referenced to the CDI and liability positions in derivatives (currency hedge and IPCA) pegged to floating interest rates (CDI).
To reduce exposure to the floating interest rate (CDI), the Company and its subsidiaries invested cash equivalents of R$3,143,209 and R$3,175,730 on December 31, 2019 and 2018, respectively, mostly in short-term CDI-based financial investments (CDBs). The carrying amounts of these instruments approximate their fair values, as they may be redeemed in the short term.
g.3)Liquidity Risk
Liquidity risk may arise from having insufficient funds to meet commitments in different currencies and dates of realization of rights and settlement of obligations.
The Company structures the maturity dates of non-derivative financial contracts (Note 20), and their respective derivatives, as shown in the schedule of payments disclosed in this note, to avoid affecting their liquidity.
The Company’s cash flow and liquidity are managed on a daily basis by the operating departments to ensure that cash flows and contracted funding, when necessary, it is sufficient to meet scheduled commitments in to avoid liquidity risk.
The following is a summary of the maturity profile of the consolidated financial liabilities, which include principal and future interest rates up to the date of maturity. For fixed rate liabilities, interest was calculated on the basis of the indices established in each contract. For variable rate liabilities, interest was calculated on the basis of the market forecast for each period.
On 12.31.19 |
| 2020 |
| 2021 |
| 2022 |
| 2023 |
| 2024 |
| 2025 onwards |
| Total | ||||||||||||||
Trade accounts payable |
|
| 6,871,799 |
|
|
| - |
|
|
| - |
|
|
| - |
|
|
| - |
|
|
| - |
|
|
| 6,871,799 |
|
Loans and financing |
|
| 1,022,302 |
|
|
| 16,307 |
|
| 10,243 |
|
| 4 |
|
| - |
|
| - |
|
|
| 1,048,856 |
| ||||
Leases (1) |
|
| 2,098,941 |
|
|
| 1,896,313 |
|
|
| 1,670,508 |
|
|
| 1,484,652 |
|
|
| 1,086,093 |
|
|
| 2,696,282 |
|
|
| 10,932,789 |
|
Contingent consideration |
|
| - |
|
|
| - |
|
|
| - |
|
|
| - |
|
|
| - |
|
|
| 484,048 |
|
|
| 484,048 |
|
Debentures |
|
| 1,148,732 |
|
|
| 1,083,292 |
|
|
| 1,034,796 |
|
|
| - |
|
|
| - |
|
|
| - |
|
|
| 3,266,820 |
|
Derivative transactions |
|
| 1,921 |
|
|
| - |
|
|
| - |
|
|
| - |
|
|
| - |
|
|
| 54,212 |
|
|
| 56,133 |
|
Total |
|
| 11,143,695 |
|
|
| 2,995,912 |
|
|
| 2,715,547 |
|
|
| 1,484,656 |
|
|
| 1,086,093 |
|
|
| 3,234,542 |
|
|
| 22,660,445 |
|
(1) | Includes the effects of the adoption of IFRS 16 on January 1, 2019 (note 20). |
g.4)Credit Risk
The risk arises from the possibility of the Company and its subsidiaries incurring losses due to difficulty in receiving amounts billed to their customers and sales of prepaid handsets and cards that have been pre-activated for the distribution network.
The credit risk on accounts receivable is diversified and mitigated by strict control of the customer base. The Company constantly monitors the level of accounts receivable from postpaid services and limits bad credit risk by cutting off access to telephone lines if bills are past due. The mobile customer base predominantly uses the prepaid system, which requires purchase of credits beforehand and therefore does not pose credit risk. Exceptions are made for emergency services that must be maintained for security or national defense reasons.
F-97
Credit risk on sales of pre-activated prepaid handsets and cards is managed by a conservative policy for granting credit, using modern credit scoring methods, analyzing financial statements and consultations to commercial databases, in addition to requesting guarantees.
The Company and its subsidiaries are also subject to credit risk arising from their investments, letters of guarantee received as collateral for certain transactions and receivables from derivative transactions. The Company and its subsidiaries control the credit limits granted to each counterpart and diversify this exposure across first-tier financial institutions as per current credit policies of financial counterparts.
g.5)Social and Environmental Risks
The Company's operations and properties are subject to various environmental laws and regulations that, among others, govern environmental licenses and records, protection of fauna and flora, air emissions, waste management and remediation of contaminated sites. If the Company fails to meet present and future requirements, or to identify and manage new or existing contamination, it will incur significant costs, which include cleaning costs, damages, compensation, fines, activities suspension and other penalties, investments to improve its facilities or change its processes, or interruption of operations. The identification of environmental conditions not currently identified, more stringent inspections by regulatory agencies, the entry into force of more stringent laws and regulations or other unanticipated events may occur and, ultimately, result in significant environmental liabilities and their costs. The occurrence of any of the above factors could have a material adverse effect on the Company's business, results of operations and financial position. According to Article 75 of Law No. 9605 of 1998, the maximum fine per breach of environmental law is R$50,000 (fifty million Reais).
From a social point of view, the Company is exposed to contingent liabilities as it hires outsourced service providers. These potential liabilities may involve labor claims by employees of the service providers who file claims against the service provider and Company, request the conviction of the Company as an associate, that is, the Company may be compelled to pay in the case the provider does not settle these obligations. There is also a more remote possibility that these employees will be treated as direct employees by the Company, which would generate the risk of joint and several convictions. The demands that are known to Telefónica are already provided.
g.6)Insurance Coverage
The policy of the Company and its subsidiaries, as well as the Telefónica Group, includes contracting insurance coverage for all assets and liabilities involving significant and high-risk amounts, based on management's judgment and following Telefónica corporate program guidelines.
On December 31, 2019, maximum limits of claims (established pursuant to the agreements of each entity consolidated by the Company) for significant assets, liabilities or interests covered by insurance and their respective amounts were R$900,000 for operational risks (including business interruption) and R$75,000 for general civil liability.
g.7)Other Risks
The Company is required to comply with Brazilian anti-corruption laws and regulations on the same subject in jurisdictions where it has its securities traded. In particular, the Company is subject, in Brazil, to the Law n 12.846/2013 and, in the United States, to the U.S. Foreign Corrupt Practices Act of 1977.
F-98
Although the Company has internal policies and procedures designed to ensure compliance with the aforementioned anti-corruption laws and regulations, there can be no assurance that such policies and procedures will be sufficient or that the Company’s employees, directors, officers, partners, agents and service providers will not take actions in violation of the Company’s policies and procedures (or otherwise in violation of the relevant anti-corruption laws and regulations) for which the Company or they may be ultimately held responsible. Violations of anti-corruption laws and regulations could lead to financial penalties, damage to the Company’s reputation or other legal consequences that could have a material adverse effect on the Company’s business, results of operations and financial condition.
32) CONTRACTUAL COMMITMENTS
The Company and its subsidiaries have unrecognized contractual commitments arising from the purchase of goods and services, which mature on several dates, with monthly payments.
On December 31, 2019, the total nominal values equivalent to the full contract period were:
2020 |
|
| 1,191,801 |
|
2021 |
|
| 1,284,244 |
|
2022 |
|
| 919,747 |
|
2023 |
|
| 279,386 |
|
2024 |
|
| 278,609 |
|
2025 onwards |
|
| 569,264 |
|
Total |
|
| 4,523,051 |
|
33) ADDITIONAL INFORMATION ON CASH FLOWS
a) | Reconciliation of cash flow financing activities |
The following is a reconciliation of consolidated cash flow financing activities for the years ended December 31, 2019 and 2018.
|
|
|
| Cash flows from financing activities |
| Cash flows from operating activities |
| Financing activities not involving cash and cash equivalents |
|
| ||||||||||||||||||||||
|
| Balance on 12.31.18 |
| Write-offs (payments) |
| Write-offs (payments) |
| Financial charges and foreign exchange variation |
| Additions of leases and supplier financing |
| Initial adoption IFRS 16 |
| Interim and unclaimed dividends and interest on equity |
| Balance on 12.31.19 | ||||||||||||||||
Interim dividends and interest on equity |
|
| 4,172,916 |
|
|
| (6,176,842 | ) |
|
| - |
|
|
| - |
|
|
| - |
|
|
| - |
|
|
| 5,591,343 |
|
|
| 3,587,417 |
|
Loans and financing |
|
| 2,106,814 |
|
|
| (2,070,665 | ) |
|
| (129,974 | ) |
|
| 171,636 |
|
|
| 967,313 |
|
|
| - |
|
|
| - |
|
|
| 1,045,124 |
|
Leases |
|
| 393,027 |
|
|
| (1,559,165 | ) |
|
| (415,496 | ) |
|
| 350,772 |
|
|
| 1,803,941 |
|
|
| 8,618,072 |
|
|
| - |
|
|
| 9,191,151 |
|
Debentures |
|
| 3,173,910 |
|
|
| (66,830 | ) |
|
| (201,516 | ) |
|
| 198,786 |
|
|
| - |
|
|
| - |
|
|
| - |
|
|
| 3,104,350 |
|
Derivative financial instruments |
|
| (56,150 | ) |
|
| 91,543 |
|
|
| 26,234 |
|
|
| (77,657 | ) |
|
| - |
|
|
| - |
|
|
| - |
|
|
| (16,030 | ) |
Contingent Consideration |
|
| 465,686 |
|
|
| - |
|
|
| - |
|
|
| 18,362 |
|
|
| - |
|
|
| - |
|
|
| - |
|
|
| 484,048 |
|
Total |
|
| 10,256,203 |
|
|
| (9,781,959 | ) |
|
| (720,752 | ) |
|
| 661,899 |
|
|
| 2,771,254 |
|
|
| 8,618,072 |
|
|
| 5,591,343 |
|
|
| 17,396,060 |
|
F-99
|
|
|
| Cash flows from financing activities |
| Cash flows from operating activities |
| Financing activities not involving cash and cash equivalents |
|
| ||||||||||||||||||
|
| Balance on 12.31.17 |
| Write-offs (payments) |
| Write-offs (payments) |
| Financial charges and foreign exchange variation |
| Additions of leases and supplier financing |
| Interim and unclaimed dividends and interest on equity |
| Balance on 12.31.18 | ||||||||||||||
Interim dividends and interest on equity |
|
| 2,396,116 |
|
|
| (4,136,878 | ) |
|
| - |
|
|
| - |
|
|
| - |
|
|
| 5,913,678 |
|
|
| 4,172,916 |
|
Loans and financing |
|
| 3,109,498 |
|
|
| (1,533,121 | ) |
|
| (207,708 | ) |
|
| 231,748 |
|
|
| 506,397 |
|
|
| - |
|
|
| 2,106,814 |
|
Leases |
|
| 385,460 |
|
|
| (35,375 | ) |
|
| (21,231 | ) |
|
| 45,501 |
|
|
| 18,672 |
|
|
| - |
|
|
| 393,027 |
|
Debentures |
|
| 4,520,739 |
|
|
| (1,324,723 | ) |
|
| (265,992 | ) |
|
| 243,886 |
|
|
| - |
|
|
| - |
|
|
| 3,173,910 |
|
Derivative financial instruments |
|
| (143,754 | ) |
|
| 95,993 |
|
|
| - |
|
|
| (8,389 | ) |
|
| - |
|
|
| - |
|
|
| (56,150 | ) |
Contingent Consideration |
|
| 446,144 |
|
|
| - |
|
|
| - |
|
|
| 19,542 |
|
|
| - |
|
|
| - |
|
|
| 465,686 |
|
Total |
|
| 10,714,203 |
|
|
| (6,934,104 | ) |
|
| (494,931 | ) |
|
| 532,288 |
|
|
| 525,069 |
|
|
| 5,913,678 |
|
|
| 10,256,203 |
|
|
|
|
|
|
|
|
|
|
|
|
|
|
|
|
|
|
|
|
|
|
|
|
|
|
|
|
|
|
b) | Financing transactions that do not involve cash |
The main transactions that do not involve cash of the Company refer to the acquisition of assets through leases and income from financing with suppliers, as follows:
|
| 12.31.19 |
| 12.31.18 | ||||
Initial adoption IFRS 16 on 01.01.19 |
|
| 8,618,072 |
|
|
| 0 |
|
Financing transactions with suppliers |
|
| 967,313 |
|
|
| 506,397 |
|
Acquisition of assets through leases |
|
| 1,803,941 |
|
|
| 18,672 |
|
Total |
|
| 11,389,326 |
|
|
| 525,069 |
|
34) ADDITIONAL INFORMATION ON THE CONSOLIDATED STATEMENT OF INCOME - IFRS 16
The consolidated statement of income in the year ended December 31, 2019 includes the effects of the adoption of IFRS 16. To facilitate the understanding and comparability of the information, the following is the consolidated statement of income in the year ended 31 December 2019, 2018 and 2017, excluding the effects of adopting IFRS 16.
Item |
| Cost of sales |
| Selling expenses |
| General and administrative expenses |
| Financial expenses |
| Total | ||||||||||
Rental costs and expenses |
|
| (1,699,886 | ) |
|
| (71,335 | ) |
|
| (130,477 | ) |
|
| - |
|
|
| (1,901,698 | ) |
Depreciation costs and expenses |
|
| 1,604,829 |
|
|
| 76,591 |
|
|
| 201,530 |
|
|
| - |
|
|
| 1,882,950 |
|
Financial charges |
|
| - |
|
|
| - |
|
|
| - |
|
|
| 401,484 |
|
|
| 401,484 |
|
Income and social contribution taxes |
|
| - |
|
|
| - |
|
|
| - |
|
|
| - |
|
|
| (130,130 | ) |
Total |
|
| (95,057 | ) |
|
| 5,256 |
|
|
| 71,053 |
|
|
| 401,484 |
|
|
| 252,606 |
|
F-100
|
| 2019 |
| 2018 |
| 2017 | ||||||||||||||
|
| Statements of income ( IFRS 16) |
| IFRS 15 and IFRS 16 adjustments |
| Statements of income (IAS 17) |
| Statements of income (IAS 17) |
| Statements of income (IAS 17) | ||||||||||
Net operating revenue |
|
| 44,268,171 |
|
|
| - |
|
|
| 44,268,171 |
|
|
| 43,462,740 |
|
|
| 43,206,832 |
|
Cost of sales |
|
| (22,158,947 | ) |
|
| (95,057 | ) |
|
| (22,254,004 | ) |
|
| (21,025,767 | ) |
|
| (20,272,530 | ) |
Gross profit |
|
| 22,109,224 |
|
|
| (95,057 | ) |
|
| 22,014,167 |
|
|
| 22,436,973 |
|
|
| 22,934,302 |
|
|
|
|
|
|
|
|
|
|
|
|
|
|
|
|
|
|
|
|
|
|
Operating income (expenses) |
|
| (14,895,300 | ) |
|
| 76,309 |
|
|
| (14,818,991 | ) |
|
| (12,980,789 | ) |
|
| (16,302,065 | ) |
Selling expenses |
|
| (12,701,222 | ) |
|
| 5,256 |
|
|
| (12,695,966 | ) |
|
| (12,832,741 | ) |
|
| (13,136,474 | ) |
General and administrative expenses |
|
| (2,498,096 | ) |
|
| 71,053 |
|
|
| (2,427,043 | ) |
|
| (2,598,970 | ) |
|
| (2,443,105 | ) |
Other operating income |
|
| 929,498 |
|
|
| - |
|
|
| 929,498 |
|
|
| 4,077,003 |
|
|
| 464,182 |
|
Other operating expenses |
|
| (625,480 | ) |
|
| - |
|
|
| (625,480 | ) |
|
| (1,626,081 | ) |
|
| (1,186,668 | ) |
Operating income |
|
| 7,213,924 |
|
|
| (18,748 | ) |
|
| 7,195,176 |
|
|
| 9,456,184 |
|
|
| 6,632,237 |
|
|
|
|
|
|
|
|
|
|
|
|
|
|
|
|
|
|
|
|
|
|
Financial income |
|
| 1,132,870 |
|
|
| - |
|
|
| 1,132,870 |
|
|
| 4,112,640 |
|
|
| 1,755,958 |
|
Financial expenses |
|
| (1,953,011 | ) |
|
| 401,484 |
|
|
| (1,551,527 | ) |
|
| (2,285,487 | ) |
|
| (2,659,002 | ) |
Equity pickup |
|
| 752 |
|
|
| - |
|
|
| 752 |
|
|
| (5,847 | ) |
|
| 1,580 |
|
Income before taxes |
|
| 6,394,535 |
|
|
| 382,736 |
|
|
| 6,777,271 |
|
|
| 11,277,490 |
|
|
| 5,730,773 |
|
Income and social contribution taxes |
|
| (1,393,521 | ) |
|
| (130,130 | ) |
|
| (1,523,651 | ) |
|
| (2,349,232 | ) |
|
| (1,121,983 | ) |
|
|
|
|
|
|
|
|
|
|
|
|
|
|
|
|
|
|
|
|
|
Net income for the year |
|
| 5,001,014 |
|
|
| 252,606 |
|
|
| 5,253,620 |
|
|
| 8,928,258 |
|
|
| 4,608,790 |
|
35) SUBSEQUENT EVENTS
a)Infringement notice from the Brazilian Federal Revenue Service (“RFB”) against the Company
On February 3, 2020, the RFB issued a tax assessment notice against the Company, in the amount of R$983,487, alleging insufficient payment of income tax at source on capital gain on the sale of the GVT Group to the Company. Although the preliminary assessment is that there was no insufficiency in the payment of said tax, the Company is protected by an indemnity clause in the purchase and sale agreement signed with the seller, with respect to any losses related to income tax at source on capital gain of the GVT Group in said transaction.
b)Sale of the Company's towers
On February 7, 2020, the Company concluded the sale of 1,909 structures (rooftops and towers) of its ownership to Telxius Torres Brasil Ltda., indirect subsidiary of Telefónica S.A., for the total amount of R$641 million. The conclusion came after the fulfillment of all suspensive conditions common to this type of operation, including its approval by the Administrative Council for Economic Defense - CADE.
c)Interim interest on equity declared by the Company
At a meeting held on February 14, 2020, calling upon the General Shareholders’ Meeting to be held in 2021, the Board of Directors approved the payment of interest on equity for the fiscal year 2020, under the terms of article 28 of the Company’s Articles of Incorporation, article 9 of Law No. 9249/95 and CVM Ruling No. 638/12, in the gross amount of R$270,000, equivalent to 0.14994770587 per common share and 0.16494247646 per preferred share, corresponding to a net amount of Withholding Income Tax (IRRF) of R$229,500, equivalent to 0.12745554999 per common share and 0.14020110499 per preferred share, calculated based on the balance sheet of the January 31, 2020.
Payment thereof will be made up to the end of fiscal year 2021, on a date to be set by the Board of Directors and timely communicated to the market, being paid individually to shareholders, according to the ownership structure contained in the Company's records, through the end of day February 28, 2020.
F-101
SIGNATURE
Pursuant to the requirements of the Securities Exchange Act of 1934, the registrant has duly caused this report to be signed on its behalf by the undersigned, thereunto duly authorized.
|
| TELEFÔNICA BRASIL S.A. | |||
Date: | March 17, 2020 |
| By: | /s/Luis Carlos da Costa Plaster | |
|
|
|
| Name: | Luis Carlos da Costa Plaster |
|
|
|
| Title: | Investor Relations Director |