EXHIBIT 99.1
A TECHNICAL REVIEW
OF THE
NUEVO MILENIO PROJECT, TEPIC AREA, NAYARIT STATE, MEXICO
FOR
CREAM MINERALS LIMITED
prepared by
Dr. Derek E. McBride P. Eng.
Senior Associate Geologist
and
Al Workman, P.Geo.
Vice President and Senior Geologist
20 March, 2013 Toronto, Canada |  |
TABLE OF CONTENTS
| | | Page |
| 1. | SUMMARY | 1 |
| | | |
| 2. | INTRODUCTION | 5 |
| | 2.1 | General | 5 |
| | 2.2 | Terms of Reference | 5 |
| | 2.3 | Sources of Information | 5 |
| | 2.4 | Reliance on Other Experts and Site Visits | 5 |
| | 2.5 | Units and Currency | 6 |
| | 2.6 | Risk Factors | 7 |
| | | |
| 3. | PROPERTY DESCRIPTION AND LOCATION | 9 |
| | 3.1 | Location | 9 |
| | 3.2 | Property Description | 10 |
| | 3.3 | Nature of CMA’s Interest | 10 |
| | | |
| 4. | ACCESS, CLIMATE, LOCAL RESOURCES, INFRASTRUCTURE AND PHYSIOGRAPHY | 12 |
| | 4.1 | Access | 12 |
| | 4.2 | Climate | 12 |
| | 4.3 | Local Resources and Infrastructure | 12 |
| | 4.4 | Physiography and Agriculture | 13 |
| | | |
| 5. | HISTORY | 15 |
| | | |
| 6. | GEOLOGICAL SETTING AND MINERALIZATION | 17 |
| | 6.1 | Regional, Local and Property Geology | 17 |
| | 6.2 | Setting of Mineralization | 25 |
| | | |
| 7. | DEPOSIT TYPES | 27 |
| | | |
| 8. | MINERALIZATION | 28 |
| | | |
| 9. | EXPLORATION | 30 |
| | 9.1 | Procedures/Parameters of Surveys and Investigation | 30 |
| | 9.2 | Sampling Methods and Sample Quality | 30 |
| | 9.3 | Relevant Information | 31 |
| | 9.4 | Results and Interpretation of Exploration | 31 |
| | | |
| 10. | DRILLING | 47 |
| | 10.1 | Introduction | 47 |
| | 10.2 | Dos Hornos 1 | 47 |
| | 10.3 | Dos Hornos 2 | 50 |
| | 10.4 | Veta Tomas | 52 |
| | 10.5 | Once Bocas North | 54 |
| | 10.6 | Once Bocas South | 56 |
| | 10.7 | Chacuaco | 56 |
| | 10.8 | La Cafetal Veta Olvidada Prospect | 57 |
| | | |
| 11. | SAMPLING METHOD, ANALYSIS AND SECURITY | 59 |
| | 11.1 | Sample Preparation and Assaying | 59 |
| | 11.2 | Quality Assurrance / Quality Control | 60 |
| | 11.3 | Security | 61 |
| 12. | DATA VERIFICATION | 62 |
| | 12.1 | General | 62 |
| | 12.2 | Check Sampling and Assaying | 62 |
| | | |
| 13. | MINERAL PROCESSING AND METALLURGICAL TESTING | 65 |
| | | |
| 14. | MINERAL RESOURCE ESTIMATES | 66 |
| | 14.1 | Definitions | 66 |
| | 14.2 | Previous Resource Estimates | 68 |
| | 14.3 | Current Wgm 2013 Mineral Resources Estimates | 70 |
| | 14.4 | General Mineral Resource Estimation Procedures | 72 |
| | 14.5 | Database | 72 |
| | 14.6 | Geological Modelling Procedures | 74 |
| | 14.7 | Geological Interpretation | 75 |
| | 14.8 | Topographic Surface Creation | 76 |
| | 14.9 | Statistical Analysis, Compositing, Grade Capping and Specific Gravity | 76 |
| | 14.10 | Polygonal Model Parameters, Grade Interpolation and Classification of Mineral Resources | 82 |
| | 14.11 | Dos Hornos 1 and 2 Current Mineral Resources Estimates | 85 |
| | 14.12 | Veta Tomas Current Mineral Resources Estimates | 93 |
| | 14.13 | Once Bocas Current Mineral Resources Estimates | 98 |
| | 14.14 | Discussion of Current Nuevo Milenio Mineral Resources | 106 |
| | | |
| 15. | MINERAL RESERVE ESTIMATES | 109 |
| | | |
| 16. | MINING METHODS | 109 |
| | | |
| 17. | RECOVERY METHODS | 110 |
| | | |
| 18. | PROJECT INFRASTRUCTURE | 110 |
| | | |
| 19. | MARKET STUDIES AND CONTRACTS | 110 |
| | | |
| 20. | ENVIRONMENTAL STUDIES, PERMIT, AND SOCIAL OR COMMUNITY IMPACT | 111 |
| | | |
| 21. | CAPITAL AND OPERATING COSTS | 111 |
| | | |
| 22. | ECONOMIC ANALYSIS | 111 |
| | | |
| 23. | ADJACENT PROPERTIES | 112 |
| | | |
| 24. | OTHER RELEVANT DATA AND INFORMATION | 113 |
| | | |
| 25. | INTERPRETATION AND CONCLUSIONS | 114 |
| | | |
| 26. | RECOMMENDATIONS | 118 |
| | | |
| 27. | DATE AND SIGNATURE PAGE | 122 |
| | | |
| 28. | REFERENCES | 123 |
| | |
| CERTIFICATE | 124 |
LIST OF TABLES
| | | Page |
| Table 1 | Summary of CMA’s Nuevo Milenio Project Mineral Exploration Concessions | 10 |
| Table 2 | Condition of Spanish Colonial Mine Workings, Nuevo Milenio Project | 32 |
| Table 3 | Summary of Selected Dos Hornos 1 Drill Hole Intersections | 33 |
| Table 4 | Summary of Selected Dos Hornos 2 Intersections | 35 |
| Table 5 | Summary of Selected Veta Tomas Drill Hole Intersections | 37 |
| Table 6 | Summary of Selected Once Bocas North Drill Hole Intersections | 41 |
| Table 7 | Summary of Selected Once Bocas South Drill Hole Intersections | 44 |
| Table 8 | Summary of Selected Chacuaco Prospect Drill Hole Intersections | 45 |
| Table 9 | Summary of Selected La Cafetal Veta Olvidada Prospect Drill Hole Intersections | 46 |
| Table 10 | Dos Hornos Segment 1 Drill hole Data | 48 |
| Table 11 | Dos Hornos Segment 2 Drill Hole Data | 50 |
| Table 12 | Veta Tomas Drill Hole Data | 52 |
| Table 13 | Once Bocas North Drill Hole Data | 54 |
| Table 14 | Once Bocas South Drill Hole Data | 56 |
| Table 15 | Chacuaco Prospect Drill Hole Data | 57 |
| Table 16 | Cafetal Veta Olvidada Prospect Drill Hole Data | 58 |
| Table 17 | Comparison of Original Assay Data and New Data Derived from WGM Check Samples | 63 |
| Table 18 | Summary of Metallurgical Test Sample Information | 65 |
| Table 19 | Summary of Metallurgical Test Results | 65 |
| Table 20 | Summary of Previous Resource Estimates (after Holcapek, 2008a) | 69 |
| Table 21 | Frequency of Host Rocks in Sample Population from Major Zones | 77 |
| Table 22 | Frequency of Host Rocks in Sample Population | 79 |
| Table 23 | Dos Hornos 1 Mineral Resource Estimates | 85 |
| Table 24 | Dos Hornos 2 Mineral Resource Estimates | 91 |
| Table 25 | Distribution of Raw Ag and Au Assays in Various Rock Types, Dos Hornos 1 and 2 Zones | 92 |
| Table 26 | Dos Hornos 1 and 2 Mineral Resource Estimates – Sensitivity Analysis | 93 |
| Table 27 | Veta Tomas Mineral Resource Estimates | 94 |
| Table 28 | Distribution of Raw Ag and Au Assays in Various Rock Types, Veta Tomas Zone | 95 |
| Table 29 | Veta Tomas Mineral Resource Estimates – Sensitivity Analysis | 98 |
| Table 30 | Once Bocas North Mineral Resource Estimates | 100 |
| Table 31 | Distribution of Raw Ag and Au Assays in Various Rock Types, Once Bocas North Zone | 104 |
| Table 32 | Once Bocas North Mineral Resource Estimates - Sensitivity Analysis | 105 |
| Table 33 | Summary of Nuevo Milenio Mineral Resource Estimates | 106 |
| Table 34 | Comparison of Previous and Current Nuevo Milenio Mineral Resource Estimates | 107 |
| Table 35 | Summary of Nuevo Milenio Mineral Resource Estimates | 116 |
| Table 36 | Recommended Exploration Program for the Nuevo Milenio Project | 121 |
LIST OF FIGURES
| | | Page |
| Figure 1: | General Location of the CMA Project | 8 |
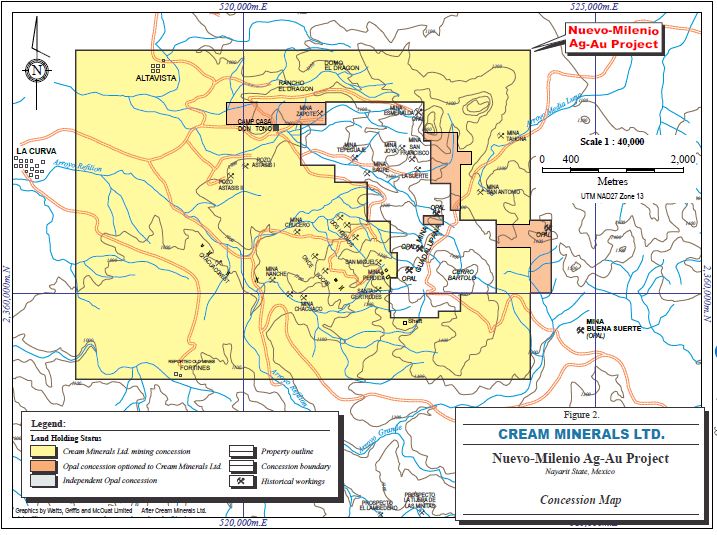
| Figure 2: | Map Showing Boundaries of CMA’s Mineral Concessions for the Nuevo Milenio Project | 14 |
| Figure 3: | Regional Geology Map for the Nuevo Milenio Project | 19 |
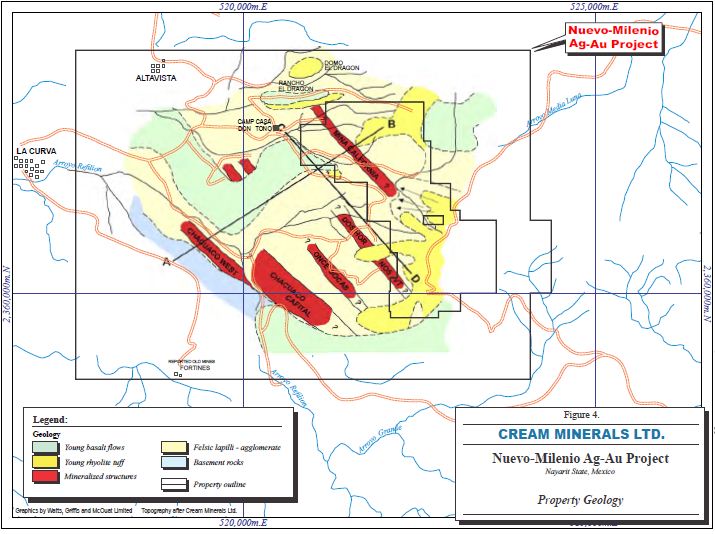
| Figure 4: | Property Geology | 23 |
| Figure 5: | Idealized Cross-sections Across the CMA Property | 24 |
| Figure 6: | Surface Plan of Dos Hornos 1 Area | 34 |
| Figure 7: | Surface Plan of the Dos Hornos 2 Area | 36 |
| Figure 8: | Surface Plan of the Veta Tomas Area | 39 |
| Figure 9: | Surface Plan of the Once Bocas North Area | 42 |
| Figure 10: | Surface Plan of the Once Bocas South Area | 43 |
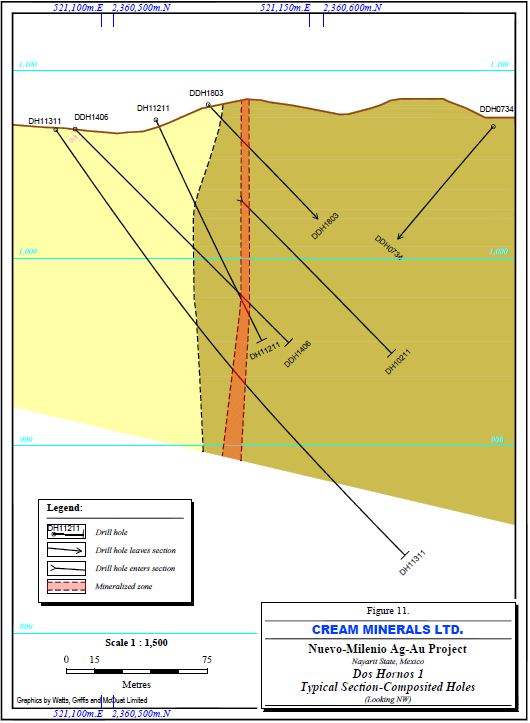
| Figure 11: | Typical Dos Hornos 1 Drill Section | 49 |
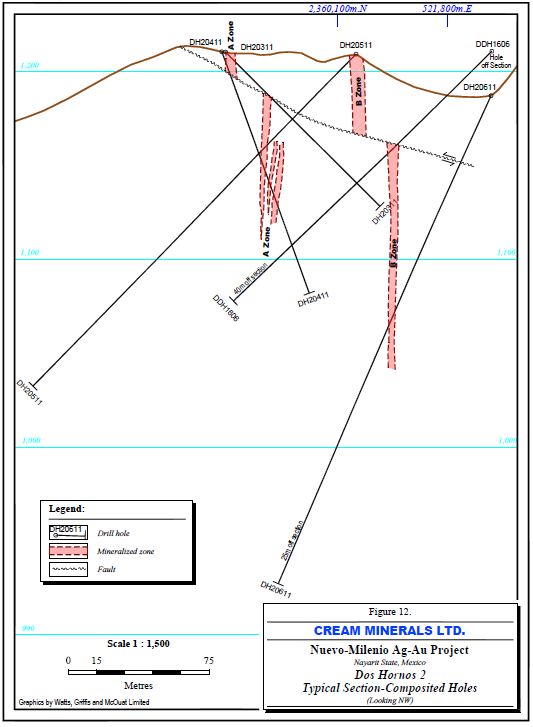
| Figure 12: | Typical Dos Hornos 2 Drill Section | 51 |
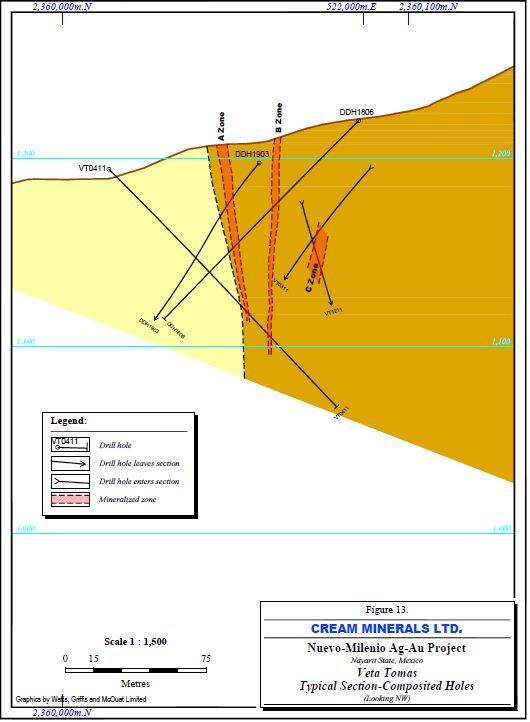
| Figure 13: | Typical Veta Tomas Drill Section | 53 |
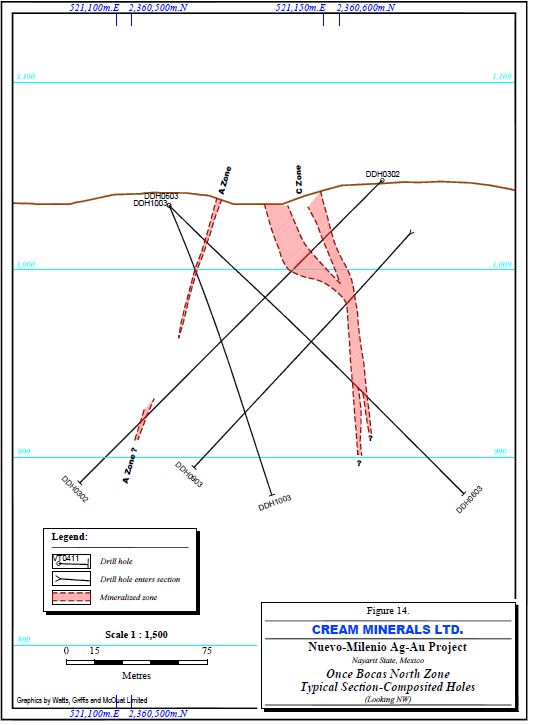
| Figure 14: | Typical Once Bocas North drill section | 55 |
| Figure 15: | Comparison of Original Gold Assays with WGM Check Samples | 63 |
| Figure 16: | Comparison of Original Silver Assays with WGM Check samples | 64 |
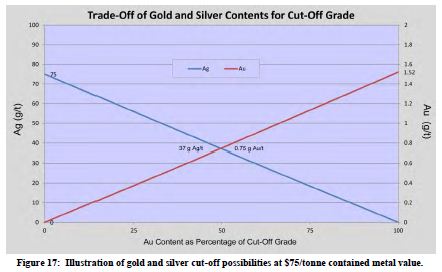
| Figure 17: | Illustration of Gold and Silver Cut-off Possibilities at $75/tonne Contained Metal Value | 78 |
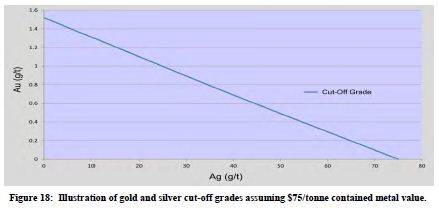
| Figure 18: | Illustration of Gold and Silver Cut-off Grades Assuming $75/tonne Contained Metal Value | 79 |
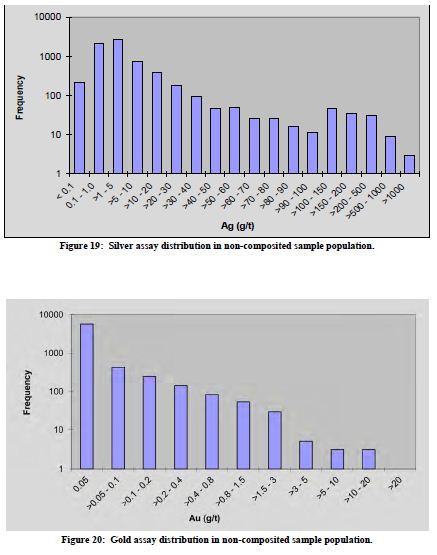
| Figure 19: | Silver Assay Distribution in Non-composited Sample Population | 80 |
| Figure 20: | Gold Assay Distribution in Non-composited Sample Population | 80 |
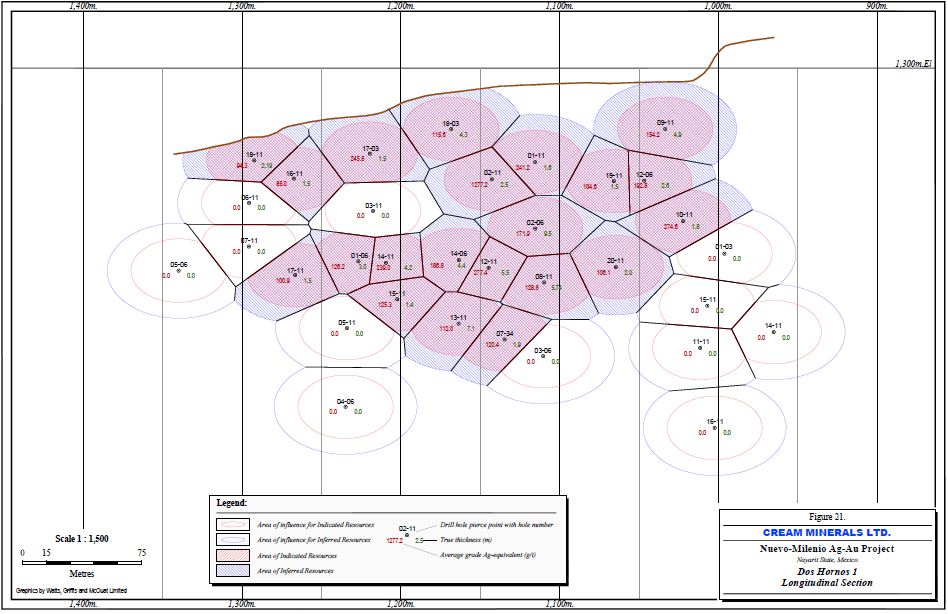
| Figure 21: | Dos Hornos 1 - Longitudinal Section Showing Polygonal Model with Grade and Thickness Data | 87 |
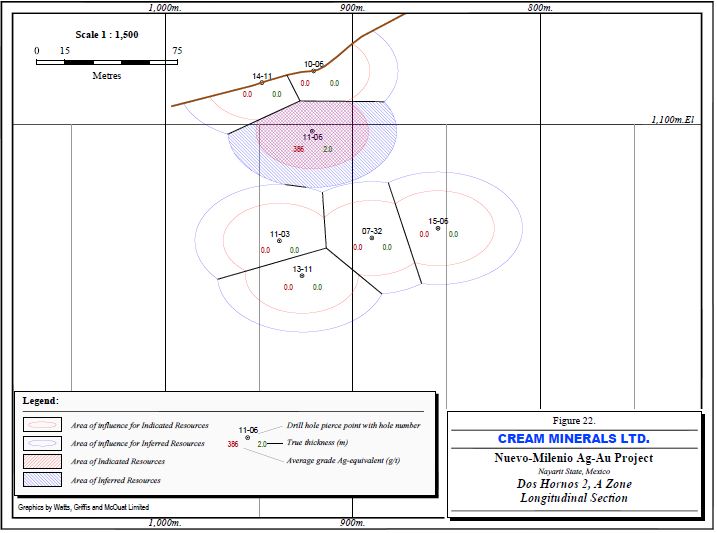
| Figure 22: | Dos Hornos 2 - Longitudinal Section of the ‘A’ Sub-zone Showing Polygonal Model with Grade and Thickness Data | 88 |
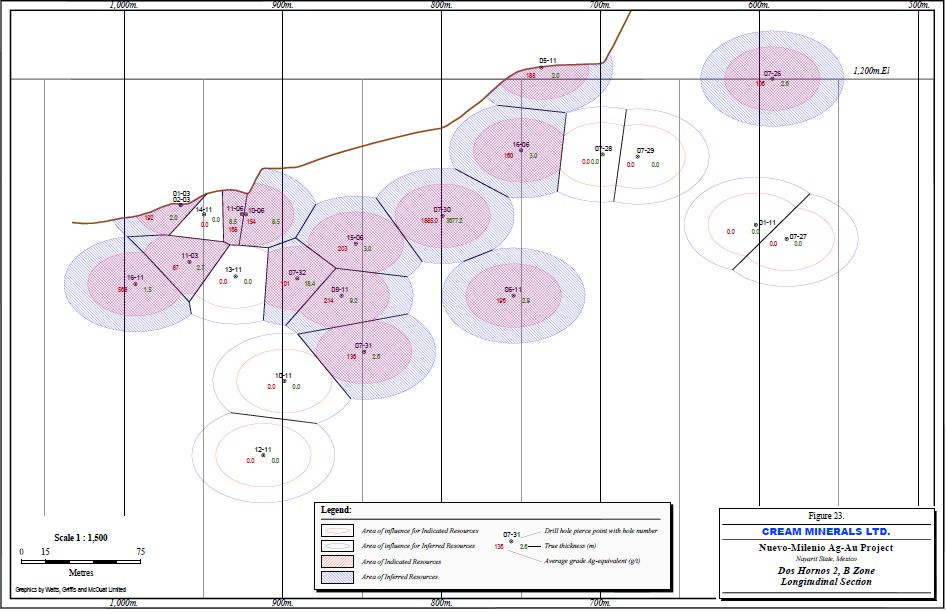
| Figure 23: | Dos Hornos 2 - Longitudinal Section of the ‘B’ Sub-zone Showing Polygonal Model with Grade and Thickness data | 89 |
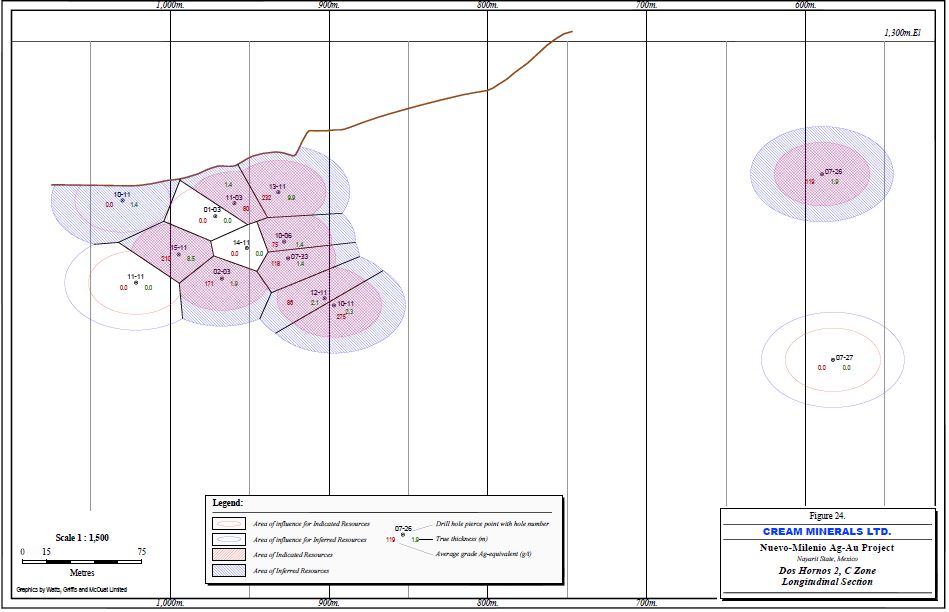
| Figure 24: | Dos Hornos 2 - Longitudinal Section of the ‘C’ Sub-zone Showing Polygonal Model with Grade and Thickness data | 90 |
| Figure 25: | Veta Tomas - Longitudinal Section of the ‘A’ Sub-zone Showing Polygonal Model with Grade and Thickness data | 96 |
| Figure 26: | Veta Tomas - Longitudinal Section of the ‘B’ Sub-zone Showing Polygonal Model with Grade and Thickness Data | 97 |
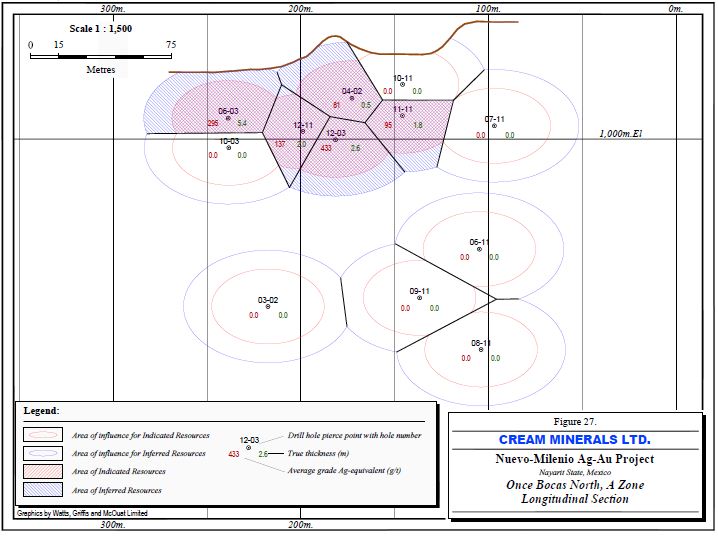
| Figure 27: | Once Bocas North - Longitudinal section of the ‘A’ Sub-zone Showing Polygonal Model with Grade and Thickness Data | 101 |
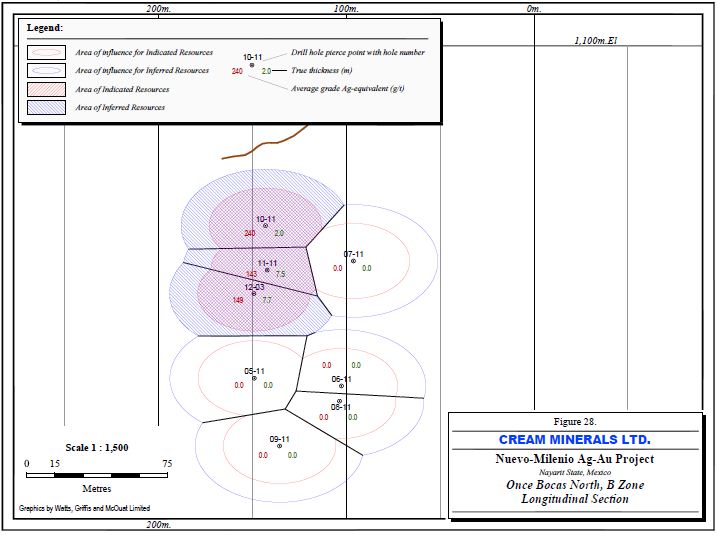
| Figure 28: | Once Bocas North - Longitudinal section of the ‘B’ Sub-zone Showing Polygonal Model with Grade and Thickness Data | 102 |
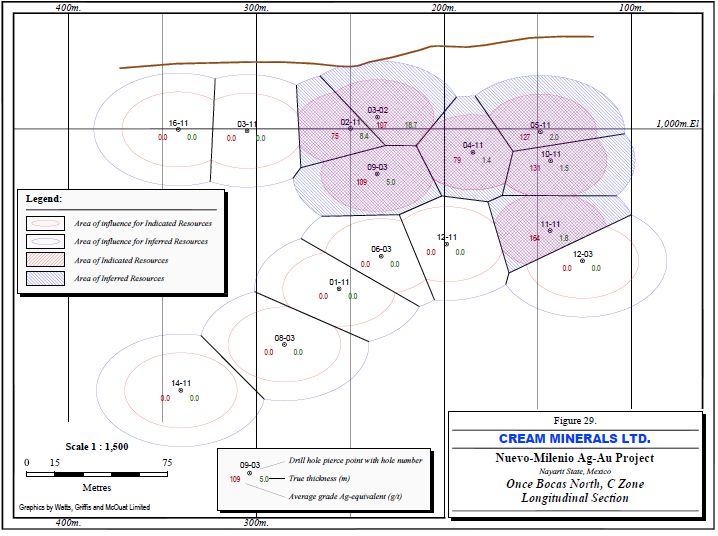
| Figure 29: | Once Bocas North - Longitudinal section of the ‘C’ Sub-zone Showing Polygonal Model with Grade and Thickness Data | 103 |
LIST OF PHOTOGRAPHIC PLATES
| | | Page |
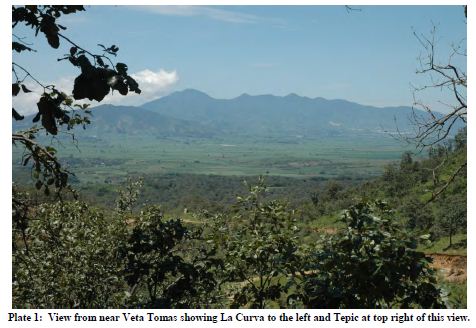
| Plate 1: | View from near Veta Tomas showing La Curva to the left and Tepic at top right of this view | 9 |
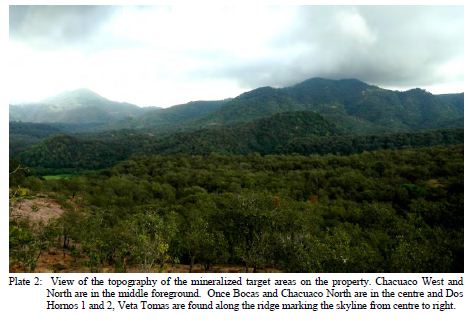
| Plate 2: | View of the topography of the mineralized target areas on the property | 13 |
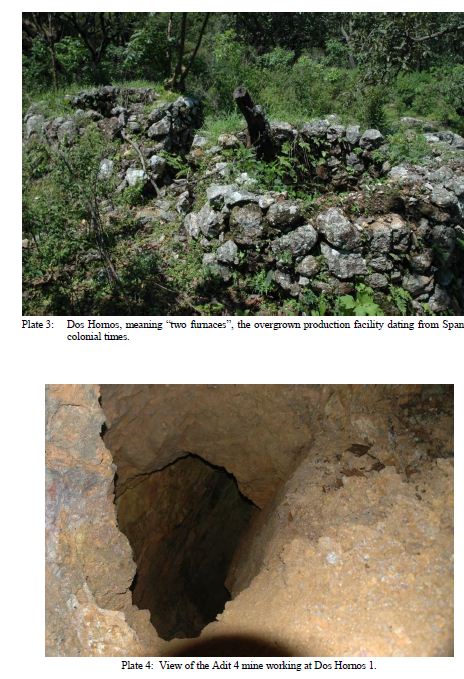
| Plate 3: | Dos Hornos, meaning “two furnaces”, the overgrown production facility dating from Spanish colonial times | 16 |
| Plate 4: | View of the Adit 4 mine working at Dos Hornos 1 | 16 |
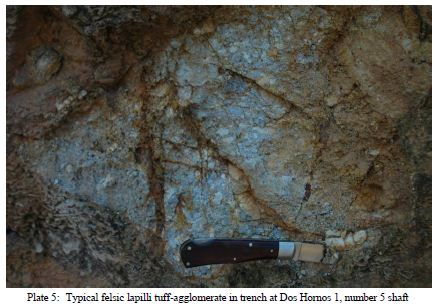
| Plate 5: | Typical felsic lapilli tuff-agglomerate in trench at Dos Hornos 1, Number 5 shaft | 20 |
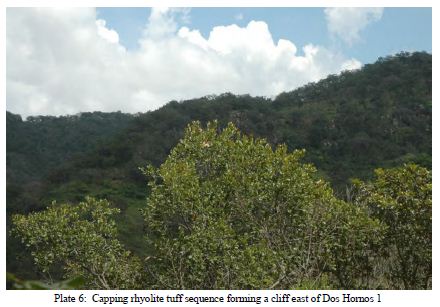
| Plate 6: | Capping rhyolite tuff sequence forming a cliff east of Dos Hornos 1 | 21 |
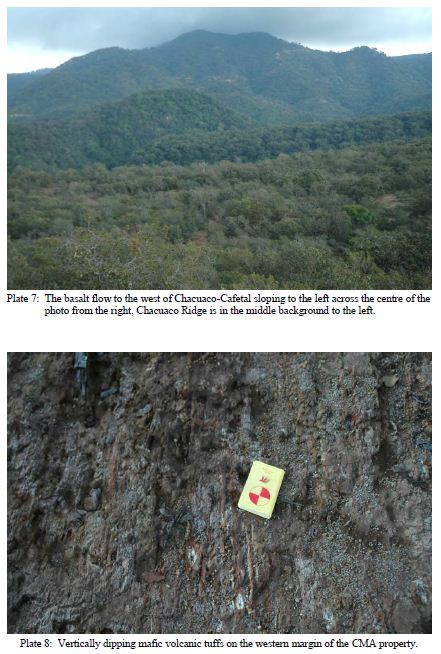
| Plate 7: | The basalt flow to the west of Chacuaco-Cafetal sloping to the left across the centre of the photo from the right, Chacuaco Ridge is in the middle background to the left | 22 |
| Plate 8: | Vertically dipping mafic volcanic tuffs on the western margin of the property | 22 |
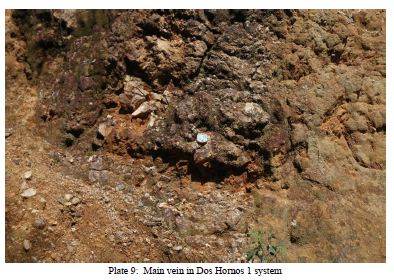
| Plate 9: | Main vein in Dos Hornos 1 system | 25 |
| Plate 10: | San Miguel Mine on Veta Tomas | 38 |
| Plate 11: | Hill above San Miguel Adit capped by rhyolite | 38 |
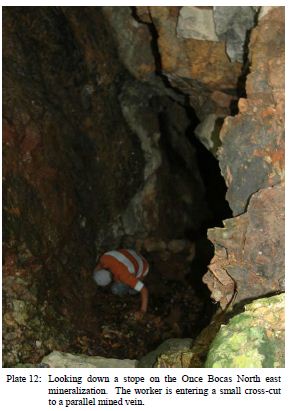
| Plate 12: | Looking down a stope on the Once Bocas North east mineralization. The worker is entering a small cross-cut to a parallel mined vein | 40 |
| Plate 13: | Entrance to the La Mina California mine | 112 |
1. SUMMARY
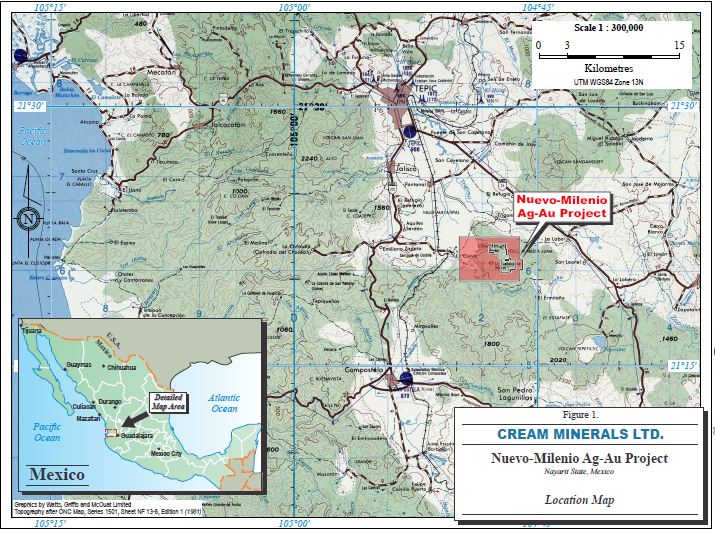
Watts, Griffis and McOuat Limited (“WGM”) was retained by Cream Minerals Limited (“CMA”), to complete this technical report for its Nuevo Milenio Property located south of Tepic, Nayarit State, Mexico (Photo 1, Figure 1) in compliance with Canadian securities rule National Instrument 43-101 (“NI 43-101”). A major component of the assignment is the Mineral Resource estimate that is contained herein.
CMA holds its mineral titles through its wholly-owned Mexican subsidiary Cream Minerals de Mexico S.A. de C.V. which owns 100% of the 2,612.5 ha Nuevo Milenio Gold-Silver Property. Together these companies are referenced interchangeably as CMA in this report. The Nuevo Milenio property is not subject to royalty payments or any other underlying encumbrances, and is maintained in good standing under the prevailing mineral licensing system. Property taxes of approximately US $33,000 are paid semi-annually.
Most of the field work carried out on the Nuevo Milenio Property has been under the direction of Mr. Fred Holcapek P. Eng. who managed the exploration project for CMA and Ing. G. Fransisco, the Nuevo Milenio Project Geologist, both of whom provided valuable information and insights into the geoscience aspects of the project. WGM’s review of the property included a 5-day site visit by its senior Associate Geologist, Dr. Derek McBride, who visited all the mineralized zones described in this report. The present interpretation of the geology is based on this visit and Dr. McBride’s previous experience working on other epithermal deposits in the Sierra Madre Occidental of Mexico.
Spanish dominance of the project area commenced in 1534 with the arrival of Captain Francisco Cortez de San Buena Ventura at Tepic. Over the next few years the Spanish conquistadores consolidated their position and learned of gold and silver from the local indigenous peoples. Mining and exploration spread throughout the area. Today, the remnants of this work are seen in pits, trenches and small shafts and adits.
In the project area, bedrock exposure is poor despite the youthful topography. Most exposures are found along creeks and roads constructed for drilling. Veins can be traced by residual quartz float, pits, trenches and mine workings. Most of the property is covered by a felsic lapilli tuff-agglomerate assemblage that is distinguished by lapilli-sized clasts, some larger clasts up to 5 centimetres, and clasts locally including agglomerate sized (20 cm) fragments. No bedding was seen, but the unit’s distribution suggests a gentle north-westerly dip. This unit hosts all of the known mineralization. Rhyolite, including flow-banded rhyolite is seen elsewhere but it is generally younger in age and devoid of mineralization.
Economically interesting gold-silver mineralization occurs in steeply dipping veins and stockworks that are exclusively hosted in the felsic lapilli tuff-agglomerate formation. Numerous vein systems (zones) have been identified, the major ones being Dos Hornos 1 and 2, Veta Tomas, Once Bocas North and South, Cafetal and Chacuaco. These zones define segments of what is thought to be a single, continuous structure that crosses the property from northwest to southeast. Surface mapping, quartz vein float and diamond drilling has demonstrated good structural continuity within each segment. The segments themselves are composed of multiple, closely spaced parallel veins and/or shears all of which contain nodes of economically interesting silver and gold mineralization. The structure(s) that control mineralization extend beyond their explored length, and pass under the younger volcanic tuffs and flows – these covered extensions have not been explored in any detail.
The disseminated mineralization in the host rocks suggest fluids passing through the porous felsic lapilli tuff-agglomerate unit. Deposition is in the form of fine-grained sulphides which give the rock a bluish or greyish colouration. The alteration minerals and the presence of silica show the influence of the hydrothermal solutions. These textures are interpreted as the product of a combination of near surface vein formation coupled with simultaneous sinter formation at the surface. Metallic minerals are deposited throughout this process, but become scarcer in the upper portions of the geothermal system, especially above the mean elevation of the water table, and gradually decrease with depth as PT conditions increase.
Recent drilling at Dos Hornos 1 demonstrates that the mineralized system can be traced for as much as 200 metres vertically and on sections spaced approximately 50 metres apart for the full length of the zone. This mineralization is composed of a high grade linear core, usually a quartz vein(s) and flanking halo. It is poorly exposed on surface and was traced by the Spanish by a series of shallow shafts, pits and locally by more extensive workings. Inspection of the lower mine workings showed that they followed high grade pods of mineralization which was concentrated in two parallel veins. These workings are only a metre wide and do not consider the potential beyond the veins. For that reason, they are not included in the resource calculation if a drill hole or cross cut is in proximity. Similar mineralization is found in the other zones, many of which include multiple parallel structures (shears).
The current WGM Mineral Resource estimates for CMA’s Nuevo Milenio property includes individual estimates for the Dos Hornos 1, Dos Hornos 2, Veta Tomas and Once Bocas North zones. These estimates incorporate both gold and silver mineralization and are based on the entire drill hole database which spans approximately 10 years of drilling. The estimates were prepared from a polygonal model using a C$:US$ exchange rate of par (1:1) and on the following metal prices in US dollars per ounce: Au at $1635.00 and Ag at $31.50 as established at the close of trading on 7 February, 2013. Gold and silver assays and metal
prices were also used to calculate equivalent-silver grades. WGM’s review of the assay data indicates that extreme high-grade assays (nuggets) are rare in the assay database. High grade silver assays were cut to 1,000 g Ag/t. No assay cutting was required for gold values. A minimum true thickness of 1.5 metres (5.7 feet) was imposed on intersections to qualify as Mineral resources. WGM’s base case estimate of the Mineral Resources used a minimum cut-off grade of $75 contained value in silver + gold. The resources were estimated without consideration for metal recoveries and were classified in compliance with NI 43-101. The Mineral Resources for the project in accordance with WGM’s base case cut-off are summarized as follows. Detailed sub-divisions of the zones appear in the Mineral resources section of this report.
SUMMARY OF NUEVO MILENIO PROJECT MINERAL RESOURCE ESTIMATES
(using grade cut-off equivalent to US $75/tonne Au-Ag value)
Zone and Resource Class | | Tonnes | | | Thickness (avg. m.) | | | Average Grade | | | Equivalent Silver Grade | |
| | | | | | g Ag/t | | | g Au/t | | | Ageq (g/t) | |
| Dos Hornos 1 | | | | | | | | | | | | | | | |
| Indicated Resources | | | 268,116 | | | | 4.80 | | | | 164 | | | | 0.66 | | | | 198 | |
| Inferred Resources | | | 80,594 | | | | 4.60 | | | | 155 | | | | 0.75 | | | | 194 | |
| Dos Hornos 2 | | | | | | | | | | | | | | | | | | | | |
| Indicated Resources | | | 335,887 | | | | 7.92 | | | | 124 | | | | 1.00 | | | | 175 | |
| Inferred Resources | | | 183,107 | | | | 5.79 | | | | 107 | | | | 1.00 | | | | 164 | |
| | | | | | | | | | | | | | | | | | | | | |
| Veta Tomas | | | | | | | | | | | | | | | | | | | | |
| Indicated Resources | | | 278,967 | | | | 5.70 | | | | 173 | | | | 0.87 | | | | 199 | |
| Inferred Resources | | | 156,185 | | | | 4.76 | | | | 126 | | | | 0.82 | | | | 166 | |
| Once Bocas North | | | | | | | | | | | | | | | | | | | | |
| Indicated Resources | | | 223,783 | | | | 8.95 | | | | 112 | | | | 0.63 | | | | 145 | |
| Inferred Resources | | | 117,949 | | | | 9.68 | | | | 119 | | | | 0.70 | | | | 155 | |
| All Zone Segments | | | | | | | | | | | | | | | | | | | | |
| Indicated Resources | | | 1,106753 | | | | 6.81 | | | | 144 | | | | 0.81 | | | | 181 | |
| Inferred Resources | | | 537,835 | | | | 6.17 | | | | 122 | | | | 0.84 | | | | 167 | |
| | 1. | Mineral Resources which are not Mineral Reserves do not have demonstrated economic viability. Mineral Resources may be materially affected by environmental, permitting, legal, title, taxation, socio-political, marketing, or other relevant issues. |
| | 2. | The quantity and grade of reported Inferred Resources in this estimation are uncertain in nature and there has been insufficient exploration to define these Inferred Resources as an Indicated or Measured Mineral Resource and it is uncertain if further exploration will result in upgrading them to an Indicated or Measured Mineral Resource category. |
| | 3. | The Mineral Resources were estimated using the Canadian Institute of Mining, Metallurgy and Petroleum standards on Mineral Resources and Reserves, Definitions and Guidelines prepared by the CIM Standing Committee on Reserve Definitions and adopted by CIM Council December 11, 2005. |
| | 4. | S.G. of 2.65 tonnes/m3 was used. |
| | 5. | Tonnage and contained Ag and Au are rounded to nearest thousand or thousandth. Totals may not add up due to rounding. |
Sensitivity analysis demonstrates that the resources are not greatly affected by $10 value changes in the cu-off grade. This is a consequence of general lack of shoulders to the mineralization on most sections. It is possible that a substantial reduction of the cut-off grade to, for example $50 of gold and silver value would bring additional sub-zones into Mineral Resources, however WGM believes that it would be difficult to mine such grades at a profit. Additional resources might be forthcoming if those portions of the deposit amenable to open- cut mining were modelled separately, however it is WGM’s view that such operations would not substantially alter the current resource total because the average true thickness of all zones contributing to the base case Mineral Resources is in excess of 6 metres.
Additional drilling is recommended. WGM has commented herein on the quality of core recovered from past programs – in general it has been less than optimum. WGM understands that CMA pressure on the former drilling contractor (2003 and 2006-07 programs) to provide more experienced drillers was resisted. A change in contractors for the 2011 drilling program resulted in better core recoveries, commonly averaging 90%. In WGM’s opinion, it is vital for future drilling programs that core recovery be improved and that penalty clauses be built into the drilling contract to ensure that the drillers have a vested interest in maximizing recovery.
2. INTRODUCTION
Watts, Griffis and McOuat Limited (“WGM”) was retained by Cream Minerals Limited (“CMA”), to complete this technical report in compliance with Canadian securities rule National Instrument 43-101 (“NI 43-101”) for CMA’s Nuevo Milenio Property located south of Tepic, Nayarit State, Mexico (Photo 1, Figure 1). A major component of the assignment is the Mineral resource estimate that is contained herein.
The request to complete this NI 43-101 compliant report was made to support the August 12th, 2012, resource estimate made on the property. The initial resource estimate was not prepared by WGM which considers all previous resource estimates to be of a non-compliant nature.
2.3 SOURCES OF INFORMATION
Mr. Fred Holcapek, P.Eng. has managed the project since its inception in 2000 and has been responsible for the geological interpretations as represented by plans and sections contained in a previous report written in 2008. Following the 2011 drilling program, Mr. Holcapek updated this technical information with an internal CMA report that served as a key reference document for the locations of drill holes and intersections of mineralization in this report. The field observations reported herein as well as WGM’s resource estimate were made independently and subject to WGM’s internal due diligence process.
2.4 RELIANCE ON OTHER EXPERTS AND site visits
The authors have relied on Mr. Fred Holcapek P. Eng. who managed the exploration project for CMA and Ing. G. Fransisco, the Nuevo Milenio Project Geologist, both of whom provided valuable information and insights into the geoscience aspects of the project.
Ing. G. Fransisco, the field geologist for the Nuevo Milenio Project during the last 8 years guided Dr. McBride on WGM’s site visit. His knowledge of the property was extremely helpful. Dr. McBride spent five days on the site and visited all the mineralized zones described in this report. He took UTM coordinates of selected mine workings and drill holes
which were compared with Company maps and confirmed their accuracy. Selected samples were collected from sample pulps, drill core and underground workings for confirmation purposes and to test the accuracy and precision of the original sampling and assaying techniques. Two key visits were made to investigate the extent of the underground workings, the first at Dos Hornos 1 and the second at Chacuaco. The present interpretation of the geology is based on this visit and Dr. McBride’s previous experience working on three other epithermal deposits in the Sierra Madre Occidental of Mexico.
All dollar figures are reported in United States Dollars (US $) which at the time of this report was trading approximately at par with the Canadian dollar. Expenditure requirements are reported in Dollars as well as Pesos (MXN $) which at the time of this reports was trading at approximately 12.71 Pesos to the Canadian Dollar and 12.76 to the US Dollar.
Measurements in this report are stated in the SI (metric) system. In keeping with norms in the industry, gold and silver contents are reported as grams per metric tonne (g Au/t or g Ag/t). Assay data may also be reported as parts per million (ppm). In some cases, both metric and Imperial units are measure are stated for reasons of clarity.
The classification of Mineral Resources and Mineral Reserves in Canada follows the codification established by the Canadian Institute for Mining and Metallurgy (“CIM”). The CIM system must be followed in order to assure compliance with the Canadian security regulator’s rule named National Instrument 43-101 (“NI 43-101”). The CIM system ranks Mineral Resources and Mineral Reserves in terms of confidence level which in turn is a reflection of the types and amounts of exploration work completed. The conversion of resources to reserves is based on a study of mineral economics, a Feasibility Study, that establishes the economic viability of the existing resources under a specific set of conditions. The Mineral Resources estimated by WGM are based on drilling programs and are in compliance with NI 43-101.
Any previous resources or resource estimates mentioned herein this report cannot be precisely confirmed by the authors and are not compliant with NI 43-101, and as such should not be used by the reader for investment decisions.
As is generally the case in the world at large, natural resources including mineral commodities are the property of the sovereign State, and the right to develop and exploit mineral deposits is conveyed to private interests via permitting and licensing procedures and agreements. Mineral projects must therefore meet certain conditions and pass certain statutory requirements to be permitted to go into production. Due to a combination of legitimate concerns and irrational fears, projects can sometime receive special attention which can prolong the permitting process. This is especially true for mining projects that are located close to settlements or are highly visible from existing roadways. The CMA project has suffered from some delays in the past due to uncooperative landowners, however at this time WGM understands from its site visit and from various conversations that the local person(s) involved have left the area some time ago and are not returning. Although the CMA project is located in an area that should not attract special attention, care should be taken to ensure that local residents are generally informed insofar as exploration activities are concerned. Land access rights should always be executed with the degree of sensitivity needed to ensure local support.
Subject to the foregoing caution, however, which is not in any way a fatal flaw to the project, there are no land use restrictions of which WGM is aware which might restrict the ability of CMA to access the project areas, or which might restrict its ability to bring its gold-silver property into production. CMA will eventually need to negotiate a surface rights agreement with land-owners as it does not own such rights at this time.
Balancing the forgoing caution are several factors which are favourable for the CMA project:
| | — | new mine infrastructure development would be in an areas already affected by historical mining activity; |
| | — | electrical, transportation and communications infrastructure is close at hand; |
| | — | the mineralization is amenable to conventional processing; and, |
| | — | the impact of mining activities will likely be reduced through underground mining. |
As far as WGM knows, all of the claims that are the subject of this report are presently held by CMA without legal encumbrances by the Government which would relate to previous mining activities. The reader is also directed to the section in this report entitled “Other Relevant Data and Information”.
3. PROPERTY DESCRIPTION AND LOCATION
CMA’s Nuevo Milenio Property is owned though its wholly-owned Mexican subsidiary, Cream Minerals de Mexico S.A. de C.V. It is situated approximately 20 kilometres south-southeast of Tepic in the Municipality of Xalisco, Mexico.
The CMA property consists of a group of Mining Concessions which are in good standing as of the date of this report (Table 1). The group has a total area of 2,612.5 ha. Within the concession are several opal leases which have the same mineral rights as the Mining Concession and are excluded. Some have expired and the land they cover has been absorbed into Cream’s mining lease (Figure 2).
TABLE 1
SUMMARY OF CMA’S NUEVO MILENIO PROJECT MINERAL EXPLORATION CONCESSIONS
| Mining Lot | Title No. | Type | Area (Hectares) | Expiry Date |
| Nuevo Milenio Fracc. 1 | 225967 | Mining Concession | 2,560.063 | 19 Feb., 2051 |
| Nuevo Milenio Fracc. II | 212959 | Mining Concession | 4.1459 | 19 Feb., 2051 |
| Pancho Fracc. I | 234832 | Mining Concession | 23.6754 | 27 Aug., 2059 |
| Pancho Fracc. II | 234833 | Mining Concession | 23.4476 | 27 Aug., 2059 |
| Pancho Fracc. III | 234834 | Mining Concession | 1.2160 | 27 Aug., 2059 |
| | | Total | 2,612.5479 | |
3.3 NATURE OF CMA’s INTEREST
CMA holds its mineral titles through its wholly-owned Mexican subsidiary Cream Minerals de Mexico S.A. de C.V. (“CMA”) which owns 100% of the 2,612.5 ha Nuevo Milenio Gold- Silver Property. The Nuevo Milenio property is not subject to royalty payments or any other underlying encumbrances.
In order to maintain the titles in good standing, CMA must pay annual taxes on its exploration holdings in two instalments, the first due on 31 January and the second on 31 July. Taxes are calculated on a per hectare basis and therefore depend on the size of the property and the duration the property is held. In January, 2013, CMA paid the first semester instalment of MN$ 320,710 or approximately US$ 25,134 which is 99.6% attributable to the size of the Nuevo Milenio Fracc. 1 block. In July, 2013 the second instalment will be greater unless the property is reduced by that time. All filings and tax payments must be performed by CMA’s legal representative who has an official licence number (“RUPA”) without which the filing will not be accepted for confidentially and security reasons.
Mineral properties are also subject to annual work expenditure (severance) requirements. The amount of expenditure required is posted in the official Gazette every year and is determined on a hectare basis depending on the age and size of the licence. The following is an excerpt from the 2012 work application filed May 9, 2012:
| Excess Work from 2010 Expenditures | MN$ 27,824,255.00 | (approx. US$ 2,180,584) | |
| Actual Credit Received | MN$ 28,734,108.00 | (approx. US$ 2,251,889) | (a) |
| Total Expenditures in 2011 | MN$ 42,811,613.00 | (approx. US$ 3,355,142) | (b) |
| Total Credits Carried Forward | MN$ 71,545,721.00 | (approx. US$ 5,607,031) | (a+b) |
The minimum required expenditure for 2012 is MN$ 1,192,246 (US $93,436) or approximately MN$ 465 (US $36.44) per hectare. A credit in the amount of MN$ 70,353,475 (approx. US$ 5,513,595) remains for future use. Any exploration carried out during 2013 must be reported by 31 May, 2014 and documented in a standard format report detailing the types of work completed and the expenditures associated with each. Any expenditures in excess of the basic requirements will be banked and drawn on to meet future obligations, however the obligation structures change should the properties be put into production.
In January of each year two additional reports (questionnaires concerning company activities) must be filed by CMA’s subsidiary office in Durango, a statistical report with the Secretariate of the Economy and a technical report with the Department of Mines.
In respect to the Mexican authorities, as long as all obligations are met and the prescribed land use permits are obtained for any mining activities, there are no additional requirements that impact exploration or mine development activities. In any case whereby a concession-holder is in default of its obligations, the Mining Department advices the owner and he has 60 days to correct the default before the concession is cancelled. These notices of default can happen periodically for a variety of reasons including perceived defaults such as a failure to up-date company records, errors in the records or reports, and loss of documents. At this time, WGM understands that the CMA records are complete and in good standing.
4. ACCESS, CLIMATE, LOCAL RESOURCES, INFRASTRUCTURE AND
PHYSIOGRAPHY
The Property is reached by travelling south on highway 200 from Tepic towards Puerto Vallarta and taking a secondary local road to La Curva. The property lies 3 kilometres east of La Curva along a dirt road on the eastern side of a northwest-southeast trending valley. Historical mine workings on the low hills outline the areas of mineralization. La Curva is named for a large curve in the main railway line from Guadalajara to Tepic, located approximately 6 km west of the CMA property.
The climate in the project area is temporal and is made up of a dry (winter and spring) season and a wet season which extends from June to October. Annual precipitation is approximately 900 millimetres. Working in the hills can be difficult during the rainy season due to landslides, flooding and severe weather incidents.
Temperatures average 32°C in the day time. In the dry period; daytime temperatures can reach the mid-40s°. Temperatures at night typically fall to 20° C in mid-winter and may reach freezing at higher elevations. This visit was made during the rainy season, but was not hindered because of the continuous road maintenance by CMA.
4.3 LOCAL RESOURCES AND INFRASTRUCTURE
Tepic is the major local commercial centre with a population of approximately 300,000. It is the capital of the State of Nayarit. It serves the large farming industry which is the main source of income for the local residents. The city is serviced by excellent highways including the autopista from Guadalajara to Mazatlan, a railway line and airport. The local business community can supply most requirements for an exploration project including heavy earth-moving machinery and construction equipment. Assaying services are available through ALS Chemex in Guadalajara or the Inpsectorate Exploration and Mining Services preparation laboratory in Durango. Drilling services are available in Guadalajara and in other centres in the Mexican northwest.
4.4 PHYSIOGRAPHY AND AGRICULTURE
The concessions are situated in youthful topography between 1000 and 1500 m above sea level. Geologically the rocks are very young, flat-lying mafic to felsic volcanic sequences that provide a rolling to rugged landscape (Plate 2). About 25 km to the south is the volcano Ceboruco which was last active approximately 200 years ago. Many other volcanic cones dot the nearby countryside. These represent eruptions much later than the host rocks and their mineralization.
The property is well vegetated with an open forest composed of small trees and shrubs. More moderate slopes are used as grazing land for cattle. In the wet season (June to October), the growth becomes quite dense. It subsequently slowly dries out during the long dry period becoming more open and accessible.
The lower elevations in the area are farmed for a variety of crops. As measured from the centre of the prospect area, the closest cultivated fields are approximately 1.5 km to the north and 2.5 km to the west.
5. HISTORY
Spanish dominance of the project area commenced in 1534 with the arrival of Captain Francisco Cortez de San Buena Ventura at Tepic. Over the next few years the Spanish conquistadores consolidated their position and learned of gold and silver from the local indigenous peoples. Mining and exploration spread throughout the area. Today, the remnants of this work are seen in pits, trenches and small shafts and adits which show pick marks from the hand excavation of these tunnels indicating that they predate the use of blasting powder. The workings likely date from the sixteenth century. No buildings remain, but two old furnaces (hornos) are present (Plate 3). The ruins of a smelting complex are reported in the north-western corner of the property. Mining activity was extensive throughout this part of Mexico from the very early days of colonization, yet few records exist of these activities. CMA believes that the boundaries of the active mining areas have likely changed (migrated) over the years due to changing conditions and the limited ability of the miners to overcome engineering challenges.
The mine workings are similar to those seen in other nearby mining centres in the Sierra Madre Occidental. The extensive workings at Stroud Resources Property near Santo Domingo de Guzman approximately 70 kilometres to the southeast in the same rock sequence, were the subject of Dr. McBride’s presentation in Guadalajara during February, 2007. There, many hundreds of metres of underground workings followed four parallel mineralized structures. On CMA’s Nuevo Milenio property, Spanish exploration workings follow each of the mineralized structures continuously for over 1000 metres. There is no evidence that systematic exploration has taken place from that time until the work of CMA.
A photo of a Dos Hornos working is shown in Plate 4. During the last 20 years, local people have attempted the mining of a vein on the CMA property between Dos Hornos 1 and 2 in a “transition zone”. Locals have also tried to exploit the La Mina California which is situated on an opal concession within CMA’s Mining Concession, east of the Dos Hornos-Veta Tomas structure. A mill was set up circa 2007 to process mineralization from La Mina California. The operation lasted two years, following which the mill sat idle until early 2012 when it was removed.
6. GEOLOGICAL SETTING AND MINERALIZATION
6.1 REGIONAL, LOCAL AND PROPERTY GEOLOGY
6.1.1 Regional Geology
The Nuevo Milenio Project is located in a part of Mexico that is included in the Sierra Madre Occidental Geological Province which extends from the American border to Guadalajara. Magmatic activity, which includes the emplacement of intrusions into the upper crust as well as eruptive volcanic activity, occurs as the result of the subduction of the Pacific (Faralon) Plate under the North American Plate. The Faralon Plate has been shown to be descending on an angle of approximately 50 degrees at a rate of approximately 3-4 cm per year. The province is adjoined on its south-western flank by the Jalisco Block, a segment of crust bordered by the Pacific Plate to the west and a series of pull-apart basins (grabens or rifts) to the northeast and southeast. This pull-apart activity has been responsible for detaching the Jalisco Block from the North American Plate, and it now acts as a separate floating segment of crust bordered by the Colima rift to the east and the Tepic-Zacoalco rift to the north. The grabens are controlled by steeply dipping normal faults. These faults and related structures act as important controls on the development of gold and silver-bearing vein systems.
Two major volcanic-magmatic periods occur in this area of western Mexico: an older sequence of granodiorite intrusions and approximately coeval rhyolitic ash-flow tuffs ranging in age from 114 Ma to 70 Ma (Cretaceous to Eocene), and a younger bimodal sequence which is 37 Ma to 18 Ma (Oligocene to mid-Miocene). The younger sequence is primarily rhyolitic with lesser basalt. Some volcanic activity continues today as recent explosive calc-alkaline rhyolitic eruptions related to Pacific Plate subduction and alkaline basalt to basaltic-andesite eruptions related to rifting.
Recently a paper in National Geographic considered this part of western Mexico a super volcano similar to that under Yellowstone National Park in the United States and the North Island of New Zealand. Evidence included the presence of thick and widely spread volcanic units up to 100 m thick. These volcanic sequences consist of a series of young flat-lying volcanic rocks varying from basalts to rhyolites. They are well exposed in the deep valleys such as the Grand Valley of the Rio Santiago which passes about 20 km east of the project area and on the mountain slopes of the Nuevo Milenio Mining Concession. Most were deposited on land and preserve depositional textures; obsidian is common. In the project area, rock compositions include rhyolites, basalts and possibly some ultramafic rocks.
The Sierra Madre Occidental Geological Province ends a short distance south against the east-west trending Trans-Mexican volcanic belt of similar age (Figure 3). It hosts many silver-gold deposits including the Minefinder’s, Deloro, the Gammon Lake, O’Campo and Stroud Resources Ltd.’s Santo Domingo deposits. The co-author, McBride, has worked on all these deposits and managed the Stroud exploration project for two years from 2006 to 2008. In all these deposits, the old mine workings have demonstrated tops and bottoms; the main mined areas are hosted by one rock type above or below a major change in rock type. This pattern is present on the Nuevo Milenio property. McBride sees many common features between these deposits and the present property which lies about 70 km northwest of the Stroud Deposit.
Regionally, the basement rocks seem to be vertically dipping, well bedded, deeply weathered mafic tuffs which are exposed along the western margin of the property and are probably part of the Jalisco Block. They can be traced to within 200 m of the flat lying Nuevo Milenio sequence of felsic volcanic rock and appear to continue beneath it. The contact should be a deeply weathered angular unconformity.
The Nuevo Milenio mineralized lapilli tuff-agglomerate terminates in a sinter zone and is capped by finely bedded ignimbritic units of fine-grained felsic welded, ash fall tuffs. These two units make up the Nuevo Milenio sequence which is surrounded by volcanic rocks of the San Pedro-Ceboruco Graben. These rocks are much younger and were deposited in a graben within the Sierra Madre Occidental rocks. They have been studied in detail (Ferrari. L. et al, 2003).
Major faulting has been identified in the graben, in north-south and west-northwest directions, and may be present in the mineralized sequence. East-northeast faulting has been reported from the property and appears to offset sections of the mineralized structures. The extent of these faults and their displacements is unknown, but the thick ash fall tuff unit that forms the hanging wall of the deposits does not seem to be significantly displaced.
Major faulting has been postulated in the area, but the thick ash fall tuff unit that forms the hanging wall of the deposits does not seem to be displaced. To produce a fault pattern would require complicated cross-faulting that is not observed in the surrounding well-exposed mountain ridges on the edges of the valley. Similarly the fresh, flat-lying volcanic sequence eliminates the possibility of shear zones which would be easily seen.
6.1.2 Property Geology and Mineralization
In the project area, bedrock exposure is poor in spite of the youthful topography. Most exposures are found along creeks and roads constructed for drilling. Veins can be traced by residual quartz float, pits, trenches and mine workings. McBride spent three days on the property mapping outcrops, examining mine workings, and outlining the major rock units. The geological interpretation in Figures 4 and 5 is derived from the author’s examination of the property and revises the map of Holcapek (2008). Most of the property is covered by a felsic lapilli tuff-agglomerate unit which is diagnostic by its lapilli-sized clasts and some larger clasts up to 5 cm in size (Plate 5). Locally clasts to 20 cm were seen in the Once Bocas North area. Bedding was not seen in this unit, but its overall distribution suggests a gentle north to north-westerly dip. This unit hosts all the known mineralization.
The felsic lapilli tuff-agglomerate unit is capped by a rhyolitic welded tuff unit with 4 to 5 cm long fragments that are highly flattened parallel to bedding which itself is well developed on a 4 or 5 mm scale. In many areas the rhyolitic tuff unit is resistive and forms cliffs (Plate 6). This unit is barren of mineralization, but hosts opals. It is restricted to the eastern part of the property and at the higher elevations. Its distribution suggests that it dips gently to the north and covers the favourable felsic lapilli tuff-agglomerate which is present at lower elevations.
North of Dos Hornos 1, the rhyolitic tuff is capped by a thin younger basalt flow that extends north for a couple of kilometres.
West of Cafetal, a similar basaltic sequence of flow, tuffs and agglomerates forms a ridge that marks the limit of the Cafetal and Once Bocas South mineralized zones (Plate 7). Large blocks on the front of the ridge suggest that the last activity was a debris flow. Two drill holes at Cafetal contain weathered basaltic agglomerate at depth which appears to be inter-bedded with the felsic lapilli-agglomerate.
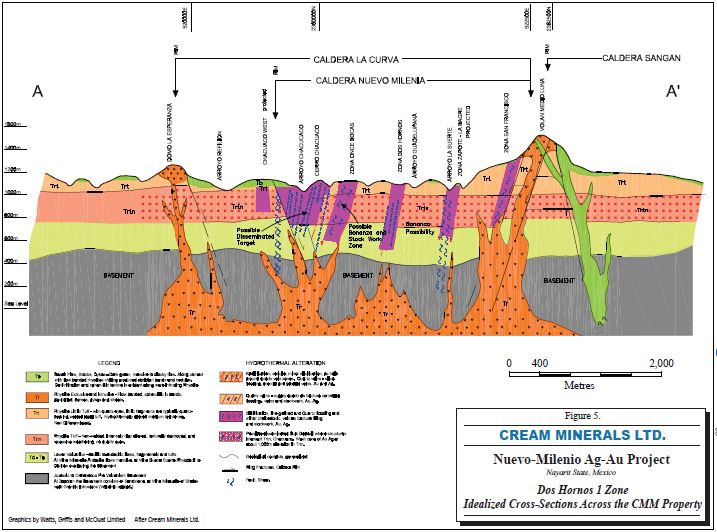
A barren, low-lying ridge marks the western limit of the property. It consists of thinly bedded, mafic tuffs and flows that have been folded into a vertical position (Plate 8). These rocks were deformed and deeply weathered prior to the deposition of the recent volcanic mineralized sequence described above. It probably forms the basement rocks in the Nuevo Milenio area. The cross-sections in Figure 5 demonstrate these relationships as observed by the author in the field.
6.2 SETTING OF MINERALIZATION
Mineralization is restricted to the felsic lapilli tuff-agglomerate unit. Steeply dipping quartz veins and quartz stockworks are concentrated within these rocks (Plate 9). The known structures and their extensions were shown in Figures 4 and 5. Question marks indicate possible extensions based on the author’s observations.
In general, mineralization is restricted to the felsic lapilli-agglomerate, the base of which has not been defined by drilling. The weathered surface of the deformed basement seems to dip gently under the younger rocks to the east. Each of the known mineralized zones can be traced for more than 1000 m in a northwest-southeast direction and consists of narrow high grade veins with lower grade halos made up of quartz veinlets forming a stockwork. The three known mineralized zones, the Dos Hornos-Veta Tomas, the Once Bocas and the Chacuaco-Cafetal, are known to have lengths of over a kilometre and widths of up to 200 m; only part of the width is of economic interest and seems be continuous for the length of the zone. The unexplored Chacuaco West suggests that additional mineralization may be found in the lower sequences under the younger rocks.
Diamond drilling has demonstrated the continuity of the aforementioned zones, and the Dos Hornos-Veta Tomas and Once Bocas zones are now recognized as being located on a single
controlling structure. As such, Dos Hornos 1, Dos Hornos 2, Veta Tomas, Once Bocas North and Once Bocas South are individual segments along the structure which are defined by economically interesting silver and gold mineralization. Locally some breaks in the continuity of the mineralization can be seen and barren quartz vein float is commonly found between the structures. The reason for this break may be due to localization or metal values within the structure or erosion that has cut through the potentially economic section of the main controlling structure. The structure extends beyond its explored length and passes under the younger volcanic tuffs and flows, where it has not been explored in any detail. The known mineralized segments and their extensions are shown on Figures 4 and 5. Question marks indicate possible extensions based on the McBride’s observations.
Observations of the vein textures show that they are commonly laminated and vuggy. The disseminated mineralization in the host rocks suggests that fluids passed through the porous felsic lapilli tuff-agglomerate. Metals were deposited in the form of fine-grained sulphides which gives the rock a bluish or greyish colouration. The alteration minerals and the presence of silica show the influence of the hydrothermal solutions. These textures are interpreted as the product of a combination of near-surface vein formation coupled with simultaneous sinter formation at the proximal surface.
Mr. Holcapek and Ing. Francisco have reported faulting in drill core and surface exposures. A significant fault offset along an east, northeast fault is apparent between Dos Hornos 1 and Dos Hornos 2 with an apparent lateral offset of approximately 60 m. Faulting has also truncated a vein at the north end of the Chacuaco; its displacement is unknown. Mr Holcapek shows extensive faulting in his sections, including reverse (thrust) faulting which causes repetition of the mineralized zones on section and resultant thickening of the mineralized zone. Most of these faults are steeply dipping east-northeast structures. WGM was not able to corroborate these interpreted faults during its site visit. Although there is substantial faulting in some drill holes, the fault orientations are unclear.
7. DEPOSIT TYPES
Vein development is restricted to the felsic lapilli tuff-agglomerate unit. The underlying deformed basaltic tuffs in the basement are not considered to be a viable source for the economic metals because they were deposited, deformed and metamorphosed prior to the deposition of the flat-lying host rocks. Geological evidence indicates that metallic minerals were deposited in the porous host rocks in a vertical range extending from near-surface to well below the top of the existing volcanic surface. The mineralization was blocked by the rapid deposition of impermeable welded tuff deposits that form the tops of the hills.
The origin of this mineralization is not clear. It may be related to fluids channelled by pre-existing faults in the basement rocks, however no evidence supporting this interpretation has been seen. The lack of mineralization in the footwall rocks at the other deposits quoted, suggests that these rocks had little or nothing to do with the mineralizing event. Similarly, the hanging wall rocks lack mineralization even in fractures. The obvious conclusion is that they were not present when the silver-gold mineralization was deposited.
The host felsic lapilli tuff-agglomerate was clearly the preferred host rock and the mineralizing systems were confined to this formation. The source of the fluids is likely from the same volcanic source that may have earlier produced the host rocks. The mineralizing solutions circulated within the volcanic pile and were forced up permeable structures by hydraulic pressure, serving to focus outflow and creating zones of concentrated vein-hosted mineralization. This model provides an effective guide for explorationists who should simply trace the favourable host rocks and test areas where they are cut by deeply rooted fault/shear zones. Exploration targets can especially be extended to zones which may occur under the capping rhyolite tuff.
8. MINERALIZATION
Economically interesting gold-silver mineralization occurs in steeply dipping veins and stockworks that are exclusively hosted in the felsic lapilli tuff-agglomerate formation. The known structures and their extensions were shown in Figures 4 and 5.
Numerous vein systems have been identified and have been given names such as Dos Hornos 1 and 2, Veta Tomas, Once Bocas, Cafetal and Chacuaco. They define three continuous structures across the property from northwest to southeast (Figure 6) which are termed the Dos Hornos-Veta Tomas, Once Bocas and Chacuaco-Cafetal Structures. Surface mapping, quartz vein float and drilling has demonstrated the continuity of these structures
Locally, minor breaks in the continuity of the mineralization can be seen on surface. Barren quartz vein float can be found between the structures. The reason for these breaks may be the localization of metal values within the structure, or alternatively, erosion that has cut through the potentially economic section of the structures. It is important to keep in mind that the vertical range exposed is only a small component of the mineralized system, and that discontinuities on surface do not necessarily represent discontinuities in the overall zone. The structures that control mineralization extend beyond their explored length and pass under the younger volcanic tuffs and flows – these have not been explored in any detail.
Observations of the vein textures show that they are commonly laminated and vuggy. The disseminated mineralization in the host rocks suggest fluids passing through the porous felsic lapilli tuff-agglomerate unit. Deposition is in the form of fine-grained sulphides which give the rock a bluish or greyish colouration. The alteration minerals and the presence of silica show the influence of the hydrothermal solutions. These textures are interpreted as the product of a combination of near surface vein formation coupled with simultaneous sinter formation at the surface. Metallic minerals are deposited throughout this process, but become scarcer in the upper portions of the geothermal system due to its acidic, vapour-dominated geochemistry.
Oxide mineralization was observed in float at Dos Hornos 1. Similar oxide mineralization was seen by the author at the top of veins at Delores (Minefinders Corporation Ltd.) and at Santo Domingo (Stroud Resources Ltd.). It is thought to be the result of acidic, oxidizing groundwaters encroaching on the top of the mineralized system near surface causing destruction of sulphide mineral phases combined with the downwards ingress of subsequent weathering processes.
Precious metal and sulphide mineralization are lacking in the overlying rhyolite tuffs which were either deposited after hydrothermal activity had ceased, or they were well above the level of the fluid-dominated epithermal system. However, opal is common in the overlying sequence and it probably represents the product of cool, silica-saturated solutions depositing opal as they pass through these rocks. A similar relationship is seen near the Stroud Deposit and the opal production is significant making the town of Magdelena an important opal mining centre.
Recent drilling at Dos Hornos 1 demonstrates that the mineralized system can be traced for 200 metres vertically and on sections spaced approximately 50 metres apart for the full length of the zone. This mineralization is composed of a high grade linear core, usually a quartz vein(s) and flanking halo. It is poorly exposed on surface and was traced by the Spanish by a series of shallow shafts, pits and locally by more extensive workings. Inspection of the lower mine workings showed that they followed high grade pods of mineralization which was concentrated in two parallel veins. At Dos Hornos 1, these workings are only a metre wide and do not show evidence for potential mineralization beyond the vein margins. For that reason, they are not included in the resource calculation if a drill hole or cross-cut is in proximity.
The parallel veins mined by the Spanish may correspond to or give evidence for the subparallel sub-zones defined by multiple, mineralized quartz veins in the CMA drilling at Dos Hornos 2, Veta Tomas and Once Bocas North. In the spatial context of the mine workings, it may be impossible to determine whether the parallel veins/vein structures are separate veins, or are the same vein simply repeating across a thrust fault as interpreted by Holcapek. Clearly this has important implications insofar as the estimation of mineral resources. In the absence of irrefutable proof of thrust faulting, which seems unlikely to WGM in an extensional environment, WGM believes that the simpler of the two explanations is most likely. In this case, WGM believes that the parallel veins are the product of bifurcation along the host structure, a very common feature of most fault and shear zones.
9. EXPLORATION
9.1 PROCEDURES/PARAMETERS OF SURVEYS AND INVESTIGATION
During 2002, Ing. G. Francisco, completed geological mapping along creeks hill sides and roads in the project area. This work formed the basis for the geological map shown on Figure 4. Prior to his work, extensive sampling of old showings, mine workings and surface outcrops had been carried out. Chip samples were collected throughout the accessible mine workings, along trenches cut across the known zones near old pits and surface mine workings. Many grab samples had been taken of the extensive quartz float.
Soil geochemical sampling was carried out over most of the property during 2002 except to the west of Chacuaco West where safety concerns relating to an uncooperative landowner limited the program. This survey outlined anomalies that correlate with the known mineralized zones. To the east the usefulness of geochemical sampling is impaired due to the presence of the barren “capping” welded rhyolitic tuff.
9.2 SAMPLING METHODS AND SAMPLE QUALITY
The sampling mentioned in the foregoing sections has effectively outlined the mineralized trends and provided an indication of the grade of ore mined by the Spanish colonial operators. This information remains useful in locating the mineralized zones. It is the view of WGM, however, that this analytical data is excessively based on grab samples or irregular chip samples to be useful for resource modelling purposes other than to confirm the extensions to surface of drilled mineralization. To date there has been a general lack of systematic channel sampling of outcrops and underground workings. This is not to say that the sample data is not representative, but only a cut channel sample can ensure a level of uniform sampling similar to that attained by diamond drilling.
Drill core was sampled using a conventional approach whereby zones thought to be mineralized in each hole were identified and marked for sampling. In general, samples were delimited by changes in the geology. WGM did not determine whether there was a clear goal in maintaining a maximum sample length, as geologists normally strive to ensure sample lengths do not exceed one metre for precious metal analyses. It is clear that the sample lengths on the Nuevo Milenio Project were compromised by poor core recovery in many sections, and that this forced the geologist to sample continuously between known depths, often exceeding several metres. The core was cut in half with a diamond saw, with one half of the core bagged for analysis and the remaining half returned to the core tray. In some
instances, the majority of the core in poorly recovered sections may have been consumed in order to maintain as representative a sample as possible.
The Spanish colonial workings clearly offer the potential for CMA geologists to acquire 3D geological and geochemical data, however this is not always possible due to the condition of the various underground mine openings. The condition of the various mine areas is summarized as follows in Table 2.
Where possible, and safe access can be assured through improvements by CMA, the sampling of the upper portions of the mineralized zones could be increased in workings not previously entered.
9.4 RESULTS AND INTERPRETATION OF EXPLORATION
9.4.1 General
CMA’s initial surveys confirmed the mineralization worked by the Spanish and allowed the exploration to progress directly to diamond drilling. CMA drilled Nuevo Milenio in four campaigns from 2002 to 2011 - 149 holes were drilled for a total of 31,537 m. Five holes were drilled in 2002, and 2003-04 saw the drilling of 19 holes. An additional 36 holes were drilled in 2006-07. All of the holes were surveyed. The discussion of this drilling is included under the section on drilling as they tested the same mineralized structures.
Strong structural controls define the strike of the main silver and gold bearing zones which are actually segments of a single mineralized structure. Each zone or segment commonly comprises multiple, closely spaced mineralized splays that seem to have a converging downwards geometry in some instances. The mineralized zones are generally more complex than initially realized. Lateral continuity of the splays is good over distances of many hundreds of metres, however in some cases the lesser splays only appear on one or two drill sections over a strike of less than 200 m. In terms of thickness and silver-gold content, most zones appear to weaken downwards, however this is not a universal feature at this time, and good potential exists in some areas for the discovery of additional mineralization below the levels currently drill-tested.
TABLE 2
CONDITION OF SPANISH COLONIAL MINE WORKINGS, NUEVO MILENIO PROJECT
| Mining Area | Mine Working | Comments |
| Dos Hornos 1 | Shaft 1 | Shallow and slumped |
| | Shaft 2 | Open – was sampled previously |
| | Shafts 3 & 4 | Collar was sampled previously |
| | Shaft 5 | Collar plus all 3 sub-levels were mapped and sampled |
| | Shaft 6 | Open but water filled |
| | Shaft 7 | Shallow and closed at this time |
| | Adits 1 & 2 | Open – were sampled previously |
| | Adit 4 | Cross-cut on level 0 sampled; Levels 1, 2 & 3 sampled |
| | NW and NE Shafts | sampled |
| Dos Hornos 1 | Shaft 8 | Water-filled (in Transition Zone) |
| | Shaft 9 | In Fault Zone |
| | Shaft 10 | In Fault Zone – vein adjacent to shaft sampled |
| | Adit 3 | Opened and sampled |
| Veta Tomas | Shaft 12 | Open and sampled – carries high-grade Au |
| | San Miguel Adit | Cleaned, surveyed and sampled |
| | Shafts 13 to 15 | Very small workings – not opened/not sampled |
| | South Area | Shafts & trenches opened and sampled in 2012 |
| Once Bocas | Shafts 1 & 2 | Open – workings mapped and sampled |
| | Shaft 3 | Access to workings possible |
| | Shaft 4 | Surface samples taken |
| | Shaft 5 | Workings sampled |
| | Shaft 6 | Workings were opened, but were not sampled |
| | Shaft 7 | Not opened |
| | Shaft 8 | Inclined shaft – opened and sampled; Cross-cut not |
| | Adits 1 & 2 | Opened,mapped any sampled |
| | Adit 3 | Cross-cuts into workings from Shaft 2 |
| Chacuaco | Shaft Nanche | Opened, mapped and sampled |
| | Mina Nanche | Adits 1 and 2 collapsed |
| | Mina Chacuaco | Mapped and sampled |
| | Mina Peridido 1 | Mapped and sampled |
| | Mina Peridido 2 | Mapped and sampled |
| | Mina Peridido 3 | Mapped and sampled,, plus 3 sub-levels |
| Arroyo Chacuaco | Incline | Not opened |
| Chacuaco West | Adit Site ? | Possible adit buried in slide area, not open |
| Astasis 1 | Shaft | Shaft and trenches sampled |
| Astasis 2 | Shaft | Shaft and trenches sampled |
| Mina Sabalo | Mine | inaccessible |
| Pozo Antonio | __ | Area mapped and sampled |
| Dos Pinos | Adit | Portal area mapped with some sampling |
| Veta de Arroyo | Trenches | Mapped with some sampling |
| Mina San Francisco | Shaft & Adit | Shaft is caved; Sampling at Portal |
| Mina Joya | Adit | Sampled at the portal only |
| Mina la Suerte | | Mapped and sampled |
9.4.2 Dos Hornos 1 and 2 Zones
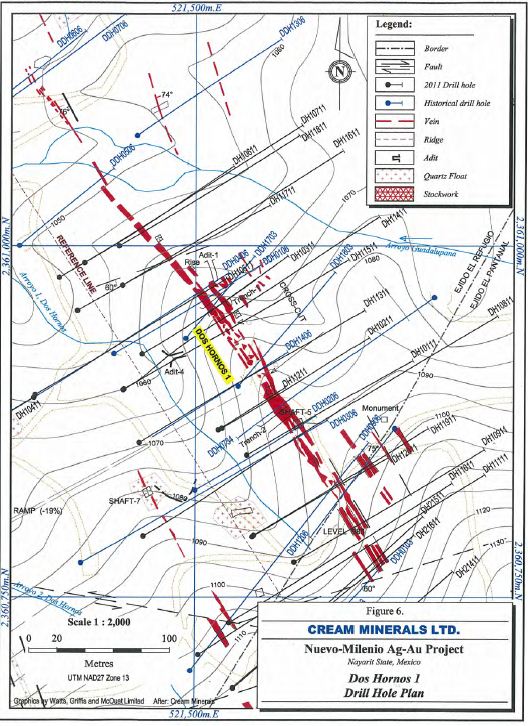
The results from the Dos Hornos 1 drilling are summarized in Table 3 which shows the most economically significant intersections. A surface plan of the drilling is shown in Figure 6. In this figure, the boundary shown delineates surface rights holders, Ejido eo Refugio and Ejido Pantanal. An apparent offset of hole DH1-13-11 is probably due to hole collar and deviation because this hole was measured from the others, but not surveyed.
TABLE 3
SUMMARY OF SELECTED DOS HORNOS 1 DRILL HOLE INTERSECTIONS
| Section | Hole Number | Interval (m) | True | Gold | Silver |
| | | from | to | Thickness (m) | (g/t) | (g/t) |
| 0 | DH-18-11 | 16.00 | | 19.00 | | 2.19 | 0.32 | 72.1 | |
| 1 | DH1-16-11 DH1-17-11 | 40.00 245.00 | | 42.00 247.00 | | 1.49 1.46 | 0.28 0.14 | 70.7 93.6 | |
| 2 | DDH-17-03 DDH-01-06 | 38.00 105.00 | | 48.00 109.00 | | 1.49 2.97 | 1.05 0.26 | 191.5 112.5 | |
| 3 | DH1-14-11 DH1-15-11 | 117.00 129.00 | | 123.00 131.00 | | 4.24 1.41 | 0.69 0.16 | 203.2 116.8 | |
| 4 | DDH-18-03 DDH-14-06 DH1-13-11 | 26.00 126.00 158.00 | | 32.00 132.00 160.00 | | 4.32 4.39 7.07 | 0.61 0.72 0.24 | 83.7 149.5 99.5 | |
| 5 | DH1-02-11 DH1-12-11 DDH-07-34 | 63.34 106.00 188.30 | | 66.82 118.00 190.30 | | 2.50 5.45 1.89 | 3.87 0.57 0.13 | 1076.2 247.0 113.5 | |
| 6 | DH1-01-11 DDH-02-06 DH1-08-11 | 53.00 108.50 169.70 | | 55.00 120.50 176.80 | | 1.58 9.46 5.74 | 1.50 0.47 0.29 | 163.6 147.8 114.0 | |
| 7 | DH1-19-11 DH1-20-11 | 74.70 117.50 | | 76.70 121.50 | | 1.51 2.00 | 0.90 0.23 | 57.8 94.1 | |
| 7.5 | DDH-12-06 DH1-09-11 DH1-10-11 | 109.60 35.50 144.50 | | 113.60 45.70 151.70 | | 2.57 4.88 1.84 | 0.69 0.85 1.31 | 157.0 110.3 206.7 | |
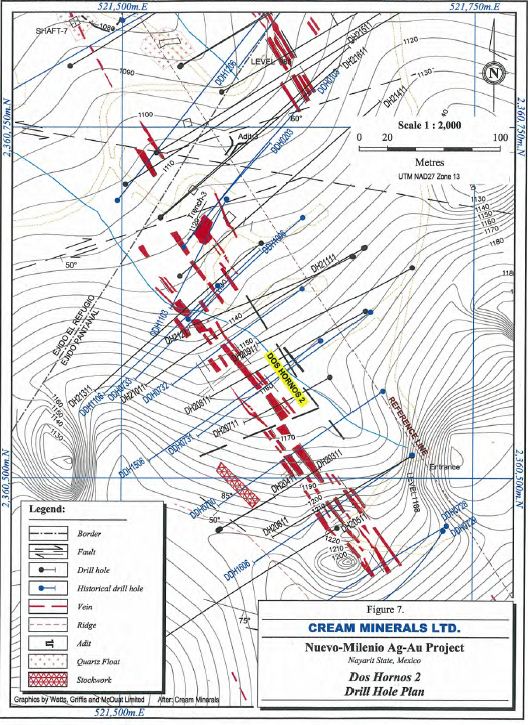
The mineralized zone in Dos Hornos 2 (Table 4, Figure 7) is continuous and the host rocks remain the same as in Dos Hornos 1. However, Dos Hornos 2 is different in that it comprises as many as four mineralized, parallel to slightly downwards-convergent splays. Generally the deeper intersections are lower grade than those nearer the hanging wall rhyolite tuff. Data on the Dos Hornos 2 sections indicates a vertical or very steep north-easterly dip. Dos Hornos 2 is separated from Veta Tomas, the next structural segment to the south, by an east-northeast trending fault. The justification for this fault is an apparent change in dip from steeply southwest to northeast. The Dos Hornos 2 and Veta Tomas segments are therefore the same mineralized structure as the Dos Hornos 1 segment, displaced by a post mineralization fault.
TABLE 4
SUMMARY OF SELECTED DOS HORNOS 2 INTERSECTIONS
| Section | Hole Number | Interval (m) | True | Gold | Silver |
| | | from | to | Thickness (m) | (g/t) | (g/t) |
| | | | | | | | | | | |
| 9 | DDH-02-03 | 84.00 | | 88.00 | | 1.88 | | 1.12 | 113.0 | |
| 9 | DH2-15-11 | 52.00 | | 64.00 | | 8.49 | | 0.93 | 162.1 | |
| 9 | DH2-16-11 | 44.00 | | 47.00 | | 1.50 | | 1.11 | 509.9 | |
| | | | | | | | | | | |
| 9A | DDH-02-03 | 0.00 | | 4.00 | | 2.00 | | 0.52 | 164.9 | |
| 9A | DDH-11-03 | 28.00 | | 30.00 | | 1.36 | | 0.22 | 68.0 | |
| 9A | DDH-11-03 | 50.00 | | 54.00 | | 2.73 | | 0.41 | 65.7 | |
| | | | | | | | | | | |
| 11 | DDH-10-06 | 12.50 | | 24.50 | | 8.49 | | 0.93 | 106.1 | |
| 11 | DDH-10-06 | 74.50 | | 76.50 | | 1.36 | | 0.46 | 51.0 | |
| 11 | DDH-07-33 | 86.00 | | 88.00 | | 1.41 | | 0.33 | 101.0 | |
| 11 | DDH-11-06 | 9.30 | | 23.30 | | 8.49 | | 0.86 | 123.7 | |
| 11 | DDH-11-06 | 58.20 | | 61.20 | | 1.97 | | 6.96 | 24.7 | |
| 11 | DH2-13-11 | 28.00 | | 42.00 | | 9.90 | | 0.92 | 183.8 | |
| | | | | | | | | | | |
| 12 | DDH-07-32 | 86.00 | | 113.50 | | 18.40 | | 0.55 | 72.5 | |
| 12 | DH2-10-11 | 144.50 | | 147.70 | | 2.26 | | 1.31 | 206.7 | |
| 12 | DH2-12-11 | 124.20 | | 128.20 | | 2.06 | | 0.12 | 80.0 | |
| | | | | | | | | | | |
| 13 | DDH-15-06 | 87.00 | | 91.00 | | 2.97 | | 0.83 | 159.8 | |
| | | | | | | | | | | |
| 14 | DDH-07-31 | 164.00 | | 168.00 | | 2.62 | | 0.66 | 101.5 | |
| | | | | | | | | | | |
| 15 | DDH-16-06 | 73.50 | | 77.20 | | 3.03 | | 0.85 | 116.3 | |
| 15 | DH2-05-11 | 1.00 | | 3.00 | | 1.97 | | 0.70 | 151.9 | |
| 15 | DH2-06-11 | 127.60 | | 133.60 | | 2.91 | | 0.95 | 146.3 | |
| | | | | | | | | | | |
| 19 | DDH-07-26 | 137.50 | | 140.50 | | 1.93 | | 1.22 | 55.8 | |
| 19 | DDH-07-26 | 161.50 | | 165.50 | | 2.57 | | 0.62 | 74.0 | |
Adit 3 was driven between Dos Hornos 1 and 2 on what is termed a “Transition Zone”, and there appears to be an additional vein structure of unknown extent situated between the two Dos Hornos zones. The Transition Zone could add significant potential to the structures, however, no attempt has been made at this time to trace the zone. It is thought to be parallel to the Dos Hornos structures, and it may be represented in some holes as a second intersection. In-fill drilling is needed to better define the Transition Zone.
9.4.3 Veta Tomas Zone
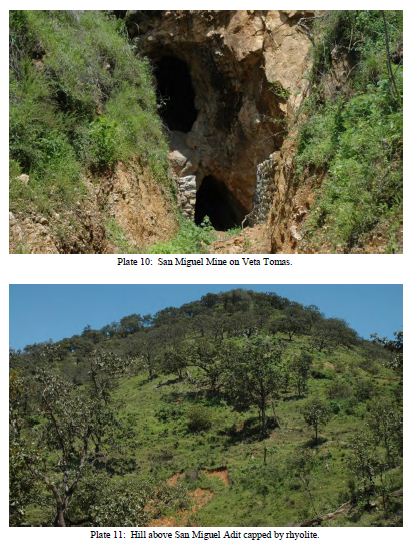
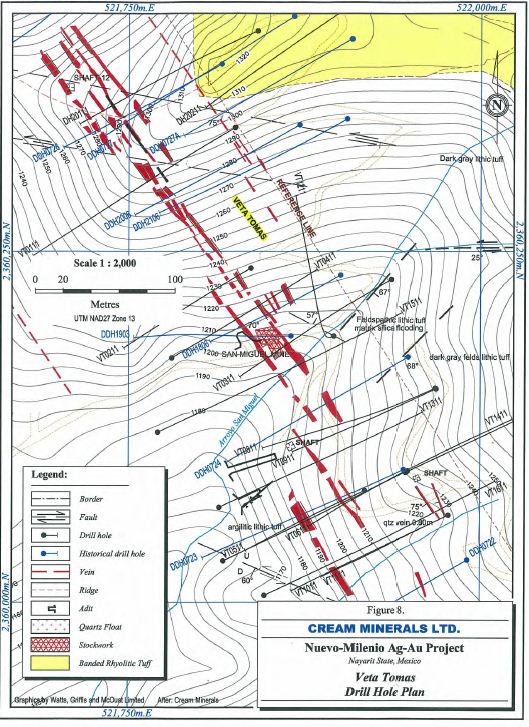
Near the portal of the San Miguel Mine on Veta Tomas (Plate 10), two parallel vein-structures comprising the Veta Tomas segment were tested by 20 drill holes. The results show the mineralization to be continuous over a strike length of 300 m, and from surface down to a vertical depth of 100 m. Below 100 m, the silver-gold values decrease and become spotty. The most economically significant intersections are summarized in Table 5. The host rocks remain the same felsic lapilli tuff-agglomerate as seen all along the Dos Hornos structure. A surface plan of the area shows drill hole locations (Figure 8).
TABLE 5
SUMMARY OF SELECTED VETA TOMAS DRILL HOLE INTERSECTIONS
| Section | Hole Number | Interval (m) | True | Gold | Silver |
| | | from | to | Thickness (m) | (g/t) | (g/t) |
| | | | | | | | | | | |
| 20 | VT-01-11 | 110.50 | | 114.84 | | 3.32 | | 0.97 | 42.8 | |
| | | | | | | | | | | |
| 21 | DDH-20-06 | 148.80 | | 156.80 | | 6.78 | | 1.66 | 160.9 | |
| | | | | | | | | | | |
| 23 | DDH-19-03 | 38.00 | | 44.00 | | 4.09 | | 0.50 | 125.7 | |
| 23 | DDH-18-06 | 61.10 | | 65.10 | | 2.73 | | 0.52 | 61.5 | |
| 23 | DDH-18-06 | 91.20 | | 95.20 | | 3.19 | | 1.78 | 203.2 | |
| 23 | VT-04-11 | 122.17 | | 123.50 | | 0.96 | | 0.47 | 84.9 | |
| | | | | | | | | | | |
| 24 | VT-12-11 | 57.26 | | 59.26 | | 1.64 | | 0.23 | 107.9 | |
| 24 | VT-12-11 | 69.26 | | 74.52 | | 4.31 | | 1.33 | 194.7 | |
| 24 | VT-03-11 | 144.05 | | 149.28 | | 4.01 | | 0.95 | 138.2 | |
| 24 | VT-15-11 | 195.00 | | 201.00 | | 3.00 | | 0.44 | 157.6 | |
| 24 | VT-15-11 | 213.00 | | 217.00 | | 2.00 | | 0.01 | 101.1 | |
| 24 | DDH-07-24 | 104.00 | | 122.00 | | 12.04 | | 0.13 | 69.3 | |
| | | | | | | | | | | |
| 25 | VT-08-11 | 108.64 | | 114.99 | | 4.49 | | 0.84 | 200.8 | |
| | | | | | | | | | | |
| 27 | VT-05-11 | 45.05 | | 47.02 | | 1.93 | | 0.17 | 67.7 | |
| 27 | DDH-07-23 | 95.25 | | 98.13 | | 2.74 | | 2.70 | 579.0 | |
| 27 | VT-06-11 | 78.60 | | 84.60 | | 5.09 | | 1.65 | 525.7 | |
| | | | | | | | | | | |
| 28 | VT-10-11 | 89.27 | | 98.80 | | 8.90 | | 0.49 | 172.1 | |
The Veta Tomas mineralization continues to the southeast into the St. Gertrudis Mine and the Dos Pinos area – these have not been investigated in any detail and were not visited by WGM. Although the mineralization appears to be continuous into this area from the Dos Hornos-Veta Tomas structure, there is insufficient drilling in this strike extension to demonstrate the presence of an economically interesting zone.
9.4.4 Once Bocas Zone
The Once Bocas structure, composed of the Once Bocas North and South Zones or segments is situated parallel to and southwest of the Dos Hornos - Veta Tomas structure. The North Zone has been explored with 30 drill holes over a strike length of 350 m. Two parallel, structurally controlled zone (splays) of mineralization, approximately 60 m apart, have been identified which are exposed on each side of an arroyo. The east one has been investigated by numerous shafts, adits and limited underground stoping (Plate 12). The western zone has seen some underground workings, but has mostly been traced by pits and some trenches. These veins strike approximately 120° Az which is more easterly than those at Dos Hornos and Veta Tomas. The reason for this change could not be determined during Dr. McBride’s site visit. The most significant intersections from the Once Bocas North drilling are summarized in Table 6.
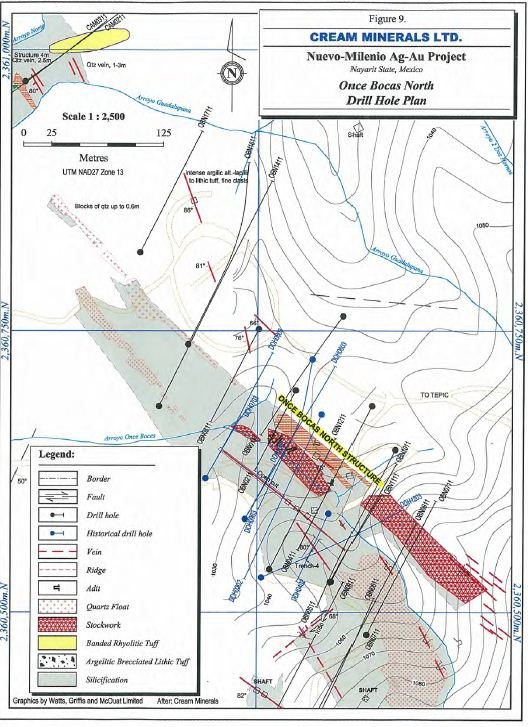
In the Once Bocas area, the geochemical soil survey identified gold and silver anomalies coincident with this mineralization. Drilling has shown that the best intersections occur within 75 metres of surface, and that below this elevation the mineralization is quite weak. A surface plan of Once Bocas North is presented in Figure 9 which shows the mineralization about midpoint in the zone. Nineteen holes were drilled in this area during two drilling campaigns. They show the two zones with the eastern one being much wider and higher grade.
TABLE 6
SUMMARY OF SELECTED ONCE BOCAS NORTH DRILL HOLE INTERSECTIONS
| Section | Hole Number | Interval (m) | True | Gold | Silver |
| | | from | to | Thickness (m) | (g/t) | (g/t) |
| | | | | | | | | | | |
| OBN-2 | OBN-5-11 | 108.00 | | 114.00 | | 2.05 | | 0.64 | 94.3 | |
| OBN-2 | OBN-10-11 | 58.00 | | 60.00 | | 1.99 | | 1.05 | 185.4 | |
| OBN-2 | OBN-10-11 | 78.00 | | 80.00 | | 1.53 | | 1.51 | 52.6 | |
| OBN-2 | OBN-11-11 | 40.00 | | 42.00 | | 1.81 | | 0.31 | 78.7 | |
| OBN-2 | OBN-11-11 | 62.00 | | 70.00 | | 7.52 | | 0.55 | 114.4 | |
| OBN-2 | OBN-11-11 | 102.00 | | 104.00 | | 1.77 | | 0.50 | 138.3 | |
| OBN-2 | DDH-12-03 | 56.00 | | 60.00 | | 2.57 | | 1.39 | 360.5 | |
| OBN-2 | DDH-12-03 | 96.00 | | 108.00 | | 7.71 | | 0.56 | 120.4 | |
| | | | | | | | | | | |
| OBN-3 | DDH-12-11 | 46.50 | | 48.50 | | 1.97 | | 0.53 | 109.5 | |
| OBN-3 | DDH-04-02 | 79.50 | | 82.50 | | 0.52 | | 0.15 | 73.0 | |
| OBN-3 | OBN-04-11 | 91.00 | | 93.00 | | 1.39 | | 0.17 | 70.6 | |
| | | | | | | | | | | |
| OBN-4 | DDH-06-03 | 22.00 | | 28.00 | | 5.39 | | 1.93 | 194.8 | |
| OBN-4 | DDH-03-02 | 39.00 | | 60.00 | | 18.71 | | 0.38 | 87.8 | |
| OBN-4 | DDH-09-03 | 84.00 | | 90.00 | | 5.03 | | 0.34 | 91.1 | |
| | | | | | | | | | | |
| OBN-5 | OBN-02-11 | 40.50 | | 50.50 | | 8.39 | | 0.30 | 59.3 | |
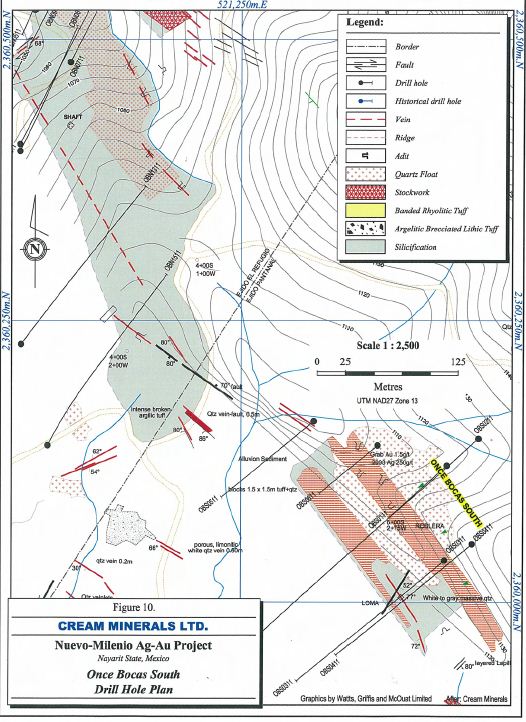
The Once Bocas South Prospect occurs on the adjacent ridge to the southeast of Once Bocas North. The zone is shown in Figure 10 which is a surface plan also showing the drill hole traces. It is separated by an area that contains quartz-veining but lacks economically interesting gold and silver values on surface. The zone was tested with 6 drill holes in the 2011 drilling program. All of the holes were drilled from northeast to southwest. The holes returned numerous gold and silver values of interest over narrow widths. The most significant assay results from the drilling program are summarized in Table 7. These intersections were separated by background silver values in the range of a few grams per tonne.
Hole OBS-5-11 is the most northerly hole and it is approximately 400 m south of the most southerly hole in the Once Bocas North structure. This hole carried 0.325 g Au/t and 75.30 g Ag/t over a 20-metre core length near the top of the hole. Sampling was limited to the top section of the hole and no samples were taken below 59 m. Mineralization continues through Hole OBS-05-11, 100 m to the southeast where an 8 m length near the top of the hole carried only 0.06 g Au/t and 12.50 g Ag/t. Only a part of this hole was sampled. A further 100 m to the southeast, holes OBS-01-11 and OBS-02-11 tested the zone. The uppermost hole (01-11) contained anomalous values across a 16 m core length followed by 27.14 m averaging 0.30 g Au/t and 85.26 g Ag/t after a bonanza-grade silver value of 1,252 g/t had been intersected. Unfortunately in the deeper hole, OBS-02-11, situated approximately 60 m below, only geochemically anomalous gold and silver values were intersected. If the higher grading sections are correlated, they show a strike of 120° to 130°, similar to the strike of the Once Bocas North mineralization. No NI 43-101 compliant Mineral Resources have been credited to Once Bocas South, however WGM believes that in-fill drilling is likely to demonstrate sufficient continuity that Mineral Resources will be outlined in this area.
TABLE 7
SUMMARY OF SELECTED ONCE BOCAS SOUTH DRILL HOLE INTERSECTIONS
| Section | Hole Number | Interval (m) | True | Gold | Silver |
| | | from | to | Thickness (m) | (g/t) | (g/t) |
| | | | | | | | | | |
| 1 | OBS-05-11 | 5.50 | | 19.50 | | 9.90 | 0.40 | 91.6 | |
| 3 | OBS-01-11 | 42.02 | | 47.14 | | 3.62 | 3.39 | 371.5 | |
| | OBS-02-11 | | | | | low values | | | |
| 4 | OBS-03-11 | 187.2 | | 189.15 | | 1.38 | 0.17 | 42.6 | |
| | OBS-04-11 OBS-04-11 | 51.00 86.00 | | 53.00 88.00 | | 1.41 1.41 | 0.10 0.16 | 95.1 83.1 | |
The two most southerly holes, OBS-03-11 and OBS-04-11, had narrow intersections of low to moderate values which are difficult to correlate. These values are encouraging as they suggest that the Once Bocas structure extends further to the southeast.
9.4.5 Chacuaco Prospect
The Chacuaco Prospect is located along a prominent ridge west of the Once Bocas structure. The mineralization can be traced by quartz float along the ridge and by numerous small artisanal workings including four small mines that date to Spanish colonial times. The ridge has a very steep western face that impedes drilling unless drill sites are selected along the base
of the slope. Drilling from the ridge-base was not initially possible due to of a hostile landowner who permanently moved out of the area some time ago. Future drilling programs will now be able to use this approach. Seven holes were drilled in the Chacuaco area during the period 2002 to 2011. Table 8 is a summary of the more interesting drill hole intersections. Holes ‘01-02 and ‘02-02 were drilled in a north-easterly direction (030° Az.) on the western side of the ridge during 2002 and intersected anomalous to low silver and gold values. Holes ‘03-03, ‘04-03 and ‘05-03 were drilled during 2003 in a southerly direction to test the Mina Chacuaco-Mina Nanche area and the south-eastern extension. Those holes drilled to the south probably cut the mineralized veins at an oblique angle.
TABLE 8
SUMMARY OF SELECTED CHACUACO PROSPECT DRILL HOLE INTERSECTIONS
| Section | Hole Number | Interval (m) | True | Gold | Silver |
| | | from | to | Thickness (m) | (g/t) | (g/t) |
| | | | | | | | | |
| 520175 E | DDH-01-02 | 105.00 | | 105.40 | | 0.30 | 0.67 | 38.6 |
| 520755 E | CHA-01-11 | 185.2 | | 187.2 | | 1.41 | 0.31 | 78.8 |
| 520780 E | CHA-02-11 | 179.9 | | 181.8 | | 1.41 | 0.26 | 60.4 |
The holes located at the north end of the structure did not test the best part of the zone as indicated by the distribution of historical workings, but did undercut the Mina Chacuaco, Mina Perdita 3 and Mina Nanche workings intersecting multiple low to marginal silver and gold values. CHA-01-11 and CHA-02-11, drilled in 2011, tested the southern continuation of the structure towards the Cafetal prospect. The best silver values in the holes were most commonly between 15 g/t and 30 g/t (max. 76 g/t). The better gold values were in the range of 0.10 g/t to 0.40 g/t (max. 0.68 g/t). Two interesting observations can be made from the data. First, the drill values are lower than the surface and underground sampling which suggests that the system is better developed in the upper part of the felsic lapilli tuff-agglomerate formation, and secondly, the silver/gold ratio also increases upward.
The Chacuaco West area is a low-lying area found further to the northwest. Very little is known about this area which is near the contact between the younger volcanic rocks and basement rocks. Soils in the area were found to be geochemically anomalous in gold. The coverage of the original geochemical surveys was restricted due to a hostile landowner. That person has now left the area and future more aerially extensive surveys should be possible
9.4.6 Cafetal Prospect
The Cafetal Prospect is the south-eastern extension of the Chacuaco structure and is approximately 40 m lower in elevation. The prospect, comprising the La Cafetal Veta Olvidada (vein), was tested by 10 historical holes that were completed during 2003 and in 2011. Holes #14 and #15 of the 2003 program probed the area close to the overlying basalt situated to the southwest. They intersected the felsic lapilli tuff-agglomerate formation and intersected some mafic agglomerate bands which are weathered but not deformed like the basement rocks to the west. In both these holes, the gold and silver values were geochemically anomalous but not economically interesting. The third hole from this program, #16, tested the south-eastern end of the Olvidada Vein, and returned four intersections of potential economic significance (Table 9). Younger basaltic tuff and flows encroach on this area from the southwest, and cover the favourable felsic lapilli tuff-agglomerate formation in that direction.
During 2011, seven holes tested La Cafetal Veta Olvidada and adjacent rocks. The assay data show that the structure is silver–bearing over a length of 400 m with intersections ranging from 2 m to 10 m. Gold and silver values vary considerably over the tested length of the vein. More drilling is required to determine the importance of this mineralization.
TABLE 9
SUMMARY OF SELECTED LA CAFETAL VETA OLVIDADA PROSPECT DRILL HOLE INTERSECTIONS
| Section | Hole Number | Interval (m) | True | Gold | Silver |
| | | from | to | Thickness (m) | (g/t) | (g/t) |
| | | | | | | | | | |
| n.a. | CAF-01-11 | 60.50 | | 62.50 | | 1.40 | 0.45 | 147.0 | |
| n.a. | CAF-05-11 | 229.90 | | 233.90 | | 2.90 | 0.19 | 81.4 | |
| n.a. | CAF-06-11 | 218.70 | | 220.70 | | 1.40 | 0.64 | 139.9 | |
| n.a. | CAF-07-11 | 325.30 | | 327.30 | | 1.40 | 0.12 | 81.2 | |
10. DRILLING
The most recent drilling phase in 2011 resulted in the drilling of 89 diamond drill holes. These holes were surveyed relative to the previous holes using a compass and chain. They are not described individually, but are grouped by the structures and the segments of each structure that they tested. All drill core is catalogued and stored in the CMA warehouse except for the 2002 holes which were stored outside and lost in a landslide.
Dos Hornos 1 is the northern segment of the Dos Hornos-Veta Tomas System and occurs under a ridge capped by the welded rhyolite tuff that represents the stratigraphic hanging wall. The zone was tested by 35 holes over a strike length of approximately 300 metres. Location and other information concerning the drill holes is summarized in Table 10. The drill sections start at Section 0 located at the north end of Dos Hornos 1 and continue to Section 29 at the south end of Veta Tomas. The section spacing is less than 50 metres. Figure 10 is the Dos Hornos 1 drill plan incorporating all the drill holes. Most of the holes were drilled on a bearing of 060°Az or approximately perpendicular to the regional strike of the structure. During 2003, the strike was unknown and the holes were drilled at approximately 040°Az.
The results of the drilling are shown in Figures 11 which depicts a typical section. The singular strong Dos Hornos 1 zone is a contrast to the Dos Hornos 2 zone which comprises as many as four close-spaced silver- and gold-bearing shears/splays. CMA geologists interpret this mineralization as vertical to steep south-westerly dipping.
TABLE 10
DOS HORNOS SEGMENT 1 DRILL HOLE DATA
| Section | Drill Hole | UTM Co-Ordinates | Elevation | Bearing | Dip | Length |
| No. | | Northing | Easting | Metres ASL | (Az.) | | (Metres) |
| 0 | DH1-18-11 DH1-06-11 | 2361000 2360988 | 521446 521421 | 1054 1055 | 060° 060° | -45° -45° | 204 180 | |
| 1 | DH1-16-11 DH1-17-11 DDH-01-06 | 2360968 2360953 2360923 | 521448 521426 521442 | 1059 1058 1054 | 060° 060° 060° | -45° -55° -45° | 250.5 265 174 | |
| 2 | DDH-17-03 DH1-03-11 DDH-01-06 | 2360934 2360923 2360923 | 521493 521462 521442 | 1073 1055 1054 | 040° 060° 060° | -45° -45° -45° | 108 181 174 | |
| 3 | DH1-14-11 DH1-15-11 | 2360898 2360898 | 521449 521449 | 1063 1063 | 060° 060° | -45° -55° | 294.5 316 | |
| 4 | DDH-18-03 DDH-14-06 DH1-13-11 DH1-13-11 2nd | 2360900 2360864 2360860 2360860 | 521531 521470 521460 521460 | 1082 1069 1069 1069 | 040° 058° 060° 060° | -45° -45° -55° -55° | 152 161 294 294 | |
| 5 | DH1-12-11 DDH-03-06 | 2360869 2360775 | 521517 521419 | 1074 1081 | 060° 060° | -65° -45° | 130.5 289 | |
| 6 | DH1-07-11 DDH-02-06 DH1-08-11 DH1-08-11 2nd DDH-03-06 | 2360978 2360826 2360794 2360794 2360775 | 521403 521500 521463 521463 521419 | 1054 1077 1089 1089 1081 | 060° 060° 060° 060° 060° | -50° -45° -45° -45° -45° | 296.5 143 415.5 415.5 289 | |
| 7 | DH1-19-11 DH1-20-11 | 2360794 2360793 | 521542 521541 | 1083 1083 | 060° 060° | -45° -65° | 199.5 246 | |
| 7A | DDH-12-06 DDH-09-06 | 2360870 2360698 | 521642 521497 | 1099 1106 | 218° 038° | -47° -46° | 139 296 | |
| 8 | DH1-11-11 | 2360710 | 521503 | 1106 | 060° | -53° | 358.5 | |
10.3 DOS HORNOS 2
The Dos Hornos 2 segment continues the structural trend to the southeast from Dos Hornos 1. It has been interpreted as being faulted approximately 125 m to the west-southwest from Dos Hornos 1. The zone was tested on approximately 50 metre sections over a strike of 300 metres. Technical specifications for the holes are summarized in Table 11. In total, 28 holes intersected the zone. A typical section is presented in Figure 12 which shows the multiple parallel sub-zones each of which carry economically significant silver-gold mineralization.
TABLE 11
DOS HORNOS SEGMENT 2 DRILL HOLE DATA
| Section | Drill Hole | UTM Co-Ordinates | Elevation | Bearing | Dip | Length |
| No. | | Northing | Easting | Metres ASL | (Az.) | | (Metres) |
| | | | | | | | | |
| 9 | DH2-15-11 DH2-16-11 | 2360898 2360968 | 521449 521448 | 1063 1059 | 060° 060° | -55° -45° | 316 250.5 | |
| 9a | DDH-11-03 | 2360699 | 521475 | 1119 | 217° | -45° | 124 | |
| 10 | DH2-14-11 | 2360664 | 521541 | 1121 | 050° | -50° | 292 | |
| 11 | DDH-07-33 DDH-11-06 DD2-13-11 | 2360635 2360637 2360668 | 521629 521569 521600 | 1145 1129 1129 | 235° 235° 230° | -45° -45° -45° | 168 165 226 | |
| 12 | DH2-11-11 DDH-07-32 DH2-12-11 DH2-10-11 | 2360665 2360635 2360658 2360664 | 521673 521629 521665 521672 | 1147 1145 1146 1147 | 240° 235° 240° 240° | -65° -45° -60° -55° | 50.4 168 2415 274.5 | |
| 13 | DDH-15-06 DHH-07-31 DH2-08-11 DH2-09-11 | 2360596 2360618 2360619 2360650 | 521649 521677 521674 521707 | 1194 1165 1186 1166 | 221° 235° 240° 240° | -44.7° -55° -45° -60° | 217 264 178.5 240 | |
| 14 | DDH-07-30 DH2-07-11 | 2360562 2360572 | 521686 521649 | 1187 1187 | 236° 240° | -46° -65° | 205 149.3 | |
| 15 | DDH-16-06 DH2-06-11 | 2360513 2360516 | 521711 521707 | 1211 1187 | 235° 240° | -45° -65° | 188 284 | |
| 16 | DH2-05-11 DH2-03-11 DH2-04-11 | 2360465 2360464 2360892 | 521655 521571 521385 | 1209 1211 1055 | 240° 060° 240° | -45° -45° -45° | 247.5 117 159 | |
| 17 | DDH-07-29 | 2360463 | 521729 | 1233 | 210° | -45° | 205 | |
| 18 | DDH-07-28 | 2360466 | 521652 | 1233 | 240° | -45° | 177 | |
| 19 | DDH-07-26 DH2-01-11 DDH-07-27 DH2-02-11 | 2360383 2360407 2360418 2360427 | 521816 521842 521868 521928 | 1323 1321 1318 1305 | 240° 246° 238° 240° | -50° -55° -60° -60° | 198 265.5 319 301.5 | |
Veta Tomas is the continuation of the Dos Hornos structure to the southeast. It was explored by La Mina San Miguel which is an adit driven from the southeast under the hill below the rhyolite cap (Plates 10 and 11). This adit was used historically as a powder magazine, however it has been sealed off at about 10 m from the entrance portal. Near the portal, two parallel veins were explored by 20 drill holes which show the Veta Tomas mineralization to be continuous over a strike length of 300 m, and from surface down to a vertical depth of 100 m. The technical specifications for the drill holes are summarized in Table 12. Below 100 m, the gold values decrease and become spotty. The host rocks remain the same felsic lapilli tuff-agglomerate unit as seen consistently along the Dos Hornos structure. Figure 13 illustrates a typical drill section showing the sub-zones (splays) within Veta Tomas.
TABLE 12
VETA TOMAS DRILL HOLE DATA
| Section | Drill Hole | UTM Co-Ordinates | Elevation | Bearing | Dip | Length |
| No. | | Northing | Easting | Metres ASL | (Az.) | | (Metres) |
| 20 | VT1-01-11 | 2360338 | 521626 | 1293 | 240° | -45° | 245.5 | |
| 21 | DDH-02-06 DDH-21-06 | 2360826 2360344 | 521500 521906 | 1077 1282 | 060° 242° | -45° -45° | 143 255 | |
| 22 | VT1-02-11 | 2360238 | 521838 | 1235 | 240° | -45° | 147 | |
| 23 | DDH-18-06 DDH-19-03 VT1-04-11 | 2360233 2360190 2360174 | 521901 521866 521781 | 1220 1198 1194 | 225° 089° 240° | -45° -45° -45° | 177.2 176 175.5 | |
| 24 | VT1-12-11 VT1-03-11 VT1-15-11 | 2360190 2360230 2360005 | 521897 521937 521848 | 1198 1218 1144 | 245° 240° 065° | -50° -45° -45° | 176.5 211.5 280.5 | |
| 25 | DDH-24-06 | 2360175 | 521949 | 1235 | 245° | -50° | 193.5 | |
| 26 | VT1-08-11 VT1-09-11 VT1-13-11 | 2360153 2360152 2360068 | 521968 521969 521815 | 1233 1234 1160 | 245° 245° 065° | -45° -60° -45° | 184.5 221.5 227.6 | |
| 27 | VT1-05-11 DDH-23-06 VT1-14-11 | 2360080 2360094 2369030 | 521918 521946 521819 | 1221 1233 1158 | 245° 240° 065° | -45° -50° -45° | 138.5 168 332.5 | |
| 28 | VT1-10-11 VT1-11-11 VT1-16-11 | 2360062 2360062 2360005 | 521978 521978 521848 | 1226 1226 1144 | 245° 245° 065° | -45° -60° -45° | 171 213.3 280.5 | |
| 29 | DDH-22-06 | 2360030 | 521991 | 1238 | 240° | -50° | 160.5 | |
10.5 ONCE BOCAS NORTH
At Once Bocas North, two parallel zones of mineralization approximately 60 m apart were explored using 30 diamond drill holes over a strike length of 350 m. A summary of the drilling is presented in Table 13, and the geometry of the sub-zones on a typical drill section is shown in Figure 14. Based on this drilling, the data density and continuity were considered to be sufficient to support a resource estimate, however additional shallow drill holes and in-fill assaying are required to increase the level of confidence in the zone.
TABLE 13
ONCE BOCAS NORTH DRILL HOLE DATA
| Section | Drill Hole | UTM Co-Ordinates | Elevation | Bearing | Dip | Length |
| No. | | Northing | Easting | Metres ASL | (Az.) | | (Metres) |
| 1 | OBN-14-11 OBN-15-11 OBN-16-11 | 2360685 2360144 2360741 | 520915 521072 520936 | 1011 1092 1043 | 030° 040° 030° | -45° -45° -45° | 325.5 261 246 | |
| 2 | DDH-07-03 DDH-08-03 OBN-03-11 | 2360619 2360619 2360762 | 520954 520954 521010 | 1023 1023 1047 | 030° 030° 210° | -45° -45° -45° | 90 191 142.5 | |
| 3 | DDH-06-03 DDH-09-03 DDH-10-03 OBN-01-11 OBN-02-11 | 2360583 2360725 2360583 2360761 2360697 | 520989 521049 520989 521078 521032 | 1034 1046 1034 1035 1041 | 030° 210° 030° 220° 210° | -45° -45° -67° -50° -50° | 220 208 164 206.5 117 | |
| 4 | DDH-12-03 OBN-12-11 OBN-04-11 | 2360531 2360536 2360684 | 521004 521009 521100 | 1042 1043 1053 | 066° 030° 210° | -45° -45° -45° | 197 180 213 | |
| 4.5 | DDH-04-02 | 2360587 | 521064 | 1034 | 215° | -45° | 94 | |
| 5 | OBN-11-11 OBN-10-11 OBN-05-11 | 2360524 2360525 2360643 | 521056 521056 521121 | 1056 1056 1038 | 030° 030° 210° | -65° -45° -45° | 202.5 165 210 | |
| 5.5 | OBN-09-11 | 2360397 | 520993 | 1034 | 030° | -45° | 207 | |
| 6 | OBN-06-11 OBN-07-11 OBN-08-11 | 2360403 2360476 2360399 | 521036 521084 521036 | 1057 1064 1057 | 030° 030° 030° | -45° -45° -65° | 258 177 276 | |
10.6 ONCE BOCAS SOUTH
The Once Bocas South Prospect occurs on the adjacent ridge to the southeast of Once Bocas North. It was tested with 6 holes in the 2011 drill program; all holes were drilled from northeast to southwest (Table 14). The drill holes returned numerous gold and silver over narrow widths separated by background silver values of a few grams per tonne range. If the higher grade sections are correlated, they show a strike of 120 to 130 degrees similar to the strike of the Once Bocas North mineralization.
TABLE 14
ONCE BOCAS SOUTH DRILL HOLE DATA
| Section | Drill Hole | UTM Co-Ordinates | Elevation | Bearing | Dip | Length |
| No. | | Northing | Easting | Metres ASL | (Az.) | | (Metres) |
| 1 | OBS-05-11 | 2360161 | 521315 | 1106 | 230° | -45° | 150 | |
| 2 | OBS-06-11 | 2360139 | 521371 | 1108 | 230° | -45° | 91.5 | |
| 3 | OBS-01-11 OBS-02-11 | 2360121 2360145 | 521433 521461 | 1117 1122 | 230° 230° | -45° -55° | 308.5 178.5 | |
| 4 | OBS-03-11 OBS-04-11 | 2360037 2360052 | 521439 521456 | 1142 1145 | 227° 230° | -45° -55° | 223.2 268.5 | |
The two most southerly holes, OBS-03 and OBS-04-11, had narrow intersections of low to moderate precious metal values which are difficult to correlate. These values are encouraging as they suggest that the Once Bocas Structure extends further to the southeast.
The Chacuaco Prospect occurs along a prominent ridge that is situated west of the Once Bocas structure. The steep terrain along the western flank impeded drilling to the extent that some hole collars were located in less than ideal locations. Drill sites were possible along the base of the ridge, however a hostile landowner prevented this until the most recent drilling. This person left the area in 2008 and future programs can now utilize this alternative. Seven holes were drilled in the Chacuaco area between 2002 and 2011. A summary of the drill sites is provided in Table 15.
TABLE 15
CHACUACO PROSPECT DRILL HOLE DATA
| Section | Drill Hole | UTM Co-Ordinates | Elevation | Bearing | Dip | Length |
| No. | | Northing | Easting | Metres ASL | (Az.) | | (Metres) |
| 520175 E | DDH-01-02 | 2360070 | 520179 | 1000 | 030° | -45° | 150 | |
| 520175 E | DDH-02-02 | 2360069 | 520205 | 1000 | 030° | -45° | 109 | |
| 520785 E | DDH-03-03 | 2360225 | 520407 | 1081 | 185° | -50° | 246 | |
| 520340 E | DDH-04-03 | 2360298 | 520472 | 1076 | 185° | -45° | 208 | |
| 520310 E | DDH-05-03 | 2360262 | 520433 | 1074 | 185° | -45° | 218 | |
| 520755 E* | CHA-01-11 | 2359442 | 520834 | 1020 | 030° | -45° | 258 | |
| 520780 E* | CHA-02-11 | 2359932 | 520780 | 1079 | 030° | -45° | 231.9 | |
Note: All holes are drilled on north-south sections except those marked (*) which are on NE-striking sections.
During 2002, holes ‘01-02 and ‘02-02 were completed on the western side of the ridge and were drilled to the northeast. The next three holes, ‘03-03 through ‘05-03 were drilled to test the Mina Chacuaco-Mina Nanche area, and were drilled in a southerly direction oblique to the gold- and silver-bearing veins. These holes were located at the north end of the structure and did not test the best part of it as indicated by the historical workings. Two holes drilled in 2011 tested the southern continuation of the structure towards the Cafetal prospect.
10.8 LA CAFETAL VETA OLVIDADA PROSPECT
La Cafetal Veta Olvidada Prospect (“Cafetal”) is the south-eastern extension of the Chacuaco structure and is approximately 40 m lower in elevation. The prospect has been tested by 10 holes that were completed during 2003 and in 2011. The locations for these holes are given in Table 16. Holes #14 and #15 of the 2003 program probed the area close to the overlying basalt situated to the southwest. They intersected the felsic lapilli tuff-agglomerate formation and intersected some mafic agglomerate bands which are weathered but not deformed like the basement rocks to the west. In both these holes, the gold and silver values were geochemically anomalous but not economically interesting. The third hole from this program, #16, tested the south-eastern end of the Olvidada Vein, and returned two values of potential economic significance. Younger basaltic tuff and flows encroach on this area from the southwest, and bury the favourable felsic lapilli tuff-agglomerate formation in that direction.
During 2011, seven holes tested the Olvidada Vein and adjacent rocks and showed that it is mineralized over a length of 400 m with intersected core lengths of 2 to 10 m. Gold and silver values vary considerably over the tested length of the vein. More drilling is required to determine the importance of this mineralization.
TABLE 16
CAFETAL VETA OLVIDADA PROSPECT DRILL HOLE DATA
| Section | Drill Hole | UTM Co-Ordinates | Elevation | Bearing | Dip | Length |
| No. | | Northing | Easting | Metres ASL | (Az.) | | (Metres) |
| n.a. | DDH-14-03 | 2359535 | 521247 | 1082 | 226° | -41° | 186 | |
| n.a. | DDH-15-03 | 2359432 | 521287 | 1109 | 212° | -45° | 228 | |
| n.a. | DDH-16-03 | 2359426 | 521328 | 1114 | 075° | -45° | 243 | |
| n.a. | CAF-01-11 | 2359613 | 521227 | 1078 | 050° | -45° | 321 | |
| n.a. | CAF-02-11 | 2359537 | 521266 | 1088 | 050° | -45° | 270 | |
| n.a. | CAF-03-11 | 2359536 | 521265 | 1088 | 050° | -65° | 256.5 | |
| n.a. | CAF-04-11 | 2359678 | 521211 | 1068 | 050° | -45° | 129 | |
| n.a. | CAF-05-11 | 2359546 | 521092 | 1067 | 050° | -45° | 382 | |
| n.a. | CAF-06-11 | 2359424 | 521281 | 1115 | 050° | -45° | 297 | |
| n.a. | CAF-07-11 | 2359423 | 521281 | 1115 | 050° | -65° | 344 | |
11. SAMPLING METHOD, ANALYSIS AND SECURITY
11.1 SAMPLE PREPARATION AND ASSAYING
Ing. G. Francisco supervised the drilling program during 2003-2004 as well as later drilling programs. All drill core has been organized according to program, and is stored in a large secure warehouse.
All drill core samples were cut in half with a diamond saw under the direction of Ing. Francisco. Each was bagged and shipped by commercial courier to Inspectorate Exploration and Mining Services (“Inspectorate”) preparation laboratory in Durango, Mexico. Following the preparation of the samples, the samples were shipped to the Inspectorate laboratory in Sparks, Nevada and analysed for gold and silver.
During the most recent drilling campaign in 2011, the drill core was picked up in the field by Ing. German or Mr. Holcapek and immediately checked and roughly logged for possible mineralized intervals. In the core shack, the core boxes were laid out in numerical order, opened and each drill run was measured to allow the percent core recovery to be calculated and recorded. The total amount of core in each core tray was measured and the length of core in the box was compared to the accumulated core per run to determine whether the indicated depths were accurately represented. The core trays were then transferred to a logging table, the core was logged and sample intervals were marked.
After logging, the core was transferred to the cutting area and core marked for sampling was cut. From the cut core half was but into a plastic bag which was then marked with the sample number and the corresponding sample tag was inserted into the sample bag. The second half of the core was reinserted into the core tray in the same order as it was taken out. Core samples were put into sacks, tied and transported to the company office in Tepic where they were securely stored for shipment with a commercial agent. A sample list was attached to each shipment for the labs reference. A copy of the sample list and assay instructions were sent to the CMA office in Durango. The Durango office contacted the preparation lab of Inspectorate in Durango to advise them of the samples in transit, and arranged for delivery of the samples. Following preparation, a +/- 200 g sample of pulp was sent to the Inspectorate laboratory in Reno, Nevada for analysis, and a split of the pulp from designated check samples was sent to a third party referee lab. Each check sample was given the same sample number as the original sample to avoid potential confusion at a later date when original and duplicate assay results are compared.
11.2 QUALITY ASSURRANCE / QUALITY CONTROL
Historically, a pulp of every fifth sample sent to the Inspectorate laboratory in Nevada was also sent to the Stewart Laboratory in Kamloops, British Columbia for check assaying. Check sample preparation and shipping was carried out automatically by the lab in accordance with CMA’s directions at the time the core samples were submitted, and without any delay or additional handling by CMA personnel. Rejects and surplus pulps were returned to the CMA core warehouse for storage. Ing. Francisco oversaw the sample security during preparation and the subsequent independent service providers during their control of the samples.
CMA has checked the use of reject material for quality control purposes and found it to be an unreliable practice. Separate samples prepared from the same reject can give results with sufficient variance that the check purposes are defeated. To WGM, this is not a surprising outcome. WGM has found field duplicates and reject duplicates to be an unreliable measure of laboratory precision, especially in the case of precious metal projects. WGM’s experience has been that even the best laboratories fail to produce well homogenized rejects, and in most instances this is due to the irregular nature of the mineralization. The problem is compounded if the mineralization is nuggety. WGM believes that CMA’s use of pulp material and third-party labs is the best possible solution to QA/QC concerns. CMA does not insert commercial standards or blanks in its sample groups which would provide for a stronger QA/QC protocol, however WGM views the independent checking procedures used by CMA as a good alternative.
Most recently, CMA’s check program has continued as before and centred on the resubmission of selected pulps to a third party laboratory for reanalysis. In this case, the Durango office is given a list of all samples selected by the project manager for check assaying. Following the initial sample preparation, a sub-sample of pulp from the selected check samples is shipped to the ALS Chemex Laboratory in Vancouver, British Columbia for check assaying. In exceptional circumstances, for example when very high-grade assays were reported by Inspectorate (Reno), those intervals showing high assays were resubmitted for check assaying by Inspectorate. The check assays were always found to be within acceptable limits and these were independently confirmed by the check samples sent to the Stewart laboratory. In keeping with industry-wide best practices, both lab’s internal QA/QC protocols involve the use of one standard, one duplicate and one blank in every set of 25 samples analysed.
Ing. Francisco has established an organized sampling and storage facility. He supervised the drilling programs, sampling and shipment of the samples to the commercial sample laboratory. Shipment to the preparation laboratory of Inspectorate Exploration and Mining Services in Durango, was by commercial bus courier, and this is the only step in the process whereby CMA personnel do not maintain their direct chain of custody. It is WGM’s view that everything concerning the samples was done in a systematic professional manner.
Dr. McBride selected and personally supervised the collection of check samples for data verification purposes (see next section). All samples were sealed in plastic bags which he personally transported to the Company office in Vancouver where they were sent by courier to ALS Chemex in North Vancouver and analysed.
12. DATA VERIFICATION
12.1 GENERAL
During the site visit, Dr. McBride checked the general layout of the drilling programs and confirmed that each prospect was accurately located. He also checked the general geology and a sufficient number of drill holes to confirm that the co-ordinates given were reasonable accurate (within the GPS range of error).
12.2 CHECK SAMPLING AND ASSAYING
Check samples were selected by Dr. McBride to check the accuracy of the sample handling and to test the precision of the original assaying. All samples were personally taken by McBride and delivered to the ALS Chemex Laboratory in North Vancouver for analysis. Eight samples were taken from the pulps of the original core assays. They represent a range of values from <0.005 g Au/t and 0.60 g Ag/t to 6.21 g Au/t and 1,849.30 g Ag/t. The check samples gave values that are generally within 10 percent of the original assays which demonstrates good precision of the values between laboratories and over the range of values expected in the deposit (Table 16, Figures 15 and 16).
Four core samples from the 2006-7 and 2011 drilling programs were selected, re-cut (quartered) by diamond saw and analysed. A comparison of these analytical results is shown in Table 17. The new values are within 15% of the original assay except for the high values in DDH-07-23 which shows values of the same magnitude. This difference is not unexpected in fracture-controlled mineralization which may be coarse and prone to nugget effects. A final check sample was taken from underground workings from the same location as a previous chip sample. The check values are substantially lower than the original, but are in the same order of magnitude.
In summary the check sampling was sufficient to demonstrate and to substantially confirm the assay precision of the commercial laboratories used for the project. Differences are always expected between two data sets because the twinned samples are not exact duplicates even when they are from the same section of drill core. The greatest variance was seen in the underground chip sample #182194 which was the single sample most prone to variation, either as a result of the sampling technique or due to imprecision in locating the sample. Check values show a better correlation when the original sample material is duplicated as in the case of well homogenized pulp samples.
TABLE 17
COMPARISON OF ORIGINAL ASSAY DATA AND NEW DATA DERIVED FROM WGM CHECK SAMPLES
| Hole # or | Sample # | Sample Interval | Original Assays | Check assays |
| Location | | From | To | Au (g/t) | Ag (g/t) | Au (g/t) | Ag (g/t) |
| Pulp Samples | | | | | | | | | | | | |
| DH1-02-11 | 51755 | 16.5 | | 17.40 | | 0.053 | | 11 | | 0.051 | | 13.10 | |
| | 51773 | 63.34 | | 64.83 | | 6.21 | | 1849.3 | | 6.47 | | 1925.0 | |
| | 51788 | 98 | | 100 | | 0.095 | | 28.9 | | 0.094 | | 29.6 | |
| | 51782 | 78.82 | | 85.05 | | <0.005 | | 0.6 | | 0.006 | | 1.40 | |
| DH2-05-11 | 52183 | 70.5 | | 72.50 | | 0.011 | | 4.8 | | 0.014 | | 1.00 | |
| DH2-06-11 | 51289 | 129.6 | | 131.60 | | 1.356 | | 218.9 | | 1.295 | | 236.0 | |
| DH2-10-11 | 52216 | 118.3 | | 120.50 | | 0.486 | | 108.2 | | 0.451 | | 99.0 | |
| | 52223 | 132.5 | | 134.50 | | 0.005 | | 2.3 | | 0.009 | | 2.0 | |
| Quartered Core Samples | | | | | | | | | | | |
| DH1-02-11 | 51775 | 66 | | 66.82 | | 0.664 | | 162.5 | | 0.576 | | 132.0 | |
| DH2-06-11 | 52189 | 129.6 | | 131.6 | | 1.356 | | 218.9 | | 1.51 | | 220.0 | |
| DDH-07-23 | 295759 | 80.6 | | 82.6 | | 4.35 | | 1388.4 | | 1.665 | | 729.0 | |
| OBN-01-11 | 52875 | 37 | | 39 | | 0.218 | | 32.1 | | 0.224 | | 27.0 | |
| Underground Chip Samples | | | | | | | | | | | |
| Dos Hornos1 | 182194 | Adit 4 | | 2 m | | 5.84 | | 306.00 | | 1.06 | | 145.00 | |
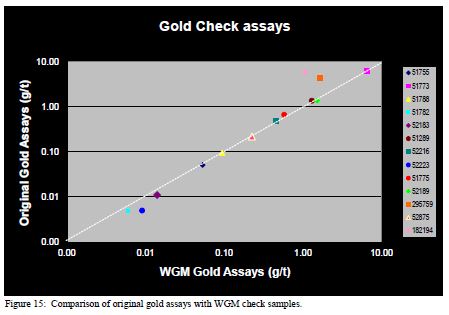
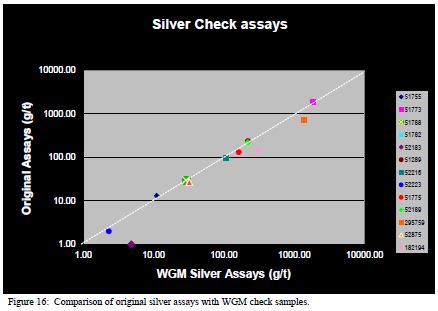
As can be seen from the two foregoing graphs, there is no systemic variation whereby one data set is consistently higher or lower than the other which might indicate preferential sampling or variances between laboratories as a result of analytical technique. Such variances can potentially occur, for example, when core recovery is less than optimum and the geologist uses the best sample material to ensure uniform sampling of the interval. This can leave an unrepresentative sample in the core tray which impedes any meaningful resampling at a later date. Variances in precious metals assays can result from differences in the size of the charge (30 g or 50 g), the approach to analysis (conventional fire assay versus screened fire assaying), or the means of analysis for silver (fire assay versus aqua regia digestion). The foregoing data suggest that there are no such variations in the samples tested, however WGM cautions that its check samples represent a very small population. WGM spot checked only a very small percentage of the sample inventory and this should not be taken as a definitive audit.
13. MINERAL PROCESSING AND METALLURGICAL TESTING
CMA contracted Inspectorate America Corporation to perform preliminary metallurgical testing of samples from the Nuevo Milenio Project. Four samples were selected; two from the Spanish mine workings on Dos Hornos 1, one from a shaft 12 on Veta Tomas and one from the stope on the Once Bocas North structures. Dr. McBride’s visits to the Spanish mine workings would suggest that these samples represent partially weathered material as previously shown in Plates 3, 4 and 9. Table 18 summarizes the sample information.
TABLE 18
SUMMARY OF METALLURGICAL TEST SAMPLE INFORMATION
| Sample Number | Location | Sample Weight | Head Assays (g/t) |
| | | (Kg) | Au | Ag |
| E687746-47 | X-cut Adit 4 | 18.6 | | 1.44 | 266 |
| E687748-49 | Shaft 5 level 3 | 33.2 | | 2.95 | 148.6 |
| E687750 | Shaft 12 Veta Tomas | 17 | | 1.44 | 43.7 |
| E687751 | Internal Stope Once Bocas | 13.4 | | 1.18 | 195.5 |
These samples were pulverized to 80 percent passing -200 mesh and tested using flotation, cyanide bottle roll and thiosulphate leaches. Follow-up cyanidation of the flotation tails was used to determine the amount of gold and silver in the residues and to assess recovery efficiencies. The results are summarized in Table 19. Each sample was tested by all methods and the results were averaged to give an average for each method. Average consumption of NaCN was 0.92 kg/ton and lime 1.68 kg/ton. Details are available in news releases on the CMA website (http://www.creamminerals.com/).
TABLE 19
SUMMARY OF METALLURGICAL TEST RESULTS
| Test | Variable | Average Recovery |
| | | Au | Ag |
| Bottle-Roll Cyanide Leach | 24 hr retention | 89% | 62% |
| Bottle-Roll Cyanide Leach | 72 hr retention | 94% | 78% |
| Flotation | one cleaning circuit | 66% | 81% |
| Bottle-Roll Cyanide Leach | on flotation tails | 88% | 56% |
| Flotation and Cyanidation of Tailings | on tailings | 94% | 90% |
| Thiosulphate Leach | | 21% | 76% |
14. MINERAL RESOURCE ESTIMATES
The classification of Mineral Resources and Mineral Reserves used in this report conforms with the definitions and standards provided in the final version of National Instrument 43-101 ("NI 43-101"), which came into effect on February 1, 2001. The Definitions and Standards are now specified under a revised NI 43-101 document which became effective June 30, 2011. WGM further confirms that, in arriving at our classifications, we have followed the guidelines and standards by the Canadian Institute of Mining Metallurgy and Petroleum ("CIM") Council adopted on November 27, 2010. The relevant definitions for the CIM Standards are as follows:
A Mineral Resource is a concentration or occurrence of diamonds, natural, solid, inorganic or fossilized organic material including base and precious metals, coal, and industrial minerals in or on the Earth's crust in such form and quantity and of such a grade or quality that it has reasonable prospects for economic extraction. The location, quantity, grade, geological characteristics and continuity of a Mineral Resource are known, estimated or interpreted from specific geological evidence and knowledge.
An Inferred Mineral Resource is that part of a Mineral Resource for which quantity and grade or quality can be estimated on the basis of geological evidence and limited sampling and reasonably assumed, but not verified, geological and grade continuity. The estimate is based on limited information and sampling gathered through appropriate techniques from locations such as outcrops, trenches, pits, workings and drill holes.
An Indicated Mineral Resource is that part of a Mineral Resource for which quantity, grade or quality, densities, shape and physical characteristics, can be estimated with a level of confidence sufficient to allow the appropriate application of technical and economic parameters, to support mine planning and evaluation of the economic viability of the deposit. The estimate is based on detailed and reliable exploration and testing information gathered through appropriate techniques from locations such as outcrops, trenches, pits, workings and drill holes that are spaced closely enough for geological and grade continuity to be reasonably assumed.
A Measured Mineral Resource is that part of a Mineral Resource for which quantity, grade or quality, densities, shape, physical characteristics are so well established that they can be estimated with confidence sufficient to allow the
appropriate application of technical and economic parameters, to support production planning and evaluation of the economic viability of the deposit. The estimate is based on detailed and reliable exploration, sampling and testing information gathered through appropriate techniques from locations such as outcrops, trenches, pits, workings and drill holes that are spaced closely enough to confirm both geological and grade continuity.
A Mineral Reserve is the economically mineable part of a Measured or Indicated Mineral Resource demonstrated by at least a Preliminary Feasibility Study. This Study must include adequate information on mining, processing, metallurgical, economic and other relevant factors that demonstrate, at the time of reporting, that economic extraction can be justified. A Mineral Reserve includes diluting materials and allowances for losses that may occur when the material is mined.
A Probable Mineral Reserve is the economically mineable part of an Indicated, and in some circumstances a Measured Mineral Resource demonstrated by at least a Preliminary Feasibility Study. This Study must include adequate information on mining, processing, metallurgical, economic, and other relevant factors that demonstrate, at the time of reporting, that economic extraction can be justified.
A Proven Mineral Reserve is the economically mineable part of a Measured Mineral Resource demonstrated by at least a Preliminary Feasibility Study. This Study must include adequate information on mining, processing, metallurgical, economic, and other relevant factors that demonstrate, at the time of reporting, that economic extraction is justified.
Mineral Resource classification is based on certainty and continuity of geology and grades. In most deposits, there are areas where the uncertainty is greater than in others. The majority of the time, this is directly related to the drilling density. Areas more densely drilled are usually better known and understood than areas with sparser drilling. Sampling of the bedrock surface, in trenches or in mine excavations and workings, can increase the confidence in the near surface zone and provide valuable information concerning the weathering characteristics of the mineralization. Where underground workings are available to provide sampling in three dimensions, it is not unusual for these blocks to be up-graded to Measured Resources in contrast to underlying blocks defined solely on the basis of drill hole data.
14.2 PREVIOUS RESOURCE ESTIMATES
Several previous resource estimates have been made for the Nuevo Milenio property. An ‘in-house’ estimate by Mr. Fred Holcapek, P.Eng. was disclosed by CMA on 12 February, 2008 (Holcapek, 2008). The following basic parameters were used for that estimate:
| | — | minimum horizontal thickness | |
| | — | | 2.65 tonnes per cubic metre |
| | — | silver : gold conversion | 50:1 (equivalent to $1,500/oz Au and $30/oz Ag) |
| | — | cut-off grades (2 estimates) | US $45/tonne |
| | — | resource classification | intersection grades projected vertically a maximum of 200 m for Inferred Resources; horizontal projects are governed by sectional spacing (assumed to be half the distance of spacing) |
| | — | high-grade assay cutting | none |
Holcapek (2008) carried out a study of variances in gold and silver contents between samples collected from channels in surface trenches and mine workings and drill core samples. Specifically, the author tried to explain the differences between the high-grade assays returned from outcrop and the significantly lower assays returned from drill core. The main factor to which this was attributed centred on core recovery which varied from 20% to 80% in the quartz vein/breccia structures. Loss of sample is largely due to the sheared nature of the rock in the mineralized zones, and various steps were reportedly taken to improve core recovery. Resource estimates were made for the Don Hornos 1 and 2 zones, and the Veta Tomas zone based on the assumption that they would be mined via underground workings. A mineral resource was also estimated for the Once Bocas zone using the assumption that this zone would be mined as an open pit operation. Holcapek believed that sufficient uncertainties existed in the drill core assay database that none of the mineral resources were classified above the level of Inferred Resources. To test the sensitivity of the resources to various cut-off grades, Holcapek re-estimated the resources in a subsequent report dated 24 Dec, 2008 using a 120 g Ag/t to 150 g Ag/t cut-off (Holcapek, 2008b). WGM is uncertain how this variable cut-off was applied, but the purpose this sensitivity analysis was to determine the impact of lower precious metal prices.
The previous resource estimates for the zones are summarized as follows in Table 20.
TABLE 20
SUMMARY OF PREVIOUS RESOURCE ESTIMATES (AFTER HOLCAPEK, 2008a)
| Zone | Resource Classification | Tonnes | Gold (g/t) | Silver (g/t) | Contained Gold (oz.) | Contained Silver (oz.) |
| | | | | | | | | | | | |
| Dos Hornos 1 | | | | | | | | | | | |
| | Inferred | 2,132,803 | | 1.530 | | 133.71 | | 104,593 | | 9,168,652 | |
| Dos Hornos 2 | | | | | | | | | | |
| | Inferred | 2,949,215 | | 0.946 | | 76.47 | | 89,657 | | 7,250,803 | |
| Veta Tomas | | | | | | | | | | |
| | Inferred | 1,246,163 | | 1.282 | | 354.72 | | 51,344 | | 14,212,287 | |
| Once Bocas | | | | | | | | | | |
| | Inferred | 11,590,000 | | 0.345 | | 57.90 | | 120,000 | | 21,580,000 | |
| TOTAL OF ALL ZONES | | | | | | | | | | |
| | Inferred | 17,918,181 | | 0.65 | | 90.62 | | 374,584 | | 52,211,800 | |
The above mentioned resources were estimated using in-puts and procedures which WGM cannot fully understand, and which we believe may not be supported by current practices and assumptions. For example, WGM believes there are examples where the previous resources are excessively extended below the deepest drilling. With an average width of 68.3 m, it is clear that high-grade intersections were extended and diluted with uneconomic intervals to increase the thickness of the resource blocks. While WGM has no reason to believe that the sampling methods, analytical procedures and quality control measures used over the last 10 years fail to meet current best practices standards, there is inadequate documentation to prove that previous exploration practices consistently met the requirements of NI 43-101.
WGM also has doubts that the variances between surface or mine samples and drill core are adequately explained. WGM does not argue the fact that core loss can certainly explain the lower values seen in drill core. However, WGM has also seen evidence for surface enrichment of precious metals in epithermal systems in arid regions leading to higher grades in outcrop than could be replicated in shallow drill holes. Usually such weathering effects result in unrepresentative variances in gold:silver ratios. Clearly, the only way to assess the impact of surface effects is to have high-quality drill core data immediately below the surface samples, and until such time as this is available, questions will exist concerning the distance to which high-grade surface samples should be projected downwards and thereby influence resource estimates.
As defined in Section 14.1, Inferred Resources are that part of a Mineral Resource for which the quantity and grade or quality can be estimated on the basis of geological evidence and
limited sampling and reasonably assumed, but not verified, geological and grade continuity. The previous estimate as detailed above is based on limited information and sampling gathered through various sampling techniques from locations such as outcrops, trenches, pits, workings and drill holes. In practice, the definition allows for any resource to be down-graded to “Inferred” if any of the data or assumptions are in question such that uncertainty is created. Notwithstanding the generality of the definition, for the various reasons cited concerning the estimation practices it is clear they are non-compliant, and WGM cannot justify the use of the term Inferred Resources for the foregoing resources.
They previous resources therefore cannot and should not be relied upon for investment decisions as the estimates are not compliant with CIM Standards and Guidelines for the estimation of Mineral Resources and Mineral Reserves and are therefore not compliant with current National Instrument 43-101 requirements. Neither CMA nor its Qualified Persons nor WGM have done sufficient work to reclassify the previous resources as current Mineral Resources under current mineral resource terminology, and they are not treating the previous resources as current Mineral Resources.
14.3 CURRENT WGM 2013 MINERAL RESOURCES ESTIMATES
14.3.1 General Approach
The current WGM Mineral Resource estimates for CMA’s Nuevo Milenio property includes individual estimates for the Dos Hornos 1, Dos Hornos 2, Veta Tomas and Once Bocas North zones (Table 21). These estimates incorporate both gold and silver mineralization and are based on the entire drill hole database which spans approximately 10 years of drilling.
The estimates were prepared from a polygonal model using a C$:US$ exchange rate of par (1:1) and on the following metal prices in US dollars per ounce: Au at $1635.00 and Ag at $31.50 as established at the close of trading on 7 February, 2013. Gold and silver assays expressed in grams per tonne were used to calculate equivalent silver grades were based on the formula:
Ageq = Ag + 52.9 Au
wherein:
Ageq | = | the equivalent silver grade |
| Au | = | the original gold assay |
| Ag | = | the original silver assay |
WGM’s review of the assay data indicates that extreme high-grade assays (nuggets) are rare in the assay database.
The deposits all exhibit a vein-structure control that precludes the use of a marker horizon or other geological formation as a control for the delineation of resource blocks. Therefore WGM imposed grade and thickness cut-offs on the mineralized zones for the reporting of Mineral Resources. In so doing, the current resource envelop is not geologically constrained by defined lithological contacts although in a larger context the resources are likely to be confined to the lapilli tuff-agglomerate unit, a conclusion which is implicit in WGM’s understanding that no significant intersections has been found within any other geological formation (host rock).
Given the steeply dipping configuration of the Don Hornos1, Don Hornos 2 and Veta Tomas veins, WGM imposed a 1.5 metre (5.7 ft) minimum horizontal thickness requirement on the resource blocks which reflects our best estimate of the minimum mining thickness achievable. On rare occasions, where an intersection substantially exceeded the cut-off grade, but where the true thickness did not meet the minimum required, the interval was diluted at the surrounding grade by all or part of an adjoining sample interval such that the minimum thickness was achieved and the weighted average grade was taken into resources. A minimum grade equivalent to US $75 of contained gold and silver value per tonne was also imposed based on WGM’s estimate of the cost of mining and processing ore at Nuevo Milenio. Other in-puts for the resource estimate are summarized as follows:
| | — | minimum horizontal thickness | |
| | — | | 2.65 tonnes per cubic metre |
| | — | silver : gold conversion | 52.9 : 1 (equivalent to metal prices of $1,635/oz Au and $31.50/oz Ag) |
| | — | cut-off grade | US $75/tonne contained gold + silver |
| | — | resource classification | intersection grades projected in a ellipsoidal zone with maximum horizontal and vertical dimensions of, respectively, 30 m and 20 m for Indicated Resources, and 45 m and 30 m for Inferred Resources. |
| | — | high-grade assay cutting | silver values cut to 1,000 g/t; gold values are uncut. |
Indicated and Inferred Mineral Resources are reported in this report in the following sections. For reasons cited in the foregoing section of this report, none of the resources can be classified as Measured Resources at this time, however, we believe that underground tape and
compass mapping and sampling of the workings could result in areas of Measured Resources in the upper parts of the zones.
In light of the geological nature of the deposit, especially its structural control, mineralization was extrapolated between data points only along the plane of the structure. No evidence was seen to justify linking zones or projecting mineralization normal to the plane of the structures although this is a structural possibility that is consistent with the geological model.
WGM’s experience in Turkey, SE Asia and elsewhere in Mexico has shown that low-sulphidation epithermal precious metal deposits can demonstrate excellent lateral continuity. These deposits are typically hosted in quartz-alunite vein systems that have great consistency in thickness over distances measured in hundreds of metres. The grade of the mineralization is also relatively uniform from hole to hole. Under such conditions, it can be demonstrated that economically significant assay values are relevant over projected distances of 40 metres or more. That also appears to be the case with the mineralization at Nuevo Milenio.
14.4 GENERAL MINERAL RESOURCE ESTIMATION PROCEDURES
The Mineral Resource estimate procedures consisted of:
| | — | Database compilation and verification; |
| | — | Statistical analysis and assay compositing; and, |
| | — | Employment of a geological model based on the epithermal deposit type and using a polygonal approach based on observed trends in the mineralization. |
14.5.1 General
The data used to generate the Mineral Resource estimates originated from a Microsoft Excel file supplied to WGM by CMA containing key data such as drill hole collar, survey and assays. Lithological information was extracted from the geological logs that were created for each hole by the project geologist. The CMA database was checked against individual Microsoft (“MS”) Excel, CSV and PDF files that originated from various sources including the project laboratories. As WGM’s check program progressed, specific laboratory certificate numbers were identified that corresponded to higher grading assays, and these certificates were requested directly from the lab for additional comparative studies.
The complete set of drill hole logs as MS Excel files was reviewed and the geological information was digested into the essential components needed for plotting purposes: hole number, location co-ordinates, elevation, bearing, dip, down-hole survey data (if available), major geological units, sample numbers, sample intervals and analytical data. All geological information was coded by WGM for ease of handling and as a means of relating similar units or features. A GEMS project database was established to hold all of the data and to be used for plotting purposes.
The project database consisted of 149 diamond drill hole collar locations in the UTM co-ordinate system and 6,695 assay intervals containing values for gold (g/t) and silver (g/t). Assay intervals averaged 1.96 m in length, with the smallest interval measuring 0.19 m and the largest measuring 5.0 m. Plotted cross-sections showing the drill holes were available from the previous resource estimates which were used by WGM as a general guide in associating groups of holes.
It is clear from the sample population that the distribution of assay intervals within the various rock type units heavily favours the lapilli tuff-agglomerate unit, and specifically quartz vein and quartz breccia zones within this formation. The high concentration of samples in such rocks coincides with structural zones (shears) along which the veins are developed. However, it is also clear that many veins and structures exist that are not mineralized.
14.5.2 Data Validation
Following receipt of the CMA data, WGM performed the following validation steps specifically:
| ü | checking for location and elevation discrepancies by comparing a randomly selected group of collar coordinates with the available cross-sections and topographic maps; |
| ü | checking minimum and maximum values for each assay value field and double checking-confirming those outside of expected ranges; |
| ü | comparing assay values in the database to those indicated on original digital assay certificates; |
| ü | checking for inconsistency in lithological unit terminology and/or gaps in the lithological code; and, |
| ü | checking for gaps, overlaps and out of sequence intervals for both assays and lithology intervals. |
Although WGM confirmed only a sampling of the drill hole collars, WGM’s checking included those most likely to influence the Mineral Resource estimate. No significant errors were found and WGM therefore accepts the locations as reported. WGM also accepts the drill hole directions and dips as recorded in the drill logs.
WGM found that gaps in the assay record on a hole by hole basis were the result of unsampled and unassayed intervals outside of the mineralized zones. WGM found the initial database to be a “collage” of randomly named files that impeded data assimilation and review, however no errors in the assay table were identified through WGM’s comparison of sample numbers and assays recorded in various file formats. WGM’s spot checks of original certificate data also confirmed the values reported. The database assembled by WGM is now in good order and accurate, and no errors have been identified that would have a significant impact on a Mineral Resource estimate derived from this database. On this basis, WGM deemed the database to be appropriate for use in its subsequent Mineral Resource estimate.
14.5.3 Database Management
The drill hole data were stored in a MS Excel file as a multi-tabled workspace specifically designed to manage drill hole, collar co-ordinate, down-hole survey and interval data. Other data, such as surface contours, were stored in 3-D digital format. A copy of all project data is stored on WGM’s file servers in Toronto.
14.6 GEOLOGICAL MODELLING PROCEDURES
Initially, a surface plan was prepared for each mineralized zone on which all drill holes were plotted as hole traces projected vertically to surface. These plans provided a basis for the design of a set of sections taking into account the location and strike of the mineralized zone. A set of parallel, vertical sections was then plotted for each zone incorporating all of the diamond drill holes, and using a sectional orientation normal to the strike of the zone. Holes that were not precisely on section were projected at right angles to the plane of the section.
The bedrock surface and the major lithological contacts were traced on section from hole to hole. The mineralized zone was then traced from hole to hole on each section based on the drill hole geology plotted on the sections supplemented by information recorded in the drill hole logs. Geological data on angled contacts and structures was an integral part of this
modelling exercise. The assay data was sufficiently irregular that it did not allow or justify the simple process of connecting gold-silver assays.
After the interpretation was completed on two adjacent sections, the location of the zone(s) was checked between the sections to ensure consistency of approach.
When the geological model was completed, the average grade of the mineralized zone in each hole was calculated, subject to the selected cut-off grade, and the true thickness of the zone was calculated based on the intersection angle between the hole and the projected zone.
The foregoing procedure is summarized as the following steps:
| | — | database assembly and manipulation from assorted MS Excel spreadsheet files; |
| | — | database validation to ensure no assayed samples were omitted; |
| | — | audits of all assay data likely to be included in Mineral Resources (results exceeding the cut-off grade) against original certificates received from the project laboratories; |
| | — | incorporation of the topographic model into the project information base; |
| | — | simple statistical analyses of the assay database; |
| | — | sample compositing within mineralized zones exceeding the cut-off criteria; |
| | — | preparation of a set of conventional vertical sections and a longitudinal in the plane of mineralization for each of the silver-gold zones; |
| | — | on section modelling of the quartz vein stockworks, quartz breccia zones and other identifiable units, and transferral of mineralized zones and composited grades to each section for on-section modelling between holes; |
| | — | drawing of elliptical polygons around holes with mineralization meeting or exceeding the cut-off parameters; |
| | — | recording of XYZ dimensions of each polygon together with grade and classification criteria in a MS Excel spreadsheet; |
| | — | calculation, classification and reporting of Mineral Resources. |
14.7 GEOLOGICAL INTERPRETATION
Although gold and silver are commonly associated with quartz veins, stockworks and quartz breccia, the zones used for the resource estimate are structures rather than lithological units or horizons. As such, the mineralization is discordant to formational contacts or boundaries.
The mineralized zones are defined by the volume of the mineralized zone as constrained by the limits of the samples assaying above the cut-off grade.
14.8 TOPOGRAPHIC SURFACE CREATION
Spot elevation data was available from the diamond drill hole collars. CMA also commissioned a topographic survey of Dos Hornos 1, Dos Hornos 2, Veta Tomas and part of Once Bocas North. The survey was performed using a laser theodolite, however the spacing between some data points is too wide to allow the production of accurate contours. The 2002 through 2008 drill holes were surveyed at that time, and the data was processed using Autocad software. The 2011 drill holes were surveyed by GPS and physically checked by using chain and compass to tie them into existing surveyed stations and drill holes.
The abovementioned topographic data was the means by which the bedrock surface was modelled on section for resource estimation purposes, and it was deemed to be sufficiently accurate for the purposes of defining and classifying the Mineral Resources. In consideration of the narrow, steeply dipping geometry of the mineralized zones, any imprecision in the location of the bedrock surface is seen as having only a very minor impact on the size of the reported mineral resources. This might not be the case if, for example, the mineralized zone was flat-lying or shallowly dipping.
14.9 STATISTICAL ANALYSIS, COMPOSITING, GRADE CAPPING AND SPECIFIC GRAVITY
14.9.1 Statistical Analysis and Assay Compositing
The original assay intervals varied in length from 19 cm to 5.0 m. Some of the longer samples were the result of poor sample recovery that resulted in (1) uncertainties in the precise location of sample boundaries; (2) reduced core mass for sampling purposes; and, (3) a need to extend sample lengths in order to achieve sufficient mass for analytical purposes. This was not always the case as the earlier drilling programs (e.g. 2002) seemed to make use of 3-metre samples as a standard sample length even in good ground. While reducing long samples into multiple 1-metre or 2-metre lengths could have been used to composite the database into equi-length samples for statistical analysis, WGM is less than certain that the data generated from poorly recovered sections would be an accurate reflection of the distribution of mineralization. It is WGM’s view that statistical analysis must be based on
meaningful data, not on data that has been manipulated to make it appear to be meaningful. For this reason, variography was not used to define grade distribution parameters. The basic distribution of assay values in the native database containing non-composited samples appears in Table 21.
TABLE 21
FREQUENCY OF HOST ROCKS IN SAMPLE POPULATION FROM MAJOR ZONES
| Host Rock | | All | | | Dos Hornos 1 & 2 | | | Veta Tomas | | | Once Bocas N & S | | | Cafetal | | | Chacuaco | | | Dos Pinos | |
| All Assayed Samples | | | | | | | | | | | | | | | | | | | | | |
| Andesite | | | 108 | | | | 30 | | | | 0 | | | | 11 | | | | 67 | | | | 0 | | | | 0 | |
| Ash | | | 20 | | | | 0 | | | | 0 | | | | 3 | | | | 11 | | | | 6 | | | | 0 | |
| Breccia | | | 118 | | | | 48 | | | | 70 | | | | 0 | | | | 0 | | | | 0 | | | | 0 | |
| Dec | | | 3 | | | | 3 | | | | 0 | | | | 0 | | | | 0 | | | | 0 | | | | 0 | |
| Dyke | | | 1 | | | | 0 | | | | 0 | | | | 1 | | | | 0 | | | | 0 | | | | 0 | |
| Fault | | | 961 | | | | 312 | | | | 333 | | | | 175 | | | | 80 | | | | 53 | | | | 6 | |
| Quartz Vein Zone | | | 374 | | | | 204 | | | | 52 | | | | 51 | | | | 18 | | | | 45 | | | | 0 | |
| Rhyolite | | | 2730 | | | | 718 | | | | 524 | | | | 744 | | | | 287 | | | | 435 | | | | 11 | |
| Stockwork Zone | | | 2349 | | | | 1149 | | | | 338 | | | | 614 | | | | 160 | | | | 56 | | | | 14 | |
| Unclassified | | | 7 | | | | 6 | | | | 0 | | | | 0 | | | | 1 | | | | 0 | | | | 0 | |
Total | | | 6671 | | | | 2470 | | | | 1317 | | | | 1599 | | | | 624 | | | | 595 | | | | 31 | |
| | |
| Samples Assaying > 75g Ag-equivalent per Tonne | |
| Andesite | | | 1 | | | | 0 | | | | 0 | | | | 0 | | | | 1 | | | | 0 | | | | 0 | |
| Ash | | | 0 | | | | 0 | | | | 0 | | | | 0 | | | | 0 | | | | 0 | | | | 0 | |
| Breccia | | | 14 | | | | 4 | | | | 8 | | | | 2 | | | | 0 | | | | 0 | | | | 0 | |
| Dacite | | | 0 | | | | 0 | | | | 0 | | | | 0 | | | | 0 | | | | 0 | | | | 0 | |
| Dyke | | | 0 | | | | 0 | | | | 0 | | | | 0 | | | | 0 | | | | 0 | | | | 0 | |
| Fault | | | 31 | | | | 9 | | | | 10 | | | | 9 | | | | 3 | | | | 0 | | | | 0 | |
| Quartz Vein Zone | | | 58 | | | | 28 | | | | 16 | | | | 10 | | | | 3 | | | | 1 | | | | 0 | |
| Rhyolite | | | 16 | | | | 10 | | | | 2 | | | | 4 | | | | 0 | | | | 0 | | | | 0 | |
| Stockwork Zone | | | 94 | | | | 62 | | | | 7 | | | | 22 | | | | 2 | | | | 1 | | | | 0 | |
| Unclassified | | | 0 | | | | 0 | | | | 0 | | | | 0 | | | | 0 | | | | 0 | | | | 0 | |
Total | | | 214 | | | | 113 | | | | 43 | | | | 47 | | | | 9 | | | | 2 | | | | 0 | |
14.9.2 Cut-Off Grade and Grade Capping
During 2008, the Cerro San Pedro Mine operated by NewGold mined ore grading approximately 0.50 g Au/t and 22.5 g Ag/t at a cash cost of $432 per ounce of gold, net of silver credits or a cost of less than $10 per tonne. Since that time, the mine has transitioned to
open pit mining at the same gold grade and 20 g Ag/t and costs per ounce have been halved to approximately $220 net of credits.
Avino Silver and Gold Co. mined ore grading approximately 1.1 g Auy/t and 74 g Ag/t from its 250 t/day San Gonzalo underground operation. Its economic analysis includes operation costs of approximately $16 per tonne and processing costs of approximately $14 per tonne for a 1,400 tonne/day operation, larger than that envisioned at Nuevo Milenio.
WGM reviewed the basic operating parameters for a small-scale 500 tonne/day mine in Mexico, and concluded that such mines would likely experience costs for underground mining and ore processing of approximately $65-75 per tonne. Using gold and silver prices of $1,635/oz and $31.59/oz, respectively, a cost of $75 per tonne equates to a cut-off grade equivalent to 1.43 g Au/t or 74.06 g Ag/t or some combination of both (Figure 17 and 18).
The average gold contents for each of the major host rock types is shown in Table 22.
TABLE 22
FREQUENCY OF HOST ROCKS IN SAMPLE POPULATION
| Host Rock | All Samples Assayed | Samples Assaying >75 g Ag-Equivalent / Tonne |
| Andesite | 3.3 | 105.9 |
| Ash | 7.3 | ----- |
| Breccia | 27.7 | 200.2 |
| Dec | 1.1 | ----- |
| Dyke | 1.7 | ----- |
| Fault | 16.3 | 279.7 |
| Quartz Vein Zone | 57.3 | 294.9 |
| Rhyolite | 4.8 | 203.3 |
| Stockwork Zone | 15.4 | 197.4 |
| Unclassified | 1.4 | ----- |
All Samples (undifferentiated) | 13.6 | 235.9 |
Grade distribution data show that most samples contain <5 g Ag/t and <0.05 g Au/t (Figures 19 and 20). The frequency of samples containing greater than these thresholds decreases along a more or less normal distribution curve. A second population exists of 136 samples with 90 to 777 g Ag/t, representing a subset within the mineralized zone which in
isolation shows a normal distribution with means of 1.17g Au/t and 209 g Ag/t. At the 99.96 percentile level, three outliers contain >1,000 g Ag/t (1252 g/t, 1388 g/t and 1849 g/t). No similar subset occurs in the gold population.
Philosophies or approaches to establishing and using a grade cap, also referred to as “assay cutting”, are variable across the industry. Schools of thought include, for example:
| | — | not using grade caps at all; |
| | — | arbitrarily setting all assay grades greater than a certain value to a high grade "limit"; |
| | — | choosing the grade cap value to correspond to the 95th percentile in a cumulative distribution; |
| | — | using an evaluation of Mean grades + multiple levels of Standard Deviations to establish a cap; and, |
| | — | the evaluation of the shape and values of histograms and/or probability plots to identify an outlier population as a basis for establishing a limit. |
Another rule of thumb is to set a capping level that effectively lowers the top 10% of the assays in the deposit, however this can unjustifiably penalize deposits that actually do contain a significant number of high-grade zones, the assays from which are not spurious results. Ultimately, there is no “one-size-fits-all” solution, because in reality the size of the sample population and the distribution of assays within the population is completely determined by the sampling philosophy of the geologist, and specifically, how far sampling extends beyond the limits of the mineralized zone.
Although WGM believes that the influence of the three high-grade assays from the Nuevo Milenio drill holes is adequately constrained by adjacent drill holes, it has top-capped these samples at 1,000 g Ag/t to ensure that these high-grade outliers do not overly influence the Mineral Resource grade.
One final consideration in determining such inputs as a cut-off grade would be whether or not the ore from Nuevo Milenio could be processed (custom milled) in a central milling facility in the district that could accommodate neighbouring mining operations. This would significantly reduce capital and operating costs and allow for a lower cut-off. This aspect requires additional study.
14.9.3 Density / Specific Gravity
A specific gravity factor of 2.65 tonnes per cubic metre was used for volume conversion based on the specific gravity of silica which is the prevalent mineral within the quartz-veined, quartz breccia zones. The relatively minor amounts of clay and gangue minerals present are not expected to have a great impact on the overall density.
WGM recommends that any future specific gravity test results, like all assays, should also be stored in an assay database table for ease of use and comparison purposes.
14.10 POLYGONAL MODEL PARAMETERS, GRADE INTERPOLATION AND CLASSIFICATION OF MINERAL RESOURCES
14.10.1 General
The Mineral Resources for the Nuevo Milenio project have been estimated using the Polygonal method whereby an area of influence is assigned to each drill hole intersection (composited interval) from which a volume can be calculated using the true thickness of the composite interval. Various methods exist for defining the area of influence which may or may not be equal on all axes (isotropic). Digital models are commonly anisotropic whereby assay data located along strike or along plunge directions is allowed to more strongly influence average overall grades that assay data normal to this direction. Anisotropic areas of influence also allow drill hole intersections to influence the overall tonnage in the direction of strike or plunge more so than across this direction.
For the Nuevo Milenio estimate, WGM carried out an overall review of the assay data in the context of the epithermal geological model. Epithermal deposits are vertically zoned as a result of strong pressure and temperature gradients in the hydrothermal system which gives rise to the mineralization. Pressure, in particular, affects the solubility of gases in solution and the area immediately below and above the fluctuating water table is commonly the most strongly mineralized. The scale of the zoning, from geochemically anomalous rocks to economically significant mineralization, can be measured in hundreds and in some cases close to 1,000 m, however short-distance variations are also common. The area of influence of each drill hole intersection must take the geological model into account even if the model is not well demonstrated in the available data provided that the data is generally supportive of the model.
14.10.2 Polygonal Model Set-Up and Parameters
Longitudinal sections were constructed for each mineralized zone. The plane of the longitudinal is in the plane of the mineralized zone as defined by drill hole to drill hole intersections and the geometric relationship between pierce points is maintained by ensuring that the distance between points is measured in the plane of the mineralized zone. The visual comparison of polygonal block grades with the composited intersection grades shows a reasonable correlation between the values. The orientation of the polygons follows the plane of mineralization. At this early stage of the resource model, it is doubtful that computer block modelling of the resource would significantly improve the interpolation.
The geological model was used to create two sets of elliptical polygons around each drill hole composite. The X, Y ands Z axes of each polygon were defined as follows:
| | — | X the direction of strongest grade continuity |
| | — | Y the direction of lesser grade continuity |
| | — | Z the direction of least grade continuity, typically represented along or sub-parallel to the direction of the drill hole |
where typically X > Y > Z. The polygons therefore have a rectangular shape, elongated in the direction of greatest grade continuity.
The first set of polygons was generated based on an ellipsoid with horizontal and vertical radii of influence of 30 m and 20 m, respectively, and resources within this envelope were classified as Indicated Mineral Resources. A second set of elliptical polygons was generated with horizontal and vertical radii of influence of 45 m and 30 m, respectively, and resources within this envelope but outside of the 30 m envelop were classified as Inferred Mineral Resources. The maximum volume of each polygon was therefore established for each set as follows:
| | | Indicated Resources | Inferred Resources |
| X | = | 30 m | 45 m |
| Y | = | 20 m | 30 m |
| Z | = | true thickness of the drill hole intersection |
The size of areas lying between drill holes (polygons) varied according to the density of diamond drilling. A few small areas lying between polygons (drill holes) remain unclassified where WGM observed insufficient data that it believes additional drilling is needed to confirm
continuous mineralization. Typically these areas are not located on the fringes of the deposit but rather are located within the drill hole cluster.
Polygon data including area, volume, density, tonnage, grade and hole-id, was stored in a multi-tabled workspace in a MS Excel file.
14.10.3 Grade Interpolation / Zone Composites
The spatial continuity of the mineralization in the named zones was not defined using variography for the reasons cited in the foregoing section, essentially due to the extreme variability of sample lengths (19 cm to 5 m) and issues relating to drill core recovery in the longer samples. WGM is of the view that the sample population must be capable of generating meaningful variogram plots otherwise the data so-generated will have little real meaning even though it may have all the appearances of being representative. Typically, this is a problem with small databases more so than large data sets such as that for the Nuevo Milenio project.
The geology and geometry of the Nuevo Milenio quartz vein/breccia zones is fairly well understood, so the area of influence and orientation of the polygons were based on this geological knowledge, as opposed to variograms. Thus, grades were assigned to the polygons based on a single length-weighted average composite.
14.10.4 Mineral Resource Classification
To categorize the Mineral Resources, WGM classified each of the smaller polygons (30x20 m radius) as Indicated Resources, and the larger sets of polygons (45x30 m radius) as Inferred Resources.
Not all drill holes were included in the resource estimates as many failed to meet the minimum true thickness of 1.5 m for the mineralized zone. Some of these were added as a result of WGM’s sensitivity analysis using a lower cut-off grade of $65 contained silver and gold. Using a higher grade cut-off of $85 contained value resulted in the removal of some polygons that did not meet the minimum true thickness requirement.
WGM recommends that subsequent studies on the Nuevo Milenio property include preliminary underground mining studies to determine the appropriateness of the 1.5 metre minimum thickness restriction in light of recent developments in the design of mining equipment. Such studies should also consider the potential for dilution of the ore in those areas that meet only the minimum thickness criteria. The Mineral Resource estimates contained herein do not account for mineability, selectivity, mining loss and dilution.
14.11 DOS HORNOS 1 AND 2 CURRENT MINERAL RESOURCES ESTIMATES
A set of lithological cross-sections containing the drill hole traces and assayed intervals was generated from the database by WGM. The locations of the Dos Hornos 1 and 2 drill holes were shown in Section 9 – Exploration as Figure 6 and Figure 7.
WGM prepared a NI 43-101 compliant Mineral Resource estimate for the two segments of the Dos Hornos silver-gold zone – Dos Hornos 1 and Dos Hornos 2. The Dos Hornos mineral resources are summarized in Table 23. The Mineral Resource estimate is based on the drill holes previously summarized in Tables 3 and 4 in the Exploration section of this report. Drill hole locations were provided in Tables 10 and 11 in the Drilling Section.
TABLE 23
DOS HORNOS 1 MINERAL RESOURCE ESTIMATES
(using grade cut-off equivalent to US $75/tonne Au-Ag value)
| Zone and | Tonnes | True Thickness | Average Grade | Equivalent Silver Grade |
| Resource Class | | (avg. m.) | g Ag/t | g Au/t | Ageq (g/t) |
| Dos Hornos 1 Zone | | | | | |
| Indicated Resources | 268,116 | 4.80 | 164 | 0.66 | 198 |
| Inferred Resources | 80,594 | 4.60 | 155 | 0.75 | 194 |
| | 1. | Mineral Resources which are not Mineral Reserves do not have demonstrated economic viability. Mineral Resources may be materially affected by environmental, permitting, legal, title, taxation, socio-political, marketing, or other relevant issues. |
| | 2. | The quantity and grade of reported Inferred Resources in this estimation are uncertain in nature and there has been insufficient exploration to define these Inferred Resources as an Indicated or Measured Mineral Resource and it is uncertain if further exploration will result in upgrading them to an Indicated or Measured Mineral Resource category. |
| | 3. | The Mineral Resources were estimated using the Canadian Institute of Mining, Metallurgy and Petroleum standards on Mineral Resources and Reserves, Definitions and Guidelines prepared by the CIM Standing Committee on Reserve Definitions and adopted by CIM Council December 11, 2005. |
| | 4. | S.G. of 2.65 tonnes/m3 was used. |
| | 5. | Tonnage and contained Ag and Au are rounded to nearest thousand or thousandth. Totals may not add up due to rounding. |
As detailed in the foregoing section, the Mineral Resource estimate was prepared from a model that used a grade cut-off equal to US $75 in contained silver + gold value as previously described herein, and a minimum true thickness of 1.5 m to accommodate underground mining. On rare occasions, where an intersection substantially exceeded the cut-off grade, but where the true thickness did not meet the minimum required, the interval was diluted at the surrounding grade by all or part of an adjoining sample interval such that the minimum thickness was achieved and the weighted average grade was taken into resources.
An east-looking longitudinal section for the Dos Hornos 1 Zone is shown in Figure 21. The plane of the longitudinal is in the plane of the mineralization. The interpolated ellipsoidal polygons for all drill holes intersecting the plane of the mineralized zone are outlined showing the inner zone of influence for Indicated Resources in red and for Inferred Resources in blue. Those holes contributing intersections meeting or exceeding the grade thickness criteria for Mineral Resources are darker toned, and the average grade and tonnage of each block is shown. Those holes not taken into resources are retained on the longitudinal to shown how each resource block is constrained.
As is clear, the Mineral Resources are predominantly located above approximately 200 m as measured down the plane of dip. The resources are mostly constrained to the north and at depth although narrow leads may exist at a depth of approximately 150-200 m below holes numbered 05-06 and between 04-06 and 03-06. There is clear potential for the addition of Mineral Resources close to surface to the south.
Unlike the Dos Hornos 1 zone, the Dos Hornos 2 zone comprises three (or possibly four) parallel structures all of which carry economically interesting mineralization. Consequently, a separate longitudinal section was generated for each of the constituent structures permitting WGM to calculate individual resource estimates for each sub-zone. A set of longitudinal sections for the Dos Hornos A, B and C sub-zones is provided as Figures 22 through 24. The Mineral Resources for Dos Hornos 2 are summarized in Table 24.
The longitudinal section shown in Figure 22 shows that economically significant mineralization in the Dos Hornos ‘A’ sub-zone equaling or exceeding the cut-off parameters was intersected in only one hole shown as 11-06 on the longitudinal section. The mineralization is well constrained up- and down-dip but may be open laterally.
Mineralization in the ‘B’ and ‘C’ sub-zones, as shown in Figures 23 and 24, is open in most directions and it is clear that additional drilling is warranted to better define this mineralization.
TABLE 24
DOS HORNOS 2 MINERAL RESOURCE ESTIMATES
(using grade cut-off equivalent to US $75/tonne Au-Ag value)
| Zone and | Tonnes | True Thickness | Average Grade | Equivalent Silver Grade |
| Resource Class | | | (avg. m.) | g Ag/t | g Au/t | Ageq (g/t) |
| Dos Hornos 2 Zone | | | | | | | |
| Subzone A | | | | | | | |
| Indicated Resources | 8,959 | | 8.49 | | 25 | 6.96 | 386 |
| Inferred Resources | 7,635 | | 8.49 | | 25 | 6.96 | 386 |
| Subzone B | | | | | | | |
| Indicated Resources | 220,156 | | 8.70 | | 120 | 0.83 | 163 |
| Inferred Resources | 119,597 | | 5.77 | | 136 | 0.86 | 181 |
| Subzone C | | | | | | | |
| Indicated Resources | 106,772 | | 6.27 | | 140 | 0.85 | 183 |
| Inferred Resources | 55,875 | | 5.45 | | 135 | 0.94 | 183 |
| All Sub-Zones | | | | | | | |
| Indicated Resources | 335,887 | | 7.92 | | 124 | 1.00 | 175 |
| Inferred Resources | 183,107 | | 5.79 | | 107 | 1.00 | 164 |
NOTE: See qualifying notes with Table 23.
The distribution of assay intervals within the various rock type units in the project area is summarized in Table 25. The samples in the quartz vein and stockworks generally coincide with silver-gold mineralization, but high values are noted locally in rocks that are predominantly rhyolitic tuff/agglomerate.
TABLE 25
DISTRIBUTION OF RAW AG AND AU ASSAYS
IN VARIOUS ROCK TYPES, DOS HORNOS 1 AND 2 ZONES
| Rock Type | # Samples | Mean Ag (g/t) | Mean Au (g/t) | Mean Ag-Equi. (g/t) | Samples With > 75 g Ag |
| | | | | | | | | | | |
| Andesite | 30 | | 3.0 | | 0.01 | | 3.7 | | 0 | |
| Ash | 0 | | --- | | --- | | --- | | 0 | |
| Breccia | 48 | | 15.1 | | 0.06 | | 18.4 | | 4 | |
| Dacite | 3 | | 0.8 | | 0.01 | | 1.1 | | 0 | |
| Dyke | 0 | | --- | | --- | | --- | | 0 | |
| Fault | 312 | | 17.1 | | 0.07 | | 21.0 | | 9 | |
| Quartz Vein Zone | 204 | | 36.1 | | 0.24 | | 48.7 | | 28 | |
| Rhyolite | 718 | | 4.7 | | 0.03 | | 6.2 | | 10 | |
| Stockwork Zone | 1149 | | 14.8 | | 0.09 | | 19.5 | | 62 | |
| Unclassified | 6 | | 0.8 | | 0.01 | | 1.0 | | 0 | |
WGM classified the Dos Hornos 1 and 2 Mineral Resources as Indicated and Inferred Resources for reasons cited in the foregoing sections, principally involving core loss due to a combination of: (1) poor drilling conditions; (2) the capabilities of the drilling equipment; and/or (3) the skill of the drillers. WGM believes that some of the resources could be elevated to the Measured category if the Spanish colonial workings can be tied into the drilling pattern with an acceptable level of confidence. In-fill drilling in some areas will also allow substantial up-grades of the level of confidence of the Indicated and Inferred Resources.
The following table (Table 26) summarizes the sensitivity of the Dos Hornos Resources to cut-off grade (or cost). As can be seen, the true thickness of the mineralization increases little when the cut-off grade is reduced because the silver and gold-bearing sections have narrow shoulders - grades generally diminish sharply on the margins of the quartz-veined zones. Effectively, dropping the cut-off grade from $75 to $65, a 13% decrease, does not appreciably add to the thickness of mineralized zones, but does bring a few narrow, lower grading intersections into the resources. The overall effect is a minor decrease in the average thickness of the resources, a small increase in tonnage with a commensurate decrease in average grade. Alternatively, an increase in cut-off grade does have a significant effect on reducing the tonnage because mineralized intersections in drill holes are completely eliminated from the assay database contributing to resources. The US $75 cut-off chosen as WGM’s base case, appears to represent a natural break above which the resources are significantly diminished as the cut-off grade increases.
TABLE 26
DOS HORNOS 1 AND 2 MINERAL RESOURCE ESTIMATES – SENSITIVITY ANALYSIS
(using grade cut-off equivalent to US $75/tonne Au-Ag value)
| Zone/Segment and | Cut-off | Tonnes | True Thickness | Average Grade |
| Resource Class | ($/tonne) | | (avg. m.) | g Ag/t | g Au/t |
| Dos Hornos 1 Zone | | | | | |
| Indicated Resources | $65. | 273,673 | 4.87 | 162 | 0.64 |
| | $75 | 268,116 | 4.80 | 164 | 0.66 |
| | $85. | 224,027 | 4.61 | 180 | 0.75 |
| Inferred Resources | $65. | 81,659 | 4.62 | 154 | 0.74 |
| | $75. | 80,594 | 4.60 | 155 | 0.75 |
| | $85. | 72,348 | 4.43 | 163 | 0.82 |
| Dos Hornos 2 Zone (all-sub-zones) | | | | | |
| Indicated Resources | $65. | 354,046 | 8.16 | 108 | 0.85 |
| | $75. | 335,887 | 7.92 | 124 | 1.00 |
| | $85. | 249,860 | 5.49 | 155 | 1.21 |
| Inferred Resources | $65. | 198,232 | 5.24 | 121 | 1.02 |
| | $75. | 183,107 | 5.79 | 135 | 1.00 |
| | $85 | 146,061 | 4.49 | 156 | 1.33 |
Notes: See conditional notes in Table 23.
14.12 VETA TOMAS CURRENT MINERAL RESOURCES ESTIMATES
WGM prepared a NI 43-101 compliant Mineral Resource estimate for the Veta Tomas segment of the silver and gold bearing structural zone that is essentially on strike with the Dos Hornos 1 and Dos Hornos 2 zones (segments). The Mineral Resource estimate, summarized in Table 27, is based on the drill holes previously summarized in Table 5 in the Exploration Section of this report and in Table 12 in the Exploration Section. As detailed in the foregoing section, the estimate was prepared from a model that used a grade cut-off equal to US $75 in contained metal value as previously described herein, and a minimum true thickness of 1.5 m to accommodate underground mining.
As with the Dos Hornos zones, a set of lithological cross-sections containing the drill hole traces and assayed intervals was generated from the database by WGM. The locations of the Veta Tomas drill holes were shown in Section 9 – Exploration as Figure 8. The Veta Tomas Zone is similar to the Dos Hornos 2 Zone immediately along strike to the northwest in that mineralization is located on (hosted within) a number of closely spaced parallel structures.
The mineralization intersected in the drilling indicates that two closely spaced shears are the primary hosts to economically interesting silver and gold values, herein referred to as the Veta Tomas ‘A’ and ‘B’ sub-zones. WGM generated a longitudinal section for each enabling individualized mineral resource estimates (Figures 25 and 26).
TABLE 27
VETA TOMAS MINERAL RESOURCE ESTIMATES
(using grade cut-off equivalent to US $75/tonne Au-Ag value)
| Zone and | Tonnes | True Thickness | Average Grade | Equivalent Silver Grade |
| Resource Class | | | (avg. m.) | g Ag/t | g Au/t | Ageq (g/t) |
| Sub-zone A | | | | | | | |
| Indicated Resources | | | 6.22 | | 186 | | 213 |
| Inferred Resources | | | 5.47 | | 137 | | 183 |
| Sub-zone B | | | | | | | |
| | | 2.04 | | 86 | | 102 |
| Inferred Resources | | | 2.03 | | 85 | | 100 |
| All Sub-Zones | | | | | | | |
| | | 5.70 | | 173 | | 199 |
| Inferred Resources | | | 4.76 | | 126 | | 166 |
NOTE: See qualifying notes with Table 23.
The east-looking longitudinal section in Figure 25 illustrates the Mineral Resource polygons in the “A” sub-zone. The mineralization appears to be constrained to the south by holes 07-22 and 11-11 whereas the northern extension has not yet been drilled off. There is some potential for small additions to the Mineral Resources close to surface and perhaps to depth at the northern end. While the down-dip potential is limited, holes drilled below 21-06 and 04-11 have good potential to add to the resource base.
The longitudinal section in Figure 26 shows that mineralization in the Veta Tomas ‘B’ sub-zone is apparently a tightly confined and relatively thin shoot more or less running down the plane of the zone without significant lateral expansion in the near surface area. The mineralization is clearly open between 350 N and 500 N and in-fill drilling is likely to add to
this resource. Although the zone has a true thickness of only 1.0 m through drill hole 04-11, it was added to the resources due to the higher grading nature of this intersection. The thickness of the intersection could have been increased through dilution to meet the 1.5 m minimum while still exceeding the $75 Ag+Au value cut-off.
The distribution of assay intervals within the various rock type units in the area was summarized in Table 21 and the distribution specifically for the Veta Tomas Zone is shown in Table 28. As at Dos Hornos, the samples in the quartz vein zones and quartz stockwork units coincide with silver-gold mineralization. Most samples were taken in the adjacent rocks which belong to the lapilli tuff-agglomerate formation.
TABLE 28
DISTRIBUTION OF RAW AG AND AU ASSAYS
IN VARIOUS ROCK TYPES, VETA TOMAS ZONE
| Rock Type | # Samples | Mean Ag (g/t) | Mean Au (g/t) | Mean Ag-Equi. (g/t) | Samples With >75 g Ag |
| Andesite | 0 | | --- | | --- | | --- | | 0 | |
| Ash | 0 | | --- | | --- | | --- | | 0 | |
| Breccia | 70 | | 27.7 | | 0.15 | | 35.6 | | 8 | |
| Dec | 0 | | --- | | --- | | --- | | 0 | |
| Dyke | 0 | | --- | | --- | | --- | | 0 | |
| Fault | 333 | | 10.2 | | 0.05 | | 12.9 | | 10 | |
| Quartz Vein Zone | 52 | | 94.5 | | 0.57 | | 124.7 | | 16 | |
| Rhyolite | 524 | | 3.8 | | 0.02 | | 4.9 | | 2 | |
| Stockwork Zone | 338 | | 8.6 | | 0.05 | | 11.1 | | 7 | |
| Unclassified | 0 | | --- | | --- | | --- | | 0 | |
WGM classified the Veta Tomas Mineral Resources as Indicated and Inferred Resources for reasons cited in the foregoing sections, principally involving core loss due to a combination of: (1) poor drilling conditions; (2) the capabilities of the drilling equipment; and/or (3) the skill of the drillers. WGM believes that some of the resources could be elevated to the Measured category if the Spanish colonial workings can be tied into the drilling pattern with an acceptable level of confidence. Although many of the workings have been sampled, WGM concerns expressed in the foregoing chapters about the variations between surface samples and drill core samples suggest that more work and/or better controlled sampling is needed before the surface sample data is incorporated into the resource database. In-fill drilling in some areas will also allow substantial up-grades of the level of confidence of the Indicated and Inferred Resources.
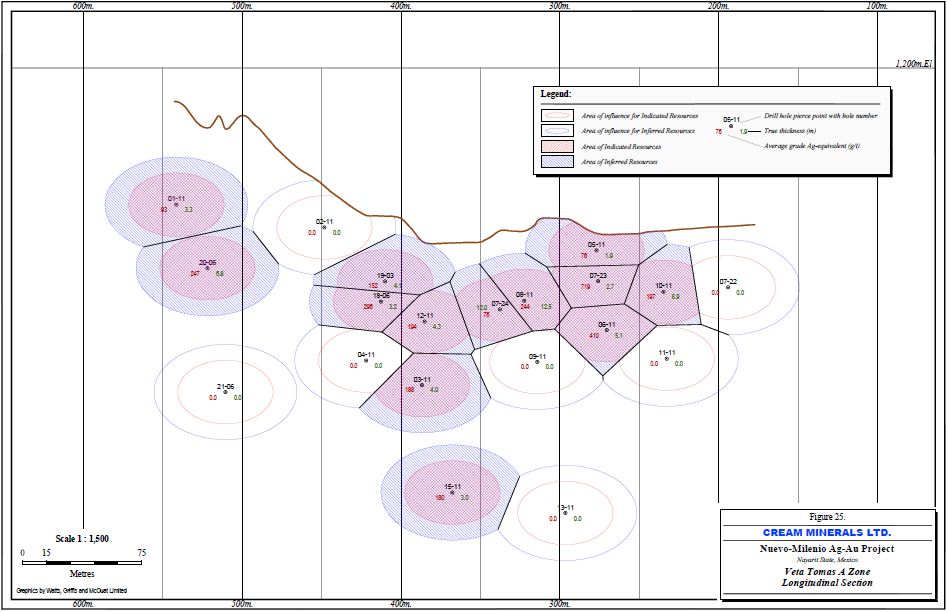
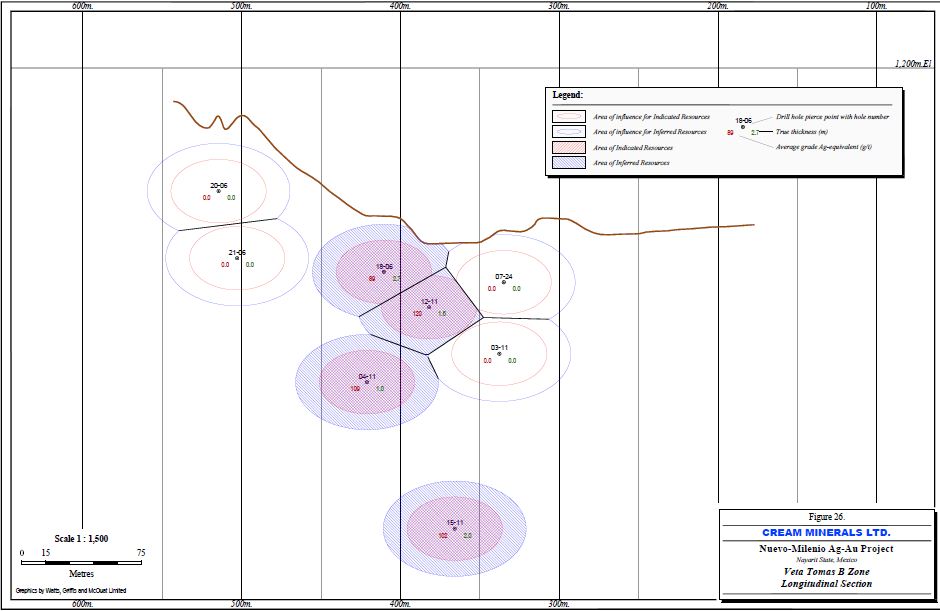
The following table (Table 29) summarizes for all zones the sensitivity of the Veta Tomas Resources to cut-off grade (or cost). The effects of varying the cut-off grade are virtually the same as for the Dos Hornos segments. Dropping the cut-off grade below $75 Ag+Au metal value contributes a small increase in tonnage, a small decrease in the average thickness due to the addition of narrow, lower grading zones, and not surprisingly a small decrease in average grade. As at Dos Hornos, the lack of significant shoulders on the intersections results in the thickness of the mineralized zone being relatively insensitive to the cut-off grade unless the grade is dropped much more than the $10 (13.3%) increment used in this study. Alternatively, the same increase in the cut-off grade does result in the loss of intersections from the reporting database, and causes a significant 15-20% reduction in the average thickness of the mineralized blocks with a similar decrease in tonnage, and an off-setting increase in average grade.
TABLE 29
VETA TOMAS MINERAL RESOURCE ESTIMATES – SENSITIVITY ANALYSIS
(using grade cut-off equivalent to US $75/tonne Au-Ag value)
| Zone and | Cut-off | Tonnes | Thickness | Average Grade |
| Resource Class | ($/tonne) | | (avg. m.) | g Ag/t | g Au/t |
| Veta Tomas Zone | | | | | |
| Indicated Resources | $65. | 285,392 | 5.30 | 128 | 0.69 |
| | $75 | 278,967 | 5.70 | 173 | 0.87 |
| | $85. | 221,258 | 4.60 | 198 | 1.00 |
| Inferred Resources | $65. | 157,535 | 4.70 | 118 | 0.76 |
| | $75. | 156,185 | 4.76 | 126 | 0.82 |
| | $85. | 130,026 | 4.18 | 138 | 0.91 |
Notes: See conditional notes in Table 23.
14.13 ONCE BOCAS CURRENT MINERAL RESOURCES ESTIMATES
WGM prepared a NI 43-101 compliant Mineral Resource estimate for the Once Bocas North silver and gold bearing structural zone that is similar to the Dos Hornos and Veta Tomas zones. The Mineral Resource estimate for Once Bocas North, summarized in Table 28, is based on the drill holes previously summarized in Table 6 in the Exploration Section of this report and in Table 13 in the Drilling Section. As detailed in the foregoing section, the estimate was prepared from a model that used a grade cut-off equal to US $75 in contained metal value as previously described herein, and a minimum true thickness of 1.5 m to accommodate underground mining.
As with the other zones, a set of lithological cross-sections containing the drill hole traces and assayed intervals was generated from the database by WGM. The locations of the Once Bocas drill holes were shown in Section 9 – Exploration as Figure 9. The Once Bocas North Zone is similar to the Dos Hornos 2 and Veta Tomas zones, which are not far removed to the north, in that mineralization is located on (hosted within) a number of closely spaced parallel structures. WGM generated a longitudinal section for each of the three sub-zones, herein referred to as ‘A’, ‘B’ and ‘C’, enabling individualized mineral resource estimates (Figures 27-29).
It is worth noting that the previous non-compliant resource estimate for Once Bocas mentioned earlier in this report was based in whole or in part on a conceptual plan to mine the zone by open pit or open cut method. This has obvious implications on the selection of a cut-off grade. WGM’s estimate for Once Bocas North which is presented herein is based solely on what it thought to be a reasonable approach to underground mining although one or two sections are recognized to provide sufficient width of mineralization to be make open pit mining worth consideration from a conceptual viewpoint. The Once Bocas North Mineral Resources are summarized in Table 30.
Figure 27 illustrates the easterly looking longitudinal section of the ‘A’ sub-zone at Once Bocas North. It can be seen very clear that the zone is a near-surface body which has limited potential below hole 12-03 in which the mineralization has a true thickness of 2.6 m, and north of hole 06-03 where the mineralization has a true thickness of 5.4 m.
The Once Bocas North ‘B’ sub-zone is shown in Figure 28. This mineralization is not well constrained by the current drilling and may be open along strike near surface and to depth towards the north. The thickness of the mineralization appears to increase downwards although its sharp termination between holes 12-03 and 05-11 suggests the presence of crossfault with an approximate E to NE strike.
The Once Bocas North ‘C’ sub-zone, shown in Figure 29, is the most important contributer of Mineral Resources in this area. A down-plunge lead of mineralization from hole 09-03 may exist to the north, but generally the mineralization is well constrained by drilling in this direction. Strong mineralization occurs in a large breccia zone at and near surface, and this mineralization is open towards the south. The Mineral Resources in the ‘C’ sub-zone are heavily influenced by the 18.7 m thick intersection in hole 03-02 and 02-11 (8.4 m), and to a lesser degree by 09-03 (5.0 m). The tonnage assigned to these polygons is constrained to the north by hole 03-11 which did not contribute to the Mineral Resources. Away from this location, the mineralization thins rapidly towards the south. As a result, the average thickness
of all resources in the Once Bocas North segment is strongly influenced by two shallow holes highlighting the near-surface potential. While there may be potential for an open-pittable resource at Once Bocas North, this potential is not borne out at depth as it is clear from the remaining holes that the sub-zone thins downwards.
TABLE 30
ONCE BOCAS NORTH MINERAL RESOURCE ESTIMATES
(using grade cut-off equivalent to US $75/tonne Au-Ag value)
| Zone and | Tonnes | True Thickness | Average Grade | Equivalent Silver Grade |
| Resource Class | | (avg. m.) | g Ag/t | g Au/t | Ageq (g/t) |
| Sub-Zone A | | | | | |
| Indicated Resources | 36,208 | 3.73 | 194 | 1.35 | 264 |
| Inferred Resources | 18,778 | 4.28 | 219 | 1.61 | 303 |
| | | | | | |
| Sub-Zone B | | | | | |
| Indicated Resources | 54,601 | 6.77 | 128 | 0.63 | 161 |
| Inferred Resources | 30,898 | 6.43 | 134 | 0.67 | 169 |
| | | | | | |
| Sub-Zone C | | | | | |
| Indicated Resources | 132,974 | 11.26 | 84 | 0.42 | 106 |
| Inferred Resources | 68,273 | 12.64 | 85 | 0.46 | 108 |
| | | | | | |
| All Sub-Zones | | | | | |
| Indicated Resources | 223,783 | 8.95 | 112 | 0.63 | 145 |
| Inferred Resources | 117,949 | 9.68 | 119 | 0.70 | 155 |
NOTE: See qualifying notes with Table 23.
The distribution of assay intervals within the various rock type units is summarized in Table 31 below. The samples in the quartz vein zones and in the quartz stockworks coincide with silver-gold mineralization. Most samples were taken in the adjacent rocks which belong to the lapilli tuff-agglomerate formation.
TABLE 31
DISTRIBUTION OF RAW AG AND AU ASSAYS
IN VARIOUS ROCK TYPES, ONCE BOCAS NORTH ZONE
| Rock Type | # Samples | Mean Ag (g/t) | Mean Au (g/t) | Mean Ag-Equi. (g/t) | Samples With >75 g Ag |
| Andesite | 11 | | 0.4 | | 0.01 | | 0.7 | | 0 | |
| Ash | 3 | | 8.5 | | 0.02 | | 9.8 | | 0 | |
| Breccia | 0 | | 24.8 | | 0.10 | | 29.9 | | 2 | |
| Dec | 0 | | --- | | --- | | --- | | 0 | |
| Dyke | 1 | | 1.4 | | 0.01 | | 1.7 | | 0 | |
| Fault | 175 | | 15.8 | | 0.12 | | 22.1 | | 9 | |
| Quartz Vein Zone | 51 | | 54.1 | | 0.39 | | 74.6 | | 10 | |
| Rhyolite | 744 | | 3.5 | | 0.02 | | 4.4 | | 4 | |
| Stockwork Zone | 614 | | 10.1 | | 0.07 | | 13.6 | | 22 | |
| Unclassified | 0 | | --- | | --- | | --- | | 0 | |
WGM classified the Once Bocas North Mineral Resources as Indicated and Inferred Resources for reasons cited in the foregoing sections, principally involving core loss due to a combination of: (1) poor drilling conditions; (2) the capabilities of the drilling equipment; and/or (3) the skill of the drillers. WGM believes that some of the resources could be elevated to the Measured category if the Spanish colonial workings can be tied into the drilling pattern with an acceptable level of confidence. In-fill drilling in some areas will also allow substantial up-grades of the level of confidence of the Indicated and Inferred Resources.
The following table (Table 32) summarizes the sensitivity of the Once Bocas North Mineral Resources to cut-off grade (or cost). Unlike the Dos Hornos and Veta Tomas segments of the mineralized structure, a 13% reduction in the cut-off grade does have a marked affect in adding tonnage to Mineral Resources. This is influenced by the lower grading shoulders of mineralization associated with the breccia zone intersected in hole 03-02 as relatively few intersections were surrounded by halos of lower grading mineralization. Nevertheless, an 18-20% increase in tonnage was achieved with a 1-3% increase in average thickness, a 6-8% decrease in silver grade and a 9.5-11.5% decrease in gold grade. The same increase in cut-off grade produced a 10-18% decrease in tonnage with an 18-20% decrease in average thickness,
a 5-8% increase in silver grade and an 11-14% increase in gold grade. WGM believes that the noted impact magnitude of changes in cut-off grade on the resources is likely to prove unrepresentative as additional drilling fills in gaps in the individual sub-zones and reduces the influence of the ‘C’ sub-zone in hole 03-02.
TABLE 32
ONCE BOCAS NORTH MINERAL RESOURCE ESTIMATES
SENSITIVITY ANALYSIS
(using grade cut-off equivalent to US $75/tonne Au-Ag value)
| Zone and | Cut-off | Tonnes | True Thickness | Average Grade |
| Resource Class | ($/tonne) | | (avg. m.) | g Ag/t | g Au/t |
| Once Bocas North Zone | | | | | |
| Indicated Resources | $65. | 264,113 | 9.24 | 105 | 0.57 |
| | $75 | 223,783 | 8.95 | 112 | 0.63 |
| | $85. | 190,267 | 7.56 | 122 | 0.73 |
| Inferred Resources | $65. | 142,337 | 9.79 | 109 | 0.62 |
| | $75. | 117,949 | 9.68 | 119 | 0.70 |
| | $85 | 107,471 | 8.09 | 125 | 0.79 |
Notes: See conditional notes in Table 23 or 33.
WGM examined the Once Bocas South geology and drill hole data and concluded that the amount of data available for this part of the structural zone is insufficient to support an estimate of the Mineral Resources at this time. Data for the drill holes in this area are presented in Table 7 which lists the most interesting intersections, and Table 14 which lists the drill hole locations. A surface plan of the drilling is included in Figure 10 in the Exploration section of this report.
14.14 DISCUSSION OF CURRENT NUEVO MILENIO MINERAL RESOURCES
The Nuevo Milenio Mineral resources for all segments of the mineralized zone are summarized as follows in Table 33.
TABLE 33
SUMMARY OF NUEVO MILENIO MINERAL RESOURCE ESTIMATES
(using grade cut-off equivalent to US $75/tonne Au-Ag value)
| Zone/Segment and | Tonnes | True Thickness | Average Grade | Equivalent Silver Grade |
| Resource Class | | (avg. m.) | g Ag/t | g Au/t | Ageq (g/t) |
| Dos Hornos 1 | | | | | |
| Indicated Resources | 268,116 | 4.80 | 164 | 0.66 | 198 |
| Inferred Resources | 80,594 | 4.60 | 155 | 0.75 | 194 |
| | | | | | |
| Dos Hornos 2 | | | | | |
| Indicated Resources | 335,887 | 7.92 | 124 | 1.00 | 175 |
| Inferred Resources | 183,107 | 5.79 | 107 | 1.00 | 164 |
| | | | | | |
| Veta Tomas | | | | | |
| Indicated Resources | 278,967 | 5.70 | 173 | 0.87 | 199 |
| Inferred Resources | 156,185 | 4.76 | 126 | 0.82 | 166 |
| | | | | | |
| Once Bocas North | | | | | |
| Indicated Resources | 223,783 | 8.95 | 112 | 0.63 | 145 |
| Inferred Resources | 117,949 | 9.68 | 119 | 0.70 | 155 |
| | | | | | |
| All Zone Segments | | | | | |
| Indicated Resources | 1,106,753 | 6.81 | 144 | 0.81 | 181 |
| Inferred Resources | 537,835 | 6.17 | 122 | 0.84 | 167 |
Notes:
| | 1. | Mineral Resources which are not Mineral Reserves do not have demonstrated economic viability Mineral Resources may be materially affected by environmental, permitting, legal, title, taxation, socio-political, marketing, or other relevant issues. |
| | 2. | The quantity and grade of reported Inferred Resources in this estimation are uncertain in nature and there has been insufficient exploration to define these Inferred Resources as an Indicated or Measured Mineral Resource and it is uncertain if further exploration will result in upgrading them to an Indicated or Measured Mineral Resource category. |
| | 3. | The Mineral Resources were estimated using the Canadian Institute of Mining, Metallurgy and Petroleum standards on Mineral Resources and Reserves, Definitions and Guidelines prepared by the CIM Standing Committee on Reserve Definitions and adopted by CIM Council December 11, 2005. |
| | 4. | S.G. of 2.65 tonnes/m3 was used. |
| | 5. | Tonnage and contained Ag and Au are rounded to nearest thousand or thousandth. Totals may not add up due to rounding. |
It is clear that the current Mineral Resources differ from those previous resource estimates mentioned earlier in this report. Those resources classified as “inferred”, however it is WGM’s view that they were not compliant with the provisions of National Instrument 43-101 (“NI 43-101”) for a variety of reasons, chief amongst which was the use of surface sample
data that differed markedly from drill hole data, and potential differences in sampling approach between the surface samples and underlying drill holes making it difficult to reconcile the two sample groups. In addition, the previous resources attributed substantial tonnage to the Once Bocas area as a result of the assumption that this zone can be open pitted. Although WGM views this as a possibility at Once Bocas North, the area with this potential is quite small and it is unlikely that the entire resource is exploitable by this method. WGM also concluded that there is insufficient data to attribute any Mineral Resources to Once Bocas South. A substantial part of the previous resources derived from the geological model which included substantial repetition of the mineralized zones as a result of thrust faulting. Although some faulting of this type may be present, WGM believes that a simpler model is more likely and is better supported by the available data. WGM’s model effectively removes the areas of overlap, straightening the mineralized segments and substantially reducing the tonnage of mineralization. WGM did not extrapolate mineralization to depth below the base of the drilling in the manner previously used. The result is a substantially reduced tonnage and, with the exception of Veta Tomas, a significantly higher grade. The two estimates are compared as follows in Table 34.
TABLE 34
COMPARISON OF PREVIOUS AND CURRENT
NUEVO MILENIO MINERAL RESOURCE ESTIMATES
| Zone/Segment and | | Tonnes | | | Average Grade | | | Thickness | | | Tonnes | | | Average Grade | | | Thickness | |
| Resource Class | | | | | g Ag/t | | | g Au/t | | | (m) | | | | | | g Ag/t | | | g Au/t | | | (m) | |
| Dos Hornos 1 | | | | | | | | | | | | | | | | | | | | | | | | |
| Indicated | | | 0 | | | | --- | | | | --- | | | | --- | | | | 268,116 | | | | 164 | | | | 0.66 | | | | 4.80 | |
| Inferred | | | 2,132,803 | | | | 133.71 | | | | 1.530 | | | | 7.13 | | | | 80,594 | | | | 155 | | | | 0.75 | | | | 4.60 | |
| | | | | | | | | | | | | | | | | | | | | | | | | | | | | | | | | |
| Dos Hornos 2 | | | | | | | | | | | | | | | | | | | | | | | | | | | | | | | | |
| Indicated | | | 0 | | | | --- | | | | --- | | | | --- | | | | 335,887 | | | | 124 | | | | 1.00 | | | | 7.92 | |
| Inferred | | | 2,949,215 | | | | 76.47 | | | | 0.946 | | | | 14.88 | | | | 183,107 | | | | 107 | | | | 1.00 | | | | 5.79 | |
| | | | | | | | | | | | | | | | | | | | | | | | | | | | | | | | | |
| Veta Tomas | | | | | | | | | | | | | | | | | | | | | | | | | | | | | | | | |
| Indicated | | | 0 | | | | --- | | | | --- | | | | --- | | | | 278,967 | | | | 173 | | | | 0.87 | | | | 5.70 | |
| Inferred | | | 1,246,163 | | | | 354.72 | | | | 1.282 | | | | 5.09 | | | | 156,185 | | | | 126 | | | | 0.82 | | | | 4.76 | |
| | | | | | | | | | | | | | | | | | | | | | | | | | | | | | | | | |
| Once Bocas North | | | | | | | | | | | | | | | | | | | | | | | | | | | | | | | | |
| Indicated | | | 0 | | | | --- | | | | --- | | | | --- | | | | 223,783 | | | | 112 | | | | 0.63 | | | | 8.95 | |
| Inferred | | | 11,590,000 | | | | 57.90 | | | | 0.345 | | | | 100.0 | | | | 117,949 | | | | 119 | | | | 0.70 | | | | 9.68 | |
| | | | | | | | | | | | | | | | | | | | | | | | | | | | | | | | | |
| All Zone Segments | | | | | | | | | | | | | | | | | | | | | | | | | | | | | | | | |
| Indicated | | | 0 | | | | --- | | | | --- | | | | --- | | | | 1,106,753 | | | | 144 | | | | 0.81 | | | | 6.81 | |
| Inferred | | | 17,918,181 | | | | 0.65 | | | | 90.62 | | | | 68.33 | | | | 537,835 | | | | 122 | | | | 0.84 | | | | 6.17 | |
Notes: See Table 33 for conditional and cautionary notes.
As is clear from the preceding table, the previous non-compliant estimate maximized the thickness for each intersection through dilution at the edges of each mineralized zone. In an
extreme case, as at Once Bocas, the average thickness of the zone in the previous estimate is more than 10 x the thickness in the WGM NI 43-101 compliant estimate. For Dos Hornos 1 and 2, the previous estimates are approximately 2-3 X greater. In general, the WGM grades are significantly higher than the previous estimate. The Veta Tomas grade in the WGM estimate is lower which is attributed to WGM’s exclusion of high-grade surface sample data.
The author’s believe that WGM’s estimate takes a conservative approach both in respect to the geological model and to the extrapolation of drill hole data. If significant repetition or stacking of the silver and gold-bearing zones occurs due to thrust faulting, then an increase in resource tonnage will certainly be possible. However, WGM is doubtful that the magnitude of the Mineral resources will double within the area drilled. In all instances, additional drilling is needed to in-fill gaps in the drill hole distribution as discussed in the foregoing sections. WGM believes that the Once Bocas North area has the potential for a small open-pitable resource in an area measuring approximately 200 m in length north to south on the ‘C’ sub-zone. Additional drilling is needed to better define this zone following which it should be modelled separately in accordance with cut-off grades that are appropriate for open cut mining.
15. MINERAL RESERVE ESTIMATES
The confidence level of the Mineral Resources reported herein is insufficient to support engineering studies at the level of a feasibility study. Although sufficient certainty exists in some areas, and metallurgical test data is encouraging, additional exploration and further studies are required to produce the database needed to support a feasibility study. This level of study is required to convert Mineral Resources to Mineral Reserves, and for this reason, there are no NI 43-101 compliant Mineral Reserves on the CMA property at this time.
16. MINING METHODS
No studies have been carried out to review mining methods or design a mine lay-out or flowsheet. In view of the geometry of the mineralized zones, it is WGM’s opinion that mining is most likely to occur by underground methods, and the selection of a cut-off grade and minimum thickness reflects this view.
It is possible that a portion of the Once Bocas North mineral resources might be mined using an open-cut method with steep walls to minimize dilution, however, no studies have been carried out to determine the tonnage and grade of the mineralization that might be extracted, or how the amount of available ore might have been diminished by Spanish colonial mining and recent artisanal mining.
17. RECOVERY METHODS
A previous study by CMA was carried out by Inspectorate America Corporation to examine what potential processing alternatives might be appropriate for consideration in flow-sheet development. This previous study was described and the key findings presented in this report in Section 13 – Mineral Processing and Metallurgical Testing.
Four weathered samples with grades ranging from 43.7 g Ag/t to 266 g Ag/t and 1.18 g Au/t to 2.95 g Au/t were selected from surface workings. WGM cautions that these samples may not have been representative of unweathered mineralization at depth. The samples were pulverized to 80 percent passing -200 mesh and tested using flotation, cyanide bottle roll and thiosulphate leaches. The average consumption of NaCN was 0.92 kg/ton and of lime was 1.68 kg/ton. Cyanide leaching resulted in silver recoveries ranging from 56% to 90% and gold recoveries ranging from 88% to 94%.
It is WGM’s view that the previous tests need to be replicated and expanded upon using sample media derived from representative mineralization, presumably unweathered or substantially unweathered drill core. If sufficient material is not available from archived drill core, then a few drill holes should be completed using larger diameter (HQ) core to produce material specifically for metallurgical testing. One sample should be assembled for each of the major mineralized zones.
18. PROJECT INFRASTRUCTURE
The infrastructure available in the region is described in a foregoing section of this report. No studies have been completed by CMA to assess the availability of electrical power or water in the project area, nor has the need for improvement of existing facilities been reviewed.
19. MARKET STUDIES AND CONTRACTS
No market studies have been carried out for the Nuevo Milenio project. No contracts are in effect whereby any such studies are being carried out, nor are any such studies anticipated in the foreseeable future.
20. ENVIRONMENTAL STUDIES, PERMIT, AND SOCIAL OR
COMMUNITY IMPACT
No environmental baseline studies have been made of the Nuevo Milenio Project area, and the project is not permitted for development and production.
The area has been the subject of mining during Spanish colonial times, and therefore certain local environmental impacts can be attributed to that time. Nevertheless, as part of CMA’s corporate social responsibility and in order to meet regulatory requirements, baseline geochemical, environmental, social and other studies are needed in support of any application by CMA’s to bring the Nuevo Milenio Project into development and production. It is WGM’s view that the project is sufficiently advanced to justify initiating baseline geochemical studies at this time.
21. CAPITAL AND OPERATING COSTS
WGM reviewed various sources of current information on small-scale gold-silver mining projects in Mexico to enable it to establish a cut-off grade for the purpose of the Mineral Resource estimates. The results of this study indicate that a total mining and processing cost of $75 per tonne might be incurred, and WGM has based its base case on this cost.
As stated previously in this report, no studies have been undertaken by WGM to determine an optimal mining technique or mining rate. Without such information, it is not possible to accurately determine what costs might be incurred in mining on the Nuevo Milenio Project. Consequently, the reader is advised that the costs used herein do not represent the outcome of a formal study, and therefore should not be relied upon for investment decisions.
22. ECONOMIC ANALYSIS
No assessments or preliminary economic assessments have been made of the Nuevo Milenio Project. The Mineral Resources stated in this report have not been qualified on the basis of a study to show that the resources can actually be mined for a profit.
23. ADJACENT PROPERTIES
The author’s observations show the favourable rocks terminate near the west side of the property and no mineralization can be expected in the rocks to the west for some distance. The potential to the east is demonstrated by La Mina California on the next ridge (Photo 14). This old mine was reopened about 5 years ago and was worked for three years. A small mill was built in the valley below but has not operated for 3 years and was recently removed. Production figures are not available. During the author’s visit, he investigated the underground workings. The recent operators had enlarged the tunnel without stabilization and much of the back has fallen in and blocks the tunnel at approximately 100 metres. All the ventilation tubing and plastic supply lines remain. It appears that the mine was abandoned, possibly after a rock fall. The tunnel seemed to have followed the vein system which is in a very weak, almost a muddy white rock.
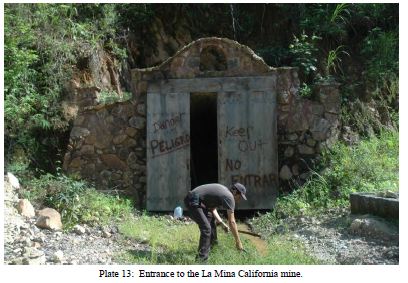
Outside the “ore” dump shows a similar felsic lapilli-agglomerate with clear quartz eyes and quartz vein mineralization with the same bluish colouration of the higher grade at Nuevo Milenio. Across the arroyo to the south this zone is covered by the same rhyolite tuff of the Nuevo Milenio Property.
24. OTHER RELEVANT DATA AND INFORMATION
There are considerable accumulated data of various types, including drawings, sketches and reports for the Nuevo Milenio Project that are of interest to exploration professionals. In fact WGM faced a major challenge in reviewing the info-base for this project which has been on-going for more than a decade. However to include all of the available material in this report is neither practical nor required under NI 43-101. WGM has therefore used its discretion in selecting such information as is needed to make this report informative and not misleading to the reader.
There is no significant material information known to WGM that is relevant to this report, or that would refute any of the conclusions in this report, that has not been included or discussed herein.
25. INTERPRETATION AND CONCLUSIONS
The Nuevo Milenio Property contains silver-gold mineralization in a series of zones or segments that represent portions of a single structural zone: Dos Hornos 1 and 2, Veta Tomas and Once Bocas North and South. The mineralization was the subject of underground mining during Spanish colonial times. In addition to recent surface exploration, the zones have been explored by 149 diamond drill holes. The holes drilled during the programs between 2002 and 2007 intersected the mineralized zones, demonstrating that they contained economically interesting mineralization. The most recent holes completed during 2011 were drilled for the purpose of defined NI 43-101 compliant Mineral Resources on all structures.
Drilling has shown that each of the vein systems contains a central higher grading zone surrounded by lower grading shoulders of mineralization, however in general, the shoulders containing significant mineralization are narrow and measure less than 2 m. For this reason, the geometry of the zone indicates that it could only be exploited through underground mining although open cuts might be used locally to mine the remaining near-surface mineralization, for example at Once Bocas North. Parallel structures, notable at Dos Hornos 2 and locally at Veta Tomas and Once Bocas North, may be of importance to be mined as a single mineable block, or more likely as separate higher grading stopes. However, no studies have been carried out at this time to indicate an optimal mining method. At this time there is insufficient drilling to allow for the estimation of Mineral resources at Once Bocas South, or in other areas of the CMA property such as Chacuaco and Cafetal.
WGM’s property-wide investigation has shown that the mineralization and vein systems are confined to a felsic lapilli tuff-agglomerate sequence which is approximately 200 to 300 m thick. The better grades occur in the upper part of the sequence and are exposed on hillsides. This sequence is floored by highly deformed basement rocks and capped by the rhyolite tuff. Within the lapilli tuff-agglomerate sequence, steeply dipping veins and siliceous stockworks carrying silver and gold cut across the unit. The presence of La Mina California in an Opal Concession within the property shows that parallel vein systems continue in this unit to the east and beyond into areas with reported old workings, but little recent exploration has been done in these areas.
It is apparent that the felsic lapilli-agglomerate is the preferred host for the mineralization. Oxide minerals in the system near the top of the felsic lapilli tuff-agglomerate unit and capping sinter zones suggest that the mineralizing solutions were becoming depleted in sulphur, gold and silver as they rose through the host rocks to surface. The hanging wall rhyolite tuff sealed the system and some workers have postulated that the opals in this tuff were formed from the residual silica in cool acid waters permeating these rocks.
The discovery, along the western boundary of the property, of deformed basement rocks whose weathered surface dips east under the property at a shallow angle, suggests that these rocks form the basement under the entire property. Any contribution of mineralizing fluids from this basement is extremely unlikely, however faulting within it probably opened up fractures for the more recent volcanism and its mineralizing fluids.
In conclusion it can be said that the vein systems follow preferred northwest-southeast shears/faults/fracture systems over a limited time span. The mineralizing fluids are probably derived from a nearby magmatic/hydrothermal source and deposited in the favourable porous felsic lapilli-agglomerate. Within this unit, the fluids formed extensive, structurally-controlled vein systems and stockworks. Two systems, notably at Dos Hornos-Veta Tomas and Once Bocas, as well as a less explored third structure at Chacuaco-Cafetal, are exposed on the property, and a fourth (La Mina California) is present within the property limits on an Opal Concession. Others are indicated by “transition zones” and unexplored areas like Dos Pinos and Santa Gertrudis. It seems that the felsic lapilli-agglomerate is mineralized throughout its lateral extent and that the better mineralization is concentrated in the top 150 metres of this rock. It is the authors’ opinion that more parallel structures remain to be discovered. Drill results consistently show the best values to be in the upper part of the felsic lapilli-agglomerate. Thus new prime new targets are under the rhyolite cap along the extension of La Mina California and elsewhere east of the Dos Hornos-Veta Tomas. A second target area may exist under the young basalt that caps the felsic lapilli-agglomerate to the south, west and north.
An early mineral resource estimate, herein referred to as the previous estimate, was made using a variable cut-off grade which produced an inferred global resource for the Dos Hornos, Veta Tomas and Once Bocas mineralization totalling 17,918,181 tonnes having an average grade of 90.62 g Ag/t and 0.65 g Au/t, with an average horizontal width of 68.33 m. The inputs and procedures used for this estimate are not fully understood by WGM. The area of influence of some drill hole assays was over-extended below the deepest drilling, and it is clear that high-grade intersections were extended and diluted with uneconomic intervals to increase the thickness of the resource blocks. The resource estimate also relied on surface samples that vary markedly with core samples in adjacent holes, and the variance is not well explained. Clearly, the only way to assess the impact of surface effects is to have high-quality drill core data immediately below the surface samples, and until such time as this is available, questions will exist concerning the distance to which high-grade surface samples should be projected downwards and thereby influence resource estimates. For these and other reasons, WGM concludes that the previous estimate is not in compliance with NI 43-101 and therefore cannot and should not be relied upon for investment decisions as the estimates are not compliant with CIM Standards and Guidelines for the estimation of Mineral Resources and
Mineral Reserves. Neither CMA nor its Qualified Persons nor WGM have done sufficient work to reclassify the previous resources as current Mineral Resources under current mineral resource terminology, and they are not treating the previous resources as current Mineral Resources.
The current NI 43-101 Mineral Resources were estimated by WGM without consideration for metal recoveries and were classified in compliance with CIM Standards and Guidelines. The Mineral Resources for the project in accordance with WGM’s base case cut-off using a $75 value for the contained silver and gold and a minimum 1.5 m true thickness are summarized as follows in Table 35.
TABLE 35
SUMMARY OF NUEVO MILENIO MINERAL RESOURCE ESTIMATES
(using grade cut-off equivalent to US $75/tonne Au-Ag value)
| Zone/Segment and | Tonnes | True Thickness | Average Grade | Equivalent Silver Grade |
| Resource Class | | (avg. m.) | g Ag/t | g Au/t | Ageq (g/t) |
| Dos Hornos 1 | | | | | |
| Indicated Resources | 268,116 | 4.80 | 164 | 0.66 | 198 |
| Inferred Resources | 80,594 | 4.60 | 155 | 0.75 | 194 |
| | | | | | |
| Dos Hornos 2 | | | | | |
| Indicated Resources | 335,887 | 7.92 | 124 | 1.00 | 175 |
| Inferred Resources | 183,107 | 5.79 | 107 | 1.00 | 164 |
| | | | | | |
| Veta Tomas | | | | | |
| Indicated Resources | 278,967 | 5.70 | 173 | 0.87 | 199 |
| Inferred Resources | 156,185 | 4.76 | 126 | 0.82 | 166 |
| | | | | | |
| Once Bocas North | | | | | |
| Indicated Resources | 223,783 | 8.95 | 112 | 0.63 | 145 |
| Inferred Resources | 117,949 | 9.68 | 119 | 0.70 | 155 |
| | | | | | |
| All Zone Segments | | | | | |
| Indicated Resources | 1,106,753 | 6.81 | 144 | 0.81 | 181 |
| Inferred Resources | 537,835 | 6.17 | 122 | 0.84 | 167 |
Notes:
| | 1. | Mineral Resources which are not Mineral Reserves to not have demonstrated economic viability Mineral Resources may be materially affected by environmental, permitting, legal, title, taxation, socio-political, marketing, or other relevant issues. |
| | 2. | The quantity and grade of reported Inferred Resources in this estimation are uncertain in nature and there has been insufficient exploration to define these Inferred Resources as an Indicated or Measured Mineral Resource and it is uncertain if further exploration will result in upgrading them to an Indicated or Measured Mineral Resource category. |
| | 3. | The Mineral Resources were estimated using the Canadian Institute of Mining, Metallurgy and Petroleum standards on Mineral Resources and Reserves, Definitions and Guidelines prepared by the CIM Standing Committee on Reserve Definitions and adopted by CIM Council December 11, 2005. |
| | 4. | S.G. of 2.65 tonnes/m3 was used. |
| | 5. | Tonnage and contained Ag and Au are rounded to nearest thousand or thousandth. Totals may not add up due to rounding. |
Sensitivity analysis demonstrates that the resources are not greatly affected by $10 value changes in the cut-off grade. This is a consequence of general lack of shoulders to the mineralization on most sections. It is possible that a substantial reduction of the cut-off grade to, for example $50 of contained gold plus silver value would bring additional sub-zones into Mineral Resources, however WGM believes that it would be difficult to mine such grades at a profit. Additional resources might be forthcoming if those portions of the deposit amenable to open-cut mining were modelled separately using parameters suitable for such mining.
26. RECOMMENDATIONS
The geology outlined by the drilling to date has been interpreted as being affected by considerable faulting. Although there is evidence for many shears and faults in the drilling, the net displacements are probably less important than previously thought because most structure seems to be parallel to the mineralization. During the modelling of the geology, WGM did note that the mineralization was cross-cut by fault zones at varying angles to the strike and dip of the mineralization. These faults did not constrain the mineralization, and maximum off-sets were generally on the order of 10-20 metres. One of the proposed geological models introduced the possibility of thrust faulting across mineralization zones and repeating of the mineral resource blocks (zones). The current Mineral Resource estimate by WGM does not provide for additional resource blocks that might exist if thrust repeats are present. Clearly, this possibility needs to be addressed by drill holes specifically located to test this hypothesis.
Additional drilling is needed to enlarge the mineralized zones and to provide in-fill data. In particular, greater hole density is needed on well mineralized sections to up-grade the confidence level of the mineralization. A sectional spacing of 25 m is recommended.
At Dos Hornos 2 and at Once Bocas, at least three parallel silver-gold mineralized structures are present, however not all structures are adequately tested on all sections. Additional drilling is needed to ensure complete coverage. Additional drilling is required at Once Bocas South to support a resource estimate in this area.
The mineralization on all sections is seen as weakening at depth, however, in some areas it is possible that the apparent weakening is an artefact of the drill hole spacing. Additional close-spaced drilling is needed to explore the possibility of changes in plunge direction of the hydrothermal system within the shear or breccia zone that hosts the mineralization.
Currently, the drilling has been carried out on a number of orientations that impede data interpretation. A systematic approach is needed for each zone that ensures optimum intersection angles.
Some drill holes exhibit excessive deviation resulting in substantial off-centreline drift of the hole’s bearing. Drill hole flattening is not generally excessive, however it is clear that the drilling technology requires improvement. Notwithstanding the variability of the rock conditions, the core loss seen in some drill holes has the hallmarks of worn-out reaming shells, worn-out or inadequate drill bits and core barrel/core tube assemblies that are not up to the job. Excessive core loss in many sections is unacceptable by WGM’s standards, and
WGM welcomes and encourages CMA’s increasingly proactive pressure on the drilling contractor to improve its services. All future drilling must incorporate equipment to ensure straighter drilling and better core recovery such as:
| | — | suitable impregnated drill bits; |
| | — | good quality reaming shells; |
| | — | stabilized (3-rib reaming-type) core barrels; and, |
| | — | triple-tube core tube assemblies. |
The use of proper drilling equipment will allow better production which has suffered as a result of core loss, probably a result of excessive down-pressure.
In a number of drill holes, the sampling of the mineralized zone is restricted only to rocks that were obviously mineralized, and no sampling extended beyond the margins of the zone. While this approach may economize the assaying budget, it invokes many questions as to the nature of the borders of the mineralized zone. This is especially the case where high-grade samples are not constrained by lower-grading samples. Additional sampling is needed on the margins of those zones where the boundary sample is economically interesting, and no adjacent sample was taken.
Greater care needs to be taken in the recording of drill hole survey data. At least one instance was found where the recorded data shown in the drill hole log was an impossibility. This should have been recognized long before the data was given to WGM. Other instances of poorly recorded sample interval data have been corrected after being noted by WGM. While errors in such data are encountered in all projects, usually the internal checking procedures identify and correct these mistakes before the data becomes entrenched in the project information base.
A program of diamond drilling is proposed. Targets for this drilling include the Dos Hornos-Veta Tomas structure which may include parallel structures. The previous drilling stressed the vertical continuity of the structures. WGM’s recommends that the continuing drilling program stress in-fill drilling where higher silver and gold values are found to establish continuity both at shallow levels and in selected areas at depth.
The Mineral Resources at Dos Hornos 1 are predominantly located above +/- 200 m as measured down the plane of dip. A few holes would be useful to explore narrow leads that may exist at a depth of approximately 150-200 m below holes numbered 05-06 and between 04-06 and 03-06. Additional resources are also likely to be located below holes 13-11 and 07-34.
Although the Mineral Resources are constrained to the north and at depth, additional drilling is needed to explore the potential for the addition resources close to surface to the south.
In Dos Hornos 2, the economically significant mineralization in the ‘A’ sub-zone was intersected in only one hole shown as 11-06 on the longitudinal section. The mineralization is well constrained up- and down-dip but may be open laterally and additional drilling is needed. Mineralization in the ‘B’ and ‘C’ sub-zones is open in most directions, and it is clear that additional drilling is warranted to better define this mineralization.
At Veta Tomas, the mineralization in the ‘A’ sub-zone appears to be open at depth below holes 03-11 and 15-11 as well as northerly from holes 01-11 and 20-06. Additional drilling in these areas is likely to add significantly to the Veta Tomas resources. Mineralization in the Veta Tomas ‘B’ sub-zone is apparently a tightly confined and relatively thin shoot more or less running down the plane of the zone without significant lateral expansion in the near surface area. The mineralization is clearly open between 350 N and 500 N and in-fill drilling is likely to add to the current resources. Since the original field mapping was completed, many more outcrops have been exposed along roads. These need to be mapped for geological information and mineralization.
At Once Bocas North, the mineralized zone in the ‘A’ subzone is a near-surface body that has limited potential. However, additional drilling is needed below hole 12-03 in which the mineralization has a true thickness of 2.6 m, and north of hole 06-03 where the mineralization has a true thickness of 5.4 m. The ‘B’ sub-zone is not well constrained by the current drilling and may be open along strike near surface and to depth towards the north. The thickness of the mineralization appears to increase downwards although its sharp termination between holes 12-03 and 05-11 suggests either: (1) the presence of cross-fault with an approximate E to NE strike; (2) a transition of mineralization from the ‘B’ to the ‘C’ sub-zone; or (2) a misinterpretation of the sub-zone alignments in this area – this also should be tested by drilling or confirmed through surface mapping although the impact in the contained resources is believed to be minimal. The Once Bocas North ‘C’ sub-zone is the most important contributor of Mineral Resources in this area. A down-plunge lead of mineralization from hole 09-03 may exist to the north, but generally the mineralization is well constrained by drilling in this direction. Strong mineralization occurs in a large breccia zone at and near surface, and this mineralization is open towards the south where additional drilling is recommended. The drilling should be carried out with the purpose of exploring the potential for an open-pitable resource in this area. In addition, the drill core from the 2011 program at Once Bocas was only selectively sampled, and remaining sections within a projected pit limit should be sampled and assayed.
There is a considerable gap between the Once Bocas North and South drilling which lies in lower ground. This area should be tested. Recent work on Once Bocas South suggests that the vein direction may be more easterly than used to plan the 2011 holes. This possibility should be investigated and tested by trenching and drilling. Additional drilling is recommended at Once Bocas South to provide supporting data for a resource estimate in this area.
The Spanish workings on the west-dipping veins at Chacuaco North indicate a broad mineralized system and drilling has intersected values that may be exploitable using an open pit. Additional shallow drilling is needed, and the same approach is recommended for Cafetal.
To provide a preliminary assessment of these targets a drill program of 2,500 metres with the testing in between 15 and 20 holes is recommended. Target selection will be based on the updated database. The cost of this Phase 1 of this program is projected at US $800,000. The follow up Phase 2 is US $3,000,000 for a total of US $3,800,000. Phase 2 is contingent on the results of Phase 1 (Table 36).
TABLE 36
RECOMMENDED EXPLORATION PROGRAM
FOR THE NUEVO MILENIO PROJECT
| Item | | Unit Cost | | | Cost | |
| Phase 1 | | | | | | |
| 2,500 metres drilling | | $ | 150. | | | $ | 375,000. | |
| 2,000 samples assaying | | $ | 30. | | | | 60,000. | |
| Field Consumables | | | | | | | 20,000. | |
| Field Office and support staff | | | | | | | 100,000. | |
| Supervision | | | | | | | 50,000. | |
| Reporting | | | | | | | 20,000. | |
| Head office overhead 15% | | | | | | | 100,000. | |
| Contingency 10% | | | | | | | 75,000 | |
| Total | | | | | | $ | 800,000. | |
| | | | | | | | | |
| Phase 2 | | | | | | | | |
| 10,500 metres drilling | | $ | 150. | | | $ | 1,500,00. | |
| 8,000 samples assaying | | $ | 30. | | | | 240,000. | |
| Field Consumables | | | | | | | 120,000. | |
| Field Office and support staff | | | | | | | 320,000. | |
| Supervision | | | | | | | 160,000. | |
| Reporting | | | | | | | 40,000. | |
| Head office overhead 15% | | | | | | | 350,000. | |
| Contingency 10% | | | | | | | 270,000. | |
| | | | | | | | | |
| Total | | | | | | $ | 3,000,000. | |
| Grand Total | | | | | | $ | 3,800,000. | |
27. DATE AND SIGNATURE PAGE
This report titled “A Technical Review of the Nuevo Milenio Project, Tepic Area, Nayarit State, Mexico for Cream Minerals Limited” and dated 20 March, 2013, was prepared and signed by the following authors:
Date effective as of 20 March, 2013.
| /s/ Derek McBride | | /s/ Al Workman |
Derek McBride, P. Eng. Senior Associate Geologist | | Al Workman, P. Geo. Senior Geologist |
28. REFERENCES
| | Ferrari and Rosas-Euglena, 1999, Late Miocene to Quaternary Extension of the North Boundary of the Jalisco Block: The Tepic-Zacoalco Rift Revised. |
| | Ferrari, L., Petrone, C., Francalanci, L., Tagani, T., Eguchi, M., Manetti, P., and Venegas-Salgado, S., 2003, Geology of the Pedro-Cebaruco Graben, Western Trans-Mexican Volcanic Belt; Revisita Mexicana de Ciencias Geologicas, Vol.20, pp. 165-181. |
| | Holacpek, F., 2005, Discussion Silver – Gold and Associated Bulk Tonnage Potential from Stockwork Zones and Zones of Dissemination, Application to Nuevo Milenio Project; Cream Company Report Minerals Ltd. |
| | Holcapek, F., 2008, Evaluation Report Dos Honos and Veta Tomas Gold-Silver Structures, Nuevo Milenio Project, Municipality of Xalisco, State of Nayarit, Mexico, Latitude: 21 21 35 North, Latitude: 104 46 53 West, Dated January 30 2008 (“The Technical Report”); Cream Minerals Ltd www.sedar.com Website. |
| | Holcapek, F., 2012, Power Point Presentation on Nuevo Milenio, Dos Hornos 1, 2011 Fill-in Drilling, Drill Sections – Interpretation, Blocks of Mineral Resources 2012; Cream Company Report Minerals Ltd. |
| | Holcapek, F., 2012, Power Point Presentation on Nuevo Milenio, Dos Hornos 2, Length of Mineral Blocks in Long Sections and Down Dip Extent in X-Sections; Company Report Cream Minerals Ltd. |
| | Holcapek, F., 2012, Power Point Presentation on Nuevo Milenio, Once Bocas Sur: Company Report Cream Minerals Ltd. |
| | Holcapek, F., 2012, Power Point Presentation on Nuevo Milenio, Once Bocas 2011 Fill-in Drilling: Company Report Cream Minerals Ltd. |
| | Holcapek, F., 2012, Power Point Presentation on Nuevo Milenio, VetaTomas 2011 Fill-in Drilling: Company Report Cream Minerals Ltd. |
| | Holcapek, F., 2012, Power Point Presentation on Nuevo Milenio, Chacuaco: Company Report Cream Minerals Ltd. |
| | Holcapek, F., 2012, Power Point Presentation on Nuevo Milenio, Cafetal: Company Report Cream Minerals Ltd. |
| | McBride, D. E., 2007, Investigation of 300 Year Old Mine Workings Defines New Potential, Santo Domingo Project, Stroud Resources Limited; Power Point Presentation, Guadalajara Mexico, February 2007. |
| | McBride, D. E., 2010, Santo Domingo II and Nombre De Dios Concessions, Hostotipaquillo Area, State of Jalisco, in Behre Dolbert de Mexico, 2010, NI 34-101 Technical Report, Santo Domingo Silver-Gold Exploration Project; prepared for Stroud Resources Ltd. www.sedar.com Website. |
CERTIFICATE
to accompany the report entitled
“A Technical Review
of the Nuevo Milenio Project, Tepic Area, Nayarit State, Mexico for Cream Minerals Limited”
dated 20 March, 2013
I, Derek E. McBride, P.Eng., do hereby certify that:
| 1. | My permanent address is 20 Forsythia Dr., West Hill, Ontario, M1E 1Y1. |
| 2. | I am an associate with Watts, Griffis and McOuat Limited, a firm of consulting geologists and engineers, which has been authorized to practice professional engineering by the Professional Engineers Ontario since 1969. Watts, Griffis and McOuat Limited also carries a licence to practise issued by the Association of Professional Geoscientists of Ontario. |
| 3. | I am a graduate of the Haileybury School of Mines with a diploma in Mining Technology and from the Queen’s University, Kingston, Ontario with B. Sc. Eng. and M.Sc. Eng. Degrees in 1968 and 1972 respectively, and a Ph.D. in geology from the University of New Brunswick 1976. I have practised my profession continuously 1968. My speciality has been in mineral exploration and has included porphyry copper, volcanogenic massive sulphide, orogenic gold, silver, iron, uranium and diamond experience. Projects have covered most geological provinces in Canada and in 16 different countries. I accomplishments include the discovery of two gold mines; The Nugget Pond Gold Deposit in Newfoundland and the Reward Gold Zone in New South Wales, Australia and technical reviews of several epithermal gold-silver projects in Mexico and the Ukraine. I have worked on precious metals projects in Turkey, Canada, Australia, the United States, Cuba, Haiti, Indonesia, Ghana, Nicaragua and Mexico, and I have directed exploration projects in Mexico, Argentina, Australia, Haiti, Ghana, Mongolia, and Canada. I have published papers on metallogeny and plate tectonics, gold, volcanogenic massive sulphide, porphyry copper and nickel-copper deposits plus company reports on the above and silver-gold, uranium and diamond deposits. |
| 4. | I am a Practicing Member Professional Engineer licensed by PEO (Membership Number 29879012), a Fellow of the Geological Association of Canada (GAC), a Member of the Society of Economic Geologists (SEG) and the Association of Applied Geochemists (AGG), a life member of the Canadian Institute of Mining, Metallurgy and Petroleum (CIM), and the Prospectors and Developers Association of Canada (PDAC). |
| 5. | I have read the definition of "Qualified Person" in National Instrument 43-101 and certify that by reason of my education, past relevant work experience and affiliation with a professional association (as defined in NI 43-101), I fulfill the requirements to be a "Qualified Person" for the purposes of NI 43-101. |
| 6. | I am independent of the issuer applying all of the tests in Section 1.5 of Canadian securities rule National Instrument 43-101. |
| 7. | I visited the Nuevo Milenio Property during from September 4th to 8th, 2012 spent 3 days in the field examining the geology, and two days examining and sampling core and core sample pulps and examining field maps in the Company’s Tepic Office with Ing. G. Francisco, the Field Manager for Cream Minerals Limited. |
| 8. | I am responsible for items 2 to 6, 8 to 13 and 17 to 23. I am jointly responsible with Mr. Al. Workman for items 1, 7, 24 to 27. |
| 9. | I have had no previous involvement with the Neuvo Milenio Property prior to the work that supported this technical report. |
| 10. | I have no personal knowledge as of the date of this certificate of any material fact or change, which is not reflected in this report. |
| 10. | Neither I, nor any affiliated entity of mine, is at present, under an agreement, arrangement or understanding or expects to become, an insider, associate, affiliated entity or employee of Cream Minerals Limited, or any associated or affiliated entities. |
| 11. | Neither I, nor any affiliated entity of mine, own, directly, or indirectly, nor expect to receive, any interest in the properties or securities of Cream Minerals Limited or any associated or affiliated companies. |
| 12. | Neither I, nor any affiliated entity of mine, have earned the majority of our income during the preceding three years from Cream Minerals Limited or any associated or any affiliated companies. |
| 13. | I have read National Instrument 43-101 and Form 43-101F1 and have prepared the Technical Report in compliance with NI 43-101 and Form 43-101F1; and have prepared the report in conformity with generally accepted Canadian mining industry practice, and as of the date of the certificate, to the best of my knowledge, information and belief, the technical report contains all scientific and technical information that is required to be disclosed to make the technical report not misleading. |
| |  |
| | /s/ Dr. Derek McBride P. Eng. |
| | 20 March, 2013 |
CERTIFICATE
to accompany the report entitled
“A Technical Review
of the Nuevo Milenio Project, Tepic Area, Nayarit State, Mexico for Cream Minerals Limited”
dated 20 March, 2013
| | I, Albert W. Workman, do hereby certify that: |
| 1. | My permanent address is 2285 Lakeshore Blvd. West, Suite 2413, Toronto, Ontario, Canada, M8V 3X9. |
��
| 2. | I graduated from Brock University in St. Catharines, Ontario, Canada, in 1975 with an Honours B.Sc. in Geological Sciences and I have practiced my profession continuously since then for a total of 38 years in Canada and internationally. I have worked extensively in structurally-hosted gold exploration since 1983. My accomplishments include being a co-discoverer of the Holt-McDermott gold mine in NE Ontario, the discovery of several undocumented epithermal gold systems in Yemen and Indonesia, and positive technical reviews of several epithermal gold-silver projects in Indonesia which were subsequently developed into producing mines. I have worked on epithermal precious metals projects in Turkey, Saudi Arabia, Vietnam, Laos, Papua New Guinea, Fiji, Nicaragua and Mexico, and I have directed similar projects in Cambodia, Mali, Guyana and Brazil. I have carried out mineral resource estimates on a wide range of deposit types including structurally controlled PGEs, porphyry copper, structurally-controlled gold-silver, stratabound uranium, VMS and MVT. |
| 3. | I am a Senior Geologist and Vice-President with Watts, Griffis and McOuat Limited, a firm of consulting geologists and engineers, which has been authorized to practice professional engineering by the Professional Engineers Ontario since 1969. Watts, Griffis and McOuat Limited also carries a licence to practise issued by the Association of Professional Geoscientists of Ontario. |
| 4. | I am a Practicing Member of the Association of Professional Geoscientists of Ontario (Member #0170). I am also a Fellow of the Australian Institute of Mining and Metallurgy (AusIMM) as well as a Member of the Society of Economic Geologists (SEG), the Canadian Institute of Mining, Metallurgy and Petroleum (CIM), and the Prospectors and Developers Association of Canada (PDAC). |
| 5 | I have read the definition of "Qualified Person" in National Instrument 43-101 and certify that by reason of my education, past relevant work experience and affiliation with a professional association (as defined in NI 43-101), I fulfill the requirements to be a "Qualified Person" for the purposes of NI 43-101. |
| 6. | I am independent of the issuer applying all of the tests in Section 1.4 of Canadian securities rule National Instrument 43-101. |
| 7. | I did not visit the Cream Mineral Nuevo Milenio property, however I have engaged in detailed correspondence with Mr. Fred Holcapek, P.Eng. who has a long history of involvement with the exploration of the subject property. |
| 8. | I am responsible for editing the report, contributing to the Regional Geology discussion in Section 7, and I am specifically responsible for the Mineral Resource estimates contained in Section 14 as well as Sections 15 and 16. I am jointly responsible with Mr. Derek McBride, P.Eng. for Sections 1, and 24-27. |
| 9. | I have no personal knowledge as of the date of this certificate of any material fact or change, which is not reflected in this report. |
| 10. | Neither I, nor any affiliated entity of mine, is at present, under an agreement, arrangement or understanding or expects to become, an insider, associate, affiliated entity or employee of Cream Minerals Limited, or any associated or affiliated entities. |
| 11. | Neither I, nor any affiliated entity of mine, own, directly or indirectly, nor expect to receive, any interest in the properties or securities of Cream Minerals Limited or any associated or affiliated companies. |
| 12. | Neither I, nor any affiliated entity of mine, have earned the majority of our income during the preceding three years from Cream Minerals Limited or any associated or any affiliated companies. |
| 13. | I have read National Instrument 43-101 and Form 43-101F1 and have prepared the Technical Report in compliance with NI 43-101 and Form 43-101F1; and have prepared the report in conformity with generally accepted Canadian mining industry practice, and as of the date of the certificate, to the best of my knowledge, information and belief, the technical report contains all scientific and technical information that is required to be disclosed to make the technical report not misleading. |
| |  |
| | /s/ Al Workman, P. Geo. |
| | 19 March, 2013 |