Exhibit 99.01
Exhibit 99.01
Forward Looking Statements
Statements in this Press Release relating to plans, strategies, economic performance and trends, projections of results of specific activities or investments, expectations or beliefs about future events or results, and other statements that are not descriptions of historical facts, may be forward-looking statements within the meaning of the Private Securities Litigation Reform Act of 1995, Section 27A of the Securities Act of 1933 and Section 21E of the Securities Exchange Act of 1934. Forward-looking information is inherently subject to risks and uncertainties, and actual results could differ materially from those currently anticipated due to a number of factors, which include, but are not limited to, risk factors discussed in the Company’s Annual Report on Form 10-K and in other documents filed by the Company with the Securities and Exchange Commission from time to time. Forward-looking statements may be identified by terms such as “may”, “will”, “should”, “could”, “expects”, “plans”, “intends”, “anticipates”, “believes”, “estimates”, “predicts”, “forecasts”, “potential” or “continue,” or similar terms or the negative of these terms, or other statements concerning opinions or judgments of the Company’s management about future events. Factors that could influence the accuracy of such forward-looking statements include, but are not limited to pressures on the earnings, capital and liquidity of financial institutions in general, resulting from current and future conditions in the credit and equity markets, the financial success or changing strategies of the Company’s customers, actions of government regulators, the level of market interest rates, weather and similar conditions, particularly the effect of hurricanes on the Company’s banking and operations facilities and on the Company’s customers and the communities in which it does business, changes in general economic conditions and the real estate values in our banking market (particularly changes that affect our loan portfolio, the abilities of our borrowers to repay their loans, and the values of loan collateral). Although the Company believes that the expectations reflected in the forward-looking statements are reasonable, it cannot guarantee future results, levels of activity, performance or achievements. All forward-looking statements attributable to the Company are expressly qualified in their entirety by the cautionary statements in this paragraph. The Company has no obligations, and does not intend to update these forward-looking statements. 2

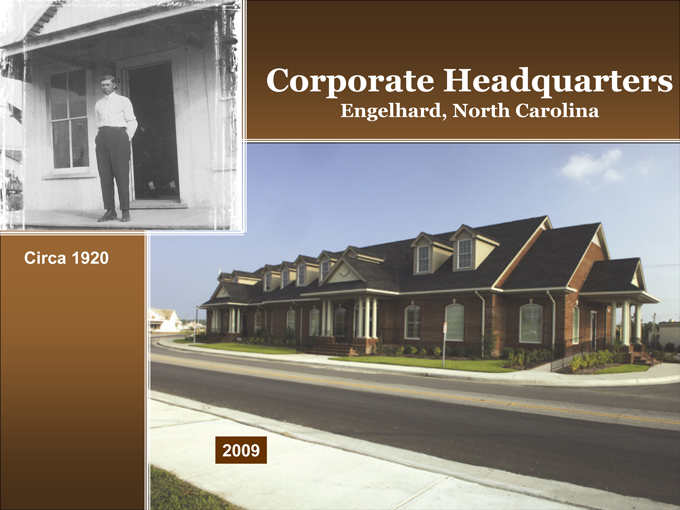
Corporate Headquarters
Engelhard, North Carolina
Circa 1920
2009
Overview
Who are we
Business Strategy & Growth Opportunities
Financial Highlights
Building Shareholder Value
Summary
5
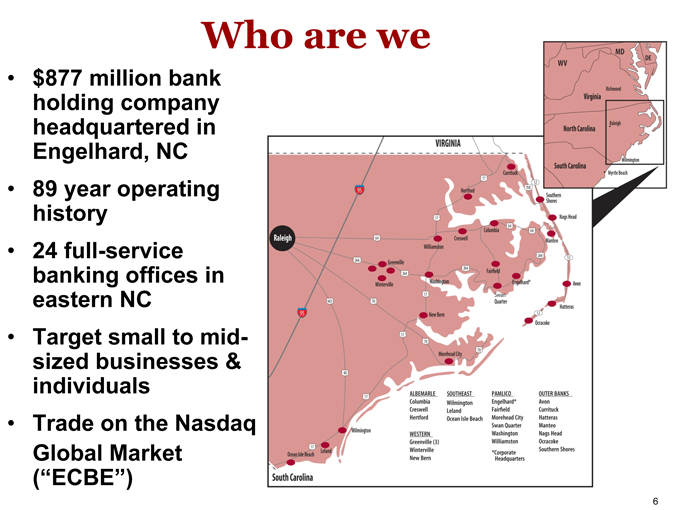
Who are we
$877 million bank holding company headquartered in Engelhard, NC
89 year operating history
24 full-service banking offices in eastern NC
Target small to mid-sized businesses & individuals
Trade on the Nasdaq Global Market (“ECBE”)
6
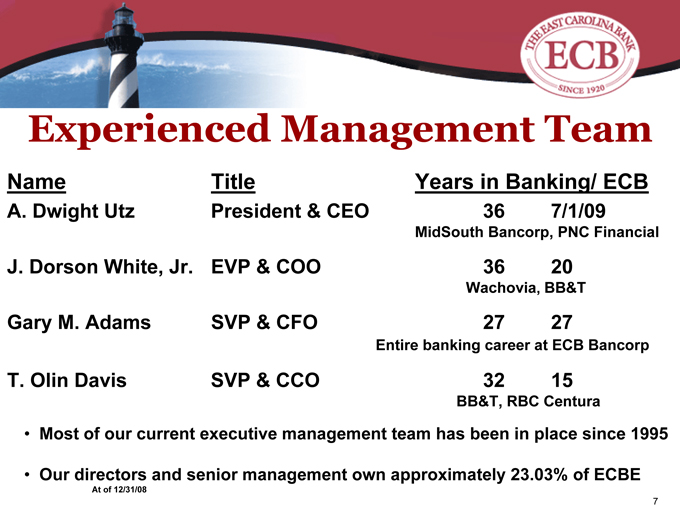
Experienced Management Team
Name A. Dwight Utz
J. Dorson White, Jr. Gary M. Adams T. Olin Davis
Title
President & CEO EVP & COO SVP & CFO SVP & CCO
Years in Banking/ ECB
36 7/1/09
MidSouth Bancorp, PNC Financial
36 20
Wachovia, BB&T
27 27
Entire banking career at ECB Bancorp
32 15
BB&T, RBC Centura
Most of our current executive management team has been in place since 1995
Our directors and senior management own approximately 23.03% of ECBE
At of 12/31/08
7

Business Strategy & Growth Opportunities
8
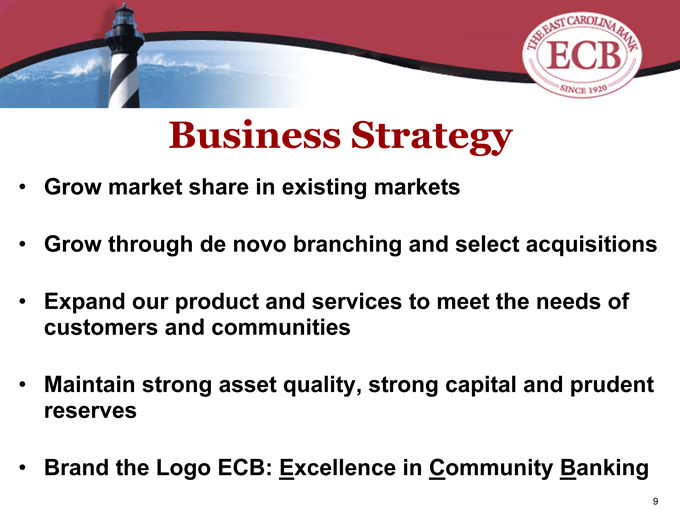
Business Strategy
Grow market share in existing markets
Grow through de novo branching and select acquisitions
Expand our product and services to meet the needs of customers and communities
Maintain strong asset quality, strong capital and prudent reserves
Brand the Logo ECB: Excellence in Community Banking
9
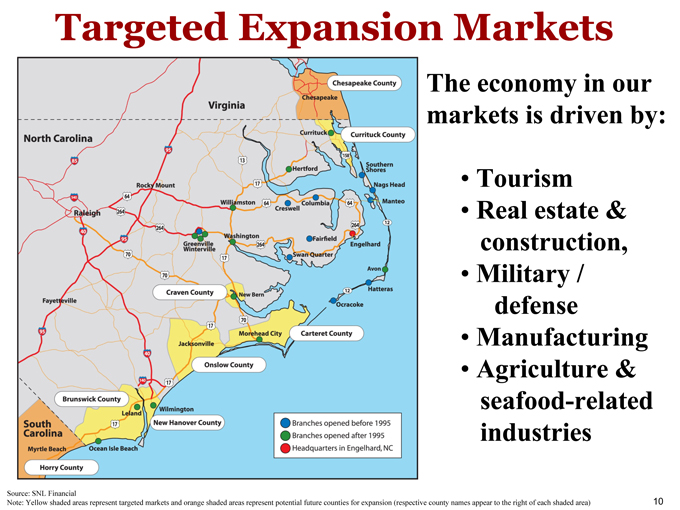
Targeted Expansion Markets
The economy in our markets is driven by:
Tourism
Real estate & construction,
Military / defense
Manufacturing
Agriculture & seafood-related industries
Source: SNL Financial 10 Note: Yellow shaded areas represent targeted markets and orange shaded areas represent potential future counties for expansion (respective county names appear to the right of each shaded area)
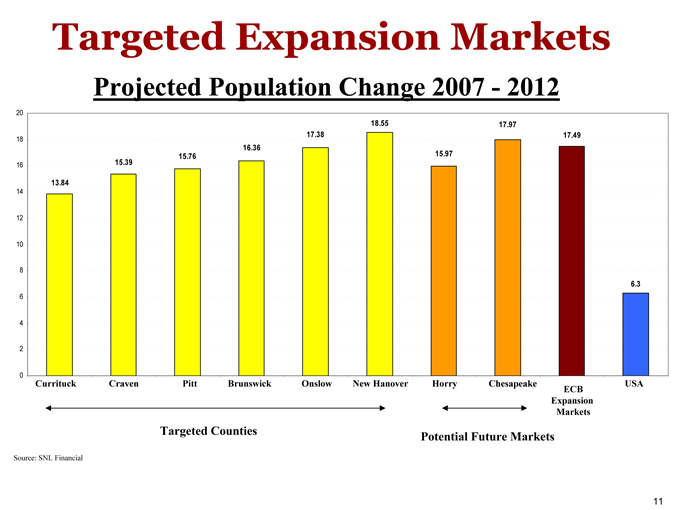
Targeted Expansion Markets
Projected Population Change 2007 - 2012
20 18 16 14 12 10 8 6 4 2 0
13.84
15.39
15.76
16.36
17.38
18.55
15.97
17.97
17.49
6.3
Currituck Craven Pitt Brunswick Onslow New Hanover Horry Chesapeake USA
ECB
Expansion Markets
Targeted Counties
Potential Future Markets
Source: SNL Financial
11
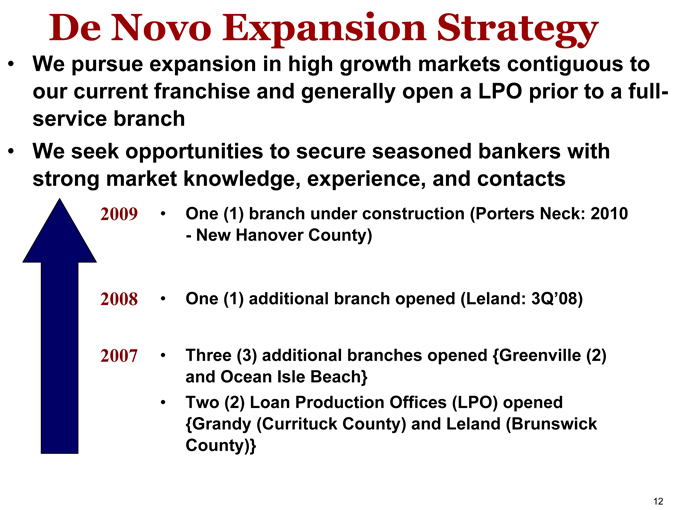
De Novo Expansion Strategy
We pursue expansion in high growth markets contiguous to our current franchise and generally open a LPO prior to a full-service branch
We seek opportunities to secure seasoned bankers with strong market knowledge, experience, and contacts
2009 One (1) branch under construction (Porters Neck: 2010
- New Hanover County)
2008 One (1) additional branch opened (Leland: 3Q’08)
2007 Three (3) additional branches opened {Greenville (2) and Ocean Isle Beach}
Two (2) Loan Production Offices (LPO) opened {Grandy (Currituck County) and Leland (Brunswick County)}
12
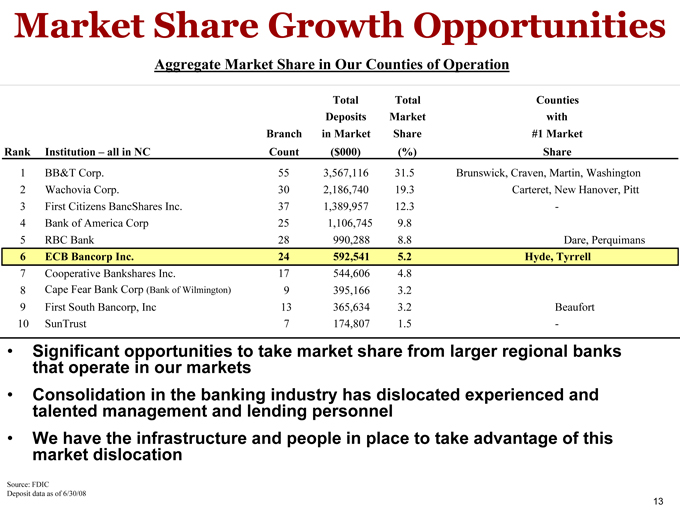
Market Share Growth Opportunities
Aggregate Market Share in Our Counties of Operation
Total Total Counties
Deposits Market with
Branch in Market Share #1 Market
Rank Institution – all in NC Count ($000) (%) Share
1 BB&T Corp. 55 3,567,116 31.5 Brunswick, Craven, Martin, Washington
2 Wachovia Corp. 30 2,186,740 19.3 Carteret, New Hanover, Pitt
3 First Citizens BancShares Inc. 37 1,389,957 12.3 -
4 Bank of America Corp 25 1,106,745 9.8
5 RBC Bank 28 990,288 8.8 Dare, Perquimans
6 ECB Bancorp Inc. 24 592,541 5.2 Hyde, Tyrrell
7 Cooperative Bankshares Inc. 17 544,606 4.8
8 Cape Fear Bank Corp (Bank of Wilmington) 9 395,166 3.2
9 First South Bancorp, Inc 13 365,634 3.2 Beaufort
10 SunTrust 7 174,807 1.5 -
Significant opportunities to take market share from larger regional banks that operate in our markets
Consolidation in the banking industry has dislocated experienced and talented management and lending personnel
We have the infrastructure and people in place to take advantage of this market dislocation
Source: FDIC
Deposit data as of 6/30/08 13

Financial Highlights
14
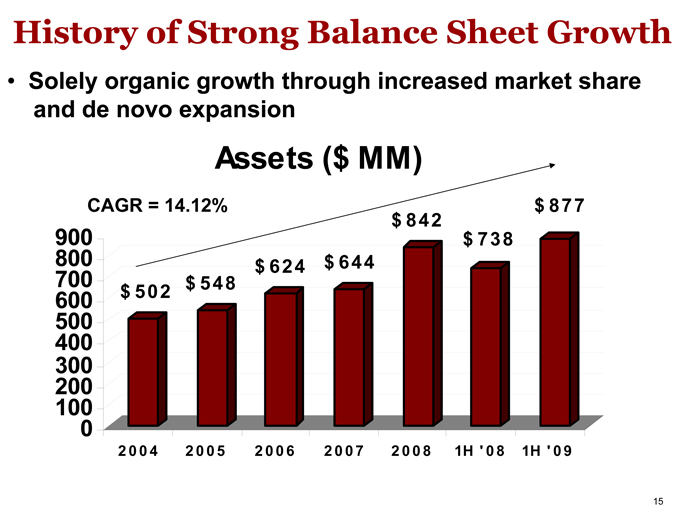
History of Strong Balance Sheet Growth
Solely organic growth through increased market share and de novo expansion
Assets ($ MM)
CAGR = 14.12%
$ 502
$ 548
$ 624
$ 644
$ 842
$ 738
$ 877
900 800 700 600 500 400 300 200 100 0
2004 2005 2006 2007 2008 1H ‘ 08 1H ‘ 09
15
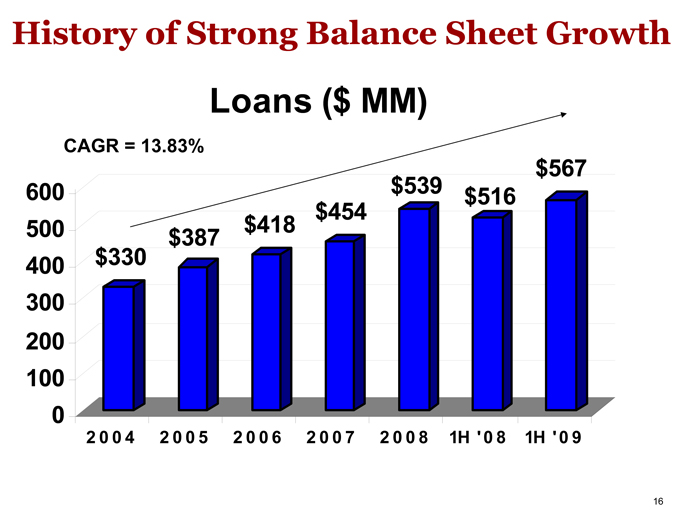
History of Strong Balance Sheet Growth
Loans ($ MM)
CAGR = 13.83%
$330
$387
$418
$454
$539
$516
$567
600 500 400 300 200 100 0
2004 2005 2006 2007 2008 1H ‘ 08 1H ‘ 09
16
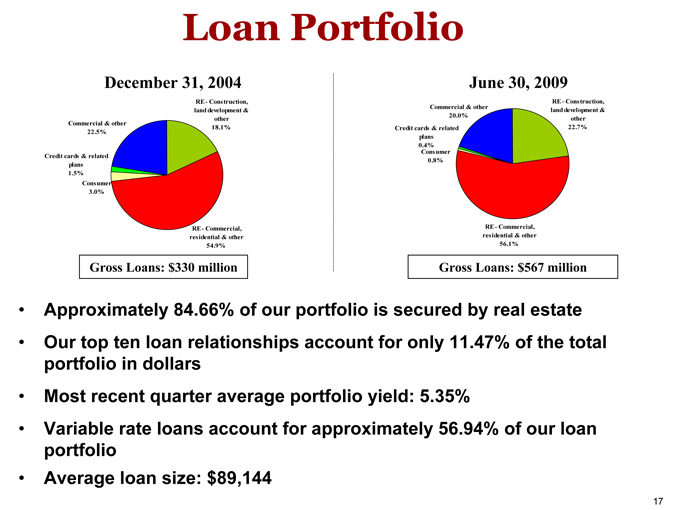
Loan Portfolio
December 31, 2004
RE - Construction, land development & other Commercial & other 18.1% 22.5%
Credit cards & related plans 1.5% Consumer 3.0%
RE - Commercial, residential & other 54.9%
Gross Loans: $330 million
June 30, 2009
Commercial & other RE - Construction, 20.0% land development & other Credit cards & related 22.7% plans 0.4% Consumer 0.8%
RE - Commercial, residential & other 56.1%
Gross Loans: $567 million
Approximately 84.66% of our portfolio is secured by real estate
Our top ten loan relationships account for only 11.47% of the total portfolio in dollars
Most recent quarter average portfolio yield: 5.35%
Variable rate loans account for approximately 56.94% of our loan portfolio
Average loan size: $89,144
17

Loan Totals By Region
Southeast Region
13.0%
OBX Region
28.2%
Western Region
21.9%
Pamlico Region
21.4%
Albemarle Region
15.5%
18
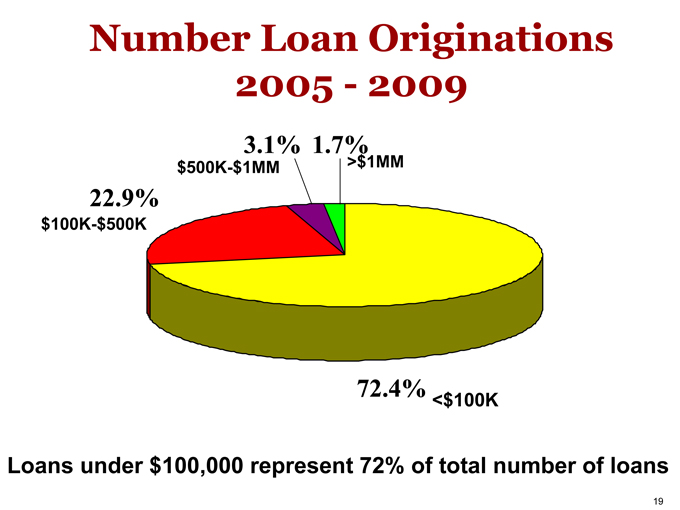
Number Loan Originations 2005 - 2009
3.1% 1.7%
$500K-$1MM >$1MM
22.9%
$100K-$500K
72.4%
<$100K
Loans under $100,000 represent 72% of total number of loans
19
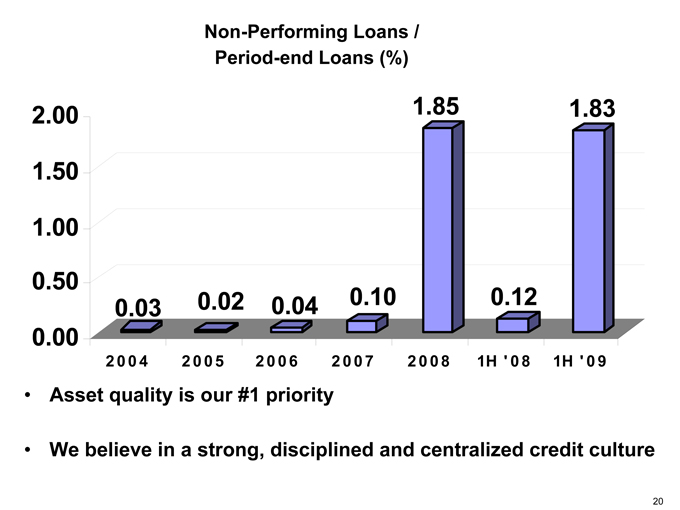
Non-Performing Loans / Period-end Loans (%)
1.85 1.83
0.02 0.04 0.10 0.12 0.03
2004 2005 2006 2007 2008 1H ‘ 08 1H ‘ 09
2.00 1.50 1.00 0.50 0.00
Asset quality is our #1 priority
We believe in a strong, disciplined and centralized credit culture
20
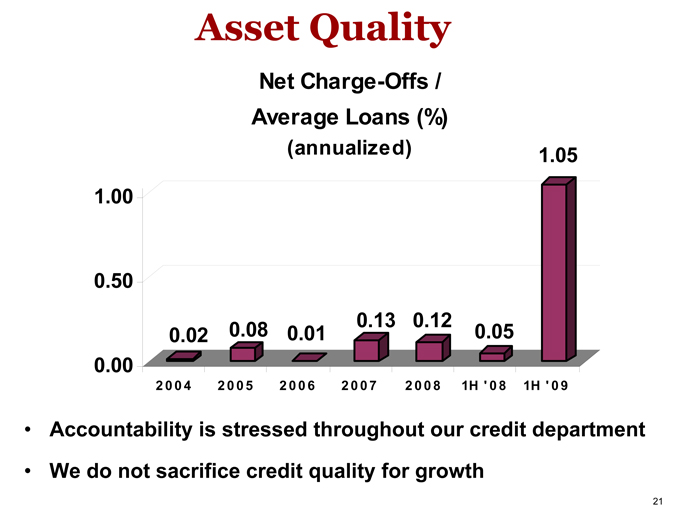
Asset Quality
Net Charge-Offs / Average Loans (%) (annualized)
0.02
0.08
0.01
0.13
0.12
0.05
1.05
1.00 0.50 0.00
2004 2005 2006 2007 2008 1H ‘ 08 1H ‘ 09
Accountability is stressed throughout our credit department
We do not sacrifice credit quality for growth
21
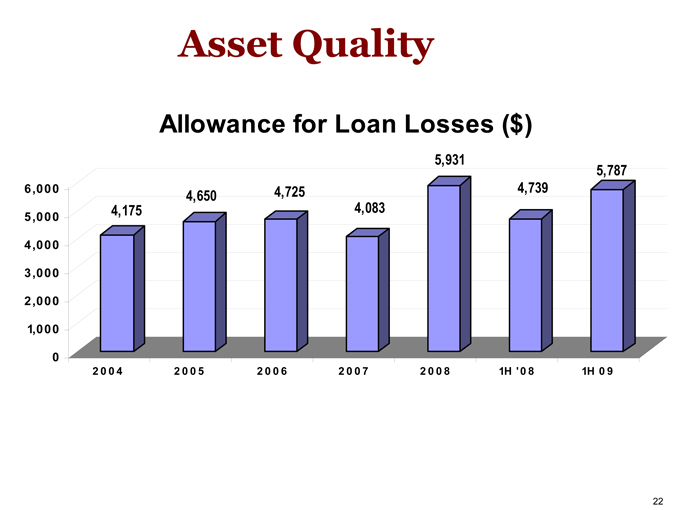
Asset Quality
Allowance for Loan Losses ($)
6,000 5,000 4,000 3,000 2,000 1,000 0
4,175
4,650
4,725
4,083
5,931
4,739
5,787
2004 2005 2006 2007 2008 1H ‘08 1H 09
22
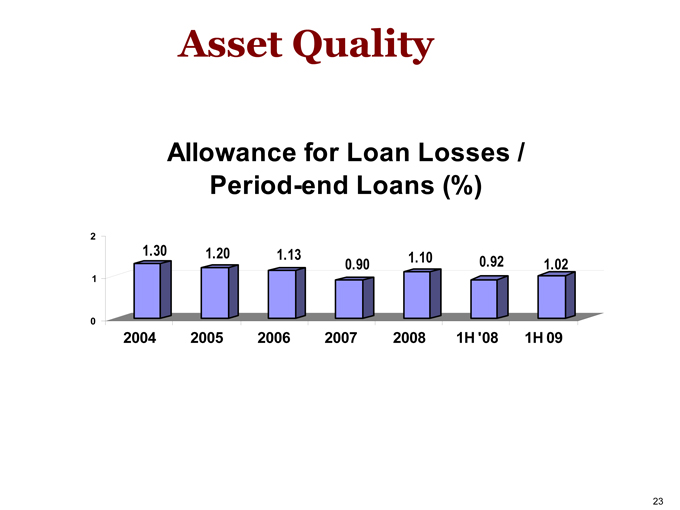
Asset Quality
Allowance for Loan Losses / Period-end Loans (%)
1.30
1.20
1.13
1.10
0.90
0.92
1.02
2 1 0
2004 2005 2006 2007 2008 1H ‘08 1H 09
23
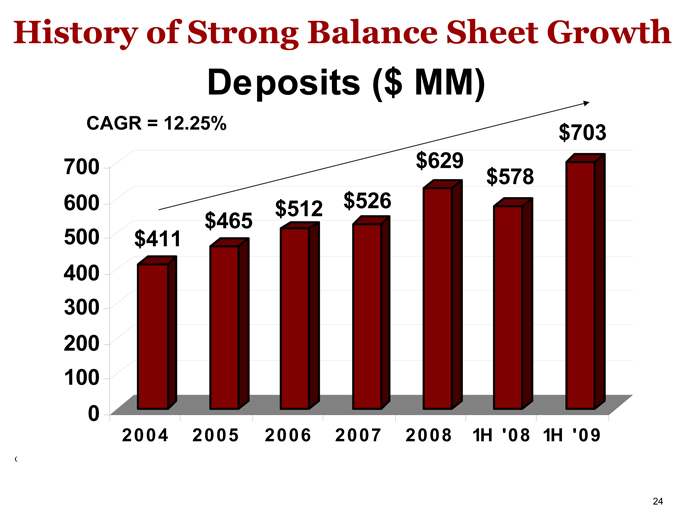
History of Strong Balance Sheet Growth
Deposits ($ MM)
CAGR = 12.25%
700 600 500 400 300 200 100 0
$411
$465
$512
$526
$629
$578
$703
2004 2005 2006 2007 2008 1H ‘08 1H ‘09
24
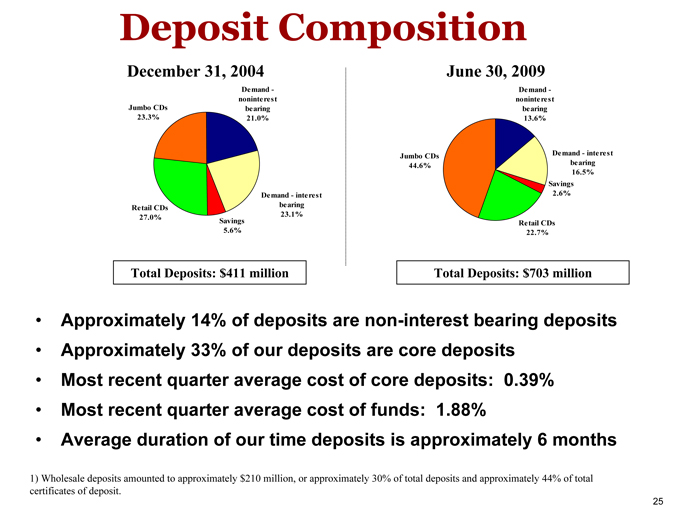
Deposit Composition
December 31, 2004
Demand - noninterest Jumbo CDs bearing 23.3% 21.0%
Demand - interest Retail CDs bearing 27.0% Savings 23.1% 5.6%
Total Deposits: $411 million
June 30, 2009
Demand - noninterest bearing
13.6%
Jumbo CDs Demand—interest
44.6% bearing
16.5% Savings 2.6%
Retail CDs
22.7%
Total Deposits: $703 million
Approximately 14% of deposits are non-interest bearing deposits
Approximately 33% of our deposits are core deposits
Most recent quarter average cost of core deposits: 0.39%
Most recent quarter average cost of funds: 1.88%
Average duration of our time deposits is approximately 6 months
1) Wholesale deposits amounted to approximately $210 million, or approximately 30% of total deposits and approximately 44% of total certificates of deposit.
25
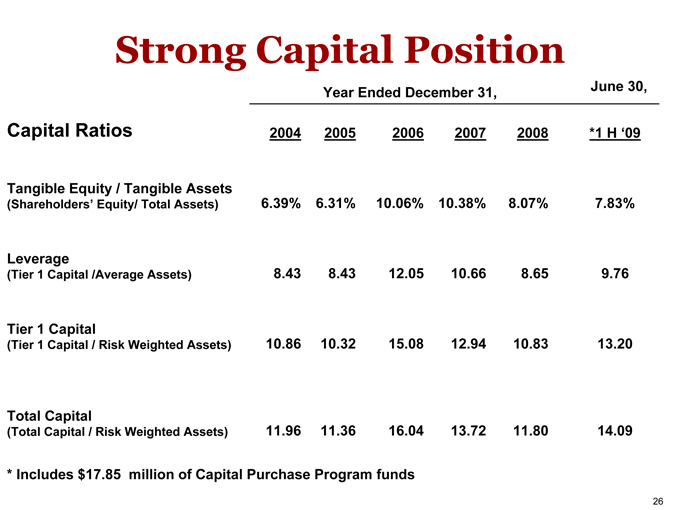
Strong Capital Position
Year Ended December 31, June 30,
Capital Ratios 2004 2005 2006 2007 2008 *1 H ‘09
Tangible Equity / Tangible Assets
(Shareholders’ Equity/ Total Assets) 6.39% 6.31% 10.06% 10.38% 8.07% 7.83%
Leverage
(Tier 1 Capital /Average Assets) 8.43 8.43 12.05 10.66 8.65 9.76
Tier 1 Capital
(Tier 1 Capital / Risk Weighted Assets) 10.86 10.32 15.08 12.94 10.83 13.20
Total Capital
(Total Capital / Risk Weighted Assets) 11.96 11.36 16.04 13.72 11.80 14.09
* Includes $17.85 million of Capital Purchase Program funds
26
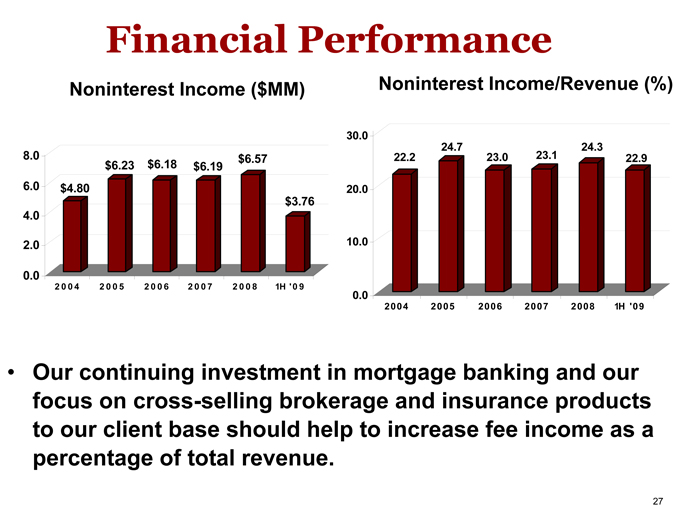
Financial Performance
Noninterest Income ($MM)
Noninterest Income/Revenue (%)
8.0 6.0 4.0 2.0 0.0
$4.80
$6.23
$6.18
$6.19
$6.57
$3.76
30.0 20.0 10.0 0.0
2004 2005 2006 2007 2008 1H ‘09
22.2
24.7
23.0
23.1
24.3
22.9
2004 2005 2006 2007 2008 1H ‘09
Our continuing investment in mortgage banking and our focus on cross-selling brokerage and insurance products to our client base should help to increase fee income as a percentage of total revenue.
27
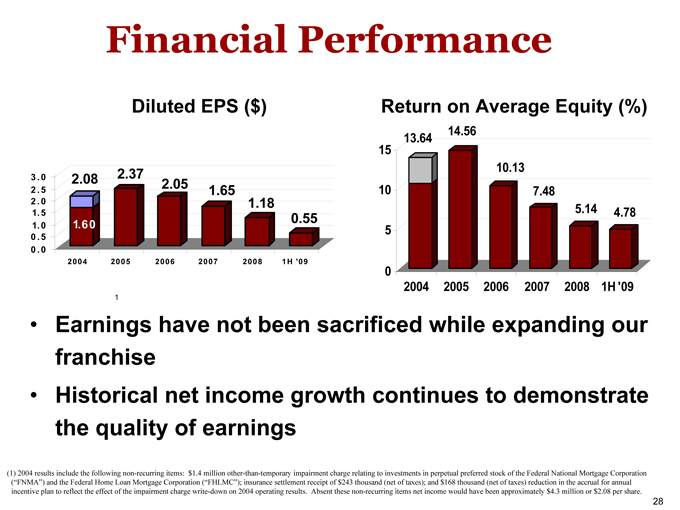
Financial Performance
Diluted EPS ($)
3.0 2.08 2.37 2.05
2.5 1.65
2.0 1.18
1.5 0.55
1.0 1.60
0.5
0.0
2004 2005 2006 2007 2008 1H ‘09
Return on Average Equity (%)
13.64 14.56
15
10.13
10 7.48
5.14 4.78
5
0
2004 2005 2006 2007 2008 1H ‘09
Earnings have not been sacrificed while expanding our franchise
Historical net income growth continues to demonstrate the quality of earnings
(1) 2004 results include the following non-recurring items: $1.4 million other-than-temporary impairment charge relating to investments in perpetual preferred stock of the Federal National Mortgage Corporation (“FNMA”) and the Federal Home Loan Mortgage Corporation (“FHLMC”); insurance settlement receipt of $243 thousand (net of taxes); and $168 thousand (net of taxes) reduction in the accrual for annual incentive plan to reflect the effect of the impairment charge write-down on 2004 operating results. Absent these non-recurring items net income would have been approximately $4.3 million or $2.08 per share.
28
Building Shareholder Value
29
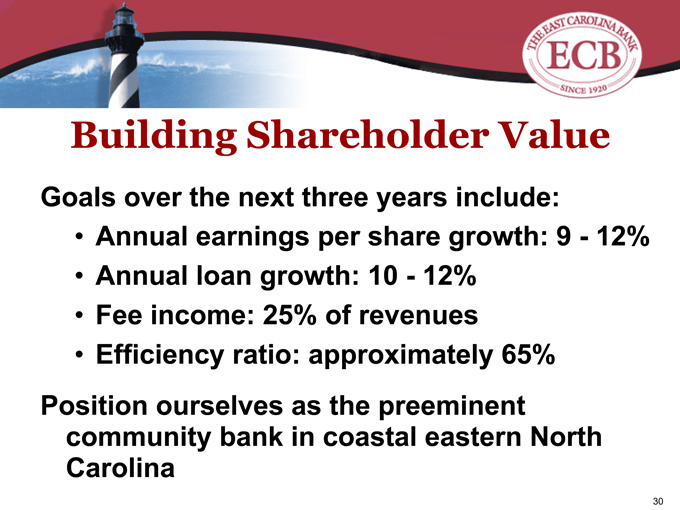
Building Shareholder Value
Goals over the next three years include:
Annual earnings per share growth: 9 - 12%
Annual loan growth: 10 - 12%
Fee income: 25% of revenues
Efficiency ratio: approximately 65% Position ourselves as the preeminent community bank in coastal eastern North Carolina
30
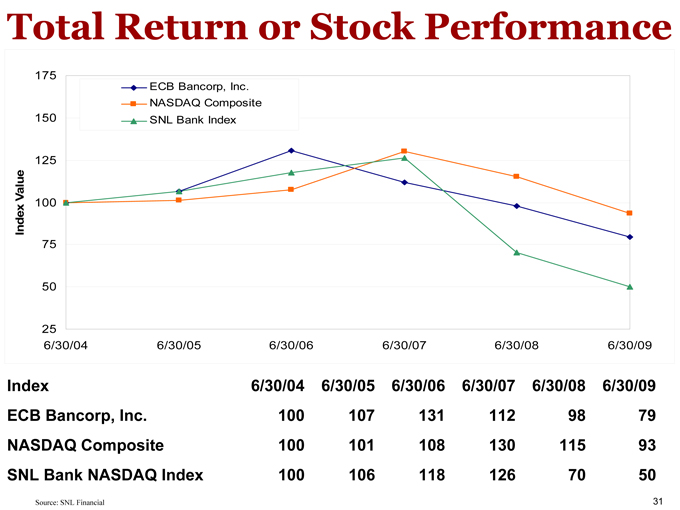
Total Return or Stock Performance
175
ECB Bancorp, Inc.
NASDAQ Composite
150 SNL Bank Index
125
Value 100
Index
75
50
25
6/30/04 6/30/05 6/30/06 6/30/07 6/30/08 6/30/09
Index 6/30/04 6/30/05 6/30/06 6/30/07 6/30/08 6/30/09
ECB Bancorp, Inc. 100 107 131 112 98 79
NASDAQ Composite 100 101 108 130 115 93
SNL Bank NASDAQ Index 100 106 118 126 70 50
Source: SNL Financial 31
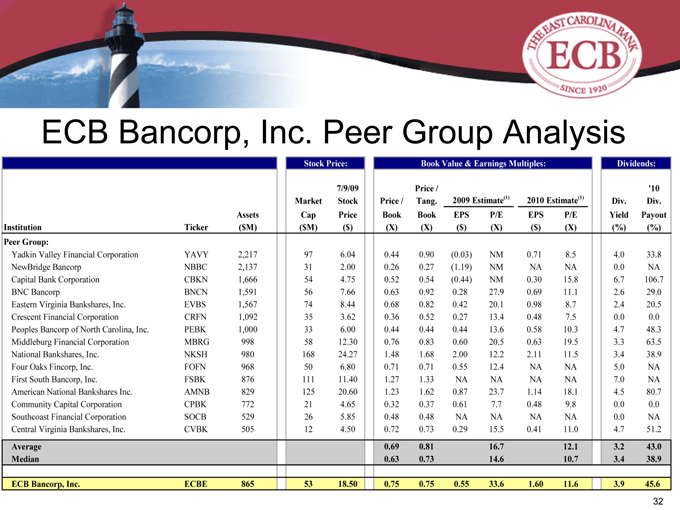
ECB Bancorp, Inc. Peer Group Analysis
Institution Peer Group:
Yadkin Valley Financial Corporation
NewBridge Bancorp
Capital Bank Corporation BNC Bancorp
Eastern Virginia Bankshares, Inc.
Crescent Financial Corporation
Peoples Bancorp of North Carolina, Inc.
Middleburg Financial Corporation
National Bankshares, Inc.
Four Oaks Fincorp, Inc.
First South Bancorp, Inc.
American National Bankshares Inc.
Community Capital Corporation
Southcoast Financial Corporation
Central Virginia Bankshares, Inc. Average
Median ECB Bancorp, Inc.
Ticker YAVY NBBC CBKN BNCN EVBS CRFN PEBK MBRG NKSH FOFN FSBK AMNB CPBK SOCB CVBK ECBE Assets
($M) 2,217 2,137 1,666 1,591 1,567 1,092 1,000 998 980 968 876 829 772 529 505 865 Market Cap ($M)
97 31 54 56 74 35 33 58 168 50 111 125 21 26 12 53 Stock Price: 7/9/09
Stock Price ($) 6.04 2.00 4.75 7.66 8.44 3.62 6.00 12.30 24.27 6.80 11.40 20.60 4.65 5.85 4.50 18.50
Price / Book (X) 0.44 0.26 0.52 0.63 0.68 0.36 0.44 0.76 1.48 0.71 1.27 1.23 0.32 0.48 0.72 0.69 0.63 0.75
Book Value & Earnings Multiples: Price / Tang. Book
(X) 0.90 0.27 0.54 0.92 0.82 0.52 0.44 0.83 1.68 0.71 1.33 1.62 0.37 0.48 0.73 0.81 0.73 0.75
2009 Estimate(1) EPS ($) (0.03) (1.19) (0.44) 0.28 0.42 0.27 0.44 0.60 2.00 0.55 NA 0.87 0.61 NA 0.29 0.55 P/E (X) NM NM NM 27.9 20.1
13.4 13.6 20.5 12.2 12.4 NA 23.7 7.7 NA 15.5 16.7 14.6 33.6
2010 Estimate(1) EPS ($) 0.71 NA 0.30 0.69 0.98 0.48 0.58 0.63 2.11 NA NA 1.14 0.48 NA 0.41 1.60 P/E (X) 8.5 NA 15.8 11.1 8.7 7.5 10.3 19.5 11.5
NA NA 18.1 9.8 NA 11.0 12.1 10.7 11.6
Dividends: Div. Yield (%) 4.0 0.0 6.7 2.6 2.4 0.0 4.7 3.3 3.4 5.0 7.0 4.5 0.0 0.0 4.7 3.2 3.4 3.9
‘10 Div. Payout (%) 33.8 NA 106.7 29.0 20.5 0.0 48.3 63.5 38.9 NA NA 80.7 0.0 NA 51.2 43.0 38.9 45.6
32
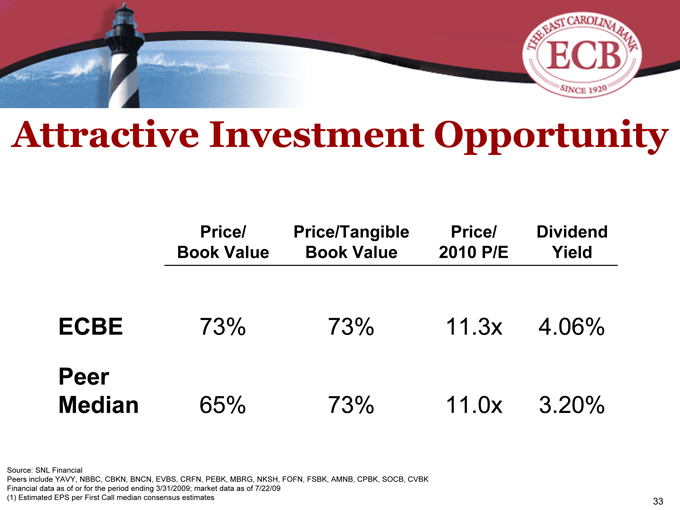
Attractive Investment Opportunity
Price/ Price/Tangible Price/ Dividend
Book Value Book Value 2010 P/E Yield
ECBE 73% 73% 11.3x 4.06%
Peer
Median 65% 73% 11.0x 3.20%
Source: SNL Financial
Peers include YAVY, NBBC, CBKN, BNCN, EVBS, CRFN, PEBK, MBRG, NKSH, FOFN, FSBK, AMNB, CPBK, SOCB, CVBK Financial data as of or for the period ending 3/31/2009; market data as of 7/22/09
(1) Estimated EPS per First Call median consensus estimates 33

Summary
34
Summary
Experienced management team
Attractive branch footprint
Strong balance sheet/ quality growth
Record of excellent asset quality
Solid financial performance/consistent dividend
Attractive valuation
35
ECB Contacts
President & CEO A. Dwight Utz
(252) 925-9411, ext. 55509 (252) 925-8491 – Fax Dwight.Utz@ecbbancorp.com
Chief Financial Officer & SVP Gary M. Adams (252) 925-5525 (252) 925-8491 – Fax Gary.Adams@ecbbancorp.com
Chief Operating Officer & EVP J. Dorson White, Jr. (252) 925-9411, ext. 53300 (252) 925-8491 – Fax Dorson.White@ecbbancorp.com
Chief Credit Officer & SVP T. Olin Davis (252) 925-5472 (252) 925-8491 – Fax Olin.Davis@ecbbancorp.com
Chief Risk Officer & SVP Thomas B. Heggie III (252) 925-5508 (252) 925-8491 – Fax Tom.Heggie@ecbbancorp.com
36
Member FDIC
37