OMB APPROVAL
OMB Number: 3235-0570
Expires: January 31, 2017
Estimated average burden hours per response: 20.6
UNITED STATES
SECURITIES AND EXCHANGE COMMISSION
Washington, D.C. 20549
FORM N-CSR
CERTIFIED SHAREHOLDER REPORT OF
REGISTERED MANAGEMENT INVESTMENT COMPANIES
Investment Company Act file number: 811-08895
Voya Funds Trust
(Exact name of registrant as specified in charter)
| 7337 E. Doubletree Ranch Rd. Suite 100, Scottsdale, AZ | 85258 |
| (Address of principal executive offices) | (Zip code) |
The Corporation Trust Company, 1209 Orange Street, Wilmington, DE 19801
(Name and address of agent for service)
Registrant’s telephone number, including area code: 1-800-992-0180
Date of fiscal year end: March 31
Date of reporting period: March 31, 2015
Item 1. Reports to Stockholders.
The following is a copy of the report transmitted to stockholders pursuant to Rule 30e-1 under the Act (17 CFR 270.30e-1):

Annual Report
March 31, 2015
Classes A, B, C, I, O, P*, R, R6 and W
Fixed-Income Funds
| ■ | Voya High Yield Bond Fund |
| ■ | Voya Intermediate Bond Fund |
| ■ | Voya Short Term Bond Fund |
| ■ | Voya Strategic Income Opportunities Fund (formerly, Voya Strategic Income Fund) |
*Patent Pending
 E-Delivery Sign-up – details inside
| | | This report is submitted for general information to shareholders of the Voya mutual funds. It is not authorized for distribution to prospective shareholders unless accompanied or preceded by a prospectus which includes details regarding the funds’ investment objectives, risks, charges, expenses and other information. This information should be read carefully. | | |

TABLE OF CONTENTS
| | | | | | Go Paperless with E-Delivery! | | | | |
| | | Sign up now for on-line prospectuses, fund reports, and proxy statements. In less than five minutes, you can help reduce paper mail and lower fund costs. | |
| | | Just go to www.voyainvestments.com, click on the E-Delivery icon from the home page, follow the directions and complete the quick 5 Steps to Enroll. | |
| | | You will be notified by e-mail when these communications become available on the internet. Documents that are not available on the internet will continue to be sent by mail. | |
PROXY VOTING INFORMATION
A description of the policies and procedures that the Funds use to determine how to vote proxies related to portfolio securities is available: (1) without charge, upon request, by calling Shareholder Services toll-free at (800) 992-0180; (2) on the Funds’ website at www.voyainvestments.com; and (3) on the U.S. Securities and Exchange Commission’s (“SEC’s”) website at www.sec.gov. Information regarding how the Funds voted proxies related to portfolio securities during the most recent 12-month period ended June 30 is available without charge on the Funds’ website at www.voyainvestments.com and on the SEC’s website at www.sec.gov.
QUARTERLY PORTFOLIO HOLDINGS
The Funds file their complete schedule of portfolio holdings with the SEC for the first and third quarters of each fiscal year on Form N-Q. This report contains a summary portfolio of investments for the Funds. The Funds’ Forms N-Q are available on the SEC’s website at www.sec.gov. The Funds’ Forms N-Q may be reviewed and copied at the SEC’s Public Reference Room in Washington, DC, and information on the operation of the Public Reference Room may be obtained by calling (800) SEC-0330. The Funds’ Forms N-Q, as well as a complete portfolio of investments, are available without charge upon request from the Fund by calling Shareholder Services toll-free at (800) 992-0180.
PRESIDENT’S LETTER
A question of resources
Dear Shareholder,
Geopolitical strategy and diplomacy — not to mention the global economy — are deeply driven by questions of access to resources. Who has what you need? How much do you have to pay to get it? How friendly do buyers and sellers need to be?
Today we are confronted with a variety of such issues that may profoundly affect the world for decades to come. For example, the renewed prominence of the United States as an energy producer likely will impact the relationships between consumers, like Europe, and producers, such as Russia and OPEC. While the surge of people fleeing wars in the Middle East and Africa may present an integration challenge to Europe, it also may represent an infusion of youth and energy that the aging continent needs. And as traditional supplies of water come under stress, the need for alternative water sources will likely spur the creation of new technologies and new investment opportunities.
Of course, there are more immediate economic concerns, notably whether central bank support — waning in the U.S., expanding pretty much everywhere else — can sustain global economic growth. Add in elements of political uncertainty, and bouts of market volatility should not be unexpected.
What lessons lie here for your investment program? The most important: Don’t try to “game” diversification. No one can be certain how the global economy will turn, or know where the best investment opportunities will arise. Rather than groping for the next hot investment, you’re well advised to remain broadly diversified, retaining the potential to benefit from whatever the next generation of opportunities has to offer. Periodically review your portfolio with your financial advisor to make sure it remains focused on your investing goals. And as always, do not make changes to your portfolio without first discussing them with your financial advisor.
We appreciate your continued confidence in us, and we look forward to serving your investment needs in the future.
Sincerely,

Shaun Mathews
President and Chief Executive Officer
Voya Family of Funds
May 1, 2015
The views expressed in the President’s Letter reflect those of the President as of the date of the letter. Any such views are subject to change at any time based upon market or other conditions and the Voya mutual funds disclaim any responsibility to update such views. These views may not be relied on as investment advice and, because investment decisions for a Voya mutual fund are based on numerous factors, may not be relied on as an indication of investment intent on behalf of any Voya mutual fund. Reference to specific company securities should not be construed as recommendations or investment advice.
For more complete information, or to obtain a prospectus for any Voya mutual fund, please call your financial advisor or Voya Investments Distributor, LLC at (800) 992-0180 or log on to www.voyainvestments.com. A prospectus should be read carefully before investing. Consider a fund’s investment objectives, risks, charges and expenses carefully before investing. A prospectus contains this information and other information about a fund. Check with your financial advisor to determine which Voya mutual funds are available for sale within their firm. Not all funds are available for sale at all firms.
Market Perspective: Year Ended March 31, 2015
As our fiscal year started, global equities, in the form of the MSCI World IndexSM (the “Index”) measured in local currencies, including net reinvested dividends had just recovered from a 5% slump after ending 2013 at a record high. The Index progressed in fits and starts with some wide swings, to end up 13.98% for the fiscal year. (The Index returned 6.03% for the one year ended March 31, 2015, measured in U.S. dollars.)
A cold and snowy winter depressed hiring and other key statistics like durable goods orders and home sales early in 2014. But with the improvement in the season came a pick-up in U.S. economic data. Employment reports looked steadily better and the unemployment rate fell below 6%. The March bulletin marked the twelfth consecutive month in which more than 200,000 jobs were created. National purchasing managers’ activity indices signaled expansion at mostly healthy rates. While the housing market was cooling, the rate of increase in the S&P/Case-Shiller 20-City Composite Home Price Index seemed to be stabilizing in the mid-single digits. The most widely watched measures of consumer confidence touched multi-year high levels. Growth in gross domestic product (“GDP”) was -2.1% (annualized) in the first quarter but rebounded to 5.0% in the third, before pulling back to 2.2% in the fourth.
Yet concerns periodically surfaced about the sustainability of the recovery in the U.S. and worldwide. The improving U.S. employment situation was accompanied by labor force participation rates at or near the lowest since 1978. Wage growth was sluggish, near 2% annually. The U.S. Federal Reserve Board’s (“Fed’s”) monthly Treasury and mortgage-backed securities purchases ended as expected in October. But by then the Fed’s balance sheet had increased fivefold over six years to $4.5 trillion and the aftermath of any attempt to bring the total down was far from clear. In March, the Fed signaled that a rate rise was probably two or three meetings away, even as some measures like industrial production, retail sales and durable goods orders were starting to fade.
Outside of the U.S., growth in China decelerated to 7.4% in 2014, the slowest since 1990, which weighed on global commodity supplying countries. For this and other reasons, oil prices halved between June and December and floundered thereafter. Japan re-entered recession in the third quarter after an April rise in the consumption tax and the rebound, to growth of 1.5% annualized, was a disappointment. But it was predominantly the euro zone that seemed the most problematic. Growth was barely 1% in 2014. Unemployment seemed stuck above 11.0%, while deflation emerged in December. In Greece, a new government was elected with a mandate to ease the terms of its bailout and roll back reforms. At last in January the European Central Bank (“ECB”) announced quantitative easing, the elixir that despite all else, might drive asset prices higher, judging from the experience of the U.S. and Japan. Monthly purchases of bonds worth €60 billion would be made from March 2015 until September 2016.
Securities prices mirrored investors’ mood swings in the later months. The Index actually reached a new peak on September 19, but by October 16 fell 8%. From there the Index rebounded 12% to December 5, fell 5% to December 16 then rose 11% to March 20, before ending the fiscal year 1.7% below its all-time high.
In U.S. fixed income markets, the Barclays Long-Term U.S. Treasury sub-index returned a remarkable 21.40% over the fiscal year; the Barclays U.S. Treasury Bond sub-index just 5.36% as the Treasury yield curve flattened. The Barclays U.S. Aggregate Bond Index (“Barclays Aggregate”) added 5.72%, while the Barclays U.S. Corporate Investment Grade Bond sub-index gained 6.81%. Both outperformed the Barclays High Yield Bond — 2% Issuer Constrained Composite Index (not a part of the Barclays Aggregate), which returned only 2.00%, reflecting the significant representation of the ailing energy industry and perhaps a pull-back after strong returns in recent years.
U.S. equities, represented by the S&P 500® Index including dividends, advanced 12.73% in the fiscal year, completing nine consecutive winning quarters, the best run since 1998. The health care sector was the top performer, returning 26.19%; not surprisingly, the only loser was energy, which dropped 11.11% as oil prices sagged. Record operating earnings per share for S&P 500® companies in the second and third quarters were supported by low interest rates, slow wage growth and historically high share buy-back volumes. Operating margins breached 10% for the first time. Both retreated in the last quarter.
In currencies, the dollar gained ground against most other currencies, surging 28.31% against the euro, as the U.S. ended quantitative easing just as the ECB embarked on it and 16.37% against the yen, on the likelihood of further monetary easing in Japan and an announced partial re-allocation into stocks (including non-yen) for the giant Government Pension Investment Fund (“GPIF”). The dollar gained less, 12.44%, on the pound. The UK had a better growth story than the euro zone, which however is the destination for about 40% of the UK’s exports.
In international markets, the MSCI Japan® Index leaped 30.49% in the fiscal year, boosted in the case of Japan’s large exporters by the falling yen, by continued quantitative easing and by the GPIF’s announcement described above. The MSCI Europe ex UK® Index added 18.85%. The poor economic data were ultimately trumped by the prospect of quantitative easing, plus the declining euro that went with it. The MSCI UK® Index was much weaker, edging up 6.11%. Nearly half of this index is comprised of 15 names, mostly global banking, energy, pharmaceuticals and materials companies, not particularly representative of an improving economy, and which on average returned barely 1%.
Past performance does not guarantee future results. The performance quoted represents past performance.
Investment return and principal value of an investment will fluctuate, and shares, when redeemed, may be worth more or less than their original cost. Each Fund’s performance is subject to change since the period’s end and may be lower or higher than the performance data shown. Please call (800) 992-0180 or log on to www.voyainvestments.com to obtain performance data current to the most recent month end.
Market Perspective reflects the views of Voya Investment Management’s Chief Investment Risk Officer only through the end of the period, and is subject to change based on market and other conditions.
Benchmark Descriptions
| | | Index | | | | Description | | |
| | | Bank of America Merrill Lynch U.S. Dollar Three-Month LIBOR Constant Maturity Index | | | | The Index is designed to track the performance of a synthetic asset paying LIBOR to a stated maturity. The index is based on the assumed purchase at par of a synthetic instrument having exactly its stated maturity and with a coupon equal to that day’s fixing rate. That issue is assumed to be sold the following business day (priced at a yield equal to the current day rate) and rolled into a new instrument. | | |
| | | Barclays GNMA Index | | | | An unmanaged index comprised of all fixed security mortgage pools sponsored by GNMA, including GNMA Graduated Payment Mortgages. | | |
| | | Barclays High Yield Bond — 2% Issuer Constrained Composite Index | | | | An unmanaged index that includes all fixed income securities having a maximum quality rating of Ba1, a minimum amount outstanding of $150 million, and at least one year to maturity. | | |
| | | Barclays Long-Term U.S. Treasury Index | | | | The Index includes all publicly issued, U.S. Treasury securities that have a remaining maturity of 10 or more years, are rated investment grade, and have $250 million or more of outstanding face value. | | |
| | | Barclays U.S. 1-3 Year Government / Credit Bond Index | | | | A widely recognized index of publicly issued fixed rate, investment grade debt securities, including Treasuries, Agencies and credit securities with a maturity of one to three years. | | |
| | | Barclays U.S. Aggregate Bond Index | | | | An unmanaged index of publicly issued investment grade U.S. Government, mortgage-backed, asset-backed and corporate debt securities. | | |
| | | Barclays U.S. Corporate Investment Grade Bond Index | | | | An unmanaged index consisting of publicly issued, fixed rate, nonconvertible, investment grade debt securities. | | |
| | | Barclays U.S. Treasury Bond Index | | | | A market capitalization-weighted index that measures the performance of public obligations of the U.S. Treasury that have a remaining maturity of one year or more. | | |
| | | Barclays U.S. Universal Bond Index | | | | The Index represents the union of the U.S. Aggregate Index, U.S. Corporate High Yield Index, Investment Grade 144A Index, Eurodollar Index, U.S. Emerging Markets Index, and the non-ERISA eligible portion of the CMBS Index. The index covers USD-denominated, taxable bonds that are rated either investment grade or high-yield. Some U.S. Universal Index constituents may be eligible for one or more of its contributing subcomponents that are not mutually exclusive. These securities are not double-counted in the index. The U.S. Universal index was created on January 1, 1999, with index history backfilled to January 1, 1990. | | |
| | | MSCI Europe ex UK® Index | | | | A free float-adjusted market capitalization index that is designed to measure developed market equity performance in Europe, excluding the UK. | | |
| | | MSCI Japan® Index | | | | A free float-adjusted market capitalization index that is designed to measure developed market equity performance in Japan. | | |
| | | MSCI UK® Index | | | | A free float-adjusted market capitalization index that is designed to measure developed market equity performance in the UK. | | |
| | | MSCI World IndexSM | | | | An unmanaged index that measures the performance of over 1,400 securities listed on exchanges in the U.S., Europe, Canada, Australia, New Zealand and the Far East. | | |
| | | S&P 500® Index | | | | An unmanaged index that measures the performance of securities of approximately 500 large-capitalization companies whose securities are traded on major U.S. stock markets. | | |
| | | S&P/Case-Shiller 20-City Composite Home Price Index | | | | A composite index of the home price index for the top 20 Metropolitan Statistical Areas in the United States. The index is published monthly by Standard & Poor’s. | | |
| Voya GNMA Income Fund | Portfolio Managers’ Report |
| | | |
| | Investment Type Allocation as of March 31, 2015 (as a percentage of net assets) | |
| | | | | | |
| | U.S. Government Agency Obligations | | | 112.0% | |
| | Collateralized Mortgage Obligations | | | 0.2% | |
| | Liabilities in Excess of Other Assets* | | | (12.2)% | |
| | Net Assets | | | 100.0% | |
| | | |
| | * Includes short-term investments. | |
| | | |
| | Portfolio holdings are subject to change daily. | |
| | | |
Voya GNMA Income Fund (the “Fund”) seeks a high level of current income consistent with liquidity and safety of principal through investment primarily in Government National Mortgage Association (“GNMA”) mortgage-backed securities (also known as GNMA Certificates) that are guaranteed as to the timely payment of principal and interest by the U.S. government. The Fund is managed by Peter Guan, Jeff Dutra and Justin McWhorter, Portfolio Managers of Voya Investment Management Co. LLC — the Sub-Adviser.
Securities issued by the U.S. Treasury are backed by the full faith and credit of the federal government. Securities issued by individual agencies and organizations may be backed by the full faith and credit of the federal government as to principal or interest but are not direct obligations of the U.S. Treasury. Securities of some agencies and organizations are backed solely by the entity’s own resources or by the ability of the entity to borrow from the U.S. Treasury. Government securities also include certain mortgage-related securities that are sponsored by a U.S. government agency or organization and are not direct obligations of the U.S. government.
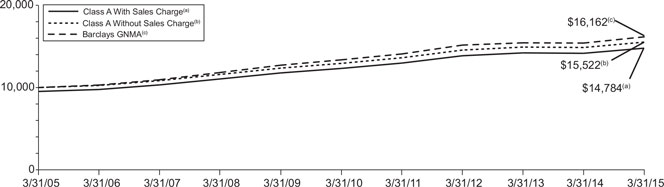
Performance: For the year ended March 31, 2015, the Fund���s Class A shares, excluding sales charges, provided a total return of 4.40%, compared to the Barclays GNMA Index (the “Index” or “Barclays GNMA”), which returned 4.91%, for the same period.
Portfolio Specifics: The first two quarters of the fiscal year were characterized by continued Federal Reserve Board (“Fed”) purchases of agency mortgages and low rate volatility. In response, bond markets performed very well as interest rates decreased due to what we believed were growing concerns about global economic growth and geopolitical instability. By the end of its large scale asset purchase program in October 2014, the Fed owned $1.7 trillion in agency mortgages, accounting for a third of all outstanding mortgage-backed securities (“MBS”). Given this overwhelming technical factor combined with low net supply, “spreads” on agency mortgages tightened throughout 2014 and ended the first three quarters of the fiscal year with 0.64% of excess return. (The “spread” is the yield premium between a bond that entails some credit risk, such as a mortgage-backed bond, and a U.S. Treasury bond of equivalent maturity. Investors demand the spread premium as compensation for taking on the credit risk.) Volatility increased in 2015 as rates plunged in January, rebounded in February, and then fell again in March. The increase in volatility and lower Fed support for mortgages resulted in 0.51% of underperformance of agency MBS relative to Treasuries in the first quarter of 2015.
The Fund outperformed the Index before fees and expenses, but underperformed net of fees during the period. Performance was dampened as the Fund maintained a slight underweight in duration, or interest-rate risk, versus the benchmark throughout the year. Nonetheless, increased exposure to Fannie Mae and Freddie Mac mortgage securities boosted performance as GNMA backed bonds lagged their conventional counterparts. Also, prepayment-protected collateral in the form of pools and collateralized mortgage obligations (“CMOs”) continued to provide positive “carry” versus the Index in volatile markets. (“Carry” is a strategy of holding two offsetting positions, one of which creates an incoming cash flow that is greater than the obligations of the other.)
Additional outperformance was achieved through participation in “dollar rolls”. The dollar roll market is a very large and well developed one, in which MBS are bought and sold again in monthly cycles. The terms on which this is done can be more cost effective than simply holding comparable MBS. This was the case from time to time during the fiscal year.
Current Strategy & Outlook: As the annual period concludes, MBS performance has been mixed versus equal-duration U.S. Treasury securities. In our opinion, due to policy changes handed down by the Federal Housing Administration during the first quarter of 2015, GNMA MBS continued to lag their conventional counterparts, as refinancing activity increased substantially in 2015. Although valuations throughout the coupon stack remain at tight option-adjusted spread levels, lower coupons provide better protection from the current rate environment and from the trend of credit-widening policies from the government. Furthermore, despite the conclusion of Fed balance sheet expansion, the Fed continues to reinvest principal payments on its current holdings. We believe this activity maintains a backstop for agency MBS demand and has helped keep spreads anchored near current levels.
With this in mind, we continue to manage the Fund seeking high current income investments while seeking to modestly reduce interest rate and basis risk. The focus remains on specified GNMA pools and CMOs that provide more attractive current income while seeking to minimize prepayment risks. Moreover, we are reducing exposure to cohorts with higher risk of prepayments either due to the low rate environment or government policy.
Portfolio holdings and characteristics are subject to change and may not be representative of current holdings and characteristics. The outlook for this Fund may differ from that presented for other Voya mutual funds. Performance for the different classes of shares will vary based on differences in fees associated with each class. An index has no cash in its portfolio, imposes no sales charges and incurs no operating expenses. An investor cannot invest directly in an index. The views expressed in this report reflect those of the portfolio managers, only through the end of the period as stated on the cover. The portfolio managers’ views are subject to change at any time based on market and other conditions. Fund holdings are subject to change daily. This report contains statements that may be “forward-looking” statements. Actual results may differ materially from those projected in the “forward-looking” statements.
| Portfolio Managers’ Report | Voya GNMA Income Fund |
| | | Average Annual Total Returns for the Periods Ended March 31, 2015 | | |
| | | | | | 1 Year | | | 5 Year | | | 10 Year | | | Since Inception of Class W December 17, 2007 | | |
| | | Including Sales Charge: | | | | | | |
| | | Class A(1) | | | | | 1.80% | | | | | | 3.20% | | | | | | 4.00% | | | | | | — | | | |
| | | Class B(2) | | | | | -1.38% | | | | | | 2.58% | | | | | | 3.72% | | | | | | — | | | |
| | | Class C(3) | | | | | 2.62% | | | | | | 2.93% | | | | | | 3.72% | | | | | | — | | | |
| | | Class I | | | | | 4.70% | | | | | | 4.00% | | | | | | 4.80% | | | | | | — | | | |
| | | Class W | | | | | 4.66% | | | | | | 3.96% | | | | | | — | | | | | | 4.80% | | | |
| | | Excluding Sales Charge: | | | | | | |
| | | Class A | | | | | 4.40% | | | | | | 3.71% | | | | | | 4.50% | | | | | | — | | | |
| | | Class B | | | | | 3.62% | | | | | | 2.93% | | | | | | 3.72% | | | | | | — | | | |
| | | Class C | | | | | 3.62% | | | | | | 2.93% | | | | | | 3.72% | | | | | | — | | | |
| | | Class I | | | | | 4.70% | | | | | | 4.00% | | | | | | 4.80% | | | | | | — | | | |
| | | Class W | | | | | 4.66% | | | | | | 3.96% | | | | | | — | | | | | | 4.80% | | | |
| | | Barclays GNMA | | | | | 4.91% | | | | | | 3.87% | | | | | | 4.92% | | | | | | 4.86% | | | |
| | | | | |
Based on a $10,000 initial investment, the graph and table above illustrate the total return of Voya GNMA Income Fund against the index indicated. The index is unmanaged and has no cash in its portfolio, imposes no sales charges and incurs no operating expenses. An investor cannot invest directly in an index. The Fund’s performance is shown both with and without the imposition of sales charges.
The performance graph and table do not reflect the deduction of taxes that a shareholder will pay on Fund distributions or the redemption of Fund shares.
The performance shown may include the effect of fee waivers and/or expense reimbursements by the Investment Adviser and/or other service providers, which have the effect of increasing total net return. Had all fees and expenses been considered, the total net returns would have been lower.
Performance data represents past performance and is no assurance of future results. Investment return and principal value of an investment in the Fund will fluctuate. Shares, when sold, may be worth more or less than their original cost. The Fund’s current performance may be lower or higher than the performance data shown. Please log on to www.voyainvestments.com or call (800) 992-0180 to get performance through the most recent month end.
This report contains statements that may be “forward-looking” statements. Actual results may differ materially from those projected in the “forward-looking” statements.
The views expressed in this report reflect those of the portfolio managers, only through the end of the period as stated on the cover. The portfolio managers’ views are subject to change at any time based on market and other conditions.
Fund holdings are subject to change daily.
| (1) | Reflects deduction of the maximum Class A sales charge of 4.75%. Effective July 31, 2006, the maximum Class A sales charge was lowered to 2.50%. |
| (2) | Reflects deduction of the Class B deferred sales charge of 5% and 2% for the 1 year and 5 year returns, respectively. |
| (3) | Reflects deduction of the Class C deferred sales charge of 1% for the 1 year return. |
| Voya High Yield Bond Fund | Portfolio Managers’ Report |
| | | |
| | Sector Diversification as of March 31, 2015 (as a percentage of net assets) | |
| | | | | | |
| | Consumer, Non-cyclical | | | 21.9% | |
| | Communications | | | 17.4% | |
| | Consumer, Cyclical | | | 16.3% | |
| | Energy | | | 11.2% | |
| | Industrials | | | 7.7% | |
| | Financials | | | 6.3% | |
| | Technology | | | 6.0% | |
| | Basic Materials | | | 5.9% | |
| | Utilities | | | 1.8% | |
| | Diversified | | | 1.4% | |
| | Telecommunication Services | | | 0.3% | |
| | Other Asset-Backed Securities | | | 0.2% | |
| | Information Technology | | | 0.2% | |
| | Consumer Discretionary | | | 0.0% | |
| | Assets in Excess of Other Liabilities* | | | 3.4% | |
| | Net Assets | | | 100.0% | |
| | | | | | |
| | * Includes short-term investments. | |
| | | |
| | Portfolio holdings are subject to change daily. | |
| | | |
Voya High Yield Bond Fund (the “Fund”) seeks to provide investors with a high level of current income and total return. The Fund is managed by Randall Parrish, CFA, Matthew Toms, CFA, and Rick Cumberledge, CFA, Portfolio Managers of Voya Investment Management Co. LLC — the Sub-Adviser.
Performance: For the year ended March 31, 2015, the Fund’s Class A shares, excluding sales charges, provided a total return of 0.98%, compared to the Barclays High Yield Bond — 2% Issuer Constrained Composite Index (the “Index” or “Barclays High Yield Bond — 2% Issuer Constrained Composite”), which returned 2.00%, for the same period.
Portfolio Specifics: A year ago, the ten-year Treasury yield of 2.73% reflected investor expectation of an imminent Federal Reserve Board rate hiking cycle, oil prices above $100 per barrel that gave evidence of emerging market growth and a multi-year run in the S&P 500® Index reflected the continued rebound of the U.S. economy from the Great Recession. What a difference a year makes. The 10-year Treasury yield is now nearly 100 basis points (“bp”) lower, oil is down by more than half and volatility has spiked dramatically in recent months. (A bp equals one one-hundredth of one percent.) Equities did manage a double-digit return over the reporting period, although that was likely driven more by the expectation of continued low rates than by strong earnings growth. The high yield market started off strong, with the market yield hitting an all-time low of 4.83% in June 2014, but ultimately succumbed to concerns about valuations (July), U.S. economic growth (September/October) and oil prices (December), with the most dramatic adjustment the oil-driven one, reflecting the fact that the proportion of energy-related debt in the high yield market had increased dramatically in recent years.
| | | |
| | Top Ten Holdings
as of March 31, 2015*
(as a percentage of net assets) | |
| | | | | | |
| | HCA Holdings, Inc., 6.250%, 02/15/21 | | | 0.6% | |
| | AerCap Ireland Capital Ltd. / AerCap Global Aviation Trust, 4.500%, 05/15/21 | | | 0.6% | |
| | Sprint Corp., 7.125%, 06/15/24 | | | 0.5% | |
| | Ashtead Capital, Inc., 6.500%, 07/15/22 | | | 0.5% | |
| | Univision Communications, Inc., 5.125%, 05/15/23 | | | 0.5% | |
| | Numericable Group SA, 6.250%, 05/15/24 | | | 0.5% | |
| | Parsley Energy LLC / Parsley Finance Corp., 7.500%, 02/15/22 | | | 0.5% | |
| | Hot Topic, Inc., 9.250%, 06/15/21 | | | 0.5% | |
| | Chesapeake Energy Corp., 6.125%, 02/15/21 | | | 0.5% | |
| | First Data Corp., 11.750%, 08/15/21 | | | 0.4% | |
| | | |
| | * Excludes short-term investments. | |
| | | |
| | Portfolio holdings are subject to change daily. | |
| | | |
The Barclays U.S. High Yield 2% Issuer Constrained Index (“Index”) posted a return of 2.00% for the 12 months ended March 31, 2015, underperforming the return of like-duration Treasuries by 202 bp as spreads widened. The index yield to worst — the lowest potential yield that can be received on the bonds that comprise the index, without an issuer actually defaulting — rose by 0.95% to 6.18% at March 31, 2015, as the spread to Treasuries widened 109 bp to T+5.01%. The total market return was dragged down by the energy (-8.5%) and metals & mining (-5.8%) sectors, reflecting the sharp sell-off in global commodities. Excluding the energy sector, the Index returned 3.9% for the 12 month reporting period, roughly keeping pace with Treasuries. Higher quality outperformed lower quality, with BB-rated bonds returning 4.9% versus a loss of 2.4% for CCC-rated securities. This reflected both general investor caution and the heavier weighting of lower-quality energy companies most exposed to the decline in oil prices. The Index’s par-weighted default rate of 3.0% reflected the large defaults of Energy Future Holdings Corp. (the former TXU Corp.) and Caesars Entertainment Resort Properties LLC, but default activity remained well below historical averages at just 1.7% on an issuer-weighted basis, per JPMorgan.
The Fund outperformed its Index before fees and expenses, but underperformed net of fees during the period. The detractors for the period largely reflected our (ultimately unfounded) desire to avoid significant exposure to potentially rising interest rates. We were underweight long-dated subordinated securities issued by large banks that traded up in price as rates moved lower, as well as higher-quality utilities that also benefited from lower rates. Despite our long-held overweight to independent domestic energy producers and the fourth quarter 2014 sell-off in oil, the energy sector was a net positive contributor to relative performance for the reporting period, as we generally limited our exposure to low-cost operators in the best basins and those who had hedged forward production. We also largely avoided oil service companies. We did exit some holdings with weaker balance sheets (Energy XXI Ltd. and Halcon Resources Corp.) as we became increasingly convinced that oil prices would stay lower for longer than originally anticipated. Our favored companies (Memorial Production Partners L.P., Parsley Energy LLC and Sanchez Energy Corp.) held up reasonably well, while we successfully avoided the bonds of companies that are likely restructuring candidates (Samson Technologies, Quicksilver Resources, Inc. and Sabine Oil & Gas). Outside energy, positive contribution came from our underweight to metals & mining and select issuers within retailing (Hot Topic, Inc., Dollar Tree, Inc. and Murphy Oil USA, Inc.).
| Portfolio Managers’ Report | Voya High Yield Bond Fund |
Current Strategy & Outlook: Our fundamental view of high yield credit quality is largely unchanged. Though we acknowledge the weaker U.S. economic data of late and the potential for further fundamental deterioration in the energy space, we continue to believe that the economy will show improvement with the arrival of spring and that the next broad default cycle is still some distance down the road. We believe the above concerns, combined with weakness in China and global geopolitical risk, justify wider spreads than we saw at the 2014 post-crisis tights, but with ex-energy high yield spreads above their long term average at more than 450 bp above U.S Treasury securities, it seems that high yield investors are being more than adequately compensated for credit risk taken. We believe at current levels, high yield bonds may have the ability to absorb at least a portion of an eventual rise in interest rates. In our opinion, this environment should position high yield to outperform most other fixed income asset classes over the coming year.
We believe the portfolio is well positioned for the environment described above. In keeping with our view of U.S. economic recovery and continuing solid credit fundamentals, we maintain our slight domestic-focused cyclical bias and an overweight to single-B profile credits (underweight BBs and what we view as the most at-risk securities of those rated CCC and below). We remain underweight the most commodity price-sensitive sectors such as metals and mining and oilfield services; the sectors we are overweight include those that benefit from lower energy costs (chemicals) and from increased consumer discretionary income (retailers).
Portfolio holdings and characteristics are subject to change and may not be representative of current holdings and characteristics. The outlook for this Fund may differ from that presented for other Voya mutual funds. Performance for the different classes of shares will vary based on differences in fees associated with each class. An index has no cash in its portfolio, imposes no sales charges and incurs no operating expenses. An investor cannot invest directly in an index. The views expressed in this report reflect those of the portfolio managers, only through the end of the period as stated on the cover. The portfolio managers’ views are subject to change at any time based on market and other conditions. Fund holdings are subject to change daily. This report contains statements that may be “forward-looking” statements. Actual results may differ materially from those projected in the “forward-looking” statements.
| Voya High Yield Bond Fund | Portfolio Managers’ Report |
| | | Average Annual Total Returns for the Periods Ended March 31, 2015 | | |
| | | | | | 1 Year | | | 5 Year | | | 10 Year | | | Since Inception
of Class I
July 31, 2008 | | | Since Inception
of Class P
June 14, 2013 | | | Since Inception
of Class R
January 30, 2014 | | | Since Inception
of Class W
July 29, 2011 | | |
| | | Including Sales Charge: | | | | | | | |
| | | Class A(1) | | | | | -1.57% | | | | | | 7.96% | | | | | | 6.15% | | | | | | — | | | | | | — | | | | | | — | | | | | | — | | | |
| | | Class B(2) | | | | | -4.49% | | | | | | 7.41% | | | | | | 5.88% | | | | | | — | | | | | | — | | | | | | — | | | | | | — | | | |
| | | Class C(3) | | | | | -0.75% | | | | | | 7.70% | | | | | | 5.87% | | | | | | — | | | | | | — | | | | | | — | | | | | | — | | | |
| | | Class I | | | | | 1.48% | | | | | | 8.99% | | | | | | — | | | | | | 9.29% | | | | | | — | | | | | | — | | | | | | — | | | |
| | | Class P | | | | | 2.09% | | | | | | — | | | | | | — | | | | | | — | | | | | | 5.81% | | | | | | — | | | | | | — | | | |
| | | Class R | | | | | 0.91% | | | | | | — | | | | | | — | | | | | | — | | | | | | — | | | | | | 2.64% | | | | | | — | | | |
| | | Class W | | | | | 1.26% | | | | | | — | | | | | | — | | | | | | — | | | | | | — | | | | | | — | | | | | | 7.79% | | | |
| | | Excluding Sales Charge: | | | | | | | |
| | | Class A | | | | | 0.98% | | | | | | 8.51% | | | | | | 6.67% | | | | | | — | | | | | | — | | | | | | — | | | | | | — | | | |
| | | Class B | | | | | 0.31% | | | | | | 7.71% | | | | | | 5.88% | | | | | | — | | | | | | — | | | | | | — | | | | | | — | | | |
| | | Class C | | | | | 0.21% | | | | | | 7.70% | | | | | | 5.87% | | | | | | — | | | | | | — | | | | | | — | | | | | | — | | | |
| | Class I | | | | | 1.48% | | | | | | 8.99% | | | | | | — | | | | | | 9.29% | | | | | | — | | | | | | — | | | | |
| | | Class P | | | | | 2.09% | | | | | | — | | | | | | — | | | | | | — | | | | | | 5.81% | | | | | | — | | | | | | — | | | |
| | | Class R | | | | | 0.91% | | | | | | — | | | | | | — | | | | | | — | | | | | | — | | | | | | 2.64% | | | | | | — | | | |
| | | Class W | | | | | 1.26% | | | | | | — | | | | | | — | | | | | | — | | | | | | — | | | | | | — | | | | | | 7.79% | | | |
| | | Barclays High Yield Bond – 2% Issuer Constrained Composite | | | | | 2.00% | | | | | | 8.56% | | | | | | 8.17% | | | | | | 10.10% | | | | | | 5.32% | | | | | | 3.63% | | | | | | 7.22% | | | |
| | | | | |
Based on a $10,000 initial investment, the graph and table above illustrate the total return of Voya High Yield Bond Fund against the index indicated. The index is unmanaged and has no cash in its portfolio, imposes no sales charges and incurs no operating expenses. An investor cannot invest directly in an index. The Fund’s performance is shown both with and without the imposition of sales charges.
The performance graph and table do not reflect the deduction of taxes that a shareholder will pay on Fund distributions or the redemption of Fund shares.
The performance shown may include the effect of fee waivers and/ or expense reimbursements by the Investment Adviser and/or other service providers, which have the effect of increasing total net return. Had all fees and expenses been considered, the total net returns would have been lower.
Performance data represents past performance and is no assurance of future results. Investment return and principal value of an investment in the Fund will fluctuate. Shares, when sold, may be worth more or less than their original cost. The Fund’s current performance may be lower or higher than the performance data
shown. Please log on to www.voyainvestments.com or call (800) 992-0180 to get performance through the most recent month end.
This report contains statements that may be “forward-looking” statements. Actual results may differ materially from those projected in the “forward-looking” statements.
The views expressed in this report reflect those of the portfolio managers, only through the end of the period as stated on the cover. The portfolio managers’ views are subject to change at any time based on market and other conditions.
Fund holdings are subject to change daily.
| (1) | Reflects deduction of the maximum Class A sales charge of 4.75%. Effective July 31, 2006, the maximum Class A sales charge was lowered to 2.50%. |
| (2) | Reflects deduction of the Class B deferred sales charge of 5% and 2% for the 1 year and 5 year returns, respectively. |
| (3) | Reflects deduction of the Class C deferred sales charge of 1% for the 1 year return. |
| Portfolio Managers’ Report | Voya Intermediate Bond Fund |
| | | |
| | Investment Type Allocation as of March 31, 2015 (as a percentage of net assets) | |
| | | | | | |
| | Corporate Bonds/Notes | | | 33.2% | |
| | U.S. Treasury Obligations | | | 28.5% | |
| | U.S. Government Agency Obligations | | | 25.4% | |
| | Collateralized Mortgage Obligations | | | 11.6% | |
| | Asset-Backed Securities | | | 7.5% | |
| | Foreign Government Bonds | | | 1.4% | |
| | Purchased Options | | | 0.0% | |
| | Liabilities in Excess of Other Assets* | | | (7.6)% | |
| | Net Assets | | | 100.0% | |
| | | |
| | * Includes short-term investments. | |
| | | |
| | Portfolio holdings are subject to change daily. | |
| | | |
Voya Intermediate Bond Fund (the “Fund”) seeks to maximize total return through income and capital appreciation. The Fund is managed by Christine Hurtsellers, CFA, and Matthew Toms, CFA, Portfolio Managers of Voya Investment Management Co. LLC — the Sub-Adviser.
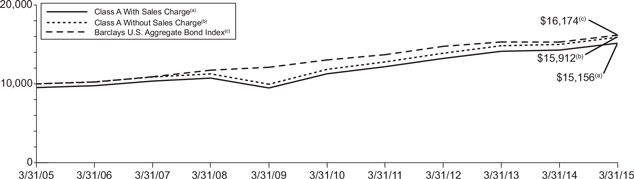
Performance: For the year ended March 31, 2015, the Fund’s Class A shares, excluding sales charges, provided a total return of 6.09% compared to the Barclays U.S. Aggregate Bond Index, which returned 5.72% for the same period.
Portfolio Specifics: For the reporting period, the Fund outperformed its benchmark, the Barclays U.S. Aggregate Bond Index, due to security selection and asset allocation. Security selection was generally additive. Securitized assets helped results, particularly within commercial mortgage-backed securities and asset-backed securities. The risk appetite in the search for yield remained robust and underlying fundamentals provided a supportive backdrop. Issue selection among agency mortgages contributed to performance even though at times we were less constructive on the agency mortgages sector, which we expect will continue to trade directionally with interest rates. Investment grade credit security selection was a drag even though corporate revenue and earnings growth remained fairly stable during the period.
Holding off-benchmark allocations to non-agency mortgages was beneficial. We remained constructive on non-agency mortgage-backed securities, as the housing market continued its recovery and credit access continued to improve across borrower types. The Fund's overweight in high-yield corporate bonds, and its underweight of U.S. Treasury securities, were less favorable to relative results. In our view, high yield fundamentals generally remained in good shape, and the risk of a near-term default spike remained very low. Sector allocation and security selection within the emerging markets contributed to results for the period. The European Central Bank's (“ECB”) asset purchases, as part of its quantitative easing program, increased the attractiveness of yields across emerging markets. In our opinion, it was crucial, however, to be selective about countries and sectors within the asset class and to manage overall volatility.
Duration and yield curve detracted from results for the period. The Fund started the period with a slightly shorter duration and ended close to that of the benchmark’s duration. During the period, the Fund used swaps, options and futures in conjunction with cash bonds to manage interest-rate risk and yield-curve risk. Swaps and options were employed to aid in managing sector allocation and security selection. The Fund used exchange-traded credit default index swaps, such as CDX and iTraxx, to hedge corporate credit exposures. In sum, these investment decisions — i.e., to hold positions in derivative instruments and cash securities — detracted from Fund results over the reporting period.
| | | |
| | Top Ten Holdings
as of March 31, 2015*
(as a percentage of net assets) | |
| | | | | | |
| | United States Treasury Note, 1.000%, 03/15/18 | | | 7.4% | |
| | United States Treasury Note, 0.500%, 03/31/17 | | | 6.5% | |
| | United States Treasury Bond, 2.000%, 02/15/25 | | | 5.4% | |
| | United States Treasury Bond, 3.000%, 11/15/44 | | | 4.0% | |
| | Fannie Mae, 3.000%, 05/01/43 | | | 3.3% | |
| | Freddie Mac, 3.500%, 09/15/41 | | | 3.1% | |
| | United States Treasury Note, 1.750%, 03/31/22 | | | 2.4% | |
| | Freddie Mac, 3.000%, 05/01/43 | | | 1.7% | |
| | Fannie Mae, 2.500%, 11/25/26 | | | 1.5% | |
| | United States Treasury Note, 1.375%, 03/31/20 | | | 1.5% | |
| | | |
| | * Excludes short-term investments. | |
| | | |
| | Portfolio holdings are subject to change daily. | |
| | | |
Current Strategy & Outlook: We believe the removal of “patient” from the Federal Reserve Board’s (“Fed’s”) latest announcement implies a shift in policy could happen in 2015. With forward guidance gone and the emphasis squarely on the economy, we believe the message is clear: the Fed will not be impatient about raising rates. Job growth alone likely isn’t enough to offset the weak global growth forecast. On the other hand, a weaker euro and quantitative easing by the ECB are reviving growth prospects in Europe. Keeping Fed policy on hold allows more time for U.S. labor market improvement to percolate into other areas of the economy. Low commodity prices and a strong U.S. dollar restrain inflation and are also positive tailwinds for consumers.
We believe supportive policy globally will help smooth over economic and seasonal noise. With a quiescent Fed for now, we will likely maintain an overweight to investment grade corporate bonds, which we expect to benefit from the strength and stability of the U.S. economy and from capital seeking more attractive yield than can be found elsewhere. We believe rates are likely to be range-bound and interest rate volatility is likely to decline in the near term. Low short-term interest rates, an elevated Fed balance sheet, low long-term rates in major developed countries, quantitative easing overseas, strong demand for safe assets and disappointments in growth in advanced countries are conspiring to keep long-term interest rates low. If clearer signs emerge that the economy is heating up, we believe we could see rising volatility and rising interest rates later this year.
Portfolio holdings and characteristics are subject to change and may not be representative of current holdings and characteristics. The outlook for this Fund may differ from that presented for other Voya mutual funds. Performance for the different classes of shares will vary based on differences in fees associated with each class. An index has no cash in its portfolio, imposes no sales charges and incurs no operating expenses. An investor cannot invest directly in an index. The views expressed in this report reflect those of the portfolio managers, only through the end of the period as stated on the cover. The portfolio managers’ views are subject to change at any time based on market and other conditions. Fund holdings are subject to change daily. This report contains statements that may be “forward-looking” statements. Actual results may differ materially from those projected in the “forward-looking” statements.
| Voya Intermediate Bond Fund | Portfolio Managers’ Report |
| | | Average Annual Total Returns for the Periods Ended March 31, 2015 | | |
| | | | | | 1 Year | | | 5 Year | | | 10 Year | | | Since
Inception
of Class R6
May 31,
2013 | | | Since
Inception
of Class W
December 17,
2007 | | |
| | | Including Sales Charge: | | | | | | | |
| | | Class A(1) | | | | | 3.47% | | | | | | 5.55% | | | | | | 4.25% | | | | | | — | | | | | | — | | | |
| | | Class B(2) | | | | | 0.17% | | | | | | 4.96% | | | | | | 3.96% | | | | | | — | | | | | | — | | | |
| | | Class C(3) | | | | | 4.21% | | | | | | 5.28% | | | | | | 3.96% | | | | | | — | | | | | | — | | | |
| | | Class I | | | | | 6.46% | | | | | | 6.43% | | | | | | 5.09% | | | | | | — | | | | | | — | | | |
| | | Class O | | | | | 6.01% | | | | | | 6.07% | | | | | | 4.75% | | | | | | — | | | | | | — | | | |
| | | Class R | | | | | 5.71% | | | | | | 5.83% | | | | | | 4.48% | | | | | | — | | | | | | — | | | |
| | | Class R6 | | | | | 6.38% | | | | | | — | | | | | | — | | | | | | 4.37% | | | | | | — | | | |
| | | Class W | | | | | 6.36% | | | | | | 6.61% | | | | | | — | | | | | | — | | | | | | 5.47% | | | |
| | | Excluding Sales Charge: | | | | | | | | | | | | |
| | | Class A | | | | | 6.09% | | | | | | 6.09% | | | | | | 4.75% | | | | | | — | | | | | | — | | | |
| | | Class B | | | | | 5.17% | | | | | | 5.29% | | | | | | 3.96% | | | | | | — | | | | | | — | | | |
| | | Class C | | | | | 5.21% | | | | | | 5.28% | | | | | | 3.96% | | | | | | — | | | | | | — | | | |
| | | Class I | | | | | 6.46% | | | | | | 6.43% | | | | | | 5.09% | | | | | | — | | | | | | — | | | |
| | | Class O | | | | | 6.01% | | | | | | 6.07% | | | | | | 4.75% | | | | | | — | | | | | | — | | | |
| | | Class R | | | | | 5.71% | | | | | | 5.83% | | | | | | 4.48% | | | | | | — | | | | | | — | | | |
| | | Class R6 | | | | | 6.38% | | | | | | — | | | | | | — | | | | | | 4.37% | | | | |
| | | Class W | | | | | 6.36% | | | | | | 6.61% | | | | | | — | | | | | | — | | | | | | 5.47% | | | |
| | | Barclays U.S. Aggregate Bond Index | | | | | 5.72% | | | | | | 4.41% | | | | | | 4.93% | | | | | | 3.47% | | | | | | 4.96% | | | |
| | | | | |
Based on a $10,000 initial investment, the graph and table above illustrate the total return of Voya Intermediate Bond Fund against the index indicated. The index is unmanaged and has no cash in its portfolio, imposes no sales charges and incurs no operating expenses. An investor cannot invest directly in an index. The Fund’s performance is shown both with and without the imposition of sales charges.
The performance graph and table do not reflect the deduction of taxes that a shareholder will pay on Fund distributions or the redemption of Fund shares.
The performance shown may include the effect of fee waivers and/or expense reimbursements by the Investment Adviser and/or other service providers, which have the effect of increasing total net return. Had all fees and expenses been considered, the total net returns would have been lower.
Performance data represents past performance and is no assurance of future results. Investment return and principal value of an investment in the Fund will fluctuate. Shares, when sold, may be worth more or less than their original cost. The Fund’s current performance may be lower or higher than the performance data
shown. Please log on to www.voyainvestments.com or call (800) 992-0180 to get performance through the most recent month end.
This report contains statements that may be “forward-looking” statements. Actual results may differ materially from those projected in the “forward-looking” statements.
The views expressed in this report reflect those of the portfolio managers, only through the end of the period as stated on the cover. The portfolio managers’ views are subject to change at any time based on market and other conditions.
Fund holdings are subject to change daily.
| (1) | Reflects deduction of the maximum Class A sales charge of 4.75%. Effective July 31, 2006, the maximum Class A sales charge was lowered to 2.50%. |
| (2) | Reflects deduction of the Class B deferred sales charge of 5% and 2% for the 1 year and 5 year returns, respectively. |
| (3) | Reflects deduction of the Class C deferred sales charge of 1% for the 1 year return. |
| Portfolio Managers’ Report | Voya Short Term Bond Fund |
| | | |
| | Investment Type Allocation as of March 31, 2015 (as a percentage of net assets) | |
| | | | | | |
| | Corporate Bonds/Notes | | | 58.7% | |
| | Asset-Backed Securities | | | 18.0% | |
| | Collateralized Mortgage Obligations | | | 10.7% | |
| | U.S. Government Agency Obligations | | | 7.6% | |
| | U.S. Treasury Obligations | | | 3.8% | |
| | Purchased Options | | | 0.0% | |
| | Assets in Excess of Other Liabilities* | | | 1.2% | |
| | Net Assets | | | 100.0% | |
| | | |
| | * Includes short-term investments. | |
| | | |
| | Portfolio holdings are subject to change daily. | |
| | | |
Voya Short Term Bond Fund (the “Fund”) seeks maximum total return. The Fund is managed by Christine Hurtsellers, CFA, and Matthew Toms, CFA, Portfolio Managers of Voya Investment Management Co. LLC — the Sub-Adviser.
Performance: For the year ended March 31, 2015, the Fund’s Class I shares, excluding sales charges, provided a total return of 1.50% compared to the Barclays U.S. 1-3 Year Government/Credit Bond Index (the “Index” or “Barclays U.S. 1-3 Year Government/Credit Bond”), which returned 1.12%, for the same period.
Portfolio Specifics: The Fund outperformed its benchmark for the reporting period; sector allocation was the main driver of results. Duration/yield curve positioning and security selection detracted from results for the period.
An overweighting in asset-backed securities was the most important contributor to return. An overweight to commercial mortgage-backed securities also contributed to relative results. An overweight of high yield corporate bonds also contributed, as did an overweight of investment grade corporate bonds.
During the first half of the reporting period the Fund’s duration, or interest rate risk exposure, was shorter than the benchmark; during the second half of the period, it was neutral. This positioning detracted from results for the period. Toward period-end, the Fund’s yield decreased as short-term rates decreased and spreads moved slightly tighter. At the end of the period duration was neutral versus the benchmark.
Security selection detracted the most among investment grade corporates, partially offsetting the benefit of our overweight in that sector. In addition, off-benchmark allocations to high yield corporates benefited performance.
Current Strategy & Outlook: Punxsutawney Phil won’t be adding “economic soothsayer” to his resume this year. The prescient marmot saw his shadow on Groundhog Day, which typically prognosticates six more weeks of winter. But if the latest U.S. Federal Reserve Board (“Fed”) announcement was any barometer of the economic climate, we believe it would be superstitious to believe in a spring of interest rates anytime soon.
| | | |
| | Top Ten Holdings
as of March 31, 2015*
(as a percentage of net assets) | |
| | | | | | |
| | United States Treasury Note, 0.375%, 03/31/16 | | | 2.9% | |
| | Ginnie Mae, 7.120%, 04/20/39 | | | 1.1% | |
| | LB-UBS Commercial Mortgage Trust, 5.127%, 09/15/40 | | | 0.8% | |
| | Freddie Mac, 6.000%, 12/15/28 | | | 0.9% | |
| | Bank of America Corp., 2.600%, 01/15/19 | | | 0.8% | |
| | Freddie Mac, 5.000%, 07/15/39 | | | 0.8% | |
| | Muir Grove CLO Ltd., 3.256%, 03/25/20 | | | 0.7% | |
| | Barclays Bank PLC, 5.000%, 09/22/16 | | | 0.6% | |
| | BB&T Corp., 1.600%, 08/15/17 | | | 0.6% | |
| | Freddie Mac, 5.500%, 11/01/38 | | | 0.6% | |
| | | |
| | * Excludes short-term investments. | |
| | | |
| | Portfolio holdings are subject to change daily. | |
| | | |
While the improving labor market points to sunnier days ahead, the Fed’s dovish tone suggests that job growth is being overshadowed by the realities of low wage inflation, a strong dollar and collapsing oil prices. And though snowy weather was partially to blame for housing starts falling in February, the decline was the largest in four years — evidence that the housing market is cooling off.
We believe the removal of “patient” from the Fed’s latest announcement implies a shift in policy could happen in 2015. With forward guidance gone and the emphasis squarely on the economy, we believe the message is clear: the Fed will not be impatient about raising rates. Job growth alone likely isn’t enough to offset the weak global growth forecast. On the other hand, a weaker euro and quantitative easing by the European Central Bank are reviving growth prospects in Europe. Keeping Fed policy on hold allows more time for U.S. labor market improvement to percolate into other areas of the economy. Low commodity prices and a strong dollar restrain inflation and are also positive tailwinds for consumers.
We believe supportive policy globally will help smooth over economic and seasonal noise. With a quiescent Fed for now, we will likely maintain our bias for U.S. dollar-denominated spread sectors, which we expect to benefit from the strength and stability of the U.S. economy and from capital seeking more attractive yield than can be found elsewhere. We believe rates are likely to be range-bound and interest rate volatility is likely to decline in the near term. If clearer signs emerge that the economy is heating up, we believe we could see rising volatility and a spring of interest rates later this year.
Leverage has been on the rise in recent quarters. In our opinion, corporate revenue and earnings growth have remained fairly stable for the past few years. However, we do not see an inflection point on the horizon for the credit cycle. Excluding metals and energy, corporate spreads have moved back into the range of their cycle lows, but flows have been positive and we believe demand remains sound despite heavy issuance.
Though changes in Fed language are a concern, above-trend growth in the U.S. and low inflation expectations in Europe lead us to believe that domestic corporates are attractive and able to generate positive excess returns.
Portfolio holdings and characteristics are subject to change and may not be representative of current holdings and characteristics. The outlook for this Fund may differ from that presented for other Voya mutual funds. Performance for the different classes of shares will vary based on differences in fees associated with each class. An index has no cash in its portfolio, imposes no sales charges and incurs no operating expenses. An investor cannot invest directly in an index. The views expressed in this report reflect those of the portfolio managers, only through the end of the period as stated on the cover. The portfolio managers’ views are subject to change at any time based on market and other conditions.Fund holdings are subject to change daily. This report contains statements that may be “forward-looking” statements. Actual results may differ materially from those projected in the “forward-looking” statements.
| Voya Short Term Bond Fund | Portfolio Managers’ Report |
| | | Average Annual Total Returns for the Periods Ended March 31, 2015 | | |
| | | | | | 1 Year | | | Since Inception of Classes A, C, I, and W December 19, 2012 | | | Since Inception of Class R July 31, 2014 | | | Since Inception of Class R6 July 31, 2013 | | |
| | | Including Sales Charge: | | | | | | |
| | | Class A(1) | | | | | -1.36% | | | | | | 0.07% | | | | | | — | | | | | | — | | | |
| | | Class C(2) | | | | | -0.56% | | | | | | 0.47% | | | | | | — | | | | | | — | | | |
| | | Class I | | | | | 1.50% | | | | | | 1.51% | | | | | | — | | | | | | — | | | |
| | | Class R | | | | | — | | | | | | — | | | | | | 0.72% | | | | | | — | | | |
| | | Class R6 | | | | | 1.53% | | | | | | — | | | | | | — | | | | | | 1.81% | | | |
| | | Class W | | | | | 1.41% | | | | | | 1.43% | | | | | | — | | | | | | — | | | |
| | | Excluding Sales Charge: | | | | | | |
| | | Class A | | | | | 1.20% | | | | | | 1.20% | | | | | | — | | | | | | — | | | |
| | | Class C | | | | | 0.44% | | | | | | 0.47% | | | | | | — | | | | | | — | | | |
| | | Class I | | | | | 1.50% | | | | | | 1.51% | | | | | | — | | | | | | — | | | |
| | | Class R | | | | | — | | | | | | — | | | | | | 0.72% | | | | | | — | | | |
| | | Class R6 | | | | | 1.53% | | | | | | — | | | | | | — | | | | | | 1.81% | | | |
| | | Class W | | | | | 1.41% | | | | | | 1.43% | | | | | | — | | | | | | — | | | |
| | | Barclays U.S. 1-3 Year Government/Credit Bond | | | | | 1.12% | | | | | | 0.90% | | | | | | 0.86% | | | | | | 1.03% | | | |
| | | | | |
Based on a $10,000 initial investment, the graph and table above illustrate the total return of Voya Short Term Bond Fund against the index indicated. The index is unmanaged and has no cash in its portfolio, imposes no sales charges and incurs no operating expenses. An investor cannot invest directly in an index. The Fund’s performance is shown both with and without the imposition of sales charges.
The performance graph and table do not reflect the deduction of taxes that a shareholder will pay on Fund distributions or the redemption of Fund shares.
The performance shown may include the effect of fee waivers and/or expense reimbursements by the Investment Adviser and/or other service providers, which have the effect of increasing total net return. Had all fees and expenses been considered, the total net returns would have been lower.
Performance data represents past performance and is no assurance of future results. Investment return and principal value of an investment in the Fund will fluctuate. Shares, when sold, may be worth more or less than their original cost. The Fund’s current
performance may be lower or higher than the performance data shown. Please log on to www.voyainvestments.com or call (800) 992-0180 to get performance through the most recent month end.
It is important to note that the Fund has a limited operating history. Performance over a longer period of time may be more meaningful than short-term performance.
This report contains statements that may be “forward-looking” statements. Actual results may differ materially from those projected in the “forward-looking” statements.
The views expressed in this report reflect those of the portfolio managers, only through the end of the period as stated on the cover. The portfolio managers’ views are subject to change at any time based on market and other conditions.
Fund holdings are subject to change daily.
| (1) | Reflects deduction of the maximum Class A sales charge of 2.50%. |
| (2) | Reflects deduction of the Class C deferred sales charge of 1% for the 1 year return. |
| Portfolio Managers’ Report | Voya Strategic Income Opportunities Fund |
| | | |
| | Investment Type Allocation as of March 31, 2015 (as a percentage of net assets) | |
| | | | | | |
| | Mutual Funds | | | 71.0% | |
| | U.S. Government Agency Obligations | | | 13.2% | |
| | Collateralized Mortgage Obligations | | | 8.4% | |
| | U.S. Treasury Obligations | | | 3.3% | |
| | Corporate Bonds/Notes | | | 1.5% | |
| | Assets in Excess of Other Liabilities* | | | 2.6% | |
| | Net Assets | | | 100.0% | |
| | | |
| | * Includes short-term investments. | |
| | | |
| | Portfolio holdings are subject to change daily. | |
| | | |
Voya Strategic Income Opportunities Fund* (the “Fund”) seeks total return through income and capital appreciation through all market cycles. The Fund is managed by Christine Hurtsellers, CFA, and Matthew Toms, CFA, Portfolio Managers of Voya Investment Management Co. LLC — the Sub-Adviser.
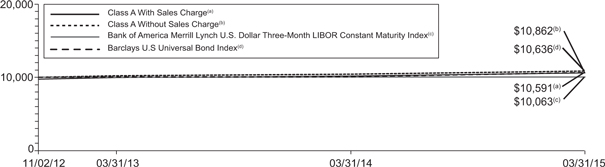
Performance: For the year ended March 31, 2015, the Fund’s Class A shares, excluding sales charges, provided a total return of 3.97% compared to the Bank of America Merrill Lynch U.S. Dollar Three-Month LIBOR Constant Maturity Index** (the “Index” or Bank of America Merrill Lynch U.S. Dollar Three-Month LIBOR Constant Maturity”), which returned 0.23%, for the same period.
Portfolio Specifics: The Fund outperformed its benchmark during the reporting period. The main contributors to results were the Fund’s overweight of senior loans and high yield bonds, security selection in commercial mortgage-backed securities and residential mortgage-backed securities and the Fund’s duration, or sensitivity to interest-rate changes.
Senior loans performed relatively well during the period, and the Fund’s significant overweight of them was the most important contributor to relative results. In our view, senior loans represent an attractive income opportunity with little interest-rate risk. Because the interest rates that senior loans pay “float,” i.e., are reset at regular, short intervals, there is little chance that loan interest payments will get significantly out of line with market rates. This in turn implies a low likelihood that the prices of senior loans will have to be reduced to compensate for higher market rates. As we head towards eventual rate hikes from the U.S. Federal Reserve Board (“Fed”) and higher market rates, we believe senior loans will continue to offer attractive benefits to investors. Tumult in the energy industry as oil prices fell caused many investors to worry about a spike of defaults in the high yield sector, which contains a fairly high percentage of energy issuers. A default spike did not arise, however; and so without significant, adverse market effects the Fund was able to benefit from the income generated by its high-yield bond holdings. As interest rates fell significantly during the period, the Fund was able to benefit from its slightly longer duration posture versus that of the benchmark. The Fund’s allocation to mortgage-related investments contributed to performance as prepayment speeds increased less than the market feared. Markets subsequently rallied, which caused the Fund’s mortgage valuations to increase, further contributing to performance.
| | | |
| | Top Ten Holdings
as of March 31, 2015
(as a percentage of net assets) | |
| | | | | | |
| | Voya Floating Rate Fund - Class P | | | 28.7% | |
| | Voya High Yield Bond Fund - Class P | | | 18.9% | |
| | Voya Securitized Credit Fund - Class P | | | 14.7% | |
| | Fannie Mae Connecticut Avenue Securities, 5.174%, 11/25/24 | | | 4.5% | |
| | Voya Investment Grade Credit Fund - Class P | | | 4.0% | |
| | Freddie Mac, 6.500%, 06/15/32 | | | 3.0% | |
| | Fannie Mae, 4.500%, 10/25/41 | | | 2.5% | |
| | Voya Emerging Markets Corporate Debt Fund - Class P | | | 2.4% | |
| | Voya Emerging Markets Hard Currency Debt Fund - Class P | | | 2.3% | |
| | Ginnie Mae Series, 0.650%, 11/20/37 | | | 2.1% | |
| | | |
| | Portfolio holdings are subject to change daily. | |
| | | |
On the other hand, some positions detracted from Fund performance. Most significant were the Fund’s exposure to emerging markets, its yield curve positioning and its derivative holdings. Concerns about the wobbly global economy — and higher rates to come in the United States — put pressure on emerging market (“EM”) debt across all venues, most notably in Brazil and Russia. Though the Fund’s exposure to EM debt was small, it nonetheless detracted from results.
The Fund employed interest rate futures to manage exposure to U.S. interest-rate risk; the futures were a drag on results as interest rates fell. We seek to use these instruments as means to protect the Fund from adverse market changes in interest rates or credit conditions.
Current Strategy & Outlook: While the improving labor market points to sunnier days ahead, the Fed’s dovish tone suggests that job growth is being overshadowed by the realities of low wage inflation, a strong dollar and collapsing oil prices. And though snowy weather was partially to blame for housing starts falling in the first quarter of 2015, the decline was the largest in four years — evidence that the housing market advance may be cooling.
We believe the removal of “patient” from the Fed’s latest announcement implies a shift in policy is coming. With forward guidance gone and the emphasis squarely on the economy, we believe the message is clear: although the timing of the first Fed move is approaching, the cumulative magnitude of Fed hikes will remain muted. This measured approach by the Fed will allow more time for U.S. labor market improvement to percolate into other areas of the economy. Low commodity prices and a strong dollar restrain inflation and are also positive tailwinds for consumers. Also, a weaker euro and quantitative easing by the European Central Bank are reviving growth prospects in Europe.
We believe supportive policy globally will help smooth over economic and seasonal noise. With a quiescent Fed for now, we maintain an overweight to investment grade corporates, which we expect to benefit from the strength and stability of the U.S. economy and from capital seeking more attractive yield than can be found elsewhere. Leverage has been on the rise in recent quarters. Corporate revenue and earnings growth have remained fairly stable for the past few years. However, we do not see an inflection point on the horizon for the credit cycle. Excluding metals and energy, corporate spreads have moved back into the range of their cycle lows, but flows have been
| Voya Strategic Income Opportunities Fund | Portfolio Managers’ Report |
positive and we believe demand remains sound despite heavy issuance. We also remain constructive on the forward prospects for below-investment grade credit sectors such as senior loans. This is driven by what we believe are attractive yields and a reasonably sanguine outlook for fundamental credit risk (ex-energy).
We believe interest rates are likely to be range-bound and interest rate volatility is likely to decline in the near term. Low short-term interest rates, an elevated Fed balance sheet, low long-term rates in major advanced countries, QE overseas, strong demand for safe assets and disappointments in growth in advanced countries are conspiring to keep long-term interest rates low. If clearer signs emerge that the economy is heating up, we could see rising volatility and a spring of interest rates later this year. We remain on watch for unexpected weakness in earnings and any resultant shift in investor expectations for the broader economy in general.
| * | Prior to December 1, 2014, the Fund was known as “Voya Strategic Income Fund.” |
| ** | Effective on December 1, 2014, the Fund changed its primary benchmark from the Barclay’s U.S. Universal Bond Index to the Bank of America Merrill Lynch U.S. Dollar Three-Month LIBOR Constant Maturity Index because the Bank of America Merrill Lynch U.S. Dollar Three-Month LIBOR Constant Maturity Index is considered by the adviser to be a more appropriate benchmark. |
Portfolio holdings and characteristics are subject to change and may not be representative of current holdings and characteristics. The outlook for this Fund may differ from that presented for other Voya mutual funds. Performance for the different classes of shares will vary based on differences in fees associated with each class. An index has no cash in its portfolio, imposes no sales charges and incurs no operating expenses. An investor cannot invest directly in an index. The views expressed in this report reflect those of the portfolio managers, only through the end of the period as stated on the cover. The portfolio managers’ views are subject to change at any time based on market and other conditions. Fund holdings are subject to change daily. This report contains statements that may be “forward-looking” statements. Actual results may differ materially from those projected in the “forward-looking” statements.
| Portfolio Managers’ Report | Voya Strategic Income Opportunities Fund |
| | | Average Annual Total Returns for the Periods Ended March 31, 2015 | | |
| | | | | | 1 Year | | | Since Inception of Classes A, C, I, R, and W November 2, 2012 | | |
| | | Including Sales Charge: | | | | |
| | | Class A(1) | | | | | 1.41% | | | | | | 2.39% | | | |
| | | Class C(2) | | | | | 2.23% | | | | | | 2.62% | | | |
| | | Class I | | | | | 4.29% | | | | | | 3.70% | | | |
| | | Class R | | | | | 3.70% | | | | | | 3.05% | | | |
| | | Class W | | | | | 4.24% | | | | | | 3.45% | | | |
| | | Excluding Sales Charge: | | | | |
| | | Class A | | | | | 3.97% | | | | | | 3.49% | | | |
| | | Class C | | | | | 3.22% | | | | | | 2.62% | | | |
| | | Class I | | | | | 4.29% | | | | | | 3.70% | | | |
| | | Class R | | | | | 3.70% | | | | | | 3.05% | | | |
| | | Class W | | | | | 4.24% | | | | | | 3.45% | | | |
| | | Bank of America Merrill Lynch U.S. Dollar Three-Month LIBOR Constant Maturity Index | | | | | 0.23% | | | | | | 0.26% | | | |
| | | Barclays U.S. Universal Bond Index | | | | | 5.33% | | | | | | 2.58% | | | |
| | | | | | | | | | | | | | | | | |
Based on a $10,000 initial investment, the graph and table above illustrate the total return of Voya Strategic Income Opportunities Fund against the indices indicated. An index is unmanaged and has no cash in its portfolio, imposes no sales charges and incurs no operating expenses. An investor cannot invest directly in an index. The Fund’s performance is shown both with and without the imposition of sales charges.
The performance graph and table do not reflect the deduction of taxes that a shareholder will pay on Fund distributions or the redemption of Fund shares.
The performance shown may include the effect of fee waivers and/or expense reimbursements by the Investment Adviser and/or other service providers, which have the effect of increasing total net return. Had all fees and expenses been considered, the total net returns would have been lower.
Performance data represents past performance and is no assurance of future results. Investment return and principal value of an investment in the Fund will fluctuate. Shares, when sold, may be worth more or less than their original cost. The Fund’s current performance may be lower or higher than the performance data shown. Please log on to www.voyainvestments.com or call (800) 992-0180 to get performance through the most recent month end.
It is important to note that the Fund has a limited operating history. Performance over a longer period of time may be more meaningful than short-term performance.
This report contains statements that may be “forward-looking” statements. Actual results may differ materially from those projected in the “forward-looking” statements.
The views expressed in this report reflect those of the portfolio managers, only through the end of the period as stated on the cover. The portfolio managers’ views are subject to change at any time based on market and other conditions.
Fund holdings are subject to change daily.
| (1) | Reflects deduction of the maximum Class A sales charge of 2.50%. |
| (2) | Reflects deduction of the Class C deferred sales charge of 1% for the 1 year return. |
On December 1, 2014 the Fund changed its primary benchmark from the Barclay’s U.S. Universal Bond Index to the Bank of America Merrill Lynch U.S. Dollar Three-Month LIBOR Constant Maturity Index because the Bank of America Merrill Lynch U.S. Dollar Three-Month LIBOR Constant Maturity Index is considered by the adviser to be a more appropriate benchmark.
| SHAREHOLDER EXPENSE EXAMPLES (Unaudited) |
As a shareholder of a Fund, you incur two types of costs: (1) transaction costs, including sales charges (loads) on purchase payments, redemption fees, and exchange fees, and (2) ongoing costs, including management fees, distribution and/or service (12b-1) fees, and other Fund expenses. These Examples are intended to help you understand your ongoing costs (in dollars) of investing in a Fund and to compare these costs with the ongoing costs of investing in other mutual funds.
The Examples are based on an investment of $1,000 invested at the beginning of the period and held for the entire period from October 1, 2014 to March 31, 2015. The Funds’ expenses are shown without the imposition of any sales charges or fees. Expenses would have been higher if such charges were included.
Actual Expenses
The left section of the table shown below, “Actual Fund Return,” provides information about actual account values and actual expenses. You may use the information in this section, together with the amount you invested, to estimate the expenses that you paid over the period. Simply divide your account value by $1,000 (for example, an $8,600 account value divided by $1,000 = 8.6), then multiply the result by the number in the first section under the heading entitled “Expenses Paid During the Period” to estimate the expenses you paid on your account during this period.
Hypothetical Example for Comparison Purposes
The right section of the table shown below, “Hypothetical (5% return before expenses)” provides information about hypothetical account values and hypothetical expenses based on a Fund’s actual expense ratio and an assumed rate of return of 5% per year before expenses, which is not the Fund’s actual return. The hypothetical account values and expenses may not be used to estimate the actual ending account balance or expenses you paid for the period. You may use this information to compare the ongoing costs of investing in each Fund and other mutual funds. To do so, compare this 5% hypothetical example with the 5% hypothetical examples that appear in the shareholder reports of the other mutual funds.
Please note that the expenses shown in the table are meant to highlight your ongoing costs only and do not reflect any transactional costs, such as sales charges (loads), redemption fees, or exchange fees. Therefore, the hypothetical section of the table is useful in comparing ongoing costs only, and will not help you determine the relative total costs of owning different mutual funds. In addition, if these transactional costs were included, your costs would have been higher.
| | | | Actual Fund Return | | | Hypothetical (5% return before expenses) | |
| | | | Beginning Account Value October 1, 2014 | | | Ending Account Value March 31, 2015 | | | Annualized Expense Ratio | | | Expenses Paid During the Period Ended March 31, 2015* | | | Beginning Account Value October 1, 2014 | | | Ending Account Value March 31, 2015 | | | Annualized Expense Ratio | | | Expenses Paid During the Period Ended March 31, 2015* | |
| Voya GNMA Income Fund | | | |
| Class A | | | | $ | 1,000.00 | | | | | $ | 1,022.70 | | | | | | 0.92 | % | | | | $ | 4.64 | | | | | $ | 1,000.00 | | | | | $ | 1,020.34 | | | | | | 0.92 | % | | | | $ | 4.63 | | |
| Class B | | | | | 1,000.00 | | | | | | 1,019.00 | | | | | | 1.67 | | | | | | 8.41 | | | | | | 1,000.00 | | | | | | 1,016.60 | | | | | | 1.67 | | | | | | 8.40 | | |
| Class C | | | | | 1,000.00 | | | | | | 1,019.00 | | | | | | 1.67 | | | | | | 8.41 | | | | | | 1,000.00 | | | | | | 1,016.60 | | | | | | 1.67 | | | | | | 8.40 | | |
| Class I | | | | | 1,000.00 | | | | | | 1,024.10 | | | | | | 0.65 | | | | | | 3.28 | | | | | | 1,000.00 | | | | | | 1,021.69 | | | | | | 0.65 | | | | | | 3.28 | | |
| Class W | | | | | 1,000.00 | | | | | | 1,024.00 | | | | | | 0.67 | | | | | | 3.38 | | | | | | 1,000.00 | | | | | | 1,021.59 | | | | | | 0.67 | | | | | | 3.38 | | |
| Voya High Yield Bond Fund | | | |
| Class A | | | | $ | 1,000.00 | | | | | $ | 1,011.20 | | | | | | 1.10 | % | | | | $ | 5.52 | | | | | $ | 1,000.00 | | | | | $ | 1,019.45 | | | | | | 1.10 | % | | | | $ | 5.54 | | |
| Class B | | | | | 1,000.00 | | | | | | 1,008.60 | | | | | | 1.85 | | | | | | 9.26 | | | | | | 1,000.00 | | | | | | 1,015.71 | | | | | | 1.85 | | | | | | 9.30 | | |
| Class C | | | | | 1,000.00 | | | | | | 1,008.60 | | | | | | 1.85 | | | | | | 9.26 | | | | | | 1,000.00 | | | | | | 1,015.71 | | | | | | 1.85 | | | | | | 9.30 | | |
| Class I | | | | | 1,000.00 | | | | | | 1,015.50 | | | | | | 0.69 | | | | | | 3.47 | | | | | | 1,000.00 | | | | | | 1,021.49 | | | | | | 0.69 | | | | | | 3.48 | | |
| Class P | | | | | 1,000.00 | | | | | | 1,018.50 | | | | | | 0.07 | | | | | | 0.35 | | | | | | 1,000.00 | | | | | | 1,024.58 | | | | | | 0.07 | | | | | | 0.35 | | |
| Class R | | | | | 1,000.00 | | | | | | 1,012.50 | | | | | | 1.34 | | | | | | 6.72 | | | | | | 1,000.00 | | | | | | 1,018.25 | | | | | | 1.34 | | | | | | 6.74 | | |
| Class W | | | | | 1,000.00 | | | | | | 1,013.80 | | | | | | 0.85 | | | | | | 4.27 | | | | | | 1,000.00 | | | | | | 1,020.69 | | | | | | 0.85 | | | | | | 4.28 | | |
| SHAREHOLDER EXPENSE EXAMPLES (Unaudited) (continued) |
| | | | Actual Fund Return | | | Hypothetical (5% return before expenses) | |
| | | | Beginning Account Value October 1, 2014 | | | Ending Account Value March 31, 2015 | | | Annualized Expense Ratio | | | Expenses Paid During the Period Ended March 31, 2015* | | | Beginning Account Value October 1, 2014 | | | Ending Account Value March 31, 2015 | | | Annualized Expense Ratio | | | Expenses Paid During the Period Ended March 31, 2015* | |
| Voya Intermediate Bond Fund | | |
| Class A | | | | $ | 1,000.00 | | | | | $ | 1,033.50 | | | | | | 0.66% | | | | | $ | 3.35 | | | | | $ | 1,000.00 | | | | | $ | 1,021.64 | | | | | | 0.66 | % | | | | $ | 3.33 | | |
| Class B | | | | | 1,000.00 | | | | | | 1,029.00 | | | | | | 1.41 | | | | | | 7.13 | | | | | | 1,000.00 | | | | | | 1,017.90 | | | | | | 1.41 | | | | | | 7.09 | | |
| Class C | | | | | 1,000.00 | | | | | | 1,029.70 | | | | | | 1.41 | | | | | | 7.14 | | | | | | 1,000.00 | | | | | | 1,017.90 | | | | | | 1.41 | | | | | | 7.09 | | |
| Class I | | | | | 1,000.00 | | | | | | 1,036.20 | | | | | | 0.32 | | | | | | 1.62 | | | | | | 1,000.00 | | | | | | 1,023.34 | | | | | | 0.32 | | | | | | 1.61 | | |
| Class O | | | | | 1,000.00 | | | | | | 1,033.60 | | | | | | 0.66 | | | | | | 3.35 | | | | | | 1,000.00 | | | | | | 1,021.64 | | | | | | 0.66 | | | | | | 3.33 | | |
| Class R | | | | | 1,000.00 | | | | | | 1,032.10 | | | | | | 0.91 | | | | | | 4.61 | | | | | | 1,000.00 | | | | | | 1,020.39 | | | | | | 0.91 | | | | | | 4.58 | | |
| Class R6 | | | | | 1,000.00 | | | | | | 1,035.30 | | | | | | 0.31 | | | | | | 1.57 | | | | | | 1,000.00 | | | | | | 1,023.39 | | | | | | 0.31 | | | | | | 1.56 | | |
| Class W | | | | | 1,000.00 | | | | | | 1,035.80 | | | | | | 0.41 | | | | | | 2.08 | | | | | | 1,000.00 | | | | | | 1,022.89 | | | | | | 0.41 | | | | | | 2.07 | | |
| Voya Short Term Bond Fund | | |
| Class A | | | | $ | 1,000.00 | | | | | $ | 1,008.50 | | | | | | 0.80% | | | | | $ | 4.01 | | | | | $ | 1,000.00 | | | | | $ | 1,020.94 | | | | | | 0.80 | % | | | | $ | 4.03 | | |
| Class C | | | | | 1,000.00 | | | | | | 1,004.70 | | | | | | 1.55 | | | | | | 7.75 | | | | | | 1,000.00 | | | | | | 1,017.20 | | | | | | 1.55 | | | | | | 7.80 | | |
| Class I | | | | | 1,000.00 | | | | | | 1,009.90 | | | | | | 0.50 | | | | | | 2.51 | | | | | | 1,000.00 | | | | | | 1,022.44 | | | | | | 0.50 | | | | | | 2.52 | | |
| Class R | | | | | 1,000.00 | | | | | | 1,007.20 | | | | | | 1.05 | | | | | | 5.25 | | | | | | 1,000.00 | | | | | | 1,019.70 | | | | | | 1.05 | | | | | | 5.29 | | |
| Class R6 | | | | | 1,000.00 | | | | | | 1,010.10 | | | | | | 0.47 | | | | | | 2.36 | | | | | | 1,000.00 | | | | | | 1,022.59 | | | | | | 0.47 | | | | | | 2.37 | | |
| Class W | | | | | 1,000.00 | | | | | | 1,009.80 | | | | | | 0.55 | | | | | | 2.76 | | | | | | 1,000.00 | | | | | | 1,022.19 | | | | | | 0.55 | | | | | | 2.77 | | |
| Voya Strategic Income Opportunities Fund** | |
| Class A | | | | $ | 1,000.00 | | | | | $ | 1,028.30 | | | | | | 1.03% | | | | | $ | 5.21 | | | | | $ | 1,000.00 | | | | | $ | 1,019.80 | | | | | | 1.03 | % | | | | $ | 5.19 | | |
| Class C | | | | | 1,000.00 | | | | | | 1,025.00 | | | | | | 1.78 | | | | | | 8.99 | | | | | | 1,000.00 | | | | | | 1,016.06 | | | | | | 1.78 | | | | | | 8.95 | | |
| Class I | | | | | 1,000.00 | | | | | | 1,029.40 | | | | | | 0.64 | | | | | | 3.24 | | | | | | 1,000.00 | | | | | | 1,021.74 | | | | | | 0.64 | | | | | | 3.23 | | |
| Class R | | | | | 1,000.00 | | | | | | 1,026.60 | | | | | | 1.28 | | | | | | 6.47 | | | | | | 1,000.00 | | | | | | 1,018.55 | | | | | | 1.28 | | | | | | 6.44 | | |
| Class W | | | | | 1,000.00 | | | | | | 1,028.80 | | | | | | 0.78 | | | | | | 3.95 | | | | | | 1,000.00 | | | | | | 1,021.04 | | | | | | 0.78 | | | | | | 3.93 | | |
| * | Expenses are equal to each Fund’s respective annualized expense ratios multiplied by the average account value over the period, multiplied by 182/365 to reflect the most recent fiscal half-year. |
| ** | The annualized expense ratios do not include expenses of the underlying funds. |
| Report of Independent Registered Public Accounting Firm |
The Shareholders and Board of Trustees
Voya Funds Trust
We have audited the accompanying statements of assets and liabilities, including the summary portfolio of investments, of Voya GNMA Income Fund, Voya High Yield Bond Fund, Voya Intermediate Bond Fund, Voya Short Term Bond Fund, and Voya Strategic Income Opportunities Fund (formerly, Voya Strategic Income Fund), each a series of Voya Funds Trust, as of March 31, 2015, and the related statements of operations for the year then ended, the statements of changes in net assets for each of the years in the two-year period then ended, and the financial highlights for each of the years in the five-year period then ended. These financial statements and financial highlights are the responsibility of management. Our responsibility is to express an opinion on these financial statements and financial highlights based on our audits.
We conducted our audits in accordance with the standards of the Public Company Accounting Oversight Board (United States). Those standards require that we plan and perform the audit to obtain reasonable assurance about whether the financial statements, financial highlights, and portfolios of investments are free of material misstatement. An audit includes examining, on a test basis, evidence supporting the amounts and disclosures in the financial statements and portfolios of investments. Our procedures included confirmation of securities owned as of March 31, 2015, by correspondence with the custodian, transfer agent, and brokers, or by other appropriate auditing procedures when replies from brokers were not received. An audit also includes assessing the accounting principles used and significant estimates made by management, as well as evaluating the overall financial statement presentation. We believe that our audits provide a reasonable basis for our opinion.
In our opinion, the financial statements and financial highlights referred to above present fairly, in all material respects, the financial position of the aforementioned funds of Voya Funds Trust as of March 31, 2015, and the results of their operations for the year then ended, the changes in their net assets for each of the years in the two-year period then ended, and the financial highlights for each of the years in the five-year period then ended, in conformity with accounting principles generally accepted in the United States of America.

Boston, Massachusetts
May 22, 2015
| STATEMENTS OF ASSETS AND LIABILITIES as of March 31, 2015 |
| | | Voya GNMA Income Fund | | | Voya High Yield Bond Fund | | | Voya Intermediate Bond Fund | |
| ASSETS: | | | | | | | | | | | | |
| Investments in securities at fair value+* | | $ | 986,906,081 | | | $ | 499,809,455 | | | $ | 2,831,571,651 | |
| Short-term investments at fair value** | | | 54,998,295 | | | | 12,717,000 | | | | 314,294,863 | |
| Total investments at fair value | | $ | 1,041,904,376 | | | $ | 512,526,455 | | | $ | 3,145,866,514 | |
| Cash | | | 172,183,769 | | | | 27,125 | | | | 8,428,671 | |
| Cash collateral for futures | | | 2,056,090 | | | | — | | | | 2,043,328 | |
| Cash pledged for centrally cleared swaps (Note 2) | | | — | | | | — | | | | 1,708,000 | |
| Receivables: | | | | | | | | | | | | |
| Investment securities sold | | | 514 | | | | — | | | | 23,254,388 | |
| Investment securities sold on a delayed-delivery or when-issued basis | | | 587,375,498 | | | | — | | | | 464,978,861 | |
| Fund shares sold | | | 4,298,245 | | | | 809,903 | | | | 5,619,332 | |
| Dividends | | | — | | | | 358 | | | | 8,834 | |
| Interest | | | 2,339,757 | | | | 9,347,542 | | | | 13,869,592 | |
| Prepaid expenses | | | 44,048 | | | | 47,642 | | | | 119,566 | |
| Other assets | | | 16,987 | | | | 4,271 | | | | 25,533 | |
| Total assets | | | 1,810,219,284 | | | | 522,763,296 | | | | 3,665,922,619 | |
| | | | | | | | | | | | | |
| LIABILITIES: | | | | | | | | | | | | |
| Income distribution payable | | | — | | | | 94,489 | | | | 330,259 | |
| Payable for investment securities purchased | | | — | | | | 4,628,411 | | | | 57,532,545 | |
| Payable for investment securities purchased on a delayed-delivery or when-issued basis | | | 926,452,130 | | | | — | | | | 826,548,082 | |
| Payable for fund shares redeemed | | | 1,377,356 | | | | 789,976 | | | | 2,099,650 | |
| Payable upon receipt of securities loaned | | | — | | | | — | | | | 142,669,449 | |
| Unrealized depreciation on forward foreign currency contracts | | | — | | | | — | | | | 71,247 | |
| Variation margin payable on centrally cleared swaps | | | — | | | | — | | | | 85,985 | |
| Cash received as collateral for delayed-delivery or when-issued securities (Note 2) | | | 2,448,000 | | | | — | | | | 1,505,146 | |
| Payable for investment management fees | | | 345,329 | | | | 159,309 | | | | 365,040 | |
| Payable for administrative fees | | | 73,474 | | | | 45,608 | | | | 214,729 | |
| Payable for distribution and shareholder service fees | | | 180,885 | | | | 28,187 | | | | 280,857 | |
| Payable to trustees under the deferred compensation plan (Note 6) | | | 16,987 | | | | 4,271 | | | | 25,533 | |
| Payable for trustee fees | | | 4,140 | | | | 2,514 | | | | 9,818 | |
| Other accrued expenses and liabilities | | | 194,428 | | | | 67,927 | | | | 569,802 | |
| Total liabilities | | | 931,092,729 | | | | 5,820,692 | | | | 1,032,308,142 | |
| NET ASSETS | | $ | 879,126,555 | | | $ | 516,942,604 | | | $ | 2,633,614,477 | |
| | | | | | | | | | | | | |
| NET ASSETS WERE COMPRISED OF: | | | | | | | | | | | | |
| Paid-in capital | | $ | 878,376,632 | | | $ | 546,827,356 | | | $ | 2,686,409,701 | |
| Undistributed (distributions in excess of) net investment income | | | (1,951,018 | ) | | | (259,292 | ) | | | 575,720 | |
| Accumulated net realized loss | | | (16,145,786 | ) | | | (28,775,210 | ) | | | (104,173,888 | ) |
| Net unrealized appreciation (depreciation) | | | 18,846,727 | | | | (850,250 | ) | | | 50,802,944 | |
| NET ASSETS | | $ | 879,126,555 | | | $ | 516,942,604 | | | $ | 2,633,614,477 | |
| | | | | | | | | | | | | |
| + Including securities loaned at value | | $ | — | | | $ | — | | | $ | 139,648,005 | |
| * Cost of investments in securities | | $ | 966,584,802 | | | $ | 500,659,705 | | | $ | 2,776,736,276 | |
| ** Cost of short-term investments | | $ | 54,998,295 | | | $ | 12,717,000 | | | $ | 314,294,863 | |
See Accompanying Notes to Financial Statements
| STATEMENTS OF ASSETS AND LIABILITIES as of March 31, 2015 (continued) |
| | | Voya GNMA Income Fund | | | Voya High Yield Bond Fund | | | Voya Intermediate Bond Fund | |
| Class A | | | | | | | | | | | | |
| Net assets | | $ | 521,225,947 | | | $ | 75,587,751 | | | $ | 995,117,263 | |
| Shares authorized | | | unlimited | | | | unlimited | | | | unlimited | |
| Par value | | $ | 0.001 | | | $ | 0.001 | | | $ | 0.001 | |
| Shares outstanding | | | 59,894,555 | | | | 9,280,835 | | | | 97,299,138 | |
| Net asset value and redemption price per share† | | $ | 8.70 | | | $ | 8.14 | | | $ | 10.23 | |
| Maximum offering price per share (2.50%)(1) | | $ | 8.92 | | | $ | 8.35 | | | $ | 10.49 | |
| | | | | | | | | | | | | |
| Class B | | | | | | | | | | | | |
| Net assets | | $ | 332,876 | | | $ | 473,238 | | | $ | 447,151 | |
| Shares authorized | | | unlimited | | | | unlimited | | | | unlimited | |
| Par value | | $ | 0.001 | | | $ | 0.001 | | | $ | 0.001 | |
| Shares outstanding | | | 38,462 | | | | 58,128 | | | | 43,822 | |
| Net asset value and redemption price per share† | | $ | 8.65 | | | $ | 8.14 | | | $ | 10.20 | |
| | | | | | | | | | | | | |
| Class C | | | | | | | | | | | | |
| Net assets | | $ | 83,809,415 | | | $ | 13,568,491 | | | $ | 32,592,681 | |
| Shares authorized | | | unlimited | | | | unlimited | | | | unlimited | |
| Par value | | $ | 0.001 | | | $ | 0.001 | | | $ | 0.001 | |
| Shares outstanding | | | 9,683,621 | | | | 1,666,389 | | | | 3,190,927 | |
| Net asset value and redemption price per share† | | $ | 8.65 | | | $ | 8.14 | | | $ | 10.21 | |
| | | | | | | | | | | | | |
| Class I | | | | | | | | | | | | |
| Net assets | | $ | 223,920,244 | | | $ | 233,374,263 | | | $ | 613,642,579 | |
| Shares authorized | | | unlimited | | | | unlimited | | | | unlimited | |
| Par value | | $ | 0.001 | | | $ | 0.001 | | | $ | 0.001 | |
| Shares outstanding | | | 25,694,494 | | | | 28,685,002 | | | | 60,003,480 | |
| Net asset value and redemption price per share | | $ | 8.71 | | | $ | 8.14 | | | $ | 10.23 | |
| | | | | | | | | | | | | |
| Class O | | | | | | | | | | | | |
| Net assets | | | n/a | | | | n/a | | | $ | 36,329,075 | |
| Shares authorized | | | n/a | | | | n/a | | | | unlimited | |
| Par value | | | n/a | | | | n/a | | | $ | 0.001 | |
| Shares outstanding | | | n/a | | | | n/a | | | | 3,551,502 | |
| Net asset value and redemption price per share | | | n/a | | | | n/a | | | $ | 10.23 | |
| | | | | | | | | | | | | |
| Class P | | | | | | | | | | | | |
| Net assets | | | n/a | | | $ | 145,331,639 | | | | n/a | |
| Shares authorized | | | n/a | | | | unlimited | | | | n/a | |
| Par value | | | n/a | | | $ | 0.001 | | | | n/a | |
| Shares outstanding | | | n/a | | | | 17,856,539 | | | | n/a | |
| Net asset value and redemption price per share | | | n/a | | | $ | 8.14 | | | | n/a | |
| | | | | | | | | | | | | |
| Class R | | | | | | | | | | | | |
| Net assets | | | n/a | | | $ | 181,453 | | | $ | 121,657,132 | |
| Shares authorized | | | n/a | | | | unlimited | | | | unlimited | |
| Par value | | | n/a | | | $ | 0.001 | | | $ | 0.001 | |
| Shares outstanding | | | n/a | | | | 22,273 | | | | 11,877,920 | |
| Net asset value and redemption price per share | | | n/a | | | $ | 8.15 | | | $ | 10.24 | |
| | | | | | | | | | | | | |
| Class R6 | | | | | | | | | | | | |
| Net assets | | | n/a | | | | n/a | | | $ | 371,049,356 | |
| Shares authorized | | | n/a | | | | n/a | | | | unlimited | |
| Par value | | | n/a | | | | n/a | | | $ | 0.001 | |
| Shares outstanding | | | n/a | | | | n/a | | | | 36,303,469 | |
| Net asset value and redemption price per share | | | n/a | | | | n/a | | | $ | 10.22 | |
| | | | | | | | | | | | | |
| Class W | | | | | | | | | | | | |
| Net assets | | $ | 49,838,073 | | | $ | 48,425,769 | | | $ | 462,779,240 | |
| Shares authorized | | | unlimited | | | | unlimited | | | | unlimited | |
| Par value | | $ | 0.001 | | | $ | 0.001 | | | $ | 0.001 | |
| Shares outstanding | | | 5,712,961 | | | | 5,940,011 | | | | 45,301,526 | |
| Net asset value and redemption price per share | | $ | 8.72 | | | $ | 8.15 | | | $ | 10.22 | |
| (1) | Maximum offering price is computed at 100/97.50 of net asset value. On purchases of $100,000 or more, the offering price is reduced. |
| † | Redemption price per share may be reduced for any applicable contingent deferred sales charges. |
See Accompanying Notes to Financial Statements
| STATEMENTS OF ASSETS AND LIABILITIES as of March 31, 2015 |
| | | Voya Short Term Bond Fund | | | Voya Strategic Income Opportunities Fund | |
| ASSETS: | | | | | | | | |
| Investments in securities at fair value+* | | $ | 139,486,042 | | | $ | 1,687,094 | |
| Investments in affiliated underlying funds at fair value** | | | — | | | | 4,540,972 | |
| Short-term investments at fair value*** | | | 2,728,526 | | | | 59,000 | |
| Total investments at fair value | | $ | 142,214,568 | | | $ | 6,287,066 | |
| Cash | | | 9,742 | | | | 9,942 | |
| Cash collateral for futures | | | 250,966 | | | | 19,234 | |
| Cash pledged for centrally cleared swaps (Note 2) | | | — | | | | 25,000 | |
| Foreign currencies at value**** | | | 49,493 | | | | — | |
| Receivables: | | | | | | | | |
| Investment in affiliated underlying funds sold | | | — | | | | 8,340 | |
| Fund shares sold | | | 8,526 | | | | 11,421 | |
| Dividends | | | 94 | | | | 14,098 | |
| Interest | | | 662,889 | | | | 18,018 | |
| Unrealized appreciation on forward foreign currency contracts | | | — | | | | 3,559 | |
| Variation margin receivable on centrally cleared swaps | | | — | | | | 628 | |
| Prepaid expenses | | | 34,652 | | | | 38,398 | |
| Reimbursement due from manager | | | 9,073 | | | | 8,727 | |
| Other assets | | | 981 | | | | — | |
| Total assets | | | 143,240,984 | | | | 6,444,431 | |
| | | | | | | | | |
| LIABILITIES: | | | | | | | | |
| Payable for investments in affiliated underlying funds purchased | | | — | | | | 31,438 | |
| Payable for investment securities purchased | | | 605,866 | | | | — | |
| Payable for fund shares redeemed | | | 360,310 | | | | — | |
| Payable upon receipt of securities loaned | | | 1,021,526 | | | | — | |
| Unrealized depreciation on forward foreign currency contracts | | | — | | | | 1,219 | |
| Variation margin payable on centrally cleared swaps | | | — | | | | 1,174 | |
| Payable for investment management fees | | | 42,065 | | | | 2,988 | |
| Payable for administrative fees | | | 12,018 | | | | 543 | |
| Payable for distribution and shareholder service fees | | | 358 | | | | 362 | |
| Payable to trustees under the deferred compensation plan (Note 6) | | | 981 | | | | — | |
| Payable for trustee fees | | | 810 | | | | 30 | |
| Other accrued expenses and liabilities | | | 30,613 | | | | 13,174 | |
| Total liabilities | | | 2,074,547 | | | | 50,928 | |
| NET ASSETS | | $ | 141,166,437 | | | $ | 6,393,503 | |
| | | | | | | | | |
| NET ASSETS WERE COMPRISED OF: | | | | | | | | |
| Paid-in capital | | $ | 141,548,519 | | | $ | 6,392,345 | |
| Undistributed net investment income | | | 9,837 | | | | 55,719 | |
| Accumulated net realized loss | | | (680,816 | ) | | | (106,540 | ) |
| Net unrealized appreciation | | | 288,897 | | | | 51,979 | |
| | | | | | | | | |
| NET ASSETS | | $ | 141,166,437 | | | $ | 6,393,503 | |
| + Including securities loaned at value | | $ | 1,000,246 | | | $ | — | |
| * Cost of investments in securities | | $ | 139,167,314 | | | $ | 1,611,636 | |
| ** Cost of investments in affiliated underlying funds | | $ | — | | | $ | 4,566,518 | |
| *** Cost of short-term investments | | $ | 2,728,526 | | | $ | 59,000 | |
| **** Cost of foreign currencies | | $ | 55,805 | | | $ | — | |
See Accompanying Notes to Financial Statements
| STATEMENTS OF ASSETS AND LIABILITIES as of March 31, 2015 (continued) |
| | | Voya Short Term Bond Fund | | | Voya Strategic Income Opportunities Fund | |
| Class A | | | | | | | | |
| Net assets | | $ | 303,118 | | | $ | 438,266 | |
| Shares authorized | | | unlimited | | | | unlimited | |
| Par value | | $ | 0.001 | | | $ | 0.001 | |
| Shares outstanding | | | 30,397 | | | | 43,956 | |
| Net asset value and redemption price per share† | | $ | 9.97 | | | $ | 9.97 | |
| Maximum offering price per share (2.50%)(1) | | $ | 10.23 | | | $ | 10.23 | |
| | | | | | | | | |
| Class C | | | | | | | | |
| Net assets | | $ | 343,576 | | | $ | 169,535 | |
| Shares authorized | | | unlimited | | | | unlimited | |
| Par value | | $ | 0.001 | | | $ | 0.001 | |
| Shares outstanding | | | 34,434 | | | | 17,217 | |
| Net asset value and redemption price per share† | | $ | 9.98 | | | $ | 9.85 | |
| | | | | | | | | |
| Class I | | | | | | | | |
| Net assets | | $ | 7,416,081 | | | $ | 5,452,895 | |
| Shares authorized | | | unlimited | | | | unlimited | |
| Par value | | $ | 0.001 | | | $ | 0.001 | |
| Shares outstanding | | | 743,281 | | | | 546,281 | |
| Net asset value and redemption price per share | | $ | 9.98 | | | $ | 9.98 | |
| | | | | | | | | |
| Class R | | | | | | | | |
| Net assets | | $ | 3,034 | | | $ | 329,552 | |
| Shares authorized | | | unlimited | | | | unlimited | |
| Par value | | $ | 0.001 | | | $ | 0.001 | |
| Shares outstanding | | | 304 | | | | 33,279 | |
| Net asset value and redemption price per share | | $ | 9.97 | | | $ | 9.90 | |
| | | | | | | | | |
| Class R6 | | | | | | | | |
| Net assets | | $ | 133,097,529 | | | | n/a | |
| Shares authorized | | | unlimited | | | | n/a | |
| Par value | | $ | 0.001 | | | | n/a | |
| Shares outstanding | | | 13,335,636 | | | | n/a | |
| Net asset value and redemption price per share | | $ | 9.98 | | | | n/a | |
| | | | | | | | | |
| Class W | | | | | | | | |
| Net assets | | $ | 3,099 | | | $ | 3,255 | |
| Shares authorized | | | unlimited | | | | unlimited | |
| Par value | | $ | 0.001 | | | $ | 0.001 | |
| Shares outstanding | | | 311 | | | | 327 | |
| Net asset value and redemption price per share | | $ | 9.98 | | | $ | 9.96 | |
| (1) | Maximum offering price is computed at 100/97.50 of net asset value. On purchases of $100,000 or more, the offering price is reduced. |
| † | Redemption price per share may be reduced for any applicable contingent deferred sales charges. |
See Accompanying Notes to Financial Statements
| STATEMENTS OF OPERATIONS for the year ended March 31, 2015 |
| | | Voya GNMA Income Fund | | | Voya High Yield Bond Fund | | | Voya Intermediate Bond Fund | |
| INVESTMENT INCOME: | | | | | | | | | | | | |
| Dividends | | $ | — | | | $ | 2,335 | | | $ | 67,762 | |
| Interest | | | 22,639,078 | | | | 31,162,805 | | | | 59,749,746 | |
| Securities lending income, net | | | — | | | | — | | | | 572,817 | |
| Total investment income | | | 22,639,078 | | | | 31,165,140 | | | | 60,390,325 | |
| | | | | | | | | | | | | |
| EXPENSES: | | | | | | | | | | | | |
| Investment management fees | | | 3,892,449 | | | | 2,554,346 | | | | 3,338,033 | |
| Distribution and shareholder service fees: | | | | | | | | | | | | |
| Class A | | | 1,334,088 | | | | 203,313 | | | | 1,685,215 | |
| Class B | | | 4,250 | | | | 6,044 | | | | 5,421 | |
| Class C | | | 870,486 | | | | 144,209 | | | | 293,656 | |
| Class O | | | — | | | | — | | | | 91,893 | |
| Class R | | | — | | | | 275 | | | | 137,364 | |
| Transfer agent fees: | | | | | | | | | | | | |
| Class A | | | 307,423 | | | | 135,356 | | | | 692,126 | |
| Class B | | | 239 | | | | 641 | | | | 594 | |
| Class C | | | 50,005 | | | | 23,934 | | | | 31,079 | |
| Class I | | | 66,224 | | | | 25,228 | | | | 38,795 | |
| Class O | | | — | | | | — | | | | 39,419 | |
| Class P | | | — | | | | 3,332 | | | | — | |
| Class R | | | — | | | | 60 | | | | 21,288 | |
| Class R6 | | | — | | | | — | | | | 974 | |
| Class W | | | 25,086 | | | | 46,988 | | | | 434,880 | |
| Administrative service fees | | | 828,173 | | | | 502,836 | | | | 1,963,544 | |
| Shareholder reporting expense | | | 47,578 | | | | 38,260 | | | | 99,375 | |
| Registration fees | | | 88,524 | | | | 96,351 | | | | 183,340 | |
| Professional fees | | | 66,975 | | | | 50,717 | | | | 175,292 | |
| Custody and accounting expense | | | 98,035 | | | | 100,084 | | | | 163,300 | |
| Trustee fees | | | 24,845 | | | | 15,085 | | | | 58,907 | |
| Miscellaneous expense | | | 27,166 | | | | 19,610 | | | | 56,204 | |
| Interest expense | | | — | | | | 926 | | | | 915 | |
| Total expenses | | | 7,731,546 | | | | 3,967,595 | | | | 9,511,614 | |
| Net waived and reimbursed fees | | | (50 | ) | | | (628,524 | ) | | | — | |
| Net expenses | | | 7,731,496 | | | | 3,339,071 | | | | 9,511,614 | |
| Net investment income | | | 14,907,582 | | | | 27,826,069 | | | | 50,878,711 | |
| | | | | | | | | | | | | |
| REALIZED AND UNREALIZED GAIN (LOSS): | | | | | | | | | | | | |
| Net realized gain (loss) on: | | | | | | | | | | | | |
| Investments | | | 16,455,527 | | | | (3,118,247 | ) | | | 44,732,614 | |
| Foreign currency related transactions | | | — | | | | — | | | | 53,240 | |
| Futures | | | (7,650,211 | ) | | | — | | | | (10,212,685 | ) |
| Swaps | | | — | | | | 52,917 | | | | (147,608 | ) |
| Written options | | | — | | | | — | | | | 3,108,521 | |
| Net realized gain (loss) | | | 8,805,316 | | | | (3,065,330 | ) | | | 37,534,082 | |
| Net change in unrealized appreciation (depreciation) on: | | | | | | | | | | | | |
| Investments | | | 13,864,530 | | | | (18,129,733 | ) | | | 34,040,894 | |
| Foreign currency related transactions | | | — | | | | — | | | | (227,231 | ) |
| Futures | | | (1,694,195 | ) | | | — | | | | (1,494,939 | ) |
| Swaps | | | — | | | | — | | | | (2,417,747 | ) |
| Net change in unrealized appreciation (depreciation) | | | 12,170,335 | | | | (18,129,733 | ) | | | 29,900,977 | |
| Net realized and unrealized gain (loss) | | | 20,975,651 | | | | (21,195,063 | ) | | | 67,435,059 | |
| Increase in net assets resulting from operations | | $ | 35,883,233 | | | $ | 6,631,006 | | | $ | 118,313,770 | |
See Accompanying Notes to Financial Statements
| STATEMENTS OF OPERATIONS for the year ended March 31, 2015 |
| | | Voya Short Term Bond Fund | | | Voya Strategic Income Opportunities Fund | |
| INVESTMENT INCOME: | | | | | | | | |
| Dividends | | $ | 827 | | | $ | 75 | |
| Interest | | | 3,396,057 | | | | 52,203 | |
| Dividends from affiliated funds | | | — | | | | 213,179 | |
| Securities lending income, net | | | 5,628 | | | | — | |
| Total investment income | | | 3,402,512 | | | | 265,457 | |
| | | | | | | | | |
| EXPENSES: | | | | | | | | |
| Investment management fees | | | 566,896 | | | | 32,993 | |
| Distribution and shareholder service fees: | | | | | | | | |
| Class A | | | 741 | | | | 1,202 | |
| Class C | | | 3,688 | | | | 886 | |
| Class R | | | 10 | | | | 527 | |
| Transfer agent fees: | | | | | | | | |
| Class A | | | 306 | | | | 701 | |
| Class C | | | 381 | | | | 125 | |
| Class I | | | 2,652 | | | | 55 | |
| Class R | | | 4 | | | | 134 | |
| Class R6 | | | 411 | | | | — | |
| Class W | | | 131 | | | | 5 | |
| Administrative service fees | | | 161,969 | | | | 5,999 | |
| Shareholder reporting expense | | | 5,110 | | | | 4,470 | |
| Registration fees | | | 65,572 | | | | 69,765 | |
| Professional fees | | | 20,735 | | | | 11,134 | |
| Custody and accounting expense | | | 30,069 | | | | 11,538 | |
| Trustee fees | | | 4,859 | | | | 180 | |
| Miscellaneous expense | | | 12,487 | | | | 5,287 | |
| Interest expense | | | 855 | | | | 160 | |
| Total expenses | | | 876,876 | | | | 145,161 | |
| Net waived and reimbursed fees | | | (105,869 | ) | | | (103,078 | ) |
| Net expenses | | | 771,007 | | | | 42,083 | |
| Net investment income | | | 2,631,505 | | | | 223,374 | |
| | | | | | | | | |
| REALIZED AND UNREALIZED GAIN (LOSS): | | | | | | | | |
| Net realized gain (loss) on: | | | | | | | | |
| Investments | | | 457,697 | | | | 32,789 | |
| Capital gain distributions from affiliated underlying funds | | | — | | | | 4,940 | |
| Sale of affiliated underlying funds | | | — | | | | 3,035 | |
| Foreign currency related transactions | | | (6,219 | ) | | | 5,184 | |
| Futures | | | (353,349 | ) | | | 1,537 | |
| Swaps | | | (43,617 | ) | | | (4,785 | ) |
| Net realized gain | | | 54,512 | | | | 42,700 | |
| Net change in unrealized appreciation (depreciation) on: | | | | | | | | |
| Investments | | | (178,927 | ) | | | — | |
| Investments | | | — | | | | 47,553 | |
| Affiliated underlying funds | | | — | | | | (66,791 | ) |
| Foreign currency related transactions | | | (12,529 | ) | | | 5,673 | |
| Futures | | | (129,952 | ) | | | 2,954 | |
| Swaps | | | — | | | | (7 | ) |
| Net change in unrealized appreciation (depreciation) | | | (321,408 | ) | | | (10,618 | ) |
| Net realized and unrealized gain (loss) | | | (266,896 | ) | | | 32,082 | |
| Increase in net assets resulting from operations | | $ | 2,364,609 | | | $ | 255,456 | |
See Accompanying Notes to Financial Statements
| STATEMENTS OF CHANGES IN NET ASSETS |
| | | Voya GNMA Income Fund | | | Voya High Yield Bond Fund | |
| | | Year Ended March 31, 2015 | | | Year Ended March 31, 2014 | | | Year Ended March 31, 2015 | | | Year Ended March 31, 2014 | |
| FROM OPERATIONS: | | | | | | | | | | | | | | | | |
| Net investment income | | $ | 14,907,582 | | | $ | 25,781,000 | | | $ | 27,826,069 | | | $ | 18,167,659 | |
| Net realized gain (loss) | | | 8,805,316 | | | | (7,626,882 | ) | | | (3,065,330 | ) | | | 1,557,504 | |
| Net change in unrealized appreciation (depreciation) | | | 12,170,335 | | | | (27,137,508 | ) | | | (18,129,733 | ) | | | 4,811,152 | |
| Increase (decrease) in net assets resulting from operations | | | 35,883,233 | | | | (8,983,390 | ) | | | 6,631,006 | | | | 24,536,315 | |
| | | | | | | | | | | | | | | | | |
| FROM DISTRIBUTIONS TO SHAREHOLDERS: | | | | | | | | | | | | | | | | |
| Net investment income: | | | | | | | | | | | | | | | | |
| Class A | | | (16,005,727 | ) | | | (22,236,511 | ) | | | (4,217,998 | ) | | | (4,346,379 | ) |
| Class B | | | (10,192 | ) | | | (26,141 | ) | | | (26,400 | ) | | | (61,595 | ) |
| Class C | | | (1,960,019 | ) | | | (3,539,296 | ) | | | (638,356 | ) | | | (665,143 | ) |
| Class I | | | (5,090,084 | ) | | | (5,526,422 | ) | | | (14,993,658 | ) | | | (10,330,073 | ) |
| Class P | | | — | | | | — | | | | (6,691,664 | ) | | | (2,287,149 | ) |
| Class R | | | — | | | | — | | | | (2,755 | ) | | | (26 | ) |
| Class W | | | (1,328,936 | ) | | | (1,195,033 | ) | | | (1,550,951 | ) | | | (784,589 | ) |
| Return of capital: | | | | | | | | | | | | | | | | |
| Class A | | | (2,091,266 | ) | | | — | | | | — | | | | — | |
| Class B | | | (1,510 | ) | | | — | | | | — | | | | — | |
| Class C | | | (341,985 | ) | | | — | | | | — | | | | — | |
| Class I | | | (797,369 | ) | | | — | | | | — | | | | — | |
| Class W | | | (190,890 | ) | | | — | | | | — | | | | — | |
| Total distributions | | | (27,817,978 | ) | | | (32,523,403 | ) | | | (28,121,782 | ) | | | (18,474,954 | ) |
| | | | | | | | | | | | | | | | | |
| FROM CAPITAL SHARE TRANSACTIONS: | | | | | | | | | | | | | | | | |
| Net proceeds from sale of shares | | | 274,391,931 | | | | 173,728,495 | | | | 286,247,406 | | | | 282,439,993 | |
| Reinvestment of distributions | | | 24,282,307 | | | | 28,313,396 | | | | 26,903,753 | | | | 17,075,745 | |
| | | | 298,674,238 | | | | 202,041,891 | | | | 313,151,159 | | | | 299,515,738 | |
| Cost of shares redeemed | | | (246,414,994 | ) | | | (491,825,335 | ) | | | (195,088,556 | ) | | | (102,708,636 | ) |
| Net increase (decrease) in net assets resulting from capital share transactions | | | 52,259,244 | | | | (289,783,444 | ) | | | 118,062,603 | | | | 196,807,102 | |
| Net increase (decrease) in net assets | | | 60,324,499 | | | | (331,290,237 | ) | | | 96,571,827 | | | | 202,868,463 | |
| | | | | | | | | | | | | | | | | |
| NET ASSETS: | | | | | | | | | | | | | | | | |
| Beginning of year or period | | | 818,802,056 | | | | 1,150,092,293 | | | | 420,370,777 | | | | 217,502,314 | |
| End of year or period | | $ | 879,126,555 | | | $ | 818,802,056 | | | $ | 516,942,604 | | | $ | 420,370,777 | |
| Undistributed (distributions in excess of) net investment income at end of year or period | | $ | (1,951,018 | ) | | $ | 1,727,020 | | | $ | (259,292 | ) | | $ | (115,004 | ) |
See Accompanying Notes to Financial Statements
| STATEMENTS OF CHANGES IN NET ASSETS |
| | | Voya Intermediate Bond Fund | | | Voya Short Term Bond Fund | |
| | | Year Ended March 31, 2015 | | | Year Ended March 31, 2014 | | | Year Ended March 31, 2015 | | | Year Ended March 31, 2014 | |
| FROM OPERATIONS: | | | | | | | | | | | | | | | | |
| Net investment income | | $ | 50,878,711 | | | $ | 43,694,079 | | | $ | 2,631,505 | | | $ | 2,170,236 | |
| Net realized gain (loss) | | | 37,534,082 | | | | (11,787,156 | ) | | | 54,512 | | | | 374,660 | |
| Net change in unrealized appreciation (depreciation) | | | 29,900,977 | | | | (7,397,608 | ) | | | (321,408 | ) | | | 425,207 | |
| Increase in net assets resulting from operations | | | 118,313,770 | | | | 24,509,315 | | | | 2,364,609 | | | | 2,970,103 | |
| | | | | | | | | | | | | | | | | |
| FROM DISTRIBUTIONS TO SHAREHOLDERS: | | | | | | | | | | | | | | | | |
| Net investment income: | | | | | | | | | | | | | | | | |
| Class A | | | (18,252,026 | ) | | | (11,614,335 | ) | | | (4,713 | ) | | | (1,336 | ) |
| Class B | | | (11,267 | ) | | | (26,384 | ) | | | — | | | | — | |
| Class C | | | (582,567 | ) | | | (638,683 | ) | | | (3,096 | ) | | | (894 | ) |
| Class I | | | (15,552,223 | ) | | | (12,335,637 | ) | | | (110,828 | ) | | | (840,121 | ) |
| Class O | | | (1,016,623 | ) | | | (1,127,902 | ) | | | — | | | | — | |
| Class R | | | (646,611 | ) | | | (337,705 | ) | | | (28 | ) | | | — | |
| Class R6 | | | (8,406,345 | ) | | | (5,547,624 | ) | | | (2,954,335 | ) | | | (1,831,525 | ) |
| Class W | | | (12,267,238 | ) | | | (9,067,721 | ) | | | (2,305 | ) | | | (48 | ) |
| Total distributions | | | (56,734,900 | ) | | | (40,695,991 | ) | | | (3,075,305 | ) | | | (2,673,924 | ) |
| | | | | | | | | | | | | | | | | |
| FROM CAPITAL SHARE TRANSACTIONS: | | | | | | | | | | | | | | | | |
| Net proceeds from sale of shares | | | 1,379,161,890 | | | | 940,990,797 | | | | 25,393,018 | | | | 204,441,076 | |
| Reinvestment of distributions | | | 53,503,830 | | | | 38,149,447 | | | | 3,074,347 | | | | 2,666,991 | |
| | | | 1,432,665,720 | | | | 979,140,244 | | | | 28,467,365 | | | | 207,108,067 | |
| Cost of shares redeemed | | | (475,975,682 | ) | | | (499,804,359 | ) | | | (61,033,689 | ) | | | (210,624,030 | ) |
| Net increase (decrease) in net assets resulting from capital share transactions | | | 956,690,038 | | | | 479,335,885 | | | | (32,566,324 | ) | | | (3,515,963 | ) |
| Net increase (decrease) in net assets | | | 1,018,268,908 | | | | 463,149,209 | | | | (33,277,020 | ) | | | (3,219,784 | ) |
| | | | | | | | | | | | | | | | | |
| NET ASSETS: | | | | | | | | | | | | | | | | |
| Beginning of year or period | | | 1,615,345,569 | | | | 1,152,196,360 | | | | 174,443,457 | | | | 177,663,241 | |
| End of year or period | | $ | 2,633,614,477 | | | $ | 1,615,345,569 | | | $ | 141,166,437 | | | $ | 174,443,457 | |
| Undistributed net investment income at end of year or period | | $ | 575,720 | | | $ | 4,697,169 | | | $ | 9,837 | | | $ | 37,672 | |
See Accompanying Notes to Financial Statements
| STATEMENTS OF CHANGES IN NET ASSETS |
| | | Voya Strategic Income Opportunities Fund | |
| | | Year Ended March 31, 2015 | | | Year Ended March 31, 2014 | |
| FROM OPERATIONS: | | | | | | | | |
| Net investment income | | $ | 223,374 | | | $ | 228,294 | |
| Net realized gain (loss) | | | 42,700 | | | | (116,552 | ) |
| Net change in unrealized appreciation (depreciation) | | | (10,618 | ) | | | 4,098 | |
| Increase in net assets resulting from operations | | | 255,456 | | | | 115,840 | |
| | | | | | | | | |
| FROM DISTRIBUTIONS TO SHAREHOLDERS: | | | | | | | | |
| Net investment income: | | | | | | | | |
| Class A | | | (17,154 | ) | | | (2,005 | ) |
| Class C | | | (4,133 | ) | | | (938 | ) |
| Class I | | | (198,534 | ) | | | (226,223 | ) |
| Class R | | | (7,861 | ) | | | (118 | ) |
| Class W | | | (108 | ) | | | (272 | ) |
| Total distributions | | | (227,790 | ) | | | (229,556 | ) |
| | | | | | | | | |
| FROM CAPITAL SHARE TRANSACTIONS: | | | | | | | | |
| Net proceeds from sale of shares | | | 936,695 | | | | 457,861 | |
| Reinvestment of distributions | | | 226,283 | | | | 228,932 | |
| | | | 1,162,978 | | | | 686,793 | |
| Cost of shares redeemed | | | (424,342 | ) | | | (66,730 | ) |
| Net increase in net assets resulting from capital share transactions | | | 738,636 | | | | 620,063 | |
| Net increase in net assets | | | 766,302 | | | | 506,347 | |
| | | | | | | | | |
| NET ASSETS: | | | | | | | | |
| Beginning of year or period | | | 5,627,201 | | | | 5,120,854 | |
| End of year or period | | $ | 6,393,503 | | | $ | 5,627,201 | |
| Undistributed net investment income at end of year or period | | $ | 55,719 | | | $ | 61,090 | |
See Accompanying Notes to Financial Statements
Selected data for a share of beneficial interest outstanding throughout each year or period.
| | | | | | Income (loss) | | | | | | | | | | | | | | | | | | | | | | | | | | | | | | | | | | | | | | | | | | | |
| | | | | | from | | | | | | | | | | | | | | | | | | | | | | | | | | | | | | | | | | | | | | | | | | | |
| | | | | | investment | | | | | | | | | | | | | | | | | | | | | | | | | | | | | | | | | | | | | | | Supplemental | |
| | | | | | operations | | | | | | Less Distributions | | | | | | | | | | | | | | | Ratios to average net assets | | | Data | |
| | | Net asset
value,
beginning
of year
or period | | | Net investment
income (loss) | | | Net
realized
and
unrealized
gain (loss) | | | Total from
investment
operations | | | From net
investment
income | | | From net
realized
gains | | | From
return
of
capital | | | Total
distributions | | | Payment
by
affiliate | | | Net
asset
value,
end of
year
or period | | | Total
Return(1) | | | Expenses
before
reductions/
additions(2)(3) | | | Expenses
net of fee
waivers and/or
recoupments
if any(2)(3) | | | Expense
net of all
reductions/
additions(2)(3) | | | Net
investment
income
(loss)(2)(3) | | | Net
assets,
end of
year or
period | | | Portfolio
turnover
rate | |
| Year or | | | | | | | | | | | | | | | | | | | | | | | | | | | | | | | | | | | | | | | | | | | | | | | | | | | |
| period ended | | ($) | | | ($) | | | ($) | | | ($) | | | ($) | | | ($) | | | ($) | | | ($) | | | ($) | | | ($) | | | (%) | | | (%) | | | (%) | | | (%) | | | (%) | | | ($000’s) | | | (%) | |
| Voya GNMA Income Fund | | | | | | | | | | | | | | | | | | | | | | | | | | | | | | | | | | | | | | | | | | | | | | | | | | | | | | | | | | | | | | | | | | | | |
| Class A | | | | | | | | | | | | | | | | | | | | | | | | | | | | | | | | | | | | | | | | | | | | | | | | | | | | | | | | | | | | | | | | | | | | |
| 03-31-15 | | | 8.62 | | | | 0.16 | | | | 0.22 | | | | 0.38 | | | | 0.26 | | | | — | | | | 0.04 | | | | 0.30 | | | | — | | | | 8.70 | | | | 4.40 | | | | 0.92 | | | | 0.92 | | | | 0.92 | | | | 1.85 | | | | 521,226 | | | | 511 | |
| 03-31-14 | | | 8.95 | | | | 0.24• | | | | (0.27 | ) | | | (0.03 | ) | | | 0.30 | | | | — | | | | — | | | | 0.30 | | | | — | | | | 8.62 | | | | (0.35 | ) | | | 0.94 | | | | 0.94 | | | | 0.94 | | | | 2.74 | | | | 558,520 | | | | 302 | |
| 03-31-13 | | | 9.09 | | | | 0.22 | | | | 0.00 | * | | | 0.22 | | | | 0.29 | | | | 0.05 | | | | 0.02 | | | | 0.36 | | | | — | | | | 8.95 | | | | 2.51 | | | | 0.90 | | | | 0.90 | | | | 0.90 | | | | 2.38 | | | | 727,058 | | | | 352 | |
| 03-31-12 | | | 8.84 | | | | 0.23• | | | | 0.37 | | | | 0.60 | | | | 0.34 | | | | 0.01 | | | | — | | | | 0.35 | | | | — | | | | 9.09 | | | | 6.87 | | | | 0.93 | | | | 0.93 | | | | 0.93 | | | | 2.58 | | | | 681,900 | | | | 335 | |
| 03-31-11 | | | 8.75 | | | | 0.32 | | | | 0.13 | | | | 0.45 | | | | 0.36 | | | | — | | | | — | | | | 0.36 | | | | — | | | | 8.84 | | | | 5.26 | | | | 0.93 | | | | 0.93 | | | | 0.93 | | | | 3.63 | | | | 593,080 | | | | 193 | |
| Class B | | | | | | | | | | | | | | | | | | | | | | | | | | | | | | | | | | | | | | | | | | | | | | | | | | | | | | | | | | | | | | | | | | | | |
| 03-31-15 | | | 8.57 | | | | 0.10• | | | | 0.21 | | | | 0.31 | | | | 0.19 | | | | — | | | | 0.04 | | | | 0.23 | | | | — | | | | 8.65 | | | | 3.62 | | | | 1.67 | | | | 1.67 | | | | 1.67 | | | | 1.21 | | | | 333 | | | | 511 | |
| 03-31-14 | | | 8.90 | | | | 0.17• | | | | (0.27 | ) | | | (0.10 | ) | | | 0.23 | | | | — | | | | — | | | | 0.23 | | | | — | | | | 8.57 | | | | (1.11 | ) | | | 1.69 | | | | 1.69 | | | | 1.69 | | | | 1.97 | | | | 622 | | | | 302 | |
| 03-31-13 | | | 9.04 | | | | 0.14• | | | | 0.01 | | | | 0.15 | | | | 0.22 | | | | 0.05 | | | | 0.02 | | | | 0.29 | | | | — | | | | 8.90 | | | | 1.74 | | | | 1.65 | | | | 1.65 | | | | 1.65 | | | | 1.59 | | | | 1,430 | | | | 352 | |
| 03-31-12 | | | 8.79 | | | | 0.17• | | | | 0.36 | | | | 0.53 | | | | 0.27 | | | | 0.01 | | | | — | | | | 0.28 | | | | — | | | | 9.04 | | | | 6.08 | | | | 1.68 | | | | 1.68 | | | | 1.68 | | | | 1.87 | | | | 3,676 | | | | 335 | |
| 03-31-11 | | | 8.70 | | | | 0.26• | | | | 0.13 | | | | 0.39 | | | | 0.30 | | | | — | | | | — | | | | 0.30 | | | | — | | | | 8.79 | | | | 4.48 | | | | 1.68 | | | | 1.68 | | | | 1.68 | | | | 2.90 | | | | 11,262 | | | | 193 | |
| Class C | | | | | | | | | | | | | | | | | | | | | | | | | | | | | | | | | | | | | | | | | | | | | | | | | | | | | | | | | | | | | | | | | | | | |
| 03-31-15 | | | 8.57 | | | | 0.09 | | | | 0.22 | | | | 0.31 | | | | 0.19 | | | | — | | | | 0.04 | | | | 0.23 | | | | — | | | | 8.65 | | | | 3.62 | | | | 1.67 | | | | 1.67 | | | | 1.67 | | | | 1.11 | | | | 83,809 | | | | 511 | |
| 03-31-14 | | | 8.90 | | | | 0.17• | | | | (0.27 | ) | | | (0.10 | ) | | | 0.23 | | | | — | | | | — | | | | 0.23 | | | | — | | | | 8.57 | | | | (1.12 | ) | | | 1.69 | | | | 1.69 | | | | 1.69 | | | | 1.97 | | | | 95,602 | | | | 302 | |
| 03-31-13 | | | 9.04 | | | | 0.16 | | | | 0.00 | * | | | 0.16 | | | | 0.23 | | | | 0.05 | | | | 0.02 | | | | 0.30 | | | | — | | | | 8.90 | | | | 1.78 | | | | 1.65 | | | | 1.65 | | | | 1.65 | | | | 1.63 | | | | 177,823 | | | | 352 | |
| 03-31-12 | | | 8.79 | | | | 0.16• | | | | 0.37 | | | | 0.53 | | | | 0.27 | | | | 0.01 | | | | — | | | | 0.28 | | | | — | | | | 9.04 | | | | 6.12 | | | | 1.68 | | | | 1.68 | | | | 1.68 | | | | 1.82 | | | | 138,543 | | | | 335 | |
| 03-31-11 | | | 8.71 | | | | 0.25 | | | | 0.13 | | | | 0.38 | | | | 0.30 | | | | — | | | | — | | | | 0.30 | | | | — | | | | 8.79 | | | | 4.38 | | | | 1.68 | | | | 1.68 | | | | 1.68 | | | | 2.88 | | | | 104,196 | | | | 193 | |
| Class I | | | | | | | | | | | | | | | | | | | | | | | | | | | | | | | | | | | | | | | | | | | | | | | | | | | | | | | | | | | | | | | | | | | | |
| 03-31-15 | | | 8.63 | | | | 0.17• | | | | 0.23 | | | | 0.40 | | | | 0.28 | | | | — | | | | 0.04 | | | | 0.32 | | | | — | | | | 8.71 | | | | 4.70 | | | | 0.65 | | | | 0.65 | | | | 0.65 | | | | 1.94 | | | | 223,920 | | | | 511 | |
| 03-31-14 | | | 8.96 | | | | 0.26• | | | | (0.27 | ) | | | (0.01 | ) | | | 0.32 | | | | — | | | | — | | | | 0.32 | | | | — | | | | 8.63 | | | | (0.09 | ) | | | 0.66 | | | | 0.66 | | | | 0.66 | | | | 3.00 | | | | 130,878 | | | | 302 | |
| 03-31-13 | | | 9.10 | | | | 0.25 | | | | 0.00 | * | | | 0.25 | | | | 0.32 | | | | 0.05 | | | | 0.02 | | | | 0.39 | | | | — | | | | 8.96 | | | | 2.79 | | | | 0.63 | | | | 0.63 | | | | 0.63 | | | | 2.64 | | | | 206,100 | | | | 352 | |
| 03-31-12 | | | 8.85 | | | | 0.26• | | | | 0.36 | | | | 0.62 | | | | 0.36 | | | | 0.01 | | | | — | | | | 0.37 | | | | — | | | | 9.10 | | | | 7.16 | | | | 0.65 | | | | 0.65 | | | | 0.65 | | | | 2.83 | | | | 144,678 | | | | 335 | |
| 03-31-11 | | | 8.76 | | | | 0.34 | | | | 0.14 | | | | 0.48 | | | | 0.39 | | | | — | | | | — | | | | 0.39 | | | | — | | | | 8.85 | | | | 5.57 | | | | 0.63 | | | | 0.63 | | | | 0.63 | | | | 3.92 | | | | 68,996 | | | | 193 | |
| Class W | | | | | | | | | | | | | | | | | | | | | | | | | | | | | | | | | | | | | | | | | | | | | | | | | | | | | | | | | | | | | | | | | | | | |
| 03-31-15 | | | 8.64 | | | | 0.17• | | | | 0.23 | | | | 0.40 | | | | 0.28 | | | | — | | | | 0.04 | | | | 0.32 | | | | — | | | | 8.72 | | | | 4.66 | | | | 0.67 | | | | 0.67 | | | | 0.67 | | | | 2.00 | | | | 49,838 | | | | 511 | |
| 03-31-14 | | | 8.97 | | | | 0.26 | | | | (0.27 | ) | | | (0.01 | ) | | | 0.32 | | | | — | | | | — | | | | 0.32 | | | | — | | | | 8.64 | | | | (0.09 | ) | | | 0.69 | | | | 0.69 | | | | 0.69 | | | | 3.00 | | | | 33,180 | | | | 302 | |
| 03-31-13 | | | 9.11 | | | | 0.25• | | | | (0.01 | ) | | | 0.24 | | | | 0.31 | | | | 0.05 | | | | 0.02 | | | | 0.38 | | | | — | | | | 8.97 | | | | 2.76 | | | | 0.65 | | | | 0.65 | | | | 0.65 | | | | 2.72 | | | | 37,682 | | | | 352 | |
| 03-31-12 | | | 8.86 | | | | 0.26• | | | | 0.36 | | | | 0.62 | | | | 0.36 | | | | 0.01 | | | | — | | | | 0.37 | | | | — | | | | 9.11 | | | | 7.12 | | | | 0.68 | | | | 0.68 | | | | 0.68 | | | | 2.83 | | | | 11,700 | | | | 335 | |
| 03-31-11 | | | 8.77 | | | | 0.35 | | | | 0.13 | | | | 0.48 | | | | 0.39 | | | | — | | | | — | | | | 0.39 | | | | — | | | | 8.86 | | | | 5.51 | | | | 0.68 | | | | 0.68 | | | | 0.68 | | | | 3.88 | | | | 7,221 | | | | 193 | |
See Accompanying Notes to Financial Statements
| Financial Highlights (continued) |
| | | | | | Income (loss) | | | | | | | | | | | | | | | | | | | | | | | | | | | | | | | | | | | | | | | | | | | |
| | | | | | from | | | | | | | | | | | | | | | | | | | | | | | | | | | | | | | | | | | | | | | | | | | |
| | | | | | investment | | | | | | | | | | | | | | | | | | | | | | | | | | | | | | | | | | | | | | | Supplemental | |
| | | | | | operations | | | | | | Less Distributions | | | | | | | | | | | | | | | Ratios to average net assets | | | Data | |
| | | Net asset
value,
beginning
of year
or period | | | Net investment
income (loss) | | | Net
realized
and
unrealized
gain (loss) | | | Total from
investment
operations | | | From net
investment
income | | | From net
realized
gains | | | From
return
of
capital | | | Total
distributions | | | Payment
by
affiliate | | | Net
asset
value,
end of
year
or period | | | Total
Return(1) | | | Expenses
before
reductions/
additions(2)(3) | | | Expenses
net of fee
waivers and/or
recoupments
if any(2)(3) | | | Expense
net of all
reductions/
additions(2)(3) | | | Net
investment
income
(loss)(2)(3) | | | Net
assets,
end of
year or
period | | | Portfolio
turnover
rate | |
| Year or | | | | | | | | | | | | | | | | | | | | | | | | | | | | | | | | | | | | | | | | | | | | | | | | | | | |
| period ended | | ($) | | | ($) | | | ($) | | | ($) | | | ($) | | | ($) | | | ($) | | | ($) | | | ($) | | | ($) | | | (%) | | | (%) | | | (%) | | | (%) | | | (%) | | | ($000’s) | | | (%) | |
| Voya High Yield Bond Fund | | | | | | | | | | | | | | | | | | | | | | | | | | | | | | | | | | | | | | | | | | | | | | | | | | | | | | | | | | | | | | | | | | | | |
| Class A | | | | | | | | | | | | | | | | | | | | | | | | | | | | | | | | | | | | | | | | | | | | | | | | | | | | | | | | | | | | | | | | | | | | |
| 03-31-15 | | | 8.49 | | | | 0.42 | | | | (0.34 | ) | | | 0.08 | | | | 0.43 | | | | — | | | | — | | | | 0.43 | | | | — | | | | 8.14 | | | | 0.98 | | | | 1.09 | | | | 1.10 | | | | 1.10 | | | | 5.10 | | | | 75,588 | | | | 37 | |
| 03-31-14 | | | 8.34 | | | | 0.44 | | | | 0.16 | | | | 0.60 | | | | 0.45 | | | | — | | | | — | | | | 0.45 | | | | — | | | | 8.49 | | | | 7.49 | | | | 1.08 | | | | 1.10 | | | | 1.10 | | | | 5.34 | | | | 79,309 | | | | 47 | |
| 03-31-13 | | | 7.80 | | | | 0.49 | | | | 0.54 | | | | 1.03 | | | | 0.49 | | | | — | | | | — | | | | 0.49 | | | | — | | | | 8.34 | | | | 13.69 | | | | 1.06 | | | | 1.10 | | | | 1.10 | | | | 6.20 | | | | 85,429 | | | | 109 | |
| 03-31-12 | | | 7.82 | | | | 0.52 | | | | (0.02 | ) | | | 0.50 | | | | 0.52 | | | | — | | | | — | | | | 0.52 | | | | — | | | | 7.80 | | | | 6.72 | | | | 1.14 | | | | 1.10 | | | | 1.10 | | | | 6.73 | | | | 98,123 | | | | 100 | |
| 03-31-11 | | | 7.38 | | | | 0.56 | | | | 0.45 | | | | 1.01 | | | | 0.55 | | | | — | | | | 0.02 | | | | 0.57 | | | | — | | | | 7.82 | | | | 14.22 | | | | 1.13 | | | | 1.10 | † | | | 1.10 | † | | | 7.43 | † | | | 86,017 | | | | 87 | |
| Class B | | | | | | | | | | | | | | | | | | | | | | | | | | | | | | | | | | | | | | | | | | | | | | | | | | | | | | | | | | | | | | | | | | | | |
| 03-31-15 | | | 8.48 | | | | 0.36 | | | | (0.33 | ) | | | 0.03 | | | | 0.37 | | | | — | | | | — | | | | 0.37 | | | | — | | | | 8.14 | | | | 0.31 | | | | 1.84 | | | | 1.85 | | | | 1.85 | | | | 4.33 | | | | 473 | | | | 37 | |
| 03-31-14 | | | 8.33 | | | | 0.38 | | | | 0.16 | | | | 0.54 | | | | 0.39 | | | | — | | | | — | | | | 0.39 | | | | — | | | | 8.48 | | | | 6.69 | | | | 1.83 | | | | 1.85 | | | | 1.85 | | | | 4.58 | | | | 1,086 | | | | 47 | |
| 03-31-13 | | | 7.79 | | | | 0.43 | | | | 0.54 | | | | 0.97 | | | | 0.43 | | | | — | | | | — | | | | 0.43 | | | | — | | | | 8.33 | | | | 12.85 | | | | 1.81 | | | | 1.85 | | | | 1.85 | | | | 5.47 | | | | 1,629 | | | | 109 | |
| 03-31-12 | | | 7.81 | | | | 0.46 | | | | (0.02 | ) | | | 0.44 | | | | 0.46 | | | | — | | | | — | | | | 0.46 | | | | — | | | | 7.79 | | | | 5.89 | | | | 1.89 | | | | 1.85 | | | | 1.85 | | | | 6.00 | | | | 2,370 | | | | 100 | |
| 03-31-11 | | | 7.37 | | | | 0.51 | • | | | 0.44 | | | | 0.95 | | | | 0.49 | | | | — | | | | 0.02 | | | | 0.51 | | | | — | | | | 7.81 | | | | 13.35 | | | | 1.88 | | | | 1.85 | † | | | 1.85 | † | | | 6.74 | † | | | 6,864 | | | | 87 | |
| Class C | | | | | | | | | | | | | | | | | | | | | | | | | | | | | | | | | | | | | | | | | | | | | | | | | | | | | | | | | | | | | | | | | | | | |
| 03-31-15 | | | 8.49 | | | | 0.36 | | | | (0.34 | ) | | | 0.02 | | | | 0.37 | | | | — | | | | — | | | | 0.37 | | | | — | | | | 8.14 | | | | 0.21 | | | | 1.84 | | | | 1.85 | | | | 1.85 | | | | 4.35 | | | | 13,568 | | | | 37 | |
| 03-31-14 | | | 8.34 | | | | 0.38 | | | | 0.16 | | | | 0.54 | | | | 0.39 | | | | — | | | | — | | | | 0.39 | | | | — | | | | 8.49 | | | | 6.69 | | | | 1.83 | | | | 1.85 | | | | 1.85 | | | | 4.59 | | | | 15,051 | | | | 47 | |
| 03-31-13 | | | 7.80 | | | | 0.44 | | | | 0.53 | | | | 0.97 | | | | 0.43 | | | | — | | | | — | | | | 0.43 | | | | — | | | | 8.34 | | | | 12.85 | | | | 1.81 | | | | 1.85 | | | | 1.85 | | | | 5.43 | | | | 14,354 | | | | 109 | |
| 03-31-12 | | | 7.81 | | | | 0.46 | | | | (0.01 | ) | | | 0.45 | | | | 0.46 | | | | — | | | | — | | | | 0.46 | | | | — | | | | 7.80 | | | | 6.05 | | | | 1.89 | | | | 1.85 | | | | 1.85 | | | | 6.00 | | | | 12,727 | | | | 100 | |
| 03-31-11 | | | 7.38 | | | | 0.50 | | | | 0.44 | | | | 0.94 | | | | 0.49 | | | | — | | | | 0.02 | | | | 0.51 | | | | — | | | | 7.81 | | | | 13.22 | | | | 1.88 | | | | 1.85 | † | | | 1.85 | † | | | 6.66 | † | | | 11,938 | | | | 87 | |
| Class I | | | | | | | | | | | | | | | | | | | | | | | | | | | | | | | | | | | | | | | | | | | | | | | | | | | | | | | | | | | | | | | | | | | | |
| 03-31-15 | | | 8.48 | | | | 0.46 | | | | (0.34 | ) | | | 0.12 | | | | 0.46 | | | | — | | | | — | | | | 0.46 | | | | — | | | | 8.14 | | | | 1.48 | | | | 0.68 | | | | 0.69 | | | | 0.69 | | | | 5.51 | | | | 233,374 | | | | 37 | |
| 03-31-14 | | | 8.33 | | | | 0.48 | | | | 0.15 | | | | 0.63 | | | | 0.48 | | | | — | | | | — | | | | 0.48 | | | | — | | | | 8.48 | | | | 7.89 | | | | 0.68 | | | | 0.70 | | | | 0.70 | | | | 5.74 | | | | 223,686 | | | | 47 | |
| 03-31-13 | | | 7.80 | | | | 0.52 | • | | | 0.53 | | | | 1.05 | | | | 0.52 | | | | — | | | | — | | | | 0.52 | | | | — | | | | 8.33 | | | | 13.98 | | | | 0.71 | | | | 0.75 | | | | 0.75 | | | | 6.40 | | | | 101,387 | | | | 109 | |
| 03-31-12 | | | 7.81 | | | | 0.55 | | | | (0.01 | ) | | | 0.54 | | | | 0.55 | | | | — | | | | — | | | | 0.55 | | | | — | | | | 7.80 | | | | 7.30 | | | | 0.71 | | | | 0.67 | | | | 0.67 | | | | 7.09 | | | | 24,849 | | | | 100 | |
| 03-31-11 | | | 7.37 | | | | 0.57 | • | | | 0.48 | | | | 1.05 | | | | 0.59 | | | | — | | | | 0.02 | | | | 0.61 | | | | — | | | | 7.81 | | | | 14.86 | | | | 0.76 | | | | 0.73 | † | | | 0.73 | † | | | 7.53 | † | | | 21,590 | | | | 87 | |
| Class P | | | | | | | | | | | | | | | | | | | | | | | | | | | | | | | | | | | | | | | | | | | | | | | | | | | | | | | | | | | | | | | | | | | | |
| 03-31-15 | | | 8.48 | | | | 0.51 | | | | (0.34 | ) | | | 0.17 | | | | 0.51 | | | | — | | | | — | | | | 0.51 | | | | — | | | | 8.14 | | | | 2.09 | | | | 0.68 | | | | 0.07 | | | | 0.07 | | | | 6.13 | | | | 145,332 | | | | 37 | |
| 06-14-13(4) - | | | | | | | | | | | | | | | | | | | | | | | | | | | | | | | | | | | | | | | | | | | | | | | | | | | | | | | | | | | | | | | | | | | | |
| 03-31-14 | | | 8.23 | | | | 0.42 | • | | | 0.25 | | | | 0.67 | | | | 0.42 | | | | — | | | | — | | | | 0.42 | | | | — | | | | 8.48 | | | | 8.40 | | | | 0.68 | | | | 0.07 | | | | 0.07 | | | | 6.35 | | | | 81,146 | | | | 47 | |
| Class R | | | | | | | | | | | | | | | | | | | | | | | | | | | | | | | | | | | | | | | | | | | | | | | | | | | | | | | | | | | | | | | | | | | | |
| 03-31-15 | | | 8.49 | | | | 0.42 | | | | (0.34 | ) | | | 0.08 | | | | 0.42 | | | | — | | | | — | | | | 0.42 | | | | — | | | | 8.15 | | | | 0.91 | | | | 1.34 | | | | 1.34 | | | | 1.34 | | | | 4.93 | | | | 181 | | | | 37 | |
| 01-30-14(4) - | | | | | | | | | | | | | | | | | | | | | | | | | | | | | | | | | | | | | | | | | | | | | | | | | | | | | | | | | | | | | | | | | | | | |
| 03-31-14 | | | 8.38 | | | | 0.08 | • | | | 0.10 | | | | 0.18 | | | | 0.07 | | | | — | | | | — | | | | 0.07 | | | | — | | | | 8.49 | | | | 2.17 | | | | 1.33 | | | | 1.33 | | | | 1.33 | | | | 5.50 | | | | 3 | | | | 47 | |
See Accompanying Notes to Financial Statements
| Financial Highlights (continued) |
| | | | | | Income (loss) | | | | | | | | | | | | | | | | | | | | | | | | | | | | | | | | | | | | | | | | | | | |
| | | | | | from | | | | | | | | | | | | | | | | | | | | | | | | | | | | | | | | | | | | | | | | | | | |
| | | | | | investment | | | | | | | | | | | | | | | | | | | | | | | | | | | | | | | | | | | | | | | Supplemental | |
| | | | | | operations | | | | | | Less Distributions | | | | | | | | | | | | | | | Ratios to average net assets | | | Data | |
| | | Net asset
value,
beginning
of year
or period | | | Net investment
income (loss) | | | Net
realized
and
unrealized
gain (loss) | | | Total from
investment
operations | | | From net
investment
income | | | From net
realized
gains | | | From
return
of
capital | | | Total
distributions | | | Payment
by
affiliate | | | Net
asset
value,
end of
year
or period | | | Total
Return(1) | | | Expenses
before
reductions/
additions(2)(3) | | | Expenses
net of fee
waivers and/or
recoupments
if any(2)(3) | | | Expense
net of all
reductions/
additions(2)(3) | | | Net
investment
income
(loss)(2)(3) | | | Net
assets,
end of
year or
period | | | Portfolio
turnover
rate | |
| Year or | | | | | | | | | | | | | | | | | | | | | | | | | | | | | | | | | | | | | | | | | | | | | | | | | | | |
| period ended | | ($) | | | ($) | | | ($) | | | ($) | | | ($) | | | ($) | | | ($) | | | ($) | | | ($) | | | ($) | | | (%) | | | (%) | | | (%) | | | (%) | | | (%) | | | ($000’s) | | | (%) | |
| Voya High Yield Bond Fund (continued) | | | | | | | | | | | | | | | | | | | | | | | | | | | | | | | | | | | | | | | | | | | | | | | | | | | | | | | | | | | | | | | | | | | | |
| Class W | | | | | | | | | | | | | | | | | | | | | | | | | | | | | | | | | | | | | | | | | | | | | | | | | | | | | | | | | | | | | | | | | | | | |
| 03-31-15 | | | 8.50 | | | | 0.45 | | | | (0.35 | ) | | | 0.10 | | | | 0.45 | | | | — | | | | — | | | | 0.45 | | | | — | | | | 8.15 | | | | 1.26 | | | | 0.84 | | | | 0.85 | | | | 0.85 | | | | 5.37 | | | | 48,426 | | | | 37 | |
| 03-31-14 | | | 8.35 | | | | 0.47 | | | | 0.16 | | | | 0.63 | | | | 0.48 | | | | — | | | | — | | | | 0.48 | | | | — | | | | 8.50 | | | | 7.78 | | | | 0.83 | | | | 0.85 | | | | 0.85 | | | | 5.60 | | | | 20,090 | | | | 47 | |
| 03-31-13 | | | 7.81 | | | | 0.51 | • | | | 0.55 | | | | 1.06 | | | | 0.52 | | | | — | | | | — | | | | 0.52 | | | | — | | | | 8.35 | | | | 14.11 | | | | 0.81 | | | | 0.85 | | | | 0.85 | | | | 6.30 | | | | 14,703 | | | | 109 | |
| 07-29-11(4) - | | | | | | | | | | | | | | | | | | | | | | | | | | | | | | | | | | | | | | | | | | | | | | | | | | | | | | | | | | | | | | | | | | | | |
| 03-31-12 | | | 7.82 | | | | 0.36 | • | | | 0.07 | | | | 0.43 | | | | 0.44 | | | | — | | | | — | | | | 0.44 | | | | — | | | | 7.81 | | | | 5.77 | | | | 0.89 | | | | 0.85 | | | | 0.85 | | | | 6.93 | | | | 1,552 | | | | 100 | |
| Voya Intermediate Bond Fund | | | | | | | | | | | | | | | | | | | | | | | | | | | | | | | | | | | | | | | | | | | | | | | | | | | | | | | | | | | | | | | | | | | | |
| Class A | | | | | | | | | | | | | | | | | | | | | | | | | | | | | | | | | | | | | | | | | | | | | | | | | | | | | | | | | | | | | | | | | | | | |
| 03-31-15 | | | 9.91 | | | | 0.24 | | | | 0.36 | | | | 0.60 | | | | 0.28 | | | | — | | | | — | | | | 0.28 | | | | — | | | | 10.23 | | | | 6.09 | | | | 0.66 | | | | 0.66 | | | | 0.66 | | | | 2.41 | | | | 995,117 | | | | 587 | †† |
| 03-31-14 | | | 10.09 | | | | 0.31 | • | | | (0.20 | ) | | | 0.11 | | | | 0.29 | | | | — | | | | — | | | | 0.29 | | | | — | | | | 9.91 | | | | 1.11 | | | | 0.70 | | | | 0.70 | | | | 0.70 | | | | 3.16 | | | | 535,194 | | | | 525 | †† |
| 03-31-13 | | | 9.90 | | | | 0.34 | | | | 0.33 | | | | 0.67 | | | | 0.48 | | | | — | | | | — | | | | 0.48 | | | | — | | | | 10.09 | | | | 6.83 | | | | 0.70 | | | | 0.70 | | | | 0.70 | | | | 3.38 | | | | 301,544 | | | | 490 | †† |
| 03-31-12 | | | 9.53 | | | | 0.38 | | | | 0.42 | | | | 0.80 | | | | 0.43 | | | | — | | | | — | | | | 0.43 | | | | — | | | | 9.90 | | | | 8.61 | | | | 0.68 | | | | 0.68 | | | | 0.68 | | | | 3.99 | | | | 293,277 | | | | 500 | †† |
| 03-31-11 | | | 9.23 | | | | 0.47 | • | | | 0.26 | | | | 0.73 | | | | 0.43 | | | | — | | | | — | | | | 0.43 | | | | — | | | | 9.53 | | | | 8.00 | | | | 0.68 | | | | 0.68 | † | | | 0.68 | † | | | 4.97 | † | | | 316,000 | | | | 384 | †† |
| Class B | | | | | | | | | | | | | | | | | | | | | | | | | | | | | | | | | | | | | | | | | | | | | | | | | | | | | | | | | | | | | | | | | | | | |
| 03-31-15 | | | 9.90 | | | | 0.18 | | | | 0.33 | | | | 0.51 | | | | 0.21 | | | | — | | | | — | | | | 0.21 | | | | — | | | | 10.20 | | | | 5.17 | | | | 1.41 | | | | 1.41 | | | | 1.41 | | | | 1.69 | | | | 447 | | | | 587 | †† |
| 03-31-14 | | | 10.07 | | | | 0.22 | • | | | (0.18 | ) | | | 0.04 | | | | 0.21 | | | | — | | | | — | | | | 0.21 | | | | — | | | | 9.90 | | | | 0.43 | | | | 1.45 | | | | 1.45 | | | | 1.45 | | | | 2.27 | | | | 727 | | | | 525 | †† |
| 03-31-13 | | | 9.88 | | | | 0.27 | • | | | 0.32 | | | | 0.59 | | | | 0.40 | | | | — | | | | — | | | | 0.40 | | | | — | | | | 10.07 | | | | 6.02 | | | | 1.45 | | | | 1.45 | | | | 1.45 | | | | 2.63 | | | | 1,928 | | | | 490 | †† |
| 03-31-12 | | | 9.51 | | | | 0.32 | • | | | 0.41 | | | | 0.73 | | | | 0.36 | | | | — | | | | — | | | | 0.36 | | | | — | | | | 9.88 | | | | 7.77 | | | | 1.43 | | | | 1.43 | | | | 1.43 | | | | 3.30 | | | | 4,144 | | | | 500 | †† |
| 03-31-11 | | | 9.21 | | | | 0.40 | • | | | 0.26 | | | | 0.66 | | | | 0.36 | | | | — | | | | — | | | | 0.36 | | | | — | | | | 9.51 | | | | 7.21 | | | | 1.43 | | | | 1.43 | † | | | 1.43 | † | | | 4.24 | † | | | 9,379 | | | | 384 | †† |
| Class C | | | | | | | | | | | | | | | | | | | | | | | | | | | | | | | | | | | | | | | | | | | | | | | | | | | | | | | | | | | | | | | | | | | | |
| 03-31-15 | | | 9.90 | | | | 0.17 | | | | 0.34 | | | | 0.51 | | | | 0.20 | | | | — | | | | — | | | | 0.20 | | | | — | | | | 10.21 | | | | 5.21 | | | | 1.41 | | | | 1.41 | | | | 1.41 | | | | 1.68 | | | | 32,593 | | | | 587 | †† |
| 03-31-14 | | | 10.07 | | | | 0.24 | | | | (0.20 | ) | | | 0.04 | | | | 0.21 | | | | — | | | | — | | | | 0.21 | | | | — | | | | 9.90 | | | | 0.44 | | | | 1.45 | | | | 1.45 | | | | 1.45 | | | | 2.32 | | | | 26,604 | | | | 525 | †† |
| 03-31-13 | | | 9.89 | | | | 0.27 | | | | 0.31 | | | | 0.58 | | | | 0.40 | | | | — | | | | — | | | | 0.40 | | | | — | | | | 10.07 | | | | 5.93 | | | | 1.45 | | | | 1.45 | | | | 1.45 | | | | 2.63 | | | | 35,308 | | | | 490 | †† |
| 03-31-12 | | | 9.52 | | | | 0.32 | | | | 0.41 | | | | 0.73 | | | | 0.36 | | | | — | | | | — | | | | 0.36 | | | | — | | | | 9.89 | | | | 7.78 | | | | 1.43 | | | | 1.43 | | | | 1.43 | | | | 3.22 | | | | 35,256 | | | | 500 | †† |
| 03-31-11 | | | 9.22 | | | | 0.40 | • | | | 0.26 | | | | 0.66 | | | | 0.36 | | | | — | | | | — | | | | 0.36 | | | | — | | | | 9.52 | | | | 7.21 | | | | 1.43 | | | | 1.43 | † | | | 1.43 | † | | | 4.22 | † | | | 33,994 | | | | 384 | †† |
| Class I | | | | | | | | | | | | | | | | | | | | | | | | | | | | | | | | | | | | | | | | | | | | | | | | | | | | | | | | | | | | | | | | | | | | |
| 03-31-15 | | | 9.91 | | | | 0.28 | | | | 0.35 | | | | 0.63 | | | | 0.31 | | | | — | | | | — | | | | 0.31 | | | | — | | | | 10.23 | | | | 6.46 | | | | 0.32 | | | | 0.32 | | | | 0.32 | | | | 2.76 | | | | 613,643 | | | | 587 | †† |
| 03-31-14 | | | 10.08 | | | | 0.35 | | | | (0.20 | ) | | | 0.15 | | | | 0.32 | | | | — | | | | — | | | | 0.32 | | | | — | | | | 9.91 | | | | 1.56 | | | | 0.33 | | | | 0.33 | | | | 0.33 | | | | 3.48 | | | | 408,114 | | | | 525 | †† |
| 03-31-13 | | | 9.90 | | | | 0.37 | • | | | 0.32 | | | | 0.69 | | | | 0.51 | | | | — | | | | — | | | | 0.51 | | | | — | | | | 10.08 | | | | 7.04 | | | | 0.42 | | | | 0.42 | | | | 0.42 | | | | 3.64 | | | | 531,681 | | | | 490 | †† |
| 03-31-12 | | | 9.53 | | | | 0.41 | | | | 0.42 | | | | 0.83 | | | | 0.46 | | | | — | | | | — | | | | 0.46 | | | | — | | | | 9.90 | | | | 8.90 | | | | 0.40 | | | | 0.40 | | | | 0.40 | | | | 4.26 | | | | 331,423 | | | | 500 | †† |
| 03-31-11 | | | 9.23 | | | | 0.50 | | | | 0.26 | | | | 0.76 | | | | 0.46 | | | | — | | | | — | | | | 0.46 | | | | — | | | | 9.53 | | | | 8.35 | | | | 0.38 | | | | 0.38 | † | | | 0.38 | † | | | 5.25 | † | | | 332,193 | | | | 384 | †† |
See Accompanying Notes to Financial Statements
| Financial Highlights (continued) |
| | | | | | Income (loss) | | | | | | | | | | | | | | | | | | | | | | | | | | | | | | | | | | | | | | | | | | | |
| | | | | | from | | | | | | | | | | | | | | | | | | | | | | | | | | | | | | | | | | | | | | | | | | | |
| | | | | | investment | | | | | | | | | | | | | | | | | | | | | | | | | | | | | | | | | | | | | | | Supplemental | |
| | | | | | operations | | | | | | Less Distributions | | | | | | | | | | | | | | | Ratios to average net assets | | | Data | |
| | | Net asset
value,
beginning
of year
or period | | | Net investment
income (loss) | | | Net
realized
and
unrealized
gain (loss) | | | Total from
investment
operations | | | From net
investment
income | | | From net
realized
gains | | | From
return
of
capital | | | Total
distributions | | | Payment
by
affiliate | | | Net
asset
value,
end of
year
or period | | | Total
Return(1) | | | Expenses
before
reductions/
additions(2)(3) | | | Expenses
net of fee
waivers and/or
recoupments
if any(2)(3) | | | Expense
net of all
reductions/
additions(2)(3) | | | Net
investment
income
(loss)(2)(3) | | | Net
assets,
end of
year or
period | | | Portfolio
turnover
rate | |
| Year or | | | | | | | | | | | | | | | | | | | | | | | | | | | | | | | | | | | | | | | | | | | | | | | | | | | |
| period ended | | ($) | | | ($) | | | ($) | | | ($) | | | ($) | | | ($) | | | ($) | | | ($) | | | ($) | | | ($) | | | (%) | | | (%) | | | (%) | | | (%) | | | (%) | | | ($000’s) | | | (%) | |
| Voya Intermediate Bond Fund (continued) | | | | | | | | | | | | | | | | | | | | | | | | | | | | | | | | | | | | | | | | | | | | | | | | | | | | | | | | | | | | | | | | | | | | |
| Class O | | | | | | | | | | | | | | | | | | | | | | | | | | | | | | | | | | | | | | | | | | | | | | | | | | | | | | | | | | | | | | | | | | | | |
| 03-31-15 | | | 9.92 | | | | 0.25 | | | | 0.34 | | | | 0.59 | | | | 0.28 | | | | — | | | | — | | | | 0.28 | | | | — | | | | 10.23 | | | | 6.01 | | | | 0.66 | | | | 0.66 | | | | 0.66 | | | | 2.43 | | | | 36,329 | | | | 587 | †† |
| 03-31-14 | | | 10.09 | | | | 0.31 | | | | (0.19 | ) | | | 0.12 | | | | 0.29 | | | | — | | | | — | | | | 0.29 | | | | — | | | | 9.92 | | | | 1.21 | | | | 0.70 | | | | 0.70 | | | | 0.70 | | | | 3.09 | | | | 37,673 | | | | 525 | †† |
| 03-31-13 | | | 9.90 | | | | 0.34 | • | | | 0.33 | | | | 0.67 | | | | 0.48 | | | | — | | | | — | | | | 0.48 | | | | — | | | | 10.09 | | | | 6.83 | | | | 0.70 | | | | 0.70 | | | | 0.70 | | | | 3.38 | | | | 41,596 | | | | 490 | †† |
| 03-31-12 | | | 9.54 | | | | 0.39 | | | | 0.40 | | | | 0.79 | | | | 0.43 | | | | — | | | | — | | | | 0.43 | | | | — | | | | 9.90 | | | | 8.49 | | | | 0.68 | | | | 0.68 | | | | 0.68 | | | | 3.98 | | | | 42,500 | | | | 500 | †† |
| 03-31-11 | | | 9.24 | | | | 0.47 | • | | | 0.26 | | | | 0.73 | | | | 0.43 | | | | — | | | | — | | | | 0.43 | | | | — | | | | 9.54 | | | | 8.00 | | | | 0.68 | | | | 0.68 | † | | | 0.68 | † | | | 4.96 | † | | | 41,335 | | | | 384 | †† |
| Class R | | | | | | | | | | | | | | | | | | | | | | | | | | | | | | | | | | | | | | | | | | | | | | | | | | | | | | | | | | | | | | | | | | | | |
| 03-31-15 | | | 9.93 | | | | 0.22 | | | | 0.34 | | | | 0.56 | | | | 0.25 | | | | — | | | | — | | | | 0.25 | | | | — | | | | 10.24 | | | | 5.71 | | | | 0.91 | | | | 0.91 | | | | 0.91 | | | | 2.08 | | | | 121,657 | | | | 587 | †† |
| 03-31-14 | | | 10.10 | | | | 0.30 | | | | (0.20 | ) | | | 0.10 | | | | 0.27 | | | | — | | | | — | | | | 0.27 | | | | — | | | | 9.93 | | | | 0.96 | | | | 0.95 | | | | 0.95 | | | | 0.95 | | | | 2.82 | | | | 11,139 | | | | 525 | †† |
| 03-31-13 | | | 9.91 | | | | 0.30 | | | | 0.35 | | | | 0.65 | | | | 0.46 | | | | — | | | | — | | | | 0.46 | | | | — | | | | 10.10 | | | | 6.57 | | | | 0.95 | | | | 0.95 | | | | 0.95 | | | | 3.14 | | | | 14,401 | | | | 490 | †† |
| 03-31-12 | | | 9.54 | | | | 0.35 | | | | 0.43 | | | | 0.78 | | | | 0.41 | | | | — | | | | — | | | | 0.41 | | | | — | | | | 9.91 | | | | 8.33 | | | | 0.93 | | | | 0.93 | | | | 0.93 | | | | 3.73 | | | | 12,323 | | | | 500 | †† |
| 03-31-11 | | | 9.24 | | | | 0.45 | • | | | 0.25 | | | | 0.70 | | | | 0.40 | | | | — | | | | — | | | | 0.40 | | | | — | | | | 9.54 | | | | 7.72 | | | | 0.93 | | | | 0.93 | † | | | 0.93 | † | | | 4.72 | † | | | 14,339 | | | | 384 | †† |
| Class R6 | | | | | | | | | | | | | | | | | | | | | | | | | | | | | | | | | | | | | | | | | | | | | | | | | | | | | | | | | | | | | | | | | | | | |
| 03-31-15 | | | 9.91 | | | | 0.28 | | | | 0.34 | | | | 0.62 | | | | 0.31 | | | | — | | | | — | | | | 0.31 | | | | — | | | | 10.22 | | | | 6.38 | | | | 0.31 | | | | 0.31 | | | | 0.31 | | | | 2.77 | | | | 371,049 | | | | 587 | †† |
| 05-31-13(4) - | | | | | | | | | | | | | | | | | | | | | | | | | | | | | | | | | | | | | | | | | | | | | | | | | | | | | | | | | | | | | | | | | | | | |
| 03-31-14 | | | 10.02 | | | | 0.29 | • | | | (0.13 | ) | | | 0.16 | | | | 0.27 | | | | — | | | | — | | | | 0.27 | | | | — | | | | 9.91 | | | | 1.67 | | | | 0.33 | | | | 0.33 | | | | 0.33 | | | | 3.52 | | | | 241,001 | | | | 525 | †† |
| Class W | | | | | | | | | | | | | | | | | | | | | | | | | | | | | | | | | | | | | | | | | | | | | | | | | | | | | | | | | | | | | | | | | | | | |
| 03-31-15 | | | 9.90 | | | | 0.27 | | | | 0.35 | | | | 0.62 | | | | 0.30 | | | | — | | | | — | | | | 0.30 | | | | — | | | | 10.22 | | | | 6.36 | | | | 0.41 | | | | 0.41 | | | | 0.41 | | | | 2.67 | | | | 462,779 | | | | 587 | †† |
| 03-31-14 | | | 10.07 | | | | 0.33 | • | | | (0.19 | ) | | | 0.14 | | | | 0.31 | | | | — | | | | — | | | | 0.31 | | | | — | | | | 9.90 | | | | 1.46 | | | | 0.45 | | | | 0.45 | | | | 0.45 | | | | 3.39 | | | | 354,894 | | | | 525 | †† |
| 03-31-13 | | | 9.89 | | | | 0.37 | • | | | 0.32 | | | | 0.69 | | | | 0.51 | | | | — | | | | — | | | | 0.51 | | | | — | | | | 10.07 | | | | 7.04 | | | | 0.45 | | | | 0.45 | | | | 0.45 | | | | 3.64 | | | | 225,738 | | | | 490 | †† |
| 03-31-12 | | | 9.52 | | | | 0.40 | • | | | 0.53 | | | | 0.93 | | | | 0.56 | | | | — | | | | — | | | | 0.56 | | | | — | | | | 9.89 | | | | 10.09 | | | | 0.43 | | | | 0.43 | | | | 0.43 | | | | 4.17 | | | | 108,016 | | | | 500 | †† |
| 03-31-11 | | | 9.22 | | | | 0.48 | | | | 0.27 | | | | 0.75 | | | | 0.45 | | | | — | | | | — | | | | 0.45 | | | | — | | | | 9.52 | | | | 8.29 | | | | 0.43 | | | | 0.43 | † | | | 0.43 | † | | | 5.21 | † | | | 2,276 | | | | 384 | †† |
| Voya Short Term Bond Fund | | | | | | | | | | | | | | | | | | | | | | | | | | | | | | | | | | | | | | | | | | | | | | | | | | | | | | | | | | | | | | | | | | | | |
| Class A | | | | | | | | | | | | | | | | | | | | | | | | | | | | | | | | | | | | | | | | | | | | | | | | | | | | | | | | | | | | | | | | | | | | |
| 03-31-15 | | | 10.01 | | | | 0.13 | | | | (0.01 | ) | | | 0.12 | | | | 0.16 | | | | — | | | | — | | | | 0.16 | | | | — | | | | 9.97 | | | | 1.20 | | | | 0.89 | | | | 0.80 | | | | 0.80 | | | | 1.31 | | | | 303 | | | | 95 | |
| 03-31-14 | | | 10.01 | | | | 0.11 | • | | | 0.03 | | | | 0.14 | | | | 0.14 | | | | — | | | | — | | | | 0.14 | | | | — | | | | 10.01 | | | | 1.43 | | | | 0.91 | | | | 0.80 | | | | 0.80 | | | | 1.12 | | | | 173 | | | | 116 | |
| 12-19-12(4) - | | | | | | | | | | | | | | | | | | | | | | | | | | | | | | | | | | | | | | | | | | | | | | | | | | | | | | | | | | | | | | | | | | | | |
| 03-31-13 | | | 10.00 | | | | 0.02 | | | | (0.01 | ) | | | 0.01 | | | | 0.00 | * | | | — | | | | — | | | | 0.00 | * | | | — | | | | 10.01 | | | | 0.13 | | | | 2.39 | | | | 0.80 | | | | 0.80 | | | | 0.63 | | | | 4 | | | | 85 | |
| Class C | | | | | | | | | | | | | | | | | | | | | | | | | | | | | | | | | | | | | | | | | | | | | | | | | | | | | | | | | | | | | | | | | | | | |
| 03-31-15 | | | 10.02 | | | | 0.05 | | | | (0.01 | ) | | | 0.04 | | | | 0.08 | | | | — | | | | — | | | | 0.08 | | | | — | | | | 9.98 | | | | 0.44 | | | | 1.64 | | | | 1.55 | | | | 1.55 | | | | 0.56 | | | | 344 | | | | 95 | |
| 03-31-14 | | | 9.99 | | | | 0.03 | | | | 0.04 | | | | 0.07 | | | | 0.04 | | | | — | | | | — | | | | 0.04 | | | | — | | | | 10.02 | | | | 0.73 | | | | 1.66 | | | | 1.55 | | | | 1.55 | | | | 0.35 | | | | 352 | | | | 116 | |
| 12-19-12(4) - | | | | | | | | | | | | | | | | | | | | | | | | | | | | | | | | | | | | | | | | | | | | | | | | | | | | | | | | | | | | | | | | | | | | |
| 03-31-13 | | | 10.00 | | | | (0.01 | ) | | | 0.00 | * | | | (0.01 | ) | | | — | | | | — | | | | — | | | | — | | | | — | | | | 9.99 | | | | (0.10 | ) | | | 3.14 | | | | 1.55 | | | | 1.55 | | | | (0.39 | ) | | | 3 | | | | 85 | |
See Accompanying Notes to Financial Statements
| Financial Highlights (continued) |
| | | | | | Income (loss) | | | | | | | | | | | | | | | | | | | | | | | | | | | | | | | | | | | | | | | | | | | |
| | | | | | from | | | | | | | | | | | | | | | | | | | | | | | | | | | | | | | | | | | | | | | | | | | |
| | | | | | investment | | | | | | | | | | | | | | | | | | | | | | | | | | | | | | | | | | | | | | | Supplemental | |
| | | | | | operations | | | | | | Less Distributions | | | | | | | | | | | | | | | Ratios to average net assets | | | Data | |
| | | Net asset
value,
beginning
of year
or period | | | Net investment
income (loss) | | | Net
realized
and
unrealized
gain (loss) | | | Total from
investment
operations | | | From net
investment
income | | | From net
realized
gains | | | From
return
of
capital | | | Total
distributions | | | Payment
by
affiliate | | | Net
asset
value,
end of
year
or period | | | Total
Return(1) | | | Expenses
before
reductions/
additions(2)(3) | | | Expenses
net of fee
waivers and/or
recoupments
if any(2)(3) | | | Expense
net of all
reductions/
additions(2)(3) | | | Net
investment
income
(loss)(2)(3) | | | Net
assets,
end of
year or
period | | | Portfolio
turnover
rate | |
| Year or | | | | | | | | | | | | | | | | | | | | | | | | | | | | | | | | | | | | | | | | | | | | | | | | | | | |
| period ended | | ($) | | | ($) | | | ($) | | | ($) | | | ($) | | | ($) | | | ($) | | | ($) | | | ($) | | | ($) | | | (%) | | | (%) | | | (%) | | | (%) | | | (%) | | | ($000’s) | | | (%) | |
| Voya Short Term Bond Fund (continued) | | | | | | | | | | | | | | | | | | | | | | | | | | | | | | | | | | | | | | | | | | | | | | | | | | | | | | | | | | | | | | | | | | | | |
| Class I | | | | | | | | | | | | | | | | | | | | | | | | | | | | | | | | | | | | | | | | | | | | | | | | | | | | | | | | | | | | | | | | | | | | |
| 03-31-15 | | | 10.02 | | | | 0.17 | | | | (0.02 | ) | | | 0.15 | | | | 0.19 | | | | — | | | | — | | | | 0.19 | | | | — | | | | 9.98 | | | | 1.50 | | | | 0.59 | | | | 0.50 | | | | 0.50 | | | | 1.63 | | | | 7,416 | | | | 95 | |
| 03-31-14 | | | 10.00 | | | | 0.11 | • | | | 0.06 | | | | 0.17 | | | | 0.15 | | | | — | | | | — | | | | 0.15 | | | | — | | | | 10.02 | | | | 1.74 | | | | 0.61 | | | | 0.50 | | | | 0.50 | | | | 1.13 | | | | 4,419 | | | | 116 | |
| 12-19-12(4) - | | | | | | | | | | | | | | | | | | | | | | | | | | | | | | | | | | | | | | | | | | | | | | | | | | | | | | | | | | | | | | | | | | | | |
| 03-31-13 | | | 10.00 | | | | 0.02 | | | | 0.00 | * | | | 0.02 | | | | 0.02 | | | | — | | | | — | | | | 0.02 | | | | — | | | | 10.00 | | | | 0.22 | | | | 0.61 | | | | 0.50 | | | | 0.50 | | | | 0.84 | | | | 177,653 | | | | 85 | |
| Class R | | | | | | | | | | | | | | | | | | | | | | | | | | | | | | | | | | | | | | | | | | | | | | | | | | | | | | | | | | | | | | | | | | | | |
| 07-31-14(4) - | | | | | | | | | | | | | | | | | | | | | | | | | | | | | | | | | | | | | | | | | | | | | | | | | | | | | | | | | | | | | | | | | | | | |
| 03-31-15 | | | 9.99 | | | | 0.07 | • | | | 0.00 | * | | | 0.07 | | | | 0.09 | | | | — | | | | — | | | | 0.09 | | | | — | | | | 9.97 | | | | 0.72 | | | | 1.14 | | | | 1.05 | | | | 1.05 | | | | 1.00 | | | | 3 | | | | 95 | |
| Class R6 | | | | | | | | | | | | | | | | | | | | | | | | | | | | | | | | | | | | | | | | | | | | | | | | | | | | | | | | | | | | | | | | | | | | |
| 03-31-15 | | | 10.02 | | | | 0.16 | | | | (0.01 | ) | | | 0.15 | | | | 0.19 | | | | — | | | | — | | | | 0.19 | | | | — | | | | 9.98 | | | | 1.53 | | | | 0.54 | | | | 0.47 | | | | 0.47 | | | | 1.63 | | | | 133,098 | | | | 95 | |
| 07-31-13(4) - | | | | | | | | | | | | | | | | | | | | | | | | | | | | | | | | | | | | | | | | | | | | | | | | | | | | | | | | | | | | | | | | | | | | |
| 03-31-14 | | | 9.98 | | | | 0.09 | • | | | 0.06 | | | | 0.15 | | | | 0.11 | | | | — | | | | — | | | | 0.11 | | | | — | | | | 10.02 | | | | 1.49 | | | | 0.55 | | | | 0.47 | | | | 0.47 | | | | 1.31 | | | | 169,497 | | | | 116 | |
| Class W | | | | | | | | | | | | | | | | | | | | | | | | | | | | | | | | | | | | | | | | | | | | | | | | | | | | | | | | | | | | | | | | | | | | |
| 03-31-15 | | | 10.02 | | | | 0.15 | • | | | (0.01 | ) | | | 0.14 | | | | 0.18 | | | | — | | | | — | | | | 0.18 | | | | — | | | | 9.98 | | | | 1.41 | | | | 0.64 | | | | 0.55 | | | | 0.55 | | | | 1.46 | | | | 3 | | | | 95 | |
| 03-31-14 | | | 10.01 | | | | 0.12 | | | | 0.05 | | | | 0.17 | | | | 0.16 | | | | — | | | | — | | | | 0.16 | | | | — | | | | 10.02 | | | | 1.70 | | | | 0.66 | | | | 0.55 | | | | 0.55 | | | | 1.24 | | | | 3 | | | | 116 | |
| 12-19-12(4) - | | | | | | | | | | | | | | | | | | | | | | | | | | | | | | | | | | | | | | | | | | | | | | | | | | | | | | | | | | | | | | | | | | | | |
| 03-31-13 | | | 10.00 | | | | 0.02 | | | | 0.00 | * | | | 0.02 | | | | 0.01 | | | | — | | | | — | | | | 0.01 | | | | — | | | | 10.01 | | | | 0.17 | | | | 2.14 | | | | 0.55 | | | | 0.55 | | | | 0.59 | | | | 3 | | | | 85 | |
| Voya Strategic Income Opportunities Fund(5) | | | | | | | | | | | | | | | | | | | | | | | | | | | | | | | | | | | | | | | | | | | | | | | | | | | | | | | | | | | | | | | | | | | | |
| Class A | | | | | | | | | | | | | | | | | | | | | | | | | | | | | | | | | | | | | | | | | | | | | | | | | | | | | | | | | | | | | | | | | | | | |
| 03-31-15 | | | 9.93 | | | | 0.34 | • | | | 0.05 | | | | 0.39 | | | | 0.35 | | | | — | | | | — | | | | 0.35 | | | | — | | | | 9.97 | | | | 3.97 | | | | 2.75 | | | | 1.03 | | | | 1.03 | | | | 3.40 | | | | 438 | | | | 158 | |
| 03-31-14 | | | 10.16 | | | | 0.50 | • | | | (0.29 | ) | | | 0.21 | | | | 0.44 | | | | — | | | | — | | | | 0.44 | | | | — | | | | 9.93 | | | | 2.21 | | | | 4.23 | | | | 0.87 | | | | 0.87 | | | | 5.11 | | | | 309 | | | | 338 | |
| 11-02-12(4) - | | | | | | | | | | | | | | | | | | | | | | | | | | | | | | | | | | | | | | | | | | | | | | | | | | | | | | | | | | | | | | | | | | | | |
| 03-31-13 | | | 10.00 | | | | 0.12 | | | | 0.10 | | | | 0.22 | | | | 0.06 | | | | — | | | | — | | | | 0.06 | | | | — | | | | 10.16 | | | | 2.21 | | | | 3.78 | | | | 0.83 | | | | 0.83 | | | | 3.26 | | | | 4 | | | | 193 | |
| Class C | | | | | | | | | | | | | | | | | | | | | | | | | | | | | | | | | | | | | | | | | | | | | | | | | | | | | | | | | | | | | | | | | | | | |
| 03-31-15 | | | 9.86 | | | | 0.26 | • | | | 0.05 | | | | 0.31 | | | | 0.32 | | | | — | | | | — | | | | 0.32 | | | | — | | | | 9.85 | | | | 3.22 | | | | 3.50 | | | | 1.78 | | | | 1.78 | | | | 2.61 | | | | 170 | | | | 158 | |
| 03-31-14 | | | 10.14 | | | | 0.36 | • | | | (0.25 | ) | | | 0.11 | | | | 0.39 | | | | — | | | | — | | | | 0.39 | | | | — | | | | 9.86 | | | | 1.18 | | | | 4.98 | | | | 1.62 | | | | 1.62 | | | | 3.63 | | | | 48 | | | | 338 | |
| 11-02-12(4) - | | | | | | | | | | | | | | | | | | | | | | | | | | | | | | | | | | | | | | | | | | | | | | | | | | | | | | | | | | | | | | | | | | | | |
| 03-31-13 | | | 10.00 | | | | 0.11 | | | | 0.08 | | | | 0.19 | | | | 0.05 | | | | — | | | | — | | | | 0.05 | | | | — | | | | 10.14 | | | | 1.91 | | | | 4.53 | | | | 1.58 | | | | 1.58 | | | | 2.69 | | | | 3 | | | | 193 | |
| Class I | | | | | | | | | | | | | | | | | | | | | | | | | | | | | | | | | | | | | | | | | | | | | | | | | | | | | | | | | | | | | | | | | | | | |
| 03-31-15 | | | 9.94 | | | | 0.38 | | | | 0.04 | | | | 0.42 | | | | 0.38 | | | | — | | | | — | | | | 0.38 | | | | — | | | | 9.98 | | | | 4.29 | | | | 2.36 | | | | 0.64 | | | | 0.64 | | | | 3.78 | | | | 5,453 | | | | 158 | |
| 03-31-14 | | | 10.17 | | | | 0.44 | | | | (0.22 | ) | | | 0.22 | | | | 0.45 | | | | — | | | | — | | | | 0.45 | | | | — | | | | 9.94 | | | | 2.26 | | | | 3.84 | | | | 0.48 | | | | 0.48 | | | | 4.42 | | | | 5,264 | | | | 338 | |
| 11-02-12(4) - | | | | | | | | | | | | | | | | | | | | | | | | | | | | | | | | | | | | | | | | | | | | | | | | | | | | | | | | | | | | | | | | | | | | |
| 03-31-13 | | | 10.00 | | | | 0.16 | | | | 0.08 | | | | 0.24 | | | | 0.07 | | | | — | | | | — | | | | 0.07 | | | | — | | | | 10.17 | | | | 2.36 | | | | 3.33 | | | | 0.38 | | | | 0.38 | | | | 3.87 | | | | 5,107 | | | | 193 | |
| Class R | | | | | | | | | | | | | | | | | | | | | | | | | | | | | | | | | | | | | | | | | | | | | | | | | | | | | | | | | | | | | | | | | | | | |
| 03-31-15 | | | 9.91 | | | | 0.31 | • | | | 0.05 | | | | 0.36 | | | | 0.37 | | | | — | | | | — | | | | 0.37 | | | | — | | | | 9.90 | | | | 3.70 | | | | 3.00 | | | | 1.28 | | | | 1.28 | | | | 3.12 | | | | 330 | | | | 158 | |
| 03-31-14 | | | 10.15 | | | | 0.38 | | | | (0.23 | ) | | | 0.15 | | | | 0.39 | | | | — | | | | — | | | | 0.39 | | | | — | | | | 9.91 | | | | 1.57 | | | | 4.48 | | | | 1.12 | | | | 1.12 | | | | 3.77 | | | | 3 | | | | 338 | |
| 11-02-12(4) - | | | | | | | | | | | | | | | | | | | | | | | | | | | | | | | | | | | | | | | | | | | | | | | | | | | | | | | | | | | | | | | | | | | | |
| 03-31-13 | | | 10.00 | | | | 0.13 | | | | 0.08 | | | | 0.21 | | | | 0.06 | | | | — | | | | — | | | | 0.06 | | | | — | | | | 10.15 | | | | 2.08 | | | | 4.03 | | | | 1.08 | | | | 1.08 | | | | 3.20 | | | | 3 | | | | 193 | |
See Accompanying Notes to Financial Statements
| Financial Highlights (continued) |
| | | | | | Income (loss) | | | | | | | | | | | | | | | | | | | | | | | | | | | | | | | | | | | | | | | | | | | |
| | | | | | from | | | | | | | | | | | | | | | | | | | | | | | | | | | | | | | | | | | | | | | | | | | |
| | | | | | investment | | | | | | | | | | | | | | | | | | | | | | | | | | | | | | | | | | | | | | | Supplemental | |
| | | | | | operations | | | | | | Less Distributions | | | | | | | | | | | | | | | Ratios to average net assets | | | Data | |
| | | Net asset
value,
beginning
of year
or period | | | Net investment
income (loss) | | | Net
realized
and
unrealized
gain (loss) | | | Total from
investment
operations | | | From net
investment
income | | | From net
realized
gains | | | From
return
of
capital | | | Total
distributions | | | Payment
by
affiliate | | | Net
asset
value,
end of
year
or period | | | Total
Return(1) | | | Expenses
before
reductions/
additions(2)(3) | | | Expenses
net of fee
waivers and/or
recoupments
if any(2)(3) | | | Expense
net of all
reductions/
additions(2)(3) | | | Net
investment
income
(loss)(2)(3) | | | Net
assets,
end of
year or
period | | | Portfolio
turnover
rate | |
| Year or | | | | | | | | | | | | | | | | | | | | | | | | | | | | | | | | | | | | | | | | | | | | | | | | | | | |
| period ended | | ($) | | | ($) | | | ($) | | | ($) | | | ($) | | | ($) | | | ($) | | | ($) | | | ($) | | | ($) | | | (%) | | | (%) | | | (%) | | | (%) | | | (%) | | | ($000’s) | | | (%) | |
| Voya Strategic Income Opportunities Fund(5) (continued) | | | | | | | | | | | | | | | | | | | | | | | | | | | | | | | | | | | | | | | | | | | | | | | | | | | | | | | | | | | | | | | | | | | | |
| Class W | | | | | | | | | | | | | | | | | | | | | | | | | | | | | | | | | | | | | | | | | | | | | | | | | | | | | | | | | | | | | | | | | | | | |
| 03-31-15 | | | 9.89 | | | | 0.36 | | | | 0.05 | | | | 0.41 | | | | 0.34 | | | | — | | | | — | | | | 0.34 | | | | — | | | | 9.96 | | | | 4.24 | | | | 2.50 | | | | 0.78 | | | | 0.78 | | | | 3.60 | | | | 3 | | | | 158 | |
| 03-31-14 | | | 10.17 | | | | 0.43• | | | | (0.26 | ) | | | 0.17 | | | | 0.45 | | | | — | | | | — | | | | 0.45 | | | | — | | | | 9.89 | | | | 1.72 | | | | 3.98 | | | | 0.62 | | | | 0.62 | | | | 4.29 | | | | 3 | | | | 338 | |
| 11-02-12(4) - | | | | | | | | | | | | | | | | | | | | | | | | | | | | | | | | | | | | | | | | | | | | | | | | | | | | | | | | | | | | | | | | | | | | |
| 03-31-13 | | | 10.00 | | | | 0.15 | | | | 0.09 | | | | 0.24 | | | | 0.07 | | | | — | | | | — | | | | 0.07 | | | | — | | | | 10.17 | | | | 2.36 | | | | 3.53 | | | | 0.58 | | | | 0.58 | | | | 3.68 | | | | 3 | | | | 193 | |
| (1) | Total return is calculated assuming reinvestment of all dividends, capital gain distributions and return of capital distributions, if any, at net asset value and excluding the deduction of sales charges or contingent deferred sales charges, if applicable. Total return for periods less than one year is not annualized. |
| (2) | Annualized for periods less than one year. |
| (3) | Expense ratios reflect operating expenses of a Fund. Expenses before reductions/additions do not reflect amounts reimbursed by the Investment Adviser and/or Distributor or reductions from brokerage service arrangements or other expense offset arrangements and do not represent the amount paid by a Fund during periods when reimbursements or reductions occur. Expenses net of fee waivers reflect expenses after reimbursement by an Investment Adviser and/or Distributor but prior to reductions from brokerage service arrangements or other expense offset arrangements. Expenses net of all reductions/additions represent the net expenses paid by a Fund. Net investment income (loss) is net of all such additions or reductions. |
| (4) | Commencement of operations. |
| (5) | Ratios do not include expenses of underlying funds. |
| • | Calculated using average number of shares outstanding throughout the period. |
| * | Amount is less than $0.005 or 0.005% or more than $(0.005) or (0.005)%. |
| † | Impact of waiving the advisory fee for the ING Institutional Prime Money Market Fund holding has less than 0.005% impact on the expense ratio and net investment income or loss ratio. |
| †† | The Fund’s use of treasury securities and “to be announced” (TBA) securities contribute significantly to the portfolio turnover rate. Excluding all purchase and sale transactions involving treasury securities and TBAs, the Fund’s portfolio turnover rate was 31%, 68%, 98%, 105%, and 92% for the fiscal years ended March 31, 2015, 2014, 2013, 2012 and 2011, respectively. The Fund’s strategies involving treasury securities and TBA securities are employed to increase liquidity and to manage interest rate risk while not changing the economic exposure to treasury and mortgage backed securities. The Fund invests in treasury securities and may purchase and sell treasury securities to manage the duration of the Fund and for hedging purposes when selling or buying corporate bonds. In addition, the Fund commonly employs an investment strategy involving the purchase of the most recently issued treasury security with a particular time to maturity while selling its position in a previously issued treasury security with a substantially similar time to maturity. This strategy is employed in order for the Fund to own the most liquid treasury security available for a given time to maturity. The Fund also invests in TBA securities whereby the actual identity of the securities to be delivered at settlement is not specified, but rather the general characteristics of the securities are agreed to (i.e. issuer, mortgage type, maturity, coupon and month of settlement). The Fund may engage in rolling strategies with TBAs whereby the Fund seeks to extend the expiration or maturity of a TBA position by closing out the position before expiration and simultaneously opening a new position that has substantially similar terms except for a later expiration date. Such rolls enable the Fund to maintain continuous investment exposure to an underlying asset beyond the expiration of the initial position without delivery of the underlying asset. |
See Accompanying Notes to Financial Statements
| NOTES TO FINANCIAL STATEMENTS as of March 31, 2015 |
NOTE 1 — ORGANIZATION
Voya Funds Trust (“Trust”) is a Delaware statutory trust and is registered as an open-end management investment company under the Investment Company Act of 1940, as amended (“1940 Act”). The Trust was organized on August 6, 1998 and was established under a Trust Instrument dated July 30, 1998. It consists of six separately managed series. This report is for: Voya GNMA Income Fund (“GNMA Income”), Voya High Yield Bond Fund (“High Yield Bond”), Voya Intermediate Bond Fund (“Intermediate Bond”), Voya Short Term Bond Fund (“Short Term Bond”) and Voya Strategic Income Opportunities Fund (“Strategic Income Opportunities”) (each, a “Fund” and collectively, the “Funds”). Each Fund is a diversified series of the Trust. Prior to December 1, 2014, Strategic Income Opportunities was known as “Voya Strategic Income Fund.”
Each Fund offers at least four of the following classes of shares: Class A, Class B, Class C, Class I, Class O, Class P*, Class R, Class R6 and Class W. The separate classes of shares differ principally in the applicable sales charges (if any), transfer agent fees, distribution fees and shareholder servicing fees. Generally, shareholders of each class also bear certain expenses that pertain to that particular class. All shareholders bear the common expenses of a fund and earn income and realized gains/losses from a fund pro rata based on the daily ending net assets of each class, without discrimination between share classes. Expenses that are specific to a fund or a class are charged directly to that fund or class. Other operating expenses shared by several funds are generally allocated among those funds based on average net assets. Dividends are determined separately for each class based on income and expenses allocated to each class. Realized gain distributions are allocated to each class pro rata based on the shares outstanding of each class on the date of the distribution. Differences in per share dividend rates generally result from the differences in separate class expenses, including distribution, and shareholder servicing fees. Class B shares, along with their pro rata reinvested dividend shares, automatically convert to Class A shares eight years after purchase.
Class B shares of the Funds that offer Class B shares are closed to new investment, provided that (1) Class B shares of the Funds may be purchased through the reinvestment of dividends issued by Class B shares of a Fund; and (2) subject to the terms and conditions of relevant exchange privileges and as permitted under their respective prospectuses, Class B shares of the Funds may be acquired through exchange of Class B shares of other funds in the Voya family of funds.
Voya Investments, LLC (“Voya Investments” or the “Investment Adviser”), an Arizona limited liability company, serves as the Investment Adviser to the Funds. Voya Investment Management Co. LLC (“Voya IM”), a Delaware limited liability company, serves as the sub-adviser to the Funds. Voya Funds Services, LLC (“VFS” or the “Administrator”), a Delaware limited liability company, serves as the Administrator to the Funds. Voya Investments Distributor, LLC (“VID” or the “Distributor”), a Delaware limited liability company, serves as the principal underwriter to the Funds.
NOTE 2 — SIGNIFICANT ACCOUNTING POLICIES
The following significant accounting policies are consistently followed by the Funds in the preparation of their financial statements. Each Fund is considered an investment company under U.S. generally accepted accounting principles (“GAAP”) and follows the accounting and reporting guidance applicable to investment companies.
A. Security Valuation. The net asset value (“NAV”) per share for each class of each Fund is determined each business day as of the close of regular trading (“Market Close”) on the New York Stock Exchange (“NYSE”) (normally 4:00 p.m. Eastern time unless otherwise designated by the NYSE) each day on which the NYSE is open for trading. The Funds are open for business every day the NYSE is open. Fund shares will not be priced on days when the NYSE is closed. The NAV per share of each class of each Fund is calculated by taking the value of the Fund’s assets attributable to that class, subtracting the Fund’s liabilities attributable to that class, and dividing by the number of shares of that class that are outstanding.
Assets for which market quotations are readily available are valued at market value. A security listed or traded on an exchange is valued at its last sales price or official closing price as of the close of the normal trading session on the exchange where the security is principally traded, or lacking any sales or official closing price on a particular day, the security may be valued at the mean of the closing bid and ask price on that day. Bank loans are valued at the average of the averages between the bid and ask prices provided to an independent pricing service by brokers. Futures contracts are valued at the final settlement price set by an exchange on which they are principally traded. Listed options are valued at the mean between the last bid and ask prices from the exchange on which they are principally traded. Investments in open-end registered investment companies that do not trade on an exchange are valued at the end of day net asset value per share. Investments in registered investment companies that trade on an exchange are valued at the last sales price or official
| NOTES TO FINANCIAL STATEMENTS as of March 31, 2015 (continued) |
NOTE 2 — SIGNIFICANT ACCOUNTING POLICIES (continued)
closing price as of the close of the customary trading session on the exchange where the security is principally traded.
When a market quotation is not readily available or is deemed unreliable, a Fund will determine a fair value for the relevant asset in accordance with procedures adopted by the Board of Trustees (“Board”). Such procedures provide, for example, that: (a) Debt obligations are valued using an evaluated price provided by an independent pricing service. Evaluated prices provided by the pricing service may be determined without exclusive reliance on quoted prices, and may reflect factors such as institution-size trading in similar groups of securities, developments related to specific securities, benchmark yield, quality, type of issue, coupon rate, maturity individual trading characteristics and other market data; (b) Securities traded in the over-the-counter market are valued based on prices provided by independent pricing services or market makers; (c) Options not listed on an exchange are valued by an independent source using an industry accepted model, such as Black-Scholes; (d) Centrally cleared swap agreements are valued using a price provided by the central counterparty clearinghouse; (e) Over-the-counter swap agreements are valued using a price provided by an independent pricing service; (f) Forward foreign currency contracts are valued utilizing current and forward rates obtained from an independent pricing service. Such prices from the third party pricing service are for specific settlement periods and each Fund’s forward foreign currency contracts are valued at an interpolated rate between the closest preceding and subsequent period reported by the independent pricing service and (g) Securities for which market prices are not provided by any of the above methods may be valued based upon quotes furnished by brokers.
The prospectuses of the open-end registered investment companies in which a Fund may invest explain the circumstances under which they will use fair value pricing and the effects of using fair value pricing.
Foreign securities’ (including foreign exchange contracts) prices are converted into U.S. dollar amounts using the applicable exchange rates as of the close of the NYSE. If market quotations are available and believed to be reliable for foreign exchange-traded equity securities, the securities will be valued at the market quotations. Because trading hours for certain foreign securities end before the close of the NYSE, closing market quotations may become unreliable. An independent pricing service determines the degree of certainty, based on historical data, that the closing price in the principal market where a foreign
security trades is not the current value as of the close of the NYSE. Foreign securities’ prices meeting the approved degree of certainty that the price is not reflective of current value will be valued by the independent pricing service using pricing models designed to estimate likely changes in the values of those securities between the times in which the trading in those securities is substantially completed and the close of the NYSE. Multiple factors may be considered by the independent pricing service in determining the value of such securities and may include information relating to sector indices, American Depositary Receipts and domestic and foreign index futures.
All other assets for which market quotations are not readily available or became unreliable (or if the above fair valuation methods are unavailable or determined to be unreliable) are valued at fair value as determined in good faith by or under the supervision of the Board following procedures approved by the Board. Issuer specific events, transaction price, position size, nature and duration of restrictions on disposition of the security, market trends, bid/ask quotes of brokers and other market data may be reviewed in the course of making a good faith determination of a security’s fair value. Valuations change in response to many factors including the historical and prospective earnings of the issuer, the value of the issuer’s assets, general economic conditions, interest rates, investor perceptions and market liquidity. Because of the inherent uncertainties of fair valuation, the values used to determine a Fund’s NAV may materially differ from the value received upon actual sale of those investments. Thus, fair valuation may have an unintended dilutive or accretive effect on the value of shareholders’ investments in a Fund.
Each investment asset or liability of the Funds is assigned a level at measurement date based on the significance and source of the inputs to its valuation. Quoted prices in active markets for identical securities are classified as “Level 1,” inputs other than quoted prices for an asset or liability that are observable are classified as “Level 2” and unobservable inputs, including the sub-adviser’s judgment about the assumptions that a market participant would use in pricing an asset or liability are classified as “Level 3”. The inputs used for valuing securities are not necessarily an indication of the risks associated with investing in those securities. Short-term securities of sufficient credit quality are generally considered to be Level 2 securities under applicable accounting rules. A table summarizing the Funds’ investments under these levels of classification is included following the Summary Portfolios of Investments.
The Board has adopted methods for valuing securities and other assets in circumstances where market quotes are not readily available, and has delegated the responsibility for
| NOTES TO FINANCIAL STATEMENTS as of March 31, 2015 (continued) |
NOTE 2 — SIGNIFICANT ACCOUNTING POLICIES (continued)
applying the valuation methods to the “Pricing Committee” as established by the Fund’s Administrator. The Pricing Committee considers all facts it deems relevant that are reasonably available, through either public information or information available to the Investment Adviser or sub-adviser, when determining the fair value of the security. In the event that a security or asset cannot be valued pursuant to one of the valuation methods established by the Board, the fair value of the security or asset will be determined in good faith by the Pricing Committee. When a Fund uses these fair valuation methods that use significant unobservable inputs to determine its NAV, securities will be priced by a method that the Pricing Committee believes accurately reflects fair value and are categorized as Level 3 of the fair value hierarchy. The methodologies used for valuing securities are not necessarily an indication of the risks of investing in those securities valued in good faith at fair value nor can it be assured a Fund can obtain the fair value assigned to a security if it were to sell the security.
To assess the continuing appropriateness of security valuations, the Pricing Committee may compare prior day prices, prices on comparable securities, and traded prices to the prior or current day prices and the Pricing Committee challenges those prices exceeding certain tolerance levels with the independent pricing service or broker source. For those securities valued in good faith at fair value, the Pricing Committee reviews and affirms the reasonableness of the valuation on a regular basis after considering all relevant information that is reasonably available.
For fair valuations using significant unobservable inputs, U.S. GAAP requires a reconciliation of the beginning to ending balances for reported fair values that presents changes attributable to total realized and unrealized gains or losses, purchases and sales, and transfers in or out of the Level 3 category during the period. The beginning of period timing recognition is used for the transfers between Levels of a Fund’s assets and liabilities. A reconciliation of Level 3 investments is presented when a Fund has a significant amount of Level 3 investments.
For the year ended March 31, 2015, there have been no significant changes to the fair valuation methodologies.
B. Security Transactions and Revenue Recognition. Securities transactions are accounted for on the trade date. Realized gains and losses are reported on the basis of identified cost of securities sold. Interest income is recorded on an accrual basis. Dividend income is recorded on the ex-dividend date, or for certain foreign securities,
when the information becomes available to the Funds. Premium amortization and discount accretion are determined by the effective yield method.
C. Foreign Currency Translation. The books and records of the Funds are maintained in U.S. dollars. Any foreign currency amounts are translated into U.S. dollars on the following basis:
| (1) | Market value of investment securities, other assets and liabilities — at the exchange rates prevailing at the end of the day. |
| (2) | Purchases and sales of investment securities, income and expenses — at the rates of exchange prevailing on the respective dates of such transactions. |
Although the net assets and the market values are presented at the foreign exchange rates at the end of the day, the Funds do not isolate the portion of the results of operations resulting from changes in foreign exchange rates on investments from the fluctuations arising from changes in market prices of securities held. Such fluctuations are included with the net realized and unrealized gains or losses from investments. For securities that are subject to foreign withholding tax upon disposition, liabilities are recorded on the Statements of Assets and Liabilities for the estimated tax withholding based on the securities’ current market values. Upon disposition, realized gains or losses on such securities are recorded net of foreign withholding tax.
Reported net realized foreign exchange gains or losses arise from sales of foreign currencies, currency gains or losses realized between the trade and settlement dates on securities transactions, the difference between the amounts of dividends, interest, and foreign withholding taxes recorded on the Funds’ books, and the U.S. dollar equivalent of the amounts actually received or paid. Net unrealized foreign exchange gains and losses arise from changes in the value of assets and liabilities other than investments in securities at fiscal year end, resulting from changes in the exchange rate. Foreign security and currency transactions may involve certain considerations and risks not typically associated with investing in U.S. companies and U.S. government securities. These risks include, but are not limited to revaluation of currencies and future adverse political and economic developments which could cause securities and their markets to be less liquid and prices more volatile than those of comparable U.S. companies and U.S. government securities. The foregoing risks are even greater with respect to securities in emerging markets.
D. Risk Exposures and the use of Derivative Instruments. The Funds’ investment objectives permit them to enter into various types of derivatives contracts,
| NOTES TO FINANCIAL STATEMENTS as of March 31, 2015 (continued) |
NOTE 2 — SIGNIFICANT ACCOUNTING POLICIES (continued)
including, but not limited to, forward foreign currency exchange contracts, futures, purchased options, written options, and swaps. In doing so, the Funds will employ strategies in differing combinations to permit them to increase or decrease the level of risk, or change the level or types of exposure to market risk factors. This may allow the Funds to pursue their objectives more quickly, and efficiently than if they were to make direct purchases or sales of securities capable of affecting a similar response to market factors.
Market Risk Factors. In pursuit of their investment objectives, the Funds may seek to use derivatives to increase or decrease their exposure to the following market risk factors:
Credit Risk. Credit risk relates to the ability of the issuer to meet interest and principal payments, or both, as they come due. In general, lower-grade, higher-yield bonds are subject to credit risk to a greater extent than lower-yield, higher-quality bonds.
Equity Risk. Equity risk relates to the change in value of equity securities as they relate to increases or decreases in the general market.
Foreign Exchange Rate Risk. Foreign exchange rate risk relates to the change in the U.S. dollar value of a security held that is denominated in a foreign currency. The U.S. dollar value of a foreign currency denominated security will decrease as the U.S. dollar appreciates against the currency, while the U.S. dollar value will increase as the U.S. dollar depreciates against the currency.
Interest Rate Risk. Interest rate risk refers to the fluctuations in value of fixed-income securities resulting from the inverse relationship between price and yield. For example, an increase in general interest rates will tend to reduce the market value of already issued fixed-income investments, and a decline in general interest rates will tend to increase their value. In addition, debt securities with longer durations, which tend to have higher yields, are subject to potentially greater fluctuations in value from changes in interest rates than obligations with shorter durations.
Risks of Investing in Derivatives. The Funds’ use of derivatives can result in losses due to unanticipated changes in the market risk factors and the overall market. In instances where the Funds are using derivatives to decrease, or hedge, exposures to market risk factors for
securities held by a Fund, there are also risks that those derivatives may not perform as expected resulting in losses for the combined or hedged positions.
The use of these strategies involves certain special risks, including a possible imperfect correlation, or even no correlation, between price movements of derivative instruments and price movements of related investments. While some strategies involving derivative instruments can reduce the risk of loss, they can also reduce the opportunity for gain or even result in losses by offsetting favorable price movements in related investments or otherwise, due to the possible inability of the Funds to purchase or sell a portfolio security at a time that otherwise would be favorable or the possible need to sell a portfolio security at a disadvantageous time because the Funds are required to maintain asset coverage or offsetting positions in connection with transactions in derivative instruments. Additional associated risks from investing in derivatives also exist and potentially could have significant effects on the valuation of the derivatives and the Funds. Associated risks are not the risks that the Funds are attempting to increase or decrease exposure to, per their investment objectives, but are the additional risks from investing in derivatives. Examples of these associated risks are liquidity risk, which is the risk that the Funds will not be able to sell the derivative in the open market in a timely manner, and counterparty credit risk, which is the risk that the counterparty will not fulfill its obligation to the Funds. Associated risks can be different for each type of derivative and are discussed by each derivative type in the following notes.
Counterparty Credit Risk and Credit Related Contingent Features. Certain derivative positions are subject to counterparty credit risk, which is the risk that the counterparty will not fulfill its obligation to the Funds. The Funds’ derivative counterparties are financial institutions who are subject to market conditions that may weaken their financial position. The Funds intend to enter into financial transactions with counterparties that they believe to be creditworthy at the time of the transaction. To reduce this risk, the Funds generally enter into master netting arrangements, established within the Funds’ International Swap and Derivatives Association, Inc. (“ISDA”) Master Agreements (“Master Agreements”). These agreements are with select counterparties and they govern transactions, including certain over-the-counter (“OTC”) derivative and forward foreign currency contracts, entered into by the Funds and the counterparty. The Master Agreements maintain provisions for general obligations, representations, agreements, collateral, and events of default or termination. The occurrence of a specified event
| NOTES TO FINANCIAL STATEMENTS as of March 31, 2015 (continued) |
NOTE 2 — SIGNIFICANT ACCOUNTING POLICIES (continued)
of termination may give a counterparty the right to terminate all of its contracts and affect settlement of all outstanding transactions under the applicable Master Agreement.
The Funds may also enter into collateral agreements with certain counterparties to further mitigate credit risk associated with OTC derivative and forward foreign currency contracts. Subject to established minimum levels, collateral is generally determined based on the net aggregate unrealized gain or loss on contracts with a certain counterparty. Collateral pledged to or from the Funds is held in a segregated account by a third-party agent and can be in the form of cash or debt securities issued by the U.S. government or related agencies.
As of March 31, 2015, the maximum amount of loss that Strategic Income Opportunities would incur if the counterparties to its derivative transactions failed to perform would be $3,559, which represents the gross payments to be received by the Funds on open forward foreign currency contracts were they to be unwound as of March 31, 2015. There was no collateral posted by any counterparty at March 31, 2015.
The Funds’ master agreements with derivative counterparties have credit related contingent features that if triggered would allow its derivatives counterparties to close out and demand payment or additional collateral to cover their exposure from the Funds. Credit related contingent features are established between the Funds and their derivatives counterparties to reduce the risk that the Funds will not fulfill their payment obligations to their counterparties. These triggering features include, but are not limited to, a percentage decrease in the Funds’ net assets and or a percentage decrease in the Funds’ NAV, which could cause the Funds to accelerate payment of any net liability owed to the counterparty. The contingent features are established within the Funds’ Master Agreements.
As of March 31, 2015, Intermediate Bond and Strategic Income Opportunities had a net liability position of $71,247 and $1,219, respectively, on open forward foreign currency with credit related contingent features. If a contingent feature would have been triggered as of March 31, 2015, Intermediate Bond or Strategic Income Opportunities could have been required to pay this amount in cash to its counterparties. As of March 31, 2015 there was no cash collateral pledged by either Fund for its open OTC derivatives transactions.
E. Foreign Currency Transactions and Futures Contracts. Certain Funds may enter into foreign currency
exchange transactions to convert to and from different foreign currencies and to and from the U.S. dollar in connection with the planned purchases or sales of securities. The Funds either enter into these transactions on a spot basis at the spot rate prevailing in the foreign currency exchange market or use forward foreign currency contracts to purchase or sell foreign currencies. When the contract is fulfilled or closed, gains or losses are realized. Until then, the gain or loss is included in unrealized appreciation or depreciation. Risks may arise upon entering into forward contracts from the potential inability of counterparties to meet the terms of their forward contracts and from unanticipated movements in the value of foreign currencies relative to the U.S. dollar.
For the year ended March 31, 2015, Intermediate Bond, Short Term Bond and Strategic Income Opportunities entered into forward foreign currency contracts with the obligation to buy and sell specified foreign currencies in the future at a currently negotiated forward rate in order to increase or decrease exposure to foreign exchange rate risk.
The Funds use forward foreign currency contracts primarily to protect its non-U.S. dollar-denominated holdings from adverse currency movements. Please refer to the tables following the respective Summary Portfolio of Investments for open forward foreign currency contracts at March 31, 2015.
During the year ended March 31, 2015, the Funds had average contract amounts on forward foreign currency contracts to buy and sell as disclosed below:
| | | Buy | | | Sell | |
| Intermediate Bond | | $ | 7,228,071 | | | $ | 6,672,485 | |
| Short Term Bond | | | 1,894,936 | | | | 3,814,632 | |
| Strategic Income Opportunities | | | 170,272 | | | | 123,725 | |
Certain Funds may enter into futures contracts involving foreign currency, interest rates, securities and securities indices. A futures contract obligates the seller of the contract to deliver and the purchaser of the contract to take delivery of the type of foreign currency, financial instrument or security called for in the contract at a specified future time for a specified price. Upon entering into such a contract, a Fund is required to deposit and maintain as collateral such initial margin as required by the exchange on which the contract is traded. Pursuant to the contract, a Fund agrees to receive from or pay to the broker an amount equal to the daily fluctuations in the value of the contract. Such receipts or payments are known as variation margins and are recorded as unrealized gains or losses by the Fund. When the contract is closed, the Fund records a realized gain or loss equal to the difference
| NOTES TO FINANCIAL STATEMENTS as of March 31, 2015 (continued) |
NOTE 2 — SIGNIFICANT ACCOUNTING POLICIES (continued)
between the value of the contract at the time it was opened and the value at the time it was closed.
Futures contracts are exposed to the market risk factor of the underlying financial instrument. During the year ended March 31, 2015, GNMA Income, Intermediate Bond, Short Term Bond and Strategic Income Opportunities have both purchased and sold futures contracts on various bonds and notes to manage duration and yield curve exposure. Additional associated risks of entering into futures contracts include the possibility that there may be an illiquid market where a Fund is unable to liquidate the contract or enter into an offsetting position and, if used for hedging purposes, the risk that the price of the contract will correlate imperfectly with the prices of the Fund’s securities. With futures, there is minimal counterparty credit risk to a Fund since futures are exchange traded and the exchange’s clearinghouse, as counterparty to all exchange traded futures, guarantees the futures against default.
During the year ended March 31, 2015, the following Funds had an average notional value on futures contracts purchased and sold as disclosed below. Please refer to the tables following each respective Summary Portfolio of Investments for open futures contracts at March 31, 2015.
| | | Purchased | | | Sold | |
| GNMA Income | | $ | 5,781,563 | | | $ | 178,696,760 | |
| Intermediate Bond | | | 136,576,605 | | | | 283,103,598 | |
| Short Term Bond | | | 48,929,349 | | | | 20,046,681 | |
| Strategic Income Opportunities | | | 486,972 | | | | 1,303,202 | |
F. Distributions to Shareholders. The Funds record distributions to their shareholders on the ex-dividend date. Each Fund distributes capital gains, if any, annually. All Funds, with the exception of GNMA Income and Strategic Income Opportunities, declare dividends daily and pay dividends monthly. GNMA Income declares and pays dividends monthly. Strategic Income Opportunities declares and pays dividends annually. The characteristics of income and gains to be distributed are determined in accordance with income tax regulations, which may differ from U.S. GAAP for investment companies.
G. Federal Income Taxes. It is the policy of the Funds to comply with the requirements of subchapter M of the Internal Revenue Code that are applicable to regulated investment companies and to distribute substantially all of their net investment income and any net realized capital gains to their shareholders. Therefore, a federal income tax or excise tax provision is not required. Management has considered the sustainability of the Funds’ tax positions taken on federal income tax returns for all open tax years in
making this determination. No capital gain distributions shall be made until the capital loss carryforwards have been fully utilized or expire.
H. Use of Estimates. The preparation of financial statements in conformity with U.S. GAAP requires management to make estimates and assumptions that affect the reported amounts of assets and liabilities and disclosure of contingent assets and liabilities at the date of the financial statements and the reported amounts of increases and decreases in net assets from operations during the reporting period. Actual results could differ from those estimates.
I. Repurchase Agreements. Each Fund may invest in repurchase agreements only with government securities dealers recognized by the Board of Governors of the Federal Reserve System. Under such agreements, the seller of the security agrees to repurchase it at a mutually agreed upon time and price. The resale price is in excess of the purchase price and reflects an agreed upon interest rate for the period of time the agreement is outstanding. The period of the repurchase agreements is generally short, from possibly overnight to one week, (although it may extend over a number of months) while the underlying securities generally have longer maturities. Each Fund will receive as collateral securities acceptable to it whose market value is equal to at least 100% of the carrying amount of the repurchase agreements, plus accrued interest, being invested by a Fund. The underlying collateral is valued daily on a mark to market basis to assure that the value, including accrued interest is at least equal to the repurchase price. There would be potential loss to a Fund in the event a Fund is delayed or prevented from exercising its right to dispose of the collateral, and it may incur disposition costs in liquidating the collateral.
J. Securities Lending. Each Fund has the option to temporarily loan up to 331∕3% of its total assets to brokers, dealers or other financial institutions in exchange for a negotiated lender’s fee. The borrower is required to fully collateralize the loans with cash or U.S. government securities. Generally, in the event of counterparty default, a Fund has the right to use collateral to offset losses incurred. There would be potential loss to a Fund in the event the Fund is delayed or prevented from exercising its right to dispose of the collateral. Each Fund bears the risk of loss with respect to the investment of collateral with the following exception: The Bank of New York Mellon (“BNY”) provides the Funds indemnification from loss with respect to the investment of collateral provided that the cash collateral is invested solely in overnight repurchase agreements. Engaging in securities lending could have a leveraging effect, which may intensify the credit, market and other risks associated with investing in a Fund.
| NOTES TO FINANCIAL STATEMENTS as of March 31, 2015 (continued) |
NOTE 2 — SIGNIFICANT ACCOUNTING POLICIES (continued)
K. Restricted Securities. Each Fund may invest in restricted securities which include those sold under Rule 144A of the Securities Act of 1933 (“1933 Act”) or securities offered pursuant to Section 4(a)(2) of the 1933 Act, and/or are subject to legal or contractual restrictions on resale and may not be publicly sold without registration under the 1933 Act. Restricted securities are fair valued using market quotations when readily available. In the absence of market quotations, the securities are valued based upon their fair value determined in good faith under procedures approved by the Board.
L. Delayed-Delivery or When-Issued Transactions. The Funds may purchase or sell securities on a when-issued or a delayed-delivery basis. Each Fund may enter into forward commitments. The price of the underlying securities and date when the securities will be delivered and paid for are fixed at the time the transaction is negotiated. The market value of such is identified in the Funds’ Summary Portfolio of investments. Losses may arise due to changes in the market value of the securities or from the inability of counterparties to meet the terms of the contract. In connection with such purchases, the Funds are required to segregate liquid assets with the Funds’ custodian sufficient to cover the purchase price.
To mitigate counterparty risk, the Funds have entered into Master Securities Forward Transaction Agreements (“MSFTA”) with their respective counterparties that provide for collateral and the right to offset amounts due to or from those counterparties under specified conditions. Subject to minimum transfer amounts, collateral requirements are determined and transfers made based on the net aggregate unrealized gain or loss on all the when-issued or delayed-delivery transactions with a particular counterparty. Cash collateral, if any, is presented on the Statement of Assets and Liabilities as an asset (Cash pledged as collateral for delayed-delivery or when-issued securities) and a liability (Cash received as collateral for delayed-delivery or when-issued securities).
At March 31, 2015, certain counterparties had posted $2,448,000 and $1,505,146, respectively, in cash collateral to GNMA Income and Intermediate Bond for delayed-delivery or when-issued transactions.
M. Mortgage Dollar Roll Transactions. Each Fund may engage in dollar roll transactions with respect to mortgage-backed securities issued or to be issued by Government National Mortgage Association, Federal National Mortgage Association and Federal Home Loan Mortgage Corp. In a dollar roll transaction, a Fund sells a mortgage-backed security to a financial institution, such as a bank or broker/dealer, and simultaneously agrees to
repurchase a substantially similar (i.e., same type, coupon, and maturity) security from the institution on a delayed delivery basis at an agreed upon price. The mortgage-backed securities that are repurchased will bear the same interest rate as those sold, but generally will be collateralized by different pools of mortgages with different prepayment histories. The Funds account for dollar roll transactions as purchases and sales.
N. Options Contracts. The Funds may write call and put options on futures, swaptions, securities, commodity or currencies they own or in which they may invest. Writing put options tends to increase the Funds exposure to the underlying instrument. Writing call options tends to decrease the Funds exposure to the underlying instrument. When a Fund writes a call or put option, an amount equal to the premium received is recorded as a liability and subsequently marked to market to reflect the current value of the option written. These liabilities are reflected as written options outstanding on the Statements of Assets and Liabilities. Certain options may be written with premiums to be determined on a future date. Premiums received from writing options which expire are treated as realized gains. Premiums received from writing options which are exercised or closed are added to the proceeds or offset against amounts paid on the underlying futures, swap, security or currency transaction to determine the realized gain or loss. Each Fund as a writer of an option has no control over whether the underlying instrument may be sold (call) or purchased (put) and as a result bears the market risk of an unfavorable change in the price of the instrument underlying the written option. There is the risk the Funds may not be able to enter into a closing transaction because of an illiquid market.
The Funds may also purchase put and call options. Purchasing call options tends to increase the Funds exposure to the underlying instrument. Purchasing put options tends to decrease the Funds’ exposure to the underlying instrument. The Funds pay a premium which is included on the Statements of Assets and Liabilities as an investment and subsequently marked to market to reflect the current value of the option. Premiums paid for purchasing options which expire are treated as realized losses. Certain options may be purchased with premiums to be determined on a future date. The premiums for these options are based upon implied volatility parameters at specified terms. The risk associated with purchasing put and call options is limited to the premium paid. Premiums paid for purchasing options which are exercised or closed are added to the amounts paid or offset against the proceeds on the underlying investment transaction to determine the realized gain or loss.
During the year ended March 31, 2015, Intermediate Bond had purchased and written interest rate swaptions to
| NOTES TO FINANCIAL STATEMENTS as of March 31, 2015 (continued) |
NOTE 2 — SIGNIFICANT ACCOUNTING POLICIES (continued)
manage duration and yield curve exposures and to generate income. Please refer to the Summary Portfolio of Investments for open purchased swaptions at March 31, 2015. There were no open written swaptions at March 31, 2015.
During the year ended March 31, 2015, Short Term Bond had purchased interest rate swaptions to manage duration and yield curve exposures. Please refer to the Summary Portfolio of Investments for open purchased swaptions at March 31, 2015.
Please refer to Note 10 for the volume of both purchased and written options and swaption activity during the year ended March 31, 2015.
O. Swap Agreements. High Yield Bond and Intermediate Bond may enter into swap agreements. A swap is an agreement between two parties pursuant to which each party agrees to make one or more payments to the other at specified future intervals based on the return of an asset (such as a stock, bond or currency) or non-asset reference (such as an interest rate or index). The swap agreement will specify the “notional” amount of the asset or non-asset reference to which the contract relates. Subsequent changes in fair value, if any, are calculated based upon changes in the performance of the asset or non-asset reference multiplied by the notional value of the contract. A Fund may enter into credit default, interest rate, total return and currency swaps to manage its exposure to credit, currency and interest rate risk. All outstanding swap agreements are reported following each Fund’s Summary Portfolio of Investments.
Swaps are marked to market daily using quotations primarily from third party pricing services, counterparties or brokers. The fair value of the swap contract is recorded on each Fund’s Statement of Assets and Liabilities. During the term of the swap, changes in the fair value of the swap, if any, are recorded as unrealized gains or losses on the Statement of Operations. Upfront payments paid or received by a Fund when entering into the agreements are reported on the Statement of Assets and Liabilities and as a component of the changes in unrealized gains or losses on the Statement of Operations. These upfront payments represent the amounts paid or received when initially entering into the swap agreement to compensate for differences between the stated terms of the swap agreement and the prevailing market conditions. The upfront payments are included as a component in the realized gains or losses on each Fund’s Statement of Operations upon termination or maturity of the swap. A
Fund also records net periodic payments paid or received on the swap contract as a realized gain or loss on the Statement of Operations.
Entering into swap agreements involves the risk that the maximum potential loss of an investment exceeds the current value of the investment as reported on each Fund’s Statement of Assets and Liabilities. Other risks involve the possibility that the counterparty to the agreements may default on its obligation to perform, that there will be no liquid market for these investments and that unfavorable changes in the market will have a negative impact on the value of the index or securities underlying the respective swap agreement.
Credit Default Swap Contracts. A credit default swap is a bilateral agreement between counterparties in which the buyer of the protection agrees to make a stream of periodic payments to the seller of protection in exchange for the right to receive a specified return in the event of a default or other credit event for a referenced entity, obligation or index. As a seller of protection on credit default swaps, a Fund will generally receive from the buyer a fixed payment stream based on the notional amount of the swap contract. This fixed payment stream will continue until the swap contract expires or a defined credit event occurs.
A Fund is subject to credit risk in the normal course of pursuing its investment objectives. As a seller of protection in a credit default swap, a Fund may execute these contracts to manage its exposure to the market or certain sectors of the market. A Fund may also enter into credit default swaps to speculate on changes in an issuer’s credit quality, to take advantage of perceived spread advantages, or to offset an existing short equivalent (i.e. buying protection on an equivalent reference entity).
Intermediate Bond and Strategic Income Opportunities may sell credit default swaps which expose these Funds to the risk of loss from credit risk- related events specified in the contract. Although contract specific, credit events are generally defined as bankruptcy, failure to pay, restructuring, obligation acceleration, obligation default or repudiation/moratorium. If a Fund is a seller of protection, and a credit event occurs, as defined under the terms of that particular swap agreement, a Fund will generally either (i) pay to the buyer an amount equal to the notional amount of the swap and take delivery of the referenced obligation, other deliverable obligations, or underlying securities comprising a referenced index or (ii) pay a net settlement amount in the form of cash or securities equal to the notional amount of the swap less the recovery value of the referenced obligation or underlying securities comprising a referenced index. If a Fund is a buyer of
| NOTES TO FINANCIAL STATEMENTS as of March 31, 2015 (continued) |
NOTE 2 — SIGNIFICANT ACCOUNTING POLICIES (continued)
protection and a credit event occurs, as defined under the terms of that particular swap agreement, a Fund will either (i) receive from the seller of protection an amount equal to the notional amount of the swap and deliver the referenced obligation, other deliverable obligations or underlying securities comprising the referenced index or (ii) receive a net settlement amount in the form of cash or securities equal to the notional amount of the swap less the recovery value of the referenced obligation or underlying securities comprising the referenced index. Recovery values are assumed by market makers considering either industry standard recovery rates or entity specific factors and considerations until a credit event occurs. If a credit event has occurred, the recovery value is determined by a facilitated auction whereby a minimum number of allowable broker bids, together with a specified valuation method, are used to calculate the settlement value.
Implied credit spreads, represented in absolute terms, utilized in determining the fair value of credit default swap agreements on corporate issues or sovereign issues are disclosed in each Fund’s Summary Portfolio of Investments and serve as an indicator of the current status of the payment/performance risk and represent the likelihood or risk of default for the credit derivative. The implied credit spread of a particular referenced entity reflects the cost of buying/selling protection and may include upfront payments required to be made to enter into the agreement. For credit default swaps on asset-backed securities or credit indices, the quoted market prices and resulting fair values serve as the indicator of the current status of the payment/performance risk. Wider credit spreads and increasing fair values, in absolute terms when compared to the notional amount of the swap, represent a deterioration of the referenced entity’s credit soundness and a greater likelihood or risk of default or other credit event occurring as defined under the terms of the agreement.
The maximum amount of future payments (undiscounted) that a Fund as seller of protection could be required to make under a credit default swap agreement would be an amount equal to the notional amount of the agreement. Notional amounts of all credit default swap agreements outstanding as of March 31, 2015, for which a Fund is seller of protection, are disclosed in each Fund’s Summary Portfolio of Investments. These potential amounts would be partially offset by any recovery values of the respective referenced obligations, upfront payments received upon entering into the agreements, or net amounts received from the settlement of buy protection credit default swap agreements entered into by a Fund for the same referenced entity or entities.
For the year ended March 31, 2015, High Yield Bond, Intermediate Bond, Short Term Bond and Strategic Income Opportunities had purchased credit protection through credit default swaps to decrease exposure to the credit risk of individual securities or credit default swap indices to hedge against anticipated potential credit events. For the year ended March 31, 2015, High Yield entered into one contract to buy protection with a notional amount of $5,000,000. For the year ended March 31, 2015, Intermediate Bond had average notional amounts of $33,434,960 on credit default swaps to buy protection. For the year ended March 31, 2015, Short Term Bond and Strategic Income Opportunities entered into three and two contracts to buy prorection respectively, with notional amounts equal to $16,065,000 and $1,311,000, respectively.
There were no open credit default swaps to buy protection at March 31, 2015 for any Fund.
Interest Rate Swap Contracts. An interest rate swap involves the agreement between counterparties to exchange periodic payments based on interest rates. One payment will be based on a floating rate of a specified interest rate while the other will be a fixed rate. Risks involve the future fluctuations of interest rates in which a Fund may make payments that are greater than what a Fund received from the counterparty. Other risks include credit, liquidity and market risk.
For the year ended March 31, 2015, Intermediate Bond and Strategic Income Opportunities had entered into interest rate swaps in which it pays a floating interest rate and receives a fixed interest rate (“Long interest rate swap”) in order to increase exposure to interest rate risk. Average notional amounts on long interest rate swaps were $415,697,000 and $882,000, respectively.
For the year ended March 31, 2015, Intermediate Bond had entered into interest rate swaps in which it pays a fixed interest rate and receives a floating interest rate (“Short interest rate swap”) in order to decrease exposure to interest rate risk. Average notional amounts on short interest rate swaps were $338,039,000.
Please refer to the table following the Summary Portfolio of Investments for Intermediate Bond and the Portfolio of Investments for Strategic Income Opportunities open interest rate swaps at March 31, 2015.
At March 31, 2015, Intermediate Bond and Strategic Income Opportunities had posted $1,708,00 and $25,000 as initial margin for open centrally cleared interest rate swaps.
P. Construction Loan Securities. GNMA Income may purchase construction loan securities, which are issued to
| NOTES TO FINANCIAL STATEMENTS as of March 31, 2015 (continued) |
NOTE 2 — SIGNIFICANT ACCOUNTING POLICIES (continued)
finance building costs. The funds are disbursed as needed or in accordance with a prearranged plan. The securities provide for the timely payment to the registered holder of interest at the specified rate plus scheduled installments of principal. Upon completion of the construction phase, the construction loan securities are terminated and project loan securities are issued. It is GNMA Income’s policy to record these GNMA certificates on trade date, and to segregate assets to cover its commitments on trade date as well.
Q. Indemnifications. In the normal course of business, the Trust may enter into contracts that provide certain indemnifications. The Trust’s maximum exposure under these arrangements is dependent on future claims that may be made against the Funds and, therefore, cannot be estimated; however, based on experience, management considers risk of loss from such claims remote.
NOTE 3 — INVESTMENT TRANSACTIONS
For the year ended March 31, 2015, the cost of purchases and proceeds from the sales of securities excluding short-term and U.S. government securities, were as follows:
| | | Purchases | | | Sales | |
| GNMA Income | | $ | 6,079,981 | | | $ | 9,305,386 | |
| High Yield Bond | | | 300,646,600 | | | | 178,304,660 | |
| Intermediate Bond | | | 1,143,114,646 | | | | 610,185,317 | |
| Short Term Bond | | | 69,099,199 | | | | 100,145,307 | |
| Strategic Income Opportunities | | | 4,616,843 | | | | 3,083,515 | |
U.S. government securities not included above were as follows:
| | | Purchases | | | Sales | |
| GNMA Income | | $ | 5,005,306,189 | | | $ | 4,922,870,135 | |
| Intermediate Bond | | | 12,590,844,418 | | | | 11,994,762,575 | |
| Short Term Bond | | | 81,662,724 | | | | 83,965,309 | |
| Strategic Income Opportunities | | | 5,754,390 | | | | 6,275,389 | |
NOTE 4 — INVESTMENT MANAGEMENT AND ADMINISTRATIVE FEES
The Investment Adviser serves pursuant to an investment management agreement (“Management Agreement”) between the Investment Adviser and the Trust, on behalf of the Funds. The Management Agreement compensates the Investment Adviser with a fee, computed daily and payable monthly, based on the average daily net assets of each Fund, at the following annual rates:
| Fund | | Fee |
| GNMA Income | | 0.47% on first $1 billion, 0.40% on next $4 billion and 0.35% on assets thereafter |
| High Yield Bond | | 0.51% on first $500 million, 0.45% on next $4.5 billion and 0.40% on assets thereafter |
| Intermediate Bond | | 0.17% on all assets |
| Short Term Bond | | 0.35% on all assets |
| Strategic Income Opportunities | | 0.55% on all assets |
The Investment Adviser is contractually obligated to waive the investment management fee for Class P shares of High Yield Bond. This waiver is not eligible for recoupment. Termination or modification of this obligation requires approval by the Board.
The Investment Adviser has entered into a sub-advisory agreement with Voya IM. Subject to such policies as the Board or the Investment Adviser may determine, Voya IM manages the Funds’ assets in accordance with the Funds’ investment objectives, policies, and limitations.
The Funds have entered into an administrative agreement (“Administrative Agreement”) with the Administrator. The Administrator provides certain administrative and shareholder services necessary for each Fund’s operations and is responsible for the supervision of other service providers. For its services, the Administrator is entitled to receive from each Fund a fee at an annual rate of 0.10% of each Fund’s average daily net assets. The Administrator is contractually obligated to waive the administrative fee for Class P shares of High Yield Bond. Termination or modification of this obligation requires approval by the Board.
Please see Note 16 — Subsequent Events on the Combination of the former Management Agreement and Administrative Agreement.
NOTE 5 — DISTRIBUTION AND SERVICE FEES
Each share class of the Funds (except Class I, Class P, Class R6 and Class W and as otherwise noted below) has a Distribution Plan pursuant to Rule 12b-1 under the 1940 Act and/or a Service Plan (the “Plans”), whereby the Distributor is reimbursed or compensated (depending on the class of shares) by certain of the Funds for expenses incurred in the distribution of each Fund’s shares (“Distribution Fees”). Pursuant to the Plans, the Distributor is entitled to payment each month for expenses incurred in the distribution and promotion of certain of each Fund’s shares, including expenses incurred in printing prospectuses and reports used for sales purposes, expenses incurred in preparing and printing sales literature
NOTES TO FINANCIAL STATEMENTS as of March 31, 2015 (continued)
NOTE 5 — DISTRIBUTION AND SERVICE FEES (continued)
and other such distribution related expenses, including any distribution or shareholder servicing fees (“Service Fees”) paid to securities dealers who have executed a distribution agreement with the Distributor. Under the Plans, each class of shares of each Fund pays the Distributor a Distribution and/or Service Fee based on average daily net assets at the following annual rates:
| | | Class A | | Class B | | Class C | | Class O | | Class R |
| GNMA Income | | 0.25% | | 1.00% | | 1.00% | | N/A | | N/A |
| High Yield Bond | | 0.25% | | 1.00% | | 1.00% | | N/A | | 0.50% |
| Intermediate Bond | | 0.25% | | 1.00% | | 1.00% | | 0.25% | | 0.50% |
| Short Term Bond | | 0.25% | | N/A | | 1.00% | | N/A | | 0.50% |
| Strategic Income Opportunities | | 0.25% | | N/A | | 1.00% | | N/A | | 0.50% |
The Distributor may also retain the proceeds of the initial sales charge paid by shareholders upon the purchase of Class A shares of the Funds, and the contingent deferred sales charge paid by shareholders upon certain redemptions for Class A, Class B, and Class C shares. For the year ended March 31, 2015, the Distributor retained the following amounts in sales charges:
| | | Class A | | | Class C | |
| Initial Sales Charges: | | | | | | | | |
| GNMA Income | | $ | 30,370 | | | $ | — | |
| High Yield Bond | | | 4,393 | | | | — | |
| Intermediate Bond | | | 15,122 | | | | — | |
| Short Term Bond | | | 1,041 | | | | — | |
| Strategic Income Opportunities | | | 882 | | | | — | |
| Contingent Deferred Sales Charges: | | | | | | | | |
| GNMA Income | | $ | 611 | | | $ | 572 | |
| High Yield Bond | | | — | | | | 160 | |
| Intermediate Bond | | | — | | | | 587 | |
NOTE 6 — OTHER TRANSACTIONS WITH AFFILIATES AND RELATED PARTIES
At March 31, 2015, the following direct or indirect, wholly-owned subsidiaries of Voya Financial, Inc. or affiliated investment companies owned more than 5% of the following Funds:
Subsidiary/Affiliated
Investment Company | | Fund | | Percentage | |
| Voya Global Target Payment Fund | | High Yield Bond | | | 5.96 | % |
| Voya Institutional Trust Company | | GNMA Income | | | 22.81 | |
| | | Strategic Income Opportunities | | | 5.08 | |
| Voya Intermediate Bond Portfolio | | High Yield Bond | | | 20.27 | |
Subsidiary/Affiliated
Investment Company | | Fund | | Percentage | |
| Voya Investment Management Co. LLC | | Strategic Income Opportunities | | | 85.37 | |
| Voya Retirement Insurance | | GNMA Income | | | 10.91 | |
| and Annuity Company | | Intermediate Bond | | | 17.07 | |
| Voya Solution 2015 Portfolio | | Short Term Bond | | | 30.89 | |
| Voya Solution 2025 Portfolio | | High Yield Bond
Short Term Bond | | | 6.58
40.57 | |
| Voya Solution 2035 Portfolio | | Short Term Bond | | | 7.42 | |
| Voya Solution Income Portfolio | | Short Term Bond | | | 9.42 | |
Control is defined by the 1940 Act as the beneficial ownership, either directly or through one or more controlled companies, of more than 25% of the voting securities of a company. The 1940 Act defines affiliates as companies that are under common control. Therefore, if certain Funds have a common owner that owns over 25% of the outstanding securities of the Funds, they may be deemed to be affiliates of each other. Investment activities of these shareholders could have a material impact on the Funds.
The Funds have adopted a Deferred Compensation Plan (the “Plan”), which allows eligible non-affiliated trustees, as described in the Plan, to defer the receipt of all or a portion of the trustees’ fees that they are entitled to receive from the Funds. For purposes of determining the amount owed to the trustee under the Plan, the amounts deferred are invested in shares of the funds selected by the trustee (the “Notional Funds”). The Funds purchase shares of the Notional Funds, which are all advised by Voya Investments, in amounts equal to the trustees’ deferred fees, resulting in a Fund asset equal to the deferred compensation liability. Such assets are included as a component of “Other assets” on the accompanying Statement of Assets and Liabilities. Deferral of trustees’ fees under the Plan will not affect net assets of the Fund, and will not materially affect the Funds’ assets, liabilities or net investment income per share. Amounts will be deferred until distributed in accordance with the Plan.
NOTE 7 — OTHER ACCRUED EXPENSES AND LIABILITIES
At March 31, 2015, the following Fund had the below payables included in Other Accrued Expenses and Liabilities on the Statements of Assets and Liabilities that exceed 5% of total liabilities:
| Fund | | Accrued Expenses | | Amount | |
| Strategic Income Opportunities | | Audit | | $ | 4,345 | |
| | | Custody | | | 3,668 | |
NOTES TO FINANCIAL STATEMENTS as of March 31, 2015 (continued)
NOTE 8 — EXPENSE LIMITATIONS
Pursuant to a written expense limitation agreement (“Expense Limitation Agreement”), between the Investment Adviser and the Trust, on behalf of the Funds, the Investment Adviser has agreed to limit expenses of each Fund, excluding interest, taxes, investment-related costs, leverage expenses, extraordinary expenses, and acquired fund fees and expenses, as applicable, to the levels listed below:
| Fund | | Class A | | Class B | | Class C | | Class I | | Class O | | Class P | | Class R | | Class R6 | | Class W |
| GNMA Income(1) | | 0.95% | | 1.70% | | 1.70% | | 0.65% | | N/A | | N/A | | N/A | | N/A | | 0.70% |
| High Yield Bond | | 1.10% | | 1.85% | | 1.85% | | 0.85% | | N/A | | 0.15% | | 1.35% | | N/A | | 0.85% |
| Intermediate Bond | | 0.75% | | 1.50% | | 1.50% | | 0.50% | | 0.75% | | N/A | | 1.00% | | 0.50% | | 0.50% |
| Short Term Bond | | 0.80% | | N/A | | 1.55% | | 0.50% | | N/A | | N/A | | 1.05% | | 0.47% | | 0.55% |
| Strategic Income Opportunities(2) | | 1.15% | | N/A | | 1.90% | | 0.70% | | N/A | | N/A | | 1.40% | | N/A | | 0.90% |
| (1) | Prior to January 1, 2015, the expense limits were 0.97%, 1.72%, 1.72%, 0.67% and 0.72% for Class A, Class B, Class C, Class I and Class W, respectively. |
| (2) | For Strategic Income Opportunities, the expense limits shown include the expenses of the underlying investment companies. The amount of fees and expenses of an underlying investment company borne by the Fund will vary based on the Fund’s allocation of assets to, and the net expenses of, a particular underlying investment company. |
The Investment Adviser may at a later date recoup from a Fund for management fees waived and other expenses assumed by the Investment Adviser during the previous 36 months, but only if, after such recoupment, a Fund’s expense ratio does not exceed the percentage described above. Waived and reimbursed fees net of any recoupment by the Investment Adviser of such waived and reimbursed fees are reflected on the accompanying Statements of Operations. Amounts payable by the Investment Adviser are reflected on the accompanying Statements of Assets and Liabilities.
As of March 31, 2015 the amounts of waived and reimbursed fees that are subject to possible recoupment by the Investment Adviser, and the related expiration dates are as follows:
| | | March 31, | | | | |
| | | 2016 | | | 2017 | | | 2018 | | | Total | |
| Short Term Bond | | $ | 47,690 | | | $ | 154,487 | | | $ | 104,644 | | | $ | 306,821 | |
| Strategic Income Opportunities | | | 59,959 | | | | 173,603 | | | | 103,078 | | | | 336,640 | |
In addition to the above waived or reimbursed fees, the amount of class specific fees waived or reimbursed that are subject to possible recoupment by the Investment Adviser, and the related expiration dates, as of March 31, 2015, are as follows:
| | | March 31, | | | | |
| | | 2016 | | | 2017 | | | 2018 | | | Total | |
| GNMA Income | | | | | | | | | | | | | | | | |
| Class I | | $ | — | | | $ | — | | | $ | 50 | | | $ | 50 | |
| Short Term Bond | | | | | | | | | | | | | | | | |
| Class A | | $ | 15 | | | $ | 28 | | | $ | 66 | | | $ | 109 | |
| | | March 31, | | | | |
| | | 2016 | | | 2017 | | | 2018 | | | Total | |
| Class C | | | 12 | | | | 49 | | | | 88 | | | | 149 | |
| Class I | | | — | | | | — | | | | 1,041 | | | | 1,041 | |
| Class R | | | — | | | | — | | | | 1 | | | | 1 | |
| Class W | | | 12 | | | | 1 | | | | 28 | | | | 41 | |
The Expense Limitation Agreement is contractual through August 1, 2016 and shall renew automatically for one-year terms. Termination or modification of this obligation requires approval by the Board.
NOTE 9 — LINE OF CREDIT
Each Fund, in addition to certain other funds managed by the Investment Adviser, has entered into an unsecured committed revolving line of credit agreement (the “Credit Agreement”) with BNY for an aggregate amount of $200,000,000. The proceeds may be used only to: (1) temporarily finance the purchase and sale of securities; or (2) finance the redemption of shares of an investor in the funds. The funds to which the line of credit is available pay a commitment fee equal to 0.07% per annum on the daily unused portion of the committed line amount payable quarterly in arrears. Prior to May 23, 2014, the funds to which the Credit Agreement is available paid a commitment fee equal to 0.08% per annum on the daily unused portion of the committed line amount payable quarterly in arrears.
Borrowings under the Credit Agreement accrue interest at the federal funds rate plus a specified margin. Repayments generally must be made within 60 days after the date of a revolving credit advance. The following Funds utilized the line of credit during the year ended March 31, 2015:
NOTES TO FINANCIAL STATEMENTS as of March 31, 2015 (continued)
NOTE 9 — LINE OF CREDIT (continued)
| Fund | | Days
Utilized | | | Approximate
Average Daily
Balance For
Days Utilized | | | Approximate
Weighted
Average Interest
Rate For Days
Utilized | |
| High Yield Bond | | | 4 | | | $ | 622,750 | | | | 1.09% | |
| Intermediate Bond | | | 10 | | | | 2,235,500 | | | | 1.10 | |
| Short Term Bond | | | 10 | | | | 1,225,900 | | | | 1.12 | |
NOTE 10 — PURCHASED AND WRITTEN OPTIONS
Transactions in purchased interest rate swaptions for Intermediate Bond during the year ended March 31, 2015 were as follows:
| | | Number of
Contracts | | | Cost | |
| Balance at 03/31/14 | | | — | | | $ | — | |
| Options Purchased | | | 2,260,506,087 | | | | 11,262,995 | |
| | | Number of
Contracts | | | Cost | |
| Options Terminated in Closing Sell Transactions | | | (1,585,680,000 | ) | | | (7,028,651 | ) |
| Options Expired | | | (331,320,000 | ) | | | (2,551,164 | ) |
| Balance at 03/31/15 | | | 343,506,087 | | | $ | 1,683,180 | |
Transactions in written interest rate swaptions for Intermediate Bond during the year ended March 31, 2015 were as follows:
| | | Number of
Contracts | | | Premiums
Received | |
| Balance at 03/31/14 | | | — | | | $ | — | |
| Options Written | | | 1,968,320,000 | | | | 6,619,863 | |
| Options Terminated in Closing Purchase Transactions | | | (1,378,640,000 | ) | | | (2,970,696 | ) |
| Options Expired | | | (589,680,000 | ) | | | (3,649,167 | ) |
| Balance at 03/31/15 | | | — | | | $ | — | |
NOTE 11 — CAPITAL SHARES
| | | Shares
sold | | | Shares
issued in
merger | | | Reinvestment of
distributions | | | Shares
redeemed | | | Net increase
(decrease)
in shares
outstanding | | | Shares
sold | | | Proceeds
from
shares
issued in
merger | | | Reinvestment of
distributions | | | Shares
redeemed | | | Net
increase
(decrease) | |
Year or
period ended | | # | | | # | | | # | | | # | | | # | | | ($) | | | ($) | | | ($) | | | ($) | | | ($) | |
| GNMA Income |
| Class A | | | | | | | | | | | | | | | | | | | | | | | | | | | | | | | | | | | | | | | | |
| 3/31/2015 | | | 8,481,431 | | | | — | | | | 1,851,743 | | | | (15,241,031 | ) | | | (4,907,857 | ) | | | 73,545,141 | | | | — | | | | 16,038,624 | | | | (132,117,253 | ) | | | (42,533,488 | ) |
| 3/31/2014 | | | 8,800,223 | | | | — | | | | 2,264,762 | | | | (27,506,996 | ) | | | (16,442,011 | ) | | | 77,019,414 | | | | — | | | | 19,672,584 | | | | (238,448,450 | ) | | | (141,756,452 | ) |
| Class B | | | | | | | | | | | | | | | | | | | | | | | | | | | | | | | | | | | | | | | | |
| 3/31/2015 | | | 2,117 | | | | — | | | | 1,290 | | | | (37,530 | ) | | | (34,123 | ) | | | 18,319 | | | | — | | | | 11,118 | | | | (323,139 | ) | | | (293,702 | ) |
| 3/31/2014 | | | 308 | | | | — | | | | 2,629 | | | | (91,014 | ) | | | (88,077 | ) | | | 2,659 | | | | — | | | | 22,760 | | | | (791,193 | ) | | | (765,774 | ) |
| Class C | | | | | | | | | | | | | | | | | | | | | | | | | | | | | | | | | | | | | | | | |
| 3/31/2015 | | | 1,546,305 | | | | — | | | | 213,066 | | | | (3,229,107 | ) | | | (1,469,736 | ) | | | 13,341,728 | | | | — | | | | 1,836,146 | | | | (27,842,850 | ) | | | (12,664,976 | ) |
| 3/31/2014 | | | 1,250,237 | | | | — | | | | 326,912 | | | | (10,405,348 | ) | | | (8,828,199 | ) | | | 10,938,740 | | | | — | | | | 2,829,014 | | | | (89,903,799 | ) | | | (76,136,045 | ) |
| Class I | | | | | | | | | | | | | | | | | | | | | | | | | | | | | | | | | | | | | | | | |
| 3/31/2015 | | | 18,608,945 | | | | — | | | | 562,340 | | | | (8,637,068 | ) | | | 10,534,217 | | | | 161,568,106 | | | | — | | | | 4,876,804 | | | | (74,959,593 | ) | | | 91,485,317 | |
| 3/31/2014 | | | 7,492,601 | | | | — | | | | 527,743 | | | | (15,859,224 | ) | | | (7,838,880 | ) | | | 65,560,856 | | | | — | | | | 4,594,743 | | | | (138,050,342 | ) | | | (67,894,743 | ) |
| Class W | | | | | | | | | | | | | | | | | | | | | | | | | | | | | | | | | | | | | | | | |
| 3/31/2015 | | | 2,983,502 | | | | — | | | | 175,021 | | | | (1,285,948 | ) | | | 1,872,575 | | | | 25,918,637 | | | | — | | | | 1,519,615 | | | | (11,172,159 | ) | | | 16,266,093 | |
| 3/31/2014 | | | 2,317,507 | | | | — | | | | 137,229 | | | | (2,815,932 | ) | | | (361,196 | ) | | | 20,206,826 | | | | — | | | | 1,194,295 | | | | (24,631,551 | ) | | | (3,230,430 | ) |
| High Yield Bond |
| Class A | | | | | | | | | | | | | | | | | | | | | | | | | | | | | | | | | | | | | | | | |
| 3/31/2015 | | | 2,681,679 | | | | — | | | | 420,664 | | | | (3,161,502 | ) | | | (59,159 | ) | | | 22,388,863 | | | | — | | | | 3,493,998 | | | | (26,100,139 | ) | | | (217,278 | ) |
| 3/31/2014 | | | 989,822 | | | | — | | | | 415,756 | | | | (2,304,023 | ) | | | (898,445 | ) | | | 8,242,849 | | | | — | | | | 3,460,327 | | | | (19,176,452 | ) | | | (7,473,276 | ) |
| Class B | | | | | | | | | | | | | | | | | | | | | | | | | | | | | | | | | | | | | | | | |
| 3/31/2015 | | | 277 | | | | — | | | | 2,702 | | | | (72,900 | ) | | | (69,921 | ) | | | 2,294 | | | | — | | | | 22,464 | | | | (614,594 | ) | | | (589,836 | ) |
| 3/31/2014 | | | 1,215 | | | | — | | | | 6,027 | | | | (74,717 | ) | | | (67,475 | ) | | | 10,099 | | | | — | | | | 50,088 | | | | (621,179 | ) | | | (560,992 | ) |
| Class C | | | | | | | | | | | | | | | | | | | | | | | | | | | | | | | | | | | | | | | | |
| 3/31/2015 | | | 288,862 | | | | — | | | | 53,260 | | | | (449,044 | ) | | | (106,922 | ) | | | 2,409,717 | | | | — | | | | 442,360 | | | | (3,713,985 | ) | | | (861,908 | ) |
| 3/31/2014 | | | 377,083 | | | | — | | | | 53,081 | | | | (377,668 | ) | | | 52,496 | | | | 3,140,930 | | | | — | | | | 441,849 | | | | (3,128,825 | ) | | | 453,954 | |
| Class I | | | | | | | | | | | | | | | | | | | | | | | | | | | | | | | | | | | | | | | | |
| 3/31/2015 | | | 19,723,170 | | | | — | | | | 1,775,425 | | | | (19,194,473 | ) | | | 2,304,122 | | | | 164,525,957 | | | | — | | | | 14,700,080 | | | | (157,443,673 | ) | | | 21,782,364 | |
| 3/31/2014 | | | 21,384,279 | | | | — | | | | 1,213,112 | | | | (8,387,192 | ) | | | 14,210,199 | | | | 179,258,136 | | | | — | | | | 10,078,850 | | | | (69,476,302 | ) | | | 119,860,684 | |
| Class P | | | | | | | | | | | | | | | | | | | | | | | | | | | | | | | | | | | | | | | | |
| 3/31/2015 | | | 7,608,658 | | | | — | | | | 808,879 | | | | (128,844 | ) | | | 8,288,693 | | | | 62,545,000 | | | | — | | | | 6,691,664 | | | | (1,080,000 | ) | | | 68,156,664 | |
6/14/2013(1) -
3/31/2014 | | | 9,317,725 | | | | — | | | | 274,102 | | | | (23,981 | ) | | | 9,567,846 | | | | 77,424,912 | | | | — | | | | 2,287,149 | | | | (200,000 | ) | | | 79,512,061 | |
NOTES TO FINANCIAL STATEMENTS as of March 31, 2015 (continued)
NOTE 11 — CAPITAL SHARES (continued)
| | | Shares
sold | | | Shares
issued in
merger | | | Reinvestment of
distributions | | | Shares
redeemed | | | Net increase
(decrease)
in shares
outstanding | | | Shares
sold | | | Proceeds
from
shares
issued in
merger | | | Reinvestment of
distributions | | | Shares
redeemed | | | Net
increase
(decrease) | |
Year or
period ended | | # | | | # | | | # | | | # | | | # | | | ($) | | | ($) | | | ($) | | | ($) | | | ($) | |
| High Yield Bond (continued) |
| Class R | | | | | | | | | | | | | | | | | | | | | | | | | | | | | | | | | | | | | | | | |
| 3/31/2015 | | | 21,589 | | | | — | | | | 338 | | | | (16 | ) | | | 21,911 | | | | 177,055 | | | | — | | | | 2,755 | | | | (130 | ) | | | 179,680 | |
| 1/30/2014(1) - 3/31/2014 | | | 359 | | | | — | | | | 3 | | | | — | | | | 362 | | | | 3,010 | | | | — | | | | 26 | | | | — | | | | 3,036 | |
| Class W | | | | | | | | | | | | | | | | | | | | | | | | | | | | | | | | | | | | | | | | |
| 3/31/2015 | | | 4,130,453 | | | | — | | | | 187,184 | | | | (742,394 | ) | | | 3,575,243 | | | | 34,198,520 | | | | — | | | | 1,550,432 | | | | (6,136,035 | ) | | | 29,612,917 | |
| 3/31/2014 | | | 1,725,371 | | | | — | | | | 90,774 | | | | (1,212,751 | ) | | | 603,394 | | | | 14,360,057 | | | | — | | | | 757,456 | | | | (10,105,878 | ) | | | 5,011,635 | |
| Intermediate Bond |
| Class A | | | | | | | | | | | | | | | | | | | | | | | | | | | | | | | | | | | | | | | | |
| 3/31/2015 | | | 49,882,269 | | | | — | | | | 1,735,824 | | | | (8,298,193 | ) | | | 43,319,900 | | | | 504,572,399 | | | | — | | | | 17,550,788 | | | | (83,748,634 | ) | | | 438,374,553 | |
| 3/31/2014 | | | 31,081,015 | | | | — | | | | 1,115,768 | | | | (8,115,179 | ) | | | 24,081,604 | | | | 305,616,550 | | | | — | | | | 11,001,050 | | | | (79,923,732 | ) | | | 236,693,868 | |
| Class B | | | | | | | | | | | | | | | | | | | | | | | | | | | | | | | | | | | | | | | | |
| 3/31/2015 | | | 1,181 | | | | — | | | | 901 | | | | (31,650 | ) | | | (29,568 | ) | | | 11,911 | | | | — | | | | 9,067 | | | | (317,520 | ) | | | (296,542 | ) |
| 3/31/2014 | | | 5,764 | | | | — | | | | 2,083 | | | | (125,927 | ) | | | (118,080 | ) | | | 57,018 | | | | — | | | | 20,527 | | | | (1,241,880 | ) | | | (1,164,335 | ) |
| Class C | | | | | | | | | | | | | | | | | | | | | | | | | | | | | | | | | | | | | | | | |
| 3/31/2015 | | | 1,189,477 | | | | — | | | | 43,880 | | | | (728,978 | ) | | | 504,379 | | | | 11,954,750 | | | | — | | | | 442,566 | | | | (7,330,450 | ) | | | 5,066,866 | |
| 3/31/2014 | | | 482,564 | | | | — | | | | 49,205 | | | | (1,350,467 | ) | | | (818,698 | ) | | | 4,785,474 | | | | — | | | | 484,843 | | | | (13,281,478 | ) | | | (8,011,161 | ) |
| Class I | | | | | | | | | | | | | | | | | | | | | | | | | | | | | | | | | | | | | | | | |
| 3/31/2015 | | | 38,077,784 | | | | — | | | | 1,404,554 | | | | (20,643,909 | ) | | | 18,838,429 | | | | 384,858,039 | | | | — | | | | 14,198,706 | | | | (208,772,634 | ) | | | 190,284,111 | |
| 3/31/2014 | | | 15,039,271 | | | | — | | | | 1,184,159 | | | | (27,790,996 | ) | | | (11,567,566 | ) | | | 148,868,623 | | | | — | | | | 11,707,860 | | | | (277,758,535 | ) | | | (117,182,052 | ) |
| Class O | | | | | | | | | | | | | | | | | | | | | | | | | | | | | | | | | | | | | | | | |
| 3/31/2015 | | | 252,504 | | | | — | | | | 9,092 | | | | (508,043 | ) | | | (246,447 | ) | | | 2,548,055 | | | | — | | | | 91,843 | | | | (5,117,170 | ) | | | (2,477,272 | ) |
| 3/31/2014 | | | 298,462 | | | | — | | | | 9,986 | | | | (632,953 | ) | | | (324,505 | ) | | | 2,952,729 | | | | — | | | | 98,559 | | | | (6,252,929 | ) | | | (3,201,641 | ) |
| Class R | | | | | | | | | | | | | | | | | | | | | | | | | | | | | | | | | | | | | | | | |
| 3/31/2015 | | | 11,586,402 | | | | — | | | | 62,647 | | | | (892,971 | ) | | | 10,756,078 | | | | 117,757,208 | | | | — | | | | 637,474 | | | | (9,035,410 | ) | | | 109,359,272 | |
| 3/31/2014 | | | 364,547 | | | | — | | | | 34,187 | | | | (702,865 | ) | | | (304,131 | ) | | | 3,618,524 | | | | — | | | | 337,645 | | | | (6,908,808 | ) | | | (2,952,639 | ) |
| Class R6 | | | | | | | | | | | | | | | | | | | | | | | | | | | | | | | | | | | | | | | | |
| 3/31/2015 | | | 20,414,898 | | | | — | | | | 829,092 | | | | (9,260,411 | ) | | | 11,983,579 | | | | 206,151,460 | | | | — | | | | 8,374,293 | | | | (93,415,472 | ) | | | 121,110,281 | |
| 5/31/2013(1) - 3/31/2014 | | | 29,671,565 | | | | — | | | | 565,001 | | | | (5,916,676 | ) | | | 24,319,890 | | | | 295,403,008 | | | | — | | | | 5,547,628 | | | | (57,849,103 | ) | | | 243,101,533 | |
| Class W | | | | | | | | | | | | | | | | | | | | | | | | | | | | | | | | | | | | | | | | |
| 3/31/2015 | | | 15,019,704 | | | | — | | | | 1,208,595 | | | | (6,761,789 | ) | | | 9,466,510 | | | | 151,308,068 | | | | — | | | | 12,199,093 | | | | (68,238,392 | ) | | | 95,268,769 | |
| 3/31/2014 | | | 18,258,042 | | | | — | | | | 908,752 | | | | (5,739,760 | ) | | | 13,427,034 | | | | 179,688,871 | | | | — | | | | 8,951,335 | | | | (56,587,894 | ) | | | 132,052,312 | |
| Short Term Bond |
| Class A | | | | | | | | | | | | | | | | | | | | | | | | | | | | | | | | | | | | | | | | |
| 3/31/2015 | | | 71,672 | | | | — | | | | 466 | | | | (58,976 | ) | | | 13,162 | | | | 717,363 | | | | — | | | | 4,651 | | | | (590,265 | ) | | | 131,749 | |
| 3/31/2014 | | | 23,505 | | | | — | | | | 133 | | | | (6,784 | ) | | | 16,854 | | | | 234,529 | | | | — | | | | 1,328 | | | | (67,837 | ) | | | 168,020 | |
| Class C | | | | | | | | | | | | | | | | | | | | | | | | | | | | | | | | | | | | | | | | |
| 3/31/2015 | | | 11,550 | | | | — | | | | 304 | | | | (12,512 | ) | | | (658 | ) | | | 115,440 | | | | — | | | | 3,035 | | | | (124,780 | ) | | | (6,305 | ) |
| 3/31/2014 | | | 37,229 | | | | — | | | | 88 | | | | (2,527 | ) | | | 34,790 | | | | 371,661 | | | | — | | | | 881 | | | | (25,332 | ) | | | 347,210 | |
| Class I | | | | | | | | | | | | | | | | | | | | | | | | | | | | | | | | | | | | | | | | |
| 3/31/2015 | | | 367,433 | | | | — | | | | 11,091 | | | | (76,340 | ) | | | 302,184 | | | | 3,670,317 | | | | — | | | | 110,793 | | | | (761,694 | ) | | | 3,019,416 | |
| 3/31/2014 | | | 1,119,082 | | | | — | | | | 83,488 | | | | (18,523,291 | ) | | | (17,320,721 | ) | | | 11,187,752 | | | | — | | | | 833,208 | | | | (184,826,979 | ) | | | (172,806,019 | ) |
| Class R | | | | | | | | | | | | | | | | | | | | | | | | | | | | | | | | | | | | | | | | |
| 7/31/2014(1) - 3/31/2015 | | | 301 | | | | — | | | | 3 | | | | — | | | | 304 | | | | 3,015 | | | | — | | | | 28 | | | | — | | | | 3,043 | |
| Class R6 | | | | | | | | | | | | | | | | | | | | | | | | | | | | | | | | | | | | | | | | |
| 3/31/2015 | | | 1,973,923 | | | | — | | | | 295,538 | | | | (5,847,021 | ) | | | (3,577,560 | ) | | | 19,752,114 | | | | — | | | | 2,954,334 | | | | (58,419,810 | ) | | | (35,713,362 | ) |
| 7/31/2013(1) - 3/31/2014 | | | 19,297,821 | | | | — | | | | 183,050 | | | | (2,567,674 | ) | | | 16,913,197 | | | | 192,647,134 | | | | — | | | | 1,831,526 | | | | (25,703,872 | ) | | | 168,774,788 | |
| Class W | | | | | | | | | | | | | | | | | | | | | | | | | | | | | | | | | | | | | | | | |
| 3/31/2015 | | | 113,138 | | | | — | | | | 150 | | | | (113,282 | ) | | | 6 | | | | 1,134,769 | | | | — | | | | 1,507 | | | | (1,137,140 | ) | | | (864 | ) |
| 3/31/2014 | | | — | | | | — | | | | 5 | | | | (1 | ) | | | 4 | | | | — | | | | — | | | | 48 | | | | (10 | ) | | | 38 | |
| Strategic Income Opportunities |
| Class A | | | | | | | | | | | | | | | | | | | | | | | | | | | | | | | | | | | | | | | | |
| 3/31/2015 | | | 44,611 | | | | — | | | | 1,605 | | | | (33,347 | ) | | | 12,869 | | | | 446,140 | | | | — | | | | 15,647 | | | | (332,062 | ) | | | 129,725 | |
| 3/31/2014 | | | 33,351 | | | | — | | | | 142 | | | | (2,828 | ) | | | 30,665 | | | | 329,670 | | | | — | | | | 1,381 | | | | (27,998 | ) | | | 303,053 | |
NOTES TO FINANCIAL STATEMENTS as of March 31, 2015 (continued)
NOTE 11 — CAPITAL SHARES (continued)
| | | Shares
sold | | | Shares
issued in
merger | | | Reinvestment of
distributions | | | Shares
redeemed | | | Net increase
(decrease)
in shares
outstanding | | | Shares
sold | | | Proceeds
from
shares
issued in
merger | | | Reinvestment of
distributions | | | Shares
redeemed | | | Net
increase
(decrease) | |
Year or
period ended | | # | | | # | | | # | | | # | | | # | | | ($) | | | ($) | | | ($) | | | ($) | | | ($) | |
| Strategic Income Opportunities (continued) | | |
| Class C | | | | | | | | | | | | | | | | | | | | | | | | | | | | | | | | | | | | | | | | |
| 3/31/2015 | | | 13,387 | | | | — | | | | 429 | | | | (1,504 | ) | | | 12,312 | | | | 132,914 | | | | — | | | | 4,133 | | | | (14,770 | ) | | | 122,277 | |
| 3/31/2014 | | | 4,822 | | | | — | | | | 97 | | | | (316 | ) | | | 4,603 | | | | 47,954 | | | | — | | | | 938 | | | | (3,136 | ) | | | 45,756 | |
| Class I | | | | | | | | | | | | | | | | | | | | | | | | | | | | | | | | | | | | | | | | |
| 3/31/2015 | | | 644 | | | | — | | | | 20,362 | | | | (4,545 | ) | | | 16,461 | | | | 6,465 | | | | — | | | | 198,534 | | | | (45,591 | ) | | | 159,408 | |
| 3/31/2014 | | | 4,546 | | | | — | | | | 23,226 | | | | (1 | ) | | | 27,771 | | | | 45,000 | | | | — | | | | 226,223 | | | | (1 | ) | | | 271,222 | |
| Class R | | | | | | | | | | | | | | | | | | | | | | | | | | | | | | | | | | | | | | | | |
| 3/31/2015 | | | 35,362 | | | | — | | | | 812 | | | | (3,209 | ) | | | 32,965 | | | | 351,176 | | | | — | | | | 7,861 | | | | (31,919 | ) | | | 327,118 | |
| 3/31/2014 | | | — | | | | — | | | | 12 | | | | (1 | ) | | | 11 | | | | — | | | | — | | | | 118 | | | | (10 | ) | | | 108 | |
| Class W | | | | | | | | | | | | | | | | | | | | | | | | | | | | | | | | | | | | | | | | |
| 3/31/2015 | | | — | | | | — | | | | 11 | | | | — | | | | 11 | | | | — | | | | — | | | | 108 | | | | — | | | | 108 | |
| 3/31/2014 | | | 3,521 | | | | — | | | | 28 | | | | (3,536 | ) | | | 13 | | | | 35,237 | | | | — | | | | 272 | | | | (35,585 | ) | | | (76 | ) |
| (1) | Commencement of operations. |
NOTE 12 — CREDIT RISK AND DEFAULTED SECURITIES
Although each Fund has a diversified portfolio, High Yield Bond and Intermediate Bond may invest in lower rated and comparable quality unrated high yield securities. Investments in high-yield debt securities generally provide greater income and increased opportunity for capital appreciation than investments in higher quality debt securities, but they also typically entail greater potential price volatility and principal and income risk. High-yield debt securities are not considered investment grade, and are regarded as predominantly speculative with respect to the issuing company’s continuing ability to meet principal and interest payments. The prices of high-yield debt securities have been found to be less sensitive to interest rate changes than higher-rated investments, but more sensitive to adverse economic downturns or individual corporate developments. The risk of loss due to default by the issuer may be significantly greater for the holders of high yielding securities, because such securities are generally unsecured and are often subordinated to other creditors of the issuer. There were no defaulted securities at March 31, 2015.
NOTE 13 — CONCENTRATION OF INVESTMENT RISKS
All mutual funds involve risk — some more than others — and there is always the chance that you could lose money or not earn as much as you hope. Each Fund’s risk profile is largely a factor of the principal securities in which it invests and investment techniques that it uses. For more information regarding the types of securities and investment techniques that may be used by each Fund and
its corresponding risks, see each Fund’s most recent Prospectus and/or the Statement of Additional Information.
Credit Risk (All Funds). A Fund could lose money if a bond issuer (debtor) fails to repay interest and principal in a timely manner or if it goes bankrupt. This is especially true during periods of economic uncertainty or economic downturns. High-yield/high-risk bonds are especially subject to credit risk and are considered to be mostly speculative in nature.
Foreign Securities (High Yield Bond, Intermediate Bond, Short Term Bond and Strategic Income Opportunities). There are certain risks in owning foreign securities, including those resulting from: fluctuations in currency exchange rates; devaluation of currencies; political or economic developments and the possible imposition of currency exchange blockages or other foreign governmental laws or restrictions; reduced availability of public information concerning issuers; accounting, auditing and financial reporting standards or other regulatory practices and requirements that are not uniform when compared to those applicable to domestic companies; settlement and clearance procedures in some countries that may not be reliable and can result in delays in settlement; higher transaction and custody expenses than for domestic securities; and limitations on foreign ownership of equity securities. Also, securities of many foreign companies may be less liquid and the prices more volatile than those of domestic companies.
Emerging Markets Investments (High Yield Bond, Intermediate Bond and Strategic Income Opportunities). Because of less developed markets and
NOTES TO FINANCIAL STATEMENTS as of March 31, 2015 (continued)
NOTE 13 — CONCENTRATION OF INVESTMENT RISKS (continued)
economies and, in some countries, less mature governments and governmental institutions, the risks of investing in foreign securities can be intensified in the case of investments in issuers domiciled or doing substantial business in emerging market countries. These risks include: high concentration of market capitalization and trading volume in a small number of issuers representing a limited number of industries, as well as a high concentration of investors and financial intermediaries; political and social uncertainties; overdependence on exports, especially with respect to primary commodities, making these economies vulnerable to changes in commodity prices; overburdened infrastructure and obsolete or unseasoned financial systems; environmental problems; less well-developed legal systems; and less reliable custodial services and settlement practices.
Asset Allocation (Strategic Income Opportunities). Assets will be allocated among other investment companies (“Underlying Funds”) and markets based on judgments by the Investment Adviser or sub-adviser. There is a risk that the Fund may allocate assets to an Underlying Fund or market that underperforms other funds or asset classes.
Interest Rate Risk (All Funds). Interest rate risk refers to the fluctuations in value of fixed-income securities resulting from the inverse relationship between price and yield. For example, an increase in general interest rates will tend to reduce the market value of already issued fixed-income investments, and a decline in general interest rates will tend to increase their value. In addition, debt securities with longer durations, which tend to have higher yields, are subject to potentially greater fluctuations in value from changes in interest rates than obligations with shorter durations.
Investment by Funds-of-Funds (Short Term Bond). As an Underlying Fund of a fund-of-fund, shares of the Underlying Fund may be purchased by other investment companies. In some cases, an Underlying Fund may experience large inflows or redemptions due to allocations or rebalancing. While it is impossible to predict the overall impact of these transactions over time, there could be adverse effects on portfolio management. The Investment Adviser will monitor transactions by each Underlying Fund and will attempt to minimize any adverse effects on the Underlying Funds and the Fund as a result of these transactions. So long as an Underlying Fund accepts investments by other investment companies, it will not purchase securities of other investment companies, except
to the extent permitted by the 1940 Act or under the terms of an exemptive order granted by the SEC.
NOTE 14 — FEDERAL INCOME TAXES
The amount of distributions from net investment income and net realized capital gains are determined in accordance with federal income tax regulations, which may differ from U.S. GAAP for investment companies. These book/tax differences may be either temporary or permanent. Permanent differences are reclassified within the capital accounts based on their federal tax-basis treatment; temporary differences are not reclassified. Key differences include the treatment of short-term capital gains, foreign currency transactions, paydowns, wash sale deferrals and the expiration of capital loss carryforwards. Distributions in excess of net investment income and/or net realized capital gains for tax purposes are reported as return of capital.
The following permanent tax differences have been reclassified as of March 31, 2015:
| | | Paid-in
Capital | | | Undistributed
Net Investment
Income | | | Accumulated
Net Realized
Gains/(Losses) | |
| GNMA Income | | $ | — | | | $ | 5,809,338 | | | $ | (5,809,338 | ) |
| High Yield Bond(1) | | | (10,065,643 | ) | | | 151,425 | | | | 9,914,218 | |
| Intermediate Bond | | | — | | | | 1,734,740 | | | | (1,734,740 | ) |
| Short Term Bond | | | — | | | | 415,965 | | | | (415,965 | ) |
| Strategic Income Opportunities | | | — | | | | (955 | ) | | | 955 | |
| (1) | Relates to the expiration of capital loss carryforwards and distributions in excess of net investment income taxed as ordinary income due to current year earnings and profits. |
Dividends paid by the Funds from net investment income and distributions of net realized short-term capital gains are, for federal income tax purposes, taxable as ordinary income to shareholders.
The tax composition of dividends to shareholders was as follows:
| | | Year Ended March 31, 2015 | | | Year Ended
March 31, 2014 | |
| | | Ordinary
Income | | | Return of
Capital | | | Ordinary
Income | |
| GNMA Income | | $ | 24,394,958 | | | $ | 3,423,020 | | | $ | 32,523,403 | |
| High Yield Bond | | | 28,121,782 | | | | — | | | | 18,474,954 | |
| Intermediate Bond | | | 56,734,900 | | | | — | | | | 40,695,991 | |
| Short Term Bond | | | 3,075,305 | | | | — | | | | 2,673,924 | |
| Strategic Income Opportunities | | | 227,790 | | | | — | | | | 229,556 | |
NOTES TO FINANCIAL STATEMENTS as of March 31, 2015 (continued)
NOTE 14 — FEDERAL INCOME TAXES (continued)
The tax-basis components of distributable earnings and the capital loss carryforwards which may be used to offset future realized capital gains for federal income tax purposes as of March 31, 2015 are detailed below. The Regulated Investment Company Modernization Act of 2010 (the “Act”) provides an unlimited carryforward period for newly generated capital losses. Under the Act, there may be a greater likelihood that all or a portion of the Funds’ pre-enactment capital loss carryforwards may expire without being utilized due to the fact that post-enactment capital losses are required to be utilized before pre-enactment capital loss carryforwards.
| | | Undistributed | | | Post-October | | | Unrealized | | | | | | | | |
| | | Ordinary | | | Capital Losses | | | Appreciation/ | | | Capital Loss Carryforwards | |
| | | Income | | | Deferred | | | (Depreciation) | | | Amount | | | Character | | Expiration |
| GNMA Income | | $ | — | | | $ | (1,893,232 | ) | | $ | 18,386,197 | | | $ | (10,419,439 | ) | | Short-term | | None |
| | | | | | | | | | | | | | | | (5,307,304 | ) | | Long-term | | None |
| | | | | | | | | | | | | | | $ | (15,726,743 | ) | | | | |
| High Yield Bond | | | — | | | | (4,753,474 | ) | | | (1,046,092 | ) | | | (9,006,267 | ) | | Short-term | | 2017 |
| | | | | | | | | | | | | | | | (14,980,165 | ) | | Short-term | | 2018 |
| | | | | | | | | | | | | | | $ | (23,986,432 | ) | | | | |
| Intermediate Bond | | | 1,363,583 | | | | (4,583,527 | ) | | | 49,543,262 | | | | (98,762,983 | ) | | Short-term | | 2018 |
| Short Term Bond | | | 10,769 | | | | (394,138 | ) | | | 312,417 | | | | (220,277 | ) | | Short-term | | None |
| | | | | | | | | | | | | | | | (89,921 | ) | | Long-term | | None |
| | | | | | | | | | | | | | | $ | (310,198 | ) | | | | |
| Strategic Income Opportunities | | | 58,709 | | | | — | | | | 48,954 | | | | (42,895 | ) | | Short-term | | None |
| | | | | | | | | | | | | | | | (63,577 | ) | | Long-term | | None |
| | | | | | | | | | | | | | | $ | (106,472 | ) | | | | |
The Funds’ major tax jurisdictions are U.S. federal and Arizona. The earliest tax year that remains subject to examination by these jurisdictions is 2010.
As of March 31, 2015, no provision for income tax is required in the Funds' financial statements as a result of tax positions taken on federal and state income tax returns for open tax years. The Funds' federal and state income and federal excise tax returns for tax years for which the applicable statutes of limitations have not expired are subject to examination by the Internal Revenue Service and state department of revenue.
NOTE 15 — SECURITIES LENDING
Under a Master Securities Lending Agreement (the “Agreement”) with BNY, the Funds can lend their securities to approved brokers, dealers and other financial institutions. Loans are collateralized by cash and U.S. government securities. The collateral is equal to at least 105% of the market value of non-U.S. securities loaned and 102% of the market value of U.S. securities loaned. The market value of the loaned securities is determined at the close of business of the Funds at their last sale price or official closing price on the principal exchange or system on which they are traded and any additional collateral is delivered to the Funds on the next business day. The cash collateral received is invested in approved investments as defined in the Securities Lending Agreement with BNY (the “Agreement”). The Funds bear the risk of loss with respect to the investment of collateral with the following exception: BNY provides the Funds’ indemnification from loss with respect to the investment of collateral provided that the cash collateral is invested solely in overnight repurchase agreements.
The cash collateral is invested in overnight repurchase agreements that are collateralized at 102% with securities issued or fully guaranteed by the United States Treasury; United States government or any agency, instrumentality or authority of the United States government. The securities purchased with cash collateral received are reflected in the Summary Portfolio of Investments under Securities Lending Collateral.
Generally, in the event of counterparty default, the Funds have the right to use the collateral to offset losses incurred. The Agreement contains certain guarantees by BNY in the event of counterparty default and/or a borrower’s failure to return a loaned security; however, there would be a potential loss to the Funds in the event the Funds are delayed or prevented from exercising its right to dispose of the collateral. Engaging in securities lending could have a leveraging effect, which may intensify the credit, market and other risks associated with investing in a Fund.
NOTES TO FINANCIAL STATEMENTS as of March 31, 2015 (continued)
NOTE 15 — SECURITIES LENDING (continued)
The following tables represent a summary of each respective Fund’s securities lending agreements by counterparty which are subject to offset under a MSLA as of March 31, 2015:
| Intermediate Bond |
| Counterparty | | Securities
Loaned at Value | | | Cash Collateral
Received(1) | | | Net
Amount | |
| Barclays Capital Inc. | | $ | 131,692,649 | | | $ | (131,692,649 | ) | | $ | — | |
| Citadel Securities LLC | | | 1,563,561 | | | | (1,563,561 | ) | | | — | |
| Citigroup Global Markets | | | 418,901 | | | | (418,901 | ) | | | — | |
| Credit Suisse Securities USA LLC | | | 906 | | | | (906 | ) | | | — | |
| Goldman, Sachs & Co. | | | 1,544,007 | | | | (1,544,007 | ) | | | — | |
| JPMorgan Clearing Corp. | | | 1,893,567 | | | | (1,893,567 | ) | | | — | |
| Janney Montgomery Scott LLC | | | 53,289 | | | | (53,289 | ) | | | — | |
| RBC Capital Markets LLC | | | 2,372,771 | | | | (2,372,771 | ) | | | — | |
| Scotia Capital (USA) INC | | | 108,354 | | | | (108,354 | ) | | | — | |
| Total | | $ | 139,648,005 | | | $ | (139,648,005 | ) | | $ | — | |
| (1) | Collateral with a fair value of $142,669,449 has been received in connection with the above securities lending transactions. Excess collateral received from the individual counterparty is not shown for financial reporting purposes. |
| Short Term Bond |
| Counterparty | | Securities
Loaned at Value | | | Cash Collateral
Received(1) | | | Net
Amount | |
| Barclays Capital Inc. | | $ | 470,545 | | | $ | (470,545 | ) | | $ | — | |
| RBC Capital Markets LLC | | | 529,701 | | | | (529,701 | ) | | | — | |
| Total | | $ | 1,000,246 | | | $ | (1,000,246 | ) | | $ | — | |
| (1) | Collateral with a fair value of $1,021,526 has been received in connection with the above securities lending transactions. Excess collateral received from the individual counterparty is not shown for financial reporting purposes. |
NOTE 16 — RESTRUCTURING PLAN
Prior to May 2013, Voya Financial, Inc. was a wholly-owned subsidiary of ING Groep N.V. (“ING Groep”). In October 2009, ING Groep submitted a restructuring plan (the “Restructuring Plan”) to the European Commission in order to receive approval for state aid granted to ING Groep by the Kingdom of the Netherlands in November 2008 and March 2009. To receive approval for this state aid, ING Groep was required to divest its insurance and investment management businesses, including Voya Financial, Inc. (formerly, ING U.S., Inc.), before the end of 2013. In November 2012, the Restructuring Plan was amended to permit ING Groep additional time to complete the divestment. Pursuant to the
amended Restructuring Plan, ING Groep was required to divest at least 25% of Voya Financial, Inc. by the end of 2013 and more than 50% by the end of 2014, and was required to divest its remaining interest by the end of 2016 (such divestment, the “Separation Plan”).
In May 2013, Voya Financial, Inc. conducted an initial public offering of its common stock (the “IPO”). In October 2013, March 2014, and September 2014, ING Groep divested additional shares in several secondary offerings of common stock of Voya Financial, Inc. and concurrent share repurchases by Voya Financial, Inc. These transactions reduced ING Groep’s ownership interest in Voya Financial, Inc. to 32%. Voya Financial, Inc. did not receive any proceeds from these offerings.
In November 2014, through an additional secondary offering and the concurrent repurchase of shares by Voya Financial, Inc., ING Groep further reduced its interest in Voya Financial, Inc. below 25% to approximately 19% (the “November 2014 Offering”). The November 2014 Offering was deemed by the Investment Adviser to be a change of control (the “Change of Control”), which resulted in the automatic termination of the existing investment advisory and sub-advisory agreements under which the Investment Adviser and sub-adviser provide services to the Funds. In anticipation of this termination, and in order to ensure that the existing investment advisory and sub-advisory services could continue uninterrupted, in 2013 the Board approved new advisory and sub-advisory agreements for the Funds, as applicable, in connection with the IPO. In addition, in 2013, shareholders of each Fund approved new investment advisory and affiliated sub-advisory agreements prompted by the IPO, as well as any future advisory and affiliated sub-advisory agreements prompted by the Separation Plan that are approved by the Board and that have terms not materially different from the current agreements. This meant that shareholders would not have another opportunity to vote on a new agreement with the Investment Adviser or the current affiliated sub-adviser even upon a change of control prompted by the Separation Plan, as long as no single person or group of persons acting together gains “control” (as defined in the 1940 Act) of Voya Financial, Inc.
On November 18, 2014, in response to the Change of Control, the Board, at an in-person meeting, approved new investment advisory and sub-advisory agreements. At that meeting, the Investment Adviser represented that the new investment advisory and affiliated sub-advisory agreements approved by the Board were not materially different from the agreements approved by shareholders in 2013 and no single person or group of persons acting together was expected to gain “control” (as defined in the 1940 Act) of Voya Financial, Inc. As a result, shareholders
NOTES TO FINANCIAL STATEMENTS as of March 31, 2015 (continued)
NOTE 16 — RESTRUCTURING PLAN (continued)
of the Funds will not be asked to vote again on the new agreements with the Investment Adviser and affiliated sub-adviser.
In March 2015, ING Groep divested the remainder of its interest in Voya Financial, Inc. through a secondary offering of Voya Financial, Inc.’s common stock of and a concurrent share repurchase by Voya Financial, Inc. Voya Financial, Inc. did not receive any proceeds from these transactions.
NOTE 17 — SUBSEQUENT EVENTS
Dividends. Subsequent to March 31, 2015, the Funds declared dividends from net investment income of:
| | | Type | | Per
Share
Amount | | | Payable Date | | Record Date |
| GNMA Income | | | | | | | | | | |
| Class A | | NII | | $ | 0.0218 | | | April 2, 2015 | | March 31, 2015 |
| Class B | | NII | | $ | 0.0158 | | | April 2, 2015 | | March 31, 2015 |
| Class C | | NII | | $ | 0.0159 | | | April 2, 2015 | | March 31, 2015 |
| Class I | | NII | | $ | 0.0241 | | | April 2, 2015 | | March 31, 2015 |
| Class W | | NII | | $ | 0.0238 | | | April 2, 2015 | | March 31, 2015 |
| Class A | | NII | | $ | 0.0218 | | | May 4, 2015 | | April 30, 2015 |
| Class B | | NII | | $ | 0.0164 | | | May 4, 2015 | | April 30, 2015 |
| Class C | | NII | | $ | 0.0165 | | | May 4, 2015 | | April 30, 2015 |
| Class I | | NII | | $ | 0.0238 | | | May 4, 2015 | | April 30, 2015 |
| Class W | | NII | | $ | 0.0236 | | | May 4, 2015 | | April 30, 2015 |
| High Yield Bond | | | | | | | | | | |
| Class A | | NII | | $ | 0.0349 | | | May 1, 2015 | | Daily |
| Class B | | NII | | $ | 0.0298 | | | May 1, 2015 | | Daily |
| Class C | | NII | | $ | 0.0298 | | | May 1, 2015 | | Daily |
| Class I | | NII | | $ | 0.0372 | | | May 1, 2015 | | Daily |
| Class P | | NII | | $ | 0.0413 | | | May 1, 2015 | | Daily |
| Class R | | NII | | $ | 0.0332 | | | May 1, 2015 | | Daily |
| Class W | | NII | | $ | 0.0367 | | | May 1, 2015 | | Daily |
| Intermediate Bond | | | | | | | | | | |
| Class A | | NII | | $ | 0.0207 | | | May 1, 2015 | | Daily |
| Class B | | NII | | $ | 0.0144 | | | May 1, 2015 | | Daily |
| Class C | | NII | | $ | 0.0144 | | | May 1, 2015 | | Daily |
| Class I | | NII | | $ | 0.0231 | | | May 1, 2015 | | Daily |
| | | Type | | Per
Share
Amount | | | Payable Date | | Record Date |
| Class O | | NII | | $ | 0.0207 | | | May 1, 2015 | | Daily |
| Class R | | NII | | $ | 0.0187 | | | May 1, 2015 | | Daily |
| Class R6 | | NII | | $ | 0.0232 | | | May 1, 2015 | | Daily |
| Class W | | NII | | $ | 0.0228 | | | May 1, 2015 | | Daily |
| Short Term Bond | | | | | | | | | | |
| Class A | | NII | | $ | 0.0125 | | | May 1, 2015 | | Daily |
| Class C | | NII | | $ | 0.0063 | | | May 1, 2015 | | Daily |
| Class I | | NII | | $ | 0.0149 | | | May 1, 2015 | | Daily |
| Class R | | NII | | $ | 0.0100 | | | May 1, 2015 | | Daily |
| Class R6 | | NII | | $ | 0.0151 | | | May 1, 2015 | | Daily |
| Class W | | NII | | $ | 0.0143 | | | May 1, 2015 | | Daily |
Combination of former Management Agreement and Administrative Agreement: At a meeting held on March 12, 2015, the Board approved amending and restating the Funds’ Management Agreements so that, effective May 1, 2015, the terms of each Fund’s Management Agreement and its Administrative Agreement are combined under a single Amended and Restated Investment Management Agreement with a single management fee. The single management fee rate under each Fund’s Amended and Restated Investment Management Agreement does not exceed the former combined investment management and administrative services fee rates for each Fund and, under each Fund’s Amended and Restated Investment Management Agreement, there was no change to the investment management or administrative services provided or the fees charged to each Fund.
Line of Credit: Effective May 22, 2015, the funds to which the Credit Agreement is available will pay a commitment fee equal to 0.10% per annum on the daily unused portion of the committed line amount payable quarterly in arrears.
The Funds have evaluated events occurring after the Statements of Assets and Liabilities date (“subsequent events”) to determine whether any subsequent events necessitated adjustment to or disclosure in the financial statements. Other than the above, no such subsequent events were identified.
| Voya GNMA Income Fund | SUMMARY PORTFOLIO OF INVESTMENTS
as of March 31, 2015 |
| Principal Amount† | | | Value | | | Percentage
of Net
Assets | |
| COLLATERALIZED MORTGAGE OBLIGATIONS: 0.2% | |
| 20,732,538 | | | ^ | | Ginnie Mae, 0.493%,
02/16/44 | | $ | 678,078 | | | | 0.1 | |
| | 1,045,550 | | | | | Vendee Mortgage Trust,
3.750%, 10/15/41 | | | 1,110,229 | | | | 0.1 | |
| | | | | | Total Collateralized
Mortgage Obligations
(Cost $1,815,119) | | | 1,788,307 | | | | 0.2 | |
| U.S. GOVERNMENT AGENCY OBLIGATIONS: 112.0% | |
| | | | | | Federal Home Loan Mortgage Corporation: 10.6%## | |
| 11,683,529 | | | ^ | | 0.500%, due 07/15/36 | | | 201,439 | | | | 0.0 | |
| 80,376,000 | | | W | | 3.000%, due 05/01/43 | | | 81,812,404 | | | | 9.3 | |
| 4,162,168 | | | ^ | | 4.500%, due 12/15/40 | | | 680,900 | | | | 0.1 | |
| 1,253,982 | | | ^ | | 5.500%, due 09/15/35 | | | 249,978 | | | | 0.1 | |
| 1,840,926 | | | ^ | | 5.926%, due 06/15/40 | | | 138,168 | | | | 0.0 | |
| 591,829 | | | ^ | | 7.826%, due 10/25/23 | | | 121,890 | | | | 0.0 | |
| 8,403,594 | | | | | 5.450%-27.902%, due
07/01/20-05/01/38 | | | 10,120,507 | | | | 1.1 | |
| | | | | | | | | 93,325,286 | | | | 10.6 | |
| | | | | | Federal National Mortgage Association: 12.7%## | |
| 31,421,965 | | | | | 0.374%, due 10/27/37 | | | 31,027,478 | | | | 3.5 | |
| 7,199,689 | | | ^ | | 3.000%, due 01/25/33 | | | 1,058,204 | | | | 0.1 | |
| 22,000,000 | | | W | | 3.000%, due 05/01/43 | | | 22,439,570 | | | | 2.6 | |
| 3,457,000 | | | | | 3.500%, due 09/25/42 | | | 3,683,209 | | | | 0.4 | |
| 7,513,217 | | | ^ | | 4.000%, due 05/25/42 | | | 1,324,598 | | | | 0.1 | |
| 8,803,625 | | | | | 4.500%, due 09/01/41 | | | 9,651,563 | | | | 1.1 | |
| 4,630,250 | | | | | 4.500%, due 09/01/41 | | | 5,071,883 | | | | 0.6 | |
| 11,048,862 | | | W | | 4.592%, due 11/25/33 | | | 11,449,383 | | | | 1.3 | |
| 3,023,450 | | | | | 6.000%, due 10/25/37 | | | 3,521,004 | | | | 0.4 | |
| 7,083,051 | | | ^ | | 6.076%, due 06/25/42 | | | 1,356,667 | | | | 0.2 | |
| 2,631,282 | | | | | 16.441%, due 05/25/35 | | | 3,415,159 | | | | 0.4 | |
| 15,860,753 | | | | | 4.250%-8.500%, due
09/01/15-01/25/44 | | | 17,653,498 | | �� | | 2.0 | |
| | | | | | | | | 111,652,216 | | | | 12.7 | |
| | | | | | Government National Mortgage Association: 88.7% | |
| 24,443,587 | | | ^ | | 0.120%, due 01/16/50 | | | 453,209 | | | | 0.1 | |
| 54,125,705 | | | ^ | | 0.233%, due 01/16/51 | | | 1,054,082 | | | | 0.1 | |
| 26,570,366 | | | ^ | | 0.250%, due 06/20/36 | | | 250,295 | | | | 0.0 | |
| 22,527,621 | | | ^ | | 0.386%, due 11/16/46 | | | 314,934 | | | | 0.0 | |
| 5,300,000 | | | | | 0.450%, due 04/01/44 | | | 5,759,609 | | | | 0.7 | |
| 9,258,481 | | | | | 0.571%, due 02/20/62 | | | 9,282,021 | | | | 1.1 | |
| 959,000 | | | ^ | | 0.599%, due 02/16/48 | | | 10,085 | | | | 0.0 | |
| 8,408,979 | | | | | 0.620%, due 04/20/63 | | | 8,419,746 | | | | 1.0 | |
| 4,053,098 | | | | | 0.641%, due 06/20/63 | | | 4,049,967 | | | | 0.5 | |
| Principal Amount† | | Value | | | Percentage
of Net
Assets | |
| | U.S. GOVERNMENT AGENCY OBLIGATIONS: (continued) | |
| | | | | | | | | Government National Mortgage Association (continued) | |
| | 5,916,098 | | | | | | | 0.686%, due 10/20/62 | | $ | 5,925,126 | | | | 0.7 | |
| | 14,693,132 | | | | | | | 0.771%, due 12/20/63 | | | 14,770,146 | | | | 1.7 | |
| | 3,474,021 | | | | | | | 0.821%, due 05/20/62 | | | 3,502,617 | | | | 0.4 | |
| | 5,607,388 | | | | | | | 0.821%, due 05/20/63 | | | 5,645,238 | | | | 0.6 | |
| | 4,384,631 | | | | | | | 0.891%, due 09/20/63 | | | 4,430,998 | | | | 0.5 | |
| | 4,082,360 | | | | | | | 0.992%, due 01/20/60 | | | 4,118,635 | | | | 0.5 | |
| | 877,428 | | | | ^ | | | 1.000%, due 06/16/37 | | | 30,872 | | | | 0.0 | |
| | 6,343,142 | | | | | | | 1.172%, due 05/20/60 | | | 6,480,024 | | | | 0.7 | |
| | 11,583,882 | | | | | | | 1.221%, due 02/20/62 | | | 11,862,740 | | | | 1.3 | |
| | 1,326,135 | | | | ^ | | | 1.817%, due 10/16/52 | | | 101,013 | | | | 0.0 | |
| | 6,003,349 | | | | | | | 2.312%, due 10/20/63 | | | 6,627,109 | | | | 0.8 | |
| | 1,900,000 | | | | ^ | | | 2.500%, due 11/20/43 | | | 705,672 | | | | 0.1 | |
| | 6,259,160 | | | | ^ | | | 3.500%, due 08/16/40 | | | 781,583 | | | | 0.1 | |
| | 203,300,000 | | | | | | | 3.500%, due 12/20/41 | | | 213,425,300 | | | | 24.3 | |
| | 11,827,755 | | | | | | | 3.500%, due 12/20/44 | | | 12,471,005 | | | | 1.4 | |
| | 4,000,000 | | | | | | | 3.526%, due 01/16/40 | | | 4,188,200 | | | | 0.5 | |
| | 13,648,652 | | | | | | | 3.750%, due 05/20/42 | | | 14,485,052 | | | | 1.6 | |
| | 13,115,291 | | | | | | | 3.750%, due 05/20/42 | | | 13,918,446 | | | | 1.6 | |
| | 3,622,155 | | | | | | | 3.894%, due 05/20/41 | | | 3,882,840 | | | | 0.4 | |
| | 4,163,131 | | | | ^ | | | 4.000%, due 04/20/38 | | | 352,263 | | | | 0.0 | |
| | 3,038,615 | | | | ^ | | | 4.000%, due 08/20/39 | | | 825,604 | | | | 0.1 | |
| | 7,156,471 | | | | | | | 4.000%, due 09/20/40 | | | 7,496,267 | | | | 0.9 | |
| | 4,015,847 | | | | ^ | | | 4.000%, due 04/20/41 | | | 711,021 | | | | 0.1 | |
| | 10,065,324 | | | | | | | 4.000%, due 07/20/41 | | | 10,736,337 | | | | 1.2 | |
| | 1,989,720 | | | | ^ | | | 4.000%, due 03/20/42 | | | 280,753 | | | | 0.0 | |
| | 4,103,237 | | | | | | | 4.000%, due 04/20/42 | | | 4,637,854 | | | | 0.5 | |
| | 3,231,625 | | | | | | | 4.000%, due 10/20/42 | | | 3,465,369 | | | | 0.4 | |
| | 3,120,257 | | | | ^ | | | 4.000%, due 12/20/42 | | | 479,329 | | | | 0.1 | |
| | 16,600,000 | | | | | | | 4.000%, due 04/01/44 | | | 17,687,430 | | | | 2.0 | |
| | 9,354,967 | | | | | | | 4.000%, due 10/20/44 | | | 10,030,022 | | | | 1.1 | |
| | 7,884,362 | | | | | | | 4.000%, due 12/20/44 | | | 8,457,987 | | | | 1.0 | |
| | 40,445,001 | | | | | | | 4.000%, due 03/20/45 | | | 43,396,469 | | | | 4.9 | |
| | 500,515 | | | | ^ | | | 4.500%, due 02/20/35 | | | 9,384 | | | | 0.0 | |
| | 647,369 | | | | ^ | | | 4.500%, due 02/20/36 | | | 21,037 | | | | 0.0 | |
| | 354,499 | | | | ^ | | | 4.500%, due 12/20/37 | | | 27,517 | | | | 0.0 | |
| | 130,047 | | | | ^ | | | 4.500%, due 02/20/38 | | | 11,204 | | | | 0.0 | |
| | 5,807,393 | | | | ^ | | | 4.500%, due 04/20/39 | | | 890,732 | | | | 0.1 | |
| | 9,038,331 | | | | | | | 4.500%, due 05/16/39 | | | 9,994,681 | | | | 1.1 | |
| | 4,761,000 | | | | | | | 4.500%, due 05/20/39 | | | 5,158,370 | | | | 0.6 | |
| | 9,356,676 | | | | | | | 4.500%, due 05/20/39 | | | 10,241,209 | | | | 1.2 | |
| | 6,044,841 | | | | | | | 4.500%, due 02/15/40 | | | 6,696,178 | | | | 0.8 | |
| | 4,023,865 | | | | | | | 4.500%, due 09/20/41 | | | 4,386,977 | | | | 0.5 | |
| | 16,338,774 | | | | ^ | | | 4.500%, due 12/16/42 | | | 3,066,546 | | | | 0.3 | |
See Accompanying Notes to Financial Statements
| Voya GNMA Income Fund | SUMMARY PORTFOLIO OF INVESTMENTS
as of March 31, 2015 (continued) |
| Principal Amount† | | Value | | | Percentage
of Net
Assets | |
| U.S. GOVERNMENT AGENCY OBLIGATIONS: (continued) | | |
| | | | | | | Government National Mortgage Association (continued) | |
| | 10,313,519 | | | | | 4.660%, due 09/20/61 | | $ | 11,659,794 | | | | 1.3 | |
| | 4,481,482 | | | | | 4.861%, due 06/20/61 | | | 4,829,704 | | | | 0.5 | |
| | 5,549,310 | | | | | 5.000%, due 10/20/34 | | | 6,380,394 | | | | 0.7 | |
| | 299,495 | | | ^ | | 5.000%, due 09/16/35 | | | 9,757 | | | | 0.0 | |
| | 3,929,835 | | | ^ | | 5.000%, due 01/20/38 | | | 443,135 | | | | 0.1 | |
| | 1,967,172 | | | ^ | | 5.000%, due 07/16/39 | | | 330,111 | | | | 0.0 | |
| | 7,765,345 | | | ^ | | 5.000%, due 03/20/40 | | | 1,322,364 | | | | 0.2 | |
| | 41,123,195 | | | | | 5.000%, due 05/20/40 | | | 47,314,827 | | | | 5.4 | |
| | 1,154,594 | | | ^ | | 5.000%, due 05/20/41 | | | 243,329 | | | | 0.0 | |
| | 10,837,932 | | | | | 5.500%, due 12/16/35 | | | 12,539,135 | | | | 1.4 | |
| | 2,798,463 | | | | | 5.500%, due 02/20/36 | | | 3,403,591 | | | | 0.4 | |
| | 3,329,979 | | | | | 5.500%, due 10/20/37 | | | 3,751,430 | | | | 0.4 | |
| | 2,704,605 | | | | | 5.500%, due 09/16/39 | | | 3,463,397 | | | | 0.4 | |
| | 710,937 | | | ^ | | 5.500%, due 09/16/40 | | | 103,937 | | | | 0.0 | |
| | 7,858,457 | | | ^ | | 5.824%, due 09/20/38 | | | 1,258,721 | | | | 0.1 | |
| | 10,122,376 | | | ^ | | 5.824%, due 12/20/40 | | | 1,868,407 | | | | 0.2 | |
| | 4,489,689 | | | ^ | | 5.874%, due 12/20/40 | | | 750,794 | | | | 0.1 | |
| | 3,556,576 | | | ^ | | 5.924%, due 05/20/32 | | | 474,672 | | | | 0.1 | |
| | 3,039,840 | | | ^ | | 5.976%, due 09/16/39 | | | 561,315 | | | | 0.1 | |
| | 937,565 | | | ^ | | 6.000%, due 01/20/34 | | | 197,291 | | | | 0.0 | |
| | 4,034,819 | | | | | 6.000%, due 10/20/37 | | | 4,802,173 | | | | 0.5 | |
| | 2,123,551 | | | ^ | | 6.000%, due 01/16/40 | | | 941,765 | | | | 0.1 | |
| | 15,441,875 | | | ^ | | 6.176%, due 04/16/39 | | | 2,161,336 | | | | 0.2 | |
| | 6,287,235 | | | ^ | | 6.324%, due 09/20/37 | | | 1,079,889 | | | | 0.1 | |
| | 6,803,110 | | | ^ | | 6.324%, due 09/20/38 | | | 696,063 | | | | 0.1 | |
| | 3,482,364 | | | ^ | | 6.326%, due 05/16/38 | | | 652,822 | | | | 0.1 | |
| | 5,811,950 | | | ^ | | 6.476%, due 09/16/40 | | | 1,142,842 | | | | 0.1 | |
| | 11,119,062 | | | ^ | | 6.476%, due 04/16/42 | | | 2,635,335 | | | | 0.3 | |
| | 3,042,081 | | | ^ | | 6.524%, due 11/20/34 | | | 623,296 | | | | 0.1 | |
| | 2,771,721 | | | ^ | | 6.596%, due 02/16/35 | | | 531,760 | | | | 0.1 | |
| | 1,373,857 | | | ^ | | 7.426%, due 10/16/29 | | | 325,392 | | | | 0.0 | |
| | 4,269,418 | | | ^ | | 7.500%, due 04/16/37 | | | 1,317,193 | | | | 0.2 | |
| | 139,151,202 | | | | | 0.396%-24.660%, due
05/15/16-07/20/63 | | | 156,317,197 | | | | 17.8 | |
| | | | | | | | | | 780,140,272 | | | | 88.7 | |
| | | | | | | Total U.S. Government
Agency Obligations
(Cost $964,769,683) | | | 985,117,774 | | | | 112.0 | |
| | | | | | | Total Long-Term
Investments
(Cost $966,584,802) | | | 986,906,081 | | | | 112.2 | |
| Shares | | | Value | | | Percentage
of Net
Assets | |
| SHORT-TERM INVESTMENTS: 6.3% | |
| | | | | U.S. Treasury Bills: 6.3% | |
| 55,000,000 | | | United States Treasury
Bill, 0.02%, 5/21/2015
(Cost $54,998,295) | | $ | 54,998,295 | | | | 6.3 | |
| | | | | Total Short-Term
Investments
(Cost $54,998,295) | | | 54,998,295 | | | | 6.3 | |
| | | | | Total Investments in Securities (Cost $1,021,583,097) | | $ | 1,041,904,376 | | | | 118.5 | |
| | | | | Liabilities in Excess of Other Assets | | | (162,777,821 | ) | | | (18.5 | ) |
| | | | | Net Assets | | $ | 879,126,555 | | | | 100.0 | |
“Other Securities” represents issues not identified as the top 50 holdings in terms of market value and issues or issuers not exceeding 1% of net assets individually or in aggregate respectively as of March 31, 2015.
The following footnotes apply to either the individual securities noted or one or more of the securities aggregated and listed as a single line item.
| † | Unless otherwise indicated, principal amount is shown in USD. |
| ## | The Federal Housing Finance Agency (“FHFA”) placed the Federal Home Loan Mortgage Corporation and Federal National Mortgage Association into conservatorship with FHFA as the conservator. As such, the FHFA oversees the continuing affairs of these companies. |
| W | Settlement is on a when-issued or delayed-delivery basis. |
| ^ | Interest only securities represent the right to receive the monthly interest payments on an underlying pool of mortgage loans. Principal amount shown represents the notional amount on which current interest is calculated. Payments of principal on the pool reduce the value of the interest only security. |
Cost for federal income tax purposes is $1,023,518,179.
Net unrealized appreciation consists of:
| Gross Unrealized Appreciation | | $ | 20,308,804 | |
| Gross Unrealized Depreciation | | | (1,922,607 | ) |
| Net Unrealized Appreciation | | $ | 18,386,197 | |
See Accompanying Notes to Financial Statements
| Voya GNMA Income Fund | SUMMARY PORTFOLIO OF INVESTMENTS
as of March 31, 2015 (continued) |
Fair Value Measurements^
The following is a summary of the fair valuations according to the inputs used as of March 31, 2015 in valuing the assets and liabilities:
| | | Quoted Prices
in Active Markets
for Identical
Investments
(Level 1) | | | Significant
Other
Observable
Inputs
(Level 2) | | | Significant
Unobservable
Inputs
(Level 3) | | | Fair Value
at
March 31, 2015 | |
| Asset Table | | | | | | | | | | | | | | | | |
| Investments, at fair value | | | | | | | | | | | | | | | | |
| Collateralized Mortgage Obligations | | $ | — | | | $ | 1,788,307 | | | $ | — | | | $ | 1,788,307 | |
| Short-Term Investments | | | — | | | | 54,998,295 | | | | — | | | | 54,998,295 | |
| U.S. Government Agency Obligations | | | — | | | | 985,117,774 | | | | — | | | | 985,117,774 | |
| Total Investments, at fair value | | $ | — | | | $ | 1,041,904,376 | | | $ | — | | | $ | 1,041,904,376 | |
| Liabilities Table | | | | | | | | | | | | | | | | |
| Other Financial Instruments+ | | | | | | | | | | | | | | | | |
| Futures | | $ | (1,474,552 | ) | | $ | — | | | $ | — | | | $ | (1,474,552 | ) |
| Total Liabilities | | $ | (1,474,552 | ) | | $ | — | | | $ | — | | | $ | (1,474,552 | ) |
| ^ | See Note 2, ’’Significant Accounting Policies" in the Notes to Financial Statements for additional information. |
| + | Other Financial Instruments are derivatives not reflected in the Portfolio of Investments and may include open forward foreign currency contracts, futures, centrally cleared swaps, OTC swaps and written options. Forward foreign currency contracts, futures and centrally cleared swaps are valued at the unrealized gain (loss) on the instrument. OTC swaps and written options are valued at the fair value of the instrument. |
At March 31, 2015, the following futures contracts were outstanding for Voya GNMA Income Fund:
| Contract Description | | Number
of Contracts | | | Expiration
Date | | Notional
Value | | | Unrealized
Appreciation/
(Depreciation) | |
| Short Contracts | | | | | | | | | | | | | | |
| U.S. Treasury 10-Year Note | | | (400) | | | 06/19/15 | | $ | (51,562,500 | ) | | $ | (578,729 | ) |
| U.S. Treasury 5-Year Note | | | (953) | | | 06/30/15 | | | (114,561,026 | ) | | | (895,823 | ) |
| | | | | | | | | $ | (166,123,526 | ) | | $ | (1,474,552 | ) |
A summary of derivative instruments by primary risk exposure is outlined in the following tables.
The fair value of derivative instruments as of March 31, 2015 was as follows:
| Derivatives not accounted for as hedging instruments | | Location on Statement
of Assets and Liabilities | | Fair Value | |
| Liability Derivatives | | | | | | |
| Interest rate contracts | | Net Assets — Unrealized depreciation* | | $ | 1,474,552 | |
| Total Liability Derivatives | | | | $ | 1,474,552 | |
| * | Includes cumulative appreciation/depreciation of futures contracts as reported in the table following the Summary Portfolio of Investments. |
See Accompanying Notes to Financial Statements
| Voya GNMA Income Fund | SUMMARY PORTFOLIO OF INVESTMENTS
as of March 31, 2015 (continued) |
The effect of derivative instruments on the Fund’s Statement of Operations for the year ended March 31, 2015 was as follows:
| | | Amount of Realized
Gain or (Loss)
on Derivatives
Recognized in Income | |
| Derivatives not accounted for as hedging instruments | | Futures | |
| Interest rate contracts | | $ | (7,650,211 | ) |
| Total | | $ | (7,650,211 | ) |
| | | Change in Unrealized
Appreciation or
(Depreciation) on
Derivatives
Recognized in Income | |
| Derivatives not accounted for as hedging instruments | | Futures | |
| Interest rate contracts | | $ | (1,694,195 | ) |
| Total | | $ | (1,694,195 | ) |
See Accompanying Notes to Financial Statements
| Voya High Yield Bond Fund | SUMMARY PORTFOLIO OF INVESTMENTS
as of March 31, 2015 |
| | |
Principal
Amount† | | | Value | | | Percentage
of Net
Assets | |
| CORPORATE BONDS/NOTES: 96.4% | |
| | | | | | | Basic Materials: 5.9% | |
| | 1,635,000 | | | # | | Aruba Investments, Inc.,
8.750%, 02/15/23 | | $ | 1,635,000 | | | | 0.3 | |
| | 1,470,000 | | | # | | Cascades, Inc., 5.500%,
07/15/22 | | | 1,497,562 | | | | 0.3 | |
| | 920,000 | | | # | | Constellium NV, 5.750%,
05/15/24 | | | 874,000 | | | | 0.2 | |
| | 375,000 | | | # | | Eco Services Operations
LLC/Eco Finance Corp.,
8.500%, 11/01/22 | | | 380,625 | | | | 0.1 | |
| | 1,105,000 | | | # | | Evolution Escrow Issuer
LLC, 7.500%, 03/15/22 | | | 1,121,575 | | | | 0.2 | |
| | 920,000 | | | # | | FMG Resources August
2006 Pty Ltd., 6.000%,
04/01/17 | | | 913,675 | | | | 0.2 | |
| | 750,000 | | | # | | FMG Resources August
2006 Pty Ltd., 8.250%,
11/01/19 | | | 636,562 | | | | 0.1 | |
| | 1,550,000 | | | | | Huntsman International
LLC, 4.875%, 11/15/20 | | | 1,557,750 | | | | 0.3 | |
| | 780,000 | | | # | | Huntsman International
LLC, 5.125%, 11/15/22 | | | 783,900 | | | | 0.1 | |
| | 305,000 | | | # | | Platform Specialty Products
Corp., 6.500%, 02/01/22 | | | 320,250 | | | | 0.1 | |
| | 2,269,000 | | | | | PolyOne Corp.,
5.250%-7.375%,
09/15/20-03/15/23 | | | 2,386,054 | | | | 0.5 | |
| | 1,250,000 | | | # | | PQ Corp., 8.750%, 05/01/18 | | | 1,301,563 | | | | 0.2 | |
| | 1,500,000 | | | # | | Prince Mineral Holding
Corp., 11.500%, 12/15/19 | | | 1,458,750 | | | | 0.3 | |
| | 307,000 | | | # | | Rain CII Carbon, LLC / CII
Carbon Corp., 8.000%,
12/01/18 | | | 293,185 | | | | 0.0 | |
| | 500,000 | | | # | | Rain CII Carbon, LLC / CII
Carbon Corp., 8.250%,
01/15/21 | | | 468,750 | | | | 0.1 | |
| | 1,110,000 | | | # | | SPCM SA, 6.000%, 01/15/22 | | | 1,154,400 | | | | 0.2 | |
| | 925,000 | | | # | | Steel Dynamics, Inc., 5.125%,
10/01/21 | | | 935,407 | | | | 0.2 | |
| | 925,000 | | | # | | Steel Dynamics, Inc., 5.500%,
10/01/24 | | | 940,031 | | | | 0.2 | |
| | 1,500,000 | | | # | | Unifrax I LLC / Unifrax
Holding Co., 7.500%,
02/15/19 | | | 1,515,000 | | | | 0.3 | |
| | 1,940,000 | | | # | | US Coatings Acquisition,
Inc. / Axalta Coating
Systems Dutch Holding
B BV, 7.375%, 05/01/21 | | | 2,095,200 | | | | 0.4 | |
Principal
Amount† | | | Value | | | Percentage
of Net
Assets | |
| CORPORATE BONDS/NOTES: (continued) | |
| | | | | | | Basic Materials (continued) | |
| | 1,605,000 | | | # | | WR Grace & Co-Conn,
5.125%, 10/01/21 | | $ | 1,669,200 | | | | 0.3 | |
| | 555,000 | | | # | | WR Grace & Co-Conn,
5.625%, 10/01/24 | | | 594,544 | | | | 0.1 | |
| | 8,600,000 | | | | | Other Securities(a) | | | 6,229,875 | | | | 1.2 | |
| | | | | | | | | | 30,762,858 | | | | 5.9 | |
| | | | | | | Communications: 17.4% | |
| | 1,000,000 | | | # | | Alcatel-Lucent USA, Inc.,
6.750%, 11/15/20 | | | 1,070,000 | | | | 0.2 | |
| | 600,000 | | | # | | Altice Financing SA, 6.500%,
01/15/22 | | | 618,375 | | | | 0.1 | |
| | 905,000 | | | # | | Altice Financing SA, 6.625%,
02/15/23 | | | 936,675 | | | | 0.2 | |
| | 1,000,000 | | | # | | Altice Finco SA, 8.125%,
01/15/24 | | | 1,063,125 | | | | 0.2 | |
| | 1,470,000 | | | # | | Altice SA, 7.625%, 02/15/25 | | | 1,480,106 | | | | 0.3 | |
| | 1,640,000 | | | # | | Altice SA, 7.750%, 05/15/22 | | | 1,672,800 | | | | 0.3 | |
| | 34,781 | | | # | | American Media, Inc.,
13.500%, 06/15/18 | | | 36,716 | | | | 0.0 | |
| | 665,000 | | | # | | Block Communications, Inc.,
7.250%, 02/01/20 | | | 679,962 | | | | 0.1 | |
| | 2,860,000 | | | | | CCO Holdings LLC / CCO
Holdings Capital Corp.,
5.250%-7.250%,
10/30/17-04/30/21 | | | 2,963,187 | | | | 0.6 | |
| | 2,050,000 | | | | | CenturyLink, Inc., 5.625%,
04/01/20 | | | 2,160,187 | | | | 0.4 | |
| | 1,750,000 | | | # | | Cequel Communications
Holdings I LLC / Cequel
Capital Corp., 5.125%,
12/15/21 | | | 1,754,375 | | | | 0.3 | |
| | 500,000 | | | # | | Cequel Communications
Holdings I, LLC / Cequel
Capital Corp., 6.375%,
09/15/20 | | | 529,375 | | | | 0.1 | |
| | 2,635,000 | | | | | Clear Channel Worldwide
Holdings, Inc.,
6.500%-7.625%,
03/15/20-11/15/22 | | | 2,780,625 | | | | 0.5 | |
| | 1,500,000 | | | #,& | | CommScope Holding Co.,
Inc., 6.625%, 06/01/20 | | | 1,545,000 | | | | 0.3 | |
| | 1,650,000 | | | # | | CSC Holdings, LLC, 5.250%,
06/01/24 | | | 1,687,125 | | | | 0.3 | |
| | 4,190,000 | | | | | DISH DBS Corp.,
5.000%-6.750%,
05/01/20-03/15/23 | | | 4,267,136 | | | | 0.8 | |
See Accompanying Notes to Financial Statements
|
| Voya High Yield Bond Fund | SUMMARY PORTFOLIO OF INVESTMENTS
as of March 31, 2015 (continued) |
Principal
Amount† | | | Value | | | Percentage
of Net
Assets | |
| CORPORATE BONDS/NOTES: (continued) | |
| | | | | | | Communications (continued) | |
| | 1,750,000 | | | | | Gannett Co., Inc., 6.375%,
10/15/23 | | $ | 1,905,312 | | | | 0.4 | |
| | 600,000 | | | # | | Gannett Co., Inc., 5.500%,
09/15/24 | | | 629,250 | | | | 0.1 | |
| | 1,225,000 | | | # | | GCI, Inc., 6.875%, 04/15/25 | | | 1,240,312 | | | | 0.2 | |
| | 1,950,000 | | | | | Gray Television, Inc.,
7.500%, 10/01/20 | | | 2,062,125 | | | | 0.4 | |
| | 825,000 | | | # | | Harron Communications
L.P./Harron Finance Corp.,
9.125%, 04/01/20 | | | 906,469 | | | | 0.2 | |
| | 2,000,000 | | | | | Lamar Media Corp.,
5.875%, 02/01/22 | | | 2,115,000 | | | | 0.4 | |
| | 780,000 | | | # | | Media General Financing
Sub, Inc., 5.875%,
11/15/22 | | | 797,550 | | | | 0.2 | |
| | 1,750,000 | | | # | | Midcontinent
Communications &
Midcontinent Finance Corp.,
6.250%, 08/01/21 | | | 1,828,750 | | | | 0.4 | |
| | 1,500,000 | | | | | Netflix, Inc., 5.750%,
03/01/24 | | | 1,535,625 | | | | 0.3 | |
| | 800,000 | | | # | | Netflix, Inc., 5.875%,
02/15/25 | | | 825,000 | | | | 0.2 | |
| | 575,000 | | | # | | Nielsen Finance LLC /
Nielsen Finance Co., 5.000%,
04/15/22 | | | 580,750 | | | | 0.1 | |
| | 1,750,000 | | | # | | Numericable Group SA,
6.000%, 05/15/22 | | | 1,778,437 | | | | 0.3 | |
| | 2,425,000 | | | # | | Numericable Group SA,
6.250%, 05/15/24 | | | 2,458,344 | | | | 0.5 | |
| | 1,000,000 | | | # | | Sable International Finance
Ltd., 8.750%, 02/01/20 | | | 1,080,000 | | | | 0.2 | |
| | 1,030,000 | | | # | | SBA Communications Corp.,
4.875%, 07/15/22 | | | 1,011,523 | | | | 0.2 | |
| | 2,150,000 | | | | | Sinclair Television Group,
Inc., 6.125%-6.375%,
11/01/21-10/01/22 | | | 2,268,205 | | | | 0.4 | |
| | 2,060,000 | | | # | | Sirius XM Radio, Inc.,
5.750%, 08/01/21 | | | 2,151,413 | | | | 0.4 | |
| | 660,000 | | | # | | Sirius XM Radio, Inc.,
6.000%, 07/15/24 | | | 694,650 | | | | 0.2 | |
| | 2,845,000 | | | | | Sprint Corp., 7.125%,
06/15/24 | | | 2,802,325 | | | | 0.5 | |
| | 1,400,000 | | | | | Sprint Capital Corp., 6.875%,
11/15/28 | | | 1,291,500 | | | | 0.3 | |
Principal
Amount† | | | Value | | | Percentage
of Net
Assets | |
| CORPORATE BONDS/NOTES: (continued) | | |
| | | | | | | Communications (continued) | |
| | 2,000,000 | | | | | Sprint Corp., 7.250%,
09/15/21 | | $ | 2,017,500 | | | | 0.4 | |
| | 1,500,000 | | | | | Sprint Nextel Corp.,
6.000%, 11/15/22 | | | 1,430,625 | | | | 0.3 | |
| | 665,000 | | | # | | Sprint Nextel Corp.,
9.000%, 11/15/18 | | | 764,750 | | | | 0.1 | |
| | 4,230,000 | | | | | T-Mobile USA, Inc.,
5.250%-6.836%,
09/01/18-04/28/23 | | | 4,423,938 | | | | 0.9 | |
| | 2,500,000 | | | # | | Univision Communications,
Inc., 5.125%, 05/15/23 | | | 2,550,000 | | | | 0.5 | |
| | 1,860,000 | | | # | | West Corp., 5.375%,
07/15/22 | | | 1,828,613 | | | | 0.4 | |
| | 1,200,000 | | | # | | Wind Acquisition Finance SA,
4.750%, 07/15/20 | | | 1,206,000 | | | | 0.2 | |
| | 1,310,000 | | | # | | Wind Acquisition Finance SA,
7.375%, 04/23/21 | | | 1,362,400 | | | | 0.3 | |
| | 1,265,000 | | | # | | Zayo Group LLC / Zayo
Capital, Inc., 6.000%,
04/01/23 | | | 1,276,676 | | | | 0.3 | |
| | 17,057,000 | | | | | Other Securities | | | 17,709,089 | | | | 3.4 | |
| | | | | | | | | | 89,776,900 | | | | 17.4 | |
| | | | | | | Consumer, Cyclical: 16.3% | |
| | 840,000 | | | # | | American Tire Distributors,
Inc., 10.250%, 03/01/22 | | | 877,800 | | | | 0.2 | |
| | 2,095,000 | | | | | Asbury Automotive Group,
Inc., 6.000%, 12/15/24 | | | 2,184,037 | | | | 0.4 | |
| | 2,070,000 | | | # | | Ashton Woods USA LLC,
6.875%, 02/15/21 | | | 1,888,875 | | | | 0.4 | |
| | 1,500,000 | | | # | | Building Materials Holding
Corp., 9.000%, 09/15/18 | | | 1,597,500 | | | | 0.3 | |
| | 2,685,000 | | | | | Caesars Entertainment
Resort Properties LLC /
Caesars Entertainment
Resort Prope,
8.000%-11.000%,
10/01/20-10/01/21 | | | 2,588,400 | | | | 0.5 | |
| | 1,535,000 | | | # | | Carlson Wagonlit BV, 6.875%,
06/15/19 | | | 1,615,587 | | | | 0.3 | |
| | 1,080,000 | | | # | | CDR DB Sub, Inc., 7.750%,
10/15/20 | | | 977,400 | | | | 0.2 | |
| | 1,365,000 | | | # | | Cedar Fair L.P. / Canada’s
Wonderland Co. / Magnum
Management Corp., 5.375%,
06/01/24 | | | 1,397,419 | | | | 0.3 | |
See Accompanying Notes to Financial Statements
| Voya High Yield Bond Fund | SUMMARY PORTFOLIO OF INVESTMENTS
as of March 31, 2015 (continued) |
Principal Amount† | | | Value | | | Percentage of Net Assets | |
| CORPORATE BONDS/NOTES: (continued) | | | | | |
| | | | | | | Consumer, Cyclical (continued) |
| | 1,625,000 | | | #,& | | Chinos Intermediate
Holdings A, Inc., 7.750%,
05/01/19 | | $ | 1,430,000 | | | | 0.3 | |
| | 1,800,000 | | | | | Chrysler Group LLC/CG
Co-Issuer, Inc., 8.250%,
06/15/21 | | | 2,005,398 | | | | 0.4 | |
| | 450,000 | | | | | Chrysler Group, LLC/CG
Co-Issuer, Inc., 8.000%,
06/15/19 | | | 474,187 | | | | 0.1 | |
| | 860,000 | | | # | | Cleopatra Finance Ltd,
5.625%, 02/15/20 | | | 842,370 | | | | 0.2 | |
| | 900,000 | | | # | | Cleopatra Finance Ltd,
6.250%, 02/15/22 | | | 882,000 | | | | 0.2 | |
| | 865,000 | | | # | | Cleopatra Finance Ltd,
6.500%, 02/15/25 | | | 836,887 | | | | 0.1 | |
| | 1,960,000 | | | | | Dana Holding Corp.,
5.500%, 12/15/24 | | | 2,028,600 | | | | 0.4 | |
| | 415,000 | | | # | | Family Tree Escrow LLC,
5.250%, 03/01/20 | | | 436,788 | | | | 0.1 | |
| | 2,085,000 | | | # | | Family Tree Escrow LLC,
5.750%, 03/01/23 | | | 2,199,675 | | | | 0.4 | |
| | 395,000 | | | | | General Motors Co.,
4.000%, 04/01/25 | | | 402,856 | | | | 0.1 | |
| | 2,050,000 | | | | | General Motors Financial
Co., Inc., 4.000%,
01/15/25 | | | 2,094,953 | | | | 0.4 | |
| | 1,400,000 | | | # | | HD Supply, Inc., 5.250%,
12/15/21 | | | 1,445,500 | | | | 0.3 | |
| | 2,190,000 | | | # | | Hot Topic, Inc., 9.250%,
06/15/21 | | | 2,381,625 | | | | 0.5 | |
| | 2,000,000 | | | # | | MCE Finance Ltd., 5.000%,
02/15/21 | | | 1,880,000 | | | | 0.4 | |
| | 4,500,000 | | | | | MGM Resorts International,
5.250%-8.625%,
02/01/19-03/15/23 | | | 4,831,775 | | | | 0.9 | |
| | 232,000 | | | #,& | | Michaels FinCo Holdings
LLC / Michaels FinCo, Inc.,
7.500%, 08/01/18 | | | 237,800 | | | | 0.0 | |
| | 1,678,000 | | | # | | Michaels Stores, Inc.,
5.875%, 12/15/20 | | | 1,732,535 | | | | 0.3 | |
| | 300,000 | | | # | | NCL Corp. Ltd., 5.250%,
11/15/19 | | | 309,000 | | | | 0.0 | |
| | 250,000 | | | # | | Neiman Marcus Group LLC.,
8.000%, 10/15/21 | | | 266,250 | | | | 0.0 | |
| | 1,750,000 | | | #,& | | Neiman Marcus Group LLC.,
8.750%, 10/15/21 | | | 1,863,750 | | | | 0.4 | |
| | 2,085,000 | | | # | | Rite Aid Corp., 6.125%,
04/01/23 | | | 2,147,550 | | | | 0.4 | |
Principal Amount† | | | Value | | | Percentage of Net Assets | |
| CORPORATE BONDS/NOTES: (continued) | | | | | |
| | | | | | | Consumer, Cyclical (continued) |
| | 240,000 | | | # | | Rite Aid Corp., 6.875%,
12/15/28 | | $ | 264,000 | | | | 0.1 | |
| | 1,685,000 | | | # | | RSI Home Products, Inc.,
6.500%, 03/15/23 | | | 1,722,913 | | | | 0.3 | |
| | 2,000,000 | | | # | | Schaeffler Finance BV,
4.250%, 05/15/21 | | | 2,000,000 | | | | 0.4 | |
| | 250,000 | | | #,& | | Schaeffler Holding Finance
BV, 6.750%, 11/15/22 | | | 271,250 | | | | 0.0 | |
| | 1,351,000 | | | #,& | | Schaeffler Holding Finance
BV, 6.875%, 08/15/18 | | | 1,416,861 | | | | 0.3 | |
| | 790,000 | | | # | | Scientific Games
International, Inc., 7.000%,
01/01/22 | | | 811,725 | | | | 0.2 | |
| | 1,185,000 | | | # | | Scientific Games
International, Inc., 10.000%,
12/01/22 | | | 1,116,863 | | | | 0.2 | |
| | 420,000 | | | # | | Shea Homes L.P. / Shea
Homes Funding Corp.,
5.875%, 04/01/23 | | | 429,450 | | | | 0.1 | |
| | 420,000 | | | # | | Shea Homes L.P. / Shea
Homes Funding Corp.,
6.125%, 04/01/25 | | | 425,250 | | | | 0.1 | |
| | 2,000,000 | | | | | Sonic Automotive, Inc.,
5.000%, 05/15/23 | | | 1,990,000 | | | | 0.4 | |
| | 1,830,000 | | | # | | Viking Cruises Ltd., 8.500%,
10/15/22 | | | 2,045,025 | | | | 0.4 | |
| | 245,000 | | | # | | WMG Acquisition Corp.,
5.625%, 04/15/22 | | | 246,531 | | | | 0.0 | |
| | 1,460,000 | | | # | | WMG Acquisition Corp.,
6.750%, 04/15/22 | | | 1,390,650 | | | | 0.3 | |
| | 25,420,000 | | | | | Other Securities | | | 26,435,400 | | | | 5.1 | |
| | | | | | | | | | 84,422,435 | | | | 16.3 | |
| | | | | | | Consumer, Non-cyclical: 21.9% |
| | 1,660,000 | | | | | Acadia Healthcare Co., Inc.,
5.125%, 07/01/22 | | | 1,670,375 | | | | 0.3 | |
| | 1,000,000 | | | # | | Acadia Healthcare Co., Inc.,
5.625%, 02/15/23 | | | 1,022,500 | | | | 0.2 | |
| | 1,750,000 | | | # | | Albea Beauty Holdings SA,
8.375%, 11/01/19 | | | 1,885,625 | | | | 0.4 | |
| | 1,061,000 | | | # | | Albertsons Holdings LLC
/Saturn Acquisition Merger
Sub, Inc., 7.750%, 10/15/22 | | | 1,140,575 | | | | 0.2 | |
| | 1,800,000 | | | # | | Alliance Data Systems Corp.,
5.375%, 08/01/22 | | | 1,800,000 | | | | 0.3 | |
| | 3,015,000 | | | | | Amsurg Corp., 5.625%,
11/30/20-07/15/22 | | | 3,094,887 | | | | 0.6 | |
See Accompanying Notes to Financial Statements
| Voya High Yield Bond Fund | SUMMARY PORTFOLIO OF INVESTMENTS
as of March 31, 2015 (continued) |
Principal Amount† | | | Value | | | Percentage of Net Assets | |
| CORPORATE BONDS/NOTES: (continued) | | | | | |
| | | | | | | Consumer, Non-cyclical (continued) |
| | 1,860,000 | | | # | | Anna Merger Sub, Inc.,
7.750%, 10/01/22 | | $ | 1,927,425 | | | | 0.4 | |
| | 2,500,000 | | | # | | Ashtead Capital, Inc.,
6.500%, 07/15/22 | | | 2,675,000 | | | | 0.5 | |
| | 1,675,000 | | | # | | BI-LO LLC / BI-LO Finance
Corp., 9.250%, 02/15/19 | | | 1,695,937 | | | | 0.3 | |
| | 1,250,000 | | | # | | Brand Energy &
Infrastructure Services, Inc.,
8.500%, 12/01/21 | | | 1,178,125 | | | | 0.2 | |
| | 1,836,000 | | | # | | Bumble Bee Holdings, Inc.,
9.000%, 12/15/17 | | | 1,932,390 | | | | 0.4 | |
| | 1,430,000 | | | # | | C&S Group Enterprises
LLC, 5.375%, 07/15/22 | | | 1,401,400 | | | | 0.3 | |
| | 1,913,000 | | | #,& | | Capsugel SA, 7.000%,
05/15/19 | | | 1,947,673 | | | | 0.4 | |
| | 710,000 | | | # | | Ceridian HCM Holding, Inc.,
11.000%, 03/15/21 | | | 737,512 | | | | 0.1 | |
| | 1,210,000 | | | # | | Cott Beverages, Inc.,
6.750%, 01/01/20 | | | 1,255,375 | | | | 0.2 | |
| | 1,820,000 | | | # | | Diamond Foods, Inc.,
7.000%, 03/15/19 | | | 1,879,150 | | | | 0.4 | |
| | 1,915,000 | | | # | | Envision Healthcare Corp.,
5.125%, 07/01/22 | | | 1,962,875 | | | | 0.4 | |
| | 1,610,000 | | | # | | Grifols Worldwide
Operations Ltd., 5.250%,
04/01/22 | | | 1,640,187 | | | | 0.3 | |
| | 3,120,000 | | | | | HCA Holdings, Inc., 6.250%,
02/15/21 | | | 3,381,144 | | | | 0.6 | |
| | 1,405,000 | | | | | HCA Holdings, Inc., 7.750%,
05/15/21 | | | 1,498,517 | | | | 0.3 | |
| | 1,800,000 | | | | | HCA, Inc., 7.500%, 02/15/22 | | | 2,103,750 | | | | 0.4 | |
| | 1,895,000 | | | | | HCA, Inc., 5.250%-5.375%,
02/01/25-04/15/25 | | | 2,025,028 | | | | 0.4 | |
| | 865,000 | | | #,& | | Jaguar Holding Co. I, 9.375%,
10/15/17 | | | 886,625 | | | | 0.2 | |
| | 500,000 | | | # | | Jaguar Holding Co., 9.500%,
12/01/19 | | | 539,375 | | | | 0.1 | |
| | 750,000 | | | # | | JBS USA LLC / JBS USA
Finance, Inc., 5.875%,
07/15/24 | | | 761,250 | | | | 0.2 | |
| | 1,150,000 | | | # | | JBS USA LLC / JBS USA
Finance, Inc., 7.250%,
06/01/21 | | | 1,216,125 | | | | 0.2 | |
| | 1,000,000 | | | # | | KeHE Distributors LLC /
KeHE Finance Corp.,
7.625%, 08/15/21 | | | 1,063,750 | | | | 0.2 | |
| | 1,460,000 | | | # | | Live Nation Entertainment,
Inc., 5.375%, 06/15/22 | | | 1,496,500 | | | | 0.3 | |
Principal Amount† | | | Value | | | Percentage of Net Assets | |
| CORPORATE BONDS/NOTES: (continued) | | | | | |
| | | | | | | Consumer, Non-cyclical (continued) |
| | 1,975,000 | | | # | | Logo Merger Sub Corp.,
8.375%, 10/15/20 | | $ | 2,009,563 | | | | 0.4 | |
| | 2,080,000 | | | # | | Midas Intermediate Holdco
II LLC / Midas Intermediate
Holdco II Finance, Inc.,
7.875%, 10/01/22 | | | 2,054,000 | | | | 0.4 | |
| | 2,125,000 | | | # | | MPH Acquisition Holdings
LLC, 6.625%, 04/01/22 | | | 2,207,344 | | | | 0.4 | |
| | 1,975,000 | | | # | | Multi-Color Corp., 6.125%,
12/01/22 | | | 2,058,938 | | | | 0.4 | |
| | 1,500,000 | | | # | | Mustang Merger Corp.,
8.500%, 08/15/21 | | | 1,526,250 | | | | 0.3 | |
| | 1,224,000 | | | # | | Physio-Control International,
Inc., 9.875%, 01/15/19 | | | 1,306,620 | | | | 0.3 | |
| | 1,635,000 | | | # | | Quad/Graphics, Inc.,
7.000%, 05/01/22 | | | 1,579,819 | | | | 0.3 | |
| | 3,250,000 | | | | | Reynolds Group Issuer,
Inc., 7.875%-9.875%,
04/15/19-08/15/19 | | | 3,447,813 | | | | 0.7 | |
| | 2,335,000 | | | | | RR Donnelley & Sons Co.,
6.000%-7.875%,
03/15/21-04/01/24 | | | 2,556,187 | | | | 0.5 | |
| | 1,495,000 | | | # | | Safway Group Holding
LLC / Safway Finance Corp.,
7.000%, 05/15/18 | | | 1,487,525 | | | | 0.3 | |
| | 1,500,000 | | | # | | Salix Pharmaceuticals
Ltd, 6.500%, 01/15/21 | | | 1,666,875 | | | | 0.3 | |
| | 1,050,000 | | | # | | Shearer’s Foods, LLC /
Chip Fin Corp., 9.000%,
11/01/19 | | | 1,149,750 | | | | 0.2 | |
| | 1,280,000 | | | # | | STHI Holding Corp., 8.000%,
03/15/18 | | | 1,329,600 | | | | 0.3 | |
| | 1,580,000 | | | # | | Teleflex, Inc., 5.250%,
06/15/24 | | | 1,615,550 | | | | 0.3 | |
| | 1,975,000 | | | | | Tenet Healthcare Corp.,
6.750%, 02/01/20 | | | 2,091,031 | | | | 0.4 | |
| | 2,595,000 | | | | | Tenet Healthcare Corp.,
6.000%-8.125%,
11/01/18-04/01/22 | | | 2,813,313 | | | | 0.5 | |
| | 2,335,000 | | | | | United Rentals North
America, Inc.,
5.750%-7.625%,
07/15/18-06/15/23 | | | 2,515,234 | | | | 0.5 | |
| | 1,950,000 | | | # | | Universal Health Services,
Inc., 4.750%, 08/01/22 | | | 2,052,375 | | | | 0.4 | |
| | 1,500,000 | | | # | | Valeant Pharmaceuticals
International, Inc., 5.500%,
03/01/23 | | | 1,524,375 | | | | 0.3 | |
See Accompanying Notes to Financial Statements
| Voya High Yield Bond Fund | SUMMARY PORTFOLIO OF INVESTMENTS
as of March 31, 2015 (continued) |
Principal Amount† | | | Value | | | Percentage of Net Assets | |
| CORPORATE BONDS/NOTES: (continued) | | | | | |
| | | | | | | Consumer, Non-cyclical (continued) |
| | 2,000,000 | | | # | | Valeant Pharmaceuticals
International, Inc., 7.500%,
07/15/21 | | $ | 2,170,620 | | | | 0.4 | |
| | 1,500,000 | | | # | | Valeant Pharmaceuticals
International, 6.750%,
08/15/18 | | | 1,584,375 | | | | 0.3 | |
| | 1,025,000 | | | # | | Valeant Pharmaceuticals
International, 6.750%,
08/15/21 | | | 1,074,969 | | | | 0.2 | |
| | 490,000 | | | # | | VPI Escrow Corp., 6.375%,
10/15/20 | | | 510,825 | | | | 0.1 | |
| | 420,000 | | | # | | VRX Escrow Corp., 5.375%,
03/15/20 | | | 425,250 | | | | 0.1 | |
| | 420,000 | | | # | | VRX Escrow Corp., 5.875%,
05/15/23 | | | 431,550 | | | | 0.1 | |
| | 920,000 | | | # | | VRX Escrow Corp., 6.125%,
04/15/25 | | | 955,650 | | | | 0.2 | |
| | 21,993,000 | | | | | Other Securities | | | 23,124,201 | | | | 4.5 | |
| | | | | | | | | | 113,088,677 | | | | 21.9 | |
| | | | | | | Diversified: 1.4% |
| | 2,095,000 | | | # | | Argos Merger Sub, Inc.,
7.125%, 03/15/23 | | | 2,176,181 | | | | 0.4 | |
| | 715,000 | | | #,& | | Carlson Travel Holdings,
Inc., 7.500%, 08/15/19 | | | 725,725 | | | | 0.1 | |
| | 1,440,000 | | | # | | James Hardie International
Finance Ltd, 5.875%,
02/15/23 | | | 1,490,400 | | | | 0.3 | |
| | 779,000 | | | # | | The Nielsen Co.
Luxembourg SARL,
5.500%, 10/01/21 | | | 808,213 | | | | 0.2 | |
| | 1,900,000 | | | | | Other Securities | | | 1,866,750 | | | | 0.4 | |
| | | | | | | | | | 7,067,269 | | | | 1.4 | |
| | | | | | | Energy: 11.2% |
| | 925,000 | | | # | | American Energy - Woodford
LLC/AEW Finance Corp.,
9.000%, 09/15/22 | | | 536,500 | | | | 0.1 | |
| | 2,250,000 | | | | | Approach Resources, Inc.,
7.000%, 06/15/21 | | | 2,025,000 | | | | 0.4 | |
| | 1,000,000 | | | # | | Arch Coal, Inc., 8.000%,
01/15/19 | | | 483,125 | | | | 0.1 | |
| | 1,970,000 | | | # | | Blue Racer Midstream
LLC / Blue Racer Finance
Corp., 6.125%, 11/15/22 | | | 2,029,100 | | | | 0.4 | |
| | 750,000 | | | # | | Calumet Specialty Products
Partners L.P. / Calumet
Finance Corp., 7.750%,
04/15/23 | | | 762,187 | | | | 0.2 | |
Principal Amount† | | | Value | | | Percentage of Net Assets | |
| CORPORATE BONDS/NOTES: (continued) | | | | | |
| | | | | | | Energy (continued) |
| | 400,000 | | | | | Calumet Specialty Products
Partners L.P. / Calumet
Finance Corp., 9.625%,
08/01/20 | | $ | 454,000 | | | | 0.1 | |
| | 1,290,000 | | | # | | Calumet Specialty Products
Partners L.P./Calumet
Finance Corp., 6.500%,
04/15/21 | | | 1,257,750 | | | | 0.2 | |
| | 2,275,000 | | | | | Chesapeake Energy Corp.,
6.125%, 02/15/21 | | | 2,314,812 | | | | 0.5 | |
| | 1,200,000 | | | | | Chesapeake Energy Corp.,
6.625%, 08/15/20 | | | 1,245,000 | | | | 0.2 | |
| | 1,800,000 | | | # | | CrownRock L.P. / CrownRock
Finance, Inc., 7.125%,
04/15/21 | | | 1,802,250 | | | | 0.3 | |
| | 250,000 | | | # | | CrownRock L.P. / CrownRock
Finance, Inc., 7.750%,
02/15/23 | | | 253,750 | | | | 0.1 | |
| | 1,750,000 | | | # | | Hilcorp Energy I L.P./Hilcorp
Finance Co., 5.000%,
12/01/24 | | | 1,653,750 | | | | 0.3 | |
| | 875,000 | | | # | | Hilcorp Energy I L.P./Hilcorp
Finance Co., 8.000%,
02/15/20 | | | 910,000 | | | | 0.2 | |
| | 1,135,000 | | | # | | Lonestar Resources America,
Inc., 8.750%, 04/15/19 | | | 879,625 | | | | 0.1 | |
| | 1,050,000 | | | # | | Memorial Resource
Development Corp., 5.875%,
07/01/22 | | | 981,750 | | | | 0.2 | |
| | 1,910,000 | | | | | Murphy Oil USA, Inc.,
6.000%, 08/15/23 | | | 2,058,025 | | | | 0.4 | |
| | 1,000,000 | | | # | | Murray Energy Corp.,
8.625%, 06/15/21 | | | 1,050,000 | | | | 0.2 | |
| | 360,000 | | | # | | Paragon Offshore PLC,
6.750%, 07/15/22 | | | 121,500 | | | | 0.0 | |
| | 720,000 | | | # | | Paragon Offshore PLC,
7.250%, 08/15/24 | | | 244,800 | | | | 0.1 | |
| | 2,400,000 | | | # | | Parsley Energy LLC / Parsley
Finance Corp., 7.500%,
02/15/22 | | | 2,436,000 | | | | 0.5 | |
| | 2,670,000 | | | | | Regency Energy Partners L.P.
/ Regency Energy Finance
Corp., 4.500%-5.500%,
10/01/22-11/01/23 | | | 2,727,312 | | | | 0.5 | |
| | 1,950,000 | | | # | | Rockies Express Pipeline,
LLC, 5.625%, 04/15/20 | | | 2,047,695 | | | | 0.4 | |
See Accompanying Notes to Financial Statements
| Voya High Yield Bond Fund | SUMMARY PORTFOLIO OF INVESTMENTS
as of March 31, 2015 (continued) |
Principal Amount† | | | Value | | | Percentage of Net Assets | |
| CORPORATE BONDS/NOTES: (continued) | | | | | |
| | | | | | | Energy (continued) |
| | 2,455,000 | | | | | Sanchez Energy Corp.,
6.125%-7.750%,
06/15/21-01/15/23 | | $ | 2,269,388 | | | | 0.4 | |
| | 1,995,000 | | | | | SemGroup Corp.,
7.500%, 06/15/21 | | | 2,099,738 | | | | 0.4 | |
| | 520,000 | | | # | | SunCoke Energy Partners
L.P. / SunCoke Energy
Partners Finance Corp.,
7.375%, 02/01/20 | | | 535,600 | | | | 0.1 | |
| | 500,000 | | | # | | SunCoke Energy Partners
L.P. / SunCoke Energy
Partners Finance Corp.,
7.375%, 02/01/20 | | | 515,000 | | | | 0.1 | |
| | 405,000 | | | # | | SunCoke Energy Partners
L.P. / SunCoke Energy
Partners Finance Corp.,
7.375%, 02/01/20 | | | 417,150 | | | | 0.1 | |
| | 815,000 | | | # | | Sunoco L.P. / Sunoco
Finance Corp., 6.375%,
04/01/23 | | | 841,488 | | | | 0.1 | |
| | 1,645,000 | | | # | | Talos Production LLC,
9.750%, 02/15/18 | | | 1,167,950 | | | | 0.2 | |
| | 2,000,000 | | | | | Tesoro Logistics L.P. /
Tesoro Logistics Finance
Corp., 6.125%, 10/15/21 | | | 2,070,000 | | | | 0.4 | |
| | 23,808,000 | | | | | Other Securities | | | 20,030,574 | | | | 3.9 | |
| | | | | | | | | | 58,220,819 | | | | 11.2 | |
| | | | | | | Financial: 6.3% |
| | 2,935,000 | | | # | | AerCap Ireland Capital
Ltd. / AerCap Global
Aviation Trust, 4.500%,
05/15/21 | | | 3,059,591 | | | | 0.6 | |
| | 2,000,000 | | | | | Ally Financial, Inc.,
4.125%, 03/30/20 | | | 1,992,500 | | | | 0.4 | |
| | 3,735,000 | | | | | Ally Financial, Inc.,
3.125%-8.000%,
01/15/16-09/15/20 | | | 4,131,450 | | | | 0.8 | |
| | 1,850,000 | | | | | CBRE Services, Inc.,
5.250%, 03/15/25 | | | 1,993,375 | | | | 0.4 | |
| | 290,000 | | | # | | CIT Group, Inc., 6.625%,
04/01/18 | | | 311,750 | | | | 0.0 | |
| | 3,330,000 | | | | | CIT Group, Inc.,
4.250%-5.375%,
05/15/17-08/15/22 | | | 3,440,122 | | | | 0.7 | |
| | 1,150,000 | | | # | | CNG Holdings, Inc./OH,
9.375%, 05/15/20 | | | 830,875 | | | | 0.2 | |
| | 2,095,000 | | | | | International Lease Finance
Corp., 5.875%-8.250%,
05/15/19-08/15/22 | | | 2,372,287 | | | | 0.4 | |
Principal Amount† | | | Value | | | Percentage of Net Assets | |
| CORPORATE BONDS/NOTES: (continued) | | | | | |
| | | | | | | Financial (continued) |
| | 1,320,000 | | | # | | Rayonier AM Products,
Inc., 5.500%, 06/01/24 | | $ | 1,138,500 | | | | 0.2 | |
| | 500,000 | | | # | | Realogy Corp., 7.625%,
01/15/20 | | | 540,625 | | | | 0.1 | |
| | 1,290,000 | | | # | | Realogy Group LLC /
Realogy Co-Issuer Corp.,
5.250%, 12/01/21 | | | 1,319,025 | | | | 0.3 | |
| | 2,000,000 | | | #,& | | Sophia Holding Finance
L.P. / Sophia Holding
Finance, Inc., 9.625%,
12/01/18 | | | 2,027,500 | | | | 0.4 | |
| | 9,105,000 | | | | | Other Securities | | | 9,224,318 | | | | 1.8 | |
| | | | | | | | | | 32,381,918 | | | | 6.3 | |
| | | | | | | Industrial: 7.7% |
| | 370,000 | | | # | | AECOM Technology Corp.,
5.750%, 10/15/22 | | | 383,875 | | | | 0.1 | |
| | 370,000 | | | # | | AECOM Technology Corp.,
5.875%, 10/15/24 | | | 389,425 | | | | 0.1 | |
| | 1,534,450 | | | #,& | | Ardagh Finance Holdings
SA, 8.625%, 06/15/19 | | | 1,606,385 | | | | 0.3 | |
| | 1,000,000 | | | # | | Ardagh Packaging Finance
PLC / Ardagh Holdings
USA, Inc., 6.750%, 01/31/21 | | | 1,011,250 | | | | 0.2 | |
| | 88,235 | | | # | | Ardagh Packaging Finance
PLC, 7.000%, 11/15/20 | | | 88,787 | | | | 0.0 | |
| | 1,480,000 | | | # | | BC Mountain LLC / BC
Mountain Finance, Inc.,
7.000%, 02/01/21 | | | 1,398,600 | | | | 0.3 | |
| | 250,000 | | | # | | Beverage Packaging
Holdings Luxembourg II
SA / Beverage Packaging
Holdings II Is, 6.000%,
06/15/17 | | | 252,500 | | | | 0.0 | |
| | 165,000 | | | # | | Building Materials Corp.
of America, 6.750%,
05/01/21 | | | 175,725 | | | | 0.0 | |
| | 1,500,000 | | | # | | Cleaver-Brooks, Inc.,
8.750%, 12/15/19 | | | 1,537,500 | | | | 0.3 | |
| | 1,700,000 | | | # | | Consolidated Container
Co., LLC/Consolidated
Container Capital, Inc.,
10.125%, 07/15/20 | | | 1,487,500 | | | | 0.3 | |
| | 1,320,000 | | | # | | CTP Transportation
Products LLC / CTP
Finance, Inc., 8.250%,
12/15/19 | | | 1,366,200 | | | | 0.3 | |
| | 1,250,000 | | | # | | Dematic SA / DH Services
Luxembourg Sarl, 7.750%,
12/15/20 | | | 1,312,500 | | | | 0.3 | |
See Accompanying Notes to Financial Statements
| Voya High Yield Bond Fund | SUMMARY PORTFOLIO OF INVESTMENTS
as of March 31, 2015 (continued) |
Principal Amount† | | | Value | | | Percentage of Net Assets | |
| CORPORATE BONDS/NOTES: (continued) | | | | | |
| | | | | | | Industrial (continued) |
| | 1,250,000 | | | # | | Gardner Denver, Inc.,
6.875%, 08/15/21 | | $ | 1,140,625 | | | | 0.2 | |
| | 1,720,000 | | | # | | Gates Global LLC /
Gates Global Co.,
6.000%, 07/15/22 | | | 1,631,850 | | | | 0.3 | |
| | 880,000 | | | # | | JM Huber Corp., 9.875%,
11/01/19 | | | 955,900 | | | | 0.2 | |
| | 1,265,000 | | | # | | Masonite International
Corp., 5.625%, 03/15/23 | | | 1,302,950 | | | | 0.3 | |
| | 233,000 | | | # | | Mcron Finance Sub, LLC /
Mcron Finance Corp.,
8.375%, 05/15/19 | | | 249,892 | | | | 0.0 | |
| | 500,000 | | | # | | Milacron LLC / Mcron
Finance Corp., 7.750%,
02/15/21 | | | 520,000 | | | | 0.1 | |
| | 1,620,000 | | | # | | PaperWorks Industries,
Inc., 9.500%, 08/15/19 | | | 1,666,575 | | | | 0.3 | |
| | 2,000,000 | | | # | | Plastipak Holdings, Inc.,
6.500%, 10/01/21 | | | 2,045,000 | | | | 0.4 | |
| | 1,625,000 | | | # | | Sanmina Corp., 4.375%,
06/01/19 | | | 1,620,937 | | | | 0.3 | |
| | 500,000 | | | # | | Sealed Air Corp., 4.875%,
12/01/22 | | | 511,250 | | | | 0.1 | |
| | 1,000,000 | | | # | | Sealed Air Corp., 5.125%,
12/01/24 | | | 1,037,500 | | | | 0.2 | |
| | 1,470,000 | | | # | | Syncreon Group BV /
Syncreon Global Finance
US, Inc., 8.625%, 11/01/21 | | | 1,264,200 | | | | 0.2 | |
| | 1,485,000 | | | # | | Waterjet Holdings, Inc.,
7.625%, 02/01/20 | | | 1,570,388 | | | | 0.3 | |
| | 1,500,000 | | | # | | Wise Metals Group LLC,
8.750%, 12/15/18 | | | 1,601,250 | | | | 0.3 | |
| | 325,000 | | | # | | Wise Metals Intermediate
Holdings LLC / Wise
Holdings Finance Corp.,
9.750%, 06/15/19 | | | 352,625 | | | | 0.1 | |
| | 11,032,000 | | | | | Other Securities | | | 11,556,470 | | | | 2.2 | |
| | | | | | | | | | 40,037,659 | | | | 7.7 | |
| | | | | | | Information Technology: 0.2% |
| | 1,000,000 | | | | | Other Securities | | | 1,037,500 | | | | 0.2 | |
| | | | | | | Technology: 6.0% |
| | 1,000,000 | | | # | | ACI Worldwide, Inc., 6.375%,
08/15/20 | | | 1,048,750 | | | | 0.2 | |
| | 1,545,000 | | | # | | Activision Blizzard, Inc.,
6.125%, 09/15/23 | | | 1,687,912 | | | | 0.3 | |
Principal Amount† | | | Value | | | Percentage of Net Assets | |
| CORPORATE BONDS/NOTES: (continued) | | | | | |
| | | | | | | Technology (continued) |
| | 770,000 | | | # | | Audatex North America, Inc.,
6.000%, 06/15/21 | | $ | 818,125 | | | | 0.2 | |
| | 1,040,000 | | | # | | Audatex North America,
Inc., 6.125%, 11/01/23 | | | 1,103,700 | | | | 0.2 | |
| | 1,290,000 | | | # | | BCP Singapore VI Cayman
Financing Co. Ltd., 8.000%,
04/15/21 | | | 1,273,875 | | | | 0.2 | |
| | 1,750,000 | | | # | | BMC Software Finance,
Inc., 8.125%, 07/15/21 | | | 1,610,000 | | | | 0.3 | |
| | 900,000 | | | #,& | | Boxer Parent Co., Inc.,
9.000%, 10/15/19 | | | 747,000 | | | | 0.1 | |
| | 615,000 | | | | | CDW, LLC / CDW Finance
Corp., 8.500%, 04/01/19 | | | 641,137 | | | | 0.1 | |
| | 2,300,000 | | | | | CDW LLC / CDW Finance
Corp., 5.500%-6.000%,
08/15/22-12/01/24 | | | 2,436,760 | | | | 0.5 | |
| | 1,000,000 | | | #,& | | Eagle Midco, Inc., 9.000%,
06/15/18 | | | 1,022,500 | | | | 0.2 | |
| | 1,795,000 | | | | | Emdeon, Inc., 11.000%,
12/31/19 | | | 1,965,525 | | | | 0.4 | |
| | 1,395,000 | | | # | | Entegris, Inc., 6.000%,
04/01/22 | | | 1,461,263 | | | | 0.3 | |
| | 1,730,000 | | | | | First Data Corp., 10.625%,
06/15/21 | | | 1,976,525 | | | | 0.4 | |
| | 1,918,000 | | | | | First Data Corp., 11.750%,
08/15/21 | | | 2,227,278 | | | | 0.4 | |
| | 145,000 | | | # | | First Data Corp., 8.250%,
01/15/21 | | | 156,962 | | | | 0.0 | |
| | 646,000 | | | #,& | | First Data Corp., 8.750%,
01/15/22 | | | 698,488 | | | | 0.2 | |
| | 750,000 | | | # | | IMS Health, Inc., 6.000%,
11/01/20 | | | 782,813 | | | | 0.2 | |
| | 1,640,000 | | | #,& | | Infor Software Parent
LLC / Infor Software
Parent, Inc., 7.125%,
05/01/21 | | | 1,630,258 | | | | 0.3 | |
| | 590,000 | | | # | | MSCI, Inc., 5.250%,
11/15/24 | | | 611,388 | | | | 0.1 | |
| | 1,720,000 | | | # | | Open Text Corp., 5.625%,
01/15/23 | | | 1,788,800 | | | | 0.3 | |
| | 5,510,000 | | | | | Other Securities | | | 5,538,431 | | | | 1.1 | |
| | | | | | | | | | 31,227,490 | | | | 6.0 | |
| | | | | | | Telecommunication Services: 0.3% |
| | 1,495,000 | | | | | CenturyLink, Inc., 5.800%,
03/15/22 | | | 1,564,144 | | | | 0.3 | |
See Accompanying Notes to Financial Statements
| Voya High Yield Bond Fund | SUMMARY PORTFOLIO OF INVESTMENTS
as of March 31, 2015 (continued) |
Principal Amount† | | | Value | | | Percentage of Net Assets | |
| CORPORATE BONDS/NOTES: (continued) | | | | | |
| | | | | | | Utilities: 1.8% |
| | 750,000 | | | # | | Calpine Corp., 6.000%,
01/15/22 | | $ | 806,250 | | | | 0.1 | |
| | 2,450,000 | | | | | Calpine Corp.,
5.375%-5.750%,
01/15/23-01/15/25 | | | 2,473,031 | | | | 0.5 | |
| | 1,500,000 | | | # | | LBC Tank Terminals
Holding Netherlands BV,
6.875%, 05/15/23 | | | 1,541,250 | | | | 0.3 | |
| | 4,040,000 | | | | | Other Securities | | | 4,322,650 | | | | 0.9 | |
| | | | | | | | | | 9,143,181 | | | | 1.8 | |
| | | | | | | Total Corporate Bonds/Notes
(Cost $499,654,248) | | | 498,730,850 | | | | 96.4 | |
| ASSET-BACKED SECURITIES: 0.2% | | | | | | | | |
| | | | | | | Other Asset-Backed Securities: 0.2% |
| | 1,000,000 | | | # | | Castle Garden Funding,
6.560%, 10/27/20 | | | 1,078,507 | | | | 0.2 | |
| | | | | | | Total Asset-Backed
Securities
(Cost $997,500) | | | 1,078,507 | | | | 0.2 | |
| Shares | | | Value | | | Percentage of Net Assets | |
| COMMON STOCK: 0.0% |
| | | | | | | Consumer Discretionary: 0.0% |
| | 195 | | | | | Other Securities | | | 98 | | | | 0.0 | |
| | | | | | | Total Common Stock
(Cost $7,957) | | | 98 | | | | 0.0 | |
| | | | | | | Total Long-Term Investments
(Cost $500,659,705) | | | 499,809,455 | | | | 96.6 | |
| SHORT-TERM INVESTMENTS: 2.5% | | | | | | | | |
| | | | | | | Mutual Funds: 2.5% |
| | 12,717,000 | | | | | BlackRock Liquidity Funds,
TempFund, Institutional Class,
0.070%†† (Cost $12,717,000) | | | 12,717,000 | | | | 2.5 | |
| Shares | | | Value | | | Percentage of Net Assets | |
| SHORT-TERM INVESTMENTS: (continued) | | | | | |
| | | | | | | Mutual Funds (continued) |
| | | | | | | Total Short-Term Investments
(Cost $12,717,000) | | $ | 12,717,000 | | | | 2.5 | |
| | | | | | | Total Investments in Securities (Cost $513,376,705) | | $ | 512,526,455 | | | | 99.1 | |
| | | | | | | Assets in Excess of Other Liabilities | | | 4,416,149 | | | | 0.9 | |
| | | | | | | Net Assets | | $ | 516,942,604 | | | | 100.0 | |
| | | | | | | | | | | | | | | |
“Other Securities” represents issues not identified as the top 50 holdings in terms of market value and issues or issuers not exceeding 1% of net assets individually or in aggregate respectively as of March 31, 2015.
The following footnotes apply to either the individual securities noted or one or more of the securities aggregated and listed as a single line item.
| † | Unless otherwise indicated, principal amount is shown in USD. |
| †† | Rate shown is the 7-day yield as of March 31, 2015. |
| # | Securities with purchases pursuant to Rule 144A or section 4(a)(2), under the Securities Act of 1933 and may not be resold subject to that rule except to qualified institutional buyers. |
| (a) | The grouping contains securities in default. |
Cost for federal income tax purposes is $513,572,547.
Net unrealized depreciation consists of:
| Gross Unrealized Appreciation | | $ | 11,009,697 | |
| Gross Unrealized Depreciation | | | (12,055,789 | ) |
| Net Unrealized Depreciation | | $ | (1,046,092 | ) |
See Accompanying Notes to Financial Statements
| Voya High Yield Bond Fund | SUMMARY PORTFOLIO OF INVESTMENTS
as of March 31, 2015 (continued) |
Fair Value Measurements^
The following is a summary of the fair valuations according to the inputs used as of March 31, 2015 in valuing the assets and liabilities:
| | | Quoted Prices in Active Markets for Identical Investments (Level 1) | | | Significant Other Observable Inputs (Level 2) | | | Significant Unobservable Inputs (Level 3) | | | Fair Value at March 31, 2015 | |
| Asset Table | | | | | | | | | | | | | | | | |
| Investments, at fair value | | | | | | | | | | | | | | | | |
| Common Stock | | | | | | | | | | | | | | | | |
| Consumer Discretionary | | $ | — | | | $ | — | | | $ | 98 | | | $ | 98 | |
| Total Common Stock | | | — | | | | — | | | | 98 | | | | 98 | |
| Corporate Bonds/Notes | | | — | | | | 498,730,850 | | | | — | | | | 498,730,850 | |
| Asset-Backed Securities | | | — | | | | 1,078,507 | | | | — | | | | 1,078,507 | |
| Short-Term Investments | | | 12,717,000 | | | | — | | | | — | | | | 12,717,000 | |
| Total Investments, at fair value | | $ | 12,717,000 | | | $ | 499,809,357 | | | $ | 98 | | | $ | 512,526,455 | |
| ^ | See Note 2, ’’Significant Accounting Policies" in the Notes to Financial Statements for additional information. |
The effect of derivative instruments on the Fund’s Statement of Operations for the year ended March 31, 2015 was as follows:
| | | Amount of Realized
Gain or (Loss)
on Derivatives
Recognized in Income | |
| Derivatives not accounted for as hedging instruments | | Swaps | |
| Credit contracts | | $ | 52,917 | |
| Total | | $ | 52,917 | |
See Accompanying Notes to Financial Statements
VOYA INTERMEDIATE BOND FUND | SUMMARY PORTFOLIO OF INVESTMENTS
as of March 31, 2015 |
Principal Amount† | | | Value | | | Percentage of Net Assets | |
| CORPORATE BONDS/NOTES: 33.2% | | | | | |
| | | | | | | Basic Materials: 1.8% |
| | 2,564,000 | | | # | | Anglo American Capital
PLC, 2.625%, 09/27/17 | | $ | 2,599,350 | | | | 0.1 | |
| | 2,110,000 | | | #,L | | FMG Resources August
2006 Pty Ltd., 6.875%,
04/01/22 | | | 1,566,675 | | | | 0.1 | |
| | 1,861,000 | | | # | | Georgia-Pacific LLC,
2.539%, 11/15/19 | | | 1,888,762 | | | | 0.1 | |
| | 1,960,000 | | | # | | Georgia-Pacific LLC,
3.163%, 11/15/21 | | | 2,012,062 | | | | 0.1 | |
| | 1,860,000 | | | # | | Georgia-Pacific LLC,
3.600%, 03/01/25 | | | 1,910,588 | | | | 0.1 | |
| | 1,334,000 | | | # | | Georgia-Pacific LLC,
3.734%, 07/15/23 | | | 1,399,821 | | | | 0.0 | |
| | 1,770,000 | | | # | | Mexichem SAB de CV,
4.875%, 09/19/22 | | | 1,866,465 | | | | 0.1 | |
| | 2,017,000 | | | # | | Xstrata Finance Canada
Ltd., 4.250%, 10/25/22 | | | 2,076,845 | | | | 0.1 | |
| | 778,000 | | | # | | Xstrata Finance Canada
Ltd., 4.950%, 11/15/21 | | | 841,784 | | | | 0.0 | |
| | 28,672,000 | | | | | Other Securities(a) | | | 29,726,410 | | | | 1.1 | |
| | | | | | | | | | 45,888,762 | | | | 1.8 | |
| | | | | | | Communications: 5.6% |
| | 2,571,000 | | | # | | Alibaba Group Holding Ltd.,
3.125%, 11/28/21 | | | 2,592,990 | | | | 0.1 | |
| | 2,455,000 | | | # | | Alibaba Group Holding Ltd.,
3.600%, 11/28/24 | | | 2,467,805 | | | | 0.1 | |
| | 800,000 | | | # | | Altice Financing SA,
6.625%, 02/15/23 | | | 828,000 | | | | 0.0 | |
| | 7,276,000 | | | L | | AT&T, Inc., 3.900%-5.350%,
03/11/24-06/15/44 | | | 7,626,060 | | | | 0.3 | |
| | 713,000 | | | # | | CommScope, Inc., 5.000%,
06/15/21 | | | 715,674 | | | | 0.0 | |
| | 884,000 | | | # | | CommScope, Inc., 5.500%,
06/15/24 | | | 888,420 | | | | 0.1 | |
| | 2,696,000 | | | # | | Cox Communications, Inc.,
3.850%, 02/01/25 | | | 2,777,692 | | | | 0.1 | |
| | 772,000 | | | # | | COX Communications, Inc.,
4.500%, 06/30/43 | | | 770,405 | | | | 0.0 | |
| | 2,000,000 | | | # | | CSC Holdings, LLC,
5.250%, 06/01/24 | | | 2,045,000 | | | | 0.1 | |
| | 707,000 | | | # | | Digicel Ltd, 6.750%,
03/01/23 | | | 686,674 | | | | 0.0 | |
| | 4,854,000 | | | | | DIRECTV Holdings LLC /
DIRECTV Financing Co.,
Inc., 3.800%, 03/15/22 | | | 5,038,768 | | | | 0.2 | |
| | 1,500,000 | | | | | DIRECTV Holdings LLC/
DIRECTV Financing Co.,
Inc., 5.150%, 03/15/42 | | | 1,575,906 | | | | 0.0 | |
Principal Amount† | | | Value | | | Percentage of Net Assets | |
| CORPORATE BONDS/NOTES: (continued) | | | | | |
| | | | | | | Communications (continued) |
| | 2,385,000 | | | # | | Nielsen Finance LLC /
Nielsen Finance Co.,
5.000%, 04/15/22 | | $ | 2,408,850 | | | | 0.1 | |
| | 770,000 | | | # | | Sable International Finance
Ltd., 8.750%, 02/01/20 | | | 831,600 | | | | 0.0 | |
| | 3,000,000 | | | # | | Sinclair Television Group,
Inc., 5.625%, 08/01/24 | | | 3,067,500 | | | | 0.1 | |
| | 2,640,000 | | | # | | Sirius XM Radio, Inc.,
5.875%, 10/01/20 | | | 2,758,800 | | | | 0.1 | |
| | 2,110,000 | | | # | | Softbank Corp., 4.500%,
04/15/20 | | | 2,162,750 | | | | 0.1 | |
| | 2,600,000 | | | # | | Telefonica Chile SA,
3.875%, 10/12/22 | | | 2,623,985 | | | | 0.1 | |
| | 2,833,000 | | | | | Time Warner Cable, Inc.,
5.875%, 11/15/40 | | | 3,400,744 | | | | 0.1 | |
| | 5,944,000 | | | | | Time Warner, Inc.,
4.050%-6.500%,
12/15/23-12/15/43 | | | 6,848,006 | | | | 0.3 | |
| | 1,395,000 | | | # | | Univision Communications,
Inc., 5.125%, 02/15/25 | | | 1,428,131 | | | | 0.1 | |
| | 7,358,000 | | | | | Verizon Communications,
Inc., 4.150%, 03/15/24 | | | 7,910,034 | | | | 0.3 | |
| | 4,814,000 | | | | | Verizon Communications,
Inc., 5.150%, 09/15/23 | | | 5,523,015 | | | | 0.2 | |
| | 13,256,000 | | | | | Verizon Communications,
Inc., 3.000%-6.550%,
11/01/21-08/21/54 | | | 14,141,185 | | | | 0.5 | |
| | 65,400,000 | | | | | Other Securities(a) | | | 67,292,428 | | | | 2.6 | |
| | | | | | | | | | 148,410,422 | | | | 5.6 | |
| | | | | | | Consumer, Cyclical: 1.3% |
| | 1,375,000 | | | # | | Carlson Wagonlit BV,
6.875%, 06/15/19 | | | 1,447,188 | | | | 0.0 | |
| | 500,000 | | | # | | Cedar Fair L.P. / Canada’s
Wonderland Co. / Magnum
Management Corp.,
5.375%, 06/01/24 | | | 511,875 | | | | 0.0 | |
| | 1,680,000 | | | #,& | | Schaeffler Holding Finance
BV, 6.875%, 08/15/18 | | | 1,761,900 | | | | 0.1 | |
| | 28,904,000 | | | | | Other Securities(a) | | | 30,527,777 | | | | 1.2 | |
| | | | | | | | | | 34,248,740 | | | | 1.3 | |
| | | | | | | Consumer, Non-cyclical: 6.6% |
| | 10,289,000 | | | | | Actavis Funding SCS,
3.450%-4.850%,
03/15/22-06/15/44 | | | 10,715,124 | | | | 0.4 | |
| | 2,922,000 | | | # | | Bayer US Finance LLC,
2.375%, 10/08/19 | | | 2,974,459 | | | | 0.1 | |
See Accompanying Notes to Financial Statements
VOYA INTERMEDIATE BOND FUND | SUMMARY PORTFOLIO OF INVESTMENTS
as of March 31, 2015 (continued) |
Principal Amount† | | | Value | | | Percentage of Net Assets | |
| CORPORATE BONDS/NOTES: (continued) | | | | | |
| | | | | | | Consumer, Non-cyclical (continued) |
| | 2,506,000 | | | # | | Bayer US Finance LLC,
3.000%, 10/08/21 | | $ | 2,595,028 | | | | 0.1 | |
| | 7,051,000 | | | | | Becton Dickinson and Co.,
1.800%-3.734%,
12/15/17-12/15/24 | | | 7,268,127 | | | | 0.3 | |
| | 6,714,000 | | | | | Celgene Corp.,
2.250%-3.250%,
05/15/19-08/15/22 | | | 6,830,756 | | | | 0.3 | |
| | 1,140,000 | | | # | | ERAC USA Finance LLC,
2.800%, 11/01/18 | | | 1,173,995 | | | | 0.0 | |
| | 2,021,000 | | | # | | JM Smucker Co, 3.500%,
03/15/25 | | | 2,081,967 | | | | 0.1 | |
| | 8,521,000 | | | | | Laboratory Corp. of
America Holdings,
2.200%-3.200%,
08/23/17-02/01/22 | | | 8,617,852 | | | | 0.3 | |
| | 2,493,000 | | | # | | Medtronic, Inc., 3.150%,
03/15/22 | | | 2,591,060 | | | | 0.1 | |
| | 4,121,000 | | | # | | Medtronic, Inc., 3.500%,
03/15/25 | | | 4,317,110 | | | | 0.1 | |
| | 1,895,000 | | | # | | Medtronic, Inc., 4.375%,
03/15/35 | | | 2,073,515 | | | | 0.1 | |
| | 1,830,000 | | | # | | Medtronic, Inc., 4.625%,
03/15/45 | | | 2,079,804 | | | | 0.1 | |
| | 1,619,000 | | | | | Medtronic, Inc.,
2.750%-3.625%,
04/01/23-03/15/24 | | | 1,693,170 | | | | 0.1 | |
| | 5,080,000 | | | | | Merck & Co., Inc.,
2.350%, 02/10/22 | | | 5,088,900 | | | | 0.2 | |
| | 4,150,000 | | | | | Merck & Co., Inc.,
1.850%-2.750%,
02/10/20-02/10/25 | | | 4,165,092 | | | | 0.2 | |
| | 8,295,000 | | | | | Philip Morris International,
Inc., 1.250%-4.250%,
11/09/17-11/10/44 | | | 8,560,636 | | | | 0.3 | |
| | 7,120,000 | | | | | Synchrony Financial,
3.000%-4.250%,
08/15/19-08/15/24 | | | 7,389,654 | | | | 0.3 | |
| | 3,000,000 | | | # | | Universal Health Services,
Inc., 4.750%, 08/01/22 | | | 3,157,500 | | | | 0.1 | |
| | 1,000,000 | | | # | | Valeant Pharmaceuticals
International, 5.625%,
12/01/21 | | | 1,017,500 | | | | 0.1 | |
| | 915,000 | | | # | | Valeant Pharmaceuticals
International, 7.250%,
07/15/22 | | | 971,044 | | | | 0.0 | |
| | 1,000,000 | | | # | | VPI Escrow Corp.,
6.375%, 10/15/20 | | | 1,042,500 | | | | 0.0 | |
Principal Amount† | | | Value | | | Percentage of Net Assets | |
| CORPORATE BONDS/NOTES: (continued) | | | | | |
| | | | | | | Consumer, Non-cyclical (continued) |
| | 2,309,000 | | | | | Anthem, Inc., 3.500%,
08/15/24 | | $ | 2,375,469 | | | | 0.1 | |
| | 4,305,000 | | | | | WellPoint, Inc.,
4.625%-4.650%,
05/15/42-08/15/44 | | | 4,722,324 | | | | 0.2 | |
| | 1,753,000 | | | # | | WM Wrigley Jr Co.,
2.400%, 10/21/18 | | | 1,785,891 | | | | 0.1 | |
| | 2,464,000 | | | # | | WM Wrigley Jr Co.,
2.900%, 10/21/19 | | | 2,543,176 | | | | 0.1 | |
| | 71,280,000 | | | | | Other Securities | | | 74,562,244 | | | | 2.8 | |
| | | | | | | | | | 172,393,897 | | | | 6.6 | |
| | | | | | | Diversified: 0.2% |
| | 1,700,000 | | | # | | Hutchison Whampoa
International 12 Ltd.,
6.000%, 05/29/49 | | | 1,811,299 | | | | 0.1 | |
| | 1,185,000 | | | # | | Tenedora Nemak SA
de CV, 5.500%, 02/28/23 | | | 1,226,475 | | | | 0.0 | |
| | 2,760,000 | | | | | Other Securities | | | 2,768,460 | | | | 0.1 | |
| | | | | | | | | | 5,806,234 | | | | 0.2 | |
| | | | | | | Energy: 3.1% |
| | 850,000 | | | # | | Antero Resources Corp.,
5.625%, 06/01/23 | | | 843,625 | | | | 0.0 | |
| | 1,467,000 | | | # | | Dolphin Energy Ltd.,
5.500%, 12/15/21 | | | 1,690,427 | | | | 0.1 | |
| | 1,652,000 | | | # | | Enable Midstream
Partners L.P., 3.900%,
05/15/24 | | | 1,594,810 | | | | 0.1 | |
| | 1,402,000 | | | # | | Enable Midstream
Partners L.P., 5.000%,
05/15/44 | | | 1,284,121 | | | | 0.0 | |
| | 285,000 | | | # | | Hilcorp Energy I L.P./
Hilcorp Finance Co.,
5.000%, 12/01/24 | | | 269,325 | | | | 0.0 | |
| | 1,367,000 | | | # | | Schlumberger Investment
SA, 3.300%, 09/14/21 | | | 1,436,173 | | | | 0.0 | |
| | 74,759,000 | | | | | Other Securities(a) | | | 75,255,593 | | | | 2.9 | |
| | | | | | | | | | 82,374,074 | | | | 3.1 | |
| | | | | | | Financial: 10.8% |
| | 7,265,000 | | | | | American Tower Corp.,
3.400%-4.500%,
01/15/18-09/15/21 | | | 7,530,923 | | | | 0.3 | |
| | 400,000 | | | # | | Banco de Reservas de LA
Republica Dominicana,
7.000%, 02/01/23 | | | 404,164 | | | | 0.0 | |
| | 13,255,000 | | | | | Bank of America Corp.,
4.000%-5.000%,
01/22/24-01/21/44 | | | 14,249,909 | | | | 0.5 | |
See Accompanying Notes to Financial Statements
VOYA INTERMEDIATE BOND FUND | SUMMARY PORTFOLIO OF INVESTMENTS
as of March 31, 2015 (continued) |
Principal Amount† | | | Value | | | Percentage of Net Assets | |
| CORPORATE BONDS/NOTES: (continued) | | | | | |
| | | | | | | Financial (continued) |
| | 3,158,000 | | | # | | Barclays Bank PLC,
6.050%, 12/04/17 | | $ | 3,479,737 | | | | 0.1 | |
| | 1,333,000 | | | | | BPCE SA, 2.500%,
12/10/18 | | | 1,365,848 | | | | 0.1 | |
| | 3,034,000 | | | # | | BPCE SA, 5.150%,
07/21/24 | | | 3,247,821 | | | | 0.1 | |
| | 2,111,000 | | | # | | BPCE SA, 5.700%,
10/22/23 | | | 2,341,487 | | | | 0.1 | |
| | 4,457,000 | | | | | Citigroup, Inc., 5.500%,
09/13/25 | | | 5,061,748 | | | | 0.2 | |
| | 7,562,000 | | | | | Citigroup, Inc.,
1.800%-6.675%,
02/05/18-09/13/43 | | | 7,890,021 | | | | 0.3 | |
| | 5,130,000 | | | | | Citizens Bank
NA/Providence RI,
2.450%, 12/04/19 | | | 5,198,783 | | | | 0.2 | |
| | 1,660,000 | | | # | | Cooperatieve Centrale
Raiffeisen-Boerenleenbank
BA/Netherlands, 11.000%,
12/29/49 | | | 2,141,400 | | | | 0.1 | |
| | 3,396,000 | | | #,L | | Credit Agricole SA/London,
2.500%, 04/15/19 | | | 3,466,528 | | | | 0.1 | |
| | 3,890,000 | | | # | | Credit Agricole SA, 4.375%,
03/17/25 | | | 3,941,161 | | | | 0.2 | |
| | 4,386,000 | | | # | | Credit Suisse AG, 6.500%,
08/08/23 | | | 5,018,843 | | | | 0.2 | |
| | 2,699,000 | | | # | | Credit Suisse Group
Funding Guernsey Ltd.,
3.750%, 03/26/25 | | | 2,733,955 | | | | 0.1 | |
| | 4,144,000 | | | | | Credit Suisse/New York NY,
1.750%, 01/29/18 | | | 4,157,687 | | | | 0.2 | |
| | 5,989,000 | | | | | Deutsche Bank AG/London,
1.875%, 02/13/18 | | | 6,007,344 | | | | 0.2 | |
| | 3,661,000 | | | # | | Five Corners Funding Trust,
4.419%, 11/15/23 | | | 3,934,671 | | | | 0.1 | |
| | 7,018,000 | | | | | Goldman Sachs Group, Inc.,
3.850%, 07/08/24 | | | 7,353,229 | | | | 0.3 | |
| | 10,762,000 | | | | | Goldman Sachs Group, Inc.,
2.550%-6.750%,
07/19/18-10/01/37 | | | 11,364,618 | | | | 0.4 | |
| | 1,763,000 | | | # | | HBOS PLC, 6.750%,
05/21/18 | | | 1,976,612 | | | | 0.1 | |
| | 2,100,000 | | | # | | ICICI Bank Ltd./Dubai,
4.700%, 02/21/18 | | | 2,232,031 | | | | 0.1 | |
Principal Amount† | | | Value | | | Percentage of Net Assets | |
| CORPORATE BONDS/NOTES: (continued) | | | | | |
| | | | | | | Financial (continued) |
| | 1,037,000 | | | # | | International Lease
Finance Corp., 7.125%,
09/01/18 | | $ | 1,166,625 | | | | 0.0 | |
| | 559,000 | | | # | | IPIC GMTN Ltd., 3.750%,
03/01/17 | | | 584,155 | | | | 0.0 | |
| | 800,000 | | | # | | IPIC GMTN Ltd., 5.500%,
03/01/22 | | | 938,000 | | | | 0.1 | |
| | 10,534,000 | | | | | JPMorgan Chase & Co.,
3.875%-6.125%,
09/10/24-12/29/49 | | | 10,855,275 | | | | 0.4 | |
| | 1,881,000 | | | # | | Mizuho Bank Ltd.,
3.200%, 03/26/25 | | | 1,882,708 | | | | 0.1 | |
| | 8,078,000 | | | | | Morgan Stanley, 3.875%,
04/29/24 | | | 8,510,949 | | | | 0.3 | |
| | 9,051,000 | | | | | Morgan Stanley,
2.125%-5.000%,
04/25/18-01/27/45 | | | 9,432,537 | | | | 0.4 | |
| | 1,345,000 | | | # | | Nordea Bank AB,
6.125%, 12/29/49 | | | 1,390,364 | | | | 0.1 | |
| | 1,147,000 | | | # | | RBS Citizens Financial
Group, Inc., 4.150%,
09/28/22 | | | 1,206,918 | | | | 0.0 | |
| | 3,914,000 | | | | | Santander Bank NA,
2.000%, 01/12/18 | | | 3,932,775 | | | | 0.1 | |
| | 2,893,000 | | | # | | Scentre Group Trust 1/
Scentre Group Trust 2,
3.500%, 02/12/25 | | | 2,963,225 | | | | 0.1 | |
| | 1,860,000 | | | | | Synchrony Financial,
2.700%, 02/03/20 | | | 1,870,152 | | | | 0.1 | |
| | 2,514,000 | | | # | | Washington Prime Group
L.P., 3.850%, 04/01/20 | | | 2,538,978 | | | | 0.1 | |
| | 2,052,000 | | | # | | WEA Finance LLC/
Westfield UK & Europe
Finance PLC, 2.700%,
09/17/19 | | | 2,079,347 | | | | 0.1 | |
| | 2,181,000 | | | # | | WEA Finance LLC/
Westfield UK & Europe
Finance PLC, 3.750%,
09/17/24 | | | 2,260,231 | | | | 0.1 | |
| | 13,362,000 | | | | | Wells Fargo & Co.,
2.150%-5.900%,
01/30/20-12/29/49 | | | 14,413,631 | | | | 0.5 | |
| | 107,774,600 | | | | | Other Securities(a) | | | 112,470,682 | | | | 4.3 | |
| | | | | | | | | | 283,595,072 | | | | 10.8 | |
See Accompanying Notes to Financial Statements
VOYA INTERMEDIATE BOND FUND | SUMMARY PORTFOLIO OF INVESTMENTS
as of March 31, 2015 (continued) |
Principal Amount† | | | Value | | | Percentage of Net Assets | |
| CORPORATE BONDS/NOTES: (continued) | |
| | | | | | | Industrial: 1.1% |
| | 1,872,000 | | | # | | AP Moeller - Maersk A/S,
2.550%, 09/22/19 | | $ | 1,904,741 | | | | 0.1 | |
| | 2,449,000 | | | # | | Cemex SAB de CV,
6.125%, 05/05/25 | | | 2,478,878 | | | | 0.1 | |
| | 23,400,000 | | | | | Other Securities | | | 24,235,689 | | | | 0.9 | |
| | | | | | | | | | 28,619,308 | | | | 1.1 | |
| | | | | | | Technology: 1.3% |
| | 6,040,000 | | | | | Apple, Inc., 1.550%,
02/07/20 | | | 6,005,934 | | | | 0.2 | |
| | 890,000 | | | | | Apple, Inc., 2.500%,
02/09/25 | | | 872,859 | | | | 0.1 | |
| | 26,839,000 | | | | | Other Securities | | | 27,574,723 | | | | 1.0 | |
| | | | | | | | | | 34,453,516 | | | | 1.3 | |
| | | | | | | Utilities: 1.4% |
| | 2,865,000 | | | # | | Calpine Corp., 6.000%,
01/15/22 | | | 3,079,875 | | | | 0.1 | |
| | 612,000 | | | # | | Duquesne Light Holdings,
Inc., 5.900%, 12/01/21 | | | 720,714 | | | | 0.0 | |
| | 1,249,000 | | | # | | Duquesne Light Holdings,
Inc., 6.400%, 09/15/20 | | | 1,481,619 | | | | 0.1 | |
| | 873,000 | | | # | | Empresa de Energia
de Bogota SA, 6.125%,
11/10/21 | | | 938,475 | | | | 0.0 | |
| | 30,121,000 | | | | | Other Securities | | | 31,729,318 | | | | 1.2 | |
| | | | | | | | | | 37,950,001 | | | | 1.4 | |
| | | | | | | Total Corporate
Bonds/Notes
(Cost $845,871,318) | | | 873,740,026 | | | | 33.2 | |
| COLLATERALIZED MORTGAGE OBLIGATIONS: 11.6% | | | | | | | | |
| | 6,881,637 | | | | | Alternative Loan Trust
2005-10CB, 0.674%,
05/25/35 | | | 5,801,564 | | | | 0.2 | |
| | 2,268,800 | | | | | Alternative Loan Trust
2005-6CB, 5.250%,
04/25/35 | | | 2,200,798 | | | | 0.1 | |
| | 4,540,919 | | | | | Alternative Loan Trust
2005-J2, 0.574%,
04/25/35 | | | 3,921,324 | | | | 0.1 | |
| | 1,436,220 | | | | | Alternative Loan Trust
2006-18CB A11, 0.674%,
07/25/36 | | | 1,009,644 | | | | 0.0 | |
| | 5,597,035 | | | | | Alternative Loan Trust
2007-2CB, 0.774%,
03/25/37 | | | 3,988,487 | | | | 0.2 | |
| | 1,039,000 | | | # | | American General
Mortgage Loan Trust,
5.650%, 03/25/58 | | | 1,063,052 | | | | 0.0 | |
Principal Amount† | | | Value | | | Percentage of Net Assets | |
| COLLATERALIZED MORTGAGE OBLIGATIONS: (continued) | |
| | 2,610,000 | | | # | | BAMLL Re-REMIC Trust
2015-FRR11, 09/27/44 | | $ | 2,382,237 | | | | 0.1 | |
| | 2,330,000 | | | # | | Bank of America
Re-REMIC Trust
2014-FRR7 A, 2.421%,
10/26/44 | | | 2,299,552 | | | | 0.1 | |
| | 6,073,093 | | | # | | BAMLL Re-REMIC Trust
2014-FRR9, 2.192%,
12/26/46 | | | 6,000,665 | | | | 0.2 | |
| | 2,770,000 | | | | | Banc of America
Commercial Mortgage
Trust 2007-3 AJ, 5.575%,
06/10/49 | | | 2,855,643 | | | | 0.1 | |
| | 2,030,000 | | | | | Banc of America
Commercial Mortgage
Trust 2007-3 B, 5.575%,
06/10/49 | | | 2,075,980 | | | | 0.1 | |
| | 2,870,000 | | | | | Banc of America
Commercial Mortgage
Trust 2007-4 AJ, 5.821%,
02/10/51 | | | 3,034,445 | | | | 0.1 | |
| | 720,963 | | | # | | Banc of America Funding
Corp., 5.250%, 08/26/35 | | | 747,298 | | | | 0.0 | |
| | 860,000 | | | | | Banc of America Merrill
Lynch Commercial
Mortgage, Inc. 2005-6 C,
5.179%, 09/10/47 | | | 876,484 | | | | 0.1 | |
| | 1,300,000 | | | # | | Banc of America Merrill
Lynch Commercial
Mortgage, Inc.,
5.418%, 07/10/42 | | | 1,285,945 | | | | 0.0 | |
| | 1,271,000 | | | # | | Banc of America Merrill
Lynch Commercial
Mortgage, Inc., 5.754%,
03/11/41 | | | 1,424,697 | | | | 0.1 | |
| | 480,000 | | | # | | Banc of America Merrill
Lynch Commercial
Mortgage, Inc., 5.754%,
03/11/41 | | | 480,404 | | | | 0.0 | |
| | 851,120 | | | | | Banc of America Mortgage
2005-J Trust 2A4, 2.700%,
11/25/35 | | | 788,937 | | | | 0.0 | |
| | 860,000 | | | # | | Bank of America Merrill
Lynch Commercial
Mortgage, Inc., 5.456%,
07/10/43 | | | 862,040 | | | | 0.0 | |
See Accompanying Notes to Financial Statements
VOYA INTERMEDIATE BOND FUND | SUMMARY PORTFOLIO OF INVESTMENTS
as of March 31, 2015 (continued) |
Principal Amount† | | | Value | | | Percentage of Net Assets | |
| COLLATERALIZED MORTGAGE OBLIGATIONS: (continued) | | | | | |
| | 1,710,000 | | | # | | Bank of America Merrill
Lynch Commercial
Mortgage, Inc., 6.233%,
11/10/38 | | $ | 1,748,817 | | | | 0.1 | |
| | 7,487,000 | | | | | Banc of America Merrill
Lynch Commercial
Mortgage, Inc.,
5.147%-5.331%,
07/10/45-09/10/47 | | | 7,632,498 | | | | 0.3 | |
| | 1,422,008 | | | | | Bear Stearns Adjustable
Rate Mortgage Trust,
2.657%, 07/25/36 | | | 1,193,069 | | | | 0.0 | |
| | 4,183,200 | | | | | Bear Stearns Alternative-A
Trust, 2.671%, 05/25/35 | | | 4,062,705 | | | | 0.2 | |
| | 2,180,000 | | | # | | Bear Stearns Commercial
Mortgage Securities Trust
2004-PWR4, 5.859%,
06/11/41 | | | 2,363,738 | | | | 0.1 | |
| | 1,400,000 | | | # | | Bear Stearns Commercial
Mortgage Securities Trust
2005-TOP18 G 2/42,
5.743%, 02/13/42 | | | 1,338,249 | | | | 0.1 | |
| | 3,520,000 | | | # | | Bear Stearns Commercial
Mortgage Securities Trust
2005-TOP18, 5.743%,
02/13/42 | | | 3,462,802 | | | | 0.1 | |
| | 2,050,000 | | | | | Bear Stearns Commercial
Mortgage Securities Trust
2005-TOP20, 5.142%,
10/12/42 | | | 2,078,354 | | | | 0.1 | |
| | 1,013,000 | | | # | | Bear Stearns Commercial
Mortgage Securities Trust
2006-TOP22, 5.575%,
04/12/38 | | | 1,069,517 | | | | 0.0 | |
| | 2,595,518 | | | # | | Beckman Coulter, Inc.
2000-A A, 7.498%,
12/15/18 | | | 2,876,872 | | | | 0.1 | |
| | 53,952 | | | # | | Citigroup Commercial
Mortgage Trust 2004-C1,
5.679%, 04/15/40 | | | 54,254 | | | | 0.0 | |
| | 1,700,000 | | | # | | Citigroup Commercial
Mortgage Trust 2012-GC8,
4.878%, 09/10/45 | | | 1,749,819 | | | | 0.1 | |
| | 2,811,000 | | | # | | Citigroup Mortgage Loan
Trust 2010-7, 5.958%,
12/25/35 | | | 2,945,668 | | | | 0.1 | |
Principal Amount† | | | Value | | | Percentage of Net Assets | |
| COLLATERALIZED MORTGAGE OBLIGATIONS: (continued) | | | | |
| | 4,305,109 | | | | | Citigroup Mortgage Loan
Trust, 5.486%, 11/25/36 | | $ | 3,817,332 | | | | 0.1 | |
| | 5,475,633 | | | | | Citigroup Mortgage Loan
Trust, Inc.,
2.600%-2.715%,
03/25/36-09/25/37 | | | 5,145,268 | | | | 0.2 | |
| | 6,478,021 | | | ^ | | COMM 2012-CCRE1 XA
Mortgage Trust, 2.109%,
05/15/45 | | | 653,903 | | | | 0.0 | |
| | 8,363,361 | | | ^ | | COMM 2013-LC6 XA
Mortgage Trust, 1.766%,
01/10/46 | | | 680,605 | | | | 0.0 | |
| | 1,135,000 | | | | | Commercial Mortgage
Trust 2007-GG11 AJ,
6.254%, 12/10/49 | | | 1,205,304 | | | | 0.1 | |
| | 29,106,375 | | | ^ | | Commercial Mortgage
Trust, 1.413%, 10/10/46 | | | 2,416,030 | | | | 0.1 | |
| | 26,005,705 | | | ^ | | Commercial Mortgage
Trust, 1.432%, 08/10/46 | | | 1,844,549 | | | | 0.1 | |
| | 4,898,783 | | | ^ | | Commercial Mortgage
Trust, 1.899%, 08/15/45 | | | 472,964 | | | | 0.0 | |
| | 27,260,000 | | | #,^ | | Commercial Mortgage
Trust, 0.597%, 10/15/45 | | | 1,150,996 | | | | 0.0 | |
| | 1,280,000 | | | | | Commercial Mortgage
Trust, 5.225%, 07/15/44 | | | 1,299,469 | | | | 0.1 | |
| | 5,628,986 | | | | | Countrywide Home Loan
Mortgage Pass-through
Trust, 2.408%, 11/25/34 | | | 5,348,111 | | | | 0.2 | |
| | 4,368,942 | | | | | Countrywide Alternative
Loan Trust, 0.294%-5.500%,
12/25/35-06/25/36 | | | 3,900,034 | | | | 0.2 | |
| | 110,488 | | | # | | Credit Suisse First Boston
Mortgage Securities Corp.
2003-C4 J, 5.322%, 08/15/36 | | | 110,582 | | | | 0.0 | |
| | 442,500 | | | | | Credit Suisse First Boston
Mortgage Securities Corp.,
5.736%, 05/15/36 | | | 484,164 | | | | 0.0 | |
| | 1,143,781 | | | # | | Credit Suisse First Boston
Mortgage Securities Corp.,
5.671%, 04/12/49 | | | 1,143,753 | | | | 0.1 | |
| | 900,000 | | | # | | Credit Suisse First Boston
Mortgage Securities Corp.,
6.256%, 05/15/36 | | | 1,033,858 | | | | 0.0 | |
See Accompanying Notes to Financial Statements
VOYA INTERMEDIATE BOND FUND | SUMMARY PORTFOLIO OF INVESTMENTS
as of March 31, 2015 (continued) |
Principal Amount† | | | Value | | | Percentage of Net Assets | |
| COLLATERALIZED MORTGAGE OBLIGATIONS: (continued) | | |
| | 1,500,000 | | | # | | DBUBS 2011-LC2
Mortgage Trust, 5.459%,
07/10/44 | | $ | 1,623,325 | | | | 0.1 | |
| | 4,158,204 | | | # | | Deutsche Mortgage
Securities, Inc. Re-REMIC
Trust Certificates Series
2007-WM1, 4.364%,
06/27/37 | | | 4,180,243 | | | | 0.2 | |
| | 3,549,224 | | | | | Deutsche ALT-A Securities,
Inc. Alternate Loan Trust,
0.294%-0.364%,
08/25/36-10/25/36 | | | 2,400,787 | | | | 0.1 | |
| | 1,120,000 | | | | | Fannie Mae Connecticut
Avenue Securities
2013-CO1 M2, 4.724%,
02/25/25 | | | 1,147,558 | | | | 0.1 | |
| | 6,690,000 | | | | | Fannie Mae Connecticut
Avenue Securities
2014-C03 2M2, 3.074%,
07/25/24 | | | 6,261,579 | | | | 0.2 | |
| | 1,960,000 | | | | | Fannie Mae Connecticut
Avenue Securities
2014-CO3 M2, 3.174%,
07/25/24 | | | 1,846,491 | | | | 0.1 | |
| | 3,500,000 | | | | | Fannie Mae Connecticut
Avenue Securities
2015-CO1 M2, 4.474%,
02/25/25 | | | 3,571,304 | | | | 0.1 | |
| | 3,773,900 | | | ^ | | Fannie Mae, 3.000%,
08/25/28 | | | 373,980 | | | | 0.0 | |
| | 811,492 | | | ^ | | Fannie Mae, 3.000%,
05/25/43 | | | 111,750 | | | | 0.0 | |
| | 12,408,401 | | | ^ | | Fannie Mae, 5.776%,
10/25/39 | | | 1,705,681 | | | | 0.1 | |
| | 8,303,000 | | | | | Fannie Mae Connecticut
Avenue Securities,
2.774%-5.174%,
01/25/24-11/25/24 | | | 8,501,956 | | | | 0.3 | |
| | 1,514,776 | | | ^ | | First Horizon Alternative
Mortgage Securities,
6.526%, 12/25/36 | | | 389,899 | | | | 0.0 | |
| | 1,730,000 | | | | | Freddie Mac Structured
Agency Credit Risk Debt
Notes 2014-HQ3 M3,
4.924%, 10/25/24 | | | 1,816,073 | | | | 0.1 | |
| | 1,640,000 | | | | | Freddie Mac Structured
Agency Credit Risk Debt
Notes 2015-HQ1 M2,
2.373%, 03/25/25 | | | 1,642,282 | | | | 0.1 | |
Principal Amount† | | | Value | | | Percentage of Net Assets | |
| COLLATERALIZED MORTGAGE OBLIGATIONS: (continued) | | | | | | | | |
| | 2,000,000 | | | | | Freddie Mac Structured
Agency Credit Risk Debt
Notes 2015-HQ1 M3,
3.973%, 03/25/25 | | $ | 2,015,023 | | | | 0.1 | |
| | 3,700,000 | | | | | Freddie Mac Structured
Agency Credit Risk Debt
Notes, 2.374%-4.324%,
09/25/24-01/25/25 | | | 3,764,953 | | | | 0.1 | |
| | 230,629,672 | | | #,^ | | FREMF Mortgage Trust,
0.100%, 12/25/44 | | | 1,234,561 | | | | 0.1 | |
| | 126,935 | | | # | | GMAC Commercial
Mortgage Securities, Inc.
Series 2003-C1 Trust,
5.000%, 05/10/36 | | | 129,424 | | | | 0.0 | |
| | 8,581,094 | | | ^ | | GS Mortgage Securities
Corp. II 2012-GCJ9 XA,
2.512%, 11/10/45 | | | 988,993 | | | | 0.0 | |
| | 46,187,457 | | | ^ | | GS Mortgage Securities
Corp. II, 1.715%, 11/10/46 | | | 3,521,073 | | | | 0.1 | |
| | 10,046,388 | | | ^ | | GS Mortgage Securities
Corp. II, 2.551%, 05/10/45 | | | 1,080,973 | | | | 0.1 | |
| | 3,290,000 | | | # | | GS Mortgage Securities
Trust 2010-C2, 5.223%,
12/10/43 | | | 3,531,409 | | | | 0.1 | |
| | 1,930,000 | | | # | | GS Mortgage Securities
Trust 2011-GC3, 5.555%,
03/10/44 | | | 2,106,457 | | | | 0.1 | |
| | 955,043 | | | # | | Jefferies Resecuritization
Trust 2009-R6, 5.031%,
03/26/36 | | | 937,547 | | | | 0.0 | |
| | 736,763 | | | | | JP Morgan Alternative
Loan Trust, 5.500%,
12/25/35 | | | 602,675 | | | | 0.0 | |
| | 26,111,914 | | | ^ | | JP Morgan Chase
Commercial Mortgage
Securities Corp. 2012-LC9
XA, 1.887%, 12/15/47 | | | 2,364,081 | | | | 0.1 | |
| | 15,265,000 | | | #,^ | | JP Morgan Chase
Commercial Mortgage
Securities Corp. 2012-LC9
XB, 0.358%, 12/15/47 | | | 374,707 | | | | 0.0 | |
| | 630,000 | | | # | | JP Morgan Chase
Commercial Mortgage
Securities Corp.
Commercial Mortgage
Pass-Thr, 5.600%,
05/15/41 | | | 665,435 | | | | 0.0 | |
See Accompanying Notes to Financial Statements
VOYA INTERMEDIATE BOND FUND | SUMMARY PORTFOLIO OF INVESTMENTS
as of March 31, 2015 (continued) |
Principal Amount† | | | Value | | | Percentage of Net Assets | |
| COLLATERALIZED MORTGAGE OBLIGATIONS: (continued) | | | | |
| | 42,924,251 | | | ^ | | JP Morgan Chase
Commercial Mortgage
Securities Corp., 0.648%,
01/15/46 | | $ | 960,658 | | | | 0.0 | |
| | 3,190,000 | | | # | | JP Morgan Chase
Commercial Mortgage
Securities Corp., 5.415%,
07/15/46 | | | 3,508,135 | | | | 0.1 | |
| | 1,489,457 | | | # | | JP Morgan Chase
Commercial Mortgage
Securities Trust
2003-LN1 H, 5.466%,
10/15/37 | | | 1,498,450 | | | | 0.1 | |
| | 1,430,000 | | | # | | JP Morgan Chase
Commercial Mortgage
Securities Trust 2003-PM1,
5.600%, 08/12/40 | | | 1,531,254 | | | | 0.1 | |
| | 1,300,000 | | | | | JP Morgan Chase
Commercial Mortgage
Securities Trust
2004-CIBC9 E, 5.697%,
06/12/41 | | | 1,285,008 | | | | 0.1 | |
| | 1,200,000 | | | | | JP Morgan Chase
Commercial Mortgage
Securities Trust
2006-LDP8, 5.618%,
05/15/45 | | | 1,212,212 | | | | 0.1 | |
| | 466,614 | | | # | | JP Morgan Chase
Commercial Mortgage
Securities Trust 2011-C4,
7.990%, 07/15/46 | | | 516,409 | | | | 0.0 | |
| | 41,553,947 | | | ^ | | JP Morgan Chase
Commercial Mortgage
Securities Trust
2012-CIBX XA, 1.755%,
06/15/45 | | | 3,128,476 | | | | 0.1 | |
| | 3,272,013 | | | | | JP Morgan Mortgage
Trust 2005-S3, 6.000%,
01/25/36 | | | 2,959,634 | | | | 0.1 | |
| | 3,290,000 | | | | | JP Morgan Chase
Commercial Mortgage
Securities Trust
2004-CIBC10,
5.066%-5.097%, 01/12/37 | | | 3,313,177 | | | | 0.1 | |
| | 18,659,785 | | | #,^ | | LB-UBS Commercial
Mortgage Trust 2004-C1,
1.000%, 01/15/36 | | | 267,964 | | | | 0.0 | |
| | 1,581,000 | | | # | | LB-UBS Commercial
Mortgage Trust 2005-C1 G,
5.637%, 02/15/40 | | | 1,585,613 | | | | 0.1 | |
Principal Amount† | | | Value | | | Percentage of Net Assets | |
| COLLATERALIZED MORTGAGE OBLIGATIONS: (continued) | | | |
| | 1,730,000 | | | | | LB-UBS Commercial
Mortgage Trust 2005-C3 E,
4.983%, 07/15/40 | | $ | 1,737,414 | | | | 0.1 | |
| | 1,100,000 | | | # | | LB-UBS Commercial
Mortgage Trust 2005-C5,
5.350%, 09/15/40 | | | 1,115,534 | | | | 0.0 | |
| | 3,205,000 | | | | | LB-UBS Commercial
Mortgage Trust 2005-C7,
5.350%, 11/15/40 | | | 3,245,104 | | | | 0.1 | |
| | 720,000 | | | | | LB-UBS Commercial
Mortgage Trust 2006-C4 D,
5.842%, 06/15/38 | | | 737,958 | | | | 0.0 | |
| | 2,090,000 | | | | | LB-UBS Commercial
Mortgage Trust 2006-C4 E,
5.842%, 06/15/38 | | | 2,127,923 | | | | 0.1 | |
| | 830,000 | | | # | | LB-UBS Commercial
Mortgage Trust 2006-C6
JR15, 5.991%, 09/15/39 | | | 844,687 | | | | 0.0 | |
| | 820,000 | | | # | | LB-UBS Commercial
Mortgage Trust 2006-C6
JR16, 5.991%, 09/15/39 | | | 817,724 | | | | 0.0 | |
| | 73,629,143 | | | #,^ | | LB-UBS Commercial
Mortgage Trust, 0.634%,
11/15/38 | | | 729,930 | | | | 0.0 | |
| | 1,100,000 | | | # | | LB-UBS Commercial
Mortgage Trust, 5.166%,
10/15/36 | | | 1,169,334 | | | | 0.0 | |
| | 1,830,000 | | | # | | LB-UBS Commercial
Mortgage Trust, 5.991%,
09/15/39 | | | 1,898,561 | | | | 0.1 | |
| | 1,760,000 | | | # | | LB-UBS Commercial
Mortgage Trust, 5.991%,
09/15/39 | | | 1,837,132 | | | | 0.1 | |
| | 2,070,000 | | | # | | LB-UBS Commercial
Mortgage Trust, 6.890%,
07/15/32 | | | 2,080,948 | | | | 0.1 | |
| | 1,121,864 | | | | | LB-UBS Commercial
Mortgage Trust,
4.954%-8.150%,
07/15/32-07/15/40 | | | 1,124,359 | | | | 0.1 | |
| | 1,500,000 | | | # | | Morgan Stanley Bank of
America Merrill Lynch
Trust 2012-C5, 4.696%,
08/15/45 | | | 1,593,895 | | | | 0.1 | |
| | 30,726,867^ | | | | | Morgan Stanley Bank of
America Merrill Lynch
Trust 2013-C7, 1.704%,
02/15/46 | | | 2,570,137 | | | | 0.1 | |
See Accompanying Notes to Financial Statements
VOYA INTERMEDIATE BOND FUND | SUMMARY PORTFOLIO OF INVESTMENTS
as of March 31, 2015 (continued) |
Principal Amount† | | | Value | | | Percentage of Net Assets | |
| COLLATERALIZED MORTGAGE OBLIGATIONS: (continued) | | |
| | 19,261,874 | | | #,^ | | Morgan Stanley Bank of
America Merrill Lynch
Trust, 2.131%, 11/15/45 | | $ | 1,753,807 | | | | 0.1 | |
| | 108,461 | | | | | Morgan Stanley Capital I
Trust 2004-IQ7 C, 5.189%,
06/15/38 | | | 108,254 | | | | 0.0 | |
| | 1,310,000 | | | # | | Morgan Stanley Capital
I Trust 2005-HQ6, 5.379%,
08/13/42 | | | 1,301,128 | | | | 0.0 | |
| | 2,760,000 | | | # | | Morgan Stanley Capital I
Trust 2008-TOP29, 6.270%,
01/11/43 | | | 2,876,898 | | | | 0.1 | |
| | 3,090,000 | | | # | | Morgan Stanley Capital I
Trust 2011-C1 D, 5.252%,
09/15/47 | | | 3,408,800 | | | | 0.1 | |
| | 1,300,000 | | | # | | Morgan Stanley Capital
I Trust 2011-C1 E,
5.252%, 09/15/47 | | | 1,416,946 | | | | 0.1 | |
| | 250,000 | | | # | | Morgan Stanley Capital I,
Inc., 5.910%, 11/15/31 | | | 255,140 | | | | 0.0 | |
| | 1,080,000 | | | | | Morgan Stanley Capital I,
5.336%, 01/14/42 | | | 1,079,653 | | | | 0.0 | |
| | 19,902 | | | # | | Morgan Stanley Capital I,
7.350%, 07/15/32 | | | 20,106 | | | | 0.0 | |
| | 600,000 | | | # | | Morgan Stanley Dean
Witter Capital I, 7.508%,
07/15/33 | | | 688,002 | | | | 0.0 | |
| | 1,561,619 | | | | | Morgan Stanley Mortgage
Loan Trust 2006-3AR 2A1,
2.767%, 03/25/36 | | | 1,290,230 | | | | 0.0 | |
| | 3,968,115 | | | # | | Morgan Stanley Re-REMIC
Trust 2010-C30 A3B,
5.246%, 12/17/43 | | | 4,003,139 | | | | 0.2 | |
| | 2,590,000 | | | # | | Morgan Stanley Re-REMIC
Trust, 0.250%, 07/27/49 | | | 2,296,553 | | | | 0.1 | |
| | 1,880,730 | | | # | | N-Star Real Estate CDO
Ltd. 2013-1A A, 2.024%,
08/25/29 | | | 1,879,602 | | | | 0.1 | |
| | 7,762,197 | | | #,^ | | UBS-Barclays Commercial
Mortgage Trust, 1.900%,
05/10/63 | | | 581,588 | | | | 0.0 | |
| | 2,200,000 | | | | | Wachovia Bank
Commercial Mortgage
Trust Series 2006-C25,
5.715%, 05/15/43 | | | 2,227,033 | | | | 0.1 | |
Principal Amount† | | | Value | | | Percentage of Net Assets | |
| COLLATERALIZED MORTGAGE OBLIGATIONS: (continued) | | |
| | 5,230,000 | | | | | Wachovia Bank
Commercial Mortgage
Trust Series, 5.715%,
05/15/43 | | $ | 5,346,574 | | | | 0.2 | |
| | 740,379 | | | | | WaMu Alternative
Mortgage Pass-Through
Certificates, 5.500%,
10/25/35 | | | 695,611 | | | | 0.0 | |
| | 902,740 | | | | | WaMu Mortgage Pass
Through Certificates,
1.728%, 10/25/36 | | | 758,426 | | | | 0.0 | |
| | 2,261,909 | | | | | WaMu Mortgage
Pass-Through Certificates
Series 2006-AR14 Trust,
1.959%, 11/25/36 | | | 2,014,172 | | | | 0.1 | |
| | 5,857,840 | | | | | WaMu Mortgage
Pass-Through Certificates
Series 2006-AR16 Trust,
2.014%, 12/25/36 | | | 4,978,063 | | | | 0.2 | |
| | 2,533,786 | | | | | WaMu Mortgage
Pass-Through Certificates
Series 2006-AR16 Trust,
2.014%, 12/25/36 | | | 2,153,241 | | | | 0.1 | |
| | 1,758,166 | | | | | WaMu Mortgage
Pass-Through
Certificates Series
2006-AR6 Trust, 4.484%,
08/25/36 | | | 1,605,086 | | | | 0.1 | |
| | 4,819,356 | | | | | WaMu Mortgage
Pass-Through Certificates
Series 2007-HY2 1A1,
2.194%, 12/25/36 | | | 4,353,088 | | | | 0.2 | |
| | 968,730 | | | | | WaMu Mortgage
Pass-Through Certificates
Series 2007-HY4 Trust,
1.937%, 04/25/37 | | | 844,723 | | | | 0.0 | |
| | 1,367,846 | | | | | WaMu Mortgage
Pass-Through Certificates
WMALT Series Trust
2007-OC1 A3, 0.404%,
01/25/47 | | | 963,438 | | | | 0.0 | |
| | 4,596,931 | | | | | WaMu Mortgage
Pass-Through Certificates,
2.099%, 07/25/37 | | | 3,929,590 | | | | 0.1 | |
See Accompanying Notes to Financial Statements
| Voya Intermediate Bond Fund | SUMMARY PORTFOLIO OF INVESTMENTS
as of March 31, 2015 (continued) |
Principal Amount† | | | Value | | | Percentage of Net Assets | |
| COLLATERALIZED MORTGAGE OBLIGATIONS: (continued) |
| | 2,833,763 | | | | | Washington Mutual
Mortgage Pass-Through
Certificates WMALT
Series 2007-OC1,
0.494%, 01/25/47 | | $ | 2,025,418 | | | | 0.1 | |
| | 3,203,475 | | | | | Wells Fargo Alternative Loan Trust, 6.250%,
07/25/37 | | | 2,927,076 | | | | 0.1 | |
| | 1,520,554 | | | | | Wells Fargo Mortgage
Backed Securities
2005-AR15 Trust, 2.613%,
09/25/35 | | | 1,450,566 | | | | 0.0 | |
| | 1,880,643 | | | | | Wells Fargo Mortgage
Backed Securities
2006-AR6 Trust 3A1,
2.580%, 03/25/36 | | | 1,829,893 | | | | 0.1 | |
| | 1,560,881 | | | | | Wells Fargo Mortgage
Backed Securities Trust,
5.652%, 04/25/36 | | | 1,557,213 | | | | 0.1 | |
| | 5,484,568 | | | #,^ | | Wells Fargo Mortgage
Backed Securities Trust,
1.568%, 06/15/45 | | | 460,789 | | | | 0.0 | |
| | 10,238,233 | | | #,^ | | WFRBS Commercial
Mortgage Trust
2012-C8 XA, 2.193%,
08/15/45 | | | 1,017,102 | | | | 0.0 | |
| | 26,976,371 | | | #,^ | | WFRBS Commercial
Mortgage Trust
2013-C12, 1.490%,
03/15/48 | | | 2,121,182 | | | | 0.1 | |
| | 31,673,231 | | | | | Other Securities | | | 27,867,287 | | | | 1.1 | |
| | | | | | | Total Collateralized
Mortgage Obligations
(Cost $297,694,316) | | | 304,755,746 | | | | 11.6 | |
| FOREIGN GOVERNMENT BONDS: 1.4% |
| | 700,000 | | | # | | Bolivian Government
International Bond,
5.950%, 08/22/23 | | | 728,000 | | | | 0.1 | |
| | 350,000 | | | # | | Costa Rica Government
International Bond,
4.250%, 01/26/23 | | | 336,000 | | | | 0.0 | |
| | 300,000 | | | # | | Dominican Republic
International Bond,
6.600%, 01/28/24 | | | 327,000 | | | | 0.0 | |
| | 232,000 | | | # | | El Salvador Government
International Bond,
5.875%, 01/30/25 | | | 228,230 | | | | 0.0 | |
Principal Amount† | | | Value | | | Percentage of Net Assets | |
| FOREIGN GOVERNMENT BONDS: (continued) |
| | 290,380 | | | # | | Gabonese Republic,
6.375%, 12/12/24 | | $ | 275,135 | | | | 0.0 | |
| | 300,000 | | | # | | Guatemala Government
Bond, 4.875%, 02/13/28 | | | 312,375 | | | | 0.0 | |
| | 900,000 | | | # | | Indonesia Government
International Bond,
4.125%, 01/15/25 | | | 928,125 | | | | 0.1 | |
| | 600,000 | | | # | | KazAgro National
Management Holding
JSC, 4.625%, 05/24/23 | | | 511,836 | | | | 0.0 | |
| | 600,000 | | | # | | Kazakhstan Temir Zholy
Finance BV, 6.950%,
07/10/42 | | | 555,120 | | | | 0.0 | |
| | 600,000 | | | # | | KazMunayGas National Co.
JSC, 4.400%, 04/30/23 | | | 520,500 | | | | 0.0 | |
| | 600,000 | | | # | | Morocco Government
International Bond,
4.250%, 12/11/22 | | | 624,000 | | | | 0.0 | |
| | 600,000 | | | # | | Republic of Paraguay,
4.625%, 01/25/23 | | | 624,000 | | | | 0.0 | |
| | 136,000 | | | # | | Romanian Government
International Bond,
4.375%, 08/22/23 | | | 146,200 | | | | 0.0 | |
| | 630,000 | | | # | | Republic of Serbia,
5.250%, 11/21/17 | | | 656,365 | | | | 0.0 | |
| | 1,000,000 | | | # | | Transnet SOC Ltd.,
4.000%, 07/26/22 | | | 978,220 | | | | 0.1 | |
| | 300,000 | | | # | | Zambia Government
International Bond,
5.375%, 09/20/22 | | | 276,825 | | | | 0.0 | |
| | 27,635,613 | | | | | Other Securities(a) | | | 28,942,660 | | | | 1.1 | |
| | | | | | | Total Foreign
Government Bonds
(Cost $37,151,454) | | | 36,970,591 | | | | 1.4 | |
| ASSET-BACKED SECURITIES: 7.5% |
| | | | | | | Automobile Asset-Backed Securities: 1.0% |
| | 840,000 | | | # | | AmeriCredit Automobile
Receivables Trust 2011-3,
5.760%, 12/10/18 | | | 862,623 | | | | 0.0 | |
| | 1,500,000 | | | | | AmeriCredit Automobile
Receivables Trust 2013-4,
3.310%, 10/08/19 | | | 1,541,219 | | | | 0.1 | |
| | 1,890,000 | | | | | AmeriCredit Automobile
Receivables Trust 2013-5,
2.860%, 12/08/19 | | | 1,918,471 | | | | 0.1 | |
See Accompanying Notes to Financial Statements
| Voya Intermediate Bond Fund | SUMMARY PORTFOLIO OF INVESTMENTS
as of March 31, 2015 (continued) |
Principal Amount† | | | Value | | | Percentage of Net Assets | |
| ASSET-BACKED SECURITIES: (continued) |
| | | | | | | Automobile Asset-Backed Securities (continued) |
| | 3,050,000 | | | # | | AmeriCredit Automobile
Receivables Trust, 3.290%,
05/08/20 | | $ | 3,102,426 | | | | 0.1 | |
| | 800,000 | | | # | | MMCA Automobile Trust,
2.260%, 10/15/20 | | | 809,628 | | | | 0.0 | |
| | 2,900,000 | | | # | | Oscar US Funding Trust
2014-1, 2.550%, 12/15/21 | | | 2,975,119 | | | | 0.1 | |
| | 2,100,000 | | | | | Santander Drive Auto
Receivables Trust 2013-1,
2.270%, 01/15/19 | | | 2,100,816 | | | | 0.1 | |
| | 940,000 | | | | | Santander Drive Auto
Receivables Trust 2013-4,
3.920%, 01/15/20 | | | 978,754 | | | | 0.0 | |
| | 3,380,000 | | | # | | Santander Drive Auto
Receivables Trust 2013-A,
3.780%, 10/15/19 | | | 3,500,306 | | | | 0.1 | |
| | 2,200,000 | | | # | | Santander Drive Auto
Receivables Trust 2013-A,
4.710%, 01/15/21 | | | 2,305,076 | | | | 0.1 | |
| | 4,820,000 | | | | | Santander Drive Auto
Receivables Trust 2014-3,
2.650%, 08/17/20 | | | 4,815,276 | | | | 0.2 | |
| | 2,510,000 | | | | | Other Securities | | | 2,530,374 | | | | 0.1 | |
| | | | | | | | | | 27,440,088 | | | | 1.0 | |
| | | | | | | Home Equity Asset-Backed Securities: 0.0% |
| | 914,022 | | | | | Other Securities | | | 891,808 | | | | 0.0 | |
| | | | | | | Other Asset-Backed Securities: 6.5% |
| | 5,000,000 | | | # | | 1776 CLO Ltd. 2006-1A D,
2.006%, 05/08/20 | | | 4,987,575 | | | | 0.2 | |
| | 2,000,000 | | | # | | Apidos Cinco CDO Ltd.,
2.507%, 05/14/20 | | | 1,975,672 | | | | 0.1 | |
| | 3,910,000 | | | # | | Ares XII CLO Ltd.
2007-12A C, 2.262%,
11/25/20 | | | 3,912,057 | | | | 0.2 | |
| | 1,000,000 | | | # | | Ares XII CLO Ltd., 3.512%,
11/25/20 | | | 994,309 | | | | 0.0 | |
| | 2,750,000 | | | # | | Atrium V, 0.951%, 07/20/20 | | | 2,670,668 | | | | 0.1 | |
| | 650,000 | | | # | | Atrium V, 3.961%, 07/20/20 | | | 643,695 | | | | 0.0 | |
| | 1,625,000 | | | # | | Babson CLO, Inc. 2005-III,
0.656%, 11/10/19 | | | 1,606,226 | | | | 0.1 | |
| | 3,000,000 | | | # | | Babson CLO, Inc. 2005-III,
1.956%, 11/10/19 | | | 2,987,070 | | | | 0.1 | |
| | 1,000,000 | | | # | | Babson Mid-Market CLO,
Inc. 2007-II, 1.103%,
04/15/21 | | | 978,681 | | | | 0.0 | |
Principal Amount† | | | Value | | | Percentage of Net Assets | |
| ASSET-BACKED SECURITIES: (continued) |
| | | | | | | Other Asset-Backed Securities (continued) |
| | 2,000,000 | | | # | | Babson Mid-Market CLO,
Inc. 2007-II, 1.953%,
04/15/21 | | $ | 1,936,552 | | | | 0.1 | |
| | 1,750,000 | | | # | | BlackRock Senior Income
Series V Ltd. 2007-5A D,
2.508%, 08/13/19 | | | 1,714,186 | | | | 0.1 | |
| | 3,500,000 | | | # | | Bluemountain CLO III Ltd.
2007-3A C, 0.961%,
03/17/21 | | | 3,403,522 | | | | 0.1 | |
| | 4,604,008 | | | # | | Callidus Debt Partners
CLO Fund VI Ltd. 6A A1T,
0.517%, 10/23/21 | | | 4,523,074 | | | | 0.2 | |
| | 800,000 | | | # | | Callidus Debt Partners CLO
Fund VI Ltd., 3.257%,
10/23/21 | | | 792,210 | | | | 0.0 | |
| | 1,500,000 | | | # | | Carlyle High Yield Partners
IX Ltd., 0.598%, 08/01/21 | | | 1,463,553 | | | | 0.1 | |
| | 1,250,000 | | | # | | Carlyle High Yield Partners
IX Ltd., 0.668%, 08/01/21 | | | 1,199,451 | | | | 0.0 | |
| | 4,000,000 | | | # | | Carlyle High Yield Partners
IX Ltd., 1.868%, 08/01/21 | | | 3,865,768 | | | | 0.1 | |
| | 1,350,000 | | | # | | Carlyle Veyron CLO Ltd.,
0.933%, 07/15/18 | | | 1,337,098 | | | | 0.1 | |
| | 1,850,000 | | | # | | Castle Garden Funding,
1.012%, 10/27/20 | | | 1,818,966 | | | | 0.1 | |
| | 1,600,000 | | | # | | Castle Garden Funding,
5.012%, 10/27/20 | | | 1,599,807 | | | | 0.1 | |
| | 1,000,000 | | | # | | Castle Garden Funding,
6.560%, 10/27/20 | | | 1,078,507 | | | | 0.0 | |
| | 5,500,000 | | | # | | CIFC Funding 2006-I Ltd.,
1.857%, 10/20/20 | | | 5,409,558 | | | | 0.2 | |
| | 954,128 | | | # | | CIFC Funding 2006-I Ltd.,
4.257%, 10/20/20 | | | 951,858 | | | | 0.0 | |
| | 3,200,000 | | | # | | CIFC Funding 2006-II Ltd.,
1.862%, 03/01/21 | | | 3,107,363 | | | | 0.1 | |
| | 2,070,387 | | | # | | CIFC Funding 2006-II Ltd.,
4.262%, 03/01/21 | | | 2,039,000 | | | | 0.1 | |
| | 2,000,000 | | | # | | Clydesdale CLO 2006 Ltd,
0.937%, 12/19/18 | | | 1,939,742 | | | | 0.1 | |
| | 1,750,000 | | | # | | ColumbusNova CLO IV Ltd
2007-2A C, 2.503%,
10/15/21 | | | 1,719,825 | | | | 0.1 | |
| | 1,000,000 | | | # | | ColumbusNova CLO Ltd
2006-2A E, 4.006%,
04/04/18 | | | 989,804 | | | | 0.0 | |
See Accompanying Notes to Financial Statements
| Voya Intermediate Bond Fund | SUMMARY PORTFOLIO OF INVESTMENTS
as of March 31, 2015 (continued) |
Principal Amount† | | | Value | | | Percentage of Net Assets | |
| ASSET-BACKED SECURITIES: (continued) | |
| | | | | | Other Asset-Backed Securities (continued) |
| | 750,000 | | | # | | ColumbusNova CLO Ltd
2006-II, 1.006%, 04/04/18 | | $ | 740,926 | | | | 0.0 | |
| | 500,000 | | | # | | ColumbusNova CLO Ltd
2006-II, 1.756%, 04/04/18 | | | 490,854 | | | | 0.0 | |
| | 1,970,000 | | | # | | Diamond Lake CLO Ltd.,
1.862%, 12/01/19 | | | 1,928,803 | | | | 0.1 | |
| | 2,000,000 | | | # | | Duane Street CLO III Ltd,
1.752%, 01/11/21 | | | 1,980,074 | | | | 0.1 | |
| | 1,500,000 | | | # | | Eaton Vance CDO IX Ltd.
2007-9A D, 1.757%,
04/20/19 | | | 1,465,773 | | | | 0.1 | |
| | 3,500,000 | | | # | | Eaton Vance CDO IX Ltd.,
0.907%, 04/20/19 | | | 3,455,123 | | | | 0.1 | |
| | 1,500,000 | | | # | | Flagship CLO V, 0.970%,
09/20/19 | | | 1,460,440 | | | | 0.1 | |
| | 1,250,000 | | | # | | Flagship CLO V, 1.820%,
09/20/19 | | | 1,211,098 | | | | 0.0 | |
| | 1,950,000 | | | # | | Fraser Sullivan CLO I Ltd.,
2.071%, 03/15/20 | | | 1,912,614 | | | | 0.1 | |
| | 1,450,000 | | | # | | Fraser Sullivan CLO II Ltd.,
0.670%, 12/20/20 | | | 1,429,090 | | | | 0.0 | |
| | 1,500,000 | | | # | | Fraser Sullivan CLO II Ltd.,
0.990%, 12/20/20 | | | 1,469,128 | | | | 0.1 | |
| | 3,250,000 | | | # | | Fraser Sullivan CLO II Ltd.,
1.770%, 12/20/20 | | | 3,167,239 | | | | 0.1 | |
| | 1,500,000 | | | # | | Gale Force 3 CLO Ltd.
2007-3A D, 1.657%,
04/19/21 | | | 1,425,341 | | | | 0.0 | |
| | 2,000,000 | | | # | | Gallatin CLO III 2007-1
Ltd., 1.507%, 05/15/21 | | | 1,943,924 | | | | 0.1 | |
| | 1,125,000 | | | # | | GoldenTree Loan
Opportunities III Ltd.,
1.505%, 05/01/22 | | | 1,078,345 | | | | 0.0 | |
| | 1,500,000 | | | # | | GoldenTree Loan
Opportunities V Ltd.,
3.507%, 10/18/21 | | | 1,500,009 | | | | 0.1 | |
| | 1,000,000 | | | # | | GSC Group CDO Fund VIII
Ltd, 1.007%, 04/17/21 | | | 986,893 | | | | 0.0 | |
| | 1,750,000 | | | # | | Gulf Stream - Compass
CLO 2007-I Ltd., 1.156%,
10/28/19 | | | 1,731,369 | | | | 0.1 | |
| | 1,825,000 | | | # | | Gulf Stream - Compass
CLO, 2.256%, 10/28/19 | | | 1,825,339 | | | | 0.1 | |
| | 3,100,000 | | | # | | Gulf Stream - Compass
CLO, 3.706%, 10/28/19 | | | 3,102,031 | | | | 0.1 | |
| | 1,500,000 | | | # | | Gulf Stream - Sextant CLO
2007-1 Ltd., 2.670%,
06/17/21 | | | 1,463,964 | | | | 0.0 | |
Principal Amount† | | | Value | | | Percentage of Net Assets | |
| ASSET-BACKED SECURITIES: (continued) |
| | | | | | | Other Asset-Backed Securities (continued) |
| | 1,565,000 | | | # | | Gulf Stream - Sextant CLO,
1.862%, 08/21/20 | | $ | 1,545,200 | | | | 0.1 | |
| | 650,000 | | | # | | Gulf Stream - Rashinban
CLO 2006-1 Ltd., 0.941%,
11/26/20 | | | 633,849 | | | | 0.0 | |
| | 1,150,000 | | | # | | Halcyon Structured Asset
Management Long
Secured/Short Unsecured
2007-1 Ltd. B, 0.706%,
08/07/21 | | | 1,131,582 | | | | 0.0 | |
| | 4,850,000 | | | # | | Halcyon Structured Asset
Management Long
Secured/Short Unsecured,
2.556%, 08/07/21 | | | 4,850,082 | | | | 0.2 | |
| | 900,000 | | | # | | Invitation Homes Trust
2013-SFR1 E, 2.900%,
12/17/30 | | | 886,370 | | | | 0.0 | |
| | 1,380,000 | | | # | | Invitation Homes Trust
2014-SFR1 C, 2.273%,
06/17/31 | | | 1,389,677 | | | | 0.1 | |
| | 2,500,000 | | | # | | Invitation Homes Trust
2014-SFR2 E, 3.328%,
06/17/32 | | | 2,500,000 | | | | 0.1 | |
| | 1,500,000 | | | # | | Katonah IX CLO Ltd.,
0.976%, 01/25/19 | | | 1,462,206 | | | | 0.1 | |
| | 1,630,727 | | | # | | Kennecott Funding Ltd.,
2.054%, 01/13/18 | | | 1,623,147 | | | | 0.1 | |
| | 1,250,000 | | | # | | Kingsland III Ltd., 0.913%,
08/24/21 | | | 1,202,764 | | | | 0.0 | |
| | 1,500,000 | | | # | | Latitude CLO II Corp.,
1.071%, 12/15/18 | | | 1,470,089 | | | | 0.1 | |
| | 1,500,000 | | | # | | LCM V Ltd, 1.615%,
03/21/19 | | | 1,438,749 | | | | 0.0 | |
| | 1,000,000 | | | # | | LightPoint CLO V, 0.966%,
08/05/19 | | | 985,077 | | | | 0.0 | |
| | 2,000,000 | | | # | | LightPoint CLO V, 1.836%,
08/05/19 | | | 1,969,056 | | | | 0.1 | |
| | 2,250,000 | | | # | | Madison Park Funding II
Ltd. 2006-2A D, 5.017%,
03/25/20 | | | 2,222,737 | | | | 0.1 | |
| | 2,500,000 | | | # | | Madison Park Funding II
Ltd., 5.793%, 03/25/20 | | | 2,668,340 | | | | 0.1 | |
| | 1,281,728 | | | # | | Madison Park Funding IV
Ltd., 3.865%, 03/22/21 | | | 1,235,948 | | | | 0.1 | |
| | 1,000,000 | | | # | | Madison Park Funding
Ltd., 2.067%, 03/25/20 | | | 986,772 | | | | 0.0 | |
| | 1,000,000 | | | # | | Madison Park Funding
Ltd., 3.506%, 07/26/21 | | | 1,000,031 | | | | 0.0 | |
See Accompanying Notes to Financial Statements
| Voya Intermediate Bond Fund | SUMMARY PORTFOLIO OF INVESTMENTS
as of March 31, 2015 (continued) |
Principal Amount† | | | Value | | | Percentage of Net Assets | |
| ASSET-BACKED SECURITIES: (continued) |
| | | | | | | Other Asset-Backed Securities (continued) |
| | 1,250,000 | | | # | | Madison Park Funding
Ltd., 5.506%, 07/26/21 | | $ | 1,246,366 | | | | 0.1 | |
| | 1,100,000 | | | # | | Momentum Capital Fund
Ltd., 1.657%, 09/18/21 | | | 1,088,573 | | | | 0.0 | |
| | 3,000,000 | | | # | | Mountain Capital CLO V
Ltd. 2006-5A A3L, 0.951%,
09/15/18 | | | 2,974,503 | | | | 0.1 | |
| | 4,250,000 | | | # | | MSIM Peconic Bay Ltd.,
2.257%, 07/20/19 | | | 4,250,000 | | | | 0.2 | |
| | 5,500,000 | | | # | | Muir Grove CLO Ltd.
2007-1A B, 2.256%,
03/25/20 | | | 5,497,217 | | | | 0.2 | |
| | 1,500,000 | | | # | | Muir Grove CLO Ltd.,
3.256%, 03/25/20 | | | 1,497,881 | | | | 0.1 | |
| | 850,000 | | | # | | Northwoods Capital VII
Ltd., 3.757%, 10/22/21 | | | 850,201 | | | | 0.0 | |
| | 1,500,000 | | | # | | Ocean Trails CLO I,
1.002%, 10/12/20 | | | 1,443,363 | | | | 0.0 | |
| | 1,600,000 | | | # | | Regatta Funding Ltd,
1.571%, 06/15/20 | | | 1,530,795 | | | | 0.1 | |
| | 3,420,000 | | | # | | Springleaf Funding Trust
2015-A, 3.160%, 11/15/24 | | | 3,463,424 | | | | 0.1 | |
| | 1,750,000 | | | # | | St James River CLO Ltd.
2007-1A D, 2.567%,
06/11/21 | | | 1,729,005 | | | | 0.1 | |
| | 2,000,000 | | | # | | Telos CLO 2006-1 Ltd.,
1.952%, 10/11/21 | | | 1,955,350 | | | | 0.1 | |
| | 2,000,000 | | | # | | Trade MAPS 1 Ltd.,
2.431%, 12/10/18 | | | 1,990,000 | | | | 0.1 | |
| | 1,550,000 | | | # | | WhiteHorse III Ltd./Corp
2006-1A A3L, 1.005%,
05/01/18 | | | 1,549,898 | | | | 0.1 | |
| | 1,250,000 | | | # | | WhiteHorse III Ltd/Corp,
2.105%, 05/01/18 | | | 1,248,520 | | | | 0.0 | |
| | 10,190,233 | | | | | Other Securities | | | 9,083,104 | | | | 0.3 | |
| | | | | | | | | | 170,014,050 | | | | 6.5 | |
| | | | | | | Total Asset-Backed
Securities
(Cost $197,332,029) | | | 198,345,946 | | | | 7.5 | |
| U.S. GOVERNMENT AGENCY OBLIGATIONS: 25.4% |
| | | | | | | Federal Home Loan Mortgage Corporation: 9.5% # # |
| | 43,538,000 | | | W | | 3.000%, due 05/01/43 | | | 44,316,070 | | | | 1.7 | |
| | 78,081,000 | | | W | | 3.500%, due 09/15/41 | | | 81,837,127 | | | | 3.1 | |
| | 5,022,790 | | | | | 3.500%, due 03/01/45 | | | 5,285,028 | | | | 0.2 | |
| | 1,751,111 | | | ^^ | | 4.000%, due 01/15/36 | | | 1,710,484 | | | | 0.1 | |
| | 8,501,308 | | | ^ | | 4.000%, due 04/15/43 | | | 1,552,006 | | | | 0.1 | |
Principal Amount† | | | Value | | | Percentage of Net Assets | |
| U.S. GOVERNMENT AGENCY OBLIGATIONS: (continued) |
| | | | | | | Federal Home Loan Mortgage Corporation (continued) |
| | 4,781,245 | | | | | 4.000%, due 08/01/44 | | $ | 5,113,106 | | | | 0.2 | |
| | 25,000,000 | | | | | 4.500%, due 05/15/38 | | | 27,386,512 | | | | 1.1 | |
| | 6,243,252 | | | ^ | | 4.500%, due 12/15/40 | | | 1,021,350 | | | | 0.0 | |
| | 930,598 | | | ^ | | 4.910%, due 03/15/33 | | | 988,826 | | | | 0.0 | |
| | 5,290,054 | | | | | 5.500%, due 11/01/38 | | | 6,027,648 | | | | 0.2 | |
| | 9,214,937 | | | ^ | | 5.826%, due 05/15/36 | | | 1,026,440 | | | | 0.1 | |
| | 3,732,135 | | | ^ | | 5.876%, due 07/15/40 | | | 604,822 | | | | 0.0 | |
| | 18,276,095 | | | ^ | | 5.926%, due 09/15/44 | | | 3,537,594 | | | | 0.1 | |
| | 342,849 | | | ^ | | 6.000%, due 04/15/33 | | | 80,575 | | | | 0.0 | |
| | 8,402,125 | | | ^ | | 6.276%, due 08/15/36 | | | 1,684,907 | | | | 0.1 | |
| | 5,276,647 | | | ^ | | 6.311%, due 06/15/36 | | | 881,146 | | | | 0.0 | |
| | 3,698,773 | | | ^ | | 6.376%, due 05/15/41 | | | 820,836 | | | | 0.0 | |
| | 8,059,865 | | | ^ | | 6.426%, due 09/15/34 | | | 974,004 | | | | 0.0 | |
| | 60,175,706 | | | W | | 2.283%-7.000%, due
12/15/17-03/01/45 | | | 65,391,349 | | | | 2.5 | |
| | | | | | | | | | 250,239,830 | | | | 9.5 | |
| | | | | | | Federal National Mortgage Association: 12.0% # # |
| | 39,457,000 | | | W | | 2.500%, due 11/25/26 | | | 40,444,965 | | | | 1.5 | |
| | 6,878,000 | | | W | | 3.000%, due 10/25/26 | | | 7,197,182 | | | | 0.3 | |
| | 18,295,000 | | | W | | 3.000%, due 11/25/42 | | | 18,705,209 | | | | 0.7 | |
| | 85,856,000 | | | W | | 3.000%, due 05/01/43 | | | 87,571,442 | | | | 3.3 | |
| | 5,873,222 | | | | | 3.000%, due 07/01/43 | | | 6,016,950 | | | | 0.2 | |
| | 10,963,000 | | | W | | 3.500%, due 12/25/40 | | | 11,487,597 | | | | 0.4 | |
| | 11,087,733 | | | ^ | | 3.500%, due 06/25/42 | | | 1,440,131 | | | | 0.1 | |
| | 376,883 | | | ^ | | 4.000%, due 11/01/18 | | | 19,088 | | | | 0.0 | |
| | 24,982,000 | | | W | | 4.000%, due 04/25/39 | | | 26,713,176 | | | | 1.0 | |
| | 6,800,412 | | | ^ | | 4.000%, due 04/25/41 | | | 994,097 | | | | 0.0 | |
| | 4,604,784 | | | | | 4.000%, due 07/01/42 | | | 4,934,515 | | | | 0.2 | |
| | 10,261,007 | | | | | 5.000%, due 07/01/39 | | | 11,504,880 | | | | 0.4 | |
| | 4,746,964 | | | | | 5.500%, due 10/01/39 | | | 5,386,752 | | | | 0.2 | |
| | 27,561,934 | | | ^ | | 5.896%, due 11/25/40 | | | 3,729,863 | | | | 0.1 | |
| | 7,519,020 | | | ^ | | 5.976%, due 11/25/39 | | | 1,173,418 | | | | 0.1 | |
| | 17,088,927 | | | ^ | | 5.976%, due 11/25/42 | | | 4,177,757 | | | | 0.2 | |
| | 573,952 | | | ^ | | 6.000%, due 08/25/33 | | | 128,296 | | | | 0.0 | |
| | 4,996,950 | | | | | 6.000%, due 01/01/38 | | | 5,789,250 | | | | 0.2 | |
| | 20,120,612 | | | ^ | | 6.026%, due 06/25/33 | | | 4,611,932 | | | | 0.2 | |
| | 7,017,849 | | | ^ | | 6.026%, due 08/25/43 | | | 1,382,427 | | | | 0.1 | |
| | 18,537,258 | | | ^ | | 6.226%, due 05/25/40 | | | 3,291,438 | | | | 0.1 | |
| | 7,243,001 | | | ^ | | 6.376%, due 09/25/40 | | | 1,408,996 | | | | 0.1 | |
| | 19,699,992 | | | ^ | | 6.426%, due 04/25/31 | | | 3,743,331 | | | | 0.2 | |
| | 6,041,586 | | | ^ | | 6.426%, due 10/25/41 | | | 1,193,054 | | | | 0.1 | |
| | 15,321,394 | | | ^ | | 6.446%, due 06/25/40 | | | 2,639,012 | | | | 0.1 | |
| | 731,069 | | | ^ | | 6.526%, due 08/25/26 | | | 101,931 | | | | 0.0 | |
| | 4,601,388 | | | ^ | | 6.526%, due 07/25/42 | | | 967,763 | | | | 0.0 | |
See Accompanying Notes to Financial Statements
| Voya Intermediate Bond Fund | SUMMARY PORTFOLIO OF INVESTMENTS
as of March 31, 2015 (continued) |
Principal Amount† | | | Value | | | Percentage of Net Assets | |
| U.S. GOVERNMENT AGENCY OBLIGATIONS: (continued) | |
| | | | | | | Federal National Mortgage Association (continued) |
| | 2,501,331 | | | ^ | | 6.566%, due 01/25/37 | | $ | 504,335 | | | | 0.0 | |
| | 9,010,666 | | | ^ | | 6.576%, due 10/25/35 | | | 1,690,979 | | | | 0.1 | |
| | 4,385,094 | | | ^ | | 7.476%, due 07/25/33 | | | 909,621 | | | | 0.0 | |
| | 659,064 | | | ^ | | 7.509%, due 02/17/29 | | | 119,911 | | | | 0.0 | |
| | 50,259,251 | | | | | 0.570%-32.581%, due
08/01/16-03/01/45 | | | 55,014,240 | | | | 2.1 | |
| | | | | | | | | | 314,993,538 | | | | 12.0 | |
| | | | | | | Government National Mortgage Association: 3.9% |
| | 20,018,000 | | | | | 3.500%, due 12/20/41 | | | 21,014,991 | | | | 0.8 | |
| | 12,600,000 | | | | | 4.000%, due 03/20/45 | | | 13,519,483 | | | | 0.5 | |
| | 7,658,067 | | | ^ | | 4.500%, due 01/16/29 | | | 941,588 | | | | 0.0 | |
| | 6,025,554 | | | | | 4.500%, due 05/16/39 | | | 6,663,121 | | | | 0.3 | |
| | 2,926,303 | | | ^ | | 4.500%, due 09/20/41 | | | 491,632 | | | | 0.0 | |
| | 6,643,426 | | | | | 4.500%, due 01/20/45 | | | 7,227,359 | | | | 0.3 | |
| | 2,017,343 | | | ^ | | 5.000%, due 04/20/40 | | | 841,721 | | | | 0.0 | |
| | 12,628,013 | | | ^ | | 5.176%, due 05/16/41 | | | 2,185,803 | | | | 0.1 | |
| | 24,395,576 | | | ^ | | 5.426%, due 04/16/44 | | | 3,997,101 | | | | 0.2 | |
| | 21,618,191 | | | ^ | | 5.500%, due 11/20/43 | | | 4,751,036 | | | | 0.2 | |
| | 5,641,835 | | | ^ | | 5.674%, due 06/20/40 | | | 865,597 | | | | 0.0 | |
| | 29,233,215 | | | ^ | | 5.874%, due 07/20/39 | | | 4,588,799 | | | | 0.2 | |
| | 32,353,110 | | | ^ | | 5.926%, due 05/16/40 | | | 4,933,849 | | | | 0.2 | |
| | 1,849,931 | | | ^ | | 6.024%, due 06/20/38 | | | 214,614 | | | | 0.0 | |
| | 3,375,053 | | | ^ | | 6.024%, due 04/20/39 | | | 570,008 | | | | 0.0 | |
| | 22,083,277 | | | ^ | | 6.026%, due 12/16/39 | | | 3,583,537 | | | | 0.1 | |
| | 13,053,814 | | | ^ | | 6.124%, due 05/20/39 | | | 1,479,340 | | | | 0.1 | |
| | 2,415,345 | | | ^ | | 6.224%, due 04/20/38 | | | 381,586 | | | | 0.0 | |
| | 1,202,889 | | | ^ | | 6.326%, due 05/16/38 | | | 225,500 | | | | 0.0 | |
| | 3,054,958 | | | ^ | | 6.374%, due 01/20/38 | | | 491,043 | | | | 0.0 | |
| | 14,549,172 | | | ^ | | 6.444%, due 08/20/40 | | | 3,324,212 | | | | 0.1 | |
| | 6,570,030 | | | ^ | | 6.476%, due 09/16/40 | | | 1,291,908 | | | | 0.1 | |
| | 2,075,192 | | | ^ | | 6.596%, due 02/16/35 | | | 398,130 | | | | 0.0 | |
| | 87,740 | | | ^ | | 8.076%, due 06/16/31 | | | 8,078 | | | | 0.0 | |
| | 16,774,117 | | | | | 4.000%-5.500%, due
05/20/39-10/20/60 | | | 18,317,797 | | | | 0.7 | |
| | | | | | | | | | 102,307,833 | | | | 3.9 | |
| | | | | | | Total U.S. Government
Agency Obligations
(Cost $652,091,390) | | | 667,541,201 | | | | 25.4 | |
| U.S. TREASURY OBLIGATIONS: 28.5% |
| | | | | | | U.S. Treasury Bonds: 9.4% |
| | 140,634,000 | | | L | | 2.000%, due 02/15/25 | | | 141,534,902 | | | | 5.4 | |
| | 95,897,000 | | | | | 3.000%, due 11/15/44 | | | 105,104,646 | | | | 4.0 | |
| | | | | | | | | | 246,639,548 | | | | 9.4 | |
| | | | | | | U.S. Treasury Notes: 19.1% |
| | 24,428,000 | | | | | 0.375%, due 03/31/16 | | | 24,450,913 | | | | 0.9 | |
Principal Amount† | | | Value | | | Percentage of Net Assets | |
| U.S. TREASURY OBLIGATIONS: (continued) |
| | | | | | | U.S. Treasury Notes: (continued) |
| | 192,626,000 | | | | | 1.000%, due 03/15/18 | | $ | 193,318,298 | | | | 7.4 | |
| | 39,020,000 | | | | | 1.375%, due 03/31/20 | | | 39,029,131 | | | | 1.5 | |
| | 10,980,000 | | | | | 1.750%, due 02/28/22 | | | 11,012,600 | | | | 0.4 | |
| | 63,580,000 | | | | | 1.750%, due 03/31/22 | | | 63,743,909 | | | | 2.4 | |
| | 75,000 | | | | | 0.500%, due 02/28/17 | | | 74,947 | | | | 0.0 | |
| | 172,164,000 | | | | | 0.500%, due 03/31/17 | | | 171,948,795 | | | | 6.5 | |
| | | | | | | | | | 503,578,593 | | | | 19.1 | |
| | | | | | | Total U.S. Treasury
Obligations
(Cost $744,912,589) | | | 750,218,141 | | | | 28.5 | |
| # of Contracts | | | Value | | | Percentage of Net Assets | |
| PURCHASED OPTIONS: —% |
| | | | | | | OTC Interest Rate Swaptions: —% |
| | 343,506,087 | | | @ | | Receive a floating rate
equal to the 3-month
USD-LIBOR-BBA and
pay a fixed rate equal to
5.008%, Exp. 05/29/15
Counterparty: Goldman
Sachs & Co. | | | — | | | | — | |
| | | | | | | Total Purchased
Options
(Cost $1,683,180) | | | — | | | | — | |
| | | | | | | Total Long-Term
Investments
(Cost $2,776,736,276) | | | 2,831,571,651 | | | | 107.6 | |
Principal Amount† | | | Value | | | Percentage of Net Assets | |
| SHORT-TERM INVESTMENTS: 11.9% |
| | | | | | | Securities Lending Collateralcc: 5.4% |
| | 7,133,413 | | | | | BNP Paribas Bank,
Repurchase Agreement
dated 03/31/15, 0.13%,
due 04/01/15 (Repurchase
Amount $7,133,438,
collateralized by various
U.S. Government Agency
Obligations, 1.625%-
6.000%, Market Value plus
accrued interest $7,276,081,
due 06/01/16-03/01/45) | | | 7,133,413 | | | | 0.2 | |
See Accompanying Notes to Financial Statements
| Voya Intermediate Bond Fund | SUMMARY PORTFOLIO OF INVESTMENTS
as of March 31, 2015 (continued) |
Principal Amount† | | | Value | | | Percentage of Net Assets | |
| SHORT-TERM INVESTMENTS: (continued) |
| | | | | | | Securities Lending Collateralcc (continued) |
| | 33,884,009 | | | | | Daiwa Capital Markets,
Repurchase Agreement
dated 03/31/15, 0.18%, due
04/01/15 (Repurchase
Amount $33,884,176,
collateralized by various U.S.
Government/U.S.
Government Agency
Obligations, 0.000%-8.000%,
Market Value plus accrued
interest $34,561,690, due
02/15/16-03/01/48) | | $ | 33,884,009 | | | | 1.3 | |
| | 33,884,009 | | | | | Merrill Lynch & Co., Inc.,
Repurchase Agreement
dated 03/31/15, 0.15%,
due 04/01/15 (Repurchase
Amount $33,884,148,
collateralized by various
U.S. Government Agency
Obligations, 0.000%-
7.000%, Market Value
plus accrued interest
$34,561,689, due
06/01/15-04/01/45) | | | 33,884,009 | | | | 1.3 | |
| | 33,884,009 | | | | | Millenium Fixed Income
Ltd., Repurchase Agreement
dated 03/31/15, 0.22%,
due 04/01/15 (Repurchase
Amount $33,884,213,
collateralized by various
U.S. Government Securities,
0.875%-3.125%, Market
Value plus accrued interest
$34,561,690, due
08/15/17-02/15/42) | | | 33,884,009 | | | | 1.3 | |
| | 33,884,009 | | | | | Nomura Securities,
Repurchase Agreement
dated 03/31/15, 0.13%,
due 04/01/15 (Repurchase
Amount $33,884,130,
collateralized by various
U.S. Government Agency
Obligations, 1.280%-
7.500%, Market Value
plus accrued interest
$34,561,689, due
08/18/15-10/20/64) | | | 33,884,009 | | | | 1.3 | |
| | | | | | | | | | 142,669,449 | | | | 5.4 | |
| Shares | | | Value | | | Percentage of Net Assets | |
| | | | | | | Mutual Funds: 6.5% |
| | 171,625,414 | | | | | BlackRock Liquidity
Funds, TempFund,
Institutional Class,
0.070%††
(Cost $171,625,414) | | $ | 171,625,414 | | | | 6.5 | |
| | | | | | | Total Short-Term
Investments
(Cost $314,294,863) | | | 314,294,863 | | | | 11.9 | |
| | | | | | | Total Investments in Securities (Cost $3,091,031,139) | | $ | 3,145,866,514 | | | | 119.5 | |
| | | | | | | Liabilities in Excess of Other Assets | | | (512,252,037 | ) | | | (19.5 | ) |
| | | | | | | Net Assets | | $ | 2,633,614,477 | | | | 100.0 | |
“Other Securities” represents issues not identified as the top 50 holdings in terms of market value and issues or issuers not exceeding 1% of net assets individually or in aggregate respectively as of March 31, 2015.
The following footnotes apply to either the individual securities noted or one or more of the securities aggregated and listed as a single line item.
| † | Unless otherwise indicated, principal amount is shown in USD. |
| †† | Rate shown is the 7-day yield as of March��31, 2015. |
| # | Securities with purchases pursuant to Rule 144A or section 4(a)(2), under the Securities Act of 1933 and may not be resold subject to that rule except to qualified institutional buyers. |
| # | The Federal Housing Finance Agency (“FHFA”) placed the Federal Home Loan Mortgage Corporation and Federal National Mortgage Association into conservatorship with FHFA as the conservator. As such, the FHFA oversees the continuing affairs of these companies. |
| @ | Non-income producing security. |
| cc | Represents securities purchased with cash collateral received for securities on loan. |
| W | Settlement is on a when-issued or delayed-delivery basis. |
| L | Loaned security, a portion or all of the security is on loan at March 31, 2015. |
| ^ | Interest only securities represent the right to receive the monthly interest payments on an underlying pool of mortgage loans. Principal amount shown represents the notional amount on which current interest is calculated. Payments of principal on the pool reduce the value of the interest only security. |
| ^^ | Principal only securities represent the right to receive the monthly principal payments on an underlying pool of mortgage loans. No payments of interest on the pool are passed through the principal only security. |
| (a) | This grouping contains securities on loan. |
Cost for federal income tax purposes is $3,092,296,041.
See Accompanying Notes to Financial Statements
| Voya Intermediate Bond Fund | SUMMARY PORTFOLIO OF INVESTMENTS
as of March 31, 2015 (continued) |
Net unrealized appreciation consists of:
| Gross Unrealized Appreciation | | $ | 64,979,619 | |
| Gross Unrealized Depreciation | | | (11,409,146 | ) |
| Net Unrealized Appreciation | | $ | 53,570,473 | |
Fair Value Measurements^
The following is a summary of the fair valuations according to the inputs used as of March 31, 2015 in valuing the assets and liabilities:
| | | Quoted Prices
in Active Markets
for Identical
Investments
(Level 1) | | | Significant
Other
Observable
Inputs
(Level 2) | | | Significant
Unobservable
Inputs
(Level 3) | | | Fair Value
at
March 31, 2015 | |
| Asset Table | | | | | | | | | | | | | | | | |
| Investments, at fair value | | | | | | | | | | | | | | | | |
| Purchased Options | | $ | — | | | $ | — | | | | $ — | | | $ | — | |
| Corporate Bonds/Notes | | | — | | | | 873,740,026 | | | | — | | | | 873,740,026 | |
| Collateralized Mortgage Obligations | | | — | | | | 304,755,746 | | | | — | | | | 304,755,746 | |
| Short-Term Investments | | | 171,625,414 | | | | 142,669,449 | | | | — | | | | 314,294,863 | |
| U.S. Treasury Obligations | | | — | | | | 750,218,141 | | | | — | | | | 750,218,141 | |
| Asset-Backed Securities | | | — | | | | 198,345,946 | | | | — | | | | 198,345,946 | |
| U.S. Government Agency Obligations | | | — | | | | 667,541,201 | | | | — | | | | 667,541,201 | |
| Foreign Government Bonds | | | — | | | | 36,970,591 | | | | — | | | | 36,970,591 | |
| Total Investments, at fair value | | $ | 171,625,414 | | | $ | 2,974,241,100 | | | $ | — | | | $ | 3,145,866,514 | |
| Other Financial Instruments+ | | | | | | | | | | | | | | | | |
| Centrally Cleared Swaps | | | — | | | | 10,969,851 | | | | — | | | | 10,969,851 | |
| Futures | | | 938,646 | | | | — | | | | — | | | | 938,646 | |
| Total Assets | | $ | 172,564,060 | | | $ | 2,985,210,951 | | | $ | — | | | $ | 3,157,775,011 | |
| Liabilities Table | | | | | | | | | | | | | | | | |
| Other Financial Instruments+ | | | | | | | | | | | | | | | | |
| Centrally Cleared Swaps | | $ | — | | | $ | (13,288,433 | ) | | $ | — | | | $ | (13,288,433 | ) |
| Forward Foreign Currency Contracts | | | — | | | | (71,247 | ) | | | — | | | | (71,247 | ) |
| Futures | | | (2,581,248 | ) | | | — | | | | — | | | | (2,581,248 | ) |
| Total Liabilities | | $ | (2,581,248 | ) | | $ | (13,359,680 | ) | | $ | — | | | $ | (15,940,928 | ) |
| ^ | See Note 2, “Significant Accounting Policies” in the Notes to Financial Statements for additional information. |
| + | Other Financial Instruments are derivatives not reflected in the Portfolio of Investments and may include open forward foreign currency contracts, futures, centrally cleared swaps, OTC swaps and written options. Forward foreign currency contracts, futures and centrally cleared swaps are valued at the unrealized gain (loss) on the instrument. OTC swaps and written options are valued at the fair value of the instrument. |
At March 31, 2015, the following forward foreign currency contracts were outstanding for Voya Intermediate Bond Fund:
| Counterparty | | Currency | | Contract
Amount | | | Buy/Sell | | Settlement
Date | | In Exchange
For | | | Fair Value | | | Unrealized
Appreciation
(Depreciation) | |
| Goldman Sachs & Co. | | EU Euro | | | 908,756 | | | Buy | | 05/22/15 | | $ | 1,032,172 | | | $ | 977,806 | | | $ | (54,366 | ) |
| | | | | | | | | | | | | | | | | | | | | $ | (54,366 | ) |
| JPMorgan Chase & Co. | | Brazilian Real | | | 295,654 | | | Sell | | 06/19/15 | | $ | 89,146 | | | $ | 90,499 | | | $ | (1,353 | ) |
| JPMorgan Chase & Co. | | South African Rand | | | 6,920,236 | | | Sell | | 06/19/15 | | | 547,626 | | | | 563,154 | | | | (15,528 | ) |
| | | | | | | | | | | | | | | | | | | | | $ | (16,881 | ) |
See Accompanying Notes to Financial Statements
| Voya Intermediate Bond Fund | SUMMARY PORTFOLIO OF INVESTMENTS
as of March 31, 2015 (continued) |
At March 31, 2015, the following futures contracts were outstanding for Voya Intermediate Bond Fund:
| Contract Description | | Number of Contracts | | | Expiration Date | | Notional Value | | | Unrealized Appreciation/ (Depreciation) | |
| Long Contracts | | | | | | | | | | | | | | |
| U.S. Treasury 2-Year Note | | | 642 | | | 06/30/15 | | $ | 140,698,319 | | | $ | 389,631 | |
| U.S. Treasury Long Bond | | | 2 | | | 06/19/15 | | | 327,750 | | | | 557 | |
| U.S. Treasury Ultra Long Bond | | | 188 | | | 06/19/15 | | | 31,936,500 | | | | 548,458 | |
| | | | | | | | | $ | 172,962,569 | | | $ | 938,646 | |
| Short Contracts | | | | | | | | | | | | | | |
| U.S. Treasury 5-Year Note | | | (2,746 | ) | | 06/30/15 | | | (330,099,241 | ) | | | (2,581,248 | ) |
| | | | | | | | | $ | (330,099,241 | ) | | $ | (2,581,248 | ) |
At March 31, 2015, the following centrally cleared interest rate swaps were outstanding for Voya Intermediate Bond Fund:
| | | Clearinghouse | | Termination Date | | Notional Amount | | Fair Value | | | Unrealized Appreciation/ (Depreciation) | |
Receive a floating rate equal to the 3-month
USD-LIBOR-BBA and pay a fixed rate
equal to 1.668% | | Chicago Mercantile Exchange | | 10/30/19 | | USD | 162,439,000 | | | $ | (1,505,535 | ) | | $ | (1,505,535 | ) |
| Receive a fixed rate equal to 2.408% and pay a floating rate based on the 3-month USD-LIBOR-BBA | | Chicago Mercantile Exchange | | 10/30/24 | | USD | 84,377,000 | | | | 3,030,828 | | | | 3,030,828 | |
| Receive a fixed rate equal to 2.000% and pay a floating rate equal to the 3-month USD-LIBOR-BBA | | Chicago Mercantile Exchange | | 11/05/19 | | USD | 331,320,000 | | | | 7,939,023 | | | | 7,939,023 | |
Receive a floating rate equal to the 3-month
USD-LIBOR-BBA and pay a fixed rate
equal to 2.760% | | Chicago Mercantile Exchange | | 11/05/24 | | USD | 175,600,000 | | | | (11,782,898 | ) | | | (11,782,898 | ) |
| | | | | | | | | | | | | $ | (2,318,582 | ) | | $ | (2,318,582 | ) |
A summary of derivative instruments by primary risk exposure is outlined in the following tables.
The fair value of derivative instruments as of March 31, 2015 was as follows:
| Derivatives not accounted for as hedging instruments | | Location on Statement of Assets and Liabilities | | Fair Value | |
| Asset Derivatives | | | | | | |
| Interest rate contracts | | Net Assets — Unrealized appreciation* | | $ | 938,646 | |
| Interest rate contracts | | Net Assets — Unrealized appreciation** | | | 10,969,851 | |
| Total Asset Derivatives | | | | $ | 11,908,497 | |
| Liability Derivatives | | | | | | |
| Foreign exchange contracts | | Unrealized depreciation on forward foreign currency contracts | | $ | 71,247 | |
| Interest rate contracts | | Net Assets — Unrealized depreciation* | | | 2,581,248 | |
| Interest rate contracts | | Net Assets — Unrealized depreciation** | | | 13,288,433 | |
| Total Liability Derivatives | | | | $ | 15,940,928 | |
| * | Includes cumulative appreciation/depreciation of futures contracts as reported in the table following the Summary Portfolio of Investments. |
| ** | Includes cumulative appreciation/depreciation of centrally cleared swaps as reported in the table following the Summary Portfolio of Investments. Only current days variation margin receivable/payable is included on the Statement of Assets and Liabilities. |
See Accompanying Notes to Financial Statements
| Voya Intermediate Bond Fund | SUMMARY PORTFOLIO OF INVESTMENTS
as of March 31, 2015 (continued) |
The effect of derivative instruments on the Fund’s Statement of Operations for the year ended March 31, 2015 was as follows:
| | | Amount of Realized Gain or (Loss) on Derivatives Recognized in Income | |
Derivatives not accounted for as hedging instruments | | Investments* | | | Foreign currency related transactions** | | | Futures | | | Swaps | | | Written options | | | Total | |
| Credit contracts | | $ | — | | | $ | — | | | $ | — | | | $ | (718,995 | ) | | $ | — | | | $ | (718,995 | ) |
| Foreign exchange contracts | | | — | | | | 2,216 | | | | — | | | | — | | | | — | | | | 2,216 | |
| Interest rate contracts | | | (2,134,015 | ) | | | — | | | | (10,212,685 | ) | | | 571,387 | | | | 3,108,521 | | | | (8,666,792 | ) |
| Total | | $ | (2,134,015 | ) | | $ | 2,216 | | | $ | (10,212,685 | ) | | $ | (147,608 | ) | | $ | 3,108,521 | | | $ | (9,383,571 | ) |
| | | Change in Unrealized Appreciation or (Depreciation) on Derivatives Recognized in Income | |
| Derivatives not accounted for as hedging instruments | | Investments* | | | Foreign currency related transactions** | | | Futures | | | Swaps | | | Total | |
| Credit contracts | | $ | — | | | $ | — | | | $ | — | | | $ | (99,165 | ) | | $ | (99,165 | ) |
| Foreign exchange contracts | | | — | | | | (227,037 | ) | | | — | | | | — | | | | (227,037 | ) |
| Interest rate contracts | | | (1,683,180 | ) | | | — | | | | (1,494,939 | ) | | | (2,318,582 | ) | | | (5,496,701 | ) |
| Total | | $ | (1,683,180 | ) | | $ | (227,037 | ) | | $ | (1,494,939 | ) | | $ | (2,417,747 | ) | | $ | (5,822,903 | ) |
| * | Amounts recognized for purchased options are included in net realized gain (loss) on investments. |
| ** | Amounts recognized for forward foreign currency contracts are included in net realized gain (loss) on foreign currency related transactions and net change in unrealized appreciation or depreciation on foreign currency related transactions. |
The following is a summary by counterparty of the fair value of OTC derivative instruments subject to Master Netting Agreements and collateral pledged (received), if any, at March 31, 2015:
| | | Goldman
Sachs & Co. | | | JPMorgan
Chase & Co. | | | Totals | |
| Liabilities: | | | | | | | | | |
| Forward foreign currency contracts | | $ | 54,366 | | | $ | 16,881 | | | $ | 71,247 | |
| Total Liabilities | | $ | 54,366 | | | $ | 16,881 | | | $ | 71,247 | |
| Net OTC derivative instruments by counterparty, at fair value | | $ | (54,366 | ) | | $ | (16,881 | ) | | $ | (71,247 | ) |
| Total collateral pledged by the Fund/(Received from counterparty) | | $ | — | | | $ | — | | | $ | — | |
| Net Exposure(1) | | $ | (54,366 | ) | | $ | (16,881 | ) | | $ | (71,247 | ) |
| (1) | Positive net exposure represents amounts due from each respective counterparty. Negative exposure represents amounts due from the Fund. Please refer to Note 2 for additional details regarding counterparty credit risk and credit related contingent features. |
See Accompanying Notes to Financial Statements
| Voya Short Term Bond Fund | SUMMARY PORTFOLIO OF INVESTMENTS
as of March 31, 2015 |
| Principal Amount† | | | Value | | | Percentage of Net Assets | |
| CORPORATE BONDS/NOTES: 58.7% |
| | | | | | | Basic Materials: 2.5% | | | | | |
| | 580,000 | | | | | BHP Billiton Finance
USA Ltd., 2.050%,
09/30/18 | | $ | 592,491 | | | | 0.4 | |
| | 500,000 | | | #,L | | FMG Resources August
2006 Pty Ltd., 6.000%,
04/01/17 | | | 496,563 | | | | 0.4 | |
| | 2,406,000 | | | | | Other Securities | | | 2,447,246 | | | | 1.7 | |
| | | | | | | | | | 3,536,300 | | | | 2.5 | |
| | | | | | | Communications: 4.4% | | | | | |
| | 395,000 | | | # | | Alibaba Group Holding Ltd.,
1.625%, 11/28/17 | | | 396,217 | | | | 0.3 | |
| | 600,000 | | | | | Juniper Networks, Inc.,
3.100%, 03/15/16 | | | 610,355 | | | | 0.4 | |
| | 822,000 | | | | | Thomson Reuters Corp.,
0.875%-1.650%,
05/23/16-09/29/17 | | | 822,502 | | | | 0.6 | |
| | 4,120,000 | | | | | Other Securities | | | 4,327,924 | | | | 3.1 | |
| | | | | | | | | | 6,156,998 | | | | 4.4 | |
| | | | | | | Consumer Staples: 0.4% | | | | | |
| | 500,000 | | | | | Other Securities | | | 558,750 | | | | 0.4 | |
| | | | | | | Consumer, Cyclical: 4.3% | | | | | |
| | 679,000 | | | | | American Honda Finance
Corp., 1.200%-2.250%,
07/14/17-08/15/19 | | | 687,901 | | | | 0.5 | |
| | 375,000 | | | # | | Daimler Finance North
America LLC, 1.650%,
03/02/18 | | | 377,187 | | | | 0.3 | |
| | 277,000 | | | # | | Glencore Funding LLC,
1.700%, 05/27/16 | | | 278,210 | | | | 0.2 | |
| | 180,000 | | | # | | Hyundai Capital America,
1.625%, 10/02/15 | | | 180,813 | | | | 0.1 | |
| | 300,000 | | | # | | Hyundai Capital America,
1.875%, 08/09/16 | | | 302,692 | | | | 0.2 | |
| | 322,000 | | | # | | Volkswagen Group of
America Finance LLC,
1.600%, 11/20/17 | | | 324,961 | | | | 0.2 | |
| | 200,000 | | | # | | Volkswagen International
Finance NV, 1.125%,
11/18/16 | | | 200,746 | | | | 0.2 | |
| | 3,593,000 | | | | | Other Securities(a) | | | 3,674,062 | | | | 2.6 | |
| | | | | | | | | | 6,026,572 | | | | 4.3 | |
| | | | | | | Consumer, Non-cyclical: 11.2% | | | | | | | | |
| | 600,000 | | | | | Abbott Laboratories,
2.000%, 03/15/20 | | | 604,319 | | | | 0.4 | |
| Principal Amount† | | | Value | | | Percentage of Net Assets | |
| CORPORATE BONDS/NOTES: (continued) |
| | | | | | | Consumer, Non-cyclical (continued) | | | | | |
| | 927,000 | | | | | Actavis Funding SCS,
1.300%-2.350%,
06/15/17-03/12/18 | | $ | 927,094 | | | | 0.7 | |
| | 650,000 | | | | | Altria Group, Inc., 2.625%,
01/14/20 | | | 660,280 | | | | 0.5 | |
| | 333,000 | | | # | | Bayer US Finance LLC,
1.500%, 10/06/17 | | | 335,198 | | | | 0.2 | |
| | 440,000 | | | # | | JM Smucker Co/The,
1.750%, 03/15/18 | | | 442,089 | | | | 0.3 | |
| | 223,000 | | | # | | Medtronic, Inc., 2.500%,
03/15/20 | | | 227,990 | | | | 0.2 | |
| | 666,000 | | | | | Ventas Realty L.P.,
1.250%-1.550%,
09/26/16-04/17/17 | | | 667,534 | | | | 0.5 | |
| | 359,000 | | | # | | WM Wrigley Jr Co., 1.400%,
10/21/16 | | | 360,411 | | | | 0.2 | |
| | 11,275,000 | | | | | Other Securities | | | 11,519,417 | | | | 8.2 | |
| | | | | | | | | | 15,744,332 | | | | 11.2 | |
| | | | | | | Energy: 4.5% | | | | | | | | |
| | 600,000 | | | | | TransCanada PipeLines Ltd.,
0.750%, 01/15/16 | | | 599,193 | | | | 0.4 | |
| | 215,000 | | | | | TransCanada PipeLines Ltd,
1.875%, 01/12/18 | | | 217,151 | | | | 0.2 | |
| | 5,475,000 | | | | | Other Securities | | | 5,530,812 | | | | 3.9 | |
| | | | | | | | | | 6,347,156 | | | | 4.5 | |
| | | | | | | Financial: 26.5% | | | | | | | | |
| | 637,000 | | | | | Abbey National Treasury
Services PLC/London,
1.650%, 09/29/17 | | | 641,241 | | | | 0.5 | |
| | 450,000 | | | # | | ABN AMRO Bank NV,
1.375%, 01/22/16 | | | 452,399 | | | | 0.3 | |
| | 740,000 | | | | | American International
Group, Inc., 5.600%,
10/18/16 | | | 789,140 | | | | 0.6 | |
| | 600,000 | | | | | Australia & New Zealand
Banking Group Ltd.,
0.900%, 02/12/16 | | | 601,843 | | | | 0.4 | |
| | 1,100,000 | | | | | Bank of America Corp.,
2.600%, 01/15/19 | | | 1,120,174 | | | | 0.8 | |
| | 320,000 | | | | | Bank of Nova Scotia AM8,
2.550%, 01/12/17 | | | 328,651 | | | | 0.2 | |
| | 506,000 | | | | | Bank of Nova Scotia,
1.300%, 07/21/17 | | | 507,009 | | | | 0.4 | |
See Accompanying Notes to Financial Statements
| Voya Short Term Bond Fund | SUMMARY PORTFOLIO OF INVESTMENTS
as of March 31, 2015 (continued) |
| Principal Amount† | | | Value | | | Percentage of Net Assets | |
| CORPORATE BONDS/NOTES: (continued) |
| | | | | | | Financial (continued) | | | | | | | | |
| | 295,000 | | | # | | Bank of Tokyo-Mitsubishi
UFJ Ltd./The, 1.700%,
03/05/18 | | $ | 295,507 | | | | 0.2 | |
| | 425,000 | | | # | | Bank of Tokyo-Mitsubishi
UFJ Ltd., 1.550%, 09/09/16 | | | 427,649 | | | | 0.3 | |
| | 339,000 | | | # | | Banque Federative du
Credit Mutuel SA, 1.700%,
01/20/17 | | | 341,526 | | | | 0.2 | |
| | 870,000 | | | | | Barclays Bank PLC,
5.000%, 09/22/16 | | | 919,704 | | | | 0.6 | |
| | 900,000 | | | | | BB&T Corp., 1.600%,
08/15/17 | | | 906,106 | | | | 0.6 | |
| | 210,000 | | | | | BB&T Corp., 5.200%,
12/23/15 | | | 216,647 | | | | 0.2 | |
| | 500,000 | | | # | | BBVA Banco Continental
SA, 2.250%, 07/29/16 | | | 504,000 | | | | 0.4 | |
| | 622,000 | | | | | Citigroup, Inc., 1.850%,
11/24/17 | | | 626,686 | | | | 0.4 | |
| | 648,000 | | | | | Commonwealth Bank of
Australia/New York NY,
1.125%-1.400%,
03/13/17-09/08/17 | | | 649,431 | | | | 0.5 | |
| | 630,000 | | | | | Compass Bank, 1.850%,
09/29/17 | | | 634,832 | | | | 0.4 | |
| | 641,000 | | | | | Goldman Sachs Group, Inc.,
2.375%, 01/22/18 | | | 654,266 | | | | 0.5 | |
| | 425,000 | | | | | Goldman Sachs Group, Inc.,
2.550%, 10/23/19 | | | 431,461 | | | | 0.3 | |
| | 426,000 | | | # | | HSBC Bank PLC, 1.500%,
05/15/18 | | | 426,074 | | | | 0.3 | |
| | 299,000 | | | | | HSBC USA, Inc., 1.500%,
11/13/17 | | | 300,237 | | | | 0.2 | |
| | 358,000 | | | | | Huntington National
Bank/The, 1.700%,
02/26/18 | | | 357,856 | | | | 0.3 | |
| | 325,000 | | | | | Huntington National Bank,
1.350%, 08/02/16 | | | 326,836 | | | | 0.2 | |
| | 846,000 | | | | | JPMorgan Chase & Co.,
1.350%-1.625%,
02/15/17-05/15/18 | | | 846,216 | | | | 0.6 | |
| | 750,000 | | | # | | Macquarie Bank Ltd.,
1.600%, 10/27/17 | | | 749,972 | | | | 0.5 | |
| | 1,078,000 | | | | | Manufacturers &
Traders Trust Co.,
1.400%-1.450%,
07/25/17-03/07/18 | | | 1,080,510 | | | | 0.8 | |
| Principal Amount† | | | Value | | | Percentage of Net Assets | |
| CORPORATE BONDS/NOTES: (continued) |
| | | | | | | Financial (continued) | | | | | | | | |
| | 312,000 | | | # | | MassMutual Global
Funding II, 3.125%,
04/14/16 | | $ | 320,025 | | | | 0.2 | |
| | 674,000 | | | | | MetLife, Inc.,
1.756%-1.903%, 12/15/17 | | | 681,628 | | | | 0.5 | |
| | 295,000 | | | # | | Mitsubishi UFJ Trust &
Banking Corp., 1.600%,
10/16/17 | | | 294,877 | | | | 0.2 | |
| | 289,000 | | | # | | Mizuho Bank Ltd., 1.300%,
04/16/17 | | | 287,940 | | | | 0.2 | |
| | 1,118,000 | | | | | Morgan Stanley,
1.875%-5.450%,
01/09/17-04/25/18 | | | 1,144,196 | | | | 0.8 | |
| | 500,000 | | | # | | Nordea Bank AB, 0.875%,
05/13/16 | | | 501,084 | | | | 0.4 | |
| | 580,000 | | | | | PNC Bank NA, 2.400%,
10/18/19 | | | 591,477 | | | | 0.4 | |
| | 315,000 | | | | | PNC Funding Corp.,
2.700%, 09/19/16 | | | 322,561 | | | | 0.3 | |
| | 550,000 | | | | | PNC Funding Corp.,
5.625%, 02/01/17 | | | 591,431 | | | | 0.4 | |
| | 600,000 | | | | | Royal Bank of Canada,
1.500%, 01/16/18 | | | 603,192 | | | | 0.4 | |
| | 363,000 | | | # | | Scentre Group Trust 1/
Scentre Group Trust 2,
2.375%, 11/05/19 | | | 367,157 | | | | 0.3 | |
| | 848,000 | | | | | State Street Corp.,
1.350%-2.875%,
03/07/16-05/15/18 | | | 860,787 | | | | 0.6 | |
| | 680,000 | | | | | Sumitomo Mitsui Banking
Corp., 1.500%, 01/18/18 | | | 679,550 | | | | 0.5 | |
| | 593,000 | | | | | Toronto-Dominion Bank,
2.250%, 11/05/19 | | | 603,191 | | | | 0.4 | |
| | 286,000 | | | # | | WEA Finance LLC/
Westfield UK & Europe
Finance PLC, 1.750%,
09/15/17 | | | 287,593 | | | | 0.2 | |
| | 422,000 | | | | | Wells Fargo & Co., 1.500%,
01/16/18 | | | 424,245 | | | | 0.3 | |
| | 644,000 | | | | | Wells Fargo & Co., 2.100%,
05/08/17 | | | 658,135 | | | | 0.5 | |
| | 12,864,000 | | | | | Other Securities | | | 13,056,758 | | | | 9.2 | |
| | | | | | | | | | 37,411,800 | | | | 26.5 | |
See Accompanying Notes to Financial Statements
| Voya Short Term Bond Fund | SUMMARY PORTFOLIO OF INVESTMENTS
as of March 31, 2015 (continued) |
| Principal Amount† | | | Value | | | Percentage of Net Assets | |
| CORPORATE BONDS/NOTES: (continued) |
| | | | | | | Industrial: 1.9% | | | | | | | | |
| | 500,000 | | | # | | Aviation Capital Group
Corp., 3.875%, 09/27/16 | | $ | 510,779 | | | | 0.3 | |
| | 2,175,000 | | | | | Other Securities | | | 2,241,278 | | | | 1.6 | |
| | | | | | | | | | 2,752,057 | | | | 1.9 | |
| | | | | | | Technology: 1.2% | | | | | | | | |
| | 1,737,000 | | | | | Other Securities | | | 1,752,507 | | | | 1.2 | |
| | | | | | | Utilities: 1.8% | | | | | | | | |
| | 600,000 | | | | | Dominion Resources, Inc.,
1.400%, 09/15/17 | | | 600,976 | | | | 0.4 | |
| | 1,912,000 | | | | | Other Securities | | | 1,958,895 | | | | 1.4 | |
| | | | | | | | | | 2,559,871 | | | | 1.8 | |
| | | | | | | Total Corporate
Bonds/Notes
(Cost $82,395,764) | | | 82,846,343 | | | | 58.7 | |
| COLLATERALIZED MORTGAGE OBLIGATIONS: 10.7% |
| | 193,720 | | | # | | American General
Mortgage Loan Trust
2010-1, 5.650%, 03/25/58 | | | 194,787 | | | | 0.1 | |
| | 365,381 | | | # | | BAMLL Re-REMIC Trust
2014-FRR9, 2.192%,
12/26/46 | | | 361,024 | | | | 0.3 | |
| | 480,000 | | | | | Banc of America
Commercial Mortgage
Trust 2007-3 AJ, 5.575%,
06/10/49 | | | 494,841 | | | | 0.3 | |
| | 100,000 | | | # | | Banc of America Merrill
Lynch Commercial
Mortgage, Inc., 5.456%,
07/10/43 | | | 100,275 | | | | 0.1 | |
| | 277,212 | | | # | | Banc of America Re-REMIC
Trust 2009-UB2 A4AA,
5.678%, 02/24/51 | | | 290,407 | | | | 0.2 | |
| | 630,000 | | | # | | Bank of America Merrill
Lynch Commercial
Mortgage, Inc., 5.456%,
07/10/43 | | | 631,494 | | | | 0.4 | |
| | 640,000 | | | # | | Bank of America Merrill
Lynch Commercial
Mortgage, Inc., 6.233%,
11/10/38 | | | 654,528 | | | | 0.5 | |
| | 350,000 | | | | | Bear Stearns Commercial
Mortgage Securities Trust
2005-PWR9, 5.055%,
09/11/42 | | | 353,883 | | | | 0.3 | |
| | 913,068 | | | | | Bear Stearns Commercial
Mortgage Securities Trust,
4.750%-5.957%,
06/11/41-06/11/50 | | | 915,273 | | | | 0.6 | |
| Principal Amount† | | | Value | | | Percentage of Net Assets | |
| COLLATERALIZED MORTGAGE OBLIGATIONS: (continued) |
| | 430,000 | | | | | CD 2007-CD5 Mortgage
Trust AJ, 6.124%, 11/15/44 | | $ | 469,330 | | | | 0.3 | |
| | 250,000 | | | # | | Commercial Mortgage Trust
2004-GG1 F, 6.235%,
06/10/36 | | | 255,115 | | | | 0.2 | |
| | 330,000 | | | | | Commercial Mortgage Trust,
5.225%, 07/15/44 | | | 334,851 | | | | 0.2 | |
| | 625,261 | | | | | Commercial Mortgage Trust,
5.289%, 12/11/49 | | | 653,636 | | | | 0.5 | |
| | 16,248 | | | # | | Credit Suisse First Boston
Mortgage Securities Corp.
2003-C4 J, 5.322%,
08/15/36 | | | 16,262 | | | | 0.0 | |
| | 600,000 | | | | | Credit Suisse First Boston
Mortgage Securities Corp.,
4.877%, 04/15/37 | | | 600,121 | | | | 0.4 | |
| | 577,000 | | | | | Credit Suisse First Boston
Mortgage Securities Corp.,
5.290%, 08/15/38 | | | 581,404 | | | | 0.4 | |
| | 620,000 | | | # | | Credit Suisse Mortgage
Capital Certificates,
5.342%, 12/16/43 | | | 654,819 | | | | 0.5 | |
| | 335,000 | | | # | | CSMC Series 2009-RR3
A5A, 5.342%, 12/15/43 | | | 354,030 | | | | 0.3 | |
| | 100,000 | | | # | | Del Coronado Trust,
4.000%, 03/15/26 | | | 100,120 | | | | 0.1 | |
| | 790,728 | | | | | GMAC Commercial
Mortgage Securities, Inc.
Series 2005-C1 Trust,
4.754%, 05/10/43 | | | 790,344 | | | | 0.6 | |
| | 270,000 | | | # | | Hilton USA Trust 2013-HLT,
2.662%, 11/05/30 | | | 271,155 | | | | 0.2 | |
| | 39,818 | | | | | JP Morgan Chase
Commercial Mortgage
Securities Corp., 5.260%,
01/12/43 | | | 39,818 | | | | 0.0 | |
| | 260,000 | | | | | JP Morgan Chase
Commercial Mortgage
Securities Trust
2005-CIBC12, 4.987%,
09/12/37 | | | 261,105 | | | | 0.2 | |
| | 160,000 | | | | | JP Morgan Chase
Commercial Mortgage
Securities Trust 2005-LDP5,
5.382%, 12/15/44 | | | 164,472 | | | | 0.1 | |
| | 380,000 | | | # | | JP Morgan Chase
Commercial Mortgage
Securities Trust 2014-BXH,
2.425%, 04/15/27 | | | 379,178 | | | | 0.3 | |
See Accompanying Notes to Financial Statements
| Voya Short Term Bond Fund | SUMMARY PORTFOLIO OF INVESTMENTS
as of March 31, 2015 (continued) |
| Principal Amount† | | | Value | | | Percentage of Net Assets | |
| COLLATERALIZED MORTGAGE OBLIGATIONS: (continued) |
| | 1,210,000 | | | | | LB-UBS Commercial
Mortgage Trust, 5.127%,
09/15/40 | | $ | 1,223,498 | | | | 0.8 | |
| | 798,912 | | | | | LB-UBS Commercial
Mortgage Trust,
5.300%-5.323%,
11/15/38-11/15/40 | | | 813,288 | | | | 0.6 | |
| | 640,000 | | | | | Morgan Stanley Capital
I Trust, 5.073%, 08/13/42 | | | 642,478 | | | | 0.5 | |
| | 88,372 | | | | | Morgan Stanley Capital
I Trust, 5.185%, 10/12/52 | | | 88,233 | | | | 0.1 | |
| | 71,433 | | | # | | Morgan Stanley Re-REMIC
Trust 2010-C30 A3B,
5.246%, 12/17/43 | | | 72,064 | | | | 0.0 | |
| | 800,000 | | | # | | TIAA CMBS I Trust
2001-C1A L, 5.770%,
06/19/33 | | | 839,046 | | | | 0.6 | |
| | 180,809 | | | | | TIAA Seasoned
Commercial Mortgage Trust,
5.532%, 08/15/39 | | | 180,989 | | | | 0.1 | |
| | 1,338,162 | | | | | Other Securities | | | 1,348,332 | | | | 0.9 | |
| | | | | | | Total Collateralized
Mortgage Obligations
(Cost $15,501,020) | | | 15,130,200 | | | | 10.7 | |
| ASSET-BACKED SECURITIES: 18.0% |
| | | | | | | Automobile Asset-Backed Securities: 3.7% | | | |
| | 370,000 | | | | | Capital Auto Receivables
Asset Trust 2015-1, 1.610%,
06/20/19 | | | 370,524 | | | | 0.3 | |
| | 350,000 | | | | | Capital Auto Receivables
Asset Trust, 1.620%,
10/22/18 | | | 352,589 | | | | 0.2 | |
| | 226,000 | | | | | Harley-Davidson
Motorcycle Trust 2012-1,
0.910%, 02/15/18 | | | 226,333 | | | | 0.2 | |
| | 480,000 | | | | | Harley-Davidson Motorcycle
Trust 2015-1, 1.670%,
08/15/22 | | | 480,854 | | | | 0.3 | |
| | 350,000 | | | | | Hyundai Auto Receivables
Trust 2013-A, 1.130%,
09/17/18 | | | 350,283 | | | | 0.3 | |
| | 768,000 | | | | | Hyundai Auto Receivables
Trust, 0.750%, 09/17/18 | | | 767,345 | | | | 0.5 | |
| | 650,000 | | | | | Nissan Auto Receivables
2013-B Owner Trust, 1.310%,
10/15/19 | | | 653,466 | | | | 0.5 | |
| | 140,000 | | | | | Nissan Auto Receivables
2013-C Owner Trust,
1.300%, 06/15/20 | | | 140,405 | | | | 0.1 | |
| Principal Amount† | | | Value | | | Percentage of Net Assets | |
| ASSET-BACKED SECURITIES: (continued) |
| | | | | | | Automobile Asset-Backed Securities (continued) |
| | 700,000 | | | | | Smart Trust, 1.050%,
10/14/18 | | $ | 699,772 | | | | 0.5 | |
| | 1,162,564 | | | | | Other Securities | | | 1,165,652 | | | | 0.8 | |
| | | | | | | | | | 5,207,223 | | | | 3.7 | |
| | | | | | | Credit Card Asset-Backed Securities: 3.0% | | | | | | | | |
| | 300,000 | | | | | BA Credit Card Trust,
0.445%, 09/16/16 | | | 300,202 | | | | 0.2 | |
| | 800,000 | | | | | Chase Issuance Trust,
1.150%, 01/15/19 | | | 803,794 | | | | 0.6 | |
| | 210,000 | | | | | Citibank Credit Card
Issuance Trust, 2.150%,
07/15/21 | | | 213,752 | | | | 0.1 | |
| | 786,000 | | | | | Citibank Credit Card
Issuance Trust, 5.350%,
02/07/20 | | | 874,150 | | | | 0.6 | |
| | 582,000 | | | | | Citibank Credit Card
Issuance Trust, 5.650%,
09/20/19 | | | 645,156 | | | | 0.5 | |
| | 650,000 | | | | | Discover Card Execution
Note Trust 2015-A1 A1,
0.525%, 08/17/20 | | | 650,807 | | | | 0.5 | |
| | 740,000 | | | | | Discover Card Execution
Note Trust, 0.605%-2.120%,
07/15/21-01/18/22 | | | 743,091 | | | | 0.5 | |
| | | | | | | | | | 4,230,952 | | | | 3.0 | |
| | | | | | | Home Equity Asset-Backed Securities: 0.2% |
| | 205,683 | | | | | Other Securities | | | 209,078 | | | | 0.2 | |
| | | | | | | Other Asset-Backed Securities: 11.1% | | | | | | | | |
| | 430,000 | | | # | | American Residential
Properties 2014-SFR1 Trust,
2.527%, 09/17/31 | | | 435,203 | | | | 0.3 | |
| | 500,000 | | | # | | Apidos CDO IV 2006-4A D,
1.756%, 10/27/18 | | | 493,090 | | | | 0.3 | |
| | 325,000 | | | # | | ARES XII CLO Ltd.
2007-12A C, 2.262%,
11/25/20 | | | 325,171 | | | | 0.2 | |
| | 250,000 | | | # | | Ares XII CLO Ltd., 3.512%,
11/25/20 | | | 248,577 | | | | 0.2 | |
| | 250,000 | | | # | | Atrium V, 3.961%, 07/20/20 | | | 247,575 | | | | 0.2 | |
| | 500,000 | | | # | | Babson CLO, Inc. 2005-III,
1.956%, 11/10/19 | | | 497,845 | | | | 0.4 | |
| | 250,000 | | | # | | Castle Garden Funding,
1.012%, 10/27/20 | | | 245,806 | | | | 0.2 | |
See Accompanying Notes to Financial Statements
| Voya Short Term Bond Fund | SUMMARY PORTFOLIO OF INVESTMENTS
as of March 31, 2015 (continued) |
| Principal Amount† | | | Value | | | Percentage of Net Assets | |
| ASSET-BACKED SECURITIES: (continued) |
| | | | | | | Other Asset-Backed Securities (continued) | | | | | | | | |
| | 300,000 | | | # | | Castle Garden Funding,
5.012%, 10/27/20 | | $ | 299,964 | | | | 0.2 | |
| | 500,000 | | | # | | CIFC Funding 2006-I Ltd.,
1.857%, 10/20/20 | | | 491,778 | | | | 0.3 | |
| | 400,000 | | | # | | CIFC Funding 2006-II Ltd.,
1.862%, 03/01/21 | | | 388,420 | | | | 0.3 | |
| | 120,371 | | | # | | CIFC Funding 2006-II Ltd.,
4.262%, 03/01/21 | | | 118,547 | | | | 0.1 | |
| | 250,000 | | | # | | ColumbusNova CLO Ltd
2006-2A E, 4.006%,
04/04/18 | | | 247,451 | | | | 0.2 | |
| | 250,000 | | | # | | ColumbusNova CLO Ltd
2006-II, 1.006%, 04/04/18 | | | 246,975 | | | | 0.2 | |
| | 400,000 | | | # | | Diamond Lake CLO Ltd.,
1.862%, 12/01/19 | | | 391,635 | | | | 0.3 | |
| | 500,000 | | | # | | Eaton Vance CDO IX Ltd.,
0.907%, 04/20/19 | | | 493,589 | | | | 0.3 | |
| | 500,000 | | | # | | Emporia Preferred Funding III
Ltd. 2007-3A B,
0.707%, 04/23/21 | | | 490,192 | | | | 0.3 | |
| | 500,000 | | | # | | Fraser Sullivan CLO I Ltd.,
2.071%, 03/15/20 | | | 490,414 | | | | 0.3 | |
| | 500,000 | | | # | | FRASR 2006-1A B 3/20,
0.741%, 03/15/20 | | | 498,134 | | | | 0.4 | |
| | 300,000 | | | # | | GoldenTree Loan
Opportunities IV Ltd.,
4.506%, 08/18/22 | | | 297,830 | | | | 0.2 | |
| | 500,000 | | | # | | GoldenTree Loan
Opportunities V Ltd.,
3.507%, 10/18/21 | | | 500,003 | | | | 0.4 | |
| | 500,000 | | | # | | Greens Creek Funding Ltd.,
2.507%, 04/18/21 | | | 493,536 | | | | 0.3 | |
| | 141,758 | | | # | | GSAMP Trust 2005-SEA2,
0.521%, 01/25/45 | | | 139,252 | | | | 0.1 | |
| | 500,000 | | | # | | Gulf Stream - Compass
CLO, 2.256%, 10/28/19 | | | 500,093 | | | | 0.3 | |
| | 500,000 | | | # | | Gulf Stream - Compass
CLO, 3.706%, 10/28/19 | | | 500,328 | | | | 0.4 | |
| | 500,000 | | | # | | Gulf Stream - Sextant CLO
2007-1 Ltd.,
2.670%, 06/17/21 | | | 487,988 | | | | 0.3 | |
| | 300,000 | | | # | | Gulf Stream - Sextant CLO,
0.962%, 08/21/20 | | | 297,562 | | | | 0.2 | |
| | 225,000 | | | # | | Gulf Stream - Sextant CLO,
1.862%, 08/21/20 | | | 222,153 | | | | 0.2 | |
| Principal Amount† | | | Value | | | Percentage of Net Assets | |
| ASSET-BACKED SECURITIES: (continued) |
| | | | | | | Other Asset-Backed Securities (continued) |
| | 400,000 | | | # | | Halcyon Structured Asset
Management Long Secured/
Short Unsecured 2007-1
Ltd. B, 0.706%, 08/07/21 | | | $ 393,594 | | | | 0.3 | |
| | 500,000 | | | # | | Halcyon Structured Asset
Management Long Secured/
Short Unsecured, 2.556%,
08/07/21 | | | 500,008 | | | | 0.3 | |
| | 300,000 | | | # | | Invitation Homes Trust
2014-SFR2 C, 2.178%,
06/17/32 | | | 300,000 | | | | 0.2 | |
| | 370,620 | | | # | | Kennecott Funding Ltd.,
2.054%, 01/13/18 | | | 368,897 | | | | 0.3 | |
| | 250,000 | | | # | | Kingsland III Ltd., 0.913%,
08/24/21 | | | 240,553 | | | | 0.2 | |
| | 500,000 | | | # | | Madison Park Funding II Ltd.
2006-2A D, 5.017%,
03/25/20 | | | 493,942 | | | | 0.3 | |
| | 250,000 | | | # | | Madison Park Funding Ltd.,
5.506%, 07/26/21 | | | 249,273 | | | | 0.2 | |
| | 330,000 | | | # | | MSIM Peconic Bay Ltd.,
2.257%, 07/20/19 | | | 330,000 | | | | 0.2 | |
| | 500,000 | | | # | | Muir Grove CLO Ltd.
2007-1A B, 2.256%,
03/25/20 | | | 499,747 | | | | 0.4 | |
| | 1,000,000 | | | # | | Muir Grove CLO Ltd.,
3.256%, 03/25/20 | | | 998,587 | | | | 0.7 | |
| | 500,000 | | | # | | Northwoods Capital VII Ltd.,
3.757%, 10/22/21 | | | 500,119 | | | | 0.4 | |
| | 425,000 | | | # | | WhiteHorse III Ltd./Corp
2006-1A A3L, 1.005%,
05/01/18 | | | 424,972 | | | | 0.3 | |
| | 346,090 | | | | | Other Securities | | | 346,193 | | | | 0.2 | |
| | | | | | | | | | 15,734,996 | | | | 11.1 | |
| | | | | | | Total Asset-Backed
Securities
(Cost $25,291,573) | | | 25,382,249 | | | | 18.0 | |
| U.S. GOVERNMENT AGENCY OBLIGATIONS: 7.6% |
| | | | | | | Federal Home Loan Mortgage Corporation: 3.1%## | | | |
| | 1,020,671 | | | | | 5.000%, due 07/15/39 | | | 1,089,369 | | | | 0.8 | |
| | 784,234 | | | | | 5.500%, due 11/01/38 | | | 893,580 | | | | 0.6 | |
| | 563,900 | | | | | 5.500%, due 02/01/39 | | | 635,695 | | | | 0.4 | |
| | 1,060,246 | | | | | 6.000%, due 12/15/28 | | | 1,216,252 | | | | 0.9 | |
See Accompanying Notes to Financial Statements
| Voya Short Term Bond Fund | SUMMARY PORTFOLIO OF INVESTMENTS
as of March 31, 2015 (continued) |
| Principal Amount† | | | Value | | | Percentage of Net Assets | |
| U.S. GOVERNMENT AGENCY OBLIGATIONS: (continued) |
| | | | | | | Federal Home Loan Mortgage Corporation (continued) | |
| | 476,583 | | | | | 5.500%, due 01/01/37-
10/01/38 | | $ | 540,238 | | | | 0.4 | |
| | | | | | | | | | 4,375,134 | | | | 3.1 | |
| | | | | | | Federal National Mortgage Association: 2.9%## | |
| | 672,602 | | | | | 3.000%, due 04/25/40 | | | 692,432 | | | | 0.5 | |
| | 724,425 | | | | | 5.000%, due 01/01/23 | | | 786,956 | | | | 0.6 | |
| | 555,233 | | | | | 6.000%, due 01/01/38 | | | 643,268 | | | | 0.4 | |
| | 1,940,393 | | | | | 3.000%-5.000%, due
07/01/34-10/25/50 | | | 2,023,096 | | | | 1.4 | |
| | | | | | | | | | 4,145,752 | | | | 2.9 | |
| | | | | | | Government National Mortgage Association: 1.6% | |
| | 632,033 | | | | | 4.397%, due 05/16/51 | | | 688,801 | | | | 0.5 | |
| | 1,329,855 | | | | | 7.120%, due 04/20/39 | | | 1,567,059 | | | | 1.1 | |
| | | | | | | | | | 2,255,860 | | | | 1.6 | |
| | | | | | | Total U.S. Government
Agency Obligations
(Cost $10,555,559) | | | 10,776,746 | | | | 7.6 | |
| U.S. TREASURY OBLIGATIONS: 3.8% |
| | | | | | | U.S. Treasury Notes: 3.8% | | | |
| | 4,040,000 | | | | | 0.375%, due 03/31/16 | | | 4,043,790 | | | | 2.9 | |
| | 686,000 | | | | | 1.000%, due 03/15/18 | | | 688,465 | | | | 0.5 | |
| | 618,000 | | | | | 0.500%-1.750%, due
03/31/17-03/31/22 | | | 618,249 | | | | 0.4 | |
| | | | | | | Total U.S. Treasury
Obligations
(Cost $5,343,836) | | | 5,350,504 | | | | 3.8 | |
| # of Contracts | | | Value | | | Percentage of Net Assets | |
| PURCHASED OPTIONS: —% | |
| | | | | | OTC Interest Rate Swaptions: —% |
| | 17,296,000 | | | @ | | Receive a floating rate
equal to the 3-month
USD-LIBOR-BBA
and pay a fixed rate equal
to 5.070%, Exp. 05/29/15
Counterparty: Credit
Suisse Group AG | | | — | | | | — | |
| | | | | | | Total Purchased Options
(Cost $79,562) | | | — | | | | — | |
| | | | | | | Total Long-Term
Investments
(Cost $139,167,314) | | | 139,486,042 | | | | 98.8 | |
| Principal Amount† | | | Value | | | Percentage of Net Assets | |
| SHORT-TERM INVESTMENTS: 1.9% | |
| | | | | | Securities Lending Collateralcc: 0.7% |
| | 1,000,000 | | | | | Millenium Fixed Income Ltd.,
Repurchase Agreement
dated 03/31/15, 0.22%,
due 04/01/15 (Repurchase
Amount $1,000,006,
collateralized by various U.S.
Government Securities,
0.875%-3.125%,
Market Value plus accrued
interest $1,020,000,
due 08/15/17-02/15/42) | | $ | 1,000,000 | | | | 0.7 | |
| | 21,526 | | | | | Nomura Securities,
Repurchase Agreement
dated 03/31/15, 0.13%,
due 04/01/15 (Repurchase
Amount $21,526,
collateralized by various U.S.
Government Agency
Obligations, 1.280%-7.500%,
Market Value plus accrued
interest $21,956,
due 08/18/15-10/20/64) | | | 21,526 | | | | 0.0 | |
| | | | | | | | | | 1,021,526 | | | | 0.7 | |
| Shares | | | Value | | | Percentage of Net Assets | |
| | | | | | Mutual Funds: 1.2% |
| | 1,707,000 | | | | | BlackRock Liquidity Funds,
TempFund, Institutional
Class, 0.070%††
(Cost $1,707,000) | | | 1,707,000 | | | | 1.2 | |
| | | | | | | Total Short-Term
Investments
(Cost $2,728,526) | | | 2,728,526 | | | | 1.9 | |
| | | | | | | Total Investments in Securities (Cost $141,895,840) | | $ | 142,214,568 | | | | 100.7 | |
| | | | | | | Liabilities in Excess of Other Assets | | | (1,048,131 | ) | | | (0.7 | ) |
| | | | | | | Net Assets | | $ | 141,166,437 | | | | 100.0 | |
“Other Securities” represents issues not identified as the top 50 holdings in terms of market value and issues or issuers not exceeding 1% of net assets individually or in aggregate respectively as of March 31, 2015.
The following footnotes apply to either the individual securities noted or one or more of the securities aggregated and listed as a single line item.
| † | Unless otherwise indicated, principal amount is shown in USD. |
See Accompanying Notes to Financial Statements
| Voya Short Term Bond Fund | SUMMARY PORTFOLIO OF INVESTMENTS
as of March 31, 2015 (continued) |
| †† | Rate shown is the 7-day yield as of March 31, 2015. |
| | |
| # | Securities with purchases pursuant to Rule 144A or section 4(a)(2), under the Securities Act of 1933 and may not be resold subject to that rule except to qualified institutional buyers. |
| | |
| ## | The Federal Housing Finance Agency (“FHFA”) placed the Federal Home Loan Mortgage Corporation and Federal National Mortgage Association into conservatorship with FHFA as the conservator. As such, the FHFA oversees the continuing affairs of these companies. |
| | |
| @ | Non-income producing security. |
| | |
| cc | Represents securities purchased with cash collateral received for securities on loan. |
| L | Loaned security, a portion or all of the security is on loan at March 31, 2015. |
| | |
| (a) | This grouping contains securities on loan. |
| | |
| | Cost for federal income tax purposes is the same as for financial statement purposes. |
| | |
| | Net unrealized appreciation consists of: |
| Gross Unrealized Appreciation | | $ | 961,228 | |
| Gross Unrealized Depreciation | | | (642,500 | ) |
| Net Unrealized Appreciation | | $ | 318,728 | |
Fair Value Measurements^
The following is a summary of the fair valuations according to the inputs used as of March 31, 2015 in valuing the assets and liabilities:
| | | Quoted Prices
in Active Markets
for Identical
Investments
(Level 1) | | | Significant
Other
Observable
Inputs
(Level 2) | | | Significant
Unobservable
Inputs
(Level 3) | | | Fair Value
at
March 31, 2015 | |
| Asset Table | | | | | | | | | | | | | | | | |
| Investments, at fair value | | | | | | | | | | | | | | | | |
| Purchased Options | | $ | — | | | $ | — | | | $ | — | | | $ | — | |
| Corporate Bonds/Notes | | | — | | | | 82,846,343 | | | | — | | | | 82,846,343 | |
| Collateralized Mortgage Obligations | | | — | | | | 15,130,200 | | | | — | | | | 15,130,200 | |
| Short-Term Investments | | | 1,707,000 | | | | 1,021,526 | | | | — | | | | 2,728,526 | |
| Asset-Backed Securities | | | — | | | | 25,382,249 | | | | — | | | | 25,382,249 | |
| U.S. Treasury Obligations | | | — | | | | 5,350,504 | | | | — | | | | 5,350,504 | |
| U.S. Government Agency Obligations | | | — | | | | 10,776,746 | | | | — | | | | 10,776,746 | |
| Total Investments, at fair value | | $ | 1,707,000 | | | $ | 140,507,568 | | | $ | — | | | $ | 142,214,568 | |
| Other Financial Instruments+ | | | | | | | | | | | | | | | | |
| Futures | | | 129,526 | | | | — | | | | — | | | | 129,526 | |
| Total Assets | | $ | 1,836,526 | | | $ | 140,507,568 | | | $ | — | | | $ | 142,344,094 | |
| Liabilities Table | | | | | | | | | | | | | | | | |
| Other Financial Instruments+ | | | | | | | | | | | | | | | | |
| Futures | | $ | (153,046 | ) | | $ | — | | | $ | — | | | $ | (153,046 | ) |
| Total Liabilities | | $ | (153,046 | ) | | $ | — | | | $ | — | | | $ | (153,046 | ) |
| ^ | See Note 2, “Significant Accounting Policies” in the Notes to Financial Statements for additional information. |
| | |
| + | Other Financial Instruments are derivatives not reflected in the Portfolio of Investments and may include open forward foreign currency contracts, futures, centrally cleared swaps, OTC swaps and written options. Forward foreign currency contracts, futures and centrally cleared swaps are valued at the unrealized gain (loss) on the instrument. OTC swaps and written options are valued at the fair value of the instrument. |
See Accompanying Notes to Financial Statements
| Voya Short Term Bond Fund | SUMMARY PORTFOLIO OF INVESTMENTS
as of March 31, 2015 (continued) |
At March 31, 2015, the following futures contracts were outstanding for Voya Short Term Bond Fund:
| Contract Description | | Number of Contracts | | Expiration Date | | Notional Value | | | Unrealized Appreciation/ (Depreciation) | |
| Long Contracts | | | | | | | | | | | | |
| U.S. Treasury 2-Year Note | | 201 | | 06/30/15 | | $ | 44,050,408 | | | $ | 125,784 | |
| U.S. Treasury Long Bond | | 3 | | 06/19/15 | | | 491,625 | | | | 3,742 | |
| | | | | | | $ | 44,542,033 | | | $ | 129,526 | |
| Short Contracts | | | | | | | | | | | | |
| U.S. Treasury 10-Year Note | | (38) | | 06/19/15 | | | (4,898,437 | ) | | | (31,407 | ) |
| U.S. Treasury 5-Year Note | | (118) | | 06/30/15 | | | (14,184,891 | ) | | | (121,639 | ) |
| | | | | | | $ | (19,083,328 | ) | | $ | (153,046 | ) |
A summary of derivative instruments by primary risk exposure is outlined in the following tables.
The fair value of derivative instruments as of March 31, 2015 was as follows:
| Derivatives not accounted for as hedging instruments | | Location on Statement of Assets and Liabilities | | Fair Value | |
| Asset Derivatives | | | | | | |
| Interest rate contracts | | Net Assets — Unrealized appreciation* | | $ | 129,526 | |
| Total Asset Derivatives | | | | $ | 129,526 | |
| Liability Derivatives | | | | | | |
| Interest rate contracts | | Net Assets — Unrealized depreciation* | | $ | 153,046 | |
| Total Liability Derivatives | | | | $ | 153,046 | |
| * | Includes cumulative appreciation/depreciation of futures contracts as reported in the table following the Summary Portfolio of Investments. |
The effect of derivative instruments on the Fund’s Statement of Operations for the year ended March 31, 2015 was as follows:
| | | Amount of Realized Gain or (Loss) on
Derivatives Recognized in Income | |
| Derivatives not accounted for as hedging instruments | | Foreign
currency
related
transactions** | | | Futures | | | Swaps | | | Total | |
| Foreign exchange contracts | | $ | 8,535 | | | $ | — | | | $ | — | | | $ | 8,535 | |
| Credit contracts | | | — | | | | — | | | | (43,617 | ) | | | (43,617 | ) |
| Interest rate contracts | | | — | | | | (353,349 | ) | | | — | | | | (353,349 | ) |
| Total | | $ | 8,535 | | | $ | (353,349 | ) | | $ | (43,617 | ) | | $ | (388,431 | ) |
| | | Change in Unrealized Appreciation or (Depreciation) on
Derivatives Recognized in Income | |
| Derivatives not accounted for as hedging instruments | | Investments* | | | Foreign
currency
related
transactions** | | | Futures | | | Total | |
| Foreign exchange contracts | | $ | — | | | $ | (5,895 | ) | | $ | — | | | $ | (5,895 | ) |
| Interest rate contracts | | | (79,562 | ) | | | — | | | | (129,952 | ) | | | (209,514 | ) |
| Total | | $ | (79,562 | ) | | $ | (5,895 | ) | | $ | (129,952 | ) | | $ | (215,409 | ) |
| * | Amounts recognized for purchased options are included in net realized gain (loss) on investments and net change in unrealized appreciation or depreciation on investments. |
| ** | Amounts recognized for forward foreign currency contracts are included in net realized gain (loss) on foreign currency related transactions and net change in unrealized appreciation or depreciation on foreign currency related transactions. |
See Accompanying Notes to Financial Statements
Voya Strategic Income Opportunities Fund | PORTFOLIO OF INVESTMENTS
as of March 31, 2015 |
| Shares | | Value | | | Percentage
of Net
Assets | |
| MUTUAL FUNDS: 71.0% | | | | | | | | |
| | | | | | | Affiliated Investment Companies: 71.0% |
| | 15,353 | | | | | Voya Emerging Markets
Corporate Debt Fund -
Class P | | $ | 151,075 | | | | 2.4 | |
| | 15,803 | | | | | Voya Emerging Markets
Hard Currency Debt Fund -
Class P | | | 149,658 | | | | 2.3 | |
| | 181,515 | | | | | Voya Floating Rate Fund -
Class P | | | 1,835,117 | | | | 28.7 | |
| | 148,764 | | | | | Voya High Yield Bond Fund -
Class P | | | 1,210,939 | | | | 18.9 | |
| | 23,280 | | | | | Voya Investment Grade
Credit Fund - Class P | | | 257,707 | | | | 4.0 | |
| | 90,920 | | | | | Voya Securitized Credit
Fund - Class P | | | 936,476 | | | | 14.7 | |
| | | | | | | Total Mutual Funds
(Cost $4,566,518) | | | 4,540,972 | | | | 71.0 | |
Principal Amount† | | Value | | | Percentage
of Net
Assets | |
| CORPORATE BONDS/NOTES: 1.5% | | | | | | | | |
| | | | | | | Financial: 1.5% | | | | | | | | |
| | 30,000 | | | | | JPMorgan Chase & Co.,
6.125%, 12/29/49 | | | 30,747 | | | | 0.5 | |
| | 30,000 | | | | | M&T Bank Corp., 6.450%,
12/29/49 | | | 32,550 | | | | 0.5 | |
| | 30,000 | | | | | Wells Fargo & Co., 5.900%,
12/29/49 | | | 31,313 | | | | 0.5 | |
| | | | | | | Total Corporate
Bonds/Notes
(Cost $93,329) | | | 94,610 | | | | 1.5 | |
| COLLATERALIZED MORTGAGE OBLIGATIONS: 8.4% |
| | 10,000 | | | | | Banc of America Commercial
Mortgage Trust 2007-4 AJ,
5.821%, 02/10/51 | | | 10,573 | | | | 0.2 | |
| | 10,000 | | | # | | Banc of America Merrill
Lynch Commercial Mortgage,
Inc., 5.456%, 07/10/43 | | | 10,028 | | | | 0.1 | |
| | 11,022 | | | | | Citigroup Mortgage Loan
Trust, 5.486%, 11/25/36 | | | 9,773 | | | | 0.1 | |
| | 98,902 | | | ^ | | Commercial Mortgage Pass
Through Certificates, 1.415%,
04/10/47 | | | 7,953 | | | | 0.1 | |
| | 98,733 | | | ^ | | Commercial Mortgage Trust,
1.413%, 10/10/46 | | | 8,196 | | | | 0.1 | |
| | 20,000 | | | | | Commercial Mortgage Trust,
5.225%, 07/15/44 | | | 20,294 | | | | 0.3 | |
Principal Amount† | | Value | | | Percentage
of Net
Assets | |
| COLLATERALIZED MORTGAGE OBLIGATIONS: (continued) | | | | | | | | |
| | 10,000 | | | | | Commercial Mortgage Trust,
5.225%, 07/15/44 | | $ | 10,152 | | | | 0.2 | |
| | 10,000 | | | | | Credit Suisse First Boston
Mortgage Securities Corp.,
5.736%, 05/15/36 | | | 10,942 | | | | 0.2 | |
| | 275,000 | | | | | Fannie Mae Connecticut
Avenue Securities, 5.174%,
11/25/24 | | | 289,378 | | | | 4.5 | |
| | 780,258 | | | #,^ | | FREMF Mortgage Trust,
0.100%, 12/25/44 | | | 4,177 | | | | 0.1 | |
| | 1,000,000 | | | #,^ | | JP Morgan Chase
Commercial Mortgage
Securities Corp. 2012-LC9
XB, 0.358%, 12/15/47 | | | 24,547 | | | | 0.4 | |
| | 10,000 | | | | | JP Morgan Chase
Commercial Mortgage
Securities Trust 2004-CIBC9
E, 5.697%, 06/12/41 | | | 9,885 | | | | 0.1 | |
| | 10,000 | | | | | LB-UBS Commercial
Mortgage Trust 2005-C7,
5.350%, 11/15/40 | | | 10,125 | | | | 0.2 | |
| | 10,000 | | | | | LB-UBS Commercial
Mortgage Trust 2006-C4 D,
5.842%, 06/15/38 | | | 10,249 | | | | 0.2 | |
| | 10,000 | | | | | LB-UBS Commercial
Mortgage Trust 2006-C4 E,
5.842%, 06/15/38 | | | 10,181 | | | | 0.2 | |
| | 10,000 | | | | | LB-UBS Commercial
Mortgage Trust, 4.954%,
07/15/40 | | | 10,014 | | | | 0.1 | |
| | 10,000 | | | | | LB-UBS Commercial
Mortgage Trust, 5.206%,
08/15/36 | | | 10,097 | | | | 0.1 | |
| | 5,668 | | | | | LB-UBS Commercial
Mortgage Trust, 6.284%,
04/15/40 | | | 5,712 | | | | 0.1 | |
| | 4,239 | | | | | LB-UBS Commercial
Mortgage Trust,
8.150%, 07/15/32 | | | 4,256 | | | | 0.1 | |
| | 139,335 ^ | | | | | Morgan Stanley Bank of
America Merrill Lynch
Trust 2014-C17 XA,
1.285%, 08/15/47 | | | 10,728 | | | | 0.2 | |
| | 13,363 | | | | | Prime Mortgage Trust,
5.500%, 03/25/37 | | | 12,168 | | | | 0.2 | |
| | 20,000 | | | | | Wachovia Bank Commercial
Mortgage Trust Series,
5.715%, 05/15/43 | | | 20,446 | | | | 0.3 | |
See Accompanying Notes to Financial Statements
Voya Strategic Income Opportunities Fund | PORTFOLIO OF INVESTMENTS
as of March 31, 2015 (continued) |
Principal Amount† | | | Value | | | Percentage of Net Assets | |
| COLLATERALIZED MORTGAGE OBLIGATIONS: (continued) |
| | 10,000 | | | | | Wachovia Bank Commercial
Mortgage Trust Series,
5.964%, 02/15/51 | | $ | 10,241 | | | | 0.2 | |
| | 97,882 | | | #,^ | | WFRBS Commercial
Mortgage Trust 2013-C12,
1.490%, 03/15/48 | | | 7,697 | | | | 0.1 | |
| | | | | | | Total Collateralized
Mortgage Obligations
(Cost $520,351) | | | 537,812 | | | | 8.4 | |
| U.S. GOVERNMENT AGENCY OBLIGATIONS: 13.2% |
| | | | | | | Federal Home Loan Mortgage Corporation: 4.0%## |
| | 1,295,583 | | | ^ | | 6.500%, due 06/15/32 | | | 191,504 | | | | 3.0 | |
| | 58,493 | | | | | 8.000%, due 08/15/35 | | | 68,785 | | | | 1.0 | |
| | | | | | | | | | 260,289 | | | | 4.0 | |
| | | | | | | Federal National Mortgage Association: 6.7%## |
| | 61,363,744 | | | ^ | | 0.050%, due 06/25/42 | | | 113,983 | | | | 1.8 | |
| | 941,594 | | | ^ | | 4.500%, due 10/25/41 | | | 162,825 | | | | 2.5 | |
| | 21,679 | | | | | 5.500%, due 10/01/39 | | | 24,601 | | | | 0.4 | |
| | 730,080 | | | ^ | | 6.426%, due 03/25/32 | | | 125,194 | | | | 2.0 | |
| | | | | | | | | | 426,603 | | | | 6.7 | |
| | | | | | | Government National Mortgage Association: 2.5% |
| | 6,767,355 | | | ^ | | 0.650%, due 11/20/37 | | | 134,008 | | | | 2.1 | |
| | 149,510 | | | ^ | | 3.500%, due 10/20/41 | | | 25,236 | | | | 0.4 | |
| | | | | | | | | | 159,244 | | | | 2.5 | |
| | | | | | | Total U.S. Government
Agency Obligations
(Cost $792,013) | | | 846,136 | | | | 13.2 | |
| U.S. TREASURY OBLIGATIONS: 3.3% |
| | | | | | | U.S. Treasury Bonds: 1.0% |
| | 55,000 | | | | | 3.000%, due 11/15/44 | | | 60,281 | | | | 1.0 | |
| | | | | | | U.S. Treasury Notes: 2.3% |
| | 54,000 | | | | | 1.375%, due 03/31/20 | | | 54,012 | | | | 0.8 | |
| | 1,000 | | | | | 1.750%, due 02/28/22 | | | 1,003 | | | | 0.0 | |
| | 93,000 | | | | | 1.750%, due 03/31/22 | | | 93,240 | | | | 1.5 | |
| | | | | | | | | | 148,255 | | | | 2.3 | |
| | | | | | | Total U.S. Treasury
Obligations
(Cost $205,943) | | | 208,536 | | | | 3.3 | |
| | | | | | | Total Long-Term
Investments
(Cost $6,178,154) | | | 6,228,066 | | | | 97.4 | |
| Shares | | | Value | | | Percentage
of Net
Assets | |
| SHORT-TERM INVESTMENTS: 0.9% |
| | | | | | | Mutual Funds: 0.9% | | | | | | | | |
| | 59,000 | | | | | BlackRock Liquidity Funds,
TempFund, Institutional
Class, 0.070%††
(Cost $59,000) | | $ | 59,000 | | | | 0.9 | |
| | | | | | | Total Short-Term
Investments
(Cost $59,000) | | | 59,000 | | | | 0.9 | |
| | | | | | | Total Investments in Securities (Cost $6,237,154) | | $ | 6,287,066 | | | | 98.3 | |
| | | | | | | Assets in Excess of Other Liabilities | | | 106,437 | | | | 1.7 | |
| | | | | | | Net Assets | | $ | 6,393,503 | | | | 100.0 | |
| † | Unless otherwise indicated, principal amount is shown in USD. |
| | |
| †† | Rate shown is the 7-day yield as of March 31, 2015. |
| | |
| # | Securities with purchases pursuant to Rule 144A or section 4(a)(2), under the Securities Act of 1933 and may not be resold subject to that rule except to qualified institutional buyers. |
| | |
| ## | The Federal Housing Finance Agency (“FHFA”) placed the Federal Home Loan Mortgage Corporation and Federal National Mortgage Association into conservatorship with FHFA as the conservator. As such, the FHFA oversees the continuing affairs of these companies. |
| | |
| ^ | Interest only securities represent the right to receive the monthly interest payments on an underlying pool of mortgage loans. Principal amount shown represents the notional amount on which current interest is calculated. Payments of principal on the pool reduce the value of the interest only security. |
| | |
| | Cost for federal income tax purposes is $6,237,299. |
| | |
| | Net unrealized appreciation consists of: |
| Gross Unrealized Appreciation | | $ | 103,494 | |
| Gross Unrealized Depreciation | | | (53,727 | ) |
| Net Unrealized Appreciation | | $ | 49,767 | |
See Accompanying Notes to Financial Statements
Voya Strategic Income Opportunities Fund | PORTFOLIO OF INVESTMENTS
as of March 31, 2015 (continued) |
Fair Value Measurements^
The following is a summary of the fair valuations according to the inputs used as of March 31, 2015 in valuing the assets and liabilities:
| | | Quoted Prices in Active Markets for Identical Investments (Level 1) | | | Significant Other Observable Inputs (Level 2) | | | Significant Unobservable Inputs (Level 3) | | | Fair Value at March 31, 2015 | |
| Asset Table | | | | | | | | | | | | | | | | |
| Investments, at fair value | | | | | | | | | | | | | | | | |
| Mutual Funds | | $ | 4,540,972 | | | $ | — | | | $ | — | | | $ | 4,540,972 | |
| Corporate Bonds/Notes | | | — | | | | 94,610 | | | | — | | | | 94,610 | |
| Collateralized Mortgage Obligations | | | — | | | | 537,812 | | | | — | | | | 537,812 | |
| U.S. Government Agency Obligations | | | — | | | | 846,136 | | | | — | | | | 846,136 | |
| U.S. Treasury Obligations | | | — | | | | 208,536 | | | | — | | | | 208,536 | |
| Short-Term Investments | | | 59,000 | | | | — | | | | — | | | | 59,000 | |
| Total Investments, at fair value | | $ | 4,599,972 | | | $ | 1,687,094 | | | $ | — | | | $ | 6,287,066 | |
| Other Financial Instruments+ | | | | | | | | | | | | | | | | |
| Centrally Cleared Swaps | | | — | | | | 5,050 | | | | — | | | | 5,050 | |
| Forward Foreign Currency Contracts | | | — | | | | 3,559 | | | | — | | | | 3,559 | |
| Futures | | | 5,248 | | | | — | | | | — | | | | 5,248 | |
| Total Assets | | $ | 4,605,220 | | | $ | 1,695,703 | | | $ | — | | | $ | 6,300,923 | |
| Liabilities Table | | | | | | | | | | | | | | | | |
| Other Financial Instruments+ | | | | | | | | | | | | | | | | |
| Centrally Cleared Swaps | | $ | — | | | $ | (5,057 | ) | | $ | — | | | $ | (5,057 | ) |
| Forward Foreign Currency Contracts | | | — | | | | (1,219 | ) | | | — | | | | (1,219 | ) |
| Futures | | | (5,485 | ) | | | — | | | | — | | | | (5,485 | ) |
| Total Liabilities | | $ | (5,485 | ) | | $ | (6,276 | ) | | $ | — | | | $ | (11,761 | ) |
| ^ | See Note 2, “Significant Accounting Policies” in the Notes to Financial Statements for additional information. |
| + | Other Financial Instruments are derivatives not reflected in the Portfolio of Investments and may include open forward foreign currency contracts, futures, centrally cleared swaps, OTC swaps and written options. Forward foreign currency contracts, futures and centrally cleared swaps are valued at the unrealized gain (loss) on the instrument. OTC swaps and written options are valued at the fair value of the instrument. |
Transactions with Affiliates
An investment of at least 5% of the voting securities of an issuer, or a company which is under common control results in that issuer becoming an affiliated person as defined by the 1940 Act.
The following table provides transactions during the period ended March 31, 2015, where the following issuers were considered an affiliate:
| Issuer | | Beginning
Market
Value at
3/31/14 | | | Purchases
at Cost | | | Sales
at Cost | | | Change in
Unrealized
Appreciation/
(Depreciation) | | | Ending
Market
Value at
3/31/15 | | | Investment
Income | | | Realized
Gains/
(Losses) | | | Net
Capital Gain
Distributions | |
| Voya Emerging Markets Corporate Debt Fund - Class P | | $ | — | | | $ | 305,112 | | | $ | (151,054 | ) | | $ | (2,983 | ) | | $ | 151,075 | | | $ | 5,112 | | | $ | (1,053 | ) | | $ | — | |
| Voya Emerging Markets Hard Currency Debt Fund - Class P | | | — | | | | 152,448 | | | | — | | | | (2,790 | ) | | | 149,658 | | | | 2,448 | | | | — | | | | | |
| Voya Emerging Markets Local Currency Debt Fund - Class P | | | — | | | | 290,074 | | | | (290,074 | ) | | | — | | | | — | | | | 5,074 | | | | (7,066 | ) | | | — | |
| Voya Floating Rate Fund - Class P | | | 1,975,053 | | | | 660,936 | | | | (785,859 | ) | | | (15,013 | ) | | | 1,835,117 | | | | 90,936 | | | | (5,859 | ) | | | — | |
| Voya High Yield Bond Fund - Class P | | | 1,745,189 | | | | 600,434 | | | | (1,066,826 | ) | | | (67,858 | ) | | | 1,210,939 | | | | 91,058 | | | | 13,174 | | | | — | |
| Voya Investment Grade Credit Fund - Class P | | | — | | | | 252,408 | | | | — | | | | 5,299 | | | | 257,707 | | | | 2,408 | | | | — | | | | | |
| Voya Securitized Credit Fund - Class P | | | — | | | | 1,216,083 | | | | (296,161 | ) | | | 16,554 | | | | 936,476 | | | | 16,143 | | | | 3,839 | | | | 4,940 | |
| | | $ | 3,720,242 | | | $ | 3,477,495 | | | $ | (2,589,974 | ) | | $ | (66,791 | ) | | $ | 4,540,972 | | | $ | 213,179 | | | $ | 3,035 | | | $ | 4,940 | |
See Accompanying Notes to Financial Statements
Voya Strategic Income Opportunities Fund | PORTFOLIO OF INVESTMENTS
as of March 31, 2015 (continued) |
The financial statements for the above mutual fund[s] can be found at www.sec.gov.
At March 31, 2015, the following forward foreign currency contracts were outstanding for Voya Strategic Income Opportunities Fund:
| Counterparty | | Currency | | Contract Amount | | | Buy/Sell | | Settlement Date | | In Exchange For | | | Fair Value | | | Unrealized Appreciation (Depreciation) | |
| JPMorgan Chase & Co. | | Brazilian Real | | | 50,444 | | | Buy | | 06/19/15 | | $ | 15,210 | | | $ | 15,441 | | | $ | 231 | |
| HSBC Bank PLC | | Colombian Peso | | | 36,024,560 | | | Buy | | 06/19/15 | | | 13,253 | | | | 13,725 | | | | 472 | |
| Barclays Bank PLC | | Hungarian Forint | | | 2,629,873 | | | Buy | | 06/19/15 | | | 9,156 | | | | 9,395 | | | | 239 | |
| Goldman Sachs & Co. | | Indonesian Rupiah | | | 213,010,000 | | | Buy | | 05/22/15 | | | 16,101 | | | | 16,039 | | | | (62 | ) |
| Barclays Bank PLC | | Mexican Peso | | | 324,325 | | | Buy | | 06/19/15 | | | 20,839 | | | | 21,149 | | | | 310 | |
| JPMorgan Chase & Co. | | Malaysian Ringgit | | | 70,639 | | | Buy | | 05/22/15 | | | 19,265 | | | | 18,955 | | | | (310 | ) |
| Morgan Stanley | | Peruvian Nuevo Sol | | | 10,410 | | | Buy | | 06/19/15 | | | 3,301 | | | | 3,315 | | | | 14 | |
| Morgan Stanley | | Philippine Peso | | | 44,460 | | | Buy | | 05/22/15 | | | 1,003 | | | | 993 | | | | (10 | ) |
| Morgan Stanley | | Polish Zloty | | | 69,089 | | | Buy | | 06/19/15 | | | 17,640 | | | | 18,183 | | | | 543 | |
| HSBC Bank PLC | | Russian Ruble | | | 396,806 | | | Buy | | 06/19/15 | | | 6,625 | | | | 6,609 | | | | (16 | ) |
| Morgan Stanley | | Thai Baht | | | 457,471 | | | Buy | | 05/22/15 | | | 13,977 | | | | 14,028 | | | | 51 | |
| Morgan Stanley | | Turkish Lira | | | 45,250 | | | Buy | | 06/19/15 | | | 16,828 | | | | 17,063 | | | | 235 | |
| JPMorgan Chase & Co. | | South African Rand | | | 215,760 | | | Buy | | 06/19/15 | | | 17,074 | | | | 17,558 | | | | 484 | |
| | | | | | | | | | | | | | | | | | | | | $ | 2,181 | |
| BNP Paribas Bank | | Mexican Peso | | | 324,325 | | | Sell | | 06/19/15 | | $ | 21,339 | | | $ | 21,150 | | | $ | 189 | |
| Citigroup, Inc. | | Thai Baht | | | 457,471 | | | Sell | | 05/22/15 | | | 13,984 | | | | 14,028 | | | | (44 | ) |
| Deutsche Bank AG | | Polish Zloty | | | 69,089 | | | Sell | | 06/19/15 | | | 18,249 | | | | 18,184 | | | | 65 | |
| Deutsche Bank AG | | Hungarian Forint | | | 2,629,873 | | | Sell | | 06/19/15 | | | 9,517 | | | | 9,395 | | | | 122 | |
| Deutsche Bank AG | | South African Rand | | | 215,760 | | | Sell | | 06/19/15 | | | 17,791 | | | | 17,558 | | | | 233 | |
| HSBC Bank PLC | | Philippine Peso | | | 44,460 | | | Sell | | 05/22/15 | | | 989 | | | | 993 | | | | (4 | ) |
| HSBC Bank PLC | | Indonesian Rupiah | | | 213,010,000 | | | Sell | | 05/22/15 | | | 16,076 | | | | 16,038 | | | | 38 | |
| HSBC Bank PLC | | Peruvian Nuevo Sol | | | 10,410 | | | Sell | | 06/19/15 | | | 3,324 | | | | 3,315 | | | | 9 | |
| HSBC Bank PLC | | Brazilian Real | | | 50,444 | | | Sell | | 06/19/15 | | | 15,213 | | | | 15,441 | | | | (228 | ) |
| JPMorgan Chase & Co. | | Malaysian Ringgit | | | 70,639 | | | Sell | | 05/22/15 | | | 19,079 | | | | 18,955 | | | | 124 | |
| JPMorgan Chase & Co. | | Turkish Lira | | | 45,250 | | | Sell | | 06/19/15 | | | 17,054 | | | | 17,063 | | | | (9 | ) |
| JPMorgan Chase & Co. | | Colombian Peso | | | 36,024,560 | | | Sell | | 06/19/15 | | | 13,925 | | | | 13,725 | | | | 200 | |
| Morgan Stanley | | Russian Ruble | | | 396,806 | | | Sell | | 06/19/15 | | | 6,072 | | | | 6,608 | | | | (536 | ) |
| | | | | | | | | | | | | | | | | | | | | $ | 159 | |
At March 31, 2015, the following futures contracts were outstanding for Voya Strategic Income Opportunities Fund:
| Contract Description | | Number of Contracts | | Expiration Date | | Notional Value | | | Unrealized Appreciation/ (Depreciation) | |
| Long Contracts | | | | | | | | | | | | |
| U.S. Treasury Long Bond | | 1 | | 06/19/15 | | $ | 163,875 | | | $ | 5,248 | |
| | | | | | | $ | 163,875 | | | $ | 5,248 | |
| Short Contracts | | | | | | | | | | | | |
| U.S. Treasury 2-Year Note | | (4) | | 06/30/15 | | | (876,625 | ) | | | (2,665 | ) |
| U.S. Treasury 5-Year Note | | (3) | | 06/30/15 | | | (360,633 | ) | | | (2,820 | ) |
| | | | | | | $ | (1,237,258 | ) | | $ | (5,485 | ) |
See Accompanying Notes to Financial Statements
Voya Strategic Income Opportunities Fund | PORTFOLIO OF INVESTMENTS
as of March 31, 2015 (continued) |
At March 31, 2015, the following centrally cleared interest rate swaps were outstanding for Voya Strategic Income Opportunities Fund:
| | | Clearinghouse | | Termination Date | | Notional Amount | | Fair Value | | | Unrealized Appreciation/ (Depreciation) | |
| Receive a fixed rate equal to 2.026% and pay a floating rate equal to the 3-month USD-LIBOR-BBA | | Chicago Mercantile
Exchange | | 03/12/22 | | USD | | | 258,000 | | | $ | 4,068 | | | $ | 4,068 | |
| Receive a fixed rate equal to 1.9225% and pay a floating rate equal to the 3-month USD-LIBOR-BBA | | Chicago Mercantile
Exchange | | 03/20/22 | | USD | | | 575,000 | | | | (5,057 | ) | | | (5,057 | ) |
| Receive a fixed rate equal to 2.246% and pay a floating rate equal to the 3-month USD-LIBOR-BBA | | Chicago Mercantile
Exchange | | 03/12/25 | | USD | | | 49,000 | | | | 982 | | | | 982 | |
| | | | | | | | | | | | | $ | (7 | ) | | $ | (7 | ) |
A summary of derivative instruments by primary risk exposure is outlined in the following tables.
The fair value of derivative instruments as of March 31, 2015 was as follows:
| Derivatives not accounted for as hedging instruments | | Location on Statement of Assets and Liabilities | | Fair Value | |
| Asset Derivatives | | | | | | |
| Foreign exchange contracts | | Unrealized appreciation on forward foreign currency contracts | | $ | 3,559 | |
| Interest rate contracts | | Net Assets — Unrealized appreciation* | | | 5,248 | |
| Interest rate contracts | | Net Assets — Unrealized appreciation** | | | 5,050 | |
| Total Asset Derivatives | | | | $ | 13,857 | |
| Liability Derivatives | | | | | | |
| Foreign exchange contracts | | Unrealized depreciation on forward foreign currency contracts | | $ | 1,219 | |
| Interest rate contracts | | Net Assets — Unrealized depreciation* | | | 5,485 | |
| Interest rate contracts | | Net Assets — Unrealized depreciation** | | | 5,057 | |
| Total Liability Derivatives | | | | $ | 11,761 | |
| * | Includes cumulative appreciation/depreciation of futures contracts as reported in the table following the Portfolio of Investments. |
| ** | Includes cumulative appreciation/depreciation of centrally cleared swaps as reported in the table following the Portfolio of Investments. Only current days variation margin receivable/payable is included on the Statement of Assets and Liabilities. |
See Accompanying Notes to Financial Statements
Voya Strategic Income Opportunities Fund | PORTFOLIO OF INVESTMENTS
as of March 31, 2015 (continued) |
The effect of derivative instruments on the Fund’s Statement of Operations for the year ended March 31, 2015 was as follows:
| | | Amount of Realized Gain or (Loss) on Derivatives Recognized in Income | |
| Derivatives not accounted for as hedging instruments | | Foreign currency related transactions* | | | Futures | | | Swaps | | | Total | |
| Foreign exchange contracts | | $ | 4,836 | | | $ | — | | | $ | — | | | $ | 4,836 | |
| Credit contracts | | | — | | | | — | | | | (4,788 | ) | | | (4,788 | ) |
| Interest rate contracts | | | — | | | | 1,537 | | | | 3 | | | | 1,540 | |
| Total | | $ | 4,836 | | | $ | 1,537 | | | $ | (4,785 | ) | | $ | 1,588 | |
| | | Change in Unrealized Appreciation or (Depreciation) on Derivatives Recognized in Income | |
| Derivatives not accounted for as hedging instruments | | Foreign currency related transactions* | | | Futures | | | Swaps | | | Total | |
| Foreign exchange contracts | | $ | 5,702 | | | $ | — | | | $ | — | | | $ | 5,702 | |
| Interest rate contracts | | | — | | | | 2,954 | | | | (7 | ) | | | 2,947 | |
| Total | | $ | 5,702 | | | $ | 2,954 | | | $ | (7 | ) | | $ | 8,649 | |
| * | Amounts recognized for forward foreign currency contracts are included in net realized gain (loss) on foreign currency related transactions and net change in unrealized appreciation or depreciation on foreign currency related transactions. |
The following is a summary by counterparty of the fair value of OTC derivative instruments subject to Master Netting Agreements and collateral pledged (received), if any, at March 31, 2015:
| | | Barclays
Bank PLC | | | BNP
Paribas
Bank | | | Citigroup,
Inc. | | | Deutsche
Bank AG | | | Goldman
Sachs & Co. | | | HSBC
Bank PLC | | | JPMorgan
Chase & Co. | | | Morgan
Stanley | | | Totals | |
| Assets: | | | | | | | | | | | | | | | | | | | | | | | | | | | | | | | | | | | | |
| Forward foreign currency contracts | | $ | 549 | | | $ | 189 | | | $ | — | | | $ | 420 | | | $ | — | | | $ | 519 | | | $ | 1,039 | | | $ | 843 | | | $ | 3,559 | |
| Total Assets | | $ | 549 | | | $ | 189 | | | $ | — | | | $ | 420 | | | $ | — | | | $ | 519 | | | $ | 1,039 | | | $ | 843 | | | $ | 3,559 | |
| Liabilities: | | | | | | | | | | | | | | | | | | | | | | | | | | | | | | | | | | | | |
| Forward foreign currency contracts | | $ | — | | | $ | — | | | $ | 44 | | | $ | — | | | $ | 62 | | | $ | 248 | | | $ | 319 | | | $ | 546 | | | $ | 1,219 | |
| Total Liabilities | | $ | — | | | $ | — | | | $ | 44 | | | $ | — | | | $ | 62 | | | $ | 248 | | | $ | 319 | | | $ | 546 | | | $ | 1,219 | |
| Net OTC derivative instruments by counterparty, at fair value | | $ | 549 | | | $ | 189 | | | $ | (44 | ) | | $ | 420 | | | $ | (62 | ) | | $ | 271 | | | $ | 720 | | | $ | 297 | | | $ | 2,340 | |
Total collateral pledged by the
Fund/(Received from counterparty) | | $ | — | | | $ | — | | | $ | — | | | $ | — | | | $ | — | | | $ | — | | | $ | — | | | $ | — | | | $ | — | |
| Net Exposure(1) | | $ | 549 | | | $ | 189 | | | $ | (44 | ) | | $ | 420 | | | $ | (62 | ) | | $ | 271 | | | $ | 720 | | | $ | 297 | | | $ | 2,340 | |
| (1) | Positive net exposure represents amounts due from each respective counterparty. Negative exposure represents amounts due from the Fund. Please refer to Note 2 for additional details regarding counterparty credit risk and credit related contingent features. |
See Accompanying Notes to Financial Statements
| TAX INFORMATION (Unaudited) |
Dividends and distributions paid during the year ended March 31, 2015 were as follows:
| Fund Name | | Type | | Per Share Amount | |
| Voya GNMA Income Fund | | | | |
| Class A | | NII | | $ | 0.2584 | |
| Class B | | NII | | $ | 0.1915 | |
| Class C | | NII | | $ | 0.1920 | |
| Class I | | NII | | $ | 0.2838 | |
| Class W | | NII | | $ | 0.2811 | |
| All Classes | | ROC | | $ | 0.0351 | |
| Voya High Yield Bond Fund | | | | |
| Class A | | NII | | $ | 0.4311 | |
| Class B | | NII | | $ | 0.3655 | |
| Class C | | NII | | $ | 0.3678 | |
| Class I | | NII | | $ | 0.4624 | |
| Class P | | NII | | $ | 0.5123 | |
| Class R | | NII | | $ | 0.4155 | |
| Class W | | NII | | $ | 0.4546 | |
| Voya Intermediate Bond Fund | | | | |
| Class A | | NII | | $ | 0.2761 | |
| Class B | | NII | | $ | 0.2074 | |
| Class C | | NII | | $ | 0.2015 | |
| Fund Name | | Type | | Per Share Amount | |
| Voya Intermediate Bond Fund (continued) | |
| Class I | | NII | | $ | 0.3120 | |
| Class O | | NII | | $ | 0.2788 | |
| Class R | | NII | | $ | 0.2512 | |
| Class R6 | | NII | | $ | 0.3134 | |
| Class W | | NII | | $ | 0.3015 | |
| Voya Short Term Bond Fund | | | | |
| Class A | | NII | | $ | 0.1591 | |
| Class C | | NII | | $ | 0.0837 | |
| Class I | | NII | | $ | 0.1889 | |
| Class R(1) | | NII | | $ | 0.0917 | |
| Class R6 | | NII | | $ | 0.1916 | |
| Class W | | NII | | $ | 0.1799 | |
| Voya Strategic Income Opportunities Fund | |
| Class A | | NII | | $ | 0.3460 | |
| Class C | | NII | | $ | 0.3210 | |
| Class I | | NII | | $ | 0.3775 | |
| Class R | | NII | | $ | 0.3681 | |
| Class W | | NII | | $ | 0.3409 | |
NII − Net investment income
ROC − Return of capital
| (1) | Commenced operations July 31, 2014. |
Pursuant to Internal Revenue Code Section 871(k)(1), the Funds designate the following percentages of net investment income distributions as interest-related dividends:
| Voya GNMA Income Fund | | | 100.00 | % |
| Voya High Yield Bond Fund | | | 100.00 | % |
| Voya Intermediate Bond Fund | | | 100.00 | % |
| Voya Short Term Bond Fund | | | 100.00 | % |
| Voya Strategic Income Opportunities Fund | | | 18.16 | % |
Above figures may differ from those cited elsewhere in this report due to differences in the calculation of income and gains under U.S. generally accepted accounting principles (book) purposes and Internal Revenue Service (tax) purposes.
Shareholders are strongly advised to consult their own tax advisers with respect to the tax consequences of their investments in the Funds. In January, shareholders, excluding corporate shareholders, receive an IRS 1099-DIV regarding the federal tax status of the dividends and distributions they received in the calendar year.
| TRUSTEE AND OFFICER INFORMATION (Unaudited) |
The business and affairs of the Trust are managed under the direction of the Board. A Trustee, who is not an interested person of the Trust, as defined in the 1940 Act, is an independent trustee (“Independent Trustee”). The Trustees and Officers of the Trust are listed below. The Statement of Additional Information includes additional information about trustees of the Trust and is available, without charge, upon request at (800) 992-0180.
| Name, Address and Age | | | Position(s) Held with the Trust | | | Term of Office and Length of Time Served(1) | | | Principal Occupation(s) - During the Past 5 Years | | | Number of Funds in Fund Complex Overseen by Trustee(2) | | | Other Board Positions Held by Trustee | |
| Independent Trustees: | | | | | | | | | | | | | | | | |
| | | | | | | | | | | | | | | | | |
Colleen D. Baldwin 7337 East Doubletree Ranch Rd. Suite 100 Scottsdale, Arizona 85258 Age: 54 | | | Trustee | | | November 2007 - Present | | | President, Glantuam Partners, LLC, a business consulting firm (January 2009 - Present). | | | 158 | | | DSM/Dentaquest, Boston, MA (February 2014 - Present). | |
| | | | | | | | | | | | | | | | | |
John V. Boyer 7337 East Doubletree Ranch Rd. Suite 100 Scottsdale, Arizona 85258 Age: 61 | | | Chairperson Trustee | | | January 2014 - Present January 2005 - Present | | | President and Chief Executive Officer, Bechtler Arts Foundation, an arts and education foundation (January 2008 - Present). | | | 158 | | | None. | |
| | | | | | | | | | | | | | | | | |
Patricia W. Chadwick 7337 East Doubletree Ranch Rd. Suite 100 Scottsdale, Arizona 85258 Age: 66 | | | Trustee | | | January 2006 - Present | | | Consultant and President, Ravengate Partners LLC, a consulting firm that provides advice regarding financial markets and the global economy (January 2000 - Present). | | | 158 | | | Wisconsin Energy Corporation (June 2006 - Present) and The Royce Funds (35 funds) (December 2009 - Present). | |
| | | | | | | | | | | | | | | | | |
Albert E. DePrince, Jr. 7337 East Doubletree Ranch Rd. Suite 100 Scottsdale, Arizona 85258 Age: 74 | | | Trustee | | | May 2013 - Present | | | Retired. Formerly, Professor of Economics and Finance, Middle Tennessee State University (August 1991 - July 2014); Dr. DePrince continued to hold a position with the university under a post-retirement contract through the end of 2014. | | | 158 | | | None. | |
| | | | | | | | | | | | | | | | | |
Peter S. Drotch 7337 East Doubletree Ranch Rd. Suite 100 Scottsdale, Arizona 85258 Age: 73 | | | Trustee | | | November 2007 - Present | | | Retired. | | | 158 | | | First Marblehead Corporation (September 2003 - Present). | |
| | | | | | | | | | | | | | | | | |
Russell H. Jones 7337 East Doubletree Ranch Rd. Suite 100 Scottsdale, Arizona 85258 Age: 71 | | | Trustee | | | May 2013 - Present | | | Retired. | | | 158 | | | None. | |
| | | | | | | | | | | | | | | | | |
Patrick W. Kenny 7337 East Doubletree Ranch Rd. Suite 100 Scottsdale, Arizona 85258 Age: 72 | | | Trustee | | | January 2005 - Present | | | Retired. | | | 158 | | | Assured Guaranty Ltd. (April 2004 - Present). | |
| TRUSTEE AND OFFICER INFORMATION (Unaudited) (continued) |
| Name, Address and Age | | | Position(s)
Held with the
Trust | | | Term of Office and
Length of
Time Served(1) | | | Principal
Occupation(s) -
During the Past 5 Years | | | Number of
Funds in
Fund
Complex
Overseen by
Trustee(2) | | | Other Board Positions
Held by Trustee | |
Joseph E. Obermeyer 7337 East Doubletree
Ranch Rd. Suite 100 Scottsdale, Arizona 85258 Age: 57 | | | Trustee | | | May 2013 - Present | | | President, Obermeyer & Associates, Inc., a provider of financial and economic consulting services (November 1999 - Present). | | | 158 | | | None. | |
| | | | | | | | | | | | | | | | | |
Sheryl K. Pressler 7337 East Doubletree Ranch Rd. Suite 100 Scottsdale, Arizona 85258 Age: 64 | | | Trustee | | | January 2006 - Present | | | Consultant (May 2001 - Present). | | | 158 | | | None. | |
| | | | | | | | | | | | | | | | | |
Roger B. Vincent 7337 East Doubletree Ranch Rd. Suite 100 Scottsdale, Arizona 85258 Age: 69 | | | Trustee | | | February 2002 - Present | | | Retired. Formerly, President, Springwell Corporation, a corporate finance firm (March 1989 - August 2011). | | | 158 | | | UGI Corporation (February 2006 - Present) and UGI Utilities, Inc. (February 2006 - Present). | |
| | | | | | | | | | | | | | | | | |
| Trustee who is an “interested person”: |
| | | | | | | | | | | | | | | | | |
Shaun P. Mathews(3) 7337 East Doubletree Ranch Rd. Suite 100 Scottsdale, Arizona 85258 Age: 59 | | | Trustee | | | November 2007 - Present | | | President and Chief Executive Officer, Voya Investments, LLC (November 2006 - Present). | | | 158 | | | Voya Capital Corporation, LLC and Voya Investments Distributor, LLC (December 2005 - Present); Voya Funds Services, LLC, Voya Investments, LLC and Voya Investment Management, LLC (March 2006 - Present); and Voya Investment Trust Co. (April 2009 - Present). | |
| (1) | Trustees serve until their successors are duly elected and qualified. The tenure of each Trustee who is not an “interested person” as defined in the 1940 Act, of each Fund (“Independent Trustee”) is subject to the Board’s retirement policy which states that each duly elected or appointed Independent Trustee shall retire from and cease to be a member of the Board of Trustees at the close of business on December 31 of the calendar year in which the Independent Trustee attains the age of 75. A majority vote of the Board’s other Independent Trustees may extend the retirement date of an Independent Trustee if the retirement would trigger a requirement to hold a meeting of shareholders of the Trust under applicable law, whether for the purposes of appointing a successor to the Independent Trustee or otherwise comply under applicable law, in which case the extension would apply until such time as the shareholder meeting can be held or is no longer required (as determined by a vote of a majority of the other Independent Trustees). |
| (2) | For the purposes of this table, “Fund Complex” means the Voya family of funds including the following investment companies: Voya Asia Pacific High Dividend Equity Income Fund; Voya Balanced Portfolio, Inc.; Voya Emerging Markets High Dividend Equity Fund; Voya Equity Trust; Voya Funds Trust; Voya Global Advantage and Premium Opportunity Fund; Voya Global Equity Dividend and Premium Opportunity Fund; Voya Infrastructure, Industrials and Materials Fund; Voya Intermediate Bond Portfolio; Voya International High Dividend Equity Income Fund; Voya Investors Trust; Voya Money Market Portfolio; Voya Mutual Funds; Voya Natural Resources Equity Income Fund; Voya Partners, Inc.; Voya Prime Rate Trust; Voya Senior Income Fund; Voya Separate Portfolios Trust; Voya Series Fund, Inc.; Voya Strategic Allocation Portfolios, Inc.; Voya Variable Funds; Voya Variable Insurance Trust; Voya Variable Portfolios, Inc.; and Voya Variable Products Trust. The number of funds in the Fund Complex is as of April 30, 2015. |
| (3) | Mr. Mathews is deemed to be an “interested person” of the Trust as defined in the 1940 Act, because of his current affiliation with any of the Voya funds, Voya Financial, Inc. or Voya Financial, Inc.’s affiliates. |
| TRUSTEE AND OFFICER INFORMATION (Unaudited) (continued) |
| Name, Address and Age | | | Position(s) Held
With the Trust | | | Term of Office and
Length of Time Served(1) | | | Principal Occupation(s) - During the Past 5 Years | |
Shaun P. Mathews 7337 East Doubletreec Ranch Rd. Suite 100 Scottsdale, Arizona 85258 Age: 59 | | | President and
Chief Executive
Officer | | | November 2006 - Present | | | President and Chief Executive Officer, Voya Investments, LLC (November 2006 - Present). | |
| | | | | | | | | | | |
Michael J. Roland 7337 East Doubletree Ranch Rd. Suite 100 Scottsdale, Arizona 85258 Age: 57 | | | Executive Vice President | | | February 2002 - Present | | | Managing Director and Chief Operating Officer, Voya Investments, LLC and Voya Funds Services, LLC (April 2012 - Present). Formerly, Chief Compliance Officer, Directed Services LLC and Voya Investments, LLC (March 2011 - December 2013); Executive Vice President and Chief Operating Officer, Voya Investments, LLC and Voya Funds Services, LLC (January 2007 - April 2012) and Chief Compliance Officer, Voya Family of Funds (March 2011 - February 2012). | |
| | | | | | | | | | | |
Stanley D. Vyner 230 Park Avenue New York, New York 10169 Age: 65 | | | Executive Vice President Chief Investment Risk Officer | | | October 2000 - Present September 2009 - Present | | | Executive Vice President, Voya Investments, LLC (July 2000 - Present) and Chief Investment Risk Officer, Voya Investments, LLC (January 2003 - Present). | |
| | | | | | | | | | | |
Kevin M. Gleason 7337 East Doubletree Ranch Rd. Suite 100 Scottsdale, Arizona 85258 Age: 48 | | | Chief Compliance Officer | | | February 2012 - Present | | | Senior Vice President and Chief Compliance Officer, Voya Investments, LLC (February 2012 - Present). Formerly, Assistant General Counsel and Assistant Secretary, The Northwestern Mutual Life Insurance Company (June 2004 - January 2012). | |
| | | | | | | | | | | |
Todd Modic 7337 East Doubletree Ranch Rd. Suite 100 Scottsdale, Arizona 85258 Age: 47 | | | Senior Vice President, Chief/Principal Financial Officer and Assistant Secretary | | | March 2005 - Present | | | Senior Vice President, Voya Funds Services, LLC (March 2005 - Present). | |
| | | | | | | | | | | |
Kimberly A. Anderson 7337 East Doubletree Ranch Rd. Suite 100 Scottsdale, Arizona 85258 Age: 50 | | | Senior Vice President | | | November 2003 - Present | | | Senior Vice President, Voya Investments, LLC (October 2003 - Present). | |
| | | | | | | | | | | |
Julius A. Drelick, III 7337 East Doubletree Ranch Rd. Suite 100 Scottsdale, Arizona 85258 Age: 48 | | | Senior Vice President | | | July 2012 - Present | | | Senior Vice President - Fund Compliance, Voya Funds Services, LLC (June 2012 - Present); Chief Compliance Officer of Directed Services LLC and Voya Investments, LLC (January 2014 - Present). Formerly, Vice President - Platform Product Management & Project Management, Voya Investments, LLC (April 2007 - June 2012). | |
| | | | | | | | | | | |
Robert Terris 7337 East Doubletree Ranch Rd. Suite 100 Scottsdale, Arizona 85258 Age: 44 | | | Senior Vice President | | | May 2006 - Present | | | Senior Vice President, Head of Division Operations, Voya Funds Services, LLC (January 2006 - Present). | |
| | | | | | | | | | | |
Fred Bedoya 7337 East Doubletree Ranch Rd. Suite 100 Scottsdale, Arizona 85258 Age: 42 | | | Vice President and Treasurer | | | September 2012 - Present | | | Vice President, Voya Funds Services, LLC (March 2012 - Present). Formerly, Assistant Vice President - Director, Voya Funds Services, LLC (March 2003 - March 2012). | |
| | | | | | | | | | | |
Maria M. Anderson 7337 East Doubletree Ranch Rd. Suite 100 Scottsdale, Arizona 85258 Age: 57 | | | Vice President | | | September 2004 - Present | | | Vice President, Voya Funds Services, LLC (September 2004 - Present). | |
| TRUSTEE AND OFFICER INFORMATION (Unaudited) (continued) |
| Name, Address and Age | | | Position(s) Held
With the Trust | | | Term of Office and
Length of Time
Served(1) | | | Principal Occupation(s) - During the Past 5 Years | |
Lauren D. Bensinger 7337 East Doubletree Ranch Rd. Suite 100 Scottsdale, Arizona 85258 Age: 61 | | | Vice President | | | February 2003 - Present | | | Vice President, Voya Investments, LLC and Voya Funds Services, LLC (February 1996 - Present); Vice President, Voya Investments, LLC (October 2004 - Present); Vice President and Money Laundering Reporting Officer, Voya Investments Distributor, LLC (April 2010 - Present); Anti-Money Laundering Compliance Officer, Voya Financial, Inc. (January 2013 - Present); and Money Laundering Reporting Officer, Voya Investment Management Trust Co. (October 2012 - Present). Formerly, Chief Compliance Officer, Voya Investments Distributor, LLC (August 1995 - April 2010). | |
| | | | | | | | | | | |
Sara M. Donaldson 7337 East Doubletree Ranch Rd. Suite 100 Scottsdale, Arizona 85258 Age: 55 | | | Vice President | | | September 2014 - Present | | | Vice President, Voya Funds Services, LLC (April 2014 - Present). Formerly, Director, Compliance, AXA Rosenberg Global Services, LLC (September 1997 - March 2014). | |
| | | | | | | | | | | |
Robyn L. Ichilov 7337 East Doubletree Ranch Rd. Suite 100 Scottsdale, Arizona 85258 Age: 47 | | | Vice President | | | October 2000 - Present | | | Vice President, Voya Funds Services, LLC (November 1995 - Present) and Voya Investments, LLC (August 1997 - Present). Formerly, Treasurer, Voya Family of Funds (November 1999 - February 2012). | |
| | | | | | | | | | | |
Jason Kadavy 7337 East Doubletree Ranch Rd. Suite 100 Scottsdale, Arizona 85258 Age: 39 | | | Vice President | | | September 2012 - Present | | | Vice President, Voya Funds Services, LLC (July 2007 - Present). | |
| | | | | | | | | | | |
Kimberly K. Springer 7337 East Doubletree Ranch Rd. Suite 100 Scottsdale, Arizona 85258 Age: 58 | | | Vice President | | | March 2006 - Present | | | Vice President - Mutual Fund Product Development, Voya Investments, LLC (July 2012 - Present); Vice President, Voya Investment Management - Voya Family of Funds (March 2010 - Present) and Vice President, Voya Funds Services, LLC (March 2006 - Present). Formerly Managing Paralegal, Registration Statements (June 2003 - July 2012). | |
| | | | | | | | | | | |
Craig Wheeler 7337 East Doubletree Ranch Rd. Suite 100 Scottsdale, Arizona 85258 Age: 46 | | | Vice President | | | May 2013 - Present | | | Vice President - Director of Tax, Voya Funds Services, LLC (March 2013 - Present). Formerly, Assistant Vice President - Director of Tax, Voya Funds Services, LLC (March 2008 - February 2013). | |
| | | | | | | | | | | |
Huey P. Falgout, Jr. 7337 East Doubletree Ranch Rd. Suite 100 Scottsdale, Arizona 85258 Age: 51 | | | Secretary | | | August 2003 - Present | | | Senior Vice President and Chief Counsel, Voya Investment Management - Mutual Fund Legal Department (March 2010 - Present). Formerly, Chief Counsel, ING Americas, U.S. Legal Services (October 2003 - March 2010). | |
| | | | | | | | | | | |
Paul A. Caldarelli 7337 East Doubletree Ranch Rd. Suite 100 Scottsdale, Arizona 85258 Age: 63 | | | Assistant Secretary | | | June 2010 - Present | | | Vice President and Senior Counsel, Voya Investment Management - Mutual Fund Legal Department (March 2010 - Present). Formerly, Senior Counsel, ING Americas, U.S. Legal Services (April 2008 - March 2010). | |
| | | | | | | | | | | |
Theresa K. Kelety 7337 East Doubletree Ranch Rd. Suite 100 Scottsdale, Arizona 85258 Age: 52 | | | Assistant Secretary | | | August 2003 - Present | | | Vice President and Senior Counsel, Voya Investment Management - Mutual Fund Legal Department (March 2010 - Present). Formerly, Senior Counsel, ING Americas, U.S. Legal Services (April 2008 - March 2010). | |
| (1) | The Officers hold office until the next annual meeting of the Board of Trustees and until their successors shall have been elected and qualified. |
| ADVISORY CONTRACT APPROVAL DISCUSSION (Unaudited) |
APPROVAL OF INVESTMENT ADVISORY AND SUB-ADVISORY CONTRACTS IN CONNECTION WITH CHANGE OF CONTROL EVENT
Section 15(c) of the Investment Company Act of 1940, as amended (the “1940 Act”), provides that, when Voya GNMA Income Fund, Voya High Yield Bond Fund, Voya Intermediate Bond Fund, Voya Short Term Bond Fund, and Voya Strategic Income Opportunities Fund (collectively, the “Funds”), each a series of Voya Funds Trust (the “Trust”), enters into a new investment advisory contract with Voya Investments, LLC (the “Adviser”), and the Adviser enters into a new sub-advisory contract between the Adviser and Voya Investment Management Co. LLC (the “Sub-Adviser”), the Board of Trustees (the “Board”) of the Trust, including a majority of the Board members who have no direct or indirect interest in the Funds’ investment advisory and sub-advisory contracts, and who are not “interested persons” of the Funds, as such term is defined under the 1940 Act (the “Independent Trustees”), must approve the new arrangements. Discussed below are certain factors that the Board considered at a meeting held on November 18, 2014 in determining whether to approve new advisory and sub-advisory arrangements for the Funds in connection with a Change of Control Event, as such term is defined below.
At the November 18, 2014 meeting, the Board noted that pursuant to an agreement with the European Commission, ING Groep N.V. (“ING Groep”), the former parent company of the Adviser and the Sub-Adviser, is required to divest its entire interest in Voya Financial, Inc. (formerly known as ING U.S., Inc.), its U.S.-based insurance, retirement services, and investment management operations, which include the Adviser and the Sub-Adviser, by the end of 2016 (the “Separation Plan”). Voya Financial, Inc. previously was a wholly-owned, indirect subsidiary of ING Groep and is a parent company of the Adviser and the Sub-Adviser.
The Funds are subject to the 1940 Act, which provides that any investment advisory agreement, including any sub-advisory agreement, must terminate automatically upon its “assignment.” As used in the 1940 Act, the term assignment includes any transfer of a controlling block of outstanding voting securities of an adviser or the parent company of an adviser. Such a transfer is referred to herein as a “Change of Control Event.”
ING Groep’s base case to achieve the Separation Plan was through an initial public offering of Voya Financial, Inc. (the “IPO”) followed by the divestment of ING Groep’s remaining ownership interest over time through one or more additional public offerings of Voya Financial, Inc. stock, or, possibly, through one or more privately negotiated sales of the stock. The Board recognized that
the Separation Plan contemplated several public offerings and each may have been deemed to be a Change of Control Event, triggering the necessity for new agreements, which would require the approval of the Board. The Board concluded that approval by shareholders of the new agreements that would become effective in the event of one or more Change of Control Events would permit the Funds to benefit from the continuation of services by the Adviser, the Sub-Adviser, and their affiliates throughout the Separation Plan without the need for multiple shareholder meetings. The Board was informed by the Adviser and its counsel that the Adviser obtained regulatory assurances from the staff of the U.S. Securities and Exchange Commission in March 2013 that they would not object to approval of future agreements by shareholders at a single shareholder meeting. The Funds’ shareholders approved the future agreements in May 2013.
The IPO was completed in May 2013. ING Groep divested additional shares in Voya Financial, Inc. through four subsequent public offerings since May 2013, including a secondary common stock offering that closed on November 18, 2014 (the “November Transaction”). (In addition, concurrently with the November Transaction, Voya Financial, Inc. repurchased $175 million of its shares directly from ING Groep.) Upon the completion of the November Transaction and the concurrent direct share repurchase, ING Groep’s ownership in Voya Financial, Inc. was reduced from approximately 32.5% to approximately 19%. This was deemed to be a Change of Control Event that resulted in the termination of the Funds’ existing advisory and sub-advisory agreements (the “Prior Agreements”) at the close of business on November 18, 2014.
In light of the foregoing, on November 18, 2014, the Board, at an in-person meeting, approved new investment advisory and sub-advisory agreements (the “New Agreements”) for the Funds to replace the Prior Agreements upon termination. At that meeting, the Adviser represented that the agreements approved by the Board were not materially different from the agreements approved by shareholders of the Funds in 2013 and no single person or group of persons acting together was expected to gain “control” (as defined in the 1940 Act) of Voya Financial, Inc. As a result, shareholders of the Funds will not be asked to vote again on these new agreements with the Adviser and affiliated sub-advisers, including the Sub-Adviser.
The decision by the Board, including a majority of the Independent Trustees, to approve the New Agreements was based on a determination by the Board that it would be in the best interests of the shareholders of the Funds for
| ADVISORY CONTRACT APPROVAL DISCUSSION (Unaudited) (continued) |
the Adviser and Sub-Adviser to continue providing investment advisory, sub-advisory, and related services for the Funds, without interruption, after the Change of Control Event.
Prior to its approval of the New Agreements, the Board reviewed, among other matters, the quality, extent and nature of the services currently being provided by the Adviser and Sub-Adviser under the Prior Agreements and to be provided under the New Agreements. A substantial portion of this review was conducted as part of, and in conjunction with, the Board’s annual reviews of the Prior Agreements, which were most recently approved for continuation at the in-person meeting of the Board held on September 12, 2014. During the review process that led to its approval of the Prior Agreements on September 12, 2014, the Board was informed by the Adviser that it was likely the Board would be asked in the very near future to consider approval of the New Agreements. The Board further noted that the Change of Control Event would result in the Adviser’s and the Sub-Adviser’s loss of access to certain services and resources of ING Groep, which could adversely affect their businesses and profitability.
On September 12, 2014, the Board concluded, in light of all factors it considered, including undertakings by the Adviser relating to certain follow-up actions, to renew the Prior Agreements and that the fee rates set forth in the Prior Agreements were fair and reasonable. Among other factors, the Board considered: (1) the nature, extent and quality of services provided and to be provided under the Prior Agreements; (2) the extent to which economies of scale are reflected in fee rate schedules under the Prior Agreements; (3) the existence of any “fall-out” benefits to the Adviser, Sub-Adviser, and their affiliates; (4) a comparison of fee rates, expense ratios, and investment performance to those of similar funds; and (5) the costs incurred and profits realized by the Adviser, the Sub-Adviser, and their affiliates with respect to their services to the Funds.
A further description of the process followed by the Board in approving the Prior Agreements on September 12, 2014, including the information reviewed, certain material factors considered and certain related conclusions reached, is set forth in the Funds’ Semi-Annual Report, dated September 30, 2014, under the section titled “Board Consideration and Approval of Investment Advisory and Sub-Advisory Contracts.”
In connection with its approval of the New Agreements, on November 18, 2014, the Board considered its conclusions in connection with its September 12, 2014 approvals of those Prior Agreements that were in effect on that date, including the Board’s assessment of the nature, extent and
quality of services being provided and, as applicable, actions taken in certain instances to improve the relationship between the costs and the quality of services being provided. Also in connection with its November 18, 2014 approvals of the New Agreements, the Board considered a representation from the Adviser that there were no additional developments not already disclosed to the Board since September 12, 2014 that would be a material consideration to the Board in connection with its consideration of the New Agreements.
In addition, in determining whether to approve the New Agreements, the Board took into account the considerations set out below.
| 1) | The Independent Trustees solicited and received ongoing advice regarding the Board’s legal duties when approving the New Agreements from K&L Gates, their independent legal counsel, which law firm has extensive experience regarding such matters. |
| 2) | The Board considered Management’s representations regarding its commitment to maintain appropriate levels of overall staffing, ongoing resources and service quality through the transactions under the Separation Plan and after the Change of Control Event. The Board noted that such services include, but are not limited to, portfolio management services, administrative services, and regulatory compliance services. In this regard, the Board considered representations by the Adviser and its affiliates that their separation from ING Groep, as contemplated by the Separation Plan, will not lead to a reduction in the quality or scope of these and other services provided by those firms to the funds in the Voya funds complex, including the Funds. The Board also considered the importance of the asset management operations to the overall success of Voya Financial, Inc., which provides a strong incentive to Voya Financial, Inc. to provide appropriate resource allocations to support those asset management operations. |
| 3) | The Board considered representations by the Adviser and its affiliates that approval of the New Agreements would be necessary for the Funds to continue receiving investment management services from the Adviser and Sub-Adviser following the November 18, 2014 Change of Control Event. In addition, the Board considered representations by the Adviser and its affiliates, as well as related supporting documentation, indicating that the New Agreements, including the fees payable thereunder, are substantially similar to and, in any event, are no less favorable to the Funds than the terms of the corresponding Prior Agreements. |
| ADVISORY CONTRACT APPROVAL DISCUSSION (Unaudited) (continued) |
| 4) | The Board considered representations by the Adviser and its affiliates, including senior investment management personnel, as well as related supporting documentation, indicating that: (a) the Adviser and Sub-Adviser can be expected to provide services of the same nature, extent and quality under the New Agreements as were provided thereby under the Prior Agreements; and (b) the November 18, 2014, Change of Control Event is not expected to result in any changes to: (i) the management of the Funds, including the continuity of the Funds’ portfolio managers and other personnel responsible for the management operations of the Funds; or (ii) the investment objective of or the principal investment strategies used to manage the Funds. |
| 5) | The Board considered actions taken by the Adviser subsequent to the September 12, 2014 approvals of the Prior Agreements with respect to certain Voya funds in response to requests made by the Board in connection with those approvals. |
| 6) | The Board considered the potential benefits to be realized by the Adviser and its affiliates as a result of the New Agreements. |
Based on the foregoing and other relevant considerations, at a meeting of the Board held on November 18, 2014, the Board, including a majority of the Independent Trustees, voted to approve the New Agreements. In this connection, the Board concluded that, in light of all factors considered, the terms of the New Agreements, including fee rates, were fair and reasonable, and the New Agreements should be approved so as to enable a continuation without interruption of the services being provided by the current service providers pursuant to the Prior Agreements. The Board noted that no one factor was determinative of its decisions which, instead, were premised upon the totality of factors considered. The Board also noted that different Board members likely placed emphasis on different factors in reaching their individual conclusions to vote in favor of the New Agreements.
APPROVAL OF AMENDED AND RESTATED INVESTMENT MANAGEMENT AGREEMENTS
At a meeting held on March 12, 2015, the Board approved amending and restating the Funds’ Management Agreements so that, effective May 1, 2015, the terms of each Fund’s Management Agreement and its
Administrative Agreement are combined under a single Amended and Restated Investment Management Agreement with a single management fee. The single management fee rate under each Fund’s Amended and Restated Investment Management Agreement does not exceed the former combined investment management and administrative services fee rates for each Fund and, under each Fund’s Amended and Restated Investment Management Agreement, there was no change to the investment management or administrative services provided or the fees charged to each Fund.
In connection with its review, the Board determined that it did not need to consider certain factors it typically considers during its review of the Funds’ advisory agreements because it had reviewed, among other matters, the nature, extent and quality of services being provided and, as applicable, actions taken in certain instances to improve the relationship between the costs and the quality of services being provided on September 12, 2014, when it renewed the agreements. In analyzing whether to approve the Amended and Restated Investment Management Agreement, the Board did consider, among other things: (1) a memorandum and related materials outlining the terms of these agreements and Management’s rationale for proposing the amendments that combine the terms of each Funds’ investment management and administrative services arrangements under a single agreement; (2) Management’s representations that, under the Amended and Restated Investment Management Agreement, there would be no change in the fees payable for the combination of advisory and administrative services provided to the Funds; (3) Management’s confirmation that the implementation of the Amended and Restated Investment Management Agreement would result in no change in the scope of services that the Adviser provides to the Funds and that the personnel who have provided administrative and advisory services to the Funds previously would continue to do so after the Amended and Restated Investment Management Agreement become effective; and (4) representations from Management that the combination of the agreements better aligns the Funds’ contracts with the manner in which Voya provides such services to the Funds. In approving the amendments to the Funds’ Management Agreement, different Board members may have given different weight to different individual factors and related conclusions.
Investment Adviser
Voya Investments, LLC
7337 East Doubletree Ranch Road, Suite 100
Scottsdale, Arizona 85258 Administrator
Voya Funds Services, LLC
7337 East Doubletree Ranch Road, Suite 100
Scottsdale, Arizona 85258 Distributor
Voya Investments Distributor, LLC
7337 East Doubletree Ranch Road, Suite 100
Scottsdale, Arizona 85258 Transfer Agent
BNY Mellon Investment Servicing (U.S.) Inc.
301 Bellevue Parkway
Wilmington, Delaware 19809 | Independent Registered Public Accounting Firm
KPMG LLP
Two Financial Center
60 South Street
Boston, Massachusetts 02111 Custodian
The Bank of New York Mellon
One Wall Street
New York, New York 10286 Legal Counsel
Ropes & Gray LLP
Prudential Tower
800 Boylston Street
Boston, Massachusetts 02199 |
For more complete information, or to obtain a prospectus on any Voya mutual fund, please call your financial advisor or Voya Investments Distributor, LLC at (800) 992-0180 or log on to www.voyainvestments.com. The prospectus should be read carefully before investing. Consider the fund’s investment objectives, risks, charges and expenses carefully before investing. The prospectus contains this information and other information about the fund.
| RETIREMENT | INVESTMENTS | INSURANCE |  |
| voyainvestments.com | AR-FIALL (0315-052115) |
Annual Report
March 31, 2015
Voya Floating Rate Fund
Classes A, C, I, P*, R and W
 E-Delivery Sign-up – details inside
This report is submitted for general information to shareholders of the Voya mutual funds. It is not authorized for distribution to prospective shareholders unless accompanied or preceded by a prospectus which includes details regarding the fund’s investment objectives, risks, charges, expenses and other information. This information should be read carefully. |
INVESTMENT MANAGEMENT
voyainvestments.com |  |
TABLE OF CONTENTS
| President’s Letter | | | | | 1 | |
| Market Perspective | | | | | 2 | |
| Portfolio Managers’ Report | | | | | 4 | |
| Shareholder Expense Example | | | | | 7 | |
| Report of Independent Registered Public Accounting Firm | | | | | 8 | |
| Statement of Assets and Liabilities | | | | | 9 | |
| Statement of Operations | | | | | 11 | |
| Statements of Changes in Net Assets | | | | | 12 | |
| Financial Highlights | | | | | 13 | |
| Notes to Financial Statements | | | | | 14 | |
| Portfolio of Investments | | | | | 22 | |
| Tax Information | | | | | 31 | |
| Trustee and Officer Information | | | | | 32 | |
| Advisory Contract Approval Discussion | | | | | 36 | |
| | | | Go Paperless with E-Delivery!
| | |
Sign up now for on-line prospectuses, fund reports, and proxy statements. In less than five minutes, you can help reduce paper mail and lower fund costs. |
| Just go to www.voyainvestments.com, click on the E-Delivery icon from the home page, follow the directions and complete the quick 5 Steps to Enroll. |
| You will be notified by e-mail when these communications become available on the internet. Documents that are not available on the internet will continue to be sent by mail. |
PROXY VOTING INFORMATION
A description of the policies and procedures that the Fund uses to determine how to vote proxies related to portfolio securities is available: (1) without charge, upon request, by calling Shareholder Services toll-free at (800) 992-0180; (2) on the Fund’s website at www.voyainvestments.com; and (3) on the U.S. Securities and Exchange Commission’s (“SEC’s”) website at www.sec.gov. Information regarding how the Fund voted proxies related to portfolio securities during the most recent 12-month period ended June 30 is available without charge on the Fund’s website at www.voyainvestments.com and on the SEC’s website at www.sec.gov.
QUARTERLY PORTFOLIO HOLDINGS
The Fund files its complete schedule of portfolio holdings with the SEC for the first and third quarters of each fiscal year on Form N-Q. The Fund’s Forms N-Q are available on the SEC’s website at www.sec.gov. The Fund’s Forms N-Q may be reviewed and copied at the SEC’s Public Reference Room in Washington D.C., and information on the operation of the Public Reference Room may be obtained by calling (800) SEC-0330. The Fund’s Forms N-Q, as well as a complete portfolio of investments, are available without charge upon request from the Fund by calling Shareholder Services toll-free at (800) 992-0180.
(THIS PAGE INTENTIONALLY LEFT BLANK)
PRESIDENT’S LETTER
Dear Shareholder,
Geopolitical strategy and diplomacy—not to mention the global economy—are deeply driven by questions of access to resources. Who has what you need? How much do you have to pay to get it? How friendly do buyers and sellers need to be?
Today we are confronted with a variety of such issues that may profoundly affect the world for decades to come. For example, the renewed prominence of the United States as an energy producer likely will impact the relationships between consumers, like Europe, and producers, such as Russia and OPEC. While the surge of people fleeing wars in the Middle East and Africa may present an integration challenge to Europe, it also may represent an infusion of youth and energy that the aging continent needs. And as traditional supplies of water come under stress, the need for alternative water sources will likely spur the creation of new technologies and new investment opportunities.
Of course, there are more immediate economic concerns, notably whether central bank support—waning in the U.S., expanding pretty much everywhere else—can sustain global economic growth. Add in elements of political uncertainty, and bouts of market volatility should not be unexpected.
What lessons lie here for your investment program? The most important: Don’t try to “game” diversification. No one can be certain how the global economy will turn, or know where the best investment opportunities will arise. Rather than groping for the next hot investment, you’re well advised to remain broadly diversified, retaining the potential to benefit from whatever the next generation of opportunities has to offer. Periodically review your portfolio with your financial advisor to make sure it remains focused on your investing goals. And as always, do not make changes to your portfolio without first discussing them with your financial advisor.
We appreciate your continued confidence in us, and we look forward to serving your investment needs in the future.
Shaun Mathews
President and Chief Executive Officer
Voya Family of Funds
May 1, 2015
The views expressed in the President’s Letter reflect those of the President as of the date of the letter. Any such views are subject to change at any time based upon market or other conditions and the Voya mutual funds disclaim any responsibility to update such views. These views may not be relied on as investment advice and, because investment decisions for a Voya mutual fund are based on numerous factors, may not be relied on as an indication of investment intent on behalf of any Voya mutual fund. Reference to specific company securities should not be construed as recommendations or investment advice.For more complete information, or to obtain a prospectus for any Voya mutual fund, please call your financial advisor or Voya Investments Distributor, LLC at (800) 992-0180 or log on to www.voyainvestments.com. A prospectus should be read carefully before investing. Consider a fund’s investment objectives, risks, charges and expenses carefully before investing. A prospectus contains this information and other information about a fund. Check with your financial advisor to determine which Voya mutual funds are available for sale within their firm. Not all funds are available for sale at all firms.
1
MARKET PERSPECTIVE: YEAR ENDED MARCH 31, 2015
As our fiscal year started, global equities, in the form of the MSCI World IndexSM (the “Index”) measured in local currencies, including net reinvested dividends had just recovered from a 5% slump after ending 2013 at a record high. The Index progressed in fits and starts with some wide swings, to end up 13.98% for the fiscal year. (The Index returned 6.03% for the one year ended March 31, 2015, measured in U.S. dollars.)
A cold and snowy winter depressed hiring and other key statistics like durable goods orders and home sales early in 2014. But with the improvement in the season came a pick-up in U.S. economic data. Employment reports looked steadily better and the unemployment rate fell below 6%. The March bulletin marked the twelfth consecutive month in which more than 200,000 jobs were created. National purchasing managers’ activity indices signaled expansion at mostly healthy rates. While the housing market was cooling, the rate of increase in the S&P/Case-Shiller 20-City Composite Home Price Index seemed to be stabilizing in the mid-single digits. The most widely watched measures of consumer confidence touched multi-year high levels. Growth in gross domestic product (“GDP”) was –2.1% (annualized) in the first quarter but rebounded to 5.0% in the third, before pulling back to 2.2% in the fourth.
Yet concerns periodically surfaced about the sustainability of the recovery in the U.S. and worldwide. The improving U.S. employment situation was accompanied by labor force participation rates at or near the lowest since 1978. Wage growth was sluggish, near 2% annually. The U.S. Federal Reserve Board’s (“Fed’s”) monthly Treasury and mortgage-backed securities purchases ended as expected in October. But by then the Fed’s balance sheet had increased fivefold over six years to $4.5 trillion and the aftermath of any attempt to bring the total down was far from clear. In March, the Fed signaled that a rate rise was probably two or three meetings away, even as some measures like industrial production, retail sales and durable goods orders were starting to fade.
Outside of the U.S., growth in China decelerated to 7.4% in 2014, the slowest since 1990, which weighed on global commodity supplying countries. For this and other reasons, oil prices halved between June and December and floundered thereafter. Japan re-entered recession in the third quarter after an April rise in the consumption tax and the rebound, to growth of 1.5% annualized, was a disappointment. But it was predominantly the euro zone that seemed the most problematic. Growth was barely 1% in 2014. Unemployment seemed stuck above 11.0%, while deflation emerged in December. In Greece, a new government was elected with a mandate to ease the terms of its bailout and roll back reforms. At last in January the European Central Bank (“ECB”) announced quantitative easing, the elixir that despite all else, might drive asset prices higher, judging from the experience of the U.S. and Japan. Monthly purchases of bonds worth €60 billion would be made from March 2015 until September 2016.
Securities prices mirrored investors’ mood swings in the later months. The Index actually reached a new peak on September 19, but by October 16 fell 8%. From there the Index rebounded 12% to December 5, fell 5% to December 16 then rose 11% to March 20, before ending the fiscal year 1.7% below its all-time high.
In U.S. fixed income markets, the Barclays Long-Term U.S. Treasury sub-index returned a remarkable 21.40% over the fiscal year; the Barclays U.S. Treasury Bond sub-index just 5.36% as the Treasury yield curve flattened. The Barclays U.S. Aggregate Bond Index (“Barclays Aggregate”) added 5.72%, while the Barclays U.S. Corporate Investment Grade Bond sub-index gained 6.81%. Both outperformed the Barclays High Yield Bond — 2% Issuer Constrained Composite Index (not a part of the Barclays Aggregate), which returned only 2.00%, reflecting the significant representation of the ailing energy industry and perhaps a pull-back after strong returns in recent years.
U.S. equities, represented by the S&P 500® Index including dividends, advanced 12.73% in the fiscal year, completing nine consecutive winning quarters, the best run since 1998. The health care sector was the top performer, returning 26.19%; not surprisingly, the only loser was energy, which dropped 11.11% as oil prices sagged. Record operating earnings per share for S&P 500® companies in the second and third quarters were supported by low interest rates, slow wage growth and historically high share buy-back volumes. Operating margins breached 10% for the first time. Both retreated in the last quarter.
In currencies, the dollar gained ground against most other currencies, surging 28.31% against the euro, as the U.S. ended quantitative easing just as the ECB embarked on it and 16.37% against the yen, on the likelihood of further monetary easing in Japan and an announced partial re-allocation into stocks (including non-yen) for the giant Government Pension Investment Fund (“GPIF”). The dollar gained less, 12.44%, on the pound. The UK had a better growth story than the euro zone, which however is the destination for about 40% of the UK’s exports.
In international markets, the MSCI Japan® Index leaped 30.49% in the fiscal year, boosted in the case of Japan’s large exporters by the falling yen, by continued quantitative easing and by the GPIF’s announcement described above. The MSCI Europe ex UK® Index added 18.85%. The poor economic data were ultimately trumped by the prospect of quantitative easing, plus the declining euro that went with it. The MSCI UK® Index was much weaker, edging up 6.11%. Nearly half of this index is comprised of 15 names, mostly global banking, energy, pharmaceuticals and materials companies, not particularly representative of an improving economy, and which on average returned barely 1%.
Past performance does not guarantee future results. The performance quoted represents past performance.
Investment return and principal value of an investment will fluctuate, and shares, when redeemed, may be worth more or less than their original cost. The Fund’s performance is subject to change since the period’s end and may be lower or higher than the performance data shown. Please call (800) 992-0180 or log on to www.voyainvestments.com to obtain performance data current to the most recent month end.
Market Perspective reflects the views of Voya Investment Management’s Chief Investment Risk Officer only through the end of the period, and is subject to change based on market and other conditions.
2
BENCHMARK DESCRIPTIONS
| Index | | | | Description |
|---|
| Barclays High Yield Bond — 2% Issuer Constrained Composite Index | | | | An unmanaged index that includes all fixed income securities having a maximum quality rating of Ba1, a minimum amount outstanding of $150 million, and at least one year to maturity. |
| Barclays Long-Term U.S. Treasury Index | | | | The Index includes all publicly issued, U.S. Treasury securities that have a remaining maturity of 10 or more years, are rated investment grade, and have $250 million or more of outstanding face value. |
| Barclays U.S. Aggregate Bond Index | | | | An unmanaged index of publicly issued investment grade U.S. Government, mortgage-backed, asset-backed and corporate debt securities. |
| Barclays U.S. Corporate Investment Grade Bond Index | | | | An unmanaged index consisting of publicly issued, fixed rate, nonconvertible, investment grade debt securities. |
| Barclays U.S. Treasury Bond Index | | | | A market capitalization-weighted index that measures the performance of public obligations of the U.S. Treasury that have a remaining maturity of one year or more. |
| MSCI Europe ex UK® Index | | | | A free float-adjusted market capitalization index that is designed to measure developed market equity performance in Europe, excluding the UK. |
| MSCI Japan® Index | | | | A free float-adjusted market capitalization index that is designed to measure developed market equity performance in Japan. |
| MSCI UK® Index | | | | A free float-adjusted market capitalization index that is designed to measure developed market equity performance in the UK. |
MSCI World IndexSM | | | | An unmanaged index that measures the performance of over 1,400 securities listed on exchanges in the U.S., Europe, Canada, Australia, New Zealand and the Far East. |
| S&P 500® Index | | | | An unmanaged index that measures the performance of securities of approximately 500 large-capitalization companies whose securities are traded on major U.S. stock markets. |
S&P/Case-Shiller 20-City Composite Home Price Index | | | | A composite index of the home price index for the top 20 Metropolitan Statistical Areas in the United States. The index is published monthly by Standard & Poor’s. |
| The S&P/LSTA Leveraged Loan Index | | | | An unmanaged total return index that captures accrued interest, repayments, and market value changes. It represents a broad cross section of leveraged loans syndicated in the United States, including dollar-denominated loans to overseas issuers. Standard & Poor’s (“S&P”) and the Loan Syndications and Trading Association (“LSTA”) conceived the index to establish a performance benchmark for the syndicated leveraged loan industry. |
3
| VOYA FLOATING RATE FUND | PORTFOLIO MANAGERS’ REPORT |
| | Ratings Distribution
as of March 31, 2015 | |
|---|
| |
| | Ba | | | | | 23.5 | % |
| | B | | | | | 71.6 | % |
| | Caa and below | | | | | 4.9 | % |
| | Not rated* | | | | | 0.0 | % |
| | | | | | | | |
| | Bond ratings apply to the underlying holdings of the Fund and not the Fund itself. Ratings distribution shows the percentage of the Fund’s loan commitments (excluding cash and foreign cash) that are rated in each ratings category, based upon the categories provided by Moody’s Investors Service, Inc. Ratings distribution is based on Moody’s senior secured facility ratings. Moody’s ratings classification methodology: Aaa rating denotes the least credit risk; C rating denotes the greatest credit risk. Loans rated below Baa by Moody’s are considered to be below investment grade. When a bond is not rated by Moody’s it is designated as “Not Rated”. Ratings can change from time to time, and current ratings may not fully reflect the actual credit condition or risks posed by a loan.
|
| | * Not rated includes loans to non-U.S. borrowers (which are typically unrated) and loans for which the rating has been withdrawn. |
Voya Floating Rate Fund (the “Fund”) seeks to provide investors with a high level of current income. The Fund is managed by Jeffrey A. Bakalar and Daniel A. Norman, Portfolio Managers of Voya Investment Management Co. LLC — the Sub-Adviser.
Performance: For the year ended March 31, 2015, the Fund’s Class A shares, excluding sales charges, provided a total return of 2.49% compared to the S&P/LSTA Leveraged Loan Index (the “Index” or “S&P/LSTA Leveraged Loan”), which returned 2.53% for the same period.
Portfolio Specifics: While credit fundamentals remained relatively healthy during the Fund’s fiscal year, overall investor sentiment and, in turn, average loan prices, were buffeted by a series of external headwinds. These included, but were not contained to, widely divergent views as to interest rate expectations and the health of the global economy, intensifying geopolitical risk, escalating regulatory pressure on U.S. financial markets and rapidly declining energy and commodity prices.
As we mentioned in the Fund’s September 30, 2014 semi-annual report, retail investors began moving out of the loan market in April 2014, following 95 straight weeks of inflows. Although collateralized loan obligation (“CLO”) and institutional investors were able to pick up much of the slack, the missing retail investor did create some technical pressure. This was particularly true when new issue supply was, at times during the fiscal year, surprisingly strong.
Adding a little extra drama to the equation was the post-Thanksgiving decline in oil prices. Despite the loan market’s significant underweight to energy as compared to high yield bonds (4-5%, versus 15-17%), we believe loans were pressured by the stress and sell-off in both high yield and equities. In fact, December 2014 was the poorest monthly showing for the Index since August 2011. We believe this was triggered by a confluence of factors, front and center being the energy sector freefall (most pronounced in equities and high yield but certainly not bypassing loans) and a record retail outflow in the first half of the month, itself a function of a “flight to quality” as evidenced by the 10-year Treasury yield falling near the psychological 2% level. By the mid-way point in December, the Index’s calendar year-to-date return was nearing negative territory for the first time since 2008.
TOP TEN LOAN ISSUERS
AS OF MARCH 31, 2015
AS A PERCENTAGE OF: | | |
|---|
| | | | | | NET
ASSETS
|
|---|
| Level 3 Financing, Inc | 1.3% |
| Delta2 Sarl Luxembourg (Formula One World Championship) | 1.1% |
| Freescale Semiconductor, Inc. | 1.1% |
| Amaya Gaming Group Inc. | 1.1% |
| BJs Wholesale Club | 1.1% |
| Valeant Pharmaceuticals International, Inc. | 1.0% |
| Asurion, LLC | 0.9% |
| Fitness International, LLC. | 0.9% |
| Dell International LLC | 0.9% |
| PetSmart, Inc. | 0.9% |
| | | | | | | | | |
Subject to change daily.
|
Following the negative impact in December from plunging oil prices, the loan market spent the first quarter of 2015 recovering much of its losses. Retail outflows moderated and overall sentiment improved, buoyed in part by the slowing descent of oil and the Bureau of Economic Analysis revision of third-quarter U.S. gross domestic product growth to 5% from 3.9% (the largest increase in 11 years). Prices were further supported by a shift in technical factors toward demand, with CLO and institutional investors providing a steady stream of strong inflows against weakening new issue supply.
Fundamental credit risk, as traditionally measured by trailing default rates and forward default indictors, remained exceptionally low for the reporting period. Although the Index’s trailing default rate by principal did rise materially and abruptly in April 2014 due to the highly anticipated bankruptcy of Energy Futures Holdings (“EFH”, the largest single Index constituent), the event had little immediate impact on market sentiment or average loan prices. The Index’s trailing 12-month default rate by principal amount ended the Fund’s fiscal year at 3.79%. Excluding EFH (which will be removed from the figure at the end of April 2015) the default rate ended the reporting period at 1.02%.
The Fund underperformed its benchmark after deducting fees and operating costs. Performance for the reporting period was attributable primarily to a conscious underweight of the oil and gas sector and a zero weight to Energy Future Holdings. The Fund’s top industry exposures at the end of the reporting period were electronics, health care, retail, business equipment & services and telecommunications. These sector exposures were generally beneficial to returns during the reporting period. During the period, the Fund held positions in three of the five the largest contributors to Index performance: iHeart Communications, Inc., Asurion Corp. LLC and Dell International LLC. During the period, the Fund held no position in any of the five largest detractors to Index performance. Cash levels were brought up slightly higher than normal during December 2014, due to a highly volatile investor sentiment period that created an atmosphere of unpredictable redemption activity. However, the Fund’s cash position was brought back down by the end of the fiscal year as market dynamics improved.
Credit spreads remained range bound for much of the period, although they widened at the end of December. By end of the fiscal year, nominal spreads for the Index were at 4.43%, 15 basis points wider than the same point in 2014. In an effort to capture what we believed
4
| VOYA FLOATING RATE FUND | PORTFOLIO MANAGERS’ REPORT |
to be the best relative value available, the bulk of incremental investment during the fiscal year took place in the new issue market (which typically offers a slight discount to face value), with increasing opportunity in the last few months of the fiscal year to find what we believed to be attractive valuation in the secondary market. As of period-end, the weighted average coupon of the portfolio’s loan assets, inclusive of LIBOR floors, was 4.98%, as compared to 4.70% for the Index.
The Fund continues to be well diversified, with 302 individual issuers and 36 different industry sectors represented. The average issuer exposure at period-end stood at 0.33% of assets under management (“AUM”), while the average industry exposure closed the fiscal year at 2.78% of AUM. Both measures were relatively unchanged from the prior reporting period.
Current Strategy & Outlook: Even though the floating rate loan market has recently rallied as a result of a less than robust forward new issue calendar, we remain constructive on the forward prospects for the loan asset class given a still attractive absolute and relative yield and a reasonably sanguine outlook for fundamental credit risk (ex-energy). In addition, although recent data related to global growth prospects have in some cases tempered expectations for a June or September 2015 rate hike, it does appear that the U.S. Federal Reserve Board continues to take incremental measures to prepare the markets for an eventual move higher. We believe predominant risks to loan performance continue to include potential energy-related volatility, particularly in those issuers and sub-sectors most vulnerable to persistent price weakness. We also remain on watch for unexpected weakness in first quarter 2015 corporate earnings and any resultant shift in investor expectations for the broader economy in general.
Portfolio holdings and characteristics are subject to change and may not be representative of current holdings and characteristics. The outlook for this Fund may differ from that presented for other Voya mutual funds. Performance for the different classes of shares will vary based on differences in fees associated with each class. An index has no cash in its portfolio, imposes no sales charges and incurs no operating expenses. An investor cannot invest directly in an index.
| | | | |
Jeffrey A. Bakalar
Managing Director
Voya Investment Management Co. LLC | | | | Daniel A. Norman
Managing Director
Voya Investment Management Co. LLC |
| | | | |
Voya Floating Rate Fund
April 27, 2015 | | | | | | |
5
| VOYA FLOATING RATE FUND | PORTFOLIO MANAGERS’ REPORT |
Average Annual Total Returns for the Periods Ended March 31, 2015
|
|
|---|
| | | | 1 Year
| | 3 Year
| | Since Inception
of Class A, C, I, R and W
August 17, 2010
| | Since Inception
of Class P
June 14, 2013
|
|---|
Including Sales Charge: | | | | | | | | | | | | | | | | | | |
Class A(1) | | | | | –0.05 | % | | | 3.59 | % | | | 4.10 | % | | | — | |
Class C(2) | | | | | 0.73 | % | | | 3.70 | % | | | 3.90 | % | | | — | |
| Class I | | | | | 2.85 | % | | | 4.73 | % | | | 4.94 | % | | | — | |
| Class P | | | | | 3.53 | % | | | — | | | | — | | | | 4.04 | % |
| Class R | | | | | 2.34 | % | | | 4.22 | % | | | 4.39 | % | | | — | |
| Class W | | | | | 2.74 | % | | | 4.72 | % | | | 4.97 | % | | | — | |
Excluding Sales Charge: | | | | | | | | | | | | | | | | | | |
| Class A | | | | | 2.49 | % | | | 4.47 | % | | | 4.67 | % | | | — | |
| Class C | | | | | 1.72 | % | | | 3.70 | % | | | 3.90 | % | | | — | |
| Class I | | | | | 2.85 | % | | | 4.73 | % | | | 4.94 | % | | | — | |
| Class P | | | | | 3.53 | % | | | — | | | | — | | | | 4.04 | % |
| Class R | | | | | 2.34 | % | | | 4.22 | % | | | 4.39 | % | | | — | |
| Class W | | | | | 2.74 | % | | | 4.72 | % | | | 4.97 | % | | | — | |
| S&P/LSTA Leveraged Loan | | | | | 2.53 | % | | | 4.90 | % | | | 5.37 | % | | | 3.51 | % |
Based on a $10,000 initial investment, the graph and table above illustrate the total return of Voya Floating Rate Fund against the index indicated. The index is unmanaged and has no cash in its portfolio, imposes no sales charges and incurs no operating expenses. An investor cannot invest directly in an index. The Fund’s performance is shown both with and without the imposition of sales charges.
The performance graph and table do not reflect the deduction of taxes that a shareholder will pay on Fund distributions or the redemption of Fund shares.
The performance shown may include the effect of fee waivers and/or expense reimbursements by the Investment Adviser and/or other service providers, which have the effect of increasing total net return. Had all fees and expenses been considered, the total net returns would have been lower.
Performance data represents past performance and is no assurance of future results. Investment return and principal value of an investment in the Fund will fluctuate. Shares, when sold, may be worth more or less than their original cost. The Fund’s current performance may be lower or higher than the performance data shown. Please log on to www.voyainvestments.com or call (800) 992-0180 to get performance through the most recent month end.
This report contains statements that may be “forward-looking” statements. Actual results may differ materially from those projected in the “forward-looking” statements.
The views expressed in this report reflect those of the portfolio managers, only through the end of the period as stated on the cover. The portfolio managers’ views are subject to change at any time based on market and other conditions.
Fund holdings are subject to change daily.
(1) | | Reflects deduction of the maximum Class A sales charge of 2.50%. |
(2) | | Reflects deduction of the Class C deferred sales charge of 1% for the 1 year return. |
6
SHAREHOLDER EXPENSE EXAMPLE (UNAUDITED)
As a shareholder of the Fund, you incur two types of costs: (1) transaction costs, including sales charges (loads) on purchase payments, redemption fees and exchange fees, and (2) ongoing costs, including management fees, distribution and/or service (12b-1) fees, and other Fund expenses. These Examples are intended to help you understand your ongoing costs (in dollars) of investing in the Fund and to compare these costs with the ongoing costs of investing in other mutual funds.
The Examples are based on an investment of $1,000 invested at the beginning of the period and held for the entire period from October 1, 2014 to March 31, 2015. The Fund’s expenses are shown without the imposition of any sales charges or fees. Expenses would have been higher if such charges were included.
Actual Expenses
The left section of the table shown below, “Actual Fund Return,” provides information about actual account values and actual expenses. You may use the information in this section, together with the amount you invested, to estimate the expenses that you paid over the period. Simply divide your account value by $1,000 (for example, an $8,600 account value divided by $1,000 = 8.6), then multiply the result by the number in the first section under the heading entitled “Expenses Paid During the Period” to estimate the expenses you paid on your account during this period.
Hypothetical Example for Comparison Purposes
The right section of the table shown below, “Hypothetical (5% return before expenses),” provides information about hypothetical account values and hypothetical expenses based on the Fund’s actual expense ratio and an assumed rate of return of 5% per year before expenses, which is not the Fund’s actual return. The hypothetical account values and expenses may not be used to estimate the actual ending account balance or expenses you paid for the period. You may use this information to compare the ongoing costs of investing in the Fund and other mutual funds. To do so, compare this 5% hypothetical example with the 5% hypothetical examples that appear in the shareholder reports of the other mutual funds.
Please note that the expenses shown in the table are meant to highlight your ongoing costs only and do not reflect any transactional costs, such as sales charges (loads), redemption fees or exchange fees. Therefore, the hypothetical section of the table is useful in comparing ongoing costs only, and will not help you determine the relative total costs of owning different mutual funds. In addition, if these transactional costs were included, your costs would have been higher.
| | | | Actual Fund Return
| | Hypothetical (5% return before expenses)
| |
|---|
| | | | Beginning
Account
Value
October 1, 2014
| | Ending
Account
Value
March 31, 2015
| | Annualized
Expense
Ratio
| | Expenses Paid
During the
Period Ended
March 31, 2015*
| | Beginning
Account
Value
October 1, 2014
| | Ending
Account
Value
March 31, 2015
| | Annualized
Expense
Ratio
| | Expenses Paid
During the
Period Ended
March 31, 2015*
|
|---|
| | | | |
| Class A | | | | $ | 1,000.00 | | | $ | 1,019.80 | | | | 1.02 | % | | $ | 5.14 | | | $ | 1,000.00 | | | $ | 1,019.85 | | | | 1.02 | % | | $ | 5.14 | |
| Class C | | | | | 1,000.00 | | | | 1,016.00 | | | | 1.77 | | | | 8.90 | | | | 1,000.00 | | | | 1,016.11 | | | | 1.77 | | | | 8.90 | |
| Class I | | | | | 1,000.00 | | | | 1,021.10 | | | | 0.77 | | �� | | 3.88 | | | | 1,000.00 | | | | 1,021.09 | | | | 0.77 | | | | 3.88 | |
| Class P | | | | | 1,000.00 | | | | 1,025.50 | | | | 0.11 | | | | 0.56 | | | | 1,000.00 | | | | 1,024.38 | | | | 0.11 | | | | 0.56 | |
| Class R | | | | | 1,000.00 | | | | 1,018.60 | | | | 1.27 | | | | 6.39 | | | | 1,000.00 | | | | 1,018.60 | | | | 1.27 | | | | 6.39 | |
| Class W | | | | | 1,000.00 | | | | 1,021.00 | | | | 0.77 | | | | 3.88 | | | | 1,000.00 | | | | 1,021.09 | | | | 0.77 | | | | 3.88 | |
| * | | Expenses are equal to the Fund’s respective annualized expense ratios multiplied by the average account value over the period, multiplied by 182/365 to reflect the most recent fiscal half-year. |
7
REPORT OF INDEPENDENT REGISTERED PUBLIC ACCOUNTING FIRM
The Shareholders and Board of Trustees
Voya Funds Trust
We have audited the accompanying statements of assets and liabilities, including the portfolio of investments, of Voya Floating Rate Fund, a series of Voya Funds Trust, as of March 31, 2015, and the related statements of operations for the year then ended, the statements of changes in net assets for each of the years in the two-year period then ended, and the financial highlights for each of the years or periods in the five-year period then ended. These financial statements and financial highlights are the responsibility of management. Our responsibility is to express an opinion on these financial statements and financial highlights based on our audits.
We conducted our audits in accordance with the standards of the Public Company Accounting Oversight Board (United States). Those standards require that we plan and perform the audit to obtain reasonable assurance about whether the financial statements, financial highlights, and portfolios of investments are free of material misstatement. An audit includes examining, on a test basis, evidence supporting the amounts and disclosures in the financial statements and portfolios of investments. Our procedures included confirmation of securities owned as of March 31, 2015, by correspondence with the custodian, transfer agent, and brokers, or by other appropriate auditing procedures when replies from brokers were not received. An audit also includes assessing the accounting principles used and significant estimates made by management, as well as evaluating the overall financial statement presentation. We believe that our audits provide a reasonable basis for our opinion.
In our opinion, the financial statements and financial highlights referred to above present fairly, in all material respects, the financial position of Voya Floating Rate Fund as of March 31, 2015, and the results of its operations for the year then ended, the changes in its net assets for each of the years in the two-year period then ended, and the financial highlights for each of the years or periods in the five-year period then ended, in conformity with accounting principles generally accepted in the United States of America.
Boston, Massachusetts
May 22, 2015
8
STATEMENTS OF ASSETS AND LIABILITIES AS OF MARCH 31, 2015
ASSETS: | | | | | | |
| Investments in securities at fair value (Cost $903,422,043) | | | | $ | 900,951,897 | |
| Short-term investments at fair value (Cost $73,500,000) | | | | | 73,500,000 | |
| Total Investments at fair value | | | | | 974,451,897 | |
| Receivables: | | | | | | |
| Investment securities sold | | | | | 15,134,516 | |
| Fund shares sold | | | | | 2,514,107 | |
| Interest | | | | | 4,343,861 | |
| Prepaid structuring fee (Note 7) | | | | | 39,891 | |
| Prepaid expenses | | | | | 64,870 | |
| Reimbursement due from manager | | | | | 17,121 | |
| Other assets | | | | | 4,859 | |
| Total assets | | | | | 996,571,122 | |
LIABILITIES: | | | | | | |
| Payable for investment securities purchased | | | | | 37,089,780 | |
| Payable for fund shares redeemed | | | | | 2,053,815 | |
| Income distribution payable | | | | | 98,583 | |
| Payable for investment management fees | | | | | 433,568 | |
| Payable for administrative fees | | | | | 78,830 | |
| Payable for distribution and shareholder service fees | | | | | 107,055 | |
| Accrued trustees fees | | | | | 8,362 | |
| Payable to trustees under the deferred compensation plan (Note 8) | | | | | 4,859 | |
| Other accrued expenses and liabilities | | | | | 270,041 | |
| Total liabilities | | | | | 40,144,893 | |
NET ASSETS | | | | $ | 956,426,229 | |
NET ASSETS WERE COMPRISED OF: | | | | | | |
| Paid-in capital | | | | | 962,220,798 | |
| Undistributed net investment income | | | | | 165,688 | |
| Accumulated net realized loss | | | | | (3,490,111 | ) |
| Net unrealized depreciation | | | | | (2,470,146 | ) |
NET ASSETS | | | | $ | 956,426,229 | |
See Accompanying Notes to Financial Statements
9
STATEMENTS OF ASSETS AND LIABILITIES AS OF MARCH 31, 2015 (CONTINUED)
Class A: | | | | | | |
| Net assets | | | | $ | 46,566,062 | |
| Shares authorized | | | | | unlimited | |
| Par value | | | | $ | 0.001 | |
| Shares outstanding | | | | | 4,605,538 | |
| Net asset value and redemption price per share | | | | $ | 10.11 | |
Maximum offering price per share (2.50%)(1)(2) | | | | $ | 10.37 | |
| |
Class C: | | | | | | |
| Net assets | | | | $ | 63,817,925 | |
| Shares authorized | | | | | unlimited | |
| Par value | | | | $ | 0.001 | |
| Shares outstanding | | | | | 6,310,671 | |
Net asset value and redemption price per share(2) | | | | $ | 10.11 | |
| |
Class I: | | | | | | |
| Net assets | | | | $ | 590,583,219 | |
| Shares authorized | | | | | unlimited | |
| Par value | | | | $ | 0.001 | |
| Shares outstanding | | | | | 58,426,660 | |
Net asset value and redemption price per share(2) | | | | $ | 10.11 | |
| |
Class P: | | | | | | |
| Net assets | | | | $ | 23,301,708 | |
| Shares authorized | | | | | unlimited | |
| Par value | | | | $ | 0.001 | |
| Shares outstanding | | | | | 2,305,889 | |
| Net asset value and redemption price per share | | | | $ | 10.11 | |
| |
Class R: | | | | | | |
| Net assets | | | | $ | 99,782,691 | |
| Shares authorized | | | | | unlimited | |
| Par value | | | | $ | 0.001 | |
| Shares outstanding | | | | | 9,880,727 | |
| Net asset value and redemption price per share | | | | $ | 10.10 | |
| |
Class W: | | | | | | |
| Net assets | | | | $ | 132,374,624 | |
| Shares authorized | | | | | unlimited | |
| Par value | | | | $ | 0.001 | |
| Shares outstanding | | | | | 13,066,735 | |
| Net asset value and redemption price per share | | | | $ | 10.13 | |
___________________
| | | | | | |
(1) Maximum offering price is computed at 100/97.50 of net asset value. On purchases of $100,000 or more, the offering price is reduced. |
(2) Redemption price per share may be reduced for any applicable contingent deferred sales charge. |
See Accompanying Notes to Financial Statements
10
STATEMENTS OF OPERATIONS FOR THE YEAR ENDED MARCH 31, 2015
INVESTMENT INCOME: | | | | | | |
| Interest | | | | $ | 38,724,925 | |
| Other | | | | | 514,965 | |
| Total investment income | | | | | 39,239,890 | |
| |
EXPENSES: | | | | | | |
| Investment management fees | | | | | 4,682,824 | |
| Administration fees | | | | | 851,422 | |
| Distribution and service fees: | | | | | | |
| Class A | | | | | 162,838 | |
| Class C | | | | | 758,305 | |
| Class R | | | | | 516,604 | |
| Transfer agent fees: | | | | | | |
| Class A | | | | | 52,489 | |
| Class C | | | | | 59,298 | |
| Class I | | | | | 62,738 | |
| Class P | | | | | 684 | |
| Class R | | | | | 79,565 | |
| Class W | | | | | 111,375 | |
| Shareholder reporting expense | | | | | 70,514 | |
| Custody and accounting expense | | | | | 419,350 | |
| Registration fees | | | | | 156,853 | |
| Professional fees | | | | | 89,510 | |
| Trustees fees | | | | | 29,335 | |
| Structuring fee (Note 7) | | | | | 40,109 | |
| Commitment fee | | | | | 147,278 | |
| Miscellaneous expense | | | | | 44,024 | |
| Total expenses | | | | | 8,335,115 | |
| Net waived and reimbursed fees | | | | | (504,903 | ) |
| Net expenses | | | | | 7,830,212 | |
| Net investment income | | | | | 31,409,678 | |
| |
REALIZED AND UNREALIZED GAIN (LOSS): | | | | | | |
| Net realized loss on investments | | | | | (3,488,489 | ) |
| Net change in unrealized appreciation (depreciation) on: | | | | | | |
| Investments | | | | | (4,990,447 | ) |
| Net change in unrealized appreciation (depreciation) | | | | | (4,990,447 | ) |
| Net realized and unrealized loss | | | | | (8,478,936 | ) |
| Increase in net assets resulting from operations | | | | $ | 22,930,742 | |
See Accompanying Notes to Financial Statements
11
STATEMENTS OF CHANGES IN NET ASSETS
| | | | Year
Ended
March 31, 2015
| | Year
Ended
March 31, 2014
|
|---|
FROM OPERATIONS: | | | | | | | | | | |
| Net investment income | | | | $ | 31,409,678 | | | $ | 23,580,425 | |
| Net realized gain (loss) | | | | | (3,488,489 | ) | | | 665,332 | |
| Net change in unrealized appreciation (depreciation) | | | | | (4,990,447 | ) | | | (2,033,568 | ) |
| Net increase in net assets resulting from operations | | | | | 22,930,742 | | | | 22,212,189 | |
| |
FROM DISTRIBUTIONS TO SHAREHOLDERS: | | | | | | | | | | |
| Net investment income: | | | | | | | | | | |
| Class A | | | | | (2,308,081 | ) | | | (3,173,407 | ) |
| Class C | | | | | (2,120,446 | ) | | | (1,966,091 | ) |
| Class I | | | | | (16,500,685 | ) | | | (9,915,178 | ) |
| Class P | | | | | (1,253,355 | ) | | | (1,108,235 | ) |
| Class R | | | | | (3,411,073 | ) | | | (2,311,746 | ) |
| Class W | | | | | (5,452,998 | ) | | | (5,205,552 | ) |
| Net realized gains: | | | | | | | | | | |
| Class A | | | | | — | | | | (88,302 | ) |
| Class C | | | | | — | | | | (70,871 | ) |
| Class I | | | | | — | | | | (257,093 | ) |
| Class P | | | | | — | | | | (48,328 | ) |
| Class R | | | | | — | | | | (76,469 | ) |
| Class W | | | | | — | | | | (124,245 | ) |
| Return of capital: | | | | | | | | | | |
| Class A | | | | | — | | | | (93,754 | ) |
| Class C | | | | | — | | | | (76,711 | ) |
| Class I | | | | | — | | | | (290,450 | ) |
| Class P | | | | | — | | | | (78,318 | ) |
| Class R | | | | | — | | | | (87,417 | ) |
| Class W | | | | | — | | | | (136,297 | ) |
| Total distributions | | | | | (31,046,638 | ) | | | (25,108,464 | ) |
FROM CAPITAL SHARE TRANSACTIONS: | | | | | | | | | | |
| Net proceeds from sale of shares | | | | | 512,077,195 | | | | 663,037,010 | |
| Reinvestment of distributions | | | | | 29,275,148 | | | | 22,965,642 | |
| | | | | | 541,352,343 | | | | 686,002,652 | |
| Cost of shares redeemed | | | | | (426,249,871 | ) | | | (181,142,287 | ) |
| Net increase in net assets resulting from capital share transactions | | | | | 115,102,472 | | | | 504,860,365 | |
| Net increase in net assets | | | | | 106,986,576 | | | | 501,964,090 | |
NET ASSETS: | | | | | | | | | | |
| Beginning of year or period | | | | | 849,439,653 | | | | 347,475,563 | |
| End of year or period | | | | $ | 956,426,229 | | | $ | 849,439,653 | |
| Undistributed (distributions in excess of) net investment income at end of year or period | | | | $ | 165,688 | | | $ | (197,352 | ) |
See Accompanying Notes to Financial Statements
12
FINANCIAL HIGHLIGHTS
Selected data for a share of beneficial interest outstanding throughout each year or period.
| | | Income (loss)
from investment
operations
| | | | Less distributions
| | | | Ratios to average net assets
| | Supplemental data
| |
|---|
| |
|---|
| Net
asset
value,
beginning
of
year
or
period
| | Net
investment
income
(loss)
| | Net
realized
and
unrealized
gain
(loss)
| | Total
from
investment
operations
| | From
net
investment
income
| | From
net
realized
gains
| | From
return
of
capital
| | Total
distributions
| | Net
asset
value,
end
of
year
or
period
| | Total
Return
(1)
| | Expenses
before
reductions/
additions
(2)(3)
| | Expenses,
net of fee
waivers
and/or
recoupments,
if any
(2)(3)
| | Expenses,
net
of
all
reductions/
additions
(2)(3)
| | Net
investment
income
(loss)
(2)(3)
| | Net
assets,
end
of
year
or
period
| | Portfolio
Turnover
rate
|
|---|
Year or period ended
| ($)
| | ($)
| | ($)
| | ($)
| | ($)
| | ($)
| | ($)
| | ($)
| | ($)
| | (%)
| | (%)
| | (%)
| | (%)
| | (%)
| | ($000’s)
| | (%)
|
|---|
Class A | | | | | | | | | | | | | | | | | | | | | | | | | | | | | | | | | | | | | | | | | | | | | | | | | | | | | | | | | | | | | | | |
| 03-31-15 | | 10.22 | | | | 0.36 | | | | (0.11 | ) | | | 0.25 | | | | 0.36 | | | | — | | | | — | | | | 0.36 | | | | 10.11 | | | | 2.49 | | | | 1.09 | | | | 1.02 | | | | 1.02 | | | | 3.53 | | | | 46,566 | | | | 60 | |
| 03-31-14 | | 10.28 | | | | 0.38 | * | | | (0.02 | ) | | | 0.36 | | | | 0.40 | | | | 0.01 | | | | 0.01 | | | | 0.42 | | | | 10.22 | | | | 3.58 | | | | 1.08 | | | | 1.01 | | | | 1.01 | | | | 3.71 | | | | 98,669 | | | | 124 | |
| 03-31-13 | | 10.10 | | | | 0.52 | * | | | 0.21 | | | | 0.73 | | | | 0.53 | | | | 0.02 | | | | — | | | | 0.55 | | | | 10.28 | | | | 7.41 | | | | 1.11 | | | | 1.01 | | | | 1.01 | | | | 5.08 | | | | 35,918 | | | | 101 | |
| 03-31-12 | | 10.26 | | | | 0.43 | * | | | (0.08 | ) | | | 0.35 | | | | 0.45 | | | | 0.06 | | | | — | | | | 0.51 | | | | 10.10 | | | | 3.58 | | | | 1.12 | | | | 1.01 | | | | 1.01 | | | | 4.23 | | | | 10,266 | | | | 79 | |
08-17-10(4)–03-31-11 | | 10.00 | | | | 0.21 | * | | | 0.25 | | | | 0.46 | | | | 0.19 | | | | 0.01 | | | | — | | | | 0.20 | | | | 10.26 | | | | 4.57 | | | | 1.30 | | | | 1.02 | | | | 1.02 | | | | 3.49 | | | | 18,411 | | | | 73 | |
Class C | | | | | | | | | | | | | | | | | | | | | | | | | | | | | | | | | | | | | | | | | | | | | | | | | | | | | | | | | | | | | | | |
| 03-31-15 | | 10.22 | | | | 0.28 | | | | (0.11 | ) | | | 0.17 | | | | 0.28 | | | | — | | | | — | | | | 0.28 | | | | 10.11 | | | | 1.72 | | | | 1.84 | | | | 1.77 | | | | 1.77 | | | | 2.81 | | | | 63,818 | | | | 60 | |
| 03-31-14 | | 10.28 | | | | 0.30 | * | | | (0.02 | ) | | | 0.28 | | | | 0.32 | | | | 0.01 | | | | 0.01 | | | | 0.34 | | | | 10.22 | | | | 2.81 | | | | 1.83 | | | | 1.76 | | | | 1.76 | | | | 2.97 | | | | 84,619 | | | | 124 | |
| 03-31-13 | | 10.10 | | | | 0.44 | * | | | 0.21 | | | | 0.65 | | | | 0.45 | | | | 0.02 | | | | — | | | | 0.47 | | | | 10.28 | | | | 6.61 | | | | 1.86 | | | | 1.76 | | | | 1.76 | | | | 4.33 | | | | 26,367 | | | | 101 | |
| 03-31-12 | | 10.26 | | | | 0.36 | * | | | (0.09 | ) | | | 0.27 | | | | 0.37 | | | | 0.06 | | | | — | | | | 0.43 | | | | 10.10 | | | | 2.80 | | | | 1.87 | | | | 1.76 | | | | 1.76 | | | | 3.71 | | | | 7,409 | | | | 79 | |
08-17-10(4)–03-31-11 | | 10.00 | | | | 0.19 | * | | | 0.22 | | | | 0.41 | | | | 0.14 | | | | 0.01 | | | | — | | | | 0.15 | | | | 10.26 | | | | 4.11 | | | | 2.05 | | | | 1.77 | | | | 1.77 | | | | 3.46 | | | | 3,356 | | | | 73 | |
Class I | | | | | | | | | | | | | | | | | | | | | | | | | | | | | | | | | | | | | | | | | | | | | | | | | | | | | | | | | | | | | | | |
| 03-31-15 | | 10.21 | | | | 0.39 | | | | (0.11 | ) | | | 0.28 | | | | 0.38 | | | | — | | | | — | | | | 0.38 | | | | 10.11 | | | | 2.85 | | | | 0.78 | | | | 0.77 | | | | 0.77 | | | | 3.86 | | | | 590,583 | | | | 60 | |
| 03-31-14 | | 10.28 | | | | 0.41 | * | | | (0.03 | ) | | | 0.38 | | | | 0.43 | | | | 0.01 | | | | 0.01 | | | | 0.45 | | | | 10.21 | | | | 3.74 | | | | 0.76 | | | | 0.76 | | | | 0.76 | | | | 3.99 | | | | 327,896 | | | | 124 | |
| 03-31-13 | | 10.10 | | | | 0.54 | * | | | 0.21 | | | | 0.75 | | | | 0.55 | | | | 0.02 | | | | — | | | | 0.57 | | | | 10.28 | | | | 7.67 | | | | 0.86 | | | | 0.76 | | | | 0.76 | | | | 5.33 | | | | 165,936 | | | | 101 | |
| 03-31-12 | | 10.27 | | | | 0.47 | * | | | (0.10 | ) | | | 0.37 | | | | 0.48 | | | | 0.06 | | | | — | | | | 0.54 | | | | 10.10 | | | | 3.74 | | | | 0.87 | | | | 0.76 | | | | 0.76 | | | | 4.65 | | | | 173,722 | | | | 79 | |
08-17-10(4)–03-31-11 | | 10.00 | | | | 0.25 | * | | | 0.23 | | | | 0.48 | | | | 0.20 | | | | 0.01 | | | | — | | | | 0.21 | | | | 10.27 | | | | 4.83 | | | | 1.05 | | | | 0.77 | | | | 0.77 | | | | 3.93 | | | | 170,660 | | | | 73 | |
Class P | | | | | | | | | | | | | | | | | | | | | | | | | | | | | | | | | | | | | | | | | | | | | | | | | | | | | | | | | | | | | | | |
| 03-31-15 | | 10.21 | | | | 0.45 | * | | | (0.10 | ) | | | 0.35 | | | | 0.45 | | | | — | | | | — | | | | 0.45 | | | | 10.11 | | | | 3.53 | | | | 0.77 | | | | 0.11 | | | | 0.11 | | | | 4.40 | | | | 23,302 | | | | 60 | |
06-14-13(4)–03-31-14 | | 10.22 | | | | 0.37 | * | | | 0.00 | • | | | 0.37 | | | | 0.36 | | | | 0.01 | | | | 0.01 | | | | 0.38 | | | | 10.21 | | | | 3.71 | | | | 0.75 | | | | 0.10 | | | | 0.10 | | | | 4.58 | | | | 86,265 | | | | 124 | |
Class R | | | | | | | | | | | | | | | | | | | | | | | | | | | | | | | | | | | | | | | | | | | | | | | | | | | | | | | | | | | | | | | |
| 03-31-15 | | 10.20 | | | | 0.34 | | | | (0.11 | ) | | | 0.23 | | | | 0.33 | | | | — | | | | — | | | | 0.33 | | | | 10.10 | | | | 2.34 | | | | 1.34 | | | | 1.27 | | | | 1.27 | | | | 3.33 | | | | 99,783 | | | | 60 | |
| 03-31-14 | | 10.27 | | | | 0.35 | * | | | (0.03 | ) | | | 0.32 | | | | 0.37 | | | | 0.01 | | | | 0.01 | | | | 0.39 | | | | 10.20 | | | | 3.23 | | | | 1.33 | | | | 1.26 | | | | 1.26 | | | | 3.47 | | | | 98,457 | | | | 124 | |
| 03-31-13 | | 10.09 | | | | 0.49 | * | | | 0.21 | | | | 0.70 | | | | 0.50 | | | | 0.02 | | | | — | | | | 0.52 | | | | 10.27 | | | | 7.15 | | | | 1.36 | | | | 1.26 | | | | 1.26 | | | | 4.84 | | | | 32,371 | | | | 101 | |
| 03-31-12 | | 10.26 | | | | 0.41 | * | | | (0.09 | ) | | | 0.32 | | | | 0.43 | | | | 0.06 | | | | — | | | | 0.49 | | | | 10.09 | | | | 3.22 | | | | 1.37 | | | | 1.26 | | | | 1.26 | | | | 4.26 | | | | 16,515 | | | | 79 | |
08-17-10(4)–03-31-11 | | 10.00 | | | | 0.21 | * | | | 0.23 | | | | 0.44 | | | | 0.17 | | | | 0.01 | | | | — | | | | 0.18 | | | | 10.26 | | | | 4.39 | | | | 1.55 | | | | 1.27 | | | | 1.27 | | | | 3.87 | | | | 7,897 | | | | 73 | |
Class W | | | | | | | | | | | | | | | | | | | | | | | | | | | | | | | | | | | | | | | | | | | | | | | | | | | | | | | | | | | | | | | |
| 03-31-15 | | 10.24 | | | | 0.38 | * | | | (0.11 | ) | | | 0.27 | | | | 0.38 | | | | — | | | | — | | | | 0.38 | | | | 10.13 | | | | 2.74 | | | | 0.84 | | | | 0.77 | | | | 0.77 | | | | 3.82 | | | | 132,375 | | | | 60 | |
| 03-31-14 | | 10.30 | | | | 0.41 | * | | | (0.02 | ) | | | 0.39 | | | | 0.43 | | | | 0.01 | | | | 0.01 | | | | 0.45 | | | | 10.24 | | | | 3.83 | | | | 0.83 | | | | 0.76 | | | | 0.76 | | | | 3.98 | | | | 153,532 | | | | 124 | |
| 03-31-13 | | 10.12 | | | | 0.54 | * | | | 0.21 | | | | 0.75 | | | | 0.55 | | | | 0.02 | | | | — | | | | 0.57 | | | | 10.30 | | | | 7.66 | | | | 0.86 | | | | 0.76 | | | | 0.76 | | | | 5.34 | | | | 86,844 | | | | 101 | |
| 03-31-12 | | 10.27 | | | | 0.45 | * | | | (0.06 | ) | | | 0.39 | | | | 0.48 | | | | 0.06 | | | | — | | | | 0.54 | | | | 10.12 | | | | 3.93 | | | | 0.87 | | | | 0.76 | | | | 0.76 | | | | 4.74 | | | | 52,351 | | | | 79 | |
08-17-10(4)–03-31-11 | | 10.00 | | | | 0.24 | | | | 0.24 | | | | 0.48 | | | | 0.20 | | | | 0.01 | | | | — | | | | 0.21 | | | | 10.27 | | | | 4.83 | | | | 1.05 | | | | 0.77 | | | | 0.77 | | | | 4.49 | | | | 3,319 | | | | 73 | |
(1) | | Total return is calculated assuming reinvestment of all dividends, capital gain distributions and return of capital distributions, if any, at net asset value and excluding the deduction of sales charges or contingent deferred sales charges, if applicable. Total return for periods less than one year is not annualized. |
(2) | | Annualized for periods less than one year. |
(3) | | Expense ratios reflect operating expenses of a Fund. Expenses before reductions/additions do not reflect amounts reimbursed by the Investment Adviser and/or Distributor or reductions from brokerage service arrangements or other expense offset arrangements and do not represent the amount paid by a Fund during periods when reimbursements or reductions occur. Expenses net of fee waivers reflect expenses after reimbursement by an Investment Adviser and/or Distributor but prior to reductions from brokerage service arrangements or other expense offset arrangements. Expenses net of all reductions/additions represent the net expenses paid by a Fund. Net investment income (loss) is net of all such additions or reductions. |
(4) | | Commencement of operations. |
| * | | Calculated using average number of shares outstanding throughout the period. |
• | | Amount is less than $0.005 or 0.005% or more than $(0.005) or (0.005)% |
See Accompanying Notes to Financial Statements
13
NOTES TO FINANCIAL STATEMENTS AS OF MARCH 31, 2015
NOTE 1 — ORGANIZATION
Voya Funds Trust (“Trust”) is a Delaware statutory trust and is registered as an open-end management investment company under the Investment Company Act of 1940, as amended (“1940 Act”). The Trust was organized on August 6, 1998 and was established under a Trust Instrument dated July 30, 1998. It consists of six separately managed series. This report is for Voya Floating Rate Fund (“Floating Rate” or the “Fund”), a diversified series of the Trust.
The Fund offers the following classes of shares: Class A, Class C, Class I, Class P*, Class R and Class W. The separate classes of shares differ principally in the applicable sales charges (if any), transfer agent fees, distribution fees and shareholder servicing fees. Generally, shareholders of each class also bear certain expenses that pertain to that particular class. All shareholders bear the common expenses of a fund and earn income and realized gains/losses from a fund pro rata based on the daily ending net assets of each class, without distinction between share classes. Differences in per share dividend rates generally result from the differences in separate class expenses, including distribution, and shareholder servicing fees.
Voya Investments, LLC (“Voya Investments” or the “Investment Adviser”), an Arizona limited liability company, serves as the Investment Adviser to the Fund. Voya Investment Management Co. LLC (“Voya IM”), a Delaware limited liability company, serves as the sub-adviser to the Fund. Voya Funds Services, LLC (“VFS” or the “Administrator”), a Delaware limited liability company, serves as the Administrator to the Fund. Voya Investments Distributor, LLC (“VID” or the “Distributor”), a Delaware limited liability company, serves as the principal underwriter to the Fund.
NOTE 2 — SIGNIFICANT ACCOUNTING POLICIES
The following significant accounting policies are consistently followed by the Fund in the preparation of its financial statements. The Fund is considered an investment company under U.S. generally accepted accounting principles (“GAAP”) and follows the accounting and reporting guidance applicable to investment companies.
A. Loan and Other Security Valuation. The net asset value (“NAV”) per share for each class of the Fund is determined each business day as of the close of regular trading (“Market Close”) on the New York Stock Exchange (“NYSE”) (normally 4:00 p.m. Eastern time unless otherwise designated by the NYSE) each day on which the NYSE is open for trading. The Fund is open for business every day the NYSE is open. Fund shares will not be priced on days when the NYSE is closed. The NAV per share of each class of the Fund is calculated by taking the value of the Fund’s assets attributable to that class, subtracting the Fund’s liabilities attributable to that class, and dividing by the number of shares of that class that are outstanding.
Assets for which market quotations are readily available are valued at market value. A security listed or traded on an exchange is valued at its last sales price or official closing price as of the close of the normal trading session on the exchange where the security is principally traded, or lacking any sales or official closing price on a particular day, the security may be valued at the mean of the closing bid and ask price on that day. Bank loans are valued at the average of the averages between the bid and ask prices provided to an independent pricing service by brokers. Futures contracts are valued at the final settlement price set by an exchange on which they are principally traded. Listed options are valued at the mean between the last bid and ask prices from the exchange on which they are principally traded. Investments in open-end registered investment companies that do not trade on an exchange are valued at the end of day net asset value per share. Investments in registered investment companies that trade on an exchange are valued at the last sales price or official closing price as of the close of the customary trading session on the exchange where the security is principally traded.
When a market quotation is not readily available or is deemed unreliable, the Fund will determine a fair value for the relevant asset in accordance with procedures adopted by the Board of Trustees (“Board”). Such procedures provide, for example, that: (a) Debt obligations are valued using an evaluated price provided by an independent pricing service. Evaluated prices provided by the pricing service may be determined without exclusive reliance on quoted prices, and may reflect factors such as institution-size trading in similar groups of securities, developments related to specific securities, benchmark yield, quality, type of issue, coupon rate, maturity individual trading characteristics and other market data; (b) Securities traded in the over-the-counter market are valued based on prices provided by independent pricing services or market makers; (c) Options not listed on an exchange are valued by an independent source using an industry accepted model, such as Black-Scholes; (d) Centrally cleared swap agreements are valued using a price provided by the central counterparty clearinghouse; (e) Over-the-counter swap agreements are valued using a price provided by an independent pricing service; (f) Forward foreign currency contracts are valued utilizing current and forward rates obtained from an independent pricing service. Such prices from the third party pricing service are for specific settlement periods and each Fund’s forward foreign currency contracts are valued at an interpolated rate between the closest preceding and subsequent period reported by the independent pricing service and
14
NOTES TO FINANCIAL STATEMENTS AS OF MARCH 31, 2015 (CONTINUED)
NOTE 2 — SIGNIFICANT ACCOUNTING POLICIES (continued)
(g) Securities for which market prices are not provided by any of the above methods may be valued based upon quotes furnished by brokers.
The prospectuses of the open-end registered investment companies in which the Fund may invest explain the circumstances under which they will use fair value pricing and the effects of using fair value pricing.
Foreign securities’ (including foreign exchange contracts) prices are converted into U.S. dollar amounts using the applicable exchange rates as of the close of the NYSE. If market quotations are available and believed to be reliable for foreign exchange-traded equity securities, the securities will be valued at the market quotations. Because trading hours for certain foreign securities end before the close of the NYSE, closing market quotations may become unreliable. An independent pricing service determines the degree of certainty, based on historical data, that the closing price in the principal market where a foreign security trades is not the current value as of the close of the NYSE. Foreign securities’ prices meeting the approved degree of certainty that the price is not reflective of current value will be valued by the independent pricing service using pricing models designed to estimate likely changes in the values of those securities between the times in which the trading in those securities is substantially completed and the close of the NYSE. Multiple factors may be considered by the independent pricing service in determining the value of such securities and may include information relating to sector indices, American Depositary Receipts and domestic and foreign index futures.
All other assets for which market quotations are not readily available or became unreliable (or if the above fair valuation methods are unavailable or determined to be unreliable) are valued at fair value as determined in good faith by or under the supervision of the Board following procedures approved by the Board. Issuer specific events, transaction price, position size, nature and duration of restrictions on disposition of the security, market trends, bid/ask quotes of brokers and other market data may be reviewed in the course of making a good faith determination of a security’s fair value. Valuations change in response to many factors including the historical and prospective earnings of the issuer, the value of the issuer’s assets, general economic conditions, interest rates, investor perceptions and market liquidity. Because of the inherent uncertainties of fair valuation, the values used to determine the Fund’s NAV may materially differ from the value received upon actual sale of those investments. Thus, fair valuation may have an unintended dilutive or accretive effect on the value of shareholders’ investments in the Fund.
Each investment asset or liability of the Fund is assigned a level at measurement date based on the significance and source of the inputs to its valuation. Quoted prices in active markets for identical securities are classified as “Level 1,” inputs other than quoted prices for an asset or liability that are observable are classified as “Level 2” and unobservable inputs, including the sub-adviser’s judgment about the assumptions that a market participant would use in pricing an asset or liability are classified as “Level 3.” The inputs used for valuing securities are not necessarily an indication of the risks associated with investing in those securities. Short-term securities of sufficient credit quality are generally considered to be Level 2 securities under applicable accounting rules. A table summarizing the Fund’s investments under these levels of classification is included following the Portfolio of Investments.
The Board has adopted methods for valuing securities and other assets in circumstances where market quotes are not readily available, and has delegated the responsibility for applying the valuation methods to the “Pricing Committee” as established by the Fund’s Administrator. The Pricing Committee considers all facts it deems relevant that are reasonably available, through either public information or information available to the Investment Adviser or sub-adviser, when determining the fair value of the security. In the event that a security or asset cannot be valued pursuant to one of the valuation methods established by the Board, the fair value of the security or asset will be determined in good faith by the Pricing Committee. When the Fund uses these fair valuation methods that use significant unobservable inputs to determine its NAV, securities will be priced by a method that the Pricing Committee believes accurately reflects fair value and are categorized as Level 3 of the fair value hierarchy. The methodologies used for valuing securities are not necessarily an indication of the risks of investing in those securities valued in good faith at fair value nor can it be assured the Fund can obtain the fair value assigned to a security if it were to sell the security.
To assess the continuing appropriateness of security valuations, the Pricing Committee may compare prior day prices, prices on comparable securities, and traded prices to the prior or current day prices and the Pricing Committee challenges those prices exceeding certain tolerance levels with the independent pricing service or broker source. For those securities valued in good faith at fair value, the Pricing Committee reviews and affirms the reasonableness of the valuation on a regular basis after considering all relevant information that is reasonably available.
For fair valuations using significant unobservable inputs, U.S. GAAP requires a reconciliation of the beginning to ending balances for reported fair values that presents changes attributable to total realized and unrealized gains
15
NOTES TO FINANCIAL STATEMENTS AS OF MARCH 31, 2015 (CONTINUED)
NOTE 2 — SIGNIFICANT ACCOUNTING POLICIES (continued)
or losses, purchases and sales, and transfers in or out of the Level 3 category during the period. The beginning of period timing recognition is used for the transfers between Levels of the Fund’s assets and liabilities. A reconciliation of Level 3 investments is presented only when the Fund has a significant amount of Level 3 investments.
For the period ended March 31, 2015, there have been no significant changes to the fair valuation methodologies.
B. Security Transactions and Revenue Recognition. Revolver and delayed draw loans are booked on a settlement date basis. Security transactions and loans are accounted for on trade date (date the order to buy or sell is executed). Realized gains or losses are reported on the basis of identified cost of securities sold. Interest income is recorded on an accrual basis at the then-current loan rate. The accrual of interest on loans is partially or fully discontinued when, in the opinion of management, there is an indication that the borrower may be unable to meet payments as they become due. If determined to be uncollectible, unpaid accrued interest is also written off. Cash collections on non-accrual loans are generally applied as a reduction to the recorded investment of the loan. Loans are generally returned to accrual status only after all past due amounts have been received and the borrower has demonstrated sustained performance. Loan premiums and discounts are amortized and/or accreted for financial reporting purposes. Arrangement fees received on revolving credit facilities, which represent non-refundable fees or purchase discounts associated with the acquisition of loans, are deferred and recognized using the effective yield for financial reporting purposes. No such fees are recognized on loans which have been placed on non-accrual status. Arrangement fees associated with all other loans, except revolving credit facilities, are treated as discounts and are accreted as described above. Dividend income is recorded on the ex-dividend date. Amendment fees are earned as compensation for evaluating and accepting changes to an original loan agreement and are recognized when received. Amendment fees and other fees earned are reported on the Statement of Operations.
C. Distributions to Shareholders. The Fund declares and goes ex-dividend daily and pays dividends monthly from net investment income. Distributions from capital gains, if any, are declared and paid annually. The Fund may make additional distributions to comply with the distribution requirements of the Internal Revenue Code. The character and amounts of income and gains to be distributed are determined in accordance with federal income tax regulations, which may differ from U.S. GAAP for investment companies. Distributions in excess of net investment income and/or net realized capital gains for tax purposes are reported as return of capital. The Fund records distributions to its shareholders on the ex-dividend date.
D. Futures Contracts. A futures contract is an agreement between a buyer or seller and an established futures exchange or its clearinghouse in which the buyer or seller agrees to take or make a delivery of a specific amount of a financial instrument at a specified price on a specific date (settlement date). The Fund did not enter into any futures contracts during the period ended March 31, 2015.
Futures contracts are valued at the most recent settlement price. Upon entering into a futures contract, the Fund is required to deposit with a financial intermediary cash or securities (“initial margin”) in an amount equal to a certain percentage of the face value indicated in the futures contract. Subsequent payments (“variation margin”) are made or received by the Fund dependent upon the daily fluctuations in the value and are recorded as unrealized gains or losses by the Fund. Gains or losses are realized when the contract expires or is closed. Since all futures contracts are exchange-traded, counterparty risk is minimized as the exchange’s clearinghouse acts as the counterparty, and guarantees the futures against default.
Certain risks may arise upon entering into futures contracts, including the risk that an illiquid market will limit the Fund’s ability to close out a futures contract prior to the settlement date and that a change in the value of a futures contract may not correlate exactly with the changes in the value of the underlying hedged security, index or currency.
E. When-Issued and Delayed-Delivery Transactions. Securities purchased or sold on a when-issued, delayed-delivery or forward purchase commitment basis may have extended settlement periods. The value of the security so purchased is subject to market fluctuations during this period. Due to the nature of the loan market, the actual settlement date may not be certain at the time of the purchase or sale for some of the loans. Interest income on such loans is not accrued until settlement date.
F. Federal Income Taxes. It is the policy of the Fund to comply with the requirements of subchapter M of the Internal Revenue Code that are applicable to regulated investment companies and to distribute substantially all of its net investment income and any net realized capital gains to its shareholders. Therefore, a federal income tax or excise tax provision is not required. Management has considered the sustainability of the Fund’s tax positions taken on federal income tax returns for all open tax years in making this determination. No capital gain distributions shall be made until the capital loss carryforwards have been fully utilized or expire.
G. Use of Estimates. The preparation of financial statements in conformity with U.S. GAAP requires
16
NOTES TO FINANCIAL STATEMENTS AS OF MARCH 31, 2015 (CONTINUED)
NOTE 2 — SIGNIFICANT ACCOUNTING POLICIES (continued)
management to make estimates and assumptions that affect the reported amounts of assets and liabilities and disclosure of contingent assets and liabilities at the date of the financial statements and the reported amounts of increases and decreases in net assets from operations during the reporting period. Actual results could differ from those estimates.
H. Foreign Currency Translation. The books and records of the Fund are maintained in U.S. dollars. Any foreign currency amounts are translated into U.S. dollars on the following basis:
| (1) | | Market value of investment securities, other assets and liabilities — at the exchange rates prevailing at the end of the day. |
| (2) | | Purchases and sales of investment securities, income and expenses — at the rates of exchange prevailing on the respective dates of such transactions. |
Although the net assets and the market values are presented at the foreign exchange rates at the end of the day, the Fund does not isolate the portion of the results of operations resulting from changes in foreign exchange rates on investments from the fluctuations arising from changes in market prices of securities held. Such fluctuations are included with the net realized and unrealized gains or losses from investments. For securities, which are subject to foreign withholding tax upon disposition, liabilities are recorded on the Statement of Assets and Liabilities for the estimated tax withholding based on the securities current market value. Upon disposition, realized gains or losses on such securities are recorded net of foreign withholding tax.
Reported net realized foreign exchange gains or losses arise from sales of foreign currencies, currency gains or losses realized between the trade and settlement dates on securities transactions, the difference between the amounts of dividends, interest, and foreign withholding taxes recorded on the Fund’s books, and the U.S. dollar equivalent of the amounts actually received or paid. Net unrealized foreign exchange gains and losses arise from changes in the value of assets and liabilities other than investments in securities at fiscal year end, resulting from changes in the exchange rate. Foreign security and currency transactions may involve certain considerations and risks not typically associated with investing in U.S. companies and the U.S. government. These risks include, but are not limited to, revaluation of currencies and future adverse political and economic developments which could cause securities and their markets to be less liquid and prices more volatile than those of comparable U.S. companies and U.S. government securities. The foregoing risks are even greater with respect to securities in emerging markets.
I. Indemnifications. In the normal course of business, the Trust may enter into contracts that provide certain indemnifications. The Trust’s maximum exposure under these arrangements is dependent on future claims that may be made against the Fund and, therefore, cannot be estimated; however, management believes based on experience, the risk of loss from such claims is considered remote.
NOTE 3 — INVESTMENTS
For the year ended March 31, 2015, the cost of purchases and the proceeds from principal repayment and sales of investments, excluding short-term investments, totaled $602,650,894 and $481,422,684, respectively. At March 31, 2015, the Fund held loans valued at $900,951,897 representing 92.5% of its total investments. The fair value of these assets is established as set forth in Note 2.
The loans acquired by the Fund typically take the form of a direct lending relationship with the borrower acquired through an assignment of another lender’s interest in a loan. The lead lender in a typical corporate loan syndicate administers the loan and monitors collateral. In the event that the lead lender becomes insolvent, enters Federal Deposit Insurance Corporation (“FDIC”) receivership or, if not FDIC insured, enters into bankruptcy, the Fund may incur certain costs and delays in realizing payment, or may suffer a loss of principal and/or interest.
NOTE 4 — INVESTMENT MANAGEMENT AND ADMINISTRATION FEES
The Investment Adviser serves pursuant to an investment management agreement (“Management Agreement”) between the Investment Adviser and the Trust, on behalf of the Fund. The Management Agreement compensates the Investment Adviser with a fee, computed daily and payable monthly, at an annual rate of 0.55% of the Fund’s average daily net assets. The Investment Adviser is contractually obligated to waive the investment management fee for Class P shares of the Fund. This waiver is not eligible for recoupment. Termination or modification of this obligation requires approval by the Board.
The Investment Adviser has entered into a sub-advisory agreement with Voya IM. Subject to such policies as the Board or the Investment Adviser may determine, Voya IM manages the Fund’s assets in accordance with the Fund’s investment objectives, policies, and limitations.
The Fund has entered into an administrative agreement (“Administrative Agreement”) with the Administrator. The
17
NOTES TO FINANCIAL STATEMENTS AS OF MARCH 31, 2015 (CONTINUED)
NOTE 4 — INVESTMENT MANAGEMENT AND ADMINISTRATION FEES (continued)
Administrator provides certain administrative and shareholder services necessary for the Fund’s operations and is responsible for the supervision of other service providers. For its services, the Administrator is entitled to receive from the Fund a fee at an annual rate of 0.10% of its average daily net assets. The Administrator is contractually obligated to waive the administrative fee for Class P shares of the Fund. This waiver is not eligible for recoupment. Termination or modification of this obligation requires approval by the Board.
Please see Note 13 — Subsequent Events on the Combination of the former Management Agreement and Administrative Agreement.
NOTE 5 — DISTRIBUTION AND SERVICE FEES
Each share class of the Fund, except Class I, Class P and Class W, has a plan (each a “Plan” and collectively, the ��Plans”), whereby the Distributor is compensated by the Fund for expenses incurred in the distribution of the Fund’s shares (“Distribution Fees”). Pursuant to the Plans, the Distributor is entitled to a payment each month for actual expenses incurred in the distribution and promotion of the Fund’s shares, including expenses incurred in printing prospectuses and reports used for sales purposes, expenses incurred in preparing and printing sales literature and other such distribution related expenses, including any distribution or Shareholder Servicing Fees (“Service Fees”) paid to securities dealers who executed a distribution agreement with the Distributor. Under the Plans, each class of shares of the Fund pays the Distributor a combined Distribution and/or Service Fee based on average daily net assets at the following annual rates:
Class A
| | | | Class C
| | Class R
|
|---|
| 0.25% | | | | 1.00% | | 0.50% |
The Distributor may also retain the proceeds of the initial sales charge paid by shareholders upon the purchase of Class A shares of the Fund, and the contingent deferred sales charge paid by shareholders upon certain redemptions for Class A and Class C shares. For the period ended March 31, 2015, the Distributor retained the following amounts in sales charges:
| | | | Class A
| | Class C
|
|---|
| Initial Sales Charges | | | | $ | 9,705 | | | $ | — | |
| Contingent Deferred Sales Charge | | | | | 1 | | | | 2,022 | |
NOTE 6 — EXPENSE LIMITATIONS
Pursuant to a written expense limitation agreement (“Expense Limitation Agreement”) with the Fund, the Investment Adviser has agreed to limit expenses, excluding interest, taxes, investment-related costs, leverage expenses, extraordinary expenses, and acquired fund fees and expenses, to the levels listed below:
Maximum Operating Expense Limit
(as a percentage of average daily net assets)
Class A — 1.00%
Class C — 1.75%
Class I — 0.75%
Class P — 0.15%
Class R — 1.25%
Class W — 0.75%
The Investment Adviser may at a later date recoup from the Fund for management fees waived and other expenses assumed by the Investment Adviser during the previous 36 months, but only if, after such recoupment, the Fund’s expense ratio does not exceed the percentage described above. Waived and reimbursed fees net of any recoupment by the Investment Adviser of such waived and reimbursed fees are reflected on the accompanying Statement of Operations. Amounts payable by the Investment Adviser are reflected on the accompanying Statements of Assets and Liabilities.
The Expense Limitation Agreement is contractual through August 1, 2016 and shall renew automatically for one-year terms. Termination or modification of this obligation requires approval by the Board.
As of March 31, 2015, the amounts of waived and reimbursed fees that are subject to recoupment by the Investment Adviser, and the related expiration dates are as follows:
March 31,
| |
|---|
2016
| | | | 2017
| | 2018
| | Total
|
|---|
| $258,001 | | | | $27,772 | | $73,436 | | $359,209 |
In addition to the above waived or reimbursed fees, the amount of class specific fees waived or reimbursed that are subject to possible recoupment by the Investment Adviser, and the related expiration dates, as of March 31, 2015 are as follows:
| | | | March 31,
| |
|---|
| | | | 2016
| | 2017
| | 2018
| | Total
|
|---|
| Class A | | | | $ | — | | | $ | 58,561 | | | $ | 42,325 | | | $ | 100,886 | |
| Class C | | | | | — | | | | 45,651 | | | | 48,425 | | | | 94,076 | |
| Class R | | | | | — | | | | 45,543 | | | | 64,840 | | | | 110,383 | |
| Class W | | | | | — | | | | 89,220 | | | | 90,613 | | | | 179,833 | |
NOTE 7 — LINE OF CREDIT
Effective September 30, 2014, the Fund has entered into an unsecured committed revolving line of credit agreement (the “Credit Agreement”) with State Street Bank and Trust Company (“SSB”) for an aggregate amount of $160,000,000. The proceeds may be used only to: (1) temporarily finance the purchase and sale of securities;
18
NOTES TO FINANCIAL STATEMENTS AS OF MARCH 31, 2015 (CONTINUED)
or (2) temporarily finance the redemption of shares of an investor in the Fund. The Fund pays a commitment fee equal to 0.15% per annum on the daily unused portion of the committed line amount payable quarterly in arrears and a structuring fee of $80,000, which is expensed over a year. Prior to September 30, 2014, the aggregate amount of the Fund’s Credit Agreement was $50,000,000, the Fund paid a commitment fee equal to 0.10% on the daily unused portion of the committed line amount payable quarterly in arrears. Generally, borrowings under the Credit Agreement accrue interest at the federal funds rate plus a specified margin. Repayments generally must be made within 60 days after the date of a revolving credit advance.
During the period ended March 31, 2015, the Fund did not utilize the line of credit.
NOTE 8 — OTHER TRANSACTIONS WITH AFFILIATES AND RELATED PARTIES
At March 31, 2015, the following direct or indirect, wholly-owned subsidiary of Voya Financial, Inc. or affiliated investment companies owned more than 5% of the Fund:
Subsidiary/Affiliated Investment Company
| | | | Percentage
|
|---|
| Voya Institutional Trust Company | | | | | 10.36 | % |
| Voya Solution 2025 Portfolio | | | | | 6.05 | |
| Voya Solution 2035 Portfolio | | | | | 5.55 | |
Control is defined by the 1940 Act as the beneficial ownership, either directly or through one or more controlled companies, of more than 25% of the voting securities of a company. The 1940 Act defines affiliates as companies that are under common control. When the Fund has a common owner that owns over 25% of the outstanding securities of the Fund, they may be deemed to be affiliates of each other. Investment activities of these shareholders could have a material impact on the Fund.
The Fund has adopted a Deferred Compensation Plan (the “Plan”), which allows eligible non-affiliated trustees, as described in the Plan, to defer the receipt of all or a portion of the trustees’ fees that they are entitled to receive from the Fund. For purposes of determining the amount owed to the trustee under the Plan, the amounts deferred are invested in shares of the funds selected by the trustee (the “Notional Funds”). The Fund purchases shares of the Notional Funds, which are all advised by Voya Investments, in amounts equal to the trustees’ deferred fees, resulting in a Fund asset equal to the deferred compensation liability. Such assets are included as a component of “Other assets” on the accompanying Statement of Assets and Liabilities. Deferral of trustees’ fees under the Plan will not affect net assets of the Fund, and will not materially affect the Fund’s assets, liabilities or net investment income per share. Amounts will be deferred until distributed in accordance with the Plan.
NOTE 9 — UNFUNDED COMMITMENTS
As of March 31, 2015 the fund had no unfunded loan commitments.
Transactions in capital shares and dollars were as follows:
| | | | Shares
sold
| | Reinvestment
of
distributions
| | Shares
redeemed
| | Net increase
(decrease)
in shares
outstanding
| | Shares
sold
| | Reinvestment
of
distributions
| | Shares
redeemed
| | Net increase
(decrease)
|
|---|
Year or period ended
| | | | #
| | #
| | #
| | #
| | ($)
| | ($)
| | ($)
| | ($)
|
|---|
Class A | | | | | | | | | | | | | | | | | | | | | | | | | | | | | | | | | | |
| 03-31-15 | | | | | 2,249,021 | | | | 203,973 | | | | (7,504,150 | ) | | | (5,051,156 | ) | | | 22,719,599 | | | | 2,066,570 | | | | (76,107,000 | ) | | | (51,320,831 | ) |
| 03-31-14 | | | | | 10,358,888 | | | | 300,298 | | | | (4,496,100 | ) | | | 6,163,086 | | | | 105,961,693 | | | | 3,069,687 | | | | (45,976,978 | ) | | | 63,054,402 | |
Class C | | | | | | | | | | | | | | | | | | | | | | | | | | | | | | | | | | |
| 03-31-15 | | | | | 1,362,500 | | | | 171,414 | | | | (3,503,895 | ) | | | (1,969,981 | ) | | | 13,836,136 | | | | 1,735,015 | | | | (35,440,920 | ) | | | (19,869,769 | ) |
| 03-31-14 | | | | | 7,090,057 | | | | 146,813 | | | | (1,520,485 | ) | | | 5,716,385 | | | | 72,569,083 | | | | 1,500,823 | | | | (15,551,282 | ) | | | 58,518,624 | |
Class I | | | | | | | | | | | | | | | | | | | | | | | | | | | | | | | | | | |
| 03-31-15 | | | | | 41,396,712 | | | | 1,527,485 | | | | (16,605,069 | ) | | | 26,319,128 | | | | 418,053,737 | | | | 15,430,153 | | | | (167,643,166 | ) | | | 265,840,724 | |
| 03-31-14 | | | | | 23,772,696 | | | | 903,969 | | | | (8,713,189 | ) | | | 15,963,476 | | | | 243,019,631 | | | | 9,237,941 | | | | (89,046,679 | ) | | | 163,210,893 | |
Class P | | | | | | | | | | | | | | | | | | | | | | | | | | | | | | | | | | |
| 03-31-15 | | | | | 1,039,221 | | | | 118,003 | | | | (7,297,558 | ) | | | (6,140,334 | ) | | | 10,570,000 | | | | 1,193,972 | | | | (74,339,304 | ) | | | (62,575,332 | ) |
06/14/13(1)–03-31-14 | | | | | 8,325,387 | | | | 120,836 | | | | — | | | | 8,446,223 | | | | 85,118,085 | | | | 1,234,895 | | | | — | | | | 86,352,980 | |
Class R | | | | | | | | | | | | | | | | | | | | | | | | | | | | | | | | | | |
| 03-31-15 | | | | | 1,761,833 | | | | 336,863 | | | | (1,866,362 | ) | | | 232,334 | | | | 17,852,280 | | | | 3,403,897 | | | | (18,804,991 | ) | | | 2,451,186 | |
| 03-31-14 | | | | | 6,582,358 | | | | 241,982 | | | | (327,028 | ) | | | 6,497,312 | | | | 67,216,665 | | | | 2,470,595 | | | | (3,339,976 | ) | | | 66,347,284 | |
Class W | | | | | | | | | | | | | | | | | | | | | | | | | | | | | | | | | | |
| 03-31-15 | | | | | 2,856,992 | | | | 537,128 | | | | (5,326,743 | ) | | | (1,932,623 | ) | | | 29,045,443 | | | | 5,445,541 | | | | (53,914,490 | ) | | | (19,423,506 | ) |
| 03-31-14 | | | | | 8,689,498 | | | | 532,300 | | | | (2,656,442 | ) | | | 6,565,356 | | | | 89,151,853 | | | | 5,451,701 | | | | (27,227,372 | ) | | | 67,376,182 | |
(1) | | Commencement of Operations. |
19
NOTES TO FINANCIAL STATEMENTS AS OF MARCH 31, 2015 (CONTINUED)
NOTE 11 — FEDERAL INCOME TAXES
The amount of distributions from net investment income and net realized capital gains are determined in accordance with federal income tax regulations, which may differ from U.S. GAAP for investment companies. These book/tax differences may be either temporary or permanent. Permanent differences are reclassified within the capital accounts based on their federal tax-basis treatment; temporary differences are not reclassified. Key differences include the treatment of short-term capital gains and wash sale deferrals. Distributions in excess of net investment income and/or net realized capital gains for tax purposes are reported as return of capital.
The following permanent tax differences have been reclassified as of March 31, 2015:
Paid-in
Capital
| | | | Accumulated
Net Realized
Gains/(Losses)
|
|---|
| $12 | | | | $ (12) |
Dividends paid by the Fund from net investment income and distributions of net realized short-term capital gains are, for federal income tax purposes, taxable as ordinary income to shareholders.
The tax composition of dividends to shareholders was as follows:
Year Ended March 31, 2015
| | | | Year Ended March 31, 2014
| |
|---|
Ordinary
Income
| | | | Ordinary
Income
| | Long-term
Capital Gain
| | Return of
Capital
|
|---|
| $ 31,046,638 | | | | $ | 24,088,134 | | | $ | 257,383 | | | $ | 762,947 | |
The tax-basis components of distributable earnings and the capital loss carryforwards which may be used to offset future realized capital gains for federal income tax purposes as of March 31, 2015 were:
| | | | | | | | Capital Loss Carryforwards
| |
|---|
Undistributed
Ordinary
Income
| | Post-October
Capital Losses
Deferred
| | Unrealized
Appreciation/
(Depreciation)
| | Amount
| | | Character
| | Expiration
|
|---|
| $ 268,976 | | $ (2,143,096) | | $ (2,768,341) | | $ | (790,937 | ) | | Short-term | | None |
| | | | | | | | (257,883 | ) | | Long-term | | None |
| | | | | | | $ | (1,048,820 | ) | | | | |
The Fund’s major tax jurisdictions are U.S. federal and Arizona. The earliest tax year that remains subject to examination by these jurisdictions is 2010.
As of March 31, 2015, no provision for income tax is required in the Fund’s financial statements as a result of tax positions taken on federal and state income tax returns for open tax years. The Fund’s federal and state income and federal excise tax returns for tax years for which the applicable statutes of limitations have not expired are subject to examination by the Internal Revenue Service and state department of revenue.
NOTE 12 — RESTRUCTURING PLAN
Prior to May 2013, Voya Financial, Inc. was a wholly-owned subsidiary of ING Groep N.V. (“ING Groep”). In October 2009, ING Groep submitted a restructuring plan (the “Restructuring Plan”) to the European Commission in order to receive approval for state aid granted to ING Groep by the Kingdom of the Netherlands in November 2008 and March 2009. To receive approval for this state aid, ING Groep was required to divest its insurance and investment management businesses, including Voya Financial, Inc. (formerly, ING U.S., Inc.), before the end of 2013. In November 2012, the Restructuring Plan was amended to permit ING Groep additional time to complete the divestment. Pursuant to the amended Restructuring Plan, ING Groep was required to divest at least 25% of Voya Financial, Inc. by the end of 2013 and more than 50% by the end of 2014, and was required to divest its remaining interest by the end of 2016 (such divestment, the “Separation Plan”).
In May 2013, Voya Financial, Inc. conducted an initial public offering of its common stock (the “IPO”). In October 2013, March 2014, and September 2014, ING Groep divested additional shares in several secondary offerings of common stock of Voya Financial, Inc. and concurrent share repurchases by Voya Financial, Inc. These transactions reduced ING Groep’s ownership interest in Voya Financial, Inc. to 32%. Voya Financial, Inc. did not receive any proceeds from these offerings.
20
NOTES TO FINANCIAL STATEMENTS AS OF MARCH 31, 2015 (CONTINUED)
NOTE 12 — Restructuring Plan (continued)
In November 2014, through an additional secondary offering and the concurrent repurchase of shares by Voya Financial, Inc., ING Groep further reduced its interest in Voya Financial, Inc. below 25% to approximately 19% (the “November 2014 Offering”). The November 2014 Offering was deemed by the Investment Adviser to be a change of control (the “Change of Control”), which resulted in the automatic termination of the existing investment advisory and sub-advisory agreements under which the Investment Adviser and sub-adviser provide services to the Fund. In anticipation of this termination, and in order to ensure that the existing investment advisory and sub-advisory services could continue uninterrupted, in 2013 the Board approved new advisory and sub-advisory agreements for the Fund, as applicable, in connection with the IPO. In addition, in 2013, shareholders of the Fund approved new investment advisory and affiliated sub-advisory agreements prompted by the IPO, as well as any future advisory and affiliated sub-advisory agreements prompted by the Separation Plan that are approved by the Board and that have terms not materially different from the current agreements. This meant that shareholders would not have another opportunity to vote on a new agreement with the Investment Adviser or the current affiliated sub-adviser even upon a change of control prompted by the Separation Plan, as long as no single person or group of persons acting together gains “control” (as defined in the 1940 Act) of Voya Financial, Inc.
On November 18, 2014, in response to the Change of Control, the Board, at an in-person meeting, approved new investment advisory and sub-advisory agreements. At that meeting, the Investment Adviser represented that the new investment advisory and affiliated sub-advisory agreements approved by the Board were not materially different from the agreements approved by shareholders in 2013 and no single person or group of persons acting together was expected to gain “control” (as defined in the 1940 Act) of Voya Financial, Inc. As a result, shareholders of the Fund will not be asked to vote again on the new agreements with the Investment Adviser and affiliated sub-adviser.
In March 2015, ING Groep divested the remainder of its interest in Voya Financial, Inc. through a secondary offering of Voya Financial, Inc.’s common stock of and a concurrent share repurchase by Voya Financial, Inc. Voya Financial, Inc. did not receive any proceeds from these transactions.
NOTE 13 — SUBSEQUENT EVENTS
Dividends. Subsequent to March 31, 2015, the Fund declared dividends from net investment income of:
| | | | Per Share
Amount
| | Payable
Date
| | Record
Date
|
|---|
| Class A | | | | $ 0.0303 | | May 1, 2015 | | Daily |
| Class C | | | | $ 0.0241 | | May 1, 2015 | | Daily |
| Class I | | | | $ 0.0324 | | May 1, 2015 | | Daily |
| Class P | | | | $ 0.0379 | | May 1, 2015 | | Daily |
| Class R | | | | $ 0.0283 | | May 1, 2015 | | Daily |
| Class W | | | | $ 0.0324 | | May 1, 2015 | | Daily |
Combination of former Management Agreement and Administrative Agreement: At a meeting held on March 12, 2015, the Board approved amending and restating the Fund’s Management Agreement so that, effective May 1, 2015, the terms of the Fund’s Management Agreement and its Administrative Agreement are combined under a single Amended and Restated Investment Management Agreement with a single management fee. The single management fee rate under the Fund’s Amended and Restated Investment Management Agreement does not exceed the former combined investment management and administrative services fee rates for the Fund and, under the Fund’s Amended and Restated Investment Management Agreement, there was no change to the investment management or administrative services provided or the fees charged to the Fund.
The Fund has evaluated events occurring after the Statement of Assets and Liabilities date (“subsequent events”) to determine whether any subsequent events necessitated adjustment to or disclosure in the financial statements. Other than the above, no such subsequent events were identified.
21
| VOYA FLOATING RATE FUND | PORTFOLIO OF INVESTMENTS
AS OF MARCH 31, 2015 |
Principal Amount†
|
|
|
|
|
| Borrower/Tranche Description
|
| Fair Value
|
| Percentage
of Net
Assets
|
|---|
LOANS*: 94.2% |
Aerospace & Defense: 0.4% |
| 2,961,372 | | | | | | Custom Sensors & Technologies, First Lien Term Loan, 4.500%, 09/30/21 | | $ | 2,972,477 | | | | 0.3 | |
| 997,449 | | | | | | Transdigm, Inc., Term Loan C, 3.750%, 02/28/20 | | | 997,371 | | | | 0.1 | |
| | | | | | | | | | 3,969,848 | | | | 0.4 | |
Air Transport: 0.1% |
| 997,494 | | | | | | United Airlines, Inc., New Term Loan, 3.750%, 09/15/21 | | | 998,117 | | | | 0.1 | |
Automotive: 3.9% |
| 1,000,000 | | | | | | BBB Industries US Holdings, Inc., First Lien Term Loan, 6.000%, 11/03/21 | | | 1,003,750 | | | | 0.1 | |
| 2,493,750 | | | | | | Dealer Tire, LLC, Term Loan B, 5.500%, 12/22/21 | | | 2,512,453 | | | | 0.3 | |
| 2,375,000 | | | | (1) | | Dynacast International LLC, First Lien Term Loan, 5.250%, 01/28/22 | | | 2,391,300 | | | | 0.3 | |
| 6,223,750 | | | | (1) | | Federal-Mogul Corporation, Term Loan C, 4.750%, 04/15/21 | | | 6,214,414 | | | | 0.6 | |
| 3,454,129 | | | | | | Fram Group Holdings Inc., First Lien Term Loan, 6.500%, 07/31/17 | | | 3,453,590 | | | | 0.4 | |
| 196,859 | | | | | | Fram Group Holdings Inc., Second Lien Term Loan, 10.500%, 01/29/18 | | | 195,136 | | | | 0.0 | |
| 7,116,744 | | | | | | Gates Global LLC, First Lien Secured Term Loan, 4.250%, 07/05/21 | | | 7,098,397 | | | | 0.7 | |
| 3,111,968 | | | | (1) | | Key Safety Systems, Inc., First Lien Term Loan, 4.750%, 08/29/21 | | | 3,137,252 | | | | 0.3 | |
| 3,832,472 | | | | | | Metaldyne Performance Group, Term Loan B, 4.250%, 10/20/21 | | | 3,856,755 | | | | 0.4 | |
| 75,696 | | | | | | Service King, Delayed Draw Term Loan, 4.750%, 08/18/21 | | | 76,216 | | | | 0.0 | |
| 671,801 | | | | | | Service King, Term Loan B, 4.750%, 08/18/21 | | | 676,420 | | | | 0.1 | |
| 5,758,076 | | | | | | TI Group Automotive Systems, L.L.C., Term Loan B, 4.250%, 07/02/21 | | | 5,762,872 | | | | 0.6 | |
| 720,531 | | | | | | UCI International, Inc., Term Loan B, 5.500%, 07/26/17 | | | 710,624 | | | | 0.1 | |
| | | | | | | | | | 37,089,179 | | | | 3.9 | |
Beverage & Tobacco: 0.6% |
| 6,000,000 | | | | | | Jacobs Douwe Egberts , Term Loan B-1 USD, 3.500%, 07/23/21 | | | 5,988,750 | | | | 0.6 | |
Building & Development: 1.4% |
| 2,209,951 | | | | | | Doosan Infracore Bobcat Holdings Co., Ltd., Term Loan B, 4.500%, 05/27/21 | | | 2,237,575 | | | | 0.2 | |
| 2,068,657 | | | | | | Minimax Viking GmbH, Facility B1 Loan, 4.250%, 08/16/20 | | | 2,057,021 | | | | 0.2 | |
| 2,643,247 | | | | | | NCI Building Systems, Inc., Term Loan, 4.250%, 06/24/19 | | | 2,643,246 | | | | 0.3 | |
| 1,496,222 | | | | | | Ply Gem Industries, Inc., Term Loan, 4.000%, 01/30/21 | | | 1,485,000 | | | | 0.2 | |
| 243,158 | | | | | | Quikrete Holdings, Second Lien Term Loan, 7.000%, 03/23/21 | | | 244,830 | | | | 0.0 | |
| 1,991,000 | | | | | | Quikrete Holdings, Term Loan B, 4.000%, 09/23/20 | | | 1,992,244 | | | | 0.2 | |
| 989,975 | | | | | | SMG, First Lien Term Facility, 4.500%, 03/03/20 | | | 990,594 | | | | 0.1 | |
| 1,417,376 | | | | | | Wilsonart LLC, Term Loan B, 4.000%, 10/31/19 | | | 1,415,605 | | | | 0.2 | |
| | | | | | | | | | 13,066,115 | | | | 1.4 | |
Business Equipment & Services: 6.7% |
| 5,835,375 | | | | | | Acosta, Inc., Term Loan B, 5.000%, 09/26/21 | | | 5,891,686 | | | | 0.6 | |
| 5,074,500 | | | | | | Advantage Sales & Marketing, Inc., First Lien Term Loan, 4.250%, 07/23/21 | | | 5,079,032 | | | | 0.5 | |
| 500,000 | | | | | | AlixPartners LLP, Second Lien Term Loan, 9.000%, 07/09/21 | | | 504,375 | | | | 0.1 | |
| 3,930,972 | | | | | | AlixPartners LLP, Term Loan B-2, 4.000%, 07/09/20 | | | 3,953,084 | | | | 0.4 | |
| 3,641,563 | | | | | | Allflex Holdings III, Inc., First Lien Term Loan, 4.250%, 07/17/20 | | | 3,646,114 | | | | 0.4 | |
| 475,000 | | | | | | Allflex Holdings III, Inc., Second Lien Term Loan, 8.000%, 07/19/21 | | | 475,989 | | | | 0.1 | |
| 1,200,000 | | | | | | Catalina Marketing Corporation, Second Lien Term Loan, 7.750%, 04/11/22 | | | 957,000 | | | | 0.1 | |
| 1,246,875 | | | | | | Central Security Group, Inc., First Lien Term Loan, 6.250%, 09/30/20 | | | 1,248,434 | | | | 0.1 | |
| 2,918,328 | | | | (1) | | Coinmach Service Corp., Feb 2014 Upsized Term Loan, 4.250%, 11/14/19 | | | 2,909,209 | | | | 0.3 | |
| 1,386,656 | | | | | | First American Payment Systems, First Lien Term Loan, 5.750%, 10/12/18 | | | 1,383,190 | | | | 0.2 | |
| 815,631 | | | | | | First American Payment Systems, Second Lien, 10.750%, 04/12/19 | | | 809,513 | | | | 0.1 | |
| 1,238,975 | | | | | | GCA Services, Replacement Term Loan, 4.297%, 11/01/19 | | | 1,239,556 | | | | 0.1 | |
| 7,511,734 | | | | (1) | | Interactive Data Corporation, Term Loan B, 4.750%, 05/01/21 | | | 7,557,510 | | | | 0.8 | |
| 346,154 | | | | | | ION Trading Technologies Limited, Second Lien Term Loan, 7.250%, 06/10/22 | | | 342,476 | | | | 0.0 | |
| 2,890,238 | | | | | | iQor, First Lien Term Loan, 6.000%, 04/01/21 | | | 2,752,952 | | | | 0.3 | |
| 1,000,000 | | | | | | iQor, Second Lien Term Loan, 9.750%, 04/01/22 | | | 940,000 | | | | 0.1 | |
| 717,750 | | | | | | Knowledge Universe Education, LLC, Term Loan B, 5.250%, 03/20/21 | | | 725,825 | | | | 0.1 | |
| 1,240,625 | | | | | | Learning Care Group, Term Loan, 5.500%, 05/01/21 | | | 1,248,379 | | | | 0.1 | |
| 2,177,419 | | | | | | Legal Shield, First Lien Term Loan, 6.250%, 07/01/19 | | | 2,176,511 | | | | 0.2 | |
| 1,000,000 | | | | | | Legal Shield, Second Lien Term Loan, 9.750%, 07/01/20 | | | 1,000,000 | | | | 0.1 | |
| 382,991 | | | | | | Miller Heiman, Inc., Term Loan B, 6.750%, 09/30/19 | | | 371,023 | | | | 0.0 | |
See Accompanying Notes to Financial Statements
22
| VOYA FLOATING RATE FUND | PORTFOLIO OF INVESTMENTS
AS OF MARCH 31, 2015 (CONTINUED) |
Principal Amount†
|
|
|
|
|
| Borrower/Tranche Description
|
| Fair Value
|
| Percentage
of Net
Assets
|
|---|
Business Equipment & Services: (continued) |
| 19 | | | | | | Misys (Magic Newco 2 S.a.r.l.), Term Loan B add-on, 5.000%, 12/12/18 | | $ | 19 | | | | 0.0 | |
| 2,641,725 | | | | | | Onsite Rental Group Operations Pty Ltd., Senior Secured Term Loan, 5.500%, 07/30/21 | | | 2,608,703 | | | | 0.3 | |
| 1,500,000 | | | | | | Ship US Bidco, Inc. (Worldpay), Term Loan B2A-II, 5.250%, 11/30/19 | | | 1,509,687 | | | | 0.2 | |
| 2,040,000 | | | | | | Ship US Bidco, Inc. (Worldpay), Term Loan C2, 4.750%, 11/29/19 | | | 2,052,750 | | | | 0.2 | |
| 1,881,000 | | | | | | Sophos, Term Loan B USD, 5.000%, 01/30/21 | | | 1,890,796 | | | | 0.2 | |
| 4,030,000 | | | | | | SourceHOV, First Lien Term Loan, 7.750%, 10/27/19 | | | 3,911,619 | | | | 0.4 | |
| 1,155,000 | | | | | | SourceHOV, Second Lien Term Loan, 11.500%, 04/27/20 | | | 1,111,687 | | | | 0.1 | |
| 3,705,618 | | | | | | SurveyMonkey.com, LLC, Term Loan B, 5.500%, 02/07/19 | | | 3,735,634 | | | | 0.4 | |
| 187,879 | | | | | | Sutherland Global Services, Term Loan B Cayman, 6.000%, 04/22/21 | | | 189,171 | | | | 0.0 | |
| 807,121 | | | | | | Sutherland Global Services, Term Loan B, 6.000%, 04/22/21 | | | 812,670 | | | | 0.1 | |
| 891,731 | | | | | | Wash Multi-Family Services, USD Term Loan, 4.503%, 02/21/19 | | | 892,846 | | | | 0.1 | |
| | | | | | | | | | 63,927,440 | | | | 6.7 | |
Cable & Satellite Television: 2.5% |
| 4,500,000 | | | | | | Charter Communications Operating, LLC, Term Loan G, 4.250%, 09/12/21 | | | 4,541,837 | | | | 0.5 | |
| 2,709,526 | | | | | | Liberty Cablevision of Puerto Rico LLC., First Lien Term Facility, 4.500%, 01/07/22 | | | 2,697,672 | | | | 0.3 | |
| 250,000 | | | | | | Liberty Cablevision of Puerto Rico LLC., Second Lien Facility, 7.750%, 06/30/23 | | | 251,094 | | | | 0.0 | |
| 1,868,944 | | | | | | New Wave Communications, Including Add on Term Loan B, 4.750%, 04/30/20 | | | 1,868,944 | | | | 0.2 | |
| 5,705,658 | | | | | | RCN Cable, Term Loan B, 4.500%, 02/25/20 | | | 5,735,373 | | | | 0.6 | |
| 2,564,428 | | | | | | Virgin Media Investment Holdings Limited, Term Loan B USD, 3.500%, 06/07/20 | | | 2,564,605 | | | | 0.3 | |
| 6,282,971 | | | | | | Wideopenwest Finance, LLC, Term Loan B, 4.750%, 04/01/19 | | | 6,300,921 | | | | 0.6 | |
| | | | | | | | | | 23,960,446 | | | | 2.5 | |
Chemicals & Plastics: 4.4% |
| 1,338,063 | | | | | | Armacell, First Lien Term Loan USD, 5.500%, 07/02/20 | | | 1,341,408 | | | | 0.1 | |
| 1,000,000 | | | | (1) | | Aruba Investments, Inc (a.k.a Angus Chemical), US Term Loan, 5.250%, 02/02/22 | | | 1,008,750 | | | | 0.1 | |
| 1,471,718 | | | | | | AZ Chem US Inc., First Lien Senior Secured Term Loan, 4.518%, 06/13/21 | | | 1,476,546 | | | | 0.2 | |
| 947,625 | | | | | | Eco Services, Term Loan, 4.750%, 12/01/21 | | | 953,548 | | | | 0.1 | |
| 2,887,994 | | | | | | Emerald Performance Materials LLC, First Lien Term Loan, 4.500%, 08/01/21 | | | 2,894,009 | | | | 0.3 | |
| 750,000 | | | | | | Emerald Performance Materials LLC, Second Lien Term Loan, 7.750%, 08/01/22 | | | 736,875 | | | | 0.1 | |
| 495,000 | | | | | | Ennis Flint (a.k.a Road Infrastructure Investment LLC), First Lien Term Facility, 4.250%, 04/01/21 | | | 486,337 | | | | 0.1 | |
| 1,000,000 | | | | | | Flint Group Holdings S.A.R.L., Second Lien, 8.250%, 09/05/22 | | | 977,500 | | | | 0.1 | |
| 2,222,147 | | | | | | Flint Group Holdings S.A.R.L., USD Term Loan B2, 4.750%, 09/03/21 | | | 2,223,536 | | | | 0.2 | |
| 367,347 | | | | | | Flint Group Holdings S.A.R.L., USD Term Loan C, 4.750%, 09/03/21 | | | 367,576 | | | | 0.0 | |
| 1,144,255 | | | | | | Gemini HDPE LLC, Senior Secured Term Loan, 4.750%, 08/06/21 | | | 1,145,686 | | | | 0.1 | |
| 325,000 | | | | | | Houghton International, Inc., Second Lien Term Loan, 9.500%, 12/20/20 | | | 324,594 | | | | 0.0 | |
| 2,198,344 | | | | | | Houghton International, Inc., USD First Lien Term Loan, 4.000%, 12/20/19 | | | 2,196,513 | | | | 0.2 | |
| 417,744 | | | | | | Kleopatra Lux 2 S.À. R.L, New Term Loan B, 4.750%, 12/21/16 | | | 420,442 | | | | 0.1 | |
| 792,000 | | | | | | Kronos Worldwide, Inc., Term Loan B Facility, 4.750%, 02/21/20 | | | 796,455 | | | �� | 0.1 | |
| 2,690,104 | | | | (1) | | MacDermid, Inc., First Lien Term Loan, 4.500%, 06/07/20 | | | 2,704,755 | | | | 0.3 | |
| 919,931 | | | | | | Monarch (Allnex S.a.r.l.), First Lien Term Loan B-1, 4.500%, 10/03/19 | | | 923,380 | | | | 0.1 | |
| 477,308 | | | | | | Monarch (Allnex S.a.r.l.), First Lien Term Loan B-2, 4.500%, 10/03/19 | | | 479,098 | | | | 0.1 | |
| 1,294,497 | | | | | | Orion Engineered Carbons, Term Loan B USD, 5.000%, 07/25/21 | | | 1,302,048 | | | | 0.1 | |
| 2,147,813 | | | | | | Oxea S.a.r.l., First Lien Term Loan USD, 4.250%, 01/15/20 | | | 2,090,090 | | | | 0.2 | |
| 1,496,173 | | | | | | PQ Corporation, First Lien Term Loan Facility, 4.000%, 08/07/17 | | | 1,492,603 | | | | 0.2 | |
| 1,737,306 | | | | | | Royal Adhesives & Sealants, First Lien Term Facility, 5.500%, 07/31/18 | | | 1,746,717 | | | | 0.2 | |
| 2,788,494 | | | | | | Solenis International, L.P., USD First Lien Term Loan, 4.250%, 07/31/21 | | | 2,785,881 | | | | 0.3 | |
| 2,294,424 | | | | | | Styrolution Group GmbH, Term Loan B-1 USD, 6.500%, 11/07/19 | | | 2,305,896 | | | | 0.2 | |
| 3,701,337 | | | | | | Tronox Pigments (Netherlands) BV, Term Loan, 4.000%, 03/19/20 | | | 3,706,660 | | | | 0.4 | |
| 3,677,896 | | | | | | Univar Inc., Term Loan B, 5.000%, 06/30/17 | | | 3,678,757 | | | | 0.4 | |
| 1,125,263 | | | | | | Vantage Specialties Inc., Incremental Term Loan Facility, 5.000%, 02/10/19 | | | 1,125,263 | | | | 0.1 | |
| | | | | | | | | | 41,690,923 | | | | 4.4 | |
Clothing/Textiles: 0.4% |
| 3,832,459 | | | | | | Herff Jones, Inc., First Lien Term Loan, 6.000%, 12/10/21 | | | 3,870,784 | | | | 0.4 | |
| 294,553 | | | | | | Vince, LLC, Term Loan, 5.750%, 11/27/19 | | | 295,474 | | | | 0.0 | |
| | | | | | | | | | 4,166,258 | | | | 0.4 | |
See Accompanying Notes to Financial Statements
23
| VOYA FLOATING RATE FUND | PORTFOLIO OF INVESTMENTS
AS OF MARCH 31, 2015 (CONTINUED) |
Principal Amount†
|
|
|
|
|
| Borrower/Tranche Description
|
| Fair Value
|
| Percentage
of Net
Assets
|
|---|
Conglomerates: 0.9% |
| 900 | | | | | | Fender Musical Instruments Corp., Term Loan B, 5.750%, 04/03/19 | | $ | 900 | | | | 0.0 | |
| 1,796,000 | | | | (1) | | Jason Incorporated, First Lien Term Loan, 5.500%, 06/30/21 | | | 1,793,755 | | | | 0.2 | |
| 400,000 | | | | | | Jason Incorporated, Second Lien Term Loan, 9.000%, 06/30/22 | | | 380,000 | | | | 0.0 | |
| 3,947,669 | | | | | | ServiceMaster Company, Term Loan, 4.250%, 07/01/21 | | | 3,958,343 | | | | 0.4 | |
| 2,073,521 | | | | | | Waterpik, First Lien, 5.750%, 07/08/20 | | | 2,070,929 | | | | 0.2 | |
| 386,308 | | | | | | WireCo WorldGroup, Inc., Term Loan B, 6.000%, 02/15/17 | | | 386,308 | | | | 0.1 | |
| | | | | | | | | | 8,590,235 | | | | 0.9 | |
Containers & Glass Products: 2.3% |
| 3,483,747 | | | | | | Berlin Packaging, LLC, First Lien Term Loan, 4.500%, 10/01/21 | | | 3,497,901 | | | | 0.4 | |
| 450,000 | | | | | | Berlin Packaging, LLC, Second Lien Term Facility, 7.750%, 09/30/22 | | | 452,672 | | | | 0.0 | |
| 1,000,000 | | | | | | Berry Plastics Corporation, Term E Loan, 3.750%, 01/06/21 | | | 1,001,806 | | | | 0.1 | |
| 1,000,000 | | | | (1) | | Constantia Flexibles, TL B USD, 02/25/22 | | | 1,001,875 | | | | 0.1 | |
| 984,724 | | | | (2),(3) | | EveryWare, Inc., Term Loan, 7.750%, 05/21/20 | | | 516,980 | | | | 0.1 | |
| 1,450,000 | | | | | | Hilex Poly Co, LLC (aka Novolex), First Lien Term Loan Facility, 6.000%, 12/03/21 | | | 1,462,676 | | | | 0.1 | |
| 3,397,911 | | | | | | Husky Injection Molding Systems, Ltd, Incremental Term Loan, 4.250%, 06/30/21 | | | 3,394,877 | | | | 0.4 | |
| 4,295,050 | | | | | | Otter Products, Term Loan B, 5.750%, 06/03/20 | | | 4,284,312 | | | | 0.4 | |
| 1,469,155 | | | | | | Reynolds Group Holdings Inc, USD Term Loan, 4.500%, 12/01/18 | | | 1,476,632 | | | | 0.2 | |
| 1,800,000 | | | | | | SIG Combibloc Group AG, USD TL, 5.250%, 03/14/22 | | | 1,819,969 | | | | 0.2 | |
| 1,779,905 | | | | (1) | | WNA Holdings Inc (a.k.a Waddington Group), USD Term Loan (Canadian Borrower), 4.503%, 06/07/20 | | | 1,773,231 | | | | 0.2 | |
| 1,121,719 | | | | (1) | | WNA Holdings Inc (a.k.a Waddington Group), USD Upsized Term Loan (US Borrower), 4.500%, 06/07/20 | | | 1,117,512 | | | | 0.1 | |
| | | | | | | | | | 21,800,443 | | | | 2.3 | |
Cosmetics/Toiletries: 0.2% |
| 1,545,465 | | | | | | KIK Custom Products, Inc., First Lien with incremental, 5.500%, 04/29/19 | | | 1,546,431 | | | | 0.2 | |
Diversified Insurance: 4.0% |
| 1,934,619 | | | | | | Alliant Holdings, I, LLC, Term Loan B, 5.000%, 12/20/19 | | | 1,936,635 | | | | 0.2 | |
| 900,000 | | | | | | AmWINS Group, Inc., Second Lien Term Loan, 9.500%, 09/06/20 | | | 904,500 | | | | 0.1 | |
| 6,834,613 | | | | | | AmWINS Group, Inc., Term Loan B, 5.250%, 09/06/19 | | | 6,890,144 | | | | 0.7 | |
| 3,308,125 | | | | | | Applied Systems Inc., First Lien Term Loan, 4.286%, 01/25/21 | | | 3,313,501 | | | | 0.3 | |
| 650,000 | | | | | | Applied Systems Inc., Second Lien Term Loan, 7.500%, 01/24/22 | | | 649,838 | | | | 0.1 | |
| 1,621,125 | | | | | | Cooper Gay Swett & Crawford, Ltd., First Lien Term Loan, 5.000%, 04/16/20 | | | 1,523,858 | | | | 0.2 | |
| 1,400,000 | | | | | | Cooper Gay Swett & Crawford, Ltd., Second Lien Term Loan, 8.250%, 10/15/20 | | | 1,221,500 | | | | 0.1 | |
| 8,779,339 | | | | | | Hub International Limited, Term Loan B, 4.250%, 10/02/20 | | | 8,720,807 | | | | 0.9 | |
| 5,109,565 | | | | | | National Financial Partners Corp., Term Loan B, 4.500%, 07/01/20 | | | 5,105,574 | | | | 0.5 | |
| 1,000,000 | | | | | | Sedgwick Holdings, Inc., Incremental Second Lien Term Loan, 6.750%, 02/28/22 | | | 980,000 | | | | 0.1 | |
| 1,500,000 | | | | | | Sedgwick Holdings, Inc., Second Lien Term Loan, 6.750%, 02/28/22 | | | 1,470,000 | | | | 0.2 | |
| 5,622,990 | | | | | | USI, Inc., Term Loan, 4.250%, 12/27/19 | | | 5,594,875 | | | | 0.6 | |
| | | | | | | | | | 38,311,232 | | | | 4.0 | |
Drugs: 0.4% |
| 3,482,500 | | | | | | Akorn, Inc, Term Loan, 4.500%, 04/17/21 | | | 3,499,912 | | | | 0.4 | |
Ecological Services & Equipment: 1.0% |
| 4,527,250 | | | | | | 4L Holdings Inc., Term Loan B, 5.500%, 05/08/20 | | | 4,414,069 | | | | 0.5 | |
| 4,182,895 | | | | | | ADS Waste Holdings, Inc., B-2, 3.750%, 10/09/19 | | | 4,145,642 | | | | 0.4 | |
| 910,000 | | | | | | Waste Industries USA, Inc., Term Loan B, 4.250%, 02/24/20 | | | 913,981 | | | | 0.1 | |
| | | | | | | | | | 9,473,692 | | | | 1.0 | |
Electronics/Electrical: 11.1% |
| 2,000,000 | | | | | | Accuvant Inc., First Lien Term Loan, 6.250%, 01/28/22 | | | 2,015,000 | | | | 0.2 | |
| 1,876,257 | | | | | | Active Network, Inc., First Lien Term Loan, 5.500%, 11/15/20 | | | 1,873,912 | | | | 0.2 | |
| 2,871,000 | | | | | | Aptean Holdings, Inc., First Lien Term Loan, 5.250%, 02/27/20 | | | 2,820,758 | | | | 0.3 | |
| 700,000 | | | | | | Aptean Holdings, Inc., Second Lien Term Loan, 8.500%, 02/27/21 | | | 678,125 | | | | 0.1 | |
| 2,304,065 | | | | | | Aspect Software, Inc., Term Loan, 7.250%, 05/07/16 | | | 2,304,065 | | | | 0.2 | |
| 867,856 | | | | | | Avago Technologies, Term Loan B, 3.750%, 05/06/21 | | | 870,731 | | | | 0.1 | |
| 3,356,440 | | | | (1) | | Avast Software, Term Loan, 4.750%, 03/21/20 | | | 3,376,720 | | | | 0.4 | |
See Accompanying Notes to Financial Statements
24
| VOYA FLOATING RATE FUND | PORTFOLIO OF INVESTMENTS
AS OF MARCH 31, 2015 (CONTINUED) |
Principal Amount†
|
|
|
|
|
| Borrower/Tranche Description
|
| Fair Value
|
| Percentage
of Net
Assets
|
|---|
Electronics/Electrical: (continued) |
| 4,934,404 | | | | (1) | | Blackboard Inc., Term Loan B-3, 4.750%, 10/04/18 | | $ | 4,938,810 | | | | 0.5 | |
| 3,388,363 | | | | | | Blue Coat Systems, Inc., First Lien Term Loan, 4.000%, 05/31/19 | | | 3,391,893 | | | | 0.4 | |
| 1,000,000 | | | | | | Blue Coat Systems, Inc., Second Lien Term Loan, 9.500%, 06/28/20 | | | 1,026,250 | | | | 0.1 | |
| 2,804,361 | | | | | | BMC Software, Inc., U.S. Term Loan, 5.000%, 09/10/20 | | | 2,750,204 | | | | 0.3 | |
| 3,850,350 | | | | | | Compuware Corporation, Term Loan B-2, 6.250%, 12/15/21 | | | 3,741,258 | | | | 0.4 | |
| 8,895,188 | | | | | | Dell International LLC, Term B Loans, 4.500%, 04/30/20 | | | 8,960,665 | | | | 0.9 | |
| 1,417,931 | | | | | | ECI, Term Loan B, 5.750%, 05/28/21 | | | 1,425,612 | | | | 0.1 | |
| 2,358,900 | | | | | | Epiq Systems, Inc., Term Loan, 4.500%, 08/27/20 | | | 2,364,797 | | | | 0.2 | |
| 450,000 | | | | | | Eze Castle Software, Inc., Second Lien Term Loan, 7.250%, 04/04/21 | | | 426,375 | | | | 0.0 | |
| 1,969,560 | | | | | | Eze Castle Software, Inc., Term Loan B-1, 4.000%, 04/04/20 | | | 1,966,277 | | | | 0.2 | |
| 950,000 | | | | | | FCI International S.A.S., Term Loan B, 6.250%, 12/31/20 | | | 952,969 | | | | 0.1 | |
| 6,694,498 | | | | | | Freescale Semiconductor, Inc., Tranche B-4 Term Loan, 4.250%, 02/28/20 | | | 6,717,213 | | | | 0.7 | |
| 3,467,412 | | | | | | Freescale Semiconductor, Inc., Tranche B-5 Term Loan, 5.000%, 01/15/21 | | | 3,490,321 | | | | 0.4 | |
| 8,618,503 | | | | (1) | | Go Daddy Operating Company, LLC, Term Loan, 4.750%, 05/13/21 | | | 8,664,293 | | | | 0.9 | |
| 1,653,756 | | | | | | Greeneden U.S. Holdings II, LLC, Existing Term Loan B, 4.000%, 02/08/20 | | | 1,647,211 | | | | 0.2 | |
| 2,149,903 | | | | | | Hyland Software, Inc., First Lien Term Loan, 4.750%, 02/19/21 | | | 2,165,692 | | | | 0.2 | |
| 475,725 | | | | | | Infor (US), Inc., Term Loan B5, 3.750%, 06/03/20 | | | 472,199 | | | | 0.1 | |
| 6,444,291 | | | | | | Kronos Incorporated, Upsized Term Loan, 4.500%, 10/30/19 | | | 6,465,100 | | | | 0.7 | |
| 1,694,000 | | | | | | M/A-COM Technology Solutions Holdings, Inc., Term Loan B, 4.500%, 05/07/21 | | | 1,711,999 | | | | 0.2 | |
| 2,213,208 | | | | | | Omnitracs Inc., Upsized First Lien Term Loan, 4.750%, 11/25/20 | | | 2,220,469 | | | | 0.2 | |
| 550,000 | | | | | | Omnitracs Inc., Upsized Second Lien Term Loan, 8.750%, 05/25/21 | | | 539,860 | | | | 0.1 | |
| 1,239,726 | | | | | | Open Link Financial, Inc., Term Loan, 6.250%, 10/30/17 | | | 1,236,626 | | | | 0.1 | |
| 5,129,547 | | | | | | RedPrairie Corporation, Incremental First Lien Term Loan, 6.000%, 12/21/18 | | | 5,060,940 | | | | 0.5 | |
| 500,000 | | | | | | RedPrairie Corporation, Second Lien Term Loan, 11.250%, 12/20/19 | | | 454,584 | | | | 0.0 | |
| 4,200,000 | | | | (1) | | Riverbed Technology, Inc., First Lien Term Loan, 02/25/22 | | | 4,241,248 | | | | 0.4 | |
| 1,006,413 | | | | | | Rovi Solutions Corporation, Term Loan B, 3.750%, 07/02/21 | | | 1,003,897 | | | | 0.1 | |
| 3,587,000 | | | | | | Skillsoft Corp., First Lien Term Loan, 5.750%, 04/28/21 | | | 3,550,233 | | | | 0.4 | |
| 738,774 | | | | | | Websense, Inc., Second Lien Term Loan, 8.250%, 12/24/20 | | | 740,621 | | | | 0.1 | |
| 1,624,384 | | | | | | Websense, Inc., Term Loan B, 4.500%, 06/25/20 | | | 1,624,384 | | | | 0.2 | |
| 8,062,500 | | | | | | Zebra Technologies, Term Loan B, 4.750%, 10/27/21 | | | 8,166,643 | | | | 0.9 | |
| | | | | | | | | | 106,057,954 | | | | 11.1 | |
Equity REITs and REOCs: 0.1% |
| 1,350,000 | | | | | | Capital Automotive L.P., Second Lien Term Loan, 6.000%, 04/29/20 | | | 1,376,156 | | | | 0.1 | |
Financial Intermediaries: 1.6% |
| 3,745,927 | | | | | | Duff & Phelps, Add-on Term Loan, 4.500%, 04/23/20 | | | 3,736,562 | | | | 0.4 | |
| 1,957,775 | | | | | | Guggenheim Partners Investment Management Holdings, LLC, Term Loan B, 4.253%, 07/22/20 | | | 1,967,563 | | | | 0.2 | |
| 1,648,906 | | | | | | MoneyGram International, Inc., Term Loan B, 4.250%, 03/27/20 | | | 1,560,277 | | | | 0.2 | |
| 3,505,625 | | | | | | Santander Asset Management, Term Loan B-1 USD, 4.250%, 12/17/20 | | | 3,518,771 | | | | 0.4 | |
| 3,168,000 | | | | | | Trans Union LLC, Term Loan B, 4.000%, 04/09/21 | | | 3,171,960 | | | | 0.3 | |
| 1,086,250 | | | | | | Walker & Dunlop, Term Loan, 5.250%, 12/20/20 | | | 1,088,966 | | | | 0.1 | |
| | | | | | | | | | 15,044,099 | | | | 1.6 | |
Food Products: 1.7% |
| 3,440,997 | | | | | | Advance Pierre Foods, First Lien Term Loan B, 5.750%, 07/10/17 | | | 3,451,214 | | | | 0.4 | |
| 1,500,000 | | | | | | Advance Pierre Foods, Second Lien Term Loan, 9.500%, 10/10/17 | | | 1,511,250 | | | | 0.2 | |
| 1,463,045 | | | | | | Atkins Nutritionals Holdings II, Inc., First Lien Term Loan, 6.250%, 01/02/19 | | | 1,459,388 | | | | 0.1 | |
| 247,500 | | | | | | Atrium Innovations, Inc., USD First Lien Term Loan, 4.250%, 02/15/21 | | | 243,478 | | | | 0.0 | |
| 250,000 | | | | | | Atrium Innovations, Inc., USD Second Lien Term Loan, 7.750%, 08/13/21 | | | 232,500 | | | | 0.0 | |
| 5,294,727 | | | | | | CSM Bakery Supplies, First Lien Term Loan, 5.000%, 07/03/20 | | | 5,293,075 | | | | 0.6 | |
| 2,724,969 | | | | | | Del Monte Foods Consumer Products, Inc., First Lien, 4.253%, 02/18/21 | | | 2,597,803 | | | | 0.3 | |
| 450,000 | | | | | | Del Monte Foods Consumer Products, Inc., Second Lien, 8.250%, 08/18/21 | | | 408,937 | | | | 0.0 | |
| 812,628 | | | | | | NPC International, Term Loan, 4.000%, 12/28/18 | | | 801,455 | | | | 0.1 | |
| | | | | | | | | | 15,999,100 | | | | 1.7 | |
See Accompanying Notes to Financial Statements
25
| VOYA FLOATING RATE FUND | PORTFOLIO OF INVESTMENTS
AS OF MARCH 31, 2015 (CONTINUED) |
Principal Amount†
|
|
|
|
|
| Borrower/Tranche Description
|
| Fair Value
|
| Percentage
of Net
Assets
|
|---|
Food Service: 1.4% |
| 7,929,363 | | | | | | Burger King Corporation, Term Loan B, 4.500%, 12/12/21 | | $ | 8,017,831 | | | | 0.8 | |
| 3,269,481 | | | | | | CEC Entertainment, Inc., First Lien Term Loan, 4.000%, 02/14/21 | | | 3,236,378 | | | | 0.4 | |
| 1,748,963 | | | | | | P.F. Chang’s China Bistro, Inc., Term Loan, 4.250%, 06/30/19 | | | 1,710,704 | | | | 0.2 | |
| | | | | | | | | | 12,964,913 | | | | 1.4 | |
Food/Drug Retailers: 1.9% |
| 4,700,000 | | | | (1) | | Albertsons LLC, Term Loan B4, 5.500%, 08/25/21 | | | 4,744,387 | | | | 0.5 | |
| 2,528,302 | | | | | | Dave & Buster’s, Inc., Term Loan, 4.250%, 07/31/20 | | | 2,540,943 | | | | 0.3 | |
| 1,673,408 | | | | | | Del Taco, Term Loan, 5.500%, 10/01/18 | | | 1,665,041 | | | | 0.2 | |
| 2,487,500 | | | | | | Portillo Restaurant Group (The), First Lien Term Loan, 4.750%, 08/04/21 | | | 2,491,647 | | | | 0.2 | |
| 650,000 | | | | | | Portillo Restaurant Group (The), Second Lien Term Loan, 8.000%, 08/04/22 | | | 648,375 | | | | 0.1 | |
| 1,015,076 | | | | | | Roundys Supermarkets, Inc., Term Loan B, 5.750%, 03/03/21 | | | 979,232 | | | | 0.1 | |
| 4,990,214 | | | | | | Supervalu, Term Loan, 4.500%, 03/21/19 | | | 5,012,046 | | | | 0.5 | |
| 196,040 | | | | | | TGI Friday’s, Inc., First Lien Term Loan, 5.250%, 07/15/20 | | | 196,346 | | | | 0.0 | |
| | | | | | | | | | 18,278,017 | | | | 1.9 | |
Forest Products: 0.0% |
| 393,003 | | | | | | Xerium Technologies, Inc., Term Loan B, 5.750%, 05/17/19 | | | 397,916 | | | | 0.0 | |
Health Care: 10.7% |
| 2,970,000 | | | | | | Accellent, Inc., First Lien Term Loan, 4.500%, 03/14/21 | | | 2,954,687 | | | | 0.3 | |
| 1,417,875 | | | | | | Aegis Sciences, First Lien Term Loan, 5.500%, 02/19/21 | | | 1,426,737 | | | | 0.1 | |
| 3,325,259 | | | | | | ATI Physical Therapy, Term Loan B, 5.250%, 12/20/19 | | | 3,348,120 | | | | 0.3 | |
| 1,741,206 | | | | | | CareCore National, LLC, Term Loan B, 5.500%, 03/05/21 | | | 1,752,089 | | | | 0.2 | |
| 5,911,411 | | | | | | Catalent Pharma Solutions, Inc. , USD Term Loan, 4.250%, 05/20/21 | | | 5,944,201 | | | | 0.6 | |
| 1,973,807 | | | | | | CHG Medical Staffing, Inc., New First Lien Term, 4.250%, 11/19/19 | | | 1,981,826 | | | | 0.2 | |
| 209,783 | | | | | | CHG Medical Staffing, Inc., Upsized Second Lien Term Loan, 9.000%, 11/19/20 | | | 210,897 | | | | 0.0 | |
| 4,547,425 | | | | | | CHS/Community Health Systems, Inc., Term Loan D, 4.250%, 01/27/21 | | | 4,574,900 | | | | 0.5 | |
| 3,176,000 | | | | | | Connolly / iHealth Technologies, First Lien, 5.000%, 05/12/21 | | | 3,197,835 | | | | 0.3 | |
| 1,000,000 | | | | | | Connolly / iHealth Technologies, Second Lien, 8.000%, 05/12/22 | | | 997,500 | | | | 0.1 | |
| 2,289,747 | | | | | | Correct Care Solutions, First Lien Term Loan, 5.000%, 07/22/21 | | | 2,269,712 | | | | 0.2 | |
| 2,420,578 | | | | | | DJO Finance LLC, First Lien Term Loan, 4.250%, 09/05/17 | | | 2,428,445 | | | | 0.3 | |
| 2,955,000 | | | | | | Envision Pharmaceutical Services, First Lien Term Loan, 5.750%, 11/04/20 | | | 2,958,676 | | | | 0.3 | |
| 1,896,500 | | | | | | Healogics, Inc., First Lien Term Loan, 5.250%, 07/01/21 | | | 1,905,982 | | | | 0.2 | |
| 1,250,000 | | | | | | Healogics, Inc., Second Lien Term Loan, 9.000%, 07/01/22 | | | 1,209,375 | | | | 0.1 | |
| 2,536,320 | | | | | | Iasis Healthcare LLC, Term Loan B-2, 4.500%, 05/03/18 | | | 2,544,880 | | | | 0.3 | |
| 5,384,024 | | | | | | Ikaria Acquisition Inc., First Lien Term Loan, 5.000%, 02/12/21 | | | 5,397,484 | | | | 0.6 | |
| 1,300,000 | | | | | | Ikaria Acquisition Inc., Second Lien Term Loan, 8.750%, 02/05/22 | | | 1,316,250 | | | | 0.1 | |
| 1,962,767 | | | | | | Immucor, Inc., Term B-2 Loan, 5.000%, 08/17/18 | | | 1,973,195 | | | | 0.2 | |
| 1,433,962 | | | | | | Medpace Holdings, Inc., Term Loan B, 4.750%, 04/05/21 | | | 1,441,430 | | | | 0.2 | |
| 6,557,981 | | | | | | Millennium Laboratories, LLC, Term Loan B, 5.250%, 04/15/21 | | | 6,618,098 | | | | 0.7 | |
| 2,374,773 | | | | | | Multiplan, Inc, Term Loan, 3.750%, 04/01/21 | | | 2,371,379 | | | | 0.2 | |
| 1,145,504 | | | | | | NVA Holdings, Inc., First Lien Term Loan, 4.986%, 08/15/21 | | | 1,148,368 | | | | 0.1 | |
| 3,611,029 | | | | | | Onex Carestream Finance LP, First Lien, 5.000%, 06/07/19 | | | 3,628,709 | | | | 0.4 | |
| 739,209 | | | | | | Onex Carestream Finance LP, Second Lien, 9.500%, 11/30/19 | | | 740,133 | | | | 0.1 | |
| 4,565,500 | | | | | | Ortho-Clinical Diagnostics, Inc., Term Loan B, 4.750%, 06/30/21 | | | 4,530,903 | | | | 0.5 | |
| 3,382,382 | | | | | | Par Pharmaceutical Companies, B-2, 4.000%, 09/30/19 | | | 3,382,382 | | | | 0.4 | |
| 249,375 | | | | | | Par Pharmaceutical Companies, B-3, 4.250%, 09/28/19 | | | 250,466 | | | | 0.0 | |
| 3,958,916 | | | | | | Pharmaceutical Product Development, Inc., Term Loan B-1, 4.000%, 12/05/18 | | | 3,964,573 | | | | 0.4 | |
| 2,534,227 | | | | | | Phillips-Medisize Corporation, First Lien Term Loan, 4.750%, 06/16/21 | | | 2,537,395 | | | | 0.3 | |
| 250,000 | | | | | | Phillips-Medisize Corporation, Second Lien Term Loan, 8.250%, 06/16/22 | | | 242,500 | | | | 0.0 | |
| 1,423,447 | | | | | | Progressive Solutions, Inc., First Lien, 5.500%, 10/22/20 | | | 1,424,633 | | | | 0.1 | |
| 3,000,000 | | | | | | Siemens Audiology Solutions, Term Loan B USD, 5.500%, 01/17/22 | | | 3,033,750 | | | | 0.3 | |
| 2,687,747 | | | | | | Sterigenics International LLC, Term Loan, 4.500%, 08/05/21 | | | 2,689,427 | | | | 0.3 | |
| 3,636,917 | | | | | | Surgery Center Holdings, Inc., First Lien Term Loan, 5.250%, 11/03/20 | | | 3,646,009 | | | | 0.4 | |
| 850,000 | | | | (1) | | Surgical Care Affiliates LLC, Term Loan B, 4.250%, 03/17/22 | | | 850,531 | | | | 0.1 | |
| 2,673,130 | | | | | | United Surgical Partners International, Inc., Incremental Term Loan, 4.750%, 04/03/19 | | | 2,681,066 | | | | 0.3 | |
| 3,114,458 | | | | (1) | | Valeant Pharmaceuticals International, Inc., F1 Term Loan, 03/12/22 | | | 3,132,462 | | | | 0.3 | |
| 2,385,542 | | | | (1) | | Valeant Pharmaceuticals International, Inc., F2 Term Loan, 03/12/22 | | | 2,399,333 | | | | 0.3 | |
See Accompanying Notes to Financial Statements
26
| VOYA FLOATING RATE FUND | PORTFOLIO OF INVESTMENTS
AS OF MARCH 31, 2015 (CONTINUED) |
Principal Amount†
|
|
|
|
|
| Borrower/Tranche Description
|
| Fair Value
|
| Percentage
of Net
Assets
|
|---|
Health Care: (continued) |
| 2,589,714 | | | | | | Valeant Pharmaceuticals International, Inc., Series E-1 Tranche B, 3.500%, 08/05/20 | | $ | 2,592,144 | | | | 0.3 | |
| 1,047,165 | | | | | | Valeant Pharmaceuticals International, Inc., Tranche B Series D-2, 3.500%, 02/13/19 | | | 1,047,891 | | | | 0.1 | |
| | | | | | | | | | 102,746,373 | | | | 10.7 | |
Home Furnishings: 1.0% |
| 4,611,842 | | | | | | AOT Bedding Super Holdings, LLC, Term Loan B, 4.250%, 10/01/19 | | | 4,626,960 | | | | 0.5 | |
| 2,734,362 | | | | | | Hillman Group (The), Inc., Term Loan B, 4.500%, 06/30/21 | | | 2,758,288 | | | | 0.3 | |
| 2,298,250 | | | | | | Monitronics International, Inc., Add-on Term Loan, 4.250%, 03/23/18 | | | 2,303,637 | | | | 0.2 | |
| | | | | | | | | | 9,688,885 | | | | 1.0 | |
Industrial Equipment: 3.9% |
| 4,328,425 | | | | | | Accudyne Industries LLC, Term Loan, 4.000%, 12/13/19 | | | 4,117,414 | | | | 0.4 | |
| 4,759,653 | | | | | | Apex Tool Group, Term Loan B, 4.500%, 01/31/20 | | | 4,680,824 | | | | 0.5 | |
| 622,904 | | | | | | CeramTec GmbH, Dollar Term B-1 Loan, 4.250%, 08/30/20 | | | 624,851 | | | | 0.1 | |
| 62,391 | | | | | | CeramTec GmbH, Dollar Term B-2 Loan, 4.250%, 08/30/20 | | | 62,586 | | | | 0.0 | |
| 184,668 | | | | | | CeramTec GmbH, Dollar Term B-3 Loan, 4.250%, 08/30/20 | | | 185,245 | | | | 0.0 | |
| 3,078,699 | | | | | | Doncasters Group Limited, First Lien Term Loan USD, 4.500%, 04/09/20 | | | 3,085,915 | | | | 0.3 | |
| 2,498,400 | | | | | | Filtration Group Corporation, First Lien Term Loan, 4.500%, 11/30/20 | | | 2,515,034 | | | | 0.3 | |
| 500,000 | | | | | | Filtration Group Corporation, Second Lien Term Loan, 8.250%, 11/30/21 | | | 503,334 | | | | 0.1 | |
| 5,663,763 | | | | | | Gardner Denver, Inc., Term Loan B USD, 4.250%, 07/30/20 | | | 5,386,595 | | | | 0.6 | |
| 1,338,033 | | | | | | International Equipment Solutions, LLC, Term Loan, 6.750%, 08/16/19 | | | 1,342,214 | | | | 0.1 | |
| 6,887,519 | | | | | | Rexnord Corporation / RBS Global, Inc., First Lien Term Loan, 4.000%, 08/21/20 | | | 6,898,588 | | | | 0.7 | |
| 1,151,458 | | | | | | Sensus Metering Systems Inc., Upsized First Lien Term Loan, 4.500%, 05/09/17 | | | 1,152,897 | | | | 0.1 | |
| 982,222 | | | | | | Signode Industrial Group, US Dollar Tranche Term Loan, 3.750%, 05/01/21 | | | 976,697 | | | | 0.1 | |
| 820,491 | | | | | | SunSource, First Lien Term Loan, 4.750%, 02/15/21 | | | 808,183 | | | | 0.1 | |
| 569,898 | | | | | | VAT Holding, Term Loan B, 4.750%, 02/11/21 | | | 568,740 | | | | 0.1 | |
| 3,935,387 | | | | | | WTG Holdings III Corp., First Lien Term Loan, 4.750%, 01/15/21 | | | 3,932,927 | | | | 0.4 | |
| 250,000 | | | | | | WTG Holdings III Corp., Second Lien Term Loan, 8.500%, 01/15/22 | | | 246,250 | | | | 0.0 | |
| | | | | | | | | | 37,088,294 | | | | 3.9 | |
Leisure Goods/Activities/Movies: 4.7% |
| 6,456,231 | | | | | | 24 Hour Fitness Worldwide, Inc, Term Loan B, 4.750%, 05/28/21 | | | 6,446,146 | | | | 0.7 | |
| 2,528,927 | | | | | | Bauer Performance Sports, Term Loan B, 4.000%, 04/15/21 | | | 2,528,401 | | | | 0.3 | |
| 7,977,650 | | | | | | Delta2 Sarl Luxembourg (Formula One World Championship), Facility B3, 4.750%, 07/30/21 | | | 7,939,421 | | | | 0.8 | |
| 2,500,000 | | | | (1) | | Delta2 Sarl Luxembourg (Formula One World Championship), Second Lien Facility, 7.750%, 08/08/22 | | | 2,488,542 | | | | 0.3 | |
| 4,279,705 | | | | | | Equinox Holdings, Inc., First Lien Term Loan, 5.000%, 01/31/20 | | | 4,306,453 | | | | 0.4 | |
| 250,000 | | | | | | Equinox Holdings, Inc., Second Lien Term Loan, 9.750%, 07/31/20 | | | 253,750 | | | | 0.0 | |
| 3,726,475 | | | | (1) | | FGI Operating, Fungible Term Loan B Add On, 5.500%, 04/19/19 | | | 3,640,301 | | | | 0.4 | |
| 9,614,157 | | | | (1) | | Fitness International, LLC., Term Loan B, 5.500%, 07/01/20 | | | 8,989,237 | | | | 0.9 | |
| 1,082,857 | | | | | | NEP/NCP Holdco, Inc, Second Lien, 9.500%, 07/23/20 | | | 1,063,907 | | | | 0.1 | |
| 5,206,308 | | | | | | NEP/NCP Holdco, Inc, Term Loan B with Add on, 4.250%, 01/22/20 | | | 5,082,658 | | | | 0.5 | |
| 2,719,299 | | | | (1) | | SRAM, LLC, First Lien Term Loan, 4.013%, 04/10/20 | | | 2,719,299 | | | | 0.3 | |
| 13,883 | | | | | | Wilton Brands, Inc., Term Loan, 7.549%, 08/31/18 | | | 13,310 | | | | 0.0 | |
| | | | | | | | | | 45,471,425 | | | | 4.7 | |
Lodging & Casinos: 5.2% |
| 7,564,494 | | | | | | Amaya Gaming Group Inc., First Lien Term Loan B, 5.000%, 08/01/21 | | | 7,504,606 | | | | 0.8 | |
| 2,650,000 | | | | (1) | | Amaya Gaming Group Inc., Second Lien Term Loan, 8.000%, 08/01/22 | | | 2,653,312 | | | | 0.3 | |
| 1,479,425 | | | | | | American Casino and Entertainment Properties LLC, First Lien Term Loan, 4.500%, 07/03/19 | | | 1,488,671 | | | | 0.2 | |
| 3,307,417 | | | | | | Boyd Gaming Corporation, Term Loan B, 4.000%, 08/14/20 | | | 3,317,236 | | | | 0.3 | |
| 2,251,360 | | | | (1) | | Cannery Casino Resorts, LLC, First Lien Term Loan, 6.000%, 10/02/18 | | | 2,223,218 | | | | 0.2 | |
| 5,727,794 | | | | | | CityCenter Holdings, LLC, Term Loan, 4.250%, 10/15/20 | | | 5,757,624 | | | | 0.6 | |
| 2,189,000 | | | | | | Global Cash Access, Inc., Term Loan B, 6.250%, 12/18/20 | | | 2,178,968 | | | | 0.2 | |
| 1,027,856 | | | | | | Golden Nugget, Inc., Delayed Draw Term Loan, 5.500%, 11/21/19 | | | 1,035,565 | | | | 0.1 | |
| 2,398,331 | | | | | | Golden Nugget, Inc., Term Loan, 5.500%, 11/21/19 | | | 2,416,318 | | | | 0.3 | |
| 350,000 | | | | | | Horseshoe Baltimore, Funded Term Loan B, 8.250%, 07/02/20 | | | 339,500 | | | | 0.0 | |
| 2,099,172 | | | | | | La Quinta, First Lien Term Loan, 4.000%, 04/14/21 | | | 2,108,684 | | | | 0.2 | |
| 2,090,522 | | | | | | Peppermill Casinos, Inc., Term Loan B, 7.250%, 11/09/18 | | | 2,095,748 | | | | 0.2 | |
See Accompanying Notes to Financial Statements
27
| VOYA FLOATING RATE FUND | PORTFOLIO OF INVESTMENTS
AS OF MARCH 31, 2015 (CONTINUED) |
Principal Amount†
|
|
|
|
|
| Borrower/Tranche Description
|
| Fair Value
|
| Percentage
of Net
Assets
|
|---|
Lodging & Casinos: (continued) |
| 4,435,972 | | | | | | Scientific Games International, Inc., Term Loan B, 6.000%, 10/18/20 | | $ | 4,452,607 | | | | 0.5 | |
| 2,995,000 | | | | (1) | | Scientific Games International, Inc., Term Loan B-2, 6.000%, 10/01/21 | | | 3,005,815 | | | | 0.3 | |
| 6,471,671 | | | | | | Station Casinos LLC, Term Loan, 4.250%, 03/02/20 | | | 6,496,516 | | | | 0.7 | |
| 2,581,718 | | | | | | Twin River Management Group, Inc., Term Loan B, 5.250%, 07/10/20 | | | 2,583,868 | | | | 0.3 | |
| | | | | | | | | | 49,658,256 | | | | 5.2 | |
Mortgage REITs: 0.2% |
| 1,745,625 | | | | | | International Market Centers, First Lien Term Loan, 5.250%, 08/11/20 | | | 1,754,353 | | | | 0.2 | |
| 500,000 | | | | | | International Market Centers, Second Lien Term Loan, 8.750%, 08/11/21 | | | 498,750 | | | | 0.0 | |
| | | | | | | | | | 2,253,103 | | | | 0.2 | |
Nonferrous Metals/Minerals: 0.2% |
| 2,340,268 | | | | | | Fairmount Minerals, Ltd., Tranche B-2 Term Loans, 4.500%, 09/05/19 | | | 2,068,212 | | | | 0.2 | |
Oil & Gas: 1.9% |
| 3,300,032 | | | | | | Bronco Midstream Funding, LLC, Term Loan, 5.000%, 08/15/20 | | | 3,225,781 | | | | 0.3 | |
| 357,500 | | | | (1) | | C&J Energy Services, Inc., Term Loan B-1, 03/23/20 | | | 320,112 | | | | 0.0 | |
| 1,243,750 | | | | | | CITGO, Term Loan B, 4.500%, 07/30/21 | | | 1,231,831 | | | | 0.1 | |
| 2,643,375 | | | | | | CITGO Holding, Inc., Holdco Term Loan, 9.500%, 05/12/18 | | | 2,631,260 | | | | 0.3 | |
| 228,716 | | | | | | Crestwood Holdings LLC, Term Loan, 7.000%, 06/19/19 | | | 216,852 | | | | 0.0 | |
| 2,000,000 | | | | | | Energy Transfer Equity, L.P., New Term Loan, 4.000%, 12/02/19 | | | 1,996,250 | | | | 0.2 | |
| 1,761,034 | | | | | | FTS International, Inc. (fka FracTech), Term Loan, 5.750%, 04/16/21 | | | 1,382,412 | | | | 0.1 | |
| 3,431,563 | | | | | | Harvey Gulf International Marine, LLC, Upsized Term Loan B, 5.503%, 06/15/20 | | | 2,362,058 | | | | 0.3 | |
| 997,494 | | | | | | Seventy Seven Energy Inc., Term Loan, 3.750%, 06/25/21 | | | 876,797 | | | | 0.1 | |
| 248,125 | | | | | | Southcross Energy Partners, L.P., Term Loan, 5.250%, 08/01/21 | | | 242,852 | | | | 0.0 | |
| 1,491,237 | | | | | | Southcross Holdings L.P., Term Loan B, 6.000%, 08/04/21 | | | 1,420,404 | | | | 0.2 | |
| 2,567,525 | | | | | | Western Refining, Inc., Term Loan, 4.250%, 11/12/20 | | | 2,553,886 | | | | 0.3 | |
| | | | | | | | | | 18,460,495 | | | | 1.9 | |
Publishing: 1.6% |
| 3,178,000 | | | | (1) | | Cengage Learning Acquisition, Inc., First Lien Term Loan, 7.000%, 03/31/20 | | | 3,195,082 | | | | 0.3 | |
| 1,838,674 | | | | (1) | | McGraw Hill Global Education, Term Loan B, 5.750%, 03/22/19 | | | 1,857,347 | | | | 0.2 | |
| 1,970,000 | | | | | | Penton Media, Inc, First Lien, 5.500%, 09/30/19 | | | 1,983,953 | | | | 0.2 | |
| 925,000 | | | | | | Penton Media, Inc, Second Lien, 9.000%, 09/30/20 | | | 926,156 | | | | 0.1 | |
| 648,619 | | | | | | R.H. Donnelley Corporation, Term Loan, 9.750%, 12/31/16 | | | 451,871 | | | | 0.0 | |
| 1,457,753 | | | | | | Springer Science + Business Media S.A., Term B3 Loan, 4.750%, 08/14/20 | | | 1,460,790 | | | | 0.2 | |
| 5,617,960 | | | | | | Tribune Company, Term Loan B, 4.000%, 12/31/20 | | | 5,629,899 | | | | 0.6 | |
| | | | | | | | | | 15,505,098 | | | | 1.6 | |
Radio & Television: 2.0% |
| 3,476,399 | | | | | | Clear Channel Communications, Inc., Term Loan E, 7.678%, 07/30/19 | | | 3,360,809 | | | | 0.3 | |
| 2,681,947 | | | | | | Cumulus Media Holdings Inc., Term Loan, 4.250%, 12/23/20 | | | 2,640,377 | | | | 0.3 | |
| 212,633 | | | | | | Hubbard Radio LLC, Tranche 1 Term Loan, 4.500%, 04/29/19 | | | 212,301 | | | | 0.0 | |
| 1,338,151 | | | | | | Learfield Communications, Inc, First Lien Term Loan, 4.500%, 10/08/20 | | | 1,346,514 | | | | 0.1 | |
| 562,500 | | | | | | Learfield Communications, Inc, Second Lien Term Loan, 8.750%, 10/08/21 | | | 562,852 | | | | 0.1 | |
| 2,462,919 | | | | | | Media General, Inc, DD Term Loan L-B, 4.250%, 07/31/20 | | | 2,475,618 | | | | 0.3 | |
| 1,663,571 | | | | | | Salem Communications Corporation, Term Loan B, 4.500%, 03/14/20 | | | 1,657,333 | | | | 0.2 | |
| 3,809,177 | | | | | | Univision Communications, Inc., Term Loan-C3, 4.000%, 03/01/20 | | | 3,806,400 | | | | 0.4 | |
| 3,416,181 | | | | | | Univision Communications, Inc., Term Loan-C4, 4.000%, 03/01/20 | | | 3,414,578 | | | | 0.3 | |
| | | | | | | | | | 19,476,782 | | | | 2.0 | |
Retailers (Except Food & Drug): 7.6% |
| 2,368,314 | | | | | | 99 Cents Only Stores, Term Loan Facility, 4.500%, 01/15/19 | | | 2,372,755 | | | | 0.2 | |
| 1,496,250 | | | | | | Abercrombie & Fitch Management Co., Term Loan B, 4.750%, 08/07/21 | | | 1,485,028 | | | | 0.2 | |
| 8,696,614 | | | | | | BJs Wholesale Club, First Lien Term Loan, 4.500%, 09/26/19 | | | 8,713,598 | | | | 0.9 | |
| 1,365,000 | | | | | | BJs Wholesale Club, Second Lien Term Loan, 8.500%, 03/26/20 | | | 1,366,706 | | | | 0.1 | |
| 6,200,000 | | | | | | Dollar Tree, TL-B, 4.250%, 03/09/22 | | | 6,272,658 | | | | 0.7 | |
| 5,064,652 | | | | (1) | | Harbor Freight Tools USA, Inc., Term Loan, 4.750%, 07/26/19 | | | 5,100,737 | | | | 0.5 | |
| 1,458,016 | | | | | | Hudson’s Bay Company, Term Loan, 4.750%, 11/04/20 | | | 1,463,597 | | | | 0.2 | |
| 997,487 | | | | | | J. Crew, Term Loan B, 4.000%, 03/01/21 | | | 928,162 | | | | 0.1 | |
See Accompanying Notes to Financial Statements
28
| VOYA FLOATING RATE FUND | PORTFOLIO OF INVESTMENTS
AS OF MARCH 31, 2015 (CONTINUED) |
Principal Amount†
|
|
|
|
|
| Borrower/Tranche Description
|
| Fair Value
|
| Percentage
of Net
Assets
|
|---|
Retailers (Except Food & Drug): (continued) |
| 2,234,981 | | | | | | Lands’ End, Inc., Term Loan B, 4.250%, 04/04/21 | | $ | 2,157,456 | | | | 0.2 | |
| 4,528,944 | | | | | | Leslies Poolmart, Inc., Term Loan, 4.250%, 10/16/19 | | | 4,517,622 | | | | 0.5 | |
| 1,745,625 | | | | | | Mattress Firm Holding Corp., Term Loan B, 5.250%, 10/20/21 | | | 1,757,626 | | | | 0.2 | |
| 3,980,000 | | | | | | Men’s Wearhouse, Term Loan, 4.500%, 06/18/21 | | | 3,998,658 | | | | 0.4 | |
| 5,000 | | | | | | National Vision, Inc., First Lien Term Loan, 4.003%, 03/13/21 | | | 4,934 | | | | 0.0 | |
| 900,000 | | | | | | National Vision, Inc., Second Lien Term Loan, 6.750%, 03/13/22 | | | 874,125 | | | | 0.1 | |
| 4,922,857 | | | | | | Neiman Marcus Group, Inc, Term Loan, 4.250%, 10/25/20 | | | 4,911,948 | | | | 0.5 | |
| 3,369,347 | | | | | | Ollie’s Holdings, Inc., Term Loan, 4.750%, 09/28/19 | | | 3,354,607 | | | | 0.4 | |
| 2,990,343 | | | | | | OneStopPlus, First Lien Term Loan, 4.500%, 03/15/21 | | | 2,971,654 | | | | 0.3 | |
| 4,944,333 | | | | | | Party City Holdings Inc, Term Loan B, 4.002%, 07/29/19 | | | 4,942,568 | | | | 0.5 | |
| 2,539,898 | | | | | | Payless ShoeSource, First Lien Term Loan, 5.000%, 03/05/21 | | | 2,431,317 | | | | 0.3 | |
| 8,800,000 | | | | (1) | | PetSmart, Inc., TL-B, 5.000%, 03/11/22 | | | 8,875,002 | | | | 0.9 | |
| 2,112,777 | | | | | | Savers, Term Loan B, 5.000%, 07/09/19 | | | 2,076,684 | | | | 0.2 | |
| 462,480 | | | | | | Sleepy’s Holdings, LLC, Term Loan, 5.000%, 03/30/19 | | | 460,167 | | | | 0.1 | |
| 1,339,875 | | | | | | Stuart Weitzman Holdings, LLC, Term Loan, 4.500%, 04/08/20 | | | 1,339,875 | | | | 0.1 | |
| | | | | | | | | | 72,377,484 | | | | 7.6 | |
Surface Transport: 0.9% |
| 3,500,000 | | | | | | Goodpack Ltd., First Lien Term Loan, 4.750%, 09/09/21 | | | 3,507,108 | | | | 0.4 | |
| 500,000 | | | | | | Goodpack Ltd., Second Lien Term Loan, 8.000%, 09/09/22 | | | 500,000 | | | | 0.1 | |
| 1,987,487 | | | | | | OSG Bulk Ships, Inc., First Lien Term Loan, 5.250%, 08/05/19 | | | 1,982,519 | | | | 0.2 | |
| 322,563 | | | | | | V.Group, Term Loan B, 5.000%, 06/30/21 | | | 324,982 | | | | 0.0 | |
| 1,920,000 | | | | (1) | | Wabash National Corporation, Term Loan B, 03/19/22 | | | 1,924,800 | | | | 0.2 | |
| | | | | | | | | | 8,239,409 | | | | 0.9 | |
Telecommunications: 5.6% |
| 500,000 | | | | | | Altice International S.A., USD TLB, 5.250%, 01/28/22 | | | 505,750 | | | | 0.1 | |
| 3,373,263 | | | | | | Aricent Group, First Lien Term Loan, 5.500%, 04/14/21 | | | 3,390,831 | | | | 0.4 | |
| 7,873,353 | | | | | | Asurion, LLC, Incremental Tranche B-1 Term Loan, 5.000%, 05/24/19 | | | 7,909,909 | | | | 0.8 | |
| 1,150,000 | | | | | | Asurion, LLC, Second Lien Term Loan, 8.500%, 02/28/21 | | | 1,157,906 | | | | 0.1 | |
| 1,581,447 | | | | | | Avaya Inc., Term B-3 Loan, 4.676%, 10/26/17 | | | 1,560,395 | | | | 0.2 | |
| 2,701,619 | | | | | | Avaya Inc., Term B-6 Loan, 6.500%, 03/31/18 | | | 2,699,180 | | | | 0.3 | |
| 1,990,652 | | | | | | Consolidated Communications, Inc., Term Loan B, 4.250%, 12/19/20 | | | 2,001,850 | | | | 0.2 | |
| 1,193,494 | | | | | | Encompass Digital Media, Inc., First Lien, 5.500%, 06/05/21 | | | 1,197,969 | | | | 0.1 | |
| 525,000 | | | | | | Encompass Digital Media, Inc., Second Lien, 8.750%, 06/05/22 | | | 525,656 | | | | 0.1 | |
| 3,332,542 | | | | | | Global Tel*Link Corporation, First Lien Term Loan, 5.000%, 05/23/20 | | | 3,298,384 | | | | 0.3 | |
| 850,000 | | | | | | Global Tel*Link Corporation, Second Lien Term Loan, 9.000%, 11/23/20 | | | 826,625 | | | | 0.1 | |
| 2,462,985 | | | | | | Hawaiian Telcom Communications, Inc., Term Loan B, 5.000%, 06/06/19 | | | 2,471,194 | | | | 0.3 | |
| 3,610,000 | | | | | | Level 3 Financing, Inc, Term Loan B-4, 4.000%, 01/15/20 | | | 3,622,787 | | | | 0.4 | |
| 6,975,498 | | | | | | Level 3 Financing, Inc, Tranche B 2022 Term Loan, 4.500%, 01/31/22 | | | 7,020,964 | | | | 0.7 | |
| 1,450,000 | | | | | | Level 3 Financing, Inc, Tranche B-III 2019 Term Loan, 4.000%, 08/01/19 | | | 1,453,988 | | | | 0.1 | |
| 2,618,363 | | | | | | Lightower Fiber Networks, First Lien Term Loan, 4.000%, 04/13/20 | | | 2,612,885 | | | | 0.3 | |
| 1,724,987 | | | | | | Securus Technologies, Inc., Upsized First Lien Term Loan, 4.750%, 04/30/20 | | | 1,705,581 | | | | 0.2 | |
| 3,376,340 | | | | | | Syniverse Holdings, Inc., Initial Term Loan, 4.000%, 04/23/19 | | | 3,201,895 | | | | 0.3 | |
| 4,254,930 | | | | (1) | | U.S. Telepacific Corp, Term Loan B, 6.000%, 11/21/20 | | | 4,256,704 | | | | 0.4 | |
| 2,403,281 | | | | | | XO Communications, First Lien Term Loan, 4.250%, 03/19/21 | | | 2,412,668 | | | | 0.2 | |
| | | | | | | | | | 53,833,121 | | | | 5.6 | |
Utilities: 1.7% |
| 802,961 | | | | | | Atlantic Power Limited Partnership, Term Loan, 4.750%, 02/28/21 | | | 807,980 | | | | 0.1 | |
| 1,124,717 | | | | | | Channelview Cogeneration, Term Loan, 4.250%, 05/08/20 | | | 1,126,123 | | | | 0.1 | |
| 625,000 | | | | | | Energy Future Intermediate Holding Company LLC, First Lien DIP, 4.250%, 06/11/16 | | | 628,386 | | | | 0.1 | |
| 1,643,415 | | | | | | EquiPower Resources Holdings, LLC, Term Loan B, 4.250%, 12/21/18 | | | 1,644,185 | | | | 0.2 | |
| 1,105,321 | | | | | | EquiPower Resources Holdings, LLC, Upsized Term Loan C, 4.250%, 12/31/19 | | | 1,106,011 | | | | 0.1 | |
| 3,071,407 | | | | | | La Frontera Generation, LLC, Term Loan, 4.500%, 09/30/20 | | | 3,080,366 | | | | 0.3 | |
| 2,369,063 | | | | | | Pike Corporation, First Lien Term Loan, 5.500%, 12/22/21 | | | 2,371,254 | | | | 0.2 | |
| 1,471,313 | | | | | | Southeast PowerGen, LLC, Term Loan B, 4.500%, 12/02/21 | | | 1,485,106 | | | | 0.2 | |
See Accompanying Notes to Financial Statements
29
| VOYA FLOATING RATE FUND | PORTFOLIO OF INVESTMENTS
AS OF MARCH 31, 2015 (CONTINUED) |
Principal Amount†
|
|
|
|
|
| Borrower/Tranche Description
|
| Fair Value
|
| Percentage
of Net
Assets
|
|---|
Utilities: (continued) |
| 1,989,899 | | | | | | TPF Generation Holdings, LLC, Term Loan, 4.750%, 12/31/17 | | $ | 1,868,018 | | | | 0.2 | |
| 1,745,625 | | | | | | TPF II Power, LLC, Term Loan, 5.500%, 09/30/21 | | | 1,770,355 | | | | 0.2 | |
| | | | | | | | | | 15,887,784 | | | | 1.7 | |
| | | | | | | Total Loans
(Cost $903,422,043) | | | 900,951,897 | | | | 94.2 | |
| |
Shares
|
|
|
|
|
|
|
| Value
|
| Percentage
of Net
Assets
|
|---|
SHORT-TERM INVESTMENTS: 7.7% |
Short-Term Investments: 7.7% |
| 73,500,000 | | | | | | State Street Institutional Liquid Reserves Fund — Institutional Class, 0.10%††
(Cost $73,500,000) | | $ | 73,500,000 | | | | 7.7 | |
| |
| | | | | | | Total Short-Term Investments
(Cost $73,500,000) | | | 73,500,000 | | | | 7.7 | |
| |
| | | | | | | Total Investments
(Cost $976,922,043) | | $ | 974,451,897 | | | | 101.9 | |
| | | | | | | Liabilities in Excess of Other Assets | | | (18,025,668 | ) | | | (1.9 | ) |
| | | | | | | Net Assets | | $ | 956,426,229 | | | | 100.0 | |
| |
| | | | | * | | Loans, while exempt from registration under the Securities Act of 1933, as amended, contain certain restrictions on resale and cannot be sold publicly. These loans bear interest (unless otherwise noted) at rates that float periodically at a margin above the London Inter-Bank Offered Rate (“LIBOR”) and other short-term rates. | | | | | | | | |
| | | | | † | | Unless otherwise indicated, principal amount is shown in USD. | | | | | | | | |
| | | | | †† | | Rate shown is the 7-day yield as of March 31, 2015. | | | | | | | | |
| | | | | (1) | | Loans purchased on a when-issued or delayed-delivery basis. Contract rates that are not disclosed do not take effect until settlement date and have yet to be determined. | | | | | | | | |
| | | | | (2) | | The borrower filed for protection under Chapter 11 of the U.S. Federal Bankruptcy code. | | | | | | | | |
| | | | | (3) | | Loan is on non-accrual basis. | | | | | | | | |
| |
| | | | | | | Cost for federal income tax purposes is $977,220,238. | | | | | | | | |
| |
| | | | | | | Net unrealized depreciation consists of: | | | | | | | | |
| | | | | | | Gross Unrealized Appreciation | | $ | 4,356,816 | | | | | |
| | | | | | | Gross Unrealized Depreciation | | | (7,125,157 | ) | | | | |
| | | | | | | Net Unrealized Depreciation | | $ | (2,768,341 | ) | | | | |
Fair Value Measurementsˆ
The following is a summary of the fair valuations according to the inputs used as of March 31, 2015 in valuing the assets and liabilities:
| | | | Quoted Prices
in Active Markets
for Identical
Investments
(Level 1)
| | Significant
Other
Observable
Inputs
(Level 2)
| | Significant
Unobservable
Inputs
(Level 3)
| | Fair Value
at
March 31, 2015
|
|---|
Asset Table | | | | | | | | | | | | | | | | | | |
Investments, at fair value | | | | | | | | | | | | | | | | | | |
| Loans | | | | $ | — | | | $ | 900,951,897 | | | $ | — | | | $ | 900,951,897 | |
| Short-Term Investments | | | | | 73,500,000 | | | | — | | | | — | | | | 73,500,000 | |
| Total Investments, at fair value | | | | $ | 73,500,000 | | | $ | 900,951,897 | | | $ | — | | | $ | 974,451,897 | |
| ˆ | | See Note 2, “Significant Accounting Policies” in the Notes to Financial Statements for additional information. |
See Accompanying Notes to Financial Statements
30
TAX INFORMATION (UNAUDITED)
Dividends paid during the year ended March 31, 2015 were as follows:
Fund Name
| | | | Type
| | Per Share Amount
|
|---|
| Voya Floating Rate Fund | | | | | | | | | | |
| Class A | | | | | NII | | | | $0.3590 | |
| Class C | | | | | NII | | | | $0.2829 | |
| Class I | | | | | NII | | | | $0.3844 | |
| Class P | | | | | NII | | | | $0.4513 | |
| Class R | | | | | NII | | | | $0.3337 | |
| Class W | | | | | NII | | | | $0.3844 | |
NII — Net investment income
Pursuant to Internal Revenue Code Section 871(k)(1), the Fund designates 98.69% of net investment income distributions as interest-related dividends.
Above figures may differ from those cited elsewhere in this report due to differences in the calculation of income and gains under U.S. generally accepted accounting principles (book) purposes and Internal Revenue Service (tax) purposes.
Shareholders are strongly advised to consult their own tax advisers with respect to the tax consequences of their investments in the Fund. In January, shareholders, excluding corporate shareholders, receive an IRS 1099-DIV regarding the federal tax status of the dividends and distributions they received in the calendar year.
31
TRUSTEE AND OFFICER INFORMATION (UNAUDITED)
The business and affairs of the Trust are managed under the direction of the Board. A Trustee, who is not an interested person of the Trust, as defined in the 1940 Act, is an independent trustee (“Independent Trustee”). The Trustees and Officers of the Trust are listed below. The Statement of Additional Information includes additional information about trustees of the Trust and is available, without charge, upon request at (800) 992-0180.
Name, Address and Age
| | | | Position(s) Held
with the Trust
| | Term of Office
and Length of
Time Served(1)
| | Principal
Occupation(s) —
During the Past 5 Years
| | Number of
Funds in
Fund
Complex
Overseen by
Trustee(2)
| | Other Board
Positions
Held by
Trustee
|
|---|
| |
Independent Trustees: | | |
| |
Colleen D. Baldwin
7337 East Doubletree Ranch Rd.
Suite 100
Scottsdale, Arizona 85258
Age: 54 | | | | Trustee | | November 2007–Present | | President, Glantuam Partners, LLC, a business consulting firm (January 2009–Present). | | 158 | | DSM/Dentaquest, Boston, MA (February 2014–Present). |
| |
John V. Boyer
7337 East Doubletree Ranch Rd.
Suite 100
Scottsdale, Arizona 85258
Age: 61 | | | | Chairperson
Trustee | | January 2014–Present
January 2005–Present | | President and Chief Executive Officer, Bechtler Arts Foundation, an arts and education foundation (January 2008–Present). | | 158 | | None. |
| |
Patricia W. Chadwick
7337 East Doubletree Ranch Rd.
Suite 100
Scottsdale, Arizona 85258
Age: 66 | | | | Trustee | | January 2006–Present | | Consultant and President, Ravengate Partners LLC, a consulting firm that provides advice regarding financial markets and the global economy (January 2000–Present). | | 158 | | Wisconsin Energy Corporation (June 2006–Present) and The Royce Funds (35 funds) (December 2009–Present). |
| |
Albert E. DePrince, Jr.
7337 East Doubletree Ranch Rd.
Suite 100
Scottsdale, Arizona 85258
Age: 74 | | | | Trustee | | May 2013–Present | | Retired. Formerly, Professor of Economics and Finance, Middle Tennessee State University (August 1991–July 2014); Dr. DePrince continued to hold a position with the university under a post-retirement contract through the end of 2014. | | 158 | | None. |
| |
Peter S. Drotch
7337 East Doubletree Ranch Rd.
Suite 100
Scottsdale, Arizona 85258
Age: 73 | | | | Trustee | | November 2007–Present | | Retired. | | 158 | | First Marblehead Corporation (September 2003–Present). |
| |
Russell H. Jones
7337 East Doubletree Ranch Rd.
Suite 100
Scottsdale, Arizona 85258
Age: 71 | | | | Trustee | | May 2013–Present | | Retired. | | 158 | | None. |
| |
Patrick W. Kenny
7337 East Doubletree Ranch Rd.
Suite 100
Scottsdale, Arizona 85258
Age: 72 | | | | Trustee | | January 2005–Present | | Retired. | | 158 | | Assured Guaranty Ltd. (April 2004–Present). |
| |
Joseph E. Obermeyer
7337 East Doubletree Ranch Rd.
Suite 100
Scottsdale, Arizona 85258
Age: 57 | | | | Trustee | | May 2013–Present | | President, Obermeyer & Associates, Inc., a provider of financial and economic consulting services (November 1999–Present). | | 158 | | None. |
| |
Sheryl K. Pressler
7337 East Doubletree Ranch Rd.
Suite 100
Scottsdale, Arizona 85258
Age: 64 | | | | Trustee | | January 2006–Present | | Consultant (May 2001–Present). | | 158 | | None. |
32
TRUSTEE AND OFFICER INFORMATION (UNAUDITED) (CONTINUED)
Name, Address and Age
| | | | Position(s) Held
with the Trust
| | Term of Office
and Length of
Time Served(1)
| | Principal
Occupation(s) —
During the Past 5 Years
| | Number of
Funds in
Fund
Complex
Overseen by
Trustee(2)
| | Other Board
Positions
Held by
Trustee
|
|---|
| |
Roger B. Vincent
7337 East Doubletree Ranch Rd.
Suite 100
Scottsdale, Arizona 85258
Age: 69 | | | | Trustee | | February 2002–Present | | Retired. Formerly, President, Springwell Corporation, a corporate finance firm (March 1989–August 2011). | | 158 | | UGI Corporation (February 2006–Present) and UGI Utilities, Inc. (February 2006–Present). |
| |
Trustee who is an “interested person”: |
| |
Shaun P. Mathews(3)
7337 East Doubletree Ranch Rd.
Suite 100
Scottsdale, Arizona 85258
Age: 59 | | | | Trustee | | November 2007–Present | | President and Chief Executive Officer, Voya Investments, LLC (November 2006–Present). | | 158 | | Voya Capital Corporation, LLC and Voya Investments Distributor, LLC (December 2005–Present); Voya Funds Services, LLC, Voya Investments, LLC and Voya Investment Management, LLC (March 2006–Present); and Voya Investment Trust Co. (April 2009–Present). |
(1) | | Trustees serve until their successors are duly elected and qualified. The tenure of each Trustee who is not an “interested person” as defined in the 1940 Act, of each Fund (“Independent Trustee”) is subject to the Board’s retirement policy which states that each duly elected or appointed Independent Trustee shall retire from and cease to be a member of the Board of Trustees at the close of business on December 31 of the calendar year in which the Independent Trustee attains the age of 75. A majority vote of the Board’s other Independent Trustees may extend the retirement date of an Independent Trustee if the retirement would trigger a requirement to hold a meeting of shareholders of the Trust under applicable law, whether for the purposes of appointing a successor to the Independent Trustee or otherwise comply under applicable law, in which case the extension would apply until such time as the shareholder meeting can be held or is no longer required (as determined by a vote of a majority of the other Independent Trustees). |
(2) | | For the purposes of this table, “Fund Complex” means the Voya family of funds including the following investment companies: Voya Asia Pacific High Dividend Equity Income Fund; Voya Balanced Portfolio, Inc.; Voya Emerging Markets High Dividend Equity Fund; Voya Equity Trust; Voya Funds Trust; Voya Global Advantage and Premium Opportunity Fund; Voya Global Equity Dividend and Premium Opportunity Fund; Voya Infrastructure, Industrials and Materials Fund; Voya Intermediate Bond Portfolio; Voya International High Dividend Equity Income Fund; Voya Investors Trust; Voya Money Market Portfolio; Voya Mutual Funds; Voya Natural Resources Equity Income Fund; Voya Partners, Inc.; Voya Prime Rate Trust; Voya Senior Income Fund; Voya Separate Portfolios Trust; Voya Series Fund, Inc.; Voya Strategic Allocation Portfolios, Inc.; Voya Variable Funds; Voya Variable Insurance Trust; Voya Variable Portfolios, Inc.; and Voya Variable Products Trust. The number of funds in the Fund Complex is as of April 30, 2015. |
(3) | | Mr. Mathews is deemed to be an “interested person” of the Trust as defined in the 1940 Act, because of his current affiliation with any of the Voya funds, Voya Financial, Inc. or Voya Financial, Inc.’s affiliates. |
33
TRUSTEE AND OFFICER INFORMATION (UNAUDITED) (CONTINUED)
Name, Address and Age
| | | | Position(s)
Held With
the Trust
| | Term of Office
and Length of
Time Served(1)
| | Principal
Occupation(s) —
During the Past 5 Years
|
|---|
| |
Shaun P. Mathews
7337 East Doubletree Ranch Rd.
Suite 100
Scottsdale, Arizona 85258
Age: 59 | | | | President and Chief Executive Officer | | November 2006–Present | | President and Chief Executive Officer, Voya Investments, LLC (November 2006–Present). |
| |
Michael J. Roland
7337 East Doubletree Ranch Rd.
Suite 100
Scottsdale, Arizona 85258
Age: 57 | | | | Executive Vice President | | February 2002–Present | | Managing Director and Chief Operating Officer, Voya Investments, LLC and Voya Funds Services, LLC (April 2012–Present). Formerly, Chief Compliance Officer, Directed Services LLC and Voya Investments, LLC (March 2011–December 2013); Executive Vice President and Chief Operating Officer, Voya Investments, LLC and Voya Funds Services, LLC (January 2007–April 2012) and Chief Compliance Officer, Voya Family of Funds (March 2011–February 2012). |
| |
Stanley D. Vyner
230 Park Avenue
New York, New York 10169
Age: 65 | | | | Executive Vice President
Chief Investment Risk Officer | | October 2000–Present
September 2009–Present | | Executive Vice President, Voya Investments, LLC (July 2000–Present) and Chief Investment Risk Officer, Voya Investments, LLC (January 2003–Present). |
| |
Kevin M. Gleason
7337 East Doubletree Ranch Rd.
Suite 100
Scottsdale, Arizona 85258
Age: 48 | | | | Chief Compliance Officer | | February 2012–Present | | Senior Vice President and Chief Compliance Officer, Voya Investments, LLC (February 2012–Present). Formerly, Assistant General Counsel and Assistant Secretary, The Northwestern Mutual Life Insurance Company (June 2004–January 2012). |
| |
Todd Modic
7337 East Doubletree Ranch Rd.
Suite 100
Scottsdale, Arizona 85258
Age: 47 | | | | Senior Vice President, Chief/Principal Financial Officer and Assistant Secretary | | March 2005–Present | | Senior Vice President, Voya Funds Services, LLC (March 2005–Present). |
| |
Kimberly A. Anderson
7337 East Doubletree Ranch Rd.
Suite 100
Scottsdale, Arizona 85258
Age: 50 | | | | Senior Vice President | | November 2003–Present | | Senior Vice President, Voya Investments, LLC (October 2003–Present). |
| |
Julius A. Drelick, III
7337 East Doubletree Ranch Rd.
Suite 100
Scottsdale, Arizona 85258
Age: 48 | | | | Senior Vice President | | July 2012–Present | | Senior Vice President–Fund Compliance, Voya Funds Services, LLC (June 2012–Present); Chief Compliance Officer of Directed Services LLC and Voya Investments, LLC (January 2014–Present). Formerly, Vice President — Platform Product Management & Project Management, Voya Investments, LLC (April 2007–June 2012). |
| |
Robert Terris
7337 East Doubletree Ranch Rd.
Suite 100
Scottsdale, Arizona 85258
Age: 44 | | | | Senior Vice President | | May 2006–Present | | Senior Vice President, Head of Division Operations, Voya Funds Services, LLC (January 2006–Present). |
| |
Fred Bedoya
7337 East Doubletree Ranch Rd.
Suite 100
Scottsdale, Arizona 85258
Age: 42 | | | | Vice President and Treasurer | | September 2012–Present | | Vice President, Voya Funds Services, LLC (March 2012–Present). Formerly, Assistant Vice President — Director, Voya Funds Services, LLC (March 2003–March 2012). |
| |
Maria M. Anderson
7337 East Doubletree Ranch Rd.
Suite 100
Scottsdale, Arizona 85258
Age: 57 | | | | Vice President | | September 2004–Present | | Vice President, Voya Funds Services, LLC (September 2004–Present). |
34
TRUSTEE AND OFFICER INFORMATION(UNAUDITED) (CONTINUED)
Name, Address and Age
| | | | Position(s)
Held With
the Trust
| | Term of Office
and Length of
Time Served(1)
| | Principal
Occupation(s) —
During the Past 5 Years
|
|---|
| |
Lauren D. Bensinger
7337 East Doubletree Ranch Rd.
Suite 100
Scottsdale, Arizona 85258
Age: 61 | | | | Vice President | | February 2003–Present | | Vice President, Voya Investments, LLC and Voya Funds Services, LLC (February 1996–Present); Vice President, Voya Investments, LLC (October 2004–Present); Vice President and Money Laundering Reporting Officer, Voya Investments Distributor, LLC (April 2010–Present); Anti-Money Laundering Compliance Officer, Voya Financial, Inc. (January 2013–Present); and Money Laundering Reporting Officer, Voya Investment Management Trust Co. (October 2012–Present). Formerly, Chief Compliance Officer, Voya Investments Distributor, LLC (August 1995–April 2010). |
| |
Sara M. Donaldson
7337 East Doubletree Ranch Rd.
Suite 100
Scottsdale, Arizona 85258
Age: 55 | | | | Vice President | | September 2014–Present | | Vice President, Voya Funds Services, LLC (April 2014–Present). Formerly, Director, Compliance, AXA Rosenberg Global Services, LLC (September 1997–March 2014). |
| |
Robyn L. Ichilov
7337 East Doubletree Ranch Rd.
Suite 100
Scottsdale, Arizona 85258
Age: 47 | | | | Vice President | | October 2000–Present | | Vice President, Voya Funds Services, LLC (November 1995–Present) and Voya Investments, LLC (August 1997–Present). Formerly, Treasurer, Voya Family of Funds (November 1999–February 2012). |
| |
Jason Kadavy
7337 East Doubletree Ranch Rd.
Suite 100
Scottsdale, Arizona 85258
Age: 39 | | | | Vice President | | September 2012–Present | | Vice President, Voya Funds Services, LLC (July 2007–Present). |
| |
Kimberly K. Springer
7337 East Doubletree Ranch Rd.
Suite 100
Scottsdale, Arizona 85258
Age: 58 | | | | Vice President | | March 2006–Present | | Vice President — Mutual Fund Product Development, Voya Investments, LLC (July 2012–Present); Vice President, Voya Investment Management — Voya Family of Funds (March 2010–Present) and Vice President, Voya Funds Services, LLC (March 2006–Present). Formerly Managing Paralegal, Registration Statements (June 2003–July 2012). |
| |
Craig Wheeler
7337 East Doubletree Ranch Rd.
Suite 100
Scottsdale, Arizona 85258
Age: 46 | | | | Vice President | | May 2013–Present | | Vice President — Director of Tax, Voya Funds Services, LLC (March 2013–Present). Formerly, Assistant Vice President — Director of Tax, Voya Funds Services, LLC (March 2008–February 2013). |
| |
Huey P. Falgout, Jr.
7337 East Doubletree Ranch Rd.
Suite 100
Scottsdale, Arizona 85258
Age: 51 | | | | Secretary | | August 2003–Present | | Senior Vice President and Chief Counsel, Voya Investment Management — Mutual Fund Legal Department (March 2010–Present). Formerly, Chief Counsel, ING Americas, U.S. Legal Services (October 2003–March 2010). |
| |
Paul A. Caldarelli
7337 East Doubletree Ranch Rd.
Suite 100
Scottsdale, Arizona 85258
Age: 63 | | | | Assistant Secretary | | June 2010–Present | | Vice President and Senior Counsel, Voya Investment Management — Mutual Fund Legal Department (March 2010–Present). Formerly, Senior Counsel, ING Americas, U.S. Legal Services (April 2008–March 2010). |
| |
Theresa K. Kelety
7337 East Doubletree Ranch Rd.
Suite 100
Scottsdale, Arizona 85258
Age: 52 | | | | Assistant Secretary | | August 2003–Present | | Vice President and Senior Counsel, Voya Investment Management — Mutual Fund Legal Department (March 2010–Present). Formerly, Senior Counsel, ING Americas, U.S. Legal Services (April 2008–March 2010). |
(1) | | The Officers hold office until the next annual meeting of the Board of Trustees and until their successors shall have been elected and qualified. |
35
ADVISORY CONTRACT APPROVAL DISCUSSION (UNAUDITED)
APPROVAL OF INVESTMENT ADVISORY AND SUB-ADVISORY CONTRACTS IN CONNECTION WITH CHANGE OF CONTROL EVENT
Section 15(c) of the Investment Company Act of 1940, as amended (the “1940 Act”), provides that, when Voya Floating Rate Fund (the “Fund”), a series of Voya Funds Trust (the “Trust”), enters into a new investment advisory contract with Voya Investments, LLC (the “Adviser”), and the Adviser enters into a new sub-advisory contract between the Adviser and Voya Investment Management Co. LLC (the “Sub-Adviser”), the Board of Trustees (the “Board”) of the Trust, including a majority of the Board members who have no direct or indirect interest in the Fund’s investment advisory and sub-advisory contracts, and who are not “interested persons” of the Fund, as such term is defined under the 1940 Act (the “Independent Trustees”), must approve the new arrangements. Discussed below are certain factors that the Board considered at a meeting held on November 18, 2014 in determining whether to approve new advisory and sub-advisory arrangements for the Fund in connection with a Change of Control Event, as such term is defined below.
At the November 18, 2014 meeting, the Board noted that pursuant to an agreement with the European Commission, ING Groep N.V. (“ING Groep”), the former parent company of the Adviser and the Sub-Adviser, is required to divest its entire interest in Voya Financial, Inc. (formerly known as ING U.S., Inc.), its U.S.-based insurance, retirement services, and investment management operations, which include the Adviser and the Sub-Adviser, by the end of 2016 (the “Separation Plan”). Voya Financial, Inc. previously was a wholly owned, indirect subsidiary of ING Groep and is a parent company of the Adviser and the Sub-Adviser.
The Fund is subject to the 1940 Act, which provides that any investment advisory agreement, including any sub-advisory agreement, must terminate automatically upon its “assignment.” As used in the 1940 Act, the term assignment includes any transfer of a controlling block of outstanding voting securities of an adviser or the parent company of an adviser. Such a transfer is referred to herein as a “Change of Control Event.”
ING Groep’s base case to achieve the Separation Plan was through an initial public offering of Voya Financial, Inc. (the “IPO”) followed by the divestment of ING Groep’s remaining ownership interest over time through one or more additional public offerings of Voya Financial, Inc. stock, or, possibly, through one or more privately negotiated sales of the stock. The Board recognized that the Separation Plan contemplated several public offerings and each may have been deemed to be a Change of Control Event, triggering the necessity for new agreements, which would require the approval of the Board. The Board concluded that approval by shareholders of the new agreements that would become effective in the event of one or more Change of Control Events would permit the Fund to benefit from the continuation of services by the Adviser, the Sub-Adviser, and their affiliates throughout the Separation Plan without the need for multiple shareholder meetings. The Board was informed by the Adviser and its counsel that the Adviser obtained regulatory assurances from the staff of the U.S. Securities and Exchange Commission in March 2013 that they would not object to approval of future agreements by shareholders at a single shareholder meeting. Fund shareholders approved the future agreements in May 2013.
The IPO was completed in May 2013. ING Groep divested additional shares in Voya Financial, Inc. through four subsequent public offerings since May 2013, including a secondary common stock offering that closed on November 18, 2014 (the “November Transaction”). (In addition, concurrently with the November Transaction, Voya Financial, Inc. repurchased $175 million of its shares directly from ING Groep.) Upon the completion of the November Transaction and the concurrent direct share repurchase, ING Groep’s ownership in Voya Financial, Inc. was reduced from approximately 32.5% to approximately 19%. This was deemed to be a Change of Control Event that resulted in the termination of the Fund’s existing advisory and sub-advisory agreements (the “Prior Agreements”) at the close of business on November 18, 2014.
In light of the foregoing, on November 18, 2014 the Board, at an in-person meeting, approved new investment advisory and sub-advisory agreements (the “New Agreements”) for the Fund to replace the Prior Agreements upon termination. At that meeting, the Adviser represented that the agreements approved by the Board were not materially different from the agreements approved by shareholders of the Fund in 2013 and no single person or group of persons acting together was expected to gain “control” (as defined in the 1940 Act) of Voya Financial, Inc. As a result, shareholders of the Fund will not be asked to vote again on these new agreements with the Adviser and affiliated sub-advisers, including the Sub-Adviser.
The decision by the Board, including a majority of the Independent Trustees, to approve the New Agreements was based on a determination by the Board that it would be in the best interests of the shareholders of the Fund for the Adviser and Sub-Adviser to continue providing investment advisory, sub-advisory, and related services for the Fund, without interruption, after the Change of Control Event.
Prior to its approval of the New Agreements, the Board reviewed, among other matters, the quality, extent and nature of the services currently being provided by the
36
ADVISORY CONTRACT APPROVAL DISCUSSION (UNAUDITED) (CONTINUED)
Adviser and Sub-Adviser under the Prior Agreements and to be provided under the New Agreements. A substantial portion of this review was conducted as part of, and in conjunction with, the Board’s annual reviews of the Prior Agreements, which were most recently approved for continuation at the in-person meeting of the Board held on September 12, 2014. During the review process that led to its approval of the Prior Agreements on September 12, 2014, the Board was informed by the Adviser that it was likely the Board would be asked in the very near future to consider approval of the New Agreements. The Board further noted that the Change of Control Event would result in the Adviser’s and the Sub-Adviser’s loss of access to certain services and resources of ING Groep, which could adversely affect their businesses and profitability.
On September 12, 2014, the Board concluded, in light of all factors it considered, including undertakings by the Adviser relating to certain follow-up actions, to renew the Prior Agreements and that the fee rates set forth in the Prior Agreements were fair and reasonable. Among other factors, the Board considered: (1) the nature, extent and quality of services provided and to be provided under the Prior Agreements; (2) the extent to which economies of scale are reflected in fee rate schedules under the Prior Agreements; (3) the existence of any “fall-out” benefits to the Adviser, Sub-Adviser, and their affiliates; (4) a comparison of fee rates, expense ratios, and investment performance to those of similar funds; and (5) the costs incurred and profits realized by the Adviser, the Sub-Adviser, and their affiliates with respect to their services to the Fund.
A further description of the process followed by the Board in approving the Prior Agreements on September 12, 2014, including the information reviewed, certain material factors considered and certain related conclusions reached, is set forth in the Fund’s Semi-Annual Report, dated September 30, 2014, under the section titled “Board Consideration and Approval of Investment Advisory and Sub-Advisory Contracts.”
In connection with its approval of the New Agreements, on November 18, 2014 the Board considered its conclusions in connection with its September 12, 2014 approvals of those Prior Agreements that were in effect on that date, including the Board’s assessment of the nature, extent and quality of services being provided and, as applicable, actions taken in certain instances to improve the relationship between the costs and the quality of services being provided. Also in connection with its November 18, 2014 approvals of the New Agreements, the Board considered a representation from the Adviser that there were no additional developments not already disclosed to the Board since September 12, 2014 that would be a material consideration to the Board in connection with its consideration of the New Agreements.
In addition, in determining whether to approve the New Agreements, the Board took into account the considerations set out below.
| 1) | | The Independent Trustees solicited and received ongoing advice regarding the Board’s legal duties when approving the New Agreements from K&L Gates, their independent legal counsel, which law firm has extensive experience regarding such matters. |
| 2) | | The Board considered Management’s representations regarding its commitment to maintain appropriate levels of overall staffing, ongoing resources and service quality through the transactions under the Separation Plan and after the Change of Control Event. The Board noted that such services include, but are not limited to, portfolio management services, administrative services, and regulatory compliance services. In this regard, the Board considered representations by the Adviser and its affiliates that their separation from ING Groep, as contemplated by the Separation Plan, will not lead to a reduction in the quality or scope of these and other services provided by those firms to the funds in the Voya funds complex, including the Fund. The Board also considered the importance of the asset management operations to the overall success of Voya Financial, Inc., which provides a strong incentive to Voya Financial, Inc. to provide appropriate resource allocations to support those asset management operations. |
| 3) | | The Board considered representations by the Adviser and its affiliates that approval of the New Agreements would be necessary for the Fund to continue receiving investment management services from the Adviser and Sub-Adviser following the November 18, 2014 Change of Control Event. In addition, the Board considered representations by the Adviser and its affiliates, as well as related supporting documentation, indicating that the New Agreements, including the fees payable thereunder, are substantially similar to and, in any event, are no less favorable to the Fund than, the terms of the corresponding Prior Agreements. |
| 4) | | The Board considered representations by the Adviser and its affiliates, including senior investment management personnel, as well as related supporting documentation, indicating that: (a) the Adviser and Sub-Adviser can be expected to provide services of the same nature, extent and quality under the New Agreements as were provided thereby under the Prior Agreements; and (b) the November 18, 2014 Change of Control Event is not expected to result in any changes to: (i) the management of the Fund, including the |
37
ADVISORY CONTRACT APPROVAL DISCUSSION (UNAUDITED) (CONTINUED)
| | continuity of the Fund’s portfolio managers and other personnel responsible for the management operations of the Fund; or (ii) the investment objective of or the principal investment strategies used to manage the Fund. |
| 5) | | The Board considered actions taken by the Adviser subsequent to the September 12, 2014 approvals of the Prior Agreements with respect to certain Voya funds in response to requests made by the Board in connection with those approvals. |
| 6) | | The Board considered the potential benefits to be realized by the Adviser and its affiliates as a result of the New Agreements. |
Based on the foregoing and other relevant considerations, at a meeting of the Board held on November 18, 2014, the Board, including a majority of the Independent Trustees, voted to approve the New Agreements. In this connection, the Board concluded that, in light of all factors considered, the terms of the New Agreements, including fee rates, were fair and reasonable, and the New Agreements should be approved so as to enable a continuation without interruption of the services being provided by the current service providers pursuant to the Prior Agreements. The Board noted that no one factor was determinative of its decisions which, instead, were premised upon the totality of factors considered. The Board also noted that different Board members likely placed emphasis on different factors in reaching their individual conclusions to vote in favor of the New Agreements.
APPROVAL OF AMENDED AND RESTATED INVESTMENT MANAGEMENT AGREEMENT
At a meeting held on March 12, 2015, the Board approved amending and restating the Fund’s Management Agreement so that, effective May 1, 2015, the terms of the Fund’s Management Agreement and its Administrative Agreement are combined under a single Amended and Restated Investment Management Agreement with a single management fee. The single management fee rate under the Fund’s Amended and Restated Investment Management Agreement does not exceed the former combined investment management and administrative services fee rates for the Fund and, under the Fund’s Amended and Restated Investment Management Agreement, there was no change to the investment management or administrative services provided or the fees charged to the Fund.
In connection with its review, the Board determined that it did not need to consider certain factors it typically considers during its review of the Fund’s advisory agreement because it had reviewed, among other matters, the nature, extent and quality of services being provided and, as applicable, actions taken in certain instances to improve the relationship between the costs and the quality of services being provided on September 12, 2014, when it renewed the agreement. In analyzing whether to approve the Amended and Restated Investment Management Agreement, the Board did consider, among other things: (1) a memorandum and related materials outlining the terms of these agreements and Management’s rationale for proposing the amendments that combine the terms of the Fund’s investment management and administrative services arrangements under a single agreement; (2) Management’s representations that, under the Amended and Restated Investment Management Agreement, there would be no change in the fees payable for the combination of advisory and administrative services provided to the Fund; (3) Management’s confirmation that the implementation of the Amended and Restated Investment Management Agreement would result in no change in the scope of services that the Adviser provides to the Fund and that the personnel who have provided administrative and advisory services to the Fund previously would continue to do so after the Amended and Restated Investment Management Agreement become effective; and (4) representations from Management that the combination of the agreements better aligns the Fund’s contracts with the manner in which Voya provides such services to the Fund. In approving the amendments to the Fund’s Management Agreement, different Board members may have given different weight to different individual factors and related conclusions.
38
(THIS PAGE INTENTIONALLY LEFT BLANK)
Investment Adviser
Voya Investments, LLC
7337 East Doubletree Ranch Road, Suite 100
Scottsdale, Arizona 85258
Administrator
Voya Funds Services, LLC
7337 East Doubletree Ranch Road, Suite 100
Scottsdale, Arizona 85258
Distributor
Voya Investments Distributor, LLC
7337 East Doubletree Ranch Road, Suite 100
Scottsdale, Arizona 85258
Transfer Agent
BNY Mellon Investment Servicing (U.S.) Inc.
301 Bellevue Parkway
Wilmington, Delaware 19809
Independent Registered Public Accounting Firm
KPMG LLP
Two Financial Center
60 South Street
Boston, Massachusetts 02111
Custodian
State Street Bank and Trust Company
801 Pennsylvania Avenue
Kansas City, Missouri 64105
Legal Counsel
Ropes & Gray LLP
Prudential Tower
800 Boylston Street
Boston, Massachusetts 02199
Toll-Free Shareholder Information
Call us from 9:00 a.m. to 7:00 p.m. Eastern time on any business day for account or other information, at (800) 992-0180
For more complete information, or to obtain a prospectus on any Voya mutual fund, please call your financial advisor or Voya Investments Distributor, LLC at (800) 992-0180 or log on to www.voyainvestments.com. The prospectus should be read carefully before investing. Consider the fund’s investment objectives, risks, charges and expenses carefully before investing. The prospectus contains this information and other information about the fund.
RETIREMENT | INVESTMENTS | INSURANCE
voyainvestments.com
|
AR-FR (0315-052115) |
Item 2. Code of Ethics.
As of the end of the period covered by this report, Registrant had adopted a code of ethics, as defined in Item 2 of Form N-CSR, that applies to the Registrant’s principal executive officer and principal financial officer. There were no amendments to the Code during the period covered by the report. The Registrant did not grant any waivers, including implicit waivers, from any provisions of the Code during the period covered by this report. The code of ethics is filed herewith pursuant to Item 10(a)(1), Exhibit 99.CODEETH.s
Item 3. Audit Committee Financial Expert.
The Board of Trustees has determined that Colleen D. Baldwin, Peter S. Drotch, Patrick W. Kenny, Joseph E. Obermayer, and Roger B. Vincent are audit committee financial experts, as defined in Item 3 of Form N-CSR. Ms. Baldwin, Mr. Drotch, Mr. Kenny, Mr. Obermayer and Mr. Vincent are “independent” for purposes of Item 3 of Form N-CSR.
Item 4. Principal Accountant Fees and Services.
| (a) | Audit Fees: The aggregate fees billed for each of the last two fiscal years for professional services rendered by KPMG LLP (“KPMG”), the principal accountant for the audit of the registrant’s annual financial statements, for services that are normally provided by the accountant in connection with statutory and regulatory filings or engagements for those fiscal years were $148,000 for year ended March 31, 2015 and $148,000 for year ended March 31, 2014. |
| (b) | Audit-Related Fees: The aggregate fees billed in the last fiscal year for assurance and related services by KPMG that are reasonably related to the performance of the audit of the registrant’s financial statements and are not reported under paragraph (a) of this Item were $15,150 for the year ended March 31, 2015 and $14,400 for year ended March 31, 2014. |
| (c) | Tax Fees: The aggregate fees billed in each of the last two fiscal years for professional services rendered by KPMG for tax compliance, tax advice, and tax planning were $46,419 in the year ended March 31, 2015 and $51,881 in the year ended March 31, 2014. Such services included review of excise distribution calculations (if applicable), preparation of the Funds’ federal, state and excise tax returns, tax services related to mergers and routine consulting. |
| (e)(1) | Audit Committee Pre-Approval Policies and Procedures |
AUDIT AND NON-AUDIT SERVICES
PRE-APPROVAL POLICY
| I. | Statement of Principles |
Under the Sarbanes-Oxley Act of 2002 (the “Act”), the Audit Committee of the Board of Directors or Trustees (the “Committee”) of the Voya funds (each a “Fund,” collectively, the “Funds”) set out on Exhibit A to this Audit and Non-Audit Services Pre-Approval Policy (“Policy”) is responsible for the oversight of the work of the Funds’ independent auditors. As part of its responsibilities, the Committee must pre-approve the audit and non-audit services performed by the auditors in order to assure that the provision of these services does not impair the auditors’ independence from the Funds. The Committee has adopted, and the Board has ratified, this Policy, which sets out the procedures and conditions under which the services of the independent auditors may be pre-approved.
Under Securities and Exchange Commission (“SEC”) rules promulgated in accordance with the Act, the Funds may establish two different approaches to pre-approving audit and non-audit services. The Committee may approve services without consideration of specific case-by-case services (“general pre-approval”) or it may pre-approve specific services (“specific pre-approval”). The Committee believes that the combination of these approaches contemplated in this Policy results in an effective and efficient method for pre-approving audit and non-audit services to be performed by the Funds’ independent auditors. Under this Policy, services that are not of a type that may receive general pre-approval require specific pre-approval by the Committee. Any proposed services that exceed pre-approved cost levels or budgeted amounts will also require the Committee’s specific pre-approval.
For both types of approval, the Committee considers whether the subject services are consistent with the SEC’s rules on auditor independence and that such services are compatible with maintaining the auditors independence. The Committee also considers whether a particular audit firm is in the best position to provide effective and efficient services to the Funds. Reasons that the auditors are in the best position include the auditors’ familiarity with the Funds’ business, personnel, culture, accounting systems, risk profile, and other factors, and whether the services will enhance the Funds’ ability to manage and control risk or improve audit quality. Such factors will be considered as a whole, with no one factor being determinative.
The appendices attached to this Policy describe the audit, audit-related, tax-related, and other services that have the Committee’s general pre-approval. For any service that has been approved through general pre-approval, the general pre-approval will remain in place for a period 12 months from the date of pre-approval, unless the Committee determines that a different period is appropriate. The Committee will annually review and pre-approve the services that may be provided by the independent auditors without specific pre-approval. The Committee will revise the list of services subject to general pre-approval as appropriate. This Policy does not serve as a delegation to Fund management of the Committee’s duty to pre-approve services performed by the Funds’ independent auditors.
The annual audit services engagement terms and fees are subject to the Committee’s specific pre-approval. Audit services are those services that are normally provided by auditors in connection with statutory and regulatory filings or engagements or those that generally only independent auditors can reasonably provide. They include the Funds’ annual financial statement audit and procedures that the independent auditors must perform in order to form an opinion on the Funds’ financial statements (e.g., information systems and procedural reviews and testing). The Committee will monitor the audit services engagement and approve any changes in terms, conditions or fees deemed by the Committee to be necessary or appropriate.
The Committee may grant general pre-approval to other audit services, such as statutory audits and services associated with SEC registration statements, periodic reports and other documents filed with the SEC or issued in connection with securities offerings.
The Committee has pre-approved the audit services listed on Appendix A. The Committee must specifically approve all audit services not listed on Appendix A.
| III. | Audit-related Services |
Audit-related services are assurance and related services that are reasonably related to the performance of the audit or the review of the Funds’ financial statements or are traditionally performed by the independent auditors. The Committee believes that the provision of audit-related services will not impair the independent auditors’ independence, and therefore may grant pre-approval to audit-related services. Audit-related services include accounting consultations related to accounting, financial reporting or disclosure matters not classified as “audit services;” assistance with understanding and implementing new accounting and financial reporting guidance from rulemaking authorities; agreed-upon or expanded audit procedures relating to accounting and/or billing records required to respond to or comply with financial, accounting or regulatory reporting matters; and assistance with internal control reporting requirements under Form N-SAR or Form N-CSR.
The Committee has pre-approved the audit-related services listed on Appendix B. The Committee must specifically approve all audit-related services not listed on Appendix B.
The Committee believes the independent auditors can provide tax services to the Funds, including tax compliance, tax planning, and tax advice, without compromising the auditors’ independence. Therefore, the Committee may grant general pre-approval with respect to tax services historically provided by the Funds’ independent auditors that do not, in the Committee’s view, impair auditor independence and that are consistent with the SEC’s rules on auditor independence.
The Committee will not grant pre-approval if the independent auditors initially recommends a transaction the sole business purpose of which is tax avoidance and the tax treatment of which may not be supported in the Internal Revenue Code and related regulations. The Committee may consult
outside counsel to determine that tax planning and reporting positions are consistent with this Policy.
The Committee has pre-approved the tax-related services listed on Appendix C. The Committee must specifically approve all tax-related services not listed on Appendix C.
The Committee believes it may grant approval of non-audit services that are permissible services for independent auditors to a Fund. The Committee has determined to grant general pre-approval to other services that it believes are routine and recurring, do not impair auditor independence, and are consistent with SEC rules on auditor independence.
The Committee has pre-approved the non-audit services listed on Appendix D. The Committee must specifically approve all non-audit services not listed on Appendix D.
A list of the SEC’s prohibited non-audit services is attached to this Policy as Appendix E. The SEC’s rules and relevant guidance should be consulted to determine the precise definitions of these impermissible services and the applicability of exceptions to certain of the SEC’s prohibitions.
| VI. | Pre-approval of Fee levels and Budgeted Amounts |
The Committee will annually establish pre-approval fee levels or budgeted amounts for audit, audit-related, tax and non-audit services to be provided to the Funds by the independent auditors. Any proposed services exceeding these levels or amounts require the Committee’s specific pre-approval. The Committee considers fees for audit and non-audit services when deciding whether to pre-approve services. The Committee may determine, for a pre-approval period of 12 months, the appropriate ratio between the total amount of fees for the Fund’s audit, audit-related, and tax services (including fees for services provided to Fund affiliates that are subject to pre-approval), and the total amount of fees for certain permissible non-audit services for the Fund classified as other services (including any such services provided to Fund affiliates that are subject to pre-approval).
Requests or applications for services to be provided by the independent auditors will be submitted to management. If management determines that the services do not fall within those services generally pre-approved by the Committee and set out in the appendices to these procedures, management will submit the services to the Committee or its delagee. Any such submission will include a detailed description of the services to be rendered. Notwithstanding this paragraph, the Committee will, on a quarterly basis, receive from the independent auditors a list of services provided for the previous calendar quarter on a cumulative basis by the auditors during the Pre-Approval Period.
The Committee may delegate pre-approval authority to one or more of the Committee’s members. Any member or members to whom such pre-approval authority is delegated must report any pre-approval decisions, including any pre-approved services, to the Committee at its next scheduled meeting. The Committee will identify any member to whom pre-approval authority is delegated in writing. The member will retain such authority for a period of 12 months from the date of pre-approval unless the Committee determines that a different period is appropriate. The period of delegated authority may be terminated by the Committee or at the option of the member.
| IX. | Additional Requirements |
The Committee will take any measures the Committee deems necessary or appropriate to oversee the work of the independent auditors and to assure the auditors’ independence from the Funds. This may include reviewing a formal written statement from the independent auditors delineating all relationships between the auditors and the Funds, consistent with Independence Standards Board No. 1, and discussing with the auditors their methods and procedures for ensuring independence.
Part of KPMG’s performance of an audit in accordance with standards of the Public Company Accounting Oversight Board (US) includes their responsibility to maintain and monitor auditor independence with respect to the Voya funds. Using a proprietary system called Sentinel, the audit team is able to identify and manage potential conflicts of interest across the member firms of the KPMG International Network and prevent the provision of prohibited services to the Voya entities that would impair KPMG independence with the respect to the Voya funds. KPMG requests pre-approval from the Voya funds Audit Committee for services provided to the Voya funds and for services to affiliated entities that relate to the financial reporting or nature of operations of the Voya Funds. Additionally, KPMG provides an annual summary of the fees for services that have commenced for Voya funds and Affiliates.
Last Approved: November 20, 2014
Appendix A
Pre-Approved Audit Services for the Pre-Approval Period January 1, 2015 through December 31, 2015
| Service |
| | The Fund(s) | Fee Range |
| Statutory audits or financial audits (including tax services associated with audit services) | √ | As presented to Audit Committee1 |
| Services associated with SEC registration statements, periodic reports and other documents filed with the SEC or other documents issued in connection with securities offerings (e.g., consents), and assistance in responding to SEC comment letters. | √ | Not to exceed $9,750 per filing |
| Consultations by Fund management with respect to accounting or disclosure treatment of transactions or events and/or the actual or potential effect of final or proposed rules, standards or interpretations by the SEC, Financial Accounting Standards Board, or other regulatory or standard setting bodies. | √ | Not to exceed $8,000 during the Pre-Approval Period |
| Seed capital audit and related review and issuance of consent on the N-2 registration statement | √ | Not to exceed $13,750 per audit |
| Audit of summary portfolio of investments | √ | Not to exceed $525 per fund |
| 1 | For new Funds launched during the Pre-Approval Period, the fee ranges pre-approved will be the same as those for existing Funds, pro-rated in accordance with inception dates as provided in the auditors’ Proposal or any Engagement Letter covering the period at issue. Fees in the Engagement Letter will be controlling. |
Appendix B
Pre-Approved Audit-Related Services for the Pre-Approval Period January 1, 2015 through December 31, 2015
| Service |
| | The Fund(s) | Fund Affiliates | Fee Range |
| Services related to Fund mergers (Excludes tax services - See Appendix C for tax services associated with Fund mergers) | √ | √ | Not to exceed $10,000 per merger |
| Consultations by Fund management with respect to accounting or disclosure treatment of transactions or events and/or the actual or potential effect of final or proposed rules, standards or interpretations by the SEC, Financial Accounting Standards Board, or other regulatory or standard setting bodies. [Note: Under SEC rules some consultations may be “audit” services and others may be “audit-related” services.] | √ | | Not to exceed $5,000 per occurrence during the Pre-Approval Period |
| Review of the Funds’ semi-annual and quarterly financial statements | √ | | Not to exceed $2,525 per set of financial statements per fund |
| Reports to regulatory or government agencies related to the annual engagement | √ | | Up to $5,000 per occurrence during the Pre-Approval Period |
| Regulatory compliance assistance | √ | √ | Not to exceed $5,000 per quarter |
| Training courses | | √ | Not to exceed $5,000 per course |
| For Prime Rate Trust, agreed upon procedures for quarterly reports to rating agencies | √ | | Not to exceed $9,450 per quarter |
Appendix C
Pre-Approved Tax Services for the Pre-Approval Period January 1, 2015 through December 31, 2015
| Service |
| | The Fund(s) | Fund
Affiliates | Fee Range |
| Preparation of federal and state income tax returns and federal excise tax returns for the Funds including assistance and review with excise tax distributions | √ | | As presented to Audit Committee2 |
| Review of IRC Sections 851(b) and 817(h) diversification testing on a real-time basis | √ | | As presented to Audit Committee2 |
| Assistance and advice regarding year-end reporting for 1099’s, as requested | √ | | As presented to Audit Committee2 |
| Tax assistance and advice regarding statutory, regulatory or administrative developments | √ | √ | Not to exceed $5,000 for the Funds or for the Funds’ investment adviser during the Pre-Approval Period |
| 2 | For new Funds launched during the Pre-Approval Period, the fee ranges pre-approved will be the same as those for existing Funds, pro-rated in accordance with inception dates as provided in the auditors’ Proposal or any Engagement Letter covering the period at issue. Fees in the Engagement Letter will be controlling. |
Appendix C, continued
| Service |
| | The Fund(s) | Fund
Affiliates | Fee Range |
| Tax training courses | | √ | Not to exceed $5,000 per course during the Pre-Approval Period |
| Tax services associated with Fund mergers | √ | √ | Not to exceed $4,000 per fund per merger during the Pre-Approval Period |
| Other tax-related assistance and consultation, including, without limitation, assistance in evaluating derivative financial instruments and international tax issues, qualification and distribution issues, and similar routine tax consultations. | √ | | Not to exceed $120,000 during the Pre-Approval Period |
Appendix D
Pre-Approved Other Services for the Pre-Approval Period January 1, 2015 through December 31, 2015
| Service |
| | The Fund(s) | Fund Affiliates | Fee Range |
| Agreed-upon procedures for Class B share 12b-1 programs | | √ | Not to exceed $60,000 during the Pre-Approval Period |
Security counts performed pursuant to Rule 17f-2 of the 1940 Act (i.e., counts for Funds holding securities with affiliated sub-custodians) Cost to be borne 50% by the Funds and 50% by Voya Investments, LLC. | √ | √ | Not to exceed $5,300 per Fund during the Pre-Approval Period |
| Agreed upon procedures for 15 (c) FACT Books | √ | | Not to exceed $50,000 during the Pre-Approval Period |
Appendix E
Prohibited Non-Audit Services
Dated: January 1, 2015 to December 31, 2015
| · | Bookkeeping or other services related to the accounting records or financial statements of the Funds |
| · | Financial information systems design and implementation |
| · | Appraisal or valuation services, fairness opinions, or contribution-in-kind reports |
| · | Internal audit outsourcing services |
| · | Broker-dealer, investment adviser, or investment banking services |
| · | Expert services unrelated to the audit |
| · | Any other service that the Public Company Accounting Oversight Board determines, by regulation, is impermissible |
EXHIBIT A
VOYA ASIA PACIFIC HIGH DIVIDEND EQUITY INCOME FUND
VOYA BALANCED PORTFOLIO, INC.
VOYA EMERGING MARKETS HIGH DIVIDEND EQUITY FUND
VOYA EQUITY TRUST
VOYA FUNDS TRUST
VOYA GLOBAL ADVANTAGE AND PREMIUM OPPORTUNITY FUND
VOYA GLOBAL EQUITY DIVIDEND AND PREMIUM OPPORTUNITY FUND
VOYA INFRASTRUCTURE, INDUSTRIALS, AND MATERIALS FUND
VOYA INTERMEDIATE BOND PORTFOLIO
VOYA INTERNATIONAL HIGH DIVIDEND EQUITY INCOME FUND
VOYA INVESTORS TRUST
VOYA MONEY MARKET PORTFOLIO
VOYA MUTUAL FUNDS
VOYA PARTNERS, INC.
VOYA PRIME RATE TRUST
VOYA NATURAL RESOURCES EQUITY INCOME FUND
VOYA SENIOR INCOME FUND
VOYA SEPARATE PORTFOLIOS TRUST
VOYA SERIES FUND, INC.
VOYA STRATEGIC ALLOCATIONS PORTFOLIOS, INC.
VOYA VARIABLE FUNDS
VOYA VARIABLE PORTFOLIOS INC,
VOYA VARIABLE PRODUCTS TRUST
| (e)(2) | Percentage of services referred to in (4)(b)-(4)(d) that were approved by the audit committee |
100% of the services were approved by the audit committee.
| (f) | Percentage of hours expended attributable to work performed by other than full time employees of KPMG if greater than 50% |
Not applicable
| (g) | Non-Audit Fees: The following table presents (i) the aggregate non-audit fees (i.e., fees for audit-related, tax, and other services) billed to each Registrant by the independent registered public accounting firm for each Registrant's fiscal years ended March 31, 2015 and March 31, 2014; and (ii) the aggregate non-audit fees billed to the investment adviser, or any of its affiliates that provide ongoing services to the registrant, by the independent registered public accounting firm for the same time periods. |
| Registrant/Investment Adviser | | 2015 | | 2014 |
| Voya Funds Trust | | $ | 61,569 | | | $ | 66,281 | |
| Voya Investments, LLC(1) | | $ | 224,075 | | | $ | 103,625 | |
| (1) | Each Registrant's investment adviser and any of its affiliates, which are subsidiaries of Voya Financial, Inc. |
| (h) | Principal Accountants Independence: the Registrant’s Audit committee has considered whether the provision of non-audit services that were rendered to the registrant’s investment adviser and any entity controlling, controlled by, or under common control with the investment adviser that provides ongoing services to the registrant that were not pre-approved pursuant to Rule 2.01(c)(7)(ii) of Regulation S-X is compatible with maintaining KPMG’s independence. |
ITEM 5. AUDIT COMMITTEE OF LISTED REGISTRANTS.
Not applicable.
ITEM 6. SCHEDULE OF INVESTMENTS
Summary schedule or complete schedule of investments, if applicable, is included as part of the report to shareholders filed under Item 1 of this Form.
Report of Independent Registered Public Accounting Firm
The Shareholders and Board of Trustees
Voya Funds Trust
We have audited the accompanying statements of assets and liabilities, including the summary portfolios of investments, of Voya GNMA Income Fund, Voya High Yield Bond Fund, Voya Intermediate Bond Fund, and Voya Short Term Bond Fund, each a series of Voya Funds Trust, as of March 31, 2015, and the related statements of operations for the year then ended, the statements of changes in net assets for each of the years in the two-year period then ended (collectively, the "financial statements"), and the financial highlights for each of the years in the five-year period then ended (the financial statements and financial highlights are included in Item 1 of this Form N-CSR), and the portfolios of investments as of March 31, 2015 (included in Item 6 of this Form N-CSR). These financial statements, financial highlights, and portfolios of investments are the responsibility of management. Our responsibility is to express an opinion on these financial statements, financial highlights, and portfolios of investments based on our audits.
We conducted our audits in accordance with the standards of the Public Company Accounting Oversight Board (United States). Those standards require that we plan and perform the audit to obtain reasonable assurance about whether the financial statements, financial highlights, and portfolios of investments are free of material misstatement. An audit includes examining, on a test basis, evidence supporting the amounts and disclosures in the financial statements and portfolios of investments. Our procedures included confirmation of securities owned as of March 31, 2015, by correspondence with the custodian, transfer agent, and brokers, or by other appropriate auditing procedures when replies from brokers were not received. An audit also includes assessing the accounting principles used and significant estimates made by management, as well as evaluating the overall financial statement presentation. We believe that our audits provide a reasonable basis for our opinion.
In our opinion, the financial statements, financial highlights, and portfolios of investments referred to above present fairly, in all material respects, the financial position of the aforementioned funds of Voya Funds Trust as of March 31, 2015, and the results of their operations for the year then ended, the changes in their net assets for each of the years in the two-year period then ended, and the financial highlights for each of the years in the five-year period then ended, in conformity with U.S. generally accepted accounting principles.

Boston, Massachusetts
May 22, 2015
| Voya GNMA Income Fund | PORTFOLIO OF INVESTMENTS
as of March 31, 2015 |
Principal
Amount† | | | | | | | Value | | | Percentage
of Net
Assets | |
| COLLATERALIZED MORTGAGE OBLIGATIONS: 0.2% |
| | 20,732,538 | | | ^ | | Ginnie Mae, 0.493%, 02/16/44 | | $ | 678,078 | | | | 0.1 | |
| | 1,045,550 | | | | | Vendee Mortgage Trust, 3.750%, 10/15/41 | | | 1,110,229 | | | | 0.1 | |
| | | | | | | | | | | | | | | |
| | | | | Total Collateralized Mortgage Obligations | | | | | | | | |
| | | | | (Cost $1,815,119) | | | 1,788,307 | | | | 0.2 | |
| | | | | | | | | | | | | |
| U.S. GOVERNMENT AGENCY OBLIGATIONS: 112.0% |
| | | | | | | Federal Home Loan Mortgage Corporation: 10.6%## |
| | 11,683,529 | | | ^ | | 0.500%, due 07/15/36 | | | 201,439 | | | | 0.0 | |
| | 80,376,000 | | | W | | 3.000%, due 05/01/43 | | | 81,812,404 | | | | 9.3 | |
| | 4,162,168 | | | ^ | | 4.500%, due 12/15/40 | | | 680,900 | | | | 0.1 | |
| | 121,978 | | | | | 5.450%, due 12/01/37 | | | 135,814 | | | | 0.0 | |
| | 158,577 | | | | | 5.450%, due 12/01/37 | | | 176,392 | | | | 0.0 | |
| | 141,711 | | | | | 5.450%, due 05/01/38 | | | 157,529 | | | | 0.0 | |
| | 1,253,982 | | | ^ | | 5.500%, due 09/15/35 | | | 249,978 | | | | 0.0 | |
| | 490,528 | | | | | 5.625%, due 12/01/36 | | | 556,084 | | | | 0.1 | |
| | 43,954 | | | | | 5.625%, due 01/01/37 | | | 49,389 | | | | 0.0 | |
| | 487,046 | | | | | 5.625%, due 01/01/37 | | | 549,672 | | | | 0.1 | |
| | 37,475 | | | | | 5.625%, due 02/01/37 | | | 42,122 | | | | 0.0 | |
| | 297,783 | | | | | 5.625%, due 03/01/37 | | | 334,729 | | | | 0.1 | |
| | 78,432 | | | | | 5.625%, due 03/01/37 | | | 88,151 | | | | 0.0 | |
| | 182,143 | | | | | 5.625%, due 03/01/37 | | | 204,684 | | | | 0.0 | |
| | 108,567 | | | | | 5.625%, due 06/01/37 | | | 121,992 | | | | 0.0 | |
| | 98,665 | | | | | 5.625%, due 07/01/37 | | | 110,878 | | | | 0.0 | |
| | 138,304 | | | | | 5.625%, due 07/01/37 | | | 155,468 | | | | 0.0 | |
| | 14,100 | | | | | 5.625%, due 12/01/37 | | | 15,839 | | | | 0.0 | |
| | 129,380 | | | | | 5.625%, due 02/01/38 | | | 145,359 | | | | 0.0 | |
| | 212,323 | | | | | 5.700%, due 06/01/37 | | | 239,142 | | | | 0.0 | |
| | 153,969 | | | | | 5.700%, due 09/01/37 | | | 173,464 | | | | 0.0 | |
| | 157,366 | | | | | 5.700%, due 12/01/37 | | | 176,264 | | | | 0.0 | |
| | 1,840,926 | | | ^ | | 5.926%, due 06/15/40 | | | 138,168 | | | | 0.0 | |
| | 965,556 | | | | | 6.000%, due 03/15/34 | | | 1,054,739 | | | | 0.1 | |
| | 112,277 | | | | | 6.090%, due 12/01/37 | | | 127,779 | | | | 0.0 | |
| | 1,043,287 | | | | | 6.710%, due 07/15/33 | | | 1,231,301 | | | | 0.2 | |
| | 20,269 | | | | | 7.500%, due 01/01/30 | | | 25,247 | | | | 0.0 | |
| | 591,829 | | | ^ | | 7.826%, due 10/25/23 | | | 121,890 | | | | 0.0 | |
| | 10,944 | | | | | 8.000%, due 01/01/30 | | | 10,989 | | | | 0.0 | |
| | 17,363 | | | | | 9.500%, due 07/01/20 | | | 18,019 | | | | 0.0 | |
| | 777,570 | | | | | 19.337%, due 03/15/35 | | | 1,136,543 | | | | 0.2 | |
| | 509,229 | | | | | 21.332%, due 04/15/35 | | | 762,975 | | | | 0.1 | |
| | 1,894,798 | | | | | 27.902%, due 04/15/32 | | | 2,319,943 | | | | 0.3 | |
| | | | | | | | | | 93,325,286 | | | | 10.6 | |
| | | | | | | | | | | | | | | |
| | | | | | | Federal National Mortgage Association: 12.7%## |
| | 31,421,965 | | | | | 0.374%, due 10/27/37 | | | 31,027,478 | | | | 3.5 | |
| | 7,199,689 | | | ^ | | 3.000%, due 01/25/33 | | | 1,058,204 | | | | 0.1 | |
| | 22,000,000 | | | W | | 3.000%, due 05/01/43 | | | 22,439,570 | | | | 2.6 | |
| | 3,457,000 | | | | | 3.500%, due 09/25/42 | | | 3,683,209 | | | | 0.4 | |
| | 7,513,217 | | | ^ | | 4.000%, due 05/25/42 | | | 1,324,598 | | | | 0.1 | |
| | 1,412,202 | | | | | 4.250%, due 08/01/35 | | | 1,524,962 | | | | 0.2 | |
| | 4,630,250 | | | | | 4.500%, due 09/01/41 | | | 5,071,883 | | | | 0.6 | |
| | 8,803,625 | | | | | 4.500%, due 09/01/41 | | | 9,651,563 | | | | 1.1 | |
| | 11,048,862 | | | W | | 4.592%, due 11/25/33 | | | 11,449,383 | | | | 1.3 | |
| | 563,385 | | | | | 4.750%, due 11/01/34 | | | 625,391 | | | | 0.1 | |
| | 1,283,516 | | | | | 4.750%, due 11/01/34 | | | 1,431,122 | | | | 0.2 | |
| | 1,278,944 | | | | | 4.750%, due 02/01/35 | | | 1,425,936 | | | | 0.2 | |
| | 1,556,991 | | | | | 4.750%, due 04/01/35 | | | 1,741,709 | | | | 0.2 | |
| | 1,250,671 | | | | | 4.750%, due 05/01/35 | | | 1,393,790 | | | | 0.2 | |
| | 1,412,592 | | | | | 4.750%, due 07/01/35 | | | 1,574,197 | | | | 0.2 | |
| | 198,081 | | | | | 4.750%, due 07/01/35 | | | 217,865 | | | | 0.0 | |
| | 1,879,376 | | | | | 5.000%, due 10/25/35 | | | 2,099,154 | | | | 0.2 | |
| | 118,956 | | | | | 5.300%, due 09/01/36 | | | 133,065 | | | | 0.0 | |
| | 81,863 | | | | | 5.300%, due 10/01/36 | | | 91,551 | | | | 0.0 | |
| | 125,835 | | | | | 5.300%, due 10/01/36 | | | 140,850 | | | | 0.0 | |
| | 293,342 | | | | | 5.300%, due 12/01/36 | | | 328,410 | | | | 0.0 | |
| | 191,896 | | | | | 5.300%, due 12/01/36 | | | 214,422 | | | | 0.0 | |
| | 227,337 | | | | | 5.300%, due 02/01/37 | | | 254,171 | | | | 0.0 | |
| | 151,368 | | | | | 5.300%, due 04/01/37 | | | 169,221 | | | | 0.0 | |
| | 168,650 | | | | | 5.300%, due 05/01/37 | | | 188,705 | | | | 0.0 | |
| | 562,768 | | | | | 5.300%, due 08/01/37 | | | 629,689 | | | | 0.1 | |
| | 70,054 | | | | | 5.300%, due 10/01/37 | | | 78,969 | | | | 0.0 | |
| | 548,869 | | | | | 5.500%, due 05/25/34 | | | 617,193 | | | | 0.1 | |
| | 92,407 | | | | | 5.875%, due 06/01/35 | | | 105,078 | | | | 0.0 | |
| | 3,023,450 | | | | | 6.000%, due 10/25/37 | | | 3,521,005 | | | | 0.4 | |
| | 473,306 | | | | | 6.000%, due 01/25/44 | | | 544,047 | | | | 0.1 | |
| | 7,083,051 | | | ^ | | 6.076%, due 06/25/42 | | | 1,356,667 | | | | 0.2 | |
| | 175,211 | | | | | 6.600%, due 07/01/27 | | | 193,267 | | | | 0.0 | |
| | 100,939 | | | | | 6.600%, due 09/01/27 | | | 111,410 | | | | 0.0 | |
| | 45,491 | | | | | 6.600%, due 11/01/27 | | | 47,031 | | | | 0.0 | |
| | 37,071 | | | | | 6.600%, due 03/01/28 | | | 38,041 | | | | 0.0 | |
| | 91,627 | | | | | 6.600%, due 06/01/28 | | | 98,123 | | | | 0.0 | |
| | 50,320 | | | | | 7.500%, due 05/01/28 | | | 53,184 | | | | 0.0 | |
| | 1,416,814 | | | | | 8.106%, due 03/25/39 | | | 1,582,069 | | | | 0.2 | |
| | 871 | | | | | 8.500%, due 09/01/15 | | | 875 | | | | 0.0 | |
| | 2,631,282 | | | | | 16.441%, due 05/25/35 | | | 3,415,159 | | | | 0.4 | |
| | | | | | | | | | 111,652,216 | | | | 12.7 | |
| | | | | | | | | | | | | | | |
| | | | | | | Government National Mortgage Association: 88.7% |
| | 24,443,587 | | | ^ | | 0.120%, due 01/16/50 | | | 453,209 | | | | 0.1 | |
| | 54,125,705 | | | ^ | | 0.233%, due 01/16/51 | | | 1,054,082 | | | | 0.1 | |
| | 26,570,366 | | | ^ | | 0.250%, due 06/20/36 | | | 250,295 | | | | 0.0 | |
| | 22,527,621 | | | ^ | | 0.386%, due 11/16/46 | | | 314,934 | | | | 0.0 | |
| | 619,364 | | | | | 0.396%, due 02/20/34 | | | 619,554 | | | | 0.1 | |
| | 5,300,000 | | | | | 0.450%, due 04/01/44 | | | 5,759,609 | | | | 0.7 | |
| | 2,233,287 | | | | | 0.501%, due 10/20/60 | | | 2,223,374 | | | | 0.3 | |
| | 9,258,481 | | | | | 0.571%, due 02/20/62 | | | 9,282,021 | | | | 1.1 | |
| | 1,600,754 | | | | | 0.571%, due 03/20/63 | | | 1,593,952 | | | | 0.2 | |
| | 959,000 | | | ^ | | 0.599%, due 02/16/48 | | | 10,085 | | | | 0.0 | |
| | 8,408,979 | | | | | 0.620%, due 04/20/63 | | | 8,419,746 | | | | 1.0 | |
| | 4,053,098 | | | | | 0.641%, due 06/20/63 | | | 4,049,967 | | | | 0.5 | |
| | 5,916,098 | | | | | 0.686%, due 10/20/62 | | | 5,925,126 | | | | 0.7 | |
| | 2,129,149 | | | | | 0.771%, due 07/20/63 | | | 2,142,160 | | | | 0.2 | |
| | 14,693,132 | | | | | 0.771%, due 12/20/63 | | | 14,770,146 | | | | 1.7 | |
| | 3,474,021 | | | | | 0.821%, due 05/20/62 | | | 3,502,618 | | | | 0.4 | |
| | 5,607,388 | | | | | 0.821%, due 05/20/63 | | | 5,645,238 | | | | 0.6 | |
| | 4,384,631 | | | | | 0.891%, due 09/20/63 | | | 4,430,998 | | | | 0.5 | |
| | 4,082,360 | | | | | 0.992%, due 01/20/60 | | | 4,118,635 | | | | 0.5 | |
| | 877,428 | | | ^ | | 1.000%, due 06/16/37 | | | 30,872 | | | | 0.0 | |
| | 1,853,946 | | | | | 1.172%, due 05/20/60 | | | 1,889,765 | | | | 0.2 | |
| | 6,343,142 | | | | | 1.172%, due 05/20/60 | | | 6,480,024 | | | | 0.7 | |
| | 11,583,882 | | | | | 1.221%, due 02/20/62 | | | 11,862,740 | | | | 1.4 | |
| | 1,326,135 | | | ^ | | 1.817%, due 10/16/52 | | | 101,013 | | | | 0.0 | |
| | 6,003,349 | | | | | 2.312%, due 10/20/63 | | | 6,627,109 | | | | 0.8 | |
| | 1,900,000 | | | ^ | | 2.500%, due 11/20/43 | | | 705,672 | | | | 0.1 | |
| | 6,259,160 | | | ^ | | 3.500%, due 08/16/40 | | | 781,583 | | | | 0.1 | |
| | 203,300,000 | | | | | 3.500%, due 12/20/41 | | | 213,425,300 | | | | 24.3 | |
| | 11,827,755 | | | | | 3.500%, due 12/20/44 | | | 12,471,005 | | | | 1.4 | |
| | 4,000,000 | | | | | 3.526%, due 01/16/40 | | | 4,188,200 | | | | 0.5 | |
| | 13,115,291 | | | | | 3.750%, due 05/20/42 | | | 13,918,446 | | | | 1.6 | |
| | 13,648,652 | | | | | 3.750%, due 05/20/42 | | | 14,485,052 | | | | 1.7 | |
| | 3,622,155 | | | | | 3.894%, due 05/20/41 | | | 3,882,840 | | | | 0.4 | |
| | 225,934 | | | | | 4.000%, due 05/20/33 | | | 242,952 | | | | 0.0 | |
| | 247,237 | | | | | 4.000%, due 08/15/33 | | | 265,693 | | | | 0.0 | |
See Accompanying Notes to Financial Statements
| Voya GNMA Income Fund | PORTFOLIO OF INVESTMENTS
as of March 31, 2015 (CONTINUED) |
| | 469,014 | | | | | 4.000%, due 01/15/34 | | | 505,466 | | | | 0.1 | |
| | 199,613 | | | | | 4.000%, due 03/15/34 | | | 214,397 | | | | 0.0 | |
| | 187,345 | | | | | 4.000%, due 08/20/35 | | | 199,778 | | | | 0.0 | |
| | 4,163,131 | | | ^ | | 4.000%, due 04/20/38 | | | 352,263 | | | | 0.0 | |
| | 3,038,615 | | | ^ | | 4.000%, due 08/20/39 | | | 825,604 | | | | 0.1 | |
| | 587,479 | | | | | 4.000%, due 05/15/40 | | | 632,508 | | | | 0.1 | |
| | 7,156,471 | | | | | 4.000%, due 09/20/40 | | | 7,496,267 | | | | 0.9 | |
| | 1,777,455 | | | | | 4.000%, due 12/20/40 | | | 1,885,346 | | | | 0.2 | |
| | 4,015,847 | | | ^ | | 4.000%, due 04/20/41 | | | 711,021 | | | | 0.1 | |
| | 10,065,324 | | | | | 4.000%, due 07/20/41 | | | 10,736,337 | | | | 1.2 | |
| | 1,298,087 | | | | | 4.000%, due 10/20/41 | | | 1,369,328 | | | | 0.2 | |
| | 1,989,720 | | | ^ | | 4.000%, due 03/20/42 | | | 280,753 | | | | 0.0 | |
| | 4,103,237 | | | | | 4.000%, due 04/20/42 | | | 4,637,854 | | | | 0.5 | |
| | 1,455,321 | | | | | 4.000%, due 09/15/42 | | | 1,577,734 | | | | 0.2 | |
| | 3,231,625 | | | | | 4.000%, due 10/20/42 | | | 3,465,369 | | | | 0.4 | |
| | 3,120,257 | | | ^ | | 4.000%, due 12/20/42 | | | 479,329 | | | | 0.1 | |
| | 16,600,000 | | | | | 4.000%, due 04/01/44 | | | 17,687,430 | | | | 2.0 | |
| | 9,354,967 | | | | | 4.000%, due 10/20/44 | | | 10,030,022 | | | | 1.1 | |
| | 7,884,362 | | | | | 4.000%, due 12/20/44 | | | 8,457,987 | | | | 1.0 | |
| | 40,445,001 | | | | | 4.000%, due 03/20/45 | | | 43,396,469 | | | | 4.9 | |
| | 1,911,202 | | | | | 4.350%, due 01/16/48 | | | 2,139,416 | | | | 0.2 | |
| | 2,872,877 | | | | | 4.397%, due 05/16/51 | | | 3,130,914 | | | | 0.4 | |
| | 1,915,251 | | | | | 4.397%, due 05/16/51 | | | 2,071,632 | | | | 0.2 | |
| | 525,004 | | | | | 4.500%, due 10/20/33 | | | 579,295 | | | | 0.1 | |
| | 165,336 | | | | | 4.500%, due 01/20/34 | | | 179,883 | | | | 0.0 | |
| | 305,367 | | | | | 4.500%, due 01/20/34 | | | 332,225 | | | | 0.0 | |
| | 187,636 | | | | | 4.500%, due 03/20/34 | | | 204,146 | | | | 0.0 | |
| | 155,035 | | | | | 4.500%, due 05/20/34 | | | 168,599 | | | | 0.0 | |
| | 192,652 | | | | | 4.500%, due 06/20/34 | | | 208,330 | | | | 0.0 | |
| | 500,515 | | | ^ | | 4.500%, due 02/20/35 | | | 9,384 | | | | 0.0 | |
| | 616,971 | | | | | 4.500%, due 10/20/35 | | | 670,986 | | | | 0.1 | |
| | 647,369 | | | ^ | | 4.500%, due 02/20/36 | | | 21,037 | | | | 0.0 | |
| | 34,560 | | | | | 4.500%, due 07/20/36 | | | 37,726 | | | | 0.0 | |
| | 94,176 | | | | | 4.500%, due 08/20/36 | | | 103,111 | | | | 0.0 | |
| | 354,499 | | | ^ | | 4.500%, due 12/20/37 | | | 27,517 | | | | 0.0 | |
| | 130,047 | | | ^ | | 4.500%, due 02/20/38 | | | 11,204 | | | | 0.0 | |
| | 818,857 | | | | | 4.500%, due 07/20/38 | | | 890,255 | | | | 0.1 | |
| | 139,332 | | | | | 4.500%, due 07/20/38 | | | 145,423 | | | | 0.0 | |
| | 5,807,393 | | | ^ | | 4.500%, due 04/20/39 | | | 890,732 | | | | 0.1 | |
| | 9,038,331 | | | | | 4.500%, due 05/16/39 | | | 9,994,681 | | | | 1.1 | |
| | 4,761,000 | | | | | 4.500%, due 05/20/39 | | | 5,158,370 | | | | 0.6 | |
| | 9,356,676 | | | | | 4.500%, due 05/20/39 | | | 10,241,209 | | | | 1.2 | |
| | 197,530 | | | | | 4.500%, due 06/20/39 | | | 210,112 | | | | 0.0 | |
| | 2,246,913 | | | | | 4.500%, due 10/15/39 | | | 2,516,369 | | | | 0.3 | |
| | 1,946,268 | | | | | 4.500%, due 11/15/39 | | | 2,180,774 | | | | 0.3 | |
| | 2,113,120 | | | | | 4.500%, due 11/15/39 | | | 2,365,898 | | | | 0.3 | |
| | 553,962 | | | | | 4.500%, due 12/15/39 | | | 620,784 | | | | 0.1 | |
| | 1,720,469 | | | | | 4.500%, due 01/15/40 | | | 1,906,189 | | | | 0.2 | |
| | 256,983 | | | | | 4.500%, due 01/20/40 | | | 268,989 | | | | 0.0 | |
| | 6,044,841 | | | | | 4.500%, due 02/15/40 | | | 6,696,178 | | | | 0.8 | |
| | 638,032 | | | | | 4.500%, due 06/15/40 | | | 705,628 | | | | 0.1 | |
| | 437,652 | | | | | 4.500%, due 07/20/40 | | | 458,009 | | | | 0.1 | |
| | 1,901,953 | | | | | 4.500%, due 08/20/40 | | | 1,990,265 | | | | 0.2 | |
| | 3,047,033 | | | | | 4.500%, due 09/20/40 | | | 3,305,341 | | | | 0.4 | |
| | 320,656 | | | | | 4.500%, due 07/20/41 | | | 335,546 | | | | 0.0 | |
| | 4,023,865 | | | | | 4.500%, due 09/20/41 | | | 4,386,977 | | | | 0.5 | |
| | 16,338,774 | | | ^ | | 4.500%, due 12/16/42 | | | 3,066,546 | | | | 0.4 | |
| | 1,804,101 | | | | | 4.500%, due 02/16/48 | | | 2,058,950 | | | | 0.2 | |
| | 1,913,802 | | | | | 4.546%, due 07/20/62 | | | 2,120,751 | | | | 0.2 | |
| | 1,977,681 | | | | | 4.625%, due 10/20/35 | | | 2,188,475 | | | | 0.3 | |
| | 1,201,965 | | | | | 4.639%, due 08/20/42 | | | 1,334,170 | | | | 0.2 | |
| | 10,313,519 | | | | | 4.660%, due 09/20/61 | | | 11,659,795 | | | | 1.3 | |
| | 1,000,000 | | | | | 4.673%, due 01/16/50 | | | 1,103,344 | | | | 0.1 | |
| | 1,888,218 | | | | | 4.750%, due 08/20/35 | | | 2,094,034 | | | | 0.2 | |
| | 2,847,758 | | | | | 4.750%, due 11/20/35 | | | 3,164,807 | | | | 0.4 | |
| | 1,440,825 | | | | | 4.850%, due 05/20/40 | | | 1,561,247 | | | | 0.2 | |
| | 4,481,482 | | | | | 4.861%, due 06/20/61 | | | 4,829,704 | | | | 0.6 | |
| | 1,387,805 | | | | | 4.865%, due 04/16/48 | | | 1,460,079 | | | | 0.2 | |
| | 88,148 | | | | | 5.000%, due 05/15/18 | | | 93,396 | | | | 0.0 | |
| | 116,727 | | | | | 5.000%, due 03/20/24 | | | 124,215 | | | | 0.0 | |
| | 358,326 | | | | | 5.000%, due 04/15/29 | | | 400,930 | | | | 0.1 | |
| | 342,742 | | | | | 5.000%, due 04/15/30 | | | 383,663 | | | | 0.0 | |
| | 2,924,240 | | | | | 5.000%, due 04/20/30 | | | 3,159,241 | | | | 0.4 | |
| | 366,583 | | | | | 5.000%, due 10/15/30 | | | 408,898 | | | | 0.1 | |
| | 409,951 | | | | | 5.000%, due 07/15/33 | | | 460,897 | | | | 0.1 | |
| | 296,088 | | | | | 5.000%, due 10/20/33 | | | 324,340 | | | | 0.0 | |
| | 167,084 | | | | | 5.000%, due 12/20/33 | | | 183,027 | | | | 0.0 | |
| | 136,203 | | | | | 5.000%, due 02/20/34 | | | 149,166 | | | | 0.0 | |
| | 155,044 | | | | | 5.000%, due 03/15/34 | | | 172,940 | | | | 0.0 | |
| | 343,217 | | | | | 5.000%, due 04/15/34 | | | 382,835 | | | | 0.0 | |
| | 221,364 | | | | | 5.000%, due 04/15/34 | | | 247,016 | | | | 0.0 | |
| | 203,753 | | | | | 5.000%, due 07/20/34 | | | 223,146 | | | | 0.0 | |
| | 5,549,310 | | | | | 5.000%, due 10/20/34 | | | 6,380,394 | | | | 0.7 | |
| | 410,923 | | | | | 5.000%, due 12/20/34 | | | 451,550 | | | | 0.1 | |
| | 84,681 | | | | | 5.000%, due 01/15/35 | | | 94,489 | | | | 0.0 | |
| | 79,375 | | | | | 5.000%, due 03/15/35 | | | 88,717 | | | | 0.0 | |
| | 624,631 | | | | | 5.000%, due 03/15/35 | | | 704,689 | | | | 0.1 | |
| | 3,032,511 | | | | | 5.000%, due 03/20/35 | | | 3,388,753 | | | | 0.4 | |
| | 168,851 | | | | | 5.000%, due 04/15/35 | | | 188,435 | | | | 0.0 | |
| | 180,235 | | | | | 5.000%, due 04/15/35 | | | 201,111 | | | | 0.0 | |
| | 779,617 | | | | | 5.000%, due 04/15/35 | | | 880,955 | | | | 0.1 | |
| | 160,092 | | | | | 5.000%, due 04/15/35 | | | 179,605 | | | | 0.0 | |
| | 61,745 | | | | | 5.000%, due 05/15/35 | | | 70,173 | | | | 0.0 | |
| | 241,497 | | | | | 5.000%, due 05/20/35 | | | 271,020 | | | | 0.0 | |
| | 92,438 | | | | | 5.000%, due 06/15/35 | | | 103,123 | | | | 0.0 | |
| | 668,320 | | | | | 5.000%, due 07/20/35 | | | 743,037 | | | | 0.1 | |
| | 110,099 | | | | | 5.000%, due 09/15/35 | | | 122,808 | | | | 0.0 | |
| | 299,495 | | | ^ | | 5.000%, due 09/16/35 | | | 9,757 | | | | 0.0 | |
| | 1,439,786 | | | | | 5.000%, due 10/20/35 | | | 1,631,445 | | | | 0.2 | |
| | 1,222,359 | | | | | 5.000%, due 11/20/35 | | | 1,371,390 | | | | 0.2 | |
| | 105,744 | | | | | 5.000%, due 12/15/35 | | | 118,042 | | | | 0.0 | |
| | 669,250 | | | | | 5.000%, due 04/20/36 | | | 750,669 | | | | 0.1 | |
| | 69,767 | | | | | 5.000%, due 05/20/37 | | | 76,371 | | | | 0.0 | |
| | 119,521 | | | | | 5.000%, due 09/20/37 | | | 123,422 | | | | 0.0 | |
| | 71,705 | | | | | 5.000%, due 12/20/37 | | | 78,882 | | | | 0.0 | |
| | 114,197 | | | | | 5.000%, due 12/20/37 | | | 125,007 | | | | 0.0 | |
| | 3,929,835 | | | ^ | | 5.000%, due 01/20/38 | | | 443,135 | | | | 0.1 | |
| | 333,798 | | | | | 5.000%, due 01/20/38 | | | 367,208 | | | | 0.0 | |
| | 168,349 | | | | | 5.000%, due 02/15/38 | | | 187,891 | | | | 0.0 | |
| | 180,069 | | | | | 5.000%, due 06/20/38 | | | 192,035 | | | | 0.0 | |
| | 349,922 | | | | | 5.000%, due 06/20/38 | | | 372,856 | | | | 0.0 | |
| | 58,342 | | | | | 5.000%, due 08/20/38 | | | 62,219 | | | | 0.0 | |
| | 318,581 | | | | | 5.000%, due 10/20/38 | | | 339,722 | | | | 0.0 | |
| | 339,339 | | | | | 5.000%, due 11/20/38 | | | 361,875 | | | | 0.0 | |
| | 988,731 | | | | | 5.000%, due 01/20/39 | | | 1,054,214 | | | | 0.1 | |
| | 369,516 | | | | | 5.000%, due 02/15/39 | | | 413,782 | | | | 0.1 | |
| | 636,564 | | | | | 5.000%, due 03/15/39 | | | 721,678 | | | | 0.1 | |
| | 1,029,000 | | | | | 5.000%, due 05/20/39 | | | 1,180,380 | | | | 0.1 | |
| | 1,967,172 | | | ^ | | 5.000%, due 07/16/39 | | | 330,111 | | | | 0.0 | |
| | 438,998 | | | | | 5.000%, due 10/20/39 | | | 480,620 | | | | 0.1 | |
| | 465,256 | | | | | 5.000%, due 11/15/39 | | | 518,960 | | | | 0.1 | |
| | 2,812,095 | | | | | 5.000%, due 11/15/39 | | | 3,193,680 | | | | 0.4 | |
| | 1,760,030 | | | | | 5.000%, due 11/15/39 | | | 1,999,569 | | | | 0.2 | |
| | 2,712,260 | | | | | 5.000%, due 12/20/39 | | | 3,027,442 | | | | 0.3 | |
| | 1,378,919 | | | | | 5.000%, due 12/20/39 | | | 1,526,784 | | | | 0.2 | |
| | 7,765,345 | | | ^ | | 5.000%, due 03/20/40 | | | 1,322,364 | | | | 0.2 | |
| | 763,512 | | | | | 5.000%, due 04/15/40 | | | 863,201 | | | | 0.1 | |
| | 1,819,553 | | | | | 5.000%, due 05/15/40 | | | 2,068,706 | | | | 0.2 | |
| | 41,123,195 | | | | | 5.000%, due 05/20/40 | | | 47,314,827 | | | | 5.4 | |
| | 941,260 | | | | | 5.000%, due 09/15/40 | | | 1,049,909 | | | | 0.1 | |
| | 1,632,900 | | | | | 5.000%, due 09/15/40 | | | 1,821,384 | | | | 0.2 | |
| | 1,154,594 | | | ^ | | 5.000%, due 05/20/41 | | | 243,329 | | | | 0.0 | |
| | 2,809,272 | | | | | 5.000%, due 07/20/41 | | | 3,151,722 | | | | 0.4 | |
| | 2,926,232 | | | | | 5.250%, due 01/20/36 | | | 3,352,361 | | | | 0.4 | |
| | 997,281 | | | | | 5.423%, due 04/16/39 | | | 1,093,922 | | | | 0.1 | |
| | 913,314 | | | | | 5.456%, due 03/16/44 | | | 1,013,870 | | | | 0.1 | |
| | 168,904 | | | | | 5.500%, due 08/20/24 | | | 187,198 | | | | 0.0 | |
| | 3,543 | | | | | 5.500%, due 04/20/29 | | | 3,933 | | | | 0.0 | |
| | 105,712 | | | | | 5.500%, due 12/20/32 | | | 119,813 | | | | 0.0 | |
| | 2,401,790 | | | | | 5.500%, due 01/17/33 | | | 2,751,524 | | | | 0.3 | |
See Accompanying Notes to Financial Statements
| Voya GNMA Income Fund | PORTFOLIO OF INVESTMENTS
as of March 31, 2015 (CONTINUED) |
| | 366,870 | | | | | 5.500%, due 08/20/33 | | | 416,008 | | | | 0.1 | |
| | 1,871,017 | | | | | 5.500%, due 10/20/33 | | | 2,151,430 | | | | 0.3 | |
| | 85,157 | | | | | 5.500%, due 11/20/33 | | | 94,724 | | | | 0.0 | |
| | 108,632 | | | | | 5.500%, due 12/20/33 | | | 123,153 | | | | 0.0 | |
| | 225,000 | | | | | 5.500%, due 02/20/34 | | | 255,841 | | | | 0.0 | |
| | 82,152 | | | | | 5.500%, due 03/20/34 | | | 91,370 | | | | 0.0 | |
| | 10,292 | | | | | 5.500%, due 04/20/34 | | | 11,404 | | | | 0.0 | |
| | 501,763 | | | | | 5.500%, due 04/20/34 | | | 537,136 | | | | 0.1 | |
| | 1,105,826 | | | | | 5.500%, due 04/20/34 | | | 1,312,932 | | | | 0.2 | |
| | 648,128 | | | | | 5.500%, due 04/20/34 | | | 734,854 | | | | 0.1 | |
| | 407,126 | | | | | 5.500%, due 06/20/34 | | | 453,188 | | | | 0.1 | |
| | 106,109 | | | | | 5.500%, due 06/20/34 | | | 118,012 | | | | 0.0 | |
| | 281,505 | | | | | 5.500%, due 07/20/34 | | | 312,062 | | | | 0.0 | |
| | 135,124 | | | | | 5.500%, due 07/20/34 | | | 149,802 | | | | 0.0 | |
| | 131,363 | | | | | 5.500%, due 01/20/35 | | | 146,090 | | | | 0.0 | |
| | 695,031 | | | | | 5.500%, due 05/15/35 | | | 786,245 | | | | 0.1 | |
| | 465,404 | | | | | 5.500%, due 05/20/35 | | | 518,439 | | | | 0.1 | |
| | 161,292 | | | | | 5.500%, due 06/20/35 | | | 178,813 | | | | 0.0 | |
| | 1,261,316 | | | | | 5.500%, due 07/15/35 | | | 1,423,903 | | | | 0.2 | |
| | 778,432 | | | | | 5.500%, due 08/15/35 | | | 884,674 | | | | 0.1 | |
| | 32,192 | | | | | 5.500%, due 08/20/35 | | | 35,698 | | | | 0.0 | |
| | 558,659 | | | | | 5.500%, due 09/20/35 | | | 623,061 | | | | 0.1 | |
| | 10,837,932 | | | | | 5.500%, due 12/16/35 | | | 12,539,135 | | | | 1.4 | |
| | 2,798,463 | | | | | 5.500%, due 02/20/36 | | | 3,403,591 | | | | 0.4 | |
| | 184,696 | | | | | 5.500%, due 04/15/36 | | | 208,579 | | | | 0.0 | |
| | 179,717 | | | | | 5.500%, due 06/20/36 | | | 203,687 | | | | 0.0 | |
| | 200,000 | | | | | 5.500%, due 07/16/37 | | | 223,953 | | | | 0.0 | |
| | 3,329,979 | | | | | 5.500%, due 10/20/37 | | | 3,751,430 | | | | 0.4 | |
| | 61,749 | | | | | 5.500%, due 06/20/38 | | | 65,975 | | | | 0.0 | |
| | 76,329 | | | | | 5.500%, due 08/20/38 | | | 81,552 | | | | 0.0 | |
| | 116,877 | | | | | 5.500%, due 09/20/38 | | | 125,009 | | | | 0.0 | |
| | 18,950 | | | | | 5.500%, due 10/20/38 | | | 20,247 | | | | 0.0 | |
| | 207,154 | | | | | 5.500%, due 11/20/38 | | | 221,394 | | | | 0.0 | |
| | 20,076 | | | | | 5.500%, due 12/20/38 | | | 21,470 | | | | 0.0 | |
| | 102,577 | | | | | 5.500%, due 01/15/39 | | | 115,922 | | | | 0.0 | |
| | 78,184 | | | | | 5.500%, due 01/20/39 | | | 83,559 | | | | 0.0 | |
| | 626,529 | | | | | 5.500%, due 03/20/39 | | | 670,062 | | | | 0.1 | |
| | 150,773 | | | | | 5.500%, due 06/15/39 | | | 170,208 | | | | 0.0 | |
| | 48,664 | | | | | 5.500%, due 06/20/39 | | | 51,994 | | | | 0.0 | |
| | 2,704,605 | | | | | 5.500%, due 09/16/39 | | | 3,463,397 | | | | 0.4 | |
| | 127,032 | | | | | 5.500%, due 10/20/39 | | | 144,022 | | | | 0.0 | |
| | 343,230 | | | | | 5.500%, due 09/15/40 | | | 388,143 | | | | 0.0 | |
| | 710,937 | | | ^ | | 5.500%, due 09/16/40 | | | 103,937 | | | | 0.0 | |
| | 7,858,457 | | | ^ | | 5.824%, due 09/20/38 | | | 1,258,721 | | | | 0.1 | |
| | 10,122,376 | | | ^ | | 5.824%, due 12/20/40 | | | 1,868,407 | | | | 0.2 | |
| | 4,489,689 | | | ^ | | 5.874%, due 12/20/40 | | | 750,794 | | | | 0.1 | |
| | 3,556,576 | | | ^ | | 5.924%, due 05/20/32 | | | 474,672 | | | | 0.1 | |
| | 1,660,929 | | | | | 5.970%, due 11/15/31 | | | 1,707,434 | | | | 0.2 | |
| | 3,039,840 | | | ^ | | 5.976%, due 09/16/39 | | | 561,315 | | | | 0.1 | |
| | 144,499 | | | | | 6.000%, due 01/20/24 | | | 155,718 | | | | 0.0 | |
| | 272,087 | | | | | 6.000%, due 10/15/25 | | | 314,983 | | | | 0.0 | |
| | 563,834 | | | | | 6.000%, due 04/15/26 | | | 645,102 | | | | 0.1 | |
| | 150,224 | | | | | 6.000%, due 10/20/27 | | | 169,954 | | | | 0.0 | |
| | 252,432 | | | | | 6.000%, due 05/15/29 | | | 289,027 | | | | 0.0 | |
| | 937,565 | | | ^ | | 6.000%, due 01/20/34 | | | 197,291 | | | | 0.0 | |
| | 1,931,613 | | | | | 6.000%, due 03/20/34 | | | 2,508,761 | | | | 0.3 | |
| | 186,017 | | | | | 6.000%, due 10/20/34 | | | 216,195 | | | | 0.0 | |
| | 861,188 | | | | | 6.000%, due 04/20/36 | | | 999,794 | | | | 0.1 | |
| | 483,755 | | | | | 6.000%, due 03/15/37 | | | 550,700 | | | | 0.1 | |
| | 340,050 | | | | | 6.000%, due 09/20/37 | | | 385,440 | | | | 0.0 | |
| | 4,034,819 | | | | | 6.000%, due 10/20/37 | | | 4,802,173 | | | | 0.6 | |
| | 2,174,128 | | | | | 6.000%, due 03/20/38 | | | 2,869,419 | | | | 0.3 | |
| | 30,770 | | | | | 6.000%, due 05/20/38 | | | 34,054 | | | | 0.0 | |
| | 530,615 | | | | | 6.000%, due 08/20/38 | | | 572,672 | | | | 0.1 | |
| | 130,276 | | | | | 6.000%, due 09/20/38 | | | 140,504 | | | | 0.0 | |
| | 209,278 | | | | | 6.000%, due 10/20/38 | | | 225,708 | | | | 0.0 | |
| | 244,837 | | | | | 6.000%, due 11/15/38 | | | 278,681 | | | | 0.0 | |
| | 318,977 | | | | | 6.000%, due 12/15/38 | | | 363,850 | | | | 0.0 | |
| | 316,719 | | | | | 6.000%, due 12/15/38 | | | 362,196 | | | | 0.0 | |
| | 2,291,383 | | | | | 6.000%, due 07/16/39 | | | 2,988,290 | | | | 0.3 | |
| | 829,378 | | | | | 6.000%, due 08/15/39 | | | 961,346 | | | | 0.1 | |
| | 814,370 | | | | | 6.000%, due 08/15/39 | | | 952,387 | | | | 0.1 | |
| | 2,458,322 | | | | | 6.000%, due 08/16/39 | | | 2,933,845 | | | | 0.3 | |
| | 681,775 | | | | | 6.000%, due 10/20/39 | | | 923,406 | | | | 0.1 | |
| | 2,123,551 | | | ^ | | 6.000%, due 01/16/40 | | | 941,765 | | | | 0.1 | |
| | 15,441,875 | | | ^ | | 6.176%, due 04/16/39 | | | 2,161,336 | | | | 0.3 | |
| | 6,287,235 | | | ^ | | 6.324%, due 09/20/37 | | | 1,079,889 | | | | 0.1 | |
| | 6,803,110 | | | ^ | | 6.324%, due 09/20/38 | | | 696,063 | | | | 0.1 | |
| | 3,482,364 | | | ^ | | 6.326%, due 05/16/38 | | | 652,822 | | | | 0.1 | |
| | 5,811,950 | | | ^ | | 6.476%, due 09/16/40 | | | 1,142,842 | | | | 0.1 | |
| | 11,119,062 | | | ^ | | 6.476%, due 04/16/42 | | | 2,635,335 | | | | 0.3 | |
| | 188,789 | | | | | 6.490%, due 01/15/28 | | | 216,445 | | | | 0.0 | |
| | 72,715 | | | | | 6.500%, due 07/20/29 | | | 83,841 | | | | 0.0 | |
| | 61,966 | | | | | 6.500%, due 07/20/32 | | | 64,340 | | | | 0.0 | |
| | 2,522 | | | | | 6.500%, due 09/20/34 | | | 2,921 | | | | 0.0 | |
| | 119,184 | | | | | 6.500%, due 05/20/38 | | | 129,399 | | | | 0.0 | |
| | 3,042,081 | | | ^ | | 6.524%, due 11/20/34 | | | 623,296 | | | | 0.1 | |
| | 2,771,721 | | | ^ | | 6.596%, due 02/16/35 | | | 531,760 | | | | 0.1 | |
| | 3,601 | | | | | 6.750%, due 08/15/28 | | | 4,126 | | | | 0.0 | |
| | 420,865 | | | | | 7.000%, due 05/16/32 | | | 475,090 | | | | 0.1 | |
| | 18,532 | | | | | 7.250%, due 01/15/29 | | | 19,098 | | | | 0.0 | |
| | 1,373,857 | | | ^ | | 7.426%, due 10/16/29 | | | 325,392 | | | | 0.0 | |
| | 23,869 | | | | | 7.500%, due 08/20/27 | | | 28,443 | | | | 0.0 | |
| | 684,123 | | | | | 7.500%, due 02/20/34 | | | 720,479 | | | | 0.1 | |
| | 4,269,418 | | | ^ | | 7.500%, due 04/16/37 | | | 1,317,193 | | | | 0.2 | |
| | 1,320,264 | | | | | 7.500%, due 08/20/39 | | | 1,706,376 | | | | 0.2 | |
| | 1,311,622 | | | | | 7.500%, due 08/20/39 | | | 1,939,416 | | | | 0.2 | |
| | 11,198 | | | | | 7.800%, due 05/15/19 | | | 11,242 | | | | 0.0 | |
| | 943 | | | | | 8.000%, due 03/20/24 | | | 946 | | | | 0.0 | |
| | 19,529 | | | | | 8.000%, due 11/15/25 | | | 22,423 | | | | 0.0 | |
| | 34,381 | | | | | 8.000%, due 07/15/26 | | | 39,452 | | | | 0.0 | |
| | 10,242 | | | | | 8.000%, due 07/15/26 | | | 11,960 | | | | 0.0 | |
| | 16,786 | | | | | 8.000%, due 09/15/26 | | | 17,179 | | | | 0.0 | |
| | 17,797 | | | | | 8.000%, due 09/20/26 | | | 20,232 | | | | 0.0 | |
| | 18,331 | | | | | 8.000%, due 12/15/26 | | | 20,965 | | | | 0.0 | |
| | 6,852 | | | | | 8.000%, due 04/15/27 | | | 7,613 | | | | 0.0 | |
| | 3,916 | | | | | 8.000%, due 06/15/27 | | | 3,932 | | | | 0.0 | |
| | 37,335 | | | | | 8.000%, due 07/15/27 | | | 41,923 | | | | 0.0 | |
| | 12,373 | | | | | 8.000%, due 03/15/28 | | | 12,520 | | | | 0.0 | |
| | 16,329 | | | | | 8.050%, due 07/15/19 | | | 16,397 | | | | 0.0 | |
| | 61,729 | | | | | 8.824%, due 04/20/34 | | | 64,857 | | | | 0.0 | |
| | 7,681 | | | | | 9.000%, due 05/15/16 | | | 7,714 | | | | 0.0 | |
| | 2,395 | | | | | 9.500%, due 11/15/21 | | | 2,748 | | | | 0.0 | |
| | 1,193,754 | | | | | 13.951%, due 09/16/31 | | | 1,529,639 | | | | 0.2 | |
| | 61,294 | | | | | 15.648%, due 01/20/32 | | | 85,862 | | | | 0.0 | |
| | 130,730 | | | | | 19.677%, due 09/20/37 | | | 187,188 | | | | 0.0 | |
| | 376,919 | | | | | 20.477%, due 02/16/32 | | | 530,807 | | | | 0.1 | |
| | 323,428 | | | | | 24.660%, due 04/16/37 | | | 457,971 | | | | 0.1 | |
| | | | | | | | | | 780,140,272 | | | | 88.7 | |
| | | | | | | | | | | | | | | |
| | | | | Total U.S. Government
Agency Obligations | | | | | | | | |
| | | | | (Cost $964,769,683) | | | 985,117,774 | | | | 112.0 | |
| | | | | | | | | | | | | | | |
| | | | | Total Long-Term Investments | | | | | | | | |
| | | | | (Cost $966,584,802) | | | 986,906,081 | | | | 112.2 | |
See Accompanying Notes to Financial Statements
| Voya GNMA Income Fund | PORTFOLIO OF INVESTMENTS
as of March 31, 2015 (CONTINUED) |
| Shares | | | | | | | Value | | | Percentage
of Net
Assets | |
| SHORT-TERM INVESTMENTS: 6.3% | | | |
| | | | | | | Sovereign: 6.3% | | | | | | | | |
| | 55,000,000 | | | | | United States Treasury Bill, 0.02%, 5/21/2015"" | | | | | | | | |
| | | | | | | (Cost $54,998,295) | | | 54,998,295 | | | | 6.3 | |
| | | | | | | | | | | | | | | |
| | | | | Total Short-Term Investments | | | | | | | | |
| | | | | (Cost $54,998,295) | | | 54,998,295 | | | | 6.3 | |
| | | | | | | | | | | | | | | |
| | | | | Total Investments in Securities
(Cost $1,021,583,097) | | $ | 1,041,904,376 | | | | 118.5 | |
| | | | | Liabilities in Excess of Other Assets | | | (162,777,821 | ) | | | (18.5 | ) |
| | | | | Net Assets | | $ | 879,126,555 | | | | 100.0 | |
| † | Unless otherwise indicated, principal amount is shown in USD. |
| ## | The Federal Housing Finance Agency (“FHFA”) placed the Federal Home Loan Mortgage Corporation and Federal National Mortgage Association into conservatorship with FHFA as the conservator. As such, the FHFA oversees the continuing affairs of these companies. |
| W | Settlement is on a when-issued or delayed-delivery basis. |
| ^ | Interest only securities represent the right to receive the monthly interest payments on an underlying pool of mortgage loans. Principal amount shown represents the notional amount on which current interest is calculated. Payments of principal on the pool reduce the value of the interest only security. |
Cost for federal income tax purposes is $1,023,518,179.
Net unrealized appreciation consists of:
| Gross Unrealized Appreciation | | $ | 20,308,804 | |
| Gross Unrealized Depreciation | | | (1,922,607 | ) |
| | | | | |
| Net Unrealized Appreciation | | $ | 18,386,197 | |
See Accompanying Notes to Financial Statements
| Voya High Yield Bond Fund | PORTFOLIO OF INVESTMENTS
as of March 31, 2015 |
Principal
Amount† | | | | | | | Value | | | Percentage
of Net
Assets | |
| CORPORATE BONDS/NOTES: 96.4% | | | | | | | | |
| | | | | | | Basic Materials: 5.9% | | | | | | | | |
| | 650,000 | | | | | Aleris International, Inc., 7.875%, 11/01/20 | | $ | 664,625 | | | | 0.1 | |
| | 1,635,000 | | | # | | Aruba Investments, Inc., 8.750%, 02/15/23 | | | 1,635,000 | | | | 0.3 | |
| | 1,470,000 | | | # | | Cascades, Inc., 5.500%, 07/15/22 | | | 1,497,562 | | | | 0.3 | |
| | 920,000 | | | # | | Constellium NV, 5.750%, 05/15/24 | | | 874,000 | | | | 0.2 | |
| | 1,500,000 | | | | | Eagle Spinco, Inc., 4.625%, 02/15/21 | | | 1,488,750 | | | | 0.3 | |
| | 375,000 | | | # | | Eco Services Operations LLC/Eco Finance Corp., 8.500%, 11/01/22 | | | 380,625 | | | | 0.1 | |
| | 1,105,000 | | | # | | Evolution Escrow Issuer LLC, 7.500%, 03/15/22 | | | 1,121,575 | | | | 0.2 | |
| | 920,000 | | | # | | FMG Resources August 2006 Pty Ltd., 6.000%, 04/01/17 | | | 913,675 | | | | 0.2 | |
| | 750,000 | | | # | | FMG Resources August 2006 Pty Ltd., 8.250%, 11/01/19 | | | 636,563 | | | | 0.1 | |
| | 1,000,000 | | | | | Hexion US Finance Corp. / Hexion Nova Scotia Finance ULC, 8.875%, 02/01/18 | | | 885,000 | | | | 0.2 | |
| | 950,000 | | | | | Hexion US Finance Corp., 6.625%, 04/15/20 | | | 874,000 | | | | 0.2 | |
| | 1,550,000 | | | | | Huntsman International LLC, 4.875%, 11/15/20 | | | 1,557,750 | | | | 0.3 | |
| | 780,000 | | | # | | Huntsman International LLC, 5.125%, 11/15/22 | | | 783,900 | | | | 0.1 | |
| | 1,500,000 | | | | | Momentive Performance Materials, Inc., 3.880%, 10/24/21 | | | 1,335,000 | | | | 0.2 | |
| | 2,000,000 | | | | | Momentive Performance Materials, Inc. Escrow, 8.875%, 10/15/20 | | | – | | | | – | |
| | 305,000 | | | # | | Platform Specialty Products Corp., 6.500%, 02/01/22 | | | 320,250 | | | | 0.1 | |
| | 1,000,000 | | | | | PolyOne Corp., 5.250%, 03/15/23 | | | 1,042,500 | | | | 0.2 | |
| | 1,269,000 | | | | | PolyOne Corp., 7.375%, 09/15/20 | | | 1,343,554 | | | | 0.3 | |
| | 1,250,000 | | | # | | PQ Corp., 8.750%, 05/01/18 | | | 1,301,563 | | | | 0.2 | |
| | 1,500,000 | | | # | | Prince Mineral Holding Corp., 11.500%, 12/15/19 | | | 1,458,750 | | | | 0.3 | |
| | 307,000 | | | # | | Rain CII Carbon, LLC / CII Carbon Corp., 8.000%, 12/01/18 | | | 293,185 | | | | 0.0 | |
| | 500,000 | | | # | | Rain CII Carbon, LLC / CII Carbon Corp., 8.250%, 01/15/21 | | | 468,750 | | | | 0.1 | |
| | 1,110,000 | | | # | | SPCM SA, 6.000%, 01/15/22 | | | 1,154,400 | | | | 0.2 | |
| | 925,000 | | | # | | Steel Dynamics, Inc., 5.125%, 10/01/21 | | | 935,406 | | | | 0.2 | |
| | 925,000 | | | # | | Steel Dynamics, Inc., 5.500%, 10/01/24 | | | 940,031 | | | | 0.2 | |
| | 1,000,000 | | | | | Tronox Finance LLC, 6.375%, 08/15/20 | | | 982,500 | | | | 0.2 | |
| | 1,500,000 | | | # | | Unifrax I LLC / Unifrax Holding Co., 7.500%, 02/15/19 | | | 1,515,000 | | | | 0.3 | |
| | 1,940,000 | | | # | | US Coatings Acquisition, Inc. / Axalta Coating Systems Dutch Holding B BV, 7.375%, 05/01/21 | | | 2,095,200 | | | | 0.4 | |
| | 1,605,000 | | | # | | WR Grace & Co-Conn, 5.125%, 10/01/21 | | | 1,669,200 | | | | 0.3 | |
| | 555,000 | | | # | | WR Grace & Co-Conn, 5.625%, 10/01/24 | | | 594,544 | | | | 0.1 | |
| | | | | | | | | | 30,762,858 | | | | 5.9 | |
| | | | | | | | | | | | | | | |
| | | | | | | Communications: 17.7% | | | | | | | | |
| | 1,000,000 | | | # | | Alcatel-Lucent USA, Inc., 6.750%, 11/15/20 | | | 1,070,000 | | | | 0.2 | |
| | 600,000 | | | # | | Altice Financing SA, 6.500%, 01/15/22 | | | 618,375 | | | | 0.1 | |
| | 905,000 | | | # | | Altice Financing SA, 6.625%, 02/15/23 | | | 936,675 | | | | 0.2 | |
| | 1,000,000 | | | # | | Altice Finco SA, 8.125%, 01/15/24 | | | 1,063,125 | | | | 0.2 | |
| | 1,470,000 | | | # | | Altice SA, 7.625%, 02/15/25 | | | 1,480,106 | | | | 0.3 | |
| | 1,640,000 | | | # | | Altice SA, 7.750%, 05/15/22 | | | 1,672,800 | | | | 0.3 | |
| | 34,781 | | | # | | American Media, Inc., 13.500%, 06/15/18 | | | 36,716 | | | | 0.0 | |
| | 665,000 | | | # | | Block Communications, Inc., 7.250%, 02/01/20 | | | 679,962 | | | | 0.1 | |
| | 720,000 | | | | | Cablevision Systems Corp., 7.750%, 04/15/18 | | | 801,900 | | | | 0.2 | |
| | 1,750,000 | | | | | CCO Holdings LLC / CCO Holdings Capital Corp., 5.250%, 03/15/21 | | | 1,798,125 | | | | 0.3 | |
| | 650,000 | | | | | CCO Holdings LLC / CCO Holdings Capital Corp., 6.500%, 04/30/21 | | | 684,937 | | | | 0.1 | |
| | 460,000 | | | | | CCO Holdings LLC / CCO Holdings Capital Corp., 7.250%, 10/30/17 | | | 480,125 | | | | 0.1 | |
| | 780,000 | | | | | CCOH Safari LLC, 5.500%, 12/01/22 | | | 799,500 | | | | 0.2 | |
| | 780,000 | | | | | CCOH Safari LLC, 5.750%, 12/01/24 | | | 805,350 | | | | 0.2 | |
| | 2,050,000 | | | | | CenturyLink, Inc., 5.625%, 04/01/20 | | | 2,160,187 | | | | 0.4 | |
| | 1,495,000 | | | | | CenturyLink, Inc., 5.800%, 03/15/22 | | | 1,564,144 | | | | 0.3 | |
| | 1,750,000 | | | # | | Cequel Communications Holdings I LLC / Cequel Capital Corp., 5.125%, 12/15/21 | | | 1,754,375 | | | | 0.3 | |
| | 500,000 | | | # | | Cequel Communications Holdings I, LLC / Cequel Capital Corp., 6.375%, 09/15/20 | | | 529,375 | | | | 0.1 | |
| | 735,000 | | | | | Cincinnati Bell, Inc., 8.375%, 10/15/20 | | | 785,531 | | | | 0.2 | |
| | 350,000 | | | | | Cincinnati Bell, Inc., 8.750%, 03/15/18 | | | 359,187 | | | | 0.1 | |
See Accompanying Notes to Financial Statements
| Voya High Yield Bond Fund | PORTFOLIO OF INVESTMENTS
as of March 31, 2015 (CONTINUED) |
| | 270,000 | | | | | Clear Channel Worldwide Holdings, Inc., 6.500%, 11/15/22 | | | 281,475 | | | | 0.1 | |
| | 730,000 | | | | | Clear Channel Worldwide Holdings, Inc., 6.500%, 11/15/22 | | | 771,975 | | | | 0.2 | |
| | 105,000 | | | | | Clear Channel Worldwide Holdings, Inc., 7.625%, 03/15/20 | | | 109,200 | | | | 0.0 | |
| | 1,530,000 | | | | | Clear Channel Worldwide Holdings, Inc., 7.625%, 03/15/20 | | | 1,617,975 | | | | 0.3 | |
| | 1,500,000 | | | #,& | | CommScope Holding Co., Inc., 6.625%, 06/01/20 | | | 1,545,000 | | | | 0.3 | |
| | 1,130,000 | | | | | Crown Media Holdings, Inc., 10.500%, 07/15/19 | | | 1,214,750 | | | | 0.2 | |
| | 1,650,000 | | | # | | CSC Holdings, LLC, 5.250%, 06/01/24 | | | 1,687,125 | | | | 0.3 | |
| | 750,000 | | | | | DISH DBS Corp., 5.125%, 05/01/20 | | | 757,500 | | | | 0.1 | |
| | 1,070,000 | | | | | DISH DBS Corp., 5.000%, 03/15/23 | | | 1,043,036 | | | | 0.2 | |
| | 1,300,000 | | | | | DISH DBS Corp., 5.875%, 07/15/22 | | | 1,324,375 | | | | 0.3 | |
| | 1,070,000 | | | | | DISH DBS Corp., 6.750%, 06/01/21 | | | 1,142,225 | | | | 0.2 | |
| | 715,000 | | | | | Equinix, Inc., 5.375%, 04/01/23 | | | 745,745 | | | | 0.1 | |
| | 300,000 | | | | | Equinix, Inc., 5.750%, 01/01/25 | | | 314,250 | | | | 0.1 | |
| | 1,000,000 | | | | | Frontier Communications Corp., 7.625%, 04/15/24 | | | 1,046,250 | | | | 0.2 | |
| | 200,000 | | | | | Frontier Communications Corp., 8.250%, 04/15/17 | | | 221,250 | | | | 0.0 | |
| | 600,000 | | | # | | Gannett Co., Inc., 5.500%, 09/15/24 | | | 629,250 | | | | 0.1 | |
| | 1,750,000 | | | | | Gannett Co., Inc., 6.375%, 10/15/23 | | | 1,905,312 | | | | 0.4 | |
| | 1,225,000 | | | # | | GCI, Inc., 6.875%, 04/15/25 | | | 1,240,312 | | | | 0.2 | |
| | 1,950,000 | | | | | Gray Television, Inc., 7.500%, 10/01/20 | | | 2,062,125 | | | | 0.4 | |
| | 825,000 | | | # | | Harron Communications L.P./Harron Finance Corp., 9.125%, 04/01/20 | | | 906,469 | | | | 0.2 | |
| | 500,000 | | | | | Intelsat Jackson Holdings SA, 5.500%, 08/01/23 | | | 474,375 | | | | 0.1 | |
| | 500,000 | | | | | Intelsat Jackson Holdings SA, 7.250%, 10/15/20 | | | 516,250 | | | | 0.1 | |
| | 440,000 | | | | | Intelsat Jackson Holdings SA, 7.500%, 04/01/21 | | | 453,750 | | | | 0.1 | |
| | 1,000,000 | | | | | Intelsat Luxembourg SA, 8.125%, 06/01/23 | | | 926,250 | | | | 0.2 | |
| | 2,000,000 | | | | | Lamar Media Corp., 5.875%, 02/01/22 | | | 2,115,000 | | | | 0.4 | |
| | 1,607,000 | | | | | LIN Television Corp., 6.375%, 01/15/21 | | | 1,667,262 | | | | 0.3 | |
| | 780,000 | | | # | | Media General Financing Sub, Inc., 5.875%, 11/15/22 | | | 797,550 | | | | 0.2 | |
| | 1,500,000 | | | | | Mediacom Broadband LLC / Mediacom Broadband Corp., 6.375%, 04/01/23 | | | 1,582,500 | | | | 0.3 | |
| | 630,000 | | | | | MetroPCS Wireless, Inc., 6.625%, 11/15/20 | | | 660,713 | | | | 0.1 | |
| | 1,750,000 | | | # | | Midcontinent Communications & Midcontinent Finance Corp., 6.250%, 08/01/21 | | | 1,828,750 | | | | 0.4 | |
| | 1,500,000 | | | | | Netflix, Inc., 5.750%, 03/01/24 | | | 1,535,625 | | | | 0.3 | |
| | 800,000 | | | # | | Netflix, Inc., 5.875%, 02/15/25 | | | 825,000 | | | | 0.2 | |
| | 1,500,000 | | | | | Nexstar Broadcasting, Inc., 6.875%, 11/15/20 | | | 1,590,000 | | | | 0.3 | |
| | 1,250,000 | | | | | Nielsen Finance LLC / Nielsen Finance Co., 4.500%, 10/01/20 | | | 1,278,125 | | | | 0.2 | |
| | 575,000 | | | # | | Nielsen Finance LLC / Nielsen Finance Co., 5.000%, 04/15/22 | | | 580,750 | | | | 0.1 | |
| | 2,425,000 | | | # | | Numericable Group SA, 6.250%, 05/15/24 | | | 2,458,344 | | | | 0.5 | |
| | 1,750,000 | | | # | | Numericable Group SA, 6.000%, 05/15/22 | | | 1,778,438 | | | | 0.3 | |
| | 1,000,000 | | | # | | Sable International Finance Ltd., 8.750%, 02/01/20 | | | 1,080,000 | | | | 0.2 | |
| | 1,030,000 | | | # | | SBA Communications Corp., 4.875%, 07/15/22 | | | 1,011,523 | | | | 0.2 | |
| | 1,650,000 | | | | | Sinclair Television Group, Inc., 6.125%, 10/01/22 | | | 1,736,955 | | | | 0.3 | |
| | 500,000 | | | | | Sinclair Television Group, Inc., 6.375%, 11/01/21 | | | 531,250 | | | | 0.1 | |
| | 2,060,000 | | | # | | Sirius XM Radio, Inc., 5.750%, 08/01/21 | | | 2,151,413 | | | | 0.4 | |
| | 660,000 | | | # | | Sirius XM Radio, Inc., 6.000%, 07/15/24 | | | 694,650 | | | | 0.1 | |
| | 2,845,000 | | | | | Sprint Corp., 7.125%, 06/15/24 | | | 2,802,325 | | | | 0.5 | |
| | 1,400,000 | | | | | Sprint Capital Corp., 6.875%, 11/15/28 | | | 1,291,500 | | | | 0.3 | |
| | 2,000,000 | | | | | Sprint Corp., 7.250%, 09/15/21 | | | 2,017,500 | | | | 0.4 | |
| | 1,500,000 | | | | | Sprint Nextel Corp., 6.000%, 11/15/22 | | | 1,430,625 | | | | 0.3 | |
| | 665,000 | | | # | | Sprint Nextel Corp., 9.000%, 11/15/18 | | | 764,750 | | | | 0.1 | |
| | 1,420,000 | | | | | Starz LLC / Starz Finance Corp., 5.000%, 09/15/19 | | | 1,466,150 | | | | 0.3 | |
| | 400,000 | | | | | T-Mobile USA, Inc., 5.250%, 09/01/18 | | | 414,500 | | | | 0.1 | |
| | 1,000,000 | | | | | T-Mobile USA, Inc., 6.125%, 01/15/22 | | | 1,035,000 | | | | 0.2 | |
| | 780,000 | | | | | T-Mobile USA, Inc., 6.250%, 04/01/21 | | | 814,125 | | | | 0.2 | |
| | 1,000,000 | | | | | T-Mobile USA, Inc., 6.633%, 04/28/21 | | | 1,051,250 | | | | 0.2 | |
| | 800,000 | | | | | T-Mobile USA, Inc., 6.731%, 04/28/22 | | | 845,000 | | | | 0.2 | |
| | 250,000 | | | | | T-Mobile USA, Inc., 6.836%, 04/28/23 | | | 264,063 | | | | 0.1 | |
| | 2,500,000 | | | # | | Univision Communications, Inc., 5.125%, 05/15/23 | | | 2,550,000 | | | | 0.5 | |
See Accompanying Notes to Financial Statements
| Voya High Yield Bond Fund | PORTFOLIO OF INVESTMENTS
as of March 31, 2015 (CONTINUED) |
| | 1,860,000 | | | # | | West Corp., 5.375%, 07/15/22 | | | 1,828,613 | | | | 0.4 | |
| | 1,200,000 | | | # | | Wind Acquisition Finance SA, 4.750%, 07/15/20 | | | 1,206,000 | | | | 0.2 | |
| | 1,310,000 | | | # | | Wind Acquisition Finance SA, 7.375%, 04/23/21 | | | 1,362,400 | | | | 0.3 | |
| | 1,265,000 | | | # | | Zayo Group LLC / Zayo Capital, Inc., 6.000%, 04/01/23 | | | 1,276,676 | | | | 0.2 | |
| | | | | | | | | | 91,341,044 | | | | 17.7 | |
| | | | | | | | | | | | | | | |
| | | | | | | Consumer, Cyclical: 16.3% | | | | | | | | |
| | 1,470,000 | | | | | Affinia Group, Inc., 7.750%, 05/01/21 | | | 1,528,800 | | | | 0.3 | |
| | 1,070,000 | | | | | Allegion US Holding Co., Inc., 5.750%, 10/01/21 | | | 1,123,500 | | | | 0.2 | |
| | 500,000 | | | | | AMC Entertainment, Inc., 5.875%, 02/15/22 | | | 521,250 | | | | 0.1 | |
| | 950,000 | | | | | AMC Entertainment, Inc., 9.750%, 12/01/20 | | | 1,043,812 | | | | 0.2 | |
| | 840,000 | | | # | | American Tire Distributors, Inc., 10.250%, 03/01/22 | | | 877,800 | | | | 0.2 | |
| | 2,095,000 | | | | | Asbury Automotive Group, Inc., 6.000%, 12/15/24 | | | 2,184,037 | | | | 0.4 | |
| | 2,070,000 | | | # | | Ashton Woods USA LLC, 6.875%, 02/15/21 | | | 1,888,875 | | | | 0.4 | |
| | 1,500,000 | | | # | | Building Materials Holding Corp., 9.000%, 09/15/18 | | | 1,597,500 | | | | 0.3 | |
| | 1,920,000 | | | | | Caesars Entertainment Resort Properties LLC / Caesars Entertainment Resort Prope, 8.000%, 10/01/20 | | | 1,915,200 | | | | 0.4 | |
| | 765,000 | | | | | Caesars Entertainment Resort Properties LLC / Caesars Entertainment Resort Prope, 11.000%, 10/01/21 | | | 673,200 | | | | 0.1 | |
| | 1,535,000 | | | # | | Carlson Wagonlit BV, 6.875%, 06/15/19 | | | 1,615,587 | | | | 0.3 | |
| | 1,080,000 | | | # | | CDR DB Sub, Inc., 7.750%, 10/15/20 | | | 977,400 | | | | 0.2 | |
| | 1,365,000 | | | # | | Cedar Fair L.P. / Canada's Wonderland Co. / Magnum Management Corp., 5.375%, 06/01/24 | | | 1,397,419 | | | | 0.3 | |
| | 1,315,000 | | | | | Century Communities, Inc., 6.875%, 05/15/22 | | | 1,308,425 | | | | 0.2 | |
| | 1,625,000 | | | #,& | | Chinos Intermediate Holdings A, Inc., 7.750%, 05/01/19 | | | 1,430,000 | | | | 0.3 | |
| | 1,800,000 | | | | | Chrysler Group LLC/CG Co-Issuer, Inc., 8.250%, 06/15/21 | | | 2,005,398 | | | | 0.4 | |
| | 450,000 | | | | | Chrysler Group, LLC/CG Co-Issuer, Inc., 8.000%, 06/15/19 | | | 474,187 | | | | 0.1 | |
| | 860,000 | | | # | | Cleopatra Finance Ltd, 5.625%, 02/15/20 | | | 842,370 | | | | 0.2 | |
| | 900,000 | | | # | | Cleopatra Finance Ltd, 6.250%, 02/15/22 | | | 882,000 | | | | 0.2 | |
| | 865,000 | | | # | | Cleopatra Finance Ltd, 6.500%, 02/15/25 | | | 836,887 | | | | 0.2 | |
| | 1,960,000 | | | | | Dana Holding Corp., 5.500%, 12/15/24 | | | 2,028,600 | | | | 0.4 | |
| | 415,000 | | | # | | Family Tree Escrow LLC, 5.250%, 03/01/20 | | | 436,787 | | | | 0.1 | |
| | 2,085,000 | | | # | | Family Tree Escrow LLC, 5.750%, 03/01/23 | | | 2,199,675 | | | | 0.4 | |
| | 395,000 | | | | | General Motors Co., 4.000%, 04/01/25 | | | 402,856 | | | | 0.1 | |
| | 2,050,000 | | | | | General Motors Financial Co., Inc., 4.000%, 01/15/25 | | | 2,094,952 | | | | 0.4 | |
| | 1,400,000 | | | # | | HD Supply, Inc., 5.250%, 12/15/21 | | | 1,445,500 | | | | 0.3 | |
| | 2,190,000 | | | # | | Hot Topic, Inc., 9.250%, 06/15/21 | | | 2,381,625 | | | | 0.5 | |
| | 1,480,000 | | | | | JC Penney Corp., Inc., 8.125%, 10/01/19 | | | 1,457,800 | | | | 0.3 | |
| | 1,450,000 | | | | | LKQ Corp., 4.750%, 05/15/23 | | | 1,428,250 | | | | 0.3 | |
| | 2,000,000 | | | # | | MCE Finance Ltd., 5.000%, 02/15/21 | | | 1,880,000 | | | | 0.4 | |
| | 1,000,000 | | | | | Meritage Homes Corp., 7.150%, 04/15/20 | | | 1,082,500 | | | | 0.2 | |
| | 1,065,000 | | | | | Meritage Homes Corp., 7.000%, 04/01/22 | | | 1,147,538 | | | | 0.2 | |
| | 1,665,000 | | | | | Meritor, Inc., 6.250%, 02/15/24 | | | 1,685,813 | | | | 0.3 | |
| | 1,000,000 | | | | | MGM Resorts International, 5.250%, 03/31/20 | | | 1,017,400 | | | | 0.2 | |
| | 1,500,000 | | | | | MGM Resorts International, 6.000%, 03/15/23 | | | 1,548,750 | | | | 0.3 | |
| | 1,500,000 | | | | | MGM Resorts International, 7.750%, 03/15/22 | | | 1,693,125 | | | | 0.3 | |
| | 500,000 | | | | | MGM Resorts International, 8.625%, 02/01/19 | | | 572,500 | | | | 0.1 | |
| | 232,000 | | | #,& | | Michaels FinCo Holdings LLC / Michaels FinCo, Inc., 7.500%, 08/01/18 | | | 237,800 | | | | 0.0 | |
| | 1,678,000 | | | # | | Michaels Stores, Inc., 5.875%, 12/15/20 | | | 1,732,535 | | | | 0.3 | |
| | 1,100,000 | | | | | NCL Corp. Ltd., 5.000%, 02/15/18 | | | 1,127,500 | | | | 0.2 | |
| | 300,000 | | | # | | NCL Corp. Ltd., 5.250%, 11/15/19 | | | 309,000 | | | | 0.1 | |
| | 250,000 | | | # | | Neiman Marcus Group LLC., 8.000%, 10/15/21 | | | 266,250 | | | | 0.0 | |
| | 1,750,000 | | | #,& | | Neiman Marcus Group LLC., 8.750%, 10/15/21 | | | 1,863,750 | | | | 0.4 | |
| | 1,545,000 | | | | | Oshkosh Corp., 5.375%, 03/01/22 | | | 1,610,663 | | | | 0.3 | |
| | 1,025,000 | | | | | Party City Holdings, Inc., 8.875%, 08/01/20 | | | 1,109,563 | | | | 0.2 | |
| | 1,000,000 | | | | | PC Nextco Holdings LLC / PC Nextco Finance, Inc., 8.750%, 08/15/19 | | | 1,022,500 | | | | 0.2 | |
| | 2,085,000 | | | # | | Rite Aid Corp., 6.125%, 04/01/23 | | | 2,147,550 | | | | 0.4 | |
| | 240,000 | | | # | | Rite Aid Corp., 6.875%, 12/15/28 | | | 264,000 | | | | 0.0 | |
| | 1,685,000 | | | # | | RSI Home Products, Inc., 6.500%, 03/15/23 | | | 1,722,913 | | | | 0.3 | |
See Accompanying Notes to Financial Statements
| Voya High Yield Bond Fund | PORTFOLIO OF INVESTMENTS
as of March 31, 2015 (CONTINUED) |
| | 600,000 | | | | | Ryland Group, Inc., 5.375%, 10/01/22 | | | 601,500 | | | | 0.1 | |
| | 750,000 | | | | | Ryland Group, Inc., 6.625%, 05/01/20 | | | 813,750 | | | | 0.2 | |
| | 2,000,000 | | | # | | Schaeffler Finance BV, 4.250%, 05/15/21 | | | 2,000,000 | | | | 0.4 | |
| | 250,000 | | | #,& | | Schaeffler Holding Finance BV, 6.750%, 11/15/22 | | | 271,250 | | | | 0.0 | |
| | 1,351,000 | | | #,& | | Schaeffler Holding Finance BV, 6.875%, 08/15/18 | | | 1,416,861 | | | | 0.3 | |
| | 790,000 | | | # | | Scientific Games International, Inc., 7.000%, 01/01/22 | | | 811,725 | | | | 0.1 | |
| | 1,185,000 | | | # | | Scientific Games International, Inc., 10.000%, 12/01/22 | | | 1,116,863 | | | | 0.2 | |
| | 420,000 | | | # | | Shea Homes L.P. / Shea Homes Funding Corp., 5.875%, 04/01/23 | | | 429,450 | | | | 0.1 | |
| | 420,000 | | | # | | Shea Homes L.P. / Shea Homes Funding Corp., 6.125%, 04/01/25 | | | 425,250 | | | | 0.1 | |
| | 2,000,000 | | | | | Sonic Automotive, Inc., 5.000%, 05/15/23 | | | 1,990,000 | | | | 0.4 | |
| | 1,910,000 | | | | | Springs Industries, Inc., 6.250%, 06/01/21 | | | 1,895,675 | | | | 0.4 | |
| | 1,100,000 | | | | | Standard Pacific Corp., 8.375%, 01/15/21 | | | 1,278,750 | | | | 0.2 | |
| | 800,000 | | | | | United Continental Holdings, Inc., 6.375%, 06/01/18 | | | 855,000 | | | | 0.2 | |
| | 1,000,000 | | | | | United Continental Holdings, Inc., 6.000%, 07/15/28 | | | 1,003,750 | | | | 0.2 | |
| | 1,500,000 | | | | | US Airways Group, Inc., 6.125%, 06/01/18 | | | 1,582,500 | | | | 0.3 | |
| | 1,830,000 | | | # | | Viking Cruises Ltd., 8.500%, 10/15/22 | | | 2,045,025 | | | | 0.4 | |
| | 245,000 | | | # | | WMG Acquisition Corp., 5.625%, 04/15/22 | | | 246,531 | | | | 0.0 | |
| | 1,460,000 | | | # | | WMG Acquisition Corp., 6.750%, 04/15/22 | | | 1,390,650 | | | | 0.3 | |
| | 1,125,000 | | | | | Wolverine World Wide, Inc., 6.125%, 10/15/20 | | | 1,206,563 | | | | 0.2 | |
| | | | | | | | | | 84,422,435 | | | | 16.3 | |
| | | | | | | | | | | | | | | |
| | | | | | | Consumer, Non-cyclical: 21.9% |
| | 1,660,000 | | | | | Acadia Healthcare Co., Inc., 5.125%, 07/01/22 | | | 1,670,375 | | | | 0.3 | |
| | 1,000,000 | | | # | | Acadia Healthcare Co., Inc., 5.625%, 02/15/23 | | | 1,022,500 | | | | 0.2 | |
| | 1,750,000 | | | # | | Albea Beauty Holdings SA, 8.375%, 11/01/19 | | | 1,885,625 | | | | 0.4 | |
| | 1,061,000 | | | # | | Albertsons Holdings LLC/Saturn Acquisition Merger Sub, Inc., 7.750%, 10/15/22 | | | 1,140,575 | | | | 0.2 | |
| | 1,800,000 | | | # | | Alliance Data Systems Corp., 5.375%, 08/01/22 | | | 1,800,000 | | | | 0.3 | |
| | 1,210,000 | | | | | Amsurg Corp., 5.625%, 11/30/20 | | | 1,240,250 | | | | 0.2 | |
| | 1,805,000 | | | | | Amsurg Corp., 5.625%, 07/15/22 | | | 1,854,637 | | | | 0.4 | |
| | 1,860,000 | | | # | | Anna Merger Sub, Inc., 7.750%, 10/01/22 | | | 1,927,425 | | | | 0.4 | |
| | 1,150,000 | | | | | ARAMARK Corp., 5.750%, 03/15/20 | | | 1,204,625 | | | | 0.2 | |
| | 2,500,000 | | | # | | Ashtead Capital, Inc., 6.500%, 07/15/22 | | | 2,675,000 | | | | 0.5 | |
| | 1,675,000 | | | # | | BI-LO LLC / BI-LO Finance Corp., 9.250%, 02/15/19 | | | 1,695,937 | | | | 0.3 | |
| | 1,500,000 | | | | | Biomet, Inc., 6.500%, 10/01/20 | | | 1,578,750 | | | | 0.3 | |
| | 1,250,000 | | | # | | Brand Energy & Infrastructure Services, Inc., 8.500%, 12/01/21 | | | 1,178,125 | | | | 0.2 | |
| | 1,836,000 | | | # | | Bumble Bee Holdings, Inc., 9.000%, 12/15/17 | | | 1,932,390 | | | | 0.4 | |
| | 1,430,000 | | | # | | C&S Group Enterprises LLC, 5.375%, 07/15/22 | | | 1,401,400 | | | | 0.3 | |
| | 1,913,000 | | | #,& | | Capsugel SA, 7.000%, 05/15/19 | | | 1,947,673 | | | | 0.4 | |
| | 710,000 | | | # | | Ceridian HCM Holding, Inc., 11.000%, 03/15/21 | | | 737,512 | | | | 0.1 | |
| | 600,000 | | | | | CHS/Community Health Systems, Inc., 5.125%, 08/15/18 | | | 620,250 | | | | 0.1 | |
| | 1,000,000 | | | | | CHS/Community Health Systems, Inc., 6.875%, 02/01/22 | | | 1,068,750 | | | | 0.2 | |
| | 190,000 | | | | | CHS/Community Health Systems, Inc., 7.125%, 07/15/20 | | | 201,637 | | | | 0.0 | |
| | 250,000 | | | | | CHS/Community Health Systems, Inc., 8.000%, 11/15/19 | | | 266,250 | | | | 0.0 | |
| | 1,210,000 | | | # | | Cott Beverages, Inc., 6.750%, 01/01/20 | | | 1,255,375 | | | | 0.2 | |
| | 1,340,000 | | | | | DaVita HealthCare Partners, Inc., 5.125%, 07/15/24 | | | 1,371,825 | | | | 0.3 | |
| | 745,000 | | | | | DaVita HealthCare Partners, Inc., 6.625%, 11/01/20 | | | 782,716 | | | | 0.1 | |
| | 1,820,000 | | | # | | Diamond Foods, Inc., 7.000%, 03/15/19 | | | 1,879,150 | | | | 0.4 | |
| | 1,915,000 | | | # | | Envision Healthcare Corp., 5.125%, 07/01/22 | | | 1,962,875 | | | | 0.4 | |
| | 1,610,000 | | | # | | Grifols Worldwide Operations Ltd., 5.250%, 04/01/22 | | | 1,640,187 | | | | 0.3 | |
| | 600,000 | | | | | H&E Equipment Services, Inc., 7.000%, 09/01/22 | | | 621,000 | | | | 0.1 | |
| | 3,120,000 | | | | | HCA Holdings, Inc., 6.250%, 02/15/21 | | | 3,381,144 | | | | 0.7 | |
| | 1,405,000 | | | | | HCA Holdings, Inc., 7.750%, 05/15/21 | | | 1,498,517 | | | | 0.3 | |
| | 1,080,000 | | | | | HCA, Inc., 5.250%, 04/15/25 | | | 1,167,750 | | | | 0.2 | |
| | 815,000 | | | | | HCA, Inc., 5.375%, 02/01/25 | | | 857,278 | | | | 0.2 | |
| | 1,800,000 | | | | | HCA, Inc., 7.500%, 02/15/22 | | | 2,103,750 | | | | 0.4 | |
| | 375,000 | | | | | HDTFS, Inc., 6.250%, 10/15/22 | | | 389,531 | | | | 0.1 | |
| | 1,630,000 | | | | | HealthSouth Corp., 5.750%, 11/01/24 | | | 1,703,350 | | | | 0.3 | |
| | 1,500,000 | | | | | Hertz Corp., 6.750%, 04/15/19 | | | 1,556,250 | | | | 0.3 | |
| | 1,480,000 | | | | | Immucor, Inc., 11.125%, 08/15/19 | | | 1,596,550 | | | | 0.3 | |
| | 865,000 | | | #,& | | Jaguar Holding Co. I, 9.375%, 10/15/17 | | | 886,625 | | | | 0.2 | |
See Accompanying Notes to Financial Statements
| Voya High Yield Bond Fund | PORTFOLIO OF INVESTMENTS
as of March 31, 2015 (CONTINUED) |
| | 500,000 | | | # | | Jaguar Holding Co., 9.500%, 12/01/19 | | | 539,375 | | | | 0.1 | |
| | 750,000 | | | # | | JBS USA LLC / JBS USA Finance, Inc., 5.875%, 07/15/24 | | | 761,250 | | | | 0.1 | |
| | 1,150,000 | | | # | | JBS USA LLC / JBS USA Finance, Inc., 7.250%, 06/01/21 | | | 1,216,125 | | | | 0.2 | |
| | 1,000,000 | | | # | | KeHE Distributors LLC / KeHE Finance Corp., 7.625%, 08/15/21 | | | 1,063,750 | | | | 0.2 | |
| | 1,255,000 | | | | | Kindred Healthcare, Inc., 4.250%, 04/09/21 | | | 1,262,583 | | | | 0.2 | |
| | 1,460,000 | | | # | | Live Nation Entertainment, Inc., 5.375%, 06/15/22 | | | 1,496,500 | | | | 0.3 | |
| | 1,975,000 | | | # | | Logo Merger Sub Corp., 8.375%, 10/15/20 | | | 2,009,563 | | | | 0.4 | |
| | 2,080,000 | | | # | | Midas Intermediate Holdco II LLC / Midas Intermediate Holdco II Finance, Inc., 7.875%, 10/01/22 | | | 2,054,000 | | | | 0.4 | |
| | 2,125,000 | | | # | | MPH Acquisition Holdings LLC, 6.625%, 04/01/22 | | | 2,207,344 | | | | 0.4 | |
| | 1,975,000 | | | # | | Multi-Color Corp., 6.125%, 12/01/22 | | | 2,058,937 | | | | 0.4 | |
| | 1,500,000 | | | # | | Mustang Merger Corp., 8.500%, 08/15/21 | | | 1,526,250 | | | | 0.3 | |
| | 1,224,000 | | | # | | Physio-Control International, Inc., 9.875%, 01/15/19 | | | 1,306,620 | | | | 0.3 | |
| | 1,635,000 | | | # | | Quad/Graphics, Inc., 7.000%, 05/01/22 | | | 1,579,819 | | | | 0.3 | |
| | 1,250,000 | | | | | Reynolds Group Issuer, Inc., 7.875%, 08/15/19 | | | 1,325,000 | | | | 0.3 | |
| | 1,250,000 | | | | | Reynolds Group Issuer, Inc., 9.000%, 04/15/19 | | | 1,315,625 | | | | 0.3 | |
| | 750,000 | | | | | Reynolds Group Issuer, Inc., 9.875%, 08/15/19 | | | 807,188 | | | | 0.2 | |
| | 585,000 | | | | | RR Donnelley & Sons Co., 6.000%, 04/01/24 | | | 606,937 | | | | 0.1 | |
| | 500,000 | | | | | RR Donnelley & Sons Co., 6.500%, 11/15/23 | | | 533,750 | | | | 0.1 | |
| | 500,000 | | | | | RR Donnelley & Sons Co., 7.000%, 02/15/22 | | | 553,750 | | | | 0.1 | |
| | 750,000 | | | | | RR Donnelley & Sons Co., 7.875%, 03/15/21 | | | 861,750 | | | | 0.2 | |
| | 1,495,000 | | | # | | Safway Group Holding LLC / Safway Finance Corp., 7.000%, 05/15/18 | | | 1,487,525 | | | | 0.3 | |
| | 1,500,000 | | | # | | Salix Pharmaceuticals Ltd, 6.500%, 01/15/21 | | | 1,666,875 | | | | 0.3 | |
| | 420,000 | | | | | ServiceMaster Co., 7.450%, 08/15/27 | | | 427,350 | | | | 0.1 | |
| | 743,000 | | | | | ServiceMaster Co., 7.000%, 08/15/20 | | | 793,153 | | | | 0.2 | |
| | 1,050,000 | | | # | | Shearer's Foods, LLC / Chip Fin Corp., 9.000%, 11/01/19 | | | 1,149,750 | | | | 0.2 | |
| | 1,100,000 | | | | | Spectrum Brands, Inc., 6.375%, 11/15/20 | | | 1,171,500 | | | | 0.2 | |
| | 1,280,000 | | | # | | STHI Holding Corp., 8.000%, 03/15/18 | | | 1,329,600 | | | | 0.3 | |
| | 1,580,000 | | | # | | Teleflex, Inc., 5.250%, 06/15/24 | | | 1,615,550 | | | | 0.3 | |
| | 1,000,000 | | | | | Tenet Healthcare Corp., 6.000%, 10/01/20 | | | 1,061,250 | | | | 0.2 | |
| | 595,000 | | | | | Tenet Healthcare Corp., 6.250%, 11/01/18 | | | 647,063 | | | | 0.1 | |
| | 1,975,000 | | | | | Tenet Healthcare Corp., 6.750%, 02/01/20 | | | 2,091,031 | | | | 0.4 | |
| | 1,000,000 | | | | | Tenet Healthcare Corp., 8.125%, 04/01/22 | | | 1,105,000 | | | | 0.2 | |
| | 750,000 | | | | | Truven Health Analytics, Inc., 10.625%, 06/01/20 | | | 791,250 | | | | 0.2 | |
| | 165,000 | | | | | United Rentals North America, Inc., 5.750%, 07/15/18 | | | 172,054 | | | | 0.0 | |
| | 1,000,000 | | | | | United Rentals North America, Inc., 6.125%, 06/15/23 | | | 1,062,500 | | | | 0.2 | |
| | 385,000 | | | | | United Rentals North America, Inc., 7.375%, 05/15/20 | | | 417,966 | | | | 0.1 | |
| | 785,000 | | | | | United Rentals North America, Inc., 7.625%, 04/15/22 | | | 862,715 | | | | 0.2 | |
| | 875,000 | | | | | United Surgical Partners International, Inc., 9.000%, 04/01/20 | | | 943,906 | | | | 0.2 | |
| | 1,950,000 | | | # | | Universal Health Services, Inc., 4.750%, 08/01/22 | | | 2,052,375 | | | | 0.4 | |
| | 1,250,000 | | | | | US Foods, Inc., 8.500%, 06/30/19 | | | 1,315,625 | | | | 0.3 | |
| | 1,500,000 | | | # | | Valeant Pharmaceuticals International, Inc., 5.500%, 03/01/23 | | | 1,524,375 | | | | 0.3 | |
| | 2,000,000 | | | # | | Valeant Pharmaceuticals International, Inc., 7.500%, 07/15/21 | | | 2,170,620 | | | | 0.4 | |
| | 1,500,000 | | | # | | Valeant Pharmaceuticals International, 6.750%, 08/15/18 | | | 1,584,375 | | | | 0.3 | |
| | 1,025,000 | | | # | | Valeant Pharmaceuticals International, 6.750%, 08/15/21 | | | 1,074,969 | | | | 0.2 | |
| | 490,000 | | | # | | VPI Escrow Corp., 6.375%, 10/15/20 | | | 510,825 | | | | 0.1 | |
| | 420,000 | | | # | | VRX Escrow Corp., 5.375%, 03/15/20 | | | 425,250 | | | | 0.1 | |
| | 420,000 | | | # | | VRX Escrow Corp., 5.875%, 05/15/23 | | | 431,550 | | | | 0.1 | |
| | 920,000 | | | # | | VRX Escrow Corp., 6.125%, 04/15/25 | | | 955,650 | | | | 0.2 | |
| | 1,500,000 | | | | | WellCare Health Plans, Inc., 5.750%, 11/15/20 | | | 1,582,500 | | | | 0.3 | |
| | 1,740,000 | | | | | WhiteWave Foods Co., 5.375%, 10/01/22 | | | 1,874,850 | | | | 0.4 | |
| | | | | | | | | | 113,088,677 | | | | 21.9 | |
| | | | | | | | | | | | | | | |
| | | | | | | Diversified: 1.4% | | | | | | | | |
| | 1,900,000 | | | & | | Alphabet Holding Co., Inc., 7.750%, 11/01/17 | | | 1,866,750 | | | | 0.4 | |
| | 2,095,000 | | | # | | Argos Merger Sub, Inc., 7.125%, 03/15/23 | | | 2,176,181 | | | | 0.4 | |
| | 715,000 | | | #,& | | Carlson Travel Holdings, Inc., 7.500%, 08/15/19 | | | 725,725 | | | | 0.1 | |
| | 1,440,000 | | | # | | James Hardie International Finance Ltd, 5.875%, 02/15/23 | | | 1,490,400 | | | | 0.3 | |
See Accompanying Notes to Financial Statements
| Voya High Yield Bond Fund | PORTFOLIO OF INVESTMENTS
as of March 31, 2015 (CONTINUED) |
| | 779,000 | | | # | | The Nielsen Co. Luxembourg SARL, 5.500%, 10/01/21 | | | 808,213 | | | | 0.2 | |
| | | | | | | | | | 7,067,269 | | | | 1.4 | |
| | | | | | | | | | | | | | | |
| | | | | | | Energy: 11.2% | | | | | | | | |
| | 1,055,000 | | | | | Alta Mesa Holdings / Alta Mesa Finance Services Corp., 9.625%, 10/15/18 | | | 807,075 | | | | 0.2 | |
| | 925,000 | | | # | | American Energy - Woodford LLC/AEW Finance Corp., 9.000%, 09/15/22 | | | 536,500 | | | | 0.1 | |
| | 1,500,000 | | | | | Antero Resources Corp., 5.125%, 12/01/22 | | | 1,447,500 | | | | 0.3 | |
| | 2,250,000 | | | | | Approach Resources, Inc., 7.000%, 06/15/21 | | | 2,025,000 | | | | 0.4 | |
| | 1,035,000 | | | | | Arch Coal, Inc., 7.250%, 06/15/21 | | | 235,462 | | | | 0.0 | |
| | 1,000,000 | | | # | | Arch Coal, Inc., 8.000%, 01/15/19 | | | 483,125 | | | | 0.1 | |
| | 1,970,000 | | | # | | Blue Racer Midstream LLC / Blue Racer Finance Corp., 6.125%, 11/15/22 | | | 2,029,100 | | | | 0.4 | |
| | 1,600,000 | | | | | Bonanza Creek Energy, Inc., 6.750%, 04/15/21 | | | 1,564,000 | | | | 0.3 | |
| | 750,000 | | | # | | Calumet Specialty Products Partners L.P. / Calumet Finance Corp., 7.750%, 04/15/23 | | | 762,187 | | | | 0.1 | |
| | 1,290,000 | | | # | | Calumet Specialty Products Partners L.P./Calumet Finance Corp., 6.500%, 04/15/21 | | | 1,257,750 | | | | 0.2 | |
| | 400,000 | | | | | Calumet Specialty Products Partners L.P./Calumet Finance Corp., 9.625%, 08/01/20 | | | 454,000 | | | | 0.1 | |
| | 750,000 | | | | | Chaparral Energy, Inc., 7.625%, 11/15/22 | | | 510,000 | | | | 0.1 | |
| | 895,000 | | | | | Chaparral Energy, Inc., 8.250%, 09/01/21 | | | 626,500 | | | | 0.1 | |
| | 2,275,000 | | | | | Chesapeake Energy Corp., 6.125%, 02/15/21 | | | 2,314,812 | | | | 0.4 | |
| | 1,200,000 | | | | | Chesapeake Energy Corp., 6.625%, 08/15/20 | | | 1,245,000 | | | | 0.2 | |
| | 1,500,000 | | | | | Crestwood Midstream Partners L.P. / Crestwood Midstream Finance Corp., 6.125%, 03/01/22 | | | 1,518,750 | | | | 0.3 | |
| | 1,800,000 | | | # | | CrownRock L.P. / CrownRock Finance, Inc., 7.125%, 04/15/21 | | | 1,802,250 | | | | 0.4 | |
| | 250,000 | | | # | | CrownRock L.P. / CrownRock Finance, Inc., 7.750%, 02/15/23 | | | 253,750 | | | | 0.1 | |
| | 1,200,000 | | | | | Energy Transfer Equity L.P., 7.500%, 10/15/20 | | | 1,350,000 | | | | 0.3 | |
| | 1,750,000 | | | # | | Hilcorp Energy I L.P./Hilcorp Finance Co., 5.000%, 12/01/24 | | | 1,653,750 | | | | 0.3 | |
| | 875,000 | | | # | | Hilcorp Energy I L.P./Hilcorp Finance Co., 8.000%, 02/15/20 | | | 910,000 | | | | 0.2 | |
| | 500,000 | | | | | Legacy Reserves L.P. / Legacy Reserves Finance Corp., 6.625%, 12/01/21 | | | 397,500 | | | | 0.1 | |
| | 500,000 | | | | | Legacy Reserves L.P. / Legacy Reserves Finance Corp., 8.000%, 12/01/20 | | | 412,500 | | | | 0.1 | |
| | 1,345,000 | | | | | Linn Energy LLC / Linn Energy Finance Corp., 6.250%, 11/01/19 | | | 1,069,275 | | | | 0.2 | |
| | 525,000 | | | | | Linn Energy LLC / Linn Energy Finance Corp., 7.750%, 02/01/21 | | | 420,000 | | | | 0.1 | |
| | 1,135,000 | | | # | | Lonestar Resources America, Inc., 8.750%, 04/15/19 | | | 879,625 | | | | 0.2 | |
| | 1,500,000 | | | | | Memorial Production Partners L.P. / Memorial Production Finance Corp., 7.625%, 05/01/21 | | | 1,372,500 | | | | 0.3 | |
| | 1,050,000 | | | # | | Memorial Resource Development Corp., 5.875%, 07/01/22 | | | 981,750 | | | | 0.2 | |
| | 1,910,000 | | | | | Murphy Oil USA, Inc., 6.000%, 08/15/23 | | | 2,058,025 | | | | 0.4 | |
| | 1,000,000 | | | # | | Murray Energy Corp., 8.625%, 06/15/21 | | | 1,050,000 | | | | 0.2 | |
| | 360,000 | | | # | | Paragon Offshore PLC, 6.750%, 07/15/22 | | | 121,500 | | | | 0.0 | |
| | 720,000 | | | # | | Paragon Offshore PLC, 7.250%, 08/15/24 | | | 244,800 | | | | 0.0 | |
| | 2,400,000 | | | # | | Parsley Energy LLC / Parsley Finance Corp., 7.500%, 02/15/22 | | | 2,436,000 | | | | 0.5 | |
| | 1,655,000 | | | | | Regency Energy Partners L.P. / Regency Energy Finance Corp., 4.500%, 11/01/23 | | | 1,671,550 | | | | 0.3 | |
| | 360,000 | | | | | Regency Energy Partners L.P. / Regency Energy Finance Corp., 5.000%, 10/01/22 | | | 376,200 | | | | 0.1 | |
| | 655,000 | | | | | Regency Energy Partners L.P. / Regency Energy Finance Corp., 5.500%, 04/15/23 | | | 679,563 | | | | 0.1 | |
| | 1,950,000 | | | # | | Rockies Express Pipeline, LLC, 5.625%, 04/15/20 | | | 2,047,695 | | | | 0.4 | |
| | 360,000 | | | | | Rose Rock Midstream L.P. / Rose Rock Finance Corp., 5.625%, 07/15/22 | | | 356,400 | | | | 0.1 | |
| | 1,815,000 | | | | | Rosetta Resources, Inc., 5.625%, 05/01/21 | | | 1,715,175 | | | | 0.3 | |
| | 140,000 | | | | | Rosetta Resources, Inc., 5.875%, 06/01/24 | | | 130,900 | | | | 0.0 | |
| | 1,690,000 | | | | | Sanchez Energy Corp., 6.125%, 01/15/23 | | | 1,527,338 | | | | 0.3 | |
| | 765,000 | | | | | Sanchez Energy Corp., 7.750%, 06/15/21 | | | 742,050 | | | | 0.1 | |
| | 1,100,000 | | | | | SandRidge Energy, Inc., 7.500%, 02/15/23 | | | 682,000 | | | | 0.1 | |
| | 1,995,000 | | | | | SemGroup Corp., 7.500%, 06/15/21 | | | 2,099,738 | | | | 0.4 | |
| | 1,835,000 | | | | | Seventy Seven Energy, Inc., 6.500%, 07/15/22 | | | 862,450 | | | | 0.2 | |
See Accompanying Notes to Financial Statements
| Voya High Yield Bond Fund | PORTFOLIO OF INVESTMENTS
as of March 31, 2015 (CONTINUED) |
| | 600,000 | | | | | SM Energy Co., 6.500%, 01/01/23 | | | 618,000 | | | | 0.1 | |
| | 1,000,000 | | | | | Summit Midstream Holdings LLC / Summit Midstream Finance Corp., 5.500%, 08/15/22 | | | 952,500 | | | | 0.2 | |
| | 1,000,000 | | | | | Summit Midstream Holdings LLC / Summit Midstream Finance Corp., 7.500%, 07/01/21 | | | 1,045,000 | | | | 0.2 | |
| | 405,000 | | | # | | SunCoke Energy Partners L.P. / SunCoke Energy Partners Finance Corp., 7.375%, 02/01/20 | | | 417,150 | | | | 0.1 | |
| | 500,000 | | | # | | SunCoke Energy Partners L.P. / SunCoke Energy Partners Finance Corp., 7.375%, 02/01/20 | | | 515,000 | | | | 0.1 | |
| | 520,000 | | | # | | SunCoke Energy Partners L.P. / SunCoke Energy Partners Finance Corp., 7.375%, 02/01/20 | | | 535,600 | | | | 0.1 | |
| | 188,000 | | | | | SunCoke Energy, Inc., 7.625%, 08/01/19 | | | 193,311 | | | | 0.0 | |
| | 815,000 | | | # | | Sunoco L.P. / Sunoco Finance Corp., 6.375%, 04/01/23 | | | 841,488 | | | | 0.2 | |
| | 1,645,000 | | | # | | Talos Production LLC, 9.750%, 02/15/18 | | | 1,167,950 | | | | 0.2 | |
| | 2,000,000 | | | | | Tesoro Logistics L.P. / Tesoro Logistics Finance Corp., 6.125%, 10/15/21 | | | 2,070,000 | | | | 0.4 | |
| | 1,865,000 | | | | | WPX Energy, Inc., 6.000%, 01/15/22 | | | 1,743,775 | | | | 0.3 | |
| | | | | | | | | | 58,220,819 | | | | 11.2 | |
| | | | | | | | | | | | | | | |
| | | | | | | Financial: 6.3% | | | | | | | | |
| | 2,935,000 | | | # | | AerCap Ireland Capital Ltd. / AerCap Global Aviation Trust, 4.500%, 05/15/21 | | | 3,059,591 | | | | 0.6 | |
| | 500,000 | | | | | Ally Financial, Inc., 3.125%, 01/15/16 | | | 502,500 | | | | 0.1 | |
| | 1,000,000 | | | | | Ally Financial, Inc., 3.500%, 01/27/19 | | | 990,000 | | | | 0.2 | |
| | 2,000,000 | | | | | Ally Financial, Inc., 4.125%, 03/30/20 | | | 1,992,500 | | | | 0.4 | |
| | 1,500,000 | | | | | Ally Financial, Inc., 7.500%, 09/15/20 | | | 1,760,625 | | | | 0.3 | |
| | 735,000 | | | | | Ally Financial, Inc., 8.000%, 03/15/20 | | | 878,325 | | | | 0.2 | |
| | 540,000 | | | | | American General Finance Corp., 5.400%, 12/01/15 | | | 550,179 | | | | 0.1 | |
| | 1,850,000 | | | | | CBRE Services, Inc., 5.250%, 03/15/25 | | | 1,993,375 | | | | 0.4 | |
| | 520,000 | | | | | CIT Group, Inc., 4.250%, 08/15/17 | | | 529,100 | | | | 0.1 | |
| | 1,500,000 | | | | | CIT Group, Inc., 5.250%, 03/15/18 | | | 1,556,250 | | | | 0.3 | |
| | 250,000 | | | | | CIT Group, Inc., 5.375%, 05/15/20 | | | 263,750 | | | | 0.0 | |
| | 250,000 | | | | | CIT Group, Inc., 5.000%, 05/15/17 | | | 257,735 | | | | 0.0 | |
| | 810,000 | | | | | CIT Group, Inc., 5.000%, 08/15/22 | | | 833,287 | | | | 0.2 | |
| | 290,000 | | | # | | CIT Group, Inc., 6.625%, 04/01/18 | | | 311,750 | | | | 0.1 | |
| | 1,150,000 | | | # | | CNG Holdings, Inc./OH, 9.375%, 05/15/20 | | | 830,875 | | | | 0.2 | |
| | 1,150,000 | | | | | Crown Castle International Corp., 5.250%, 01/15/23 | | | 1,213,250 | | | | 0.2 | |
| | 500,000 | | | | | Icahn Enterprises L.P. / Icahn Enterprises Finance Corp., 4.875%, 03/15/19 | | | 510,625 | | | | 0.1 | |
| | 1,000,000 | | | | | Icahn Enterprises L.P. / Icahn Enterprises Finance Corp., 6.000%, 08/01/20 | | | 1,042,550 | | | | 0.2 | |
| | 1,115,000 | | | | | International Lease Finance Corp., 5.875%, 08/15/22 | | | 1,240,437 | | | | 0.2 | |
| | 510,000 | | | | | International Lease Finance Corp., 6.250%, 05/15/19 | | | 558,450 | | | | 0.1 | |
| | 470,000 | | | | | International Lease Finance Corp., 8.250%, 12/15/20 | | | 573,400 | | | | 0.1 | |
| | 335,000 | | | | | iStar Financial, Inc., 4.000%, 11/01/17 | | | 332,069 | | | | 0.1 | |
| | 670,000 | | | | | iStar Financial, Inc., 5.000%, 07/01/19 | | | 672,512 | | | | 0.1 | |
| | 1,965,000 | | | | | Navient Corp., 5.875%, 10/25/24 | | | 1,842,187 | | | | 0.4 | |
| | 1,320,000 | | | # | | Rayonier AM Products, Inc., 5.500%, 06/01/24 | | | 1,138,500 | | | | 0.2 | |
| | 500,000 | | | # | | Realogy Corp., 7.625%, 01/15/20 | | | 540,625 | | | | 0.1 | |
| | 1,290,000 | | | # | | Realogy Group LLC / Realogy Co-Issuer Corp., 5.250%, 12/01/21 | | | 1,319,025 | | | | 0.3 | |
| | 750,000 | | | | | Sabra Health Care L.P. / Sabra Capital Corp., 5.500%, 02/01/21 | | | 801,563 | | | | 0.2 | |
| | 2,000,000 | | | #,& | | Sophia Holding Finance L.P. / Sophia Holding Finance, Inc., 9.625%, 12/01/18 | | | 2,027,500 | | | | 0.4 | |
| | 400,000 | | | | | Springleaf Finance Corp., 5.250%, 12/15/19 | | | 396,500 | | | | 0.1 | |
| | 595,000 | | | | | Springleaf Finance Corp., 6.900%, 12/15/17 | | | 635,163 | | | | 0.1 | |
| | 1,200,000 | | | | | Synovus Financial Corp., 5.125%, 06/15/17 | | | 1,227,720 | | | | 0.2 | |
| | | | | | | | | | 32,381,918 | | | | 6.3 | |
| | | | | | | | | | | | | | | |
| | | | | | �� | Industrial: 7.7% | | | | | | | | |
| | 1,509,000 | | | | | ADS Waste Holdings, Inc., 8.250%, 10/01/20 | | | 1,584,450 | | | | 0.3 | |
| | 370,000 | | | # | | AECOM Technology Corp., 5.750%, 10/15/22 | | | 383,875 | | | | 0.1 | |
| | 370,000 | | | # | | AECOM Technology Corp., 5.875%, 10/15/24 | | | 389,425 | | | | 0.1 | |
| | 1,165,000 | | | | | Anixter, Inc., 5.625%, 05/01/19 | | | 1,258,200 | | | | 0.2 | |
| | 1,534,450 | | | #,& | | Ardagh Finance Holdings SA, 8.625%, 06/15/19 | | | 1,606,385 | | | | 0.3 | |
See Accompanying Notes to Financial Statements
| Voya High Yield Bond Fund | PORTFOLIO OF INVESTMENTS
as of March 31, 2015 (CONTINUED) |
| | 1,000,000 | | | # | | Ardagh Packaging Finance PLC / Ardagh Holdings USA, Inc., 6.750%, 01/31/21 | | | 1,011,250 | | | | 0.2 | |
| | 88,235 | | | # | | Ardagh Packaging Finance PLC, 7.000%, 11/15/20 | | | 88,787 | | | | 0.0 | |
| | 1,480,000 | | | # | | BC Mountain LLC / BC Mountain Finance, Inc., 7.000%, 02/01/21 | | | 1,398,600 | | | | 0.3 | |
| | 250,000 | | | # | | Beverage Packaging Holdings Luxembourg II SA / Beverage Packaging Holdings II Is, 6.000%, 06/15/17 | | | 252,500 | | | | 0.0 | |
| | 500,000 | | | | | Boise Cascade Co., 6.375%, 11/01/20 | | | 528,750 | | | | 0.1 | |
| | 165,000 | | | # | | Building Materials Corp. of America, 6.750%, 05/01/21 | | | 175,725 | | | | 0.0 | |
| | 1,500,000 | | | # | | Cleaver-Brooks, Inc., 8.750%, 12/15/19 | | | 1,537,500 | | | | 0.3 | |
| | 1,700,000 | | | # | | Consolidated Container Co., LLC/Consolidated Container Capital, Inc., 10.125%, 07/15/20 | | | 1,487,500 | | | | 0.3 | |
| | 1,320,000 | | | # | | CTP Transportation Products LLC / CTP Finance, Inc., 8.250%, 12/15/19 | | | 1,366,200 | | | | 0.3 | |
| | 1,250,000 | | | # | | Dematic SA / DH Services Luxembourg Sarl, 7.750%, 12/15/20 | | | 1,312,500 | | | | 0.3 | |
| | 860,000 | | | | | Ducommun, Inc., 9.750%, 07/15/18 | | | 913,750 | | | | 0.2 | |
| | 1,250,000 | | | # | | Gardner Denver, Inc., 6.875%, 08/15/21 | | | 1,140,625 | | | | 0.2 | |
| | 1,720,000 | | | # | | Gates Global LLC / Gates Global Co., 6.000%, 07/15/22 | | | 1,631,850 | | | | 0.3 | |
| | 500,000 | | | | | Headwaters, Inc., 7.250%, 01/15/19 | | | 526,250 | | | | 0.1 | |
| | 1,000,000 | | | | | Headwaters, Inc., 7.625%, 04/01/19 | | | 1,044,200 | | | | 0.2 | |
| | 788,000 | | | & | | Interline Brands, Inc., 10.000%, 11/15/18 | | | 829,370 | | | | 0.2 | |
| | 880,000 | | | # | | JM Huber Corp., 9.875%, 11/01/19 | | | 955,900 | | | | 0.2 | |
| | 1,110,000 | | | | | Kemet Corp., 10.500%, 05/01/18 | | | 1,137,750 | | | | 0.2 | |
| | 1,265,000 | | | # | | Masonite International Corp., 5.625%, 03/15/23 | | | 1,302,950 | | | | 0.3 | |
| | 233,000 | | | # | | Mcron Finance Sub, LLC / Mcron Finance Corp., 8.375%, 05/15/19 | | | 249,892 | | | | 0.0 | |
| | 500,000 | | | # | | Milacron LLC / Mcron Finance Corp., 7.750%, 02/15/21 | | | 520,000 | | | | 0.1 | |
| | 1,600,000 | | | | | Nortek, Inc., 8.500%, 04/15/21 | | | 1,720,000 | | | | 0.3 | |
| | 1,620,000 | | | # | | PaperWorks Industries, Inc., 9.500%, 08/15/19 | | | 1,666,575 | | | | 0.3 | |
| | 2,000,000 | | | # | | Plastipak Holdings, Inc., 6.500%, 10/01/21 | | | 2,045,000 | | | | 0.4 | |
| | 1,625,000 | | | # | | Sanmina Corp., 4.375%, 06/01/19 | | | 1,620,937 | | | | 0.3 | |
| | 500,000 | | | # | | Sealed Air Corp., 4.875%, 12/01/22 | | | 511,250 | | | | 0.1 | |
| | 1,000,000 | | | # | | Sealed Air Corp., 5.125%, 12/01/24 | | | 1,037,500 | | | | 0.2 | |
| | 1,470,000 | | | # | | Syncreon Group BV / Syncreon Global Finance US, Inc., 8.625%, 11/01/21 | | | 1,264,200 | | | | 0.2 | |
| | 1,000,000 | | | | | TransDigm, Inc., 6.500%, 07/15/24 | | | 1,010,000 | | | | 0.2 | |
| | 1,000,000 | | | | | TransDigm, Inc., 6.000%, 07/15/22 | | | 1,003,750 | | | | 0.2 | |
| | 1,485,000 | | | # | | Waterjet Holdings, Inc., 7.625%, 02/01/20 | | | 1,570,388 | | | | 0.3 | |
| | 1,500,000 | | | # | | Wise Metals Group LLC, 8.750%, 12/15/18 | | | 1,601,250 | | | | 0.3 | |
| | 325,000 | | | # | | Wise Metals Intermediate Holdings LLC/Wise Holdings Finance Corp., 9.750%, 06/15/19 | | | 352,625 | | | | 0.1 | |
| | | | | | | | | | 40,037,659 | | | | 7.7 | |
| | | | | | | | | | | | | | | |
| | | | | | | Information Technology: 0.2% |
| | 1,000,000 | | | | | Equinix, Inc., 4.875%, 04/01/20 | | | 1,037,500 | | | | 0.2 | |
| | | | | | | | | | | | | | | |
| | | | | | | Technology: 6.0% | | | | | | | | |
| | 1,000,000 | | | # | | ACI Worldwide, Inc., 6.375%, 08/15/20 | | | 1,048,750 | | | | 0.2 | |
| | 1,545,000 | | | # | | Activision Blizzard, Inc., 6.125%, 09/15/23 | | | 1,687,912 | | | | 0.3 | |
| | 1,555,000 | | | | | Aspect Software, Inc., 10.625%, 05/15/17 | | | 1,360,625 | | | | 0.3 | |
| | 1,040,000 | | | # | | Audatex North America, Inc., 6.125%, 11/01/23 | | | 1,103,700 | | | | 0.2 | |
| | 770,000 | | | # | | Audatex North America, Inc., 6.000%, 06/15/21 | | | 818,125 | | | | 0.2 | |
| | 1,290,000 | | | # | | BCP Singapore VI Cayman Financing Co. Ltd., 8.000%, 04/15/21 | | | 1,273,875 | | | | 0.2 | |
| | 1,750,000 | | | # | | BMC Software Finance, Inc., 8.125%, 07/15/21 | | | 1,610,000 | | | | 0.3 | |
| | 900,000 | | | #,& | | Boxer Parent Co., Inc., 9.000%, 10/15/19 | | | 747,000 | | | | 0.1 | |
| | 1,500,000 | | | | | CDW LLC / CDW Finance Corp., 5.500%, 12/01/24 | | | 1,575,000 | | | | 0.3 | |
| | 800,000 | | | | | CDW LLC / CDW Finance Corp., 6.000%, 08/15/22 | | | 861,760 | | | | 0.2 | |
| | 615,000 | | | | | CDW, LLC / CDW Finance Corp., 8.500%, 04/01/19 | | | 641,137 | | | | 0.1 | |
| | 1,000,000 | | | #,& | | Eagle Midco, Inc., 9.000%, 06/15/18 | | | 1,022,500 | | | | 0.2 | |
| | 1,795,000 | | | | | Emdeon, Inc., 11.000%, 12/31/19 | | | 1,965,525 | | | | 0.4 | |
| | 1,395,000 | | | # | | Entegris, Inc., 6.000%, 04/01/22 | | | 1,461,262 | | | | 0.3 | |
| | 1,050,000 | | | | | Epicor Software Corp., 8.625%, 05/01/19 | | | 1,102,500 | | | | 0.2 | |
| | 145,000 | | | # | | First Data Corp., 8.250%, 01/15/21 | | | 156,963 | | | | 0.0 | |
| | 646,000 | | | #,& | | First Data Corp., 8.750%, 01/15/22 | | | 698,488 | | | | 0.1 | |
| | 1,730,000 | | | | | First Data Corp., 10.625%, 06/15/21 | | | 1,976,525 | | | | 0.4 | |
| | 1,918,000 | | | | | First Data Corp., 11.750%, 08/15/21 | | | 2,227,278 | | | | 0.4 | |
See Accompanying Notes to Financial Statements
| Voya High Yield Bond Fund | PORTFOLIO OF INVESTMENTS
as of March 31, 2015 (CONTINUED) |
| | 750,000 | | | # | | IMS Health, Inc., 6.000%, 11/01/20 | | | 782,813 | | | | 0.2 | |
| | 1,640,000 | | | #,& | | Infor Software Parent LLC / Infor Software Parent, Inc., 7.125%, 05/01/21 | | | 1,630,258 | | | | 0.3 | |
| | 355,000 | | | | | Infor US, Inc., 9.375%, 04/01/19 | | | 381,181 | | | | 0.1 | |
| | 500,000 | | | | | Infor US, Inc., 11.500%, 07/15/18 | | | 541,875 | | | | 0.1 | |
| | 590,000 | | | # | | MSCI, Inc., 5.250%, 11/15/24 | | | 611,388 | | | | 0.1 | |
| | 750,000 | | | | | NCR Corp., 5.000%, 07/15/22 | | | 761,250 | | | | 0.2 | |
| | 1,300,000 | | | | | NCR Corp., 6.375%, 12/15/23 | | | 1,391,000 | | | | 0.3 | |
| | 1,720,000 | | | # | | Open Text Corp., 5.625%, 01/15/23 | | | 1,788,800 | | | | 0.3 | |
| | | | | | | | | | 31,227,490 | | | | 6.0 | |
| | | | | | | | | | | | | | | |
| | | | | | | Utilities: 1.8% | | | | | | | | |
| | 710,000 | | | | | AES Corp., 7.375%, 07/01/21 | | | 798,750 | | | | 0.2 | |
| | 725,000 | | | | | Calpine Corp., 5.375%, 01/15/23 | | | 728,625 | | | | 0.1 | |
| | 1,725,000 | | | | | Calpine Corp., 5.750%, 01/15/25 | | | 1,744,406 | | | | 0.3 | |
| | 750,000 | | | # | | Calpine Corp., 6.000%, 01/15/22 | | | 806,250 | | | | 0.2 | |
| | 500,000 | | | | | DPL, Inc., 6.500%, 10/15/16 | | | 526,250 | | | | 0.1 | |
| | 1,000,000 | | | | | DPL, Inc., 7.250%, 10/15/21 | | | 1,067,500 | | | | 0.2 | |
| | 1,500,000 | | | # | | LBC Tank Terminals Holding Netherlands BV, 6.875%, 05/15/23 | | | 1,541,250 | | | | 0.3 | |
| | 1,000,000 | | | | | NRG Energy, Inc., 6.250%, 07/15/22 | | | 1,033,750 | | | | 0.2 | |
| | 830,000 | | | | | NRG Energy, Inc., 7.875%, 05/15/21 | | | 896,400 | | | | 0.2 | |
| | | | | | | | | | 9,143,181 | | | | 1.8 | |
| | | | | | | | | | | | | | | |
| | | | | Total Corporate Bonds/Notes | | | | | | | | |
| | | | | (Cost $499,654,248) | | | 498,730,850 | | | | 96.4 | |
| | | | | | | | | | | | | | | |
| ASSET-BACKED SECURITIES: 0.2% | | | | | |
| | | | | | | Other Asset-Backed Securities: 0.2% |
| | 1,000,000 | | | # | | Castle Garden Funding, 6.560%, 10/27/20 | | | 1,078,507 | | | | 0.2 | |
| | | | | | | | | | | | | | | |
| | | | | Total Asset-Backed Securities | | | | | | | | |
| | | | | (Cost $997,500) | | | 1,078,507 | | | | 0.2 | |
| | | | | | | |
| Shares | | Value | | | Percentage
of Net
Assets | |
| COMMON STOCK: 0.0% | | | | | | | | |
| | | | | | | Consumer Discretionary: 0.0% |
| | 195 | | | @ | | American Media, Inc. | | | 98 | | | | 0.0 | |
| | | | | | | | | | | | | | | |
| | | | | Total Common Stock | | | | | | | |
| | | | | (Cost $7,957) | | 98 | | | | 0.0 | |
| | | | | | | | | | | | | | | |
| | | | | Total Long-Term Investments | | | | | | | |
| | | | | (Cost $500,659,705) | | 499,809,455 | | | | 96.6 | |
| SHORT-TERM INVESTMENTS: 2.5% | | | | |
| | | | | | | Mutual Funds: 2.5% | | | | | | | | |
| | 12,717,000 | | | | | BlackRock Liquidity Funds, TempFund, Institutional Class, 0.070%†† | | | | | | | | |
| | | | | | | (Cost $12,717,000) | | | 12,717,000 | | | | 2.5 | |
| | | | | | | | | | | | | | | |
| | | | | Total Short-Term Investments | | | | | | | |
| | | | | (Cost $12,717,000) | | | 12,717,000 | | | | 2.5 | |
| | | | | | | | | | | | | | | |
| | | | | Total Investments in Securities
(Cost $513,376,705) | | $ | 512,526,455 | | | | 99.1 | |
| | | | | Assets in Excess of Other Liabilities | | 4,416,149 | | | | 0.9 | |
| | | | | Net Assets | | $ | 516,942,604 | | | | 100.0 | |
| † | Unless otherwise indicated, principal amount is shown in USD. |
| †† | Rate shown is the 7-day yield as of March 31, 2015. |
| # | Securities with purchases pursuant to Rule 144A or section 4(a)(2), under the Securities Act of 1933 and may not be resold subject to that rule except to qualified institutional buyers. |
| @ | Non-income producing security. |
Cost for federal income tax purposes is $513,412,009.
Net unrealized depreciation consists of:
| Gross Unrealized Appreciation | | $ | 11,170,235 | |
| Gross Unrealized Depreciation | | | (12,055,789 | ) |
| | | | | |
| Net Unrealized Depreciation | | $ | (885,554 | ) |
See Accompanying Notes to Financial Statements
| Voya Intermediate Bond Fund | |
PORTFOLIO OF INVESTMENTS
as of March 31, 2015 |
Principal
Amount† | | | | | | | Value | | | Percentage
of Net
Assets | |
| CORPORATE BONDS/NOTES: 33.2% | | | | | | | | |
| | | | | | | Basic Materials: 1.8% | | | | | | | | |
| | 1,440,000 | | | | | Agrium, Inc., 3.375%, 03/15/25 | | $ | 1,442,467 | | | | 0.0 | |
| | 1,965,000 | | | | | Agrium, Inc., 5.250%, 01/15/45 | | | 2,223,111 | | | | 0.1 | |
| | 510,000 | | | | | Albemarle Corp., 3.000%, 12/01/19 | | | 516,162 | | | | 0.0 | |
| | 2,564,000 | | | # | | Anglo American Capital PLC, 2.625%, 09/27/17 | | | 2,599,350 | | | | 0.1 | |
| | 2,000,000 | | | | | ArcelorMittal, 6.250%, 03/01/21 | | | 2,132,500 | | | | 0.1 | |
| | 1,373,000 | | | | | Barrick Gold Corp., 4.100%, 05/01/23 | | | 1,356,784 | | | | 0.0 | |
| | 1,484,000 | | | | | BHP Billiton Finance USA Ltd, 5.000%, 09/30/43 | | | 1,706,498 | | | | 0.1 | |
| | 2,020,000 | | | | | Eastman Chemical Co., 2.700%, 01/15/20 | | | 2,051,453 | | | | 0.1 | |
| | 1,680,000 | | | | | Eastman Chemical Co., 3.800%, 03/15/25 | | | 1,745,785 | | | | 0.1 | |
| | 2,110,000 | | | #,L | | FMG Resources August 2006 Pty Ltd., 6.875%, 04/01/22 | | | 1,566,675 | | | | 0.1 | |
| | 1,649,000 | | | | | Freeport-McMoRan Copper & Gold, Inc., 2.375%, 03/15/18 | | | 1,641,825 | | | | 0.1 | |
| | 2,480,000 | | | | | Freeport-McMoRan, Inc., 4.000%, 11/14/21 | | | 2,424,029 | | | | 0.1 | |
| | 1,861,000 | | | # | | Georgia-Pacific LLC, 2.539%, 11/15/19 | | | 1,888,762 | | | | 0.1 | |
| | 1,960,000 | | | # | | Georgia-Pacific LLC, 3.163%, 11/15/21 | | | 2,012,062 | | | | 0.1 | |
| | 1,860,000 | | | # | | Georgia-Pacific LLC, 3.600%, 03/01/25 | | | 1,910,588 | | | | 0.1 | |
| | 1,334,000 | | | # | | Georgia-Pacific LLC, 3.734%, 07/15/23 | | | 1,399,821 | | | | 0.0 | |
| | 1,126,000 | | | | | Goldcorp, Inc., 3.700%, 03/15/23 | | | 1,116,477 | | | | 0.0 | |
| | 2,010,000 | | | | | Huntsman International LLC, 4.875%, 11/15/20 | | | 2,020,050 | | | | 0.1 | |
| | 1,378,000 | | | | | LYB International Finance BV, 4.000%, 07/15/23 | | | 1,464,317 | | | | 0.1 | |
| | 1,770,000 | | | # | | Mexichem SAB de CV, 4.875%, 09/19/22 | | | 1,866,465 | | | | 0.1 | |
| | 1,206,000 | | | | | Monsanto Co., 4.400%, 07/15/44 | | | 1,302,528 | | | | 0.0 | |
| | 2,810,000 | | | | | PolyOne Corp., 5.250%, 03/15/23 | | | 2,929,425 | | | | 0.1 | |
| | 2,513,000 | | | | | Rockwood Specialties Group, Inc., 4.625%, 10/15/20 | | | 2,622,944 | | | | 0.1 | |
| | 1,028,000 | | | L | | Vale Overseas Ltd., 4.625%, 09/15/20 | | | 1,030,056 | | | | 0.0 | |
| | 2,017,000 | | | # | | Xstrata Finance Canada Ltd., 4.250%, 10/25/22 | | | 2,076,844 | | | | 0.1 | |
| | 778,000 | | | # | | Xstrata Finance Canada Ltd., 4.950%, 11/15/21 | | | 841,784 | | | | 0.0 | |
| | | | | | | | | | 45,888,762 | | | | 1.8 | |
| | | | | | | Communications: 5.6% | | | | | | | | |
| | 2,571,000 | | | # | | Alibaba Group Holding Ltd., 3.125%, 11/28/21 | | | 2,592,990 | | | | 0.1 | |
| | 2,455,000 | | | # | | Alibaba Group Holding Ltd., 3.600%, 11/28/24 | | | 2,467,805 | | | | 0.1 | |
| | 800,000 | | | # | | Altice Financing SA, 6.625%, 02/15/23 | | | 828,000 | | | | 0.0 | |
| | 3,137,000 | | | | | Amazon.com, Inc., 4.950%, 12/05/44 | | | 3,436,458 | | | | 0.1 | |
| | 3,018,000 | | | L | | AT&T, Inc., 3.900%, 03/11/24 | | | 3,172,721 | | | | 0.1 | |
| | 3,215,000 | | | | | AT&T, Inc., 4.800%, 06/15/44 | | | 3,310,894 | | | | 0.1 | |
| | 1,043,000 | | | | | AT&T, Inc., 5.350%, 09/01/40 | | | 1,142,446 | | | | 0.0 | |
| | 740,000 | | | | | Cablevision Systems Corp., 8.625%, 09/15/17 | | | 834,350 | | | | 0.0 | |
| | 2,098,000 | | | | | CBS Corp., 2.300%, 08/15/19 | | | 2,100,484 | | | | 0.1 | |
| | 3,488,000 | | | | | CBS Corp., 3.700%, 08/15/24 | | | 3,598,587 | | | | 0.1 | |
| | 1,025,000 | | | | | CC Holdings GS V LLC / Crown Castle GS III Corp., 2.381%, 12/15/17 | | | 1,034,042 | | | | 0.0 | |
| | 2,500,000 | | | | | CCO Holdings LLC / CCO Holdings Capital Corp., 5.125%, 02/15/23 | | | 2,534,375 | | | | 0.1 | |
| | 475,000 | | | | | CCO Holdings LLC / CCO Holdings Capital Corp., 5.750%, 09/01/23 | | | 498,156 | | | | 0.0 | |
| | 1,212,000 | | | | | CenturyLink, Inc., 5.625%, 04/01/20 | | | 1,277,145 | | | | 0.1 | |
| | 920,000 | | | | | CenturyLink, Inc., 6.750%, 12/01/23 | | | 1,016,600 | | | | 0.0 | |
| | 2,000,000 | | | | | Clear Channel Worldwide Holdings, Inc., 6.500%, 11/15/22 | | | 2,115,000 | | | | 0.1 | |
| | 884,000 | | | # | | CommScope, Inc., 5.500%, 06/15/24 | | | 888,420 | | | | 0.0 | |
| | 713,000 | | | # | | CommScope, Inc., 5.000%, 06/15/21 | | | 715,674 | | | | 0.0 | |
| | 2,696,000 | | | # | | Cox Communications, Inc., 3.850%, 02/01/25 | | | 2,777,691 | | | | 0.1 | |
| | 772,000 | | | # | | COX Communications, Inc., 4.500%, 06/30/43 | | | 770,405 | | | | 0.0 | |
| | 2,000,000 | | | # | | CSC Holdings, LLC, 5.250%, 06/01/24 | | | 2,045,000 | | | | 0.1 | |
| | 1,683,000 | | | | | Digicel Ltd., 6.000%, 04/15/21 | | | 1,603,058 | | | | 0.1 | |
| | 707,000 | | | # | | Digicel Ltd, 6.750%, 03/01/23 | | | 686,674 | | | | 0.0 | |
| | 4,854,000 | | | | | DIRECTV Holdings LLC / DIRECTV Financing Co., Inc., 3.800%, 03/15/22 | | | 5,038,768 | | | | 0.2 | |
| | 1,500,000 | | | | | DIRECTV Holdings LLC / DIRECTV Financing Co., Inc., 5.150%, 03/15/42 | | | 1,575,906 | | | | 0.1 | |
| | 510,000 | | | | | DISH DBS Corp., 4.250%, 04/01/18 | | | 513,825 | | | | 0.0 | |
| | 1,500,000 | | | | | DISH DBS Corp., 5.875%, 07/15/22 | | | 1,528,125 | | | | 0.1 | |
| | 1,542,000 | | | L | | eBay, Inc., 2.875%, 08/01/21 | | | 1,548,405 | | | | 0.1 | |
| | 1,605,000 | | | | | eBay, Inc., 3.450%, 08/01/24 | | | 1,591,144 | | | | 0.1 | |
See Accompanying Notes to Financial Statements
| Voya Intermediate Bond Fund | PORTFOLIO OF INVESTMENTS as of March 31, 2015 (continued) |
| | 2,391,000 | | | | | eBay, Inc., 4.000%, 07/15/42 | | | 2,081,098 | | | | 0.1 | |
| | 2,463,000 | | | | | Equinix, Inc., 5.375%, 04/01/23 | | | 2,568,909 | | | | 0.1 | |
| | 2,035,000 | | | | | Gannett Co., Inc., 6.375%, 10/15/23 | | | 2,215,606 | | | | 0.1 | |
| | 2,135,000 | | | | | Intelsat Jackson Holdings SA, 7.250%, 10/15/20 | | | 2,204,387 | | | | 0.1 | |
| | 1,440,000 | | | | | Juniper Networks, Inc., 4.350%, 06/15/25 | | | 1,462,856 | | | | 0.1 | |
| | 699,000 | | | | | Motorola Solutions, Inc., 3.500%, 03/01/23 | | | 702,624 | | | | 0.0 | |
| | 671,000 | | | | | Motorola Solutions, Inc., 3.750%, 05/15/22 | | | 687,868 | | | | 0.0 | |
| | 2,339,000 | | | | | Motorola Solutions, Inc., 4.000%, 09/01/24 | | | 2,421,660 | | | | 0.1 | |
| | 2,575,000 | | | L | | Netflix, Inc., 5.750%, 03/01/24 | | | 2,636,156 | | | | 0.1 | |
| | 3,132,000 | | | | | 21st Century Fox America, Inc., 3.000%, 09/15/22 | | | 3,175,002 | | | | 0.1 | |
| | 2,385,000 | | | # | | Nielsen Finance LLC / Nielsen Finance Co., 5.000%, 04/15/22 | | | 2,408,850 | | | | 0.1 | |
| | 770,000 | | | # | | Sable International Finance Ltd., 8.750%, 02/01/20 | | | 831,600 | | | | 0.0 | |
| | 860,000 | | | | | Scripps Networks Interactive, Inc., 2.750%, 11/15/19 | | | 868,191 | | | | 0.0 | |
| | 1,650,000 | | | | | Scripps Networks Interactive, Inc., 3.900%, 11/15/24 | | | 1,705,729 | | | | 0.1 | |
| | 3,000,000 | | | # | | Sinclair Television Group, Inc., 5.625%, 08/01/24 | | | 3,067,500 | | | | 0.1 | |
| | 2,640,000 | | | # | | Sirius XM Radio, Inc., 5.875%, 10/01/20 | | | 2,758,800 | | | | 0.1 | |
| | 2,110,000 | | | # | | Softbank Corp., 4.500%, 04/15/20 | | | 2,162,750 | | | | 0.1 | |
| | 1,105,000 | | | | | Sprint Corp., 7.125%, 06/15/24 | | | 1,088,425 | | | | 0.0 | |
| | 1,105,000 | | | | | Sprint Nextel Corp., 7.875%, 09/15/23 | | | 1,132,625 | | | | 0.0 | |
| | 625,000 | | | | | Telefonica Emisiones SAU, 3.192%, 04/27/18 | | | 652,212 | | | | 0.0 | |
| | 1,428,000 | | | | | Telefonica Emisiones SAU, 3.992%, 02/16/16 | | | 1,464,563 | | | | 0.1 | |
| | 2,600,000 | | | # | | Telefonica Chile SA, 3.875%, 10/12/22 | | | 2,623,985 | | | | 0.1 | |
| | 2,833,000 | | | | | Time Warner Cable, Inc., 5.875%, 11/15/40 | | | 3,400,745 | | | | 0.1 | |
| | 2,812,000 | | | | | Time Warner, Inc., 4.050%, 12/15/23 | | | 3,015,355 | | | | 0.1 | |
| | 1,881,000 | | | | | Time Warner, Inc., 5.350%, 12/15/43 | | | 2,203,768 | | | | 0.1 | |
| | 1,251,000 | | | | | Time Warner, Inc., 6.500%, 11/15/36 | | | 1,628,882 | | | | 0.1 | |
| | 2,131,000 | | | | | Time Warner Cable, Inc., 5.500%, 09/01/41 | | | 2,453,638 | | | | 0.1 | |
| | 1,000,000 | | | | | T-Mobile USA, Inc., 5.250%, 09/01/18 | | | 1,036,250 | | | | 0.0 | |
| | 575,000 | | | | | T-Mobile USA, Inc., 6.250%, 04/01/21 | | | 600,156 | | | | 0.0 | |
| | 1,435,000 | | | | | T-Mobile USA, Inc., 6.625%, 04/01/23 | | | 1,510,337 | | | | 0.1 | |
| | 1,395,000 | | | # | | Univision Communications, Inc., 5.125%, 02/15/25 | | | 1,428,131 | | | | 0.1 | |
| | 1,370,000 | | | | | UPCB Finance IV Ltd., 5.375%, 01/15/25 | | | 1,370,000 | | | | 0.1 | |
| | 2,720,000 | | | | | Verizon Communications, Inc., 3.000%, 11/01/21 | | | 2,779,209 | | | | 0.1 | |
| | 4,186,000 | | | | | Verizon Communications, Inc., 3.500%, 11/01/24 | | | 4,292,492 | | | | 0.2 | |
| | 7,358,000 | | | | | Verizon Communications, Inc., 4.150%, 03/15/24 | | | 7,910,034 | | | | 0.3 | |
| | 1,042,000 | | | | | Verizon Communications, Inc., 4.862%, 08/21/46 | | | 1,093,716 | | | | 0.0 | |
| | 1,206,000 | | | | | Verizon Communications, Inc., 5.012%, 08/21/54 | | | 1,256,979 | | | | 0.1 | |
| | 2,897,000 | | | | | Verizon Communications, Inc., 5.050%, 03/15/34 | | | 3,151,826 | | | | 0.1 | |
| | 4,814,000 | | | | | Verizon Communications, Inc., 5.150%, 09/15/23 | | | 5,523,016 | | | | 0.2 | |
| | 1,205,000 | | | | | Verizon Communications, Inc., 6.550%, 09/15/43 | | | 1,566,964 | | | | 0.1 | |
| | 2,226,000 | | | | | Viacom, Inc., 3.875%, 04/01/24 | | | 2,294,481 | | | | 0.1 | |
| | 2,551,000 | | | | | Viacom, Inc., 4.250%, 09/01/23 | | | 2,699,769 | | | | 0.1 | |
| | 1,200,000 | | | | | Viacom, Inc., 4.375%, 03/15/43 | | | 1,123,242 | | | | 0.0 | |
| | 1,824,000 | | | | | WPP Finance 2010, 3.750%, 09/19/24 | | | 1,906,888 | | | | 0.1 | |
| | | | | | | | | | 148,410,422 | | | | 5.6 | |
| | | | | | | | | | | | | | | |
| | | | | | | Consumer, Cyclical: 1.5% | | | | | | | | |
| | 1,375,000 | | | # | | Carlson Wagonlit BV, 6.875%, 06/15/19 | | | 1,447,188 | | | | 0.1 | |
| | 500,000 | | | # | | Cedar Fair L.P. / Canada's Wonderland Co. / Magnum Management Corp., 5.375%, 06/01/24 | | | 511,875 | | | | 0.0 | |
| | 2,010,000 | | | | | Chrysler Group LLC/CG Co-Issuer, Inc., 8.250%, 06/15/21 | | | 2,239,361 | | | | 0.1 | |
| | 561,000 | | | | | Ford Motor Co., 3.000%, 06/12/17 | | | 578,365 | | | | 0.0 | |
| | 1,466,000 | | | | | Ford Motor Co., 4.750%, 01/15/43 | | | 1,609,463 | | | | 0.1 | |
| | 1,065,000 | | | | | Ford Motor Credit Co. LLC, 8.125%, 01/15/20 | | | 1,332,084 | | | | 0.0 | |
| | 2,091,000 | | | | | Ford Motor Credit Co. LLC, 2.597%, 11/04/19 | | | 2,120,847 | | | | 0.1 | |
| | 1,335,000 | | | | | General Motors Co., 4.875%, 10/02/23 | | | 1,452,098 | | | | 0.1 | |
| | 1,608,000 | | | | | Johnson Controls, Inc., 4.625%, 07/02/44 | | | 1,731,853 | | | | 0.1 | |
| | 2,623,000 | | | | | Kohl's Corp., 4.750%, 12/15/23 | | | 2,886,150 | | | | 0.1 | |
| | 900,000 | | | L | | Lennar Corp., 4.750%, 12/15/17 | | | 940,500 | | | | 0.0 | |
| | 2,292,000 | | | | | MDC Holdings, Inc., 6.000%, 01/15/43 | | | 1,953,930 | | | | 0.1 | |
See Accompanying Notes to Financial Statements
| Voya Intermediate Bond Fund | PORTFOLIO OF INVESTMENTS as of March 31, 2015 (continued) |
| | 2,480,000 | | | | | MGM Resorts International, 6.750%, 10/01/20 | | | 2,656,700 | | | | 0.1 | |
| | 1,805,000 | | | | | Newell Rubbermaid, Inc., 2.875%, 12/01/19 | | | 1,841,365 | | | | 0.1 | |
| | 335,000 | | | | | Ryland Group, Inc., 6.625%, 05/01/20 | | | 363,475 | | | | 0.0 | |
| | 1,680,000 | | | #,& | | Schaeffler Holding Finance BV, 6.875%, 08/15/18 | | | 1,761,900 | | | | 0.1 | |
| | 1,260,000 | | | | | Suburban Propane Partners L.P./Suburban Energy Finance Corp., 5.750%, 03/01/25 | | | 1,291,500 | | | | 0.0 | |
| | 269,000 | | | | | Suburban Propane Partners L.P./Suburban Energy Finance Corp., 7.375%, 08/01/21 | | | 290,520 | | | | 0.0 | |
| | 863,000 | | | | | Toll Brothers Finance Corp., 6.750%, 11/01/19 | | | 979,505 | | | | 0.0 | |
| | 3,076,000 | | | | | Walgreens Boots Alliance, Inc., 3.800%, 11/18/24 | | | 3,186,696 | | | | 0.1 | |
| | 1,632,000 | | | | | Whirlpool Corp., 4.000%, 03/01/24 | | | 1,725,378 | | | | 0.1 | |
| | 1,768,000 | | | | | Yum! Brands, Inc., 3.875%, 11/01/23 | | | 1,840,902 | | | | 0.1 | |
| | 3,182,000 | | | | | Yum! Brands, Inc., 5.350%, 11/01/43 | | | 3,538,381 | | | | 0.1 | |
| | | | | | | | | | 38,280,036 | | | | 1.5 | |
| | | | | | | | | | | | | | | |
| | | | | | | Consumer, Non-cyclical: 6.6% | | | | | | | | |
| | 3,053,000 | | | | | Actavis Funding SCS, 3.450%, 03/15/22 | | | 3,131,603 | | | | 0.1 | |
| | 2,017,000 | | | | | Actavis Funding SCS, 3.800%, 03/15/25 | | | 2,084,132 | | | | 0.1 | |
| | 2,108,000 | | | | | Actavis Funding SCS, 3.850%, 06/15/24 | | | 2,181,548 | | | | 0.1 | |
| | 3,111,000 | | | | | Actavis Funding SCS, 4.850%, 06/15/44 | | | 3,317,841 | | | | 0.1 | |
| | 3,661,000 | | | | | Altria Group, Inc., 2.625%, 01/14/20 | | | 3,718,899 | | | | 0.1 | |
| | 1,951,000 | | | | | Altria Group, Inc., 5.375%, 01/31/44 | | | 2,290,938 | | | | 0.1 | |
| | 1,950,000 | | | | | AmerisourceBergen Corp., 3.250%, 03/01/25 | | | 1,980,059 | | | | 0.1 | |
| | 785,000 | | | | | Amgen, Inc., 3.875%, 11/15/21 | | | 845,856 | | | | 0.0 | |
| | 366,000 | | | | | Amgen, Inc., 5.150%, 11/15/41 | | | 423,188 | | | | 0.0 | |
| | 2,901,000 | | | | | Amsurg Corp., 5.625%, 07/15/22 | | | 2,980,777 | | | | 0.1 | |
| | 2,922,000 | | | # | | Bayer US Finance LLC, 2.375%, 10/08/19 | | | 2,974,459 | | | | 0.1 | |
| | 2,506,000 | | | # | | Bayer US Finance LLC, 3.000%, 10/08/21 | | | 2,595,028 | | | | 0.1 | |
| | 1,983,000 | | | | | Becton Dickinson and Co., 1.800%, 12/15/17 | | | 1,999,090 | | | | 0.1 | |
| | 1,983,000 | | | | | Becton Dickinson and Co., 2.675%, 12/15/19 | | | 2,031,268 | | | | 0.1 | |
| | 3,085,000 | | | | | Becton Dickinson and Co., 3.734%, 12/15/24 | | | 3,237,769 | | | | 0.1 | |
| | 1,882,000 | | | | | Cardinal Health, Inc., 2.400%, 11/15/19 | | | 1,906,588 | | | | 0.1 | |
| | 3,251,000 | | | | | Celgene Corp., 3.250%, 08/15/22 | | | 3,329,258 | | | | 0.1 | |
| | 3,463,000 | | | | | Celgene Corp., 2.250%, 05/15/19 | | | 3,501,498 | | | | 0.1 | |
| | 319,000 | | | | | Constellation Brands, Inc., 7.250%, 05/15/17 | | | 352,694 | | | | 0.0 | |
| | 1,140,000 | | | # | | ERAC USA Finance LLC, 2.800%, 11/01/18 | | | 1,173,995 | | | | 0.0 | |
| | 1,218,000 | | | | | Express Scripts Holding Co., 3.500%, 06/15/24 | | | 1,256,363 | | | | 0.0 | |
| | 3,107,000 | | | | | General Mills, Inc., 2.200%, 10/21/19 | | | 3,136,417 | | | | 0.1 | |
| | 2,210,000 | | | | | Gilead Sciences, Inc., 3.500%, 02/01/25 | | | 2,337,172 | | | | 0.1 | |
| | 600,000 | | | | | HCA Holdings, Inc., 7.750%, 05/15/21 | | | 639,936 | | | | 0.0 | |
| | 1,005,000 | | | | | HCA, Inc., 5.250%, 04/15/25 | | | 1,086,656 | | | | 0.0 | |
| | 1,500,000 | | | | | HCA, Inc., 5.875%, 03/15/22 | | | 1,661,250 | | | | 0.1 | |
| | 2,695,000 | | | | | HealthSouth Corp., 5.125%, 03/15/23 | | | 2,755,638 | | | | 0.1 | |
| | 2,920,000 | | | | | HJ Heinz Co., 4.250%, 10/15/20 | | | 2,999,570 | | | | 0.1 | |
| | 1,153,000 | | | | | Humana, Inc., 3.150%, 12/01/22 | | | 1,162,172 | | | | 0.0 | |
| | 2,021,000 | | | # | | JM Smucker Co, 3.500%, 03/15/25 | | | 2,081,968 | | | | 0.1 | |
| | 3,781,000 | | | | | Kroger Co., 2.300%, 01/15/19 | | | 3,839,295 | | | | 0.1 | |
| | 1,983,000 | | | | | Laboratory Corp. of America Holdings, 2.200%, 08/23/17 | | | 2,019,277 | | | | 0.1 | |
| | 4,638,000 | | | | | Laboratory Corp. of America Holdings, 2.625%, 02/01/20 | | | 4,672,298 | | | | 0.2 | |
| | 1,900,000 | | | | | Laboratory Corp. of America Holdings, 3.200%, 02/01/22 | | | 1,926,277 | | | | 0.1 | |
| | 2,289,000 | | | | | McKesson Corp., 2.284%, 03/15/19 | | | 2,316,834 | | | | 0.1 | |
| | 4,000,000 | | | | | McKesson Corp., 3.796%, 03/15/24 | | | 4,228,188 | | | | 0.2 | |
| | 464,000 | | | | | Medtronic, Inc., 2.750%, 04/01/23 | | | 465,482 | | | | 0.0 | |
| | 2,493,000 | | | # | | Medtronic, Inc., 3.150%, 03/15/22 | | | 2,591,060 | | | | 0.1 | |
| | 4,121,000 | | | # | | Medtronic, Inc., 3.500%, 03/15/25 | | | 4,317,110 | | | | 0.2 | |
| | 1,155,000 | | | | | Medtronic, Inc., 3.625%, 03/15/24 | | | 1,227,689 | | | | 0.0 | |
| | 1,895,000 | | | # | | Medtronic, Inc., 4.375%, 03/15/35 | | | 2,073,515 | | | | 0.1 | |
| | 1,830,000 | | | # | | Medtronic, Inc., 4.625%, 03/15/45 | | | 2,079,804 | | | | 0.1 | |
| | 1,980,000 | | | | | Merck & Co., Inc., 1.850%, 02/10/20 | | | 1,992,197 | | | | 0.1 | |
| | 5,080,000 | | | | | Merck & Co., Inc., 2.350%, 02/10/22 | | | 5,088,900 | | | | 0.2 | |
| | 2,170,000 | | | | | Merck & Co., Inc., 2.750%, 02/10/25 | | | 2,172,895 | | | | 0.1 | |
| | 4,141,000 | | | | | Perrigo Finance plc, 3.900%, 12/15/24 | | | 4,295,339 | | | | 0.2 | |
| | 2,719,000 | | | | | Pfizer, Inc., 3.400%, 05/15/24 | | | 2,857,305 | | | | 0.1 | |
| | 2,344,000 | | | | | Philip Morris International, Inc., 1.250%, 11/09/17 | | | 2,357,480 | | | | 0.1 | |
| | 2,315,000 | | | | | Philip Morris International, Inc., 3.250%, 11/10/24 | | | 2,379,614 | | | | 0.1 | |
See Accompanying Notes to Financial Statements
| Voya Intermediate Bond Fund | PORTFOLIO OF INVESTMENTS as of March 31, 2015 (continued) |
| | 3,636,000 | | | | | Philip Morris International, Inc., 4.250%, 11/10/44 | | | 3,823,541 | | | | 0.1 | |
| | 2,000,000 | | | | | Reynolds Group Issuer, Inc., 5.750%, 10/15/20 | | | 2,072,500 | | | | 0.1 | |
| | 2,079,000 | | | | | RR Donnelley & Sons Co., 6.500%, 11/15/23 | | | 2,219,333 | | | | 0.1 | |
| | 1,434,000 | | | | | St Jude Medical, Inc., 3.250%, 04/15/23 | | | 1,469,319 | | | | 0.1 | |
| | 1,320,000 | | | | | St Jude Medical, Inc., 4.750%, 04/15/43 | | | 1,450,914 | | | | 0.1 | |
| | 3,277,000 | | | | | Synchrony Financial, 3.750%, 08/15/21 | | | 3,400,851 | | | | 0.1 | |
| | 1,370,000 | | | | | Synchrony Financial, 3.000%, 08/15/19 | | | 1,400,578 | | | | 0.1 | |
| | 2,473,000 | | | | | Synchrony Financial, 4.250%, 08/15/24 | | | 2,588,224 | | | | 0.1 | |
| | 2,355,000 | | | | | Sysco Corp., 3.500%, 10/02/24 | | | 2,446,708 | | | | 0.1 | |
| | 2,405,000 | | | | | Tenet Healthcare Corp., 6.000%, 10/01/20 | | | 2,552,306 | | | | 0.1 | |
| | 3,236,000 | | | | | Tyson Foods, Inc., 3.950%, 08/15/24 | | | 3,425,335 | | | | 0.1 | |
| | 1,236,000 | | | | | Tyson Foods, Inc., 5.150%, 08/15/44 | | | 1,444,443 | | | | 0.1 | |
| | 2,135,000 | | | | | United Rentals North America, Inc., 7.625%, 04/15/22 | | | 2,346,365 | | | | 0.1 | |
| | 3,000,000 | | | # | | Universal Health Services, Inc., 4.750%, 08/01/22 | | | 3,157,500 | | | | 0.1 | |
| | 1,000,000 | | | # | | Valeant Pharmaceuticals International, 5.625%, 12/01/21 | | | 1,017,500 | | | | 0.0 | |
| | 915,000 | | | # | | Valeant Pharmaceuticals International, 7.250%, 07/15/22 | | | 971,044 | | | | 0.0 | |
| | 1,000,000 | | | # | | VPI Escrow Corp., 6.375%, 10/15/20 | | | 1,042,500 | | | | 0.0 | |
| | 2,309,000 | | | | | Anthem, Inc., 3.500%, 08/15/24 | | | 2,375,469 | | | | 0.1 | |
| | 2,171,000 | | | | | WellPoint, Inc., 4.625%, 05/15/42 | | | 2,362,901 | | | | 0.1 | |
| | 2,134,000 | | | | | WellPoint, Inc., 4.650%, 08/15/44 | | | 2,359,423 | | | | 0.1 | |
| | 1,753,000 | | | # | | WM Wrigley Jr Co., 2.400%, 10/21/18 | | | 1,785,892 | | | | 0.1 | |
| | 2,464,000 | | | # | | WM Wrigley Jr Co., 2.900%, 10/21/19 | | | 2,543,176 | | | | 0.1 | |
| | 2,880,000 | | | | | Zimmer Holdings, Inc., 3.550%, 04/01/25 | | | 2,940,944 | | | | 0.1 | |
| | 1,780,000 | | | | | Zimmer Holdings, Inc., 4.450%, 08/15/45 | | | 1,854,538 | | | | 0.1 | |
| | 1,267,000 | | | | | Zoetis, Inc., 1.875%, 02/01/18 | | | 1,268,404 | | | | 0.1 | |
| | | | | | | | | | 172,393,897 | | | | 6.6 | |
| | | | | | | | | | | | | | | |
| | | | | | | Diversified: 0.2% | | | | | | | | |
| | 1,700,000 | | | # | | Hutchison Whampoa International 12 Ltd., 6.000%, 05/29/49 | | | 1,811,299 | | | | 0.1 | |
| | 2,760,000 | | | | | MUFG Americas Holdings Corp., 2.250%, 02/10/20 | | | 2,768,460 | | | | 0.1 | |
| | 1,185,000 | | | # | | Tenedora Nemak SA de CV, 5.500%, 02/28/23 | | | 1,226,475 | | | | 0.0 | |
| | | | | | | | | | 5,806,234 | | | | 0.2 | |
| | | | | | | | | | | | | | | |
| | | | | | | Energy: 3.1% | | | | | | | | |
| | 825,000 | | | | | Alpha Natural Resources, Inc., 6.250%, 06/01/21 | | | 212,437 | | | | 0.0 | |
| | 870,000 | | | | | Anadarko Petroleum Corp., 6.375%, 09/15/17 | | | 968,368 | | | | 0.0 | |
| | 870,000 | | | | | Antero Resources Corp., 5.375%, 11/01/21 | | | 847,163 | | | | 0.0 | |
| | 850,000 | | | # | | Antero Resources Corp., 5.625%, 06/01/23 | | | 843,625 | | | | 0.0 | |
| | 2,380,000 | | | | | BP Capital Markets PLC, 2.315%, 02/13/20 | | | 2,401,622 | | | | 0.1 | |
| | 1,876,000 | | | | | BP Capital Markets PLC, 3.062%, 03/17/22 | | | 1,910,154 | | | | 0.1 | |
| | 2,551,000 | | | | | Cenovus Energy, Inc., 3.800%, 09/15/23 | | | 2,537,431 | | | | 0.1 | |
| | 1,300,000 | | | | | Chesapeake Energy Corp., 6.125%, 02/15/21 | | | 1,322,750 | | | | 0.1 | |
| | 1,350,000 | | | | | Chesapeake Energy Corp., 6.625%, 08/15/20 | | | 1,400,625 | | | | 0.1 | |
| | 1,678,000 | | | | | ConocoPhillips Co., 3.350%, 11/15/24 | | | 1,731,263 | | | | 0.1 | |
| | 1,678,000 | | | | | ConocoPhillips Co., 4.300%, 11/15/44 | | | 1,785,749 | | | | 0.1 | |
| | 2,172,000 | | | L | | Diamond Offshore Drilling, Inc., 3.450%, 11/01/23 | | | 2,089,944 | | | | 0.1 | |
| | 1,467,000 | | | # | | Dolphin Energy Ltd., 5.500%, 12/15/21 | | | 1,690,427 | | | | 0.1 | |
| | 1,843,000 | | | | | El Paso Pipeline Partners Operating Co. LLC, 4.300%, 05/01/24 | | | 1,879,759 | | | | 0.1 | |
| | 1,652,000 | | | # | | Enable Midstream Partners L.P., 3.900%, 05/15/24 | | | 1,594,809 | | | | 0.1 | |
| | 1,402,000 | | | # | | Enable Midstream Partners L.P., 5.000%, 05/15/44 | | | 1,284,121 | | | | 0.0 | |
| | 1,523,000 | | | | | Enbridge Energy Partners, 9.875%, 03/01/19 | | | 1,919,521 | | | | 0.1 | |
| | 891,000 | | | | | Enbridge, Inc., 3.500%, 06/10/24 | | | 876,919 | | | | 0.0 | |
| | 1,770,000 | | | | | Enbridge, Inc., 4.000%, 10/01/23 | | | 1,803,143 | | | | 0.1 | |
| | 504,000 | | | | | Enbridge, Inc., 4.500%, 06/10/44 | | | 469,693 | | | | 0.0 | |
| | 1,070,000 | | | | | Energy Transfer Equity L.P., 7.500%, 10/15/20 | | | 1,203,750 | | | | 0.0 | |
| | 1,217,000 | | | | | Energy Transfer Partners L.P., 4.650%, 06/01/21 | | | 1,302,042 | | | | 0.1 | |
| | 2,074,000 | | | | | Energy Transfer Partners L.P., 6.050%, 06/01/41 | | | 2,304,372 | | | | 0.1 | |
| | 1,244,000 | | | | | Energy Transfer Partners L.P., 9.700%, 03/15/19 | | | 1,565,014 | | | | 0.1 | |
| | 1,706,000 | | | L | | Ensco PLC, 4.500%, 10/01/24 | | | 1,656,695 | | | | 0.1 | |
| | 1,270,000 | | | | | Enterprise Products Operating LLC, 3.750%, 02/15/25 | | | 1,316,280 | | | | 0.1 | |
See Accompanying Notes to Financial Statements
| Voya Intermediate Bond Fund | PORTFOLIO OF INVESTMENTS as of March 31, 2015 (continued) |
| | 1,231,000 | | | | | EQT Midstream Partners L.P., 4.000%, 08/01/24 | | | 1,224,388 | | | | 0.0 | |
| | 1,810,000 | | | | | FMC Technologies, Inc., 3.450%, 10/01/22 | | | 1,782,475 | | | | 0.1 | |
| | 1,254,000 | | | | | Halliburton Co., 4.750%, 08/01/43 | | | 1,374,632 | | | | 0.1 | |
| | 285,000 | | | # | | Hilcorp Energy I L.P./Hilcorp Finance Co., 5.000%, 12/01/24 | | | 269,325 | | | | 0.0 | |
| | 1,270,000 | | | | | Kinder Morgan Energy Partners L.P., 4.250%, 09/01/24 | | | 1,301,072 | | | | 0.0 | |
| | 1,766,000 | | | | | Kinder Morgan Energy Partners L.P., 5.400%, 09/01/44 | | | 1,836,638 | | | | 0.1 | |
| | 1,207,000 | | | | | Kinder Morgan, Inc./DE, 4.300%, 06/01/25 | | | 1,241,409 | | | | 0.0 | |
| | 1,310,000 | | | | | Kinder Morgan, Inc./DE, 5.050%, 02/15/46 | | | 1,313,500 | | | | 0.1 | |
| | 1,113,000 | | | | | Marathon Petroleum Corp., 4.750%, 09/15/44 | | | 1,137,260 | | | | 0.0 | |
| | 863,000 | | | | | Marathon Petroleum Corp., 5.000%, 09/15/54 | | | 870,000 | | | | 0.0 | |
| | 2,254,000 | | | | | Marathon Petroleum Corp., 6.500%, 03/01/41 | | | 2,755,988 | | | | 0.1 | |
| | 2,500,000 | | | | | Newfield Exploration Co., 5.375%, 01/01/26 | | | 2,530,000 | | | | 0.1 | |
| | 650,000 | | | | | ONEOK Partners L.P., 2.000%, 10/01/17 | | | 648,480 | | | | 0.0 | |
| | 663,000 | | | | | ONEOK Partners L.P., 3.375%, 10/01/22 | | | 630,049 | | | | 0.0 | |
| | 1,443,000 | | | | | Phillips 66, 2.950%, 05/01/17 | | | 1,492,977 | | | | 0.1 | |
| | 2,530,000 | | | | | Phillips 66, 4.875%, 11/15/44 | | | 2,720,580 | | | | 0.1 | |
| | 1,145,000 | | | | | Regency Energy Partners L.P. / Regency Energy Finance Corp., 4.500%, 11/01/23 | | | 1,156,450 | | | | 0.0 | |
| | 1,145,000 | | | | | Regency Energy Partners L.P. / Regency Energy Finance Corp., 5.500%, 04/15/23 | | | 1,187,938 | | | | 0.0 | |
| | 1,220,000 | | | | | Rowan Cos, Inc., 5.850%, 01/15/44 | | | 1,054,789 | | | | 0.0 | |
| | 1,330,000 | | | | | SandRidge Energy, Inc., 7.500%, 03/15/21 | | | 831,250 | | | | 0.0 | |
| | 1,367,000 | | | # | | Schlumberger Investment SA, 3.300%, 09/14/21 | | | 1,436,173 | | | | 0.1 | |
| | 2,017,000 | | | | | Spectra Energy Partners L.P., 3.500%, 03/15/25 | | | 2,031,190 | | | | 0.1 | |
| | 2,860,000 | | | | | Statoil ASA, 2.450%, 01/17/23 | | | 2,819,128 | | | | 0.1 | |
| | 850,000 | | | | | Sunoco Logistics Partners Operations L.P., 4.250%, 04/01/24 | | | 874,461 | | | | 0.0 | |
| | 910,000 | | | | | Sunoco Logistics Partners Operations L.P., 5.350%, 05/15/45 | | | 960,692 | | | | 0.0 | |
| | 790,000 | | | | | Transcontinental Gas Pipe Line Corp., 6.400%, 04/15/16 | | | 831,372 | | | | 0.0 | |
| | 2,600,000 | | | | | Transocean, Inc., 2.500%, 10/15/17 | | | 2,395,250 | | | | 0.1 | |
| | 1,070,000 | | | L | | Transocean, Inc., 3.800%, 10/15/22 | | | 785,113 | | | | 0.0 | |
| | 2,042,000 | | | | | Weatherford International Ltd., 5.950%, 04/15/42 | | | 1,800,652 | | | | 0.1 | |
| | 969,000 | | | | | Weatherford International Ltd., 6.750%, 09/15/40 | | | 911,682 | | | | 0.0 | |
| | 1,285,000 | | | | | Williams Cos, Inc., 4.550%, 06/24/24 | | | 1,251,485 | | | | 0.0 | |
| | | | | | | | | | 82,374,074 | | | | 3.1 | |
| | | | | | | | | | | | | | | |
| | | | | | | Financial: 10.6% | | | | | | | | |
| | 3,513,600 | | | | | Aegon NV, 2.168%, 07/29/49 | | | 3,018,762 | | | | 0.1 | |
| | 1,636,000 | | | | | American International Group, Inc., 3.375%, 08/15/20 | | | 1,728,349 | | | | 0.1 | |
| | 2,876,000 | | | | | American International Group, Inc., 3.875%, 01/15/35 | | | 2,900,627 | | | | 0.1 | |
| | 1,050,000 | | | | | American International Group, Inc., 5.850%, 01/16/18 | | | 1,173,757 | | | | 0.0 | |
| | 88,000 | | | | | American International Group, Inc., 8.175%, 05/15/68 | | | 125,228 | | | | 0.0 | |
| | 2,195,000 | | | | | Air Lease Corp., 3.750%, 02/01/22 | | | 2,233,702 | | | | 0.1 | |
| | 1,100,000 | | | | | Air Lease Corp., 3.875%, 04/01/21 | | | 1,138,500 | | | | 0.0 | |
| | 2,568,000 | | | | | Air Lease Corp., 4.250%, 09/15/24 | | | 2,651,460 | | | | 0.1 | |
| | 3,450,000 | | | | | American Express Co., 4.900%, 12/29/49 | | | 3,508,650 | | | | 0.1 | |
| | 2,894,000 | | | | | American Tower Corp., 3.400%, 02/15/19 | | | 2,991,288 | | | | 0.1 | |
| | 2,961,000 | | | | | American Tower Corp., 3.450%, 09/15/21 | | | 3,026,838 | | | | 0.1 | |
| | 1,410,000 | | | | | American Tower Corp., 4.500%, 01/15/18 | | | 1,512,797 | | | | 0.1 | |
| | 3,374,000 | | | | | AvalonBay Communities, Inc., 3.500%, 11/15/24 | | | 3,473,445 | | | | 0.1 | |
| | 400,000 | | | # | | Banco de Reservas de LA Republica Dominicana, 7.000%, 02/01/23 | | | 404,164 | | | | 0.0 | |
| | 1,973,000 | | | | | Bank of America Corp., 4.125%, 01/22/24 | | | 2,115,107 | | | | 0.1 | |
| | 2,540,000 | | | | | Bank of America Corp., 4.250%, 10/22/26 | | | 2,625,735 | | | | 0.1 | |
| | 3,564,000 | | | | | Bank of America Corp., 4.200%, 08/26/24 | | | 3,691,477 | | | | 0.1 | |
| | 1,725,000 | | | | | Bank of America Corp., 4.000%, 04/01/24 | | | 1,837,689 | | | | 0.1 | |
| | 3,453,000 | | | | | Bank of America Corp., 5.000%, 01/21/44 | | | 3,979,900 | | | | 0.2 | |
| | 3,158,000 | | | # | | Barclays Bank PLC, 6.050%, 12/04/17 | | | 3,479,737 | | | | 0.1 | |
| | 2,034,000 | | | | | Barclays PLC, 3.650%, 03/16/25 | | | 2,044,579 | | | | 0.1 | |
| | 1,333,000 | | | | | BPCE SA, 2.500%, 12/10/18 | | | 1,365,848 | | | | 0.1 | |
| | 3,034,000 | | | # | | BPCE SA, 5.150%, 07/21/24 | | | 3,247,821 | | | | 0.1 | |
| | 2,111,000 | | | # | | BPCE SA, 5.700%, 10/22/23 | | | 2,341,487 | | | | 0.1 | |
| | 3,040,000 | | | | | Capital One NA/Mclean VA, 1.650%, 02/05/18 | | | 3,030,436 | | | | 0.1 | |
See Accompanying Notes to Financial Statements
| Voya Intermediate Bond Fund | PORTFOLIO OF INVESTMENTS as of March 31, 2015 (continued) |
| | 3,020,000 | | | | | Citigroup, Inc., 1.800%, 02/05/18 | | | 3,027,943 | | | | 0.1 | |
| | 1,682,000 | | | | | Citigroup, Inc., 3.500%, 05/15/23 | | | 1,679,105 | | | | 0.1 | |
| | 2,077,000 | | | | | Citigroup, Inc., 4.000%, 08/05/24 | | | 2,134,923 | | | | 0.1 | |
| | 4,457,000 | | | | | Citigroup, Inc., 5.500%, 09/13/25 | | | 5,061,748 | | | | 0.2 | |
| | 783,000 | | | | | Citigroup, Inc., 6.675%, 09/13/43 | | | 1,048,049 | | | | 0.0 | |
| | 5,130,000 | | | | | Citizens Bank NA/Providence RI, 2.450%, 12/04/19 | | | 5,198,783 | | | | 0.2 | |
| | 3,057,000 | | | | | Comerica, Inc., 3.800%, 07/22/26 | | | 3,117,703 | | | | 0.1 | |
| | 1,490,000 | | | | | Cooperatieve Centrale Raiffeisen-Boerenleenbank BA/Netherlands, 5.750%, 12/01/43 | | | 1,859,255 | | | | 0.1 | |
| | 1,660,000 | | | # | | Cooperatieve Centrale Raiffeisen-Boerenleenbank BA/Netherlands, 11.000%, 12/29/49 | | | 2,141,400 | | | | 0.1 | |
| | 2,886,000 | | | | | Corporate Office Properties L.P., 3.700%, 06/15/21 | | | 2,921,281 | | | | 0.1 | |
| | 3,396,000 | | | #,L | | Credit Agricole SA/London, 2.500%, 04/15/19 | | | 3,466,528 | | | | 0.1 | |
| | 3,890,000 | | | # | | Credit Agricole SA, 4.375%, 03/17/25 | | | 3,941,161 | | | | 0.1 | |
| | 4,386,000 | | | # | | Credit Suisse AG, 6.500%, 08/08/23 | | | 5,018,843 | | | | 0.2 | |
| | 2,699,000 | | | # | | Credit Suisse Group Funding Guernsey Ltd., 3.750%, 03/26/25 | | | 2,733,955 | | | | 0.1 | |
| | 4,144,000 | | | | | Credit Suisse/New York NY, 1.750%, 01/29/18 | | | 4,157,688 | | | | 0.2 | |
| | 5,989,000 | | | | | Deutsche Bank AG/London, 1.875%, 02/13/18 | | | 6,007,344 | | | | 0.2 | |
| | 1,284,000 | | | | | Discover Bank/Greenwood DE, 2.000%, 02/21/18 | | | 1,286,164 | | | | 0.0 | |
| | 805,000 | | | | | Discover Financial Services, 3.850%, 11/21/22 | | | 827,261 | | | | 0.0 | |
| | 367,000 | | | | | Discover Financial Services, 6.450%, 06/12/17 | | | 404,691 | | | | 0.0 | |
| | 1,840,000 | | | | | Equity One, Inc., 3.750%, 11/15/22 | | | 1,870,312 | | | | 0.1 | |
| | 4,104,000 | | | | | Fifth Third Bancorp, 4.500%, 06/01/18 | | | 4,392,733 | | | | 0.2 | |
| | 3,661,000 | | | # | | Five Corners Funding Trust, 4.419%, 11/15/23 | | | 3,934,671 | | | | 0.1 | |
| | 1,828,000 | | | | | General Electric Capital Corp., 5.300%, 02/11/21 | | | 2,113,192 | | | | 0.1 | |
| | 1,200,000 | | | | | General Electric Capital Corp., 6.250%, 12/15/49 | | | 1,356,000 | | | | 0.1 | |
| | 1,700,000 | | | | | General Electric Capital Corp., 7.125%, 12/15/49 | | | 2,001,750 | | | | 0.1 | |
| | 1,685,000 | | | | | Goldman Sachs Group, Inc., 2.550%, 10/23/19 | | | 1,710,615 | | | | 0.1 | |
| | 3,405,000 | | | | | Goldman Sachs Group, Inc., 2.600%, 04/23/20 | | | 3,445,216 | | | | 0.1 | |
| | 2,048,000 | | | | | Goldman Sachs Group, Inc., 2.900%, 07/19/18 | | | 2,117,272 | | | | 0.1 | |
| | 7,018,000 | | | | | Goldman Sachs Group, Inc., 3.850%, 07/08/24 | | | 7,353,229 | | | | 0.3 | |
| | 2,626,000 | | | | | Goldman Sachs Group, Inc., 4.000%, 03/03/24 | | | 2,778,421 | | | | 0.1 | |
| | 998,000 | | | | | Goldman Sachs Group, Inc., 6.750%, 10/01/37 | | | 1,313,094 | | | | 0.1 | |
| | 593,000 | | | | | Hartford Financial Services Group, Inc., 6.625%, 03/30/40 | | | 798,110 | | | | 0.0 | |
| | 1,763,000 | | | # | | HBOS PLC, 6.750%, 05/21/18 | | | 1,976,612 | | | | 0.1 | |
| | 3,158,000 | | | | | HCP, Inc., 3.875%, 08/15/24 | | | 3,215,305 | | | | 0.1 | |
| | 2,578,000 | | | | | HSBC Holdings PLC, 6.375%, 03/29/49 | | | 2,642,450 | | | | 0.1 | |
| | 2,544,000 | | | L | | HSBC Holdings PLC, 5.625%, 12/29/49 | | | 2,586,930 | | | | 0.1 | |
| | 3,121,000 | | | | | Huntington Bancshares, Inc./OH, 2.600%, 08/02/18 | | | 3,184,934 | | | | 0.1 | |
| | 2,100,000 | | | # | | ICICI Bank Ltd./Dubai, 4.700%, 02/21/18 | | | 2,232,031 | | | | 0.1 | |
| | 1,037,000 | | | # | | International Lease Finance Corp., 7.125%, 09/01/18 | | | 1,166,625 | | | | 0.0 | |
| | 2,416,000 | | | | | Intesa Sanpaolo SpA, 3.875%, 01/15/19 | | | 2,550,368 | | | | 0.1 | |
| | 3,100,000 | | | | | Intesa Sanpaolo SpA, 5.250%, 01/12/24 | | | 3,495,312 | | | | 0.1 | |
| | 559,000 | | | # | | IPIC GMTN Ltd., 3.750%, 03/01/17 | | | 584,155 | | | | 0.0 | |
| | 800,000 | | | # | | IPIC GMTN Ltd., 5.500%, 03/01/22 | | | 938,000 | | | | 0.0 | |
| | 2,207,000 | | | | | JPMorgan Chase & Co., 3.875%, 09/10/24 | | | 2,266,814 | | | | 0.1 | |
| | 3,727,000 | | | | | JPMorgan Chase & Co., 4.125%, 12/15/26 | | | 3,872,741 | | | | 0.1 | |
| | 1,755,000 | | | | | JPMorgan Chase & Co., 6.100%, 10/29/49 | | | 1,812,038 | | | | 0.1 | |
| | 1,643,000 | | | | | JPMorgan Chase & Co., 6.000%, 12/29/49 | | | 1,671,752 | | | | 0.1 | |
| | 1,202,000 | | | | | JPMorgan Chase & Co., 6.125%, 12/29/49 | | | 1,231,930 | | | | 0.0 | |
| | 1,858,000 | | | | | JPMorgan Chase & Co., 3.125%, 01/23/25 | | | 1,862,684 | | | | 0.1 | |
| | 2,989,000 | | | | | KeyBank NA/Cleveland OH, 2.250%, 03/16/20 | | | 3,011,734 | | | | 0.1 | |
| | 1,705,000 | | | | | Kimco Realty Corp., 3.125%, 06/01/23 | | | 1,698,362 | | | | 0.1 | |
| | 2,073,000 | | | | | Kimco Realty Corp., 3.200%, 05/01/21 | | | 2,128,407 | | | | 0.1 | |
| | 2,876,000 | | | | | Manufacturers & Traders Trust Co., 2.100%, 02/06/20 | | | 2,883,636 | | | | 0.1 | |
| | 3,294,000 | | | | | MetLife, Inc., 4.875%, 11/13/43 | | | 3,811,629 | | | | 0.1 | |
| | 1,881,000 | | | # | | Mizuho Bank Ltd., 3.200%, 03/26/25 | | | 1,882,708 | | | | 0.1 | |
| | 1,353,000 | | | | | Morgan Stanley, 2.125%, 04/25/18 | | | 1,368,653 | | | | 0.1 | |
| | 3,910,000 | | | | | Morgan Stanley, 2.650%, 01/27/20 | | | 3,976,044 | | | | 0.2 | |
| | 8,078,000 | | | | | Morgan Stanley, 3.875%, 04/29/24 | | | 8,510,948 | | | | 0.3 | |
| | 1,560,000 | | | | | Morgan Stanley, 4.300%, 01/27/45 | | | 1,623,586 | | | | 0.1 | |
See Accompanying Notes to Financial Statements
| Voya Intermediate Bond Fund | PORTFOLIO OF INVESTMENTS as of March 31, 2015 (continued) |
| | 2,228,000 | | | | | Morgan Stanley, 5.000%, 11/24/25 | | | 2,464,255 | | | | 0.1 | |
| | 435,000 | | | | | MPT Operating Partnership L.P./MPT Finance Corp., 6.375%, 02/15/22 | | | 473,150 | | | | 0.0 | |
| | 1,345,000 | | | # | | Nordea Bank AB, 6.125%, 12/29/49 | | | 1,390,364 | | | | 0.1 | |
| | 868,000 | | | | | PNC Bank NA, 4.200%, 11/01/25 | | | 948,509 | | | | 0.0 | |
| | 1,843,000 | | | | | PNC Bank NA, 2.250%, 07/02/19 | | | 1,869,626 | | | | 0.1 | |
| | 1,147,000 | | | # | | RBS Citizens Financial Group, Inc., 4.150%, 09/28/22 | | | 1,206,918 | | | | 0.0 | |
| | 3,914,000 | | | | | Santander Bank NA, 2.000%, 01/12/18 | | | 3,932,775 | | | | 0.1 | |
| | 2,893,000 | | | # | | Scentre Group Trust 1 / Scentre Group Trust 2, 3.500%, 02/12/25 | | | 2,963,225 | | | | 0.1 | |
| | 2,332,000 | | | | | Simon Property Group L.P., 4.250%, 10/01/44 | | | 2,451,016 | | | | 0.1 | |
| | 2,785,000 | | | | | State Street Corp., 3.300%, 12/16/24 | | | 2,899,012 | | | | 0.1 | |
| | 4,140,000 | | | | | Sumitomo Mitsui Banking Corp., 2.450%, 01/16/20 | | | 4,195,327 | | | | 0.2 | |
| | 1,860,000 | | | | | Synchrony Financial, 2.700%, 02/03/20 | | | 1,870,152 | | | | 0.1 | |
| | 1,470,000 | | | | | UBS AG/Stamford CT, 7.625%, 08/17/22 | | | 1,785,524 | | | | 0.1 | |
| | 3,360,000 | | | | | US Bancorp/MN, 3.600%, 09/11/24 | | | 3,509,527 | | | | 0.1 | |
| | 2,805,000 | | | | | Vornado Realty L.P., 2.500%, 06/30/19 | | | 2,830,293 | | | | 0.1 | |
| | 2,514,000 | | | # | | Washington Prime Group L.P., 3.850%, 04/01/20 | | | 2,538,978 | | | | 0.1 | |
| | 2,199,000 | | | | | Washington Real Estate Investment Trust, 4.950%, 10/01/20 | | | 2,391,586 | | | | 0.1 | |
| | 2,052,000 | | | # | | WEA Finance LLC / Westfield UK & Europe Finance PLC, 2.700%, 09/17/19 | | | 2,079,347 | | | | 0.1 | |
| | 2,181,000 | | | # | | WEA Finance LLC / Westfield UK & Europe Finance PLC, 3.750%, 09/17/24 | | | 2,260,231 | | | | 0.1 | |
| | 1,960,000 | | | | | Wells Fargo & Co., 2.150%, 01/30/20 | | | 1,971,458 | | | | 0.1 | |
| | 3,096,000 | | | | | Wells Fargo & Co., 4.100%, 06/03/26 | | | 3,266,491 | | | | 0.1 | |
| | 2,801,000 | | | | | Wells Fargo & Co., 4.650%, 11/04/44 | | | 2,999,563 | | | | 0.1 | |
| | 3,096,000 | | | | | Wells Fargo & Co., 5.375%, 11/02/43 | | | 3,661,726 | | | | 0.1 | |
| | 2,409,000 | | | | | Wells Fargo & Co., 5.900%, 12/29/49 | | | 2,514,394 | | | | 0.1 | |
| | 2,030,000 | | | | | XLIT Ltd., 5.500%, 03/31/45 | | | 2,038,118 | | | | 0.1 | |
| | | | | | | | | | 279,563,776 | | | | 10.6 | |
| | | | | | | | | | | | | | | |
| | | | | | | Industrial: 1.1% | | | | | | | | |
| | 1,872,000 | | | # | | AP Moeller - Maersk A/S, 2.550%, 09/22/19 | | | 1,904,741 | | | | 0.1 | |
| | 1,288,000 | | | | | Burlington Northern Santa Fe LLC, 4.550%, 09/01/44 | | | 1,417,454 | | | | 0.1 | |
| | 1,175,000 | | | | | Case New Holland, Inc., 7.875%, 12/01/17 | | | 1,307,540 | | | | 0.0 | |
| | 1,109,000 | | | | | Caterpillar, Inc., 3.400%, 05/15/24 | | | 1,164,068 | | | | 0.0 | |
| | 2,449,000 | | | # | | Cemex SAB de CV, 6.125%, 05/05/25 | | | 2,478,878 | | | | 0.1 | |
| | 640,000 | | | | | Cummins, Inc., 4.875%, 10/01/43 | | | 761,301 | | | | 0.0 | |
| | 2,319,000 | | | | | Eaton Corp., 1.500%, 11/02/17 | | | 2,328,814 | | | | 0.1 | |
| | 4,405,000 | | | | | FedEx Corp., 2.300%, 02/01/20 | | | 4,455,851 | | | | 0.2 | |
| | 1,380,000 | | | | | FedEx Corp., 3.200%, 02/01/25 | | | 1,401,587 | | | | 0.1 | |
| | 1,340,000 | | | | | FedEx Corp., 3.900%, 02/01/35 | | | 1,354,223 | | | | 0.0 | |
| | 2,679,000 | | | | | Ingersoll-Rand Global Holding Co. Ltd., 4.250%, 06/15/23 | | | 2,865,389 | | | | 0.1 | |
| | 1,163,000 | | | | | Jabil Circuit, Inc., 7.750%, 07/15/16 | | | 1,253,133 | | | | 0.0 | |
| | 2,940,000 | | | | | Lockheed Martin Corp., 3.800%, 03/01/45 | | | 2,935,884 | | | | 0.1 | |
| | 1,457,000 | | | | | Thermo Fisher Scientific, Inc., 1.850%, 01/15/18 | | | 1,462,920 | | | | 0.1 | |
| | 1,505,000 | | | | | Thermo Fisher Scientific, Inc., 2.400%, 02/01/19 | | | 1,527,525 | | | | 0.1 | |
| | | | | | | | | | 28,619,308 | | | | 1.1 | |
| | | | | | | | | | | | | | | |
| | | | | | | Technology: 1.3% | | | | | | | | |
| | 6,040,000 | | | | | Apple, Inc., 1.550%, 02/07/20 | | | 6,005,934 | | | | 0.2 | |
| | 2,930,000 | | | | | Apple, Inc., 2.150%, 02/09/22 | | | 2,894,600 | | | | 0.1 | |
| | 890,000 | | | | | Apple, Inc., 2.500%, 02/09/25 | | | 872,859 | | | | 0.0 | |
| | 945,000 | | | | | Apple, Inc., 4.450%, 05/06/44 | | | 1,057,427 | | | | 0.0 | |
| | 2,458,000 | | | | | Fidelity National Information Services, Inc., 3.500%, 04/15/23 | | | 2,470,673 | | | | 0.1 | |
| | 825,000 | | | | | Hewlett-Packard Co., 2.600%, 09/15/17 | | | 846,234 | | | | 0.0 | |
| | 2,673,000 | | | | | Hewlett-Packard Co., 3.000%, 09/15/16 | | | 2,744,190 | | | | 0.1 | |
| | 625,000 | | | | | Hewlett-Packard Co., 5.400%, 03/01/17 | | | 674,406 | | | | 0.0 | |
| | 3,020,000 | | | | | International Business Machines Corp., 1.125%, 02/06/18 | | | 3,015,446 | | | | 0.1 | |
| | 1,820,000 | | | | | KLA-Tencor Corp., 4.125%, 11/01/21 | | | 1,918,759 | | | | 0.1 | |
| | 1,410,000 | | | | | Microsoft Corp., 2.375%, 02/12/22 | | | 1,421,508 | | | | 0.1 | |
| | 1,530,000 | | | | | Microsoft Corp., 3.500%, 02/12/35 | | | 1,529,380 | | | | 0.1 | |
| | 1,360,000 | | | | | Microsoft Corp., 3.750%, 02/12/45 | | | 1,371,424 | | | | 0.1 | |
| | 2,000,000 | | | | | NCR Corp., 6.375%, 12/15/23 | | | 2,140,000 | | | | 0.1 | |
| | 1,254,000 | | | | | Oracle Corp., 3.400%, 07/08/21 | | | 1,319,727 | | | | 0.0 | |
| | 1,849,000 | | | | | Oracle Corp., 3.625%, 07/15/23 | | | 1,990,064 | | | | 0.1 | |
See Accompanying Notes to Financial Statements
| Voya Intermediate Bond Fund | PORTFOLIO OF INVESTMENTS as of March 31, 2015 (continued) |
| | 2,140,000 | | | | | Xerox Corp., 2.750%, 03/15/19 | | | 2,180,885 | | | | 0.1 | |
| | | | | | | | | | 34,453,516 | | | | 1.3 | |
| | | | | | | | | | | | | | | |
| | | | | | | Utilities: 1.4% | | | | | | | | |
| | 2,945,000 | | | | | AES Corporation, 5.500%, 04/15/20 | | | 2,915,550 | | | | 0.1 | |
| | 105,000 | | | | | AES Corp., 8.000%, 10/15/17 | | | 121,669 | | | | 0.0 | |
| | 771,000 | | | | | American Electric Power Co., Inc., 1.650%, 12/15/17 | | | 775,825 | | | | 0.0 | |
| | 3,124,000 | | | | | Berkshire Hathaway Energy Co., 3.500%, 02/01/25 | | | 3,260,019 | | | | 0.1 | |
| | 2,865,000 | | | # | | Calpine Corp., 6.000%, 01/15/22 | | | 3,079,875 | | | | 0.1 | |
| | 566,000 | | | | | CenterPoint Energy Houston Electric LLC, 3.550%, 08/01/42 | | | 560,829 | | | | 0.0 | |
| | 1,833,000 | | | | | Dominion Gas Holdings LLC, 3.600%, 12/15/24 | | | 1,925,746 | | | | 0.1 | |
| | 1,760,000 | | | | | Duke Energy Corp., 2.100%, 06/15/18 | | | 1,794,756 | | | | 0.1 | |
| | 1,406,000 | | | | | Duke Energy Corp., 3.950%, 10/15/23 | | | 1,537,434 | | | | 0.1 | |
| | 612,000 | | | # | | Duquesne Light Holdings, Inc., 5.900%, 12/01/21 | | | 720,714 | | | | 0.0 | |
| | 1,249,000 | | | # | | Duquesne Light Holdings, Inc., 6.400%, 09/15/20 | | | 1,481,619 | | | | 0.1 | |
| | 873,000 | | | # | | Empresa de Energia de Bogota SA, 6.125%, 11/10/21 | | | 938,475 | | | | 0.0 | |
| | 782,000 | | | | | Entergy Texas, Inc., 7.125%, 02/01/19 | | | 931,124 | | | | 0.0 | |
| | 1,019,000 | | | | | FirstEnergy Corp., 2.750%, 03/15/18 | | | 1,044,127 | | | | 0.0 | |
| | 1,519,000 | | | | | FirstEnergy Corp., 4.250%, 03/15/23 | | | 1,592,615 | | | | 0.1 | |
| | 618,000 | | | | | Metropolitan Edison, 7.700%, 01/15/19 | | | 739,081 | | | | 0.0 | |
| | 709,000 | | | | | Nevada Power Co., 7.125%, 03/15/19 | | | 849,444 | | | | 0.0 | |
| | 3,384,000 | | | | | NextEra Energy Capital Holdings, Inc., 2.700%, 09/15/19 | | | 3,471,009 | | | | 0.1 | |
| | 1,192,000 | | | | | NextEra Energy Capital Holdings, Inc., 3.625%, 06/15/23 | | | 1,249,762 | | | | 0.1 | |
| | 521,000 | | | | | Nisource Finance Corp., 5.950%, 06/15/41 | | | 672,922 | | | | 0.0 | |
| | 701,000 | | | | | Oncor Electric Delivery Co. LLC, 4.100%, 06/01/22 | | | 769,968 | | | | 0.0 | |
| | 980,000 | | | | | Oncor Electric Delivery Co. LLC, 6.800%, 09/01/18 | | | 1,145,281 | | | | 0.1 | |
| | 1,237,000 | | | | | Pacific Gas & Electric Co., 3.400%, 08/15/24 | | | 1,292,075 | | | | 0.1 | |
| | 577,000 | | | | | PPL Capital Funding, Inc., 3.400%, 06/01/23 | | | 599,321 | | | | 0.0 | |
| | 2,173,000 | �� | | | | PSEG Power LLC, 2.450%, 11/15/18 | | | 2,203,809 | | | | 0.1 | |
| | 1,169,000 | | | | | Southwestern Electric Power, 5.550%, 01/15/17 | | | 1,260,320 | | | | 0.1 | |
| | 1,030,000 | | | | | TransAlta Corp., 4.500%, 11/15/22 | | | 1,016,632 | | | | 0.0 | |
| | | | | | | | | | 37,950,001 | | | | 1.4 | |
| | | | | | | | | | | | | | | |
| | | | | Total Corporate Bonds/Notes | | | | | | | | |
| | | | | (Cost $845,871,318) | | | 873,740,026 | | | | 33.2 | |
| | | | | | | | | | | | | |
| COLLATERALIZED MORTGAGE OBLIGATIONS: 11.6% |
| | 6,881,637 | | | | | Alternative Loan Trust 2005-10CB, 0.674%, 05/25/35 | | | 5,801,564 | | | | 0.2 | |
| | 2,268,800 | | | | | Alternative Loan Trust 2005-6CB, 5.250%, 04/25/35 | | | 2,200,798 | | | | 0.1 | |
| | 4,540,919 | | | | | Alternative Loan Trust 2005-J2, 0.574%, 04/25/35 | | | 3,921,324 | | | | 0.2 | |
| | 1,436,220 | | | | | Alternative Loan Trust 2006-18CB A11, 0.674%, 07/25/36 | | | 1,009,644 | | | | 0.0 | |
| | 5,597,035 | | | | | Alternative Loan Trust 2007-2CB, 0.774%, 03/25/37 | | | 3,988,486 | | | | 0.2 | |
| | 3,777,590 | | | | | Alternative Loan Trust 2007-HY6, 0.394%, 08/25/47 | | | 3,596,523 | | | | 0.1 | |
| | 1,039,000 | | | # | | American General Mortgage Loan Trust, 5.650%, 03/25/58 | | | 1,063,052 | | | | 0.0 | |
| | 2,610,000 | | | # | | BAMLL Re-REMIC Trust 2015-FRR11, 09/27/44 | | | 2,382,237 | | | | 0.1 | |
| | 2,330,000 | | | # | | Bank of America Re-REMIC Trust 2014-FRR7 A, 2.421%, 10/26/44 | | | 2,299,553 | | | | 0.1 | |
| | 6,073,093 | | | # | | BAMLL Re-REMIC Trust 2014-FRR9, 2.192%, 12/26/46 | | | 6,000,665 | | | | 0.2 | |
| | 2,770,000 | | | | | Banc of America Commercial Mortgage Trust 2007-3 AJ, 5.575%, 06/10/49 | | | 2,855,643 | | | | 0.1 | |
| | 2,030,000 | | | | | Banc of America Commercial Mortgage Trust 2007-3 B, 5.575%, 06/10/49 | | | 2,075,979 | | | | 0.1 | |
| | 2,870,000 | | | | | Banc of America Commercial Mortgage Trust 2007-4 AJ, 5.821%, 02/10/51 | | | 3,034,445 | | | | 0.1 | |
| | 720,963 | | | # | | Banc of America Funding Corp., 5.250%, 08/26/35 | | | 747,297 | | | | 0.0 | |
| | 860,000 | | | | | Banc of America Merrill Lynch Commercial Mortgage, Inc. 2005-6 C, 5.179%, 09/10/47 | | | 876,484 | | | | 0.0 | |
| | 4,557,000 | | | | | Banc of America Merrill Lynch Commercial Mortgage, Inc., 5.147%, 07/10/45 | | | 4,645,258 | | | | 0.2 | |
| | 1,030,000 | | | | | Banc of America Merrill Lynch Commercial Mortgage, Inc., 5.179%, 09/10/47 | | | 1,045,867 | | | | 0.0 | |
| | 1,900,000 | | | | | Banc of America Merrill Lynch Commercial Mortgage, Inc., 5.331%, 09/10/47 | | | 1,941,373 | | | | 0.1 | |
See Accompanying Notes to Financial Statements
| Voya Intermediate Bond Fund | PORTFOLIO OF INVESTMENTS as of March 31, 2015 (continued) |
| | 1,300,000 | | | # | | Banc of America Merrill Lynch Commercial Mortgage, Inc., 5.418%, 07/10/42 | | | 1,285,945 | | | | 0.1 | |
| | 480,000 | | | # | | Banc of America Merrill Lynch Commercial Mortgage, Inc., 5.754%, 03/11/41 | | | 480,404 | | | | 0.0 | |
| | 1,271,000 | | | # | | Banc of America Merrill Lynch Commercial Mortgage, Inc., 5.754%, 03/11/41 | | | 1,424,698 | | | | 0.1 | |
| | 851,120 | | | | | Banc of America Mortgage 2005-J Trust 2A4, 2.700%, 11/25/35 | | | 788,937 | | | | 0.0 | |
| | 860,000 | | | # | | Bank of America Merrill Lynch Commercial Mortgage, Inc., 5.456%, 07/10/43 | | | 862,040 | | | | 0.0 | |
| | 1,710,000 | | | # | | Bank of America Merrill Lynch Commercial Mortgage, Inc., 6.233%, 11/10/38 | | | 1,748,817 | | | | 0.1 | |
| | 3,926,131 | | | | | BCAP LLC Trust 2007-AA2, 0.384%, 05/25/47 | | | 2,928,874 | | | | 0.1 | |
| | 1,422,008 | | | | | Bear Stearns Adjustable Rate Mortgage Trust, 2.657%, 07/25/36 | | | 1,193,069 | | | | 0.0 | |
| | 4,183,200 | | | | | Bear Stearns Alternative-A Trust, 2.671%, 05/25/35 | | | 4,062,705 | | | | 0.2 | |
| | 2,180,000 | | | # | | Bear Stearns Commercial Mortgage Securities Trust 2004-PWR4, 5.859%, 06/11/41 | | | 2,363,738 | | | | 0.1 | |
| | 1,400,000 | | | # | | Bear Stearns Commercial Mortgage Securities Trust 2005-TOP18 G 2/42, 5.743%, 02/13/42 | | | 1,338,249 | | | | 0.1 | |
| | 3,520,000 | | | # | | Bear Stearns Commercial Mortgage Securities Trust 2005-TOP18, 5.743%, 02/13/42 | | �� | 3,462,802 | | | | 0.1 | |
| | 2,050,000 | | | | | Bear Stearns Commercial Mortgage Securities Trust 2005-TOP20, 5.142%, 10/12/42 | | | 2,078,354 | | | | 0.1 | |
| | 1,013,000 | | | # | | Bear Stearns Commercial Mortgage Securities Trust 2006-TOP22, 5.575%, 04/12/38 | | | 1,069,517 | | | | 0.0 | |
| | 4,722,105 | | | | | Bear Stearns ALT-A Trust 2005-10, 2.645%, 01/25/36 | | | 3,857,408 | | | | 0.1 | |
| | 2,450,000 | | | | | Bear Stearns Commercial Mortgage Securities Trust 2005-PWR9, 5.074%, 09/11/42 | | | 2,483,637 | | | | 0.1 | |
| | 2,595,518 | | | # | | Beckman Coulter, Inc. 2000-A A, 7.498%, 12/15/18 | | | 2,876,872 | | | | 0.1 | |
| | 53,952 | | | # | | Citigroup Commercial Mortgage Trust 2004-C1, 5.679%, 04/15/40 | | | 54,254 | | | | 0.0 | |
| | 1,700,000 | | | # | | Citigroup Commercial Mortgage Trust 2012-GC8, 4.878%, 09/10/45 | | | 1,749,819 | | | | 0.1 | |
| | 2,811,000 | | | # | | Citigroup Mortgage Loan Trust 2010-7, 5.958%, 12/25/35 | | | 2,945,668 | | | | 0.1 | |
| | 3,759,675 | | | | | Citigroup Mortgage Loan Trust, Inc., 2.600%, 03/25/36 | | | 3,599,821 | | | | 0.1 | |
| | 1,715,958 | | | | | Citigroup Mortgage Loan Trust, Inc., 2.715%, 09/25/37 | | | 1,545,447 | | | | 0.1 | |
| | 4,305,109 | | | | | Citigroup Mortgage Loan Trust, 5.486%, 11/25/36 | | | 3,817,331 | | | | 0.1 | |
| | 6,478,021 | | | ^ | | COMM 2012-CCRE1 XA Mortgage Trust, 2.109%, 05/15/45 | | | 653,903 | | | | 0.0 | |
| | 8,363,361 | | | ^ | | COMM 2013-LC6 XA Mortgage Trust, 1.766%, 01/10/46 | | | 680,605 | | | | 0.0 | |
| | 1,135,000 | | | | | Commercial Mortgage Trust 2007-GG11 AJ, 6.254%, 12/10/49 | | | 1,205,304 | | | | 0.0 | |
| | 27,260,000 | | | #,^ | | Commercial Mortgage Trust, 0.597%, 10/15/45 | | | 1,150,996 | | | | 0.0 | |
| | 29,106,375 | | | ^ | | Commercial Mortgage Trust, 1.413%, 10/10/46 | | | 2,416,030 | | | | 0.1 | |
| | 26,005,705 | | | ^ | | Commercial Mortgage Trust, 1.432%, 08/10/46 | | | 1,844,548 | | | | 0.1 | |
| | 4,898,783 | | | ^ | | Commercial Mortgage Trust, 1.899%, 08/15/45 | | | 472,964 | | | | 0.0 | |
| | 1,280,000 | | | | | Commercial Mortgage Trust, 5.225%, 07/15/44 | | | 1,299,469 | | | | 0.1 | |
| | 2,583,529 | | | | | Countrywide Alternative Loan Trust, 0.294%, 06/25/36 | | | 2,272,320 | | | | 0.1 | |
| | 1,785,413 | | | | | Countrywide Alternative Loan Trust, 5.500%, 12/25/35 | | | 1,627,715 | | | | 0.1 | |
| | 5,628,986 | | | | | Countrywide Home Loan Mortgage Pass-through Trust, 2.408%, 11/25/34 | | | 5,348,111 | | | | 0.2 | |
| | 110,488 | | | # | | Credit Suisse First Boston Mortgage Securities Corp. 2003-C4 J, 5.322%, 08/15/36 | | | 110,582 | | | | 0.0 | |
| | 1,143,781 | | | # | | Credit Suisse First Boston Mortgage Securities Corp., 5.671%, 04/12/49 | | | 1,143,753 | | | | 0.0 | |
| | 442,500 | | | | | Credit Suisse First Boston Mortgage Securities Corp., 5.736%, 05/15/36 | | | 484,164 | | | | 0.0 | |
| | 900,000 | | | # | | Credit Suisse First Boston Mortgage Securities Corp., 6.256%, 05/15/36 | | | 1,033,858 | | | | 0.0 | |
| | 1,500,000 | | | # | | DBUBS 2011-LC2 Mortgage Trust, 5.459%, 07/10/44 | | | 1,623,325 | | | | 0.1 | |
| | 1,442,943 | | | | | Deutsche ALT-A Securities, Inc. Alternate Loan Trust, 0.294%, 08/25/36 | | | 1,181,385 | | | | 0.0 | |
| | 2,106,280 | | | | | Deutsche ALT-A Securities, Inc. Alternate Loan Trust, 0.364%, 10/25/36 | | | 1,219,401 | | | | 0.0 | |
See Accompanying Notes to Financial Statements
| Voya Intermediate Bond Fund | PORTFOLIO OF INVESTMENTS as of March 31, 2015 (continued) |
| | 4,158,204 | | | # | | Deutsche Mortgage Securities, Inc. Re-REMIC Trust Certificates Series 2007-WM1, 4.364%, 06/27/37 | | | 4,180,243 | | | | 0.2 | |
| | 1,120,000 | | | | | Fannie Mae Connecticut Avenue Securities 2013-CO1 M2, 4.724%, 02/25/25 | | | 1,147,558 | | | | 0.0 | |
| | 6,690,000 | | | | | Fannie Mae Connecticut Avenue Securities 2014-C03 2M2, 3.074%, 07/25/24 | | | 6,261,579 | | | | 0.2 | |
| | 1,960,000 | | | | | Fannie Mae Connecticut Avenue Securities 2014-CO3 M2, 3.174%, 07/25/24 | | | 1,846,491 | | | | 0.1 | |
| | 3,500,000 | | | | | Fannie Mae Connecticut Avenue Securities 2015-CO1 M2, 4.474%, 02/25/25 | | | 3,571,304 | | | | 0.1 | |
| | 1,670,000 | | | | | Fannie Mae Connecticut Avenue Securities, 2.774%, 05/25/24 | | | 1,528,255 | | | | 0.1 | |
| | 1,428,000 | | | | | Fannie Mae Connecticut Avenue Securities, 4.574%, 01/25/24 | | | 1,484,522 | | | | 0.1 | |
| | 3,580,000 | | | | | Fannie Mae Connecticut Avenue Securities, 5.074%, 11/25/24 | | | 3,779,216 | | | | 0.1 | |
| | 1,625,000 | | | | | Fannie Mae Connecticut Avenue Securities, 5.174%, 11/25/24 | | | 1,709,962 | | | | 0.1 | |
| | 811,492 | | | ^ | | Fannie Mae, 3.000%, 05/25/43 | | | 111,750 | | | | 0.0 | |
| | 3,773,900 | | | ^ | | Fannie Mae, 3.000%, 08/25/28 | | | 373,980 | | | | 0.0 | |
| | 12,408,401 | | | ^ | | Fannie Mae, 5.776%, 10/25/39 | | | 1,705,681 | | | | 0.1 | |
| | 1,494,808 | | | | | First Horizon Alternative Mortgage Securities Trust 2006-FA8, 6.000%, 02/25/37 | | | 1,261,602 | | | | 0.1 | |
| | 1,514,776 | | | | | First Horizon Alternative Mortgage Securities, 0.474%, 12/25/36 | | | 879,703 | | | | 0.0 | |
| | 1,514,776 | | | ^ | | First Horizon Alternative Mortgage Securities, 6.526%, 12/25/36 | | | 389,899 | | | | 0.0 | |
| | 1,730,000 | | | | | Freddie Mac Structured Agency Credit Risk Debt Notes 2014-HQ3 M3, 4.924%, 10/25/24 | | | 1,816,073 | | | | 0.1 | |
| | 1,640,000 | | | | | Freddie Mac Structured Agency Credit Risk Debt Notes 2015-HQ1 M2, 2.373%, 03/25/25 | | | 1,642,282 | | | | 0.1 | |
| | 2,000,000 | | | | | Freddie Mac Structured Agency Credit Risk Debt Notes 2015-HQ1 M3, 3.973%, 03/25/25 | | | 2,015,023 | | | | 0.1 | |
| | 1,350,000 | | | | | Freddie Mac Structured Agency Credit Risk Debt Notes, 2.374%, 09/25/24 | | | 1,344,657 | | | | 0.1 | |
| | 2,350,000 | | | | | Freddie Mac Structured Agency Credit Risk Debt Notes, 4.324%, 01/25/25 | | | 2,420,297 | | | | 0.1 | |
| | 230,629,672 | | | #,^ | | FREMF Mortgage Trust, 0.100%, 12/25/44 | | | 1,234,561 | | | | 0.1 | |
| | 126,935 | | | # | | GMAC Commercial Mortgage Securities, Inc. Series 2003-C1 Trust, 5.000%, 05/10/36 | | | 129,424 | | | | 0.0 | |
| | 8,581,094 | | | ^ | | GS Mortgage Securities Corp. II 2012-GCJ9 XA, 2.512%, 11/10/45 | | | 988,993 | | | | 0.0 | |
| | 46,187,457 | | | ^ | | GS Mortgage Securities Corp. II, 1.715%, 11/10/46 | | | 3,521,073 | | | | 0.1 | |
| | 10,046,388 | | | ^ | | GS Mortgage Securities Corp. II, 2.551%, 05/10/45 | | | 1,080,973 | | | | 0.0 | |
| | 3,290,000 | | | # | | GS Mortgage Securities Trust 2010-C2, 5.223%, 12/10/43 | | | 3,531,409 | | | | 0.1 | |
| | 1,930,000 | | | # | | GS Mortgage Securities Trust 2011-GC3, 5.555%, 03/10/44 | | | 2,106,457 | | | | 0.1 | |
| | 12,962 | | | | | GSR Mortgage Loan Trust, 0.674%, 06/25/35 | | | 12,617 | | | | 0.0 | |
| | 1,094,885 | | | | | GSR Mortgage Loan Trust, 5.500%, 05/25/36 | | | 1,017,666 | | | | 0.0 | |
| | 672,900 | | | | | GSR Mortgage Loan Trust, 6.000%, 01/25/37 | | | 644,942 | | | | 0.0 | |
| | 2,144,232 | | | | | HomeBanc Mortgage Trust 2005-3, 0.484%, 07/25/35 | | | 1,989,699 | | | | 0.1 | |
| | 1,758,412 | | | | | HomeBanc Mortgage Trust 2006-2 A2, 0.394%, 12/25/36 | | | 1,529,994 | | | | 0.1 | |
| | 491,861 | | | | | Homebanc Mortgage Trust, 1.034%, 08/25/29 | | | 462,021 | | | | 0.0 | |
| | 955,043 | | | # | | Jefferies Resecuritization Trust 2009-R6, 5.031%, 03/26/36 | | | 937,547 | | | | 0.0 | |
| | 736,763 | | | | | JP Morgan Alternative Loan Trust, 5.500%, 12/25/35 | | | 602,675 | | | | 0.0 | |
| | 26,111,914 | | | ^ | | JP Morgan Chase Commercial Mortgage Securities Corp. 2012-LC9 XA, 1.887%, 12/15/47 | | | 2,364,081 | | | | 0.1 | |
| | 15,265,000 | | | #,^ | | JP Morgan Chase Commercial Mortgage Securities Corp. 2012-LC9 XB, 0.358%, 12/15/47 | | | 374,707 | | | | 0.0 | |
| | 630,000 | | | # | | JP Morgan Chase Commercial Mortgage Securities Corp. Commercial Mortgage Pass-Thr, 5.600%, 05/15/41 | | | 665,435 | | | | 0.0 | |
| | 42,924,251 | | | ^ | | JP Morgan Chase Commercial Mortgage Securities Corp., 0.648%, 01/15/46 | | | 960,658 | | | | 0.0 | |
| | 3,190,000 | | | # | | JP Morgan Chase Commercial Mortgage Securities Corp., 5.415%, 07/15/46 | | | 3,508,136 | | | | 0.1 | |
| | 1,489,457 | | | # | | JP Morgan Chase Commercial Mortgage Securities Trust 2003-LN1 H, 5.466%, 10/15/37 | | | 1,498,450 | | | | 0.1 | |
See Accompanying Notes to Financial Statements
| Voya Intermediate Bond Fund | PORTFOLIO OF INVESTMENTS as of March 31, 2015 (continued) |
| | 1,430,000 | | | # | | JP Morgan Chase Commercial Mortgage Securities Trust 2003-PM1, 5.600%, 08/12/40 | | | 1,531,254 | | | | 0.1 | |
| | 1,910,000 | | | | | JP Morgan Chase Commercial Mortgage Securities Trust 2004-CIBC10, 5.066%, 01/12/37 | | | 1,926,117 | | | | 0.1 | |
| | 1,380,000 | | | | | JP Morgan Chase Commercial Mortgage Securities Trust 2004-CIBC10, 5.097%, 01/12/37 | | | 1,387,060 | | | | 0.1 | |
| | 1,300,000 | | | | | JP Morgan Chase Commercial Mortgage Securities Trust 2004-CIBC9 E, 5.697%, 06/12/41 | | �� | 1,285,008 | | | | 0.1 | |
| | 1,200,000 | | | | | JP Morgan Chase Commercial Mortgage Securities Trust 2006-LDP8, 5.618%, 05/15/45 | | | 1,212,212 | | | | 0.0 | |
| | 466,614 | | | # | | JP Morgan Chase Commercial Mortgage Securities Trust 2011-C4, 7.990%, 07/15/46 | | | 516,409 | | | | 0.0 | |
| | 41,553,947 | | | ^ | | JP Morgan Chase Commercial Mortgage Securities Trust 2012-CIBX XA, 1.755%, 06/15/45 | | | 3,128,476 | | | | 0.1 | |
| | 3,272,013 | | | | | JP Morgan Mortgage Trust 2005-S3, 6.000%, 01/25/36 | | | 2,959,634 | | | | 0.1 | |
| | 18,659,785 | | | #,^ | | LB-UBS Commercial Mortgage Trust 2004-C1, 1.000%, 01/15/36 | | | 267,964 | | | | 0.0 | |
| | 1,581,000 | | | # | | LB-UBS Commercial Mortgage Trust 2005-C1 G, 5.637%, 02/15/40 | | | 1,585,613 | | | | 0.1 | |
| | 1,730,000 | | | | | LB-UBS Commercial Mortgage Trust 2005-C3 E, 4.983%, 07/15/40 | | | 1,737,414 | | | | 0.1 | |
| | 1,100,000 | | | # | | LB-UBS Commercial Mortgage Trust 2005-C5, 5.350%, 09/15/40 | | | 1,115,534 | | | | 0.0 | |
| | 3,205,000 | | | | | LB-UBS Commercial Mortgage Trust 2005-C7, 5.350%, 11/15/40 | | | 3,245,104 | | | | 0.1 | |
| | 720,000 | | | | | LB-UBS Commercial Mortgage Trust 2006-C4 D, 5.842%, 06/15/38 | | | 737,958 | | | | 0.0 | |
| | 2,090,000 | | | | | LB-UBS Commercial Mortgage Trust 2006-C4 E, 5.842%, 06/15/38 | | | 2,127,923 | | | | 0.1 | |
| | 830,000 | | | # | | LB-UBS Commercial Mortgage Trust 2006-C6 JR15, 5.991%, 09/15/39 | | | 844,687 | | | | 0.0 | |
| | 820,000 | | | # | | LB-UBS Commercial Mortgage Trust 2006-C6 JR16, 5.991%, 09/15/39 | | | 817,725 | | | | 0.0 | |
| | 73,629,143 | | | #,^ | | LB-UBS Commercial Mortgage Trust, 0.634%, 11/15/38 | | | 729,930 | | | | 0.0 | |
| | 770,000 | | | | | LB-UBS Commercial Mortgage Trust, 4.954%, 07/15/40 | | | 771,111 | | | | 0.0 | |
| | 1,100,000 | | | # | | LB-UBS Commercial Mortgage Trust, 5.166%, 10/15/36 | | | 1,169,334 | | | | 0.0 | |
| | 1,760,000 | | | # | | LB-UBS Commercial Mortgage Trust, 5.991%, 09/15/39 | | | 1,837,132 | | | | 0.1 | |
| | 1,830,000 | | | # | | LB-UBS Commercial Mortgage Trust, 5.991%, 09/15/39 | | | 1,898,561 | | | | 0.1 | |
| | 2,070,000 | | | # | | LB-UBS Commercial Mortgage Trust, 6.890%, 07/15/32 | | | 2,080,948 | | | | 0.1 | |
| | 351,864 | | | | | LB-UBS Commercial Mortgage Trust, 8.150%, 07/15/32 | | | 353,248 | | | | 0.0 | |
| | 140,078 | | | | | Merrill Lynch Mortgage Investors, Inc., 6.250%, 12/10/29 | | | 140,201 | | | | 0.0 | |
| | 2,030,000 | | | | | Merrill Lynch Mortgage Trust 2006-C2, 5.802%, 08/12/43 | | | 2,063,403 | | | | 0.1 | |
| | 1,500,000 | | | # | | Morgan Stanley Bank of America Merrill Lynch Trust 2012-C5, 4.696%, 08/15/45 | | | 1,593,895 | | | | 0.1 | |
| | 30,726,867 | | | ^ | | Morgan Stanley Bank of America Merrill Lynch Trust 2013-C7, 1.704%, 02/15/46 | | | 2,570,136 | | | | 0.1 | |
| | 19,261,874 | | | #,^ | | Morgan Stanley Bank of America Merrill Lynch Trust, 2.131%, 11/15/45 | | | 1,753,807 | | | | 0.1 | |
| | 108,461 | | | | | Morgan Stanley Capital I Trust 2004-IQ7 C, 5.189%, 06/15/38 | | | 108,254 | | | | 0.0 | |
| | 1,310,000 | | | # | | Morgan Stanley Capital I Trust 2005-HQ6, 5.379%, 08/13/42 | | | 1,301,128 | | | | 0.1 | |
| | 2,760,000 | | | # | | Morgan Stanley Capital I Trust 2008-TOP29, 6.270%, 01/11/43 | | | 2,876,898 | | | | 0.1 | |
| | 3,090,000 | | | # | | Morgan Stanley Capital I Trust 2011-C1 D, 5.252%, 09/15/47 | | | 3,408,800 | | | | 0.1 | |
| | 1,300,000 | | | # | | Morgan Stanley Capital I Trust 2011-C1 E, 5.252%, 09/15/47 | | | 1,416,946 | | | | 0.1 | |
| | 250,000 | | | # | | Morgan Stanley Capital I, Inc., 5.910%, 11/15/31 | | | 255,140 | | | | 0.0 | |
| | 1,080,000 | | | | | Morgan Stanley Capital I, 5.336%, 01/14/42 | | | 1,079,653 | | | | 0.0 | |
| | 19,902 | | | # | | Morgan Stanley Capital I, 7.350%, 07/15/32 | | | 20,106 | | | | 0.0 | |
| | 600,000 | | | # | | Morgan Stanley Dean Witter Capital I, 7.508%, 07/15/33 | | | 688,002 | | | | 0.0 | |
| | 1,561,619 | | | | | Morgan Stanley Mortgage Loan Trust 2006-3AR 2A1, 2.767%, 03/25/36 | | | 1,290,230 | | | | 0.1 | |
| | 3,968,115 | | | # | | Morgan Stanley Re-REMIC Trust 2010-C30 A3B, 5.246%, 12/17/43 | | | 4,003,139 | | | | 0.2 | |
| | 2,590,000 | | | # | | Morgan Stanley Re-REMIC Trust, 0.250%, 07/27/49 | | | 2,296,553 | | | | 0.1 | |
| | 1,880,730 | | | # | | N-Star Real Estate CDO Ltd. 2013-1A A, 2.024%, 08/25/29 | | | 1,879,602 | | | | 0.1 | |
See Accompanying Notes to Financial Statements
| Voya Intermediate Bond Fund | PORTFOLIO OF INVESTMENTS as of March 31, 2015 (continued) |
| | 467,717 | | | | | Prime Mortgage Trust, 5.500%, 03/25/37 | | | 425,893 | | | | 0.0 | |
| | 258,758 | | | | | Structured Adjustable Rate Mortgage Loan Trust, 2.694%, 09/25/34 | | | 259,403 | | | | 0.0 | |
| | 464,192 | | | | | Structured Asset Mortgage Investments, Inc., 0.658%, 04/19/35 | | | 429,895 | | | | 0.0 | |
| | 7,762,197 | | | #,^ | | UBS-Barclays Commercial Mortgage Trust, 1.900%, 05/10/63 | | | 581,588 | | | | 0.0 | |
| | 2,200,000 | | | | | Wachovia Bank Commercial Mortgage Trust Series 2006-C25, 5.715%, 05/15/43 | | | 2,227,033 | | | | 0.1 | |
| | 5,230,000 | | | | | Wachovia Bank Commercial Mortgage Trust Series, 5.715%, 05/15/43 | | | 5,346,574 | | | | 0.2 | |
| | 4,251,823 | | | | | Wachovia Mortgage Loan Trust LLC Series 2005-B Trust 2A1, 2.485%, 10/20/35 | | | 3,883,807 | | | | 0.2 | |
| | 740,379 | | | | | WaMu Alternative Mortgage Pass-Through Certificates, 5.500%, 10/25/35 | | | 695,611 | | | | 0.0 | |
| | 902,740 | | | | | WaMu Mortgage Pass Through Certificates, 1.728%, 10/25/36 | | | 758,426 | | | | 0.0 | |
| | 2,261,909 | | | | | WaMu Mortgage Pass-Through Certificates Series 2006-AR14 Trust, 1.959%, 11/25/36 | | | 2,014,172 | | | | 0.1 | |
| | 5,857,840 | | | | | WaMu Mortgage Pass-Through Certificates Series 2006-AR16 Trust, 2.014%, 12/25/36 | | | 4,978,063 | | | | 0.2 | |
| | 2,533,786 | | | | | WaMu Mortgage Pass-Through Certificates Series 2006-AR16 Trust, 2.014%, 12/25/36 | | | 2,153,242 | | | | 0.1 | |
| | 1,758,166 | | | | | WaMu Mortgage Pass-Through Certificates Series 2006-AR6 Trust, 4.484%, 08/25/36 | | | 1,605,086 | | | | 0.1 | |
| | 4,819,356 | | | | | WaMu Mortgage Pass-Through Certificates Series 2007-HY2 1A1, 2.194%, 12/25/36 | | | 4,353,088 | | | | 0.2 | |
| | 968,730 | | | | | WaMu Mortgage Pass-Through Certificates Series 2007-HY4 Trust, 1.937%, 04/25/37 | | | 844,723 | | | | 0.0 | |
| | 1,367,846 | | | | | WaMu Mortgage Pass-Through Certificates WMALT Series Trust 2007-OC1 A3, 0.404%, 01/25/47 | | | 963,438 | | | | 0.0 | |
| | 4,596,931 | | | | | WaMu Mortgage Pass-Through Certificates, 2.099%, 07/25/37 | | | 3,929,590 | | | | 0.2 | |
| | 2,833,763 | | | | | Washington Mutual Mortgage Pass-Through Certificates WMALT Series 2007-OC1, 0.494%, 01/25/47 | | | 2,025,418 | | | | 0.1 | |
| | 3,203,475 | | | | | Wells Fargo Alternative Loan Trust, 6.250%, 07/25/37 | | | 2,927,076 | | | | 0.1 | |
| | 1,520,554 | | | | | Wells Fargo Mortgage Backed Securities 2005-AR15 Trust, 2.613%, 09/25/35 | | | 1,450,566 | | | | 0.1 | |
| | 1,880,643 | | | | | Wells Fargo Mortgage Backed Securities 2006-AR6 Trust 3A1, 2.580%, 03/25/36 | | | 1,829,893 | | | | 0.1 | |
| | 5,484,568 | | | #,^ | | Wells Fargo Mortgage Backed Securities Trust, 1.568%, 06/15/45 | | | 460,789 | | | | 0.0 | |
| | 1,560,881 | | | | | Wells Fargo Mortgage Backed Securities Trust, 5.652%, 04/25/36 | | | 1,557,213 | | | | 0.1 | |
| | 10,238,233 | | | #,^ | | WFRBS Commercial Mortgage Trust 2012-C8 XA, 2.193%, 08/15/45 | | | 1,017,102 | | | | 0.0 | |
| | 26,976,371 | | | #,^ | | WFRBS Commercial Mortgage Trust 2013-C12, 1.490%, 03/15/48 | | | 2,121,182 | | | | 0.1 | |
| | | | | | | | | | | | | | | |
| | | | | Total Collateralized Mortgage Obligations | | | | | | | | |
| | | | | (Cost $297,694,316) | | | 304,755,746 | | | | 11.6 | |
| | | | | | | | | | | | | |
| FOREIGN GOVERNMENT BONDS: 1.4% | | | | | | |
| | – | | | | | Republic of Belarus, 8.750%, 08/03/15 | | | – | | | | – | |
| | 700,000 | | | # | | Bolivian Government International Bond, 5.950%, 08/22/23 | | | 728,000 | | | | 0.0 | |
| | 1,968,000 | | | | | Brazilian Government International Bond, 2.625%, 01/05/23 | | | 1,773,168 | | | | 0.1 | |
| | 1,062,000 | | | | | Colombia Government International Bond, 2.625%, 03/15/23 | | | 1,003,059 | | | | 0.1 | |
| | – | | | | | Colombia Government International Bond, 7.375%, 03/18/19 | | | – | | | | – | |
| | 760,000 | | | | | Colombia Government International Bond, 8.125%, 05/21/24 | | | 1,012,700 | | | | 0.1 | |
| | 350,000 | | | # | | Costa Rica Government International Bond, 4.250%, 01/26/23 | | | 336,000 | | | | 0.0 | |
| | 400,000 | | | | | Costa Rica Government International Bond, 9.995%, 08/01/20 | | | 513,000 | | | | 0.0 | |
| | 272,000 | | | | | Croatia Government International Bond, 6.375%, 03/24/21 | | | 301,077 | | | | 0.0 | |
| | 270,000 | | | | | Dominican Republic International Bond, 5.875%, 04/18/24 | | | 284,175 | | | | 0.0 | |
| | 300,000 | | | # | | Dominican Republic International Bond, 6.600%, 01/28/24 | | | 327,000 | | | | 0.0 | |
| | 232,000 | | | # | | El Salvador Government International Bond, 5.875%, 01/30/25 | | | 228,230 | | | | 0.0 | |
| | 290,380 | | | # | | Gabonese Republic, 6.375%, 12/12/24 | | | 275,135 | | | | 0.0 | |
| | 300,000 | | | # | | Guatemala Government Bond, 4.875%, 02/13/28 | | | 312,375 | | | | 0.0 | |
| | 559,000 | | | | | Guatemala Government Bond, 8.125%, 10/06/34 | | | 737,880 | | | | 0.0 | |
See Accompanying Notes to Financial Statements
| Voya Intermediate Bond Fund | PORTFOLIO OF INVESTMENTS as of March 31, 2015 (continued) |
| | 156,000 | | | | | Hungary Government International Bond, 5.375%, 02/21/23 | | | 175,110 | | | | 0.0 | |
| | 916,000 | | | | | Hungary Government International Bond, 7.625%, 03/29/41 | | | 1,329,114 | | | | 0.1 | |
| | 900,000 | | | # | | Indonesia Government International Bond, 4.125%, 01/15/25 | | | 928,125 | | | | 0.1 | |
| | 1,890,000 | | | | | Inter-American Development Bank, 1.375%, 07/15/20 | | | 1,876,405 | | | | 0.1 | |
| | 1,246,000 | | | | | Ivory Coast Government International Bond, 5.750%, 12/31/32 | | | 1,196,260 | | | | 0.1 | |
| | 600,000 | | | # | | KazAgro National Management Holding JSC, 4.625%, 05/24/23 | | | 511,836 | | | | 0.0 | |
| | 600,000 | | | # | | Kazakhstan Temir Zholy Finance BV, 6.950%, 07/10/42 | | | 555,120 | | | | 0.0 | |
| | 600,000 | | | # | | KazMunayGas National Co. JSC, 4.400%, 04/30/23 | | | 520,500 | | | | 0.0 | |
| | 534,000 | | | | | Mexico Government International Bond, 4.000%, 10/02/23 | | | 566,708 | | | | 0.0 | |
| | 160,000 | | | | | Mexico Government International Bond, 4.750%, 03/08/44 | | | 168,800 | | | | 0.0 | |
| | 500,000 | | | | | Morocco Government International Bond, 4.250%, 12/11/22 | | | 520,000 | | | | 0.0 | |
| | 600,000 | | | # | | Morocco Government International Bond, 4.250%, 12/11/22 | | | 624,000 | | | | 0.0 | |
| | 850,000 | | | | | Namibia International Bonds, 5.500%, 11/03/21 | | | 926,500 | | | | 0.0 | |
| | 350,000 | | | | | Nigeria Government International Bond, 6.750%, 01/28/21 | | | 360,500 | | | | 0.0 | |
| | 200,000 | | | | | Pakistan Government International Bond, 6.875%, 06/01/17 | | | 206,540 | | | | 0.0 | |
| | 200,000 | | | | | Pakistan Government International Bond, 7.875%, 03/31/36 | | | 189,540 | | | | 0.0 | |
| | 693,000 | | | | | Panama Government International Bond, 6.700%, 01/26/36 | | | 911,295 | | | | 0.0 | |
| | 400,000 | | | | | Pertamina Persero PT, 4.300%, 05/20/23 | | | 403,000 | | | | 0.0 | |
| | 1,500,000 | | | | | Pertamina Persero PT, 5.625%, 05/20/43 | | | 1,464,375 | | | | 0.1 | |
| | 948,000 | | | | | Petroleos de Venezuela SA, 5.250%, 04/12/17 | | | 393,467 | | | | 0.0 | |
| | 853,000 | | | | | Petroleos de Venezuela SA, 9.000%, 11/17/21 | | | 320,728 | | | | 0.0 | |
| | 270,000 | | | | | Petroleos Mexicanos, 3.500%, 07/18/18 | | | 281,475 | | | | 0.0 | |
| | 330,000 | | | | | Petroleos Mexicanos, 4.875%, 01/18/24 | | | 350,130 | | | | 0.0 | |
| | 1,073,000 | | | | | Petroleos Mexicanos, 5.500%, 01/21/21 | | | 1,182,982 | | | | 0.1 | |
| | 1,370,000 | | | | | Petroleos Mexicanos, 5.500%, 06/27/44 | | | 1,388,837 | | | | 0.1 | |
| | 1,100,000 | | | | | Petroleum Co. of Trinidad & Tobago Ltd., 6.000%, 05/08/22 | | | 1,148,950 | | | | 0.1 | |
| | 607,000 | | | | | Philippine Government International Bond, 4.000%, 01/15/21 | | | 666,028 | | | | 0.0 | |
| | 300,000 | | | | | Philippine Government International Bond, 7.750%, 01/14/31 | | | 451,677 | | | | 0.0 | |
| | 950,000 | | | | | Republic of Angola Via Northern Lights III BV, 7.000%, 08/16/19 | | | 957,914 | | | | 0.1 | |
| | 600,000 | | | | | Republic of Paraguay, 4.625%, 01/25/23 | | | 624,000 | | | | 0.0 | |
| | 600,000 | | | # | | Republic of Paraguay, 4.625%, 01/25/23 | | | 624,000 | | | | 0.0 | |
| | 136,000 | | | # | | Romanian Government International Bond, 4.375%, 08/22/23 | | | 146,200 | | | | 0.0 | |
| | 630,000 | | | # | | Republic of Serbia, 5.250%, 11/21/17 | | | 656,366 | | | | 0.0 | |
| | 570,000 | | | | | Tanzania Government International Bond, 6.397%, 03/09/20 | | | 591,375 | | | | 0.0 | |
| | 1,000,000 | | | # | | Transnet SOC Ltd., 4.000%, 07/26/22 | | | 978,220 | | | | 0.1 | |
| | 800,000 | | | | | Turkey Government International Bond, 6.000%, 01/14/41 | | | 912,160 | | | | 0.0 | |
| | 200,000 | | | | | Turkey Government International Bond, 6.250%, 09/26/22 | | | 228,000 | | | | 0.0 | |
| | 2,183,000 | | | | | Turkey Government International Bond, 7.375%, 02/05/25 | | | 2,714,124 | | | | 0.1 | |
| | 253,970 | | | L | | Uruguay Government International Bond, 7.625%, 03/21/36 | | | 360,637 | | | | 0.0 | |
| | 341,643 | | | | | Uruguay Government International Bond, 8.000%, 11/18/22 | | | 450,969 | | | | 0.0 | |
| | 300,000 | | | # | | Zambia Government International Bond, 5.375%, 09/20/22 | | | 276,825 | | | | 0.0 | |
| | | | | | | | | | | | | | | |
| | | | | Total Foreign Government Bonds | | | | | | | | |
| | | | | (Cost $37,151,454) | | | 36,970,591 | | | | 1.4 | |
| | | | | | | | | | | | | |
| ASSET-BACKED SECURITIES: 7.5% | | | | | | |
| | | | | | | Automobile Asset-Backed Securities: 1.0% | |
| | 840,000 | | | # | | AmeriCredit Automobile Receivables Trust 2011-3, 5.760%, 12/10/18 | | | 862,623 | | | | 0.0 | |
| | 1,500,000 | | | | | AmeriCredit Automobile Receivables Trust 2013-4, 3.310%, 10/08/19 | | | 1,541,219 | | | | 0.1 | |
| | 1,890,000 | | | | | AmeriCredit Automobile Receivables Trust 2013-5, 2.860%, 12/08/19 | | | 1,918,471 | | | | 0.1 | |
| | 3,050,000 | | | # | | AmeriCredit Automobile Receivables Trust, 3.290%, 05/08/20 | | | 3,102,426 | | | | 0.1 | |
| | 1,280,000 | | | | | Capital Auto Receivables Asset Trust/Ally, 2.220%, 01/22/19 | | | 1,298,645 | | | | 0.1 | |
| | 1,230,000 | | | | | CarMax Auto Owner Trust, 1.950%, 09/16/19 | | | 1,231,729 | | | | 0.0 | |
See Accompanying Notes to Financial Statements
| Voya Intermediate Bond Fund | PORTFOLIO OF INVESTMENTS as of March 31, 2015 (continued) |
| | 800,000 | | | # | | MMCA Automobile Trust, 2.260%, 10/15/20 | | | 809,628 | | | | 0.0 | |
| | 2,900,000 | | | # | | Oscar US Funding Trust 2014-1, 2.550%, 12/15/21 | | | 2,975,119 | | | | 0.1 | |
| | 2,100,000 | | | | | Santander Drive Auto Receivables Trust 2013-1, 2.270%, 01/15/19 | | | 2,100,816 | | | | 0.1 | |
| | 940,000 | | | | | Santander Drive Auto Receivables Trust 2013-4, 3.920%, 01/15/20 | | | 978,754 | | | | 0.0 | |
| | 3,380,000 | | | # | | Santander Drive Auto Receivables Trust 2013-A, 3.780%, 10/15/19 | | | 3,500,306 | | | | 0.1 | |
| | 2,200,000 | | | # | | Santander Drive Auto Receivables Trust 2013-A, 4.710%, 01/15/21 | | | 2,305,076 | | | | 0.1 | |
| | 4,820,000 | | | | | Santander Drive Auto Receivables Trust 2014-3, 2.650%, 08/17/20 | | | 4,815,276 | | | | 0.2 | |
| | | | | | | | | | 27,440,088 | | | | 1.0 | |
| | | | | | | | | | | | | | | |
| | | | | | | Home Equity Asset-Backed Securities: 0.0% |
| | 835,278 | | | | | Freddie Mac Structured Pass-Through Securities, 0.424%, 05/25/31 | | | 822,127 | | | | 0.0 | |
| | 34,900 | | | | | Freddie Mac Structured Pass-Through Securities, 0.474%, 01/25/32 | | | 33,801 | | | | 0.0 | |
| | 43,844 | | | | | Residential Asset Securities Corp., 0.774%, 06/25/32 | | | 35,880 | | | | 0.0 | |
| | | | | | | | | | 891,808 | | | | 0.0 | |
| | | | | | | | | | | | | | | |
| | | | | | | Other Asset-Backed Securities: 6.5% |
| | 5,000,000 | | | # | | 1776 CLO Ltd. 2006-1A D, 2.006%, 05/08/20 | | | 4,987,575 | | | | 0.2 | |
| | 2,000,000 | | | # | | Apidos Cinco CDO Ltd., 2.507%, 05/14/20 | | | 1,975,672 | | | | 0.1 | |
| | 3,910,000 | | | # | | Ares XII CLO Ltd. 2007-12A C, 2.262%, 11/25/20 | | | 3,912,057 | | | | 0.1 | |
| | 1,000,000 | | | # | | Ares XII CLO Ltd., 3.512%, 11/25/20 | | | 994,309 | | | | 0.0 | |
| | 2,750,000 | | | # | | Atrium V, 0.951%, 07/20/20 | | | 2,670,668 | | | | 0.1 | |
| | 650,000 | | | # | | Atrium V, 3.961%, 07/20/20 | | | 643,695 | | | | 0.0 | |
| | 1,625,000 | | | # | | Babson CLO, Inc. 2005-III, 0.656%, 11/10/19 | | | 1,606,226 | | | | 0.1 | |
| | 3,000,000 | | | # | | Babson CLO, Inc. 2005-III, 1.956%, 11/10/19 | | | 2,987,070 | | | | 0.1 | |
| | 1,000,000 | | | # | | Babson Mid-Market CLO, Inc. 2007-II, 1.103%, 04/15/21 | | | 978,681 | | | | 0.0 | |
| | 2,000,000 | | | # | | Babson Mid-Market CLO, Inc. 2007-II, 1.953%, 04/15/21 | | | 1,936,552 | | | | 0.1 | |
| | 1,750,000 | | | # | | BlackRock Senior Income Series V Ltd. 2007-5A D, 2.508%, 08/13/19 | | | 1,714,186 | | | | 0.1 | |
| | 3,500,000 | | | # | | Bluemountain CLO III Ltd. 2007-3A C, 0.961%, 03/17/21 | | | 3,403,522 | | | | 0.1 | |
| | 4,604,008 | | | # | | Callidus Debt Partners CLO Fund VI Ltd. 6A A1T, 0.517%, 10/23/21 | | | 4,523,074 | | | | 0.2 | |
| | 800,000 | | | # | | Callidus Debt Partners CLO Fund VI Ltd., 3.257%, 10/23/21 | | | 792,210 | | | | 0.0 | |
| | 1,500,000 | | | # | | Carlyle High Yield Partners IX Ltd., 0.598%, 08/01/21 | | | 1,463,553 | | | | 0.1 | |
| | 1,250,000 | | | # | | Carlyle High Yield Partners IX Ltd., 0.668%, 08/01/21 | | | 1,199,451 | | | | 0.0 | |
| | 4,000,000 | | | # | | Carlyle High Yield Partners IX Ltd., 1.868%, 08/01/21 | | | 3,865,768 | | | | 0.1 | |
| | 1,350,000 | | | # | | Carlyle Veyron CLO Ltd., 0.933%, 07/15/18 | | | 1,337,098 | | | | 0.0 | |
| | 1,850,000 | | | # | | Castle Garden Funding, 1.012%, 10/27/20 | | | 1,818,966 | | | | 0.1 | |
| | 1,600,000 | | | # | | Castle Garden Funding, 5.012%, 10/27/20 | | | 1,599,806 | | | | 0.1 | |
| | 1,000,000 | | | # | | Castle Garden Funding, 6.560%, 10/27/20 | | | 1,078,507 | | | | 0.0 | |
| | 55,547 | | | | | Chase Funding Trust Series 2003-5 2A2, 0.774%, 07/25/33 | | | 52,210 | | | | 0.0 | |
| | 5,500,000 | | | # | | CIFC Funding 2006-I Ltd., 1.857%, 10/20/20 | | | 5,409,558 | | | | 0.2 | |
| | 954,128 | | | # | | CIFC Funding 2006-I Ltd., 4.257%, 10/20/20 | | | 951,859 | | | | 0.0 | |
| | 3,200,000 | | | # | | CIFC Funding 2006-II Ltd., 1.862%, 03/01/21 | | | 3,107,363 | | | | 0.1 | |
| | 2,070,387 | | | # | | CIFC Funding 2006-II Ltd., 4.262%, 03/01/21 | | | 2,038,999 | | | | 0.1 | |
| | 2,000,000 | | | # | | Clydesdale CLO 2006 Ltd, 0.937%, 12/19/18 | | | 1,939,742 | | | | 0.1 | |
| | 1,750,000 | | | # | | ColumbusNova CLO IV Ltd 2007-2A C, 2.503%, 10/15/21 | | | 1,719,825 | | | | 0.1 | |
| | 1,000,000 | | | # | | ColumbusNova CLO Ltd 2006-2A E, 4.006%, 04/04/18 | | | 989,804 | | | | 0.0 | |
| | 750,000 | | | # | | ColumbusNova CLO Ltd 2006-II, 1.006%, 04/04/18 | | | 740,926 | | | | 0.0 | |
| | 500,000 | | | # | | ColumbusNova CLO Ltd 2006-II, 1.756%, 04/04/18 | | | 490,854 | | | | 0.0 | |
| | 1,773,843 | | | | | Countrywide Asset-Backed Certificates, 5.530%, 04/25/47 | | | 1,767,562 | | | | 0.1 | |
| | 266,972 | | | + | | Credit-Based Asset Servicing and Securitization, LLC, 4.241%, 08/25/35 | | | 269,259 | | | | 0.0 | |
| | 1,970,000 | | | # | | Diamond Lake CLO Ltd., 1.862%, 12/01/19 | | | 1,928,803 | | | | 0.1 | |
| | 2,000,000 | | | # | | Duane Street CLO III Ltd, 1.752%, 01/11/21 | | | 1,980,074 | | | | 0.1 | |
| | 1,500,000 | | | # | | Eaton Vance CDO IX Ltd. 2007-9A D, 1.757%, 04/20/19 | | | 1,465,773 | | | | 0.1 | |
| | 3,500,000 | | | # | | Eaton Vance CDO IX Ltd., 0.907%, 04/20/19 | | | 3,455,123 | | | | 0.1 | |
| | 3,590,927 | | | | | FBR Securitization Trust, 0.851%, 10/25/35 | | | 2,997,842 | | | | 0.1 | |
| | 1,500,000 | | | # | | Flagship CLO V, 0.970%, 09/20/19 | | | 1,460,440 | | | | 0.1 | |
See Accompanying Notes to Financial Statements
| Voya Intermediate Bond Fund | PORTFOLIO OF INVESTMENTS as of March 31, 2015 (continued) |
| | 1,250,000 | | | # | | Flagship CLO V, 1.820%, 09/20/19 | | | 1,211,097 | | | | 0.0 | |
| | 1,950,000 | | | # | | Fraser Sullivan CLO I Ltd., 2.071%, 03/15/20 | | | 1,912,615 | | | | 0.1 | |
| | 1,450,000 | | | # | | Fraser Sullivan CLO II Ltd., 0.670%, 12/20/20 | | | 1,429,090 | | | | 0.1 | |
| | 1,500,000 | | | # | | Fraser Sullivan CLO II Ltd., 0.990%, 12/20/20 | | | 1,469,128 | | | | 0.1 | |
| | 3,250,000 | | | # | | Fraser Sullivan CLO II Ltd., 1.770%, 12/20/20 | | | 3,167,239 | | | | 0.1 | |
| | 1,500,000 | | | # | | Gale Force 3 CLO Ltd. 2007-3A D, 1.657%, 04/19/21 | | | 1,425,341 | | | | 0.1 | |
| | 2,000,000 | | | # | | Gallatin CLO III 2007-1 Ltd., 1.507%, 05/15/21 | | | 1,943,924 | | | | 0.1 | |
| | 1,125,000 | | | # | | GoldenTree Loan Opportunities III Ltd., 1.505%, 05/01/22 | | | 1,078,345 | | | | 0.0 | |
| | 1,500,000 | | | # | | Goldentree Loan Opportunities V Ltd., 3.507%, 10/18/21 | | | 1,500,009 | | | | 0.1 | |
| | 1,000,000 | | | # | | GSC Group CDO Fund VIII Ltd, 1.007%, 04/17/21 | | | 986,893 | | | | 0.0 | |
| | 1,750,000 | | | # | | Gulf Stream - Compass CLO 2007-I Ltd., 1.156%, 10/28/19 | | | 1,731,370 | | | | 0.1 | |
| | 1,825,000 | | | # | | Gulf Stream - Compass CLO, 2.256%, 10/28/19 | | | 1,825,339 | | | | 0.1 | |
| | 3,100,000 | | | # | | Gulf Stream - Compass CLO, 3.706%, 10/28/19 | | | 3,102,031 | | | | 0.1 | |
| | 1,500,000 | | | # | | Gulf Stream - Sextant CLO 2007-1 Ltd., 2.670%, 06/17/21 | | | 1,463,964 | | | | 0.1 | |
| | 1,565,000 | | | # | | Gulf Stream - Sextant CLO, 1.862%, 08/21/20 | | | 1,545,200 | | | | 0.1 | |
| | 650,000 | | | # | | Gulf Stream-Rashinban CLO 2006-1 Ltd., 0.941%, 11/26/20 | | | 633,849 | | | | 0.0 | |
| | 1,150,000 | | | # | | Halcyon Structured Asset Management Long Secured/Short Unsecured 2007-1 Ltd. B, 0.706%, 08/07/21 | | | 1,131,582 | | | | 0.0 | |
| | 4,850,000 | | | # | | Halcyon Structured Asset Management Long Secured/Short Unsecured, 2.556%, 08/07/21 | | | 4,850,082 | | | | 0.2 | |
| | 900,000 | | | # | | Invitation Homes Trust 2013-SFR1 E, 2.900%, 12/17/30 | | | 886,370 | | | | 0.0 | |
| | 1,380,000 | | | # | | Invitation Homes Trust 2014-SFR1 C, 2.273%, 06/17/31 | | | 1,389,677 | | | | 0.0 | |
| | 2,500,000 | | | # | | Invitation Homes Trust 2014-SFR2 E, 3.328%, 06/17/32 | | | 2,500,000 | | | | 0.1 | |
| | 1,500,000 | | | # | | Katonah IX CLO Ltd., 0.976%, 01/25/19 | | | 1,462,206 | | | | 0.1 | |
| | 1,630,727 | | | # | | Kennecott Funding Ltd., 2.054%, 01/13/18 | | | 1,623,147 | | | | 0.1 | |
| | 1,250,000 | | | # | | Kingsland III Ltd., 0.913%, 08/24/21 | | | 1,202,764 | | | | 0.0 | |
| | 1,500,000 | | | # | | Latitude CLO II Corp., 1.071%, 12/15/18 | | | 1,470,089 | | | | 0.1 | |
| | 1,500,000 | | | # | | LCM V Ltd, 1.615%, 03/21/19 | | | 1,438,749 | | | | 0.1 | |
| | 268,300 | | | | | Lehman XS Trust, 0.731%, 08/25/35 | | | 261,932 | | | | 0.0 | |
| | 1,000,000 | | | # | | LightPoint CLO V, 0.966%, 08/05/19 | | | 985,077 | | | | 0.0 | |
| | 2,000,000 | | | # | | LightPoint CLO V, 1.836%, 08/05/19 | | | 1,969,056 | | | | 0.1 | |
| | 2,250,000 | | | # | | Madison Park Funding II Ltd. 2006-2A D, 5.017%, 03/25/20 | | | 2,222,737 | | | | 0.1 | |
| | 2,500,000 | | | # | | Madison Park Funding II Ltd., 5.793%, 03/25/20 | | | 2,668,340 | | | | 0.1 | |
| | 1,281,728 | | | # | | Madison Park Funding IV Ltd., 3.865%, 03/22/21 | | | 1,235,948 | | | | 0.0 | |
| | 1,000,000 | | | # | | Madison Park Funding Ltd., 2.067%, 03/25/20 | | | 986,772 | | | | 0.0 | |
| | 1,000,000 | | | # | | Madison Park Funding Ltd., 3.506%, 07/26/21 | | | 1,000,031 | | | | 0.0 | |
| | 1,250,000 | | | # | | Madison Park Funding Ltd., 5.506%, 07/26/21 | | | 1,246,366 | | | | 0.0 | |
| | 1,100,000 | | | # | | Momentum Capital Fund Ltd., 1.657%, 09/18/21 | | | 1,088,573 | | | | 0.0 | |
| | 3,000,000 | | | # | | Mountain Capital CLO V Ltd. 2006-5A A3L, 0.951%, 09/15/18 | | | 2,974,503 | | | | 0.1 | |
| | 4,250,000 | | | # | | MSIM Peconic Bay Ltd., 2.257%, 07/20/19 | | | 4,250,000 | | | | 0.2 | |
| | 5,500,000 | | | # | | Muir Grove CLO Ltd. 2007-1A B, 2.256%, 03/25/20 | | | 5,497,217 | | | | 0.2 | |
| | 1,500,000 | | | # | | Muir Grove CLO Ltd., 3.256%, 03/25/20 | | | 1,497,881 | | | | 0.1 | |
| | 850,000 | | | # | | Northwoods Capital VII Ltd., 3.757%, 10/22/21 | | | 850,201 | | | | 0.0 | |
| | 1,500,000 | | | # | | Ocean Trails CLO I, 1.002%, 10/12/20 | | | 1,443,363 | | | | 0.1 | |
| | 1,600,000 | | | # | | Regatta Funding Ltd, 1.571%, 06/15/20 | | | 1,530,795 | | | | 0.1 | |
| | 4,234,644 | | | | | Securitized Asset Backed Receivables LLC Trust 2006-NC2 A3, 0.414%, 03/25/36 | | | 3,734,299 | | | | 0.1 | |
| | 3,420,000 | | | # | | Springleaf Funding Trust 2015-A, 3.160%, 11/15/24 | | | 3,463,424 | | | | 0.1 | |
| | 1,750,000 | | | # | | St James River CLO Ltd. 2007-1A D, 2.567%, 06/11/21 | | | 1,729,005 | | | | 0.1 | |
| | 2,000,000 | | | # | | Telos CLO 2006-1 Ltd., 1.952%, 10/11/21 | | | 1,955,350 | | | | 0.1 | |
| | 2,000,000 | | | # | | Trade MAPS 1 Ltd., 2.431%, 12/10/18 | | | 1,990,000 | | | | 0.1 | |
| | 1,550,000 | | | # | | WhiteHorse III Ltd./Corp 2006-1A A3L, 1.005%, 05/01/18 | | | 1,549,898 | | | | 0.1 | |
| | 1,250,000 | | | # | | WhiteHorse III Ltd/Corp, 2.105%, 05/01/18 | | | 1,248,520 | | | | 0.0 | |
| | | | | | | | | | 170,014,050 | | | | 6.5 | |
| | | | | | | | | | | | | | | |
| | | | | Total Asset-Backed Securities | | | | | | | | |
| | | | | (Cost $197,332,029) | | | 198,345,946 | | | | 7.5 | |
| | | | | | | | | | | | | |
| U.S. GOVERNMENT AGENCY OBLIGATIONS: 25.4% | |
| | | | | | | Federal Home Loan Mortgage Corporation: 9.5%## |
| | 13,816 | | | | | 2.283%, due 05/01/37 | | | 14,748 | | | | 0.0 | |
| | 1,244,000 | | | W | | 3.000%, due 11/15/26 | | | 1,300,174 | | | | 0.1 | |
| | 2,586,277 | | | | | 3.000%, due 02/01/27 | | | 2,718,279 | | | | 0.1 | |
See Accompanying Notes to Financial Statements
| Voya Intermediate Bond Fund | PORTFOLIO OF INVESTMENTS as of March 31, 2015 (continued) |
| | 1,408,423 | | | | | 3.000%, due 02/01/27 | | | 1,480,376 | | | | 0.1 | |
| | 1,916,000 | | | | | 3.000%, due 08/15/40 | | | 1,953,554 | | | | 0.1 | |
| | 43,538,000 | | | W | | 3.000%, due 05/01/43 | | | 44,316,070 | | | | 1.7 | |
| | 3,552,725 | | | | | 3.000%, due 03/01/45 | | | 3,632,750 | | | | 0.1 | |
| | 3,558,040 | | | | | 3.000%, due 03/01/45 | | | 3,640,395 | | | | 0.1 | |
| | 230,966 | | | | | 3.275%, due 03/15/38 | | | 248,031 | | | | 0.0 | |
| | 78,081,000 | | | W | | 3.500%, due 09/15/41 | | | 81,837,127 | | | | 3.1 | |
| | 5,022,790 | | | | | 3.500%, due 03/01/45 | | | 5,285,028 | | | | 0.2 | |
| | 1,751,111 | | | ^^ | | 4.000%, due 01/15/36 | | | 1,710,484 | | | | 0.1 | |
| | 2,892,667 | | | | | 4.000%, due 10/01/41 | | | 3,098,265 | | | | 0.1 | |
| | 4,252,238 | | | | | 4.000%, due 12/01/41 | | | 4,556,763 | | | | 0.2 | |
| | 8,501,308 | | | ^ | | 4.000%, due 04/15/43 | | | 1,552,006 | | | | 0.1 | |
| | 4,781,245 | | | | | 4.000%, due 08/01/44 | | | 5,113,106 | | | | 0.2 | |
| | 3,520,000 | | | | | 4.000%, due 03/01/45 | | | 3,765,874 | | | | 0.2 | |
| | 25,000,000 | | | | | 4.500%, due 05/15/38 | | | 27,386,512 | | | | 1.0 | |
| | 6,243,252 | | | ^ | | 4.500%, due 12/15/40 | | | 1,021,350 | | | | 0.0 | |
| | 1,856,397 | | | | | 4.500%, due 08/01/41 | | | 2,030,380 | | | | 0.1 | |
| | 612,581 | | | | | 4.500%, due 08/01/41 | | | 668,945 | | | | 0.0 | |
| | 2,617,837 | | | | | 4.500%, due 09/01/41 | | | 2,862,521 | | | | 0.1 | |
| | 2,668,525 | | | | | 4.500%, due 10/01/41 | | | 2,915,745 | | | | 0.1 | |
| | 1,176,051 | | | | | 4.500%, due 01/15/42 | | | 1,296,961 | | | | 0.1 | |
| | 2,935,431 | | | | | 4.500%, due 03/01/44 | | | 3,199,435 | | | | 0.1 | |
| | 930,598 | | | ^ | | 4.910%, due 03/15/33 | | | 988,826 | | | | 0.0 | |
| | 307,197 | | | | | 5.000%, due 12/15/17 | | | 320,075 | | | | 0.0 | |
| | 1,941,438 | | | | | 5.000%, due 08/15/34 | | | 2,160,098 | | | | 0.1 | |
| | 973,506 | | | | | 5.000%, due 02/15/35 | | | 1,082,849 | | | | 0.1 | |
| | 856,465 | | | | | 5.000%, due 02/15/35 | | | 953,693 | | | | 0.0 | |
| | 267,627 | | | | | 5.000%, due 02/15/35 | | | 280,422 | | | | 0.0 | |
| | 326,258 | | | | | 5.000%, due 01/01/41 | | | 362,674 | | | | 0.0 | |
| | 770,809 | | | | | 5.500%, due 11/15/22 | | | 828,316 | | | | 0.0 | |
| | 925,469 | | | | | 5.500%, due 12/15/32 | | | 1,042,931 | | | | 0.0 | |
| | 368,454 | | | | | 5.500%, due 09/15/34 | | | 414,918 | | | | 0.0 | |
| | 3,491,263 | | | | | 5.500%, due 02/15/36 | | | 3,924,019 | | | | 0.2 | |
| | 1,658,081 | | | | | 5.500%, due 08/15/36 | | | 1,881,192 | | | | 0.1 | |
| | 1,234,860 | | | | | 5.500%, due 06/15/37 | | | 1,387,190 | | | | 0.1 | |
| | 99,260 | | | | | 5.500%, due 07/01/37 | | | 112,674 | | | | 0.0 | |
| | 1,551,539 | | | | | 5.500%, due 07/15/37 | | | 1,744,139 | | | | 0.1 | |
| | 5,290,054 | | | | | 5.500%, due 11/01/38 | | | 6,027,648 | | | | 0.2 | |
| | 9,214,937 | | | ^ | | 5.826%, due 05/15/36 | | | 1,026,440 | | | | 0.0 | |
| | 3,732,135 | | | ^ | | 5.876%, due 07/15/40 | | | 604,822 | | | | 0.0 | |
| | 18,276,095 | | | ^ | | 5.926%, due 09/15/44 | | | 3,537,594 | | | | 0.1 | |
| | 8,520 | | | | | 6.000%, due 12/01/28 | | | 9,678 | | | | 0.0 | |
| | 21,088 | | | | | 6.000%, due 01/01/29 | | | 23,970 | | | | 0.0 | |
| | 349,264 | | | | | 6.000%, due 01/15/29 | | | 399,216 | | | | 0.0 | |
| | 329,743 | | | | | 6.000%, due 01/15/29 | | | 378,444 | | | | 0.0 | |
| | 2,275,840 | | | | | 6.000%, due 04/15/29 | | | 2,608,916 | | | | 0.1 | |
| | 374,312 | | | | | 6.000%, due 07/15/32 | | | 427,862 | | | | 0.0 | |
| | 342,849 | | | ^ | | 6.000%, due 04/15/33 | | | 80,575 | | | | 0.0 | |
| | 1,288,589 | | | | | 6.000%, due 07/15/36 | | | 1,475,542 | | | | 0.1 | |
| | 2,283,217 | | | | | 6.000%, due 10/15/37 | | | 2,519,250 | | | | 0.1 | |
| | 8,402,125 | | | ^ | | 6.276%, due 08/15/36 | | | 1,684,907 | | | | 0.1 | |
| | 5,276,647 | | | ^ | | 6.311%, due 06/15/36 | | | 881,146 | | | | 0.0 | |
| | 3,698,773 | | | ^ | | 6.376%, due 05/15/41 | | | 820,836 | | | | 0.0 | |
| | 8,059,865 | | | ^ | | 6.426%, due 09/15/34 | | | 974,004 | | | | 0.0 | |
| | 14,750 | | | | | 6.500%, due 01/01/24 | | | 16,909 | | | | 0.0 | |
| | 15,273 | | | | | 6.500%, due 12/01/31 | | | 18,186 | | | | 0.0 | |
| | 1,386,337 | | | | | 6.500%, due 09/01/34 | | | 1,618,648 | | | | 0.1 | |
| | 6,357 | | | | | 7.000%, due 11/01/31 | | | 6,660 | | | | 0.0 | |
| | 8,216 | | | | | 7.000%, due 03/01/32 | | | 9,682 | | | | 0.0 | |
| | | | | | | | | | 250,239,830 | | | | 9.5 | |
| | | | | | | | | | | | | | | |
| | | | | | | Federal National Mortgage Association: 12.0%## | |
| | 84,549 | | | | | 0.570%, due 01/25/32 | | | 84,068 | | | | 0.0 | |
| | 61,764 | | | | | 0.700%, due 10/25/33 | | | 62,355 | | | | 0.0 | |
| | 921,238 | | | | | 1.679%, due 06/25/33 | | | 929,671 | | | | 0.0 | |
| | 39,457,000 | | | W | | 2.500%, due 11/25/26 | | | 40,444,965 | | | | 1.5 | |
| | 6,878,000 | | | W | | 3.000%, due 10/25/26 | | | 7,197,182 | | | | 0.3 | |
| | 18,295,000 | | | W | | 3.000%, due 11/25/42 | | | 18,705,209 | | | | 0.7 | |
| | 4,630,511 | | | | | 3.000%, due 05/01/43 | | | 4,744,623 | | | | 0.2 | |
| | 85,856,000 | | | W | | 3.000%, due 05/01/43 | | | 87,571,442 | | | | 3.3 | |
| | 5,873,222 | | | | | 3.000%, due 07/01/43 | | | 6,016,950 | | | | 0.2 | |
| | 10,963,000 | | | W | | 3.500%, due 12/25/40 | | | 11,487,597 | | | | 0.4 | |
| | 11,087,733 | | | ^ | | 3.500%, due 06/25/42 | | | 1,440,131 | | | | 0.1 | |
| | 376,883 | | | ^ | | 4.000%, due 11/01/18 | | | 19,088 | | | | 0.0 | |
| | 24,982,000 | | | W | | 4.000%, due 04/25/39 | | | 26,713,176 | | | | 1.0 | |
| | 6,800,412 | | | ^ | | 4.000%, due 04/25/41 | | | 994,097 | | | | 0.0 | |
| | 1,421,836 | | | | | 4.000%, due 03/01/42 | | | 1,523,787 | | | | 0.1 | |
| | 4,373,130 | | | | | 4.000%, due 07/01/42 | | | 4,687,907 | | | | 0.2 | |
| | 4,604,784 | | | | | 4.000%, due 07/01/42 | | | 4,934,515 | | | | 0.2 | |
| | 902,068 | | | | | 4.000%, due 07/01/42 | | | 966,686 | | | | 0.0 | |
| | 732,185 | | | | | 4.000%, due 07/01/42 | | | 784,560 | | | | 0.0 | |
| | 3,385,773 | | | | | 4.000%, due 01/01/45 | | | 3,626,254 | | | | 0.1 | |
| | 3,945,883 | | | | | 4.000%, due 03/01/45 | | | 4,226,464 | | | | 0.2 | |
| | 4,126,058 | | | | | 4.250%, due 11/01/43 | | | 4,479,650 | | | | 0.2 | |
| | 3,759,557 | | | | | 4.500%, due 10/25/34 | | | 4,124,202 | | | | 0.2 | |
| | 607,664 | | | | | 4.500%, due 11/01/40 | | | 665,395 | | | | 0.0 | |
| | 1,189,068 | | | | | 4.500%, due 11/01/40 | | | 1,302,949 | | | | 0.1 | |
| | 11,429 | | | | | 4.500%, due 12/01/40 | | | 12,530 | | | | 0.0 | |
| | 17,275 | | | | | 4.500%, due 12/01/40 | | | 18,935 | | | | 0.0 | |
| | 21,300 | | | | | 4.500%, due 01/01/41 | | | 23,353 | | | | 0.0 | |
| | 18,111 | | | | | 4.500%, due 01/01/41 | | | 19,851 | | | | 0.0 | |
| | 1,018,655 | | | | | 4.500%, due 09/01/41 | | | 1,115,815 | | | | 0.1 | |
| | 1,555,431 | | | | | 4.500%, due 10/01/41 | | | 1,700,901 | | | | 0.1 | |
| | 310,409 | | | | | 4.939%, due 07/01/35 | | | 331,011 | | | | 0.0 | |
| | 347,123 | | | | | 5.000%, due 06/01/33 | | | 387,550 | | | | 0.0 | |
| | 58,256 | | | | | 5.000%, due 09/01/33 | | | 65,062 | | | | 0.0 | |
| | 1,782,405 | | | | | 5.000%, due 09/25/33 | | | 1,982,300 | | | | 0.1 | |
| | 207,962 | | | | | 5.000%, due 11/01/33 | | | 232,213 | | | | 0.0 | |
| | 70,532 | | | | | 5.000%, due 03/01/34 | | | 78,788 | | | | 0.0 | |
| | 44,516 | | | | | 5.000%, due 03/01/34 | | | 49,716 | | | | 0.0 | |
| | 394,791 | | | | | 5.000%, due 07/25/34 | | | 401,400 | | | | 0.0 | |
| | 452,125 | | | | | 5.000%, due 02/01/35 | | | 505,039 | | | | 0.0 | |
| | 18,824 | | | | | 5.000%, due 06/01/35 | | | 21,035 | | | | 0.0 | |
| | 328,101 | | | | | 5.000%, due 06/01/35 | | | 366,742 | | | | 0.0 | |
| | 762,825 | | | | | 5.000%, due 07/01/35 | | | 852,534 | | | | 0.0 | |
| | 187,474 | | | | | 5.000%, due 07/01/35 | | | 209,499 | | | | 0.0 | |
| | 885,576 | | | | | 5.000%, due 08/01/35 | | | 988,269 | | | | 0.0 | |
| | 1,746,983 | | | | | 5.000%, due 10/01/35 | | | 1,946,608 | | | | 0.1 | |
| | 89,727 | | | | | 5.000%, due 10/01/35 | | | 99,783 | | | | 0.0 | |
| | 903,596 | | | | | 5.000%, due 02/01/36 | | | 1,005,535 | | | | 0.1 | |
| | 176,587 | | | | | 5.000%, due 03/01/36 | | | 196,473 | | | | 0.0 | |
| | 13,647 | | | | | 5.000%, due 03/01/36 | | | 15,165 | | | | 0.0 | |
| | 30,212 | | | | | 5.000%, due 05/01/36 | | | 33,620 | | | | 0.0 | |
| | 18,476 | | | | | 5.000%, due 06/01/36 | | | 20,554 | | | | 0.0 | |
| | 631,703 | | | | | 5.000%, due 07/01/36 | | | 705,582 | | | | 0.0 | |
| | 842,134 | | | | | 5.000%, due 07/01/37 | | | 940,344 | | | | 0.0 | |
| | 10,261,007 | | | | | 5.000%, due 07/01/39 | | | 11,504,880 | | | | 0.4 | |
| | 486,269 | | | | | 5.000%, due 11/01/40 | | | 547,146 | | | | 0.0 | |
| | 203,811 | | | | | 5.000%, due 05/01/41 | | | 227,250 | | | | 0.0 | |
| | 536,455 | | | | | 5.000%, due 06/01/41 | | | 598,075 | | | | 0.0 | |
| | 982,868 | | | | | 5.000%, due 06/01/41 | | | 1,096,073 | | | | 0.1 | |
| | 16,474 | | | | | 5.500%, due 02/01/18 | | | 17,322 | | | | 0.0 | |
| | 397,831 | | | | | 5.500%, due 08/25/34 | | | 421,004 | | | | 0.0 | |
| | 484,242 | | | | | 5.500%, due 03/01/37 | | | 546,380 | | | | 0.0 | |
| | 488,206 | | | | | 5.500%, due 06/01/39 | | | 556,116 | | | | 0.0 | |
| | 4,746,964 | | | | | 5.500%, due 10/01/39 | | | 5,386,752 | | | | 0.2 | |
| | 27,561,934 | | | ^ | | 5.896%, due 11/25/40 | | | 3,729,863 | | | | 0.2 | |
| | 7,519,020 | | | ^ | | 5.976%, due 11/25/39 | | | 1,173,418 | | | | 0.1 | |
| | 17,088,927 | | | ^ | | 5.976%, due 11/25/42 | | | 4,177,757 | | | | 0.2 | |
| | 12,546 | | | | | 6.000%, due 08/01/16 | | | 12,824 | | | | 0.0 | |
| | 146 | | | | | 6.000%, due 12/01/16 | | | 150 | | | | 0.0 | |
| | 7,375 | | | | | 6.000%, due 03/01/17 | | | 7,582 | | | | 0.0 | |
| | 72,987 | | | | | 6.000%, due 09/01/17 | | | 75,421 | | | | 0.0 | |
| | 4,496 | | | | | 6.000%, due 11/01/17 | | | 4,647 | | | | 0.0 | |
| | 7,302 | | | | | 6.000%, due 10/01/18 | | | 7,673 | | | | 0.0 | |
| | 429,449 | | | | | 6.000%, due 07/25/29 | | | 487,284 | | | | 0.0 | |
| | 336,845 | | | | | 6.000%, due 04/25/31 | | | 386,396 | | | | 0.0 | |
| | 573,952 | | | ^ | | 6.000%, due 08/25/33 | | | 128,296 | | | | 0.0 | |
| | 153,396 | | | | | 6.000%, due 09/01/36 | | | 174,784 | | | | 0.0 | |
| | 203,912 | | | | | 6.000%, due 02/25/37 | | | 225,294 | | | | 0.0 | |
See Accompanying Notes to Financial Statements
| Voya Intermediate Bond Fund | PORTFOLIO OF INVESTMENTS as of March 31, 2015 (continued) |
| | 4,996,950 | | | | | 6.000%, due 01/01/38 | | | 5,789,250 | | | | 0.2 | |
| | 1,008,344 | | | | | 6.000%, due 05/01/38 | | | 1,114,092 | | | | 0.1 | |
| | 20,120,612 | | | ^ | | 6.026%, due 06/25/33 | | | 4,611,932 | | | | 0.2 | |
| | 7,017,849 | | | ^ | | 6.026%, due 08/25/43 | | | 1,382,427 | | | | 0.1 | |
| | 18,537,258 | | | ^ | | 6.226%, due 05/25/40 | | | 3,291,438 | | | | 0.1 | |
| | 7,243,001 | | | ^ | | 6.376%, due 09/25/40 | | | 1,408,996 | | | | 0.1 | |
| | 19,699,992 | | | ^ | | 6.426%, due 04/25/31 | | | 3,743,331 | | | | 0.2 | |
| | 6,041,586 | | | ^ | | 6.426%, due 10/25/41 | | | 1,193,054 | | | | 0.1 | |
| | 15,321,394 | | | ^ | | 6.446%, due 06/25/40 | | | 2,639,012 | | | | 0.1 | |
| | 4,014 | | | | | 6.500%, due 02/01/28 | | | 4,611 | | | | 0.0 | |
| | 151 | | | | | 6.500%, due 06/01/31 | | | 173 | | | | 0.0 | |
| | 249 | | | | | 6.500%, due 09/01/31 | | | 286 | | | | 0.0 | |
| | 716 | | | | | 6.500%, due 09/01/31 | | | 822 | | | | 0.0 | |
| | 27,376 | | | | | 6.500%, due 11/01/31 | | | 32,372 | | | | 0.0 | |
| | 11,866 | | | | | 6.500%, due 04/01/32 | | | 13,634 | | | | 0.0 | |
| | 5,357 | | | | | 6.500%, due 08/01/32 | | | 6,156 | | | | 0.0 | |
| | 2,308 | | | | | 6.500%, due 08/01/32 | | | 2,652 | | | | 0.0 | |
| | 12,830 | | | | | 6.500%, due 01/01/33 | | | 14,742 | | | | 0.0 | |
| | 56,047 | | | | | 6.500%, due 02/01/33 | | | 64,400 | | | | 0.0 | |
| | 731,069 | | | ^ | | 6.526%, due 08/25/26 | | | 101,931 | | | | 0.0 | |
| | 4,601,388 | | | ^ | | 6.526%, due 07/25/42 | | | 967,763 | | | | 0.0 | |
| | 2,501,331 | | | ^ | | 6.566%, due 01/25/37 | | | 504,335 | | | | 0.0 | |
| | 9,010,666 | | | ^ | | 6.576%, due 10/25/35 | | | 1,690,978 | | | | 0.1 | |
| | 14,280 | | | | | 7.000%, due 12/01/27 | | | 14,904 | | | | 0.0 | |
| | 3,739 | | | | | 7.000%, due 10/01/31 | | | 4,266 | | | | 0.0 | |
| | 4,818 | | | | | 7.000%, due 03/01/32 | | | 5,639 | | | | 0.0 | |
| | 4,385,094 | | | ^ | | 7.476%, due 07/25/33 | | | 909,621 | | | | 0.0 | |
| | 2,929 | | | | | 7.500%, due 09/01/30 | | | 3,455 | | | | 0.0 | |
| | 2,824 | | | | | 7.500%, due 10/01/30 | | | 2,852 | | | | 0.0 | |
| | 1,091 | | | | | 7.500%, due 10/01/30 | | | 1,127 | | | | 0.0 | |
| | 7,869 | | | | | 7.500%, due 09/01/31 | | | 9,944 | | | | 0.0 | |
| | 28,447 | | | | | 7.500%, due 02/01/32 | | | 33,751 | | | | 0.0 | |
| | 659,064 | | | ^ | | 7.509%, due 02/17/29 | | | 119,911 | | | | 0.0 | |
| | 571,251 | | | | | 22.335%, due 01/25/35 | | | 744,690 | | | | 0.0 | |
| | 67,194 | | | | | 27.905%, due 02/25/34 | | | 90,507 | | | | 0.0 | |
| | 513,472 | | | | | 32.581%, due 11/25/36 | | | 922,967 | | | | 0.0 | |
| | | | | | | | | | 314,993,538 | | | | 12.0 | |
| | | | | | | | | | | | | | | |
| | | | | | | Government National Mortgage Association: 3.9% | |
| | 20,018,000 | | | | | 3.500%, due 12/20/41 | | | 21,014,991 | | | | 0.8 | |
| | 889,518 | | | | | 4.000%, due 11/20/40 | | | 955,453 | | | | 0.0 | |
| | 1,045,852 | | | | | 4.000%, due 10/20/41 | | | 1,103,250 | | | | 0.1 | |
| | 3,638,891 | | | | | 4.000%, due 10/20/44 | | | 3,901,474 | | | | 0.2 | |
| | 12,600,000 | | | | | 4.000%, due 03/20/45 | | | 13,519,483 | | | | 0.5 | |
| | 7,658,067 | | | ^ | | 4.500%, due 01/16/29 | | | 941,588 | | | | 0.0 | |
| | 6,025,554 | | | | | 4.500%, due 05/16/39 | | | 6,663,121 | | | | 0.3 | |
| | 2,858,984 | | | | | 4.500%, due 05/20/39 | | | 3,129,258 | | | | 0.1 | |
| | 945,730 | | | | | 4.500%, due 10/15/39 | | | 1,059,145 | | | | 0.0 | |
| | 927,841 | | | | | 4.500%, due 11/15/39 | | | 1,039,637 | | | | 0.0 | |
| | 813,885 | | | | | 4.500%, due 11/15/39 | | | 911,245 | | | | 0.0 | |
| | 227,621 | | | | | 4.500%, due 12/15/39 | | | 255,077 | | | | 0.0 | |
| | 248,075 | | | | | 4.500%, due 08/20/41 | | | 270,539 | | | | 0.0 | |
| | 2,926,303 | | | ^ | | 4.500%, due 09/20/41 | | | 491,632 | | | | 0.0 | |
| | 6,643,426 | | | | | 4.500%, due 01/20/45 | | | 7,227,359 | | | | 0.3 | |
| | 1,718,000 | | | | | 4.750%, due 05/20/39 | | | 1,910,479 | | | | 0.1 | |
| | 2,017,343 | | | ^ | | 5.000%, due 04/20/40 | | | 841,721 | | | | 0.0 | |
| | 1,234,508 | | | | | 5.140%, due 10/20/60 | | | 1,343,320 | | | | 0.1 | |
| | 12,628,013 | | | ^ | | 5.176%, due 05/16/41 | | | 2,185,803 | | | | 0.1 | |
| | 1,301,797 | | | | | 5.288%, due 10/20/60 | | | 1,429,843 | | | | 0.1 | |
| | 24,395,576 | | | ^ | | 5.426%, due 04/16/44 | | | 3,997,101 | | | | 0.2 | |
| | 21,618,191 | | | ^ | | 5.500%, due 11/20/43 | | | 4,751,036 | | | | 0.2 | |
| | 923,414 | | | | | 5.500%, due 03/20/60 | | | 1,009,077 | | | | 0.0 | |
| | 5,641,835 | | | ^ | | 5.674%, due 06/20/40 | | | 865,597 | | | | 0.0 | |
| | 29,233,215 | | | ^ | | 5.874%, due 07/20/39 | | | 4,588,799 | | | | 0.2 | |
| | 32,353,110 | | | ^ | | 5.926%, due 05/16/40 | | | 4,933,849 | | | | 0.2 | |
| | 1,849,931 | | | ^ | | 6.024%, due 06/20/38 | | | 214,614 | | | | 0.0 | |
| | 3,375,053 | | | ^ | | 6.024%, due 04/20/39 | | | 570,008 | | | | 0.0 | |
| | 22,083,277 | | | ^ | | 6.026%, due 12/16/39 | | | 3,583,537 | | | | 0.1 | |
| | 13,053,814 | | | ^ | | 6.124%, due 05/20/39 | | | 1,479,340 | | | | 0.1 | |
| | 2,415,345 | | | ^ | | 6.224%, due 04/20/38 | | | 381,586 | | | | 0.0 | |
| | 1,202,889 | | | ^ | | 6.326%, due 05/16/38 | | | 225,500 | | | | 0.0 | |
| | 3,054,958 | | | ^ | | 6.374%, due 01/20/38 | | | 491,043 | | | | 0.0 | |
| | 14,549,172 | | | ^ | | 6.444%, due 08/20/40 | | | 3,324,212 | | | | 0.1 | |
| | 6,570,030 | | | ^ | | 6.476%, due 09/16/40 | | | 1,291,908 | | | | 0.1 | |
| | 2,075,192 | | | ^ | | 6.596%, due 02/16/35 | | | 398,130 | | | | 0.0 | |
| | 87,740 | | | ^ | | 8.076%, due 06/16/31 | | | 8,078 | | | | 0.0 | |
| | | | | | | | | | 102,307,833 | | | | 3.9 | |
| | | | | | | | | | | | | | | |
| | | | | Total U.S. Government Agency Obligations
(Cost $652,091,390) | | 667,541,201 | | | | 25.4 | |
| | | | | | | | | | | | | | | |
| U.S. TREASURY OBLIGATIONS: 28.5% | | | | | |
|
| | | | | | | U.S. Treasury Bonds: 9.4% | | | | | |
| | 140,634,000 | | | L | | 2.000%, due 02/15/25 | | | 141,534,902 | | | | 5.4 | |
| | 95,897,000 | | | | | 3.000%, due 11/15/44 | | | 105,104,646 | | | | 4.0 | |
| | | | | | | | | | 246,639,548 | | | | 9.4 | |
| | | | | | | | | | | | | | | |
| | | | | | | U.S. Treasury Notes: 19.1% | | | | | |
| | 24,428,000 | | | | | 0.375%, due 03/31/16 | | | 24,450,913 | | | | 0.9 | |
| | 75,000 | | | | | 0.500%, due 02/28/17 | | | 74,947 | | | | 0.0 | |
| | 172,164,000 | | | | | 0.500%, due 03/31/17 | | | 171,948,795 | | | | 6.5 | |
| | 192,626,000 | | | | | 1.000%, due 03/15/18 | | | 193,318,298 | | | | 7.4 | |
| | 39,020,000 | | | | | 1.375%, due 03/31/20 | | | 39,029,131 | | | | 1.5 | |
| | 10,980,000 | | | | | 1.750%, due 02/28/22 | | | 11,012,600 | | | | 0.4 | |
| | 63,580,000 | | | | | 1.750%, due 03/31/22 | | | 63,743,909 | | | | 2.4 | |
| | | | | | | | | | 503,578,593 | | | | 19.1 | |
| | | | | | | | | | | | | | | |
| | | | | Total U.S. Treasury Obligations
(Cost $744,912,589) | | | 750,218,141 | | | | 28.5 | |
| | | | | | | | | | | | | |
| # of Contracts | | Value | | | Percentage
of Net
Assets | |
| PURCHASED OPTIONS: –% | | | | | | |
| | | | | | | OTC Interest Rate Swaptions: –% | |
| | 343,506,087 | | | @ | | Pay a fixed rate equal to 5.008% and receive a floating rate based on the 3-month USD-LIBOR-BBA, Exp. 05/29/15 Counterparty: Goldman Sachs & Co. | | | – | | | | – | |
| | | | | | | | | | | | | | | |
| | | | | Total Purchased Options
(Cost $1,683,180) | | | – | | | | – | |
| | | | | | | | | | | | | | | |
| | | | | Total Long-Term Investments
(Cost $2,776,736,276) | | | 2,831,571,651 | | | | 107.6 | |
See Accompanying Notes to Financial Statements
| Voya Intermediate Bond Fund | PORTFOLIO OF INVESTMENTS as of March 31, 2015 (continued) |
Principal
Amount† | | | | | | | Value | | | Percentage
of Net
Assets | |
| SHORT-TERM INVESTMENTS: 11.9% | | | | | |
| | | | | | | Securities Lending Collateralcc: 5.4% | |
| | 7,133,413 | | | | | BNP Paribas Bank, Repurchase Agreement dated 03/31/15, 0.13%, due 04/01/15 (Repurchase Amount $7,133,438, collateralized by various U.S. Government Agency Obligations, 1.625%-6.000%, Market Value plus accrued interest $7,276,081, due 06/01/16-03/01/45) | | | 7,133,413 | | | | 0.2 | |
| | 33,884,009 | | | | | Daiwa Capital Markets, Repurchase Agreement dated 03/31/15, 0.18%, due 04/01/15 (Repurchase Amount $33,884,176, collateralized by various U.S. Government/U.S. Government Agency Obligations, 0.000%-8.000%, Market Value plus accrued interest $34,561,690, due 02/15/16-03/01/48) | | | 33,884,009 | | | | 1.3 | |
| | 33,884,009 | | | | | Merrill Lynch & Co., Inc., Repurchase Agreement dated 03/31/15, 0.15%, due 04/01/15 (Repurchase Amount $33,884,148, collateralized by various U.S. Government Agency Obligations, 0.000%-7.000%, Market Value plus accrued interest $34,561,689, due 06/01/15-04/01/45) | | | 33,884,009 | | | | 1.3 | |
| | 33,884,009 | | | | | Millenium Fixed Income Ltd., Repurchase Agreement dated 03/31/15, 0.22%, due 04/01/15 (Repurchase Amount $33,884,213, collateralized by various U.S. Government Securities, 0.875%-3.125%, Market Value plus accrued interest $34,561,690, due 08/15/17-02/15/42) | | | 33,884,009 | | | | 1.3 | |
| | 33,884,009 | | | | | Nomura Securities, Repurchase Agreement dated 03/31/15, 0.13%, due 04/01/15 (Repurchase Amount $33,884,130, collateralized by various U.S. Government Agency Obligations, 1.280%-7.500%, Market Value plus accrued interest $34,561,689, due 08/18/15-10/20/64) | | | 33,884,009 | | | | 1.3 | |
| | | | | | | | | | 142,669,449 | | | | 5.4 | |
| | | | | | | | | | | | |
| Shares | | | | | | | Value | | | Percentage
of Net
Assets | |
| | | | | | | Mutual Funds: 6.5% | |
| | 171,625,414 | | | | | BlackRock Liquidity Funds, TempFund, Institutional Class, 0.070%††
(Cost $171,625,414) | | | 171,625,414 | | | | 6.5 | |
| | | | | | | | | | | | | | | |
| | | | Total Short-Term Investments
(Cost $314,294,863) | 314,294,863 | | | | 11.9 | |
| | | | | | | | | | | | | | | |
| | | | Total Investments in Securities
(Cost $3,091,031,139) | $3,145,866,514 | | | | 119.5 | |
| | | | Liabilities in Excess of Other Assets | (512,252,037 | ) | | | (19.5 | ) |
| | | | Net Assets | $2,633,614,477 | | | | 100.0 | |
| † | Unless otherwise indicated, principal amount is shown in USD. |
| †† | Rate shown is the 7-day yield as of March 31, 2015. |
| # | Securities with purchases pursuant to Rule 144A or section 4(a)(2), under the Securities Act of 1933 and may not be resold subject to that rule except to qualified institutional buyers. |
| ## | The Federal Housing Finance Agency (“FHFA”) placed the Federal Home Loan Mortgage Corporation and Federal National Mortgage Association into conservatorship with FHFA as the conservator. As such, the FHFA oversees the continuing affairs of these companies. |
| @ | Non-income producing security. |
| + | Step-up basis bonds. Interest rates shown reflect current and next coupon rates. |
| cc | Represents securities purchased with cash collateral received for securities on loan. |
| W | Settlement is on a when-issued or delayed-delivery basis. |
| L | Loaned security, a portion or all of the security is on loan at March 31, 2015. |
| ^ | Interest only securities represent the right to receive the monthly interest payments on an underlying pool of mortgage loans. Principal amount shown represents the notional amount on which current interest is calculated. Payments of principal on the pool reduce the value of the interest only security. |
| ^^ | Principal only securities represent the right to receive the monthly principal payments on an underlying pool of mortgage loans. No payments of interest on the pool are passed through the principal only security. |
See Accompanying Notes to Financial Statements
| Voya Intermediate Bond Fund | PORTFOLIO OF INVESTMENTS as of March 31, 2015 (continued) |
Cost for federal income tax purposes is $3,092,296,041.
Net unrealized appreciation consists of:
| Gross Unrealized Appreciation | | $ | 64,979,619 | |
| Gross Unrealized Depreciation | | | (11,409,146 | ) |
| | | | | |
| Net Unrealized Appreciation | | $ | 53,570,473 | |
See Accompanying Notes to Financial Statements
| Voya Short Term Bond Fund | PORTFOLIO OF INVESTMENTS as of March 31, 2015 |
Principal
Amount† | | | | | | | Value | | | Percentage
of Net
Assets | |
| CORPORATE BONDS/NOTES: 58.7% | | | | | | | | |
| | | | | | | Basic Materials: 2.5% | | | | | | | | |
| | 580,000 | | | | | BHP Billiton Finance USA Ltd., 2.050%, 09/30/18 | | $ | 592,491 | | | | 0.4 | |
| | 489,000 | | | | | Eastman Chemical Co., 2.400%, 06/01/17 | | | 499,434 | | | | 0.4 | |
| | 500,000 | | | #,L | | FMG Resources August 2006 Pty Ltd., 6.000%, 04/01/17 | | | 496,562 | | | | 0.4 | |
| | 308,000 | | | | | Freeport-McMoRan, Inc., 2.300%, 11/14/17 | | | 307,169 | | | | 0.2 | |
| | 580,000 | | | | | Monsanto Co., 1.150%, 06/30/17 | | | 582,530 | | | | 0.4 | |
| | 329,000 | | | | | PPG Industries, Inc., 2.300%, 11/15/19 | | | 333,082 | | | | 0.2 | |
| | 301,000 | | | | | Rio Tinto Finance USA PLC, 1.375%, 06/17/16 | | | 302,690 | | | | 0.2 | |
| | 210,000 | | | | | Rockwood Specialties Group, Inc., 4.625%, 10/15/20 | | | 219,188 | | | | 0.2 | |
| | 189,000 | | | | | Valspar Corp./The, 6.050%, 05/01/17 | | | 203,154 | | | | 0.1 | |
| | | | | | | | | | 3,536,300 | | | | 2.5 | |
| | | | | | | | | | | | | | | |
| | | | | | | Communications: 4.4% | | | | | | | | |
| | 395,000 | | | # | | Alibaba Group Holding Ltd., 1.625%, 11/28/17 | | | 396,217 | | | | 0.3 | |
| | 337,000 | | | | | AT&T, Inc., 1.400%, 12/01/17 | | | 335,368 | | | | 0.2 | |
| | 257,000 | | | | | British Telecommunications PLC, 5.950%, 01/15/18 | | | 287,560 | | | | 0.2 | |
| | 500,000 | | | | | Cablevision Systems Corp., 8.625%, 09/15/17 | | | 563,750 | | | | 0.4 | |
| | 342,000 | | | | | Comcast Corp., 6.300%, 11/15/17 | | | 386,351 | | | | 0.3 | |
| | 500,000 | | | | | DirecTV Financing Co., Inc., 1.750%, 01/15/18 | | | 500,345 | | | | 0.4 | |
| | 500,000 | | | | | DISH DBS Corp., 7.125%, 02/01/16 | | | 520,625 | | | | 0.4 | |
| | 414,000 | | | | | eBay, Inc., 1.350%, 07/15/17 | | | 413,661 | | | | 0.3 | |
| | 600,000 | | | | | Juniper Networks, Inc., 3.100%, 03/15/16 | | | 610,355 | | | | 0.4 | |
| | 300,000 | | | | | Sprint Nextel Corp., 6.000%, 12/01/16 | | | 313,763 | | | | 0.2 | |
| | 300,000 | | | | | Telefonica Emisiones SAU, 3.992%, 02/16/16 | | | 307,681 | | | | 0.2 | |
| | 567,000 | | | | | Thomson Reuters Corp., 0.875%, 05/23/16 | | | 566,891 | | | | 0.4 | |
| | 255,000 | | | | | Thomson Reuters Corp., 1.650%, 09/29/17 | | | 255,610 | | | | 0.2 | |
| | 409,000 | | | | | Verizon Communications, Inc., 2.625%, 02/21/20 | | | 416,860 | | | | 0.3 | |
| | 261,000 | | | | | Vodafone Group PLC, 5.625%, 02/27/17 | | | 281,961 | | | | 0.2 | |
| | | | | | | | | | 6,156,998 | | | | 4.4 | |
| | | | | | | Consumer Staples: 0.4% | | | | | | | | |
| | 500,000 | | | | | Smithfield Foods, Inc., 7.750%, 07/01/17 | | | 558,750 | | | | 0.4 | |
| | | | | | | | | | | | | | | |
| | | | | | | Consumer, Cyclical: 4.6% | | | | | | | | |
| | 193,000 | | | | | American Honda Finance Corp., 1.200%, 07/14/17 | | | 193,531 | | | | 0.1 | |
| | 486,000 | | | | | American Honda Finance Corp., 2.250%, 08/15/19 | | | 494,370 | | | | 0.4 | |
| | 190,000 | | | | | CVS Caremark Corp., 2.250%, 08/12/19 | | | 193,129 | | | | 0.1 | |
| | 375,000 | | | # | | Daimler Finance North America LLC, 1.650%, 03/02/18 | | | 377,187 | | | | 0.3 | |
| | 435,000 | | | | | Ford Motor Credit Co. LLC, 1.684%, 09/08/17 | | | 434,556 | | | | 0.3 | |
| | 277,000 | | | # | | Glencore Funding LLC, 1.700%, 05/27/16 | | | 278,210 | | | | 0.2 | |
| | 180,000 | | | # | | Hyundai Capital America, 1.625%, 10/02/15 | | | 180,813 | | | | 0.1 | |
| | 300,000 | | | # | | Hyundai Capital America, 1.875%, 08/09/16 | | | 302,692 | | | | 0.2 | |
| | 176,000 | | | | | Johnson Controls, Inc., 1.400%, 11/02/17 | | | 175,551 | | | | 0.1 | |
| | 500,000 | | | L | | Lennar Corp., 4.750%, 12/15/17 | | | 522,500 | | | | 0.4 | |
| | 300,000 | | | | | MGM Mirage, 7.500%, 06/01/16 | | | 315,960 | | | | 0.2 | |
| | 210,000 | | | | | PACCAR Financial Corp., 1.450%, 03/09/18 | | | 210,996 | | | | 0.2 | |
| | 314,000 | | | | | Southwest Airlines Co., 2.750%, 11/06/19 | | | 321,487 | | | | 0.2 | |
| | 495,000 | | | | | Starbucks Corp., 0.875%, 12/05/16 | | | 496,175 | | | | 0.4 | |
| | 280,000 | | | | | Target Corp., 5.875%, 07/15/16 | | | 298,596 | | | | 0.2 | |
| | 251,000 | | | | | Toyota Motor Credit Corp., 1.450%, 01/12/18 | | | 252,673 | | | | 0.2 | |
| | 322,000 | | | # | | Volkswagen Group of America Finance LLC, 1.600%, 11/20/17 | | | 324,960 | | | | 0.2 | |
| | 200,000 | | | # | | Volkswagen International Finance NV, 1.125%, 11/18/16 | | | 200,746 | | | | 0.2 | |
| | 414,000 | | | | | Walgreen Co., 1.800%, 09/15/17 | | | 418,439 | | | | 0.3 | |
| | 150,000 | | | | | Walgreens Boots Alliance, Inc., 2.700%, 11/18/19 | | | 153,403 | | | | 0.1 | |
| | 313,000 | | | | | Whirlpool Corp., 1.650%, 11/01/17 | | | 315,155 | | | | 0.2 | |
| | | | | | | | | | 6,461,129 | | | | 4.6 | |
| | | | | | | | | | | | | | | |
| | | | | | | Consumer, Non-cyclical: 11.2% | | | | | | | | |
| | 600,000 | | | | | Abbott Laboratories, 2.000%, 03/15/20 | | | 604,319 | | | | 0.4 | |
| | 338,000 | | | | | AbbVie, Inc., 1.750%, 11/06/17 | | | 339,345 | | | | 0.2 | |
| | 582,000 | | | | | Actavis Funding SCS, 1.300%, 06/15/17 | | | 577,234 | | | | 0.4 | |
| | 345,000 | | | | | Actavis Funding SCS, 2.350%, 03/12/18 | | | 349,860 | | | | 0.3 | |
See Accompanying Notes to Financial Statements
| Voya Short Term Bond Fund | PORTFOLIO OF INVESTMENTS as of March 31, 2015 (continued) |
| | 502,000 | | | | | Aetna, Inc., 1.500%, 11/15/17 | | | 504,648 | | | | 0.4 | |
| | 650,000 | | | | | Altria Group, Inc., 2.625%, 01/14/20 | | | 660,280 | | | | 0.5 | |
| | 521,000 | | | | | AmerisourceBergen Corp., 1.150%, 05/15/17 | | | 519,362 | | | | 0.4 | |
| | 208,000 | | | | | Archer-Daniels-Midland Co., 5.450%, 03/15/18 | | | 233,190 | | | | 0.2 | |
| | 333,000 | | | # | | Bayer US Finance LLC, 1.500%, 10/06/17 | | | 335,198 | | | | 0.2 | |
| | 329,000 | | | | | Beam, Inc., 1.875%, 05/15/17 | | | 331,474 | | | | 0.2 | |
| | 276,000 | | | | | Becton Dickinson and Co., 1.800%, 12/15/17 | | | 278,239 | | | | 0.2 | |
| | 253,000 | | | | | CareFusion Corp., 1.450%, 05/15/17 | | | 253,280 | | | | 0.2 | |
| | 417,000 | | | | | Diageo Capital PLC, 1.500%, 05/11/17 | | | 421,050 | | | | 0.3 | |
| | 195,000 | | | | | Eli Lilly & Co., 1.250%, 03/01/18 | | | 195,699 | | | | 0.1 | |
| | 200,000 | | | | | Express Scripts Holding Co., 1.250%, 06/02/17 | | | 199,885 | | | | 0.1 | |
| | 410,000 | | | | | Express Scripts, Inc., 3.125%, 05/15/16 | | | 420,054 | | | | 0.3 | |
| | 351,000 | | | | | Gilead Sciences, Inc., 2.350%, 02/01/20 | | | 360,897 | | | | 0.3 | |
| | 500,000 | | | | | HCA, Inc., 6.500%, 02/15/16 | | | 519,425 | | | | 0.4 | |
| | 300,000 | | | | | Hertz Corp., 6.750%, 04/15/19 | | | 311,250 | | | | 0.2 | |
| | 500,000 | | | | | Jarden Corp., 7.500%, 05/01/17 | | | 553,750 | | | | 0.4 | |
| | 440,000 | | | # | | JM Smucker Co., 1.750%, 03/15/18 | | | 442,089 | | | | 0.3 | |
| | 202,000 | | | | | Kimberly-Clark Corp., 6.125%, 08/01/17 | | | 225,645 | | | | 0.2 | |
| | 204,000 | | | | | The Kroger Co., 6.400%, 08/15/17 | | | 227,546 | | | | 0.2 | |
| | 304,000 | | | | | Lorillard Tobacco Co., 3.500%, 08/04/16 | | | 312,377 | | | | 0.2 | |
| | 303,000 | | | | | McKesson Corp., 1.292%, 03/10/17 | | | 303,406 | | | | 0.2 | |
| | 379,000 | | | | | Medtronic, Inc., 0.875%, 02/27/17 | | | 379,452 | | | | 0.3 | |
| | 223,000 | | | # | | Medtronic, Inc., 2.500%, 03/15/20 | | | 227,990 | | | | 0.2 | |
| | 200,000 | | | | | Molson Coors Brewing Co., 2.000%, 05/01/17 | | | 202,559 | | | | 0.1 | |
| | 420,000 | | | | | PepsiCo, Inc., 1.250%, 08/13/17 | | | 422,024 | | | | 0.3 | |
| | 323,000 | | | | | Perrigo Co. PLC, 1.300%, 11/08/16 | | | 322,888 | | | | 0.2 | |
| | 462,000 | | | | | Philip Morris International, Inc., 1.250%, 11/09/17 | | | 464,657 | | | | 0.3 | |
| | 550,000 | | | | | Sanofi, 1.250%, 04/10/18 | | | 551,068 | | | | 0.4 | |
| | 465,000 | | | | | Synchrony Financial, 1.875%, 08/15/17 | | | 465,553 | | | | 0.3 | |
| | 409,000 | | | | | Sysco Corp., 1.450%, 10/02/17 | | | 412,349 | | | | 0.3 | |
| | 300,000 | | | | | Tenet Healthcare Corp., 6.250%, 11/01/18 | | | 326,250 | | | | 0.2 | |
| | 303,000 | | | | | UnitedHealth Group, Inc., 1.400%, 12/15/17 | | | 305,512 | | | | 0.2 | |
| | 350,000 | | | | | Ventas Realty L.P., 1.250%, 04/17/17 | | | 349,357 | | | | 0.3 | |
| | 316,000 | | | | | Ventas Realty L.P., 1.550%, 09/26/16 | | | 318,177 | | | | 0.2 | |
| | 575,000 | | | | | WellPoint, Inc., 2.250%, 08/15/19 | | | 578,187 | | | | 0.4 | |
| | 359,000 | | | # | | WM Wrigley Jr Co., 1.400%, 10/21/16 | | | 360,411 | | | | 0.3 | |
| | 245,000 | | | | | Zimmer Holdings, Inc., 2.000%, 04/01/18 | | | 247,029 | | | | 0.2 | |
| | 331,000 | | | | | Zoetis, Inc., 1.875%, 02/01/18 | | | 331,367 | | | | 0.2 | |
| | | | | | | | | | 15,744,332 | | | | 11.2 | |
| | | | | | | | | | | | | | | |
| | | | | | | Energy: 4.5% | | | | | | | | |
| | 135,000 | | | | | BP Capital Markets PLC, 1.674%, 02/13/18 | | | 135,675 | | | | 0.1 | |
| | 200,000 | | | | | BP Capital Markets PLC, 2.248%, 11/01/16 | | | 203,839 | | | | 0.1 | |
| | 287,000 | | | | | BP Capital Markets PLC, 2.521%, 01/15/20 | | | 292,107 | | | | 0.2 | |
| | 283,000 | | | | | Canadian Natural Resources Ltd., 1.750%, 01/15/18 | | | 281,747 | | | | 0.2 | |
| | 500,000 | | | | | Chesapeake Energy Corp., 3.250%, 03/15/16 | | | 500,625 | | | | 0.4 | |
| | 390,000 | | | | | Chevron Corp., 1.365%, 03/02/18 | | | 392,008 | | | | 0.3 | |
| | 500,000 | | | | | CNOOC Finance 2013 Ltd., 1.125%, 05/09/16 | | | 499,476 | | | | 0.4 | |
| | 282,000 | | | | | ConocoPhillips, 5.200%, 05/15/18 | | | 313,439 | | | | 0.2 | |
| | 314,000 | | | | | Hess Corp., 1.300%, 06/15/17 | | | 311,428 | | | | 0.2 | |
| | 357,000 | | | | | Kinder Morgan, Inc./DE, 2.000%, 12/01/17 | | | 356,624 | | | | 0.3 | |
| | 321,000 | | | | | Murphy Oil Corp., 2.500%, 12/01/17 | | | 316,592 | | | | 0.2 | |
| | 302,000 | | | | | Petrobras Global Finance BV, 2.000%, 05/20/16 | | | 289,618 | | | | 0.2 | |
| | 312,000 | | | | | Statoil ASA, 1.250%, 11/09/17 | | | 312,635 | | | | 0.2 | |
| | 201,000 | | | | | Statoil ASA, 1.950%, 11/08/18 | | | 203,911 | | | | 0.1 | |
| | 500,000 | | | | | Tesoro Corp., 4.250%, 10/01/17 | | | 522,500 | | | | 0.4 | |
| | 250,000 | | | | | Total Capital International SA, 1.550%, 06/28/17 | | | 252,899 | | | | 0.2 | |
| | 600,000 | | | | | TransCanada PipeLines Ltd., 0.750%, 01/15/16 | | | 599,193 | | | | 0.4 | |
| | 215,000 | | | | | TransCanada PipeLines Ltd, 1.875%, 01/12/18 | | | 217,151 | | | | 0.2 | |
| | 341,000 | | | | | Transocean, Inc., 5.050%, 12/15/16 | | | 345,689 | | | | 0.2 | |
| | | | | | | | | | 6,347,156 | | | | 4.5 | |
| | | | | | | | | | | | | | | |
| | | | | | | Financial: 26.2% | | | | | | | | |
| | 637,000 | | | | | Abbey National Treasury Services PLC/London, 1.650%, 09/29/17 | | | 641,241 | | | | 0.5 | |
| | 450,000 | | | # | | ABN AMRO Bank NV, 1.375%, 01/22/16 | | | 452,398 | | | | 0.3 | |
| | 280,000 | | | | | ACE INA Holdings, Inc., 5.700%, 02/15/17 | | | 304,249 | | | | 0.2 | |
| | 357,000 | | | | | Air Lease Corp., 2.125%, 01/15/18 | | | 356,107 | | | | 0.3 | |
| | 500,000 | | | | | Ally Financial, Inc., 5.500%, 02/15/17 | | | 521,250 | | | | 0.4 | |
See Accompanying Notes to Financial Statements
| Voya Short Term Bond Fund | PORTFOLIO OF INVESTMENTS as of March 31, 2015 (continued) |
| | 191,000 | | | | | American Express Credit Corp., 1.550%, 09/22/17 | | | 192,461 | | | | 0.1 | |
| | 286,000 | | | | | American Express Credit Corp., 2.800%, 09/19/16 | | | 294,110 | | | | 0.2 | |
| | 740,000 | | | | | American International Group, Inc., 5.600%, 10/18/16 | | | 789,140 | | | | 0.6 | |
| | 600,000 | | | | | Australia & New Zealand Banking Group Ltd., 0.900%, 02/12/16 | | | 601,843 | | | | 0.4 | |
| | 500,000 | | | | | Banco BTG Pactual SA/Cayman Islands, 4.875%, 07/08/16 | | | 513,125 | | | | 0.4 | |
| | 1,100,000 | | | | | Bank of America Corp., 2.600%, 01/15/19 | | | 1,120,174 | | | | 0.8 | |
| | 415,000 | | | | | Bank of Montreal, 1.300%, 07/14/17 | | | 416,465 | | | | 0.3 | |
| | 320,000 | | | | | Bank of Nova Scotia AM8, 2.550%, 01/12/17 | | | 328,651 | | | | 0.2 | |
| | 506,000 | | | | | Bank of Nova Scotia, 1.300%, 07/21/17 | | | 507,009 | | | | 0.4 | |
| | 295,000 | | | # | | Bank of Tokyo-Mitsubishi UFJ Ltd./The, 1.700%, 03/05/18 | | | 295,507 | | | | 0.2 | |
| | 425,000 | | | # | | Bank of Tokyo-Mitsubishi UFJ Ltd., 1.550%, 09/09/16 | | | 427,649 | | | | 0.3 | |
| | 339,000 | | | # | | Banque Federative du Credit Mutuel SA, 1.700%, 01/20/17 | | | 341,526 | | | | 0.2 | |
| | 870,000 | | | | | Barclays Bank PLC, 5.000%, 09/22/16 | | | 919,704 | | | | 0.7 | |
| | 900,000 | | | | | BB&T Corp., 1.600%, 08/15/17 | | | 906,106 | | | | 0.6 | |
| | 210,000 | | | | | BB&T Corp., 5.200%, 12/23/15 | | | 216,647 | | | | 0.2 | |
| | 500,000 | | | # | | BBVA Banco Continental SA, 2.250%, 07/29/16 | | | 504,000 | | | | 0.4 | |
| | 342,000 | | | | | BPCE SA, 1.625%, 02/10/17 | | | 345,293 | | | | 0.2 | |
| | 385,000 | | | | | Charles Schwab Corp., 1.500%, 03/10/18 | | | 386,988 | | | | 0.3 | |
| | 500,000 | | | | | CIT Group, Inc., 5.000%, 05/15/17 | | | 515,470 | | | | 0.4 | |
| | 622,000 | | | | | Citigroup, Inc., 1.850%, 11/24/17 | | | 626,686 | | | | 0.4 | |
| | 258,000 | | | | | Citizens Bank NA/Providence RI, 1.600%, 12/04/17 | | | 259,186 | | | | 0.2 | |
| | 315,000 | | | | | Comerica, Inc., 2.125%, 05/23/19 | | | 316,389 | | | | 0.2 | |
| | 303,000 | | | | | Commonwealth Bank of Australia/New York NY, 1.125%, 03/13/17 | | | 303,869 | | | | 0.2 | |
| | 345,000 | | | | | Commonwealth Bank of Australia/New York NY, 1.400%, 09/08/17 | | | 345,562 | | | | 0.2 | |
| | 630,000 | | | | | Compass Bank, 1.850%, 09/29/17 | | | 634,832 | | | | 0.5 | |
| | 446,000 | | | | | Credit Suisse/New York NY, 1.375%, 05/26/17 | | | 446,871 | | | | 0.3 | |
| | 183,000 | | | | | Deutsche Bank AG/London, 1.350%, 05/30/17 | | | 182,856 | | | | 0.1 | |
| | 355,000 | | | | | Deutsche Bank AG/London, 1.875%, 02/13/18 | | | 356,087 | | | | 0.3 | |
| | 500,000 | | | | | Discover Bank/Greenwood DE, 2.000%, 02/21/18 | | | 500,842 | | | | 0.4 | |
| | 260,000 | | | | | Equity One, Inc., 6.250%, 01/15/17 | | | 279,615 | | | | 0.2 | |
| | 305,000 | | | | | General Electric Capital Corp., 2.200%, 01/09/20 | | | 308,570 | | | | 0.2 | |
| | 641,000 | | | | | Goldman Sachs Group, Inc., 2.375%, 01/22/18 | | | 654,266 | | | | 0.5 | |
| | 425,000 | | | | | Goldman Sachs Group, Inc., 2.550%, 10/23/19 | | | 431,461 | | | | 0.3 | |
| | 252,000 | | | | | Health Care REIT, Inc., 2.250%, 03/15/18 | | | 255,566 | | | | 0.2 | |
| | 312,000 | | | | | Health Care REIT, Inc., 3.625%, 03/15/16 | | | 319,903 | | | | 0.2 | |
| | 426,000 | | | # | | HSBC Bank PLC, 1.500%, 05/15/18 | | | 426,074 | | | | 0.3 | |
| | 299,000 | | | | | HSBC USA, Inc., 1.500%, 11/13/17 | | | 300,237 | | | | 0.2 | |
| | 325,000 | | | | | Huntington National Bank, 1.350%, 08/02/16 | | | 326,836 | | | | 0.2 | |
| | 358,000 | | | | | Huntington National Bank, 1.700%, 02/26/18 | | | 357,856 | | | | 0.3 | |
| | 339,000 | | | | | Intesa Sanpaolo SpA, 2.375%, 01/13/17 | | | 343,144 | | | | 0.2 | |
| | 404,000 | | | | | JPMorgan Chase & Co., 1.350%, 02/15/17 | | | 405,540 | | | | 0.3 | |
| | 442,000 | | | | | JPMorgan Chase & Co., 1.625%, 05/15/18 | | | 440,677 | | | | 0.3 | |
| | 515,000 | | | | | JPMorgan Chase & Co., 1.700%, 03/01/18 | | | 517,206 | | | | 0.4 | |
| | 313,000 | | | | | KeyCorp, 2.300%, 12/13/18 | | | 318,306 | | | | 0.2 | |
| | 103,000 | | | | | Kilroy Realty L.P., 4.800%, 07/15/18 | | | 110,916 | | | | 0.1 | |
| | 750,000 | | | # | | Macquarie Bank Ltd., 1.600%, 10/27/17 | | | 749,972 | | | | 0.5 | |
| | 500,000 | | | | | Manufacturers & Traders Trust Co., 1.450%, 03/07/18 | | | 500,634 | | | | 0.4 | |
| | 578,000 | | | | | Manufacturers & Traders Trust Co., 1.400%, 07/25/17 | | | 579,876 | | | | 0.4 | |
| | 312,000 | | | # | | MassMutual Global Funding II, 3.125%, 04/14/16 | | | 320,025 | | | | 0.2 | |
| | 419,000 | | | | | MetLife, Inc., 1.756%, 12/15/17 | | | 424,761 | | | | 0.3 | |
| | 255,000 | | | | | MetLife, Inc., 1.903%, 12/15/17 | | | 256,868 | | | | 0.2 | |
| | 295,000 | | | # | | Mitsubishi UFJ Trust & Banking Corp., 1.600%, 10/16/17 | | | 294,877 | | | | 0.2 | |
| | 289,000 | | | # | | Mizuho Bank Ltd., 1.300%, 04/16/17 | | | 287,940 | | | | 0.2 | |
| | 323,000 | | | | | Morgan Stanley, 1.875%, 01/05/18 | | | 325,381 | | | | 0.2 | |
| | 545,000 | | | | | Morgan Stanley, 2.125%, 04/25/18 | | | 551,305 | | | | 0.4 | |
| | 250,000 | | | | | Morgan Stanley, 5.450%, 01/09/17 | | | 267,510 | | | | 0.2 | |
| | 397,000 | | | | | National Rural Utilities Cooperative Finance Corp., 1.100%, 01/27/17 | | | 398,762 | | | | 0.3 | |
| | 500,000 | | | # | | Nordea Bank AB, 0.875%, 05/13/16 | | | 501,084 | | | | 0.4 | |
| | 580,000 | | | | | PNC Bank NA, 2.400%, 10/18/19 | | | 591,478 | | | | 0.4 | |
See Accompanying Notes to Financial Statements
| Voya Short Term Bond Fund | PORTFOLIO OF INVESTMENTS as of March 31, 2015 (continued) |
| | 315,000 | | | | | PNC Funding Corp., 2.700%, 09/19/16 | | | 322,561 | | | | 0.2 | |
| | 550,000 | | | | | PNC Funding Corp., 5.625%, 02/01/17 | | | 591,430 | | | | 0.4 | |
| | 332,000 | | | | | Principal Financial Group, Inc., 1.850%, 11/15/17 | | | 335,028 | | | | 0.2 | |
| | 418,000 | | | | | Realty Income Corp., 2.000%, 01/31/18 | | | 422,126 | | | | 0.3 | |
| | 343,000 | | | | | Regions Financial Corp., 2.000%, 05/15/18 | | | 342,884 | | | | 0.2 | |
| | 600,000 | | | | | Royal Bank of Canada, 1.500%, 01/16/18 | | | 603,192 | | | | 0.4 | |
| | 322,000 | | | | | Santander Bank NA, 2.000%, 01/12/18 | | | 323,545 | | | | 0.2 | |
| | 363,000 | | | # | | Scentre Group Trust 1 / Scentre Group Trust 2, 2.375%, 11/05/19 | | | 367,157 | | | | 0.3 | |
| | 194,000 | | | | | Select Income REIT, 2.850%, 02/01/18 | | | 195,762 | | | | 0.1 | |
| | 400,000 | | | | | Navient Corp., 3.875%, 09/10/15 | | | 403,368 | | | | 0.3 | |
| | 303,000 | | | | | State Street Corp., 1.350%, 05/15/18 | | | 303,974 | | | | 0.2 | |
| | 545,000 | | | | | State Street Corp., 2.875%, 03/07/16 | | | 556,813 | | | | 0.4 | |
| | 680,000 | | | | | Sumitomo Mitsui Banking Corp., 1.500%, 01/18/18 | | | 679,550 | | | | 0.5 | |
| | 223,000 | | | | | SunTrust Banks, Inc., 2.500%, 05/01/19 | | | 226,816 | | | | 0.2 | |
| | 593,000 | | | | | Toronto-Dominion Bank, 2.250%, 11/05/19 | | | 603,191 | | | | 0.4 | |
| | 342,000 | | | | | UBS AG/Stamford CT, 1.375%, 08/14/17 | | | 342,101 | | | | 0.2 | |
| | 210,000 | | | | | UBS AG, 5.875%, 07/15/16 | | | 222,210 | | | | 0.2 | |
| | 250,000 | | | | | US Bancorp, 2.200%, 11/15/16 | | | 255,316 | | | | 0.2 | |
| | 250,000 | | | | | US Bank NA/Cincinnati OH, 1.375%, 09/11/17 | | | 251,548 | | | | 0.2 | |
| | 286,000 | | | # | | WEA Finance LLC / Westfield UK & Europe Finance PLC, 1.750%, 09/15/17 | | | 287,593 | | | | 0.2 | |
| | 422,000 | | | | | Wells Fargo & Co., 1.500%, 01/16/18 | | | 424,245 | | | | 0.3 | |
| | 644,000 | | | | | Wells Fargo & Co., 2.100%, 05/08/17 | | | 658,135 | | | | 0.5 | |
| | 336,000 | | | | | Westpac Banking Corp., 1.500%, 12/01/17 | | | 337,822 | | | | 0.2 | |
| | 200,000 | | | | | Westpac Banking Corp., 2.000%, 08/14/17 | | | 203,937 | | | | 0.1 | |
| | | | | | | | | | 36,977,243 | | | | 26.2 | |
| | | | | | | | | | | | | | | |
| | | | | | | Industrial: 1.9% | | | | | | | | |
| | 500,000 | | | # | | Aviation Capital Group Corp., 3.875%, 09/27/16 | | | 510,779 | | | | 0.3 | |
| | 420,000 | | | | | Caterpillar Financial Services Corp., 2.250%, 12/01/19 | | | 426,572 | | | | 0.3 | |
| | 254,000 | | | | | L-3 Communications Corp., 1.500%, 05/28/17 | | | 252,499 | | | | 0.2 | |
| | 500,000 | | | | | SPX Corp., 6.875%, 09/01/17 | | | 546,250 | | | | 0.4 | |
| | 322,000 | | | | | Thermo Fisher Scientific, Inc., 2.250%, 08/15/16 | | | 327,596 | | | | 0.2 | |
| | 279,000 | | | | | United Parcel Service, Inc., 1.125%, 10/01/17 | | | 280,945 | | | | 0.2 | |
| | 400,000 | | | | | Waste Management, Inc., 2.600%, 09/01/16 | | | 407,416 | | | | 0.3 | |
| | | | | | | | | | 2,752,057 | | | | 1.9 | |
| | | | | | | | | | | | | | | |
| | | | | | | Technology: 1.2% | | | | | | | | |
| | 320,000 | | | | | Altera Corp., 1.750%, 05/15/17 | | | 322,078 | | | | 0.2 | |
| | 313,000 | | | | | KLA-Tencor Corp., 2.375%, 11/01/17 | | | 318,271 | | | | 0.2 | |
| | 375,000 | | | | | NetApp Inc., 2.000%, 12/15/17 | | | 376,153 | | | | 0.3 | |
| | 550,000 | | | | | Oracle Corp., 1.200%, 10/15/17 | | | 551,612 | | | | 0.4 | |
| | 179,000 | | | | | Xerox Corp., 2.950%, 03/15/17 | | | 184,393 | | | | 0.1 | |
| | | | | | | | | | 1,752,507 | | | | 1.2 | |
| | | | | | | | | | | | | | | |
| | | | | | | Utilities: 1.8% | | | | | | | | |
| | 600,000 | | | | | Dominion Resources, Inc., 1.400%, 09/15/17 | | | 600,976 | | | | 0.4 | |
| | 560,000 | | | | | Entergy Corp., 4.700%, 01/15/17 | | | 589,017 | | | | 0.4 | |
| | 400,000 | | | | | Georgia Power Co., 3.000%, 04/15/16 | | | 410,002 | | | | 0.3 | |
| | 252,000 | | | | | PSEG Power, LLC, 2.750%, 09/15/16 | | | 258,193 | | | | 0.2 | |
| | 294,000 | | | | | Southern California Edison Co., 1.125%, 05/01/17 | | | 295,321 | | | | 0.2 | |
| | 406,000 | | | | | Southern Co., 1.300%, 08/15/17 | | | 406,362 | | | | 0.3 | |
| | | | | | | | | | 2,559,871 | | | | 1.8 | |
| | | | | | | | | | | | | | | |
| | | | | Total Corporate Bonds/Notes
(Cost $82,395,764) | | | 82,846,343 | | | | 58.7 | |
| | | | | | | | | | | | | | | |
| COLLATERALIZED MORTGAGE OBLIGATIONS: 10.7% |
| | 193,720 | | | # | | American General Mortgage Loan Trust 2010-1, 5.650%, 03/25/58 | | | 194,787 | | | | 0.1 | |
| | 365,381 | | | # | | BAMLL Re-REMIC Trust 2014-FRR9, 2.192%, 12/26/46 | | | 361,024 | | | | 0.3 | |
| | 480,000 | | | | | Banc of America Commercial Mortgage Trust 2007-3 AJ, 5.575%, 06/10/49 | | | 494,841 | | | | 0.3 | |
| | 100,000 | | | # | | Banc of America Merrill Lynch Commercial Mortgage, Inc., 5.456%, 07/10/43 | | | 100,275 | | | | 0.1 | |
| | 277,212 | | | # | | Banc of America Re-REMIC Trust 2009-UB2 A4AA, 5.678%, 02/24/51 | | | 290,407 | | | | 0.2 | |
| | 630,000 | | | # | | Bank of America Merrill Lynch Commercial Mortgage, Inc., 5.456%, 07/10/43 | | | 631,494 | | | | 0.4 | |
| | 640,000 | | | # | | Bank of America Merrill Lynch Commercial Mortgage, Inc., 6.233%, 11/10/38 | | | 654,528 | | | | 0.5 | |
| | 350,000 | | | | | Bear Stearns Commercial Mortgage Securities Trust 2005-PWR9, 5.055%, 09/11/42 | | | 353,883 | | | | 0.2 | |
See Accompanying Notes to Financial Statements
| Voya Short Term Bond Fund | PORTFOLIO OF INVESTMENTS as of March 31, 2015 (continued) |
| | 300,000 | | | | | Bear Stearns Commercial Mortgage Securities Trust, 4.750%, 06/11/41 | | | 301,493 | | | | 0.2 | |
| | 590,000 | | | | | Bear Stearns Commercial Mortgage Securities Trust, 5.074%, 02/13/42 | | | 590,622 | | | | 0.4 | |
| | 23,068 | | | | | Bear Stearns Commercial Mortgage Securities Trust, 5.957%, 06/11/50 | | | 23,158 | | | | 0.0 | |
| | 430,000 | | | | | CD 2007-CD5 Mortgage Trust AJ, 6.124%, 11/15/44 | | | 469,330 | | | | 0.3 | |
| | 250,000 | | | # | | Commercial Mortgage Trust 2004-GG1 F, 6.235%, 06/10/36 | | | 255,115 | | | | 0.2 | |
| | 330,000 | | | | | Commercial Mortgage Trust, 5.225%, 07/15/44 | | | 334,851 | | | | 0.2 | |
| | 625,261 | | | | | Commercial Mortgage Trust, 5.289%, 12/11/49 | | | 653,636 | | | | 0.5 | |
| | 16,248 | | | # | | Credit Suisse First Boston Mortgage Securities Corp. 2003-C4 J, 5.322%, 08/15/36 | | | 16,262 | | | | 0.0 | |
| | 600,000 | | | | | Credit Suisse First Boston Mortgage Securities Corp., 4.877%, 04/15/37 | | | 600,121 | | | | 0.4 | |
| | 577,000 | | | | | Credit Suisse First Boston Mortgage Securities Corp., 5.290%, 08/15/38 | | | 581,404 | | | | 0.4 | |
| | 620,000 | | | # | | Credit Suisse Mortgage Capital Certificates, 5.342%, 12/16/43 | | | 654,819 | | | | 0.5 | |
| | 335,000 | | | # | | CSMC Series 2009-RR3 A5A, 5.342%, 12/15/43 | | | 354,030 | | | | 0.2 | |
| | 100,000 | | | # | | Del Coronado Trust, 4.000%, 03/15/26 | | | 100,120 | | | | 0.1 | |
| | 560,000 | | | | | GE Capital Commercial Mortgage Corp., 5.133%, 05/10/43 | | | 559,675 | | | | 0.4 | |
| | 54,986 | | | | | GE Capital Commercial Mortgage Corp., 5.322%, 11/10/45 | | | 54,958 | | | | 0.0 | |
| | 790,728 | | | | | GMAC Commercial Mortgage Securities, Inc. Series 2005-C1 Trust, 4.754%, 05/10/43 | | | 790,344 | | | | 0.6 | |
| | 120,207 | | | | | Greenwich Capital Commercial Funding Corp., 4.894%, 08/10/42 | | | 120,186 | | | | 0.1 | |
| | 169,523 | | | | | Greenwich Capital Commercial Funding Corp., 5.447%, 03/10/39 | | | 169,730 | | | | 0.1 | |
| | 270,000 | | | # | | Hilton USA Trust 2013-HLT, 2.662%, 11/05/30 | | | 271,155 | | | | 0.2 | |
| | 39,818 | | | | | JP Morgan Chase Commercial Mortgage Securities Corp., 5.260%, 01/12/43 | | | 39,818 | | | | 0.0 | |
| | 260,000 | | | | | JP Morgan Chase Commercial Mortgage Securities Trust 2005-CIBC12, 4.987%, 09/12/37 | | | 261,105 | | | | 0.2 | |
| | 160,000 | | | | | JP Morgan Chase Commercial Mortgage Securities Trust 2005-LDP5, 5.382%, 12/15/44 | | | 164,473 | | | | 0.1 | |
| | 380,000 | | | # | | JP Morgan Chase Commercial Mortgage Securities Trust 2014-BXH, 2.425%, 04/15/27 | | | 379,178 | | | | 0.3 | |
| | 1,210,000 | | | | | LB-UBS Commercial Mortgage Trust, 5.127%, 09/15/40 | | | 1,223,498 | | | | 0.9 | |
| | 298,912 | | | | | LB-UBS Commercial Mortgage Trust, 5.300%, 11/15/38 | | | 301,787 | | | | 0.2 | |
| | 500,000 | | | | | LB-UBS Commercial Mortgage Trust, 5.323%, 11/15/40 | | | 511,501 | | | | 0.4 | |
| | 106,297 | | | | | ML-CFC Commercial Mortgage Trust, 5.644%, 09/12/49 | | | 106,337 | | | | 0.1 | |
| | 640,000 | | | | | Morgan Stanley Capital I Trust, 5.073%, 08/13/42 | | | 642,478 | | | | 0.5 | |
| | 88,372 | | | | | Morgan Stanley Capital I Trust, 5.185%, 10/12/52 | | | 88,233 | | | | 0.1 | |
| | 71,433 | | | # | | Morgan Stanley Re-REMIC Trust 2010-C30 A3B, 5.246%, 12/17/43 | | | 72,064 | | | | 0.0 | |
| | 800,000 | | | # | | TIAA CMBS I Trust 2001-C1A L, 5.770%, 06/19/33 | | | 839,046 | | | | 0.6 | |
| | 180,809 | | | | | TIAA Seasoned Commercial Mortgage Trust, 5.532%, 08/15/39 | | | 180,989 | | | | 0.1 | |
| | 107,150 | | | | | Wachovia Bank Commercial Mortgage Trust, 5.246%, 12/15/43 | | | 109,118 | | | | 0.1 | |
| | 220,000 | | | | | Wachovia Bank Commercial Mortgage Trust, 5.715%, 05/15/43 | | | 228,327 | | | | 0.2 | |
| | | | | | | | | | | | | | | |
| | | | | Total Collateralized Mortgage Obligations
(Cost $15,501,020) | | | 15,130,200 | | | | 10.7 | |
| | | | | | | | | | | | | | | |
| ASSET-BACKED SECURITIES: 18.0% | | |
| | | | | | | Automobile Asset-Backed Securities: 3.7% |
| | 370,000 | | | | | Capital Auto Receivables Asset Trust 2015-1, 1.610%, 06/20/19 | | | 370,524 | | | | 0.3 | |
| | 350,000 | | | | | Capital Auto Receivables Asset Trust, 1.620%, 10/22/18 | | | 352,590 | | | | 0.2 | |
| | 250,000 | | | | | CarMax Auto Owner Trust 2014-4, 1.810%, 07/15/20 | | | 252,352 | | | | 0.2 | |
| | 100,000 | | | | | CarMax Auto Owner Trust, 1.610%, 10/15/19 | | | 100,664 | | | | 0.1 | |
| | 226,000 | | | | | Harley-Davidson Motorcycle Trust 2012-1, 0.910%, 02/15/18 | | | 226,333 | | | | 0.2 | |
| | 480,000 | | | | | Harley-Davidson Motorcycle Trust 2015-1, 1.670%, 08/15/22 | | | 480,853 | | | | 0.3 | |
| | 350,000 | | | | | Hyundai Auto Receivables Trust 2013-A, 1.130%, 09/17/18 | | | 350,283 | | | | 0.2 | |
| | 768,000 | | | | | Hyundai Auto Receivables Trust, 0.750%, 09/17/18 | | | 767,345 | | | | 0.5 | |
See Accompanying Notes to Financial Statements
| Voya Short Term Bond Fund | PORTFOLIO OF INVESTMENTS as of March 31, 2015 (continued) |
| | 180,000 | | | | | Mercedes-Benz Auto Receivables Trust 2014-1, 1.310%, 11/16/20 | | | 180,385 | | | | 0.1 | |
| | 650,000 | | | | | Nissan Auto Receivables 2013-B Owner Trust, 1.310%, 10/15/19 | | | 653,466 | | | | 0.5 | |
| | 140,000 | | | | | Nissan Auto Receivables 2013-C Owner Trust, 1.300%, 06/15/20 | | | 140,405 | | | | 0.1 | |
| | 700,000 | | | | | Smart Trust, 1.050%, 10/14/18 | | | 699,772 | | | | 0.5 | |
| | 5,564 | | | | | Toyota Auto Receivables Owner Trust, 0.750%, 02/16/16 | | | 5,565 | | | | 0.0 | |
| | 100,000 | | | | | Toyota Auto Receivables Owner Trust, 1.180%, 06/17/19 | | | 100,202 | | | | 0.1 | |
| | 527,000 | | | | | World Omni Auto Receivables Trust, 0.870%, 07/15/19 | | | 526,484 | | | | 0.4 | |
| | | | | | | | | | 5,207,223 | | | | 3.7 | |
| | | | | | | | | | | | | | | |
| | | | | | | Credit Card Asset-Backed Securities: 3.0% |
| | 300,000 | | | | | BA Credit Card Trust, 0.445%, 09/16/16 | | | 300,202 | | | | 0.2 | |
| | 800,000 | | | | | Chase Issuance Trust, 1.150%, 01/15/19 | | | 803,794 | | | | 0.6 | |
| | 210,000 | | | | | Citibank Credit Card Issuance Trust, 2.150%, 07/15/21 | | | 213,752 | | | | 0.1 | |
| | 786,000 | | | | | Citibank Credit Card Issuance Trust, 5.350%, 02/07/20 | | | 874,150 | | | | 0.6 | |
| | 582,000 | | | | | Citibank Credit Card Issuance Trust, 5.650%, 09/20/19 | | | 645,156 | | | | 0.5 | |
| | 650,000 | | | | | Discover Card Execution Note Trust 2015-A1 A1, 0.525%, 08/17/20 | | | 650,807 | | | | 0.5 | |
| | 170,000 | | | | | Discover Card Execution Note Trust, 0.605%, 07/15/21 | | | 170,544 | | | | 0.1 | |
| | 340,000 | | | | | Discover Card Execution Note Trust, 1.670%, 01/18/22 | | | 338,498 | | | | 0.2 | |
| | 230,000 | | | | | Discover Card Execution Note Trust, 2.120%, 12/15/21 | | | 234,049 | | | | 0.2 | |
| | | | | | | | | | 4,230,952 | | | | 3.0 | |
| | | | | | | | | | | | | | | |
| | | | | | | Home Equity Asset-Backed Securities: 0.2% |
| | 205,683 | | | | | Chase Funding Loan Acquisition Trust Series, 4.750%, 12/25/19 | | | 209,078 | | | | 0.2 | |
| | | | | | | | | | | | | | | |
| | | | | | | Other Asset-Backed Securities: 11.1% |
| | 430,000 | | | # | | American Residential Properties 2014-SFR1 Trust, 2.527%, 09/17/31 | | | 435,203 | | | | 0.3 | |
| | 500,000 | | | # | | Apidos CDO IV 2006-4A D, 1.756%, 10/27/18 | | | 493,090 | | | | 0.3 | |
| | 325,000 | | | # | | Ares XII CLO Ltd. 2007-12A C, 2.262%, 11/25/20 | | | 325,171 | | | | 0.2 | |
| | 250,000 | | | # | | Ares XII CLO Ltd., 3.512%, 11/25/20 | | | 248,577 | | | | 0.2 | |
| | 250,000 | | | # | | Atrium V, 3.961%, 07/20/20 | | | 247,575 | | | | 0.2 | |
| | 500,000 | | | # | | Babson CLO, Inc. 2005-III, 1.956%, 11/10/19 | | | 497,845 | | | | 0.3 | |
| | 250,000 | | | # | | Castle Garden Funding, 1.012%, 10/27/20 | | | 245,806 | | | | 0.2 | |
| | 300,000 | | | # | | Castle Garden Funding, 5.012%, 10/27/20 | | | 299,964 | | | | 0.2 | |
| | 500,000 | | | # | | CIFC Funding 2006-I Ltd., 1.857%, 10/20/20 | | | 491,778 | | | | 0.3 | |
| | 400,000 | | | # | | CIFC Funding 2006-II Ltd., 1.862%, 03/01/21 | | | 388,420 | | | | 0.3 | |
| | 120,371 | | | # | | CIFC Funding 2006-II Ltd., 4.262%, 03/01/21 | | | 118,546 | | | | 0.1 | |
| | 301,068 | | | | | CNH Equipment Trust, 0.650%, 04/16/18 | | | 301,090 | | | | 0.2 | |
| | 250,000 | | | # | | ColumbusNova CLO Ltd 2006-2A E, 4.006%, 04/04/18 | | | 247,451 | | | | 0.2 | |
| | 250,000 | | | # | | ColumbusNova CLO Ltd 2006-II, 1.006%, 04/04/18 | | | 246,975 | | | | 0.2 | |
| | 400,000 | | | # | | Diamond Lake CLO Ltd., 1.862%, 12/01/19 | | | 391,635 | | | | 0.3 | |
| | 500,000 | | | # | | Eaton Vance CDO IX Ltd., 0.907%, 04/20/19 | | | 493,589 | | | | 0.3 | |
| | 500,000 | | | # | | Emporia Preferred Funding III Ltd. 2007-3A B, 0.707%, 04/23/21 | | | 490,192 | | | | 0.3 | |
| | 500,000 | | | # | | Fraser Sullivan CLO I Ltd., 2.071%, 03/15/20 | | | 490,414 | | | | 0.3 | |
| | 500,000 | | | # | | FRASR 2006-1A B 3/20, 0.741%, 03/15/20 | | | 498,134 | | | | 0.3 | |
| | 300,000 | | | # | | GoldenTree Loan Opportunities IV Ltd., 4.506%, 08/18/22 | | | 297,830 | | | | 0.2 | |
| | 500,000 | | | # | | Goldentree Loan Opportunities V Ltd., 3.507%, 10/18/21 | | | 500,003 | | | | 0.4 | |
| | 500,000 | | | # | | Greens Creek Funding Ltd., 2.507%, 04/18/21 | | | 493,536 | | | | 0.3 | |
| | 141,758 | | | # | | GSAMP Trust 2005-SEA2, 0.521%, 01/25/45 | | | 139,252 | | | | 0.1 | |
| | 500,000 | | | # | | Gulf Stream - Compass CLO, 2.256%, 10/28/19 | | | 500,093 | | | | 0.4 | |
| | 500,000 | | | # | | Gulf Stream - Compass CLO, 3.706%, 10/28/19 | | | 500,328 | | | | 0.4 | |
| | 500,000 | | | # | | Gulf Stream - Sextant CLO 2007-1 Ltd., 2.670%, 06/17/21 | | | 487,988 | | | | 0.3 | |
| | 300,000 | | | # | | Gulf Stream - Sextant CLO, 0.962%, 08/21/20 | | | 297,562 | | | | 0.2 | |
| | 225,000 | | | # | | Gulf Stream - Sextant CLO, 1.862%, 08/21/20 | | | 222,153 | | | | 0.2 | |
| | 400,000 | | | # | | Halcyon Structured Asset Management Long Secured/Short Unsecured 2007-1 Ltd. B, 0.706%, 08/07/21 | | | 393,594 | | | | 0.3 | |
| | 500,000 | | | # | | Halcyon Structured Asset Management Long Secured/Short Unsecured, 2.556%, 08/07/21 | | | 500,009 | | | | 0.4 | |
| | 300,000 | | | # | | Invitation Homes Trust 2014-SFR2 C, 2.178%, 06/17/32 | | | 300,000 | | | | 0.2 | |
| | 370,620 | | | # | | Kennecott Funding Ltd., 2.054%, 01/13/18 | | | 368,897 | | | | 0.3 | |
| | 250,000 | | | # | | Kingsland III Ltd., 0.913%, 08/24/21 | | | 240,553 | | | | 0.2 | |
See Accompanying Notes to Financial Statements
| Voya Short Term Bond Fund | PORTFOLIO OF INVESTMENTS as of March 31, 2015 (continued) |
| | 500,000 | | | # | | Madison Park Funding II Ltd. 2006-2A D, 5.017%, 03/25/20 | | | 493,942 | | | | 0.3 | |
| | 250,000 | | | # | | Madison Park Funding Ltd., 5.506%, 07/26/21 | | | 249,273 | | | | 0.2 | |
| | 330,000 | | | # | | MSIM Peconic Bay Ltd., 2.257%, 07/20/19 | | | 330,000 | | | | 0.2 | |
| | 500,000 | | | # | | Muir Grove CLO Ltd. 2007-1A B, 2.256%, 03/25/20 | | | 499,747 | | | | 0.4 | |
| | 1,000,000 | | | # | | Muir Grove CLO Ltd., 3.256%, 03/25/20 | | | 998,587 | | | | 0.7 | |
| | 500,000 | | | # | | Northwoods Capital VII Ltd., 3.757%, 10/22/21 | | | 500,119 | | | | 0.4 | |
| | 45,022 | | | | | Structured Asset Securities Corp. Trust, 0.374%, 09/25/35 | | | 45,103 | | | | 0.0 | |
| | 425,000 | | | # | | WhiteHorse III Ltd./Corp 2006-1A A3L, 1.005%, 05/01/18 | | | 424,972 | | | | 0.3 | |
| | | | | | | | | | 15,734,996 | | | | 11.1 | |
| | | | | | | | | | | | | | | |
| | | | | Total Asset-Backed Securities | | | | | | | | |
| | | | | (Cost $25,291,573) | | | 25,382,249 | | | | 18.0 | |
| | | | | | | | | | | | | | | |
| U.S. GOVERNMENT AGENCY OBLIGATIONS: 7.6% |
| | | | | | | Federal Home Loan Mortgage Corporation: 3.1%## |
| | 1,020,671 | | | | | 5.000%, due 07/15/39 | | | 1,089,369 | | | | 0.8 | |
| | 116,360 | | | | | 5.500%, due 01/01/37 | | | 130,354 | | | | 0.1 | |
| | 307,667 | | | | | 5.500%, due 08/01/38 | | | 351,006 | | | | 0.2 | |
| | 19,094 | | | | | 5.500%, due 10/01/38 | | | 21,400 | | | | 0.0 | |
| | 33,462 | | | | | 5.500%, due 10/01/38 | | | 37,478 | | | | 0.0 | |
| | 784,234 | | | | | 5.500%, due 11/01/38 | | | 893,580 | | | | 0.6 | |
| | 563,900 | | | | | 5.500%, due 02/01/39 | | | 635,695 | | | | 0.5 | |
| | 1,060,246 | | | | | 6.000%, due 12/15/28 | | | 1,216,252 | | | | 0.9 | |
| | | | | | | | | | 4,375,134 | | | | 3.1 | |
| | | | | | | | | | | | | | | |
| | | | | | | Federal National Mortgage Association: 2.9%## |
| | 285,488 | | | | | 3.000%, due 12/25/39 | | | 291,236 | | | | 0.2 | |
| | 672,602 | | | | | 3.000%, due 04/25/40 | | | 692,431 | | | | 0.5 | |
| | 569,361 | | | | | 3.000%, due 05/25/40 | | | 578,454 | | | | 0.4 | |
| | 255,509 | | | | | 4.000%, due 10/25/50 | | | 263,359 | | | | 0.2 | |
| | 434,567 | | | �� | | 4.500%, due 10/25/40 | | | 448,459 | | | | 0.3 | |
| | 724,425 | | | | | 5.000%, due 01/01/23 | | | 786,956 | | | | 0.6 | |
| | 395,468 | | | | | 5.000%, due 07/01/34 | | | 441,589 | | | | 0.3 | |
| | 555,233 | | | | | 6.000%, due 01/01/38 | | | 643,268 | | | | 0.4 | |
| | | | | | | | | | 4,145,752 | | | | 2.9 | |
| | | | | | | | | | | | | | | |
| | | | | | | Government National Mortgage Association: 1.6% |
| | 632,033 | | | | | 4.397%, due 05/16/51 | | | 688,801 | | | | 0.5 | |
| | 1,329,855 | | | | | 7.120%, due 04/20/39 | | | 1,567,059 | | | | 1.1 | |
| | | | | | | | | | 2,255,860 | | | | 1.6 | |
| | | | | | | | | | | | | | | |
| | | | | Total U.S. Government Agency Obligations | | | | | | | | |
| | | | | (Cost $10,555,559) | | | 10,776,746 | | | | 7.6 | |
| | | | | | | | | | | | | | | |
| U.S. TREASURY OBLIGATIONS: 3.8% |
| | | | | | | U.S. Treasury Notes: 3.8% |
| | 4,040,000 | | | | | 0.375%, due 03/31/16 | | | 4,043,790 | | | | 2.9 | |
| | 336,000 | | | | | 0.500%, due 03/31/17 | | | 335,580 | | | | 0.2 | |
| | 686,000 | | | | | 1.000%, due 03/15/18 | | | 688,465 | | | | 0.5 | |
| | 25,000 | | | | | 1.375%, due 03/31/20 | | | 25,006 | | | | 0.0 | |
| | 2,000 | | | | | 1.750%, due 02/28/22 | | | 2,006 | | | | 0.0 | |
| | 255,000 | | | | | 1.750%, due 03/31/22 | | | 255,657 | | | | 0.2 | |
| | | | | | | | | | | | | | | |
| | | | | Total U.S. Treasury Obligations | | | | | | | | |
| | | | | (Cost $5,343,836) | | | 5,350,504 | | | | 3.8 | |
| | | | | | | | | | | | | |
| # of Contracts | | | | | | | Value | | | Percentage
of Net
Assets | |
| PURCHASED OPTIONS: –% | |
| | | | | | | OTC Interest Rate Swaptions: –% |
| | 17,296,000 | | | @ | | Receive a floating rate equal to the 3-month USD-LIBOR-BBA and pay a fixed rate equal to 5.070%, Exp. 05/29/15 Counterparty: Credit Suisse Group AG | | | – | | | | – | |
| | | | | | | | | | | | | | | |
| | | | | Total Purchased Options | | | | | | | | |
| | | | | (Cost $79,562) | | | – | | | | – | |
| | | | | | | | | | | | | | | |
| | | | | Total Long-Term Investments | | | | | | | | |
| | | | | (Cost $139,167,314) | | | 139,486,042 | | | | 98.8 | |
| | | | | | | | | | | | | |
Principal
Amount† | | | | | | | Value | | | Percentage
of Net
Assets | |
| SHORT-TERM INVESTMENTS: 1.9% |
| | | | | | | Securities Lending Collateralcc: 0.7% |
| | 1,000,000 | | | | | Millenium Fixed Income Ltd., Repurchase Agreement dated 03/31/15, 0.22%, due 04/01/15 (Repurchase Amount $1,000,006, collateralized by various U.S. Government Securities, 0.875%-3.125%, Market Value plus accrued interest $1,020,000, due 08/15/17-02/15/42) | | | 1,000,000 | | | | 0.7 | |
| | 21,526 | | | | | Nomura Securities, Repurchase Agreement dated 03/31/15, 0.13%, due 04/01/15 (Repurchase Amount $21,526, collateralized by various U.S. Government Agency Obligations, 1.280%-7.500%, Market Value plus accrued interest $21,956, due 08/18/15-10/20/64) | | | 21,526 | | | | 0.0 | |
| | | | | | | | | | 1,021,526 | | | | 0.7 | |
See Accompanying Notes to Financial Statements
| Voya Short Term Bond Fund | PORTFOLIO OF INVESTMENTS as of March 31, 2015 (continued) |
| Shares | | | | | | | Value | | | Percentage
of Net
Assets | |
| | | | | | | Mutual Funds: 1.2% | | | | | | | | |
| | 1,707,000 | | | | | BlackRock Liquidity Funds, TempFund, Institutional Class, 0.070%†† | | | | | | | | |
| | | | | | | (Cost $1,707,000) | | | 1,707,000 | | | | 1.2 | |
| | | | | | | | | | | | | | | |
| | | | | Total Short-Term Investments | | | | | | | | |
| | | | | (Cost $2,728,526) | | | 2,728,526 | | | | 1.9 | |
| | | | | | | | | | | | | | | |
| | | | | Total Investments in Securities
(Cost $141,895,840) | | $ | 142,214,568 | | | | 100.7 | |
| | | | | Liabilities in Excess of Other Assets | | | (1,048,131 | ) | | | (0.7 | ) |
| | | | | Net Assets | | $ | 141,166,437 | | | | 100.0 | |
| † | Unless otherwise indicated, principal amount is shown in USD. |
| †† | Rate shown is the 7-day yield as of March 31, 2015. |
| # | Securities with purchases pursuant to Rule 144A or section 4(a)(2), under the Securities Act of 1933 and may not be resold subject to that rule except to qualified institutional buyers. |
| ## | The Federal Housing Finance Agency (“FHFA”) placed the Federal Home Loan Mortgage Corporation and Federal National Mortgage Association into conservatorship with FHFA as the conservator. As such, the FHFA oversees the continuing affairs of these companies. |
| @ | Non-income producing security. |
| cc | Represents securities purchased with cash collateral received for securities on loan. |
| L | Loaned security, a portion or all of the security is on loan at March 31, 2015. |
Cost for federal income tax purposes is the same as for financial statement purposes.
Net unrealized appreciation consists of:
| Gross Unrealized Appreciation | | $ | 961,227 | |
| Gross Unrealized Depreciation | | | (642,499 | ) |
| | | | | |
| Net Unrealized Appreciation | | $ | 318,728 | |
See Accompanying Notes to Financial Statements
ITEM 7. DISCLOSURE OF PROXY VOTING POLICIES AND PROCEDURES FOR CLOSED-END MANAGEMENT INVESTMENT COMPANIES.
Not applicable.
ITEM 8. PORTFOLIO MANAGERS OF CLOSED-END MANAGEMENT INVESTMENT COMPANIES.
Not applicable.
ITEM 9. PURCHASES OF EQUITY SECURITIES BY CLOSED-END MANAGEMENT INVESTMENT COMPANY AND AFFILIATED PURCHASERS.
Not applicable.
ITEM 10. SUBMISSION OF MATTERS TO A VOTE OF SECURITY HOLDERS.
Nominating Committee. The Nominating Committee operates pursuant to a Charter approved by the Board. The primary purpose of the Nominating Committee is to consider, evaluate and make recommendations to the Board with respect to the nomination and selection of Independent Trustees. In evaluating candidates, the Nominating Committee may consider a variety of factors, but specific qualifications of candidates for Board membership will be based on the needs of the Board at the time of nomination.
The Nominating Committee is willing to consider nominations received from shareholders and shall assess shareholder nominees in the same manner as it reviews nominees it identifies. A shareholder nominee for director should be submitted in writing to the Fund’s Secretary. Any such shareholder nomination should include sufficient background information concerning the candidate and should be received in a timely manner. At a minimum, the following information as to each individual proposed for nomination as director should be included: the individual’s written consent to be named in the proxy statement as a nominee (if nominated) and to serve as a director (if elected), and all information relating to such individual that is required to be disclosed in a solicitation of proxies for election of directors, or is otherwise required, in each case under applicable federal securities laws, rules and regulations.
The Secretary shall submit all nominations received in a timely manner to the Nominating Committee. To be timely, any such submission must be delivered to the Fund’s Secretary not earlier than the 90th day prior to such meeting and not later than the close of business on the later of the 60th day prior to such meeting or the 10th day following the day on which public announcement of the date of the meeting is first made, by either disclosure in a press release or in a document publicly filed by the Fund with the SEC.
In evaluating a candidate for the position of Independent Trustee, including any candidate recommended by
shareholders of the Fund, the Nominating Committee shall consider the following: (i) the candidate’s knowledge in matters relating to the mutual fund industry; (ii) any experience possessed by the candidate as a director or senior officer of other public companies; (iii) the candidate’s educational background, reputation for high ethical standards and professional integrity; (iv) any specific financial, technical or other expertise possessed by the candidate, and the extent to which such expertise would complement the Board’s existing mix of skills, core competencies and qualifications; (v) the candidate’s perceived ability to contribute to the ongoing functions of the Board, including the candidate’s ability and commitment to attend meetings regularly and work collaboratively with other members of the Board; (vi) the candidate’s ability to qualify as an Independent Trustee for purposes of the 1940 Act; and (vii) such other factors as the Committee determines to be relevant in light of the existing composition of the Board and any anticipated vacancies. Prior to making a final recommendation to the Board, the Committee shall conduct personal interviews with those candidates it concludes are the most qualified candidates.
ITEM 11. CONTROLS AND PROCEDURES.
| (a) | Based on our evaluation conducted within 90 days of the filing date, hereof, the design and operation of the registrant’s disclosure controls and procedures are effective to ensure that material information relating to the registrant is made known to the certifying officers by others within the appropriate entities, particularly during the period in which Forms N-CSR are being prepared, and the registrant’s disclosure controls and procedures allow timely preparation and review of the information for the registrant’s Form N-CSR and the officer certifications of such Form N-CSR. |
| (b) | There were no significant changes in the registrant’s internal controls that occurred during the second fiscal quarter of the period covered by this report that has materially affected, or is reasonably likely to materially affect, the registrant’s internal control over financial reporting. |
ITEM 12. EXHIBITS.
| (a)(1) | Code of Ethics pursuant to Item 2 of Form N-CSR is filed and attached hereto as EX-99.CODE ETH. |
| (a)(2) | A separate certification for each principal executive officer and principal financial officer of the registrant as required by Rule 30a-2 under the Act (17 CFR 270.30a-2) is attached hereto as EX-99.CERT. |
| (b) | The officer certifications required by Section 906 of the Sarbanes-Oxley Act of 2002 are attached hereto as EX-99.906CERT |
SIGNATURES
Pursuant to the requirements of the Securities Exchange Act of 1934 and the Investment Company Act of 1940, the registrant has duly caused this report to be signed on its behalf by the undersigned, thereunto duly authorized.
(Registrant): Voya Funds Trust
| By | /s/ Shaun P. Mathews | |
| | Shaun P. Mathews | |
| | President and Chief Executive Officer | |
Date: June 5, 2015
Pursuant to the requirements of the Securities Exchange Act of 1934 and the Investment Company Act of 1940, this report has been signed below by the following persons on behalf of the registrant and in the capacities and on the dates indicated.
| By | /s/ Shaun P. Mathews | |
| | Shaun P. Mathews | |
| | President and Chief Executive Officer | |
Date: June 5, 2015
| By | /s/ Todd Modic | |
| | Todd Modic | |
| | Senior Vice President and Chief Financial Officer | |
Date: June 5, 2015