
DOV Pharmaceutical, Inc.
Bicifadine Clinical Data Update
May 22, 2006

Safe Harbor Statement
This document contains forward-looking statements that involve significant
risks and uncertainties, including those discussed below and described more
fully in our annual report on Form 10-K to filed with the Securities and
Exchange Commission on March 15, 2006 and subsequent 10-Q filings.
These statements are made as aids to a verbal presentation. They reflect our
current expectations concerning future events, and thus our actual results
could differ materially from those anticipated in these forward-looking
statements as a result of many factors. These factors include our ability to
achieve and maintain profitability, the extent to which we collaborate with third
parties on drug discovery and development activities, the ability of our
collaborators and of DOV to meet drug development objectives tied to
milestones and royalties and our ability to attract and retain experienced
scientists and management. We undertake no duty and have no intention to
update any forward-looking statements to reflect new facts that come to light.
2

Bicifadine: Clinical Data Update
Analysis of Phase III Trial (study 020) of
bicifadine in Chronic Low Back Pain:
Placebo response
VAS pain score improvements
Sub-group analyses
Drop out rates and Adverse Event profile
3

Study 020: Pain Score Improvements
The study data enabled us to detect an 8 mm
difference in improvement between bicifadine
and placebo
0-100 mm Visual Analog Scale (VAS) used
Placebo response = 25 mm
Published placebo responses range from
8-17 mm
Bicifadine VAS pain score improvements:
200 mg b.i.d. = 28 mm
300 mg b.i.d. = 24 mm
400 mg b.i.d. = 25 mm
4

Study 020: Sub-Group Analyses
Bicifadine More Effective in Key Populations
Patients whose back pain extends into the leg at
baseline
Back pain that also radiates down the leg (sciatica) a
predictor of bicifadine effect size
Placebo response rate lower in this sub-group
Bicifadine more effective than placebo in this sub-group
Patients with greater disability at baseline
Disability and limited functionality (RDQ scores = 17 )
a predictor of bicifadine effect size
Placebo response rate lower in this sub-group
Bicifadine more effective than placebo in this sub-group
5
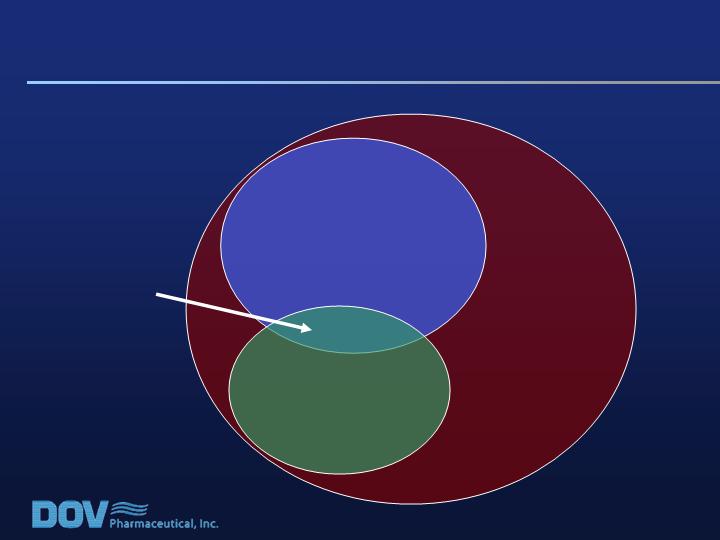
Study 020: Low Back Pain and Disability
Chronic Low
Back Pain (CLBP):
100% of Patients
CLBP + Radiating Pain
Down the Leg:
31% of Patients
CLBP + Moderate to
Severe Disability:
21% of Patients
CLBP +
Radiating Pain +
Disability:
7% of Patients
6
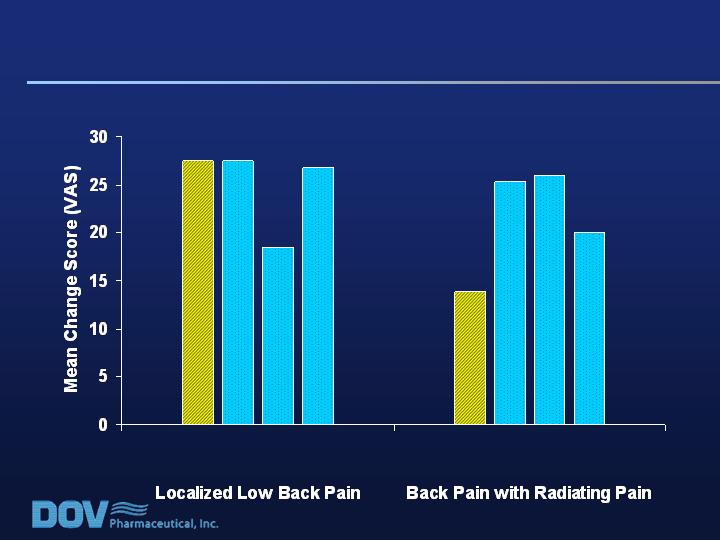
Pain Scores:
Back Pain – Localized vs. Radiating Pain
Placebo Bicifadine (mg b.i.d)
200 300 400
n=77 n=69 n=55 n=71
Placebo Bicifadine (mg b.i.d.)
200 300 400
n=30 n=36 n=38 n=40
7
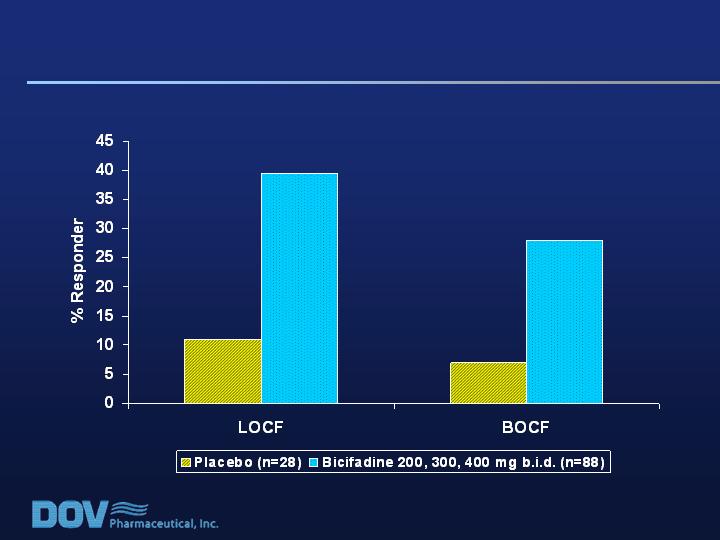
Pain Scores:
Responder Analysis for RDQ > 17 at Baseline
Responders = Patients Showing At Least a 50% Improvement in VAS Pain Score
Responder Analyses are commonly included in
Package Inserts and are required by the FDA
8
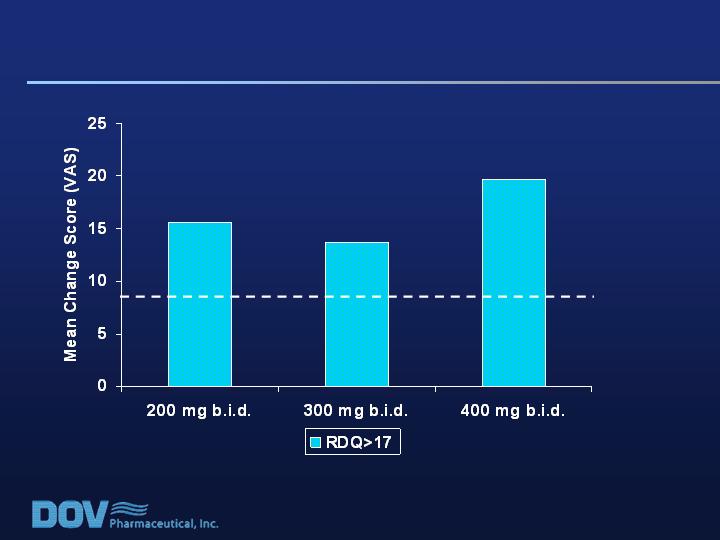
Baseline Disability Scores:
Effect on Pain Score Improvement
RDQ Score at Baseline: Impact on Pain Improvement Score, Difference from Placebo
Mean placebo response: RDQ>17 = 10.8; RDQ=17 = 28.2
Min Effect Size
Detectable for
Significance in
Study 020
9

Study 020: Drop Out Rates
Placebo = 29%
Bicifadine overall = 40%
19% were due to AEs, 7% due to lack of
efficacy, 14% for other causes
Bicifadine by treatment group
200 mg b.i.d. = 29%
300 mg b.i.d. = 47%
400 mg b.i.d. = 45%
10

Study 020: Common Adverse Events
(>5% of Patients)*
2.8%
5.9%
0.7%
3.2%
1.3%
Dyspepsia
3.1%
6.5%
2.7%
2.6%
0.7%
Somnolence
3.3%
4.6%
6.1%
1.9%
0.7%
Vomiting
3.5%
1.3%
6.1%
3.9%
2.6%
Abdominal Pain
3.8%
3.9%
2.7%
5.2%
3.3%
Upper Respiratory
Infection
4.1%
3.3%
4.1%
3.9%
5.3%
Diarrhea
4.8%
7.2%
6.1%
5.2%
0.7%
Insomnia
7.6%
15.0%
8.1%
5.2%
2.0%
Dizziness
12.7%
13.1%
10.8%
16.2%
10.6%
Headache
13.2%
17.6%
16.2%
12.3%
6.6%
Nausea
Total
(n=606)
Bicifadine
400 mg b.i.d.
(n=153)
Bicifadine
300 mg b.i.d.
(n=148)
Bicifadine
200 mg b.i.d.
(n=154)
Placebo
(n=151)
* Note: Any individual patient might appear in more than one category
11

Study 020: Safety
Bicifadine and placebo-treated patients
showed comparable values (minimal
changes) for:
Vital Signs
ECG
Serious Adverse Events
Liver Function Tests
12