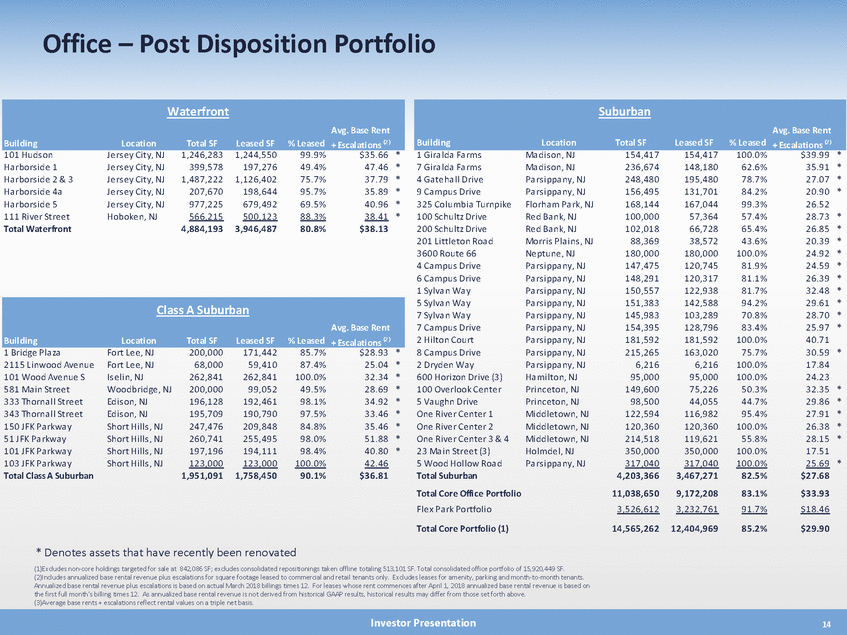
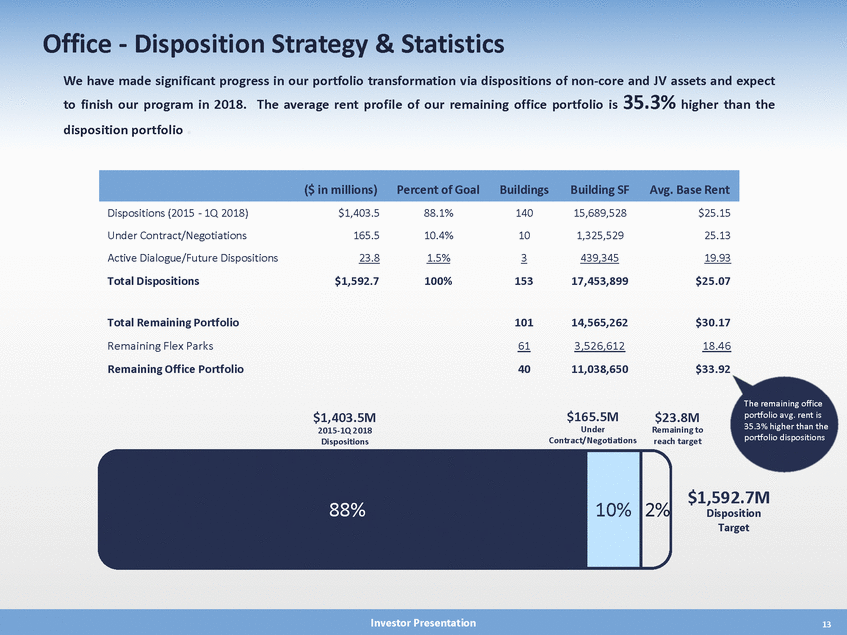
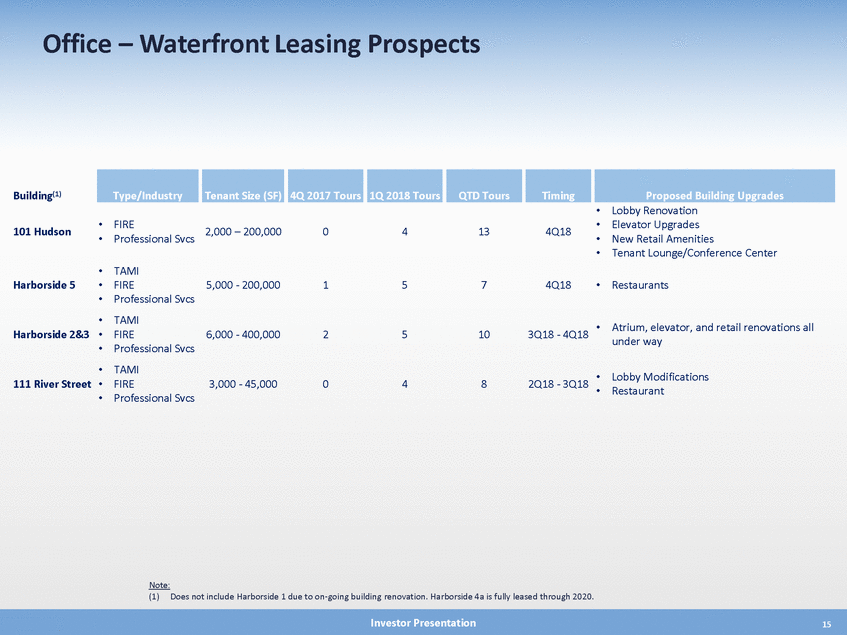
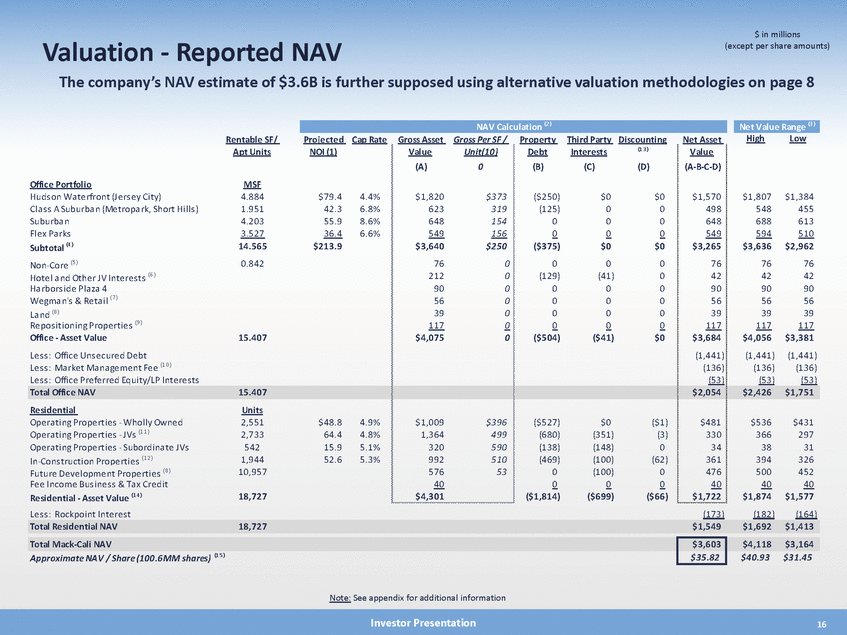
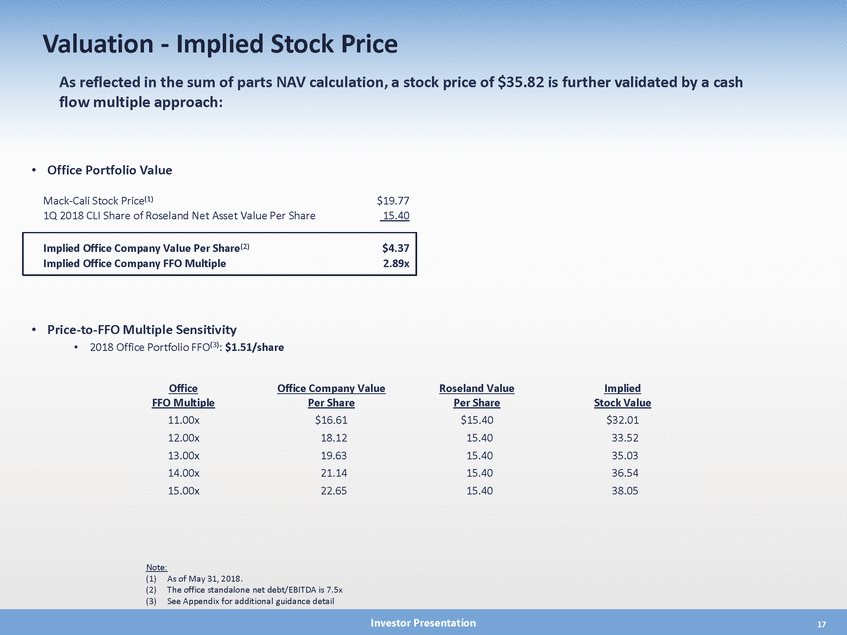
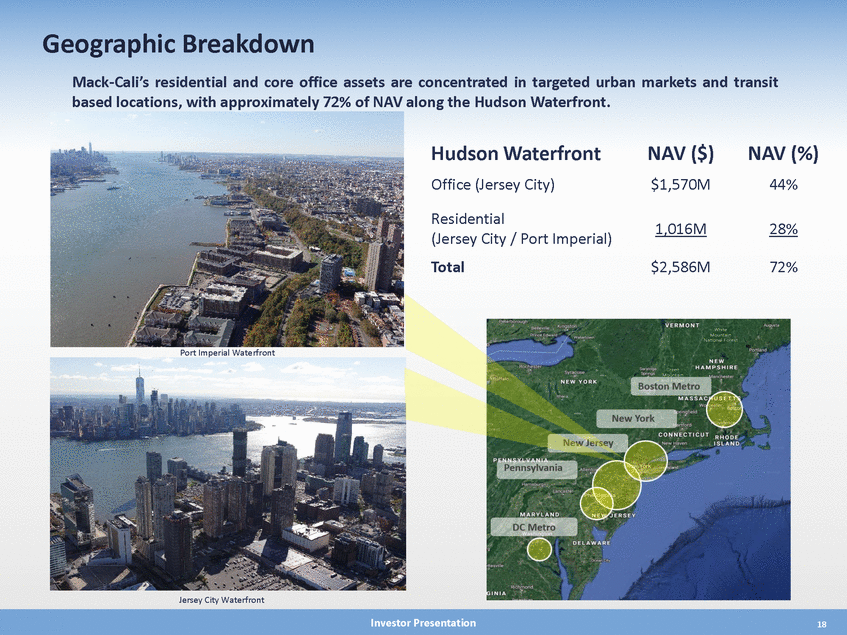
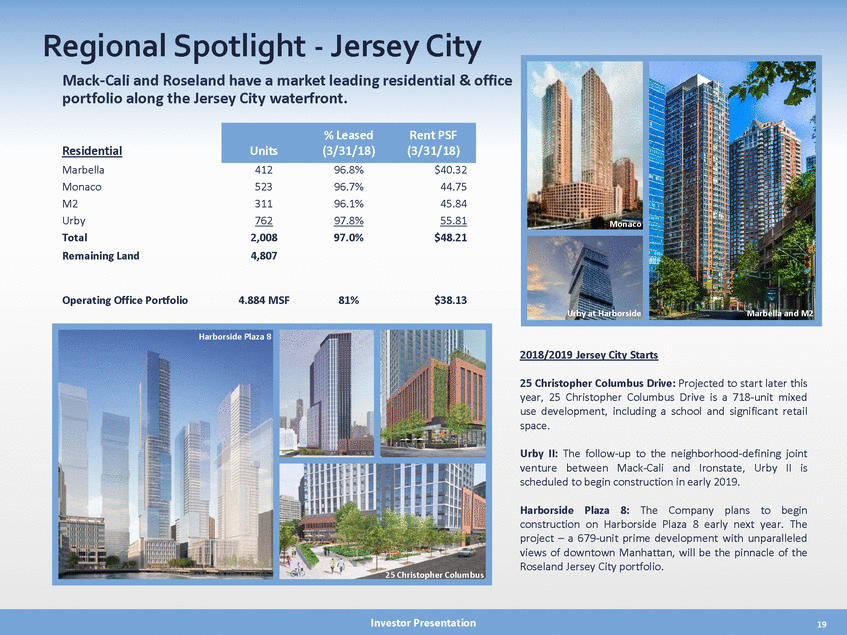
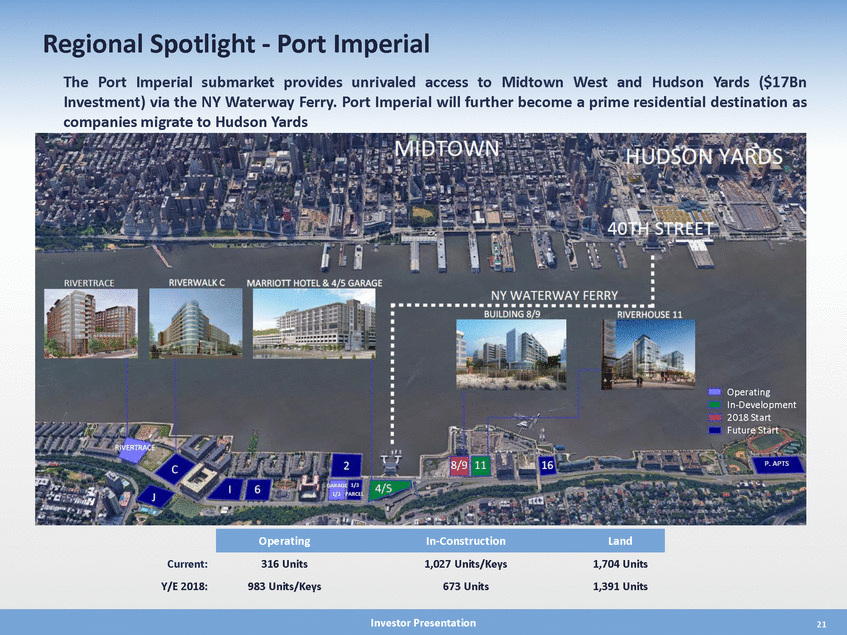
Office – Post Disposition Portfolio Waterfront Suburban Avg. Base Rent + Escalations (2 ) Avg. Base Rent + Escalations (2 ) Building Location Total SF Leased SF % Leased Building Location Total SF Leased SF % Leased 101 Huds on Ha rbors ide 1 Ha rbors ide 2 & 3 Ha rbors ide 4a Ha rbors ide 5 111 River Street Total Waterfront Jers ey City, NJ Jers ey City, NJ Jers ey City, NJ Jers ey City, NJ Jers ey City, NJ Hoboken, NJ 1,246,283 399,578 1,487,222 207,670 977,225 566,215 4,884,193 1,244,550 197,276 1,126,402 198,644 679,492 500,123 3,946,487 99.9% 49.4% 75.7% 95.7% 69.5% 88.3% 80.8% $35.66 47.46 37.79 35.89 40.96 38.41 $38.13 * * * * * * 1 Gira lda Fa rms 7 Gira lda Fa rms 4 Ga teha ll Drive 9 Ca mpus Drive 325 Columbia Turnpike 100 Schultz Drive 200 Schultz Drive 201 Littleton Roa d 3600 Route 66 4 Ca mpus Drive 6 Ca mpus Drive 1 Sylva n Wa y 5 Sylva n Wa y 7 Sylva n Wa y 7 Ca mpus Drive 2 Hilton Court 8 Ca mpus Drive 2 Dryden Wa y 600 Horizon Drive (3) 100 Overlook Center 5 Va ughn Drive One River Center 1 One River Center 2 One River Center 3 & 4 23 Ma in Street (3) 5 Wood Hollow Roa d Total Suburban Total Core Office Portfolio Flex Pa rk Portfolio Total Core Portfolio (1) Ma dis on, NJ Ma dis on, NJ Pa rs ippa ny, NJ Pa rs ippa ny, NJ Florha m Pa rk, NJ Red Ba nk, NJ Red Ba nk, NJ Morris Pla ins , NJ Neptune, NJ Pa rs ippa ny, NJ Pa rs ippa ny, NJ Pa rs ippa ny, NJ Pa rs ippa ny, NJ Pa rs ippa ny, NJ Pa rs ippa ny, NJ Pa rs ippa ny, NJ Pa rs ippa ny, NJ Pa rs ippa ny, NJ Ha milton, NJ Princeton, NJ Princeton, NJ Middletown, NJ Middletown, NJ Middletown, NJ Holmdel, NJ Pa rs ippa ny, NJ 154,417 236,674 248,480 156,495 168,144 100,000 102,018 88,369 180,000 147,475 148,291 150,557 151,383 145,983 154,395 181,592 215,265 6,216 95,000 149,600 98,500 122,594 120,360 214,518 350,000 317,040 4,203,366 11,038,650 3,526,612 14,565,262 154,417 148,180 195,480 131,701 167,044 57,364 66,728 38,572 180,000 120,745 120,317 122,938 142,588 103,289 128,796 181,592 163,020 6,216 95,000 75,226 44,055 116,982 120,360 119,621 350,000 317,040 3,467,271 9,172,208 3,232,761 12,404,969 100.0% 62.6% 78.7% 84.2% 99.3% 57.4% 65.4% 43.6% 100.0% 81.9% 81.1% 81.7% 94.2% 70.8% 83.4% 100.0% 75.7% 100.0% 100.0% 50.3% 44.7% 95.4% 100.0% 55.8% 100.0% 100.0% 82.5% 83.1% 91.7% 85.2% $39.99 35.91 27.07 20.90 26.52 28.73 26.85 20.39 24.92 24.59 26.39 32.48 29.61 28.70 25.97 40.71 30.59 17.84 24.23 32.35 29.86 27.91 26.38 28.15 17.51 25.69 $27.68 $33.93 $18.46 $29.90 * * * * * * * * * * * * * * Class A Suburban Avg. Base Rent + Escalations (2 ) Building Location Total SF Leased SF % Leased 1 Bridge Pla za 2115 Linwood Avenue 101 Wood Avenue S 581 Ma in Street 333 Thorna ll Street 343 Thorna ll Street 150 JFK Pa rkwa y 51 JFK Pa rkwa y 101 JFK Pa rkwa y 103 JFK Pa rkwa y Total Class A Suburban Fort Lee, NJ Fort Lee, NJ Is elin, NJ Woodbridge, NJ Edis on, NJ Edis on, NJ Short Hills , NJ Short Hills , NJ Short Hills , NJ Short Hills , NJ 200,000 68,000 262,841 200,000 196,128 195,709 247,476 260,741 197,196 123,000 1,951,091 171,442 59,410 262,841 99,052 192,461 190,790 209,848 255,495 194,111 123,000 1,758,450 85.7% 87.4% 100.0% 49.5% 98.1% 97.5% 84.8% 98.0% 98.4% 100.0% 90.1% $28.93 25.04 32.34 28.69 34.92 33.46 35.46 51.88 40.80 42.46 $36.81 * * * * * * * * * * * * * * * * * Denotes assets that have recently been renovated (1)Excludes non-core holdings targeted for sale at 842,086 SF; excludes consolidated repositionings taken offline totaling 513,101 SF. Total consolidated office portfolio of 15,920,449 SF. (2)Includes annualized base rental revenue plus escalations for square footage leased to commercial and retail tenants only. Excludes leases for amenity, parking and month-to-month tenants. Annualized base rental revenue plus escalations is based on actual March 2018 billings times 12. For leases whose rent commences after April 1, 2018 annualized base rental revenue is based on the first full month’s billing times 12. As annualized base rental revenue is not derived from historical GAAP results, historical results may differ from those set forth above. (3)Average base rents + escalations reflect rental values on a triple net basis. Investor Presentation 4Q 2017 14
