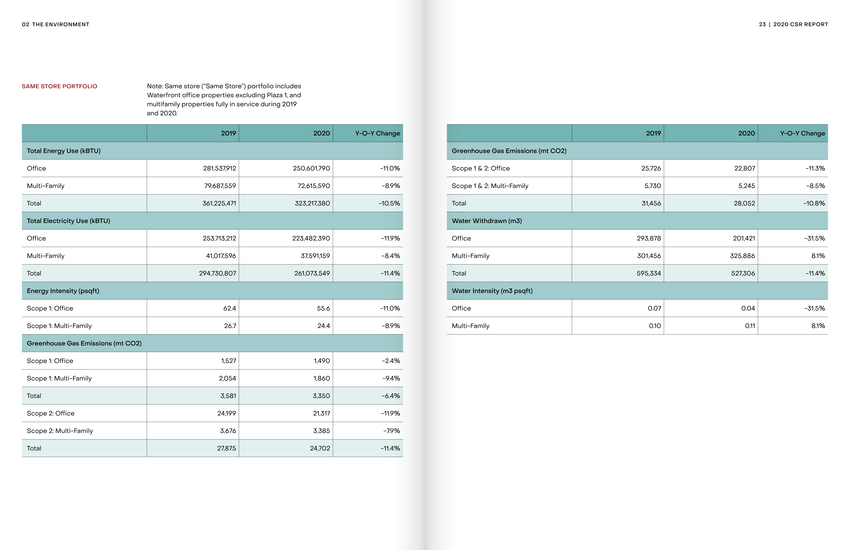
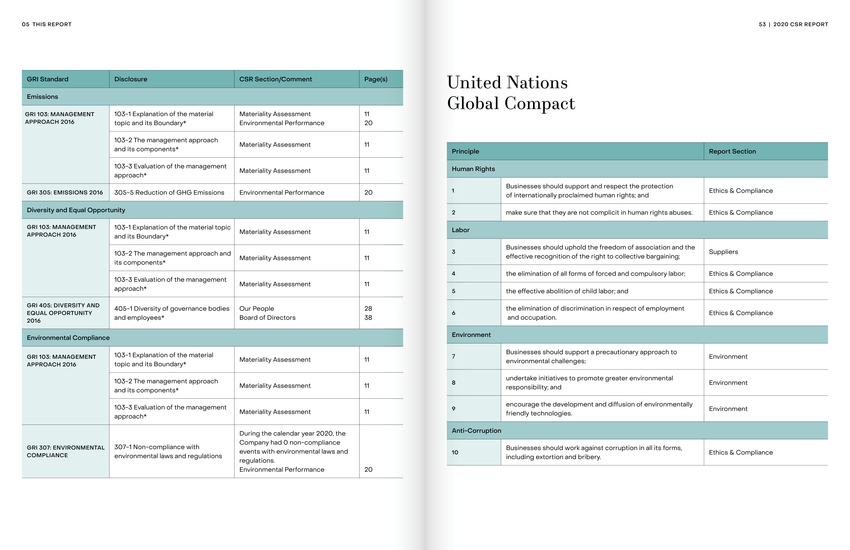
 | 02 THE ENVIRONMENT 21 | 2020 CSR REPORT 2019 2020 Y-O-Y Change Total Energy Use (kBTU) Office 675,323,147 557,025,229 -17.5% Multi-Family 96,430,369 109,171,166 13.2% Total 771,753,516 666,196,395 -13.7% Total Electricity Use (kBTU) Office 606,134,747 501,563,829 -17.3% Multi-Family 51,604,762 57,925,064 12.2% Total 657,739,509 559,488,893 -14.9% Greenhouse Gas Emissions (mt CO2) Scope 1: Office 3,799 3,046 -19.8% Scope 1: Multi-Family 2,381 2,664 11.9% Total 6,180 5,710 -7.6% Scope 2: Office 57,814 47,840 -17.3% Scope 2: Multi-Family 4,689 5,388 14.9% Total 62,503 53,228 -14.8% Scope 1 & 2: Office 61,613 50,886 -17.4% Scope 1 & 2: Multi-Family 7,070 8,052 13.9% Total 68,683 58,938 -14.2% Water Withdrawn (m3) Office 544,880 374,804 -31.2% Multi-Family 398,765 538,608 35.1% Total 943,645 913,412 -3.2% Reported direct and indirect GHG emissions, energy consumption and water withdrawal metrics, represent data from Mack-Cali’s operational office and multifamily assets over which the Company has financial control, excluding multifamily tenant areas and the Plaza 1 office property, which is undergoing redevelopment. The following total portfolio metrics for the year ended December 31, 2020 presented in the Environment section of this report have been subject to an external review engagement: total energy use (kBTU), total Scope 1 and total Scope 2 greenhouse gas emissions (MT CO2e), and total water withdrawn (m3). The report of independent accountants can be found at the end of this report. TOTAL PORTFOLIO Note: 2019 amounts exclude properties sold during the year |