SECURITIES AND EXCHANGE COMMISSION
Washington, D.C. 20549
Form 6-K
REPORT OF FOREIGN PRIVATE ISSUER
PURSUANT TO RULE 13a-16 OR 15d-16 UNDER
THE SECURITIES EXCHANGE ACT OF 1934
For the month of July 2007
Commission File Number 1-12356
DAIMLERCHRYSLER AG
(Translation of registrant’s name into English)
MERCEDESSTRASSE 137, 70327 STUTTGART, GERMANY
(Address of principal executive office)
Indicate by check mark whether the registrant files or will file annual reports under cover of Form 20-F or Form 40-F.
| Form 20-F | x |
| Form 40-F | o |
|
Indicate by check mark whether the registrant by furnishing the information contained in this Form is also thereby furnishing the information to the Commission pursuant to Rule 12g3-2(b) under the Securities Exchange Act of 1934.
| Yes | o |
| No x |
|
|
If “Yes” is marked, indicate below the file number assigned to the registrant in connection with Rule 12g3-2(b): 82-
DAIMLERCHRYSLER AG
FORM 6-K: TABLE OF CONTENTS
1. Press information: Key figures for the Mercedes Car Group and Truck Group divisions and the Van, Bus, Other segment in Q2 2007
2. Preliminary Q2 2007 results
3. Fact sheet second quarter and first half 2007
CAUTIONARY STATEMENT REGARDING FORWARD-LOOKING STATEMENTS
Forward-looking statements in this document:
This document contains forward-looking statements that reflect our current views about future events, including, among others, the pendency and consummation of the transaction with Cerberus Capital Management, L.P. regarding Chrysler Group. The words “anticipate,” “assume,” “believe,” “estimate,” “expect,” “intend,” “may,” “plan,” “project,” “should” and similar expressions are used to identify forward-looking statements. These statements are subject to many risks and uncertainties, including an economic downturn or slow economic growth, especially in Europe or North America; changes in currency exchange rates and interest rates; introduction of competing products and possible lack of acceptance of our products or services; competitive pressures which may limit our ability to reduce sales incentives and raise prices; price increases in fuel, raw materials, and precious metals; disruption of production or delivery of new vehicles due to shortages of materials, labor strikes, or supplier insolvencies; a decline in resale prices of used vehicles; our ability to close the transaction with Cerberus Capital Management, L.P., regarding Chrysler Group; the ability of the Chrysler Group to implement successfully its Recovery and Transformation Plan; the business outlook for our Truck Group, which may experience a significant decline in demand as a result of accelerated purchases in 2006 made in advance of the effectiveness of new emission regulations; effective implementation of cost reduction and efficiency optimization programs, including our new management model; the business outlook of our equity investee EADS, including the financial effects of delays in and potentially lower volume of future aircraft deliveries; changes in laws, regulations and government policies, particularly those relating to vehicle emissions, fuel economy and safety, the resolution of pending governmental investigations and the outcome of pending or threatened future legal proceedings; and other risks and uncertainties, some of which we describe under the heading “Risk Report” in DaimlerChrysler’s most recent Annual Report and under the headings “Risk Factors” and “Legal Proceedings” in DaimlerChrysler’s most recent Annual Report on Form 20-F filed with the Securities and Exchange Commission. If any of these risks and uncertainties materialize, or if the assumptions underlying any of our forward-looking statements prove incorrect, then our actual results may be materially different from those we express or imply by such statements. We do not intend or assume any obligation to update these forward-looking statements. Any forward-looking statement speaks only as of the date on which it is made.
1
![]()
Contact: |
| Press Information |
|
|
|
Thomas Fröhlich | Phone: +49 (0)711/17-41361 | Date |
Key figures for the Mercedes Car Group and Truck Group divisions and the Van, Bus, Other segment in Q2 2007
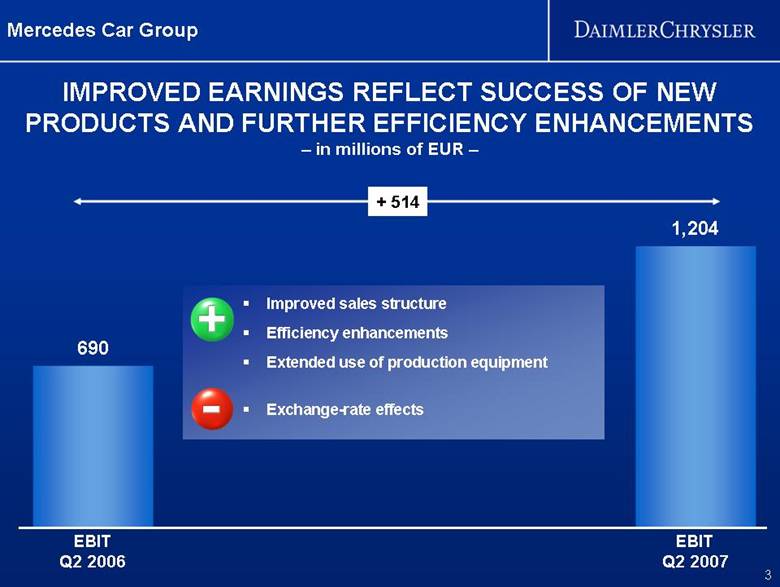
• Mercedes Car Group EBIT improves from €690 million to €1,204 million
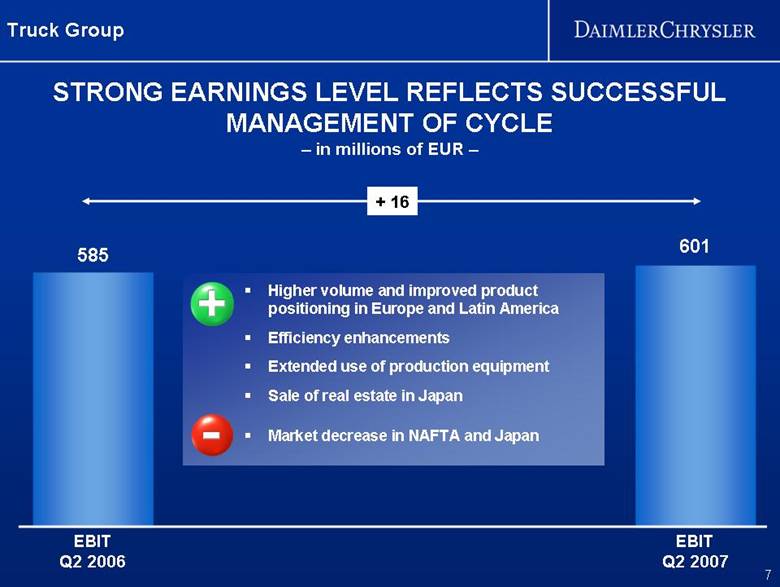
• Truck Group achieves EBIT of €601 million (Q2 2006: €585 million)
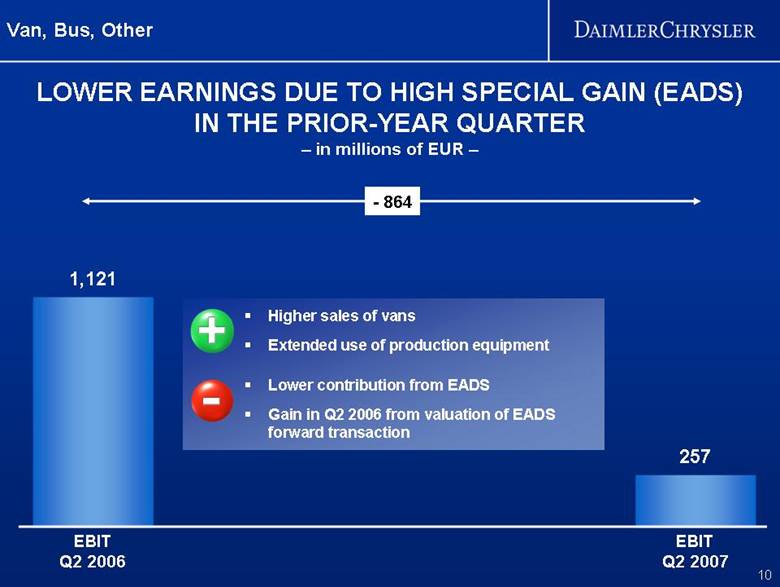
• Van, Bus, Other: EBIT of €257 million (Q2 2006: €1,121 million due to positive special items)
• New target for Mercedes Car Group: return on sales of 10% by 2010 at the latest
Stuttgart - DaimlerChrysler (stock-exchange abbreviation DCX) today published key figures for its Mercedes Car Group and Truck Group divisions and for its Van, Bus, Other segment for the second quarter of 2007 on a preliminary basis. Results for the DaimlerChrysler Group, the Financial Services division and the discontinued activities of the Chrysler Group and Chrysler Financial (NAFTA) will be published together with the complete interim report for the second quarter of 2007 on August 29, 2007, as announced at the beginning of July 2007.
Details of the divisions in the second quarter of 2007
The Mercedes Car Group sold 320,200 vehicles in the second quarter (Q2 2006: 325,500), while its revenues of €12.6 billion
DaimlerChrysler Communications, Stuttgart (Germany), Auburn Hills (USA)
reached the prior-year level.
The Mercedes Car Group posted second-quarter EBIT of €1,204 million, and thus significantly increased its earnings compared with the prior-year quarter (Q2 2006: €690 million). The increase was a result of the positive development of the sales mix and the quality and efficiency improvements achieved within the context of the CORE program. However, earnings were negatively impacted by exchange-rate effects in the second quarter of 2007.
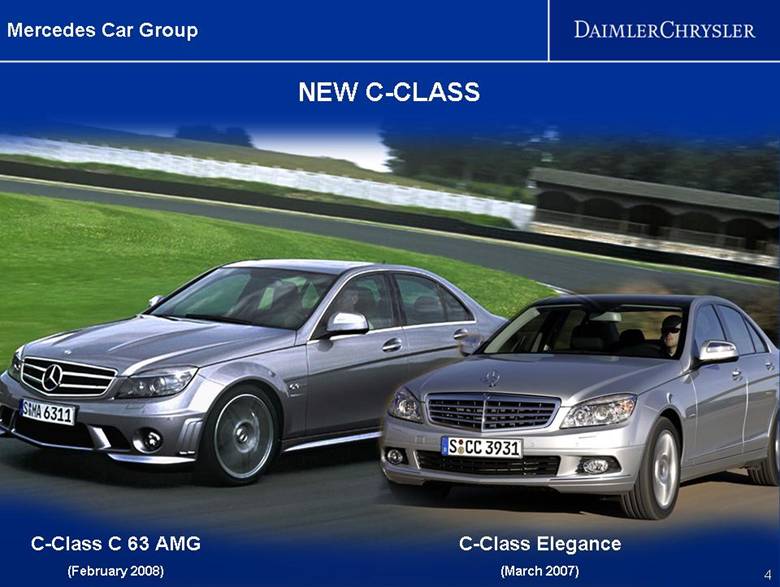
Second-quarter sales of 285,600 Mercedes-Benz brand passenger cars were 2% below the high prior-year figure. 17,200 of the new
C-Class model, which was launched in Western Europe in March 2007, were sold in June alone, although it had not yet been launched in other major markets and additional engine versions are still to come. As expected, unit sales by the smart brand decreased to 31,700 (Q2 2006: 34,500) due to the discontinuation of the smart forfour, of which 12,000 units were sold in the second quarter of last year. Unit sales of the new smart fortwo, which was launched at the end of March, have been developing very positively. Second-quarter unit sales of the smart fortwo increased by 44% compared with the prior year.
The comprehensive measures taken to achieve further quality improvements also had a positive impact. In the past two years, the number of faults per vehicle delivered was reduced by 25%, which also led to lower warranty expenses. This positive development has been confirmed by J.D. Power surveys.
2
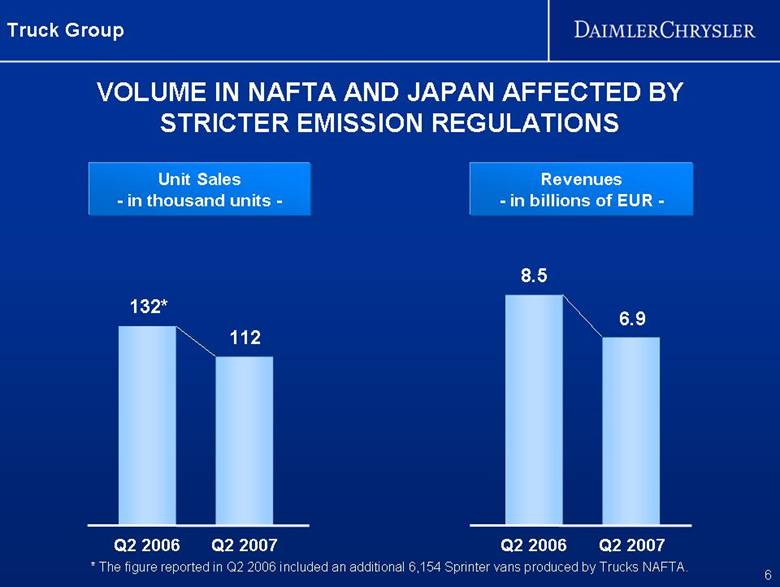
The Truck Group sold 112,100 vehicles in the second quarter of this year, which as expected was lower than the high prior-year figure (Q2 2006: 132,400). The figure reported in the prior year included an additional 6,200 Sprinter vans produced by Trucks NAFTA. This sales decrease was primarily due to a drop in demand caused by stricter emission regulations in the United States, Canada and Japan. Revenues of €6.9 billion were 19% below the figure for the second quarter of last year.
The Truck Group posted second-quarter EBIT of €601 million (Q2 2006: €585 million). Earnings were boosted by the positive development of unit sales in Europe and Latin America, improved product positioning and ongoing efficiency enhancements. There were also negative effects, however, due to lower sales of trucks in the NAFTA region and Japan. But the measures initiated for the management of market cycles and the other initiatives of the Global Excellence program had a distinct positive effect. The sale of real-estate properties in Japan led to a capital gain of €68 million in the second quarter.
Unit sales by Trucks Europe/Latin America increased by 8% to 39,700 vehicles. Trucks NAFTA sold 24,500 vehicles of the Freightliner, Sterling, Western Star and Thomas Built Buses brands (Q2 2006: 46,800). The figure reported in the prior year included an additional 6,200 Sprinter vans produced by Trucks NAFTA. The substantial decrease in unit sales is primarily a result of the EPA07 emission regulations, which came into force this year and led to purchases being brought forward to 2006. Trucks Asia sold 47,800 vehicles of the Mitsubishi Fuso brand (Q2 2006: 49,800).
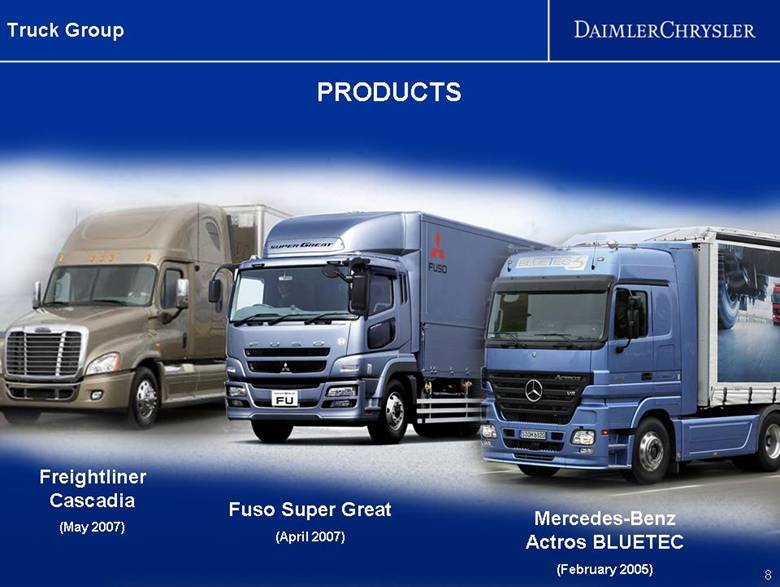
In May, Freightliner presented its new heavy truck, Cascadia,
3
the first truck to be fitted with engines of the new Heavy Duty Engine Platform. The further developed Mitsubishi Fuso Super Great model, which fulfills the new, stricter Japanese emission regulations, was already unveiled in April.
The Van, Bus, Other segment primarily comprises the Vans and Buses units, the Group’s equity interest in the European Aeronautic Defence and Space Company (EADS), and its real-estate activities.
The second-quarter EBIT of the Van, Bus, Other segment was €257 million (Q2 2006: €1,121 million). In the prior-year period, there was a capital gain totaling €814 million resulting from the valuation of derivative financial instruments used to hedge the price risks of EADS shares; most of this valuation gain was accounted for by a financial transaction that was completed in the first quarter of 2007. In total, income from the participation in EADS was €56 million in the quarter under review compared to €940 million in the prior-year.
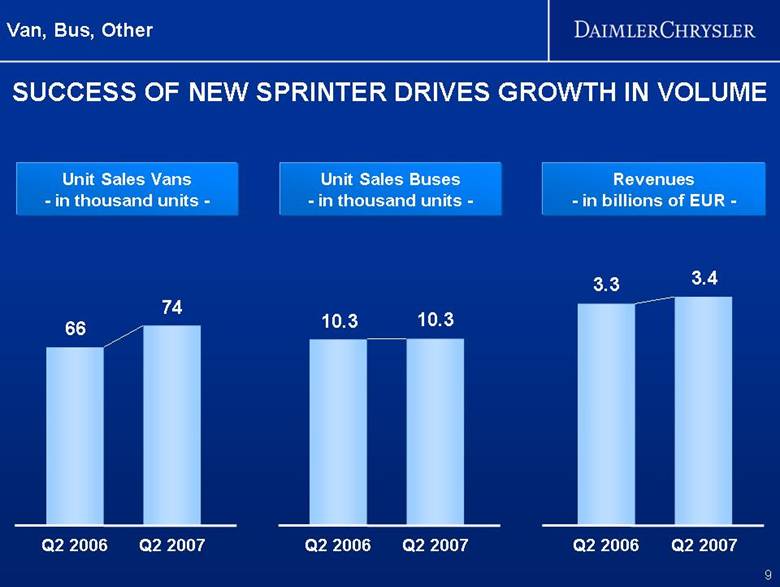
Mercedes-Benz Vans increased its unit sales by 13% compared with the prior-year period to 73,800 vehicles. Due to high demand for the new Sprinter, production capacities in the Düsseldorf and Ludwigsfelde plants are fully utilized.
DaimlerChrysler Buses sold 10,300 buses and chassis in the second quarter, equaling the very high unit sales achieved in the prior-year period. The development of unit sales was particularly positive in Latin America. With these sales figures, DaimlerChrysler Buses maintained its worldwide market
4
leadership.
Both units achieved positive earnings in the second quarter.
Outlook
In the second half of this year, DaimlerChrysler expects the expansion of global automotive markets – both for passenger cars and for commercial vehicles – to slow down compared to the same period of 2006. This is primarily due to developments in the triad markets. In full-year 2007, demand for passenger cars in the markets of North America, Western Europe and Japan is expected to fall slightly. However, significant increases in demand for both passenger cars and commercial vehicles are anticipated for the emerging markets of Asia and Latin America, as well as for Eastern Europe. Demand for trucks in North America is expected to fall sharply. The market volume for trucks in Japan should also be significantly lower than in the prior year. In view of the positive economic conditions in Western Europe, DaimlerChrysler anticipates slightly positive market developments in this region.
The Mercedes Car Group continues to assume that its unit sales in the year 2007 will at least be equal to the record level of the prior year. Following the launch of two high-volume models in spring – the new C-Class sedan and the new smart fortwo – the station-wagon version of the C-Class will be presented at the Frankfurt Motor Show in September and will be on sale by the end of the year. The division will continue implementing the CORE program in order to achieve profitable growth and create sustained value.
5
For full-year 2007, the Mercedes Car Group expects to achieve a return on sales of significantly more than 7%. Despite increased expenditure for more efficient and alternative drive systems, the return on sales should increase to 10% by the year 2010 at the latest.
The Truck Group anticipates significantly lower unit sales in 2007 than in the prior year. This is mainly due to the drop in demand due to stricter emission regulations in the United States, Canada and Japan. However, unit sales are expected to develop positively in Europe and Latin America.
As a result of strong demand for the Sprinter and the very positive development of the Vito/Viano models, unit sales of vans are expected to increase compared to the year 2006. Despite cyclical market downturns in some key bus markets, unit sales of buses are anticipated at the high level of the prior year due to very positive market developments in Latin America.
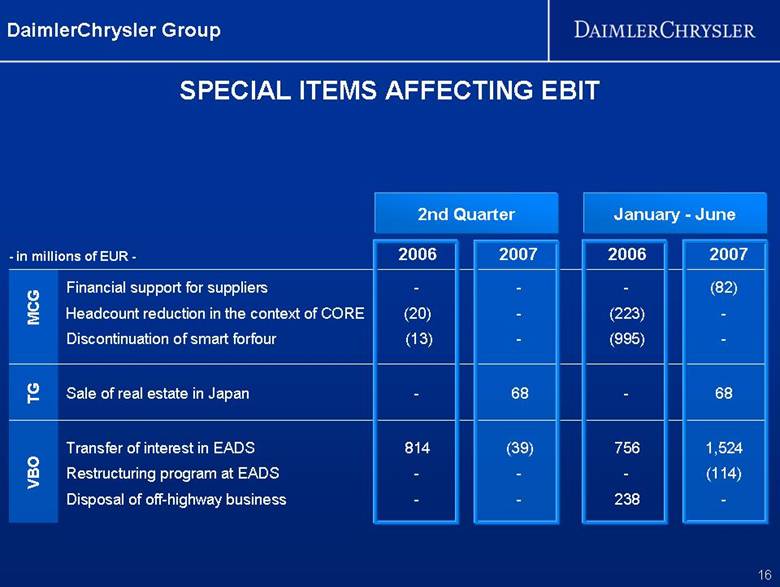
The special items shown in the following table influenced EBIT in the second quarters of 2007 and 2006:
Special items affecting EBIT |
|
|
|
|
|
Amounts in millions of € |
| Q2 2007 |
| Q2 2006 |
|
Mercedes Car Group |
|
|
|
|
|
Headcount reductions in the context of CORE |
| — |
| (20 | ) |
|
|
|
|
|
|
Discontinuation of smart forfour |
| — |
| (13 | ) |
|
|
|
|
|
|
Truck Group |
|
|
|
|
|
Sale of real estate in Japan |
| 68 |
| — |
|
|
|
|
|
|
|
Van, Bus, Other |
|
|
|
|
|
Income/expenses relating to the transfer of interest in EADS |
| (39 | ) | 814 |
|
6
All figures are preliminary.
This document contains forward-looking statements that reflect our current views about future events, including, among others, the pendency and consummation of the transaction with Cerberus Capital Management, L.P. regarding Chrysler Group. The words “anticipate,” “assume,” “believe,” “estimate,” “expect,” “intend,” “may,” “plan,” “project,” “should” and similar expressions are used to identify forward-looking statements. These statements are subject to many risks and uncertainties, including an economic downturn or slow economic growth, especially in Europe or North America; changes in currency exchange rates and interest rates; introduction of competing products and possible lack of acceptance of our products or services; competitive pressures which may limit our ability to reduce sales incentives and raise prices; price increases in fuel, raw materials, and precious metals; disruption of production or delivery of new vehicles due to shortages of materials, labor strikes, or supplier insolvencies; a decline in resale prices of used vehicles; our ability to close the transaction with Cerberus Capital Management, L.P., regarding Chrysler Group; the ability of the Chrysler Group to implement successfully its Recovery and Transformation Plan; the business outlook for our Truck Group, which may experience a significant decline in demand as a result of accelerated purchases in 2006 made in advance of the effectiveness of new emission regulations; effective implementation of cost reduction and efficiency optimization programs, including our new management model; the business outlook of our equity investee EADS, including the financial effects of delays in and potentially lower volume of future aircraft deliveries; changes in laws, regulations and government policies, particularly those relating to vehicle emissions, fuel economy and safety, the resolution of pending governmental investigations and the outcome of pending or threatened future legal proceedings; and other risks and uncertainties, some of which we describe under the heading “Risk Report” in DaimlerChrysler’s most recent Annual Report and under the headings “Risk Factors” and “Legal Proceedings” in DaimlerChrysler’s most recent Annual Report on Form 20-F filed with the Securities and Exchange Commission. If any of these risks and uncertainties materialize, or if the assumptions underlying any of our forward-looking statements prove incorrect, then our actual results may be materially different from those we express or imply by such statements. We do not intend or assume any obligation to update these forward-looking statements. Any forward-looking statement speaks only as of the date on which it is made.
Further information on DaimlerChrysler is available on the Internet: www.media.daimlerchrysler.com
7
Preliminary Figures for the 2nd Quarter 2007/First Half-Year 2007
EBIT by Divisions |
| Q2 |
| Q2 |
| Change |
| Jan-Jun |
| Jan-Jun |
| Change |
|
in millions of € |
| 2007 |
| 2006 |
| 07/06 |
| 2007 |
| 2006 |
| 07/06 |
|
Mercedes Car Group |
| 1,204 |
| 690 |
| + 74 | % | 1,996 |
| -45 |
| . |
|
Truck Group |
| 601 |
| 585 |
| + 3 | % | 1,129 |
| 1,007 |
| + 12 | % |
Van, Bus, Other |
| 257 |
| 1,121 |
| - 77 | % | 2,129 |
| 1,487 |
| + 43 | % |
|
|
|
|
|
|
|
|
|
|
|
|
|
|
Revenues by Divisons |
| Q2 |
| Q2 |
| Change |
| Jan-Jun |
| Jan-Jun |
| Change |
|
in millions of € |
| 2007 |
| 2006 |
| 07/06 |
| 2007 |
| 2006 |
| 07/06 |
|
Mercedes Car Group |
| 12,558 |
| 12,497 |
| + 0 | % | 24,628 |
| 24,434 |
| + 1 | % |
Truck Group |
| 6,930 |
| 8,508 |
| - 19 | % | 14,220 |
| 15,869 |
| - 10 | % |
Van, Bus, Other |
| 3,376 |
| 3,272 |
| + 3 | % | 6,258 |
| 6,426 |
| - 3 | % |
|
|
|
|
|
|
|
|
|
|
|
|
|
|
Unit Sales |
| Q2 |
| Q2 |
| Change |
| Jan-Jun |
| Jan-Jun |
| Change |
|
(in units) |
| 2007 |
| 2006 |
| 07/06 |
| 2007 |
| 2006 |
| 07/06 |
|
Mercedes Car Group |
| 320,200 |
| 325,500 |
| - 2 | % | 591,200 |
| 607,000 |
| - 3 | % |
Truck Group |
| 112,100 |
| 132,400 | (1) | - 15 | % | 231,300 |
| 245,800 | (1) | - 6 | % |
Vans |
| 73,800 |
| 65,600 |
| + 13 | % | 135,500 |
| 125,300 |
| + 8 | % |
Busses |
| 10,300 |
| 10,300 |
| + 0 | % | 18,600 |
| 18,100 |
| + 3 | % |
(1) The figure reported in the prior year included an an additional 6,154 Sprinter vans produced by Trucks NAFTA.
2
| DAIMLERCHRYSLER PRELIMINARY Q2 2007 RESULTS CONFERENCE CALL Dr. Dieter Zetsche Chairman of the Board of Management / Head of Mercedes Car Group Stuttgart July 25, 2007 |
| Mercedes Car Group Revenues - in billions of EUR - 12.5 Q2 2006 Q2 2007 Unit Sales - in thousand units - Q2 2006 Q2 2007 326 LOWER UNIT SALES BUT HIGHER REVENUES DUE TO IMPROVED SALES STRUCTURE 320 2 12.6 |

| EBIT Q2 2006 EBIT Q2 2007 690 1,204 IMPROVED EARNINGS REFLECT SUCCESS OF NEW PRODUCTS AND FURTHER EFFICIENCY ENHANCEMENTS – in millions of EUR – Mercedes Car Group + 514 Improved sales structure Efficiency enhancements Extended use of production equipment Exchange-rate effects 3 |
| Mercedes Car Group NEW C-CLASS C-Class C 63 AMG (February 2008) C-Class Elegance (March 2007) 4 |
| Coupe (March 2007) Convertible (March 2007) Mercedes Car Group NEW SMART FORTWO 5 |

| VOLUME IN NAFTA AND JAPAN AFFECTED BY STRICTER EMISSION REGULATIONS Unit Sales - in thousand units - 132* Q2 2006 Q2 2007 Revenues - in billions of EUR - 8.5 6.9 Q2 2006 Q2 2007 Truck Group 112 6 * The figure reported in Q2 2006 included an additional 6,154 Sprinter vans produced by Trucks NAFTA. |
| EBIT Q2 2006 EBIT Q2 2007 585 601 + 16 STRONG EARNINGS LEVEL REFLECTS SUCCESSFUL MANAGEMENT OF CYCLE – in millions of EUR – Truck Group Higher volume and improved product positioning in Europe and Latin America Efficiency enhancements Extended use of production equipment Sale of real estate in Japan Market decrease in NAFTA and Japan 7 |
| Freightliner Cascadia (May 2007) Mercedes-Benz Actros BLUETEC (February 2005) Fuso Super Great (April 2007) Truck Group PRODUCTS 8 |
| Unit Sales Vans - in thousand units - Q2 2006 Q2 2007 66 74 Revenues - in billions of EUR - Q2 2006 Q2 2007 3.4 3.3 Unit Sales Buses - in thousand units - Q2 2006 Q2 2007 10.3 10.3 SUCCESS OF NEW SPRINTER DRIVES GROWTH IN VOLUME Van, Bus, Other 9 |
| EBIT Q2 2006 EBIT Q2 2007 1,121 257 - 864 LOWER EARNINGS DUE TO HIGH SPECIAL GAIN (EADS) IN THE PRIOR-YEAR QUARTER – in millions of EUR – Higher sales of vans Extended use of production equipment Lower contribution from EADS Gain in Q2 2006 from valuation of EADS forward transaction Van, Bus, Other 10 |
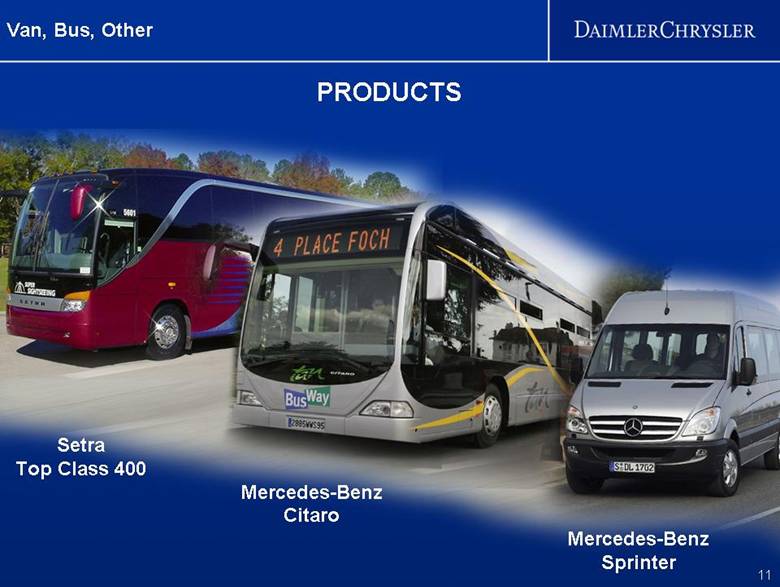
| Mercedes-Benz Sprinter Van, Bus, Other PRODUCTS 11 Setra Top Class 400 Mercedes-Benz Citaro |
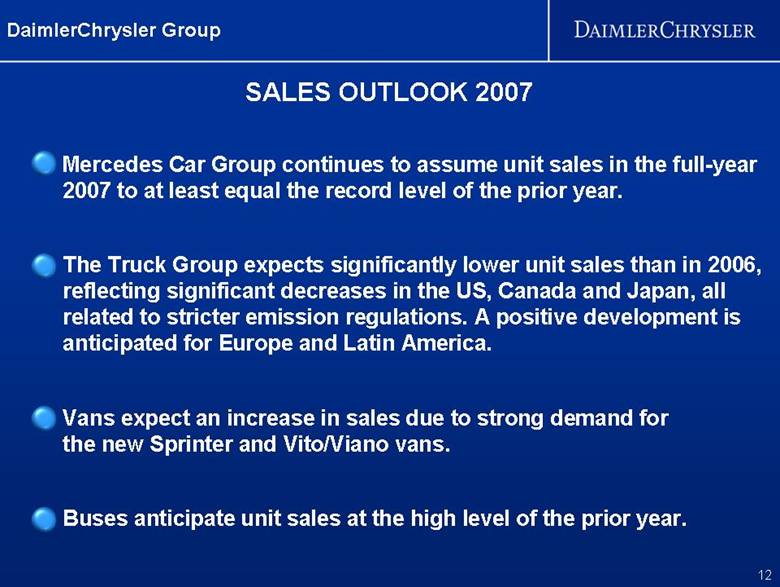
| The Truck Group expects significantly lower unit sales than in 2006, reflecting significant decreases in the US, Canada and Japan, all related to stricter emission regulations. A positive development is anticipated for Europe and Latin America. SALES OUTLOOK 2007 DaimlerChrysler Group Mercedes Car Group continues to assume unit sales in the full-year 2007 to at least equal the record level of the prior year. Vans expect an increase in sales due to strong demand for the new Sprinter and Vito/Viano vans. Buses anticipate unit sales at the high level of the prior year. 12 |
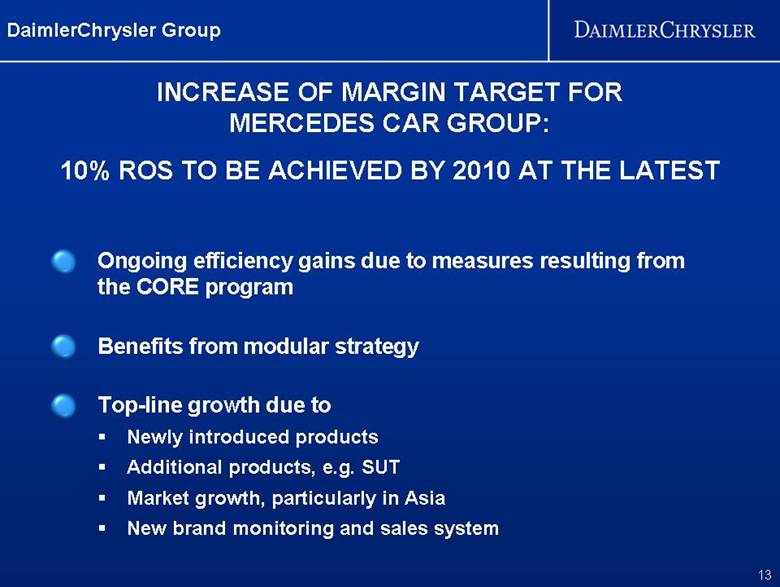
| Ongoing efficiency gains due to measures resulting from the CORE program INCREASE OF MARGIN TARGET FOR MERCEDES CAR GROUP: 10% ROS TO BE ACHIEVED BY 2010 AT THE LATEST Benefits from modular strategy DaimlerChrysler Group Top-line growth due to Newly introduced products Additional products, e.g. SUT Market growth, particularly in Asia New brand monitoring and sales system 13 |
| – Q & A – Stuttgart July 25, 2007 DAIMLERCHRYSLER PRELIMINARY Q2 2007 RESULTS CONFERENCE CALL 14 |
| DISCLAIMER DaimlerChrysler Group This document contains forward-looking statements that reflect our current views about future events, including, among others, the pendency and consummation of the transaction with Cerberus Capital Management, L.P. regarding Chrysler Group. The words “anticipate,” “assume,” “believe,” “estimate,” “expect,” “intend,” “may,” “plan,” “project,” “should” and similar expressions are used to identify forward-looking statements. These statements are subject to many risks and uncertainties, including an economic downturn or slow economic growth, especially in Europe or North America; changes in currency exchange rates and interest rates; introduction of competing products and possible lack of acceptance of our products or services; competitive pressures which may limit our ability to reduce sales incentives and raise prices; price increases in fuel, raw materials, and precious metals; disruption of production or delivery of new vehicles due to shortages of materials, labor strikes, or supplier insolvencies; a decline in resale prices of used vehicles; our ability to close the transaction with Cerberus Capital Management, L.P., regarding Chrysler Group; the ability of the Chrysler Group to implement successfully its Recovery and Transformation Plan; the business outlook for our Truck Group, which may experience a significant decline in demand as a result of accelerated purchases in 2006 made in advance of the effectiveness of new emission regulations; effective implementation of cost reduction and efficiency optimization programs, including our new management model; the business outlook of our equity investee EADS, including the financial effects of delays in and potentially lower volume of future aircraft deliveries; changes in laws, regulations and government policies, particularly those relating to vehicle emissions, fuel economy and safety, the resolution of pending governmental investigations and the outcome of pending or threatened future legal proceedings; and other risks and uncertainties, some of which we describe under the heading “Risk Report” in DaimlerChrysler’s most recent Annual Report and under the headings “Risk Factors” and “Legal Proceedings” in DaimlerChrysler’s most recent Annual Report on Form 20-F filed with the Securities and Exchange Commission. If any of these risks and uncertainties materialize, or if the assumptions underlying any of our forward-looking statements prove incorrect, then our actual results may be materially different from those we express or imply by such statements. We do not intend or assume any obligation to update these forward-looking statements. Any forward-looking statement speaks only as of the date on which it is made. 15 |
| SPECIAL ITEMS AFFECTING EBIT DaimlerChrysler Group - in millions of EUR - 2007 2006 2nd Quarter MCG VBO TG Financial support for suppliers - - - (82) Headcount reduction in the context of CORE (20) - (223) - Discontinuation of smart forfour (13) - (995) - Sale of real estate in Japan - 68 - 68 Transfer of interest in EADS 814 (39) 756 1,524 Restructuring program at EADS - - - (114) Disposal of off-highway business - - 238 - 16 January - June 2007 2006 |
3

Fact Sheet Second Quarter
and First Half 2007
July 25, 2007
DAIMLERCHRYSLER
Contents
DaimlerChrysler Group |
|
|
|
|
|
|
|
• Stock Market Information |
|
| 3 |
|
|
|
|
• Earnings Situation |
|
| 4 - 7 |
|
|
|
|
Sales Information |
|
|
|
|
|
|
|
• Mercedes Car Group |
|
| 8 - 10 |
|
|
|
|
• Truck Group |
|
| 11 - 13 |
|
|
|
|
• Vans & Buses |
|
| 14 |
|
|
|
|
|
|
|
|
The figures in this document are preliminary. |
|
|
|
2
|
| 3rd Quarter |
| 4th Quarter |
| 1st Quarter |
| 2nd Quarter |
| January - June |
| ||||||||||||||
|
| 2006 |
| 2005 |
| 2006 |
| 2005 |
| 2007 |
| 2006 |
| 2007 |
| 2006 |
| Change |
| 2007 |
| 2006 |
| Change |
|
|
|
|
|
|
|
|
|
|
|
|
|
|
|
|
|
|
|
|
|
|
|
|
|
|
|
Average number of shares outstanding |
|
|
|
|
|
|
|
|
|
|
|
|
|
|
|
|
|
|
|
|
|
|
|
|
|
basic |
| 1,022.8 |
| 1,015.6 |
| 1,025.9 |
| 1,018.0 |
| 1,028.7 |
| 1,018.4 |
| 1,043.2 |
| 1,021.4 |
| +2% |
| 1,035.9 |
| 1,019.9 |
| +2% |
|
diluted |
| 1,025.7 |
| 1,019.9 |
| 1,031.4 |
| 1,022.5 |
| 1,038.7 |
| 1,026.9 |
| 1,054.6 |
| 1,025.2 |
| +3% |
| 1,046.7 |
| 1,026.1 |
| +2% |
|
|
|
|
|
|
|
|
|
|
|
|
|
|
|
|
|
|
|
|
|
|
|
|
|
|
|
Number of shares outstanding |
|
|
|
|
|
|
|
|
|
|
|
|
|
|
|
|
|
|
|
|
|
|
|
|
|
adjusted for treasury stock |
| 1,023.3 |
| 1,017.8 |
| 1,028.2 |
| 1,018.2 |
| 1,029.4 |
| 1,018.7 |
| 1,054.1 |
| 1,022.3 |
| +3% |
|
|
|
|
|
|
|
total shares outstanding |
| 1,023.3 |
| 1,017.8 |
| 1,028.2 |
| 1,018.2 |
| 1,029.4 |
| 1,018.7 |
| 1,054.1 |
| 1,022.3 |
| +3% |
|
|
|
|
|
|
|
|
|
|
|
|
|
|
|
|
|
|
|
|
|
|
|
|
|
|
|
|
|
|
|
|
|
Share price Frankfurt |
| 39.41 |
| 44.14 |
| 46.80 |
| 43.14 |
| 61.40 |
| 47.40 |
| 68.59 |
| 38.63 |
| +78% |
|
|
|
|
|
|
|
|
|
|
|
|
|
|
|
|
|
|
|
|
|
|
|
|
|
|
|
|
|
|
|
|
|
Share price New York |
| 49.96 |
| 53.12 |
| 61.41 |
| 51.03 |
| 81.81 |
| 57.41 |
| 91.95 |
| 49.36 |
| +86% |
|
|
|
|
|
|
|
|
|
|
|
|
|
|
|
|
|
|
|
|
|
|
|
|
|
|
|
|
|
|
|
|
|
Market capitalization Frankfurt |
| 40.33 |
| 44.93 |
| 48.12 |
| 43.92 |
| 63.20 |
| 48.28 |
| 72.30 |
| 39.49 |
| +83% |
|
|
|
|
|
|
|
|
|
|
|
|
|
|
|
|
|
|
|
|
|
|
|
|
|
|
|
|
|
|
|
|
|
Market capitalization New York |
| 51.12 |
| 54.07 |
| 63.14 |
| 51.96 |
| 84.21 |
| 58.48 |
| 96.93 |
| 50.46 |
| +92% |
|
|
|
|
|
|
|
|
|
|
|
|
|
|
|
|
|
|
|
|
|
|
|
|
|
|
|
|
|
|
|
|
|
|
|
|
|
|
|
|
|
|
|
|
|
|
|
|
|
|
|
|
|
|
|
|
|
|
|
3
Unit Sales
|
| 3rd Quarter |
| 4th Quarter |
| 1st Quarter |
| 2nd Quarter |
| January - June |
| ||||||||||||||
(in units) |
| 2006 |
| 2005 |
| 2006 |
| 2005 |
| 2007 |
| 2006 |
| 2007 |
| 2006 |
| Change |
| 2007 |
| 2006 |
| Change |
|
|
|
|
|
|
|
|
|
|
|
|
|
|
|
|
|
|
|
|
|
|
|
|
|
|
|
Mercedes Car Group |
|
|
|
|
|
|
|
|
|
|
|
|
|
|
|
|
|
|
|
|
|
|
|
|
|
(Wholesales) |
| 307,483 |
| 310,885 |
| 337,355 |
| 350,904 |
| 271,058 |
| 281,458 |
| 320,151 |
| 325,501 |
| -2% |
| 591,209 |
| 606,959 |
| -3% |
|
|
|
|
|
|
|
|
|
|
|
|
|
|
|
|
|
|
|
|
|
|
|
|
|
|
|
Truck Group |
|
|
|
|
|
|
|
|
|
|
|
|
|
|
|
|
|
|
|
|
|
|
|
|
|
(Wholesales) |
| 136,051 |
| 133,585 |
| 134,253 |
| 121,520 |
| 119,218 |
| 113,377 |
| 112,054 |
| 132,406 |
| -15% |
| 231,272 |
| 245,783 |
| -6% |
|
|
|
|
|
|
|
|
|
|
|
|
|
|
|
|
|
|
|
|
|
|
|
|
|
|
|
Vans |
|
|
|
|
|
|
|
|
|
|
|
|
|
|
|
|
|
|
|
|
|
|
|
|
|
(Wholesales) |
| 58,812 |
| 64,236 |
| 72,785 |
| 79,120 |
| 61,703 |
| 59,724 |
| 73,823 |
| 65,574 |
| +13% |
| 135,526 |
| 125,298 |
| +8% |
|
|
|
|
|
|
|
|
|
|
|
|
|
|
|
|
|
|
|
|
|
|
|
|
|
|
|
Buses |
|
|
|
|
|
|
|
|
|
|
|
|
|
|
|
|
|
|
|
|
|
|
|
|
|
(Wholesales) |
| 8,620 |
| 9,200 |
| 9,437 |
| 10,103 |
| 8,302 |
| 7,840 |
| 10,338 |
| 10,295 |
| +0% |
| 18,640 |
| 18,135 |
| +3% |
|
4
Revenues
|
| 3rd Quarter |
| 4th Quarter |
| 1st Quarter |
| 2nd Quarter |
| January - June |
| ||||||||||
(in millions of EUR) |
| 2006 |
| 2006 |
| 2007 |
| 2006 |
| 2007 |
| 2006 |
| Change |
| 2007 |
| 2006 |
| Change |
|
|
|
|
|
|
|
|
|
|
|
|
|
|
|
|
|
|
|
|
|
|
|
Mercedes Car Group |
| 12,581 |
| 14,395 |
| 12,070 |
| 11,937 |
| 12,558 |
| 12,497 |
| +0% |
| 24,628 |
| 24,434 |
| +1% |
|
|
|
|
|
|
|
|
|
|
|
|
|
|
|
|
|
|
|
|
|
|
|
Truck Group |
| 7,959 |
| 7,961 |
| 7,290 |
| 7,361 |
| 6,930 |
| 8,508 |
| -19% |
| 14,220 |
| 15,869 |
| -10% |
|
|
|
|
|
|
|
|
|
|
|
|
|
|
|
|
|
|
|
|
|
|
|
Van, Bus, Other |
| 3,127 |
| 3,598 |
| 2,882 |
| 3,154 |
| 3,376 |
| 3,272 |
| +3% |
| 6,258 |
| 6,426 |
| -3% |
|
5
Earnings Before Interest and Taxes (EBIT)
|
| 3rd Quarter |
| 4th Quarter |
| 1st Quarter |
| 2nd Quarter |
| January - June |
| ||||||||||
(in millions of EUR) |
| 2006 |
| 2006 |
| 2007 |
| 2006 |
| 2007 |
| 2006 |
| Change |
| 2007 |
| 2006 |
| Change |
|
|
|
|
|
|
|
|
|
|
|
|
|
|
|
|
|
|
|
|
|
|
|
Mercedes Car Group |
| 850 |
| 978 |
| 792 |
| (735 | ) | 1,204 |
| 690 |
| +74% |
| 1,996 |
| (45 | ) | — |
|
|
|
|
|
|
|
|
|
|
|
|
|
|
|
|
|
|
|
|
|
|
|
Truck Group |
| 565 |
| 279 |
| 528 |
| 422 |
| 601 |
| 585 |
| +3% |
| 1,129 |
| 1,007 |
| +12% |
|
|
|
|
|
|
|
|
|
|
|
|
|
|
|
|
|
|
|
|
|
|
|
Van, Bus, Other |
| 341 |
| (501 | ) | 1,872 |
| 366 |
| 257 |
| 1,121 |
| -77% |
| 2,129 |
| 1,487 |
| +43% |
|
6
Special Reporting Items affecting EBIT
|
| 3rd Quarter |
| 4th Quarter |
| 1st Quarter |
| 2nd Quarter |
| January - June |
| ||||||
(in millions of EUR) |
| 2006 |
| 2006 |
| 2007 |
| 2006 |
| 2007 |
| 2006 |
| 2007 |
| 2006 |
|
|
|
|
|
|
|
|
|
|
|
|
|
|
|
|
|
|
|
Mercedes Car Group |
|
|
|
|
|
|
|
|
|
|
|
|
|
|
|
|
|
|
|
|
|
|
|
|
|
|
|
|
|
|
|
|
|
|
|
Discontinuation of smart forfour |
| 40 |
| 9 |
| — |
| (982 | ) | — |
| (13 | ) | — |
| (995 | ) |
Headcount reduction in the context of CORE |
| (47 | ) | (16 | ) | — |
| (203 | ) | — |
| (20 | ) | — |
| (223 | ) |
Immediate recognition of early retirement agreements |
| — |
| (216 | ) | — |
| — |
| — |
| — |
| — |
| — |
|
Financial support for suppliers |
| — |
| — |
| (82 | ) | — |
| — |
| — |
| (82 | ) | — |
|
|
|
|
|
|
|
|
|
|
|
|
|
|
|
|
|
|
|
Truck Group |
|
|
|
|
|
|
|
|
|
|
|
|
|
|
|
|
|
|
|
|
|
|
|
|
|
|
|
|
|
|
|
|
|
|
|
Sale of real estate in Japan |
| — |
| — |
| — |
| — |
| 68 |
| — |
| 68 |
| — |
|
Immediate recognition of early retirement agreements |
| — |
| (134 | ) | — |
| — |
| — |
| — |
| — |
| — |
|
Disposal of the off-highway business |
| — |
| 13 |
| — |
| — |
| — |
| — |
| — |
| — |
|
Changes in healthcare benefits |
| — |
| (161 | ) | — |
| — |
| — |
| — |
| — |
| — |
|
|
|
|
|
|
|
|
|
|
|
|
|
|
|
|
|
|
|
Van, Bus, Other |
|
|
|
|
|
|
|
|
|
|
|
|
|
|
|
|
|
|
|
|
|
|
|
|
|
|
|
|
|
|
|
|
|
|
|
Disposal of the off-highway business |
| — |
| 15 |
| — |
| 238 |
| — |
| — |
| — |
| 238 |
|
Sale of real estate |
| 86 |
| 185 |
| — |
| — |
| — |
| — |
| — |
| — |
|
Immediate recognition of early retirement agreements |
| — |
| (29 | ) | — |
| — |
| — |
| — |
| — |
| — |
|
Transfer of interest in EADS |
| 4 |
| (241 | ) | 1,563 |
| (58 | ) | (39 | ) | 814 |
| 1,524 |
| 756 |
|
Restructuring program at EADS |
| — |
| — |
| (114 | ) | — |
| — |
| — |
| (114 | ) | — |
|
Charges for A350 and A380 |
| — |
| (435 | ) | — |
| — |
| — |
| — |
| — |
| — |
|
7
Wholesales
|
| 3rd Quarter |
| 4th Quarter |
| 1st Quarter |
| 2nd Quarter |
| January - June |
| ||||||||||||||
(in units) |
| 2006 |
| 2005 |
| 2006 |
| 2005 |
| 2007 |
| 2006 |
| 2007 |
| 2006 |
| Change |
| 2007 |
| 2006 |
| Change |
|
|
|
|
|
|
|
|
|
|
|
|
|
|
|
|
|
|
|
|
|
|
|
|
|
|
|
Mercedes Car Group |
| 307,483 |
| 310,885 |
| 337,355 |
| 350,904 |
| 271,058 |
| 281,458 |
| 320,151 |
| 325,501 |
| -2% |
| 591,209 |
| 606,959 |
| -3% |
|
|
|
|
|
|
|
|
|
|
|
|
|
|
|
|
|
|
|
|
|
|
|
|
|
|
|
Western Europe |
| 190,878 |
| 201,731 |
| 204,114 |
| 215,469 |
| 159,487 |
| 180,128 |
| 208,570 |
| 209,729 |
| -1% |
| 368,057 |
| 389,857 |
| -6% |
|
of which Germany |
| 86,155 |
| 93,345 |
| 100,553 |
| 96,872 |
| 72,165 |
| 75,705 |
| 89,680 |
| 90,862 |
| -1% |
| 161,845 |
| 166,567 |
| -3% |
|
|
|
|
|
|
|
|
|
|
|
|
|
|
|
|
|
|
|
|
|
|
|
|
|
|
|
NAFTA |
| 66,790 |
| 62,560 |
| 80,039 |
| 77,397 |
| 59,608 |
| 53,705 |
| 56,785 |
| 71,258 |
| -20% |
| 116,393 |
| 124,963 |
| -7% |
|
of which USA |
| 61,588 |
| 56,746 |
| 73,599 |
| 71,233 |
| 54,669 |
| 48,304 |
| 50,091 |
| 65,069 |
| -23% |
| 104,760 |
| 113,373 |
| -8% |
|
|
|
|
|
|
|
|
|
|
|
|
|
|
|
|
|
|
|
|
|
|
|
|
|
|
|
Japan |
| 11,291 |
| 11,325 |
| 12,414 |
| 14,648 |
| 10,311 |
| 13,158 |
| 8,999 |
| 11,597 |
| -22% |
| 19,310 |
| 24,755 |
| -22% |
|
|
|
|
|
|
|
|
|
|
|
|
|
|
|
|
|
|
|
|
|
|
|
|
|
|
|
Rest of World |
| 38,524 |
| 35,269 |
| 40,788 |
| 43,390 |
| 41,652 |
| 34,467 |
| 45,797 |
| 32,917 |
| +39% |
| 87,449 |
| 67,384 |
| +30% |
|
of which Mitsubishi products manufactured in South Africa |
| n/a |
| n/a |
| n/a |
| n/a |
| 2,434 |
| n/a |
| 2,782 |
| n/a |
| — |
| 5,216 |
| n/a |
| — |
|
8
Mercedes Car Group
Retail Sales*
|
| 3rd Quarter |
| 4th Quarter |
| 1st Quarter |
| 2nd Quarter |
| January - June |
| ||||||||||||||
(in units) |
| 2006 |
| 2005 |
| 2006 |
| 2005 |
| 2007 |
| 2006 |
| 2007 |
| 2006 |
| Change |
| 2007 |
| 2006 |
| Change |
|
|
|
|
|
|
|
|
|
|
|
|
|
|
|
|
|
|
|
|
|
|
|
|
|
|
|
Mercedes Car Group |
| 306,961 |
| 306,033 |
| 326,447 |
| 338,013 |
| 286,764 |
| 294,966 |
| 330,935 |
| 332,286 |
| -0% |
| 617,699 |
| 627,252 |
| -2% |
|
|
|
|
|
|
|
|
|
|
|
|
|
|
|
|
|
|
|
|
|
|
|
|
|
|
|
Western Europe |
| 190,318 |
| 199,309 |
| 200,736 |
| 214,193 |
| 171,062 |
| 186,080 |
| 208,246 |
| 211,101 |
| -1% |
| 379,308 |
| 397,181 |
| -4% |
|
of which Germany |
| 84,839 |
| 94,708 |
| 103,020 |
| 98,262 |
| 71,667 |
| 75,369 |
| 88,701 |
| 90,851 |
| -2% |
| 160,368 |
| 166,220 |
| -4% |
|
|
|
|
|
|
|
|
|
|
|
|
|
|
|
|
|
|
|
|
|
|
|
|
|
|
|
NAFTA |
| 67,686 |
| 63,111 |
| 76,760 |
| 73,717 |
| 61,274 |
| 56,623 |
| 69,440 |
| 70,173 |
| -1% |
| 130,714 |
| 126,796 |
| +3% |
|
of which USA |
| 62,130 |
| 57,685 |
| 70,861 |
| 67,948 |
| 56,048 |
| 51,326 |
| 62,333 |
| 63,775 |
| -2% |
| 118,381 |
| 115,101 |
| +3% |
|
|
|
|
|
|
|
|
|
|
|
|
|
|
|
|
|
|
|
|
|
|
|
|
|
|
|
Japan |
| 11,858 |
| 11,338 |
| 11,447 |
| 11,344 |
| 11,991 |
| 13,780 |
| 9,472 |
| 13,070 |
| -28% |
| 21,463 |
| 26,850 |
| -20% |
|
|
|
|
|
|
|
|
|
|
|
|
|
|
|
|
|
|
|
|
|
|
|
|
|
|
|
Rest of World |
| 37,099 |
| 32,275 |
| 37,504 |
| 38,759 |
| 42,437 |
| 38,483 |
| 43,777 |
| 37,942 |
| +15% |
| 86,214 |
| 76,425 |
| +13% |
|
*) Excluding the Mitsubishi Pickup L200 and the Mitsubishi Pajero produced in South Africa
9
Mercedes Car Group
Market Shares*
|
| 3rd Quarter |
| 4th Quarter |
| 1st Quarter |
| 2nd Quarter |
| January - June |
| ||||||||||||||
(in %) |
| 2006 |
| 2005 |
| 2006 |
| 2005 |
| 2007 |
| 2006 |
| 2007 |
| 2006 |
| Change |
| 2007 |
| 2006 |
| Change |
|
|
|
|
|
|
|
|
|
|
|
|
|
|
|
|
|
|
|
|
|
|
|
|
|
|
|
|
|
|
|
|
|
|
|
|
|
|
|
|
|
|
|
|
|
|
|
|
|
|
|
|
|
Western Europe |
| 4.9 |
| 4.8 |
| 4.8 |
| 5.3 |
| 4.2 |
| 4.2 |
| 4.5 |
| 4.5 |
| +0.0 |
| 4.4 |
| 4.3 |
| +0.1 |
|
of which Germany |
| 9.8 |
| 10.5 |
| 10.3 |
| 10.3 |
| 10.7 |
| 9.4 |
| 10.1 |
| 9.7 |
| +0.4 |
| 10.4 |
| 9.6 |
| +0.8 |
|
|
|
|
|
|
|
|
|
|
|
|
|
|
|
|
|
|
|
|
|
|
|
|
|
|
|
USA |
| 1.5 |
| 1.3 |
| 1.9 |
| 1.8 |
| 1.5 |
| 1.3 |
| 1.3 |
| 1.5 |
| -0.2 |
| 1.4 |
| 1.4 |
| +0.0 |
|
|
|
|
|
|
|
|
|
|
|
|
|
|
|
|
|
|
|
|
|
|
|
|
|
|
|
Japan |
| 1.0 |
| 0.9 |
| 1.0 |
| 0.8 |
| 0.9 |
| 0.9 |
| 0.9 |
| 1.2 |
| -0.3 |
| 0.9 |
| 1.0 |
| -0.1 |
|
* Mercedes-Benz Passenger Cars excluding smart
10
Wholesales
|
| 3rd Quarter |
| 4th Quarter |
| 1st Quarter |
| 2nd Quarter |
| January - June |
| ||||||||||||||
(in units) |
| 2006 |
| 2005 |
| 2006 |
| 2005 |
| 2007 |
| 2006 |
| 2007 |
| 2006 |
| Change |
| 2007 |
| 2006 |
| Change |
|
|
|
|
|
|
|
|
|
|
|
|
|
|
|
|
|
|
|
|
|
|
|
|
|
|
|
Truck Group * |
| 136,051 |
| 133,585 |
| 134,253 |
| 121,520 |
| 119,218 |
| 113,377 |
| 112,054 |
| 132,406 |
| -15% |
| 231,272 |
| 245,783 |
| -6% |
|
|
|
|
|
|
|
|
|
|
|
|
|
|
|
|
|
|
|
|
|
|
|
|
|
|
|
Western Europe * |
| 22,329 |
| 19,744 |
| 21,913 |
| 24,315 |
| 18,855 |
| 18,579 |
| 21,203 |
| 22,751 |
| -7% |
| 40,058 |
| 41,330 |
| -3% |
|
of which Germany * |
| 10,717 |
| 8,689 |
| 10,027 |
| 11,753 |
| 8,825 |
| 8,045 |
| 9,019 |
| 9,991 |
| -10% |
| 17,844 |
| 18,036 |
| -1% |
|
|
|
|
|
|
|
|
|
|
|
|
|
|
|
|
|
|
|
|
|
|
|
|
|
|
|
NAFTA |
| 49,265 |
| 48,330 |
| 46,579 |
| 41,332 |
| 45,952 |
| 45,092 |
| 23,784 |
| 46,861 |
| -49% |
| 69,736 |
| 91,953 |
| -24% |
|
of which USA |
| 42,613 |
| 41,583 |
| 40,564 |
| 35,991 |
| 40,042 |
| 39,557 |
| 18,836 |
| 40,994 |
| -54% |
| 58,878 |
| 80,551 |
| -27% |
|
|
|
|
|
|
|
|
|
|
|
|
|
|
|
|
|
|
|
|
|
|
|
|
|
|
|
Latin America (excl. Mexico) |
| 9,770 |
| 10,490 |
| 10,424 |
| 10,083 |
| 11,017 |
| 8,960 |
| 14,113 |
| 10,569 |
| +34% |
| 25,130 |
| 19,529 |
| +29% |
|
|
|
|
|
|
|
|
|
|
|
|
|
|
|
|
|
|
|
|
|
|
|
|
|
|
|
Asia |
| 39,733 |
| 42,065 |
| 38,714 |
| 32,386 |
| 29,124 |
| 28,748 |
| 36,329 |
| 36,855 |
| -1% |
| 65,453 |
| 65,603 |
| -0% |
|
of which Japan |
| 19,159 |
| 15,273 |
| 19,037 |
| 14,413 |
| 14,254 |
| 14,430 |
| 14,415 |
| 18,440 |
| -22% |
| 28,669 |
| 32,870 |
| -13% |
|
|
|
|
|
|
|
|
|
|
|
|
|
|
|
|
|
|
|
|
|
|
|
|
|
|
|
Rest of World |
| 14,954 |
| 12,956 |
| 16,623 |
| 13,404 |
| 14,270 |
| 11,998 |
| 16,625 |
| 15,370 |
| +8% |
| 30,895 |
| 27,368 |
| +13% |
|
|
|
|
|
|
|
|
|
|
|
|
|
|
|
|
|
|
|
|
|
|
|
|
|
|
|
* Adjusted for Sprinter vans produced by Trucks NAFTA until the end of 2006. | |||||||||||||||||||||||||
|
|
|
|
|
|
|
|
|
|
|
|
|
|
|
|
|
|
|
|
|
|
|
|
|
|
Sprinter vans |
| 5,854 |
| 5,364 |
| 2,895 |
| 5,451 |
|
|
| 5,966 |
|
|
| 6,154 |
|
|
|
|
| 12,120 |
|
|
|
11
Truck Group
Retail Sales
|
| 3rd Quarter |
| 4th Quarter |
| 1st Quarter |
| 2nd Quarter |
| January - June |
| ||||||||||||||
(in units) |
| 2006 |
| 2005 |
| 2006 |
| 2005 |
| 2007 |
| 2006 |
| 2007 |
| 2006 |
| Change |
| 2007 |
| 2006 |
| Change |
|
|
|
|
|
|
|
|
|
|
|
|
|
|
|
|
|
|
|
|
|
|
|
|
|
|
|
Truck Group |
| 136,309 |
| 131,245 |
| 134,171 |
| 122,172 |
| 113,704 |
| 110,256 |
| 118,887 |
| 126,666 |
| -6% |
| 232,591 |
| 236,922 |
| -2% |
|
|
|
|
|
|
|
|
|
|
|
|
|
|
|
|
|
|
|
|
|
|
|
|
|
|
|
Western Europe |
| 22,122 |
| 19,614 |
| 22,200 |
| 23,880 |
| 18,601 |
| 18,143 |
| 19,988 |
| 22,174 |
| -10% |
| 38,589 |
| 40,317 |
| -4% |
|
of which Germany |
| 10,754 |
| 8,661 |
| 9,992 |
| 11,323 |
| 8,777 |
| 7,701 |
| 9,018 |
| 10,021 |
| -10% |
| 17,795 |
| 17,722 |
| +0% |
|
|
|
|
|
|
|
|
|
|
|
|
|
|
|
|
|
|
|
|
|
|
|
|
|
|
|
NAFTA |
| 44,937 |
| 46,241 |
| 45,842 |
| 42,189 |
| 41,200 |
| 42,702 |
| 31,464 |
| 47,354 |
| -34% |
| 72,664 |
| 90,056 |
| -19% |
|
of which USA |
| 38,856 |
| 40,185 |
| 39,931 |
| 36,995 |
| 36,220 |
| 37,756 |
| 25,381 |
| 41,604 |
| -39% |
| 61,601 |
| 79,360 |
| -22% |
|
|
|
|
|
|
|
|
|
|
|
|
|
|
|
|
|
|
|
|
|
|
|
|
|
|
|
Latin America |
| 10,169 |
| 10,518 |
| 10,429 |
| 10,057 |
| 11,019 |
| 8,793 |
| 14,114 |
| 10,346 |
| +36% |
| 25,133 |
| 19,139 |
| +31% |
|
|
|
|
|
|
|
|
|
|
|
|
|
|
|
|
|
|
|
|
|
|
|
|
|
|
|
Asia |
| 44,735 |
| 42,173 |
| 38,877 |
| 32,420 |
| 29,209 |
| 28,869 |
| 36,501 |
| 32,029 |
| +14% |
| 65,710 |
| 60,898 |
| +8% |
|
of which Japan |
| 23,922 |
| 15,329 |
| 19,037 |
| 14,439 |
| 14,254 |
| 14,431 |
| 14,415 |
| 13,677 |
| +5% |
| 28,669 |
| 28,108 |
| +2% |
|
|
|
|
|
|
|
|
|
|
|
|
|
|
|
|
|
|
|
|
|
|
|
|
|
|
|
Rest of World |
| 14,346 |
| 12,699 |
| 16,823 |
| 13,626 |
| 13,675 |
| 11,749 |
| 16,820 |
| 14,763 |
| +14% |
| 30,495 |
| 26,512 |
| +15% |
|
12
Truck Group
Market Shares
|
| 3rd Quarter |
| 4th Quarter |
| 1st Quarter |
| 2nd Quarter |
| January - June |
| ||||||||||||||
(in %) |
| 2006 |
| 2005 |
| 2006 |
| 2005 |
| 2007 |
| 2006 |
| 2007 |
| 2006 |
| Change |
| 2007 |
| 2006 |
| Change |
|
|
|
|
|
|
|
|
|
|
|
|
|
|
|
|
|
|
|
|
|
|
|
|
|
|
|
Trucks Europe / Latin America (Mercedes-Benz) |
|
|
|
|
|
|
|
|
|
|
|
|
|
|
|
|
|
|
|
|
|
|
|
|
|
Western Europe MDT/HDT |
| 22.1 |
| 23.0 |
| 22.9 |
| 23.0 |
| 19.3 |
| 21.1 |
| 21.4 |
| 21.2 |
| +0.2 |
| 20.6 |
| 21.2 |
| -0.6 |
|
Germany MDT/HDT |
| 42.5 |
| 42.5 |
| 41.4 |
| 43.3 |
| 36.7 |
| 41.6 |
| 38.4 |
| 38.2 |
| +0.2 |
| 37.8 |
| 39.1 |
| -1.3 |
|
Brazil MDT/HDT |
| 31.1 |
| 33.0 |
| 31.8 |
| 32.0 |
| 30.9 |
| 34.1 |
| 31.8 |
| 31.8 |
| +0.0 |
| 31.5 |
| 32.5 |
| -1.0 |
|
|
|
|
|
|
|
|
|
|
|
|
|
|
|
|
|
|
|
|
|
|
|
|
|
|
|
Trucks NAFTA |
|
|
|
|
|
|
|
|
|
|
|
|
|
|
|
|
|
|
|
|
|
|
|
|
|
(Freightliner/Sterling/Western Star) |
|
|
|
|
|
|
|
|
|
|
|
|
|
|
|
|
|
|
|
|
|
|
|
|
|
NAFTA Class 8 |
| 32.8 |
| 36.3 |
| 32.3 |
| 35.1 |
| 38.6 |
| 34.4 |
| 36.6 |
| 34.0 |
| +2.6 |
| 37.4 |
| 34.2 |
| +3.2 |
|
NAFTA Class 5-7 |
| 20.0 |
| 23.7 |
| 21.7 |
| 23.3 |
| 27.3 |
| 21.4 |
| 22.5 |
| 22.3 |
| +0.2 |
| 24.4 |
| 22.0 |
| +2.4 |
|
|
|
|
|
|
|
|
|
|
|
|
|
|
|
|
|
|
|
|
|
|
|
|
|
|
|
Trucks Asia |
|
|
|
|
|
|
|
|
|
|
|
|
|
|
|
|
|
|
|
|
|
|
|
|
|
Japan Trucks Total |
| 25.7 |
| 24.2 |
| 28.5 |
| 21.8 |
| 22.2 |
| 20.2 |
| 23.8 |
| 23.6 |
| +0.2 |
| 23.3 |
| 22.5 |
| +0.8 |
|
13
Market Data
|
| 3rd Quarter |
| 4th Quarter |
| 1st Quarter |
| 2nd Quarter |
| January - June |
| ||||||||||||||
|
| 2006 |
| 2005 |
| 2006 |
| 2005 |
| 2007 |
| 2006 |
| 2007 |
| 2006 |
| Change |
| 2007 |
| 2006 |
| Change |
|
|
|
|
|
|
|
|
|
|
|
|
|
|
|
|
|
|
|
|
|
|
|
|
|
|
|
Vans |
|
|
|
|
|
|
|
|
|
|
|
|
|
|
|
|
|
|
|
|
|
|
|
|
|
Wholesales (in units) |
| 58,812 |
| 64,236 |
| 72,785 |
| 79,120 |
| 61,703 |
| 59,724 |
| 73,823 |
| 65,574 |
| +13% |
| 135,526 |
| 125,298 |
| +8% |
|
Retail sales (in units) |
| 59,254 |
| 68,120 |
| 72,655 |
| 76,954 |
| 62,356 |
| 59,406 |
| 74,635 |
| 68,532 |
| +9% |
| 136,991 |
| 127,938 |
| +7% |
|
Market shares |
|
|
|
|
|
|
|
|
|
|
|
|
|
|
|
|
|
|
|
|
|
|
|
|
|
Western Europe midsize/large |
| 16.2 |
| 16.6 |
| 16.3 |
| 16.8 |
| 16.1 |
| 15.3 |
| 15.9 |
| 15.8 |
| +0.1pts. |
| 15.9 |
| 15.6 |
| +0.3 pts. |
|
Germany midsize/large |
| 26.7 |
| 27.7 |
| 27.3 |
| 28.0 |
| 25.2 |
| 24.0 |
| 24.8 |
| 24.5 |
| +0.3pts. |
| 24.9 |
| 24.3 |
| +0.6 pts. |
|
|
|
|
|
|
|
|
|
|
|
|
|
|
|
|
|
|
|
|
|
|
|
|
|
|
|
Buses |
|
|
|
|
|
|
|
|
|
|
|
|
|
|
|
|
|
|
|
|
|
|
|
|
|
Wholesales (in units) |
| 8,620 |
| 9,200 |
| 9,437 |
| 10,103 |
| 8,302 |
| 7,840 |
| 10,338 |
| 10,295 |
| +0% |
| 18,640 |
| 18,135 |
| +3% |
|
Retail sales (in units) |
| 8,620 |
| 9,200 |
| 9,437 |
| 10,103 |
| 8,302 |
| 7,840 |
| 10,338 |
| 10,295 |
| +0% |
| 18,640 |
| 18,135 |
| +3% |
|
Market shares |
|
|
|
|
|
|
|
|
|
|
|
|
|
|
|
|
|
|
|
|
|
|
|
|
|
Western Europe heavy |
| 25.5 |
| 23.9 |
| 25.9 |
| 27.8 |
| 26.3 |
| 26.3 |
| 23.8 |
| 24.5 |
| -0.7pts. |
| 24.5 |
| 25.2 |
| -0.7 pts. |
|
Germany heavy |
| 58.6 |
| 55.3 |
| 57.1 |
| 61.7 |
| 51.8 |
| 40.8 |
| 46.2 |
| 49.7 |
| -3.5pts. |
| 48.2 |
| 48.0 |
| +0.2 pts. |
|
14
SIGNATURES
Pursuant to the requirements of the Securities Exchange Act of 1934, the registrant has duly caused this report to be signed on its behalf by the undersigned, thereunto duly authorized.
| DaimlerChrysler AG | |||
|
|
|
| |
|
|
|
| |
| By: | /s/ ppa. | Robert Köthner |
|
|
| Name: | Robert Köthner | |
|
| Title: | Vice President | |
|
|
| Chief Accounting Officer | |
|
|
|
| |
|
|
|
| |
| By: | /s/ i.V. | Silvia Nierbauer |
|
|
| Name: | Silvia Nierbauer | |
|
| Title: | Director | |
Date: July 25, 2007