SECURITIES AND EXCHANGE COMMISSION
Washington, D.C. 20549
Form 6-K
REPORT OF FOREIGN PRIVATE ISSUER
PURSUANT TO RULE 13a-16 OR 15d-16 UNDER
THE SECURITIES EXCHANGE ACT OF 1934
October 27, 2009
Commission File Number 1-12356
DAIMLER AG
(Translation of registrant’s name into English)
MERCEDESSTRASSE 137, 70327 STUTTGART, GERMANY
(Address of principal executive office)
Indicate by check mark whether the registrant files or will file annual reports under cover of Form 20-F or Form 40-F.
| Form 20-F | x | Form 40-F | o |
Indicate by check mark whether the registrant by furnishing the information contained in this Form is also thereby furnishing the information to the Commission pursuant to Rule 12g3-2(b) under the Securities Exchange Act of 1934.
| Yes | o | No | x |
If “Yes” is marked, indicate below the file number assigned to the registrant in connection with Rule 12g3-2(b): 82-
This report on Form 6-K is hereby incorporated by reference in the registration statements on Form S-8 (Nos. 333-5074, 333-7082, 333-8998, 333-86934, 333-86936 and 333-134198) of Daimler AG
DAIMLER AG
FORM 6-K: TABLE OF CONTENTS
1. |
| Press release: Daimler anticipates positive earnings from ongoing business also in the fourth quarter of 2009 |
|
|
|
2. |
| Interim Report for the three- and nine-month periods ended September 30, 2009 |
CAUTIONARY STATEMENT REGARDING FORWARD-LOOKING STATEMENTS
Forward-looking statements in this document:
This document contains forward-looking statements that reflect our current views about future events. The words “anticipate,” “assume,” “believe,” “estimate,” “expect,” “intend,” “may,” “plan,” “project,” “should” and similar expressions are used to identify forward-looking statements. These statements are subject to many risks and uncertainties, including a lack of or a considerable delay in improvement or a further deterioration of global economic conditions; a continuation or worsening of the tense situation in the credit and financial markets, which could result in ongoing high borrowing costs or limit our funding flexibility; changes in currency exchange rates and interest rates; the introduction of competing, fuel-efficient products and the possible lack of acceptance of our products or services, which may limit our ability to adequately utilize our production capacities or raise prices; price increases in fuel, raw materials and precious metals; disruption of production due to shortages of materials, labor strikes, or supplier insolvencies; a further decline in resale prices of used vehicles; the effective implementation of cost-reduction and efficiency-optimization programs at all of our segments, including the repositioning of our truck activities in the NAFTA region and in Asia; the business outlook of companies in which we hold an equity interest, most notably EADS; changes in laws, regulations and government policies, particularly those relating to vehicle emissions, fuel economy and safety; the resolution of pending governmental investigations and the outcome of pending or threatened future legal proceedings; and other risks and uncertainties, some of which we describe under the heading “Risk Report” in Daimler’s most recent Annual Report and under the headings “Risk Factors” and “Legal Proceedings” in Daimler’s most recent Annual Report on Form 20-F filed with the Securities and Exchange Commission. If any of these risks and uncertainties materialize, or if the assumptions underlying any of our forward-looking statements prove incorrect, then our actual results may be materially different from those we express or imply by such statements. We do not intend or assume any obligation to update these forward-looking statements. Any forward-looking statement speaks only as of the date on which it is made.
1
![]()
Contact: |
| Telephone: |
|
|
Thomas Fröhlich |
| +49 711 17 41361 |
| Press information |
Brigitte Bertram |
| +49 711 17 40624 |
|
|
|
|
|
| Date: |
|
|
|
| October 27, 2009 |
Daimler anticipates positive earnings from ongoing business also in fourth quarter of 2009
· EBIT in Q3 2009 of plus €470 million (Q2 2009: minus €1,005 million)
· Third-quarter net profit of €56 million (Q2 2009: net loss of €1,062 million)
· Third-quarter revenue of €19.3 billion (Q2 2009: €19.6 billion)
Stuttgart — After returning to profitability in the third quarter of 2009, Daimler AG (stock-exchange abbreviation DAI) anticipates positive EBIT from its ongoing business also in the fourth quarter. However, general economic developments and their effects on dealerships and suppliers could lead to an impact on fourth-quarter earnings.
Dr. Dieter Zetsche, Chairman of the Board of Management (CEO) of Daimler AG and Head of Mercedes-Benz Cars: “In recent months, we have increasingly mastered the crisis. Daimler has been able to maintain its financial flexibility and has intensified the actions taken to enhance efficiency, while pushing forward with the development of new products and markets. We are now very well positioned and can look with confidence to the coming year, which will remain challenging due to the still-difficult situation of automobile markets worldwide.”
Daimler Communications, 70546 Stuttgart, Germany
Daimler anticipates significant decreases in unit sales and revenue in full-year 2009 (2008: 2.1 million vehicles and €95.9 billion).
The Group has taken measures to cut costs and avoid additional expenditure. These actions include reducing fixed and material costs, reducing labor costs and streamlining the Group’s organizational structures. The measures taken are a supplement to the existing efficiency-enhancing programs. Daimler now assumes that it will surpass the original target of saving a total of €4 billion in full-year 2009.
Despite the still-difficult situation of the world’s financial markets, the Daimler Group has a sound financial position, which should remain stable also during the fourth quarter. Due to its current very high levels of liquidity, it is intended to make use of the capital markets to only a slight extent during the rest of this year.
The free cash flow of the industrial business increased to plus €2.3 billion in the first three quarters of the year, primarily due to the effective management of inventories, receivables and payables. Due to higher payments to suppliers and a seasonal inventory increase at the end of the year, from today’s perspective, the Group forecasts a negative cash flow in the fourth quarter. For full-year 2009, Daimler expects a positive free cash flow in the industrial business.
Mercedes-Benz Cars assumes that business will continue to improve in the last quarter of the year. Sales impetus will be provided not only by the recently launched new E-Class models and the station wagon to be launched in November, but also by the new generation of the S-Class, which was launched at the end of June 2009. However, Mercedes-Benz Cars will not be able to fully compensate for the
2
weakness during the year to date of some important sales markets and market segments.
Overall, the division’s unit sales will therefore be lower in 2009 than in the prior year. Daimler sees lower volumes above all in the markets of the United States, Western Europe and Japan. But unit sales will be partially stabilized by growth in the emerging markets, particularly in China.
With support from the new E-Class station wagon and the full availability of the E-Class sedan, unit sales in the fourth quarter of the year are expected to be higher than in the third quarter.
Based on the expected development of unit sales and ongoing efficiency improvements, Mercedes-Benz Cars anticipates a moderate improvement in earnings from the ongoing business in the fourth quarter of the year compared to the third quarter.
At Daimler Trucks, orders received have improved continuously in recent months. Nonetheless, the division anticipates a significant decrease in unit sales in full-year 2009 as a result of substantially lower demand for transport services and underutilized transport capacities. From today’s perspective, unit sales in the last quarter of the year are expected to be similar to the volume sold in the third quarter. The division assumes that its market shares will at least remain stable in the major markets, although its regional mix will change. Whereas unit sales will rise in Asia, the European markets’ share of total unit sales will decrease.
The weak condition of major markets will also be reflected by the development of the division’s earnings, and the fourth quarter will be
3
additionally affected by the unfavorable regional mix of its sales structure. The measures taken to reduce costs will only partially offset that negative effect.
The expenses of the measures initiated to restructure and reposition the business operations of Daimler Trucks North America and Mitsubishi Fuso Truck and Bus Corporation will reduce EBIT once again in the fourth quarter of 2009.
Overall, EBIT in the fourth quarter is likely to be lower than in the third quarter.
Despite the continuation of the very difficult economic situation in major regions, Mercedes-Benz Vans expects unit sales in the fourth quarter of the year to be slightly higher than in the third quarter. In terms of EBIT, the division anticipates at least breakeven in the fourth quarter.
Daimler Buses expects core markets to stabilize in the fourth quarter. Due to higher vehicle shipments in connection with major orders, unit sales should increase compared to the third quarter. The division continues to anticipate positive EBIT in the fourth quarter.
Daimler Financial Services anticipates rising credit defaults and continued high refinancing expenses in full-year 2009. The division is confident that it will be able to compensate for the increased costs at least partially through its efficiency programs, and expects its operating result to be positive once again in the last quarter of the year.
4
Overview of the third quarter of 2009
As already disclosed on October 19, 2009, Daimler posted Group EBIT of €470 million in the third quarter of 2009 (Q3 2008: €648 million). Group EBIT had amounted to minus €1,005 million in the second quarter of 2009 and minus €1,426 million in the first.
The development of earnings in the third quarter reflects on the one hand declining unit sales in all vehicle segments. On the other hand, the full availability of the E-Class and the measures taken to improve efficiency had a positive impact on third-quarter earnings. Daimler Financial Services posted a decrease in earnings, primarily due to increased credit risks.
A gain of €48 million was recognized on the valuation of Chrysler-related assets in the third quarter. The plans for the repositioning of the business operations of Mitsubishi Fuso Truck and Bus Corporation and Daimler Trucks North America led to total charges of €3 million in the reporting period. In connection with the expected increase in annual contributions to the German Pension Protection Association, the Group increased its provisions for contributions by a prorated €59 million.
EBIT for the prior-year quarter was reduced by charges relating to the reassessment of vehicles’ residual values (€449 million) and relating to the equity interest in Chrysler that the Group still held at that time (€351 million). (See the table on page 10 for special items.)
Net profit for the third quarter of 2009 amounted to €56 million (Q3 2008: €213 million). In the second quarter of this year, the Group posted a net loss of €1,062 million. Earnings per share for the third
5
quarter amounted to €0.04 (Q3 2008: €0.21).
Unit sales down by 26% in third quarter
In the third quarter of 2009, Daimler sold 386,500 cars and commercial vehicles worldwide, which is 26% fewer than in the prior-year quarter.
Daimler’s revenue fell to €19.3 billion from €24.5 billion in the third quarter of 2008. Adjusted for exchange-rate effects, revenue fell by 22%.
At the end of the third quarter of 2009, 256,900 people were employed by Daimler worldwide (end of Q3 2008: 275,500). Of that total, 163,500 people were employed in Germany (end of Q3 2008: 168,700).
The free cash flow of the industrial business was positive in the first three quarters despite the difficult economic situation at €2.3 billion (Q1-3 2008: negative €0.3 billion). The main reason for the increase in the free cash flow was the development of inventories, trade receivables and payables, as well as of investments in property, plant and equipment, which offset the negative effects from the divisions’ earnings.
There was also a negative net impact of €0.6 billion from internal payments within the Group received by the industrial business from companies in the financial services business in connection with fiscal unities (cash outflow in prior-year periods). These intercompany payments are related to a settlement with the US tax authorities and are not recognized in profit and loss.
6
Details of the divisions in the third quarter
In a still challenging market environment, Mercedes-Benz Cars sold 271,900 vehicles in the third quarter of this year (Q3 2008: 315,800). After the seasonally weaker summer months of July and August, the division achieved its strongest month of the year in September. Compared to the third quarter of last year, revenue decreased by 12% to €10.2 billion.
The division’s EBIT amounted to €355 million, which is significantly higher than the €112 million posted in the prior-year quarter. The earnings improvement primarily reflects the fact that EBIT for the prior-year quarter was reduced by €449 million due to charges relating to the reassessment of leased vehicles’ residual values. The reduction in earnings in the third quarter of 2009 caused by generally lower unit sales was partially offset by the actions taken to optimize business operations, particularly in production and sales, as well as by measures designed to adjust personnel expenses. There were additional positive effects on earnings from the full availability of the new E-Class and a more favorable model mix.
Daimler Trucks sold 66,100 units in the third quarter of 2009 (Q3 2008: 122,700). This substantial drop in sales is due to a slump in demand for transport services. Revenue fell from €7.3 billion to €4.4 billion.
The division’s EBIT of minus €127 million was substantially below the very high EBIT for the prior-year period of plus €510 million. This earnings development was primarily the result of lower unit sales. The implementation of efficiency improvements such as the adjustment of personnel expenses had a positive effect on EBIT. The realignment of
7
the business operations of Mitsubishi Fuso Truck and Bus Corporation resulted in additional charges of €13 million. The adjustment of provisions recognized in connection with the repositioning of Daimler Trucks North America had an opposing effect, leading to a gain of €10 million.
Mercedes-Benz Vans sold 40,100 vehicles in the third quarter, which is significantly better than the average of the first and second quarters (Q3 2008: 73,200). Weak markets continued to affect the division’s business development, however, so it was not possible to equal the record unit sales of the prior-year quarter (Q3 2008: 73,200 units). Revenue fell from €2.4 billion to €1.6 billion.
The division achieved EBIT breakeven (Q3 2008: €212 million). It was unable to escape the general market development, so unit sales fell although market share increased. The resulting charges on earnings were not fully offset by efficiency improvements.
Daimler Buses slightly increased its unit sales compared to the second quarter of this year, but sales of 8,400 buses and chassis were below the high level recorded in the third quarter of last year (Q3 2008: 10,800). Revenue of €1.0 billion was also lower than in the prior-year quarter (€1.2 billion).
The division posted third-quarter EBIT of €23 million, which was below the high prior-year figure of €92 million. In addition to negative currency effects, the division’s earnings decline was primarily caused by the worldwide slump in demand, reflecting the general market development. Demand was significantly weaker than the high level of the prior-year quarter, above all in Mexico and the other markets of Latin America. In Europe, the city bus business
8
continued its stable development, while demand for coaches weakened.
At the end of the third quarter, Daimler Financial Services’ contract volume decreased compared to the end of 2008 by 7% to €58.7 billion. Adjusted for exchange-rate effects, there was also a decrease of 7%. Compared to the third quarter of 2008, new business decreased by 22% to €6.0 billion.
The division posted EBIT of €101 million (Q3 2008: €173 million). The decline in earnings was mainly caused by higher expenses for credit risks, but expenses were also incurred in connection with the expansion of the direct banking business at Mercedes-Benz Bank.
Other business activities, in particular the investments in EADS and Tognum, which are accounted for using the equity method, have been included in the “reconciliation” item since the beginning of the year 2009.
9
The special items shown in the following table affected EBIT in the third quarters of 2009 and 2008:
Special items affecting EBIT
Amounts in millions of € |
| Q3 2009 |
| Q3 2008 |
|
Mercedes-Benz Cars |
|
|
|
|
|
Reassessment of residual values |
| — |
| (449 | ) |
Daimler Trucks |
|
|
|
|
|
Realignment of Mitsubishi Fuso Truck and Bus Corporation |
| (13 | ) | — |
|
|
|
|
|
|
|
Repositioning of Daimler Trucks North America |
| 10 |
| — |
|
|
|
|
|
|
|
Reconciliation |
|
|
|
|
|
Gain/loss related to the transfer of shares in EADS |
| — |
| (7 | ) |
|
|
|
|
|
|
Equity-method result Chrysler |
| — |
| (351 | ) |
|
|
|
|
|
|
Other charges/gains relating to Chrysler |
| 48 |
| — |
|
|
|
|
|
|
|
New management model |
| — |
| (61 | ) |
Further information on Daimler is available on the Internet: www.media.daimler.com
This document contains forward-looking statements that reflect our current views about future events. The words “anticipate,” “assume,” “believe,” “estimate,” “expect,” “intend,” “may,” “plan,” “project,” “should” and similar expressions are used to identify forward-looking statements. These statements are subject to many risks and uncertainties, including a lack of or a considerable delay in improvement or a further deterioration of global economic conditions; a continuation or worsening of the tense situation in the credit and financial markets, which could result in ongoing high borrowing costs or limit our funding flexibility; changes in currency exchange rates and interest rates; the introduction of competing, fuel-efficient products and the possible lack of acceptance of our products or services, which may limit our ability to adequately utilize our production capacities or raise prices; price increases in fuel, raw materials and precious metals; disruption of production due to shortages of materials, labor strikes, or supplier insolvencies; a further decline in
10
resale prices of used vehicles; the effective implementation of cost-reduction and efficiency-optimization programs at all of our segments, including the repositioning of our truck activities in the NAFTA region and in Asia; the business outlook of companies in which we hold an equity interest, most notably EADS; changes in laws, regulations and government policies, particularly those relating to vehicle emissions, fuel economy and safety; the resolution of pending governmental investigations and the outcome of pending or threatened future legal proceedings; and other risks and uncertainties, some of which we describe under the heading “Risk Report” in Daimler’s most recent Annual Report and under the headings “Risk Factors” and “Legal Proceedings” in Daimler’s most recent Annual Report on Form 20-F filed with the Securities and Exchange Commission. If any of these risks and uncertainties materialize, or if the assumptions underlying any of our forward-looking statements prove incorrect, then our actual results may be materially different from those we express or imply by such statements. We do not intend or assume any obligation to update these forward-looking statements. Any forward-looking statement speaks only as of the date on which it is made.
About Daimler
Daimler AG, Stuttgart, with its businesses Mercedes-Benz Cars, Daimler Trucks, Mercedes-Benz Vans, Daimler Buses and Daimler Financial Services, is a globally leading producer of premium passenger cars and the global market leader of heavy- and medium-duty trucks as well as buses. The Daimler Financial Services division has a broad offering of financial services, including vehicle financing, leasing, insurance and fleet management. Daimler sells its products in nearly all the countries of the world and has production facilities on five continents. The company’s founders, Gottlieb Daimler and Carl Benz, continued to make automotive history following their invention of the automobile in 1886. As an automotive pioneer, Daimler and its employees willingly accept an obligation to act responsibly towards society and the environment and to shape the future of safe and sustainable mobility with groundbreaking technologies and high-quality products. The current brand portfolio includes the world’s most valuable automobile brand, Mercedes-Benz, as well as smart, AMG, Maybach, Freightliner, Western Star, Mitsubishi Fuso, Setra, Orion and Thomas Built Buses. The company is listed on the stock exchanges in Frankfurt, New York and Stuttgart (stock exchange abbreviation DAI). In 2008, the Group sold 2.1 million vehicles and employed a workforce of over 270,000 people; revenue totaled €95.9 billion and EBIT amounted to €2.7 billion. Daimler is an automotive Group with a commitment to excellence, and aims to achieve sustainable growth and industry-leading profitability.
11
Figures for the 3rd quarter and the first nine months 2009
Daimler Group
|
| Q3 |
| Q3 |
| Change |
| YTD |
| YTD |
| Change |
|
amounts in € |
| 2009 |
| 2008 |
| 09/08 |
| 2009 |
| 2008 |
| 09/08 |
|
Revenue, in millions |
| 19,310 |
| 24,470 |
| - 21 | % | 57,601 |
| 74,473 |
| - 23 | % |
EBIT, in millions |
| 470 |
| 648 |
| - 27 | % | (1,961 | ) | 4,677 |
| — |
|
Net profit (loss), in millions |
| 56 |
| 213 |
| - 74 | % | (2,292 | ) | 2,940 |
| — |
|
Net profit (loss) from continuing operations, in millions |
| 56 |
| 218 |
| - 74 | % | (2,292 | ) | 2,965 |
| — |
|
Earnings (loss) per share (EPS) |
| 0.04 |
| 0.21 |
| - 81 | % | (2.30 | ) | 2.94 |
| — |
|
Employees (September 30) |
| 256,857 |
| 275,535 |
| - 7 | % | 256,857 |
| 275,535 |
| - 7 | % |
EBIT by Divisions
|
| Q3 |
| Q3 |
| Change |
| YTD |
| YTD |
| Change |
|
in millions of € |
| 2009 |
| 2008 |
| 09/08 |
| 2009 |
| 2008 |
| 09/08 |
|
Mercedes-Benz Cars |
| 355 |
| 112 |
| + 217 | % | (1,108 | ) | 2,476 |
| — |
|
Daimler Trucks |
| (127 | ) | 510 |
| — |
| (777 | ) | 1,521 |
| — |
|
Mercedes-Benz Vans |
| 1 |
| 212 |
| - 100 | % | (100 | ) | 660 |
| — |
|
Daimler Buses |
| 23 |
| 92 |
| - 75 | % | 137 |
| 337 |
| - 59 | % |
Daimler Financial Services |
| 101 |
| 173 |
| - 42 | % | 13 |
| 524 |
| - 98 | % |
Reconciliation |
| 117 |
| (451 | ) | — |
| (126 | ) | (841 | ) | + 85 | % |
Revenue by Divisions
|
| Q3 |
| Q3 |
| Change |
| YTD |
| YTD |
| Change |
|
in millions of € |
| 2009 |
| 2008 |
| 09/08 |
| 2009 |
| 2008 |
| 09/08 |
|
Mercedes-Benz Cars |
| 10,238 |
| 11,608 |
| - 12 | % | 29,873 |
| 37,026 |
| - 19 | % |
Daimler Trucks |
| 4,388 |
| 7,307 |
| - 40 | % | 13,523 |
| 21,019 |
| - 36 | % |
Mercedes-Benz Vans |
| 1,601 |
| 2,388 |
| - 33 | % | 4,373 |
| 7,280 |
| - 40 | % |
Daimler Buses |
| 1,024 |
| 1,202 |
| - 15 | % | 3,031 |
| 3,442 |
| - 12 | % |
Daimler Financial Services |
| 2,864 |
| 3,030 |
| - 5 | % | 9,122 |
| 8,721 |
| + 5 | % |
Reconciliation |
| (805 | ) | (1,065 | ) | + 24 | % | (2,321 | ) | (3,015 | ) | + 23 | % |
Unit Sales
|
| Q3 |
| Q3 |
| Change |
| YTD |
| YTD |
| Change |
|
in units |
| 2009 |
| 2008 |
| 09/08 |
| 2009 |
| 2008 |
| 09/08 |
|
Daimler Group |
| 386,461 |
| 522,525 |
| - 26 | % | 1,110,253 |
| 1,592,821 |
| - 30 | % |
Mercedes-Benz Cars |
| 271,917 |
| 315,796 |
| - 14 | % | 790,353 |
| 988,057 |
| - 20 | % |
Daimler Trucks |
| 66,071 |
| 122,678 |
| - 46 | % | 185,610 |
| 353,215 |
| - 47 | % |
Mercedes-Benz Vans |
| 40,123 |
| 73,241 |
| - 45 | % | 110,828 |
| 220,496 |
| - 50 | % |
Daimler Buses |
| 8,350 |
| 10,810 |
| - 23 | % | 23,462 |
| 31,053 |
| - 24 | % |
12
Figures for the 3rd Quarter 2009/2nd Quarter 2009
Daimler Group
|
| Q3 |
| Q2 |
| Change |
|
amounts in € |
| 2009 |
| 2009 |
| Q3 /Q2 |
|
Revenue, in millions |
| 19,310 |
| 19,612 |
| - 2 | % |
EBIT, in millions |
| 470 |
| (1,005 | ) | — |
|
Net profit (loss), in millions |
| 56 |
| (1,062 | ) | — |
|
Net profit (loss) from continuing operations, in millions |
| 56 |
| (1,062 | ) | — |
|
Earnings (loss) per share (EPS) |
| 0.04 |
| (0.99 | ) | — |
|
Employees (September 30) |
| 256,857 |
| 257,427 |
| 0 | % |
EBIT by Divisions/Segments
|
| Q3 |
| Q2 |
| Change |
|
in millions of € |
| 2009 |
| 2009 |
| Q3 /Q2 |
|
Mercedes-Benz Cars |
| 355 |
| (340 | ) | — |
|
Daimler Trucks |
| (127 | ) | (508 | ) | + 75 | % |
Mercedes-Benz Vans |
| 1 |
| (10 | ) | — |
|
Daimler Buses |
| 23 |
| 49 |
| - 53 | % |
Daimler Financial Services |
| 101 |
| 79 |
| + 28 | % |
Reconciliation |
| 117 |
| (275 | ) | — |
|
Revenue by Divisions/Segments
|
| Q3 |
| Q2 |
| Change |
|
in millions of € |
| 2009 |
| 2009 |
| Q3 /Q2 |
|
Mercedes-Benz Cars |
| 10,238 |
| 10,568 |
| - 3 | % |
Daimler Trucks |
| 4,388 |
| 4,217 |
| + 4 | % |
Mercedes-Benz Vans |
| 1,601 |
| 1,481 |
| + 8 | % |
Daimler Buses |
| 1,024 |
| 1,103 |
| - 7 | % |
Daimler Financial Services |
| 2,864 |
| 3,108 |
| - 8 | % |
Reconciliation |
| (805 | ) | (865 | ) | + 7 | % |
Unit Sales
|
| Q3 |
| Q2 |
| Change |
|
in units |
| 2009 |
| 2009 |
| Q3 /Q2 |
|
Daimler Group |
| 386,461 |
| 391,540 |
| - 1 | % |
Mercedes-Benz Cars |
| 271,917 |
| 287,243 |
| - 5 | % |
Daimler Trucks |
| 66,071 |
| 54,134 |
| + 22 | % |
Mercedes-Benz Vans |
| 40,123 |
| 41,871 |
| - 4 | % |
Daimler Buses |
| 8,350 |
| 8,292 |
| + 1 | % |
13
2
DAIMLER
Interim Report Q3 2009

2
Contents
4 |
| Key Figures |
6 |
| Management Report |
15 |
| Mercedes-Benz Cars |
16 |
| Daimler Trucks |
17 |
| Mercedes-Benz Vans |
18 |
| Daimler Buses |
19 |
| Daimler Financial Services |
20 |
| Interim Consolidated Financial Statements |
26 |
| Notes to the Interim Consolidated Financial Statements |
35 |
| Addresses | Information |
|
| Financial Calendar 2009 | 2010 |
Cover photo:
The new Mercedes-Benz SLS AMG embodies the utmost in automotive fascination and high technology. This exciting super-sports car features puristic design, lightweight construction and superior driving dynamics. At the same time, the SLS fulfills all expectations for typical Mercedes usability in everyday traffic as well as exemplary safety. This makes the new gull-wing the ideal synthesis of the strengths of Mercedes-Benz and AMG. The distinctive design of the new SLS expresses a passion for sporting performance and represents a new interpretation of the breathtaking shape of the original Mercedes-Benz 300 SL. The reincarnation of the legendary gull-wing will be launched on the market in the spring of 2010.
3
Q3
Key figures
Amounts in millions of € |
| Q3 2009 |
| Q3 2008 |
| Change in % |
|
|
|
|
|
|
|
|
|
Revenue |
| 19,310 |
| 24,470 |
| -21 | (1) |
Western Europe |
| 8,923 |
| 10,922 |
| -18 |
|
thereof Germany |
| 4,680 |
| 5,981 |
| -22 |
|
United States |
| 3,898 |
| 5,121 |
| -24 |
|
Other markets |
| 6,489 |
| 8,427 |
| -23 |
|
Employees (September 30) |
| 256,857 |
| 275,535 |
| -7 |
|
Research and development expenditure |
| 1,055 |
| 1,128 |
| -6 |
|
thereof capitalized development costs |
| 327 |
| 339 |
| -4 |
|
Investment in property, plant and equipment |
| 624 |
| 948 |
| -34 |
|
Cash provided by (used for) operating activities |
| 3,315 |
| (428 | ) | . |
|
EBIT |
| 470 |
| 648 |
| -27 |
|
Net profit |
| 56 |
| 213 |
| -74 |
|
Earnings per share (in €) |
| 0.04 |
| 0.21 |
| -81 |
|
(1) Adjusted for the effects of currency translation, decrease in revenue of 22%

4
Q1-3
Key figures
Amounts in millions of € |
| Q1-3 2009 |
| Q1-3 2008 |
| Change in % |
|
|
|
|
|
|
|
|
|
Revenue |
| 57,601 |
| 74,473 |
| -23 | (1) |
Western Europe |
| 27,023 |
| 35,205 |
| -23 |
|
thereof Germany |
| 13,937 |
| 17,252 |
| -19 |
|
United States |
| 12,227 |
| 14,991 |
| -18 |
|
Other markets |
| 18,351 |
| 24,277 |
| -24 |
|
Employees (September 30) |
| 256,857 |
| 275,535 |
| -7 |
|
Research and development expenditure |
| 3,331 |
| 3,313 |
| +1 |
|
thereof capitalized development costs |
| 1,016 |
| 911 |
| +12 |
|
Investment in property, plant and equipment |
| 1,866 |
| 2,484 |
| -25 |
|
Cash provided by operating activities |
| 9,741 |
| 924 |
| +954 |
|
EBIT |
| (1,961 | ) | 4,677 |
| . |
|
Net profit (loss) |
| (2,292 | ) | 2,940 |
| . |
|
Earnings (loss) per share (in €) |
| (2.30 | ) | 2.94 |
| . |
|
(1) Adjusted for the effects of currency translation, decrease in revenue of 25%
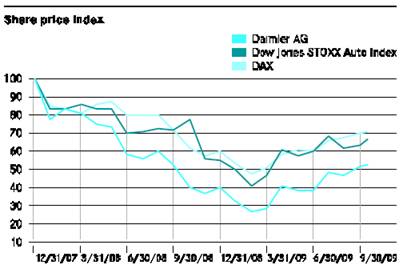
Equity prices on international stock exchanges were supported in the third quarter of 2009 by the positive development of economic leading indicators and state economic stimulus programs. The automobile sector, including Daimler’s share price, profited more than the overall equity market from the gradually improving economic environment and a revival of sales markets. The stabilization of credit markets and a fall in refinancing costs provided some positive impetus, especially for manufacturers with a well-developed financial services business. In this environment, Daimler’s share price increased by 33% to €34.41 in the third quarter. Daimler’s stock thus developed significantly better than the DAX and the DJ Auto Index. Compared to the low point reached in March 2009, the share price nearly doubled by the end of the third quarter.
5
Management Report
Business development still impacted by global recession
Group EBIT of €470 million (Q3 2008: €648 million)
Net profit of €56 million (Q3 2008: €213 million)
Revenue significantly below prior-year level at €19.3 billion
Positive EBIT from ongoing business expected for the fourth quarter
Business development
World economy bottoms out
The world economy passed through the worst of the financial and economic crisis in the third quarter of 2009 and probably grew compared to the second quarter. Final economic data on the second quarter from Germany, France and Japan has been surprisingly positive, and the US economy should also have bottomed out. Equity markets, business confidence, orders received and industrial production generally improved again in the past three months, laying the foundations for an ongoing revival. But it remains to be seen how sustained this development will be, because many special and one-time factors are now taking effect. As well as continued support from the side of monetary policy, the effects of extensive state stimulus programs were also apparent in the third quarter. An additional factor is that growth has been aided by cyclical inventory effects, particularly in the industrialized countries. Strong demand from the Asian economies, especially from China and India, has played an important role for this generally positive development. The development of Eastern European economies has been largely disappointing, however. The euro climbed against other major currencies in the third quarter, in particular against the US dollar and the British pound. Interest rates fell once again during the reporting period, in both the euro zone and the dollar area. In combination with lower risk premiums, this has led to a reduction in refinancing costs in the bond markets.
Global automotive markets developed very disparately in the third quarter. Demand for cars has meanwhile reached or passed through the lowest point of the crisis nearly everywhere in the world, but the market recovery shows significant regional differences. In Western Europe, demand was higher than in the third quarter of 2008 thanks to extensive state scrappage incentives. In the United States, the federal incentive program led only to a temporary revival of unit sales of cars and light trucks in July and August. The Japanese car market also showed slight growth thanks to state incentives. In the major emerging markets, demand developed disparately also in the third quarter. Whereas the Russian market shrank by more than half, unit sales in China, India and Brazil were higher than in the prior-year quarter once again, although they were also influenced by substantial state support.
Markets for commercial vehicles in Western Europe, the United States and Japan were between 30 and 50% down on the prior-year period in all segments once again in the third quarter, but with increasing indications that the bottom of the curve has been reached. Developments were varied in the major emerging markets. The slump in the truck market was particularly drastic in Russia but less severe in Brazil. Demand for trucks continued to revive in India and was similar to the prior-year level in the third quarter, while the Chinese market grew significantly compared to the relatively low volume of the prior-year period.
Unit sales down by 26% in third quarter
In the third quarter of 2009, Daimler sold 386,500 cars and commercial vehicles worldwide, which was 26% fewer than in the same period of last year.
Mercedes-Benz Cars sold 271,900 vehicles in the third quarter (Q3 2008: 315,800). Following the seasonally weaker summer months of July and August, the division recorded its strongest month of the year to date in September. Daimler Trucks sold 66,100 vehicles in the third quarter (Q3 2008: 122,700). The sharp drop in sales was related to the slump in demand for transport services. Mercedes-Benz Vans stabilized its sales in the third quarter, selling 40,100 units, although this was 45% below the record figure of the prior-year period. Daimler Buses’ unit sales decreased by 23% to 8,400 buses and chassis. Daimler Financial Services’ new business amounted to €6.0 billion, which is 22% less than in the third quarter of last year. The division’s contract volume of €58.7 billion at the end of the quarter was 7% lower than at December 31, 2008.
The Daimler Group’s third-quarter revenue decreased from €24.5 billion in 2008 to €19.3 billion this year. Adjusted for exchange-rate effects, revenue fell by 22%.
The measures designed to improve efficiency and reduce costs that were already initiated in the first quarter and intensified as the year progressed showed positive results in the third quarter, partially offsetting the burdens of lower unit sales and revenue.
Daimler has pushed forward with activities to develop new technologies and products designed to achieve further reductions in fuel consumption and emissions. We presented impressive examples of our progress so far at the Frankfurt Motor Show: the S 400 HYBRID, the Vision S 500 Plug-in HYBRID, and the B-Class equipped with fuel cells. An additional focus of our research and development work was the further development of safety technologies for cars and commercial vehicles.
6
Profitability
EBIT by segment
Amounts in millions of € |
| Q3 2009 |
| Q3 2008 |
| % change |
| Q1-3 2009 |
| Q1-3 2008 |
| % change |
|
|
|
|
|
|
|
|
|
|
|
|
|
|
|
Mercedes-Benz Cars |
| 355 |
| 112 |
| +217 |
| (1,108 | ) | 2,476 |
| . |
|
Daimler Trucks |
| (127 | ) | 510 |
| — |
| (777 | ) | 1,521 |
| . |
|
Mercedes-Benz Vans |
| 1 |
| 212 |
| -100 |
| (100 | ) | 660 |
| . |
|
Daimler Buses |
| 23 |
| 92 |
| -75 |
| 137 |
| 337 |
| -59 |
|
Daimler Financial Services |
| 101 |
| 173 |
| -42 |
| 13 |
| 524 |
| -98 |
|
Reconciliation |
| 117 |
| (451 | ) | — |
| (126 | ) | (841 | ) | +85 |
|
Daimler Group |
| 470 |
| 648 |
| -27 |
| (1,961 | ) | 4,677 |
| . |
|
Daimler posted EBIT of €470 million for the third quarter of 2009 (Q3 2008: €648 million).
This result reflects on the one hand the declines in unit sales at our vehicle segments. On the other hand, the Group’s third quarter earnings were positively affected by the full availability of the E-Class and the actions taken to optimize operations. Daimler Financial Services posted lower earnings primarily as a result of increased credit risks.
The valuation of Chrysler-related assets resulted in a gain of €48 million in the third quarter of 2009. The plans for the repositioning of the business operations of Mitsubishi Fuso Truck and Bus Corporation and Daimler Trucks North America led to total charges of €3 million in the three months ended September 30, 2009 (see Note 3 of the Notes to the Unaudited Interim Consolidated Financial Statements for more information). Due to an expected increase in annual contributions to the German Pension Protection Association, the Group increased its provisions accordingly by a prorated €59 million in the third quarter.
EBIT for the prior-year quarter was reduced by charges relating to the reassessment of vehicles’ residual values (€449 million) and due to proportionate losses from our equity method investment in Chrysler that the Group still held at that time (€351 million).
Compared to the first and second quarters of 2009, the Group was able to improve its EBIT by approximately €1.9 billion and €1.5 billion respectively.
The special items shown in the following table affected EBIT in the third quarters and the first nine months of 2009 and 2008:
Special items affecting EBIT
Amounts in millions of € |
| Q3 2009 |
| Q3 2008 |
| Q1-3 2009 |
| Q1-3 2008 |
|
|
|
|
|
|
|
|
|
|
|
Mercedes-Benz Cars |
|
|
|
|
|
|
|
|
|
Reassessment of residual values |
| — |
| (449 | ) | — |
| (449 | ) |
|
|
|
|
|
|
|
|
|
|
Daimler Trucks |
|
|
|
|
|
|
|
|
|
Realignment of Mitsubishi Fuso Truck and Bus Corporation |
| (13 | ) | — |
| (217 | ) | — |
|
Repositioning of Daimler Trucks North America |
| 10 |
| — |
| (48 | ) | — |
|
|
|
|
|
|
|
|
|
|
|
Reconciliation |
|
|
|
|
|
|
|
|
|
Sale of real estate (Potsdamer Platz) |
| — |
| — |
| — |
| 449 |
|
Gain/loss related to the transfer of shares in EADS |
| — |
| (7 | ) | — |
| 130 |
|
Equity-method result Chrysler |
| — |
| (351 | ) | — |
| (1,047 | ) |
Other charges/gains relating to Chrysler |
| 48 |
| — |
| (299 | ) | (168 | ) |
|
|
|
|
|
|
|
|
|
|
New management model |
| — |
| (61 | ) | — |
| (169 | ) |
7
Mercedes-Benz Cars posted EBIT of €355 million in the third quarter, which was significantly higher than the prior-year figure of €112 million. Return on sales was 3.5% (Q3 2008: 1.0%).
The earnings improvement primarily reflects the fact that EBIT for the prior-year quarter was reduced by €449 million due to charges relating to the reassessment of leased vehicles’ residual values. The reduction in earnings in the third quarter of 2009 caused by generally lower unit sales was partially offset by the actions taken to optimize operations, particularly in production and sales, as well as by measures designed to adjust personnel expenses. In addition, the full availability of the new E-Class and a more favorable model mix contributed positively to this earnings development.
Daimler Trucks recorded third-quarter EBIT of minus €127 million, which was substantially below the very high EBIT for the prior-year period of plus €510 million. The division’s return on sales was minus 2.9% (Q3 2008: plus 7.0%).
This earnings development was primarily the result of lower unit sales. The implementation of efficiency improvements such as the adjustment of personnel expenses had a positive effect on EBIT. The realignment of the business operations of Mitsubishi Fuso Truck and Bus Corporation resulted in additional charges of €13 million. The adjustment of provisions recognized in connection with the repositioning of Daimler Trucks North America had a positive effect of €10 million.
The Mercedes-Benz Vans division achieved EBIT break-even of €1 million (Q3 2008: €212 million); its return on sales was 0.1% compared to 8.9% in the prior-year quarter.
Mercedes-Benz Vans was unable to escape the general market development also in the third quarter of 2009, so unit sales fell although market shares increased. The resulting negative effects on earnings were not fully offset by efficiency improvements.
Daimler Buses posted EBIT of €23 million, which was €69 million below the high prior-year EBIT of €92 million; its return on sales was 2.2% (Q3 2008: 7.7%).
In addition to negative currency effects, the division’s earnings decline was primarily caused by the worldwide slump in demand, reflecting the general market development. Demand was significantly lower than the high level of the prior-year quarter, above all in Mexico and the other markets of Latin America. In Europe, the city bus business continued its stable development, while demand for coaches weakened.
Daimler Financial Services posted EBIT of €101 million for the third quarter of 2009 (Q3 2008: €173 million).
The decline in earnings was mainly caused by higher expenses for credit risks. The division also incurred expenses as a result of the expansion of the direct banking business at Mercedes-Benz Bank.
The reconciliation of the divisions’ EBIT to Group EBIT primarily reflects the proportionate result of the equity-method investment in EADS (Q3 2009: plus €24 million, Q3 2008 minus €8 million). In addition, the reconciliation includes a gain of €48 million recognized on the valuation of Chrysler-related assets. It also includes corporate gains of €26 million (Q3 2008: charges of €97 million) and gains of €19 million realized on the elimination of intersegment transactions (Q3 2008: €12 million). Group EBIT for the prior-year quarter was reduced by proportionate losses of €351 million due to the equity interest in Chrysler that was still held at that time.
Net interest expense in the third quarter amounted to €184 million (Q3 2008: net interest income of €110 million). The decrease in the net interest result was primarily due to a decline in average net liquidity in the industrial business as well as the maintenance of higher levels of gross liquidity while financing liabilities also increased. The resulting negative interest-rate margin had a negative effect on the net interest result. Lower expected returns on pension-plan assets also contributed to this development.
The income-tax expense of €230 million in the third quarter of 2009 was mainly the result of the Group’s profit before income taxes as well as additional tax expenses relating to the tax assessment of prior years. The tax expense of €540 million in the third quarter of 2008 resulted primarily from the Group’s pre-tax profit for that period, which was affected by, among other things, non-tax-deductible losses connected with the equity interest that we still held in Chrysler.
Net profit from continuing operations and net profit each amounted to €56 million in the third quarter of 2009 (Q3 2008: net profit from continuing operations of €218 million and net profit of €213 million), equivalent to a profit per share of €0.04 for both metrics (Q3 2008: profit per share of €0.22 and €0.21 respectively).
8
Cash flows
The presentation of cash flows has been changed compared to the prior year due to an amendment to the International Financial Reporting Standards (IFRS). All cash flows related to leased vehicles and receivables from financial services are now allocated to cash provided by operating activities. The figures for the prior-year period have been adjusted accordingly (see also Note 1 of the Notes to the Unaudited Interim Consolidated Financial Statements).
Cash provided by operating activities increased significantly in the first nine months of 2009 to €9.7 billion (Q1-3 2008: €0.9 billion). The negative effects from the net loss were primarily offset by the development of inventories, which decreased in the first nine months of this year due to the adjustment of vehicle production to the market situation, but increased in the prior-year period. Additionally the development was affected by the lower level of new leasing and sales-financing business and by the sale of non-automotive portfolios in the financial services business. Cash provided by operating activities increased also as a result of the reduced trade receivables and lower tax payments. There were opposing effects from the lower increase in trade payables than in the prior-year period.
Cash flows from investing activities in the first nine months of 2009 resulted in a net cash outflow of €7.9 billion, compared to a net cash outflow of €3.6 billion in the prior-year period. This development was almost solely the result of the purchase and sale of securities carried out in the context of liquidity management, which led to a net cash outflow of €5.0 billion (Q1-3 2008: €0.5 billion). An additional factor was that investments in intangible assets resulted in a slightly higher cash outflow from capitalized development costs, while investments in property, plant and equipment were lower than in the prior-year period. Cash flows from investing activities in the prior-year period included inflows from the sale of real estate at Potsdamer Platz and from the transfer of EADS shares in a total amount of €1.7 billion, as well as outflows for a loan extended to Chrysler (€1.0 billion) and for the acquisition of shares in Tognum (€0.7 billion).
Cash flows from financing activities resulted in a net cash inflow of €3.0 billion, mainly related to higher financing liabilities, but also in the context of increased customer deposits in the direct banking business at Mercedes-Benz Bank. Furthermore, the capital increase from the issue of new shares led to a cash inflow of €1.95 billion. There was an opposing effect from the payment of the dividend for the year 2008 (€0.6 billion). The net cash outflow of €4.5 billion in the prior-year period primarily reflects the payment of the dividend for the year 2007 (€2.0 billion) and the share buyback program (€4.1 billion).
Cash and cash equivalents with an original maturity of three months or less increased compared to December 31, 2008 by €4.6 billion, after taking into account the effects of currency translation. Total liquidity, which also includes deposits and marketable securities with an original maturity of more than three months, increased by €9.6 billion to €17.6 billion. The high level of liquidity will partially decrease again before the end of 2009, primarily due to the repayment of financing liabilities as they fall due.
The free cash flow of the industrial business, the parameter used by Daimler to measure the Group’s financing capability, was positive despite the difficult economic situation at €2.3 billion (Q1-3 2008: negative €0.3 billion).
The main reason for increase in the free cash flow was the development of inventories and trade receivables, as well as investments in property, plant and equipment, which offset the negative effects from the divisions’ earnings. There was also an impact from internal payments within the Group that were received by the industrial business from the financial services business in connection with fiscal unities (cash outflow in the prior-year period).
Free cash flow of the industrial business
Amounts in millions of € |
| Q1-3 2009 |
| Q1-3 2008 |
| 09/08 |
|
|
|
|
|
|
|
|
|
Cash provided by operating activities |
| 5,153 |
| 3,215 |
| 1,938 |
|
Cash used for investing activities |
| (6,346 | ) | (3,724 | ) | (2,622 | ) |
Changes in cash (>3 months) and marketable securities included in liquidity |
| 3,446 |
| 200 |
| 3,246 |
|
Free cash flow of the industrial business |
| 2,253 |
| (309 | ) | 2,562 |
|
9
The net liquidity of the industrial business increased by €3.6 billion to €6.7 billion.
Net liquidity of the industrial business
Amounts in millions of € |
| Sept. 30, |
| Dec. 31, |
| 09/08 |
|
|
|
|
|
|
|
|
|
Cash and cash equivalents |
| 8,688 |
| 4,664 |
| 4,024 |
|
Marketable securities and long-term deposits |
| 4,559 |
| 959 |
| 3,600 |
|
Liquidity |
| 13,247 |
| 5,623 |
| 7,624 |
|
Financing liabilities |
| (8,069 | ) | (4,448 | ) | (3,621 | ) |
Market valuation and currency hedges for financing liabilities |
| 1,536 |
| 1,931 |
| (395 | ) |
Financing liabilities (nominal) |
| (6,533 | ) | (2,517 | ) | (4,016 | ) |
Net liquidity |
| 6,714 |
| 3,106 |
| 3,608 |
|
The increase in net liquidity was primarily caused by the positive free cash flow and the capital increase from the issue of new shares (€1.95 billion). On the other hand, the net liquidity of the industrial business was reduced by the payment of the dividend for the year 2008.
Net debt at Group level, which is primarily related to the refinancing of the leasing and sales-financing business, decreased by €7.8 billion compared to December 31, 2008. In addition to the development of the industrial business, this was primarily due to the positive free cash flow of the financial services business, which was mainly caused by the lower new business resulting from lower vehicle sales. These factors were partially offset by currency translation effects.
Net debt of the Daimler Group
Amounts in millions of € |
| Sept. 30, |
| Dec. 31, |
| 09/08 |
|
|
|
|
|
|
|
|
|
Cash and cash equivalents |
| 11,498 |
| 6,912 |
| 4,586 |
|
Marketable securities and long-term deposits |
| 6,143 |
| 1,091 |
| 5,052 |
|
Liquidity |
| 17,641 |
| 8,003 |
| 9,638 |
|
Financing liabilities |
| (60,096 | ) | (58,637 | ) | (1,459 | ) |
Market valuation and currency hedges for financing liabilities |
| 1,536 |
| 1,931 |
| (395 | ) |
Financing liabilities (nominal) |
| (58,560 | ) | (56,706 | ) | (1,854 | ) |
Net debt |
| (40,919 | ) | (48,703 | ) | 7,784 |
|
Balance sheet structure
Compared to December 31, 2008, the balance sheet total decreased by €0.2 billion to €132.0 billion. The financial services business accounted for €65.0 billion of the balance sheet total (December 31, 2008: €67.7 billion), equivalent to 49% of the Daimler Group’s total assets (December 31, 2008: 51%).
Intangible assets increased to €6.5 billion (December 31, 2008: €6.0 billion). The increase primarily resulted from capitalized development costs, reflecting expenditures for the development of new models and drive components.
Property, plant and equipment amounted to €16.0 billion, the same level as at December 31, 2008. The main areas of investment were for the E-Class and the S-Class at the Mercedes-Benz Cars division and for new drive components at the Daimler Trucks division.
Equipment on operating leases and receivables from financial services decreased by €4.1 billion to €57.0 billion (December 31, 2008: €61.1 billion), equivalent to 43% of the balance sheet total (December 31, 2008: 46%). The reduction is primarily due to a lower volume of new leasing and sales-financing business caused by the development of unit sales. In addition, parts of the non-automotive leasing and financing portfolio were sold in 2009 with a carrying amount of €0.6 billion.
Investments accounted for using the equity method of €4.3 billion mainly comprise the carrying amounts of our investments in EADS, Tognum and Kamaz (December 31, 2008: €4.3 billion).
Inventories decreased by €3.4 billion to €13.4 billion, accounting for 10% of the balance sheet total. The decrease is primarily attributable to stocks of new and used vehicles and was achieved by means of active inventory management in all automotive divisions.
In line with the development of unit sales, trade receivables fell by 21% to €5.5 billion (December 31, 2008: €7.0 billion).
Other financial assets (€12.3 billion) primarily comprise securities, derivative financial instruments, loans and other receivables due from third parties. The increase of €4.3 billion primarily reflects the acquisition of securities in connection with liquidity management. There was an opposing effect from reductions in the carrying amounts of derivative financial instruments.
Compared to December 31, 2008, cash and cash equivalents increased by €4.6 billion to €11.5 billion. The change was partially the result of increased customer deposits in the direct banking business since the end of last year.
10
Provisions accounted for 14% of the balance sheet total. They primarily comprise warranty, personnel and pension obligations and increased by €0.7 billion to €18.9 billion as a result of higher provisions for income taxes and pensions. Provisions for product warranties and for obligations in the area of personnel and social security decreased, however.
Trade payables increased compared to December 31, 2008 by €0.4 billion or 6% to €6.8 billion.
Financing liabilities increased by €1.5 billion to €60.1 billion, accounting for 46% of the balance sheet total (December 31, 2008: 44%). The increase was primarily due to customers’ deposits in Mercedes-Benz Bank’s direct banking business, which rose by €6.6 billion to €12.6 billion.
Other financial liabilities fell by €1.2 billion to €9.1 billion, mainly related to liabilities from derivative financial instruments, especially resulting from changes in currency exchange rates.
The Group’s equity decreased by €0.8 billion compared to December 31, 2008. The net loss of €2.3 billion and the dividend distribution for 2008 (€0.6 billion) were partly offset by the capital increase through the issue of new shares to Aabar Investments PJSC in the first quarter (€1.95 billion). The equity ratio was 24.2% for the Group (December 31, 2008: 24.3%) and 40.6% for the industrial business (December 31, 2008: 42.7%). The equity ratios at December 31, 2008 are adjusted for the dividend payout for the year 2008.
Workforce
At the end of the third quarter of 2009, 256,900 people were employed by Daimler worldwide (end of Q3 2008: 275,500). Of that total, 163,500 people were employed in Germany (end of Q3 2008: 168,700). The reduction in worldwide employment was primarily the result of repositioning the Group’s truck business in North America, the expiry of limited-period employment contracts, and employees leaving the Group in the context of early retirement agreements. Again in the third quarter, nearly all of the German car and commercial vehicle plants were affected by short-time work due to the adjustment of production to the difficult market situation. Nearly all of the employees who are not on short-time work have temporarily had their working time reduced by 8.75% with a corresponding reduction in salary, as agreed with the Group Labor Council. At the end of September 2009, approximately 27,400 persons were on short-time work and 89,000 persons were affected by the 8.75% reduction.
However, the good situation of demand for trucks in the Brazilian market has allowed workforce expansion in that country. 800 people are being recruited for bus and truck production at our plant in Sao Bernardo do Campo near Sao Paolo.
Events after the end of Q3 2009
Since the end of the third quarter of 2009, there have been no further occurrences that are of major significance for Daimler. The course of business in the first weeks of the fourth quarter of 2009 confirms the statements made in the “Outlook” section of this interim report.
11
Outlook
The statements made in the Outlook section of this Interim Report are based on the current assumptions of the Daimler management. In turn, those assumptions are based on the expectations for general economic developments described below and the targets set by our divisions. Expectations for future business developments reflect the opportunities and risks arising from prevailing market conditions and competitive situations as the year progresses.
With regard to existing opportunities and risks, we refer to the statements made in our Annual Report 2008, the following assessment of the prospects for the global economy and specific industries, and the notes on forward-looking statements at the end of this Management Report. We are aware that forecasts still have to be regarded as highly uncertain in the present environment. Another factor is that no reliable statements can currently be made on the extent to which the economic stimulus packages decided upon by the governments of various countries will contribute to the sustained recovery of financial markets and markets for products.
Economic developments in the third quarter of 2009 have confirmed hopes that the world economy has bottomed out after its recent drastic contraction and is now recovering again. But this gradual upturn will not change the fact that 2009 has been the worst year in economic terms since the end of the Second World War. Another fact is that the recovery has not yet started in all countries or in all industries. Furthermore, a degree of uncertainty is still connected with the current economic improvements, especially in the industrialized countries: The upturn is at present relying on special and one-time effects such as fiscal stimulus, inventory cycles, low interest rates and low inflation. These positive factors should also allow solid economic growth rates for the rest of the year, but key economic parameters like consumption and investment are still too low in many regions and industries. While private consumption is being dampened by rising unemployment and the unfavorable development of real incomes, very low utilization of industrial capacity is reducing the need for investment. Solely exports are increasing slowly in some countries, benefiting from the revival of demand in Asia. But overall, global economic output in 2009 is likely to shrink by a good 2% as a result of the dramatic slump in the first half of the year. Apart from some emerging economies such as China and India, there are not yet any signs of a self-sustaining upswing. In the coming months, much will depend on the extent to which the finance and credit markets provide appropriate support to the incipient recovery.
The deep economic crisis will have serious effects on the global demand for motor vehicles in 2009, although the picture has been distorted by governments’ car-buying incentives, particularly in some of the large automotive markets. State support programs have created artificial demand for cars, above all in Western Europe, so total unit sales in this market will probably be only slightly lower than in 2008. Also in Japan, the market slump that was originally anticipated will be significantly reduced by state support programs. The US market, however, is expected to contract by more than 20% in 2009, despite a temporary market revival caused by a federal scrappage scheme. Demand for cars has been boosted by government purchase incentives also in many large emerging markets. Above all in China and India, significant tax reductions have triggered booming car sales, causing demand to rise well above prior-year levels in both countries. And thanks to state incentives, the Brazilian market will probably also surpass the record volume of the prior year. In Russia, however, from today’s perspective only about half as many cars are likely to be sold as in 2008. In global terms, demand should decrease this year by only approximately 10%, thanks to the widespread state support programs. But negative effects on demand can be expected when the state support programs are phased out in the following years, particularly in the volume segments of more mature markets.
Although global markets for commercial vehicles should now have bottomed out in line with overall economic stabilization, the demand shortfall will be very large this year, with only a few exceptions. In the three major regions (North America, Western Europe and Japan), total demand for medium and heavy trucks will decline by approximately 40%. Whereas sales in the NAFTA region will fall by rather lower rates of 30 to 40%, declines are likely to be above average in Western Europe (40-50%) and Japan (45-55%). Total demand for trucks will fall also in the emerging markets, although developments in the major regions and individual countries are very diverse. In Russia and Eastern Europe, truck markets are likely to slump by between 60 and 70%. Latin American markets will decline by about 20 to 30%, although the Brazilian market is showing the first signs of recovery. But in China, demand for trucks should exceed the prior-year level, thanks to massive state infrastructure programs. From a global perspective, the gradual recovery of truck markets that now seems to be starting will probably be only moderate due to the difficult conditions for investment.
Expectations for van markets in the United States, Western Europe and Japan also remain subdued. We anticipate only a slight recovery in the fourth quarter compared to developments during the year to date.
We expect a stable development in the city bus segment this year, but market conditions for coaches are likely to remain difficult.
Based on developments during the year to date and the divisions’ planning, Daimler expects its total unit sales to decrease significantly in the year 2009 (2008: 2.1 million vehicles).
12
Mercedes-Benz Cars assumes that business will continue to improve in the last quarter of the year. Sales impetus will be provided not only by the recently launched new E-Class models and the station wagon to be launched in November, but also by the new generation of the S-Class, which was launched at the end of June 2009. However, Mercedes-Benz Cars will not be able to fully compensate for the weakness during the year to date of some major sales markets and in particular of the market segments important to us. Overall, the division’s unit sales will therefore be lower in 2009 than in the prior year. We see lower volumes above all in the markets of the United States, Western Europe and Japan. Unit sales will be partially stabilized by growth in the emerging markets, however, particularly in China. With support from the new E-Class station wagon and the full availability of the E-Class sedan, we expect unit sales in the fourth quarter of the year to be higher than in the third quarter.
Based on the expected development of unit sales and ongoing efficiency improvements, Mercedes-Benz Cars anticipates a moderate improvement in earnings from the ongoing business in the fourth quarter of the year compared to the third quarter.
As a result of substantially lower demand for transport services and underutilized transport capacities, Daimler Trucks anticipates a significant decrease in unit sales in full-year 2009. From today’s perspective, we expect unit sales in the last quarter of the year to be similar to the volume sold in the third quarter. We assume that our market shares will at least remain stable in the major markets, although our regional mix will change. Whereas unit sales will rise in Asia, the European markets’ share of total unit sales will decrease.
The weak condition of major markets will also be reflected by the development of the division’s earnings, and the fourth quarter will be additionally impacted by the unfavorable regional mix of our sales structure. The measures we have taken to reduce costs will only partially offset that negative effect. The expenses of the measures we have initiated to restructure and reposition the business operations of Daimler Trucks North America and Mitsubishi Fuso Truck and Bus Corporation will reduce EBIT in the fourth quarter of 2009 once again. Overall, EBIT in the fourth quarter is likely to be lower than in the third quarter.
Despite the continuation of the very difficult economic situation, the Mercedes-Benz Vans division expects unit sales in the fourth quarter of the year to be slightly higher than in the third quarter. In terms of EBIT, we anticipate breakeven in the fourth quarter.
At Daimler Buses, we expect core markets to stabilize in the fourth quarter. Due to higher deliveries in connection with major orders, we assume that unit sales will increase compared to the third quarter. We continue to anticipate solid EBIT in the fourth quarter.
Daimler Financial Services anticipates rising credit defaults and higher refinancing expenses in full-year 2009. We are confident that we will be able to compensate for the increased costs at least partially through our efficiency programs. We expect EBIT for the last quarter of the year to be positive once again.
We anticipate a significant decrease in the Daimler Group’s total revenue in full-year 2009.
As a result of reduced production volumes and the targeted productivity advances, we assume that the number of employees at the end of 2009 will be significantly lower than a year earlier.
At the Group level, we have taken measures to reduce costs and avoid additional expenditure. These actions include reducing fixed and material costs, reducing labor costs and streamlining the Group’s organizational structures. The measures taken are a supplement to the existing efficiency-enhancing programs. In addition, we are examining projects and postponing those that are not directly relevant to our competitiveness. We assume that we will surpass the original target of saving a total of €4 billion in full-year 2009.
As a result of these measures, we anticipate positive EBIT from the ongoing business for the Daimler Group also in the fourth quarter of 2009. However, general economic developments and their effects on dealerships and suppliers could lead to a negative impact on fourth-quarter earnings.
Despite the still-difficult situation of the world’s financial markets, the Daimler Group has a sound financial position, which should remain stable also during the fourth quarter. Due to our current very high levels of liquidity, we intend to make use of the capital markets to only a slight extent during the rest of this year.
13
Forward-looking statements in this Interim Report:
This document contains forward-looking statements that reflect our current views about future events. The words “anticipate,” “assume,” “believe,” “estimate,” “expect,” “intend,” “may,” “plan,” “project,” “should” and similar expressions are used to identify forward-looking statements. These statements are subject to many risks and uncertainties, including a lack of or a considerable delay in improvement or a further deterioration of global economic conditions; a continuation or worsening of the tense situation in the credit and financial markets, which could result in ongoing high borrowing costs or limit our funding flexibility; changes in currency exchange rates and interest rates; the introduction of competing, fuel-efficient products and the possible lack of acceptance of our products or services, which may limit our ability to adequately utilize our production capacities or raise prices; price increases in fuel, raw materials and precious metals; disruption of production due to shortages of materials, labor strikes, or supplier insolvencies; a further decline in resale prices of used vehicles; the effective implementation of cost-reduction and efficiency-optimization programs at all of our segments, including the repositioning of our truck activities in the NAFTA region and in Asia; the business outlook of companies in which we hold an equity interest, most notably EADS; changes in laws, regulations and government policies, particularly those relating to vehicle emissions, fuel economy and safety; the resolution of pending governmental investigations and the outcome of pending or threatened future legal proceedings; and other risks and uncertainties, some of which we describe under the heading “Risk Report” in Daimler’s most recent Annual Report and under the headings “Risk Factors” and “Legal Proceedings” in Daimler’s most recent Annual Report on Form 20-F filed with the Securities and Exchange Commission. If any of these risks and uncertainties materialize, or if the assumptions underlying any of our forward-looking statements prove incorrect, then our actual results may be materially different from those we express or imply by such statements. We do not intend or assume any obligation to update these forward-looking statements. Any forward-looking statement speaks only as of the date on which it is made.
14
Mercedes-Benz Cars
271,900 vehicles sold
E-Class maintains clear market leadership
Positive launch of new-generation S-Class
EBIT of €355 million (Q3 2008: €112 million)
Amounts in millions of € |
| Q3 2009 |
| Q3 2008 |
| % change |
|
|
|
|
|
|
|
|
|
EBIT |
| 355 |
| 112 |
| +217 |
|
Revenue |
| 10,238 |
| 11,608 |
| -12 |
|
Unit sales |
| 271,917 |
| 315,796 |
| -14 |
|
Production |
| 287,171 |
| 343,368 |
| -16 |
|
Employees (September 30) |
| 93,960 |
| 98,203 |
| -4 |
|
Positive trend for unit sales, revenue and EBIT
In a still-challenging market environment, Mercedes-Benz Cars sold 271,900 vehicles in the third quarter of this year (Q3 2008: 315,800). After the seasonally weaker summer months of July and August, the division achieved its strongest month of the year in September. Compared to the third quarter of last year, revenue decreased by 12% to €10.2 billion while EBIT improved from €112 million to €355 million.
E-Class and S-Class perform successfully in the market
Sales of the new E-Class developed very positively. Deliveries of the new sedan and the new coupe increased by more than 50% to 61,200 automobiles (Q3 2008: 40,600). The sedan version of the E-Class thus maintained its position as the market leader in its class also in the third quarter. The S-Class has also sold better than any other car in its segment since the beginning of the year, and from July to September, Mercedes-Benz Cars delivered 14,600 of this model (Q3 2008: 23,100). The new-generation S-Class and the S 400 HYBRID have been available also in China since September. Due partially to the discontinuation of the CLK, unit sales in the C-Class segment fell to 79,300 in the reporting period (Q3 2008: 114,700). However, with the full availability of the four-wheel-drive GLK, Mercedes-Benz achieved a slight increase in the SUV segment to 38,200 units (Q3 2008: 37,600). 53,800 A-Class and B-Class cars were delivered in the third quarter (Q3 2008: 66,100). Sales of the smart decreased to 23,600 units for lifecycle reasons (Q3 2008: 32,300).
Unit sales |
| Q3 2009 |
| Q3 2008 |
| % change |
|
|
|
|
|
|
|
|
|
Total |
| 271,917 |
| 315,796 |
| -14 |
|
Western Europe |
| 154,739 |
| 176,959 |
| -13 |
|
Germany |
| 73,378 |
| 84,044 |
| -13 |
|
United States |
| 48,610 |
| 64,866 |
| -25 |
|
China |
| 17,011 |
| 13,587 |
| +25 |
|
Other markets |
| 51,557 |
| 60,384 |
| -15 |
|
In Western Europe, Mercedes-Benz Cars shipped 154,700 vehicles in a weak market environment (Q3 2008: 177,000). Unit sales also fell in the United States, where 48,600 units were sold compared to 64,900 in the prior-year quarter. Mercedes-Benz Cars was the fastest-growing premium brand in the growth market of China, increasing its unit sales by 25% to 17,000 vehicles (Q3 2008: 13,600).
Presentation of new E-Class station wagon and studies for future emission-free driving at the Frankfurt Motor Show
At the Frankfurt International Motor Show, Mercedes-Benz presented the new E-Class station wagon, which will be delivered to customers as of November. Visitors to the trade fair were also enthusiastic about the new Mercedes-Benz SLS AMG. The three BlueZERO studies that we presented provided a concrete view of future environmentally compatible electric mobility. Already this year, we started production of a small series of the fuel-cell version of the B-Class, which is an important milestone on the way to an emission-free future. The levels of consumption achievable by large and luxurious automobiles in the future were demonstrated by the Vision S 500 Plug-in HYBRID, the first luxury limousine capable of running on less than four liters of fuel per one hundred kilometers.
New E-Class station wagon launched on schedule
Parallel to the unveiling of the E-Class station wagon, the plant in Sindelfingen started series production of this model on schedule. The station wagon and sedan versions of the E-Class are built on one assembly line in a flexible production system.
Q1-3
Amounts in millions of € |
| Q1-3 2009 |
| Q1-3 2008 |
| % change |
|
|
|
|
|
|
|
|
|
EBIT |
| (1,108 | ) | 2,476 |
| . |
|
Revenue |
| 29,873 |
| 37,026 |
| -19 |
|
Unit sales |
| 790,353 |
| 988,057 |
| -20 |
|
Production |
| 739,167 |
| 1,062,162 |
| -30 |
|
Employees (September 30) |
| 93,960 |
| 98,203 |
| -4 |
|
Unit sales |
| Q1-3 2009 |
| Q1-3 2008 |
| % change |
|
|
|
|
|
|
|
|
|
Total |
| 790,353 |
| 988,057 |
| -20 |
|
Western Europe |
| 459,758 |
| 565,710 |
| -19 |
|
Germany |
| 220,936 |
| 252,832 |
| -13 |
|
United States |
| 143,251 |
| 200,426 |
| -29 |
|
China |
| 43,072 |
| 37,214 |
| +16 |
|
Other markets |
| 144,272 |
| 184,707 |
| -22 |
|
15
Daimler Trucks
Unit sales down by 46% from prior-year figure for market reasons
Daimler Trucks anticipates long-term growth in Russia
New generation of Mercedes-Benz Safety Truck unveiled
Worldwide market developments lead to EBIT of minus €127 million
Amounts in millions of € |
| Q3 2009 |
| Q3 2008 |
| % change |
|
|
|
|
|
|
|
|
|
EBIT |
| (127 | ) | 510 |
| . |
|
Revenue |
| 4,388 |
| 7,307 |
| -40 |
|
Unit sales |
| 66,071 |
| 122,678 |
| -46 |
|
Production |
| 57,332 |
| 125,756 |
| -54 |
|
Employees (September 30) |
| 70,098 |
| 80,768 |
| -13 |
|
Earnings impacted by ongoing worldwide market weakness
Daimler Trucks sold 66,100 vehicles in the third quarter of 2009 (Q3 2008: 122,700). This substantial drop in sales was due to a slump in demand for transport services. Revenue fell from €7.3 billion to €4.4 billion. EBIT of minus €127 million was well below the prior-year result (Q3 2008: plus €510 million), but significantly better than in the second quarter of 2009.
Daimler Trucks still operating in a difficult market environment
The number of 23,600 vehicles sold by Trucks Europe/Latin America (Mercedes-Benz) was significantly below the record level of the prior-year quarter. The sharpest declines were in Eastern Europe (-72%) and Western Europe (-58%), whereby the volume markets of Germany (-54%), France (-69%) and the United Kingdom (-64%) were particularly affected. Unit sales in Latin America (-23%) decreased in line with market developments, but at a lower rate than in Europe.
Trucks NAFTA (Freightliner, Western Star and Thomas Built Buses) sold 15,200 vehicles, which was lower than the number sold in the prior-year quarter (-41%). The decline in Mexico was particularly sharp, due to the global economic crisis as well as pull-forward effects before the introduction of the EPA 04 emission limits in August 2008.
Trucks Asia (Fuso) sold 27,200 vehicles in the third quarter of 2009 (Q3 2008: 49,600). While unit sales in Japan fell by 55%, there was a decrease of 42% in the regions outside Japan because of economic developments.
Unit sales |
| Q3 2009 |
| Q3 2008 |
| % change |
|
|
|
|
|
|
|
|
|
Total |
| 66,071 |
| 122,678 |
| -46 |
|
Western Europe |
| 10,031 |
| 24,130 |
| -58 |
|
Germany |
| 5,986 |
| 12,996 |
| -54 |
|
United States |
| 13,075 |
| 18,836 |
| -31 |
|
Latin America (excluding Mexico) |
| 10,149 |
| 16,388 |
| -38 |
|
Asia |
| 24,122 |
| 38,793 |
| -38 |
|
Other markets |
| 8,694 |
| 24,531 |
| -65 |
|
Daimler Trucks anticipates long-term growth in Russia
At the beginning of October, Daimler Trucks announced the further extension of its strategic partnership with Kamaz, Russia’s biggest truck producer. Following Daimler’s acquisition of a 10% equity interest in Kamaz last December, two specific projects were decided upon: Mitsubishi Fuso Truck and Bus Corporation (MFTBC) and Kamaz have signed a letter of intent on a 50:50 joint venture for the import, production and distribution of Fuso trucks in Russia; Fuso Kamaz Trucks Rus Ltd. will sell trucks under the Fuso brand in the Russian market. And Mercedes-Benz Trucks and Kamaz have signed a letter of intent on the establishment of another 50:50 joint venture with the goal of producing Mercedes-Benz trucks and distributing trucks and buses of the Mercedes-Benz and Setra brands in Russia.
Daimler Trucks applies outstanding safety technology
At the Truck Transport Safety Symposium in Stuttgart, Daimler Trucks presented a new generation of the Mercedes-Benz Safety Truck. And at the end of September, we delivered to a customer the 10,000th Mercedes-Benz Actros truck with the Active Brake Assist emergency braking system. Active Brake Assist was introduced in the year 2006 and has since then proven its worth in well over one billion kilometers driven in practical use on the road. This system is still unique in the industry and — like many other Mercedes-Benz safety systems — demonstrably helps to reduce the frequency of road accidents and to save lives.
Q1-3
Amounts in millions of € |
| Q1-3 2009 |
| Q1-3 2008 |
| % change |
|
|
|
|
|
|
|
|
|
EBIT |
| (777 | ) | 1,521 |
| . |
|
Revenue |
| 13,523 |
| 21,019 |
| -36 |
|
Unit sales |
| 185,610 |
| 353,215 |
| -47 |
|
Production |
| 161,681 |
| 362,227 |
| -55 |
|
Employees (September 30) |
| 70,098 |
| 80,768 |
| -13 |
|
Unit sales |
| Q1-3 2009 |
| Q1-3 2008 |
| % change |
|
|
|
|
|
|
|
|
|
Total |
| 185,610 |
| 353,215 |
| -47 |
|
Western Europe |
| 31,509 |
| 64,471 |
| -51 |
|
Germany |
| 17,770 |
| 29,840 |
| -40 |
|
United States |
| 37,635 |
| 60,015 |
| -37 |
|
Latin America (excluding Mexico) |
| 25,864 |
| 46,300 |
| -44 |
|
Asia |
| 62,912 |
| 112,120 |
| -44 |
|
Other markets |
| 27,690 |
| 70,309 |
| -61 |
|
16
Mercedes-Benz Vans
Unit sales significantly below prior-year level at 40,100 vehicles
Van market shows signs of stabilization
Mercedes-Benz Sprinter wins “Fleet Van of the Year” award
EBIT of €1 million (Q3 2008: €212 million)
Amounts in millions of € |
| Q3 2009 |
| Q3 2008 |
| % change |
|
|
|
|
|
|
|
|
|
EBIT |
| 1 |
| 212 |
| -100 |
|
Revenue |
| 1,601 |
| 2,388 |
| -33 |
|
Unit sales |
| 40,123 |
| 73,241 |
| -45 |
|
Production |
| 39,726 |
| 79,085 |
| -50 |
|
Employees (September 30) |
| 15,524 |
| 17,396 |
| -11 |
|
Unit sales, revenue and EBIT affected by weak markets
Mercedes-Benz Vans sold 40,100 vehicles in the third quarter of this year, which was significantly better than the average of the first two quarters. Weak markets continued to affect the division’s business development, however, so it was not possible to equal the record unit sales of the prior-year quarter (Q3 2008: 73,200 units). Revenue fell from €2.4 billion to €1.6 billion, while EBIT amounted to €1 million (Q3 2008: €212 million).
Van market shows signs of stabilization
In what is still a very difficult market environment, unit sales of Mercedes-Benz Vans were 45% lower than in the third quarter of last year. The decreases were particularly sharp in the major markets of Western Europe — the United Kingdom, France, Italy, Spain and the Netherlands — at an average of 50% below the prior-year level. In Germany, the division’s most important market, we experienced a significantly lower decline in unit sales of 25%.
In the United States, unit sales fell compared with the prior-year quarter at an above-average rate (-82%). The market launch of the Sprinter in the United States through the sales organization of Mercedes-Benz USA is now in preparation, and the first vehicles are to be delivered to customers at the beginning of 2010.
Worldwide unit sales of the Sprinter fell compared to the third quarter of last year by 48% to 26,100 vehicles, while third-quarter unit sales of the Vito and Viano models decreased by 41% to 13,300 vehicles.
Unit sales |
| Q3 2009 |
| Q3 2008 |
| % change |
|
|
|
|
|
|
|
|
|
Total |
| 40,123 |
| 73,241 |
| -45 |
|
Western Europe |
| 30,606 |
| 51,936 |
| -41 |
|
Germany |
| 14,451 |
| 19,239 |
| -25 |
|
United States |
| 775 |
| 4,207 |
| -82 |
|
Latin America (excluding Mexico) |
| 2,488 |
| 3,799 |
| -35 |
|
Asia |
| 1,166 |
| 2,309 |
| -50 |
|
Other markets |
| 5,088 |
| 10,990 |
| -54 |
|
The development of the retail business and a significant improvement in the division’s order situation in the third quarter indicate that the van market is now stabilizing. This is corroborated by a distinct increase in sales figures in September.
Mercedes-Benz Vans was able to further strengthen its market position in Europe in the segment of mid-size and large vans, increasing its market share by 0.6 of a percentage point to 17.0% in the third quarter.
As a result of effective inventory management, stocks of vans at dealerships and sales subsidiaries were further optimized and were reduced to the targeted levels.
Mercedes-Benz Sprinter wins “Fleet Van of the Year” award
With the “Fleet Van of the Year” award, the Sprinter has received yet another prize for its popularity with customers and its high levels of functionality. Mercedes-Benz Vans has now won this British award for the third time in succession, reflecting its outstanding innovation, convincing products and excellent services.
In the third quarter of 2009, the Sprinter product program was extended with the addition of the low-consumption BlueEFFICIENCY models. This means that Mercedes-Benz Vans now offers products to its customers with an extremely high level of environmental compatibility, distinguished by the BlueEFFICIENCY label.
Q1-3
Amounts in millions of € |
| Q1-3 2009 |
| Q1-3 2008 |
| % change |
|
|
|
|
|
|
|
|
|
EBIT |
| (100 | ) | 660 |
| . |
|
Revenue |
| 4,373 |
| 7,280 |
| -40 |
|
Unit sales |
| 110,828 |
| 220,496 |
| -50 |
|
Production |
| 105,045 |
| 240,776 |
| -56 |
|
Employees (September 30) |
| 15,524 |
| 17,396 |
| -11 |
|
Unit sales |
| Q1-3 2009 |
| Q1-3 2008 |
| % change |
|
|
|
|
|
|
|
|
|
Total |
| 110,828 |
| 220,496 |
| -50 |
|
Western Europe |
| 85,395 |
| 155,841 |
| -45 |
|
Germany |
| 40,009 |
| 54,468 |
| -27 |
|
United States |
| 1,063 |
| 16,005 |
| -93 |
|
Latin America (excluding Mexico) |
| 6,435 |
| 9,857 |
| -35 |
|
Asia |
| 3,415 |
| 6,317 |
| -46 |
|
Other markets |
| 14,520 |
| 32,476 |
| -55 |
|
17
Daimler Buses
Unit sales of 8,400 buses and chassis are below prior-year level for market reasons
City bus business remains stable
Delivery of 25,000th Mercedes-Benz Citaro city bus
EBIT below prior-year level at €23 million due to lower unit sales (Q3 2008: €92 million)
Amounts in millions of € |
| Q3 2009 |
| Q3 2008 |
| % change |
|
|
|
|
|
|
|
|
|
EBIT |
| 23 |
| 92 |
| -75 |
|
Revenue |
| 1,024 |
| 1,202 |
| -15 |
|
Unit sales |
| 8,350 |
| 10,810 |
| -23 |
|
Production |
| 8,733 |
| 11,315 |
| -23 |
|
Employees (September 30) |
| 17,480 |
| 18,048 |
| -3 |
|
Weak markets affect unit sales, revenue and EBIT
Daimler Buses slightly increased its unit sales compared to the second quarter of this year, but sales of 8,400 buses and chassis were below the high level recorded in the third quarter of last year (Q3 2008: 10,800). Revenue of €1.0 billion was also lower than in the prior-year quarter (€1.2 billion). EBIT decreased to €23 million as a result of the lower unit sales (Q3 2008: €92 million).
Stronger position in key markets
In Western Europe, sales of 1,700 buses and chassis of the Mercedes-Benz and Setra brands were 2% above the number sold in the prior-year quarter. Whereas the business with city buses continued its stable development, the division sold fewer coaches. In Germany, sales of Daimler Buses increased by 7% to 700 buses.
In the NAFTA region, higher unit sales in the United States and Canada did not compensate for the sharp decline of the Mexican market. Overall, unit sales in the region decreased by 59% to 900 units. Due to ongoing strong demand for Orion city buses, unit sales in North America increased, contrary to the general market trend, by 54% to 291 units (Q3 2008: 189); over 90% of these were hybrid buses. In Mexico, Daimler Buses sold just 575 units (Q3 2008: 1,923).
There were signs of slight market stabilization in Latin America. In this environment, Daimler Buses achieved sales of 4,600 units (Q3 2008: 5,300).
Unit sales |
| Q3 2009 |
| Q3 2008 |
| % change |
|
|
|
|
|
|
|
|
|
Total |
| 8,350 |
| 10,810 |
| -23 |
|
Western Europe |
| 1,713 |
| 1,675 |
| +2 |
|
Germany |
| 672 |
| 630 |
| +7 |
|
NAFTA |
| 866 |
| 2,112 |
| -59 |
|
Latin America (excluding Mexico) |
| 4,554 |
| 5,300 |
| -14 |
|
Other markets |
| 1,217 |
| 1,723 |
| -29 |
|
Most successful city bus of all time: delivery of 25,000th Mercedes-Benz Citaro
At the beginning of September, we delivered the 25,000th Mercedes-Benz Citaro. This sales volume makes the Citaro the most successful city bus of all time. Low costs over its lifecycle as well as reliability and continuous further development have guaranteed the Citaro’s success. In July, the Bucharest transport authority took delivery of its 1,000th Citaro city bus. In another major order for 350 vehicles, the Dutch customer Qbuzz ordered primarily city buses of the types Citaro LE and Citaro NF as both solo buses and articulated buses, which are to be delivered before the end of this year.
Major order in Latin America
Daimler Buses succeeded in gaining the biggest order placed in the region this year: 1,045 chassis with particulate filters will be delivered to a customer in Chile. Daimler Buses is thus supporting the integrated transport system in Santiago with effective bus rapid transit (BRT) solutions. Thanks to their high flexibility and low infrastructure costs, buses have great advantages over other forms of transport. This is particularly the case when quickly realizable, high-volume and cost-effective local transport systems are needed for crowded big cities and the enormous transport requirements of their populations.
Q1-3
Amounts in millions of € |
| Q1-3 2009 |
| Q1-3 2008 |
| % change |
|
|
|
|
|
|
|
|
|
EBIT |
| 137 |
| 337 |
| -59 |
|
Revenue |
| 3,031 |
| 3,442 |
| -12 |
|
Unit sales |
| 23,462 |
| 31,053 |
| -24 |
|
Production |
| 24,198 |
| 33,123 |
| -27 |
|
Employees (September 30) |
| 17,480 |
| 18,048 |
| -3 |
|
Unit sales |
| Q1-3 2009 |
| Q1-3 2008 |
| % change |
|
|
|
|
|
|
|
|
|
Total |
| 23,462 |
| 31,053 |
| -24 |
|
Western Europe |
| 4,501 |
| 4,751 |
| -5 |
|
Germany |
| 1,716 |
| 1,724 |
| 0 |
|
NAFTA |
| 2,979 |
| 5,184 |
| -43 |
|
Latin America (excluding Mexico) |
| 12,079 |
| 16,595 |
| -27 |
|
Other markets |
| 3,903 |
| 4,523 |
| -14 |
|
18
Daimler Financial Services
Contract volume below prior-year level due to lower unit sales
Start of sales financing in the United Arab Emirates
First places in J.D. Power survey in the United States
EBIT of €101 million (Q3 2008: €173 million)
Amounts in millions of € |
| Q3 2009 |
| Q3 2008 |
| % change |
|
|
|
|
|
|
|
|
|
EBIT |
| 101 |
| 173 |
| -42 |
|
Revenue |
| 2,865 |
| 3,030 |
| -5 |
|
New business |
| 6,021 |
| 7,680 |
| -22 |
|
Contract volume |
| 58,738 |
| 63,890 |
| -8 |
|
Employees (September 30) |
| 6,793 |
| 7,097 |
| -4 |
|
Contract volume below prior-year level
At the end of the third quarter, Daimler Financial Services’ contract volume decreased compared to the end of 2008 by 7% to €58.7 billion. Adjusted for exchange-rate effects, there was also a decrease of 7%. Compared to the third quarter of 2008, new business decreased by 22% to €6.0 billion. EBIT for the period amounted to €101 million (Q3 2008: €173 million).
Start of sales financing in the United Arab Emirates
In the Europe, Africa & Asia/Pacific region, the financial services division’s contract volume of €35.5 billion at the end of the quarter was 6% lower than at December 31, 2008.
Mercedes-Benz Bank’s contract volume decreased by 5% compared to the end of last year to €16.4 billion. In the direct banking business, the total deposit volume increased substantially from €6.0 billion to €12.6 billion. The higher deposit volume has made a significant contribution to the Group’s high level of gross liquidity. Mercedes-Benz Bank is supporting the launch of the new E-Class station wagon with attractive financial services, including a 15% price reduction on insurance for cars with safety packages as well as complete offers combining leasing contracts with auto insurance.
Daimler Financial Services started business operations in the United Arab Emirates (UAE) in the third quarter of 2009. Two new subsidiaries domiciled in Dubai — Mercedes-Benz Finance Middle East LLC and Mercedes-Benz Leasing Middle East LLC — are part of a joint venture with the Al Fahim Group and Gargash Enterprises, which are the two Mercedes-Benz importers in the UAE. This move gives Daimler Financial Services a direct presence in the Middle East region for the first time and continues its expansion in important growth markets.
Two first places with J.D. Power in the United States
Contract volume in the Americas region of €23.2 billion was 9% lower than at the end of 2008. Adjusted for exchange-rate effects, there was a decrease of 8%.
Mercedes-Benz Financial gained first place in two of the three main categories of J.D. Power’s dealer satisfaction survey in the United States. In this survey, J.D. Power and Associates investigate how satisfied auto dealers are with their financial services providers. In the Floor Planning category, Mercedes-Benz Financial returned to first place after ranking fourth in the prior year. And Mercedes-Benz Financial took first place in the Prime Retail Credit category, which was also an improvement of three places compared to 2008. In the Retail Leasing category, Mercedes-Benz Financial achieved an excellent second place.
Daimler Financial Services has successfully placed an ABS tranche in the finance market. This securitization of receivables due from first-class customers of Mercedes-Benz Financial in the United States has a volume of approximately US $1 billion and makes an important contribution to the refinancing of the financial services business in North America. The issuance met with strong demand in the capital market.
Q1-3
Amounts in millions of € |
| Q1-3 2009 |
| Q1-3 2008 |
| % change |
|
|
|
|
|
|
|
|
|
EBIT |
| 13 |
| 524 |
| -98 |
|
Revenue |
| 9,122 |
| 8,721 |
| +5 |
|
New business |
| 18,427 |
| 22,107 |
| -17 |
|
Contract volume |
| 58,738 |
| 63,890 |
| -8 |
|
Employees (September 30) |
| 6,793 |
| 7,097 |
| -4 |
|
19
Daimler AG and Subsidiaries
Unaudited Consolidated Statement of Income (Loss) Q3
|
| Consolidated |
| Industrial Business |
| Daimler Financial Services |
| ||||||
Amounts in millions of € |
| Q3 2009 |
| Q3 2008 |
| Q3 2009 |
| Q3 2008 |
| Q3 2009 |
| Q3 2008 |
|
|
|
|
|
|
|
|
|
|
|
|
|
|
|
Revenue |
| 19,310 |
| 24,470 |
| 16,446 |
| 21,440 |
| 2,864 |
| 3,030 |
|
Cost of sales |
| (15,469 | ) | (19,622 | ) | (12,814 | ) | (16,936 | ) | (2,655 | ) | (2,686 | ) |
Gross profit |
| 3,841 |
| 4,848 |
| 3,632 |
| 4,504 |
| 209 |
| 344 |
|
Selling expenses |
| (1,790 | ) | (2,012 | ) | (1,716 | ) | (1,945 | ) | (74 | ) | (67 | ) |
General administrative expenses |
| (722 | ) | (1,000 | ) | (619 | ) | (881 | ) | (103 | ) | (119 | ) |
Research and non-capitalized development costs |
| (728 | ) | (789 | ) | (728 | ) | (789 | ) | — |
| — |
|
Other operating income (expense), net |
| 33 |
| 49 |
| (32 | ) | 40 |
| 65 |
| 9 |
|
Share of profit (loss) from investments accounted for using the equity method, net |
| 7 |
| (309 | ) | 3 |
| (315 | ) | 4 |
| 6 |
|
Other financial expense, net |
| (171 | ) | (139 | ) | (171 | ) | (139 | ) | — |
| — |
|
Earnings before interest and taxes (EBIT)(1) |
| 470 |
| 648 |
| 369 |
| 475 |
| 101 |
| 173 |
|
Interest income (expense), net |
| (184 | ) | 110 |
| (181 | ) | 112 |
| (3 | ) | (2 | ) |
Profit before income taxes |
| 286 |
| 758 |
| 188 |
| 587 |
| 98 |
| 171 |
|
Income tax benefit (expense) |
| (230 | ) | (540 | ) | (240 | ) | (530 | ) | 10 |
| (10 | ) |
Net profit (loss) from continuing operations |
| 56 |
| 218 |
| (52 | ) | 57 |
| 108 |
| 161 |
|
Net loss from discontinued operations |
| — |
| (5 | ) | — |
| (5 | ) | — |
| — |
|
Net profit (loss) |
| 56 |
| 213 |
| (52 | ) | 52 |
| 108 |
| 161 |
|
Minority interest |
| (15 | ) | (13 | ) |
|
|
|
|
|
|
|
|
Profit attributable to shareholders of Daimler AG |
| 41 |
| 200 |
|
|
|
|
|
|
|
|
|
|
|
|
|
|
|
|
|
|
|
|
|
|
|
Earnings (loss) per share (in €) for profit (loss) attributable to shareholders of Daimler AG |
|
|
|
|
|
|
|
|
|
|
|
|
|
Basic |
|
|
|
|
|
|
|
|
|
|
|
|
|
Net profit from continuing operations |
| 0.04 |
| 0.22 |
|
|
|
|
|
|
|
|
|
Net loss from discontinued operations |
| — |
| (0.01 | ) |
|
|
|
|
|
|
|
|
Net profit |
| 0.04 |
| 0.21 |
|
|
|
|
|
|
|
|
|
Diluted |
|
|
|
|
|
|
|
|
|
|
|
|
|
Net profit from continuing operations |
| 0.04 |
| 0.22 |
|
|
|
|
|
|
|
|
|
Net loss from discontinued operations |
| — |
| (0.01 | ) |
|
|
|
|
|
|
|
|
Net profit |
| 0.04 |
| 0.21 |
|
|
|
|
|
|
|
|
|
(1) EBIT includes expenses from the compounding of provisions (2009: €180 million; 2008: €106 million).
The accompanying notes are an integral part of these Unaudited Interim Consolidated Financial Statements
20
Daimler AG and Subsidiaries
Unaudited Consolidated Statement of Income (Loss) Q1-3
|
| Consolidated |
| Industrial Business |
| Daimler Financial Services |
| ||||||
Amounts in millions of € |
| Q1-3 2009 |
| Q1-3 2008 |
| Q1-3 2009 |
| Q1-3 2008 |
| Q1-3 2009 |
| Q1-3 2008 |
|
|
|
|
|
|
|
|
|
|
|
|
|
|
|
Revenue |
| 57,601 |
| 74,473 |
| 48,479 |
| 65,752 |
| 9,122 |
| 8,721 |
|
Cost of sales |
| (48,364 | ) | (57,615 | ) | (39,757 | ) | (49,999 | ) | (8,607 | ) | (7,616 | ) |
Gross profit |
| 9,237 |
| 16,858 |
| 8,722 |
| 15,753 |
| 515 |
| 1,105 |
|
Selling expenses |
| (5,562 | ) | (6,283 | ) | (5,324 | ) | (6,046 | ) | (238 | ) | (237 | ) |
General administrative expenses |
| (2,442 | ) | (2,866 | ) | (2,103 | ) | (2,485 | ) | (339 | ) | (381 | ) |
Research and non-capitalized development costs |
| (2,315 | ) | (2,402 | ) | (2,315 | ) | (2,402 | ) | — |
| — |
|
Other operating income, net |
| 146 |
| 692 |
| 75 |
| 664 |
| 71 |
| 28 |
|
Share of profit (loss) from investments accounted for using the equity method, net |
| 95 |
| (839 | ) | 89 |
| (849 | ) | 6 |
| 10 |
|
Other financial expense, net |
| (1,120 | ) | (483 | ) | (1,118 | ) | (482 | ) | (2 | ) | (1 | ) |
Earnings before interest and taxes (EBIT)(1) |
| (1,961 | ) | 4,677 |
| (1,974 | ) | 4,153 |
| 13 |
| 524 |
|
Interest income (expense), net |
| (596 | ) | 167 |
| (588 | ) | 174 |
| (8 | ) | (7 | ) |
Profit (loss) before income taxes |
| (2,557 | ) | 4,844 |
| (2,562 | ) | 4,327 |
| 5 |
| 517 |
|
Income tax benefit (expense) |
| 265 |
| (1,879 | ) | 236 |
| (1,721 | ) | 29 |
| (158 | ) |
Net profit (loss) from continuing operations |
| (2,292 | ) | 2,965 |
| (2,326 | ) | 2,606 |
| 34 |
| 359 |
|
Net loss from discontinued operations |
| — |
| (25 | ) | — |
| (25 | ) | — |
| — |
|
Net profit (loss) |
| (2,292 | ) | 2,940 |
| (2,326 | ) | 2,581 |
| 34 |
| 359 |
|
Minority interest |
| — |
| (96 | ) |
|
|
|
|
|
|
|
|
Profit (loss) attributable to shareholders of Daimler AG |
| (2,292 | ) | 2,844 |
|
|
|
|
|
|
|
|
|
|
|
|
|
|
|
|
|
|
|
|
|
|
|
Earnings (loss) per share (in €) for profit (loss) attributable to shareholders of Daimler AG |
|
|
|
|
|
|
|
|
|
|
|
|
|
Basic |
|
|
|
|
|
|
|
|
|
|
|
|
|
Net profit (loss) from continuing operations |
| (2.30 | ) | 2.97 |
|
|
|
|
|
|
|
|
|
Net loss from discontinued operations |
| — |
| (0.03 | ) |
|
|
|
|
|
|
|
|
Net profit (loss) |
| (2.30 | ) | 2.94 |
|
|
|
|
|
|
|
|
|
Diluted |
|
|
|
|
|
|
|
|
|
|
|
|
|
Net profit (loss) from continuing operations |
| (2.30 | ) | 2.96 |
|
|
|
|
|
|
|
|
|
Net loss from discontinued operations |
| — |
| (0.03 | ) |
|
|
|
|
|
|
|
|
Net profit (loss) |
| (2.30 | ) | 2.93 |
|
|
|
|
|
|
|
|
|
(1) EBIT includes expenses from the compounding of provisions (2009: €818 million; 2008: €320 million).
The accompanying notes are an integral part of these Unaudited Interim Consolidated Financial Statements
21
Daimler AG and Subsidiaries
Unaudited Consolidated Statement of Comprehensive Income (Loss) Q3
|
| Consolidated |
| ||
Amounts in millions of € |
| Q3 2009 |
| Q3 2008 |
|
|
|
|
|
|
|
Net profit |
| 56 |
| 213 |
|
Unrealized gains (losses) from currency translation adjustments |
| (93 | ) | 534 |
|
Unrealized gains (losses) from financial assets available for sale |
| 113 |
| (32 | ) |
Unrealized gains (losses) from derivative financial instruments |
| 58 |
| (678 | ) |
Unrealized gains (losses) from investments accounted for using the equity method |
| 377 |
| (53 | ) |
Other comprehensive income (loss), net of taxes |
| 455 |
| (229 | ) |
Total comprehensive income (loss) |
| 511 |
| (16 | ) |
Thereof minority interest |
| 152 |
| 116 |
|
Thereof profit (loss) attributable to shareholders of Daimler AG |
| 359 |
| (132 | ) |
Unaudited Consolidated Statement of Comprehensive Income (Loss) Q1-3
|
| Consolidated |
| ||
Amounts in millions of € |
| Q1-3 2009 |
| Q1-3 2008 |
|
|
|
|
|
|
|
Net profit (loss) |
| (2,292 | ) | 2,940 |
|
Unrealized gains (losses) from currency translation adjustments |
| 78 |
| (35 | ) |
Unrealized gains (losses) from financial assets available for sale |
| 168 |
| (208 | ) |
Unrealized gains (losses) from derivative financial instruments |
| (84 | ) | (503 | ) |
Unrealized gains (losses) from investments accounted for using the equity method |
| 4 |
| 78 |
|
Other comprehensive income (loss), net of taxes |
| 166 |
| (668 | ) |
Total comprehensive income (loss) |
| (2,126 | ) | 2,272 |
|
Thereof minority interest |
| 25 |
| 185 |
|
Thereof profit (loss) attributable to shareholders of Daimler AG |
| (2,151 | ) | 2,087 |
|
The accompanying notes are an integral part of these Unaudited Interim Consolidated Financial Statements
22
Daimler AG and Subsidiaries
Consolidated Statement of Financial Position
|
| Consolidated |
| Industrial Business |
| Daimler Financial Services |
| ||||||
Amounts in millions of € |
| At Sept. |
| At Dec. |
| At Sept. |
| At Dec. |
| At Sept. |
| At Dec. |
|
|
|
|
|
|
|
|
|
|
|
|
|
|
|
Assets |
|
|
|
|
|
|
|
|
|
|
|
|
|
Intangible assets |
| 6,501 |
| 6,037 |
| 6,437 |
| 5,964 |
| 64 |
| 73 |
|
Property, plant and equipment |
| 15,970 |
| 16,087 |
| 15,916 |
| 16,022 |
| 54 |
| 65 |
|
Equipment on operating leases |
| 17,013 |
| 18,672 |
| 7,161 |
| 7,185 |
| 9,852 |
| 11,487 |
|
Investments accounted for using the equity method |
| 4,308 |
| 4,319 |
| 4,253 |
| 4,258 |
| 55 |
| 61 |
|
Receivables from financial services |
| 23,533 |
| 25,003 |
| (127 | ) | (302 | ) | 23,660 |
| 25,305 |
|
Other financial assets |
| 4,208 |
| 3,278 |
| 2,968 |
| 3,060 |
| 1,240 |
| 218 |
|
Deferred tax assets |
| 2,935 |
| 2,828 |
| 2,526 |
| 2,544 |
| 409 |
| 284 |
|
Other assets |
| 452 |
| 606 |
| 300 |
| 454 |
| 152 |
| 152 |
|
Total non-current assets |
| 74,920 |
| 76,830 |
| 39,434 |
| 39,185 |
| 35,486 |
| 37,645 |
|
Inventories |
| 13,356 |
| 16,805 |
| 12,985 |
| 16,244 |
| 371 |
| 561 |
|
Trade receivables |
| 5,505 |
| 6,999 |
| 5,240 |
| 6,793 |
| 265 |
| 206 |
|
Receivables from financial services |
| 16,479 |
| 17,384 |
| (86 | ) | (67 | ) | 16,565 |
| 17,451 |
|
Cash and cash equivalents |
| 11,498 |
| 6,912 |
| 8,688 |
| 4,664 |
| 2,810 |
| 2,248 |
|
Other financial assets |
| 8,089 |
| 4,718 |
| 848 |
| (2,489 | ) | 7,241 |
| 7,207 |
|
Other assets |
| 2,161 |
| 2,571 |
| (139 | ) | 181 |
| 2,300 |
| 2,390 |
|
Total current assets |
| 57,088 |
| 55,389 |
| 27,536 |
| 25,326 |
| 29,552 |
| 30,063 |
|
Total assets |
| 132,008 |
| 132,219 |
| 66,970 |
| 64,511 |
| 65,038 |
| 67,708 |
|
|
|
|
|
|
|
|
|
|
|
|
|
|
|
Equity and liabilities |
|
|
|
|
|
|
|
|
|
|
|
|
|
Share capital |
| 3,044 |
| 2,768 |
|
|
|
|
|
|
|
|
|
Capital reserves |
| 11,860 |
| 10,204 |
|
|
|
|
|
|
|
|
|
Retained earnings |
| 16,511 |
| 19,359 |
|
|
|
|
|
|
|
|
|
Other reserves |
| 469 |
| 328 |
|
|
|
|
|
|
|
|
|
Treasury shares |
| (1,443 | ) | (1,443 | ) |
|
|
|
|
|
|
|
|
Equity attributable to shareholders of Daimler AG |
| 30,441 |
| 31,216 |
|
|
|
|
|
|
|
|
|
Minority interest |
| 1,476 |
| 1,508 |
|
|
|
|
|
|
|
|
|
Total equity |
| 31,917 |
| 32,724 |
| 27,162 |
| 28,092 |
| 4,755 |
| 4,632 |
|
Provisions for pensions and similar obligations |
| 4,406 |
| 4,140 |
| 4,225 |
| 3,969 |
| 181 |
| 171 |
|
Provisions for income taxes |
| 2,704 |
| 1,582 |
| 2,702 |
| 1,579 |
| 2 |
| 3 |
|
Provisions for other risks |
| 4,917 |
| 4,910 |
| 4,797 |
| 4,801 |
| 120 |
| 109 |
|
Financing liabilities |
| 35,407 |
| 31,209 |
| 15,838 |
| 10,505 |
| 19,569 |
| 20,704 |
|
Other financial liabilities |
| 1,737 |
| 1,942 |
| 1,669 |
| 1,846 |
| 68 |
| 96 |
|
Deferred tax liabilities |
| 850 |
| 1,725 |
| (3,223 | ) | (3,171 | ) | 4,073 |
| 4,896 |
|
Deferred income |
| 1,694 |
| 1,728 |
| 1,117 |
| 1,210 |
| 577 |
| 518 |
|
Other liabilities |
| 70 |
| 77 |
| 63 |
| 78 |
| 7 |
| (1 | ) |
Total non-current liabilities |
| 51,785 |
| 47,313 |
| 27,188 |
| 20,817 |
| 24,597 |
| 26,496 |
|
Trade payables |
| 6,847 |
| 6,478 |
| 6,633 |
| 6,268 |
| 214 |
| 210 |
|
Provisions for income taxes |
| 486 |
| 774 |
| 191 |
| 39 |
| 295 |
| 735 |
|
Provisions for other risks |
| 6,408 |
| 6,830 |
| 6,180 |
| 6,647 |
| 228 |
| 183 |
|
Financing liabilities |
| 24,689 |
| 27,428 |
| (7,769 | ) | (6,057 | ) | 32,458 |
| 33,485 |
|
Other financial liabilities |
| 7,354 |
| 8,376 |
| 5,807 |
| 7,193 |
| 1,547 |
| 1,183 |
|
Deferred income |
| 1,140 |
| 1,239 |
| 475 |
| 573 |
| 665 |
| 666 |
|
Other liabilities |
| 1,382 |
| 1,057 |
| 1,103 |
| 939 |
| 279 |
| 118 |
|
Total current liabilities |
| 48,306 |
| 52,182 |
| 12,620 |
| 15,602 |
| 35,686 |
| 36,580 |
|
Total equity and liabilities |
| 132,008 |
| 132,219 |
| 66,970 |
| 64,511 |
| 65,038 |
| 67,708 |
|
The accompanying notes are an integral part of these Unaudited Interim Consolidated Financial Statements
23
Daimler AG and Subsidiaries
Unaudited Consolidated Statement of Changes in Equity
|
|
|
|
|
|
|
|
|
|
|
|
|
| Other reserves |
|
|
|
|
|
|
|
|
|
Amounts in millions of € |
| Share |
| Capital |
| Retained |
| Currency |
| Financial |
| Derivative |
| Share of |
| Treasury |
| Equity |
| Minority |
| Total |
|
|
|
|
|
|
|
|
|
|
|
|
|
|
|
|
|
|
|
|
|
|
|
|
|
Balance at January 1, 2008 |
| 2,766 |
| 10,221 |
| 22,656 |
| (412 | ) | 296 |
| 630 |
| 561 |
| — |
| 36,718 |
| 1,512 |
| 38,230 |
|
Net profit |
| — |
| — |
| 2,844 |
| — |
| — |
| — |
| — |
| — |
| 2,844 |
| 96 |
| 2,940 |
|
Unrealized gains (losses) |
| — |
| — |
| — |
| (50 | ) | (209 | ) | (703 | ) | (10 | ) | — |
| (972 | ) | 123 |
| (849 | ) |
Deferred taxes on unrealized gains (losses) |
| — |
| — |
| — |
| — |
| 1 |
| 200 |
| 14 |
| — |
| 215 |
| (34 | ) | 181 |
|
Total comprehensive income (loss) |
| — |
| — |
| 2,844 |
| (50 | ) | (208 | ) | (503 | ) | 4 |
| — |
| 2,087 |
| 185 |
| 2,272 |
|
Dividends |
| — |
| — |
| (1,928 | ) | — |
| — |
| — |
| — |
| — |
| (1,928 | ) | (77 | ) | (2,005 | ) |
Share-based payments |
| — |
| (18 | ) | — |
| — |
| — |
| — |
| — |
| — |
| (18 | ) | — |
| (18 | ) |
Issue of new shares |
| 2 |
| 18 |
| — |
| — |
| — |
| — |
| — |
| — |
| 20 |
| 10 |
| 30 |
|
Acquisition of treasury shares |
| — |
| — |
| — |
| — |
| — |
| — |
| — |
| (4,127 | ) | (4,127 | ) | — |
| (4,127 | ) |
Issue of treasury shares |
| — |
| — |
| — |
| — |
| — |
| — |
| — |
| 32 |
| 32 |
| — |
| 32 |
|
Retirement of own shares |
| — |
| — |
| (2,717 | ) | — |
| — |
| — |
| — |
| 2,717 |
| — |
| — |
| — |
|
Other |
| — |
| 14 |
| — |
| — |
| — |
| — |
| — |
| — |
| 14 |
| 22 |
| 36 |
|
Balance at September 30, 2008 |
| 2,768 |
| 10,235 |
| 20,855 |
| (462 | ) | 88 |
| 127 |
| 565 |
| (1,378 | ) | 32,798 |
| 1,652 |
| 34,450 |
|
|
|
|
|
|
|
|
|
|
|
|
|
|
|
|
|
|
|
|
|
|
|
|
|
Balance at January 1, 2009 |
| 2,768 |
| 10,204 |
| 19,359 |
| (493 | ) | 23 |
| 576 |
| 222 |
| (1,443 | ) | 31,216 |
| 1,508 |
| 32,724 |
|
Net loss |
| — |
| — |
| (2,292 | ) | — |
| — |
| — |
| — |
| — |
| (2,292 | ) | — |
| (2,292 | ) |
Unrealized gains (losses) |
| — |
| — |
| — |
| 91 |
| 180 |
| (127 | ) | (59 | ) | — |
| 85 |
| 37 |
| 122 |
|
Deferred taxes on unrealized gains (losses) |
| — |
| — |
| — |
| — |
| (12 | ) | 42 |
| 26 |
| — |
| 56 |
| (12 | ) | 44 |
|
Total comprehensive income (loss) |
| — |
| — |
| (2,292 | ) | 91 |
| 168 |
| (85 | ) | (33 | ) | — |
| (2,151 | ) | 25 |
| (2,126 | ) |
Dividends |
| — |
| — |
| (556 | ) | — |
| — |
| — |
| — |
| — |
| (556 | ) | (65 | ) | (621 | ) |
Share-based payments |
| — |
| — |
| — |
| — |
| — |
| — |
| — |
| — |
| — |
| — |
| — |
|
Issue of new shares |
| 276 |
| 1,671 |
| — |
| — |
| — |
| — |
| — |
| — |
| 1,947 |
| — |
| 1,947 |
|
Other |
| — |
| (15 | ) | — |
| — |
| — |
| — |
| — |
| — |
| (15 | ) | 8 |
| (7 | ) |
Balance at September 30, 2009 |
| 3,044 |
| 11,860 |
| 16,511 |
| (402 | ) | 191 |
| 491 |
| 189 |
| (1,443 | ) | 30,441 |
| 1,476 |
| 31,917 |
|
The accompanying notes are an integral part of these Unaudited Interim Consolidated Financial Statements
24
Daimler AG and Subsidiaries
Unaudited Consolidated Statement of Cash Flows
|
| Consolidated |
| Industrial Business |
| Daimler Financial Services |
| ||||||
Amounts in millions of € |
| Q1-3 2009 |
| Q1-3 2008 |
| Q1-3 2009 |
| Q1-3 2008 |
| Q1-3 2009 |
| Q1-3 2008 |
|
|
|
|
|
|
|
|
|
|
|
|
|
|
|
Net profit (loss) adjusted for |
| (2,292 | ) | 2,940 |
| (2,326 | ) | 2,581 |
| 34 |
| 359 |
|
Depreciation and amortization |
| 2,478 |
| 2,256 |
| 2,452 |
| 2,225 |
| 26 |
| 31 |
|
Other non-cash expense and income |
| (1,093 | ) | 2,013 |
| (380 | ) | 1,593 |
| (713 | ) | 420 |
|
(Gains) losses on disposals of assets |
| 8 |
| (692 | ) | 8 |
| (679 | ) | — |
| (13 | ) |
Change in operating assets and liabilities |
|
|
|
|
|
|
|
|
|
|
|
|
|
– Inventories |
| 3,535 |
| (3,666 | ) | 3,472 |
| (3,641 | ) | 63 |
| (25 | ) |
– Trade receivables |
| 1,543 |
| (846 | ) | 1,589 |
| (774 | ) | (46 | ) | (72 | ) |
– Trade payables |
| 355 |
| 1,589 |
| 354 |
| 1,538 |
| 1 |
| 51 |
|
– Receivables from financial services |
| 2,885 |
| (2,421 | ) | (413 | ) | 203 |
| 3,298 |
| (2,624 | ) |
– Vehicles on operating leases |
| 1,467 |
| (129 | ) | (67 | ) | 384 |
| 1,534 |
| (513 | ) |
– Other operating assets and liabilities |
| 855 |
| (120 | ) | 464 |
| (215 | ) | 391 |
| 95 |
|
Cash provided by (used for) operating activities |
| 9,741 |
| 924 |
| 5,153 |
| 3,215 |
| 4,588 |
| (2,291 | ) |
Additions to property, plant and equipment |
| (1,866 | ) | (2,484 | ) | (1,857 | ) | (2,444 | ) | (9 | ) | (40 | ) |
Additions to intangible assets |
| (1,115 | ) | (1,020 | ) | (1,110 | ) | (1,006 | ) | (5 | ) | (14 | ) |
Proceeds from disposals of property, plant and equipment and intangible assets |
| 175 |
| 1,430 |
| 166 |
| 1,423 |
| 9 |
| 7 |
|
Investments in businesses |
| (156 | ) | (737 | ) | (156 | ) | (736 | ) | — |
| (1 | ) |
Proceeds from disposals of businesses |
| 18 |
| 497 |
| 15 |
| 443 |
| 3 |
| 54 |
|
Acquisition of securities (other than trading) |
| (11,779 | ) | (7,438 | ) | (10,252 | ) | (7,438 | ) | (1,527 | ) | — |
|
Proceeds from sales of securities (other than trading) |
| 6,795 |
| 6,979 |
| 6,795 |
| 6,876 |
| — |
| 103 |
|
Change in other cash |
| 51 |
| (811 | ) | 53 |
| (842 | ) | (2 | ) | 31 |
|
Cash provided by (used for) investing activities |
| (7,877 | ) | (3,584 | ) | (6,346 | ) | (3,724 | ) | (1,531 | ) | 140 |
|
Change in financing liabilities |
| 1,668 |
| 1,597 |
| 4,240 |
| (1,365 | ) | (2,572 | ) | 2,962 |
|
Dividends paid (including profit transferred from subsidiaries) |
| (621 | ) | (2,005 | ) | (601 | ) | (1,976 | ) | (20 | ) | (29 | ) |
Proceeds from issuance of share capital (including minority interest) |
| 1,947 |
| 62 |
| 1,806 |
| (20 | ) | 141 |
| 82 |
|
Purchase of treasury shares |
| — |
| (4,127 | ) | — |
| (4,127 | ) | — |
| — |
|
Cash provided by (used for) financing activities |
| 2,994 |
| (4,473 | ) | 5,445 |
| (7,488 | ) | (2,451 | ) | 3,015 |
|
Effect of foreign exchange-rate changes on cash and cash equivalents |
| (272 | ) | (210 | ) | (228 | ) | (210 | ) | (44 | ) | — |
|
Net increase (decrease) in cash and cash equivalents |
| 4,586 |
| (7,343 | ) | 4,024 |
| (8,207 | ) | 562 |
| 864 |
|
Cash and cash equivalents at the beginning of the period |
| 6,912 |
| 15,631 |
| 4,664 |
| 14,894 |
| 2,248 |
| 737 |
|
Cash and cash equivalents at the end of the period |
| 11,498 |
| 8,288 |
| 8,688 |
| 6,687 |
| 2,810 |
| 1,601 |
|
The accompanying notes are an integral part of these Unaudited Interim Consolidated Financial Statements
25
Daimler AG and Subsidiaries
Notes to the Unaudited Interim Consolidated Financial Statements
1. Presentation of the Interim Consolidated Financial Statements
General. These unaudited interim consolidated financial statements (interim financial statements) of Daimler AG and its subsidiaries (“Daimler” or “the Group”) have been prepared in accordance with Section 37x Subsection 3 of the German Securities Trading Act (WpHG) and International Accounting Standard (IAS) 34 “Interim Financial Reporting.” The interim financial statements comply with International Financial Reporting Standards (IFRS) as adopted by the European Union and as approved by the International Accounting Standards Board (IASB).
Daimler AG is a stock corporation organized under the laws of the Federal Republic of Germany. Daimler AG is entered in the Commercial Register of the Stuttgart District Court under No. HRB 19360 and its registered office is located at Mercedesstraße 137, 70327 Stuttgart, Germany.
The interim financial statements of the Daimler Group are presented in euros (€).
All significant intercompany accounts and transactions have been eliminated. In the opinion of the management, the interim financial statements reflect all adjustments (i.e. normal recurring adjustments) necessary for a fair presentation of the results of operations and the financial position of the Group. Operating results for the interim periods presented are not necessarily indicative of the results that may be expected for any future period or for the full fiscal year. The interim financial statements should be read in conjunction with the December 31, 2008 audited IFRS consolidated financial statements and notes thereto which Daimler published on February 27, 2009 and which were included in Daimler’s 2008 Annual Report on Form 20-F filed with the United States Securities and Exchange Commission (SEC). The accounting policies applied by the Group in these interim financial statements are principally the same as those applied in the audited IFRS consolidated financial statements as at and for the year ended December 31, 2008.
With the amendment of IAS 1 “Presentation of Financial Statements,” the consolidated financial statements contain in addition to the consolidated statement of income (loss) a consolidated statement of comprehensive income (loss). The latter comprises the profit or loss of the reporting period as well as equity changes other than those changes resulting from transactions with owners in their capacity as owners that are not recognized in profit or loss (other comprehensive income or loss).
Commercial practice with respect to certain products manufactured by Daimler necessitates that sales financing, including leasing alternatives, be made available to the Group’s customers. Accordingly, the Group’s consolidated financial statements are also significantly influenced by the activities of its financial services business. To enhance readers’ understanding of the Group’s financial position, cash flows and operating results, the accompanying interim consolidated financial statements also present unaudited information with respect to the Group’s industrial and financial services business activities. Such information, however, is not required by IFRS and is not intended to, and does not represent the separate IFRS results of operations, cash flows and the financial position of the Group’s industrial or financial services business activities. Eliminations of the effects of transactions between the industrial and financial services businesses have generally been allocated to the industrial business columns.
Preparation of interim financial statements in conformity with IFRS requires management to make estimates and judgments related to the reported amounts of assets and liabilities and the disclosure of contingent assets and liabilities at the reporting date and the reported amounts of revenue and expenses for the reporting period. Actual amounts could differ from those estimates.
IFRS adopted and changes in accounting policies. In May 2008, the IASB published its omnibus standard for improvements to International Financial Reporting Standards (IFRS). One of the improvements is an amendment to the presentation of the derecognition of assets held for rental. Proceeds from the sale of assets held for rental in the course of ordinary activities have to be recognized as revenue in accordance with the amended IAS 16 “Property, Plant and Equipment.” Cash flows in conjunction with these sales are shown under cash flows from operating activities in accordance with the amended IAS 7 “Statement of Cash Flows.” Daimler applies these amendments as of January 1, 2009 and has adjusted prior-year presentations accordingly. As a result, revenue and cost of sales recognized in the consolidated statements of income for the three- and nine-month periods ended September 30, 2009 each increased by €572 million and €2,116 million (2008: €674 million and €1,840 million). The changes in the presentation of the consolidated statement of cash flows result in cash flows from vehicles on operating leases of the Daimler Financial Services business being presented within “Cash provided by (used for) operating activities” in the separate line item “Vehicles on operating leases” together with the cash flows from vehicles on operating leases of the industrial business. This change in classification resulted in decreases of €569 million and €873 million in “Cash provided by (used for) operating activities” in the three- and nine-month periods ended September 30, 2009 (2008: decreases of €413 million and €1,802 million). With an opposite effect, “Cash provided by (used for) investing activities” changed to the same extent in both periods due to this reclassification.
26
In connection with this mandatory reclassification of cash flows from vehicles on operating leases of the Daimler Financial Services business, the Group decided also to reclassify changes in receivables from financial services from “Cash provided by (used for) investing activities” to “Cash provided by (used for) operating activities.” This change in classification resulted in increases of €141 million and €908 million in “Cash provided by (used for) operating activities” in the three- and nine-month periods ended September 30, 2009 (2008: decreases of €1,109 million and €1,868 million). This additional reclassification harmonizes the presentation of changes in the entire sales financing and leasing portfolio in the Group’s consolidated statements of cash flows within “Cash provided by (used for) operating activities.”
Discontinued operations. Adjustments of the loss related to the transfer of the majority interest in Chrysler in 2007 are presented as discontinued operations in the Group’s consolidated statements of income (loss) (see Note 2).
2. Significant dispositions of interests in companies and other disposals of assets and liabilities
Chrysler. Based on a binding term sheet signed in April 2009, Daimler and Cerberus entered into a redemption agreement in June 2009. As a result, Daimler no longer has any equity interest in Chrysler Holding LLC (Chrysler Holding) or its subsidiaries and all Daimler representatives resigned from the boards of Chrysler Holding and its subsidiaries.
The binding term sheet also provided for a settlement agreement covering issues relating to Chrysler which Daimler, the US Pension Benefit Guaranty Corporation (PBGC), Chrysler LLC (Chrysler) and Cerberus entered into in June 2009. Among other matters, Chrysler and Cerberus waived all claims that might arise from the representations and warranties made in the contribution agreement dated August 3, 2007, including claims by Cerberus that Daimler allegedly improperly managed certain issues in the period between the signing of the contribution agreement and the conclusion of the transaction, as well as certain other claims against Daimler.
In addition, in June 2009, Daimler has paid US $200 million into Chrysler’s pension plans and will make further payments of US $200 million in each of the next two years. The 2007 Daimler pension guarantee of US $1 billion vis-à-vis the PBGC has been replaced by a new guarantee in an amount of US $200 million that will remain in place until August 2012.
Moreover, the settlement agreement provides for the forgiveness of Daimler’s receivables in connection with a subordinated loan and a credit line which was drawn in 2008. The nominal amounts of these receivables, which were fully impaired at December 31, 2008, were US $0.4 billion and US $1.5 billion. However, the forgiveness of the US $1.5 billion second lien loan by Daimler was subject to the condition that certain unsecured creditors of Chrysler, represented by a committee under US bankruptcy law, will not bring litigation against Daimler in the course of the current Chrysler bankruptcy proceedings. In the third quarter 2009, the committee of the unsecured creditors filed a complaint with the bankruptcy court which is primarily related to transactions in connection with the transfer of the majority in Chrysler in 2007. In consequence, the forgiveness was rescinded. Daimler believes the complaint, which does not quantify the alleged damages, is without merit.
The contractual agreements described above negatively impacted EBIT for the three- and nine-month periods ended September 30, 2009 by €3 million and €381 million respectively; these effects are included in the reconciliation of total segments’ EBIT to Group EBIT.
In connection with the legal transfer of Chrysler’s international sales activities to Chrysler in the first quarter of 2009 and due to the valuation of Chrysler-related assets, the Group recorded a total gain before income taxes of €51 million and €82 million for the three- and nine-month periods ended September 30, 2009. These gains (losses) are included in the reconciliation of total segments’ EBIT to Group EBIT in the segment reporting.
In the nine months ended September 30, 2008, the Group recorded an impairment charge of €168 million following a decline in the value of an asset whose future cash flows were contingent upon the occurrence of certain events, in particular the development of residual values of leased Chrysler vehicles. This impairment charge is included in the reconciliation of total segments’ EBIT to Group EBIT in the segment reporting.
Net loss from discontinued operations for the three- and nine-month periods ended September 30, 2008 amounted to €5 million and €25 million and reflects adjustments of the loss in connection with the transfer of the majority interest in Chrysler in 2007.
Potsdamer Platz. The sale of real-estate properties at Potsdamer Platz to the SEB Group resulted in a cash inflow of €1.3 billion in the nine months ended September 30, 2008 (in addition to a €0.1 billion cash inflow in 2007). This transaction had a positive effect of €449 million on Group EBIT in the nine months ended September 30, 2008. The gain is included in the reconciliation of total segments’ EBIT to Group EBIT in the segment reporting.
27
3. Functional costs
Daimler Trucks. In response to continuing depressed demand across the industry and structural changes in the company’s core markets, the Group adopted a wide-ranging plan in October 2008 to optimize and reposition the business operations of its subsidiary Daimler Trucks North America (DTNA). Relating to this plan, the Group recorded income of €10 million due to revisions of estimates in the third quarter of 2009 and aggregate expenses of €48 million in the nine months ended September 30, 2009. The measures initiated resulted in cash outflows of €23 million and €134 million in the three- and nine-month periods ended September 30, 2009.
In connection with the plan to realign the operations of our subsidiary Mitsubishi Fuso Truck and Bus Corporation (MFTBC) adopted in May 2009, the Group recorded additional charges of €13 million and €217 million in the three- and nine-month periods ended September 2009. Of these charges, €7 million and €52 million are included within cost of sales and €6 million and €130 million within selling expenses in the three- and nine-month periods ended September 2009. In addition, for the nine months ended September 30, 2009, charges of €23 million are included within general administrative expenses and charges of €12 million are included within research and non-capitalized development costs in the consolidated statement of income. The measures initiated resulted in cash outflows of €21 million and €23 million in the three- and nine-month periods ended September 30, 2009.
4. Investments accounted for using the equity method
EADS. As of September 30, 2009, the European Aeronautic Defence and Space Company EADS N.V. (EADS) was the most significant investee accounted for using the equity method. The Group principally includes its proportionate share in the profit (loss) of EADS with a time lag of three months and reports the results in the reconciliation of total segments’ EBIT to Group EBIT in the segment reporting.
Daimler’s proportionate share in the profit (loss) of EADS for the three- and nine-month periods ended September 30, 2009 was €24 million and €122 million (2008: loss of €8 million and profit of €46 million) including investor-level adjustments. The carrying amount of the Group’s investment in EADS at September 30, 2009 was €2,958 million (December 31, 2008: €2,886 million).
In 2004, Daimler entered into a securities lending agreement concerning an approximate 3% equity interest in EADS shares. Simultaneously, the Group also entered into interrelated option contracts. The Group had exercised all option rights by the end of the third quarter of 2008. The transfer of equity interests in EADS resulted in a loss before income taxes of €7 million in the third quarter of 2008 and in a gain before income taxes of €130 million for the nine months ended September 2008.
Chrysler. As of December 31, 2008, the carrying amount of the Group’s equity interest in Chrysler Holding and the carrying amounts of the subordinated loans granted to Chrysler were reduced to zero. As a result, until the redemption of the remaining interest in Chrysler Holding on June 3, 2009, the equity-method accounting of the Group’s 19.9% equity interest in Chrysler Holding did not result in a further impact on Daimler’s EBIT (see also Note 2). For the three- and nine-month periods ended September 30, 2008, the Group’s proportionate share in the losses of Chrysler Holding negatively impacted Group EBIT by €351 million and €1,047 million.
5. Intangible assets
Intangible assets are comprised of the following:
Amounts in millions of € |
| At Sept. 30, |
| At Dec. 31, |
|
|
|
|
|
|
|
Goodwill |
| 670 |
| 660 |
|
Development costs |
| 5,255 |
| 4,716 |
|
Other intangible assets |
| 576 |
| 661 |
|
|
| 6,501 |
| 6,037 |
|
6. Inventories
Inventories are comprised of the following:
Amounts in millions of € |
| At Sept. 30, |
| At Dec. 31, |
|
|
|
|
|
|
|
Raw materials and manufacturing supplies |
| 1,665 |
| 1,725 |
|
Work in progress |
| 1,732 |
| 1,880 |
|
Finished goods, parts and products held for resale |
| 9,918 |
| 13,066 |
|
Advance payments to suppliers |
| 41 |
| 134 |
|
|
| 13,356 |
| 16,805 |
|
28
7. Equity
The resolution issued by the Annual Meeting on April 9, 2008 that authorized Daimler AG to acquire, until October 9, 2009, treasury shares for certain predefined purposes up to 10% of the share capital as of the day of the resolution was terminated by resolution of the Annual Meeting on April 8, 2009 insofar as it had not been utilized. Simultaneously, Daimler was again authorized to acquire, until October 8, 2010, treasury shares for certain predefined purposes, i.e. for the purpose of cancellation and to meet subscription rights arising from stock option programs, up to 10% of the share capital as of date of that resolution.
37.1 million treasury shares, repurchased under the resolution of the Annual Meeting on April 9, 2008, were still held by Daimler AG as of September 30, 2009.
By way of a resolution adopted at the Annual Meeting on April 9, 2008, the Board of Management was authorized, with the consent of the Supervisory Board, to increase Daimler AG’s capital in the period until April 8, 2013 by a total of €500 million by issuing new registered no par value shares in exchange for cash contributions and by a total of €500 million by issuing new registered no par value shares in exchange for non-cash contributions (Authorized Capital I and II). The Board of Management was also authorized with the consent of the Supervisory Board to exclude shareholders’ subscription rights under certain conditions. Under partial utilization of the authorized capital, the Board of Management decided, with the consent of the Supervisory Board of March 22, 2009, to increase Daimler AG’s share capital of €2,768 million by €276 million to €3,044 million in exchange for cash contributions, excluding any shareholders’ subscription rights, by issuing 96.4 million new registered no par value shares at an issue price of €20.27 per share to Semare Beteiligungsverwaltungsgesellschaft mbH. Semare Beteiligungsverwaltungsgesellschaft mbH is an indirect subsidiary of Aabar Investments PJSC (Aabar), Abu Dhabi. The capital increase became effective upon entry in the Commercial Register (“Handelsregister”) on March 24, 2009. Resulting transaction costs of €7 million (net of taxes) were deducted from capital reserves. The new shares are entitled to dividends for the first time for the financial year beginning on January 1, 2009.
The Annual Meeting on April 8, 2009 again authorized the Board of Management, with the consent of the Supervisory Board, to increase Daimler AG’s share capital in the period until April 7, 2014 by a total of €1,000 million in one lump sum or by separate partial amounts at different times by issuing new, registered no par value shares in exchange for cash and/or non-cash contributions (Approved Capital 2009). Among other things, the Board of Management was authorized with the consent of the Supervisory Board to exclude shareholders’ subscription rights under certain conditions. In this context, the Annual Meeting further resolved to cancel the former Authorized Capital I and II with effect as of the time when the new Approved Capital 2009 becomes effective, but only to the extent that they had not been utilized. The new Approved Capital 2009 and the cancellation of the remaining former Authorized Capital I and II came into effect with their entry in the Commercial Register on June 5, 2009.
The Annual Meeting on April 8, 2009 also authorized Daimler to distribute a dividend of €556 million (€0.60 per share) from the unappropriated earnings for 2008 of Daimler AG. The dividend was paid out on April 9, 2009.
29
8. Pension obligations
Net pension cost. The components of net pension cost from defined benefit plans for the three-month periods ended September 30, 2009 and 2008 were as follows:
|
| Three months ended September 30, 2009 |
| Three months ended September 30, 2008 |
| ||||||||
Amounts in millions of € |
| Total |
| German |
| Non-German |
| Total |
| German |
| Non-German |
|
|
|
|
|
|
|
|
|
|
|
|
|
|
|
Current service cost |
| 71 |
| 55 |
| 16 |
| 92 |
| 70 |
| 22 |
|
Interest cost |
| 211 |
| 184 |
| 27 |
| 205 |
| 179 |
| 26 |
|
Expected return on plan assets |
| (164 | ) | (142 | ) | (22 | ) | (224 | ) | (195 | ) | (29 | ) |
Amortization of net actuarial (gains)/losses |
| 7 |
| 4 |
| 3 |
| (1 | ) | — |
| (1 | ) |
Net periodic pension cost |
| 125 |
| 101 |
| 24 |
| 72 |
| 54 |
| 18 |
|
Curtailments and settlements |
| 1 |
| — |
| 1 |
| 4 |
| — |
| 4 |
|
|
| 126 |
| 101 |
| 25 |
| 76 |
| 54 |
| 22 |
|
For the nine-month periods ended September 30, 2009 and 2008, the components of net pension cost from defined benefit plans were as follows:
|
| Nine months ended September 30, 2009 |
| Nine months ended September 30, 2008 |
| ||||||||
Amounts in millions of € |
| Total |
| German |
| Non-German |
| Total |
| German |
| Non-German |
|
| �� |
|
|
|
|
|
|
|
|
|
|
|
|
Current service cost |
| 221 |
| 167 |
| 54 |
| 262 |
| 207 |
| 55 |
|
Interest cost |
| 635 |
| 550 |
| 85 |
| 613 |
| 536 |
| 77 |
|
Expected return on plan assets |
| (495 | ) | (426 | ) | (69 | ) | (672 | ) | (586 | ) | (86 | ) |
Amortization of net actuarial (gains)/losses |
| 20 |
| 11 |
| 9 |
| (1 | ) | — |
| (1 | ) |
Net periodic pension cost |
| 381 |
| 302 |
| 79 |
| 202 |
| 157 |
| 45 |
|
Curtailments and settlements |
| 12 |
| — |
| 12 |
| (2 | ) | — |
| (2 | ) |
|
| 393 |
| 302 |
| 91 |
| 200 |
| 157 |
| 43 |
|
Contributions by the employer to plan assets. In the three- and nine-month periods ended September 30, 2009, contributions by Daimler to the Group’s pension plans were €31 million and €83 million (2008: €13 million and €37 million).
30
9. Provisions for other risks
Provisions for other risks are comprised of the following:
|
| At September 30, 2009 |
| At December 31, 2008 |
| ||||||||
Amounts in millions of € |
| Current |
| Non-current |
| Total |
| Current |
| Non-current |
| Total |
|
|
|
|
|
|
|
|
|
|
|
|
|
|
|
Product warranties |
| 2,832 |
| 2,797 |
| 5,629 |
| 3,025 |
| 2,901 |
| 5,926 |
|
Sales incentives |
| 729 |
| — |
| 729 |
| 887 |
| — |
| 887 |
|
Personnel and social costs |
| 1,096 |
| 1,344 |
| 2,440 |
| 1,031 |
| 1,319 |
| 2,350 |
|
Other |
| 1,751 |
| 776 |
| 2,527 |
| 1,887 |
| 690 |
| 2,577 |
|
|
| 6,408 |
| 4,917 |
| 11,325 |
| 6,830 |
| 4,910 |
| 11,740 |
|
10. Financing liabilities
Financing liabilities are comprised of the following:
|
| At September 30, 2009 |
| At December 31, 2008 |
| ||||||||
Amounts in millions of € |
| Current |
| Non-current |
| Total |
| Current |
| Non-current |
| Total |
|
|
|
|
|
|
|
|
|
|
|
|
|
|
|
Notes / bonds |
| 7,481 |
| 23,661 |
| 31,142 |
| 11,158 |
| 22,935 |
| 34,093 |
|
Commercial paper |
| 424 |
| — |
| 424 |
| 2,320 |
| — |
| 2,320 |
|
Liabilities to financial institutions |
| 6,370 |
| 7,870 |
| 14,240 |
| 8,038 |
| 6,570 |
| 14,608 |
|
Deposits from the direct banking business |
| 9,610 |
| 2,995 |
| 12,605 |
| 5,033 |
| 977 |
| 6,010 |
|
Liabilities from ABS transactions |
| 327 |
| 394 |
| 721 |
| 370 |
| 327 |
| 697 |
|
Liabilities from finance leases |
| 39 |
| 368 |
| 407 |
| 60 |
| 391 |
| 451 |
|
Loans, other financing liabilities |
| 438 |
| 119 |
| 557 |
| 449 |
| 9 |
| 458 |
|
|
| 24,689 |
| 35,407 |
| 60,096 |
| 27,428 |
| 31,209 |
| 58,637 |
|
11. Segment reporting
Segment information. At the beginning of 2009, the Group adjusted the presentation of its segment reporting. The business activities of Mercedes-Benz Vans and Daimler Buses, which were previously reported as part of Vans, Buses, Other, are now presented separately. The other business activities of the Group which previously also formed part of Vans, Buses, Other and which primarily include the equity method investment in EADS are included in the column “Reconciliation” together with corporate items and eliminations of intersegment transactions. Prior-year figures have been adjusted accordingly. The Group’s proportionate share in the results of Chrysler Holding as well as other Chrysler-related gains and losses (see Notes 2 and 4) are also included in the reconciliation of total segments’ EBIT to Group EBIT.
31
Segment information for the three-month periods ended September 30, 2009 and 2008 is as follows:
Amounts in millions of € |
| Mercedes- |
| Daimler |
| Mercedes- |
| Daimler |
| Daimler |
| Total |
| Reconciliation |
| Consolidated |
|
|
|
|
|
|
|
|
|
|
|
|
|
|
|
|
|
|
|
Three months ended September 30, 2009 |
|
|
|
|
|
|
|
|
|
|
|
|
|
|
|
|
|
Revenue |
| 9,864 |
| 3,995 |
| 1,584 |
| 1,008 |
| 2,721 |
| 19,172 |
| 138 |
| 19,310 |
|
Intersegment revenue |
| 374 |
| 393 |
| 17 |
| 16 |
| 143 |
| 943 |
| (943 | ) | — |
|
Total revenue |
| 10,238 |
| 4,388 |
| 1,601 |
| 1,024 |
| 2,864 |
| 20,115 |
| (805 | ) | 19,310 |
|
|
|
|
|
|
|
|
|
|
|
|
|
|
|
|
|
|
|
Segment profit (loss) (EBIT) |
| 355 |
| (127 | ) | 1 |
| 23 |
| 101 |
| 353 |
| 117 |
| 470 |
|
|
|
|
|
|
|
|
|
|
|
|
|
|
|
|
|
|
|
Amounts in millions of € |
| Mercedes- |
| Daimler |
| Mercedes- |
| Daimler |
| Daimler |
| Total |
| Reconciliation |
| Consolidated |
|
|
|
|
|
|
|
|
|
|
|
|
|
|
|
|
|
|
|
Three months ended September 30, 2008 |
|
|
|
|
|
|
|
|
|
|
|
|
|
|
|
|
|
Revenue |
| 11,176 |
| 6,660 |
| 2,369 |
| 1,181 |
| 2,915 |
| 24,301 |
| 169 |
| 24,470 |
|
Intersegment revenue |
| 432 |
| 647 |
| 19 |
| 21 |
| 115 |
| 1,234 |
| (1,234 | ) | — |
|
Total revenue |
| 11,608 |
| 7,307 |
| 2,388 |
| 1,202 |
| 3,030 |
| 25,535 |
| (1,065 | ) | 24,470 |
|
|
|
|
|
|
|
|
|
|
|
|
|
|
|
|
|
|
|
Segment profit (loss) (EBIT) |
| 112 |
| 510 |
| 212 |
| 92 |
| 173 |
| 1,099 |
| (451 | ) | 648 |
|
Segment information for the nine-month periods ended September 30, 2009 and 2008 is as follows:
Amounts in millions of € |
| Mercedes- |
| Daimler |
| Mercedes- |
| Daimler |
| Daimler |
| Total |
| Reconciliation |
| Consolidated |
|
|
|
|
|
|
|
|
|
|
|
|
|
|
|
|
|
|
|
Nine months ended September 30, 2009 |
|
|
|
|
|
|
|
|
|
|
|
|
|
|
|
|
|
Revenue |
| 28,959 |
| 12,356 |
| 4,217 |
| 3,000 |
| 8,653 |
| 57,185 |
| 416 |
| 57,601 |
|
Intersegment revenue |
| 914 |
| 1,167 |
| 156 |
| 31 |
| 469 |
| 2,737 |
| (2,737 | ) | — |
|
Total revenue |
| 29,873 |
| 13,523 |
| 4,373 |
| 3,031 |
| 9,122 |
| 59,922 |
| (2,321 | ) | 57,601 |
|
|
|
|
|
|
|
|
|
|
|
|
|
|
|
|
|
|
|
Segment profit (loss) (EBIT) |
| (1,108 | ) | (777 | ) | (100 | ) | 137 |
| 13 |
| (1,835 | ) | (126 | ) | (1,961 | ) |
|
|
|
|
|
|
|
|
|
|
|
|
|
|
|
|
|
|
Amounts in millions of € |
| Mercedes- |
| Daimler |
| Mercedes- |
| Daimler |
| Daimler |
| Total |
| Reconciliation |
| Consolidated |
|
|
|
|
|
|
|
|
|
|
|
|
|
|
|
|
|
|
|
Nine months ended September 30, 2008 |
|
|
|
|
|
|
|
|
|
|
|
|
|
|
|
|
|
Revenue |
| 35,903 |
| 19,199 |
| 7,023 |
| 3,410 |
| 8,363 |
| 73,898 |
| 575 |
| 74,473 |
|
Intersegment revenue |
| 1,123 |
| 1,820 |
| 257 |
| 32 |
| 358 |
| 3,590 |
| (3,590 | ) | — |
|
Total revenue |
| 37,026 |
| 21,019 |
| 7,280 |
| 3,442 |
| 8,721 |
| 77,488 |
| (3,015 | ) | 74,473 |
|
|
|
|
|
|
|
|
|
|
|
|
|
|
|
|
|
|
|
Segment profit (loss) (EBIT) |
| 2,476 |
| 1,521 |
| 660 |
| 337 |
| 524 |
| 5,518 |
| (841 | ) | 4,677 |
|
32
Reconciliation. Reconciliation of the total segments’ profit (loss) (EBIT) to profit (loss) before income taxes is as follows:
|
| Three months ended |
| Nine months ended |
| ||||
Amounts in millions of € |
| 2009 |
| 2008 |
| 2009 |
| 2008 |
|
|
|
|
|
|
|
|
|
|
|
Total segments’ profit (loss) (EBIT) |
| 353 |
| 1,099 |
| (1,835 | ) | 5,518 |
|
Equity method result EADS(1) |
| 24 |
| (15 | ) | 122 |
| 176 |
|
Equity method result Chrysler |
| — |
| (351 | ) | — |
| (1,047 | ) |
Corporate items / Other |
| 74 |
| (97 | ) | (406 | ) | 34 |
|
Eliminations |
| 19 |
| 12 |
| 158 |
| (4 | ) |
Group EBIT |
| 470 |
| 648 |
| (1,961 | ) | 4,677 |
|
Interest income (expense), net |
| (184 | ) | 110 |
| (596 | ) | 167 |
|
Profit (loss) before income taxes |
| 286 |
| 758 |
| (2,557 | ) | 4,844 |
|
(1) The amounts for 2008 also include gains in connection with the transfer of equity interests in EADS.
The line item “Corporate items / Other” includes corporate items for which headquarters is responsible. Transactions between the segments are eliminated in the reconciliation.
12. Related party relationships
Associated companies and joint ventures. Most of the goods and services supplied within the ordinary course of business between the Group and related parties comprise transactions with associated companies and joint ventures. These transactions are included in the following tables:
|
| Sales of goods and |
| Purchases of goods and |
| ||||||||||||
|
| Three months ended |
| Nine months ended |
| Three months ended |
| Nine months ended |
| ||||||||
Amounts in millions of € |
| 2009 |
| 2008 |
| 2009 |
| 2008 |
| 2009 |
| 2008 |
| 2009 |
| 2008 |
|
|
|
|
|
|
|
|
|
|
|
|
|
|
|
|
|
|
|
Associated companies |
| 94 |
| 381 |
| 829 |
| 1,253 |
| 51 |
| 266 |
| 1,045 |
| 737 |
|
Joint ventures |
| 89 |
| 78 |
| 252 |
| 198 |
| 4 |
| — |
| 25 |
| — |
|
|
| Receivables |
| Payables |
| ||||
Amounts in millions of |
| At Sept. 30, |
| At Dec. 31, |
| At Sept. 30, |
| At Dec. 30, |
|
|
|
|
|
|
|
|
|
|
|
Associated companies |
| 190 |
| 587 |
| 26 |
| 1,370 |
|
Joint ventures |
| 124 |
| 134 |
| 207 |
| 264 |
|
33
Income and expenses resulting from transactions with Chrysler that occurred before the redemption of the remaining 19.9% equity interest in Chrysler Holding on June 3, 2009 are included in the above table in the line “Associated companies.” Therein included is a gain before income taxes of €0.1 billion in connection with the legal transfer of Chrysler’s international sales activities to Chrysler in the first quarter of 2009. In addition, the Group has agreed to pay US $600 million in total to Chrysler’s pension plans in connection with the redemption of the 19.9% equity interest in Chrysler Holding (see Note 2); the respective expenses resulting from this agreement are also included in the above table. Due to the redemption of the equity interest in Chrysler Holding, receivables and payables at September 30, 2009 did not have to be reported.
Significant other goods and services supplied or received by the Group relate to the business relations with the associated companies McLaren Group Ltd. and Tognum AG.
The transactions with joint ventures predominantly comprise the business relationship with Beijing Benz-DaimlerChrysler Automotive Corporation, Ltd.
In connection with the Group’s 45% equity interest in Toll Collect, Daimler has provided a number of guarantees for Toll Collect, which are not included in the table above (€155 million and €165 million as of September 30, 2009 and December 31, 2008 respectively).
Shareholder. The Group distributes vehicles in Turkey through a dealership which also holds a minority interest in one of the Group’s subsidiaries. In addition, the Group has business relationships with vehicle importers in certain other countries that also hold minority interests in Group companies. For the three- and nine-month periods ended September 30, 2009, revenue in connection with these transactions amounted to €31 million and €130 million (2008: €63 million and €173 million). Related to these transactions, the Group incurred expenses of €4 million and €18 million in the three- and nine-month periods ended September 30, 2009, resulting primarily from the depreciation of purchased vehicles.
34
Addresses | Information
Investor Relations
Phone +49 711 17 95256
+49 711 17 92261
+49 711 17 97778
+49 711 17 95277
Fax +49 711 17 94075
This report and additional information on Daimler are available on the Internet at www.daimler.com
Concept and contents
Daimler AG
Investor Relations
Publications for our shareholders:
Annual Reports (German, English)
Form 20-F (English)
Interim Reports on 1st, 2nd and 3rd quarters
(German, English)
Sustainability Reports (Facts and Magazine)
(German, English)
www.daimler.com/ir/reports
Financial Calendar 2009 | 2010
Interim Report Q3 2009
October 27, 2009
Annual Press Conference /
Investors’ and Analysts’ Conference Call
February 18, 2010
Annual Meeting 2010
Messe Berlin
April 14, 2010
Interim Report Q1 2010
April 27, 2010
Interim Report Q2 2010
July 27, 2010
Interim Report Q3 2010
October 28, 2010
35

SIGNATURES
Pursuant to the requirements of the Securities Exchange Act of 1934, the registrant has duly caused this report to be signed on its behalf by the undersigned, thereunto duly authorized.
| Daimler AG | |
|
|
|
|
|
|
| By: | /s/ ppa. Robert Köthner |
|
| Name: Robert Köthner |
|
| Title: Vice President |
|
| Chief Accounting Officer |
|
|
|
|
|
|
| By: | /s/ i.V. Silvia Nierbauer |
|
| Name: Silvia Nierbauer |
|
| Title: Director |
|
|
|
|
|
|
Date: October 27, 2009 |
|
|