Exhibit 99.7
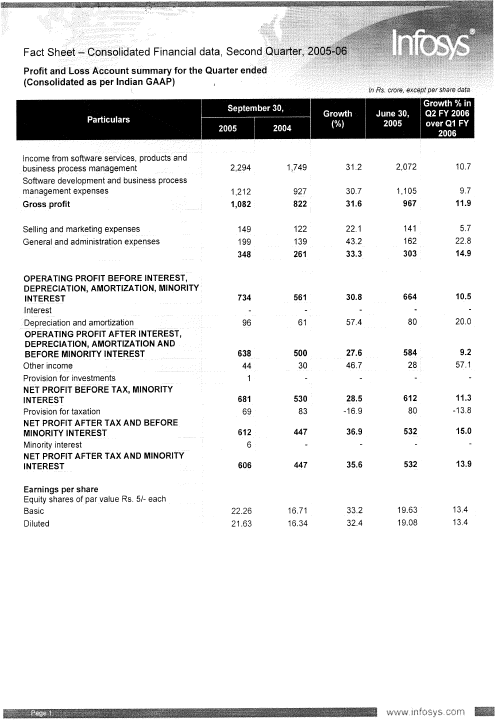
| Fact Sheet — Consolidated Financial data, SecondProfit and Loss Account summary for the Quarter ended (Consolidated as per Indian GAAP)In Rs. crore, except per share data |
| Particulars 1 Growth % in — June 30, Q2 FY 2006 September 30 Growth 2005 2004 (%) 2005 2006 overQIFY |
| Income from software services, products and business process management 2,294 1,749 31.2 2,072 10.7 Software development and business process management expenses 1,212 927 30.7 1,105 9.7Gross profit 1,082 822 31.6 967 11.9 Selling and marketing expenses 149 122 22.1 141 5.7 General and administration expenses 199 139 43.2 162 22.8 |
| 348 261 33.3 303 14.9OPERATING PROFIT BEFORE INTEREST, DEPRECIATION, AMORTIZATION, MINORITY INTEREST 734 561 30.8 664 10.5 Interest — — — — - |
| Depreciation and amortization 96 61 57.4 80 20.0 |
| OPERATING PROFIT AFTER INTEREST, DEPRECIATION, AMORTIZATION AND BEFORE MINORITY INTEREST 638 500 27.6 584 9.2 |
| Other income 44 30 46.7 28 57.1 |
| Provision for investments 1 — — . - |
| NET PROFIT BEFORE TAX, MINORITY INTEREST 681 530 28.5 612 11.3 Provision for taxation 69 83 -16.9 80 -13.8 |
| NET PROFIT AFTER TAX AND BEFORE MINORITY INTEREST 612 447 36.9 532 15.0 |
| Minority interest 6 — — — - |
| NET PROFIT AFTER TAX AND MINORITY INTEREST 606 447 35.6 532 13.9 Earnings per share |
| Equity shares of par value Rs. 5/- each Basic 22.26 16.71 33.2 19.63 13.4 |
| Diluted 21.63 16.34 32.4 19.08 13.4 |
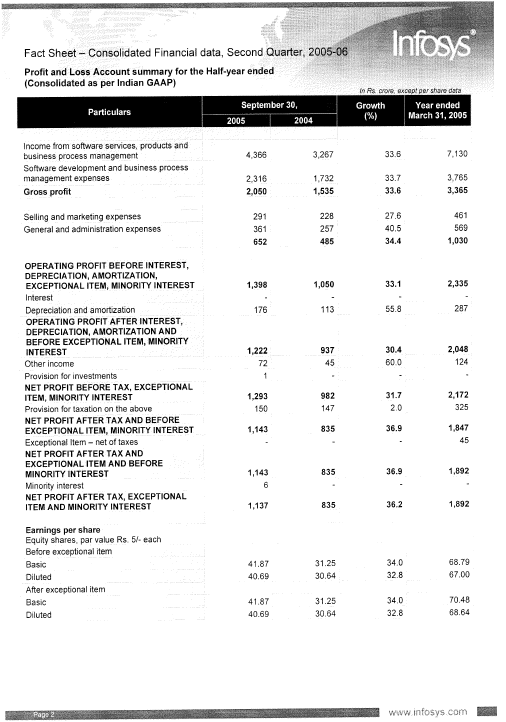
| Fact Sheet — Consolidated Financial data, SecondProfit and Loss Account summary for the Half-year ended (Consolidated as per Indian GAAP)In Rs. crore, except per share data |
| Particulars September230, Growth Year ended 20052004(%) March 31 ,2005 |
| Income from software services, products and business process management 4,366 3,267 33.6 7,130 |
| Software development and business process management expenses 2,316 1,732 33.7 3,765 |
| Gross profit 2,050 1,535 33.6 3,365 |
| Selling and marketing expenses 291 228 27.6 461 |
| General and administration expenses 361 257 40.5 569 |
| 652 485 34.4 1,030 OPERATING PROFIT BEFORE INTEREST, DEPRECIATION, AMORTIZATION, EXCEPTIONAL ITEM, MINORITY INTEREST 1,398 1,050 33.1 2,335 |
| Interest — — — - |
| Depreciation and amortization 176 113 55.8 287 |
| OPERATING PROFIT AFTER INTEREST, DEPRECIATION, AMORTIZATION AND BEFORE EXCEPTIONAL ITEM, MINORITY INTEREST 1,222 937 30.4 2,048 |
| Other income 72 45 60.0 124 |
| Provision for investments 1 . — - |
| NET PROFIT BEFORE TAX, EXCEPTIONAL ITEM, MINORITY INTEREST 1,293 982 31.7 2,172 |
| Provision for taxation on the above 150 147 2.0 325 |
| NET PROFIT AFTER TAX AND BEFORE EXCEPTIONAL ITEM, MINORITY INTEREST 1,143 835 36.9 1,847 |
| Exceptional Item — net of taxes — — — 45 |
| NET PROFIT AFTER TAX AND EXCEPTIONAL ITEM AND BEFORE MINORITY INTEREST 1,143 835 36.9 1,892 |
| Minority interest 6 — — - |
| NET PROFIT AFTER TAX, EXCEPTIONAL ITEM AND MINORITY INTEREST 1,137 835 36.2 1,892 Earnings per share |
| Equity shares, par value Rs. 5/-each Before exceptional item Basic 41.87 31.25 34.0 68.79 |
| Diluted 40.69 30.64 32.8 67.00 |
| After exceptional item Basic 41.87 31.25 34.0 70.48 |
| Diluted 40.69 30.64 32.8 68.64 |
| Fact Sheet — Consolidated Financial data, Second, Quarter, |
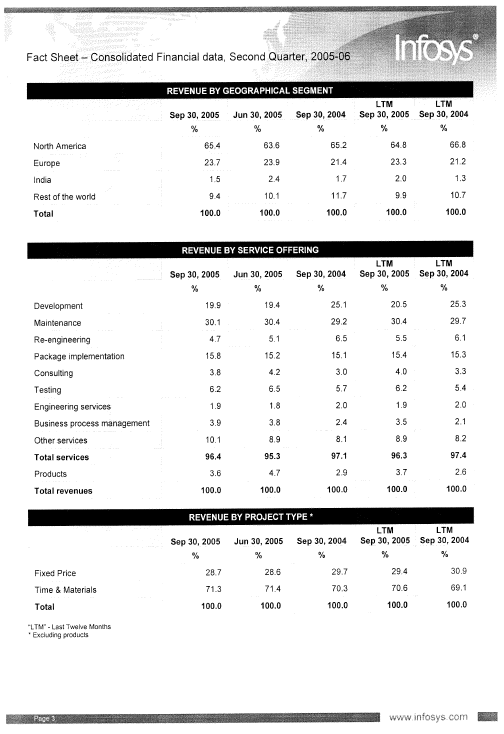
| REVENUE BY GEOGRAPHICAL SEGMENT |
| LTM LTM Sep 30, 2005 Jun 30, 2005 Sep 30, 2004 Sep 30, 2005 Sep 30, 2004 % % % % % North America 65.4 63.6 65.2 64.8 66.8 Europe 23.7 23.9 21.4 23.3 21.2 India 1.5 2.4 1.7 2.0 1.3 Rest of the world 9.4 10.1 11.7 9.9 10.7Total 100.0 100.0 100.0 100.0 100.0 |
| LTM LTM Sep 30, 2005 Jun 30, 2005 Sep 30, 2004 Sep 30, 2005 Sep 30, 2004 % % % % % Development 19.9 19.4 25.1 20.5 25.3 Maintenance 30.1 30.4 29.2 30.4 29.7 Re-engineering 4.7 5.1 6.5 5.5 6.1 Package implementation 15.8 15.2 15.1 15.4 15.3 Consulting 3.8 4.2 3.0 4.0 3.3 Testing 6.2 6.5 5.7 6.2 5.4 Engineering services 1.9 1.8 2.0 1.9 2.0 Business process management 3.9 3.8 2.4 3.5 2.1 Other services 10.1 8.9 8.1 8.9 8.2Total services 96.4 95.3 97.1 96.3 97.4 Products 3.6 4.7 2.9 3.7 2.6Total revenues 100.0 100.0 100.0 100.0 100.0 |
| LTM LTM Sep 30, 2005 Jun 30, 2005 Sep 30, 2004 Sep 30, 2005 Sep 30, 2004 % % % % % Fixed Price 28.7 28.6 29.7 29.4 30.9 Time & Materials 71.3 71.4 70.3 70.6 69.1Total 100.0 100.0 100.0 100.0 100.0 |
| “LTM” — Last Twelve Months * Excluding products |

| Fact Sheet — Consolidated Financial data, Second |
| LTM LTM Sep 30, 2005 Jun 30, 2005 Sep 30, 2004 Sep 30, 2005 Sep 30, 2004 % % % % % insurance, banking & financial 35.7 36.3 35.1 35.3 35.0Insurance7.98.49.8 8.610.5 Banking & financial services27.827.925.3 26.724.5 Manufacturing 13.5 13.3 14.7 13.7 14.6 Retail 10.5 9.6 9.5 9.7 11.0 Telecom 16.7 17.2 18.5 17.8 18.0 Energy & Utilities 4.3 3.7 2.9 3.7 2.8 Transportation & logistics 5.6 7.0 7.5 6.9 7.3 Services 9.9 9.4 8.1 9.3 6.5 Others 3.8 3.5 3.7 3.6 4.8Total 100.0 100.0 100.0 100.0 100.0 |
| Sep 30, 2005 Jun 30, 2005 Sep 30, 2004 Number of Clients Active 450 443 431 Added during the quarter 34 36 32 Accounting for > 5% of revenue — 1 1 Number of Million Dollar Clients 1 Million dollar+* 191 172 146 5 million dollar +* 76 73 60 10 million dollar+* 48 43 31 20 million dollar ** 23 22 16 30 million dollar+* 16 14 10 40 million dollar+* 11 8 7 50 million dollar+* 6 5 3 60 million dollar +* 4 4 1 70 million dollar+* 2 3 — 80 million dollar+* 1 1 — 90 million dollar +* 1 1 — Client Contribution to Revenue Top client 4.4% 5.2% 5.5% Top 5 clients 17.8% 19.1% 21.6% Top 10 clients 30.6% 31.8% 34.7% Repeat business 96.5% 98.7% 96.3% Account receivables — LTM (in days) 59 59 58 |
| “LTM” — Last Twelve Months * LTM Revenues |
| Fact Sheet — Consolidated Financial data, Second |
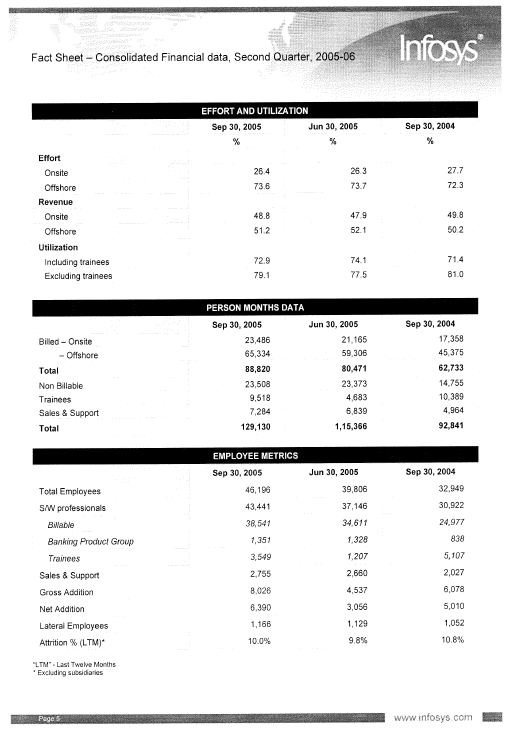
| Sep 30, 2005 Jun 30, 2005 Sep 30, 2004 % % % Effort Onsite 26.4 26.3 27.7 Offshore 73.6 73.7 72.3Revenue Onsite 48.8 47.9 49.8 Offshore 51.2 52.1 50.2 Utilization Including trainees 72.9 74.1 71.4 Excluding trainees 79.1 77.5 81.0 |
| Sep 30, 2005 Jun 30, 2005 Sep 30, 2004 Billed — Onsite 23,486 21,165 17,358 — Offshore 65,334 59,306 45,375Total 88,820 80,471 62,733 Non Billable 23,508 23,373 14,755 Trainees 9,518 4,683 10,389 Sales & Support 7,284 6,839 4,964Total 129,130 1,15,366 92,841 |
| EMPLOYEE METRICS |
| Sep 30, 2005 Jun 30, 2005 Sep 30, 2004 Total Employees 46,196 39,806 32,949 S/W professionals 43,441 37,146 30,922Billable 38,541 34,61124,977Banking Product Group 1,351 1,328838Trainees 3,549 1,2075,707 Sales & Support 2,755 2,660 2,027 Gross Addition 8,026 4,537 6,078 Net Addition 6,390 3,056 5,010 Lateral Employees 1,166 1,129 1,052 Attrition % (LTM)* 10.0% 9.8% 10.8% |
| “LTM” — Last Twelve Months * Excluding subsidiaries |
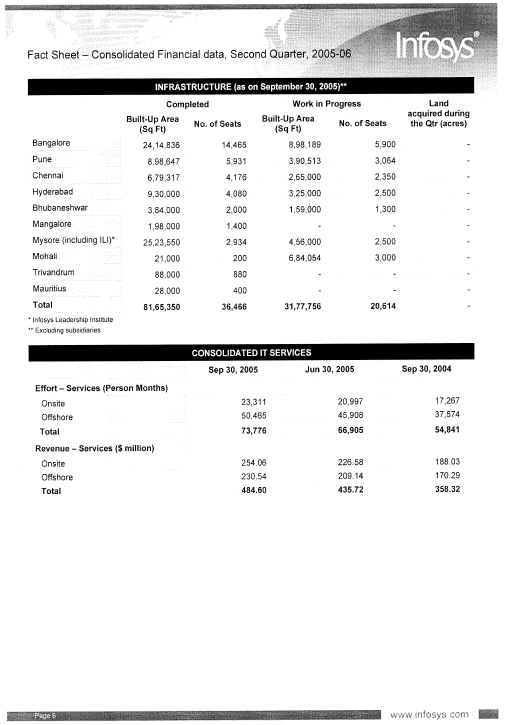
| Fact Sheet-Consolidated Financial data, Second |
| Completed Work in Progress Land Built-Up Area Built-UpArea acquired during (Sq Ft) No. of Seats (Sq Ft) No. of Seats the Qtr (acres) Bangalore 24,14,836 14,465 8,98,189 5,900 Pune 8,98,647 5,931 3,90,513 3,064 Chennai 6,79,317 4,176 2,65,000 2,350 Hyderabad 9,30,000 4,080 3,25,000 2,500 Bhubaneshwar 3,84,000 2,000 1,59,000 1,300 Mangalore 1,98,000 1,400 — . Mysore (including ILI)* 25,23,550 2,934 4,56,000 2,500 Mohali 21,000 200 6,84,054 3,000 Trivandrum 88,000 880 — — Mauritius 28,000 400 — .Total 81,65,350 36,466 31,77,756 20,614 * Infosys Leadership Institute ** Excluding subsidiaries |
| CONSOLIDATED IT SERVICES |
| Sep 30, 2005 Jun 30, 2005 Sep 30, 2004 Effort — Services (Person Months) Onsite 23,311 20,997 17,267 Offshore 50,465 45,908 37,574Total 73,776 66,905 54,841 Revenue — Services ($ million) Onsite 254.06 226.58 188.03 Offshore 230.54 209.14 170.29Total 484.60 435.72 358.32 |
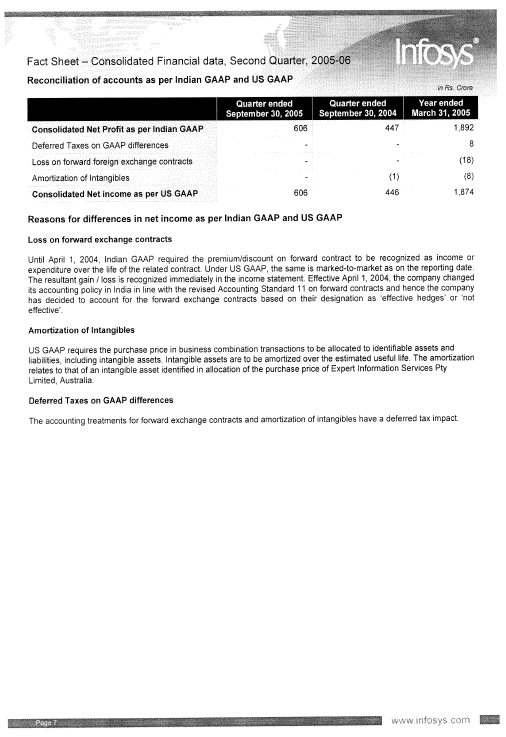
| Fact Sheet — Consolidated Financial data, SecondReconciliation of accounts as per Indian GAAP and US GAAP. In Rs. Crore |
| Quarter ended Quarter ended Year ended September 30, 2005 September 30, 2004 March 31, 2005 Consolidated Net Profit as per Indian GAAP 606 447 1,892 Deferred Taxes on GAAP differences — — 8 Loss on forward foreign exchange contracts — — (18) Amortization of Intangibles — (1) (8)Consolidated Net income as per US GAAP 606 446 1,874 |
| Reasons for differences in net income as per Indian GAAP and US GAAP Loss on forward exchange contracts |
| Until April 1, 2004, Indian GAAP required the premium/discount on forward contract to be recognized as income or expenditure over the life of the related contract. Under US GAAP, the same is marked-to-market as on the reporting date. The resultant gain / loss is recognized immediately in the income statement. Effective April 1, 2004, the company changed its accounting policy in India in line with the revised Accounting Standard 11 on forward contracts and hence the company has decided to account for the forward exchange contracts based on their designation as ‘effective hedges’ or ‘not effective’.. |
| Amortization of Intangibles |
| US GAAP requires the purchase price in business combination transactions to be allocated to identifiable assets and liabilities, including intangible assets. Intangible assets are to be amortized over the estimated useful life. The amortization relates to that of an intangible asset identified in allocation of the purchase price of Expert Information Services Pty Limited, Australia. |
| Deferred Taxes on GAAP differences |
| The accounting treatments for forward exchange contracts and amortization of intangibles have a deferred tax impact. |