At a glance - Indian GAAP (Non-consolidated financials)
| Quarter ended |
| Nine months ended | Year ended | ||
| Dec 31, 2005 | Dec 31, 2004 |
| Dec 31, 2005 | Dec 31, 2004 | March 31, 2005 |
For the period |
|
|
|
|
|
|
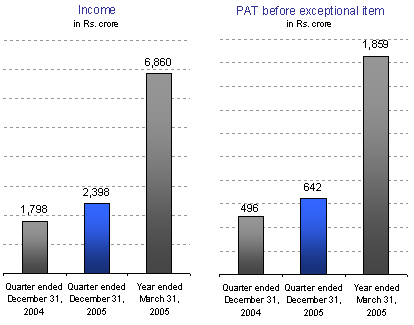
| Income | 2,398 | 1,798 |
| 6,535 | 4,960 | 6,860 |
| Operating profit (PBIDTA) | 833 | 611 |
| 2,184 | 1,662 | 2,325 |
| Operating profit / total income (%) | 34.74% | 33.98% |
| 33.42% | 33.51% | 33.90% |
| Profit after tax (PAT) and before exceptional item | 642 | 496 |
| 1,757 | 1,345 | 1,859 |
| PAT and before exceptional items / total income (%) | 26.77% | 27.59% |
| 26. 89% | 27.12% | 27.10% |
| Profit after tax (PAT) and exceptional item | 642 | 496 |
| 1,757 | 1,345 | 1,904 |
| PAT and exceptional item / total income (%) | 26.77% | 27.59% |
| 26.89% | 27.12% | 27.76% |
| Earnings per share (par value of Rs. 5 each, fully paid) |
|
|
|
|
|
|
| Basic | 23.43 | 18.45 |
| 64.53 | 50.22 | 69.26 |
| Diluted | 22.78 | 17.90 |
| 62.70 | 49.14 | 67.46 |
| Capital expenditure | 244 | 247 |
| 783 | 559 | 794 |
| Dividend per share |
|
|
| 6.50 | 5.00 | 11.50 |
| Dividend amount |
|
|
| 177 | 134 | 310 |
At the end of the period |
|
|
|
|
|
|
| Total assets |
|
|
| 7,250 | 4,744 | 5,242 |
| Fixed assets - net |
|
|
| 2,004 | 1,354 | 1,494 |
| Cash and cash equivalents (including liquid mutual funds) |
|
|
| 4,122 | 2,584 | 2,851 |
| Net current assets |
|
|
| 2,891 | 2,176 | 2,385 |
| Debt |
|
|
| - | - | - |
| Net worth |
|
|
| 7,250 | 4,744 | 5,242 |
| Equity |
|
|
| 137 | 135 | 135 |
| Market capitalization |
|
|
| 82,271 | 56,362 | 61,073 |
Ratio analysis as per Indian GAAP (Non-consolidated)
| Quarter ended |
| Nine months ended December 31 | Year ended | ||
| 2005 | 2004 |
| 2005 | 2004 | 2005 |
Ratios - Financial performance |
|
|
|
|
|
|
| Software development expenses / total revenue (%) | 53.21 | 53.39 |
| 53.67 | 53.68 | 53.28 |
| Gross profit / total revenue (%) | 46.79 | 46.61 |
| 46.33 | 46.32 | 46.72 |
| Selling and marketing expenses / total revenue (%) | 5.38 | 5.63 |
| 5.70 | 5.88 | 5.72 |
| General and administration expenses / total revenue (%) | 6.67 | 7.00 |
| 7.19 | 6.93 | 7.11 |
| SG&A expenses / total revenue (%) | 12.05 | 12.63 |
| 12.89 | 12.82 | 12.83 |
| Aggregate employee costs / total revenue (%) | 47.54 | 47.63 |
| 46.79 | 46.93 | 46.39 |
| Operating profit / total revenue (%) | 34.74 | 33.98 |
| 33.44 | 33.51 | 33.90 |
| Depreciation and amortization / total revenue (%) | 4.55 | 3.86 |
| 4.19 | 3.53 | 3.91 |
| Operating profit after depreciation and Interest / total revenue (%) | 30.19 | 30.13 |
| 29.25 | 29.97 | 29.99 |
| Other income / total revenue (%) | (0.08) | 2.60 |
| 1.12 | 1.92 | 1.86 |
| Profit before tax and exceptional items / total revenue (%) | 30.11 | 32.75 |
| 30.35 | 31.89 | 31.85 |
| Tax / total revenue (%) | 3.34 | 5.17 |
| 3.46 | 4.77 | 4.74 |
| Tax / PBT (%) | 11.08 | 15.79 |
| 11.39 | 14.95 | 14.89 |
| PAT before exceptional items / total revenue (%) | 26.77 | 27.58 |
| 26.89 | 27.13 | 27.10 |
Ratios - Growth (%) |
|
|
|
|
|
|
| Overseas revenue | 34 | 43 |
| 32 | 43 | 43 |
| Total revenue | 33 | 46 |
| 32 | 44 | 44 |
| Operating profit | 36 | 49 |
| 31 | 46 | 47 |
| Net Profit ( before exceptional items) | 29 | 51 |
| 31 | 48 | 50 |
| Basic EPS ( before exceptional items) | 27 | 50 |
| 29 | 47 | 48 |
Data - Per-share ( period end) |
|
|
|
|
|
|
| Basic EPS (before exceptional items) (Rs.) | 23.43 | 18.45 |
| 64.53 | 50.22 | 69.26 |
| Basic EPS (after exceptional items) (Rs.) | 23.43 | 18.45 |
| 64.53 | 50.22 | 70.95 |
| Basic cash EPS ( before exceptional items) (Rs.) | 27.43 | 21.11 |
| 74.60 | 56.77 | 79.26 |
| Basic cash EPS (after exceptional items) (Rs.) | 27.43 | 21.11 |
| 74.60 | 56.77 | 80.94 |
| Book value (Rs.) | 266.26 | 177.09 |
| 266.26 | 177.09 | 193.73 |
| Price / earning ( LTM) ** | 35.93 | 33.30 |
| 35.93 | 33.30 | 32.59 |
| Price / cash earnings ( LTM) ** | 30.93 | 29.18 |
| 30.93 | 29.18 | 28.48 |
| Price / book value ** | 11.26 | 11.81 |
| 11.26 | 11.81 | 11.65 |
| PE / EPS growth ** | 1.31 | 0.67 |
| 1.26 | 0.70 | 0.68 |
| Dividend per share (Rs.) | - | - |
| 6.50 | 5.00 | 11.50 |
Ratios - Return |
|
|
|
|
|
|
| PAT before exceptional items / average net worth (%) (LTM) |
| 37.88 | 39.73 | 43.77 | ||
| ROCE ( PBIT/Average capital employed) (%) (LTM) |
| 43.12 | 46.50 | 51.43 | ||
| Return on average invested capital (%)(LTM)* |
| 86.03 | 100.88 | 123.56 | ||
| Capital output ratio (LTM) |
| 1.41 | 1.48 | 1.61 | ||
| Invested capital output ratio (LTM)* |
| 3.28 | 3.86 | 4.77 | ||
Ratios - Balance sheet |
|
|
|
|
|
|
| Debt-equity ratio |
| - | - | - | ||
| Day's sales outstanding ( Days) (LTM) |
| 57 | 57 | 67 | ||
| Current ratio |
| 3.00 | 2.99 | 2.77 | ||
| Cash and cash equivalents / total assets (%)* |
| 56.86 | 57.65 | 54.38 | ||
| Cash and cash equivalents / total revenue (%) (LTM)* |
| 48.87 | 43.63 | 41.56 | ||
| Capital expenditure / total revenue (%)(LTM) |
| 11.97 | 11.27 | 11.57 | ||
| Depreciation and amortization / average gross block (%) (LTM) |
| 14.91 | 13.28 | 14.29 | ||
| Technology investment / total revenue (%) (LTM) |
| 4.72 | 5.31 | 4.11 | ||
At a glance - US GAAP
| Three months ended December 31, |
| Nine months ended December 31, | Year ended March 31, | ||
| 2004 | 2005 |
| 2004 | 2005 | 2005 |
For the period |
|
|
|
|
|
|
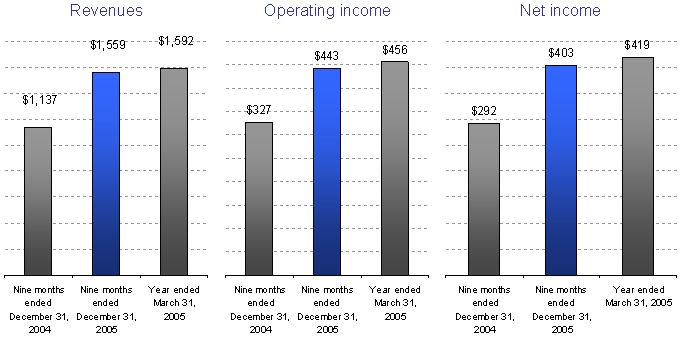
| Revenues | $423 | $559 |
| $1,137 | $1,559 | $1,592 |
| Operating income | $122 | $164 |
| $327 | $443 | $456 |
| Operating income/revenues (%) | 28.8% | 29.3% |
| 28.8% | 28.4% | 28.6% |
| Net income | $112 | $143 |
| $292 | $403 | $419 |
| Net income/ revenues (%) | 26.5% | 25.6% |
| 25.7% | 25.8% | 26.3% |
| Basic earnings per equity share ($) | $0.42 | $0.53 |
| $1.09 | $1.49 | $1.57 |
| Cash dividend per equity share ($) | $0.12 | $0.14 |
| $0.75 | $0.29 | $0.75 |
| Capital expenditure | $58 | $57 |
| $130 | $184 | $186 |
|
|
|
|
|
|
|
At the end of the period |
|
|
|
|
|
|
| Total assets |
|
|
| $1,305 | $1,862 | $1,454 |
| Property, plant and equipment- net |
|
|
| $321 | $457 | $352 |
| Cash and cash equivalents |
|
|
| $389 | $477 | $410 |
| Investment in liquid mutual fund units |
|
|
| $244 | $492 | $278 |
| Working capital |
|
|
| $762 | $1,150 | $885 |
| Stockholders' equity |
|
|
| $1,097 | $1,639 | $1,253 |
| Common stock |
|
|
| $31 | $31 | $31 |
| Market capitalization |
|
|
| $13,026 | $18,303 | $14,001 |
- Market capitalization is calculated by considering the share price at National Stock Exchange of India Limited on the shares outstanding at the period / year end.
Shareholder information
| 1. Registered office | Electronics City, Hosur Road, Bangalore 560 100, India | |
| Tel.: +91-80-2852-0261, Fax: +91-80-2852-0362 | ||
| Homepage: www.infosys.com | ||
| 2. Listing on stock exchanges | In India : The Bombay Stock Exchange Limited (BSE), and National Stock Exchange of India Ltd. (NSE) | |
| Outside India: NASDAQ National Market in the US. | ||
| 3. Par value of equity shares | Rs. 5/- each fully paid-up | |
| 4. Registrar and share transfer agent | Share transfers in physical form and other communication regarding share certificate, dividends, change of address, etc. may be addressed to : Karvy Computershare Private Limited, | |
| BSE | NSE | Total | ||||
| High | Low | Volume | High | Low | Volume | Volume |
| Rs. | Rs. | Nos | Rs. | Rs. | Nos | Nos |
October, 2005 | 2,727.00 | 2,401.00 | 67,61,034 | 2,682.90 | 2,415.40 | 2,34,76,673 | 3,02,37,707 |
November | 2,767.00 | 2,498.00 | 45,83,875 | 2,758.40 | 2,538.35 | 1,61,24,005 | 2,07,07,880 |
December | 3,039.70 | 2,667.00 | 57,02,692 | 3,023.75 | 2,767.90 | 1,92,67,540 | 2,49,70,232 |
For the period | 3,039.70 | 2,401.00 | 1,70,47,601 | 3,023.75 | 2,415.40 | 5,88,68,218 | 7,59,15,819 |
Volume traded to average shares outstanding (%) * | |||||||
Quarter ended December 31, 2005 |
|
| 7.21% |
|
| 24.91% | 32.12% |
Quarter ended December 31, 2004 |
|
| 9.91% |
|
| 29.75% | 39.66% |
| Quarter ended | |||
Nature of complaints | December 31, 2005 | December 31, 2004 | ||
| Received | Attended to | Received | Attended to |
Dividend Related | 229 | 229 | 128 | 128 |
9. Categories of shareholders as on December 31, 2005
Category | No. of shareholders | Voting strength (%) | No. of shares held |
PROMOTER HOLDING |
|
|
|
Indian promoters | 79 | 19.70 | 5,37,40,717 |
NON PROMOTER HOLDING |
|
|
|
Institutional investors |
|
|
|
Mutual funds | 179 | 2.73 | 75,02,766 |
Banks, financial institutions and insurance companies | 42 | 2.62 | 71,88,098 |
Foreign institutional investors | 538 | 39.30 | 10,78,99,961 |
Others |
|
|
|
Private corporate bodies | 2,570 | 1.32 | 36,21,881 |
Indian public | 1,61,349 | 15.17 | 4,16,27,922 |
Non resident Indians/ overseas corporate bodies | 2,437 | 4.52 | 1,24,15,945 |
Trusts | 35 | 0.81 | 22,33,475 |
Equity shares underlying American Depository Shares* | 1 | 13.95 | 3,82,94,398 |
Total of non promoter holding | 1,67,151 | 80.42 | 22,07,84,446 |
Total | 1,67,230 | 100.00 | 27,45,25,163 |
For investor matters in India: Mr. V. Balakrishnan, | For investor matters in US: Mr. Sandeep Mahindroo, | For queries relating to financial statements: Mr. T. V. Mohandas Pai, |
Reuters Code | Telerate/Moneyline code | Bloomberg code |
INFY.BO (BSE) | IN;INF (BSE) | INFO IN (BSE) |
INFY.NS (NSE) | IN;INFN (NSE) | NINFO IN (NSE) |
INFY.O (NASDAQ) | US;INFY (NASDAQ) |
|
| High* | Low* | Volume | ||
| $ | Rs. | $ | Rs. |
|
October 2005 | 74.79 | 3,372.28 | 65.59 | 2,957.45 | 18,820,074 |
November | 75.00 | 3,440.25 | 69.00 | 3,165.03 | 9,826,663 |
December | 82.53 | 3,709.72 | 73.47 | 3,302.47 | 13,535,596 |
For the period | 82.53 | 3,709.72 | 65.59 | 2,957.45 | 42,182,333 |
United States Bellevue Bridgewater , NJ Charlotte Detroit Fremont Lake Forest Lisle Phoenix Plano Quincy Reston Houston
| Belgium Canada Czech Republic France Germany FrankFurt Stuttgart Walldorf Hong Kong Italy Japan Mauritius Sweden | Switzerland Geneva The Netherlands United Arab Emirates United Kingdom Infosys Technologies Limited 3rd Floor, 288 Bishops Gate Room 303 India Bangalore Reddy Building Bhubaneswar Chennai Mahindra Industrial Park | Hyderabad Mangalore Mohali Mumbai Mysore New Delhi Pune Plot No. 24, Rajiv Gandhi Infotech Park Thiruvananthapuram Subsidiaries Infosys Consulting, Inc.
| Infosys Technologies Level 2 & 3, 484, St. Kilda Road Level 18 & 25 Sydney Infosys Technologies Beijing Branch Progeon Limited 27, SJR Towers Bannerghatta Road Pune Progeon SRO
|
Bankers Company Secretary Auditors Independent Auditors | Visit Infosys at Call us at outside the U.S.
|
Infosys acknowledges the proprietary rights in the trademarks and product names of other companies mentioned in the document.