At a glance - Indian GAAP (Non-consolidated financials)
in Rs. crore, except per share data | |||||
| Quarter ended | Half-year ended | Year ended | ||
| Sep 30, 2006 | Sep 30, 2005 | Sep 30, 2006 | Sep 30, 2005 | March 31, 2006 |
For the period |
|
|
|
|
|
Income | 3,273 | 2,170 | 6,140 | 4,137 | 9,028 |
Operating profit (PBIDTA) | 1,054 | 705 | 1,928 | 1,352 | 2,989 |
Operating profit/ total income (%) | 32.20% | 32.49% | 31.40% | 32.68% | 33.11% |
Profit after tax (PAT) and before exceptional item | 896 | 592 | 1,695 | 1,116 | 2,421 |
PAT and before exceptional item/ total income (%) | 27.38% | 27.28% | 27.61% | 26.98% | 26.82% |
Profit after tax (PAT) and exceptional item | 896 | 592 | 1,701 | 1,116 | 2,421 |
PAT and exceptional item/ total income (%) | 27.38% | 27.28% | 27.70% | 26.98% | 26.82% |
Earnings per share (par value Rs. 5/- each)* |
|
|
|
|
|
Before exceptional items |
|
|
|
|
|
Basic | 16.15 | 10.87 | 30.61 | 20.54 | 44.34 |
Diluted | 15.79 | 10.57 | 29.90 | 19.96 | 43.10 |
After exceptional items |
|
|
|
|
|
Basic | 16.15 | 10.87 | 30.72 | 20.54 | 44.34 |
Diluted | 15.79 | 10.57 | 30.01 | 19.96 | 43.10 |
Capital Expenditure | 313 | 291 | 491 | 539 | 1,048 |
Dividend per share * (1) |
|
| 5.00 | 3.25 | 22.50 |
Dividend amount |
|
| 278 | 177 | 1,238 |
At the end of the period |
|
|
|
|
|
Total assets |
|
| 8,551 | 6,405 | 6,897 |
Fixed assets - net |
|
| 2,417 | 1,869 | 2,133 |
Cash and cash equivalents (including liquid mutual funds) |
|
| 4,005 | 3,704 | 4,463 |
Net current assets |
|
| 2,624 | 2,058 | 3,832 |
Debt |
|
| - | - | - |
Net worth |
|
| 8,551 | 6,405 | 6,897 |
Equity |
|
| 278 | 136 | 138 |
Market capitalization |
|
| 102,801 | 68,582 | 82,154 |
Note:
* Adjusted for issue of 1:1 bonus shares allotted on July 15, 2006.
Market capitalization is calculated by considering the share price at National Stock Exchange of India Limited on the shares outstanding at the period / year end.
(1) Dividend for the year ended March 31, 2006 includes a silver Jubilee special dividend of Rs.15 per share
 |  |
Ratio analysis as per Indian GAAP (Non-consolidated)
| Quarter ended September 30, | Half year ended September 30, | Year ended | ||
| 2006 | 2005 | 2006 | 2005 | March 31, 2006 |
Ratios - Financial Performance | |||||
Software development expenses / total revenue (%) | 54.87 | 53.79 | 55.55 | 53.94 | 54.13 |
Gross profit / total revenue (%) | 45.13 | 46.21 | 44.45 | 46.06 | 45.87 |
Selling and marketing expenses / total revenue (%) | 5.50 | 5.76 | 5.67 | 5.89 | 5.53 |
General and administration expenses / total revenue (%) | 7.42 | 7.97 | 7.38 | 7.49 | 7.23 |
SG&A expenses / total revenue (%) | 12.92 | 13.73 | 13.05 | 13.38 | 12.76 |
Aggregate employee costs / total revenue (%) | 48.09 | 46.28 | 48.49 | 46.36 | 47.29 |
Operating profit / total revenue (%) | 32.20 | 32.48 | 31.40 | 32.68 | 33.12 |
Depreciation and amortization / total revenue (%) | 3.36 | 4.15 | 3.37 | 3.98 | 4.53 |
Operating profit after depreciation and Interest / total revenue (%) | 28.84 | 28.33 | 28.03 | 28.70 | 28.58 |
Other income / total revenue (%) | 2.02 | 2.07 | 3.18 | 1.82 | 1.59 |
Profit before tax and exceptional items / total revenue (%) | 30.86 | 30.35 | 31.16 | 30.49 | 30.17 |
Tax / total revenue (%) | 3.48 | 3.09 | 3.55 | 3.53 | 3.36 |
Tax / PBT (%) | 11.29 | 10.17 | 11.40 | 11.57 | 11.12 |
PAT before exceptional items / total revenue (%) | 27.38 | 27.28 | 27.61 | 26.98 | 26.82 |
Ratios - Balance sheet | |||||
Debt-equity ratio | - | - | - | ||
Day's sales outstanding ( Days) (LTM) | 65 | 58 | 61 | ||
Current ratio* | 4.30 | 3.90 | 3.04 | ||
Cash and cash equivalents / total assets (%)* | 46.84 | 57.83 | 64.71 | ||
Cash and cash equivalents / total revenue (%) (LTM)* | 36.31 | 47.27 | 49.44 | ||
Capital expenditure / total revenue (%) (LTM) | 9.07 | 6.14 | 11.61 | ||
Depreciation and amortization / average gross block (%) (LTM) | 14.86 | 14.71 | 16.30 | ||
Technology investment / total revenue (%) (LTM) | 5.63 | 4.84 | 3.69 | ||
Ratios - Return | |||||
PAT before exceptional items / average net worth (%) (LTM) | 40.14 | 40.57 | 39.89 | ||
ROCE (PBIT/Average capital employed) (%) (LTM) | 45.16 | 46.83 | 44.89 | ||
Return on average invested capital (%)(LTM)* | 80.03 | 93.71 | 93.96 | ||
Capital output ratio (LTM) | 1.48 | 1.50 | 1.49 | ||
Invested capital output ratio (LTM)* | 3.04 | 3.57 | 3.74 | ||
Ratios - Growth (%) | |||||
Total revenue | 51 | 28 | 48 | 31 | 32 |
Operating profit | 50 | 26 | 43 | 29 | 29 |
Net Profit ( before exceptional items) | 51 | 30 | 52 | 31 | 30 |
Basic EPS ( before exceptional items) | 49 | 28 | 49 | 29 | 28 |
Data - Per-share (period end) | |||||
Basic EPS (before exceptional items) (Rs.) | 16.15 | 10.87 | 30.61 | 20.54 | 44.33 |
Basic EPS (after exceptional items) (Rs.) | 16.15 | 10.87 | 30.72 | 20.54 | 44.33 |
Basic cash EPS ( before exceptional items) (Rs.) | 18.13 | 12.52 | 34.34 | 23.57 | 51.84 |
Basic cash EPS (after exceptional items) (Rs.) | 18.13 | 12.52 | 34.45 | 23.57 | 51.84 |
Book value (Rs.) | 153.85 | 117.48 | 153.85 | 117.48 | 125.15 |
Price / earning ( LTM) ** | 34.00 | 32.14 | 34.00 | 32.14 | 33.62 |
Price / cash earnings ( LTM) ** | 29.54 | 27.85 | 29.54 | 27.85 | 28.76 |
Price / book value ** | 12.02 | 10.71 | 12.02 | 10.71 | 11.91 |
PE / EPS growth ** | 0.70 | 1.16 | 0.70 | 1.10 | 1.20 |
Dividend per share (Rs.)*** | - | - | 5.00 | 3.25 | 7.50 |
* Investments in Liquid funds have been considered as Cash & Cash equivalents for the purpose of above ratio analysis
** Before exceptional items
*** Excludes silver jubilee dividend of Rs 15 per share for fiscal 2006
Ratios above are adjusted for issue of 1:1 bonus shares allotted on July 15, 2006.
LTM : Last Twelve Months
** Before exceptional items
*** Excludes silver jubilee dividend of Rs 15 per share for fiscal 2006
Ratios above are adjusted for issue of 1:1 bonus shares allotted on July 15, 2006.
LTM : Last Twelve Months
At a glance - US GAAP
(Dollars in millions except per share data) | |||||
| Three months ended September 30, | Six months ended September 30, | Year ended March 31 | ||
| 2005 | 2006 | 2005 | 2006 | 2006 |
For the period |
|
|
|
| |
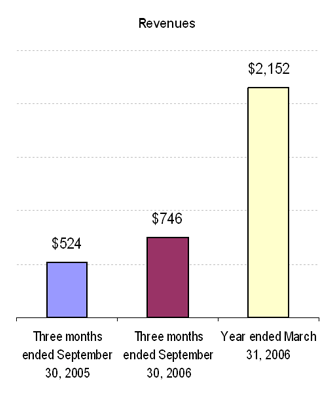
Revenues | $524 | $746 | $1,000 | $1,406 | $2,152 |
Operating income | $146 | $211 | $279 | $381 | $599 |
Operating income/revenues (%) | 27.9% | 28.3% | 27.9% | 27.1% | 27.8% |
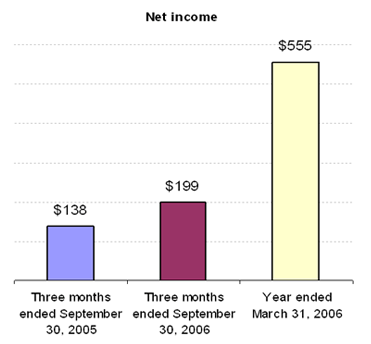
Net income | $138 | $199 | $260 | $373 | $555 |
Net income/ revenues (%) | 26.3% | 26.7% | 26.0% | 26.5% | 25.8% |
Basic earnings per equity share ($) (1) | $0.25 | $0.36 | $0.48 | $0.68 | $1.02 |
Cash dividend per equity share ($) (1), (2) | NA | NA | $0.07 | $0.42 | $0.15 |
Capital expenditure | $69 | $72 | $127 | $114 | $246 |
At the end of the period |
|
|
|
|
|
Total assets | $1,734 | $2,220 | $2,066 | ||
Property, plant and equipment- net | $435 | $540 | $491 | ||
Cash and cash equivalents | $334 | $328 | $889 | ||
Investment in liquid mutual fund units | $531 | $615 | $170 | ||
Working capital | $1,061 | $1,264 | $1,300 | ||
Stockholders' equity | $1,528 | $1,955 | $1,837 | ||
Common stock (1) | $31 | $62 | $31 | ||
Market capitalization (3) | $15,608 | $22,372 | $18,470 | ||
Note :
(1) Basic earnings per equity share, cash dividend per equity share and common stock for September 2006 are adjusted for stock split.
(2) Cash dividend for the six months ended September 30, 2006 includes a silver jubilee special dividend of $0.33 per equity share paid in June 2006.
(3) Market capitalization is calculated by considering the share price at National Stock Exchange of India Limited on the shares outstanding at the period / year end.
 |  |  |
Shareholder information
| 1. Registered office | Electronics City, Hosur Road, Bangalore 560 100, India |
| 2. Listing on stock exchanges | In India : The Bombay Stock Exchange Limited (BSE), and National Stock Exchange of India Ltd. (NSE) Outside India : NASDAQ Global Select Market in the US. |
| 3. Par value of equity shares | Rs. 5/- each fully paid-up |
| 4. Registrar and share transfer agent | Share transfers in physical form and other communication regarding share certificate, dividends, change of address, etc. may be addressed to : Karvy Computershare Private Limited Registrars and Share Transfer Agents 46, Avenue-4, Street No.1 Banjara Hills, Hyderabad-500 034 Tel.: +91-40-23431595 Fax: +91-40-23420814 |
5. Stock market data relating to shares listed in India
a. The company's market capitalization is included in the computation of the BSE-30 Sensitive Index (Sensex), the BSE Dollex and S&P CNX NIFTY Index.
b. Monthly high and low quotations as well as the volume of shares traded at BSE and NSE for the quarter ended September 30, 2006 are:
| BSE | NSE | Total | ||||
| High | Low | Volume | High | Low | Volume | Volume |
| Rs. | Rs. | Nos | Rs. | Rs. | Nos | Nos |
July, 2006 | 1,693.22 | 1,551.95 | 74,13,066 | 1,693.83 | 1,552.50 | 2,79,89,035 | 3,54,02,101 |
August | 1,808.80 | 1,658.70 | 54,39,160 | 1,806.40 | 1,658.00 | 2,26,05,028 | 2,80,44,188 |
September | 1,856.45 | 1,736.35 | 40,85,075 | 1,858.15 | 1,733.55 | 1,83,59,072 | 2,24,44,147 |
For the period | 1,69,37,301 | 6,89,53,135 | 8,58,90,436 | ||||
Volume traded to shares outstanding (%) * | |||||||
Quarter ended September 30, 2006 | 3.54% | 14.41% | 17.95% | ||||
Quarter ended September 30, 2005 | 5.19% | 22.51% | 27.70% | ||||
The number of shares outstanding is 47,82,43,986. American Depositary Shares (ADSs) have been excluded for the purpose of this calculation.
6. Share transfer system
Shares sent for physical transfer are effected after giving a notice of 15 days to the seller for sale confirmation. The share transfer committee of the company meets as often as required.
The total number of shares transferred in physical form during the quarter ended September 30, 2006 was 3,231 (quarter ended September 30, 2005 - 4,810).
7. Investor services - Complaints Received
Quarter ended | ||||
Nature of complaints | September 30, 2006 | September 30, 2005 | ||
Received | Attended to | Received | Attended to | |
Dividend Related | 274 | 274 | 63 | 63 |
The company has attended to most of the investors' grievances/correspondences within a period of 10 days from the date of receipt of the same, during the quarter ended September 30, 2006 except in cases that are constrained by disputes or legal impediments.
8. Legal Proceedings
There are some pending cases relating to disputes over title to shares, in which the company has been made a party. However, these cases are not material in nature.
9. Categories of shareholders as on September 30, 2006
Category | No. of shareholders | Voting strength (%) | No. of shares held |
PROMOTER HOLDING | |||
Indian promoters | 19 | 19.33 | 10,74,25,434 |
NON PROMOTER HOLDING | |||
Institutional investors | |||
Mutual funds | 220 | 3.86 | 2,14,25,514 |
Banks, financial institutions and insurance companies | 45 | 2.80 | 1,55,51,764 |
Foreign institutional investors | 611 | 36.19 | 20,11,38,122 |
Others | |||
Private corporate bodies | 3,824 | 1.94 | 1,07,61,949 |
Indian public | 3,71,474 | 17.75 | 9,86,58,804 |
Non resident Indians/ overseas corporate bodies | 5,332 | 3.62 | 2,01,27,029 |
Trusts | 50 | 0.52 | 28,81,883 |
Foreign Nationals | 7 | 0.00 | 43,252 |
Clearing Members | 630 | 0.04 | 2,30,235 |
Total of public shareholding | 3,82,212 | 86.05 | 47,82,43,986 |
Equity shares underlying American Depository Shares* | 1 | 13.95 | 7,75,41,015 |
Total | 3,82,213 | 100.00 | 555,785,001 |
* Held by beneficial owners outside India.
10. Financial calendar (tentative and subject to change)
Financial results
| Quarter ending December 31, 2006 | Jan 11, 2007 |
| Quarter and Year ending March 31, 2007 | Apr 13, 2007 |
| Annual General Meeting for year ending March 31, 2007 | Jun 2007 |
11. Investors' correspondence
| For queries relating to financial statements: | For investor correspondence: | For queries relating to shares/dividends: |
| Mr. V. Balakrishnan, Chief Financial Officer Infosys Technologies Limited Electronics City, Hosur Road Bagnalore-560 100, India Tel. : +91-80-2852-0440 Fax : +91-80-2852-0754 E-mail: balakv@infosys.com | Mr. Sandeep Mahindroo Manager-Investor Relations Infosys Technologies Limited 66-7, Kaiser Drive Fremont , CA 94555 Tel. : 001-510-739-3407 Fax : 001-510-742 3090 E-mail: sandeep_mahindroo@infosys.com | Mr. Parvatheesam K Company Secretary Infosys Technologies Limited Electronics City, Hosur Road Bangalore 561 100, India Tel. : +91-80-2852-0261 Fax : +91-80-2852-0754 E-mail: parvatheesam_k@infosys.com |
Stock exchange codes
Reuters Code | Telerate/Moneyline code | Bloomberg code |
INFY.BO (BSE) | IN;INF (BSE) | INFO IN (BSE) |
INFY.NS (NSE) | IN;INFN (NSE) | NINFO IN (NSE) |
INFY.O (NASDAQ) | US;INFY (NASDAQ) |
|
13. Stock market data relating to American Depositary Shares (ADSs)
| a. ADS listed at : | NASDAQ Global Select Market in the US |
| b. Ratio of ADS to equity shares : | One ADS for one equity share |
| c. ADS symbol : | INFY |
d. The American Depositary Shares issued under the ADS program of the company were listed on the NASDAQ Global Select Market in the US on March 11, 1999. The monthly high and low quotations as well as the volume of ADSs traded at the NASDAQ Global Select Market for the quarter ended September 30, 2006 are: | |
| High* | Low* | Volume | ||
| $ | Rs. | $ | Rs. |
|
July 2006 | 41.61 | 1,934.45 | 38.18 | 1,775.00 | 40,519,519 |
August | 44.96 | 2,087.50 | 40.26 | 1,869.27 | 17,607,487 |
September | 48.24 | 2,216.62 | 44.11 | 2,026.85 | 18,782,288 |
For the period | 48.24 | 2,216.62 | 38.18 | 1,775.00 | 76,909,294 |
Note: 1 ADS = 1 equity share. US$ has been converted into Indian rupees at the monthly closing rates. The number of ADSs outstanding as on September 30, 2006 was 7,75,41,015. The percentage of volume traded to the total float was 99.18%.
14. ECS mandate
The company has received complaints regarding non-receipt of dividend warrants. All shareholders are requested to update their bank account details with their respective depositories. This would enable the company to service its investors better.
15. Change of address
The company has received complaints regarding non-receipt of dividend warrants and other corporate communications. All shareholders are requested to update their current address with their respective depositories immediately. This would enable the company to service its investors better.
Infosys Technologies Limited United States Atlanta Bellevue Bridge Water Charlotte Detroit Fremont Lake Forest Lisle Phoenix Plano Quincy Reston Belgium Canada
| Germany Ireland Japan Mauritius Sweden Switzerland Geneva The Netherlands United Arab Emirates United Kingdom Part First Floor | India Reddy Building K-310 Bhubaneswar Chennai Mahindra Industrial Park Hyderabad Mangalore Mohali Chandigarh Plot No. 8-15, Rajiv Gandhi Technology Park Mumbai Mysore New Delhi Plot No. 24,
| Thiruvananthapuram Infosys Consulting, Inc. Infosys Technologies ( Australia) Pty. Limited Melbourne Level 18 & 25 Sydney Infosys Technologies (China) Co. Ltd. Bldg 18, Capital of Leaders Hangzhou | Infosys BPO Limited 27, SJR Towers Pune Jaipur Gurgaon United Kingdom Toronto Melbourne Czech Republic Holandka 3 |
Bankers Company Secretary Auditors Independent Auditors | Visit Infosys at Call us at within the U.S. outside the U.S | |||
| ||||