UNITED STATES
SECURITIES AND EXCHANGE COMMISSION
Washington, D.C. 20549
FORM N-CSR
CERTIFIED SHAREHOLDER REPORT
OF
REGISTERED MANAGEMENT INVESTMENT COMPANIES
| | |
| Investment Company Act file number: | 811-02554 |
Name of Registrant: | Vanguard Money Market Reserves |
Address of Registrant: | P.O. Box 2600 |
| | Valley Forge, PA 19482 |
Name and address of agent for service: | Heidi Stam, Esquire |
| | P.O. Box 876 |
| | Valley Forge, PA 19482 |
Registrant’s telephone number, including area code: (610) 669-1000 |
Date of fiscal year end: August 31 |
Date of reporting period: September 1, 2015 – February 29, 2016 |
Item 1: Reports to Shareholders |

Semiannual Report | February 29, 2016
Vanguard Money Market Funds
Vanguard Prime Money Market Fund
Vanguard Federal Money Market Fund
Vanguard Treasury Money Market Fund
Vanguard’s Principles for Investing Success
We want to give you the best chance of investment success. These principles, grounded in Vanguard’s research and experience, can put you on the right path.
Goals. Create clear, appropriate investment goals.
Balance. Develop a suitable asset allocation using broadly diversified funds. Cost. Minimize cost.
Discipline. Maintain perspective and long-term discipline.
A single theme unites these principles: Focus on the things you can control.
We believe there is no wiser course for any investor.
| |
| Contents | |
| Your Fund’s Total Returns. | 1 |
| Chairman’s Letter. | 2 |
| Advisor’s Report. | 8 |
| Prime Money Market Fund. | 11 |
| Federal Money Market Fund. | 30 |
| Treasury Money Market Fund. | 41 |
| About Your Fund’s Expenses. | 50 |
| Glossary. | 52 |
Please note: The opinions expressed in this report are just that—informed opinions. They should not be considered promises or advice.
Also, please keep in mind that the information and opinions cover the period through the date on the front of this report. Of course, the
risks of investing in your fund are spelled out in the prospectus.
See the Glossary for definitions of investment terms used in this report.
About the cover: Pictured is a sailing block on the Brilliant, a 1932 schooner docked in Mystic, Connecticut. A type of pulley, the
sailing block helps coordinate the setting of the sails. At Vanguard, the intricate coordination of technology and people allows
us to help millions of clients around the world reach their financial goals.
Your Fund’s Total Returns
| | |
| Six Months Ended February 29, 2016 | | |
| | 7-Day | Total |
| | SEC Yield | Returns |
| Vanguard Prime Money Market Fund | | |
| Investor Shares | 0.40% | 0.10% |
| Money Market Funds Average | | 0.00 |
| Admiral™ Shares | 0.46% | 0.13% |
| Institutional Money Market Funds Average | | 0.04 |
| Money Market Funds Average and Institutional Money Market Funds Average: Derived from data provided by Lipper, a Thomson Reuters Company. |
| | |
| Vanguard Federal Money Market Fund | 0.30% | 0.07% |
| Government Money Market Funds Average | | 0.00 |
| Government Money Market Funds Average: Derived from data provided by Lipper, a Thomson Reuters Company. | |
| Vanguard Treasury Money Market Fund | 0.25% | 0.05% |
| iMoneyNet Money Fund Report’s 100% Treasury Funds Average | | 0.00 |
| iMoneyNet Money Fund Report’s 100% Treasury Funds Average: Derived from data provided by iMoneyNet, Inc. |
| The 7-day SEC yield of a money market fund more closely reflects the current earnings of the fund than its total return. |
| Admiral Shares carry lower expenses and are available to investors who meet certain account-balance requirements. |
1

Chairman’s Letter
Dear Shareholder,
Ending months of uncertainty, the Federal Reserve in mid-December increased its target for short-term interest rates to 0.25%–0.5%—the first time the target has been above the near-zero threshold since 2008. Although rates are still exceptionally low by historical standards, the increase marked a start toward normalizing monetary policy.
Over the six months ended February 29, 2016, returns for money market and savings accounts reflected the muted rate levels that persisted through much of the period. Still, yields rose somewhat in anticipation of December’s increase and, later, as a result of it. Vanguard Prime Money Market Fund returned 0.10% for Investor Shares and 0.13% for Admiral Shares, which have a lower expense ratio. Vanguard Federal Money Market Fund returned 0.07% and Vanguard Treasury Money Market Fund 0.05%.
These slight returns were nevertheless ahead of the average result for competing money market funds, and we adhered to our mandate to invest in securities of very high credit quality.
Please note that as of December 14, the Treasury Money Market Fund’s name was changed from the Admiral Treasury Money Market Fund, and Institutional Shares of the Prime Money Market Fund were reclassified as Admiral Shares. Also, the Treasury Money Market Fund reopened
2
to all investors effective January 20, joining the Federal Money Market Fund, which reopened last June.
As you may recall, the Securities and Exchange Commission in 2014 adopted new money market fund regulations that fund sponsors must comply with by October 2016. As U.S. government money market funds, the Treasury Money Market Fund and the Federal Money Market Fund will continue to maintain a share price of $1. Moreover, they will not be subject to new liquidity fee or redemption gate requirements.
The Prime Money Market Fund will be designated a retail fund, meaning that individual investors will continue to have access to this fund at a share price of $1.
Please see the fund’s prospectus for information on fees and gates that apply to retail money market funds.
Bonds registered gains as investors cut their risk
The broad U.S. taxable bond market returned 2.20% over the fiscal half year. Most of the gains came in January and February as investors sought safe-haven assets amid stock market turmoil. The yield of the 10-year U.S. Treasury note closed at 1.74% in February, down from 2.18% six months earlier. (Bond prices and yields move in opposite directions.)
International bond markets (as measured by the Barclays Global Aggregate Index ex USD) returned 3.13%. Bonds globally have been buoyed by negative interest
| | | |
| Market Barometer | | | |
| | Total Returns |
| | Periods Ended February 29, 2016 |
| | Six | One | Five Years |
| | Months | Year | (Annualized) |
| Bonds | | | |
| Barclays U.S. Aggregate Bond Index (Broad taxable | | | |
| market) | 2.20% | 1.50% | 3.60% |
| Barclays Municipal Bond Index (Broad tax-exempt market) | 3.62 | 3.95 | 5.45 |
| Citigroup Three-Month U.S. Treasury Bill Index | 0.04 | 0.06 | 0.04 |
| |
| Stocks | | | |
| Russell 1000 Index (Large-caps) | -2.03% | -7.21% | 9.92% |
| Russell 2000 Index (Small-caps) | -10.16 | -14.97 | 6.11 |
| Russell 3000 Index (Broad U.S. market) | -2.68 | -7.84 | 9.61 |
| FTSE All-World ex US Index (International) | -9.12 | -16.79 | -0.89 |
| |
| CPI | | | |
| Consumer Price Index | -0.51% | 1.02% | 1.39% |
3
rates. As central banks in Europe and Asia boosted stimulus efforts to battle weak growth and low inflation, the European Central Bank in December cut a key rate further into negative territory, and the Bank of Japan in late January adopted a negative-rate policy.
Stocks mostly slumped over the fiscal half year
U.S. stocks returned about –3%. Results were negative in four of the six months. Only October’s return of about 8% prevented an even weaker performance for the half year.
Fears that China’s economic slowdown would spread globally weighed on results. Oil and commodity prices, which declined through most of the period before showing some resiliency in February, also concerned investors.
International stocks returned about –9%, a result that would have been less severe if not for the U.S. dollar’s strength against many foreign currencies. European stocks were among the worst performers.
The funds were prepared for the Fed to raise rates
The Fed’s strategy to normalize monetary policy hinges on the health of the U.S. economy, which generally fared better over the six months than many of its international counterparts. Although corporate earnings weren’t particularly impressive and stock markets were volatile at times, the economy expanded and
| | |
| Expense Ratios | | |
| Your Fund Compared With Its Peer Group | | |
| | | Peer Group |
| | Fund | Average |
| Prime Money Market Fund | | |
| Investor Shares | 0.16% | 0.17% |
| Admiral Shares | 0.10 | 0.18 |
| Federal Money Market Fund | 0.11 | 0.08 |
| Treasury Money Market Fund | 0.09 | 0.06 |
The fund expense ratios shown are from the prospectus dated December 14, 2015, and represent estimated costs for the current fiscal year.
For the six months ended February 29, 2016, the funds’ annualized expense ratios were: for the Prime Money Market Fund, 0.16% for
Investor Shares and 0.10% for Admiral Shares; for the Federal Money Market Fund, 0.11%; for the Treasury Money Market Fund, 0.09%.
Peer groups: For the Prime Money Market Fund Investor Shares, Money Market Funds; and for the Admiral Shares, Institutional Money
Market Funds; for the Federal Money Market Fund, Government Money Market Funds; and for the Treasury Money Market Fund; iMoneyNet
Money Fund Report’s 100% Treasury Fund.
4
labor markets improved. Vanguard Chief Economist Joe Davis expects short-term interest rates to rise further in 2016.
The Vanguard Money Market Funds were well-prepared to benefit from the Fed’s initial increase. In anticipation of it, the funds’ advisor, Vanguard Fixed Income Group, repositioned the portfolios by shortening their weighted average maturity and increasing exposure to floating-rate securities. These moves allowed the funds to reflect the higher yields more quickly.
Vanguard’s low expense ratios proved to be a significant advantage for all three funds, ensuring that we don’t have to take unreasonable risks to reach for yield. With the Prime Money Market Fund, we’re able to invest in higher-quality debt and avoid exposure to the debt of financially unstable countries, as well as limit exposure to volatile industry sectors.
At the period’s end, the Prime Money Market Fund held nearly 50% of its assets in Yankee/foreign issues. These securities are denominated in U.S. dollars to eliminate currency risk, are from highly rated foreign issuers, and do not include financial paper from Greece or other economically troubled countries in southern Europe.
U.S. government securities are the focus of the Treasury Money Market Fund and the Federal Money Market Fund and also constitute a significant portion of the Prime Money Market Fund. U.S. Treasury securities are backed by the full faith and credit of the United States and are
| | | |
| Changes in Yields | | | |
| | | | 7-Day SEC Yield |
| | February 29, | August 31, | February 28, |
| Money Market Fund | 2016 | 2015 | 2015 |
| Prime | | | |
| Investor Shares | 0.40% | 0.06% | 0.01% |
| Admiral Shares | 0.46 | 0.12 | 0.07 |
| Federal | 0.30 | 0.02 | 0.01 |
| Treasury | 0.25 | 0.01 | 0.01 |
5
considered a safe haven when investors are most concerned about the economy or financial markets. The Federal Money Market Fund holds federal agency securities, which maintain nearly the same credit quality as securities issued by the U.S. government.
Yield is important to the funds’ managers and to investors seeking income, but safety and liquidity are the top priorities. Our credit analysts, together with our portfolio managers and traders in the Fixed Income Group, operate under a framework in which avoiding risk and maintaining liquidity are paramount.
| Vanguard’s growth translates into lower costs for you |
| |
| Research indicates that lower-cost investments have tended to outperform higher-cost ones. |
| So it’s little wonder that funds with lower expense ratios—including those at Vanguard—have |
| dominated the industry’s cash inflows in recent years. |
| |
| Vanguard has long been a low-cost leader, with expenses well below those of many other |
| investment management companies. That cost difference remains a powerful advantage for |
| Vanguard clients. Why? Because a lower expense ratio allows a fund to pass along a greater |
| share of its returns to its investors. |
| |
| What’s more, as you can see in the chart below, we’ve been able to lower our costs continually |
| as our assets under management have grown. Our steady growth has not been an explicit |
| business objective. Rather, we focus on putting our clients’ interests first at all times, and |
| giving them the best chance for investment success. But economies of scale—the cost |
| efficiencies that come with our growth—have allowed us to keep lowering our fund costs, |
| even as we invest in our people and technology. |
| |
| The benefit of economies of scale |
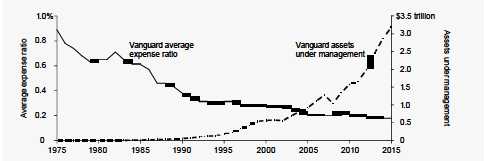
| Note: Data are for U.S.-based Vanguard funds only. |
| Source: Vanguard. |
6
For more information about the advisor’s strategies and the funds’ positioning during the period, please see the Advisor’s Report that follows this letter.
Doing what’s best for clients: That’s how we were built
It’s hard for me to believe, but this year will be my 30th with Vanguard. I knew little about the company when I started in June 1986, but I soon learned what makes Vanguard unique.
Simply put, we’re built differently.
We don’t have stockholders or outside owners. Instead, Vanguard is owned by its funds, which in turn are owned by you—Vanguard clients.
This structure matters because it ensures that our interests are completely aligned with those of our clients. We never have to weigh what’s best for clients against what’s best for the company’s owners; their interests are one and the same. Our client-owned structure is what allows us to run our funds at cost, and it’s why Vanguard’s expense ratios remain among the lowest in the industry. (For more on this, see the insight box on page 6.)
At the same time, we continually dedicate resources to enhance Vanguard’s service and investment capabilities. We aspire to provide the highest possible quality at the lowest possible price. That was true 30 years ago, it’s true today, and it will remain our focus for decades to come. After all, we’re built to put the long-term interests of our clients first.
As always, thank you for investing with Vanguard.
Sincerely,

F. William McNabb III
Chairman and Chief Executive Officer
March 10, 2016
7
Advisor’s Report
With the Federal Reserve’s intentions well-telegraphed in advance, money market rates began to rise even before the Fed’s first interest rate increase in almost a decade came in mid-December. The hike was a welcome development for money market investors who in recent years have used these high-quality, very liquid investments for their short-term savings goals or cash management needs without earning much income from them.
For the six months ended February 29, 2016, Investor Shares of Vanguard Prime Money Market Fund returned 0.10%, while Admiral Shares, with their lower expense ratio, returned 0.13%. Those results were better than the 0.00% average return of its peer group. Vanguard Federal Money Market Fund returned 0.07%, and Vanguard Treasury Money Market Fund 0.05%, exceeding their 0.00% peer average returns.
The investment environment
The Fed held off on raising rates in September, citing in part “recent global economic and financial developments.” Among them, China’s economic growth slowed amid further weakness in investment spending and manufacturing. That slide was accompanied by erratic currency movements as well as sharp corrections in mainland China stock markets despite government intervention aimed at stabilizing the situation.
Growth also remained fragile in Japan, where consumer sentiment was downbeat and exports tepid. And in Europe, fears of deflation were hard to shake off given the weak euro and the slump in oil prices.
Many central banks responded to weak growth and worryingly low inflation with more monetary easing over the half year. The People’s Bank of China cut interest rates, the Bank of Japan introduced negative rates on deposits, and the European Central Bank lowered its already negative deposit rate. Japan and Europe also maintained their stimulative bond-buying programs.
In contrast, the U.S. economy continued to show improvement. Although exports softened a little and inflation stayed below target, the housing market remained on the mend, wages ticked higher, and the unemployment rate fell to an eight-year low of 4.9% by the end of the period.
Yields of most U.S. Treasury securities headed lower amid demand from international investors, along with concerns about global growth, deflationary pressures, and stock market volatility. Yields of very short-term Treasuries and money market instruments, however, finished the period higher in response to the Fed’s less accommodative monetary stance.
8
Management of the funds
As a December rate increase looked more likely, we made some adjustments to the three funds, including shortening their weighted average maturity. Doing so meant we received principal from maturing securities sooner, and we were then able to reinvest it at higher rates. The resulting rise in yields for the funds, along with their low expense ratios, accounted for a sizable part of their outperformance versus their peer groups.
Another strength for the Prime and Federal Money Market Funds was our added exposure to Treasuries ahead of the increase. Those securities were quick to price in the growing likelihood of the Fed action. More supply coming onto the market was a factor as well in the rise seen in their yields.
We increased the Prime Money Market Fund’s exposure to floating-rate notes. Their yields fluctuate with interest rate movements, in this case allowing the fund’s yield to adjust upward more quickly than if it had been holding only fixed-rate instruments.
For diversification purposes, the Prime Money Market Fund continued to hold debt issued by Canadian and Australian banks. After a third bailout eased Greece’s debt crisis, we gradually added back some exposure to U.K. and northern European banks, which provided value for the fund.
We also have a small position in Japanese banks, given the improvement in their fundamentals.
We have made some changes to our funds ahead of the October 2016 compliance date for new Securities and Exchange Commission money market regulations. Importantly, all three funds will continue to maintain a stable $1 share price. The Prime Money Market Fund has been designated a retail fund that will be open to individual investors. The Treasury and Federal Money Market Funds have been designated government funds, which means they will be open to all investors and not subject to liquidity fee or redemption gate requirements. (The Treasury Money Market Fund reopened in January to new investors.)
The outlook
Our outlook hasn’t changed much over the past six months. Global growth is likely to remain frustratingly fragile. Although the U.S. economy expanded by 2.4% in 2015 on an inflation-adjusted basis, we expect it will slow to about 2% in 2016. Capital investment in the energy sector is likely to remain low, and manufacturing, which is feeling a drag from the strong U.S. dollar and weak demand from abroad, may slow even further. On the other side of the ledger, we should see continued improvements in housing, the services sector, and the labor market.
9
The Fed’s rate move was positive for savers and our money market funds. Further increases, however, are likely to be slow and gradual given that the pace of growth remains modest and that inflation is still below the Fed’s target. We wouldn’t be surprised if the federal funds target rate doesn’t break 1% by the end of 2016. The lack of certainty about the timing of further Fed action may well add to market volatility.
Heading into the second half of the fiscal year, the funds’ average maturities are a little longer than they were six months ago. In the absence of further rate increases in the near term, that positioning should allow us to capture the higher yields on offer from securities with longer maturities.
As always, whatever the markets may bring, our experienced team of portfolio managers, traders, and credit analysts will continue to seek out opportunities to produce competitive returns.
David R. Glocke, Principal
Vanguard Fixed Income Group
March 16, 2016
10
Prime Money Market Fund
Fund Profile
As of February 29, 2016
| | |
| Financial Attributes | | |
| |
| | Investor | Admiral |
| | Shares | Shares |
| Ticker Symbol | VMMXX | VMRXX |
| Expense Ratio1 | 0.16% | 0.10% |
| 7-Day SEC Yield | 0.40% | 0.46% |
| Average Weighted | | |
| Maturity | 56 days | 56 days |
| |
| Sector Diversification (% of portfolio) | |
| Certificates of Deposit | 10.1% |
| U.S. Commercial Paper | 5.5 |
| Other | 1.6 |
| Repurchase Agreements | 0.2 |
| U.S. Government Obligations | 13.7 |
| U.S. Treasury Bills | 20.7 |
| Yankee/Foreign | 48.2 |
The agency and mortgage-backed securities sectors may include issues from government-sponsored enterprises; such issues are
generally not backed by the full faith and credit of the U.S. government.
| |
| Distribution by Credit Quality (% of portfolio) |
| First Tier | 100.0% |
A First Tier security is one that is eligible for money market funds and has been rated in the highest short-term rating category for
debt obligations by nationally recognized statistical rating organizations. Credit-quality ratings are obtained from Moody's,
Fitch, and S&P. For securities rated by all three agencies, where two of them are in agreement and assign the highest rating
category, the highest rating applies. If a security is only rated by two agencies, and their ratings are in different categories, the
lower of the ratings applies. An unrated security is First Tier if it represents quality comparable to that of a rated security, as
determined in accordance with SEC Rule 2a-7. For more information about these ratings, see the Glossary entry for Credit
Quality.
1 The expense ratios shown are from the prospectus dated December 14, 2015, and represent estimated costs for the current fiscal year. For the six
months ended February 29, 2016, the annualized expense ratios were 0.16% for Investor Shares and 0.10% for Admiral Shares.
11
Prime Money Market Fund
Performance Summary
Investment returns will fluctuate. All of the returns in this report represent past performance, which is not a guarantee of future results that may be achieved by the fund. (Current performance may be lower or higher than the performance data cited. For performance data current to the most recent month-end, visit our website at vanguard.com/performance.) The returns shown do not reflect taxes that a shareholder would pay on fund distributions. An investment in a money market fund is not insured or guaranteed by the Federal Deposit Insurance Corporation or any other government agency. Although the fund seeks to preserve the value of your investment at $1 per share, it is possible to lose money by investing in the fund. The fund’s 7-day SEC yield reflects its current earnings more closely than do the average annual returns.
| | |
| Fiscal-Year Total Returns (%): August 31, 2005, Through February 29, 2016 | |
| | | Money |
| | | Market |
| | | Funds |
| | Investor Shares | Average |
| Fiscal Year | Total Returns | Total Returns |
| 2006 | 4.38% | 3.69% |
| 2007 | 5.23 | 4.55 |
| 2008 | 3.60 | 3.02 |
| 2009 | 1.31 | 0.62 |
| 2010 | 0.08 | 0.02 |
| 2011 | 0.06 | 0.00 |
| 2012 | 0.04 | 0.00 |
| 2013 | 0.02 | 0.00 |
| 2014 | 0.02 | 0.00 |
| 2015 | 0.02 | 0.00 |
| 2016 | 0.10 | 0.00 |
| 7-day SEC yield (2/29/2016): 0.40% |
| Money Market Funds Average: Derived from data provided by Lipper, a Thomson Reuters Company. |
| Note: For 2016, performance data reflect the six months ended February 29, 2016. |
Average Annual Total Returns: Periods Ended December 31, 2015
This table presents returns through the latest calendar quarter—rather than through the end of the fiscal period.
Securities and Exchange Commission rules require that we provide this information.
| | | | |
| | Inception | One | Five | Ten |
| | Date | Year | Years | Years |
| Investor Shares | 6/4/1975 | 0.05% | 0.03% | 1.34% |
| Admiral Shares | 10/3/1989 | 0.11 | 0.09 | 1.44 |
See Financial Highlights for dividend information.
12
Prime Money Market Fund
Financial Statements (unaudited)
Statement of Net Assets
As of February 29, 2016
The fund reports a complete list of its holdings in various monthly and quarterly regulatory filings. The fund publishes its holdings on a monthly basis at vanguard.com and files them with the Securities and Exchange Commission on Form N-MFP. The fund’s Form N-MFP filings become public 60 days after the relevant month-end, and may be viewed at sec.gov or via a link on the “Portfolio Holdings” page on vanguard.com. For the second and fourth fiscal quarters, the lists appear in the fund’s semiannual and annual reports to shareholders. For the first and third fiscal quarters, the fund files the lists with the SEC on Form N-Q. Shareholders can look up the fund’s Forms N-Q on the SEC’s website at sec.gov. Forms N-Q may also be reviewed and copied at the SEC’s Public Reference Room (see the back cover of this report for further information).
| | | | | |
| | | | | Face | Market |
| | | | Maturity | Amount | Value• |
| | | Yield1 | Date | ($000) | ($000) |
| U.S. Government and Agency Obligations (37.2%) | | | |
| 2 | Fannie Mae Discount Notes | 0.200% | 3/1/16 | 4,100 | 4,100 |
| 3 | Federal Home Loan Bank Discount Notes | 0.200% | 3/1/16 | 1,870 | 1,870 |
| 3 | Federal Home Loan Bank Discount Notes | 0.315% | 3/2/16 | 64,500 | 64,499 |
| 3 | Federal Home Loan Bank Discount Notes | 0.360% | 3/4/16 | 650,000 | 649,981 |
| 3 | Federal Home Loan Bank Discount Notes | 0.340% | 3/10/16 | 985 | 985 |
| 3 | Federal Home Loan Bank Discount Notes | 0.461% | 3/16/16 | 250,000 | 249,952 |
| 3 | Federal Home Loan Bank Discount Notes | 0.380% | 3/22/16 | 513,477 | 513,363 |
| 3 | Federal Home Loan Bank Discount Notes | 0.380% | 3/28/16 | 600,000 | 599,829 |
| 3 | Federal Home Loan Bank Discount Notes | 0.310% | 4/8/16 | 1,500,000 | 1,499,509 |
| 3 | Federal Home Loan Bank Discount Notes | 0.330% | 4/15/16 | 964,275 | 963,877 |
| 3 | Federal Home Loan Bank Discount Notes | 0.374% | 5/18/16 | 1,123,500 | 1,122,590 |
| 3 | Federal Home Loan Bank Discount Notes | 0.395% | 5/25/16 | 1,013,000 | 1,012,055 |
| 2 | Freddie Mac Discount Notes | 0.430% | 3/1/16 | 950,000 | 950,000 |
| 2 | Freddie Mac Discount Notes | 0.430% | 3/2/16 | 950,000 | 949,989 |
| 2 | Freddie Mac Discount Notes | 0.430% | 3/3/16 | 950,000 | 949,977 |
| 2 | Freddie Mac Discount Notes | 0.280% | 3/11/16 | 727,554 | 727,497 |
| | United States Treasury Bill | 0.280%–0.285% | 3/24/16 | 1,950,000 | 1,949,647 |
| | United States Treasury Bill | 0.280%–0.350% | 5/5/16 | 3,300,000 | 3,297,952 |
| | United States Treasury Bill | 0.341% | 5/12/16 | 1,595,600 | 1,594,515 |
| | United States Treasury Bill | 0.331%–0.336% | 5/19/16 | 2,500,000 | 2,498,176 |
| | United States Treasury Bill | 0.321%–0.346% | 5/26/16 | 3,500,000 | 3,497,262 |
| | United States Treasury Bill | 0.321%–0.417% | 6/2/16 | 7,000,082 | 6,993,614 |
| | United States Treasury Bill | 0.536%–0.552% | 6/9/16 | 4,500,000 | 4,493,215 |
| | United States Treasury Bill | 0.552%–0.572% | 6/16/16 | 2,200,000 | 2,196,365 |
| | United States Treasury Bill | 0.421% | 8/11/16 | 6,200,000 | 6,188,210 |
| | United States Treasury Floating Rate Note | 0.389% | 4/30/16 | 1,041,000 | 1,040,989 |
| | United States Treasury Floating Rate Note | 0.390% | 7/31/16 | 350,000 | 349,990 |
| | United States Treasury Floating Rate Note | 0.373% | 10/31/16 | 2,912,200 | 2,911,189 |
| | United States Treasury Floating Rate Note | 0.404% | 1/31/17 | 1,779,183 | 1,779,167 |
| | United States Treasury Note/Bond | 0.375% | 3/15/16 | 300,000 | 300,021 |
| | United States Treasury Note/Bond | 0.375% | 3/31/16 | 139,045 | 139,064 |
| | United States Treasury Note/Bond | 2.250% | 3/31/16 | 588,750 | 589,711 |
| | United States Treasury Note/Bond | 2.375% | 3/31/16 | 164,000 | 164,292 |
| | United States Treasury Note/Bond | 3.250% | 5/31/16 | 576,000 | 580,066 |
13
| | | | | |
| Prime Money Market Fund | | | | |
| |
| |
| |
| | | | | Face | Market |
| | | | Maturity | Amount | Value• |
| | | Yield1 | Date | ($000) | ($000) |
| | United States Treasury Note/Bond | 0.500% | 6/15/16 | 600,000 | 600,144 |
| | United States Treasury Note/Bond | 1.500% | 7/31/16 | 110,000 | 110,459 |
| | United States Treasury Note/Bond | 3.250% | 7/31/16 | 150,000 | 151,720 |
| Total U.S. Government and Agency Obligations (Cost $51,685,841) | | | 51,685,841 |
| Commercial Paper (22.6%) | | | | |
| Bank Holding Company (0.2%) | | | | |
| 4 | ABN Amro Funding USA LLC | 0.631% | 4/11/16 | 37,750 | 37,723 |
| 4 | ABN Amro Funding USA LLC | 0.641% | 4/14/16 | 142,250 | 142,139 |
| 4 | ABN Amro Funding USA LLC | 0.641% | 4/20/16 | 44,750 | 44,710 |
| | | | | | 224,572 |
| Finance—Auto (1.6%) | | | | |
| | American Honda Finance Corp. | 0.480% | 3/22/16 | 134,750 | 134,712 |
| | American Honda Finance Corp. | 0.480% | 3/23/16 | 320,250 | 320,156 |
| 4 | BMW US Capital LLC | 0.531% | 5/5/16 | 60,000 | 59,943 |
| 4 | BMW US Capital LLC | 0.531% | 5/9/16 | 210,000 | 209,787 |
| 4 | BMW US Capital LLC | 0.531% | 5/10/16 | 25,000 | 24,974 |
| 4 | BMW US Capital LLC | 0.531% | 5/17/16 | 30,000 | 29,966 |
| 5 | Toyota Motor Credit Corp. | 0.632% | 4/15/16 | 452,000 | 452,000 |
| | Toyota Motor Credit Corp. | 0.521% | 5/23/16 | 36,750 | 36,706 |
| | Toyota Motor Credit Corp. | 0.521% | 5/24/16 | 47,000 | 46,943 |
| | Toyota Motor Credit Corp. | 0.823% | 6/27/16 | 198,000 | 197,468 |
| | Toyota Motor Credit Corp. | 0.823% | 7/7/16 | 39,750 | 39,634 |
| 5 | Toyota Motor Credit Corp. | 0.699% | 7/22/16 | 110,500 | 110,500 |
| 5 | Toyota Motor Credit Corp. | 0.699% | 7/22/16 | 55,000 | 55,000 |
| 5 | Toyota Motor Credit Corp. | 0.678% | 7/29/16 | 18,000 | 18,000 |
| 5 | Toyota Motor Credit Corp. | 0.704% | 8/18/16 | 155,000 | 155,000 |
| 5 | Toyota Motor Credit Corp. | 0.704% | 8/19/16 | 153,000 | 153,000 |
| 5 | Toyota Motor Credit Corp. | 0.709% | 8/25/16 | 174,000 | 174,000 |
| | | | | | 2,217,789 |
| Foreign Banks (10.0%) | | | | |
| 4,5 | Australia & New Zealand Banking Group, Ltd. | 0.538% | 4/8/16 | 357,000 | 357,000 |
| 4 | Australia & New Zealand Banking Group, Ltd. | 0.441% | 4/28/16 | 191,000 | 190,865 |
| 4,5 | Australia & New Zealand Banking Group, Ltd. | 0.654% | 5/23/16 | 397,000 | 397,000 |
| 4 | Australia & New Zealand Banking Group, Ltd. | 0.672% | 6/2/16 | 129,000 | 128,777 |
| 4,5 | Australia & New Zealand Banking Group, Ltd. | 0.592% | 6/20/16 | 415,000 | 415,000 |
| 4,5 | Australia & New Zealand Banking Group, Ltd. | 0.649% | 7/27/16 | 329,250 | 329,250 |
| 4,5 | Australia & New Zealand Banking Group, Ltd. | 0.635% | 8/2/16 | 88,500 | 88,499 |
| 4,5 | Australia & New Zealand Banking Group, Ltd. | 0.637% | 8/3/16 | 133,000 | 133,000 |
| 4,5 | Australia & New Zealand Banking Group, Ltd. | 0.638% | 8/4/16 | 111,000 | 111,000 |
| 4 | Australia & New Zealand Banking Group, Ltd. | 0.910% | 8/4/16 | 175,000 | 174,314 |
| 4,5 | Australia & New Zealand Banking Group, Ltd. | 0.917% | 2/1/17 | 346,750 | 346,750 |
| 4,5 | Commonwealth Bank of Australia | 0.598% | 3/7/16 | 280,000 | 280,000 |
| 4,5 | Commonwealth Bank of Australia | 0.552% | 3/14/16 | 249,000 | 248,999 |
| 4,5 | Commonwealth Bank of Australia | 0.546% | 3/18/16 | 350,000 | 350,000 |
| 4,5 | Commonwealth Bank of Australia | 0.543% | 3/24/16 | 145,000 | 145,000 |
| 4,5 | Commonwealth Bank of Australia | 0.548% | 3/30/16 | 125,000 | 125,000 |
| 4,5 | Commonwealth Bank of Australia | 0.548% | 3/31/16 | 40,000 | 40,000 |
| 4,5 | Commonwealth Bank of Australia | 0.614% | 4/26/16 | 80,000 | 80,000 |
| 4,5 | Commonwealth Bank of Australia | 0.562% | 5/13/16 | 100,000 | 99,999 |
| 4,5 | Commonwealth Bank of Australia | 0.574% | 5/23/16 | 375,000 | 374,996 |
| 4,5 | Commonwealth Bank of Australia | 0.612% | 6/22/16 | 250,250 | 250,245 |
| 4 | Commonwealth Bank of Australia | 0.844% | 6/23/16 | 65,000 | 64,827 |
| 4,5 | Commonwealth Bank of Australia | 0.604% | 6/24/16 | 59,000 | 58,999 |
14
| | | | | |
| Prime Money Market Fund | | | | |
| |
| |
| |
| | | | | Face | Market |
| | | | Maturity | Amount | Value• |
| | | Yield1 | Date | ($000) | ($000) |
| 4,5 | Commonwealth Bank of Australia | 0.640% | 7/19/16 | 350,000 | 350,000 |
| 4,5 | Commonwealth Bank of Australia | 0.642% | 7/20/16 | 350,000 | 350,000 |
| 4,5 | Commonwealth Bank of Australia | 0.786% | 9/26/16 | 268,000 | 268,000 |
| 4,5 | Commonwealth Bank of Australia | 0.784% | 10/24/16 | 300,000 | 300,000 |
| 4,5 | Commonwealth Bank of Australia | 0.939% | 2/3/17 | 349,000 | 349,000 |
| | ING US Funding LLC | 0.661% | 5/2/16 | 189,500 | 189,285 |
| | ING US Funding LLC | 0.702% | 5/11/16 | 447,500 | 446,882 |
| | ING US Funding LLC | 0.702% | 5/12/16 | 447,500 | 446,873 |
| 4 | National Australia Bank Ltd. | 0.803% | 7/5/16 | 399,000 | 397,883 |
| 4 | National Australia Bank Ltd. | 0.803% | 7/7/16 | 400,000 | 398,862 |
| 4 | National Australia Bank Ltd. | 0.773% | 7/26/16 | 385,000 | 383,789 |
| 4 | Skandinaviska Enskilda Banken AB | 0.656% | 5/4/16 | 247,750 | 247,461 |
| 4 | Sumitomo Mitsui Banking Corporation | 0.651% | 4/15/16 | 595,000 | 594,517 |
| | Swedbank AB | 0.641% | 5/2/16 | 152,500 | 152,332 |
| | Swedbank AB | 0.641% | 5/3/16 | 152,500 | 152,329 |
| | Swedbank AB | 0.641% | 5/4/16 | 152,500 | 152,326 |
| | Swedbank AB | 0.641% | 5/5/16 | 42,500 | 42,451 |
| | Swedbank AB | 0.793% | 7/1/16 | 252,500 | 251,824 |
| | Swedbank AB | 0.793% | 7/7/16 | 247,500 | 246,805 |
| | Swedbank AB | 0.773% | 7/19/16 | 199,000 | 198,404 |
| | Swedbank AB | 0.773% | 7/20/16 | 200,000 | 199,397 |
| | Swedbank AB | 0.773% | 7/21/16 | 200,000 | 199,392 |
| | Swedbank AB | 0.773% | 7/22/16 | 200,000 | 199,388 |
| | Swedbank AB | 0.773% | 7/25/16 | 100,000 | 99,688 |
| 4,5 | Westpac Banking Corp. | 0.543% | 3/24/16 | 220,000 | 220,000 |
| 4,5 | Westpac Banking Corp. | 0.543% | 3/24/16 | 100,000 | 100,000 |
| 4,5 | Westpac Banking Corp. | 0.548% | 5/5/16 | 77,000 | 76,988 |
| 4,5 | Westpac Banking Corp. | 0.588% | 5/27/16 | 317,000 | 317,000 |
| 4,5 | Westpac Banking Corp. | 0.588% | 5/27/16 | 100,000 | 100,000 |
| 4,5 | Westpac Banking Corp. | 0.575% | 6/2/16 | 245,000 | 245,000 |
| 4,5 | Westpac Banking Corp. | 0.579% | 6/10/16 | 135,000 | 134,998 |
| 4,5 | Westpac Banking Corp. | 0.642% | 6/21/16 | 500,000 | 499,992 |
| 4,5 | Westpac Banking Corp. | 0.644% | 6/23/16 | 150,000 | 149,998 |
| 4,5 | Westpac Banking Corp. | 0.781% | 10/14/16 | 400,000 | 399,989 |
| 4,5 | Westpac Banking Corp. | 0.781% | 10/14/16 | 250,000 | 249,994 |
| | | | | | 13,900,367 |
| Foreign Governments (3.6%) | | | | |
| 4 | CDP Financial Inc. | 0.601%–0.631% | 3/15/16 | 133,500 | 133,468 |
| 4 | CDP Financial Inc. | 0.601% | 3/16/16 | 112,250 | 112,222 |
| 4 | CDP Financial Inc. | 0.421% | 4/1/16 | 79,000 | 78,971 |
| 4 | CDP Financial Inc. | 0.591% | 4/28/16 | 23,000 | 22,978 |
| 4 | CDP Financial Inc. | 0.461% | 4/29/16 | 26,000 | 25,980 |
| 4 | CDP Financial Inc. | 0.451%–0.591% | 5/2/16 | 64,500 | 64,438 |
| 4 | CDP Financial Inc. | 0.581% | 5/9/16 | 60,500 | 60,433 |
| 6 | CPPIB Capital Inc. | 0.371% | 3/14/16 | 149,000 | 148,980 |
| 6 | CPPIB Capital Inc. | 0.551% | 3/16/16 | 37,000 | 36,992 |
| 6 | CPPIB Capital Inc. | 0.561% | 3/21/16 | 37,000 | 36,989 |
| 6 | CPPIB Capital Inc. | 0.501% | 5/13/16 | 300,000 | 299,696 |
| 6 | CPPIB Capital Inc. | 0.501% | 5/16/16 | 300,000 | 299,683 |
| 6 | CPPIB Capital Inc. | 0.833% | 6/1/16 | 248,000 | 247,474 |
| 6 | CPPIB Capital Inc. | 0.833% | 6/2/16 | 248,000 | 247,468 |
| 6 | CPPIB Capital Inc. | 0.551% | 6/3/16 | 300,000 | 299,569 |
| 6 | CPPIB Capital Inc. | 0.556% | 6/6/16 | 170,000 | 169,746 |
| 6 | CPPIB Capital Inc. | 0.803% | 6/13/16 | 283,250 | 282,595 |
| 6 | CPPIB Capital Inc. | 0.803% | 6/14/16 | 128,750 | 128,450 |
15
| | | | | |
| Prime Money Market Fund | | | | |
| |
| |
| |
| | | | | Face | Market |
| | | | Maturity | Amount | Value• |
| | | Yield1 | Date | ($000) | ($000) |
| 5,6 | CPPIB Capital Inc. | 0.732% | 7/12/16 | 247,750 | 247,750 |
| 5,6 | CPPIB Capital Inc. | 0.732% | 7/13/16 | 247,750 | 247,750 |
| | Export Development Canada | 0.500% | 3/8/16 | 148,500 | 148,486 |
| | Export Development Canada | 0.541% | 3/14/16 | 112,000 | 111,978 |
| | Export Development Canada | 0.541% | 3/16/16 | 112,000 | 111,975 |
| | Export Development Canada | 0.561% | 5/19/16 | 125,000 | 124,846 |
| | Export Development Canada | 0.561% | 5/20/16 | 125,000 | 124,844 |
| | Province of British Columbia | 0.601% | 3/14/16 | 15,975 | 15,972 |
| | Province of British Columbia | 0.601% | 3/16/16 | 18,710 | 18,705 |
| 6 | PSP Capital Inc. | 0.390% | 3/1/16 | 74,250 | 74,250 |
| 6 | PSP Capital Inc. | 0.551% | 3/11/16 | 80,250 | 80,238 |
| 6 | PSP Capital Inc. | 0.551% | 3/14/16 | 132,750 | 132,724 |
| 6 | PSP Capital Inc. | 0.591% | 4/7/16 | 49,500 | 49,470 |
| 6 | PSP Capital Inc. | 0.601% | 4/11/16 | 37,750 | 37,724 |
| 6 | PSP Capital Inc. | 0.581% | 4/12/16 | 24,750 | 24,733 |
| 6 | PSP Capital Inc. | 0.581% | 4/13/16 | 49,500 | 49,466 |
| 6 | PSP Capital Inc. | 0.531% | 5/6/16 | 50,000 | 49,951 |
| 6 | PSP Capital Inc. | 0.541% | 5/19/16 | 25,000 | 24,970 |
| 6 | PSP Capital Inc. | 0.561% | 6/1/16 | 59,000 | 58,916 |
| 6 | PSP Capital Inc. | 0.793% | 6/27/16 | 99,250 | 98,993 |
| 6 | PSP Capital Inc. | 0.793% | 6/28/16 | 99,000 | 98,741 |
| 6 | PSP Capital Inc. | 0.793% | 6/29/16 | 138,750 | 138,385 |
| 6 | PSP Capital Inc. | 0.793%–0.803% | 7/5/16 | 119,250 | 118,917 |
| 6 | PSP Capital Inc. | 0.823% | 7/20/16 | 96,250 | 95,941 |
| | | | | | 4,981,857 |
| Foreign Industrial (3.1%) | | | | |
| 4 | BASF SE | 0.501%–0.571% | 3/29/16 | 301,250 | 301,123 |
| 4 | BASF SE | 0.611% | 5/9/16 | 41,300 | 41,252 |
| 4 | Nestle Capital Corp. | 0.551% | 5/25/16 | 76,500 | 76,401 |
| 4 | Nestle Capital Corp. | 0.551% | 6/1/16 | 200,000 | 199,719 |
| 4 | Nestle Capital Corp. | 0.551% | 6/2/16 | 77,250 | 77,140 |
| 4 | Nestle Capital Corp. | 0.556% | 6/16/16 | 99,000 | 98,837 |
| 4 | Nestle Capital Corp. | 0.556% | 6/21/16 | 99,000 | 98,829 |
| 4 | Nestle Capital Corp. | 0.556% | 6/22/16 | 99,000 | 98,828 |
| | Nestle Finance International Ltd. | 0.551% | 5/25/16 | 76,500 | 76,401 |
| | Nestle Finance International Ltd. | 0.551% | 6/10/16 | 200,000 | 199,691 |
| | Nestle Finance International Ltd. | 0.556% | 6/20/16 | 148,750 | 148,495 |
| | Nestle Finance International Ltd. | 0.556% | 6/24/16 | 148,750 | 148,486 |
| | Nestle Finance International Ltd. | 0.556% | 6/27/16 | 198,250 | 197,889 |
| | Nestle Finance International Ltd. | 0.556% | 6/28/16 | 100,000 | 99,817 |
| 4 | Reckitt Benckiser Treasury Services plc | 0.581% | 4/12/16 | 49,500 | 49,467 |
| 4 | Roche Holdings Inc. | 0.501% | 5/9/16 | 50,000 | 49,952 |
| 4 | Roche Holdings Inc. | 0.491% | 5/23/16 | 225,000 | 224,746 |
| 4 | Siemens Capital Co. LLC | 0.551% | 3/21/16 | 198,250 | 198,189 |
| 4 | Siemens Capital Co. LLC | 0.551% | 3/23/16 | 396,500 | 396,367 |
| 4 | Siemens Capital Co. LLC | 0.551% | 3/29/16 | 247,750 | 247,644 |
| 4 | Total Capital Canada Ltd. | 0.561% | 3/1/16 | 24,200 | 24,200 |
| 4 | Total Capital Canada Ltd. | 0.571% | 3/21/16 | 153,250 | 153,201 |
| 4 | Total Capital Canada Ltd. | 0.556% | 4/13/16 | 414,250 | 413,975 |
| 4 | Total Capital Canada Ltd. | 0.803% | 7/5/16 | 147,000 | 146,588 |
| | Toyota Credit Canada Inc. | 0.461% | 4/5/16 | 49,500 | 49,478 |
| | Toyota Credit Canada Inc. | 0.572% | 5/13/16 | 49,500 | 49,443 |
| | Toyota Credit Canada Inc. | 0.562% | 6/1/16 | 25,750 | 25,713 |
| | Toyota Credit Canada Inc. | 0.642% | 6/2/16 | 24,750 | 24,709 |
| | Toyota Credit Canada Inc. | 0.833% | 6/14/16 | 37,000 | 36,910 |
16
| | | | |
| Prime Money Market Fund | | | | |
| |
| |
| |
| | | | Face | Market |
| | | Maturity | Amount | Value• |
| | Yield1 | Date | ($000) | ($000) |
| 4 Unilever Capital Corp. | 0.521% | 5/2/16 | 100,000 | 99,910 |
| 4 Unilever Capital Corp. | 0.501% | 5/3/16 | 30,700 | 30,673 |
| 4 Unilever Capital Corp. | 0.531% | 5/9/16 | 45,700 | 45,654 |
| 4 Unilever Capital Corp. | 0.541% | 5/16/16 | 50,000 | 49,943 |
| 4 Unilever Capital Corp. | 0.551% | 5/23/16 | 50,000 | 49,937 |
| 4 Unilever Capital Corp. | 0.511% | 5/31/16 | 59,000 | 58,924 |
| | | | | 4,288,531 |
| Industrial (4.1%) | | | | |
| 4 Apple Inc. | 0.420% | 3/18/16 | 218,500 | 218,457 |
| Caterpillar Financial Services Corp. | 0.531% | 5/9/16 | 200,000 | 199,797 |
| 4 Chevron Corp. | 0.260% | 3/4/16 | 85,000 | 84,998 |
| 4 Emerson Electric Co. | 0.450% | 3/8/16 | 110,000 | 109,990 |
| 4 Emerson Electric Co. | 0.541% | 5/9/16 | 53,500 | 53,445 |
| 4 Emerson Electric Co. | 0.541% | 5/11/16 | 51,000 | 50,946 |
| Exxon Mobil Corp. | 0.410% | 3/17/16 | 500,000 | 499,909 |
| Exxon Mobil Corp. | 0.410% | 3/18/16 | 500,000 | 499,903 |
| 4 Honeywell International Inc. | 0.440% | 3/14/16 | 34,630 | 34,624 |
| 4 Pfizer Inc | 0.581% | 4/1/16 | 247,750 | 247,626 |
| 4 Pfizer Inc | 0.491% | 5/10/16 | 248,600 | 248,363 |
| 4 Pfizer Inc | 0.491% | 5/11/16 | 271,500 | 271,238 |
| 4 Pfizer Inc | 0.491% | 5/12/16 | 298,400 | 298,107 |
| 4 Pfizer Inc | 0.491% | 5/16/16 | 81,500 | 81,416 |
| 4 Pfizer Inc | 0.491% | 5/23/16 | 520,500 | 519,912 |
| 4 The Coca-Cola Co. | 0.501% | 3/16/16 | 50,000 | 49,990 |
| 4 The Coca-Cola Co. | 0.501% | 3/18/16 | 64,250 | 64,235 |
| 4 The Coca-Cola Co. | 0.491% | 3/21/16 | 75,000 | 74,980 |
| 4 The Coca-Cola Co. | 0.421% | 3/22/16 | 54,000 | 53,987 |
| 4 The Coca-Cola Co. | 0.501% | 3/23/16 | 60,000 | 59,982 |
| 4 The Coca-Cola Co. | 0.501% | 3/24/16 | 55,000 | 54,982 |
| 4 The Coca-Cola Co. | 0.562% | 4/19/16 | 350,000 | 349,733 |
| 4 The Coca-Cola Co. | 0.481%–0.552% | 4/20/16 | 258,500 | 258,315 |
| 4 The Coca-Cola Co. | 0.481% | 4/21/16 | 49,500 | 49,466 |
| 4 The Coca-Cola Co. | 0.501% | 5/17/16 | 68,500 | 68,427 |
| 4 The Coca-Cola Co. | 0.501% | 5/18/16 | 38,000 | 37,959 |
| 4 The Coca-Cola Co. | 0.491% | 5/19/16 | 38,000 | 37,959 |
| 4 The Coca-Cola Co. | 0.551% | 5/25/16 | 198,250 | 197,992 |
| 4 The Coca-Cola Co. | 0.561% | 6/21/16 | 182,270 | 181,952 |
| 4 The Coca-Cola Co. | 0.561% | 6/22/16 | 50,000 | 49,912 |
| 4 The Coca-Cola Co. | 0.753% | 8/15/16 | 272,500 | 271,552 |
| 4 The Coca-Cola Co. | 0.753% | 8/16/16 | 297,250 | 296,210 |
| 4 The Coca-Cola Co. | 0.753% | 8/17/16 | 99,000 | 98,651 |
| 4 The Walt Disney Co. | 0.491% | 5/20/16 | 31,250 | 31,216 |
| 4 The Walt Disney Co. | 0.481% | 5/27/16 | 49,500 | 49,443 |
| | | | | 5,755,674 |
| Total Commercial Paper (Cost $31,368,790) | | | | 31,368,790 |
| Certificates of Deposit (39.4%) | | | | |
| Domestic Banks (8.4%) | | | | |
| Citibank NA | 0.350% | 3/7/16 | 263,000 | 263,000 |
| Citibank NA | 0.500% | 3/8/16 | 198,250 | 198,250 |
| Citibank NA | 0.590% | 4/6/16 | 110,500 | 110,500 |
| Citibank NA | 0.580% | 4/7/16 | 253,000 | 253,000 |
| Citibank NA | 0.580% | 4/22/16 | 247,750 | 247,750 |
| Citibank NA | 0.580% | 5/18/16 | 361,750 | 361,750 |
17
| | | | |
| Prime Money Market Fund | | | | |
| |
| |
| |
| | | | Face | Market |
| | | Maturity | Amount | Value• |
| | Yield1 | Date | ($000) | ($000) |
| HSBC Bank USA NA | 0.840% | 7/11/16 | 99,000 | 99,000 |
| HSBC Bank USA NA | 0.850% | 7/12/16 | 247,750 | 247,750 |
| HSBC Bank USA NA | 0.840% | 7/14/16 | 99,000 | 99,000 |
| HSBC Bank USA NA | 0.830% | 7/26/16 | 99,000 | 99,000 |
| HSBC Bank USA NA | 0.840% | 8/1/16 | 99,000 | 99,000 |
| HSBC Bank USA NA | 0.845% | 8/3/16 | 149,000 | 149,000 |
| HSBC Bank USA NA | 0.840% | 8/5/16 | 198,250 | 198,250 |
| HSBC Bank USA NA | 0.840% | 8/5/16 | 396,500 | 396,500 |
| 5 HSBC Bank USA NA | 0.797% | 9/2/16 | 500,000 | 500,000 |
| 5 State Street Bank & Trust Co. | 0.664% | 5/23/16 | 1,627,500 | 1,627,500 |
| State Street Bank & Trust Co. | 0.800% | 7/5/16 | 396,500 | 396,500 |
| State Street Bank & Trust Co. | 0.800% | 7/11/16 | 644,250 | 644,250 |
| State Street Bank & Trust Co. | 0.820% | 7/12/16 | 842,500 | 842,500 |
| State Street Bank & Trust Co. | 0.800% | 7/29/16 | 400,000 | 400,000 |
| 5 State Street Bank & Trust Co. | 0.729% | 8/12/16 | 275,000 | 275,000 |
| 5 Wells Fargo Bank NA | 0.546% | 4/1/16 | 220,000 | 220,000 |
| Wells Fargo Bank NA | 0.450% | 4/11/16 | 50,000 | 50,000 |
| 5 Wells Fargo Bank NA | 0.558% | 5/6/16 | 405,000 | 405,000 |
| 5 Wells Fargo Bank NA | 0.656% | 5/25/16 | 40,000 | 40,000 |
| 5 Wells Fargo Bank NA | 0.588% | 5/27/16 | 100,000 | 100,000 |
| Wells Fargo Bank NA | 0.830% | 7/7/16 | 100,000 | 100,000 |
| Wells Fargo Bank NA | 0.820% | 7/20/16 | 250,000 | 250,000 |
| 5 Wells Fargo Bank NA | 0.780% | 8/18/16 | 330,000 | 330,000 |
| Wells Fargo Bank NA | 0.850% | 8/18/16 | 150,000 | 150,000 |
| 5 Wells Fargo Bank NA | 0.782% | 8/22/16 | 400,000 | 400,000 |
| 5 Wells Fargo Bank NA | 0.773% | 10/21/16 | 450,000 | 450,000 |
| 5 Wells Fargo Bank NA | 0.773% | 10/24/16 | 450,000 | 450,000 |
| 5 Wells Fargo Bank NA | 0.765% | 11/2/16 | 495,000 | 495,000 |
| 5 Wells Fargo Bank NA | 0.782% | 11/16/16 | 495,000 | 495,000 |
| 5 Wells Fargo Bank NA | 0.892% | 1/11/17 | 240,000 | 240,000 |
| | | | | 11,682,500 |
| Eurodollar Certificates of Deposit (0.7%) | | | | |
| National Australia Bank Ltd. | 0.800% | 6/15/16 | 1,000,000 | 1,000,000 |
| |
| Yankee Certificates of Deposit (30.3%) | | | | |
| Australia & New Zealand Banking Group, Ltd. | | | | |
| (New York Branch) | 0.550% | 3/22/16 | 185,000 | 185,000 |
| Australia & New Zealand Banking Group, Ltd. | | | | |
| (New York Branch) | 0.600% | 4/29/16 | 148,750 | 148,750 |
| 5 Bank of Montreal (Chicago Branch) | 0.586% | 3/1/16 | 368,000 | 368,000 |
| 5 Bank of Montreal (Chicago Branch) | 0.586% | 3/1/16 | 391,000 | 391,000 |
| 5 Bank of Montreal (Chicago Branch) | 0.599% | 3/9/16 | 182,000 | 182,000 |
| 5 Bank of Montreal (Chicago Branch) | 0.599% | 3/10/16 | 184,500 | 184,500 |
| 5 Bank of Montreal (Chicago Branch) | 0.602% | 3/21/16 | 410,000 | 410,000 |
| 5 Bank of Montreal (Chicago Branch) | 0.609% | 5/4/16 | 1,300,000 | 1,300,000 |
| Bank of Montreal (Chicago Branch) | 0.680% | 6/2/16 | 400,000 | 400,000 |
| Bank of Montreal (Chicago Branch) | 0.810% | 6/21/16 | 200,000 | 199,997 |
| 5 Bank of Nova Scotia (Houston Branch) | 0.622% | 4/21/16 | 1,065,000 | 1,065,000 |
| 5 Bank of Nova Scotia (Houston Branch) | 0.782% | 7/11/16 | 987,000 | 987,000 |
| 5 Bank of Nova Scotia (Houston Branch) | 0.782% | 7/12/16 | 885,000 | 885,000 |
| Bank of Nova Scotia (Houston Branch) | 0.810% | 7/21/16 | 100,000 | 100,000 |
| Bank of Nova Scotia (Houston Branch) | 0.850% | 8/18/16 | 445,000 | 444,990 |
| Bank of Tokyo-Mitsubishi UFJ Ltd. | | | | |
| (New York Branch) | 0.560% | 3/21/16 | 1,000,000 | 1,000,000 |
18
| | | | |
| Prime Money Market Fund | | | | |
| |
| |
| |
| | | | Face | Market |
| | | Maturity | Amount | Value• |
| | Yield1 | Date | ($000) | ($000) |
| Bank of Tokyo-Mitsubishi UFJ Ltd. | | | | |
| (New York Branch) | 0.600% | 4/14/16 | 1,000,000 | 1,000,000 |
| Bank of Tokyo-Mitsubishi UFJ Ltd. | | | | |
| (New York Branch) | 0.700% | 5/11/16 | 608,000 | 608,000 |
| Bank of Tokyo-Mitsubishi UFJ Ltd. | | | | |
| (New York Branch) | 0.700% | 5/23/16 | 90,000 | 90,000 |
| Bank of Tokyo-Mitsubishi UFJ Ltd. | | | | |
| (New York Branch) | 0.680% | 6/20/16 | 88,000 | 88,000 |
| Canadian Imperial Bank of Commerce | | | | |
| (New York Branch) | 0.580% | 4/4/16 | 380,000 | 380,000 |
| 5 Canadian Imperial Bank of Commerce | | | | |
| (New York Branch) | 0.642% | 4/20/16 | 77,250 | 77,254 |
| 5 Canadian Imperial Bank of Commerce | | | | |
| (New York Branch) | 0.607% | 5/20/16 | 885,000 | 885,000 |
| Canadian Imperial Bank of Commerce | | | | |
| (New York Branch) | 0.760% | 6/6/16 | 500,000 | 500,000 |
| Canadian Imperial Bank of Commerce | | | | |
| (New York Branch) | 0.800% | 6/14/16 | 425,000 | 425,000 |
| Canadian Imperial Bank of Commerce | | | | |
| (New York Branch) | 0.810% | 7/19/16 | 700,000 | 700,000 |
| 5 Canadian Imperial Bank of Commerce | | | | |
| (New York Branch) | 0.758% | 8/3/16 | 485,000 | 485,000 |
| 5 Commonwealth Bank of Australia | | | | |
| (New York Branch) | 0.938% | 2/1/17 | 99,000 | 99,000 |
| Credit Suisse (New York Branch) | 0.620% | 4/5/16 | 397,000 | 397,000 |
| Credit Suisse (New York Branch) | 0.620% | 4/11/16 | 376,000 | 376,000 |
| DNB Bank ASA (New York Branch) | 0.370% | 3/1/16 | 2,000,000 | 2,000,000 |
| DNB Bank ASA (New York Branch) | 0.370% | 3/2/16 | 1,400,000 | 1,400,000 |
| Lloyds Bank plc (New York Branch) | 0.470% | 3/3/16 | 500,000 | 500,000 |
| Lloyds Bank plc (New York Branch) | 0.590% | 3/14/16 | 247,750 | 247,750 |
| Lloyds Bank plc (New York Branch) | 0.640% | 3/18/16 | 300,000 | 300,000 |
| Lloyds Bank plc (New York Branch) | 0.630% | 4/4/16 | 377,000 | 377,000 |
| National Australia Bank Ltd. (New York Branch) | 0.650% | 4/13/16 | 665,000 | 665,000 |
| National Australia Bank Ltd. (New York Branch) | 0.800% | 6/13/16 | 300,000 | 300,000 |
| Nordea Bank Finland plc (New York Branch) | 0.580% | 3/21/16 | 1,500,000 | 1,499,996 |
| Nordea Bank Finland plc (New York Branch) | 0.670% | 4/25/16 | 250,000 | 250,000 |
| Nordea Bank Finland plc (New York Branch) | 0.795% | 6/10/16 | 500,000 | 500,000 |
| Nordea Bank Finland plc (New York Branch) | 0.795% | 6/28/16 | 850,000 | 850,000 |
| 5 Royal Bank of Canada (New York Branch) | 0.595% | 3/2/16 | 541,250 | 541,250 |
| Royal Bank of Canada (New York Branch) | 0.420% | 4/4/16 | 390,000 | 390,000 |
| 5 Royal Bank of Canada (New York Branch) | 0.597% | 5/3/16 | 423,000 | 423,000 |
| 5 Royal Bank of Canada (New York Branch) | 0.644% | 5/23/16 | 1,375,000 | 1,375,000 |
| 5 Royal Bank of Canada (New York Branch) | 0.622% | 6/22/16 | 1,300,000 | 1,300,000 |
| Skandinaviska Enskilda Banken (New York Branch) | 0.370% | 3/1/16 | 1,000,000 | 1,000,000 |
| Skandinaviska Enskilda Banken (New York Branch) | 0.360% | 3/7/16 | 1,200,000 | 1,200,000 |
| Skandinaviska Enskilda Banken (New York Branch) | 0.570% | 4/4/16 | 452,000 | 452,000 |
| Skandinaviska Enskilda Banken (New York Branch) | 0.650% | 5/5/16 | 225,000 | 224,998 |
| Svenska HandelsBanken (New York Branch) | 0.550% | 3/14/16 | 1,000,000 | 1,000,000 |
| Svenska HandelsBanken (New York Branch) | 0.385% | 3/22/16 | 25,000 | 24,997 |
| Svenska HandelsBanken (New York Branch) | 0.570% | 4/4/16 | 150,750 | 150,750 |
| Svenska HandelsBanken (New York Branch) | 0.635% | 4/14/16 | 500,000 | 500,000 |
| Svenska HandelsBanken (New York Branch) | 0.650% | 5/5/16 | 1,200,000 | 1,200,000 |
| Svenska HandelsBanken (New York Branch) | 0.790% | 6/14/16 | 1,000,000 | 1,000,000 |
| Svenska HandelsBanken (New York Branch) | 0.800% | 7/15/16 | 285,000 | 285,000 |
| Swedbank AB (New York Branch) | 0.370% | 3/2/16 | 1,550,000 | 1,550,000 |
19
| | | | | |
| Prime Money Market Fund | | | | |
| |
| |
| |
| | | | | Face | Market |
| | | | Maturity | Amount | Value• |
| | | Yield1 | Date | ($000) | ($000) |
| | Swedbank AB (New York Branch) | 0.790% | 7/15/16 | 700,000 | 700,000 |
| 5 | Toronto Dominion Bank (New York Branch) | 0.586% | 3/3/16 | 825,000 | 825,000 |
| | Toronto Dominion Bank (New York Branch) | 0.450% | 4/14/16 | 30,000 | 30,000 |
| 5 | Toronto Dominion Bank (New York Branch) | 0.591% | 4/14/16 | 124,000 | 124,000 |
| 5 | Toronto Dominion Bank (New York Branch) | 0.592% | 4/21/16 | 130,000 | 130,000 |
| 5 | Toronto Dominion Bank (New York Branch) | 0.599% | 5/17/16 | 255,000 | 255,000 |
| 5 | Toronto Dominion Bank (New York Branch) | 0.644% | 5/23/16 | 540,000 | 540,000 |
| 5 | Toronto Dominion Bank (New York Branch) | 0.605% | 6/2/16 | 625,000 | 625,000 |
| | Toronto Dominion Bank (New York Branch) | 0.810% | 6/21/16 | 100,000 | 100,000 |
| | Toronto Dominion Bank (New York Branch) | 0.900% | 8/15/16 | 80,000 | 80,000 |
| 5 | Toronto Dominion Bank (New York Branch) | 0.784% | 9/23/16 | 488,000 | 488,000 |
| 5 | Toronto Dominion Bank (New York Branch) | 0.784% | 9/26/16 | 210,000 | 210,000 |
| | UBS AG (Stamford Branch) | 0.610% | 3/31/16 | 496,000 | 496,000 |
| | UBS AG (Stamford Branch) | 0.610% | 3/31/16 | 258,000 | 258,000 |
| 5 | Westpac Banking Corp. (New York Branch) | 0.539% | 3/9/16 | 40,000 | 40,000 |
| 5 | Westpac Banking Corp. (New York Branch) | 0.577% | 6/3/16 | 350,000 | 350,000 |
| 5 | Westpac Banking Corp. (New York Branch) | 0.578% | 7/6/16 | 240,000 | 240,000 |
| 5 | Westpac Banking Corp. (New York Branch) | 0.754% | 9/1/16 | 227,000 | 227,000 |
| 5 | Westpac Banking Corp. (New York Branch) | 0.784% | 9/23/16 | 159,000 | 159,000 |
| 5 | Westpac Banking Corp. (New York Branch) | 0.942% | 1/11/17 | 230,000 | 230,000 |
| | | | | | 41,975,232 |
| Total Certificates of Deposit (Cost $54,657,732) | | | | 54,657,732 |
| Other Notes (1.9%) | | | | |
| | Bank of America NA | 0.480% | 3/1/16 | 496,000 | 496,000 |
| | Bank of America NA | 0.480% | 3/2/16 | 496,000 | 496,000 |
| 5 | Bank of America NA | 0.607% | 3/3/16 | 184,000 | 184,000 |
| | Bank of America NA | 0.460% | 4/4/16 | 176,000 | 176,000 |
| | Bank of America NA | 0.500% | 5/5/16 | 221,000 | 221,000 |
| 5 | Bank of America NA | 0.599% | 5/9/16 | 221,250 | 221,250 |
| 5 | Bank of America NA | 0.623% | 5/17/16 | 283,000 | 283,000 |
| 5 | Bank of America NA | 0.614% | 5/23/16 | 178,000 | 178,000 |
| 5 | Bank of America NA | 0.755% | 8/1/16 | 376,500 | 376,500 |
| Total Other Notes (Cost $2,631,750) | | | | 2,631,750 |
| Repurchase Agreements (0.2%) | | | | |
| | Bank of Nova Scotia | | | | |
| | (Dated 2/29/16, Repurchase Value | | | | |
| | $280,002,000, collateralized by U.S. | | | | |
| | Treasury Bill 0.000%, 3/31/16–8/18/16, | | | | |
| | and U.S. Treasury Note/Bond | | | | |
| | 0.875%–3.625%, 10/15/17–4/15/28, | | | | |
| | with a value of $285,600,000) | 0.300% | 3/1/16 | 280,000 | 280,000 |
| Total Repurchase Agreements (Cost $280,000) | | | | 280,000 |
| Corporate Bonds (0.9%) | | | | |
| Industrial (0.9%) | | | | |
| 5 | Toyota Motor Credit Corp. | 0.817% | 10/7/16 | 544,000 | 544,000 |
| 5 | Toyota Motor Credit Corp. | 0.522% | 6/13/16 | 734,000 | 734,000 |
| Total Corporate Bonds (Cost $1,278,000) | | | | 1,278,000 |
| Taxable Municipal Bonds (0.7%) | | | | |
| 6,7 | BlackRock Municipal Bond Trust TOB VRDO | 0.370% | 3/1/16 | 25,930 | 25,930 |
| 6,7 | BlackRock Municipal Income Investment | | | | |
| | Quality Trust TOB VRDO | 0.370% | 3/1/16 | 30,715 | 30,715 |
20
| | | | | |
| Prime Money Market Fund | | | | |
| |
| |
| |
| | | | | Face | Market |
| | | | Maturity | Amount | Value• |
| | | Yield1 | Date | ($000) | ($000) |
| 6,7 | BlackRock Municipal Income Trust II TOB VRDO | 0.370% | 3/1/16 | 81,250 | 81,250 |
| 6,7 | BlackRock Municipal Income Trust TOB VRDO | 0.370% | 3/1/16 | 207,000 | 207,000 |
| 6,7 | BlackRock MuniHoldings Fund II, Inc. TOB VRDO | 0.370% | 3/1/16 | 40,385 | 40,385 |
| 6,7 | BlackRock MuniHoldings Fund, Inc. TOB VRDO | 0.370% | 3/1/16 | 19,165 | 19,165 |
| 6,7 | BlackRock MuniHoldings Quality Fund II, Inc. | | | | |
| | TOB VRDO | 0.370% | 3/1/16 | 100,000 | 100,000 |
| 6,7 | BlackRock MuniHoldings Quality Fund II, Inc. | | | | |
| | TOB VRDO | 0.370% | 3/1/16 | 38,905 | 38,905 |
| 6,7 | BlackRock MuniVest Fund II, Inc. TOB VRDO | 0.370% | 3/1/16 | 89,750 | 89,750 |
| 6,7 | BlackRock MuniVest Fund, Inc. TOB VRDO | 0.370% | 3/1/16 | 130,340 | 130,340 |
| 6,7 | BlackRock MuniYield Investment Quality Fund | | | | |
| | TOB VRDO | 0.370% | 3/1/16 | 41,065 | 41,065 |
| 6,7 | BlackRock MuniYield Investment Quality Fund | | | | |
| | TOB VRDO | 0.370% | 3/1/16 | 89,100 | 89,100 |
| 6,7 | BlackRock Strategic Municipal Trust TOB VRDO | 0.370% | 3/1/16 | 16,555 | 16,555 |
| 6 | Los Angeles CA Department of Water | | | | |
| | & Power Revenue TOB VRDO | 0.410% | 3/7/16 | 13,000 | 13,000 |
| 6 | Massachusetts Transportation Fund Revenue | | | | |
| | TOB VRDO | 0.410% | 3/7/16 | 13,100 | 13,100 |
| 7 | New York State Housing Finance Agency | | | | |
| | Housing Revenue VRDO | 0.380% | 3/7/16 | 33,000 | 33,000 |
| 6 | Seattle WA Municipal Light & Power Revenue | | | | |
| | TOB VRDO | 0.410% | 3/7/16 | 6,400 | 6,400 |
| Total Taxable Municipal Bonds (Cost $975,660) | | | | 975,660 |
| Total Investments (102.9%) (Cost $142,877,773) | | | | 142,877,773 |
| |
| | | | | | Amount |
| | | | | | ($000) |
| Other Assets and Liabilities (-2.9%) | | | | |
| Other Assets | | | | |
| Investment in Vanguard | | | | 12,516 |
| Receivables for Accrued Income | | | | 59,878 |
| Receivables for Capital Shares Issued | | | | 122,437 |
| Other Assets | | | | 92,341 |
| Total Other Assets | | | | 287,172 |
| Liabilities | | | | |
| Payables for Investment Securities Purchased | | | | (3,996,814) |
| Payables for Capital Shares Redeemed | | | | (361,937) |
| Payables for Distributions | | | | (504) |
| Payables to Vanguard | | | | (10,099) |
| Total Liabilities | | | | (4,369,354) |
| Net Assets (100%) | | | | 138,795,591 |
21
Prime Money Market Fund
| |
| At February 29, 2016, net assets consisted of: | |
| | Amount |
| | ($000) |
| Paid-in Capital | 138,790,839 |
| Undistributed Net Investment Income | 3 |
| Accumulated Net Realized Gains | 4,749 |
| Net Assets | 138,795,591 |
| |
| Investor Shares—Net Assets | |
| Applicable to 110,037,104,801 outstanding $.001 par value shares of | |
| beneficial interest (unlimited authorization) | 110,050,413 |
| Net Asset Value Per Share—Investor Shares | $1.00 |
| |
| Admiral Shares—Net Assets | |
| Applicable to 28,743,173,372 outstanding $.001 par value shares of | |
| beneficial interest (unlimited authorization) | 28,745,178 |
| Net Asset Value Per Share—Admiral Shares | $1.00 |
• See Note A in Notes to Financial Statements.
1 Represents annualized yield at date of purchase for discount securities, and coupon for coupon-bearing securities.
2 The issuer was placed under federal conservatorship in September 2008; since that time, its daily operations have been managed by the
Federal Housing Finance Agency and it receives capital from the U.S. Treasury, as needed to maintain a positive net worth, in exchange for
senior preferred stock.
3 The issuer operates under a congressional charter; its securities are generally neither guaranteed by the U.S. Treasury nor backed by the full
faith and credit of the U.S. government.
4 Security exempt from registration under Section 4(2) of the Securities Act of 1933. Such securities may be sold in transactions exempt from
registration only to dealers in that program or other “accredited investors.” At February 29, 2016, the aggregate value of these securities
was $19,758,287,000, representing 14.2% of net assets.
5 Adjustable-rate security.
6 Security exempt from registration under Rule 144A of the Securities Act of 1933. Such securities may be sold in transactions exempt from
registration, normally to qualified institutional buyers. At February 29, 2016, the aggregate value of these securities was $4,769,220,000,
representing 3.4% of net assets.
7 Scheduled principal and interest payments are guaranteed by bank letter of credit.
TOB—Tender Option Bond.
VRDO—Variable Rate Demand Obligation.
See accompanying Notes, which are an integral part of the Financial Statements.
22
Prime Money Market Fund
Statement of Operations
| |
| | Six Months Ended |
| | February 29, 2016 |
| | ($000) |
| Investment Income | |
| Income | |
| Interest | 241,418 |
| Total Income | 241,418 |
| Expenses | |
| The Vanguard Group—Note B | |
| Investment Advisory Services | 1,899 |
| Management and Administrative—Investor Shares | 68,137 |
| Management and Administrative—Admiral Shares | 13,431 |
| Marketing and Distribution—Investor Shares | 15,897 |
| Marketing and Distribution—Admiral Shares | 505 |
| Custodian Fees | 736 |
| Shareholders’ Reports—Investor Shares | 226 |
| Shareholders’ Reports—Admiral Shares | 69 |
| Trustees’ Fees and Expenses | 41 |
| Total Expenses | 100,941 |
| Expense Reduction—Note B | (3) |
| Net Expenses | 100,938 |
| Net Investment Income | 140,480 |
| Realized Net Gain (Loss) on Investment Securities Sold | 1,753 |
| Net Increase (Decrease) in Net Assets Resulting from Operations | 142,233 |
See accompanying Notes, which are an integral part of the Financial Statements.
23
Prime Money Market Fund
Statement of Changes in Net Assets
| | |
| Six Months Ended | Year Ended |
| | February 29, | August 31, |
| | 2016 | 2015 |
| | ($000) | ($000) |
| Increase (Decrease) in Net Assets | | |
| Operations | | |
| Net Investment Income | 140,480 | 36,345 |
| Realized Net Gain (Loss) | 1,753 | 1,570 |
| Net Increase (Decrease) in Net Assets Resulting from Operations | 142,233 | 37,915 |
| Distributions | | |
| Net Investment Income | | |
| Investor Shares | (104,124) | (16,453) |
| Admiral Shares1 | (36,352) | (19,893) |
| Realized Capital Gain | | |
| Investor Shares | — | — |
| Admiral Shares1 | — | — |
| Total Distributions | (140,476) | (36,346) |
| Capital Share Transactions | | |
| Investor Shares | 4,228,591 | 3,908,734 |
| Admiral Shares1 | (242,968) | 288,391 |
| Net Increase (Decrease) from Capital Share Transactions (at $1.00 per share) | 3,985,623 | 4,197,125 |
| Total Increase (Decrease) | 3,987,380 | 4,198,694 |
| Net Assets | | |
| Beginning of Period | 134,808,211 | 130,609,517 |
| End of Period2 | 138,795,591 | 134,808,211 |
1 Institutional Shares were renamed Admiral Shares in December 2015. Prior period’s Distributions and Capital Share Transactions are for the Institutional Class.
2 Net Assets—End of Period includes undistributed (overdistributed) net investment income of $3,000 and ($1,000).
See accompanying Notes, which are an integral part of the Financial Statements.
24
Prime Money Market Fund
Financial Highlights
| | | | | | | |
| Investor Shares | | | | | | | |
| | Six Months | | | | | |
| | | Ended | | | | | |
| For a Share Outstanding | February 29, | Year Ended August 31, |
| Throughout Each Period | | 2016 | 2015 | 2014 | 2013 | 2012 | 2011 |
| Net Asset Value, Beginning of Period | $1.00 | $1.00 | $1.00 | $1.00 | $1.00 | $1.00 |
| Investment Operations | | | | | | | |
| Net Investment Income | | .001 | .0002 | .0001 | .0002 | .0004 | .001 |
| Net Realized and Unrealized Gain (Loss) | | | | | | |
| on Investments | | — | — | — | — | — | — |
| Total from Investment Operations | .001 | .0002 | .0001 | .0002 | .0004 | .001 |
| Distributions | | | | | | | |
| Dividends from Net Investment Income | (.001) | (.0002) | (.0001) | (.0002) | (.0004) | (.001) |
| Distributions from Realized Capital Gains | — | — | (.0000)1 | — | — | — |
| Total Distributions | | (.001) | (.0002) | (.0001) | (.0002) | (.0004) | (.001) |
| Net Asset Value, End of Period | $1.00 | $1.00 | $1.00 | $1.00 | $1.00 | $1.00 |
| |
| Total Return2 | | 0.10% | 0.02% | 0.02% | 0.02% | 0.04% | 0.06% |
| |
| Ratios/Supplemental Data | | | | | | | |
| Net Assets, End of Period (Millions) | $110,050 | $105,820 | $101,910 | $102,160 | $90,212 | $92,404 |
| Ratio of Expenses to | | | | | | | |
| Average Net Assets | | 0.16%3 | 0.15%3 | 0.14%3 | 0.16%3 | 0.16% | 0.20% |
| Ratio of Net Investment Income to | | | | | | |
| Average Net Assets | | 0.19% | 0.02% | 0.01% | 0.02% | 0.04% | 0.06% |
The expense ratio and net income ratio for the current period have been annualized.
1 Distribution was less than $.0001 per share.
2 Total returns do not include account service fees that may have applied in the periods shown. Fund prospectuses provide information about any applicable account service fees.
3 The ratio of total expenses to average net assets before an expense reduction was 0.16% for 2016, 0.16% for 2015, 0.16% for 2014, and 0.17% for 2013. See Note B in the Notes to Financial Statements.
See accompanying Notes, which are an integral part of the Financial Statements.
25
Prime Money Market Fund
Financial Highlights
| | | | | | | |
| Admiral Shares | | | | | | | |
| | Six Months | | | | | |
| | | Ended | | | | | |
| For a Share Outstanding | February 29, | Year Ended August 31, |
| Throughout Each Period | | 2016 | 2015 | 2014 | 2013 | 2012 | 2011 |
| Net Asset Value, Beginning of Period | $1.00 | $1.00 | $1.00 | $1.00 | $1.00 | $1.00 |
| Investment Operations | | | | | | | |
| Net Investment Income | | .001 | .001 | .001 | .001 | .001 | .002 |
| Net Realized and Unrealized Gain (Loss) | | | | | | |
| on Investments | | — | — | — | — | — | — |
| Total from Investment Operations | .001 | .001 | .001 | .001 | .001 | .002 |
| Distributions | | | | | | | |
| Dividends from Net Investment Income | (. 001) | (. 001) | (. 001) | (. 001) | (. 001) | (. 002) |
| Distributions from Realized Capital Gains | — | — | (.000)1 | — | — | — |
| Total Distributions | | (. 001) | (. 001) | (. 001) | (. 001) | (. 001) | (. 002) |
| Net Asset Value, End of Period | $1.00 | $1.00 | $1.00 | $1.00 | $1.00 | $1.00 |
| |
| Total Return | | 0.13%2 | 0.07% | 0.06% | 0.07% | 0.11% | 0.17% |
| |
| Ratios/Supplemental Data | | | | | | | |
| Net Assets, End of Period (Millions) | $28,745 | $28,988 | $28,699 | $27,015 | $24,543 | $21,739 |
| Ratio of Expenses to | | | | | | | |
| Average Net Assets | | 0.10% | 0.10% | 0.10% | 0.10% | 0.09% | 0.09% |
| Ratio of Net Investment Income to | | | | | | |
| Average Net Assets | | 0.25% | 0.07% | 0.05% | 0.07% | 0.11% | 0.17% |
The expense ratio and net income ratio for the current period have been annualized.
Institutional Shares were renamed Admiral Shares in December 2015. Prior periods’ Financial Highlights are for the Institutional Class.
1 Distribution was less than $.001 per share.
2 Total returns do not include account service fees that may have applied in the periods shown. Fund prospectuses provide information about any applicable account service fees.
See accompanying Notes, which are an integral part of the Financial Statements.
26
Prime Money Market Fund
Notes to Financial Statements
Vanguard Prime Money Market Fund is registered under the Investment Company Act of 1940 as an open-end investment company, or mutual fund. The fund invests in short-term debt instruments of companies primarily operating in specific industries, particularly financial services; the issuers’ abilities to meet their obligations may be affected by economic developments in such industries. The fund offers two classes of shares, Investor Shares and Admiral Shares. Investor Shares are available to any investor who meets the fund’s minimum purchase requirements. Admiral Shares are designed for investors who meet certain administrative, service, and account-size criteria. Effective December 2015, Institutional Shares were renamed Admiral Shares.
A. The following significant accounting policies conform to generally accepted accounting principles for U.S. investment companies. The fund consistently follows such policies in preparing its financial statements.
1. Security Valuation: Securities are valued as of the close of trading on the New York Stock Exchange (generally 4 p.m., Eastern time) on the valuation date. Securities are valued at amortized cost, which approximates market value.
2. Repurchase Agreements: The fund enters into repurchase agreements with institutional counter-parties. Securities pledged as collateral to the fund under repurchase agreements are held by a custodian bank until the agreements mature. Each agreement requires that the market value of the collateral be sufficient to cover payments of interest and principal. The fund further mitigates its counterparty risk by entering into repurchase agreements only with a diverse group of prequalified counterparties, monitoring their financial strength, and entering into master repurchase agreements with its counterparties. The master repurchase agreements provide that, in the event of a counter-party’s default (including bankruptcy), the fund may terminate any repurchase agreements with that counterparty, determine the net amount owed, and sell or retain the collateral up to the net amount owed to the fund. Such action may be subject to legal proceedings, which may delay or limit the disposition of collateral.
3. Federal Income Taxes: The fund intends to continue to qualify as a regulated investment company and distribute all of its taxable income. Management has analyzed the fund’s tax positions taken for all open federal income tax years (August 31, 2012–2015), and for the period ended February 29, 2016, and has concluded that no provision for federal income tax is required in the fund’s financial statements.
4. Distributions: Distributions from net investment income are declared daily and paid on the first business day of the following month.
5. Credit Facility: The fund and certain other funds managed by The Vanguard Group (“Vanguard”) participate in a $3 billion committed credit facility provided by a syndicate of lenders pursuant to a credit agreement that may be renewed annually; each fund is individually liable for its borrowings, if any, under the credit facility. Borrowings may be utilized for temporary and emergency purposes, and are subject to the fund’s regulatory and contractual borrowing restrictions. The participating funds are charged administrative fees and an annual commitment fee of 0.06% of the undrawn amount of the facility; these fees are allocated to the funds based on a method approved by the fund’s board
27
Prime Money Market Fund
of trustees and included in Management and Administrative expenses on the fund’s Statement of Operations. Any borrowings under this facility bear interest at a rate equal to the higher of the federal funds rate or LIBOR reference rate plus an agreed-upon spread.
The fund had no borrowings outstanding at February 29, 2016, or at any time during the period then ended.
6. Other: Interest income is accrued daily. Premiums and discounts on debt securities purchased are amortized and accreted, respectively, to interest income over the lives of the respective securities. Security transactions are accounted for on the date securities are bought or sold. Costs used to determine realized gains (losses) on the sale of investment securities are those of the specific securities sold.
Each class of shares has equal rights as to assets and earnings, except that each class separately bears certain class-specific expenses related to maintenance of shareholder accounts (included in Management and Administrative expenses) and shareholder reporting. Marketing and distribution expenses are allocated to each class of shares based on a method approved by the board of trustees. Income, other non-class-specific expenses, and gains and losses on investments are allocated to each class of shares based on its relative net assets.
B. In accordance with the terms of a Funds’ Service Agreement (the “FSA”) between Vanguard and the fund, Vanguard furnishes to the fund investment advisory, corporate management, administrative, marketing, and distribution services at Vanguard’s cost of operations (as defined by the FSA). These costs of operations are allocated to the fund based on methods and guidelines approved by the board of trustees. Vanguard does not require reimbursement in the current period for certain costs of operations (such as deferred compensation/benefits and risk/insurance costs); the fund’s liability for these costs of operations is included in Payables to Vanguard on the Statement of Net Assets.
Upon the request of Vanguard, the fund may invest up to 0.40% of its net assets as capital in Vanguard. At February 29, 2016, the fund had contributed to Vanguard capital in the amount of $12,516,000, representing 0.01% of the fund’s net assets and 5.01% of Vanguard’s capitalization. The fund’s trustees and officers are also directors and employees, respectively, of Vanguard.
Vanguard and the board of trustees have agreed to temporarily limit certain net operating expenses in excess of the fund’s daily yield in order to maintain a zero or positive yield for the fund. Vanguard and the board of trustees may terminate the temporary expense limitation at any time. For the period ended February 29, 2016, Vanguard’s expenses were reduced by $3,000 (an effective annual rate of 0.00% of the fund’s average net assets); the fund is not obligated to repay this amount to Vanguard.
C. Various inputs may be used to determine the value of the fund’s investments. These inputs are summarized in three broad levels for financial statement purposes. The inputs or methodologies used to value securities are not necessarily an indication of the risk associated with investing in those securities.
Level 1—Quoted prices in active markets for identical securities.
Level 2—Other significant observable inputs (including quoted prices for similar securities, interest rates, prepayment speeds, credit risk, etc.).
Level 3—Significant unobservable inputs (including the fund’s own assumptions used to determine the fair value of investments).
28
Prime Money Market Fund
At February 29, 2016, 100% of the market value of the fund’s investments was determined using amortized cost, in accordance with rules under the Investment Company Act of 1940. Amortized cost approximates the current fair value of a security, but since the value is not obtained from a quoted price in an active market, securities valued at amortized cost are considered to be valued using Level 2 inputs.
D. Capital share transactions for each class of shares were:
| | | | |
| | Six Months Ended | Year Ended |
| | February 29, 2016 | August 31, 2015 |
| | Amount | Shares | Amount | Shares |
| | ($000) | (000) | ($000) | (000) |
| Investor Shares | | | | |
| Issued | 58,419,014 | 58,419,016 | 136,070,155 | 136,070,155 |
| Issued in Lieu of Cash Distributions | 101,801 | 101,801 | 16,094 | 16,094 |
| Redeemed | (54,292,224) | (54,292,224) | (132,177,515) | (132,177,515) |
| Net Increase (Decrease)—Investor Shares | 4,228,591 | 4,228,593 | 3,908,734 | 3,908,734 |
| Admiral Shares1 | | | | |
| Issued | 10,156,750 | 10,156,751 | 19,863,406 | 19,863,406 |
| Issued in Lieu of Cash Distributions | 35,553 | 35,553 | 19,409 | 19,409 |
| Redeemed | (10,435,271) | (10,435,271) | (19,594,424) | (19,594,424) |
| Net Increase (Decrease)—Admiral Shares | (242,968) | (242,967) | 288,391 | 288,391 |
| 1 Institutional Shares were renamed Admiral Shares in December 2015. Prior period’s capital share transactions are for the Institutional Class. |
E. Management has determined that no material events or transactions occurred subsequent to February 29, 2016, that would require recognition or disclosure in these financial statements.
29
Federal Money Market Fund
Fund Profile
As of February 29, 2016
| |
| Financial Attributes | |
| Ticker Symbol | VMFXX |
| Expense Ratio1 | 0.11% |
| 7-Day SEC Yield | 0.30% |
| Average Weighted | |
| Maturity | 51 days |
| |
| Sector Diversification (% of portfolio) | |
| U.S. Treasury Bills | 4.8% |
| U.S. Government Obligations | 67.3 |
| Repurchase Agreements | 27.9 |
The agency and mortgage-backed securities sectors may include issues from government-sponsored enterprises; such issues are
generally not backed by the full faith and credit of the U.S. government.
| |
| Distribution by Credit Quality (% of portfolio) |
| First Tier | 100.0% |
A First Tier security is one that is eligible for money market funds and has been rated in the highest short-term rating category for
debt obligations by nationally recognized statistical rating organizations. Credit-quality ratings are obtained from Moody's,
Fitch, and S&P. For securities rated by all three agencies, where two of them are in agreement and assign the highest rating
category, the highest rating applies. If a security is only rated by two agencies, and their ratings are in different categories, the
lower of the ratings applies. An unrated security is First Tier if it represents quality comparable to that of a rated security, as
determined in accordance with SEC Rule 2a-7. For more information about these ratings, see the Glossary entry for Credit
Quality.
1 The expense ratio shown is from the prospectus dated December 14, 2015, and represents estimated costs for the current fiscal year. For the six
months ended February 29, 2016, the annualized expense ratio was 0.11%.
30
Federal Money Market Fund
Performance Summary
Investment returns will fluctuate. All of the returns in this report represent past performance, which is not a guarantee of future results that may be achieved by the fund. (Current performance may be lower or higher than the performance data cited. For performance data current to the most recent month-end, visit our website at vanguard.com/performance.) The returns shown do not reflect taxes that a shareholder would pay on fund distributions. An investment in a money market fund is not insured or guaranteed by the Federal Deposit Insurance Corporation or any other government agency. Although the fund seeks to preserve the value of your investment at $1 per share, it is possible to lose money by investing in the fund. The fund’s 7-day SEC yield reflects its current earnings more closely than do the average annual returns.
| | |
| Fiscal-Year Total Returns (%): August 31, 2005, Through February 29, 2016 | |
| | | US Gov’t Money |
| | | Market Funds |
| | | Average |
| Fiscal Year | Total Returns | Total Returns |
| 2006 | 4.31% | 3.78% |
| 2007 | 5.17 | 4.58 |
| 2008 | 3.46 | 2.71 |
| 2009 | 1.06 | 0.43 |
| 2010 | 0.04 | 0.00 |
| 2011 | 0.02 | 0.00 |
| 2012 | 0.01 | 0.00 |
| 2013 | 0.01 | 0.00 |
| 2014 | 0.02 | 0.00 |
| 2015 | 0.01 | 0.00 |
| 2016 | 0.07 | 0.00 |
| 7-day SEC yield (2/29/2016): 0.30% |
| Government Money Market Funds Average: Derived from data provided by Lipper, a Thomson Reuters Company. |
| Note: For 2016, performance data reflect the six months ended February 29, 2016. |
Average Annual Total Returns: Periods Ended December 31, 2015
This table presents returns through the latest calendar quarter—rather than through the end of the fiscal period.
Securities and Exchange Commission rules require that we provide this information.
| | | | |
| | Inception | One | Five | Ten |
| | Date | Year | Years | Years |
| Federal Money Market Fund | 7/13/1981 | 0.04% | 0.02% | 1.27% |
See Financial Highlights for dividend information.
31
Federal Money Market Fund
Financial Statements (unaudited)
Statement of Net Assets
As of February 29, 2016
The fund reports a complete list of its holdings in various monthly and quarterly regulatory filings. The fund publishes its holdings on a monthly basis at vanguard.com and files them with the Securities and Exchange Commission on Form N-MFP. The fund’s Form N-MFP filings become public 60 days after the relevant month-end, and may be viewed at sec.gov or via a link on the “Portfolio Holdings” page on vanguard.com. For the second and fourth fiscal quarters, the lists appear in the fund’s semiannual and annual reports to shareholders. For the first and third fiscal quarters, the fund files the lists with the SEC on Form N-Q. Shareholders can look up the fund’s Forms N-Q on the SEC’s website at sec.gov. Forms N-Q may also be reviewed and copied at the SEC’s Public Reference Room (see the back cover of this report for further information).
| | | | | |
| | | | | Face | Market |
| | | | Maturity | Amount | Value• |
| | | Yield1 | Date | ($000) | ($000) |
| U.S. Government and Agency Obligations (77.1%) | | | |
| 2 | Fannie Mae Discount Notes | 0.350% | 3/1/16 | 738 | 738 |
| 2 | Fannie Mae Discount Notes | 0.476% | 3/9/16 | 75,000 | 74,992 |
| 2 | Fannie Mae Discount Notes | 0.341%–0.400% | 3/16/16 | 22,577 | 22,574 |
| 2 | Fannie Mae Discount Notes | 0.251% | 4/1/16 | 2,850 | 2,849 |
| 2 | Fannie Mae Discount Notes | 0.220% | 4/6/16 | 4,146 | 4,145 |
| 2 | Fannie Mae Discount Notes | 0.230% | 4/13/16 | 980 | 980 |
| 2 | Fannie Mae Discount Notes | 0.400% | 5/2/16 | 3,890 | 3,887 |
| 2 | Fannie Mae Discount Notes | 0.511% | 5/25/16 | 7,702 | 7,693 |
| 2 | Fannie Mae Discount Notes | 0.401%–0.521% | 6/1/16 | 126,857 | 126,720 |
| 2 | Fannie Mae Discount Notes | 0.377% | 6/2/16 | 52,500 | 52,449 |
| 2 | Fannie Mae Discount Notes | 0.637% | 6/8/16 | 10,671 | 10,652 |
| 2 | Fannie Mae Discount Notes | 0.552% | 6/16/16 | 9,388 | 9,373 |
| 2 | Fannie Mae Discount Notes | 0.366% | 6/21/16 | 60,000 | 59,932 |
| 2 | Fannie Mae Discount Notes | 0.471%–0.541% | 6/22/16 | 89,900 | 89,761 |
| 2 | Fannie Mae Discount Notes | 0.602% | 6/29/16 | 25,000 | 24,950 |
| 2 | Fannie Mae Discount Notes | 0.572% | 7/1/16 | 2,078 | 2,074 |
| 2 | Fannie Mae Discount Notes | 0.562% | 7/6/16 | 501 | 500 |
| 2 | Fannie Mae Discount Notes | 0.501% | 7/27/16 | 1,168 | 1,166 |
| 2 | Fannie Mae Discount Notes | 0.481% | 8/17/16 | 1,067 | 1,065 |
| 3 | Federal Home Loan Bank Discount Notes | 0.315%–0.360% | 3/2/16 | 25,745 | 25,745 |
| 3 | Federal Home Loan Bank Discount Notes | 0.280%–0.450% | 3/4/16 | 21,743 | 21,742 |
| 3 | Federal Home Loan Bank Discount Notes | 0.250%–0.481% | 3/9/16 | 53,375 | 53,369 |
| 3 | Federal Home Loan Bank Discount Notes | 0.481% | 3/11/16 | 43,144 | 43,138 |
| 3 | Federal Home Loan Bank Discount Notes | 0.360% | 3/16/16 | 389 | 389 |
| 3 | Federal Home Loan Bank Discount Notes | 0.340% | 3/21/16 | 15,100 | 15,097 |
| 3 | Federal Home Loan Bank Discount Notes | 0.398%–0.420% | 3/23/16 | 250,000 | 249,938 |
| 3 | Federal Home Loan Bank Discount Notes | 0.380% | 3/28/16 | 25,825 | 25,818 |
| 3 | Federal Home Loan Bank Discount Notes | 0.431% | 3/30/16 | 20,100 | 20,093 |
| 3 | Federal Home Loan Bank Discount Notes | 0.400% | 4/8/16 | 299 | 299 |
| 3 | Federal Home Loan Bank Discount Notes | 0.400% | 4/13/16 | 504 | 504 |
| 3 | Federal Home Loan Bank Discount Notes | 0.250%–0.420% | 4/15/16 | 61,079 | 61,055 |
| 3 | Federal Home Loan Bank Discount Notes | 0.250%–0.471% | 4/20/16 | 30,000 | 29,988 |
| 3 | Federal Home Loan Bank Discount Notes | 0.250% | 4/22/16 | 50,000 | 49,982 |
| 3 | Federal Home Loan Bank Discount Notes | 0.380% | 4/28/16 | 1,486 | 1,485 |
32
| | | | | |
| Federal Money Market Fund | | | | |
| |
| |
| |
| | | | | Face | Market |
| | | | Maturity | Amount | Value• |
| | | Yield1 | Date | ($000) | ($000) |
| 3 | Federal Home Loan Bank Discount Notes | 0.410% | 4/29/16 | 904 | 903 |
| 3 | Federal Home Loan Bank Discount Notes | 0.481% | 5/4/16 | 428 | 428 |
| 3 | Federal Home Loan Bank Discount Notes | 0.402% | 5/6/16 | 58,000 | 57,957 |
| 3 | Federal Home Loan Bank Discount Notes | 0.390% | 5/11/16 | 15,112 | 15,100 |
| 3 | Federal Home Loan Bank Discount Notes | 0.351%–0.461% | 5/20/16 | 2,904 | 2,902 |
| 3 | Federal Home Loan Bank Discount Notes | 0.398% | 5/25/16 | 65,000 | 64,939 |
| 3 | Federal Home Loan Bank Discount Notes | 0.390%–0.602% | 5/27/16 | 103,672 | 103,572 |
| 3 | Federal Home Loan Bank Discount Notes | 0.521%–0.541% | 6/1/16 | 40,000 | 39,946 |
| 3 | Federal Home Loan Bank Discount Notes | 0.411% | 6/9/16 | 592 | 591 |
| 3 | Federal Home Loan Bank Discount Notes | 0.572% | 7/6/16 | 21,000 | 20,958 |
| 3 | Federal Home Loan Bank Discount Notes | 0.572%–0.582% | 7/8/16 | 115,798 | 115,560 |
| 3 | Federal Home Loan Bank Discount Notes | 0.511%–0.521% | 7/20/16 | 32,450 | 32,385 |
| 3 | Federal Home Loan Bank Discount Notes | 0.505% | 7/22/16 | 75,000 | 74,850 |
| 3 | Federal Home Loan Bank Discount Notes | 0.520% | 7/27/16 | 75,000 | 74,840 |
| 3 | Federal Home Loan Bank Discount Notes | 0.481%–0.491% | 8/10/16 | 48,122 | 48,016 |
| 3 | Federal Home Loan Bank Discount Notes | 0.465% | 8/12/16 | 137,500 | 137,209 |
| 3,4 | Federal Home Loan Banks | 0.420% | 7/6/16 | 40,000 | 40,000 |
| 3,4 | Federal Home Loan Banks | 0.375% | 8/18/16 | 10,000 | 9,996 |
| 3,4 | Federal Home Loan Banks | 0.464% | 9/2/16 | 245,000 | 245,002 |
| 3,4 | Federal Home Loan Banks | 0.524% | 1/26/17 | 100,000 | 100,000 |
| 2,4 | Federal Home Loan Mortgage Corp. | 0.427% | 7/21/16 | 87,000 | 86,998 |
| 2,4 | Federal Home Loan Mortgage Corp. | 0.374% | 8/17/16 | 50,000 | 50,000 |
| 2,4 | Federal Home Loan Mortgage Corp. | 0.390% | 9/2/16 | 200,000 | 200,000 |
| 2,4 | Federal Home Loan Mortgage Corp. | 0.562% | 7/21/17 | 100,000 | 99,986 |
| 2,4 | Federal National Mortgage Assn. | 0.446% | 7/25/16 | 25,000 | 25,003 |
| 2,4 | Federal National Mortgage Assn. | 0.451% | 8/12/16 | 35,000 | 35,005 |
| 2,4 | Federal National Mortgage Assn. | 0.447% | 8/15/16 | 143,985 | 144,009 |
| 2,4 | Federal National Mortgage Assn. | 0.438% | 9/8/17 | 100,000 | 99,985 |
| 2 | Freddie Mac Discount Notes | 0.430% | 3/1/16 | 170,000 | 170,000 |
| 2 | Freddie Mac Discount Notes | 0.361% | 3/7/16 | 5,000 | 5,000 |
| 2 | Freddie Mac Discount Notes | 0.280% | 3/11/16 | 60,000 | 59,995 |
| 2 | Freddie Mac Discount Notes | 0.240% | 3/16/16 | 25,000 | 24,997 |
| 2 | Freddie Mac Discount Notes | 0.370%–0.408% | 4/1/16 | 250,000 | 249,914 |
| 2 | Freddie Mac Discount Notes | 0.225%–0.350% | 4/4/16 | 78,598 | 78,580 |
| 2 | Freddie Mac Discount Notes | 0.421%–0.451% | 4/8/16 | 80,622 | 80,586 |
| 2 | Freddie Mac Discount Notes | 0.270% | 4/15/16 | 2,227 | 2,226 |
| 2 | Freddie Mac Discount Notes | 0.230% | 4/25/16 | 25,000 | 24,991 |
| 2 | Freddie Mac Discount Notes | 0.662% | 6/1/16 | 1,550 | 1,547 |
| 2 | Freddie Mac Discount Notes | 0.377%–0.390% | 6/2/16 | 50,945 | 50,895 |
| 2 | Freddie Mac Discount Notes | 0.380% | 6/3/16 | 25,000 | 24,975 |
| 2 | Freddie Mac Discount Notes | 0.411% | 6/7/16 | 50,000 | 49,944 |
| 2 | Freddie Mac Discount Notes | 0.381% | 6/9/16 | 21,775 | 21,752 |
| 2 | Freddie Mac Discount Notes | 0.481%–0.521% | 8/2/16 | 41,165 | 41,080 |
| 2 | Freddie Mac Discount Notes | 0.480% | 8/5/16 | 55,500 | 55,384 |
| 2 | Freddie Mac Discount Notes | 0.456% | 8/12/16 | 30,000 | 29,938 |
| | United States Treasury Bill | 0.341% | 5/12/16 | 21,195 | 21,181 |
| | United States Treasury Bill | 0.416%–0.431% | 6/2/16 | 65,000 | 64,929 |
| | United States Treasury Bill | 0.542% | 6/9/16 | 20,000 | 19,970 |
| | United States Treasury Bill | 0.587% | 6/16/16 | 100,000 | 99,826 |
| 4 | United States Treasury Floating Rate Note | 0.389% | 4/30/16 | 4,000 | 4,000 |
| 4 | United States Treasury Floating Rate Note | 0.373% | 10/31/16 | 50,000 | 49,983 |
| 4 | United States Treasury Floating Rate Note | 0.404% | 1/31/17 | 18,234 | 18,234 |
| | United States Treasury Note/Bond | 2.250% | 3/31/16 | 20,000 | 20,034 |
| | United States Treasury Note/Bond | 0.375% | 3/31/16 | 19,955 | 19,958 |
33
| | | | |
| Federal Money Market Fund | | | | |
| |
| |
| |
| | | | Face | Market |
| | | Maturity | Amount | Value• |
| | Yield1 | Date | ($000) | ($000) |
| United States Treasury Note/Bond | 5.125% | 5/15/16 | 45,000 | 45,454 |
| United States Treasury Note/Bond | 3.250% | 5/31/16 | 50,000 | 50,353 |
| United States Treasury Note/Bond | 0.375% | 5/31/16 | 25,000 | 25,003 |
| United States Treasury Note/Bond | 3.250% | 7/31/16 | 194,813 | 197,029 |
| United States Treasury Note/Bond | 0.875% | 9/15/16 | 75,000 | 75,139 |
| Total U.S. Government and Agency Obligations (Cost $4,704,179) | | | 4,704,179 |
| Repurchase Agreements (19.5%) | | | | |
| Bank of Montreal | | | | |
| (Dated 2/29/16, Repurchase Value | | | | |
| $144,001,000, collateralized by Treasury | | | | |
| Inflation Indexed Note/Bond, 0.125%–0.750%, | | | | |
| 4/15/17–2/15/45, U.S. Treasury Bond/Note | | | | |
| 0.750%–3.125%, 2/28/18–5/15/21; | | | | |
| with a value of $146,880,000) | 0.290% | 3/1/16 | 144,000 | 144,000 |
| Bank of Nova Scotia | | | | |
| (Dated 2/29/16, Repurchase Value | | | | |
| $145,001,000, collateralized by Treasury | | | | |
| Inflation Indexed Note/Bond, 0.125%–3.875%, | | | | |
| 1/15/23–4/15/29, U.S. Treasury Bond/Note | | | | |
| 0.500%–2.125%, 3/31/17–8/15/25; | | | | |
| with a value of $147,900,000) | 0.300% | 3/1/16 | 145,000 | 145,000 |
| Federal Reserve Bank of New York | | | | |
| (Dated 2/29/16, Repurchase Value $48,000,000, | | | | |
| collateralized by U.S. Treasury Bond/Note | | | | |
| 2.000%–6.625%, 7/31/20–2/15/27; | | | | |
| with a value of $48,000,000) | 0.250% | 3/1/16 | 48,000 | 48,000 |
| TD Securities (USA) LLC | | | | |
| (Dated 2/23/16, Repurchase Value | | | | |
| $400,025,000, collateralized by U.S. Treasury | | | | |
| Bond/Note 1.000%–5.375%, 6/30/18–8/15/45; | | | | |
| with a value of $408,000,000) | 0.320% | 3/1/16 | 400,000 | 400,000 |
| TD Securities (USA) LLC | | | | |
| (Dated 2/24/16, Repurchase Value | | | | |
| $250,016,000, collateralized by U.S. Treasury | | | | |
| Bond/Note 0.875%–3.875%, 4/15/17–8/15/40; | | | | |
| with a value of $255,000,000) | 0.320% | 3/2/16 | 250,000 | 250,000 |
| TD Securities (USA) LLC | | | | |
| (Dated 2/25/16, Repurchase Value | | | | |
| $200,012,000, collateralized by U.S. Treasury | | | | |
| Bill 0.000%, 5/26/16, U.S. Treasury Bond/Note | | | | |
| 0.625%–2.750%, 11/15/16–8/31/20; | | | | |
| with a value of $204,000,000) | 0.320% | 3/3/16 | 200,000 | 200,000 |
| Total Repurchase Agreements (Cost $1,187,000) | | | | 1,187,000 |
| Total Investments (96.6%) (Cost $5,891,179) | | | | 5,891,179 |
34
Federal Money Market Fund
| |
| | Amount |
| | ($000) |
| Other Assets and Liabilities (3.4%) | |
| Other Assets | |
| Investment in Vanguard | 472 |
| Receivables for Accrued Income | 2,479 |
| Receivables for Capital Shares Issued | 202,660 |
| Other Assets | 3,991 |
| Total Other Assets | 209,602 |
| Liabilities | |
| Payables for Capital Shares Redeemed | (180) |
| Payables for Distributions | (55) |
| Payables to Vanguard | (309) |
| Total Liabilities | (544) |
| Net Assets (100%) | |
| Applicable to 6,099,672,877 outstanding $.001 par value shares of | |
| beneficial interest (unlimited authorization) | 6,100,237 |
| Net Asset Value Per Share | $1.00 |
| |
| |
| At February 29, 2016, net assets consisted of: | |
| | Amount |
| | ($000) |
| Paid-in Capital | 6,100,183 |
| Overdistributed Net Investment Income | (1) |
| Accumulated Net Realized Gains | 55 |
| Net Assets | 6,100,237 |
• See Note A in Notes to Financial Statements.
1 Represents annualized yield at date of purchase for discount securities, and coupon for coupon-bearing securities.
2 The issuer was placed under federal conservatorship in September 2008; since that time, its daily operations have been managed by the
Federal Housing Finance Agency and it receives capital from the U.S. Treasury, as needed to maintain a positive net worth, in exchange
for senior preferred stock.
3 The issuer operates under a congressional charter; its securities are generally neither guaranteed by the U.S. Treasury nor backed by the
full faith and credit of the U.S. government.
4 Adjustable-rate security.
See accompanying Notes, which are an integral part of the Financial Statements.
35
Federal Money Market Fund
Statement of Operations
| |
| | Six Months Ended |
| | February 29, 2016 |
| | ($000) |
| Investment Income | |
| Income | |
| Interest | 5,868 |
| Total Income | 5,868 |
| Expenses | |
| The Vanguard Group—Note B | |
| Investment Advisory Services | 60 |
| Management and Administrative | 1,788 |
| Marketing and Distribution | 454 |
| Custodian Fees | 17 |
| Shareholders’ Reports | 13 |
| Trustees’ Fees and Expenses | 1 |
| Total Expenses | 2,333 |
| Expense Reduction—Note B | — |
| Net Expenses | 2,333 |
| Net Investment Income | 3,535 |
| Realized Net Gain (Loss) on Investment Securities Sold | 16 |
| Net Increase (Decrease) in Net Assets Resulting from Operations | 3,551 |
See accompanying Notes, which are an integral part of the Financial Statements.
36
Federal Money Market Fund
Statement of Changes in Net Assets
| | |
| | Six Months Ended | Year Ended |
| | February 29, | August 31, |
| | 2016 | 2015 |
| | ($000) | ($000) |
| Increase (Decrease) in Net Assets | | |
| Operations | | |
| Net Investment Income | 3,535 | 317 |
| Realized Net Gain (Loss) | 16 | 14 |
| Net Increase (Decrease) in Net Assets Resulting from Operations | 3,551 | 331 |
| Distributions | | |
| Net Investment Income | (3,536) | (317) |
| Realized Capital Gain | — | — |
| Total Distributions | (3,536) | (317) |
| Capital Share Transactions (at $1.00 per share) | | |
| Issued | 3,824,135 | 972,690 |
| Issued in Lieu of Cash Distributions | 3,418 | 311 |
| Redeemed | (1,052,081) | (756,637) |
| Net Increase (Decrease) from Capital Share Transactions | 2,775,472 | 216,364 |
| Total Increase (Decrease) | 2,775,487 | 216,378 |
| Net Assets | | |
| Beginning of Period | 3,324,750 | 3,108,372 |
| End of Period1 | 6,100,237 | 3,324,750 |
| 1 Net Assets—End of Period includes undistributed (overdistributed) net investment income of ($1,000) and $0. |
See accompanying Notes, which are an integral part of the Financial Statements.
37
Federal Money Market Fund
Financial Highlights
| | | | | | | |
| | Six Months | | | | | |
| | | Ended | | | | | |
| For a Share Outstanding | February 29, | Year Ended August 31, |
| Throughout Each Period | | 2016 | 2015 | 2014 | 2013 | 2012 | 2011 |
| Net Asset Value, Beginning of Period | $1.00 | $1.00 | $1.00 | $1.00 | $1.00 | $1.00 |
| Investment Operations | | | | | | | |
| Net Investment Income | | .001 | .0001 | .0001 | .0001 | .0001 | .0002 |
| Net Realized and Unrealized Gain (Loss) | | | | | | |
| on Investments | | — | — | — | — | — | — |
| Total from Investment Operations | .001 | .0001 | .0001 | .0001 | .0001 | .0002 |
| Distributions | | | | | | | |
| Dividends from Net Investment Income | (.001) | (.0001) | (.0001) | (.0001) | (.0001) | (.0002) |
| Distributions from Realized Capital Gains | — | — | (.0000)1 | — | — | — |
| Total Distributions | | (.001) | (.0001) | (.0001) | (.0001) | (.0001) | (.0002) |
| Net Asset Value, End of Period | $1.00 | $1.00 | $1.00 | $1.00 | $1.00 | $1.00 |
| |
| Total Return2 | | 0.07% | 0.01% | 0.02% | 0.01% | 0.01% | 0.02% |
| |
| Ratios/Supplemental Data | | | | | | | |
| Net Assets, End of Period (Millions) | $6,100 | $3,325 | $3,108 | $3,522 | $4,103 | $4,794 |
| Ratio of Expenses to | | | | | | | |
| Average Net Assets3 | | 0.11% | 0.10% | 0.09% | 0.13% | 0.12% | 0.19% |
| Ratio of Net Investment Income to | | | | | | |
| Average Net Assets | | 0.17% | 0.01% | 0.01% | 0.01% | 0.01% | 0.02% |
The expense ratio and net income ratio for the current period have been annualized.
1 Distribution was less than $.0001 per share.
2 Total returns do not include account service fees that may have applied in the periods shown. Fund prospectuses provide information about any applicable account service fees.
3 The ratio of total expenses to average net assets before an expense reduction was 0.11% for 2016, 0.11% for 2015, 0.11% for 2014, 0.14%
for 2013, 0.16% for 2012, and 0.20% for 2011. See Note B in the Notes to Financial Statements.
See accompanying Notes, which are an integral part of the Financial Statements.
38
Federal Money Market Fund
Notes to Financial Statements
Vanguard Federal Money Market Fund is registered under the Investment Company Act of 1940 as an open-end investment company, or mutual fund. The fund invests in short-term debt instruments issued by the U.S. government or its agencies and instrumentalities, and repurchase agreements collateralized by such instruments.
A. The following significant accounting policies conform to generally accepted accounting principles for U.S. investment companies. The fund consistently follows such policies in preparing its financial statements.
1. Security Valuation: Securities are valued as of the close of trading on the New York Stock Exchange (generally 4 p.m., Eastern time) on the valuation date. Securities are valued at amortized cost, which approximates market value.
2. Repurchase Agreements: The fund enters into repurchase agreements with institutional counter-parties. Securities pledged as collateral to the fund under repurchase agreements are held by a custodian bank until the agreements mature. Each agreement requires that the market value of the collateral be sufficient to cover payments of interest and principal. The fund further mitigates its counterparty risk by entering into repurchase agreements only with a diverse group of prequalified counterparties, monitoring their financial strength, and entering into master repurchase agreements with its counterparties. The master repurchase agreements provide that, in the event of a counter-party’s default (including bankruptcy), the fund may terminate any repurchase agreements with that counterparty, determine the net amount owed, and sell or retain the collateral up to the net amount owed to the fund. Such action may be subject to legal proceedings, which may delay or limit the disposition of collateral.
3. Federal Income Taxes: The fund intends to continue to qualify as a regulated investment company and distribute all of its taxable income. Management has analyzed the fund’s tax positions taken for all open federal income tax years (August 31, 2012–2015), and for the period ended February 29, 2016, and has concluded that no provision for federal income tax is required in the fund’s financial statements.
4. Distributions: Distributions from net investment income are declared daily and paid on the first business day of the following month.
5. Credit Facility: The fund and certain other funds managed by The Vanguard Group (“Vanguard”) participate in a $3 billion committed credit facility provided by a syndicate of lenders pursuant to a credit agreement that may be renewed annually; each fund is individually liable for its borrowings, if any, under the credit facility. Borrowings may be utilized for temporary and emergency purposes, and are subject to the fund’s regulatory and contractual borrowing restrictions. The participating funds are charged administrative fees and an annual commitment fee of 0.06% of the undrawn amount of the facility; these fees are allocated to the funds based on a method approved by the fund’s board of trustees and included in Management and Administrative expenses on the fund’s Statement of Operations. Any borrowings under this facility bear interest at a rate equal to the higher of the federal funds rate or LIBOR reference rate plus an agreed-upon spread.
The fund had no borrowings outstanding at February 29, 2016, or at any time during the period then ended.
39
Federal Money Market Fund
6. Other: Interest income is accrued daily. Premiums and discounts on debt securities purchased are amortized and accreted, respectively, to interest income over the lives of the respective securities. Security transactions are accounted for on the date securities are bought or sold. Costs used to determine realized gains (losses) on the sale of investment securities are those of the specific securities sold.
B. In accordance with the terms of a Funds’ Service Agreement (the “FSA”) between Vanguard and the fund, Vanguard furnishes to the fund investment advisory, corporate management, administrative, marketing, and distribution services at Vanguard’s cost of operations (as defined by the FSA). These costs of operations are allocated to the fund based on methods and guidelines approved by the board of trustees. Vanguard does not require reimbursement in the current period for certain costs of operations (such as deferred compensation/benefits and risk/insurance costs); the fund’s liability for these costs of operations is included in Payables to Vanguard on the Statement of Net Assets.
Upon the request of Vanguard, the fund may invest up to 0.40% of its net assets as capital in Vanguard. At February 29, 2016, the fund had contributed to Vanguard capital in the amount of $472,000, representing 0.01% of the fund’s net assets and 0.19% of Vanguard’s capitalization. The fund’s trustees and officers are also directors and employees, respectively, of Vanguard.
Vanguard and the board of trustees have agreed to temporarily limit certain net operating expenses in excess of the fund’s daily yield in order to maintain a zero or positive yield for the fund. Vanguard and the board of trustees may terminate the temporary expense limitation at any time. For the period ended February 29, 2016, Vanguard’s expenses were reduced by $385 (an effective annual rate of 0.00% of the fund’s average net assets); the fund is not obligated to repay this amount to Vanguard.
C. Various inputs may be used to determine the value of the fund’s investments. These inputs are summarized in three broad levels for financial statement purposes. The inputs or methodologies used to value securities are not necessarily an indication of the risk associated with investing in those securities.
Level 1—Quoted prices in active markets for identical securities.
Level 2—Other significant observable inputs (including quoted prices for similar securities, interest rates, prepayment speeds, credit risk, etc.).
Level 3—Significant unobservable inputs (including the fund’s own assumptions used to determine the fair value of investments).
At February 29, 2016, 100% of the market value of the fund’s investments was determined using amortized cost, in accordance with rules under the Investment Company Act of 1940. Amortized cost approximates the current fair value of a security, but since the value is not obtained from a quoted price in an active market, securities valued at amortized cost are considered to be valued using Level 2 inputs.
D. Management has determined that no material events or transactions occurred subsequent to February 29, 2016, that would require recognition or disclosure in these financial statements.
Treasury Money Market Fund
Fund Profile
As of February 29, 2016
| |
| Financial Attributes | |
| Ticker Symbol | VUSXX |
| Expense Ratio1 | 0.09% |
| 7-Day SEC Yield | 0.25% |
| Average Weighted | |
| Maturity | 58 days |
| |
| Sector Diversification (% of portfolio) | |
| U.S. Treasury Bills | 100.0% |
The agency and mortgage-backed securities sectors may include issues from government-sponsored enterprises; such issues are
generally not backed by the full faith and credit of the U.S. government.
| |
| Distribution by Credit Quality (% of portfolio) |
| First Tier | 100.0% |
A First Tier security is one that is eligible for money market funds and has been rated in the highest short-term rating category for
debt obligations by nationally recognized statistical rating organizations. Credit-quality ratings are obtained from Moody's,
Fitch, and S&P. For securities rated by all three agencies, where two of them are in agreement and assign the highest rating
category, the highest rating applies. If a security is only rated by two agencies, and their ratings are in different categories, the
lower of the ratings applies. An unrated security is First Tier if it represents quality comparable to that of a rated security, as
determined in accordance with SEC Rule 2a-7. For more information about these ratings, see the Glossary entry for Credit
Quality.
1 The expense ratio shown is from the prospectus dated December 14, 2015, and represents estimated costs for the current fiscal year. For the six
months ended February 29, 2016, the annualized expense ratio was 0.09%.
41
Treasury Money Market Fund
Performance Summary
Investment returns will fluctuate. All of the returns in this report represent past performance, which is not a guarantee of future results that may be achieved by the fund. (Current performance may be lower or higher than the performance data cited. For performance data current to the most recent month-end, visit our website at vanguard.com/performance.) The returns shown do not reflect taxes that a shareholder would pay on fund distributions. An investment in a money market fund is not insured or guaranteed by the Federal Deposit Insurance Corporation or any other government agency. Although the fund seeks to preserve the value of your investment at $1 per share, it is possible to lose money by investing in the fund. The fund’s 7-day SEC yield reflects its current earnings more closely than do the average annual returns.
| | |
| Fiscal-Year Total Returns (%): August 31, 2005, Through February 29, 2016 | |
| | | iMoneyNet |
| | | Average |
| Fiscal Year | Total Returns | Total Returns |
| 2006 | 4.22% | 3.54% |
| 2007 | 5.01 | 4.34 |
| 2008 | 3.08 | 2.08 |
| 2009 | 0.70 | 0.17 |
| 2010 | 0.03 | 0.00 |
| 2011 | 0.02 | 0.00 |
| 2012 | 0.01 | 0.00 |
| 2013 | 0.02 | 0.00 |
| 2014 | 0.01 | 0.00 |
| 2015 | 0.01 | 0.00 |
| 2016 | 0.05 | 0.00 |
| 7-day SEC yield (2/29/2016): 0.25% |
| iMoneyNet Money Fund Report’s 100% Treasury Funds Average: Derived from data provided by iMoneyNet, Inc. |
| Note: For 2016, performance data reflect the six months ended February 29, 2016. |
Average Annual Total Returns: Periods Ended December 31, 2015
This table presents returns through the latest calendar quarter—rather than through the end of the fiscal period.
Securities and Exchange Commission rules require that we provide this information.
| | | | |
| | Inception | One | Five | Ten |
| | Date | Year | Years | Years |
| Treasury Money Market Fund | 12/14/1992 | 0.02% | 0.02% | 1.17% |
See Financial Highlights for dividend information.
42
Treasury Money Market Fund
Financial Statements (unaudited)
Statement of Net Assets
As of February 29, 2016
The fund reports a complete list of its holdings in various monthly and quarterly regulatory filings. The fund publishes its holdings on a monthly basis at vanguard.com and files them with the Securities and Exchange Commission on Form N-MFP. The fund’s Form N-MFP filings become public 60 days after the relevant month-end, and may be viewed at sec.gov or via a link on the “Portfolio Holdings” page on vanguard.com. For the second and fourth fiscal quarters, the lists appear in the fund’s semiannual and annual reports to shareholders. For the first and third fiscal quarters, the fund files the lists with the SEC on Form N-Q. Shareholders can look up the fund’s Forms N-Q on the SEC’s website at sec.gov. Forms N-Q may also be reviewed and copied at the SEC’s Public Reference Room (see the back cover of this report for further information).
| | | | | |
| | | | | Face | Market |
| | | | Maturity | Amount | Value• |
| | | Yield1 | Date | ($000) | ($000) |
| U.S. Government and Agency Obligations (101.4%) | | | |
| | United States Treasury Bill | 0.151%–0.261% | 3/3/16 | 149,797 | 149,795 |
| | United States Treasury Bill | 0.230%–0.280% | 3/10/16 | 961,437 | 961,371 |
| | United States Treasury Bill | 0.250%–0.252% | 3/24/16 | 316,000 | 315,949 |
| | United States Treasury Bill | 0.260% | 3/31/16 | 769,000 | 768,833 |
| | United States Treasury Bill | 0.251%–0.255% | 4/21/16 | 143,000 | 142,949 |
| | United States Treasury Bill | 0.306% | 4/28/16 | 439,000 | 438,784 |
| | United States Treasury Bill | 0.280%–0.347% | 5/5/16 | 1,419,000 | 1,418,176 |
| | United States Treasury Bill | 0.311%–0.315% | 5/12/16 | 698,402 | 697,962 |
| | United States Treasury Bill | 0.306% | 5/19/16 | 491,000 | 490,670 |
| | United States Treasury Bill | 0.303%–0.320% | 5/26/16 | 621,585 | 621,122 |
| | United States Treasury Bill | 0.321% | 6/2/16 | 149,918 | 149,796 |
| | United States Treasury Bill | 0.558% | 6/9/16 | 320,000 | 319,506 |
| | United States Treasury Bill | 0.458% | 8/25/16 | 300,000 | 299,326 |
| 2 | United States Treasury Floating Rate Note | 0.389% | 4/30/16 | 35,000 | 35,000 |
| 2 | United States Treasury Floating Rate Note | 0.390% | 7/31/16 | 150,000 | 150,000 |
| 2 | United States Treasury Floating Rate Note | 0.373% | 10/31/16 | 640,000 | 639,899 |
| 2 | United States Treasury Floating Rate Note | 0.404% | 1/31/17 | 300,287 | 300,281 |
| 2 | United States Treasury Floating Rate Note | 0.397% | 7/31/17 | 100,000 | 99,938 |
| 2 | United States Treasury Floating Rate Note | 0.488% | 10/31/17 | 100,000 | 99,799 |
| 2 | United States Treasury Floating Rate Note | 0.592% | 1/31/18 | 135,000 | 135,081 |
| | United States Treasury Note/Bond | 0.375% | 3/31/16 | 300,000 | 300,002 |
| | United States Treasury Note/Bond | 0.375% | 4/30/16 | 175,000 | 174,997 |
| | United States Treasury Note/Bond | 3.250% | 5/31/16 | 300,000 | 302,118 |
| | United States Treasury Note/Bond | 0.625% | 7/15/16 | 457,000 | 457,361 |
| | United States Treasury Note/Bond | 1.500% | 7/31/16 | 250,000 | 251,043 |
| | United States Treasury Note/Bond | 0.500% | 7/31/16 | 40,000 | 40,010 |
| Total U.S. Government and Agency Obligations (Cost $9,759,768) | | | 9,759,768 |
| Total Investments (101.4%) (Cost $9,759,768) | | | 9,759,768 |
43
Treasury Money Market Fund
| |
| | Amount |
| | ($000) |
| Other Assets and Liabilities (-1.4%) | |
| Other Assets | |
| Investment in Vanguard | 835 |
| Receivables for Accrued Income | 4,329 |
| Receivables for Capital Shares Issued | 11,953 |
| Other Assets | 4,005 |
| Total Other Assets | 21,122 |
| Liabilities | |
| Payables for Investment Securities Purchased | (149,796) |
| Payables for Capital Shares Redeemed | (8,428) |
| Payables for Distributions | (36) |
| Payables to Vanguard | (424) |
| Total Liabilities | (158,684) |
| Net Assets (100%) | |
| Applicable to 9,619,204,496 outstanding $.001 par value shares of | |
| beneficial interest (unlimited authorization) | 9,622,206 |
| Net Asset Value Per Share | $1.00 |
| |
| |
| At February 29, 2016, net assets consisted of: | |
| | Amount |
| | ($000) |
| Paid-in Capital | 9,622,244 |
| Undistributed Net Investment Income | — |
| Accumulated Net Realized Losses | (38) |
| Net Assets | 9,622,206 |
• See Note A in Notes to Financial Statements.
1 Represents annualized yield at date of purchase for discount securities, and coupon for coupon-bearing securities.
2 Adjustable-rate security.
See accompanying Notes, which are an integral part of the Financial Statements.
44
Treasury Money Market Fund
Statement of Operations
| |
| | Six Months Ended |
| | February 29, 2016 |
| | ($000) |
| Investment Income | |
| Income | |
| Interest | 8,254 |
| Total Income | 8,254 |
| Expenses | |
| The Vanguard Group—Note B | |
| Investment Advisory Services | 127 |
| Management and Administrative | 3,160 |
| Marketing and Distribution | 813 |
| Custodian Fees | 45 |
| Shareholders’ Reports | 10 |
| Trustees’ Fees and Expenses | 3 |
| Total Expenses | 4,158 |
| Expense Reduction—Note B | (199) |
| Net Expenses | 3,959 |
| Net Investment Income | 4,295 |
| Realized Net Gain (Loss) on Investment Securities Sold | (38) |
| Net Increase (Decrease) in Net Assets Resulting from Operations | 4,257 |
See accompanying Notes, which are an integral part of the Financial Statements.
45
Treasury Money Market Fund
Statement of Changes in Net Assets
| | |
| | Six Months Ended | Year Ended |
| | February 29, | August 31, |
| | 2016 | 2015 |
| | ($000) | ($000) |
| Increase (Decrease) in Net Assets | | |
| Operations | | |
| Net Investment Income | 4,295 | 985 |
| Realized Net Gain (Loss) | (38) | 37 |
| Net Increase (Decrease) in Net Assets Resulting from Operations | 4,257 | 1,022 |
| Distributions | | |
| Net Investment Income | (4,295) | (985) |
| Realized Capital Gain | — | — |
| Total Distributions | (4,295) | (985) |
| Capital Share Transactions (at $1.00 per share) | | |
| Issued | 950,289 | 568,831 |
| Issued in Lieu of Cash Distributions | 4,186 | 960 |
| Redeemed | (720,163) | (1,546,511) |
| Net Increase (Decrease) from Capital Share Transactions | 234,312 | (976,720) |
| Total Increase (Decrease) | 234,274 | (976,683) |
| Net Assets | | |
| Beginning of Period | 9,387,932 | 10,364,615 |
| End of Period1 | 9,622,206 | 9,387,932 |
| 1 Net Assets—End of Period includes undistributed (overdistributed) net investment income of $0 and $0. |
See accompanying Notes, which are an integral part of the Financial Statements.
46
Treasury Money Market Fund
Financial Highlights
| | | | | | | |
| | Six Months | | | | | |
| | | Ended | | | | | |
| For a Share Outstanding | February 29, | Year Ended August 31, |
| Throughout Each Period | | 2016 | 2015 | 2014 | 2013 | 2012 | 2011 |
| Net Asset Value, Beginning of Period | $1.00 | $1.00 | $1.00 | $1.00 | $1.00 | $1.00 |
| Investment Operations | | | | | | | |
| Net Investment Income | | .0005 | .0001 | .0001 | .0002 | .0001 | .0002 |
| Net Realized and Unrealized Gain (Loss) | | | | | | |
| on Investments | | — | — | — | — | — | — |
| Total from Investment Operations | .0005 | .0001 | .0001 | .0002 | .0001 | .0002 |
| Distributions | | | | | | | |
| Dividends from Net Investment Income | (.0005) | (.0001) | (.0001) | (.0002) | (.0001) | (.0002) |
| Distributions from Realized Capital Gains | — | — | (.0000)1 | — | — | — |
| Total Distributions | | (.0005) | (.0001) | (.0001) | (.0002) | (.0001) | (.0002) |
| Net Asset Value, End of Period | $1.00 | $1.00 | $1.00 | $1.00 | $1.00 | $1.00 |
| |
| Total Return2 | | 0.05% | 0.01% | 0.01% | 0.02% | 0.01% | 0.02% |
| |
| Ratios/Supplemental Data | | | | | | | |
| Net Assets, End of Period (Millions) | $9,622 | $9,388 | $10,365 | $11,660 | $13,354 | $15,314 |
| Ratio of Expenses to | | | | | | | |
| Average Net Assets3 | | 0.09% | 0.04% | 0.05% | 0.08% | 0.05% | 0.11% |
| Ratio of Net Investment Income to | | | | | | |
| Average Net Assets | | 0.09% | 0.01% | 0.01% | 0.02% | 0.01% | 0.02% |
The expense ratio and net income ratio for the current period have been annualized.
1 Distribution was less than $.0001 per share.
2 Total returns do not include account service fees that may have applied in the periods shown. Fund prospectuses provide information about
any applicable account service fees.
3 The ratio of total expenses to average net assets before an expense reduction was 0.09% for 2016, 0.09% for 2015, 0.09% for 2014, 0.09%
for 2013, 0.10% for 2012, and 0.12% for 2011. See Note B in the Notes to Financial Statements.
See accompanying Notes, which are an integral part of the Financial Statements.
47
Treasury Money Market Fund
Notes to Financial Statements
Vanguard Treasury Money Market Fund is registered under the Investment Company Act of 1940 as an open-end investment company, or mutual fund. The fund invests in short-term debt instruments backed by the full faith and credit of the U.S. government.
A. The following significant accounting policies conform to generally accepted accounting principles for U.S. investment companies. The fund consistently follows such policies in preparing its financial statements.
1. Security Valuation: Securities are valued as of the close of trading on the New York Stock Exchange (generally 4 p.m., Eastern time) on the valuation date. Securities are valued at amortized cost, which approximates market value.
2. Federal Income Taxes: The fund intends to continue to qualify as a regulated investment company and distribute all of its taxable income. Management has analyzed the fund’s tax positions taken for all open federal income tax years (August 31, 2012–2015), and for the period ended February 29, 2016, and has concluded that no provision for federal income tax is required in the fund’s financial statements.
3. Distributions: Distributions from net investment income are declared daily and paid on the first business day of the following month.
4. Credit Facility: The fund and certain other funds managed by The Vanguard Group (“Vanguard”) participate in a $3 billion committed credit facility provided by a syndicate of lenders pursuant to a credit agreement that may be renewed annually; each fund is individually liable for its borrowings, if any, under the credit facility. Borrowings may be utilized for temporary and emergency purposes, and are subject to the fund’s regulatory and contractual borrowing restrictions. The participating funds are charged administrative fees and an annual commitment fee of 0.06% of the undrawn amount of the facility; these fees are allocated to the funds based on a method approved by the fund’s board of trustees and included in Management and Administrative expenses on the fund’s Statement of Operations. Any borrowings under this facility bear interest at a rate equal to the higher of the federal funds rate or LIBOR reference rate plus an agreed-upon spread.
The fund had no borrowings outstanding at February 29, 2016, or at any time during the period then ended.
5. Other: Interest income is accrued daily. Premiums and discounts on debt securities purchased are amortized and accreted, respectively, to interest income over the lives of the respective securities. Security transactions are accounted for on the date securities are bought or sold. Costs used to determine realized gains (losses) on the sale of investment securities are those of the specific securities sold.
B. In accordance with the terms of a Funds’ Service Agreement (the “FSA”) between Vanguard and the fund, Vanguard furnishes to the fund investment advisory, corporate management, administrative, marketing, and distribution services at Vanguard’s cost of operations (as defined by the FSA). These costs of operations are allocated to the fund based on methods and guidelines approved by the board of trustees. Vanguard does not require reimbursement in the current period for certain costs of operations (such as deferred compensation/benefits and risk/insurance costs); the fund’s liability for these costs of operations is included in Payables to Vanguard on the Statement of Net Assets.
48
Treasury Money Market Fund
Upon the request of Vanguard, the fund may invest up to 0.40% of its net assets as capital in Vanguard. At February 29, 2016, the fund had contributed to Vanguard capital in the amount of $835,000, representing 0.01% of the fund’s net assets and 0.33% of Vanguard’s capitalization. The fund’s trustees and officers are also directors and employees, respectively, of Vanguard.
Vanguard and the board of trustees have agreed to temporarily limit certain net operating expenses in excess of the fund’s daily yield in order to maintain a zero or positive yield for the fund. Vanguard and the board of trustees may terminate the temporary expense limitation at any time. For the period ended February 29, 2016, Vanguard’s expenses were reduced by $199,000 (an effective annual rate of 0.00% of the fund’s average net assets); the fund is not obligated to repay this amount to Vanguard.
C. Various inputs may be used to determine the value of the fund’s investments. These inputs are summarized in three broad levels for financial statement purposes. The inputs or methodologies used to value securities are not necessarily an indication of the risk associated with investing in those securities.
Level 1—Quoted prices in active markets for identical securities.
Level 2—Other significant observable inputs (including quoted prices for similar securities, interest rates, prepayment speeds, credit risk, etc.).
Level 3—Significant unobservable inputs (including the fund’s own assumptions used to determine the fair value of investments).
At February 29, 2016, 100% of the market value of the fund’s investments was determined using amortized cost, in accordance with rules under the Investment Company Act of 1940. Amortized cost approximates the current fair value of a security, but since the value is not obtained from a quoted price in an active market, securities valued at amortized cost are considered to be valued using Level 2 inputs.
D. Management has determined that no material events or transactions occurred subsequent to February 29, 2016, that would require recognition or disclosure in these financial statements.
49
About Your Fund’s Expenses
As a shareholder of the fund, you incur ongoing costs, which include costs for portfolio management, administrative services, and shareholder reports (like this one), among others. Operating expenses, which are deducted from a fund’s gross income, directly reduce the investment return of the fund.
A fund’s expenses are expressed as a percentage of its average net assets. This figure is known as the expense ratio. The following examples are intended to help you understand the ongoing costs (in dollars) of investing in your fund and to compare these costs with those of other mutual funds. The examples are based on an investment of $1,000 made at the beginning of the period shown and held for the entire period.
The accompanying table illustrates your fund’s costs in two ways:
• Based on actual fund return. This section helps you to estimate the actual expenses that you paid over the period. The ”Ending Account Value“ shown is derived from the fund‘s actual return, and the third column shows the dollar amount that would have been paid by an investor who started with $1,000 in the fund. You may use the information here, together with the amount you invested, to estimate the expenses that you paid over the period.
To do so, simply divide your account value by $1,000 (for example, an $8,600 account value divided by $1,000 = 8.6), then multiply the result by the number given for your fund under the heading ”Expenses Paid During Period.“
• Based on hypothetical 5% yearly return. This section is intended to help you compare your fund‘s costs with those of other mutual funds. It assumes that the fund had a yearly return of 5% before expenses, but that the expense ratio is unchanged. In this case—because the return used is not the fund’s actual return—the results do not apply to your investment. The example is useful in making comparisons because the Securities and Exchange Commission requires all mutual funds to calculate expenses based on a 5% return. You can assess your fund’s costs by comparing this hypothetical example with the hypothetical examples that appear in shareholder reports of other funds.
Note that the expenses shown in the table are meant to highlight and help you compare ongoing costs only and do not reflect transaction costs incurred by the fund for buying and selling securities. Further, the expenses do not include any purchase, redemption, or account service fees described in the fund prospectus. If such fees were applied to your account, your costs would be higher. Your fund does not carry a “sales load.”
The calculations assume no shares were bought or sold during the period. Your actual costs may have been higher or lower, depending on the amount of your investment and the timing of any purchases or redemptions.
You can find more information about the fund’s expenses, including annual expense ratios, in the Financial Statements section of this report. For additional information on operating expenses and other shareholder costs, please refer to your fund’s current prospectus.
50
| | | |
| Six Months Ended February 29, 2016 | | | |
| | Beginning | Ending | Expenses |
| | Account Value | Account Value | Paid During |
| | 8/31/2015 | 2/29/2016 | Period |
| Based on Actual Fund Return | | | |
| Prime Money Market Fund | | | |
| Investor Shares | $1,000.00 | $1,000.95 | $0.80 |
| Admiral Shares | 1,000.00 | 1,001.25 | 0.50 |
| Federal Money Market Fund | $1,000.00 | $1,000.74 | $0.55 |
| Treasury Money Market Fund | $1,000.00 | $1,000.46 | $0.45 |
| Based on Hypothetical 5% Yearly Return | | | |
| Prime Money Market Fund | | | |
| Investor Shares | $1,000.00 | $1,024.07 | $0.81 |
| Admiral Shares | 1,000.00 | 1,024.37 | 0.50 |
| Federal Money Market Fund | $1,000.00 | $1,024.32 | $0.55 |
| Treasury Money Market Fund | $1,000.00 | $1,024.42 | $0.45 |
The calculations are based on expenses incurred in the most recent six-month period. The funds’ annualized six-month expense ratios for the
period are: for the Prime Money Market Fund, 0.16% for Investor Shares and 0.10% for Admiral Shares; for the Federal Money Market Fund,
0.11%; and for the Treasury Money Market Fund, 0.09%. The dollar amounts shown as “Expenses Paid” are equal to the annualized expense
ratio multiplied by the average account value over the period, multiplied by the number of days in the most recent six-month period, then
divided by the number of days in the most recent 12-month period (182/366).
51
Glossary
SEC Yields. A money market fund’s 7-day SEC yield is calculated by annualizing its income distributions for the previous seven days, as required by the U.S. Securities and Exchange Commission.
Average Weighted Maturity. The average length of time until fixed income securities held by a fund reach maturity and are repaid. The figure reflects the proportion of fund assets represented by each security.
Credit Quality. For Vanguard money market funds, the Distribution by Credit Quality table includes tier ratings for consistency with SEC Rule 2a-7 under the Investment Company Act of 1940, which governs money market funds. A First Tier security is one that is eligible for money market funds and has been rated in the highest short-term rating category for debt obligations by nationally recognized statistical rating organizations. Credit-quality ratings are obtained from Moody’s, Fitch, and S&P. For securities rated by all three agencies, where two of them are in agreement and assign the highest rating category, the highest rating applies. If a security is only rated by two agencies, and their ratings are in different categories, the lower of the ratings applies. An unrated security is First Tier if it represents quality comparable to that of a rated security, as determined in accordance with SEC Rule 2a-7.
Expense Ratio. A fund’s total annual operating expenses expressed as a percentage of the fund’s average net assets. The expense ratio includes management and administrative expenses, but does not include the transaction costs of buying and selling portfolio securities.
Inception Date. The date on which the assets of a fund (or one of its share classes) are first invested in accordance with the fund’s investment objective. For funds with a subscription period, the inception date is the day after that period ends. Investment performance is measured from the inception date.
52
This page intentionally left blank.
This page intentionally left blank.
This page intentionally left blank.
The People Who Govern Your Fund
The trustees of your mutual fund are there to see that the fund is operated and managed in your best interests since, as a shareholder, you are a part owner of the fund. Your fund’s trustees also serve on the board of directors of The Vanguard Group, Inc., which is owned by the Vanguard funds and provides services to them on an at-cost basis.
A majority of Vanguard’s board members are independent, meaning that they have no affiliation with Vanguard or the funds they oversee, apart from the sizable personal investments they have made as private individuals. The independent board members have distinguished backgrounds in business, academia, and public service. Each of the trustees and executive officers oversees 196 Vanguard funds.
The following table provides information for each trustee and executive officer of the fund. More information about the trustees is in the Statement of Additional Information, which can be obtained, without charge, by contacting Vanguard at 800-662-7447, or online at vanguard.com.
| |
| InterestedTrustee1 | Rajiv L. Gupta |
| | Born 1945. Trustee Since December 2001.2 Principal |
| F. William McNabb III | Occupation(s) During the Past Five Years and Other |
| Born 1957. Trustee Since July 2009. Chairman of | Experience: Chairman and Chief Executive Officer |
| the Board. Principal Occupation(s) During the Past | (retired 2009) and President (2006–2008) of |
| Five Years and Other Experience: Chairman of the | Rohm and Haas Co. (chemicals); Director of Tyco |
| Board of The Vanguard Group, Inc., and of each of | International PLC (diversified manufacturing and |
| the investment companies served by The Vanguard | services), HP Inc. (printer and personal computer |
| Group, since January 2010; Director of The Vanguard | manufacturing), and Delphi Automotive PLC |
| Group since 2008; Chief Executive Officer and | (automotive components); Senior Advisor at |
| President of The Vanguard Group, and of each of | New Mountain Capital. |
| the investment companies served by The Vanguard | |
| Group, since 2008; Director of Vanguard Marketing | Amy Gutmann |
| Corporation; Managing Director of The Vanguard | Born 1949. Trustee Since June 2006. Principal |
| Group (1995–2008). | Occupation(s) During the Past Five Years and |
| | Other Experience: President of the University of |
| IndependentTrustees | Pennsylvania; Christopher H. Browne Distinguished |
| | Professor of Political Science, School of Arts and |
| Emerson U. Fullwood | Sciences, and Professor of Communication, Annenberg |
| Born 1948. Trustee Since January 2008. Principal | School for Communication, with secondary faculty |
| Occupation(s) During the Past Five Years and Other | appointments in the Department of Philosophy, School |
| Experience: Executive Chief Staff and Marketing | of Arts and Sciences, and at the Graduate School of |
| Officer for North America and Corporate Vice President | Education, University of Pennsylvania; Trustee of the |
| (retired 2008) of Xerox Corporation (document manage- | National Constitution Center; Chair of the Presidential |
| ment products and services); Executive in Residence | Commission for the Study of Bioethical Issues. |
| and 2009–2010 Distinguished Minett Professor at | |
| the Rochester Institute of Technology; Lead Director | JoAnn Heffernan Heisen |
| of SPX FLOW, Inc. (multi-industry manufacturing); | Born 1950. Trustee Since July 1998. Principal |
| Director of the United Way of Rochester, the University | Occupation(s) During the Past Five Years and |
| of Rochester Medical Center, Monroe Community | Other Experience: Corporate Vice President and |
| College Foundation, North Carolina A&T University, | Chief Global Diversity Officer (retired 2008) and |
| and Roberts Wesleyan College. | Member of the Executive Committee (1997–2008) |
| | of Johnson & Johnson (pharmaceuticals/medical |
| | devices/consumer products); Director of Skytop |
| | Lodge Corporation (hotels) and the Robert Wood |
| | Johnson Foundation; Member of the Advisory |
| | Board of the Institute for Women’s Leadership |
| | at Rutgers University. |
| | |
| F. Joseph Loughrey | Executive Officers | |
| Born 1949. Trustee Since October 2009. Principal | | |
| Occupation(s) During the Past Five Years and Other | Glenn Booraem | |
| Experience: President and Chief Operating Officer | Born 1967. Treasurer Since May 2015. Principal |
| (retired 2009) of Cummins Inc. (industrial machinery); | Occupation(s) During the Past Five Years and |
| Chairman of the Board of Hillenbrand, Inc. (specialized | Other Experience: Principal of The Vanguard Group, |
| consumer services), and of Oxfam America; Director | Inc.; Treasurer of each of the investment companies |
| of SKF AB (industrial machinery), Hyster-Yale Materials | served by The Vanguard Group; Controller of each of |
| Handling, Inc. (forklift trucks), the Lumina Foundation | the investment companies served by The Vanguard |
| for Education, and the V Foundation for Cancer | Group (2010–2015); Assistant Controller of each of |
| Research; Member of the Advisory Council for the | the investment companies served by The Vanguard |
| College of Arts and Letters and of the Advisory Board | Group (2001–2010). | |
| to the Kellogg Institute for International Studies, both | | |
| at the University of Notre Dame. | Thomas J. Higgins | |
| Born 1957. Chief Financial Officer Since September |
| Mark Loughridge | 2008. Principal Occupation(s) During the Past Five |
| Born 1953. Trustee Since March 2012. Principal | Years and Other Experience: Principal of The Vanguard |
| Occupation(s) During the Past Five Years and Other | Group, Inc.; Chief Financial Officer of each of the |
| Experience: Senior Vice President and Chief Financial | investment companies served by The Vanguard Group; |
| Officer (retired 2013) at IBM (information technology | Treasurer of each of the investment companies served |
| services); Fiduciary Member of IBM’s Retirement Plan | by The Vanguard Group (1998–2008). |
| Committee (2004–2013); Director of the Dow Chemical | | |
| Company; Member of the Council on Chicago Booth. | Peter Mahoney | |
| Born 1974. Controller Since May 2015. Principal |
| Scott C. Malpass | Occupation(s) During the Past Five Years and |
| Born 1962. Trustee Since March 2012. Principal | Other Experience: Head of Global Fund Accounting |
| Occupation(s) During the Past Five Years and Other | at The Vanguard Group, Inc.; Controller of each of the |
| Experience: Chief Investment Officer and Vice | investment companies served by The Vanguard Group; |
| President at the University of Notre Dame; Assistant | Head of International Fund Services at The Vanguard |
| Professor of Finance at the Mendoza College of | Group (2008–2014). | |
| Business at Notre Dame; Member of the Notre Dame | | |
| 403(b) Investment Committee, the Board of Advisors | Heidi Stam | |
| for Spruceview Capital Partners, and the Investment | Born 1956. Secretary Since July 2005. Principal |
| Advisory Committee of Major League Baseball; Board | Occupation(s) During the Past Five Years and Other |
| Member of TIFF Advisory Services, Inc., and Catholic | Experience: Managing Director of The Vanguard |
| Investment Services, Inc. (investment advisors). | Group, Inc.; General Counsel of The Vanguard Group; |
| Secretary of The Vanguard Group and of each of the |
| André F. Perold | investment companies served by The Vanguard Group; |
| Born 1952. Trustee Since December 2004. Principal | Director and Senior Vice President of Vanguard |
| Occupation(s) During the Past Five Years and Other | Marketing Corporation. | |
| Experience: George Gund Professor of Finance and | | |
| Banking, Emeritus at the Harvard Business School | Vanguard Senior ManagementTeam |
| (retired 2011); Chief Investment Officer and Managing | Mortimer J. Buckley | James M. Norris |
| Partner of HighVista Strategies LLC (private investment | Kathleen C. Gubanich | Thomas M. Rampulla |
| firm); Director of Rand Merchant Bank; Overseer of | Martha G. King | Glenn W. Reed |
| the Museum of Fine Arts Boston. | John T. Marcante | Karin A. Risi |
| Chris D. McIsaac | |
| Peter F. Volanakis | | |
| Born 1955. Trustee Since July 2009. Principal | | |
| Occupation(s) During the Past Five Years and Other | Chairman Emeritus and Senior Advisor |
| Experience: President and Chief Operating Officer | | |
| (retired 2010) of Corning Incorporated (communications | John J. Brennan | |
| equipment); Trustee of Colby-Sawyer College and | Chairman, 1996–2009 | |
| Chairman of its Finance and Enrollment Committee; | Chief Executive Officer and President, 1996–2008 |
| Member of the Advisory Board of the Norris Cotton | | |
| Cancer Center. | Founder | |
| John C. Bogle | |
| | Chairman and Chief Executive Officer, 1974–1996 |
1 Mr. McNabb is considered an “interested person,” as defined in the Investment Company Act of 1940, because he is an officer of the Vanguard funds.
2 December 2002 for Vanguard Equity Income Fund, the Vanguard Municipal Bond Funds, and the Vanguard State Tax-Exempt Funds.
|  |
| | P.O. Box 2600 |
| | Valley Forge, PA 19482-2600 |
| |
| |
| |
| Connect with Vanguard® > vanguard.com |
| |
| |
| |
| Fund Information > 800-662-7447 | |
| Direct Investor Account Services > 800-662-2739 | |
| Institutional Investor Services > 800-523-1036 | |
| Text Telephone for People | |
| Who Are Deaf or Hard of Hearing> 800-749-7273 | |
| |
| This material may be used in conjunction | |
| with the offering of shares of any Vanguard | |
| fund only if preceded or accompanied by | |
| the fund’s current prospectus. | |
| |
| All comparative mutual fund data are from Lipper, a | |
| Thomson Reuters Company, or Morningstar, Inc., unless | |
| otherwise noted. | |
| |
| You can obtain a free copy of Vanguard’s proxy voting | |
| guidelines by visiting vanguard.com/proxyreporting or by | |
| calling Vanguard at 800-662-2739. The guidelines are | |
| also available from the SEC’s website, sec.gov. In | |
| addition, you may obtain a free report on how your fund | |
| voted the proxies for securities it owned during the 12 | |
| months ended June 30. To get the report, visit either | |
| vanguard.com/proxyreporting or sec.gov. | |
| |
| You can review and copy information about your fund at | |
| the SEC’s Public Reference Room in Washington, D.C. To | |
| find out more about this public service, call the SEC at | |
| 202-551-8090. Information about your fund is also | |
| available on the SEC’s website, and you can receive | |
| copies of this information, for a fee, by sending a | |
| request in either of two ways: via email addressed to | |
| publicinfo@sec.gov or via regular mail addressed to the | |
| Public Reference Section, Securities and Exchange | |
| Commission, Washington, DC 20549-1520. | |
| |
| | © 2016 The Vanguard Group, Inc. |
| | All rights reserved. |
| | Vanguard Marketing Corporation, Distributor. |
| |
| | Q302 042016 |
Item 2: Code of Ethics.
Not Applicable.
Item 3: Audit Committee Financial Expert.
Not Applicable.
Item 4: Principal Accountant Fees and Services.
(a) Audit Fees.
Not Applicable.
Item 5: Audit Committee of Listed Registrants.
Not Applicable.
Item 6: Investments.
Not Applicable.
Item 7: Disclosure of Proxy Voting Policies and Procedures for Closed-End Management
Investment Companies.
Not Applicable.
Item 8: Portfolio Managers of Closed-End Management Investment Companies.
Not Applicable.
Item 9: Purchase of Equity Securities by Closed-End Management Investment Company and
Affiliated Purchasers.
Not Applicable.
Item 10: Submission of Matters to a Vote of Security Holders.
Not Applicable.
Item 11: Controls and Procedures.
(a) Disclosure Controls and Procedures. The Principal Executive and Financial Officers concluded that the Registrant’s Disclosure Controls and Procedures are effective based on their evaluation of the Disclosure Controls and Procedures as of a date within 90 days of the filing date of this report.
(b) Internal Control Over Financial Reporting. There were no significant changes in Registrant’s Internal Control Over Financial Reporting or in other factors that could significantly affect this control subsequent to the date of the evaluation, including any corrective actions with regard to significant deficiencies and material weaknesses.
Item 12: Exhibits.
(a) Certifications.
Pursuant to the requirements of the Securities Exchange Act of 1934 and the Investment Company Act of 1940, the registrant has duly caused this report to be signed on its behalf by the undersigned, thereunto duly authorized.
| | VANGUARD MONEY MARKET RESERVES |
| |
| |
| BY: | /s/ F. WILLIAM MCNABB III* |
| | F. WILLIAM MCNABB III |
| | CHIEF EXECUTIVE OFFICER |
| |
| Date: April 15, 2016 |
Pursuant to the requirements of the Securities Exchange Act of 1934 and the Investment Company Act of 1940, this report has been signed below by the following persons on behalf of the registrant and in the capacities and on the dates indicated.
| | VANGUARD MONEY MARKET RESERVES |
| |
| BY: | /s/ F. WILLIAM MCNABB III* |
| | F. WILLIAM MCNABB III |
| | CHIEF EXECUTIVE OFFICER |
| Date: April 15, 2016 |
| | VANGUARD MONEY MARKET RESERVES |
| |
| BY: | /s/ THOMAS J. HIGGINS* |
| | THOMAS J. HIGGINS |
| | CHIEF FINANCIAL OFFICER |
| Date: April 15, 2016 |
* By: /s/ Heidi Stam
Heidi Stam, pursuant to a Power of Attorney filed on April 22, 2014 see file Number 2-17620, Incorporated by Reference.